UNITED STATES
SECURITIES AND EXCHANGE COMMISSION
Washington, D.C. 20549
FORM N-CSR
CERTIFIED SHAREHOLDER REPORT OF REGISTERED
MANAGEMENT INVESTMENT COMPANIES
| | |
Investment Company Act file number | | 811-02884 |
Barrett Opportunity Fund, Inc.
|
| (Exact name of registrant as specified in charter) |
| | |
| 55 Water Street, New York, NY | | 10041 |
| (Address of principal executive offices) | | (Zip code) |
Robert I. Frenkel, Esq.
Legg Mason & Co., LLC
100 First Stamford Place
Stamford, CT 06902
|
| (Name and address of agent for service) |
Registrant’s telephone number, including area code:
Fund Investors Services 1-800-822-5544
or
Institutional Shareholder Services 1-888-425-6432
Date of fiscal year end: August 31
Date of reporting period: February 28, 2009
| ITEM 1. | REPORT TO STOCKHOLDERS. |
The Semi-Annual Report to Stockholders is filed herewith.

Semi-Annual Report
February 28, 2009
INVESTMENT PRODUCTS: NOT FDIC INSURED Ÿ NO BANK GUARANTEE Ÿ MAY LOSE VALUE

BARRETT
OPPORTUNITY FUND, INC.
Semi-Annual Report • February 28, 2009
Fund Objective | The Fund seeks to achieve above average long-term capital appreciation. Current income is a secondary objective. The Fund invests primarily in common stocks and securities convertible into or exchangeable for common stock such as convertible preferred stock or convertible debt securities. |
BARRETT
OPPORTUNITY FUND, INC.
Letter from the Chairperson | Dear Shareholder, |
We are pleased to provide the semi-annual report of Barrett Opportunity Fund, Inc. (the “Fund”) for the six-month period ended February 28, 2009.
The management team at Barrett Associates, Inc. has prepared the enclosed Manager Overview, which includes a brief market overview as well as a performance review. I urge you to read it as well as the accompanying financial statements. A detailed summary of the Fund’s performance and other pertinent information are also included in this report. I am sure you will find this report informative and useful.
On behalf of the Directors and the officers of the Fund, and in these difficult economic times, I thank you for your ongoing confidence in the Fund and its investment policies.
Sincerely,

Rosalind A. Kochman
Chairperson
March 27, 2009
1
BARRETT
OPPORTUNITY FUND, INC.
Manager Overview | Market Overview |
Economic and financial conditions have been deteriorating worldwide.
All the developed countries are in a recession, and the economies of faster growing, export-driven emerging countries are slowing rapidly. The spending retrenchment by the U.S. consumer, who normally accounts for 15-20% of total worldwide economic activity, is ongoing and likely to continue well into 2010. Not only is the U.S. consumer heavily indebted and suffering losses in home values and stock portfolios, but higher layoffs are also adding to the consumers’ list of problems. The other major problem is the continuing disarray in large, global financial institutions. Financial institutions worldwide are hoarding capital, shedding staff, and extending credit to only their most credit-worthy customers. We are in the midst of one of the longest recessions since the 1930s.
Most of the major economies have developed stimulus programs in an effort to use federal spending to fill the hole left by consumers. The U.S. stimulus plan generally has not been well received by markets and government officials in other countries, particularly Europe, have viewed the plan as too little, too late. At the upcoming Group of Twenty (“G-20”) Finance Ministers and Central Bank Governors meeting in April, we think that the U.S. will push their foreign friends to increase their stimulus plans, whereas the U.S. will face pressure to focus on improved regulation of financial companies and markets. For whatever reason, either lack of vision or disagreement on policies, the U.S. Department of the Treasury has not formulated a specific plan to deal with compromised institutions. Until stock and bond markets better understand how these problems are going to be addressed, we believe uncertainty will reign. However, it is clear that the pressure is mounting to provide answers to regulatory questions, bailouts, the disposition of toxic assets and other issues.
The huge stock market losses posted in 2008 have continued into 2009. Companies worldwide have reported a sharp drop-off in business at the tail end of last year. This abrupt decline in business has led to major reductions in earnings estimates, as well as increased dividend cuts across a broader range of industries. Regionally, Europe and Japan have felt the brunt of weaker export markets because their auto industries are more important to their economies than in other regions. Investors are desperately trying to calculate at what levels markets might bottom. With S&P 500 Index earnings estimated as low as $50 per share for 2009 and 2010, some market strategists now estimate that the S&P is likely to find support in the 600 range, or at a price earnings multiple of twelve. We currently agree with these estimates.
When we recalculate the earnings multiples of companies in the Fund to the current economic and earnings environment, we still think that our Fund holdings appear undervalued. As of the end of the reporting period, many of the companies in the Fund have yields in excess of 4%, and the total Fund portfolio produces a yield of 3.6%. With 30-year U.S. Treasuries at a similar yield, we think the Fund is reaching levels where our holdings may be better supported by yield.
Performance Review
There have not been very many six-month periods in the stock market of 40 percent declines, but, unfortunately we just completed one. As a result of the steep decline in economy activity, the more cyclical, industrial area of the market was one of the most severely affected. Fund Industrials holdings ABB Ltd. (ADR), Ameron International Corp. and General Dynamics Corp. declined more than the broad market. The Financials sector was also one of the worst performing segments of the market. Our largest positions in the Fund, Chubb Corp. and Bank of New York Mellon Corp., held up relatively well, but other companies, including Leucadia National Corp. and Forest City Enterprises Inc., fell more than the market. The less cyclical sectors of the Fund, such as Consumer Staples, performed considerably better than the market.
For the six-month period ended February 28, 2009, the Fund underperformed both the S&P 500 Index and its Lipper peer group. The Fund outperformed its peer group on an average annualized total return basis over the past 3- and 5-year periods. It trailed the peer group by over 2 percentage points for the 1-year period and by less than 35 basis points for the 10-year period. The Fund outperformed the S&P 500 Index for the past 5- and 10-year periods, but underperformed the
2
BARRETT
OPPORTUNITY FUND, INC.
broad market over the 1-year period and the 3-year period, primarily as a result of the difficult last 12 months.
| | | | | | | | | | |
Total Returns for Periods Ended February 28, 2009 (unaudited) |
| | | Total Returns | | Average Annual Total Returns |
| | | 6 Months | | 1 Year | | 3 Year | | 5 Year | | 10 Year |
Barrett Opportunity Fund, Inc. | | -44.28% | | -48.01% | | -16.54% | | -6.03% | | -0.18% |
S&P 500® Index1 | | -41.82% | | -43.32% | | -15.11% | | -6.64% | | -3.43% |
Lipper Multi-Cap Value Funds Category Average2 | | -43.20% | | -45.81% | | -17.37% | | -7.05% | | 0.16% |
The performance data quoted represent past performance. Past performance does not guarantee future results and current performance may be lower or higher than the performance data shown above. The investment return and principal value of an investment will fluctuate. An investor’s shares, when redeemed, may be worth more or less than their original cost. As economic and market conditions change frequently, there can be no assurance that trends described will continue or that forecasts will come to pass. Fund returns assume the reinvestment of all distributions, including returns of capital, if any, at net asset value and the deduction of all Fund expenses. Returns have not been adjusted to include the deduction of taxes that a shareholder would pay on Fund distributions. Performance data current to the most recent month end may be obtained by calling Funds Investor Services at 1-800-822-5544 or Institutional Shareholder Services at 1-888-425-6432. Shares of the Fund are distributed by Legg Mason Investor Services, LLC (“LMIS”) (Member SIPC/FINRA). LMIS and Barrett Associates, Inc., the Fund’s investment manager, are both wholly-owned subsidiaries of Legg Mason, Inc.
The Fund’s total annual operating expense ratio as of the Fund’s most current Prospectus dated December 15, 2008 was 1.03%.
All investing entails risk, including the possible loss of principal. The Fund is non-diversified, which means that it can invest a higher percentage of its assets in any one issuer than a diversified fund. Being non-diversified may magnify the Fund’s losses from events affecting a particular issuer. Please see the Fund’s current prospectus for more information on this and other risks.
| | 1 | The S&P 500® Index is a market-value weighted index comprised of 500 widely held common stocks. It is not possible to invest directly in the Index. The Index does not reflect deductions for fees, expenses or taxes. |
| | 2 | Lipper Multi-Cap Value Funds Category Average includes funds which invest in a variety of market cap ranges, generally have between 25-75% of their equity assets in companies with market caps above 300% of the dollar-weighted median of the S&P MidCap 400 Index, invest in companies considered to be undervalued, and have below-average price-to-earnings ratios, price-to-book ratios, and three-year earnings growth figures. |
Thank you for your continued interest in the Fund.
Sincerely,
| | |
 | |  |
Amy LaGuardia, CFA Portfolio Manager | | Robert Milnamow Portfolio Manager |
March 17, 2009
The outlook and views presented above are those of the Fund’s portfolio managers as of March 17, 2009 and are subject to change. This information is intended for the shareholders of the Fund and is not for distribution to prospective investors unless preceded or accompanied by a current prospectus. Investors should consider the risks, investment objective, charges and expenses of the Fund carefully before investing. The prospectus, which contains this and other information about the Fund, is available at www.barrettassociates.com. Investors should read the prospectus carefully before investing.
3
BARRETT
OPPORTUNITY FUND, INC.
Fund at a Glance (Unaudited)
| | | | |
Top Ten Holdings - as of 2/28/2009
(As a percentage of Total Investments) | | | | Sector Weightings - as of 2/28/2009
(As a percentage of Total Investments) |
| | |
Chubb Corp. | | 17.2% | | 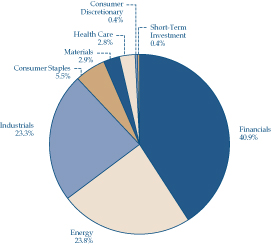 |
Bank of New York Mellon Corp. | | 13.6% | |
Royal Dutch Shell PLC | | 13.5% | |
General Dynamics Corp. | | 8.3% | |
Koninklijke Philips Electronics NV | | 8.2% | |
Murphy Oil Corp. | | 7.2% | |
Ameron International Corp. | | 3.6% | |
Leucadia National Corp. | | 3.4% | |
| Rayonier Inc. | | 3.2% | |
| Hershey Co. | | 2.9% | |
| | | |
| | | |
| | | |
| | | |
| | | |
| | | |
| | | |
| | | |
4
BARRETT
OPPORTUNITY FUND, INC.
Fund Expenses (Unaudited)
Example
As a shareholder of the Fund, you may incur two types of costs: (1) transaction costs; and (2) ongoing costs, including management fees and other Fund expenses. This example is intended to help you understand your ongoing costs (in dollars) of investing in the Fund and to compare these costs with the ongoing costs of investing in other mutual funds.
This example is based on an investment of $1,000 invested on September 1, 2008 and held for the six months ended February 28, 2009.
Actual Expenses
The table below titled “Based on Actual Total Return” provides information about actual account values and actual expenses. You may use the information provided in this table, together with the amount you invested, to estimate the expenses that you paid over the period. To estimate the expenses you paid on your account, divide your ending account value by $1,000 (for example, an $8,600 ending account value divided by $1,000 = 8.6), then multiply the result by the number under the heading entitled “Expenses Paid During the Period”.
Based on Actual Total Return1
| | | | | | | | | | | | | | | |
| | | Actual
Total Return2 | | | Beginning
Account
Value | | Ending
Account
Value | | Annualized
Expense
Ratio | | | Expenses
Paid During
the Period3 |
Barrett Opportunity Fund, Inc. | | -44.28 | % | | $ | 1,000.00 | | $ | 557.20 | | 1.20 | % | | $ | 4.63 |
1 | | For the six months ended February 28, 2009. |
2 | | Assumes the reinvestment of all distributions, including returns of capital, if any, at net asset value. Total return is not annualized, as it may not be representative of the total return for the year. Performance figures may reflect fee waivers and/or expense reimbursements. In the absence of fee waivers and/or expense reimbursements, the total return would have been lower. Past performance is no guarantee of future results. |
3 | | Expenses (net of fee waivers and/or expense reimbursements) are equal to the Fund’s annualized expense ratio, multiplied by the average account value over the period, multiplied by the number of days in the most recent fiscal half-year, then divided by 365. |
5
BARRETT
OPPORTUNITY FUND, INC.
Fund Expenses (Unaudited) (Continued)
Hypothetical Example for Comparison Purposes
The table below titled “Based on Hypothetical Total Return” provides information about hypothetical account values and hypothetical expenses based on the actual expense ratio and an assumed rate of return of 5.00% per year before expenses, which is not the Fund’s actual return. The hypothetical account values and expenses may not be used to estimate the actual ending account balance or expenses you paid for the period. You may use the information provided in this table to compare the ongoing costs of investing in the Fund and other funds. To do so, compare the 5.00% hypothetical example relating to the Fund with the 5.00% hypothetical examples that appear in the shareholder reports of the other funds.
Please note that the expenses shown in the table below are meant to highlight your ongoing costs only and do not reflect any transactional costs. Therefore, the table is useful in comparing ongoing costs only, and will not help you determine the relative total costs of owning different funds. In addition, if these transaction costs were included, your costs would have been higher.
Based on Hypothetical Total Return1
| | | | | | | | | | | | | | | |
| | | Hypothetical
Annualized
Total Return | | | Beginning
Account
Value | | Ending
Account
Value | | Annualized
Expense
Ratio | | | Expenses
Paid During
the Period2 |
Barrett Opportunity Fund, Inc. | | 5.00 | % | | $ | 1,000.00 | | $ | 1,018.84 | | 1.20 | % | | $ | 6.01 |
1 | | For the six months ended February 28, 2009. |
2 | | Expenses (net of fee waivers and/or expense reimbursements) are equal to the Fund’s annualized expense ratio, multiplied by the average account value over the period, multiplied by the number of days in the most recent fiscal half-year, then divided by 365. |
6
BARRETT
OPPORTUNITY FUND, INC.
Schedule of Investments
February 28, 2009
(Unaudited)
| | | | | |
Shares | |
Security | | Value |
| | COMMON STOCKS - 99.5% |
| | CONSUMER DISCRETIONARY - 0.4% |
| | Household Durables - 0.0% |
| | Liberty Homes Inc.: | | | |
| 14,850 | | Class A Shares (a) | | $ | 9,281 |
| 22,050 | | Class B Shares (a) | | | 5,513 |
| | | | | |
| | Total Household Durables | | | 14,794 |
| | | | | |
| | Media - 0.4% | | | |
| 10,000 | | Omnicom Group Inc. | | | 240,300 |
| | | | | |
| | Total Consumer Discretionary | | | 255,094 |
| | | | | |
| |
| | CONSUMER STAPLES - 5.5% |
| | Food & Staples Retailing - 0.0% |
| 96,000 | | FHC Delaware Inc. (a)(b)* | | | 0 |
| | | | | |
| | Food Products - 2.9% | | | |
| 47,400 | | Hershey Co. | | | 1,596,906 |
| | | | | |
| | Household Products - 2.6% |
| 29,900 | | Procter & Gamble Co. | | | 1,440,283 |
| | | | | |
| | Total Consumer Staples | | | 3,037,189 |
| | | | | |
| |
| | ENERGY - 23.8% |
| | Energy Equipment & Services - 1.5% |
| 13,300 | | Diamond Offshore Drilling Inc. | | | 833,112 |
| | | | | |
| | Oil, Gas & Consumable Fuels - 22.3% |
| 10,176 | | EnCana Corp. | | | 400,629 |
| 95,100 | | Murphy Oil Corp. | | | 3,976,131 |
| 19,600 | | Overseas Shipholding Group Inc. | | | 504,112 |
| 170,100 | | Royal Dutch Shell PLC, ADR, Class A Shares | | | 7,479,297 |
| | | | | |
| | Total Oil, Gas & Consumable Fuels | | | 12,360,169 |
| | | | | |
| | Total Energy | | | 13,193,281 |
| | | | | |
| |
| | FINANCIALS - 40.8% |
| | Capital Markets - 13.6% |
| 340,071 | | Bank of New York Mellon Corp. | | | 7,539,374 |
| | | | | |
| | | | | |
Shares | |
Security | | Value |
| | Diversified Financial Services - 3.4% |
| 130,600 | | Leucadia National Corp. * | | $ | 1,910,678 |
| | | | | |
| | Insurance - 18.7% |
| 244,700 | | Chubb Corp. | | | 9,553,088 |
| 41,500 | | CNA Financial Corp. | | | 330,340 |
| 24,700 | | Loews Corp. | | | 490,295 |
| | | | | |
| | Total Insurance | | | 10,373,723 |
| | | | | |
| | Real Estate Investment Trusts
(REITs) - 3.1% |
| 65,890 | | Rayonier Inc. | | | 1,752,674 |
| | | | | |
| | Real Estate Management & Development - 2.0% |
| | Forest City Enterprises Inc.: | | | |
| 103,400 | | Class A Shares | | | 518,034 |
| 115,900 | | Class B Shares (c) | | | 571,387 |
| | | | | |
| | Total Real Estate Management & Development | | | 1,089,421 |
| | | | | |
| | Total Financials | | | 22,665,870 |
| | | | | |
| |
| | HEALTH CARE - 2.8% |
| | Health Care Providers & Services - 2.8% |
| 45,308 | | WellPoint Inc. * | | | 1,536,848 |
| | | | | |
| |
| | INDUSTRIALS - 23.3% |
| | Aerospace & Defense - 9.4% |
| 104,800 | | General Dynamics Corp. | | | 4,592,336 |
| 9,900 | | Lockheed Martin Corp. | | | 624,789 |
| | | | | |
| | Total Aerospace & Defense | | | 5,217,125 |
| | | | | |
| | Building Products - 3.6% | | | |
| 40,700 | | Ameron International Corp. | | | 1,989,009 |
| | | | | |
| | Commercial Services & Supplies - 0.5% |
| 96,650 | | TRC Cos. Inc. * | | | 266,754 |
| | | | | |
| | Electrical Equipment - 0.8% |
| 38,000 | | ABB Ltd., ADR | | | 457,900 |
| | | | | |
See Notes to Financial Statements.
7
BARRETT
OPPORTUNITY FUND, INC.
Schedule of Investments
February 28, 2009
(Unaudited) (Continued)
| | | | | |
Shares | |
Security | | Value |
| | Industrial Conglomerates - 8.2% |
| 285,710 | | Koninklijke Philips Electronics NV, New York Registered Shares | | $ | 4,568,503 |
| | | | | |
| | Marine - 0.8% |
| 23,400 | | Alexander & Baldwin Inc. | | | 439,686 |
| | | | | |
| | Total Industrials | | | 12,938,977 |
| | | | | |
| | |
| | MATERIALS - 2.9% | | | |
| | Chemicals - 2.9% |
| 20,842 | | Monsanto Co. | | | 1,589,619 |
| | | | | |
| | Total Investments Before
Short-term Investment
(Cost - $15,048,957) | | | 55,216,878 |
| | | | | |
| | | | | |
Face
Amount | | Security | | Value |
| | SHORT-TERM INVESTMENT - 0.4% |
| | Repurchase Agreement - 0.4% |
| $221,000 | | State Street Bank & Trust
Co. dated 2/27/09, 0.010% due 3/2/09; Proceeds at maturity - $221,000;
(Fully collateralized by
U.S. Treasury Bill,
0.000% due 8/27/09;
Market value - $229,494) (Cost - $221,000) | | $ | 221,000 |
| | | | | |
| | Total Investments - 99.9%
(Cost - $15,269,957#) | | | 55,437,878 |
| | Other Assets in Excess of Liabilities - 0.1% | | | 83,219 |
| | | | | |
| | Total Net Assets - 100.0% | | $ | 55,521,097 |
| | | | | |
| * | Non-income producing security. |
| (b) | Security is valued in good faith at fair value by or under the direction of the Board of Directors (See Note 1). |
| (c) | Convertible into Forest City Enterprises Inc., Class A Shares. |
| # | Aggregate cost for federal income tax purposes is substantially the same. |
| | Abbreviation used in this schedule: |
| | ADR—American Depositary Receipt |
See Notes to Financial Statements.
8
BARRETT
OPPORTUNITY FUND, INC.
Statement of Assets and Liabilities
February 28, 2009
(Unaudited)
| | | |
ASSETS: | | | |
Investments, at value
(Cost - $15,269,957) | | $ | 55,437,878 |
Cash | | | 556 |
Dividends and interest receivable | | | 203,277 |
Prepaid expenses | | | 12,382 |
| | | |
Total assets | | | 55,654,093 |
| | | |
LIABILITIES: | | | |
Investment management fee payable | | | 35,562 |
Directors’ fees payable | | | 8,560 |
Accrued expenses | | | 88,874 |
| | | |
Total liabilities | | | 132,996 |
| | | |
Total net assets | | $ | 55,521,097 |
| | | |
NET ASSETS: | | | |
Par value (Note 4) | | $ | 23,340 |
Paid-in capital in excess of par value | | | 13,639,400 |
Undistributed net investment income | | | 5,014 |
Accumulated net realized gain on investments | | | 1,685,422 |
Net unrealized appreciation on investments | | | 40,167,921 |
| | | |
Total net assets | | $ | 55,521,097 |
| | | |
Shares outstanding | | | 2,334,013 |
| | | |
Net asset value | | | $23.79 |
| | | |
Statement of Operations
For the Six Months Ended February 28, 2009 (Unaudited)
| | | | |
INVESTMENT INCOME: | | | | |
Dividends | | $ | 1,048,266 | |
Interest | | | 3,006 | |
Less: Foreign taxes withheld | | | (42,045 | ) |
| | | | |
Total investment income | | | 1,009,227 | |
| | | | |
| |
EXPENSES: | | | | |
Investment management fee (Note 2) | | | 288,644 | |
Legal fees | | | 79,392 | |
Directors’ fees | | | 29,429 | |
Audit and tax | | | 21,436 | |
Transfer agent fees | | | 16,409 | |
Registration fees | | | 12,605 | |
Shareholder reports | | | 9,654 | |
Insurance | | | 1,583 | |
Custody fees | | | 156 | |
Miscellaneous expenses | | | 4,339 | |
| | | | |
Total expenses | | | 463,647 | |
| | | | |
Net investment income | | | 545,580 | |
| | | | |
|
REALIZED AND UNREALIZED
GAIN (LOSS) ON INVESTMENTS
(NOTES 1 and 3): | |
Net realized gain from investment transactions | | | 1,685,656 | |
Change in net unrealized appreciation/depreciation from investments | | | (50,917,698 | ) |
| | | | |
Net loss on investments | | | (49,232,042 | ) |
| | | | |
Decrease in net assets from operations | | $ | (48,686,462 | ) |
| | | | |
See Notes to Financial Statements.
9
BARRETT
OPPORTUNITY FUND, INC.
Statements of Changes in Net Assets
For the Six Months Ended February 28, 2009 (Unaudited) and the Year Ended August 31, 2008
| | | | | | | | |
| | | 2009 | | | 2008 | |
OPERATIONS: | | | | | | | | |
Net investment income | | $ | 545,580 | | | $ | 1,103,991 | |
Net realized gain | | | 1,685,656 | | | | 18,269,983 | |
Change in net unrealized appreciation/depreciation | | | (50,917,698 | ) | | | (35,127,326 | ) |
| | | | | | | | |
Decrease in net assets from operations | | | (48,686,462 | ) | | | (15,753,352 | ) |
| | | | | | | | |
| | |
DISTRIBUTIONS TO SHAREHOLDERS FROM (NOTE 1): | | | | | | | | |
Net investment income | | | (1,300,001 | ) | | | (900,000 | ) |
Net realized gains | | | (9,524,702 | ) | | | (7,350,641 | ) |
| | | | | | | | |
Decrease in net assets from distributions to shareholders | | | (10,824,703 | ) | | | (8,250,641 | ) |
| | | | | | | | |
| | |
FUND SHARE TRANSACTIONS (NOTES 4 AND 5): | | | | | | | | |
Net proceeds from sale of shares | | | 202,078 | | | | 944,085 | |
Reinvestment of distributions | | | 5,697,627 | | | | 4,667,815 | |
Cost of shares repurchased | | | (4,631,129 | ) | | | (15,634,908 | ) |
| | | | | | | | |
Increase (Decrease) in net assets from fund share transactions | | | 1,268,576 | | | | (10,023,008 | ) |
| | | | | | | | |
Decrease in net assets | | | (58,242,589 | ) | | | (34,027,001 | ) |
| | |
NET ASSETS: | | | | | | | | |
Beginning of period | | | 113,763,686 | | | | 147,790,687 | |
| | | | | | | | |
End of period* | | $ | 55,521,097 | | | $ | 113,763,686 | |
| | | | | | | | |
*Includes undistributed net investment income of: | | | $5,014 | | | | $759,435 | |
| | | | | | | | |
See Notes to Financial Statements.
10
BARRETT
OPPORTUNITY FUND, INC.
Financial Highlights
For a share of capital stock outstanding throughout each year ended August 31, unless otherwise noted:
| | | | | | | | | | | | | | | | | | |
| | | 2009(1) | | | 2008 | | | 2007 | | | 2006 | | | 2005 | | | 2004 | |
NET ASSET VALUE | | | | | | | | | | | | | | | | | | |
Beginning of period | | $50.14 | | | $60.62 | | | $56.71 | | | $50.98 | | | $42.92 | | | $41.34 | |
| | | | | | | | | | | | | | | | | | |
INCOME (LOSS) FROM OPERATIONS: | | | | | | | | | | | | | | | | | | |
Net investment income | | 0.25 | | | 0.48 | | | 0.45 | | | 0.32 | | | 0.53 | | | 0.49 | |
Net realized and unrealized gain (loss) | | (21.71 | ) | | (7.55 | ) | | 5.67 | | | 7.04 | | | 8.31 | | | 3.99 | |
| | | | | | | | | | | | | | | | | | |
Total Income (Loss) From Operations | | (21.46 | ) | | (7.07 | ) | | 6.12 | | | 7.36 | | | 8.84 | | | 4.48 | |
| | | | | | | | | | | | | | | | | | |
LESS DISTRIBUTIONS FROM: | | | | | | | | | | | | | | | | | | |
Net investment income | | (0.59 | ) | | (0.37 | ) | | (0.35 | ) | | (0.46 | ) | | (0.56 | ) | | (0.37 | ) |
Net realized gains | | (4.30 | ) | | (3.04 | ) | | (1.86 | ) | | (1.17 | ) | | (0.22 | ) | | (2.53 | ) |
| | | | | | | | | | | | | | | | | | |
Total Distributions | | (4.89 | ) | | (3.41 | ) | | (2.21 | ) | | (1.63 | ) | | (0.78 | ) | | (2.90 | ) |
| | | | | | | | | | | | | | | | | | |
NET ASSET VALUE | | | | | | | | | | | | | | | | | | |
End of period | | $23.79 | | | $50.14 | | | $60.62 | | | $56.71 | | | $50.98 | | | $42.92 | |
| | | | | | | | | | | | | | | | | | |
Total return(2) | | (44.28 | )% | | (12.55 | )% | | 10.92 | % | | 14.79 | % | | 20.77 | % | | 11.09 | % |
Net Assets, end of period (millions) | | $56 | | | $114 | | | $148 | | | $158 | | | $137 | | | $131 | |
RATIOS TO AVERAGE NET ASSETS: | | | | | | | | | | | | | | | | | | |
Gross expenses | | 1.20 | %(3) | | 1.03 | % | | 1.01 | % | | 1.04 | % | | 0.96 | % | | 1.06 | % |
Net expenses | | 1.20 | (3) | | 1.03 | | | 1.01 | | | 1.04 | (4) | | 0.96 | | | 1.06 | |
Net investment income | | 1.42 | (3) | | 0.83 | | | 0.70 | | | 0.66 | | | 1.06 | | | 1.04 | |
Portfolio Turnover Rate | | 0 | %(5) | | 3 | %(6) | | 6 | % | | 0 | %(5)(6) | | 1 | %(6) | | 1 | %(6) |
(1) | For the six months ended February 28, 2009 (unaudited). |
(2) | Performance figures may reflect fee waivers and/or expense reimbursements. In the absence of fee waivers and/or expense reimbursements, the total return would have been lower. Past performance is no guarantee of future results. Total returns for periods of less than one year are not annualized. |
(4) | Reflects fee waivers and/or expense reimbursements. |
(5) | Amount represents less than 1%. |
(6) | Excludes the value of portfolio securities delivered as a result of in-kind redemptions of the Fund’s capital shares. |
See Notes to Financial Statements.
11
BARRETT
OPPORTUNITY FUND, INC.
Notes to Financial Statements (Unaudited)
1. ORGANIZATION AND SIGNIFICANT ACCOUNTING POLICIES | Barrett Opportunity Fund, Inc. (the “Fund”) is registered as a non-diversified, open-end management investment company under the Investment Company Act of 1940, as amended, (the “1940 Act”). |
The following are significant accounting policies consistently followed by the Fund and are in conformity with U.S. generally accepted accounting principles (“GAAP”). Estimates and assumptions are required to be made regarding assets, liabilities and changes in net assets resulting from operations when financial statements are prepared. Changes in the economic environment, financial markets and any other parameters used in determining these estimates could cause actual results to differ.
(a) Investment Valuation
Equity securities for which market quotations are available are valued at the last reported sales price or official closing price on the primary market or exchange on which they trade. Debt securities are valued at the mean between the last quoted bid and asked prices provided by an independent pricing service that are based on transactions in debt obligations, quotations from bond dealers, market transactions in comparable securities and various other relationships between securities. When prices are not readily available, or are determined not to reflect fair value, such as when the value of a security has been significantly affected by events after the close of the exchange or market on which the security is principally traded, but before the Fund calculates its net asset value, the Fund may value these securities at fair value as determined in accordance with the procedures approved by the Fund’s Board of Directors. Short-term obligations with maturities of 60 days or less are valued at amortized cost, which approximates fair value.
Effective September 1, 2008, the Fund adopted Statement of Financial Accounting Standards No. 157 (“FAS 157”). FAS 157 establishes a single definition of fair value, creates a three-tier hierarchy as a framework for measuring fair value based on inputs used to value the Fund’s investments, and requires additional disclosure about fair value. The hierarchy of inputs is summarized below.
| | • | | Level 1 - quoted prices in active markets for identical investments |
| | • | | Level 2 - other significant observable inputs (including quoted prices for similar investments, interest rates, prepayment speeds, credit risk, etc.) |
| | • | | Level 3 - significant unobservable inputs (including the Fund’s own assumptions in determining the fair value of investments) |
The inputs or methodology used for valuing securities are not necessarily an indication of the risk associated with investing in those securities.
12
BARRETT
OPPORTUNITY FUND, INC.
The following is a summary of the inputs used in valuing the Fund’s assets carried at fair value:
| | | | | | | | | | | | |
| | | February 28, 2009 | | Quoted
Prices
(Level 1) | | Other
Significant
Observable
Inputs
(Level 2) | | Significant
Unobservable
Inputs
(Level 3) |
Investments in securities | | $ | 55,437,878 | | $ | 55,211,365 | | $ | 221,000 | | $ | 5,513 |
Following is a reconciliation of investments in which significant unobservable inputs (Level 3) were used in determining fair value:
| | | |
| | | Investments
in Securities |
Balance as of August 31, 2008 | | | — |
Accrued premiums/discounts | | | — |
Realized gain (loss) | | | — |
Change in unrealized appreciation (depreciation) | | | — |
Net purchases (sales) | | | — |
Transfers in and/or out of Level 3 | | $ | 5,513 |
| | | |
Balance as of February 28, 2009 | | $ | 5,513 |
| | | |
(b) Repurchase Agreements
When entering into repurchase agreements, it is the Fund’s policy that its custodian or a third party custodian take possession of the underlying collateral securities, the market value of which, at all times, at least equals the principal amount of the repurchase transaction, including accrued interest. To the extent that any repurchase transaction exceeds one business day, the value of the collateral is marked-to-market to ensure the adequacy of the collateral. If the seller defaults, and the market value of the collateral declines or if bankruptcy proceedings are commenced with respect to the seller of the security, realization of the collateral by the Fund may be delayed or limited.
(c) Security Transactions and Investment Income
Security transactions are accounted for on a trade date basis. Interest income, adjusted for amortization of premium and accretion of discount, is recorded on the accrual basis. Dividend income is recorded on the ex-dividend date. Foreign dividend income is recorded on the ex-dividend date or as soon as practicable after the Fund determines the existence of a dividend declaration after exercising reasonable due diligence. The cost of investments sold is determined by use of the specific identification method.
(d) Distributions to Shareholders
Distributions from net investment income and distributions of net realized gains, if any, are declared at least annually. Distributions to shareholders of the Fund
13
BARRETT
OPPORTUNITY FUND, INC.
are recorded on the ex-dividend date and are determined in accordance with income tax regulations, which may differ from GAAP.
(e) REIT Distributions
The character of distributions received from Real Estate Investment Trusts (“REITs”) held by the Fund is generally comprised of net investment income, capital gains, and return of capital. It is the policy of the Fund to estimate the character of distributions received from underlying REITs based on historical data provided by the REITs. After each calendar year end, REITs report the actual tax character of these distributions. Differences between the estimated and actual amounts reported by the REITs are reflected in the Fund’s records in the year in which they are reported by the REITs.
(f) Federal and Other Taxes
It is the Fund’s policy to comply with the federal income and excise tax requirements of the Internal Revenue Code of 1986, as amended, applicable to regulated investment companies. Accordingly, the Fund intends to distribute substantially all of its taxable income and net realized gains, if any, to shareholders each year. Therefore, no federal income tax provision is required in the Fund’s financial statements.
Management has analyzed the Fund’s tax positions taken on federal income tax returns for all open tax years and has concluded that as of February 28, 2009, no provision for income tax would be required in the Fund’s financial statements. The Fund’s federal and state income and federal excise tax returns for tax years for which the applicable statutes of limitations have not expired are subject to examination by the Internal Revenue Service and state departments of revenue.
Under the applicable foreign tax laws, a withholding tax may be imposed on interest, dividends and capital gains at various rates.
(g) Reclassification
GAAP requires that certain components of net assets be adjusted to reflect permanent differences between financial and tax reporting. These reclassifications have no effect on net assets or net asset values per share.
2. INVESTMENT MANAGEMENT AGREEMENT AND OTHER TRANSACTIONS WITH AFFILIATES | Barrett Associates, Inc. (“Barrett”) is the Fund’s investment manager. Barrett is a wholly-owned subsidiary of Legg Mason, Inc. (“Legg Mason”). Under the investment management agreement, the Fund pays an investment management fee calculated daily and paid monthly in accordance with the following breakpoint schedule: |
| | | |
Average Daily Net Assets | | Annual Rate | |
| First $1 billion | | 0.750 | % |
| Next $1 billion | | 0.725 | |
| Next $3 billion | | 0.700 | |
| Next $5 billion | | 0.675 | |
| Over $10 billion | | 0.650 | |
14
BARRETT
OPPORTUNITY FUND, INC.
Legg Mason Fund Advisor, LLC (“LMPFA”) serves as the sub-administrator of the Fund, providing certain administrative services to the Fund pursuant to a sub-administration agreement between Barrett and LMPFA. LMPFA is an affiliate of Legg Mason and Barrett. Barrett, and not the Fund, pays LMPFA for its services as sub-administrator.
Legg Mason Investor Services, LLC, a wholly-owned broker-dealer subsidiary of Legg Mason, serves as the Fund’s sole and exclusive distributor.
The officers of the Fund are employees of Legg Mason or its affiliates and do not receive compensation from the Fund.
3. INVESTMENTS | During the six months ended February 28, 2009, the aggregate cost of purchases and proceeds from sales of investments (excluding short-term investments) were as follows: |
| | |
Purchases | | Sales |
| $0 | | $6,007,397 |
At February 28, 2009, the aggregate gross unrealized appreciation and depreciation of investments for federal income tax purposes were substantially as follows:
| | | | |
Gross unrealized appreciation | | $ | 42,831,766 | |
Gross unrealized depreciation | | | (2,663,845 | ) |
| | | | |
Net unrealized appreciation | | $ | 40,167,921 | |
| | | | |
4. CAPITAL SHARES | At February 28, 2009, the Fund had 15,000,000 shares of capital stock authorized with a par value of $0.01 per share. Transactions in shares of the Fund were as follows: |
| | | | | | |
| | | Six Months Ended
February 28, 2009 | | | Year Ended
August 31, 2008 | |
Shares sold | | 7,084 | | | 16,358 | |
Shares issued on reinvestment | | 203,052 | | | 78,280 | |
Shares repurchased | | (145,261 | ) | | (263,666 | ) |
| | | | | | |
Net increase (decrease) | | 64,875 | | | (169,028 | ) |
| | | | | | |
5. REDEMPTIONS- IN-KIND | The Fund may make payment for Fund shares redeemed wholly or in part by distributing portfolio securities to shareholders. For the year ended August 31, 2008, the Fund had redemptions-in-kind with total proceeds in the amount of $9,831,464. The net realized gains on these redemptions-in-kind amounted to $8,557,015, which will not be realized for tax purposes. |
6. LEGAL MATTERS | Beginning in June 2004, class action lawsuits alleging violations of the federal securities laws were filed against Citigroup Global Markets Inc. (“CGM”), a former distributor of the Fund, and other affiliated funds (collectively, the “Funds”) and a number of its then affiliates, including Smith Barney Fund Management LLC (“SBFM”) and Salomon Brothers Asset Management Inc. (“SBAM”), which were then investment adviser or manager to certain of the |
15
BARRETT
OPPORTUNITY FUND, INC.
| | Funds (the “Managers”), substantially all of the mutual funds then managed by the Managers (the “Defendant Funds”), and Board members of the Defendant Funds (collectively, the “Defendants”). The complaints alleged, among other things, that CGM created various undisclosed incentives for its brokers to sell Smith Barney and Salomon Brothers funds. In addition, according to the complaints, the Managers caused the Defendant Funds to pay excessive brokerage commissions to CGM for steering clients towards proprietary funds. The complaints also alleged that the Defendants breached their fiduciary duty to the Defendant Funds by improperly charging Rule 12b-1 fees and by drawing on fund assets to make undisclosed payments of soft dollars and excessive brokerage commissions. The complaints also alleged that the Defendant Funds failed to adequately disclose certain of the allegedly wrongful conduct. The complaints sought injunctive relief and compensatory and punitive damages, rescission of the Defendant Funds’ contracts with the Managers, recovery of all fees paid to the Managers pursuant to such contracts and an award of attorneys’ fees and litigation expenses. |
On December 15, 2004, a consolidated amended complaint (the “Complaint”) was filed alleging substantially similar causes of action. On May 27, 2005, all of the Defendants filed motions to dismiss the Complaint. On July 26, 2006, the court issued a decision and order (1) finding that plaintiffs lacked standing to sue on behalf of the shareholders of the Funds in which none of the plaintiffs had invested and dismissing those Funds from the case (although stating that they could be brought back into the case if standing as to them could be established), and (2) other than one stayed claim, dismissing all of the causes of action against the remaining Defendants, with prejudice, except for the cause of action under Section 36(b) of the 1940 Act, which the court granted plaintiffs leave to repeal as a derivative claim.
On October 16, 2006, plaintiffs filed their Second Consolidated Amended Complaint (“Second Amended Complaint”) which alleges derivative claims on behalf of nine funds identified in the Second Amended Complaint, under Section 36(b) of the 1940 Act, against Citigroup Asset Management, SBAM and SBFM as investment advisers to the identified funds, as well as CGM as a distributor for the identified funds (collectively, the “Second Amended Complaint Defendants”). The Fund was not identified in the Second Amended Complaint. The Second Amended Complaint alleges no claims against any of the funds or any of their Board Members. Under Section 36(b), the Second Amended Complaint alleges similar facts and seeks similar relief against the Second Amended Complaint Defendants as the Complaint.
On December 3, 2007, the court granted the Defendant’s motion to dismiss, with prejudice. On January 2, 2008, the plaintiffs filed a notice of appeal to the Second Circuit Court of Appeals.
Additional lawsuits arising out of these circumstances and presenting similar allegations and requests for relief may be filed in the future.
* * *
16
BARRETT
OPPORTUNITY FUND, INC.
Beginning in August 2005, five class action lawsuits alleging violations of federal securities laws and state law were filed against CGM and SBFM, (collectively, the “Defendants”) based on the May 31, 2005 settlement order issued against the Defendants by the Securities and Exchange Commission as previously described. The complaints seek injunctive relief and compensatory and punitive damages, removal of SBFM as the investment manager for the Smith Barney family of funds, rescission of the funds’ management and other contracts with SBFM, recovery of all fees paid to SBFM pursuant to such contracts, and an award of attorneys’ fees and litigation expenses. The five actions were subsequently consolidated, and a consolidated complaint was filed.
On September 26, 2007, the United States District Court for the Southern District of New York issued an order dismissing the consolidated complaint, and judgement was later entered. An appeal has been filed and is pending before the U.S. Court of Appeals for the Second Circuit.
7. RECENT
ACCOUNTING PRONOUNCE-
MENT | In March 2008, the Financial Accounting Standards Board issued the Statement of Financial Accounting Standards No. 161, Disclosures about Derivative Instruments and Hedging Activities (“FAS 161”). FAS 161 is effective for fiscal years and interim periods beginning after November 15, 2008. FAS 161 requires enhanced disclosures about the Fund’s derivative and hedging activities, including how such activities are accounted for and their effect on the Fund’s financial position, performance and cash flows. Management is currently evaluating the impact the adoption of FAS 161 will have on the Fund’s financial statements and related disclosures. |
17
BARRETT
OPPORTUNITY FUND, INC.
Basis for Approval of the Fund’s Management Agreement (Unaudited)
Background
The Investment Company Act of 1940 (the “1940 Act”) requires that the Board of Directors (the “Board”) of The Barrett Opportunity Fund, Inc. (the “Fund”), including a majority of its members that are not considered to be “interested persons” under the 1940 Act (the “Independent Directors”) voting separately, approve the continuation of the investment management contract (the “Management Agreement”) with the Fund’s manager, Barrett Associates (the “Manager”), on an annual basis. At a meeting (the “Contract Renewal Meeting”) held in-person on December 9, 2008, the Board, including the Independent Directors, considered and approved continuation of the Management Agreement for an additional one-year term. To assist in its consideration of the renewals of the Management Agreement, the Board received and considered a variety of information about the Manager and affiliates of the Manager that provide services to the Fund, as well as the investment advisory and other management arrangements for the Fund (together with the information provided at the Contract Renewal Meeting, the “Contract Renewal Information”), certain portions of which are discussed below. In addition to the Contract Renewal Information, the Board received performance and other information throughout the year related to the services rendered by the Manager and its affiliates to the Fund. The Board’s evaluation took into account the information received throughout the year and also reflected the knowledge and familiarity gained as Board members of the Fund with respect to the services provided to the Fund by the Manager and its affiliates.
The discussion below covers both the investment advisory and administrative functions being rendered to the Fund by the Manager directly and through its affiliates pursuant to the Management Agreement.
Board Approval of Management Agreement
In its deliberations regarding renewal of the Management Agreement, the Fund’s Board, including the Independent Directors, considered the factors below.
Nature, Extent and Quality of the Services under the Management Agreement
The Board received and considered Contract Renewal Information regarding the nature, extent and quality of the investment advisory services provided to the Fund by the Manager and its affiliates under the Management Agreement during the past year. The Board also reviewed Contract Renewal Information regarding the Fund’s compliance policies and procedures established pursuant to Rule 38a-1 under the 1940 Act.
The Board reviewed the qualifications, backgrounds and responsibilities of the Fund’s senior personnel and the portfolio management team primarily responsible for the day-to-day portfolio management of the Fund. The Board also considered, based on its knowledge of the Manager and its affiliates and the Contract Renewal Information, the financial resources available to the corporate parent of the Manager, Legg Mason, Inc. (“Legg Mason”).
The Board concluded that, overall, the nature, extent and quality of services provided (and expected to be provided) to the Fund under the Management Agreement have been satisfactory under the circumstances.
Fund Performance
The Board received and considered performance information and analyses (the “Lipper Performance Information”) for the Fund, as well as for a group of funds (the “Performance Universe”) selected by Lipper, Inc. (“Lipper”), an independent provider of investment company data. The Board was provided with a
18
BARRETT
OPPORTUNITY FUND, INC.
description of the methodology Lipper used to determine the similarity of the Fund with the funds included in the Performance Universe. The Performance Universe consisted of the Fund and all retail and institutional multi-cap value funds, as classified by Lipper, regardless of asset size or primary channel of distribution.
The Lipper Performance Information comparing the Fund’s performance to that of the Performance Universe based on net asset value per share showed, among other things, that the Fund’s performance for the 1- and 10-year periods ended September 30, 2008 in each case was ranked in the third quintile of funds in the Performance Universe for those periods and that the Fund’s performance for the 3- and 5-year periods ended September 30, 2008 in each case was ranked in the second quintile of funds in the Performance Universe for those periods. The Board also considered the Fund’s performance in relation to its benchmark(s) and in absolute terms. In evaluating the Fund’s performance, the Board noted the adverse market conditions during the past year and that the Fund’s investment portfolio is managed in a tax-aware manner.
Based on its review, which included consideration of all of the factors noted above, the Board concluded that, under the circumstances, the Fund’s performance supported continuation of the Management Agreement for an additional period not to exceed one year.
Management Fees and Expense Ratios
The Board reviewed and considered the management fee (the “Management Fee”) payable by the Fund to the Manager in light of the nature, extent and quality of the management services provided by the Manager and its affiliates under the Management Agreement.
Additionally, the Board received and considered information and analyses prepared by Lipper (the “Lipper Expense Information”) comparing the Management Fee and the Fund’s overall expenses for the Fund’s latest fiscal year with those of funds in an expense group (the “Expense Group”) selected and provided by Lipper. The Expense Group consisted of the Fund and twelve other retail no-load multi-cap value funds, as classified by Lipper. The thirteen funds in the Expense Group had average net assets ranging from $94.5 million to $468.3 million. Nine of the Expense Group funds were larger than the Fund and three funds were smaller.
The Lipper Expense Information comparing the Management Fee as well as the Fund’s actual total expenses to the Fund’s Expense Group showed that the Fund’s contractual Management Fee was ranked second among the thirteen funds in the Expense Group. The Lipper Expense Information also showed that the Fund’s actual Management Fee (i.e., giving effect to any voluntary fee waivers implemented by the Manager with respect to the Fund and by the managers of the other Expense Group funds) and total expenses each ranked third among the funds in the Expense Group. The Board noted that the small number of funds in the Expense Group, which included funds varying widely in size, made meaningful comparisons difficult.
The Board also reviewed Contract Renewal Information regarding fees charged by the Manager to other U.S. clients investing primarily in an asset class similar to that of the Fund, including, where applicable, separate accounts. The Board was advised that the fees paid by such other clients generally are lower, and may be significantly lower, than the Management Fee. The Contract Renewal Information discussed the significant differences in scope of services provided to the Fund and to these other clients, noting that the Fund is provided with administrative services, office facilities, Fund officers (including the Fund’s chief executive, chief financial and chief compliance officers), and that the Manager and its affiliates coordinate and oversee the provision of services to the Fund by other fund service providers. The Board considered the fee comparisons in light of the differences required to manage these different types of accounts. The
19
BARRETT
OPPORTUNITY FUND, INC.
Contract Renewal Information included an analysis of complex-wide management fees provided by the Manager, which, among other things, set out a proposed framework of fees based on asset classes.
Taking all of the above into consideration, the Board determined that the Management Fee was reasonable in light of the nature, extent and quality of the services provided to the Fund under the Management Agreement.
Manager Profitability
The Board, as part of the Contract Renewal Information, received an analysis of the profitability to the Manager and its affiliates in providing services to the Fund. The Board also received profitability information with respect to the Legg Mason fund complex as a whole. In addition, the Board received Contract Renewal Information with respect to the revenue and cost allocation methodologies used in preparing such profitability data. The Manager noted that its methodologies were reviewed by an outside consultant in 2007 and the Board was assured at the Contract Renewal Meeting that there had been no significant changes in those methodologies since the report was rendered. The profitability analysis presented to the Board as part of the Contract Renewal Information indicated that profitability to the Manager and its affiliates in providing services to the Fund was not excessive and, in fact, had declined over the period covered by the analysis.
Economies of Scale
The Board received and discussed Contract Renewal Information concerning whether the Manager realizes economies of scale if the Fund’s assets grow. The Board noted that the assets of the Fund had decreased during the past year and that the Fund’s contractual and actual Management Fee was ranked in the first quintile of funds in its Expense Group in the Lipper Expense Information. The Board determined that the management fee structure was appropriate under present circumstances.
Other Benefits to the Manager and the Subadviser
The Board considered other benefits received by the Manager and its affiliates as a result of their relationship with the Fund, including the opportunity to obtain research services from brokers who effect Fund portfolio transactions.
* * * * * *
In light of all of the foregoing, the Board determined that, under the circumstances, continuation of the Management Agreement would be consistent with the interests of the Fund and its shareholders and unanimously voted to continue the Agreement for a period of one additional year.
No single factor reviewed by the Board was identified by the Board as the principal factor in determining whether to approve continuation of the Management Agreement, and each Board member attributed different weights to the various factors. The Independent Directors were advised by separate independent legal counsel throughout the process. Prior to the Contract Renewal Meeting, the Board received a memorandum discussing its responsibilities in connection with the proposed continuation of the Management Agreement as part of the Contract Renewal Information and the Independent Directors separately received a memorandum discussing such responsibilities from their independent counsel. Prior to voting, the Independent Directors also discussed the proposed continuation of the Management Agreement in private sessions with their independent legal counsel at which no representatives of the Manager were present.
20
BARRETT OPPORTUNITY FUND, INC.
DIRECTORS
Irving G. Brilliant
Barry Handel, CPA
Rosalind A. Kochman
Chairperson
William Morris, Jr., CPA
Irving Sonnenschein
INVESTMENT MANAGER
Barrett Associates, Inc.
90 Park Avenue
New York, NY 10016
SUB-ADMINISTRATOR
Legg Mason Partners Fund Advisor, LLC
620 Eighth Avenue
New York, NY 10018
DISTRIBUTOR
Legg Mason Investor Services, LLC (LMIS)
100 Light Street
Baltimore, MD 21202
CUSTODIAN
State Street Bank and Trust Company
2 Avenue De Lafeyette
Boston, MA 02111
TRANSFER AGENT*
Boston Financial Data Services, Inc.
2 Heritage Drive
North Quincy, Massachusetts 02171
INDEPENDENT REGISTERED PUBLIC ACCOUNTING FIRM
KPMG LLP
345 Park Avenue
New York, NY 10154
| * | | Prior to April 4, 2009, PNC Global Investment Servicing was the Fund’s transfer agent. |
Barrett Opportunity Fund, Inc.
55 Water Street
New York, New York 10041
This report is transmitted to the shareholders of Barrett Opportunity Fund, Inc. for their information. This is not a prospectus, circular or representation intended for use in the purchase of shares of the Fund or any securities mentioned in this report.
This report must be preceded or accompanied by a free prospectus. Investors should consider the Fund’s investment objectives, risks, charges and expenses carefully before investing. The prospectus contains this and other important information about the Fund. Please read the prospectus carefully before investing.
www.barrettassociates.com
©2009 Legg Mason
Investor Services, LLC
Member FINRA, SIPC
BARX010341
The Fund files its complete schedule of portfolio holdings with the Securities and Exchange Commission (“SEC”) for the first and third quarters of each fiscal year on Form N-Q. The Fund’s Forms N-Q are available on the SEC’s website at www.sec.gov. The Fund’s Forms N-Q may be reviewed and copied at the SEC’s Public Reference Room in Washington, D.C., and information on the operation of the Public Reference Room may be obtained by calling 1-800-SEC-0330. To obtain information on Form N-Q from the Fund, shareholders can call Funds Investor Services at 1-800-822-5544 or Institutional Shareholder Services at 1-888-425-6432.
Information on how the Fund voted proxies relating to portfolio securities during the prior 12-month period ended June 30th of each year and a description of the policies and procedures that the Fund uses to determine how to vote proxies related to portfolio transactions are available (1) without charge, upon request, by calling Funds Investor Services at 1-800-822-5544 or Institutional Shareholder Services at 1-888-425-6432 and (2) on the SEC’s website at www.sec.gov.
Not Applicable.
| ITEM 3. | AUDIT COMMITTEE FINANCIAL EXPERT. |
Not Applicable.
| ITEM 4. | PRINCIPAL ACCOUNTANT FEES AND SERVICES. |
Not applicable.
| ITEM 5. | AUDIT COMMITTEE OF LISTED REGISTRANTS. |
Not applicable.
| ITEM 6. | SCHEDULE OF INVESTMENTS. |
Included herein under Item 1.
| ITEM 7. | DISCLOSURE OF PROXY VOTING POLICIES AND PROCEDURES FOR CLOSED-END MANAGEMENT INVESTMENT COMPANIES. |
Not applicable.
| ITEM 8. | PORTFOLIO MANAGERS OF CLOSED-END MANAGEMENT INVESTMENT COMPANIES. |
Not applicable.
| ITEM 9. | PURCHASES OF EQUITY SECURITIES BY CLOSED-END MANAGEMENT INVESTMENT COMPANY AND AFFILIATED PURCHASERS. |
Not applicable.
| ITEM 10. | SUBMISSION OF MATTERS TO A VOTE OF SECURITY HOLDERS. |
Not applicable.
| ITEM 11. | CONTROLS AND PROCEDURES. |
| | (a) | The registrant’s principal executive officer and principal financial officer have concluded that the registrant’s disclosure controls and procedures (as defined in Rule 30a- 3(c) under the Investment Company Act of 1940, as amended (the “1940 Act”)) are effective as of a date within 90 days of the filing date of this report that includes the disclosure required by this paragraph, based on their evaluation of the disclosure controls and procedures required by Rule 30a-3(b) under the 1940 Act and 15d-15(b) under the Securities Exchange Act of 1934. |
| | (b) | There were no changes in the registrant’s internal control over financial reporting (as defined in Rule 30a-3(d) under the 1940 Act) that occurred during the registrant’s last fiscal half-year (the registrant’s second fiscal half-year in the case of an annual report) that have materially affected, or are likely to materially affect the registrant’s internal control over financial reporting. |
(a)(1) Not applicable.
Exhibit 99.CODE ETH
(a)(2) Certifications pursuant to section 302 of the Sarbanes-Oxley Act of 2002 attached hereto.
Exhibit 99.CERT
(b) Certifications pursuant to Section 906 of the Sarbanes-Oxley Act of 2002 attached hereto.
Exhibit 99.906CERT
SIGNATURES
Pursuant to the requirements of the Securities Exchange Act of 1934 and the Investment Company Act of 1940, the registrant has duly caused this Report to be signed on its behalf by the undersigned, there unto duly authorized.
| | |
| Barrett Opportunity Fund, Inc. |
| |
| By: | | /s/ Peter H. Shriver |
| | Peter H. Shriver Chief Executive Officer of |
| | Barrett Opportunity Fund, Inc. |
| |
| Date: | | May 5, 2009 |
Pursuant to the requirements of the Securities Exchange Act of 1934 and the Investment Company Act of 1940, this report has been signed below by the following persons on behalf of the registrant and in the capacities and on the dates indicated.
| | |
| By: | | /s/ Peter H. Shriver |
| | Peter H. Shriver |
| | Chief Executive Officer of |
| | Barrett Opportunity Fund, Inc. |
| |
| Date: | | May 5, 2009 |
| |
| By: | | /s/ Frances M. Guggino |
| | Frances M. Guggino |
| | Chief Financial Officer of |
| | Barrett Opportunity Fund, Inc. |
| |
| Date: | | May 5, 2009 |