UNITED STATES
SECURITIES AND EXCHANGE COMMISSION
Washington, D.C. 20549
FORM N-CSR
CERTIFIED SHAREHOLDER REPORT OF REGISTERED
MANAGEMENT INVESTMENT COMPANIES
| | |
Investment Company Act file number | | 811-2884 |
| | |
Barrett Opportunity Fund, Inc.
(Exact name of registrant as specified in charter)
125 Broad Street, New York, NY 10004
(Address of principal executive offices) (Zip code)
Robert I. Frenkel, Esq.
Legg Mason & Co., LLC
300 First Stamford Place, 4th Fl.
Stamford, CT 06902
(Name and address of agent for service)
Registrant’s telephone number, including area code: (800) 451-2010
Date of fiscal year end: August 31
Date of reporting period: February 28, 2007
| ITEM 1. | REPORT TO STOCKHOLDERS. |
The Semi-Annual Report to Stockholders is filed herewith.


Semi-Annual Report
February 28, 2007
INVESTMENT PRODUCTS: NOT FDIC INSURED Ÿ NO BANK GUARANTEE Ÿ MAY LOSE VALUE
BAR RETT
OPPORTUNITY FUND, INC.
Semi-Annual Report • February 28, 2007
Fund Objective | The Fund seeks to achieve above average long-term capital appreciation. Current income is a secondary objective. The Fund invests primarily in common stocks and securities convertible into or exchangeable for common stock such as convertible preferred stock or convertible debt securities. |
BARRETT
OPPORTUNITY FUND, INC.
Letter from the Chairperson | Dear Shareholder, |
We are pleased to provide this semi-annual report of the Barrett Opportunity Fund, Inc.1 (the “Fund”) for the six month period ended February 28, 2007.
As you are aware, on December 1, 2006, the Fund’s investment manager became Barrett Associates, Inc., (“Barrett”), a wholly-owned subsidiary of Legg Mason, Inc.
The management team at Barrett has prepared the enclosed Manager’s Overview, which includes a brief market overview as well as a performance review. I urge you to read it as well as the accompanying financial statements. A detailed summary of the Fund’s performance and other pertinent information are also included in this report. I am sure you will find this report informative and useful.
On behalf of the Directors and the officers of the Fund, I thank you for your ongoing confidence in the Fund and its investment policies.
Sincerely,

Rosalind A. Kochman
Chairperson
March 6, 2007
| | 1 | The Fund was formerly known as Salomon Brothers Opportunity Fund Inc. The Fund name, investment manager and certain investment policies were changed effective December 1, 2006. |
1
BARRETT
OPPORTUNITY FUND, INC.
MANAGER OVERVIEW | Market Overview |
Most of the economic data over the past six months has been weaker than forecasters expected. In fact, the weakness seems to have accelerated most recently as the nationwide housing slump persists and deepens. Several mortgage originators have gone bankrupt, builder and individual home seller inventories remain high, housing starts are dropping rapidly, and buyers are moving to the sidelines. Mortgage equity withdrawals through home equity loans are down by over 50% from their highs. Many economists believe that these mortgage equity withdrawals have buttressed consumer spending over the past several years. In fact, retail sales have been particularly soft recently at the low-end price points, as evidenced by Wal-Mart’s lackluster sales. For now, the U.S. economy appears locked into a growth range of 2-3%, but some economists are contemplating even weaker numbers. As an offset, foreign economies have been more vigorous than our domestic economy. Asia continues to lead the pack with its superior growth, but Europe and Japan have also experienced a revival in growth. Nevertheless, it is expected that the slowdown in the U.S. will affect these export economies to some extent.
The Federal Reserve appears to be “on hold” with respect to changes in the Federal Funds rate. Central banks worldwide have been increasing their short-term rates, but overall these rates remain below U.S. rates with a few exceptions. Most commodity prices are off from their highs, but prices of key commodities such as oil and many food products remain elevated. We believe inflation rates in general are sufficiently high to give the Federal Reserve second thoughts about cutting rates. If the U.S. economy does not pick up soon, however, we think it is more likely that the Federal Reserve will begin the process of cutting rates. In our opinion, it is not a question of “if”, but “when” rates will begin to be cut. Normally, a cut in interest rates may be a prelude to a stock market rally. Since we believe the U.S. markets are not overvalued, we are confident that a cut in rates may support a stronger equity market. However, the market is now dealing with a significant slowdown in corporate earnings growth. And, in our opinion, although the turmoil in the Middle East is not new, the worst case outcome of the current strife would make any significant advance in the market less likely.
Performance Review
For the six-month period ended February 28, 2007, the U.S. equity market, as measured by the S&P 500® Index, generated a total return of 8.93%, primarily as a result of the strong year-end rally. In fact, after eight consecutive months of gains, the market advance finally came to an abrupt halt in February. Although the correction was widespread, some of the riskier segments of the U.S. market, such as small capitalization stocks, took the biggest hits. Similarly, riskier segments of the bond market, such as junk credits, suffered the most. For the six months ended February 28, 2007, shares of the Barrett Opportunity Fund, Inc. (the “Fund”) returned 8.25%. The Fund’s Lipper Multi-Cap Value Funds Category Average increased 10.00% for the same period.
2
BARRETT
OPPORTUNITY FUND, INC.
| | | | | | | | | | |
Total Returns for Periods Ended February 28, 2007* |
| | | Total
Return | | Average Annual Total Returns |
| | | Six months | | 1 Year | | 3 Year | | 5 Year | | 10 Year |
Barrett Opportunity Fund, Inc. | | +8.25% | | +16.42% | | +13.65% | | +9.38% | | +9.14% |
Lipper Multi-Cap Value Funds Category Average1 | | +10.00% | | +13.52% | | +11.15% | | +9.29% | | +9.09% |
S&P 500® Index2 | | +8.93% | | +11.97% | | +9.10% | | +6.82% | | +7.63% |
The performance data quoted represents past performance. Past performance does not guarantee future results and current performance may be lower or higher than the performance data shown above. The investment return and principal value of an investment will fluctuate. An investor’s shares, when redeemed, may be worth more or less than their original cost. As economic and market conditions change frequently, there can be no assurance that trends described will continue or that forecasts will come to pass. Performance data current to the most recent month end may be obtained by calling (800) 451-2010. Shares of the Fund are distributed by Legg Mason Investor Services LLC (“LMIS”) (Member SIPC/NASD) and Citigroup Global Markets Inc., LMIS and Barrett Associates, Inc., the Fund’s investment manager, are both wholly-owned subsidiaries of Legg Mason, Inc.
The Fund’s total annual operating expenses as of the date of the Fund’s current Prospectus are 1.04%.
All investing entails risk, including the possible loss of principal. The Fund is non-diversified, which means that it can invest a higher percentage of its assets in any one issuer than a diversified fund. Being non-diversified may magnify the Fund’s losses from events affecting a particular issuer. Please see the Fund’s current prospectus for more information on this and other risks.
| | * | On December 1, 2006, Barrett Associates, Inc. became the Fund’s investment manager and certain changes to the Fund’s investment program were made effective that date. |
| | 1 | Lipper Multi-Cap Value Funds Category Average includes funds which invest in a variety of market cap ranges, generally have between 25-75% of their equity assets in companies with market caps above 300% of the dollar-weighted median of the S&P MidCap 400 Index, invest in companies considered to be undervalued, and have below-average price-to-earnings ratios, price-to-book ratios, and 3-year earnings growth figures. |
| | 2 | The S&P 500® Index is a market-value weighted index comprised of 500 widely held common stocks. It is not possible to invest directly in the Index. The Index does not reflect deductions for fees, expenses or taxes. |
Thank you for your continued interest in the Fund.
Sincerely,
| | |
 | |  |
Amy LaGuardia, CFA Portfolio Manager | | Robert Milnamow Portfolio Manager |
March 16, 2007
The outlook and views presented above are those of the Fund’s portfolio managers as of 3/16/07, and are subject to change. This information is intended for the shareholders of the Fund and is not for distribution to prospective investors unless preceded or accompanied by a current prospectus. Investors should consider the risks, investment objective, charges and expenses of the Fund carefully before investing. The prospectus, which contains this and other information about the Fund, is available on www.barrettassociates.com. Investors should read the prospectus carefully before investing.
3
BARRETT
OPPORTUNITY FUND, INC.
Fund at a Glance (Unaudited)
| | | | | | | | | | |
Top Ten Holdings - as of 2/28/2007
(As Percent of Total Investments) | | | | Sector Weightings - as of 2/28/2007 (As Percent of Total Investments) |
| 1. | | Bank New York Co. Inc. | | 11.58% | | | | 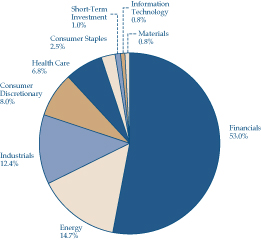
|
| 2. | | Forest City Enterprises Inc. Class A Shares | | 10.33% | | | |
| 3. | | Chubb Corp. | | 9.69% | | | |
| 4. | | Royal Dutch Shell PLC ADR | | 8.86% | | | |
| 5. | | Koninklijke Philips
Electronics NV NY | | 7.52% | | | |
| 6. | | Forest City Enterprises Inc. Class B Shares | | 7.10% | | | |
| 7. | | General Dynamics Corp. | | 5.74% | | | |
| 8. | | Murphy Oil Corp. | | 3.90% | | | |
| 9. | | Wellpoint Inc. | | 3.15% | | | |
| 10. | | Popular Inc. | | 2.78% | | | |
| | | | | | | |
| | | | | | | |
| | | | | | | |
| | | | | | | |
| | | | | | | |
| | | | | | | |
4
BARRETT
OPPORTUNITY FUND, INC.
Fund Expenses (Unaudited)
Example
As a shareholder of the Fund, you may incur two types of costs: (1) transaction costs; and (2) ongoing costs, including management fees and other Fund expenses. This example is intended to help you understand your ongoing costs (in dollars) of investing in the Fund and to compare these costs with the ongoing costs of investing in other mutual funds.
This example is based on an investment of $1,000 invested on September 1, 2006 and held for the six months ended February 28, 2007.
Actual Expenses
The table below titled “Based on Actual Total Return” provides information about actual account values and actual expenses. You may use the information provided in this table, together with the amount you invested, to estimate the expenses that you paid over the period. To estimate the expenses you paid on your account, divide your ending account value by $1,000 (for example, an $8,600 ending account value divided by $1,000 = 8.6), then multiply the result by the number under the heading entitled “Expenses Paid During the Period”.
Based on Actual Total Return1
| | | | | | | | | | | | | | | |
| | | Actual
Total Return2 | | | Beginning
Account
Value | | Ending
Account
Value | | Annualized
Expense
Ratio | | | Expenses
Paid During
the Period3 |
Barrett Opportunity Fund, Inc. | | 8.25 | % | | $ | 1,000.00 | | $ | 1,082.50 | | 0.98 | % | | $ | 5.06 |
1 | | For the six months ended February 28, 2007. |
2 | | Assumes reinvestment of all distributions, including returns of capital, if any, at net asset value. Total return is not annualized, as it may not be representative of the total return for the year. Performance figures may reflect fee waivers and/or expense reimbursements. In the absence of fee waivers and/or expense reimbursements, the total return would have been lower. Past performance is no guarantee of future results. |
3 | | Expenses (net of fee waivers and/or expense reimbursements) are equal to the Fund’s annualized expense ratio, multiplied by the average account value over the period, multiplied by the number of days in the most recent fiscal half-year, then divided by 365. |
5
BARRETT
OPPORTUNITY FUND, INC.
Fund Expenses (Unaudited) (Continued)
Hypothetical Example for Comparison Purposes
The table below titled “Based on Hypothetical Total Return” provides information about hypothetical account values and hypothetical expenses based on the actual expense ratio and an assumed rate of return of 5.00% per year before expenses, which is not the Fund’s actual return. The hypothetical account values and expenses may not be used to estimate the actual ending account balance or expenses you paid for the period. You may use the information provided in this table to compare the ongoing costs of investing in the Fund and other funds. To do so, compare the 5.00% hypothetical example relating to the Fund with the 5.00% hypothetical examples that appear in the shareholder reports of the other funds.
Please note that the expenses shown in the table below are meant to highlight your ongoing costs only and do not reflect any transactional costs. Therefore, the table is useful in comparing ongoing costs only, and will not help you determine the relative total costs of owning different funds. In addition, if these transaction costs were included, your costs would have been higher.
Based on Hypothetical Total Return1
| | | | | | | | | | | | | | | |
| | | Hypothetical
Annualized
Total Return | | | Beginning
Account
Value | | Ending
Account
Value | | Annualized
Expense
Ratio | | | Expenses
Paid During
the Period2 |
Barrett Opportunity Fund, Inc. | | 5.00 | % | | $ | 1,000.00 | | $ | 1,019.93 | | 0.98 | % | | $ | 4.91 |
1 | | For the six months ended February 28, 2007. |
2 | | Expenses (net of fee waivers and/or expense reimbursements) are equal to the Fund’s annualized expense ratio, multiplied by the average account value over the period, multiplied by the number of days in the most recent fiscal half-year, then divided by 365. |
6
BARRETT
OPPORTUNITY FUND, INC.
Schedule of Investments
February 28, 2007
(Unaudited)
| | | | | |
| Shares | | Security | | Value |
| | | | | |
| | COMMON STOCKS - 99.0% |
| | CONSUMER DISCRETIONARY - 8.0% |
| | Household Durables - 7.7% | | | |
| 306,010 | | Koninklijke Philips Electronics NV, New York Registered Shares | | $ | 11,236,687 |
| 14,850 | | Liberty Homes Inc., Class A Shares (a) | | | 86,130 |
| 22,050 | | Liberty Homes Inc., Class B Shares (a)(b) | | | 128,441 |
| | | | | |
| | Total Household Durables | | | 11,451,258 |
| | | | | |
| | Media - 0.3% | | | |
| 19,400 | | News Corp., Class A Shares | | | 437,082 |
| | | | | |
| | Total Consumer Discretionary | | | 11,888,340 |
| | | | | |
| |
| | CONSUMER STAPLES - 2.5% |
| | Food & Staples Retailing - 1.1% |
| 96,000 | | FHC Delaware Inc. (a)(b)* | | | 0 |
| 35,000 | | Walgreen Co. | | | 1,564,850 |
| | | | | |
| | Total Food & Staples Retailing | | | 1,564,850 |
| | | | | |
| | Food Products - 1.4% | | | |
| 40,000 | | Hershey Co. | | | 2,115,200 |
| | | | | |
| | Total Consumer Staples | | | 3,680,050 |
| | | | | |
| | |
| | ENERGY - 14.7% | | | |
| | Energy Equipment & Services - 0.7% |
| 14,200 | | Diamond Offshore Drilling Inc. | | | 1,105,044 |
| | | | | |
| | Oil, Gas & Consumable Fuels - 14.0% |
| 10,876 | | EnCana Corp. | | | 528,574 |
| 112,500 | | Murphy Oil Corp. | | | 5,829,750 |
| 20,900 | | Overseas Shipholding Group Inc. | | | 1,266,122 |
| 203,600 | | Royal Dutch Shell PLC, ADR, Class A Shares | | | 13,236,036 |
| | | | | |
| | Total Oil, Gas & Consumable Fuels | | | 20,860,482 |
| | | | | |
| | Total Energy | | | 21,965,526 |
| | | | | |
| | | | | |
| Shares | | Security | | Value |
| | | | | |
| | FINANCIALS - 53.0% | | | |
| | Capital Markets - 11.6% | | | |
| 425,876 | | Bank of New York Co. Inc. | | $ | 17,299,083 |
| | | | | |
| | Commercial Banks - 2.8% | | | |
| 237,400 | | Popular Inc. | | | 4,156,874 |
| | | | | |
| | Diversified Financial Services - 2.7% |
| 139,900 | | Leucadia National Corp. | | | 3,960,569 |
| | | | | |
| | Insurance - 14.8% | | | |
| 283,600 | | Chubb Corp. | | | 14,477,780 |
| 81,900 | | CNA Financial Corp. * | | | 3,362,814 |
| 26,400 | | Loews Corp. | | | 1,146,816 |
| 40,000 | | Merchants Group Inc. (a) | | | 1,310,000 |
| 82,500 | | Old Republic International Corp. | | | 1,841,400 |
| | | | | |
| | Total Insurance | | | 22,138,810 |
| | | | | |
| | Real Estate Investment Trusts
(REITs) - 2.1% |
| 70,490 | | Rayonier Inc. | | | 3,148,083 |
| | | | | |
| | Real Estate Management & Development - 17.4% | | | |
| 249,700 | | Forest City Enterprises Inc., Class A Shares | | | 15,426,466 |
| 172,300 | | Forest City Enterprises Inc., Class B Shares (c) | | | 10,613,680 |
| | | | | |
| | Total Real Estate Management & Development | | | 26,040,146 |
| | | | | |
| | Thrifts & Mortgage Finance - 1.6% |
| 38,300 | | Freddie Mac | | | 2,458,094 |
| | | | | |
| | Total Financials | | | 79,201,659 |
| | | | | |
| |
| | HEALTH CARE - 6.8% |
| | Health Care Equipment & Supplies - 2.2% | | | |
| 32,000 | | Medtronic Inc. | | | 1,611,520 |
| 3,500 | | Stryker Corp. | | | 217,070 |
| 30,000 | | Varian Medical Systems Inc. * | | | 1,378,500 |
| | | | | |
| | Total Health Care Equipment & Supplies | | | 3,207,090 |
| | | | | |
See accompanying Notes to the Financial Statements.
7
BARRETT
OPPORTUNITY FUND, INC.
Schedule of Investments
February 28, 2007
(Unaudited)
| | | | | |
| Shares | | Security | | Value |
| | | | | |
| | Health Care Providers & Services - 3.7% | | | |
| 13,900 | | Humana Inc. * | | $ | 831,776 |
| 59,208 | | WellPoint Inc. * | | | 4,700,523 |
| | | | | |
| | Total Health Care Providers & Services | | | 5,532,299 |
| | | | | |
| | Pharmaceuticals - 0.9% | | | |
| 55,864 | | Pfizer Inc. | | | 1,394,366 |
| | | | | |
| | Total Health Care | | | 10,133,755 |
| | | | | |
| | |
| | INDUSTRIALS - 12.4% | | | |
| | Aerospace & Defense - 6.4% |
| 112,200 | | General Dynamics Corp. | | | 8,578,812 |
| 10,600 | | Lockheed Martin Corp. | | | 1,031,168 |
| | | | | |
| | Total Aerospace & Defense | | | 9,609,980 |
| | | | | |
| | Airlines - 1.2% | | | |
| 52,100 | | AMR Corp. * | | | 1,776,089 |
| | | | | |
| | Building Products - 2.2% | | | |
| 43,500 | | Ameron International Corp. | | | 3,213,780 |
| | | | | |
| | Commercial Services & Supplies - 0.7% |
| 103,550 | | TRC Cos. Inc. * | | | 1,047,926 |
| | | | | |
| | Industrial Conglomerates - 1.0% |
| 44,100 | | General Electric Co. | | | 1,539,972 |
| | | | | |
| | Machinery - 0.1% | | | |
| 10,900 | | Tecumseh Products Co., Class B Shares * | | | 184,210 |
| | | | | |
| | Marine - 0.8% | | | |
| 25,000 | | Alexander & Baldwin Inc. | | | 1,235,500 |
| | | | | |
| | Total Industrials | | | 18,607,457 |
| | | | | |
| |
| | INFORMATION TECHNOLOGY - 0.8% |
| | IT Services - 0.2% | | | |
| 8,134 | | Sabre Holdings Corp., Class A Shares | | | 262,972 |
| | | | | |
| | Software - 0.6% | | | |
| 35,200 | | Microsoft Corp. | | | 991,584 |
| | | | | |
| | Total Information Technology | | | 1,254,556 |
| | | | | |
| | | | | |
| Shares | | Security | | Value |
| | | | | |
| | MATERIALS - 0.8% | | | |
| | Chemicals - 0.8% | | | |
| 22,242 | | Monsanto Co. | | $ | 1,171,931 |
| | | | | |
| | Total Investments Before Short-term Investment
(Cost - $24,354,143) | | | 147,903,274 |
| | | | | |
Face
Amount | | | | |
| | SHORT-TERM INVESTMENT - 1.0% |
| | Repurchase Agreement - 1.0% |
| $1,495,000 | | State Street Bank & Trust Co. dated 2/28/07, 4.820% due 3/1/07; Proceeds at maturity - $1,495,200; (Fully collateralized by U.S. Treasury Bond, 8.875% due 8/15/17; Market value - $1,530,161) (Cost - $1,495,000) | | | 1,495,000 |
| | | | | |
| | Total Investments - 100.0% (Cost - $25,849,143#) | | | 149,398,274 |
| | Other Assets in Excess of Liabilities - 0.0% | | | 43,352 |
| | | | | |
| | Total Net Assets - 100.0% | | $ | 149,441,626 |
| | | | | |
| * | Non-income producing security. |
| (b) | Security is valued in good faith at fair value by or under the direction of the Board of Directors. |
| (c) | Convertible into Forest City Enterprises Inc., Class A Shares. |
| # | Aggregate cost for federal income tax purposes is substantially the same. |
Abbreviation used in this schedule:
ADR—American Depositary Receipt
See accompanying Notes to the Financial Statements.
8
BARRETT
OPPORTUNITY FUND, INC.
Statement of Assets and Liabilities
February 28, 2007 (Unaudited)
| | | |
ASSETS: | | | |
Investments, at value
(Cost - $25,849,143) | | $ | 149,398,274 |
Cash | | | 58 |
Dividends and interest receivable | | | 293,736 |
Receivable for Fund shares sold | | | 38,302 |
Prepaid expenses | | | 18,228 |
| | | |
Total assets | | | 149,748,598 |
| | | |
LIABILITIES: | | | |
Payable for Fund shares repurchased | | | 102,161 |
Investment management fee payable | | | 88,647 |
Directors’ fees payable | | | 6,668 |
Accrued expenses and other | | | 109,496 |
| | | |
Total liabilities | | | 306,972 |
| | | |
Total net assets | | $ | 149,441,626 |
| | | |
NET ASSETS: | | | |
Par value (Note 4) | | $ | 25,260 |
Paid-in capital in excess of par value | | | 18,817,578 |
Undistributed net investment income | | | 56,222 |
Accumulated net realized gain on investments | | | 6,993,435 |
Net unrealized appreciation on investments | | | 123,549,131 |
| | | |
Total net assets | | $ | 149,441,626 |
| | | |
Shares outstanding | | | 2,525,943 |
| | | |
Net asset value | | | $59.16 |
| | | |
Statement of Operations
For the Six Months Ended February 28, 2007 (Unaudited)
| | | | |
INVESTMENT INCOME: | | | | |
Dividends | | $ | 1,180,396 | |
Interest | | | 165,307 | |
Less: Foreign taxes withheld | | | (49,353 | ) |
| | | | |
Total investment income | | | 1,296,350 | |
| | | | |
| | | | |
EXPENSES: | | | | |
Investment management fee
(Note 2) | | | 578,065 | |
Legal fees | | | 73,794 | |
Shareholder reports | | | 29,463 | |
Directors’ fees | | | 23,676 | |
Registration fees | | | 15,329 | |
Transfer agent fees | | | 15,088 | |
Audit and tax | | | 14,500 | |
Insurance | | | 1,977 | |
Custody fees | | | 408 | |
Miscellaneous expenses | | | 2,802 | |
| | | | |
Total expenses | | | 755,102 | |
| | | | |
Net investment income | | | 541,248 | |
| | | | |
| | | | |
REALIZED AND UNREALIZED GAIN ON INVESTMENTS (NOTES 1 AND 3): | | | | |
Net realized gain from investment transactions | | | 7,113,252 | |
Change in net unrealized appreciation/depreciation from | | | | |
Investments | | | 4,670,471 | |
| | | | |
Net gain on investments | | | 11,783,723 | |
| | | | |
Increase in net assets from operations | | $ | 12,324,971 | |
| | | | |
See accompanying Notes to the Financial Statements.
9
BARRETT
OPPORTUNITY FUND, INC.
Statements of Changes in Net Assets
| | | | | | | | |
| | | Six Months Ended
February 28, 2007
(Unaudited) | | | Year Ended
August 31, 2006 | |
OPERATIONS: | | | | | | | | |
Net investment income | | $ | 541,248 | | | $ | 923,921 | |
Net realized gain (Note 5) | | | 7,113,252 | | | | 6,471,248 | |
Change in net unrealized appreciation/depreciation | | | 4,670,471 | | | | 11,969,845 | |
| | | | | | | | |
Increase in net assets from operations | | | 12,324,971 | | | | 19,365,014 | |
| | | | | | | | |
| | | | | | | | |
DISTRIBUTIONS TO SHAREHOLDERS FROM (NOTE 1): | | | | | | | | |
Net investment income | | | (900,000 | ) | | | (1,199,486 | ) |
Net realized gains | | | (4,731,882 | ) | | | (3,070,462 | ) |
| | | | | | | | |
Decrease in net assets from distributions to shareholders | | | (5,631,882 | ) | | | (4,269,948 | ) |
| | | | | | | | |
| | | | | | | | |
FUND SHARE TRANSACTIONS (NOTE 4): | | | | | | | | |
Net proceeds from sale of shares | | | 5,880,312 | | | | 12,287,794 | |
Reinvestment of distributions | | | 2,777,928 | | | | 2,092,345 | |
Cost of shares repurchased | | | (23,666,498 | ) | | | (8,557,079 | ) |
| | | | | | | | |
Increase (Decrease) in net assets from fund share transactions | | | (15,008,258 | ) | | | 5,823,060 | |
| | | | | | | | |
Increase (Decrease) in net assets | | | (8,315,169 | ) | | | 20,918,126 | |
| | | | | | | | |
NET ASSETS: | | | | | | | | |
Beginning of period | | | 157,756,795 | | | | 136,838,669 | |
| | | | | | | | |
End of period* | | $ | 149,441,626 | | | $ | 157,756,795 | |
| | | | | | | | |
*Includes undistributed net investment income of: | | | $56,222 | | | | $414,974 | |
| | | | | | | | |
See accompanying Notes to the Financial Statements.
10
BARRETT
OPPORTUNITY FUND, INC.
Financial Highlights
For a share of capital stock outstanding throughout each year ended August 31, unless otherwise noted:
| | | | | | | | | | | | | | | | | | | | | | | | |
| | | 20071 | | | 2006 | | | 2005 | | | 2004 | | | 2003 | | | 2002 | |
NET ASSET VALUE | | | | | | | | | | | | | | | | | | | | | | | | |
Beginning of period | | $ | 56.71 | | | $ | 50.98 | | | $ | 42.92 | | | $ | 41.34 | | | $ | 41.86 | | | $ | 48.72 | |
| | | | | | | | | | | | | | | | | | | | | | | | |
INCOME (LOSS) FROM OPERATIONS: | | | | | | | | | | | | | | | | | | | | | | | | |
Net investment income | | | 0.23 | | | | 0.32 | | | | 0.53 | | | | 0.49 | | | | 0.33 | | | | 0.28 | |
Net realized and unrealized gain (loss) | | | 4.43 | | | | 7.04 | | | | 8.31 | | | | 3.99 | | | | 0.61 | | | | (3.74 | ) |
| | | | | | | | | | | | | | | | | | | | | | | | |
Total Income (Loss) From Operations | | | 4.66 | | | | 7.36 | | | | 8.84 | | | | 4.48 | | | | 0.94 | | | | (3.46 | ) |
| | | | | | | | | | | | | | | | | | | | | | | | |
LESS DISTRIBUTIONS FROM: | | | | | | | | | | | | | | | | | | | | | | | | |
Net investment income | | | (0.35 | ) | | | (0.46 | ) | | | (0.56 | ) | | | (0.37 | ) | | | (0.19 | ) | | | (0.64 | ) |
Net realized gains | | | (1.86 | ) | | | (1.17 | ) | | | (0.22 | ) | | | (2.53 | ) | | | (1.27 | ) | | | (2.76 | ) |
| | | | | | | | | | | | | | | | | | | | | | | | |
Total Distributions | | | (2.21 | ) | | | (1.63 | ) | | | (0.78 | ) | | | (2.90 | ) | | | (1.46 | ) | | | (3.40 | ) |
| | | | | | | | | | | | | | | | | | | | | | | | |
NET ASSET VALUE | | | | | | | | | | | | | | | | | | | | | | | | |
End of period | | $ | 59.16 | | | $ | 56.71 | | | $ | 50.98 | | | $ | 42.92 | | | $ | 41.34 | | | $ | 41.86 | |
| | | | | | | | | | | | | | | | | | | | | | | | |
Total return2 | | | 8.25% | | | | 14.79% | | | | 20.77% | | | | 11.09% | | | | 2.57% | | | | (7.65)% | |
Net assets, end of period (millions) | | | $149 | | | | $158 | | | | $137 | | | | $131 | | | | $146 | | | | $160 | |
RATIOS TO AVERAGE NET ASSETS: | | | | | | | | | | | | | | | | | | | | | | | | |
Gross expenses | | | 0.98% | 3 | | | 1.04% | | | | 0.96% | | | | 1.06% | | | | 1.12% | | | | 1.11% | |
Net expenses | | | 0.983 | | | | 1.044 | | | | 0.96 | | | | 1.06 | | | | 1.12 | | | | 1.11 | |
Net investment income | | | 0.703 | | | | 0.66 | | | | 1.06 | | | | 1.04 | | | | 0.82 | | | | 0.64 | |
Portfolio Turnover Rate | | | 5% | | | | 0% | 5,6 | | | 1% | 5 | | | 1% | 5 | | | 5% | | | | 1% | |
1 | | For the six months ended February 28, 2007 (unaudited). |
2 | | Performance figures may reflect fee waivers and/or expense reimbursements. In the absence of fee waivers and/or expense reimbursements, the total return would have been lower. Past performance is no guarantee of future results. Total returns for periods of less than one year are not annualized. |
4 | | Reflects fee waivers and/or expense reimbursements. |
5 | | Excludes the value of portfolio securities delivered as a result of in-kind redemptions of the Fund’s capital shares. |
6 | | Amount represents less than 1%. |
See accompanying Notes to the Financial Statements.
11
BARRETT
OPPORTUNITY FUND, INC.
Notes to Financial Statements (Unaudited)
1. ORGANIZATION AND SIGNIFICANT ACCOUNTING POLICIES | Barrett Opportunity Fund Inc. (formerly known as Salomon Brothers Opportunity Fund Inc.) (the “Fund”), is registered as a non-diversified, open-end management investment company under the Investment Company Act of 1940, as amended (the “1940 Act”). |
The following are significant accounting policies consistently followed by the Fund and are in conformity with U.S. generally accepted accounting principles (“GAAP”). Estimates and assumptions are required to be made regarding assets, liabilities and changes in net assets resulting from operations when financial statements are prepared. Changes in the economic environment, financial markets and any other parameters used in determining these estimates could cause actual results to differ.
(a) Investment Valuation
Equity securities for which market quotations are available are valued at the last sale price or official closing price on the primary market or exchange on which they trade. Debt securities are valued at the mean between the bid and asked prices provided by an independent pricing service that are based on transactions in debt obligations, quotations from bond dealers, market transactions in comparable securities and various other relationships between securities. When prices are not readily available, or are determined not to reflect fair value, such as when the value of a security has been significantly affected by events after the close of the exchange or market on which the security is principally traded, but before the Fund calculates its net asset value, the Fund may value these investments at fair value as determined in accordance with the procedures approved by the Fund’s Board of Directors. Short-term obligations with maturities of 60 days or less are valued at amortized cost, which approximates market value.
(b) Security Transactions and Investment Income
Security transactions are accounted for on a trade date basis. Interest income, adjusted for amortization of premium and accretion of discount, is recorded on the accrual basis. Dividend income is recorded on the ex-dividend date. Foreign dividend income is recorded on the ex-dividend date or as soon as practical after the Fund determines the existence of a dividend declaration after exercising reasonable due diligence. The cost of investments sold is determined by use of the specific identification method. To the extent any issuer defaults on an expected interest payment, the Fund’s policy is to generally halt any additional interest income accruals and consider the realizability of interest accrued up to the date of default.
(c) Distributions to Shareholders
Distributions from net investment income and distributions of net realized gains, if any, are declared at least annually. Distributions to shareholders of the Fund are recorded on the ex-dividend date and are determined in accordance with income tax regulations, which may differ from GAAP.
12
BARRETT
OPPORTUNITY FUND, INC.
(d) REIT Distributions
The character of distributions received from Real Estate Investment Trusts (“REITs”) held by the Fund is generally comprised of net investment income, capital gains, and return of capital. It is the policy of the Fund to estimate the character of distributions received from underlying REITs based on historical data provided by the REITs. After each calendar year end, REITs report the true tax character of these distributions. Differences between the estimated and actual amounts reported by the REITs are reflected in the Fund’s records in the year in which they are reported by the REITs.
(e) Federal and Other Taxes
It is the Fund’s policy to comply with the federal income and excise tax requirements of the Internal Revenue Code of 1986, as amended, applicable to regulated investment companies. Accordingly, the Fund intends to distribute substantially all of its income and net realized gains on investments, if any, to shareholders each year. Therefore, no federal income tax provision is required in the Fund’s financial statements. Under the applicable foreign tax laws, a withholding tax may be imposed on interest, dividends and capital gains at various rates.
(f) Reclassification
GAAP requires that certain components of net assets be adjusted to reflect permanent differences between financial and tax reporting. These reclassifications have no effect on net assets or net asset values per share.
2. INVESTMENT MANAGEMENT AGREEMENT AND OTHER TRANSACTIONS WITH AFFILIATES | Before December 1, 2006, ClearBridge Asset Management Inc. (“Clearbridge”), a wholly-owned subsidiary of Legg Mason, Inc. (“Legg Mason”), served as the investment manager of the Fund. Effective December 1, 2006, Barrett Associates, Inc. (“Barrett”), a wholly-owned subsidiary of Legg Mason, became the Fund’s investment manager pursuant to a new investment management agreement. Under the investment management agreement with Barrett, the Fund pays an investment management fee calculated daily and paid monthly in accordance with the following breakpoint schedule: |
| | | |
Average Daily Net Assets | | Annual Rate | |
First $1 billion | | 0.750 | % |
Next $1 billion | | 0.725 | |
Next $3 billion | | 0.700 | |
Next $5 billion | | 0.675 | |
Over $10 billion | | 0.650 | |
Under the investment management agreement with ClearBridge, the Fund paid an investment management fee calculated daily and paid monthly in accordance with the same breakpoint schedule shown above.
Since December 1, 2006, Legg Mason Partners Fund Advisor, LLC (“LMPFA”) serves as the sub-administrator for the Fund, providing certain administrative services for the Fund pursuant to a sub-administration agreement between
13
BARRETT
OPPORTUNITY FUND, INC.
Barrett and LMPFA. LMPFA is an affiliate of Legg Mason and Barrett. Barrett, and not the Fund, pays LMPFA for its services as sub-administrator.
Citigroup Global Markets Inc. (“CGM”) and Legg Mason Investor Services, LLC (“LMIS”) serve as co-distributors of the Fund. LMIS is a wholly-owned broker-dealer subsidiary of Legg Mason.
The officers of the Fund are employees of Legg Mason or its affiliates and do not receive compensation from the Fund.
3. INVESTMENTS | During the six months ended February 28, 2007, the aggregate cost of purchases and proceeds from sales of investments (excluding short-term investments) were as follows: |
| | | |
| Purchases | | Sales |
| $6,572,371 | | $ | 12,632,337 |
At February 28, 2007, the aggregate gross unrealized appreciation and depreciation of investments for federal income tax purposes were substantially as follows:
| | | | |
| Gross unrealized appreciation | | $ | 124,436,897 | |
| Gross unrealized depreciation | | | (887,766 | ) |
| | | | |
| Net unrealized appreciation | | $ | 123,549,131 | |
| | | | |
4. CAPITAL SHARES | At February 28, 2007, the Fund had 15,000,000 shares of capital stock authorized with a par value of $0.01 per share. Transactions in shares of the Fund were as follows: |
| | | | | | |
| | | Six Months Ended
February 28, 2007 | | | Year Ended
August 31, 2006 | |
Shares sold | | 102,677 | | | 218,940 | |
Shares issued on reinvestment | | 47,381 | | | 40,890 | |
Shares repurchased | | (405,995 | ) | | (162,328 | ) |
| | | | | | |
Net Increase (Decrease) | | (255,937 | ) | | 97,502 | |
| | | | | | |
5. REDEMPTIONS- IN-KIND | The Fund may make payment for Fund shares redeemed wholly or in part by distributing portfolio securities to the shareholders. For the year ended August 31, 2006, the Fund had redemptions-in-kind with total proceeds in the amount of $1,689,456. The net realized gains on these redemptions-in-kind amounted to $1,305,603, which will not be realized for tax purposes. |
6. REGULATORY MATTERS | On May 31, 2005, the U.S. Securities and Exchange Commission (“SEC”) issued an order in connection with the settlement of an administrative proceeding against Smith Barney Fund Management Inc. (“SBFM”), the then-investment advisor or manager to certain of the funds, and CGM, relating to the appointment of an |
14
BARRETT
OPPORTUNITY FUND, INC.
| | affiliated transfer agent for the Smith Barney family of mutual funds (the “Affected Funds”). |
The SEC order finds that SBFM and CGM willfully violated Section 206(1) of the Investment Advisers Act of 1940, as amended, and the rules promulgated thereunder (the “Advisers Act”). Specifically, the order finds that SBFM and CGM knowingly or recklessly failed to disclose to the boards of the Affected Funds in 1999 when proposing a new transfer agent arrangement with an affiliated transfer agent that: First Data Investors Services Group (“First Data”), the Affected Funds’ then-existing transfer agent, had offered to continue as transfer agent and do the same work for substantially less money than before; and that Citigroup Asset Management (“CAM”), the Citigroup business unit that, at the time, included the Affected Funds’ investment manager and other investment advisory companies, had entered into a side letter with First Data under which CAM agreed to recommend the appointment of First Data as sub-transfer agent to the affiliated transfer agent in exchange for, among other things, a guarantee by First Data of specified amounts of asset management and investment banking fees to CAM and CGM. The order also finds that SBFM and CGM willfully violated Section 206(2) of the Advisers Act by virtue of the omissions discussed above and other misrepresentations and omissions in the materials provided to the Affected Funds’ boards, including the failure to make clear that the affiliated transfer agent would earn a high profit for performing limited functions while First Data continued to perform almost all of the transfer agent functions, and the suggestion that the proposed arrangement was in the Affected Funds’ best interests and that no viable alternatives existed. SBFM and CGM do not admit or deny any wrongdoing or liability. The settlement does not establish wrongdoing or liability for purposes of any other proceeding.
The SEC censured SBFM and CGM and ordered them to cease and desist from violations of Sections 206(1) and 206(2) of the Advisers Act. The order required Citigroup to pay $208.1 million, including $109 million in disgorgement of profits, $19.1 million in interest, and a civil money penalty of $80 million. Approximately $24.4 million has already been paid to the Affected Funds, primarily through fee waivers. The remaining $183.7 million, including the penalty, has been paid to the U.S. Treasury and will be distributed pursuant to a plan submitted for the approval of the SEC. At this time, there is no certainty as to how the above described proceeds of the settlement will be distributed, to whom such distributions will be made, the methodology by which such distributions will be allocated, and when such distributions will be made.
The order also required that transfer agency fees received from the Affected Funds since December 1, 2004, less certain expenses, be placed in escrow and provided that a portion of such fees might be subsequently distributed in accordance with the terms of the order.
On April 3, 2006, an aggregate amount of approximately $9 million held in escrow was distributed to the Affected Funds.
15
BARRETT
OPPORTUNITY FUND, INC.
The order required SBFM to recommend a new transfer agent contract to the Affected Fund boards within 180 days of the entry of the order; if a Citigroup affiliate submitted a proposal to serve as transfer agent or sub-transfer agent, SBFM and CGM would have been required, at their expense, to engage an independent monitor to oversee a competitive bidding process. On November 21, 2005, and within the specified timeframe, the Affected Funds’ Boards selected a new transfer agent for the Funds. No Citigroup affiliate submitted a proposal to serve as transfer agent. Under the order, SBFM also must comply with an amended version of a vendor policy that Citigroup instituted in August 2004.
This Fund is not among the Affected Funds and therefore did not implement the transfer agent arrangement described above and therefore has not received and will not receive any portion of the distributions.
Although there can be no assurance, LMPFA does not believe that this matter will have a material adverse effect on the Affected Funds.
On December 1, 2005, Citigroup completed the sale of substantially all of its global asset management business, including SBFM, to Legg Mason.
Beginning in June 2004, class action lawsuits alleging violations of the federal securities laws were filed against CGM and a number of its then affiliates, including SBFM and Salomon Brothers Asset Management Inc. (“SBAM”), which were then investment adviser or manager to certain of the funds (the “Managers”), substantially all of the mutual funds then managed by the Managers (the “Defendant Funds”), and Board Members of the Defendant Funds (collectively, the “Defendants”). The complaints alleged, among other things, that CGM created various undisclosed incentives for its brokers to sell Smith Barney and Salomon Brothers funds. In addition, according to the complaints, the Managers caused the Defendant Funds to pay excessive brokerage commissions to CGM for steering clients towards proprietary funds. The complaints also alleged that the Defendants breached their fiduciary duty to the Defendant Funds by improperly charging Rule 12b-1 fees and by drawing on fund assets to make undisclosed payments of soft dollars and excessive brokerage commissions. The complaints also alleged that the Defendant Funds failed to adequately disclose certain of the allegedly wrongful conduct. The complaints sought injunctive relief and compensatory and punitive damages, rescission of the Defendant Funds’ contracts with the Managers, recovery of all fees paid to the Managers pursuant to such contracts and an award of attorneys’ fees and litigation expenses.
On December 15, 2004, a consolidated amended complaint (the “Complaint”) was filed alleging substantially similar causes of action. On May 27, 2005, all of the Defendants filed motions to dismiss the Complaint. On July 26, 2006, the court issued a decision and order (1) finding that plaintiffs lacked standing to sue on behalf of the shareholders of the funds in which none of the plaintiffs had invested (including the Fund) and dismissing those funds from the case
16
BARRETT
OPPORTUNITY FUND, INC.
(although stating that they could be brought back into the case if standing as to them could be established), and (2) other than one stayed claim, dismissing all of the causes of action against the remaining Defendants, with prejudice, except for the cause of action under Section 36(b) of the 1940 Act, which the court granted plaintiffs leave to repeal as a derivative claim.
On October 16, 2006, plaintiffs filed their Second Consolidated Amended Complaint (“Second Amended Complaint”) which alleges derivative claims on behalf of nine funds identified in the Second Amended Complaint, under Section 36(b) of the 1940 Act, against CAM, SBAM, SBFM and CGM as investment advisers to the identified funds, as well as CGM as a distributor for the identified funds (collectively, the “Second Amended Complaint Defendants”). The Fund was not identified in the Second Amended Complaint. The Second Amended Complaint alleges no claims against any of the funds or any of their Board Members. Under Section 36(b), the Second Amended Complaint alleges similar facts and seeks similar relief against the Second Amended Complaint Defendants as the Complaint.
Additional lawsuits arising out of these circumstances and presenting similar allegations and requests for relief may be filed in the future.
8. OTHER MATTERS | On September 16, 2005, the staff of the SEC informed SBFM and SBAM, the Fund’s former investment manager, that the staff is considering recommending that the SEC institute administrative proceedings against SBFM and SBAM for alleged violations of Section 19(a) and 34(b) of the 1940 Act (and related Rule 19a-1). The notification is a result of an industry wide inspection by the SEC and is based upon alleged deficiencies in disclosures regarding dividends and distributions paid to shareholders of certain funds. Section 19(a) and related Rule 19a-1 of the 1940 Act generally require funds that are making dividend and distribution payments to provide shareholders with a written statement disclosing the source of the dividends and distributions, and, in particular, the portion of the payments made from each of net investment income, undistributed net profits and/or paid-in capital. In connection with the contemplated proceedings, the staff may seek a cease and desist order and/or monetary damages from SBFM or SBAM. Although there can be no assurance, LMPFA believes that this matter is not likely to have a material adverse effect on the Fund. |
9. RECENT ACCOUNTING PRONOUNCE- MENTS | During June 2006, the Financial Accounting Standards Board (“FASB”) issued FASB Interpretation 48 (“FIN 48” or the “Interpretation”), Accounting for Uncertainty in Income Taxes — an interpretation of FASB Statement 109. FIN 48 supplements FASB Statement 109, Accounting for Income Taxes, by defining the confidence level that a tax position must meet in order to be recognized in the financial statements. FIN 48 prescribes a comprehensive model for how a fund should recognize, measure, present, and disclose in its financial statements uncertain tax positions that the fund has taken or expects to take on a tax return. FIN 48 requires that the tax effects of a position be recognized only if it is “more |
17
BARRETT
OPPORTUNITY FUND, INC.
| | likely than not” to be sustained based solely on its technical merits. Management must be able to conclude that the tax law, regulations, case law, and other objective information regarding the technical merits sufficiently support the position’s sustainability with a likelihood of more than 50 percent. FIN 48 is effective for fiscal periods beginning after December 15, 2006, which for this Fund will be September 1, 2007. At adoption, the financial statements must be adjusted to reflect only those tax positions that are more likely than not to be sustained as of the adoption date. Management of the Fund has determined that adopting FIN 48 will not have a material impact on the Fund’s financial statements. |
* * *
On September 20, 2006, FASB released Statement of Financial Accounting Standards No. 157 Fair Value Measurements (“FAS 157”). FAS 157 establishes an authoritative definition of fair value, sets out a framework for measuring fair value, and requires additional disclosures about fair value measurements. The application of FAS 157 is required for fiscal years beginning after November 15, 2007 and interim periods within those fiscal years. At this time, management is evaluating the implications of FAS 157 and its impact on the financial statements has not yet been determined.
18
BARRETT
OPPORTUNITY FUND, INC.
Basis for Approval of the Fund’s Management Agreement (Unaudited)
At a meeting held in person on September 6, 2006 the Board, including the Directors who are not “interested persons” of the Fund or Barrett (the “Independent Directors”), approved a new management agreement (the “New Management Agreement”) between the Fund and Barrett. The New Management Agreement replaced the Fund’s prior management agreement with ClearBridge. The Board also was provided with information about LMPFA and its fund administration capabilities in advance of the September 6, 2006 Board meeting. In addition, the Independent Directors consulted with their independent legal counsel, discussing, among other things, the legal standards and certain other considerations relevant to the Directors’ deliberations.
At the September meeting and at two earlier meetings in May and June of 2006, the Directors discussed with representatives of Barrett and Legg Mason the past performance of Barrett; Barrett’s investment management experience, business organization, personnel, operations, history and philosophy; and the compatibility of Barrett’s investment management style with the Fund’s investment policies and objectives and past investment management style. The Board considered whether the terms of the New Management Agreement were in the best interests of the Fund and its shareholders. Legg Mason and Barrett discussed the timing of the transition to Barrett and how the transition could be accomplished with minimal disruption and expense. The Independent Directors also conferred separately and with their independent legal counsel about the proposed replacement of the Fund’s investment manager on a number of occasions, including in connection with the May, June and September Board meetings.
At the three meetings with the Board, representatives of Legg Mason and Barrett made presentations to, and responded to questions from, the Board. After the presentations and after reviewing the written materials provided, at the September 6 meeting, the Independent Directors met in executive session with their independent legal counsel to consider the New Management Agreement.
Among other things, the Directors considered:
(a) the reputation, financial strength and resources of Legg Mason and its investment advisory subsidiaries, including Barrett and LMPFA;
(b) that Barrett is affiliated with a highly regarded investment management organization and is an experienced and respected asset management firm in its own right; that the Board has been provided information that Barrett has the resources and personnel necessary to provide the investment advisory services to the Fund; and such other matters as the Directors considered relevant in the exercise of their reasonable judgment;
(c) that Legg Mason has advised the Board that there is not expected to be any diminution in the nature, quality and extent of services provided to the Fund and its shareholders by Barrett and LMPFA, including administrative and compliance services;
(d) the terms and conditions of the New Management Agreement, which contains no material differences from the Fund’s previous management agreement other than the identity of Barrett and differences in dates of effectiveness and termination;
(e) that the advisory fees paid by the Fund represent reasonable compensation to Barrett in light of the services expected to be provided and the fees paid by similar funds and such other matters as the Directors considered relevant in the exercise of their reasonable judgment;
19
BARRETT
OPPORTUNITY FUND, INC.
Basis for Approval of the Fund’s Management Agreement (Unaudited) (Continued)
(f) that Legg Mason would bear a portion of the cost of obtaining shareholder approval of the New Management Agreement; and
(g) that the Fund would no longer be managed by ClearBridge, and therefore it would be necessary to provide for continuation of investment advisory services to the Fund.
Certain of these considerations are discussed in more detail below.
The Directors did not identify any particular information that was all-important or controlling, and each Director attributed different weights to the various factors. The Directors, including a majority of the Independent Directors, concluded that the terms of the New Management Agreement are fair and reasonable, that the fees stated therein are reasonable in light of the services anticipated to be provided to the Fund, and that the New Management Agreement should be approved and recommended to Fund shareholders.
Nature, Quality and Extent of Services Provided
In evaluating the nature, quality and extent of the services to be provided by Barrett under the New Management Agreement, the Directors considered, among other things, the expected impact, if any, of the appointment of Barrett on the operations, facilities, organization and personnel to be made available to the Fund, and the ability of Barrett to perform its duties under the New Management Agreement, taking into account the delegation of certain duties to LMPFA, as sub-administrator. The Board reviewed and discussed information regarding Barrett’s investment process and the performance of the registered investment companies and other accounts advised and sub-advised by Barrett. The Board noted favorable performance compared with the applicable benchmark indices. The Board also noted that Barrett’s investment process was based on fundamental analysis and similar to the process employed by ClearBridge. The Directors recognized, however, that past performance is no guarantee of future results.
Based on their review of the materials provided and the assurances they had received from Legg Mason and Barrett, the Directors determined that the appointment of Barrett as the Fund’s investment manager would not, based upon the information provided to the Board, adversely affect the nature and quality of services provided to the Fund.
Cost of Services Provided
The Directors considered, among other things, that the management fee rate would remain unchanged under the New Management Agreement. The Directors noted that fees payable under the sub-administration agreement with LMPFA would be paid by Barrett and not by the Fund.
The Board received and considered pro forma information as to the profitability to the Legg Mason organization of its relationship with the Fund. However, the Board recognized the speculative nature of such information, which was based upon the Fund’s past relationship with Citigroup Asset Management and did not give such information significant weight. The Directors noted that they expect to receive cost, expense and profitability information prior to the end of the initial term of the New Management Agreement and, thus, be in a position to evaluate at that time whether any adjustments in Fund fees would be appropriate in connection with a renewal of the Agreement.
20
BARRETT
OPPORTUNITY FUND, INC.
Basis for Approval of the Fund’s Management Agreement (Unaudited) (Continued)
Fall-Out Benefits
In evaluating the fall-out benefits to be received by Barrett under the New Management Agreement, the Directors considered whether the replacement of ClearBridge by Barrett as investment manager to the Fund would have an impact on the fall-out benefits received by the Fund’s investment manager. Based on their review of the materials provided, and their discussions with Legg Mason, the Directors determined that those benefits could include the use of portfolio brokerage transactions to pay for research services generated by parties other than the executing broker-dealer. The Directors noted that any such benefits were difficult to quantify with certainty at this time, and indicated that they would continue to evaluate them going forward.
Fees and Economies of Scale
In considering the New Management Agreement, the Directors considered, among other things, that the management fee rate would remain unchanged. The Directors determined that the total fees for management (including administrative) services for the Fund were reasonable in light of the services provided. It was noted that ClearBridge, at its expense, had provided the Directors with, among other things, a report from Lipper comparing the Fund’s fees, expenses and performance with those of a peer group for the Fund selected by Lipper, and information as to the fees charged by other registered investment company clients for investment management services. The Directors concluded that the Fund’s proposed fees for management (including administrative) services are reasonable in light of the services expected to be provided and the fees paid by similar funds.
Investment Performance
As noted above, the Board noted Barrett’s investment management experience, past performance and capabilities, but the Directors were unable to predict what effect, if any, execution of the New Management Agreement would have on the future performance of the Fund.
21
(This page intentionally left blank.)
(This page intentionally left blank.)
(This page intentionally left blank.)
BARRETT OPPORTUNITY FUND, INC.
DIRECTORS
Irving G. Brilliant
Barry Handel, CPA
Rosalind A. Kochman
Chairperson
William Morris, Jr., CPA
Irving Sonnenschein
INVESTMENT MANAGER
Barrett Associates, Inc.
90 Park Avenue
New York, NY 10016
SUB-ADMINISTRATOR
Legg Mason Fund Advisor, LLC
399 Park Avenue
New York, NY 10022
DISTRIBUTORS
Legg Mason Investor Services, LLC (LMIS)
100 Light Street
Baltimore, MD 21202
Citigroup Global Markets Inc. (CGM)
388 Greenwich Street
New York, NY 10013
CUSTODIAN
State Street Bank and Trust Company
2 Avenue De Lafeyette
Boston, MA 02111
TRANSFER AGENT
PFPC Inc.
P.O. Box 9699
Providence, Rhode Island 02940-9699
INDEPENDENT REGISTERED PUBLIC ACCOUNTING FIRM
KPMG LLP
345 Park Avenue
New York, NY 10154
Barrett Opportunity Fund, Inc.
125 Broad Street
10th Floor, MF-2
New York, New York 10004
This report is transmitted to the shareholders of Barrett Opportunity Fund, Inc. for their information. This is not a prospectus, circular or representation intended for use in the purchase of shares of the Fund or any securities mentioned in this report.
This report must be preceded or accompanied by a free prospectus. Investors should consider the Fund’s investment objectives, risks, charges and expenses carefully before investing. The prospectus contains this and other important information about the Fund. Please read the prospectus carefully before investing.
www.barrettassociates.com
©2007 Legg Mason Investor Services, LLC Member NASD, SIPC
BAR02
The Fund files its complete schedule of portfolio holdings with the Securities and Exchange Commission (“SEC”) for the first and third quarters of each fiscal year on Form N-Q. The Fund’s Forms N-Q are available on the SEC’s website at www.sec.gov. The Fund’s Forms N-Q may be reviewed and copied at the SEC’s Public Reference Room in Washington, D.C., and information on the operation of the Public Reference Room may be obtained by calling 1-800-SEC-0330. To obtain information on Form N-Q from the Fund, shareholders can call 1-800-451-2010.
Information on how the Fund voted proxies relating to portfolio securities during the prior 12-month period ended June 30th of each year, and a description of the policies and procedures that the Fund uses to determine how to vote proxies related to portfolio transactions is available (1) without charge, upon request, by calling 1-800-451-2010 and (2) on the SEC’s website at www.sec.gov.
Not Applicable.
| ITEM 3. | AUDIT COMMITTEE FINANCIAL EXPERT. |
Not Applicable.
| ITEM 4. | PRINCIPAL ACCOUNTANT FEES AND SERVICES. |
Not applicable.
| ITEM 5. | AUDIT COMMITTEE OF LISTED REGISTRANTS. |
Not applicable.
| ITEM 6. | SCHEDULE OF INVESTMENTS. |
Included herein under Item 1.
| ITEM 7. | DISCLOSURE OF PROXY VOTING POLICIES AND PROCEDURES FOR CLOSED-END MANAGEMENT INVESTMENT COMPANIES. |
Not applicable.
| ITEM 8. | PORTFOLIO MANAGERS OF CLOSED-END MANAGEMENT INVESTMENT COMPANIES. |
Not applicable.
| ITEM 9. | PURCHASES OF EQUITY SECURITIES BY CLOSED-END MANAGEMENT INVESTMENT COMPANY AND AFFILIATED PURCHASERS. |
Not applicable.
| ITEM 10. | SUBMISSION OF MATTERS TO A VOTE OF SECURITY HOLDERS. |
Not applicable.
| ITEM 11. | CONTROLS AND PROCEDURES. |
| | (a) | The registrant’s principal executive officer and principal financial officer have concluded that the registrant’s disclosure controls and procedures (as defined in Rule 30a- 3(c) under the Investment Company Act of 1940, as amended (the “1940 Act”)) are effective as of a date within 90 days of the filing date of this report that includes the disclosure required by this paragraph, based on their evaluation of the disclosure controls and procedures required by Rule 30a-3(b) under the 1940 Act and 15d-15(b) under the Securities Exchange Act of 1934. |
| | (b) | There were no changes in the registrant’s internal control over financial reporting (as defined in Rule 30a-3(d) under the 1940 Act) that occurred during the registrant’s last fiscal half-year (the registrant’s second fiscal half-year in the case of an annual report) that have materially affected, or are likely to materially affect the registrant’s internal control over financial reporting. |
| | |
| (a) (1) | | Not applicable. |
| |
| | Exhibit 99.CODE ETH |
| |
(a) (2) | | Certifications pursuant to section 302 of the Sarbanes-Oxley Act of 2002 attached hereto. |
| |
| | Exhibit 99.CERT |
| |
(b) | | Certifications pursuant to Section 906 of the Sarbanes-Oxley Act of 2002 attached hereto. |
| |
| | Exhibit 99.906CERT |
SIGNATURES
Pursuant to the requirements of the Securities Exchange Act of 1934 and the Investment Company Act of 1940, the registrant has duly caused this Report to be signed on its behalf by the undersigned, there unto duly authorized.
| | | | |
| Barrett Opportunity Fund, Inc. | | |
| | |
| By: | | /s/ Peter H. Shriver | | |
| | Peter H. Shriver | | |
| | Chief Executive Officer of Barrett Opportunity Fund, Inc. | | |
| | |
| Date: | | May 7, 2007 | | |
Pursuant to the requirements of the Securities Exchange Act of 1934 and the Investment Company Act of 1940, this report has been signed below by the following persons on behalf of the registrant and in the capacities and on the dates indicated.
| | | | |
| By: | | /s/ Peter H. Shriver | | |
| | Peter H. Shriver | | |
| | Chief Executive Officer of Barrett Opportunity Fund, Inc. | | |
| | |
| Date: | | May 7, 2007 | | |
| | |
| By: | | /s/ Frances M. Guggino | | |
| | Frances M. Guggino | | |
| | Chief Financial Officer of Barrett Opportunity Fund, Inc. | | |
| | |
| Date: | | May 7, 2007 | | |