UNITED STATES
SECURITIES AND EXCHANGE COMMISSION
Washington, D.C. 20549
FORM N-CSR
CERTIFIED SHAREHOLDER REPORT OF REGISTERED
MANAGEMENT INVESTMENT COMPANIES
| | |
Investment Company Act file number | | 811-2884 |
Barrett Opportunity Fund, Inc.
|
| (Exact name of registrant as specified in charter) |
| | |
| 55 Water Street, New York, NY | | 10041 |
| (Address of principal executive offices) | | (Zip code) |
Robert I. Frenkel, Esq.
Legg Mason & Co., LLC
300 First Stamford Place, 4th Fl.
Stamford, CT 06902
|
| (Name and address of agent for service) |
Registrant’s telephone number, including area code: (800) 451-2010
Date of fiscal year end: August 31
Date of reporting period: February 29, 2008
| ITEM 1. | REPORT TO STOCKHOLDERS. |
The Semi-Annual Report to Stockholders is filed herewith.


Semi-Annual Report
February 29, 2008
INVESTMENT PRODUCTS: NOT FDIC INSURED Ÿ NO BANK GUARANTEE Ÿ MAY LOSE VALUE
BAR RETT
OPPORTUNITY FUND, INC.
Semi-Annual Report • February 29, 2008
Fund Objective | The Fund seeks to achieve above average long-term capital appreciation. Current income is a secondary objective. The Fund invests primarily in common stocks and securities convertible into or exchangeable for common stock such as convertible preferred stock or convertible debt securities. |
BARRETT
OPPORTUNITY FUND, INC.
Letter from the Chairperson |
Dear Shareholder,
We are pleased to provide this semi-annual report of the Barrett Opportunity Fund, Inc. (the “Fund”) for the six-month period ended February 29, 2008.
The management team at Barrett Associates, Inc. has prepared the enclosed Manager Overview, which includes a brief market overview as well as performance review. I urge you to read it as well as the accompanying financial statements. A detailed summary of the Fund’s performance and other pertinent information are also included in this report. I am sure you will find this report informative and useful.
On behalf of the Directors and the officers of the Fund, I thank you for your ongoing confidence in the Fund and its investment policies.
Sincerely,

Rosalind A. Kochman
Chairperson
March 28, 2008
1
BARRETT
OPPORTUNITY FUND, INC.
Manager Overview | Market Overview |
The U.S. economic environment has deteriorated over the past six months. The U.S. economy grew by less than 1% in the fourth quarter of 2007 and recent economic data suggests that it is likely to grow at a similar rate in the first half of 2008. The weakness in the U.S. housing market, as well as the collapse in the value of mortgage-backed securities, has caused homeowners and financial institutions to suffer significant losses. Many homeowners and financial institutions increased their leverage over the past several years and now are being forced to reduce their borrowing. The credit crunch is affecting all kinds of borrowers, from small home builders to the largest private equity firms. The U.S. Federal Reserve, U.S. Treasury and various governmental agencies appear to be pulling out all stops to try and stabilize the housing market and resolve the credit problems. Consumer and business confidence have collapsed to levels typical of recessionary periods. Weak automobile sales reflect the widespread weakness in consumer spending.
The economic picture outside the U.S. is generally better although weakening as well. Japan’s economy is soft and a declining U.S. dollar does not help Japan’s exports. Europe also is mixed with the weakness in Britain’s financial industry offset by some relative strength in Germany. Asia’s growth continues to be the support for all the developed regions, including the U.S., Japan and Europe. Nonetheless, both China and India are experiencing a slower rate of growth as a result of the weakness in the U.S. economy. The other hurdle for policy makers and economies worldwide is the rising cost of key commodities, including food, energy and metals. Inflation rates in developing economies are causing sporadic bouts of civil unrest and, we believe, will eventually require either more aggressive interest rate policies or significant strengthening in currencies. The U.S. Federal Reserve has decided to fight the current domestic economic weakness now and address the inflation risks after the credit crunch subsides.
The U.S. stock market has been extremely volatile since last summer, and for the most part, under downward pressure. Earnings have been disappointing, particularly in the Financials and Consumer Discretionary sectors. Multinational companies have benefited from foreign economic strength and currency benefits. At this point in time, we expect first quarter earnings for U.S. companies to be on the weak side, with continued sizable write-offs in the Financials sector. From a historical perspective, stock markets tend to bottom out during periods similar to the current environment. We expect this to be the case again, but we believe it may be a very volatile and rocky bottoming process. The collapse of Bear Stearns has unnerved the more sanguine forecasters and the overall complexity and lack of transparency in our leading financial institutions hardly engenders confidence. Nonetheless, we think the “rescue mission” led by the Federal Reserve and U.S. Treasury is now in full swing and expect it to ultimately be successful.
Performance Review
For the six-month period ended February 29, 2008, the U.S. equity market, as measured by the S&P 500 Index, generated a total return of -8.79%. Over the past 12 months, the U.S. equity market also has generated a negative return. Value funds, in general, performed significantly worse than the U.S. equity market, primarily because value funds typically have significant allocations to the Financials sector, which has been the worst performing group during the reporting period. The Fund has outperformed its Lipper peer group of multi-cap value funds during the past 6 months, as well as over the 1 year, 3 year and 5 year periods. The overweighting of the Energy sector helped the Fund offset its heavy exposure to the Financials sector. Additionally, certain portfolio holdings, such as Monsanto Co., posted significant price gains.
2
BARRETT
OPPORTUNITY FUND, INC.
| | | | | | | | | | |
Total Returns for Periods Ended February 29, 2008 |
| | | Total Return | | Average Annual Total Returns |
| | | Six months | | 1 Year | | 3 Year | | 5 Year | | 10 Year |
Barrett Opportunity Fund, Inc. | | -6.27% | | -3.96% | | +8.16% | | +13.52% | | +5.80% |
Lipper Multi-Cap Value Funds Category Average1 | | -10.67% | | -8.33% | | +4.65% | | +13.08% | | +6.06% |
S&P 500® Index2 | | -8.79% | | -3.60% | | +5.37% | | +11.63% | | +4.07% |
The performance data quoted represents past performance. Past performance does not guarantee future results and current performance may be lower or higher than the performance data shown above. The investment return and principal value of an investment will fluctuate. An investor’s shares, when redeemed, may be worth more or less than their original cost. As economic and market conditions change frequently, there can be no assurance that trends described will continue or that forecasts will come to pass. Performance data current to the most recent month end may be obtained by calling (800) 451-2010. Shares of the Fund are distributed by Legg Mason Investor Services, LLC (“LMIS”) (Member SIPC/FINRA). LMIS and Barrett Associates, Inc., the Fund’s investment manager, are both wholly-owned subsidiaries of Legg Mason, Inc.
The Fund’s total annual operating expenses as of the Fund’s most current Prospectus dated December 1, 2007 are 1.01%.
All investing entails risk, including the possible loss of principal. The Fund is non-diversified, which means that it can invest a higher percentage of its assets in any one issuer than a diversified fund. Being non-diversified may magnify the Fund’s losses from events affecting a particular issuer. Please see the Fund’s current prospectus for more information on this and other risks.
| | 1 | Lipper Multi-Cap Value Funds Category Average includes funds which invest in a variety of market cap ranges, generally have between 25-75% of their equity assets in companies with market caps above 300% of the dollar-weighted median of the S&P MidCap 400 Index, invest in companies considered to be undervalued, and have below-average price-to-earnings ratios, price-to-book ratios, and 3-year earnings growth figures. |
| | 2 | The S&P 500® Index is a market-value weighted index comprised of 500 widely held common stocks. It is not possible to invest directly in the Index. The Index does not reflect deductions for fees, expenses or taxes. |
Thank you for your continued interest in the Fund.
Sincerely,
| | |
 | |  |
Amy LaGuardia, CFA Portfolio Manager | | Robert Milnamow Portfolio Manager |
March 28, 2008
The outlook and views presented above are those of the Fund’s portfolio managers as of March 28, 2008 and are subject to change. This information is intended for the shareholders of the Fund and is not for distribution to prospective investors unless preceded or accompanied by a current prospectus. Investors should consider the risks, investment objective, charges and expenses of the Fund carefully before investing. The prospectus, which contains this and other information about the Fund, is available at www.barrettassociates.com. Investors should read the prospectus carefully before investing.
3
BARRETT
OPPORTUNITY FUND, INC.
Fund at a Glance (Unaudited)
| | | | | | |
Top Ten Holdings - as of 2/29/2008
(As a percentage of Total Investments) | | | | Sector Weightings - as of 2/29/2008 (As a percentage of Total Investments) |
| | | |
| 1. | | Bank of New York Mellon Corp. | | 13.2% | | 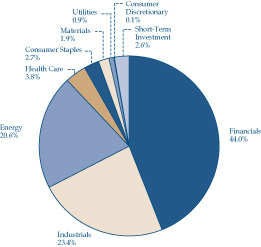
|
| 2. | | Royal Dutch Shell PLC, ADR, Class A Shares | | 10.9% | |
| 3. | | Chubb Corp. | | 10.8% | |
| 4. | | Koninklijke Philips Electronics NV, New York Registered Shares | | 8.9% | |
| 5. | | General Dynamics Corp. | | 6.9% | |
| 6. | | Murphy Oil Corp. | | 6.8% | |
| 7. | | Forest City Enterprises Inc., Class A Shares | | 5.7% | |
| 8. | | Leucadia National Corp. | | 4.8% | |
| 9. | | Forest City Enterprises Inc., Class B Shares | | 3.8% | |
| 10. | | Ameron International Corp. | | 3.6% | |
| | | | | |
| | | | | |
| | | | | |
| | | | | |
| | | | | |
| | | | | |
| | | | | |
4
BARRETT
OPPORTUNITY FUND, INC.
Fund Expenses (Unaudited)
Example
As a shareholder of the Fund, you may incur two types of costs: (1) transaction costs; and (2) ongoing costs, including management fees and other Fund expenses. This example is intended to help you understand your ongoing costs (in dollars) of investing in the Fund and to compare these costs with the ongoing costs of investing in other mutual funds.
This example is based on an investment of $1,000 invested on September 1, 2007 and held for the six months ended February 29, 2008.
Actual Expenses
The table below titled “Based on Actual Total Return” provides information about actual account values and actual expenses. You may use the information provided in this table, together with the amount you invested, to estimate the expenses that you paid over the period. To estimate the expenses you paid on your account, divide your ending account value by $1,000 (for example, an $8,600 ending account value divided by $1,000 = 8.6), then multiply the result by the number under the heading entitled “Expenses Paid During the Period”.
Based on Actual Total Return1
| | | | | | | | | | | | | | | |
| | | Actual
Total Return2 | | | Beginning
Account
Value | | Ending
Account
Value | | Annualized
Expense
Ratio | | | Expenses
Paid During
the Period3 |
Barrett Opportunity Fund, Inc. | | -6.27 | % | | $ | 1,000.00 | | $ | 937.30 | | 1.02 | % | | $ | 4.91 |
1 | | For the six months ended February 29, 2008. |
2 | | Assumes reinvestment of all distributions, including returns of capital, if any, at net asset value. Total return is not annualized, as it may not be representative of the total return for the year. Performance figures may reflect fee waivers and/or expense reimbursements. In the absence of fee waivers and/or expense reimbursements, the total return would have been lower. Past performance is no guarantee of future results. |
3 | | Expenses (net of fee waivers and/or expense reimbursements) are equal to the Fund’s annualized expense ratio, multiplied by the average account value over the period, multiplied by the number of days in the most recent fiscal half-year, then divided by 366. |
5
BARRETT
OPPORTUNITY FUND, INC.
Fund Expenses (Unaudited) (Continued)
Hypothetical Example for Comparison Purposes
The table below titled “Based on Hypothetical Total Return” provides information about hypothetical account values and hypothetical expenses based on the actual expense ratio and an assumed rate of return of 5.00% per year before expenses, which is not the Fund’s actual return. The hypothetical account values and expenses may not be used to estimate the actual ending account balance or expenses you paid for the period. You may use the information provided in this table to compare the ongoing costs of investing in the Fund and other funds. To do so, compare the 5.00% hypothetical example relating to the Fund with the 5.00% hypothetical examples that appear in the shareholder reports of the other funds.
Please note that the expenses shown in the table below are meant to highlight your ongoing costs only and do not reflect any transactional costs. Therefore, the table is useful in comparing ongoing costs only, and will not help you determine the relative total costs of owning different funds. In addition, if these transaction costs were included, your costs would have been higher.
Based on Hypothetical Total Return1
| | | | | | | | | | | | | | | |
| | | Hypothetical
Annualized
Total Return | | | Beginning
Account
Value | | Ending
Account
Value | | Annualized
Expense
Ratio | | | Expenses
Paid During
the Period2 |
Barrett Opportunity Fund, Inc. | | 5.00 | % | | $ | 1,000.00 | | $ | 1,019.79 | | 1.02 | % | | $ | 5.12 |
1 | | For the six months ended February 29, 2008. |
2 | | Expenses (net of fee waivers and/or expense reimbursements) are equal to the Fund’s annualized expense ratio, multiplied by the average account value over the period, multiplied by the number of days in the most recent fiscal half-year, then divided by 366. |
6
BARRETT
OPPORTUNITY FUND, INC.
Schedule of Investments
February 29, 2008
(Unaudited)
| | | | | |
Shares | | Security | | Value |
| | | | | |
| | COMMON STOCKS - 97.4% |
| | CONSUMER DISCRETIONARY - 0.1% |
| | Household Durables - 0.1% |
| | Liberty Homes Inc.: | | | |
| 14,850 | | Class A Shares (a) | | $ | 47,520 |
| 22,050 | | Class B Shares (a) | | | 103,635 |
| | | | | |
| | Total Consumer Discretionary | | | 151,155 |
| | | | | |
| |
| | CONSUMER STAPLES - 2.7% |
| | Food & Staples Retailing - 0.0% |
| 96,000 | | FHC Delaware Inc. (a)(b)* | | | 0 |
| | | | | |
| | Food Products - 1.1% | | | |
| 37,400 | | Hershey Co. | | | 1,386,792 |
| | | | | |
| | Household Products - 1.6% |
| 29,900 | | Procter & Gamble Co. | | | 1,978,782 |
| | | | | |
| | Total Consumer Staples | | | 3,365,574 |
| | | | | |
| | |
| | ENERGY - 20.6% | | | |
| | Energy Equipment & Services - 1.3% |
| 13,300 | | Diamond Offshore Drilling Inc. | | | 1,607,039 |
| | | | | |
| | Oil, Gas & Consumable Fuels - 19.3% |
| 10,176 | | EnCana Corp. | | | 775,513 |
| 105,100 | | Murphy Oil Corp. | | | 8,447,938 |
| 19,600 | | Overseas Shipholding Group Inc. | | | 1,229,312 |
| 190,100 | | Royal Dutch Shell PLC, ADR, Class A Shares | | | 13,582,645 |
| | | | | |
| | Total Oil, Gas & Consumable Fuels | | | 24,035,408 |
| | | | | |
| | Total Energy | | | 25,642,447 |
| | | | | |
| | |
| | FINANCIALS - 44.0% | | | |
| | Capital Markets - 13.2% | | | |
| 375,071 | | Bank of New York Mellon Corp. | | | 16,454,365 |
| | | | | |
| | Diversified Financial Services - 4.8% |
| 130,600 | | Leucadia National Corp. | | | 5,910,956 |
| | | | | |
| | | | | |
Shares | |
Security | | Value |
| | | | | |
| | Insurance - 14.1% | | | |
| 264,700 | | Chubb Corp. | | $ | 13,473,230 |
| 76,500 | | CNA Financial Corp. | | | 2,038,725 |
| 24,700 | | Loews Corp. | | | 1,033,448 |
| 77,100 | | Old Republic International Corp. | | | 1,057,812 |
| | | | | |
| | Total Insurance | | | 17,603,215 |
| | | | | |
| | Real Estate Investment Trusts
(REITs) - 2.3% |
| 65,890 | | Rayonier Inc. | | | 2,803,619 |
| | | | | |
| | Real Estate Management & Development - 9.6% |
| | Forest City Enterprises Inc.: | | | |
| 203,400 | | Class A Shares | | | 7,149,510 |
| 135,900 | | Class B Shares (c) | | | 4,787,757 |
| | | | | |
| | Total Real Estate Management & Development | | | 11,937,267 |
| | | | | |
| | Total Financials | | | 54,709,422 |
| | | | | |
| | |
| | HEALTH CARE - 3.8% | | | |
| | Health Care Providers & Services - 3.8% |
| 13,000 | | Humana Inc. * | | | 888,290 |
| 55,308 | | WellPoint Inc. * | | | 3,875,985 |
| | | | | |
| | Total Health Care | | | 4,764,275 |
| | | | | |
| | |
| | INDUSTRIALS - 23.4% | | | |
| | Aerospace & Defense - 7.7% |
| 104,800 | | General Dynamics Corp. | | | 8,577,880 |
| 9,900 | | Lockheed Martin Corp. | | | 1,021,680 |
| | | | | |
| | Total Aerospace & Defense | | | 9,599,560 |
| | | | | |
| | Building Products - 3.6% |
| 40,700 | | Ameron International Corp. | | | 4,492,059 |
| | | | | |
| | Commercial Services & Supplies - 0.4% |
| 96,650 | | TRC Cos. Inc. * | | | 490,016 |
| | | | | |
| | Electrical Equipment - 0.8% |
| 38,000 | | ABB Ltd., ADR | | | 951,520 |
| | | | | |
See Accompanying Notes to the Financial Statements.
7
BARRETT
OPPORTUNITY FUND, INC.
Schedule of Investments
February 29, 2008
(Unaudited) (Continued)
| | | | | |
Shares | | Security | | Value |
| | | | | |
| | Industrial Conglomerates - 10.1% |
| 41,200 | | General Electric Co. | | $ | 1,365,368 |
| 285,710 | | Koninklijke Philips Electronics NV, New York Registered Shares | | | 11,119,833 |
| | | | | |
| | Total Industrial Conglomerates | | | 12,485,201 |
| | | | | |
| | Marine - 0.8% | | | |
| 23,400 | | Alexander & Baldwin Inc. | | | 1,030,536 |
| | | | | |
| | Total Industrials | | | 29,048,892 |
| | | | | |
| |
| | MATERIALS - 1.9% |
| | Chemicals - 1.9% | | | |
| 20,842 | | Monsanto Co. | | | 2,411,002 |
| | | | | |
| | |
| | UTILITIES - 0.9% | | | |
| | Water Utilities - 0.9% |
| 12,000 | | Veolia Environment, ADR | | | 1,068,600 |
| | | | | |
| | Total Investments Before Short-term Investment (Cost - $17,997,567) | | | 121,161,367 |
| | | | | |
| | | | | |
Face
Amount | | Security | | Value |
| | | | | |
| | SHORT-TERM INVESTMENT - 2.6% |
| | Repurchase Agreement - 2.6% |
| $3,250,000 | | State Street Bank & Trust Co. dated 2/29/08, 1.380% due 3/3/08; Proceeds at maturity - $3,250,374; (Fully collateralized by U.S. Treasury Bond, 8.125% due 8/15/19; Market value - $3,320,625) (Cost - $3,250,000) | | $ | 3,250,000 |
| | | | | |
| | Total Investments - 100.0% (Cost - $21,247,567 #) | | | 124,411,367 |
| | | | | |
| | Other Assets in Excess of Liabilities - 0.0% | | | 15,100 |
| | | | | |
| | Total Net Assets - 100.0% | | $ | 124,426,467 |
| | | | | |
| * | Non-income producing security. |
| (b) | Security is valued in good faith at fair value by or under the direction of the Board of Directors (See Note 1). |
| (c) | Convertible into Forest City Enterprises Inc., Class A Shares. |
| # | Aggregate cost for federal income tax purposes is substantially the same. |
Abbreviation used in this schedule:
ADR—American Depositary Receipt
See Accompanying Notes to the Financial Statements.
8
BARRETT
OPPORTUNITY FUND, INC.
Statement of Assets and Liabilities
February 29, 2008
(Unaudited)
| | | |
ASSETS: | | | |
Investments, at value
(Cost - $21,247,567) | | $ | 124,411,367 |
Cash | | | 730 |
Dividends and interest receivable | | | 238,422 |
Receivable for Fund shares sold | | | 1,731 |
Prepaid expenses | | | 15,375 |
| | | |
Total assets | | | 124,667,625 |
| | | |
LIABILITIES: | | | |
Investment management fee payable | | | 80,336 |
Payable for Fund shares repurchased | | | 52,509 |
Directors’ fees payable | | | 10,415 |
Accrued expenses and other liabilities | | | 97,898 |
| | | |
Total liabilities | | | 241,158 |
| | | |
Total net assets | | $ | 124,426,467 |
| | | |
NET ASSETS: | | | |
Par value (Note 4) | | $ | 23,154 |
Paid-in capital in excess of par value | | | 5,987,153 |
Undistributed net investment income | | | 194,962 |
Accumulated net realized gain on investments | | | 15,057,398 |
Net unrealized appreciation on investments | | | 103,163,800 |
| | | |
Total net assets | | $ | 124,426,467 |
| | | |
Shares outstanding | | | 2,315,407 |
| | | |
Net asset value | | | $53.74 |
| | | |
Statement of Operations
For the Six Months Ended February 29, 2008
(Unaudited)
| | | | |
INVESTMENT INCOME: | | | | |
Dividends | | $ | 1,257,258 | |
Interest | | | 16,875 | |
Less: Foreign taxes withheld | | | (50,769 | ) |
| | | | |
Total investment income | | | 1,223,364 | |
| | | | |
| | | | |
EXPENSES: | | | | |
Investment management fee (Note 2) | | | 542,975 | |
Legal fees | | | 68,739 | |
Directors’ fees | | | 33,787 | |
Shareholder reports | | | 33,650 | |
Transfer agent fees | | | 20,218 | |
Audit and tax | | | 19,775 | |
Registration fees | | | 11,240 | |
Insurance | | | 1,871 | |
Custody fees | | | 563 | |
Miscellaneous expenses | | | 1,447 | |
| | | | |
Total expenses | | | 734,265 | |
Less: Fees paid indirectly (Note 1) | | | (10 | ) |
| | | | |
Net expenses | | | 734,255 | |
| | | | |
Net investment income | | | 489,109 | |
| | | | |
| | | | |
REALIZED AND UNREALIZED GAIN (LOSS) ON INVESTMENTS (NOTES 1, 3 and 5): | | | | |
Net realized gain from investment transactions | | | 14,911,344 | |
Change in net unrealized appreciation/depreciation from investments | | | (23,049,145 | ) |
| | | | |
Net loss on investments | | | (8,137,801 | ) |
| | | | |
Decrease in net assets from operations | | $ | (7,648,692 | ) |
| | | | |
See Accompanying Notes to the Financial Statements.
9
BARRETT
OPPORTUNITY FUND, INC.
Statements of Changes in Net Assets
| | | | | | | | |
| | | Six Months Ended
February 29, 2008
(Unaudited) | | | Year Ended
August 31, 2007 | |
OPERATIONS: | | | | | | | | |
Net investment income | | $ | 489,109 | | | $ | 1,093,553 | |
Net realized gain | | | 14,911,344 | | | | 7,628,829 | |
Change in net unrealized appreciation/depreciation | | | (23,049,145 | ) | | | 7,334,285 | |
| | | | | | | | |
Increase (Decrease) in net assets from operations | | | (7,648,692 | ) | | | 16,056,667 | |
| | | | | | | | |
| | | | | | | | |
DISTRIBUTIONS TO SHAREHOLDERS FROM (NOTE 1): | | | | | | | | |
Net investment income | | | (900,000 | ) | | | (900,000 | ) |
Net realized gains | | | (7,350,641 | ) | | | (4,731,882 | ) |
| | | | | | | | |
Decrease in net assets from distributions to shareholders | | | (8,250,641 | ) | | | (5,631,882 | ) |
| | | | | | | | |
| | | | | | | | |
FUND SHARE TRANSACTIONS (NOTES 4 and 5): | | | | | | | | |
Net proceeds from sale of shares | | | 660,582 | | | | 6,449,093 | |
Reinvestment of distributions | | | 4,667,815 | | | | 2,777,928 | |
Cost of shares repurchased | | | (12,793,284 | ) | | | (29,617,914 | ) |
| | | | | | | | |
Decrease in net assets from fund share transactions | | | (7,464,887 | ) | | | (20,390,893 | ) |
| | | | | | | | |
Decrease in net assets | | | (23,364,220 | ) | | | (9,966,108 | ) |
| | | | | | | | |
NET ASSETS: | | | | | | | | |
Beginning of period | | | 147,790,687 | | | | 157,756,795 | |
| | | | | | | | |
End of period* | | $ | 124,426,467 | | | $ | 147,790,687 | |
| | | | | | | | |
*Includes undistributed net investment income of: | | | $194,962 | | | | $605,853 | |
| | | | | | | | |
See Accompanying Notes to the Financial Statements.
10
BARRETT
OPPORTUNITY FUND, INC.
Financial Highlights
For a share of capital stock outstanding throughout each year ended August 31, unless otherwise noted:
| | | | | | | | | | | | | | | | | | | | | | | | |
| | | 2008(1) | | | 2007 | | | 2006 | | | 2005 | | | 2004 | | | 2003 | |
NET ASSET VALUE | | | | | | | | | | | | | | | | | | | | | | | | |
Beginning of period | | $ | 60.62 | | | $ | 56.71 | | | $ | 50.98 | | | $ | 42.92 | | | $ | 41.34 | | | $ | 41.86 | |
| | | | | | | | | | | | | | | | | | | | | | | | |
INCOME (LOSS) FROM OPERATIONS: | | | | | | | | | | | | | | | | | | | | | | | | |
Net investment income | | | 0.21 | | | | 0.45 | | | | 0.32 | | | | 0.53 | | | | 0.49 | | | | 0.33 | |
Net realized and unrealized gain (loss) | | | (3.68 | ) | | | 5.67 | | | | 7.04 | | | | 8.31 | | | | 3.99 | | | | 0.61 | |
| | | | | | | | | | | | | | | | | | | | | | | | |
Total Income (Loss) From Operations | | | (3.47 | ) | | | 6.12 | | | | 7.36 | | | | 8.84 | | | | 4.48 | | | | 0.94 | |
| | | | | | | | | | | | | | | | | | | | | | | | |
LESS DISTRIBUTIONS FROM: | | | | | | | | | | | | | | | | | | | | | | | | |
Net investment income | | | (0.37 | ) | | | (0.35 | ) | | | (0.46 | ) | | | (0.56 | ) | | | (0.37 | ) | | | (0.19 | ) |
Net realized gains | | | (3.04 | ) | | | (1.86 | ) | | | (1.17 | ) | | | (0.22 | ) | | | (2.53 | ) | | | (1.27 | ) |
| | | | | | | | | | | | | | | | | | | | | | | | |
Total Distributions | | | (3.41 | ) | | | (2.21 | ) | | | (1.63 | ) | | | (0.78 | ) | | | (2.90 | ) | | | (1.46 | ) |
| | | | | | | | | | | | | | | | | | | | | | | | |
NET ASSET VALUE | | | | | | | | | | | | | | | | | | | | | | | | |
End of period | | $ | 53.74 | | | $ | 60.62 | | | $ | 56.71 | | | $ | 50.98 | | | $ | 42.92 | | | $ | 41.34 | |
| | | | | | | | | | | | | | | | | | | | | | | | |
Total return(2) | | | (6.27 | )% | | | 10.92 | % | | | 14.79 | % | | | 20.77 | % | | | 11.09 | % | | | 2.57 | % |
Net assets, end of period (millions) | | | $124 | | | | $148 | | | | $158 | | | | $137 | | | | $131 | | | | $146 | |
RATIOS TO AVERAGE NET ASSETS: | | | | | | | | | | | | | | | | | | | | | | | | |
Gross expenses | | | 1.02 | %(3) | | | 1.01 | % | | | 1.04 | % | | | 0.96 | % | | | 1.06 | % | | | 1.12 | % |
Net expenses(4) | | | 1.02 | (3) | | | 1.01 | | | | 1.04 | (5) | | | 0.96 | | | | 1.06 | | | | 1.12 | |
Net investment income | | | 0.68 | (3) | | | 0.70 | | | | 0.66 | | | | 1.06 | | | | 1.04 | | | | 0.82 | |
Portfolio Turnover Rate | | | 1 | %(6) | | | 6 | % | | | 0 | %(6)(7) | | | 1 | %(6) | | | 1 | %(6) | | | 5 | % |
(1) | | For the six months ended February 29, 2008 (unaudited). |
(2) | | Performance figures may reflect fee waivers and/or expense reimbursements. In the absence of fee waivers and/or expense reimbursements, the total return would have been lower. Past performance is no guarantee of future results. Total returns for periods of less than one year are not annualized. |
(4) | | There was no impact to the expense ratio as a result of fees paid indirectly. |
(5) | | Reflects fee waivers and/or expense reimbursements. |
(6) | | Excludes the value of portfolio securities delivered as a result of in-kind redemptions of the Fund’s capital shares. |
(7) | | Amount represents less than 1%. |
See Accompanying Notes to the Financial Statements.
11
BARRETT
OPPORTUNITY FUND, INC.
Notes to Financial Statements (Unaudited)
1. ORGANIZATION AND SIGNIFICANT ACCOUNTING POLICIES | Barrett Opportunity Fund, Inc. (the “Fund”) is registered as a non-diversified, open-end management investment company under the Investment Company Act of 1940, as amended (the “1940 Act”). |
The following are significant accounting policies consistently followed by the Fund and are in conformity with U.S. generally accepted accounting principles (“GAAP”). Estimates and assumptions are required to be made regarding assets, liabilities and changes in net assets resulting from operations when financial statements are prepared. Changes in the economic environment, financial markets and any other parameters used in determining these estimates could cause actual results to differ.
(a) Investment Valuation
Equity securities for which market quotations are available are valued at the last reported sales price or official closing price on the primary market or exchange on which they trade. Debt securities are valued at the mean between the last quoted bid and asked prices provided by an independent pricing service that are based on transactions in debt obligations, quotations from bond dealers, market transactions in comparable securities and various other relationships between securities. When prices are not readily available, or are determined not to reflect fair value, such as when the value of a security has been significantly affected by events after the close of the exchange or market on which the security is principally traded, but before the Fund calculates its net asset value, the Fund may value these securities at fair value as determined in accordance with the procedures approved by the Fund’s Board of Directors. Short-term obligations with maturities of 60 days or less are valued at amortized cost, which approximates fair value.
(b) Repurchase Agreements
When entering into repurchase agreements, it is the Fund’s policy that its custodian or a third party custodian take possession of the underlying collateral securities, the market value of which, at all times, at least equals the principal amount of the repurchase transaction, including accrued interest. To the extent that any repurchase transaction exceeds one business day, the value of the collateral is marked-to-market to ensure the adequacy of the collateral. If the seller defaults, and the market value of the collateral declines or if bankruptcy proceedings are commenced with respect to the seller of the security, realization of the collateral by the Fund may be delayed or limited.
(c) Security Transactions and Investment Income
Security transactions are accounted for on a trade date basis. Interest income, adjusted for amortization of premium and accretion of discount, is recorded on the accrual basis. Dividend income is recorded on the ex-dividend date. Foreign dividend income is recorded on the ex-dividend date or as soon as practical after the Fund determines the existence of a dividend declaration after exercising
12
BARRETT
OPPORTUNITY FUND, INC.
reasonable due diligence. The cost of investments sold is determined by use of the specific identification method. To the extent any issuer defaults on an expected interest payment, the Fund’s policy is to generally halt any additional interest income accruals and consider the realizability of interest accrued up to the date of default.
(d) Fees Paid Indirectly
The Fund’s custody fees are reduced according to a fee arrangement, which provides for a reduction based on the level of cash deposited with the custodian by the Fund. The amount is shown as a reduction of expenses on the Statement of Operations.
(e) Distributions to Shareholders
Distributions from net investment income and distributions of net realized gains, if any, are declared at least annually. Distributions to shareholders of the Fund are recorded on the ex-dividend date and are determined in accordance with income tax regulations, which may differ from GAAP.
(f) REIT Distributions
The character of distributions received from Real Estate Investment Trusts (“REITs”) held by the Fund is generally comprised of net investment income, capital gains, and return of capital. It is the policy of the Fund to estimate the character of distributions received from underlying REITs based on historical data provided by the REITs. After each calendar year end, REITs report the actual tax character of these distributions. Differences between the estimated and actual amounts reported by the REITs are reflected in the Fund’s records in the year in which they are reported by the REITs.
(g) Federal and Other Taxes
It is the Fund’s policy to comply with the federal income and excise tax requirements of the Internal Revenue Code of 1986, as amended, applicable to regulated investment companies. Accordingly, the Fund intends to distribute substantially all of its taxable income and net realized gains, if any, to shareholders each year. Therefore, no federal income tax provision is required in the Fund’s financial statements.
Management has analyzed the Fund’s tax positions taken on federal income tax returns for all open tax years and has concluded that as of February 29, 2008, no provision for income tax would be required in the Fund’s financial statements. The Fund’s federal and state income and federal excise tax returns for tax years for which the applicable statutes of limitations have not expired are subject to examination by the Internal Revenue Service and state departments of revenue.
Under the applicable foreign tax laws, a withholding tax may be imposed on interest, dividends and capital gains at various rates.
(h) Reclassification
GAAP requires that certain components of net assets be adjusted to reflect permanent differences between financial and tax reporting. These reclassifications have no effect on net assets or net asset values per share.
13
BARRETT
OPPORTUNITY FUND, INC.
| 2. | | INVESTMENT MANAGEMENT AGREEMENT AND OTHER TRANSACTIONS WITH AFFILIATES |
Barrett Associates, Inc. (“Barrett”), is the Fund’s investment manager. Barrett is a wholly-owned subsidiary of Legg Mason, Inc. (“Legg Mason”). Under the investment management agreement, the Fund pays an investment management fee calculated daily and paid monthly in accordance with the following breakpoint schedule:
| | | |
Average Daily Net Assets | | Annual Rate | |
| First $1 billion | | 0.750 | % |
| Next $1 billion | | 0.725 | |
| Next $3 billion | | 0.700 | |
| Next $5 billion | | 0.675 | |
| Over $10 billion | | 0.650 | |
Legg Mason Fund Advisor, LLC (“LMPFA”) serves as the sub-administrator of the Fund, providing certain administrative services to the Fund pursuant to a sub-administration agreement between Barrett and LMPFA. LMPFA is an affiliate of Legg Mason and Barrett. Barrett, and not the Fund, pays LMPFA for its services as sub-administrator.
Effective December 1, 2007, Legg Mason Investor Services, LLC (“LMIS”), a wholly owned broker-dealer subsidiary of Legg Mason, serves as the Fund’s sole and exclusive distributor. Prior to December 1, 2007, Citigroup Global Markets Inc. (“CGM”) and LMIS served as co-distributors of the Fund.
The officers of the Fund are employees of Legg Mason or its affiliates and do not receive compensation from the Fund.
During the six months ended February 29, 2008, the aggregate cost of purchases and proceeds from sales of investments (excluding short-term investments) were as follows:
| | |
Purchases | | Sales* |
| $1,974,015 | | $10,169,976 |
| | * | Excludes the value of portfolio securities delivered as a result of in-kind redemptions of the Fund’s capital shares. |
At February 29, 2008, the aggregate gross unrealized appreciation and depreciation of investments for federal income tax purposes were substantially as follows:
| | | | |
Gross unrealized appreciation | | $ | 104,252,647 | |
Gross unrealized depreciation | | | (1,088,847 | ) |
| | | | |
Net unrealized appreciation | | $ | 103,163,800 | |
| | | | |
14
BARRETT
OPPORTUNITY FUND, INC.
At February 29, 2008, the Fund had 15,000,000 shares of capital stock authorized with a par value of $0.01 per share. Transactions in shares of the Fund were as follows:
| | | | | | |
| | | Six Months Ended
February 29, 2008 | | | Year Ended
August 31, 2007 | |
Shares sold | | 11,090 | | | 111,929 | |
Shares issued on reinvestment | | 78,280 | | | 47,381 | |
Shares repurchased | | (212,129 | ) | | (503,024 | ) |
| | | | | | |
Net decrease | | (122,759 | ) | | (343,714 | ) |
| | | | | | |
The Fund may make payment for Fund shares redeemed wholly or in part by distributing portfolio securities to shareholders. For the six months ended February 29, 2008, the Fund had redemptions-in-kind with total proceeds in the amount of $9,831,464. The net realized gains on these redemptions-in-kind amounted to $8,557,015, which will not be realized for tax purposes.
Beginning in June 2004, class action lawsuits alleging violations of the federal securities laws were filed against CGM, a former distributor of the Fund, and a number of its then affiliates, including Smith Barney Fund Management LLC (“SBFM”) and Salomon Brothers Asset Management Inc. (“SBAM”), which were then investment adviser or manager to certain of the Funds (the “Managers”), substantially all of the mutual funds then managed by the Managers (the “Defendant Funds”), and Board members of the Defendant Funds (collectively, the “Defendants”). The complaints alleged, among other things, that CGM created various undisclosed incentives for its brokers to sell Smith Barney and Salomon Brothers funds. In addition, according to the complaints, the Managers caused the Defendant Funds to pay excessive brokerage commissions to CGM for steering clients towards proprietary funds. The complaints also alleged that the Defendants breached their fiduciary duty to the Defendant Funds by improperly charging Rule 12b-1 fees and by drawing on fund assets to make undisclosed payments of soft dollars and excessive brokerage commissions. The complaints also alleged that the Defendant Funds failed to adequately disclose certain of the allegedly wrongful conduct. The complaints sought injunctive relief and compensatory and punitive damages, rescission of the Defendant Funds’ contracts with the Managers, recovery of all fees paid to the Managers pursuant to such contracts and an award of attorneys’ fees and litigation expenses.
On December 15, 2004, a consolidated amended complaint (the “Complaint”) was filed alleging substantially similar causes of action. On May 27, 2005, all of the Defendants filed motions to dismiss the Complaint. On July 26, 2006, the court issued a decision and order (1) finding that plaintiffs lacked standing to sue on behalf of the shareholders of the Funds in which none of the plaintiffs had invested and dismissing those Funds from the case (although stating that they could be brought back into the case if standing as to them could be established),
15
BARRETT
OPPORTUNITY FUND, INC.
and (2) other than one stayed claim, dismissing all of the causes of action against the remaining Defendants, with prejudice, except for the cause of action under Section 36(b) of the 1940 Act, which the court granted plaintiffs leave to repeal as a derivative claim.
On October 16, 2006, plaintiffs filed their Second Consolidated Amended Complaint (“Second Amended Complaint”) which alleges derivative claims on behalf of nine funds identified in the Second Amended Complaint, under Section 36(b) of the 1940 Act, against CAM, SBAM, SBFM and CGM as investment advisers to the identified funds, as well as CGM as a distributor for the identified funds (collectively, the “Second Amended Complaint Defendants”). The Fund was not identified in the Second Amended Complaint. The Second Amended Complaint alleges no claims against any of the funds or any of their Board Members. Under Section 36(b), the Second Amended Complaint alleges similar facts and seeks similar relief against the Second Amended Complaint Defendants as the Complaint.
On December 3, 2007, the court granted the Defendants’ motion to dismiss, with prejudice. On January 2, 2008, the plaintiffs filed a notice of appeal to the Second Circuit Court of Appeals.
Additional lawsuits arising out of these circumstances and presenting similar allegations and requests for relief may be filed in the future.
* * *
Beginning in August 2005, five class action lawsuits alleging violations of federal securities laws and state law were filed against CGM and SBFM, (collectively, the “Defendants”) based on the May 31, 2005 settlement order issued against the Defendants by the Securities and Exchange Commission (“SEC”) as previously described. The complaints seek injunctive relief and compensatory and punitive damages, removal of SBFM as the investment manager for the Smith Barney family of funds, rescission of the funds’ management and other contracts with SBFM, recovery of all fees paid to SBFM pursuant to such contracts, and an award of attorneys’ fees and litigation expenses. The five actions were subsequently consolidated, and a consolidated complaint was filed.
On September 26, 2007, the United States District Court for the Southern District of New York issued an order dismissing the consolidated complaint and judgement was later entered. An appeal has been filed and is pending before the U.S. Courts of Appeals for the Second Circuit.
16
BARRETT
OPPORTUNITY FUND, INC.
| 7. | | RECENT ACCOUNTING PRONOUNCEMENTS |
On September 20, 2006, the Financial Accounting Standards Board (“FASB”) released Statement of Financial Accounting Standards No. 157, Fair Value Measurements (“FAS 157”). FAS 157 establishes an authoritative definition of fair value, sets out a framework for measuring fair value, and requires additional disclosures about fair value measurements. The application of FAS 157 is required for fiscal years beginning after November 15, 2007 and interim periods within those fiscal years. Management has determined that there is no material impact to the Fund’s valuation policies as a result of adopting FAS 157. The Fund will implement the disclosure requirements beginning with its November 30, 2008 Form N-Q.
In March 2008, FASB issued the Statement of Financial Accounting Standards No. 161, “Disclosures about Derivative Instruments and Hedging Activities” (“SFAS 161”). SFAS 161 is effective for fiscal years and interim periods beginning after November 15, 2008. SFAS 161 requires enhanced disclosures about the Fund’s derivative and hedging activities, including how such activities are accounted for and their effect on the Fund’s financial position, performance and cash flows. Management is currently evaluating the impact the adoption of SFAS 161 will have on the Fund’s financial statements and related disclosures.
17
(This Page Intentionally Left Blank.)
(This Page Intentionally Left Blank.)
(This Page Intentionally Left Blank.)
BARRETT OPPORTUNITY FUND, INC.
DIRECTORS
Irving G. Brilliant
Barry Handel, CPA
Rosalind A. Kochman
Chairperson
William Morris, Jr., CPA
Irving Sonnenschein
INVESTMENT MANAGER
Barrett Associates, Inc.
90 Park Avenue
New York, NY 10016
SUB-ADMINISTRATOR
Legg Mason Partners Fund Advisor, LLC
620 Eighth Avenue
New York, NY 10018
DISTRIBUTOR
Legg Mason Investor Services, LLC (LMIS)
100 Light Street
Baltimore, MD 21202
CUSTODIAN
State Street Bank and Trust Company
2 Avenue De Lafeyette
Boston, MA 02111
TRANSFER AGENT
PFPC Inc.
P.O. Box 9699
Providence, Rhode Island 02940-9699
INDEPENDENT REGISTERED PUBLIC ACCOUNTING FIRM
KPMG LLP
345 Park Avenue
New York, NY 10154
Barrett Opportunity Fund, Inc.
55 Water Street
32nd Floor
New York, New York 10041
This report is transmitted to the shareholders of Barrett Opportunity Fund, Inc. for their information. This is not a prospectus, circular or representation intended for use in the purchase of shares of the Fund or any securities mentioned in this report.
This report must be preceded or accompanied by a free prospectus. Investors should consider the Fund’s investment objectives, risks, charges and expenses carefully before investing. The prospectus contains this and other important information about the Fund. Please read the prospectus carefully before investing.
www.barrettassociates.com
©2008 Legg Mason
Investor Services, LLC
Member FINRA, SIPC
BARX010341
The Fund files its complete schedule of portfolio holdings with the Securities and Exchange Commission (“SEC”) for the first and third quarters of each fiscal year on Form N-Q. The Fund’s Forms N-Q are available on the SEC’s website at www.sec.gov. The Fund’s Forms N-Q may be reviewed and copied at the SEC’s Public Reference Room in Washington, D.C., and information on the operation of the Public Reference Room may be obtained by calling 1-800-SEC-0330. To obtain information on Form N-Q from the Fund, shareholders can call 1-800-451-2010.
Information on how the Fund voted proxies relating to portfolio securities during the prior 12-month period ended June 30th of each year and a description of the policies and procedures that the Fund uses to determine how to vote proxies related to portfolio transactions are available (1) without charge, upon request, by calling 1-800-451-2010 and (2) on the SEC’s website at www.sec.gov.
Not Applicable.
| ITEM 3. | AUDIT COMMITTEE FINANCIAL EXPERT. |
Not Applicable.
| ITEM 4. | PRINCIPAL ACCOUNTANT FEES AND SERVICES. |
Not applicable.
| ITEM 5. | AUDIT COMMITTEE OF LISTED REGISTRANTS. |
Not applicable.
| ITEM 6. | SCHEDULE OF INVESTMENTS. |
Included herein under Item 1.
| ITEM 7. | DISCLOSURE OF PROXY VOTING POLICIES AND PROCEDURES FOR CLOSED-END MANAGEMENT INVESTMENT COMPANIES. |
Not applicable.
| ITEM 8. | PORTFOLIO MANAGERS OF CLOSED-END MANAGEMENT INVESTMENT COMPANIES. |
Not applicable.
| ITEM 9. | PURCHASES OF EQUITY SECURITIES BY CLOSED-END MANAGEMENT INVESTMENT COMPANY AND AFFILIATED PURCHASERS. |
Not applicable.
| ITEM 10. | SUBMISSION OF MATTERS TO A VOTE OF SECURITY HOLDERS. |
Not applicable.
| ITEM 11. | CONTROLS AND PROCEDURES. |
| | (a) | The registrant’s principal executive officer and principal financial officer have concluded that the registrant’s disclosure controls and procedures (as defined in Rule 30a- 3(c) under the Investment Company Act of 1940, as amended (the “1940 Act”)) are effective as of a date within 90 days of the filing date of this report that includes the disclosure required by this paragraph, based on their evaluation of the disclosure controls and procedures required by Rule 30a-3(b) under the 1940 Act and 15d-15(b) under the Securities Exchange Act of 1934. |
| | (b) | There were no changes in the registrant’s internal control over financial reporting (as defined in Rule 30a-3(d) under the 1940 Act) that occurred during the registrant’s last fiscal half-year (the registrant’s second fiscal half-year in the case of an annual report) that have materially affected, or are likely to materially affect the registrant’s internal control over financial reporting. |
| | |
| (a) (1) | | Not applicable. |
| |
| | Exhibit 99.CODE ETH |
| |
| (a) (2) | | Certifications pursuant to section 302 of the Sarbanes-Oxley Act of 2002 attached hereto. |
| |
| | Exhibit 99.CERT |
| |
| (b) | | Certifications pursuant to Section 906 of the Sarbanes-Oxley Act of 2002 attached hereto. |
| |
| | Exhibit 99.906CERT |
SIGNATURES
Pursuant to the requirements of the Securities Exchange Act of 1934 and the Investment Company Act of 1940, the registrant has duly caused this Report to be signed on its behalf by the undersigned, there unto duly authorized.
| | |
| Barrett Opportunity Fund, Inc. |
| |
| By: | | /s/ Peter H. Shriver |
| | Peter H. Shriver |
| | Chief Executive Officer of |
| | Barrett Opportunity Fund, Inc. |
| |
| Date: | | April 28, 2008 |
Pursuant to the requirements of the Securities Exchange Act of 1934 and the Investment Company Act of 1940, this report has been signed below by the following persons on behalf of the registrant and in the capacities and on the dates indicated.
| | |
| By: | | /s/ Peter H. Shriver |
| | Peter H. Shriver |
| | Chief Executive Officer of |
| | Barrett Opportunity Fund, Inc. |
| |
| Date: | | April 28, 2008 |
| |
| By: | | /s/ Frances M. Guggino |
| | Frances M. Guggino |
| | Chief Financial Officer of |
| | Barrett Opportunity Fund, Inc. |
| |
| Date: | | April 28, 2008 |