UNITED STATES
SECURITIES AND EXCHANGE COMMISSION
Washington, D.C. 20549
FORM N-CSR
CERTIFIED SHAREHOLDER REPORT OF REGISTERED
MANAGEMENT INVESTMENT COMPANIES
Investment Company Act file number 811-2884
Salomon Brothers Opportunity Fund Inc
(Exact name of registrant as specified in charter)
| | |
| 125 Broad Street, New York, NY | | 10004 |
| | |
| (Address of principal executive offices) | | (Zip code) |
Robert I. Frenkel, Esq.
Legg Mason & Co., LLC
300 First Stamford Place, 4th Fl.
Stamford, CT 06902
(Name and address of agent for service)
Registrant’s telephone number, including area code: (800) 725-6666
Date of fiscal year end: August 31
Date of reporting period: February 28, 2006
ITEM 1. REPORT TO STOCKHOLDERS.
The Semi-Annual Report to Stockholders is filed herewith.
SEMI-ANNUAL REPORT
FEBRUARY 28, 2006


Salomon Brothers
Opportunity Fund Inc
INVESTMENT PRODUCTS: NOT FDIC INSURED Ÿ NO BANK GUARANTEE Ÿ MAY LOSE VALUE
Salomon Brothers
Opportunity Fund Inc
Semi-Annual Report • February 28, 2006
What’s
Inside
Fund Objective
The Fund seeks to achieve above average long-term capital appreciation. Current income is a secondary objective. The Fund invests primarily in common stocks and securities convertible into or exchangeable for common stock such as convertible preferred stock or convertible debt securities.
“Smith Barney” and “Salomon Brothers” are service marks of Citigroup, licensed for use by Legg Mason as the names of funds and investment managers. Legg Mason and its affiliates, as well as the Fund’s investment manager, are not affiliated with Citigroup.
Letter from the Chairperson
Dear Shareholder,
We are pleased to provide this semi-annual report of the Salomon Brothers Opportunity Fund Inc (the “Fund”) for the period ended February 28, 2006.
I urge you to read carefully the Manager’s Overview and the accompanying financial statements. Also included is a detailed summary of the Fund’s performance and other pertinent information, which I hope you find useful.
Special Shareholder Notice
On December 1, 2005, Citigroup Inc. (“Citigroup”) completed the sale of substantially all of its asset management business, Citigroup Asset Management (“CAM”), to Legg Mason, Inc. (“Legg Mason”). As a result, the Fund’s investment adviser (the “Manager”), previously an indirect wholly-owned subsidiary of Citigroup, has become a wholly-owned subsidiary of Legg Mason. Completion of the sale caused the Fund’s investment management contract to terminate. The Fund’s shareholders previously approved a new investment management contract between the Fund and the Manager, which became effective on December 1, 2005.
Information About Your Fund
As you may be aware, several issues in the mutual fund industry have come under the scrutiny of federal and state regulators. The Manager and some of its affiliates have received requests for information from various government regulators regarding market timing, late trading, fees, and other mutual fund issues in connection with various investigations. The regulators appear to be examining, among other things, the Fund’s response to market timing and shareholder exchange activity, including compliance with prospectus disclosure related to these subjects. The Fund has been informed that the Manager and its affiliates are responding to those information requests, but are not in a position to predict the outcome of these requests and investigations.
Important information concerning the Fund and its Manager with regard to recent regulatory developments is contained in the Notes to Financial Statements included in this report.
Salomon Brothers Opportunity Fund Inc I
On behalf of the Directors and officers of the Fund, I also want to thank you for your ongoing confidence in the Fund and its investment policies.
Sincerely,

Rosalind A. Kochman
Chairperson
March 30, 2006
II Salomon Brothers Opportunity Fund Inc
Manager Overview
Market Overview
The U.S. economy was mixed during the six-month reporting period. Early in the period, the economy overcame several headwinds, including high oil prices, rising short-term interest rates and geopolitical issues. After a 3.3% advance in the second quarter of 2005, third quarter gross domestic product (“GDP”)i growth was a strong 4.1%. This marked the tenth consecutive quarter that GDP growth surpassed 3.0%. However, there were conflicting economic signals in the fourth quarter. While the Labor Department announced that the unemployment rate fell to 4.7% in January 2006, its lowest level in four years, fourth quarter GDP growth was 1.7%. This decline was, due in large part, to slower consumer spending.
Given the economic expansion and inflationary concerns, the Federal Reserve Board (“Fed”)ii continued to raise interest rates throughout the period. After raising rates ten times from June 2004 through August 2005, the Fed increased its target for the federal funds rateiii in 0.25% increments four additional times over the reporting period. This represents the longest sustained Fed tightening cycle since the 1970s. All told, the Fed’s 14 rate hikes have brought the target for the federal funds rate from 1.00% to 4.50%. After the end of the Fund’s reporting period, at its March meeting, the Fed raised the federal funds rate by an additional 0.25% to 4.75%.
For the six-month period ended February 28, 2006, the U.S. stock market generated solid results, with the S&P 500 Indexiv returning 5.92%. Looking at the market more closely, small-cap stocks generally outperformed their mid- and large-cap counterparts, with the Russell 2000v, Russell Midcapvi and Russell 1000vii Indexes returning 10.24%, 8.90%, and 6.20%, respectively. From an investment style perspective, value stocks generally outperformed growth stocks, with the Russell 3000 Valueviii and Russell 3000 Growthix Indexes returning 7.46% and 5.68%, respectively, over the reporting period.
Performance Review
For the six months ended February 28, 2006, shares of the Salomon Brothers Opportunity Fund Inc (the “Fund”), returned 6.73%. The Fund’s Lipper Multi-Cap Value Funds Category Average1 increased 6.34% for the same period. The Fund’s unmanaged benchmark, the S&P 500 Index, returned 5.92% over the same time frame.
| 1 | | Lipper, Inc. is a major independent mutual-fund tracking organization. Returns are based on the 6-month period ended February 28, 2006, including the reinvestment of distributions, including returns of capital, if any, calculated among the 499 funds in the Fund’s Lipper category, and excluding sales charges. |
Salomon Brothers Opportunity Fund Inc 2006 Semi-Annual Report 1
| | | | |
| Performance Snapshot as of February 28, 2006 (unaudited) | | |
| | |
| | | 6 Months | | |
Salomon Brothers Opportunity Fund Inc | | 6.73% | | |
|
S&P 500 Index | | 5.92% | | |
|
Lipper Multi-Cap Value Funds Category Average | | 6.34% | | |
|
| The performance shown represents past performance. Past performance is no guarantee of future results and current performance may be higher or lower than the performance shown above. Principal value and investment returns will fluctuate and investors’ shares, when redeemed, may be worth more or less than their original cost. |
| Performance figures reflect reimbursements and/or fee waivers, without which the performance would have been lower. |
| Fund return assumes the reinvestment of all distributions, including returns of capital, if any, at net asset value and the deduction of all fund expenses. |
As always, thank you for your confidence in our stewardship of your assets. We look forward to helping you continue to meet your financial goals.
Sincerely,

George J. Williamson
Vice President and Investment Officer
March 30, 2006
2 Salomon Brothers Opportunity Fund Inc 2006 Semi-Annual Report
The information provided is not intended to be a forecast of future events, a guarantee of future results or investment advice. Views expressed may differ from those of the firm as a whole.
RISKS: Investments in small- and medium capitalization companies may involve a higher degree of risk and volatility than investments in larger, more established companies. The Fund may invest in high yield and foreign securities, including those in emerging markets, which involve risks beyond those inherent in higher-rated and domestic investments. High yield bonds involve greater credit and liquidity risks than investment grade bonds. Investing in foreign securities is subject to certain risks not associated with domestic investing, such as currency fluctuations and changes in political and economic conditions. These risks are magnified in emerging or developing markets. The Fund may use derivatives, such as options or futures, which can be illiquid, may disproportionately increase losses, and have a potentially large impact on fund performance.
All index performance reflects no deduction for fees, expenses or taxes. Please note that an investor cannot invest directly in an index.
| i | | Gross domestic product is a market value of goods and services produced by labor and property in a given country. |
| ii | | The Federal Reserve Board is responsible for the formulation of a policy designed to promote economic growth, full employment, stable prices, and a sustainable pattern of international trade and payments. |
| iii | | The federal funds rate is the interest rate that banks with excess reserves at a Federal Reserve district bank charge other banks that need overnight loans. |
| iv | | The S&P 500 Index is an unmanaged index of 500 stocks that is generally representative of the performance of larger companies in the U.S. |
| v | | The Russell 2000 Index measures the performance of the 2,000 smallest companies in the Russell 3000 Index, which represents approximately 8% of the total market capitalization of the Russell 3000 Index. |
| vi | | The Russell Midcap Index measures the performance of the 800 smallest companies in the Russell 1000 Index whose average market capitalization was approximately $4.7 billion as of June 24, 2005. |
| viiThe | | Russell 1000 Index measures the performance of the 1,000 largest companies in the Russell 3000 Index, which represents approximately 92% of the total market capitalization of the Russell 3000 Index. |
| viiiThe | | Russell 3000 Value Index measures the performance of those Russell 3000 Index companies with lower price-to-book ratios and lower forecasted growth values. (A price-to-book ratio is the price of a stock compared to the difference between a company’s assets and liabilities.) |
| ix | | The Russell 3000 Growth Index measures the performance of those Russell 3000 Index companies with higher price-to-book ratios and higher forecasted growth values. |
Salomon Brothers Opportunity Fund Inc 2006 Semi-Annual Report 3
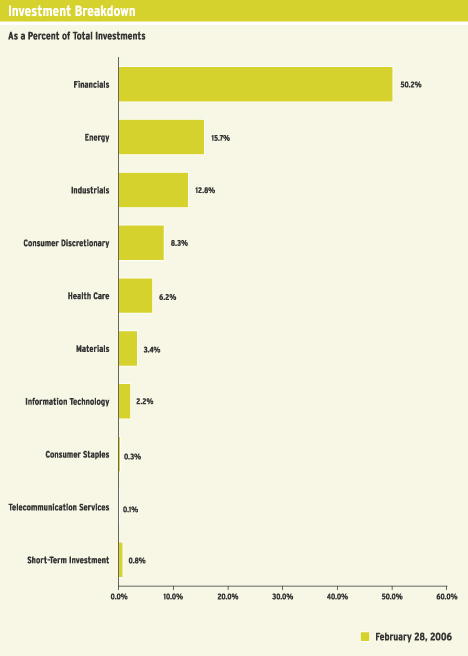
Fund at a Glance (unaudited)
4 Salomon Brothers Opportunity Fund Inc 2006 Semi-Annual Report
Fund Expenses (unaudited)
Example
As a shareholder of the Fund, you may incur two types of costs: (1) transaction costs; and (2) ongoing costs, including management fees; and other Fund expenses. This example is intended to help you understand your ongoing costs (in dollars) of investing in the Fund and to compare these costs with the ongoing costs of investing in other mutual funds.
This example is based on an investment of $1,000 invested on September 1, 2005 and held for the six months ended February 28, 2006.
Actual Expenses
The table below titled “Based on Actual Total Return” provides information about actual account values and actual expenses. You may use the information provided in this table, together with the amount you invested, to estimate the expenses that you paid over the period. To estimate the expenses you paid on your account, divide your ending account value by $1,000 (for example, an $8,600 ending account value divided by $1,000 = 8.6), then multiply the result by the number under the heading entitled “Expenses Paid During the Period”.
| | | | | | | | | | | | |
Based on Actual Total Return(1) | | | | | | |
| | | | |
Actual
Total Return(2) | | Beginning
Account
Value | | Ending
Account
Value | | Annualized
Expense
Ratio | | | Expenses
Paid During
the Period(3) |
6.73% | | $ | 1,000.00 | | $ | 1,067.30 | | 0.97 | % | | $ | 4.97 |
|
| (1) | | For the six months ended February 28, 2006. |
| (2) | | Assumes reinvestment of all distributions, including returns of capital, if any, at net asset value. Total return is not annualized, as it may not be representative of the total return for the year. Performance figure reflects a voluntary fee waiver. Past performance is no guarantee of future results. In the absence of this voluntary fee waiver, the total return would have been lower. |
| (3) | | Expenses (net of voluntary fee waiver) are equal to the Fund’s annualized expense ratio, multiplied by the average account value over the period, multiplied by the number of days in the most recent fiscal half-year, then divided by 365. |
Salomon Brothers Opportunity Fund Inc 2006 Semi-Annual Report 5
Fund Expenses (unaudited) (continued)
Hypothetical Example for Comparison Purposes
The table below titled “Based on Hypothetical Total Return” provides information about hypothetical account values and hypothetical expenses based on the actual expense ratio and an assumed rate of return of 5.00% per year before expenses, which is not the Fund’s actual return. The hypothetical account values and expenses may not be used to estimate the actual ending account balance or expenses you paid for the period. You may use the information provided in this table to compare the ongoing costs of investing in the Fund and other funds. To do so, compare the 5.00% hypothetical example relating to the Fund with the 5.00% hypothetical examples that appear in the shareholder reports of the other funds.
Please note that the expenses shown in the table below are meant to highlight your ongoing costs only and do not reflect any transactional costs, such as front-end or back-end sales charges (loads). Therefore, the table is useful in comparing ongoing costs only, and will not help you determine the relative total costs of owning different funds. In addition, if these transaction costs were included, your costs would have been higher.
| | | | | | | | | | | | |
Based on Hypothetical Total Return(1) | | | | | | |
| | | | |
Hypothetical
Annualized
Total Return | | Beginning
Account
Value | | Ending
Account
Value | | Annualized
Expense
Ratio | | | Expenses
Paid During
the Period(2) |
5.00% | | $ | 1,000.00 | | $ | 1,019.98 | | 0.97 | % | | $ | 4.86 |
|
| (1) | | For the six months ended February 28, 2006. |
| (2) | | Expenses (net of voluntary fee waiver) are equal to the Fund’s annualized expense ratio, multiplied by the average account value over the period, multiplied by the number of days in the most recent fiscal half-year, then divided by 365. |
6 Salomon Brothers Opportunity Fund Inc 2006 Semi-Annual Report
Schedule of Investments (February 28, 2006) (unaudited)
SALOMON BROTHERS OPPORTUNITY FUND INC
| | | | | | |
| | |
| Shares | | Security | | Value | |
| | | | | | | |
| COMMON STOCKS — 99.1% | | | | |
| CONSUMER DISCRETIONARY — 8.3% | | | | |
| Hotels, Restaurants & Leisure — 0.2% | | | | |
| 7,100 | | Fairmont Hotels & Resorts Inc. | | $ | 314,672 | |
|
|
| Household Durables — 7.5% | | | | |
| 309,210 | | Koninklijke Philips Electronics NV, New York Registered Shares | | | 10,055,509 | |
| 14,850 | | Liberty Homes Inc., Class A Shares (a) | | | 96,822 | |
| 22,050 | | Liberty Homes Inc., Class B Shares (a) | | | 143,325 | |
|
|
| | | Total Household Durables | | | 10,295,656 | |
|
|
| Media — 0.6% | | | | |
| 19,400 | | News Corp., Class A Shares | | | 315,832 | |
| 28,700 | | Time Warner Inc. | | | 496,797 | |
|
|
| | | Total Media | | | 812,629 | |
|
|
| | | TOTAL CONSUMER DISCRETIONARY | | | 11,422,957 | |
|
|
| CONSUMER STAPLES — 0.3% | | | | |
| Food & Staples Retailing — 0.3% | | | | |
| 96,000 | | FHC Delaware Inc. (a)(b)* | | | 456,000 | |
|
|
| ENERGY — 15.7% | | | | |
| Energy Equipment & Services — 0.8% | | | | |
| 14,200 | | Diamond Offshore Drilling Inc. | | | 1,098,938 | |
|
|
| Oil, Gas & Consumable Fuels — 14.9% | | | | |
| 10,876 | | EnCana Corp. | | | 449,288 | |
| 112,500 | | Murphy Oil Corp. | | | 5,272,875 | |
| 20,900 | | Overseas Shipholding Group Inc. | | | 1,056,913 | |
| 228,600 | | Royal Dutch Shell PLC, Sponsored ADR, Class A Shares | | | 13,825,728 | |
|
|
| | | Total Oil, Gas & Consumable Fuels | | | 20,604,804 | |
|
|
| | | TOTAL ENERGY | | | 21,703,742 | |
|
|
| FINANCIALS — 50.1% | | | | |
| Capital Markets — 10.6% | | | | |
| 428,876 | | Bank of New York Co. Inc. | | | 14,684,714 | |
|
|
| Commercial Banks — 3.5% | | | | |
| 237,400 | | Popular Inc. | | | 4,850,082 | |
|
|
| Diversified Financial Services — 2.7% | | | | |
| 69,950 | | Leucadia National Corp. | | | 3,794,788 | |
|
|
| Insurance — 15.3% | | | | |
| 155,300 | | Chubb Corp. | | | 14,869,975 | |
| 81,900 | | CNA Financial Corp.* | | | 2,532,348 | |
| 8,800 | | Loews Corp. | | | 811,888 | |
| 40,000 | | Merchants Group Inc. (a) | | | 1,192,000 | |
| 82,500 | | Old Republic International Corp. | | | 1,756,425 | |
|
|
| | | Total Insurance | | | 21,162,636 | |
|
|
See Notes to Financial Statements.
Salomon Brothers Opportunity Fund Inc 2006 Semi-Annual Report 7
Schedule of Investments (February 28, 2006) (unaudited) (continued)
| | | | | | |
| | |
| Shares | | Security | | Value | |
| | | | | | | |
| Real Estate — 16.2% | | | | |
| 304,200 | | Forest City Enterprises Inc., Class A Shares | | $ | 12,323,142 | |
| 174,300 | | Forest City Enterprises Inc., Class B Shares (c) | | | 7,006,860 | |
| 5,500 | | Harbor Global Co., Ltd. | | | 51,425 | |
| 70,490 | | Rayonier Inc. | | | 3,038,119 | |
|
|
| | | Total Real Estate | | | 22,419,546 | |
|
|
| Thrifts & Mortgage Finance — 1.8% | | | | |
| 38,300 | | Freddie Mac | | | 2,581,037 | |
|
|
| | | TOTAL FINANCIALS | | | 69,492,803 | |
|
|
| HEALTH CARE — 6.2% | | | | |
| Health Care Equipment & Supplies — 0.1% | | | | |
| 3,500 | | Stryker Corp. | | | 161,770 | |
|
|
| Health Care Providers & Services — 5.0% | |
| 10,600 | | Health Net Inc.* | | | 508,270 | |
| 23,900 | | Humana Inc.* | | | 1,234,913 | |
| 68,508 | | WellPoint Inc.* | | | 5,260,730 | |
|
|
| | | Total Health Care Providers & Services | | | 7,003,913 | |
|
|
| Pharmaceuticals — 1.1% | |
| 55,864 | | Pfizer Inc. | | | 1,463,078 | |
|
|
| | | TOTAL HEALTH CARE | | | 8,628,761 | |
|
|
| INDUSTRIALS — 12.8% | |
| Aerospace & Defense — 5.6% | |
| 56,900 | | General Dynamics Corp. | | | 7,014,063 | |
| 10,600 | | Lockheed Martin Corp. | | | 772,422 | |
|
|
| | | Total Aerospace & Defense | | | 7,786,485 | |
|
|
| Air Freight & Logistics — 0.4% | |
| 64,300 | | ABX Air Inc.* | | | 515,686 | |
|
|
| Airlines — 0.9% | |
| 52,100 | | AMR Corp.* | | | 1,307,710 | |
|
|
| Building Products — 1.9% | |
| 43,500 | | Ameron International Corp. | | | 2,583,900 | |
|
|
| Commercial Services & Supplies — 0.8% | |
| 103,550 | | TRC Cos. Inc.* | | | 1,146,299 | |
|
|
| Industrial Conglomerates — 1.2% | |
| 44,100 | | General Electric Co. | | | 1,449,567 | |
| 8,303 | | Tyco International Ltd. | | | 214,134 | |
|
|
| | | Total Industrial Conglomerates | | | 1,663,701 | |
|
|
| Machinery — 1.1% | |
| 35,300 | | Tecumseh Products Co., Class A Shares* | | | 798,133 | |
| 36,000 | | Tecumseh Products Co., Class B Shares* | | | 729,360 | |
|
|
| | | Total Machinery | | | 1,527,493 | |
|
|
See Notes to Financial Statements.
8 Salomon Brothers Opportunity Fund Inc 2006 Semi-Annual Report
Schedule of Investments (February 28, 2006) (unaudited) (continued)
| | | | | | |
| | |
| Shares | | Security | | Value | |
| | | | | | | |
| Marine — 0.9% | |
| 25,000 | | Alexander & Baldwin Inc. | | $ | 1,218,250 | |
|
|
| | | TOTAL INDUSTRIALS | | | 17,749,524 | |
|
|
| INFORMATION TECHNOLOGY — 2.2% | |
| Computers & Peripherals — 1.0% | |
| 9,200 | | Hewlett-Packard Co. | | | 301,852 | |
| 13,300 | | International Business Machines Corp. | | | 1,067,192 | |
|
|
| | | Total Computers & Peripherals | | | 1,369,044 | |
|
|
| IT Services — 0.1% | |
| 8,134 | | Sabre Holdings Corp., Class A Shares | | | 196,273 | |
|
|
| Semiconductors & Semiconductor Equipment — 0.4% | |
| 21,000 | | National Semiconductor Corp. | | | 589,050 | |
|
|
| Software — 0.7% | |
| 35,200 | | Microsoft Corp. | | | 946,880 | |
|
|
| | | TOTAL INFORMATION TECHNOLOGY | | | 3,101,247 | |
|
|
| MATERIALS — 3.4% | |
| Chemicals — 0.9% | |
| 6,320 | | Kronos Worldwide Inc. | | | 183,912 | |
| 11,121 | | Monsanto Co. | | | 932,829 | |
| 11,400 | | NL Industries Inc. | | | 150,366 | |
|
|
| | | Total Chemicals | | | 1,267,107 | |
|
|
| Construction Materials — 2.2% | | | | |
| 36,900 | | Lafarge North America Inc. | | | 3,057,903 | |
|
|
| Metals & Mining — 0.3% | | | | |
| 7,177 | | Newmont Mining Corp. | | | 379,807 | |
|
|
| | | TOTAL MATERIALS | | | 4,704,817 | |
|
|
| TELECOMMUNICATION SERVICES — 0.1% | |
| Diversified Telecommunication Services — 0.1% | |
| 5,500 | | Verizon Communications Inc. | | | 185,350 | |
|
|
| | | TOTAL INVESTMENTS BEFORE SHORT-TERM INVESTMENT (Cost — $25,209,872) | | | 137,445,201 | |
See Notes to Financial Statements.
Salomon Brothers Opportunity Fund Inc 2006 Semi-Annual Report 9
Schedule of Investments (February 28, 2006) (unaudited) (continued)
| | | | | | | |
| | |
Face
Amount | | Security | | Value | |
| | | | | | | | |
| | SHORT-TERM INVESTMENT — 0.8% | | | | |
| | Commercial Paper — 0.8% | | | | |
| $ | 1,069,000 | | Consolidated Edison Co., 4.561% due 3/1/06 (d)(e) (Cost — $1,069,000) | | $ | 1,069,000 | |
|
|
|
| | | | TOTAL INVESTMENTS — 99.9% (Cost — $26,278,872#) | | | 138,514,201 | |
| | | | Other Assets in Excess of Liabilities — 0.1% | | | 80,086 | |
|
|
|
| | | | TOTAL NET ASSETS — 100.0% | | $ | 138,594,287 | |
|
|
|
| * | | Non-income producing security. |
| (b) | | Security is valued in good faith at fair value by or under the direction of the Board of Directors (See Note 1). |
| (c) | | Convertible into Forest City Enterprises Inc., Class A Shares. |
| (d) | | Security is exempt from registration under Rule 144A of the Securities Act of 1933. This security may be resold in transactions that are exempt from registration, normally to qualified institutional buyers. This security has been deemed liquid pursuant to guidelines approved by the Board of Directors, unless otherwise noted. |
| (e) | | Rate shown represents yield-to-maturity on date of purchase. |
| # | | Aggregate cost for federal income tax purposes is substantially the same. |
| | |
Abbreviation used in this schedule:
|
| ADR—American Depositary Receipt |
See Notes to Financial Statements.
10 Salomon Brothers Opportunity Fund Inc 2006 Semi-Annual Report
Statement of Assets and Liabilities (February 28, 2006) (unaudited)
| | | |
| ASSETS: | | | |
Investments, at value (Cost — $26,278,872) | | $ | 138,514,201 |
Cash | | | 86 |
Dividends receivable | | | 236,928 |
Receivable for Fund shares sold | | | 5,986 |
Prepaid expenses | | | 14,008 |
|
Total Assets | | | 138,771,209 |
|
| LIABILITIES: | | | |
Investment Management fee payable | | | 76,304 |
Transfer agent fees payable | | | 11,519 |
Directors’ fees payable | | | 4,194 |
Accrued expenses | | | 84,905 |
|
Total Liabilities | | | 176,922 |
|
Total Net Assets | | $ | 138,594,287 |
|
| NET ASSETS: | | | |
Par value (Note 4) | | $ | 26,286 |
Paid-in capital in excess of par value | | | 23,803,978 |
Undistributed net investment income | | | 98,837 |
Accumulated net realized gain on investments | | | 2,429,857 |
Net unrealized appreciation on investments | | | 112,235,329 |
|
Total Net Assets | | $ | 138,594,287 |
|
Shares Outstanding | | | 2,628,582 |
|
Net Asset Value | | | $52.73 |
|
See Notes to Financial Statements.
Salomon Brothers Opportunity Fund Inc 2006 Semi-Annual Report 11
Statement of Operations (For the six months ended February 28, 2006) (unaudited)
| | | | |
| INVESTMENT INCOME: | | | | |
Dividends | | $ | 1,187,819 | |
Interest | | | 50,459 | |
Income from securities lending | | | 4,912 | |
Less: Foreign taxes withheld | | | (46,352 | ) |
|
|
Total Investment Income | | | 1,196,838 | |
|
|
| EXPENSES: | | | | |
Investment Management fee (Note 2) | | | 506,447 | |
Legal fees | | | 38,275 | |
Directors’ fees | | | 27,790 | |
Shareholder reports | | | 23,530 | |
Audit and tax | | | 21,720 | |
Transfer agent fees (Note 2) | | | 13,575 | |
Registration fees | | | 11,629 | |
Custody fees | | | 9,050 | |
Insurance | | | 3,394 | |
Miscellaneous expenses | | | 5,430 | |
|
|
Total Expenses | | | 660,840 | |
Less: Investment Management fee waiver (Note 2) | | | (2,988 | ) |
|
|
Net Expenses | | | 657,852 | |
|
|
Net Investment Income | | | 538,986 | |
|
|
REALIZED AND UNREALIZED GAIN ON INVESTMENTS
(NOTES 1 AND 3): | | | | |
Net Realized Gain From Investment Transactions | | | 3,005,254 | |
Change in Net Unrealized Appreciation/Depreciation From Investments | | | 5,375,877 | |
|
|
Net Gain on Investments | | | 8,381,131 | |
|
|
Increase in Net Assets From Operations | | $ | 8,920,117 | |
|
|
See Notes to Financial Statements.
12 Salomon Brothers Opportunity Fund Inc 2006 Semi-Annual Report
Statements of Changes in Net Assets
| | | | | | | | |
For the six months ended February 28, 2006 (unaudited)
and the year ended August 31, 2005 | | | | | | | | |
| | |
| | | 2006 | | | 2005 | |
| OPERATIONS: | | | | | | | | |
Net investment income | | $ | 538,986 | | | $ | 1,397,595 | |
Net realized gain | | | 3,005,254 | | | | 7,792,806 | |
Change in net unrealized appreciation/depreciation | | | 5,375,877 | | | | 15,694,793 | |
|
|
Increase in Net Assets From Operations | | | 8,920,117 | | | | 24,885,194 | |
|
|
| DISTRIBUTIONS TO SHAREHOLDERS FROM (NOTE 1): | | | | | | | | |
Net investment income | | | (1,199,768 | ) | | | (1,600,228 | ) |
Net realized gains | | | (3,070,180 | ) | | | (639,003 | ) |
|
|
Decrease in Net Assets From Distributions to Shareholders | | | (4,269,948 | ) | | | (2,239,231 | ) |
|
|
| FUND SHARE TRANSACTIONS (NOTES 4 AND 5): | | | | | | | | |
Net proceeds from sale of shares | | | 223,086 | | | | 737,875 | |
Reinvestment of distributions | | | 2,092,345 | | | | 1,075,977 | |
Cost of shares repurchased | | | (5,209,982 | ) | | | (18,346,019 | ) |
|
|
Decrease in Net Assets From Fund Share Transactions | | | (2,894,551 | ) | | | (16,532,167 | ) |
|
|
Increase in Net Assets | | | 1,755,618 | | | | 6,113,796 | |
| NET ASSETS: | | | | | | | | |
Beginning of period | | | 136,838,669 | | | | 130,724,873 | |
|
|
End of period* | | $ | 138,594,287 | | | $ | 136,838,669 | |
|
|
* Includes undistributed net investment income of: | | | $98,837 | | | | $759,619 | |
|
|
See Notes to Financial Statements.
Salomon Brothers Opportunity Fund Inc 2006 Semi-Annual Report 13
Financial Highlights
For a share of capital stock outstanding throughout each year ended August 31, unless otherwise noted:
| | | | | | | | | | | | | | | | | | | | | | | | |
| | | | | | |
| | | 2006(1) | | | 2005 | | | 2004 | | | 2003 | | | 2002 | | | 2001 | |
Net Asset Value, Beginning of Period | | $ | 50.98 | | | $ | 42.92 | | | $ | 41.34 | | | $ | 41.86 | | | $ | 48.72 | | | $ | 55.98 | |
|
|
Income (Loss) From Operations: | | | | | | | | | | | | | | | | | | | | | | | | |
Net investment income | | | 0.21 | | | | 0.53 | | | | 0.49 | | | | 0.33 | | | | 0.28 | | | | 0.69 | |
Net realized and unrealized gain (loss) | | | 3.17 | | | | 8.31 | | | | 3.99 | | | | 0.61 | | | | (3.74 | ) | | | (2.23 | ) |
|
|
Total Income (Loss) From Operations | | | 3.38 | | | | 8.84 | | | | 4.48 | | | | 0.94 | | | | (3.46 | ) | | | (1.54 | ) |
|
|
Less Distributions From: | | | | | | | | | | | | | | | | | | | | | | | | |
Net investment income | | | (0.46 | ) | | | (0.56 | ) | | | (0.37 | ) | | | (0.19 | ) | | | (0.64 | ) | | | (0.76 | ) |
Net realized gains | | | (1.17 | ) | | | (0.22 | ) | | | (2.53 | ) | | | (1.27 | ) | | | (2.76 | ) | | | (4.96 | ) |
|
|
Total Distributions | | | (1.63 | ) | | | (0.78 | ) | | | (2.90 | ) | | | (1.46 | ) | | | (3.40 | ) | | | (5.72 | ) |
|
|
Net Asset Value, End of Period | | $ | 52.73 | | | $ | 50.98 | | | $ | 42.92 | | | $ | 41.34 | | | $ | 41.86 | | | $ | 48.72 | |
|
|
Total Return | | | 6.73 | %(2) | | | 20.77 | % | | | 11.09 | % | | | 2.57 | % | | | (7.65 | )% | | | (3.16 | )% |
|
|
Net Assets, End of Period (millions) | | | $139 | | | | $137 | | | | $131 | | | | $146 | | | | $160 | | | | $185 | |
|
|
Ratios to Average Net Assets: | | | | | | | | | | | | | | | | | | | | | | | | |
Gross expenses | | | 0.98 | %(3) | | | 0.96 | % | | | 1.06 | % | | | 1.12 | % | | | 1.11 | % | | | 1.10 | % |
Net expenses | | | 0.97 | (3)(4) | | | 0.96 | | | | 1.06 | | | | 1.12 | | | | 1.11 | | | | 1.10 | |
Net investment income | | | 0.80 | (3) | | | 1.06 | | | | 1.04 | | | | 0.82 | | | | 0.64 | | | | 1.30 | |
|
|
Portfolio Turnover Rate | | | 0 | %(5)(6) | | | 1 | %(6) | | | 1 | %(6) | | | 5 | % | | | 1 | % | | | 1 | % |
|
|
| (1) | | For the six months ended February 28, 2006 (unaudited). |
| (2) | | Performance figure reflects a voluntary fee waiver. Past performance is no guarantee of future results. In the absence of this voluntary waiver, the total return would have been lower. Total returns for periods of less than one year are not annualized. |
| (4) | | The investment manager voluntarily waived a portion of its fee. |
| (5) | | Amount represents less than 1%. |
| (6) | | Excludes the value of portfolio securities delivered as a result of in-kind redemptions of the Fund’s capital shares. |
See Notes to Financial Statements.
14 Salomon Brothers Opportunity Fund Inc 2006 Semi-Annual Report
Notes to Financial Statements (unaudited)
| 1. | Organization and Significant Accounting Policies |
The Salomon Brothers Opportunity Fund Inc. (the “Fund”), is registered as a non-diversified, open-end management investment company under the Investment Company Act of 1940, as amended, (the “1940 Act”).
The following are significant accounting policies consistently followed by the Fund and are in conformity with U.S. generally accepted accounting principles (“GAAP”). Estimates and assumptions are required to be made regarding assets, liabilities and changes in net assets resulting from operations when financial statements are prepared. Changes in the economic environment, financial markets and any other parameters used in determining these estimates could cause actual results to differ.
(a) Investment Valuation. Equity securities for which market quotations are available are valued at the last sale price or official closing price on the primary market or exchange on which they trade. Debt securities are valued at the mean between the bid and ask prices provided by an independent pricing service that are based on transactions in debt obligations, quotations from bond dealers, market transactions in comparable securities and various other relationships between securities. When prices are not readily available, or are determined not to reflect fair value, such as when the value of a security has been significantly affected by events after the close of the exchange or market on which the security is principally traded, but before the Fund calculates its net asset value, the Fund may value these investments at fair value as determined in accordance with the procedures approved by the Fund’s Board of Directors. Short-term obligations with maturities of 60 days or less are valued at amortized cost, which approximates market value.
(b) Lending of Portfolio Securities. The Fund has an agreement with its custodian whereby the custodian may lend securities owned by the Fund to brokers, dealers and other financial organizations. In exchange for lending securities under the terms of the agreement with its custodian, the Fund receives a lender’s fee. Fees earned by the Fund on securities lending are recorded as securities lending income. Loans of securities by the Fund are collateralized by cash, U.S. government securities or high quality money market instruments that are maintained at all times in an amount at least equal to the current market value of the loaned securities, plus a margin which varies depending on the type of securities loaned. The custodian establishes and maintains the collateral in a segregated account. The Fund has the right under the lending agreement to recover the securities from the borrower on demand.
The Fund maintains the risk of any loss on the securities on loan as well as the potential loss on investments purchased with cash collateral received from securities lending.
(c) Security Transactions and Investment Income. Security transactions are accounted for on a trade date basis. Interest income, adjusted for amortization of premium and accretion of discount, is recorded on the accrual basis. Dividend income is recorded on the ex-dividend date. Foreign dividend income is recorded on the ex-dividend date or as soon as practical after the Fund determines the existence of a dividend declaration after exercising reasonable due diligence. The cost of investments sold is determined by use of the specific identification method. To the extent any issuer defaults on an expected interest payment, the Fund’s policy is to generally halt any additional interest income accruals and consider the realizability of interest accrued up to the date of default.
Salomon Brothers Opportunity Fund Inc 2006 Semi-Annual Report 15
Notes to Financial Statements (unaudited) (continued)
(d) Distributions to Shareholders. Distributions from net investment income and distributions of net realized gains, if any, are declared at least annually. Distributions to shareholders of the Fund are recorded on the ex-dividend date and are determined in accordance with income tax regulations, which may differ from GAAP.
(e) Federal and Other Taxes. It is the Fund’s policy to comply with the federal income and excise tax requirements of the Internal Revenue Code of 1986, as amended, applicable to regulated investment companies. Accordingly, the Fund intends to distribute substantially all of its income and net realized gains on investments, if any, to shareholders each year. Therefore, no federal income tax provision is required in the Fund’s financial statements. Under the applicable foreign tax laws, a withholding tax may be imposed on interest, dividends and capital gains at various rates.
(f) Reclassification. GAAP requires that certain components of net assets be adjusted to reflect permanent differences between financial and tax reporting. These reclassifications have no effect on net assets or net asset values per share.
| 2. | Management Agreement and Other Transactions with Affiliates |
On December 1, 2005, Citigroup Inc. (“Citigroup”) completed the sale of substantially all of its asset management business, Citigroup Asset Management (“CAM”), to Legg Mason, Inc. (“Legg Mason”). As a result, the Fund’s investment manager, Salomon Brothers Asset Management Inc (“SBAM” or the “Manager”), previously an indirect wholly-owned subsidiary of Citigroup, became a wholly-owned subsidiary of Legg Mason. Completion of the sale caused the Fund’s existing investment management contract to terminate. The Fund’s shareholders approved a new investment management contract between the Fund and the Manager, which became effective on December 1, 2005.
Legg Mason, whose principal executive offices are in Baltimore, Maryland, is a financial services holding company.
Prior to October 1, 2005, the Fund paid the Manager a fee calculated at an annual rate of 0.75% of the Fund’s average daily net assets.
Effective October 1, 2005 and under the new investment management contract, the management fee is calculated daily and paid monthly at the annual rate of the Fund’s average daily net assets as follows:
| | | |
| |
| Average Daily Net Assets | | Management Fee Rate | |
First $1 billion | | 0.750 | % |
Next $1 billion | | 0.725 | |
Next $3 billion | | 0.700 | |
Next $5 billion | | 0.675 | |
Over $10 billion | | 0.650 | |
|
|
For the six months ended February 28, 2006, the Manager voluntarily waived a portion of its fee amounting to $2,988.
The Fund’s Board has appointed the Fund’s current distributor, Citigroup Global Markets Inc. (“CGM”), and Legg Mason Investor Services, LLC (“LMIS”), a wholly-
16 Salomon Brothers Opportunity Fund Inc 2006 Semi-Annual Report
Notes to Financial Statements (unaudited) (continued)
owned broker-dealer subsidiary of Legg Mason, as co-distributors of the Fund. CGM and other broker-dealers, financial intermediaries and financial institutions (each called a “Service Agent”) that currently offer Fund shares will continue to make the Fund’s shares available to their clients. Additional Service Agents may offer Fund shares in the future.
Certain officers of the Fund are employees of Legg Mason or its affiliates and do not receive compensation from the Fund.
The Fund has a concentration of several shareholders who may be a related party, holding a significant percentage of shares outstanding. Investment activities of these shareholders could have a material impact on the Fund.
During the six months ended February 28, 2006, the aggregate cost of purchases and proceeds from sales of investments (excluding short-term investments and redemption in-kind transactions) were as follows:
| | | |
Purchases | | $ | 144,833 |
|
Sales | | | 2,225,192 |
|
At February 28, 2006, the aggregate gross unrealized appreciation and depreciation of investments for federal income tax purposes were substantially as follows:
| | | | |
Gross unrealized appreciation | | $ | 114,000,512 | |
Gross unrealized depreciation | | | (1,765,183 | ) |
|
|
Net unrealized appreciation | | $ | 112,235,329 | |
|
|
At February 28, 2006, the Fund had 15,000,000 shares of capital stock authorized with a par value of $0.01 per share. Transactions in shares of the Fund were as follows:
| | | | | | |
| | |
| | | Six Months Ended
February 28, 2006 | | | Year Ended
August 31, 2005 | |
Shares sold | | 4,347 | | | 15,857 | |
Shares issued on reinvestment | | 40,890 | | | 23,085 | |
Shares repurchased | | (101,033 | ) | | (400,224 | ) |
|
|
Net Decrease | | (55,796 | ) | | (361,282 | ) |
|
|
The Fund may make payment for Fund shares redeemed wholly or in part by distributing portfolio securities to the shareholders. For the period ended February 28, 2006, the Fund had redemptions in-kind with total proceeds in the amount of $1,689,456. The net realized gains on these redemptions in-kind amounted to $1,305,603, which will not be realized for tax purposes.
Salomon Brothers Opportunity Fund Inc 2006 Semi-Annual Report 17
Notes to Financial Statements (unaudited) (continued)
6. Regulatory Matters
On May 31, 2005, the U.S. Securities and Exchange Commission (“SEC”) issued an order in connection with the settlement of an administrative proceeding against Smith Barney Fund Management LLC (“SBFM”) and Citigroup Global Markets Inc. (“CGM”) relating to the appointment of an affiliated transfer agent for the Smith Barney family of mutual funds (the “Affected Funds”).
The SEC order finds that SBFM and CGM willfully violated Section 206(1) of the Investment Advisers Act of 1940 (“Advisers Act”). Specifically, the order finds that SBFM and CGM knowingly or recklessly failed to disclose to the boards of the Affected Funds in 1999 when proposing a new transfer agent arrangement with an affiliated transfer agent that: First Data Investors Services Group (“First Data”), the Affected Funds’ then-existing transfer agent, had offered to continue as transfer agent and do the same work for substantially less money than before; and that CAM, the Citigroup business unit that, at the time, included the Affected Funds’ investment manager and other investment advisory companies, had entered into a side letter with First Data under which CAM agreed to recommend the appointment of First Data as sub-transfer agent to the affiliated transfer agent in exchange for, among other things, a guarantee by First Data of specified amounts of asset management and investment banking fees to CAM and CGM. The order also finds that SBFM and CGM willfully violated Section 206(2) of the Advisers Act by virtue of the omissions discussed above and other misrepresentations and omissions in the materials provided to the Affected Funds’ boards, including the failure to make clear that the affiliated transfer agent would earn a high profit for performing limited functions while First Data continued to perform almost all of the transfer agent functions, and the suggestion that the proposed arrangement was in the Affected Funds’ best interests and that no viable alternatives existed. SBFM and CGM do not admit or deny any wrongdoing or liability. The settlement does not establish wrongdoing or liability for purposes of any other proceeding.
The SEC censured SBFM and CGM and ordered them to cease and desist from violations of Sections 206(1) and 206(2) of the Advisers Act. The order requires Citigroup to pay $208.1 million, including $109 million in disgorgement of profits, $19.1 million in interest, and a civil money penalty of $80 million. Approximately $24.4 million has already been paid to the Affected Funds, primarily through fee waivers. The remaining $183.7 million, including the penalty, has been paid to the U.S. Treasury and will be distributed pursuant to a plan submitted for the approval of the SEC. At this time, there is no certainty as to how the above described proceeds of the settlement will be distributed, to whom such distributions will be made, the methodology by which such distributions will be allocated, and when such distributions will be made. The order also required that transfer agency fees received from the Affected Funds since December 1, 2004 less certain expenses be placed in escrow and provided that a portion of such fees might be subsequently distributed in accordance with the terms of the order. On April 3, 2006, an aggregate amount of approximately $9 million was distributed to the Affected Funds.
The order required SBFM to recommend a new transfer agent contract to the Affected Funds’ boards within 180 days of the entry of the order; if a Citigroup affiliate submitted a
18 Salomon Brothers Opportunity Fund Inc 2006 Semi-Annual Report
Notes to Financial Statements (unaudited) (continued)
proposal to serve as transfer agent or sub-transfer agent, SBFM and CGM would have been required, at their expense, to engage an independent monitor to oversee a competitive bidding process. On November 21, 2005, and within the specified timeframe, the Affected Funds’ Boards selected a new transfer agent for the Affected Funds. No Citigroup affiliate submitted a proposal to serve as transfer agent. Under the order, SBFM also must comply with an amended version of a vendor policy that Citigroup instituted in August 2004.
Although there can be no assurance, SBFM does not believe that this matter will have a material adverse effect on the Affected Funds.
This Fund is not one of the Affected Funds and therefore did not implement the transfer agent arrangement described above and therefore has not received and will not receive any portion of the distributions.
On December 1, 2005, Citigroup completed the sale of substantially all of its global asset management business, including SBFM, to Legg Mason.
Beginning in August 2005, five class action lawsuits alleging violations of federal securities laws and state law were filed against CGM and SBFM (collectively, the “Defendants”) based on the May 31, 2005 settlement order issued against the Defendants by the SEC described in Note 6. The complaints seek injunctive relief and compensatory and punitive damages, removal of SBFM as the investment manager for the Smith Barney family of funds, rescission of the funds’ management and other contracts with SBFM, recovery of all fees paid to SBFM pursuant to such contracts, and an award of attorneys’ fees and litigation expenses.
On October 5, 2005, a motion to consolidate the five actions and any subsequently filed, related action was filed. That motion contemplates that a consolidated amended complaint alleging substantially similar causes of action will be filed in the future. As of the date of this report, SBFM believes that resolution of the pending lawsuit will not have a material effect on the financial position or results of operations of the funds or the ability of SBFM and its affiliates to continue to render services to the funds under their respective contracts.
* * *
Beginning in June 2004, class action lawsuits alleging violations of the federal securities laws were filed against CGM and a number of its affiliates, including SBFM and Salomon Brothers Asset Management Inc. (the “Advisers”), substantially all of the mutual funds managed by the Advisers, including the Fund (the “Funds”), and directors or trustees of the Funds (collectively, the “Defendants”). The complaints alleged, among other things, that CGM created various undisclosed incentives for its brokers to sell Smith Barney and Salomon Brothers funds. In addition, according to the complaints, the Advisers caused the Funds to pay excessive brokerage commissions to CGM for steering clients towards proprietary funds. The complaints also alleged that the Defendants breached their fiduciary duty to the Funds by improperly charging Rule l2b-1 fees and by drawing on fund assets to make undisclosed payments of soft dollars and excessive brokerage commissions.
Salomon Brothers Opportunity Fund Inc 2006 Semi-Annual Report 19
Notes to Financial Statements (unaudited) (continued)
The complaints also alleged that the Funds failed to adequately disclose certain aspects of the allegedly wrongful conduct. The complaints sought injunctive relief and compensatory and punitive damages, rescission of the Funds’ contracts with the Advisers, recovery of all fees paid to the Advisers pursuant to such contracts and an award of attorneys’ fees and litigation expenses.
On December 15, 2004, a consolidated amended complaint (the “Complaint”) was filed alleging substantially similar causes of action. While the lawsuit is in its earliest stages, to the extent that the Complaint purports to state causes of action against the Funds, the Fund’s investment manager believes the Funds have significant defenses to such allegations, which the Funds intend to vigorously assert in responding to the Complaint.
Additional lawsuits arising out of theses circumstances and presenting similar allegations and requests for relief may be filed against the Defendants in the future.
As of the date of this report, the Fund’s investment manager and the Funds believe that the resolution of the pending lawsuit will not have a material effect on the financial position or results of operations of the Funds or the ability of the Advisers and their affiliates to continue to render services to the Funds under their respective contracts.
The Defendants have moved to dismiss the Complaint. Those motions are pending before the court.
8. Other Matters
On September 16, 2005, the staff of the SEC informed SBFM and SBAM that the staff is considering recommending that the SEC institute administrative proceedings against SBFM and SBAM for alleged violations of Section 19(a) and 34(b) of the Investment Company Act (and related Rule 19a-1). The notification is a result of an industry wide inspection by the SEC and is based upon alleged deficiencies in disclosures regarding dividends and distributions paid to shareholders of certain funds. Section 19(a) and related Rule 19a-1 of the Investment Company Act generally require funds that are making dividend and distribution payments to provide shareholders with a written statement disclosing the source of the dividends and distributions, and, in particular, the portion of the payments made from each of net investment income, undistributed net profits and/or paid-in capital. In connection with the contemplated proceedings, the staff may seek a cease and desist order and/or monetary damages from SBFM or SBAM.
Although there can be no assurance, SBAM believes that this matter is not likely to have a material adverse effect on the Fund or SBAM’s ability to perform investment management services relating to the Fund.
20 Salomon Brothers Opportunity Fund Inc 2006 Semi-Annual Report
Board Approval of Management Agreement (unaudited)
On June 23, 2005, Citigroup Inc. entered into a definitive agreement (the “Transaction Agreement”) with Legg Mason, Inc. (“Legg Mason”) under which Citigroup agreed to sell substantially all of its asset management business, Citigroup Asset Management (“CAM”), which includes Salomon Brothers Asset Management Inc., (the “Adviser”), to Legg Mason in exchange for the broker-dealer and investment banking businesses of Legg Mason and certain other considerations (the “Transaction”). The Transaction closed on December 1, 2005.
The consummation of the Transaction resulted in the automatic termination of the Fund’s then current management agreement (the “Prior Management Agreement”) in accordance with the Investment Company Act of 1940, as amended (the “1940 Act”). Prior to the closing of the Transaction, the Fund’s Board approved a new management agreement between the Fund and the Adviser (the “Current Management Agreement”) and authorized the Fund’s officers to submit the Current Management Agreement to shareholders for their approval.
On July 11, 2005, members of the Board discussed with CAM management and certain Legg Mason representatives the Transaction and Legg Mason’s general plans and intentions regarding CAM’s business and its combination with Legg Mason’s business. The Board Members also inquired about the plans for and anticipated roles and responsibilities of certain CAM employees and officers after the Transaction.
At a meeting held on August 29, 2005, the Fund’s Board, including a majority of the Board Members who are not “interested persons” of the Fund or the Adviser as defined in the 1940 Act (the “Independent Board Members”), approved continuance of the Prior Management Agreement until the closing of the Transaction and the Current Management Agreement to take effect upon such closing. To assist the Board in its consideration of the Current Management Agreement, Legg Mason provided materials and information about Legg Mason, including its financial condition, asset management capabilities and organization, and CAM provided materials and information about the Transaction between Legg Mason and Citigroup. Representatives of CAM and Legg Mason also made presentations to and responded to questions from the Board. The Independent Board Members, through their independent legal counsel, also requested and received additional information from CAM and Legg Mason in connection with their consideration of the Current Management Agreement. The additional information was provided in advance of and at the August meeting. After the presentations and after reviewing the written materials provided, the Independent Board Members met with their counsel to consider the Current Management Agreement. The Independent Board Members also conferred separately from CAM management with their counsel about the Transaction on a number of occasions, including in connection with the July and August meetings.
In their deliberations concerning the Current Management Agreement, among other things, the Board Members considered the need to provide for continuity of investment management services to the Fund following termination of the Prior Agreement and:
(i) the reputation, financial strength and resources of Legg Mason and its investment advisory subsidiaries;
Salomon Brothers Opportunity Fund Inc 21
Board Approval of Management Agreement (unaudited) (continued)
(ii) that, following the Transaction, CAM will be part of an organization focused on the asset management business;
(iii) that Legg Mason is an experienced and respected asset management firm, and that Legg Mason has advised the Board Members that (a) it may wish to combine certain CAM operations with those of certain Legg Mason subsidiaries; (b) it is expected that these combination processes will result in changes to portfolio managers or portfolio management teams for a number of the CAM funds, subject to Board oversight and appropriate notice to shareholders, and that, in other cases, the current portfolio managers or portfolio management teams will remain in place; and (c) in the future, it may recommend that Legg Mason subsidiaries be appointed as the adviser or subadviser to some or all of the CAM funds, subject to applicable regulatory requirements;
(iv) that CAM management had advised the Board that a number of portfolio managers and other key CAM personnel would be retained after the closing of the Transaction;
(v) that CAM management and Legg Mason have advised the Board that following the Transaction, there is not expected to be any diminution in the nature, quality and extent of services provided to the Fund and their shareholders by the Adviser, including compliance services;
(vi) that Legg Mason has advised the Board that it has no present intention to alter any expense waivers and reimbursements currently in effect for CAM Funds and, while it reserves the right to do so in the future, it would consult with the relevant boards before making any changes;
(vii) that under the Transaction Agreement, Citigroup and Legg Mason have agreed not to take any action that is not contemplated by the Transaction or fail to take any action that to their respective knowledge would cause any “undue burden” on Fund shareholders under applicable provisions of the 1940 Act;
(viii) the potential benefits to Fund shareholders from being part of a combined fund family with Legg Mason-sponsored funds;
(ix) that Citigroup and Legg Mason would derive benefits from the Transaction and that, as a result, they have a financial interest in the matters that were being considered;
(x) the potential effects of regulatory restrictions on the Fund if Citigroup-affiliated broker-dealer remain principal underwriters of the Fund after the closing of the Transactions;
(xi) the fact that the Fund’s total advisory and administrative fees will not increase by virtue of the New Management Agreement, but will remain the same;
(xii) the terms and conditions of the Current Management Agreement, including the differences from the current management agreement, and the benefits of a single, uniform form of agreement covering these services;
(xiii) that the Fund would not bear the costs of obtaining shareholder approval of the Current Management Agreement;
22 Salomon Brothers Opportunity Fund Inc
Board Approval of Management Agreement (unaudited) (continued)
(xiv) that the Fund would avail itself of permissions granted under certain licensing arrangements between Citigroup and Legg Mason that would permit the Fund (including any share classes thereof) to maintain its current name, as well as all logos, trademarks and service marks, related to Citigroup or any of its affiliates for some agreed upon time period after the closing of the Transaction: and
(xv) that the Board, earlier at its meeting held on August 29, 2005 had performed a full annual review of the Prior Management Agreement as required by the 1940 Act. In that regard, the Board, in its deliberations concerning the Current Management Agreement, considered the same factors regarding the nature, quality and extent of services provided, costs of services provided, profitability, fall-out benefits, fees and economics of scale and investment performance as it did when it renewed the Prior Management Agreement, and reached substantially the same conclusions.
Salomon Brothers Opportunity Fund Inc 23
Additional Shareholder Information (unaudited)
Results of a Special Meeting of Shareholders
On October 21, 2005, a Special Meeting of Shareholders was held for the following purposes: (1) to elect Directors of Salomon Brothers Opportunity Fund Inc. and (2) to approve a new management agreement for Salomon Brothers Opportunity Fund Inc. The following table provides the number of votes cast for, withheld or against, as well as the number of abstentions and broker non-votes as to each matter.
Election of Directors
| | | | | | | | |
| Nominees: | | Votes For | | Withheld | | Abstentions | | Broker
Non-Votes |
Rosalind A. Kochman | | 1,849,011.774 | | 63,183.218 | | 0 | | 0 |
Irving Sonnenschein | | 1,825,272.078 | | 86,922.914 | | 0 | | 0 |
Irving Brilliant | | 1,845,334.729 | | 66,860.263 | | 0 | | 0 |
Barry Handel | | 1,849,048.015 | | 63,146.977 | | 0 | | 0 |
William Morris | | 1,849,045.859 | | 63,149.133 | | 0 | | 0 |
|
Approval of New Management Agreement
| | | | | | | | |
| Item Voted On | | Votes For | | Votes
Against | | Abstentions | | Broker
Non-Votes |
New Management Agreement | | 1,649,186.079 | | 6,832.042 | | 63,820.871 | | 192,356.000 |
|
24 Salomon Brothers Opportunity Fund Inc 2006 Semi-Annual Report
Salomon Brothers Opportunity Fund Inc
| | |
DIRECTORS Irving G. Brilliant Barry Handel, CPA Rosalind A. Kochman Chairperson William Morris, Jr., CPA Irving Sonnenschein OFFICERS R. Jay Gerken, CFA Executive Vice President Andrew B. Shoup Senior Vice President and
Chief Administrative Officer Frances M. Guggino Chief Financial Officer and Treasurer George J. Williamson Vice President and Investment Officer Patrick Hughes Vice President
and Investment Officer Ted P. Becker Chief Compliance Officer John Chiota Chief Anti-Money Laundering Compliance Officer Wendy S. Setnicka Controller Robert I. Frenkel Secretary and
Chief Legal Officer | | INVESTMENT MANAGER Salomon Brothers Asset Management Inc 399 Park Avenue
New York, New York 10022 DISTRIBUTORS Citigroup Global Markets Inc. Legg Mason Investor Services, LLC CUSTODIAN State Street Bank and Trust Company 225 Franklin Street
Boston, Massachusetts 02110 TRANSFER AGENT PFPC Inc.
4400 Computer Drive
Westborough, Massachusetts 01581 LEGAL COUNSEL Simpson Thacher & Bartlett LLP
425 Lexington Avenue
New York, New York 10017-3909 INDEPENDENT REGISTERED PUBLIC ACCOUNTING FIRM KPMG LLP
345 Park Avenue
New York, NY 10154 |
This report is transmitted to the shareholders of Salomon Brothers Opportunity Fund Inc for their information. This is not a prospectus, circular or representation intended for use in the purchase of shares of the Fund or any securities mentioned in this report.
This report must be preceded or accompanied by a free prospectus. Investors should consider the Fund’s investment objectives, risks, charges and expenses carefully before investing. The prospectus contains this and other important information about the Fund. Please read the prospectus carefully before investing.
www.leggmason.com/InvestorServices
©2006 Legg Mason Investor Services, LLC
Member NASD, SIPC
Salomon Brothers
Opportunity Fund Inc
The Fund files its complete schedule of portfolio holdings with the Securities and Exchange Commission for the first and third quarters of each fiscal year on Form N-Q. The Fund’s Forms N-Q are available on the SEC’s website at www.sec.gov. The Fund’s Forms N-Q may be reviewed and copied at the SEC’s Public Reference Room in Washington, D.C., and information on the operation of the Public Reference Room may be obtained by calling 1-800-SEC-0330. To obtain information on Form N-Q from the Fund, shareholders can call 1-800-446-1013.
Information on how the Fund voted proxies relating to portfolio securities during the prior 12 month period ended June 30th of each year and a description of the policies and procedures that the Fund uses to determine how to vote proxies related to portfolio transactions is available (1) without charge, upon request, by calling 1-800-446-1013, (2) on the Fund’s website at www.leggmason.com/InvestorServices and (3) on the SEC’s website at www.sec.gov. Proxy voting reports for the period ending June 30, 2005 will be continued to be listed under Salomon Brothers Opportunity Fund Inc. name.
ITEM 2. CODE OF ETHICS.
Not Applicable.
ITEM 3. AUDIT COMMITTEE FINANCIAL EXPERT.
Not Applicable.
ITEM 4. PRINCIPAL ACCOUNTANT FEES AND SERVICES.
Not applicable.
ITEM 5. AUDIT COMMITTEE OF LISTED REGISTRANTS.
Not applicable.
ITEM 6. SCHEDULE OF INVESTMENTS.
Included herein under Item 1.
ITEM 7. DISCLOSURE OF PROXY VOTING POLICIES AND PROCEDURES FOR CLOSED-END MANAGEMENT INVESTMENT COMPANIES.
Not applicable.
ITEM 8. PORTFOLIO MANAGERS OF CLOSED-END MANAGEMENT INVESTMENT COMPANIES.
Not applicable.
ITEM 9. PURCHASES OF EQUITY SECURITIES BY CLOSED-END MANAGEMENT INVESTMENT COMPANY AND AFFILIATED PURCHASERS.
Not applicable.
ITEM 10. SUBMISSION OF MATTERS TO A VOTE OF SECURITY HOLDERS.
Not applicable.
ITEM 11. CONTROLS AND PROCEDURES.
| | (a) | The registrant’s principal executive officer and principal financial officer have concluded that the registrant’s disclosure controls and procedures (as defined in Rule 30a- 3(c) under the Investment Company Act of 1940, as amended (the “1940 Act”)) are effective as of a date within 90 days of the filing date of this report that includes the disclosure required by this paragraph, based on their evaluation of the disclosure controls and procedures required by Rule 30a-3(b) under the 1940 Act and 15d-15(b) under the Securities Exchange Act of 1934. |
| | (b) | There were no changes in the registrant’s internal control over financial reporting (as defined in Rule 30a-3(d) under the 1940 Act) that occurred during the registrant’s last fiscal half-year (the registrant’s second fiscal half-year in the case of an annual report) that have materially affected, or are likely to materially affect the registrant’s internal control over financial reporting. |
ITEM 12. EXHIBITS.
| | |
| Exhibit 99.CERT | | Certifications pursuant to section 302 of the Sarbanes-Oxley Act of 2002 |
| |
| Exhibit 99.906CERT | | Certifications pursuant to Section 906 of the Sarbanes-Oxley Act of 2002 |
SIGNATURES
Pursuant to the requirements of the Securities Exchange Act of 1934 and the Investment Company Act of 1940, the registrant has duly caused this Report to be signed on its behalf by the undersigned, there unto duly authorized.
Salomon Brothers Opportunity Fund Inc
| | |
| By: | | /s/ R. Jay Gerken |
| | R. Jay Gerken |
| | Executive Vice President of |
| | Salomon Brothers Opportunity Fund Inc |
Date: May 8, 2006
Pursuant to the requirements of the Securities Exchange Act of 1934 and the Investment Company Act of 1940, this report has been signed below by the following persons on behalf of the registrant and in the capacities and on the dates indicated.
| | |
| By: | | /s/ R. Jay Gerken |
| | R. Jay Gerken |
| | Executive Vice President of |
| | Salomon Brothers Opportunity Fund Inc |
Date: May 8, 2006
| | |
| By: | | /s/ Frances M. Guggino |
| | Frances M. Guggino |
| | Chief Financial Officer of |
| | Salomon Brothers Opportunity Fund Inc |
Date: May 8, 2006