UNITED STATES
SECURITIES AND EXCHANGE COMMISSION
Washington, D.C. 20549
FORM N-CSR
CERTIFIED SHAREHOLDER REPORT OF REGISTERED
MANAGEMENT INVESTMENT COMPANIES
Investment Company Act file number: 811-2884
Salomon Brothers Opportunity Fund Inc
(Exact name of registrant as specified in charter)
125 Broad Street, New York, NY 10004
(Address of principal executive offices) (Zip code)
Robert I. Frenkel, Esq.
Salomon Brothers Asset Management Inc
300 First Stamford Place
Stamford, CT 06902
(Name and address of agent for service)
Registrant’s telephone number, including area code: (800) 725-6666
Date of fiscal year end: August 31
Date of reporting period: February 28, 2005
| ITEM 1. | REPORT TO STOCKHOLDERS. |
The Semi-Annual Report to Stockholders is filed herewith.

Salomon Brothers
Opportunity Fund Inc
Semi-Annual Report
February 28, 2005
PFPC Inc.
P.O. Box 9764
Providence, Rhode Island 02940-9764
OPSEMI 2/05
05-8242
SALOMON BROTHERS OPPORTUNITY FUND INC
Letter From the Chairman
Dear Shareholder,
We are pleased to provide this semi-annual report of the Salomon Brothers Opportunity Fund Inc (the “Fund”) for the period ended February 28, 2005.
I am taking this occasion to introduce myself as the newly elected Chairman of the Fund’s Board following Irving Brilliant’s retirement as Chairman. As you may know, I have served as a Director on the Fund’s Board for over 15 years.
While the Chairmanship has changed hands, the Fund’s investment philosophy and strategy remains unchanged.
I urge you to read carefully the Manager’s Overview and the accompanying financial statements. Also included is a detailed summary of the Fund’s performance and other pertinent information which I hope you will find useful.
On behalf of the Directors and officers of the Fund, I also want to thank you for your ongoing confidence in the Fund and its investment policies.
Sincerely,

Rosalind A. Kochman
Chairman
March 17, 2005
SALOMON BROTHERS OPPORTUNITY FUND INC
Manager Overview
Market Overview
During the six months covered by this report, the U.S. stock market generated strong results, with the S&P 500 Indexi returning 9.99%. Early in the period, stocks traded in a fairly narrow range. However, from late October 2004 through the end of the year, U.S. and foreign equities rallied sharply. Investors were drawn to the U.S. market as the uncertainty of the U.S. Presidential election ended and oil prices fell from their record highs. Equities weakened in January, but subsequently rallied in February, leaving the performance of the equity markets generally flat during the first two months of 2005.
Looking at the reporting period as a whole, the trend of value-oriented stocks outperforming their growth counterparts continued. In addition, small- and mid-capitalization stocks generally outperformed their larger brethren during the period.
Performance Review
For the six months ended February 28, 2005, the Salomon Brothers Opportunity Fund Inc returned 13.90%. These shares outperformed the fund’s unmanaged benchmark, the S&P 500 Index, which returned 9.99% for the same period. The Lipper Multi-Cap Value Funds Category Average1 was 12.93% over the same time frame.
PERFORMANCE SNAPSHOT
AS OF FEBRUARY 28, 2005
(unaudited)
| | |
| | | 6 Months |
| | | |
| Salomon Brothers Opportunity Fund Inc | | 13.90% |
| | | |
| S&P 500 Index | | 9.99% |
| | | |
| Lipper Multi-Cap Value Funds Category Average | | 12.93% |
The performance shown represents past performance. Past performance is no guarantee of future results and current performance may be higher or lower than the performance shown above. Principal value and investment returns will fluctuate and investors’ shares, when redeemed, may be worth more or less than their original cost.
The fund’s returns assume the reinvestment of income dividends and capital gains distributions at net asset value and the deduction of all fund expenses. Returns have not been adjusted to include sales charges that may apply when shares are purchased or the deduction of taxes that a shareholder would pay on fund distributions.
Information About Your Fund
As you may be aware, several issues in the mutual fund industry have recently come under the scrutiny of federal and state regulators. The fund’s Adviser and some of its affiliates have received requests for information from various government regulators regarding market timing, late trading, fees, and other mutual fund issues in connection with various investigations. The regulators appear to be examining, among other things, the fund’s response to market timing and shareholder exchange activity, including
| 1 | | Lipper, Inc. is a major independent mutual-fund tracking organization. Returns are based on the six-month period ended February 28, 2005, including the reinvestment of dividends and capital gains distributions, if any, calculated among the 510 funds in the fund’s Lipper category, and excluding sales charges. |
SALOMON BROTHERS OPPORTUNITY FUND INC
compliance with prospectus disclosure related to these subjects. The fund has been informed that the Adviser and its affiliates are responding to those information requests, but are not in a position to predict the outcome of these requests and investigations.
As previously disclosed by Citigroup, the Staff of the Securities and Exchange Commission (“SEC”) has notified Citigroup Asset Management (“CAM”) and Citicorp Trust Bank (“CTB”), an affiliate of CAM, that the Staff is considering recommending a civil injunctive action and/or an administrative proceeding against CAM, CTB, the former CEO of CAM, two former employees and a current employee of CAM, relating to the creation, operation and fees of an internal transfer agent unit that serves various CAM-managed funds. Citigroup is cooperating with the SEC and will seek to resolve this matter in discussion with the SEC Staff. Although there can be no assurance, Citigroup does not believe that this matter will have a material adverse effect on the fund. For further information, please see the “Additional Information” note in the Notes to the Financial Statements included in this report.
Thank you for your investment in the Salomon Brothers Opportunity Fund Inc. As always, thank you for your confidence in our stewardship of your assets. We look forward to helping you continue to meet your financial goals.
Sincerely,

George J. Williamson
Investment Officer
March 17, 2005
The information provided is not intended to be a forecast of future events, a guarantee of future results or investment advice. Views expressed may differ from those of the firm as a whole.
RISKS: Investments in small- and medium-capitalization companies may involve a higher degree of risk and volatility than investments in larger, more established companies. The fund may invest in high yield and foreign securities, including those in emerging markets, which involve risks beyond those inherent in higher-rated and domestic investments. High yield bonds involve greater credit and liquidity risks than investment grade bonds. Investing in foreign securities is subject to certain risks not associated with domestic investing, such as currency fluctuations and changes in political and economic conditions. These risks are magnified in emerging or developing markets. The fund may use derivatives, such as options or futures, which can be illiquid, may disproportionately increase losses, and have a potentially large impact on fund performance.
All index performance reflects no deduction for fees, expenses or taxes. Please note that an investor cannot invest directly in an index.
| i | | The S&P 500 Index is a market capitalization-weighted index of 500 widely held common stocks. |
SALOMON BROTHERS OPPORTUNITY FUND INC
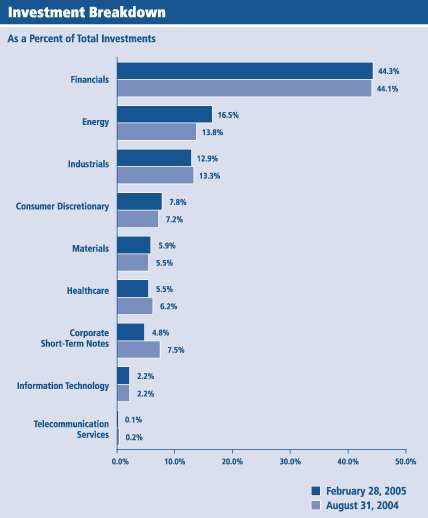
Fund at a Glance (unaudited)
Page 4
SALOMON BROTHERS OPPORTUNITY FUND INC
Fund Expenses (unaudited)
Example
As a shareholder of the Fund, you may incur two types of costs: (1) transaction costs, including reinvested dividends, or other distributions; and (2) ongoing costs, including management fees; and other Fund expenses. This example is intended to help you understand your ongoing costs (in dollars) of investing in the Fund and to compare these costs with the ongoing costs of investing in other mutual funds.
This example is based on an investment of $1,000 invested on September 1, 2004 and held for the six months ended February 28, 2005.
Actual Expenses
The table below titled “Based on Actual Total Return” provides information about actual account values and actual expenses. You may use the information provided in this table, together with the amount you invested, to estimate the expenses that you paid over the period. To estimate the expenses you paid on your account, divide your ending account value by $1,000 (for example, an $8,600 ending account value divided by $1,000 = 8.6), then multiply the result by the number under the heading entitled “Expenses Paid During the Period”.
Based on Actual Total Return(1)
| | | | | | | | | | | |
Actual
Total Return
Without
Sales Charges(2)
| | Beginning
Account
Value
| | Ending
Account
Value
| | Annualized
Expense
Ratio
| | Expenses
Paid During
the Period(3)
|
| 13.90% | | $ | 1,000.00 | | $ | 1,139.00 | | 0.95% | | $ | 5.04 |
| (1) | | For the six months ended February 28, 2005. |
| (2) | | Assumes reinvestment of all dividends and capital gain distributions, if any, at net asset value. Total return is not annualized, as it may not be representative of the total return for the year. |
| (3) | | Expenses are equal to the Fund’s annualized expense ratio, multiplied by the average account value over the period, multiplied by the number of days in the most recent fiscal half-year, then divided by 365. |
Page 5
SALOMON BROTHERS OPPORTUNITY FUND INC
Fund Expenses (unaudited) (continued)
Hypothetical Example for Comparison Purposes
The table below titled “Based on Hypothetical Total Return” provides information about hypothetical account values and hypothetical expenses based on the actual expense ratio and an assumed rate of return of 5.00% per year before expenses, which is not the Fund’s actual return. The hypothetical account values and expenses may not be used to estimate the actual ending account balance or expenses you paid for the period. You may use the information provided in this table to compare the ongoing costs of investing in the Fund and other funds. To do so, compare the 5.00% hypothetical example relating to the Fund with the 5.00% hypothetical examples that appear in the shareholder reports of the other funds.
Please note that the expenses shown in the table below are meant to highlight your ongoing costs only and do not reflect any transactional costs, such as front-end or back-end sales charges (loads). Therefore, the table is useful in comparing ongoing costs only, and will not help you determine the relative total costs of owning different funds. In addition, if these transaction costs were included, your costs would have been higher.
Based on Hypothetical Total Return(1)
| | | | | | | | | | | | |
Hypothetical
Total Return
| | Beginning
Account
Value
| | Ending
Account
Value
| | Annualized
Expense
Ratio
| | | Expenses
Paid During
the Period(2)
|
| 5.00% | | $ | 1,000.00 | | $ | 1,020.08 | | 0.95 | % | | $ | 4.76 |
| (1) | | For the six months ended February 28, 2005. |
| (2) | | Expenses are equal to the Fund’s annualized expense ratio, multiplied by the average account value over the period, multiplied by the number of days in the most recent fiscal half-year, then divided by 365. |
Page 6
SALOMON BROTHERS OPPORTUNITY FUND INC
Schedule of Investments (unaudited)
February 28, 2005
| | | | | |
| Shares | | Security† | | Value |
| Common Stock — 95.1% | | | |
| Consumer Discretionary — 7.8% | | | |
| Food Services — 0.3% | | | |
| 96,000 | | FHC (a)(b) | | $ | 456,000 |
| | | | |
|
|
| Hotels, Restaurants & Leisure — 0.2% | | | |
| 7,100 | | Fairmont Hotels & Resorts, Inc. | | | 228,194 |
| | | | |
|
|
| Household Durables — 6.7% | | | |
| 313,410 | | Koninklijke Philips Electronics N.V., ADR | | | 8,687,725 |
| | | Liberty Homes, Inc.: | | | |
| 14,850 | | Class A shares | | | 67,568 |
| 22,050 | | Class B shares | | | 132,300 |
| | | | |
|
|
| | | | | | 8,887,593 |
| | | | |
|
|
| Media — 0.6% | | | |
| 19,600 | | News Corp., Class A shares | | | 326,144 |
| 29,000 | | Time Warner, Inc. (a) | | | 499,670 |
| | | | |
|
|
| | | | | | 825,814 |
| | | | |
|
|
| | |
| | �� | Total Consumer Discretionary | | | 10,397,601 |
| | | | |
|
|
| Energy — 16.5% | | | |
| Energy Equipment & Services — 1.0% | | | |
| 28,300 | | Diamond Offshore Drilling, Inc. | | | 1,400,850 |
| | | | |
|
|
| Oil & Gas — 15.5% | | | |
| 5,488 | | EnCana Corp. | | | 367,092 |
| 57,000 | | Murphy Oil Corp. | | | 5,702,280 |
| 231,700 | | Royal Dutch Petroleum Co., ADR | | | 14,617,953 |
| | | | |
|
|
| | | | | | 20,687,325 |
| | | | |
|
|
| | |
| | | Total Energy | | | 22,088,175 |
| | | | |
|
|
| Financials — 44.2% | | | |
| Banks — 14.6% | | | |
| 434,776 | | The Bank of New York Co., Inc. | | | 13,151,974 |
| 240,600 | | Popular, Inc. | | | 6,373,494 |
| | | | |
|
|
| | | | | | 19,525,468 |
| | | | |
|
|
See Notes to Financial Statements.
Page 7
SALOMON BROTHERS OPPORTUNITY FUND INC
Schedule of Investments (unaudited) (continued)
February 28, 2005
| | | | | |
| Shares | | Security† | | Value |
| Diversified Financials — 2.0% | | | |
| 42,800 | | Freddie Mac | | $ | 2,653,600 |
| | | | |
|
|
| Insurance — 16.0% | | | |
| 169,500 | | The Chubb Corp. | | | 13,409,145 |
| 83,000 | | CNA Financial Corp. (a) | | | 2,387,910 |
| 70,850 | | Leucadia National Corp. | | | 2,374,184 |
| 8,900 | | Loews Corp. | | | 634,392 |
| 40,000 | | Merchants Group, Inc. | | | 1,046,000 |
| 66,900 | | Old Republic International Corp. | | | 1,604,931 |
| | | | |
|
|
| | | | | | 21,456,562 |
| | | | |
|
|
| Real Estate — 11.6% | | | |
| | | Forest City Enterprises, Inc.: | | | |
| 154,150 | | Class A shares | | | 9,765,403 |
| 88,350 | | Class B shares, Convertible (c) | | | 5,681,788 |
| 5,500 | | Harbor Global Co., Ltd. | | | 49,913 |
| | | | |
|
|
| | | | | | 15,497,104 |
| | | | |
|
|
| | |
| | | Total Financials | | | 59,132,734 |
| | | | |
|
|
| Healthcare — 5.5% | | | |
| Healthcare Providers & Services — 4.4% | | | |
| 10,700 | | Health Net, Inc. (a) | | | 319,930 |
| 24,200 | | Humana, Inc. (a) | | | 805,134 |
| 38,454 | | WellPoint Inc. (a) | | | 4,693,695 |
| | | | |
|
|
| | | | | | 5,818,759 |
| | | | |
|
|
| Pharmaceuticals — 1.1% | | | |
| 56,564 | | Pfizer, Inc. | | | 1,487,068 |
| | | | |
|
|
| | |
| | | Total Healthcare | | | 7,305,827 |
| | | | |
|
|
| Industrials — 12.9% | | | |
| Aerospace & Defense — 5.2% | | | |
| 60,600 | | General Dynamics Corp. | | | 6,384,210 |
| 10,700 | | Lockheed Martin Corp. | | | 633,654 |
| | | | |
|
|
| | | | | | 7,017,864 |
| | | | |
|
|
| Air Freight & Couriers — 0.4% | | | |
| 65,100 | | ABX Air, Inc. (a) | | | 524,055 |
| | | | |
|
|
See Notes to Financial Statements.
Page 8
SALOMON BROTHERS OPPORTUNITY FUND INC
Schedule of Investments (unaudited) (continued)
February 28, 2005
| | | | | |
| Shares | | Security† | | Value |
| Airlines — 0.3% | | | |
| 52,800 | | AMR Corp. (a) | | $ | 448,272 |
| | | | |
|
|
| Commercial Services & Supplies — 1.4% | | | |
| 8,234 | | Sabre Holdings Corp. | | | 173,573 |
| 104,950 | | TRC Cos., Inc. (a) | | | 1,704,388 |
| | | | |
|
|
| | | | | | 1,877,961 |
| | | | |
|
|
| Electrical Equipment — 2.2% | | | |
| | | Tecumseh Products Co.: | | | |
| 35,700 | | Class A shares | | | 1,465,485 |
| 36,400 | | Class B shares | | | 1,426,880 |
| | | | |
|
|
| | | | | | 2,892,365 |
| | | | |
|
|
| Industrial Conglomerates — 1.4% | | | |
| 44,700 | | General Electric Co. | | | 1,573,440 |
| 8,403 | | Tyco International Ltd. | | | 281,332 |
| | | | |
|
|
| | | | | | 1,854,772 |
| | | | |
|
|
| Marine — 2.0% | | | |
| 25,300 | | Alexander & Baldwin, Inc. | | | 1,148,620 |
| 7,000 | | CP Ships Ltd. | | | 96,600 |
| 21,100 | | Overseas Shipholding Group, Inc. | | | 1,374,032 |
| | | | |
|
|
| | | | | | 2,619,252 |
| | | | |
|
|
| | |
| | | Total Industrials | | | 17,234,541 |
| | | | |
|
|
| Information Technology — 2.2% | | | |
| Computers & Peripherals — 1.2% | | | |
| 18,600 | | Hewlett-Packard Co. | | | 386,880 |
| 13,400 | | International Business Machines Corp. | | | 1,240,572 |
| | | | |
|
|
| | | | | | 1,627,452 |
| | | | |
|
|
| Semiconductor Equipment & Products — 0.3% | | | |
| 21,200 | | National Semiconductor Corp. | | | 422,940 |
| | | | |
|
|
| Software — 0.7% | | | |
| 35,600 | | Microsoft Corp. | | | 896,408 |
| | | | |
|
|
| | |
| | | Total Information Technology | | | 2,946,800 |
| | | | |
|
|
See Notes to Financial Statements.
Page 9
SALOMON BROTHERS OPPORTUNITY FUND INC
Schedule of Investments (unaudited) (continued)
February 28, 2005
| | | | | | |
| Shares | | Security† | | Value |
| | Materials — 5.9% | | | |
| | Chemicals — 0.9% | | | |
| | 6,257 | | Kronos Worldwide Inc. | | $ | 294,642 |
| | 11,221 | | Monsanto Co. | | | 659,570 |
| | 11,500 | | NL Industries, Inc. | | | 251,850 |
| | | | | |
|
|
| | | | | | | 1,206,062 |
| | | | | |
|
|
| | Construction Materials — 2.9% | | | |
| | 44,100 | | Ameron International Corp. | | | 1,548,792 |
| | 37,400 | | Lafarge North America, Inc. | | | 2,297,856 |
| | | | | |
|
|
| | | | | | | 3,846,648 |
| | | | | |
|
|
| | Metals & Mining — 0.2% | | | |
| | 7,177 | | Newmont Mining Corp. | | | 323,108 |
| | | | | |
|
|
| | Paper & Forest Products — 1.9% | | | |
| | 51,660 | | Rayonier, Inc. | | | 2,479,680 |
| | | | | |
|
|
| | |
| | | | Total Materials | | | 7,855,498 |
| | | | | |
|
|
| | Telecommunication Services — 0.1% | | | |
| | Diversified Telecommunications Services — 0.1% | | | |
| | 5,500 | | Verizon Communications, Inc. | | | 197,835 |
| | | | | |
|
|
| | |
| | | | Total Common Stock (Cost — $26,373,046) | | | 127,159,011 |
| | | | | |
|
|
Face
Amount
| | | | |
| | Corporate Short-Term Notes — 4.8% |
| $ | 2,500,000 | | Guardian Industries Corp., 2.540% due 3/9/05 | | | 2,498,589 |
| | 1,506,000 | | National Australia Funding, 2.550% due 3/7/05 | | | 1,505,360 |
| | 2,416,000 | | Societe Generale North America, 2.500% due 3/1/05 | | | 2,416,000 |
| | | | | |
|
|
| | |
| | | | Total Corporate Short-Term Notes (Cost — $6,419,949) | | | 6,419,949 |
| | | | | |
|
|
See Notes to Financial Statements.
Page 10
SALOMON BROTHERS OPPORTUNITY FUND INC
Schedule of Investments (unaudited) (continued)
February 28, 2005
| | | | | |
| | | | | Value |
| | |
| | | Total Investments — 99.9% (Cost — $32,792,995*) | | $ | 133,578,960 |
| | | Other Assets in Excess of Liabilities — 0.1% | | | 144,864 |
| | | | |
|
|
| | |
| | | Total Net Assets — 100.0% | | $ | 133,723,824 |
| | | | |
|
|
| † | | Reduced by redemptions-in-kind (Note 5). |
| (a) | | Non-income producing security. |
| (b) | | Security is valued in accordance with fair valuation procedures. |
| (c) | | Convertible into Forest City Enterprises, Inc., Class A shares. |
| * | | Aggregate cost for federal income tax purposes is substantially the same. |
Abbreviation used in this schedule:
ADR — American Depositary Receipt
See Notes to Financial Statements.
Page 11
SALOMON BROTHERS OPPORTUNITY FUND INC
Statement of Assets and Liabilities (unaudited)
February 28, 2005
| | | |
| ASSETS: | | | |
Investments, at value (Cost — $32,792,995) | | $ | 133,578,960 |
Cash | | | 52 |
Dividends receivable | | | 351,778 |
Prepaid expenses | | | 8,536 |
| | |
|
|
Total Assets | | | 133,939,326 |
| | |
|
|
| |
| LIABILITIES: | | | |
Management fee payable (Note 2) | | | 75,790 |
Payable for Fund shares reacquired | | | 65,566 |
Directors’ fees payable | | | 1,500 |
Transfer agency fees payable | | | 360 |
Accrued expenses | | | 72,286 |
| | |
|
|
Total Liabilities | | | 215,502 |
| | |
|
|
Total Net Assets | | $ | 133,723,824 |
| | |
|
|
| |
| NET ASSETS: | | | |
Par value of capital shares (Note 4) | | $ | 27,811 |
Capital paid in excess of par value | | | 26,275,252 |
Undistributed net investment income | | | 249,063 |
Accumulated net realized gain from investment transactions | | | 6,385,733 |
Net unrealized appreciation of investments | | | 100,785,965 |
| | |
|
|
Total Net Assets | | $ | 133,723,824 |
| | |
|
|
Net Asset Value, Per Share ($133,723,824 ÷ 2,781,088 shares outstanding) | | | $48.08 |
| | |
|
|
See Notes to Financial Statements.
Page 12
SALOMON BROTHERS OPPORTUNITY FUND INC
Statement of Operations (unaudited)
For the Six Months Ended February 28, 2005
| | | | |
| INVESTMENT INCOME: | | | | |
Dividends | | $ | 1,323,950 | |
Interest | | | 87,057 | |
Less: Foreign withholding tax | | | (54,445 | ) |
| | |
|
|
|
Total Investment Income | | | 1,356,562 | |
| | |
|
|
|
| |
| EXPENSES: | | | | |
Management fees (Note 2) | | | 492,898 | |
Legal fees | | | 51,850 | |
Audit and tax fees | | | 23,307 | |
Shareholder communications | | | 17,356 | |
Transfer agency services (Note 2) | | | 12,675 | |
Custody | | | 8,927 | |
Registration fees | | | 6,445 | |
Directors’ fees | | | 2,976 | |
Other | | | 8,043 | |
| | |
|
|
|
Total Expenses | | | 624,477 | |
| | |
|
|
|
Net Investment Income | | | 732,085 | |
| | |
|
|
|
| |
| REALIZED AND UNREALIZED GAIN ON INVESTMENTS (NOTES 1, 3 AND 5): | | | | |
Net Realized Gain From Investment Transactions | | | 6,777,602 | |
Net Change in Unrealized Appreciation/Depreciation of Investments | | | 9,621,306 | |
| | |
|
|
|
Net Gain on Investments | | | 16,398,908 | |
| | |
|
|
|
Increase in Net Assets From Operations | | $ | 17,130,993 | |
| | |
|
|
|
See Notes to Financial Statements.
Page 13
SALOMON BROTHERS OPPORTUNITY FUND INC
Statements of Changes in Net Assets
For the Six Months Ended February 28, 2005 (unaudited)
and the Year Ended August 31, 2004
| | | | | | | | |
| | | 2005 | | | 2004 | |
| OPERATIONS: | | | | | | | | |
Net investment income | | $ | 732,085 | | | $ | 1,461,302 | |
Net realized gain | | | 6,777,602 | | | | 4,553,176 | |
Net change in unrealized appreciation/depreciation | | | 9,621,306 | | | | 8,827,065 | |
| | |
|
|
| |
|
|
|
Increase in Net Assets From Operations | | | 17,130,993 | | | | 14,841,543 | |
| | |
|
|
| |
|
|
|
| | |
| DISTRIBUTIONS TO SHAREHOLDERS FROM (NOTE 1): | | | | | | | | |
Net investment income | | | (1,600,228 | ) | | | (1,200,206 | ) |
Net realized gains | | | (639,002 | ) | | | (8,285,776 | ) |
| | |
|
|
| |
|
|
|
Decrease in Net Assets From Distributions to Shareholders | | | (2,239,230 | ) | | | (9,485,982 | ) |
| | |
|
|
| |
|
|
|
| | |
| FUND SHARE TRANSACTIONS (NOTES 4 AND 5): | | | | | | | | |
Net Proceeds from sale of shares | | | 469,399 | | | | 681,920 | |
Net asset value of shares issued for reinvestment of distributions | | | 1,075,972 | | | | 4,479,096 | |
Cost of shares reacquired | | | (13,438,183 | ) | | | (25,445,782 | ) |
| | |
|
|
| |
|
|
|
Decrease in Net Assets From Fund Share Transactions | | | (11,892,812 | ) | | | (20,284,766 | ) |
| | |
|
|
| |
|
|
|
Increase (Decrease) in Net Assets | | | 2,998,951 | | | | (14,929,205 | ) |
| | |
| NET ASSETS: | | | | | | | | |
Beginning of period | | | 130,724,873 | | | | 145,654,078 | |
| | |
|
|
| |
|
|
|
End of period* | | $ | 133,723,824 | | | $ | 130,724,873 | |
| | |
|
|
| |
|
|
|
* Includes undistributed net investment income of: | | | $249,063 | | | | $1,117,206 | |
| | |
|
|
| |
|
|
|
See Notes to Financial Statements.
Page 14
SALOMON BROTHERS OPPORTUNITY FUND INC
Financial Highlights
For a share of capital stock outstanding throughout each year or period ended August 31, unless otherwise noted:
| | | | | | | | | | | | | | | | | | |
| | | 2005(1) | | | 2004 | | | 2003 | | | 2002 | | | 2001 | | | 2000 | |
Net Asset Value, Beginning of Period | | $42.92 | | | $41.34 | | | $41.86 | | | $48.72 | | | $55.98 | | | $49.69 | |
| | |
|
| |
|
| |
|
| |
|
| |
|
| |
|
|
Income (Loss) From Operations: | | | | | | | | | | | | | | | | | | |
Net investment income | | 0.28 | | | 0.49 | | | 0.33 | | | 0.28 | | | 0.69 | | | 0.82 | |
Net realized and unrealized gain (loss) | | 5.66 | | | 3.99 | | | 0.61 | | | (3.74 | ) | | (2.23 | ) | | 8.79 | |
| | |
|
| |
|
| |
|
| |
|
| |
|
| |
|
|
Total Income (Loss) From Operations | | 5.94 | | | 4.48 | | | 0.94 | | | (3.46 | ) | | (1.54 | ) | | 9.61 | |
| | |
|
| |
|
| |
|
| |
|
| |
|
| |
|
|
Less Distributions From: | | | | | | | | | | | | | | | | | | |
Net investment income | | (0.56 | ) | | (0.37 | ) | | (0.19 | ) | | (0.64 | ) | | (0.76 | ) | | (0.80 | ) |
Net realized gains | | (0.22 | ) | | (2.53 | ) | | (1.27 | ) | | (2.76 | ) | | (4.96 | ) | | (2.52 | ) |
| | |
|
| |
|
| |
|
| |
|
| |
|
| |
|
|
Total Distributions | | (0.78 | ) | | (2.90 | ) | | (1.46 | ) | | (3.40 | ) | | (5.72 | ) | | (3.32 | ) |
| | |
|
| |
|
| |
|
| |
|
| |
|
| |
|
|
Net Asset Value, End of Period | | $48.08 | | | $42.92 | | | $41.34 | | | $41.86 | | | $48.72 | | | $55.98 | |
| | |
|
| |
|
| |
|
| |
|
| |
|
| |
|
|
Total Return | | 13.9 | %‡ | | 11.1 | % | | 2.6 | % | | (7.7 | )% | | (3.2 | )% | | 20.4 | % |
Net Assets, End of Period (millions) | | $134 | | | $131 | | | $146 | | | $160 | | | $185 | | | $212 | |
Ratios to Average Net Assets: | | | | | | | | | | | | | | | | | | |
Expenses . | | 0.95 | %† | | 1.06 | % | | 1.12 | % | | 1.11 | % | | 1.10 | % | | 1.11 | % |
Net investment income | | 1.11 | %† | | 1.04 | % | | 0.82 | % | | 0.64 | % | | 1.30 | % | | 1.65 | % |
Portfolio Turnover Rate | | 1 | % | | 1 | % | | 5 | % | | 1 | % | | 1 | % | | 3 | % |
| (1) | | For the six months ended February 28, 2005 (unaudited). |
| ‡ | | Total return is not annualized, as it may not be representative of the total return for the year. |
See Notes to Financial Statements.
Page 15
SALOMON BROTHERS OPPORTUNITY FUND INC
Notes to Financial Statements (unaudited)
1. Organization and Significant Accounting Policies
Salomon Brothers Opportunity Fund Inc (“Fund”), is registered as a non-diversified, open-end management investment company under the Investment Company Act of 1940, as amended.
The following are significant accounting policies consistently followed by the fund. These policies are in conformity with U.S. generally accepted accounting principles (“GAAP”). Estimates and assumptions are required to be made regarding assets, liabilities and changes in net assets resulting from operations when financial statements are prepared. Changes in the economic environment, financial markets and any other parameters used in determining these estimates could cause actual results to differ.
(a) INVESTMENT VALUATION. Securities traded on national securities markets are valued at the last sale price on such markets. Securities listed on the NASDAQ National Market System for which market quotations are available are valued at the official closing price or, if there is no official closing price on that day, at the last sale price. Securities traded in over-the counter markets, securities for which no sales price was reported and fixed-income securities are valued at the mean between the closing bid and asked prices. When market quotations or official closing prices are not readily available, or are determined not to reflect accurately fair value, such as when the value of a security has been significantly affected by events after the close of the exchange or market on which the security is principally traded but before the Fund calculates its net asset value, the Fund may value these investments at fair value as determined in accordance with the procedures approved by the Fund’s Board of Directors. Short-term obligations with maturities of 60 days or less are valued at amortized cost, which approximates value.
(b) SECURITY TRANSACTIONSAND INVESTMENT INCOME. Security transactions are accounted for on a trade date basis. Interest income, adjusted for amortization of premium and accretion of discount, is recorded on the accrual basis. Dividend income is recorded on the ex-dividend date. Foreign dividend income is recorded on the ex-dividend date or as soon as practical after the Fund determines the existence of a dividend declaration after exercising reasonable due diligence. The cost of investments sold is determined by use of the specific identification method.
(c) FOREIGN CURRENCY TRANSLATION. The books and records of the Fund are maintained in U.S. dollars. Transactions denominated in foreign currencies are recorded at the current prevailing exchange rates. All assets and liabilities denominated in foreign currencies are translated into U.S. dollar amounts at the current exchange rates on the date of valuation. Translation gains or losses resulting from changes in the exchange rates during the reporting period and realized gains and losses on the settlement of foreign currency transactions are reported in the statement of operations for the current period. The Fund does not isolate that portion of realized gains and losses on investments in securities, which is due to changes in the foreign exchange rates from that which is due to changes in market prices of securities.
Page 16
SALOMON BROTHERS OPPORTUNITY FUND INC
Notes to Financial Statements (unaudited) (continued)
(d) DIVIDENDSAND DISTRIBUTIONSTO SHAREHOLDERS. Dividends from net investment income and distributions of net realized gains to shareholders of the Fund, if any, are declared at least annually. Dividends and distributions to shareholders of the Fund are recorded on the ex-dividend date and are determined in accordance with income tax regulations which may differ from GAAP.
(e) FEDERALAND OTHER TAXES. It is the Fund’s policy to comply with the federal income and excise tax requirements of the Internal Revenue Code of 1986, as amended, applicable to regulated investment companies. Accordingly, the Fund intends to distribute substantially all of its taxable income and net realized gains on investments, if any, to shareholders each year. Therefore, no federal income tax provision is required.
(f) RECLASSIFICATION. GAAP requires that certain components of net assets be adjusted to reflect permanent differences between financial and tax reporting. These reclassifications have no effect on net asset values per share.
2. Management Fee and Other Transactions with Affiliates
The Fund retains Salomon Brothers Asset Management Inc (“SBAM”), an indirect wholly-owned subsidiary of Citigroup Inc. (“Citigroup”), to act as investment manager of the Fund. The management fee is payable monthly at an annual rate of 0.75% of the Fund’s average daily net assets. SBAM has delegated certain administrative responsibilities to Smith Barney Fund Management LLC (“SBFM”), another indirect wholly-owned subsidiary of Citigroup, pursuant to a Sub-Administration Agreement between SBAM and SBFM. SBFM has also entered into an agreement with State Street Bank & Trust (“SSB&T”) for the performance of certain Fund administrative functions. SBAM pays SBFM a fee calculated daily and paid monthly, at an annual rate of 0.05% of the Fund’s average daily net assets and SBFM pays SSB&T out of this fee.
Citigroup Global Markets Inc., another indirect wholly-owned subsidiary of Citigroup and an affiliate of SBAM, acts as the Fund’s distributor.
For the six months ended February 28, 2005, the Fund paid $120 to other Citigroup affiliates for shareholder recordkeeping services.
Certain officers and/or directors of the Fund are also officers and/or directors of Citigroup and/or its affiliates and do not receive compensation from the Fund.
The Fund has a concentration of several shareholders who may be a related party, holding a significant percentage of shares outstanding. Investment activities of these shareholders could have a material impact on the Fund.
Page 17
SALOMON BROTHERS OPPORTUNITY FUND INC
Notes to Financial Statements (unaudited) (continued)
3. Portfolio Activity
During the six months ended February 28, 2005, the aggregate cost of purchases and proceeds from sales of investments (excluding short-term investments) were as follows:
| | | |
Purchases | | $ | 792,798 |
| | |
|
|
Sales | | $ | 3,592,300 |
| | |
|
|
At February 28, 2005, the aggregate gross unrealized appreciation and depreciation of investments for federal income tax purposes were substantially as follows:
| | | | |
Gross unrealized appreciation | | $ | 101,751,536 | |
Gross unrealized depreciation | | | (965,571 | ) |
| | |
|
|
|
Net unrealized appreciation | | $ | 100,785,965 | |
| | |
|
|
|
4. Shares of Capital Stock
At February 28, 2005, the Fund had 15,000,000 shares of capital stock authorized with a par value of $0.01 per share. Transactions in shares of the Fund were as follows:
| | | | | | | | | | | | | | |
| | | Six Months Ended
February 28, 2005
| | | Year Ended
August 31, 2004
| |
| | | Shares
| | | Amount
| | | Shares
| | | Amount
| |
Shares sold | | 10,377 | | | $ | 469,399 | | | 15,854 | | | $ | 681,920 | |
Shares issued on reinvestment | | 23,085 | | | | 1,075,972 | | | 108,321 | | | | 4,479,096 | |
Shares reacquired | | (298,034 | ) | | | (13,438,183 | ) | | (601,671 | ) | | | (25,445,782 | ) |
| | |
|
| |
|
|
| |
|
| |
|
|
|
Net Decrease | | (264,572 | ) | | $ | (11,892,812 | ) | | (477,496 | ) | | $ | (20,284,766 | ) |
| | |
|
| |
|
|
| |
|
| |
|
|
|
5. Redemptions-In-Kind
The Fund had redemptions-in-kind with total proceeds in the amount of $7,103,573. The net realized gains on these redemptions-in-kind amounted to $5,446,446, which will not be realized for tax purposes.
6. Additional Information
In connection with an investigation previously disclosed by Citigroup, the Staff of the Securities and Exchange Commission (“SEC”) has notified Citigroup Asset Management (“CAM”), the Citigroup business unit that includes the funds’ investment manager and other investment advisory companies; Citicorp Trust Bank (“CTB”), an affiliate of CAM; Thomas W. Jones, the former CEO of CAM; and three other individuals, one of whom is an employee and two of whom are former employees of CAM, that the SEC Staff is considering recommending a civil injunctive
Page 18
SALOMON BROTHERS OPPORTUNITY FUND INC
Notes to Financial Statements (unaudited) (continued)
action and/or an administrative proceeding against each of them relating to the creation and operation of an internal transfer agent unit to serve various CAM-managed funds.
In 1999, CTB entered the transfer agent business. CTB hired an unaffiliated subcontractor to perform some of the transfer agent services. The subcontractor, in exchange, had signed a separate agreement with CAM in 1998 that guaranteed investment management revenue to CAM and investment banking revenue to a CAM affiliate. The subcontractor’s business was later taken over by PFPC Inc., and at that time the revenue guarantee was eliminated and a one-time payment was made by the subcontractor to a CAM affiliate.
CAM did not disclose the revenue guarantee when the boards of various CAM-managed funds hired CTB as transfer agent. Nor did CAM disclose to the boards of the various CAM-managed funds the one-time payment received by the CAM affiliate when it was made. As previously disclosed, CAM has already paid the applicable funds, primarily through voluntary fee waivers, a total of approximately $17 million (plus interest), which is the amount of the revenue received by Citigroup relating to the revenue guarantee.
In addition, the SEC Staff has indicated that it is considering recommending action based on the adequacy of the disclosures made to the fund boards that approved the transfer agency arrangement, CAM’s initiation and operation of, and compensation for, the transfer agent business and CAM’s retention of, and agreements with, the subcontractor.
Citigroup is cooperating fully in the SEC’s investigation and is seeking to resolve the matter in discussions with the SEC Staff. On January 20, 2005, Citigroup stated that it had established an aggregate reserve of $196 million ($25 million in the third quarter of 2004 and $171 million in the fourth quarter of 2004) related to its discussions with the SEC Staff. Settlement negotiations are ongoing and any settlement of this matter with the SEC will require approval by the Citigroup Board and acceptance by the Commission.
Unless and until any settlement is consummated, there can be no assurance that any amount reserved by Citigroup will be distributed. Nor is there at this time any certainty as to how the proceeds of any settlement would be distributed, to whom any such distribution would be made, the methodology by which such distribution would be allocated, and when such distribution would be made.
Although there can be no assurance, Citigroup does not believe that this matter will have a material adverse effect on the funds. The Fund did not implement the contractual arrangement described above and will not receive any payments.
7. Legal Matters
Beginning in June 2004, class action lawsuits alleging violations of the federal securities laws were filed against Citigroup Global Markets Inc. (the “Distributor”) and a number of its
Page 19
SALOMON BROTHERS OPPORTUNITY FUND INC
Notes to Financial Statements (unaudited) (continued)
affiliates, including Smith Barney Fund Management LLC and Salomon Brothers Asset Management Inc (the “Advisers”), substantially all of the mutual funds managed by the Advisers, including the Fund (the “Funds”), and directors or trustees of the Funds (collectively, the “Defendants”). The complaints alleged, among other things, that the Distributor created various undisclosed incentives for its brokers to sell Smith Barney and Salomon Brothers funds. In addition, according to the complaints, the Advisers caused the Funds to pay excessive brokerage commissions to the Distributor for steering clients towards proprietary funds. The complaints also alleged that the defendants breached their fiduciary duty to the Funds by improperly charging Rule 12b-1 fees and by drawing on fund assets to make undisclosed payments of soft dollars and excessive brokerage commissions. The complaints also alleged that the Funds failed to adequately disclose certain of the allegedly wrongful conduct. The complaints sought injunctive relief and compensatory and punitive damages, rescission of the Funds’ contracts with the Advisers, recovery of all fees paid to the Advisers pursuant to such contracts and an award of attorneys’ fees and litigation expenses.
On December 15, 2004, a consolidated amended complaint (the “Complaint”) was filed alleging substantially similar causes of action. While the lawsuit is in its earliest stages, to the extent that the Complaint purports to state causes of action against the Funds, Citigroup Asset Management believes the Funds have significant defenses to such allegations, which the Funds intend to vigorously assert in responding to the Complaint.
Additional lawsuits arising out of these circumstances and presenting similar allegations and requests for relief may be filed against the Defendants in the future.
As of the date of this report, Citigroup Asset Management and the Funds believe that the resolution of the pending lawsuit will not have a material effect on the financial position or results of operations of the Funds or the ability of the Advisers and their affiliates to continue to render services to the Funds under their respective contracts.
Page 20
SALOMON BROTHERS OPPORTUNITY FUND INC
Directors
IRVING G. BRILLIANT
B. ALEXANDER GAGUINE
ROSALIND A. KOCHMAN
IRVING SONNENSCHEIN
Officers
ROSALIND A. KOCHMAN
Chairman
R. JAY GERKEN, CFA
Executive Vice President
ANDREW B. SHOUP
Senior Vice President and Chief Administrative Officer
FRANCES M. GUGGINO
Chief Financial Officer and Treasurer
GEORGE J. WILLIAMSON
Investment Officer
ANDREW BEAGLEY
Chief Anti-Money Laundering Compliance Officer and Chief Compliance Officer
WENDY S. SETNICKA
Controller
ROBERT I. FRENKEL
Secretary and Chief Legal Officer
Salomon Brothers Opportunity Fund Inc
125 Broad Street
10th Floor, MF-2
New York, New York 10004
1-888-777-0102, toll free
INVESTMENT MANAGER
Salomon Brothers Asset Management Inc 399 Park Avenue New York, New York 10022
DISTRIBUTOR
Citigroup Global Markets Inc. 388 Greenwich Street New York, New York 10013
CUSTODIAN
State Street Bank and Trust Company 225 Franklin Street Boston, Massachusetts 02110
TRANSFER AGENT
PFPC Inc. P.O. Box 9764 Providence, Rhode Island 02940-9764
LEGAL COUNSEL
Simpson Thacher & Bartlett LLP 425 Lexington Avenue New York, New York 10017-3909
INDEPENDENT REGISTERED PUBLIC ACCOUNTING FIRM
PricewaterhouseCoopers LLP 300 Madison Avenue New York, New York 10017
This report is transmitted to the shareholders of Salomon Brothers Opportunity Fund Inc for their information. This is not a prospectus, circular or representation intended for use in the purchase of shares of the Fund or any securities mentioned in this report.
The Fund files its complete schedule of portfolio holdings with the Securities and Exchange Commission for the first and third quarters of each fiscal year on Form N-Q. The Fund’s Forms N-Q are available on the SEC’s website at www.sec.gov. The Fund’s Forms N-Q may be reviewed and copied at the SEC’s Public Reference Room in Washington, D.C., and information on the operation of the Public Reference Room may be obtained by calling 1-800-SEC-0330. To obtain information on Form N-Q from the Fund, shareholders can call 1-800-446-1013.
Information on how the Fund voted proxies relating to portfolio securities during the 12-month period ended June 30, 2004 and a description of the policies and procedures that the Fund uses to determine how to vote proxies relating to portfolio securities is available (1) without charge, upon request, by calling 1-800-446-1013, (2) on the Fund’s website at www.citigroupAM.com and (3) on the SEC’s website at www.sec.gov.
Page 21
| ITEM 3. | AUDIT COMMITTEE FINANCIAL EXPERT. |
| ITEM 4. | PRINCIPAL ACCOUNTANT FEES AND SERVICES. |
| ITEM 5. | AUDIT COMMITTEE OF LISTED REGISTRANTS. |
| ITEM 7. | DISCLOSURE OF PROXY VOTING POLICIES AND PROCEDURES FOR CLOSED-END MANAGEMENT INVESTMENT COMPANIES. |
| ITEM 9. | SUBMISSION OF MATTERS TO A VOTE OF SECURITY HOLDERS. |
| ITEM 10. | CONTROLS AND PROCEDURES. |
| | (a) | The registrant’s principal executive officer and principal financial officer have concluded that the registrant’s disclosure controls and procedures (as defined in Rule 30a- 3(c) under the Investment Company Act of 1940, as amended (the “1940 Act”)) are effective as of a date within 90 days of the filing date of this report that includes the disclosure required by this paragraph, based on their evaluation of the disclosure controls and procedures required by Rule 30a-3(b) under the 1940 Act and 15d-15(b) under the Securities Exchange Act of 1934. |
| | (b) | There were no changes in the registrant’s internal control over financial reporting (as defined in Rule 30a-3(d) under the 1940 Act) that occurred during the registrant’s last fiscal half-year (the registrant’s second fiscal half-year in the case of an annual report) that have materially affected, or are likely to materially affect the registrant’s internal control over financial reporting. |
| | |
| Exhibit 99.CERT | | Certifications pursuant to section 302 of the Sarbanes-Oxley Act of 2002 |
| |
| Exhibit 99.906CERT | | Certifications pursuant to Section 906 of the Sarbanes-Oxley Act of 2002 |
SIGNATURES
Pursuant to the requirements of the Securities Exchange Act of 1934 and the Investment Company Act of 1940, the registrant has duly caused this Report to be signed on its behalf by the undersigned, there unto duly authorized.
Salomon Brothers Opportunity Fund Inc
| | |
| By: | | /s/ R. Jay Gerken
|
| | | R. Jay Gerken |
| | | Chief Executive Officer of |
| | | Salomon Brothers Opportunity Fund Inc |
Date: May 6, 2005
Pursuant to the requirements of the Securities Exchange Act of 1934 and the Investment Company Act of 1940, this report has been signed below by the following persons on behalf of the registrant and in the capacities and on the dates indicated.
| | |
| By: | | /s/ R. Jay Gerken
|
| | | R. Jay Gerken |
| | | Chief Executive Officer of |
| | | Salomon Brothers Opportunity Fund Inc |
Date: May 6, 2005
| | |
| By: | | /s/ Frances M. Guggino
|
| | | Frances M. Guggino |
| | | Chief Financial Officer of |
| | | Salomon Brothers Opportunity Fund Inc |
Date: May 6, 2005