UNITED STATES
SECURITIES AND EXCHANGE COMMISSION
Washington, D.C. 20549
FORM N-CSR
CERTIFIED SHAREHOLDER REPORT OF REGISTERED MANAGEMENT INVESTMENT COMPANIES
Investment Company Act file number
Delaware Group® Income Funds
(Exact name of registrant as specified in charter)
610 Market Street
Philadelphia, PA 19106
Registrant's telephone number, including area code:
Date of reporting period:
Item 1. Report to Stockholders.
(a) The registrant’s annual report transmitted to shareholders pursuant to Rule 30e-1 under the Investment Company Act of 1940 is as follows:
Delaware Corporate Bond Fund
Class A: DGCAX
Annual shareholder report | July 31, 2024
This annual shareholder report contains important information about Delaware Corporate Bond Fund (Fund) for the period of August 1, 2023, to July 31, 2024. You can find additional information about the Fund at delawarefunds.com/literature. You can also request this information by contacting us at 800 523-1918, weekdays from 8:30am to 6:00pm ET.
What were the Fund's costs for the last 12 months?
(Based on a hypothetical $10,000 investment)
| Class | Costs of a $10,000 investment | Costs paid as a percentage of a $10,000 investment |
| Class A | $85 | 0.82% |
Management’s discussion of Fund performance
Performance highlights
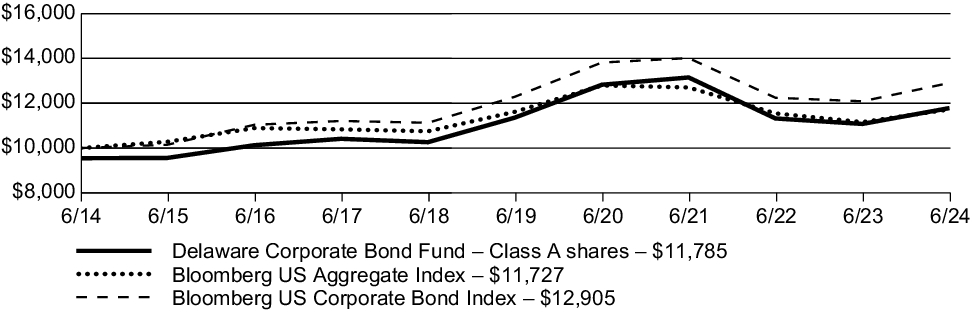
Delaware Corporate Bond Fund (Class A) returned 6.38% (excluding sales charge) for the 12 months ended July 31, 2024. During the same period, the Bloomberg US Aggregate Index, the Fund's broad-based securities market index and primary benchmark, returned 5.10%, while the Bloomberg US Corporate Bond Index, the Fund's narrowly based securities market index and secondary benchmark, returned 6.76%.
Top contributors to performance relative to the primary benchmark:
Overweight to lower-quality corporate debt, such as BBB-rated (investment grade) and BB-rated (high yield) bonds, which outperformed higher-quality investments over the Fund's fiscal year ended July 31, 2024 due to the risk rally and overall positive market tone that began late in 2023
Investments in banking and energy companies
Top detractors from performance relative to the primary benchmark:
Long-duration investments, which lagged as long-end Treasury rates climbed over the fiscal year
Investments in the corporate debt of basic industry and real estate investment trusts (REITs)
Fund performance
The following graph compares the initial and subsequent account values at the end of each of the most recently completed 10 fiscal years of the Class. It also assumes a $10,000 initial investment at the beginning of the first full fiscal year in a broad-based securities market index and an additional narrowly based securities market index for the same period and the deduction of the maximum applicable sales charge for Class A shares.
Growth of $10,000 investment
For the period July 31, 2014, through July 31, 2024
| Average annual total returns (as of July 31, 2024) | 1 year | | 5 year | | 10 year | |
| Delaware Corporate Bond Fund (Class A) – including sales charge | 1.60 | % | -0.20 | % | 1.66 | % |
| Delaware Corporate Bond Fund (Class A) – excluding sales charge | 6.38 | % | 0.72 | % | 2.13 | % |
| Bloomberg US Aggregate Index | 5.10 | % | 0.19 | % | 1.61 | % |
| Bloomberg US Corporate Bond Index | 6.76 | % | 0.98 | % | 2.58 | % |
Keep in mind that the Fund's past performance is not a good predictor of how the Fund will perform in the future.
Visit delawarefunds.com/performance for the most recent performance information. The graph and table do not reflect the deduction of taxes that a shareholder would pay on Fund distributions or redemption of Fund shares. Performance results reflect any expense caps in effect during these periods. All results shown assume reinvestment of distributions.
In connection with new regulatory requirements, effective the date of this report, the Fund changed its broad-based securities market benchmark index to the Bloomberg US Aggregate Index. Although the Bloomberg US Aggregate Index can be considered broadly representative of the overall securities market applicable to the Fund, the Fund will continue to show the performance of the Bloomberg US Corporate Bond Index for comparative purposes because the Delaware Management Company, the Fund's manager, believes it is more representative of the Fund’s investment universe.
Fund statistics (as of July 31, 2024)
| Fund net assets | $1,269,022,895% |
| Total number of portfolio holdings | $244% |
| Total advisory fees paid | $4,791,798% |
| Portfolio turnover rate | $123% |
Fund holdings (as of July 31, 2024)
The table below shows the investment makeup of the Fund, with each category representing a percentage of the total net assets of the Fund.
| Banking | 24.29% |
| Energy | 11.81% |
| Electric | 10.04% |
| Consumer Non-Cyclical | 8.38% |
| Communications | 7.72% |
| Capital Goods | 7.50% |
| Consumer Cyclical | 6.80% |
| Technology | 4.96% |
| Insurance | 4.84% |
| Finance Companies | 3.97% |
| |
| |
| |
Availability of additional information
You can find additional information about the Fund, such as the prospectus, financial information, holdings, and proxy voting information, at delawarefunds.com/literature. You can also request this information by contacting us at 800 523-1918, weekdays from 8:30am to 6:00pm ET.
Householding
In order to reduce expenses, we will deliver a single copy of prospectuses, proxies, financial reports, and other communication to shareholders with the same residential address, provided they have the same last name or we reasonably believe them to be members of the same family. Unless we are notified otherwise, we will continue to send recipients only one copy of these materials for as long as they remain a shareholder of the Fund. If you would like to receive individual mailings, please call 800 523-1918 and we will begin sending you separate copies of these materials within 30 days after receiving your request.
For more information, please scan the QR code at left to navigate to additional hosted material at delawarefunds.com/literature.
Delaware Corporate Bond Fund
Class C: DGCCX
Annual shareholder report | July 31, 2024
This annual shareholder report contains important information about Delaware Corporate Bond Fund (Fund) for the period of August 1, 2023, to July 31, 2024. You can find additional information about the Fund at delawarefunds.com/literature. You can also request this information by contacting us at 800 523-1918, weekdays from 8:30am to 6:00pm ET.
What were the Fund's costs for the last 12 months?
(Based on a hypothetical $10,000 investment)
| Class | Costs of a $10,000 investment | Costs paid as a percentage of a $10,000 investment |
| Class C | $161 | 1.57% |
Management’s discussion of Fund performance
Performance highlights
Delaware Corporate Bond Fund (Class C) returned 5.66% (excluding sales charge) for the 12 months ended July 31, 2024. During the same period, the Bloomberg US Aggregate Index, the Fund's broad-based securities market index and primary benchmark, returned 5.10%, while the Bloomberg US Corporate Bond Index, the Fund's narrowly based securities market index and secondary benchmark, returned 6.76%.
Top contributors to performance relative to the primary benchmark:
Overweight to lower-quality corporate debt, such as BBB-rated (investment grade) and BB-rated (high yield) bonds, which outperformed higher-quality investments over the Fund's fiscal year ended July 31, 2024 due to the risk rally and overall positive market tone that began late in 2023
Investments in banking and energy companies
Top detractors from performance relative to the primary benchmark:
Long-duration investments, which lagged as long-end Treasury rates climbed over the fiscal year
Investments in the corporate debt of basic industry and real estate investment trusts (REITs)
Fund performance
The following graph compares the initial and subsequent account values at the end of each of the most recently completed 10 fiscal years of the Class. It also assumes a $10,000 initial investment at the beginning of the first full fiscal year in a broad-based securities market index and an additional narrowly based securities market index for the same period.
Growth of $10,000 investment
For the period July 31, 2014, through July 31, 2024
| Average annual total returns (as of July 31, 2024) | 1 year | | 5 year | | 10 year | |
| Delaware Corporate Bond Fund (Class C) – including sales charge | 4.66 | % | -0.01 | % | 1.38 | % |
| Delaware Corporate Bond Fund (Class C) – excluding sales charge | 5.66 | % | -0.01 | % | 1.38 | % |
| Bloomberg US Aggregate Index | 5.10 | % | 0.19 | % | 1.61 | % |
| Bloomberg US Corporate Bond Index | 6.76 | % | 0.98 | % | 2.58 | % |
Keep in mind that the Fund's past performance is not a good predictor of how the Fund will perform in the future.
Visit delawarefunds.com/performance for the most recent performance information. The graph and table do not reflect the deduction of taxes that a shareholder would pay on Fund distributions or redemption of Fund shares. Performance results reflect any expense caps in effect during these periods. All results shown assume reinvestment of distributions.
In connection with new regulatory requirements, effective the date of this report, the Fund changed its broad-based securities market benchmark index to the Bloomberg US Aggregate Index. Although the Bloomberg US Aggregate Index can be considered broadly representative of the overall securities market applicable to the Fund, the Fund will continue to show the performance of the Bloomberg US Corporate Bond Index for comparative purposes because the Delaware Management Company, the Fund's manager, believes it is more representative of the Fund’s investment universe.
Fund statistics (as of July 31, 2024)
| Fund net assets | $1,269,022,895% |
| Total number of portfolio holdings | $244% |
| Total advisory fees paid | $4,791,798% |
| Portfolio turnover rate | $123% |
Fund holdings (as of July 31, 2024)
The table below shows the investment makeup of the Fund, with each category representing a percentage of the total net assets of the Fund.
| Banking | 24.29% |
| Energy | 11.81% |
| Electric | 10.04% |
| Consumer Non-Cyclical | 8.38% |
| Communications | 7.72% |
| Capital Goods | 7.50% |
| Consumer Cyclical | 6.80% |
| Technology | 4.96% |
| Insurance | 4.84% |
| Finance Companies | 3.97% |
| |
| |
| |
Availability of additional information
You can find additional information about the Fund, such as the prospectus, financial information, holdings, and proxy voting information, at delawarefunds.com/literature. You can also request this information by contacting us at 800 523-1918, weekdays from 8:30am to 6:00pm ET.
Householding
In order to reduce expenses, we will deliver a single copy of prospectuses, proxies, financial reports, and other communication to shareholders with the same residential address, provided they have the same last name or we reasonably believe them to be members of the same family. Unless we are notified otherwise, we will continue to send recipients only one copy of these materials for as long as they remain a shareholder of the Fund. If you would like to receive individual mailings, please call 800 523-1918 and we will begin sending you separate copies of these materials within 30 days after receiving your request.
For more information, please scan the QR code at left to navigate to additional hosted material at delawarefunds.com/literature.
Delaware Corporate Bond Fund
Class R: DGCRX
Annual shareholder report | July 31, 2024
This annual shareholder report contains important information about Delaware Corporate Bond Fund (Fund) for the period of August 1, 2023, to July 31, 2024. You can find additional information about the Fund at delawarefunds.com/literature. You can also request this information by contacting us at 800 523-1918, weekdays from 8:30am to 6:00pm ET.
What were the Fund's costs for the last 12 months?
(Based on a hypothetical $10,000 investment)
| Class | Costs of a $10,000 investment | Costs paid as a percentage of a $10,000 investment |
| Class R | $110 | 1.07% |
Management’s discussion of Fund performance
Performance highlights
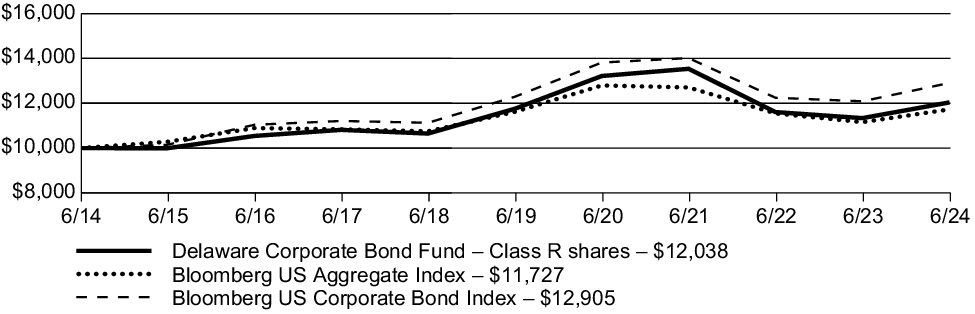
Delaware Corporate Bond Fund (Class R) returned 6.18% (excluding sales charge) for the 12 months ended July 31, 2024. During the same period, the Bloomberg US Aggregate Index, the Fund's broad-based securities market index and primary benchmark, returned 5.10%, while the Bloomberg US Corporate Bond Index, the Fund's narrowly based securities market index and secondary benchmark, returned 6.76%.
Top contributors to performance relative to the primary benchmark:
Overweight to lower-quality corporate debt, such as BBB-rated (investment grade) and BB-rated (high yield) bonds, which outperformed higher-quality investments over the Fund's fiscal year ended July 31, 2024 due to the risk rally and overall positive market tone that began late in 2023
Investments in banking and energy companies
Top detractors from performance relative to the primary benchmark:
Long-duration investments, which lagged as long-end Treasury rates climbed over the fiscal year
Investments in the corporate debt of basic industry and real estate investment trusts (REITs)
Fund performance
The following graph compares the initial and subsequent account values at the end of each of the most recently completed 10 fiscal years of the Class. It also assumes a $10,000 initial investment at the beginning of the first full fiscal year in a broad-based securities market index and an additional narrowly based securities market index for the same period.
Growth of $10,000 investment
For the period July 31, 2014, through July 31, 2024
| Average annual total returns (as of July 31, 2024) | 1 year | | 5 year | | 10 year | |
| Delaware Corporate Bond Fund (Class R) – including sales charge | 6.18 | % | 0.47 | % | 1.87 | % |
| Delaware Corporate Bond Fund (Class R) – excluding sales charge | 6.18 | % | 0.47 | % | 1.87 | % |
| Bloomberg US Aggregate Index | 5.10 | % | 0.19 | % | 1.61 | % |
| Bloomberg US Corporate Bond Index | 6.76 | % | 0.98 | % | 2.58 | % |
Keep in mind that the Fund's past performance is not a good predictor of how the Fund will perform in the future.
Visit delawarefunds.com/performance for the most recent performance information. The graph and table do not reflect the deduction of taxes that a shareholder would pay on Fund distributions or redemption of Fund shares. Performance results reflect any expense caps in effect during these periods. All results shown assume reinvestment of distributions.
In connection with new regulatory requirements, effective the date of this report, the Fund changed its broad-based securities market benchmark index to the Bloomberg US Aggregate Index. Although the Bloomberg US Aggregate Index can be considered broadly representative of the overall securities market applicable to the Fund, the Fund will continue to show the performance of the Bloomberg US Corporate Bond Index for comparative purposes because the Delaware Management Company, the Fund's manager, believes it is more representative of the Fund’s investment universe.
Fund statistics (as of July 31, 2024)
| Fund net assets | $1,269,022,895% |
| Total number of portfolio holdings | $244% |
| Total advisory fees paid | $4,791,798% |
| Portfolio turnover rate | $123% |
Fund holdings (as of July 31, 2024)
The table below shows the investment makeup of the Fund, with each category representing a percentage of the total net assets of the Fund.
| Banking | 24.29% |
| Energy | 11.81% |
| Electric | 10.04% |
| Consumer Non-Cyclical | 8.38% |
| Communications | 7.72% |
| Capital Goods | 7.50% |
| Consumer Cyclical | 6.80% |
| Technology | 4.96% |
| Insurance | 4.84% |
| Finance Companies | 3.97% |
| |
| |
| |
Availability of additional information
You can find additional information about the Fund, such as the prospectus, financial information, holdings, and proxy voting information, at delawarefunds.com/literature. You can also request this information by contacting us at 800 523-1918, weekdays from 8:30am to 6:00pm ET.
Householding
In order to reduce expenses, we will deliver a single copy of prospectuses, proxies, financial reports, and other communication to shareholders with the same residential address, provided they have the same last name or we reasonably believe them to be members of the same family. Unless we are notified otherwise, we will continue to send recipients only one copy of these materials for as long as they remain a shareholder of the Fund. If you would like to receive individual mailings, please call 800 523-1918 and we will begin sending you separate copies of these materials within 30 days after receiving your request.
For more information, please scan the QR code at left to navigate to additional hosted material at delawarefunds.com/literature.
Delaware Corporate Bond Fund
Institutional Class: DGCIX
Annual shareholder report | July 31, 2024
This annual shareholder report contains important information about Delaware Corporate Bond Fund (Fund) for the period of August 1, 2023, to July 31, 2024. You can find additional information about the Fund at delawarefunds.com/literature. You can also request this information by contacting us at 800 523-1918, weekdays from 8:30am to 6:00pm ET.
What were the Fund's costs for the last 12 months?
(Based on a hypothetical $10,000 investment)
| Class | Costs of a $10,000 investment | Costs paid as a percentage of a $10,000 investment |
| Institutional Class | $59 | 0.57% |
Management’s discussion of Fund performance
Performance highlights
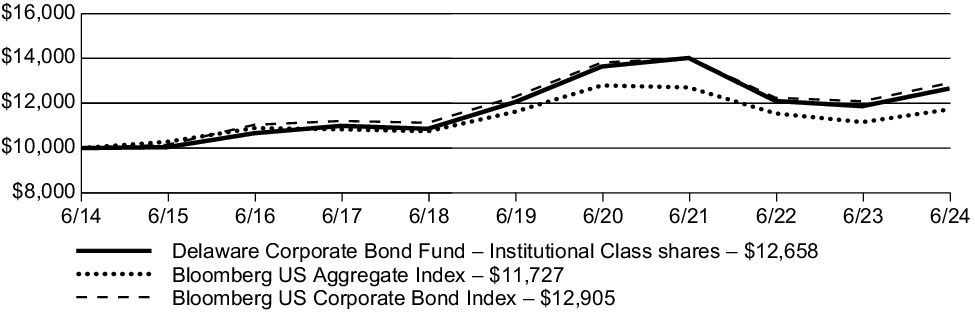
Delaware Corporate Bond Fund (Institutional Class) returned 6.65% (excluding sales charge) for the 12 months ended July 31, 2024. During the same period, the Bloomberg US Aggregate Index, the Fund's broad-based securities market index and primary benchmark, returned 5.10%, while the Bloomberg US Corporate Bond Index, the Fund's narrowly based securities market index and secondary benchmark, returned 6.76%.
Top contributors to performance relative to the primary benchmark:
Overweight to lower-quality corporate debt, such as BBB-rated (investment grade) and BB-rated (high yield) bonds, which outperformed higher-quality investments over the Fund's fiscal year ended July 31, 2024 due to the risk rally and overall positive market tone that began late in 2023
Investments in banking and energy companies
Top detractors from performance relative to the primary benchmark:
Long-duration investments, which lagged as long-end Treasury rates climbed over the fiscal year
Investments in the corporate debt of basic industry and real estate investment trusts (REITs)
Fund performance
The following graph compares the initial and subsequent account values at the end of each of the most recently completed 10 fiscal years of the Class. It also assumes a $10,000 initial investment at the beginning of the first full fiscal year in a broad-based securities market index and an additional narrowly based securities market index for the same period.
Growth of $10,000 investment
For the period July 31, 2014, through July 31, 2024
| Average annual total returns (as of July 31, 2024) | 1 year | | 5 year | | 10 year | |
| Delaware Corporate Bond Fund (Institutional Class) – including sales charge | 6.65 | % | 0.97 | % | 2.38 | % |
| Delaware Corporate Bond Fund (Institutional Class) – excluding sales charge | 6.65 | % | 0.97 | % | 2.38 | % |
| Bloomberg US Aggregate Index | 5.10 | % | 0.19 | % | 1.61 | % |
| Bloomberg US Corporate Bond Index | 6.76 | % | 0.98 | % | 2.58 | % |
Keep in mind that the Fund's past performance is not a good predictor of how the Fund will perform in the future.
Visit delawarefunds.com/performance for the most recent performance information. The graph and table do not reflect the deduction of taxes that a shareholder would pay on Fund distributions or redemption of Fund shares. Performance results reflect any expense caps in effect during these periods. All results shown assume reinvestment of distributions.
In connection with new regulatory requirements, effective the date of this report, the Fund changed its broad-based securities market benchmark index to the Bloomberg US Aggregate Index. Although the Bloomberg US Aggregate Index can be considered broadly representative of the overall securities market applicable to the Fund, the Fund will continue to show the performance of the Bloomberg US Corporate Bond Index for comparative purposes because the Delaware Management Company, the Fund's manager, believes it is more representative of the Fund’s investment universe.
Fund statistics (as of July 31, 2024)
| Fund net assets | $1,269,022,895% |
| Total number of portfolio holdings | $244% |
| Total advisory fees paid | $4,791,798% |
| Portfolio turnover rate | $123% |
Fund holdings (as of July 31, 2024)
The table below shows the investment makeup of the Fund, with each category representing a percentage of the total net assets of the Fund.
| Banking | 24.29% |
| Energy | 11.81% |
| Electric | 10.04% |
| Consumer Non-Cyclical | 8.38% |
| Communications | 7.72% |
| Capital Goods | 7.50% |
| Consumer Cyclical | 6.80% |
| Technology | 4.96% |
| Insurance | 4.84% |
| Finance Companies | 3.97% |
| |
| |
| |
Availability of additional information
You can find additional information about the Fund, such as the prospectus, financial information, holdings, and proxy voting information, at delawarefunds.com/literature. You can also request this information by contacting us at 800 523-1918, weekdays from 8:30am to 6:00pm ET.
Householding
In order to reduce expenses, we will deliver a single copy of prospectuses, proxies, financial reports, and other communication to shareholders with the same residential address, provided they have the same last name or we reasonably believe them to be members of the same family. Unless we are notified otherwise, we will continue to send recipients only one copy of these materials for as long as they remain a shareholder of the Fund. If you would like to receive individual mailings, please call 800 523-1918 and we will begin sending you separate copies of these materials within 30 days after receiving your request.
For more information, please scan the QR code at left to navigate to additional hosted material at delawarefunds.com/literature.
Delaware Corporate Bond Fund
Class R6: DGCZX
Annual shareholder report | July 31, 2024
This annual shareholder report contains important information about Delaware Corporate Bond Fund (Fund) for the period of August 1, 2023, to July 31, 2024. You can find additional information about the Fund at delawarefunds.com/literature. You can also request this information by contacting us at 800 523-1918, weekdays from 8:30am to 6:00pm ET.
This report describes changes to the Fund that occurred during the reporting period.
What were the Fund's costs for the last 12 months?
(Based on a hypothetical $10,000 investment)
| Class | Costs of a $10,000 investment | Costs paid as a percentage of a $10,000 investment |
| Class R6 | $48 | 0.46% |
Management’s discussion of Fund performance
Performance highlights
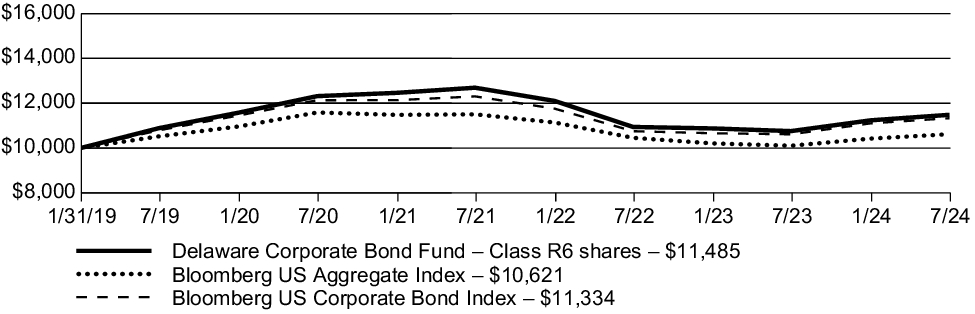
Delaware Corporate Bond Fund (Class R6) returned 6.76% (excluding sales charge) for the 12 months ended July 31, 2024. During the same period, the Bloomberg US Aggregate Index, the Fund's broad-based securities market index and primary benchmark, returned 5.10%, while the Bloomberg US Corporate Bond Index, the Fund's narrowly based securities market index and secondary benchmark, returned 6.76%.
Top contributors to performance relative to the primary benchmark:
Overweight to lower-quality corporate debt, such as BBB-rated (investment grade) and BB-rated (high yield) bonds, which outperformed higher-quality investments over the Fund's fiscal year ended July 31, 2024 due to the risk rally and overall positive market tone that began late in 2023
Investments in banking and energy companies
Top detractors from performance relative to the primary benchmark:
Long-duration investments, which lagged as long-end Treasury rates climbed over the fiscal year
Investments in the corporate debt of basic industry and real estate investment trusts (REITs)
Fund performance
The following graph compares the initial and subsequent account values at the end of each of the most recently completed fiscal years (or period) of the Class for the life of the Class. It also assumes a $10,000 initial investment at the Class's inception date in a broad-based securities market index and an additional narrowly based securities market index for the same period.
Growth of $10,000 investment
For the period January 31, 2019 (Class R6's inception), through July 31, 2024
| Average annual total returns (as of July 31, 2024) | 1 year | | 5 year | | Since Inception
(1/31/19) | |
| Delaware Corporate Bond Fund (Class R6) – including sales charge | 6.76 | % | 1.06 | % | 2.55 | % |
| Delaware Corporate Bond Fund (Class R6) – excluding sales charge | 6.76 | % | 1.06 | % | 2.55 | % |
| Bloomberg US Aggregate Index | 5.10 | % | 0.19 | % | 1.10 | % |
| Bloomberg US Corporate Bond Index | 6.76 | % | 0.98 | % | 2.30 | % |
Keep in mind that the Fund's past performance is not a good predictor of how the Fund will perform in the future.
Visit delawarefunds.com/performance for the most recent performance information. The graph and table do not reflect the deduction of taxes that a shareholder would pay on Fund distributions or redemption of Fund shares. Performance results reflect any expense caps in effect during these periods. All results shown assume reinvestment of distributions.
In connection with new regulatory requirements, effective the date of this report, the Fund changed its broad-based securities market benchmark index to the Bloomberg US Aggregate Index. Although the Bloomberg US Aggregate Index can be considered broadly representative of the overall securities market applicable to the Fund, the Fund will continue to show the performance of the Bloomberg US Corporate Bond Index for comparative purposes because the Delaware Management Company, the Fund's manager, believes it is more representative of the Fund’s investment universe.
Fund statistics (as of July 31, 2024)
| Fund net assets | $1,269,022,895% |
| Total number of portfolio holdings | $244% |
| Total advisory fees paid | $4,791,798% |
| Portfolio turnover rate | $123% |
Fund holdings (as of July 31, 2024)
The table below shows the investment makeup of the Fund, with each category representing a percentage of the total net assets of the Fund.
| Banking | 24.29% |
| Energy | 11.81% |
| Electric | 10.04% |
| Consumer Non-Cyclical | 8.38% |
| Communications | 7.72% |
| Capital Goods | 7.50% |
| Consumer Cyclical | 6.80% |
| Technology | 4.96% |
| Insurance | 4.84% |
| Finance Companies | 3.97% |
| |
| |
| |
During the fiscal year ended July 31, 2024, the Fund introduced a new fee waiver for Class R6 shares of 0.45% (excluding certain items).
This is a summary of certain changes to the Fund since the beginning of the reporting period. For more complete information, you may review the Fund's next prospectus, which we expect to be available by November 30, 2024, at delawarefunds.com/literature or upon request at 800 523-1918, weekdays from 8:30am to 6:00pm ET.
Availability of additional information
You can find additional information about the Fund, such as the prospectus, financial information, holdings, and proxy voting information, at delawarefunds.com/literature. You can also request this information by contacting us at 800 523-1918, weekdays from 8:30am to 6:00pm ET.
Householding
In order to reduce expenses, we will deliver a single copy of prospectuses, proxies, financial reports, and other communication to shareholders with the same residential address, provided they have the same last name or we reasonably believe them to be members of the same family. Unless we are notified otherwise, we will continue to send recipients only one copy of these materials for as long as they remain a shareholder of the Fund. If you would like to receive individual mailings, please call 800 523-1918 and we will begin sending you separate copies of these materials within 30 days after receiving your request.
For more information, please scan the QR code at left to navigate to additional hosted material at delawarefunds.com/literature.
Delaware Extended Duration Bond Fund
Class A: DEEAX
Annual shareholder report | July 31, 2024
This annual shareholder report contains important information about Delaware Extended Duration Bond Fund (Fund) for the period of August 1, 2023, to July 31, 2024. You can find additional information about the Fund at delawarefunds.com/literature. You can also request this information by contacting us at 800 523-1918, weekdays from 8:30am to 6:00pm ET.
What were the Fund's costs for the last 12 months?
(Based on a hypothetical $10,000 investment)
| Class | Costs of a $10,000 investment | Costs paid as a percentage of a $10,000 investment |
| Class A | $84 | 0.82% |
Management’s discussion of Fund performance
Performance highlights
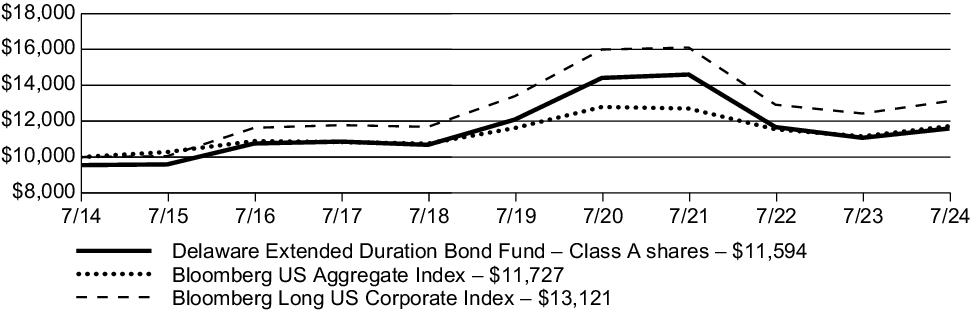
Delaware Extended Duration Bond Fund (Class A) returned 4.70% (excluding sales charge) for the 12 months ended July 31, 2024. During the same period, the Bloomberg US Aggregate Index, the Fund's broad-based securities market index and primary benchmark, returned 5.10%, while the Bloomberg Long US Corporate Index, the Fund's narrowly based securities market index and secondary benchmark, returned 5.56%.
Top contributors to performance relative to the primary benchmark:
Overweight to lower-quality corporate debt, such as BBB-rated (investment grade) and BB-rated (high yield) bonds, which outperformed higher-quality investments over the Fund's fiscal year ended July 31, 2024 due to the risk rally and overall positive market tone that began late in 2023
Investments in communications and energy companies
Top detractors from performance relative to the primary benchmark:
Long-duration investments, which lagged as long-end Treasury rates climbed over the fiscal year
Investments in consumer non-cyclicals and insurance
Fund performance
The following graph compares the initial and subsequent account values at the end of each of the most recently completed 10 fiscal years of the Class. It also assumes a $10,000 initial investment at the beginning of the first full fiscal year in a broad-based securities market index and an additional narrowly based securities market index for the same period and the deduction of the maximum applicable sales charge for Class A shares.
Growth of $10,000 investment
For the period July 31, 2014, through July 31, 2024
| Average annual total returns (as of July 31, 2024) | 1 year | | 5 year | | 10 year | |
| Delaware Extended Duration Bond Fund (Class A) – including sales charge | -0.02 | % | -1.75 | % | 1.49 | % |
| Delaware Extended Duration Bond Fund (Class A) – excluding sales charge | 4.70 | % | -0.85 | % | 1.96 | % |
| Bloomberg US Aggregate Index | 5.10 | % | 0.19 | % | 1.61 | % |
| Bloomberg Long US Corporate Index | 5.56 | % | -0.41 | % | 2.75 | % |
Keep in mind that the Fund's past performance is not a good predictor of how the Fund will perform in the future.
Visit delawarefunds.com/performance for the most recent performance information. The graph and table do not reflect the deduction of taxes that a shareholder would pay on Fund distributions or redemption of Fund shares. Performance results reflect any expense caps in effect during these periods. All results shown assume reinvestment of distributions.
In connection with new regulatory requirements, effective the date of this report, the Fund changed its broad-based securities market benchmark index to the Bloomberg US Aggregate Index. Although the Bloomberg US Aggregate Index can be considered broadly representative of the overall securities market applicable to the Fund, the Fund will continue to show the performance of the Bloomberg Long US Corporate Index for comparative purposes because the Delaware Management Company, the Fund's manager, believes it is more representative of the Fund’s investment universe.
Fund statistics (as of July 31, 2024)
| Fund net assets | $475,509,003% |
| Total number of portfolio holdings | $151% |
| Total advisory fees paid | $1,741,311% |
| Portfolio turnover rate | $86% |
Fund holdings (as of July 31, 2024)
The table below shows the investment makeup of the Fund, with each category representing a percentage of the total net assets of the Fund.
| Energy | 17.24% |
| Electric | 14.99% |
| Insurance | 10.62% |
| Communications | 9.57% |
| Banking | 9.34% |
| Capital Goods | 8.58% |
| Consumer Non-Cyclical | 7.92% |
| Consumer Cyclical | 5.34% |
| Basic Industry | 4.67% |
| Natural Gas | 3.41% |
| |
| |
| |
Availability of additional information
You can find additional information about the Fund, such as the prospectus, financial information, holdings, and proxy voting information, at delawarefunds.com/literature. You can also request this information by contacting us at 800 523-1918, weekdays from 8:30am to 6:00pm ET.
Householding
In order to reduce expenses, we will deliver a single copy of prospectuses, proxies, financial reports, and other communication to shareholders with the same residential address, provided they have the same last name or we reasonably believe them to be members of the same family. Unless we are notified otherwise, we will continue to send recipients only one copy of these materials for as long as they remain a shareholder of the Fund. If you would like to receive individual mailings, please call 800 523-1918 and we will begin sending you separate copies of these materials within 30 days after receiving your request.
For more information, please scan the QR code at left to navigate to additional hosted material at delawarefunds.com/literature.
Delaware Extended Duration Bond Fund
Class C: DEECX
Annual shareholder report | July 31, 2024
This annual shareholder report contains important information about Delaware Extended Duration Bond Fund (Fund) for the period of August 1, 2023, to July 31, 2024. You can find additional information about the Fund at delawarefunds.com/literature. You can also request this information by contacting us at 800 523-1918, weekdays from 8:30am to 6:00pm ET.
What were the Fund's costs for the last 12 months?
(Based on a hypothetical $10,000 investment)
| Class | Costs of a $10,000 investment | Costs paid as a percentage of a $10,000 investment |
| Class C | $160 | 1.57% |
Management’s discussion of Fund performance
Performance highlights
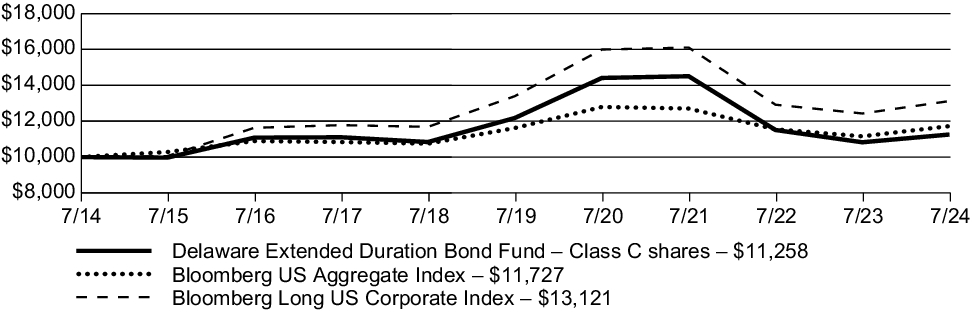
Delaware Extended Duration Bond Fund (Class C) returned 3.99% (excluding sales charge) for the 12 months ended July 31, 2024. During the same period, the Bloomberg US Aggregate Index, the Fund's broad-based securities market index and primary benchmark, returned 5.10%, while the Bloomberg Long US Corporate Index, the Fund's narrowly based securities market index and secondary benchmark, returned 5.56%.
Top contributors to performance relative to the primary benchmark:
Overweight to lower-quality corporate debt, such as BBB-rated (investment grade) and BB-rated (high yield) bonds, which outperformed higher-quality investments over the Fund's fiscal year ended July 31, 2024 due to the risk rally and overall positive market tone that began late in 2023
Investments in communications and energy companies
Top detractors from performance relative to the primary benchmark:
Long-duration investments, which lagged as long-end Treasury rates climbed over the fiscal year
Investments in consumer non-cyclicals and insurance
Fund performance
The following graph compares the initial and subsequent account values at the end of each of the most recently completed 10 fiscal years of the Class. It also assumes a $10,000 initial investment at the beginning of the first full fiscal year in a broad-based securities market index and an additional narrowly based securities market index for the same period.
Growth of $10,000 investment
For the period July 31, 2014, through July 31, 2024
| Average annual total returns (as of July 31, 2024) | 1 year | | 5 year | | 10 year | |
| Delaware Extended Duration Bond Fund (Class C) – including sales charge | 2.99 | % | -1.57 | % | 1.19 | % |
| Delaware Extended Duration Bond Fund (Class C) – excluding sales charge | 3.99 | % | -1.57 | % | 1.19 | % |
| Bloomberg US Aggregate Index | 5.10 | % | 0.19 | % | 1.61 | % |
| Bloomberg Long US Corporate Index | 5.56 | % | -0.41 | % | 2.75 | % |
Keep in mind that the Fund's past performance is not a good predictor of how the Fund will perform in the future.
Visit delawarefunds.com/performance for the most recent performance information. The graph and table do not reflect the deduction of taxes that a shareholder would pay on Fund distributions or redemption of Fund shares. Performance results reflect any expense caps in effect during these periods. All results shown assume reinvestment of distributions.
In connection with new regulatory requirements, effective the date of this report, the Fund changed its broad-based securities market benchmark index to the Bloomberg US Aggregate Index. Although the Bloomberg US Aggregate Index can be considered broadly representative of the overall securities market applicable to the Fund, the Fund will continue to show the performance of the Bloomberg Long US Corporate Index for comparative purposes because the Delaware Management Company, the Fund's manager, believes it is more representative of the Fund’s investment universe.
Fund statistics (as of July 31, 2024)
| Fund net assets | $475,509,003% |
| Total number of portfolio holdings | $151% |
| Total advisory fees paid | $1,741,311% |
| Portfolio turnover rate | $86% |
Fund holdings (as of July 31, 2024)
The table below shows the investment makeup of the Fund, with each category representing a percentage of the total net assets of the Fund.
| Energy | 17.24% |
| Electric | 14.99% |
| Insurance | 10.62% |
| Communications | 9.57% |
| Banking | 9.34% |
| Capital Goods | 8.58% |
| Consumer Non-Cyclical | 7.92% |
| Consumer Cyclical | 5.34% |
| Basic Industry | 4.67% |
| Natural Gas | 3.41% |
| |
| |
| |
Availability of additional information
You can find additional information about the Fund, such as the prospectus, financial information, holdings, and proxy voting information, at delawarefunds.com/literature. You can also request this information by contacting us at 800 523-1918, weekdays from 8:30am to 6:00pm ET.
Householding
In order to reduce expenses, we will deliver a single copy of prospectuses, proxies, financial reports, and other communication to shareholders with the same residential address, provided they have the same last name or we reasonably believe them to be members of the same family. Unless we are notified otherwise, we will continue to send recipients only one copy of these materials for as long as they remain a shareholder of the Fund. If you would like to receive individual mailings, please call 800 523-1918 and we will begin sending you separate copies of these materials within 30 days after receiving your request.
For more information, please scan the QR code at left to navigate to additional hosted material at delawarefunds.com/literature.
Delaware Extended Duration Bond Fund
Class R: DEERX
Annual shareholder report | July 31, 2024
This annual shareholder report contains important information about Delaware Extended Duration Bond Fund (Fund) for the period of August 1, 2023, to July 31, 2024. You can find additional information about the Fund at delawarefunds.com/literature. You can also request this information by contacting us at 800 523-1918, weekdays from 8:30am to 6:00pm ET.
What were the Fund's costs for the last 12 months?
(Based on a hypothetical $10,000 investment)
| Class | Costs of a $10,000 investment | Costs paid as a percentage of a $10,000 investment |
| Class R | $109 | 1.07% |
Management’s discussion of Fund performance
Performance highlights
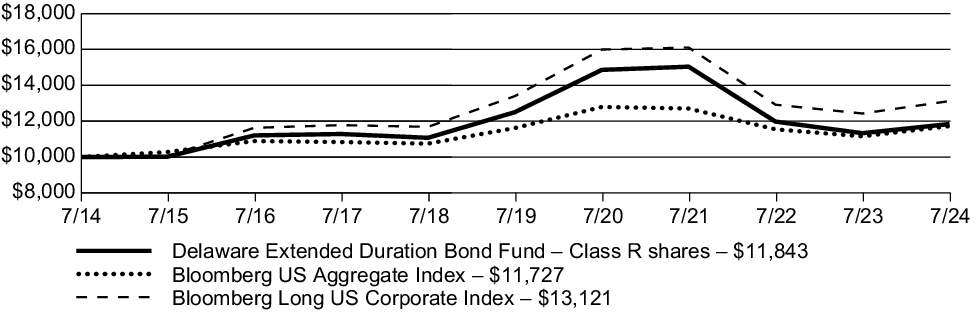
Delaware Extended Duration Bond Fund (Class R) returned 4.51% (excluding sales charge) for the 12 months ended July 31, 2024. During the same period, the Bloomberg US Aggregate Index, the Fund's broad-based securities market index and primary benchmark, returned 5.10%, while the Bloomberg Long US Corporate Index, the Fund's narrowly based securities market index and secondary benchmark, returned 5.56%.
Top contributors to performance relative to the primary benchmark:
Overweight to lower-quality corporate debt, such as BBB-rated (investment grade) and BB-rated (high yield) bonds, which outperformed higher-quality investments over the Fund's fiscal year ended July 31, 2024 due to the risk rally and overall positive market tone that began late in 2023
Investments in communications and energy companies
Top detractors from performance relative to the primary benchmark:
Long-duration investments, which lagged as long-end Treasury rates climbed over the fiscal year
Investments in consumer non-cyclicals and insurance
Fund performance
The following graph compares the initial and subsequent account values at the end of each of the most recently completed 10 fiscal years of the Class. It also assumes a $10,000 initial investment at the beginning of the first full fiscal year in a broad-based securities market index and an additional narrowly based securities market index for the same period.
Growth of $10,000 investment
For the period July 31, 2014, through July 31, 2024
| Average annual total returns (as of July 31, 2024) | 1 year | | 5 year | | 10 year | |
| Delaware Extended Duration Bond Fund (Class R) – including sales charge | 4.51 | % | -1.09 | % | 1.71 | % |
| Delaware Extended Duration Bond Fund (Class R) – excluding sales charge | 4.51 | % | -1.09 | % | 1.71 | % |
| Bloomberg US Aggregate Index | 5.10 | % | 0.19 | % | 1.61 | % |
| Bloomberg Long US Corporate Index | 5.56 | % | -0.41 | % | 2.75 | % |
Keep in mind that the Fund's past performance is not a good predictor of how the Fund will perform in the future.
Visit delawarefunds.com/performance for the most recent performance information. The graph and table do not reflect the deduction of taxes that a shareholder would pay on Fund distributions or redemption of Fund shares. Performance results reflect any expense caps in effect during these periods. All results shown assume reinvestment of distributions.
In connection with new regulatory requirements, effective the date of this report, the Fund changed its broad-based securities market benchmark index to the Bloomberg US Aggregate Index. Although the Bloomberg US Aggregate Index can be considered broadly representative of the overall securities market applicable to the Fund, the Fund will continue to show the performance of the Bloomberg Long US Corporate Index for comparative purposes because the Delaware Management Company, the Fund's manager, believes it is more representative of the Fund’s investment universe.
Fund statistics (as of July 31, 2024)
| Fund net assets | $475,509,003% |
| Total number of portfolio holdings | $151% |
| Total advisory fees paid | $1,741,311% |
| Portfolio turnover rate | $86% |
Fund holdings (as of July 31, 2024)
The table below shows the investment makeup of the Fund, with each category representing a percentage of the total net assets of the Fund.
| Energy | 17.24% |
| Electric | 14.99% |
| Insurance | 10.62% |
| Communications | 9.57% |
| Banking | 9.34% |
| Capital Goods | 8.58% |
| Consumer Non-Cyclical | 7.92% |
| Consumer Cyclical | 5.34% |
| Basic Industry | 4.67% |
| Natural Gas | 3.41% |
| |
| |
| |
Availability of additional information
You can find additional information about the Fund, such as the prospectus, financial information, holdings, and proxy voting information, at delawarefunds.com/literature. You can also request this information by contacting us at 800 523-1918, weekdays from 8:30am to 6:00pm ET.
Householding
In order to reduce expenses, we will deliver a single copy of prospectuses, proxies, financial reports, and other communication to shareholders with the same residential address, provided they have the same last name or we reasonably believe them to be members of the same family. Unless we are notified otherwise, we will continue to send recipients only one copy of these materials for as long as they remain a shareholder of the Fund. If you would like to receive individual mailings, please call 800 523-1918 and we will begin sending you separate copies of these materials within 30 days after receiving your request.
For more information, please scan the QR code at left to navigate to additional hosted material at delawarefunds.com/literature.
Delaware Extended Duration Bond Fund
Institutional Class: DEEIX
Annual shareholder report | July 31, 2024
This annual shareholder report contains important information about Delaware Extended Duration Bond Fund (Fund) for the period of August 1, 2023, to July 31, 2024. You can find additional information about the Fund at delawarefunds.com/literature. You can also request this information by contacting us at 800 523-1918, weekdays from 8:30am to 6:00pm ET.
What were the Fund's costs for the last 12 months?
(Based on a hypothetical $10,000 investment)
| Class | Costs of a $10,000 investment | Costs paid as a percentage of a $10,000 investment |
| Institutional Class | $58 | 0.57% |
Management’s discussion of Fund performance
Performance highlights
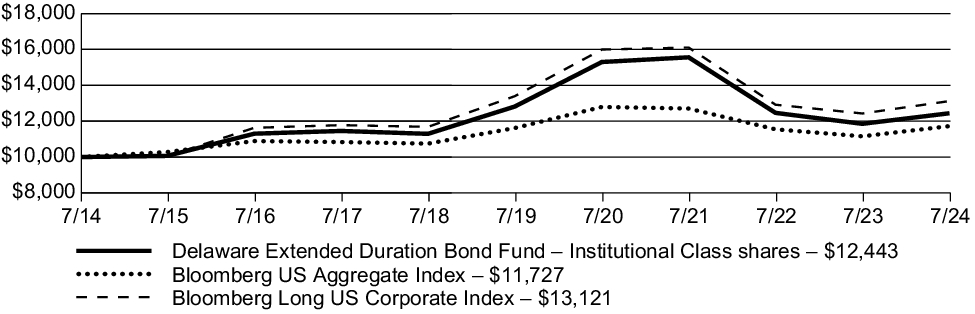
Delaware Extended Duration Bond Fund (Institutional Class) returned 4.96% (excluding sales charge) for the 12 months ended July 31, 2024. During the same period, the Bloomberg US Aggregate Index, the Fund's broad-based securities market index and primary benchmark, returned 5.10%, while the Bloomberg Long US Corporate Index, the Fund's narrowly based securities market index and secondary benchmark, returned 5.56%.
Top contributors to performance relative to the primary benchmark:
Overweight to lower-quality corporate debt, such as BBB-rated (investment grade) and BB-rated (high yield) bonds, which outperformed higher-quality investments over the Fund's fiscal year ended July 31, 2024 due to the risk rally and overall positive market tone that began late in 2023
Investments in communications and energy companies
Top detractors from performance relative to the primary benchmark:
Long-duration investments, which lagged as long-end Treasury rates climbed over the fiscal year
Investments in consumer non-cyclicals and insurance
Fund performance
The following graph compares the initial and subsequent account values at the end of each of the most recently completed 10 fiscal years of the Class. It also assumes a $10,000 initial investment at the beginning of the first full fiscal year in a broad-based securities market index and an additional narrowly based securities market index for the same period.
Growth of $10,000 investment
For the period July 31, 2014, through July 31, 2024
| Average annual total returns (as of July 31, 2024) | 1 year | | 5 year | | 10 year | |
| Delaware Extended Duration Bond Fund (Institutional Class) – including sales charge | 4.96 | % | -0.61 | % | 2.21 | % |
| Delaware Extended Duration Bond Fund (Institutional Class) – excluding sales charge | 4.96 | % | -0.61 | % | 2.21 | % |
| Bloomberg US Aggregate Index | 5.10 | % | 0.19 | % | 1.61 | % |
| Bloomberg Long US Corporate Index | 5.56 | % | -0.41 | % | 2.75 | % |
Keep in mind that the Fund's past performance is not a good predictor of how the Fund will perform in the future.
Visit delawarefunds.com/performance for the most recent performance information. The graph and table do not reflect the deduction of taxes that a shareholder would pay on Fund distributions or redemption of Fund shares. Performance results reflect any expense caps in effect during these periods. All results shown assume reinvestment of distributions.
In connection with new regulatory requirements, effective the date of this report, the Fund changed its broad-based securities market benchmark index to the Bloomberg US Aggregate Index. Although the Bloomberg US Aggregate Index can be considered broadly representative of the overall securities market applicable to the Fund, the Fund will continue to show the performance of the Bloomberg Long US Corporate Index for comparative purposes because the Delaware Management Company, the Fund's manager, believes it is more representative of the Fund’s investment universe.
Fund statistics (as of July 31, 2024)
| Fund net assets | $475,509,003% |
| Total number of portfolio holdings | $151% |
| Total advisory fees paid | $1,741,311% |
| Portfolio turnover rate | $86% |
Fund holdings (as of July 31, 2024)
The table below shows the investment makeup of the Fund, with each category representing a percentage of the total net assets of the Fund.
| Energy | 17.24% |
| Electric | 14.99% |
| Insurance | 10.62% |
| Communications | 9.57% |
| Banking | 9.34% |
| Capital Goods | 8.58% |
| Consumer Non-Cyclical | 7.92% |
| Consumer Cyclical | 5.34% |
| Basic Industry | 4.67% |
| Natural Gas | 3.41% |
| |
| |
| |
Availability of additional information
You can find additional information about the Fund, such as the prospectus, financial information, holdings, and proxy voting information, at delawarefunds.com/literature. You can also request this information by contacting us at 800 523-1918, weekdays from 8:30am to 6:00pm ET.
Householding
In order to reduce expenses, we will deliver a single copy of prospectuses, proxies, financial reports, and other communication to shareholders with the same residential address, provided they have the same last name or we reasonably believe them to be members of the same family. Unless we are notified otherwise, we will continue to send recipients only one copy of these materials for as long as they remain a shareholder of the Fund. If you would like to receive individual mailings, please call 800 523-1918 and we will begin sending you separate copies of these materials within 30 days after receiving your request.
For more information, please scan the QR code at left to navigate to additional hosted material at delawarefunds.com/literature.
Delaware Extended Duration Bond Fund
Class R6: DEZRX
Annual shareholder report | July 31, 2024
This annual shareholder report contains important information about Delaware Extended Duration Bond Fund (Fund) for the period of August 1, 2023, to July 31, 2024. You can find additional information about the Fund at delawarefunds.com/literature. You can also request this information by contacting us at 800 523-1918, weekdays from 8:30am to 6:00pm ET.
This report describes changes to the Fund that occurred during the reporting period.
What were the Fund's costs for the last 12 months?
(Based on a hypothetical $10,000 investment)
| Class | Costs of a $10,000 investment | Costs paid as a percentage of a $10,000 investment |
| Class R6 | $47 | 0.46% |
Management’s discussion of Fund performance
Performance highlights
Delaware Extended Duration Bond Fund (Class R6) returned 5.07% (excluding sales charge) for the 12 months ended July 31, 2024. During the same period, the Bloomberg US Aggregate Index, the Fund's broad-based securities market index and primary benchmark, returned 5.10%, while the Bloomberg Long US Corporate Index, the Fund's narrowly based securities market index and secondary benchmark, returned 5.56%.
Top contributors to performance relative to the primary benchmark:
Overweight to lower-quality corporate debt, such as BBB-rated (investment grade) and BB-rated (high yield) bonds, which outperformed higher-quality investments over the Fund's fiscal year ended July 31, 2024 due to the risk rally and overall positive market tone that began late in 2023
Investments in communications and energy companies
Top detractors from performance relative to the primary benchmark:
Long-duration investments, which lagged as long-end Treasury rates climbed over the fiscal year
Investments in consumer non-cyclicals and insurance
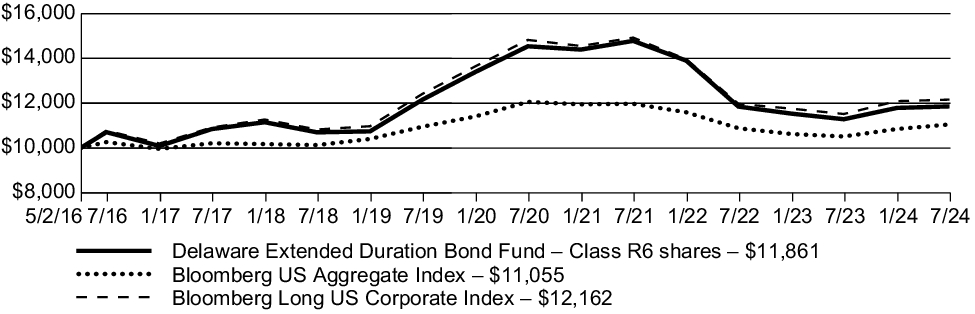
Fund performance
The following graph compares the initial and subsequent account values at the end of each of the most recently completed fiscal years (or period) of the Class for the life of the Class. It also assumes a $10,000 initial investment at the Class's inception date in a broad-based securities market index and an additional narrowly based securities market index for the same period.
Growth of $10,000 investment
For the period May 2, 2016 (Class R6's inception), through July 31, 2024
| Average annual total returns (as of July 31, 2024) | 1 year | | 5 year | | Since Inception
(5/2/16) | |
| Delaware Extended Duration Bond Fund (Class R6) – including sales charge | 5.07 | % | -0.51 | % | 2.09 | % |
| Delaware Extended Duration Bond Fund (Class R6) – excluding sales charge | 5.07 | % | -0.51 | % | 2.09 | % |
| Bloomberg US Aggregate Index | 5.10 | % | 0.19 | % | 1.22 | % |
| Bloomberg Long US Corporate Index | 5.56 | % | -0.41 | % | 2.40 | % |
Keep in mind that the Fund's past performance is not a good predictor of how the Fund will perform in the future.
Visit delawarefunds.com/performance for the most recent performance information. The graph and table do not reflect the deduction of taxes that a shareholder would pay on Fund distributions or redemption of Fund shares. Performance results reflect any expense caps in effect during these periods. All results shown assume reinvestment of distributions.
In connection with new regulatory requirements, effective the date of this report, the Fund changed its broad-based securities market benchmark index to the Bloomberg US Aggregate Index. Although the Bloomberg US Aggregate Index can be considered broadly representative of the overall securities market applicable to the Fund, the Fund will continue to show the performance of the Bloomberg Long US Corporate Index for comparative purposes because the Delaware Management Company, the Fund's manager, believes it is more representative of the Fund’s investment universe.
Fund statistics (as of July 31, 2024)
| Fund net assets | $475,509,003% |
| Total number of portfolio holdings | $151% |
| Total advisory fees paid | $1,741,311% |
| Portfolio turnover rate | $86% |
Fund holdings (as of July 31, 2024)
The table below shows the investment makeup of the Fund, with each category representing a percentage of the total net assets of the Fund.
| Energy | 17.24% |
| Electric | 14.99% |
| Insurance | 10.62% |
| Communications | 9.57% |
| Banking | 9.34% |
| Capital Goods | 8.58% |
| Consumer Non-Cyclical | 7.92% |
| Consumer Cyclical | 5.34% |
| Basic Industry | 4.67% |
| Natural Gas | 3.41% |
| |
| |
| |
During the fiscal year ended July 31, 2024, the Fund introduced a new fee waiver for Class R6 shares of 0.46% (excluding certain items).
This is a summary of certain changes to the Fund since the beginning of the reporting period. For more complete information, you may review the Fund's next prospectus, which we expect to be available by November 30, 2024, at delawarefunds.com/literature or upon request at 800 523-1918, weekdays from 8:30am to 6:00pm ET.
Availability of additional information
You can find additional information about the Fund, such as the prospectus, financial information, holdings, and proxy voting information, at delawarefunds.com/literature. You can also request this information by contacting us at 800 523-1918, weekdays from 8:30am to 6:00pm ET.
Householding
In order to reduce expenses, we will deliver a single copy of prospectuses, proxies, financial reports, and other communication to shareholders with the same residential address, provided they have the same last name or we reasonably believe them to be members of the same family. Unless we are notified otherwise, we will continue to send recipients only one copy of these materials for as long as they remain a shareholder of the Fund. If you would like to receive individual mailings, please call 800 523-1918 and we will begin sending you separate copies of these materials within 30 days after receiving your request.
For more information, please scan the QR code at left to navigate to additional hosted material at delawarefunds.com/literature.
Delaware Floating Rate Fund
Class A: DDFAX
Annual shareholder report | July 31, 2024
This annual shareholder report contains important information about Delaware Floating Rate Fund (Fund) for the period of August 1, 2023, to July 31, 2024. You can find additional information about the Fund at delawarefunds.com/literature. You can also request this information by contacting us at 800 523-1918, weekdays from 8:30am to 6:00pm ET.
What were the Fund's costs for the last 12 months?
(Based on a hypothetical $10,000 investment)
| Class | Costs of a $10,000 investment | Costs paid as a percentage of a $10,000 investment |
| Class A | $98 | 0.93% |
Management’s discussion of Fund performance
Performance highlights
Delaware Floating Rate Fund (Class A) returned 10.18% (excluding sales charge) for the 12 months ended July 31, 2024. During the same period, the Bloomberg US Aggregate Index, the Fund's broad-based securities market index and primary benchmark, returned 5.10%, while the Morningstar LSTA US Leveraged Loan Index, the Fund's narrowly based securities market index and secondary benchmark, returned 10.45%.
Top contributors to performance relative to the secondary benchmark:
A high average coupon of approximately 9.5%, plus reduced capital markets volatility, helped drive the historically strong total returns.
Positioning skewed more to single-B rated loans, which outperformed BB-rated loans.
An overweight and security selection in the materials, telecommunications, and utilities sectors
An overweight and security selection in the consumer discretionary and retail sectors
Top detractors from performance relative to the secondary benchmark:
An underweight in the financial services, consumer services, and the commercial and professional services sectors
An overweight and security selection in the media sector
Security selection in the healthcare sector
Overweight to BB-rated loans
Fund performance
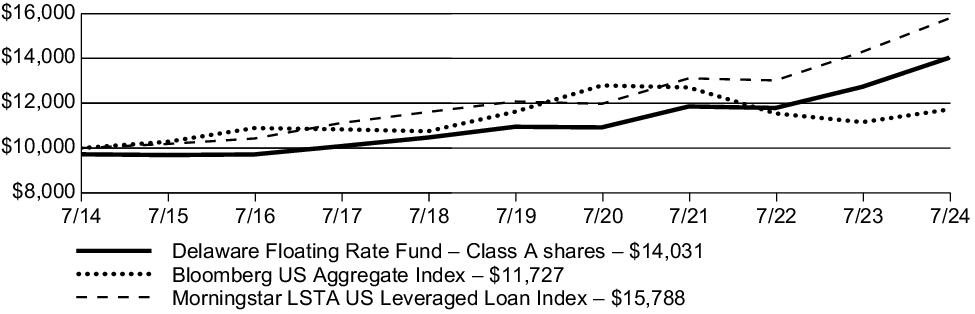
The following graph compares the initial and subsequent account values at the end of each of the most recently completed 10 fiscal years of the Class. It also assumes a $10,000 initial investment at the beginning of the first full fiscal year in a broad-based securities market index and an additional narrowly based securities market index for the same period and the deduction of the maximum applicable sales charge for Class A shares.
Growth of $10,000 investment
For the period July 31, 2014, through July 31, 2024
| Average annual total returns (as of July 31, 2024) | 1 year | | 5 year | | 10 year | |
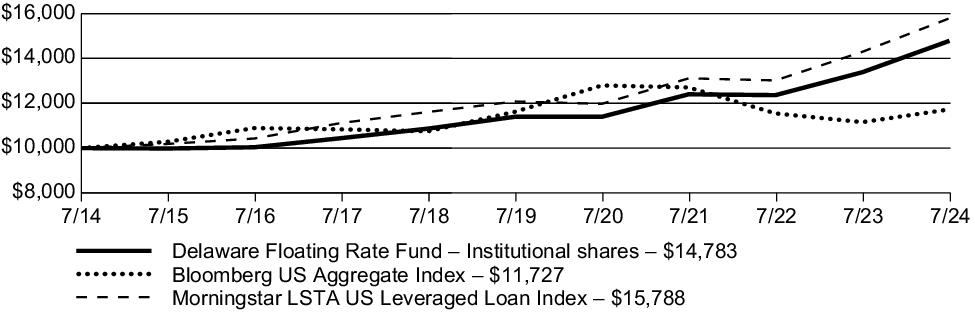
| Delaware Floating Rate Fund (Class A) – including sales charge | 7.20 | % | 4.48 | % | 3.44 | % |
| Delaware Floating Rate Fund (Class A) – excluding sales charge | 10.18 | % | 5.05 | % | 3.73 | % |
| Bloomberg US Aggregate Index | 5.10 | % | 0.19 | % | 1.61 | % |
| Morningstar LSTA US Leveraged Loan Index | 10.45 | % | 5.50 | % | 4.67 | % |
Keep in mind that the Fund's past performance is not a good predictor of how the Fund will perform in the future.
Visit delawarefunds.com/performance for the most recent performance information. The graph and table do not reflect the deduction of taxes that a shareholder would pay on Fund distributions or redemption of Fund shares. Performance results reflect any expense caps in effect during these periods. All results shown assume reinvestment of distributions.
In connection with new regulatory requirements, effective the date of this report, the Fund changed its broad-based securities market benchmark index to the Bloomberg US Aggregate Index. Although the Bloomberg US Aggregate Index can be considered broadly representative of the overall securities market applicable to the Fund, the Fund will continue to show the performance of the Morningstar LSTA US Leveraged Loan Index for comparative purposes because the Delaware Management Company, the Fund's manager, believes it is more representative of the Fund’s investment universe.
Fund statistics (as of July 31, 2024)
| Fund net assets | $624,069,415% |
| Total number of portfolio holdings | $197% |
| Total advisory fees paid | $2,897,103% |
| Portfolio turnover rate | $104% |
Fund holdings (as of July 31, 2024)
The table below shows the investment makeup of the Fund, with each category representing a percentage of the total net assets of the Fund.
| Industrials | 15.82% |
| Information Technology | 14.76% |
| Consumer Discretionary | 11.92% |
| Communication Services | 11.72% |
| Financials | 11.44% |
| Materials | 10.66% |
| Utilities | 8.81% |
| Healthcare | 8.44% |
| Consumer Staples | 2.09% |
| Energy | 0.78% |
| |
| |
| |
Availability of additional information
You can find additional information about the Fund, such as the prospectus, financial information, holdings, and proxy voting information, at delawarefunds.com/literature. You can also request this information by contacting us at 800 523-1918, weekdays from 8:30am to 6:00pm ET.
Householding
In order to reduce expenses, we will deliver a single copy of prospectuses, proxies, financial reports, and other communication to shareholders with the same residential address, provided they have the same last name or we reasonably believe them to be members of the same family. Unless we are notified otherwise, we will continue to send recipients only one copy of these materials for as long as they remain a shareholder of the Fund. If you would like to receive individual mailings, please call 800 523-1918 and we will begin sending you separate copies of these materials within 30 days after receiving your request.
For more information, please scan the QR code at left to navigate to additional hosted material at delawarefunds.com/literature.
Delaware Floating Rate Fund
Class C: DDFCX
Annual shareholder report | July 31, 2024
This annual shareholder report contains important information about Delaware Floating Rate Fund (Fund) for the period of August 1, 2023, to July 31, 2024. You can find additional information about the Fund at delawarefunds.com/literature. You can also request this information by contacting us at 800 523-1918, weekdays from 8:30am to 6:00pm ET.
What were the Fund's costs for the last 12 months?
(Based on a hypothetical $10,000 investment)
| Class | Costs of a $10,000 investment | Costs paid as a percentage of a $10,000 investment |
| Class C | $176 | 1.68% |
Management’s discussion of Fund performance
Performance highlights
Delaware Floating Rate Fund (Class C) returned 9.37% (excluding sales charge) for the 12 months ended July 31, 2024. During the same period, the Bloomberg US Aggregate Index, the Fund's broad-based securities market index and primary benchmark, returned 5.10%, while the Morningstar LSTA US Leveraged Loan Index, the Fund's narrowly based securities market index and secondary benchmark, returned 10.45%.
Top contributors to performance relative to the secondary benchmark:
A high average coupon of approximately 9.5%, plus reduced capital markets volatility, helped drive the historically strong total returns.
Positioning skewed more to single-B rated loans, which outperformed BB-rated loans.
An overweight and security selection in the materials, telecommunications, and utilities sectors
An overweight and security selection in the consumer discretionary and retail sectors
Top detractors from performance relative to the secondary benchmark:
An underweight in the financial services, consumer services, and the commercial and professional services sectors
An overweight and security selection in the media sector
Security selection in the healthcare sector
Overweight to BB-rated loans
Fund performance
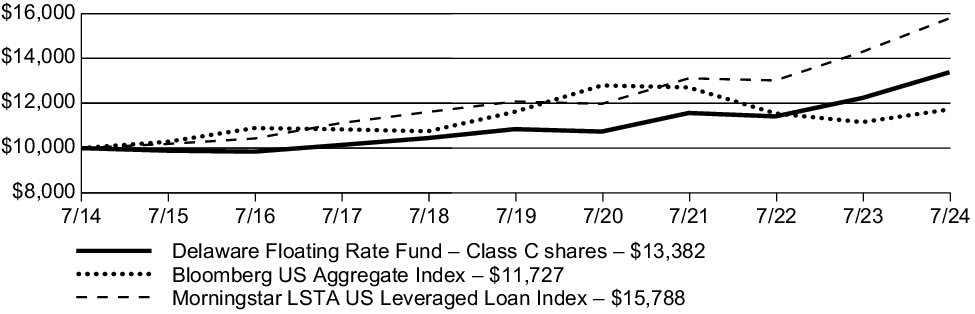
The following graph compares the initial and subsequent account values at the end of each of the most recently completed 10 fiscal years of the Class. It also assumes a $10,000 initial investment at the beginning of the first full fiscal year in a broad-based securities market index and an additional narrowly based securities market index for the same period.
Growth of $10,000 investment
For the period July 31, 2014, through July 31, 2024
| Average annual total returns (as of July 31, 2024) | 1 year | | 5 year | | 10 year | |
| Delaware Floating Rate Fund (Class C) – including sales charge | 8.37 | % | 4.27 | % | 2.96 | % |
| Delaware Floating Rate Fund (Class C) – excluding sales charge | 9.37 | % | 4.27 | % | 2.96 | % |
| Bloomberg US Aggregate Index | 5.10 | % | 0.19 | % | 1.61 | % |
| Morningstar LSTA US Leveraged Loan Index | 10.45 | % | 5.50 | % | 4.67 | % |
Keep in mind that the Fund's past performance is not a good predictor of how the Fund will perform in the future.
Visit delawarefunds.com/performance for the most recent performance information. The graph and table do not reflect the deduction of taxes that a shareholder would pay on Fund distributions or redemption of Fund shares. Performance results reflect any expense caps in effect during these periods. All results shown assume reinvestment of distributions.
In connection with new regulatory requirements, effective the date of this report, the Fund changed its broad-based securities market benchmark index to the Bloomberg US Aggregate Index. Although the Bloomberg US Aggregate Index can be considered broadly representative of the overall securities market applicable to the Fund, the Fund will continue to show the performance of the Morningstar LSTA US Leveraged Loan Index for comparative purposes because the Delaware Management Company, the Fund's manager, believes it is more representative of the Fund’s investment universe.
Fund statistics (as of July 31, 2024)
| Fund net assets | $624,069,415% |
| Total number of portfolio holdings | $197% |
| Total advisory fees paid | $2,897,103% |
| Portfolio turnover rate | $104% |
Fund holdings (as of July 31, 2024)
The table below shows the investment makeup of the Fund, with each category representing a percentage of the total net assets of the Fund.
| Industrials | 15.82% |
| Information Technology | 14.76% |
| Consumer Discretionary | 11.92% |
| Communication Services | 11.72% |
| Financials | 11.44% |
| Materials | 10.66% |
| Utilities | 8.81% |
| Healthcare | 8.44% |
| Consumer Staples | 2.09% |
| Energy | 0.78% |
| |
| |
| |
Availability of additional information
You can find additional information about the Fund, such as the prospectus, financial information, holdings, and proxy voting information, at delawarefunds.com/literature. You can also request this information by contacting us at 800 523-1918, weekdays from 8:30am to 6:00pm ET.
Householding
In order to reduce expenses, we will deliver a single copy of prospectuses, proxies, financial reports, and other communication to shareholders with the same residential address, provided they have the same last name or we reasonably believe them to be members of the same family. Unless we are notified otherwise, we will continue to send recipients only one copy of these materials for as long as they remain a shareholder of the Fund. If you would like to receive individual mailings, please call 800 523-1918 and we will begin sending you separate copies of these materials within 30 days after receiving your request.
For more information, please scan the QR code at left to navigate to additional hosted material at delawarefunds.com/literature.
Delaware Floating Rate Fund
Class R: DDFFX
Annual shareholder report | July 31, 2024
This annual shareholder report contains important information about Delaware Floating Rate Fund (Fund) for the period of August 1, 2023, to July 31, 2024. You can find additional information about the Fund at delawarefunds.com/literature. You can also request this information by contacting us at 800 523-1918, weekdays from 8:30am to 6:00pm ET.
What were the Fund's costs for the last 12 months?
(Based on a hypothetical $10,000 investment)
| Class | Costs of a $10,000 investment | Costs paid as a percentage of a $10,000 investment |
| Class R | $124 | 1.18% |
Management’s discussion of Fund performance
Performance highlights
Delaware Floating Rate Fund (Class R) returned 9.91% (excluding sales charge) for the 12 months ended July 31, 2024. During the same period, the Bloomberg US Aggregate Index, the Fund's broad-based securities market index and primary benchmark, returned 5.10%, while the Morningstar LSTA US Leveraged Loan Index, the Fund's narrowly based securities market index and secondary benchmark, returned 10.45%.
Top contributors to performance relative to the secondary benchmark:
A high average coupon of approximately 9.5%, plus reduced capital markets volatility, helped drive the historically strong total returns.
Positioning skewed more to single-B rated loans, which outperformed BB-rated loans.
An overweight and security selection in the materials, telecommunications, and utilities sectors
An overweight and security selection in the consumer discretionary and retail sectors
Top detractors from performance relative to the secondary benchmark:
An underweight in the financial services, consumer services, and the commercial and professional services sectors
An overweight and security selection in the media sector
Security selection in the healthcare sector
Overweight to BB-rated loans
Fund performance
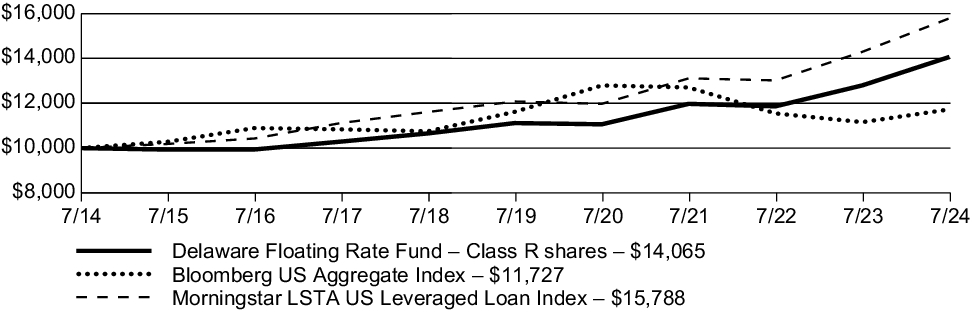
The following graph compares the initial and subsequent account values at the end of each of the most recently completed 10 fiscal years of the Class. It also assumes a $10,000 initial investment at the beginning of the first full fiscal year in a broad-based securities market index and an additional narrowly based securities market index for the same period.
Growth of $10,000 investment
For the period July 31, 2014, through July 31, 2024
| Average annual total returns (as of July 31, 2024) | 1 year | | 5 year | | 10 year | |
| Delaware Floating Rate Fund (Class R) – including sales charge | 9.91 | % | 4.79 | % | 3.47 | % |
| Delaware Floating Rate Fund (Class R) – excluding sales charge | 9.91 | % | 4.79 | % | 3.47 | % |
| Bloomberg US Aggregate Index | 5.10 | % | 0.19 | % | 1.61 | % |
| Morningstar LSTA US Leveraged Loan Index | 10.45 | % | 5.50 | % | 4.67 | % |
Keep in mind that the Fund's past performance is not a good predictor of how the Fund will perform in the future.
Visit delawarefunds.com/performance for the most recent performance information. The graph and table do not reflect the deduction of taxes that a shareholder would pay on Fund distributions or redemption of Fund shares. Performance results reflect any expense caps in effect during these periods. All results shown assume reinvestment of distributions.
In connection with new regulatory requirements, effective the date of this report, the Fund changed its broad-based securities market benchmark index to the Bloomberg US Aggregate Index. Although the Bloomberg US Aggregate Index can be considered broadly representative of the overall securities market applicable to the Fund, the Fund will continue to show the performance of the Morningstar LSTA US Leveraged Loan Index for comparative purposes because the Delaware Management Company, the Fund's manager, believes it is more representative of the Fund’s investment universe.
Fund statistics (as of July 31, 2024)
| Fund net assets | $624,069,415% |
| Total number of portfolio holdings | $197% |
| Total advisory fees paid | $2,897,103% |
| Portfolio turnover rate | $104% |
Fund holdings (as of July 31, 2024)
The table below shows the investment makeup of the Fund, with each category representing a percentage of the total net assets of the Fund.
| Industrials | 15.82% |
| Information Technology | 14.76% |
| Consumer Discretionary | 11.92% |
| Communication Services | 11.72% |
| Financials | 11.44% |
| Materials | 10.66% |
| Utilities | 8.81% |
| Healthcare | 8.44% |
| Consumer Staples | 2.09% |
| Energy | 0.78% |
| |
| |
| |
Availability of additional information
You can find additional information about the Fund, such as the prospectus, financial information, holdings, and proxy voting information, at delawarefunds.com/literature. You can also request this information by contacting us at 800 523-1918, weekdays from 8:30am to 6:00pm ET.
Householding
In order to reduce expenses, we will deliver a single copy of prospectuses, proxies, financial reports, and other communication to shareholders with the same residential address, provided they have the same last name or we reasonably believe them to be members of the same family. Unless we are notified otherwise, we will continue to send recipients only one copy of these materials for as long as they remain a shareholder of the Fund. If you would like to receive individual mailings, please call 800 523-1918 and we will begin sending you separate copies of these materials within 30 days after receiving your request.
For more information, please scan the QR code at left to navigate to additional hosted material at delawarefunds.com/literature.
Delaware Floating Rate Fund
Institutional Class: DDFLX
Annual shareholder report | July 31, 2024
This annual shareholder report contains important information about Delaware Floating Rate Fund (Fund) for the period of August 1, 2023, to July 31, 2024. You can find additional information about the Fund at delawarefunds.com/literature. You can also request this information by contacting us at 800 523-1918, weekdays from 8:30am to 6:00pm ET.
What were the Fund's costs for the last 12 months?
(Based on a hypothetical $10,000 investment)
| Class | Costs of a $10,000 investment | Costs paid as a percentage of a $10,000 investment |
| Institutional Class | $72 | 0.68% |
Management’s discussion of Fund performance
Performance highlights
Delaware Floating Rate Fund (Institutional Class) returned 10.46% (excluding sales charge) for the 12 months ended July 31, 2024. During the same period, the Bloomberg US Aggregate Index, the Fund's broad-based securities market index and primary benchmark, returned 5.10%, while the Morningstar LSTA US Leveraged Loan Index, the Fund's narrowly based securities market index and secondary benchmark, returned 10.45%.
Top contributors to performance relative to the secondary benchmark:
A high average coupon of approximately 9.5%, plus reduced capital markets volatility, helped drive the historically strong total returns.
Positioning skewed more to single-B rated loans, which outperformed BB-rated loans.
An overweight and security selection in the materials, telecommunications, and utilities sectors
An overweight and security selection in the consumer discretionary and retail sectors
Top detractors from performance relative to the secondary benchmark:
An underweight in the financial services, consumer services, and the commercial and professional services sectors
An overweight and security selection in the media sector
Security selection in the healthcare sector
Overweight to BB-rated loans
Fund performance
The following graph compares the initial and subsequent account values at the end of each of the most recently completed 10 fiscal years of the Class. It also assumes a $10,000 initial investment at the beginning of the first full fiscal year in a broad-based securities market index and an additional narrowly based securities market index for the same period.
Growth of $10,000 investment
For the period July 31, 2014, through July 31, 2024
| Average annual total returns (as of July 31, 2024) | 1 year | | 5 year | | 10 year | |
| Delaware Floating Rate Fund (Institutional Class) – including sales charge | 10.46 | % | 5.31 | % | 3.99 | % |
| Delaware Floating Rate Fund (Institutional Class) – excluding sales charge | 10.46 | % | 5.31 | % | 3.99 | % |
| Bloomberg US Aggregate Index | 5.10 | % | 0.19 | % | 1.61 | % |
| Morningstar LSTA US Leveraged Loan Index | 10.45 | % | 5.50 | % | 4.67 | % |
Keep in mind that the Fund's past performance is not a good predictor of how the Fund will perform in the future.
Visit delawarefunds.com/performance for the most recent performance information. The graph and table do not reflect the deduction of taxes that a shareholder would pay on Fund distributions or redemption of Fund shares. Performance results reflect any expense caps in effect during these periods. All results shown assume reinvestment of distributions.
In connection with new regulatory requirements, effective the date of this report, the Fund changed its broad-based securities market benchmark index to the Bloomberg US Aggregate Index. Although the Bloomberg US Aggregate Index can be considered broadly representative of the overall securities market applicable to the Fund, the Fund will continue to show the performance of the Morningstar LSTA US Leveraged Loan Index for comparative purposes because the Delaware Management Company, the Fund's manager, believes it is more representative of the Fund’s investment universe.
Fund statistics (as of July 31, 2024)
| Fund net assets | $624,069,415% |
| Total number of portfolio holdings | $197% |
| Total advisory fees paid | $2,897,103% |
| Portfolio turnover rate | $104% |
Fund holdings (as of July 31, 2024)
The table below shows the investment makeup of the Fund, with each category representing a percentage of the total net assets of the Fund.
| Industrials | 15.82% |
| Information Technology | 14.76% |
| Consumer Discretionary | 11.92% |
| Communication Services | 11.72% |
| Financials | 11.44% |
| Materials | 10.66% |
| Utilities | 8.81% |
| Healthcare | 8.44% |
| Consumer Staples | 2.09% |
| Energy | 0.78% |
| |
| |
| |
Availability of additional information
You can find additional information about the Fund, such as the prospectus, financial information, holdings, and proxy voting information, at delawarefunds.com/literature. You can also request this information by contacting us at 800 523-1918, weekdays from 8:30am to 6:00pm ET.
Householding
In order to reduce expenses, we will deliver a single copy of prospectuses, proxies, financial reports, and other communication to shareholders with the same residential address, provided they have the same last name or we reasonably believe them to be members of the same family. Unless we are notified otherwise, we will continue to send recipients only one copy of these materials for as long as they remain a shareholder of the Fund. If you would like to receive individual mailings, please call 800 523-1918 and we will begin sending you separate copies of these materials within 30 days after receiving your request.
For more information, please scan the QR code at left to navigate to additional hosted material at delawarefunds.com/literature.
Delaware Floating Rate Fund
Class R6: DDFZX
Annual shareholder report | July 31, 2024
This annual shareholder report contains important information about Delaware Floating Rate Fund (Fund) for the period of August 1, 2023, to July 31, 2024. You can find additional information about the Fund at delawarefunds.com/literature. You can also request this information by contacting us at 800 523-1918, weekdays from 8:30am to 6:00pm ET.
This report describes changes to the Fund that occurred during the reporting period.
What were the Fund's costs for the last 12 months?
(Based on a hypothetical $10,000 investment)
| Class | Costs of a $10,000 investment | Costs paid as a percentage of a $10,000 investment |
| Class R6 | $63 | 0.60% |
Management’s discussion of Fund performance
Performance highlights
Delaware Floating Rate Fund (Class R6) returned 10.55% (excluding sales charge) for the 12 months ended July 31, 2024. During the same period, the Bloomberg US Aggregate Index, the Fund's broad-based securities market index and primary benchmark, returned 5.10%, while the Morningstar LSTA US Leveraged Loan Index, the Fund's narrowly based securities market index and secondary benchmark, returned 10.45%.
Top contributors to performance relative to the secondary benchmark:
A high average coupon of approximately 9.5%, plus reduced capital markets volatility, helped drive the historically strong total returns.
Positioning skewed more to single-B rated loans, which outperformed BB-rated loans.
An overweight and security selection in the materials, telecommunications, and utilities sectors
An overweight and security selection in the consumer discretionary and retail sectors
Top detractors from performance relative to the secondary benchmark:
An underweight in the financial services, consumer services, and the commercial and professional services sectors
An overweight and security selection in the media sector
Security selection in the healthcare sector
Overweight to BB-rated loans
Fund performance
The following graph compares the initial and subsequent account values at the end of each of the most recently completed fiscal years (or period) of the Class for the life of the Class. It also assumes a $10,000 initial investment at the Class's inception date in a broad-based securities market index and an additional narrowly based securities market index for the same period.
Growth of $10,000 investment
For the period August 31, 2021 (Class R6's inception), through July 31, 2024
| Average annual total returns (as of July 31, 2024) | 1 year | | Since Inception
(8/31/21) | |
| Delaware Floating Rate Fund (Class R6) – including sales charge | 10.55 | % | 6.18 | % |
| Delaware Floating Rate Fund (Class R6) – excluding sales charge | 10.55 | % | 6.18 | % |
| Bloomberg US Aggregate Index | 5.10 | % | -2.65 | % |
| Morningstar LSTA US Leveraged Loan Index | 10.45 | % | 6.40 | % |
Keep in mind that the Fund's past performance is not a good predictor of how the Fund will perform in the future.
Visit delawarefunds.com/performance for the most recent performance information. The graph and table do not reflect the deduction of taxes that a shareholder would pay on Fund distributions or redemption of Fund shares. Performance results reflect any expense caps in effect during these periods. All results shown assume reinvestment of distributions.
In connection with new regulatory requirements, effective the date of this report, the Fund changed its broad-based securities market benchmark index to the Bloomberg US Aggregate Index. Although the Bloomberg US Aggregate Index can be considered broadly representative of the overall securities market applicable to the Fund, the Fund will continue to show the performance of the Morningstar LSTA US Leveraged Loan Index for comparative purposes because the Delaware Management Company, the Fund's manager, believes it is more representative of the Fund’s investment universe.
Fund statistics (as of July 31, 2024)
| Fund net assets | $624,069,415% |
| Total number of portfolio holdings | $197% |
| Total advisory fees paid | $2,897,103% |
| Portfolio turnover rate | $104% |
Fund holdings (as of July 31, 2024)
The table below shows the investment makeup of the Fund, with each category representing a percentage of the total net assets of the Fund.
| Industrials | 15.82% |
| Information Technology | 14.76% |
| Consumer Discretionary | 11.92% |
| Communication Services | 11.72% |
| Financials | 11.44% |
| Materials | 10.66% |
| Utilities | 8.81% |
| Healthcare | 8.44% |
| Consumer Staples | 2.09% |
| Energy | 0.78% |
| |
| |
| |
During the fiscal year ended July 31, 2024, the Fund introduced a new fee waiver for Class R6 shares of 0.60% (excluding certain items).
This is a summary of certain changes to the Fund since the beginning of the reporting period. For more complete information, you may review the Fund's next prospectus, which we expect to be available by November 30, 2024, at delawarefunds.com/literature or upon request at 800 523-1918, weekdays from 8:30am to 6:00pm ET.
Availability of additional information
You can find additional information about the Fund, such as the prospectus, financial information, holdings, and proxy voting information, at delawarefunds.com/literature. You can also request this information by contacting us at 800 523-1918, weekdays from 8:30am to 6:00pm ET.
Householding
In order to reduce expenses, we will deliver a single copy of prospectuses, proxies, financial reports, and other communication to shareholders with the same residential address, provided they have the same last name or we reasonably believe them to be members of the same family. Unless we are notified otherwise, we will continue to send recipients only one copy of these materials for as long as they remain a shareholder of the Fund. If you would like to receive individual mailings, please call 800 523-1918 and we will begin sending you separate copies of these materials within 30 days after receiving your request.
For more information, please scan the QR code at left to navigate to additional hosted material at delawarefunds.com/literature.
| | (a) | The registrant has adopted a code of ethics that applies to the registrant’s principal executive officer, principal financial officer, principal accounting officer or controller, or persons performing similar functions, regardless of whether these individuals are employed by the registrant or a third party. A copy of the registrant’s Code of Business Ethics has been posted on the Delaware Funds by Macquarie® Internet Web site at www.delawarefunds.com. Any amendments to the Code of Business Ethics, and information on any waiver from its provisions granted by the registrant, will also be posted on this Web site within five business days of such amendment or waiver and will remain on the Web site for at least 12 months. |
| Item 3. | Audit Committee Financial Expert. |
The registrant’s Board of Trustees has determined that certain members of the registrant’s Audit Committee are audit committee financial experts, as defined below. For purposes of this item, an “audit committee financial expert” is a person who has the following attributes:
a. An understanding of generally accepted accounting principles and financial statements;
b. The ability to assess the general application of such principles in connection with the accounting for estimates, accruals, and reserves;
c. Experience preparing, auditing, analyzing, or evaluating financial statements that present a breadth and level of complexity of accounting issues that are generally comparable to the breadth and complexity of issues that can reasonably be expected to be raised by the registrant’s financial statements, or experience actively supervising one or more persons engaged in such activities;
d. An understanding of internal controls and procedures for financial reporting; and
e. An understanding of audit committee functions.
An “audit committee financial expert” shall have acquired such attributes through:
a. Education and experience as a principal financial officer, principal accounting officer, controller, public accountant, or auditor or experience in one or more positions that involve the performance of similar functions;
b. Experience actively supervising a principal financial officer, principal accounting officer, controller, public accountant, auditor, or person performing similar functions;
c. Experience overseeing or assessing the performance of companies or public accountants with respect to the preparation, auditing, or evaluation of financial statements; or
d. Other relevant experience.
The registrant’s Board of Trustees has also determined that each member of the registrant’s Audit Committee is independent. In order to be “independent” for purposes of this item, the Audit Committee member may not, other than in his or her capacity as a member of the Board of Trustees or any committee thereof, (i) accept directly or indirectly any consulting, advisory or other compensatory fee from the issuer; or (ii) be an “interested person” of the registrant as defined in Section 2(a)(19) of the Investment Company Act of 1940.
The names of the audit committee financial experts on the registrant’s Audit Committee are set forth below:
H. Jeffrey Dobbs
Frances Sevilla-Sacasa, Chair
Christianna Wood
| Item 4. | Principal Accountant Fees and Services. |
Audit Fees
| | (a) | The aggregate fees billed for each of the last two fiscal years for professional services rendered by the principal accountant for the audit of the registrant’s annual financial statements or services that are normally provided by the accountant in connection with statutory and regulatory filings or engagements for those fiscal years are $129,000 for 2024 and $169,360 for 2023. |
Audit-Related Fees
| | (b) | The aggregate fees billed in each of the last two fiscal years for assurance and related services by the principal accountant that are reasonably related to the performance of the audit of the registrant’s financial statements and are not reported under paragraph (a) of this Item are $0 for 2024 and $0 for 2023. |
Tax Fees
| | (c) | The aggregate fees billed in each of the last two fiscal years for professional services rendered by the principal accountant for tax compliance, tax advice, and tax planning are $20,280 for 2024 and $25,040 for 2023. |
All Other Fees
| | (d) | The aggregate fees billed in each of the last two fiscal years for products and services provided by the principal accountant, other than the services reported in paragraphs (a) through (c) of this Item are $0 for 2024 and $0 for 2023. |
| (e)(1) | The registrant’s Audit Committee has established pre-approval policies and procedures as permitted by Rule 2-01(c)(7)(i)(B) of Regulation S-X (the “Pre-Approval Policy”) with respect to services provided by the registrant’s independent auditors. Pursuant to the Pre-Approval Policy, the Audit Committee has pre-approved the services set forth in the table below with respect to the registrant up to the specified fee limits. Certain fee limits are based on aggregate fees to the registrant and other registrants within the Delaware Funds® by Macquarie. |
| | |
Service | | Range of Fees |
Audit Services | | |
| |
| Statutory audits or financial audits for new Funds | | up to $50,000 per Fund |
| |
| Services associated with SEC registration statements (e.g., Form N-1A, Form N-14, etc.), periodic reports and other documents filed with the SEC or other documents issued in connection with securities offerings (e.g., comfort letters for closed-end Fund offerings, consents), and assistance in responding to SEC comment letters | | up to $10,000 per Fund |
| |
| Consultations by Fund management as to the accounting or disclosure treatment of transactions or events and/or the actual or potential impact of final or proposed rules, standards or interpretations by the SEC, FASB, or other regulatory or standard-setting bodies (Note: Under SEC rules, some consultations may be considered “audit-related services” rather than “audit services”) | | up to $25,000 in the aggregate |
| |
| Audit-Related Services | | |
| |
| Consultations by Fund management as to the accounting or disclosure treatment of transactions or events and /or the actual or potential impact of final or proposed rules, standards or interpretations by the SEC, FASB, or other regulatory or standard-setting bodies (Note: Under SEC rules, some consultations may be considered “audit services” rather than “audit-related services”) | | up to $25,000 in the aggregate |
| |
| Tax Services | | |
| |
| U.S. federal, state and local and international tax planning and advice (e.g., consulting on statutory, regulatory or administrative developments, evaluation of Funds’ tax compliance function, etc.) | | up to $25,000 in the aggregate |
| |
| U.S. federal, state and local tax compliance (e.g., excise distribution reviews, etc.) | | up to $5,000 per Fund |
| |
| Review of federal, state, local and international income, franchise and other tax returns | | up to $5,000 per Fund |
Under the Pre-Approval Policy, the Audit Committee has also pre-approved the services set forth in the table below with respect to the registrant’s investment adviser and other entities controlling, controlled by or under common control with the investment adviser that provide ongoing services to the registrant (the “Control Affiliates”) up to the specified fee limit. This fee limit is based on aggregate fees to the investment adviser and its Control Affiliates.
| | |
Service | | Range of Fees |
Non-Audit Services | | |
| |
| Services associated with periodic reports and other documents filed with the SEC and assistance in responding to SEC comment letters | | up to $10,000 in the aggregate |
The Pre-Approval Policy requires the registrant’s independent auditors to report to the Audit Committee at each of its regular meetings regarding all services initiated since the last such report was rendered, including those services authorized by the Pre-Approval Policy.
| (e)(2) | The percentage of services described in each of paragraphs (b) through (d) of this Item that were approved by the audit committee pursuant to paragraph (c)(7)(i)(C) of Rule 2-01 of Regulation S-X are as follows: |
(b) 0%
(c) 0%
(d) 0%
| | (g) | The aggregate non-audit fees billed by the registrant’s accountant for services rendered to the registrant, and rendered to the registrant’s investment adviser (not including any sub-adviser whose role is primarily portfolio management and is subcontracted with or overseen by another investment adviser), and any entity controlling, controlled by, or under common control with the adviser that provides ongoing services to the registrant for each of the last two fiscal years of the registrant was $17,300,000 for 2024 and $24,428,000 for 2023. |
| | (h) | The audit committee of the registrant’s board of trustees has considered whether the provision of non-audit services that were rendered to the registrant’s investment adviser (not including any sub-adviser whose role is primarily portfolio management and is subcontracted with or overseen by another investment adviser), and any entity controlling, controlled by, or under common control with the investment adviser that provides ongoing services to the registrant that were not pre-approved pursuant to paragraph (c)(7)(ii) of Rule 2-01 of Regulation S-X is compatible with maintaining the principal accountant’s independence. |
| Item 5. | Audit Committee of Listed Registrants. |
Not applicable.
| (a) | Schedule of Investments in securities of unaffiliated issuers as of the close of the reporting period is included as part of the Financial Statements filed under Item 7 of this form. |
| Item 7. | Financial Statements and Financial Highlights for Open-End Management Investment Companies. |
| (a) | An open-end management investment company registered on Form N-1A [17 CFR 239.15A and 17 CFR 274.11A] must file its most recent annual or semi-annual financial statements required, and for the periods specified, by Regulation S-X. |
The annual financial statements are attached herewith.
| (b) | An open-end management investment company registered on Form N-1A [17 CFR 239.15A and 17 CFR 274.11A] must file the information required by Item 13 of Form N-1A. |
The Financial Highlights are attached herewith.
Fixed income mutual funds
Delaware Corporate Bond Fund
Delaware Extended Duration Bond Fund
Financial statements and other information
For the year ended July 31, 2024
This report and the financial statements contained herein are submitted for the general information of the shareholders of the Funds. This report is not authorized for distribution to prospective investors in the Funds unless preceded or accompanied by an effective prospectus.
Form N-PORT and proxy voting information
Each Fund files its complete schedule of portfolio holdings with the Securities and Exchange Commission (SEC) for the first and third quarters of each fiscal year on Form N-PORT. Each Fund’s Form N-PORT, as well as a description of the policies and procedures that the Funds use to determine how to vote proxies (if any) relating to portfolio securities, are available without charge (i) upon request, by calling 800 523-1918; and (ii) on the SEC’s website at sec.gov. In addition, a description of the policies and procedures that the Funds use to determine how to vote proxies (if any) relating to portfolio securities and the Schedule of Investments included in the Funds’ most recent Form N-PORT are available without charge on the Funds’ website at delawarefunds.com/literature.
Information (if any) regarding how the Funds voted proxies relating to portfolio securities during the most recently disclosed 12-month period ended June 30 is available without charge (i) through the Funds’ website at delawarefunds.com/proxy; and (ii) on the SEC’s website at sec.gov.
Schedules of investments
| Delaware Corporate Bond Fund | July 31, 2024 |
| | | Principal
amount° | Value (US $) |
| Corporate Bonds — 96.31% |
| Banking — 24.29% |
| Ally Financial 6.184% 7/26/35 μ | | 2,540,000 | $ 2,553,050 |
| Banco Santander 8.00% 2/1/34 μ, ψ | | 4,600,000 | 4,653,291 |
| Bank of America | | | |
| 2.482% 9/21/36 μ | | 5,770,000 | 4,736,352 |
| 5.468% 1/23/35 μ | | 3,850,000 | 3,938,208 |
| 5.819% 9/15/29 μ | | 17,970,000 | 18,611,491 |
| 6.204% 11/10/28 μ | | 6,820,000 | 7,102,598 |
| Bank of Montreal | | | |
| 7.30% 11/26/84 μ | | 3,115,000 | 3,153,277 |
| 7.70% 5/26/84 μ | | 5,897,000 | 6,084,472 |
|
|
| Bank of New York Mellon 4.70% 9/20/25 μ, ψ | | 10,250,000 | 10,100,666 |
| Barclays | | | |
| 6.224% 5/9/34 μ | | 5,978,000 | 6,293,696 |
| 9.625% 12/15/29 μ, ψ | | 6,980,000 | 7,640,322 |
|
|
| Citibank 5.57% 4/30/34 | | 8,900,000 | 9,261,125 |
| Citigroup | | | |
| 7.00% 8/15/34 μ, ψ | | 2,710,000 | 2,755,817 |
| 7.125% 8/15/29 μ, ψ | | 6,430,000 | 6,450,937 |
|
|
| Citizens Bank 6.064% 10/24/25 μ | | 3,760,000 | 3,751,551 |
| Credit Agricole 144A 6.316% 10/3/29 #, μ | | 381,000 | 397,868 |
| Deutsche Bank | | | |
| 6.72% 1/18/29 μ | | 3,746,000 | 3,913,273 |
| 6.819% 11/20/29 μ | | 4,903,000 | 5,188,049 |
| 7.146% 7/13/27 μ | | 4,120,000 | 4,258,819 |
|
|
| Fifth Third Bancorp 5.631% 1/29/32 μ | | 5,580,000 | 5,674,767 |
| Fifth Third Bank 5.852% 10/27/25 μ | | 3,305,000 | 3,306,339 |
| Goldman Sachs Group | | | |
| 5.049% 7/23/30 μ | | 11,820,000 | 11,881,164 |
| 5.727% 4/25/30 μ | | 3,525,000 | 3,641,871 |
| 5.851% 4/25/35 μ | | 4,050,000 | 4,233,737 |
| 6.484% 10/24/29 μ | | 8,145,000 | 8,621,220 |
| 7.50% 5/10/29 μ, ψ | | 6,700,000 | 6,922,179 |
| Huntington National Bank | | | |
| 4.552% 5/17/28 μ | | 3,488,000 | 3,442,379 |
| 5.699% 11/18/25 μ | | 3,690,000 | 3,689,354 |
| JPMorgan Chase & Co. | | | |
| 5.571% 4/22/28 μ | | 9,660,000 | 9,842,476 |
| 5.766% 4/22/35 μ | | 6,210,000 | 6,510,953 |
| 6.254% 10/23/34 μ | | 8,497,000 | 9,201,604 |
Schedules of investments
Delaware Corporate Bond Fund
| | | Principal
amount° | Value (US $) |
| Corporate Bonds (continued) |
| Banking (continued) |
| KeyBank | | | |
| 4.15% 8/8/25 | | 1,439,000 | $ 1,420,683 |
| 5.85% 11/15/27 | | 3,703,000 | 3,753,341 |
|
|
| KeyCorp 6.628% (SOFR03M + 1.25%) 5/23/25 • | | 4,060,000 | 4,064,271 |
| Lloyds Banking Group 5.721% 6/5/30 μ | | 2,900,000 | 2,984,139 |
| Morgan Stanley | | | |
| 2.484% 9/16/36 μ | | 4,309,000 | 3,495,438 |
| 5.831% 4/19/35 μ | | 11,921,000 | 12,460,692 |
| 6.407% 11/1/29 μ | | 7,610,000 | 8,051,449 |
| 6.627% 11/1/34 μ | | 6,485,000 | 7,152,912 |
| Morgan Stanley Bank | | | |
| 4.968% 7/14/28 μ | | 3,155,000 | 3,170,536 |
| 5.504% 5/26/28 μ | | 1,870,000 | 1,903,739 |
|
|
| PNC Financial Services Group 5.401% 7/23/35 μ | | 3,785,000 | 3,826,243 |
| Popular 7.25% 3/13/28 | | 7,805,000 | 8,148,756 |
| Societe Generale 144A 7.132% 1/19/55 #, μ | | 4,675,000 | 4,618,239 |
| State Street | | | |
| 4.993% 3/18/27 | | 5,100,000 | 5,151,891 |
| 6.123% 11/21/34 μ | | 6,450,000 | 6,864,662 |
| SVB Financial Group | | | |
| 1.80% 2/2/31 ‡ | | 2,597,000 | 1,555,032 |
| 2.10% 5/15/28 ‡ | | 995,000 | 598,781 |
| 4.00% 5/15/26 ‡, ψ | | 4,372,000 | 16,395 |
| 4.57% 4/29/33 ‡ | | 2,833,000 | 1,673,531 |
|
|
| Truist Bank 2.636% 9/17/29 μ | | 8,210,000 | 8,100,448 |
| Truist Financial 4.95% 9/1/25 μ, ψ | | 10,180,000 | 10,003,114 |
| UBS Group | | | |
| 144A 5.699% 2/8/35 #, μ | | 2,095,000 | 2,144,664 |
| 144A 9.25% 11/13/28 #, μ, ψ | | 6,065,000 | 6,618,249 |
| US Bancorp | | | |
| 2.491% 11/3/36 μ | | 5,730,000 | 4,621,569 |
| 6.787% 10/26/27 μ | | 2,720,000 | 2,824,870 |
|
|
| Wells Fargo Bank 5.254% 12/11/26 | | 5,180,000 | 5,241,402 |
| | 308,277,951 |
| Basic Industry — 2.52% |
| Freeport-McMoRan 5.45% 3/15/43 | | 14,635,000 | 14,047,403 |
| LYB International Finance III | | | |
| 3.625% 4/1/51 | | 14,095,000 | 9,972,843 |
| 5.50% 3/1/34 | | 3,285,000 | 3,331,593 |
|
|
| | | Principal
amount° | Value (US $) |
| Corporate Bonds (continued) |
| Basic Industry (continued) |
|
| Sherwin-Williams 2.90% 3/15/52 | | 7,185,000 | $ 4,615,808 |
| | 31,967,647 |
| Brokerage — 1.47% |
| Jefferies Financial Group | | | |
| 2.625% 10/15/31 | | 4,629,000 | 3,863,839 |
| 5.875% 7/21/28 | | 1,470,000 | 1,511,231 |
| 6.20% 4/14/34 | | 10,680,000 | 11,090,177 |
| 6.50% 1/20/43 | | 2,090,000 | 2,241,604 |
| | 18,706,851 |
| Capital Goods — 6.95% |
| Amphenol | | | |
| 2.20% 9/15/31 | | 6,420,000 | 5,415,594 |
| 5.05% 4/5/27 | | 2,325,000 | 2,350,200 |
| Ashtead Capital | | | |
| 144A 1.50% 8/12/26 # | | 8,495,000 | 7,877,979 |
| 144A 5.80% 4/15/34 # | | 3,550,000 | 3,614,226 |
| 144A 5.95% 10/15/33 # | | 3,125,000 | 3,211,646 |
| BAE Systems | | | |
| 144A 5.125% 3/26/29 # | | 6,665,000 | 6,755,108 |
| 144A 5.30% 3/26/34 # | | 6,105,000 | 6,189,672 |
|
|
| Boeing 2.196% 2/4/26 | | 13,870,000 | 13,204,221 |
| Howmet Aerospace 5.95% 2/1/37 | | 10,745,000 | 11,302,010 |
| Ingersoll Rand | | | |
| 5.314% 6/15/31 | | 3,900,000 | 4,018,357 |
| 5.45% 6/15/34 | | 5,655,000 | 5,834,446 |
|
|
| John Deere Capital 5.05% 6/12/34 | | 3,765,000 | 3,829,246 |
| L3Harris Technologies 5.25% 6/1/31 | | 4,940,000 | 5,034,458 |
| Northrop Grumman 5.20% 6/1/54 | | 6,700,000 | 6,452,386 |
| Waste Connections 2.95% 1/15/52 | | 4,760,000 | 3,154,758 |
| | 88,244,307 |
| Communications — 7.72% |
| American Tower | | | |
| 2.30% 9/15/31 | | 12,525,000 | 10,496,818 |
| 5.45% 2/15/34 | | 5,370,000 | 5,478,001 |
|
|
| AT&T 3.50% 9/15/53 | | 16,360,000 | 11,447,198 |
| CCO Holdings | | | |
| 144A 4.75% 2/1/32 # | | 3,870,000 | 3,313,909 |
| 144A 6.375% 9/1/29 # | | 2,005,000 | 1,953,450 |
|
|
| Cellnex Finance 144A 3.875% 7/7/41 # | | 8,702,000 | 7,027,623 |
Schedules of investments
Delaware Corporate Bond Fund
| | | Principal
amount° | Value (US $) |
| Corporate Bonds (continued) |
| Communications (continued) |
|
| Charter Communications Operating 3.85% 4/1/61 | | 11,195,000 | $ 6,764,430 |
| Netflix 4.90% 8/15/34 | | 4,085,000 | 4,109,256 |
| Rogers Communications | | | |
| 5.00% 2/15/29 | | 4,045,000 | 4,059,579 |
| 5.30% 2/15/34 | | 7,220,000 | 7,239,885 |
|
|
| Sprint Capital 6.875% 11/15/28 | | 6,625,000 | 7,108,168 |
| Sprint Spectrum 144A 4.738% 9/20/29 # | | 786,562 | 784,130 |
| Time Warner Cable 7.30% 7/1/38 | | 2,930,000 | 3,056,790 |
| T-Mobile USA | | | |
| 3.375% 4/15/29 | | 7,045,000 | 6,609,039 |
| 5.50% 1/15/55 | | 3,295,000 | 3,258,272 |
| 5.75% 1/15/34 | | 4,060,000 | 4,270,272 |
| Verizon Communications | | | |
| 2.875% 11/20/50 | | 8,640,000 | 5,592,272 |
| 5.50% 2/23/54 | | 2,475,000 | 2,483,333 |
|
|
| VZ Secured Financing 144A 5.00% 1/15/32 # | | 3,340,000 | 2,933,826 |
| | 97,986,251 |
| Consumer Cyclical — 6.80% |
| Alimentation Couche-Tard | | | |
| 144A 5.267% 2/12/34 # | | 9,410,000 | 9,496,005 |
| 144A 5.617% 2/12/54 # | | 905,000 | 917,258 |
|
|
| Amazon.com 2.50% 6/3/50 | | 7,625,000 | 4,800,903 |
| Aptiv 3.10% 12/1/51 | | 7,419,000 | 4,628,015 |
| Ford Motor Credit | | | |
| 6.125% 3/8/34 | | 2,780,000 | 2,784,957 |
| 6.798% 11/7/28 | | 1,810,000 | 1,898,270 |
| 6.80% 5/12/28 | | 4,875,000 | 5,085,927 |
| 6.95% 3/6/26 | | 2,435,000 | 2,488,652 |
| 6.95% 6/10/26 | | 3,335,000 | 3,426,351 |
| General Motors | | | |
| 5.40% 4/1/48 | | 2,450,000 | 2,230,528 |
| 5.95% 4/1/49 | | 1,426,000 | 1,405,379 |
| 6.25% 10/2/43 | | 6,670,000 | 6,793,311 |
| General Motors Financial | | | |
| 5.60% 6/18/31 | | 1,895,000 | 1,918,123 |
| 5.95% 4/4/34 | | 1,940,000 | 1,978,071 |
| Home Depot | | | |
| 4.85% 6/25/31 | | 4,685,000 | 4,751,894 |
| 4.875% 6/25/27 | | 1,650,000 | 1,668,670 |
| 4.95% 6/25/34 | | 4,410,000 | 4,455,000 |
| | | Principal
amount° | Value (US $) |
| Corporate Bonds (continued) |
| Consumer Cyclical (continued) |
| Hyundai Capital America | | | |
| 144A 5.275% 6/24/27 # | | 2,490,000 | $ 2,512,589 |
| 144A 5.30% 3/19/27 # | | 5,440,000 | 5,484,964 |
| 144A 5.40% 6/24/31 # | | 7,005,000 | 7,121,253 |
| VICI Properties | | | |
| 4.95% 2/15/30 | | 7,065,000 | 6,928,366 |
| 5.75% 4/1/34 | | 3,475,000 | 3,530,141 |
| | 86,304,627 |
| Consumer Non-Cyclical — 8.38% |
| AbbVie | | | |
| 4.95% 3/15/31 | | 6,345,000 | 6,471,942 |
| 5.35% 3/15/44 | | 11,875,000 | 12,076,595 |
|
|
| Bimbo Bakeries USA 144A 4.00% 5/17/51 # | | 3,540,000 | 2,758,469 |
| Bunge Limited Finance 2.75% 5/14/31 | | 6,130,000 | 5,379,270 |
| Campbell Soup 5.20% 3/19/27 | | 5,775,000 | 5,860,290 |
| Coca-Cola Consolidated 5.25% 6/1/29 | | 8,985,000 | 9,193,174 |
| Gilead Sciences 4.80% 4/1/44 | | 10,235,000 | 9,444,966 |
| HCA | | | |
| 3.50% 7/15/51 | | 8,384,000 | 5,761,299 |
| 5.45% 4/1/31 | | 3,210,000 | 3,274,526 |
| 6.00% 4/1/54 | | 4,490,000 | 4,527,358 |
|
|
| JBS USA Holding Lux 3.00% 2/2/29 | | 4,090,000 | 3,707,086 |
| Merck & Co. 2.75% 12/10/51 | | 15,502,000 | 10,007,716 |
| Perrigo Finance Unlimited 4.375% 3/15/26 | | 7,415,000 | 7,255,213 |
| Roche Holdings 144A 4.909% 3/8/31 # | | 6,060,000 | 6,165,848 |
| Royalty Pharma | | | |
| 1.20% 9/2/25 | | 3,750,000 | 3,590,337 |
| 3.35% 9/2/51 | | 15,728,000 | 10,389,049 |
| 5.90% 9/2/54 | | 447,000 | 445,025 |
| | 106,308,163 |
| Electric — 10.04% |
| AEP Texas 5.45% 5/15/29 | | 3,950,000 | 4,037,864 |
| Appalachian Power 4.50% 8/1/32 | | 4,140,000 | 3,925,680 |
| Baltimore Gas and Electric | | | |
| 5.30% 6/1/34 | | 2,270,000 | 2,317,751 |
| 5.65% 6/1/54 | | 3,920,000 | 4,017,186 |
|
|
| Berkshire Hathaway Energy 2.85% 5/15/51 | | 5,078,000 | 3,245,902 |
| CenterPoint Energy Houston Electric 5.20% 10/1/28 | | 4,100,000 | 4,184,855 |
| Commonwealth Edison 2.75% 9/1/51 | | 9,525,000 | 5,933,389 |
| Constellation Energy Generation 5.75% 3/15/54 | | 5,235,000 | 5,220,087 |
Schedules of investments
Delaware Corporate Bond Fund
| | | Principal
amount° | Value (US $) |
| Corporate Bonds (continued) |
| Electric (continued) |
| Dominion Energy | | | |
| Series A 6.875% 2/1/55 μ | | 9,515,000 | $ 9,881,132 |
| Series B 7.00% 6/1/54 μ | | 3,210,000 | 3,379,160 |
|
|
| Duke Energy Indiana 5.40% 4/1/53 | | 4,580,000 | 4,497,625 |
| Edison International 8.125% 6/15/53 μ | | 3,852,000 | 4,045,135 |
| Fells Point Funding Trust 144A 3.046% 1/31/27 # | | 4,685,000 | 4,465,813 |
| NextEra Energy Capital Holdings | | | |
| 5.55% 3/15/54 | | 9,579,000 | 9,470,351 |
| 6.75% 6/15/54 μ | | 6,070,000 | 6,324,715 |
|
|
| Northern States Power 5.40% 3/15/54 | | 6,975,000 | 6,952,582 |
| Oglethorpe Power | | | |
| 3.75% 8/1/50 | | 5,235,000 | 3,861,458 |
| 4.50% 4/1/47 | | 7,040,000 | 5,874,305 |
| 5.25% 9/1/50 | | 3,995,000 | 3,726,575 |
| 6.20% 12/1/53 | | 1,195,000 | 1,261,799 |
| Pacific Gas & Electric | | | |
| 3.50% 8/1/50 | | 11,615,000 | 7,851,754 |
| 5.55% 5/15/29 | | 2,705,000 | 2,764,004 |
|
|
| PacifiCorp 2.90% 6/15/52 | | 6,889,000 | 4,203,717 |
| Public Service Co. of Oklahoma 3.15% 8/15/51 | | 5,235,000 | 3,473,658 |
| Vistra Operations 144A 6.95% 10/15/33 # | | 11,477,000 | 12,475,350 |
| | 127,391,847 |
| Energy — 11.73% |
| Apache 5.10% 9/1/40 | | 9,630,000 | 8,436,543 |
| BP Capital Markets 4.875% 3/22/30 μ, ψ | | 10,680,000 | 10,123,271 |
| BP Capital Markets America 2.939% 6/4/51 | | 4,970,000 | 3,272,046 |
| Cheniere Energy Partners | | | |
| 4.50% 10/1/29 | | 6,453,000 | 6,249,027 |
| 144A 5.75% 8/15/34 # | | 3,695,000 | 3,769,199 |
|
|
| ConocoPhillips 5.55% 3/15/54 | | 3,735,000 | 3,765,999 |
| Diamondback Energy | | | |
| 5.20% 4/18/27 | | 2,220,000 | 2,244,877 |
| 5.40% 4/18/34 | | 2,479,000 | 2,510,569 |
| 5.75% 4/18/54 | | 8,455,000 | 8,375,992 |
| 6.25% 3/15/33 | | 2,575,000 | 2,751,823 |
| Enbridge | | | |
| 5.75% 7/15/80 μ | | 9,596,000 | 9,119,607 |
| 7.20% 6/27/54 μ | | 3,365,000 | 3,432,953 |
| | | Principal
amount° | Value (US $) |
| Corporate Bonds (continued) |
| Energy (continued) |
| Energy Transfer | | | |
| 5.95% 5/15/54 | | 3,705,000 | $ 3,661,505 |
| 6.10% 12/1/28 | | 2,415,000 | 2,519,577 |
| 6.25% 4/15/49 | | 3,415,000 | 3,499,478 |
| 6.50% 11/15/26 μ, ψ | | 11,164,000 | 11,119,036 |
| 8.00% 5/15/54 μ | | 1,680,000 | 1,789,577 |
| Eni | | | |
| 144A 5.50% 5/15/34 # | | 2,470,000 | 2,520,612 |
| 144A 5.95% 5/15/54 # | | 6,200,000 | 6,286,303 |
|
|
| Galaxy Pipeline Assets Bidco 144A 2.94% 9/30/40 # | | 3,896,644 | 3,172,865 |
| Kinder Morgan | | | |
| 5.00% 2/1/29 | | 1,790,000 | 1,804,106 |
| 5.20% 6/1/33 | | 10,435,000 | 10,373,884 |
| Occidental Petroleum | | | |
| 5.375% 1/1/32 | | 2,485,000 | 2,510,717 |
| 5.55% 10/1/34 | | 1,720,000 | 1,730,492 |
| 6.05% 10/1/54 | | 1,660,000 | 1,669,941 |
| 6.20% 3/15/40 | | 1,608,000 | 1,654,331 |
| 6.60% 3/15/46 | | 6,211,000 | 6,618,914 |
| 7.95% 6/15/39 | | 1,826,000 | 2,171,351 |
| Targa Resources Partners | | | |
| 4.00% 1/15/32 | | 3,905,000 | 3,560,214 |
| 5.00% 1/15/28 | | 13,331,000 | 13,216,431 |
|
|
| Transcanada Trust 5.625% 5/20/75 μ | | 1,754,000 | 1,736,028 |
| Venture Global LNG 144A 8.375% 6/1/31 # | | 3,036,000 | 3,192,362 |
| | 148,859,630 |
| Finance Companies — 3.97% |
| AerCap Ireland Capital DAC | | | |
| 3.00% 10/29/28 | | 10,525,000 | 9,742,432 |
| 5.10% 1/19/29 | | 2,205,000 | 2,219,807 |
| Air Lease | | | |
| 4.125% 12/15/26 μ, ψ | | 5,546,000 | 5,106,877 |
| 4.625% 10/1/28 | | 1,843,000 | 1,818,724 |
| 5.10% 3/1/29 | | 1,333,000 | 1,343,067 |
| 5.20% 7/15/31 | | 3,605,000 | 3,604,899 |
| Apollo Debt Solutions BDC | | | |
| 144A 6.70% 7/29/31 # | | 3,910,000 | 3,958,274 |
| 144A 6.90% 4/13/29 # | | 1,115,000 | 1,144,569 |
|
|
| Ares Capital 5.95% 7/15/29 | | 2,735,000 | 2,744,838 |
Schedules of investments
Delaware Corporate Bond Fund
| | | Principal
amount° | Value (US $) |
| Corporate Bonds (continued) |
| Finance Companies (continued) |
| Aviation Capital Group | | | |
| 144A 1.95% 1/30/26 # | | 9,032,000 | $ 8,582,923 |
| 144A 1.95% 9/20/26 # | | 2,535,000 | 2,369,815 |
| 144A 5.375% 7/15/29 # | | 4,350,000 | 4,369,467 |
| 144A 6.375% 7/15/30 # | | 1,540,000 | 1,623,534 |
|
|
| Blue Owl Credit Income 144A 6.60% 9/15/29 # | | 1,705,000 | 1,720,284 |
| | 50,349,510 |
| Insurance — 4.84% |
| Aon North America | | | |
| 5.125% 3/1/27 | | 3,830,000 | 3,874,204 |
| 5.30% 3/1/31 | | 8,840,000 | 9,011,585 |
| Athene Global Funding | | | |
| 144A 1.985% 8/19/28 # | | 18,309,000 | 16,234,634 |
| 144A 2.50% 3/24/28 # | | 3,455,000 | 3,149,214 |
| 144A 2.717% 1/7/29 # | | 3,205,000 | 2,908,487 |
| Athene Holding | | | |
| 3.45% 5/15/52 | | 3,215,000 | 2,102,944 |
| 6.25% 4/1/54 | | 2,505,000 | 2,557,563 |
| Elevance Health | | | |
| 5.15% 6/15/29 | | 1,650,000 | 1,683,618 |
| 5.375% 6/15/34 | | 2,545,000 | 2,611,951 |
|
|
| Hartford Financial Services Group 2.90% 9/15/51 | | 6,100,000 | 3,960,976 |
| Pine Street Trust III 144A 6.223% 5/15/54 # | | 5,345,000 | 5,499,619 |
| UnitedHealth Group | | | |
| 5.375% 4/15/54 | | 2,935,000 | 2,914,596 |
| 5.50% 7/15/44 | | 4,795,000 | 4,852,600 |
| | 61,361,991 |
| Natural Gas — 1.11% |
| Engie | | | |
| 144A 5.25% 4/10/29 # | | 3,205,000 | 3,252,267 |
| 144A 5.875% 4/10/54 # | | 4,638,000 | 4,633,761 |
|
|
| Sempra 4.875% 10/15/25 μ, ψ | | 6,363,000 | 6,248,960 |
| | 14,134,988 |
| Real Estate Investment Trusts — 1.08% |
| American Homes 4 Rent 5.50% 7/15/34 | | 6,565,000 | 6,611,736 |
| Extra Space Storage | | | |
| 2.35% 3/15/32 | | 5,465,000 | 4,470,595 |
| 2.55% 6/1/31 | | 3,095,000 | 2,638,645 |
| | 13,720,976 |
| | | Principal
amount° | Value (US $) |
| Corporate Bonds (continued) |
| Technology — 4.96% |
| Broadcom | | | |
| 144A 3.469% 4/15/34 # | | 5,267,000 | $ 4,602,373 |
| 5.05% 7/12/29 | | 3,960,000 | 4,009,950 |
| 5.15% 11/15/31 | | 2,480,000 | 2,513,048 |
|
|
| CDW 3.276% 12/1/28 | | 12,755,000 | 11,821,014 |
| CoStar Group 144A 2.80% 7/15/30 # | | 7,012,000 | 6,108,584 |
| Entegris | | | |
| 144A 4.75% 4/15/29 # | | 4,410,000 | 4,259,109 |
| 144A 5.95% 6/15/30 # | | 3,680,000 | 3,674,549 |
|
|
| Marvell Technology 1.65% 4/15/26 | | 5,585,000 | 5,284,554 |
| Oracle | | | |
| 3.60% 4/1/50 | | 9,110,000 | 6,536,325 |
| 6.125% 7/8/39 | | 9,415,000 | 9,991,354 |
|
|
| Sensata Technologies 144A 3.75% 2/15/31 # | | 4,730,000 | 4,181,847 |
| | 62,982,707 |
| Transportation — 0.45% |
| ERAC USA Finance 144A 5.625% 3/15/42 # | | 5,505,000 | 5,648,030 |
| | 5,648,030 |
| Total Corporate Bonds (cost $1,240,508,180) | 1,222,245,476 |
|
|
|
| Municipal Bonds — 0.31% |
GDB Debt Recovery Authority of Puerto Rico Revenue
7.50% 8/20/40 | | 4,037,268 | 3,926,243 |
| Total Municipal Bonds (cost $3,841,688) | 3,926,243 |
|
|
|
| Non-Agency Asset-Backed Securities — 1.11% |
| Frontier Issuer Series 2024-1 A2 144A 6.19% 6/20/54 # | | 13,700,000 | 14,068,285 |
| Total Non-Agency Asset-Backed Securities (cost $13,695,095) | 14,068,285 |
|
|
|
| Loan Agreements — 0.55% |
| Capital Goods — 0.55% |
| Standard Industries 7.345% (SOFR01M + 2.00%) 9/22/28 • | | 6,906,785 | 6,931,249 |
| Total Loan Agreements (cost $6,906,785) | 6,931,249 |
Schedules of investments
Delaware Corporate Bond Fund
| | | Number of
shares | Value (US $) |
| Convertible Preferred Stock — 0.08% |
| Energy — 0.08% | | | |
| El Paso Energy Capital Trust I 4.75% exercise price $34.49, maturity date 3/31/28 | | 22,731 | $ 1,072,903 |
| Total Convertible Preferred Stock (cost $1,136,296) | 1,072,903 |
|
|
|
| Short-Term Investments — 1.22% |
| Money Market Mutual Funds — 1.22% |
| BlackRock Liquidity FedFund – Institutional Shares (seven-day effective yield 5.21%) | | 3,854,266 | 3,854,266 |
| Fidelity Investments Money Market Government Portfolio – Class I (seven-day effective yield 5.22%) | | 3,854,266 | 3,854,266 |
| Goldman Sachs Financial Square Government Fund – Institutional Shares (seven-day effective yield 5.35%) | | 3,854,266 | 3,854,266 |
| Morgan Stanley Institutional Liquidity Funds Government Portfolio – Institutional Class (seven-day effective yield 5.21%) | | 3,854,266 | 3,854,266 |
| Total Short-Term Investments (cost $15,417,064) | 15,417,064 |
Total Value of Securities—99.58%
(cost $1,281,505,108) | | | $1,263,661,220 |
| ° | Principal amount shown is stated in USD unless noted that the security is denominated in another currency. |
| μ | Fixed to variable rate investment. The rate shown reflects the fixed rate in effect at July 31, 2024. Rate will reset at a future date. |
| ψ | Perpetual security. Maturity date represents next call date. |
| # | Security exempt from registration under Rule 144A of the Securities Act of 1933, as amended. At July 31, 2024, the aggregate value of Rule 144A securities was $229,769,104, which represents 18.11% of the Fund’s net assets. See Note 11 in “Notes to financial statements.” |
| • | Variable rate investment. Rates reset periodically. Rate shown reflects the rate in effect at July 31, 2024. For securities based on a published reference rate and spread, the reference rate and spread are indicated in their descriptions. The reference rate descriptions (i.e. SOFR01M, SOFR03M, etc.) used in this report are identical for different securities, but the underlying reference rates may differ due to the timing of the reset period. Certain variable rate securities are not based on a published reference rate and spread but are determined by the issuer or agent and are based on current market conditions, or for mortgage-backed securities, are impacted by the individual mortgages which are paying off over time. These securities do not indicate a reference rate and spread in their descriptions. |
| ‡ | Non-income producing security. Security is currently in default. |
| Summary of abbreviations: |
| BDC – Business Development Company |
| DAC – Designated Activity Company |
| LNG – Liquefied Natural Gas |
| SOFR01M – Secured Overnight Financing Rate 1 Month |
| SOFR03M – Secured Overnight Financing Rate 3 Month |
| USD – US Dollar |
See accompanying notes, which are an integral part of the financial statements.
Schedules of investments
| Delaware Extended Duration Bond Fund | July 31, 2024 |
| | | Principal
amount° | Value (US $) |
| Corporate Bonds — 96.47% |
| Banking — 9.34% |
| Banco Santander 8.00% 2/1/34 μ, ψ | | 1,800,000 | $ 1,820,853 |
| Bank of America 2.676% 6/19/41 μ | | 8,405,000 | 6,026,209 |
| Bank of Montreal 7.70% 5/26/84 μ | | 2,260,000 | 2,331,848 |
| Bank of New York Mellon 4.70% 9/20/25 μ, ψ | | 2,600,000 | 2,562,120 |
| Barclays 9.625% 12/15/29 μ, ψ | | 2,230,000 | 2,440,962 |
| Citigroup 7.125% 8/15/29 μ, ψ | | 2,360,000 | 2,367,685 |
| Goldman Sachs Group | | | |
| 2.908% 7/21/42 μ | | 6,110,000 | 4,423,794 |
| 7.50% 5/10/29 μ, ψ | | 2,385,000 | 2,464,089 |
|
|
| JPMorgan Chase & Co. 3.109% 4/22/51 μ | | 8,795,000 | 6,184,281 |
| Morgan Stanley | | | |
| 2.802% 1/25/52 μ | | 7,800,000 | 5,112,021 |
| 6.627% 11/1/34 μ | | 1,840,000 | 2,029,508 |
|
|
| Societe Generale 144A 7.132% 1/19/55 #, μ | | 1,925,000 | 1,901,628 |
| Truist Financial 4.95% 9/1/25 μ, ψ | | 2,365,000 | 2,323,906 |
| UBS Group 144A 9.25% 11/13/28 #, μ, ψ | | 2,220,000 | 2,422,508 |
| | 44,411,412 |
| Basic Industry — 4.67% |
| Dow Chemical 5.60% 2/15/54 | | 5,825,000 | 5,751,063 |
| Freeport-McMoRan 5.45% 3/15/43 | | 6,005,000 | 5,763,899 |
| LYB International Finance III 3.625% 4/1/51 | | 7,630,000 | 5,398,566 |
| Packaging Corp. of America | | | |
| 3.05% 10/1/51 | | 2,915,000 | 1,975,118 |
| 4.05% 12/15/49 | | 2,200,000 | 1,766,308 |
|
|
| Sherwin-Williams 2.90% 3/15/52 | | 2,415,000 | 1,551,451 |
| | 22,206,405 |
| Brokerage — 0.78% |
| Jefferies Financial Group 6.50% 1/20/43 | | 3,480,000 | 3,732,431 |
| | 3,732,431 |
| Capital Goods — 8.05% |
| BAE Systems 144A 5.50% 3/26/54 # | | 4,630,000 | 4,639,184 |
| Boeing 2.196% 2/4/26 | | 1,715,000 | 1,632,678 |
| Carrier Global 3.577% 4/5/50 | | 6,455,000 | 4,871,046 |
| Howmet Aerospace 5.95% 2/1/37 | | 5,630,000 | 5,921,853 |
| Ingersoll Rand 5.70% 6/15/54 | | 4,700,000 | 4,853,867 |
| Northrop Grumman 5.20% 6/1/54 | | 6,750,000 | 6,500,538 |
| Parker-Hannifin 4.00% 6/14/49 | | 2,780,000 | 2,246,903 |
| Republic Services 3.05% 3/1/50 | | 3,765,000 | 2,599,549 |
| | | Principal
amount° | Value (US $) |
| Corporate Bonds (continued) |
| Capital Goods (continued) |
| Waste Connections 2.95% 1/15/52 | | 7,590,000 | $ 5,030,382 |
| | 38,296,000 |
| Communications — 9.57% |
| American Tower 3.10% 6/15/50 | | 9,550,000 | 6,375,012 |
| AT&T 3.50% 9/15/53 | | 9,295,000 | 6,503,772 |
| Cellnex Finance 144A 3.875% 7/7/41 # | | 5,466,000 | 4,414,271 |
| Charter Communications Operating 3.85% 4/1/61 | | 8,225,000 | 4,969,847 |
| Comcast 2.80% 1/15/51 | | 3,355,000 | 2,123,845 |
| Netflix 5.40% 8/15/54 | | 4,145,000 | 4,194,499 |
| Time Warner Cable 7.30% 7/1/38 | | 2,360,000 | 2,462,124 |
| T-Mobile USA | | | |
| 3.00% 2/15/41 | | 9,005,000 | 6,636,311 |
| 5.50% 1/15/55 | | 1,210,000 | 1,196,513 |
| Verizon Communications | | | |
| 2.875% 11/20/50 | | 7,485,000 | 4,844,694 |
| 5.50% 2/23/54 | | 925,000 | 928,114 |
|
|
| VZ Secured Financing 144A 5.00% 1/15/32 # | | 955,000 | 838,863 |
| | 45,487,865 |
| Consumer Cyclical — 5.34% |
| Alimentation Couche-Tard 144A 5.617% 2/12/54 # | | 2,965,000 | 3,005,160 |
| Amazon.com 2.50% 6/3/50 | | 5,190,000 | 3,267,762 |
| Aptiv 3.10% 12/1/51 | | 2,279,000 | 1,421,653 |
| Ford Motor 4.75% 1/15/43 | | 1,995,000 | 1,633,759 |
| General Motors 5.40% 4/1/48 | | 6,290,000 | 5,726,540 |
| Home Depot 5.30% 6/25/54 | | 5,630,000 | 5,606,573 |
| Lowe's 2.80% 9/15/41 | | 6,725,000 | 4,746,205 |
| | 25,407,652 |
| Consumer Non-Cyclical — 7.92% |
| AbbVie | | | |
| 4.25% 11/21/49 | | 3,105,000 | 2,655,282 |
| 5.35% 3/15/44 | | 4,545,000 | 4,622,158 |
|
|
| Bimbo Bakeries USA 144A 4.00% 5/17/51 # | | 1,385,000 | 1,079,231 |
| Gilead Sciences 4.80% 4/1/44 | | 5,360,000 | 4,946,265 |
| HCA | | | |
| 3.50% 7/15/51 | | 4,616,000 | 3,172,013 |
| 6.00% 4/1/54 | | 2,195,000 | 2,213,263 |
|
|
| JBS USA Holding Lux 4.375% 2/2/52 | | 2,580,000 | 1,946,038 |
| Merck & Co. 2.75% 12/10/51 | | 9,025,000 | 5,826,322 |
| Nestle Holdings 144A 2.625% 9/14/51 # | | 3,365,000 | 2,154,943 |
| Royalty Pharma 3.35% 9/2/51 | | 9,283,000 | 6,131,837 |
Schedules of investments
Delaware Extended Duration Bond Fund
| | | Principal
amount° | Value (US $) |
| Corporate Bonds (continued) |
| Consumer Non-Cyclical (continued) |
|
| Takeda Pharmaceutical 3.175% 7/9/50 | | 4,290,000 | $ 2,917,415 |
| | 37,664,767 |
| Electric — 14.99% |
| Arizona Public Service | | | |
| 4.20% 8/15/48 | | 2,720,000 | 2,198,389 |
| 4.25% 3/1/49 | | 2,324,000 | 1,888,922 |
| Baltimore Gas and Electric | | | |
| 4.55% 6/1/52 | | 2,540,000 | 2,198,988 |
| 5.65% 6/1/54 | | 1,440,000 | 1,475,701 |
|
|
| Berkshire Hathaway Energy 2.85% 5/15/51 | | 1,048,000 | 669,891 |
| Commonwealth Edison 2.75% 9/1/51 | | 4,745,000 | 2,955,793 |
| Constellation Energy Generation 5.75% 3/15/54 | | 5,665,000 | 5,648,862 |
| Dominion Energy | | | |
| Series A 6.875% 2/1/55 μ | | 2,570,000 | 2,668,892 |
| Series B 7.00% 6/1/54 μ | | 1,170,000 | 1,231,656 |
|
|
| Dominion Energy South Carolina 6.25% 10/15/53 | | 2,772,000 | 3,085,827 |
| Duke Energy 5.00% 8/15/52 | | 2,490,000 | 2,235,736 |
| Duke Energy Carolinas 5.35% 1/15/53 | | 4,215,000 | 4,157,676 |
| Edison International 8.125% 6/15/53 μ | | 1,327,000 | 1,393,535 |
| NextEra Energy Capital Holdings | | | |
| 3.00% 1/15/52 | | 6,085,000 | 3,951,413 |
| 6.75% 6/15/54 μ | | 2,245,000 | 2,339,207 |
|
|
| Northern States Power 5.40% 3/15/54 | | 2,570,000 | 2,561,740 |
| NSTAR Electric 4.95% 9/15/52 | | 2,635,000 | 2,447,968 |
| Oglethorpe Power | | | |
| 3.75% 8/1/50 | | 3,190,000 | 2,353,018 |
| 4.50% 4/1/47 | | 3,380,000 | 2,820,334 |
| 5.05% 10/1/48 | | 1,295,000 | 1,162,296 |
| 6.20% 12/1/53 | | 410,000 | 432,919 |
|
|
| Pacific Gas & Electric 3.50% 8/1/50 | | 7,450,000 | 5,036,209 |
| PacifiCorp 2.90% 6/15/52 | | 2,905,000 | 1,772,652 |
| Public Service Co. of Oklahoma 3.15% 8/15/51 | | 2,240,000 | 1,486,341 |
| Southern California Edison 4.125% 3/1/48 | | 2,928,000 | 2,355,279 |
| Southwestern Electric Power 3.25% 11/1/51 | | 4,310,000 | 2,827,415 |
| Tampa Electric 3.45% 3/15/51 | | 4,087,000 | 2,915,784 |
| Virginia Electric and Power 2.95% 11/15/51 | | 2,420,000 | 1,564,716 |
| Vistra Operations 144A 6.95% 10/15/33 # | | 3,185,000 | 3,462,054 |
| | 71,299,213 |
| | | Principal
amount° | Value (US $) |
| Corporate Bonds (continued) |
| Energy — 17.09% |
| Apache 5.10% 9/1/40 | | 5,315,000 | $ 4,656,306 |
| BP Capital Markets 4.875% 3/22/30 μ, ψ | | 2,400,000 | 2,274,892 |
| BP Capital Markets America 2.939% 6/4/51 | | 6,320,000 | 4,160,831 |
| ConocoPhillips | | | |
| 5.30% 5/15/53 | | 1,125,000 | 1,097,297 |
| 5.55% 3/15/54 | | 4,240,000 | 4,275,190 |
|
|
| Diamondback Energy 5.75% 4/18/54 | | 9,100,000 | 9,014,965 |
| Enbridge | | | |
| 5.75% 7/15/80 μ | | 2,835,000 | 2,694,256 |
| 6.70% 11/15/53 | | 2,350,000 | 2,627,752 |
| 7.20% 6/27/54 μ | | 1,255,000 | 1,280,344 |
| Energy Transfer | | | |
| 5.00% 5/15/50 | | 2,500,000 | 2,182,246 |
| 5.95% 5/15/54 | | 1,355,000 | 1,339,093 |
| 6.25% 4/15/49 | | 1,700,000 | 1,742,054 |
| 6.50% 11/15/26 μ, ψ | | 2,197,000 | 2,188,151 |
| 8.00% 5/15/54 μ | | 625,000 | 665,765 |
|
|
| Eni 144A 5.95% 5/15/54 # | | 5,405,000 | 5,480,237 |
| Enterprise Products Operating 3.30% 2/15/53 | | 5,680,000 | 3,946,206 |
| Galaxy Pipeline Assets Bidco 144A 2.94% 9/30/40 # | | 1,437,775 | 1,170,716 |
| Kinder Morgan 5.95% 8/1/54 | | 6,375,000 | 6,399,112 |
| Northern Natural Gas 144A 3.40% 10/16/51 # | | 4,505,000 | 3,078,941 |
| Occidental Petroleum | | | |
| 6.05% 10/1/54 | | 615,000 | 618,683 |
| 6.20% 3/15/40 | | 4,590,000 | 4,722,252 |
| 6.60% 3/15/46 | | 354,000 | 377,249 |
| 7.95% 6/15/39 | | 667,000 | 793,150 |
|
|
| Shell International Finance 3.00% 11/26/51 | | 7,410,000 | 4,999,234 |
| Targa Resources 6.50% 2/15/53 | | 4,695,000 | 5,042,802 |
| Transcanada Trust 5.625% 5/20/75 μ | | 647,000 | 640,371 |
| Venture Global LNG 144A 8.375% 6/1/31 # | | 1,091,000 | 1,147,189 |
| Williams 3.50% 10/15/51 | | 3,700,000 | 2,631,352 |
| | 81,246,636 |
| Finance Companies — 1.90% |
| AerCap Holdings 5.875% 10/10/79 μ | | 260,000 | 259,563 |
| AerCap Ireland Capital DAC 3.85% 10/29/41 | | 8,420,000 | 6,795,327 |
| Air Lease 4.125% 12/15/26 μ, ψ | | 1,470,000 | 1,353,608 |
| Blue Owl Credit Income 144A 6.60% 9/15/29 # | | 620,000 | 625,558 |
| | 9,034,056 |
Schedules of investments
Delaware Extended Duration Bond Fund
| | | Principal
amount° | Value (US $) |
| Corporate Bonds (continued) |
| Insurance — 10.62% |
| Aon 2.90% 8/23/51 | | 8,112,000 | $ 5,156,123 |
| Arthur J Gallagher & Co. 3.50% 5/20/51 | | 5,720,000 | 4,065,778 |
| Athene Holding | | | |
| 3.45% 5/15/52 | | 5,065,000 | 3,313,037 |
| 3.95% 5/25/51 | | 945,000 | 692,431 |
| 6.25% 4/1/54 | | 920,000 | 939,305 |
|
|
| Elevance Health 4.55% 5/15/52 | | 5,995,000 | 5,169,680 |
| Hartford Financial Services Group 2.90% 9/15/51 | | 5,520,000 | 3,584,359 |
| Humana 5.75% 4/15/54 | | 4,335,000 | 4,272,644 |
| Marsh & McLennan | | | |
| 5.45% 3/15/53 | | 4,230,000 | 4,239,481 |
| 5.70% 9/15/53 | | 1,403,000 | 1,460,884 |
|
|
| MetLife 5.00% 7/15/52 | | 4,400,000 | 4,127,904 |
| Pine Street Trust III 144A 6.223% 5/15/54 # | | 6,190,000 | 6,369,062 |
| UnitedHealth Group | | | |
| 5.375% 4/15/54 | | 5,330,000 | 5,292,946 |
| 5.50% 7/15/44 | | 1,785,000 | 1,806,442 |
| | 50,490,076 |
| Natural Gas — 3.41% |
| Engie 144A 5.875% 4/10/54 # | | 3,575,000 | 3,571,733 |
| Piedmont Natural Gas 3.64% 11/1/46 | | 4,035,000 | 2,977,354 |
| Southern California Gas 4.30% 1/15/49 | | 4,500,000 | 3,714,468 |
| Southwest Gas | | | |
| 3.80% 9/29/46 | | 2,150,000 | 1,640,570 |
| 4.15% 6/1/49 | | 2,430,000 | 1,908,478 |
|
|
| Spire Missouri 3.30% 6/1/51 | | 3,440,000 | 2,378,732 |
| | 16,191,335 |
| Technology — 1.91% |
| Entegris 144A 5.95% 6/15/30 # | | 749,000 | 747,891 |
| Oracle 3.60% 4/1/50 | | 8,759,000 | 6,284,486 |
| Sensata Technologies 144A 6.625% 7/15/32 # | | 2,000,000 | 2,027,502 |
| | 9,059,879 |
| Transportation — 0.39% |
| ERAC USA Finance 144A 5.625% 3/15/42 # | | 1,820,000 | 1,867,287 |
| | 1,867,287 |
| | | Principal
amount° | Value (US $) |
| Corporate Bonds (continued) |
| Utilities — 0.49% |
| Essential Utilities 4.276% 5/1/49 | | 2,876,000 | $ 2,316,884 |
| | 2,316,884 |
| Total Corporate Bonds (cost $497,915,281) | 458,711,898 |
|
|
|
| Municipal Bonds — 1.71% |
GDB Debt Recovery Authority of Puerto Rico Revenue
7.50% 8/20/40 | | 957,820 | 931,480 |
Long Island, New York Power Authority Electric System Revenue (Build America Bonds)
Series B 5.85% 5/1/41 | | 3,600,000 | 3,773,232 |
New York Metropolitan Transportation Authority Revenue (Build America Bonds)
Series A-2 6.089% 11/15/40 | | 3,205,000 | 3,433,741 |
| Total Municipal Bonds (cost $7,735,563) | 8,138,453 |
|
|
|
| Loan Agreements — 0.53% |
| Capital Goods — 0.53% |
| Standard Industries 7.345% (SOFR01M + 2.00%) 9/22/28 • | | 2,537,754 | 2,546,743 |
| Total Loan Agreements (cost $2,537,754) | 2,546,743 |
| | | Number of
shares | |
| Convertible Preferred Stock — 0.15% |
| Energy — 0.15% | | | |
| El Paso Energy Capital Trust I 4.75% exercise price $34.49, maturity date 3/31/28 | | 14,912 | 703,846 |
| Total Convertible Preferred Stock (cost $740,232) | 703,846 |
|
|
|
| Short-Term Investments — 1.24% |
| Money Market Mutual Funds — 1.24% |
| BlackRock Liquidity FedFund – Institutional Shares (seven-day effective yield 5.21%) | | 1,474,077 | 1,474,077 |
| Fidelity Investments Money Market Government Portfolio – Class I (seven-day effective yield 5.22%) | | 1,474,076 | 1,474,076 |
| Goldman Sachs Financial Square Government Fund – Institutional Shares (seven-day effective yield 5.35%) | | 1,474,076 | 1,474,076 |
Schedules of investments
Delaware Extended Duration Bond Fund
| | | Number of
shares | Value (US $) |
| Short-Term Investments (continued) |
| Money Market Mutual Funds (continued) |
| Morgan Stanley Institutional Liquidity Funds Government Portfolio – Institutional Class (seven-day effective yield 5.21%) | | 1,474,076 | $ 1,474,076 |
| Total Short-Term Investments (cost $5,896,305) | 5,896,305 |
Total Value of Securities—100.10%
(cost $514,825,135) | | | $475,997,245 |
| ° | Principal amount shown is stated in USD unless noted that the security is denominated in another currency. |
| μ | Fixed to variable rate investment. The rate shown reflects the fixed rate in effect at July 31, 2024. Rate will reset at a future date. |
| ψ | Perpetual security. Maturity date represents next call date. |
| # | Security exempt from registration under Rule 144A of the Securities Act of 1933, as amended. At July 31, 2024, the aggregate value of Rule 144A securities was $50,003,958, which represents 10.52% of the Fund’s net assets. See Note 11 in “Notes to financial statements.” |
| • | Variable rate investment. Rates reset periodically. Rate shown reflects the rate in effect at July 31, 2024. For securities based on a published reference rate and spread, the reference rate and spread are indicated in their descriptions. The reference rate descriptions (i.e. SOFR01M, SOFR03M, etc.) used in this report are identical for different securities, but the underlying reference rates may differ due to the timing of the reset period. Certain variable rate securities are not based on a published reference rate and spread but are determined by the issuer or agent and are based on current market conditions, or for mortgage-backed securities, are impacted by the individual mortgages which are paying off over time. These securities do not indicate a reference rate and spread in their descriptions. |
| Summary of abbreviations: |
| DAC – Designated Activity Company |
| LNG – Liquefied Natural Gas |
| SOFR01M – Secured Overnight Financing Rate 1 Month |
| SOFR03M – Secured Overnight Financing Rate 3 Month |
| USD – US Dollar |
See accompanying notes, which are an integral part of the financial statements.
Statements of assets and liabilities
July 31, 2024
| | Delaware
Corporate
Bond Fund | | Delaware
Extended Duration
Bond Fund |
| Assets: | | | |
| Investments, at value* | $1,263,661,220 | | $475,997,245 |
| Cash | 459,961 | | 420 |
| Dividends and interest receivable | 16,432,826 | | 6,404,126 |
| Receivable for fund shares sold | 1,766,067 | | 449,948 |
| Prepaid expenses | 80,171 | | 67,620 |
| Other assets | 22,814 | | 3,583 |
| Total Assets | 1,282,423,059 | | 482,922,942 |
| Liabilities: | | | |
| Payable for securities purchased | 8,672,588 | | 5,936,295 |
| Payable for fund shares redeemed | 2,346,432 | | 995,017 |
| Distribution payable | 1,382,803 | | 36,412 |
| Other accrued expenses | 565,528 | | 223,814 |
| Investment management fees payable to affiliates | 343,942 | | 209,583 |
| Distribution fees payable to affiliates | 88,871 | | 12,818 |
| Total Liabilities | 13,400,164 | | 7,413,939 |
| Total Net Assets | $1,269,022,895 | | $475,509,003 |
|
| Net Assets Consist of: | | | |
| Paid-in capital | $1,619,580,702 | | $597,247,910 |
| Total distributable earnings (loss) | (350,557,807) | | (121,738,907) |
| Total Net Assets | $1,269,022,895 | | $475,509,003 |
Statements of assets and liabilities
| | Delaware
Corporate
Bond Fund | Delaware
Extended Duration
Bond Fund |
|
| Net Asset Value | | |
|
| Class A: | | |
| Net assets | $367,603,905 | $36,939,910 |
| Shares of beneficial interest outstanding, unlimited authorization, no par | 23,880,693 | 2,561,553 |
| Net asset value per share | $15.39 | $14.42 |
| Sales charge | 4.50% | 4.50% |
Offering price per share, equal to net asset value per
share / (1 - sales charge) | $16.12 | $15.10 |
|
| Class C: | | |
| Net assets | $9,542,437 | $3,690,200 |
| Shares of beneficial interest outstanding, unlimited authorization, no par | 619,780 | 256,105 |
| Net asset value per share | $15.40 | $14.41 |
|
| Class R: | | |
| Net assets | $7,549,528 | $4,472,278 |
| Shares of beneficial interest outstanding, unlimited authorization, no par | 489,992 | 309,546 |
| Net asset value per share | $15.41 | $14.45 |
|
| Institutional Class: | | |
| Net assets | $868,985,840 | $411,057,905 |
| Shares of beneficial interest outstanding, unlimited authorization, no par | 56,456,710 | 28,562,357 |
| Net asset value per share | $15.39 | $14.39 |
|
| Class R6: | | |
| Net assets | $15,341,185 | $19,348,710 |
| Shares of beneficial interest outstanding, unlimited authorization, no par | 997,233 | 1,343,316 |
| Net asset value per share | $15.38 | $14.40 |
*Investments, at cost | $1,281,505,108 | $514,825,135 |
See accompanying notes, which are an integral part of the financial statements.
Statements of operations
Year ended July 31, 2024
| | Delaware
Corporate
Bond Fund | | Delaware
Extended Duration
Bond Fund |
| Investment Income: | | | |
| Interest | $65,642,130 | | $24,004,544 |
| Dividends | 884,905 | | 640,463 |
| | 66,527,035 | | 24,645,007 |
|
| Expenses: | | | |
| Management fees | 6,063,923 | | 2,485,991 |
| Distribution expenses — Class A | 856,859 | | 96,574 |
| Distribution expenses — Class C | 106,954 | | 38,057 |
| Distribution expenses — Class R | 36,679 | | 23,179 |
| Dividend disbursing and transfer agent fees and expenses | 1,444,158 | | 527,836 |
| Reports and statements to shareholders expenses | 352,952 | | 45,410 |
| Accounting and administration expenses | 194,196 | | 39,148 |
| Legal fees | 107,366 | | 9,569 |
| Registration fees | 103,837 | | 102,888 |
| Trustees’ fees | 57,874 | | 20,572 |
| Audit and tax fees | 55,461 | | 50,686 |
| Custodian fees | 1,517 | | 461 |
| Other | 84,106 | | 3,434 |
| | 9,465,882 | | 3,443,805 |
| Less expenses waived | (1,272,125) | | (744,680) |
| Less expenses paid indirectly | (1,252) | | (105) |
| Total operating expenses | 8,192,505 | | 2,699,020 |
| Net Investment Income (Loss) | 58,334,530 | | 21,945,987 |
| | Delaware
Corporate
Bond Fund | | Delaware
Extended Duration
Bond Fund |
| Net Realized and Unrealized Gain (Loss): | | | |
| Net realized gain (loss) on: | | | |
| Investments | $(80,070,638) | | $(27,375,916) |
| Futures contracts | (1,211,186) | | — |
| Net realized gain (loss) | (81,281,824) | | (27,375,916) |
| Net change in unrealized appreciation (depreciation) on investments | 113,877,394 | | 31,016,212 |
| Net Realized and Unrealized Gain (Loss) | 32,595,570 | | 3,640,296 |
| Net Increase (Decrease) in Net Assets Resulting from Operations | $90,930,100 | | $25,586,283 |
See accompanying notes, which are an integral part of the financial statements.
Statements of changes in net assets
Delaware Corporate Bond Fund
| | Year ended |
| | 7/31/24 | | 7/31/23 |
| Increase (Decrease) in Net Assets from Operations: | | | |
| Net investment income (loss) | $58,334,530 | | $48,608,895 |
| Net realized gain (loss) | (81,281,824) | | (96,710,843) |
| Net change in unrealized appreciation (depreciation) | 113,877,394 | | 19,864,084 |
| Net increase (decrease) in net assets resulting from operations | 90,930,100 | | (28,237,864) |
|
| Dividends and Distributions to Shareholders from: | | | |
| Distributable earnings: | | | |
| Class A | (14,536,303) | | (9,712,558) |
| Class C | (370,924) | | (401,106) |
| Class R | (291,860) | | (300,143) |
| Institutional Class | (39,709,704) | | (36,835,466) |
| Class R6 | (721,231) | | (489,239) |
| | (55,630,022) | | (47,738,512) |
|
| Capital Share Transactions (See Note 6): | | | |
| Proceeds from shares sold: | | | |
| Class A | 32,693,821 | | 27,362,573 |
| Class C | 1,523,333 | | 3,291,472 |
| Class R | 1,344,958 | | 1,402,136 |
| Institutional Class | 212,501,234 | | 452,865,598 |
| Class R6 | 3,088,573 | | 5,930,353 |
|
| Net assets from reorganization:1 | | | |
| Class A | 166,241,070 | | — |
| Class C | 1,053,645 | | — |
| Institutional Class | 120,705,024 | | — |
|
| Net asset value of shares issued upon reinvestment of dividends and distributions: | | | |
| Class A | 13,733,055 | | 8,914,166 |
| Class C | 328,774 | | 349,964 |
| Class R | 291,376 | | 297,994 |
| Institutional Class | 23,864,024 | | 19,477,779 |
| Class R6 | 508,119 | | 317,623 |
| | 577,877,006 | | 520,209,658 |
Statements of changes in net assets
Delaware Corporate Bond Fund
| | Year ended |
| | 7/31/24 | | 7/31/23 |
| Capital Share Transactions (continued): | | | |
| Cost of shares redeemed: | | | |
| Class A | $(95,849,199) | | $(72,656,627) |
| Class C | (5,080,549) | | (7,232,527) |
| Class R | (1,840,315) | | (2,972,212) |
| Institutional Class | (430,332,937) | | (447,334,559) |
| Class R6 | (3,660,582) | | (2,766,011) |
| | (536,763,582) | | (532,961,936) |
| Increase (decrease) in net assets derived from capital share transactions | 41,113,424 | | (12,752,278) |
| Net Increase (Decrease) in Net Assets | 76,413,502 | | (88,728,654) |
|
| Net Assets: | | | |
| Beginning of year | 1,192,609,393 | | 1,281,338,047 |
| End of year | $1,269,022,895 | | $1,192,609,393 |
| 1 | See Note 7 in "Notes to financial statements." |
See accompanying notes, which are an integral part of the financial statements.
Statements of changes in net assets
Delaware Extended Duration Bond Fund
| | Year ended |
| | 7/31/24 | | 7/31/23 |
| Increase (Decrease) in Net Assets from Operations: | | | |
| Net investment income (loss) | $21,945,987 | | $17,499,062 |
| Net realized gain (loss) | (27,375,916) | | (42,100,724) |
| Net change in unrealized appreciation (depreciation) | 31,016,212 | | 4,517,536 |
| Net increase (decrease) in net assets resulting from operations | 25,586,283 | | (20,084,126) |
|
| Dividends and Distributions to Shareholders from: | | | |
| Distributable earnings: | | | |
| Class A | (1,722,991) | | (2,045,525) |
| Class C | (141,097) | | (145,890) |
| Class R | (195,231) | | (197,123) |
| Institutional Class | (18,259,992) | | (14,174,005) |
| Class R6 | (830,527) | | (542,230) |
| | (21,149,838) | | (17,104,773) |
|
| Capital Share Transactions (See Note 6): | | | |
| Proceeds from shares sold: | | | |
| Class A | 7,215,856 | | 6,624,411 |
| Class C | 1,085,671 | | 592,865 |
| Class R | 966,238 | | 1,228,630 |
| Institutional Class | 205,111,468 | | 147,308,828 |
| Class R6 | 8,132,957 | | 5,992,316 |
|
| Net asset value of shares issued upon reinvestment of dividends and distributions: | | | |
| Class A | 1,678,124 | | 1,965,635 |
| Class C | 139,318 | | 142,123 |
| Class R | 195,178 | | 196,885 |
| Institutional Class | 17,955,238 | | 13,554,338 |
| Class R6 | 797,770 | | 529,912 |
| | 243,277,818 | | 178,135,943 |
Statements of changes in net assets
Delaware Extended Duration Bond Fund
| | Year ended |
| | 7/31/24 | | 7/31/23 |
| Capital Share Transactions (continued): | | | |
| Cost of shares redeemed: | | | |
| Class A | $(15,025,634) | | $(26,429,731) |
| Class C | (1,288,676) | | (1,826,230) |
| Class R | (1,436,579) | | (1,678,688) |
| Institutional Class | (161,813,880) | | (118,155,255) |
| Class R6 | (5,544,544) | | (1,342,120) |
| | (185,109,313) | | (149,432,024) |
| Increase in net assets derived from capital share transactions | 58,168,505 | | 28,703,919 |
| Net Increase (Decrease) in Net Assets | 62,604,950 | | (8,484,980) |
|
| Net Assets: | | | |
| Beginning of year | 412,904,053 | | 421,389,033 |
| End of year | $475,509,003 | | $412,904,053 |
See accompanying notes, which are an integral part of the financial statements.
This page intentionally left blank.
Financial highlights
Delaware Corporate Bond Fund Class A
Selected data for each share of the Fund outstanding throughout each period were as follows:
| |
| |
Net asset value, beginning of period
|
| |
| Income (loss) from investment operations: |
Net investment income2
|
Net realized and unrealized gain (loss)
|
Total from investment operations
|
| |
| Less dividends and distributions from: |
Net investment income
|
Net realized gain
|
Total dividends and distributions
|
| |
Net asset value, end of period
|
| |
Total return3
|
| |
| Ratios and supplemental data: |
Net assets, end of period (000 omitted)
|
Ratio of expenses to average net assets4
|
Ratio of expenses to average net assets prior to fees waived4
|
Ratio of net investment income to average net assets
|
Ratio of net investment income to average net assets prior to fees waived
|
Portfolio turnover
|
| 1 | Updated to reflect the effect of a 3 for 1 reverse stock split on September 9, 2022. All historical per share information has been retroactively adjusted to reflect this reverse stock split. |
| 2 | Calculated using average shares outstanding. |
| 3 | Total return is based on the change in net asset value of a share during the period and assumes reinvestment of dividends and distributions at net asset value and does not reflect the impact of a sales charge. Total return during the period presented reflects waivers by the manager and/or distributor (as applicable). Performance would have been lower had the waivers not been in effect. |
| 4 | Expense ratios do not include expenses of any investment companies in which the Fund invests. |
See accompanying notes, which are an integral part of the financial statements.
| Year ended |
| 7/31/24 | | 7/31/231 | | 7/31/221 | | 7/31/211 | | 7/31/201 |
| $15.09 | | $16.01 | | $19.47 | | $19.62 | | $17.91 |
| |
| | | | | | | | | |
| 0.67 | | 0.48 | | 0.45 | | 0.45 | | 0.51 |
| 0.26 | | (0.85) | | (3.10) | | 0.03 | | 1.74 |
| 0.93 | | (0.37) | | (2.65) | | 0.48 | | 2.25 |
| |
| | | | | | | | | |
| (0.63) | | (0.55) | | (0.51) | | (0.51) | | (0.54) |
| — | | — | | (0.30) | | (0.12) | | — |
| (0.63) | | (0.55) | | (0.81) | | (0.63) | | (0.54) |
| |
| $15.39 | | $15.09 | | $16.01 | | $19.47 | | $19.62 |
| |
| 6.38% | | (2.15%) | | (13.91%) | | 2.47% | | 12.90% |
| |
| | | | | | | | | |
| $367,604 | | $233,495 | | $285,977 | | $412,495 | | $199,500 |
| 0.82% | | 0.82% | | 0.82% | | 0.82% | | 0.82% |
| 0.92% | | 0.92% | | 0.91% | | 0.91% | | 0.91% |
| 4.44% | | 3.92% | | 2.49% | | 2.31% | | 2.71% |
| 4.34% | | 3.82% | | 2.40% | | 2.22% | | 2.62% |
| 123% | | 109% | | 109% | | 123% | | 172% |
Financial highlights
Delaware Corporate Bond Fund Class C
Selected data for each share of the Fund outstanding throughout each period were as follows:
| |
| |
Net asset value, beginning of period
|
| |
| Income (loss) from investment operations: |
Net investment income2
|
Net realized and unrealized gain (loss)
|
Total from investment operations
|
| |
| Less dividends and distributions from: |
Net investment income
|
Net realized gain
|
Total dividends and distributions
|
| |
Net asset value, end of period
|
| |
Total return3
|
| |
| Ratios and supplemental data: |
Net assets, end of period (000 omitted)
|
Ratio of expenses to average net assets4
|
Ratio of expenses to average net assets prior to fees waived4
|
Ratio of net investment income to average net assets
|
Ratio of net investment income to average net assets prior to fees waived
|
Portfolio turnover
|
| 1 | Updated to reflect the effect of a 3 for 1 reverse stock split on September 9, 2022. All historical per share information has been retroactively adjusted to reflect this reverse stock split. |
| 2 | Calculated using average shares outstanding. |
| 3 | Total return is based on the change in net asset value of a share during the period and assumes reinvestment of dividends and distributions at net asset value and does not reflect the impact of a sales charge. Total return during the period presented reflects waivers by the manager and/or distributor (as applicable). Performance would have been lower had the waivers not been in effect. |
| 4 | Expense ratios do not include expenses of any investment companies in which the Fund invests. |
See accompanying notes, which are an integral part of the financial statements.
| Year ended |
| 7/31/24 | | 7/31/231 | | 7/31/221 | | 7/31/211 | | 7/31/201 |
| $15.09 | | $16.01 | | $19.47 | | $19.62 | | $17.91 |
| |
| | | | | | | | | |
| 0.55 | | 0.39 | | 0.30 | | 0.30 | | 0.36 |
| 0.28 | | (0.87) | | (3.07) | | 0.03 | | 1.77 |
| 0.83 | | (0.48) | | (2.77) | | 0.33 | | 2.13 |
| |
| | | | | | | | | |
| (0.52) | | (0.44) | | (0.39) | | (0.36) | | (0.42) |
| — | | — | | (0.30) | | (0.12) | | — |
| (0.52) | | (0.44) | | (0.69) | | (0.48) | | (0.42) |
| |
| $15.40 | | $15.09 | | $16.01 | | $19.47 | | $19.62 |
| |
| 5.66% | | (2.87%) | | (14.55%) | | 1.70% | | 12.05% |
| |
| | | | | | | | | |
| $9,542 | | $11,482 | | $15,995 | | $28,365 | | $48,283 |
| 1.57% | | 1.57% | | 1.57% | | 1.57% | | 1.57% |
| 1.67% | | 1.67% | | 1.66% | | 1.66% | | 1.66% |
| 3.69% | | 3.17% | | 1.74% | | 1.56% | | 1.96% |
| 3.59% | | 3.07% | | 1.65% | | 1.47% | | 1.87% |
| 123% | | 109% | | 109% | | 123% | | 172% |
Financial highlights
Delaware Corporate Bond Fund Class R
Selected data for each share of the Fund outstanding throughout each period were as follows:
| |
| |
Net asset value, beginning of period
|
| |
| Income (loss) from investment operations: |
Net investment income2
|
Net realized and unrealized gain (loss)
|
Total from investment operations
|
| |
| Less dividends and distributions from: |
Net investment income
|
Net realized gain
|
Total dividends and distributions
|
| |
Net asset value, end of period
|
| |
Total return3
|
| |
| Ratios and supplemental data: |
Net assets, end of period (000 omitted)
|
Ratio of expenses to average net assets4
|
Ratio of expenses to average net assets prior to fees waived4
|
Ratio of net investment income to average net assets
|
Ratio of net investment income to average net assets prior to fees waived
|
Portfolio turnover
|
| 1 | Updated to reflect the effect of a 3 for 1 reverse stock split on September 9, 2022. All historical per share information has been retroactively adjusted to reflect this reverse stock split. |
| 2 | Calculated using average shares outstanding. |
| 3 | Total return is based on the change in net asset value of a share during the period and assumes reinvestment of dividends and distributions at net asset value. Total return during the period presented reflects waivers by the manager and/or distributor (as applicable). Performance would have been lower had the waivers not been in effect. |
| 4 | Expense ratios do not include expenses of any investment companies in which the Fund invests. |
See accompanying notes, which are an integral part of the financial statements.
| Year ended |
| 7/31/24 | | 7/31/231 | | 7/31/221 | | 7/31/211 | | 7/31/201 |
| $15.10 | | $16.02 | | $19.50 | | $19.62 | | $17.94 |
| |
| | | | | | | | | |
| 0.63 | | 0.45 | | 0.39 | | 0.39 | | 0.45 |
| 0.28 | | (0.86) | | (3.09) | | 0.06 | | 1.74 |
| 0.91 | | (0.41) | | (2.70) | | 0.45 | | 2.19 |
| |
| | | | | | | | | |
| (0.60) | | (0.51) | | (0.48) | | (0.45) | | (0.51) |
| — | | — | | (0.30) | | (0.12) | | — |
| (0.60) | | (0.51) | | (0.78) | | (0.57) | | (0.51) |
| |
| $15.41 | | $15.10 | | $16.02 | | $19.50 | | $19.62 |
| |
| 6.18% | | (2.33%) | | (14.26%) | | 2.37% | | 12.43% |
| |
| | | | | | | | | |
| $7,550 | | $7,613 | | $9,419 | | $12,760 | | $14,107 |
| 1.07% | | 1.07% | | 1.07% | | 1.07% | | 1.07% |
| 1.17% | | 1.17% | | 1.16% | | 1.16% | | 1.16% |
| 4.19% | | 3.67% | | 2.24% | | 2.06% | | 2.46% |
| 4.09% | | 3.57% | | 2.15% | | 1.97% | | 2.37% |
| 123% | | 109% | | 109% | | 123% | | 172% |
Financial highlights
Delaware Corporate Bond Fund Institutional Class
Selected data for each share of the Fund outstanding throughout each period were as follows:
| |
| |
Net asset value, beginning of period
|
| |
| Income (loss) from investment operations: |
Net investment income2
|
Net realized and unrealized gain (loss)
|
Total from investment operations
|
| |
| Less dividends and distributions from: |
Net investment income
|
Net realized gain
|
Total dividends and distributions
|
| |
Net asset value, end of period
|
| |
Total return3
|
| |
| Ratios and supplemental data: |
Net assets, end of period (000 omitted)
|
Ratio of expenses to average net assets4
|
Ratio of expenses to average net assets prior to fees waived4
|
Ratio of net investment income to average net assets
|
Ratio of net investment income to average net assets prior to fees waived
|
Portfolio turnover
|
| 1 | Updated to reflect the effect of a 3 for 1 reverse stock split on September 9, 2022. All historical per share information has been retroactively adjusted to reflect this reverse stock split. |
| 2 | Calculated using average shares outstanding. |
| 3 | Total return is based on the change in net asset value of a share during the period and assumes reinvestment of dividends and distributions at net asset value. Total return during the period presented reflects waivers by the manager. Performance would have been lower had the waivers not been in effect. |
| 4 | Expense ratios do not include expenses of any investment companies in which the Fund invests. |
See accompanying notes, which are an integral part of the financial statements.
| Year ended |
| 7/31/24 | | 7/31/231 | | 7/31/221 | | 7/31/211 | | 7/31/201 |
| $15.09 | | $16.01 | | $19.47 | | $19.62 | | $17.91 |
| |
| | | | | | | | | |
| 0.70 | | 0.52 | | 0.48 | | 0.48 | | 0.54 |
| 0.27 | | (0.86) | | (3.07) | | 0.06 | | 1.77 |
| 0.97 | | (0.34) | | (2.59) | | 0.54 | | 2.31 |
| |
| | | | | | | | | |
| (0.67) | | (0.58) | | (0.57) | | (0.57) | | (0.60) |
| — | | — | | (0.30) | | (0.12) | | — |
| (0.67) | | (0.58) | | (0.87) | | (0.69) | | (0.60) |
| |
| $15.39 | | $15.09 | | $16.01 | | $19.47 | | $19.62 |
| |
| 6.65% | | (1.91%) | | (13.69%) | | 2.72% | | 13.18% |
| |
| | | | | | | | | |
| $868,986 | | $924,989 | | $957,741 | | $1,036,266 | | $903,456 |
| 0.57% | | 0.57% | | 0.57% | | 0.57% | | 0.57% |
| 0.67% | | 0.67% | | 0.66% | | 0.66% | | 0.66% |
| 4.69% | | 4.17% | | 2.74% | | 2.56% | | 2.96% |
| 4.59% | | 4.07% | | 2.65% | | 2.47% | | 2.87% |
| 123% | | 109% | | 109% | | 123% | | 172% |
Financial highlights
Delaware Corporate Bond Fund Class R6
Selected data for each share of the Fund outstanding throughout each period were as follows:
| |
| |
Net asset value, beginning of period
|
| |
| Income (loss) from investment operations: |
Net investment income2
|
Net realized and unrealized gain (loss)
|
Total from investment operations
|
| |
| Less dividends and distributions from: |
Net investment income
|
Net realized gain
|
Total dividends and distributions
|
| |
Net asset value, end of period
|
| |
Total return3
|
| |
| Ratios and supplemental data: |
Net assets, end of period (000 omitted)
|
Ratio of expenses to average net assets4
|
Ratio of expenses to average net assets prior to fees waived4
|
Ratio of net investment income to average net assets
|
Ratio of net investment income to average net assets prior to fees waived
|
Portfolio turnover
|
| 1 | Updated to reflect the effect of a 3 for 1 reverse stock split on September 9, 2022. All historical per share information has been retroactively adjusted to reflect this reverse stock split. |
| 2 | Calculated using average shares outstanding. |
| 3 | Total return is based on the change in net asset value of a share during the period and assumes reinvestment of dividends and distributions at net asset value. Total return during the period presented reflects waivers by the manager. Performance would have been lower had the waivers not been in effect. |
| 4 | Expense ratios do not include expenses of any investment companies in which the Fund invests. |
See accompanying notes, which are an integral part of the financial statements.
| Year ended |
| 7/31/24 | | 7/31/231 | | 7/31/221 | | 7/31/211 | | 7/31/201 |
| $15.08 | | $16.00 | | $19.47 | | $19.59 | | $17.91 |
| |
| | | | | | | | | |
| 0.72 | | 0.53 | | 0.51 | | 0.51 | | 0.57 |
| 0.27 | | (0.86) | | (3.11) | | 0.06 | | 1.74 |
| 0.99 | | (0.33) | | (2.60) | | 0.57 | | 2.31 |
| |
| | | | | | | | | |
| (0.69) | | (0.59) | | (0.57) | | (0.57) | | (0.63) |
| — | | — | | (0.30) | | (0.12) | | — |
| (0.69) | | (0.59) | | (0.87) | | (0.69) | | (0.63) |
| |
| $15.38 | | $15.08 | | $16.00 | | $19.47 | | $19.59 |
| |
| 6.76% | | (1.71%) | | (13.78%) | | 2.97% | | 13.12% |
| |
| | | | | | | | | |
| $15,341 | | $15,030 | | $12,206 | | $10,763 | | $4,058 |
| 0.46% | | 0.48% | | 0.48% | | 0.48% | | 0.48% |
| 0.58% | | 0.58% | | 0.57% | | 0.57% | | 0.57% |
| 4.80% | | 4.27% | | 2.83% | | 2.65% | | 3.05% |
| 4.68% | | 4.17% | | 2.74% | | 2.56% | | 2.96% |
| 123% | | 109% | | 109% | | 123% | | 172% |
Financial highlights
Delaware Extended Duration Bond Fund Class A
Selected data for each share of the Fund outstanding throughout each period were as follows:
| |
| |
Net asset value, beginning of period
|
| |
| Income (loss) from investment operations: |
Net investment income2
|
Net realized and unrealized gain (loss)
|
Total from investment operations
|
| Less dividends and distributions from: |
Net investment income
|
Net realized gain
|
Return of capital
|
Total dividends and distributions
|
Net asset value, end of period
|
| |
Total return5
|
| |
| Ratios and supplemental data: |
Net assets, end of period (000 omitted)
|
Ratio of expenses to average net assets6
|
Ratio of expenses to average net assets prior to fees waived6
|
Ratio of net investment income to average net assets
|
Ratio of net investment income to average net assets prior to fees waived
|
Portfolio turnover
|
| 1 | Updated to reflect the effect of a 3 for 1 reverse stock split on September 9, 2022. All historical per share information has been retroactively adjusted to reflect this reverse stock split. |
| 2 | Calculated using average shares outstanding. |
| 3 | Amount is less than $0.005 per share. |
| 4 | Amount is less than $(0.005) per share. |
| 5 | Total return is based on the change in net asset value of a share during the period and assumes reinvestment of dividends and distributions at net asset value and does not reflect the impact of a sales charge. Total return during the period presented reflects waivers by the manager and/or distributor (as applicable). Performance would have been lower had the waivers not been in effect. |
| 6 | Expense ratios do not include expenses of any investment companies in which the Fund invests. |
See accompanying notes, which are an integral part of the financial statements.
| Year ended |
| 7/31/24 | | 7/31/231 | | 7/31/221 | | 7/31/211 | | 7/31/201 |
| $14.40 | | $15.81 | | $21.36 | | $23.19 | | $20.52 |
| |
| | | | | | | | | |
| 0.65 | | 0.49 | | 0.57 | | 0.60 | | 0.66 |
| —3 | | (1.34) | | (4.62) | | (0.36) | | 3.15 |
| 0.65 | | (0.85) | | (4.05) | | 0.24 | | 3.81 |
| | | | | | | | | |
| (0.63) | | (0.56) | | (0.60) | | (0.63) | | (0.69) |
| — | | — | | (0.90) | | (1.44) | | (0.45) |
| — | | — | | —4 | | — | | — |
| (0.63) | | (0.56) | | (1.50) | | (2.07) | | (1.14) |
| $14.42 | | $14.40 | | $15.81 | | $21.36 | | $23.19 |
| |
| 4.70% | | (5.12%) | | (20.07%) | | 1.24% | | 19.19% |
| |
| | | | | | | | | |
| $36,940 | | $43,304 | | $66,508 | | $99,512 | | $130,678 |
| 0.82% | | 0.82% | | 0.82% | | 0.82% | | 0.82% |
| 0.98% | | 1.05% | | 1.01% | | 0.99% | | 0.98% |
| 4.64% | | 4.22% | | 3.09% | | 2.85% | | 3.16% |
| 4.48% | | 3.99% | | 2.90% | | 2.68% | | 3.00% |
| 86% | | 60% | | 76% | | 85% | | 108% |
Financial highlights
Delaware Extended Duration Bond Fund Class C
Selected data for each share of the Fund outstanding throughout each period were as follows:
| |
| |
Net asset value, beginning of period
|
| |
| Income (loss) from investment operations: |
Net investment income2
|
Net realized and unrealized gain (loss)
|
Total from investment operations
|
| Less dividends and distributions from: |
Net investment income
|
Net realized gain
|
Return of capital
|
Total dividends and distributions
|
Net asset value, end of period
|
| |
Total return4
|
| |
| Ratios and supplemental data: |
Net assets, end of period (000 omitted)
|
Ratio of expenses to average net assets5
|
Ratio of expenses to average net assets prior to fees waived5
|
Ratio of net investment income to average net assets
|
Ratio of net investment income to average net assets prior to fees waived
|
Portfolio turnover
|
| 1 | Updated to reflect the effect of a 3 for 1 reverse stock split on September 9, 2022. All historical per share information has been retroactively adjusted to reflect this reverse stock split. |
| 2 | Calculated using average shares outstanding. |
| 3 | Amount is less than $(0.005) per share. |
| 4 | Total return is based on the change in net asset value of a share during the period and assumes reinvestment of dividends and distributions at net asset value and does not reflect the impact of a sales charge. Total return during the period presented reflects waivers by the manager and/or distributor (as applicable). Performance would have been lower had the waivers not been in effect. |
| 5 | Expense ratios do not include expenses of any investment companies in which the Fund invests. |
See accompanying notes, which are an integral part of the financial statements.
| Year ended |
| 7/31/24 | | 7/31/231 | | 7/31/221 | | 7/31/211 | | 7/31/201 |
| $14.38 | | $15.80 | | $21.36 | | $23.16 | | $20.49 |
| |
| | | | | | | | | |
| 0.54 | | 0.41 | | 0.45 | | 0.45 | | 0.51 |
| 0.01 | | (1.37) | | (4.66) | | (0.33) | | 3.15 |
| 0.55 | | (0.96) | | (4.21) | | 0.12 | | 3.66 |
| | | | | | | | | |
| (0.52) | | (0.46) | | (0.45) | | (0.48) | | (0.54) |
| — | | — | | (0.90) | | (1.44) | | (0.45) |
| — | | — | | —3 | | — | | — |
| (0.52) | | (0.46) | | (1.35) | | (1.92) | | (0.99) |
| $14.41 | | $14.38 | | $15.80 | | $21.36 | | $23.16 |
| |
| 3.99% | | (5.95%) | | (20.66%) | | 0.62% | | 18.32% |
| |
| | | | | | | | | |
| $3,690 | | $3,743 | | $5,319 | | $9,171 | | $13,859 |
| 1.57% | | 1.57% | | 1.57% | | 1.57% | | 1.57% |
| 1.73% | | 1.80% | | 1.76% | | 1.74% | | 1.73% |
| 3.89% | | 3.47% | | 2.34% | | 2.10% | | 2.41% |
| 3.73% | | 3.24% | | 2.15% | | 1.93% | | 2.25% |
| 86% | | 60% | | 76% | | 85% | | 108% |
Financial highlights
Delaware Extended Duration Bond Fund Class R
Selected data for each share of the Fund outstanding throughout each period were as follows:
| |
| |
Net asset value, beginning of period
|
| |
| Income (loss) from investment operations: |
Net investment income2
|
Net realized and unrealized gain (loss)
|
Total from investment operations
|
| Less dividends and distributions from: |
Net investment income
|
Net realized gain
|
Return of capital
|
Total dividends and distributions
|
Net asset value, end of period
|
| |
Total return5
|
| |
| Ratios and supplemental data: |
Net assets, end of period (000 omitted)
|
Ratio of expenses to average net assets6
|
Ratio of expenses to average net assets prior to fees waived6
|
Ratio of net investment income to average net assets
|
Ratio of net investment income to average net assets prior to fees waived
|
Portfolio turnover
|
| 1 | Updated to reflect the effect of a 3 for 1 reverse stock split on September 9, 2022. All historical per share information has been retroactively adjusted to reflect this reverse stock split. |
| 2 | Calculated using average shares outstanding. |
| 3 | Amount is less than $0.005 per share. |
| 4 | Amount is less than $(0.005) per share. |
| 5 | Total return is based on the change in net asset value of a share during the period and assumes reinvestment of dividends and distributions at net asset value. Total return during the period presented reflects waivers by the manager and/or distributor (as applicable). Performance would have been lower had the waivers not been in effect. |
| 6 | Expense ratios do not include expenses of any investment companies in which the Fund invests. |
See accompanying notes, which are an integral part of the financial statements.
| Year ended |
| 7/31/24 | | 7/31/231 | | 7/31/221 | | 7/31/211 | | 7/31/201 |
| $14.42 | | $15.84 | | $21.42 | | $23.22 | | $20.55 |
| |
| | | | | | | | | |
| 0.62 | | 0.48 | | 0.54 | | 0.54 | | 0.63 |
| —3 | | (1.38) | | (4.68) | | (0.30) | | 3.12 |
| 0.62 | | (0.90) | | (4.14) | | 0.24 | | 3.75 |
| | | | | | | | | |
| (0.59) | | (0.52) | | (0.54) | | (0.60) | | (0.63) |
| — | | — | | (0.90) | | (1.44) | | (0.45) |
| — | | — | | —4 | | — | | — |
| (0.59) | | (0.52) | | (1.44) | | (2.04) | | (1.08) |
| $14.45 | | $14.42 | | $15.84 | | $21.42 | | $23.22 |
| |
| 4.51% | | (5.40%) | | (20.35%) | | 1.13% | | 18.87% |
| |
| | | | | | | | | |
| $4,472 | | $4,731 | | $5,489 | | $8,631 | | $12,065 |
| 1.07% | | 1.07% | | 1.07% | | 1.07% | | 1.07% |
| 1.23% | | 1.30% | | 1.26% | | 1.24% | | 1.23% |
| 4.39% | | 3.97% | | 2.84% | | 2.60% | | 2.91% |
| 4.23% | | 3.74% | | 2.65% | | 2.43% | | 2.75% |
| 86% | | 60% | | 76% | | 85% | | 108% |
Financial highlights
Delaware Extended Duration Bond Fund Institutional Class
Selected data for each share of the Fund outstanding throughout each period were as follows:
| |
| |
Net asset value, beginning of period
|
| |
| Income (loss) from investment operations: |
Net investment income2
|
Net realized and unrealized gain (loss)
|
Total from investment operations
|
| Less dividends and distributions from: |
Net investment income
|
Net realized gain
|
Return of capital
|
Total dividends and distributions
|
Net asset value, end of period
|
| |
Total return5
|
| |
| Ratios and supplemental data: |
Net assets, end of period (000 omitted)
|
Ratio of expenses to average net assets6
|
Ratio of expenses to average net assets prior to fees waived6
|
Ratio of net investment income to average net assets
|
Ratio of net investment income to average net assets prior to fees waived
|
Portfolio turnover
|
| 1 | Updated to reflect the effect of a 3 for 1 reverse stock split on September 9, 2022. All historical per share information has been retroactively adjusted to reflect this reverse stock split. |
| 2 | Calculated using average shares outstanding. |
| 3 | Amount is less than $0.005 per share. |
| 4 | Amount is less than $(0.005) per share. |
| 5 | Total return is based on the change in net asset value of a share during the period and assumes reinvestment of dividends and distributions at net asset value. Total return during the period presented reflects waivers by the manager. Performance would have been lower had the waivers not been in effect. |
| 6 | Expense ratios do not include expenses of any investment companies in which the Fund invests. |
See accompanying notes, which are an integral part of the financial statements.
| Year ended |
| 7/31/24 | | 7/31/231 | | 7/31/221 | | 7/31/211 | | 7/31/201 |
| $14.37 | | $15.78 | | $21.33 | | $23.13 | | $20.46 |
| |
| | | | | | | | | |
| 0.68 | | 0.54 | | 0.60 | | 0.66 | | 0.72 |
| —3 | | (1.36) | | (4.62) | | (0.33) | | 3.15 |
| 0.68 | | (0.82) | | (4.02) | | 0.33 | | 3.87 |
| | | | | | | | | |
| (0.66) | | (0.59) | | (0.63) | | (0.69) | | (0.75) |
| — | | — | | (0.90) | | (1.44) | | (0.45) |
| — | | — | | —4 | | — | | — |
| (0.66) | | (0.59) | | (1.53) | | (2.13) | | (1.20) |
| $14.39 | | $14.37 | | $15.78 | | $21.33 | | $23.13 |
| |
| 4.96% | | (4.90%) | | (19.90%) | | 1.63% | | 19.54% |
| |
| | | | | | | | | |
| $411,058 | | $345,299 | | $332,410 | | $404,838 | | $377,316 |
| 0.57% | | 0.57% | | 0.57% | | 0.57% | | 0.57% |
| 0.73% | | 0.80% | | 0.76% | | 0.74% | | 0.73% |
| 4.89% | | 4.47% | | 3.34% | | 3.10% | | 3.41% |
| 4.73% | | 4.24% | | 3.15% | | 2.93% | | 3.25% |
| 86% | | 60% | | 76% | | 85% | | 108% |
Financial highlights
Delaware Extended Duration Bond Fund Class R6
Selected data for each share of the Fund outstanding throughout each period were as follows:
| |
| |
Net asset value, beginning of period
|
| |
| Income (loss) from investment operations: |
Net investment income2
|
Net realized and unrealized gain (loss)
|
Total from investment operations
|
| Less dividends and distributions from: |
Net investment income
|
Net realized gain
|
Return of capital
|
Total dividends and distributions
|
Net asset value, end of period
|
| |
Total return5
|
| |
| Ratios and supplemental data: |
Net assets, end of period (000 omitted)
|
Ratio of expenses to average net assets6
|
Ratio of expenses to average net assets prior to fees waived6
|
Ratio of net investment income to average net assets
|
Ratio of net investment income to average net assets prior to fees waived
|
Portfolio turnover
|
| 1 | Updated to reflect the effect of a 3 for 1 reverse stock split on September 9, 2022. All historical per share information has been retroactively adjusted to reflect this reverse stock split. |
| 2 | Calculated using average shares outstanding. |
| 3 | The per share amount of realized and unrealized gain (loss) on investments does not accord with the amounts reported in the Statements of Operations due to the timing of creation of Fund shares in relation to fluctuating market values. |
| 4 | Amount is less than $(0.005) per share. |
| 5 | Total return is based on the change in net asset value of a share during the period and assumes reinvestment of dividends and distributions at net asset value. Total return during the period presented reflects waivers by the manager. Performance would have been lower had the waivers not been in effect. |
| 6 | Expense ratios do not include expenses of any investment companies in which the Fund invests. |
See accompanying notes, which are an integral part of the financial statements.
| Year ended |
| 7/31/24 | | 7/31/231 | | 7/31/221 | | 7/31/211 | | 7/31/201 |
| $14.38 | | $15.79 | | $21.33 | | $23.16 | | $20.49 |
| |
| | | | | | | | | |
| 0.70 | | 0.56 | | 0.69 | | 0.69 | | 0.75 |
| (0.01)3 | | (1.37) | | (4.67) | | (0.36) | | 3.12 |
| 0.69 | | (0.81) | | (3.98) | | 0.33 | | 3.87 |
| | | | | | | | | |
| (0.67) | | (0.60) | | (0.66) | | (0.72) | | (0.75) |
| — | | — | | (0.90) | | (1.44) | | (0.45) |
| — | | — | | —4 | | — | | — |
| (0.67) | | (0.60) | | (1.56) | | (2.16) | | (1.20) |
| $14.40 | | $14.38 | | $15.79 | | $21.33 | | $23.16 |
| |
| 5.07% | | (4.74%) | | (19.83%) | | 1.58% | | 19.61% |
| |
| | | | | | | | | |
| $19,349 | | $15,827 | | $11,663 | | $59,933 | | $57,108 |
| 0.46% | | 0.47% | | 0.48% | | 0.48% | | 0.49% |
| 0.62% | | 0.67% | | 0.66% | | 0.65% | | 0.63% |
| 5.00% | | 4.57% | | 3.43% | | 3.19% | | 3.49% |
| 4.84% | | 4.37% | | 3.25% | | 3.02% | | 3.35% |
| 86% | | 60% | | 76% | | 85% | | 108% |
Notes to financial statements
Delaware Corporate Bond Fund and Delaware Extended Duration Bond Fund
July 31, 2024
Delaware Group® Income Funds (Trust) is organized as a Delaware statutory trust and offers three series: Delaware Corporate Bond Fund, Delaware Extended Duration Bond Fund, and Delaware Floating Rate Fund. These financial statements and the related notes pertain to Delaware Corporate Bond Fund and Delaware Extended Duration Bond Fund (each, a Fund or collectively, the Funds). The Trust is an open-end investment company. Each Fund is considered diversified under the Investment Company Act of 1940, as amended (1940 Act), and offers Class A, Class C, Class R, Institutional Class, and Class R6 shares. Class A shares are sold with a maximum front-end sales charge of 4.50%. There is no front-end sales charge when you purchase $1 million or more of Class A shares. However, if Delaware Distributors, L.P. (DDLP) paid your financial intermediary a commission on your purchase of $1 million or more of Class A shares, you will have to pay a limited contingent deferred sales charge (Limited CDSC) of 1.00% if you redeem these shares within the first 18 months after your purchase, unless a specific waiver of the Limited CDSC applies. Class C shares have no upfront sales charge, but are sold with a contingent deferred sales charge (CDSC) of 1.00%, which will be incurred if redeemed during the first 12 months. Class R, Institutional Class, and Class R6 shares are not subject to a sales charge and are offered for sale exclusively to certain eligible investors. In addition, Class R6 shares do not pay any service fees, sub-accounting fees, and/or sub-transfer agency fees to any brokers, dealers, or other financial intermediaries.
1. Significant Accounting Policies
Each Fund follows accounting and reporting guidance under Financial Accounting Standards Board (FASB) Accounting Standards Codification Topic 946, Financial Services — Investment Companies. The following accounting policies are in accordance with US generally accepted accounting principles (US GAAP) and are consistently followed by the Funds.
Security Valuation — Equity securities and exchange-traded funds (ETFs), except those traded on the Nasdaq Stock Market LLC (Nasdaq), are valued at the last quoted sales price as of the time of the regular close of the New York Stock Exchange (NYSE) on the valuation date. Equity securities and ETFs traded on the Nasdaq are valued in accordance with the Nasdaq Official Closing Price, which may not be the last sales price. If, on a particular day, an equity security or ETF does not trade, the mean between the bid and the ask prices will be used, which approximates fair value. US government and agency securities are valued at the mean between the bid and the ask prices, which approximates fair value. Open-end investment companies, other than ETFs, are valued at their published net asset value (NAV). For asset-backed securities, collateralized mortgage obligations (CMOs), commercial mortgage securities, and US government agency mortgage securities, pricing vendors utilize matrix pricing which considers prepayment speed, attributes of the collateral, yield or price of bonds of comparable quality, coupon, maturity, and type as well as broker/dealer-supplied prices. Fixed income securities are generally priced based upon valuations provided by an independent pricing service or broker in accordance with methodologies included within Delaware Management Company (DMC)’s Pricing Policy (the Policy). Fixed income security valuations are then reviewed by DMC as part of its duties as each Fund’s valuation designee (Valuation Designee) and, to the extent required by
the Policy and applicable regulation, fair valued consistent with the Policy. To the extent current market prices are not available, the pricing service may take into account developments related to the specific security, as well as transactions in comparable securities. Valuations for fixed income securities utilize matrix systems, which reflect such factors as security prices, yields, maturities, and ratings, and are supplemented by dealer and exchange quotations. Futures contracts are valued at the daily quoted settlement prices. Investments for which market quotations are not readily available are valued at fair value as determined in good faith pursuant to Rule 2a-5 under the 1940 Act (Rule 2a-5). As a general principle, the fair value of a security or other asset is the price that would be received to sell an asset or paid to transfer a liability in an orderly transaction between market participants at the measurement date. Pursuant to Rule 2a-5, the Board of Trustees (Board) has designated DMC as the Valuation Designee for each Fund to perform the fair value determination relating to all applicable Fund investments. DMC has established a Pricing Committee to assist with its designated responsibilities as Valuation Designee, and DMC may carry out its designated responsibilities as Valuation Designee through the Pricing Committee and other teams and committees, which operate under policies and procedures approved by the Board and subject to the Board’s oversight. Fair value pricing may be used more frequently for securities traded primarily in non-US markets. In considering whether fair valuation is required and in determining fair values, the Valuation Designee may, among other things, consider significant events (which may be considered to include changes in the value of US securities or securities indexes) that occur after the close of the relevant market and before the close of the NYSE. The Valuation Designee may utilize modeling tools provided by third-party vendors to determine fair values of non-US securities.
Federal Income Taxes — No provision for federal income taxes has been made as each Fund intends to continue to qualify for federal income tax purposes as a regulated investment company under Subchapter M of the Internal Revenue Code of 1986, as amended, and make the requisite distributions to shareholders. Each Fund evaluates tax positions taken or expected to be taken in the course of preparing each Fund’s tax returns to determine whether the tax positions are “more-likely-than-not” of being sustained by the applicable tax authority. Tax positions not deemed to meet the “more-likely-than-not” threshold are recorded as a tax benefit or expense in the current year. Management has analyzed each Fund’s tax positions taken or expected to be taken on each Fund’s federal income tax returns through the year ended July 31, 2024, and for all open tax years (years ended July 31, 2021–July 31, 2023), and has concluded that no provision for federal income tax is required in each Fund’s financial statements. If applicable, each Fund recognizes interest accrued on unrecognized tax benefits in interest expense and penalties in “Other” on the “Statements of operations.” During the year ended July 31, 2024, the Funds did not incur any interest or tax penalties.
Class Accounting — Investment income and common expenses are allocated to the various classes of each Fund on the basis of “settled shares” of each class in relation to the net assets of each Fund. Realized and unrealized gain (loss) on investments are allocated to the various classes of each Fund on the basis of daily net assets of each class. Distribution expenses relating to a specific class are charged directly to that class. Class R6 shares will not be
Notes to financial statements
Delaware Corporate Bond Fund and Delaware Extended Duration Bond Fund
1. Significant Accounting Policies (continued)
allocated any expenses related to service fees, sub-accounting fees, and/or sub-transfer agency fees paid to brokers, dealers, or other financial intermediaries.
Derivative Financial Instruments — The Funds may invest in various derivative financial instruments. These instruments are used to obtain exposure to a security, commodity, index, market, and/or other assets without owning or taking physical custody of securities, commodities and/or other referenced assets or to manage market, equity, credit, interest rate, foreign currency exchange rate, commodity and/or other risks. Derivative financial instruments may give rise to a form of economic leverage and involve risks, including the imperfect correlation between the value of a derivative financial instrument and the underlying asset, possible default of the counterparty to the transaction or illiquidity of the instrument. Pursuant to Rule 18f-4 under the 1940 Act, among other things, the Funds intend to use either derivative financial instruments with embedded leverage in a limited manner or comply with an outer limit on fund leverage risk based on value-at-risk.
Segregation and Collateralization — In certain cases, based on requirements and agreements with certain exchanges and third-party broker-dealers, the Funds may deliver or receive collateral in connection with certain investments (e.g., futures contracts, forward foreign currency exchange contracts, options written, securities with extended settlement periods, and swaps). Certain countries require that cash reserves be held while investing in companies incorporated in that country. Cash collateral that has been pledged/received to cover obligations of the Funds under derivative contracts, if any, will be reported separately on the “Statements of assets and liabilities” as cash collateral due to/from broker. Securities collateral pledged for the same purpose, if any, is noted on the “Schedules of investments.”
Use of Estimates — The preparation of financial statements in conformity with US GAAP requires management to make estimates and assumptions that affect the fair value of investments, the reported amounts of assets and liabilities and disclosure of contingent assets and liabilities at the date of the financial statements, and the reported amounts of revenues and expenses during the reporting period. Actual results could differ from those estimates and the differences could be material.
Other — Expenses directly attributable to a Fund are charged directly to each Fund. Other expenses common to various funds within the Delaware Funds by Macquarie® (Delaware Funds) are generally allocated among such funds on the basis of average net assets. Management fees and certain other expenses are paid monthly. Security transactions are recorded on the date the securities are purchased or sold (trade date) for financial reporting purposes. Costs used in calculating realized gains and losses on the sale of investment securities are those of the specific securities sold. Dividend income is recorded on the ex-dividend date and interest income is recorded on an accrual basis. Income and capital gain distributions from any investment companies (Underlying Funds) in which each Fund invests are recorded on the ex-dividend date. Discounts and premiums on debt securities are accreted or amortized to interest income, respectively, over the lives of the respective securities using the effective interest method.
Premiums on callable debt securities are amortized to interest income to the earliest call date using the effective interest method. When a loan agreement is purchased, the Fund may pay an assignment fee. On an ongoing basis, the Fund may receive a commitment fee based on the undrawn portion of the underlying line of credit portion of a loan agreement. Prepayment penalty fees are received upon the prepayment of a loan agreement by the borrower. Prepayment penalty, facility, commitment, consent, and amendment fees are recorded to income as earned or paid. Each Fund declares dividends daily from net investment income and pays the dividends monthly and declares and pays distributions from net realized gain on investments, if any, at least annually. Each Fund may distribute more frequently, if necessary for tax purposes. Dividends and distributions, if any, are recorded on the ex-dividend date.
Each Fund receives earnings credits from its transfer agent when positive cash balances are maintained, which may be used to offset transfer agent fees. If the amount earned is greater than $1, the expenses paid under this arrangement are included on the “Statements of operations” under “Dividend disbursing and transfer agent fees and expenses” with the corresponding expenses offset included under “Less expenses paid indirectly.”
2. Investment Management, Administration Agreements, and Other Transactions with Affiliates
In accordance with the terms of its respective investment management agreement, each Fund pays DMC, a series of Macquarie Investment Management Business Trust (MIMBT) and the investment managers, an annual fee which is calculated daily and paid monthly based on each Fund’s average daily net assets as follows:
| | Delaware Corporate Bond Fund | | Delaware Extended Duration Bond Fund |
| On the first $500 million | 0.5000% | | 0.5500% |
| On the next $500 million | 0.4750% | | 0.5000% |
| On the next $1.5 billion | 0.4500% | | 0.4500% |
| In excess of $2.5 billion | 0.4250% | | 0.4250% |
DMC has contractually agreed to waive all or a portion of its investment advisory fees and/or pay/reimburse expenses (excluding any distribution and service (12b-1) fees, acquired fund fees and expenses, taxes, interest, short sale dividend and interest expenses, brokerage fees, certain insurance costs, and nonroutine expenses or costs, including, but not limited to, those relating to reorganizations, litigation, conducting shareholder meetings, and liquidations), in order to prevent total annual fund operating expenses from exceeding the following percentages of each Fund's average daily net assets from August 1, 2023 (except as noted) through November 29, 2024.
Notes to financial statements
Delaware Corporate Bond Fund and Delaware Extended Duration Bond Fund
2. Investment Management, Administration Agreements, and Other Transactions with Affiliates (continued)
These waivers and reimbursements may only be terminated by agreement of DMC and each Fund. The waivers and reimbursements are accrued daily and received monthly.
| Fund | | Operating expense
limitation as a
percentage of average
daily
net assets
all share classes
other than
Class R6 | | Operating expense
limitation as a
percentage of average
daily
net assets
Class R6 |
| Delaware Corporate Bond Fund | | 0.57% | | 0.45%* |
| Delaware Extended Duration Bond Fund | | 0.57% | | 0.46%** |
After consideration of class specific expenses, including 12b-1 fees, the class level operating expense limitation as a percentage of average daily net assets from August 1, 2023 (except as noted) through November 29, 2024, unless terminated by agreement of DMC and the Funds, is as follows:
| | | Operating expense limitation as a percentage of average daily net assets |
| Fund | | Class A | | Class C | | Class R | | Institutional Class | | Class R6 |
| Delaware Corporate Bond Fund | | 0.82% | | 1.57% | | 1.07% | | 0.57% | | 0.45%* |
| Delaware Extended Duration Bond Fund | | 0.82% | | 1.57% | | 1.07% | | 0.57% | | 0.46%** |
| * | Effective November 30, 2023. Prior to November 30, 2023, the expense limitation for Delaware Corporate Bond Fund Class R6 shares was 0.48%. |
| ** | Effective November 30, 2023. Prior to November 30, 2023, the expense limitation for Delaware Extended Duration Bond Fund Class R6 shares was 0.47%. |
DMC may seek investment advice and recommendations from its affiliates: Macquarie Investment Management Austria Kapitalanlage AG, Macquarie Investment Management Europe Limited, and Macquarie Investment Management Global Limited (together, the “Affiliated Sub-Advisors”). DMC may also permit these Affiliated Sub-Advisors to execute Fund security trades on its behalf and exercise investment discretion for securities in certain markets where DMC believes it will be beneficial to utilize an Affiliated Sub-Advisor’s specialized market knowledge. Although the Affiliated Sub-Advisors serve as sub-advisors, DMC has ultimate responsibility for all investment advisory services. For these services, DMC, not the Funds, pays each Affiliated Sub-Advisor a portion of its investment management fee.
Delaware Investments Fund Services Company (DIFSC), an affiliate of DMC, provides fund accounting and financial administrative oversight services to each Fund. For these services, effective October 1, 2023, DIFSC’s fees are calculated daily and paid monthly, based on the aggregate daily net assets of all funds within the Delaware Funds at the following annual rates: 0.0050% of the first $60 billion; 0.00475% of the next $30 billion; and 0.0015% of aggregate average daily net assets in excess of $90 billion (Total Fee). Prior to October 1, 2023, DIFSC’s annual rates were: 0.00475% of the first $35 billion; 0.0040% of the next $10 billion; 0.0025% of the next $45 billion; and 0.0015% of aggregate average daily net assets in excess of $90 billion. Each fund in the Delaware Funds pays a minimum of $4,000, which, in aggregate, is subtracted from the Total Fee. Each fund then pays its portion of the remainder of the Total Fee on a relative NAV basis. These amounts are included on the “Statements of operations” under “Accounting and administration expenses.” For the year ended July 31, 2024, each Fund paid for these services as follows:
| Fund | | Fees |
| Delaware Corporate Bond Fund | | $56,426 |
| Delaware Extended Duration Bond Fund | | 22,789 |
DIFSC is also the transfer agent and dividend disbursing agent of each Fund. For these services,
DIFSC’s fees are calculated daily and paid monthly, based on the aggregate daily net assets of the retail funds within the Delaware Funds at the following annual rates: 0.014% of the first $20 billion; 0.011% of the next $5 billion; 0.007% of the next $5 billion; 0.004% of the next $20 billion; 0.002% of the next $25 billion; and 0.0015% of average daily net assets in excess of $75 billion. The fees payable to DIFSC under the shareholder services agreement described above are allocated among all retail funds in the Delaware Funds on a relative NAV basis. These amounts are included on the “Statements of operations” under “Dividend disbursing and transfer agent fees and expenses.” For the year ended July 31, 2024, each Fund paid for these services as follows:
| Fund | | Fees |
| Delaware Corporate Bond Fund | | $82,618 |
| Delaware Extended Duration Bond Fund | | 29,524 |
Pursuant to a sub-transfer agency agreement between DIFSC and BNY Mellon Investment Servicing (US) Inc. (BNYIS), BNYIS provides certain sub-transfer agency services to the Funds. Sub-transfer agency fees are paid by the Funds and are also included on the “Statements of operations” under “Dividend disbursing and transfer agent fees and expenses.” The fees are calculated daily and paid as invoices on a monthly or quarterly basis.
Pursuant to a distribution agreement and distribution plan, each Fund pays DDLP, the distributor and an affiliate of DMC, an annual 12b-1 fee of 0.25%, 1.00%, and 0.50% of the average daily net assets of the Class A, Class C, and Class R shares, respectively. The fees are calculated daily and paid monthly. Institutional Class and Class R6 shares do not pay 12b-1 fees.
Notes to financial statements
Delaware Corporate Bond Fund and Delaware Extended Duration Bond Fund
2. Investment Management, Administration Agreements, and Other Transactions with Affiliates (continued)
As provided in the investment management agreement, each Fund bears a portion of the cost of certain resources shared with DMC, including the cost of internal personnel of DMC and/or its affiliates that provide legal and regulatory reporting services to the Funds. These amounts are included on the “Statements of operations” under “Legal fees.” For the year ended July 31, 2024, each Fund paid for internal legal and regulatory reporting services provided by DMC and/or its affiliates’ employees as follows:
| Fund | | Fees |
| Delaware Corporate Bond Fund | | $39,082 |
| Delaware Extended Duration Bond Fund | | 11,546 |
For the year ended July 31, 2024, DDLP earned commissions on sales of Class A shares for each Fund as follows:
| Fund | | Class A |
| Delaware Corporate Bond Fund | | $10,866 |
| Delaware Extended Duration Bond Fund | | 6,188 |
For the year ended July 31, 2024, DDLP received gross CDSC commissions on redemptions of each Fund’s Class A and Class C shares, and these commissions were entirely used to offset upfront commissions previously paid by DDLP to broker/dealers on sales of those shares. The amounts received were as follows:
| Fund | | Class A | | Class C |
| Delaware Corporate Bond Fund | | $903 | | $1,910 |
| Delaware Extended Duration Bond Fund | | — | | 430 |
Trustees’ fees include expenses accrued by each Fund for each Trustee’s retainer and meeting fees. Certain officers of DMC, DIFSC, and DDLP are officers and/or Trustees of the Trust. These officers and Trustees are paid no compensation by the Funds.
In addition to the management fees and other expenses of a Fund, a Fund indirectly bears the investment management fees and other expenses of any Underlying Funds, including ETFs, in which it invests. The amount of these fees and expenses incurred indirectly by a Fund will vary based upon the expense and fee levels of any Underlying Funds and the number of shares that are owned of any Underlying Funds at different times.
3. Investments
For the year ended July 31, 2024, each Fund made purchases and sales of investment securities other than short-term investments as follows:
| Fund | | Purchases
other than
US government
securities | | Purchases of
US government
securities | | Sales
other than
US government
securities | | Sales of
US government
securities |
| Delaware Corporate Bond Fund | | $1,338,235,815 | | $200,326,982 | | $1,462,612,403 | | $310,533,043 |
| Delaware Extended Duration Bond Fund | | 392,277,871 | | 50,783,299 | | 314,385,875 | | 64,809,928 |
The tax cost of investments includes adjustments to net unrealized appreciation (depreciation) which may not necessarily be the final tax cost basis adjustments but which approximate the tax basis unrealized gains and losses that may be realized and distributed to shareholders. At July 31, 2024, the cost and unrealized appreciation (depreciation) of investments for federal income tax purposes for each Fund were as follows:
| Fund | | Cost of
investments | | Aggregate
unrealized
appreciation
of investments | | Aggregate
unrealized
depreciation
of investments | | Net unrealized
appreciation
(depreciation)
of investments |
| Delaware Corporate Bond Fund | | $1,280,702,987 | | $27,203,370 | | $(44,245,137) | | $(17,041,767) |
| Delaware Extended Duration Bond Fund | | 514,032,559 | | 7,025,097 | | (45,060,411) | | (38,035,314) |
US GAAP defines fair value as the price that each Fund would receive to sell an asset or pay to transfer a liability in an orderly transaction between market participants at the measurement date under current market conditions. A three-level hierarchy for fair value measurements has been established based upon the transparency of inputs to the valuation of an asset or liability. Inputs may be observable or unobservable and refer broadly to the assumptions that market participants would use in pricing the asset or liability. Observable inputs reflect the assumptions market participants would use in pricing the asset or liability based on market data obtained from sources independent of the reporting entity. Unobservable inputs reflect the reporting entity’s own assumptions about the assumptions that market participants would use in pricing the asset or liability based on the best information available under the circumstances. Each Fund's
Notes to financial statements
Delaware Corporate Bond Fund and Delaware Extended Duration Bond Fund
3. Investments (continued)
investment in its entirety is assigned a level based upon the observability of the inputs which are significant to the overall valuation. The three-level hierarchy of inputs is summarized as follows:
Level 1 − Inputs are quoted prices in active markets for identical investments. (Examples: equity securities, open-end investment companies, futures contracts, and exchange-traded options contracts)
Level 2 − Other observable inputs, including, but not limited to: quoted prices for similar assets or liabilities in markets that are active, quoted prices for identical or similar assets or liabilities in markets that are not active, inputs other than quoted prices that are observable for the assets or liabilities (such as interest rates, yield curves, volatilities, prepayment speeds, loss severities, credit risks, and default rates) or other market-corroborated inputs. (Examples: debt securities, government securities, swap contracts, forward foreign currency exchange contracts, foreign securities utilizing international fair value pricing, broker-quoted securities, and fair valued securities)
Level 3 − Significant unobservable inputs, including each Fund’s own assumptions used to determine the fair value of investments. (Examples: broker-quoted securities and fair valued securities)
Level 3 investments are valued using significant unobservable inputs. Each Fund may also use an income-based valuation approach in which the anticipated future cash flows of the investment are discounted to calculate fair value. Discounts may also be applied due to the nature or duration of any restrictions on the disposition of the investments. Valuations may also be based upon current market prices of securities that are comparable in coupon, rating, maturity, and industry. The derived value of a Level 3 investment may not represent the value which is received upon disposition and this could impact the results of operations.
The following tables summarize the valuation of each Fund's investments by fair value hierarchy levels as of July 31, 2024:
| | | Delaware Corporate Bond Fund | |
| | | Level 1 | | Level 2 | Total | |
| Securities | | | | | | |
| Assets: | | | | | | |
| Convertible Preferred Stock | | $1,072,903 | | $— | $1,072,903 | |
| Corporate Bonds | | — | | 1,222,245,476 | 1,222,245,476 | |
| Loan Agreements | | — | | 6,931,249 | 6,931,249 | |
| Municipal Bonds | | — | | 3,926,243 | 3,926,243 | |
| Non-Agency Asset-Backed Securities | | — | | 14,068,285 | 14,068,285 | �� |
| Short-Term Investments | | 15,417,064 | | — | 15,417,064 | |
| Total Value of Securities | | $16,489,967 | | $1,247,171,253 | $1,263,661,220 | |
| | | Delaware Extended Duration Bond Fund | |
| | | Level 1 | | Level 2 | Total | |
| Securities | | | | | | |
| Assets: | | | | | | |
| Convertible Preferred Stock | | $703,846 | | $— | $703,846 | |
| Corporate Bonds | | — | | 458,711,898 | 458,711,898 | |
| Loan Agreements | | — | | 2,546,743 | 2,546,743 | |
| Municipal Bonds | | — | | 8,138,453 | 8,138,453 | |
| Short-Term Investments | | 5,896,305 | | — | 5,896,305 | |
| Total Value of Securities | | $6,600,151 | | $469,397,094 | $475,997,245 | |
During the year ended July 31, 2024, there were no transfers into or out of Level 3 investments. Each Fund’s policy is to recognize transfers into or out of Level 3 investments based on fair value at the beginning of the reporting year.
A reconciliation of Level 3 investments is presented when a Fund has a significant amount of Level 3 investments at the beginning or end of the year in relation to that Fund’s net assets. As of July 31, 2024, there were no Level 3 investments in either of the Funds.
4. Dividend and Distribution Information
Income and long-term capital gain distributions are determined in accordance with federal income tax regulations, which may differ from US GAAP. Additionally, distributions from net short-term gains on sales of investment securities are treated as ordinary income for federal income tax purposes. The tax character of dividends and distributions paid during the years ended July 31, 2024 and 2023 were as follows:
| | Ordinary
income |
| Year ended July 31, 2024: | |
| Delaware Corporate Bond Fund | $55,630,022 |
| Delaware Extended Duration Bond Fund | 21,149,838 |
|
| Year ended July 31, 2023: | |
| Delaware Corporate Bond Fund | 47,738,512 |
| Delaware Extended Duration Bond Fund | 17,104,773 |
Notes to financial statements
Delaware Corporate Bond Fund and Delaware Extended Duration Bond Fund
5. Components of Net Assets on a Tax Basis
As of July 31, 2024, the components of net assets on a tax basis were as follows:
| | Delaware Corporate Bond Fund | | Delaware Extended Duration Bond Fund |
| Shares of beneficial interest | $1,619,580,702 | | $597,247,910 |
| Undistributed ordinary income | 1,735,864 | | — |
| Distributions payable | (1,382,802) | | (36,412) |
| Capital loss carryforwards | (333,779,437)* | | (83,667,181) |
| Deferred directors fees | (89,665) | | — |
| Unrealized appreciation (depreciation) of investments | (17,041,767) | | (38,035,314) |
| Net assets | $1,269,022,895 | | $475,509,003 |
| * | A portion of the Fund’s capital loss carryforward is subject to limitations under the Internal Revenue Code and related regulations. |
The differences between book basis and tax basis components of net assets are primarily attributable to tax deferral of losses on wash sales, market discount and premium on debt instruments, and amortization of premium on callable bonds.
For financial reporting purposes, capital accounts are adjusted to reflect the tax character of permanent book/tax differences. Reclassifications were due to the tax treatment of unrealized on callable bonds. Results of operations and net assets were not affected by these reclassifications. For the year ended July 31, 2024, the Funds recorded the following reclassifications:
| | Paid-in capital | | Total distributable earnings (loss) |
| Delaware Corporate Bond Fund | $85,188,658 | | (85,188,658) |
| Delaware Extended Duration Bond Fund | (157,714) | | 157,714 |
For federal income tax purposes, capital loss carryforwards may be carried forward and applied against future capital gains. At July 31, 2024, the Funds have capital loss carryforwards available to offset future realized capital gains as follows:
| | Loss carryforward character | | |
| | Short-term | | Long-term | | Total |
| Delaware Corporate Bond Fund | $ 114,829,291 | | $218,950,146 | | $ 333,779,437 |
| Delaware Extended Duration Bond Fund | 18,173,628 | | 65,493,553 | | 83,667,181 |
6. Capital Shares
Transactions in capital shares were as follows:
| | Delaware Corporate Bond Fund | | Delaware Extended Duration Bond Fund |
| | Year ended | | Year ended |
| | 7/31/24 | | 7/31/23 | | 7/31/24 | | 7/31/23 |
| Shares sold: |
| Class A | 2,177,661 | | 2,272,949 | | 510,210 | | 508,459 |
| Class C | 101,351 | | 251,873 | | 78,160 | | 46,895 |
| Class R | 89,031 | | 163,730 | | 68,575 | | 91,531 |
| Institutional Class | 14,171,057 | | 34,700,163 | | 14,723,791 | | 12,199,379 |
| Class R6 | 209,164 | | 416,319 | | 584,970 | | 424,493 |
|
| Shares from reorganization:1 |
| Class A | 11,698,429 | | — | | — | | — |
| Class C | 74,200 | | — | | — | | — |
| Institutional Class | 8,477,104 | | — | | — | | — |
|
| Shares issued upon reinvestment of dividends and distributions: |
| Class A | 911,350 | | 683,655 | | 119,820 | | 162,757 |
| Class C | 21,902 | | 27,019 | | 9,949 | | 11,555 |
| Class R | 19,385 | | 22,854 | | 13,900 | | 15,722 |
| Institutional Class | 1,587,909 | | 1,477,135 | | 1,280,848 | | 1,080,858 |
| Class R6 | 33,860 | | 24,262 | | 56,886 | | 42,007 |
| | 39,572,403 | | 40,039,959 | | 17,447,109 | | 14,583,656 |
|
| Shares from reverse stock split:2 |
| Class A | — | | (35,195,263) | | — | | (8,214,119) |
| Class C | — | | (1,915,226) | | — | | (663,736) |
| Class R | — | | (1,208,451) | | — | | (679,504) |
| Institutional Class | — | | (120,376,929) | | — | | (42,864,097) |
| Class R6 | — | | (1,526,017) | | — | | (1,473,736) |
|
| Shares redeemed: |
| Class A | (6,378,958) | | (5,886,510) | | (1,076,516) | | (2,067,772) |
| Class C | (338,394) | | (600,231) | | (92,226) | | (144,439) |
| Class R | (122,480) | | (237,954) | | (100,948) | | (139,326) |
| Institutional Class | (29,076,165) | | (34,013,009) | | (11,476,604) | | (9,580,937) |
| Class R6 | (242,381) | | (207,150) | | (399,255) | | (107,636) |
| | (36,158,378) | | (201,166,740) | | (13,145,549) | | (65,935,302) |
| Net increase (decrease) | 3,414,025 | | (161,126,781) | | 4,301,560 | | (51,351,646) |
| 1 | See Note 7. |
| 2 | Updated to reflect the effect of a 3 for 1 reverse stock split on September 9, 2022. All historical capital shares information has been retroactively adjusted to reflect this reverse stock split. |
Notes to financial statements
Delaware Corporate Bond Fund and Delaware Extended Duration Bond Fund
6. Capital Shares (continued)
Certain shareholders may exchange shares of one class for shares of another class in the same Fund. These exchange transactions are included in shares sold and shares redeemed in the table on the previous page and on the “Statements of changes in net assets.” For the years ended July 31, 2024 and 2023, each Fund had the following exchange transactions:
| | | Exchange Redemptions | | Exchange Subscriptions | | |
| | | Class A
Shares | | Class C
Shares | | Institutional
Class
Shares | | Class A
Shares | | Institutional
Class
Shares | | Class R6
Shares | Value | |
| |
| Delaware Corporate Bond Fund | |
| Year ended | |
| 7/31/24 | | 22,497 | | 2,750 | | 19,273 | | 17,848 | | 23,287 | | 3,989 | $663,963 | |
| 7/31/23 | | 102,031 | | 7,047 | | 50,876 | | 9,995 | | 104,139 | | 45,952 | 2,340,380 | |
| |
| Delaware Extended Duration Bond Fund | |
| Year ended | |
| 7/31/24 | | 941 | | 876 | | 6,927 | | 7,789 | | 943 | | — | 116,435 | |
| 7/31/23 | | 34,820 | | 6,132 | | 78,956 | | 8,199 | | 35,452 | | 76,285 | 1,725,486 | |
7. Reorganizations
On February 15-16, 2023, the Board approved proposals to reorganize Delaware Ivy Crossover Credit Fund (the “Acquired Fund I”), a series of Delaware Ivy Funds, and Delaware Ivy Corporate Bond Fund (the “Acquired Fund II”), a series of Delaware Ivy Funds (and together with Acquired Fund I, the “Acquired Funds”) with and into Delaware Corporate Bond Fund (the “Acquiring Fund”), a series of the Trust (each a "Reorganization" and together the “Reorganizations”). On June 27, 2023 and September 8, 2023, Acquired Fund I shareholders and Acquired Fund II shareholders, respectively, approved the Reorganizations. Pursuant to an Agreement and Plan of Reorganization (the “Plan”): (i) all of the property and assets of the Acquired Funds were acquired by the Acquiring Fund, and (ii) the Trust, on behalf of Acquiring Fund, assumed the liabilities of the Acquired Funds in exchange for shares of the Acquiring Fund. In accordance with the Plan, the Acquired Funds liquidated and dissolved following the Reorganizations. The Reorganizations were accomplished by tax-free exchange of shares on September 15, 2023 for the Acquired Fund I Reorganization and on October 27, 2023 for the Acquired Fund II Reorganization. For financial reporting purposes, assets received and shares issued by the Acquiring Fund were recorded at fair value; however, the cost basis of the investments received from the Acquired Funds was carried forward to align ongoing reporting of the Acquiring Fund’s realized and unrealized gains and losses with amounts distributable to shareholders for tax purposes.
The share transaction information associated with the Acquired Fund I and the Acquiring Fund on the Acquired Fund I Reorganization date were as follows:
| | Acquired
Fund I
Net Assets | | Acquired
Fund I Shares
Outstanding | | Shares
Converted
to Acquiring
Fund | | Acquiring
Fund
Net Assets | | Conversion
Ratio |
| Class A | $2,544,171 | | 308,384 | | 237,279 | | $ 224,008,795 | | 0.5605 |
| Class C | — | | — | | — | | 10,792,564 | | — |
| Class R | — | | — | | — | | 7,217,940 | | — |
Class I/
Institutional Class* | 9,345,712 | | 1,132,814 | | 634,899 | | 883,887,486 | | 0.5605 |
| Class R6 | — | | — | | — | | 14,782,264 | | — |
| Class Y** | 948,568 | | 114,978 | | — | | — | | — |
* Class I shares are named Institutional Class of the Acquiring Fund.
** Class Y shares of the Acquired Fund I were converted into Class A shares of the Acquiring Fund.
The net assets of the Acquired Fund I before the Acquired Fund I Reorganization were $12,844,489. The Acquired Fund I net assets and shares outstanding presented on the table above do not include the shareholders that did not participate in the Acquired Fund I Reorganization. The net assets of the Acquiring Fund immediately following the Acquired Fund I Reorganization were $1,153,527,500.
The share transaction information associated with the Acquired Fund II and the Acquiring Fund on the Acquired Fund II Reorganization date were as follows:
| | Acquired
Fund II
Net Assets | | Acquired
Fund II
Shares
Outstanding | | Shares
Converted
to Acquiring
Fund | | Acquiring
Fund
Net Assets | | Conversion
Ratio |
| Class A | $162,552,869 | | 11,035,497 | | 11,461,150 | | $ 216,762,446 | | 1.0373 |
| Class C | 1,053,645 | | 71,677 | | 74,200 | | 10,075,494 | | 1.0352 |
| Class R | — | | — | | — | | 6,899,805 | | — |
Class I/
Institutional Class* | 111,359,312 | | 7,549,784 | | 7,842,205 | | 772,317,284 | | 1.0387 |
| Class R6 | — | | — | | — | | 15,366,569 | | — |
| Class Y** | 195,462 | | 13,270 | | — | | — | | — |
* Class I shares are named Institutional Class for the Acquiring Fund.
** Class Y shares of the Acquired Fund II were converted into Class A shares of the Acquiring Fund.
Notes to financial statements
Delaware Corporate Bond Fund and Delaware Extended Duration Bond Fund
7. Reorganizations (continued)
The net assets of the Acquired Fund II before the Acquired Fund II Reorganization were $275,324,845. The Acquired Fund II net assets and shares outstanding presented on the table above do not include the shareholders that did not participate in the Acquired Fund II Reorganization. The net assets of the Acquiring Fund immediately following the Acquired Fund II Reorganization were $1,296,582,886.
Assuming the Reorganizations had been completed on August 1, 2023, the Acquiring Fund's pro forma results of operations for the year ended July 31, 2024, would have been as follows:
| Net investment income | $60,572,185 |
| Net realized loss on investments | (114,822,878) |
| Net change in unrealized appreciation (depreciation) | 130,638,979 |
| Net increase in net assets resulting from operations | $76,388,286 |
Because the combined investment portfolios have been managed as a single integrated portfolio since the Reorganizations were completed, it is not practical to separate the amounts of revenue and earnings of the Acquired Funds that have been included in the Acquiring Fund’s "Statements of operations" since the Reorganizations were consummated on September 15, 2023 for the Acquired Fund I and October 27, 2023 for the Acquired Fund II.
8. Line of Credit
Each Fund, along with certain other funds in the Delaware Funds (Participants), was a participant in a $355,000,000 revolving line of credit (Agreement) intended to be used for temporary or emergency purposes as an additional source of liquidity to fund redemptions of investor shares. Under the Agreement, the Participants were charged an annual commitment fee of 0.15%, which was allocated across the Participants based on a weighted average of the respective net assets of each Participant. The Participants were permitted to borrow up to a maximum of one-third of their net assets under the Agreement. Each Participant was individually, and not jointly, liable for its particular advances, if any, under the line of credit. The line of credit available under the Agreement expired on October 30, 2023.
On October 30, 2023, each Fund, along with the other Participants, entered into an amendment to the Agreement for a $335,000,000 revolving line of credit to be used as described above. It operates in substantially the same manner as the original Agreement. Under the amendment to the Agreement, the Participants are charged an annual commitment fee of 0.15%, which is allocated across the Participants based on a weighted average of the respective net assets of each Participant. The line of credit available under the Agreement expires on October 28, 2024.
Each Fund had no amounts outstanding as of July 31, 2024, or at any time during the year then ended.
9. Derivatives
US GAAP requires disclosures that enable investors to understand: (1) how and why an entity uses derivatives; (2) how they are accounted for; and (3) how they affect an entity’s results of operations and financial position.
Futures Contracts — A futures contract is an agreement in which the writer (or seller) of the contract agrees to deliver to the buyer an amount of cash or securities equal to a specific dollar amount times the difference between the value of a specific security or index at the close of the last trading day of the contract and the price at which the agreement is made. Each Fund may use futures contracts in the normal course of pursuing its investment objective. Each Fund may invest in futures contracts to hedge its existing portfolio securities against fluctuations in value caused by changes in interest rates or market conditions. Upon entering into a futures contract, each Fund deposits cash or pledges US government securities to a broker, equal to the minimum “initial margin” requirements of the exchange on which the contract is traded. Subsequent payments are received from the broker or paid to the broker each day, based on the daily fluctuation in the value of the contract. These receipts or payments are known as “variation margin” and are recorded daily by the Funds as unrealized gains or losses until the contracts are closed. When the contracts are closed, the Funds record a realized gain or loss equal to the difference between the value of the contract at the time it was opened and the value at the time it was closed. Risks of entering into futures contracts include potential imperfect correlation between the futures contracts and the underlying securities and the possibility of an illiquid secondary market for these instruments. When investing in futures, there is reduced counterparty credit risk to the Funds because futures are exchange-traded and the exchange’s clearinghouse, as counterparty to all exchange-traded futures, guarantees against default. No futures contracts were outstanding at July 31, 2024 in either of the Funds.
During the year ended July 31, 2024, Delaware Corporate Bond Fund entered into futures contracts to hedge the Fund's existing portfolio securities against fluctuations in value caused by changes in interest rates or market conditions.
During the year ended July 31, 2024, Delaware Corporate Bond Fund experienced net realized gains or losses attributable to futures contracts, which is disclosed on the “Statements of operations.”
The table below summarizes the average daily balance of derivative holdings by Delaware Corporate Bond Fund during the year ended July 31, 2024:
| | Long Derivative Volume |
| Futures contracts (average notional amount) | $ | 2,417,214 |
Notes to financial statements
Delaware Corporate Bond Fund and Delaware Extended Duration Bond Fund
10. Securities Lending
Each Fund, along with other funds in the Delaware Funds, may lend its securities pursuant to a security lending agreement (Lending Agreement) with The Bank of New York Mellon (BNY). At the time a security is loaned, the borrower must post collateral equal to the required percentage of the market value of the loaned security, including any accrued interest. The required percentage is: (1) 102% with respect to US securities and foreign securities that are denominated and payable in US dollars; and (2) 105% with respect to foreign securities. With respect to each loan, if on any business day the aggregate market value of securities collateral plus cash collateral held is less than the aggregate market value of the securities which are the subject of such loan, the borrower will be notified to provide additional collateral by the end of the following business day, which, together with the collateral already held, will be not less than the applicable initial collateral requirements for such security loan. If the aggregate market value of securities collateral and cash collateral held with respect to a security loan exceeds the applicable initial collateral requirement, upon the request of the borrower, BNY must return enough collateral to the borrower by the end of the following business day to reduce the value of the remaining collateral to the applicable initial collateral requirement for such security loan. As a result of the foregoing, the value of the collateral held with respect to a loaned security on any particular day, may be more or less than the value of the security on loan. The collateral percentage with respect to the market value of the loaned security is determined by the security lending agent.
Cash collateral received by each Fund of the Trust is generally invested in a series of individual separate accounts, each corresponding to a fund. The investment guidelines permit each separate account to hold certain securities that would be considered eligible securities for a money market fund. Cash collateral received is generally invested in government securities; certain obligations issued by government sponsored enterprises; repurchase agreements collateralized by US Treasury securities; obligations issued by the central government of any Organization for Economic Cooperation and Development (OECD) country or its agencies, instrumentalities, or establishments; obligations of supranational organizations; commercial paper, notes, bonds, and other debt obligations; certificates of deposit, time deposits, and other bank obligations; certain money market funds; and asset-backed securities. Each Fund can also accept US government securities and letters of credit (non-cash collateral) in connection with securities loans.
In the event of default or bankruptcy by the lending agent, realization and/or retention of the collateral may be subject to legal proceedings. In the event the borrower fails to return loaned securities and the collateral received is insufficient to cover the value of the loaned securities and provided such collateral shortfall is not the result of investment losses, the lending agent has agreed to pay the amount of the shortfall to each Fund or, at the discretion of the lending agent, replace the loaned securities. Each Fund continues to record dividends or interest, as applicable, on the securities loaned and is subject to changes in value of the securities loaned that may occur during the term of the loan. Each Fund has the right under the Lending Agreement to recover the securities from the borrower on demand. With respect to security loans collateralized
by non-cash collateral, each Fund receives loan premiums paid by the borrower. With respect to security loans collateralized by cash collateral, the earnings from the collateral investments are shared among each Fund, the security lending agent, and the borrower. Each Fund records security lending income net of allocations to the security lending agent and the borrower.
Each Fund may incur investment losses as a result of investing securities lending collateral. This could occur if an investment in each collateral investment account defaulted or became impaired. Under those circumstances, the value of each Fund’s cash collateral account may be less than the amount each Fund would be required to return to the borrowers of the securities and each Fund would be required to make up for this shortfall.
During the year ended July 31, 2024, each Fund had no securities out on loan.
11. Credit and Market Risks
The impact of COVID-19, and other infectious illness outbreaks that may arise in the future, could adversely affect the economies of many nations or the entire global economy, individual issuers and capital markets in ways that cannot necessarily be foreseen.
Each Fund invests in high yield fixed income securities, which are securities rated lower than BBB- by Standard & Poor's Financial Service LLC and Baa3 by Moody’s Investors Service, Inc., or similarly rated by another nationally recognized statistical rating organization. Investments in these higher yielding securities are generally accompanied by a greater degree of credit risk than higher rated securities. Additionally, lower rated securities may be more susceptible to adverse economic and competitive industry conditions than investment grade securities.
When interest rates rise, fixed income securities (i.e. debt obligations) generally will decline in value. These declines in value are greater for fixed income securities with longer maturities or durations. Interest rate changes are influenced by a number of factors, such as government policy, monetary policy, inflation expectations, and the supply and demand of bonds. A fund may be subject to a greater risk of rising interest rates when interest rates are low or inflation rates are high or rising.
Each Fund invests in bank loans and other securities that may subject them to direct indebtedness risk, the risk that the Funds will not receive payment of principal, interest, and other amounts due in connection with these investments and will depend primarily on the financial condition of the borrower. Loans that are fully secured offer the Funds more protection than unsecured loans in the event of nonpayment of scheduled interest or principal, although there is no assurance that the liquidation of collateral from a secured loan would satisfy the corporate borrower’s obligation, or that the collateral can be liquidated. Some loans or claims may be in default at the time of purchase. Certain of the loans and the other direct indebtedness acquired by the Funds may involve revolving credit facilities or other standby financing commitments that obligate the Funds to pay additional cash on a certain date or on demand. These commitments may require each Fund to increase its investment in a company at a time when the Funds might not otherwise decide to do so (including at a time when the company’s financial condition makes it unlikely that such amounts will be repaid). To the extent that each Fund is committed to
Notes to financial statements
Delaware Corporate Bond Fund and Delaware Extended Duration Bond Fund
11. Credit and Market Risks (continued)
advance additional funds, it will at all times hold and maintain cash or other high grade debt obligations in an amount sufficient to meet such commitments.
As the Funds may be required to rely upon another lending institution to collect and pass on to the Funds amounts payable with respect to the loan and to enforce the Funds’ rights under the loan and other direct indebtedness, an insolvency, bankruptcy, or reorganization of the lending institution may delay or prevent the Funds from receiving such amounts. The highly leveraged nature of many loans may make them especially vulnerable to adverse changes in economic or market conditions. Investments in such loans and other direct indebtedness may involve additional risk to the Funds. There were no unfunded loan commitments at the year ended July 31, 2024.
Each Fund invests in certain obligations that may have liquidity protection designed to ensure that the receipt of payments due on the underlying security is timely. Such protection may be provided through guarantees, insurance policies, or letters of credit obtained by the issuer or sponsor through third parties, through various means of structuring the transaction, or through a combination of such approaches. The Funds will not pay any additional fees for such credit support, although the existence of credit support may increase the price of a security.
Derivatives contracts, such as futures, forward foreign currency contracts, options, and swaps, may involve additional expenses (such as the payment of premiums) and are subject to significant loss, which may exceed amounts disclosed on the "Statements of assets and liabilities", if a security, index, reference rate, or other asset or market factor to which a derivatives contract is associated, moves in the opposite direction from what the portfolio manager anticipated. When used for hedging, the change in value of the derivatives instrument may also not correlate specifically with the currency, rate, or other risk being hedged, in which case a fund may not realize the intended benefits. Derivatives contracts are also subject to the risk that the counterparty may fail to perform its obligations under the contract due to, among other reasons, financial difficulties (such as a bankruptcy or reorganization).
Each Fund may invest up to 15% of its net assets in illiquid securities, which may include securities with contractual restrictions on resale, securities exempt from registration under Rule 144A promulgated under the Securities Act of 1933, as amended, and other securities which may not be readily marketable. The relative illiquidity of these securities may impair each Fund from disposing of them in a timely manner and at a fair price when it is necessary or desirable to do so. While maintaining oversight, the Board has delegated to DMC the day-to-day functions of determining whether individual securities are liquid for purposes of the Funds’ limitation on investments in illiquid securities. Securities eligible for resale pursuant to Rule 144A, which are determined to be liquid, are not subject to the Funds’ 15% limit on investments in illiquid securities. Rule 144A securities have been identified on the “Schedules of investments.”
12. Contractual Obligations
Each Fund enters into contracts in the normal course of business that contain a variety of indemnifications. Each Fund's maximum exposure under these arrangements is unknown. However, each Fund has not had prior claims or losses pursuant to these contracts. Management has reviewed each Fund's existing contracts and expects the risk of loss to be remote.
13. Subsequent Events
MIMBT, of which DMC is a series, entered into a settlement agreement on September 19, 2024 with the U.S. Securities and Exchange Commission (SEC) consenting to an order (Settlement Order) relating to a legacy investment strategy, the Absolute Return Mortgage-Backed Securities Strategy (ARMBS Strategy). MIMBT no longer offers the ARMBS Strategy. MIMBT agreed to the Settlement Order without admitting or denying the SEC's findings. The Settlement Order does not impact MIMBT's ability to continue to provide services to the Funds.
Management has determined that no other material events or transactions occurred subsequent to July 31, 2024, that would require recognition or disclosure in the Funds’ financial statements.
Report of independent registered public accounting firm
To the Board of Trustees of Delaware Group® Income Funds and Shareholders of Delaware Corporate Bond Fund and Delaware Extended Duration Bond Fund
Opinions on the Financial Statements
We have audited the accompanying statements of assets and liabilities, including the schedules of investments, of Delaware Corporate Bond Fund and Delaware Extended Duration Bond Fund (two of the funds constituting Delaware Group® Income Funds, hereafter collectively referred to as the “Funds”) as of July 31, 2024, the related statements of operations for the year ended July 31, 2024, the statements of changes in net assets for each of the two years in the period ended July 31, 2024, including the related notes, and the financial highlights for each of the five years in the period ended July 31, 2024 (collectively referred to as the “financial statements”). In our opinion, the financial statements present fairly, in all material respects, the financial position of each of the Funds as of July 31, 2024, the results of each of their operations for the year then ended, the changes in each of their net assets for each of the two years in the period ended July 31, 2024 and each of the financial highlights for each of the five years in the period ended July 31, 2024 in conformity with accounting principles generally accepted in the United States of America.
Basis for Opinions
These financial statements are the responsibility of the Funds’ management. Our responsibility is to express an opinion on the Funds’ financial statements based on our audits. We are a public accounting firm registered with the Public Company Accounting Oversight Board (United States) (PCAOB) and are required to be independent with respect to the Funds in accordance with the U.S. federal securities laws and the applicable rules and regulations of the Securities and Exchange Commission and the PCAOB.
We conducted our audits of these financial statements in accordance with the standards of the PCAOB. Those standards require that we plan and perform the audit to obtain reasonable assurance about whether the financial statements are free of material misstatement, whether due to error or fraud.
Our audits included performing procedures to assess the risks of material misstatement of the financial statements, whether due to error or fraud, and performing procedures that respond to those risks. Such procedures included examining, on a test basis, evidence regarding the amounts and disclosures in the financial statements. Our audits also included evaluating the accounting principles used and significant estimates made by management, as well as evaluating the overall presentation of the financial statements. Our procedures included confirmation of securities owned as of July 31, 2024 by correspondence with the custodian, transfer agents, agent banks and brokers; when replies were not received from brokers, we performed other auditing procedures. We believe that our audits provide a reasonable basis for our opinions.
/s/ PricewaterhouseCoopers LLP
Philadelphia, Pennsylvania
September 27, 2024
We have served as the auditor of one or more Macquarie investment companies since 2010.
Other Fund information (Unaudited)
Delaware Corporate Bond Fund and Delaware Extended Duration Bond Fund
Tax Information
The information set forth below is for the Fund’s fiscal year as required by federal income tax laws. Shareholders, however, must report distributions on a calendar year basis for income tax purposes, which may include distributions for portions of two fiscal years of each Fund. Accordingly, the information needed by shareholders for income tax purposes will be sent to them in January of each year. Please consult your tax advisor for proper treatment of this information.
All disclosures are based on financial information available as of the date of this report and, accordingly are subject to change. For any and all items requiring reporting, it is the intention of each Fund to report the maximum amount permitted under the Internal Revenue Code and the regulations thereunder.
For the year ended July 31, 2024, each Fund reports distributions paid during the year as follows:
| | (A)
Ordinary Income
Distributions
(Tax Basis) |
| Delaware Corporate Bond Fund | 100.00% |
| Delaware Extended Duration Bond Fund | 100.00% |
(A) is based on a percentage of each Fund’s total distributions.
For the fiscal year ended July 31, 2024, certain interest income paid by each Fund determined to be Qualified Interest Income and Short-Term Capital Gains may be subject to relief from US withholding for foreign shareholders, as provided by the American Jobs Creation Act of 2004; the Tax Relief Unemployment Insurance Reauthorization and Job Creation Act of 2010; and as extended by the American Taxpayer Relief Act of 2012. Delaware Extended Duration Bond Fund did not have any foreign shareholders for the fiscal year ended July 31, 2024. For the fiscal year ended July 31, 2024, Delaware Corporate Bond Fund reported maximum distributions of Qualified Interest Income of $45,908,853.
The percentage of the ordinary dividends reported by the Funds that is treated as a Section 163(j) interest dividend and thus is eligible to be treated as interest income for purposes of Section 163(j) and the regulations thereunder is as follows:
| | Delaware Corporate Bond Fund | Delaware Extended Duration Bond Fund |
| | 100.00% | 99.44% |
Other Fund information (Unaudited)
Delaware Corporate Bond Fund and Delaware Extended Duration Bond Fund
Changes in and Disagreements with Accountants for Open-End Management Investment Companies
Not applicable.
Proxy Disclosures for Open-End Management Investment Companies
Not applicable.
Remuneration Paid to Directors, Officers, and Others of Open-End Management Investment Companies
The aggregate remuneration paid to directors, officers and others is disclosed within the financial statements.
Statement Regarding Basis of Approval for Investment Advisory Contract
Not applicable.
Contact information
Shareholder assistance by phone
800 523-1918, weekdays from 8:30am to
6:00pm ET
For securities dealers and financial
institutions representatives only
800 362-7500
Regular mail
Delaware Funds by Macquarie
P.O. Box 534437
Pittsburgh, PA 15253-4437
Overnight courier service
Delaware Funds by Macquarie
Attention: 534437
500 Ross Street, 154-0520
Pittsburgh, PA 15262
Macquarie Asset Management • 610 Market Street • Philadelphia, PA 19106-2354
Macquarie Asset Management (MAM) is the asset management division of Macquarie Group. MAM is an integrated asset manager across public and private markets offering a diverse range of capabilities, including real assets, real estate, credit, equities, and multi-asset solutions.
The Funds are advised by Delaware Management Company, a series of MIMBT, a US registered investment adviser, and distributed by Delaware Distributors, L.P. (DDLP), an affiliate of MIMBT and Macquarie Group Limited.
Other than Macquarie Bank Limited ABN 46 008 583 542 (“Macquarie Bank”), any Macquarie Group entity noted in this document is not an authorized deposit-taking institution for the purposes of the Banking Act 1959 (Commonwealth of Australia). The obligations of these other Macquarie Group entities do not represent deposits or other liabilities of Macquarie Bank. Macquarie Bank does not guarantee or otherwise provide assurance in respect of the obligations of these other Macquarie Group entities. In addition, if this document relates to an investment, (a) the investor is subject to investment risk including possible delays in repayment and loss of income and principal invested and (b) none of Macquarie Bank or any other Macquarie Group entity guarantees any particular rate of return on or the performance of the investment, nor do they guarantee repayment of capital in respect of the investment.
The Funds are governed by US laws and regulations.
This page is not part of the Financial statements and other information.
Fixed income mutual fund
Delaware Floating Rate Fund
Financial statements and other information
For the year ended July 31, 2024
This report and the financial statements contained herein are submitted for the general information of the shareholders of the Fund. This report is not authorized for distribution to prospective investors in the Fund unless preceded or accompanied by an effective prospectus.
Form N-PORT and proxy voting information
The Fund files its complete schedule of portfolio holdings with the Securities and Exchange Commission (SEC) for the first and third quarters of each fiscal year on Form N-PORT. The Fund’s Form N-PORT, as well as a description of the policies and procedures that the Fund uses to determine how to vote proxies (if any) relating to portfolio securities, is available without charge (i) upon request, by calling 800 523-1918; and (ii) on the SEC’s website at sec.gov. In addition, a description of the policies and procedures that the Fund uses to determine how to vote proxies (if any) relating to portfolio securities and the Schedule of Investments included in the Fund’s most recent Form N-PORT are available without charge on the Fund’s website at delawarefunds.com/literature.
Information (if any) regarding how the Fund voted proxies relating to portfolio securities during the most recently disclosed 12-month period ended June 30 is available without charge (i) through the Fund’s website at delawarefunds.com/proxy; and (ii) on the SEC’s website at sec.gov.
Schedule of investments
| Delaware Floating Rate Fund | July 31, 2024 |
| | | Principal
amount° | Value (US $) |
| Collateralized Debt Obligations — 1.55% |
| AGL CLO Series 2024-32A E 144A 0.00% (TSFR03M + 5.75%, Floor 5.75%) 7/21/37 #, •, ^ | | 450,000 | $ 450,000 |
| AIMCO CLO Series 2022-18A ER 144A 10.782% (TSFR03M + 5.50%, Floor 5.50%) 7/20/37 #, • | | 250,000 | 250,000 |
| Bain Capital Credit CLO Series 2017-2A ER3 144A 12.634% (TSFR03M + 7.34%, Floor 7.34%) 7/25/37 #, • | | 450,000 | 445,500 |
| Barings CLO Series 2024-2A E 144A 11.20% (TSFR03M + 5.90%, Floor 5.90%) 7/15/39 #, • | | 1,000,000 | 1,001,262 |
| Bear Mountain Park CLO Series 2022-1A ER 144A 11.251% (TSFR03M + 5.95%, Floor 5.95%) 7/15/37 #, • | | 750,000 | 747,096 |
| CARLYLE US CLO Series 2021-11A ER 144A 11.823% (TSFR03M + 6.50%, Floor 6.50%) 7/25/37 #, • | | 450,000 | 450,000 |
| Elmwood CLO Series 2022-4A ER 144A 10.986% (TSFR03M + 5.70%, Floor 5.70%) 7/17/37 #, • | | 450,000 | 448,265 |
| GoldenTree Loan Management US CLO Series 2024-20A E 144A 11.233% (TSFR03M + 5.90%, Floor 5.90%) 7/20/37 #, • | | 750,000 | 756,369 |
| Madison Park Funding XXXI Series 2018-31A ER 144A 11.739% (TSFR03M + 6.40%, Floor 6.40%) 7/23/37 #, • | | 1,000,000 | 1,005,000 |
| Neuberger Berman Loan Advisers CLO Series 2024-56A D 144A 8.419% (TSFR03M + 3.10%, Floor 3.10%) 7/24/37 #, • | | 1,000,000 | 997,612 |
| OHA Loan Funding Series 2016-1A D1R2 144A 8.385% (TSFR03M + 3.05%, Floor 3.05%) 7/20/37 #, • | | 600,000 | 598,752 |
| Palmer Square CLO Series 2024-2A E 144A 10.994% (TSFR03M + 5.70%, Floor 5.70%) 7/20/37 #, • | | 1,000,000 | 1,005,000 |
| TCW CLO Series 2024-2A E 144A 0.00% (TSFR03M + 7.25%, Floor 7.25%) 7/17/37 #, •, ^ | | 550,000 | 550,000 |
| Venture CLO Series 2024-49A E 144A 13.008% (TSFR03M + 7.68%, Floor 7.68%) 4/20/37 #, • | | 1,000,000 | 1,000,330 |
| Total Collateralized Debt Obligations (cost $9,640,500) | 9,705,186 |
|
|
|
| Convertible Bond — 0.10% |
| New Cotai PIK 5.00% exercise price $0.40, maturity date 2/2/27 =, >>, π | | 250,106 | 607,846 |
| Total Convertible Bond (cost $241,189) | 607,846 |
Schedule of investments
Delaware Floating Rate Fund
| | | Principalamount° | Value (US $) |
| Corporate Bonds — 4.24% |
| Communication Services — 1.23% |
| CCO Holdings 144A 4.50% 8/15/30 # | | 1,000,000 | $ 876,297 |
| CMG Media 144A 8.875% 12/15/27 # | | 417,000 | 244,112 |
| Consolidated Communications | | | |
| 144A 5.00% 10/1/28 # | | 500,000 | 433,242 |
| 144A 6.50% 10/1/28 # | | 1,000,000 | 903,121 |
|
|
| Directv Financing 144A 5.875% 8/15/27 # | | 500,000 | 481,873 |
| Frontier Communications Holdings 144A 6.00% 1/15/30 # | | 2,000,000 | 1,804,192 |
| Gray Television 144A 7.00% 5/15/27 # | | 500,000 | 484,504 |
| Iliad Holding 144A 8.50% 4/15/31 # | | 1,000,000 | 1,042,502 |
| Sirius XM Radio 144A 4.125% 7/1/30 # | | 1,625,000 | 1,413,855 |
| | 7,683,698 |
| Consumer Discretionary — 0.26% |
| Carnival 144A 6.00% 5/1/29 # | | 595,000 | 593,926 |
| Royal Caribbean Cruises 144A 5.50% 4/1/28 # | | 1,000,000 | 996,847 |
| | 1,590,773 |
| Energy — 0.26% |
| Hilcorp Energy I | | | |
| 144A 6.00% 2/1/31 # | | 305,000 | 297,152 |
| 144A 6.25% 4/15/32 # | | 698,000 | 679,406 |
|
|
| Transocean 144A 8.00% 2/1/27 # | | 629,000 | 630,573 |
| | 1,607,131 |
| Financials — 0.84% |
| Ardonagh Finco 144A 7.75% 2/15/31 # | | 2,000,000 | 2,030,262 |
| Castlelake Aviation Finance DAC 144A 5.00% 4/15/27 # | | 475,000 | 463,760 |
| Howden UK Refinance 144A 7.25% 2/15/31 # | | 2,000,000 | 2,007,332 |
| Jones Deslauriers Insurance Management 144A 10.50% 12/15/30 # | | 670,000 | 719,240 |
| SVB Financial Group 4.10% 2/15/31 ‡, ψ | | 75,000 | 354 |
| | 5,220,948 |
| Healthcare — 0.48% |
| CHS | | | |
| 144A 4.75% 2/15/31 # | | 1,000,000 | 823,731 |
| 144A 5.25% 5/15/30 # | | 1,000,000 | 873,208 |
| 144A 6.875% 4/15/29 # | | 500,000 | 410,532 |
|
|
| DaVita 144A 4.625% 6/1/30 # | | 1,000,000 | 916,600 |
| | 3,024,071 |
| | | Principalamount° | Value (US $) |
| Corporate Bonds (continued) |
| Industrials — 0.31% |
| TransDigm 144A 6.625% 3/1/32 # | | 1,000,000 | $ 1,024,077 |
| United Rentals North America 3.875% 2/15/31 | | 1,000,000 | 904,474 |
| | 1,928,551 |
| Information Technology — 0.53% |
| CommScope Technologies 144A 6.00% 6/15/25 # | | 250,000 | 235,000 |
| UKG 144A 6.875% 2/1/31 # | | 3,000,000 | 3,085,378 |
| | 3,320,378 |
| Materials — 0.24% |
| Cleveland-Cliffs 144A 7.00% 3/15/32 # | | 1,000,000 | 1,004,863 |
| Mauser Packaging Solutions Holding 144A 7.875% 4/15/27 # | | 500,000 | 516,641 |
| | 1,521,504 |
| Utilities — 0.09% |
| Vistra 144A 7.00% 12/15/26 #, μ, ψ | | 550,000 | 553,605 |
| | 553,605 |
| Total Corporate Bonds (cost $27,071,007) | 26,450,659 |
|
|
|
| Municipal Bonds — 0.06% |
GDB Debt Recovery Authority of Puerto Rico Revenue
7.50% 8/20/40 | | 387,935 | 377,267 |
| Total Municipal Bonds (cost $367,815) | 377,267 |
|
|
|
| Loan Agreements — 90.92% |
| Communication Services — 10.39% |
| Advantage Sales & Marketing 9.833% (SOFR03M + 4.51%) 10/28/27 • | | 5,880,433 | 5,673,148 |
| Charter Communications Operating Tranche B-4 7.332% (SOFR03M + 2.00%) 12/7/30 • | | 1,363,150 | 1,352,849 |
| Connect US Finco 9.844% (SOFR01M + 4.50%) 9/27/29 • | | 7,792,545 | 7,428,243 |
| Consolidated Communications Tranche B-1 8.958% (SOFR01M + 3.61%) 10/2/27 • | | 11,140,820 | 10,662,979 |
| Coral US Co-Borrower Tranche B-6 8.443% (SOFR01M + 3.11%) 10/15/29 • | | 2,774,524 | 2,749,750 |
| Cumulus Media New Holdings 10.328% (SOFR03M + 5.00%) 3/31/29 • | | 9,414,463 | 4,154,132 |
| DirectV Financing Tranche B 10.708% (SOFR01M + 5.36%) 8/2/29 • | | 7,268,826 | 7,260,387 |
Schedule of investments
Delaware Floating Rate Fund
| | | Principalamount° | Value (US $) |
|
| Loan Agreements (continued) |
| Communication Services (continued) |
| Frontier Communications Tranche B 8.763% (SOFR06M + 3.50%) 7/1/31 • | | 8,416,787 | $ 8,490,434 |
| Lorca Telecom Bidco Tranche B-4 TBD 3/25/31 X | | 4,885,000 | 4,891,106 |
| Terrier Media Buyer Tranche B 8.935% (SOFR03M + 3.60%) 12/17/26 • | | 5,444,232 | 4,607,862 |
| Varsity Brands 1st Lien TBD 7/29/31 X | | 4,890,000 | 4,872,274 |
| Virgin Media Bristol Tranche Y 8.656% (SOFR06M + 3.35%) 3/31/31 • | | 2,858,000 | 2,732,963 |
| | 64,876,127 |
| Consumer Discretionary — 11.63% |
| Caesars Entertainment | | | |
| Tranche B 8.097% (SOFR03M + 2.75%) 2/6/30 • | | 1,823,938 | 1,831,633 |
| Tranche B-1 8.097% (SOFR03M + 2.75%) 2/6/31 • | | 2,034,900 | 2,041,985 |
|
|
| Carnival 8.094% (SOFR01M + 2.75%) 10/18/28 • | | 1,523,277 | 1,535,177 |
| Cedar Fair Tranche B 7.343% (SOFR01M + 2.00%) 5/1/31 • | | 1,465,000 | 1,471,105 |
| Clarios Global Tranche B 7.844% (SOFR01M + 2.50%) 5/6/30 • | | 1,336,625 | 1,343,030 |
| Flutter Entertainment Tranche B 7.585% (SOFR03M + 2.25%) 11/25/30 • | | 3,980,000 | 3,990,945 |
| Hilton Worldwide Finance Tranche B-4 7.10% (SOFR01M + 1.75%) 11/8/30 • | | 1,475,000 | 1,480,071 |
| HomeServe USA Holding 7.845% (SOFR01M + 2.50%) 10/21/30 • | | 2,403,975 | 2,411,487 |
| Hunter Douglas Holding Tranche B-1 8.836% (SOFR03M + 3.50%) 2/26/29 • | | 5,582,349 | 5,531,176 |
| Light and Wonder International Tranche B-2 7.585% (SOFR01M + 2.25%) 4/14/29 • | | 2,072,564 | 2,078,116 |
| LSF9 Atlantis Holdings 11.835% (SOFR03M + 6.50%) 3/31/29 • | | 6,359,776 | 6,435,298 |
| MajorDrive Holdings IV 9.596% (SOFR03M + 4.26%) 6/1/28 • | | 6,358,167 | 6,366,680 |
| Omnia Partners 8.529% (SOFR03M + 3.25%) 7/25/30 • | | 1,216,950 | 1,220,753 |
| Peer Holding III | | | |
| Tranche B-4 8.585% (SOFR03M + 3.25%) 10/28/30 • | | 3,615,937 | 3,636,277 |
| Tranche B-5 TBD 6/20/31 X | | 4,665,000 | 4,691,241 |
|
|
| PetsMart 9.194% (SOFR01M + 3.85%) 2/11/28 • | | 1,889,613 | 1,876,386 |
| Scientific Games Holdings 8.318% (SOFR03M + 3.00%) 4/4/29 • | | 2,930,226 | 2,928,852 |
| Staples 11.084% (SOFR03M + 5.75%) 9/4/29 • | | 12,995,000 | 12,115,135 |
| | | Principalamount° | Value (US $) |
|
| Loan Agreements (continued) |
| Consumer Discretionary (continued) |
|
| Station Casinos Tranche B 7.594% (SOFR01M + 2.25%) 3/14/31 • | | 1,466,325 | $ 1,470,158 |
| Wand NewCo 3 8.597% (SOFR01M + 3.25%) 1/30/31 • | | 8,060,000 | 8,109,875 |
| | 72,565,380 |
| Consumer Staples — 1.89% |
| Fiesta Purchaser 9.344% (SOFR01M + 4.00%) 2/12/31 • | | 6,840,000 | 6,889,590 |
| United Natural Foods 10.094% (SOFR01M + 4.75%) 4/25/31 • | | 4,872,788 | 4,909,334 |
| | 11,798,924 |
| Energy — 0.52% |
| Buckeye Partners 7.344% (SOFR01M + 2.00%) 11/22/30 • | | 1,950,113 | 1,954,379 |
| GIP Pilot Acquisition Partners Tranche B 7.818% (SOFR03M + 2.50%) 10/4/30 • | | 1,310,473 | 1,318,664 |
| | 3,273,043 |
| Financials — 8.95% |
| AmWINS Group 7.708% (SOFR01M + 2.36%) 2/19/28 • | | 1,043,748 | 1,046,945 |
| Amynta Agency Borrower 9.002% - 9.094% (SOFR01M + 3.75%) 2/28/28 • | | 10,322,845 | 10,355,104 |
| Ardonagh Group Finco Pty 1st Lien TBD 2/17/31 X | | 8,980,000 | 8,985,612 |
| AssuredPartners 8.844% (SOFR01M + 3.50%) 2/14/31 • | | 2,937,638 | 2,949,879 |
| Chrysaor Bidco TBD | | | |
| 5/14/31 X | | 134,281 | 134,953 |
| 7/14/31 X | | 1,815,719 | 1,824,797 |
|
|
| HUB International 8.255% (SOFR02M + 3.00%) 6/20/30 • | | 2,872,901 | 2,878,885 |
| Husky Injection Molding Systems 10.326% (SOFR03M + 5.00%) 2/15/29 • | | 4,885,000 | 4,903,319 |
| Hyperion Refinance 8.844% (SOFR01M + 3.50%) 2/15/31 • | | 2,922,675 | 2,934,465 |
| Inception Finco Tranche B-4 9.835% (SOFR03M + 4.50%) 4/18/31 • | | 5,350,000 | 5,407,957 |
| Jones DesLauriers Insurance Management 8.752% (SOFR03M + 3.50%) 3/15/30 • | | 2,944,165 | 2,951,788 |
| NGP XI Midstream Holdings TBD 7/25/31 X | | 4,900,000 | 4,900,000 |
| Truist Insurance Holdings 8.585% (SOFR03M + 3.25%) 5/6/31 • | | 2,935,000 | 2,948,451 |
| USI | | | |
| 8.085% (SOFR03M + 2.75%) 9/27/30 • | | 2,350,986 | 2,357,157 |
| Tranche B 8.085% (SOFR03M + 2.75%) 11/22/29 • | | 1,286,121 | 1,290,140 |
| | 55,869,452 |
Schedule of investments
Delaware Floating Rate Fund
| | | Principalamount° | Value (US $) |
|
| Loan Agreements (continued) |
| Healthcare — 7.96% |
| ADMI 11.094% (SOFR01M + 5.75%) 12/23/27 • | | 4,382,975 | $ 4,415,847 |
| AthenaHealth Group 8.594% (SOFR01M + 3.25%) 2/15/29 • | | 3,517,505 | 3,515,032 |
| Bausch & Lomb 9.443% (SOFR01M + 4.00%) 9/29/28 • | | 5,830,937 | 5,801,783 |
| DaVita Tranche B-1 7.344% (SOFR01M + 2.00%) 5/9/31 • | | 1,445,000 | 1,444,850 |
| Electron Bidco 8.458% (SOFR01M + 3.11%) 11/1/28 • | | 2,363,591 | 2,373,563 |
| Endo Finance Holdings 9.783% (SOFR03M + 4.50%) 4/9/31 • | | 5,865,000 | 5,886,384 |
| Heartland Dental 9.844% (SOFR01M + 4.50%) 4/28/28 • | | 10,002,705 | 10,000,364 |
| Jazz Financing Lux Tranche B-2 7.594% (SOFR01M + 2.25%) 5/5/28 • | | 2,667,524 | 2,675,145 |
| LifePoint Health 9.329% (SOFR03M + 4.00%) 5/9/31 • | | 2,935,000 | 2,946,373 |
| Mamba Purchaser 8.579% (SOFR01M + 3.25%) 10/16/28 • | | 5,705,697 | 5,717,582 |
| Medline Borrower 7.594% (SOFR01M + 2.25%) 10/23/28 • | | 2,925,000 | 2,930,941 |
| Surgery Center Holdings 8.095% (SOFR01M + 2.75%) 6/20/31 • | | 1,950,113 | 1,958,034 |
| | 49,665,898 |
| Industrials — 15.51% |
| Air Canada 7.847% (SOFR03M + 2.50%) 3/21/31 • | | 977,550 | 980,971 |
| American Airlines 10.294% (SOFR03M + 5.01%) 4/20/28 • | | 8,306,250 | 8,601,014 |
| Aramark Services Tranche B-8 7.344% (SOFR01M + 2.00%) 6/22/30 • | | 495,000 | 497,042 |
| Asplundh Tree Expert 7.094% (SOFR01M + 1.75%) 5/23/31 • | | 1,464,268 | 1,467,155 |
| Castlelake Aviation One DAC 8.089% (SOFR03M + 2.75%) 10/22/27 • | | 2,385,097 | 2,397,023 |
| Champions Financing 10.079% (SOFR03M + 4.75%) 2/6/29 • | | 4,400,000 | 4,372,500 |
| CP Atlas Buyer Tranche B 9.194% (SOFR01M + 3.85%) 11/23/27 • | | 5,918,702 | 5,681,954 |
| Dayforce 7.844% (SOFR01M + 2.50%) 3/3/31 • | | 2,935,000 | 2,944,172 |
| Delta Air Lines 9.032% (SOFR03M + 3.75%) 10/20/27 • | | 992,213 | 1,016,567 |
| Dynasty Acquisition | | | |
| Tranche B-1 8.844% (SOFR01M + 3.50%) 8/24/28 • | | 2,098,813 | 2,111,014 |
| Tranche B-2 8.844% (SOFR01M + 3.50%) 8/24/28 • | | 809,248 | 813,953 |
|
|
| Gates Tranche B-5 7.594% (SOFR01M + 2.25%) 6/4/31 • | | 1,173,730 | 1,177,887 |
| Genesee & Wyoming Tranche B 7.335% (SOFR03M + 2.00%) 4/10/31 • | | 1,465,000 | 1,466,984 |
| | | Principalamount° | Value (US $) |
|
| Loan Agreements (continued) |
| Industrials (continued) |
|
| Grant Thornton Advisors 8.597% (SOFR03M + 3.25%) 6/2/31 • | | 7,335,000 | $ 7,365,946 |
| Isolved Tranche B-1 8.844% (SOFR01M + 3.50%) 10/14/30 • | | 3,243,125 | 3,263,395 |
| Mermaid Bidco Tranche B 8.584% (SOFR01M + 3.25%) 6/27/31 • | | 3,920,000 | 3,946,950 |
| Pre Paid Legal Services 1st Lien 9.208% (SOFR01M + 3.86%) 12/15/28 • | | 490,000 | 490,681 |
| Radar Bidco Tranche B 9.568% (SOFR03M + 4.25%) 3/27/31 • | | 7,335,000 | 7,362,506 |
| Setanta Aircraft Leasing DAC Tranche B 7.346% (SOFR03M + 2.01%) 11/6/28 • | | 628,054 | 632,273 |
| SPX Flow 8.844% (SOFR01M + 3.50%) 4/5/29 • | | 11,295,871 | 11,390,857 |
| Standard Industries 7.345% (SOFR01M + 2.00%) 9/22/28 • | | 1,230,987 | 1,235,347 |
| SunSource Borrower 9.444% (SOFR01M + 4.10%) 3/25/31 • | | 7,481,250 | 7,518,656 |
| Transdigm Tranche J 7.843% (SOFR03M + 2.50%) 2/28/31 • | | 2,381,032 | 2,389,797 |
| TransUnion Intermediate Holdings Tranche B-8 7.097% (SOFR01M + 1.75%) 6/5/31 • | | 1,475,000 | 1,476,448 |
| United AirLines Tranche B 8.033% (SOFR03M + 2.75%) 2/22/31 • | | 2,927,662 | 2,944,915 |
| United Rentals (North America) 7.094% (SOFR01M + 1.75%) 2/14/31 • | | 1,950,113 | 1,971,137 |
| White Cap Buyer Tranche C 8.594% (SOFR01M + 3.25%) 10/19/29 • | | 5,873,480 | 5,852,829 |
| Windsor Holdings III 9.345% (SOFR01M + 4.00%) 8/1/30 • | | 5,348,125 | 5,397,788 |
| | 96,767,761 |
| Information Technology — 14.23% |
| Applied Systems 2nd Lien 10.585% (SOFR03M + 5.25%) 2/23/32 • | | 11,500,000 | 11,945,625 |
| BMC Software (Boxer/Bladelogic) | | | |
| 2nd Lien TBD 7/3/32 X | | 10,125,000 | 10,068,047 |
| 9.344% (SOFR01M + 4.00%) 12/29/28 • | | 1,476,050 | 1,471,092 |
|
|
| Boost Newco Borrower 8.335% (SOFR03M + 3.00%) 1/31/31 • | | 2,450,000 | 2,456,889 |
| Cloud Software Group Tranche B 9.335% (SOFR02M + 4.00%) 3/30/29 • | | 5,375,000 | 5,382,837 |
| Commscope 8.708% (SOFR01M + 3.36%) 4/6/26 • | | 4,895,510 | 4,597,702 |
Schedule of investments
Delaware Floating Rate Fund
| | | Principalamount° | Value (US $) |
|
| Loan Agreements (continued) |
| Information Technology (continued) |
|
| Cotiviti 7.625% 5/1/31 | | 5,750,000 | $ 5,772,758 |
| Entegris Tranche B 7.085% (SOFR03M + 1.75%) 7/6/29 • | | 587,198 | 588,911 |
| Epicor Software | | | |
| TBD 5/30/31 X | | 171,457 | 172,850 |
| Tranche E 8.594% (SOFR01M + 3.25%) 5/30/31 • | | 1,461,338 | 1,472,860 |
|
|
| Evertec Group Tranche B 8.594% (SOFR01M + 3.25%) 10/30/30 • | | 2,460,000 | 2,478,450 |
| Fortress Intermediate 3 9.097% (SOFR01M + 3.75%) 6/27/31 • | | 7,825,000 | 7,839,672 |
| Gainwell Acquisition Tranche B 9.435% (SOFR03M + 4.10%) 10/1/27 • | | 1,535,000 | 1,375,744 |
| Indicor Tranche C 8.585% (SOFR03M + 3.25%) 11/22/29 • | | 6,711,960 | 6,732,935 |
| Instructure Holdings 8.354% (SOFR03M + 3.01%) 10/30/28 • | | 2,745,954 | 2,757,108 |
| Ncr Atleos Tranche B 10.102% - 10.194% (SOFR03M + 4.85%) 3/27/29 • | | 3,430,815 | 3,484,421 |
| Project Boost Purchaser 10.536% (SOFR03M + 5.25%) 7/2/32 • | | 3,000,000 | 3,063,750 |
| Quartz AcquireCo Tranche B-1 8.085% (SOFR03M + 2.75%) 6/28/30 • | | 2,100,369 | 2,110,434 |
| SS&C Technologies Holdings Tranche B-8 7.344% (SOFR01M + 2.00%) 5/9/31 • | | 1,414,740 | 1,421,609 |
| UKG Tranche B 8.555% (SOFR03M + 3.25%) 2/10/31 • | | 7,500,000 | 7,531,012 |
| Viasat | | | |
| 9.844% (SOFR01M + 4.50%) 3/2/29 • | | 1,744,847 | 1,605,259 |
| 9.941% (SOFR01M + 4.61%) 5/30/30 • | | 4,867,987 | 4,454,209 |
| | 88,784,174 |
| Materials — 10.42% |
| Arsenal Aic Parent Tranche B 9.094% (SOFR01M + 3.75%) 8/18/30 • | | 5,868,386 | 5,895,897 |
| Berry Global Tranche AA 7.316% (SOFR03M + 2.01%) 7/1/29 • | | 1,044,487 | 1,048,704 |
| Clydesdale Acquisition Holdings Tranche B 9.119% (SOFR01M + 3.78%) 4/13/29 • | | 2,540,946 | 2,546,135 |
| Derby Buyer 8.843% (SOFR01M + 3.50%) 11/1/30 • | | 3,875,287 | 3,891,436 |
| Form Technologies | | | |
| 1st Lien 14.697% (SOFR03M + 9.35%) 10/22/25 • | | 5,451,471 | 4,013,645 |
| Tranche B 10.197% (SOFR03M + 4.85%) 7/22/25 • | | 6,442,179 | 6,212,677 |
|
|
| Gulfside Supply 8.286% (SOFR03M + 3.00%) 6/17/31 • | | 1,435,000 | 1,443,072 |
| | | Principalamount° | Value (US $) |
|
| Loan Agreements (continued) |
| Materials (continued) |
|
| Hexion Holdings 2nd Lien 12.881% (SOFR01M + 7.54%) 3/15/30 • | | 7,450,024 | $ 6,805,597 |
| Olympus Water US Holding Tranche B-5 8.847% (SOFR03M + 3.50%) 6/20/31 • | | 6,796,830 | 6,826,566 |
| PMHC II 9.704% (SOFR03M + 4.25%) 4/23/29 • | | 7,625,512 | 7,470,218 |
| Pretium PKG Holdings 2nd Lien 12.339% (SOFR03M + 7.01%) 10/1/29 • | | 3,600,000 | 2,056,500 |
| Quikrete Holdings Tranche B 7.844% (SOFR01M + 2.50%) 4/14/31 • | | 1,019,133 | 1,023,719 |
| Sparts US Holdings 1st Lien 8.587% (SOFR01M + 3.25%) 8/2/30 • | | 488,747 | 490,350 |
| Touchdown Acquirer | | | |
| 9.304% (SOFR02M + 4.00%) 2/21/31 • | | 1,432,635 | 1,437,410 |
| 9.326% (SOFR03M + 4.00%) 2/21/31 • | | 6,542,365 | 6,564,171 |
|
|
| Vantage Specialty Chemicals 1st Lien 10.077% (SOFR03M + 4.75%) 10/26/26 • | | 5,836,664 | 5,840,312 |
| Zekelman Industries 7.60% (SOFR01M + 2.25%) 1/24/31 • | | 1,480,240 | 1,486,137 |
| | 65,052,546 |
| Real Estate — 0.70% |
| Iron Mountain Information Management Tranche B 7.344% (SOFR01M + 2.00%) 1/31/31 • | | 4,356,250 | 4,347,176 |
| | 4,347,176 |
| Utilities — 8.72% |
| Calpine | | | |
| 7.344% (SOFR01M + 2.00%) 12/16/27 • | | 2,079,990 | 2,089,926 |
| 7.344% (SOFR01M + 2.00%) 1/31/31 • | | 2,450,184 | 2,451,995 |
|
|
| Eastern Power Tranche B 10.594% (TSFR01M + 5.25%) 4/3/28 • | | 3,039,743 | 3,044,810 |
| Generation Bridge Northeast Tranche B 8.844% (SOFR01M + 3.50%) 8/22/29 • | | 2,812,524 | 2,838,306 |
| Hamilton Projects Acquiror 1st Lien 9.094% (SOFR01M + 3.75%) 5/22/31 • | | 10,010,000 | 10,122,613 |
| Lackawanna Energy Center | | | |
| Tranche B-2 10.344% (SOFR01M + 5.00%) 8/6/29 • | | 4,478,571 | 4,512,161 |
| Tranche C 10.344% (SOFR01M + 5.00%) 8/6/29 • | | 976,190 | 983,512 |
|
|
| NGL Energy Operating 9.844% (SOFR01M + 4.50%) 2/3/31 • | | 7,705,687 | 7,715,320 |
| Parkway Generation | | | |
| Tranche B 10.264% (SOFR03M + 5.01%) 2/18/29 • | | 5,637,637 | 5,656,574 |
| Tranche C 10.264% (SOFR03M + 5.01%) 2/18/29 • | | 742,278 | 744,771 |
|
|
Schedule of investments
Delaware Floating Rate Fund
| | | Principalamount° | Value (US $) |
|
| Loan Agreements (continued) |
| Utilities (continued) |
|
| PG&E 7.844% (SOFR01M + 2.50%) 6/23/27 • | | 3,385,000 | $ 3,404,041 |
| Talen Energy Supply | | | |
| Tranche B 8.827% (SOFR03M + 3.50%) 5/17/30 • | | 602,337 | 609,991 |
| Tranche C 8.827% (SOFR03M + 3.50%) 5/17/30 • | | 396,142 | 401,176 |
|
|
| TerraForm Power Operating 7.935% (SOFR03M + 2.60%) 5/21/29 • | | 2,260,767 | 2,271,365 |
| Vistra Operations 7.344% (SOFR01M + 2.00%) 12/20/30 • | | 2,640,953 | 2,651,907 |
| Vistra Zero Operating Company 8.097% (SOFR01M + 2.75%) 4/30/31 • | | 4,872,787 | 4,896,771 |
| | 54,395,239 |
| Total Loan Agreements (cost $568,955,684) | 567,395,720 |
| | | Number of
shares | |
| Common Stocks — 0.23% |
| Consumer Discretionary — 0.03% |
| Studio City International Holdings †, π | | 29,695 | 200,061 |
| | 200,061 |
| Consumer Staples — 0.20% |
| Endo † | | 43,835 | 1,266,613 |
| | 1,266,613 |
| Total Common Stocks (cost $2,030,210) | 1,466,674 |
|
|
|
| Exchange-Traded Funds — 1.65% |
| Invesco Senior Loan ETF | | 350,000 | 7,350,000 |
| SPDR Blackstone Senior Loan ETF | | 70,000 | 2,922,500 |
| Total Exchange-Traded Funds (cost $10,322,785) | 10,272,500 |
|
|
|
| Short-Term Investments — 3.83% |
| Money Market Mutual Funds — 3.83% |
| BlackRock Liquidity FedFund – Institutional Shares (seven-day effective yield 5.21%) | | 5,975,857 | 5,975,857 |
| Fidelity Investments Money Market Government Portfolio – Class I (seven-day effective yield 5.22%) | | 5,975,857 | 5,975,857 |
| Goldman Sachs Financial Square Government Fund – Institutional Shares (seven-day effective yield 5.35%) | | 5,975,857 | 5,975,857 |
| | | Number of
shares | Value (US $) |
| Short-Term Investments (continued) |
| Money Market Mutual Funds (continued) |
| Morgan Stanley Institutional Liquidity Funds Government Portfolio – Institutional Class (seven-day effective yield 5.21%) | | 5,975,857 | $ 5,975,857 |
| Total Short-Term Investments (cost $23,903,428) | 23,903,428 |
Total Value of Securities—102.58%
(cost $642,532,618) | | | $640,179,280 |
| ° | Principal amount shown is stated in USD unless noted that the security is denominated in another currency. |
| # | Security exempt from registration under Rule 144A of the Securities Act of 1933, as amended. At July 31, 2024, the aggregate value of Rule 144A securities was $35,251,017, which represents 5.65% of the Fund’s net assets. See Note 10 in “Notes to financial statements.” |
| • | Variable rate investment. Rates reset periodically. Rate shown reflects the rate in effect at July 31, 2024. For securities based on a published reference rate and spread, the reference rate and spread are indicated in their descriptions. The reference rate descriptions (i.e. SOFR01M, SOFR03M, etc.) used in this report are identical for different securities, but the underlying reference rates may differ due to the timing of the reset period. Certain variable rate securities are not based on a published reference rate and spread but are determined by the issuer or agent and are based on current market conditions, or for mortgage-backed securities, are impacted by the individual mortgages which are paying off over time. These securities do not indicate a reference rate and spread in their descriptions. |
| ^ | Represents a security with a settlement after July 31, 2024, at which time the interest rate will be reflected. |
| = | The value of this security was determined using significant unobservable inputs and is reported as a Level 3 security in the disclosure table located in Note 3 in “Notes to financial statements.” |
| >> | PIK. 100% of the income received was in the form of principal. |
| π | Restricted security. These investments are in securities not registered under the Securities Act of 1933, as amended, and have certain restrictions on resale which may limit their liquidity. At July 31, 2024, the aggregate value of restricted securities was $807,907, which represented 0.13% of the Fund’s net assets. See table on the next page for additional details on restricted securities. |
| ‡ | Non-income producing security. Security is currently in default. |
| ψ | Perpetual security. Maturity date represents next call date. |
| μ | Fixed to variable rate investment. The rate shown reflects the fixed rate in effect at July 31, 2024. Rate will reset at a future date. |
Schedule of investments
Delaware Floating Rate Fund
| X | This loan will settle after July 31, 2024, at which time the interest rate, based on the SOFR and the agreed upon spread on trade date, will be reflected. |
| † | Non-income producing security. |
| Restricted Securities | | | | | | |
| Investments | | Date of Acquisition | | Cost | | Value |
| New Cotai | | 2/7/22 | | $241,189 | | $607,846 |
| Studio City International Holdings | | 2/7/22 | | 89,260 | | 200,061 |
| Total | | | | $330,449 | | $807,907 |
| Summary of abbreviations: |
| CLO – Collateralized Loan Obligation |
| DAC – Designated Activity Company |
| ETF – Exchange-Traded Fund |
| PIK – Payment-in-kind |
| SOFR – Secured Overnight Financing Rate |
| SOFR01M – Secured Overnight Financing Rate 1 Month |
| SOFR02M – Secured Overnight Financing Rate 2 Month |
| SOFR03M – Secured Overnight Financing Rate 3 Month |
| SOFR06M – Secured Overnight Financing Rate 6 Month |
| SPDR – Standard & Poor's Depositary Receipt |
| TBD – To be determined |
| TSFR01M – 1 Month Term Secured Overnight Financing Rate |
| TSFR03M – 3 Month Term Secured Overnight Financing Rate |
| USD – US Dollar |
See accompanying notes, which are an integral part of the financial statements.
Statement of assets and liabilities
| Delaware Floating Rate Fund | July 31, 2024 |
| Assets: | |
| Investments, at value* | $640,179,280 |
| Receivable for securities sold | 28,328,760 |
| Dividends and interest receivable | 3,694,287 |
| Receivable for fund shares sold | 2,443,416 |
| Prepaid expenses | 52,412 |
| Other assets | 1,631 |
| Total Assets | 674,699,786 |
| Liabilities: | |
| Due to custodian | 41,583 |
| Payable for securities purchased | 44,284,102 |
| Payable for fund shares redeemed | 5,213,130 |
| Distribution payable | 507,008 |
| Investment management fees payable to affiliates | 314,468 |
| Other accrued expenses | 239,900 |
| Distribution fees payable to affiliates | 30,180 |
| Total Liabilities | 50,630,371 |
| Total Net Assets | $624,069,415 |
|
| Net Assets Consist of: | |
| Paid-in capital | $670,213,844 |
| Total distributable earnings (loss) | (46,144,429) |
| Total Net Assets | $624,069,415 |
Statement of assets and liabilities
Delaware Floating Rate Fund
|
| Net Asset Value | |
|
| Class A: | |
| Net assets | $80,549,499 |
| Shares of beneficial interest outstanding, unlimited authorization, no par | 10,091,183 |
| Net asset value per share | $7.98 |
| Sales charge | 2.75% |
| Offering price per share, equal to net asset value per share / (1 - sales charge) | $8.21 |
|
| Class C: | |
| Net assets | $14,893,798 |
| Shares of beneficial interest outstanding, unlimited authorization, no par | 1,866,007 |
| Net asset value per share | $7.98 |
|
| Class R: | |
| Net assets | $1,641,063 |
| Shares of beneficial interest outstanding, unlimited authorization, no par | 205,670 |
| Net asset value per share | $7.98 |
|
| Institutional Class: | |
| Net assets | $517,659,699 |
| Shares of beneficial interest outstanding, unlimited authorization, no par | 64,858,911 |
| Net asset value per share | $7.98 |
|
| Class R6: | |
| Net assets | $9,325,356 |
| Shares of beneficial interest outstanding, unlimited authorization, no par | 1,167,165 |
| Net asset value per share | $7.99 |
*Investments, at cost | $642,532,618 |
See accompanying notes, which are an integral part of the financial statements.
Statement of operations
| Delaware Floating Rate Fund | Year ended July 31, 2024 |
| Investment Income: | |
| Interest | $54,286,485 |
| Dividends | 3,060,816 |
| | 57,347,301 |
|
| Expenses: | |
| Management fees | 2,897,103 |
| Distribution expenses — Class A | 190,615 |
| Distribution expenses — Class C | 133,764 |
| Distribution expenses — Class R | 7,630 |
| Dividend disbursing and transfer agent fees and expenses | 570,383 |
| Registration fees | 129,673 |
| Accounting and administration expenses | 108,056 |
| Reports and statements to shareholders expenses | 82,049 |
| Legal fees | 62,939 |
| Audit and tax fees | 53,950 |
| Trustees’ fees | 26,615 |
| Custodian fees | 4,317 |
| Other | 42,127 |
| | 4,309,221 |
| Less expenses paid indirectly | (237) |
| Total operating expenses | 4,308,984 |
| Net Investment Income (Loss) | 53,038,317 |
|
| Net Realized and Unrealized Gain (Loss): | |
| Net realized gain (loss) on: | |
| Investments | (410,916) |
| Foreign currencies | (5,185) |
| Forward foreign currency exchange contracts | 6,502 |
| Net realized gain (loss) | (409,599) |
|
| Net change in unrealized appreciation (depreciation) on: | |
| Investments | 4,637,969 |
| Foreign currencies | 896 |
| Forward foreign currency exchange contracts | 13,670 |
| Net change in unrealized appreciation (depreciation) | 4,652,535 |
| Net Realized and Unrealized Gain (Loss) | 4,242,936 |
| Net Increase (Decrease) in Net Assets Resulting from Operations | $57,281,253 |
See accompanying notes, which are an integral part of the financial statements.
Statements of changes in net assets
Delaware Floating Rate Fund
| | Year ended |
| | 7/31/24 | | 7/31/23 |
| Increase (Decrease) in Net Assets from Operations: | | | |
| Net investment income (loss) | $53,038,317 | | $50,705,323 |
| Net realized gain (loss) | (409,599) | | (16,903,864) |
| Net change in unrealized appreciation (depreciation) | 4,652,535 | | 16,408,212 |
| Net increase (decrease) in net assets resulting from operations | 57,281,253 | | 50,209,671 |
|
| Dividends and Distributions to Shareholders from: | | | |
| Distributable earnings: | | | |
| Class A | (6,751,119) | | (4,882,930) |
| Class C | (1,082,526) | | (876,795) |
| Class R | (131,179) | | (87,619) |
| Institutional Class | (44,155,461) | | (43,139,141) |
| Class R6 | (650,706) | | (395,703) |
| | (52,770,991) | | (49,382,188) |
|
| Capital Share Transactions (See Note 6): | | | |
| Proceeds from shares sold: | | | |
| Class A | 37,236,127 | | 47,199,671 |
| Class C | 5,847,543 | | 4,159,046 |
| Class R | 213,002 | | 243,790 |
| Institutional Class | 284,562,708 | | 324,813,582 |
| Class R6 | 4,816,253 | | 4,782,804 |
|
| Net asset value of shares issued upon reinvestment of dividends and distributions: | | | |
| Class A | 6,598,486 | | 4,666,221 |
| Class C | 1,055,061 | | 841,423 |
| Class R | 131,179 | | 87,393 |
| Institutional Class | 39,423,288 | | 38,961,312 |
| Class R6 | 457,346 | | 256,451 |
| | 380,340,993 | | 426,011,693 |
| | Year ended |
| | 7/31/24 | | 7/31/23 |
| Capital Share Transactions (continued): | | | |
| Cost of shares redeemed: | | | |
| Class A | $(30,613,216) | | $(58,149,458) |
| Class C | (4,384,332) | | (5,726,615) |
| Class R | (147,576) | | (15,781) |
| Institutional Class | (281,889,625) | | (546,707,244) |
| Class R6 | (3,018,804) | | (3,066,296) |
| | (320,053,553) | | (613,665,394) |
| Increase (decrease) in net assets derived from capital share transactions | 60,287,440 | | (187,653,701) |
| Net Increase (Decrease) in Net Assets | 64,797,702 | | (186,826,218) |
|
| Net Assets: | | | |
| Beginning of year | 559,271,713 | | 746,097,931 |
| End of year | $624,069,415 | | $559,271,713 |
See accompanying notes, which are an integral part of the financial statements.
Financial highlights
Delaware Floating Rate Fund Class A
Selected data for each share of the Fund outstanding throughout each period were as follows:
| |
| |
Net asset value, beginning of period
|
| |
| Income (loss) from investment operations: |
Net investment income1
|
Net realized and unrealized gain (loss)
|
Total from investment operations
|
| |
| Less dividends and distributions from: |
Net investment income
|
Return of capital
|
Total dividends and distributions
|
| |
Net asset value, end of period
|
| |
Total return3
|
| |
| Ratios and supplemental data: |
Net assets, end of period (000 omitted)
|
Ratio of expenses to average net assets5
|
Ratio of expenses to average net assets prior to fees waived5
|
Ratio of net investment income to average net assets
|
Ratio of net investment income to average net assets prior to fees waived
|
Portfolio turnover
|
| 1 | Calculated using average shares outstanding. |
| 2 | Amount is less than $0.005 per share. |
| 3 | Total return is based on the change in net asset value of a share during the period and assumes reinvestment of dividends and distributions at net asset value and does not reflect the impact of a sales charge. |
| 4 | Total return during the period presented reflects waivers by the manager and/or distributor (as applicable). Performance would have been lower had the waivers not been in effect. |
| 5 | Expense ratios do not include expenses of any investment companies in which the Fund invests. |
See accompanying notes, which are an integral part of the financial statements.
| Year ended |
| 7/31/24 | | 7/31/23 | | 7/31/22 | | 7/31/21 | | 7/31/20 |
| $7.91 | | $7.89 | | $8.23 | | $7.90 | | $8.28 |
| |
| | | | | | | | | |
| 0.71 | | 0.59 | | 0.30 | | 0.31 | | 0.38 |
| 0.07 | | 0.02 | | (0.34) | | 0.32 | | (0.39) |
| 0.78 | | 0.61 | | (0.04) | | 0.63 | | (0.01) |
| |
| | | | | | | | | |
| (0.71) | | (0.59) | | (0.30) | | (0.26) | | (0.37) |
| — | | — | | — | | (0.04) | | —2 |
| (0.71) | | (0.59) | | (0.30) | | (0.30) | | (0.37) |
| |
| $7.98 | | $7.91 | | $7.89 | | $8.23 | | $7.90 |
| |
| 10.18% | | 8.00%4 | | (0.56%)4 | | 8.13%4 | | (0.02%)4 |
| |
| | | | | | | | | |
| $80,549 | | $66,676 | | $72,746 | | $36,735 | | $23,727 |
| 0.93% | | 0.94% | | 0.92% | | 0.94% | | 0.94% |
| 0.93% | | 0.95% | | 0.93% | | 1.05% | | 1.05% |
| 8.89% | | 7.55% | | 3.75% | | 3.77% | | 4.77% |
| 8.89% | | 7.54% | | 3.74% | | 3.66% | | 4.66% |
| 104% | | 60% | | 45% | | 124% | | 125% |
Financial highlights
Delaware Floating Rate Fund Class C
Selected data for each share of the Fund outstanding throughout each period were as follows:
| |
| |
Net asset value, beginning of period
|
| |
| Income (loss) from investment operations: |
Net investment income1
|
Net realized and unrealized gain (loss)
|
Total from investment operations
|
| |
| Less dividends and distributions from: |
Net investment income
|
Return of capital
|
Total dividends and distributions
|
| |
Net asset value, end of period
|
| |
Total return3
|
| |
| Ratios and supplemental data: |
Net assets, end of period (000 omitted)
|
Ratio of expenses to average net assets5
|
Ratio of expenses to average net assets prior to fees waived5
|
Ratio of net investment income to average net assets
|
Ratio of net investment income to average net assets prior to fees waived
|
Portfolio turnover
|
| 1 | Calculated using average shares outstanding. |
| 2 | Amount is less than $0.005 per share. |
| 3 | Total return is based on the change in net asset value of a share during the period and assumes reinvestment of dividends and distributions at net asset value and does not reflect the impact of a sales charge. |
| 4 | Total return during the period presented reflects waivers by the manager and/or distributor (as applicable). Performance would have been lower had the waivers not been in effect. |
| 5 | Expense ratios do not include expenses of any investment companies in which the Fund invests. |
See accompanying notes, which are an integral part of the financial statements.
| Year ended |
| 7/31/24 | | 7/31/23 | | 7/31/22 | | 7/31/21 | | 7/31/20 |
| $7.91 | | $7.89 | | $8.23 | | $7.89 | | $8.28 |
| |
| | | | | | | | | |
| 0.65 | | 0.53 | | 0.24 | | 0.24 | | 0.32 |
| 0.07 | | 0.02 | | (0.34) | | 0.34 | | (0.40) |
| 0.72 | | 0.55 | | (0.10) | | 0.58 | | (0.08) |
| |
| | | | | | | | | |
| (0.65) | | (0.53) | | (0.24) | | (0.20) | | (0.31) |
| — | | — | | — | | (0.04) | | —2 |
| (0.65) | | (0.53) | | (0.24) | | (0.24) | | (0.31) |
| |
| $7.98 | | $7.91 | | $7.89 | | $8.23 | | $7.89 |
| |
| 9.37% | | 7.20%4 | | (1.30%)4 | | 7.47%4 | | (0.90%)4 |
| |
| | | | | | | | | |
| $14,894 | | $12,273 | | $12,948 | | $8,698 | | $13,613 |
| 1.68% | | 1.69% | | 1.67% | | 1.69% | | 1.69% |
| 1.68% | | 1.70% | | 1.68% | | 1.80% | | 1.80% |
| 8.14% | | 6.80% | | 3.00% | | 3.02% | | 4.02% |
| 8.14% | | 6.79% | | 2.99% | | 2.91% | | 3.91% |
| 104% | | 60% | | 45% | | 124% | | 125% |
Financial highlights
Delaware Floating Rate Fund Class R
Selected data for each share of the Fund outstanding throughout each period were as follows:
| |
| |
Net asset value, beginning of period
|
| |
| Income (loss) from investment operations: |
Net investment income1
|
Net realized and unrealized gain (loss)
|
Total from investment operations
|
| |
| Less dividends and distributions from: |
Net investment income
|
Return of capital
|
Total dividends and distributions
|
| |
Net asset value, end of period
|
| |
Total return3
|
| |
| Ratios and supplemental data: |
Net assets, end of period (000 omitted)
|
Ratio of expenses to average net assets5
|
Ratio of expenses to average net assets prior to fees waived5
|
Ratio of net investment income to average net assets
|
Ratio of net investment income to average net assets prior to fees waived
|
Portfolio turnover
|
| 1 | Calculated using average shares outstanding. |
| 2 | Amount is less than $0.005 per share. |
| 3 | Total return is based on the change in net asset value of a share during the period and assumes reinvestment of dividends and distributions at net asset value. |
| 4 | Total return during the period presented reflects waivers by the manager and/or distributor (as applicable). Performance would have been lower had the waivers not been in effect. |
| 5 | Expense ratios do not include expenses of any investment companies in which the Fund invests. |
See accompanying notes, which are an integral part of the financial statements.
| Year ended |
| 7/31/24 | | 7/31/23 | | 7/31/22 | | 7/31/21 | | 7/31/20 |
| $7.91 | | $7.88 | | $8.23 | | $7.89 | | $8.28 |
| |
| | | | | | | | | |
| 0.69 | | 0.57 | | 0.28 | | 0.29 | | 0.36 |
| 0.07 | | 0.03 | | (0.35) | | 0.33 | | (0.40) |
| 0.76 | | 0.60 | | (0.07) | | 0.62 | | (0.04) |
| |
| | | | | | | | | |
| (0.69) | | (0.57) | | (0.28) | | (0.24) | | (0.35) |
| — | | — | | — | | (0.04) | | —2 |
| (0.69) | | (0.57) | | (0.28) | | (0.28) | | (0.35) |
| |
| $7.98 | | $7.91 | | $7.88 | | $8.23 | | $7.89 |
| |
| 9.91% | | 7.87%4 | | (0.92%)4 | | 7.99%4 | | (0.40%)4 |
| |
| | | | | | | | | |
| $1,641 | | $1,432 | | $1,111 | | $22 | | $7 |
| 1.18% | | 1.19% | | 1.17% | | 1.19% | | 1.19% |
| 1.18% | | 1.20% | | 1.18% | | 1.30% | | 1.30% |
| 8.64% | | 7.30% | | 3.50% | | 3.52% | | 4.52% |
| 8.64% | | 7.29% | | 3.49% | | 3.41% | | 4.41% |
| 104% | | 60% | | 45% | | 124% | | 125% |
Financial highlights
Delaware Floating Rate Fund Institutional Class
Selected data for each share of the Fund outstanding throughout each period were as follows:
| |
| |
Net asset value, beginning of period
|
| |
| Income (loss) from investment operations: |
Net investment income1
|
Net realized and unrealized gain (loss)
|
Total from investment operations
|
| |
| Less dividends and distributions from: |
Net investment income
|
Return of capital
|
Total dividends and distributions
|
| |
Net asset value, end of period
|
| |
Total return3
|
| |
| Ratios and supplemental data: |
Net assets, end of period (000 omitted)
|
Ratio of expenses to average net assets5
|
Ratio of expenses to average net assets prior to fees waived5
|
Ratio of net investment income to average net assets
|
Ratio of net investment income to average net assets prior to fees waived
|
Portfolio turnover
|
| 1 | Calculated using average shares outstanding. |
| 2 | Amount is less than $0.005 per share. |
| 3 | Total return is based on the change in net asset value of a share during the period and assumes reinvestment of dividends and distributions at net asset value. |
| 4 | Total return during the period presented reflects waivers by the manager. Performance would have been lower had the waivers not been in effect. |
| 5 | Expense ratios do not include expenses of any investment companies in which the Fund invests. |
See accompanying notes, which are an integral part of the financial statements.
| Year ended |
| 7/31/24 | | 7/31/23 | | 7/31/22 | | 7/31/21 | | 7/31/20 |
| $7.91 | | $7.89 | | $8.23 | | $7.90 | | $8.28 |
| |
| | | | | | | | | |
| 0.73 | | 0.61 | | 0.32 | | 0.33 | | 0.40 |
| 0.07 | | 0.02 | | (0.34) | | 0.32 | | (0.39) |
| 0.80 | | 0.63 | | (0.02) | | 0.65 | | 0.01 |
| |
| | | | | | | | | |
| (0.73) | | (0.61) | | (0.32) | | (0.28) | | (0.39) |
| — | | — | | — | | (0.04) | | —2 |
| (0.73) | | (0.61) | | (0.32) | | (0.32) | | (0.39) |
| |
| $7.98 | | $7.91 | | $7.89 | | $8.23 | | $7.90 |
| |
| 10.46% | | 8.27%4 | | (0.31%)4 | | 8.40%4 | | 0.23%4 |
| |
| | | | | | | | | |
| $517,660 | | $471,869 | | $654,307 | | $116,242 | | $79,391 |
| 0.68% | | 0.69% | | 0.67% | | 0.69% | | 0.69% |
| 0.68% | | 0.70% | | 0.68% | | 0.80% | | 0.80% |
| 9.14% | | 7.80% | | 4.00% | | 4.02% | | 5.02% |
| 9.14% | | 7.79% | | 3.99% | | 3.91% | | 4.91% |
| 104% | | 60% | | 45% | | 124% | | 125% |
Financial highlights
Delaware Floating Rate Fund Class R6
Selected data for each share of the Fund outstanding throughout each period were as follows:
| |
| |
Net asset value, beginning of period
|
| |
| Income (loss) from investment operations: |
Net investment income2
|
Net realized and unrealized gain (loss)
|
Total from investment operations
|
| |
| Less dividends and distributions from: |
Net investment income
|
Total dividends and distributions
|
| |
Net asset value, end of period
|
| |
Total return3
|
| |
| Ratios and supplemental data: |
Net assets, end of period (000 omitted)
|
Ratio of expenses to average net assets5
|
Ratio of expenses to average net assets prior to fees waived5
|
Ratio of net investment income to average net assets
|
Ratio of net investment income to average net assets prior to fees waived
|
Portfolio turnover
|
| 1 | Date of commencement of operations; ratios have been annualized and total return has not been annualized. |
| 2 | Calculated using average shares outstanding. |
| 3 | Total return is based on the change in net asset value of a share during the period and assumes reinvestment of dividends and distributions at net asset value. |
| 4 | Total return during the period presented reflects waivers by the manager. Performance would have been lower had the waivers not been in effect. |
| 5 | Expense ratios do not include expenses of any investment companies in which the Fund invests. |
| 6 | Portfolio turnover is representative of the Fund for the year ended July 31, 2022. |
See accompanying notes, which are an integral part of the financial statements.
| Year ended | | 8/31/211
to
7/31/22 |
| 7/31/24 | | 7/31/23 | |
| $7.92 | | $7.89 | | $8.24 |
| |
| | | | | |
| 0.74 | | 0.62 | | 0.33 |
| 0.06 | | 0.02 | | (0.38) |
| 0.80 | | 0.64 | | (0.05) |
| |
| | | | | |
| (0.73) | | (0.61) | | (0.30) |
| (0.73) | | (0.61) | | (0.30) |
| |
| $7.99 | | $7.92 | | $7.89 |
| |
| 10.55% | | 8.48%4 | | (0.69%)4 |
| |
| | | | | |
| $9,325 | | $7,022 | | $4,986 |
| 0.60% | | 0.62% | | 0.60% |
| 0.60% | | 0.63% | | 0.61% |
| 9.22% | | 7.87% | | 4.07% |
| 9.22% | | 7.86% | | 4.06% |
| 104% | | 60% | | 45%6 |
Notes to financial statements
| Delaware Floating Rate Fund | July 31, 2024 |
Delaware Group® Income Funds (Trust) is organized as a Delaware statutory trust and offers three series: Delaware Corporate Bond Fund, Delaware Extended Duration Bond Fund, and Delaware Floating Rate Fund. These financial statements and the related notes pertain to Delaware Floating Rate Fund (Fund). The Trust is an open-end investment company. The Fund is considered diversified under the Investment Company Act of 1940, as amended (1940 Act), and offers Class A, Class C, Class R, Institutional Class, and Class R6 shares. Class A shares are sold with a maximum front-end sales charge of 2.75%. There is no front-end sales charge when you purchase $1 million or more of Class A shares. However, if Delaware Distributors, L.P. (DDLP) paid your financial intermediary a commission on your purchase of $1 million or more of Class A shares, you will have to pay a limited contingent deferred sales charge (Limited CDSC) of 1.00% if you redeem these shares within the first 18 months after your purchase, unless a specific waiver of the Limited CDSC applies. Class C shares have no upfront sales charge, but are sold with a contingent deferred sales charge (CDSC) of 1.00%, which will be incurred if redeemed during the first 12 months. Class R, Institutional Class, and Class R6 shares are not subject to a sales charge and are offered for sale exclusively to certain eligible investors. In addition, Class R6 shares do not pay any service fees, sub-accounting fees, and/or sub-transfer agency fees to any brokers, dealers, or other financial intermediaries.
1. Significant Accounting Policies
The Fund follows accounting and reporting guidance under Financial Accounting Standards Board (FASB) Accounting Standards Codification Topic 946, Financial Services — Investment Companies. The following accounting policies are in accordance with US generally accepted accounting principles (US GAAP) and are consistently followed by the Fund.
Security Valuation — Equity securities and exchange-traded funds (ETFs), except those traded on the Nasdaq Stock Market LLC (Nasdaq), are valued at the last quoted sales price as of the time of the regular close of the New York Stock Exchange (NYSE) on the valuation date. Equity securities and ETFs traded on the Nasdaq are valued in accordance with the Nasdaq Official Closing Price, which may not be the last sales price. If, on a particular day, an equity security or ETF does not trade, the mean between the bid and the ask prices will be used, which approximates fair value. Equity securities listed on a foreign exchange are normally valued at the last quoted sales price on the valuation date. Fixed income securities are generally priced based upon valuations provided by an independent pricing service or broker in accordance with methodologies included within Delaware Management Company (DMC)’s Pricing Policy (the Policy). Fixed income security valuations are then reviewed by DMC as part of its duties as the Fund's valuation designee (Valuation Designee) and, to the extent required by the Policy and applicable regulation, fair valued consistent with the Policy. To the extent current market prices are not available, the pricing service may take into account developments related to the specific security, as well as transactions in comparable securities. Open-end investment companies, other than ETFs, are valued at their published net asset value (NAV). Forward foreign currency exchange contracts are valued at the mean between the bid and the ask prices, which approximates fair value. Interpolated values are derived when the settlement date of the contract
is an interim date for which quotations are not available. Valuations for fixed income securities utilize matrix systems, which reflect such factors as security prices, yields, maturities, and ratings, and are supplemented by dealer and exchange quotations. Investments for which market quotations are not readily available are valued at fair value as determined in good faith pursuant to Rule 2a-5 under the 1940 Act (Rule 2a-5). As a general principle, the fair value of a security or other asset is the price that would be received to sell an asset or paid to transfer a liability in an orderly transaction between market participants at the measurement date. Pursuant to Rule 2a-5, the Board of Trustees (Board) has designated DMC as the Valuation Designee for the Fund to perform the fair value determination relating to all applicable Fund investments. DMC has established a Pricing Committee to assist with its designated responsibilities as Valuation Designee, and DMC may carry out its designated responsibilities as Valuation Designee through the Pricing Committee and other teams and committees, which operate under policies and procedures approved by the Board and subject to the Board’s oversight. Fair value pricing may be used more frequently for securities traded primarily in non-US markets. In considering whether fair valuation is required and in determining fair values, the Valuation Designee may, among other things, consider significant events (which may be considered to include changes in the value of US securities or securities indexes) that occur after the close of the relevant market and before the close of the NYSE. The Valuation Designee may utilize modeling tools provided by third-party vendors to determine fair values of non-US securities.
Federal Income Taxes — No provision for federal income taxes has been made as the Fund intends to continue to qualify for federal income tax purposes as a regulated investment company under Subchapter M of the Internal Revenue Code of 1986, as amended, and make the requisite distributions to shareholders. The Fund evaluates tax positions taken or expected to be taken in the course of preparing the Fund’s tax returns to determine whether the tax positions are “more-likely-than-not” of being sustained by the applicable tax authority. Tax positions not deemed to meet the “more-likely-than-not” threshold are recorded as a tax benefit or expense in the current year. Management has analyzed the Fund’s tax positions taken or expected to be taken on the Fund’s federal income tax returns through the year ended July 31, 2024, and for all open tax years (years ended July 31, 2021–July 31, 2023), and has concluded that no provision for federal income tax is required in the Fund’s financial statements. If applicable, the Fund recognizes interest accrued on unrecognized tax benefits in interest expense and penalties in “Other” on the “Statement of operations.” During the year ended July 31, 2024, the Fund did not incur any interest or tax penalties.
Class Accounting — Investment income and common expenses are allocated to the various classes of the Fund on the basis of “settled shares” of each class in relation to the net assets of the Fund. Realized and unrealized gain (loss) on investments are allocated to the various classes of the Fund on the basis of daily net assets of each class. Distribution expenses relating to a specific class are charged directly to that class. Class R6 shares will not be allocated any expenses related to service fees, sub-accounting fees, and/or sub-transfer agency fees paid to brokers, dealers, or other financial intermediaries.
Notes to financial statements
Delaware Floating Rate Fund
1. Significant Accounting Policies (continued)
Underlying Funds — The Fund may invest in other investment companies (Underlying Funds) to the extent permitted by the 1940 Act. The Underlying Funds in which the Fund may invest include ETFs. The Fund will indirectly bear the investment management fees and other expenses of the Underlying Funds.
Foreign Currency Transactions — Transactions denominated in foreign currencies are recorded at the prevailing exchange rates on the valuation date. The value of all assets and liabilities denominated in foreign currencies is translated daily into US dollars at the exchange rate of such currencies against the US dollar. Transaction gains or losses resulting from changes in exchange rates during the reporting period or upon settlement of the foreign currency transaction are reported in operations for the current period. The Fund generally bifurcates that portion of realized gains and losses on investments in debt securities which is due to changes in foreign exchange rates from that which is due to changes in market prices of debt securities. That portion of realized gains (losses), attributable to changes in foreign exchange rates, is included on the “Statement of operations” under “Net realized gain (loss) on foreign currencies.” For foreign equity securities, the realized gains and losses are included on the “Statement of operations” under “Net realized gain (loss) on investments.” The Fund reports certain foreign currency related transactions as components of realized gains (losses) for financial reporting purposes, whereas such components are treated as ordinary income (loss) for federal income tax purposes.
Derivative Financial Instruments — The Fund may invest in various derivative financial instruments. These instruments are used to obtain exposure to a security, commodity, index, market, and/or other assets without owning or taking physical custody of securities, commodities and/or other referenced assets or to manage market, equity, credit, interest rate, forward foreign currency exchange rate, commodity and/or other risks. Derivative financial instruments may give rise to a form of economic leverage and involve risks, including the imperfect correlation between the value of a derivative financial instrument and the underlying asset, possible default of the counterparty to the transaction or illiquidity of the instrument. Pursuant to Rule 18f-4 under the 1940 Act, among other things, the Fund intends to use either derivative financial instruments with embedded leverage in a limited manner or comply with an outer limit on fund leverage risk based on value-at-risk.
Segregation and Collateralization — In certain cases, based on requirements and agreements with certain exchanges and third-party broker-dealers, the Fund may deliver or receive collateral in connection with certain investments (e.g., futures contracts, forward foreign currency exchange contracts, options written, securities with extended settlement periods, and swaps). Certain countries require that cash reserves be held while investing in companies incorporated in that country. Cash collateral that has been pledged/received to cover obligations of the Fund under derivative contracts, if any, will be reported separately on the “Statement of assets and liabilities” as cash collateral due to/from broker. Securities collateral pledged for the same purpose, if any, is noted on the “Schedule of investments.”
Use of Estimates — The preparation of financial statements in conformity with US GAAP requires management to make estimates and assumptions that affect the fair value of investments, the reported amounts of assets and liabilities and disclosure of contingent assets and liabilities at the date of the financial statements, and the reported amounts of revenues and expenses during the reporting period. Actual results could differ from those estimates and the differences could be material.
Other — Expenses directly attributable to the Fund are charged directly to the Fund. Other expenses common to various funds within the Delaware Funds by Macquarie® (Delaware Funds) are generally allocated among such funds on the basis of average net assets. Management fees and certain other expenses are paid monthly. Security transactions are recorded on the date the securities are purchased or sold (trade date) for financial reporting purposes. Costs used in calculating realized gains and losses on the sale of investment securities are those of the specific securities sold. Dividend income is recorded on the ex-dividend date and interest income is recorded on an accrual basis. Income and capital gain distributions from any Underlying Funds in which the Fund invests are recorded on the ex-dividend date. When a loan agreement is purchased, the Fund may pay an assignment fee. On an ongoing basis, the Fund may receive a commitment fee based on the undrawn portion of the underlying line of credit portion of a loan agreement. Prepayment penalty fees are received upon the prepayment of a loan agreement by the borrower. Prepayment penalty, facility, commitment, consent, and amendment fees are recorded to income as earned or paid. Discounts and premiums on debt securities are accreted or amortized to interest income, respectively, over the lives of the respective securities using the effective interest method. Premiums on callable debt securities are amortized to interest income to the earliest call date using the effective interest method. The Fund declares dividends daily from net investment income and pays dividends monthly and declares and pays distributions from net realized gain on investments, if any, at least annually. The Fund may distribute more frequently, if necessary for tax purposes. Dividends and distributions, if any, are recorded on the ex-dividend date.
The Fund receives earnings credits from its transfer agent when positive cash balances are maintained, which may be used to offset transfer agent fees. If the amount earned is greater than $1, the expenses paid under this arrangement are included on the “Statement of operations” under “Dividend disbursing and transfer agent fees and expenses” with the corresponding expenses offset included under “Less expenses paid indirectly.”
2. Investment Management, Administration Agreements, and Other Transactions with Affiliates
In accordance with the terms of its investment management agreement, the Fund pays DMC, a series of Macquarie Investment Management Business Trust (MIMBT) and the investment manager, an annual fee which is calculated daily and paid monthly at the rates of 0.50% on the first $500 million of average daily net assets of the Fund, 0.475% on the next $500 million, 0.45% on the next $1.5 billion, and 0.425% on average daily net assets in excess of $2.5 billion.
Notes to financial statements
Delaware Floating Rate Fund
2. Investment Management, Administration Agreements, and Other Transactions with Affiliates (continued)
DMC has contractually agreed to waive all or a portion of its investment advisory fees and/or pay/reimburse expenses (excluding any distribution and service (12b-1) fees, acquired fund fees and expenses, taxes, interest, short sale dividend and interest expenses, brokerage fees, certain insurance costs, and nonroutine expenses or costs, including, but not limited to, those relating to reorganizations, litigation, conducting shareholder meetings, and liquidations), in order to prevent total annual fund operating expenses from exceeding 0.69% of the Fund's Class A, Class C, Class R, and Institutional Class shares’ average daily net assets from August 1, 2023 through November 29, 2024, and 0.60% of the Fund’s Class R6 shares’ average daily net assets from November 30, 2023 through November 29, 2024. Prior to November 30, 2023, DMC contractually agreed to waive all or a portion of its investment advisory fees and/or pay/reimburse expenses to 0.62% of the Fund’s Class R6 shares’ average daily net assets. These waivers and reimbursements may only be terminated by agreement of DMC and the Fund. The waivers and reimbursements are accrued daily and received monthly.
After consideration of class specific expenses, including 12b-1 fees, the class level operating expense limitation as a percentage of average daily net assets from August 1, 2023 (except as noted) through November 29, 2024, unless terminated by agreement of DMC and the Fund, is as follows:
| | Operating expense limitation as a percentage of average daily net assets |
| | Class A | | Class C | | Class R | | Institutional Class | | Class R6 |
| | 0.94% | | 1.69% | | 1.19% | | 0.69% | | 0.60%* |
| * | Effective November 30, 2023. Prior to November 30, 2023, the expense limitation for Class R6 shares was 0.62%. |
DMC may seek investment advice and recommendations from its affiliates: Macquarie Investment Management Austria Kapitalanlage AG, Macquarie Investment Management Europe Limited, and Macquarie Investment Management Global Limited (together, the “Affiliated Sub-Advisors”). DMC may also permit these Affiliated Sub-Advisors to execute Fund security trades on its behalf and exercise investment discretion for securities in certain markets where DMC believes it will be beneficial to utilize an Affiliated Sub-Advisor’s specialized market knowledge. Although the Affiliated Sub-Advisors serve as sub-advisors, DMC has ultimate responsibility for all investment advisory services. For these services, DMC, not the Fund, pays each Affiliated Sub-Advisor a portion of its investment management fee.
Delaware Investments Fund Services Company (DIFSC), an affiliate of DMC, provides fund accounting and financial administrative oversight services to the Fund. For these services, effective October 1, 2023, DIFSC’s fees are calculated daily and paid monthly, based on the aggregate daily net assets of all funds within the Delaware Funds at the following annual rates: 0.0050% of the first $60 billion; 0.00475% of the next $30 billion; and 0.0015% of aggregate average daily net assets in excess of $90 billion (Total Fee). Prior to October 1, 2023,
DIFSC's annual rates were: 0.00475% of the first $35 billion; 0.0040% of the next $10 billion; 0.0025% of the next $45 billion; and 0.0015% of aggregate average daily net assets in excess of $90 billion. Each fund in the Delaware Funds pays a minimum of $4,000, which, in aggregate, is subtracted from the Total Fee. Each fund then pays its portion of the remainder of the Total Fee on a relative NAV basis. This amount is included on the “Statement of operations” under “Accounting and administration expenses.” For the year ended July 31, 2024, the Fund paid $28,088 for these services.
DIFSC is also the transfer agent and dividend disbursing agent of the Fund. For these services, DIFSC’s fees are calculated daily and paid monthly, based on the aggregate daily net assets of the retail funds within the Delaware Funds at the following annual rates: 0.014% of the first $20 billion; 0.011% of the next $5 billion; 0.007% of the next $5 billion; 0.004% of the next $20 billion; 0.002% of the next $25 billion; and 0.0015% of average daily net assets in excess of $75 billion. The fees payable to DIFSC under the shareholder services agreement described above are allocated among all retail funds in the Delaware Funds on a relative NAV basis. This amount is included on the “Statement of operations” under “Dividend disbursing and transfer agent fees and expenses.” For the year ended July 31, 2024, the Fund paid $38,139 for these services. Pursuant to a sub-transfer agency agreement between DIFSC and BNY Mellon Investment Servicing (US) Inc. (BNYIS), BNYIS provides certain sub-transfer agency services to the Fund. Sub-transfer agency fees are paid by the Fund and are also included on the “Statement of operations” under “Dividend disbursing and transfer agent fees and expenses.” The fees are calculated daily and paid as invoices on a monthly or quarterly basis.
Pursuant to a distribution agreement and distribution plan, the Fund pays DDLP, the distributor and an affiliate of DMC, an annual 12b-1 fee of 0.25%, 1.00%, and 0.50% of the average daily net assets of the Class A, Class C, and Class R shares, respectively. The fees are calculated daily and paid monthly. Institutional Class and Class R6 shares do not pay 12b-1 fees.
As provided in the investment management agreement, the Fund bears a portion of the cost of certain resources shared with DMC, including the cost of internal personnel of DMC and/or its affiliates that provide legal and regulatory reporting services to the Fund. For the year ended July 31, 2024, the Fund paid $15,003 for internal legal and regulatory reporting services provided by DMC and/or its affiliates’ employees. This amount is included on the “Statement of operations” under “Legal fees.”
For the year ended July 31, 2024, DDLP earned $10,006 for commissions on sales of the Fund’s Class A shares. For the year ended July 31, 2024, DDLP received gross CDSC commissions of $4,208 and $814 on redemptions of the Fund’s Class A and Class C shares, respectively, and these commissions were entirely used to offset upfront commissions previously paid by DDLP to broker/dealers on sales of those shares.
Trustees’ fees include expenses accrued by the Fund for each Trustee’s retainer and meeting fees. Certain officers of DMC, DIFSC, and DDLP are officers and/or Trustees of the Trust. These officers and Trustees are paid no compensation by the Fund.
Notes to financial statements
Delaware Floating Rate Fund
2. Investment Management, Administration Agreements, and Other Transactions with Affiliates (continued)
In addition to the management fees and other expenses of the Fund, the Fund indirectly bears the investment management fees and other expenses of any Underlying Funds, including ETFs, in which it invests. The amount of these fees and expenses incurred indirectly by the Fund will vary based upon the expense and fee levels of any Underlying Funds and the number of shares that are owned of any Underlying Funds at different times.
3. Investments
For the year ended July 31, 2024, the Fund made purchases and sales of investment securities other than short-term investments and US government securities as follows:
| Purchases | $657,368,358 |
| Sales | 599,318,382 |
The tax cost of investments includes adjustments to net unrealized appreciation (depreciation) which may not necessarily be the final tax cost basis adjustments but which approximate the tax basis unrealized gains and losses that may be realized and distributed to shareholders. At July 31, 2024, the cost and unrealized appreciation (depreciation) of investments for federal income tax purposes for the Fund were as follows:
| Cost of investments | $641,144,859 |
| Aggregate unrealized appreciation of investments | $9,089,420 |
| Aggregate unrealized depreciation of investments | (10,054,999) |
| Net unrealized depreciation of investments | $(965,579) |
US GAAP defines fair value as the price that the Fund would receive to sell an asset or pay to transfer a liability in an orderly transaction between market participants at the measurement date under current market conditions. A three-level hierarchy for fair value measurements has been established based upon the transparency of inputs to the valuation of an asset or liability. Inputs may be observable or unobservable and refer broadly to the assumptions that market participants would use in pricing the asset or liability. Observable inputs reflect the assumptions market participants would use in pricing the asset or liability based on market data obtained from sources independent of the reporting entity. Unobservable inputs reflect the reporting entity’s own assumptions about the assumptions that market participants would use in pricing the asset or liability based on the best information available under the circumstances. The Fund's investment in its entirety is assigned a level based upon the observability of the inputs which are significant to the overall valuation. The three-level hierarchy of inputs is summarized as follows:
Level 1 − Inputs are quoted prices in active markets for identical investments. (Examples: equity securities, open-end investment companies, futures contracts, and exchange-traded options contracts)
Level 2 − Other observable inputs, including, but not limited to: quoted prices for similar assets or liabilities in markets that are active, quoted prices for identical or similar assets or
liabilities in markets that are not active, inputs other than quoted prices that are observable for the assets or liabilities (such as interest rates, yield curves, volatilities, prepayment speeds, loss severities, credit risks, and default rates) or other market-corroborated inputs. (Examples: debt securities, government securities, swap contracts, forward foreign currency exchange contracts, foreign securities utilizing international fair value pricing, broker-quoted securities, and fair valued securities)
Level 3 − Significant unobservable inputs, including the Fund’s own assumptions used to determine the fair value of investments. (Examples: broker-quoted securities and fair valued securities)
Level 3 investments are valued using significant unobservable inputs. The Fund may also use an income-based valuation approach in which the anticipated future cash flows of the investment are discounted to calculate fair value. Discounts may also be applied due to the nature or duration of any restrictions on the disposition of the investments. Valuations may also be based upon current market prices of securities that are comparable in coupon, rating, maturity, and industry. The derived value of a Level 3 investment may not represent the value which is received upon disposition and this could impact the results of operations.
The following table summarizes the valuation of the Fund’s investments by fair value hierarchy levels as of July 31, 2024:
| | | Level 1 | | Level 2 | | Level 3 | Total | |
| Securities | | | | | | | | |
| Assets: | | | | | | | | |
| Collateralized Debt Obligations | | $— | | $9,705,186 | | $— | $9,705,186 | |
| Common Stocks | | 1,466,674 | | — | | — | 1,466,674 | |
| Convertible Bond | | — | | — | | 607,846 | 607,846 | |
| Corporate Bonds | | — | | 26,450,659 | | — | 26,450,659 | |
| Exchange-Traded Funds | | 10,272,500 | | — | | — | 10,272,500 | |
| Loan Agreements | | — | | 567,395,720 | | — | 567,395,720 | |
| Municipal Bonds | | — | | 377,267 | | — | 377,267 | |
| Short-Term Investments | | 23,903,428 | | — | | — | 23,903,428 | |
| Total Value of Securities | | $35,642,602 | | $603,928,832 | | $607,846 | $640,179,280 | |
During the year ended July 31, 2024, there were no transfers into or out of Level 3 investments. The Fund’s policy is to recognize transfers into or out of Level 3 investments based on fair value at the beginning of the reporting year.
A reconciliation of Level 3 investments is presented when the Fund has a significant amount of Level 3 investments at the beginning or end of the year in relation to the Fund’s net assets. Management has determined not to provide a reconciliation of Level 3 investments as the Level 3 investments were not considered significant to the Fund’s net assets at the beginning or
Notes to financial statements
Delaware Floating Rate Fund
3. Investments (continued)
end of the year. Management has determined not to provide additional disclosure on Level 3 inputs since the Level 3 investments were not considered significant to the Fund’s net assets at the end of the year.
4. Dividend and Distribution Information
Income and long-term capital gain distributions are determined in accordance with federal income tax regulations, which may differ from US GAAP. Additionally, distributions from net gains on foreign currency transactions and net short-term gains on sales of investment securities are treated as ordinary income for federal income tax purposes. The tax character of dividends and distributions paid during the years ended July 31, 2024 and 2023 were as follows:
| | Year ended |
| | 7/31/24 | | 7/31/23 |
| Ordinary income | $52,770,991 | | $49,382,188 |
5. Components of Net Assets on a Tax Basis
As of July 31, 2024, the components of net assets on a tax basis were as follows:
| Shares of beneficial interest | $670,213,844 |
| Undistributed ordinary income | 461,949 |
| Distributions payable | (507,008) |
| Capital loss carryforwards* | (45,133,791) |
| Unrealized appreciation (depreciation) of investments and foreign currencies | (965,579) |
| Net assets | $624,069,415 |
| * | A portion of the Fund’s capital loss carryforward is subject to limitations under the Internal Revenue Code and related regulations. |
The differences between book basis and tax basis components of net assets are primarily attributable to tax deferral of losses on wash sales, tax treatment of market discount and premium on debt instruments, and amortization of premium on callable bonds.
For financial reporting purposes, capital accounts are adjusted to reflect the tax character of permanent book/tax differences. Reclassifications were due to tax treatment of unrealized on callable bonds. Results of operations and net assets were not affected by these reclassifications. For the year ended July 31, 2024, the adjustments were to increase total distributable earnings (loss) and decrease paid-in-capital by $32,253.
For federal income tax purposes, capital loss carryforwards may be carried forward and applied against future capital gains. At July 31, 2024, the Fund has capital loss carryforwards available to offset future realized capital gains as follows:
| | Loss carryforward character | | |
| | Short-term | | Long-term | | Total |
| | $ 18,990,657 | | $26,143,134 | | $ 45,133,791 |
6. Capital Shares
Transactions in capital shares were as follows:
| | Year ended |
| | 7/31/24 | | 7/31/23 |
| Shares sold: |
| Class A | 4,676,085 | | 5,987,396 |
| Class C | 732,289 | | 529,159 |
| Class R | 26,564 | | 30,986 |
| Institutional Class | 35,608,707 | | 41,322,576 |
| Class R6 | 601,628 | | 610,541 |
|
| Shares issued upon reinvestment of dividends and distributions: |
| Class A | 826,206 | | 594,480 |
| Class C | 132,163 | | 107,180 |
| Class R | 16,437 | | 11,132 |
| Institutional Class | 4,939,803 | | 4,964,528 |
| Class R6 | 57,239 | | 32,609 |
| | 47,617,121 | | 54,190,587 |
|
| Shares redeemed: |
| Class A | (3,837,405) | | (7,380,465) |
| Class C | (549,584) | | (727,135) |
| Class R | (18,394) | | (2,031) |
| Institutional Class | (35,327,333) | | (69,628,140) |
| Class R6 | (378,234) | | (388,194) |
| | (40,110,950) | | (78,125,965) |
| Net increase (decrease) | 7,506,171 | | (23,935,378) |
Notes to financial statements
Delaware Floating Rate Fund
6. Capital Shares (continued)
Certain shareholders may exchange shares of one class for shares of another class in the same Fund. These exchange transactions are included in shares sold and shares redeemed in the table on the previous page and on the “Statements of changes in net assets.” For the years ended July 31, 2024 and 2023, the Fund had the following exchange transactions:
| | | Exchange Redemptions | | Exchange Subscriptions | | | |
| | | Class A
Shares | | Class C
Shares | | Institutional
Class
Shares | | Class A
Shares | | Institutional
Class
Shares | | Class R6
Shares | | Value |
| Year ended | |
| 7/31/24 | | 5,171 | | 33,961 | | 10,112 | | 8,713 | | 31,969 | | 8,581 | | $394,261 |
| 7/31/23 | | 69,086 | | 10,916 | | 468,171 | | 15,495 | | 76,384 | | 455,802 | | 4,292,443 |
7. Line of Credit
The Fund, along with certain other funds in the Delaware Funds (Participants), was a participant in a $355,000,000 revolving line of credit (Agreement) intended to be used for temporary or emergency purposes as an additional source of liquidity to fund redemptions of investor shares. Under the Agreement, the Participants were charged an annual commitment fee of 0.15%, which was allocated across the Participants based on a weighted average of the respective net assets of each Participant. The Participants were permitted to borrow up to a maximum of one-third of their net assets under the Agreement. Each Participant was individually, and not jointly, liable for its particular advances, if any, under the line of credit. The line of credit available under the Agreement expired on October 30, 2023.
On October 30, 2023, the Fund, along with the other Participants, entered into an amendment to the Agreement for a $335,000,000 revolving line of credit to be used as described above. It operates in substantially the same manner as the original Agreement. Under the amendment to the Agreement, the Participants are charged an annual commitment fee of 0.15%, which is allocated across the Participants based on a weighted average of the respective net assets of each Participant. The line of credit available under the Agreement expires on October 28, 2024.
The Fund had no amounts outstanding as of July 31, 2024, or at any time during the year then ended.
8. Derivatives
US GAAP requires disclosures that enable investors to understand: (1) how and why an entity uses derivatives; (2) how they are accounted for; and (3) how they affect an entity’s results of operations and financial position.
Forward Foreign Currency Exchange Contracts — The Fund may enter into forward foreign currency exchange contracts as a way of managing foreign exchange rate risk. The Fund may enter into these contracts to fix the US dollar value of a security that it has agreed to buy or sell for the period between the date the trade was entered into and the date the security is delivered
and paid for. The Fund may also enter into these contracts to hedge the US dollar value of securities it already owns that are denominated in foreign currencies. In addition, the Fund may enter into these contracts to facilitate or expedite the settlement of portfolio transactions. The change in value is recorded as an unrealized gain or loss. When the contract is closed, a realized gain or loss is recorded equal to the difference between the value of the contract at the time it was opened and the value at the time it was closed.
The use of forward foreign currency exchange contracts does not eliminate fluctuations in the underlying prices of the securities, but does establish a rate of exchange that can be achieved in the future. Although forward foreign currency exchange contracts limit the risk of loss due to an unfavorable change in the value of the hedged currency, they also limit any potential gain that might result should the value of the currency change favorably. In addition, the Fund could be exposed to risks if the counterparties to the contracts are unable to meet the terms of their contracts. The Fund’s maximum risk of loss from counterparty credit risk is the value of its currency exchanged with the counterparty. The risk is generally mitigated by having a netting arrangement between the Fund and the counterparty and by the posting of collateral by the counterparty to the Fund to cover the Fund’s exposure to the counterparty. No forward foreign currency exchange contracts were outstanding at July 31, 2024.
During the year ended July 31, 2024, the Fund entered into forward foreign currency exchange contracts to hedge the US dollar value of securities it already owns that are denominated in foreign currencies to decrease exposure to foreign currencies.
During the year ended July 31, 2024, the Fund experienced net realized and unrealized gains or losses attributable to forward foreign currency exchange contracts, which are disclosed on the “Statement of operations.”
The table below summarizes the average daily balance of derivative holdings by the Fund during the year ended July 31, 2024:
| | Long Derivative
Volume | | Short Derivative
Volume |
| Forward foreign currency exchange contracts (average contract amount) | $ | — | | $ | 33,514 |
9. Securities Lending
The Fund, along with other funds in the Delaware Funds, may lend its securities pursuant to a security lending agreement (Lending Agreement) with The Bank of New York Mellon (BNY). At the time a security is loaned, the borrower must post collateral equal to the required percentage of the market value of the loaned security, including any accrued interest. The required percentage is: (1) 102% with respect to US securities and foreign securities that are denominated and payable in US dollars; and (2) 105% with respect to foreign securities. With respect to each loan, if on any business day the aggregate market value of securities collateral plus cash collateral held is less than the aggregate market value of the securities which are the subject of such loan, the borrower will be notified to provide additional collateral by the end of the
Notes to financial statements
Delaware Floating Rate Fund
9. Securities Lending (continued)
following business day, which, together with the collateral already held, will be not less than the applicable initial collateral requirements for such security loan. If the aggregate market value of securities collateral and cash collateral held with respect to a security loan exceeds the applicable initial collateral requirement, upon the request of the borrower, BNY must return enough collateral to the borrower by the end of the following business day to reduce the value of the remaining collateral to the applicable initial collateral requirement for such security loan. As a result of the foregoing, the value of the collateral held with respect to a loaned security on any particular day, may be more or less than the value of the security on loan. The collateral percentage with respect to the market value of the loaned security is determined by the security lending agent.
Cash collateral received by the Fund is generally invested in an individual separate account. The investment guidelines permit each separate account to hold certain securities that would be considered eligible securities for a money market fund. Cash collateral received is generally invested in government securities; certain obligations issued by government sponsored enterprises; repurchase agreements collateralized by US Treasury securities; obligations issued by the central government of any Organization for Economic Cooperation and Development (OECD) country or its agencies, instrumentalities, or establishments; obligations of supranational organizations; commercial paper, notes, bonds, and other debt obligations; certificates of deposit, time deposits, and other bank obligations; certain money market funds; and asset-backed securities. The Fund can also accept US government securities and letters of credit (non-cash collateral) in connection with securities loans.
In the event of default or bankruptcy by the lending agent, realization and/or retention of the collateral may be subject to legal proceedings. In the event the borrower fails to return loaned securities and the collateral received is insufficient to cover the value of the loaned securities and provided such collateral shortfall is not the result of investment losses, the lending agent has agreed to pay the amount of the shortfall to the Fund or, at the discretion of the lending agent, replace the loaned securities. The Fund continues to record dividends or interest, as applicable, on the securities loaned and is subject to changes in value of the securities loaned that may occur during the term of the loan. The Fund has the right under the Lending Agreement to recover the securities from the borrower on demand. With respect to security loans collateralized by non-cash collateral, the Fund receives loan premiums paid by the borrower. With respect to security loans collateralized by cash collateral, the earnings from the collateral investments are shared among the Fund, the security lending agent, and the borrower. The Fund records security lending income net of allocations to the security lending agent and the borrower.
The Fund may incur investment losses as a result of investing securities lending collateral. This could occur if an investment in the collateral investment account defaulted or became impaired. Under those circumstances, the value of the Fund’s cash collateral account may be less than the amount the Fund would be required to return to the borrowers of the securities and the Fund would be required to make up for this shortfall.
During the year ended July 31, 2024, the Fund had no securities out on loan.
10. Credit and Market Risks
The impact of COVID-19, and other infectious illness outbreaks that may arise in the future, could adversely affect the economies of many nations or the entire global economy, individual issuers and capital markets in ways that cannot necessarily be foreseen.
The Fund invests a portion of its assets in high yield fixed income securities, which are securities rated lower than BBB- by Standard & Poor's Financial Services LLC and Baa3 by Moody's Investors Service, Inc., or similarly rated by another nationally recognized statistical rating organization. Investments in these higher yielding securities are generally accompanied by a greater degree of credit risk than higher rated securities. Additionally, lower rated securities may be more susceptible to adverse economic and competitive industry conditions than investment grade securities.
The Fund invests in certain obligations that may have liquidity protection designed to ensure that the receipt of payments due on the underlying security is timely. Such protection may be provided through guarantees, insurance policies, or letters of credit obtained by the issuer or sponsor through third parties, through various means of structuring the transaction, or through a combination of such approaches. The Fund will not pay any additional fees for such credit support, although the existence of credit support may increase the price of the security.
The Fund invests in bank loans and other securities that may subject it to direct indebtedness risk, the risk that the Fund will not receive payment of principal, interest, and other amounts due in connection with these investments and will depend primarily on the financial condition of the borrower. Loans that are fully secured offer the Fund more protection than unsecured loans in the event of nonpayment of scheduled interest or principal, although there is no assurance that the liquidation of collateral from a secured loan would satisfy the corporate borrower’s obligation, or that the collateral can be liquidated. Some loans or claims may be in default at the time of purchase. Certain of the loans and the other direct indebtedness acquired by the Fund may involve revolving credit facilities or other standby financing commitments that obligate the Fund to pay additional cash on a certain date or on demand. These commitments may require the Fund to increase its investment in a company at a time when the Fund might not otherwise decide to do so (including at a time when the company’s financial condition makes it unlikely that such amounts will be repaid). To the extent that the Fund is committed to advance additional funds, it will at all times hold and maintain cash or other high grade debt obligations in an amount sufficient to meet such commitments.
As the Fund may be required to rely upon another lending institution to collect and pass on to the Fund amounts payable with respect to the loan and to enforce the Fund’s rights under the loan and other direct indebtedness, an insolvency, bankruptcy, or reorganization of the lending institution may delay or prevent the Fund from receiving such amounts. The highly leveraged nature of many loans may make them especially vulnerable to adverse changes in economic or
Notes to financial statements
Delaware Floating Rate Fund
10. Credit and Market Risks (continued)
market conditions. Investments in such loans and other direct indebtedness may involve additional risk to the Fund. There were no unfunded loan commitments at the year ended July 31, 2024.
When interest rates rise, fixed income securities (i.e. debt obligations) generally will decline in value. These declines in value are greater for fixed income securities with longer maturities or durations. Interest rate changes are influenced by a number of factors, such as government policy, monetary policy, inflation expectations, and the supply and demand of bonds. A fund may be subject to a greater risk of rising interest rates when interest rates are low or inflation rates are high or rising.
Derivatives contracts, such as futures, forward foreign currency contracts, options, and swaps, may involve additional expenses (such as the payment of premiums) and are subject to significant loss, which may exceed amounts disclosed on the “Statement of assets and liabilities”, if a security, index, reference rate, or other asset or market factor to which a derivatives contract is associated, moves in the opposite direction from what the portfolio manager anticipated. When used for hedging, the change in value of the derivatives instrument may also not correlate specifically with the currency, rate, or other risk being hedged, in which case a fund may not realize the intended benefits. Derivatives contracts are also subject to the risk that the counterparty may fail to perform its obligations under the contract due to, among other reasons, financial difficulties (such as a bankruptcy or reorganization).
The Fund may invest up to 15% of its net assets in illiquid securities, which may include securities with contractual restrictions on resale, securities exempt from registration under Rule 144A promulgated under the Securities Act of 1933, as amended, and other securities which may not be readily marketable. The relative illiquidity of these securities may impair the Fund from disposing of them in a timely manner and at a fair price when it is necessary or desirable to do so. While maintaining oversight, the Board has delegated to DMC the day-to-day functions of determining whether individual securities are liquid for purposes of the Fund’s limitation on investments in illiquid securities. Securities eligible for resale pursuant to Rule 144A, which are determined to be liquid, are not subject to the Fund’s 15% limit on investments in illiquid securities. Rule 144A and restricted securities have been identified on the “Schedule of investments.”
11. Contractual Obligations
The Fund enters into contracts in the normal course of business that contain a variety of indemnifications. The Fund’s maximum exposure under these arrangements is unknown. However, the Fund has not had prior claims or losses pursuant to these contracts. Management has reviewed the Fund's existing contracts and expects the risk of loss to be remote.
12. Subsequent Events
MIMBT, of which DMC is a series, entered into a settlement agreement on September 19, 2024 with the U.S. Securities and Exchange Commission (SEC) consenting to an order (Settlement Order) relating to a legacy investment strategy, the Absolute Return Mortgage-Backed Securities Strategy (ARMBS Strategy). MIMBT no longer offers the ARMBS Strategy. MIMBT agreed to the Settlement Order without admitting or denying the SEC's findings. The Settlement Order does not impact MIMBT's ability to continue to provide services to the Fund.
Management has determined that no other material events or transactions occurred subsequent to July 31, 2024, that would require recognition or disclosure in the Fund’s financial statements.
Report of independent registered public accounting firm
To the Board of Trustees of Delaware Group® Income Funds and Shareholders of Delaware Floating Rate Fund
Opinion on the Financial Statements
We have audited the accompanying statement of assets and liabilities, including the schedule of investments, of Delaware Floating Rate Fund (one of the funds constituting Delaware Group® Income Funds, referred to hereafter as the “Fund”) as of July 31, 2024, the related statement of operations for the year ended July 31, 2024, the statement of changes in net assets for each of the two years in the period ended July 31, 2024, including the related notes, and the financial highlights for each of the periods indicated therein (collectively referred to as the “financial statements”). In our opinion, the financial statements present fairly, in all material respects, the financial position of the Fund as of July 31, 2024, the results of its operations for the year then ended, the changes in its net assets for each of the two years in the period ended July 31, 2024 and the financial highlights for each of the periods indicated therein in conformity with accounting principles generally accepted in the United States of America.
Basis for Opinion
These financial statements are the responsibility of the Fund’s management. Our responsibility is to express an opinion on the Fund’s financial statements based on our audits. We are a public accounting firm registered with the Public Company Accounting Oversight Board (United States) (PCAOB) and are required to be independent with respect to the Fund in accordance with the U.S. federal securities laws and the applicable rules and regulations of the Securities and Exchange Commission and the PCAOB.
We conducted our audits of these financial statements in accordance with the standards of the PCAOB. Those standards require that we plan and perform the audit to obtain reasonable assurance about whether the financial statements are free of material misstatement, whether due to error or fraud.
Our audits included performing procedures to assess the risks of material misstatement of the financial statements, whether due to error or fraud, and performing procedures that respond to those risks. Such procedures included examining, on a test basis, evidence regarding the amounts and disclosures in the financial statements. Our audits also included evaluating the accounting principles used and significant estimates made by management, as well as evaluating the overall presentation of the financial statements. Our procedures included confirmation of securities owned as of July 31, 2024 by correspondence with the custodian, transfer agents, portfolio companies, agent banks and brokers; when replies were not received from agent banks and brokers, we performed other auditing procedures. We believe that our audits provide a reasonable basis for our opinion.
/s/ PricewaterhouseCoopers LLP
Philadelphia, Pennsylvania
September 27, 2024
We have served as the auditor of one or more Macquarie investment companies since 2010.
Other Fund information (Unaudited)
Delaware Floating Rate Fund
Tax Information
The information set forth below is for the Fund’s fiscal year as required by federal income tax laws. Shareholders, however, must report distributions on a calendar year basis for income tax purposes, which may include distributions for portions of two fiscal years of the Fund. Accordingly, the information needed by shareholders for income tax purposes will be sent to them in January of each year. Please consult your tax advisor for proper treatment of this information.
All disclosures are based on financial information available as of the date of this report and, accordingly are subject to change. For any and all items requiring reporting, it is the intention of the Fund to report the maximum amount permitted under the Internal Revenue Code and the regulations thereunder.
For the year ended July 31, 2024, the Fund reports distributions paid during the year as follows:
| (A) Ordinary Income Distributions (Tax Basis) | 100.00% |
(A) is based on a percentage of the Fund's total distributions.
For the fiscal year ended July 31, 2024, certain interest income paid by the Fund, determined to be Qualified Interest Income may be subject to relief from US withholding for foreign shareholders, as provided by the American Jobs Creation Act of 2004; the Tax Relief Unemployment Insurance Reauthorization, and Job Creation Act of 2010; and as extended by the American Taxpayer Relief Act of 2012. For the year ended July 31, 2024, the Fund has reported maximum distributions of Qualified Interest Income of $44,841,957.
The percentage of the ordinary dividends reported by the Fund that is treated as a Section 163(j) interest dividend and thus is eligible to be treated as interest income for purposes of Section 163(j) and the regulations thereunder is 94.65%.
Changes in and Disagreements with Accountants for Open-End Management Investment Companies
Not applicable.
Proxy Disclosures for Open-End Management Investment Companies
Not applicable.
Remuneration Paid to Directors, Officers, and Others of Open-End Management Investment Companies
The aggregate remuneration paid to directors, officers and others is disclosed within the financial statements.
Statement Regarding Basis of Approval for Investment Advisory Contract
Not applicable.
Contact information
Shareholder assistance by phone
800 523-1918, weekdays from 8:30am to
6:00pm ET
For securities dealers and financial
institutions representatives only
800 362-7500
Regular mail
Delaware Funds by Macquarie
P.O. Box 534437
Pittsburgh, PA 15253-4437
Overnight courier service
Delaware Funds by Macquarie
Attention: 534437
500 Ross Street, 154-0520
Pittsburgh, PA 15262
Macquarie Asset Management • 610 Market Street • Philadelphia, PA 19106-2354
Macquarie Asset Management (MAM) is the asset management division of Macquarie Group. MAM is an integrated asset manager across public and private markets offering a diverse range of capabilities, including real assets, real estate, credit, equities, and multi-asset solutions.
The Fund is advised by Delaware Management Company, a series of MIMBT, a US registered investment adviser, and distributed by Delaware Distributors, L.P. (DDLP), an affiliate of MIMBT and Macquarie Group Limited.
Other than Macquarie Bank Limited ABN 46 008 583 542 (“Macquarie Bank”), any Macquarie Group entity noted in this document is not an authorized deposit-taking institution for the purposes of the Banking Act 1959 (Commonwealth of Australia). The obligations of these other Macquarie Group entities do not represent deposits or other liabilities of Macquarie Bank. Macquarie Bank does not guarantee or otherwise provide assurance in respect of the obligations of these other Macquarie Group entities. In addition, if this document relates to an investment, (a) the investor is subject to investment risk including possible delays in repayment and loss of income and principal invested and (b) none of Macquarie Bank or any other Macquarie Group entity guarantees any particular rate of return on or the performance of the investment, nor do they guarantee repayment of capital in respect of the investment.
The Fund is governed by US laws and regulations.
This page is not part of the Financial statements and other information.
| Item 8. | Changes in and Disagreements with Accountants for Open-End Management Investment Companies. |
Not applicable.
| Item 9. | Proxy Disclosures for Open-End Management Investment Companies. |
Not applicable.
| Item 10. | Remuneration Paid to Directors, Officers, and Others of Open-End Management Investment Companies. |
The information is included as part of materials filed under Item 7 of this form.
| Item 11. | Statement Regarding Basis for Approval of Investment Advisory Contract. |
Not applicable.
| Item 12. | Disclosure of Proxy Voting Policies and Procedures for Closed-End Management Investment Companies. |
Not applicable.
| Item 13. | Portfolio Managers of Closed-End Management Investment Companies. |
Not applicable.
| Item 14. | Purchases of Equity Securities by Closed-End Management Investment Company and Affiliated Purchasers. |
Not applicable.
| Item 15. | Submission of Matters to a Vote of Security Holders. |
There have been no material changes to the procedures by which shareholders may recommend nominees to the registrant’s board of trustees, where those changes were implemented after the registrant last provided disclosure in response to the requirements of Item 407(c)(2)(iv) of Regulation S-K (17 CFR 229.407) (as required by Item 22(b)(15) of Schedule 14A (17 CFR 240.14a-101)), or this Item.
| Item 16. | Controls and Procedures. |
| | (a) | The registrant’s principal executive officer and principal financial officers, or persons performing similar functions, have concluded that the registrant’s disclosure controls and procedures (as defined in Rule 30a-3(c) under the Investment Company Act of 1940, as amended (17 CFR 270.30a-3(c))) are effective, as of a date within 90 days of the filing of this report, based on their evaluation of these controls and procedures required by Rule 30a-3(b) under the Investment Company Act of 1940 (17 CFR 270.30a-3(b)) and Rules 13a-15(b) or 15d-15(b) under the Securities Exchange Act of 1934, as amended (17 CFR 240.13a-15(b) or 240.15d-15(b)) and provide reasonable assurance that the information required to be disclosed by the registrant in its reports or statements filed under the Securities Exchange Act of 1934 is recorded, processed, summarized and reported within the time periods specified in the rules and forms of the Securities and Exchange Commission. |
| | (b) | There were no significant changes in the registrant’s internal control over financial reporting (as defined in Rule 30a-3(d) under the Investment Company Act of 1940 (17 CFR 270.30a-3(d)) that occurred during the period covered by the report to stockholders included herein that have materially affected, or are reasonably likely to materially affect, the registrant’s internal control over financial reporting. |
| Item 17. | Disclosure of Securities Lending Activities for Closed-End Management Investment Companies. |
Not applicable.
| Item 18. | Recovery of Erroneously Awarded Compensation. |
Not Applicable.
SIGNATURES
Pursuant to the requirements of the Securities Exchange Act of 1934 and the Investment Company Act of 1940, the registrant has duly caused this report to be signed on its behalf, by the undersigned, thereunto duly authorized.
| | |
| Name of Registrant: Delaware Group® Income Funds |
|
SHAWN K. LYTLE |
| By: | | Shawn K. Lytle |
| Title: | | President and Chief Executive Officer |
| Date: | | October 4, 2024 |
Pursuant to the requirements of the Securities Exchange Act of 1934 and the Investment Company Act of 1940, this report has been signed below by the following persons on behalf of the registrant and in the capacities and on the dates indicated.
| | |
SHAWN K. LYTLE |
| By: | | Shawn K. Lytle |
| Title: | | President and Chief Executive Officer |
| Date: | | October 4, 2024 |
|
RICHARD SALUS |
| By: | | Richard Salus/Daniel Geatens |
| Title: | | Chief Financial Officer |
| Date: | | October 4, 2024 |