UNITED STATES SECURITIES AND EXCHANGE COMMISSION
Washington, D.C. 20549
FORM N-CSR
CERTIFIED SHAREHOLDER REPORT OF REGISTERED MANAGEMENT
INVESTMENT COMPANIES
| Investment Company Act file number: | 811-02071 |
| | |
| Exact name of registrant as specified in charter: | Delaware Group® Income Funds |
| | |
| Address of principal executive offices: | 610 Market Street
Philadelphia, PA 19106 |
| | |
| Name and address of agent for service: | David F. Connor, Esq.
610 Market Street
Philadelphia, PA 19106 |
| | |
| Registrant’s telephone number, including area code: | (800) 523-1918 |
| | |
| Date of fiscal year end: | July 31 |
| | |
| Date of reporting period: | July 31, 2022 |
Item 1. Reports to Stockholders
Table of Contents
Annual report
Fixed income mutual funds
Delaware Corporate Bond Fund
Delaware Extended Duration Bond Fund
July 31, 2022
Carefully consider the Funds' investment objectives, risk factors, charges, and expenses before investing. This and other information can be found in the Funds' prospectus and their summary prospectuses, which may be obtained by visiting delawarefunds.com/literature or calling 800 523-1918. Investors should read the prospectus and the summary prospectus carefully before investing.
You can obtain shareholder reports and prospectuses online instead of in the mail.
Visit delawarefunds.com/edelivery.
Table of Contents
Experience Delaware Funds by Macquarie®
Macquarie Asset Management (MAM) is a global asset manager that aims to deliver positive impact for everyone. MAM Public Investments traces its roots to 1929 and partners with institutional and individual clients to deliver specialist active investment capabilities across global equities, fixed income, and multi-asset solutions using a conviction-based, long-term approach to investing. In the US, retail investors recognize our Delaware Funds by Macquarie family of funds as one of the oldest mutual fund families.
If you are interested in learning more about creating an investment plan, contact your financial advisor.
You can learn more about Delaware Funds or obtain a prospectus for Delaware Corporate Bond Fund and Delaware Extended Duration Bond Fund at delawarefunds.com/literature.
Manage your account online
| ● | Check your account balance and transactions |
| ● | View statements and tax forms |
| ● | Make purchases and redemptions |
Visit delawarefunds.com/account-access.
Macquarie Asset Management (MAM) is the asset management division of Macquarie Group. MAM is a full-service asset manager offering a diverse range of products across public and private markets including fixed income, equities, multi-asset solutions, private credit, infrastructure, renewables, natural assets, real estate, and asset finance. The Public Investments business is a part of MAM and includes the following investment advisers: Macquarie Investment Management Business Trust (MIMBT), Macquarie Funds Management Hong Kong Limited, Macquarie Investment Management Austria Kapitalanlage AG, Macquarie Investment Management Global Limited, Macquarie Investment Management Europe Limited, and Macquarie Investment Management Europe S.A.
The Funds are distributed by Delaware Distributors, L.P. (DDLP), an affiliate of MIMBT and Macquarie Group Limited.
Other than Macquarie Bank Limited ABN 46 008 583 542 ("Macquarie Bank"), any Macquarie Group entity noted in this document is not an authorized deposit-taking institution for the purposes of the Banking Act 1959 (Commonwealth of Australia). The obligations of these other Macquarie Group entities do not represent deposits or other liabilities of Macquarie Bank. Macquarie Bank does not guarantee or otherwise provide assurance in respect of the obligations of these other Macquarie Group entities. In addition, if this document relates to an investment, (a) the investor is subject to investment risk including possible delays in repayment and loss of income and principal invested and (b) none of Macquarie Bank or any other Macquarie Group entity guarantees any particular rate of return on or the performance of the investment, nor do they guarantee repayment of capital in respect of the investment.
The Funds are governed by US laws and regulations.
Unless otherwise noted, views expressed herein are current as of July 31, 2022, and subject to change for events occurring after such date.
The Funds are not FDIC insured and are not guaranteed. It is possible to lose the principal amount invested.
Advisory services provided by Delaware Management Company, a series of MIMBT, a US registered investment advisor.
All third-party marks cited are the property of their respective owners.
© 2022 Macquarie Management Holdings, Inc.
Table of Contents
Portfolio management review | Delaware Corporate Bond Fund and | |
| Delaware Extended Duration Bond Fund | July 31, 2022 (Unaudited) |
| Performance preview (for the year ended July 31, 2022) | | | | | |
| Delaware Corporate Bond Fund (Institutional Class shares) | | 1-year return | | -13.69 | % |
| Delaware Corporate Bond Fund (Class A shares) | | 1-year return | | -13.91 | % |
| Bloomberg US Corporate Investment Grade Index (benchmark) | | 1-year return | | -12.61 | % |
Past performance does not guarantee future results.
For complete, annualized performance for Delaware Corporate Bond Fund, please see the table on page 7. Institutional Class shares are not subject to a sales charge and are offered for sale exclusively to certain eligible investors. In addition, Institutional Class shares pay no distribution and service fee.
The performance of Class A shares excludes the applicable sales charge. The performance of both Institutional Class shares and Class A shares reflects the reinvestment of all distributions.
Please see page 10 for a description of the index. Index performance returns do not reflect any management fees, transaction costs, or expenses. Indices are unmanaged and one cannot invest directly in an index.
| Delaware Extended Duration Bond Fund (Institutional Class shares) | 1-year return | | -19.90 | % |
| Delaware Extended Duration Bond Fund (Class A shares) | 1-year return | | -20.07 | % |
| Bloomberg Long US Corporate Index (benchmark) | 1-year return | | -19.79 | % |
Past performance does not guarantee future results.
For complete, annualized performance for Delaware Extended Duration Bond Fund, please see the table on page 12. Institutional Class shares are not subject to a sales charge and are offered for sale exclusively to certain eligible investors. In addition, Institutional Class shares pay no distribution and service fee.
The performance of Class A shares excludes the applicable sales charge. The performance of both Institutional Class shares and Class A shares reflects the reinvestment of all distributions.
Please see page 15 for a description of the index. Index performance returns do not reflect any management fees, transaction costs, or expenses. Indices are unmanaged and one cannot invest directly in an index.
Investment objectives
The Funds seek to provide investors with total return.
Market review
The first five months of the Funds’ fiscal year ended July 31, 2022 – August through December 2021 – can best be described as calm, with little movement in rates. Although the overall economic environment was slowing after the superheated recovery that characterized the latter half of the previous fiscal period, economic fundamentals were still sound. The one concern that many investors shared was inflation.
When the fiscal year began, the US Federal Reserve noted various pressures on prices and concluded that inflation was real but transitory. As 2022 began, however, it became apparent to all that inflation was severe and sticky, owing to a combination of labor shortages, low unemployment, high consumer demand, and supply chain shortages.
As did many investors, we foresaw that the Fed would react by raising rates. What we did not anticipate was just how fast, steep, and tenacious those increases would be. Many investors expected that rates would rise gradually and were surprised by the Fed’s pace of hikes that began with a
1
Table of Contents
Portfolio management review
Delaware Corporate Bond Fund and
Delaware Extended Duration Bond Fund
0.25-percentage-point increase in mid-March followed by a 0.50-percentage-point hike in early May and increases of 0.75 percentage points in both mid-June and late July. That said, we believe the Fed appears to have made the right call. Though the Fed was initially constrained by the need to reduce its balance sheet, by the time it acted, a more aggressive approach seemed necessary.
The Russia-Ukraine war and China’s economic lockdowns to prevent the spread of COVID-19 also surprised investors. Both caused severe disruptions of the global supply chain, putting significant pressure on inflation. The world learned an expensive lesson on just how important Ukraine is to the global supply of agricultural and energy products. While less surprising, the disruption in the supply of Russian energy was also painful. The problems in China were unexpected as the spread of the virus began to increase despite the onset of warmer weather. Rather than take a more moderate approach to managing the virus as many observers had predicted, China reacted with a broad swath of shutdowns that sharply curtailed industrial output.
All three events – the Fed’s aggressive response to inflation, the Russia-Ukraine war, and China’s zero-COVID policy – had a dramatic effect on bond markets in the latter half of the Funds' fiscal year. Driven primarily by rates and inflation, the first half of 2022 was the corporate bond market’s worst opening six months of any calendar year on record. This was attributable mainly to duration, a measure of a portfolio’s sensitivity to higher interest rates. The longer the duration of a portfolio, the more sensitive it is to higher rates.
As 2022 progressed, we saw significant rate volatility. When the Fed began raising rates aggressively, and investors began talking of an imminent recession, spreads reacted negatively and began to widen. The 10-year Treasury yield rose from 1.51% at December 31, 2021 to 2.65% at end of July 2022, an increase of 114 basis points (or 1.14 percentage points), which sharply stung long-duration credits. While spreads in the investment grade market increased only about 45 to 50 basis points, the combination of rising rates and widening spreads was both unusual and painful to investors.
Looking at the relative performance of investment grade versus high yield securities, duration was the key differentiator, with the activity from January through July 2022 driving results for the entire fiscal year. High yield performed much better than investment grade, with most of the damage in the investment grade market resulting more from duration than from widening spreads. Because high yield tends to be a shorter-duration asset class, it held up better. Given the perception that the corporate finance world is in good shape, with solid credit metrics and profit margins, investment grade credits tend to be longer duration. The result was a 12.6% decline for investment grade bonds, as measured by the Bloomberg US Corporate Investment Grade Index, for the fiscal year. High yield bonds, as measured by the Bloomberg US Corporate High-Yield Index, declined 8.0%, about two-thirds of investment grade’s loss.
Issuance in 2021 was the second-highest annual total ever, behind only the record pace set in 2020. While tapering off somewhat in 2022, it remained stronger than we would have expected. At July 31, 2022, year-to-date issuance was running about 15% below the previous year’s torrid pace. With rate hikes looming, however, many companies rushed to obtain financing before rates could rise even higher. So even though issuance was down, it was generally higher than anticipated. Some
2
Table of Contents
sectors, notably banking, unexpectedly flooded the market with new issuance.
As difficult as the first half of 2022 was, there was some good news for bond investors. Throughout the first half of the Funds’ fiscal year and well into the second half, corporate profitability was never higher, with record-setting margins and healthy cash flows. From a fundamental standpoint, the corporate bond market was extremely healthy. We entered 2022 with the expectation that credit upgrades would outnumber downgrades, and this proved to be true. Even at fiscal year-end, despite the worries of recession, credit upgrades were still outpacing downgrades. We think that may continue into 2023.
Source: Bloomberg.
Within the Funds
For the fiscal year ended July 31, 2022, Delaware Corporate Bond Fund underperformed its benchmark, the Bloomberg US Corporate Investment Grade Index. The Fund’s Institutional Class shares returned -13.69%. The Fund’s Class A shares returned -13.91% at net asset value and -17.83% at maximum offer price. These figures reflect all distributions reinvested. During the same period, the benchmark returned -12.61%. For complete, annualized performance of Delaware Corporate Bond Fund, please see the table on page 7.
During the same period, Delaware Extended Duration Bond Fund underperformed its benchmark, the Bloomberg Long US Corporate Index. The Fund’s Institutional Class shares returned -19.90%. The Fund’s Class A shares returned -20.07% at net asset value and -23.71% at maximum offer price. These figures reflect all distributions reinvested. During the same period, the benchmark returned -19.79%. For complete, annualized performance of Delaware Extended Duration Bond Fund, please see the table on page 12.
Duration was the chief factor in the underperformance of both Funds. Given the overweight to BBB-rated spread duration of the Funds’ holdings, higher interest rates drove the price of credits held in the portfolios sharply lower. Somewhat offsetting that, both Funds benefited from out-of-benchmark investments in high yield (non-investment-grade) securities, which generally outperformed their investment grade counterparts for the fiscal year by virtue of their lower-duration nature. The Funds are each allowed to invest up to 20% of their assets in high yield securities; each maintained a portfolio allocation that varied throughout the fiscal year, as described later.
The fiscal year was an unusual period for the Funds, in our view. Although we believe that most of the underperformance was attributable to rising rates and higher duration, we acknowledge that credit spreads widened meaningfully as well. It is rare to see rates rise and spreads widen at the same time. Usually spreads increase in the face of a potential recession and consequently weigh on issuers’ earnings. But this year, rates and spreads moved in the same direction, resulting in the corporate bond market’s worst start to a calendar year in its history.
Delaware Corporate Bond Fund
Although the Fund performed fairly well in the latter part of 2021, we knew that valuations were rich coming into 2022. At the same time, credit fundamentals and credit metrics were still extremely strong, and we wanted the Fund to own bonds that exhibited higher yields or had higher spreads than the overall benchmark. We still believed there was a long
3
Table of Contents
Portfolio management review
Delaware Corporate Bond Fund and
Delaware Extended Duration Bond Fund
runway before the Fed would become aggressive in raising rates. And of course, we did not anticipate the Russia-Ukraine war. So, we began 2022 with the assumption that the best way to add performance in this environment was through higher yield, given that we did not expect further price appreciation or spread compression, either of which would also have contributed to performance, if available. We purchased credits that had higher spreads and higher yields, believing that the strong economic backdrop would afford us some time for the Fund to benefit from this strategy.
When sentiment turned, however, the Fund’s positions were affected more than those in the benchmark, which contained higher-quality credits with less income, less spread, and less yield, the types of credits that we would not have gravitated toward unless the economy were signaling problems ahead. We got no such signals in January and February. Our attempt to achieve a higher yield and carry higher spreads than the benchmark was the source of a large part of the Fund’s underperformance.
On a more granular level, the banking sector detracted the most from the Fund’s performance. Ironically, the credit quality in the banking industry has generally been pristine, much stronger today than it was during the recession of 2008-2009. The Fund underperformed entirely due to security selection. In an effort to add yield, we invested in longer-duration and subordinated instruments, under the assumption that fundamentals were strong and valuations were attractive, in our view, relative to other sectors. As the year progressed, however, the combination of higher rates and longer duration proved detrimental for such a strategy. Banking credits that the Fund owned included Credit Suisse Group AG and Deutsche Bank AG.
Aside from banking, the remainder of the financial sector also detracted significantly from performance, again mainly during the latter half of the fiscal year. Although the Fund’s holdings were primarily BBB-rated credits (investment grade), life insurers were more volatile than the overall market because of capital market volatility. Aircraft lessors underperformed as some bonds had exposure to Russian aircraft that could not be seized after the outbreak of war in Ukraine. Real estate investment trusts (REITs) also lagged mainly due to rate volatility. Fund holdings in the sector included life insurer Brighthouse Financial Inc. and retirement services provider Athene Holding Ltd., which merged into Apollo Global Management during the fiscal year.
Among contributors to performance during the period, the Fund’s overweight in energy, particularly midstream and production, was beneficial. While we didn’t expect oil prices to reach, much less exceed, $100 a barrel, the Fund did benefit from the increase. Cheniere Energy Inc., a producer of liquefied natural gas; Devon Energy Corp., an exploration company; and ONEOK Inc., a midstream service provider, were among the Fund’s holdings in the sector.
The Fund likewise benefited from its transportation holdings, particularly airlines, including Delta Air Lines Inc. and United Airlines Holdings Inc. We recognize that airlines could struggle in a recession, but the Fund’s holdings have shorter duration and what we view as an attractive structure that includes collateral packages.
In addition, the Fund’s out-of-benchmark allocation to risk-free assets, including Treasurys and short-duration sectors, such as
4
Table of Contents
bank loans and convertibles, contributed to performance during the fiscal year.
Most of the changes that we made to the Fund’s portfolio occurred in the second half of the fiscal year. Once higher rates and wider spreads had done material damage to the asset class, we sought to increase the credit quality of the Fund. With prices at historic lows, we began buying lower-priced bonds. The asset class experienced some of the lowest dollar prices on securities in the past 30 to 40 years. Consequently, the decision to buy bonds of high-quality issuers at historically low prices appeared to us to be an attractive opportunity.
At fiscal year end, the Fund was positioned with 90% of its assets in investment grade securities and the balance in high yield. Earlier in the fiscal year, the Fund had as much as 15% in high yield. We also reduced the Fund’s BBB-rated allocation within investment grade, having moved up in quality within the asset class.
During the fiscal year, the Fund held a small position in credit default swaps on the investment grade index as a temporary hedge given valuations and technicals we observed in the market. The Fund also held a small position in credit default swaps on the investment grade index via options as a way to add incremental income with upside potential for performance gains. Neither position had a material impact on the Fund’s performance.
Delaware Extended Duration Bond Fund
Delaware Extended Duration Bond Fund is designed to provide investors with access to the long end of the US investment grade corporate market. The management of the Fund is strategically like that of Delaware Corporate Bond Fund. As many companies do not issue longer-duration bonds, however, we identify additional opportunities as needed to complete the Fund’s portfolio.
On a sector basis, financials were a leading detractor from performance as higher interest rates roiled capital markets and, in turn, life insurance companies, including Brighthouse Financial Inc. and Athene Holding Ltd., mentioned earlier. The Fund also had exposure to several aircraft lessors, who were blindsided by the outbreak of war in Ukraine. Economic sanctions imposed on Russia made it impossible for lessors to collect payments or reclaim aircraft, and those credits suffered.
The Fund also held bonds issued by chemical companies in the industrials sector. These were typically long duration and given the overweight positions, it detracted from performance during the fiscal year. Fund holdings included petrochemical producer Westlake Corp. and coatings manufacturer The Sherwin-Williams Co.
The Fund’s exposure to long Treasury futures used to control duration also detracted from performance. The Fund was invested in securities issued by banks and aircraft lessors, and in bank loans and high yield bonds. While these are often strong-performing securities, they are typically issued in the intermediate part of the yield curve that is not consistent with an extended duration portfolio. We use Treasury futures to add duration to the Fund’s portfolio, offsetting the shorter-duration credits. In this case, the long-duration futures show as detractors from performance, even as the underlying securities, in many cases, outperformed by virtue of being in the right spot on the curve.
As was the case with Delaware Corporate Bond Fund, the Fund benefited from investments in airlines Delta Air Lines Inc. and United Airlines Holdings Inc. The Fund also benefited from several high yield credits
5
Table of Contents
Portfolio management review
Delaware Corporate Bond Fund and
Delaware Extended Duration Bond Fund
including US Foods Inc., a food service distributor, and NCR Corp., a developer and supplier of point-of-sale systems and services for retailers.
At the end of the fiscal year, approximately 9% of the Fund’s portfolio was invested in high yield credits and bank loans, down from a peak exposure of about 13% in high yield earlier in the period. The remainder of the portfolio was invested in investment grade securities, where we have reduced the Fund’s position in BBB-rated bonds somewhat to go higher in quality, given the dramatic dollar-price drops that have taken place. The average dollar price in the Fund’s portfolio at the close of the period was $80, compared with the benchmark’s average price of $93.
During the period, the Fund made minimal use of Treasury futures to hedge out unwanted exposures to the Treasury yield curve. The Fund also held a small position in credit default swaps on the investment grade index as a temporary hedge given valuations and technicals we observed in the market. Lastly, the Fund held a small position in credit default swaps on the investment grade index via options as a way to add incremental income with upside potential for performance gains. None of these positions had a material impact on the Fund’s performance.
6
Table of Contents
| Performance summaries |
| Delaware Corporate Bond Fund | July 31, 2022 (Unaudited) |
The performance quoted represents past performance and does not guarantee future results. Investment return and principal value of an investment will fluctuate so that shares, when redeemed, may be worth more or less than their original cost. Current performance may be lower or higher than the performance quoted. Performance data current to the most recent month end may be obtained by calling 800 523-1918 or visiting delawarefunds.com/performance.
| Fund and benchmark performance1,2 | | Average annual total returns through July 31, 2022 |
| | 1 year | | 5 year | | 10 year | | Lifetime |
| Class A (Est. September 15, 1998) | | | | | | | | | | | | | | | | | | | | |
| Excluding sales charge | | | -13.91 | % | | | | +1.67 | % | | | | +2.74 | % | | | | +5.55 | % | |
| Including sales charge | | | -17.83 | % | | | | +0.73 | % | | | | +2.28 | % | | | | +5.35 | % | |
| Class C (Est. September 15, 1998) | | | | | | | | | | | | | | | | | | | | |
| Excluding sales charge | | | -14.55 | % | | | | +0.91 | % | | | | +1.98 | % | | | | +4.77 | % | |
| Including sales charge | | | -15.38 | % | | | | +0.91 | % | | | | +1.98 | % | | | | +4.77 | % | |
| Class R (Est. June 2, 2003) | | | | | | | | | | | | | | | | | | | | |
| Excluding sales charge | | | -14.26 | % | | | | +1.41 | % | | | | +2.47 | % | | | | +4.63 | % | |
| Including sales charge | | | -14.26 | % | | | | +1.41 | % | | | | +2.47 | % | | | | +4.63 | % | |
| Institutional Class (Est. September 15, 1998) | | | | | | | | | | | | | | | | | |
| Excluding sales charge | | | -13.69 | % | | | | +1.92 | % | | | | +3.00 | % | | | | +5.82 | % | |
| Including sales charge | | | -13.69 | % | | | | +1.92 | % | | | | +3.00 | % | | | | +5.82 | % | |
| Class R6 (Est. January 31, 2019) | | | | | | | | | | | | | | | | | | | | |
| Excluding sales charge | | | -13.78 | % | | | | — | | | | | — | | | | | +2.62 | % | |
| Including sales charge | | | -13.78 | % | | | | — | | | | | — | | | | | +2.62 | % | |
| Bloomberg US Corporate Investment | | | | | | | | | | | | | | | | | | | | |
| Grade Index | | | -12.61 | % | | | | +1.78 | % | | | | +2.65 | % | | | | +4.83 | %* | |
| * | The benchmark lifetime return is for Institutional Class share comparison only and is calculated using the last business day in the month of the Fund’s Institutional Class inception date. |
1 | Returns reflect the reinvestment of all distributions and are presented both with and without the applicable sales charges described below. Returns do not reflect the deduction of taxes the shareholder would pay on Fund distributions or redemptions of Fund shares. |
Expense limitations were in effect for certain classes during some or all of the periods shown in the “Fund and benchmark performance” table. Expenses for each class are listed in the “Fund expense ratios” table on page 9. Performance would have been lower had expense limitations not been in effect.
Institutional Class shares are not subject to a sales charge and are offered for sale exclusively to certain eligible investors. In addition, Institutional Class shares pay no distribution and service (12b-1) fee.
Class A shares are sold with a maximum front-end sales charge of 4.50%, and have an annual 12b-1 fee of 0.25% of average daily net assets.
7
Table of Contents
Performance summaries
Delaware Corporate Bond Fund
Performance for Class A shares, excluding sales charges, assumes that no front-end sales charge applied.
Class C shares are sold with a contingent deferred sales charge (CDSC) of 1.00% if redeemed during the first 12 months. They are also subject to an annual 12b-1 fee of 1.00% of average daily net assets. Performance for Class C shares, excluding sales charges, assumes either that CDSCs did not apply or that the investment was not redeemed.
Class R shares are available only for certain retirement plan products. They are sold without a sales charge and have an annual 12b-1 fee of 0.50% of average daily net assets.
Class R6 shares are available only to certain investors. In addition, Class R6 shares do not pay any service fees, sub-accounting fees, and/or sub-transfer agency fees to any brokers, dealers, or other financial intermediaries. Class R6 shares pay no 12b-1 fee.
Fixed income securities and bond funds can lose value, and investors can lose principal as interest rates rise. They also may be affected by economic conditions that hinder an issuer’s ability to make interest and principal payments on its debt. This includes prepayment risk, the risk that the principal of a bond that is held by a portfolio will be prepaid prior to maturity at the time when interest rates are lower than what the bond was paying. A portfolio may then have to reinvest that money at a lower interest rate.
High yielding, non-investment-grade bonds (junk bonds) involve higher risk than investment grade bonds. The high yield secondary market is particularly susceptible to liquidity problems when institutional investors, such as mutual funds and certain other financial institutions, temporarily stop buying bonds for regulatory, financial, or other reasons. In addition, a less liquid secondary market makes it more difficult to obtain precise valuations of the high yield securities.
The Fund may invest in derivatives, which may involve additional expenses and are subject to risk, including the risk that an underlying security or securities index moves in the opposite direction from what the portfolio manager anticipated. A derivatives transaction depends upon the counterparties’ ability to fulfill their contractual obligations.
If and when the Fund invests in forward foreign currency contracts or uses other investments to hedge against currency risks, the Fund will be subject to special risks, including counterparty risk.
The Fund may experience portfolio turnover in excess of 100%, which could result in higher transaction costs and tax liability.
International investments entail risks including fluctuation in currency values, differences in accounting principles, or economic or political instability. Investing in emerging markets can be riskier than investing in established foreign markets due to increased volatility, lower trading volume, and higher risk of market closures. In many emerging markets, there is substantially less publicly available information and the available information may be incomplete or misleading. Legal claims are generally more difficult to pursue.
IBOR risk is the risk that changes related to the use of the London interbank offered rate (LIBOR) or similar rates (such as EONIA) could have adverse impacts on financial instruments that reference these rates. The abandonment of these rates and transition to alternative rates could affect the value and liquidity of instruments that reference them and could affect investment strategy performance.
8
Table of Contents
The disruptions caused by natural disasters, pandemics, or similar events could prevent the Fund from executing advantageous investment decisions in a timely manner and could negatively impact the Fund’s ability to achieve its investment objective and the value of the Fund’s investments.
This document may mention bond ratings published by nationally recognized statistical rating organizations (NRSROs) Standard & Poor’s, Moody’s Investors Service, and Fitch, Inc. For securities rated by an NRSRO other than S&P, the rating is converted to the equivalent S&P credit rating. Bonds rated AAA are rated as having the highest quality and are generally considered to have the lowest degree of investment risk. Bonds rated AA are considered to be of high quality, but with a slightly higher degree of risk than bonds rated AAA. Bonds rated A are considered to have many favorable investment qualities, though they are somewhat more susceptible to adverse economic conditions. Bonds rated BBB are believed to be of medium-grade quality and generally riskier over the long term. Bonds rated BB, B, and CCC are regarded as having significant speculative characteristics, with BB indicating the least degree of speculation of the three.
| 2 | The Fund’s expense ratios, as described in the most recent prospectus, are disclosed in the following “Fund expense ratios” table. The expense ratios below may differ from the expense ratios in the “Financial highlights” since they are based on different time periods and the expense ratios in the prospectus include acquired fund fees and expenses, if any. See Note 2 in “Notes to financial statements” for additional details. Please see the “Financial highlights” section in this report for the most recent expense ratios. |
| | | | | | | | | | | | | | | | | Institutional | | | | | |
| Fund expense ratios | | Class A | | Class C | | Class R | | Class | | Class R6 |
Total annual operating expenses
(without fee waivers) | | | 0.91 | % | | | | 1.66 | % | | | | 1.16 | % | | | | 0.66 | % | | | | 0.57 | % | |
Net expenses (including fee
waivers, if any) | | | 0.82 | % | | | | 1.57 | % | | | | 1.07 | % | | | | 0.57 | % | | | | 0.48 | % | |
| Type of waiver | | Contractual | | Contractual | | Contractual | | Contractual | | Contractual |
9
Table of Contents
Performance summaries
Delaware Corporate Bond Fund
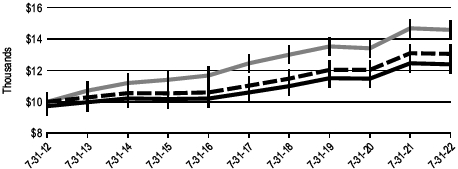
Performance of a $10,000 investment1
For the period July 31, 2012 through July 31, 2022
| | | Starting value | | Ending value |
 | Delaware Corporate Bond Fund — Institutional Class shares | | | $10,000 | | | $13,441 |
 | Bloomberg US Corporate Investment Grade Index | | | $10,000 | | | $12,991 |
 | Delaware Corporate Bond Fund — Class A shares | | | $9,550 | | | $12,529 |
| 1 | The “Performance of a $10,000 investment” graph assumes $10,000 invested in Institutional Class and Class A shares of the Fund on July 31, 2012, and includes the effect of a 4.50% front-end sales charge (for Class A shares) and the reinvestment of all distributions. The graph does not reflect the deduction of taxes the shareholders would pay on Fund distributions or redemptions of Fund shares. Expense limitations were in effect for some or all of the periods shown. Performance would have been lower had expense limitations not been in effect. Expenses are listed in the “Fund expense ratios” table on page 9. Please note additional details on pages 7 through 11. |
The graph also assumes $10,000 invested in the Bloomberg US Corporate Investment Grade Index as of July 31, 2012. The Bloomberg US Corporate Investment Grade Index is composed of US dollar-denominated, investment grade corporate bonds that are SEC-registered or 144A with registration rights, and issued by industrial, utility, and financial companies. All bonds in the index have at least one year to maturity.
The Bloomberg US Corporate High-Yield Index, mentioned on page 2, is composed of US dollar-denominated, non-investment-grade corporate bonds for which the middle rating among Moody’s Investors Service, Inc., Fitch, Inc., and Standard & Poor’s is Ba1/BB+/BB+ or below.
Index performance returns do not reflect any management fees, transaction costs, or expenses. Indices are unmanaged and one cannot invest directly in an index. Past performance does not guarantee future results.
Performance of other Fund classes will vary due to different charges and expenses.
10
Table of Contents
| | Nasdaq symbols | | CUSIPs |
| Class A | | | DGCAX | | | 245908785 |
| Class C | | | DGCCX | | | 245908769 |
| Class R | | | DGCRX | | | 245908744 |
| Institutional Class | | | DGCIX | | | 245908751 |
| Class R6 | | | DGCZX | | | 24610J100 |
11
Table of Contents
| Performance summaries | |
| Delaware Extended Duration Bond Fund | July 31, 2022 (Unaudited) |
The performance quoted represents past performance and does not guarantee future results. Investment return and principal value of an investment will fluctuate so that shares, when redeemed, may be worth more or less than their original cost. Current performance may be lower or higher than the performance quoted. Performance data current to the most recent month end may be obtained by calling 800 523-1918 or visiting delawarefunds.com/performance.
| Fund and benchmark performance1,2 | | Average annual total returns through July 31, 2022 |
| | 1 year | | 5 year | | 10 year | | Lifetime |
| Class A (Est. September 15, 1998) | | | | | | | | |
| Excluding sales charge | | -20.07% | | +1.43% | | +3.06% | | +6.67% |
| Including sales charge | | -23.71% | | +0.51% | | +2.58% | | +6.47% |
| Class C (Est. September 15, 1998) | | | | | | | | |
| Excluding sales charge | | -20.66% | | +0.71% | | +2.30% | | +5.89% |
| Including sales charge | | -21.40% | | +0.71% | | +2.30% | | +5.89% |
| Class R (Est. October 3, 2005) | | | | | | | | |
| Excluding sales charge | | -20.35% | | +1.18% | | +2.81% | | +5.78% |
| Including sales charge | | -20.35% | | +1.18% | | +2.81% | | +5.78% |
| Institutional Class (Est. September 15, 1998) | | | | | | |
| Excluding sales charge | | -19.90% | | +1.68% | | +3.32% | | +6.94% |
| Including sales charge | | -19.90% | | +1.68% | | +3.32% | | +6.94% |
| Class R6 (Est. May 2, 2016) | | | | | | | | |
| Excluding sales charge | | -19.83% | | +1.76% | | — | | +2.76% |
| Including sales charge | | -19.83% | | +1.76% | | — | | +2.76% |
| Bloomberg Long US Corporate Index | | -19.79% | | +1.86% | | +3.20% | | +5.77%* |
| * | The benchmark lifetime return is for Institutional Class share comparison only and is calculated using the last business day in the month of the Fund’s Institutional Class inception date. |
| 1 | Returns reflect the reinvestment of all distributions and are presented both with and without the applicable sales charges described below. Returns do not reflect the deduction of taxes the shareholder would pay on Fund distributions or redemptions of Fund shares. |
Expense limitations were in effect for certain classes during some or all of the periods shown in the “Fund and benchmark performance” table. Expenses for each class are listed in the “Fund expense ratios” table on page 14. Performance would have been lower had expense limitations not been in effect.
Institutional Class shares are not subject to a sales charge and are offered for sale exclusively to certain eligible investors. In addition, Institutional Class shares pay no distribution and service (12b-1) fee.
Class A shares are sold with a maximum front-end sales charge of 4.50%, and have an annual 12b-1 fee of 0.25% of average daily net assets. Performance for Class A shares,
12
Table of Contents
excluding sales charges, assumes that no front-end sales charge applied.
Class C shares are sold with a contingent deferred sales charge (CDSC) of 1.00% if redeemed during the first 12 months. They are also subject to an annual 12b-1 fee of 1.00% of average daily net assets. Performance for Class C shares, excluding sales charges, assumes either that CDSCs did not apply or that the investment was not redeemed.
Class R shares are available only for certain retirement plan products. They are sold without a sales charge and have an annual 12b-1 fee of 0.50% of average daily net assets.
Class R6 shares are available only to certain investors. In addition, Class R6 shares do not pay any service fees, sub-accounting fees, and/or sub-transfer agency fees to any brokers, dealers, or other financial intermediaries. Class R6 shares pay no 12b-1 fee.
Fixed income securities and bond funds can lose value, and investors can lose principal as interest rates rise. They also may be affected by economic conditions that hinder an issuer’s ability to make interest and principal payments on its debt. This includes prepayment risk, the risk that the principal of a bond that is held by a portfolio will be prepaid prior to maturity at the time when interest rates are lower than what the bond was paying. A portfolio may then have to reinvest that money at a lower interest rate.
High yielding, non-investment-grade bonds (junk bonds) involve higher risk than investment grade bonds. The high yield secondary market is particularly susceptible to liquidity problems when institutional investors, such as mutual funds and certain other financial institutions, temporarily stop buying bonds for regulatory, financial, or other reasons. In addition, a less liquid secondary market makes it more difficult to obtain precise valuations of the high yield securities.
The Fund may invest in derivatives, which may involve additional expenses and are subject to risk, including the risk that an underlying security or securities index moves in the opposite direction from what the portfolio manager anticipated. A derivatives transaction depends upon the counterparties’ ability to fulfill their contractual obligations.
If and when the Fund invests in forward foreign currency contracts or uses other investments to hedge against currency risks, the Fund will be subject to special risks, including counterparty risk.
The Fund may experience portfolio turnover in excess of 100%, which could result in higher transaction costs and tax liability.
International investments entail risks including fluctuation in currency values, differences in accounting principles, or economic or political instability. Investing in emerging markets can be riskier than investing in established foreign markets due to increased volatility, lower trading volume, and higher risk of market closures. In many emerging markets, there is substantially less publicly available information and the available information may be incomplete or misleading. Legal claims are generally more difficult to pursue.
IBOR risk is the risk that changes related to the use of the London interbank offered rate (LIBOR) or similar rates (such as EONIA) could have adverse impacts on financial instruments that reference these rates. The abandonment of these rates and transition to alternative rates could affect the value and liquidity of instruments that reference them and could affect investment strategy performance.
13
Table of Contents
Performance summaries
Delaware Extended Duration Bond Fund
The disruptions caused by natural disasters, pandemics, or similar events could prevent the Fund from executing advantageous investment decisions in a timely manner and could negatively impact the Fund’s ability to achieve its investment objective and the value of the Fund’s investments.
This document may mention bond ratings published by nationally recognized statistical rating organizations (NRSROs) Standard & Poor’s, Moody’s Investors Service, and Fitch, Inc. For securities rated by an NRSRO other than S&P, the rating is converted to the equivalent S&P credit rating. Bonds rated AAA are rated as having the highest quality and are generally considered to have the lowest degree of investment risk. Bonds rated AA are considered to be of high quality, but with a slightly higher degree of risk than bonds rated AAA. Bonds rated A are considered to have many favorable investment qualities, though they are somewhat more susceptible to adverse economic conditions. Bonds rated BBB are believed to be of medium-grade quality and generally riskier over the long term. Bonds rated BB, B, and CCC are regarded as having significant speculative characteristics, with BB indicating the least degree of speculation of the three.
| 2 | The Fund’s expense ratios, as described in the most recent prospectus, are disclosed in the following “Fund expense ratios” table. The expense ratios below may differ from the expense ratios in the “Financial highlights” since they are based on different time periods and the expense ratios in the prospectus include acquired fund fees and expenses, if any. See Note 2 in “Notes to financial statements” for additional details. Please see the “Financial highlights” section in this report for the most recent expense ratios. |
| | | | | | | | Institutional | | |
| Fund expense ratios | | Class A | | Class C | | Class R | | Class | | Class R6 |
| Total annual operating expenses | | | | | | | | |
| (without fee waivers) | | 0.99% | | 1.74% | | 1.24% | | 0.74% | | 0.65% |
| Net expenses (including fee | | | | | | | | | | |
| waivers, if any) | | 0.82% | | 1.57% | | 1.07% | | 0.57% | | 0.48% |
| Type of waiver | | Contractual | | Contractual | | Contractual | | Contractual | | Contractual |
14
Table of Contents
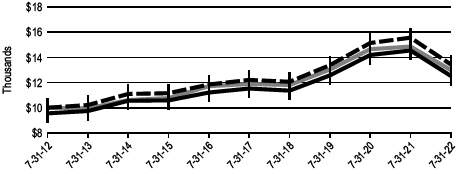
Performance of a $10,000 investment1
For the period July 31, 2012 through July 31, 2022
| | | Starting value | | Ending value |
 | Delaware Extended Duration Bond Fund — Institutional Class shares | | $10,000 | | $13,862 |
 | Bloomberg Long US Corporate Index | | $10,000 | | $13,708 |
 | Delaware Extended Duration Bond Fund — Class A shares | | $9,550 | | $12,907 |
| 1 | The “Performance of a $10,000 investment” graph assumes $10,000 invested in Institutional Class and Class A shares of the Fund on July 31, 2012, and includes the effect of a 4.50% front-end sales charge (for Class A shares) and the reinvestment of all distributions. The graph does not reflect the deduction of taxes the shareholders would pay on Fund distributions or redemptions of Fund shares. Expense limitations were in effect for some or all of the periods shown. Performance would have been lower had expense limitations not been in effect. Expenses are listed in the “Fund expense ratios” table on page 14. Please note additional details on pages 12 through 16. |
The graph also assumes $10,000 invested in the Bloomberg Long US Corporate Index as of July 31, 2012. The Bloomberg Long US Corporate Index is composed of US dollar-denominated, investment grade corporate bonds that are SEC-registered or 144A with registration rights, and issued by industrial, utility, and financial companies. All bonds in the index have at least 10 years to maturity.
The Bloomberg US Corporate Investment Grade Index, mentioned on page 2, is composed of US dollar-denominated, investment grade corporate bonds that are US Securities and Exchange Commission (SEC)-registered or 144A with registration rights, and issued by industrial, utility, and financial companies. All bonds in the index have at least one year to maturity.
The Bloomberg US Corporate High-Yield Index, mentioned on page 2, is composed of US dollar-denominated, non-investment-grade corporate bonds for which the middle rating
15
Table of Contents
Performance summaries
Delaware Extended Duration Bond Fund
among Moody’s Investors Service, Inc., Fitch, Inc., and Standard & Poor’s is Ba1/BB+/BB+ or below.
Index performance returns do not reflect any management fees, transaction costs, or expenses. Indices are unmanaged and one cannot invest directly in an index. Past performance does not guarantee future results.
Performance of other Fund classes will vary due to different charges and expenses.
| Nasdaq symbols | | CUSIPs |
| Class A | | DEEAX | | | 245908835 |
| Class C | | DEECX | | | 245908819 |
| Class R | | DEERX | | | 245908728 |
| Institutional Class | | DEEIX | | | 245908793 |
| Class R6 | | DEZRX | | | 245908629 |
16
Table of Contents
Disclosure of Fund expenses
For the six-month period from February 1, 2022 to July 31, 2022 (Unaudited)
As a shareholder of a Fund, you incur two types of costs: (1) transaction costs, including sales charges (loads) on purchase payments, reinvested dividends, or other distributions; redemption fees; and exchange fees; and (2) ongoing costs, including management fees; distribution and service (12b-1) fees; and other Fund expenses. The following examples are intended to help you understand your ongoing costs (in dollars) of investing in a Fund and to compare these costs with the ongoing costs of investing in other mutual funds.
The examples are based on an investment of $1,000 invested at the beginning of the period and held for the entire six-month period from February 1, 2022 to July 31, 2022.
Actual expenses
The first section of the tables shown, “Actual Fund return,” provides information about actual account values and actual expenses. You may use the information in this section of the table, together with the amount you invested, to estimate the expenses that you paid over the period. Simply divide your account value by $1,000 (for example, an $8,600 account value divided by $1,000 = 8.6), then multiply the result by the number in the first section under the heading entitled “Expenses Paid During Period” to estimate the expenses you paid on your account during this period.
Hypothetical example for comparison purposes
The second section of the tables shown, “Hypothetical 5% return,” provides information about hypothetical account values and hypothetical expenses based on the Funds’ actual expense ratios and an assumed rate of return of 5% per year before expenses, which is not the Funds’ actual return. The hypothetical account values and expenses may not be used to estimate the actual ending account balance or expenses you paid for the period. You may use this information to compare the ongoing costs of investing in each Fund and other funds. To do so, compare this 5% hypothetical example with the 5% hypothetical examples that appear in the shareholder reports of the other funds.
Please note that the expenses shown in the tables are meant to highlight your ongoing costs only and do not reflect any transactional costs, such as sales charges (loads), redemption fees, or exchange fees. Therefore, the second section of each table is useful in comparing ongoing costs only, and will not help you determine the relative total costs of owning different funds. In addition, if these transactional costs were included, your costs would have been higher. The Funds' expenses shown in the tables reflect fee waivers in effect and assume reinvestment of all dividends and distributions.
17
Table of Contents
Disclosure of Fund expenses
For the six-month period from February 1, 2022 to July 31, 2022 (Unaudited)
Delaware Corporate Bond Fund
Expense analysis of an investment of $1,000
| | Beginning | | Ending | | | | | | | Expenses |
| | Account Value | | Account Value | | Annualized | | Paid During Period |
| | 2/1/22 | | 7/31/22 | | Expense Ratio | | 2/1/22 to 7/31/22* |
| Actual Fund return† | | | | | | | | | | | | | | | | | |
| Class A | | | $1,000.00 | | | | $904.40 | | | | 0.82 | % | | | | $3.87 | |
| Class C | | | 1,000.00 | | | | 901.00 | | | | 1.57 | % | | | | 7.40 | |
| Class R | | | 1,000.00 | | | | 901.80 | | | | 1.07 | % | | | | 5.05 | |
| Institutional Class | | | 1,000.00 | | | | 905.50 | | | | 0.57 | % | | | | 2.69 | |
| Class R6 | | | 1,000.00 | | | | 904.20 | | | | 0.47 | % | | | | 2.22 | |
| Hypothetical 5% return (5% return before expenses) | | | | | | | | | | |
| Class A | | | $1,000.00 | | | | $1,020.73 | | | | 0.82 | % | | | | $4.11 | |
| Class C | | | 1,000.00 | | | | 1,017.01 | | | | 1.57 | % | | | | 7.85 | |
| Class R | | | 1,000.00 | | | | 1,019.49 | | | | 1.07 | % | | | | 5.36 | |
| Institutional Class | | | 1,000.00 | | | | 1,021.97 | | | | 0.57 | % | | | | 2.86 | |
| Class R6 | | | 1,000.00 | | | | 1,022.46 | | | | 0.47 | % | | | | 2.36 | |
Delaware Extended Duration Bond Fund
Expense analysis of an investment of $1,000
| | Beginning | | Ending | | | | | | | Expenses |
| | Account Value | | Account Value | | Annualized | | Paid During Period |
| | 2/1/22 | | 7/31/22 | | Expense Ratio | | 2/1/22 to 7/31/22* |
| Actual Fund return† | | | | | | | | | | | | | | | | | |
| Class A | | | $1,000.00 | | | | $851.40 | | | | 0.82 | % | | | | $3.76 | |
| Class C | | | 1,000.00 | | | | 849.60 | | | | 1.57 | % | | | | 7.20 | |
| Class R | | | 1,000.00 | | | | 850.60 | | | | 1.07 | % | | | | 4.91 | |
| Institutional Class | | | 1,000.00 | | | | 853.50 | | | | 0.57 | % | | | | 2.62 | |
| Class R6 | | | 1,000.00 | | | | 852.50 | | | | 0.48 | % | | | | 2.20 | |
| Hypothetical 5% return (5% return before expenses) | | | | | | | | | | |
| Class A | | | $1,000.00 | | | | $1,020.73 | | | | 0.82 | % | | | | $4.11 | |
| Class C | | | 1,000.00 | | | | 1,017.01 | | | | 1.57 | % | | | | 7.85 | |
| Class R | | | 1,000.00 | | | | 1,019.49 | | | | 1.07 | % | | | | 5.36 | |
| Institutional Class | | | 1,000.00 | | | | 1,021.97 | | | | 0.57 | % | | | | 2.86 | |
| Class R6 | | | 1,000.00 | | | | 1,022.41 | | | | 0.48 | % | | | | 2.41 | |
| * | “Expenses Paid During Period” are equal to the relevant Fund's annualized expense ratio, multiplied by the average account value over the period, multiplied by 181/365 (to reflect the one-half year period). |
18
Table of Contents
| † | Because actual returns reflect only the most recent six-month period, the returns shown may differ significantly from fiscal year returns. |
In addition to the Funds' expenses reflected on the previous page, each Fund also indirectly bears its portion of the fees and expenses of any investment companies (Underlying Funds) in which it invests. The tables on the previous page do not reflect the expenses of any Underlying Funds.
19
Table of Contents
| Security type / sector allocations |
| Delaware Corporate Bond Fund | As of July 31, 2022 (Unaudited) |
Sector designations may be different from the sector designations presented in other Fund materials. The sector designations may represent the investment manager’s internal sector classifications, which may result in the sector designations for one fund being different than another fund’s sector designations.
| Security type / sector | | Percentage of net assets |
| Convertible Bonds | | | 0.39 | % | |
| Corporate Bonds | | | 88.94 | % | |
| Banking | | | 18.64 | % | |
| Basic Industry | | | 3.97 | % | |
| Brokerage | | | 1.34 | % | |
| Capital Goods | | | 5.83 | % | |
| Communications | | | 9.94 | % | |
| Consumer Cyclical | | | 3.77 | % | |
| Consumer Non-Cyclical | | | 5.88 | % | |
| Electric | | | 8.81 | % | |
| Energy | | | 7.82 | % | |
| Finance Companies | | | 3.33 | % | |
| Insurance | | | 5.28 | % | |
| Natural Gas | | | 0.77 | % | |
| Real Estate Investment Trusts | | | 2.54 | % | |
| Technology | | | 8.33 | % | |
| Transportation | | | 2.28 | % | |
| Utilities | | | 0.41 | % | |
| Municipal Bonds | | | 0.33 | % | |
| Non-Agency Asset-Backed Securities | | | 1.79 | % | |
| Loan Agreements | | | 2.52 | % | |
| US Treasury Obligation | | | 1.14 | % | |
| Convertible Preferred Stock | | | 0.25 | % | |
| Short-Term Investments | | | 4.80 | % | |
| Total Value of Securities Before Options Written | | | 100.16 | % | |
| Options Written | | | 0.00 | % | |
| Liabilities Net of Receivables and Other Assets | | | (0.16 | %) | |
| Total Net Assets | | | 100.00 | % | |
20
Table of Contents
| Security type / sector allocations |
| Delaware Extended Duration Bond Fund | As of July 31, 2022 (Unaudited) |
Sector designations may be different from the sector designations presented in other Fund materials. The sector designations may represent the investment manager’s internal sector classifications, which may result in the sector designations for one fund being different than another fund’s sector designations.
| Security type / sector | | Percentage of net assets |
| Convertible Bond | | | 0.15 | % | |
| Corporate Bonds | | | 93.16 | % | |
| Banking | | | 9.45 | % | |
| Basic Industry | | | 3.93 | % | |
| Brokerage | | | 0.93 | % | |
| Capital Goods | | | 4.85 | % | |
| Communications | | | 11.28 | % | |
| Consumer Cyclical | | | 4.25 | % | |
| Consumer Non-Cyclical | | | 7.64 | % | |
| Electric | | | 14.11 | % | |
| Energy | | | 11.95 | % | |
| Finance Companies | | | 1.84 | % | |
| Insurance | | | 10.87 | % | |
| Natural Gas | | | 4.21 | % | |
| Real Estate Investment Trusts | | | 0.92 | % | |
| Technology | | | 4.79 | % | |
| Transportation | | | 1.84 | % | |
| Utilities | | | 0.30 | % | |
| Municipal Bonds | | | 2.27 | % | |
| Loan Agreements | | | 0.64 | % | |
| Convertible Preferred Stock | | | 0.86 | % | |
| Short-Term Investments | | | 2.70 | % | |
| Total Value of Securities Before Options Written | | | 99.78 | % | |
| Options Written | | | 0.00 | % | |
| Receivables and Other Assets Net of Liabilities | | | 0.22 | % | |
| Total Net Assets | | | 100.00 | % | |
21
Table of Contents
| Schedules of investments |
| Delaware Corporate Bond Fund | July 31, 2022 |
| | | | | Principal | | | |
| | | | amount° | | Value (US $) |
| Convertible Bonds – 0.39% | | | | | |
| Kaman 3.25% exercise price $65.26, maturity date | | | | | |
| | 5/1/24 | | 3,500,000 | | $ | 3,335,938 |
| Spirit Airlines 1.00% exercise price $49.07, maturity | | | | | |
| | date 5/15/26 | | 1,790,000 | | | 1,619,055 |
| Total Convertible Bonds (cost $5,106,654) | | | | | 4,954,993 |
| | | | | | | | |
| Corporate Bonds – 88.94% | | | | | |
| Banking – 18.64% | | | | | |
| Ally Financial | | | | | |
| | 4.70% 5/15/26 µ, Ψ | | 3,525,000 | | | 2,981,533 |
| | 5.75% 11/20/25 | | 4,525,000 | | | 4,588,158 |
| | 8.00% 11/1/31 | | 1,840,000 | | | 2,083,682 |
| Bank of America | | | | | |
| | 2.482% 9/21/36 µ | | 11,720,000 | | | 9,483,941 |
| | 2.676% 6/19/41 µ | | 1,795,000 | | | 1,359,151 |
| | 4.948% 7/22/28 µ | | 3,090,000 | | | 3,181,005 |
| | 5.015% 7/22/33 µ | | 1,865,000 | | | 1,946,565 |
| | 6.125% 4/27/27 µ, Ψ | | 3,505,000 | | | 3,531,288 |
| Bank of New York Mellon | | | | | |
| | 4.596% 7/26/30 µ | | 7,560,000 | | | 7,807,700 |
| | 4.70% 9/20/25 µ, Ψ | | 8,770,000 | | | 8,756,845 |
| BPCE 144A 3.582% 10/19/42 #, µ | | 2,695,000 | | | 2,017,330 |
| Fifth Third Bancorp 4.337% 4/25/33 µ | | 4,180,000 | | | 4,115,948 |
| Goldman Sachs Group | | | | | |
| | 1.542% 9/10/27 µ | | 10,839,000 | | | 9,705,456 |
| | 2.383% 7/21/32 µ | | 10,220,000 | | | 8,628,784 |
| Huntington National Bank 4.552% 5/17/28 µ | | 9,310,000 | | | 9,486,417 |
| JPMorgan Chase & Co. | | | | | |
| | 1.764% 11/19/31 µ | | 15,640,000 | | | 12,801,385 |
| | 4.851% 7/25/28 µ | | 9,705,000 | | | 9,965,178 |
| | 4.912% 7/25/33 µ | | 1,865,000 | | | 1,946,376 |
| KeyBank 4.39% 12/14/27 | | 1,445,000 | | | 1,469,244 |
| KeyCorp 4.789% 6/1/33 µ | | 2,350,000 | | | 2,391,162 |
| Morgan Stanley | | | | | |
| | 1.928% 4/28/32 µ | | 11,065,000 | | | 9,123,221 |
| | 2.484% 9/16/36 µ | | 14,899,000 | | | 12,064,577 |
| NatWest Group 4.60% 6/28/31 µ, Ψ | | 4,175,000 | | | 3,303,728 |
| PNC Bank 4.05% 7/26/28 | | 3,665,000 | | | 3,625,441 |
| PNC Financial Services Group 6.00% 5/15/27 µ, Ψ | | 3,675,000 | | | 3,707,156 |
| Popular 6.125% 9/14/23 | | 5,020,000 | | | 5,070,150 |
22
Table of Contents
| | | Principal | | | |
| | | | amount° | | Value (US $) |
| Corporate Bonds (continued) | | | | | |
| Banking (continued) | | | | | |
| State Street | | | | | |
| 1.684% 11/18/27 µ | | 4,165,000 | | $ | 3,810,544 |
| 2.203% 2/7/28 µ | | 3,630,000 | | | 3,381,664 |
| 4.421% 5/13/33 µ | | 2,125,000 | | | 2,178,860 |
| SVB Financial Group | | | | | |
| 2.10% 5/15/28 | | 5,155,000 | | | 4,490,279 |
| 4.00% 5/15/26 µ, ψ | | 4,072,000 | | | 3,306,060 |
| 4.57% 4/29/33 µ | | 3,810,000 | | | 3,695,839 |
| Toronto-Dominion Bank 4.108% 6/8/27 | | 9,770,000 | | | 9,890,965 |
| Truist Bank 2.636% 9/17/29 µ | | 10,460,000 | | | 9,982,100 |
| Truist Financial | | | | | |
| 4.916% 7/28/33 µ | | 5,721,000 | | | 5,776,410 |
| 4.95% 9/1/25 µ, ψ | | 8,635,000 | | | 8,747,255 |
| UBS 7.625% 8/17/22 | | 4,145,000 | | | 4,149,965 |
| UBS Group 144A 4.375% 2/10/31 #, µ, ψ | | 4,390,000 | | | 3,539,438 |
| US Bancorp | | | | | |
| 2.491% 11/3/36 µ | | 3,030,000 | | | 2,557,020 |
| 2.677% 1/27/33 µ | | 2,230,000 | | | 1,998,368 |
| 4.548% 7/22/28 µ | | 14,185,000 | | | 14,563,288 |
| Wells Fargo & Co. | | | | | |
| 4.611% 4/25/53 µ | | 3,260,000 | | | 3,197,445 |
| 4.808% 7/25/28 µ | | 8,190,000 | | | 8,385,511 |
| | | | | | 238,792,432 |
| Basic Industry – 3.97% | | | | | |
| Celanese US Holdings | | | | | |
| 6.05% 3/15/25 | | 5,245,000 | | | 5,291,412 |
| 6.165% 7/15/27 | | 1,215,000 | | | 1,234,618 |
| Georgia-Pacific 8.00% 1/15/24 | | 4,345,000 | | | 4,630,098 |
| Graphic Packaging International 144A 3.50% 3/1/29 # | | 3,155,000 | | | 2,847,928 |
| Newmont | | | | | |
| 2.25% 10/1/30 | | 3,210,000 | | | 2,742,335 |
| 2.60% 7/15/32 | | 2,570,000 | | | 2,195,643 |
| 2.80% 10/1/29 | | 9,845,000 | | | 8,909,545 |
| Sherwin-Williams 2.90% 3/15/52 | | 11,730,000 | | | 8,220,997 |
| Steel Dynamics 1.65% 10/15/27 | | 2,520,000 | | | 2,208,507 |
| Suzano Austria 3.125% 1/15/32 | | 7,100,000 | | | 5,779,507 |
| Westlake 3.125% 8/15/51 | | 9,465,000 | | | 6,809,349 |
| | | | | | 50,869,939 |
23
Table of Contents
Schedules of investments
Delaware Corporate Bond Fund
| | | Principal | | | |
| | | | amount° | | Value (US $) |
| Corporate Bonds (continued) | | | | | |
| Brokerage – 1.34% | | | | | |
| Blackstone Holdings Finance 144A 1.625% 8/5/28 # | | 2,865,000 | | $ | 2,491,597 |
| Charles Schwab 5.375% 6/1/25 µ, ψ | | 4,195,000 | | | 4,280,578 |
| Jefferies Group | | | | | |
| 2.625% 10/15/31 | | 10,260,000 | | | 8,287,362 |
| 6.50% 1/20/43 | | 2,090,000 | | | 2,119,056 |
| | | | | | 17,178,593 |
| Capital Goods – 5.83% | | | | | |
| Amphenol 2.20% 9/15/31 | | 3,585,000 | | | 3,050,424 |
| Ardagh Metal Packaging Finance USA 144A 4.00% | | | | | |
| 9/1/29 # | | 3,515,000 | | | 3,030,598 |
| Ashtead Capital | | | | | |
| 144A 1.50% 8/12/26 # | | 6,880,000 | | | 6,056,824 |
| 144A 2.45% 8/12/31 # | | 4,995,000 | | | 4,014,861 |
| Boeing 3.75% 2/1/50 | | 9,770,000 | | | 7,417,531 |
| Lockheed Martin | | | | | |
| 3.90% 6/15/32 | | 3,205,000 | | | 3,307,256 |
| 4.15% 6/15/53 | | 2,390,000 | | | 2,347,072 |
| Madison IAQ 144A 4.125% 6/30/28 # | | 1,880,000 | | | 1,666,253 |
| Pactiv Evergreen Group Issuer 144A 4.00% 10/15/27 # | | 3,385,000 | | | 2,986,958 |
| Parker-Hannifin 4.25% 9/15/27 | | 10,885,000 | | | 11,131,838 |
| Republic Services 2.375% 3/15/33 | | 12,537,000 | | | 10,753,231 |
| Teledyne Technologies 2.25% 4/1/28 | | 13,780,000 | | | 12,218,740 |
| Waste Connections 2.95% 1/15/52 | | 2,315,000 | | | 1,767,310 |
| Weir Group 144A 2.20% 5/13/26 # | | 5,605,000 | | | 4,966,885 |
| | | | | | 74,715,781 |
| Communications – 9.94% | | | | | |
| Altice France | | | | | |
| 144A 5.125% 1/15/29 # | | 3,720,000 | | | 3,156,067 |
| 144A 5.50% 10/15/29 # | | 3,395,000 | | | 2,923,944 |
| AMC Networks | | | | | |
| 4.25% 2/15/29 | | 600,000 | | | 529,193 |
| 4.75% 8/1/25 | | 3,325,000 | | | 3,195,807 |
| AT&T | | | | | |
| 3.50% 9/15/53 | | 16,340,000 | | | 12,937,437 |
| 4.50% 5/15/35 | | 3,270,000 | | | 3,249,574 |
| CCO Holdings | | | | | |
| 144A 4.50% 6/1/33 # | | 945,000 | | | 800,845 |
| 144A 4.75% 2/1/32 # | | 3,870,000 | | | 3,426,982 |
| Cellnex Finance 144A 3.875% 7/7/41 # | | 3,267,000 | | | 2,332,780 |
| Charter Communications Operating 3.85% 4/1/61 | | 9,585,000 | | | 6,566,019 |
24
Table of Contents
| | | Principal | | | |
| | | | amount° | | Value (US $) |
| Corporate Bonds (continued) | | | | | |
| Communications (continued) | | | | | |
| Comcast 3.20% 7/15/36 | | 12,674,000 | | $ | 11,330,254 |
| CSC Holdings 144A 4.50% 11/15/31 # | | 5,855,000 | | | 4,991,124 |
| Directv Financing 144A 5.875% 8/15/27 # | | 3,965,000 | | | 3,700,753 |
| Discovery Communications 4.00% 9/15/55 | | 7,970,000 | | | 5,803,039 |
| Magallanes 144A 5.141% 3/15/52 # | | 7,660,000 | | | 6,755,505 |
| Netflix 4.875% 4/15/28 | | 2,970,000 | | | 2,954,467 |
| Rogers Communications 144A 4.55% 3/15/52 # | | 1,235,000 | | | 1,159,242 |
| Sprint Spectrum 144A 4.738% 9/20/29 # | | 2,884,069 | | | 2,899,651 |
| Time Warner Cable 7.30% 7/1/38 | | 2,930,000 | | | 3,175,568 |
| Time Warner Entertainment 8.375% 3/15/23 | | 6,100,000 | | | 6,269,154 |
| T-Mobile USA | | | | | |
| 3.00% 2/15/41 | | 5,100,000 | | | 3,971,462 |
| 3.375% 4/15/29 | | 13,605,000 | | | 12,723,804 |
| Verizon Communications | | | | | |
| 2.875% 11/20/50 | | 4,285,000 | | | 3,174,383 |
| 4.50% 8/10/33 | | 10,110,000 | | | 10,301,228 |
| Virgin Media Secured Finance 144A 5.50% 5/15/29 # | | 7,158,000 | | | 6,813,306 |
| VZ Secured Financing 144A 5.00% 1/15/32 # | | 2,540,000 | | | 2,268,995 |
| | | | | | 127,410,583 |
| Consumer Cyclical – 3.77% | | | | | |
| ADT Security 144A 4.875% 7/15/32 # | | 3,663,000 | | | 3,249,795 |
| Amazon.com 2.50% 6/3/50 | | 15,385,000 | | | 11,578,942 |
| Aptiv 3.10% 12/1/51 | | 15,996,000 | | | 10,665,035 |
| General Motors 5.60% 10/15/32 | | 1,585,000 | | | 1,584,458 |
| General Motors Financial 5.70% 9/30/30 µ, ψ | | 2,922,000 | | | 2,779,553 |
| Levi Strauss & Co. 144A 3.50% 3/1/31 # | | 2,866,000 | | | 2,594,475 |
| Lowe's 2.80% 9/15/41 | | 3,855,000 | | | 2,953,571 |
| Prime Security Services Borrower 144A 3.375% | | | | | |
| 8/31/27 # | | 952,000 | | | 870,528 |
| VICI Properties 4.95% 2/15/30 | | 8,305,000 | | | 8,144,929 |
| Volkswagen Group of America Finance 144A 4.35% | | | | | |
| 6/8/27 # | | 3,845,000 | | | 3,826,897 |
| | | | | | 48,248,183 |
| Consumer Non-Cyclical – 5.88% | | | | | |
| Amgen 3.00% 1/15/52 | | 2,970,000 | | | 2,246,660 |
| Baxter International | | | | | |
| 2.539% 2/1/32 | | 3,645,000 | | | 3,167,294 |
| 3.132% 12/1/51 | | 6,660,000 | | | 5,074,834 |
| Bimbo Bakeries USA 144A 4.00% 5/17/51 # | | 3,540,000 | | | 2,946,295 |
| Bunge Finance 2.75% 5/14/31 | | 7,475,000 | | | 6,453,340 |
25
Table of Contents
Schedules of investments
Delaware Corporate Bond Fund
| | | Principal | | | |
| | | | amount° | | Value (US $) |
| Corporate Bonds (continued) | | | | | |
| Consumer Non-Cyclical (continued) | | | | | |
| CVS Health 2.70% 8/21/40 | | 12,941,000 | | $ | 9,873,914 |
| JBS USA LUX 144A 3.00% 2/2/29 # | | 3,287,000 | | | 2,833,614 |
| Keurig Dr Pepper 3.95% 4/15/29 | | 3,425,000 | | | 3,403,391 |
| Merck & Co. 2.75% 12/10/51 | | 4,532,000 | | | 3,528,361 |
| PepsiCo 3.90% 7/18/32 | | 3,385,000 | | | 3,502,577 |
| Perrigo Finance Unlimited 4.375% 3/15/26 | | 7,415,000 | | | 7,306,037 |
| Royalty Pharma 3.35% 9/2/51 | | 12,513,000 | | | 8,910,606 |
| Sodexo | | | | | |
| 144A 1.634% 4/16/26 # | | 5,520,000 | | | 5,082,041 |
| 144A 2.718% 4/16/31 # | | 2,290,000 | | | 2,005,674 |
| Tenet Healthcare 144A 4.25% 6/1/29 # | | 3,575,000 | | | 3,332,258 |
| US Foods 144A 4.75% 2/15/29 # | | 3,265,000 | | | 3,054,653 |
| Viatris 4.00% 6/22/50 | | 3,778,000 | | | 2,623,404 |
| | | | | | 75,344,953 |
| Electric – 8.81% | | | | | |
| Appalachian Power 4.50% 8/1/32 | | 2,415,000 | | | 2,433,362 |
| Berkshire Hathaway Energy 2.85% 5/15/51 | | 5,078,000 | | | 3,851,582 |
| Commonwealth Edison 2.75% 9/1/51 | | 5,025,000 | | | 3,783,905 |
| Duke Energy Carolinas 3.95% 11/15/28 | | 6,187,000 | | | 6,296,496 |
| Enel Finance International 144A 4.25% 6/15/25 # | | 7,357,000 | | | 7,307,687 |
| Entergy Texas 3.55% 9/30/49 | | 2,695,000 | | | 2,251,605 |
| Fells Point Funding Trust 144A 3.046% 1/31/27 # | | 4,685,000 | | | 4,415,477 |
| IPALCO Enterprises 4.25% 5/1/30 | | 3,220,000 | | | 3,070,777 |
| Liberty Utilities Finance GP 1 144A 2.05% 9/15/30 # | | 3,000,000 | | | 2,556,679 |
| NextEra Energy Capital Holdings | | | | | |
| 3.00% 1/15/52 | | 5,850,000 | | | 4,419,641 |
| 5.00% 7/15/32 | | 5,470,000 | | | 5,850,499 |
| NRG Energy | | | | | |
| 144A 2.45% 12/2/27 # | | 2,470,000 | | | 2,179,669 |
| 144A 3.375% 2/15/29 # | | 1,051,000 | | | 907,859 |
| Oglethorpe Power | | | | | |
| 3.75% 8/1/50 | | 5,235,000 | | | 4,266,923 |
| 144A 4.50% 4/1/47 # | | 5,500,000 | | | 4,931,633 |
| Pacific Gas and Electric | | | | | |
| 3.30% 8/1/40 | | 1,125,000 | | | 823,091 |
| 3.50% 8/1/50 | | 1,690,000 | | | 1,197,552 |
| 4.60% 6/15/43 | | 4,405,000 | | | 3,492,249 |
| 4.95% 7/1/50 | | 3,615,000 | | | 3,000,776 |
| PacifiCorp 2.90% 6/15/52 | | 13,799,000 | | | 10,615,231 |
| Public Service Co. of Colorado 4.10% 6/1/32 | | 6,405,000 | | | 6,609,651 |
26
Table of Contents
| | | Principal | | | |
| | | | amount° | | Value (US $) |
| Corporate Bonds (continued) | | | | | |
| Electric (continued) | | | | | |
| Public Service Co. of Oklahoma 3.15% 8/15/51 | | 4,285,000 | | $ | 3,278,146 |
| San Diego Gas & Electric 3.32% 4/15/50 | | 2,270,000 | | | 1,853,532 |
| Southern California Edison | | | | | |
| 3.45% 2/1/52 | | 1,680,000 | | | 1,326,416 |
| 4.125% 3/1/48 | | 3,090,000 | | | 2,680,104 |
| 4.875% 3/1/49 | | 1,865,000 | | | 1,767,037 |
| 6.00% 1/15/34 | | 1,415,000 | | | 1,566,727 |
| Southwestern Electric Power 3.25% 11/1/51 | | 4,281,000 | | | 3,296,731 |
| Vistra Operations | | | | | |
| 144A 3.55% 7/15/24 # | | 4,381,000 | | | 4,248,242 |
| 144A 5.125% 5/13/25 # | | 2,360,000 | | | 2,362,537 |
| Xcel Energy 4.60% 6/1/32 | | 6,075,000 | | | 6,303,277 |
| | | | | | 112,945,093 |
| Energy – 7.82% | | | | | |
| BP Capital Markets 4.875% 3/22/30 µ, ψ | | 8,805,000 | | | 8,032,292 |
| BP Capital Markets America 2.939% 6/4/51 | | 2,260,000 | | | 1,708,733 |
| Cheniere Corpus Christi Holdings 7.00% 6/30/24 | | 6,760,000 | | | 7,014,181 |
| ConocoPhillips 3.80% 3/15/52 | | 5,860,000 | | | 5,266,036 |
| Continental Resources | | | | | |
| 144A 2.875% 4/1/32 # | | 3,721,000 | | | 3,042,029 |
| 4.375% 1/15/28 | | 2,809,000 | | | 2,710,750 |
| Diamondback Energy | | | | | |
| 3.125% 3/24/31 | | 4,840,000 | | | 4,384,175 |
| 4.25% 3/15/52 | | 2,125,000 | | | 1,828,501 |
| Enbridge | | | | | |
| 1.60% 10/4/26 | | 3,180,000 | | | 2,905,780 |
| 5.75% 7/15/80 µ | | 4,710,000 | | | 4,448,124 |
| Energy Transfer | | | | | |
| 6.25% 4/15/49 | | 3,410,000 | | | 3,416,842 |
| 6.50% 11/15/26 µ, ψ | | 9,654,000 | | | 8,785,140 |
| Enterprise Products Operating 3.30% 2/15/53 | | 8,920,000 | | | 6,973,734 |
| EQM Midstream Partners 144A 4.75% 1/15/31 # | | 3,775,000 | | | 3,419,489 |
| Galaxy Pipeline Assets Bidco 144A 2.94% 9/30/40 # | | 4,181,006 | | | 3,523,921 |
| Kinder Morgan 5.45% 8/1/52 | | 6,365,000 | | | 6,390,043 |
| NuStar Logistics 5.625% 4/28/27 | | 4,294,000 | | | 4,114,446 |
| ONEOK 7.50% 9/1/23 | | 6,625,000 | | | 6,823,266 |
| Targa Resources Partners | | | | | |
| 4.00% 1/15/32 | | 2,880,000 | | | 2,573,971 |
| 4.875% 2/1/31 | | 3,225,000 | | | 3,035,800 |
| 5.00% 1/15/28 | | 2,810,000 | | | 2,763,888 |
27
Table of Contents
Schedules of investments
Delaware Corporate Bond Fund
| | | Principal | | | |
| | | | amount° | | Value (US $) |
| Corporate Bonds (continued) | | | | | |
| Energy (continued) | | | | | |
| Valero Energy 3.65% 12/1/51 | | 8,850,000 | | $ | 7,045,950 |
| | | | | | 100,207,091 |
| Finance Companies – 3.33% | | | | | |
| AerCap Ireland Capital DAC | | | | | |
| 3.00% 10/29/28 | | 5,966,000 | | | 5,238,597 |
| 3.40% 10/29/33 | | 6,712,000 | | | 5,545,806 |
| Air Lease | | | | | |
| 2.875% 1/15/32 | | 3,880,000 | | | 3,200,738 |
| 4.125% 12/15/26 µ, ψ | | 4,080,000 | | | 3,050,451 |
| Aviation Capital Group | | | | | |
| 144A 1.95% 1/30/26 # | | 7,894,000 | | | 6,908,770 |
| 144A 5.50% 12/15/24 # | | 8,565,000 | | | 8,505,609 |
| Avolon Holdings Funding 144A 2.75% 2/21/28 # | | 9,935,000 | | | 8,226,085 |
| DAE Sukuk DIFC 144A 3.75% 2/15/26 # | | 2,140,000 | | | 2,033,663 |
| | | | | | 42,709,719 |
| Insurance – 5.28% | | | | | |
| Aon 2.90% 8/23/51 | | 7,710,000 | | | 5,638,611 |
| Athene Global Funding 144A 1.985% 8/19/28 # | | 4,980,000 | | | 4,222,768 |
| Athene Holding | | | | | |
| 3.45% 5/15/52 | | 3,215,000 | | | 2,261,576 |
| 3.95% 5/25/51 | | 5,365,000 | | | 4,043,517 |
| Berkshire Hathaway Finance 3.85% 3/15/52 | | 9,335,000 | | | 8,479,633 |
| Brighthouse Financial | | | | | |
| 3.85% 12/22/51 | | 2,395,000 | | | 1,668,992 |
| 4.70% 6/22/47 | | 9,863,000 | | | 8,052,181 |
| Global Atlantic 144A 4.70% 10/15/51 #, µ | | 5,070,000 | | | 4,206,781 |
| Hartford Financial Services Group 2.90% 9/15/51 | | 3,625,000 | | | 2,618,624 |
| Humana 1.35% 2/3/27 | | 4,087,000 | | | 3,672,337 |
| Jackson Financial | | | | | |
| 144A 3.125% 11/23/31 # | | 3,140,000 | | | 2,554,414 |
| 144A 4.00% 11/23/51 # | | 135,000 | | | 95,554 |
| Prudential Financial 3.70% 10/1/50 µ | | 7,005,000 | | | 6,141,660 |
| UnitedHealth Group 4.00% 5/15/29 | | 13,655,000 | | | 14,021,388 |
| | | | | | 67,678,036 |
| Natural Gas – 0.77% | | | | | |
| Atmos Energy 2.85% 2/15/52 | | 473,000 | | | 359,718 |
28
Table of Contents
| | | | | Principal | | | |
| | | | amount° | | Value (US $) |
| Corporate Bonds (continued) | | | | | |
| Natural Gas (continued) | | | | | |
| Sempra Energy | | | | | |
| | 4.125% 4/1/52 µ | | 2,775,000 | | $ | 2,349,082 |
| | 4.875% 10/15/25 µ, Ψ | | 7,360,000 | | | 7,153,326 |
| | | | | | | 9,862,126 |
| Real Estate Investment Trusts – 2.54% | | | | | |
| American Homes 4 Rent 3.625% 4/15/32 | | 4,840,000 | | | 4,395,828 |
| Corporate Office Properties 2.75% 4/15/31 | | 5,520,000 | | | 4,516,183 |
| Crown Castle | | | | | |
| | 1.05% 7/15/26 | | 5,500,000 | | | 4,897,105 |
| | 2.10% 4/1/31 | | 4,563,000 | | | 3,806,745 |
| Extra Space Storage 2.35% 3/15/32 | | 9,040,000 | | | 7,341,766 |
| Global Net Lease 144A 3.75% 12/15/27 # | | 3,160,000 | | | 2,773,376 |
| MPT Operating Partnership 3.50% 3/15/31 | | 3,180,000 | | | 2,744,658 |
| Public Storage 1.85% 5/1/28 | | 2,240,000 | | | 2,012,031 |
| | | | | | | 32,487,692 |
| Technology – 8.33% | | | | | |
| Alphabet 2.05% 8/15/50 | | 10,280,000 | | | 7,352,205 |
| Autodesk 2.40% 12/15/31 | | 7,435,000 | | | 6,371,859 |
| Broadcom 144A 3.469% 4/15/34 # | | 9,922,000 | | | 8,503,074 |
| Broadridge Financial Solutions 2.60% 5/1/31 | | 8,112,000 | | | 7,066,119 |
| CDW 3.276% 12/1/28 | | 11,570,000 | | | 10,191,911 |
| Clarivate Science Holdings 144A 3.875% 7/1/28 # | | 3,763,000 | | | 3,432,872 |
| CoStar Group 144A 2.80% 7/15/30 # | | 4,235,000 | | | 3,587,392 |
| Entegris Escrow | | | | | |
| | 144A 4.75% 4/15/29 # | | 3,650,000 | | | 3,522,250 |
| | 144A 5.95% 6/15/30 # | | 3,680,000 | | | 3,657,221 |
| Fidelity National Information Services 4.70% 7/15/27 | | 1,505,000 | | | 1,540,281 |
| Global Payments | | | | | |
| | 2.15% 1/15/27 | | 2,335,000 | | | 2,118,312 |
| | 2.90% 11/15/31 | | 6,595,000 | | | 5,555,191 |
| KLA 4.95% 7/15/52 | | 4,345,000 | | | 4,683,326 |
| Marvell Technology | | | | | |
| | 1.65% 4/15/26 | | 4,460,000 | | | 4,094,861 |
| | 2.45% 4/15/28 | | 2,820,000 | | | 2,517,671 |
| NCR 144A 5.125% 4/15/29 # | | 3,525,000 | | | 3,392,002 |
| NXP | | | | | |
| | 3.125% 2/15/42 | | 2,940,000 | | | 2,221,094 |
| | 4.40% 6/1/27 | | 2,010,000 | | | 2,017,167 |
| | 5.55% 12/1/28 | | 3,750,000 | | | 3,899,902 |
29
Table of Contents
Schedules of investments
Delaware Corporate Bond Fund
| | | | | Principal | | | |
| | | | amount° | | Value (US $) |
| Corporate Bonds (continued) | | | | | |
| Technology (continued) | | | | | |
| PayPal Holdings | | | | | |
| | 3.90% 6/1/27 | | 9,490,000 | | $ | 9,679,638 |
| | 4.40% 6/1/32 | | 2,475,000 | | | 2,569,539 |
| Sensata Technologies 144A 3.75% 2/15/31 # | | 4,715,000 | | | 4,103,276 |
| Workday | | | | | |
| | 3.50% 4/1/27 | | 590,000 | | | 579,663 |
| | 3.70% 4/1/29 | | 915,000 | | | 883,529 |
| | 3.80% 4/1/32 | | 3,285,000 | | | 3,137,656 |
| | | | | | | 106,678,011 |
| Transportation – 2.28% | | | | | |
| Burlington Northern Santa Fe 2.875% 6/15/52 | | 5,602,000 | | | 4,438,291 |
| DAE Funding | | | | | |
| | 144A 1.55% 8/1/24 # | | 2,260,000 | | | 2,117,278 |
| | 144A 3.375% 3/20/28 # | | 1,105,000 | | | 976,197 |
| Delta Air Lines 144A 7.00% 5/1/25 # | | 4,097,000 | | | 4,283,800 |
| Mileage Plus Holdings 144A 6.50% 6/20/27 # | | 5,115,000 | | | 5,174,053 |
| Penske Truck Leasing 144A 4.40% 7/1/27 # | | 8,115,000 | | | 8,124,524 |
| Seaspan 144A 5.50% 8/1/29 # | | 3,050,000 | | | 2,394,616 |
| United Airlines 2019-1 Class AA Pass Through Trust | | | | | |
| | Series 2019-1 AA 4.15% 2/25/33 ◆ | | 1,767,857 | | | 1,675,812 |
| | | | | | | 29,184,571 |
| Utilities – 0.41% | | | | | |
| American Water Capital 4.45% 6/1/32 | | 5,080,000 | | | 5,256,236 |
| | | | | | | 5,256,236 |
| Total Corporate Bonds (cost $1,253,533,411) | | | | | 1,139,569,039 |
| | | | | | | |
| Municipal Bonds – 0.33% | | | | | |
| Commonwealth of Puerto Rico | | | | | |
| | (Restructured) | | | | | |
| | Series A-1 2.993% 7/1/24^ | | 60,624 | | | 56,412 |
| | Series A-1 4.00% 7/1/33 | | 182,199 | | | 174,860 |
| | Series A-1 4.00% 7/1/35 | | 132,326 | | | 125,273 |
| | Series A-1 4.00% 7/1/37 | | 140,560 | | | 131,670 |
| | Series A-1 4.364% 7/1/33^ | | 234,472 | | | 139,736 |
| | Series A-1 5.625% 7/1/29 | | 153,227 | | | 169,593 |
| GDB Debt Recovery Authority of Puerto Rico (Taxable) | | | | | |
| | 7.50% 8/20/40 | | 3,821,632 | | | 3,391,698 |
| Total Municipal Bonds (cost $4,470,723) | | | | | 4,189,242 |
30
Table of Contents
| | | | | Principal | | | |
| | | | amount° | | Value (US $) |
| Non-Agency Asset-Backed Securities – 1.79% | | | | | |
| Enterprise Fleet Financing | | | | | |
| | Series 2022-2 A2 144A 4.65% 5/21/29 # | | 6,100,000 | | $ | 6,166,487 |
| Ford Credit Floorplan Master Owner Trust | | | | | |
| | Series 2019-2 A 3.06% 4/15/26 | | 5,550,000 | | | 5,487,610 |
| Toyota Auto Loan Extended Note Trust | | | | | |
| | Series 2022-1A A 144A 3.82% 4/25/35 # | | 6,100,000 | | | 6,138,582 |
| Volkswagen Auto Lease Trust | | | | | |
| | Series 2022-A A3 3.44% 7/21/25 | | 5,200,000 | | | 5,195,407 |
| Total Non-Agency Asset-Backed Securities (cost $22,916,456) | | | | | 22,988,086 |
| | | | | | | |
| Loan Agreements – 2.52% | | | | | |
| AmWINS Group 4.622% (LIBOR01M + 2.25%) | | | | | |
| | 2/19/28 ● | | 2,846,667 | | | 2,766,072 |
| Applied Systems 1st Lien 5.25% (LIBOR03M + 3.00%) | | | | | |
| | 9/19/24 ● | | 2,925,158 | | | 2,879,713 |
| Gates Global Tranche B-3 4.872% (LIBOR01M + | | | | | |
| | 2.50%) 3/31/27 ● | | 2,964,850 | | | 2,865,898 |
| Horizon Therapeutics USA Tranche B-2 4.063% | | | | | |
| | (LIBOR01M + 1.75%) 3/15/28 ● | | 2,853,875 | | | 2,811,957 |
| Informatica 5.125% (LIBOR01M + 2.75%) 10/27/28 ● | | 2,992,500 | | | 2,920,180 |
| Prime Security Services Borrower Tranche B-1 4.46% | | | | | |
| | (LIBOR01M + 2.75%) 9/23/26 ● | | 2,972,375 | | | 2,895,147 |
| RealPage 1st Lien 5.372% (LIBOR01M + 3.00%) | | | | | |
| | 4/24/28 ● | | 3,007,275 | | | 2,901,082 |
| Reynolds Group Holdings Tranche B-2 5.622% | | | | | |
| | (LIBOR01M + 3.25%) 2/5/26 ● | | 2,969,779 | | | 2,888,853 |
| Standard Industries 3.788% (LIBOR03M + 2.50%) | | | | | |
| | 9/22/28 ● | | 9,578,483 | | | 9,431,061 |
| Total Loan Agreements (cost $33,006,039) | | | | | 32,359,963 |
| | | | | | | |
| US Treasury Obligation – 1.14% | | | | | |
| US Treasury Notes | | | | | |
| | 2.875% 5/15/25 | | 14,595,000 | | | 14,555,662 |
| Total US Treasury Obligation (cost $14,488,098) | | | | | 14,555,662 |
31
Table of Contents
Schedules of investments
Delaware Corporate Bond Fund
| | | | Number of | | | | |
| | | shares | | Value (US $) |
| Convertible Preferred Stock – 0.25% | | | | | | | |
| El Paso Energy Capital Trust I 4.75% exercise price | | | | | | | |
| $34.49, maturity date 3/31/28 | | 22,731 | | | $ | 1,040,853 | |
| Lyondellbasell Advanced Polymers 6.00% exercise | | | | | | | |
| price $52.33 ω | | 2,808 | | | | 2,232,360 | |
| Total Convertible Preferred Stock (cost $4,053,106) | | | | | | 3,273,213 | |
| | | | | | | | | |
| Short-Term Investments – 4.80% | | | | | | | |
| Money Market Mutual Funds – 4.80% | | | | | | | |
| BlackRock Liquidity FedFund – Institutional Shares | | | | | | | |
| (seven-day effective yield 1.73%) | | 15,377,423 | | | | 15,377,423 | |
| Fidelity Investments Money Market Government | | | | | | | |
| Portfolio – Class I (seven-day effective yield 1.49%) | | 15,377,423 | | | | 15,377,423 | |
| GS Financial Square Government Fund – Institutional | | | | | | | |
| Shares (seven-day effective yield 1.73%) | | 15,377,423 | | | | 15,377,423 | |
| Morgan Stanley Institutional Liquidity Funds | | | | | | | |
| Government Portfolio – Institutional Class | | | | | | | |
| (seven-day effective yield 1.60%) | | 15,377,424 | | | | 15,377,424 | |
| Total Short-Term Investments (cost $61,509,693) | | | | | | 61,509,693 | |
| Total Value of Securities Before | | | | | | | |
| Options Written–100.16% | | | | | | | |
| (cost $1,399,084,180) | | | | | | 1,283,399,891 | |
| | | | | | | | |
| | | Notional | | | | |
| | | amount | | | | |
| Options Written – (0.00%) | | | | | | | |
| Put Swaptions – (0.00%) | | | | | | | |
| CDX.NA.IG 38 5 yr, strike price $130.00 expiration date | | | | | | | |
| 8/17/22 (MS) | | (2,800,000 | ) | | | (258 | ) |
| Total Options Written (premium received $4,130) | | | | | $ | (258 | ) |
| ° | Principal amount shown is stated in USD unless noted that the security is denominated in another currency. |
| µ | Fixed to variable rate investment. The rate shown reflects the fixed rate in effect at July 31, 2022. Rate will reset at a future date. |
| Ψ | Perpetual security. Maturity date represents next call date. |
| # | Security exempt from registration under Rule 144A of the Securities Act of 1933, as amended. At July 31, 2022, the aggregate value of Rule 144A securities was $248,639,962, which represents 19.40% of the Fund's net assets. See Note 11 in “Notes to financial statements." |
32
Table of Contents
| ◆ | Pass Through Agreement. Security represents the contractual right to receive a proportionate amount of underlying payments due to the counterparty pursuant to various agreements related to the rescheduling of obligations and the exchange of certain notes. |
| ^ | Zero-coupon security. The rate shown is the effective yield at the time of purchase. |
| ● | Variable rate investment. Rates reset periodically. Rate shown reflects the rate in effect at July 31, 2022. For securities based on a published reference rate and spread, the reference rate and spread are indicated in their descriptions. The reference rate descriptions (i.e. LIBOR03M, LIBOR06M, etc.) used in this report are identical for different securities, but the underlying reference rates may differ due to the timing of the reset period. Certain variable rate securities are not based on a published reference rate and spread but are determined by the issuer or agent and are based on current market conditions, or for mortgage-backed securities, are impacted by the individual mortgages which are paying off over time. These securities do not indicate a reference rate and spread in their descriptions. |
| ω | Perpetual security with no stated maturity date. |
| Summary of abbreviations: |
| CDX.NA.IG – Credit Default Swap Index North America Investment Grade |
| DAC – Designated Activity Company |
| DIFC – Dubai International Financial Centre |
| GS – Goldman Sachs |
| ICE – Intercontinental Exchange, Inc. |
| LIBOR – London Interbank Offered Rate |
| LIBOR01M – ICE LIBOR USD 1 Month |
| LIBOR03M – ICE LIBOR USD 3 Month |
| LIBOR06M – ICE LIBOR USD 6 Month |
| MS – Morgan Stanley |
| USD – US Dollar |
| yr – Year |
See accompanying notes, which are an integral part of the financial statements.
33
Table of Contents
| Schedules of investments |
| Delaware Extended Duration Bond Fund | July 31, 2022 |
| | | | | Principal | | | |
| | | | amount° | | Value (US $) |
| Convertible Bond – 0.15% | | | | | |
| Spirit Airlines 1.00% exercise price $49.07, maturity | | | | | |
| | date 5/15/26 | | 680,000 | | $ | 615,060 |
| Total Convertible Bond (cost $590,862) | | | | | 615,060 |
| | | | | | | |
| Corporate Bonds – 93.16% | | | | | |
| Banking – 9.45% | | | | | |
| Ally Financial | | | | | |
| | 4.70% 5/15/26 µ, Ψ | | 1,635,000 | | | 1,382,924 |
| | 8.00% 11/1/31 | | 595,000 | | | 673,799 |
| Bank of America | | | | | |
| | 2.676% 6/19/41 µ | | 7,570,000 | | | 5,731,909 |
| | 6.125% 4/27/27 µ, Ψ | | 1,205,000 | | | 1,214,037 |
| Bank of New York Mellon 4.70% 9/20/25 µ, Ψ | | 2,600,000 | | | 2,596,100 |
| BPCE 144A 3.582% 10/19/42 #, µ | | 1,080,000 | | | 808,429 |
| Credit Agricole 144A 2.811% 1/11/41 # | | 2,410,000 | | | 1,713,335 |
| Credit Suisse Group 144A 5.25% 2/11/27 #, µ, Ψ | | 1,305,000 | | | 1,079,888 |
| JPMorgan Chase & Co. | | | | | |
| | 3.109% 4/22/51 µ | | 3,000,000 | | | 2,298,044 |
| | 3.328% 4/22/52 µ | | 5,105,000 | | | 4,083,821 |
| Morgan Stanley | | | | | |
| | 2.484% 9/16/36 µ | | 1,510,000 | | | 1,222,734 |
| | 2.802% 1/25/52 µ | | 7,065,000 | | | 5,130,293 |
| NatWest Group 4.60% 6/28/31 µ, Ψ | | 1,625,000 | | | 1,285,882 |
| PNC Financial Services Group 6.00% 5/15/27 µ, Ψ | | 690,000 | | | 696,038 |
| SVB Financial Group 4.00% 5/15/26 µ, Ψ | | 1,325,000 | | | 1,075,769 |
| Truist Financial 4.95% 9/1/25 µ, Ψ | | 3,440,000 | | | 3,484,720 |
| UBS 7.625% 8/17/22 | | 720,000 | | | 720,862 |
| UBS Group 144A 4.375% 2/10/31 #, µ, Ψ | | 1,640,000 | | | 1,322,250 |
| Wells Fargo & Co. 4.611% 4/25/53 µ | | 3,340,000 | | | 3,275,909 |
| | | | | | | 39,796,743 |
| Basic Industry – 3.93% | | | | | |
| Graphic Packaging International 144A 3.50% 3/1/29 # | | 1,265,000 | | | 1,141,879 |
| Packaging Corp. of America | | | | | |
| | 3.05% 10/1/51 | | 2,915,000 | | | 2,187,579 |
| | 4.05% 12/15/49 | | 2,200,000 | | | 1,916,528 |
| Sherwin-Williams 2.90% 3/15/52 | | 5,230,000 | | | 3,665,458 |
| Steel Dynamics 3.25% 10/15/50 | | 4,335,000 | | | 3,063,541 |
| Westlake 3.125% 8/15/51 | | 6,390,000 | | | 4,597,120 |
| | | | | | | 16,572,105 |
34
Table of Contents
| | | | Principal | | | |
| | | | | amount° | | Value (US $) |
| Corporate Bonds (continued) | | | | | |
| Brokerage – 0.93% | | | | | |
| Charles Schwab 5.375% 6/1/25 µ, ψ | | 1,855,000 | | $ | 1,892,842 |
| Jefferies Group 6.50% 1/20/43 | | 1,985,000 | | | 2,012,596 |
| | | | | | | 3,905,438 |
| Capital Goods – 4.85% | | | | | |
| Ardagh Metal Packaging Finance USA 144A 4.00% | | | | | |
| | 9/1/29 # | | 1,285,000 | | | 1,107,914 |
| Boeing 3.75% 2/1/50 | | 4,055,000 | | | 3,078,617 |
| Emerson Electric 2.80% 12/21/51 | | 3,220,000 | | | 2,488,683 |
| Lockheed Martin 4.15% 6/15/53 | | 875,000 | | | 859,284 |
| Masco 3.125% 2/15/51 | | 7,435,000 | | | 5,260,813 |
| Pactiv Evergreen Group Issuer 144A 4.00% 10/15/27 # | | 1,315,000 | | | 1,160,369 |
| Rockwell Automation 2.80% 8/15/61 | | 1,585,000 | | | 1,092,329 |
| Waste Connections 2.95% 1/15/52 | | 7,030,000 | | | 5,366,821 |
| | | | | | | 20,414,830 |
| Communications – 11.28% | | | | | |
| Altice France | | | | | |
| | 144A 5.125% 1/15/29 # | | 1,425,000 | | | 1,208,977 |
| | 144A 5.50% 10/15/29 # | | 1,360,000 | | | 1,171,300 |
| AMC Networks 4.25% 2/15/29 | | 2,000,000 | | | 1,763,975 |
| AT&T | | | | | |
| | 3.50% 9/15/53 | | 9,580,000 | | | 7,585,107 |
| | 4.50% 5/15/35 | | 540,000 | | | 536,627 |
| CCO Holdings 144A 4.75% 2/1/32 # | | 1,460,000 | | | 1,292,866 |
| Cellnex Finance 144A 3.875% 7/7/41 # | | 1,221,000 | | | 871,847 |
| Charter Communications Operating 3.85% 4/1/61 | | 3,670,000 | | | 2,514,063 |
| Comcast | | | | | |
| | 2.80% 1/15/51 | | 2,830,000 | | | 2,107,688 |
| | 3.20% 7/15/36 | | 1,575,000 | | | 1,408,013 |
| CSC Holdings 144A 4.50% 11/15/31 # | | 2,230,000 | | | 1,900,975 |
| Directv Financing 144A 5.875% 8/15/27 # | | 1,400,000 | | | 1,306,697 |
| Discovery Communications 4.00% 9/15/55 | | 5,873,000 | | | 4,276,192 |
| Magallanes 144A 5.141% 3/15/52 # | | 1,925,000 | | | 1,697,695 |
| Rogers Communications 144A 4.55% 3/15/52 # | | 460,000 | | | 431,783 |
| Time Warner Cable 7.30% 7/1/38 | | 2,360,000 | | | 2,557,795 |
| T-Mobile USA 3.00% 2/15/41 | | 8,460,000 | | | 6,587,955 |
| Verizon Communications | | | | | |
| | 2.875% 11/20/50 | | 1,230,000 | | | 911,200 |
| | 3.55% 3/22/51 | | 5,015,000 | | | 4,213,885 |
| Virgin Media Secured Finance 144A 5.50% 5/15/29 # | | 2,460,000 | | | 2,341,539 |
35
Table of Contents
Schedules of investments
Delaware Extended Duration Bond Fund
| | | | Principal | | | |
| | | | | amount° | | Value (US $) |
| Corporate Bonds (continued) | | | | | |
| Communications (continued) | | | | | |
| VZ Secured Financing 144A 5.00% 1/15/32 # | | 955,000 | | $ | 853,106 |
| | | | | | | 47,539,285 |
| Consumer Cyclical – 4.25% | | | | | |
| ADT Security 144A 4.875% 7/15/32 # | | 1,365,000 | | | 1,211,021 |
| Amazon.com 2.50% 6/3/50 | | 5,715,000 | | | 4,301,180 |
| Aptiv 3.10% 12/1/51 | | 7,649,000 | | | 5,099,828 |
| General Motors 6.25% 10/2/43 | | 1,070,000 | | | 1,055,263 |
| General Motors Financial 5.70% 9/30/30 µ, ψ | | 1,550,000 | | | 1,474,438 |
| Levi Strauss & Co. 144A 3.50% 3/1/31 # | | 305,000 | | | 276,104 |
| Lowe's 2.80% 9/15/41 | | 5,360,000 | | | 4,106,651 |
| Prime Security Services Borrower 144A 3.375% | | | | | |
| | 8/31/27 # | | 426,000 | | | 389,543 |
| | | | | | | 17,914,028 |
| Consumer Non-Cyclical – 7.64% | | | | | |
| Amgen 3.00% 1/15/52 | | 1,650,000 | | | 1,248,145 |
| Baxter International 3.132% 12/1/51 | | 6,225,000 | | | 4,743,370 |
| Bimbo Bakeries USA 144A 4.00% 5/17/51 # | | 1,385,000 | | | 1,152,717 |
| CVS Health 2.70% 8/21/40 | | 4,166,000 | | | 3,178,636 |
| JBS USA LUX 144A 4.375% 2/2/52 # | | 2,580,000 | | | 1,960,645 |
| Merck & Co. 2.75% 12/10/51 | | 2,215,000 | | | 1,724,475 |
| Regeneron Pharmaceuticals 2.80% 9/15/50 | | 6,003,000 | | | 4,323,095 |
| Royalty Pharma 3.35% 9/2/51 | | 7,591,000 | | | 5,405,611 |
| Takeda Pharmaceutical 3.175% 7/9/50 | | 4,290,000 | | | 3,374,064 |
| Tenet Healthcare 144A 4.25% 6/1/29 # | | 1,345,000 | | | 1,253,674 |
| US Foods 144A 4.75% 2/15/29 # | | 2,000,000 | | | 1,871,150 |
| Viatris 4.00% 6/22/50 | | 2,819,000 | | | 1,957,485 |
| | | | | | | 32,193,067 |
| Electric – 14.11% | | | | | |
| Arizona Public Service | | | | | |
| | 4.20% 8/15/48 | | 2,720,000 | | | 2,410,607 |
| | 4.25% 3/1/49 | | 2,324,000 | | | 2,070,786 |
| Baltimore Gas and Electric 4.55% 6/1/52 | | 3,220,000 | | | 3,287,686 |
| Berkshire Hathaway Energy | | | | | |
| | 2.85% 5/15/51 | | 1,048,000 | | | 794,891 |
| | 144A 4.60% 5/1/53 # | | 3,170,000 | | | 3,197,264 |
| Commonwealth Edison 2.75% 9/1/51 | | 4,745,000 | | | 3,573,061 |
| Entergy Arkansas 3.35% 6/15/52 | | 1,880,000 | | | 1,546,822 |
| Evergy Kansas Central 3.25% 9/1/49 | | 1,117,000 | | | 901,556 |
| Florida Power & Light Co. 2.875% 12/4/51 | | 1,820,000 | | | 1,443,283 |
| NextEra Energy Capital Holdings 3.00% 1/15/52 | | 5,875,000 | | | 4,438,528 |
36
Table of Contents
| | | | Principal | | | |
| | | | | amount° | | Value (US $) |
| Corporate Bonds (continued) | | | | | |
| Electric (continued) | | | | | |
| Oglethorpe Power | | | | | |
| | 3.75% 8/1/50 | | 3,190,000 | | $ | 2,600,093 |
| | 144A 4.50% 4/1/47 # | | 2,075,000 | | | 1,860,570 |
| | 5.05% 10/1/48 | | 2,580,000 | | | 2,450,204 |
| Pacific Gas and Electric | | | | | |
| | 3.30% 8/1/40 | | 1,105,000 | | | 808,459 |
| | 4.60% 6/15/43 | | 5,775,000 | | | 4,578,374 |
| | 4.95% 7/1/50 | | 1,620,000 | | | 1,344,746 |
| PacifiCorp 2.90% 6/15/52 | | 6,055,000 | | | 4,657,963 |
| Public Service Co. of Oklahoma 3.15% 8/15/51 | | 1,680,000 | | | 1,285,247 |
| San Diego Gas & Electric 3.32% 4/15/50 | | 1,195,000 | | | 975,758 |
| Southern California Edison | | | | | |
| | 3.45% 2/1/52 | | 1,700,000 | | | 1,342,207 |
| | 3.65% 2/1/50 | | 1,125,000 | | | 899,207 |
| | 4.125% 3/1/48 | | 5,220,000 | | | 4,527,554 |
| Southwestern Electric Power 3.25% 11/1/51 | | 3,535,000 | | | 2,722,248 |
| Tampa Electric 3.45% 3/15/51 | | 4,087,000 | | | 3,402,322 |
| Union Electric 3.90% 4/1/52 | | 490,000 | | | 456,260 |
| Virginia Electric and Power 2.95% 11/15/51 | | 2,420,000 | | | 1,893,607 |
| | | | | | | 59,469,303 |
| Energy – 11.95% | | | | | |
| BP Capital Markets 4.875% 3/22/30 µ, ψ | | 2,400,000 | | | 2,189,381 |
| BP Capital Markets America 2.939% 6/4/51 | | 6,320,000 | | | 4,778,405 |
| ConocoPhillips 3.80% 3/15/52 | | 1,980,000 | | | 1,779,309 |
| Diamondback Energy | | | | | |
| | 4.25% 3/15/52 | | 1,485,000 | | | 1,277,800 |
| | 4.40% 3/24/51 | | 4,530,000 | | | 4,064,918 |
| Enbridge 5.75% 7/15/80 µ | | 1,840,000 | | | 1,737,696 |
| Energy Transfer | | | | | |
| | 6.25% 4/15/49 | | 780,000 | | | 781,565 |
| | 6.50% 11/15/26 µ, ψ | | 2,197,000 | | | 1,999,270 |
| Enterprise Products Operating | | | | | |
| | 3.20% 2/15/52 | | 3,648,000 | | | 2,774,224 |
| | 3.30% 2/15/53 | | 4,175,000 | | | 3,264,051 |
| EQM Midstream Partners 144A 4.75% 1/15/31 # | | 1,450,000 | | | 1,313,446 |
| Galaxy Pipeline Assets Bidco 144A 2.94% 9/30/40 # | | 1,542,698 | | | 1,300,248 |
| Kinder Morgan | | | | | |
| | 3.25% 8/1/50 | | 5,860,000 | | | 4,272,870 |
| | 5.45% 8/1/52 | | 1,405,000 | | | 1,410,528 |
37
Table of Contents
Schedules of investments
Delaware Extended Duration Bond Fund
| | | | Principal | | | |
| | | | | amount° | | Value (US $) |
| Corporate Bonds (continued) | | | | | |
| Energy (continued) | | | | | |
| MPLX 4.95% 3/14/52 | | 2,285,000 | | $ | 2,097,482 |
| Northern Natural Gas 144A 3.40% 10/16/51 # | | 1,080,000 | | | 834,966 |
| NuStar Logistics | | | | | |
| | 5.625% 4/28/27 | | 305,000 | | | 292,246 |
| | 6.375% 10/1/30 | | 2,000,000 | | | 1,846,592 |
| Shell International Finance 3.00% 11/26/51 | | 6,620,000 | | | 5,320,076 |
| Valero Energy 3.65% 12/1/51 | | 3,585,000 | | | 2,854,207 |
| Williams 3.50% 10/15/51 | | 5,285,000 | | | 4,165,053 |
| | | | | | | 50,354,333 |
| Finance Companies – 1.84% | | | | | |
| AerCap Holdings 5.875% 10/10/79 µ | | 260,000 | | | 231,130 |
| AerCap Ireland Capital DAC 3.85% 10/29/41 | | 7,405,000 | | | 5,629,748 |
| Air Lease 4.125% 12/15/26 µ, ψ | | 1,470,000 | | | 1,099,060 |
| DAE Sukuk DIFC 144A 3.75% 2/15/26 # | | 830,000 | | | 788,757 |
| | | | | | | 7,748,695 |
| Insurance – 10.87% | | | | | |
| Aon 2.90% 8/23/51 | | 5,800,000 | | | 4,241,756 |
| Arthur J Gallagher & Co. 3.50% 5/20/51 | | 4,805,000 | | | 3,814,123 |
| Athene Holding | | | | | |
| | 3.45% 5/15/52 | | 1,215,000 | | | 854,686 |
| | 3.95% 5/25/51 | | 1,600,000 | | | 1,205,895 |
| Berkshire Hathaway Finance 3.85% 3/15/52 | | 5,835,000 | | | 5,300,338 |
| Brighthouse Financial | | | | | |
| | 3.85% 12/22/51 | | 975,000 | | | 679,444 |
| | 4.70% 6/22/47 | | 4,911,000 | | | 4,009,354 |
| Chubb INA Holdings 2.85% 12/15/51 | | 2,255,000 | | | 1,715,424 |
| Elevance Health 4.55% 5/15/52 | | 3,270,000 | | | 3,273,600 |
| Global Atlantic 144A 4.70% 10/15/51 #, µ | | 1,980,000 | | | 1,642,885 |
| Hartford Financial Services Group 2.90% 9/15/51 | | 6,120,000 | | | 4,420,960 |
| High Street Funding Trust II 144A 4.682% 2/15/48 # | | 3,660,000 | | | 3,471,273 |
| Jackson Financial 144A 4.00% 11/23/51 # | | 1,031,000 | | | 729,747 |
| MetLife 5.00% 7/15/52 | | 4,400,000 | | | 4,699,556 |
| Nationwide Mutual Insurance 144A 4.95% 4/22/44 # | | 3,141,000 | | | 2,955,740 |
| Old Republic International 3.85% 6/11/51 | | 1,565,000 | | | 1,239,027 |
| Pacific Life Insurance 144A 4.30% 10/24/67 #, µ | | 1,789,000 | | | 1,568,416 |
| | | | | | | 45,822,224 |
| Natural Gas – 4.21% | | | | | |
| Atmos Energy 2.85% 2/15/52 | | 2,825,000 | | | 2,148,422 |
| Brooklyn Union Gas 144A 4.273% 3/15/48 # | | 689,000 | | | 574,315 |
| Piedmont Natural Gas 3.64% 11/1/46 | | 3,035,000 | | | 2,490,823 |
38
Table of Contents
| | | | Principal | | | |
| | | | | amount° | | Value (US $) |
| Corporate Bonds (continued) | | | | | |
| Natural Gas (continued) | | | | | |
| Sempra Energy | | | | | |
| | 4.125% 4/1/52 µ | | 510,000 | | $ | 431,723 |
| | 4.875% 10/15/25 µ, ψ | | 1,485,000 | | | 1,443,300 |
| Southern California Gas 4.30% 1/15/49 | | 4,500,000 | | | 4,207,137 |
| Southwest Gas | | | | | |
| | 3.80% 9/29/46 | | 2,150,000 | | | 1,683,191 |
| | 4.15% 6/1/49 | | 2,430,000 | | | 2,017,265 |
| Spire Missouri 3.30% 6/1/51 | | 3,440,000 | | | 2,743,725 |
| | | | | | | 17,739,901 |
| Real Estate Investment Trusts – 0.92% | | | | | |
| Crown Castle 2.90% 4/1/41 | | 5,115,000 | | | 3,882,807 |
| | | | | | | 3,882,807 |
| Technology – 4.79% | | | | | |
| Alphabet 2.05% 8/15/50 | | 8,405,000 | | | 6,011,214 |
| Analog Devices 2.95% 10/1/51 | | 4,350,000 | | | 3,516,960 |
| Apple 2.70% 8/5/51 | | 1,335,000 | | | 1,050,116 |
| Broadcom 144A 3.137% 11/15/35 # | | 3,330,000 | | | 2,680,696 |
| Entegris Escrow 144A 5.95% 6/15/30 # | | 1,300,000 | | | 1,291,953 |
| KLA 4.95% 7/15/52 | | 1,580,000 | | | 1,703,028 |
| NCR 144A 5.125% 4/15/29 # | | 1,255,000 | | | 1,207,649 |
| NXP | | | | | |
| | 3.125% 2/15/42 | | 1,195,000 | | | 902,792 |
| | 3.25% 11/30/51 | | 2,535,000 | | | 1,820,192 |
| | | | | | | 20,184,600 |
| Transportation – 1.84% | | | | | |
| Burlington Northern Santa Fe | | | | | |
| | 2.875% 6/15/52 | | 1,690,000 | | | 1,338,935 |
| | 4.45% 1/15/53 | | 1,420,000 | | | 1,452,459 |
| Canadian Pacific Railway 3.10% 12/2/51 | | 2,675,000 | | | 2,111,477 |
| DAE Funding 144A 3.375% 3/20/28 # | | 415,000 | | | 366,626 |
| Mileage Plus Holdings 144A 6.50% 6/20/27 # | | 1,550,000 | | | 1,567,895 |
| Seaspan 144A 5.50% 8/1/29 # | | 1,175,000 | | | 922,516 |
| | | | | | | 7,759,908 |
| Utilities – 0.30% | | | | | |
| Essential Utilities 4.276% 5/1/49 | | 1,381,000 | | | 1,251,400 |
| | | | | | | 1,251,400 |
| Total Corporate Bonds (cost $467,416,899) | | | | | 392,548,667 |
39
Table of Contents
Schedules of investments
Delaware Extended Duration Bond Fund
| | | | Principal | | | |
| | | | | amount° | | Value (US $) |
| Municipal Bonds – 2.27% | | | | | |
| Commonwealth of Puerto Rico | | | | | |
| | (Restructured) | | | | | |
| | Series A 2.993% 7/1/24^ | | 22,980 | | $ | 21,383 |
| | Series A 4.364% 7/1/33^ | | 88,880 | | | 52,969 |
| | Series A-1 4.00% 7/1/33 | | 69,065 | | | 66,283 |
| | Series A-1 4.00% 7/1/35 | | 50,160 | | | 47,487 |
| | Series A-1 4.00% 7/1/37 | | 53,281 | | | 49,911 |
| | Series A-1 5.625% 7/1/29 | | 58,083 | | | 64,287 |
| GDB Debt Recovery Authority of Puerto Rico | | | | | |
| | 7.50% 8/20/40 | | 1,436,975 | | | 1,275,315 |
| Long Island, New York Power Authority Electric System | | | | | |
| | Revenue | | | | | |
| | Series B 5.85% 5/1/41 | | 3,600,000 | | | 4,205,664 |
| Metropolitan Transportation Authority, New York | | | | | |
| | Revenue | | | | | |
| | Series A-2 6.089% 11/15/40 | | 3,205,000 | | | 3,795,585 |
| Total Municipal Bonds (cost $8,508,090) | | | | | 9,578,884 |
| | | | | | | | |
| Loan Agreements – 0.64% | | | | | |
| Applied Systems 1st Lien 5.25% (LIBOR03M + 3.00%) | | | | | |
| | 9/19/24 ● | | 1,182,244 | | | 1,163,877 |
| Prime Security Services Borrower Tranche B-1 4.463% | | | | | |
| | (LIBOR01M + 2.75%) 9/23/26 ● | | 245,258 | | | 238,886 |
| Reynolds Group Holdings Tranche B-2 5.622% | | | | | |
| | (LIBOR01M + 3.25%) 2/5/26 ● | | 1,349,450 | | | 1,312,677 |
| Total Loan Agreements (cost $2,779,252) | | | | | 2,715,440 |
| | | | | | | | |
| | | | Number of | | | |
| | | | shares | | | |
| Convertible Preferred Stock – 0.86% | | | | | |
| Bank of America 7.25% exercise price $50.00, maturity | | | | | |
| | date 12/31/99 ω | | 1,360 | | | 1,691,908 |
| El Paso Energy Capital Trust I 4.75% exercise price | | | | | |
| | $34.49, maturity date 3/31/28 | | 14,912 | | | 682,821 |
| Lyondellbasell Advanced Polymers 6.00% exercise | | | | | |
| | price $52.33 ω | | 1,597 | | | 1,269,615 |
| Total Convertible Preferred Stock (cost $4,194,316) | | | | | 3,644,344 |
40
Table of Contents
| | | | | Number of | | |
| | | | shares | | Value (US $) |
| Short-Term Investments – 2.70% | | | | | | | |
| Money Market Mutual Funds – 2.70% | | | | | | | |
| BlackRock Liquidity FedFund – Institutional Shares | | | | | | | |
| | (seven-day effective yield 1.73%) | | 2,843,351 | | | $ | 2,843,351 | |
| Fidelity Investments Money Market Government | | | | | | | |
| | Portfolio – Class I (seven-day effective yield 1.49%) | | 2,843,352 | | | | 2,843,352 | |
| GS Financial Square Government Fund – Institutional | | | | | | | |
| | Shares (seven-day effective yield 1.73%) | | 2,843,352 | | | | 2,843,352 | |
| Morgan Stanley Institutional Liquidity Funds | | | | | | | |
| | Government Portfolio – Institutional Class | | | | | | | |
| | (seven-day effective yield 1.60%) | | 2,843,351 | | | | 2,843,351 | |
| Total Short-Term Investments (cost $11,373,406) | | | | | | 11,373,406 | |
| Total Value of Securities Before | | | | | | | |
| Options Written – 99.78% | | | | | | | |
| (cost $494,862,825) | | | | | | 420,475,801 | |
| | | | | | | | | | |
| | | | Notional | | | | |
| | | | amount | | | | |
| Options Written – (0.00%) | | | | | | | |
| Put Swaptions – (0.00%) | | | | | | | |
| CDX.NA.IG 38 5 yr, strike price $130.00 expiration date | | | | | | | |
| | 8/17/22 (MS) | | (1,000,000 | ) | | | (92 | ) |
| Total Options Written (premium received $1,475) | | | | | $ | (92 | ) |
| ° | Principal amount shown is stated in USD unless noted that the security is denominated in another currency. |
| µ | Fixed to variable rate investment. The rate shown reflects the fixed rate in effect at July 31, 2022. Rate will reset at a future date. |
| ψ | Perpetual security. Maturity date represents next call date. |
| # | Security exempt from registration under Rule 144A of the Securities Act of 1933, as amended. At July 31, 2022, the aggregate value of Rule 144A securities was $57,800,665, which represents 13.72% of the Fund's net assets. See Note 11 in “Notes to financial statements." |
| ^ | Zero-coupon security. The rate shown is the effective yield at the time of purchase. |
41
Table of Contents
Schedules of investments
Delaware Extended Duration Bond Fund
| ● | Variable rate investment. Rates reset periodically. Rate shown reflects the rate in effect at July 31, 2022. For securities based on a published reference rate and spread, the reference rate and spread are indicated in their descriptions. The reference rate descriptions (i.e. LIBOR03M, LIBOR06M, etc.) used in this report are identical for different securities, but the underlying reference rates may differ due to the timing of the reset period. Certain variable rate securities are not based on a published reference rate and spread but are determined by the issuer or agent and are based on current market conditions, or for mortgage-backed securities, are impacted by the individual mortgages which are paying off over time. These securities do not indicate a reference rate and spread in their descriptions. |
| ω | Perpetual security with no stated maturity date. |
Summary of abbreviations:
CDX.NA.IG – Credit Default Swap Index North America Investment Grade
DAC – Designated Activity Company
DIFC – Dubai International Financial Centre
GS – Goldman Sachs
ICE – Intercontinental Exchange, Inc.
LIBOR – London Interbank Offered Rate
LIBOR01M – ICE LIBOR USD 1 Month
LIBOR03M – ICE LIBOR USD 3 Month
LIBOR06M – ICE LIBOR USD 6 Month
MS – Morgan Stanley
USD – US Dollar
yr – Year
See accompanying notes, which are an integral part of the financial statements.
42
Table of Contents
| Statement of assets and liabilities |
| July 31, 2022 |
| | | | Delaware | | Delaware |
| | | Corporate | | Extended Duration |
| | | Bond Fund | | Bond Fund |
| Assets: | | | | | | | |
| Investments, at value* | | $ | 1,283,399,891 | | $ | 420,475,801 | |
| Cash | | | — | | | 22,693 | |
| Dividends and interest receivable | | | 12,119,420 | | | 5,050,792 | |
| Receivable for securities sold | | | 5,738,655 | | | 4,628,804 | |
| Receivable for fund shares sold | | | 2,191,422 | | | 667,950 | |
| Prepaid expenses | | | 16,566 | | | 12,746 | |
| Other assets | | | 9,447 | | | 3,582 | |
| Total Assets | | | 1,303,475,401 | | | 430,862,368 | |
| Liabilities: | | | | | | | |
| Options written, at valueΣ | | | 258 | | | 92 | |
| Due to custodian | | | 42,679 | | | — | |
| Payable for securities purchased | | | 15,438,621 | | | 2,268,768 | |
| Payable for fund shares redeemed | | | 4,344,004 | | | 6,746,738 | |
| Distribution payable | | | 1,403,801 | | | 47,958 | |
| Other accrued expenses | | | 632,172 | | | 336,544 | |
| Investment management fees payable to affiliates | | | 203,684 | | | 44,731 | |
| Administration expenses payable to affiliates | | | 57,042 | | | 24,466 | |
| Distribution fees payable to affiliates | | | 15,093 | | | 4,038 | |
| Total Liabilities | | | 22,137,354 | | | 9,473,335 | |
| Total Net Assets | | $ | 1,281,338,047 | | $ | 421,389,033 | |
| | | | | | | | | |
| Net Assets Consist of: | | | | | | | |
| Paid-in capital | | $ | 1,469,268,623 | | $ | 510,533,200 | |
| Total distributable earnings (loss) | | | (187,930,576 | ) | | (89,144,167 | ) |
| Total Net Assets | | $ | 1,281,338,047 | | $ | 421,389,033 | |
43
Table of Contents
Statement of assets and liabilities
| | | | Delaware | | Delaware |
| | | Corporate | | Extended Duration |
| | | Bond Fund | | Bond Fund |
| Net Asset Value | | | | | | | | |
| | | | | | | | | |
| Class A: | | | | | | | | |
| Net assets | | $ | 285,976,656 | | | $ | 66,507,890 | |
| Shares of beneficial interest outstanding, unlimited | | | | | | | | |
| authorization, no par | | | 53,597,380 | | | | 12,618,714 | |
| Net asset value per share | | $ | 5.34 | | | $ | 5.27 | |
| Sales charge | | | 4.50 | % | | | 4.50 | % |
| Offering price per share, equal to net asset value per share | | | | | | | | |
| / (1 - sales charge) | | $ | 5.59 | | | $ | 5.52 | |
| | | | | | | | | |
| Class C: | | | | | | | | |
| Net assets | | $ | 15,994,975 | | | $ | 5,318,685 | |
| Shares of beneficial interest outstanding, unlimited | | | | | | | | |
| authorization, no par | | | 2,997,286 | | | | 1,009,947 | |
| Net asset value per share | | $ | 5.34 | | | $ | 5.27 | |
| | | | | | | | | |
| Class R: | | | | | | | | |
| Net assets | | $ | 9,419,370 | | | $ | 5,489,414 | |
| Shares of beneficial interest outstanding, unlimited | | | | | | | | |
| authorization, no par | | | 1,763,877 | | | | 1,039,596 | |
| Net asset value per share | | $ | 5.34 | | | $ | 5.28 | |
| | | | | | | | | | |
| Institutional Class: | | | | | | | | |
| Net assets | | $ | 957,741,186 | | | $ | 332,409,596 | |
| Shares of beneficial interest outstanding, unlimited | | | | | | | | |
| authorization, no par | | | 179,509,445 | | | | 63,199,119 | |
| Net asset value per share | | $ | 5.34 | | | $ | 5.26 | |
| | | | | | | | | |
| Class R6: | | | | | | | | |
| Net assets | | $ | 12,205,860 | | | $ | 11,663,448 | |
| Shares of beneficial interest outstanding, unlimited | | | | | | | | |
| authorization, no par | | | 2,289,176 | | | | 2,215,587 | |
| Net asset value per share | | $ | 5.33 | | | $ | 5.26 | |
____________________
| | | | | | | | |
| * Investments, at cost | | $ | 1,399,084,180 | | | $ | 494,862,825 | |
| Σ Options written, premium received | | | (4,130 | ) | | | (1,475 | ) |
See accompanying notes, which are an integral part of the financial statements.
44
Table of Contents
| Statement of operations |
| Year ended July 31, 2022 |
| | | | Delaware | | Delaware |
| | | Corporate | | Extended Duration |
| | | Bond Fund | | Bond Fund |
| Investment Income: | | | | | | | | |
| Interest | | $ | 43,815,818 | | | $ | 19,513,930 | |
| Dividends | | | 358,974 | | | | 251,001 | |
| | | | 44,174,792 | | | | 19,764,931 | |
| | | | | | | | | | |
| Expenses: | | | | | | | | |
| Management fees | | | 6,377,578 | | | | 2,766,557 | |
| Distribution expenses – Class A | | | 872,634 | | | | 213,776 | |
| Distribution expenses – Class C | | | 220,585 | | | | 71,842 | |
| Distribution expenses – Class R | | | 56,111 | | | | 35,484 | |
| Dividend disbursing and transfer agent fees and | | | | | | | | |
| expenses | | | 1,565,761 | | | | 667,761 | |
| Accounting and administration expenses | | | 254,403 | | | | 123,034 | |
| Reports and statements to shareholders expenses | | | 182,693 | | | | 65,625 | |
| Legal fees | | | 121,814 | | | | 28,865 | |
| Audit and tax fees | | | 51,359 | | | | 45,283 | |
| Custodian fees | | | 49,641 | | | | 19,912 | |
| Trustees’ fees and expenses | | | 46,828 | | | | 18,756 | |
| Registration fees | | | 16,376 | | | | 11,847 | |
| Other | | | 138,597 | | | | 71,520 | |
| | | | 9,954,380 | | | | 4,140,262 | |
| Less expenses waived | | | (1,207,865 | ) | | | (958,580 | ) |
| Less expenses paid indirectly | | | (910 | ) | | | (144 | ) |
| Total operating expenses | | | 8,745,605 | | | | 3,181,538 | |
| Net Investment Income (Loss) | | | 35,429,187 | | | | 16,583,393 | |
45
Table of Contents
Statement of operations
| | | | | Delaware | | Delaware |
| | | | Corporate | | Extended Duration |
| | | | Bond Fund | | Bond Fund |
| Net Realized and Unrealized Gain (Loss): | | | | | | | | |
| Net realized gain (loss) on: | | | | | | | | |
| | Investments | | $ | (50,396,296 | ) | | $ | (6,474,533 | ) |
| | Futures contracts | | | — | | | | 642,309 | |
| | Swap contracts | | | (9,976 | ) | | | (4,582 | ) |
| Net realized gain (loss) | | | (50,406,272 | ) | | | (5,836,806 | ) |
| | | | | | | | | | | |
| Net change in unrealized appreciation (depreciation) on: | | | | | | | | |
| | Investments | | | (179,547,576 | ) | | | (118,546,240 | ) |
| | Futures contracts | | | — | | | | (2,191,831 | ) |
| | Options written | | | 3,872 | | | | 1,383 | |
| | Swap contracts | | | 11,692 | | | | 5,014 | |
| Net change in unrealized appreciation (depreciation) | | | (179,532,012 | ) | | | (120,731,674 | ) |
| Net Realized and Unrealized Gain (Loss) | | | (229,938,284 | ) | | | (126,568,480 | ) |
| Net Increase (Decrease) in Net Assets Resulting from | | | | | | | | |
| Operations | | $ | (194,509,097 | ) | | $ | (109,985,087 | ) |
See accompanying notes, which are an integral part of the financial statements.
46
Table of Contents
Statements of changes in net assets
Delaware Corporate Bond Fund
| | | | | Year ended | |
| | | | 7/31/22 | | | 7/31/21 | |
| Increase (Decrease) in Net Assets from Operations: | | | | | | | | |
| Net investment income (loss) | | $ | 35,429,187 | | | $ | 30,698,769 | |
| Net realized gain (loss) | | | (50,406,272 | ) | | | 33,398,236 | |
| Net change in unrealized appreciation (depreciation) | | | (179,532,012 | ) | | | (28,924,755 | ) |
| Net increase (decrease) in net assets resulting from | | | | | | | | |
| | operations | | | (194,509,097 | ) | | | 35,172,250 | |
| | | |
| Dividends and Distributions to Shareholders from: | | | | | | | | |
| Distributable earnings: | | | | | | | | |
| | Class A | | | (16,079,147 | ) | | | (6,667,398 | ) |
| | Class C | | | (858,429 | ) | | | (995,269 | ) |
| | Class R | | | (492,487 | ) | | | (399,494 | ) |
| | Institutional Class | | | (45,575,390 | ) | | | (33,363,113 | ) |
| | Class R6 | | | (529,812 | ) | | | (272,178 | ) |
| | | | | (63,535,265 | ) | | | (41,697,452 | ) |
| | | |
| Capital Share Transactions: | | | | | | | | |
| Proceeds from shares sold: | | | | | | | | |
| | Class A | | | 31,818,415 | | | | 89,400,561 | |
| | Class C | | | 2,590,744 | | | | 6,407,377 | |
| | Class R | | | 1,803,944 | | | | 4,124,114 | |
| | Institutional Class | | | 540,621,303 | | | | 430,105,546 | |
| | Class R6 | | | 4,583,181 | | | | 7,795,723 | |
| | | | | | | | | | | |
| Net assets from merger:1 | | | | | | | | |
| | Class A | | | — | | | | 173,482,646 | |
| | Institutional Class | | | — | | | | 1,526,668 | |
| | Class R6 | | | — | | | | 59,774 | |
| | | | | | | | | | | |
| Net asset value of shares issued upon reinvestment of | | | | | | | | |
| | dividends and distributions: | | | | | | | | |
| | Class A | | | 15,010,949 | | | | 6,018,329 | |
| | Class C | | | 766,552 | | | | 893,767 | |
| | Class R | | | 491,081 | | | | 403,318 | |
| | Institutional Class | | | 29,700,204 | | | | 22,695,053 | |
| | Class R6 | | | 428,765 | | | | 135,585 | |
| | | | | 627,815,138 | | | | 743,048,461 | |
47
Table of Contents
Statements of changes in net assets
Delaware Corporate Bond Fund
| | | | | Year ended | |
| | | | 7/31/22 | | | 7/31/21 | |
| Capital Share Transactions (continued): | | | | | | | | |
| Cost of shares redeemed: | | | | | | | | |
| | Class A | | $ | (104,971,738 | ) | | $ | (56,017,472 | ) |
| | Class C | | | (11,422,953 | ) | | | (26,706,524 | ) |
| | Class R | | | (3,438,764 | ) | | | (5,730,495 | ) |
| | Institutional Class | | | (467,733,349 | ) | | | (315,442,776 | ) |
| | Class R6 | | | (1,514,701 | ) | | | (1,381,056 | ) |
| | | | | (589,081,505 | ) | | | (405,278,323 | ) |
| Increase in net assets derived from capital share | | | | | | | | |
| | transactions | | | 38,733,633 | | | | 337,770,138 | |
| Net Increase (Decrease) in Net Assets | | | (219,310,729 | ) | | | 331,244,936 | |
| Net Assets: | | | | | | | | |
| Beginning of year | | | 1,500,648,776 | | | | 1,169,403,840 | |
| End of year | | $ | 1,281,338,047 | | | $ | 1,500,648,776 | |
| 1 | See Note 7 in the "Notes to financial statements." |
See accompanying notes, which are an integral part of the financial statements.
48
Table of Contents
Statements of changes in net assets
Delaware Extended Duration Bond Fund
| | | | | Year ended | |
| | | | 7/31/22 | | | 7/31/21 | |
| Increase (Decrease) in Net Assets from Operations: | | | | | | | | |
| Net investment income (loss) | | $ | 16,583,393 | | | $ | 16,961,452 | |
| Net realized gain (loss) | | | (5,836,806 | ) | | | 27,853,333 | |
| Net change in unrealized appreciation (depreciation) | | | (120,731,674 | ) | | | (36,050,970 | ) |
| Net increase (decrease) in net assets resulting from | | | | | | | | |
| | operations | | | (109,985,087 | ) | | | 8,763,815 | |
| | | |
| Dividends and Distributions to Shareholders from: | | | | | | | | |
| Distributable earnings: | | | | | | | | |
| | Class A | | | (6,861,085 | ) | | | (10,259,343 | ) |
| | Class C | | | (533,847 | ) | | | (1,069,037 | ) |
| | Class R | | | (558,490 | ) | | | (1,012,132 | ) |
| | Institutional Class | | | (30,946,647 | ) | | | (36,442,248 | ) |
| | Class R6 | | | (1,338,802 | ) | | | (5,456,563 | ) |
| | | | | (40,238,871 | ) | | | (54,239,323 | ) |
| | | |
| Capital Share Transactions: | | | | | | | | |
| Proceeds from shares sold: | | | | | | | | |
| | Class A | | | 8,345,796 | | | | 21,708,782 | |
| | Class C | | | 427,503 | | | | 1,964,039 | |
| | Class R | | | 1,038,551 | | | | 4,476,571 | |
| | Institutional Class | | | 111,528,548 | | | | 154,398,160 | |
| | Class R6 | | | 5,415,600 | | | | 4,411,563 | |
| | | | | | | | | | | |
| Net asset value of shares issued upon reinvestment of | | | | | | | | |
| | dividends and distributions: | | | | | | | | |
| | Class A | | | 6,742,603 | | | | 10,028,703 | |
| | Class C | | | 527,072 | | | | 1,061,090 | |
| | Class R | | | 558,211 | | | | 1,018,084 | |
| | Institutional Class | | | 29,697,854 | | | | 35,026,097 | |
| | Class R6 | | | 1,338,417 | | | | 5,471,382 | |
| | | | | 165,620,155 | | | | 239,564,471 | |
49
Table of Contents
Statements of changes in net assets
Delaware Extended Duration Bond Fund
| | | | | Year ended | |
| | | | 7/31/22 | | | 7/31/21 | |
| Capital Share Transactions (continued): | | | | | | | | |
| Cost of shares redeemed: | | | | | | | | |
| | Class A | | $ | (21,978,244 | ) | | $ | (52,885,444 | ) |
| | Class C | | | (2,642,980 | ) | | | (6,570,699 | ) |
| | Class R | | | (2,616,360 | ) | | | (7,930,331 | ) |
| | Institutional Class | | | (97,645,636 | ) | | | (132,963,122 | ) |
| | Class R6 | | | (51,208,958 | ) | | | (2,680,014 | ) |
| | | | | (176,092,178 | ) | | | (203,029,610 | ) |
| Increase (decrease) in net assets derived from capital | | | | | | | | |
| | share transactions | | | (10,472,023 | ) | | | 36,534,861 | |
| Net Decrease in Net Assets | | | (160,695,981 | ) | | | (8,940,647 | ) |
| Net Assets: | | | | | | | | |
| | Beginning of year | | | 582,085,014 | | | | 591,025,661 | |
| | End of year | | $ | 421,389,033 | | | $ | 582,085,014 | |
See accompanying notes, which are an integral part of the financial statements.
50
Table of Contents
Financial highlights
Delaware Corporate Bond Fund Class A
Selected data for each share of the Fund outstanding throughout each period were as follows:
| Net asset value, beginning of period |
| |
| Income (loss) from investment operations: |
| Net investment income1 |
| Net realized and unrealized gain (loss) |
| Total from investment operations |
| |
| Less dividends and distributions from: |
| Net investment income |
| Net realized gain |
| Total dividends and distributions |
| |
| Net asset value, end of period |
| |
| Total return2 |
| |
| Ratios and supplemental data: |
| Net assets, end of period (000 omitted) |
| Ratio of expenses to average net assets3 |
| Ratio of expenses to average net assets prior to fees waived3 |
| Ratio of net investment income to average net assets |
| Ratio of net investment income to average net assets prior to fees waived |
| Portfolio turnover |
| 1 | Calculated using average shares outstanding. |
| 2 | Total return is based on the change in net asset value of a share during the period and assumes reinvestment of dividends and distributions at net asset value and does not reflect the impact of a sales charge. Total return during all of the periods shown reflects a waiver by the manager. Performance would have been lower had the waiver not been in effect. |
| 3 | Expense ratios do not include expenses of any Underlying Funds in which the Fund invests. |
See accompanying notes, which are an integral part of the financial statements.
52
Table of Contents
| Year ended | |
| 7/31/22 | | 7/31/21 | | 7/31/20 | | 7/31/19 | | 7/31/18 | |
| | $ | 6.49 | | | $ | 6.54 | | | $ | 5.97 | | | $ | 5.61 | | | $ | 5.90 | | |
| | |
| | |
| | 0.15 | | | | 0.15 | | | | 0.17 | | | | 0.21 | | | | 0.19 | | |
| | (1.03 | ) | | | 0.01 | | | | 0.58 | | | | 0.37 | | | | (0.27 | ) | |
| | (0.88 | ) | | | 0.16 | | | | 0.75 | | | | 0.58 | | | | (0.08 | ) | |
| | |
| | |
| | (0.17 | ) | | | (0.17 | ) | | | (0.18 | ) | | | (0.22 | ) | | | (0.21 | ) | |
| | (0.10 | ) | | | (0.04 | ) | | | — | | | | — | | | | — | | |
| | (0.27 | ) | | | (0.21 | ) | | | (0.18 | ) | | | (0.22 | ) | | | (0.21 | ) | |
| | |
| $ | 5.34 | | | $ | 6.49 | | | $ | 6.54 | | | $ | 5.97 | | | $ | 5.61 | | |
| | |
| | (13.91% | ) | | | 2.47% | | | | 12.90% | | | | 10.65% | | | | (1.44% | ) | |
| | |
| | |
| $ | 285,977 | | | $ | 412,495 | | | $ | 199,500 | | | $ | 168,910 | | | $ | 200,600 | | |
| | 0.82% | | | | 0.82% | | | | 0.82% | | | | 0.82% | | | | 0.88% | | |
| | 0.91% | | | | 0.91% | | | | 0.91% | | | | 0.92% | | | | 0.92% | | |
| | 2.49% | | | | 2.31% | | | | 2.71% | | | | 3.68% | | | | 3.26% | | |
| | 2.40% | | | | 2.22% | | | | 2.62% | | | | 3.58% | | | | 3.22% | | |
| | 109% | | | | 123% | | | | 172% | | | | 173% | | | | 158% | | |
53
Table of Contents
Financial highlights
Delaware Corporate Bond Fund Class C
Selected data for each share of the Fund outstanding throughout each period were as follows:
| Net asset value, beginning of period |
| |
| Income (loss) from investment operations: |
| Net investment income1 |
| Net realized and unrealized gain (loss) |
| Total from investment operations |
| |
| Less dividends and distributions from: |
| Net investment income |
| Net realized gain |
| Total dividends and distributions |
| |
| Net asset value, end of period |
| |
| Total return2 |
| |
| Ratios and supplemental data: |
| Net assets, end of period (000 omitted) |
| Ratio of expenses to average net assets3 |
| Ratio of expenses to average net assets prior to fees waived3 |
| Ratio of net investment income to average net assets |
| Ratio of net investment income to average net assets prior to fees waived |
| Portfolio turnover |
| 1 | Calculated using average shares outstanding. |
| 2 | Total return is based on the change in net asset value of a share during the period and assumes reinvestment of dividends and distributions at net asset value and does not reflect the impact of a sales charge. Total return during all of the periods shown reflects a waiver by the manager. Performance would have been lower had the waiver not been in effect. |
| 3 | Expense ratios do not include expenses of any Underlying Funds in which the Fund invests. |
See accompanying notes, which are an integral part of the financial statements.
54
Table of Contents
| Year ended | |
| 7/31/22 | | 7/31/21 | | 7/31/20 | | 7/31/19 | | 7/31/18 | |
| $ | 6.49 | | | $ | 6.54 | | | $ | 5.97 | | | $ | 5.61 | | | $ | 5.90 | | |
| | |
| | |
| | 0.10 | | | | 0.10 | | | | 0.12 | | | | 0.17 | | | | 0.14 | | |
| | (1.02 | ) | | | 0.01 | | | | 0.59 | | | | 0.37 | | | | (0.27 | ) | |
| | (0.92 | ) | | | 0.11 | | | | 0.71 | | | | 0.54 | | | | (0.13 | ) | |
| | |
| | |
| | (0.13 | ) | | | (0.12 | ) | | | (0.14 | ) | | | (0.18 | ) | | | (0.16 | ) | |
| | (0.10 | ) | | | (0.04 | ) | | | — | | | | — | | | | — | | |
| | (0.23 | ) | | | (0.16 | ) | | | (0.14 | ) | | | (0.18 | ) | | | (0.16 | ) | |
| | |
| $ | 5.34 | | | $ | 6.49 | | | $ | 6.54 | | | $ | 5.97 | | | $ | 5.61 | | |
| | |
| | (14.55% | ) | | | 1.70% | | | | 12.05% | | | | 9.83% | | | | (2.18% | ) | |
| | |
| | |
| $ | 15,995 | | | $ | 28,365 | | | $ | 48,283 | | | $ | 68,277 | | | $ | 88,274 | | |
| | 1.57% | | | | 1.57% | | | | 1.57% | | | | 1.57% | | | | 1.63% | | |
| | 1.66% | | | | 1.66% | | | | 1.66% | | | | 1.67% | | | | 1.67% | | |
| | 1.74% | | | | 1.56% | | | | 1.96% | | | | 2.93% | | | | 2.51% | | |
| | 1.65% | | | | 1.47% | | | | 1.87% | | | | 2.83% | | | | 2.47% | | |
| | 109% | | | | 123% | | | | 172% | | | | 173% | | | | 158% | | |
55
Table of Contents
Financial highlights
Delaware Corporate Bond Fund Class R
Selected data for each share of the Fund outstanding throughout each period were as follows:
| Net asset value, beginning of period |
| |
| Income (loss) from investment operations: |
| Net investment income1 |
| Net realized and unrealized gain (loss) |
| Total from investment operations |
| |
| Less dividends and distributions from: |
| Net investment income |
| Net realized gain |
| Total dividends and distributions |
| |
| Net asset value, end of period |
| |
| Total return2 |
| |
| Ratios and supplemental data: |
| Net assets, end of period (000 omitted) |
| Ratio of expenses to average net assets3 |
| Ratio of expenses to average net assets prior to fees waived3 |
| Ratio of net investment income to average net assets |
| Ratio of net investment income to average net assets prior to fees waived |
| Portfolio turnover |
| 1 | Calculated using average shares outstanding. |
| 2 | Total return is based on the change in net asset value of a share during the period and assumes reinvestment of dividends and distributions at net asset value. Total return during all of the periods shown reflects a waiver by the manager. Performance would have been lower had the waiver not been in effect. |
| 3 | Expense ratios do not include expenses of any Underlying Funds in which the Fund invests. |
See accompanying notes, which are an integral part of the financial statements.
56
Table of Contents
| Year ended | |
| 7/31/22 | | 7/31/21 | | 7/31/20 | | 7/31/19 | | 7/31/18 | |
| $ | 6.50 | | | $ | 6.54 | | | $ | 5.98 | | | $ | 5.62 | | | $ | 5.90 | | |
| | |
| | |
| | 0.13 | | | | 0.13 | | | | 0.15 | | | | 0.19 | | | | 0.17 | | |
| | (1.03 | ) | | | 0.02 | | | | 0.58 | | | | 0.38 | | | | (0.26 | ) | |
| | (0.90 | ) | | | 0.15 | | | | 0.73 | | | | 0.57 | | | | (0.09 | ) | |
| | |
| | |
| | (0.16 | ) | | | (0.15 | ) | | | (0.17 | ) | | | (0.21 | ) | | | (0.19 | ) | |
| | (0.10 | ) | | | (0.04 | ) | | | — | | | | — | | | | — | | |
| | (0.26 | ) | | | (0.19 | ) | | | (0.17 | ) | | | (0.21 | ) | | | (0.19 | ) | |
| | |
| $ | 5.34 | | | $ | 6.50 | | | $ | 6.54 | | | $ | 5.98 | | | $ | 5.62 | | |
| | |
| | (14.26% | ) | | | 2.37% | | | | 12.43% | | | | 10.36% | | | | (1.51% | ) | |
| | |
| | |
| $ | 9,419 | | | $ | 12,760 | | | $ | 14,107 | | | $ | 17,517 | | | $ | 19,512 | | |
| | 1.07% | | | | 1.07% | | | | 1.07% | | | | 1.07% | | | | 1.13% | | |
| | 1.16% | | | | 1.16% | | | | 1.16% | | | | 1.17% | | | | 1.17% | | |
| | 2.24% | | | | 2.06% | | | | 2.46% | | | | 3.43% | | | | 3.01% | | |
| | 2.15% | | | | 1.97% | | | | 2.37% | | | | 3.33% | | | | 2.97% | | |
| | 109% | | | | 123% | | | | 172% | | | | 173% | | | | 158% | | |
57
Table of Contents
Financial highlights
Delaware Corporate Bond Fund Institutional Class
Selected data for each share of the Fund outstanding throughout each period were as follows:
| Net asset value, beginning of period |
| |
| Income (loss) from investment operations: |
| Net investment income1 |
| Net realized and unrealized gain (loss) |
| Total from investment operations |
| |
| Less dividends and distributions from: |
| Net investment income |
| Net realized gain |
| Total dividends and distributions |
| |
| Net asset value, end of period |
| |
| Total return2 |
| |
| Ratios and supplemental data: |
| Net assets, end of period (000 omitted) |
| Ratio of expenses to average net assets3 |
| Ratio of expenses to average net assets prior to fees waived3 |
| Ratio of net investment income to average net assets |
| Ratio of net investment income to average net assets prior to fees waived |
| Portfolio turnover |
| 1 | Calculated using average shares outstanding. |
| 2 | Total return is based on the change in net asset value of a share during the period and assumes reinvestment of dividends and distributions at net asset value. Total return during all of the periods shown reflects a waiver by the manager. Performance would have been lower had the waiver not been in effect. |
| 3 | Expense ratios do not include expenses of any Underlying Funds in which the Fund invests. |
See accompanying notes, which are an integral part of the financial statements.
58
Table of Contents
| Year ended | |
| 7/31/22 | | 7/31/21 | | 7/31/20 | | 7/31/19 | | 7/31/18 | |
| | $ | 6.49 | | | $ | 6.54 | | | $ | 5.97 | | | $ | 5.61 | | | $ | 5.90 | | |
| | | |
| | | |
| | | 0.16 | | | | 0.16 | | | | 0.18 | | | | 0.22 | | | | 0.20 | | |
| | | (1.02 | ) | | | 0.02 | | | | 0.59 | | | | 0.37 | | | | (0.27 | ) | |
| | | (0.86 | ) | | | 0.18 | | | | 0.77 | | | | 0.59 | | | | (0.07 | ) | |
| | | |
| | | |
| | | (0.19 | ) | | | (0.19 | ) | | | (0.20 | ) | | | (0.23 | ) | | | (0.22 | ) | |
| | | (0.10 | ) | | | (0.04 | ) | | | — | | | | — | | | | — | | |
| | | (0.29 | ) | | | (0.23 | ) | | | (0.20 | ) | | | (0.23 | ) | | | (0.22 | ) | |
| | | |
| | $ | 5.34 | | | $ | 6.49 | | | $ | 6.54 | | | $ | 5.97 | | | $ | 5.61 | | |
| | | |
| | | (13.69% | ) | | | 2.72% | | | | 13.18% | | | | 10.93% | | | | (1.20% | ) | |
| | | |
| | | |
| | $ | 957,741 | | | $ | 1,036,266 | | | $ | 903,456 | | | $ | 730,173 | | | $ | 860,359 | | |
| | | 0.57% | | | | 0.57% | | | | 0.57% | | | | 0.57% | | | | 0.63% | | |
| | | 0.66% | | | | 0.66% | | | | 0.66% | | | | 0.67% | | | | 0.67% | | |
| | | 2.74% | | | | 2.56% | | | | 2.96% | | | | 3.93% | | | | 3.51% | | |
| | | 2.65% | | | | 2.47% | | | | 2.87% | | | | 3.83% | | | | 3.47% | | |
| | | 109% | | | | 123% | | | | 172% | | | | 173% | | | | 158% | | |
59
Table of Contents
Financial highlights
Delaware Corporate Bond Fund Class R6
Selected data for each share of the Fund outstanding throughout each period were as follows:
| Net asset value, beginning of period |
| |
| Income (loss) from investment operations: |
| Net investment income2 |
| Net realized and unrealized gain (loss) |
| Total from investment operations |
| |
| Less dividends and distributions from: |
| Net investment income |
| Net realized gain |
| Total dividends and distributions |
| |
| Net asset value, end of period |
| |
| Total return3 |
| |
| Ratios and supplemental data: |
| Net assets, end of period (000 omitted) |
| Ratio of expenses to average net assets4 |
| Ratio of expenses to average net assets prior to fees waived4 |
| Ratio of net investment income to average net assets |
| Ratio of net investment income to average net assets prior to fees waived |
| Portfolio turnover |
| 1 | Date of commencement of operations; ratios have been annualized and total return has not been annualized. |
| 2 | Calculated using average shares outstanding. |
| 3 | Total return is based on the change in net asset value of a share during the period and assumes reinvestment of dividends and distributions at net asset value. Total return during all of the periods shown reflects a waiver by the manager. Performance would have been lower had the waiver not been in effect. |
| 4 | Expense ratios do not include expenses of any Underlying Funds in which the Fund invests. |
| 5 | Portfolio turnover is representative of the Fund for the entire period. |
See accompanying notes, which are an integral part of the financial statements.
60
Table of Contents
| | | | | | | | | | | | | 1/31/191 | |
| Year ended | | to | |
| | 7/31/22 | | 7/31/21 | | 7/31/20 | | 7/31/19 | |
| $ | 6.49 | | | $ | 6.53 | | | $ | 5.97 | | | $ | 5.59 | | |
| | |
| | |
| | 0.17 | | | | 0.17 | | | | 0.19 | | | | 0.11 | | |
| | (1.04 | ) | | | 0.02 | | | | 0.58 | | | | 0.39 | | |
| | (0.87 | ) | | | 0.19 | | | | 0.77 | | | | 0.50 | | |
| | |
| | |
| | (0.19 | ) | | | (0.19 | ) | | | (0.21 | ) | | | (0.12 | ) | |
| | (0.10 | ) | | | (0.04 | ) | | | — | | | | — | | |
| | (0.29 | ) | | | (0.23 | ) | | | (0.21 | ) | | | (0.12 | ) | |
| | |
| $ | 5.33 | | | $ | 6.49 | | | $ | 6.53 | | | $ | 5.97 | | |
| | |
| | (13.78% | ) | | | 2.97% | | | | 13.12% | | | | 8.98% | | |
| | |
| | |
| $ | 12,206 | | | $ | 10,763 | | | $ | 4,058 | | | $ | 2 | | |
| | 0.48% | | | | 0.48% | | | | 0.48% | | | | 0.48% | | |
| | 0.57% | | | | 0.57% | | | | 0.57% | | | | 0.58% | | |
| | 2.83% | | | | 2.65% | | | | 3.05% | | | | 4.01% | | |
| | 2.74% | | | | 2.56% | | | | 2.96% | | | | 3.91% | | |
| | 109% | | | | 123% | | | | 172% | | | | 173% | 5 | |
61
Table of Contents
Financial highlights
Delaware Extended Duration Bond Fund Class A
Selected data for each share of the Fund outstanding throughout each period were as follows:
| Net asset value, beginning of period |
| |
| Income (loss) from investment operations: |
| Net investment income1 |
| Net realized and unrealized gain (loss) |
| Total from investment operations |
| |
| Less dividends and distributions from: |
| Net investment income |
| Net realized gain |
| Return of capital |
| Total dividends and distributions |
| |
| Net asset value, end of period |
| |
| Total return3 |
| |
| Ratios and supplemental data: |
| Net assets, end of period (000 omitted) |
| Ratio of expenses to average net assets4 |
| Ratio of expenses to average net assets prior to fees waived4 |
| Ratio of net investment income to average net assets |
| Ratio of net investment income to average net assets prior to fees waived |
| Portfolio turnover |
| 1 | Calculated using average shares outstanding. |
| 2 | Amount is less than $(0.005) per share. |
| 3 | Total return is based on the change in net asset value of a share during the period and assumes reinvestment of dividends and distributions at net asset value and does not reflect the impact of a sales charge. Total return during all of the periods shown reflects a waiver by the manager. Performance would have been lower had the waiver not been in effect. |
| 4 | Expense ratios do not include expenses of any Underlying Funds in which the Fund invests. |
See accompanying notes, which are an integral part of the financial statements.
62
Table of Contents
| Year ended | |
| 7/31/22 | | 7/31/21 | | 7/31/20 | | 7/31/19 | | 7/31/18 | |
| | $ | 7.12 | | | $ | 7.73 | | | $ | 6.84 | | | $ | 6.28 | | | $ | 6.62 | | |
| | |
| | |
| | 0.19 | | | | 0.20 | | | | 0.22 | | | | 0.24 | | | | 0.23 | | |
| | (1.54 | ) | | | (0.12 | ) | | | 1.05 | | | | 0.56 | | | | (0.34 | ) | |
| | (1.35 | ) | | | 0.08 | | | | 1.27 | | | | 0.80 | | | | (0.11 | ) | |
| | |
| | |
| | (0.20 | ) | | | (0.21 | ) | | | (0.23 | ) | | | (0.24 | ) | | | (0.23 | ) | |
| | (0.30 | ) | | | (0.48 | ) | | | (0.15 | ) | | | — | | | | — | | |
| | — | 2 | | | — | | | | — | | | | — | | | | — | | |
| | (0.50 | ) | | | (0.69 | ) | | | (0.38 | ) | | | (0.24 | ) | | | (0.23 | ) | |
| | |
| $ | 5.27 | | | $ | 7.12 | | | $ | 7.73 | | | $ | 6.84 | | | $ | 6.28 | | |
| | |
| | (20.07% | ) | | | 1.24% | | | | 19.19% | | | | 13.17% | | | | (1.64% | ) | |
| | |
| | |
| $ | 66,508 | | | $ | 99,512 | | | $ | 130,678 | | | $ | 125,213 | | | $ | 150,397 | | |
| | 0.82% | | | | 0.82% | | | | 0.82% | | | | 0.82% | | | | 0.87% | | |
| | 1.01% | | | | 0.99% | | | | 0.98% | | | | 0.98% | | | | 0.98% | | |
| | 3.09% | | | | 2.85% | | | | 3.16% | | | | 3.78% | | | | 3.52% | | |
| | 2.90% | | | | 2.68% | | | | 3.00% | | | | 3.62% | | | | 3.41% | | |
| | 76% | | | | 85% | | | | 108% | | | | 133% | | | | 147% | | |
63
Table of Contents
Financial highlights
Delaware Extended Duration Bond Fund Class C
Selected data for each share of the Fund outstanding throughout each period were as follows:
| Net asset value, beginning of period |
| |
| Income (loss) from investment operations: |
| Net investment income1 |
| Net realized and unrealized gain (loss) |
| Total from investment operations |
| |
| Less dividends and distributions from: |
| Net investment income |
| Net realized gain |
| Return of capital |
| Total dividends and distributions |
| |
| Net asset value, end of period |
| |
| Total return3 |
| |
| Ratios and supplemental data: |
| Net assets, end of period (000 omitted) |
| Ratio of expenses to average net assets4 |
| Ratio of expenses to average net assets prior to fees waived4 |
| Ratio of net investment income to average net assets |
| Ratio of net investment income to average net assets prior to fees waived |
| Portfolio turnover |
| 1 | Calculated using average shares outstanding. |
| 2 | Amount is less than $(0.005) per share. |
| 3 | Total return is based on the change in net asset value of a share during the period and assumes reinvestment of dividends and distributions at net asset value and does not reflect the impact of a sales charge. Total return during all of the periods shown reflects a waiver by the manager. Performance would have been lower had the waiver not been in effect. |
| 4 | Expense ratios do not include expenses of any Underlying Funds in which the Fund invests. |
See accompanying notes, which are an integral part of the financial statements.
64
Table of Contents
| Year ended | |
| 7/31/22 | | 7/31/21 | | 7/31/20 | | 7/31/19 | | 7/31/18 | |
| $ | 7.12 | | | $ | 7.72 | | | $ | 6.83 | | | $ | 6.27 | | | $ | 6.61 | | |
| | |
| | |
| | 0.15 | | | | 0.15 | | | | 0.17 | | | | 0.19 | | | | 0.18 | | |
| | (1.55 | ) | | | (0.11 | ) | | | 1.05 | | | | 0.56 | | | | (0.33 | ) | |
| | (1.40 | ) | | | 0.04 | | | | 1.22 | | | | 0.75 | | | | (0.15 | ) | |
| | |
| | |
| | (0.15 | ) | | | (0.16 | ) | | | (0.18 | ) | | | (0.19 | ) | | | (0.19 | ) | |
| | (0.30 | ) | | | (0.48 | ) | | | (0.15 | ) | | | — | | | | — | | |
| | — | 2 | | | — | | | | — | | | | — | | | | — | | |
| | (0.45 | ) | | | (0.64 | ) | | | (0.33 | ) | | | (0.19 | ) | | | (0.19 | ) | |
| | |
| $ | 5.27 | | | $ | 7.12 | | | $ | 7.72 | | | $ | 6.83 | | | $ | 6.27 | | |
| | |
| | (20.66% | ) | | | 0.62% | | | | 18.32% | | | | 12.34% | | | | (2.39% | ) | |
| | |
| | |
| $ | 5,319 | | | $ | 9,171 | | | $ | 13,859 | | | $ | 14,748 | | | $ | 17,612 | | |
| | 1.57% | | | | 1.57% | | | | 1.57% | | | | 1.57% | | | | 1.62% | | |
| | 1.76% | | | | 1.74% | | | | 1.73% | | | | 1.73% | | | | 1.73% | | |
| | 2.34% | | | | 2.10% | | | | 2.41% | | | | 3.03% | | | | 2.77% | | |
| | 2.15% | | | | 1.93% | | | | 2.25% | | | | 2.87% | | | | 2.66% | | |
| | 76% | | | | 85% | | | | 108% | | | | 133% | | | | 147% | | |
65
Table of Contents
Financial highlights
Delaware Extended Duration Bond Fund Class R
Selected data for each share of the Fund outstanding throughout each period were as follows:
| Net asset value, beginning of period |
| |
| Income (loss) from investment operations: |
| Net investment income1 |
| Net realized and unrealized gain (loss) |
| Total from investment operations |
| |
| Less dividends and distributions from: |
| Net investment income |
| Net realized gain |
| Return of capital |
| Total dividends and distributions |
| |
| Net asset value, end of period |
| |
| Total return3 |
| |
| Ratios and supplemental data: |
| Net assets, end of period (000 omitted) |
| Ratio of expenses to average net assets4 |
| Ratio of expenses to average net assets prior to fees waived4 |
| Ratio of net investment income to average net assets |
| Ratio of net investment income to average net assets prior to fees waived |
| Portfolio turnover |
| 1 | Calculated using average shares outstanding. |
| 2 | Amount is less than $(0.005) per share. |
| 3 | Total return is based on the change in net asset value of a share during the period and assumes reinvestment of dividends and distributions at net asset value. Total return during all of the periods shown reflects a waiver by the manager. Performance would have been lower had the waiver not been in effect. |
| 4 | Expense ratios do not include expenses of any Underlying Funds in which the Fund invests. |
See accompanying notes, which are an integral part of the financial statements.
66
Table of Contents
| Year ended | |
| 7/31/22 | | 7/31/21 | | 7/31/20 | | 7/31/19 | | 7/31/18 | |
| $ | 7.14 | | | $ | 7.74 | | | $ | 6.85 | | | $ | 6.29 | | | $ | 6.63 | | |
| | | |
| | | |
| | 0.18 | | | | 0.18 | | | | 0.21 | | | | 0.22 | | | | 0.21 | | |
| | (1.56 | ) | | | (0.10 | ) | | | 1.04 | | | | 0.57 | | | | (0.33 | ) | |
| | (1.38 | ) | | | 0.08 | | | | 1.25 | | | | 0.79 | | | | (0.12 | ) | |
| | | |
| | | |
| | (0.18 | ) | | | (0.20 | ) | | | (0.21 | ) | | | (0.23 | ) | | | (0.22 | ) | |
| | (0.30 | ) | | | (0.48 | ) | | | (0.15 | ) | | | — | | | | — | | |
| | — | 2 | | | — | | | | — | | | | — | | | | — | | |
| | (0.48 | ) | | | (0.68 | ) | | | (0.36 | ) | | | (0.23 | ) | | | (0.22 | ) | |
| | | |
| $ | 5.28 | | | $ | 7.14 | | | $ | 7.74 | | | $ | 6.85 | | | $ | 6.29 | | |
| | | |
| | (20.35% | ) | | | 1.13% | | | | 18.87% | | | | 12.87% | | | | (1.88% | ) | |
| | | |
| | | |
| $ | 5,489 | | | $ | 8,631 | | | $ | 12,065 | | | $ | 11,984 | | | $ | 15,389 | | |
| | 1.07% | | | | 1.07% | | | | 1.07% | | | | 1.07% | | | | 1.12% | | |
| | 1.26% | | | | 1.24% | | | | 1.23% | | | | 1.23% | | | | 1.23% | | |
| | 2.84% | | | | 2.60% | | | | 2.91% | | | | 3.53% | | | | 3.27% | | |
| | 2.65% | | | | 2.43% | | | | 2.75% | | | | 3.37% | | | | 3.16% | | |
| | 76% | | | | 85% | | | | 108% | | | | 133% | | | | 147% | | |
67
Table of Contents
Financial highlights
Delaware Extended Duration Bond Fund Institutional Class
Selected data for each share of the Fund outstanding throughout each period were as follows:
| Net asset value, beginning of period |
| |
| Income (loss) from investment operations: |
| Net investment income1 |
| Net realized and unrealized gain (loss) |
| Total from investment operations |
| |
| Less dividends and distributions from: |
| Net investment income |
| Net realized gain |
| Return of capital |
| Total dividends and distributions |
| |
| Net asset value, end of period |
| |
| Total return3 |
| |
| Ratios and supplemental data: |
| Net assets, end of period (000 omitted) |
| Ratio of expenses to average net assets4 |
| Ratio of expenses to average net assets prior to fees waived4 |
| Ratio of net investment income to average net assets |
| Ratio of net investment income to average net assets prior to fees waived |
| Portfolio turnover |
| 1 | Calculated using average shares outstanding. |
| 2 | Amount is less than $(0.005) per share. |
| 3 | Total return is based on the change in net asset value of a share during the period and assumes reinvestment of dividends and distributions at net asset value. Total return during all of the periods shown reflects a waiver by the manager. Performance would have been lower had the waiver not been in effect. |
| 4 | Expense ratios do not include expenses of any Underlying Funds in which the Fund invests. |
See accompanying notes, which are an integral part of the financial statements.
68
Table of Contents
| Year ended | |
| 7/31/22 | | 7/31/21 | | 7/31/20 | | 7/31/19 | | 7/31/18 | |
| $ | 7.11 | | | $ | 7.71 | | | $ | 6.82 | | | $ | 6.27 | | | $ | 6.61 | | |
| | | |
| | | |
| | 0.20 | | | | 0.22 | | | | 0.24 | | | | 0.25 | | | | 0.25 | | |
| | (1.54 | ) | | | (0.11 | ) | | | 1.05 | | | | 0.56 | | | | (0.34 | ) | |
| | (1.34 | ) | | | 0.11 | | | | 1.29 | | | | 0.81 | | | | (0.09 | ) | |
| | | |
| | | |
| | (0.21 | ) | | | (0.23 | ) | | | (0.25 | ) | | | (0.26 | ) | | | (0.25 | ) | |
| | (0.30 | ) | | | (0.48 | ) | | | (0.15 | ) | | | — | | | | — | | |
| | — | 2 | | | — | | | | — | | | | — | | | | — | | |
| | (0.51 | ) | | | (0.71 | ) | | | (0.40 | ) | | | (0.26 | ) | | | (0.25 | ) | |
| | | |
| $ | 5.26 | | | $ | 7.11 | | | $ | 7.71 | | | $ | 6.82 | | | $ | 6.27 | | |
| | | |
| | (19.90% | ) | | | 1.63% | | | | 19.54% | | | | 13.30% | | | | (1.40% | ) | |
| | | |
| | | |
| $ | 332,410 | | | $ | 404,838 | | | $ | 377,316 | | | $ | 444,635 | | | $ | 433,957 | | |
| | 0.57% | | | | 0.57% | | | | 0.57% | | | | 0.57% | | | | 0.62% | | |
| | 0.76% | | | | 0.74% | | | | 0.73% | | | | 0.73% | | | | 0.73% | | |
| | 3.34% | | | | 3.10% | | | | 3.41% | | | | 4.03% | | | | 3.77% | | |
| | 3.15% | | | | 2.93% | | | | 3.25% | | | | 3.87% | | | | 3.66% | | |
| | 76% | | | | 85% | | | | 108% | | | | 133% | | | | 147% | | |
69
Table of Contents
Financial highlights
Delaware Extended Duration Bond Fund Class R6
Selected data for each share of the Fund outstanding throughout each period were as follows:
| Net asset value, beginning of period |
| |
| Income (loss) from investment operations: |
| Net investment income1 |
| Net realized and unrealized gain (loss) |
| Total from investment operations |
| |
| Less dividends and distributions from: |
| Net investment income |
| Net realized gain |
| Return of capital |
| Total dividends and distributions |
| |
| Net asset value, end of period |
| |
| Total return3 |
| |
| Ratios and supplemental data: |
| Net assets, end of period (000 omitted) |
| Ratio of expenses to average net assets4 |
| Ratio of expenses to average net assets prior to fees waived4 |
| Ratio of net investment income to average net assets |
| Ratio of net investment income to average net assets prior to fees waived |
| Portfolio turnover |
| 1 | Calculated using average shares outstanding. |
| 2 | Amount is less than $(0.005) per share. |
| 3 | Total return is based on the change in net asset value of a share during the period and assumes reinvestment of dividends and distributions at net asset value. Total return during all of the periods shown reflects a waiver by the manager. Performance would have been lower had the waiver not been in effect. |
| 4 | Expense ratios do not include expenses of any Underlying Funds in which the Fund invests. |
See accompanying notes, which are an integral part of the financial statements.
70
Table of Contents
| Year ended | |
| 7/31/22 | | 7/31/21 | | 7/31/20 | | 7/31/19 | | 7/31/18 | |
| $ | 7.11 | | | $ | 7.72 | | | $ | 6.83 | | | $ | 6.27 | | | $ | 6.61 | | |
| | | |
| | | |
| | 0.23 | | | | 0.23 | | | | 0.25 | | | | 0.26 | | | | 0.25 | | |
| | (1.56 | ) | | | (0.12 | ) | | | 1.04 | | | | 0.56 | | | | (0.33 | ) | |
| | (1.33 | ) | | | 0.11 | | | | 1.29 | | | | 0.82 | | | | (0.08 | ) | |
| | | |
| | | |
| | (0.22 | ) | | | (0.24 | ) | | | (0.25 | ) | | | (0.26 | ) | | | (0.26 | ) | |
| | (0.30 | ) | | | (0.48 | ) | | | (0.15 | ) | | | — | | | | — | | |
| | — | 2 | | | — | | | | — | | | | — | | | | — | | |
| | (0.52 | ) | | | (0.72 | ) | | | (0.40 | ) | | | (0.26 | ) | | | (0.26 | ) | |
| | | |
| $ | 5.26 | | | $ | 7.11 | | | $ | 7.72 | | | $ | 6.83 | | | $ | 6.27 | | |
| | | |
| | (19.83% | ) | | | 1.58% | | | | 19.61% | | | | 13.56% | | | | (1.32% | ) | |
| | | |
| | | |
| $ | 11,663 | | | $ | 59,933 | | | $ | 57,108 | | | $ | 44,970 | | | $ | 48,373 | | |
| | 0.48% | | | | 0.48% | | | | 0.49% | | | | 0.49% | | | | 0.54% | | |
| | 0.66% | | | | 0.65% | | | | 0.63% | | | | 0.64% | | | | 0.65% | | |
| | 3.43% | | | | 3.19% | | | | 3.49% | | | | 4.11% | | | | 3.85% | | |
| | 3.25% | | | | 3.02% | | | | 3.35% | | | | 3.96% | | | | 3.74% | | |
| | 76% | | | | 85% | | | | 108% | | | | 133% | | | | 147% | | |
71
Table of Contents
| Notes to financial statements | |
| Delaware Corporate Bond Fund and | |
| Delaware Extended Duration Bond Fund | July 31, 2022 |
Delaware Group® Income Funds (Trust) is organized as a Delaware statutory trust and offers four series: Delaware Corporate Bond Fund, Delaware Extended Duration Bond Fund, Delaware Floating Rate Fund, and Delaware High-Yield Opportunities Fund. These financial statements and the related notes pertain to Delaware Corporate Bond Fund and Delaware Extended Duration Bond Fund (each, a Fund or collectively, the Funds). The Trust is an open-end investment company. Each Fund is considered diversified under the Investment Company Act of 1940, as amended, and offers Class A, Class C, Class R, Institutional Class, and Class R6 shares. Class A shares are sold with a maximum front-end sales charge of 4.50%. There is no front-end sales charge when you purchase $1,000,000 or more of Class A shares. However, if Delaware Distributors, L.P. (DDLP) paid your financial intermediary a commission on your purchase of $1,000,000 or more of Class A shares, for shares purchased prior to July 1, 2020, you will have to pay a limited contingent deferred sales charge (Limited CDSC) of 1.00% if you redeem these shares within the first year after your purchase and 0.50% if you redeem these shares within the second year; or for shares purchased on or after July 1, 2020, you will have to pay a Limited CDSC of 1.00% if you redeem these shares within the first 18 months after your purchase; unless a specific waiver of the Limited CDSC applies. Class C shares have no upfront sales charge, but are sold with a contingent deferred sales charge (CDSC) of 1.00%, which will be incurred if redeemed during the first 12 months. Class R, Institutional Class, and Class R6 shares are not subject to a sales charge and are offered for sale exclusively to certain eligible investors. In addition, Class R6 shares do not pay any service fees, sub-accounting fees, and/or sub-transfer agency fees to any brokers, dealers, or other financial intermediaries.
1. Significant Accounting Policies
Each Fund follows accounting and reporting guidance under Financial Accounting Standards Board (FASB) Accounting Standards Codification Topic 946, Financial Services — Investment Companies. The following accounting policies are in accordance with US generally accepted accounting principles (US GAAP) and are consistently followed by the Funds.
Security Valuation — Equity securities, except those traded on the Nasdaq Stock Market LLC (Nasdaq), are valued at the last quoted sales price as of the time of the regular close of the New York Stock Exchange on the valuation date. Equity securities traded on the Nasdaq are valued in accordance with the Nasdaq Official Closing Price, which may not be the last sales price. If, on a particular day, an equity security does not trade, the mean between the bid and the ask prices will be used, which approximates fair value. US government and agency securities are valued at the mean between the bid and the ask prices, which approximates fair value. Open-end investment companies are valued at their published net asset value (NAV). Other debt securities and credit default swap (CDS) contracts are valued based upon valuations provided by an independent pricing service or broker/counterparty and reviewed by management. To the extent current market prices are not available, the pricing service may take into account developments related to the specific security, as well as transactions in comparable securities. Valuations for fixed income securities utilize matrix systems, which reflect such factors as security prices,
72
Table of Contents
yields, maturities, and ratings, and are supplemented by dealer and exchange quotations. Swap prices are derived using daily swap curves and models that incorporate a number of market data factors, such as discounted cash flows, trades, and values of the underlying reference instruments. Futures contracts are valued at the daily quoted settlement prices. Generally, other securities and assets for which market quotations are not readily available are valued at fair value as determined in good faith under the direction of the Trust’s Board of Trustees (Board). In determining whether market quotations are readily available or fair valuation will be used, various factors will be taken into consideration, such as market closures or suspension of trading in a security. Restricted securities are valued at fair value using methods approved by the Board.
Federal Income Taxes — No provision for federal income taxes has been made as each Fund intends to continue to qualify for federal income tax purposes as a regulated investment company under Subchapter M of the Internal Revenue Code of 1986, as amended, and make the requisite distributions to shareholders. Each Fund evaluates tax positions taken or expected to be taken in the course of preparing each Fund's tax returns to determine whether the tax positions are “more-likely-than-not” of being sustained by the applicable tax authority. Tax positions not deemed to meet the “more-likely-than-not” threshold are recorded as a tax benefit or expense in the current year. Management has analyzed each Fund’s tax positions taken or expected to be taken on each Fund’s federal income tax returns through the year ended July 31, 2022, and for all open tax years (years ended July 31, 2019–July 31, 2021), and has concluded that no provision for federal income tax is required in each Fund’s financial statements. If applicable, each Fund recognizes interest accrued on unrecognized tax benefits in interest expense and penalties in “Other” on the “Statements of operations.” During the year ended July 31, 2022, the Funds did not incur any interest or tax penalties.
Class Accounting — Investment income and common expenses are allocated to the various classes of each Fund on the basis of “settled shares” of each class in relation to the net assets of each Fund. Realized and unrealized gain (loss) on investments are allocated to the various classes of each Fund on the basis of daily net assets of each class. Distribution expenses relating to a specific class are charged directly to that class. Class R6 shares will not be allocated any expenses related to service fees, sub-accounting fees, and/or sub-transfer agency fees paid to brokers, dealers, or other financial intermediaries.
Use of Estimates — The preparation of financial statements in conformity with US GAAP requires management to make estimates and assumptions that affect the fair value of investments, the reported amounts of assets and liabilities and disclosure of contingent assets and liabilities at the date of the financial statements, and the reported amounts of revenues and expenses during the reporting period. Actual results could differ from those estimates and the differences could be material.
Other — Expenses directly attributable to a Fund are charged directly to that Fund. Other expenses common to various funds within the Delaware Funds by Macquarie® (Delaware Funds) are generally allocated among such funds on the basis of average net assets. Management fees and certain other expenses are paid monthly. Security transactions are recorded on the date the
73
Table of Contents
Notes to financial statements
Delaware Corporate Bond Fund and
Delaware Extended Duration Bond Fund
1. Significant Accounting Policies (continued)
securities are purchased or sold (trade date) for financial reporting purposes. Costs used in calculating realized gains and losses on the sale of investment securities are those of the specific securities sold. Dividend income is recorded on the ex-dividend date and interest income is recorded on the accrual basis. Income and capital gain distributions from any investment companies (Underlying Funds) in which the Fund invests are recorded on the ex-dividend date. Discounts and premiums on debt securities are accreted or amortized to interest income, respectively, over the lives of the respective securities using the effective interest method. Premiums on callable debt securities are amortized to interest income to the earliest call date using the effective interest method. Each Fund declares dividends daily from net investment income and pays the dividends monthly and declares and pays distributions from net realized gain on investments, if any, annually. Each Fund may distribute more frequently, if necessary for tax purposes. Dividends and distributions, if any, are recorded on the ex-dividend date.
Each Fund receives earnings credits from its custodian when positive cash balances are maintained, which may be used to offset custody fees. The expenses paid under this arrangement are included on the “Statement of operations” under “Custodian fees” with the corresponding expenses offset included under “Less expenses paid indirectly.” There were no such earnings credits for the year ended July 31, 2022 for Delaware Corporate Bond Fund and Delaware Extended Duration Bond Fund.
Each Fund receives earnings credits from its transfer agent when positive cash balances are maintained, which may be used to offset transfer agent fees. If the amount earned is greater than $1, the expenses paid under this arrangement are included on the “Statements of operations” under “Dividend disbursing and transfer agent fees and expenses” with the corresponding expenses offset included under “Less expenses paid indirectly.” For the year ended July 31, 2022, each Fund earned the following amounts under this arrangement:
| Fund | | Earnings Credits |
| Delaware Corporate Bond Fund | | | $ | 910 | |
| Delaware Extended Duration Bond Fund | | | | 144 | |
2. Investment Management, Administration Agreements, and Other Transactions with Affiliates
In accordance with the terms of its respective investment management agreement, each Fund pays Delaware Management Company (DMC), a series of Macquarie Investment Management Business Trust and the investment manager, an annual fee which is calculated daily and paid monthly based on each Fund’s average daily net assets as follows:
| | Delaware Corporate Bond Fund | | Delaware Extended Duration Bond Fund |
| On the first $500 million | | 0.5000% | | 0.5500% |
| On the next $500 million | | 0.4750% | | 0.5000% |
| On the next $1.5 billion | | 0.4500% | | 0.4500% |
| In excess of $2.5 billion | | 0.4250% | | 0.4250% |
74
Table of Contents
DMC has contractually agreed to waive all or a portion of its management fee and/or pay/reimburse expenses (excluding any distribution and service (12b-1) fees, acquired fund fees and expenses, taxes, interest, short sale dividend and interest expenses, brokerage fees, certain insurance costs, and nonroutine expenses or costs, including, but not limited to, those relating to reorganizations, litigation, conducting shareholder meetings, and liquidations), in order to prevent total annual fund operating expenses from exceeding 0.57% of average daily net assets of Class A, Class C, Class R, and Institutional Class shares and 0.48% of average daily net assets of Class R6 shares for each Fund. The expense waivers were in effect from August 1, 2021 through July 31, 2022.* These waivers and reimbursements may only be terminated by agreement of DMC and the Funds. The waivers and reimbursements are accrued daily and received monthly.
DMC may seek investment advice and recommendations from its affiliates: Macquarie Investment Management Europe Limited, Macquarie Investment Management Austria Kapitalanlage AG, and Macquarie Investment Management Global Limited (together, the “Affiliated Sub-Advisors”). The Manager may also permit these Affiliated Sub-Advisors to execute Fund security trades on behalf of the Manager and exercise investment discretion for securities in certain markets where DMC believes it will be beneficial to utilize an Affiliated Sub-Advisor’s specialized market knowledge. Although the Affiliated Sub-Advisors serve as sub-advisors, DMC has ultimate responsibility for all investment advisory services. For these services, DMC, not the Fund, may pay each Affiliated Sub-Advisor a portion of its investment management fee.
Delaware Investments Fund Services Company (DIFSC), an affiliate of DMC, provides fund accounting and financial administrative oversight services to each Fund. For these services, DIFSC’s fees are calculated daily and paid monthly, based on the aggregate daily net assets of all funds within the Delaware Funds at the following annual rates: 0.00475% of the first $35 billion; 0.0040% of the next $10 billion; 0.0025% of the next $45 billion; and 0.0015% of aggregate average daily net assets in excess of $90 billion (Total Fee). Each fund in the Delaware Funds pays a minimum of $4,000, which, in aggregate, is subtracted from the Total Fee. Each fund then pays its portion of the remainder of the Total Fee on a relative NAV basis. These amounts are included on the “Statements of operations” under “Accounting and administration expenses.” For the year ended July 31, 2022, each Fund paid these services as follows:
| Fund | | Fees |
| Delaware Corporate Bond Fund | | $ | 47,564 |
| Delaware Extended Duration Bond Fund | | | 20,568 |
DIFSC is also the transfer agent and dividend disbursing agent of each Fund. For these services, DIFSC’s fees are calculated daily and paid monthly, based on the aggregate daily net assets of the retail funds within the Delaware Funds at the following annual rates: 0.014% of the first $20 billion; 0.011% of the next $5 billion; 0.007% of the next $5 billion; 0.005% of the next $20 billion; and 0.0025% of average daily net assets in excess of $50 billion. The fees payable to DIFSC under the shareholder services agreement described above are allocated among all retail
75
Table of Contents
Notes to financial statements
Delaware Corporate Bond Fund and
Delaware Extended Duration Bond Fund
2. Investment Management, Administration Agreements, and Other Transactions with Affiliates (continued)
funds in the Delaware Funds on a relative NAV basis. This amount is included on the “Statements of operations” under “Dividend disbursing and transfer agent fees and expenses.” For the year ended July 31, 2022, each Fund paid for these services as follows:
| Fund | | Fees |
| Delaware Corporate Bond Fund | | $ | 60,811 |
| Delaware Extended Duration Bond Fund | | | 23,142 |
Pursuant to a sub-transfer agency agreement between DIFSC and BNY Mellon Investment Servicing (US) Inc. (BNYMIS), BNYMIS provides certain sub-transfer agency services to the Funds. Sub-transfer agency fees are paid by the Funds and are also included on the “Statements of operations” under “Dividend disbursing and transfer agent fees and expenses.” The fees that are calculated daily and paid as invoices are received on a monthly or quarterly basis.
Pursuant to a distribution agreement and distribution plan, each Fund pays DDLP, the distributor and an affiliate of DMC, an annual 12b-1 fee of 0.25%, 1.00%, and 0.50% of the average daily net assets of the Class A, Class C, and Class R shares, respectively. The fees are calculated daily and paid monthly. Institutional Class and Class R6 shares do not pay 12b-1 fees.
As provided in the investment management agreement, each Fund bears a portion of the cost of certain resources shared with DMC, including the cost of internal personnel of DMC and/or its affiliates that provide legal and regulatory reporting services to the Funds. These amounts are included on the “Statements of operations” under “Legal fees.” For the year ended July 31, 2022, each Fund paid for internal legal and regulatory reporting services provided by DMC and/or its affiliates’ employees as follows:
| Fund | | Fees |
| Delaware Corporate Bond Fund | | $ | 17,944 |
| Delaware Extended Duration Bond Fund | | | 6,494 |
For the year ended July 31, 2022, DDLP earned commissions on sales of Class A shares for each Fund as follows:
| Fund | | Class A |
| Delaware Corporate Bond Fund | | $ | 7,507 |
| Delaware Extended Duration Bond Fund | | | 8,825 |
76
Table of Contents
For the year ended July 31, 2022, DDLP received gross CDSC commissions on redemptions of each Fund’s Class A and Class C shares, respectively, and these commissions were entirely used to offset upfront commissions previously paid by DDLP to broker/dealers on sales of those shares. The amounts received were as follows:
| Fund | | Class A | | Class C |
| Delaware Corporate Bond Fund | | | $ | 309 | | | $ | 4,333 |
| Delaware Extended Duration Bond Fund | | | | 18 | | | | 2,964 |
Trustees’ fees include expenses accrued by each Fund for each Trustee’s retainer and meeting fees. Certain officers of DMC, DIFSC, and DDLP are officers and/or Trustees of the Trust. These officers and Trustees are paid no compensation by the Funds.
In addition to the management fees and other expenses of a Fund, a Fund indirectly bears the investment management fees and other expenses of any Underlying Funds in which it invests. The amount of these fees and expenses incurred indirectly by a Fund will vary based upon the expense and fee levels of any Underlying Funds and the number of shares that are owned of any Underlying Funds at different times.
| * | The aggregate contractual waiver period covering this report is from November 27, 2020 through November 26, 2022. |
3. Investments
For the year ended July 31, 2022, each Fund made purchases and sales of investment securities other than short-term investments as follows:
| | Purchases | | | | | Sales | | | |
| | other than | | Purchases of | | other than | | Sales of |
| | US government | | US government | | US government | | US government |
| Fund | | securities | | securities | | securities | | securities |
| Delaware | | | | | | | | | | | | |
| Corporate | | | | | | | | | | | | |
| Bond | | | | | | | | | | | | |
| Fund | | $ | 1,311,218,031 | | $ | 117,930,106 | | $ | 1,344,691,072 | | $ | 104,560,316 |
| Delaware | | | | | | | | | | | | |
| Extended | | | | | | | | | | | | |
| Duration | | | | | | | | | | | | |
| Bond | | | | | | | | | | | | |
| Fund | | | 358,107,263 | | | 21,361,683 | | | 400,195,066 | | | 20,915,665 |
77
Table of Contents
Notes to financial statements
Delaware Corporate Bond Fund and
Delaware Extended Duration Bond Fund
3. Investments (continued)
The tax cost of investments and derivatives includes adjustments to net unrealized appreciation (depreciation) which may not necessarily be the final tax cost basis adjustments but which approximate the tax basis unrealized gains and losses that may be realized and distributed to shareholders. At July 31, 2022, the cost and unrealized appreciation (depreciation) of investments and derivatives for federal income tax purposes for each Fund were as follows:
| | | | Aggregate | | Aggregate | | Net unrealized |
| | | | unrealized | | unrealized | | appreciation |
| | Cost of | | appreciation | | depreciation | | (depreciation) |
| | investments | | of investments | | of investments | | of investments |
| Fund | | and derivatives | | and derivatives | | and derivatives | | and derivatives |
| Delaware | | | | | | | | | | |
| Corporate | | | | | | | | | | |
| Bond | | | | | | | | | | |
| Fund | | $1,404,744,994 | | $8,296,562 | | $(129,641,923 | ) | | $(121,345,361 | ) |
| Delaware | | | | | | | | | | |
| Extended | | | | | | | | | | |
| Duration | | | | | | | | | | |
| Bond | | | | | | | | | | |
| Fund | | 495,497,923 | | 2,056,116 | | (77,078,330 | ) | | (75,022,214 | ) |
US GAAP defines fair value as the price that each Fund would receive to sell an asset or pay to transfer a liability in an orderly transaction between market participants at the measurement date under current market conditions. A three-level hierarchy for fair value measurements has been established based upon the transparency of inputs to the valuation of an asset or liability. Inputs may be observable or unobservable and refer broadly to the assumptions that market participants would use in pricing the asset or liability. Observable inputs reflect the assumptions market participants would use in pricing the asset or liability based on market data obtained from sources independent of the reporting entity. Unobservable inputs reflect the reporting entity’s own assumptions about the assumptions that market participants would use in pricing the asset or liability based on the best information available under the circumstances. Each Fund's investment in its entirety is assigned a level based upon the observability of the inputs which are significant to the overall valuation. The three-level hierarchy of inputs is summarized as follows:
| Level 1 – | Inputs are quoted prices in active markets for identical investments. (Examples: equity securities, open-end investment companies, futures contracts, and exchange-traded options contracts) |
| | |
| Level 2 – | Other observable inputs, including, but not limited to: quoted prices for similar assets or liabilities in markets that are active, quoted prices for identical or similar assets or liabilities in markets that are not active, inputs other than quoted prices that are observable for the assets or liabilities (such as interest rates, yield curves, volatilities, prepayment speeds, loss severities, credit risks, and default rates) or other market-corroborated inputs. (Examples: debt securities, government securities, swap |
78
Table of Contents
| contracts, foreign currency exchange contracts, foreign securities utilizing international fair value pricing, broker-quoted securities, and fair valued securities) |
| | |
| Level 3 – | Significant unobservable inputs, including each Fund's own assumptions used to determine the fair value of investments. (Examples: broker-quoted securities and fair valued securities) |
Level 3 investments are valued using significant unobservable inputs. Each Fund may also use an income-based valuation approach in which the anticipated future cash flows of the investment are discounted to calculate fair value. Discounts may also be applied due to the nature or duration of any restrictions on the disposition of the investments. Valuations may also be based upon current market prices of securities that are comparable in coupon, rating, maturity, and industry. The derived value of a Level 3 investment may not represent the value which is received upon disposition and this could impact the results of operations.
The following tables summarize the valuation of each Fund’s investments by fair value hierarchy levels as of July 31, 2022:
| | Delaware Corporate Bond Fund |
| | Level 1 | | Level 2 | | Total |
| Securities | | | | | | | | | | | |
| Assets: | | | | | | | | | | | |
| Convertible Bonds | | $ | — | | $ | 4,954,993 | | | $ | 4,954,993 | |
| Convertible Preferred Stock | | | 3,273,213 | | | — | | | | 3,273,213 | |
| Corporate Bonds | | | — | | | 1,139,569,039 | | | | 1,139,569,039 | |
| Loan Agreements | | | — | | | 32,359,963 | | | | 32,359,963 | |
| Municipal Bonds | | | — | | | 4,189,242 | | | | 4,189,242 | |
| Non-Agency Asset-Backed Securities | | | — | | | 22,988,086 | | | | 22,988,086 | |
| US Treasury Obligation | | | — | | | 14,555,662 | | | | 14,555,662 | |
| Short-Term Investments | | | 61,509,693 | | | — | | | | 61,509,693 | |
| Total Value of | | | | | | | | | | | |
| Securities Before Options Written | | $ | 64,782,906 | | $ | 1,218,616,985 | | | $ | 1,283,399,891 | |
| Liabilities: | | | | | | | | | | | |
| Options Written | | $ | — | | $ | (258 | ) | | $ | (258 | ) |
79
Table of Contents
Notes to financial statements
Delaware Corporate Bond Fund and
Delaware Extended Duration Bond Fund
3. Investments (continued)
| | Delaware Extended Duration Bond Fund |
| | Level 1 | | Level 2 | | Total |
| Securities | | | | | | | | | | | |
| Assets: | | | | | | | | | | | |
| Convertible Bond | | $ | — | | $ | 615,060 | | | $ | 615,060 | |
| Convertible Preferred Stock | | | 3,644,344 | | | — | | | | 3,644,344 | |
| Corporate Bonds | | | — | | | 392,548,667 | | | | 392,548,667 | |
| Loan Agreements | | | — | | | 2,715,440 | | | | 2,715,440 | |
| Municipal Bonds | | | — | | | 9,578,884 | | | | 9,578,884 | |
| Short-Term Investments | | | 11,373,406 | | | — | | | | 11,373,406 | |
| Total Value of Securities Before Options Written | | $ | 15,017,750 | | $ | 405,458,051 | | | $ | 420,475,801 | |
| Liabilities: | | | | | | | | | | | |
| Options Written | | $ | — | | $ | (92 | ) | | $ | (92 | ) |
During the year ended July 31, 2022, there were no transfers into or out of Level 3 investments. Each Fund's policy is to recognize transfers into or out of Level 3 investments based on fair value at the beginning of the reporting period.
A reconciliation of Level 3 investments is presented when each Fund has a significant amount of Level 3 investments at the beginning or end of the period in relation to each Fund's net assets. During the year ended July 31, 2022, there were no Level 3 investments.
4. Dividend and Distribution Information
Income and long-term capital gain distributions are determined in accordance with federal income tax regulations, which may differ from US GAAP. Additionally, distributions from net short-term gains on sales of investment securities are treated as ordinary income for federal income tax purposes. The tax character of dividends and distributions paid during the years ended July 31, 2022 and 2021 were as follows:
| | | | | Long-term | | | |
| | Ordinary | | capital | | | |
| | income | | gains | | Total |
| Year ended July 31, 2022: | | | | | | | | | |
| Delaware Corporate Bond Fund | | $ | 53,572,160 | | $ | 9,963,105 | | $ | 63,535,265 |
| Delaware Extended Duration Bond Fund | | | 18,148,186 | | | 22,090,685 | | | 40,238,871 |
| Year ended July 31, 2021: | | | | | | | | | |
| Delaware Corporate Bond Fund | | | 41,697,452 | | | — | | | 41,697,452 |
| Delaware Extended Duration Bond Fund | | | 31,243,518 | | | 22,995,805 | | | 54,239,323 |
80
Table of Contents
5. Components of Net Assets on a Tax Basis
As of July 31, 2022, the components of net assets on a tax basis were as follows:
| | Delaware Corporate Bond Fund | | Delaware Extended Duration Bond Fund |
| Shares of beneficial | | | | | | | | | | | | |
| interest | | | $ | 1,469,268,623 | | | | | $ | 510,533,200 | | |
| Undistributed ordinary | | | | | | | | | | | | |
| income | | | | 1,185,928 | | | | | | — | | |
| Qualified late year loss | | | | | | | | | | | | |
| deferrals | | | | (66,367,342 | ) | | | | | (14,073,995 | ) | |
| Distributions payable | | | | (1,403,801 | ) | | | | | (47,958 | ) | |
| Unrealized appreciation | | | | | | | | | | | | |
| (depreciation) of | | | | | | | | | | | | |
| investments and | | | | | | | | | | | | |
| derivatives | | | | (121,345,361 | ) | | | | | (75,022,214 | ) | |
| Net assets | | | $ | 1,281,338,047 | | | | | $ | 421,389,033 | | |
The differences between book basis and tax basis components of net assets are primarily attributable to tax deferral of losses on wash sales, market discount and premium on debt instruments, treatment of swap contracts, and amortization of premium on callable bonds.
Qualified late year ordinary and capital losses (including currency and specified gain/loss items) represent losses realized from January 1, 2022 through July 31, 2022 and November 1, 2021 through July 31, 2022, respectively, that, in accordance with federal income tax regulations, the Funds have elected to defer and treat as having arisen in the following fiscal year.
For financial reporting purposes, capital accounts are adjusted to reflect the tax character of permanent book/tax differences. Reclassifications are primarily due to the tax treatment of an over distribution. Results of operations and net assets were not affected by these reclassifications. For the year ended July 31, 2022, the Funds recorded the following reclassifications:
| | Delaware Corporate Bond Fund | | Delaware Extended Duration Bond Fund |
| Paid-in capital | | | $ | — | | | | $ | (60 | ) | |
| Total distributable | | | | | | | | | | | |
| earnings (loss) | | | | — | | | | | 60 | | |
81
Table of Contents
Notes to financial statements
Delaware Corporate Bond Fund and
Delaware Extended Duration Bond Fund
6. Capital Shares
Transactions in capital shares were as follows:
| | | Delaware Corporate Bond Fund | | Delaware Extended Duration Bond Fund |
| | | Year ended | | Year ended |
| | | | 7/31/22 | | 7/31/21 | | 7/31/22 | | 7/31/21 |
| Shares sold: | | | | | | | | | | | | |
| Class A | | 5,443,132 | | | 13,870,446 | | | 1,337,245 | | | 3,033,639 | |
| Class C | | 433,994 | | | 994,955 | | | 67,345 | | | 273,276 | |
| Class R | | 299,973 | | | 641,138 | | | 172,780 | | | 621,313 | |
| Institutional Class | | 95,679,484 | | | 66,967,180 | | | 18,352,336 | | | 22,047,194 | |
| Class R6 | | 820,125 | | | 1,223,264 | | | 965,481 | | | 642,600 | |
| | | | | | | | | | | | | |
| Shares from merger:1 | | | | | | | | | | | | |
| Class A | | — | | | 26,938,299 | | | — | | | — | |
| Institutional Class | | — | | | 237,060 | | | — | | | — | |
| Class R6 | | — | | | 9,282 | | | — | | | — | |
| | | | | | | | | | | | | |
| Shares issued upon reinvestment of dividends and distributions: | | | | |
| Class A | | 2,511,328 | | | 934,979 | | | 1,053,227 | | | 1,396,963 | |
| Class C | | 127,460 | | | 138,550 | | | 81,859 | | | 147,682 | |
| Class R | | 82,052 | | | 62,657 | | | 86,807 | | | 141,502 | |
| Institutional Class | | 4,971,110 | | | 3,529,688 | | | 4,674,917 | | | 4,899,650 | |
| Class R6 | | 72,244 | | | 21,146 | | | 204,748 | | | 764,585 | |
| | | 110,440,902 | | | 115,568,644 | | | 26,996,745 | | | 33,968,404 | |
| |
| Shares redeemed: | | | | | | | | | | | | |
| Class A | | (17,912,950 | ) | | (8,710,360 | ) | | (3,742,384 | ) | | (7,373,751 | ) |
| Class C | | (1,934,051 | ) | | (4,150,439 | ) | | (427,734 | ) | | (927,512 | ) |
| Class R | | (582,527 | ) | | (895,885 | ) | | (429,594 | ) | | (1,112,317 | ) |
| Institutional Class | | (80,802,301 | ) | | (49,302,649 | ) | | (16,774,383 | ) | | (18,920,623 | ) |
| Class R6 | | (262,597 | ) | | (215,484 | ) | | (7,378,161 | ) | | (382,592 | ) |
| | | (101,494,426 | ) | | (63,274,817 | ) | | (28,752,256 | ) | | (28,716,795 | ) |
| Net increase (decrease) | | 8,946,476 | | | 52,293,827 | | | (1,755,511 | ) | | 5,251,609 | |
82
Table of Contents
Certain shareholders may exchange shares of one class for shares of another class in the same Fund. These exchange transactions are included as subscriptions and redemptions in the table on the previous page and on the “Statements of changes in net assets.” For the years ended July 31, 2022 and 2021, each Fund had the following exchange transactions:
| | Exchange Redemptions | | Exchange Subscriptions | | | |
| | | | | | | | Institutional | | | |
| | Class A | | Class C | | Class A | | Class | | | |
| | Shares | | Shares | | Shares | | Shares | | Value |
| Delaware Corporate Bond Fund | | | | | | | | | |
| Year ended | | | | | | | | | | | |
| 7/31/22 | | 181,426 | | 17,672 | | 17,688 | | 181,435 | | $ | 1,263,189 |
| 7/31/21 | | 30,925 | | 131,264 | | 117,831 | | 45,115 | | | 1,033,858 |
| Delaware Extended Duration Bond Fund | | | | | | | |
| Year ended | | | | | | | | | | | |
| 7/31/22 | | — | | 3,347 | | 3,349 | | — | | | 22,273 |
| 7/31/21 | | 17,795 | | 38,368 | | 38,366 | | 17,828 | | | 395,253 |
7. Reorganization
On May 26-27, 2021, the Board approved a proposal to reorganize (the “Reorganization”) Delaware Investment Grade Fund (the “Acquired Fund”), a series of Delaware Group® Equity Funds IV, with and into Delaware Corporate Bond Fund (the “Acquiring Fund”), a series of the Trust. Pursuant to an Agreement and Plan of Reorganization (the “Plan”): (i) all of the property, assets, and goodwill of the Acquired Fund were acquired by the Acquiring Fund, and (ii) the Trust, on behalf of the Acquiring Fund, assumed the liabilities of the Acquired Fund, in exchange for shares of the Acquiring Fund. In accordance with the Plan, the Acquired Fund liquidated and dissolved following the Reorganization. The purpose of the transaction was to allow shareholders of the Acquired Fund to own shares of the Acquiring Fund, a fund with a similar investment objective and style as, and potentially lower net expenses than the Acquired Fund. The Reorganization was accomplished by a tax-free exchange of shares on July 9, 2021. For financial reporting purposes, assets received and shares issued by the Acquiring Fund were recorded at fair value; however, the cost basis of the investments received from the Acquired Fund was carried forward to align ongoing reporting of the Acquiring Fund’s realized and unrealized gains and losses with amounts distributable to shareholders for tax purposes.
83
Table of Contents
Notes to financial statements
Delaware Corporate Bond Fund and
Delaware Extended Duration Bond Fund
7. Reorganization (continued)
The share transactions associated with the Reorganization are as follows:
| | | | | | Shares | | | | |
| Acquired | | Acquired | | Converted | | Acquiring | | |
| Fund | | Fund Shares | | to Acquiring | | Fund | | Conversion |
| Net Assets | | Outstanding | | Fund | | Net Assets | | Ratio |
| Delaware Investment Grade Fund | | Delaware Corporate Bond Fund | | |
| Class A | $ | 173,482,646 | | 17,684,476 | | 26,938,299 | | $ | 239,540,932 | | 1.5233 |
| Institutional | | | | | | | | | | | |
| Class | | 1,526,668 | | 154,705 | | 237,060 | | | 1,013,281,202 | | 1.5323 |
| Class R6 | | 59,774 | | 6,074 | | 9,282 | | | 10,318,950 | | 1.5282 |
The net assets of the Acquired Fund before the Reorganization were $175,069,088. The net assets of the Acquiring Fund immediately following the Reorganization were $1,479,521,731.
Assuming the Reorganization had been completed on August 1, 2020, the Acquiring Fund’s pro forma results of operations for the year ended July 31, 2021, would have been as follows:
| | Delaware Corporate Bond Fund |
| Net investment income | | | $ | 35,853,534 | | |
| Net realized gain on investments | | | | 37,327,491 | | |
| Net change in unrealized appreciation (depreciation) | | | | (29,460,958 | ) | |
| Net increase in net assets resulting from operations | | | $ | 43,720,067 | | |
Because the combined investment portfolios have been managed as a single integrated portfolio since the acquisition was completed, it is not practical to separate the amounts of revenue and earnings of the Acquired Fund that have been included in the Acquiring Fund’s Statement of Operations since the Reorganization was consummated on July 9, 2021.
8. Line of Credit
Each Fund, along with certain other funds in the Delaware Funds (Participants), was a participant in a $225,000,000 revolving line of credit (Agreement) intended to be used for temporary or emergency purposes as an additional source of liquidity to fund redemptions of investor shares. Under the Agreement, the Participants were charged an annual commitment fee of 0.15% with the addition of an upfront fee of 0.05%, which was allocated across the Participants based on a weighted average of the respective net assets of each Participant. The Participants were permitted to borrow up to a maximum of one-third of their net assets under the Agreement. Each Participant was individually, and not jointly, liable for its particular advances, if any, under the line of credit. The line of credit available under the Agreement expired on November 1, 2021.
On November 1, 2021, each Fund, along with the other Participants, entered into an amendment to the agreement for a $355,000,000 revolving line of credit to be used as described above and operates in substantially the same manner as the original Agreement. Under the amendment to
84
Table of Contents
the agreement, the Participants are charged an annual commitment fee of 0.15%, with the addition of an upfront fee of 0.05%, which is allocated across the Participants based on a weighted average of the respective net assets of each Participant. The line of credit available under the agreement expires on October 31, 2022.
Each Fund had no amounts outstanding as of July 31, 2022, or at any time during the year then ended.
9. Derivatives
US GAAP requires disclosures that enable investors to understand: (1) how and why an entity uses derivatives; (2) how they are accounted for; and (3) how they affect an entity’s results of operations and financial position.
Futures Contracts — A futures contract is an agreement in which the writer (or seller) of the contract agrees to deliver to the buyer an amount of cash or securities equal to a specific dollar amount times the difference between the value of a specific security or index at the close of the last trading day of the contract and the price at which the agreement is made. Each Fund may use futures in the normal course of pursuing its investment objective. Each Fund may invest in futures contracts to hedge its existing portfolio securities against fluctuations in value caused by changes in interest rates or market conditions. Upon entering into a futures contract, each Fund deposits cash or pledges US government securities to a broker, equal to the minimum “initial margin” requirements of the exchange on which the contract is traded. Subsequent payments are received from the broker or paid to the broker each day, based on the daily fluctuation in the market value of the contract. These receipts or payments are known as “variation margin” and are recorded daily by the Funds as unrealized gains or losses until the contracts are closed. When the contracts are closed, the Funds record a realized gain or loss equal to the difference between the value of the contract at the time it was opened and the value at the time it was closed. Risks of entering into futures contracts include potential imperfect correlation between the futures contracts and the underlying securities and the possibility of an illiquid secondary market for these instruments. When investing in futures, there is reduced counterparty credit risk to the Funds because futures are exchange-traded and the exchange’s clearinghouse, as counterparty to all exchange-traded futures, guarantees against default. No futures contracts were open at July 31, 2022.
During the year ended July 31, 2022, Delaware Extended Duration Bond Fund used futures contracts to hedge the Fund’s existing portfolio securities against fluctuations in value caused by changes in interest rates or market conditions.
During the year ended July 31, 2022, Delaware Extended Duration Bond Fund experienced net realized and unrealized gain or loss attributable to their use of futures contracts, which is disclosed as “Net realized gain (loss) on futures contracts” on the “Statements of operations.”
Options Contracts — Each Fund may enter into options contracts in the normal course of pursuing its investment objective. Each Fund may buy or write options contracts for any number of reasons, including without limitation: to manage each Fund's exposure to changes in securities
85
Table of Contents
Notes to financial statements
Delaware Corporate Bond Fund and
Delaware Extended Duration Bond Fund
9. Derivatives (continued)
prices caused by interest rates or market conditions and foreign currencies; as an efficient means of adjusting each Fund's overall exposure to certain markets; to protect the value of portfolio securities; and as a cash management tool. Each Fund may buy or write call or put options on securities, futures, swaps, swaptions, financial indices, and foreign currencies. When each Fund buys an option, a premium is paid and an asset is recorded and adjusted on a daily basis to reflect the current market value of the option purchased. When each Fund writes an option, a premium is received and a liability is recorded and adjusted on a daily basis to reflect the current market value of the option written. Premiums received from writing options that expire unexercised are treated by each Fund on the expiration date as realized gains. The difference between the premium received and the amount paid on effecting a closing purchase transaction, including brokerage commissions, is treated as realized gain or loss. If a call option is exercised, the premium is added to the proceeds from the sale of the underlying security in determining whether each Fund has a realized gain or loss. If a put option is exercised, the premium reduces the cost basis of the securities purchased by each Fund. Each Fund, as writer of an option, bears the market risk of an unfavorable change in the price of the security underlying the written option. When writing options, each Fund is subject to minimal counterparty risk because the counterparty is only obligated to pay premiums and does not bear the market risk of an unfavorable market change.
During the year ended July 31, 2022, each Fund used options contracts to receive premiums for writing options.
Swap Contracts — Each Fund may enter into CDS contracts in the normal course of pursuing its investment objective. Each Fund may enter into CDS contracts in order to hedge against credit events, to enhance total return, or to gain exposure to certain securities or markets. Swap contracts are bilaterally negotiated agreements between a Fund and counterparty to exchange or swap investment cash flows, assets, foreign currencies or market-linked returns at specified, future intervals. Swap agreements are privately negotiated in the over the counter market (OTC swaps). If the OTC swap entered is one of the swaps identified by a relevant regulator as a swap that is required to be cleared, then it will be cleared through a third party, known as a central counterparty or derivatives clearing organization (centrally cleared swaps).
Credit Default Swaps. A CDS contract is a risk-transfer instrument through which one party (purchaser of protection) transfers to another party (seller of protection) the financial risk of a credit event (as defined in the CDS agreement), as it relates to a particular reference security or basket of securities (such as an index). In exchange for the protection offered by the seller of protection, the purchaser of protection agrees to pay the seller of protection a periodic amount at a stated rate that is applied to the notional amount of the CDS contract. In addition, an upfront payment may be made or received by each Fund in connection with an unwinding or assignment of a CDS contract. Upon the occurrence of a credit event, the seller of protection would pay the
86
Table of Contents
par (or other agreed-upon) value of the reference security (or basket of securities) to the counterparty. Credit events generally include, among others, bankruptcy, failure to pay, and obligation default.
During the year ended July 31, 2022, Delaware Corporate Bond Fund entered into CDS contracts as a purchaser of protection. Periodic payments (receipts) on such contracts are accrued daily and recorded as unrealized losses (gains) on swap contracts. Upon payment (receipt), such amounts are recorded as realized losses (gains) on swap contracts. Upfront payments made or received in connection with CDS contracts are amortized over the expected life of the CDS contracts as unrealized losses (gains) on swap contracts. The change in value of CDS contracts is recorded daily as unrealized appreciation or depreciation. A realized gain or loss is recorded upon a credit event (as defined in the CDS agreement) or the maturity or termination of the agreement. Initial margin and variation margin are posted to central counterparties for centrally cleared CDS basket trades, as determined by the applicable central counterparty. During the year ended July 31, 2022, the Funds did not enter into any CDS contracts as a seller of protection.
CDS contracts may involve greater risks than if each Fund had invested in the reference obligation directly. CDS contracts are subject to general market risk, liquidity risk, counterparty risk, and credit risk. Each Fund's maximum risk of loss from counterparty credit risk, either as the seller of protection or the buyer of protection, is the fair value of the contract. This risk is mitigated by (1) for bilateral swap contracts, having a netting arrangement between each Fund and the counterparty and by the posting of collateral by the counterparty to each Fund to cover the Funds exposure to the counterparty or (2) for cleared swaps, trading these instruments through a central counterparty. No CDS contracts were open at July 31, 2022.
During the year ended July 31, 2022, each Fund used CDS contracts to hedge against credit events.
Swaps Generally. For centrally cleared swaps, payments are received from the broker or paid to the broker each day, based on the daily fluctuation in the market value of the contract. These receipts or payments are known as “variation margin” and are recorded by each Fund as unrealized gains or losses until the contracts are closed. When the contracts are closed, each Fund records a realized gain or loss equal to the difference between the value of the contract at the time it was opened and the value at the time it was closed. The value of open swaps may differ from that which would be realized in the event each Fund terminated its position in the contract on a given day. Risks of entering into these contracts include the potential inability of the counterparty to meet the terms of the contracts. This type of risk is generally limited to the amount of favorable movement in the value of the underlying security, instrument, or basket of instruments, if any, at the day of default. Risks also arise from potential losses from adverse market movements and such losses could exceed the unrealized amounts shown on the “Schedules of investments.”
87
Table of Contents
Notes to financial statements
Delaware Corporate Bond Fund and
Delaware Extended Duration Bond Fund
9. Derivatives (continued)
The effect of derivative instruments on the “Statements of operations” for the year ended July 31, 2022 was as follows:
| | Delaware Corporate Bond Fund |
| | Net Realized Gain (Loss) on: |
| | Swap |
| | Contracts |
| Credit | | | | | | |
| contracts | | | $ | (9,976 | ) | |
| | Net Change in Unrealized Appreciation (Depreciation) on: |
| | Options | | Swap | | |
| | Written | | Contracts | | Total |
| Credit | | | | | | |
| contracts | | $3,872 | | $11,692 | | $15,564 |
| Delaware Extended Duration Bond Fund | |
| Net Realized Gain (Loss) on: | |
| Futures | | Swap | | | | | |
| Contracts | | Contracts | | | Total | |
| Interest rate | | | | | | | | | | |
| contracts | $ | 642,309 | | $ | — | | | $ | 642,309 | |
| Credit | | | | | | | | | | |
| contracts | | — | | | (4,582 | ) | | | (4,582 | ) |
| Total | $ | 642,309 | | $ | (4,582 | ) | | $ | 637,727 | |
| Net Change in Unrealized Appreciation (Depreciation) on: | |
| Futures | | | Options | | Swap | | | | |
| Contracts | | | Written | | Contracts | | Total | |
| Interest rate | | | | | | | | | | | | | |
| contracts | $ | (2,191,831 | ) | | $ | — | | $ | — | | $ | (2,191,831 | ) |
| Credit | | | | | | | | | | | | | |
| contracts | | — | | | | 1,383 | | | 5,014 | | | 6,397 | |
| Total | $ | (2,191,831 | ) | | $ | 1,383 | | $ | 5,014 | | $ | (2,185,434 | ) |
The table below summarizes the average daily balance of derivative holdings by each Fund during the year ended July 31, 2022:
| | Long Derivative Volume |
| | Delaware Extended Duration Bond Fund |
| Futures contracts | | | |
| (average notional | | | |
| value) | | $16,703,217 | |
88
Table of Contents
| | Short Derivative Volume |
| | Delaware Corporate Bond Fund | | Delaware Extended Duration Bond Fund |
| Futures contracts | | | | |
| (average notional | | | | |
| value) | | $— | | $107,370 |
| Options contracts | | | | |
| (average notional | | | | |
| value)* | | 99 | | 36 |
*Long represents purchased options and short represents written options
10. Securities Lending
Each Fund, along with other funds in Delaware Funds, may lend its securities pursuant to a security lending agreement (Lending Agreement) with The Bank of New York Mellon (BNY Mellon). At the time a security is loaned, the borrower must post collateral equal to the required percentage of the market value of the loaned security, including any accrued interest. The required percentage is: (1) 102% with respect to US securities and foreign securities that are denominated and payable in US dollars; and (2) 105% with respect to foreign securities. With respect to each loan, if on any business day the aggregate market value of securities collateral plus cash collateral held is less than the aggregate market value of the securities which are the subject of such loan, the borrower will be notified to provide additional collateral by the end of the following business day, which, together with the collateral already held, will be not less than the applicable initial collateral requirements for such security loan. If the aggregate market value of securities collateral and cash collateral held with respect to a security loan exceeds the applicable initial collateral requirement, upon the request of the borrower, BNY Mellon must return enough collateral to the borrower by the end of the following business day to reduce the value of the remaining collateral to the applicable initial collateral requirement for such security loan. As a result of the foregoing, the value of the collateral held with respect to a loaned security on any particular day, may be more or less than the value of the security on loan. The collateral percentage with respect to the market value of the loaned security is determined by the security lending agent.
Cash collateral received by each fund of the Trust is generally invested in a series of individual separate accounts, each corresponding to a fund. The investment guidelines permit each separate account to hold certain securities that would be considered eligible securities for a money market fund. Cash collateral received is generally invested in government securities; certain obligations issued by government sponsored enterprises; repurchase agreements collateralized by US Treasury securities; obligations issued by the central government of any Organization for Economic Cooperation and Development (OECD) country or its agencies, instrumentalities, or establishments; obligations of supranational organizations; commercial paper, notes, bonds, and other debt obligations; certificates of deposit, time deposits, and other
89
Table of Contents
Notes to financial statements
Delaware Corporate Bond Fund and
Delaware Extended Duration Bond Fund
10. Securities Lending (continued)
bank obligations; certain money market funds; and asset-backed securities. Each Fund can also accept US government securities and letters of credit (non-cash collateral) in connection with securities loans.
In the event of default or bankruptcy by the lending agent, realization and/or retention of the collateral may be subject to legal proceedings. In the event the borrower fails to return loaned securities and the collateral received is insufficient to cover the value of the loaned securities and provided such collateral shortfall is not the result of investment losses, the lending agent has agreed to pay the amount of the shortfall to each Fund or, at the discretion of the lending agent, replace the loaned securities. Each Fund continues to record dividends or interest, as applicable, on the securities loaned and is subject to changes in value of the securities loaned that may occur during the term of the loan. Each Fund has the right under the Lending Agreement to recover the securities from the borrower on demand. With respect to security loans collateralized by non-cash collateral, each Fund receives loan premiums paid by the borrower. With respect to security loans collateralized by cash collateral, the earnings from the collateral investments are shared among each Fund, the security lending agent, and the borrower. Each Fund records security lending income net of allocations to the security lending agent and the borrower.
Each Fund may incur investment losses as a result of investing securities lending collateral. This could occur if an investment in each collateral investment account defaulted or became impaired. Under those circumstances, the value of each Fund's cash collateral account may be less than the amount each Fund would be required to return to the borrowers of the securities and each Fund would be required to make up for this shortfall.
During the year ended July 31, 2022, each Fund had no securities out on loan.
11. Credit and Market Risk
Beginning in January 2020, global financial markets have experienced and may continue to experience significant volatility resulting from the spread of a novel coronavirus known as COVID-19. The outbreak of COVID-19 has resulted in travel and border restrictions, quarantines, supply chain disruptions, lower consumer demand, and general market uncertainty. The effects of COVID-19 have and may continue to adversely affect the global economy, the economies of certain nations, and individual issuers, all of which may negatively impact the Funds’ performance.
Each Fund invests in high yield fixed income securities, which are securities rated lower than BBB- by Standard & Poor's Financial Service LLC, lower than Baa3 by Moody’s Investors Service, or similarly rated by another nationally recognized statistical rating organization. Investments in these higher yielding securities are generally accompanied by a greater degree of credit risk than higher rated securities. Additionally, lower rated securities may be more susceptible to adverse economic and competitive industry conditions than investment grade securities.
90
Table of Contents
When interest rates rise, fixed income securities (i.e. debt obligations) generally will decline in value. These declines in value are greater for fixed income securities with longer maturities or durations.
IBOR is the risk that changes related to the use of the London interbank offered rate (LIBOR) and other interbank offered rate (collectively, IBORs) could have adverse impacts on financial instruments that reference LIBOR (or the corresponding IBOR). The abandonment of LIBOR could affect the value and liquidity of instruments that reference LIBOR. The use of alternative reference rate products may impact investment strategy performance. These risks may also apply with respect to changes in connection with other IBORs, such as the euro overnight index average (EONIA), which are also the subject of recent reform.
Each Fund invests in bank loans and other securities that may subject them to direct indebtedness risk, the risk that the Funds will not receive payment of principal, interest, and other amounts due in connection with these investments and will depend primarily on the financial condition of the borrower. Loans that are fully secured offer the Funds more protection than unsecured loans in the event of nonpayment of scheduled interest or principal, although there is no assurance that the liquidation of collateral from a secured loan would satisfy the corporate borrower’s obligation, or that the collateral can be liquidated. Some loans or claims may be in default at the time of purchase. Certain of the loans and the other direct indebtedness acquired by the Funds may involve revolving credit facilities or other standby financing commitments that obligate the Funds to pay additional cash on a certain date or on demand. These commitments may require each Fund to increase its investment in a company at a time when the Funds might not otherwise decide to do so (including at a time when the company’s financial condition makes it unlikely that such amounts will be repaid). To the extent that each Fund is committed to advance additional funds, it will at all times hold and maintain cash or other high grade debt obligations in an amount sufficient to meet such commitments. When a loan agreement is purchased, the Funds may pay an assignment fee. On an ongoing basis, the Funds may receive a commitment fee based on the undrawn portion of the underlying line of credit portion of a loan agreement. Prepayment penalty fees are received upon the prepayment of a loan agreement by the borrower. Prepayment penalty, facility, commitment, consent, and amendment fees are recorded to income as earned or paid.
As the Funds may be required to rely upon another lending institution to collect and pass on to the Funds amounts payable with respect to the loan and to enforce the Funds’ rights under the loan and other direct indebtedness, an insolvency, bankruptcy, or reorganization of the lending institution may delay or prevent the Funds from receiving such amounts. The highly leveraged nature of many loans may make them especially vulnerable to adverse changes in economic or market conditions. Investments in such loans and other direct indebtedness may involve additional risk to the Funds.
Each Fund invests in certain obligations that may have liquidity protection designed to ensure that the receipt of payments due on the underlying security is timely. Such protection may be provided through guarantees, insurance policies, or letters of credit obtained by the issuer or
91
Table of Contents
Notes to financial statements
Delaware Corporate Bond Fund and
Delaware Extended Duration Bond Fund
11. Credit and Market Risk (continued)
sponsor through third parties, through various means of structuring the transaction, or through a combination of such approaches. The Funds will not pay any additional fees for such credit support, although the existence of credit support may increase the price of a security.
Each Fund may invest up to 15% of its net assets in illiquid securities, which may include securities with contractual restrictions on resale, securities exempt from registration under Rule 144A promulgated under the Securities Act of 1933, as amended, and other securities which may not be readily marketable. The relative illiquidity of these securities may impair each Fund from disposing of them in a timely manner and at a fair price when it is necessary or desirable to do so. While maintaining oversight, each Board has delegated to DMC, the day-to-day functions of determining whether individual securities are liquid for purposes of the Funds’ limitation on investments in illiquid securities. Securities eligible for resale pursuant to Rule 144A, which are determined to be liquid, are not subject to the Funds’ 15% limit on investments in illiquid securities. Rule 144A securities have been identified on the “Schedules of investments.”
12. Contractual Obligations
Each Fund enters into contracts in the normal course of business that contain a variety of indemnifications. Each Fund's maximum exposure under these arrangements is unknown. However, each Fund has not had prior claims or losses pursuant to these contracts. Management has reviewed each Fund's existing contracts and expects the risk of loss to be remote.
13. Recent Accounting Pronouncements
In March 2020, FASB issued an Accounting Standards Update (ASU), ASU 2020-04, Reference Rate Reform (Topic 848) – Facilitation of the Effects of Reference Rate Reform on Financial Reporting. The amendments in ASU 2020-04 provide optional temporary financial reporting relief from the effect of certain types of contract modifications due to the planned discontinuation of LIBOR and other interbank-offered based reference rates as of the end of 2021. In March 2021, the administrator for LIBOR announced the extension of the publication of a majority of the USD LIBOR settings to June 30, 2023. ASU 2020-04 is effective for certain reference rate-related contract modifications that occur during the period March 12, 2020 through December 31, 2022. As of the financial reporting period, Management is evaluating the impact of applying this ASU.
14. Subsequent Events
On May 19, 2022, the Board of Trustees of Delaware Corporate Bond Fund and Delaware Extended Duration Bond Fund approved a reverse stock split of three to one (3:1) of the issued and outstanding shares of each share class of the Funds (the “Reverse Stock Split”). The Reverse Stock Split was completed on September 9, 2022.
92
Table of Contents
Management has determined that no other material events or transactions occurred subsequent to July 31, 2022, that would require recognition or disclosure in the Funds' financial statements.
93
Table of Contents
Report of independent
registered public accounting firm
To the Board of Trustees of Delaware Group® Income Funds and Shareholders of Delaware Corporate Bond Fund and Delaware Extended Duration Bond Fund
Opinions on the Financial Statements
We have audited the accompanying statements of assets and liabilities, including the schedules of investments, of Delaware Corporate Bond Fund and Delaware Extended Duration Bond Fund (two of the funds constituting Delaware Group® Income Funds, hereafter collectively referred to as the “Funds”) as of July 31, 2022, the related statements of operations for the year ended July 31, 2022, the statements of changes in net assets for each of the two years in the period ended July 31, 2022, including the related notes, and the financial highlights for each of the periods indicated therein (collectively referred to as the “financial statements”). In our opinion, the financial statements present fairly, in all material respects, the financial position of each of the Funds as of July 31, 2022, the results of each of their operations for the year then ended, the changes in each of their net assets for each of the two years in the period ended July 31, 2022 and each of the financial highlights for each of the periods indicated therein in conformity with accounting principles generally accepted in the United States of America.
Basis for Opinions
These financial statements are the responsibility of the Funds’ management. Our responsibility is to express an opinion on the Funds’ financial statements based on our audits. We are a public accounting firm registered with the Public Company Accounting Oversight Board (United States) (PCAOB) and are required to be independent with respect to the Funds in accordance with the U.S. federal securities laws and the applicable rules and regulations of the Securities and Exchange Commission and the PCAOB.
We conducted our audits of these financial statements in accordance with the standards of the PCAOB. Those standards require that we plan and perform the audit to obtain reasonable assurance about whether the financial statements are free of material misstatement, whether due to error or fraud.
Our audits included performing procedures to assess the risks of material misstatement of the financial statements, whether due to error or fraud, and performing procedures that respond to those risks. Such procedures included examining, on a test basis, evidence regarding the amounts and disclosures in the financial statements. Our audits also included evaluating the accounting principles used and significant estimates made by management, as well as evaluating the overall presentation of the financial statements. Our procedures included confirmation of securities owned as of July 31, 2022 by correspondence with the custodian, transfer agents, agent banks and brokers; when replies were not received from brokers, we performed other auditing procedures. We believe that our audits provide a reasonable basis for our opinions.
/s/PricewaterhouseCoopers LLP
Philadelphia, Pennsylvania
September 16, 2022
We have served as the auditor of one or more investment companies in Delaware Funds by Macquarie® since 2010.
94
Table of Contents
Other Fund information (Unaudited)
Delaware Corporate Bond Fund and
Delaware Extended Duration Bond Fund
Liquidity Risk Management Program
The Securities and Exchange Commission (the “SEC”) has adopted Rule 22e-4 under the Investment Company Act of 1940 (the “Liquidity Rule”), which requires all open-end funds (other than money market funds) to adopt and implement a program reasonably designed to assess and manage the fund’s “liquidity risk,” defined as the risk that the fund could not meet requests to redeem shares issued by the fund without significant dilution of remaining investors’ interests in the fund.
The Funds have adopted and implemented a liquidity risk management program in accordance with the Liquidity Rule (the “Program”). The Board has designated a member of the US Operational Risk Group of Macquarie Asset Management as the Program Administrator for each Fund in the Trust.
As required by the Liquidity Rule, the Program includes policies and procedures that provide for: (1) assessment, management, and review (no less frequently than annually) of each Fund’s liquidity risk; (2) classification of each of the Fund’s portfolio holdings into one of four liquidity categories (Highly Liquid, Moderately Liquid, Less Liquid, and Illiquid); (3) for funds that do not primarily hold assets that are Highly Liquid, establishing and maintaining a minimum percentage of the Fund’s net assets in Highly Liquid investments (called a “Highly Liquid Investment Minimum” or “HLIM”); and (4) prohibiting each Fund’s acquisition of Illiquid investments if, immediately after the acquisition, each Fund would hold more than 15% of its net assets in Illiquid assets. The Program also requires reporting to the SEC (on a non-public basis) and to the Board if each Fund’s holdings of Illiquid assets exceed 15% of the Fund’s net assets. Funds with HLIMs must have procedures for addressing HLIM shortfalls, including reporting to the Board and, with respect to HLIM shortfalls lasting more than seven consecutive calendar days, reporting to the SEC (on a non-public basis).
In assessing and managing each Fund’s liquidity risk, the Program Administrator considers, as relevant, a variety of factors, including: (1) each Fund’s investment strategy and liquidity of portfolio investments during both normal and reasonably foreseeable stressed conditions; (2) short-term and long-term cash flow projections for the Funds during both normal and reasonably foreseeable stressed conditions; and (3) each Fund’s holdings of cash and cash equivalents and any borrowing arrangements. Classification of each Fund’s portfolio holdings in the four liquidity categories is based on the number of days it is reasonably expected to take to convert the investment to cash (for Highly Liquid and Moderately Liquid holdings) or to sell or dispose of the investment (for Less Liquid and Illiquid investments), in current market conditions without significantly changing the investment’s market value. Each Fund primarily holds assets that are classified as Highly Liquid, and therefore is not required to establish an HLIM.
At a meeting of the Board held on May 17-19, 2022, the Program Administrator provided the required written annual report to the Board addressing the Program’s operation and assessing the adequacy and effectiveness of its implementation for the period from April 1, 2021 through March 31, 2022. The report concluded that the Program is appropriately designed and effectively implemented and that it meets the requirements of Rule 22e-4 and each Fund’s liquidity needs. Each Fund’s HLIM is set at an appropriate level and the Funds complied with their HLIM at all times during the reporting period.
95
Table of Contents
Other Fund information (Unaudited)
Delaware Corporate Bond Fund and
Delaware Extended Duration Bond Fund
Tax Information
The information set forth below is for the Fund’s fiscal year as required by federal income tax laws. Shareholders, however, must report distributions on a calendar year basis for income tax purposes, which may include distributions for portions of two fiscal years of the Fund.
Accordingly, the information needed by shareholders for income tax purposes will be sent to them in January of each year. Please consult your tax advisor for proper treatment of this information. All disclosures are based on financial information available as of the date of this annual report and, accordingly are subject to change. For any and all items requiring reporting, it is the intention of the Fund to report the maximum amount permitted under the Internal Revenue Code and the regulations thereunder.
For the fiscal year ended July 31, 2022, the Fund reports distributions paid during the year as follows:
| | (A) | | | | |
| | Long-Term | | (B) | | |
| | Capital Gains | | Ordinary Income | | Total |
| | Distributions | | Distributions | | Distributions |
| | (Tax Basis) | | (Tax Basis) | | (Tax Basis) |
| Delaware | | | | | | |
| Corporate Bond | | | | | | |
| Fund | | 15.68% | | 84.32% | | 100.00% |
| Delaware | | | | | | |
| Extended | | | | | | |
| Duration Bond | | | | | | |
| Fund | | 54.90% | | 45.10% | | 100.00% |
____________________
(A) and (B) are based on a percentage of each Fund's total distributions.
For the fiscal year ended July 31, 2022, certain interest income paid by each Fund determined to be Qualified Interest Income and Short-Term Capital Gains may be subject to relief from US withholding for foreign shareholders, as provided by the American Jobs Creation Act of 2004, and by the Tax Relief Unemployment Insurance Reauthorization and Job Creations Act of 2010, and as extended by the American Taxpayer Relief Act of 2012. Delaware Extended Duration Bond Fund did not have any foreign shareholders for the fiscal year ended July 31, 2022. For the fiscal year ended July 31, 2022, Delaware Corporate Bond Fund reported maximum distributions of Qualified Interest Income and Short-Term Capital Gains as follows:
| | Qualified Interest Income | | Qualified Short-Term Capital Gains |
| Delaware Corporate Bond | | | | |
| Fund | | $29,713,999 | | $5,043,417 |
96
Table of Contents
The percentage of the ordinary dividends reported by the funds that is treated as a Section 163(j) interest dividend and thus is eligible to be treated as interest income for purposes of Section 163(j) and the regulations thereunder is as follows:
| Delaware Corporate Bond Fund | | Delaware Extended Duration Bond Fund |
| 76.66% | | 92.41% |
97
Table of Contents
Board of trustees / directors and officers addendum
Delaware Funds by Macquarie®
A mutual fund is governed by a Board of Trustees/Directors (“Trustees”), which has oversight responsibility for the management of a fund’s business affairs. Trustees establish procedures and oversee and review the performance of the investment manager, the distributor, and others who perform services for the fund. The independent fund trustees, in particular, are advocates for shareholder interests. Each trustee has served in that capacity since he or she was elected to or appointed to the Board of Trustees, and will continue to serve until his or her retirement or the election of a new trustee in his or her place. The following is a list of the Trustees and Officers with certain background and related information.
| | | | | | | | | | Other |
| | | | | | Number of | | Principal | | Directorships |
| Name, | | Position(s) | | | | Funds in Fund | | Occupation(s) | | Held by Trustee |
| Address, | | Held with | | Length of Time | | Complex Overseen | | During the | | During the |
| and Birth Date | | the Trust | | Served | | by Trustee | | Past Five Years | | Past Five Years |
| Interested Trustee | | | | | | | | | | |
| | | | | | | | | | | |
| Shawn K. Lytle1 | | President, | | President and | | 128 | | Macquarie Asset | | None |
| 100 Independence | | Chief Executive | | Chief Executive | | | | Management2 | | |
| 610 Market Street | | Officer, | | Officer | | | | (2015–Present) | | |
| Philadelphia, PA | | and Trustee | | since August 2015 | | | | -Global Head of | | |
| 19106-2354 | | | | | | | | Macquarie Asset | | |
| February 1970 | | | | Trustee since | | | | Management | | |
| | | | September 2015 | | | | (2019–Present) | | |
| | | | | | | | -Head of Americas of | | |
| | | | | | | | Macquarie Group | | |
| | | | | | | | (2017–Present) | | |
| | | | | | | | -Deputy Global Head of | | |
| | | | | | | | Macquarie Asset | | |
| | | | | | | | Management | | |
| | | | | | | | (2017–2019) | | |
| | | | | | | | -Head of Macquarie | | |
| | | | | | | | Asset Management | | |
| | | | | | | | Americas (2015–2017) | | |
98
Table of Contents
| | | | | | | | | | Other |
| | | | | | Number of | | Principal | | Directorships |
| Name, | | Position(s) | | | | Funds in Fund | | Occupation(s) | | Held by Trustee |
| Address, | | Held with | | Length of Time | | Complex Overseen | | During the | | During the |
| and Birth Date | | the Trust | | Served | | by Trustee | | Past Five Years | | Past Five Years |
| Independent Trustees | | | | | | | | | | |
| | | | | | | | | | | |
| Jerome D. | | Trustee | | Since January 2019 | | 128 | | Stonebrook Capital | | None |
| Abernathy | | | | | | | | Management, LLC | | |
| 100 Independence | | | | | | | | (financial | | |
| 610 Market Street | | | | | | | | technology: macro | | |
| Philadelphia, PA | | | | | | | | factors and databases) | | |
| 19106-2354 | | | | | | | | -Managing Member | | |
| July 1959 | | | | | | | | (1993-Present) | | |
| | | | | | | | | | | |
| Thomas L. Bennett | | Chair and Trustee | | Trustee since March | | 128 | | Private Investor | | None |
| 100 Independence | | | | 2005 | | | | (2004–Present) | | |
| 610 Market Street | | | | | | | | | | |
| Philadelphia, PA | | | | Chair since March | | | | | | |
| 19106-2354 | | | | 2015 | | | | | | |
| October 1947 | | | | | | | | | | |
| | | | | | | | | | | |
| Ann D. Borowiec | | Trustee | | Since March 2015 | | 128 | | J.P. Morgan Chase & Co. | | Banco Santander International |
| 100 Independence | | | | | | | | (1987-2013) | | (2016–2019) |
| 610 Market Street | | | | | | | | -Chief Executive Officer, | | Santander Bank, N.A. |
| Philadelphia, PA | | | | | | | | Private Wealth | | (2016-2019) |
| 19106-2354 | | | | | | | | Management | | |
| November 1958 | | | | | | | | (2011–2013) | | |
99
Table of Contents
Board of trustees / directors and officers addendum
Delaware Funds by Macquarie®
| | | | | | | | | | Other |
| | | | | | Number of | | Principal | | Directorships |
| Name, | | Position(s) | | | | Funds in Fund | | Occupation(s) | | Held by Trustee |
| Address, | | Held with | | Length of Time | | Complex Overseen | | During the | | During the |
| and Birth Date | | the Trust | | Served | | by Trustee | | Past Five Years | | Past Five Years |
| | | | | | | | | | | |
| Joseph W. Chow | | Trustee | | Since January 2013 | | 128 | | Private Investor | | None |
| 100 Independence | | | | | | | | (2011–Present) | | |
| 610 Market Street | | | | | | | | | | |
| Philadelphia, PA | | | | | | | | | | |
| 19106-2354 | | | | | | | | | | |
| January 1953 | | | | | | | | | | |
| | | | | | | | | | | |
| H. Jeffrey Dobbs3 | | Trustee | | Since December 2021 | | 128 | | KPMG LLP | | TechAccel LLC |
| 100 Independence | | | | | | | | (2010-2015) | | (2015–Present) |
| 610 Market Street | | | | | | | | -Global Sector Chairman, | | PatientsVoices, Inc. |
| Philadelphia, PA | | | | | | | | Industrial Manufacturing | | (2018–Present) |
| 19106-2354 | | | | | | | | (2010-2015) | | Valparaiso University Board |
| May 1955 | | | | | | | | | | (2012-Present) |
| | | | | | | | | | Ivy Funds Complex (2019-2021) |
100
Table of Contents
| | | | | | | | | | Other |
| | | | | | Number of | | Principal | | Directorships |
| Name, | | Position(s) | | | | Funds in Fund | | Occupation(s) | | Held by Trustee |
| Address, | | Held with | | Length of Time | | Complex Overseen | | During the | | During the |
| and Birth Date | | the Trust | | Served | | by Trustee | | Past Five Years | | Past Five Years |
| | | | | | | | | | | |
| John A. Fry | | Trustee | | Since January 2001 | | 128 | | Drexel University | | Federal Reserve |
| 100 Independence | | | | | | | | -President | | Bank of Philadelphia |
| 610 Market Street | | | | | | | | (August 2010–Present) | | (2020–Present) |
| Philadelphia, PA | | | | | | | | | | FS Credit Real Estate Income |
| 19106-2354 | | | | | | | | | | Trust, Inc. (2018–Present) |
| May 1960 | | | | | | | | | | vTv Therapeutics Inc. |
| | | | | | | | | | (2017–Present) |
| | | | | | | | | | Community Health Systems |
| | | | | | | | | | (2004–Present) |
| | | | | | | | | | Drexel Morgan & Co. |
| | | | | | | | | | (2015–2019) |
101
Table of Contents
Board of trustees / directors and officers addendum
Delaware Funds by Macquarie®
| | | | | | | | | | Other |
| | | | | | Number of | | Principal | | Directorships |
| Name, | | Position(s) | | | | Funds in Fund | | Occupation(s) | | Held by Trustee |
| Address, | | Held with | | Length of Time | | Complex Overseen | | During the | | During the |
| and Birth Date | | the Trust | | Served | | by Trustee | | Past Five Years | | Past Five Years |
| | | | | | | | | | | |
| Joseph Harroz, Jr.3 | | Trustee | | Since December 2021 | | 128 | | University of Oklahoma | | OU Medicine, Inc. |
| 100 Independence | | | | | | | | -President | | (2020–Present) |
| 610 Market Street | | | | | | | | (2020–Present) | | Big 12 Athletic Conference |
| Philadelphia, PA | | | | | | | | -Interim President | | (2019-Present) |
| 19106-2354 | | | | | | | | (2019–2020) | | Valliance Bank |
| January 1967 | | | | | | | | -Vice President and | | (2007–Present) |
| | | | | | | | Dean, College of Law | | Ivy Funds |
| | | | | | | | (2010–2019) | | (1998-2021) |
| | | | | | | | Brookhaven Investments | | |
| | | | | | | | LLC (commercial | | |
| | | | | | | | enterprises) | | |
| | | | | | | | -Managing Member | | |
| | | | | | | | (2019–Present) | | |
| | | | | | | | St. Clair, LLC | | |
| | | | | | | | (commercial enterprises) | | |
| | | | | | | | -Managing Member | | |
| | | | | | | | (2019–Present) | | |
102
Table of Contents
| | | | | | | | | | Other |
| | | | | | Number of | | Principal | | Directorships |
| Name, | | Position(s) | | | | Funds in Fund | | Occupation(s) | | Held by Trustee |
| Address, | | Held with | | Length of Time | | Complex Overseen | | During the | | During the |
| and Birth Date | | the Trust | | Served | | by Trustee | | Past Five Years | | Past Five Years |
| | | | | | | | | | | |
| Sandra A.J. | | Trustee | | Since December 2021 | | 128 | | Children’s Mercy | | Brixmor Property Group Inc. |
| Lawrence3 | | | | | | | | Hospitals and Clinics | | (2021-Present) |
| 100 Independence | | | | | | | | (2005–2019) | | Sera Prognostics Inc. |
| 610 Market Street | | | | | | | | -Chief Administrative | | (biotechnology) (2021-Present) |
| Philadelphia, PA | | | | | | | | Officer | | Recology (resource recovery) |
| 19106-2354 | | | | | | | | (2016–2019) | | (2021-Present) |
| September 1957 | | | | | | | | | | Evergy, Inc., Kansas City Power |
| | | | | | | | | | & Light Company, KCP&L |
| | | | | | | | | | Greater Missouri Operations |
| | | | | | | | | | Company, Westar Energy, Inc. |
| | | | | | | | | | and Kansas Gas and Electric |
| | | | | | | | | | Company (related utility |
| | | | | | | | | | companies) (2018-Present) |
| | | | | | | | | | National Association of Corporate |
| | | | | | | | | | Directors (2017-Present) |
| | | | | | | | | | Ivy Funds Complex (2019-2021) |
| | | | | | | | | | American Shared Hospital |
| | | | | | | | | | Services (medical device) |
| | | | | | | | | | (2017-2021) |
| | | | | | | | | | Ivy NextShares (2019) |
| | | | | | | | | | Westar Energy (utility) |
| | | | | | | | | | (2004-2018) |
103
Table of Contents
Board of trustees / directors and officers addendum
Delaware Funds by Macquarie®
| | | | | | | | | | Other |
| | | | | | Number of | | Principal | | Directorships |
| Name, | | Position(s) | | | | Funds in Fund | | Occupation(s) | | Held by Trustee |
| Address, | | Held with | | Length of Time | | Complex Overseen | | During the | | During the |
| and Birth Date | | the Trust | | Served | | by Trustee | | Past Five Years | | Past Five Years |
| | | | | | | | | | | |
| Frances A. | | Trustee | | Since September | | 128 | | Banco Itaú International | | Florida Chapter of National |
| Sevilla-Sacasa | | | | 2011 | | | | -Chief Executive Officer | | Association of Corporate |
| 100 Independence | | | | | | | | (2012–2016) | | Directors (2021-Present) |
| 610 Market Street | | | | | | | | | | Callon Petroleum Company |
| Philadelphia, PA | | | | | | | | | | (2019-Present) |
| 19106-2354 | | | | | | | | | | Camden Property Trust |
| January 1956 | | | | | | | | | | (2011-Present) |
| | | | | | | | | | New Senior Investment |
| | | | | | | | | | Group Inc. (2021) |
| | | | | | | | | | Carrizo Oil & Gas, Inc. |
| | | | | | | | | | | (2018-2019) |
| | | | | | | | | | | |
| Thomas K. Whitford | | Trustee | | Since January 2013 | | 128 | | PNC Financial Services | | HSBC USA Inc. |
| 100 Independence | | | | | | | | Group (1983–2013) | | (2014–Present) |
| 610 Market Street | | | | | | | | -Vice Chairman | | HSBC North America |
| Philadelphia, PA | | | | | | | | (2009-2013) | | Holdings Inc. |
| 19106-2354 | | | | | | | | | | (2013–Present) |
| March 1956 | | | | | | | | | | HSBC Finance Corporation |
| | | | | | | | | | (2013–2018) |
104
Table of Contents
| | | | | | | | | | Other |
| | | | | | Number of | | Principal | | Directorships |
| Name, | | Position(s) | | | | Funds in Fund | | Occupation(s) | | Held by Trustee |
| Address, | | Held with | | Length of Time | | Complex Overseen | | During the | | During the |
| and Birth Date | | the Trust | | Served | | by Trustee | | Past Five Years | | Past Five Years |
| | | | | | | | | | | |
| Christianna Wood | | Trustee | | Since January 2019 | | 128 | | Gore Creek | | The Merger Fund |
| 100 Independence | | | | | | | | Capital, Ltd. | | (2013–2021), |
| 610 Market Street | | | | | | | | -Chief Executive Officer | | The Merger Fund VL |
| Philadelphia, PA | | | | | | | | and President | | (2013–2021), |
| 19106-2354 | | | | | | | | (2009–Present) | | WCM Alternatives: Event-Driven |
| August 1959 | | | | | | | | | | Fund (2013–2021), |
| | | | | | | | | | and WCM Alternatives: Credit |
| | | | | | | | | | Event Fund (2017–2021) |
| | | | | | | | | | Grange Insurance |
| | | | | | | | | | (2013–Present) |
| | | | | | | | | | H&R Block Corporation |
| | | | | | | | | | (2008–Present) |
105
Table of Contents
Board of trustees / directors and officers addendum
Delaware Funds by Macquarie®
| | | | | | | | | | Other |
| | | | | | Number of | | Principal | | Directorships |
| Name, | | Position(s) | | | | Funds in Fund | | Occupation(s) | | Held by Trustee |
| Address, | | Held with | | Length of Time | | Complex Overseen | | During the | | During the |
| and Birth Date | | the Trust | | Served | | by Trustee | | Past Five Years | | Past Five Years |
| | | | | | | | | | | |
| Janet L. Yeomans | | Trustee | | Since April 1999 | | 128 | | 3M Company | | Okabena Company (2009–2017) |
| 100 Independence | | | | | | | | (1995-2012) | | |
| 610 Market Street | | | | | | | | -Vice President and | | |
| Philadelphia, PA | | | | | | | | Treasurer (2006–2012) | | |
| 19106-2354 | | | | | | | | | | |
| July 1948 | | | | | | | | | | |
| | | | | | | | | | |
| Officers | | | | | | | | | | |
| | | | | | | | | | | |
| David F. Connor | | Senior Vice President, | | Senior Vice President, | | 128 | | David F. Connor has | | None4 |
| 100 Independence | | General Counsel, and | | since May 2013; | | | | served in various | | |
| 610 Market Street | | Secretary | | General Counsel | | | | capacities at different | | |
| Philadelphia, PA | | | | since May 2015; | | | | times at Macquarie Asset | | |
| 19106-2354 | | | | Secretary since | | | | Management. | | |
| December 1963 | | | | October 2005 | | | | | | |
| | | | | | | | | | | |
| Daniel V. Geatens | | Senior Vice President | | Senior Vice President | | 128 | | Daniel V. Geatens has | | None4 |
| 100 Independence | | and Treasurer | | and Treasurer since | | | | served in various | | |
| 610 Market Street | | | | October 2007 | | | | capacities at different | | |
| Philadelphia, PA | | | | | | | | times at Macquarie Asset | | |
| 19106-2354 | | | | | | | | Management. | | |
| October 1972 | | | | | | | | | | |
106
Table of Contents
| | | | | | | | | | Other |
| | | | | | Number of | | Principal | | Directorships |
| Name, | | Position(s) | | | | Funds in Fund | | Occupation(s) | | Held by Trustee |
| Address, | | Held with | | Length of Time | | Complex Overseen | | During the | | During the |
| and Birth Date | | the Trust | | Served | | by Trustee | | Past Five Years | | Past Five Years |
| | | | | | | | | | | |
| Richard Salus | | Senior Vice President | | Senior Vice President | | 128 | | Richard Salus has | | None |
| 100 Independence | | and Chief Financial | | and Chief Financial | | | | served in various | | |
| 610 Market Street | | Officer | | Officer since | | | | capacities at different | | |
| Philadelphia, PA | | | | November 2006 | | | | times at Macquarie Asset | | |
| 19106-2354 | | | | | | | | Management. | | |
| October 1963 | | | | | | | | | | |
| 1 | Shawn K. Lytle is considered to be an “Interested Trustee” because he is an executive officer of the Fund’s(s’) investment advisor. |
| 2 | Macquarie Asset Management is the marketing name for Macquarie Management Holdings, Inc. and its subsidiaries, including the Fund’s(s’) investment advisor, principal underwriter, and its transfer agent. |
| 3 | Messrs. Dobbs and Harroz and Ms. Lawrence were elected as Trustees of the Trust effective December 17, 2021. |
| 4 | David F. Connor and Daniel V. Geatens serve in similar capacities for the six portfolios of the Optimum Fund Trust, which have the same investment advisor, principal underwriter, and transfer agent as the registrant. Mr. Geatens also serves as the Chief Financial Officer of the Optimum Fund Trust and he is the Chief Financial Officer and Treasurer for Macquarie Global Infrastructure Total Return Fund Inc. |
The Statement of Additional Information for the Fund(s) includes additional information about the Trustees and Officers and is available, without charge, upon request by calling 800 523-1918.
107
Table of Contents
About the organization
| Board of trustees | | | | | | |
Shawn K. Lytle
President and
Chief Executive Officer
Delaware Funds
by Macquarie® Jerome D. Abernathy
Managing Member
Stonebrook Capital
Management, LLC Thomas L. Bennett
Chairman of the Board
Delaware Funds
by Macquarie
Private Investor | | Ann D. Borowiec
Former Chief Executive
Officer
Private Wealth Management
J.P. Morgan Chase & Co. Joseph W. Chow
Private Investor H. Jeffrey Dobbs
Former Global Sector
Chairman
Industrial Manufacturing,
KPMG, LLP | | John A. Fry
President
Drexel University Joseph Harroz, Jr.
President
University of Oklahoma Sandra A.J. Lawrence
Former Chief Administrative
Officer
Children's Mercy Hospitals
and Clinics | | Frances A.
Sevilla-Sacasa
Former Chief Executive
Officer
Banco Itaú International Thomas K. Whitford
Former Vice Chairman
PNC Financial Services
Group Christianna Wood
Chief Executive Officer
and President
Gore Creek Capital, Ltd. Janet L. Yeomans
Former Vice President and
Treasurer
3M Company |
| | | | | | | |
| Affiliated officers | | | | | | |
David F. Connor
Senior Vice President,
General Counsel,
and Secretary
Delaware Funds
by Macquarie | | Daniel V. Geatens
Senior Vice President and
Treasurer
Delaware Funds
by Macquarie | | Richard Salus
Senior Vice President and
Chief Financial Officer
Delaware Funds
by Macquarie | | |
| | | | | | | |
This annual report is for the information of Delaware Corporate Bond Fund and Delaware Extended Duration Bond Fund shareholders, but it may be used with prospective investors when preceded or accompanied by the Delaware Fund fact sheet for the most recently completed calendar quarter. These documents are available at delawarefunds.com/literature. |
Each Fund files its complete schedule of portfolio holdings with the Securities and Exchange Commission (SEC) for the first and third quarters of each fiscal year on Form N-PORT. Each Fund’s Forms N-PORT , as well as a description of the policies and procedures that the Funds use to determine how to vote proxies (if any) relating to portfolio securities, are available without charge (i) upon request, by calling 800 523-1918; and (ii) on the SEC’s website at sec.gov. In addition, a description of the policies and procedures that the Funds use to determine how to vote proxies (if any) relating to portfolio securities and the Schedule of Investments included in the Funds’ most recent Form N-PORT are available without charge on the Funds’ website at delawarefunds.com/literature. Each Fund's Forms N-PORT may be reviewed and copied at the SEC’s Public Reference Room in Washington, D.C.; information on the operation of the Public Reference Room may be obtained by calling 800 SEC-0330.
Information (if any) regarding how the Funds voted proxies relating to portfolio securities during the most recently disclosed 12-month period ended June 30 is available without charge (i) through the Funds' website at delawarefunds.com/proxy; and (ii) on the SEC’s website at sec.gov.
108
Table of Contents
Annual report
Fixed income mutual fund
Delaware Floating Rate Fund
July 31, 2022
Carefully consider the Fund's investment objectives, risk factors, charges, and expenses before investing. This and other information can be found in the Fund's prospectus and its summary prospectus, which may be obtained by visiting delawarefunds.com/literature or calling 800 523-1918. Investors should read the prospectus and the summary prospectus carefully before investing.
You can obtain shareholder reports and prospectuses online instead of in the mail.
Visit delawarefunds.com/edelivery.
Table of Contents
Experience Delaware Funds by Macquarie®
Macquarie Asset Management (MAM) is a global asset manager that aims to deliver positive impact for everyone. MAM Public Investments traces its roots to 1929 and partners with institutional and individual clients to deliver specialist active investment capabilities across global equities, fixed income, and multi-asset solutions using a conviction-based, long-term approach to investing. In the US, retail investors recognize our Delaware Funds by Macquarie family of funds as one of the oldest mutual fund families.
If you are interested in learning more about creating an investment plan, contact your financial advisor.
You can learn more about Delaware Funds or obtain a prospectus for Delaware Floating Rate Fund at delawarefunds.com/literature.
Manage your account online
| ● | Check your account balance and transactions |
| ● | View statements and tax forms |
| ● | Make purchases and redemptions |
Visit delawarefunds.com/account-access.
Macquarie Asset Management (MAM) is the asset management division of Macquarie Group. MAM is a full-service asset manager offering a diverse range of products across public and private markets including fixed income, equities, multi-asset solutions, private credit, infrastructure, renewables, natural assets, real estate, and asset finance. The Public Investments business is a part of MAM and includes the following investment advisers: Macquarie Investment Management Business Trust (MIMBT), Macquarie Funds Management Hong Kong Limited, Macquarie Investment Management Austria Kapitalanlage AG, Macquarie Investment Management Global Limited, Macquarie Investment Management Europe Limited, and Macquarie Investment Management Europe S.A.
The Fund is distributed by Delaware Distributors, L.P. (DDLP), an affiliate of MIMBT and Macquarie Group Limited.
Other than Macquarie Bank Limited ABN 46 008 583 542 ("Macquarie Bank"), any Macquarie Group entity noted in this document is not an authorized deposit-taking institution for the purposes of the Banking Act 1959 (Commonwealth of Australia). The obligations of these other Macquarie Group entities do not represent deposits or other liabilities of Macquarie Bank. Macquarie Bank does not guarantee or otherwise provide assurance in respect of the obligations of these other Macquarie Group entities. In addition, if this document relates to an investment, (a) the investor is subject to investment risk including possible delays in repayment and loss of income and principal invested and (b) none of Macquarie Bank or any other Macquarie Group entity guarantees any particular rate of return on or the performance of the investment, nor do they guarantee repayment of capital in respect of the investment.
The Fund is governed by US laws and regulations.
Unless otherwise noted, views expressed herein are current as of July 31, 2022, and subject to change for events occurring after such date.
The Fund is not FDIC insured and is not guaranteed. It is possible to lose the principal amount invested.
Advisory services provided by Delaware Management Company, a series of MIMBT, a US registered investment advisor.
All third-party marks cited are the property of their respective owners.
© 2022 Macquarie Management Holdings, Inc.
Table of Contents
| Portfolio management review | |
| Delaware Floating Rate Fund | July 31, 2022 (Unaudited) |
| Performance preview (for the year ended July 31, 2022) | | | | |
| Delaware Floating Rate Fund (Institutional Class shares) | | 1-year return | | -0.31% |
| Delaware Floating Rate Fund (Class A shares) | | 1-year return | | -0.56% |
| S&P/LSTA (Loan Syndications and Trading Association) Leveraged Loan | | | | |
| Index (benchmark) | | 1-year return | | -0.68% |
Past performance does not guarantee future results.
For complete, annualized performance for Delaware Floating Rate Fund, please see the table on page 4. Institutional Class shares are not subject to a sales charge and are offered for sale exclusively to certain eligible investors. In addition, Institutional Class shares pay no distribution and service fee.
The performance of Class A shares excludes the applicable sales charge. The performance of both Institutional Class shares and Class A shares reflects the reinvestment of all distributions.
Please see page 7 for a description of the index. Index performance returns do not reflect any management fees, transaction costs, or expenses. Indices are unmanaged and one cannot invest directly in an index.
Investment objective
The Fund seeks high current income and, secondarily, long-term total return.
Market review
The fiscal year ended July 31, 2022, comprised two distinct periods. During the weeks from late 2021 through early 2022, investors’ primary focus was on anticipated short-term interest rate increases by the US Federal Reserve. Just as we have seen previously during similar types of market conditions, floating rate loans performed well on both an absolute and relative basis by outperforming other parts of the fixed income market during this time period.
Geopolitical risks increased significantly following the Russian invasion of Ukraine, leading to heightened volatility within the equity markets and widening credit spreads in high yield bonds and loans. During this period from late February through fiscal year end, as increased volatility worked its way throughout capital markets, loans had negative absolute performance but performed well relative to most other pockets of the fixed income and equity markets.
For the full fiscal period, the Fund's index had a -0.68% return versus high single-digit
During the Fund’s fiscal year:
| ● | The Fund’s overweight to BBB-rated and BB-rated loans, the higher-quality part of the loan market, contributed to performance. |
| | |
| ● | The utilities and airlines sectors were the leading contributors to performance. |
| | |
| ● | The main detractor from performance was the Fund's minor allocation to high yield and investment grade bonds, both out-of-benchmark sectors. |
| | |
| ● | An underweight to the strong-performing oil and gas sector also detracted from the Fund's relative performance. |
1
Table of Contents
Portfolio management review
Delaware Floating Rate Fund
declines in high yield and more severe declines in equity prices.
Source: Bloomberg.
Within the Fund
For the fiscal year ended July 31, 2022, Delaware Floating Rate Fund outperformed its benchmark, the S&P/LSTA Leveraged Loan Index. The Fund’s Institutional Class shares declined 0.31%. The Fund’s Class A shares declined 0.56% at net asset value and declined 3.26% at maximum offer price. These figures reflect all distributions reinvested. The Fund’s benchmark declined 0.68% during the period. For complete, annualized performance of Delaware Floating Rate Fund, please see the table on page 4.
Regardless of the market’s macro-level conditions, we manage the Fund based on fundamental bottom-up security selection. Coming into the 12-month period, we were more positive on fundamentals overall than we were at the Fund's fiscal year end. The increased cautiousness of our positioning was a result of heightened geopolitical tensions, increased global inflationary pressures, continuing supply chain problems across many industries, and reduced forward-looking guidance by a large number of companies.
Despite these heightened risk conditions, we believe fundamentals should generally continue to be constructive for most issuers we invest in, as years of friendly capital markets have allowed for robust levels of refinancing. As a result, balance sheets are healthy and default expectations remain below historical averages. However, in our view, credit selection will likely be critical to navigating an environment in which there will be winners and losers.
For public filers within the S&P/LSTA Leveraged Loan Index, first-quarter 2022 earnings before interest, taxes, depreciation, and amortization (EBITDA) increased 15% year over year, after an 8% rise in the fourth quarter of 2021. Though, it is noteworthy that earnings growth came with most issuers experiencing margin pressures caused by increasing input costs. The S&P/LSTA Leveraged Loan Index’s default rate finished the period ended July 31, 2022, near a 10-year low of 0.3%.
Market forecasters expect default rates to be in the 1-2% range over the next 12 months, and we are positioning accordingly. We have upgraded the quality of the portfolio during the period and are focusing our positioning on the BB-rated and B-rated quality sectors, with a preference for more economically defensive industries. We believe this approach to positioning can allow an investor to carry a competitive yield while also somewhat protecting against fundamental volatility from the changing economic environment.
The Fund’s overweight to BBB-rated and BB-rated loans, the higher-quality part of the loan market, contributed to performance as these loans outperformed lower-quality loans. Likewise, we avoided the distressed part of the market – loans with weak fundamental prospects that are trading at less than 80 cents on the dollar. During the period, CCC-rated loans were the weakest-performing segment of the asset class. We think it is important to recognize that there are fundamentally well-performing CCC-rated and distressed CCC-rated loans that are not up to our credit underwriting standards. While the Fund did have some exposure to the higher-quality CCC-rated loans, it benefited from not participating in the distressed part of the market.
The utilities and airlines sectors were the leading contributors to performance. As the
2
Table of Contents
Fund moved to a more defensive market exposure, it established a sizable overweight in utilities, a sector in which security selection also contributed. Power producers Hamilton Projects Acquiror LLC and Panda Stonewall both performed well during the period.
The Fund was overweight in airlines, a sector where we also had good security selection. We viewed airlines favorably because we expected demand for airline travel to rebound strongly during the period, which it did. Consequently, United Airlines Holdings Inc. and Delta Air Lines Inc. both did well.
The main detractor from performance was the Fund’s minor allocation to high yield and investment grade bonds, both out-of-benchmark sectors. Those markets had weaker performance than loans overall. The Fund’s investment grade bonds declined roughly 7% while high yield holdings declined 5% overall.
Among sectors, chemicals performed the poorest. Along with the Fund’s overweight to the sector, security selection also detracted from performance. The largest individual detractors were Vibrantz Technologies Inc. and Hexion Inc. Although the Fund still owns both, we reduced exposure to each over the period. Vibrantz declined when the company announced disappointing quarterly results and reduced its forward guidance. Additionally, its manufacturing facility in Shanghai, China, was closed for an extended period due to COVID-19 restrictions. Those factors combined to make it the Fund’s weakest-performing position. Hexion detracted from performance largely because of deteriorating investor sentiment within the chemicals sector.
The automotive sector likewise performed poorly. The Fund’s one automotive holding, Wheel Pros LLC, released disappointing financial results, which led us to sell the position during the fiscal period.
An underweight to the strong-performing oil and gas sector also detracted from the Fund’s relative performance. During the period, the riskier part of the oil and gas sector outperformed during the quarter, and the Fund had exposure to a higher-quality mix of assets compared with the overall sector. Although the Fund had positive absolute performance within this sector, it lagged the benchmark significantly.
While we have gotten more cautious and have upgraded the credit quality of the portfolio this period, we consider the Fund’s positioning to be fundamentally appropriate. We are fundamentally based, bottom-up investors. We are focused on investing in companies with strong balance sheets and free cash flow dynamics that we think should allow them to withstand the fundamental and macro headwinds that our issuers are experiencing.
The Fund used foreign currency exchange contracts to hedge the US dollar value of securities denominated in foreign currencies to increase exposure to those currencies. Their effect was not material to Fund performance.
3
Table of Contents
| Performance summary | |
| Delaware Floating Rate Fund | July 31, 2022 (Unaudited) |
The performance quoted represents past performance and does not guarantee future results. Investment return and principal value of an investment will fluctuate so that shares, when redeemed, may be worth more or less than their original cost. Current performance may be lower or higher than the performance quoted. Performance data current to the most recent month end may be obtained by calling 800 523-1918 or visiting delawarefunds.com/performance.
| Fund and benchmark performance1,2 | | Average annual total returns through July 31, 2022 |
| | 1 year | | 5 year | | 10 year | | Lifetime |
| Class A (Est. February 26, 2010) | | | | | | | | | | | | | | | | | | | | |
| Excluding sales charge | | | -0.56 | % | | | | +3.16 | % | | | | +2.45 | % | | | | +2.49 | % | |
| Including sales charge | | | -3.26 | % | | | | +2.58 | % | | | | +2.16 | % | | | | +2.26 | % | |
| Class C (Est. February 26, 2010) | | | | | | | | | | | | | | | | | | | | |
| Excluding sales charge | | | -1.30 | % | | | | +2.39 | % | | | | +1.68 | % | | | | +1.73 | % | |
| Including sales charge | | | -2.26 | % | | | | +2.39 | % | | | | +1.68 | % | | | | +1.73 | % | |
| Class R (Est. February 26, 2010) | | | | | | | | | | | | | | | | | | | | |
| Excluding sales charge | | | -0.92 | % | | | | +2.87 | % | | | | +2.18 | % | | | | +2.22 | % | |
| Including sales charge | | | -0.92 | % | | | | +2.87 | % | | | | +2.18 | % | | | | +2.22 | % | |
| Institutional Class (Est. February 26, 2010) | | | | | | | | | | | | | | | | | | | | |
| Excluding sales charge | | | -0.31 | % | | | | +3.41 | % | | | | +2.70 | % | | | | +2.74 | % | |
| Including sales charge | | | -0.31 | % | | | | +3.41 | % | | | | +2.70 | % | | | | +2.74 | % | |
| Class R6 (Est. August 31, 2021) | | | | | | | | | | | | | | | | | | | | |
| Excluding sales charge | | | — | | | | | — | | | | | — | | | | | -0.69 | % | |
| Including sales charge | | | — | | | | | — | | | | | — | | | | | -0.69 | % | |
| S&P/LSTA Leveraged Loan Index | | | -0.68 | % | | | | +3.21 | % | | | | +3.84 | % | | | | +4.29 | %* | |
| * | The benchmark lifetime return is for Institutional Class share comparison only and is calculated using the last business day in the month of the Fund’s Institutional Class inception date. |
| 1 | Returns reflect the reinvestment of all distributions and are presented both with and without the applicable sales charges described below. Returns do not reflect the deduction of taxes the shareholder would pay on Fund distributions or redemptions of Fund shares. |
Expense limitations were in effect for certain classes during some or all of the periods shown in the “Fund and benchmark performance” table. Expenses for each class are listed in the “Fund expense ratios” table on page 6. Performance would have been lower had expense limitations not been in effect.
Institutional Class shares are not subject to a sales charge and are offered for sale exclusively to certain eligible investors. In addition, Institutional Class shares pay no distribution and service (12b-1) fee.
Class A shares are sold with a maximum front-end sales charge of 2.75%, and have an annual 12b-1 fee of 0.25% of average daily net assets. Performance for Class A shares,
4
Table of Contents
excluding sales charges, assumes that no front-end sales charge applied.
Class C shares are sold with a contingent deferred sales charge (CDSC) of 1.00% if redeemed during the first 12 months of purchase. They are also subject to an annual 12b-1 fee of 1.00% of average daily net assets. Performance for Class C shares, excluding sales charges, assumes either that CDSCs did not apply or that the investment was not redeemed.
Class R shares are available only for certain retirement plan products. They are sold without a sales charge and have an annual 12b-1 fee of 0.50% of average daily net assets.
Class R6 shares commenced operations on August 31, 2021. They are not subject to a sales charge. In addition, Class R6 shares pay no 12b-1 fee.
Fixed income securities and bond funds can lose value, and investors can lose principal, as interest rates rise. They also may be affected by economic conditions that hinder an issuer’s ability to make interest and principal payments on its debt. This includes prepayment risk, the risk that the principal of a bond that is held by a portfolio will be prepaid prior to maturity, at the time when interest rates are lower than what the bond was paying. A portfolio may then have to reinvest that money at a lower interest rate.
High yielding, non-investment-grade bonds (junk bonds) involve higher risk than investment grade bonds. The high yield secondary market is particularly susceptible to liquidity problems when institutional investors, such as mutual funds and certain other financial institutions, temporarily stop buying bonds for regulatory, financial, or other reasons. In addition, a less liquid secondary market makes it more difficult to obtain precise valuations of the high yield securities.
The Fund may invest in derivatives, which may involve additional expenses and are subject to risk, including the risk that an underlying security or securities index moves in the opposite direction from what the portfolio manager anticipated. A derivatives transaction depends upon the counterparties’ ability to fulfill their contractual obligations.
International investments entail risks including fluctuation in currency values, differences in accounting principles, or economic or political instability. Investing in emerging markets can be riskier than investing in established foreign markets due to increased volatility, lower trading volume, and higher risk of market closures. In many emerging markets, there is substantially less publicly available information and the available information may be incomplete or misleading. Legal claims are generally more difficult to pursue.
Investments may not receive payment of principal, interest, and other amounts due in connection with bank loans and other direct indebtedness because they primarily depend on the financial conditions of the borrower and lending institution. The Fund may experience portfolio turnover in excess of 100%, which could result in higher transaction costs and tax liability.
IBOR risk is the risk that changes related to the use of the London interbank offered rate (LIBOR) or similar rates (such as EONIA) could have adverse impacts on financial instruments that reference these rates. The abandonment of these rates and transition to alternative rates could affect the value and liquidity of instruments that reference them and could affect investment strategy performance.
5
Table of Contents
Performance summary
Delaware Floating Rate Fund
The disruptions caused by natural disasters, pandemics, or similar events could prevent the Fund from executing advantageous investment decisions in a timely manner and could negatively impact the Fund’s ability to achieve its investment objective and the value of the Fund’s investments.
| 2 | The Fund’s expense ratios, as described in the most recent prospectus, are disclosed in the following “Fund expense ratios” table. The expense ratios below may differ from the expense ratios in the "Financial highlights" since they are based on different time periods and the expense ratios in the prospectus include acquired fund fees and expenses, if any. See Note 2 in "Notes to financial statements" for additional details. Please see the most recent prospectus and any applicable supplement(s) for additional information on these fee waivers and/or reimbursements. Please see the “Financial highlights” section in this report for the most recent expense ratios. |
| | | | | | | | Institutional | | |
| Fund expense ratios | | Class A | | Class C | | Class R | | Class | | Class R6 |
| Total annual operating expenses | | | | | | | | | | |
| (without fee waivers) | | 1.05% | | 1.80% | | 1.30% | | 0.80% | | 0.73% |
| Net expenses (including fee | | | | | | | | | | |
| waivers, if any) | | 0.94% | | 1.69% | | 1.19% | | 0.69% | | 0.62% |
| Type of waiver | | Contractual | | Contractual | | Contractual | | Contractual | | Contractual |
6
Table of Contents
Performance of a $10,000 investment1
For the period July 31, 2012 through July 31, 2022
| | | Starting value | | Ending value |
 | S&P/LSTA Leveraged Loan Index | | | $ | 10,000 | | | | $ | 14,582 | |
 | Delaware Floating Rate Fund — Institutional Class shares | | | $ | 10,000 | | | | $ | 13,054 | |
 | Delaware Floating Rate Fund — Class A shares | | | $ | 9,725 | | | | $ | 12,387 | |
| 1 | The “Performance of a $10,000 investment” graph assumes $10,000 invested in Institutional Class and Class A shares of the Fund on July 31, 2012, and includes the effect of a 2.75% front-end sales charge (for Class A shares) and the reinvestment of all distributions. The graph does not reflect the deduction of taxes the shareholders would pay on Fund distributions or redemptions of Fund shares. Expense limitations were in effect for some or all of the periods shown. Performance would have been lower had expense limitations not been in effect. Expenses are listed in the “Fund expense ratios” table on page 6. Please note additional details on pages 4 through 8. |
The graph also assumes $10,000 invested in the S&P/LSTA Leveraged Loan Index as of July 31, 2012. The S&P/LSTA Leveraged Loan Index is a broad index designed to reflect the market-value-weighted performance of US dollar-denominated institutional leveraged loans.
Index performance returns do not reflect any management fees, transaction costs, or expenses. Indices are unmanaged and one cannot invest directly in an index.
Past performance does not guarantee future results.
Performance of other Fund classes will vary due to different charges and expenses.
7
Table of Contents
Performance summary
Delaware Floating Rate Fund
| | Nasdaq symbols | | CUSIPs |
| Class A | | DDFAX | | 245908660 |
| Class C | | DDFCX | | 245908652 |
| Class R | | DDFFX | | 245908645 |
| Institutional Class | | DDFLX | | 245908637 |
| Class R6 | | DDFZX | | 245908595 |
8
Table of Contents
Disclosure of Fund expenses
For the six-month period from February 1, 2022 to July 31, 2022 (Unaudited)
As a shareholder of the Fund, you incur two types of costs: (1) transaction costs, including sales charges (loads) on purchase payments, reinvested dividends, or other distributions; redemption fees; and exchange fees; and (2) ongoing costs, including management fees; distribution and service (12b-1) fees; and other Fund expenses. This example is intended to help you understand your ongoing costs (in dollars) of investing in the Fund and to compare these costs with the ongoing costs of investing in other mutual funds.
The example is based on an investment of $1,000 invested at the beginning of the period and held for the entire six-month period from February 1, 2022 to July 31, 2022.
Actual expenses
The first section of the table shown, “Actual Fund return,” provides information about actual account values and actual expenses. You may use the information in this section of the table, together with the amount you invested, to estimate the expenses that you paid over the period. Simply divide your account value by $1,000 (for example, an $8,600 account value divided by $1,000 = 8.6), then multiply the result by the number in the first section under the heading entitled “Expenses Paid During Period” to estimate the expenses you paid on your account during the period.
Hypothetical example for comparison purposes
The second section of the table shown, “Hypothetical 5% return,” provides information about hypothetical account values and hypothetical expenses based on the Fund’s actual expense ratio and an assumed rate of return of 5% per year before expenses, which is not the Fund’s actual return. The hypothetical account values and expenses may not be used to estimate the actual ending account balance or expenses you paid for the period. You may use this information to compare the ongoing costs of investing in the Fund and other funds. To do so, compare this 5% hypothetical example with the 5% hypothetical examples that appear in the shareholder reports of the other funds.
Please note that the expenses shown in the table are meant to highlight your ongoing costs only and do not reflect any transactional costs, such as sales charges (loads), redemption fees, or exchange fees. Therefore, the second section of the table is useful in comparing ongoing costs only, and will not help you determine the relative total costs of owning different funds. In addition, if these transactional costs were included, your costs would have been higher. The Fund's expenses shown in the table reflect fee waivers in effect and assume reinvestment of all dividends and distributions.
9
Table of Contents
Disclosure of Fund expenses
For the six-month period from February 1, 2022 to July 31, 2022 (Unaudited)
Delaware Floating Rate Fund
Expense analysis of an investment of $1,000
| | Beginning | | Ending | | | | Expenses |
| | Account Value | | Account Value | | Annualized | | Paid During Period |
| | 2/1/22 | | 7/31/22 | | Expense Ratio | | 2/1/22 to 7/31/22* |
| Actual Fund return† | | | | | | | | | | | | | | | | |
| Class A | | | $ | 1,000.00 | | | | $974.70 | | | 0.86% | | | $ | 4.21 | |
| Class C | | | | 1,000.00 | | | | 971.00 | | | 1.61% | | | | 7.87 | |
| Class R | | | | 1,000.00 | | | | 972.30 | | | 1.11% | | | | 5.43 | |
| Institutional Class | | | | 1,000.00 | | | | 975.90 | | | 0.61% | | | | 2.99 | |
| Class R6 | | | | 1,000.00 | | | | 975.10 | | | 0.54% | | | | 2.64 | |
| Hypothetical 5% return (5% return before expenses) | | | | | | | | |
| Class A | | | $ | 1,000.00 | | | | $1,020.53 | | | 0.86% | | | $ | 4.31 | |
| Class C | | | | 1,000.00 | | | | 1,016.81 | | | 1.61% | | | | 8.05 | |
| Class R | | | | 1,000.00 | | | | 1,019.29 | | | 1.11% | | | | 5.56 | |
| Institutional Class | | | | 1,000.00 | | | | 1,021.77 | | | 0.61% | | | | 3.06 | |
| Class R6 | | | | 1,000.00 | | | | 1,022.12 | | | 0.54% | | | | 2.71 | |
| * | “Expenses Paid During Period” are equal to the Fund's annualized expense ratio, multiplied by the average account value over the period, multiplied by 181/365 (to reflect the one-half year period). |
| † | Because actual returns reflect only the most recent six-month period, the returns shown may differ significantly from fiscal year returns. |
In addition to the Fund's expenses reflected above, the Fund also indirectly bears its portion of the fees and expenses of any investment companies (Underlying Funds) in which it invests. The table above does not reflect the expenses of any Underlying Funds.
10
Table of Contents
| Security type / sector allocation | |
| Delaware Floating Rate Fund | As of July 31, 2022 (Unaudited) |
Sector designations may be different from the sector designations presented in other Fund materials. The sector designations may represent the investment manager’s internal sector classifications.
| Security type / sector | Percentage of net assets |
| Convertible Bond | | 0.02 | % | |
| Corporate Bonds | | 4.77 | % | |
| Banking | | 0.30 | % | |
| Basic Industry | | 0.21 | % | |
| Capital Goods | | 0.38 | % | |
| Communications | | 0.44 | % | |
| Consumer Cyclical | | 0.89 | % | |
| Consumer Non-Cyclical | | 0.61 | % | |
| Electric | | 0.20 | % | |
| Energy | | 0.52 | % | |
| Financial Services | | 0.24 | % | |
| Insurance | | 0.06 | % | |
| Media | | 0.54 | % | |
| Technology | | 0.31 | % | |
| Utilities | | 0.07 | % | |
| Loan Agreements | | 87.83 | % | |
| Common Stock | | 0.01 | % | |
| Exchange-Traded Funds | | 2.60 | % | |
| Municipal Bond | | 0.07 | % | |
| Short-Term Investments | | 6.21 | % | |
| Total Value of Securities | | 101.51 | % | |
| Liabilities Net of Receivables and Other Assets | | (1.51 | %) | |
| Total Net Assets | | 100.00 | % | |
11
Table of Contents
| Schedule of investments | |
| Delaware Floating Rate Fund | July 31, 2022 |
| | | | Principal | | | |
| | | amount° | | Value (US $) |
| Convertible Bond – 0.02% | | | | | |
| Spirit Airlines 1.00% exercise price $49.07, maturity date | | | | | |
| 5/15/26 | | 219,000 | | $ | 198,086 |
| Total Convertible Bond (cost $190,410) | | | | | 198,086 |
| | |
| Corporate Bonds – 4.77% | | | | | |
| Banking – 0.30% | | | | | |
| Bank of America 4.375% 1/27/27 µ, ψ | | 1,000,000 | | | 910,000 |
| Barclays 6.125% 12/15/25 µ, ψ | | 200,000 | | | 193,110 |
| Deutsche Bank 6.00% 10/30/25 µ, ψ | | 200,000 | | | 174,000 |
| SVB Financial Group 4.10% 2/15/31 µ, ψ | | 75,000 | | | 58,702 |
| US Bancorp 2.215% 1/27/28 µ | | 1,000,000 | | | 934,531 |
| | | | | | 2,270,343 |
| Basic Industry – 0.21% | | | | | |
| Freeport-McMoRan 5.45% 3/15/43 | | 200,000 | | | 187,740 |
| Novelis 144A 3.25% 11/15/26 # | | 1,500,000 | | | 1,398,233 |
| | | | | | 1,585,973 |
| Capital Goods – 0.38% | | | | | |
| Granite US Holdings 144A 11.00% 10/1/27 # | | 325,000 | | | 303,079 |
| Sealed Air 144A 5.00% 4/15/29 # | | 1,000,000 | | | 991,400 |
| TransDigm 144A 6.25% 3/15/26 # | | 1,500,000 | | | 1,509,772 |
| | | | | | 2,804,251 |
| Communications – 0.44% | | | | | |
| Altice France 144A 5.50% 10/15/29 # | | 1,500,000 | | | 1,291,875 |
| Directv Financing 144A 5.875% 8/15/27 # | | 500,000 | | | 466,677 |
| Frontier Communications Holdings 144A 8.75% 5/15/30 # | | 1,000,000 | | | 1,063,445 |
| Gray Escrow II 144A 5.375% 11/15/31 # | | 500,000 | | | 442,453 |
| | | | | | 3,264,450 |
| Consumer Cyclical – 0.89% | | | | | |
| Aramark Services 144A 6.375% 5/1/25 # | | 1,500,000 | | | 1,504,620 |
| Carnival | | | | | |
| 144A 5.75% 3/1/27 # | | 20,000 | | | 16,088 |
| 144A 6.00% 5/1/29 # | | 525,000 | | | 405,521 |
| 144A 7.625% 3/1/26 # | | 1,230,000 | | | 1,061,416 |
| Dana Financing Luxembourg 144A 5.75% 4/15/25 # | | 1,500,000 | | | 1,479,427 |
| Delta Air Lines | | | | | |
| 144A 7.00% 5/1/25 # | | 527,000 | | | 551,028 |
| 7.375% 1/15/26 | | 138,000 | | | 145,086 |
| Ford Motor Credit 2.90% 2/16/28 | | 500,000 | | | 434,577 |
| Royal Caribbean Cruises 144A 5.50% 4/1/28 # | | 1,000,000 | | | 752,145 |
12
Table of Contents
| | | | Principal | | | |
| | | amount° | | Value (US $) |
| Corporate Bonds (continued) | | | | | |
| Consumer Cyclical (continued) | | | | | |
| United Airlines Holdings 4.875% 1/15/25 | | 320,000 | | $ | 306,453 |
| | | | | | 6,656,361 |
| Consumer Non-Cyclical – 0.61% | | | | | |
| CHS 144A 5.25% 5/15/30 # | | 1,000,000 | | | 842,680 |
| Encompass Health 4.625% 4/1/31 | | 2,000,000 | | | 1,797,910 |
| Hadrian Merger Sub 144A 8.50% 5/1/26 # | | 122,000 | | | 116,112 |
| HCA | | | | | |
| 3.50% 9/1/30 | | 100,000 | | | 91,415 |
| 5.875% 2/1/29 | | 156,000 | | | 163,539 |
| Medline Borrower 144A 3.875% 4/1/29 # | | 500,000 | | | 452,585 |
| Organon & Co. 144A 5.125% 4/30/31 # | | 320,000 | | | 299,994 |
| Surgery Center Holdings 144A 10.00% 4/15/27 # | | 350,000 | | | 357,171 |
| Tenet Healthcare 6.875% 11/15/31 | | 409,000 | | | 395,190 |
| | | | | | 4,516,596 |
| Electric – 0.20% | | | | | |
| Calpine 144A 5.25% 6/1/26 # | | 1,500,000 | | | 1,515,030 |
| | | | | | 1,515,030 |
| Energy – 0.52% | | | | | |
| Callon Petroleum 144A 7.50% 6/15/30 # | | 2,000,000 | | | 1,920,539 |
| CNX Resources 144A 7.25% 3/14/27 # | | 180,000 | | | 182,480 |
| Hilcorp Energy I | | | | | |
| 144A 6.00% 2/1/31 # | | 305,000 | | | 280,505 |
| 144A 6.25% 4/15/32 # | | 698,000 | | | 629,814 |
| Occidental Petroleum 4.40% 8/15/49 | | 1,000,000 | | | 836,074 |
| Targa Resources Partners 4.00% 1/15/32 | | 25,000 | | | 22,344 |
| | | | | | 3,871,756 |
| Financial Services – 0.24% | | | | | |
| AerCap Holdings 5.875% 10/10/79 µ | | 150,000 | | | 133,344 |
| Castlelake Aviation Finance DAC 144A 5.00% 4/15/27 # | | 475,000 | | | 400,241 |
| DAE Sukuk DIFC 144A 3.75% 2/15/26 # | | 400,000 | | | 380,124 |
| VistaJet Malta Finance 144A 6.375% 2/1/30 # | | 1,000,000 | | | 872,760 |
| | | | | | 1,786,469 |
| Insurance – 0.06% | | | | | |
| HUB International 144A 5.625% 12/1/29 # | | 500,000 | | | 443,619 |
| | | | | | 443,619 |
| Media – 0.54% | | | | | |
| CCO Holdings 144A 4.50% 8/15/30 # | | 1,000,000 | | | 890,640 |
| CMG Media 144A 8.875% 12/15/27 # | | 417,000 | | | 334,744 |
13
Table of Contents
Schedule of investments
Delaware Floating Rate Fund
| | | | Principal | | | |
| | | amount° | | Value (US $) |
| Corporate Bonds (continued) | | | | | |
| Media (continued) | | | | | |
| Radiate Holdco 144A 4.50% 9/15/26 # | | 1,500,000 | | $ | 1,390,050 |
| Sirius XM Radio 144A 3.125% 9/1/26 # | | 1,500,000 | | | 1,417,740 |
| | | | | | 4,033,174 |
| Technology – 0.31% | | | | | |
| Boxer Parent 144A 9.125% 3/1/26 # | | 165,000 | | | 158,031 |
| Entegris Escrow | | | | | |
| 144A 4.75% 4/15/29 # | | 1,000,000 | | | 965,000 |
| 144A 5.95% 6/15/30 # | | 1,000,000 | | | 993,810 |
| New Cotai 5.00% 2/2/27 | | 222,415 | | | 202,318 |
| | | | | | 2,319,159 |
| Utilities – 0.07% | | | | | |
| Vistra 144A 7.00% 12/15/26 #, µ, ψ | | 550,000 | | | 512,240 |
| | | | | | 512,240 |
| Total Corporate Bonds (cost $37,254,241) | | | | | 35,579,421 |
| |
| Loan Agreements – 87.83% | | | | | |
| Acrisure 1st Lien 6.622% (LIBOR01M + 4.25%) 2/15/27 ● | | 820,875 | | | 794,197 |
| Acrisure Tranche B 5.872% (LIBOR01M + 3.50%) | | | | | |
| 2/15/27 ● | | 1,090,956 | | | 1,042,408 |
| Advantage Sales & Marketing Tranche B-1 6.166% | | | | | |
| (LIBOR02M + 4.50%) 10/28/27 ● | | 5,076,989 | | | 4,807,909 |
| Air Canada 4.25% (LIBOR03M + 3.50%) 8/11/28 ● | | 3,150,000 | | | 3,039,750 |
| Amentum Government Services Holdings Tranche | | | | | |
| 3 5.163% (SOFR03M + 3.00%) 2/15/29 ● | | 10,870,000 | | | 10,521,258 |
| AmWINS Group 4.622% (LIBOR01M + 2.25%) 2/19/28 ● | | 6,298,112 | | | 6,119,800 |
| Amynta Agency Borrower Tranche B 1st Lien 6.872% | | | | | |
| (LIBOR01M + 4.50%) 2/28/25 ● | | 4,987,016 | | | 4,829,092 |
| Ankura Consulting Group 1st Lien 6.941% (SOFR01M + | | | | | |
| 4.50%) 3/17/28 ● | | 3,981,301 | | | 3,832,003 |
| Applied Systems 2nd Lien 7.75% (LIBOR03M + 5.50%) | | | | | |
| 9/19/25 ● | | 10,322,369 | | | 10,121,083 |
| Arches Buyer 5.622% (LIBOR01M + 3.25%) 12/6/27 ● | | 2,969,697 | | | 2,739,545 |
| Aruba Investments Holdings 1st Lien 6.259% (LIBOR01M | | | | | |
| + 3.75%) 11/24/27 ● | | 1,244,297 | | | 1,163,418 |
| Aruba Investments Holdings 2nd Lien 10.009% | | | | | |
| (LIBOR01M + 7.75%) 11/24/28 ● | | 1,260,000 | | | 1,171,800 |
| Asplundh Tree Expert 3.769% (LIBOR01M + 1.75%) | | | | | |
| 9/7/27 ● | | 2,369,589 | | | 2,319,235 |
14
Table of Contents
| | | | Principal | | | |
| | | amount° | | Value (US $) |
| Loan Agreements (continued) | | | | | |
| AssuredPartners | | | | | |
| 5.519% (LIBOR01M + 3.50%) 2/12/27 ● | | 1,241,976 | | $ | 1,186,864 |
| 5.872% (LIBOR01M + 3.50%) 2/12/27 ● | | 5,627,144 | | | 5,373,923 |
| AthenaHealth 5.653% (SOFR01M + 3.50%) 2/15/29 ● | | 6,284,783 | | | 6,006,681 |
| Avantor Funding Tranche B-5 4.622% (LIBOR01M + | | | | | |
| 2.25%) 11/8/27 ● | | 1,844,623 | | | 1,814,839 |
| Azurity Pharmaceuticals Tranche B 1st Lien 8.313% | | | | | |
| (LIBOR01M + 6.00%) 9/20/27 ● | | 1,837,875 | | | 1,635,709 |
| Bausch & Lomb 5.174% (SOFR01M + 2.25%) 5/10/27 ● | | 11,000,000 | | | 10,456,875 |
| Bausch Health 7.174% (SOFR01M + 5.25%) 2/1/27 ● | | 7,700,000 | | | 6,496,875 |
| Berry Global Tranche Z 4.178% (LIBOR03M + 1.75%) | | | | | |
| 7/1/26 ● | | 5,000,000 | | | 4,926,135 |
| BMC Software 6.122% (LIBOR01M + 3.75%) 10/2/25 ● | | 4,474,241 | | | 4,320,748 |
| BMC Software 2nd Lien 7.872% (LIBOR01M + 5.50%) | | | | | |
| 2/27/26 ● | | 1,440,000 | | | 1,345,200 |
| BW Gas & Convenience Holdings Tranche B 5.872% | | | | | |
| (LIBOR01M + 3.50%) 3/31/28 ● | | 5,525,634 | | | 5,318,423 |
| BWay Holding 5.037% (LIBOR01M + 3.25%) 4/3/24 ● | | 3,721,617 | | | 3,576,940 |
| Caesars Resort Collection Tranche B-1 5.872% | | | | | |
| (LIBOR01M + 3.50%) 7/21/25 ● | | 929,142 | | | 912,109 |
| Calpine TBD 12/16/27 X | | 3,491,139 | | | 3,425,680 |
| Calpine 4.38% (LIBOR01M + 2.00%) 4/5/26 ● | | 6,747,343 | | | 6,592,714 |
| Camelot US Acquisition l 5.372% (LIBOR01M + 3.00%) | | | | | |
| 10/30/26 ● | | 1,941,232 | | | 1,898,905 |
| Cano Health 6.427% (SOFR01M + 4.00%) 11/23/27 ● | | 5,813,737 | | | 5,486,715 |
| Carnival Tranche B | | | | | |
| 5.877% (LIBOR03M + 3.00%) 6/30/25 ● | | 2,165,597 | | | 2,073,559 |
| 6.127% (LIBOR06M + 3.25%) 10/18/28 ● | | 7,481,203 | | | 6,957,519 |
| Castlelake Aviation One Designated Activity 4.579% | | | | | |
| (LIBOR03M + 2.75%) 10/22/26 ● | | 8,071,668 | | | 7,916,959 |
| Charter Communications Operating Tranche B-1 4.13% | | | | | |
| (LIBOR01M + 1.75%) 4/30/25 ● | | 1,994,778 | | | 1,964,856 |
| Charter Communications Operating Tranche B-2 4.13% | | | | | |
| (LIBOR01M + 1.75%) 2/1/27 ● | | 10,473,077 | | | 10,161,063 |
| Clydesdale Acquisition Holdings Tranche B 6.602% | | | | | |
| (SOFR01M + 3.25%) 4/13/29 ● | | 12,060,000 | | | 11,604,857 |
| Connect US Finco 5.88% (LIBOR01M + 3.50%) | | | | | |
| 12/11/26 ● | | 2,929,894 | | | 2,829,179 |
| Consolidated Communications Tranche B-1 5.875% | | | | | |
| (LIBOR01M + 3.50%) 10/2/27 ● | | 2,545,820 | | | 2,229,713 |
| Core & Main Tranche B-1 4.643% (LIBOR01M + 2.50%) | | | | | |
| 7/27/28 ● | | 3,943,109 | | | 3,818,657 |
15
Table of Contents
Schedule of investments
Delaware Floating Rate Fund
| | | | | Principal | | | |
| | | | amount° | | Value (US $) |
| Loan Agreements (continued) | | | | | |
| Covis Finco Tranche B 8.704% (SOFR01M + 5.50%) | | | | | |
| | 2/18/27 ● | | 4,196,875 | | $ | 3,514,883 |
| CP Atlas Buyer Tranche B 6.122% (LIBOR01M + 3.75%) | | | | | |
| | 11/23/27 ● | | 4,526,585 | | | 3,992,589 |
| CSC Holdings 4.249% (LIBOR01M + 2.25%) 7/17/25 ● | | 837,729 | | | 812,771 |
| Cumulus Media New Holdings 4.75% (LIBOR03M + | | | | | |
| | 3.75%) 3/31/26 ● | | 4,947,545 | | | 4,758,920 |
| Delta Air Lines 6.46% (LIBOR03M + 3.75%) 10/20/27 ● | | 8,000,000 | | | 8,105,000 |
| Digicel International Finance Tranche B 1st Lien 5.622% | | | | | |
| | (LIBOR01M + 3.25%) 5/27/24 ● | | 4,646,323 | | | 4,239,770 |
| Directv Financing 7.372% (LIBOR01M + 5.00%) 8/2/27 ● | | 7,191,479 | | | 6,817,199 |
| Dun & Bradstreet Tranche B 5.55% (LIBOR01M + 3.25%) | | | | | |
| | 2/6/26 ● | | 1,304,949 | | | 1,273,304 |
| Ecovyst Catalyst Technologies 5.306% (LIBOR03M + | | | | | |
| | 2.50%) 6/9/28 ● | | 1,046,750 | | | 1,017,964 |
| Electron Bidco 5.372% (LIBOR01M + 3.00%) 11/1/28 ● | | 6,483,750 | | | 6,297,342 |
| Endo Luxembourg Finance I 7.375% (LIBOR01M + | | | | | |
| | 5.00%) 3/27/28 ● | | 4,239,268 | | | 3,419,677 |
| Ensemble RCM 6.556% (LIBOR03M + 3.75%) 8/3/26 ● | | 1,807,127 | | | 1,770,080 |
| Entergis Tranche B 5.543% (SOFR03M + 3.00%) 7/6/29 ● | | 10,500,000 | | | 10,395,000 |
| Epicor Software 2nd Lien 10.122% (LIBOR01M + 7.75%) | | | | | |
| | 7/31/28 ● | | 10,905,000 | | | 10,776,866 |
| Form Technologies 1st Lien 10.506% (LIBOR03M | | | | | |
| | +9.25%) 10/22/25 ● | | 3,553,985 | | | 3,163,046 |
| Form Technologies Tranche B 6.006% (LIBOR03M + | | | | | |
| | 4.75%) 7/22/25 ● | | 8,869,318 | | | 8,037,819 |
| Frontier Communications Tranche B 6.063% (LIBOR03M | | | | | |
| | + 3.75%) 5/1/28 ● | | 5,504,127 | | | 5,275,017 |
| Gates Global Tranche B-3 4.519% (LIBOR01M + 2.50%) | | | | | |
| | 3/31/27 ● | | 4,483,570 | | | 4,333,931 |
| Geon Performance Solutions 6.872% (LIBOR01M + | | | | | |
| | 4.50%) 8/18/28 ● | | 1,860,937 | | | 1,809,762 |
| Global Medical Response 5.963% (LIBOR01M + 4.75%) | | | | | |
| | 10/2/25 ● | | 5,046,974 | | | 4,846,144 |
| Granite US Holdings Tranche B 6.313% (LIBOR03M + | | | | | |
| | 4.00%) 9/30/26 ● | | 1,416,993 | | | 1,377,140 |
| Hamilton Projects Acquiror 6.75% (LIBOR03M + 4.50%) | | | | | |
| | 6/17/27 ● | | 6,294,364 | | | 6,102,908 |
| Heartland Dental | | | | | |
| | 5.75% (SOFR03M + 5.00%) 4/30/25 ● | | 2,500,000 | | | 2,396,875 |
| | 5.872% (LIBOR01M + 3.50%) 4/30/25 ● | | 3,789,976 | | | 3,583,108 |
| | 6.259% (LIBOR01M + 4.00%) 4/30/25 ● | | 4,347,418 | | | 4,139,560 |
16
Table of Contents
| | | | | Principal | | | |
| | | | amount° | | Value (US $) |
| Loan Agreements (continued) | | | | | |
| Hexion Holdings 1st Lien 5.924% (SOFR03M + 4.50%) | | | | | |
| | 3/15/29 ● | | 3,250,000 | | $ | 2,907,937 |
| Hexion Holdings 2nd Lien 9.638% (SOFR01M + 7.54%) | | | | | |
| | 3/15/30 ● | | 5,500,000 | | | 4,812,500 |
| HighTower Holding 6.732% (LIBOR03M + 4.00%) | | | | | |
| | 4/21/28 ● | | 3,721,875 | | | 3,530,742 |
| Horizon Therapeutics USA Tranche B-2 4.063% | | | | | |
| | (LIBOR01M + 1.75%) 3/15/28 ● | | 2,984,887 | | | 2,941,045 |
| HUB International 5.766% (LIBOR02M + 3.00%) | | | | | |
| | 4/25/25 ● | | 276,515 | | | 270,207 |
| HUB International Tranche B-3 5.981% (LIBOR03M + | | | | | |
| | 3.25%) 4/25/25 ● | | 7,086,983 | | | 6,952,089 |
| Hunter Douglas Tranche B-1 4.842% (SOFR03M + | | | | | | |
| | 3.50%) 2/26/29 ● | | 3,928,000 | | | 3,519,488 |
| Ineos US Petrochem Tranche B 5.122% (LIBOR01M + | | | | | |
| | 2.75%) 1/29/26 ● | | 1,361,250 | | | 1,296,591 |
| Informatica 5.125% (LIBOR01M + 2.75%) 10/27/28 ● | | 1,102,237 | | | 1,075,600 |
| Intertape Polymer Group 7.136% (SOFR03M + 4.75%) | | | | | |
| | 6/15/28 ● | | 9,815,000 | | | 9,155,550 |
| Jazz Financing 5.872% (LIBOR01M + 3.50%) 5/5/28 ● | | 3,403,187 | | | 3,332,996 |
| JBS USA LUX TBD 5/1/26 X | | 2,900,770 | | | 2,857,259 |
| Jones DesLauriers Insurance Management 1st Lien | | | | | |
| | 6.063% (CDOR03M + 4.25%) 3/27/28 ● | | 1,943,696 | | | 1,411,610 |
| Jones DesLauriers Insurance Management 2nd Lien | | | | | |
| | 10.998% (CDOR03M + 7.50%) 3/26/29 ● | | 910,000 | | | 660,888 |
| Kenan Advantage Group Tranche B 6.122% (LIBOR01M | | | | | |
| | + 3.75%) 3/24/26 ● | | 3,466,203 | | | 3,257,509 |
| LABL 7.372% (LIBOR01M + 5.00%) 10/30/28 ● | | 1,875,575 | | | 1,791,174 |
| Loyalty Ventures Tranche B 6.872% (LIBOR01M + | | | | | |
| | 4.50%) 11/3/27 ● | | 2,069,375 | | | 1,564,448 |
| LSF11 A5 HoldCo 5.541% (SOFR01M + 3.75%) | | | | | |
| | 10/15/28 ● | | 2,771,814 | | | 2,686,351 |
| LSF9 Atlantis Holdings Tranche B 9.304% (SOFR03M + | | | | | |
| | 6.25%) 3/31/29 ● | | 8,000,000 | | | 7,580,000 |
| Madison Iaq 4.524% (LIBOR03M + 3.25%) 6/21/28 ● | | 2,648,250 | | | 2,527,424 |
| Mamba Purchaser 5.662% (LIBOR01M + 3.75%) | | | | | |
| | 10/16/28 ● | | 2,817,937 | | | 2,712,265 |
| Mamba Purchaser 2nd Lien 8.662% (LIBOR01M + | | | | | |
| | 6.50%) 10/15/29 ● | | 950,000 | | | 916,750 |
| Medline Borrower 5.622% (LIBOR01M + 3.25%) | | | | | |
| | 10/23/28 ● | | 3,241,875 | | | 3,104,997 |
| Mermaid Bidco Tranche B-2 4.786% (LIBOR03M + | | | | | |
| | 3.50%) 12/22/27 ● | | 1,988,019 | | | 1,858,798 |
17
Table of Contents
Schedule of investments
Delaware Floating Rate Fund
| | | | | Principal | | | |
| | | | amount° | | Value (US $) |
| Loan Agreements (continued) | | | | | |
| Michaels Tranche B 6.50% (LIBOR03M + 4.25%) | | | | | |
| | 4/15/28 ● | | 3,197,800 | | $ | 2,693,005 |
| Mileage Plus Holdings 7.313% (LIBOR03M + 5.25%) | | | | | |
| | 6/21/27 ● | | 6,129,000 | | | 6,191,387 |
| Naked Juice 5.405% (SOFR03M + 3.25%) 1/24/29 ● | | 3,000,000 | | | 2,870,625 |
| Naked Juice 2nd Lien 8.154% (SOFR03M + 6.50%) | | | | | |
| | 1/24/30 ● | | 2,000,000 | | | 1,846,666 |
| Nortonlifelock Tranche B TBD 1/28/29 X | | 9,300,000 | | | 9,064,598 |
| Numericable US Tranche B-13 5.411% (LIBOR03M + | | | | | |
| | 4.00%) 8/14/26 ● | | 794,994 | | | 758,226 |
| Olympus Water US Holding | | | | | |
| | 6.063% (LIBOR03M + 3.75%) 11/9/28 ● | | 4,855,723 | | | 4,611,038 |
| | 6.654% (SOFR03M + 3.50%) 11/9/28 ● | | 1,995,000 | | | 1,940,137 |
| Organon & Co. 4.625% (LIBOR03M + 3.00%) 6/2/28 ● | | 3,408,902 | | | 3,362,029 |
| Owens & Minor Tranche B-1 6.177% (SOFR01M + | | | | | |
| | 3.75%) 3/29/29 ● | | 4,987,500 | | | 4,975,031 |
| Parkway Generation Tranche B 7.122% (LIBOR01M + | | | | | |
| | 4.75%) 2/16/29 ● | | 5,805,625 | | | 5,619,363 |
| Parkway Generation Tranche C 7.122% (LIBOR01M + | | | | | |
| | 4.75%) 2/16/29 ● | | 814,825 | | | 789,022 |
| PECF USS Intermediate Holding III 6.622% (LIBOR03M | | | | | |
| | + 4.25%) 12/15/28 ● | | 6,673,981 | | | 6,126,715 |
| Pelican Products 6.50% (LIBOR03M + 4.25%) 12/29/28 ● | | 3,233,750 | | | 2,942,712 |
| Penn National Gaming Tranche B 4.776% (SOFR01M + | | | | | |
| | 1.75%) 5/3/29 ● | | 2,450,000 | | | 2,399,469 |
| Peraton Tranche B 1st Lien 6.122% (LIBOR01M + | | | | | |
| | 3.75%) 2/1/28 ● | | 7,999,894 | | | 7,783,233 |
| Perrigo Investments Tranche B 4.199% (SOFR01M + | | | | | |
| | 2.50%) 4/20/29 ● | | 5,000,000 | | | 4,937,500 |
| PetsMart 6.12% (LIBOR01M + 3.50%) 2/11/28 ● | | 7,472,187 | | | 7,221,555 |
| PG&E Tranche B 5.375% (LIBOR01M + 3.00%) 6/23/25 ● | | 10,241,866 | | | 9,918,612 |
| Pilot Travel Centers Tranche B 4.427% (SOFR01M + | | | | | |
| | 2.00%) 8/4/28 ● | | 6,987,350 | | | 6,867,496 |
| PMHC II 6.977% (SOFR03M + 3.25%) 4/23/29 ● | | 4,250,000 | | | 3,698,826 |
| Polaris Newco 1st Lien 6.372% (LIBOR01M + 4.00%) | | | | | |
| | 6/2/28 ● | | 2,929,119 | | | 2,789,619 |
| Pre Paid Legal Services 2nd Lien 9.372% (LIBOR01M + | | | | | |
| | 7.00%) 12/14/29 ● | | 2,830,000 | | | 2,716,800 |
| Pregis Topco 1st Lien 6.235% (LIBOR03M + 4.00%) | | | | | |
| | 7/31/26 ● | | 3,151,917 | | | 3,029,780 |
| Pretium PKG Holdings 2nd Lien 8.787% (LIBOR03M + | | | | | |
| | 6.75%) 10/1/29 ● | | 3,600,000 | | | 3,138,001 |
18
Table of Contents
| | | | | Principal | | | |
| | | | amount° | | Value (US $) |
| Loan Agreements (continued) | | | | | |
| Quest Software US Holdings 1st Lien 6.255% (SOFR03M | | | | | |
| | + 3.25%) 2/1/29 ● | | 958,000 | | $ | 854,673 |
| Quest Software US Holdings 2nd Lien 10.227% | | | | | |
| | (SOFR03M + 7.50%) 2/1/30 ● | | 5,250,000 | | | 4,681,252 |
| Quikrete Holdings 1st Lien 4.997% (LIBOR01M + | | | | | |
| | 2.625%) 2/1/27 ● | | 2,728,345 | | | 2,585,320 |
| RealPage 1st Lien 5.372% (LIBOR01M + 3.00%) | | | | | |
| | 4/24/28 ● | | 3,563,075 | | | 3,437,256 |
| RealPage 2nd Lien 8.872% (LIBOR01M + 6.50%) | | | | | |
| | 4/23/29 ● | | 4,250,000 | | | 4,113,647 |
| Ryan Specialty Group Tranche B-1 5.427% (SOFR01M + | | | | | |
| | 3.00%) 9/1/27 ● | | 1,253,912 | | | 1,223,609 |
| Schweitzer-Mauduit International Tranche B 6.125% | | | | | |
| | (LIBOR01M + 3.75%) 4/20/28 ● | | 2,104,740 | | | 1,999,503 |
| Scientific Games International Tranche B 5.044% | | | | | |
| | (SOFR01M + 2.00%) 4/13/29 ● | | 6,000,000 | | | 5,880,000 |
| Setanta Aircraft Leasing DAC 4.25% (LIBOR03M + | | | | | |
| | 2.00%) 11/5/28 ● | | 6,246,107 | | | 6,146,557 |
| Sinclair Television Group Tranche B-2 4.88% (LIBOR01M | | | | | |
| | + 2.50%) 9/30/26 ● | | 297,398 | | | 277,696 |
| Sinclair Television Group Tranche B-3 5.38% (LIBOR01M | | | | | |
| | + 3.00%) 4/1/28 ● | | 732,510 | | | 670,246 |
| Sinclair Television Group Tranche B-4 6.177% | | | | | |
| | (SOFR01M + 2.75%) 4/21/29 ● | | 6,000,000 | | | 5,625,000 |
| Southwestern Energy 4.704% (SOFR03M + 1.50%) | | | | | |
| | 6/22/27 ● | | 4,982,481 | | | 4,938,884 |
| Sovos Compliance 1st Lien 6.872% (LIBOR01M + | | | | | |
| | 4.50%) 8/11/28 ● | | 2,757,547 | | | 2,690,332 |
| Sovos Compliance 1st Lien 6.471% (LIBOR01M + | | | | | |
| | 4.50%) 8/11/28 ● | | 478,596 | | | 466,930 |
| Spirit Aerosystems Tranche B 6.122% (LIBOR01M + | | | | | |
| | 3.75%) 1/15/25 ● | | 2,686,797 | | | 2,644,816 |
| SPX Flow 6.526% (SOFR01M + 4.50%) 4/5/29 ● | | 9,500,000 | | | 9,007,187 |
| SS&C Technologies Tranche B-5 4.122% (LIBOR01M + | | | | | |
| | 2.25%) 4/16/25 ● | | 3,983,592 | | | 3,906,409 |
| SS&C Technologies Tranche B-6 4.271% (SOFR01M + | | | | | |
| | 1.25%) 3/22/29 ● | | 550,000 | | | 539,057 |
| SS&C Technologies Tranche B-7 4.677% (SOFR01M + | | | | | |
| | 1.25%) 3/22/29 ● | | 787,598 | | | 771,928 |
| Standard Industries 3.788% (LIBOR03M + 2.50%) | | | | | |
| | 9/22/28 ● | | 10,704,746 | | | 10,539,989 |
| Stars Group Holdings 4.50% (LIBOR03M + 2.25%) | | | | | |
| | 7/21/26 ● | | 4,987,437 | | | 4,903,274 |
19
Table of Contents
Schedule of investments
Delaware Floating Rate Fund
| | | | | Principal | | | |
| | | | amount° | | Value (US $) |
| Loan Agreements (continued) | | | | | |
| Surgery Center Holdings 5.63% (LIBOR01M + 3.75%) | | | | | |
| | 8/31/26 ● | | 4,614,903 | | $ | 4,446,173 |
| Swf Holdings I 6.162% (LIBOR01M + 4.00%) 10/6/28 ● | | 5,118,354 | | | 4,305,815 |
| TerraForm Power Operating 4.161% (SOFR03M + | | | | | |
| | 1.75%) 5/21/29 ● | | 8,500,000 | | | 8,388,437 |
| Terrier Media Buyer Tranche B 5.872% (LIBOR01M + | | | | | |
| | 3.50%) 12/17/26 ● | | 2,785,966 | | | 2,625,773 |
| TransDigm Tranche E 4.622% (LIBOR01M + 2.25%) | | | | | |
| | 5/30/25 ● | | 6,478,287 | | | 6,309,392 |
| TransDigm Tranche F 4.622% (LIBOR01M + 2.25%) | | | | | |
| | 12/9/25 ● | | 1,496,164 | | | 1,455,851 |
| TricorBraun 5.622% (LIBOR01M + 3.25%) 3/3/28 ● | | 1,378,737 | | | 1,312,099 |
| Trident TPI Holdings 1st Lien Tranche B-3 | | | | | |
| | 6.25% (LIBOR03M + 4.00%) 9/15/28 ● | | 2,433,783 | | | 2,318,178 |
| | 6.25% (LIBOR03M + 4.00%) 9/15/28 ● | | 216,995 | | | 206,688 |
| Trident TPI Holdings TBD 9/17/28 X | | 1,000,000 | | | 956,875 |
| Tronox Finance 1st Lien 5.304% (SOFR03M + 2.25%) | | | | | |
| | 4/4/29 ● | | 3,640,875 | | | 3,590,813 |
| UKG 2nd Lien 7.535% (LIBOR03M + 5.25%) 5/3/27 ● | | 8,425,000 | | | 8,140,656 |
| United Airlines Tranche B 6.533% (LIBOR03M + 3.75%) | | | | | |
| | 4/21/28 ● | | 8,028,824 | | | 7,785,454 |
| Univision Communications 1st Lien 6.254% (SOFR03M + | | | | | |
| | 3.25%) 6/24/29 ● | | 4,000,000 | | | 3,873,332 |
| USI 5.50% (LIBOR03M + 3.25%) 12/2/26 ● | | 5,660,496 | | | 5,528,419 |
| USI Tranche B 5.25% (LIBOR03M + 3.00%) 5/16/24 ● | | 3,100,334 | | | 3,054,797 |
| USIC Holdings 5.872% (LIBOR01M + 3.50%) 5/12/28 ● | | 3,624,856 | | | 3,427,301 |
| USIC Holdings 2nd Lien 8.872% (LIBOR01M + 6.50%) | | | | | |
| | 5/14/29 ● | | 925,000 | | | 846,375 |
| Vantage Specialty Chemicals 1st Lien 6.019% | | | | | |
| | (LIBOR03M + 3.50%) 10/28/24 ● | | 1,530,954 | | | 1,469,954 |
| Vantage Specialty Chemicals 2nd Lien 9.825% | | | | | |
| | (LIBOR03M + 8.25%) 10/27/25 ● | | 3,818,425 | | | 3,686,689 |
| Verscend Holding Tranche B 6.372% (LIBOR01M + | | | | | |
| | 4.00%) 8/27/25 ● | | 3,027,969 | | | 2,958,577 |
| Vertical Midco Tranche B 6.871% (LIBOR03M + 3.50%) | | | | | |
| | 7/30/27 ● | | 2,982,534 | | | 2,886,222 |
| Viasat 6.541% (SOFR01M + 3.50%) 3/2/29 ● | | 10,500,000 | | | 9,843,750 |
| Vistra Operations 4.079% (LIBOR01M + 1.75%) | | | | | |
| | 12/31/25 ● | | 5,977,534 | | | 5,898,060 |
| West Corporation Tranche B 6.372% (LIBOR01M + | | | | | |
| | 4.00%) 10/10/24 ● | | 1,885,866 | | | 1,577,527 |
| White Cap Buyer 5.676% (SOFR01M + 4.00%) | | | | | |
| | 10/19/27 ● | | 10,134,799 | | | 9,718,005 |
20
Table of Contents
| | | | | Principal | | | |
| | | | amount° | | Value (US $) |
| Loan Agreements (continued) | | | | | |
| Windstream Services 8.622% (LIBOR01M + 6.25%) | | | | | |
| | 9/21/27 ● | | 2,927,406 | | $ | 2,776,156 |
| Zekelman Industries 4.185% (LIBOR03M + 2.00%) | | | | | |
| | 1/24/27 ● | | 1,992,319 | | | 1,918,852 |
| Total Loan Agreements (cost $675,362,139) | | | | | 655,315,318 |
| | | | | | | |
| | | | Number of | | | |
| | | | shares | | | |
| Common Stock – 0.01% | | | | | |
| Leisure – 0.01% | | | | | |
| Studio City International ADR † | | 29,695 | | | 59,093 |
| Total Common Stock (cost $89,260) | | | | | 59,093 |
| | | | | | | |
| Exchange-Traded Funds – 2.60% | | | | | |
| Invesco Senior Loan ETF | | 514,000 | | | 10,778,580 |
| iShares iBoxx High Yield Corporate Bond ETF | | 56,000 | | | 4,378,640 |
| SPDR Bloomberg High Yield Bond ETF | | 44,000 | | | 4,240,720 |
| Total Exchange-Traded Funds (cost $20,955,487) | | | | | 19,397,940 |
| | | | | | | |
| | | | Principal | | | |
| | | | amount° | | | |
| Municipal Bond – 0.07% | | | | | |
| GDB Debt Recovery Authority of Puerto Rico | | | | | |
| | 7.50% 8/20/40 | | 582,001 | | | 516,526 |
| Total Municipal Bond (cost $551,604) | | | | | 516,526 |
| | | | | | | |
| | | | Number of | | | |
| | | | shares | | | |
| Short-Term Investments – 6.21% | | | | | |
| Money Market Mutual Funds – 6.21% | | | | | |
| BlackRock Liquidity FedFund – Institutional Shares | | | | | |
| | (seven-day effective yield 1.73%) | | 11,580,573 | | | 11,580,573 |
| Fidelity Investments Money Market Government Portfolio | | | | | |
| | – Class I (seven-day effective yield 1.49%) | | 11,580,573 | | | 11,580,573 |
| GS Financial Square Government Fund – Institutional | | | | | |
| | Shares (seven-day effective yield 1.73%) | | 11,580,573 | | | 11,580,573 |
21
Table of Contents
Schedule of investments
Delaware Floating Rate Fund
| | | Number of | | | |
| | | | shares | | Value (US $) |
| Short-Term Investments (continued) | | | | | |
| Money Market Mutual Funds (continued) | | | | | |
| Morgan Stanley Institutional Liquidity Funds Government | | | | | |
| Portfolio – Institutional Class (seven-day effective yield | | | | | |
| 1.60%) | | 11,580,573 | | $ | 11,580,573 |
| Total Short-Term Investments (cost $46,322,292) | | | | | 46,322,292 |
| Total Value of Securities—101.51% | | | | | |
| (cost $780,725,433) | | | | $ | 757,388,676 |
| ° | Principal amount shown is stated in USD unless noted that the security is denominated in another currency. |
| µ | Fixed to variable rate investment. The rate shown reflects the fixed rate in effect at July 31, 2022. Rate will reset at a future date. |
| ψ | Perpetual security. Maturity date represents next call date. |
| # | Security exempt from registration under Rule 144A of the Securities Act of 1933, as amended. At July 31, 2022, the aggregate value of Rule 144A securities was $28,593,088, which represents 3.83% of the Fund's net assets. See Note 12 in “Notes to financial statements." |
| ● | Variable rate investment. Rates reset periodically. Rate shown reflects the rate in effect at July 31, 2022. For securities based on a published reference rate and spread, the reference rate and spread are indicated in their descriptions. The reference rate descriptions (i.e. LIBOR03M, LIBOR06M, etc.) used in this report are identical for different securities, but the underlying reference rates may differ due to the timing of the reset period. Certain variable rate securities are not based on a published reference rate and spread but are determined by the issuer or agent and are based on current market conditions, or for mortgage-backed securities, are impacted by the individual mortgages which are paying off over time. These securities do not indicate a reference rate and spread in their descriptions. |
| X | This loan will settle after July 31, 2022, at which time the interest rate, based on the LIBOR and the agreed upon spread on trade date, will be reflected. |
| † | Non-income producing security. |
22
Table of Contents
Unfunded Loan Commitments
The Fund may invest in floating rate loans. In connection with these investments, the Fund may also enter into unfunded corporate loan commitments (commitments). Commitments may obligate the Fund to furnish temporary financing to a borrower until permanent financing can be arranged. In connection with these commitments, the Fund earns a commitment fee, typically set as a percentage of the commitment amount. The following unfunded loan commitments were outstanding at July 31, 2022:
| | | | | | | | | | | | | Unrealized |
| | Principal | | | | | | | | | | Appreciation |
| Borrower | | Amount | | Commitment | | Value | | (Depreciation) |
| AthenaHealth TBD 2/15/29 | | $ | 1,065,217 | | | $ | 1,065,217 | | | $ | 1,018,082 | | | $(47,135 | ) | |
| Trident TPI Holdings 1st Lien Tranche B-3 6.25% | | | | | | | | | | | | | | | | |
| (LIBOR03M + 4.00%) 9/15/28 | | | 129,391 | | | | 129,391 | | | | 123,245 | | | (6,146 | ) | |
| Total | | $ | 1,194,608 | | | $ | 1,194,608 | | | $ | 1,141,327 | | | $(53,281 | ) | |
The following foreign currency exchange contract was outstanding at July 31, 2022:1
Foreign Currency Exchange Contracts
| | Currency to | | | | | | Settlement | | Unrealized |
| Counterparty | | Receive (Deliver) | | In Exchange For | | Date | | Depreciation |
| CITI | | CAD | | (2,900,000) | | USD | | 2,242,065 | | 8/19/22 | | $ | (22,513 | ) |
The use of foreign currency exchange contracts involves elements of market risk and risks in excess of the amounts disclosed in the financial statements. The foreign currency exchange contract presented above represent the Fund’s total exposure in such contracts, whereas only the net unrealized appreciation (depreciation) is reflected in the Fund’s net assets.
| 1 | See Note 9 in “Notes to financial statements.” |
Summary of abbreviations:
ADR – American Depositary Receipt
CDOR – Canadian Dollar Offered Rate
CDOR03M – 3 Month Canadian Dollar Offered Rate
CITI – Citigroup
DAC – Designated Activity Company
DIFC – Dubai International Financial Centre
ETF – Exchange-Traded Fund
GS – Goldman Sachs
ICE – Intercontinental Exchange, Inc.
LIBOR – London Interbank Offered Rate
LIBOR01M – ICE LIBOR USD 1 Month
LIBOR02M – ICE LIBOR USD 2 Month
23
Table of Contents
Schedule of investments
Delaware Floating Rate Fund
Summary of abbreviations: (continued)
LIBOR03M – ICE LIBOR USD 3 Month
LIBOR06M – ICE LIBOR USD 6 Month
SOFR01M – Secured Overnight Financing Rate 1 Month
SOFR03M – Secured Overnight Financing Rate 3 Month
SPDR – Standard & Poor's Depositary Receipt
TBD – To be determined
Summary of currencies:
CAD – Canadian Dollar
USD – US Dollar
See accompanying notes, which are an integral part of the financial statements.
24
Table of Contents
| Statement of assets and liabilities | |
| Delaware Floating Rate Fund | July 31, 2022 |
| Assets: | | | | |
| | Investments, at value* | | $ | 757,388,676 | |
| Cash | | | 1,492,726 | |
| Foreign currencies, at valueΔ | | | 142,763 | |
| Receivable for securities sold | | | 9,474,948 | |
| Receivable for fund shares sold | | | 3,074,344 | |
| Dividends and interest receivable | | | 2,605,357 | |
| Prepaid expenses | | | 89,479 | |
| Other assets | | | 1,631 | |
| Total Assets | | | 774,269,924 | |
| Liabilities: | | | | |
| Payable for securities purchased | | | 21,038,803 | |
| Payable for fund shares redeemed | | | 6,243,378 | |
| Distribution payable | | | 299,694 | |
| Investment management fees payable to affiliates | | | 272,872 | |
| Other accrued expenses | | | 219,251 | |
| Unrealized depreciation on unfunded loan commitments** | | | 53,281 | |
| Unrealized depreciation on foreign currency exchange contracts | | | 22,513 | |
| Administration expenses payable to affiliates | | | 16,853 | |
| Distribution fees payable to affiliates | | | 5,348 | |
| Total Liabilities | | | 28,171,993 | |
| Total Net Assets | | $ | 746,097,931 | |
| | |
| Net Assets Consist of: | | | | |
| Paid-in capital | | $ | 797,612,358 | |
| Total distributable earnings (loss) | | | (51,514,427 | ) |
| Total Net Assets | | $ | 746,097,931 | |
25
Table of Contents
Statement of assets and liabilities
Delaware Floating Rate Fund
| Net Asset Value | | | | |
| | | | | |
| Class A: | | | | |
| Net assets | | $ | 72,746,186 | |
| Shares of beneficial interest outstanding, unlimited authorization, no par | | | 9,224,886 | |
| Net asset value per share | | $ | 7.89 | |
| Sales charge | | | 2.75 | % |
| Offering price per share, equal to net asset value per share / (1 - sales | | | | |
| charge) | | $ | 8.11 | |
| | | | | |
| Class C: | | | | |
| Net assets | | $ | 12,948,133 | |
| Shares of beneficial interest outstanding, unlimited authorization, no par | | | 1,641,935 | |
| Net asset value per share | | $ | 7.89 | |
| | | | | |
| Class R: | | | | |
| Net assets | | $ | 1,111,349 | |
| Shares of beneficial interest outstanding, unlimited authorization, no par | | | 140,976 | |
| Net asset value per share | | $ | 7.88 | |
| | | | | |
| Institutional Class: | | | | |
| Net assets | | $ | 654,306,724 | |
| Shares of beneficial interest outstanding, unlimited authorization, no par | | | 82,978,770 | |
| Net asset value per share | | $ | 7.89 | |
| | | | | |
| Class R6: | | | | |
| Net assets | | $ | 4,985,539 | |
| Shares of beneficial interest outstanding, unlimited authorization, no par | | | 631,576 | |
| Net asset value per share | | $ | 7.89 | |
____________________ |
| *Investments, at cost | | $ | 780,725,433 | |
| ΔForeign currencies, at cost | | | 144,209 | |
| **See Note 12 in “Notes to financial statements.” | | | | |
See accompanying notes, which are an integral part of the financial statements.
26
Table of Contents
| Statement of operations | |
| Delaware Floating Rate Fund | Year ended July 31, 2022 |
| Investment Income: | | | | |
| | Interest | | $ | 18,596,647 | |
| Dividends | | | 689,565 | |
| | | | 19,286,212 | |
| |
| Expenses: | | | | |
| Management fees | | | 2,035,579 | |
| Distribution expenses — Class A | | | 170,325 | |
| Distribution expenses — Class C | | | 102,226 | |
| Distribution expenses — Class R | | | 257 | |
| Dividend disbursing and transfer agent fees and expenses | | | 446,252 | |
| Accounting and administration expenses | | | 82,653 | |
| Audit and tax fees | | | 60,578 | |
| Reports and statements to shareholders expenses | | | 56,562 | |
| Legal fees | | | 50,740 | |
| Registration fees | | | 13,200 | |
| Trustees’ fees and expenses | | | 9,279 | |
| Custodian fees | | | 5,993 | |
| Other | | | 58,553 | |
| | | | 3,092,197 | |
| Less expenses waived | | | (71,228 | ) |
| Less expenses paid indirectly | | | (161 | ) |
| Total operating expenses | | | 3,020,808 | |
| Net Investment Income (Loss) | | | 16,265,404 | |
| |
| Net Realized and Unrealized Gain (Loss): | | | | |
| Net realized gain (loss) on: | | | | |
| Investments | | | (1,783,899 | ) |
| Foreign currencies | | | (29,102 | ) |
| Foreign currency exchange contracts | | | 27,036 | |
| Net realized gain (loss) | | | (1,785,965 | ) |
| |
| Net change in unrealized appreciation (depreciation) on: | | | | |
| Investments | | | (26,215,414 | ) |
| Foreign currencies | | | (1,446 | ) |
| Foreign currency exchange contracts | | | (22,513 | ) |
| Net change in unrealized appreciation (depreciation) | | | (26,239,373 | ) |
| Net Realized and Unrealized Gain (Loss) | | | (28,025,338 | ) |
| Net Increase (Decrease) in Net Assets Resulting from Operations | | $ | (11,759,934 | ) |
See accompanying notes, which are an integral part of the financial statements.
27
Table of Contents
Statements of changes in net assets
Delaware Floating Rate Fund
| | | | Year ended |
| | | 7/31/22 | | 7/31/21 |
| Increase (Decrease) in Net Assets from Operations: | | | | | | | | |
| Net investment income (loss) | | $ | 16,265,404 | | | $ | 5,120,854 | |
| Net realized gain (loss) | | | (1,785,965 | ) | | | 608,761 | |
| Net change in unrealized appreciation (depreciation) | | | (26,239,373 | ) | | | 4,188,098 | |
| Net increase (decrease) in net assets resulting from | | | | | | | | |
| operations | | | (11,759,934 | ) | | | 9,917,713 | |
| | |
| Dividends and Distributions to Shareholders from: | | | | | | | | |
| Distributable earnings: | | | | | | | | |
| Class A | | | (2,498,874 | ) | | | (858,821 | ) |
| Class C | | | (298,643 | ) | | | (295,688 | ) |
| Class R | | | (2,254 | ) | | | (183 | ) |
| Institutional Class | | | (13,124,994 | ) | | | (3,179,797 | ) |
| Class R6 | | | (73,023 | ) | | | — | |
| | | | | | | | | | |
| Return of capital: | | | | | | | | |
| Class A | | | — | | | | (160,636 | ) |
| Class C | | | — | | | | (38,040 | ) |
| Class R | | | — | | | | (95 | ) |
| Institutional Class | | | — | | | | (508,304 | ) |
| | | | (15,997,788 | ) | | | (5,041,564 | ) |
| | |
| Capital Share Transactions: | | | | | | | | |
| Proceeds from shares sold: | | | | | | | | |
| Class A | | | 64,361,178 | | | | 19,044,873 | |
| Class C | | | 8,257,790 | | | | 1,891,740 | |
| Class R | | | 1,080,911 | | | | 15,013 | |
| Institutional Class | | | 741,732,492 | | | | 79,850,386 | |
| Class R6 | | | 4,888,760 | | | | — | |
| | | | | | | | | | |
| Net assets from merger:1 | | | | | | | | |
| Class A | | | 27,603,573 | | | | — | |
| Institutional Class | | | 18,015,552 | | | | — | |
| Class R6 | | | 238,005 | | | | — | |
28
Table of Contents
| | | | | Year ended |
| | | | 7/31/22 | | 7/31/21 |
| Net asset value of shares issued upon reinvestment of | | | | | | | | |
| | dividends and distributions: | | | | | | | | |
| | Class A | | $ | 2,454,381 | | | $ | 922,525 | |
| | Class C | | | 291,637 | | | | 329,776 | |
| | Class R | | | 2,237 | | | | 283 | |
| | Institutional Class | | | 11,895,131 | | | | 3,376,886 | |
| | Class R6 | | | 66,774 | | | | — | |
| | | | | 880,888,421 | | | | 105,431,482 | |
| Cost of shares redeemed: | | | | | | | | |
| | Class A | | | (54,719,430 | ) | | | (7,930,355 | ) |
| | Class C | | | (3,799,201 | ) | | | (7,669,500 | ) |
| | Class R | | | — | | | | (1,253 | ) |
| | Institutional Class | | | (210,070,736 | ) | | | (49,747,108 | ) |
| | Class R6 | | | (140,739 | ) | | | — | |
| | | | | (268,730,106 | ) | | | (65,348,216 | ) |
| Increase in net assets derived from capital share | | | | | | | | |
| | transactions | | | 612,158,315 | | | | 40,083,266 | |
| Net Increase in Net Assets | | | 584,400,593 | | | | 44,959,415 | |
| | | | | | | | | |
| Net Assets: | | | | | | | | |
| Beginning of year | | | 161,697,338 | | | | 116,737,923 | |
| End of year | | $ | 746,097,931 | | | $ | 161,697,338 | |
| 1 | See Note 7 in the "Notes to financial statements." |
See accompanying notes, which are an integral part of the financial statements.
29
Table of Contents
Financial highlights
Delaware Floating Rate Fund Class A
Selected data for each share of the Fund outstanding throughout each period were as follows:
| Net asset value, beginning of period |
| |
| Income (loss) from investment operations: |
| Net investment income1 |
| Net realized and unrealized gain (loss) |
| Total from investment operations |
| |
| Less dividends and distributions from: |
| Net investment income |
| Return of capital |
| Total dividends and distributions |
| |
| Net asset value, end of period |
| |
| Total return3 |
| |
| Ratios and supplemental data: |
| Net assets, end of period (000 omitted) |
| Ratio of expenses to average net assets4 |
| Ratio of expenses to average net assets prior to fees waived4 |
| Ratio of net investment income to average net assets |
| Ratio of net investment income to average net assets prior to fees waived |
| Portfolio turnover |
| 1 | Calculated using average shares outstanding. |
| 2 | Amount is less than $0.005 per share. |
| 3 | Total return is based on the change in net asset value of a share during the period and assumes reinvestment of dividends and distributions at net asset value and does not reflect the impact of a sales charge. Total return during all of the periods shown reflects a waiver by the manager. Performance would have been lower had the waiver not been in effect. |
| 4 | Expense ratios do not include expenses of any Underlying Funds in which the Fund invests. |
See accompanying notes, which are an integral part of the financial statements.
30
Table of Contents
| Year ended | |
| 7/31/22 | | 7/31/21 | | 7/31/20 | | 7/31/19 | | 7/31/18 | |
| $ | 8.23 | | | $ | 7.90 | | | $ | 8.28 | | | $ | 8.34 | | | $ | 8.39 | | |
| | |
| | |
| | 0.30 | | | | 0.31 | | | | 0.38 | | | | 0.43 | | | | 0.35 | | |
| | (0.34 | ) | | | 0.32 | | | | (0.39 | ) | | | (0.06 | ) | | | (0.03 | ) | |
| | (0.04 | ) | | | 0.63 | | | | (0.01 | ) | | | 0.37 | | | | 0.32 | | |
| | |
| | |
| | (0.30 | ) | | | (0.26 | ) | | | (0.37 | ) | | | (0.43 | ) | | | (0.37 | ) | |
| | — | | | | (0.04 | ) | | | — | 2 | | | — | 2 | | | — | 2 | |
| | (0.30 | ) | | | (0.30 | ) | | | (0.37 | ) | | | (0.43 | ) | | | (0.37 | ) | |
| | |
| $ | 7.89 | | | $ | 8.23 | | | $ | 7.90 | | | $ | 8.28 | | | $ | 8.34 | | |
| | |
| | (0.56% | ) | | | 8.13% | | | | (0.02% | ) | | | 4.62% | | | | 3.85% | | |
| | |
| | |
| $ | 72,746 | | | $ | 36,735 | | | $ | 23,727 | | | $ | 38,669 | | | $ | 38,701 | | |
| | 0.92% | | | | 0.94% | | | | 0.94% | | | | 0.94% | | | | 0.97% | | |
| | 0.93% | | | | 1.05% | | | | 1.05% | | | | 0.99% | | | | 0.98% | | |
| | 3.75% | | | | 3.77% | | | | 4.77% | | | | 5.22% | | | | 4.22% | | |
| | 3.74% | | | | 3.66% | | | | 4.66% | | | | 5.17% | | | | 4.21% | | |
| | 45% | | | | 124% | | | | 125% | | | | 143% | | | | 157% | | |
31
Table of Contents
Financial highlights
Delaware Floating Rate Fund Class C
Selected data for each share of the Fund outstanding throughout each period were as follows:
| Net asset value, beginning of period |
| |
| Income (loss) from investment operations: |
| Net investment income1 |
| Net realized and unrealized gain (loss) |
| Total from investment operations |
| |
| Less dividends and distributions from: |
| Net investment income |
| Return of capital |
| Total dividends and distributions |
| |
| Net asset value, end of period |
| |
| Total return3 |
| |
| Ratios and supplemental data: |
| Net assets, end of period (000 omitted) |
| Ratio of expenses to average net assets4 |
| Ratio of expenses to average net assets prior to fees waived4 |
| Ratio of net investment income to average net assets |
| Ratio of net investment income to average net assets prior to fees waived |
| Portfolio turnover |
| 1 | Calculated using average shares outstanding. |
| 2 | Amount is less than $0.005 per share. |
| 3 | Total return is based on the change in net asset value of a share during the period and assumes reinvestment of dividends and distributions at net asset value and does not reflect the impact of a sales charge. Total return during all of the periods shown reflects a waiver by the manager. Performance would have been lower had the waiver not been in effect. |
| 4 | Expense ratios do not include expenses of any Underlying Funds in which the Fund invests. |
See accompanying notes, which are an integral part of the financial statements.
32
Table of Contents
| Year ended | |
| 7/31/22 | | | 7/31/21 | | | 7/31/20 | | | 7/31/19 | | | 7/31/18 | | |
| $ | 8.23 | | | $ | 7.89 | | | $ | 8.28 | | | $ | 8.34 | | | $ | 8.39 | | |
| | |
| | |
| | 0.24 | | | | 0.24 | | | | 0.32 | | | | 0.37 | | | | 0.29 | | |
| | (0.34 | ) | | | 0.34 | | | | (0.40 | ) | | | (0.06 | ) | | | (0.04 | ) | |
| | (0.10 | ) | | | 0.58 | | | | (0.08 | ) | | | 0.31 | | | | 0.25 | | |
| | |
| | |
| | (0.24 | ) | | | (0.20 | ) | | | (0.31 | ) | | | (0.37 | ) | | | (0.30 | ) | |
| | — | | | | (0.04 | ) | | | — | 2 | | | — | 2 | | | — | 2 | |
| | (0.24 | ) | | | (0.24 | ) | | | (0.31 | ) | | | (0.37 | ) | | | (0.30 | ) | |
| | |
| $ | 7.89 | | | $ | 8.23 | | | $ | 7.89 | | | $ | 8.28 | | | $ | 8.34 | | |
| | |
| | (1.30% | ) | | | 7.47% | | | | (0.90% | ) | | | 3.84% | | | | 3.08% | | |
| | |
| | |
| $ | 12,948 | | | $ | 8,698 | | | $ | 13,613 | | | $ | 25,374 | | | $ | 30,512 | | |
| | 1.67% | | | | 1.69% | | | | 1.69% | | | | 1.69% | | | | 1.72% | | |
| | 1.68% | | | | 1.80% | | | | 1.80% | | | | 1.74% | | | | 1.73% | | |
| | 3.00% | | | | 3.02% | | | | 4.02% | | | | 4.47% | | | | 3.47% | | |
| | 2.99% | | | | 2.91% | | | | 3.91% | | | | 4.42% | | | | 3.46% | | |
| | 45% | | | | 124% | | | | 125% | | | | 143% | | | | 157% | | |
33
Table of Contents
Financial highlights
Delaware Floating Rate Fund Class R
Selected data for each share of the Fund outstanding throughout each period were as follows:
| Net asset value, beginning of period |
| |
| Income (loss) from investment operations: |
| Net investment income1 |
| Net realized and unrealized gain (loss) |
| Total from investment operations |
| |
| Less dividends and distributions from: |
| Net investment income |
| Return of capital |
| Total dividends and distributions |
| |
| Net asset value, end of period |
| |
| Total return3 |
| |
| Ratios and supplemental data: |
| Net assets, end of period (000 omitted) |
| Ratio of expenses to average net assets4 |
| Ratio of expenses to average net assets prior to fees waived4 |
| Ratio of net investment income to average net assets |
| Ratio of net investment income to average net assets prior to fees waived |
| Portfolio turnover |
| 1 | Calculated using average shares outstanding. |
| 2 | Amount is less than $0.005 per share. |
| 3 | Total return is based on the change in net asset value of a share during the period and assumes reinvestment of dividends and distributions at net asset value. Total return during all of the periods shown reflects a waiver by the manager. Performance would have been lower had the waiver not been in effect. |
| 4 | Expense ratios do not include expenses of any Underlying Funds in which the Fund invests. |
See accompanying notes, which are an integral part of the financial statements.
34
Table of Contents
| Year ended | |
| 7/31/22 | | 7/31/21 | | 7/31/20 | | 7/31/19 | | 7/31/18 | |
| $ | 8.23 | | | $ | 7.89 | | | $ | 8.28 | | | $ | 8.34 | | | $ | 8.39 | | |
| | |
| | |
| | 0.28 | | | | 0.29 | | | | 0.36 | | | | 0.41 | | | | 0.33 | | |
| | (0.35 | ) | | | 0.33 | | | | (0.40 | ) | | | (0.06 | ) | | | (0.03 | ) | |
| | (0.07 | ) | | | 0.62 | | | | (0.04 | ) | | | 0.35 | | | | 0.30 | | |
| | |
| | |
| | (0.28 | ) | | | (0.24 | ) | | | (0.35 | ) | | | (0.41 | ) | | | (0.35 | ) | |
| | — | | | | (0.04 | ) | | | — | 2 | | | — | 2 | | | — | 2 | |
| | (0.28 | ) | | | (0.28 | ) | | | (0.35 | ) | | | (0.41 | ) | | | (0.35 | ) | |
| | |
| $ | 7.88 | | | $ | 8.23 | | | $ | 7.89 | | | $ | 8.28 | | | $ | 8.34 | | |
| | |
| | (0.92% | ) | | | 7.99% | | | | (0.40% | ) | | | 4.36% | | | | 3.60% | | |
| | |
| | |
| $ | 1,111 | | | $ | 22 | | | $ | 7 | | | $ | 61 | | | $ | 416 | | |
| | 1.17% | | | | 1.19% | | | | 1.19% | | | | 1.19% | | | | 1.22% | | |
| | 1.18% | | | | 1.30% | | | | 1.30% | | | | 1.24% | | | | 1.23% | | |
| | 3.50% | | | | 3.52% | | | | 4.52% | | | | 4.97% | | | | 3.97% | | |
| | 3.49% | | | | 3.41% | | | | 4.41% | | | | 4.92% | | | | 3.96% | | |
| | 45% | | | | 124% | | | | 125% | | | | 143% | | | | 157% | | |
35
Table of Contents
Financial highlights
Delaware Floating Rate Fund Institutional Class
Selected data for each share of the Fund outstanding throughout each period were as follows:
| Net asset value, beginning of period |
| |
| Income (loss) from investment operations: |
| Net investment income1 |
| Net realized and unrealized gain (loss) |
| Total from investment operations |
| |
| Less dividends and distributions from: |
| Net investment income |
| Return of capital |
| Total dividends and distributions |
| |
| Net asset value, end of period |
| |
| Total return3 |
| |
| Ratios and supplemental data: |
| Net assets, end of period (000 omitted) |
| Ratio of expenses to average net assets4 |
| Ratio of expenses to average net assets prior to fees waived4 |
| Ratio of net investment income to average net assets |
| Ratio of net investment income to average net assets prior to fees waived |
| Portfolio turnover |
| 1 | Calculated using average shares outstanding. |
| 2 | Amount is less than $0.005 per share. |
| 3 | Total return is based on the change in net asset value of a share during the period and assumes reinvestment of dividends and distributions at net asset value. Total return during all of the periods shown reflects a waiver by the manager. Performance would have been lower had the waiver not been in effect. |
| 4 | Expense ratios do not include expenses of any Underlying Funds in which the Fund invests. |
See accompanying notes, which are an integral part of the financial statements.
36
Table of Contents
| Year ended | |
| 7/31/22 | | 7/31/21 | | 7/31/20 | | 7/31/19 | | 7/31/18 | |
| $ | 8.23 | | | $ | 7.90 | | | $ | 8.28 | | | $ | 8.34 | | | $ | 8.39 | | |
| | |
| | |
| | 0.32 | | | | 0.33 | | | | 0.40 | | | | 0.45 | | | | 0.37 | | |
| | (0.34 | ) | | | 0.32 | | | | (0.39 | ) | | | (0.06 | ) | | | (0.03 | ) | |
| | (0.02 | ) | | | 0.65 | | | | 0.01 | | | | 0.39 | | | | 0.34 | | |
| | |
| | |
| | (0.32 | ) | | | (0.28 | ) | | | (0.39 | ) | | | (0.45 | ) | | | (0.39 | ) | |
| | — | | | | (0.04 | ) | | | — | 2 | | | — | 2 | | | — | 2 | |
| | (0.32 | ) | | | (0.32 | ) | | | (0.39 | ) | | | (0.45 | ) | | | (0.39 | ) | |
| | |
| $ | 7.89 | | | $ | 8.23 | | | $ | 7.90 | | | $ | 8.28 | | | $ | 8.34 | | |
| | |
| | (0.31% | ) | | | 8.40% | | | | 0.23% | | | | 4.88% | | | | 4.11% | | |
| | |
| | |
| $ | 654,307 | | | $ | 116,242 | | | $ | 79,391 | | | $ | 82,643 | | | $ | 144,258 | | |
| | 0.67% | | | | 0.69% | | | | 0.69% | | | | 0.69% | | | | 0.72% | | |
| | 0.68% | | | | 0.80% | | | | 0.80% | | | | 0.74% | | | | 0.73% | | |
| | 4.00% | | | | 4.02% | | | | 5.02% | | | | 5.47% | | | | 4.47% | | |
| | 3.99% | | | | 3.91% | | | | 4.91% | | | | 5.42% | | | | 4.46% | | |
| | 45% | | | | 124% | | | | 125% | | | | 143% | | | | 157% | | |
37
Table of Contents
Financial highlights
Delaware Floating Rate Fund Class R6
Selected data for each share of the Fund outstanding throughout each period were as follows:
| 8/31/211 |
| to |
| 7/31/22 |
| Net asset value, beginning of period | $ | 8.24 | |
| |
| Income (loss) from investment operations: | | | |
| Net investment income2 | | 0.33 | |
| Net realized and unrealized loss | | (0.38 | ) |
| Total from investment operations | | (0.05 | ) |
| |
| Less dividends and distributions from: | | | |
| Net investment income | | (0.30 | ) |
| Total dividends and distributions | | (0.30 | ) |
| |
| Net asset value, end of period | $ | 7.89 | |
| |
| Total return3 | | (0.69% | ) |
| |
| Ratios and supplemental data: | | | |
| Net assets, end of period (000 omitted) | $ | 4,986 | |
| Ratio of expenses to average net assets4 | | 0.60% | |
| Ratio of expenses to average net assets prior to fees waived4 | | 0.61% | |
| Ratio of net investment income to average net assets | | 4.07% | |
| Ratio of net investment income to average net assets prior to fees waived | | 4.06% | |
| Portfolio turnover | | 45% | 5 |
| 1 | Date of commencement of operations; ratios have been annualized and total return has not been annualized. |
| 2 | Calculated using average shares outstanding. |
| 3 | Total return is based on the change in net asset value of a share during the period and assumes reinvestment of dividends and distributions at net asset value. Total return during the period shown reflects a waiver by the manager. Performance would have been lower had the waiver not been in effect. |
| 4 | Expense ratios do not include expenses of any Underlying Funds in which the Fund invests. |
| 5 | Portfolio turnover is representative of the Fund for the year ended July 31, 2022. |
38
Table of Contents
| Notes to financial statements | |
| Delaware Floating Rate Fund | July 31, 2022 |
Delaware Group® Income Funds (Trust) is organized as a Delaware statutory trust and offers four series: Delaware Corporate Bond Fund, Delaware Extended Duration Bond Fund, Delaware Floating Rate Fund, and Delaware High-Yield Opportunities Fund. These financial statements and the related notes pertain to Delaware Floating Rate Fund (Fund). The Trust is an open-end investment company. The Fund is considered diversified under the Investment Company Act of 1940, as amended, and offers Class A, Class C, Class R, Institutional Class, and Class R6 shares. Class A shares are sold with a maximum front-end sales charge of 2.75%. There is no front-end sales charge when you purchase $1,000,000 or more of Class A shares. However, if Delaware Distributors, L.P. (DDLP) paid your financial intermediary a commission on your purchase of $1,000,000 or more of Class A shares, for shares purchased prior to July 1, 2020, you will have to pay a limited contingent deferred sales charge (Limited CDSC) of 1.00% if you redeem these shares within the first year after your purchase and 0.50% if you redeem these shares within the second year; or for shares purchased on or after July 1, 2020, you will have to pay a Limited CDSC of 1.00% if you redeem these shares within the first 18 months after your purchase; unless a specific waiver of the Limited CDSC applies. Class C shares have no upfront sales charge, but sold with a contingent deferred sales charge (CDSC) of 1.00%, which will be incurred if redeemed during the first 12 months. Class R, Institutional Class, and Class R6 shares are not subject to a sales charge and are offered for sale exclusively to certain eligible investors. In addition, Class R6 shares do not pay any service fees, sub-accounting fees, and/or sub-transfer agency fees to any brokers, dealers, or other financial intermediaries.
1. Significant Accounting Policies
The Fund follows accounting and reporting guidance under Financial Accounting Standards Board (FASB) Accounting Standards Codification Topic 946, Financial Services — Investment Companies. The following accounting policies are in accordance with US generally accepted accounting principles (US GAAP) and are consistently followed by the Fund.
Security Valuation — Equity securities, except those traded on the Nasdaq Stock Market LLC (Nasdaq), are valued at the last quoted sales price as of the time of the regular close of the New York Stock Exchange on the valuation date. Equity securities traded on the Nasdaq are valued in accordance with the Nasdaq Official Closing Price, which may not be the last sales price. If, on a particular day, an equity security does not trade, the mean between the bid and the ask prices will be used, which approximates fair value. Debt securities are valued based upon valuations provided by an independent pricing service or broker and reviewed by management. To the extent current market prices are not available, the pricing service may take into account developments related to the specific security, as well as transactions in comparable securities. Open-end investment companies are valued at their published net asset value (NAV). Foreign currency exchange contracts are valued at the mean between the bid and the ask prices, which approximates fair value. Interpolated values are derived when the settlement date of the contract is an interim date for which quotations are not available. Valuations for fixed income securities utilize matrix systems, which reflect such factors as security prices, yields, maturities, and ratings, and are supplemented by dealer and exchange quotations. Generally, other securities
39
Table of Contents
Notes to financial statements
Delaware Floating Rate Fund
1. Significant Accounting Policies (continued) and assets for which market quotations are not readily available are valued at fair value as determined in good faith under the direction of the Trust’s Board of Trustees (Board). In determining whether market quotations are readily available or fair valuation will be used, various factors will be taken into consideration, such as market closures or suspension of trading in a security. Restricted securities are valued at fair value using methods approved by the Board.
Federal Income Taxes — No provision for federal income taxes has been made as the Fund intends to continue to qualify for federal income tax purposes as a regulated investment company under Subchapter M of the Internal Revenue Code of 1986, as amended, and make the requisite distributions to shareholders. The Fund evaluates tax positions taken or expected to be taken in the course of preparing the Fund’s tax returns to determine whether the tax positions are “more-likely-than-not” of being sustained by the applicable tax authority. Tax positions not deemed to meet the “more-likely-than-not” threshold are recorded as a tax benefit or expense in the current year. Management has analyzed the Fund’s tax positions taken or expected to be taken on the Fund's federal income tax returns through the year ended July 31, 2022, and for all open tax years (years ended July 31, 2019–July 31, 2021), and has concluded that no provision for federal income tax is required in the Fund's financial statements. If applicable, the Fund recognizes interest accrued on unrecognized tax benefits in interest expense and penalties in “Other” on the “Statement of operations.” During the year ended July 31, 2022, the Fund did not incur any interest or tax penalties.
Class Accounting — Investment income and common expenses are allocated to the various classes of the Fund on the basis of “settled shares” of each class in relation to the net assets of the Fund. Realized and unrealized gain (loss) on investments are allocated to the various classes of the Fund on the basis of daily net assets of each class. Distribution expenses relating to a specific class are charged directly to that class. Class R6 shares will not be allocated any expenses related to service fees, sub-accounting fees, and/or sub-transfer agency fees paid to brokers, dealers, or other financial intermediaries.
Foreign Currency Transactions — Transactions denominated in foreign currencies are recorded at the prevailing exchange rates on the valuation date in accordance with the Fund’s prospectus. The value of all assets and liabilities denominated in foreign currencies is translated daily into US dollars at the exchange rate of such currencies against the US dollar. Transaction gains or losses resulting from changes in exchange rates during the reporting period or upon settlement of the foreign currency transaction are reported in operations for the current period. The Fund generally bifurcates that portion of realized gains and losses on investments in debt securities which is due to changes in foreign exchange rates from that which is due to changes in market prices of debt securities. That portion of gains (losses), attributable to changes in foreign exchange rates, is included on the “Statement of operations” under “Net realized gain (loss) on foreign currencies.” The Fund reports certain foreign currency related transactions as components of realized gains (losses) for financial reporting purposes, whereas such components are treated as ordinary income (loss) for federal income tax purposes.
40
Table of Contents
Use of Estimates — The preparation of financial statements in conformity with US GAAP requires management to make estimates and assumptions that affect the fair value of investments, the reported amounts of assets and liabilities and disclosure of contingent assets and liabilities at the date of the financial statements, and the reported amounts of revenues and expenses during the reporting period. Actual results could differ from those estimates and the differences could be material.
Other — Expenses directly attributable to the Fund are charged directly to the Fund. Other expenses common to various funds within the Delaware Funds by Macquarie® (Delaware Funds) are generally allocated among such fund on the basis of average net assets. Management fees and certain other expenses are paid monthly. Security transactions are recorded on the date the securities are purchased or sold (trade date) for financial reporting purposes. Costs used in calculating realized gains and losses on the sale of investment securities are those of the specific securities sold. Dividend income is recorded on the ex-dividend date and interest income is recorded on the accrual basis. Income and capital gain distributions from any investment companies (Underlying Funds) in which the Fund invests are recorded on the ex-dividend date. Discounts and premiums on debt securities are accreted or amortized to interest income, respectively, over the lives of the respective securities using the effective interest method. Premiums on callable debt securities are amortized to interest income to the earliest call date using the effective interest method. The Fund declares dividends daily from net investment income and pays the dividends monthly and declares and pays distributions from net realized gain on investments, if any, annually. The Fund may distribute more frequently, if necessary for tax purposes. Dividends and distributions, if any, are recorded on the ex-dividend date.
The Fund receives earnings credits from its custodian when positive cash balances are maintained, which may be used to offset custody fees. The expenses paid under this arrangement are included on the "Statement of operations" under "Custodian fees" with the corresponding expenses offset included under "Less expense paid indirectly." There were no such earnings credits for the year ended July 31, 2022.
The Fund receives earnings credits from its transfer agent when positive cash balances are maintained, which may be used to offset transfer agent fees. If the amount earned is greater than $1, the expenses paid under this arrangement are included on the “Statement of operations” under “Dividend disbursing and transfer agent fees and expenses” with the corresponding expenses offset included under “Less expenses paid indirectly.” For the year ended July 31, 2022, the Fund earned $161 under this arrangement.
2. Investment Management, Administration Agreements, and Other Transactions with Affiliates
In accordance with the terms of its investment management agreement, the Fund pays Delaware Management Company (DMC), a series of Macquarie Investment Management Business Trust and the investment manager, an annual fee which is calculated daily and paid monthly at the
41
Table of Contents
Notes to financial statements
Delaware Floating Rate Fund
2. Investment Management, Administration Agreements, and Other Transactions with Affiliates (continued)
rates of 0.50% on the first $500 million of average daily net assets of the Fund, 0.475% on the next $500 million, 0.45% on the next $1.5 billion, and 0.425% on average daily net assets in excess of $2.5 billion.
DMC has contractually agreed to waive all or a portion of its management fee and/or pay/reimburse expenses (excluding any distribution and service (12b-1) fees, acquired fund fees and expenses, taxes, interest, short sale dividend and interest expenses, brokerage fees, certain insurance costs, and nonroutine expenses or costs, including, but not limited to, those relating to reorganizations, litigation, conducting shareholder meetings, and liquidations), in order to prevent total annual fund operating expenses from exceeding 0.69% of the Fund's Class A, Class C, Class R, and Institutional Class average daily net assets and 0.62% of the Fund’s Class R6 shares average daily net assets from August 1, 2021 through July 31, 2022.* These waivers and reimbursements may only be terminated by agreement of DMC and the Fund. The waivers and reimbursements are accrued daily and received monthly.
DMC may seek investment advice and recommendations from its affiliates: Macquarie Investment Management Europe Limited, Macquarie Investment Management Austria Kapitalanlage AG, and Macquarie Investment Management Global Limited (together, the “Affiliated Sub-Advisors”). DMC may also permit these Affiliated Sub-Advisors to execute Fund security trades on its behalf and exercise investment discretion for securities in certain markets where DMC believes it will be beneficial to utilize an Affiliated Sub-Advisor’s specialized market knowledge. Although the Affiliated Sub-Advisors serve as sub-advisors, DMC has ultimate responsibility for all investment advisory services. For these services, DMC, not the Fund, may pay each Affiliated Sub-Advisor a portion of its investment management fee.
Delaware Investments Fund Services Company (DIFSC), an affiliate of DMC, provides fund accounting and financial administrative oversight services to the Fund. For these services, DIFSC’s fees are calculated daily and paid monthly, based on the aggregate daily net assets of all funds within the Delaware Funds at the following annual rates: 0.00475% of the first $35 billion; 0.0040% of the next $10 billion; 0.0025% of the next $45 billion; and 0.0015% of aggregate average daily net assets in excess of $90 billion (Total Fee). Each fund in the Delaware Funds pays a minimum of $4,000, which, in aggregate, is subtracted from the Total Fee. Each fund then pays its portion of the remainder of the Total Fee on a relative NAV basis. This amount is included on the “Statement of operations” under “Accounting and administration expenses.” For the year ended July 31, 2022, the Fund paid $16,619 for these services.
DIFSC is also the transfer agent and dividend disbursing agent of the Fund. For these services, DIFSC’s fees are calculated daily and paid monthly, based on the aggregate daily net assets of the retail funds within the Delaware Funds at the following annual rates: 0.014% of the first $20 billion; 0.011% of the next $5 billion; 0.007% of the next $5 billion; 0.005% of the next $20 billion; and 0.0025% of average daily net assets in excess of $50 billion. The fees payable to DIFSC under the shareholder services agreement described above are allocated among all retail
42
Table of Contents
funds in the Delaware Funds on a relative NAV basis. This amount is included on the “Statement of operations” under “Dividend disbursing and transfer agent fees and expenses.” For the year ended July 31, 2022, the Fund paid $17,629 for these services. Pursuant to a sub-transfer agency agreement between DIFSC and BNY Mellon Investment Servicing (US) Inc. (BNYMIS), BNYMIS provides certain sub-transfer agency services to the Fund. Sub-transfer agency fees are paid by the Fund and are also included on the “Statement of operations” under “Dividend disbursing and transfer agent fees and expenses.” The fees that are calculated daily and paid as invoices are received on a monthly or quarterly basis.
Pursuant to a distribution agreement and distribution plan, the Fund pays DDLP, the distributor and an affiliate of DMC, an annual 12b-1 fee of 0.25%, 1.00%, and 0.50% of the average daily net assets of the Class A, Class C, and Class R shares, respectively. The fees are calculated daily and paid monthly. Institutional Class and Class R6 shares do not pay 12b-1 fees.
As provided in the investment management agreement, the Fund bears a portion of the cost of certain resources shared with DMC, including the cost of internal personnel of DMC and/or its affiliates that provide legal and regulatory reporting services to the Fund. For the year ended July 31, 2022, the Fund paid $3,632 for internal legal and regulatory reporting services provided by DMC and/or its affiliates’ employees. This amount is included on the “Statement of operations” under “Legal fees.”
For the year ended July 31, 2022, DDLP earned $9,400 for commissions on sales of the Fund’s Class A shares. For the year ended July 31, 2022, DDLP received gross CDSC commissions of $3,524 and $1,368 on redemptions of the Fund’s Class A and Class C shares, respectively, and these commissions were entirely used to offset upfront commissions previously paid by DDLP to broker/dealers on sales of those shares.
Trustees’ fees include expenses accrued by the Fund for each Trustee’s retainer and meeting fees. Certain officers of DMC, DIFSC, and DDLP are officers and/or Trustees of the Trust. These officers and Trustees are paid no compensation by the Fund.
In addition to the management fees and other expenses of the Fund, the Fund indirectly bears the investment management fees and other expenses of any Underlying Funds in which it invests. The amount of these fees and expenses incurred indirectly by the Fund will vary based upon the expense and fee levels of any Underlying Funds and the number of shares that are owned of any Underlying Funds at different times.
____________________
| * | The aggregate contractual waiver period covering this report is from November 27, 2020 through November 30, 2022. |
43
Table of Contents
Notes to financial statements
Delaware Floating Rate Fund
3. Investments
For the year ended July 31, 2022, the Fund made purchases and sales of investment securities other than short-term investments as follows:
| Purchases | | $ | 716,919,902 |
| Sales | | | 178,332,658 |
The tax cost of investments and derivatives includes adjustments to net unrealized appreciation (depreciation) which may not necessarily be the final tax cost basis adjustments but which approximate the tax basis unrealized gains and losses that may be realized and distributed to shareholders. At July 31, 2022, the cost and unrealized appreciation (depreciation) of investments and derivatives for federal income tax purposes for the Fund were as follows:
| Cost of investments and derivatives | | $ | 780,309,493 | |
| Aggregate unrealized appreciation of investments and derivatives | | $ | 1,246,427 | |
| Aggregate unrealized depreciation of investments and derivatives | | | (24,189,757 | ) |
| Net unrealized depreciation of investments and derivatives | | $ | (22,943,330 | ) |
US GAAP defines fair value as the price that the Fund would receive to sell an asset or pay to transfer a liability in an orderly transaction between market participants at the measurement date under current market conditions. A three-level hierarchy for fair value measurements has been established based upon the transparency of inputs to the valuation of an asset or liability. Inputs may be observable or unobservable and refer broadly to the assumptions that market participants would use in pricing the asset or liability. Observable inputs reflect the assumptions market participants would use in pricing the asset or liability based on market data obtained from sources independent of the reporting entity. Unobservable inputs reflect the reporting entity’s own assumptions about the assumptions that market participants would use in pricing the asset or liability based on the best information available under the circumstances. The Fund's investment in its entirety is assigned a level based upon the observability of the inputs which are significant to the overall valuation. The three-level hierarchy of inputs is summarized as follows:
| Level 1 – | Inputs are quoted prices in active markets for identical investments. (Examples: equity securities, open-end investment companies, futures contracts, and exchange-traded options contracts) |
| |
| Level 2 – | Other observable inputs, including, but not limited to: quoted prices for similar assets or liabilities in markets that are active, quoted prices for identical or similar assets or liabilities in markets that are not active, inputs other than quoted prices that are observable for the assets or liabilities (such as interest rates, yield curves, volatilities, prepayment speeds, loss severities, credit risks, and default rates) or other market-corroborated inputs. (Examples: debt securities, government securities, swap contracts, foreign currency exchange contracts, foreign securities utilizing international fair value pricing, broker-quoted securities, and fair valued securities) |
44
Table of Contents
| Level 3 – | Significant unobservable inputs, including the Fund's own assumptions used to determine the fair value of investments. (Examples: broker-quoted securities and fair valued securities) |
Level 3 investments are valued using significant unobservable inputs. The Fund may also use an income-based valuation approach in which the anticipated future cash flows of the investment are discounted to calculate fair value. Discounts may also be applied due to the nature or duration of any restrictions on the disposition of the investments. Valuations may also be based upon current market prices of securities that are comparable in coupon, rating, maturity, and industry. The derived value of a Level 3 investment may not represent the value which is received upon disposition and this could impact the results of operations.
The following table summarizes the valuation of the Fund’s investments by fair value hierarchy levels as of July 31, 2022:
| | Level 1 | | Level 2 | | Total |
| Securities | | | | | | | | | | | |
| Assets: | | | | | | | | | | | |
| Common Stock | | $ | 59,093 | | $ | — | | | $ | 59,093 | |
| Convertible Bond | | | — | | | 198,086 | | | | 198,086 | |
| Corporate Bonds | | | — | | | 35,579,421 | | | | 35,579,421 | |
| Exchange-Traded Funds | | | 19,397,940 | | | — | | | | 19,397,940 | |
| Loan Agreements | | | — | | | 655,315,318 | | | | 655,315,318 | |
| Municipal Bond | | | — | | | 516,526 | | | | 516,526 | |
| Short-Term Investments | | | 46,322,292 | | | — | | | | 46,322,292 | |
| Total Value of Securities | | $ | 65,779,325 | | $ | 691,609,351 | | | $ | 757,388,676 | |
| | | | | | | | | | | | |
| Derivatives1 | | | | | | | | | | | |
| Liabilities: | | | | | | | | | | | |
| Foreign Currency Exchange Contracts | | $ | — | | $ | (22,513 | ) | | $ | (22,513 | ) |
| 1 | Foreign currency exchange contracts are valued at the unrealized appreciation (depreciation) on the instrument at the year end. |
During the year ended July 31, 2022, there were no transfers into or out of Level 3 investments. The Fund’s policy is to recognize transfers into or out of Level 3 investments based on fair value at the beginning of the reporting period.
A reconciliation of Level 3 investments is presented when the Fund has a significant amount of Level 3 investments at the beginning or end of the year in relation to the Fund’s net assets. During the year ended July 31, 2022, there were no Level 3 investments.
45
Table of Contents
Notes to financial statements
Delaware Floating Rate Fund
4. Dividend and Distribution Information
Income and long-term capital gain distributions are determined in accordance with federal income tax regulations, which may differ from US GAAP. Additionally, distributions from net short-term gains on sales of investment securities are treated as ordinary income for federal income tax purposes. The tax character of dividends and distributions paid during the years ended July 31, 2022 and 2021 were as follows:
| | Year ended |
| | 7/31/22 | | 7/31/21 |
| Ordinary income | | $ | 15,997,788 | | $ | 4,334,489 |
| Return of capital | | | — | | | 707,075 |
| Total | | $ | 15,997,788 | | $ | 5,041,564 |
5. Components of Net Assets on a Tax Basis
As of July 31, 2022, the components of net assets on a tax basis were as follows:
| Shares of beneficial interest | | $ | 797,612,358 | |
| Undistributed ordinary income | | | 213,539 | |
| Distributions payable | | | (299,694 | ) |
| Capital loss carryforwards* | | | (28,484,942 | ) |
| Unrealized appreciation (depreciation) of investments and foreign | | | | |
| currencies | | | (22,943,330 | ) |
| Net assets | | $ | 746,097,931 | |
| * | A portion of the Fund’s capital loss carryforward is subject to limitation under the Internal Revenue Code and related regulations. |
The differences between book basis and tax basis components of net assets are primarily attributable to tax deferral of losses on wash sales, market discount and premium on debt instruments, market premium on callable bonds, and mark-to-market on foreign currency contracts.
For financial reporting purposes, capital accounts are adjusted to reflect the tax character of permanent book/tax differences. Reclassifications are primarily due to tax treatment of non-deductible expenses, wash sales and capital loss carryover from merger. Results of operations and net assets were not affected by these reclassifications. For the year ended July 31, 2022, the adjustments were to decrease total distributable earnings and increase paid-in capital in excess of par by $8,611,769.
46
Table of Contents
At July 31, 2022, capital loss carryforwards available to offset future realized capital gains, are as follows:
| | Loss carryforward character | | |
| | Short-term | | Long-term | | Total |
| | $10,343,895 | | $18,141,047 | | $28,484,942 |
6. Capital Shares
Transactions in capital shares were as follows:
| | | Year ended |
| | | 7/31/22 | | 7/31/21 |
| Shares sold: | | | | | | |
| | Class A | | 7,931,278 | | | 2,320,295 | |
| Class C | | 1,017,376 | | | 230,847 | |
| Class R | | 138,064 | | | 1,818 | |
| Institutional Class | | 91,354,894 | | | 9,766,307 | |
| Class R6 | | 611,865 | | | — | |
| | | | | | | |
| Shares from merger:1 | | | | | | |
| Class A | | 3,345,888 | | | — | |
| Institutional Class | | 2,183,703 | | | — | |
| Class R6 | | 28,814 | | | — | |
| | | | | | | |
| Shares issued upon reinvestment of dividends and distributions: | | | | | | |
| Class A | | 303,260 | | | 113,245 | |
| Class C | | 36,072 | | | 40,690 | |
| Class R | | 281 | | | 35 | |
| Institutional Class | | 1,484,513 | | | 414,936 | |
| Class R6 | | 8,306 | | | — | |
| | | 108,444,314 | | | 12,888,173 | |
| | | | | | | | |
| Shares redeemed: | | | | | | |
| Class A | | (6,816,816 | ) | | (977,197 | ) |
| Class C | | (467,999 | ) | | (939,391 | ) |
| Class R | | — | | | (157 | ) |
| Institutional Class | | (26,161,296 | ) | | (6,119,746 | ) |
| Class R6 | | (17,409 | ) | | — | |
| | | (33,463,520 | ) | | (8,036,491 | ) |
| Net increase | | 74,980,794 | | | 4,851,682 | |
47
Table of Contents
Notes to financial statements
Delaware Floating Rate Fund
6. Capital Shares (continued)
Certain shareholders may exchange shares of one class for shares of another class in the same Fund. These exchange transactions are included as subscriptions and redemptions in the table on the previous page and on the “Statements of changes in net assets.” For the years ended July 31, 2022 and 2021, the Fund had the following exchange transactions:
| | Exchange Redemptions | | Exchange Subscriptions | | | |
| | | | | | | | Institutional | | | |
| | Class A | | Class C | | Class A | | Class | | | |
| | Shares | | Shares | | Shares | | Shares | | Value |
| Year ended | | | | | | | | | | | | | |
| 7/31/22 | | 4,860 | | 14,795 | | 14,814 | | | 4,860 | | | $ | 162,046 |
| 7/31/21 | | — | | 27,474 | | 27,516 | | | — | | | | 225,779 |
7. Reorganization
On September 17, 2021, the Board approved a proposal to reorganize (the "Reorganization") Delaware Floating Rate II Fund (the "Acquired Fund"), a series of Delaware Group® Equity Funds IV, with and into Delaware Floating Rate Fund (the “Acquiring Fund”), a series of the Trust. Pursuant to an Agreement and Plan of Reorganization (the “Plan”): (i) all of the property, assets, and goodwill of the Acquired Fund were acquired by the Acquiring Fund, and (ii) the Trust, on behalf of the Acquiring Fund, assumed the liabilities of the Acquired Fund, in exchange for shares of the Acquiring Fund. In accordance with the Plan, the Acquired Fund liquidated and dissolved following the Reorganization. The purpose of the transaction was to allow shareholders of the Acquired Fund to own shares of the Acquiring Fund, a fund with a similar investment objective and style as, and potentially lower net expenses than the Acquired Fund. The Reorganization was accomplished by a tax-free exchange of shares on September 17, 2021. For financial reporting purposes, assets received and shares issued by the Acquiring Fund were recorded at fair value; however, the cost basis of the investments received from the Acquired Fund was carried forward to align ongoing reporting of the Acquiring Fund's realized and unrealized gains and losses with amounts distributable to shareholders for tax purposes.
The share transactions associated with the Reorganization are as follows:
| | | | | | | Shares | | | | | |
| | Acquired | | Acquired | | Converted | | Acquiring | | |
| | Fund | | Fund Shares | | to Acquiring | | Fund | | Conversion |
| | Net Assets | | Outstanding | | Fund | | Net Assets | | Ratio |
| | Delaware Floating Rate II Fund | | Delaware Floating Rate Fund | | |
| Class A | | $ | 27,603,573 | | 2,932,529 | | 3,345,888 | | $ | 37,271,906 | | 1.1410 |
| Class C | | | — | | — | | — | | | 8,437,606 | | — |
| Class R | | | — | | — | | — | | | 21,767 | | — |
| Institutional | | | | | | | | | | | | |
| Class | | | 18,015,552 | | 1,916,263 | | 2,183,703 | | | 125,238,425 | | 1.1396 |
| Class R6 | | | 238,005 | | 25,255 | | 28,814 | | | 27,955 | | 1.1409 |
48
Table of Contents
The net assets of the Acquiring Fund before the Reorganization were $170,997,659. The net assets of the Acquiring Fund immediately following the Reorganization were $216,854,789.
Assuming the Reorganization had been completed on August 1, 2021, the Acquiring Fund's pro forma results of operations for the year ended July 31, 2022, would have been as follows:
| Net investment income | | $ | 18,361,332 | |
| Net realized loss on investments | | | (1,045,181 | ) |
| Net change in unrealized appreciation (depreciation) | | | (25,868,833 | ) |
| Net decrease in net assets resulting from operations | | $ | (8,552,682 | ) |
Because the combined investment portfolios have been managed as a single integrated portfolio since the acquisition was completed, it is not practical to separate the amounts of revenue and earnings of the Acquired Fund that have been included in the Acquiring Fund's "Statement of Operations" since the Reorganization was consummated on September 17, 2021.
8. Line of Credit
The Fund, along with certain other funds in the Delaware Funds (Participants), was a participant in a $225,000,000 revolving line of credit (Agreement) intended to be used for temporary or emergency purposes as an additional source of liquidity to fund redemptions of investor shares. Under the Agreement, the Participants were charged an annual commitment fee of 0.15% with the addition of an upfront fee of 0.05%, which was allocated across the Participants based on a weighted average of the respective net assets of each Participant. The Participants were permitted to borrow up to a maximum of one-third of their net assets under the Agreement. Each Participant was individually, and not jointly, liable for its particular advances, if any, under the line of credit. The line of credit available under the Agreement expired on November 1, 2021.
On November 1, 2021, the Fund, along with the other Participants, entered into an amendment to the agreement for a $355,000,000 revolving line of credit to be used as described above and operates in substantially the same manner as the original Agreement. Under the amendment to the agreement, the Participants are charged an annual commitment fee of 0.15%, with the addition of an upfront fee of 0.05%, which is allocated across the Participants based on a weighted average of the respective net assets of each Participant. The line of credit available under the agreement expires on October 31, 2022.
The Fund had no amounts outstanding as of July 31, 2022, or at any time during the year then ended.
9. Derivatives
US GAAP requires disclosures that enable investors to understand: (1) how and why an entity uses derivatives; (2) how they are accounted for; and (3) how they affect an entity’s results of operations and financial position.
49
Table of Contents
Notes to financial statements
Delaware Floating Rate Fund
9. Derivatives (continued)
Foreign Currency Exchange Contracts — The Fund may enter into foreign currency exchange contracts and foreign cross currency exchange contracts as a way of managing foreign exchange rate risk. The Fund may enter into these contracts to fix the US dollar value of a security that it has agreed to buy or sell for the period between the date the trade was entered into and the date the security is delivered and paid for. The Fund may also enter into these contracts to hedge the US dollar value of securities it already owns that are denominated in foreign currencies. In addition, the Fund may enter into these contracts to facilitate or expedite the settlement of portfolio transactions. The change in value is recorded as an unrealized gain or loss. When the contract is closed, a realized gain or loss is recorded equal to the difference between the value of the contract at the time it was opened and the value at the time it was closed.
The use of foreign currency exchange contracts and foreign cross currency exchange contracts does not eliminate fluctuations in the underlying prices of the securities, but does establish a rate of exchange that can be achieved in the future. Although foreign currency exchange contracts and foreign cross currency exchange contracts limit the risk of loss due to an unfavorable change in the value of the hedged currency, they also limit any potential gain that might result should the value of the currency change favorably. In addition, the Fund could be exposed to risks if the counterparties to the contracts are unable to meet the terms of their contracts. The Fund’s maximum risk of loss from counterparty credit risk is the value of its currency exchanged with the counterparty. The risk is generally mitigated by having a netting arrangement between the Fund and the counterparty and by the posting of collateral by the counterparty to the Fund to cover the Fund’s exposure to the counterparty.
During the year ended July 31, 2022, the Fund entered into foreign currency exchange contracts to hedge the US dollar value of securities it already owns that are denominated in foreign currencies to increase/decrease exposure to foreign currencies.
During the year ended July 31, 2022, the Fund experienced net realized and unrealized gains or losses attributed to foreign currency holdings, which are disclosed on the "Statement of assets and liabilities" and "Statement of Operations".
The table below summarizes the average daily balance of derivative holdings by the Fund during the year ended July 31, 2022:
| | Long Derivative | | Short Derivative |
| | Volume | | Volume |
| Foreign currency exchange contracts (average notional value) | | $8,911 | | $1,397,180 |
10. Offsetting
The Fund entered into an International Swaps and Derivatives Association, Inc. Master Agreement (ISDA Master Agreement) or a similar agreement with certain of its derivative contract counterparties in order to better define its contractual rights and to secure rights that will help the Fund mitigate its counterparty risk. An ISDA Master Agreement is a bilateral agreement between
50
Table of Contents
the Fund and a counterparty that governs certain over-the-counter derivatives and foreign exchange contracts and typically contains, among other things, collateral posting items and netting provisions in the event of a default and/or termination event. Under an ISDA Master Agreement, the Fund may, under certain circumstances, offset with the counterparty certain derivative financial instruments’ payables and/or receivables with collateral held and/or posted and create one single net payment. The provisions of the ISDA Master Agreement typically permit a single net payment in the event of default (close-out), including the bankruptcy or insolvency of the counterparty. However, bankruptcy or insolvency laws of a particular jurisdiction may impose restrictions on or prohibitions against the right of offset in bankruptcy, insolvency, or other events.
For financial reporting purposes, the Fund does not offset derivative assets and derivative liabilities that are subject to netting arrangements on the “Statement of assets and liabilities.” At July 31, 2022, the Fund had the following assets and liabilities subject to offsetting provisions:
Offsetting of Financial Assets and Liabilities and Derivative Assets and Liabilities
Delaware Floating Rate Fund
| | Gross Value of | | Gross Value of | | |
| Counterparty | | Derivative Asset | | Derivative Liability | | Net Position |
| Citigroup | | $— | | $(22,513) | | $(22,513) |
| | | | Fair Value of | | | | Fair Value of | | | | |
| | | | Non-Cash | | | | Non-Cash | | | | |
| | | | Collateral | | Cash Collateral | | Collateral | | Cash Collateral | | |
| Counterparty | | Net Position | | Received | | Received | | Pledged | | Pledged | | Net Exposure(a) |
| Citigroup | | $(22,513) | | $— | | $— | | $— | | $— | | $(22,513) |
| (a) | Net exposure represents the receivable (payable) that would be due from (to) the counterparty in the event of default. |
11. Securities Lending
The Fund, along with other funds in Delaware Funds, may lend its securities pursuant to a security lending agreement (Lending Agreement) with The Bank of New York Mellon (BNY Mellon). At the time a security is loaned, the borrower must post collateral equal to the required percentage of the market value of the loaned security, including any accrued interest. The required percentage is: (1) 102% with respect to US securities and foreign securities that are denominated and payable in US dollars; and (2) 105% with respect to foreign securities. With respect to each loan, if on any business day the aggregate market value of securities collateral plus cash collateral held is less than the aggregate market value of the securities which are the subject of such loan, the borrower will be notified to provide additional collateral by the end of the following business day, which, together with the collateral already held, will be not less than the applicable initial collateral requirements for such security loan. If the aggregate market value of securities collateral and cash collateral held with respect to a security loan exceeds the applicable initial collateral requirement, upon the request of the borrower, BNY Mellon must
51
Table of Contents
Notes to financial statements
Delaware Floating Rate Fund
11. Securities Lending (continued) return enough collateral to the borrower by the end of the following business day to reduce the value of the remaining collateral to the applicable initial collateral requirement for such security loan. As a result of the foregoing, the value of the collateral held with respect to a loaned security on any particular day, may be more or less than the value of the security on loan. The collateral percentage with respect to the market value of the loaned security is determined by the security lending agent.
Cash collateral received by each fund of the Trust is generally invested in a series of individual separate accounts, each corresponding to a fund. The investment guidelines permit each separate account to hold certain securities that would be considered eligible securities for a money market fund. Cash collateral received is generally invested in government securities; certain obligations issued by government sponsored enterprises; repurchase agreements collateralized by US Treasury securities; obligations issued by the central government of any Organization for Economic Cooperation and Development (OECD) country or its agencies, instrumentalities, or establishments; obligations of supranational organizations; commercial paper, notes, bonds, and other debt obligations; certificates of deposit, time deposits, and other bank obligations; certain money market funds; and asset-backed securities. The Fund can also accept US government securities and letters of credit (non-cash collateral) in connection with securities loans.
In the event of default or bankruptcy by the lending agent, realization and/or retention of the collateral may be subject to legal proceedings. In the event the borrower fails to return loaned securities and the collateral received is insufficient to cover the value of the loaned securities and provided such collateral shortfall is not the result of investment losses, the lending agent has agreed to pay the amount of the shortfall to the Fund or, at the discretion of the lending agent, replace the loaned securities. The Fund continues to record dividends or interest, as applicable, on the securities loaned and is subject to changes in value of the securities loaned that may occur during the term of the loan. The Fund has the right under the Lending Agreement to recover the securities from the borrower on demand. With respect to security loans collateralized by non-cash collateral, the Fund receives loan premiums paid by the borrower. With respect to security loans collateralized by cash collateral, the earnings from the collateral investments are shared among the Fund, the security lending agent, and the borrower. The Fund records security lending income net of allocations to the security lending agent and the borrower.
The Fund may incur investment losses as a result of investing securities lending collateral. This could occur if an investment in the collateral investment account defaulted or became impaired. Under those circumstances, the value of the Fund's cash collateral account may be less than the amount the Fund would be required to return to the borrowers of the securities and the Fund would be required to make up for this shortfall.
During the year ended July 31, 2022, the Fund had no securities out on loan.
52
Table of Contents
12. Credit and Market Risk
Beginning in January 2020, global financial markets have experienced and may continue to experience significant volatility resulting from the spread of a novel coronavirus known as COVID-19. The outbreak of COVID-19 has resulted in travel and border restrictions, quarantines, supply chain disruptions, lower consumer demand, and general market uncertainty. The effects of COVID-19 have and may continue to adversely affect the global economy, the economies of certain nations, and individual issuers, all of which may negatively impact the Fund's performance.
The Fund invests a portion of its assets in high yield fixed income securities, which are securities rated lower than BBB- by S&P and Baa3 by Moody’s, or similarly rated by another nationally recognized statistical rating organization. Investments in these higher yielding securities are generally accompanied by a greater degree of credit risk than higher rated securities. Additionally, lower rated securities may be more susceptible to adverse economic and competitive industry conditions than investment grade securities.
The Fund invests in certain obligations that may have liquidity protection designed to ensure that the receipt of payments due on the underlying security is timely. Such protection may be provided through guarantees, insurance policies, or letters of credit obtained by the issuer or sponsor through third parties, through various means of structuring the transaction, or through a combination of such approaches. The Fund will not pay any additional fees for such credit support, although the existence of credit support may increase the price of a security.
The Fund invests in bank loans and other securities that may subject it to direct indebtedness risk, the risk that the Fund will not receive payment of principal, interest, and other amounts due in connection with these investments and will depend primarily on the financial condition of the borrower. Loans that are fully secured offer the Fund more protection than unsecured loans in the event of nonpayment of scheduled interest or principal, although there is no assurance that the liquidation of collateral from a secured loan would satisfy the corporate borrower’s obligation, or that the collateral can be liquidated. Some loans or claims may be in default at the time of purchase. Certain of the loans and the other direct indebtedness acquired by the Fund may involve revolving credit facilities or other standby financing commitments that obligate the Fund to pay additional cash on a certain date or on demand. These commitments may require the Fund to increase its investment in a company at a time when the Fund might not otherwise decide to do so (including at a time when the company’s financial condition makes it unlikely that such amounts will be repaid). To the extent that the Fund is committed to advance additional funds, it will at all times hold and maintain cash or other high grade debt obligations in an amount sufficient to meet such commitments. When a loan agreement is purchased, the Fund may pay an assignment fee. On an ongoing basis, the Fund may receive a commitment fee based on the undrawn portion of the underlying line of credit portion of a loan agreement. Prepayment penalty fees are received upon the prepayment of a loan agreement by the borrower. Prepayment penalty, facility, commitment, consent, and amendment fees are recorded to income as earned or paid.
53
Table of Contents
Notes to financial statements
Delaware Floating Rate Fund
12. Credit and Market Risk (continued)
As the Fund may be required to rely upon another lending institution to collect and pass on to the Fund amounts payable with respect to the loan and to enforce the Fund’s rights under the loan and other direct indebtedness, an insolvency, bankruptcy, or reorganization of the lending institution may delay or prevent the Fund from receiving such amounts. The highly leveraged nature of many loans may make them especially vulnerable to adverse changes in economic or market conditions. Investments in such loans and other direct indebtedness may involve additional risk to the Fund.
When interest rates rise, fixed income securities (i.e. debt obligations) generally will decline in value. These declines in value are greater for fixed income securities with longer maturities or durations.
IBOR is the risk that changes related to the use of the London interbank offered rate (LIBOR) and other interbank offered rate (collectively, “IBORs”) could have adverse impacts on financial instruments that reference LIBOR (or the corresponding IBOR). The abandonment of LIBOR could affect the value and liquidity of instruments that reference LIBOR. The use of alternative reference rate products may impact investment strategy performance. These risks may also apply with respect to changes in connection with other IBORs, such as the euro overnight index average (EONIA), which are also the subject of recent reform.
The Fund may invest up to 15% of its net assets in illiquid securities, which may include securities with contractual restrictions on resale, securities exempt from registration under Rule 144A promulgated under the Securities Act of 1933, as amended, and other securities which may not be readily marketable. The relative illiquidity of these securities may impair the Fund from disposing of them in a timely manner and at a fair price when it is necessary or desirable to do so. While maintaining oversight, the Board has delegated to DMC, the day-to-day functions of determining whether individual securities are liquid for purposes of the Fund’s limitation on investments in illiquid securities. Securities eligible for resale pursuant to Rule 144A, which are determined to be liquid, are not subject to the Fund’s 15% limit on investments in illiquid securities. Rule 144A securities have been identified on the “Schedule of investments.”
13. Contractual Obligations
The Fund enters into contracts in the normal course of business that contain a variety of indemnifications. The Fund's maximum exposure under these arrangements is unknown. However, the Fund has not had prior claims or losses pursuant to these contracts. Management has reviewed the Fund's existing contracts and expects the risk of loss to be remote.
14. Recent Accounting Pronouncements
In March 2020, FASB issued an Accounting Standards Update (ASU), ASU 2020-04, Reference Rate Reform (Topic 848) – Facilitation of the Effects of Reference Rate Reform on Financial Reporting. The amendments in ASU 2020-04 provide optional temporary financial reporting relief from the effect of certain types of contract modifications due to the planned discontinuation of
54
Table of Contents
LIBOR and other interbank-offered based reference rates as of the end of 2021. In March 2021, the administrator for LIBOR announced the extension of the publication of a majority of the USD LIBOR settings to June 30, 2023. ASU 2020-04 is effective for certain reference rate-related contract modifications that occur during the period March 12, 2020 through December 31, 2022. As of the financial reporting period, Management is evaluating the impact of applying this ASU.
15. Subsequent Events
Management has determined that no material events or transactions occurred subsequent to July 31, 2022, that would require recognition or disclosure in the Fund's financial statements.
55
Table of Contents
Report of independent
registered public accounting firm
To the Board of Trustees of Delaware Group® Income Funds and Shareholders of Delaware Floating Rate Fund
Opinion on the Financial Statements
We have audited the accompanying statement of assets and liabilities, including the schedule of investments, of Delaware Floating Rate Fund (one of the funds constituting Delaware Group® Income Funds, referred to hereafter as the “Fund”) as of July 31, 2022, the related statement of operations for the year ended July 31, 2022, the statements of changes in net assets for each of the two years in the period ended July 31, 2022, including the related notes, and the financial highlights for each of the periods indicated therein (collectively referred to as the “financial statements”). In our opinion, the financial statements present fairly, in all material respects, the financial position of the Fund as of July 31, 2022, the results of its operations for the year then ended, the changes in its net assets for each of the two years in the period ended July 31, 2022 and the financial highlights for each of the periods indicated therein in conformity with accounting principles generally accepted in the United States of America.
Basis for Opinion
These financial statements are the responsibility of the Fund’s management. Our responsibility is to express an opinion on the Fund’s financial statements based on our audits. We are a public accounting firm registered with the Public Company Accounting Oversight Board (United States) (PCAOB) and are required to be independent with respect to the Fund in accordance with the U.S. federal securities laws and the applicable rules and regulations of the Securities and Exchange Commission and the PCAOB.
We conducted our audits of these financial statements in accordance with the standards of the PCAOB. Those standards require that we plan and perform the audit to obtain reasonable assurance about whether the financial statements are free of material misstatement, whether due to error or fraud.
Our audits included performing procedures to assess the risks of material misstatement of the financial statements, whether due to error or fraud, and performing procedures that respond to those risks. Such procedures included examining, on a test basis, evidence regarding the amounts and disclosures in the financial statements. Our audits also included evaluating the accounting principles used and significant estimates made by management, as well as evaluating the overall presentation of the financial statements. Our procedures included confirmation of securities owned as of July 31, 2022 by correspondence with the custodian, transfer agents, agent banks and brokers; when replies were not received from agent banks, we performed other auditing procedures. We believe that our audits provide a reasonable basis for our opinion.
/s/PricewaterhouseCoopers LLP
Philadelphia, Pennsylvania
September 16, 2022
We have served as the auditor of one or more investment companies in Delaware Funds by Macquarie® since 2010.
56
Table of Contents
Other Fund information (Unaudited)
Delaware Floating Rate Fund
Liquidity Risk Management Program
The Securities and Exchange Commission (the “SEC”) has adopted Rule 22e-4 under the Investment Company Act of 1940 (the “Liquidity Rule”), which requires all open-end funds (other than money market funds) to adopt and implement a program reasonably designed to assess and manage the fund’s “liquidity risk,” defined as the risk that the fund could not meet requests to redeem shares issued by the fund without significant dilution of remaining investors’ interests in the fund.
The Fund has adopted and implemented a liquidity risk management program in accordance with the Liquidity Rule (the “Program”). The Board has designated a member of the US Operational Risk Group of Macquarie Asset Management as the Program Administrator for each Fund in the Trust.
As required by the Liquidity Rule, the Program includes policies and procedures that provide for: (1) assessment, management, and review (no less frequently than annually) of the Fund’s liquidity risk; (2) classification of each of the Fund’s portfolio holdings into one of four liquidity categories (Highly Liquid, Moderately Liquid, Less Liquid, and Illiquid); (3) for funds that do not primarily hold assets that are Highly Liquid, establishing and maintaining a minimum percentage of the Fund’s net assets in Highly Liquid investments (called a “Highly Liquid Investment Minimum” or “HLIM”); and (4) prohibiting the Fund’s acquisition of Illiquid investments if, immediately after the acquisition, the Fund would hold more than 15% of its net assets in Illiquid assets. The Program also requires reporting to the SEC (on a non-public basis) and to the Board if the Fund’s holdings of Illiquid assets exceed 15% of the Fund’s net assets. Funds with HLIMs must have procedures for addressing HLIM shortfalls, including reporting to the Board and, with respect to HLIM shortfalls lasting more than seven consecutive calendar days, reporting to the SEC (on a non-public basis).
In assessing and managing the Fund’s liquidity risk, the Program Administrator considers, as relevant, a variety of factors, including: (1) the Fund’s investment strategy and liquidity of portfolio investments during both normal and reasonably foreseeable stressed conditions; (2) short-term and long-term cash flow projections for the Fund during both normal and reasonably foreseeable stressed conditions; and (3) the Fund’s holdings of cash and cash equivalents and any borrowing arrangements. Classification of the Fund’s portfolio holdings in the four liquidity categories is based on the number of days it is reasonably expected to take to convert the investment to cash (for Highly Liquid and Moderately Liquid holdings) or to sell or dispose of the investment (for Less Liquid and Illiquid investments), in current market conditions without significantly changing the investment’s market value. The Fund primarily holds assets that are classified as Highly Liquid, and therefore is not required to establish an HLIM.
At a meeting of the Board held on May 17-19, 2022, the Program Administrator provided the required written annual report to the Board addressing the Program’s operation and assessing the adequacy and effectiveness of its implementation for the period from April 1, 2021 through March 31, 2022. The report concluded that the Program is appropriately designed and effectively implemented and that it meets the requirements of Rule 22e-4 and the Fund’s liquidity needs. The Fund’s HLIM is set at an appropriate level and the Fund complied with its HLIM at all times during the reporting period.
57
Table of Contents
Other Fund information (Unaudited)
Delaware Floating Rate Fund
Tax Information
The information set forth below is for the Fund’s fiscal year as required by federal income tax laws. Shareholders, however, must report distributions on a calendar year basis for income tax purposes, which may include distributions for portions of two fiscal years of the Fund.
Accordingly, the information needed by shareholders for income tax purposes will be sent to them in January of each year. Please consult your tax advisor for proper treatment of this information. All disclosures are based on financial information available as of the date of this annual report and, accordingly are subject to change. For any and all items requiring reporting, it is the intention of the Fund to report the maximum amount permitted under the Internal Revenue Code and the regulations thereunder.
For the year ended July 31, 2022, the Fund reports distributions paid during the year as follows:
| (A) Ordinary Income Distributions (Tax Basis) | | 100.00% |
____________________
(A) is based on a percentage of the Fund's total distributions.
For the fiscal year ended July 31, 2022, certain interest income paid by the Fund, determined to be Qualified Interest Income may be subject to relief from US withholding for foreign shareholders, as provided by the American Jobs Creation Act of 2004; the Tax Relief Unemployment Insurance Reauthorization, and Job Creation Act of 2010; and as extended by the American Taxpayer Relief Act of 2012. For the year ended July 31, 2022, the Fund has reported maximum distributions of Qualified Interest Income of $15,997,788.
The percentage of the ordinary dividends reported by the fund that is treated as a Section 163(j) interest dividend and thus is eligible to be treated as interest income for purposes of Section 163(j) and the regulations thereunder is 99.33%.
58
Table of Contents
Board of trustees / directors and officers addendum
Delaware Funds by Macquarie®
A mutual fund is governed by a Board of Trustees/Directors (“Trustees”), which has oversight responsibility for the management of a fund’s business affairs. Trustees establish procedures and oversee and review the performance of the investment manager, the distributor, and others who perform services for the fund. The independent fund trustees, in particular, are advocates for shareholder interests. Each trustee has served in that capacity since he or she was elected to or appointed to the Board of Trustees, and will continue to serve until his or her retirement or the election of a new trustee in his or her place. The following is a list of the Trustees and Officers with certain background and related information.
| | | | | | | | | | Other |
| | | | | | Number of | | Principal | | Directorships |
| Name, | | Position(s) | | | | Funds in Fund | | Occupation(s) | | Held by Trustee |
| Address, | | Held with | | Length of Time | | Complex Overseen | | During the | | During the |
| and Birth Date | | the Trust | | Served | | by Trustee | | Past Five Years | | Past Five Years |
| Interested Trustee | | | | | | | | | | |
| | | | | | | | | | | |
| Shawn K. Lytle1 | | President, | | President and | | 128 | | Macquarie Asset | | None |
| 100 Independence | | Chief Executive | | Chief Executive | | | | Management2 | | |
| 610 Market Street | | Officer, | | Officer | | | | (2015–Present) | | |
| Philadelphia, PA | | and Trustee | | since August 2015 | | | | -Global Head of | | |
| 19106-2354 | | | | | | | | Macquarie Asset | | |
| February 1970 | | | | Trustee since | | | | Management | | |
| | | | September 2015 | | | | (2019–Present) | | |
| | | | | | | | -Head of Americas of | | |
| | | | | | | | Macquarie Group | | |
| | | | | | | | (2017–Present) | | |
| | | | | | | | -Deputy Global Head of | | |
| | | | | | | | Macquarie Asset | | |
| | | | | | | | Management | | |
| | | | | | | | (2017–2019) | | |
| | | | | | | | -Head of Macquarie | | |
| | | | | | | | Asset Management | | |
| | | | | | | | Americas (2015–2017) | | |
59
Table of Contents
Board of trustees / directors and officers addendum
Delaware Funds by Macquarie®
| | | | | | | | | | Other |
| | | | | | Number of | | Principal | | Directorships |
| Name, | | Position(s) | | | | Funds in Fund | | Occupation(s) | | Held by Trustee |
| Address, | | Held with | | Length of Time | | Complex Overseen | | During the | | During the |
| and Birth Date | | the Trust | | Served | | by Trustee | | Past Five Years | | Past Five Years |
| Independent Trustees | | | | | | | | | | |
| | | | | | | | | | | |
| Jerome D. | | Trustee | | Since January 2019 | | 128 | | Stonebrook Capital | | None |
| Abernathy | | | | | | | | Management, LLC | | |
| 100 Independence | | | | | | | | (financial | | |
| 610 Market Street | | | | | | | | technology: macro | | |
| Philadelphia, PA | | | | | | | | factors and databases) | | |
| 19106-2354 | | | | | | | | -Managing Member | | |
| July 1959 | | | | | | | | (1993-Present) | | |
| | | | | | | | | | | |
| Thomas L. Bennett | | Chair and Trustee | | Trustee since March | | 128 | | Private Investor | | None |
| 100 Independence | | | | 2005 | | | | (2004–Present) | | |
| 610 Market Street | | | | | | | | | | |
| Philadelphia, PA | | | | Chair since March | | | | | | |
| 19106-2354 | | | | 2015 | | | | | | |
| October 1947 | | | | | | | | | | |
| | | | | | | | | | | |
| Ann D. Borowiec | | Trustee | | Since March 2015 | | 128 | | J.P. Morgan Chase & Co. | | Banco Santander International |
| 100 Independence | | | | | | | | (1987-2013) | | (2016–2019) |
| 610 Market Street | | | | | | | | -Chief Executive Officer, | | Santander Bank, N.A. |
| Philadelphia, PA | | | | | | | | Private Wealth | | (2016-2019) |
| 19106-2354 | | | | | | | | Management | | |
| November 1958 | | | | | | | | (2011–2013) | | |
60
Table of Contents
| | | | | | | | | | Other |
| | | | | | Number of | | Principal | | Directorships |
| Name, | | Position(s) | | | | Funds in Fund | | Occupation(s) | | Held by Trustee |
| Address, | | Held with | | Length of Time | | Complex Overseen | | During the | | During the |
| and Birth Date | | the Trust | | Served | | by Trustee | | Past Five Years | | Past Five Years |
| | | | | | | | | | | |
| Joseph W. Chow | | Trustee | | Since January 2013 | | 128 | | Private Investor | | None |
| 100 Independence | | | | | | | | (2011–Present) | | |
| 610 Market Street | | | | | | | | | | |
| Philadelphia, PA | | | | | | | | | | |
| 19106-2354 | | | | | | | | | | |
| January 1953 | | | | | | | | | | |
| | | | | | | | | | | |
| H. Jeffrey Dobbs3 | | Trustee | | Since December 2021 | | 128 | | KPMG LLP | | TechAccel LLC |
| 100 Independence | | | | | | | | (2010-2015) | | (2015–Present) |
| 610 Market Street | | | | | | | | -Global Sector Chairman, | | PatientsVoices, Inc. |
| Philadelphia, PA | | | | | | | | Industrial Manufacturing | | (2018–Present) |
| 19106-2354 | | | | | | | | (2010-2015) | | Valparaiso University Board |
| May 1955 | | | | | | | | | | (2012-Present) |
| | | | | | | | | | Ivy Funds Complex (2019-2021) |
61
Table of Contents
Board of trustees / directors and officers addendum
Delaware Funds by Macquarie®
| | | | | | | | | | Other |
| | | | | | Number of | | Principal | | Directorships |
| Name, | | Position(s) | | | | Funds in Fund | | Occupation(s) | | Held by Trustee |
| Address, | | Held with | | Length of Time | | Complex Overseen | | During the | | During the |
| and Birth Date | | the Trust | | Served | | by Trustee | | Past Five Years | | Past Five Years |
| | | | | | | | | | | |
| John A. Fry | | Trustee | | Since January 2001 | | 128 | | Drexel University | | Federal Reserve |
| 100 Independence | | | | | | | | -President | | Bank of Philadelphia |
| 610 Market Street | | | | | | | | (August 2010–Present) | | (2020–Present) |
| Philadelphia, PA | | | | | | | | | | FS Credit Real Estate Income |
| 19106-2354 | | | | | | | | | | Trust, Inc. (2018–Present) |
| May 1960 | | | | | | | | | | vTv Therapeutics Inc. |
| | | | | | | | | | (2017–Present) |
| | | | | | | | | | Community Health Systems |
| | | | | | | | | | (2004–Present) |
| | | | | | | | | | Drexel Morgan & Co. |
| | | | | | | | | | (2015–2019) |
62
Table of Contents
| | | | | | | | | | Other |
| | | | | | Number of | | Principal | | Directorships |
| Name, | | Position(s) | | | | Funds in Fund | | Occupation(s) | | Held by Trustee |
| Address, | | Held with | | Length of Time | | Complex Overseen | | During the | | During the |
| and Birth Date | | the Trust | | Served | | by Trustee | | Past Five Years | | Past Five Years |
| | | | | | | | | | | |
| Joseph Harroz, Jr.3 | | Trustee | | Since December 2021 | | 128 | | University of Oklahoma | | OU Medicine, Inc. |
| 100 Independence | | | | | | | | -President | | (2020–Present) |
| 610 Market Street | | | | | | | | (2020–Present) | | Big 12 Athletic Conference |
| Philadelphia, PA | | | | | | | | -Interim President | | (2019-Present) |
| 19106-2354 | | | | | | | | (2019–2020) | | Valliance Bank |
| January 1967 | | | | | | | | -Vice President and | | (2007–Present) |
| | | | | | | | Dean, College of Law | | Ivy Funds |
| | | | | | | | (2010–2019) | | (1998-2021) |
| | | | | | | | Brookhaven Investments | | |
| | | | | | | | LLC (commercial | | |
| | | | | | | | enterprises) | | |
| | | | | | | | -Managing Member | | |
| | | | | | | | (2019–Present) | | |
| | | | | | | | St. Clair, LLC | | |
| | | | | | | | (commercial enterprises) | | |
| | | | | | | | -Managing Member | | |
| | | | | | | | (2019–Present) | | |
63
Table of Contents
Board of trustees / directors and officers addendum
Delaware Funds by Macquarie®
| | | | | | | | | | Other |
| | | | | | Number of | | Principal | | Directorships |
| Name, | | Position(s) | | | | Funds in Fund | | Occupation(s) | | Held by Trustee |
| Address, | | Held with | | Length of Time | | Complex Overseen | | During the | | During the |
| and Birth Date | | the Trust | | Served | | by Trustee | | Past Five Years | | Past Five Years |
| |
| Sandra A.J. | | Trustee | | Since December 2021 | | 128 | | Children’s Mercy | | Brixmor Property Group Inc. |
| Lawrence3 | | | | | | | | Hospitals and Clinics | | (2021-Present) |
| 100 Independence | | | | | | | | (2005–2019) | | Sera Prognostics Inc. |
| 610 Market Street | | | | | | | | -Chief Administrative | | (biotechnology) (2021-Present) |
| Philadelphia, PA | | | | | | | | Officer | | Recology (resource recovery) |
| 19106-2354 | | | | | | | | (2016–2019) | | (2021-Present) |
| September 1957 | | | | | | | | | | Evergy, Inc., Kansas City Power |
| | | | | | | | | | & Light Company, KCP&L |
| | | | | | | | | | Greater Missouri Operations |
| | | | | | | | | | Company, Westar Energy, Inc. |
| | | | | | | | | | and Kansas Gas and Electric |
| | | | | | | | | | Company (related utility |
| | | | | | | | | | companies) (2018-Present) |
| | | | | | | | | | National Association of Corporate |
| | | | | | | | | | Directors (2017-Present) |
| | | | | | | | | | Ivy Funds Complex (2019-2021) |
| | | | | | | | | | American Shared Hospital |
| | | | | | | | | | Services (medical device) |
| | | | | | | | | | (2017-2021) |
| | | | | | | | | | Ivy NextShares (2019) |
| | | | | | | | | | Westar Energy (utility) |
| | | | | | | | | | (2004-2018) |
64
Table of Contents
| | | | | | | | | | Other |
| | | | | | Number of | | Principal | | Directorships |
| Name, | | Position(s) | | | | Funds in Fund | | Occupation(s) | | Held by Trustee |
| Address, | | Held with | | Length of Time | | Complex Overseen | | During the | | During the |
| and Birth Date | | the Trust | | Served | | by Trustee | | Past Five Years | | Past Five Years |
| |
| Frances A. | | Trustee | | Since September | | 128 | | Banco Itaú International | | Florida Chapter of National |
| Sevilla-Sacasa | | | | 2011 | | | | -Chief Executive Officer | | Association of Corporate |
| 100 Independence | | | | | | | | (2012–2016) | | Directors (2021-Present) |
| 610 Market Street | | | | | | | | | | Callon Petroleum Company |
| Philadelphia, PA | | | | | | | | | | (2019-Present) |
| 19106-2354 | | | | | | | | | | Camden Property Trust |
| January 1956 | | | | | | | | | | (2011-Present) |
| | | | | | | | | | New Senior Investment |
| | | | | | | | | | Group Inc. (2021) |
| | | | | | | | | | Carrizo Oil & Gas, Inc. |
| | | | | | | | | | (2018-2019) |
| |
| Thomas K. Whitford | | Trustee | | Since January 2013 | | 128 | | PNC Financial Services | | HSBC USA Inc. |
| 100 Independence | | | | | | | | Group (1983–2013) | | (2014–Present) |
| 610 Market Street | | | | | | | | -Vice Chairman | | HSBC North America |
| Philadelphia, PA | | | | | | | | (2009-2013) | | Holdings Inc. |
| 19106-2354 | | | | | | | | | | (2013–Present) |
| March 1956 | | | | | | | | | | HSBC Finance Corporation |
| | | | | | | | | | (2013–2018) |
65
Table of Contents
Board of trustees / directors and officers addendum
Delaware Funds by Macquarie®
| | | | | | | | | | Other |
| | | | | | Number of | | Principal | | Directorships |
| Name, | | Position(s) | | | | Funds in Fund | | Occupation(s) | | Held by Trustee |
| Address, | | Held with | | Length of Time | | Complex Overseen | | During the | | During the |
| and Birth Date | | the Trust | | Served | | by Trustee | | Past Five Years | | Past Five Years |
| |
| Christianna Wood | | Trustee | | Since January 2019 | | 128 | | Gore Creek | | The Merger Fund |
| 100 Independence | | | | | | | | Capital, Ltd. | | (2013–2021), |
| 610 Market Street | | | | | | | | -Chief Executive Officer | | The Merger Fund VL |
| Philadelphia, PA | | | | | | | | and President | | (2013–2021), |
| 19106-2354 | | | | | | | | (2009–Present) | | WCM Alternatives: Event-Driven |
| August 1959 | | | | | | | | | | Fund (2013–2021), |
| | | | | | | | | | and WCM Alternatives: Credit |
| | | | | | | | | | Event Fund (2017–2021) |
| | | | | | | | | | Grange Insurance |
| | | | | | | | | | (2013–Present) |
| | | | | | | | | | H&R Block Corporation |
| | | | | | | | | | (2008–Present) |
66
Table of Contents
| | | | | | | | | | Other |
| | | | | | Number of | | Principal | | Directorships |
| Name, | | Position(s) | | | | Funds in Fund | | Occupation(s) | | Held by Trustee |
| Address, | | Held with | | Length of Time | | Complex Overseen | | During the | | During the |
| and Birth Date | | the Trust | | Served | | by Trustee | | Past Five Years | | Past Five Years |
| |
| Janet L. Yeomans | | Trustee | | Since April 1999 | | 128 | | 3M Company | | Okabena Company (2009–2017) |
| 100 Independence | | | | | | | | (1995-2012) | | |
| 610 Market Street | | | | | | | | -Vice President and | | |
| Philadelphia, PA | | | | | | | | Treasurer (2006–2012) | | |
| 19106-2354 | | | | | | | | | | |
| July 1948 | | | | | | | | | | |
| |
| Officers | | | | | | | | | | |
| |
| David F. Connor | | Senior Vice President, | | Senior Vice President, | | 128 | | David F. Connor has | | None4 |
| 100 Independence | | General Counsel, and | | since May 2013; | | | | served in various | | |
| 610 Market Street | | Secretary | | General Counsel | | | | capacities at different | | |
| Philadelphia, PA | | | | since May 2015; | | | | times at Macquarie Asset | | |
| 19106-2354 | | | | Secretary since | | | | Management. | | |
| December 1963 | | | | October 2005 | | | | | | |
| |
| Daniel V. Geatens | | Senior Vice President | | Senior Vice President | | 128 | | Daniel V. Geatens has | | None4 |
| 100 Independence | | and Treasurer | | and Treasurer since | | | | served in various | | |
| 610 Market Street | | | | October 2007 | | | | capacities at different | | |
| Philadelphia, PA | | | | | | | | times at Macquarie Asset | | |
| 19106-2354 | | | | | | | | Management. | | |
| October 1972 | | | | | | | | | | |
67
Table of Contents
Board of trustees / directors and officers addendum
Delaware Funds by Macquarie®
| | | | | | | | | | |
| | | | | | | | | | Other |
| | | | | | Number of | | Principal | | Directorships |
| Name, | | Position(s) | | | | Funds in Fund | | Occupation(s) | | Held by Trustee |
| Address, | | Held with | | Length of Time | | Complex Overseen | | During the | | During the |
| and Birth Date | | the Trust | | Served | | by Trustee | | Past Five Years | | Past Five Years |
| |
| Richard Salus | | Senior Vice President | | Senior Vice President | | 128 | | Richard Salus has | | None |
| 100 Independence | | and Chief Financial | | and Chief Financial | | | | served in various | | |
| 610 Market Street | | Officer | | Officer since | | | | capacities at different | | |
| Philadelphia, PA | | | | November 2006 | | | | times at Macquarie Asset | | |
| 19106-2354 | | | | | | | | Management. | | |
| October 1963 | | | | | | | | | | |
| 1 | Shawn K. Lytle is considered to be an “Interested Trustee” because he is an executive officer of the Fund’s(s’) investment advisor. |
| 2 | Macquarie Asset Management is the marketing name for Macquarie Management Holdings, Inc. and its subsidiaries, including the Fund’s(s’) investment advisor, principal underwriter, and its transfer agent. |
| 3 | Messrs. Dobbs and Harroz and Ms. Lawrence were elected as Trustees of the Trust effective December 17, 2021. |
| 4 | David F. Connor and Daniel V. Geatens serve in similar capacities for the six portfolios of the Optimum Fund Trust, which have the same investment advisor, principal underwriter, and transfer agent as the registrant. Mr. Geatens also serves as the Chief Financial Officer of the Optimum Fund Trust and he is the Chief Financial Officer and Treasurer for Macquarie Global Infrastructure Total Return Fund Inc. |
The Statement of Additional Information for the Fund(s) includes additional information about the Trustees and Officers and is available, without charge, upon request by calling 800 523-1918.
68
Table of Contents
About the organization
| Board of trustees | | | | | | |
Shawn K. Lytle
President and
Chief Executive Officer
Delaware Funds
by Macquarie® Jerome D. Abernathy
Managing Member
Stonebrook Capital
Management, LLC Thomas L. Bennett
Chairman of the Board
Delaware Funds
by Macquarie
Private Investor | | Ann D. Borowiec
Former Chief Executive
Officer
Private Wealth Management
J.P. Morgan Chase & Co. Joseph W. Chow
Private Investor H. Jeffrey Dobbs
Former Global Sector
Chairman
Industrial Manufacturing,
KPMG, LLP | | John A. Fry
President
Drexel University Joseph Harroz, Jr.
President
University of Oklahoma Sandra A.J. Lawrence
Former Chief Administrative
Officer
Children's Mercy Hospitals
and Clinics | | Frances A.
Sevilla-Sacasa
Former Chief Executive
Officer
Banco Itaú International Thomas K. Whitford
Former Vice Chairman
PNC Financial Services
Group Christianna Wood
Chief Executive Officer
and President
Gore Creek Capital, Ltd. Janet L. Yeomans
Former Vice President and
Treasurer
3M Company |
| | | | | | | |
| Affiliated officers | | | | | | |
David F. Connor
Senior Vice President,
General Counsel,
and Secretary
Delaware Funds
by Macquarie | | Daniel V. Geatens
Senior Vice President and
Treasurer
Delaware Funds
by Macquarie | | Richard Salus
Senior Vice President and
Chief Financial Officer
Delaware Funds
by Macquarie | | |
| | | | | | | |
This annual report is for the information of Delaware Floating Rate Fund shareholders, but it may be used with prospective investors when preceded or accompanied by the Delaware Fund fact sheet for the most recently completed calendar quarter. These documents are available at delawarefunds.com/literature. |
The Fund files its complete schedule of portfolio holdings with the Securities and Exchange Commission (SEC) for the first and third quarters of each fiscal year on Form N-PORT. The Fund’s Forms N-PORT, as well as a description of the policies and procedures that the Fund uses to determine how to vote proxies (if any) relating to portfolio securities, are available without charge (i) upon request, by calling 800 523-1918; and (ii) on the SEC’s website at sec.gov. In addition, a description of the policies and procedures that the Fund uses to determine how to vote proxies (if any) relating to portfolio securities and the Schedule of Investments included in the Fund’s most recent Form N-PORT are available without charge on the Fund’s website at delawarefunds.com/literature. The Fund’s Forms N-PORT may be reviewed and copied at the SEC’s Public Reference Room in Washington, D.C.; information on the operation of the Public Reference Room may be obtained by calling 800 SEC-0330.
Information (if any) regarding how the Fund voted proxies relating to portfolio securities during the most recently disclosed 12-month period ended June 30 is available without charge (i) through the Fund’s website at delawarefunds.com/proxy; and (ii) on the SEC’s website at sec.gov.
69
Table of Contents
Annual report
Fixed income mutual fund
Delaware High-Yield Opportunities Fund
July 31, 2022
Carefully consider the Fund's investment objectives, risk factors, charges, and expenses before investing. This and other information can be found in the Fund's prospectus and its summary prospectus, which may be obtained by visiting delawarefunds.com/literature or calling 800 523-1918. Investors should read the prospectus and the summary prospectus carefully before investing.
You can obtain shareholder reports and prospectuses online instead of in the mail.
Visit delawarefunds.com/edelivery.
Table of Contents
Experience Delaware Funds by Macquarie®
Macquarie Asset Management (MAM) is a global asset manager that aims to deliver positive impact for everyone. MAM Public Investments traces its roots to 1929 and partners with institutional and individual clients to deliver specialist active investment capabilities across global equities, fixed income, and multi-asset solutions using a conviction-based, long-term approach to investing. In the US, retail investors recognize our Delaware Funds by Macquarie family of funds as one of the oldest mutual fund families.
If you are interested in learning more about creating an investment plan, contact your financial advisor.
You can learn more about Delaware Funds or obtain a prospectus for Delaware High-Yield Opportunities Fund at delawarefunds.com/literature.
Manage your account online
| ● | Check your account balance and transactions |
| ● | View statements and tax forms |
| ● | Make purchases and redemptions |
Visit delawarefunds.com/account-access.
Macquarie Asset Management (MAM) is the asset management division of Macquarie Group. MAM is a full-service asset manager offering a diverse range of products across public and private markets including fixed income, equities, multi-asset solutions, private credit, infrastructure, renewables, natural assets, real estate, and asset finance. The Public Investments business is a part of MAM and includes the following investment advisers: Macquarie Investment Management Business Trust (MIMBT), Macquarie Funds Management Hong Kong Limited, Macquarie Investment Management Austria Kapitalanlage AG, Macquarie Investment Management Global Limited, Macquarie Investment Management Europe Limited, and Macquarie Investment Management Europe S.A.
The Fund is distributed by Delaware Distributors, L.P. (DDLP), an affiliate of MIMBT and Macquarie Group Limited.
Other than Macquarie Bank Limited ABN 46 008 583 542 ("Macquarie Bank"), any Macquarie Group entity noted in this document is not an authorized deposit-taking institution for the purposes of the Banking Act 1959 (Commonwealth of Australia). The obligations of these other Macquarie Group entities do not represent deposits or other liabilities of Macquarie Bank. Macquarie Bank does not guarantee or otherwise provide assurance in respect of the obligations of these other Macquarie Group entities. In addition, if this document relates to an investment, (a) the investor is subject to investment risk including possible delays in repayment and loss of income and principal invested and (b) none of Macquarie Bank or any other Macquarie Group entity guarantees any particular rate of return on or the performance of the investment, nor do they guarantee repayment of capital in respect of the investment.
The Fund is governed by US laws and regulations.
Unless otherwise noted, views expressed herein are current as of July 31, 2022, and subject to change for events occurring after such date.
The Fund is not FDIC insured and is not guaranteed. It is possible to lose the principal amount invested.
Advisory services provided by Delaware Management Company, a series of MIMBT, a US registered investment advisor.
All third-party marks cited are the property of their respective owners.
© 2022 Macquarie Management Holdings, Inc.
Table of Contents
| Portfolio management review | |
| Delaware High-Yield Opportunities Fund | July 31, 2022 (Unaudited) |
| Performance preview (for the year ended July 31, 2022) | | | | |
| Delaware High-Yield Opportunities Fund (Institutional Class shares) | | 1-year return | | -7.78% |
| Delaware High-Yield Opportunities Fund (Class A shares) | | 1-year return | | -8.01% |
| ICE BofA US High Yield Constrained Index (benchmark) | | 1-year return | | -7.73% |
Past performance does not guarantee future results.
For complete, annualized performance for Delaware High-Yield Opportunities Fund, please see the table on page 4.
Institutional Class shares are not subject to a sales charge and are offered for sale exclusively to certain eligible investors. In addition, Institutional Class shares pay no distribution and service fee.
The performance of Class A shares excludes the applicable sales charge. The performance of both Institutional Class shares and Class A shares reflects the reinvestment of all distributions.
Please see page 7 for a description of the index. Index performance returns do not reflect any management fees, transaction costs, or expenses. Indices are unmanaged and one cannot invest directly in an index.
Investment objective
The Fund seeks total return and, as a secondary objective, high current income.
Market review
After treading water during the first few months of the Fund’s fiscal year ended July 31, 2022, high yield bond prices began a steady decline in December 2021 when it became clear that inflation was not transitory, and the US Federal Reserve would need to move aggressively to contain what was already the worst inflationary period in 40 years. That policy shift raised the possibility of an economic hard landing if higher borrowing costs caused both the labor market to weaken significantly and consumers to pull back. As such, the broad implications of tighter monetary policy were the main drivers of high yield returns, though there remained a notable lack of consensus about the outlook for policy rates, bond yields, and economic growth.
From a fundamental standpoint, corporate balance sheets remained in reasonably solid shape through at least the end of calendar year 2021, bolstered by rock-bottom interest rates and the strongest labor market in 50 years. These factors helped sustain consumer spending despite near double-digit inflation. However, when the Fed finally acted
High yield bonds were affected by the following factors over the Fund's fiscal year:
| ● | The Fed "retired" the term transitory to describe its outlook for inflation. |
| | |
| ● | The odds of recession increased as the Fed raced to catch up to price increases. |
| | |
| ● | High yield bonds rallied late in the measurement period on hints that the Fed might moderate the pace of interest rate hikes. |
1
Table of Contents
Portfolio management review
Delaware High-Yield Opportunities Fund
– first with the acknowledgment that policymakers had been wrong about inflation being transitory and then with actual interest rate hikes – the duration-sensitive BB-rated tier of the high yield bond market bore the brunt of the selloff. By early spring, credit concerns had moved to the forefront, as investors began to take seriously the possibility that an overzealous Fed would trigger an outright recession, a shift that exerted the most pressure on the economically sensitive CCC-rated segment of the market. Finally, high yield bonds embarked on a broad relief rally over the last several weeks of the fiscal year amid indications the Fed might soon begin to moderate the scale of its rate increases, which by then had included two mega-rate hikes of 75 basis points each. (A basis point equals one hundredth of a percentage point.)
Energy was the strongest-performing sector of the high yield market over the fiscal period. This reflected the impact of the Russia-Ukraine war on commodity prices. Transportation and leisure – areas that included airlines, gaming, and theater companies – also outperformed, as consumers sought normalcy after more than two years of caution related to the COVID-19 pandemic. Meanwhile, underperformers mostly resided in duration-sensitive and higher-quality areas, such as cable and telecommunications, retail, and housing.
Within the Fund
For the fiscal year ended July 31, 2022, Delaware High-Yield Opportunities Fund slightly underperformed its benchmark, the ICE BofA US High Yield Constrained Index. The Fund’s Institutional Class shares declined 7.78%. The Fund’s Class A shares declined 8.01% at net asset value and 12.06% at maximum offer price. These figures reflect all distributions reinvested. During the same period, the Fund’s benchmark declined 7.73%. For complete, annualized performance of Delaware High-Yield Opportunities Fund, please see the table on page 4.
Noting the high yield market’s extraordinary volatility and unusual variation in monthly returns, no wholesale shifts in the Fund's risk profile were made during the measurement period. Instead, we attempted to opportunistically exploit market inefficiencies when valuations were supportive of long-term fundamental outlooks.
During the steep market selloff in late spring, for example, we added to our holdings in select cruise lines, a segment of the leisure industry that we believe should not only survive the pandemic but thrive in its aftermath. Conversely, we viewed the sharp run-up in energy valuations as a chance to take profits in select companies and rolled the proceeds into lower-rated credits, a move that proved prescient as the market rallied strongly and broadly over the final six weeks of the Fund’s fiscal year.
Not surprisingly, the Fund’s biggest contributors to relative performance resided in the energy sector. Genesis Energy LP, a Houston-based midstream master limited partnership, outperformed the benchmark after reporting solid second-quarter earnings and providing positive forward guidance for its multiple operating units. Callon Petroleum Co., an independent oil and natural gas company engaged in the acquisition, exploration, and development of higher-quality assets in Texas and the American West, also outperformed, largely due to the powerful tailwind of surging energy prices. Similarly, TechnipFMC PLC, a high-quality oilfield services company, benefited from broad-
2
Table of Contents
based strength in the energy group. As the fiscal period ended, we continued to hold Genesis Energy and Callon Petroleum debt but exited our position in TechnipFMC after a strong rally pushed its bonds’ valuation beyond our comfort level.
Among detractors, the Canadian multinational specialty pharmaceutical business Bausch Health Companies Inc. lagged the benchmark due to disappointing earnings and a negative patent litigation ruling against its largest branded drug, Xifaxan®. We trimmed our position in the bonds and continue to own the holding at a reduced allocation. Our holdings in Carnival Corp. and Royal Caribbean Cruises Ltd. also underperformed amid the lingering aftermath of the global pandemic. Despite setbacks to passenger volume that has lasted longer than many would have predicted, we continue to view both companies – as well as the cruise business itself – favorably over the next few years. Both Carnival and Royal Caribbean are working to repair COVID-19-related damage to their balance sheets, and we believe these companies are well-positioned to benefit as pent-up demand for travel subsides in the coming years. Notably, the US Centers for Disease Control and Prevention recently suspended its COVID-19 Program for Cruise Ships, which had subjected the cruise industry to broader restrictions than those faced by most other industry groups.
At the end of the Fund’s fiscal year end, we have positioned the Fund close to its benchmark in terms of sector allocation, and only slightly short of the benchmark on a duration basis – the latter is a byproduct of our traditional bottom-up (bond-by-bond) portfolio construction process that begins with fundamentals and then moves on to valuations. Our largest sector positions are currently in energy, healthcare, and media, while automotive, real estate, and consumer goods are the Fund’s smallest sector positions. In terms of credit quality, we are mildly underweight both B and BB-rated issuers, and slightly overweight those higher-quality CCC-rated businesses that we view as solid candidates to move up the credit spectrum into the single-B tier. The Fund used foreign currency exchange contracts to hedge the US dollar value of securities denominated in foreign currencies to increase exposure to those currencies. Their effect was not material to Fund performance.
Despite the intense volatility of recent months and the unusually murky macroeconomic outlook, we believe high yield bonds still offer investors the opportunity to diversify their holdings into an area of the fixed-income market that has the potential to generate attractive nominal income in a world of high inflation alongside depressed sovereign and investment-grade yields. We recognize that the uncertain environment has created significant emotional and financial stress for households and investors. As always, we view our role as careful stewards of our shareholders’ financial resources and appreciate their continued confidence as we navigate these volatile markets.
3
Table of Contents
| Performance summary | |
| Delaware High-Yield Opportunities Fund | July 31, 2022 (Unaudited) |
The performance quoted represents past performance and does not guarantee future results. Investment return and principal value of an investment will fluctuate so that shares, when redeemed, may be worth more or less than their original cost. Current performance may be lower or higher than the performance quoted. Performance data current to the most recent month end may be obtained by calling 800 523-1918 or visiting delawarefunds.com/performance.
| Fund and benchmark performance1,2 | | Average annual total returns through July 31, 2022 |
| | 1 year | | 5 year | | 10 year | | Lifetime |
| Class A (Est. December 30, 1996) | | | | | | | | |
| Excluding sales charge | | -8.01% | | +2.68% | | +3.93% | | +5.96% |
| Including sales charge | | -12.06% | | +1.76% | | +3.46% | | +5.77% |
| Class C (Est. February 17, 1998) | | | | | | | | |
| Excluding sales charge | | -8.70% | | +1.86% | | +3.13% | | +4.58% |
| Including sales charge | | -9.58% | | +1.86% | | +3.13% | | +4.58% |
| Class R (Est. June 2, 2003) | | | | | | | | |
| Excluding sales charge | | -8.21% | | +2.43% | | +3.68% | | +5.99% |
| Including sales charge | | -8.21% | | +2.43% | | +3.68% | | +5.99% |
| Institutional Class (Est. December 30, 1996) | | | | | | | | |
| Excluding sales charge | | -7.78% | | +2.94% | | +4.19% | | +6.25% |
| Including sales charge | | -7.78% | | +2.94% | | +4.19% | | +6.25% |
| Class R6 (Est. April 29, 2021) | | | | | | | | |
| Excluding sales charge | | -7.74% | | — | | — | | -4.66% |
| Including sales charge | | -7.74% | | — | | — | | -4.66% |
| ICE BofA US High Yield Constrained Index | | -7.73% | | +2.90% | | +4.81% | | +6.29%* |
| * | The benchmark lifetime return is for Institutional Class share comparison only and is calculated using the last business day in the month of the Fund’s Institutional Class inception date. |
| 1 | Returns reflect the reinvestment of all distributions and are presented both with and without the applicable sales charges described below. Returns do not reflect the deduction of taxes the shareholder would pay on Fund distributions or redemptions of Fund shares. |
Expense limitations were in effect for certain classes during some or all of the periods shown in the “Fund and benchmark performance” table. Expenses for each class are listed in the “Fund expense ratios” table on page 6. Performance would have been lower had expense limitations not been in effect.
Institutional Class shares are not subject to a sales charge and are offered for sale exclusively to certain eligible investors. In addition, Institutional Class shares pay no distribution and service (12b-1) fee.
Class A shares are sold with a maximum front-end sales charge of 4.50%, and have an annual 12b-1 fee of 0.25% of average daily net assets. The Board has adopted a formula for calculating 12b-1 plan fees for the Fund’s
4
Table of Contents
Class A shares. The Fund’s Class A shares are subject to a blended 12b-1 fee of 0.10% on all shares acquired prior to June 1, 1992, and 0.25% on all shares acquired on or after June 1, 1992. All Class A shares currently bear 12b-1 fees at the same rate, the blended rate based on the formula described above. This method of calculating Class A 12b-1 fees may be discontinued at the sole discretion of the Board. Performance for Class A shares, excluding sales charges, assumes that no front-end sales charge applied.
Class C shares are sold with a contingent deferred sales charge (CDSC) of 1.00% if redeemed during the first 12 months. They are also subject to an annual 12b-1 fee of 1.00% of average daily net assets. Performance for Class C shares, excluding sales charges, assumes either that CDSCs did not apply or that the investment was not redeemed.
Class R shares are available only for certain retirement plan products. They are sold without a sales charge and have an annual 12b-1 fee of 0.50% of average daily net assets.
Class R6 shares are available only to certain investors. In addition, Class R6 shares do not pay any service fees, sub-accounting fees, and/or sub-transfer agency fees to any brokers, dealers, or other financial intermediaries. Class R6 shares pay no 12b-1 fee.
Fixed income securities and bond funds can lose value, and investors can lose principal, as interest rates rise. They also may be affected by economic conditions that hinder an issuer’s ability to make interest and principal payments on its debt. This includes prepayment risk, the risk that the principal of a bond that is held by a portfolio will be prepaid prior to maturity, at the time when interest rates are lower than what the bond was paying. A portfolio may then have to reinvest that money at a lower interest rate.
High yielding, non-investment-grade bonds (junk bonds) involve higher risk than investment grade bonds. The high yield secondary market is particularly susceptible to liquidity problems when institutional investors, such as mutual funds and certain other financial institutions, temporarily stop buying bonds for regulatory, financial, or other reasons. In addition, a less liquid secondary market makes it more difficult to obtain precise valuations of the high yield securities.
The Fund may invest in derivatives, which may involve additional expenses and are subject to risk, including the risk that an underlying security or securities index moves in the opposite direction from what the portfolio manager anticipated. A derivatives transaction depends upon the counterparties’ ability to fulfill their contractual obligations.
International investments entail risks including fluctuation in currency values, differences in accounting principles, or economic or political instability. Investing in emerging markets can be riskier than investing in established foreign markets due to increased volatility, lower trading volume, and higher risk of market closures. In many emerging markets, there is substantially less publicly available information and the available information may be incomplete or misleading. Legal claims are generally more difficult to pursue.
5
Table of Contents
Performance summary
Delaware High-Yield Opportunities Fund
IBOR risk is the risk that changes related to the use of the London interbank offered rate (LIBOR) or similar rates (such as EONIA) could have adverse impacts on financial instruments that reference these rates. The abandonment of these rates and transition to alternative rates could affect the value and liquidity of instruments that reference them and could affect investment strategy performance.
The disruptions caused by natural disasters, pandemics, or similar events could prevent the Fund from executing advantageous investment decisions in a timely manner and could negatively impact the Fund’s ability to achieve its investment objective and the value of the Fund’s investments.
| 2 | The Fund’s expense ratios, as described in the most recent prospectus, are disclosed in the following “Fund expense ratios” table. The expense ratios below may differ from the expense ratios in the “Financial highlights” since they are based on different time periods and the expense ratios in the prospectus include acquired fund fees and expenses, if any. See Note 2 in “Notes to financial statements” for additional details. Please see the “Financial highlights” section in this report for the most recent expense ratios. |
| | | | | | | | Institutional | | |
| Fund expense ratios | | Class A | | Class C | | Class R | | Class | | Class R6 |
| Total annual operating expenses | | | | | | | | | | |
| (without fee waivers) | | 1.23% | | 1.98% | | 1.48% | | 0.98% | | 0.87% |
| Net expenses (including fee | | | | | | | | | | |
| waivers, if any) | | 0.94% | | 1.69% | | 1.19% | | 0.69% | | 0.58% |
| Type of waiver | | Contractual | | Contractual | | Contractual | | Contractual | | Contractual |
6
Table of Contents
Performance of a $10,000 investment1
For the period July 31, 2012 through July 31, 2022

| | | | Starting value | | Ending value |
 | ICE BofA US High Yield Constrained Index | | | $ | 10,000 | | | | $ | 15,999 | |
 | Delaware High-Yield Opportunities Fund — Institutional | | | | | | | | | | |
| Class shares | | | $ | 10,000 | | | | $ | 15,075 | |
 | Delaware High-Yield Opportunities Fund — Class A | | | | | | | | | | |
| shares | | | $ | 9,550 | | | | $ | 14,049 | |
| 1 | The “Performance of a $10,000 investment” graph assumes $10,000 invested in Institutional Class and Class A shares of the Fund on July 31, 2012, and includes the effect of a 4.50% front-end sales charge (for Class A shares) and the reinvestment of all distributions. The graph does not reflect the deduction of taxes the shareholders would pay on Fund distributions or redemptions of Fund shares. Expense limitations were in effect for some or all of the periods shown. Performance would have been lower had expense limitations not been in effect. Expenses are listed in the “Fund expense ratios” table on page 6. Please note additional details on pages 4 through 8. |
The graph also assumes $10,000 invested in the ICE BofA US High Yield Constrained Index as of July 31, 2012. The ICE BofA US High Yield Constrained tracks the performance of US dollar-denominated high yield corporate debt publicly issued in the US domestic market, but caps individual issuer exposure at 2% of the benchmark.
Index performance returns do not reflect any management fees, transaction costs, or expenses. Indices are unmanaged and one cannot invest directly in an index. Past performance does not guarantee future results.
Performance of other Fund classes will vary due to different charges and expenses.
7
Table of Contents
Performance summary
Delaware High-Yield Opportunities Fund
| | Nasdaq symbols | | CUSIPs |
| Class A | | DHOAX | | 245908876 |
| Class C | | DHOCX | | 245908850 |
| Class R | | DHIRX | | 245908736 |
| Institutional Class | | DHOIX | | 245908843 |
| Class R6 | | DHIZX | | 24610J209 |
8
Table of Contents
Disclosure of Fund expenses
For the six-month period from February 1, 2022 to July 31, 2022 (Unaudited)
As a shareholder of the Fund, you incur two types of costs: (1) transaction costs, including sales charges (loads) on purchase payments, reinvested dividends, or other distributions; redemption fees; and exchange fees; and (2) ongoing costs, including management fees; distribution and service (12b-1) fees; and other Fund expenses. This example is intended to help you understand your ongoing costs (in dollars) of investing in the Fund and to compare these costs with the ongoing costs of investing in other mutual funds.
The example is based on an investment of $1,000 invested at the beginning of the period and held for the entire six-month period from February 1, 2022 to July 31, 2022.
Actual expenses
The first section of the table shown, “Actual Fund return,” provides information about actual account values and actual expenses. You may use the information in this section of the table, together with the amount you invested, to estimate the expenses that you paid over the period. Simply divide your account value by $1,000 (for example, an $8,600 account value divided by $1,000 = 8.6), then multiply the result by the number in the first section under the heading entitled “Expenses Paid During Period” to estimate the expenses you paid on your account during the period.
Hypothetical example for comparison purposes
The second section of the table shown, “Hypothetical 5% return,” provides information about hypothetical account values and hypothetical expenses based on the Fund’s actual expense ratio and an assumed rate of return of 5% per year before expenses, which is not the Fund’s actual return. The hypothetical account values and expenses may not be used to estimate the actual ending account balance or expenses you paid for the period. You may use this information to compare the ongoing costs of investing in the Fund and other funds. To do so, compare this 5% hypothetical example with the 5% hypothetical examples that appear in the shareholder reports of the other funds.
Please note that the expenses shown in the table are meant to highlight your ongoing costs only and do not reflect any transactional costs, such as sales charges (loads), redemption fees, or exchange fees. Therefore, the second section of the table is useful in comparing ongoing costs only, and will not help you determine the relative total costs of owning different funds. In addition, if these transactional costs were included, your costs would have been higher. The Fund's expenses shown in the table reflect fee waivers in effect and assume reinvestment of all dividends and distributions.
9
Table of Contents
Disclosure of Fund expenses
For the six-month period from February 1, 2022 to July 31, 2022 (Unaudited)
Delaware High-Yield Opportunities Fund
Expense analysis of an investment of $1,000
| | Beginning | | Ending | | | | | | | Expenses |
| | Account Value | | Account Value | | Annualized | | Paid During Period |
| | 2/1/22 | | 7/31/22 | | Expense Ratio | | 2/1/22 to 7/31/22* |
| Actual Fund return† |
| Class A | | | $ | 1,000.00 | | | | $ | 931.70 | | | | 0.89 | % | | | | $ | 4.26 | |
| Class C | | | | 1,000.00 | | | | | 928.30 | | | | 1.64 | % | | | | | 7.84 | |
| Class R | | | | 1,000.00 | | | | | 930.80 | | | | 1.14 | % | | | | | 5.46 | |
| Institutional Class | | | | 1,000.00 | | | | | 932.90 | | | | 0.64 | % | | | | | 3.07 | |
| Class R6 | | | | 1,000.00 | | | | | 933.10 | | | | 0.58 | % | | | | | 2.78 | |
| Hypothetical 5% return (5% return before expenses) |
| Class A | | | $ | 1,000.00 | | | | $ | 1,020.38 | | | | 0.89 | % | | | | $ | 4.46 | |
| Class C | | | | 1,000.00 | | | | | 1,016.66 | | | | 1.64 | % | | | | | 8.20 | |
| Class R | | | | 1,000.00 | | | | | 1,019.14 | | | | 1.14 | % | | | | | 5.71 | |
| Institutional Class | | | | 1,000.00 | | | | | 1,021.62 | | | | 0.64 | % | | | | | 3.21 | |
| Class R6 | | | | 1,000.00 | | | | | 1,021.92 | | | | 0.58 | % | | | | | 2.91 | |
| * | “Expenses Paid During Period” are equal to the Fund's annualized expense ratio, multiplied by the average account value over the period, multiplied by 181/365 (to reflect the one-half year period). |
| † | Because actual returns reflect only the most recent six-month period, the returns shown may differ significantly from fiscal year returns. |
In addition to the Fund's expenses reflected above, the Fund also indirectly bears its portion of the fees and expenses of any investment companies (Underlying Funds) in which it invests. The table above does not reflect the expenses of any Underlying Funds.
10
Table of Contents
| Security type / sector allocation | |
| Delaware High-Yield Opportunities Fund | As of July 31, 2022 (Unaudited) |
Sector designations may be different from the sector designations presented in other Fund materials. The sector designations may represent the investment manager’s internal sector classifications.
| Security type / sector | | Percentage of net assets |
| Convertible Bond | | | 0.15 | % | |
| Corporate Bonds | | | 87.19 | % | |
| Automotive | | | 2.30 | % | |
| Banking | | | 1.13 | % | |
| Basic Industry | | | 5.88 | % | |
| Capital Goods | | | 3.76 | % | |
| Consumer Goods | | | 1.22 | % | |
| Energy | | | 12.60 | % | |
| Financial Services | | | 4.27 | % | |
| Healthcare | | | 8.88 | % | |
| Insurance | | | 3.04 | % | |
| Leisure | | | 5.93 | % | |
| Media | | | 10.82 | % | |
| Real Estate | | | 0.33 | % | |
| Retail | | | 4.60 | % | |
| Services | | | 5.45 | % | |
| Technology & Electronics | | | 4.02 | % | |
| Telecommunications | | | 7.59 | % | |
| Transportation | | | 2.71 | % | |
| Utilities | | | 2.66 | % | |
| Municipal Bonds | | | 0.66 | % | |
| Loan Agreements | | | 8.05 | % | |
| Common Stocks | | | 0.01 | % | |
| Short-Term Investments | | | 2.54 | % | |
| Total Value of Securities | | | 98.60 | % | |
| Receivables and Other Assets Net of Liabilities | | | 1.40 | % | |
| Total Net Assets | | | 100.00 | % | |
11
Table of Contents
| Schedule of investments | |
| Delaware High-Yield Opportunities Fund | July 31, 2022 |
| | | | | Principal | | | |
| | | | amount° | | Value (US $) |
| Convertible Bond – 0.15% | | | | | |
| Spirit Airlines 1.00% exercise price $49.07, maturity date | | | | | |
| | 5/15/26 | | 768,000 | | $ | 694,656 |
| Total Convertible Bond (cost $667,307) | | | | | 694,656 |
| | | | | | | |
| Corporate Bonds – 87.19% | | | | | |
| Automotive – 2.30% | | | | | |
| Allison Transmission 144A 5.875% 6/1/29 # | | 2,757,000 | | | 2,717,768 |
| Ford Motor Credit | | | | | |
| | 3.375% 11/13/25 | | 1,405,000 | | | 1,342,407 |
| | 4.125% 8/17/27 | | 710,000 | | | 675,370 |
| | 4.542% 8/1/26 | | 1,960,000 | | | 1,909,089 |
| | 5.584% 3/18/24 | | 1,810,000 | | | 1,829,467 |
| Goodyear Tire & Rubber 5.25% 7/15/31 | | 2,935,000 | | | 2,556,458 |
| | | | | | | 11,030,559 |
| Banking – 1.13% | | | | | |
| Barclays 6.125% 12/15/25 µ, Ψ | | 3,255,000 | | | 3,142,865 |
| Deutsche Bank 6.00% 10/30/25 µ, Ψ | | 2,600,000 | | | 2,262,000 |
| | | | | | | 5,404,865 |
| Basic Industry – 5.88% | | | | | |
| ATI | | | | | |
| | 4.875% 10/1/29 | | 625,000 | | | 535,570 |
| | 5.125% 10/1/31 | | 1,790,000 | | | 1,471,285 |
| Cerdia Finanz 144A 10.50% 2/15/27 # | | 2,055,000 | | | 1,643,281 |
| Chemours 144A 5.75% 11/15/28 # | | 3,225,000 | | | 3,081,100 |
| Domtar 144A 6.75% 10/1/28 # | | 1,371,000 | | | 1,266,008 |
| Eldorado Gold 144A 6.25% 9/1/29 # | | 2,905,000 | | | 2,325,380 |
| First Quantum Minerals | | | | | |
| | 144A 6.875% 10/15/27 # | | 2,095,000 | | | 2,000,212 |
| | 144A 7.50% 4/1/25 # | | 3,120,000 | | | 3,110,125 |
| FMG Resources August 2006 Pty | | | | | |
| | 144A 5.875% 4/15/30 # | | 2,055,000 | | | 1,963,296 |
| | 144A 6.125% 4/15/32 # | | 925,000 | | | 881,345 |
| Hudbay Minerals 144A 6.125% 4/1/29 # | | 1,450,000 | | | 1,131,087 |
| INEOS Quattro Finance 2 144A 3.375% 1/15/26 # | | 3,400,000 | | | 3,014,695 |
| Novelis | | | | | |
| | 144A 3.875% 8/15/31 # | | 605,000 | | | 518,146 |
| | 144A 4.75% 1/30/30 # | | 3,425,000 | | | 3,173,262 |
| Vibrantz Technologies 144A 9.00% 2/15/30 # | | 2,813,000 | | | 2,052,815 |
| | | | | | | 28,167,607 |
12
Table of Contents
| | | | | Principal | | | |
| | | | amount° | | Value (US $) |
| Corporate Bonds (continued) | | | | | |
| Capital Goods – 3.76% | | | | | |
| ARD Finance 144A PIK 6.50% 6/30/27 #, > | | 2,225,368 | | $ | 1,689,789 |
| Clydesdale Acquisition Holdings 144A 6.625% 4/15/29 # | | 465,000 | | | 470,201 |
| Granite US Holdings 144A 11.00% 10/1/27 # | | 1,680,000 | | | 1,566,684 |
| Madison IAQ 144A 5.875% 6/30/29 # | | 2,940,000 | | | 2,302,652 |
| OT Merger 144A 7.875% 10/15/29 # | | 1,090,000 | | | 765,551 |
| Sealed Air 144A 5.00% 4/15/29 # | | 1,350,000 | | | 1,338,390 |
| Terex 144A 5.00% 5/15/29 # | | 3,760,000 | | | 3,360,274 |
| TK Elevator Holdco 144A 7.625% 7/15/28 # | | 1,434,000 | | | 1,301,527 |
| TransDigm 4.625% 1/15/29 | | 5,790,000 | | | 5,217,774 |
| | | | | | | 18,012,842 |
| Consumer Goods – 1.22% | | | | | |
| JBS USA LUX | | | | | |
| | 144A 5.50% 1/15/30 # | | 3,070,000 | | | 2,989,295 |
| | 144A 6.50% 4/15/29 # | | 157,000 | | | 159,736 |
| Pilgrim's Pride 144A 4.25% 4/15/31 # | | 2,920,000 | | | 2,623,503 |
| Scotts Miracle-Gro 4.00% 4/1/31 | | 100,000 | | | 82,636 |
| | | | | | | 5,855,170 |
| Energy – 12.60% | | | | | |
| Ascent Resources Utica Holdings | | | | | |
| | 144A 5.875% 6/30/29 # | | 3,170,000 | | | 2,788,998 |
| | 144A 7.00% 11/1/26 # | | 1,490,000 | | | 1,452,705 |
| Callon Petroleum | | | | | |
| | 144A 7.50% 6/15/30 # | | 1,225,000 | | | 1,176,331 |
| | 144A 8.00% 8/1/28 # | | 1,770,000 | | | 1,794,559 |
| CNX Midstream Partners 144A 4.75% 4/15/30 # | | 1,515,000 | | | 1,308,475 |
| CNX Resources 144A 6.00% 1/15/29 # | | 3,430,000 | | | 3,341,112 |
| Crestwood Midstream Partners | | | | | |
| | 144A 5.625% 5/1/27 # | | 482,000 | | | 463,474 |
| | 144A 6.00% 2/1/29 # | | 3,468,000 | | | 3,165,209 |
| EQM Midstream Partners 144A 4.75% 1/15/31 # | | 5,720,000 | | | 5,181,319 |
| Genesis Energy | | | | | |
| | 7.75% 2/1/28 | | 3,170,000 | | | 3,066,579 |
| | 8.00% 1/15/27 | | 5,005,000 | | | 4,919,314 |
| Hilcorp Energy I | | | | | |
| | 144A 6.00% 4/15/30 # | | 3,235,000 | | | 2,940,275 |
| | 144A 6.00% 2/1/31 # | | 395,000 | | | 363,278 |
| | 144A 6.25% 4/15/32 # | | 1,552,000 | | | 1,400,389 |
| Murphy Oil 6.375% 7/15/28 | | 5,120,000 | | | 5,119,027 |
| NuStar Logistics | | | | | |
| | 6.00% 6/1/26 | | 2,430,000 | | | 2,391,375 |
13
Table of Contents
Schedule of investments
Delaware High-Yield Opportunities Fund
| | | | | Principal | | | |
| | | | amount° | | Value (US $) |
| Corporate Bonds (continued) | | | | | |
| Energy (continued) | | | | | |
| NuStar Logistics | | | | | |
| | 6.375% 10/1/30 | | 3,568,000 | | $ | 3,294,320 |
| Occidental Petroleum | | | | | |
| | 4.20% 3/15/48 | | 160,000 | | | 130,770 |
| | 4.40% 4/15/46 | | 625,000 | | | 531,999 |
| | 4.40% 8/15/49 | | 1,240,000 | | | 1,036,732 |
| | 4.50% 7/15/44 | | 640,000 | | | 538,134 |
| | 6.45% 9/15/36 | | 1,525,000 | | | 1,697,912 |
| | 6.60% 3/15/46 | | 1,180,000 | | | 1,305,357 |
| | 6.625% 9/1/30 | | 1,095,000 | | | 1,216,129 |
| PDC Energy 5.75% 5/15/26 | | 3,794,000 | | | 3,713,377 |
| Southwestern Energy | | | | | |
| | 5.375% 2/1/29 | | 470,000 | | | 460,102 |
| | 5.375% 3/15/30 | | 3,940,000 | | | 3,885,234 |
| Weatherford International 144A 8.625% 4/30/30 # | | 1,830,000 | | | 1,660,085 |
| | | | | | | 60,342,570 |
| Financial Services – 4.27% | | | | | |
| AerCap Holdings 5.875% 10/10/79 µ | | 4,075,000 | | | 3,622,512 |
| Air Lease 4.65% 6/15/26 µ, Ψ | | 2,995,000 | | | 2,628,565 |
| Ally Financial 8.00% 11/1/31 | | 2,160,000 | | | 2,446,061 |
| Castlelake Aviation Finance DAC 144A 5.00% 4/15/27 # | | 4,565,000 | | | 3,846,531 |
| Hightower Holding 144A 6.75% 4/15/29 # | | 1,930,000 | | | 1,521,498 |
| Medline Borrower 144A 3.875% 4/1/29 # | | 2,485,000 | | | 2,249,347 |
| Midcap Financial Issuer Trust | | | | | |
| | 144A 5.625% 1/15/30 # | | 1,055,000 | | | 853,305 |
| | 144A 6.50% 5/1/28 # | | 3,345,000 | | | 3,081,464 |
| New Cotai 5.00% 2/2/27 | | 222,415 | | | 202,318 |
| | | | | | | 20,451,601 |
| Healthcare – 8.88% | | | | | |
| Avantor Funding 144A 3.875% 11/1/29 # | | 8,005,000 | | | 7,386,694 |
| Bausch Health 144A 6.25% 2/15/29 # | | 4,775,000 | | | 2,563,292 |
| Cheplapharm Arzneimittel 144A 5.50% 1/15/28 # | | 3,185,000 | | | 2,895,515 |
| CHS | | | | | |
| | 144A 4.75% 2/15/31 # | | 3,000,000 | | | 2,422,890 |
| | 144A 8.00% 3/15/26 # | | 1,715,000 | | | 1,644,085 |
| Consensus Cloud Solutions | | | | | |
| | 144A 6.00% 10/15/26 # | | 1,030,000 | | | 949,171 |
| | 144A 6.50% 10/15/28 # | | 1,610,000 | | | 1,434,045 |
| DaVita 144A 4.625% 6/1/30 # | | 2,710,000 | | | 2,227,376 |
14
Table of Contents
| | | | | Principal | | | |
| | | | amount° | | Value (US $) |
| Corporate Bonds (continued) | | | | | |
| Healthcare (continued) | | | | | |
| Encompass Health | | | | | |
| | 4.625% 4/1/31 | | 925,000 | | $ | 831,533 |
| | 4.75% 2/1/30 | | 1,209,000 | | | 1,117,606 |
| Hadrian Merger Sub 144A 8.50% 5/1/26 # | | 3,443,000 | | | 3,276,824 |
| HCA | | | | | |
| | 3.50% 9/1/30 | | 105,000 | | | 95,986 |
| | 5.875% 2/1/29 | | 1,708,000 | | | 1,790,539 |
| | 7.58% 9/15/25 | | 820,000 | | | 892,303 |
| ModivCare Escrow Issuer 144A 5.00% 10/1/29 # | | 2,915,000 | | | 2,670,767 |
| Organon & Co. 144A 5.125% 4/30/31 # | | 4,140,000 | | | 3,881,167 |
| Surgery Center Holdings 144A 10.00% 4/15/27 # | | 1,630,000 | | | 1,663,399 |
| Tenet Healthcare | | | | | |
| | 144A 4.375% 1/15/30 # | | 1,480,000 | | | 1,377,909 |
| | 144A 6.125% 10/1/28 # | | 1,920,000 | | | 1,874,237 |
| | 6.875% 11/15/31 | | 1,586,000 | | | 1,532,449 |
| | | | | | | 42,527,787 |
| Insurance – 3.04% | | | | | |
| GTCR AP Finance 144A 8.00% 5/15/27 # | | 1,072,000 | | | 1,055,445 |
| HUB International 144A 5.625% 12/1/29 # | | 4,105,000 | | | 3,642,113 |
| NFP 144A 6.875% 8/15/28 # | | 3,195,000 | | | 2,812,431 |
| Roller Bearing Co. of America 144A 4.375% 10/15/29 # | | 4,680,000 | | | 4,248,489 |
| USI 144A 6.875% 5/1/25 # | | 2,879,000 | | | 2,812,459 |
| | | | | | | 14,570,937 |
| Leisure – 5.93% | | | | | |
| Boyd Gaming | | | | | |
| | 4.75% 12/1/27 | | 3,470,000 | | | 3,343,033 |
| | 144A 4.75% 6/15/31 # | | 405,000 | | | 373,659 |
| Caesars Entertainment | | | | | |
| | 144A 6.25% 7/1/25 # | | 1,950,000 | | | 1,947,533 |
| | 144A 8.125% 7/1/27 # | | 1,650,000 | | | 1,652,318 |
| Carnival | | | | | |
| | 144A 5.75% 3/1/27 # | | 7,475,000 | | | 6,012,703 |
| | 144A 6.00% 5/1/29 # | | 940,000 | | | 726,075 |
| | 144A 7.625% 3/1/26 # | | 2,870,000 | | | 2,476,638 |
| Royal Caribbean Cruises | | | | | |
| | 144A 5.50% 8/31/26 # | | 290,000 | | | 229,813 |
| | 144A 5.50% 4/1/28 # | | 8,592,000 | | | 6,462,430 |
| Scientific Games Holdings 144A 6.625% 3/1/30 # | | 2,880,000 | | | 2,591,064 |
15
Table of Contents
Schedule of investments
Delaware High-Yield Opportunities Fund
| | | | | Principal | | | |
| | | | amount° | | Value (US $) |
| Corporate Bonds (continued) | | | | | |
| Leisure (continued) | | | | | |
| Scientific Games International 144A 7.25% 11/15/29 # | | 2,525,000 | | $ | 2,572,697 |
| | | | | | | 28,387,963 |
| Media – 10.82% | | | | | |
| AMC Networks 4.25% 2/15/29 | | 2,675,000 | | | 2,359,317 |
| Arches Buyer 144A 6.125% 12/1/28 # | | 2,905,000 | | | 2,389,261 |
| Beasley Mezzanine Holdings 144A 8.625% 2/1/26 # | | 3,195,000 | | | 2,428,503 |
| CCO Holdings | | | | | |
| | 144A 4.50% 8/15/30 # | | 6,390,000 | | | 5,691,190 |
| | 4.50% 5/1/32 | | 530,000 | | | 458,999 |
| | 144A 5.375% 6/1/29 # | | 2,520,000 | | | 2,405,970 |
| CMG Media 144A 8.875% 12/15/27 # | | 4,455,000 | | | 3,576,224 |
| CSC Holdings | | | | | |
| | 144A 4.625% 12/1/30 # | | 5,760,000 | | | 4,390,819 |
| | 144A 5.00% 11/15/31 # | | 2,870,000 | | | 2,166,764 |
| | 144A 5.75% 1/15/30 # | | 1,200,000 | | | 972,726 |
| Cumulus Media New Holdings 144A 6.75% 7/1/26 # | | 3,370,000 | | | 3,015,199 |
| Directv Financing 144A 5.875% 8/15/27 # | | 4,210,000 | | | 3,929,424 |
| DISH DBS 144A 5.75% 12/1/28 # | | 2,625,000 | | | 2,134,453 |
| Gray Escrow II 144A 5.375% 11/15/31 # | | 3,850,000 | | | 3,406,884 |
| Nexstar Media 144A 4.75% 11/1/28 # | | 2,315,000 | | | 2,162,094 |
| Nielsen Finance | | | | | |
| | 144A 4.50% 7/15/29 # | | 800,000 | | | 753,285 |
| | 144A 4.75% 7/15/31 # | | 2,655,000 | | | 2,527,109 |
| Sirius XM Radio 144A 4.00% 7/15/28 # | | 5,780,000 | | | 5,377,307 |
| VZ Secured Financing 144A 5.00% 1/15/32 # | | 1,825,000 | | | 1,630,282 |
| | | | | | | 51,775,810 |
| Real Estate – 0.33% | | | | | |
| XHR 144A 4.875% 6/1/29 # | | 1,765,000 | | | 1,594,272 |
| | | | | | | 1,594,272 |
| Retail – 4.60% | | | | | |
| Asbury Automotive Group | | | | | |
| | 144A 4.625% 11/15/29 # | | 2,265,000 | | | 2,004,525 |
| | 4.75% 3/1/30 | | 1,990,000 | | | 1,737,807 |
| Bath & Body Works | | | | | |
| | 6.875% 11/1/35 | | 2,105,000 | | | 1,934,579 |
| | 6.95% 3/1/33 | | 2,222,000 | | | 1,864,333 |
| | 144A 9.375% 7/1/25 # | | 771,000 | | | 806,853 |
| Bloomin' Brands 144A 5.125% 4/15/29 # | | 3,265,000 | | | 2,869,266 |
| CP Atlas Buyer 144A 7.00% 12/1/28 # | | 1,570,000 | | | 1,240,331 |
16
Table of Contents
| | | Principal | | | |
| | | | amount° | | Value (US $) |
| Corporate Bonds (continued) | | | | | |
| Retail (continued) | | | | | |
| LSF9 Atlantis Holdings 144A 7.75% 2/15/26 # | | 3,456,000 | | $ | 3,134,920 |
| Murphy Oil USA 144A 3.75% 2/15/31 # | | 3,000,000 | | | 2,741,058 |
| PetSmart 144A 7.75% 2/15/29 # | | 3,810,000 | | | 3,677,069 |
| | | | | | 22,010,741 |
| Services — 5.45% | | | | | |
| ADT Security 144A 4.125% 8/1/29 # | | 3,045,000 | | | 2,747,412 |
| Ahern Rentals 144A 7.375% 5/15/23 # | | 1,430,000 | | | 1,094,740 |
| Clarivate Science Holdings 144A 4.875% 7/1/29 # | | 4,090,000 | | | 3,627,912 |
| Gartner 144A 4.50% 7/1/28 # | | 2,620,000 | | | 2,527,391 |
| Iron Mountain | | | | | |
| 144A 5.25% 3/15/28 # | | 2,050,000 | | | 1,962,598 |
| 144A 5.25% 7/15/30 # | | 1,760,000 | | | 1,649,455 |
| NESCO Holdings II 144A 5.50% 4/15/29 # | | 2,780,000 | | | 2,418,016 |
| PECF USS Intermediate Holding III 144A 8.00% | | | | | |
| 11/15/29 # | | 850,000 | | | 684,114 |
| Prime Security Services Borrower 144A 5.75% 4/15/26 # | | 1,715,000 | | | 1,745,639 |
| Sotheby's 144A 5.875% 6/1/29 # | | 2,935,000 | | | 2,549,437 |
| United Rentals North America 5.25% 1/15/30 | | 1,885,000 | | | 1,908,280 |
| White Cap Buyer 144A 6.875% 10/15/28 # | | 3,733,000 | | | 3,163,083 |
| | | | | | 26,078,077 |
| Technology & Electronics — 4.02% | | | | | |
| Black Knight InfoServ 144A 3.625% 9/1/28 # | | 920,000 | | | 852,150 |
| Entegris Escrow 144A 5.95% 6/15/30 # | | 3,630,000 | | | 3,607,530 |
| Go Daddy Operating 144A 3.50% 3/1/29 # | | 3,205,000 | | | 2,860,975 |
| Minerva Merger 144A 6.50% 2/15/30 # | | 2,795,000 | | | 2,532,969 |
| NCR | | | | | |
| 144A 5.00% 10/1/28 # | | 1,370,000 | | | 1,305,121 |
| 144A 5.25% 10/1/30 # | | 2,835,000 | | | 2,739,078 |
| Sensata Technologies 144A 4.00% 4/15/29 # | | 3,600,000 | | | 3,279,240 |
| SS&C Technologies 144A 5.50% 9/30/27 # | | 2,071,000 | | | 2,045,330 |
| | | | | | 19,222,393 |
| Telecommunications — 7.59% | | | | | |
| Altice France 144A 5.50% 10/15/29 # | | 4,400,000 | | | 3,789,500 |
| Altice France Holding 144A 6.00% 2/15/28 # | | 4,835,000 | | | 3,745,844 |
| Connect Finco 144A 6.75% 10/1/26 # | | 4,545,000 | | | 4,451,191 |
| Consolidated Communications | | | | | |
| 144A 5.00% 10/1/28 # | | 1,475,000 | | | 1,168,995 |
| 144A 6.50% 10/1/28 # | | 3,060,000 | | | 2,639,250 |
| Digicel International Finance 144A 8.75% 5/25/24 # | | 2,560,000 | | | 2,397,235 |
17
Table of Contents
Schedule of investments
Delaware High-Yield Opportunities Fund
| | | Principal | | | |
| | | | amount° | | Value (US $) |
| Corporate Bonds (continued) | | | | | |
| Telecommunications (continued) | | | | | |
| Frontier Communications Holdings | | | | | |
| 144A 5.875% 10/15/27 # | | 3,530,000 | | $ | 3,486,122 |
| 144A 6.75% 5/1/29 # | | 1,735,000 | | | 1,548,808 |
| 144A 8.75% 5/15/30 # | | 670,000 | | | 712,508 |
| LCPR Senior Secured Financing DAC 144A 6.75% | | | | | |
| 10/15/27 # | | 1,939,000 | | | 1,887,893 |
| Northwest Fiber 144A 4.75% 4/30/27 # | | 1,110,000 | | | 965,750 |
| Sable International Finance 144A 5.75% 9/7/27 # | | 1,983,000 | | | 1,753,210 |
| Sprint 7.625% 3/1/26 | | 1,915,000 | | | 2,090,862 |
| T-Mobile USA | | | | | |
| 3.375% 4/15/29 | | 1,725,000 | | | 1,613,272 |
| 3.50% 4/15/31 | | 1,279,000 | | | 1,184,565 |
| Vmed O2 UK Financing I 144A 4.75% 7/15/31 # | | 3,190,000 | | | 2,890,714 |
| | | | | | 36,325,719 |
| Transportation — 2.71% | | | | | |
| Grupo Aeromexico 144A 8.50% 3/17/27 # | | 1,625,000 | | | 1,557,367 |
| Laredo Petroleum 144A 7.75% 7/31/29 # | | 2,625,000 | | | 2,497,517 |
| Seaspan 144A 5.50% 8/1/29 # | | 4,670,000 | | | 3,666,510 |
| VistaJet Malta Finance 144A 6.375% 2/1/30 # | | 6,035,000 | | | 5,267,107 |
| | | | | | 12,988,501 |
| Utilities — 2.66% | | | | | |
| Calpine | | | | | |
| 144A 4.625% 2/1/29 # | | 645,000 | | | 580,874 |
| 144A 5.00% 2/1/31 # | | 3,380,000 | | | 3,004,499 |
| 144A 5.125% 3/15/28 # | | 1,695,000 | | | 1,598,546 |
| PG&E 5.25% 7/1/30 | | 1,625,000 | | | 1,462,411 |
| Vistra | | | | | |
| 144A 7.00% 12/15/26 #, µ, ψ | | 4,135,000 | | | 3,851,112 |
| 144A 8.00% 10/15/26 #, µ, ψ | | 2,285,000 | | | 2,218,609 |
| | | | | | 12,716,051 |
| Total Corporate Bonds (cost $461,866,103) | | | | | 417,463,465 |
| | | | | |
| Municipal Bonds — 0.66% | | | | | |
| Commonwealth of Puerto Rico | | | | | |
| Series A 2.993% 7/1/24 ^ | | 30,682 | | | 28,550 |
| Series A 4.364% 7/1/33 ^ | | 118,666 | | | 70,720 |
| Series A-1 4.00% 7/1/33 | | 92,210 | | | 88,496 |
| Series A-1 4.00% 7/1/35 | | 66,970 | | | 63,400 |
| Series A-1 4.00% 7/1/37 | | 71,137 | | | 66,638 |
18
Table of Contents
| | | Principal | | | |
| | | | amount° | | Value (US $) |
| Municipal Bonds (continued) | | | | | |
| Commonwealth of Puerto Rico | | | | | |
| Series A-1 5.625% 7/1/29 | | 77,547 | | $ | 85,830 |
| GDB Debt Recovery Authority of Puerto Rico | | | | | |
| 7.50% 8/20/40 | | 3,090,269 | | | 2,742,613 |
| Total Municipal Bonds (cost $3,359,654) | | | | | 3,146,247 |
| | | | | | |
| Loan Agreements — 8.05% | | | | | |
| Applied Systems 2nd Lien 7.75% (LIBOR03M + 5.50%) | | | | | |
| 9/19/25 ● | | 9,144,458 | | | 8,966,141 |
| Clydesdale Acquisition Holdings Tranche B 6.602% | | | | | |
| (SOFR01M + 3.25%) 4/13/29 ● | | 745,000 | | | 716,884 |
| Covis Finco Tranche B 8.704% (SOFR01M + 5.50%) | | | | | |
| 2/18/27 ● | | 1,950,312 | | | 1,633,387 |
| Epicor Software 2nd Lien 10.122% (LIBOR01M + 7.75%) | | | | | |
| 7/31/28 ● | | 2,235,800 | | | 2,209,529 |
| Form Technologies Tranche B 6.006% | | | | | |
| (LIBOR03M + 4.75%) 7/22/25 ● | | 3,949,003 | | | 3,578,784 |
| Hexion Holdings 1st Lien 5.924% (SOFR03M + 4.50%) | | | | | |
| 3/15/29 ● | | 740,000 | | | 662,115 |
| Hexion Holdings 2nd Lien 9.638% (SOFR01M + 7.44%) | | | | | |
| 3/15/30 ● | | 2,100,000 | | | 1,837,500 |
| Jones DesLauriers Insurance Management 1st Lien | | | | | |
| 6.063% (CDOR03M + 4.25%) 3/27/28 ● | | 4,760,071 | | | 3,457,004 |
| Jones DesLauriers Insurance Management 2nd Lien | | | | | |
| 10.998% (CDOR03M + 7.50%) 3/26/29 ● | | 2,230,000 | | | 1,619,538 |
| Pre Paid Legal Services 2nd Lien 9.372% (LIBOR01M + | | | | | |
| 7.00%) 12/14/29 ● | | 1,450,000 | | | 1,392,000 |
| Sovos Compliance 1st Lien 6.872% (LIBOR01M + 4.50%) | | | | | |
| 8/11/28 ● | | 746,659 | | | 728,459 |
| Sovos Compliance 1st Lien TBD 8/11/28 X | | 129,589 | | | 126,430 |
| SPX Flow 6.526% (SOFR01M + 4.50%) 4/5/29 ● | | 2,908,000 | | | 2,757,147 |
| Swf Holdings I 6.162% (LIBOR01M + 4.00%) 10/6/28 ● | | 2,519,634 | | | 2,119,642 |
| UKG 2nd Lien 7.535% (LIBOR03M + 5.25%) 5/3/27 ● | | 3,624,000 | | | 3,501,690 |
| Vantage Specialty Chemicals 1st Lien 6.019% (LIBOR03M | | | | | |
| + 3.50%) 10/28/24 ● | | 1,732,783 | | | 1,663,742 |
| Vantage Specialty Chemicals 2nd Lien 9.825% | | | | | |
| (LIBOR03M + 8.25%) 10/27/25 ● | | 1,653,000 | | | 1,595,972 |
| Total Loan Agreements (cost $39,993,484) | | | | | 38,565,964 |
19
Table of Contents
Schedule of investments
Delaware High-Yield Opportunities Fund
| | | Number of | | | |
| | | | shares | | Value (US $) |
| Common Stocks — 0.01% | | | | | |
| Leisure — 0.01% | | | | | |
| Studio City International Holdings ADR † | | 29,694 | | $ | 59,091 |
| | | | | | 59,091 |
| Media — 0.00% | | | | | |
| Century Communications =, † | | 4,310,000 | | | 0 |
| | | | | | 0 |
| Total Common Stocks (cost $219,735) | | | | | 59,091 |
| | | | | | |
| Short-Term Investments — 2.54% | | | | | |
| Money Market Mutual Funds — 2.54% | | | | | |
| BlackRock Liquidity FedFund – Institutional Shares | | | | | |
| (seven-day effective yield 1.73%) | | 3,042,579 | | | 3,042,579 |
| Fidelity Investments Money Market Government Portfolio – | | | | | |
| Class I (seven-day effective yield 1.49%) | | 3,042,578 | | | 3,042,578 |
| GS Financial Square Government Fund – Institutional | | | | | |
| Shares (seven-day effective yield 1.73%) | | 3,042,578 | | | 3,042,578 |
| Morgan Stanley Institutional Liquidity Funds Government | | | | | |
| Portfolio – Institutional Class (seven-day effective yield | | | | | |
| 1.60%) | | 3,042,579 | | | 3,042,579 |
| Total Short-Term Investments (cost $12,170,314) | | | | | 12,170,314 |
| Total Value of Securities—98.60% | | | | | |
| (cost $518,276,597) | | | | $ | 472,099,737 |
| ° | Principal amount shown is stated in USD unless noted that the security is denominated in another currency. |
| # | Security exempt from registration under Rule 144A of the Securities Act of 1933, as amended. At July 31, 2022, the aggregate value of Rule 144A securities was $328,014,853, which represents 68.51% of the Fund's net assets. See Note 12 in “Notes to financial statements." |
| µ | Fixed to variable rate investment. The rate shown reflects the fixed rate in effect at July 31, 2022. Rate will reset at a future date. |
| ψ | Perpetual security. Maturity date represents next call date. |
| > | PIK. 100% of the income received was in the form of cash. |
| ^ | Zero-coupon security. The rate shown is the effective yield at the time of purchase. |
20
Table of Contents
| ● | Variable rate investment. Rates reset periodically. Rate shown reflects the rate in effect at July 31, 2022. For securities based on a published reference rate and spread, the reference rate and spread are indicated in their descriptions. The reference rate descriptions (i.e. LIBOR03M, LIBOR06M, etc.) used in this report are identical for different securities, but the underlying reference rates may differ due to the timing of the reset period. Certain variable rate securities are not based on a published reference rate and spread but are determined by the issuer or agent and are based on current market conditions, or for mortgage-backed securities, are impacted by the individual mortgages which are paying off over time. These securities do not indicate a reference rate and spread in their descriptions. |
| X | This loan will settle after July 31, 2022, at which time the interest rate, based on the LIBOR and the agreed upon spread on trade date, will be reflected. |
| † | Non-income producing security. |
| = | The value of this security was determined using significant unobservable inputs and is reported as a Level 3 security. |
The following foreign currency exchange contract was outstanding at July 31, 2022:1
Foreign Currency Exchange Contracts
| | Currency to | | | | | | Settlement | | Unrealized |
| Counterparty | | Receive (Deliver) | | In Exchange For | | Date | | Depreciation |
| CITI | | CAD | | (7,000,000) | | USD | | 5,411,882 | | 8/19/22 | | $ | (54,341 | ) |
The use of foreign currency exchange contracts involves elements of market risk and risks in excess of the amounts disclosed in the financial statements. The foreign currency exchange contract presented above represent the Fund’s total exposure in such contracts, whereas only the net unrealized appreciation (depreciation) is reflected in the Fund’s net assets.
| 1 | See Note 9 in “Notes to financial statements.” |
Summary of abbreviations:
ADR – American Depositary Receipt
CDOR – Canadian Dollar Offered Rate
CDOR03M – 3 Month Canadian Dollar Offered Rate
CITI – Citigroup
DAC – Designated Activity Company
GS – Goldman Sachs
ICE – Intercontinental Exchange, Inc.
LIBOR – London Interbank Offered Rate
LIBOR01M – ICE LIBOR USD 1 Month
LIBOR03M – ICE LIBOR USD 3 Month
LIBOR06M – ICE LIBOR USD 6 Month
21
Table of Contents
Schedule of investments
Delaware High-Yield Opportunities Fund
Summary of abbreviations: (continued)
PIK – Payment-in-kind
SOFR01M – Secured Overnight Financing Rate 1 Month
SOFR03M – Secured Overnight Financing Rate 3 Month
TBD – To be determined
Summary of currencies:
CAD – Canadian Dollar
USD – US Dollar
See accompanying notes, which are an integral part of the financial statements.
22
Table of Contents
| Statement of assets and liabilities |
| Delaware High-Yield Opportunities Fund | July 31, 2022 |
| Assets: | | | | |
| | Investments, at value* | | $ | 472,099,737 | |
| Foreign currencies, at valueΔ | | | 268,936 | |
| Dividends and interest receivable | | | 7,920,442 | |
| Receivable for fund shares sold | | | 174,247 | |
| Receivable due from Advisor | | | 108,820 | |
| Prepaid expenses | | | 9,603 | |
| Other assets | | | 4,023 | |
| Total Assets | | | 480,585,808 | |
| Liabilities: | | | | |
| Due to custodian | | | 32,229 | |
| Payable for fund shares redeemed | | | 692,669 | |
| Other accrued expenses | | | 532,829 | |
| Payable for securities purchased | | | 245,810 | |
| Distribution payable | | | 201,907 | |
| Unrealized depreciation on foreign currency exchange contracts | | | 54,341 | |
| Administration expenses payable to affiliates | | | 26,304 | |
| Distribution fees payable to affiliates | | | 15,267 | |
| Total Liabilities | | | 1,801,356 | |
| Total Net Assets | | $ | 478,784,452 | |
| |
| Net Assets Consist of: | | | | |
| Paid-in capital | | $ | 650,899,061 | |
| Total distributable earnings (loss) | | | (172,114,609 | ) |
| Total Net Assets | | $ | 478,784,452 | |
23
Table of Contents
Statement of assets and liabilities
Delaware High-Yield Opportunities Fund
| Net Asset Value | | | | |
| | | | | |
| Class A: | | | | |
| Net assets | | $ | 353,661,784 | |
| Shares of beneficial interest outstanding, unlimited authorization, no par | | | 103,316,926 | |
| Net asset value per share | | $ | 3.42 | |
| Sales charge | | | 4.50 | % |
| Offering price per share, equal to net asset value per share / (1 - sales | | | | |
| charge) | | $ | 3.58 | |
| | | | | |
| Class C: | | | | |
| Net assets | | $ | 4,664,891 | |
| Shares of beneficial interest outstanding, unlimited authorization, no par | | | 1,362,729 | |
| Net asset value per share | | $ | 3.42 | |
| | | | | |
| Class R: | | | | |
| Net assets | | $ | 2,513,144 | |
| Shares of beneficial interest outstanding, unlimited authorization, no par | | | 732,301 | |
| Net asset value per share | | $ | 3.43 | |
| | | | | |
| Institutional Class: | | | | |
| Net assets | | $ | 64,111,357 | |
| Shares of beneficial interest outstanding, unlimited authorization, no par | | | 18,744,524 | |
| Net asset value per share | | $ | 3.42 | |
| | | | | |
| Class R6: | | | | |
| Net assets | | $ | 53,833,276 | |
| Shares of beneficial interest outstanding, unlimited authorization, no par | | | 15,735,555 | |
| Net asset value per share | | $ | 3.42 | |
| ____________________ |
| *Investments, at cost | | $ | 518,276,597 | |
| ΔForeign currencies, at cost | | | 272,324 | |
See accompanying notes, which are an integral part of the financial statements.
24
Table of Contents
| Statement of operations |
| Delaware High-Yield Opportunities Fund | Year ended July 31, 2022 |
| Investment Income: | | | | |
| | Interest | | $ | 29,933,642 | |
| Dividends | | | 51,307 | |
| Interest - affiliated | | | 1,887 | |
| | | | 29,986,836 | |
| | |
| Expenses: | | | | |
| Management fees | | | 3,588,436 | |
| Distribution expenses — Class A | | | 998,156 | |
| Distribution expenses — Class C | | | 60,039 | |
| Distribution expenses — Class R | | | 13,528 | |
| Dividend disbursing and transfer agent fees and expenses | | | 557,792 | |
| Accounting and administration expenses | | | 128,390 | |
| Legal fees | | | 78,713 | |
| Reports and statements to shareholders expenses | | | 77,013 | |
| Audit and tax fees | | | 53,810 | |
| Trustees’ fees and expenses | | | 19,281 | |
| Custodian fees | | | 19,124 | |
| Registration fees | | | 11,367 | |
| Other | | | 87,312 | |
| | | | 5,692,961 | |
| Less expenses waived | | | (1,116,564 | ) |
| Less expenses paid indirectly | | | (1,344 | ) |
| Total operating expenses | | | 4,575,053 | |
| Net Investment Income (Loss) | | | 25,411,783 | |
25
Table of Contents
Statement of operations
Delaware High-Yield Opportunities Fund
| Net Realized and Unrealized Gain (Loss): | | | | |
| | Net realized gain (loss) on: | | | | |
| | Investments | | $ | (1,128,263 | ) |
| | Affiliated investments | | | 300,634 | |
| | Foreign currencies | | | (71,293 | ) |
| | Foreign currency exchange contracts | | | 65,258 | |
| Net realized gain (loss) | | | (833,664 | ) |
| | | |
| Net change in unrealized appreciation (depreciation) on: | | | | |
| | Investments | | | (69,644,252 | ) |
| | Affiliated investments | | | (379,245 | ) |
| | Foreign currencies | | | (3,388 | ) |
| | Foreign currency exchange contracts | | | (54,341 | ) |
| Net change in unrealized appreciation (depreciation) | | | (70,081,226 | ) |
| Net Realized and Unrealized Gain (Loss) | | | (70,914,890 | ) |
| Net Increase (Decrease) in Net Assets Resulting from Operations | | $ | (45,503,107 | ) |
See accompanying notes, which are an integral part of the financial statements.
26
Table of Contents
Statements of changes in net assets
Delaware High-Yield Opportunities Fund
| | | | | Year ended |
| | | | 7/31/22 | | 7/31/21 |
| Increase (Decrease) in Net Assets from Operations: | | | | | | | | |
| Net investment income (loss) | | $ | 25,411,783 | | | $ | 8,167,398 | |
| Net realized gain (loss) | | | (833,664 | ) | | | 7,037,229 | |
| Net change in unrealized appreciation (depreciation) | | | (70,081,226 | ) | | | 830,987 | |
| Net increase (decrease) in net assets resulting from | | | | | | | | |
| | operations | | | (45,503,107 | ) | | | 16,035,614 | |
| | |
| Dividends and Distributions to Shareholders from: | | | | | | | | |
| Distributable earnings: | | | | | | | | |
| | Class A | | | (20,043,867 | ) | | | (5,720,579 | ) |
| | Class C | | | (253,085 | ) | | | (460,849 | ) |
| | Class R | | | (128,861 | ) | | | (147,492 | ) |
| | Institutional Class | | | (4,020,750 | ) | | | (2,279,427 | ) |
| | Class R6 | | | (3,720,776 | ) | | | (54,401 | ) |
| | | | | (28,167,339 | ) | | | (8,662,748 | ) |
| | |
| Capital Share Transactions: | | | | | | | | |
| Proceeds from shares sold: | | | | | | | | |
| | Class A | | | 11,852,626 | | | | 13,187,706 | |
| | Class C | | | 691,405 | | | | 818,523 | |
| | Class R | | | 512,211 | | | | 982,447 | |
| | Institutional Class | | | 31,694,880 | | | | 15,654,789 | |
| | Class R6 | | | 9,996,756 | | | | 280,071 | |
| Net assets from merger:1 | | | | | | | | |
| | Class A | | | — | | | | 331,157,485 | |
| | Institutional Class | | | — | | | | 49,093,208 | |
| | Class R6 | | | — | | | | 68,193,766 | |
| | | | | | | | | | | |
| Net asset value of shares issued upon reinvestment of | | | | | | | | |
| | dividends and distributions: | | | | | | | | |
| | Class A | | | 18,028,131 | | | | 6,056,283 | |
| | Class C | | | 252,952 | | | | 471,879 | |
| | Class R | | | 128,628 | | | | 149,103 | |
| | Institutional Class | | | 3,946,675 | | | | 2,362,904 | |
| | Class R6 | | | 3,358,131 | | | | 49,015 | |
| | | | | 80,462,395 | | | | 488,457,179 | |
27
Table of Contents
Statements of changes in net assets
Delaware High-Yield Opportunities Fund
| | | | Year ended |
| | | | | 7/31/22 | | 7/31/21 |
| Cost of shares redeemed: | | | | | | | | |
| | Class A | | $ | (71,040,818 | ) | | $ | (18,856,123 | ) |
| | Class C | | | (2,682,378 | ) | | | (10,317,316 | ) |
| | Class R | | | (627,357 | ) | | | (2,308,458 | ) |
| | Institutional Class | | | (58,627,406 | ) | | | (14,065,286 | ) |
| | Class R6 | | | (17,890,376 | ) | | | — | |
| | | | | (150,868,335 | ) | | | (45,547,183 | ) |
| Increase (decrease) in net assets derived from capital | | | | | | | | |
| | share transactions | | | (70,405,940 | ) | | | 442,909,996 | |
| Net Increase (Decrease) in Net Assets | | | (144,076,386 | ) | | | 450,282,862 | |
| Net Assets: | | | | | | | | |
| Beginning of year | | | 622,860,838 | | | | 172,577,976 | |
| End of year | | $ | 478,784,452 | | | $ | 622,860,838 | |
| 1 | See Note 7 in the "Notes to financial statements." |
See accompanying notes, which are an integral part of the financial statements.
28
Table of Contents
Financial highlights
Delaware High-Yield Opportunities Fund Class A
Selected data for each share of the Fund outstanding throughout each period were as follows:
| Net asset value, beginning of period |
| |
| Income (loss) from investment operations: |
| Net investment income1 |
| Net realized and unrealized gain (loss) |
| Total from investment operations |
| |
| Less dividends and distributions from: |
| Net investment income |
| Net realized gain |
| Return of capital |
| Total dividends and distributions |
| |
| Net asset value, end of period |
| |
| Total return3 |
| |
| Ratios and supplemental data: |
| Net assets, end of period (000 omitted) |
| Ratio of expenses to average net assets4 |
| Ratio of expenses to average net assets prior to fees waived4 |
| Ratio of net investment income to average net assets |
| Ratio of net investment income to average net assets prior to fees waived |
| Portfolio turnover |
| 1 | Calculated using average shares outstanding. |
| 2 | Amount is less than $0.005 per share. |
| 3 | Total return is based on the change in net asset value of a share during the period and assumes reinvestment of dividends and distributions at net asset value and does not reflect the impact of a sales charge. Total return during all of the periods shown reflects a waiver by the manager. Performance would have been lower had the waiver not been in effect. |
| 4 | Expense ratios do not include expenses of any Underlying Funds in which the Fund invests. |
See accompanying notes, which are an integral part of the financial statements.
30
Table of Contents
| Year ended | |
| 7/31/22 | | 7/31/21 | | 7/31/20 | | 7/31/19 | | 7/31/18 | |
| | $ | 3.91 | | | $ | 3.74 | | | $ | 3.76 | | | $ | 3.71 | | | $ | 3.89 | | |
| | |
| | |
| | 0.17 | | | | 0.17 | | | | 0.19 | | | | 0.20 | | | | 0.20 | | |
| | (0.48 | ) | | | 0.18 | | | | (0.02 | ) | | | 0.06 | | | | (0.18 | ) | |
| | (0.31 | ) | | | 0.35 | | | | 0.17 | | | | 0.26 | | | | 0.02 | | |
| | |
| | |
| | (0.18 | ) | | | (0.18 | ) | | | (0.19 | ) | | | (0.21 | ) | | | (0.20 | ) | |
| | — | 2 | | | — | | | | — | | | | — | | | | — | | |
| | — | | | | — | | | | — | 2 | | | — | 2 | | | — | 2 | |
| | (0.18 | ) | | | (0.18 | ) | | | (0.19 | ) | | | (0.21 | ) | | | (0.20 | ) | |
| | | | | | | | | | | | | | | | | | | | | |
| $ | 3.42 | | | $ | 3.91 | | | $ | 3.74 | | | $ | 3.76 | | | $ | 3.71 | | |
| | |
| | (8.01% | ) | | | 9.68% | | | | 4.89% | | | | 7.25% | | | | 0.58% | | |
| | |
| | |
| $ | 353,662 | | | $ | 447,179 | | | $ | 110,750 | | | $ | 121,500 | | | $ | 131,149 | | |
| | 0.89% | | | | 0.93% | | | | 0.94% | | | | 0.94% | | | | 1.02% | | |
| | 1.09% | | | | 1.19% | | | | 1.16% | | | | 1.15% | | | | 1.15% | | |
| | 4.51% | | | | 4.55% | | | | 5.09% | | | | 5.50% | | | | 5.14% | | |
| | 4.31% | | | | 4.29% | | | | 4.87% | | | | 5.29% | | | | 5.01% | | |
| | 50% | | | | 91% | | | | 108% | | | | 76% | | | | 96% | | |
31
Table of Contents
Financial highlights
Delaware High-Yield Opportunities Fund Class C
Selected data for each share of the Fund outstanding throughout each period were as follows:
| Net asset value, beginning of period |
| |
| Income (loss) from investment operations: |
| Net investment income1 |
| Net realized and unrealized gain (loss) |
| Total from investment operations |
| |
| Less dividends and distributions from: |
| Net investment income |
| Net realized gain |
| Return of capital |
| Total dividends and distributions |
| |
| Net asset value, end of period |
| |
| Total return3 |
| |
| Ratios and supplemental data: |
| Net assets, end of period (000 omitted) |
| Ratio of expenses to average net assets4 |
| Ratio of expenses to average net assets prior to fees waived4 |
| Ratio of net investment income to average net assets |
| Ratio of net investment income to average net assets prior to fees waived |
| Portfolio turnover |
| 1 | Calculated using average shares outstanding. |
| 2 | Amount is less than $0.005 per share. |
| 3 | Total return is based on the change in net asset value of a share during the period and assumes reinvestment of dividends and distributions at net asset value and does not reflect the impact of a sales charge. Total return during all of the periods shown reflects a waiver by the manager. Performance would have been lower had the waiver not been in effect. |
| 4 | Expense ratios do not include expenses of any Underlying Funds in which the Fund invests. |
See accompanying notes, which are an integral part of the financial statements.
32
Table of Contents
| Year ended | |
| | 7/31/22 | | 7/31/21 | | 7/31/20 | | 7/31/19 | | 7/31/18 | |
| $ | 3.91 | | | $ | 3.74 | | | $ | 3.77 | | | $ | 3.72 | | | $ | 3.90 | | |
| | |
| | | |
| | 0.14 | | | | 0.15 | | | | 0.16 | | | | 0.17 | | | | 0.17 | | |
| | (0.47 | ) | | | 0.18 | | | | (0.02 | ) | | | 0.06 | | | | (0.18 | ) | |
| | (0.33 | ) | | | 0.33 | | | | 0.14 | | | | 0.23 | | | | (0.01 | ) | |
| | | |
| | | |
| | (0.16 | ) | | | (0.16 | ) | | | (0.17 | ) | | | (0.18 | ) | | | (0.17 | ) | |
| | — | 2 | | | — | | | | — | | | | — | | | | — | | |
| | — | | | | — | | | | — | 2 | | | — | 2 | | | — | 2 | |
| | (0.16 | ) | | | (0.16 | ) | | | (0.17 | ) | | | (0.18 | ) | | | (0.17 | ) | |
| | | |
| $ | 3.42 | | | $ | 3.91 | | | $ | 3.74 | | | $ | 3.77 | | | $ | 3.72 | | |
| | | |
| | (8.70% | ) | | | 8.86% | | | | 3.83% | | | | 6.45% | | | | (0.16% | ) | |
| | | |
| | | |
| $ | 4,665 | | | $ | 7,177 | | | $ | 15,622 | | | $ | 21,170 | | | $ | 25,186 | | |
| | 1.64% | | | | 1.68% | | | | 1.69% | | | | 1.69% | | | | 1.77% | | |
| | 1.84% | | | | 1.94% | | | | 1.91% | | | | 1.90% | | | | 1.90% | | |
| | 3.76% | | | | 3.80% | | | | 4.34% | | | | 4.75% | | | | 4.39% | | |
| | 3.56% | | | | 3.54% | | | | 4.12% | | | | 4.54% | | | | 4.26% | | |
| | 50% | | | | 91% | | | | 108% | | | | 76% | | | | 96% | | |
33
Table of Contents
Financial highlights
Delaware High-Yield Opportunities Fund Class R
Selected data for each share of the Fund outstanding throughout each period were as follows:
| Net asset value, beginning of period |
| |
| Income (loss) from investment operations: |
| Net investment income1 |
| Net realized and unrealized gain (loss) |
| Total from investment operations |
| |
| Less dividends and distributions from: |
| Net investment income |
| Net realized gain |
| Return of capital |
| Total dividends and distributions |
| |
| Net asset value, end of period |
| |
| Total return3 |
| |
| Ratios and supplemental data: |
| Net assets, end of period (000 omitted) |
| Ratio of expenses to average net assets4 |
| Ratio of expenses to average net assets prior to fees waived4 |
| Ratio of net investment income to average net assets |
| Ratio of net investment income to average net assets prior to fees waived |
| Portfolio turnover |
| 1 | Calculated using average shares outstanding. |
| 2 | Amount is less than $0.005 per share. |
| 3 | Total return is based on the change in net asset value of a share during the period and assumes reinvestment of dividends and distributions at net asset value. Total return during all of the periods shown reflects a waiver by the manager. Performance would have been lower had the waiver not been in effect. |
| 4 | Expense ratios do not include expenses of any Underlying Funds in which the Fund invests. |
See accompanying notes, which are an integral part of the financial statements.
34
Table of Contents
| | Year ended | |
| 7/31/22 | | | 7/31/21 | | | 7/31/20 | | | 7/31/19 | | | 7/31/18 | | |
| $ | 3.92 | | | $ | 3.75 | | | $ | 3.78 | | | $ | 3.73 | | | $ | 3.90 | | |
| | |
| | |
| | 0.16 | | | | 0.17 | | | | 0.18 | | | | 0.19 | | | | 0.19 | | |
| | (0.47 | ) | | | 0.17 | | | | (0.02 | ) | | | 0.06 | | | | (0.17 | ) | |
| | (0.31 | ) | | | 0.34 | | | | 0.16 | | | | 0.25 | | | | 0.02 | | |
| | |
| | |
| | (0.18 | ) | | | (0.17 | ) | | | (0.19 | ) | | | (0.20 | ) | | | (0.19 | ) | |
| | — | 2 | | | — | | | | — | | | | — | | | | — | | |
| | — | | | | — | | | | — | 2 | | | — | 2 | | | — | 2 | |
| | (0.18 | ) | | | (0.17 | ) | | | (0.19 | ) | | | (0.20 | ) | | | (0.19 | ) | |
| | |
| $ | 3.43 | | | $ | 3.92 | | | $ | 3.75 | | | $ | 3.78 | | | $ | 3.73 | | |
| | |
| | (8.21% | ) | | | 9.39% | | | | 4.35% | | | | 6.97% | | | | 0.62% | | |
| | |
| | |
| $ | 2,513 | | | $ | 2,857 | | | $ | 3,891 | | | $ | 4,805 | | | $ | 5,863 | | |
| | 1.14% | | | | 1.18% | | | | 1.19% | | | | 1.19% | | | | 1.27% | | |
| | 1.34% | | | | 1.44% | | | | 1.41% | | | | 1.40% | | | | 1.40% | | |
| | 4.26% | | | | 4.30% | | | | 4.84% | | | | 5.25% | | | | 4.89% | | |
| | 4.06% | | | | 4.04% | | | | 4.62% | | | | 5.04% | | | | 4.76% | | |
| | 50% | | | | 91% | | | | 108% | | | | 76% | | | | 96% | | |
35
Table of Contents
Financial highlights
Delaware High-Yield Opportunities Fund Institutional Class
Selected data for each share of the Fund outstanding throughout each period were as follows:
| Net asset value, beginning of period |
| |
| Income (loss) from investment operations: |
| Net investment income1 |
| Net realized and unrealized gain (loss) |
| Total from investment operations |
| |
| Less dividends and distributions from: |
| Net investment income |
| Net realized gain |
| Return of capital |
| Total dividends and distributions |
| |
| Net asset value, end of period |
| |
| Total return3 |
| |
| Ratios and supplemental data: |
| Net assets, end of period (000 omitted) |
| Ratio of expenses to average net assets4 |
| Ratio of expenses to average net assets prior to fees waived4 |
| Ratio of net investment income to average net assets |
| Ratio of net investment income to average net assets prior to fees waived |
| Portfolio turnover |
| 1 | Calculated using average shares outstanding. |
| 2 | Amount is less than $0.005 per share. |
| 3 | Total return is based on the change in net asset value of a share during the period and assumes reinvestment of dividends and distributions at net asset value. Total return during all of the periods shown reflects a waiver by the manager. Performance would have been lower had the waiver not been in effect. |
| 4 | Expense ratios do not include expenses of any Underlying Funds in which the Fund invests. |
See accompanying notes, which are an integral part of the financial statements.
36
Table of Contents
| | Year ended | |
| 7/31/22 | | | 7/31/21 | | | 7/31/20 | | | 7/31/19 | | | 7/31/18 | | |
| $ | 3.91 | | | $ | 3.74 | | | $ | 3.76 | | | $ | 3.71 | | | $ | 3.89 | | |
| | |
| | |
| | 0.18 | | | | 0.18 | | | | 0.20 | | | | 0.21 | | | | 0.21 | | |
| | (0.48 | ) | | | 0.18 | | | | (0.02 | ) | | | 0.06 | | | | (0.18 | ) | |
| | (0.30 | ) | | | 0.36 | | | | 0.18 | | | | 0.27 | | | | 0.03 | | |
| | |
| | |
| | (0.19 | ) | | | (0.19 | ) | | | (0.20 | ) | | | (0.22 | ) | | | (0.21 | ) | |
| | — | 2 | | | — | | | | — | | | | — | | | | — | | |
| | — | | | | — | | | | — | 2 | | | — | 2 | | | — | 2 | |
| | (0.19 | ) | | | (0.19 | ) | | | (0.20 | ) | | | (0.22 | ) | | | (0.21 | ) | |
| | |
| $ | 3.42 | | | $ | 3.91 | | | $ | 3.74 | | | $ | 3.76 | | | $ | 3.71 | | |
| | |
| | (7.78% | ) | | | 9.95% | | | | 5.15% | | | | 7.52% | | | | 0.84% | | |
| | |
| | |
| $ | 64,111 | | | $ | 97,188 | | | $ | 42,315 | | | $ | 44,923 | | | $ | 60,226 | | |
| | 0.64% | | | | 0.68% | | | | 0.69% | | | | 0.69% | | | | 0.77% | | |
| | 0.84% | | | | 0.94% | | | | 0.91% | | | | 0.90% | | | | 0.90% | | |
| | 4.76% | | | | 4.80% | | | | 5.34% | | | | 5.75% | | | | 5.39% | | |
| | 4.56% | | | | 4.54% | | | | 5.12% | | | | 5.54% | | | | 5.26% | | |
| | 50% | | | | 91% | | | | 108% | | | | 76% | | | | 96% | | |
37
Table of Contents
Financial highlights
Delaware High-Yield Opportunities Fund Class R6
Selected data for each share of the Fund outstanding throughout each period were as follows:
| | | | | 4/29/211 | | |
| Year ended | | | to | | |
| 7/31/22 | | | 7/31/21 | | |
| Net asset value, beginning of period | $ | 3.91 | | | $ | 3.88 | | |
| | |
| Income (loss) from investment operations: | | | | | | | | |
| Net investment income2 | | 0.18 | | | | 0.03 | | |
| Net realized and unrealized gain (loss) | | (0.47 | ) | | | 0.05 | | |
| Total from investment operations | | (0.29 | ) | | | 0.08 | | |
| | |
| Less dividends and distributions from: | | | | | | | | |
| Net investment income | | (0.20 | ) | | | (0.05 | ) | |
| Net realized gain | | — | 3 | | | — | | |
| Total dividends and distributions | | (0.20 | ) | | | (0.05 | ) | |
| | |
| Net asset value, end of period | $ | 3.42 | | | $ | 3.91 | | |
| | |
| Total return4 | | (7.74% | ) | | | 2.07% | | |
| | |
| Ratios and supplemental data: | | | | | | | | |
| Net assets, end of period (000 omitted) | $ | 53,833 | | | $ | 68,460 | | |
| Ratio of expenses to average net assets5 | | 0.59% | | | | 0.59% | | |
| Ratio of expenses to average net assets prior to fees waived5 | | 0.79% | | | | 0.87% | | |
| Ratio of net investment income to average net assets | | 4.81% | | | | 4.01% | | |
| Ratio of net investment income to average net assets prior to fees waived | | 4.61% | | | | 3.73% | | |
| Portfolio turnover | | 50% | | | | 91% | 6 | |
| 1 | Date of commencement of operations; ratios have been annualized and total return has not been annualized. |
| 2 | Calculated using average shares outstanding. |
| 3 | Amount is less than $0.005 per share. |
| 4 | Total return is based on the change in net asset value of a share during the period and assumes reinvestment of dividends and distributions at net asset value. Total return during the period shown reflects a waiver by the manager. Performance would have been lower had the waiver not been in effect. |
| 5 | Expense ratios do not include expenses of any Underlying Funds in which the Fund invests. |
| 6 | Portfolio turnover is representative of the Fund for the year ended July 31, 2021. |
38
Table of Contents
| Notes to financial statements | |
| Delaware High-Yield Opportunities Fund | July 31, 2022 |
Delaware Group® Income Funds (Trust) is organized as a Delaware statutory trust and offers four series: Delaware Corporate Bond Fund, Delaware Extended Duration Bond Fund, Delaware Floating Rate Fund, and Delaware High-Yield Opportunities Fund. These financial statements and the related notes pertain to Delaware High-Yield Opportunities Fund (Fund). The Trust is an open-end investment company. The Fund is considered diversified under the Investment Company Act of 1940, as amended, and offers Class A, Class C, Class R, Institutional Class, and Class R6 shares. Class A shares are sold with a maximum front-end sales charge of 4.50%. There is no front-end sales charge when you purchase $1,000,000 or more of Class A shares. However, if Delaware Distributors, L.P. (DDLP) paid your financial intermediary a commission on your purchase of $1,000,000 or more of Class A shares, for shares purchased prior to July 1, 2020, you will have to pay a limited contingent deferred sales charge (Limited CDSC) of 1.00% if you redeem these shares within the first year after your purchase and 0.50% if you redeem these shares within the second year; or for shares purchased on or after July 1, 2020, you will have to pay a Limited CDSC of 1.00% if you redeem these shares within the first 18 months after your purchase; unless a specific waiver of the Limited CDSC applies. Class C shares have no upfront sales charge, but are sold with a contingent deferred sales charge (CDSC) of 1.00%, which will be incurred if redeemed during the first 12 months. Class R, Institutional Class, and Class R6 shares are not subject to a sales charge and are offered for sale exclusively to certain eligible investors. In addition, Class R6 shares do not pay any service fees, sub-accounting fees, and/or sub-transfer agency fees to any brokers, dealers, or other financial intermediaries.
1. Significant Accounting Policies
The Fund follows accounting and reporting guidance under Financial Accounting Standards Board (FASB) Accounting Standards Codification Topic 946, Financial Services — Investment Companies. The following accounting policies are in accordance with US generally accepted accounting principles (US GAAP) and are consistently followed by the Fund.
Security Valuation — Equity securities, except those traded on the Nasdaq Stock Market LLC (Nasdaq), are valued at the last quoted sales price as of the time of the regular close of the New York Stock Exchange on the valuation date. Equity securities traded on the Nasdaq are valued in accordance with the Nasdaq Official Closing Price, which may not be the last sales price. If, on a particular day, an equity security does not trade, the mean between the bid and the ask prices will be used, which approximates fair value. Debt securities are valued based upon valuations provided by an independent pricing service or broker and reviewed by management. To the extent current market prices are not available, the pricing service may take into account developments related to the specific security, as well as transactions in comparable securities. Open-end investment companies are valued at their published net asset value (NAV). Foreign currency exchange contracts are valued at the mean between the bid and the ask prices, which approximates fair value. Interpolated values are derived when the settlement date of the contract is an interim date for which quotations are not available. Valuations for fixed income securities utilize matrix systems, which reflect such factors as security prices, yields, maturities, and ratings, and are supplemented by dealer and exchange quotations. Generally, other securities
39
Table of Contents
Notes to financial statements
Delaware High-Yield Opportunities Fund
1. Significant Accounting Policies (continued)
and assets for which market quotations are not readily available are valued at fair value as determined in good faith under the direction of the Trust’s Board of Trustees (Board). In determining whether market quotations are readily available or fair valuation will be used, various factors will be taken into consideration, such as market closures or suspension of trading in a security. Restricted securities are valued at fair value using methods approved by the Board.
Federal Income Taxes — No provision for federal income taxes has been made as the Fund intends to continue to qualify for federal income tax purposes as a regulated investment company under Subchapter M of the Internal Revenue Code of 1986, as amended, and make the requisite distributions to shareholders. The Fund evaluates tax positions taken or expected to be taken in the course of preparing the Fund's tax returns to determine whether the tax positions are “more-likely-than-not” of being sustained by the applicable tax authority. Tax positions not deemed to meet the “more-likely-than-not” threshold are recorded as a tax benefit or expense in the current year. Management has analyzed the Fund's tax positions taken or expected to be taken on the Fund's federal income tax returns through the year ended July 31, 2022, and for all open tax years (years ended July 31, 2019-July 31, 2021), and has concluded that no provision for federal income tax is required in the Fund's financial statements. If applicable, the Fund recognizes interest accrued on unrecognized tax benefits in interest expense and penalties in “Other” on the “Statement of operations.” During the year ended July 31, 2022, the Fund did not incur any interest or tax penalties.
Class Accounting — Investment income and common expenses are allocated to the various classes of the Fund on the basis of “settled shares” of each class in relation to the net assets of the Fund. Realized and unrealized gain (loss) on investments are allocated to the various classes of the Fund on the basis of daily net assets of each class. Distribution expenses relating to a specific class are charged directly to that class. Class R6 shares will not be allocated any expenses related to service fees, sub-accounting fees, and/or sub-transfer agency fees paid to brokers, dealers, or other financial intermediaries.
Foreign Currency Transactions — Transactions denominated in foreign currencies are recorded at the prevailing exchange rates on the valuation date in accordance with the Fund’s prospectus. The value of all assets and liabilities denominated in foreign currencies is translated daily into US dollars at the exchange rate of such currencies against the US dollar. Transaction gains or losses resulting from changes in exchange rates during the reporting period or upon settlement of the foreign currency transaction are reported in operations for the current period. The Fund generally bifurcates that portion of realized gains and losses on investments in debt securities which is due to changes in foreign exchange rates from that which is due to changes in market prices of debt securities. That portion of gains (losses), attributable to changes in foreign exchange rates, is included on the “Statement of operations” under “Net realized gain (loss) on foreign currencies.” The Fund reports certain foreign currency related transactions as components of realized gains (losses) for financial reporting purposes, whereas such components are treated as ordinary income (loss) for federal income tax purposes.
40
Table of Contents
Use of Estimates — The preparation of financial statements in conformity with US GAAP requires management to make estimates and assumptions that affect the fair value of investments, the reported amounts of assets and liabilities and disclosure of contingent assets and liabilities at the date of the financial statements, and the reported amounts of revenues and expenses during the reporting period. Actual results could differ from those estimates and the differences could be material.
Other — Expenses directly attributable to the Fund are charged directly to the Fund. Other expenses common to various funds within the Delaware Funds by Macquarie® (Delaware Funds) are generally allocated among such fund on the basis of average net assets. Management fees and certain other expenses are paid monthly. Security transactions are recorded on the date the securities are purchased or sold (trade date) for financial reporting purposes. Costs used in calculating realized gains and losses on the sale of investment securities are those of the specific securities sold. Dividend income is recorded on the ex-dividend date and interest income is recorded on the accrual basis. Income and capital gain distributions from any investment companies (Underlying Funds) in which the Fund invests are recorded on the ex-dividend date. Discounts and premiums on debt securities are accreted or amortized to interest income, respectively, over the lives of the respective securities using the effective interest method. Premiums on callable debt securities are amortized to interest income to the earliest call date using the effective interest method. The Fund declares dividends daily from net investment income and pays the dividends monthly and declares and pays distributions from net realized gain on investments, if any, annually. The Fund may distribute more frequently, if necessary for tax purposes. Dividends and distributions, if any, are recorded on the ex-dividend date.
The Fund receives earnings credits from its custodian when positive cash balances are maintained, which may be used to offset custody fees. The expenses paid under this arrangement are included on the "Statement of operations" under "Custodian fees" with the corresponding expenses offset included under "Less expense paid indirectly." There were no such earnings credits for the year ended July 31, 2022.
The Fund receives earnings credits from its transfer agent when positive cash balances are maintained, which may be used to offset transfer agent fees. If the amount earned is greater than $1, the expenses paid under this arrangement are included on the “Statement of operations” under “Dividend disbursing and transfer agent fees and expenses” with the corresponding expenses offset included under “Less expenses paid indirectly.” For the year ended July 31, 2022, the Fund earned $1,344 under this arrangement.
2. Investment Management, Administration Agreements, and Other Transactions with Affiliates
In accordance with the terms of its investment management agreement, the Fund pays Delaware Management Company (DMC), a series of Macquarie Investment Management Business Trust and the investment manager, an annual fee which is calculated daily and paid monthly at the
41
Table of Contents
Notes to financial statements
Delaware High-Yield Opportunities Fund
2. Investment Management, Administration Agreements, and Other Transactions with Affiliates (continued)
rates of 0.65% on the first $500 million of average daily net assets of the Fund, 0.60% on the next $500 million, 0.55% on the next $1.5 billion, and 0.50% on average daily net assets in excess of $2.5 billion.
DMC has contractually agreed to waive all or a portion, of its management fee and/or pay/reimburse expenses (excluding any distribution and service (12b-1) fees, acquired fund fees and expenses, taxes, interest, short sale dividend and interest expenses, brokerage fees, certain insurance costs, and nonroutine expenses or costs, including, but not limited to, those relating to reorganizations, litigation, conducting shareholder meetings, and liquidations), in order to prevent total annual fund operating expenses from exceeding 0.69% of the Fund’s Class A, Class C, Class R, and Institutional Class average daily net assets and 0.58% of the Fund’s Class R6 shares average daily net assets from August 1, 2021 through July 31, 2022.* These waivers and reimbursements may only be terminated by agreement of DMC and the Fund. The waivers and reimbursements are accrued daily and received monthly.
DMC may seek investment advice and recommendations from its affiliates: Macquarie Investment Management Europe Limited, Macquarie Investment Management Austria Kapitalanlage AG, and Macquarie Investment Management Global Limited (together, the “Affiliated Sub-Advisors”). DMC may also permit these Affiliated Sub-Advisors to execute Fund security trades on its behalf and exercise investment discretion for securities in certain markets where DMC believes it will be beneficial to utilize an Affiliated Sub-Advisor’s specialized market knowledge. Although the Affiliated Sub-Advisors serve as sub-advisors, DMC has ultimate responsibility for all investment advisory services. For these services, DMC, not the Fund, may pay each Affiliated Sub-Advisor a portion of its investment management fee.
Delaware Investments Fund Services Company (DIFSC), an affiliate of DMC, provides fund accounting and financial administrative oversight services to the Fund. For these services, DIFSC’s fees are calculated daily and paid monthly, based on the aggregate daily net assets of all funds within the Delaware Funds at the following annual rates: 0.00475% of the first $35 billion; 0.0040% of the next $10 billion; 0.0025% of the next $45 billion; and 0.0015% of aggregate average daily net assets in excess of $90 billion (Total Fee). Each fund in the Delaware Funds pays a minimum of $4,000, which, in aggregate, is subtracted from the Total Fee. Each fund then pays its portion of the remainder of the Total Fee on a relative NAV basis. This amount is included on the “Statement of operations” under “Accounting and administration expenses.” For the year ended July 31, 2022, the Fund paid $22,164 for these services.
DIFSC is also the transfer agent and dividend disbursing agent of the Fund. For these services, DIFSC’s fees are calculated daily and paid monthly, based on the aggregate daily net assets of the retail funds within the Delaware Funds at the following annual rates: 0.014% of the first $20 billion; 0.011% of the next $5 billion; 0.007% of the next $5 billion; 0.005% of the next $20 billion; and 0.0025% of average daily net assets in excess of $50 billion. The fees payable to DIFSC under the shareholder services agreement described above are allocated among all retail
42
Table of Contents
funds in the Delaware Funds on a relative NAV basis. This amount is included on the “Statement of operations” under “Dividend disbursing and transfer agent fees and expenses.” For the year ended July 31, 2022, the Fund paid $22,578 for these services. Pursuant to a sub-transfer agency agreement between DIFSC and BNY Mellon Investment Servicing (US) Inc. (BNYMIS), BNYMIS provides certain sub-transfer agency services to the Fund. Sub-transfer agency fees are paid by the Fund and are also included on the “Statement of operations” under “Dividend disbursing and transfer agent fees and expenses.” The fees that are calculated daily and paid as invoices are received on a monthly or quarterly basis.
Pursuant to a distribution agreement and distribution plan, the Fund pays DDLP, the distributor and an affiliate of DMC, an annual 12b-1 fee of 0.25%, 1.00%, and 0.50% of the average daily net assets of the Class A, Class C, and Class R shares, respectively. The Board has adopted a formula for calculating 12b-1 fees for the Fund’s Class A shares that went into effect on June 1, 1992. The Fund’s Class A shares are currently subject to a blended 12b-1 fee equal to the sum of: (i) 0.10% of the average daily net assets representing shares that were acquired prior to June 1, 1992, and (ii) 0.25% of the average daily net assets representing shares that were acquired on or after June 1, 1992. All Class A shareholders currently bear 12b-1 fees at the same rate, the blended rate, currently 0.25% of average daily net assets, based on the formula described above. This method of calculating Class A 12b-1 fees may be discontinued at the sole discretion of the Board. The fees are calculated daily and paid monthly. Institutional Class and Class R6 shares do not pay 12b-1 fees.
As provided in the investment management agreement, the Fund bears a portion of the cost of certain resources shared with DMC, including the cost of internal personnel of DMC and/or its affiliates that provide legal and regulatory reporting services to the Fund. For the year ended July 31, 2022, the Fund paid $8,114 for internal legal and regulatory reporting services provided by DMC and/or its affiliates’ employees. This amount is included on the “Statement of operations” under “Legal fees.”
For the year ended July 31, 2022, DDLP earned $13,071 for commissions on sales of the Fund’s Class A shares. For the year ended July 31, 2022, DDLP received gross CDSC commissions of $91 and $1,668 on redemptions of the Fund’s Class A and Class C shares, respectively, and these commissions were entirely used to offset upfront commissions previously paid by DDLP to broker/dealers on sales of those shares.
Trustees’ fees include expenses accrued by the Fund for each Trustee’s retainer and meeting fees. Certain officers of DMC, DIFSC, and DDLP are officers and/or Trustees of the Trust. These officers and Trustees are paid no compensation by the Fund.
In addition to the management fees and other expenses of the Fund, the Fund indirectly bears the investment management fees and other expenses of any Underlying Funds in which it invests. The amount of these fees and expenses incurred indirectly by the Fund will vary based upon the expense and fee levels of any Underlying Funds and the number of shares that are owned of any Underlying Funds at different times.
43
Table of Contents
Notes to financial statements
Delaware High-Yield Opportunities Fund
2. Investment Management, Administration Agreements, and Other Transactions with Affiliates (continued)
An affiliated issuer includes any company in which a Fund held 5% or more of the company’s outstanding voting shares at any point during the fiscal year. The table below represents transactions in and earnings from these affiliated issuers during the period ended July 31, 2022:
| | | | | | | | | | Net | | Net change in |
| | | | | | | | | | realized | | unrealized |
| | | | | | | | | | gain (loss) | | appreciation |
| | Value, | | | | | | | | on | | (depreciation) |
| | beginning | | Gross | | Gross | | | | affiliated | | on affiliated |
| | of period | | additions | | reductions | | | | securities | | securities |
| Corporate Bond—0.0% | | | | | | | | | | | | |
| Cincinnati Bell | | $2,963,756 | | $— | | $(2,885,145) | | | | $300,634 | | $(379,245) |
| | | | | | | | | | | | | |
| | | | | | Value, | | | | | | |
| | | | | | end of | | | | Interest | | Capital gain |
| | | | | | period | | Shares | | Income | | distributions |
| Corporate Bond—0.0% | | | | | | | | | | | | |
| Cincinnati Bell | | | | | | $— | | — | | $1,887 | | $— |
____________________
| * | The aggregate contractual waiver period covering this report is from November 29, 2019 through November 30, 2022 of the Fund’s Class A, Class C, Class R, and Institutional Class shares and from April 19, 2021 through November 30, 2022 of the Fund’s Class R6 shares. |
3. Investments
For the year ended July 31, 2022, the Fund made purchases and sales of investment securities other than short-term investments as follows:
| Purchases | | $270,485,374 |
| Sales | | 339,066,093 |
The tax cost of investments and derivatives includes adjustments to net unrealized appreciation (depreciation) which may not necessarily be the final tax cost basis adjustments but which approximate the tax basis unrealized gains and losses that may be realized and distributed to shareholders. At July 31, 2022, the cost and unrealized appreciation (depreciation) of investments and derivatives for federal income tax purposes for the Fund were as follows:
| Cost of investments and derivatives | | $ | 520,432,852 | |
| Aggregate unrealized appreciation of investments and derivatives | | $ | 1,157,835 | |
| Aggregate unrealized depreciation of investments and derivatives | | | (49,545,291 | ) |
| Net unrealized depreciation of investments and derivatives | | $ | (48,387,456 | ) |
US GAAP defines fair value as the price that the Fund would receive to sell an asset or pay to transfer a liability in an orderly transaction between market participants at the measurement date under current market conditions. A three-level hierarchy for fair value measurements has been established based upon the transparency of inputs to the valuation of an asset or liability. Inputs
44
Table of Contents
may be observable or unobservable and refer broadly to the assumptions that market participants would use in pricing the asset or liability. Observable inputs reflect the assumptions market participants would use in pricing the asset or liability based on market data obtained from sources independent of the reporting entity. Unobservable inputs reflect the reporting entity’s own assumptions about the assumptions that market participants would use in pricing the asset or liability based on the best information available under the circumstances. The Fund's investment in its entirety is assigned a level based upon the observability of the inputs which are significant to the overall valuation. The three-level hierarchy of inputs is summarized as follows:
| Level 1 – | Inputs are quoted prices in active markets for identical investments. (Examples: equity securities, open-end investment companies, futures contracts, and exchange-traded options contracts) |
| | |
| Level 2 – | Other observable inputs, including, but not limited to: quoted prices for similar assets or liabilities in markets that are active, quoted prices for identical or similar assets or liabilities in markets that are not active, inputs other than quoted prices that are observable for the assets or liabilities (such as interest rates, yield curves, volatilities, prepayment speeds, loss severities, credit risks, and default rates) or other market-corroborated inputs. (Examples: debt securities, government securities, swap contracts, foreign currency exchange contracts, foreign securities utilizing international fair value pricing, broker-quoted securities, and fair valued securities) |
| | |
| Level 3 – | Significant unobservable inputs, including the Fund's own assumptions used to determine the fair value of investments. (Examples: broker-quoted securities and fair valued securities) |
Level 3 investments are valued using significant unobservable inputs. The Fund may also use an income-based valuation approach in which the anticipated future cash flows of the investment are discounted to calculate fair value. Discounts may also be applied due to the nature or duration of any restrictions on the disposition of the investments. Valuations may also be based upon current market prices of securities that are comparable in coupon, rating, maturity, and industry. The derived value of a Level 3 investment may not represent the value which is received upon disposition and this could impact the results of operations.
45
Table of Contents
Notes to financial statements
Delaware High-Yield Opportunities Fund
3. Investments (continued)
The following table summarizes the valuation of the Fund’s investments by fair value hierarchy levels as of July 31, 2022:
| | | Level 1 | | | Level 2 | | | | Level 3 | | | Total | |
| Securities | | | | | | | | | | | | | | |
| Assets: | | | | | | | | | | | | | | |
| Common Stocks | | $ | 59,091 | | $ | — | | | $ | —1 | | $ | 59,091 | |
| Convertible Bond | | | — | | | 694,656 | | | | — | | | 694,656 | |
| Corporate Bonds | | | — | | | 417,463,465 | | | | — | | | 417,463,465 | |
| Loan Agreements | | | — | | | 38,565,964 | | | | — | | | 38,565,964 | |
| Municipal Bonds | | | — | | | 3,146,247 | | | | — | | | 3,146,247 | |
| Short-Term Investments | | | 12,170,314 | | | — | | | | — | | | 12,170,314 | |
| Total Value of Securities | | $ | 12,229,405 | | $ | 459,870,332 | | | $ | — | | $ | 472,099,737 | |
| | | | | | | | | | | | | | | |
| Derivatives2 | | | | | | | | | | | | | | |
| Liabilities: | | | | | | | | | | | | | | |
| Foreign Currency Exchange Contracts | | $ | — | | $ | (54,341 | ) | | $ | — | | $ | (54,341 | ) |
| 1 | The security that has been valued at zero on the “Schedule of investments” is considered to be Level 3 investment in this table. |
| 2 | Foreign currency exchange contracts are valued at the unrealized appreciation (depreciation) on the instrument at the year end. |
During the year ended July 31, 2022, there were no transfers into or out of Level 3 investments. The Fund’s policy is to recognize transfers into or out of Level 3 investments based on fair value at the beginning of the reporting period.
A reconciliation of Level 3 investments is presented when the Fund has a significant amount of Level 3 investments at the beginning or end of the year in relation to the Fund's net assets. Management has determined not to provide a reconciliation of Level 3 investments as the Level 3 investments were not considered significant to the Fund's net assets at the beginning or end of the year. Management has determined not to provide additional disclosure on Level 3 inputs since the Level 3 investments are not considered significant to the Fund's net assets at the end of the year.
46
Table of Contents
4. Dividend and Distribution Information
Income and long-term capital gain distributions are determined in accordance with federal income tax regulations, which may differ from US GAAP. Additionally, distributions from net short-term gains on sales of investment securities are treated as ordinary income for federal income tax purposes. The tax character of dividends and distributions paid during the years ended July 31, 2022 and 2021 were as follows:
| | Year ended |
| | 7/31/22 | | 7/31/21 |
| Ordinary income | | $ | 28,019,889 | | $ | 8,654,615 |
| Long-term capital gains | | | 147,450 | | | 8,133 |
| Total | | $ | 28,167,339 | | $ | 8,662,748 |
5. Components of Net Assets on a Tax Basis
As of July 31, 2022, the components of net assets on a tax basis were as follows:
| Shares of beneficial interest | | $ | 650,899,061 | |
| Undistributed ordinary income | | | 229,751 | |
| Distributions payable | | | (201,907 | ) |
| Capital loss carryforwards* | | | (123,754,997 | ) |
| Unrealized appreciation (depreciation) of investments and foreign | | | | |
| currencies | | | (48,387,456 | ) |
| Net assets | | $ | 478,784,452 | |
| * | A portion of the Fund’s capital loss carryforward is subject to limitation under the Internal Revenue Code and related regulations. |
The differences between book basis and tax basis components of net assets are primarily attributable to tax deferral of losses on wash sales, market discount and premium on debt instruments, market premium on callable bonds, and mark-to-market on foreign currency contracts.
For financial reporting purposes, capital accounts are adjusted to reflect the tax character of permanent book/tax differences. Reclassifications are primarily due to tax treatment of market discount on debt instruments. Results of operations and net assets were not affected by these reclassifications. For the year ended July 31, 2022, the adjustments were to increase distributable earnings and decrease paid-in capital in excess of par by $3,245.
At July 31, 2022, capital loss carryforwards available to offset future realized capital gains, are as follows:
| Loss carryforward character | | |
| Short-term | | Long-term | | Total |
| $37,270,293 | | $86,484,704 | | $123,754,997 |
47
Table of Contents
Notes to financial statements
Delaware High-Yield Opportunities Fund
6. Capital Shares
Transactions in capital shares were as follows:
| | | Year ended |
| | | | 7/31/22 | | 7/31/21 |
| Shares sold: | | | | | | |
| Class A | | 3,167,276 | | | 3,309,477 | |
| Class C | | 184,179 | | | 212,732 | |
| Class R | | 139,459 | | | 255,469 | |
| Institutional Class | | 8,458,981 | | | 4,044,411 | |
| Class R6 | | 2,682,855 | | | 59,308 | |
| | | | | | | |
| Shares from merger:1 | | | | | | |
| Class A | | — | | | 84,695,009 | |
| Institutional Class | | — | | | 12,555,808 | |
| Class R6 | | — | | | 17,440,861 | |
| | | | | | | | |
| Shares issued upon reinvestment of dividends and distributions: | | | | | | |
| Class A | | 4,904,289 | | | 1,575,695 | |
| Class C | | 68,568 | | | 123,730 | |
| Class R | | 34,967 | | | 38,864 | |
| Institutional Class | | 1,071,822 | | | 616,045 | |
| Class R6 | | 916,505 | | | 12,536 | |
| | | 21,628,901 | | | 124,939,945 | |
| Shares redeemed: | | | | | | |
| Class A | | (19,087,300 | ) | | (4,860,142 | ) |
| Class C | | (724,845 | ) | | (2,674,490 | ) |
| Class R | | (170,652 | ) | | (602,763 | ) |
| Institutional Class | | (15,656,326 | ) | | (3,665,046 | ) |
| Class R6 | | (5,376,510 | ) | | — | |
| | | (41,015,633 | ) | | (11,802,441 | ) |
| Net increase (decrease) | | (19,386,732 | ) | | 113,137,504 | |
48
Table of Contents
Certain shareholders may exchange shares of one class for shares of another class in the same Fund. These exchange transactions are included as subscriptions and redemptions in the table on previous page and on the “Statements of changes in net assets.” For the years ended July 31, 2022 and 2021, the Fund had the following exchange transactions:
| | Exchange Redemptions Exchange Subscriptions |
| | | | | | | | Institutional | | | |
| | Class A | | Class C | | Class A | | Class | | | |
| | Shares | | Shares | | Shares | | Shares | | Value |
| Year ended | | | | | | | | | | | |
| 7/31/22 | | 519 | | 4,602 | | 4,604 | | 521 | | $ | 19,214 |
| 7/31/21 | | 4,746 | | 97,342 | | 83,039 | | 19,301 | | | 394,531 |
7. Reorganization
On February 24, 2021, the Board approved a proposal to reorganize (the "Reorganization") Delaware Fund for Income, a series of Delaware Group® Equity Funds IV and Macquarie High Yield Bond Portfolio, a series of Macquarie Institutional Portfolios (the “Acquired Funds”), with and into Delaware High-Yield Opportunities Fund (the “Acquiring Fund”), a series of the Trust. Pursuant to an Agreement and Plan of Reorganization (the “Plan”): (i) all of the property, assets, and goodwill of the Acquired Funds were acquired by the Acquiring Fund, and (ii) the Trust, on behalf of the Acquiring Fund, assumed the liabilities of the Acquired Funds, in exchange for shares of the Acquiring Fund. In accordance with the Plan, the Acquired Funds liquidated and dissolved following the Reorganization. The purpose of the transaction was to allow shareholders of the Acquired Funds to own shares of the Acquiring Fund, a fund with a similar investment objective and style as, and potentially lower net expenses than the Acquired Funds. The Reorganization was accomplished by a tax-free exchange of shares on July 23, 2021. For financial reporting purposes, assets received and shares issued by the Acquiring Fund were recorded at fair value; however, the cost basis of the investments received from the Acquired Funds was carried forward to align ongoing reporting of the Acquiring Funds' realized and unrealized gains and losses with amounts distributable to shareholders for tax purposes.
The share transactions associated with the Reorganization are as follows:
| | | | | | | Shares | | | | | |
| | Acquired | | Acquired | | Converted | | Acquiring | | |
| | Fund | | Fund Shares | | to Acquiring | | Fund | | Conversion |
| | Net Assets | | Outstanding | | Fund | | Net Assets | | Ratio |
| | | | | | | Delaware High-Yield | | |
| | Delaware Fund for Income | | Opportunities Fund | | |
| Class A | | $ | 331,157,485 | | 130,794,637 | | 84,695,009 | | $ | 117,388,713 | | 0.6475 |
| Institutional | | | | | | | | | | | | |
| Class | | | 49,093,208 | | 19,534,886 | | 12,555,808 | | | 47,836,372 | | 0.6427 |
| Class R6 | | | 132,296 | | 51,998 | | 33,835 | | | 54,060 | | 0.6507 |
49
Table of Contents
Notes to financial statements
Delaware High-Yield Opportunities Fund
7. Reorganization (continued)
| | | | | Shares | | | | |
| Acquired | | Acquired | | Converted | | Acquiring | | |
| Funds | | Fund Shares | | to Acquiring | | Fund | | Conversion |
| Net Assets | | Outstanding | | Fund | | Net Assets | | Ratio |
| | | | | Delaware High-Yield | | |
| Macquarie High Yield Bond | | Opportunities | | |
| Portfolio - Portfolio Class | | Fund Class R6 | | |
| $68,061,470 | | 9,425,899 | | 17,407,026 | | $54,060 | | 1.8467 |
The net assets of the Acquired Funds before the Reorganization were $448,444,459. The net assets of the Acquiring Fund immediately following the Reorganization were $623,744,485.
Assuming the Reorganization had been completed on August 1, 2020, the Acquiring Fund's pro forma results of operations for the year ended July 31, 2021, would have been as follows:
| Net investment income | | $ | 26,151,767 |
| Net realized gain on investments | | | 22,967,377 |
| Net change in unrealized appreciation (depreciation) | | | 25,320,777 |
| Net increase in net assets resulting from operations | | $ | 74,439,921 |
Because the combined investment portfolios have been managed as a single integrated portfolio since the acquisition was completed, it is not practical to separate the amounts of revenue and earnings of the Acquired Funds that have been included in the Acquiring Fund's "Statement of Operations" since the Reorganization was consummated on July 23, 2021.
8. Line of Credit
The Fund, along with certain other funds in the Delaware Funds (Participants), was a participant in a $225,000,000 revolving line of credit (Agreement) intended to be used for temporary or emergency purposes as an additional source of liquidity to fund redemptions of investor shares. Under the Agreement, the Participants were charged an annual commitment fee of 0.15% with the addition of an upfront fee of 0.05%, which was allocated across the Participants based on a weighted average of the respective net assets of each Participant. The Participants were permitted to borrow up to a maximum of one-third of their net assets under the Agreement. Each Participant was individually, and not jointly, liable for its particular advances, if any, under the line of credit. The line of credit available under the Agreement expired on November 1, 2021.
On November 1, 2021, the Fund, along with the other Participants, entered into an amendment to the agreement for a $355,000,000 revolving line of credit to be used as described above and operates in substantially the same manner as the original Agreement. Under the amendment to the agreement, the Participants are charged an annual commitment fee of 0.15%, with the addition of an upfront fee of 0.05%, which is allocated across the Participants based on a weighted average of the respective net assets of each Participant. The line of credit available under the agreement expires on October 31, 2022.
50
Table of Contents
The Fund had no amounts outstanding as of July 31, 2022, or at any time during the year then ended.
9. Derivatives
US GAAP requires disclosures that enable investors to understand: (1) how and why an entity uses derivatives; (2) how they are accounted for; and (3) how they affect an entity’s results of operations and financial position.
Foreign Currency Exchange Contracts — The Fund may enter into foreign currency exchange contracts and foreign cross currency exchange contracts as a way of managing foreign exchange rate risk. The Fund may enter into these contracts to fix the US dollar value of a security that it has agreed to buy or sell for the period between the date the trade was entered into and the date the security is delivered and paid for. The Fund may also enter into these contracts to hedge the US dollar value of securities it already owns that are denominated in foreign currencies. In addition, the Fund may enter into these contracts to facilitate or expedite the settlement of portfolio transactions. The change in value is recorded as an unrealized gain or loss. When the contract is closed, a realized gain or loss is recorded equal to the difference between the value of the contract at the time it was opened and the value at the time it was closed.
The use of foreign currency exchange contracts and foreign cross currency exchange contracts does not eliminate fluctuations in the underlying prices of the securities, but does establish a rate of exchange that can be achieved in the future. Although foreign currency exchange contracts and foreign cross currency exchange contracts limit the risk of loss due to an unfavorable change in the value of the hedged currency, they also limit any potential gain that might result should the value of the currency change favorably. In addition, the Fund could be exposed to risks if the counterparties to the contracts are unable to meet the terms of their contracts. The Fund’s maximum risk of loss from counterparty credit risk is the value of its currency exchanged with the counterparty. The risk is generally mitigated by having a netting arrangement between the Fund and the counterparty and by the posting of collateral by the counterparty to the Fund to cover the Fund’s exposure to the counterparty.
During the year ended July 31, 2022, the Fund entered into foreign currency exchange contracts to hedge the US dollar value of securities it already owns that are denominated in foreign currencies to increase/decrease exposure to foreign currencies.
During the year ended July 31, 2022, the Fund experienced net realized and unrealized gains or losses attributed to foreign currency holdings, which are disclosed on the "Statement of assets and liabilities" and "Statement of Operations".
51
Table of Contents
Notes to financial statements
Delaware High-Yield Opportunities Fund
9. Derivatives (continued)
The table below summarizes the average daily balance of derivative holdings by the Fund during the year ended July 31, 2022:
| | Long Derivative | | Short Derivative |
| | Volume | | Volume |
| Foreign currency exchange contracts (average notional value) | | $ | 21,510 | | $ | 3,372,504 |
10. Offsetting
The Fund entered into an International Swaps and Derivatives Association, Inc. Master Agreement (ISDA Master Agreement) or a similar agreement with certain of its derivative contract counterparties in order to better define its contractual rights and to secure rights that will help the Fund mitigate its counterparty risk. An ISDA Master Agreement is a bilateral agreement between the Fund and a counterparty that governs certain over-the-counter derivatives and foreign exchange contracts and typically contains, among other things, collateral posting items and netting provisions in the event of a default and/or termination event. Under an ISDA Master Agreement, the Fund may, under certain circumstances, offset with the counterparty certain derivative financial instruments’ payables and/or receivables with collateral held and/or posted and create one single net payment. The provisions of the ISDA Master Agreement typically permit a single net payment in the event of default (close-out), including the bankruptcy or insolvency of the counterparty. However, bankruptcy or insolvency laws of a particular jurisdiction may impose restrictions on or prohibitions against the right of offset in bankruptcy, insolvency, or other events.
For financial reporting purposes, the Fund does not offset derivative assets and derivative liabilities that are subject to netting arrangements on the “Statement of assets and liabilities.”
At July 31, 2022, the Fund had the following assets and liabilities subject to offsetting provisions:
Offsetting of Financial Assets and Liabilities and Derivative Assets and Liabilities
Delaware High-Yield Opportunities Fund
| | Gross Value of | | Gross Value of | | |
| Counterparty | | Derivative Asset | | Derivative Liability | | Net Position |
| Citigroup | | $— | | $(54,341) | | $(54,341) |
| | | | | | Fair Value of | | | | Fair Value of | | | | |
| | | | | | Non-Cash | | | | Non-Cash | | | | |
| | | | | | Collateral | | Cash Collateral | | Collateral | | Cash Collateral | | |
| Counterparty | | Net Position | | Received | | Received | | Pledged | | Pledged | | Net Exposure(a) |
| Citigroup | | $ | (54,341 | ) | | $— | | $— | | $— | | $— | | $(54,341) |
| (a) | Net exposure represents the receivable (payable) that would be due from (to) the counterparty in the event of default. |
52
Table of Contents
11. Securities Lending
The Fund, along with other funds in Delaware Funds, may lend its securities pursuant to a security lending agreement (Lending Agreement) with The Bank of New York Mellon (BNY Mellon). At the time a security is loaned, the borrower must post collateral equal to the required percentage of the market value of the loaned security, including any accrued interest. The required percentage is: (1) 102% with respect to US securities and foreign securities that are denominated and payable in US dollars; and (2) 105% with respect to foreign securities. With respect to each loan, if on any business day the aggregate market value of securities collateral plus cash collateral held is less than the aggregate market value of the securities which are the subject of such loan, the borrower will be notified to provide additional collateral by the end of the following business day, which, together with the collateral already held, will be not less than the applicable initial collateral requirements for such security loan. If the aggregate market value of securities collateral and cash collateral held with respect to a security loan exceeds the applicable initial collateral requirement, upon the request of the borrower, BNY Mellon must return enough collateral to the borrower by the end of the following business day to reduce the value of the remaining collateral to the applicable initial collateral requirement for such security loan. As a result of the foregoing, the value of the collateral held with respect to a loaned security on any particular day, may be more or less than the value of the security on loan. The collateral percentage with respect to the market value of the loaned security is determined by the security lending agent.
Cash collateral received by each fund of the Trust is generally invested in a series of individual separate accounts, each corresponding to a fund. The investment guidelines permit each separate account to hold certain securities that would be considered eligible securities for a money market fund. Cash collateral received is generally invested in government securities; certain obligations issued by government sponsored enterprises; repurchase agreements collateralized by US Treasury securities; obligations issued by the central government of any Organization for Economic Cooperation and Development (OECD) country or its agencies, instrumentalities, or establishments; obligations of supranational organizations; commercial paper, notes, bonds, and other debt obligations; certificates of deposit, time deposits, and other bank obligations; certain money market funds; and asset-backed securities. The Fund can also accept US government securities and letters of credit (non-cash collateral) in connection with securities loans.
In the event of default or bankruptcy by the lending agent, realization and/or retention of the collateral may be subject to legal proceedings. In the event the borrower fails to return loaned securities and the collateral received is insufficient to cover the value of the loaned securities and provided such collateral shortfall is not the result of investment losses, the lending agent has agreed to pay the amount of the shortfall to the Fund or, at the discretion of the lending agent, replace the loaned securities. The Fund continues to record dividends or interest, as applicable, on the securities loaned and is subject to changes in value of the securities loaned that may occur during the term of the loan. The Fund has the right under the Lending Agreement to recover the securities from the borrower on demand. With respect to security loans collateralized
53
Table of Contents
Notes to financial statements
Delaware High-Yield Opportunities Fund
11. Securities Lending (continued)
by non-cash collateral, the Fund receives loan premiums paid by the borrower. With respect to security loans collateralized by cash collateral, the earnings from the collateral investments are shared among the Fund, the security lending agent, and the borrower. The Fund records security lending income net of allocations to the security lending agent and the borrower.
The Fund may incur investment losses as a result of investing securities lending collateral. This could occur if an investment in the collateral investment account defaulted or became impaired. Under those circumstances, the value of the Fund's cash collateral account may be less than the amount the Fund would be required to return to the borrowers of the securities and the Fund would be required to make up for this shortfall.
During the year ended July 31, 2022, the Fund had no securities out on loan.
12. Credit and Market Risk
Beginning in January 2020, global financial markets have experienced and may continue to experience significant volatility resulting from the spread of a novel coronavirus known as COVID-19. The outbreak of COVID-19 has resulted in travel and border restrictions, quarantines, supply chain disruptions, lower consumer demand, and general market uncertainty. The effects of COVID-19 have and may continue to adversely affect the global economy, the economies of certain nations, and individual issuers, all of which may negatively impact the Fund’s performance.
Investments in equity securities in general are subject to market risks that may cause their prices to fluctuate over time. Fluctuations in the value of equity securities in which the Fund invests will cause the NAV of the Fund to fluctuate.
When interest rates rise, fixed income securities (i.e. debt obligations) generally will decline in value. These declines in value are greater for fixed income securities with longer maturities or durations.
IBOR is the risk that changes related to the use of the London interbank offered rate (LIBOR) and other interbank offered rate (collectively, “IBORs”) could have adverse impacts on financial instruments that reference LIBOR (or the corresponding IBOR). The abandonment of LIBOR could affect the value and liquidity of instruments that reference LIBOR. The use of alternative reference rate products may impact investment strategy performance. These risks may also apply with respect to changes in connection with other IBORs, such as the euro overnight index average (EONIA), which are also the subject of recent reform.
The Fund invests a portion of its assets in high yield fixed income securities, which are securities rated lower than BBB- by S&P and Baa3 by Moody's, or similarly rated by another nationally recognized statistical rating organization. Investments in these higher yielding securities are generally accompanied by a greater degree of credit risk than higher rated securities. Additionally, lower rated securities may be more susceptible to adverse economic and competitive industry conditions than investment grade securities.
54
Table of Contents
The Fund invests in bank loans and other securities that may subject it to direct indebtedness risk, the risk that the Fund will not receive payment of principal, interest, and other amounts due in connection with these investments and will depend primarily on the financial condition of the borrower. Loans that are fully secured offer the Fund more protection than unsecured loans in the event of nonpayment of scheduled interest or principal, although there is no assurance that the liquidation of collateral from a secured loan would satisfy the corporate borrower’s obligation, or that the collateral can be liquidated. Some loans or claims may be in default at the time of purchase. Certain of the loans and the other direct indebtedness acquired by the Fund may involve revolving credit facilities or other standby financing commitments that obligate the Fund to pay additional cash on a certain date or on demand. These commitments may require the Fund to increase its investment in a company at a time when the Fund might not otherwise decide to do so (including at a time when the company’s financial condition makes it unlikely that such amounts will be repaid). To the extent that the Fund is committed to advance additional funds, it will at all times hold and maintain cash or other high grade debt obligations in an amount sufficient to meet such commitments. When a loan agreement is purchased, the Fund may pay an assignment fee. On an ongoing basis, the Fund may receive a commitment fee based on the undrawn portion of the underlying line of credit portion of a loan agreement. Prepayment penalty fees are received upon the prepayment of a loan agreement by the borrower. Prepayment penalty, facility, commitment, consent, and amendment fees are recorded to income as earned or paid.
As the Fund may be required to rely upon another lending institution to collect and pass on to the Fund amounts payable with respect to the loan and to enforce the Fund’s rights under the loan and other direct indebtedness, an insolvency, bankruptcy, or reorganization of the lending institution may delay or prevent the Fund from receiving such amounts. The highly leveraged nature of many loans may make them especially vulnerable to adverse changes in economic or market conditions. Investments in such loans and other direct indebtedness may involve additional risk to the Fund.
The Fund invests in certain obligations that may have liquidity protection designed to ensure that the receipt of payments due on the underlying security is timely. Such protection may be provided through guarantees, insurance policies, or letters of credit obtained by the issuer or sponsor through third parties, through various means of structuring the transaction, or through a combination of such approaches. The Fund will not pay any additional fees for such credit support, although the existence of credit support may increase the price of a security.
The Fund may invest up to 15% of its net assets in illiquid securities, which may include securities with contractual restrictions on resale, securities exempt from registration under Rule 144A promulgated under the Securities Act of 1933, as amended, and other securities which may not be readily marketable. The relative illiquidity of these securities may impair the Fund from disposing of them in a timely manner and at a fair price when it is necessary or desirable to do so. While maintaining oversight, the Board has delegated to DMC, the day-to-day functions of determining whether individual securities are liquid for purposes of the Fund’s limitation on investments in illiquid securities. Securities eligible for resale pursuant to Rule 144A,
55
Table of Contents
Notes to financial statements
Delaware High-Yield Opportunities Fund
12. Credit and Market Risk (continued)
which are determined to be liquid, are not subject to the Fund’s 15% limit on investments in illiquid securities. Rule 144A securities have been identified on the “Schedule of investments.”
13. Contractual Obligations
The Fund enters into contracts in the normal course of business that contain a variety of indemnifications. The Fund's maximum exposure under these arrangements is unknown. However, the Fund has not had prior claims or losses pursuant to these contracts. Management has reviewed the Fund's existing contracts and expects the risk of loss to be remote.
14. Recent Accounting Pronouncements
In March 2020, FASB issued an Accounting Standards Update (ASU), ASU 2020-04, Reference Rate Reform (Topic 848) – Facilitation of the Effects of Reference Rate Reform on Financial Reporting. The amendments in ASU 2020-04 provide optional temporary financial reporting relief from the effect of certain types of contract modifications due to the planned discontinuation of LIBOR and other interbank-offered based reference rates as of the end of 2021. In March 2021, the administrator for LIBOR announced the extension of the publication of a majority of the USD LIBOR settings to June 30, 2023. ASU 2020-04 is effective for certain reference rate-related contract modifications that occur during the period March 12, 2020 through December 31, 2022. As of the financial reporting period, Management is evaluating the impact of applying this ASU.
15. Subsequent Events
Management has determined that no material events or transactions occurred subsequent to July 31, 2022, that would require recognition or disclosure in the Fund's financial statements.
56
Table of Contents
Report of independent
registered public accounting firm
To the Board of Trustees of Delaware Group® Income Funds and Shareholders of Delaware
High-Yield Opportunities Fund
Opinion on the Financial Statements
We have audited the accompanying statement of assets and liabilities, including the schedule of investments, of Delaware High-Yield Opportunities Fund (one of the funds constituting Delaware Group® Income Funds, referred to hereafter as the “Fund”) as of July 31, 2022, the related statement of operations for the year ended July 31, 2022, the statements of changes in net assets for each of the two years in the period ended July 31, 2022, including the related notes, and the financial highlights for each of the periods indicated therein (collectively referred to as the “financial statements”). In our opinion, the financial statements present fairly, in all material respects, the financial position of the Fund as of July 31, 2022, the results of its operations for the year then ended, the changes in its net assets for each of the two years in the period ended July 31, 2022 and the financial highlights for each of the periods indicated therein in conformity with accounting principles generally accepted in the United States of America.
Basis for Opinion
These financial statements are the responsibility of the Fund’s management. Our responsibility is to express an opinion on the Fund’s financial statements based on our audits. We are a public accounting firm registered with the Public Company Accounting Oversight Board (United States) (PCAOB) and are required to be independent with respect to the Fund in accordance with the U.S. federal securities laws and the applicable rules and regulations of the Securities and Exchange Commission and the PCAOB.
We conducted our audits of these financial statements in accordance with the standards of the PCAOB. Those standards require that we plan and perform the audit to obtain reasonable assurance about whether the financial statements are free of material misstatement, whether due to error or fraud.
Our audits included performing procedures to assess the risks of material misstatement of the financial statements, whether due to error or fraud, and performing procedures that respond to those risks. Such procedures included examining, on a test basis, evidence regarding the amounts and disclosures in the financial statements. Our audits also included evaluating the accounting principles used and significant estimates made by management, as well as evaluating the overall presentation of the financial statements. Our procedures included confirmation of securities owned as of July 31, 2022 by correspondence with the custodian, transfer agents, agent banks and brokers; when replies were not received from brokers, we performed other auditing procedures. We believe that our audits provide a reasonable basis for our opinion.
/s/PricewaterhouseCoopers LLP
Philadelphia, Pennsylvania
September 16, 2022
We have served as the auditor of one or more investment companies in Delaware Funds by Macquarie® since 2010.
57
Table of Contents
Other Fund information (Unaudited)
Delaware High-Yield Opportunities Fund
Liquidity Risk Management Program
The Securities and Exchange Commission (the “SEC”) has adopted Rule 22e-4 under the Investment Company Act of 1940 (the “Liquidity Rule”), which requires all open-end funds (other than money market funds) to adopt and implement a program reasonably designed to assess and manage the fund’s “liquidity risk,” defined as the risk that the fund could not meet requests to redeem shares issued by the fund without significant dilution of remaining investors’ interests in the fund.
The Fund has adopted and implemented a liquidity risk management program in accordance with the Liquidity Rule (the “Program”). The Board has designated a member of the US Operational Risk Group of Macquarie Asset Management as the Program Administrator for each Fund in the Trust.
As required by the Liquidity Rule, the Program includes policies and procedures that provide for: (1) assessment, management, and review (no less frequently than annually) of the Fund’s liquidity risk; (2) classification of each of the Fund’s portfolio holdings into one of four liquidity categories (Highly Liquid, Moderately Liquid, Less Liquid, and Illiquid); (3) for funds that do not primarily hold assets that are Highly Liquid, establishing and maintaining a minimum percentage of the Fund’s net assets in Highly Liquid investments (called a “Highly Liquid Investment Minimum” or “HLIM”); and (4) prohibiting the Fund’s acquisition of Illiquid investments if, immediately after the acquisition, the Fund would hold more than 15% of its net assets in Illiquid assets. The Program also requires reporting to the SEC (on a non-public basis) and to the Board if the Fund’s holdings of Illiquid assets exceed 15% of the Fund’s net assets. Funds with HLIMs must have procedures for addressing HLIM shortfalls, including reporting to the Board and, with respect to HLIM shortfalls lasting more than seven consecutive calendar days, reporting to the SEC (on a non-public basis).
In assessing and managing the Fund’s liquidity risk, the Program Administrator considers, as relevant, a variety of factors, including: (1) the Fund’s investment strategy and liquidity of portfolio investments during both normal and reasonably foreseeable stressed conditions; (2) short-term and long-term cash flow projections for the Fund during both normal and reasonably foreseeable stressed conditions; and (3) the Fund’s holdings of cash and cash equivalents and any borrowing arrangements. Classification of the Fund’s portfolio holdings in the four liquidity categories is based on the number of days it is reasonably expected to take to convert the investment to cash (for Highly Liquid and Moderately Liquid holdings) or to sell or dispose of the investment (for Less Liquid and Illiquid investments), in current market conditions without significantly changing the investment’s market value. The Fund primarily holds assets that are classified as Highly Liquid, and therefore is not required to establish an HLIM.
At a meeting of the Board held on May 17-19, 2022, the Program Administrator provided the required written annual report to the Board addressing the Program’s operation and assessing the adequacy and effectiveness of its implementation for the period from April 1, 2021 through March 31, 2022. The report concluded that the Program is appropriately designed and effectively implemented and that it meets the requirements of Rule 22e-4 and the Fund’s liquidity needs. The Fund’s HLIM is set at an appropriate level and the Fund complied with its HLIM at all times during the reporting period.
58
Table of Contents
Tax Information
The information set forth below is for the Fund’s fiscal year as required by federal income tax laws. Shareholders, however, must report distributions on a calendar year basis for income tax purposes, which may include distributions for portions of two fiscal years of the Fund. Accordingly, the information needed by shareholders for income tax purposes will be sent to them in January of each year. Please consult your tax advisor for proper treatment of this information.
All disclosures are based on financial information available as of the date of this annual report and, accordingly are subject to change. For any and all items requiring reporting, it is the intention of the Fund to report the maximum amount permitted under the Internal Revenue Code and the regulations thereunder.
For the fiscal year ended July 31, 2022, the Fund reports distributions paid during the year as follows:
| (A) Ordinary Income Distributions (Tax Basis) | | 99.48% |
| (B) Long-Term Capital Gains (Tax Basis) | | 0.52% |
| Total Distributions (Tax Basis) | | 100.00% |
____________________
(A) and (B) are based on a percentage of the Fund's total distributions.
For the fiscal year ended July 31, 2022, certain interest income paid by the Fund, determined to be Qualified Interest Income may be subject to relief from US withholding for foreign shareholders, as provided by the American Jobs Creation Act of 2004; the Tax Relief Unemployment Insurance Reauthorization, and Job Creation Act of 2010; and as extended by the American Taxpayer Relief Act of 2012. For the year ended July 31, 2022, the Fund has reported maximum distributions of Qualified Interest Income of $10,374,928.
The percentage of the ordinary dividends reported by the fund that is treated as a Section 163(j) interest dividend and thus is eligible to be treated as interest income for purposes of Section 163(j) and the regulations thereunder is 95.02%.
59
Table of Contents
Board of trustees / directors and officers addendum
Delaware Funds by Macquarie®
A mutual fund is governed by a Board of Trustees/Directors (“Trustees”), which has oversight responsibility for the management of a fund’s business affairs. Trustees establish procedures and oversee and review the performance of the investment manager, the distributor, and others who perform services for the fund. The independent fund trustees, in particular, are advocates for shareholder interests. Each trustee has served in that capacity since he or she was elected to or appointed to the Board of Trustees, and will continue to serve until his or her retirement or the election of a new trustee in his or her place. The following is a list of the Trustees and Officers with certain background and related information.
| | | | | | | | | | Other |
| | | | | | Number of | | Principal | | Directorships |
| Name, | | Position(s) | | | | Funds in Fund | | Occupation(s) | | Held by Trustee |
| Address, | | Held with | | Length of Time | | Complex Overseen | | During the | | During the |
| and Birth Date | | the Trust | | Served | | by Trustee | | Past Five Years | | Past Five Years |
| Interested Trustee | | | | | | | | | | |
| |
| Shawn K. Lytle1 | | President, | | President and | | 128 | | Macquarie Asset | | None |
| 100 Independence | | Chief Executive | | Chief Executive | | | | Management2 | | |
| 610 Market Street | | Officer, | | Officer | | | | (2015–Present) | | |
| Philadelphia, PA | | and Trustee | | since August 2015 | | | | -Global Head of | | |
| 19106-2354 | | | | | | | | Macquarie Asset | | |
| February 1970 | | | | Trustee since | | | | Management | | |
| | | | September 2015 | | | | (2019–Present) | | |
| | | | | | | | -Head of Americas of | | |
| | | | | | | | Macquarie Group | | |
| | | | | | | | (2017–Present) | | |
| | | | | | | | -Deputy Global Head of | | |
| | | | | | | | Macquarie Asset | | |
| | | | | | | | Management | | |
| | | | | | | | (2017–2019) | | |
| | | | | | | | -Head of Macquarie | | |
| | | | | | | | Asset Management | | |
| | | | | | | | Americas (2015–2017) | | |
60
Table of Contents
| | | | | | | | | | Other |
| | | | | | Number of | | Principal | | Directorships |
| Name, | | Position(s) | | | | Funds in Fund | | Occupation(s) | | Held by Trustee |
| Address, | | Held with | | Length of Time | | Complex Overseen | | During the | | During the |
| and Birth Date | | the Trust | | Served | | by Trustee | | Past Five Years | | Past Five Years |
| Independent Trustees | | | | | | | | | | |
| |
| Jerome D. | | Trustee | | Since January 2019 | | 128 | | Stonebrook Capital | | None |
| Abernathy | | | | | | | | Management, LLC | | |
| 100 Independence | | | | | | | | (financial | | |
| 610 Market Street | | | | | | | | technology: macro | | |
| Philadelphia, PA | | | | | | | | factors and databases) | | |
| 19106-2354 | | | | | | | | -Managing Member | | |
| July 1959 | | | | | | | | (1993-Present) | | |
| |
| Thomas L. Bennett | | Chair and Trustee | | Trustee since March | | 128 | | Private Investor | | None |
| 100 Independence | | | | 2005 | | | | (2004–Present) | | |
| 610 Market Street | | | | | | | | | | |
| Philadelphia, PA | | | | Chair since March | | | | | | |
| 19106-2354 | | | | 2015 | | | | | | |
| October 1947 | | | | | | | | | | |
| |
| Ann D. Borowiec | | Trustee | | Since March 2015 | | 128 | | J.P. Morgan Chase & Co. | | Banco Santander International |
| 100 Independence | | | | | | | | (1987-2013) | | (2016–2019) |
| 610 Market Street | | | | | | | | -Chief Executive Officer, | | Santander Bank, N.A. |
| Philadelphia, PA | | | | | | | | Private Wealth | | (2016-2019) |
| 19106-2354 | | | | | | | | Management | | |
| November 1958 | | | | | | | | (2011–2013) | | |
61
Table of Contents
Board of trustees / directors and officers addendum
Delaware Funds by Macquarie®
| | | | | | | | | | Other |
| | | | | | Number of | | Principal | | Directorships |
| Name, | | Position(s) | | | | Funds in Fund | | Occupation(s) | | Held by Trustee |
| Address, | | Held with | | Length of Time | | Complex Overseen | | During the | | During the |
| and Birth Date | | the Trust | | Served | | by Trustee | | Past Five Years | | Past Five Years |
| | | | | | | | | | | |
| Joseph W. Chow | | Trustee | | Since January 2013 | | 128 | | Private Investor | | None |
| 100 Independence | | | | | | | | (2011–Present) | | |
| 610 Market Street | | | | | | | | | | |
| Philadelphia, PA | | | | | | | | | | |
| 19106-2354 | | | | | | | | | | |
| January 1953 | | | | | | | | | | |
| |
| H. Jeffrey Dobbs3 | | Trustee | | Since December 2021 | | 128 | | KPMG LLP | | TechAccel LLC |
| 100 Independence | | | | | | | | (2010-2015) | | (2015–Present) |
| 610 Market Street | | | | | | | | -Global Sector Chairman, | | PatientsVoices, Inc. |
| Philadelphia, PA | | | | | | | | Industrial Manufacturing | | (2018–Present) |
| 19106-2354 | | | | | | | | (2010-2015) | | Valparaiso University Board |
| May 1955 | | | | | | | | | | (2012-Present) |
| | | | | | | | | | Ivy Funds Complex (2019-2021) |
62
Table of Contents
| | | | | | | | | | Other |
| | | | | | Number of | | Principal | | Directorships |
| Name, | | Position(s) | | | | Funds in Fund | | Occupation(s) | | Held by Trustee |
| Address, | | Held with | | Length of Time | | Complex Overseen | | During the | | During the |
| and Birth Date | | the Trust | | Served | | by Trustee | | Past Five Years | | Past Five Years |
| | | | | | | | | | | |
| John A. Fry | | Trustee | | Since January 2001 | | 128 | | Drexel University | | Federal Reserve |
| 100 Independence | | | | | | | | -President | | Bank of Philadelphia |
| 610 Market Street | | | | | | | | (August 2010–Present) | | (2020–Present) |
| Philadelphia, PA | | | | | | | | | | FS Credit Real Estate Income |
| 19106-2354 | | | | | | | | | | Trust, Inc. (2018–Present) |
| May 1960 | | | | | | | | | | vTv Therapeutics Inc. |
| | | | | | | | | | (2017–Present) |
| | | | | | | | | | Community Health Systems |
| | | | | | | | | | (2004–Present) |
| | | | | | | | | | Drexel Morgan & Co. |
| | | | | | | | | | (2015–2019) |
63
Table of Contents
Board of trustees / directors and officers addendum
Delaware Funds by Macquarie®
| | | | | | | | | | Other |
| | | | | | Number of | | Principal | | Directorships |
| Name, | | Position(s) | | | | Funds in Fund | | Occupation(s) | | Held by Trustee |
| Address, | | Held with | | Length of Time | | Complex Overseen | | During the | | During the |
| and Birth Date | | the Trust | | Served | | by Trustee | | Past Five Years | | Past Five Years |
| | | | | | | | | | | |
|
| Joseph Harroz, Jr.3 | | Trustee | | Since December 2021 | | 128 | | University of Oklahoma | | OU Medicine, Inc. |
| 100 Independence | | | | | | | | -President | | (2020–Present) |
| 610 Market Street | | | | | | | | (2020–Present) | | Big 12 Athletic Conference |
| Philadelphia, PA | | | | | | | | -Interim President | | (2019-Present) |
| 19106-2354 | | | | | | | | (2019–2020) | | Valliance Bank |
| January 1967 | | | | | | | | -Vice President and | | (2007–Present) |
| | | | | | | | Dean, College of Law | | Ivy Funds |
| | | | | | | | (2010–2019) | | (1998-2021) |
| | | | | | | | Brookhaven Investments | | |
| | | | | | | | LLC (commercial | | |
| | | | | | | | enterprises) | | |
| | | | | | | | -Managing Member | | |
| | | | | | | | (2019–Present) | | |
| | | | | | | | St. Clair, LLC | | |
| | | | | | | | (commercial enterprises) | | |
| | | | | | | | -Managing Member | | |
| | | | | | | | (2019–Present) | | |
64
Table of Contents
| | | | | | | | | | Other |
| | | | | | Number of | | Principal | | Directorships |
| Name, | | Position(s) | | | | Funds in Fund | | Occupation(s) | | Held by Trustee |
| Address, | | Held with | | Length of Time | | Complex Overseen | | During the | | During the |
| and Birth Date | | the Trust | | Served | | by Trustee | | Past Five Years | | Past Five Years |
| |
| Sandra A.J. | | Trustee | | Since December 2021 | | 128 | | Children’s Mercy | | Brixmor Property Group Inc. |
| Lawrence3 | | | | | | | | Hospitals and Clinics | | (2021-Present) |
| 100 Independence | | | | | | | | (2005–2019) | | Sera Prognostics Inc. |
| 610 Market Street | | | | | | | | -Chief Administrative | | (biotechnology) (2021-Present) |
| Philadelphia, PA | | | | | | | | Officer | | Recology (resource recovery) |
| 19106-2354 | | | | | | | | (2016–2019) | | (2021-Present) |
| September 1957 | | | | | | | | | | Evergy, Inc., Kansas City Power |
| | | | | | | | | | & Light Company, KCP&L |
| | | | | | | | | | Greater Missouri Operations |
| | | | | | | | | | Company, Westar Energy, Inc. |
| | | | | | | | | | and Kansas Gas and Electric |
| | | | | | | | | | Company (related utility |
| | | | | | | | | | companies) (2018-Present) |
| | | | | | | | | | National Association of Corporate |
| | | | | | | | | | Directors (2017-Present) |
| | | | | | | | | | Ivy Funds Complex (2019-2021) |
| | | | | | | | | | American Shared Hospital |
| | | | | | | | | | Services (medical device) |
| | | | | | | | | | (2017-2021) |
| | | | | | | | | | Ivy NextShares (2019) |
| | | | | | | | | | Westar Energy (utility) |
| | | | | | | | | | (2004-2018) |
65
Table of Contents
Board of trustees / directors and officers addendum
Delaware Funds by Macquarie®
| | | | | | | | | | Other |
| | | | | | Number of | | Principal | | Directorships |
| Name, | | Position(s) | | | | Funds in Fund | | Occupation(s) | | Held by Trustee |
| Address, | | Held with | | Length of Time | | Complex Overseen | | During the | | During the |
| and Birth Date | | the Trust | | Served | | by Trustee | | Past Five Years | | Past Five Years |
| |
| Frances A. | | Trustee | | Since September | | 128 | | Banco Itaú International | | Florida Chapter of National |
| Sevilla-Sacasa | | | | 2011 | | | | -Chief Executive Officer | | Association of Corporate |
| 100 Independence | | | | | | | | (2012–2016) | | Directors (2021-Present) |
| 610 Market Street | | | | | | | | | | Callon Petroleum Company |
| Philadelphia, PA | | | | | | | | | | (2019-Present) |
| 19106-2354 | | | | | | | | | | Camden Property Trust |
| January 1956 | | | | | | | | | | (2011-Present) |
| | | | | | | | | | New Senior Investment |
| | | | | | | | | | Group Inc. (2021) |
| | | | | | | | | | Carrizo Oil & Gas, Inc. |
| | | | | | | | | | (2018-2019) |
| |
| Thomas K. Whitford | | Trustee | | Since January 2013 | | 128 | | PNC Financial Services | | HSBC USA Inc. |
| 100 Independence | | | | | | | | Group (1983–2013) | | (2014–Present) |
| 610 Market Street | | | | | | | | -Vice Chairman | | HSBC North America |
| Philadelphia, PA | | | | | | | | (2009-2013) | | Holdings Inc. |
| 19106-2354 | | | | | | | | | | (2013–Present) |
| March 1956 | | | | | | | | | | HSBC Finance Corporation |
| | | | | | | | | | (2013–2018) |
66
Table of Contents
| | | | | | | | | | Other |
| | | | | | Number of | | Principal | | Directorships |
| Name, | | Position(s) | | | | Funds in Fund | | Occupation(s) | | Held by Trustee |
| Address, | | Held with | | Length of Time | | Complex Overseen | | During the | | During the |
| and Birth Date | | the Trust | | Served | | by Trustee | | Past Five Years | | Past Five Years |
| |
| Christianna Wood | | Trustee | | Since January 2019 | | 128 | | Gore Creek | | The Merger Fund |
| 100 Independence | | | | | | | | Capital, Ltd. | | (2013–2021), |
| 610 Market Street | | | | | | | | -Chief Executive Officer | | The Merger Fund VL |
| Philadelphia, PA | | | | | | | | and President | | (2013–2021), |
| 19106-2354 | | | | | | | | (2009–Present) | | WCM Alternatives: Event-Driven |
| August 1959 | | | | | | | | | | Fund (2013–2021), |
| | | | | | | | | | and WCM Alternatives: Credit |
| | | | | | | | | | Event Fund (2017–2021) |
| | | | | | | | | | Grange Insurance |
| | | | | | | | | | (2013–Present) |
| | | | | | | | | | H&R Block Corporation |
| | | | | | | | | | (2008–Present) |
67
Table of Contents
Board of trustees / directors and officers addendum
Delaware Funds by Macquarie®
| | | | | | | | | | Other |
| | | | | | Number of | | Principal | | Directorships |
| Name, | | Position(s) | | | | Funds in Fund | | Occupation(s) | | Held by Trustee |
| Address, | | Held with | | Length of Time | | Complex Overseen | | During the | | During the |
| and Birth Date | | the Trust | | Served | | by Trustee | | Past Five Years | | Past Five Years |
| |
| Janet L. Yeomans | | Trustee | | Since April 1999 | | 128 | | 3M Company | | Okabena Company (2009–2017) |
| 100 Independence | | | | | | | | (1995-2012) | | |
| 610 Market Street | | | | | | | | -Vice President and | | |
| Philadelphia, PA | | | | | | | | Treasurer (2006–2012) | | |
| 19106-2354 | | | | | | | | | | |
| July 1948 | | | | | | | | | | |
| |
| Officers | | | | | | | | | | |
| |
| David F. Connor | | Senior Vice President, | | Senior Vice President, | | 128 | | David F. Connor has | | None4 |
| 100 Independence | | General Counsel, and | | since May 2013; | | | | served in various | | |
| 610 Market Street | | Secretary | | General Counsel | | | | capacities at different | | |
| Philadelphia, PA | | | | since May 2015; | | | | times at Macquarie Asset | | |
| 19106-2354 | | | | Secretary since | | | | Management. | | |
| December 1963 | | | | October 2005 | | | | | | |
| |
| Daniel V. Geatens | | Senior Vice President | | Senior Vice President | | 128 | | Daniel V. Geatens has | | None4 |
| 100 Independence | | and Treasurer | | and Treasurer since | | | | served in various | | |
| 610 Market Street | | | | October 2007 | | | | capacities at different | | |
| Philadelphia, PA | | | | | | | | times at Macquarie Asset | | |
| 19106-2354 | | | | | | | | Management. | | |
| October 1972 | | | | | | | | | | |
68
Table of Contents
| | | | | | | | | | Other |
| | | | | | Number of | | Principal | | Directorships |
| Name, | | Position(s) | | | | Funds in Fund | | Occupation(s) | | Held by Trustee |
| Address, | | Held with | | Length of Time | | Complex Overseen | | During the | | During the |
| and Birth Date | | the Trust | | Served | | by Trustee | | Past Five Years | | Past Five Years |
| |
| Richard Salus | | Senior Vice President | | Senior Vice President | | 128 | | Richard Salus has | | None |
| 100 Independence | | and Chief Financial | | and Chief Financial | | | | served in various | | |
| 610 Market Street | | Officer | | Officer since | | | | capacities at different | | |
| Philadelphia, PA | | | | November 2006 | | | | times at Macquarie Asset | | |
| 19106-2354 | | | | | | | | Management. | | |
| October 1963 | | | | | | | | | | |
| 1 | Shawn K. Lytle is considered to be an “Interested Trustee” because he is an executive officer of the Fund’s(s’) investment advisor. |
| 2 | Macquarie Asset Management is the marketing name for Macquarie Management Holdings, Inc. and its subsidiaries, including the Fund’s(s’) investment advisor, principal underwriter, and its transfer agent. |
| 3 | Messrs. Dobbs and Harroz and Ms. Lawrence were elected as Trustees of the Trust effective December 17, 2021. |
| 4 | David F. Connor and Daniel V. Geatens serve in similar capacities for the six portfolios of the Optimum Fund Trust, which have the same investment advisor, principal underwriter, and transfer agent as the registrant. Mr. Geatens also serves as the Chief Financial Officer of the Optimum Fund Trust and he is the Chief Financial Officer and Treasurer for Macquarie Global Infrastructure Total Return Fund Inc. |
The Statement of Additional Information for the Fund(s) includes additional information about the Trustees and Officers and is available, without charge, upon request by calling 800 523-1918.
69
Table of Contents
About the organization
| Board of trustees | | | |
| | | | |
| Shawn K. Lytle | Ann D. Borowiec | John A. Fry | Frances A. |
| President and | Former Chief Executive | President | Sevilla-Sacasa |
| Chief Executive Officer | Officer | Drexel University | Former Chief Executive |
| Delaware Funds | Private Wealth Management | | Officer |
| by Macquarie® | J.P. Morgan Chase & Co. | Joseph Harroz, Jr. | Banco Itaú International |
| | President | |
| Jerome D. Abernathy | Joseph W. Chow | University of Oklahoma | Thomas K. Whitford |
| Managing Member | Private Investor | | Former Vice Chairman |
| Stonebrook Capital | | Sandra A.J. Lawrence | PNC Financial Services |
| Management, LLC | H. Jeffrey Dobbs | Former Chief Administrative | Group |
| Former Global Sector | Officer | |
| Thomas L. Bennett | Chairman | Children's Mercy Hospitals | Christianna Wood |
| Chairman of the Board | Industrial Manufacturing, | and Clinics | Chief Executive Officer |
| Delaware Funds | KPMG, LLP | | and President |
| by Macquarie | | | Gore Creek Capital, Ltd. |
| Private Investor | | | |
| | | Janet L. Yeomans |
| | | Former Vice President and |
| | | Treasurer |
| | | 3M Company |
| |
| Affiliated officers | | | |
| | | | |
| David F. Connor | Daniel V. Geatens | Richard Salus | |
| Senior Vice President, | Senior Vice President and | Senior Vice President and | |
| General Counsel, | Treasurer | Chief Financial Officer | |
| and Secretary | Delaware Funds | Delaware Funds | |
| Delaware Funds | by Macquarie | by Macquarie | |
| by Macquarie | | | |
| | | | |
| This annual report is for the information of Delaware High-Yield Opportunities Fund shareholders, but it may be used with prospective investors when preceded or accompanied by the Delaware Fund fact sheet for the most recently completed calendar quarter. These documents are available at delawarefunds.com/literature. |
The Fund files its complete schedule of portfolio holdings with the Securities and Exchange Commission (SEC) for the first and third quarters of each fiscal year on Form N-PORT. The Fund’s Forms N-PORT, as well as a description of the policies and procedures that the Fund uses to determine how to vote proxies (if any) relating to portfolio securities, are available without charge (i) upon request, by calling 800 523-1918; and (ii) on the SEC’s website at sec.gov. In addition, a description of the policies and procedures that the Fund uses to determine how to vote proxies (if any) relating to portfolio securities and the Schedule of Investments included in the Fund’s most recent Form N-PORT are available without charge on the Fund’s website at delawarefunds.com/literature. The Fund’s Forms N-PORT may be reviewed and copied at the SEC’s Public Reference Room in Washington, D.C.; information on the operation of the Public Reference Room may be obtained by calling 800 SEC-0330.
Information (if any) regarding how the Fund voted proxies relating to portfolio securities during the most recently disclosed 12-month period ended June 30 is available without charge (i) through the Fund’s website at delawarefunds.com/proxy; and (ii) on the SEC’s website at sec.gov.
70
Item 2. Code of Ethics
The registrant has adopted a code of ethics that applies to the registrant’s principal executive officer, principal financial officer, principal accounting officer or controller, or persons performing similar functions, regardless of whether these individuals are employed by the registrant or a third party. A copy of the registrant’s Code of Business Ethics has been posted on the Delaware Funds by Macquarie® Internet Web site at www.delawarefunds.com. Any amendments to the Code of Business Ethics, and information on any waiver from its provisions granted by the registrant, will also be posted on this Web site within five business days of such amendment or waiver and will remain on the Web site for at least 12 months.
Item 3. Audit Committee Financial Expert
The registrant’s Board of Trustees has determined that certain members of the registrant’s Audit Committee are audit committee financial experts, as defined below. For purposes of this item, an “audit committee financial expert” is a person who has the following attributes:
a. An understanding of generally accepted accounting principles and financial statements;
b. The ability to assess the general application of such principles in connection with the accounting for estimates, accruals, and reserves;
c. Experience preparing, auditing, analyzing, or evaluating financial statements that present a breadth and level of complexity of accounting issues that are generally comparable to the breadth and complexity of issues that can reasonably be expected to be raised by the registrant’s financial statements, or experience actively supervising one or more persons engaged in such activities;
d. An understanding of internal controls and procedures for financial reporting; and
e. An understanding of audit committee functions.
An “audit committee financial expert” shall have acquired such attributes through:
a. Education and experience as a principal financial officer, principal accounting officer, controller, public accountant, or auditor or experience in one or more positions that involve the performance of similar functions;
b. Experience actively supervising a principal financial officer, principal accounting officer, controller, public accountant, auditor, or person performing similar functions;
c. Experience overseeing or assessing the performance of companies or public accountants with respect to the preparation, auditing, or evaluation of financial statements; or
d. Other relevant experience.
The registrant’s Board of Trustees has also determined that each member of the registrant’s Audit Committee is independent. In order to be “independent” for purposes of this item, the Audit Committee member may not: (i) other than in his or her capacity as a member of the Board of Trustees or any committee thereof, accept directly or indirectly any consulting, advisory or other compensatory fee from the issuer; or (ii) be an “interested person” of the registrant as defined in Section 2(a)(19) of the Investment Company Act of 1940.
The names of the audit committee financial experts on the registrant’s Audit Committee are set forth below:
H. Jeffrey Dobbs
John A. Fry
Sandra A.J. Lawrence
Frances Sevilla-Sacasa, Chair
Item 4. Principal Accountant Fees and Services
(a) Audit fees.
The aggregate fees billed for services provided to the registrant by its independent auditors for the audit of the registrant’s annual financial statements and for services normally provided by the independent auditors in connection with statutory and regulatory filings or engagements were $170,860 for the fiscal year ended July 31, 2022.
The aggregate fees billed for services provided to the registrant by its independent auditors for the audit of the registrant’s annual financial statements and for services normally provided by the independent auditors in connection with statutory and regulatory filings or engagements were $155,376 for the fiscal year ended July 31, 2021.
(b) Audit-related fees.
The aggregate fees billed by the registrant’s independent auditors for services relating to the performance of the audit of the registrant’s financial statements and not reported under paragraph (a) of this Item were $0 for the fiscal year ended July 31, 2022.
The aggregate fees billed by the registrant’s independent auditors for services relating to the performance of the audit of the financial statements of the registrant’s investment adviser and other service providers under common control with the adviser and that relate directly to the operations or financial reporting of the registrant were $2,050,189 for the registrant’s fiscal year ended July 31, 2022. The percentage of these fees relating to services approved by the registrant’s Audit Committee pursuant to the de minimis exception from the pre-approval requirement in Rule 2-01(c)(7)(i)(C) of Regulation S-X was 0%. These audit-related services were as follows: year end audit procedures; group reporting and subsidiary statutory audits.
The aggregate fees billed by the registrant’s independent auditors for services relating to the performance of the audit of the registrant’s financial statements and not reported under paragraph (a) of this Item were $0 for the fiscal year ended July 31, 2021.
The aggregate fees billed by the registrant’s independent auditors for services relating to the performance of the audit of the financial statements of the registrant’s investment adviser and other service providers under common control with the adviser and that relate directly to the operations or financial reporting of the registrant were $958,376 for the registrant’s fiscal year ended July 31, 2021. The percentage of these fees relating to services approved by the registrant’s Audit Committee pursuant to the de minimis exception from the pre-approval requirement in Rule 2-01(c)(7)(i)(C) of Regulation S-X was 0%. These audit-related services were as follows: year end audit procedures; group reporting and subsidiary statutory audits.
(c) Tax fees.
The aggregate fees billed by the registrant’s independent auditors for tax-related services provided to the registrant were $25,040 for the fiscal year ended July 31, 2022. The percentage of these fees relating to services approved by the registrant’s Audit Committee pursuant to the de minimis exception from the pre-approval requirement in Rule 2-01(c)(7)(i)(C) of Regulation S-X was 0%. These tax-related services were as follows: review of income tax returns and review of annual excise distribution calculations.
The aggregate fees billed by the registrant’s independent auditors for tax-related services provided to the registrant’s investment adviser and other service providers under common control with the adviser and that relate directly to the operations or financial reporting of the registrant were $0 for the registrant’s fiscal year ended July 31, 2022.
The aggregate fees billed by the registrant’s independent auditors for tax-related services provided to the registrant were $26,000 for the fiscal year ended July 31, 2021. The percentage of these fees relating to services approved by the registrant’s Audit Committee pursuant to the de minimis exception from the pre-approval requirement in Rule 2-01(c)(7)(i)(C) of Regulation S-X was 0%. These tax-related services were as follows: review of income tax returns and review of annual excise distribution calculations.
The aggregate fees billed by the registrant’s independent auditors for tax-related services provided to the registrant’s investment adviser and other service providers under common control with the adviser and that relate directly to the operations or financial reporting of the registrant were $0 for the registrant’s fiscal year ended July 31, 2021.
(d) All other fees.
The aggregate fees billed for all services provided by the independent auditors to the registrant other than those set forth in paragraphs (a), (b) and (c) of this Item were $0 for the fiscal year ended July 31, 2022.
The aggregate fees billed for all services other than those set forth in paragraphs (b) and (c) of this Item provided by the registrant’s independent auditors to the registrant’s adviser and other service providers under common control with the adviser and that relate directly to the operations or financial reporting of the registrant were $0 for the registrant’s fiscal year ended July 31, 2022. The percentage of these fees relating to services approved by the registrant’s Audit Committee pursuant to the de minimis exception from the pre-approval requirement in Rule 2-01(c)(7)(i)(C) of Regulation S-X was 0%.
The aggregate fees billed for all services provided by the independent auditors to the registrant other than those set forth in paragraphs (a), (b) and (c) of this Item were $0 for the fiscal year ended July 31, 2021.
The aggregate fees billed for all services other than those set forth in paragraphs (b) and (c) of this Item provided by the registrant’s independent auditors to the registrant’s adviser and other service providers under common control with the adviser and that relate directly to the operations or financial reporting of the registrant were $0 for the registrant’s fiscal year ended July 31, 2021. The percentage of these fees relating to services approved by the registrant’s Audit Committee pursuant to the de minimis exception from the pre-approval requirement in Rule 2-01(c)(7)(i)(C) of Regulation S-X was 0%.
(e) The registrant’s Audit Committee has established pre-approval policies and procedures as permitted by Rule 2-01(c)(7)(i)(B) of Regulation S-X (the “Pre-Approval Policy”) with respect to services provided by the registrant’s independent auditors. Pursuant to the Pre-Approval Policy, the Audit Committee has pre-approved the services set forth in the table below with respect to the registrant up to the specified fee limits. Certain fee limits are based on aggregate fees to the registrant and other registrants within the Delaware Funds by Macquarie®.
| Service | Range of Fees |
| Audit Services | |
| Statutory audits or financial audits for new Funds | up to $50,000 per Fund |
| Services associated with SEC registration statements (e.g., Form N-1A, Form N-14, etc.), periodic reports and other documents filed with the SEC or other documents issued in connection with securities offerings (e.g., comfort letters for closed-end Fund offerings, consents), and assistance in responding to SEC comment letters | up to $10,000 per Fund |
| Consultations by Fund management as to the accounting or disclosure treatment of transactions or events and/or the actual or potential impact of final or proposed rules, standards or interpretations by the SEC, FASB, or other regulatory or standard-setting bodies (Note: Under SEC rules, some consultations may be considered “audit-related services” rather than “audit services”) | up to $25,000 in the aggregate |
| Audit-Related Services | |
| Consultations by Fund management as to the accounting or disclosure treatment of transactions or events and/or the actual or potential impact of final or proposed rules, standards or interpretations by the SEC, FASB, or other regulatory or standard-setting bodies (Note: Under SEC rules, some consultations may be considered “audit services” rather than “audit-related services”) | up to $25,000 in the aggregate |
| Tax Services | |
| U.S. federal, state and local and international tax planning and advice (e.g., consulting on statutory, regulatory or administrative developments, evaluation of Funds’ tax compliance function, etc.) | up to $25,000 in the aggregate |
| U.S. federal, state and local tax compliance (e.g., excise distribution reviews, etc.) | up to $5,000 per Fund |
| Review of federal, state, local and international income, franchise and other tax returns | up to $5,000 per Fund |
Under the Pre-Approval Policy, the Audit Committee has also pre-approved the services set forth in the table below with respect to the registrant’s investment adviser and other entities controlling, controlled by or under common control with the investment adviser that provide ongoing services to the registrant (the “Control Affiliates”) up to the specified fee limit. This fee limit is based on aggregate fees to the investment adviser and its Control Affiliates.
| Service | Range of Fees |
| Non-Audit Services | |
| Services associated with periodic reports and other documents filed with the SEC and assistance in responding to SEC comment letters | up to $10,000 in the aggregate |
The Pre-Approval Policy requires the registrant’s independent auditors to report to the Audit Committee at each of its regular meetings regarding all services initiated since the last such report was rendered, including those services authorized by the Pre-Approval Policy.
(f) Not applicable.
(g) The aggregate non-audit fees billed by the registrant’s independent auditors for services rendered to the registrant and to its investment adviser and other service providers under common control with the adviser were $10,812,067 and $9,044,000 for the registrant’s fiscal years ended July 31, 2022 and July 31, 2021, respectively.
(h) In connection with its selection of the independent auditors, the registrant’s Audit Committee has considered the independent auditors’ provision of non-audit services to the registrant’s investment adviser and other service providers under common control with the adviser that were not required to be pre-approved pursuant to Rule 2-01(c)(7)(ii) of Regulation S-X. The Audit Committee has determined that the independent auditors’ provision of these services is compatible with maintaining the auditors’ independence.
Item 5. Audit Committee of Listed Registrants
Not applicable.
Item 6. Investments
(a) Included as part of report to shareholders filed under Item 1 of this Form N-CSR.
(b) Divestment of securities in accordance with Section 13(c) of the Investment Company Act of 1940.
Not applicable.
Item 7. Disclosure of Proxy Voting Policies and Procedures for Closed-End Management Investment Companies
Not applicable.
Item 8. Portfolio Managers of Closed-End Management Investment Companies
Not applicable.
Item 9. Purchases of Equity Securities by Closed-End Management Investment Companies and Affiliated Purchasers
Not applicable.
Item 10. Submission of Matters to a Vote of Security Holders
Not applicable.
Item 11. Controls and Procedures
The registrant’s principal executive officer and principal financial officers, or persons performing similar functions, have concluded that the registrant’s disclosure controls and procedures (as defined in Rule 30a-3(c) under the Investment Company Act of 1940, as amended (17 CFR 270.30a-3(c))) are effective, as of a date within 90 days of the filing of this report, based on their evaluation of these controls and procedures required by Rule 30a-3(b) under the Investment Company Act of 1940 (17 CFR 270.30a-3(b)) and Rules 13a-15(b) or 15d-15(b) under the Securities Exchange Act of 1934, as amended (17 CFR 240.13a-15(b) or 240.15d-15(b)) and provide reasonable assurance that the information required to be disclosed by the registrant in its reports or statements filed under the Securities Exchange Act of 1934 is recorded, processed, summarized and reported within the time periods specified in the rules and forms of the Securities and Exchange Commission.
There were no significant changes in the registrant’s internal control over financial reporting (as defined in Rule 30a-3(d) under the Investment Company Act of 1940 (17 CFR 270.30a-3(d)) that occurred during the period covered by the report to stockholders included herein that have materially affected, or are reasonably likely to materially affect, the registrant’s internal control over financial reporting.
Item 12. Disclosure of Securities Lending Activities for Closed-End Management Investment Companies
Not applicable.
Item 13. Exhibits
(a) (1) Code of Ethics
Not applicable.
(2) Certifications of Principal Executive Officer and Principal Financial Officer pursuant to Rule 30a-2 under the Investment Company Act of 1940 are attached hereto as Exhibit 99.CERT.
(3) Written solicitations to purchase securities pursuant to Rule 23c-1 under the Securities Exchange Act of 1934.
Not applicable.
(b) Certifications pursuant to Section 906 of the Sarbanes-Oxley Act of 2002 are furnished herewith as Exhibit 99.906CERT.
SIGNATURES
Pursuant to the requirements of the Securities Exchange Act of 1934 and the Investment Company Act of 1940, the registrant has duly caused this report to be signed on its behalf, by the undersigned, thereunto duly authorized.
DELAWARE GROUP® INCOME FUNDS
| /s/ SHAWN K. LYTLE |
| By: | Shawn K. Lytle |
| Title: | President and Chief Executive Officer |
| Date: | October 3, 2022 |
Pursuant to the requirements of the Securities Exchange Act of 1934 and the Investment Company Act of 1940, this report has been signed below by the following persons on behalf of the registrant and in the capacities and on the dates indicated.
| /s/ SHAWN K. LYTLE |
| By: | Shawn K. Lytle |
| Title: | President and Chief Executive Officer |
| Date: | October 3, 2022 |
| | |
| /s/ RICHARD SALUS |
| By: | Richard Salus |
| Title: | Chief Financial Officer |
| Date: | October 3, 2022 |