UNITED STATES
SECURITIES AND EXCHANGE COMMISSION
Washington, D.C. 20549
FORM N-CSR
CERTIFIED SHAREHOLDER REPORT OF
REGISTERED MANAGEMENT INVESTMENT COMPANIES
Investment Company Act file number: 811-02968-99
Name of Registrant: Vanguard Trustees’ Equity Fund
Address of Registrant:
P.O. Box 2600
Valley Forge, PA 19482
Name and address of agent for service:
Heidi Stam, Esquire
P.O. Box 876
Valley Forge, PA 19482
Registrant’s telephone number, including area code: (610) 669-1000
Date of fiscal year end: October 31
Date of reporting period: November 1, 2014 – October 31, 2015
Item 1: Reports to Shareholders
Annual Report | October 31, 2015
Vanguard International Value Fund
Vanguard’s Principles for Investing Success
We want to give you the best chance of investment success. These principles, grounded in Vanguard’s research and experience, can put you on the right path.
Goals. Create clear, appropriate investment goals.
Balance. Develop a suitable asset allocation using broadly diversified funds. Cost. Minimize cost.
Discipline. Maintain perspective and long-term discipline.
A single theme unites these principles: Focus on the things you can control.
We believe there is no wiser course for any investor.
| Contents | |
| Your Fund’s Total Returns. | 1 |
| Chairman’s Letter. | 2 |
| Advisors’ Report. | 8 |
| Fund Profile. | 14 |
| Performance Summary. | 16 |
| Financial Statements. | 18 |
| Your Fund’s After-Tax Returns. | 33 |
| About Your Fund’s Expenses. | 34 |
| Glossary. | 36 |
Please note: The opinions expressed in this report are just that—informed opinions. They should not be considered promises or advice. Also, please keep in mind that the information and opinions cover the period through the date on the front of this report. Of course, the risks of investing in your fund are spelled out in the prospectus.
See the Glossary for definitions of investment terms used in this report.
About the cover: Pictured is a sailing block on the Brilliant, a 1932 schooner docked in Mystic, Connecticut. A type of pulley, the sailing block helps coordinate the setting of the sails. At Vanguard, the intricate coordination of technology and people allows us to help millions of clients around the world reach their financial goals.
| Your Fund’s Total Returns | ||||
| Fiscal Year Ended October 31, 2015 | ||||
| Total | ||||
| Returns | ||||
| Vanguard International Value Fund | -7.43% | |||
| MSCI All Country World Index ex USA | -4.68 | |||
| International Funds Average | -1.46 | |||
| International Funds Average: Derived from data provided by Lipper, a Thomson Reuters Company. | ||||
| Your Fund’s Performance at a Glance | ||||
| October 31, 2014, Through October 31, 2015 | ||||
| Distributions Per Share | ||||
| Starting | Ending | |||
| Share | Share | Income | Capital | |
| Price | Price | Dividends | Gains | |
| Vanguard International Value Fund | $36.87 | $33.22 | $0.946 | $0.000 |
1

Chairman’s Letter
Dear Shareholder,
International stock markets posted a modest gain in the first half of the fiscal year ended October 31, 2015, but it was more than offset by a second-half slide. Persistent worries about global growth, including deflation signals in Europe and a slowdown in China and other emerging markets, contributed to the decline. For U.S. dollar-based investors, the already weak returns of many international markets were further eroded by the dollar’s strength against many foreign currencies.
Vanguard International Value Fund returned –7.43% for the 12 months. The fund’s result was lower than that of its benchmark, the MSCI All Country World Index ex USA, and the average return of its peers. Relative to its index, the fund’s shortfall reflected a combination of underperforming investment selections and fairvalue pricing adjustments. These adjustments, which are required by the Securities and Exchange Commission, address pricing discrepancies that may arise because of timezone differences among global stock markets.
If you hold the International Value Fund in a taxable account, you may wish to review the discussion of aftertax returns later in this report.
U.S. stock market fluctuated on its way to modest returns
The broad U.S. stock market returned more than 4% for the fiscal year ended October 31. Stocks generally climbed during the first nine months before
2
dropping sharply in August and September. Fears surfaced in late summer that slower economic growth in China would spread across the globe.
In October, however, stocks rallied as the Federal Reserve maintained its historically low shortterm interest rates. Central banks in Europe and Asia also signaled or implemented additional stimulus measures to counter sluggish growth and low inflation. Corporate earnings, although generally lower than in the past couple of years, mostly exceeded expectations.
The strength of the U.S. dollar against foreign currencies contributed to a return of about –4% for international stocks. Returns for the developed markets of the Pacific region and Europe were essentially flat. Stocks tumbled in emerging markets, where concerns about China seemed to weigh most heavily.
The search for a safe haven gave bonds a bit of a boost
The broad U.S. taxable bond market, which returned 1.96% over the fiscal year, benefited from investors’ desire for safehaven assets during periods of stock market volatility. The yield of the 10year Treasury note ended October at 2.17%, down from 2.31% a year earlier. (Bond prices and yields move in opposite directions.)
International bond markets (as measured by the Barclays Global Aggregate Index ex USD) returned –6.74%, held back by
| Market Barometer | |||
| Average Annual Total Returns | |||
| Periods Ended October 31, 2015 | |||
| One | Three | Five | |
| Year | Years | Years | |
| Stocks | |||
| Russell 1000 Index (Large-caps) | 4.86% | 16.28% | 14.32% |
| Russell 2000 Index (Small-caps) | 0.34 | 13.90 | 12.06 |
| Russell 3000 Index (Broad U.S. market) | 4.49 | 16.09 | 14.14 |
| FTSE All-World ex US Index (International) | -3.83 | 5.20 | 2.99 |
| Bonds | |||
| Barclays U.S. Aggregate Bond Index (Broad taxable market) | 1.96% | 1.65% | 3.03% |
| Barclays Municipal Bond Index (Broad tax-exempt market) | 2.87 | 2.91 | 4.28 |
| Citigroup Three-Month U.S. Treasury Bill Index | 0.02 | 0.02 | 0.04 |
| CPI | |||
| Consumer Price Index | 0.17% | 0.93% | 1.69% |
3
the dollar’s strength against many foreign currencies. Without this currency effect, international bond returns were positive.
Returns for money market funds and savings accounts continued to be constrained by the Fed’s 0%–0.25% target for shortterm interest rates.
A strong U.S. dollar hurt returns; emerging markets also lagged
The dampening effect of the stronger U.S. dollar was evident in Vanguard International Value Fund’s returns. When measured in local currencies, the fund’s holdings in most developed European and Pacific markets registered gains for the fiscal year. But returns for both regions were negative for U.S. dollarbased investors after foreign currency translation effects. Of course, whenever the tide turns and foreign currencies strengthen, U.S. investor returns will benefit.
Monetary exchange rates reflect differences in interest rates and other factors across countries, and the fiscal year brought several significant developments in these areas. Notably, the European Central Bank embarked on a stimulative bondbuying program that led to negative rates on some European sovereign bonds and a weaker euro. This program, along with a generally improving economic outlook, was welcomed by many European stock markets.
However, in Europe’s largest markets—the United Kingdom, Germany, and France—the fund’s stocks lagged,
| Expense Ratios | ||
| Your Fund Compared With Its Peer Group | ||
| Peer Group | ||
| Fund | Average | |
| International Value Fund | 0.44% | 1.39% |
The fund expense ratio shown is from the prospectus dated February 25, 2015, and represents estimated costs for the current fiscal year. For the fiscal year ended October 31, 2015, the fund’s expense ratio was 0.46%. The peer-group expense ratio is derived from data provided by Lipper, a Thomson Reuters Company, and captures information through year-end 2014.
Peer group: International Funds.
4
contributing to its underperformance. (The fund’s sliver of holdings in beleaguered Greece, which dominated headlines for many months, had only a small negative impact.)
The more upbeat tone in Europe was counterbalanced by the less sanguine outlook for growth in China. This had a domino effect on emerging markets whose economies depend on exporting commodities to China and elsewhere. As a group, emerging markets declined in double digits in both local currencies and dollars. The fund’s holdings included some small pockets of strength, but losses in China and Brazil weighed on relative performance.
The advisors’ selections in developed Pacific nations managed to break even in U.S. dollar terms. Their decision to overweight Japan, the fund’s largest market in this category on average, was beneficial, even though the fund’s Japanese holdings lagged those in the benchmark.
The benchmark’s Australian listings lost more than 20% for U.S. investors, but the advisors significantly underweighted Australia, providing a net positive against the index. The same was true in Canada, which, like Australia, has suffered from the fall in commodity prices.
| Total Returns | |
| Ten Years Ended October 31, 2015 | |
| Average | |
| Annual Return | |
| International Value Fund | 4.17% |
| Spliced International Index | 2.91 |
| International Funds Average | 3.77 |
For a benchmark description, see the Glossary.
International Funds Average: Derived from data provided by Lipper, a Thomson Reuters Company.
The figures shown represent past performance, which is not a guarantee of future results. (Current performance may be lower or higher than the performance data cited. For performance data current to the most recent month-end, visit our website at vanguard.com/performance.) Note, too, that both investment returns and principal value can fluctuate widely, so an investor’s shares, when sold, could be worth more or less than their original cost.
5
Among industry sectors, energy was among the worst performers in both your fund and its index amid the steep drop in oil prices. Materials and industrials also had significant losses, and two larger sectors, financials and information technology, finished in the red as well.
In terms of relative performance, the fund benefited from an underweight allocation to materials but suffered from poor stock picks in the industrial and consumer discretionary sectors.
For more information on the fund’s investment strategies and positioning, please see the Advisors’ Report that follows this letter.
Staying the course can help you stay closer to your fund’s return
When stock markets are highly volatile, as in recent months, it’s tempting to run for cover. But the price of panic can be high.
A rough measure of what can be lost from attempts to time the market is the difference between the returns produced by a fund and the returns earned by the fund’s investors.
The results shown in the Performance Summary later in this report are your fund’s time-weighted returns—the average annual returns investors would have earned if they had invested a lump sum in the fund at the start of the period and reinvested any distributions they received. Their actual returns, however, depend on whether they subsequently bought or sold any shares. There’s often a gap between this dollar-weighted return for investors and the fund’s timeweighted return, as shown in the figure to the right.
Many sensible investment behaviors can contribute to the difference in returns, but industry cash flow data suggest that one important factor is the generally counter
productive effort to buy and sell at the “right” time. Keeping your emotions in check can help narrow the gap.
Fund returns vs. investor returns
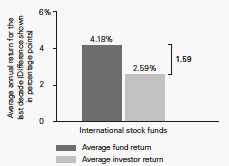
Notes: Data are for the decade ended September 30, 2015. The average fund return and average investor return are from Morningstar, based on U.S.-domiciled international equity funds that have reported ten-year returns. The average fund return is the average of the international stock funds’ time-weighted returns. The average investor return assumes that the growth of a fund’s total net assets for a given period is driven by market returns and investor cash ‚ow. To calculate investor return, a fund’s change in assets for the period is discounted by the return of the fund to isolate how much of the asset growth was driven by cash ‚ow. A model similar to an internal rate-of-return calculation is then used to calculate a constant growth rate that links the beginning total net assets and periodic cash ‚ows to the ending total net assets.
Sources: Vanguard and Morningstar, Inc.
6
Over ten years, the fund continues to outperform its index and peers
For the decade ended October 31, 2015, the International Value Fund recorded an average annual return of 4.17%. This result was more than a percentage point better than the average return of the benchmark index and fourtenths of a percentage point ahead of peer funds.
In fact, International Value’s annual return has exceeded that of its benchmark in all but two of the last ten fiscal years, thanks to the skill and experience of its advisors. The tenyear average annual return is low by historical standards.
But it’s worth remembering that the U.S. Dollar Index has risen more than 8% during the decade, which has dampened results for U.S. investors. Because currency fluctuations are unpredictable, this negative effect could reverse at any time and provide a performance boost. We remain convinced that investing in both U.S. and international stocks is a smart strategy to manage risk and gain exposure to global opportunities.
A dose of discipline is crucial when markets become volatile
The developments over the past few months remind us that nobody can control the markets or reliably predict where they’ll go in the short term. However, investors can control how they react to unstable and turbulent markets.
During periods of market adversity, it’s more important than ever to keep sight of one of Vanguard’s key principles: Maintain perspective and longterm discipline. Whether you’re investing for yourself or on behalf of clients, your success is affected greatly by how you respond—or don’t respond—during turbulent markets. (You can read
Vanguard’s Principles for Investing Success at vanguard.com/research.)
As I’ve written in the past, the best course for longterm investors is generally to ignore daily market moves and not make decisions based on emotion. This is also a good time to evaluate your portfolio and make sure your asset allocation is aligned with your time horizon, goals, and risk tolerance.
The markets are unpredictable and often confounding. Keeping your longterm plans clearly in focus can help you weather these periodic storms.
As always, thank you for investing with Vanguard.
Sincerely,

F. William McNabb III
Chairman and Chief Executive Officer
November 17, 2015
7
Advisors’ Report
For the 12 months ended October 31, 2015, Vanguard International Value Fund returned –7.43%. Your fund is managed by three independent advisors, a strategy that enhances the fund’s diversification by providing exposure to distinct yet complementary investment approaches. It is not uncommon for different advisors to have different views about individual securities or the broader investment environment.
The table below presents the advisors, the percentage and amount of fund assets that each manages, and brief descriptions of their investment strategies. Each advisor has also prepared a discussion of the investment environment during the fiscal period and of how the portfolio’s positioning reflects this assessment. These reports were prepared on November 16, 2015.
Vanguard International Value Fund Investment Advisors
| Fund Assets Managed | |||
| Investment Advisor | % | $ Million | Investment Strategy |
| Lazard Asset Management LLC | 40 | 3,141 | The advisor uses a research-driven, bottom-up, |
| relative-value approach in selecting stocks. The goal is | |||
| to identify individual stocks that offer an appropriate | |||
| trade-off between low relative valuation and high | |||
| financial productivity. | |||
| Edinburgh Partners Limited | 34 | 2,727 | The advisor employs a concentrated, low-turnover, |
| value-oriented investment approach that results in a | |||
| portfolio of companies with good long-term prospects | |||
| and below-market price/earnings ratios. In-depth | |||
| fundamental research on industries and companies is | |||
| central to this investment process. | |||
| ARGA Investment Management, | 24 | 1,911 | The advisor believes that investors overreact to |
| LP | short-term developments, leading to opportunities to | ||
| generate gains from investing in “good businesses at | |||
| great prices.” Its valuation-focused process uses a | |||
| dividend discount model to select stocks that trade at a | |||
| discount to intrinsic value based on the company’s | |||
| long-term earnings power and dividend-paying | |||
| capability. | |||
| Cash Investments | 2 | 153 | These short-term reserves are invested by Vanguard in |
| equity index products to simulate investments in | |||
| stocks. Each advisor may also maintain a modest cash | |||
| position. | |||
8
Lazard Asset Management LLC
Portfolio Managers:
Michael G. Fry, Managing Director
Michael A. Bennett, CPA, Managing Director
During the period, international equities rose in local terms but declined in U.S. dollar terms because of weakness in many currencies. Emerging markets lagged developed markets; equities in Brazil and Greece were both among the worst performers globally. In Brazil, the central bank raised interest rates to combat high inflation, and a corruption probe reached almost all corners of the government.
China announced an approximate 3% devaluation of its currency, leading to an acceleration in capital outflows and fears of further currency declines. Continued weak Chinese economic data spurred growth concerns, which spilled over to some developed stock markets left vulnerable by strong multiyear performance and associated high valuations.
Japanese equities were among the best performers; the country’s economy expanded faster than expected, and corporate governance improved at a number of companies. British equities also gained after the surprise victory of the incumbent—and traditionally businessfriendly—Conservative Party. The euro zone is doing relatively well, with betterthanexpected economic data. Recent comments from European Central Bank President Draghi suggest further quantitative easing.
Sectors most exposed to oil and China, such as energy and materials, performed worst, while defensive sectors such as consumer staples and health care generally stayed positive.
Our stock selection in and low allocation to the sagging energy sector were beneficial to relative returns. Shares of U.K.based BG Group held up well after competitor Royal Dutch Shell announced a bid for the company.
High exposure to and stock selection in the health care sector also helped relative returns. Shares of Danish pharmaceutical company Novo Nordisk increased on news that the company might be able to introduce Tresiba, a longacting insulin treatment for diabetes, in the United States as early as next year. And British company Shire rebounded strongly after initially overreacting to news that competitor AbbVie would abandon a proposed merger.
In industrials, the continued European economic recovery and lower oil prices boosted both domestic and international travel, which benefited Ireland’s discount airline Ryanair and Spanish airport operator Aena. Aena had its IPO early in 2015; we sold the stock as it approached fair valuation after performing strongly.
9
In contrast, stock selection in telecommunication services detracted from relative returns. Shares of Japanese conglomerate SoftBank fell on concerns about slowing growth at its Chinese ecommerce holding Alibaba, although the stock recovered somewhat in October as Alibaba reported encouraging results. Holdings in Turkish mobile phone operator Turkcell also hurt returns, exacerbated by a weak Turkish lira and political uncertainty despite strong company fundamentals.
In consumer discretionary, shares of Brazilian private education company Estacio declined in January after the government made an unexpected negative change to its studentloan program. British education materials provider Pearson Education also lost ground after weakerthanexpected revenues. And we sold our holdings in Macau casino operator Sands China when they fell amid China’s continuing corruption crackdown, which has taken a toll on the country’s conspicuous consumption.
The portfolio suffered from stock selection in emerging markets. Companies in Brazil such as BB Seguridade and Sabesp were hurt by the drop in Brazil’s currency, the real. South African holding Nampak declined on disappointing results and the threat of increasing competition. In Greece, shares of Piraeus Bank suffered from the uncertainty of the country leaving the euro. We sold our position before capital controls closed the banking system for three weeks.
During the fiscal year, interesting stockspecific opportunities led to changes in our exposures. In financials, our underweight to the benchmark narrowed. We purchased shares in U.K. firms Aon and London Stock Exchange, Credit Suisse, Belgian bank KBC, and South African group Sanlam. And we exited our positions in French banker BNP Paribas, Piraeus Bank, and Sberbank in Russia.
In consumer discretionary, we sold our holdings in BMW and Swatch. But purchases including U.K. food services provider Compass, Pearson Education, and Sony increased our slightly belowindex sector weighting to an overweight position.
A slight overweight to information technology increased with the additions of Israel’s Check Point Software Technologies, HCL Technologies from India, and U.K. firm Worldpay. We sold our holdings in Dutch firm NXP Semiconductors when they quickly approached fair valuation, as well as our shares in Brazilian payment system company Cielo.
Our exposure to consumer staples declined as we sold our positions in Denmark’s Carlsberg and Russian retailer Lenta. In industrials, we bought shares in German technology firm GEA, France’s Vinci construction group, U.K. engineering business The Weir Group, and heating and plumbing distributor Wolseley UK. Our overweight to the sector narrowed, however, when we sold out of Airbus,
10
Italian infrastructure company Atlantia, Japanese equipment manufacturer Komatsu, and RollsRoyce.
From a regional perspective, we increased our holdings in the United Kingdom and Canada, adding to our U.K. overweight and reducing our underweight to Canada. Our exposures to Japan and emerging markets declined.
Global growth is slowing as China continues to adjust its economic model, emerging markets become less liquid, and the commodity and energy booms unwind. Broadly, consumers look better positioned in developed markets, and the United States and Japan are showing signs of labor tightness. Many technology and health care segments remain strong. Corporations are generally healthy, but profit forecasts and, in some cases, margins are under pressure in a number of areas, and credit is showing some early signs of deterioration.
Share prices today appear dependent on both some level of economic recovery and a continuation of the current very low interest rates. This is dangerous, as the combination appears unlikely to occur over the medium term.
Our team is keeping its focus on stock selection, seeking to find those with sustainably high or improving returns trading at attractive valuations. We remain confident that the portfolio’s strong track record will continue in a variety of market conditions.
Edinburgh Partners Limited
Portfolio Manager:
Sandy Nairn, Director and CEO
Market levels have not changed dramatically since last year, and the global economy is expanding at a subdued pace. Recent concerns over China notwithstanding, we expect this to continue. Equities are not cheap globally and are potentially vulnerable to setbacks related to economic growth. However, we remain able to find new investment areas for the portfolio.
The investment world is still agonizing about energy stocks and whether oil price weakness is a supply or demandside issue. We are firmly of the view that the root cause is supply, and that this is not permanent. Oil company stocks that were priced for crude oil selling at $90 to $100 or more per barrel have retreated to reflect crude prices in the mid$70s. At this level, more oil stocks are worthy of consideration. If crude prices stay below $70 and stocks respond accordingly, we would expect our portfolio exposure to rise significantly.
Thus far, we have focused on undervalued companies such as BG Group and BP, whose assets would be attractive to their peers in an environment of cost reduction. We expect to maintain this strategy, but we could add to the major oil companies if further disappointments occur.
The prolonged decline in emerging markets has begun to reveal some value. If this continues, we would anticipate adding more investments.
11
We are still finding some of the best value in Japan. Even in U.S. dollar terms, Japanese corporate earnings growth over the past three years has been more than double that of the United States. Our Japanese exposure is unlikely to rise but may well remain at elevated levels.
As aggregate valuations rose over the past three to five years, the equity world became heavily momentum driven. This has been a difficult environment for valuationdriven investors, but the past few months suggest that conditions may be beginning to unwind to their benefit.
One promising case is that of Nokia, which we recently added to the portfolio. After the sale of its handset and mapping businesses and forthcoming merger with Alcatel, Nokia will become the secondlargest global wireless equipment company. The top three players in that market will account for 80% to 90% of sales.
Against a backdrop of moderate sales growth, an industry that faced extreme price competition ten years ago could experience more price stability and a return to sensible profit margins. We believe this will transform Nokia’s longterm profit potential and eventually be reflected in the share price.
These are some of the areas of opportunity we have identified for the portfolio. Our investment disciplines occasionally may deem it appropriate to sell a stock that has reached its target before we have found a replacement. That would entail a rise in liquidity until appropriate opportunities arose.
ARGA Investment Management, LP
Portfolio Managers:
A. Rama Krishna, CFA, Founder and Chief Investment Officer
Steven Morrow, CFA, Director of Research
International equity markets rose in the first half of the fiscal year, then reversed direction to finish lower. Positive drivers earlier in the period, such as quantitative easing by the European Central Bank, later gave way to concerns about prospective U.S. rate hikes and slowing global growth.
Our portion of the portfolio focuses on the long term, seeking to maximize returns over time by investing in companies that trade at discounts to their intrinsic value. Temporary factors such as macroeconomic, regulatory, industry, or companyspecific stress often allow us to purchase strong companies at deeply discounted valuations and then profit when those valuations recover. Two current examples demonstrate this approach.
The oil price slump has created many compelling valuations and opportunities among energy companies. Industry returns on invested capital in 2015 have plunged to low singledigit levels seen only a few times in the past 100 years. Naturally, share prices also have dropped dramatically. Instead of shunning these as many others have, we took advantage of the lower valuations to increase our energy exposure.
Our analysis shows that during past periods of low returns, energy companies cut overhead, consolidated, and otherwise
12
significantly reduced costs. This drove improved return on invested capital even before oil prices eventually recovered. Our industry analysis does project higher oil prices eventually. But even if they remain at current levels for some time, signs that the industry is now focused on reducing costs support our projected upturn in returns as early as next year. We believe stock prices will follow.
To fund our expanded exposure to energy, we exited Japanese automotive, financial services, and other positions whose valuations had become less attractive as their share prices rose.
Opportunities in emerging markets also shifted during the year as fears of a U.S. rate hike, a slowdown in China, and
political issues in Brazil pressured valuations. Despite the nearterm pressures, longterm growth rates should remain higher in emerging markets than in developed markets. We took advantage of this volatility to purchase undervalued emergingmarket companies with strong franchises. As several of our Chinese and Indian holdings recovered, we sold at higher prices to purchase attractively valued companies in Korea and elsewhere.
Many longerterm opportunities dragged on recent performance. Although such holdings caused shortterm pain, we expect these businesses’ solid earnings power to deliver strong future returns and recover their valuation over time.
13
International Value Fund
Fund Profile
As of October 31, 2015
| Portfolio Characteristics | ||
| MSCI AC | ||
| World Index | ||
| Fund | ex USA | |
| Number of Stocks | 158 | 1,831 |
| Median Market Cap | $31.8B | $30.5B |
| Price/Earnings Ratio | 18.5x | 17.3x |
| Price/Book Ratio | 1.5x | 1.7x |
| Return on Equity | 13.6% | 15.2% |
| Earnings Growth | ||
| Rate | 12.8% | 11.0% |
| Dividend Yield | 2.7% | 3.0% |
| Turnover Rate | 36% | — |
| Ticker Symbol | VTRIX | — |
| Expense Ratio1 | 0.44% | — |
| Short-Term Reserves | 1.9% | — |
Sector Diversification (% of equity exposure)
| MSCI AC | ||
| World Index | ||
| Fund | ex USA | |
| Consumer Discretionary | 15.5% | 12.1% |
| Consumer Staples | 8.9 | 10.8 |
| Energy | 8.7 | 6.5 |
| Financials | 23.4 | 27.1 |
| Health Care | 10.0 | 9.3 |
| Industrials | 11.9 | 11.3 |
| Information Technology | 9.9 | 7.4 |
| Materials | 3.5 | 6.8 |
| Telecommunication Services | 6.0 | 5.2 |
| Utilities | 2.2 | 3.5 |
| Volatility Measures | |
| MSCI AC | |
| World Index | |
| ex USA | |
| R-Squared | 0.96 |
| Beta | 1.05 |
These measures show the degree and timing of the fund’s fluctuations compared with the indexes over 36 months.
Ten Largest Holdings (% of total net assets)
| Novartis AG | Pharmaceuticals | 2.6% |
| Sumitomo Mitsui | ||
| Financial Group Inc. | Diversified Banks | 1.8 |
| BP plc | Integrated Oil & Gas | 1.7 |
| Samsung Electronics Co. Technology | ||
| Ltd. | Hardware, Storage & | |
| Peripherals | 1.7 | |
| Bayer AG | Pharmaceuticals | 1.6 |
| KDDI Corp. | Wireless | |
| Telecommunication | ||
| Services | 1.6 | |
| Japan Tobacco Inc. | Tobacco | 1.6 |
| Royal Dutch Shell plc | Integrated Oil & Gas | 1.6 |
| BHP Billiton | Diversified Metals & | |
| Mining | 1.4 | |
| Unilever | Personal Products | 1.4 |
| Top Ten | 17.0% | |
The holdings listed exclude any temporary cash investments and equity index products.
Allocation by Region (% of equity exposure)

1 The expense ratio shown is from the prospectus dated February 25, 2015, and represents estimated costs for the current fiscal year. For the fiscal year ended October 31, 2015, the expense ratio was 0.46%.
14
International Value Fund
Market Diversification (% of equity exposure)
| MSCI AC | ||
| World | ||
| Index | ||
| Fund | ex USA | |
| Europe | ||
| United Kingdom | 24.4% | 14.8% |
| Germany | 8.3 | 6.7 |
| Switzerland | 6.6 | 6.9 |
| France | 4.3 | 7.4 |
| Sweden | 1.6 | 2.1 |
| Belgium | 1.6 | 1.0 |
| Netherlands | 1.4 | 2.1 |
| Finland | 1.3 | 0.6 |
| Spain | 1.3 | 2.5 |
| Other | 2.9 | 4.0 |
| Subtotal | 53.7% | 48.1% |
| Pacific | ||
| Japan | 22.3% | 16.9% |
| South Korea | 4.5 | 3.3 |
| Hong Kong | 2.3 | 2.2 |
| Singapore | 1.2 | 0.9 |
| Other | 0.7 | 4.8 |
| Subtotal | 31.0% | 28.1% |
| Emerging Markets | ||
| China | 1.5% | 4.9% |
| Brazil | 1.5 | 1.2 |
| Russia | 1.5 | 0.8 |
| Turkey | 1.5 | 0.3 |
| South Africa | 1.4 | 1.6 |
| Taiwan | 1.3 | 2.5 |
| Thailand | 1.1 | 0.5 |
| Other | 1.5 | 5.3 |
| Subtotal | 11.3% | 17.1% |
| North America | ||
| United States | 2.8% | 0.0% |
| Other | 0.2 | 6.2 |
| Subtotal | 3.0% | 6.2% |
| Middle East | ||
| Israel | 1.0% | 0.5% |
15
International Value Fund
Performance Summary
All of the returns in this report represent past performance, which is not a guarantee of future results that may be achieved by the fund. (Current performance may be lower or higher than the performance data cited. For performance data current to the most recent month-end, visit our website at vanguard.com/performance.) Note, too, that both investment returns and principal value can fluctuate widely, so an investor’s shares, when sold, could be worth more or less than their original cost. The returns shown do not reflect taxes that a shareholder would pay on fund distributions or on the sale of fund shares.
Cumulative Performance: October 31, 2005, Through October 31, 2015
Initial Investment of $10,000

See Financial Highlights for dividend and capital gains information.
16
International Value Fund
Fiscal-Year Total Returns (%): October 31, 2005, Through October 31, 2015
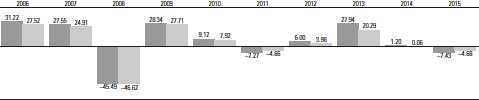
International Value Fund
Spliced International Index
For a benchmark description, see the Glossary.
Average Annual Total Returns: Periods Ended September 30, 2015
This table presents returns through the latest calendar quarter—rather than through the end of the fiscal period.
Securities and Exchange Commission rules require that we provide this information.
| Inception | One | Five | Ten | |
| Date | Year | Years | Years | |
| International Value Fund | 5/16/1983 | -13.87% | 2.64% | 3.05% |
17
International Value Fund
Financial Statements
Statement of Net Assets
As of October 31, 2015
The fund reports a complete list of its holdings in regulatory filings four times in each fiscal year, at the quarter-ends. For the second and fourth fiscal quarters, the lists appear in the fund’s semiannual and annual reports to shareholders. For the first and third fiscal quarters, the fund files the lists with the Securities and Exchange Commission on Form N-Q. Shareholders can look up the fund’s Forms N-Q on the SEC’s website at sec.gov. Forms N-Q may also be reviewed and copied at the SEC’s Public Reference Room (see the back cover of this report for further information).
| Market | ||
| Value• | ||
| Shares | ($000) | |
| Common Stocks (96.8%)1 | ||
| Australia (0.6%) | ||
| BHP Billiton Ltd. | 2,539,890 | 41,723 |
| * South32 Ltd. | 1,913,298 | 1,970 |
| 43,693 | ||
| Belgium (1.5%) | ||
| Anheuser-Busch InBev SA | 785,457 | 93,677 |
| KBC Groep NV | 423,300 | 25,726 |
| 119,403 | ||
| Brazil (1.5%) | ||
| BB Seguridade | ||
| Participacoes SA | 5,790,000 | 39,936 |
| Ambev SA | 5,103,700 | 25,263 |
| Cia de Saneamento Basico | ||
| do Estado de Sao Paulo | 4,107,100 | 17,828 |
| * | Petroleo Brasileiro |
| SA ADR | 4,349,900 | 17,356 |
| Estacio Participacoes SA | 3,938,100 | 15,787 |
| 116,170 | ||
| Canada (0.2%) | ||
| Encana Corp. | 1,836,000 | 13,971 |
| China (1.5%) | ||
| * Baidu Inc. ADR | 297,160 | 55,708 |
| Lenovo Group Ltd. | 38,000,000 | 35,248 |
| China Shenhua | ||
| Energy Co. Ltd. | 15,797,500 | 26,688 |
| 117,644 | ||
| Denmark (0.6%) | ||
| Novo Nordisk A/S Class B | 899,603 | 47,655 |
| Finland (1.2%) | ||
| Sampo Oyj Class A | 1,003,836 | 48,974 |
| Nokia Oyj | 6,514,348 | 48,342 |
| 97,316 | ||
| France (3.9%) | ||
| BNP Paribas SA | 1,219,150 | 73,947 |
| TOTAL SA | 1,189,868 | 57,660 |
| Valeo SA | 281,586 | 43,480 |
| Market | |||
| Value• | |||
| Shares | ($000) | ||
| ^ | Vinci SA | 556,801 | 37,529 |
| Vivendi SA | 1,272,900 | 30,631 | |
| ^ | Vallourec SA | 2,668,158 | 29,593 |
| ArcelorMittal | 3,798,769 | 21,115 | |
| ^ | Engie SA | 965,914 | 16,919 |
| 310,874 | |||
| Germany (7.9%) | |||
| Bayer AG | 980,319 | 130,853 | |
| SAP SE | 868,619 | 68,671 | |
| United Internet AG | 1,299,269 | 67,497 | |
| E.ON SE | 6,285,881 | 66,335 | |
| * | Commerzbank AG | 5,521,923 | 60,790 |
| adidas AG | 617,196 | 55,326 | |
| Fresenius Medical Care | |||
| AG & Co. KGaA | 554,914 | 49,990 | |
| Siemens AG | 366,019 | 36,811 | |
| Continental AG | 114,453 | 27,517 | |
| METRO AG | 858,568 | 26,461 | |
| RWE AG | 1,672,495 | 23,276 | |
| GEA Group AG | 389,400 | 15,589 | |
| 629,116 | |||
| Greece (0.9%) | |||
| CK Hutchison | |||
| Holdings Ltd. | 5,040,692 | 68,860 | |
| Hong Kong (2.3%) | |||
| Swire Pacific Ltd. Class A | 6,451,850 | 74,524 | |
| Galaxy Entertainment | |||
| Group Ltd. | 18,827,000 | 64,064 | |
| Li & Fung Ltd. | 38,162,000 | 30,807 | |
| ^ | Esprit Holdings Ltd. | 9,909,234 | 11,101 |
| * | Global Brands Group | ||
| Holding Ltd. | 8,514,000 | 1,757 | |
| 182,253 | |||
| India (0.6%) | |||
| HCL Technologies Ltd. | 3,600,945 | 47,990 | |
| Indonesia (0.5%) | |||
| Telekomunikasi Indonesia | |||
| Persero Tbk PT ADR | 1,018,469 | 40,494 | |
18
| International Value Fund | |||
| Market | |||
| Value• | |||
| Shares | ($000) | ||
| Ireland (0.4%) | |||
| * | Ryanair Holdings plc ADR | 388,657 | 30,389 |
| Israel (0.9%) | |||
| Teva Pharmaceutical | |||
| Industries Ltd. ADR | 838,345 | 49,621 | |
| * | Check Point Software | ||
| Technologies Ltd. | 301,445 | 25,605 | |
| 75,226 | |||
| Italy (0.3%) | |||
| Mediolanum SPA | 3,034,942 | 24,683 | |
| Japan (21.5%) | |||
| Sumitomo Mitsui | |||
| Financial Group Inc. | 3,670,200 | 145,915 | |
| KDDI Corp. | 5,326,300 | 128,661 | |
| Japan Tobacco Inc. | 3,691,400 | 127,527 | |
| Sumitomo Mitsui Trust | |||
| Holdings Inc. | 26,024,000 | 99,588 | |
| East Japan Railway Co. | 941,200 | 89,344 | |
| Panasonic Corp. | 7,365,300 | 86,431 | |
| Daiwa House | |||
| Industry Co. Ltd. | 3,022,900 | 78,928 | |
| Nippon Telegraph | |||
| & Telephone Corp. | 2,141,800 | 78,654 | |
| Toyota Motor Corp. | 1,254,900 | 76,838 | |
| Nomura Holdings Inc. | 12,169,400 | 76,242 | |
| Omron Corp. | 2,189,200 | 72,211 | |
| Daihatsu Motor Co. Ltd. | 5,405,600 | 65,934 | |
| Mitsubishi Corp. | 3,537,200 | 64,078 | |
| Sumitomo Electric | |||
| Industries Ltd. | 4,439,000 | 60,390 | |
| SoftBank Group Corp. | 1,035,400 | 57,631 | |
| JGC Corp. | 3,533,000 | 55,796 | |
| Honda Motor Co. Ltd. | 1,657,800 | 55,039 | |
| Makita Corp. | 864,500 | 47,146 | |
| Seven & i Holdings | |||
| Co. Ltd. | 974,883 | 44,053 | |
| * | Toshiba Corp. | 13,536,000 | 38,071 |
| Sony Corp. | 1,265,800 | 35,899 | |
| Daikin Industries Ltd. | 538,900 | 34,502 | |
| Ryohin Keikaku Co. Ltd. | 144,200 | 28,900 | |
| ^ | DeNA Co. Ltd. | 1,521,100 | 24,387 |
| Yamato Kogyo Co. Ltd. | 873,400 | 23,217 | |
| Takashimaya Co. Ltd. | 1,057,000 | 9,416 | |
| 1,704,798 | |||
| Netherlands (1.3%) | |||
| ^ | Unilever NV | 1,239,351 | 55,863 |
| Wolters Kluwer NV | 1,245,958 | 42,084 | |
| Akzo Nobel NV | 128,418 | 9,074 | |
| 107,021 | |||
| Norway (0.6%) | |||
| ^ | Telenor ASA | 1,740,400 | 32,758 |
| ^ | TGS Nopec | ||
| Geophysical Co. ASA | 814,121 | 16,131 | |
| 48,889 | |||
| Market | |||
| Value• | |||
| Shares | ($000) | ||
| Other (0.4%) | |||
| 2 | Vanguard FTSE All-World | ||
| ex-US ETF | 718,406 | 32,673 | |
| Philippines (0.4%) | |||
| Alliance Global Group Inc. | 74,306,500 | 28,855 | |
| Russia (1.5%) | |||
| Gazprom PAO ADR | |||
| (London Shares) | 9,420,057 | 39,694 | |
| Sberbank PAO ADR | 3,610,156 | 22,060 | |
| * | X5 Retail Group NV GDR | 998,538 | 20,657 |
| * | Lukoil PJSC ADR | 466,261 | 16,925 |
| Mobile TeleSystems | |||
| PJSC ADR | 1,780,147 | 12,514 | |
| Gazprom PAO ADR | 740,167 | 3,119 | |
| 114,969 | |||
| Singapore (1.2%) | |||
| DBS Group Holdings Ltd. | 4,684,000 | 57,673 | |
| Genting Singapore plc | 58,872,000 | 34,206 | |
| 91,879 | |||
| South Africa (1.4%) | |||
| Mediclinic | |||
| International Ltd. | 4,616,458 | 40,524 | |
| Sanlam Ltd. | 7,570,592 | 34,130 | |
| * | Mr Price Group Ltd. | 1,394,772 | 21,386 |
| Nampak Ltd. | 9,955,805 | 16,123 | |
| 112,163 | |||
| South Korea (4.4%) | |||
| Samsung | |||
| Electronics Co. Ltd. | 112,662 | 134,958 | |
| E-MART Inc. | 292,935 | 54,488 | |
| SK Hynix Inc. | 1,863,063 | 49,771 | |
| Hyundai Mobis Co. Ltd. | 221,706 | 46,625 | |
| Hana Financial Group Inc. | 1,149,411 | 27,902 | |
| Shinhan Financial | |||
| Group Co. Ltd. | 561,096 | 21,356 | |
| Hyundai Home Shopping | |||
| Network Corp. | 141,604 | 15,092 | |
| 350,192 | |||
| Spain (1.2%) | |||
| Banco Santander SA | 8,762,845 | 49,071 | |
| Red Electrica Corp. SA | 481,950 | 42,471 | |
| 91,542 | |||
| Sweden (1.6%) | |||
| * | Assa Abloy AB Class B | 3,122,208 | 61,921 |
| Swedbank AB Class A | 2,409,906 | 55,285 | |
| * | Oriflame Holding AG | 466,439 | 6,461 |
| 123,667 | |||
| Switzerland (6.5%) | |||
| Novartis AG | 2,275,542 | 206,314 | |
| Credit Suisse Group AG | 2,666,311 | 66,396 | |
| Roche Holding AG | 234,346 | 63,475 | |
| ABB Ltd. | 2,756,144 | 51,912 | |
| LafargeHolcim Ltd. | 718,331 | 40,399 | |
19
| International Value Fund | |||
| Market | |||
| Value• | |||
| Shares | ($000) | ||
| Actelion Ltd. | 285,863 | 39,650 | |
| Cie Financiere | |||
| Richemont SA | 392,738 | 33,592 | |
| GAM Holding AG | 577,710 | 10,560 | |
| 512,298 | |||
| Taiwan (1.2%) | |||
| Taiwan Semiconductor | |||
| Manufacturing Co. Ltd. | 22,936,704 | 96,944 | |
| Thailand (1.0%) | |||
| Bangkok Bank PCL | 13,166,800 | 61,872 | |
| Kasikornbank PCL | |||
| (Foreign) | 4,396,800 | 21,272 | |
| 83,144 | |||
| Turkey (1.4%) | |||
| Turkcell Iletisim | |||
| Hizmetleri AS | 10,534,007 | 41,899 | |
| KOC Holding AS | 7,895,022 | 35,732 | |
| Turkiye Halk Bankasi AS | 9,458,809 | 35,503 | |
| 113,134 | |||
| United Kingdom (23.7%) | |||
| BG Group plc | 6,458,104 | 101,727 | |
| Carnival plc | 1,779,082 | 98,908 | |
| Prudential plc | 3,803,092 | 88,769 | |
| British American | |||
| Tobacco plc | 1,386,832 | 82,317 | |
| HSBC Holdings plc | 10,219,327 | 79,822 | |
| Royal Dutch Shell plc | |||
| Class A | 3,029,201 | 79,215 | |
| AstraZeneca plc | 1,227,908 | 78,378 | |
| BHP Billiton plc | 4,556,281 | 72,870 | |
| BP plc ADR | 2,011,040 | 71,794 | |
| * | Royal Bank of Scotland | ||
| Group plc | 14,611,000 | 71,414 | |
| Vodafone Group plc | 19,784,694 | 65,223 | |
| BP plc | 10,714,058 | 63,596 | |
| Shire plc | 792,832 | 60,036 | |
| Lloyds Banking Group plc | 52,747,008 | 59,851 | |
| RSA Insurance Group plc | 8,877,405 | 57,517 | |
| Unilever plc | 1,195,755 | 53,103 | |
| * | Tesco plc | 18,407,953 | 51,864 |
| Compass Group plc | 2,869,750 | 49,435 | |
| Wolseley plc | 828,278 | 48,611 | |
| Royal Dutch Shell plc | |||
| Class B | 1,813,137 | 47,360 | |
| ^ | Standard Chartered plc | 4,136,439 | 45,909 |
| * | Serco Group plc | 29,728,498 | 42,896 |
| Barclays plc | 11,476,200 | 40,844 | |
| Informa plc | 4,601,133 | 40,199 | |
| Rexam plc | 4,739,551 | 39,412 | |
| Associated British | |||
| Foods plc | 710,460 | 37,782 | |
| Rolls-Royce Holdings plc | 3,524,316 | 37,286 | |
| Ashtead Group plc | 2,252,792 | 34,663 | |
| London Stock Exchange | |||
| Group plc | 872,500 | 34,132 | |
| Market | |||
| Value• | |||
| Shares | ($000) | ||
| *,3 | Worldpay Group plc | 7,901,800 | 33,987 |
| Signet Jewelers Ltd. | 202,410 | 30,557 | |
| RELX plc | 1,442,500 | 25,785 | |
| Weir Group plc | 1,314,800 | 21,596 | |
| Petrofac Ltd. | 1,590,239 | 20,588 | |
| Pearson plc | 1,195,214 | 15,827 | |
| 1,883,273 | |||
| United States (2.7%) | |||
| Aon plc | 468,455 | 43,711 | |
| * | Michael Kors Holdings Ltd. | 957,100 | 36,982 |
| RenaissanceRe | |||
| Holdings Ltd. | 363,400 | 39,840 | |
| *,^ | Ultra Petroleum Corp. | 3,707,440 | 20,317 |
| * | Weatherford | ||
| International plc | 7,254,800 | 74,289 | |
| 215,139 | |||
| Total Common Stocks | |||
| (Cost $8,014,246) | 7,676,317 | ||
| Temporary Cash Investments (5.1%)1 | |||
| Money Market Fund (4.9%) | |||
| 4,5 | Vanguard Market Liquidity | ||
| Fund, 0.207% | 384,885,000 | 384,885 | |
| Face | |||
| Amount | |||
| ($000) | |||
| U.S. Government and Agency Obligations (0.2%) | |||
| 6 | Federal Home Loan | ||
| Bank Discount Notes, | |||
| 0.105%, 11/2/15 | 2,000 | 2,000 | |
| 6,7 | Federal Home Loan | ||
| Bank Discount Notes, | |||
| 0.180%, 11/4/15 | 2,000 | 2,000 | |
| 6,7 | Federal Home Loan | ||
| Bank Discount Notes, | |||
| 0.182%, 11/25/15 | 5,000 | 5,000 | |
| 6,7,8 Federal Home Loan | |||
| Bank Discount Notes, | |||
| 0.192%, 11/27/15 | 3,500 | 3,500 | |
| 6,8 | Federal Home Loan | ||
| Bank Discount Notes, | |||
| 0.200%, 11/30/15 | 3,300 | 3,300 | |
| 6 | Federal Home Loan | ||
| Bank Discount Notes, | |||
| 0.197%, 12/4/15 | 1,100 | 1,100 | |
| 6 | Federal Home Loan | ||
| Bank Discount Notes, | |||
| 0.235%, 3/23/16 | 1,000 | 999 | |
| 17,899 | |||
| Total Temporary Cash Investments | |||
| (Cost $402,783) | 402,784 | ||
| Total Investments (101.9%) | |||
| (Cost $8,417,029) | 8,079,101 | ||
20
| International Value Fund | |
| Amount | |
| ($000) | |
| Other Assets and Liabilities (-1.9%) | |
| Other Assets | |
| Investment in Vanguard | 684 |
| Receivables for Investment Securities Sold 48,127 | |
| Receivables for Accrued Income | 23,284 |
| Receivables for Capital Shares Issued | 4,862 |
| Other Assets | 5,268 |
| Total Other Assets | 82,225 |
| Liabilities | |
| Payables for Investment | |
| Securities Purchased | (52,656) |
| Collateral for Securities on Loan | (149,895) |
| Payables to Investment Advisor | (4,147) |
| Payables for Capital Shares | |
| Redeemed | (1,885) |
| Payables to Vanguard | (17,088) |
| Other Liabilities | (4,059) |
| Total Liabilities | (229,730) |
| Net Assets (100%) | |
| Applicable to 238,781,192 outstanding | |
| $.001 par value shares of beneficial | |
| interest (unlimited authorization) | 7,931,596 |
| Net Asset Value Per Share | $33.22 |
| At October 31, 2015, net assets consisted of: | |
| Amount | |
| ($000) | |
| Paid-in Capital | 8,188,953 |
| Undistributed Net Investment Income | 123,930 |
| Accumulated Net Realized Losses | (48,802) |
| Unrealized Appreciation (Depreciation) | |
| Investment Securities | (337,928) |
| Futures Contracts | 7,406 |
| Forward Currency Contracts | (1,415) |
| Foreign Currencies | (548) |
| Net Assets | 7,931,596 |
- See Note A in Notes to Financial Statements.
- Non-income-producing security.
- Includes partial security positions on loan to broker-dealers. The total value of securities on loan is $103,654,000.
- The fund invests a portion of its cash reserves in equity markets through the use of index futures contracts. After giving effect to futures investments, the fund’s effective common stock and temporary cash investment positions represent 98.3% and 3.6%, respectively, of net assets.
- Considered an affiliated company of the fund as the issuer is another member of The Vanguard Group.
- Security exempt from registration under Rule 144A of the Securities Act of 1933. Such securities may be sold in transactions exempt from registration, normally to qualified institutional buyers. At October 31, 2015, the value of this security represented 0.4% of net assets.
- Affiliated money market fund available only to Vanguard funds and certain trusts and accounts managed by Vanguard. Rate shown is the 7-day yield.
- Includes $149,895,000 of collateral received for securities on loan.
- The issuer operates under a congressional charter; its securities are generally neither guaranteed by the U.S. Treasury nor backed by the full faith and credit of the U.S. government.
- Securities with a value of $10,100,000 have been segregated as initial margin for open futures contracts.
- Securities with a value of $3,319,000 have been segregated as collateral for open forward currency contracts. ADR—American Depositary Receipt.
GDR—Global Depositary Receipt.
See accompanying Notes, which are an integral part of the Financial Statements.
21
| International Value Fund | |
| Statement of Operations | |
| Year Ended | |
| October 31, 2015 | |
| ($000) | |
| Investment Income | |
| Income | |
| Dividends1 | 192,593 |
| Interest2 | 600 |
| Securities Lending | 4,029 |
| Total Income | 197,222 |
| Expenses | |
| Investment Advisory Fees—Note B | |
| Basic Fee | 13,777 |
| Performance Adjustment | 3,277 |
| The Vanguard Group—Note C | |
| Management and Administrative | 17,806 |
| Marketing and Distribution | 1,322 |
| Custodian Fees | 1,194 |
| Auditing Fees | 44 |
| Shareholders’ Reports | 102 |
| Trustees’ Fees and Expenses | 16 |
| Total Expenses | 37,538 |
| Net Investment Income | 159,684 |
| Realized Net Gain (Loss) | |
| Investment Securities Sold | 95,610 |
| Futures Contracts | 13,209 |
| Foreign Currencies and Forward Currency Contracts | (28,695) |
| Realized Net Gain (Loss) | 80,124 |
| Change in Unrealized Appreciation (Depreciation) | |
| Investment Securities | (866,841) |
| Futures Contracts | 7,012 |
| Foreign Currencies and Forward Currency Contracts | 4,582 |
| Change in Unrealized Appreciation (Depreciation) | (855,247) |
| Net Increase (Decrease) in Net Assets Resulting from Operations | (615,439) |
| 1 Dividends are net of foreign withholding taxes of $11,327,000. | |
| 2 Interest income from an affiliated company of the fund was $576,000. | |
See accompanying Notes, which are an integral part of the Financial Statements.
22
| International Value Fund | ||
| Statement of Changes in Net Assets | ||
| Year Ended October 31, | ||
| 2015 | 2014 | |
| ($000) | ($000) | |
| Increase (Decrease) in Net Assets | ||
| Operations | ||
| Net Investment Income | 159,684 | 218,467 |
| Realized Net Gain (Loss) | 80,124 | 557,262 |
| Change in Unrealized Appreciation (Depreciation) | (855,247) | (679,339) |
| Net Increase (Decrease) in Net Assets Resulting from Operations | (615,439) | 96,390 |
| Distributions | ||
| Net Investment Income | (213,924) | (151,178) |
| Realized Capital Gain | — | — |
| Total Distributions | (213,924) | (151,178) |
| Capital Share Transactions | ||
| Issued | 1,241,161 | 957,145 |
| Issued in Lieu of Cash Distributions | 201,817 | 144,177 |
| Redeemed | (953,508) | (802,689) |
| Net Increase (Decrease) from Capital Share Transactions | 489,470 | 298,633 |
| Total Increase (Decrease) | (339,893) | 243,845 |
| Net Assets | ||
| Beginning of Period | 8,271,489 | 8,027,644 |
| End of Period1 | 7,931,596 | 8,271,489 |
1 Net Assets—End of Period includes undistributed (overdistributed) net investment income of $123,930,000 and $184,413,000.
See accompanying Notes, which are an integral part of the Financial Statements.
23
| International Value Fund | |||||
| Financial Highlights | |||||
| For a Share Outstanding | Year Ended October 31, | ||||
| Throughout Each Period | 2015 | 2014 | 2013 | 2012 | 2011 |
| Net Asset Value, Beginning of Period | $36.87 | $37.12 | $29.78 | $28.98 | $31.92 |
| Investment Operations | |||||
| Net Investment Income | . 669 | . 9771 | .757 | .804 | .843 |
| Net Realized and Unrealized Gain (Loss) | |||||
| on Investments | (3.373) | (. 530) | 7.402 | .838 | (3.103) |
| Total from Investment Operations | (2.704) | .447 | 8.159 | 1.642 | (2.260) |
| Distributions | |||||
| Dividends from Net Investment Income | (.946) | (.697) | (.819) | (.842) | (. 680) |
| Distributions from Realized Capital Gains | — | — | — | — | — |
| Total Distributions | (.946) | (.697) | (.819) | (.842) | (. 680) |
| Net Asset Value, End of Period | $33.22 | $36.87 | $37.12 | $29.78 | $28.98 |
| Total Return2 | -7.43% | 1.20% | 27.94% | 6.00% | -7.27% |
| Ratios/Supplemental Data | |||||
| Net Assets, End of Period (Millions) | $7,932 | $8,271 | $8,028 | $6,465 | $6,553 |
| Ratio of Total Expenses to | |||||
| Average Net Assets3 | 0.46% | 0.44% | 0.43% | 0.40% | 0.39% |
| Ratio of Net Investment Income to | |||||
| Average Net Assets | 1.95% | 2.64%1 | 2.24% | 2.77% | 2.59% |
| Portfolio Turnover Rate | 36% | 37% | 52% | 53% | 39% |
1 Net investment income per share and the ratio of net investment income to average net assets include $.175 and 0.47%, respectively, resulting from income received from Vodafone Group plc in the form of cash and shares in Verizon Communications Inc. in February 2014.
2 Total returns do not include transaction or account service fees that may have applied in the periods shown. Fund prospectuses provide information about any applicable transaction and account service fees.
3 Includes performance-based investment advisory fee increases (decreases) of 0.04%, 0.03%, 0.01%, (0.03%), and (0.05%).
See accompanying Notes, which are an integral part of the Financial Statements.
24
International Value Fund
Notes to Financial Statements
Vanguard International Value Fund is registered under the Investment Company Act of 1940 as an open-end investment company, or mutual fund. The fund invests in securities of foreign issuers, which may subject it to investment risks not normally associated with investing in securities of U.S. corporations.
A. The following significant accounting policies conform to generally accepted accounting principles for U.S. investment companies. The fund consistently follows such policies in preparing its financial statements.
1. Security Valuation: Securities are valued as of the close of trading on the New York Stock Exchange (generally 4 p.m., Eastern time) on the valuation date. Equity securities are valued at the latest quoted sales prices or official closing prices taken from the primary market in which each security trades; such securities not traded on the valuation date are valued at the mean of the latest quoted bid and asked prices. Securities for which market quotations are not readily available, or whose values have been affected by events occurring before the fund’s pricing time but after the close of the securities’ primary markets, are valued at their fair values calculated according to procedures adopted by the board of trustees. These procedures include obtaining quotations from an independent pricing service, monitoring news to identify significant market- or security-specific events, and evaluating changes in the values of foreign market proxies (for example, ADRs, futures contracts, or exchange-traded funds), between the time the foreign markets close and the fund’s pricing time. When fair-value pricing is employed, the prices of securities used by a fund to calculate its net asset value may differ from quoted or published prices for the same securities. Investments in Vanguard Market Liquidity Fund are valued at that fund’s net asset value. Temporary cash investments acquired over 60 days to maturity are valued using the latest bid prices or using valuations based on a matrix system (which considers such factors as security prices, yields, maturities, and ratings), both as furnished by independent pricing services. Other temporary cash investments are valued at amortized cost, which approximates market value.
2. Foreign Currency: Securities and other assets and liabilities denominated in foreign currencies are translated into U.S. dollars using exchange rates obtained from an independent third party as of the fund’s pricing time on the valuation date. Realized gains (losses) and unrealized appreciation (depreciation) on investment securities include the effects of changes in exchange rates since the securities were purchased, combined with the effects of changes in security prices. Fluctuations in the value of other assets and liabilities resulting from changes in exchange rates are recorded as unrealized foreign currency gains (losses) until the assets or liabilities are settled in cash, at which time they are recorded as realized foreign currency gains (losses).
3. Futures and Forward Currency Contracts: The fund uses index futures contracts to a limited extent, with the objective of maintaining full exposure to the stock market while maintaining liquidity. The fund may purchase or sell futures contracts to achieve a desired level of investment, whether to accommodate portfolio turnover or cash flows from capital share transactions. The primary risks associated with the use of futures contracts are imperfect correlation between changes in market values of stocks held by the fund and the prices of futures contracts, and the possibility of an illiquid market. Counterparty risk involving futures is mitigated because a regulated clearinghouse is the counterparty instead of the clearing broker. To further mitigate counterparty risk, the fund trades
25
International Value Fund
futures contracts on an exchange, monitors the financial strength of its clearing brokers and clearing-house, and has entered into clearing agreements with its clearing brokers. The clearinghouse imposes initial margin requirements to secure the fund’s performance and requires daily settlement of variation margin representing changes in the market value of each contract.
The fund enters into forward currency contracts to provide the appropriate currency exposure related to any open futures contracts or to protect the value of securities and related receivables and payables against changes in foreign exchange rates. The fund’s risks in using these contracts include movement in the values of the foreign currencies relative to the U.S. dollar and the ability of the counterparties to fulfill their obligations under the contracts. The fund mitigates its counterparty risk by entering into forward currency contracts only with a diverse group of prequalified counterparties, monitoring their financial strength, entering into master netting arrangements with its counterparties, and requiring its counterparties to transfer collateral as security for their performance. The master netting arrangements provide that, in the event of a counterparty’s default (including bankruptcy), the fund may terminate the forward currency contracts, determine the net amount owed by either party in accordance with its master netting arrangements, and sell or retain any collateral held up to the net amount owed to the fund under the master netting arrangements. The forward currency contracts contain provisions whereby a counterparty may terminate open contracts if the fund’s net assets decline below a certain level, triggering a payment by the fund if the fund is in a net liability position at the time of the termination. The payment amount would be reduced by any collateral the fund has pledged. Any assets pledged as collateral for open contracts are noted in the Statement of Net Assets. The value of collateral received or pledged is compared daily to the value of the forward currency contracts exposure with each counterparty, and any difference, if in excess of a specified minimum transfer amount, is adjusted and settled within two business days.
Futures contracts are valued at their quoted daily settlement prices. Forward currency contracts are valued at their quoted daily prices obtained from an independent third party, adjusted for currency risk based on the expiration date of each contract. The aggregate settlement values and notional amounts of the contracts are not recorded in the Statement of Net Assets. Fluctuations in the value of the contracts are recorded in the Statement of Net Assets as an asset (liability) and in the Statement of Operations as unrealized appreciation (depreciation) until the contracts are closed, when they are recorded as realized gains (losses) on futures or forward currency contracts.
During the year ended October 31, 2015, the fund’s average investments in long and short futures contracts represented 2% and 0% of net assets, respectively, based on the average of aggregate settlement values at each quarter-end during the period. The fund’s average investment in forward currency contracts represented 3% of net assets, based on the average of notional amounts at each quarter-end during the period.
4. Federal Income Taxes: The fund intends to continue to qualify as a regulated investment company and distribute all of its taxable income. Management has analyzed the fund’s tax positions taken for all open federal income tax years (October 31, 2012–2015), and has concluded that no provision for federal income tax is required in the fund’s financial statements.
5. Distributions: Distributions to shareholders are recorded on the ex-dividend date.
26
International Value Fund
6. Securities Lending: To earn additional income, the fund lends its securities to qualified institutional borrowers. Security loans are required to be secured at all times by collateral in an amount at least equal to the market value of securities loaned. Daily market fluctuations could cause the value of loaned securities to be more or less than the value of the collateral received. When this occurs, the collateral is adjusted and settled on the next business day. The fund further mitigates its counter-party risk by entering into securities lending transactions only with a diverse group of prequalified counterparties, monitoring their financial strength, and entering into master securities lending agreements with its counterparties. The master securities lending agreements provide that, in the event of a counterparty’s default (including bankruptcy), the fund may terminate any loans with that borrower, determine the net amount owed, and sell or retain the collateral up to the net amount owed to the fund; however, such actions may be subject to legal proceedings. While collateral mitigates counterparty risk, in the absence of a default the fund may experience delays and costs in recovering the securities loaned. The fund invests cash collateral received in Vanguard Market Liquidity Fund, and records a liability in the Statement of Net Assets for the return of the collateral, during the period the securities are on loan. Securities lending income represents fees charged to borrowers plus income earned on invested cash collateral, less expenses associated with the loan.
7. Credit Facility: The fund and certain other funds managed by The Vanguard Group (“Vanguard”) participate in a $3 billion committed credit facility provided by a syndicate of lenders pursuant to a credit agreement that may be renewed annually; each fund is individually liable for its borrowings, if any, under the credit facility. Borrowings may be utilized for temporary and emergency purposes, and are subject to the fund’s regulatory and contractual borrowing restrictions. The participating funds are charged administrative fees and an annual commitment fee of 0.06% of the undrawn amount of the facility; these fees are allocated to the funds based on a method approved by the fund’s board of trustees and included in Management and Administrative expenses on the fund’s Statement of Operations. Any borrowings under this facility bear interest at a rate equal to the higher of the federal funds rate or LIBOR reference rate plus an agreed-upon spread.
The fund had no borrowings outstanding at October 31, 2015, or at any time during the period then ended.
8. Other: Dividend income is recorded on the ex-dividend date. Interest income includes income distributions received from Vanguard Market Liquidity Fund and is accrued daily. Premiums and discounts on debt securities purchased are amortized and accreted, respectively, to interest income over the lives of the respective securities. Security transactions are accounted for on the date securities are bought or sold. Costs used to determine realized gains (losses) on the sale of investment securities are those of the specific securities sold.
Withholding taxes on foreign dividends and capital gains have been provided for in accordance with the fund’s understanding of the applicable countries’ tax rules and rates. In consideration of recent decisions rendered by European courts, the fund has filed additional tax reclaims for previously withheld taxes on dividends earned in certain European Union countries. These filings are subject to various administrative and judicial proceedings within these countries. Such tax reclaims received during the year are included in dividend income. No other amounts for additional tax reclaims are reflected in the financial statements due to the uncertainty as to the ultimate resolution of proceedings, the likelihood of receipt of these reclaims, and the potential timing of payment.
27
International Value Fund
B. The investment advisory firms Lazard Asset Management LLC, Edinburgh Partners Limited, and ARGA Investment Management, LP, each provide investment advisory services to a portion of the fund for a fee calculated at an annual percentage rate of average net assets managed by the advisor. The basic fee of Lazard Asset Management LLC is subject to quarterly adjustments based on performance relative to the MSCI All Country World Index ex USA for the preceding five years. The basic fee of Edinburgh Partners Limited is subject to quarterly adjustments based on performance relative to the MSCI All Country World Index ex USA for the preceding three years. The basic fee of ARGA Investment Management, LP, is subject to quarterly adjustments based on performance relative to the MSCI All Country World Index ex USA since October 31, 2012.
Vanguard manages the cash reserves of the fund as described below.
For the year ended October 31, 2015, the aggregate investment advisory fee represented an effective annual basic rate of 0.17% of the fund’s average net assets, before an increase of $3,277,000 (0.04%) based on performance.
C. In accordance with the terms of a Funds’ Service Agreement (the “FSA”) between Vanguard and the fund, Vanguard furnishes to the fund corporate management, administrative, marketing, distribution and cash management services at Vanguard’s cost of operations (as defined by the FSA). These costs of operations are allocated to the fund based on methods and guidelines approved by the board of trustees. Vanguard does not require reimbursement in the current period for certain costs of operations (such as deferred compensation/benefits and risk/insurance costs); the fund’s liability for these costs of operations is included in Payables to Vanguard on the Statement of Net Assets.
Upon the request of Vanguard, the fund may invest up to 0.40% of its net assets as capital in Vanguard. At October 31, 2015, the fund had contributed to Vanguard capital in the amount of $684,000, representing 0.01% of the fund’s net assets and 0.27% of Vanguard’s capitalization. The fund’s trustees and officers are also directors and employees, respectively, of Vanguard.
D. Various inputs may be used to determine the value of the fund’s investments. These inputs are summarized in three broad levels for financial statement purposes. The inputs or methodologies used to value securities are not necessarily an indication of the risk associated with investing in those securities.
Level 1—Quoted prices in active markets for identical securities.
Level 2—Other significant observable inputs (including quoted prices for similar securities, interest rates, prepayment speeds, credit risk, etc.).
Level 3—Significant unobservable inputs (including the fund’s own assumptions used to determine the fair value of investments).
28
International Value Fund
The following table summarizes the market value of the fund’s investments as of October 31, 2015, based on the inputs used to value them:
| Level 1 | Level 2 | Level 3 | |
| Investments | ($000) | ($000) | ($000) |
| Common Stocks | 582,191 | 7,094,126 | — |
| Temporary Cash Investments | 384,885 | 17,899 | — |
| Futures Contracts—Assets1 | 243 | — | — |
| Futures Contracts—Liabilities1 | (174) | — | — |
| Forward Currency Contracts—Assets | — | 1,560 | — |
| Forward Currency Contracts—Liabilities | — | (2,975) | — |
| Total | 967,145 | 7,110,610 | — |
| 1 Represents variation margin on the last day of the reporting period. |
Securities in certain countries may transfer between Level 1 and Level 2 because of differences in stock market closure times that may result from transitions between standard and daylight saving time in those countries and the United States. Based on values on the date of transfer, securities valued at $127,588,000 based on Level 1 inputs were transferred from Level 2 during the fiscal year. Additionally, based on values on the date of transfer, securities valued at $103,106,000 based on Level 2 inputs were transferred from Level 1 during the fiscal year.
E. At October 31, 2015, the fair values of derivatives were reflected in the Statement of Net Assets as follows:
| Foreign | |||
| Equity | Exchange | ||
| Contracts | Contracts | Total | |
| Statement of Net Assets Caption | ($000) | ($000) | ($000) |
| Other Assets | 243 | 1,560 | 1,803 |
| Other Liabilities | (174) | (2,975) | (3,149) |
Realized net gain (loss) and the change in unrealized appreciation (depreciation) on derivatives for the
| year ended October 31, 2015, were: | |||
| Foreign | |||
| Equity | Exchange | ||
| Contracts | Contracts | Total | |
| Realized Net Gain (Loss) on Derivatives | ($000) | ($000) | ($000) |
| Futures Contracts | 13,209 | — | 13,209 |
| Forward Currency Contracts | — | (22,390) | (22,390) |
| Realized Net Gain (Loss) on Derivatives | 13,209 | (22,390) | (9,181) |
| Change in Unrealized Appreciation (Depreciation) on Derivatives | |||
| Futures Contracts | 7,012 | — | 7,012 |
| Forward Currency Contracts | — | 3,880 | 3,880 |
| Change in Unrealized Appreciation (Depreciation) on Derivatives | 7,012 | 3,880 | 10,892 |
29
International Value Fund
At October 31, 2015, the aggregate settlement value of open futures contracts and the related unrealized appreciation (depreciation) were:
| ($000) | ||||
| Aggregate | ||||
| Number of | Settlement | Unrealized | ||
| Long (Short) | Value | Appreciation | ||
| Futures Contracts | Expiration | Contracts | Long (Short) | (Depreciation) |
| Dow Jones EURO STOXX 50 Index | December 2015 | 1,485 | 55,823 | 3,400 |
| Topix Index | December 2015 | 226 | 29,188 | 2,415 |
| FTSE 100 Index | December 2015 | 251 | 24,499 | 1,104 |
| S&P ASX 200 Index | December 2015 | 126 | 11,768 | 487 |
| 7,406 |
Unrealized appreciation (depreciation) on open Dow Jones EURO STOXX 50 Index and FTSE 100 Index futures contracts is required to be treated as realized gain (loss) for tax purposes.
At October 31, 2015, the fund had open forward currency contracts to receive and deliver currencies as follows. Unrealized appreciation (depreciation) on open forward currency contracts is treated as realized gain (loss) for tax purposes.
| Unrealized | ||||||
| Contract | Appreciation | |||||
| Contract Amount (000) | ||||||
| Settlement | (Depreciation) | |||||
| Counterparty | Date | Receive | Deliver | ($000) | ||
| BNP Paribas | 12/23/15 | EUR | 79,668 | USD | 90,047 | (2,356) |
| Bank of America N.A. | 12/15/15 | JPY | 5,281,784 | USD | 44,168 | (363) |
| BNP Paribas | 12/23/15 | GBP | 26,205 | USD | 40,294 | 96 |
| BNP Paribas | 12/22/15 | AUD | 27,052 | USD | 19,166 | 73 |
| UBS AG | 12/23/15 | USD | 22,929 | EUR | 20,266 | 622 |
| Citibank, N.A. | 12/23/15 | USD | 13,456 | EUR | 11,817 | 449 |
| Bank of America N.A. | 12/15/15 | USD | 11,327 | JPY | 1,343,730 | 183 |
| Morgan Stanley Capital | 12/23/15 | USD | 11,319 | GBP | 7,440 | (148) |
| BNP Paribas | 12/15/15 | USD | 6,289 | JPY | 753,244 | 42 |
| Citibank, N.A. | 12/23/15 | USD | 6,060 | GBP | 3,945 | (20) |
| UBS AG | 12/22/15 | USD | 5,106 | AUD | 7,303 | (88) |
| Morgan Stanley Capital | 12/22/15 | USD | 3,069 | AUD | 4,183 | 95 |
| (1,415) | ||||||
| AUD—Australian dollar. | ||||||
| EUR—Euro. | ||||||
| GBP—British pound. | ||||||
| JPY—Japanese yen. | ||||||
| USD—U.S. dollar. | ||||||
30
International Value Fund
F. Distributions are determined on a tax basis and may differ from net investment income and realized capital gains for financial reporting purposes. Differences may be permanent or temporary. Permanent differences are reclassified among capital accounts in the financial statements to reflect their tax character. Temporary differences arise when certain items of income, expense, gain, or loss are recognized in different periods for financial statement and tax purposes. These differences will reverse at some time in the future. Differences in classification may also result from the treatment of short-term gains as ordinary income for tax purposes.
During the year ended October 31, 2015, the fund realized net foreign currency losses of $6,305,000, which decreased distributable net income for tax purposes; accordingly, such losses have been reclassified from accumulated net realized losses to undistributed net investment income. Certain of the fund’s investments are in securities considered to be passive foreign investment companies, for which any unrealized appreciation and/or realized gains are required to be included in distributable net income for tax purposes. During the year ended October 31, 2015, the fund realized gains on the sale of passive foreign investment companies of $62,000, which have been included in current and prior periods’ taxable income; accordingly, such gains have been reclassified from accumulated net realized losses to undistributed net investment income. Passive foreign investment companies held at October 31, 2015, had unrealized appreciation of $5,940,000 of which $4,756,000 has been distributed and is reflected in the balance of undistributed net investment income.
For tax purposes, at October 31, 2015, the fund had $141,854,000 of ordinary income available for distribution. The fund used capital loss carryforwards of $90,504,000 to offset taxable capital gains realized during the year ended October 31, 2015. At October 31, 2015, the fund had available capital losses totaling $50,118,000 to offset future net capital gains through October 31, 2017.
At October 31, 2015, the cost of investment securities for tax purposes was $8,422,969,000. Net unrealized depreciation of investment securities for tax purposes was $343,868,000, consisting of unrealized gains of $893,089,000 on securities that had risen in value since their purchase and $1,236,957,000 in unrealized losses on securities that had fallen in value since their purchase.
G. During the year ended October 31, 2015, the fund purchased $3,362,553,000 of investment securities and sold $2,793,171,000 of investment securities, other than temporary cash investments.
| H. Capital shares issued and redeemed were: | ||
| Year Ended October 31, | ||
| 2015 | 2014 | |
| Shares | Shares | |
| (000) | (000) | |
| Issued | 35,863 | 25,713 |
| Issued in Lieu of Cash Distributions | 5,845 | 3,902 |
| Redeemed | (27,294) | (21,491) |
| Net Increase (Decrease) in Shares Outstanding | 14,414 | 8,124 |
I. Management has determined that no material events or transactions occurred subsequent to October 31, 2015, that would require recognition or disclosure in these financial statements.
31
Report of Independent Registered Public Accounting Firm
To the Board of Trustees of Vanguard Trustees’ Equity Fund and the Shareholders of Vanguard International Value Fund:
In our opinion, the accompanying statement of net assets and the related statements of operations and of changes in net assets and the financial highlights present fairly, in all material respects, the financial position of Vanguard International Value Fund (constituting a separate portfolio of Vanguard Trustees’ Equity Fund, hereafter referred to as the “Fund”) at October 31, 2015, the results of its operations for the year then ended, the changes in its net assets for each of the two years in the period then ended, and the financial highlights for each of the five years in the period then ended, in conformity with accounting principles generally accepted in the United States of America. These financial statements and financial highlights (hereafter referred to as “financial statements”) are the responsibility of the Fund’s management. Our responsibility is to express an opinion on these financial statements based on our audits. We conducted our audits of these financial statements in accordance with the standards of the Public Company Accounting Oversight Board (United States). Those standards require that we plan and perform the audit to obtain reasonable assurance about whether the financial statements are free of material misstatement. An audit includes examining, on a test basis, evidence supporting the amounts and disclosures in the financial statements, assessing the accounting principles used and significant estimates made by management, and evaluating the overall financial statement presentation. We believe that our audits, which included confirmation of securities at October 31, 2015 by correspondence with the custodian and brokers, by agreement to the underlying ownership records of the transfer agent and the application of alternative auditing procedures where securities purchased had not been received, provide a reasonable basis for our opinion.
/s/PricewaterhouseCoopers LLP
Philadelphia, Pennsylvania
December 10, 2015
Special 2015 tax information (unaudited) for Vanguard International Value Fund
This information for the fiscal year ended October 31, 2015, is included pursuant to provisions of the Internal Revenue Code.
The fund distributed $167,353,000 of qualified dividend income to shareholders during the fiscal year.
The fund designates to shareholders foreign source income of $168,516,000 and foreign taxes paid of $11,819,000. Shareholders will receive more detailed information with their Form 1099-DIV in January 2016 to determine the calendar-year amounts to be included on their 2015 tax returns.
32
Your Fund’s After-Tax Returns
This table presents returns for your fund both before and after taxes. The after-tax returns are shown in two ways: (1) assuming that an investor owned the fund during the entire period and paid taxes on the fund’s distributions, and (2) assuming that an investor paid taxes on the fund’s distributions and sold all shares at the end of each period.
Calculations are based on the highest individual federal income tax and capital gains tax rates in effect at the times of the distributions and the hypothetical sales. State and local taxes were not considered. After-tax returns reflect any qualified dividend income, using actual prior-year figures and estimates for 2015. (In the example, returns after the sale of fund shares may be higher than those assuming no sale. This occurs when the sale would have produced a capital loss. The calculation assumes that the investor received a tax deduction for the loss.)
Please note that your actual after-tax returns will depend on your tax situation and may differ from those shown. Also note that if you own the fund in a tax-deferred account, such as an individual retirement account or a 401(k) plan, this information does not apply to you. Such accounts are not subject to current taxes.
Finally, keep in mind that a fund’s performance—whether before or after taxes—does not guarantee future results.
| Average Annual Total Returns: International Value Fund | |||
| Periods Ended October 31, 2015 | |||
| One | Five | Ten | |
| Year | Years | Years | |
| Returns Before Taxes | -7.43% | 3.33% | 4.17% |
| Returns After Taxes on Distributions | -8.05 | 2.84 | 3.41 |
| Returns After Taxes on Distributions and Sale of Fund Shares | -3.73 | 2.64 | 3.44 |
33
About Your Fund’s Expenses
As a shareholder of the fund, you incur ongoing costs, which include costs for portfolio management, administrative services, and shareholder reports (like this one), among others. Operating expenses, which are deducted from a fund’s gross income, directly reduce the investment return of the fund.
A fund’s expenses are expressed as a percentage of its average net assets. This figure is known as the expense ratio. The following examples are intended to help you understand the ongoing costs (in dollars) of investing in your fund and to compare these costs with those of other mutual funds. The examples are based on an investment of $1,000 made at the beginning of the period shown and held for the entire period.
The accompanying table illustrates your fund’s costs in two ways:
• Based on actual fund return. This section helps you to estimate the actual expenses that you paid over the period. The ”Ending Account Value“ shown is derived from the fund‘s actual return, and the third column shows the dollar amount that would have been paid by an investor who started with $1,000 in the fund. You may use the information here, together with the amount you invested, to estimate the expenses that you paid over the period.
To do so, simply divide your account value by $1,000 (for example, an $8,600 account value divided by $1,000 = 8.6), then multiply the result by the number given for your fund under the heading ”Expenses Paid During Period.“
• Based on hypothetical 5% yearly return. This section is intended to help you compare your fund‘s costs with those of other mutual funds. It assumes that the fund had a yearly return of 5% before expenses, but that the expense ratio is unchanged. In this case—because the return used is not the fund’s actual return—the results do not apply to your investment. The example is useful in making comparisons because the Securities and Exchange Commission requires all mutual funds to calculate expenses based on a 5% return. You can assess your fund’s costs by comparing this hypothetical example with the hypothetical examples that appear in shareholder reports of other funds.
Note that the expenses shown in the table are meant to highlight and help you compare ongoing costs only and do not reflect transaction costs incurred by the fund for buying and selling securities. Further, the expenses do not include any purchase, redemption, or account service fees described in the fund prospectus. If such fees were applied to your account, your costs would be higher. Your fund does not carry a “sales load.”
The calculations assume no shares were bought or sold during the period. Your actual costs may have been higher or lower, depending on the amount of your investment and the timing of any purchases or redemptions.
You can find more information about the fund’s expenses, including annual expense ratios, in the Financial Statements section of this report. For additional information on operating expenses and other shareholder costs, please refer to your fund’s current prospectus.
34
| Six Months Ended October 31, 2015 | |||
| Beginning | Ending | Expenses | |
| Account Value | Account Value | Paid During | |
| International Value Fund | 4/30/2015 | 10/31/2015 | Period |
| Based on Actual Fund Return | $1,000.00 | $895.66 | $2.20 |
| Based on Hypothetical 5% Yearly Return | 1,000.00 | 1,022.89 | 2.35 |
The calculations are based on expenses incurred in the most recent six-month period. The fund’s annualized six-month expense ratio for that period is 0.46%. The dollar amounts shown as “Expenses Paid” are equal to the annualized expense ratio multiplied by the average account value over the period, multiplied by the number of days in the most recent six-month period, then divided by the number of days in the most recent 12-month period (184/365).
35
Glossary
Beta. A measure of the magnitude of a fund’s past share-price fluctuations in relation to the ups and downs of a given market index. The index is assigned a beta of 1.00. Compared with a given index, a fund with a beta of 1.20 typically would have seen its share price rise or fall by 12% when the index rose or fell by 10%. For this report, beta is based on returns over the past 36 months for both the fund and the index. Note that a fund’s beta should be reviewed in conjunction with its R-squared (see definition). The lower the R-squared, the less correlation there is between the fund and the index, and the less reliable beta is as an indicator of volatility.
Dividend Yield. Dividend income earned by stocks, expressed as a percentage of the aggregate market value (or of net asset value, for a fund). The yield is determined by dividing the amount of the annual dividends by the aggregate value (or net asset value) at the end of the period. For a fund, the dividend yield is based solely on stock holdings and does not include any income produced by other investments.
Earnings Growth Rate. The average annual rate of growth in earnings over the past five years for the stocks now in a fund.
Equity Exposure. A measure that reflects a fund’s investments in stocks and stock futures. Any holdings in short-term reserves are excluded.
Expense Ratio. A fund’s total annual operating expenses expressed as a percentage of the fund’s average net assets. The expense ratio includes management and administrative expenses, but does not include the transaction costs of buying and selling portfolio securities.
Inception Date. The date on which the assets of a fund (or one of its share classes) are first invested in accordance with the fund’s investment objective. For funds with a subscription period, the inception date is the day after that period ends. Investment performance is measured from the inception date.
Median Market Cap. An indicator of the size of companies in which a fund invests; the midpoint of market capitalization (market price x shares outstanding) of a fund’s stocks, weighted by the proportion of the fund’s assets invested in each stock. Stocks representing half of the fund’s assets have market capitalizations above the median, and the rest are below it.
Price/Book Ratio. The share price of a stock divided by its net worth, or book value, per share. For a fund, the weighted average price/book ratio of the stocks it holds.
Price/Earnings Ratio. The ratio of a stock’s current price to its per-share earnings over the past year. For a fund, the weighted average P/E of the stocks it holds. P/E is an indicator of market expectations about corporate prospects; the higher the P/E, the greater the expectations for a company’s future growth.
R-Squared. A measure of how much of a fund’s past returns can be explained by the returns from the market in general, as measured by a given index. If a fund’s total returns were precisely synchronized with an index’s returns, its R-squared would be 1.00. If the fund’s returns bore no relationship to the index’s returns, its R-squared would be 0. For this report, R-squared is based on returns over the past 36 months for both the fund and the index.
36
Return on Equity. The annual average rate of return generated by a company during the past five years for each dollar of shareholder’s equity (net income divided by shareholder’s equity). For a fund, the weighted average return on equity for the companies whose stocks it holds.
Short-Term Reserves. The percentage of a fund invested in highly liquid, short-term securities that can be readily converted to cash.
Turnover Rate. An indication of the fund’s trading activity. Funds with high turnover rates incur higher transaction costs and may be more likely to distribute capital gains (which may be taxable to investors). The turnover rate excludes in-kind transactions, which have minimal impact on costs.
Benchmark Information
Spliced International Index: MSCI EAFE Index through May 31, 2010; MSCI All Country World Index ex USA thereafter.
37
This page intentionally left blank.
This page intentionally left blank.
The People Who Govern Your Fund
The trustees of your mutual fund are there to see that the fund is operated and managed in your best interests since, as a shareholder, you are a part owner of the fund. Your fund’s trustees also serve on the board of directors of The Vanguard Group, Inc., which is owned by the Vanguard funds and provides services to them on an at-cost basis.
A majority of Vanguard’s board members are independent, meaning that they have no affiliation with Vanguard or the funds they oversee, apart from the sizable personal investments they have made as private individuals. The independent board members have distinguished backgrounds in business, academia, and public service. Each of the trustees and executive officers oversees 194 Vanguard funds.
The following table provides information for each trustee and executive officer of the fund. More information about the trustees is in the Statement of Additional Information, which can be obtained, without charge, by contacting Vanguard at 800-662-7447, or online at vanguard.com.
InterestedTrustee1
F. William McNabb III
Born 1957. Trustee Since July 2009. Chairman of the Board. Principal Occupation(s) During the Past Five Years and Other Experience: Chairman of the Board of The Vanguard Group, Inc., and of each of the investment companies served by The Vanguard Group, since January 2010; Director of The Vanguard Group since 2008; Chief Executive Officer and President of The Vanguard Group, and of each of the investment companies served by The Vanguard Group, since 2008; Director of Vanguard Marketing Corporation; Managing Director of The Vanguard Group (1995–2008).
IndependentTrustees
Emerson U. Fullwood
Born 1948. Trustee Since January 2008. Principal Occupation(s) During the Past Five Years and Other Experience: Executive Chief Staff and Marketing Officer for North America and Corporate Vice President (retired 2008) of Xerox Corporation (document management products and services); Executive in Residence and 2009–2010 Distinguished Minett Professor at the Rochester Institute of Technology; Director of SPX Corporation (multi-industry manufacturing), the United Way of Rochester, the University of Rochester Medical Center, Monroe Community College Foundation, and North Carolina A&T University.
Rajiv L. Gupta
Born 1945. Trustee Since December 2001.2 Principal Occupation(s) During the Past Five Years and Other Experience: Chairman and Chief Executive Officer (retired 2009) and President (2006–2008) of Rohm and Haas Co. (chemicals); Director of Tyco International PLC (diversified manufacturing and services), Hewlett-Packard Co. (electronic computer manufacturing), and Delphi Automotive PLC (automotive components); Senior Advisor at New Mountain Capital.
Amy Gutmann
Born 1949. Trustee Since June 2006. Principal Occupation(s) During the Past Five Years and Other Experience: President of the University of Pennsylvania; Christopher H. Browne Distinguished Professor of Political Science, School of Arts and Sciences, and Professor of Communication, Annenberg School for Communication, with secondary faculty appointments in the Department of Philosophy, School of Arts and Sciences, and at the Graduate School of Education, University of Pennsylvania; Trustee of the National Constitution Center; Chair of the Presidential Commission for the Study of Bioethical Issues.
JoAnn Heffernan Heisen
Born 1950. Trustee Since July 1998. Principal Occupation(s) During the Past Five Years and Other Experience: Corporate Vice President and Chief Global Diversity Officer (retired 2008) and Member of the Executive Committee (1997–2008) of Johnson & Johnson (pharmaceuticals/medical devices/consumer products); Director of Skytop Lodge Corporation (hotels) and the Robert Wood Johnson Foundation; Member of the Advisory Board of the Institute for Women’s Leadership at Rutgers University.
F. Joseph Loughrey
Born 1949. Trustee Since October 2009. Principal Occupation(s) During the Past Five Years and Other Experience: President and Chief Operating Officer (retired 2009) of Cummins Inc. (industrial machinery); Chairman of the Board of Hillenbrand, Inc. (specialized consumer services), and of Oxfam America; Director of SKF AB (industrial machinery), Hyster-Yale Materials Handling, Inc. (forklift trucks), the Lumina Foundation for Education, and the V Foundation for Cancer Research; Member of the Advisory Council for the College of Arts and Letters and of the Advisory Board to the Kellogg Institute for International Studies, both at the University of Notre Dame.
Mark Loughridge
Born 1953. Trustee Since March 2012. Principal Occupation(s) During the Past Five Years and Other Experience: Senior Vice President and Chief Financial Officer (retired 2013) at IBM (information technology services); Fiduciary Member of IBM’s Retirement Plan Committee (2004–2013); Director of the Dow Chemical Company; Member of the Council on Chicago Booth.
Scott C. Malpass
Born 1962. Trustee Since March 2012. Principal Occupation(s) During the Past Five Years and Other Experience: Chief Investment Officer and Vice President at the University of Notre Dame; Assistant Professor of Finance at the Mendoza College of Business at Notre Dame; Member of the Notre Dame 403(b) Investment Committee; Board Member of TIFF Advisory Services, Inc., and Catholic Investment Services, Inc. (investment advisors); Member of the Investment Advisory Committee of Major League Baseball.
André F. Perold
Born 1952. Trustee Since December 2004. Principal Occupation(s) During the Past Five Years and Other Experience: George Gund Professor of Finance and Banking, Emeritus at the Harvard Business School (retired 2011); Chief Investment Officer and Managing Partner of HighVista Strategies LLC (private investment firm); Director of Rand Merchant Bank; Overseer of the Museum of Fine Arts Boston.
Peter F. Volanakis
Born 1955. Trustee Since July 2009. Principal Occupation(s) During the Past Five Years and Other Experience: President and Chief Operating Officer (retired 2010) of Corning Incorporated (communications equipment); Trustee of Colby-Sawyer College; Member of the Advisory Board of the Norris Cotton Cancer Center and of the Advisory Board of the Parthenon Group (strategy consulting).
Executive Officers
Glenn Booraem
Born 1967. Treasurer Since May 2015. Principal Occupation(s) During the Past Five Years and Other Experience: Principal of The Vanguard Group, Inc.; Treasurer of each of the investment companies served by The Vanguard Group; Controller of each of the investment companies served by The Vanguard Group (2010–2015); Assistant Controller of each of the investment companies served by The Vanguard Group (2001–2010).
Thomas J. Higgins
Born 1957. Chief Financial Officer Since September 2008. Principal Occupation(s) During the Past Five Years and Other Experience: Principal of The Vanguard Group, Inc.; Chief Financial Officer of each of the investment companies served by The Vanguard Group; Treasurer of each of the investment companies served by The Vanguard Group (1998–2008).
Peter Mahoney
Born 1974. Controller Since May 2015. Principal Occupation(s) During the Past Five Years and Other Experience: Head of Global Fund Accounting at The Vanguard Group, Inc.; Controller of each of the investment companies served by The Vanguard Group; Head of International Fund Services at The Vanguard Group (2008–2014).
Heidi Stam
Born 1956. Secretary Since July 2005. Principal Occupation(s) During the Past Five Years and Other Experience: Managing Director of The Vanguard Group, Inc.; General Counsel of The Vanguard Group; Secretary of The Vanguard Group and of each of the investment companies served by The Vanguard Group; Director and Senior Vice President of Vanguard Marketing Corporation.
Vanguard Senior Management Team
Mortimer J. Buckley
Kathleen C. Gubanich
Paul A. Heller
Martha G. King
John T. Marcante
Chris D. McIsaac
James M. Norris
Thomas M. Rampulla
Glenn W. Reed
Karin A. Risi
Chairman Emeritus and Senior Advisor
John J. Brennan
Chairman, 1996–2009
Chief Executive Officer and President, 1996–2008
Founder John C. Bogle
Chairman and Chief Executive Officer, 1974–1996
1 Mr. McNabb is considered an “interested person,” as defined in the Investment Company Act of 1940, because he is an officer of the Vanguard funds.
2 December 2002 for Vanguard Equity Income Fund, the Vanguard Municipal Bond Funds, and the Vanguard State Tax-Exempt Funds.
 |
| P.O. Box 2600 |
| Valley Forge, PA 19482-2600 |
Connect with Vanguard® > vanguard.com
| Fund Information > 800-662-7447 | CFA® is a registered trademark owned by CFA Institute. |
| Direct Investor Account Services > 800-662-2739 | |
| Institutional Investor Services > 800-523-1036 | |
| Text Telephone for People | |
| Who Are Deaf or Hard of Hearing> 800-749-7273 | |
| This material may be used in conjunction | |
| with the offering of shares of any Vanguard | |
| fund only if preceded or accompanied by | |
| the fund’s current prospectus. | |
| All comparative mutual fund data are from Lipper, a | |
| Thomson Reuters Company, or Morningstar, Inc., unless | |
| otherwise noted. | |
| You can obtain a free copy of Vanguard’s proxy voting | |
| guidelines by visiting vanguard.com/proxyreporting or by | |
| calling Vanguard at 800-662-2739. The guidelines are | |
| also available from the SEC’s website, sec.gov. In | |
| addition, you may obtain a free report on how your fund | |
| voted the proxies for securities it owned during the 12 | |
| months ended June 30. To get the report, visit either | |
| vanguard.com/proxyreporting or sec.gov. | |
| You can review and copy information about your fund at | |
| the SEC’s Public Reference Room in Washington, D.C. To | |
| find out more about this public service, call the SEC at | |
| 202-551-8090. Information about your fund is also | |
| available on the SEC’s website, and you can receive | |
| copies of this information, for a fee, by sending a | |
| request in either of two ways: via email addressed to | |
| publicinfo@sec.gov or via regular mail addressed to the | |
| Public Reference Section, Securities and Exchange | |
| Commission, Washington, DC 20549-1520. | |
| © 2015 The Vanguard Group, Inc. | |
| All rights reserved. | |
| Vanguard Marketing Corporation, Distributor. | |
| Q460 122015 | |
Annual Report | October 31, 2015
Vanguard Diversified Equity Fund
Vanguard’s Principles for Investing Success
We want to give you the best chance of investment success. These principles, grounded in Vanguard’s research and experience, can put you on the right path.
Goals. Create clear, appropriate investment goals.
Balance. Develop a suitable asset allocation using broadly diversified funds. Cost. Minimize cost.
Discipline. Maintain perspective and long-term discipline.
A single theme unites these principles: Focus on the things you can control.
We believe there is no wiser course for any investor.
| Contents | |
| Your Fund’s Total Returns. | 1 |
| Chairman’s Letter. | 2 |
| Fund Profile. | 9 |
| Performance Summary. | 10 |
| Financial Statements. | 12 |
| Your Fund’s After-Tax Returns. | 21 |
| About Your Fund’s Expenses. | 22 |
| Glossary. | 24 |
Please note: The opinions expressed in this report are just that—informed opinions. They should not be considered promises or advice. Also, please keep in mind that the information and opinions cover the period through the date on the front of this report. Of course, the risks of investing in your fund are spelled out in the prospectus.
See the Glossary for definitions of investment terms used in this report.
About the cover: Pictured is a sailing block on the Brilliant, a 1932 schooner docked in Mystic, Connecticut. A type of pulley, the sailing block helps coordinate the setting of the sails. At Vanguard, the intricate coordination of technology and people allows us to help millions of clients around the world reach their financial goals.
| Your Fund’s Total Returns | ||||
| Fiscal Year Ended October 31, 2015 | ||||
| Total | ||||
| Returns | ||||
| Vanguard Diversified Equity Fund | 4.71% | |||
| MSCI US Broad Market Index | 4.55 | |||
| Multi-Cap Core Funds Average | 2.12 | |||
| Multi-Cap Core Funds Average: Derived from data provided by Lipper, a Thomson Reuters Company. | ||||
| Your Fund’s Performance at a Glance | ||||
| October 31, 2014, Through October 31, 2015 | ||||
| Distributions Per Share | ||||
| Starting | Ending | |||
| Share | Share | Income | Capital | |
| Price | Price | Dividends | Gains | |
| Vanguard Diversified Equity Fund | $33.18 | $33.15 | $0.342 | $1.235 |
1

Chairman’s Letter
Dear Shareholder,
Investors faced a volatile U.S. stock market during the fiscal year ended October 31, 2015. Despite the turbulence, Vanguard Diversified Equity Fund returned 4.71% for the 12 months. This result put it slightly ahead of its benchmark, the MSCI U.S. Broad Market Index, and considerably in front of its multi-capitalization core fund peers.
As a “fund of funds,” the Diversified Equity Fund reflects the combined results of its eight underlying actively managed Vanguard stock funds, whose returns ranged from –8% to more than 10%. Together, these eight funds cover the style and capitalization spectrum by investing in growth and value stocks of small-, mid-, and large-cap companies. Continuing the trend of the first half of the fiscal year, large-cap growth funds generally performed better than those focused on small-cap value. Six of the underlying funds posted positive results for the period and beat their benchmark indexes.
By investing in all segments of the U.S. equity market, the Diversified Equity Fund offers broad exposure to companies that—in the view of the underlying funds’ advisors—offer opportunities for long-term capital appreciation with some income. Vanguard’s Equity Index Group is responsible for maintaining Diversified Equity’s target allocations among its underlying funds.
2
If you hold shares of the fund in a taxable account, you may wish to review the table of after-tax returns that appears later in this report.
U.S. stock market fluctuated on its way to modest returns
The broad U.S. stock market returned more than 4% for the fiscal year ended October 31. Stocks generally climbed during the first nine months before dropping sharply in August and September. Fears surfaced in late summer that slower economic growth in China would spread across the globe.
In October, however, stocks rallied as the Federal Reserve maintained its historically low short-term interest rates. Central banks in Europe and Asia also signaled or implemented additional stimulus measures to counter sluggish growth and low inflation. Corporate earnings, although generally lower than in the past couple of years, mostly exceeded expectations.
The strength of the U.S. dollar against foreign currencies contributed to a return of about –4% for international stocks. Returns for the developed markets of the Pacific region and Europe were essentially flat. Stocks tumbled in emerging markets, where concerns about China seemed to weigh most heavily.
The search for a safe haven gave bonds a bit of a boost
The broad U.S. taxable bond market, which returned 1.96% over the fiscal year, benefited from investors’ desire
| Market Barometer | |||
| Average Annual Total Returns | |||
| Periods Ended October 31, 2015 | |||
| One | Three | Five | |
| Year | Years | Years | |
| Stocks | |||
| Russell 1000 Index (Large-caps) | 4.86% | 16.28% | 14.32% |
| Russell 2000 Index (Small-caps) | 0.34 | 13.90 | 12.06 |
| Russell 3000 Index (Broad U.S. market) | 4.49 | 16.09 | 14.14 |
| FTSE All-World ex US Index (International) | -3.83 | 5.20 | 2.99 |
| Bonds | |||
| Barclays U.S. Aggregate Bond Index (Broad taxable market) | 1.96% | 1.65% | 3.03% |
| Barclays Municipal Bond Index (Broad tax-exempt market) | 2.87 | 2.91 | 4.28 |
| Citigroup Three-Month U.S. Treasury Bill Index | 0.02 | 0.02 | 0.04 |
| CPI | |||
| Consumer Price Index | 0.17% | 0.93% | 1.69% |
3
for safe-haven assets during periods of stock market volatility. The yield of the 10-year Treasury note ended October at 2.17%, down from 2.31% a year earlier. (Bond prices and yields move in opposite directions.)
International bond markets (as measured by the Barclays Global Aggregate Index ex USD) returned –6.74%, held back by the dollar’s strength against many foreign currencies. Without this currency effect, international bond returns were positive.
Returns for money market funds and savings accounts continued to be constrained by the Fed’s 0%–0.25% target for short-term interest rates.
Investors favored large-caps through market turbulence
The wide dispersion in the performance of Diversified Equity’s underlying funds reflects how unevenly this summer’s volatility affected various segments of the market. Large-cap growth stocks demonstrated the greatest endurance as they weathered turbulence in the second half of the fiscal year better than their small-cap, mid-cap, and value counterparts.
Not surprisingly, the top performers all feature large-cap growth stocks. Both Vanguard U.S. Growth Fund and Vanguard Morgan™ Growth Fund returned more than 10%. The former specializes in large-cap growth stocks; the latter invests in both large and mid-sized companies.
| Expense Ratios | ||
| Your Fund Compared With Its Peer Group | ||
| Acquired Fund Fees | Peer Group | |
| and Expenses | Average | |
| Diversified Equity Fund | 0.41% | 1.21% |
The acquired fund fees and expenses—drawn from the prospectus dated February 25, 2015—represent an estimate of the weighted average of the expense ratios and any transaction fees charged by the underlying mutual funds (the ”acquired” funds) in which the Diversified Equity Fund invests. The Diversified Equity Fund does not charge any expenses or fees of its own. For the fiscal year ended October 31, 2015, the annualized acquired fund fees and expenses were 0.40%. The peer-group expense ratio is derived from data provided by Lipper, a Thomson Reuters Company, and captures information through year-end 2014.
Peer group: Multi-Cap Core Funds.
4
Vanguard Growth and Income Fund, a blend of large-cap growth and value stocks, returned 5.94%. All three funds benefited from exposure to the health care and information technology sectors.
Also notable was Vanguard Mid-Cap Growth Fund, which easily outperformed its benchmark, the Russell Midcap Growth Index, and returned 6.68% over the 12-month period. Technology and industrial stocks drove the fund’s performance relative to the benchmark.
Vanguard Windsor™ Fund and Vanguard Windsor II Fund, which invest mainly in large-cap value stocks, each returned more than 1.50%. Both funds did slightly better than their benchmark, the Russell 1000 Value Index. They benefited from having smaller allocations to the hard-hit energy sector than the index did.
The weakest performers were Vanguard Capital Value Fund and Vanguard Explorer™ Fund, which collectively represent about 15 percent of Diversified Equity’s total assets. Capital Value, with its “go-anywhere” approach, invests in both well-known large-cap companies and less familiar small-caps. The fund struggled compared with its benchmark because of poor stock picks in technology and energy. The Explorer Fund, which holds small-cap growth companies, ended in modestly negative territory. It lagged the positive return of its benchmark largely because of poor performance in the technology and health care sectors.
| Total Returns | |
| Ten Years Ended October 31, 2015 | |
| Average | |
| Annual Return | |
| Diversified Equity Fund | 7.63% |
| MSCI US Broad Market Index | 8.15 |
| Multi-Cap Core Funds Average | 6.50 |
| Multi-Cap Core Funds Average: Derived from data provided by Lipper, a Thomson Reuters Company. |
The figures shown represent past performance, which is not a guarantee of future results. (Current performance may be lower or higher than the performance data cited. For performance data current to the most recent month-end, visit our website at vanguard.com/performance.) Note, too, that both investment returns and principal value can fluctuate widely, so an investor’s shares, when sold, could be worth more or less than their original cost.
5
The fund has achieved ten years of solid competitive performance
For the last ten years, the Diversified Equity Fund has produced an average annual return of 7.63%. This puts it a step behind the 8.15% return of its benchmark but well above the 6.50% average return of its peers. Its performance is perhaps more noteworthy when you consider the extraordinarily difficult environment that the fund had to contend with during its ten-year history. This includes, of course, the 2008 financial crisis and the worst global economic downturn since the Great Depression.
As we begin the next decade, we remain confident in the skills and experience of the advisors who manage Diversified Equity and its underlying funds. We believe the fund will continue to benefit from those advisors’ guidance and produce competitive results over the long term.
A dose of discipline is crucial when markets become volatile
The developments over the past few months remind us that nobody can control the direction of the markets or reliably predict where they’ll go in the short term. However, investors can control how they react to unstable and turbulent markets.
During periods of market adversity, it’s more important than ever to keep sight of one of Vanguard’s key principles: Maintain perspective and long-term discipline. Whether you’re investing for yourself
| Underlying Funds: Allocations and Returns | ||
| Twelve Months Ended October 31, 2015 | ||
| Percentage of | ||
| Diversified Equity Fund | ||
| Vanguard Fund | Assets | Total Returns |
| Vanguard Growth and Income Fund Investor | ||
| Shares | 20.2% | 5.94% |
| Vanguard Morgan Growth Fund Investor Shares | 15.3 | 10.44 |
| Vanguard U.S. Growth Fund Investor Shares | 15.2 | 10.71 |
| Vanguard Windsor II Fund Investor Shares | 15.1 | 1.57 |
| Vanguard Windsor Fund Investor Shares | 15.0 | 1.76 |
| Vanguard Explorer Fund Investor Shares | 9.6 | -0.62 |
| Vanguard Mid-Cap Growth Fund | 5.0 | 6.68 |
| Vanguard Capital Value Fund | 4.6 | -7.97 |
| Combined | 100.0% | 4.71% |
6
Staying the course can help you stay closer to your fund’s return
When stock markets are highly volatile, as in recent months, it’s tempting to run for cover. But the price of panic can be high.
A rough measure of what can be lost from attempts to time the market is the difference between the returns produced by a fund and the returns earned by the fund’s investors.
The results shown in your fund’s Performance Summary later in this report are its time-weighted returns—the average annual returns investors would have earned if they had invested a lump sum in the fund at the start of the period and reinvested any distributions they received. Their actual returns, however, depend on whether they subsequently bought or sold any shares. There’s often a gap between this dollar-weighted return for investors and the fund’s time-weighted return, as shown below.
Many sensible investment behaviors can contribute to the difference in returns, but industry cash flow data suggest that one important factor is the generally counterproductive effort to buy and sell at the “right” time. Keeping your emotions in check can help narrow the gap.
Mutual fund returns and investor returns over the last decade

Notes: Data are as of September 30, 2015. The average fund returns and average investor returns are from Morningstar. The average fund returns are the average of the funds’ time-weighted returns in each category. The average investor returns assume that the growth of a fund’s total net assets for a given period is driven by market returns and investor cash flow. To calculate investor return, a fund’s change in assets for the period is discounted by the return of the fund to isolate how much of the asset growth was driven by cash flow. A model, similar to an internal rate-of-return calculation, is then used to calculate a constant growth rate that links the beginning total net assets and periodic cash flows to the ending total net assets. Amounts may not add up exactly because of rounding.
Sources: Vanguard and Morningstar, Inc.
7
or on behalf of clients, your success is affected greatly by how you respond—or don’t respond—during turbulent markets. (You can read Vanguard’s Principles for Investing Success at vanguard.com/research.)
As I’ve written in the past, the best course for long-term investors is generally to ignore daily market moves and not make decisions based on emotion. This is also a good time to evaluate your portfolio and make sure your asset allocation is aligned with your time horizon, goals, and risk tolerance.
The markets are unpredictable and often confounding. Keeping your long-term plans clearly in focus can help you weather these periodic storms.
As always, thank you for investing with Vanguard.

F. William McNabb III
Chairman and Chief Executive Officer
November 17, 2015
8
Diversified Equity Fund
Fund Profile
As of October 31, 2015
| Portfolio Characteristics | ||
| MSCI US | ||
| Broad Market | ||
| Fund | Index | |
| Number of Stocks | 1,522 | 3,260 |
| Median Market Cap | $48.8B | $52.1B |
| Price/Earnings Ratio | 20.4x | 21.8x |
| Price/Book Ratio | 2.3x | 2.8x |
| Return on Equity | 16.8% | 17.3% |
| Earnings Growth | ||
| Rate | 8.7% | 10.0% |
| Dividend Yield | 2.0% | 2.0% |
| Turnover Rate | 10% | — |
| Ticker Symbol | VDEQX | — |
| Acquired Fund Fees | ||
| and Expenses1 | 0.41% | — |
| 30-Day SEC Yield | 1.21% | — |
Allocation to Underlying Vanguard Funds
| Vanguard Growth and Income Fund | |
| Investor Shares | 20.2% |
| Vanguard Morgan Growth Fund Investor | |
| Shares | 15.3 |
| Vanguard U.S. Growth Fund Investor | |
| Shares | 15.2 |
| Vanguard Windsor II Fund Investor Shares | 15.1 |
| Vanguard Windsor Fund Investor Shares | 15.0 |
| Vanguard Explorer Fund Investor Shares | 9.6 |
| Vanguard Mid-Cap Growth Fund | 5.0 |
| Vanguard Capital Value Fund | 4.6 |
| Volatility Measures | |
| MSCI US | |
| Broad Market | |
| Index | |
| R-Squared | 0.98 |
| Beta | 1.02 |
These measures show the degree and timing of the fund’s fluctuations compared with the index over 36 months.
Sector Diversification (% of equity exposure)
| MSCI US | ||
| Broad Market | ||
| Fund | Index | |
| Consumer Discretionary | 13.6% | 13.8% |
| Consumer Staples | 7.0 | 8.6 |
| Energy | 8.0 | 6.6 |
| Financials | 19.4 | 17.5 |
| Health Care | 16.4 | 14.3 |
| Industrials | 11.1 | 10.7 |
| Information Technology | 18.3 | 20.0 |
| Materials | 2.4 | 3.3 |
| Telecommunication Services | 1.9 | 2.2 |
| Utilities | 1.9 | 3.0 |
Fund percentages reflect holdings of underlying funds.
1 This figure—drawn from the prospectus dated February 25, 2015—represents an estimate of the weighted average of the expense ratios and any transaction fees charged by the underlying mutual funds (the ”acquired” funds) in which the Diversified Equity Fund invests. The Diversified Equity Fund does not charge any expenses or fees of its own. For the fiscal year ended October 31, 2015, the annualized acquired fund fees and expenses were 0.40%.
9
Diversified Equity Fund
Performance Summary
All of the returns in this report represent past performance, which is not a guarantee of future results that may be achieved by the fund. (Current performance may be lower or higher than the performance data cited. For performance data current to the most recent month-end, visit our website at vanguard.com/performance.) Note, too, that both investment returns and principal value can fluctuate widely, so an investor’s shares, when sold, could be worth more or less than their original cost. The returns shown do not reflect taxes that a shareholder would pay on fund distributions or on the sale of fund shares.
Cumulative Performance: October 31, 2005, Through October 31, 2015
Initial Investment of $10,000
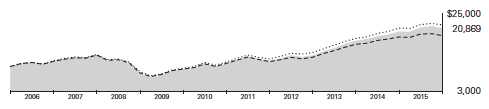
| Average Annual Total Returns | |||||
| Periods Ended October 31, 2015 | |||||
| Final Value | |||||
| One | Five | Ten | of a $10,000 | ||
| Year | Years | Years | Investment | ||
| Diversified Equity Fund* | 4.71% | 14.03% | 7.63% | $20,869 | |
| •••••••• | MSCI US Broad Market Index | 4.55 | 14.21 | 8.15 | 21,881 |
| – – – – | Multi-Cap Core Funds Average | 2.12 | 11.56 | 6.50 | 18,775 |
| Multi-Cap Core Funds Average: Derived from data provided by Lipper, a Thomson Reuters Company. | |||||
See Financial Highlights for dividend and capital gains information.
10
Diversified Equity Fund
Fiscal-Year Total Returns (%): October 31, 2005, Through October 31, 2015
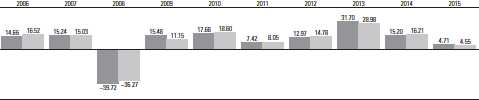
Diversified Equity Fund
MSCI US Broad Market Index
Average Annual Total Returns: Periods Ended September 30, 2015
This table presents returns through the latest calendar quarter—rather than through the end of the fiscal period.
Securities and Exchange Commission rules require that we provide this information.
| Inception | One | Five | Ten | |
| Date | Year | Years | Years | |
| Diversified Equity Fund | 6/10/2005 | -0.12% | 13.36% | 6.67% |
11
Diversified Equity Fund
Financial Statements
Statement of Net Assets
As of October 31, 2015
The fund reports a complete list of its holdings in regulatory filings four times in each fiscal year, at the quarter-ends. For the second and fourth fiscal quarters, the lists appear in the fund’s semiannual and annual reports to shareholders. For the first and third fiscal quarters, the fund files the lists with the Securities and Exchange Commission on Form N-Q. Shareholders can look up the fund’s Forms N-Q on the SEC’s website at sec.gov. Forms N-Q may also be reviewed and copied at the SEC’s Public Reference Room (see the back cover of this report for further information).
| Market | ||
| Value• | ||
| Shares | ($000) | |
| Investment Companies (100.0%) | ||
| U.S. Stock Funds (100.0%) | ||
| Vanguard Growth and Income Fund Investor Shares | 6,868,947 | 293,510 |
| Vanguard Morgan Growth Fund Investor Shares | 8,128,567 | 222,885 |
| Vanguard U.S. Growth Fund Investor Shares | 6,852,053 | 221,458 |
| Vanguard Windsor II Fund Investor Shares | 5,975,524 | 219,481 |
| Vanguard Windsor Fund Investor Shares | 10,388,991 | 218,792 |
| Vanguard Explorer Fund Investor Shares | 1,544,194 | 139,827 |
| Vanguard Mid-Cap Growth Fund | 2,923,665 | 72,741 |
| Vanguard Capital Value Fund | 5,406,238 | 67,200 |
| Total Investment Companies (Cost $1,005,018) | 1,455,894 | |
| Amount | ||
| ($000) | ||
| Other Assets and Liabilities (0.0%) | ||
| Other Assets | ||
| Receivables for Investment Securities Sold | 956 | |
| Receivables for Capital Shares Issued | 343 | |
| Total Other Assets | 1,299 | |
| Liabilities | ||
| Payables for Capital Shares Redeemed | (1,526) | |
| Other Liabilities | (71) | |
| Total Liabilities | (1,597) | |
| Net Assets (100%) | ||
| Applicable to 43,914,908 outstanding $.001 par value shares of | ||
| beneficial interest (unlimited authorization) | 1,455,596 | |
| Net Asset Value Per Share | $33.15 | |
12
| Diversified Equity Fund | |
| At October 31, 2015, net assets consisted of: | |
| Amount | |
| ($000) | |
| Paid-in Capital | 900,489 |
| Undistributed Net Investment Income | 5,251 |
| Accumulated Net Realized Gains | 98,980 |
| Unrealized Appreciation (Depreciation) | 450,876 |
| Net Assets | 1,455,596 |
- See Note A in Notes to Financial Statements.
See accompanying Notes, which are an integral part of the Financial Statements.
13
| Diversified Equity Fund | |
| Statement of Operations | |
| Year Ended | |
| October 31, 2015 | |
| ($000) | |
| Investment Income | |
| Income | |
| Income Distributions Received | 17,392 |
| Net Investment Income—Note B | 17,392 |
| Realized Net Gain (Loss) | |
| Capital Gain Distributions Received | 116,870 |
| Affiliated Investment Securities Sold | 10,453 |
| Realized Net Gain (Loss) | 127,323 |
| Change in Unrealized Appreciation (Depreciation) of Investment Securities | (75,614) |
| Net Increase (Decrease) in Net Assets Resulting from Operations | 69,101 |
See accompanying Notes, which are an integral part of the Financial Statements.
14
| Diversified Equity Fund | ||
| Statement of Changes in Net Assets | ||
| Year Ended October 31, | ||
| 2015 | 2014 | |
| ($000) | ($000) | |
| Increase (Decrease) in Net Assets | ||
| Operations | ||
| Net Investment Income | 17,392 | 15,308 |
| Realized Net Gain (Loss) | 127,323 | 55,848 |
| Change in Unrealized Appreciation (Depreciation) | (75,614) | 137,664 |
| Net Increase (Decrease) in Net Assets Resulting from Operations | 69,101 | 208,820 |
| Distributions | ||
| Net Investment Income | (15,306) | (13,538) |
| Realized Capital Gain1 | (55,272) | (18,179) |
| Total Distributions | (70,578) | (31,717) |
| Capital Share Transactions | ||
| Issued | 145,790 | 167,215 |
| Issued in Lieu of Cash Distributions | 67,884 | 30,644 |
| Redeemed | (269,946) | (281,229) |
| Net Increase (Decrease) from Capital Share Transactions | (56,272) | (83,370) |
| Total Increase (Decrease) | (57,749) | 93,733 |
| Net Assets | ||
| Beginning of Period | 1,513,345 | 1,419,612 |
| End of Period2 | 1,455,596 | 1,513,345 |
1 Includes fiscal 2015 and 2014 short-term gain distributions totaling $16,694,000 and $9,233,000, respectively. Short-term gain distributions are treated as ordinary income dividends for tax purposes.
2 Net Assets—End of Period includes undistributed (overdistributed) net investment income of $5,251,000 and $4,904,000.
See accompanying Notes, which are an integral part of the Financial Statements.
15
| Diversified Equity Fund | |||||
| Financial Highlights | |||||
| For a Share Outstanding | Year Ended October 31, | ||||
| Throughout Each Period | 2015 | 2014 | 2013 | 2012 | 2011 |
| Net Asset Value, Beginning of Period | $33.18 | $29.43 | $22.70 | $20.34 | $19.13 |
| Investment Operations | |||||
| Net Investment Income | . 394 | .3221 | .332 | .262 | .228 |
| Capital Gain Distributions Received | 2.606 | .8481 | .131 | .034 | — |
| Net Realized and Unrealized Gain (Loss) | |||||
| on Investments | (1.453) | 3.243 | 6.626 | 2.310 | 1.192 |
| Total from Investment Operations | 1.547 | 4.413 | 7.089 | 2.606 | 1.420 |
| Distributions | |||||
| Dividends from Net Investment Income | (.342) | (. 283) | (. 344) | (.246) | (. 210) |
| Distributions from Realized Capital Gains | (1.235) | (.380) | (.015) | — | — |
| Total Distributions | (1.577) | (. 663) | (. 359) | (. 246) | (. 210) |
| Net Asset Value, End of Period | $33.15 | $33.18 | $29.43 | $22.70 | $20.34 |
| Total Return2 | 4.71% | 15.20% | 31.70% | 12.97% | 7.42% |
| Ratios/Supplemental Data | |||||
| Net Assets, End of Period (Millions) | $1,456 | $1,513 | $1,420 | $1,173 | $1,183 |
| Ratio of Total Expenses to Average Net Assets | — | — | — | — | — |
| Acquired Fund Fees and Expenses | 0.40% | 0.41% | 0.40% | 0.40% | 0.41% |
| Ratio of Net Investment Income to | |||||
| Average Net Assets | 1.16% | 1.03% | 1.27% | 1.18% | 1.09% |
| Portfolio Turnover Rate | 10% | 5% | 5% | 3% | 3% |
1 Calculated based on average shares outstanding.
2 Total returns do not include account service fees that may have applied in the periods shown. Fund prospectuses provide information about any applicable account service fees.
See accompanying Notes, which are an integral part of the Financial Statements.
16
Diversified Equity Fund
Notes to Financial Statements
Vanguard Diversified Equity Fund is registered under the Investment Company Act of 1940 as an open-end investment company, or mutual fund. The fund invests in selected Vanguard actively managed U.S. stock funds. Financial statements and other information about each underlying fund are available on vanguard.com.
A. The following significant accounting policies conform to generally accepted accounting principles for U.S. investment companies. The fund consistently follows such policies in preparing its financial statements.
1. Security Valuation: Investments are valued at the net asset value of each underlying Vanguard fund determined as of the close of the New York Stock Exchange (generally 4 p.m., Eastern time) on the valuation date.
2. Federal Income Taxes: The fund intends to continue to qualify as a regulated investment company and distribute all of its taxable income. Management has analyzed the fund’s tax positions taken for all open federal income tax years (October 31, 2012–2015), and has concluded that no provision for federal income tax is required in the fund’s financial statements.
3. Distributions: Distributions to shareholders are recorded on the ex-dividend date.
4. Credit Facility: The fund and certain other funds managed by The Vanguard Group (“Vanguard”) participate in a $3 billion committed credit facility provided by a syndicate of lenders pursuant to a credit agreement that may be renewed annually; each fund is individually liable for its borrowings, if any, under the credit facility. Borrowings may be utilized for temporary and emergency purposes, and are subject to the fund’s regulatory and contractual borrowing restrictions. The participating funds are charged administrative fees and an annual commitment fee of 0.06% of the undrawn amount of the facility; these fees are allocated to the funds based on a method approved by the fund’s board of trustees and borne by the funds in which the fund invests (see Note B). Any borrowings under this facility bear interest at a rate equal to the higher of the federal funds rate or LIBOR reference rate plus an agreed-upon spread.
The fund had no borrowings outstanding at October 31, 2015, or at any time during the period then ended.
5. Other: Income and capital gain distributions received are recorded on the ex-dividend date. Security transactions are accounted for on the date securities are bought or sold. Costs used to determine realized gains (losses) on the sale of investment securities are those of the specific securities sold.
B. In accordance with the terms of a Funds’ Service Agreement (the “FSA”) between Vanguard and the fund, Vanguard furnishes to the fund investment advisory, corporate management, administrative, marketing, and distribution services at Vanguard’s cost of operations (as defined by the FSA). These costs of operations are allocated to the fund based on methods and guidelines approved by the board of trustees. The FSA provides that expenses otherwise allocable to Vanguard funds-of-funds may be reduced or eliminated to the extent of savings realized by the underlying Vanguard funds by virtue of being part of a fund-of-funds. Accordingly, all expenses for services provided by Vanguard to the fund and all other expenses incurred by the fund during the period ended October 31, 2015, were borne by the underlying Vanguard funds in which the fund invests. The fund’s trustees and officers are also trustees and officers, respectively, of the underlying Vanguard funds, as well as directors and employees, respectively, of Vanguard.
17
Diversified Equity Fund
C. Various inputs may be used to determine the value of the fund’s investments. These inputs are summarized in three broad levels for financial statement purposes. The inputs or methodologies used to value securities are not necessarily an indication of the risk associated with investing in those securities.
Level 1—Quoted prices in active markets for identical securities.
Level 2—Other significant observable inputs (including quoted prices for similar securities, interest rates, prepayment speeds, credit risk, etc.).
Level 3—Significant unobservable inputs (including the fund’s own assumptions used to determine the fair value of investments).
At October 31, 2015, 100% of the market value of the fund’s investments was determined based on Level 1 inputs.
D. Distributions are determined on a tax basis and may differ from net investment income and realized capital gains for financial reporting purposes. Differences may be permanent or temporary. Permanent differences are reclassified among capital accounts in the financial statements to reflect their tax character. Temporary differences arise when certain items of income, expense, gain, or loss are recognized in different periods for financial statement and tax purposes. These differences will reverse at some time in the future. Differences in classification may also result from the treatment of short-term gains as ordinary income for tax purposes.
The fund used a tax accounting practice to treat a portion of the price of capital shares redeemed during the year as distributions from net investment income and realized capital gains. Accordingly, the fund has reclassified $1,739,000 from undistributed net investment income, and $14,884,000 from accumulated net realized gains, to paid-in capital.
For tax purposes, at October 31, 2015, the fund had $8,006,000 of ordinary income and $96,225,000 of long-term capital gains available for distribution.
At October 31, 2015, the cost of investment securities for tax purposes was $1,005,018,000. Net unrealized appreciation of investment securities for tax purposes was $450,876,000, consisting entirely of unrealized gains on securities that had risen in value since their purchase.
| E. | Capital shares issued and redeemed were: |
| Year Ended October 31, | ||
| 2015 | 2014 | |
| Shares | Shares | |
| (000) | (000) | |
| Issued | 4,387 | 5,388 |
| Issued in Lieu of Cash Distributions | 2,068 | 1,008 |
| Redeemed | (8,157) | (9,013) |
| Net Increase (Decrease) in Shares Outstanding | (1,702) | (2,617) |
18
Diversified Equity Fund
| F. Transactions during the period in affiliated underlying Vanguard funds were as follows: | ||||||
| Current Period Transactions | ||||||
| Oct. 31, | Proceeds | Oct. 31, | ||||
| 2014 | from | Capital Gain | 2015 | |||
| Market | Purchases | Securities | Distributions | Market | ||
| Value | at Cost | Sold | Income | Received | Value | |
| ($000) | ($000) | ($000) | ($000) | ($000) | ($000) | |
| Vanguard Capital Value Fund | 73,795 | 13,225 | 5,897 | 868 | 7,412 | 67,200 |
| Vanguard Explorer Fund | 152,593 | 25,197 | 17,543 | 217 | 19,940 | 139,827 |
| Vanguard Growth and | ||||||
| Income Fund | 303,490 | 23,614 | 27,636 | 5,049 | 17,761 | 293,510 |
| Vanguard Mid-Cap Growth Fund | 76,163 | 14,029 | 13,537 | 106 | 8,827 | 72,741 |
| Vanguard Morgan Growth Fund | 227,461 | 25,256 | 28,144 | 1,522 | 22,521 | 222,885 |
| Vanguard U.S. Growth Fund | 227,730 | 18,231 | 30,285 | 1,353 | 15,919 | 221,458 |
| Vanguard Windsor Fund | 225,740 | 15,021 | 12,965 | 3,463 | 9,759 | 218,792 |
| Vanguard Windsor II Fund | 226,279 | 19,967 | 10,729 | 4,814 | 14,731 | 219,481 |
| Total | 1,513,251 | 154,540 | 146,736 | 17,392 | 116,870 | 1,455,894 |
G. Management has determined that no material events or transactions occurred subsequent to October 31, 2015, that would require recognition or disclosure in these financial statements.
19
Report of Independent Registered Public Accounting Firm
To the Board of Trustees of Vanguard Trustees’ Equity Fund and the Shareholders of Vanguard Diversified Equity Fund:
In our opinion, the accompanying statement of net assets and the related statements of operations and of changes in net assets and the financial highlights present fairly, in all material respects, the financial position of Vanguard Diversified Equity Fund (constituting a separate portfolio of Vanguard Trustees’ Equity Fund, hereafter referred to as the “Fund”) at October 31, 2015, the results of its operations for the year then ended, the changes in its net assets for each of the two years in the period then ended, and the financial highlights for each of the five years in the period then ended, in conformity with accounting principles generally accepted in the United States of America. These financial statements and financial highlights (hereafter referred to as “financial statements”) are the responsibility of the Fund’s management. Our responsibility is to express an opinion on these financial statements based on our audits. We conducted our audits of these financial statements in accordance with the standards of the Public Company Accounting Oversight Board (United States). Those standards require that we plan and perform the audit to obtain reasonable assurance about whether the financial statements are free of material misstatement. An audit includes examining, on a test basis, evidence supporting the amounts and disclosures in the financial statements, assessing the accounting principles used and significant estimates made by management, and evaluating the overall financial statement presentation. We believe that our audits, which included confirmation of securities at October 31, 2015 by agreement to the underlying ownership records of the transfer agent, provide a reasonable basis for our opinion.
/s/PricewaterhouseCoopers LLP
Philadelphia, Pennsylvania
December 10, 2015
Special 2015 tax information (unaudited) for Vanguard Diversified Equity Fund
This information for the fiscal year ended October 31, 2015, is included pursuant to provisions of the Internal Revenue Code.
The fund distributed $53,155,000 as capital gain dividends (20% rate gain distributions) to shareholders during the fiscal year.
For nonresident alien shareholders, 100% of short-term capital gain dividends distributed by the fund are qualified short-term capital gains.
The fund distributed $16,922,000 of qualified dividend income to shareholders during the fiscal year.
For corporate shareholders, 58% of investment income (dividend income plus short-term gains, if any) qualifies for the dividends-received deduction.
20
Your Fund’s After-Tax Returns
This table presents returns for your fund both before and after taxes. The after-tax returns are shown in two ways: (1) assuming that an investor owned the fund during the entire period and paid taxes on the fund’s distributions, and (2) assuming that an investor paid taxes on the fund’s distributions and sold all shares at the end of each period.
Calculations are based on the highest individual federal income tax and capital gains tax rates in effect at the times of the distributions and the hypothetical sales. State and local taxes were not considered. After-tax returns reflect any qualified dividend income, using actual prior-year figures and estimates for 2015. (In the example, returns after the sale of fund shares may be higher than those assuming no sale. This occurs when the sale would have produced a capital loss. The calculation assumes that the investor received a tax deduction for the loss.)
Please note that your actual after-tax returns will depend on your tax situation and may differ from those shown. Also note that if you own the fund in a tax-deferred account, such as an individual retirement account or a 401(k) plan, this information does not apply to you. Such accounts are not subject to current taxes.
Finally, keep in mind that a fund’s performance—whether before or after taxes—does not guarantee future results.
| Average Annual Total Returns: Diversified Equity Fund | |||
| Periods Ended October 31, 2015 | |||
| One | Five | Ten | |
| Year | Years | Years | |
| Returns Before Taxes | 4.71% | 14.03% | 7.63% |
| Returns After Taxes on Distributions | 3.37 | 13.46 | 7.09 |
| Returns After Taxes on Distributions and Sale of Fund Shares | 3.39 | 11.20 | 6.10 |
21
About Your Fund’s Expenses
As a shareholder of the fund, you incur ongoing costs, which include costs for portfolio management, administrative services, and shareholder reports (like this one), among others. Operating expenses, which are deducted from a fund’s gross income, directly reduce the investment return of the fund.
A typical fund’s expenses are expressed as a percentage of its average net assets. The Diversified Equity Fund has no direct expenses, but bears its proportionate share of the costs for the underlying funds in which it invests. These indirect expenses make up the acquired fund fees and expenses, also expressed as a percentage of average net assets.
The following examples are intended to help you understand the ongoing cost (in dollars) of investing in your fund and to compare these costs with those of other mutual funds. The examples are based on an investment of $1,000 made at the beginning of the period shown and held for the entire period. The costs were calculated using the acquired fund fees and expenses for the Diversified Equity Fund.
The accompanying table illustrates your fund’s costs in two ways:
• Based on actual fund return. This section helps you to estimate the actual expenses that you paid over the period. The ”Ending Account Value“ shown is derived from the fund‘s actual return, and the third column shows the dollar amount that would have been paid by an investor who started with $1,000 in the fund. You may use the information here, together with the amount you invested, to estimate the expenses that you paid over the period.
To do so, simply divide your account value by $1,000 (for example, an $8,600 account value divided by $1,000 = 8.6), then multiply the result by the number given for your fund under the heading ”Expenses Paid During Period.“
• Based on hypothetical 5% yearly return. This section is intended to help you compare your fund‘s costs with those of other mutual funds. It assumes that the fund had a yearly return of 5% before expenses, but that the expense ratio is unchanged. In this case—because the return used is not the fund’s actual return—the results do not apply to your investment. The example is useful in making comparisons because the Securities and Exchange Commission requires all mutual funds to calculate expenses based on a 5% return. You can assess your fund’s costs by comparing this hypothetical example with the hypothetical examples that appear in shareholder reports of other funds.
Note that the expenses shown in the table are meant to highlight and help you compare ongoing costs only and do not reflect transaction costs incurred by the fund for buying and selling securities. Further, the expenses do not include any purchase, redemption, or account service fees described in the fund prospectus. If such fees were applied to your account, your costs would be higher. Your fund does not carry a “sales load.”
The calculations assume no shares were bought or sold during the period. Your actual costs may have been higher or lower, depending on the amount of your investment and the timing of any purchases or redemptions.
You can find more information about the fund’s expenses, including annual expense ratios, in the Financial Statements section of this report. For additional information on operating expenses and other shareholder costs, please refer to your fund’s current prospectus.
22
| Six Months Ended October 31, 2015 | |||
| Beginning | Ending | Expenses | |
| Account Value | Account Value | Paid During | |
| Diversified Equity Fund | 4/30/2015 | 10/31/2015 | Period |
| Based on Actual Fund Return | $1,000.00 | $989.55 | $2.01 |
| Based on Hypothetical 5% Yearly Return | 1,000.00 | 1,023.19 | 2.04 |
The calculations are based on acquired fund fees and expenses charged by the underlying mutual funds in which the Diversified Equity Fund invests. The Diversified Equity Fund’s annualized expense figure for the period is 0.40%. The dollar amounts shown as ”Expenses Paid” are equal to the annualized average weighted expense ratio for the underlying funds multiplied by the average account value over the period, multiplied by the number of days in the most recent six-month period, then divided by the number of days in the most recent 12-month period (184/365).
23
Glossary
30-Day SEC Yield. A fund’s 30-day SEC yield is derived using a formula specified by the U.S. Securities and Exchange Commission. Under the formula, data related to the fund’s security holdings in the previous 30 days are used to calculate the fund’s hypothetical net income for that period, which is then annualized and divided by the fund’s estimated average net assets over the calculation period. For the purposes of this calculation, a security’s income is based on its current market yield to maturity (for bonds), its actual income (for asset-backed securities), or its projected dividend yield (for stocks). Because the SEC yield represents hypothetical annualized income, it will differ—at times significantly—from the fund’s actual experience. As a result, the fund’s income distributions may be higher or lower than implied by the SEC yield.
Acquired Fund Fees and Expenses. Funds that invest in other Vanguard funds incur no direct expenses, but they do bear proportionate shares of the operating, administrative, and advisory expenses of the underlying funds, and they must pay any fees charged by those funds. The figure for acquired fund fees and expenses represents a weighted average of these underlying costs. Acquired is a term that the Securities and Exchange Commission applies to any mutual fund whose shares are owned by another fund.
Beta. A measure of the magnitude of a fund’s past share-price fluctuations in relation to the ups and downs of a given market index. The index is assigned a beta of 1.00. Compared with a given index, a fund with a beta of 1.20 typically would have seen its share price rise or fall by 12% when the index rose or fell by 10%. For this report, beta is based on returns over the past 36 months for both the fund and the index. Note that a fund’s beta should be reviewed in conjunction with its R-squared (see definition). The lower the R-squared, the less correlation there is between the fund and the index, and the less reliable beta is as an indicator of volatility.
Dividend Yield. Dividend income earned by stocks, expressed as a percentage of the aggregate market value (or of net asset value, for a fund). The yield is determined by dividing the amount of the annual dividends by the aggregate value (or net asset value) at the end of the period. For a fund, the dividend yield is based solely on stock holdings and does not include any income produced by other investments.
Earnings Growth Rate. The average annual rate of growth in earnings over the past five years for the stocks now in a fund.
Equity Exposure. A measure that reflects a fund’s investments in stocks and stock futures. Any holdings in short-term reserves are excluded.
Expense Ratio. A fund’s total annual operating expenses expressed as a percentage of the fund’s average net assets. The expense ratio includes management and administrative expenses, but does not include the transaction costs of buying and selling portfolio securities.
Foreign Holdings. The percentage of a fund represented by securities or depositary receipts of companies based outside the United States.
Inception Date. The date on which the assets of a fund (or one of its share classes) are first invested in accordance with the fund’s investment objective. For funds with a subscription period, the inception date is the day after that period ends. Investment performance is measured from the inception date.
24
Median Market Cap. An indicator of the size of companies in which a fund invests; the midpoint of market capitalization (market price x shares outstanding) of a fund’s stocks, weighted by the proportion of the fund’s assets invested in each stock. Stocks representing half of the fund’s assets have market capitalizations above the median, and the rest are below it.
Price/Book Ratio. The share price of a stock divided by its net worth, or book value, per share. For a fund, the weighted average price/book ratio of the stocks it holds.
Price/Earnings Ratio. The ratio of a stock’s current price to its per-share earnings over the past year. For a fund, the weighted average P/E of the stocks it holds. P/E is an indicator of market expectations about corporate prospects; the higher the P/E, the greater the expectations for a company’s future growth.
R-Squared. A measure of how much of a fund’s past returns can be explained by the returns from the market in general, as measured by a given index. If a fund’s total returns were precisely synchronized with an index’s returns, its R-squared would be 1.00. If the fund’s returns bore no relationship to the index’s returns, its R-squared would be 0. For this report, R-squared is based on returns over the past 36 months for both the fund and the index.
Return on Equity. The annual average rate of return generated by a company during the past five years for each dollar of shareholder’s equity (net income divided by shareholder’s equity). For a fund, the weighted average return on equity for the companies whose stocks it holds.
25
This page intentionally left blank.
This page intentionally left blank.
The People Who Govern Your Fund
The trustees of your mutual fund are there to see that the fund is operated and managed in your best interests since, as a shareholder, you are a part owner of the fund. Your fund’s trustees also serve on the board of directors of The Vanguard Group, Inc., which is owned by the Vanguard funds and provides services to them on an at-cost basis.
A majority of Vanguard’s board members are independent, meaning that they have no affiliation with Vanguard or the funds they oversee, apart from the sizable personal investments they have made as private individuals. The independent board members have distinguished backgrounds in business, academia, and public service. Each of the trustees and executive officers oversees 194 Vanguard funds.
The following table provides information for each trustee and executive officer of the fund. More information about the trustees is in the Statement of Additional Information, which can be obtained, without charge, by contacting Vanguard at 800-662-7447, or online at vanguard.com.
InterestedTrustee1
F. William McNabb III
Born 1957. Trustee Since July 2009. Chairman of the Board. Principal Occupation(s) During the Past Five Years and Other Experience: Chairman of the Board of The Vanguard Group, Inc., and of each of the investment companies served by The Vanguard Group, since January 2010; Director of The Vanguard Group since 2008; Chief Executive Officer and President of The Vanguard Group, and of each of the investment companies served by The Vanguard Group, since 2008; Director of Vanguard Marketing Corporation; Managing Director of The Vanguard Group (1995–2008).
IndependentTrustees
Emerson U. Fullwood
Born 1948. Trustee Since January 2008. Principal Occupation(s) During the Past Five Years and Other Experience: Executive Chief Staff and Marketing Officer for North America and Corporate Vice President (retired 2008) of Xerox Corporation (document management products and services); Executive in Residence and 2009–2010 Distinguished Minett Professor at the Rochester Institute of Technology; Director of SPX Corporation (multi-industry manufacturing), the United Way of Rochester, the University of Rochester Medical Center, Monroe Community College Foundation, and North Carolina A&T University.
Rajiv L. Gupta
Born 1945. Trustee Since December 2001.2 Principal Occupation(s) During the Past Five Years and Other Experience: Chairman and Chief Executive Officer (retired 2009) and President (2006–2008) of Rohm and Haas Co. (chemicals); Director of Tyco International PLC (diversified manufacturing and services), Hewlett-Packard Co. (electronic computer manufacturing), and Delphi Automotive PLC (automotive components); Senior Advisor at New Mountain Capital.
Amy Gutmann
Born 1949. Trustee Since June 2006. Principal Occupation(s) During the Past Five Years and Other Experience: President of the University of Pennsylvania; Christopher H. Browne Distinguished Professor of Political Science, School of Arts and Sciences, and Professor of Communication, Annenberg School for Communication, with secondary faculty appointments in the Department of Philosophy, School of Arts and Sciences, and at the Graduate School of Education, University of Pennsylvania; Trustee of the National Constitution Center; Chair of the Presidential Commission for the Study of Bioethical Issues.
JoAnn Heffernan Heisen
Born 1950. Trustee Since July 1998. Principal Occupation(s) During the Past Five Years and Other Experience: Corporate Vice President and Chief Global Diversity Officer (retired 2008) and Member of the Executive Committee (1997–2008) of Johnson & Johnson (pharmaceuticals/medical devices/consumer products); Director of Skytop Lodge Corporation (hotels) and the Robert Wood Johnson Foundation; Member of the Advisory Board of the Institute for Women’s Leadership at Rutgers University.
F. Joseph Loughrey
Born 1949. Trustee Since October 2009. Principal Occupation(s) During the Past Five Years and Other Experience: President and Chief Operating Officer (retired 2009) of Cummins Inc. (industrial machinery); Chairman of the Board of Hillenbrand, Inc. (specialized consumer services), and of Oxfam America; Director of SKF AB (industrial machinery), Hyster-Yale Materials Handling, Inc. (forklift trucks), the Lumina Foundation for Education, and the V Foundation for Cancer Research; Member of the Advisory Council for the College of Arts and Letters and of the Advisory Board to the Kellogg Institute for International Studies, both at the University of Notre Dame.
Mark Loughridge
Born 1953. Trustee Since March 2012. Principal Occupation(s) During the Past Five Years and Other Experience: Senior Vice President and Chief Financial Officer (retired 2013) at IBM (information technology services); Fiduciary Member of IBM’s Retirement Plan Committee (2004–2013); Director of the Dow Chemical Company; Member of the Council on Chicago Booth.
Scott C. Malpass
Born 1962. Trustee Since March 2012. Principal Occupation(s) During the Past Five Years and Other Experience: Chief Investment Officer and Vice President at the University of Notre Dame; Assistant Professor of Finance at the Mendoza College of Business at Notre Dame; Member of the Notre Dame 403(b) Investment Committee; Board Member of TIFF Advisory Services, Inc., and Catholic Investment Services, Inc. (investment advisors); Member of the Investment Advisory Committee of Major League Baseball.
André F. Perold
Born 1952. Trustee Since December 2004. Principal Occupation(s) During the Past Five Years and Other Experience: George Gund Professor of Finance and Banking, Emeritus at the Harvard Business School (retired 2011); Chief Investment Officer and Managing Partner of HighVista Strategies LLC (private investment firm); Director of Rand Merchant Bank; Overseer of the Museum of Fine Arts Boston.
Peter F. Volanakis
Born 1955. Trustee Since July 2009. Principal Occupation(s) During the Past Five Years and Other Experience: President and Chief Operating Officer (retired 2010) of Corning Incorporated (communications equipment); Trustee of Colby-Sawyer College; Member of the Advisory Board of the Norris Cotton Cancer Center and of the Advisory Board of the Parthenon Group (strategy consulting).
Executive Officers
Glenn Booraem
Born 1967. Treasurer Since May 2015. Principal Occupation(s) During the Past Five Years and Other Experience: Principal of The Vanguard Group, Inc.; Treasurer of each of the investment companies served by The Vanguard Group; Controller of each of the investment companies served by The Vanguard Group (2010–2015); Assistant Controller of each of the investment companies served by The Vanguard Group (2001–2010).
Thomas J. Higgins
Born 1957. Chief Financial Officer Since September 2008. Principal Occupation(s) During the Past Five Years and Other Experience: Principal of The Vanguard Group, Inc.; Chief Financial Officer of each of the investment companies served by The Vanguard Group; Treasurer of each of the investment companies served by The Vanguard Group (1998–2008).
Peter Mahoney
Born 1974. Controller Since May 2015. Principal Occupation(s) During the Past Five Years and Other Experience: Head of Global Fund Accounting at The Vanguard Group, Inc.; Controller of each of the investment companies served by The Vanguard Group; Head of International Fund Services at The Vanguard Group (2008–2014).
Heidi Stam
Born 1956. Secretary Since July 2005. Principal Occupation(s) During the Past Five Years and Other Experience: Managing Director of The Vanguard Group, Inc.; General Counsel of The Vanguard Group; Secretary of The Vanguard Group and of each of the investment companies served by The Vanguard Group; Director and Senior Vice President of Vanguard Marketing Corporation.
Vanguard Senior Management Team
Mortimer J. Buckley
Kathleen C. Gubanich
Paul A. Heller
Martha G. King
John T. Marcante
Chris D. McIsaac
James M. Norris
Thomas M. Rampulla
Glenn W. Reed
Karin A. Risi
Chairman Emeritus and Senior Advisor
John J. Brennan
Chairman, 1996–2009
Chief Executive Officer and President, 1996–2008
Founder John C. Bogle
Chairman and Chief Executive Officer, 1974–1996
1 Mr. McNabb is considered an “interested person,” as defined in the Investment Company Act of 1940, because he is an officer of the Vanguard funds.
2 December 2002 for Vanguard Equity Income Fund, the Vanguard Municipal Bond Funds, and the Vanguard State Tax-Exempt Funds.
 |
| P.O. Box 2600 |
| Valley Forge, PA 19482-2600 |
Connect with Vanguard® > vanguard.com
| Fund Information > 800-662-7447 | |
| Direct Investor Account Services > 800-662-2739 | |
| Institutional Investor Services > 800-523-1036 | |
| Text Telephone for People | |
| Who Are Deaf or Hard of Hearing> 800-749-7273 | |
| This material may be used in conjunction | |
| with the offering of shares of any Vanguard | |
| fund only if preceded or accompanied by | |
| the fund’s current prospectus. | |
| All comparative mutual fund data are from Lipper, a | |
| Thomson Reuters Company, or Morningstar, Inc., unless | |
| otherwise noted. | |
| You can obtain a free copy of Vanguard’s proxy voting | |
| guidelines by visiting vanguard.com/proxyreporting or by | |
| calling Vanguard at 800-662-2739. The guidelines are | |
| also available from the SEC’s website, sec.gov. In | |
| addition, you may obtain a free report on how your fund | |
| voted the proxies for securities it owned during the 12 | |
| months ended June 30. To get the report, visit either | |
| vanguard.com/proxyreporting or sec.gov. | |
| You can review and copy information about your fund at | |
| the SEC’s Public Reference Room in Washington, D.C. To | |
| find out more about this public service, call the SEC at | |
| 202-551-8090. Information about your fund is also | |
| available on the SEC’s website, and you can receive | |
| copies of this information, for a fee, by sending a | |
| request in either of two ways: via email addressed to | |
| publicinfo@sec.gov or via regular mail addressed to the | |
| Public Reference Section, Securities and Exchange | |
| Commission, Washington, DC 20549-1520. | |
| © 2015 The Vanguard Group, Inc. | |
| All rights reserved. | |
| Vanguard Marketing Corporation, Distributor. | |
| Q6080 122015 | |
Annual Report | October 31, 2015
Vanguard Emerging Markets Select
Stock Fund
Vanguard’s Principles for Investing Success
We want to give you the best chance of investment success. These principles, grounded in Vanguard’s research and experience, can put you on the right path.
Goals. Create clear, appropriate investment goals.
Balance. Develop a suitable asset allocation using broadly diversified funds. Cost. Minimize cost.
Discipline. Maintain perspective and long-term discipline.
A single theme unites these principles: Focus on the things you can control.
We believe there is no wiser course for any investor.
| Contents | |
| Your Fund’s Total Returns. | 1 |
| Chairman’s Letter. | 2 |
| Advisors’ Report. | 8 |
| Fund Profile. | 13 |
| Performance Summary. | 15 |
| Financial Statements. | 17 |
| Your Fund’s After-Tax Returns. | 32 |
| About Your Fund’s Expenses. | 33 |
| Glossary. | 35 |
Please note: The opinions expressed in this report are just that—informed opinions. They should not be considered promises or advice. Also, please keep in mind that the information and opinions cover the period through the date on the front of this report. Of course, the risks of investing in your fund are spelled out in the prospectus.
See the Glossary for definitions of investment terms used in this report.
About the cover: Pictured is a sailing block on the Brilliant, a 1932 schooner docked in Mystic, Connecticut. A type of pulley, the sailing block helps coordinate the setting of the sails. At Vanguard, the intricate coordination of technology and people allows us to help millions of clients around the world reach their financial goals.
| Your Fund’s Total Returns | ||||
| Fiscal Year Ended October 31, 2015 | ||||
| Total | ||||
| Returns | ||||
| Vanguard Emerging Markets Select Stock Fund | -16.99% | |||
| FTSE Emerging Index | -15.20 | |||
| Emerging Markets Funds Average | -14.77 | |||
| Emerging Markets Funds Average: Derived from data provided by Lipper, a Thomson Reuters Company. | ||||
| Your Fund’s Performance at a Glance | ||||
| October 31, 2014, Through October 31, 2015 | ||||
| Distributions Per Share | ||||
| Starting | Ending | |||
| Share | Share | Income | Capital | |
| Price | Price | Dividends | Gains | |
| Vanguard Emerging Markets Select Stock Fund | $20.13 | $16.48 | $0.255 | $0.000 |
1

Chairman’s Letter
Dear Shareholder,
Pulled down by a summer swoon for the global markets, Vanguard Emerging Markets Select Stock Fund recorded a negative return for the 12 months ended October 31, 2015. Peer funds, on average, and the benchmark index also notched double-digit negative results, but their declines weren’t quite as steep as the fund’s –16.99%.
During the fiscal year, concerns about China seemed to weigh heavily on emerging-market stocks, which lagged those of developed countries by a considerable margin. The slowdown in China is of such significance because many emerging economies depend on exporting commodities to the world’s most populous country. Stock markets in major commodity exporters Brazil, Mexico, Russia, and South Africa all tumbled.
For U.S.-based investors, currency had a generally negative effect on emerging-market returns, reflecting the dollar’s relative strength during the period. (For more on currency effects and international diversification, see the text box later in this letter.)
If you own the fund in a taxable account, you may wish to review the section on after-tax returns that appears later in this report.
2
Global stock markets struggled, and some failed to advance
The broad U.S. stock market returned more than 4% for the fiscal year ended October 31, 2015. The market traveled a bumpy road to that result. Fears surfaced in late summer that slower economic growth in China would spread across the globe. A sharp drop in August erased the market’s earlier gains and stocks slid further in September.
In October, however, U.S. stocks staged a robust rally as the Federal Reserve maintained its historically low short-term interest rates. Corporate earnings, although lower than in recent years, mostly exceeded expectations. In Europe and Asia, central banks signaled or implemented additional stimulus measures to counter sluggish growth and low inflation.
The broad international stock market returned about –4% for U.S. investors as the dollar’s strength weighed on local-market returns. Solid gains in the developed markets of the Pacific region and Europe were essentially flat when translated into dollars.
The search for a safe haven gave bonds a bit of a boost
The broad U.S. taxable bond market, which returned 1.96% for the fiscal year, benefited from investors’ desire for safe-haven assets during periods of stock market volatility. The yield of the 10-year
| Market Barometer | |||
| Average Annual Total Returns | |||
| Periods Ended October 31, 2015 | |||
| One | Three | Five | |
| Year | Years | Years | |
| Stocks | |||
| Russell 1000 Index (Large-caps) | 4.86% | 16.28% | 14.32% |
| Russell 2000 Index (Small-caps) | 0.34 | 13.90 | 12.06 |
| Russell 3000 Index (Broad U.S. market) | 4.49 | 16.09 | 14.14 |
| FTSE All-World ex US Index (International) | -3.83 | 5.20 | 2.99 |
| Bonds | |||
| Barclays U.S. Aggregate Bond Index (Broad taxable market) | 1.96% | 1.65% | 3.03% |
| Barclays Municipal Bond Index (Broad tax-exempt market) | 2.87 | 2.91 | 4.28 |
| Citigroup Three-Month U.S. Treasury Bill Index | 0.02 | 0.02 | 0.04 |
| CPI | |||
| Consumer Price Index | 0.17% | 0.93% | 1.69% |
3
Treasury note ended October at 2.17%, down from 2.31% a year earlier. (Bond prices and yields move in opposite directions.)
International bond markets (as measured by the Barclays Global Aggregate Index ex USD) returned about –7%, also held back by the strong dollar. Without this currency effect, international bond returns were positive.
Returns for money market funds and savings accounts continued to be constrained by the Fed’s 0%–0.25% target for short-term interest rates.
The fund’s advance faltered as markets turned stormy
Through the first half of the fiscal year, the Emerging Markets Select Stock Fund managed a modestly positive return. But it reversed course in the second half amid the China-inspired market turbulence that I mentioned earlier. In addition to its slowing economy, China’s currency depreciation in August also rattled world markets.
The gyrations in the latter part of the fiscal year highlight just how challenging emerging markets can be. Diversification can help limit the risk inherent in investing in these markets, and your fund is diversified both in its holdings and in how it’s managed.
| Expense Ratios | ||
| Your Fund Compared With Its Peer Group | ||
| Peer Group | ||
| Fund | Average | |
| Emerging Markets Select Stock Fund | 0.96% | 1.57% |
The fund expense ratio shown is from the prospectus dated February 25, 2015, and represents estimated costs for the current fiscal year. For the fiscal year ended October 31, 2015, the fund’s expense ratio was 0.93%. The peer-group expense ratio is derived from data provided by Lipper, a Thomson Reuters Company, and captures information through year-end 2014.
Peer group: Emerging Markets Funds.
4
Four advisors are each responsible for investing a portion of the fund’s assets. These advisors bring a range of views and methods to their work, which allow the fund to benefit from a diversity of perspectives. And the fund’s holdings give it exposure to a wide swath of countries and industries across several continents.
Diversification can’t, however, completely neutralize the effects of the periodic turmoil that sweeps through the markets of developing nations. That’s one of the reasons Vanguard would caution against concentrating too much of a portfolio in these stocks. In our view, broad global diversification among both stocks and bonds is generally the best choice for investors.
For the 12 months just ended, negative returns were hard to avoid. The fund sustained an especially steep decline—even worse than the one experienced by its benchmark index—in Brazil. The Latin American nation has been mired in recession, and it has also felt the effects of a scandal at its giant oil company. But Brazilian markets were hardly alone in their troubles. The fund notched sharply negative returns in countries ranging from the Czech Republic to the United Arab Emirates.
None of the ten industry sectors represented in your fund produced a positive return for the period. Energy-related stocks fell the most amid a steep drop in oil prices.
| Total Returns | |
| Inception Through October 31, 2015 | |
| Average | |
| Annual Return | |
| Emerging Markets Select Stock Fund (Returns since inception: 6/27/2011) | -3.46% |
| FTSE Emerging Index | -3.38 |
| Emerging Markets Funds Average | -3.64 |
| Emerging Markets Funds Average: Derived from data provided by Lipper, a Thomson Reuters Company. |
The figures shown represent past performance, which is not a guarantee of future results. (Current performance may be lower or higher than the performance data cited. For performance data current to the most recent month-end, visit our website at vanguard.com/performance.) Note, too, that both investment returns and principal value can fluctuate widely, so an investor’s shares, when sold, could be worth more or less than their original cost.
5
For more about the fund’s strategy and positioning, please see the Advisors’ Report that follows my letter.
The fund’s results since inception reflect an overall challenging time
The period since your fund’s inception has been marked by extreme ups and downs for the emerging markets. For its first partial fiscal year (June 27 to October 31, 2011), the fund had a sharply negative return, but it went on to rebound in fiscal years 2012 and 2013. For 2014, it eked out a positive return, which was followed by the latest fiscal year’s disappointing result.
All of that translates into a –3.46% annualized return since inception. That result is roughly on par with the fund’s comparative standards (–3.38% for the FTSE Emerging Index and –3.64% for peer funds, on average).
Staying the course can help you stay closer to your fund’s return
When stock markets are highly volatile, as in recent months, it’s tempting to run for cover. But the price of panic can be high.
A rough measure of what can be lost from attempts to time the market is the difference between the returns produced by a fund and the returns earned by the fund’s investors.
The results shown in your fund’s Performance Summary later in this report are its time-weighted returns—the average annual returns investors would have earned if they had invested a lump sum in the fund at the start of the period and reinvested any distributions they received. Their actual returns, however, depend on whether they subsequently bought or sold any shares. There’s often a gap between this dollar-weighted return for investors and the fund’s time-weighted return, as shown in the figure to the right.
Many sensible investment behaviors can contribute to the difference in returns, but industry cash flow data suggest that one important factor is the generally counter- productive effort to buy and sell at the “right” time. Keeping your emotions in check can help narrow the gap.
Fund returns vs. investor returns

Notes: Data are for the decade ended September 30, 2015. The average fund return and average investor return are from Morningstar, based on U.S.-domiciled international equity funds that have reported ten-year returns. The average fund return is the average of the international stock funds’ time-weighted returns. The average investor return assumes that the growth of a fund’s total net assets for a given period is driven by market returns and investor cash ‚ow. To calculate investor return, a fund’s change in assets for the period is discounted by the return of the fund to isolate how much of the asset growth was driven by cash ‚ow. A model similar to an internal rate-of-return calculation is then used to calculate a constant growth rate that links the beginning total net assets and periodic cash ‚ows to the ending total net assets.
Sources: Vanguard and Morningstar, Inc.
6
As I’ve noted previously, if you’re a long-term, risk-tolerant investor, we believe this fund can play a role in further diversifying the international portion of your portfolio. We’re confident that the advisors’ expertise and thorough research can produce rewarding results over time.
A dose of discipline is crucial when markets become volatile
The developments over the past few months remind us that nobody can control the markets or reliably predict where they’ll go in the short term. However, investors can control how they react to unstable and turbulent markets.
During periods of market adversity, it’s more important than ever to keep sight of one of Vanguard’s key principles: Maintain perspective and long-term discipline. Whether you’re investing for yourself or on behalf of clients, your success is affected greatly by how you respond—or don’t respond—during turbulent markets. (You can read
Vanguard’s Principles for Investing Success at vanguard.com/research.)
As I’ve written in the past, the best course for long-term investors is generally to ignore daily market moves and not make decisions based on emotion. This is also a good time to evaluate your portfolio and make sure your asset allocation is aligned with your time horizon, goals, and risk tolerance.
The markets are unpredictable and often confounding. Keeping your long-term plans clearly in focus can help you weather these periodic storms.
As always, thank you for investing with Vanguard.
Sincerely,

F. William McNabb III
Chairman and Chief Executive Officer
November 17, 2015
7
Advisors’ Report
For the 12 months ended October 31, 2015, Vanguard Emerging Markets Select Stock Fund returned –16.99%. The average return of its peers was –14.77%, and its benchmark, the FTSE Emerging Index, returned –15.20%.
The fund’s assets are divided among four independent investment advisors. The use of multiple advisors provides exposure to distinct yet complementary investment approaches, enhancing the diversification of your fund. It is not uncommon for different advisors to have different views about individual securities or the broader investment environment.
Vanguard Emerging Markets Select Stock Fund Investment Advisors
| Fund Assets Managed | |||
| Investment Advisor | % | $ Million | Investment Strategy |
| Wellington Management | 25 | 65 | Allocates the assets in its portion of the fund to a team |
| Company LLP | of global analysts who seek to add value through | ||
| in-depth fundamental research and understanding of | |||
| their industries. By covering the same companies over | |||
| a period of many years, these investment professionals | |||
| gain comprehensive insight to guide decisions for their | |||
| subportfolios. | |||
| Oaktree Capital Management, L.P. | 24 | 61 | Seeks to capture misevaluation of securities caused by |
| investor behavior. Oaktree’s investment process is | |||
| driven by bottom-up research, which includes | |||
| extensive travel to meet company management and | |||
| maintaining in-house models focused on deriving | |||
| reliable cash-flow projections. | |||
| M&G Investment Management | 23 | 61 | Seeks to identify companies that can handle capital |
| Limited | with discipline, generate returns above the cost of | ||
| capital, and stay focused on creating value. M&G | |||
| attempts to take advantage of pricing deviations | |||
| created by short-term investors. | |||
| Pzena Investment Management, | 23 | 60 | Uses a deep-value approach that focuses on the most |
| LLC | undervalued companies based on price-to-normalized | ||
| earnings. The firm believes that this value philosophy | |||
| works well globally and is especially effective in | |||
| emerging markets because of generally wider valuation | |||
| spreads. | |||
| Cash Investments | 5 | 12 | These short-term reserves are invested by Vanguard in |
| equity index products to simulate investment in stocks. | |||
| Each advisor may also maintain a modest cash | |||
| position. | |||
8
The advisors, the percentage of fund assets each manages, and brief descriptions of their investment strategies are presented in the accompanying table. The advisors have also prepared a discussion of the investment environment that existed during the fiscal year and of how their portfolio positioning reflects this assessment. These comments were prepared on November 20, 2015.
Wellington Management Company llp
Portfolio Managers: Cheryl M. Duckworth, CFA, Senior Managing Director and Associate Director, Global Industry Research Mark Mandel, CFA, Senior Managing Director and Director, Global Industry Research
Our portion of the fund focuses on bottom-up stock selection as the primary driver of performance while minimizing active industry bets.
Emerging-market equities fell in U.S.-dollar terms as measured by the FTSE Emerging Index during the 12-month period; each of the ten sectors in the index posted negative returns. Energy and materials were the weakest benchmark sectors; health care and information technology outpaced the index.
Chinese conglomerate Fosun International, Greek crude oil refiner Motor Oil Hellas, and Russian commercial bank Sberbank were the top relative contributors.
Fosun International is a company in transition. It has historically been focused on asset-intensive businesses such as the manufacture and sale of iron and steel products and the mining and processing of various metals. However, management has been successfully shifting its focus to areas such as pharmaceutical and health care products, property development, asset management, and insurance. This strategy is now starting to pay off; we trimmed the position on strength.
Motor Oil Hellas is a high-quality U.S.-dollar business with a leading operating cost profile. We sold our shares as they reached our target price.
Sberbank, a position we initiated during the period, is the largest commercial bank and lending institution in Russia. The stock was hurt last year by overall market volatility following a collapse in oil prices and sanctions over the conflict in Ukraine, as well as a tumbling ruble. However, the bank got off to a positive start for 2015, bolstered by market reaction to bills passed by the Russian parliament that aim to add capital to the banking sector and improve liquidity.
We view Sberbank as a longer-term opportunity to hold an attractively valued premier Russian banking franchise. We believe it has sufficient liquidity, capital, and support from the central bank to weather the uncertainty in the economy.
Our positions in Petrobras, AmBank, and Alpha Bank weighed on performance during the year. Petrobras, an integrated oil and gas producer based in Brazil, was
9
plagued by both a corruption scandal and the depreciation of the Brazilian real. We exited the position after continued fallout from the kickback scandal and accelerating political dysfunction in Brazil.
Economic and competitive pressures caused shares of AmBank, one of the largest banking groups in Malaysia, to decline. We continue to hold the stock in light of the company’s strong management and strategy, competitive position, and attractive valuation.
Holdings in Greece-based Alpha Bank fell in tandem with the overall Greek equity market. We sold our shares because of lack of clarity about the macroeconomic and credit situations.
Oaktree Capital Management, L.P.
Portfolio Managers: Frank J. Carroll III,
Managing Director and Co-Head of Emerging Markets Equities
Timothy D. Jensen, Managing Director and Co-Head of Emerging Markets Equities
Emerging markets traded within a volatile range before ending significantly down during the 12 months ended October 31, 2015. They faced challenges including weak growth in global trade, concerns about slowing Chinese economic growth, low commodity prices, and a number of country-specific issues. As the U.S. dollar appreciated substantially during the year, most emerging-market currencies lost value.
Decelerating global trade limits opportunities for smaller economies dependent on exports for much of their growth. Slowing Chinese economic expansion contributed to weaker growth in demand for oil, metals, and other commodities just as advances in technology including shale oil extraction and large new mining projects were increasing supply.
The extraordinary plunge in the price of oil led to serious disruptions in oil-dependent economies, including Russia. These factors hurt energy- and commodity-exporting economies in emerging markets more than the corresponding lower prices helped commodity importers, including China, India, and most other Asian nations.
The portfolio’s performance was primarily hurt by weak stock selection in China, which more than offset the benefit of our overweight allocation to that market. Stock picks in India, Mexico, Taiwan, and Turkey weighed on relative performance, as did selection and an overweight allocation in Brazil.
Strong stock choices in South Africa, Indonesia, and Thailand contributed to results. Positive selection among financials was more than offset by negative picks among information technology, consumer discretionary, and consumer staples companies.
At the end of the period, the portfolio held overweight exposures to South Korea, China, Brazil, Russia, and Hungary. It was underweighted in markets including Taiwan, Malaysia, South Africa, Philippines, Poland, and India.
10
M&G Investment Management Limited
Portfolio Manager: Matthew Vaight, UKSIP
The commodities sector faced a number of challenges during the fiscal year, including a drop in the prices of raw materials amid fears of weaker demand from China.
The portfolio’s holding in First Quantum Minerals, a Canada-listed copper miner, was one of its leading detractors. Meanwhile, oil prices plunged on fears of oversupply, which weighed heavily on the share prices of Ophir Energy, an Africa-focused oil and gas explorer, and Ezion Holdings, a Singapore-listed oil services firm.
Brazil’s economic situation deteriorated as the country fell into a severe recession. Holdings in Banco Bradesco, one of the country’s largest banks, and MRV Engenharia, a house builder, were notable underperformers.
Barloworld, a distributor of industrial equipment, suffered from South Africa’s weak economic environment.
In contrast, several Chinese holdings made positive contributions, including PICC Property & Casualty, an insurance firm, and China Lesso Group Holdings, the country’s largest maker of plastic pipes. Lesso is expected to benefit from China’s ongoing infrastructure investment as well as new opportunities such as supplying fish farms. In India, Axis Bank, a non-state-owned financial group, and mortgage lender Indiabulls Housing Finance also performed well, boosted by optimism about the new government’s economic reforms.
During the period, we invested in several Taiwanese companies that in our view had been unfairly hit by concerns about China’s economic slowdown. We established a new position in Chicony Electronics, a leading manufacturer of computer hardware equipment that is shifting capital toward higher-margin, higher-growth products. We also purchased shares in Hermes Microvision, which supplies semiconductor testing equipment.
Cosan, a Brazilian conglomerate with a fuel distribution business, was another newcomer. Positive changes are taking place in its organization, and in our view, its assets are underappreciated.
These purchases were funded by selling stakes in Shanghai Electric, a Chinese power equipment firm, and South African financial group Standard Bank after good performance.
11
Pzena Investment Management, LLC
Portfolio Managers: Caroline Cai, CFA, Principal
Allison Fisch, Principal
John P. Goetz, Managing Principal and Co-Chief Investment Officer
Our weakest individual results were from Brazilian companies Randon, Usiminas, and Petrobras, whose share prices declined as a deteriorating macro environment weighed on earnings and sentiment. We see significant value in the operating businesses of these companies despite the near-term challenges.
Industrial manufacturer Randon has been actively cutting costs and is growing market share while its rivals struggle. We expect it to be well-positioned for an eventual upturn in truck and trailer demand in Brazil.
Materials holding Usiminas, which fell on low steel demand, should benefit from the devaluation of the real and ongoing cost restructuring. Petrobras weakened as the declining real further reduced its refining profitability and stretched its balance sheet. Despite political, regulatory, and financial pressures, the stock offers extraordinary value at current prices.
Outside Brazil, the biggest detractor was Hong Kong-based Pacific Basin Shipping; shipping-related businesses experienced severe earnings and valuation pressure due to historically low rates.
Somewhat offsetting these declines was China Power International, which benefited from falling coal prices and modest corresponding tariff reductions. Investor reaction to its strong growth outlook and expectations of asset injections from parent company China Power Investment Group also boosted shares. And Hungarian financial OTP Bank was up solidly as the domestic economy improved.
Although the last 12 months have been difficult for emerging-market investors, we are excited about current valuations and the continued broadening of opportunities. We are taking selective advantage of the situation to increase our exposure to high-quality franchises and strong balance sheets.
12
Emerging Markets Select Stock Fund
| Fund Profile | |||
| As of October 31, 2015 | |||
| Portfolio Characteristics | |||
| MSCI AC | |||
| FTSE | World | ||
| Emerging | Index | ||
| Fund | Index | ex USA | |
| Number of Stocks | 269 | 946 | 1,831 |
| Median Market Cap | $10.9B | $15.5B | $30.5B |
| Price/Earnings Ratio | 14.4x | 15.9x | 17.3x |
| Price/Book Ratio | 1.3x | 1.6x | 1.7x |
| Return on Equity | 17.2% | 18.3% | 15.2% |
| Earnings Growth | |||
| Rate | 12.0% | 12.9% | 11.0% |
| Dividend Yield | 2.4% | 2.8% | 3.0% |
| Turnover Rate | 49% | — | — |
| Ticker Symbol | VMMSX | — | — |
| Expense Ratio1 | 0.96% | — | — |
| Short-Term Reserves | 1.6% | — | — |
Sector Diversification (% of equity exposure)
| MSCI | |||
| AC | |||
| FTSE | World | ||
| Emerging | Index | ||
| Fund | Index | ex USA | |
| Consumer | |||
| Discretionary | 11.5% | 8.7% | 12.1% |
| Consumer Staples | 5.0 | 8.2 | 10.8 |
| Energy | 10.4 | 8.9 | 6.5 |
| Financials | 26.3 | 30.8 | 27.1 |
| Health Care | 1.9 | 3.1 | 9.3 |
| Industrials | 7.3 | 7.4 | 11.3 |
| Information | |||
| Technology | 18.8 | 14.4 | 7.4 |
| Materials | 6.9 | 6.9 | 6.8 |
| Telecommunication | |||
| Services | 5.8 | 7.7 | 5.2 |
| Utilities | 6.1 | 3.9 | 3.5 |
| Volatility Measures | ||
| MSCI AC | ||
| FTSE | World | |
| Emerging | Index | |
| Index | ex USA | |
| R-Squared | 0.96 | 0.79 |
| Beta | 1.03 | 1.13 |
These measures show the degree and timing of the fund’s fluctuations compared with the indexes over 36 months.
Ten Largest Holdings (% of total net assets)
| Taiwan Semiconductor | ||
| Manufacturing Co. Ltd. | Semiconductors | 4.0% |
| China Construction Bank | ||
| Corp. | Diversified Banks | 1.7 |
| Samsung Electronics Co. Technology | ||
| Ltd. | Hardware, Storage & | |
| Peripherals | 1.5 | |
| Sberbank PAO | Diversified Banks | 1.4 |
| Tencent Holdings Ltd. | Internet Software & | |
| Services | 1.4 | |
| China Mobile Ltd. | Wireless | |
| Telecommunication | ||
| Services | 1.3 | |
| Naspers Ltd. | Cable & Satellite | 1.3 |
| Dongfeng Motor Group | Automobile | |
| Co. Ltd. | Manufacturers | 1.3 |
| Industrial & Commercial | ||
| Bank of China Ltd. | Diversified Banks | 1.3 |
| Lukoil PJSC | Integrated Oil & Gas | 1.2 |
| Top Ten | 16.4% | |
The holdings listed exclude any temporary cash investments and equity index products.
Allocation by Region (% of equity exposure)

1 The expense ratio shown is from the prospectus dated February 25, 2015, and represents estimated costs for the current fiscal year. For the fiscal year ended October 31, 2015, the fund’s expense ratio was 0.93%.
13
Emerging Markets Select Stock Fund
Market Diversification (% of equity exposure)
| MSCI AC | |||
| FTSE | World | ||
| Emerging | Index | ||
| Fund | Index | ex USA | |
| Europe | |||
| United Kingdom | 1.7% | 0.0% | 14.8% |
| Other | 1.4 | 0.0 | 33.2 |
| Subtotal | 3.1% | 0.0% | 48.0% |
| Pacific | |||
| South Korea | 7.0% | 0.0% | 3.3% |
| Hong Kong | 2.8 | 0.0 | 2.4 |
| Other | 0.3 | 0.0 | 22.4 |
| Subtotal | 10.1% | 0.0% | 28.1% |
| Emerging Markets | |||
| China | 24.7% | 27.9% | 4.7% |
| Taiwan | 11.1 | 14.2 | 2.5 |
| India | 10.3 | 12.8 | 1.7 |
| Brazil | 7.7 | 7.0 | 1.2 |
| Russia | 6.1 | 4.5 | 0.7 |
| South Africa | 5.3 | 9.5 | 1.6 |
| Thailand | 2.9 | 2.7 | 0.4 |
| Mexico | 2.1 | 5.6 | 1.0 |
| Hungary | 1.6 | 0.3 | 0.0 |
| Turkey | 1.5 | 1.7 | 0.3 |
| Philippines | 1.5 | 1.9 | 0.3 |
| Malaysia | 1.4 | 4.0 | 0.6 |
| Indonesia | 1.2 | 2.4 | 0.5 |
| Other | 4.8 | 5.5 | 1.7 |
| Subtotal | 82.2% | 100.0% | 17.2% |
| North America | |||
| United States | 4.4% | 0.0% | 0.0% |
| Other | 0.2 | 0.0 | 6.2 |
| Subtotal | 4.6% | 0.0% | 6.2% |
| Middle East | 0.0% | 0.0% | 0.5% |
14
Emerging Markets Select Stock Fund
Performance Summary
All of the returns in this report represent past performance, which is not a guarantee of future results that may be achieved by the fund. (Current performance may be lower or higher than the performance data cited. For performance data current to the most recent month-end, visit our website at vanguard.com/performance.) Note, too, that both investment returns and principal value can fluctuate widely, so an investor’s shares, when sold, could be worth more or less than their original cost. The returns shown do not reflect taxes that a shareholder would pay on fund distributions or on the sale of fund shares.
Cumulative Performance: June 27, 2011, Through October 31, 2015
Initial Investment of $10,000

Emerging Markets Funds Average: Derived from data provided by Lipper, a Thomson Reuters Company.
"Since Inception" performance is calculated from the inception date for both the fund and its comparative standards.
See Financial Highlights for dividend and capital gains information.
15
Emerging Markets Select Stock Fund
Fiscal-Year Total Returns (%): June 27, 2011, Through October 31, 2015

Emerging Markets Select Stock Fund
FTSE Emerging Index
Average Annual Total Returns: Periods Ended September 30, 2015
This table presents returns through the latest calendar quarter—rather than through the end of the fiscal period.
Securities and Exchange Commission rules require that we provide this information.
| Inception | One | Since | |
| Date | Year | Inception | |
| Emerging Markets Select Stock | |||
| Fund | 6/27/2011 | -22.28% | -4.86% |
16
Emerging Markets Select Stock Fund
Financial Statements
Statement of Net Assets
As of October 31, 2015
The fund reports a complete list of its holdings in regulatory filings four times in each fiscal year, at the quarter-ends. For the second and fourth fiscal quarters, the lists appear in the fund’s semiannual and annual reports to shareholders. For the first and third fiscal quarters, the fund files the lists with the Securities and Exchange Commission on Form N-Q. Shareholders can look up the fund’s Forms N-Q on the SEC’s website at sec.gov. Forms N-Q may also be reviewed and copied at the SEC’s Public Reference Room (see the back cover of this report for further information).
| Market | |||
| Value• | |||
| Shares | ($000) | ||
| Common Stocks (94.6%)1 | |||
| Argentina (0.2%) | |||
| YPF SA ADR | 21,900 | 468 | |
| Bangladesh (0.1%) | |||
| British American Tobacco | |||
| Bangladesh Co. Ltd. | 5,100 | 193 | |
| Brazil (7.2%) | |||
| Ambev SA | 564,223 | 2,793 | |
| Telefonica Brasil SA ADR | 180,554 | 1,871 | |
| MRV Engenharia e | |||
| Participacoes SA | 656,176 | 1,262 | |
| Banco Bradesco SA | |||
| Preference Shares | 223,871 | 1,219 | |
| BRF SA ADR | 77,292 | 1,185 | |
| Itau Unibanco Holding | |||
| SA ADR | 163,532 | 1,120 | |
| Vale SA Class B ADR | 269,000 | 968 | |
| Usinas Siderurgicas | |||
| de Minas Gerais SA | |||
| Preference Shares | 1,216,500 | 877 | |
| Cia de Saneamento | |||
| Basico do Estado de Sao | |||
| Paulo | 191,000 | 829 | |
| * | Petroleo Brasileiro SA | ||
| ADR | 200,400 | 800 | |
| EDP - Energias do Brasil | |||
| SA | 268,236 | 785 | |
| Randon Participacoes SA | |||
| Preference Shares | 842,718 | 618 | |
| BB Seguridade | |||
| Participacoes SA | 85,955 | 593 | |
| TOTVS SA | 58,081 | 515 | |
| * | Petroleo Brasileiro SA | ||
| Preference Shares | 254,800 | 509 | |
| BM&FBovespa SA - Bolsa | |||
| de Valores Mercadorias | |||
| e Futuros | 150,600 | 445 | |
| Market | |||
| Value• | |||
| Shares | ($000) | ||
| Telefonica Brasil SA | |||
| Preference Shares | 40,700 | 422 | |
| Cyrela Brazil Realty SA | |||
| Empreendimentos e | |||
| Participacoes | 172,983 | 402 | |
| CETIP SA - Mercados | |||
| Organizados | 44,077 | 390 | |
| * | B2W Cia Digital | 95,351 | 360 |
| Itau Unibanco Holding SA | |||
| Preference Shares | 45,294 | 311 | |
| Banco do Estado do Rio | |||
| Grande do Sul SA | |||
| Preference Shares | 104,500 | 162 | |
| * | Rumo Logistica Operadora | ||
| Multimodal SA | 64,558 | 123 | |
| Raia Drogasil SA | 11,200 | 116 | |
| Brasil Insurance | |||
| Participacoes e | |||
| Administracao SA | 276,200 | 59 | |
| 18,734 | |||
| Canada (0.2%) | |||
| First Quantum Minerals | |||
| Ltd. | 114,124 | 609 | |
| Chile (0.2%) | |||
| Banco Santander Chile | |||
| ADR | 24,275 | 461 | |
| China (23.3%) | |||
| China Construction | |||
| Bank Corp. | 6,185,250 | 4,460 | |
| Tencent Holdings Ltd. | 191,085 | 3,586 | |
| China Mobile Ltd. | 288,600 | 3,433 | |
| Dongfeng Motor Group | |||
| Co. Ltd. | 2,319,000 | 3,326 | |
| Industrial & Commercial | |||
| Bank of China Ltd. | 5,153,380 | 3,270 | |
| China Unicom Hong | |||
| Kong Ltd. | 2,175,773 | 2,666 | |
| CNOOC Ltd. | 2,098,400 | 2,387 | |
17
| Emerging Markets Select Stock Fund | |||
| Market | |||
| Value• | |||
| Shares | ($000) | ||
| Greatview Aseptic | |||
| Packaging Co. Ltd. | 4,586,140 | 2,156 | |
| China Shenhua Energy | |||
| Co. Ltd. | 1,272,500 | 2,150 | |
| China Pacific Insurance | |||
| Group Co. Ltd. | 535,412 | 2,134 | |
| China Power International | |||
| Development Ltd. | 3,158,600 | 1,984 | |
| China Life Insurance | |||
| Co. Ltd. | 547,216 | 1,962 | |
| PICC Property & Casualty | |||
| Co. Ltd. | 834,040 | 1,890 | |
| China Overseas Land & | |||
| Investment Ltd. | 549,400 | 1,770 | |
| Mindray Medical | |||
| International Ltd. ADR | 69,177 | 1,659 | |
| China Resources Power | |||
| Holdings Co. Ltd. | 662,000 | 1,495 | |
| China Lesso Group | |||
| Holdings Ltd. | 1,613,000 | 1,306 | |
| * | China Agri-Industries | ||
| Holdings Ltd. | 3,230,000 | 1,186 | |
| 2 | Sinopec Engineering | ||
| Group Co. Ltd. | 1,373,000 | 1,181 | |
| Far East Horizon Ltd. | 1,136,000 | 943 | |
| China Everbright | |||
| International Ltd. | 563,500 | 903 | |
| Lenovo Group Ltd. | 919,780 | 853 | |
| Anhui Conch Cement | |||
| Co. Ltd. | 237,000 | 722 | |
| Guangdong Investment | |||
| Ltd. | 504,550 | 709 | |
| Kingboard Laminates | |||
| Holdings Ltd. | 1,627,625 | 679 | |
| * | Luye Pharma Group Ltd. | 676,104 | 662 |
| China Cinda Asset | |||
| Management Co. Ltd. | 1,653,500 | 641 | |
| *,2 | Tianhe Chemicals Group | ||
| Ltd. | 4,142,000 | 625 | |
| Brilliance China | |||
| Automotive Holdings Ltd. | 442,700 | 611 | |
| Haier Electronics Group | |||
| Co. Ltd. | 314,241 | 606 | |
| ENN Energy Holdings Ltd. | 105,530 | 605 | |
| China Shineway | |||
| Pharmaceutical Group | |||
| Ltd. | 453,000 | 586 | |
| Huadian Fuxin Energy | |||
| Corp. Ltd. | 1,850,900 | 568 | |
| * | GCL-Poly Energy | ||
| Holdings Ltd. | 2,684,000 | 553 | |
| Baoxin Auto Group Ltd. | 1,325,000 | 549 | |
| China Shipping | |||
| Development Co. Ltd. | 684,000 | 485 | |
| Dah Chong Hong Holdings | |||
| Ltd. | 1,037,000 | 470 | |
| Market | |||
| Value• | |||
| Shares | ($000) | ||
| China Vanke Co. Ltd. | 197,630 | 461 | |
| * | Sinopec Shanghai | ||
| Petrochemical Co. Ltd. | 1,058,000 | 442 | |
| Sunny Optical Technology | |||
| Group Co. Ltd. | 167,700 | 390 | |
| ANTA Sports Products Ltd. | 135,000 | 377 | |
| Sinopharm Group Co. Ltd. | 86,400 | 356 | |
| China Suntien Green | |||
| Energy Corp. Ltd. | 1,808,000 | 323 | |
| China Longyuan Power | |||
| Group Corp. Ltd. | 344,780 | 315 | |
| China Coal Energy Co. Ltd. | 732,000 | 314 | |
| China ZhengTong Auto | |||
| Services Holdings Ltd. | 579,000 | 258 | |
| XTEP International | |||
| Holdings Ltd. | 488,500 | 253 | |
| PAX Global Technology | |||
| Ltd. | 183,000 | 238 | |
| China Dongxiang Group | |||
| Co. Ltd. | 904,000 | 229 | |
| * | Li Ning Co. Ltd. | 401,000 | 208 |
| Fosun International Ltd. | 95,331 | 173 | |
| * | Best Pacific International | ||
| Holdings Ltd. | 156,000 | 67 | |
| Shandong Weigao Group | |||
| Medical Polymer Co. Ltd. | 95,500 | 66 | |
| * | China Overseas Property | ||
| Holdings Ltd. | 130,666 | 22 | |
| 60,263 | |||
| Colombia (0.1%) | |||
| Cementos Argos SA | 98,216 | 325 | |
| Czech Republic (0.8%) | |||
| CEZ AS | 79,049 | 1,580 | |
| Komercni banka as | 2,988 | 618 | |
| 2,198 | |||
| Egypt (0.4%) | |||
| Commercial International | |||
| Bank Egypt SAE | 140,323 | 923 | |
| Greece (0.3%) | |||
| Hellenic | |||
| Telecommunications | |||
| Organization SA | 87,844 | 817 | |
| Hong Kong (2.7%) | |||
| AIA Group Ltd. | 260,036 | 1,518 | |
| Pacific Basin Shipping | |||
| Ltd. | 3,858,750 | 1,143 | |
| Galaxy Entertainment | |||
| Group Ltd. | 240,000 | 817 | |
| AMVIG Holdings Ltd. | 1,618,000 | 741 | |
| Stella International | |||
| Holdings Ltd. | 255,500 | 631 | |
| Sands China Ltd. | 161,650 | 580 | |
18
| Emerging Markets Select Stock Fund | |||
| Market | |||
| Value• | |||
| Shares | ($000) | ||
| Texwinca Holdings Ltd. | 559,000 | 542 | |
| China Mengniu Dairy Co. | |||
| Ltd. | 271,954 | 526 | |
| Towngas China Co. Ltd. | 265,440 | 180 | |
| * | Cowell e Holdings Inc. | 277,818 | 133 |
| AAC Technologies | |||
| Holdings Inc. | 20,200 | 128 | |
| Wynn Macau Ltd. | 48,000 | 66 | |
| 7,005 | |||
| Hungary (1.5%) | |||
| OTP Bank plc | 151,604 | 2,936 | |
| * | Magyar Telekom | ||
| Telecommunications plc | 739,375 | 1,025 | |
| 3,961 | |||
| India (9.6%) | |||
| Reliance Industries Ltd. | 178,952 | 2,589 | |
| Axis Bank Ltd. | 284,974 | 2,066 | |
| CESC Ltd. | 208,500 | 1,850 | |
| Tata Consultancy Services | |||
| Ltd. | 37,090 | 1,414 | |
| ICICI Bank Ltd. ADR | 149,924 | 1,292 | |
| ICICI Bank Ltd. | 276,929 | 1,169 | |
| UltraTech Cement Ltd. | 23,616 | 1,041 | |
| JK Lakshmi Cement Ltd. | 170,668 | 973 | |
| NTPC Ltd. | 479,400 | 972 | |
| Hindalco Industries Ltd. | 755,750 | 968 | |
| Bharti Airtel Ltd. | 166,901 | 889 | |
| Larsen & Toubro Ltd. | 38,371 | 826 | |
| Bharti Infratel Ltd. | 137,343 | 816 | |
| State Bank of India | 225,917 | 816 | |
| Indiabulls Housing | |||
| Finance Ltd. | 73,075 | 803 | |
| Dr Reddy’s Laboratories | |||
| Ltd. ADR | 10,742 | 696 | |
| Bank of Baroda | 273,619 | 667 | |
| Power Grid Corp. of India | |||
| Ltd. | 306,014 | 602 | |
| NHPC Ltd. | 2,157,750 | 599 | |
| Godrej Consumer | |||
| Products Ltd. | 30,793 | 594 | |
| Punjab National Bank | 220,874 | 432 | |
| Sun Pharmaceutical | |||
| Industries Ltd. | 27,334 | 371 | |
| HDFC Bank Ltd. ADR | 6,050 | 370 | |
| * | IDFC Bank Ltd. | 323,659 | 359 |
| Marico Ltd. | 60,531 | 358 | |
| Oberoi Realty Ltd. | 78,970 | 344 | |
| Idea Cellular Ltd. | 156,787 | 335 | |
| IDFC Ltd. | 323,659 | 291 | |
| Jubilant Foodworks Ltd. | 9,224 | 206 | |
| * | Grasim Industries Ltd. GDR | 2,647 | 148 |
| Union Bank of India | 52,451 | 125 | |
| 24,981 | |||
| Market | |||
| Value• | |||
| Shares | ($000) | ||
| Indonesia (1.1%) | |||
| Bank Rakyat Indonesia | |||
| Persero Tbk PT | 1,497,700 | 1,144 | |
| Telekomunikasi Indonesia | |||
| Persero Tbk PT | 3,504,900 | 693 | |
| * | Bank Tabungan | ||
| Pensiunan Nasional | |||
| Tbk PT | 2,564,000 | 489 | |
| Matahari Department | |||
| Store Tbk PT | 156,900 | 189 | |
| Sumber Alfaria Trijaya | |||
| Tbk PT | 3,529,600 | 157 | |
| * | Vale Indonesia Tbk PT | 867,300 | 140 |
| 2,812 | |||
| Kenya (0.1%) | |||
| Safaricom Ltd. | 2,488,800 | 350 | |
| Malaysia (1.2%) | |||
| Genting Malaysia Bhd. | 1,438,900 | 1,438 | |
| AirAsia Bhd. | 2,122,300 | 729 | |
| AMMB Holdings Bhd. | 528,800 | 587 | |
| Guinness Anchor Bhd. | 59,900 | 199 | |
| British American Tobacco | |||
| Malaysia Bhd. | 9,266 | 133 | |
| 3,086 | |||
| Mexico (1.8%) | |||
| * | Cemex SAB de CV ADR | 191,891 | 1,211 |
| Grupo Financiero Banorte | |||
| SAB de CV | 202,644 | 1,091 | |
| Grupo Mexico SAB de | |||
| CV Class B | 306,800 | 747 | |
| Grupo Financiero | |||
| Santander Mexico SAB | |||
| de CV ADR | 73,188 | 670 | |
| Wal-Mart de Mexico SAB | |||
| de CV | 212,500 | 561 | |
| Grupo Comercial | |||
| Chedraui SA de CV | 162,606 | 450 | |
| 4,730 | |||
| Other (1.2%) | |||
| 3 | Vanguard FTSE Emerging | ||
| Markets ETF | 85,885 | 2,992 | |
| Pakistan (0.4%) | |||
| United Bank Ltd. | 612,600 | 953 | |
| Philippines (1.4%) | |||
| Energy Development | |||
| Corp. | 10,081,293 | 1,423 | |
| Metropolitan Bank & | |||
| Trust Co. | 604,323 | 1,096 | |
| Universal Robina Corp. | 103,200 | 440 | |
19
Emerging Markets Select Stock Fund
| Market | |||
| Value• | |||
| Shares | ($000) | ||
| Robinsons Land Corp. | 416,600 | 272 | |
| Petron Corp. | 1,069,300 | 185 | |
| Puregold Price Club Inc. | 113,200 | 87 | |
| 3,503 | |||
| Poland (0.8%) | |||
| * | Cyfrowy Polsat SA | 256,525 | 1,653 |
| Bank Pekao SA | 10,806 | 419 | |
| 2,072 | |||
| Qatar (0.4%) | |||
| Industries Qatar QSC | 28,856 | 975 | |
| Romania (0.1%) | |||
| 2 | Electrica SA GDR | 24,120 | 285 |
| Russia (5.8%) | |||
| * | Lukoil PJSC ADR | 89,047 | 3,232 |
| Rosneft OAO GDR | 639,610 | 2,551 | |
| Sberbank PAO ADR XLON | 314,217 | 1,920 | |
| Gazprom PAO ADR | 395,565 | 1,667 | |
| Moscow Exchange | |||
| MICEX-RTS OAO | 725,696 | 1,021 | |
| Sberbank PAO | 674,685 | 956 | |
| Magnit PJSC GDR | 18,632 | 846 | |
| Sberbank PAO ADR | 129,449 | 791 | |
| PhosAgro OAO GDR | 51,744 | 698 | |
| Gazprom Neft PAO ADR | 43,600 | 494 | |
| O’Key Group SA GDR | 166,144 | 349 | |
| Etalon Group Ltd. GDR | 137,219 | 265 | |
| MMC Norilsk Nickel PJSC | |||
| ADR | 17,427 | 258 | |
| 15,048 | |||
| Singapore (0.3%) | |||
| Ezion Holdings Ltd. | 1,634,200 | 810 | |
| South Africa (4.8%) | |||
| Naspers Ltd. | 22,919 | 3,348 | |
| Sasol Ltd. | 89,551 | 2,852 | |
| Imperial Holdings Ltd. | 139,455 | 1,815 | |
| Reunert Ltd. | 247,638 | 1,207 | |
| Barloworld Ltd. | 205,999 | 1,163 | |
| Discovery Ltd. | 58,473 | 625 | |
| Woolworths Holdings Ltd. | 61,217 | 453 | |
| * | AngloGold Ashanti Ltd. | ||
| ADR | 53,300 | 450 | |
| * | Mr Price Group Ltd. | 12,774 | 196 |
| Pick n Pay Stores Ltd. | 37,348 | 180 | |
| * | Aveng Ltd. | 511,216 | 126 |
| Adcock Ingram Holdings | |||
| Ltd. | 20,905 | 78 | |
| * | Adbee Rf Ltd. | 3,689 | 9 |
| * | Adcock Ingram Holdings | ||
| Ltd. Warrants Expires | |||
| 7/26/2019 | 1,142 | 1 | |
| 12,503 | |||
| Market | |||
| Value• | |||
| Shares | ($000) | ||
| South Korea (6.2%) | |||
| Samsung Electronics Co. Ltd. | 3,171 | 3,798 | |
| SK Hynix Inc. | 68,675 | 1,835 | |
| Hyundai Motor Co. | 12,421 | 1,697 | |
| Kia Motors Corp. | 24,239 | 1,183 | |
| Hyundai Heavy Industries | |||
| Co. Ltd. | 13,820 | 1,146 | |
| Dongbu Insurance Co. Ltd. | 17,400 | 1,044 | |
| KB Financial Group Inc. | 32,070 | 1,016 | |
| Hana Financial Group Inc. | 41,280 | 1,002 | |
| Hotel Shilla Co. Ltd. | 9,928 | 953 | |
| POSCO | 5,375 | 862 | |
| LG Electronics Inc. | 12,775 | 549 | |
| Shinhan Financial Group | |||
| Co. Ltd. | 12,650 | 481 | |
| LG Chem Ltd. | 1,702 | 451 | |
| Doosan Corp. | 1,302 | 126 | |
| 16,143 | |||
| Spain (0.6%) | |||
| Prosegur Cia de Seguridad | |||
| SA | 351,896 | 1,566 | |
| Sweden (0.0%) | |||
| * | Vostok Emerging Finance | ||
| Ltd. | 95,461 | 27 | |
| Switzerland (0.5%) | |||
| * | Dufry AG | 10,355 | 1,210 |
| Taiwan (10.3%) | |||
| Taiwan Semiconductor | |||
| Manufacturing Co. Ltd. | |||
| ADR | 265,972 | 5,841 | |
| Taiwan Semiconductor | |||
| Manufacturing Co. Ltd. | 1,055,243 | 4,460 | |
| Compal Electronics Inc. | 4,103,000 | 2,545 | |
| Delta Electronics Inc. | 427,782 | 2,169 | |
| Hon Hai Precision | |||
| Industry Co. Ltd. | 720,098 | 1,909 | |
| Teco Electric and | |||
| Machinery Co. Ltd. | 1,601,000 | 1,394 | |
| Chicony Electronics Co. | |||
| Ltd. | 473,964 | 1,126 | |
| Globalwafers Co. Ltd. | 523,459 | 1,117 | |
| Hermes Microvision Inc. | 23,000 | 877 | |
| eMemory Technology Inc. | 83,100 | 850 | |
| Mega Financial Holding | |||
| Co. Ltd. | 928,779 | 674 | |
| Yuanta Financial Holding | |||
| Co. Ltd. | 1,558,165 | 610 | |
| Casetek Holdings Ltd. | 139,000 | 606 | |
| Airtac International Group | 111,315 | 576 | |
| Largan Precision Co. Ltd. | 4,975 | 384 | |
| Catcher Technology | |||
| Co. Ltd. | 31,615 | 308 | |
20
| Emerging Markets Select Stock Fund | |||
| Market | |||
| Value• | |||
| Shares | ($000) | ||
| Advantech Co. Ltd. | 32,038 | 229 | |
| Silergy Corp. | 19,388 | 197 | |
| President Chain Store Corp. | 28,700 | 190 | |
| King Yuan Electronics | |||
| Co. Ltd. | 274,000 | 174 | |
| PChome Online Inc. | 11,418 | 127 | |
| Poya International Co. Ltd. | 8,080 | 92 | |
| Eclat Textile Co. Ltd. | 6,000 | 88 | |
| 26,543 | |||
| Thailand (2.7%) | |||
| Bangkok Bank PCL | 309,400 | 1,454 | |
| Krung Thai Bank PCL | |||
| (Foreign) | 2,225,975 | 1,069 | |
| Airports of Thailand PCL | 87,400 | 731 | |
| Kasikornbank PCL | 150,500 | 728 | |
| Total Access | |||
| Communication PCL | 378,900 | 722 | |
| * | Precious Shipping PCL | 2,968,073 | 566 |
| Tesco Lotus Retail | |||
| Growth Freehold & | |||
| Leasehold Property | |||
| Fund | 1,124,600 | 417 | |
| CP ALL PCL (Foreign) | 262,100 | 368 | |
| PTT Global Chemical PCL | 181,444 | 283 | |
| Delta Electronics Thai | |||
| PCL (Foreign) | 113,600 | 269 | |
| Hana Microelectronics | |||
| PCL (Foreign) | 256,800 | 248 | |
| KCE Electronics PCL | 60,600 | 105 | |
| * | Precious Shipping PCL | ||
| Warrants 6/15/2018 | 62,952 | — | |
| 6,960 | |||
| Turkey (1.4%) | |||
| * | Tupras Turkiye Petrol | ||
| Rafinerileri AS | 50,918 | 1,345 | |
| Akbank TAS | 513,625 | 1,319 | |
| Turkiye Halk Bankasi AS | 237,664 | 892 | |
| Ulker Biskuvi Sanayi AS | 19,564 | 132 | |
| 3,688 | |||
| United Arab Emirates (0.9%) | |||
| Union National Bank PJSC | 741,687 | 1,130 | |
| Abu Dhabi Commercial | |||
| Bank PJSC | 218,325 | 446 | |
| * | Emaar Malls Group PJSC | 518,795 | 442 |
| Dubai Financial Market | |||
| PJSC | 672,874 | 262 | |
| 2,280 | |||
| Market | |||
| Value• | |||
| Shares | ($000) | ||
| United Kingdom (1.7%) | |||
| Petrofac Ltd. | 108,216 | 1,401 | |
| Standard Chartered plc | 124,607 | 1,368 | |
| * | Ophir Energy plc | 386,040 | 570 |
| SABMiller plc | 8,280 | 509 | |
| Coca-Cola HBC AG | 18,109 | 432 | |
| 4,280 | |||
| United States (4.3%) | |||
| Hollysys Automation | |||
| Technologies Ltd. | 85,658 | 1,832 | |
| * | Genpact Ltd. | 60,085 | 1,489 |
| * | Baidu Inc. ADR | 7,313 | 1,371 |
| * | Flextronics International Ltd. 102,750 | 1,170 | |
| * | Trina Solar Ltd. ADR | 103,000 | 1,050 |
| * | JD.com Inc. ADR | 36,971 | 1,021 |
| Southern Copper Corp. | 34,800 | 966 | |
| * | Cognizant Technology | ||
| Solutions Corp. Class A | 10,000 | 681 | |
| Cosan Ltd. | 172,603 | 604 | |
| * | UTi Worldwide Inc. | 83,889 | 598 |
| * | Alibaba Group Holding | ||
| Ltd. ADR | 2,820 | 236 | |
| * | Vipshop Holdings Ltd. ADR | 4,418 | 91 |
| Avon Products Inc. | 21,783 | 88 | |
| 11,197 | |||
| Total Common Stocks | |||
| (Cost $286,015) | 244,951 | ||
| Temporary Cash Investments (5.5%)1 | |||
| Money Market Fund (5.3%) | |||
| 4 | Vanguard Market Liquidity | ||
| Fund, 0.207% | 13,665,816 | 13,666 | |
| Face | |||
| Amount | |||
| ($000) | |||
| U.S. Government and Agency Obligations (0.2%) | |||
| 5,6 | Freddie Mac Discount | ||
| Notes, 0.220%, 4/15/16 | 600 | 600 | |
| Total Temporary Cash Investments | |||
| (Cost $14,265) | 14,266 | ||
| Total Investments (100.1%) | |||
| (Cost $300,280) | 259,217 | ||
21
| Emerging Markets Select Stock Fund | |
| Amount | |
| ($000) | |
| Other Assets and Liabilities (-0.1%) | |
| Other Assets | |
| Investment in Vanguard | 22 |
| Receivables for Investment Securities Sold | 390 |
| Receivables for Accrued Income | 592 |
| Receivables for Capital Shares Issued | 304 |
| Other Assets | 500 |
| Total Other Assets | 1,808 |
| Liabilities | |
| Payables for Investment Securities | |
| Purchased | (1,224) |
| Payables to Investment Advisor | (332) |
| Payables for Capital Shares Redeemed | (274) |
| Payables to Vanguard | (272) |
| Other Liabilities | (2) |
| Total Liabilities | (2,104) |
| Net Assets (100%) | |
| Applicable to 15,709,504 outstanding | |
| $.001 par value shares of beneficial | |
| interest (unlimited authorization) | 258,921 |
| Net Asset Value Per Share | $16.48 |
| At October 31, 2015, net assets consisted of: | |
| Amount | |
| ($000) | |
| Paid-in Capital | 308,054 |
| Undistributed Net Investment Income | 3,894 |
| Accumulated Net Realized Losses | (12,499) |
| Unrealized Appreciation (Depreciation) | |
| Investment Securities | (41,063) |
| Futures Contracts | 547 |
| Foreign Currencies | (12) |
| Net Assets | 258,921 |
• See Note A in Notes to Financial Statements. * Non-income-producing security.
1 The fund invests a portion of its cash reserves in equity markets through the use of index futures contracts. After giving effect to futures investments, the fund’s effective common stock and temporary cash investment positions represent 98.5% and 1.6%, respectively, of net assets.
2 Security exempt from registration under Rule 144A of the Securities Act of 1933. Such securities may be sold in transactions exempt from registration, normally to qualified institutional buyers. At October 31, 2015, the aggregate value of these securities was $2,091,000, representing 0.8% of net assets.
3 Considered an affiliated company of the fund as the issuer is another member of The Vanguard Group.
4 Affiliated money market fund available only to Vanguard funds and certain trusts and accounts managed by Vanguard. Rate shown is the 7-day yield.
5 The issuer was placed under federal conservatorship in September 2008; since that time, its daily operations have been managed by the Federal Housing Finance Agency and it receives capital from the U.S. Treasury, as needed to maintain a positive net worth, in exchange for senior preferred stock.
6 Securities with a value of $600,000 have been segregated as initial margin for open futures contracts. ADR—American Depositary Receipt.
GDR—Global Depositary Receipt.
See accompanying Notes, which are an integral part of the Financial Statements.
22
| Emerging Markets Select Stock Fund | |
| Statement of Operations | |
| Year Ended | |
| October 31, 2015 | |
| ($000) | |
| Investment Income | |
| Income | |
| Dividends1,2 | 7,074 |
| Interest2 | 19 |
| Securities Lending | 6 |
| Total Income | 7,099 |
| Expenses | |
| Investment Advisory Fees—Note B | |
| Basic Fee | 1,488 |
| Performance Adjustment | 8 |
| The Vanguard Group—Note C | |
| Management and Administrative | 658 |
| Marketing and Distribution | 55 |
| Custodian Fees | 317 |
| Auditing Fees | 40 |
| Shareholders’ Reports | 51 |
| Trustees’ Fees and Expenses | 1 |
| Total Expenses | 2,618 |
| Net Investment Income | 4,481 |
| Realized Net Gain (Loss) | |
| Investment Securities Sold2 | (7,148) |
| Futures Contracts | (3,124) |
| Foreign Currencies | (98) |
| Realized Net Gain (Loss) | (10,370) |
| Change in Unrealized Appreciation (Depreciation) | |
| Investment Securities | (48,256) |
| Futures Contracts | 1,046 |
| Foreign Currencies | (3) |
| Change in Unrealized Appreciation (Depreciation) | (47,213) |
| Net Increase (Decrease) in Net Assets Resulting from Operations | (53,102) |
1 Dividends are net of foreign withholding taxes of $664,000
2 Dividend income, interest income, and realized net gain (loss) from affiliated companies of the fund were $75,000, $19,000, and ($172,000), respectively.
See accompanying Notes, which are an integral part of the Financial Statements.
23
| Emerging Markets Select Stock Fund | ||
| Statement of Changes in Net Assets | ||
| Year Ended October 31, | ||
| 2015 | 2014 | |
| ($000) | ($000) | |
| Increase (Decrease) in Net Assets | ||
| Operations | ||
| Net Investment Income | 4,481 | 4,242 |
| Realized Net Gain (Loss) | (10,370) | 1,726 |
| Change in Unrealized Appreciation (Depreciation) | (47,213) | (7,367) |
| Net Increase (Decrease) in Net Assets Resulting from Operations | (53,102) | (1,399) |
| Distributions | ||
| Net Investment Income | (3,870) | (3,195) |
| Realized Capital Gain | — | — |
| Total Distributions | (3,870) | (3,195) |
| Capital Share Transactions | ||
| Issued | 86,694 | 165,556 |
| Issued in Lieu of Cash Distributions | 3,672 | 3,031 |
| Redeemed | (85,487) | (75,525) |
| Net Increase (Decrease) from Capital Share Transactions | 4,879 | 93,062 |
| Total Increase (Decrease) | (52,093) | 88,468 |
| Net Assets | ||
| Beginning of Period | 311,014 | 222,546 |
| End of Period1 | 258,921 | 311,014 |
1 Net Assets—End of Period includes undistributed (overdistributed) net investment income of $3,894,000 and $3,339,000.
See accompanying Notes, which are an integral part of the Financial Statements.
24
| Emerging Markets Select Stock Fund | |||||
| Financial Highlights | |||||
| June 14, | |||||
| 20111 to | |||||
| Year Ended October 31, | |||||
| For a Share Outstanding | Oct. 31, | ||||
| Throughout Each Period | 2015 | 2014 | 2013 | 2012 | 2011 |
| Net Asset Value, Beginning of Period | $20.13 | $20.37 | $18.73 | $17.69 | $20.00 |
| Investment Operations | |||||
| Net Investment Income | .290 | .264 | .3032 | .3022 | .079 2 |
| Net Realized and Unrealized Gain (Loss) | |||||
| on Investments 3 | (3.685) | (.242) | 1.567 | .764 | (2.389) |
| Total from Investment Operations | (3.395) | .022 | 1.870 | 1.066 | (2.310) |
| Distributions | |||||
| Dividends from Net Investment Income | (. 255) | (. 262) | (. 230) | (. 026) | — |
| Distributions from Realized Capital Gains | — | — | — | — | — |
| Total Distributions | (. 255) | (. 262) | (. 230) | (. 026) | — |
| Net Asset Value, End of Period | $16.48 | $20.13 | $20.37 | $18.73 | $17.69 |
| Total Return4 | -16.99% | 0.15% | 10.04% | 6.04% | -11.55% |
| Ratios/Supplemental Data | |||||
| Net Assets, End of Period (Millions) | $259 | $311 | $223 | $110 | $48 |
| Ratio of Total Expenses to Average Net Assets5 | 0.93% | 0.96% | 0.94% | 0.92% | 0.89%6 |
| Ratio of Net Investment Income to | |||||
| Average Net Assets | 1.59% | 1.53% | 1.55% | 1.66% | 1.09%6 |
| Portfolio Turnover Rate | 49% | 54% | 54% | 93% | 18% |
1 Subscription period for the fund was June 14, 2011, to June 27, 2011, during which time all assets were held in money market instruments. Performance measurement began June 27, 2011, at a net asset value of $20.00.
2 Calculated based on average shares outstanding.
3 Includes increases from redemption fees of $.00, $.00, $.00, $.00, and $.01. Effective May 23, 2012, the redemption fee was eliminated.
4 Total returns do not include transaction or account service fees that may have applied in the periods shown. Fund prospectuses provide information about any applicable transaction and account service fees.
5 Includes performance-based investment advisory fee increases (decreases) of 0.00%, 0.04%, 0.02%, 0.01%, and 0.00%.
6 Annualized.
See accompanying Notes, which are an integral part of the Financial Statements.
25
Emerging Markets Select Stock Fund
Notes to Financial Statements
Vanguard Emerging Markets Select Stock Fund is registered under the Investment Company Act of 1940 as an open-end investment company, or mutual fund. The fund invests in securities of foreign issuers, which may subject it to investment risks not normally associated with investing in securities of U.S. corporations.
A. The following significant accounting policies conform to generally accepted accounting principles for U.S. investment companies. The fund consistently follows such policies in preparing its financial statements.
1. Security Valuation: Securities are valued as of the close of trading on the New York Stock Exchange (generally 4 p.m., Eastern time) on the valuation date. Equity securities are valued at the latest quoted sales prices or official closing prices taken from the primary market in which each security trades; such securities not traded on the valuation date are valued at the mean of the latest quoted bid and asked prices. Securities for which market quotations are not readily available, or whose values have been affected by events occurring before the fund’s pricing time but after the close of the securities’ primary markets, are valued at their fair values calculated according to procedures adopted by the board of trustees. These procedures include obtaining quotations from an independent pricing service, monitoring news to identify significant market- or security-specific events, and evaluating changes in the values of foreign market proxies (for example, ADRs, futures contracts, or exchange-traded funds), between the time the foreign markets close and the fund’s pricing time. When fair-value pricing is employed, the prices of securities used by a fund to calculate its net asset value may differ from quoted or published prices for the same securities. Investments in Vanguard Market Liquidity Fund are valued at that fund’s net asset value. Temporary cash investments acquired over 60 days to maturity are valued using the latest bid prices or using valuations based on a matrix system (which considers such factors as security prices, yields, maturities, and ratings), both as furnished by independent pricing services. Other temporary cash investments are valued at amortized cost, which approximates market value.
2. Foreign Currency: Securities and other assets and liabilities denominated in foreign currencies are translated into U.S. dollars using exchange rates obtained from an independent third party as of the fund’s pricing time on the valuation date. Realized gains (losses) and unrealized appreciation (depreciation) on investment securities include the effects of changes in exchange rates since the securities were purchased, combined with the effects of changes in security prices. Fluctuations in the value of other assets and liabilities resulting from changes in exchange rates are recorded as unrealized foreign currency gains (losses) until the assets or liabilities are settled in cash, at which time they are recorded as realized foreign currency gains (losses).
3. Futures Contracts: The fund uses index futures contracts to a limited extent, with the objective of maintaining full exposure to the stock market while maintaining liquidity. The fund may purchase or sell futures contracts to achieve a desired level of investment, whether to accommodate portfolio turnover or cash flows from capital share transactions. The primary risks associated with the use of futures contracts are imperfect correlation between changes in market values of stocks held by the fund and the prices of futures contracts, and the possibility of an illiquid market. Counterparty risk involving futures is mitigated because a regulated clearinghouse is the counterparty instead of the clearing broker. To further mitigate counterparty risk, the fund trades futures contracts on an exchange, monitors the financial strength of its clearing brokers and clearinghouse, and has entered into clearing agreements with its clearing brokers. The clearinghouse imposes initial margin requirements to secure the fund’s performance and requires daily settlement of variation margin representing changes in the market value of each contract.
26
Emerging Markets Select Stock Fund
Futures contracts are valued at their quoted daily settlement prices. The aggregate settlement values of the contracts are not recorded in the Statement of Net Assets. Fluctuations in the value of the contracts are recorded in the Statement of Net Assets as an asset (liability) and in the Statement of Operations as unrealized appreciation (depreciation) until the contracts are closed, when they are recorded as realized futures gains (losses).
During the year ended October 31, 2015, the fund’s average investments in long and short futures contracts represented 4% and 0% of net assets, respectively, based on the average of aggregate settlement values at each quarter-end during the period.
4. Federal Income Taxes: The fund intends to continue to qualify as a regulated investment company and distribute all of its taxable income. Management has analyzed the fund’s tax positions taken for all open federal income tax years (October 31, 2012–2015), and has concluded that no provision for federal income tax is required in the fund’s financial statements.
5. Distributions: Distributions to shareholders are recorded on the ex-dividend date.
6. Securities Lending: To earn additional income, the fund lends its securities to qualified institutional borrowers. Security loans are required to be secured at all times by collateral in an amount at least equal to the market value of securities loaned. Daily market fluctuations could cause the value of loaned securities to be more or less than the value of the collateral received. When this occurs, the collateral is adjusted and settled on the next business day. The fund further mitigates its counterparty risk by entering into securities lending transactions only with a diverse group of prequalified counter-parties, monitoring their financial strength, and entering into master securities lending agreements with its counterparties. The master securities lending agreements provide that, in the event of a counterparty’s default (including bankruptcy), the fund may terminate any loans with that borrower, determine the net amount owed, and sell or retain the collateral up to the net amount owed to the fund; however, such actions may be subject to legal proceedings. While collateral mitigates counter-party risk, in the absence of a default the fund may experience delays and costs in recovering the securities loaned. The fund invests cash collateral received in Vanguard Market Liquidity Fund, and records a liability in the Statement of Net Assets for the return of the collateral, during the period the securities are on loan. Securities lending income represents fees charged to borrowers plus income earned on invested cash collateral, less expenses associated with the loan.
7. Credit Facility: The fund and certain other funds managed by The Vanguard Group (“Vanguard”) participate in a $3 billion committed credit facility provided by a syndicate of lenders pursuant to a credit agreement that may be renewed annually; each fund is individually liable for its borrowings, if any, under the credit facility. Borrowings may be utilized for temporary and emergency purposes, and are subject to the fund’s regulatory and contractual borrowing restrictions. The participating funds are charged administrative fees and an annual commitment fee of 0.06% of the undrawn amount of the facility; these fees are allocated to the funds based on a method approved by the fund’s board of trustees and included in Management and Administrative expenses on the fund’s Statement of Operations. Any borrowings under this facility bear interest at a rate equal to the higher of the federal funds rate or LIBOR reference rate plus an agreed-upon spread.
The fund had no borrowings outstanding at October 31, 2015, or at any time during the period then ended.
27
Emerging Markets Select Stock Fund
8. Other: Dividend income is recorded on the ex-dividend date. Interest income includes income distributions received from Vanguard Market Liquidity Fund and is accrued daily. Premiums and discounts on debt securities purchased are amortized and accreted, respectively, to interest income over the lives of the respective securities. Security transactions are accounted for on the date securities are bought or sold. Costs used to determine realized gains (losses) on the sale of investment securities are those of the specific securities sold.
B. The investment advisory firms Wellington Management Company LLP, Oaktree Capital Management, L.P., M&G Investment Management Limited, and Pzena Investment Management, LLC, each provide investment advisory services to a portion of the fund for a fee calculated at an annual percentage rate of average net assets managed by the advisor. The basic fees of Wellington Management Company LLP, Oaktree Capital Management, L.P., M&G Investment Management Limited, and Pzena Investment Management, LLC, are subject to quarterly adjustments based on performance since July 31, 2011, relative to the MSCI Emerging Markets Index for the periods prior to August 1, 2013, and to the current benchmark, FTSE Emerging Index, beginning August 1, 2013. The benchmark change will be fully phased in by July 2016.
Vanguard manages the cash reserves of the fund as described below.
For the year ended October 31, 2015, the aggregate investment advisory fee represented an effective annual basic rate of 0.53% of the fund’s average net assets, before an increase of $8,000 (0.00%) based on performance.
C. In accordance with the terms of a Funds’ Service Agreement (the “FSA”) between Vanguard and the fund, Vanguard furnishes to the fund corporate management, administrative, marketing, distribution and cash management services at Vanguard’s cost of operations (as defined by the FSA). These costs of operations are allocated to the fund based on methods and guidelines approved by the board of trustees. Vanguard does not require reimbursement in the current period for certain costs of operations (such as deferred compensation/benefits and risk/insurance costs); the fund’s liability for these costs of operations is included in Payables to Vanguard on the Statement of Net Assets.
Upon the request of Vanguard, the fund may invest up to 0.40% of its net assets as capital in Vanguard. At October 31, 2015, the fund had contributed to Vanguard capital in the amount of $22,000, representing 0.01% of the fund’s net assets and 0.01% of Vanguard’s capitalization. The fund’s trustees and officers are also directors and employees, respectively, of Vanguard.
D. Various inputs may be used to determine the value of the fund’s investments. These inputs are summarized in three broad levels for financial statement purposes. The inputs or methodologies used to value securities are not necessarily an indication of the risk associated with investing in those securities.
Level 1—Quoted prices in active markets for identical securities.
Level 2—Other significant observable inputs (including quoted prices for similar securities, interest rates, prepayment speeds, credit risk, etc.).
Level 3—Significant unobservable inputs (including the fund’s own assumptions used to determine the fair value of investments).
28
Emerging Markets Select Stock Fund
The following table summarizes the market value of the fund’s investments as of October 31, 2015, based on the inputs used to value them:
| Level 1 | Level 2 | Level 3 | |
| Investments | ($000) | ($000) | ($000) |
| Common Stocks—North and South America | 23,734 | 12,790 | — |
| Common Stocks—Other | 17,323 | 189,202 | 1,902 |
| Temporary Cash Investments | 13,666 | 600 | — |
| Futures Contracts—Assets1 | 29 | — | — |
| Total | 54,752 | 202,592 | 1,902 |
| 1 Represents variation margin on the last day of the reporting period. |
Securities in certain countries may transfer between Level 1 and Level 2 because of differences in stock market closure times that may result from transitions between standard and daylight saving time in those countries and the United States. Based on values on the date of transfer, securities valued at $16,767,000 based on Level 1 inputs were transferred from Level 2 during the fiscal year. Additionally, based on values on the date of transfer, securities valued at $13,291,000 based on Level 2 inputs were transferred from Level 1 during the fiscal year.
E. At October 31, 2015, the aggregate settlement value of open futures contracts and the related unrealized appreciation (depreciation) were:
| ($000) | ||||
| Aggregate | ||||
| Number of | Settlement | Unrealized | ||
| Long (Short) | Value | Appreciation | ||
| Futures Contracts | Expiration | Contracts | Long (Short) | (Depreciation) |
| MSCI Emerging Markets Index | December 2015 | 238 | 10,040 | 547 |
Unrealized appreciation (depreciation) on open futures contracts is required to be treated as realized gain (loss) for tax purposes.
F. Distributions are determined on a tax basis and may differ from net investment income and realized capital gains for financial reporting purposes. Differences may be permanent or temporary. Permanent differences are reclassified among capital accounts in the financial statements to reflect their tax character. Temporary differences arise when certain items of income, expense, gain, or loss are recognized in different periods for financial statement and tax purposes. These differences will reverse at some time in the future. Differences in classification may also result from the treatment of short-term gains as ordinary income for tax purposes.
29
Emerging Markets Select Stock Fund
During the year ended October 31, 2015, the fund realized net foreign currency losses of $98,000, which decreased distributable net income for tax purposes; accordingly, such losses have been reclassified from accumulated net realized losses to undistributed net investment income. Certain of the fund’s investments are in securities considered to be passive foreign investment companies, for which any unrealized appreciation and/or realized gains are required to be included in distributable net income for tax purposes. During the year ended October 31, 2015, the fund realized gains on the sale of passive foreign investment companies of $234,000, which have been included in current and prior periods’ taxable income; accordingly, such gains have been reclassified from accumulated net realized losses to undistributed net investment income. Passive foreign investment companies held at October 31, 2015, had unrealized appreciation of $99,000, all of which has been distributed and is reflected in the balance of undistributed net investment income.
The fund realized gains on the sale of securities that were subject to capital gains tax in certain foreign countries. Capital gains taxes reduce realized gains for financial statement purposes but are treated as an expense for tax purposes. Accordingly, $192,000 of capital gains tax has been reclassified from accumulated net realized losses to undistributed net investment income.
For tax purposes, at October 31, 2015, the fund had $4,232,000 of ordinary income available for distribution. The fund had available capital losses totaling $11,633,000 that may be carried forward indefinitely to offset future net capital gains.
At October 31, 2015, the cost of investment securities for tax purposes was $300,699,000. Net unrealized depreciation of investment securities for tax purposes was $41,482,000, consisting of unrealized gains of $20,462,000 on securities that had risen in value since their purchase and $61,944,000 in unrealized losses on securities that had fallen in value since their purchase.
G. During the year ended October 31, 2015, the fund purchased $136,031,000 of investment securities and sold $130,815,000 of investment securities, other than temporary cash investments.
| H. Capital shares issued and redeemed were: | ||
| Year Ended October 31, | ||
| 2015 | 2014 | |
| Shares | Shares | |
| (000) | (000) | |
| Issued | 4,783 | 8,163 |
| Issued in Lieu of Cash Distributions | 201 | 156 |
| Redeemed | (4,724) | (3,793) |
| Net Increase (Decrease) in Shares Outstanding | 260 | 4,526 |
I. Management has determined that no material events or transactions occurred subsequent to October 31, 2015, that would require recognition or disclosure in these financial statements.
30
Report of Independent Registered Public Accounting Firm
To the Board of Trustees of Vanguard Trustees’ Equity Fund and the Shareholders of Vanguard Emerging Markets Select Stock Fund: In our opinion, the accompanying statement of net assets and the related statements of operations and of changes in net assets and the financial highlights present fairly, in all material respects, the financial position of Vanguard Emerging Markets Select Stock Fund (constituting a separate portfolio of Vanguard Trustees’ Equity Fund, hereafter referred to as the “Fund”) at October 31, 2015, the results of its operations for the year then ended, the changes in its net assets for each of the two years in the period then ended, and the financial highlights for each of the periods indicated, in conformity with accounting principles generally accepted in the United States of America. These financial statements and financial highlights (hereafter referred to as “financial statements”) are the responsibility of the Fund’s management. Our responsibility is to express an opinion on these financial statements based on our audits. We conducted our audits of these financial statements in accordance with the standards of the Public Company Accounting Oversight Board (United States). Those standards require that we plan and perform the audit to obtain reasonable assurance about whether the financial statements are free of material misstatement. An audit includes examining, on a test basis, evidence supporting the amounts and disclosures in the financial statements, assessing the accounting principles used and significant estimates made by management, and evaluating the overall financial statement presentation. We believe that our audits, which included confirmation of securities at October 31, 2015 by correspondence with the custodian and brokers, by agreement to the underlying ownership records of the transfer agent and the application of alternative auditing procedures where securities purchased had not been received, provide a reasonable basis for our opinion.
/s/PricewaterhouseCoopers LLP
Philadelphia, Pennsylvania
December 15, 2015
Special 2015 tax information (unaudited) for Vanguard Emerging Markets Select Stock Fund
This information for the fiscal year ended October 31, 2015, is included pursuant to provisions of the Internal Revenue Code.
The fund distributed $2,744,000 of qualified dividend income to shareholders during the fiscal year.
The fund designates to shareholders foreign source income of $7,577,000 and foreign taxes paid of $858,000. Shareholders will receive more detailed information with their Form 1099-DIV in January 2016 to determine the calendar-year amounts to be included on their 2015 tax returns.
31
Your Fund’s After-Tax Returns
This table presents returns for your fund both before and after taxes. The after-tax returns are shown in two ways: (1) assuming that an investor owned the fund during the entire period and paid taxes on the fund’s distributions, and (2) assuming that an investor paid taxes on the fund’s distributions and sold all shares at the end of each period.
Calculations are based on the highest individual federal income tax and capital gains tax rates in effect at the times of the distributions and the hypothetical sales. State and local taxes were not considered. After-tax returns reflect any qualified dividend income, using actual prior-year figures and estimates for 2015. (In the example, returns after the sale of fund shares may be higher than those assuming no sale. This occurs when the sale would have produced a capital loss. The calculation assumes that the investor received a tax deduction for the loss.)
Please note that your actual after-tax returns will depend on your tax situation and may differ from those shown. Also note that if you own the fund in a tax-deferred account, such as an individual retirement account or a 401(k) plan, this information does not apply to you. Such accounts are not subject to current taxes.
Finally, keep in mind that a fund’s performance—whether before or after taxes—does not guarantee future results.
| Average Annual Total Returns: Emerging Markets Select Stock Fund | ||
| Periods Ended October 31, 2015 | ||
| Since | ||
| One | Inception | |
| Year | (6/27/2011) | |
| Returns Before Taxes | -16.99% | -3.46% |
| Returns After Taxes on Distributions | -17.21 | -3.62 |
| Returns After Taxes on Distributions and Sale of Fund Shares | -9.30 | -2.52 |
32
About Your Fund’s Expenses
As a shareholder of the fund, you incur ongoing costs, which include costs for portfolio management, administrative services, and shareholder reports (like this one), among others. Operating expenses, which are deducted from a fund’s gross income, directly reduce the investment return of the fund.
A fund’s expenses are expressed as a percentage of its average net assets. This figure is known as the expense ratio. The following examples are intended to help you understand the ongoing costs (in dollars) of investing in your fund and to compare these costs with those of other mutual funds. The examples are based on an investment of $1,000 made at the beginning of the period shown and held for the entire period.
The accompanying table illustrates your fund’s costs in two ways:
• Based on actual fund return. This section helps you to estimate the actual expenses that you paid over the period. The ”Ending Account Value“ shown is derived from the fund‘s actual return, and the third column shows the dollar amount that would have been paid by an investor who started with $1,000 in the fund. You may use the information here, together with the amount you invested, to estimate the expenses that you paid over the period.
To do so, simply divide your account value by $1,000 (for example, an $8,600 account value divided by $1,000 = 8.6), then multiply the result by the number given for your fund under the heading ”Expenses Paid During Period.“
• Based on hypothetical 5% yearly return. This section is intended to help you compare your fund‘s costs with those of other mutual funds. It assumes that the fund had a yearly return of 5% before expenses, but that the expense ratio is unchanged. In this case—because the return used is not the fund’s actual return—the results do not apply to your investment. The example is useful in making comparisons because the Securities and Exchange Commission requires all mutual funds to calculate expenses based on a 5% return. You can assess your fund’s costs by comparing this hypothetical example with the hypothetical examples that appear in shareholder reports of other funds.
Note that the expenses shown in the table are meant to highlight and help you compare ongoing costs only and do not reflect transaction costs incurred by the fund for buying and selling securities. Further, the expenses do not include any purchase, redemption, or account service fees described in the fund prospectus. If such fees were applied to your account, your costs would be higher. Your fund does not carry a “sales load.”
The calculations assume no shares were bought or sold during the period. Your actual costs may have been higher or lower, depending on the amount of your investment and the timing of any purchases or redemptions.
You can find more information about the fund’s expenses, including annual expense ratios, in the Financial Statements section of this report. For additional information on operating expenses and other shareholder costs, please refer to your fund’s current prospectus.
33
| Six Months Ended October 31, 2015 | |||
| Beginning | Ending | Expenses | |
| Account Value | Account Value | Paid During | |
| Emerging Markets Select Stock Fund | 4/30/2015 | 10/31/2015 | Period |
| Based on Actual Fund Return | $1,000.00 | $815.03 | $4.25 |
| Based on Hypothetical 5% Yearly Return | 1,000.00 | 1,020.52 | 4.74 |
The calculations are based on expenses incurred in the most recent six-month period. The fund’s annualized six-month expense ratio for that period is 0.93%. The dollar amounts shown as “Expenses Paid” are equal to the annualized expense ratio multiplied by the average account value over the period, multiplied by the number of days in the most recent six-month period, then divided by the number of days in the most recent 12-month period (184/365).
34
Glossary
Dividend Yield. Dividend income earned by stocks, expressed as a percentage of the aggregate market value (or of net asset value, for a fund). The yield is determined by dividing the amount of the annual dividends by the aggregate value (or net asset value) at the end of the period. For a fund, the dividend yield is based solely on stock holdings and does not include any income produced by other investments.
Earnings Growth Rate. The average annual rate of growth in earnings over the past five years for the stocks now in a fund.
Equity Exposure. A measure that reflects a fund’s investments in stocks and stock futures. Any holdings in short-term reserves are excluded.
Expense Ratio. A fund’s total annual operating expenses expressed as a percentage of the fund’s average net assets. The expense ratio includes management and administrative expenses, but does not include the transaction costs of buying and selling portfolio securities.
Inception Date. The date on which the assets of a fund (or one of its share classes) are first invested in accordance with the fund’s investment objective. For funds with a subscription period, the inception date is the day after that period ends. Investment performance is measured from the inception date.
Median Market Cap. An indicator of the size of companies in which a fund invests; the midpoint of market capitalization (market price x shares outstanding) of a fund’s stocks, weighted by the proportion of the fund’s assets invested in each stock. Stocks representing half of the fund’s assets have market capitalizations above the median, and the rest are below it.
Price/Book Ratio. The share price of a stock divided by its net worth, or book value, per share. For a fund, the weighted average price/book ratio of the stocks it holds.
Price/Earnings Ratio. The ratio of a stock’s current price to its per-share earnings over the past year. For a fund, the weighted average P/E of the stocks it holds. P/E is an indicator of market expectations about corporate prospects; the higher the P/E, the greater the expectations for a company’s future growth.
Return on Equity. The annual average rate of return generated by a company during the past five years for each dollar of shareholder’s equity (net income divided by shareholder’s equity). For a fund, the weighted average return on equity for the companies whose stocks it holds.
Short-Term Reserves. The percentage of a fund invested in highly liquid, short-term securities that can be readily converted to cash.
Turnover Rate. An indication of the fund’s trading activity. Funds with high turnover rates incur higher transaction costs and may be more likely to distribute capital gains (which may be taxable to investors). The turnover rate excludes in-kind transactions, which have minimal impact on costs.
35
The People Who Govern Your Fund
The trustees of your mutual fund are there to see that the fund is operated and managed in your best interests since, as a shareholder, you are a part owner of the fund. Your fund’s trustees also serve on the board of directors of The Vanguard Group, Inc., which is owned by the Vanguard funds and provides services to them on an at-cost basis.
A majority of Vanguard’s board members are independent, meaning that they have no affiliation with Vanguard or the funds they oversee, apart from the sizable personal investments they have made as private individuals. The independent board members have distinguished backgrounds in business, academia, and public service. Each of the trustees and executive officers oversees 194 Vanguard funds.
The following table provides information for each trustee and executive officer of the fund. More information about the trustees is in the Statement of Additional Information, which can be obtained, without charge, by contacting Vanguard at 800-662-7447, or online at vanguard.com.
InterestedTrustee1
F. William McNabb III
Born 1957. Trustee Since July 2009. Chairman of the Board. Principal Occupation(s) During the Past Five Years and Other Experience: Chairman of the Board of The Vanguard Group, Inc., and of each of the investment companies served by The Vanguard Group, since January 2010; Director of The Vanguard Group since 2008; Chief Executive Officer and President of The Vanguard Group, and of each of the investment companies served by The Vanguard Group, since 2008; Director of Vanguard Marketing Corporation; Managing Director of The Vanguard Group (1995–2008).
IndependentTrustees
Emerson U. Fullwood
Born 1948. Trustee Since January 2008. Principal Occupation(s) During the Past Five Years and Other Experience: Executive Chief Staff and Marketing Officer for North America and Corporate Vice President (retired 2008) of Xerox Corporation (document management products and services); Executive in Residence and 2009–2010 Distinguished Minett Professor at the Rochester Institute of Technology; Director of SPX Corporation (multi-industry manufacturing), the United Way of Rochester, the University of Rochester Medical Center, Monroe Community College Foundation, and North Carolina A&T University.
Rajiv L. Gupta
Born 1945. Trustee Since December 2001.2 Principal Occupation(s) During the Past Five Years and Other Experience: Chairman and Chief Executive Officer (retired 2009) and President (2006–2008) of Rohm and Haas Co. (chemicals); Director of Tyco International PLC (diversified manufacturing and services), Hewlett-Packard Co. (electronic computer manufacturing), and Delphi Automotive PLC (automotive components); Senior Advisor at New Mountain Capital.
Amy Gutmann
Born 1949. Trustee Since June 2006. Principal Occupation(s) During the Past Five Years and Other Experience: President of the University of Pennsylvania; Christopher H. Browne Distinguished Professor of Political Science, School of Arts and Sciences, and Professor of Communication, Annenberg School for Communication, with secondary faculty appointments in the Department of Philosophy, School of Arts and Sciences, and at the Graduate School of Education, University of Pennsylvania; Trustee of the National Constitution Center; Chair of the Presidential Commission for the Study of Bioethical Issues.
JoAnn Heffernan Heisen
Born 1950. Trustee Since July 1998. Principal Occupation(s) During the Past Five Years and Other Experience: Corporate Vice President and Chief Global Diversity Officer (retired 2008) and Member of the Executive Committee (1997–2008) of Johnson & Johnson (pharmaceuticals/medical devices/consumer products); Director of Skytop Lodge Corporation (hotels) and the Robert Wood Johnson Foundation; Member of the Advisory Board of the Institute for Women’s Leadership at Rutgers University.
F. Joseph Loughrey
Born 1949. Trustee Since October 2009. Principal Occupation(s) During the Past Five Years and Other Experience: President and Chief Operating Officer (retired 2009) of Cummins Inc. (industrial machinery); Chairman of the Board of Hillenbrand, Inc. (specialized consumer services), and of Oxfam America; Director of SKF AB (industrial machinery), Hyster-Yale Materials Handling, Inc. (forklift trucks), the Lumina Foundation for Education, and the V Foundation for Cancer Research; Member of the Advisory Council for the College of Arts and Letters and of the Advisory Board to the Kellogg Institute for International Studies, both at the University of Notre Dame.
Mark Loughridge
Born 1953. Trustee Since March 2012. Principal Occupation(s) During the Past Five Years and Other Experience: Senior Vice President and Chief Financial Officer (retired 2013) at IBM (information technology services); Fiduciary Member of IBM’s Retirement Plan Committee (2004–2013); Director of the Dow Chemical Company; Member of the Council on Chicago Booth.
Scott C. Malpass
Born 1962. Trustee Since March 2012. Principal Occupation(s) During the Past Five Years and Other Experience: Chief Investment Officer and Vice President at the University of Notre Dame; Assistant Professor of Finance at the Mendoza College of Business at Notre Dame; Member of the Notre Dame 403(b) Investment Committee; Board Member of TIFF Advisory Services, Inc., and Catholic Investment Services, Inc. (investment advisors); Member of the Investment Advisory Committee of Major League Baseball.
André F. Perold
Born 1952. Trustee Since December 2004. Principal Occupation(s) During the Past Five Years and Other Experience: George Gund Professor of Finance and Banking, Emeritus at the Harvard Business School (retired 2011); Chief Investment Officer and Managing Partner of HighVista Strategies LLC (private investment firm); Director of Rand Merchant Bank; Overseer of the Museum of Fine Arts Boston.
Peter F. Volanakis
Born 1955. Trustee Since July 2009. Principal Occupation(s) During the Past Five Years and Other Experience: President and Chief Operating Officer (retired 2010) of Corning Incorporated (communications equipment); Trustee of Colby-Sawyer College; Member of the Advisory Board of the Norris Cotton Cancer Center and of the Advisory Board of the Parthenon Group (strategy consulting).
Executive Officers
Glenn Booraem
Born 1967. Treasurer Since May 2015. Principal Occupation(s) During the Past Five Years and Other Experience: Principal of The Vanguard Group, Inc.; Treasurer of each of the investment companies served by The Vanguard Group; Controller of each of the investment companies served by The Vanguard Group (2010–2015); Assistant Controller of each of the investment companies served by The Vanguard Group (2001–2010).
Thomas J. Higgins
Born 1957. Chief Financial Officer Since September 2008. Principal Occupation(s) During the Past Five Years and Other Experience: Principal of The Vanguard Group, Inc.; Chief Financial Officer of each of the investment companies served by The Vanguard Group; Treasurer of each of the investment companies served by The Vanguard Group (1998–2008).
Peter Mahoney
Born 1974. Controller Since May 2015. Principal Occupation(s) During the Past Five Years and Other Experience: Head of Global Fund Accounting at The Vanguard Group, Inc.; Controller of each of the investment companies served by The Vanguard Group; Head of International Fund Services at The Vanguard Group (2008–2014).
Heidi Stam
Born 1956. Secretary Since July 2005. Principal Occupation(s) During the Past Five Years and Other Experience: Managing Director of The Vanguard Group, Inc.; General Counsel of The Vanguard Group; Secretary of The Vanguard Group and of each of the investment companies served by The Vanguard Group; Director and Senior Vice President of Vanguard Marketing Corporation.
Vanguard Senior Management Team
Mortimer J. Buckley
Kathleen C. Gubanich
Paul A. Heller
Martha G. King
John T. Marcante
Chris D. McIsaac
James M. Norris
Thomas M. Rampulla
Glenn W. Reed
Karin A. Risi
Chairman Emeritus and Senior Advisor
John J. Brennan
Chairman, 1996–2009
Chief Executive Officer and President, 1996–2008
Founder John C. Bogle
Chairman and Chief Executive Officer, 1974–1996
1 Mr. McNabb is considered an “interested person,” as defined in the Investment Company Act of 1940, because he is an officer of the Vanguard funds.
2 December 2002 for Vanguard Equity Income Fund, the Vanguard Municipal Bond Funds, and the Vanguard State Tax-Exempt Funds.
 |
| P.O. Box 2600 |
| Valley Forge, PA 19482-2600 |
Connect with Vanguard® > vanguard.com
| Fund Information > 800-662-7447 | CFA® is a registered trademark owned by CFA Institute. |
| Direct Investor Account Services > 800-662-2739 | |
| Institutional Investor Services > 800-523-1036 | |
| Text Telephone for People | |
| Who Are Deaf or Hard of Hearing> 800-749-7273 | |
| This material may be used in conjunction | |
| with the offering of shares of any Vanguard | |
| fund only if preceded or accompanied by | |
| the fund’s current prospectus. | |
| All comparative mutual fund data are from Lipper, a | |
| Thomson Reuters Company, or Morningstar, Inc., unless | |
| otherwise noted. | |
| You can obtain a free copy of Vanguard’s proxy voting | |
| guidelines by visiting vanguard.com/proxyreporting or by | |
| calling Vanguard at 800-662-2739. The guidelines are | |
| also available from the SEC’s website, sec.gov. In | |
| addition, you may obtain a free report on how your fund | |
| voted the proxies for securities it owned during the 12 | |
| months ended June 30. To get the report, visit either | |
| vanguard.com/proxyreporting or sec.gov. | |
| You can review and copy information about your fund at | |
| the SEC’s Public Reference Room in Washington, D.C. To | |
| find out more about this public service, call the SEC at | |
| 202-551-8090. Information about your fund is also | |
| available on the SEC’s website, and you can receive | |
| copies of this information, for a fee, by sending a | |
| request in either of two ways: via email addressed to | |
| publicinfo@sec.gov or via regular mail addressed to the | |
| Public Reference Section, Securities and Exchange | |
| Commission, Washington, DC 20549-1520. | |
| © 2015 The Vanguard Group, Inc. | |
| All rights reserved. | |
| Vanguard Marketing Corporation, Distributor. | |
| Q7520 122015 | |
Annual Report | October 31, 2015
Vanguard Alternative Strategies Fund
Vanguard’s Principles for Investing Success
We want to give you the best chance of investment success. These principles, grounded in Vanguard’s research and experience, can put you on the right path.
Goals. Create clear, appropriate investment goals.
Balance. Develop a suitable asset allocation using broadly diversified funds. Cost. Minimize cost.
Discipline. Maintain perspective and long-term discipline.
A single theme unites these principles: Focus on the things you can control.
We believe there is no wiser course for any investor.
| Contents | |
| Your Fund’s Total Returns. | 1 |
| Chairman’s Letter. | 2 |
| Advisor’s Report. | 7 |
| Fund Profile. | 10 |
| Performance Summary. | 12 |
| Financial Statements. | 13 |
| Trustees Approve Advisory Arrangement. | 33 |
| Glossary. | 34 |
Please note: The opinions expressed in this report are just that—informed opinions. They should not be considered promises or advice. Also, please keep in mind that the information and opinions cover the period through the date on the front of this report. Of course, the risks of investing in your fund are spelled out in the prospectus.
See the Glossary for definitions of investment terms used in this report.
About the cover: Pictured is a sailing block on the Brilliant, a 1932 schooner docked in Mystic, Connecticut. A type of pulley, the sailing block helps coordinate the setting of the sails. At Vanguard, the intricate coordination of technology and people allows us to help millions of clients around the world reach their financial goals.
| Your Fund’s Total Returns | |
| Period Ended October 31, 2015 | |
| Returns | |
| Since Inception | |
| Vanguard Alternative Strategies Fund (Inception: 8/11/2015) | 1.15% |
| FTSE 3-month U.S. T-Bill Index + 4% | 0.88 |
| Your Fund’s Performance at a Glance | ||||
| Inception Through October 31, 2015 | ||||
| Distributions Per Share | ||||
| Starting | Ending | |||
| Share | Share | Income | Capital | |
| Price | Price | Dividends | Gains | |
| Vanguard Alternative Strategies Fund | $20.00 | $20.23 | $0.000 | $0.000 |
1

Chairman’s Letter
Dear Shareholder,
I am pleased to present the first shareholder report for Vanguard Alternative Strategies Fund. We launched this fund to broaden the investment strategies included in Vanguard Managed Payout Fund, and for certain institutional clients who may seek liquid investments beyond traditional stocks and bonds.
From its inception on August 11, 2015, through October 31, 2015, the fund’s total return was 1.15%. Its benchmark index, the FTSE 3-month U.S. T-Bill Index + 4%, returned 0.88%, as yields on short-term Treasury bills remained near zero.
The Alternative Strategies Fund seeks to generate returns that have low correlation with the returns of the stock and bond markets, and that are less volatile than those of the overall U.S. stock market. The fund tries to earn a positive absolute return regardless of the performance of the broad stock and bond markets. This contrasts with the more widely known approach of relative return funds—such as index funds that seek to track the performance of a market benchmark and actively managed funds that try to beat a designated benchmark.
That said, to help evaluate the fund’s results over time, we chose a benchmark index that we believe represents a reasonable long-term performance
2
expectation for this type of strategy. Also, the 4% rate referenced by the benchmark aligns with the target payout rate for the Managed Payout Fund, which added the Alternative Strategies Fund as an underlying fund in August, as previously announced.
This report includes an overview of the financial markets during the full 12 months ended October 31, followed by a brief discussion of the fund’s investment strategy and performance since its inception.
Global stock markets struggled, and some failed to advance
The broad U.S. stock market returned more than 4% for the fiscal year ended October 31, 2015. The market traveled a bumpy road to that result. Fears surfaced in late summer that slower economic growth in China would spread across the globe. A sharp drop in August erased the market’s earlier gains and stocks slid further in September.
In October, however, U.S. stocks staged a robust rally as the Federal Reserve maintained its historically low short-term interest rates. And central banks in Europe and Asia signaled or implemented additional stimulus measures to counter sluggish growth and low inflation.
The broad international stock market returned about –4% for U.S. investors as the dollar’s strength weighed on local-market returns. Solid gains in the developed markets of the Pacific region and Europe were essentially flat when
| Market Barometer | |||
| Average Annual Total Returns | |||
| Periods Ended October 31, 2015 | |||
| One | Three | Five | |
| Year | Years | Years | |
| Stocks | |||
| Russell 1000 Index (Large-caps) | 4.86% | 16.28% | 14.32% |
| Russell 2000 Index (Small-caps) | 0.34 | 13.90 | 12.06 |
| Russell 3000 Index (Broad U.S. market) | 4.49 | 16.09 | 14.14 |
| FTSE All-World ex US Index (International) | -3.83 | 5.20 | 2.99 |
| Bonds | |||
| Barclays U.S. Aggregate Bond Index (Broad taxable market) | 1.96% | 1.65% | 3.03% |
| Barclays Municipal Bond Index (Broad tax-exempt market) | 2.87 | 2.91 | 4.28 |
| Citigroup Three-Month U.S. Treasury Bill Index | 0.02 | 0.02 | 0.04 |
| CPI | |||
| Consumer Price Index | 0.17% | 0.93% | 1.69% |
3
translated into dollars. Stocks tumbled in emerging markets, where concerns about China seemed to weigh most heavily.
The search for a safe haven gave bonds a bit of a boost
The broad U.S. taxable bond market, which returned 1.96% for the fiscal year, benefited from investors’ desire for safe-haven assets during periods of stock market volatility. The yield of the 10-year Treasury note ended October at 2.17%, down from 2.31% a year earlier. (Bond prices and yields move in opposite directions.)
International bond markets (as measured by the Barclays Global Aggregate Index ex USD) returned about –7%, also held back by the strong dollar. Without this currency effect, international bond returns were positive.
Returns for money market funds and savings accounts continued to be constrained by the Fed’s 0%–0.25% target for short-term interest rates.
This fund can play a role in a diversified portfolio
Vanguard Quantitative Equity Group (QEG), the fund’s advisor, seeks to generate returns using several alternative strategies that individually and collectively are expected to have low correlation with traditional capital markets. And the fund’s total return is expected to have lower volatility than that of the overall U.S. stock market.
Since the fund’s inception, QEG has used five approximately equally weighted alternative strategies to accomplish these objectives: long/short equity, event-driven equity (which seeks to capitalize on price discrepancies and returns generated by corporate activity such as mergers), foreign currencies (using forward contracts), fixed income relative value, and commodity-linked investments. It expects to pursue additional strategies, depending on its assessment of investable opportunities. QEG invests only in liquid securities and derivative instruments (such as U.S. Treasury futures and forward foreign currency contracts), using rules-based strategies and risk-management techniques.
Since the fund’s inception in August, the long/short equity strategy was the largest positive contributor to returns, while the currency strategy lagged.
For more on the fund’s investment strategy and management, please see the Advisor’s Report that follows this letter.
Although 2½ months is too short a period to draw conclusions, we’re encouraged that the fund’s performance is consistent with our expectations. Because of its anticipated low correlation to stocks and bonds, the fund can be an effective vehicle to add diversification to an already diversified portfolio. The Alternative Strategies Fund provides the opportunity to maintain a more consistent return during periods of market fluctuations, but of course this outcome is not certain.
4
Those attributes make the fund an appropriate investment for Vanguard Managed Payout Fund. The Managed Payout Fund, which is also managed by QEG, is an actively managed fund designed to provide investors with regular monthly payouts as a supplement to other sources of income. QEG seeks to adjust the Managed Payout Fund’s overall asset allocation over time with an emphasis on sustaining its monthly payouts, keeping pace with inflation, and preserving capital over the long term.
In addition to the Managed Payout Fund, the Alternative Strategies Fund will be available to clients of Vanguard Institutional Advisory Services. VIAS delivers strategic
A closer look at your fund’s expenses
By Vanguard standards, the Alternative Strategies Fund’s estimated 1.10% expense ratio looks like an outlier. Why is it so much higher than the 0.27% average for all of Vanguard’s actively managed funds? The answer has to do primarily with short selling, which is one of the strategies your fund uses to generate returns that have low correlation with the stock and bond markets and lower volatility than the return of the overall U.S. stock market.
In short selling, the fund’s advisor sells borrowed shares with the hope of buying them back at a lower price and profiting from the difference. When a cash dividend is declared on a stock the fund has sold short, the fund must pay an amount equal to that dividend to the lender of the stock. That payment gets recorded as an expense. The fund also incurs borrowing costs on short sales.
Of course, the advisor anticipates that returns on the shares sold short will, on the whole, more than offset these costs. In the advisor’s view, the outlook for these shares is poor, and the fund can benefit from their
potential decline. Excluding borrowing and dividend expenses on shares sold short, your fund’s total annual operating expenses are a more Vanguard-like 0.40%. This includes 0.09% of acquired fund fees and expenses associated with the fund’s investment in a wholly owned subsidiary used to obtain its commodity exposure.

Notes: Alternative Strategies Fund expense data are according to the prospectus dated May 28, 2015. The Vanguard average expense ratio is as of December 31, 2014.
Source: Vanguard.
5
advice, portfolio management, and research and expertise for defined benefit plans, endowments, and foundations.
A dose of discipline is crucial when markets become volatile
The developments over the past few months remind us that nobody can control the direction of the markets or reliably predict where they’ll go in the short term. However, investors can control how they react to unstable and turbulent markets.
During periods of market adversity, it’s more important than ever to keep sight of one of Vanguard’s key principles: Maintain perspective and long-term discipline. Whether you’re investing for yourself or on behalf of clients, your success is affected greatly by how you respond—or don’t respond—during turbulent markets. (You can read Vanguard’s Principles for Investing Success at vanguard.com/research.)
As I’ve written in the past, the best course for long-term investors is generally to ignore daily market moves and not make decisions based on emotion. This is also a good time to evaluate your portfolio and make sure your asset allocation is aligned with your time horizon, goals, and risk tolerance.
The markets are unpredictable and often confounding. Keeping your long-term plans clearly in focus can help you weather these periodic storms.
As always, thank you for investing with Vanguard.
Sincerely,

F. William McNabb III
Chairman and Chief Executive Officer
November 17, 2015
6
Advisor’s Report
We are pleased to present the first Advisor’s Report for Vanguard Alternative Strategies Fund, which opened for investment on August 11, 2015. The fund posted encouraging results for the partial fiscal year ended October 31, 2015, with a total return of 1.15%. By comparison, its benchmark, the FTSE 3-month U.S. T-Bill Index + 4%, returned 0.88%.
Investment objective and strategy
Our objective for this portfolio is to generate positive returns that have low correlation with the returns of more traditional asset classes such as stocks and bonds. The fund seeks to meet its objective by using a combination of five alternative strategies that span multiple asset classes: equity, fixed income, currencies, and commodity-linked investments. Each strategy can use long and short positions to try to minimize market exposure while attempting to capture attractive risk premiums. Individually, the strategies are expected to have low long-term correlation with one another and with traditional capital markets, which should produce a portfolio with lower volatility than the overall U.S. stock market.
Additionally, the fund can use leverage as it seeks to match the expected risk profile for each strategy to a targeted level equal to that of the recent equity markets. For example, if the equity market’s average volatility over the last two years was 20% and one of our strategies had an unlever-aged volatility of 10% over the same
period, the strategy’s leverage target would be 2.0 times its equal weighted notional exposure. This analysis (subject to internal limits to control leverage for each of the strategies and in the fund overall) extends to each of the strategies where prudent and necessary. The goal is to achieve a similar risk profile across each of the five strategies to maximize diversification and performance.
The strategies the fund currently employs include:
• Long/short equity: This strategy focuses on building a long-short portfolio of equity securities based on their volatility characteristics by executing long positions in low-volatility stocks and short positions in high-volatility stocks. The strategy seeks to capture a risk-adjusted spread by constructing its positions to reduce the net market exposure of the overall portfolio to general market movements (beta).
• Event-driven: This strategy seeks to profit from the expectation that a specific event or catalyst (such as a merger/ aquisition deal closure) will affect the stock price of a U.S. or foreign company.
• Fixed income: This strategy seeks to exploit the steepness of the Treasury yield curve that is created by investors’ desire to hold shorter-maturity bonds because they tend to be more liquid (trade easily). We try to capture this premium by investing in Treasury futures with longer tenors (remaining time to maturity) and borrowing those with short maturities.
7
• Currencies: This strategy seeks to benefit from expected currency movements across countries by using long and short foreign currency exchange forward contracts. It does this by selling currencies of countries with poor fundamental characteristics and buying currencies of countries with strong fundamental characteristics.
• Commodity-linked investments: This strategy seeks to capture the risk premium associated with inventory levels of commodities, which are reflected in the prices in their futures contracts. We take long positions in commodities whose prices are expected to rise because of limited inventory, and short positions in commodities whose prices are expected to fall.
Given the fund’s recent launch, it is too soon to gauge our long-term ability to meet our objective. However, our results for this short period, which saw increased volatility in the equity and bond markets, are encouraging. The correlations of daily returns for the fund were 0.29 relative to the broad U.S. stock market (using the Russell 3000 Index) and 0.17 relative to the broad U.S. bond market (using the Barclays U.S. Aggregate Bond Index).
The investment environment
Global equity markets delivered modest returns for the fiscal year; the FTSE All World Index returned 0.50%. Equities rallied in October and brought major indexes back into positive territory. The rally heightened the volatility of August and September. The broad U.S. taxable bond market returned almost 2%, while currency-hedged international bonds returned about 3%.
In the United States, the Federal Reserve held off raising interest rates in order to make further progress toward its employment and inflation targets. It also cited concerns about international market volatility.
Real U.S. GDP for the third quarter increased at an annual rate of 1.5%, a deceleration from the second-quarter increase of 3.9%. This deceleration reflected a downturn in private inventory investments and a slowdown in exports. The unemployment rate has continued to improve over the past year.
The economic slowdown overseas, especially in emerging markets, continues to contribute to the recent volatility in the markets. Emerging-market currencies have lost value against the U.S. dollar. The possibility that the Fed might raise interest rates by the end of 2015 has driven the dollar higher and driven capital outflows from these currencies.
The fund’s successes and shortfalls
While it’s important to be aware of the impact of these macroeconomic factors on the markets, our process seeks to earn
8
a positive absolute return regardless of the performance of the broad stock and bond markets. From a return contribution perspective, not all strategies helped the fund: Event-driven and long-short equity strategies had the strongest performance, while our currency-strategy holdings lagged. For the period, the fund benefited from a variety of exposures, leading to diversification that helped reduce overall volatility. While the fiscal year covered only 2½ months, the diversification benefit can be seen in the fund’s annualized daily volatility of returns over the period: 4.7% for the Alternative Strategies Fund, and 22.3% for the broad U.S. stock market.
Our approach to portfolio construction paid off in this shortened fiscal year in both relative performance and low volatility, though the period is so short we caution against drawing any firm conclusions. We look forward to the next fiscal year.
Portfolio Managers:
James D. Troyer, CFA, Principal
James P. Stetler, Principal
Michael R. Roach, CFA
Vanguard Quantitative Equity Group
November 20, 2015
9
Alternative Strategies Fund
Fund Profile
As of October 31, 2015
| Fund Characteristics | ||
| Ticker Symbol | VASFX | |
| Total Expense Ratio1 | 1.10% | |
| Management Expenses | 0.18% | |
| Dividend Expenses on Securities | ||
| Sold Short2 | 0.50% | |
| Borrowing Expenses on Securities | ||
| Sold Short2 | 0.20% | |
| Other Expenses | 0.13% | |
| Turnover Rate | 25% | |
| Short-Term Reserves | 30.1% | |
| Portfolio Characteristics | ||
| Long | Short | |
| Portfolio | Portfolio | |
| Number of Stocks | 298 | 169 |
| Median Market Cap | $6.3B | $7.7B |
| Price/Earnings Ratio | 27.6x | 31.0x |
| Price/Book Ratio | 2.6x | 2.1x |
| Return on Equity | 12.2% | 14.4% |
| Earnings Growth | ||
| Rate | 6.2% | 9.9% |
| Foreign Holdings | 3.6% | 1.1% |
Sector Diversification (% of equity exposure)
| Long | Short | |
| Portfolio | Portfolio | |
| Consumer Discretionary | 9.9% | 8.1% |
| Consumer Staples | 5.1 | 2.4 |
| Energy | 3.3 | 15.8 |
| Financials | 20.2 | 25.0 |
| Health Care | 11.4 | 16.6 |
| Industrials | 12.9 | 8.2 |
| Information Technology | 18.5 | 16.3 |
| Materials | 5.4 | 5.5 |
| Telecommunication Services | 3.3 | 1.3 |
| Utilities | 10.0 | 0.8 |
1 The total expense ratio shown is from the prospectus dated May 28, 2015, and represents estimated costs for the current fiscal year. For the period from inception through October 31, 2015, the annualized total expense ratio was 0.73%.
2 In connection with a short sale, the fund may receive income or be charged a fee based on the market value of the borrowed stock. When a cash dividend is declared on a stock the fund has sold short, the fund is required to pay an amount equal to that dividend to the party from which the fund borrowed the stock and to record the payment of the dividend as an expense.
10
Alternative Strategies Fund
Ten Largest Holdings1 (% of total net assets) Long Portfolio
| Pepco Holdings Inc. | Electric Utilities | 1.1% |
| OmniVision | ||
| Technologies Inc. | Semiconductors | 1.1 |
| Altera Corp. | Semiconductors | 1.0 |
| Cameron International | Oil & Gas Equipment | |
| Corp. | & Services | 1.0 |
| Chubb Corp. | Property & Casualty | |
| Insurance | 1.0 | |
| AGL Resources Inc. | Gas Utilities | 1.0 |
| Broadcom Corp. | Semiconductors | 1.0 |
| Hudson City Bancorp | Thrifts & Mortgage | |
| Inc. | Finance | 1.0 |
| NTELOS Holdings Corp. | Wireless | |
| Telecommunication | ||
| Services | 1.0 | |
| Health Net Inc. | Managed Health | |
| Care | 0.9 | |
| Top Ten | 10.1% |
Ten Largest Holdings1 (% of total net assets) Short Portfolio
| M&T Bank Corp. | Regional Banks | 0.9% |
| Willis Group Holdings plc | Insurance Brokers | 0.9 |
| Schlumberger Ltd. | Oil & Gas | |
| Equipment & | ||
| Services | 0.8 | |
| NXP Semiconductors NV | Semiconductors | 0.7 |
| Halliburton Co. | Oil & Gas | |
| Equipment & | ||
| Services | 0.7 | |
| FNB Corp. | Regional Banks | 0.7 |
| Centene Corp. | Managed Health | |
| Care | 0.5 | |
| Avago Technologies Ltd. | Semiconductors | 0.5 |
| ACE Ltd. | Property & Casualty | |
| Insurance | 0.5 | |
| Aetna Inc. | Managed Health | |
| Care | 0.5 | |
| Top Ten | 6.7% |
1 The holdings listed exclude any temporary cash investments and equity index products.
11
Alternative Strategies Fund
Performance Summary
All of the returns in this report represent past performance, which is not a guarantee of future results that may be achieved by the fund. (Current performance may be lower or higher than the performance data cited. For performance data current to the most recent month-end, visit our website at vanguard.com/performance.) Note, too, that both investment returns and principal value can fluctuate widely, so an investor’s shares, when sold, could be worth more or less than their original cost. The returns shown do not reflect taxes that a shareholder would pay on fund distributions or on the sale of fund shares.
Cumulative Performance: August 11, 2015, Through October 31, 2015
Initial Investment of $250,000
| Total Returns | ||
| Period Ended October 31, 2015 | ||
| Since | Final Value | |
| Inception | of a $250,000 | |
| (8/11/2015) | Investment | |
| Alternative Strategies Fund | 1.15% | $252,875 |
| FTSE 3-month U.S. T-Bill Index + 4% | 0.88 | 252,203 |
| "Since Inception" performance is calculated from the fund's inception date for both the fund and its comparative standards. | ||
Total Returns: Periods Ended September 30, 2015
This table presents returns through the latest calendar quarter—rather than through the end of the fiscal period.
Securities and Exchange Commission rules require that we provide this information.
| Inception | Since | |
| Date | Inception | |
| Alternative Strategies Fund | 8/11/2015 | 0.00% |
See Financial Highlights for dividend and capital gains information.
12
Alternative Strategies Fund
Consolidated Financial Statements
Consolidated Statement of Net Assets
As of October 31, 2015
The fund reports a complete list of its holdings in regulatory filings four times in each fiscal year, at the quarter-ends. For the second and fourth fiscal quarters, the lists appear in the fund’s semiannual and annual reports to shareholders. For the first and third fiscal quarters, the fund files the lists with the Securities and Exchange Commission on Form N-Q. Shareholders can look up the fund’s Forms N-Q on the SEC’s website at sec.gov. Forms N-Q may also be reviewed and copied at the SEC’s Public Reference Room (see the back cover of this report for further information).
| Market | |||
| Value• | |||
| Shares | ($000) | ||
| Common Stocks—Long Positions (64.9%) | |||
| Consumer Discretionary (6.4%) | |||
| Remy International Inc. | 50,900 | 1,501 | |
| * | Steiner Leisure Ltd. | 22,396 | 1,419 |
| Cablevision Systems Corp. | |||
| Class A | 37,000 | 1,206 | |
| McDonald’s Corp. | 1,640 | 184 | |
| *,† | O’Reilly Automotive Inc. | 654 | 181 |
| *,† | NVR Inc. | 107 | 175 |
| † | Lowe’s Cos. Inc. | 2,334 | 172 |
| Walt Disney Co. | 1,500 | 171 | |
| Home Depot Inc. | 1,376 | 170 | |
| * | Sirius XM Holdings Inc. | 41,538 | 169 |
| † | TJX Cos. Inc. | 2,315 | 169 |
| Thomson Reuters Corp. | 4,112 | 169 | |
| NIKE Inc. Class B | 1,287 | 169 | |
| Morningstar Inc. | 2,047 | 168 | |
| Genuine Parts Co. | 1,841 | 167 | |
| Omnicom Group Inc. | 2,223 | 167 | |
| † | John Wiley & Sons Inc. | ||
| Class A | 3,170 | 166 | |
| Scripps Networks | |||
| Interactive Inc. Class A | 2,755 | 165 | |
| L Brands Inc. | 1,712 | 164 | |
| † | Starbucks Corp. | 2,615 | 164 |
| Service Corp. International | 5,743 | 162 | |
| *,† | AutoZone Inc. | 206 | 162 |
| * | Bed Bath & Beyond Inc. | 2,674 | 159 |
| Newell Rubbermaid Inc. | 3,752 | 159 | |
| Target Corp. | 2,054 | 158 | |
| Aramark | 5,048 | 153 | |
| † | Wendy’s Co. | 16,667 | 153 |
| Ross Stores Inc. | 3,010 | 152 | |
| Domino’s Pizza Inc. | 1,427 | 152 | |
| Carter’s Inc. | 1,672 | 152 | |
| * | Sally Beauty Holdings Inc. | 6,409 | 151 |
| Williams-Sonoma Inc. | 2,042 | 151 | |
| * | Panera Bread Co. Class A | 845 | 150 |
| Dollar General Corp. | 2,149 | 146 | |
| Market | |||
| Value• | |||
| Shares | ($000) | ||
| Foot Locker Inc. | 2,130 | 144 | |
| VF Corp. | 2,130 | 144 | |
| † | Darden Restaurants Inc. | 2,283 | 141 |
| † | Nordstrom Inc. | 2,125 | 139 |
| Dunkin’ Brands Group Inc. | 3,316 | 137 | |
| Brinker International Inc. | 2,916 | 133 | |
| Garmin Ltd. | 3,155 | 112 | |
| DSW Inc. Class A | 3,405 | 85 | |
| 10,211 | |||
| Consumer Staples (3.3%) | |||
| * | Rite Aid Corp. | 120,000 | 946 |
| Philip Morris International | |||
| Inc. | 2,043 | 181 | |
| Kimberly-Clark Corp. | 1,485 | 178 | |
| Dr Pepper Snapple Group | |||
| Inc. | 1,984 | 177 | |
| Procter & Gamble Co. | 2,303 | 176 | |
| PepsiCo Inc. | 1,719 | 176 | |
| McCormick & Co. Inc. | 2,069 | 174 | |
| Kellogg Co. | 2,452 | 173 | |
| Reynolds American Inc. | 3,551 | 171 | |
| General Mills Inc. | 2,943 | 171 | |
| † | Sysco Corp. | 4,114 | 170 |
| Colgate-Palmolive Co. | 2,546 | 169 | |
| Altria Group Inc. | 2,791 | 169 | |
| JM Smucker Co. | 1,427 | 167 | |
| Campbell Soup Co. | 3,281 | 167 | |
| Hormel Foods Corp. | 2,444 | 165 | |
| † | Church & Dwight Co. Inc. | 1,908 | 164 |
| Spectrum Brands Holdings | |||
| Inc. | 1,691 | 162 | |
| Clorox Co. | 1,321 | 161 | |
| Coca-Cola Co. | 3,761 | 159 | |
| † | Constellation Brands Inc. | ||
| Class A | 1,179 | 159 | |
| † | Pinnacle Foods Inc. | 3,524 | 155 |
| Hershey Co. | 1,687 | 150 | |
| CVS Health Corp. | 1,499 | 148 | |
| * | Edgewell Personal Care Co. | 1,742 | 147 |
| Wal-Mart Stores Inc. | 2,252 | 129 | |
13
| Alternative Strategies Fund | |||
| Market | |||
| Value• | |||
| Shares | ($000) | ||
| Bunge Ltd. | 927 | 68 | |
| Costco Wholesale Corp. | 307 | 48 | |
| Brown-Forman Corp. Class B | 323 | 34 | |
| 5,214 | |||
| Energy (2.2%) | |||
| * | Cameron International Corp. | 22,900 | 1,557 |
| Baker Hughes Inc. | 26,000 | 1,370 | |
| Exxon Mobil Corp. | 2,091 | 173 | |
| Spectra Energy Corp. | 5,292 | 151 | |
| Kinder Morgan Inc. | 5,182 | 142 | |
| 3,393 | |||
| Financials (13.1%) | |||
| Chubb Corp. | 12,000 | 1,552 | |
| † | Hudson City Bancorp Inc. | 149,700 | 1,515 |
| StanCorp Financial Group | |||
| Inc. | 13,100 | 1,503 | |
| PartnerRe Ltd. | 10,800 | 1,501 | |
| Symetra Financial Corp. | 47,100 | 1,494 | |
| City National Corp. | 15,600 | 1,398 | |
| * | Strategic Hotels & Resorts | ||
| Inc. | 92,000 | 1,297 | |
| BioMed Realty Trust Inc. | 53,300 | 1,248 | |
| Campus Crest Communities | |||
| Inc. | 184,800 | 1,225 | |
| Metro Bancorp Inc. | 33,000 | 1,022 | |
| Gramercy Property Trust Inc. | 23,000 | 522 | |
| † | ProAssurance Corp. | 3,331 | 176 |
| White Mountains Insurance | |||
| Group Ltd. | 222 | 175 | |
| Cincinnati Financial Corp. | 2,895 | 174 | |
| WP Carey Inc. | 2,741 | 174 | |
| Progressive Corp. | 5,238 | 174 | |
| Erie Indemnity Co. Class A | 1,982 | 173 | |
| Tanger Factory Outlet | |||
| Centers Inc. | 4,958 | 173 | |
| Travelers Cos. Inc. | 1,530 | 173 | |
| Taubman Centers Inc. | 2,226 | 171 | |
| Empire State Realty Trust | |||
| Inc. | 9,518 | 170 | |
| Columbia Property Trust Inc. | 6,810 | 169 | |
| ACE Ltd. | 1,473 | 167 | |
| * | Arch Capital Group Ltd. | 2,224 | 167 |
| RenaissanceRe Holdings Ltd. | 1,513 | 166 | |
| CBOE Holdings Inc. | 2,431 | 163 | |
| TFS Financial Corp. | 9,278 | 163 | |
| † | American Financial Group | ||
| Inc. | 2,256 | 163 | |
| Chimera Investment Corp. | 11,522 | 162 | |
| † | Lamar Advertising Co. | ||
| Class A | 2,861 | 161 | |
| Aspen Insurance | |||
| Holdings Ltd. | 3,303 | 161 | |
| Post Properties Inc. | 2,674 | 160 | |
| Plum Creek Timber Co. Inc. | 3,913 | 159 | |
| Market | |||
| Value• | |||
| Shares | ($000) | ||
| † | Annaly Capital Management | ||
| Inc. | 15,945 | 159 | |
| † | WR Berkley Corp. | 2,831 | 158 |
| People’s United Financial Inc. | 9,908 | 158 | |
| Everest Re Group Ltd. | 874 | 156 | |
| XL Group plc Class A | 4,081 | 155 | |
| Marsh & McLennan Cos. Inc. | 2,786 | 155 | |
| American Homes 4 Rent | |||
| Class A | 9,377 | 155 | |
| * | Berkshire Hathaway Inc. | ||
| Class B | 1,134 | 154 | |
| Validus Holdings Ltd. | 3,474 | 154 | |
| Brown & Brown Inc. | 4,758 | 154 | |
| American Capital Agency | |||
| Corp. | 8,470 | 151 | |
| MFA Financial Inc. | 21,804 | 151 | |
| Torchmark Corp. | 2,577 | 149 | |
| Arthur J Gallagher & Co. | 3,395 | 148 | |
| † | Starwood Property Trust Inc. | 7,297 | 147 |
| New York Community | |||
| Bancorp Inc. | 8,804 | 145 | |
| † | Two Harbors Investment | ||
| Corp. | 16,632 | 141 | |
| Allied World Assurance Co. | |||
| Holdings AG | 3,786 | 138 | |
| American Tower Corporation | 1,258 | 129 | |
| Piedmont Office Realty | |||
| Trust Inc. Class A | 1,588 | 31 | |
| 20,859 | |||
| Health Care (7.4%) | |||
| *,† | Health Net Inc. | 23,400 | 1,504 |
| * | IPC Healthcare Inc. | 18,800 | 1,476 |
| † | Humana Inc. | 7,500 | 1,340 |
| Cigna Corp. | 9,700 | 1,300 | |
| Amica Mature Lifestyles Inc. | 69,900 | 981 | |
| * | Henry Schein Inc. | 1,198 | 182 |
| DENTSPLY International Inc. | 2,894 | 176 | |
| Johnson & Johnson | 1,731 | 175 | |
| Medtronic plc | 2,348 | 173 | |
| *,† | Cerner Corp. | 2,579 | 171 |
| * | Laboratory Corp. of America | ||
| Holdings | 1,375 | 169 | |
| * | DaVita HealthCare | ||
| Partners Inc. | 2,177 | 169 | |
| Teleflex Inc. | 1,247 | 166 | |
| PerkinElmer Inc. | 3,195 | 165 | |
| Patterson Cos. Inc. | 3,479 | 165 | |
| † | Zimmer Biomet Holdings Inc. | 1,555 | 163 |
| Eli Lilly & Co. | 1,939 | 158 | |
| Hill-Rom Holdings Inc. | 2,994 | 158 | |
| Thermo Fisher Scientific Inc. | 1,204 | 157 | |
| * | Varian Medical Systems Inc. | 1,991 | 156 |
| * | Express Scripts Holding Co. | 1,810 | 156 |
| * | Waters Corp. | 1,222 | 156 |
| Pfizer Inc. | 4,613 | 156 | |
14
| Alternative Strategies Fund | |||
| Market | |||
| Value• | |||
| Shares | ($000) | ||
| Agilent Technologies Inc. | 4,110 | 155 | |
| Cardinal Health Inc. | 1,886 | 155 | |
| † | Merck & Co. Inc. | 2,805 | 153 |
| † | Stryker Corp. | 1,591 | 152 |
| * | Bio-Rad Laboratories Inc. | ||
| Class A | 1,089 | 152 | |
| CR Bard Inc. | 814 | 152 | |
| AmerisourceBergen Corp. | |||
| Class A | 1,550 | 150 | |
| Baxter International Inc. | 3,879 | 145 | |
| Abbott Laboratories | 3,215 | 144 | |
| Bio-Techne Corp. | 1,630 | 144 | |
| * | IMS Health Holdings Inc. | 5,271 | 143 |
| * | QIAGEN NV | 5,902 | 143 |
| * | MEDNAX Inc. | 2,013 | 142 |
| * | Quintiles Transnational | ||
| Holdings Inc. | 2,149 | 137 | |
| McKesson Corp. | 752 | 134 | |
| 11,773 | |||
| Industrials (8.4%) | |||
| Precision Castparts Corp. | 6,500 | 1,500 | |
| † | Towers Watson & Co. | ||
| Class A | 12,100 | 1,495 | |
| * | Avolon Holdings Ltd. | 39,800 | 1,214 |
| HellermannTyton Group plc | 137,000 | 1,001 | |
| TNT Express NV | 118,000 | 993 | |
| * | UTi Worldwide Inc. | 107,300 | 765 |
| † | General Electric Co. | 6,301 | 182 |
| Waste Connections Inc. | 3,322 | 181 | |
| Roper Technologies Inc. | 959 | 179 | |
| Republic Services Inc. | |||
| Class A | 3,938 | 172 | |
| Cintas Corp. | 1,843 | 171 | |
| 3M Co. | 1,091 | 171 | |
| † | Lockheed Martin Corp. | 776 | 171 |
| † | Waste Management Inc. | 3,144 | 169 |
| KAR Auction Services Inc. | 4,393 | 169 | |
| Allegion plc | 2,565 | 167 | |
| Illinois Tool Works Inc. | 1,816 | 167 | |
| Equifax Inc. | 1,565 | 167 | |
| Boeing Co. | 1,125 | 167 | |
| IDEX Corp. | 2,165 | 166 | |
| Danaher Corp. | 1,779 | 166 | |
| Graco Inc. | 2,259 | 166 | |
| Expeditors International of | |||
| Washington Inc. | 3,326 | 166 | |
| Stanley Black & Decker Inc. | 1,543 | 163 | |
| † | Snap-on Inc. | 981 | 163 |
| United Parcel Service Inc. | |||
| Class B | 1,573 | 162 | |
| Rockwell Collins Inc. | 1,867 | 162 | |
| * | Copart Inc. | 4,471 | 162 |
| United Technologies Corp. | 1,643 | 162 | |
| † | Toro Co. | 2,137 | 161 |
| * | Nielsen Holdings plc | 3,384 | 161 |
| Market | |||
| Value• | |||
| Shares | ($000) | ||
| General Dynamics Corp. | 1,076 | 160 | |
| Honeywell International Inc. | 1,537 | 159 | |
| Valmont Industries Inc. | 1,449 | 157 | |
| Timken Co. | 4,942 | 156 | |
| † | Watsco Inc. | 1,261 | 155 |
| JB Hunt Transport | |||
| Services Inc. | 2,013 | 154 | |
| *,† | TransDigm Group Inc. | 682 | 150 |
| WW Grainger Inc. | 710 | 149 | |
| † | Rollins Inc. | 5,506 | 148 |
| Hexcel Corp. | 3,017 | 140 | |
| † | Carlisle Cos. Inc. | 1,581 | 137 |
| * | Verisk Analytics Inc. | ||
| Class A | 1,915 | 137 | |
| * | Stericycle Inc. | 1,123 | 136 |
| Deere & Co. | 1,683 | 131 | |
| MSC Industrial Direct | |||
| Co. Inc. Class A | 1,736 | 109 | |
| 13,339 | |||
| Information Technology (12.0%) | |||
| * | OmniVision Technologies | ||
| Inc. | 59,600 | 1,721 | |
| Altera Corp. | 30,100 | 1,582 | |
| Broadcom Corp. Class A | 29,700 | 1,527 | |
| * | Xoom Corp. | 60,000 | 1,496 |
| * | PMC-Sierra Inc. | 116,600 | 1,390 |
| * | Freescale Semiconductor | ||
| Ltd. | 41,100 | 1,376 | |
| † | Integrated Silicon | ||
| Solution Inc. | 58,600 | 1,317 | |
| * | SolarWinds Inc. | 22,100 | 1,282 |
| Solera Holdings Inc. | 22,400 | 1,224 | |
| * | EZchip Semiconductor Ltd. | 47,900 | 1,169 |
| Pericom Semiconductor | |||
| Corp. | 55,000 | 960 | |
| KLA-Tencor Corp. | 7,600 | 510 | |
| † | Total System Services Inc. | 3,442 | 181 |
| * | eBay Inc. | 6,431 | 179 |
| *,† | Fiserv Inc. | 1,840 | 178 |
| * | Genpact Ltd. | 7,084 | 176 |
| † | Fidelity National | ||
| Information Services Inc. | 2,401 | 175 | |
| Paychex Inc. | 3,383 | 174 | |
| † | Automatic Data | ||
| Processing Inc. | 1,992 | 173 | |
| NetApp Inc. | 5,084 | 173 | |
| Broadridge Financial | |||
| Solutions Inc. | 2,880 | 172 | |
| † | Jack Henry & Associates | ||
| Inc. | 2,210 | 171 | |
| † | FactSet Research Systems | ||
| Inc. | 958 | 168 | |
| Accenture plc Class A | 1,564 | 168 | |
| Amdocs Ltd. | 2,774 | 165 | |
| *,† | ANSYS Inc. | 1,718 | 164 |
15
| Alternative Strategies Fund | |||
| Market | |||
| Value• | |||
| Shares | ($000) | ||
| * | Gartner Inc. | 1,797 | 163 |
| Motorola Solutions Inc. | 2,327 | 163 | |
| *,† | Synopsys Inc. | 3,168 | 158 |
| Amphenol Corp. Class A | 2,897 | 157 | |
| International Business | |||
| Machines Corp. | 1,042 | 146 | |
| CA Inc. | 5,082 | 141 | |
| FLIR Systems Inc. | 5,174 | 138 | |
| 19,037 | |||
| Materials (3.5%) | |||
| Cytec Industries Inc. | 20,100 | 1,496 | |
| Sigma-Aldrich Corp. | 10,700 | 1,495 | |
| AptarGroup Inc. | 2,342 | 172 | |
| Monsanto Co. | 1,842 | 172 | |
| Ecolab Inc. | 1,397 | 168 | |
| Sonoco Products Co. | 3,889 | 166 | |
| International Flavors & | |||
| Fragrances Inc. | 1,420 | 165 | |
| Bemis Co. Inc. | 3,581 | 164 | |
| Scotts Miracle-Gro Co. | |||
| Class A | 2,476 | 164 | |
| † | NewMarket Corp. | 414 | 163 |
| † | Valspar Corp. | 2,008 | 162 |
| † | Compass Minerals | ||
| International Inc. | 1,979 | 161 | |
| † | Sherwin-Williams Co. | 598 | 159 |
| Praxair Inc. | 1,421 | 158 | |
| † | Ashland Inc. | 1,428 | 157 |
| † | Silgan Holdings Inc. | 2,984 | 152 |
| Airgas Inc. | 1,539 | 148 | |
| Wausau Paper Corp. | 13,157 | 134 | |
| 5,556 | |||
| Telecommunication Services (2.1%) | |||
| *,† | NTELOS Holdings Corp. | 164,300 | 1,510 |
| * | Premiere Global Services | ||
| Inc. | 87,600 | 1,198 | |
| Verizon Communications Inc. | 3,588 | 168 | |
| AT&T Inc. | 4,956 | 166 | |
| CenturyLink Inc. | 5,737 | 162 | |
| *,† | SBA Communications Corp. | ||
| Class A | 1,303 | 155 | |
| 3,359 | |||
| Utilities (6.5%) | |||
| † | Pepco Holdings Inc. | 65,200 | 1,736 |
| AGL Resources Inc. | 24,700 | 1,544 | |
| Cleco Corp. | 27,400 | 1,452 | |
| TECO Energy Inc. | 45,500 | 1,229 | |
| Piedmont Natural Gas | |||
| Co. Inc. | 10,000 | 573 | |
| † | Aqua America Inc. | 6,207 | 178 |
| † | Vectren Corp. | 3,847 | 175 |
| † | SCANA Corp. | 2,889 | 171 |
| † | Ameren Corp. | 3,848 | 168 |
| † | Great Plains Energy Inc. | 6,109 | 168 |
| Market | |||
| Value• | |||
| Shares | ($000) | ||
| † | Westar Energy Inc. Class A | 4,230 | 168 |
| † | Atmos Energy Corp. | 2,657 | 167 |
| † | PG&E Corp. | 3,078 | 164 |
| † | Eversource Energy | 3,214 | 164 |
| Xcel Energy Inc. | 4,580 | 163 | |
| † | DTE Energy Co. | 1,996 | 163 |
| Consolidated Edison Inc. | 2,460 | 162 | |
| † | American Electric Power | ||
| Co. Inc. | 2,850 | 162 | |
| † | Sempra Energy | 1,575 | 161 |
| † | Entergy Corp. | 2,350 | 160 |
| † | American Water Works | ||
| Co. Inc. | 2,776 | 159 | |
| Southern Co. | 3,529 | 159 | |
| † | Alliant Energy Corp. | 2,671 | 158 |
| † | Questar Corp. | 7,599 | 157 |
| † | NextEra Energy Inc. | 1,519 | 156 |
| Duke Energy Corp. | 2,152 | 154 | |
| † | Edison International | 2,497 | 151 |
| Pinnacle West Capital Corp. | 2,257 | 143 | |
| 10,265 | |||
| Total Common Stocks—Long Positions | |||
| (Cost $102,614) | 103,006 | ||
| Common Stocks Sold Short (-23.2%) | |||
| Consumer Discretionary (-1.9%) | |||
| * | TripAdvisor Inc. | (2,380) | (199) |
| * | MGM Resorts International | (8,034) | (186) |
| Expedia Inc. | (1,337) | (182) | |
| Tribune Media Co. Class A | (4,415) | (178) | |
| Wynn Resorts Ltd. | (2,535) | (177) | |
| Harman International | |||
| Industries Inc. | (1,562) | (172) | |
| Royal Caribbean Cruises Ltd. | (1,717) | (169) | |
| TEGNA Inc. | (6,226) | (168) | |
| * | Groupon Inc. Class A | (44,960) | (167) |
| * | Netflix Inc. | (1,430) | (155) |
| * | Michaels Cos. Inc. | (6,181) | (145) |
| * | Urban Outfitters Inc. | (4,939) | (141) |
| * | Michael Kors Holdings Ltd. | (3,571) | (138) |
| * | Clear Channel Outdoor | ||
| Holdings Inc. Class A | (18,326) | (137) | |
| * | Kate Spade & Co. | (7,335) | (132) |
| * | lululemon athletica Inc. | (2,514) | (124) |
| * | Skechers U.S.A. Inc. Class A | (3,528) | (110) |
| GNC Holdings Inc. Class A | (3,207) | (96) | |
| Goodyear Tire & Rubber Co. | (2,734) | (90) | |
| Extended Stay America Inc. | (2,949) | (57) | |
| * | Amazon.com Inc. | (66) | (41) |
| (2,964) | |||
| Consumer Staples (-0.5%) | |||
| * | Rite Aid Corp. | (25,895) | (204) |
| Avon Products Inc. | (44,050) | (177) | |
| Coty Inc. Class A | (5,809) | (168) | |
16
| Alternative Strategies Fund | |||
| Market | |||
| Value• | |||
| Shares | ($000) | ||
| Keurig Green Mountain Inc. | (2,951) | (150) | |
| Whole Foods Market Inc. | (4,769) | (143) | |
| * | WhiteWave Foods Co. | ||
| Class A | (650) | (27) | |
| (869) | |||
| Energy (-3.7%) | |||
| Schlumberger Ltd. | (16,396) | (1,281) | |
| Halliburton Co. | (29,120) | (1,118) | |
| Denbury Resources Inc. | (52,637) | (186) | |
| * | Newfield Exploration Co. | (4,620) | (186) |
| RPC Inc. | (16,397) | (181) | |
| QEP Resources Inc. | (11,360) | (176) | |
| * | Weatherford | ||
| International plc | (17,068) | (175) | |
| * | Continental Resources Inc. | (4,955) | (168) |
| Superior Energy Services | |||
| Inc. | (11,851) | (168) | |
| Rowan Cos. plc Class A | (8,496) | (167) | |
| * | Cobalt International Energy | ||
| Inc. | (21,551) | (165) | |
| Targa Resources Corp. | (2,795) | (160) | |
| Patterson-UTI Energy Inc. | (10,699) | (159) | |
| * | Memorial Resource | ||
| Development Corp. | (8,941) | (158) | |
| Golar LNG Ltd. | (5,285) | (153) | |
| SM Energy Co. | (4,577) | (153) | |
| ONEOK Inc. | (4,495) | (152) | |
| Ensco plc Class A | (9,122) | (152) | |
| Nabors Industries Ltd. | (14,850) | (149) | |
| Range Resources Corp. | (4,894) | (149) | |
| * | Gulfport Energy Corp. | (4,604) | (140) |
| * | Rice Energy Inc. | (8,854) | (135) |
| PBF Energy Inc. Class A | (3,670) | (125) | |
| Frank’s International NV | (2,673) | (46) | |
| (5,802) | |||
| Financials (-5.8%) | |||
| M&T Bank Corp. | (12,579) | (1,508) | |
| Willis Group Holdings plc | (32,052) | (1,430) | |
| FNB Corp. | (78,309) | (1,055) | |
| ACE Ltd. | (7,222) | (820) | |
| Royal Bank of Canada | (11,682) | (668) | |
| Chambers Street Properties | (73,365) | (520) | |
| Lincoln National Corp. | (3,363) | (180) | |
| * | E*TRADE Financial Corp. | (6,245) | (178) |
| Communications Sales & | |||
| Leasing Inc. | (8,781) | (176) | |
| MetLife Inc. | (3,417) | (172) | |
| Waddell & Reed Financial | |||
| Inc. Class A | (4,657) | (172) | |
| * | Springleaf Holdings Inc. | ||
| Class A | (3,624) | (170) | |
| Assured Guaranty Ltd. | (6,056) | (166) | |
| TD Ameritrade Holding Corp. | (4,810) | (166) | |
| Charles Schwab Corp. | (5,348) | (163) | |
| Market | |||
| Value• | |||
| Shares | ($000) | ||
| NorthStar Asset | |||
| Management Group Inc. | (10,946) | (160) | |
| * | SVB Financial Group | (1,302) | (159) |
| Lazard Ltd. Class A | (3,364) | (156) | |
| Popular Inc. | (5,253) | (155) | |
| VEREIT Inc. | (18,451) | (152) | |
| * | Genworth Financial Inc. | ||
| Class A | (32,429) | (152) | |
| * | Realogy Holdings Corp. | (3,753) | (147) |
| * | Howard Hughes Corp. | (1,173) | (145) |
| * | Credit Acceptance Corp. | (753) | (142) |
| State Street Corp. | (1,900) | (131) | |
| * | Santander Consumer USA | ||
| Holdings Inc. | (7,257) | (131) | |
| (9,174) | |||
| Health Care (-3.8%) | |||
| * | Centene Corp. | (14,554) | (866) |
| Aetna Inc. | (6,281) | (721) | |
| Anthem Inc. | (4,997) | (695) | |
| * | Isis Pharmaceuticals Inc. | (3,889) | (187) |
| * | Alkermes plc | (2,493) | (179) |
| * | Vertex Pharmaceuticals Inc. | (1,429) | (178) |
| * | Inovalon Holdings Inc. | ||
| Class A | (7,542) | (174) | |
| * | BioMarin Pharmaceutical Inc. | (1,485) | (174) |
| * | Alexion Pharmaceuticals Inc. | (980) | (172) |
| * | Seattle Genetics Inc. | (4,103) | (170) |
| * | Celgene Corp. | (1,357) | (166) |
| * | Alnylam Pharmaceuticals | ||
| Inc. | (1,928) | (166) | |
| * | Regeneron | ||
| Pharmaceuticals Inc. | (297) | (166) | |
| * | Puma Biotechnology Inc. | (1,968) | (162) |
| * | Mallinckrodt plc | (2,458) | (161) |
| * | Veeva Systems Inc. Class A | (6,348) | (161) |
| * | Mylan NV | (3,554) | (157) |
| * | Biogen Inc. | (515) | (150) |
| * | Medivation Inc. | (3,524) | (148) |
| * | Akorn Inc. | (5,514) | (147) |
| * | IDEXX Laboratories Inc. | (2,098) | (144) |
| * | United Therapeutics Corp. | (981) | (144) |
| * | DexCom Inc. | (1,689) | (141) |
| * | Intercept | ||
| Pharmaceuticals Inc. | (868) | (136) | |
| * | Tenet Healthcare Corp. | (4,257) | (134) |
| * | Bluebird Bio Inc. | (1,681) | (130) |
| * | Community Health | ||
| Systems Inc. | (3,675) | (103) | |
| Gilead Sciences Inc. | (451) | (49) | |
| * | Incyte Corp. | (127) | (15) |
| (6,096) | |||
| Industrials (-1.9%) | |||
| Southwest Airlines Co. | (4,223) | (196) | |
| American Airlines Group Inc. | (4,002) | (185) | |
17
| Alternative Strategies Fund | |||
| Market | |||
| Value• | |||
| Shares | ($000) | ||
| * | United Rentals Inc. | (2,423) | (181) |
| * | Hertz Global Holdings Inc. | (9,115) | (178) |
| * | Avis Budget Group Inc. | (3,422) | (171) |
| Trinity Industries Inc. | (6,308) | (171) | |
| Delta Air Lines Inc. | (3,333) | (169) | |
| * | United Continental | ||
| Holdings Inc. | (2,792) | (168) | |
| Triumph Group Inc. | (3,534) | (165) | |
| Joy Global Inc. | (9,571) | (164) | |
| Oshkosh Corp. | (3,995) | (164) | |
| KBR Inc. | (8,576) | (158) | |
| * | AECOM | (5,298) | (156) |
| Manitowoc Co. Inc. | (9,791) | (150) | |
| * | JetBlue Airways Corp. | (5,865) | (146) |
| Alaska Air Group Inc. | (1,828) | (139) | |
| * | Quanta Services Inc. | (6,024) | (121) |
| * | USG Corp. | (5,086) | (120) |
| * | Spirit Airlines Inc. | (3,006) | (112) |
| (3,014) | |||
| Information Technology (-3.8%) | |||
| * | NXP Semiconductors NV | (14,471) | (1,134) |
| Avago Technologies Ltd. | |||
| Class A | (6,984) | (860) | |
| Lam Research Corp. | (3,800) | (291) | |
| * | LinkedIn Corp. Class A | (853) | (205) |
| * | First Solar Inc. | (3,511) | (200) |
| Cypress Semiconductor | |||
| Corp. | (18,225) | (192) | |
| * | HomeAway Inc. | (5,898) | (186) |
| * | NCR Corp. | (6,936) | (185) |
| * | ON Semiconductor Corp. | (15,817) | (174) |
| CDK Global Inc. | (3,337) | (166) | |
| * | CommScope Holding | ||
| Co. Inc. | (5,122) | (166) | |
| * | Tableau Software Inc. | ||
| Class A | (1,970) | (165) | |
| * | ARRIS Group Inc. | (5,802) | (164) |
| Lexmark International Inc. | |||
| Class A | (5,040) | (164) | |
| * | Zynga Inc. Class A | (68,940) | (163) |
| Cognex Corp. | (4,322) | (163) | |
| * | Twitter Inc. | (5,499) | (157) |
| * | Micron Technology Inc. | (9,361) | (155) |
| * | Yelp Inc. Class A | (6,912) | (154) |
| * | VeriFone Systems Inc. | (5,015) | (151) |
| * | Zebra Technologies Corp. | (1,955) | (150) |
| * | Splunk Inc. | (2,663) | (150) |
| * | Qorvo Inc. | (3,152) | (139) |
| * | Rackspace Hosting Inc. | (5,339) | (138) |
| * | FireEye Inc. | (4,947) | (129) |
| * | Pandora Media Inc. | (7,569) | (87) |
| (5,988) | |||
| Market | ||||
| Value• | ||||
| Shares | ($000) | |||
| Materials (-1.3%) | ||||
| Huntsman Corp. | (14,868) | (196) | ||
| Freeport-McMoRan Inc. | (14,412) | (170) | ||
| Newmont Mining Corp. | (8,656) | (168) | ||
| LyondellBasell Industries | ||||
| NV Class A | (1,797) | (167) | ||
| Westlake Chemical Corp. | (2,765) | (167) | ||
| Albemarle Corp. | (3,100) | (166) | ||
| Steel Dynamics Inc. | (8,777) | (162) | ||
| Royal Gold Inc. | (3,073) | (147) | ||
| Martin Marietta Materials | ||||
| Inc. | (947) | (147) | ||
| Eagle Materials Inc. | (2,213) | (146) | ||
| Allegheny Technologies Inc. | (9,702) | (142) | ||
| Alcoa Inc. | (15,887) | (142) | ||
| * | Platform Specialty Products | |||
| Corp. | (10,468) | (109) | ||
| (2,029) | ||||
| Telecommunication Services (-0.3%) | ||||
| * | Sprint Corp. | (37,454) | (177) | |
| Frontier Communications | ||||
| Corp. | (30,366) | (156) | ||
| * | Zayo Group Holdings Inc. | (5,759) | (153) | |
| (486) | ||||
| Utilities (-0.2%) | ||||
| TerraForm Power Inc. | ||||
| Class A | (9,408) | (172) | ||
| NRG Energy Inc. | (10,710) | (138) | ||
| (310) | ||||
| Total Common Stocks Sold Short | ||||
| (Proceeds $38,935) | (36,732) | |||
| Temporary Cash Investments (30.3%)1 | ||||
| Money Market Fund (25.4%) | ||||
| 2 | Vanguard Market | |||
| Liquidity Fund, | ||||
| 0.207% | 40,370,265 | 40,370 | ||
| Face | ||||
| Amount | ||||
| ($000) | ||||
| U.S. Government and Agency Obligations (4.9%) | ||||
| 3,4 | Federal Home Loan | |||
| Bank Discount Notes, | ||||
| 0.180%, 11/4/15 | 700 | 700 | ||
| 3,4,5 Federal Home Loan Bank | ||||
| Discount Notes, | ||||
| 0.175%, 11/13/15 | 5,000 | 5,000 | ||
| 3 | Federal Home Loan Bank | |||
| Discount Notes, | ||||
| 0.170%, 11/19/15 | 1,000 | 1,000 | ||
18
| Alternative Strategies Fund | ||
| Face | Market | |
| Amount | Value• | |
| ($000) | ($000) | |
| 3 Federal Home Loan Bank | ||
| Discount Notes, | ||
| 0.182%, 11/25/15 | 1,000 | 1,000 |
| 7,700 | ||
| Total Temporary Cash Investments | ||
| (Cost $48,070) | 48,070 | |
| †Other Assets and Liabilities—Net (28.0%) | 44,447 | |
| Net Assets (100%) | ||
| Applicable to 7,849,070 outstanding | ||
| $.001 par value shares of beneficial | ||
| interest (unlimited authorization) | 158,791 | |
| Net Asset Value Per Share | $20.23 | |
| Amount | ||
| ($000) | ||
| Consolidated Statement of Assets and Liabilities | ||
| Assets | ||
| Investments in Securities, | ||
| Long Positions, at Value | ||
| Unaffiliated Issuers | 110,706 | |
| Affiliated Vanguard Funds | 40,370 | |
| Total Long Positions | 151,076 | |
| †Cash Segregated for Short Positions | 39,932 | |
| Receivables for Investment Securities Sold | 500 | |
| Receivables for Accrued Income | 37 | |
| Investment in Vanguard | 15 | |
| Other Assets | 8,089 | |
| Total Assets | 199,649 | |
| Liabilities | ||
| Securities Sold Short, at Value | 36,732 | |
| Payables for Investment Securities | ||
| Purchased | 2,941 | |
| Payables to Vanguard | 50 | |
| Other Liabilities | 1,135 | |
| Total Liabilities | 40,858 | |
| Net Assets | 158,791 | |
| At October 31, 2015, net assets consisted of: | |
| Amount | |
| ($000) | |
| Paid-in Capital | 157,001 |
| Undistributed Net Investment Income | 45 |
| Accumulated Net Realized Losses | (2,433) |
| Unrealized Appreciation (Depreciation) | |
| Investment Securities—Long Positions | 392 |
| Investment Securities Sold Short | 2,203 |
| Futures Contracts | 815 |
| Forward Currency Contracts | 762 |
| Foreign Currencies | 6 |
| Net Assets | 158,791 |
• See Note A in Notes to Financial Statements.
* Non-income-producing security.
† Long security positions with a value of $17,818,000 and cash of $39,932,000 are held in segregated accounts at the fund’s custodian bank and pledged to a broker-dealer as collateral for the fund’s obligation to return borrowed securities. For so long as such obligations continue, the fund’s access to these assets is subject to authorization from the broker-dealer.
1 The fund invests a portion of its assets in commodities through its investment in Vanguard ASF Portfolio, a wholly owned subsidiary of the fund. After giving effect to commodity futures investments, the fund’s effective commodity and temporary cash investment positions represent 0.2% and 30.1%, respectively, of net assets.
2 Affiliated money market fund available only to Vanguard funds and certain trusts and accounts managed by Vanguard. Rate shown is the 7-day yield.
3 The issuer operates under a congressional charter; its securities are generally neither guaranteed by the U.S. Treasury nor backed by the full faith and credit of the U.S. government.
4 Securities with a value of $5,386,000 have been segregated as initial margin for open futures contracts.
5 Security is owned by the Vanguard ASF Portfolio, which is a wholly owned subsidiary of the Alternative Strategies Fund.
See accompanying Notes, which are an integral part of the Financial Statements.
19
| Alternative Strategies Fund | |
| Consolidated Statement of Operations | |
| August 11, 20151 to | |
| October 31, 2015 | |
| ($000) | |
| Investment Income | |
| Income | |
| Dividends2 | 269 |
| Interest3 | 24 |
| Total Income | 293 |
| Expenses | |
| The Vanguard Group—Note B | |
| Investment Advisory Services | 33 |
| Management and Administrative | 68 |
| Custodian Fees | — |
| Auditing Fees | 17 |
| Shareholders’ Reports | 2 |
| Trustees’ Fees and Expenses | 9 |
| Dividend Expense on Securities Sold Short | 120 |
| Borrowing Expense on Securities Sold Short | 12 |
| Total Expenses | 261 |
| Net Investment Income (Loss) | 32 |
| Realized Net Gain (Loss) | |
| Investment Securities—Long Positions | (2,000) |
| Investment Securities Sold Short | 1,710 |
| Futures Contracts | (698) |
| Foreign Currencies and Forward Currency Contracts | (1,432) |
| Realized Net Gain (Loss) | (2,420) |
| Change in Unrealized Appreciation (Depreciation) | |
| Investment Securities—Long Positions | 392 |
| Investment Securities Sold Short | 2,203 |
| Futures Contracts | 815 |
| Foreign Currencies and Forward Currency Contracts | 768 |
| Change in Unrealized Appreciation (Depreciation) | 4,178 |
| Net Increase (Decrease) in Net Assets Resulting from Operations | 1,790 |
| 1 | Inception. |
| 2 | Dividends are net of foreign withholding taxes of $3,000. |
| 3 | Interest income from an affiliated company of the fund was $21,000. |
See accompanying Notes, which are an integral part of the Financial Statements.
20
Alternative Strategies Fund
Consolidated Statement of Changes in Net Assets
| August 11, 20151 to | |
| October 31, 2015 | |
| ($000) | |
| Increase (Decrease) in Net Assets | |
| Operations | |
| Net Investment Income (Loss) | 32 |
| Realized Net Gain (Loss) | (2,420) |
| Change in Unrealized Appreciation (Depreciation) | 4,178 |
| Net Increase (Decrease) in Net Assets Resulting from Operations | 1,790 |
| Distributions | |
| Net Investment Income | — |
| Realized Capital Gain | — |
| Total Distributions | — |
| Capital Share Transactions | |
| Issued | 162,002 |
| Issued in Lieu of Cash Distributions | — |
| Redeemed | (5,001) |
| Net Increase (Decrease) from Capital Share Transactions | 157,001 |
| Total Increase (Decrease) | 158,791 |
| Net Assets | |
| Beginning of Period | — |
| End of Period2 | 158,791 |
| 1 | Inception. |
| 2 | Net Assets—End of Period includes undistributed (overdistributed) net investment income of $45,000. |
See accompanying Notes, which are an integral part of the Financial Statements.
21
| Alternative Strategies Fund | |
| Consolidated Financial Highlights | |
| August 11, 20151 to | |
| For a Share Outstanding Throughout the Period | October 31, 2015 |
| Net Asset Value, Beginning of Period | $20.00 |
| Investment Operations | |
| Net Investment Income (Loss) | . 004 |
| Net Realized and Unrealized Gain (Loss) on Investments | .226 |
| Total from Investment Operations | .230 |
| Distributions | |
| Dividends from Net Investment Income | — |
| Distributions from Realized Capital Gains | — |
| Total Distributions | — |
| Net Asset Value, End of Period | $20.23 |
| Total Return2 | 1.15% |
| Ratios/Supplemental Data | |
| Net Assets, End of Period (Millions) | $159 |
| Ratio of Total Expenses to Average Net Assets | |
| Based on Total Expenses3 | 0.73% 4 |
| Net of Dividend and Borrowing Expense on Securities Sold Short | 0.36%4 |
| Ratio of Net Investment Income (Loss) to Average Net Assets | 0.09%4 |
| Portfolio Turnover Rate | 25% |
| 1 | Inception. |
| 2 | Total returns do not include account service fees that may have applied in the periods shown. Fund prospectuses provide information about any applicable account service fees. |
| 3 | Includes 2015 dividend and borrowing expense on securities sold short of 0.34% and 0.03%, respectively. |
| 4 | Annualized. |
See accompanying Notes, which are an integral part of the Financial Statements.
22
Alternative Strategies Fund
Notes to Consolidated Financial Statements
Vanguard Alternative Strategies Fund is registered under the Investment Company Act of 1940 as an open-end investment company, or mutual fund.
The Consolidated Financial Statements include Vanguard ASF Portfolio (“the subsidiary”), which commenced operations on August 11, 2015. The subsidiary is wholly owned by the fund and is a unit trust established in the Cayman Islands under the Trusts Law (2011 Revision) of the Cayman Islands, which is organized to invest in certain commodity-linked investments on behalf of the fund, consistent with the fund’s investment objectives and policies. The commodity-linked investments and other investments held by the subsidiary are subject to the same risks that apply to similar investments if held directly by the fund. As of October 31, 2015, the fund held $7,112,000 in the subsidiary, representing 4% of the fund’s net assets. All inter-fund transactions and balances (including the fund’s investment in the subsidiary) have been eliminated, and the Consolidated Financial Statements include all investments and other accounts of the subsidiary as if held directly by the fund. A summary of the subsidiary’s financial information is presented below.
| Amount | |
| Subsidiary Financial Statement Information | ($000) |
| Total Assets | 8,083 |
| Total Liabilities | (971) |
| Net Assets | 7,112 |
| Net Investment Income (Loss) | (16) |
| Realized Net Gain (Loss) | (763) |
| Change in Unrealized Appreciation (Depreciation) | 891 |
| Net Increase (Decrease) in Net Assets Resulting from Operations | 112 |
A. The following significant accounting policies conform to generally accepted accounting principles for U.S. investment companies. The fund consistently follows such policies in preparing its financial statements.
1. Security Valuation: Securities are valued as of the close of trading on the New York Stock Exchange (generally 4 p.m., Eastern time) on the valuation date. Equity securities are valued at the latest quoted sales prices or official closing prices taken from the primary market in which each security trades; such securities not traded on the valuation date are valued at the mean of the latest quoted bid and asked prices. Securities for which market quotations are not readily available, or whose values have been materially affected by events occurring before the fund’s pricing time but after the close of the securities’ primary markets, are valued by methods deemed by the board of trustees to represent fair value. Investments in Vanguard Market Liquidity Fund are valued at that fund’s net asset value. Temporary cash investments acquired over 60 days to maturity are valued using the latest bid prices or using valuations based on a matrix system (which considers such factors as security prices, yields, maturities, and ratings), both as furnished by independent pricing services. Other temporary cash investments are valued at amortized cost, which approximates market value.
2. Foreign Currency: Securities and other assets and liabilities denominated in foreign currencies are translated into U.S. dollars using exchange rates obtained from an independent third party as of the fund’s pricing time on the valuation date. Realized gains (losses) and unrealized appreciation (depreciation) on investment securities include the effects of changes in exchange rates since the securities were purchased, combined with the effects of changes in security prices. Fluctuations
23
Alternative Strategies Fund
in the value of other assets and liabilities resulting from changes in exchange rates are recorded as unrealized foreign currency gains (losses) until the assets or liabilities are settled in cash, at which time they are recorded as realized foreign currency gains (losses).
3. Futures Contracts: The fund gains exposure to commodities through the subsidiary’s investment in exchange-traded commodity futures contracts. The primary risk associated with the use of commodity futures contracts is the chance the fund could lose all, or substantially all, of its investments in instruments linked to the returns of commodity futures. Commodity futures trading is volatile, and even a small movement in market prices could cause large losses. The fund also uses futures contracts to invest in fixed income asset classes with greater efficiency and lower cost than is possible through direct investment, to add value when these instruments are attractively priced, or to adjust sensitivity to changes in interest rates. The primary risks associated with the use of futures contracts are imperfect correlation between changes in market values of bonds held by the fund and the prices of futures contracts, and the possibility of an illiquid market. Counterparty risk involving futures is mitigated because a regulated clearinghouse is the counterparty instead of the clearing broker. To further mitigate counterparty risk, the fund trades futures contracts on an exchange, monitors the financial strength of its clearing brokers and clearinghouse, and has entered into clearing agreements with its clearing brokers. The clearinghouse imposes initial margin requirements to secure the fund’s performance and requires daily settlement of variation margin representing changes in the market value of each contract.
Futures contracts are valued at their quoted daily settlement prices. The aggregate settlement values of the contracts are not recorded in the Consolidated Statement of Assets and Liabilities. Fluctuations in the value of the contracts are recorded in the Consolidated Statement of Assets and Liabilities as an asset (liability) and in the Consolidated Statement of Operations as unrealized appreciation (depreciation) until the contracts are closed, when they are recorded as realized futures gains (losses).
During the period ended October 31, 2015, the fund’s average investments in long and short futures contracts represented 109% and 21% of net assets, respectively.
4. Forward Currency Contracts: The fund enters into forward currency contracts to enhance returns and protect the value of securities and related receivables and payables against changes in future foreign exchange rates. The fund’s risks in using these contracts include movement in the values of the foreign currencies relative to the U.S. dollar and the ability of the counterparties to fulfill their obligations under the contracts. The fund mitigates its counterparty risk by entering into forward currency contracts only with a diverse group of prequalified counterparties, monitoring their financial strength, entering into master netting arrangements with its counterparties, and requiring its counter-parties to transfer collateral as security for their performance. The master netting arrangements provide that, in the event of a counterparty’s default (including bankruptcy), the fund may terminate the forward currency contracts, determine the net amount owed by either party in accordance with its master netting arrangements, and sell or retain any collateral held up to the net amount owed to the fund under the master netting arrangements. The forward currency contracts contain provisions whereby a counterparty may terminate open contracts if the fund’s net assets decline below a certain level, triggering a payment by the fund if the fund is in a net liability position at the time of the termination. The payment amount would be reduced by any collateral the fund has pledged. Any assets pledged as collateral for open contracts are noted in the Consolidated Statement of Net Assets. The value of collateral received or pledged is compared daily to the value of the forward currency contracts exposure with each counterparty, and any difference, if in excess of a specified minimum transfer amount, is adjusted and settled within two business days.
24
Alternative Strategies Fund
Forward currency contracts are valued at their quoted daily prices obtained from an independent third party, adjusted for currency risk based on the expiration date of each contract. The notional amounts of the contracts are not recorded in the Consolidated Statement of Assets and Liabilities. Fluctuations in the value of the contracts are recorded in the Consolidated Statement of Assets and Liabilities as an asset (liability) and in the Consolidated Statement of Operations as unrealized appreciation (depreciation) until the contracts are closed, when they are recorded as realized forward currency contract gains (losses).
During the period ended October 31, 2015, the fund’s average investment in forward currency contracts represented 2% of net assets, based on the average of notional amounts at each quarter-end during the period.
5. Short Sales: Short sales are the sales of securities that the fund does not own. The fund sells a security it does not own in anticipation of a decline in the value of that security. In order to deliver the security to the purchaser, the fund borrows the security from a broker-dealer. The fund must segregate, as collateral for its obligation to return the borrowed security, an amount of cash and long security positions at least equal to the market value of the security sold short. This results in the fund holding a significant portion of its assets in cash. The fund later closes out the position by returning the security to the lender, typically by purchasing the security in the open market. A gain, limited to the price at which the fund sold the security short, or a loss, theoretically unlimited in size, is recognized upon the termination of the short sale. The fund may receive a portion of the income from the investment of collateral, or be charged a fee on borrowed securities, based on the market value of each borrowed security and a variable rate that is dependent upon the availability of such security. The net amounts of income or fees are recorded as interest income (for net income received) or borrowing expense on securities sold short (for net fees charged) on the Consolidated Statement of Operations. Dividends on securities sold short are reported as an expense in the Consolidated Statement of Operations. Cash collateral segregated for securities sold short is recorded as an asset in the Consolidated Statement of Assets and Liabilities. Long security positions segregated as collateral are shown in the Consolidated Statement of Net Assets.
6. Federal Income Taxes: The fund intends to continue to qualify as a regulated investment company and distribute all of its taxable income. The subsidiary is classified as a foreign corporation for U.S. tax purposes, and because it does not carry on a U.S. trade or business, is generally not subject to U.S. federal income tax. The subsidiary also complies with the Foreign Account Tax Compliance Act (“FATCA”) and thus will not be subject to 30% withholding under FATCA on any income from U.S. investments. In addition, the subsidiary is not subject to Cayman Islands income tax. The subsidiary will distribute any earnings and profits to the fund each year, and such income will be qualifying income to the fund. Management has analyzed the fund’s tax positions taken for its open federal income tax period ended October 31, 2015, and has concluded that no provision for federal income tax is required in the fund’s financial statements.
7. Distributions: Distributions to shareholders are recorded on the ex-dividend date.
8. Credit Facility: The fund and certain other funds managed by The Vanguard Group (“Vanguard”) participate in a $3 billion committed credit facility provided by a syndicate of lenders pursuant to a credit agreement that may be renewed annually; each fund is individually liable for its borrowings, if any, under the credit facility. Borrowings may be utilized for temporary and emergency purposes, and are subject to the fund’s regulatory and contractual borrowing restrictions. The participating funds are charged administrative fees and an annual commitment fee of 0.06% of the undrawn amount of the
25
Alternative Strategies Fund
facility; these fees are allocated to the funds based on a method approved by the fund’s board of trustees and included in Management and Administrative expenses on the fund’s Consolidated Statement of Operations. Any borrowings under this facility bear interest at a rate equal to the higher of the federal funds rate or LIBOR reference rate plus an agreed-upon spread.
The fund had no borrowings outstanding at October 31, 2015, or at any time during the period then ended.
9. Other: Dividend income (or dividend expenses on short positions) is recorded on the ex-dividend date. Interest income includes income distributions received from Vanguard Market Liquidity Fund and is accrued daily. Premiums and discounts on debt securities purchased are amortized and accreted, respectively, to interest income over the lives of the respective securities. Security transactions are accounted for on the date securities are bought or sold. Costs used to determine realized gains (losses) on the sale of investment securities are those of the specific securities sold.
B. In accordance with the terms of a Funds’ Service Agreement (the “FSA”) between Vanguard and the fund, Vanguard furnishes to the fund investment advisory, corporate management, administrative, marketing, and distribution services at Vanguard’s cost of operations (as defined by the FSA). These costs of operations are allocated to the fund based on methods and guidelines approved by the board of trustees. Vanguard does not require reimbursement in the current period for certain costs of operations (such as deferred compensation/benefits and risk/insurance costs); the fund’s liability for these costs of operations is included in Payables to Vanguard on the Consolidated Statement of Assets and Liabilities.
Upon the request of Vanguard, the fund may invest up to 0.40% of its net assets as capital in Vanguard. At October 31, 2015, the fund had contributed to Vanguard capital in the amount of $15,000, representing 0.01% of the fund’s net assets and 0.00% of Vanguard’s capitalization. The fund’s trustees and officers are also directors and employees, respectively, of Vanguard.
Under a separate agreement, Vanguard provides corporate management and administrative services to the subsidiary for an annual fee of 0.40% of average net assets of the subsidiary. In addition, the subsidiary pays an unaffiliated third party, VGMF I (Cayman) Limited, an affiliate of Maples Trustee Services (Cayman) Limited, a fee plus reasonable additional expenses for trustee services. All of the subsidiary’s expenses are reflected in the Consolidated Statement of Operations and in the Ratio of Total Expenses to Average Net Assets in the Consolidated Financial Highlights.
C. Various inputs may be used to determine the value of the fund’s investments. These inputs are summarized in three broad levels for financial statement purposes. The inputs or methodologies used to value securities are not necessarily an indication of the risk associated with investing in those securities.
Level 1—Quoted prices in active markets for identical securities.
Level 2—Other significant observable inputs (including quoted prices for similar securities, interest rates, prepayment speeds, credit risk, etc.).
Level 3—Significant unobservable inputs (including the fund’s own assumptions used to determine the fair value of investments).
26
Alternative Strategies Fund
The following table summarizes the market value of the fund’s investments as of October 31, 2015, based on the inputs used to value them:
| Level 1 | Level 2 | Level 3 | |
| Investments | ($000) | ($000) | ($000) |
| Common Stocks—Long Positions | 101,012 | 1,994 | — |
| Common Stocks Sold Short | (36,732) | — | — |
| Temporary Cash Investments | 40,370 | 7,700 | — |
| Futures Contracts—Assets1 | 336 | — | — |
| Futures Contracts—Liabilities1 | (557) | — | — |
| Forward Currency Contracts—Assets | — | 894 | — |
| Forward Currency Contracts—Liabilities | — | (132) | — |
| Total | 104,429 | 10,456 | — |
| 1 Represents variation margin on the last day of the reporting period. |
D. At October 31, 2015, the fair values of derivatives were reflected in the Consolidated Statement of Assets and Liabilities as follows:
| Foreign | ||||
| Commodity | Interest Rate | Exchange | ||
| Statement of Assets and Liabilities | Contracts | Contracts | Contracts | Total |
| Caption | ($000) | ($000) | ($000) | ($000) |
| Other Assets | 327 | 9 | 894 | 1,230 |
| Other Liabilities | (526) | (31) | (132) | (689) |
Realized net gain (loss) and the change in unrealized appreciation (depreciation) on derivatives for the period ended October 31, 2015, were:
| Foreign | ||||
| Commodity | Interest Rate | Exchange | ||
| Contracts | Contracts | Contracts | Total | |
| Realized Net Gain (Loss) on Derivatives | ($000) | ($000) | ($000) | ($000) |
| Futures Contracts | (763) | 65 | — | (698) |
| Forward Currency Contracts | — | — | (1,444) | (1,444) |
| Realized Net Gain (Loss) on Derivatives | (763) | 65 | (1,444) | (2,142) |
| Change in Unrealized Appreciation | ||||
| (Depreciation) on Derivatives | ||||
| Futures Contracts | 891 | (76) | — | 815 |
| Forward Currency Contracts | — | — | 762 | 762 |
| Change in Unrealized Appreciation | ||||
| (Depreciation) on Derivatives | 891 | (76) | 762 | 1,577 |
27
Alternative Strategies Fund
At October 31, 2015, the aggregate settlement value of open futures contracts and the related unrealized appreciation (depreciation) were:
| ($000) | ||||
| Aggregate | ||||
| Number of | Settlement | Unrealized | ||
| Long (Short) | Value | Appreciation | ||
| Futures Contracts | Expiration | Contracts | Long (Short) | (Depreciation) |
| 2-Year U. S. Treasury Note | December 2015 | 467 | 102,112 | (88) |
| 5-Year U.S. Treasury Note | December 2015 | 200 | 23,955 | (16) |
| 10-Year U.S. Treasury Note | December 2015 | 121 | 15,450 | 28 |
| KC Hard Red Winter Wheat1 | December 2015 | (170) | (4,197) | 140 |
| Natural Gas1 | November 2015 | (179) | (4,155) | 624 |
| Cotton No. 21 | December 2015 | 131 | 4,147 | 105 |
| WTI Crude Oil1 | November 2015 | (89) | (4,146) | (22) |
| Cocoa1 | March 2016 | 127 | 4,144 | 203 |
| Soybean Meal1 | December 2015 | 136 | 4,140 | (161) |
| Corn No. 2 Yellow1 | December 2015 | (216) | (4,128) | 71 |
| Soybean Oil1 | December 2015 | (241) | (4,078) | 37 |
| NY Harbor ULSD1 | November 2015 | (64) | (4,077) | (25) |
| Sugar #111 | February 2016 | 250 | 4,066 | 54 |
| Feeder Cattle1 | January 2016 | 44 | 4,030 | 65 |
| Copper1 | December 2015 | 69 | 3,998 | (188) |
| Low Sulphur Gas Oil1 | December 2015 | (86) | (3,956) | (5) |
| Lean Hogs1 | December 2015 | (167) | (3,955) | 437 |
| LME Copper1 | December 2015 | 30 | 3,843 | (166) |
| LME Tin1 | December 2015 | 50 | 3,752 | (278) |
| 815 | ||||
| 1 Security is owned by the subsidiary. |
Unrealized appreciation (depreciation) on open futures contracts, except LME Copper and LME Tin contracts, is required to be treated as realized gain (loss) for tax purposes.
28
Alternative Strategies Fund
At October 31, 2015, the fund had open forward currency contracts to receive and deliver currencies as follows. Unrealized appreciation (depreciation) on open forward currency contracts is treated as realized gain (loss) for tax purposes.
| Unrealized | ||||||
| Contract | Appreciation | |||||
| Contract Amount (000) | ||||||
| Settlement | (Depreciation) | |||||
| Counterparty | Date | Receive | Deliver | ($000) | ||
| Bank of America, N.A. | 11/6/15 | CAD | 19,130 | USD | 14,443 | 186 |
| Bank of America, N.A. | 11/6/15 | NOK | 120,818 | USD | 14,318 | (100) |
| Bank of America, N.A. | 11/6/15 | AUD | 20,196 | USD | 14,254 | 144 |
| Bank of America, N.A. | 11/6/15 | CAD | 584 | USD | 444 | 3 |
| Bank of America, N.A. | 11/6/15 | USD | 14,297 | SEK | 119,794 | 274 |
| Bank of America, N.A. | 11/6/15 | USD | 14,275 | CHF | 13,945 | 165 |
| Bank of America, N.A. | 11/6/15 | USD | 14,269 | JPY | 1,708,958 | 106 |
| Bank of America, N.A. | 11/6/15 | USD | 1,240 | CAD | 1,641 | (15) |
| Bank of America, N.A. | 11/6/15 | USD | 970 | GBP | 640 | (17) |
| Bank of America, N.A. | 11/6/15 | USD | 909 | EUR | 814 | 14 |
| Bank of America, N.A. | 11/6/15 | USD | 176 | CAD | 228 | 2 |
| 762 | ||||||
| AUD—Australian dollar. | ||||||
| CAD—Canadian dollar. | ||||||
| CHF—Swiss franc. | ||||||
| EUR—Euro. | ||||||
| GBP—British pound. | ||||||
| JPY—Japanese yen. | ||||||
| NOK—Norwegian krone. | ||||||
| SEK—Swedish krona. | ||||||
| USD—U.S. dollar. | ||||||
29
Alternative Strategies Fund
The following table summarizes the fund’s derivative assets and liabilities by counterparty for derivatives subject to arrangements that provide for offsetting assets and liabilities. Exchange-traded derivatives are listed separately.
| Assets | Liabilities | |||||
| Reflected in | Reflected in | Amounts Not Offset in the | ||||
| Consolidated | Consolidated | Consolidated Statement of | Net | |||
| Statement of | Statement of | Net Amount | Assets and Liabilities | Exposure 3 | ||
| Assets and | Assets and | Receivable | Collateral | Collateral | (Not Less | |
| Liabilities1 | Liabilities1 | (Payable) | Pledged 2 | Received 2 | Than $0) | |
| ($000) | ($000) | ($000) | ($000) | ($000) | ($000) | |
| Forwards Subject to Offsetting | ||||||
| Arrangements, by Counterparty | ||||||
| Bank of America, N.A. | 894 | (132) | 762 | — | 898 | — |
| Exchange-Traded Futures Contracts | 9 | (31) | (22) | 686 | — | — |
| Exchange-Traded Commodity | ||||||
| Futures Contracts | 327 | (526) | (199) | 4,700 | — | — |
| Total | 1,230 | (689) | 541 | 5,386 | 898 | — |
1 Absent an event of default or early termination, derivative assets and liabilities are presented gross and not offset in the Consolidated Statement of Assets and Liabilities.
2 Securities or other assets pledged as collateral are noted in the Consolidated Statement of Assets and Liabilities. Securities or other assets received as collateral are held in a segregated account and not included in the fund’s security holdings in the Consolidated Statement of Assets and Liabilities.
3 Net Exposure represents the net amount receivable from the counterparty in the event of default. Counterparties are not required to exchange collateral if amount is below a specified minimum transfer amount.
E. Distributions are determined on a tax basis and may differ from net investment income and realized capital gains for financial reporting purposes. Differences may be permanent or temporary. Permanent differences are reclassified among capital accounts in the financial statements to reflect their tax character. Temporary differences arise when certain items of income, expense, gain, or loss are recognized in different periods for financial statement and tax purposes; such differences are primarily attributed to mark-to-market of open futures contracts. These differences will reverse at some time in the future. Differences in classification may also result from the treatment of short-term gains as ordinary income for tax purposes.
During the period ended October 31, 2015, the fund realized net foreign currency gains of $12,000, which increased distributable net income for tax purposes; accordingly, such gains have been reclassified from accumulated net realized losses to undistributed net investment income.
For tax purposes, at October 31, 2015, the fund had $617,000 of ordinary income available for distribution. The fund had available capital losses totaling $838,000 that may be carried forward indefinitely to offset future net capital gains.
At October 31, 2015, the cost of investment securities for tax purposes was $150,829,000. Net unrealized appreciation of long security positions for tax purposes was $247,000, consisting of unrealized gains of $2,212,000 on securities that had risen in value since their purchase and $1,965,000 in unrealized losses on securities that had fallen in value since their purchase. Tax-basis net unrealized appreciation on securities sold short was $2,203,000, consisting of unrealized gains of $3,161,000 on securities that had fallen in value since their purchase and $958,000 in unrealized losses on securities that had risen in value since their purchase.
30
Alternative Strategies Fund
F. During the period ended October 31, 2015, the fund purchased $130,023,000 of investment securities and sold $25,336,000 of investment securities, other than temporary cash investments. The proceeds of short sales and the cost of purchases to cover short sales were $45,890,000 and $5,245,000 respectively.
| G. Capital shares issued and redeemed were: | |
| August 11, 20151 to | |
| October 31, 2015 | |
| Shares | |
| (000) | |
| Issued | 8,100 |
| Issued in Lieu of Cash Distributions | — |
| Redeemed | (251) |
| Net Increase (Decrease) in Shares Outstanding | 7,849 |
| 1 Inception. |
At October 31, 2015, Vanguard Managed Payout Fund was the record or beneficial owner of 100% of the fund’s net assets.
H. Management has determined that no material events or transactions occurred subsequent to October 31, 2015, that would require recognition or disclosure in these financial statements.
31
Report of Independent Registered Public Accounting Firm
To the Board of Trustees of Vanguard Trustees’ Equity Fund and the Shareholders of Vanguard Alternative Strategies Fund: In our opinion, the accompanying consolidated statement of net assets, consolidated statement of assets and liabilities and the related consolidated statements of operations and of changes in net assets and the consolidated financial highlights present fairly, in all material respects, the financial position of Vanguard Alternative Strategies Fund (constituting a separate portfolio of Vanguard Trustees’ Equity Fund, hereafter referred to as the “Fund”) at October 31, 2015, and the results of its operations, the changes in its net assets, and the financial highlights for the period August 11, 2015 (commencement of operations) through October 31, 2015, in conformity with accounting principles generally accepted in the United States of America. These consolidated financial statements and consolidated financial highlights (hereafter referred to as “financial statements”) are the responsibility of the Fund’s management. Our responsibility is to express an opinion on these financial statements based on our audit. We conducted our audit of these financial statements in accordance with the standards of the Public Company Accounting Oversight Board (United States). Those standards require that we plan and perform the audit to obtain reasonable assurance about whether the financial statements are free of material misstatement. An audit includes examining, on a test basis, evidence supporting the amounts and disclosures in the financial statements, assessing the accounting principles used and significant estimates made by management, and evaluating the overall financial statement presentation. We believe that our audit, which included confirmation of securities at October 31, 2015 by correspondence with the custodian and brokers, by agreement to the underlying ownership records of the transfer agent and the application of alternative auditing procedures where securities purchased had not been received, provides a reasonable basis for our opinion.
/s/PricewaterhouseCoopers LLP
Philadelphia, Pennsylvania
December 15, 2015
32
Trustees Approve Advisory Arrangement
The board of trustees approved the launch of Vanguard Alternative Strategies Fund utilizing an internalized management structure whereby The Vanguard Group, Inc. (Vanguard)—through its Quantitative Equity Group—would provide investment advisory services to the fund at cost. The board determined that the investment advisory arrangement with Vanguard was in the best interests of the fund and its prospective shareholders.
The board based its decision upon an evaluation of the advisor’s investment staff, portfolio management process, and performance. The trustees considered the factors discussed below, among others. However, no single factor determined whether the board approved the arrangement. Rather, it was the totality of the circumstances that drove the board’s decision.
Nature, extent, and quality of services
The board reviewed the quality of the investment management services to be provided to the fund and took into account the organizational depth and stability of the advisor. The board considered that Vanguard has been managing investments for more than three decades. The Quantitative Equity Group adheres to a sound, disciplined investment management process; the team has considerable experience, stability, and depth.
The board concluded that Vanguard’s experience, stability, depth, and performance, among other factors, warranted approval of the advisory arrangement.
Investment performance
The board could not consider the performance of the fund because it was newly launched. However, the board determined that, in its management of other Vanguard active funds, the Quantitative Equity Group has a track record of consistent performance and disciplined investment processes. Information about the fund’s performance since inception can be found in the Performance Summary section of this report.
Cost
The board considered the cost of services to be provided and concluded that the fund’s expense ratio would be below the average expense ratios charged by funds in its peer group. Information about the fund’s expense ratio appears in the Financial Statements section.
The board did not conduct a profitability analysis of Vanguard because of Vanguard’s unique “at-cost” structure. Unlike most other mutual fund management companies, Vanguard is owned by the funds it oversees and produces “profits” only in the form of reduced expenses for fund shareholders.
The benefit of economies of scale
The board concluded that the fund’s at-cost arrangement with Vanguard ensures that the fund will realize economies of scale as it grows, with the cost to shareholders declining as fund assets increase.
The board will consider whether to renew the advisory arrangement again after a one-year period.
33
Glossary
Earnings Growth Rate. The average annual rate of growth in earnings over the past five years for the stocks now in a fund.
Equity Exposure. A measure that reflects a fund’s investments in stocks and stock futures. Any holdings in short-term reserves are excluded.
Expense Ratio. A fund’s total annual operating expenses expressed as a percentage of the fund’s average net assets. The expense ratio includes management and administrative expenses, but does not include the transaction costs of buying and selling portfolio securities.
Foreign Holdings. The percentage of a fund represented by securities or depositary receipts of companies based outside the United States.
Inception Date. The date on which the assets of a fund (or one of its share classes) are first invested in accordance with the fund’s investment objective. For funds with a subscription period, the inception date is the day after that period ends. Investment performance is measured from the inception date.
Median Market Cap. An indicator of the size of companies in which a fund invests; the midpoint of market capitalization (market price x shares outstanding) of a fund’s stocks, weighted by the proportion of the fund’s assets invested in each stock. Stocks representing half of the fund’s assets have market capitalizations above the median, and the rest are below it.
Price/Book Ratio. The share price of a stock divided by its net worth, or book value, per share. For a fund, the weighted average price/book ratio of the stocks it holds.
Price/Earnings Ratio. The ratio of a stock’s current price to its per-share earnings over the past year. For a fund, the weighted average P/E of the stocks it holds. P/E is an indicator of market expectations about corporate prospects; the higher the P/E, the greater the expectations for a company’s future growth.
Return on Equity. The annual average rate of return generated by a company during the past five years for each dollar of shareholder’s equity (net income divided by shareholder’s equity). For a fund, the weighted average return on equity for the companies whose stocks it holds.
Short-Term Reserves. The percentage of a fund invested in highly liquid, short-term securities that can be readily converted to cash.
Turnover Rate. An indication of the fund’s trading activity. Funds with high turnover rates incur higher transaction costs and may be more likely to distribute capital gains (which may be taxable to investors). The turnover rate excludes in-kind transactions, which have minimal impact on costs.
34
This page intentionally left blank.
The People Who Govern Your Fund
The trustees of your mutual fund are there to see that the fund is operated and managed in your best interests since, as a shareholder, you are a part owner of the fund. Your fund’s trustees also serve on the board of directors of The Vanguard Group, Inc., which is owned by the Vanguard funds and provides services to them on an at-cost basis.
A majority of Vanguard’s board members are independent, meaning that they have no affiliation with Vanguard or the funds they oversee, apart from the sizable personal investments they have made as private individuals. The independent board members have distinguished backgrounds in business, academia, and public service. Each of the trustees and executive officers oversees 194 Vanguard funds.
The following table provides information for each trustee and executive officer of the fund. More information about the trustees is in the Statement of Additional Information, which can be obtained, without charge, by contacting Vanguard at 800-662-7447, or online at vanguard.com.
InterestedTrustee1
F. William McNabb III
Born 1957. Trustee Since July 2009. Chairman of the Board. Principal Occupation(s) During the Past Five Years and Other Experience: Chairman of the Board of The Vanguard Group, Inc., and of each of the investment companies served by The Vanguard Group, since January 2010; Director of The Vanguard Group since 2008; Chief Executive Officer and President of The Vanguard Group, and of each of the investment companies served by The Vanguard Group, since 2008; Director of Vanguard Marketing Corporation; Managing Director of The Vanguard Group (1995–2008).
IndependentTrustees
Emerson U. Fullwood
Born 1948. Trustee Since January 2008. Principal Occupation(s) During the Past Five Years and Other Experience: Executive Chief Staff and Marketing Officer for North America and Corporate Vice President (retired 2008) of Xerox Corporation (document management products and services); Executive in Residence and 2009–2010 Distinguished Minett Professor at the Rochester Institute of Technology; Director of SPX Corporation (multi-industry manufacturing), the United Way of Rochester, the University of Rochester Medical Center, Monroe Community College Foundation, and North Carolina A&T University.
Rajiv L. Gupta
Born 1945. Trustee Since December 2001.2 Principal Occupation(s) During the Past Five Years and Other Experience: Chairman and Chief Executive Officer (retired 2009) and President (2006–2008) of Rohm and Haas Co. (chemicals); Director of Tyco International PLC (diversified manufacturing and services), Hewlett-Packard Co. (electronic computer manufacturing), and Delphi Automotive PLC (automotive components); Senior Advisor at New Mountain Capital.
Amy Gutmann
Born 1949. Trustee Since June 2006. Principal Occupation(s) During the Past Five Years and Other Experience: President of the University of Pennsylvania; Christopher H. Browne Distinguished Professor of Political Science, School of Arts and Sciences, and Professor of Communication, Annenberg School for Communication, with secondary faculty appointments in the Department of Philosophy, School of Arts and Sciences, and at the Graduate School of Education, University of Pennsylvania; Trustee of the National Constitution Center; Chair of the Presidential Commission for the Study of Bioethical Issues.
JoAnn Heffernan Heisen
Born 1950. Trustee Since July 1998. Principal Occupation(s) During the Past Five Years and Other Experience: Corporate Vice President and Chief Global Diversity Officer (retired 2008) and Member of the Executive Committee (1997–2008) of Johnson & Johnson (pharmaceuticals/medical devices/consumer products); Director of Skytop Lodge Corporation (hotels) and the Robert Wood Johnson Foundation; Member of the Advisory Board of the Institute for Women’s Leadership at Rutgers University.
F. Joseph Loughrey
Born 1949. Trustee Since October 2009. Principal Occupation(s) During the Past Five Years and Other Experience: President and Chief Operating Officer (retired 2009) of Cummins Inc. (industrial machinery); Chairman of the Board of Hillenbrand, Inc. (specialized consumer services), and of Oxfam America; Director of SKF AB (industrial machinery), Hyster-Yale Materials Handling, Inc. (forklift trucks), the Lumina Foundation for Education, and the V Foundation for Cancer Research; Member of the Advisory Council for the College of Arts and Letters and of the Advisory Board to the Kellogg Institute for International Studies, both at the University of Notre Dame.
Mark Loughridge
Born 1953. Trustee Since March 2012. Principal Occupation(s) During the Past Five Years and Other Experience: Senior Vice President and Chief Financial Officer (retired 2013) at IBM (information technology services); Fiduciary Member of IBM’s Retirement Plan Committee (2004–2013); Director of the Dow Chemical Company; Member of the Council on Chicago Booth.
Scott C. Malpass
Born 1962. Trustee Since March 2012. Principal Occupation(s) During the Past Five Years and Other Experience: Chief Investment Officer and Vice President at the University of Notre Dame; Assistant Professor of Finance at the Mendoza College of Business at Notre Dame; Member of the Notre Dame 403(b) Investment Committee; Board Member of TIFF Advisory Services, Inc., and Catholic Investment Services, Inc. (investment advisors); Member of the Investment Advisory Committee of Major League Baseball.
André F. Perold
Born 1952. Trustee Since December 2004. Principal Occupation(s) During the Past Five Years and Other Experience: George Gund Professor of Finance and Banking, Emeritus at the Harvard Business School (retired 2011); Chief Investment Officer and Managing Partner of HighVista Strategies LLC (private investment firm); Director of Rand Merchant Bank; Overseer of the Museum of Fine Arts Boston.
Peter F. Volanakis
Born 1955. Trustee Since July 2009. Principal Occupation(s) During the Past Five Years and Other Experience: President and Chief Operating Officer (retired 2010) of Corning Incorporated (communications equipment); Trustee of Colby-Sawyer College; Member of the Advisory Board of the Norris Cotton Cancer Center and of the Advisory Board of the Parthenon Group (strategy consulting).
Executive Officers
Glenn Booraem
Born 1967. Treasurer Since May 2015. Principal Occupation(s) During the Past Five Years and Other Experience: Principal of The Vanguard Group, Inc.; Treasurer of each of the investment companies served by The Vanguard Group; Controller of each of the investment companies served by The Vanguard Group (2010–2015); Assistant Controller of each of the investment companies served by The Vanguard Group (2001–2010).
Thomas J. Higgins
Born 1957. Chief Financial Officer Since September 2008. Principal Occupation(s) During the Past Five Years and Other Experience: Principal of The Vanguard Group, Inc.; Chief Financial Officer of each of the investment companies served by The Vanguard Group; Treasurer of each of the investment companies served by The Vanguard Group (1998–2008).
Peter Mahoney
Born 1974. Controller Since May 2015. Principal Occupation(s) During the Past Five Years and Other Experience: Head of Global Fund Accounting at The Vanguard Group, Inc.; Controller of each of the investment companies served by The Vanguard Group; Head of International Fund Services at The Vanguard Group (2008–2014).
Heidi Stam
Born 1956. Secretary Since July 2005. Principal Occupation(s) During the Past Five Years and Other Experience: Managing Director of The Vanguard Group, Inc.; General Counsel of The Vanguard Group; Secretary of The Vanguard Group and of each of the investment companies served by The Vanguard Group; Director and Senior Vice President of Vanguard Marketing Corporation.
Vanguard Senior Management Team
Mortimer J. Buckley
Kathleen C. Gubanich
Paul A. Heller
Martha G. King
John T. Marcante
Chris D. McIsaac
James M. Norris
Thomas M. Rampulla
Glenn W. Reed
Karin A. Risi
Chairman Emeritus and Senior Advisor
John J. Brennan
Chairman, 1996–2009
Chief Executive Officer and President, 1996–2008
Founder John C. Bogle
Chairman and Chief Executive Officer, 1974–1996
1 Mr. McNabb is considered an “interested person,” as defined in the Investment Company Act of 1940, because he is an officer of the Vanguard funds.
2 December 2002 for Vanguard Equity Income Fund, the Vanguard Municipal Bond Funds, and the Vanguard State Tax-Exempt Funds.
 |
| P.O. Box 2600 |
| Valley Forge, PA 19482-2600 |
Connect with Vanguard® > vanguard.com
| Fund Information > 800-662-7447 | CFA® is a registered trademark owned by CFA Institute. |
| Direct Investor Account Services > 800-662-2739 | |
| Institutional Investor Services > 800-523-1036 | |
| Text Telephone for People | |
| Who Are Deaf or Hard of Hearing> 800-749-7273 | |
| This material may be used in conjunction | |
| with the offering of shares of any Vanguard | |
| fund only if preceded or accompanied by | |
| the fund’s current prospectus. | |
| All comparative mutual fund data are from Lipper, a | |
| Thomson Reuters Company, or Morningstar, Inc., unless | |
| otherwise noted. | |
| You can obtain a free copy of Vanguard’s proxy voting | |
| guidelines by visiting vanguard.com/proxyreporting or by | |
| calling Vanguard at 800-662-2739. The guidelines are | |
| also available from the SEC’s website, sec.gov. In | |
| addition, you may obtain a free report on how your fund | |
| voted the proxies for securities it owned during the 12 | |
| months ended June 30. To get the report, visit either | |
| vanguard.com/proxyreporting or sec.gov. | |
| You can review and copy information about your fund at | |
| the SEC’s Public Reference Room in Washington, D.C. To | |
| find out more about this public service, call the SEC at | |
| 202-551-8090. Information about your fund is also | |
| available on the SEC’s website, and you can receive | |
| copies of this information, for a fee, by sending a | |
| request in either of two ways: via email addressed to | |
| publicinfo@sec.gov or via regular mail addressed to the | |
| Public Reference Section, Securities and Exchange | |
| Commission, Washington, DC 20549-1520. | |
| © 2015 The Vanguard Group, Inc. | |
| All rights reserved. | |
| Vanguard Marketing Corporation, Distributor. | |
| Q12980 122015 | |
Item 2: Code of Ethics. The Registrant has adopted a code of ethics that applies to the Registrant’s principal
executive officer, principal financial officer, principal accounting officer or controller or persons performing similar
functions. The Code of Ethics was amended during the reporting period covered by this report to make certain
technical, non-material changes.
Item 3: Audit Committee Financial Expert. The following members of the Audit Committee have been determined by
the Registrant’s Board of Trustees to be Audit Committee Financial Experts serving on its Audit Committee, and to be
independent: Rajiv L. Gupta, Amy Gutmann, JoAnn Heffernan Heisen, F. Joseph Loughrey, Mark Loughridge, Scott
C. Malpass, and André F. Perold.
Item 4: Principal Accountant Fees and Services.
(a) Audit Fees.
Audit Fees of the Registrant
Fiscal Year Ended October 31, 2015: $131,000
Fiscal Year Ended October 31, 2014: $116,000
Aggregate Audit Fees of Registered Investment Companies in the Vanguard Group.
Fiscal Year Ended October 31, 2015: $7,000,200
Fiscal Year Ended October 31, 2014: $6,605,127
Includes fees billed in connection with audits of the Registrant, other registered investment companies in the Vanguard complex, The Vanguard Group, Inc. and Vanguard Marketing Corporation.
(b) Audit-Related Fees.
Fiscal Year Ended October 31, 2015: $2,899,096
Fiscal Year Ended October 31, 2014: $2,176,479
Includes fees billed in connection with assurance and related services provided to the Registrant, other registered investment companies in the Vanguard complex, The Vanguard Group, Inc., and Vanguard Marketing Corporation.
(c) Tax Fees.
Fiscal Year Ended October 31, 2015: $353,389
Fiscal Year Ended October 31, 2014: $316,869
Includes fees billed in connection with tax compliance, planning, and advice services provided to the Registrant, other registered investment companies in the Vanguard complex, The Vanguard Group, Inc., and Vanguard Marketing Corporation.
(d) All Other Fees.
Fiscal Year Ended October 31, 2015: $202,313
Fiscal Year Ended October 31, 2014: $198,163
Includes fees billed for services related to tax reported information provided to the Registrant, other registered investment companies in the Vanguard complex, The Vanguard Group, Inc., and Vanguard Marketing Corporation.
(e) (1) Pre-Approval Policies. The policy of the Registrant’s Audit Committee is to consider and, if appropriate, approve before the principal accountant is engaged for such services, all specific audit and non-audit services provided to: the Registrant, other registered investment companies in the Vanguard complex, The Vanguard Group, Inc., and entities controlled by The Vanguard Group, Inc. that provide ongoing services to the Registrant. In making a determination, the Audit Committee considers whether the services are consistent with maintaining the principal accountant’s independence.
In the event of a contingency situation in which the principal accountant is needed to provide services in between scheduled Audit Committee meetings, the Chairman of the Audit Committee would be called on to consider and, if appropriate, pre-approve audit or permitted non-audit services in an amount sufficient to complete services through the next Audit Committee meeting, and to determine if such services would be consistent with maintaining the accountant’s independence. At the next scheduled Audit Committee meeting, services and fees would be presented to the Audit Committee for formal consideration, and, if appropriate, approval by the entire Audit Committee. The Audit Committee would again consider whether such services and fees are consistent with maintaining the principal accountant’s independence.
The Registrant’s Audit Committee is informed at least annually of all audit and non-audit services provided by the principal accountant to the Vanguard complex, whether such services are provided to: the Registrant, other registered investment companies in the Vanguard complex, The Vanguard Group, Inc., or other entities controlled by The Vanguard Group, Inc. that provide ongoing services to the Registrant.
(2) No percentage of the principal accountant’s fees or services were approved pursuant to the waiver provision of paragraph (c)(7)(i)(C) of Rule 2-01 of Regulation S-X.
(f) For the most recent fiscal year, over 50% of the hours worked under the principal accountant’s engagement were not performed by persons other than full-time, permanent employees of the principal accountant.
(g) Aggregate Non-Audit Fees.
Fiscal Year Ended October 31, 2015: $555,702
Fiscal Year Ended October 31, 2014: $515,032
Includes fees billed for non-audit services provided to the Registrant, other registered investment companies in the Vanguard complex, The Vanguard Group, Inc., and Vanguard Marketing Corporation.
(h) For the most recent fiscal year, the Audit Committee has determined that the provision of all non-audit services was consistent with maintaining the principal accountant’s independence.
Item 5: Audit Committee of Listed Registrants.
Not Applicable.
Item 6: Investments.
Not Applicable.
Item 7: Disclosure of Proxy Voting Policies and Procedures for Closed-End Management Investment Companies.
Not Applicable.
Item 8: Portfolio Managers of Closed-End Management Investment Companies.
Not Applicable.
Item 9: Purchase of Equity Securities by Closed-End Management Investment Company and Affiliated Purchasers.
Not Applicable.
Item 10: Submission of Matters to a Vote of Security Holders.
Not Applicable.
Item 11: Controls and Procedures.
(a) Disclosure Controls and Procedures. The Principal Executive and Financial Officers concluded that the Registrant’s Disclosure Controls and Procedures are effective based on their evaluation of the Disclosure Controls and Procedures as of a date within 90 days of the filing date of this report.
(b) Internal Control Over Financial Reporting. There were no significant changes in Registrant’s Internal Control Over Financial Reporting or in other factors that could significantly affect this control subsequent to the date of the evaluation, including any corrective actions with regard to significant deficiencies and material weaknesses.
Item 12: Exhibits.
(a) Code of Ethics.
(b) Certifications.
Pursuant to the requirements of the Securities Exchange Act of 1934 and the Investment Company Act of 1940, the registrant has duly caused this report to be signed on its behalf by the undersigned, thereunto duly authorized.
| VANGUARD TRUSTEES’ EQUITY FUND | |
| By: | /s/ F. WILLIAM MCNABB III* |
| F. WILLIAM MCNABB III | |
| CHIEF EXECUTIVE OFFICER | |
| Date: December 18, 2015 | |
Pursuant to the requirements of the Securities Exchange Act of 1934 and the Investment Company Act of 1940, this report has been signed below by the following persons on behalf of the registrant and in the capacities and on the dates indicated.
| VANGUARD TRUSTEES’ EQUITY FUND | |
| By: | /s/ F. WILLIAM MCNABB III* |
| F. WILLIAM MCNABB III | |
| CHIEF EXECUTIVE OFFICER | |
| Date: December 18, 2015 | |
| VANGUARD TRUSTEES’ EQUITY FUND | |
| By: | /s/ THOMAS J. HIGGINS* |
| THOMAS J. HIGGINS | |
| CHIEF FINANCIAL OFFICER | |
| Date: December 18, 2015 | |
* By: /s/ Heidi Stam
Heidi Stam, pursuant to a Power of Attorney filed on April 22, 2014 see file Number 2-17620, Incorporated by Reference.