UNITED STATES
SECURITIES AND EXCHANGE COMMISSION
Washington, D.C. 20549
FORM N-CSR
CERTIFIED SHAREHOLDER REPORT
OF
REGISTERED MANAGEMENT INVESTMENT COMPANIES
| Investment Company Act file number: | 811-02968-99 | |
Name of Registrant: | Vanguard Trustees’ Equity Fund | |
Address of Registrant: | P.O. Box 2600 | |
| Valley Forge, PA 19482 | ||
Name and address of agent for service: | Anne E. Robinson, Esquire | |
| P.O. Box 876 | ||
| Valley Forge, PA 19482 | ||
Registrant’s telephone number, including area code: (610) 669-1000 | ||
Date of fiscal year end: October 31 | ||
Date of reporting period: November 1, 2016 – October 31, 2017 | ||
Item 1: Reports to Shareholders | ||

Vanguard’s Principles for Investing Success
We want to give you the best chance of investment success. These principles, grounded in Vanguard’s research and experience, can put you on the right path.
Goals. Create clear, appropriate investment goals.
Balance. Develop a suitable asset allocation using broadly diversified funds. Cost. Minimize cost.
Discipline. Maintain perspective and long-term discipline.
A single theme unites these principles: Focus on the things you can control.
We believe there is no wiser course for any investor.
| Contents | |
| Your Fund’s Performance at a Glance. | 1 |
| Chairman’s Perspective. | 3 |
| Advisors’ Report. | 6 |
| Fund Profile. | 11 |
| Performance Summary. | 13 |
| Financial Statements. | 15 |
| Your Fund’s After-Tax Returns. | 32 |
| About Your Fund’s Expenses. | 33 |
| Glossary. | 35 |
Please note: The opinions expressed in this report are just that—informed opinions. They should not be considered promises or advice. Also, please keep in mind that the information and opinions cover the period through the date on the front of this report. Of course, the risks of investing in your fund are spelled out in the prospectus.
See the Glossary for definitions of investment terms used in this report.
About the cover: Nautical images have been part of Vanguard’s rich heritage since its start in 1975. For an incoming ship, a lighthouse offers a beacon and safe path to shore. You can similarly depend on Vanguard to put you first––and light the way––as you strive to meet your financial goals. Our client focus and low costs, stemming from our unique ownership structure, assure that your interests are paramount.
Your Fund’s Performance at a Glance
• Global stocks rallied over the 12 months ended October 31, 2017, amid steady economic growth, accommodative monetary policies, and benign inflation.
• Vanguard International Value Fund returned 24.33% for the fiscal year. The fund’s result surpassed that of its benchmark and the average return of its peers.
• The fund’s three advisors primarily invest in stocks perceived to be undervalued.
European stocks performed best, returning nearly 28%. Holdings in Germany and the United Kingdom outperformed, while French and Swedish selections underperformed. The rising value of the euro and British pound against the U.S. dollar boosted returns.
• Pacific-region stocks (+26%) did relatively well. Emerging-market holdings (+21%) also generated strong returns but underperformed their benchmark counterparts.
• Among sectors, the fund’s selections within financials and consumer discretionary were the top outperformers. Stock selection was weakest in information technology.
| Total Returns: Fiscal Year Ended October 31, 2017 | |
| Total | |
| Returns | |
| Vanguard International Value Fund | 24.33% |
| MSCI All Country World Index ex USA | 23.64 |
| International Funds Average | 23.19 |
| International Funds Average: Derived from data provided by Lipper, a Thomson Reuters Company. |
| Total Returns: Ten Years Ended October 31, 2017 | |
| Average | |
| Annual Return | |
| International Value Fund | 1.06% |
| Spliced International Index | 0.36 |
| International Funds Average | 0.84 |
For a benchmark description, see the Glossary.
International Funds Average: Derived from data provided by Lipper, a Thomson Reuters Company.
The figures shown represent past performance, which is not a guarantee of future results. (Current performance may be lower or higher than the performance data cited. For performance data current to the most recent month-end, visit our website at vanguard.com/performance.) Note, too, that both investment returns and principal value can fluctuate widely, so an investor’s shares, when sold, could be worth more or less than their original cost.
1
| Expense Ratios | ||
| Your Fund Compared With Its Peer Group | ||
| Peer Group | ||
| Fund | Average | |
| International Value Fund | 0.43% | 1.34% |
The fund expense ratio shown is from the prospectus dated February 23, 2017, and represents estimated costs for the current fiscal year. For the fiscal year ended October 31, 2017, the fund’s expense ratio was 0.40%. The peer-group expense ratio is derived from data provided by Lipper, a Thomson Reuters Company, and captures information through year-end 2016.
Peer group: International Funds.
2
Chairman’s Perspective

Bill McNabb
Chairman and Chief Executive Officer
Dear Shareholder,
When I find outstanding products or services, I’m likely to be loyal to them. And my loyalty usually gets rewarded as I experience consistently high quality––whether it’s from a favorite restaurant or a favorite author. What’s past, in most cases, is prologue.
As tempting as it is to apply this rationale to investing—for example, if technology stocks have done well this year, they’re bound to do well the next—it’s not all that helpful and can actually be counterproductive. You’ve heard it many times: Past performance cannot be used to predict future returns.
Taking a new approach
The caution about past performance is so familiar that investors are apt to treat it as mere background noise. That’s why past-performance bias merited a fresh look from Vanguard’s Investment Strategy Group, which tackled the issue last year in a research paper. (I encourage you to read the full paper, Reframing Investor Choices: Right Mindset, Wrong Market, at vanguard.com/research.)
Our strategists were hardly the first to delve into the topic, but they approached it in a new way. They started with the premise that it’s perfectly understandable for investors to lean heavily on past performance, because that works well in many areas of life. After all, as the paper describes, in lots of other industries and realms, performance from one time period
3
to another is extremely consistent. The researchers looked at everything from cars to fine restaurants to heart surgeons, and in all these examples, past performance was a good predictor of later outcomes.
It’s different with investing
In a nutshell, our brains typically are rewarded and our satisfaction is boosted when we use past performance as a guide for navigating decisions, big and small. But when applied to investing, this method breaks down.
Why? Among other reasons, top-performing asset classes one year tend not to repeat as leaders the next. Strong past performance leads to higher
valuations, making an investment, all else being equal, less attractive in the future. The data are quite overwhelming in this regard.
By allowing past performance to inform their decisions, individual and institutional investors inadvertently end up as momentum investors, putting them on a treadmill of buying high and selling low.
A path to better decision-making
Of course, many investors are already aware of the pitfalls of projecting past performance into the future. The real question is, what can we all do about it? What does it take to go from having a general awareness to actually changing our behavior?
| Market Barometer | |||
| Average Annual Total Returns | |||
| Periods Ended October 31, 2017 | |||
| One Year | Three Years | Five Years | |
| Stocks | |||
| Russell 1000 Index (Large-caps) | 23.67% | 10.58% | 15.18% |
| Russell 2000 Index (Small-caps) | 27.85 | 10.12 | 14.49 |
| Russell 3000 Index (Broad U.S. market) | 23.98 | 10.53 | 15.12 |
| FTSE All-World ex US Index (International) | 23.48 | 6.12 | 7.67 |
| Bonds | |||
| Bloomberg Barclays U.S. Aggregate Bond Index | |||
| (Broad taxable market) | 0.90% | 2.40% | 2.04% |
| Bloomberg Barclays Municipal Bond Index | |||
| (Broad tax-exempt market) | 2.19 | 3.04 | 3.00 |
| Citigroup Three-Month U.S. Treasury Bill Index | 0.71 | 0.31 | 0.20 |
| CPI | |||
| Consumer Price Index | 2.04% | 1.28% | 1.29% |
4
Acknowledging that such change isn’t easy, our strategists offered a few ideas for reframing how investors approach their decisions. These recommendations were targeted at advisors working with clients, but they apply equally to individuals and institutions:
• Educate yourself. The more investors understand why a method that works so well in other areas of life—relying on past performance to drive decisions—doesn’t carry over to investing, the better off they’ll be.
• Be disciplined. The bias toward past performance is ingrained in everybody, professionals included, and shifting away from it can be difficult. But the long-term benefits make the effort worthwhile.
• Focus on what you can control. It’s always most constructive for investors to concentrate on what’s actually within their control, such as setting goals, following long-term portfolio construction principles, selecting low-cost investments, and rebalancing periodically.
Here’s to keeping the past in the rearview mirror. And, as always, thank you for investing with Vanguard.
Sincerely,

F. William McNabb III
Chairman and Chief Executive Officer
November 14, 2017
5
Advisors’ Report
For the 12 months ended October 31, 2017, Vanguard International Value Fund returned 24.33%. Your fund is managed by three independent advisors, a strategy that enhances the fund’s diversification by providing exposure to distinct yet complementary investment approaches. It is not uncommon for different advisors to have different views about individual securities or the broader investment environment.
The table at the end of the Advisors’ Report presents the advisors, the percentage and amount of fund assets that each manages, and brief descriptions of their investment strategies. Each advisor has also prepared a discussion of the investment environment during the fiscal year and of how the portfolio’s positioning reflects this assessment. These reports were prepared on November 20, 2017.
Lazard Asset Management LLC
Portfolio Managers:
Michael G. Fry, Managing Director
Michael A. Bennett, CPA, Managing Director
International equity markets rose strongly over the 12 months and were driven by growing investor focus on fundamentals, including rising corporate profits and continued global economic health. International equities mostly benefited in this environment, reaching or approaching all-time highs, yet with valuation measures still below those of the U.S. market.
The economic expansion, which began almost a year ago off a very low base, has become increasingly synchronized across global economies. Investors have focused more on quality and the widening gaps between stock prices and the earnings of some companies, and higher-quality stocks have begun to gradually rebound after a challenging period dominated by low-quality companies.
In Japan, stock selection and a lower-than-benchmark weight helped relative returns. We remain underweighted in Japan, where it has been difficult to find companies with impressive return on equity and attractive valuations. Although Japan’s macroeconomic environment has improved, the underlying pace of change for financial productivity has slowed with continued high cash balances, flat dividend payouts, and declining share buybacks. Among our Japanese holdings that we consider to represent good relative value, both Tokyo Electron and Daiwa House Industry outperformed.
In the information technology sector, Tencent has contributed significantly to performance, rallying more than 80% from January through October. In contrast, stock selection in health care, especially global specialty pharmaceutical manufacturer Shire, has been a source of portfolio underperformance. Despite consistently strong fundamentals and an attractive valuation, Shire’s stock has struggled because of concerns over debt levels, its hemophilia franchise, and the recent departure of its chief financial officer. We met with management,
6
and we believe that our investment thesis is intact. Lastly, cash was a modest drag on relative performance.
Global economic growth improved during the fiscal year, albeit off low levels, enabling strong corporate profit growth outside of the United States. Market sentiment has continued to rise above already high levels, and markets are near or past their historical highs, despite valuation, geopolitical, and credit risks. We believe optimistic economic growth expectations are reflected in low-quality stock prices. In our view, the market seems complacent, and there appears to be a disconnect between global growth expectations and interest rates, which remain at historically low levels. As global expectations are elevated, fundamentals have been improving.
Edinburgh Partners Limited
Portfolio Manager:
Sandy Nairn, Director and CEO
Non-U.S. markets on average rose by almost a quarter over the 12 months. For most of the fiscal year, sentiment in Europe was buoyed by election results in Italy, the Netherlands, and France that avoided the more populist outcomes. Only toward the end of the fiscal year did any unrest manifest itself, with the Catalan independence referendum causing concern about Spain’s political stability.
The economic backdrop has been a global picture of slow improvement and an increasing acceptance that the period of unconventional monetary measures is moving into its final phases. Companies should see generally better earnings results, and banks should finally begin to return to a more normal net interest margin and see some meaningful profit growth.
These two trends have underpinned stocks’ performance. Japanese manufacturers such as Omron and Panasonic contributed significantly, thanks to improving profits. Similarly, a rebound in the share price of Galaxy, the Macau casino, paced its profit recovery. A large exposure to banks was helpful, with Commerzbank in particular rising very sharply as the market began to take notice of its underlying profit growth potential.
In Asia, SK Hynix, a South Korean flash memory producer, performed well, reflecting industry stability and demand growth. The company reached our price targets, and we sold the shares. The most interesting new addition was Shanghai Fosun, the Chinese health care group, in which some negativity over a failed Indian acquisition allowed us an entry point.
Other main sales, specifically of Unilever and Carnival, also resulted from share price appreciation. The portfolio’s larger exposures remained broadly unchanged, with banks, health care,
7
and energy strongly represented. We do not anticipate this changing significantly, other than for performance reasons.
ARGA Investment Management, LP
Portfolio Managers:
A. Rama Krishna, CFA, Founder and Chief Investment Officer
Steven Morrow, CFA, Director of Research
International equity markets rose strongly over the 12 months. Market drivers included synchronized global growth, a generally benign inflationary environment, and solid corporate earnings growth in developed and emerging markets.
In this environment, we adhered strictly to our classic value approach. ARGA seeks to maximize returns by investing in companies that trade at discounts to their intrinsic values. Discounted stock valuations result from investor overreaction to temporary stress from company, industry, and macroeconomic factors, among others. As these stressors are resolved over time, valuations typically recover.
All sectors helped performance. Consumer staples and telecommunication services stocks also contributed to relative performance, while technology and energy holdings detracted. Reasons for these contributions—whether positive or negative—were largely company-specific.
The largest individual contributor was a Chinese internet search company. A depressed valuation at the time of purchase reflected margin declines from elevated noncore spending. Our research suggested that management’s cuts to that spending would drive sizable profitability improvement. As that played out, the stock valuation recovered.
The biggest detractor was a Japanese video game company. Shares suffered after an unsuccessful pricing strategy on a big new title and a slowed rollout of new titles. The company’s access to valuable intellectual property and improved strategy for monetizing future titles support forecasted higher returns.
Our fundamental research uncovered many new company valuation opportunities during the fiscal year. Collectively, these led to meaningful increases in financial services and emerging markets exposures, with some overlap.
Financial holdings appear particularly well-poised for valuation recovery. Many current underearners don’t appear to be pricing any increase in interest rates. Other currently overcapitalized institutions could return capital to shareholders via increased dividends and share buybacks. Still others, such as an Indian bank holding, are nearing the end of a credit cycle. All imply higher future earnings, leading to stock recoveries.
8
To fund expanded exposures, we exited several German, Japanese, and energy positions whose valuations became relatively less attractive, often because of rising share prices.
The current portfolio embeds compelling company-specific opportunities across a broad range of sectors and locations. As company stressors recede, we expect valuation recoveries to generate strong returns.
9
| Vanguard International Value Fund Investment Advisors | |||
| Fund Assets Managed | |||
| Investment Advisor | % | $ Million | Investment Strategy |
| Lazard Asset Management LLC | 39 | 3,936 | The advisor uses a research-driven, bottom-up, |
| relative-value approach in selecting stocks. The goal is | |||
| to identify individual stocks that offer an appropriate | |||
| trade-off between low relative valuation and high | |||
| financial productivity. | |||
| Edinburgh Partners Limited | 35 | 3,442 | The advisor employs a concentrated, low-turnover, |
| value-oriented investment approach that results in a | |||
| portfolio of companies with good long-term prospects | |||
| and below-market price/earnings ratios. In-depth | |||
| fundamental research on industries and companies is | |||
| central to this investment process. | |||
| ARGA Investment | 25 | 2,450 | The advisor believes that investors overreact to |
| Management, LP | short-term developments, leading to opportunities to | ||
| generate gains from investing in “good businesses at | |||
| great prices.” Its valuation-focused process uses a | |||
| dividend discount model to select stocks that trade at | |||
| a discount to intrinsic value based on the company’s | |||
| long-term earnings power and dividend-paying | |||
| capability. | |||
| Cash Investments | 1 | 136 | These short-term reserves are invested by Vanguard |
| in equity index products to simulate investments in | |||
| stocks. Each advisor may also maintain a modest cash | |||
| position. | |||
10
International Value Fund
Fund Profile
As of October 31, 2017
| Portfolio Characteristics | ||
| MSCI AC | ||
| World Index | ||
| Fund | ex USA | |
| Number of Stocks | 158 | 1,858 |
| Median Market Cap | $37.0B | $37.0B |
| Price/Earnings Ratio | 16.8x | 16.5x |
| Price/Book Ratio | 1.6x | 1.8x |
| Return on Equity | 11.6% | 12.3% |
| Earnings Growth | ||
| Rate | 4.6% | 7.1% |
| Dividend Yield | 2.6% | 2.7% |
| Turnover Rate | 34% | — |
| Ticker Symbol | VTRIX | — |
| Expense Ratio1 | 0.43% | — |
| Short-Term Reserves | 2.2% | — |
| Sector Diversification (% of equity exposure) | ||
| MSCI AC | ||
| World Index | ||
| Fund | ex USA | |
| Consumer Discretionary | 12.7% | 11.3% |
| Consumer Staples | 6.4 | 9.5 |
| Energy | 9.1 | 6.7 |
| Financials | 24.6 | 23.0 |
| Health Care | 9.6 | 7.6 |
| Industrials | 12.7 | 11.9 |
| Information Technology | 14.5 | 11.7 |
| Materials | 2.5 | 7.9 |
| Real Estate | 2.3 | 3.2 |
| Telecommunication Services | 3.9 | 4.1 |
| Utilities | 1.7 | 3.1 |
Sector categories are based on the Global Industry Classification Standard (“GICS”), except for the “Other” category (if applicable), which includes securities that have not been provided a GICS classification as of the effective reporting period.
| Volatility Measures | |
| MSCI AC | |
| World Index | |
| ex USA | |
| R-Squared | 0.95 |
| Beta | 0.99 |
These measures show the degree and timing of the fund’s fluctuations compared with the indexes over 36 months.
| Ten Largest Holdings (% of total net assets) | ||
| Novartis AG | Pharmaceuticals | 2.1% |
| Baidu Inc. | Internet Software & | |
| Services | 2.1 | |
| Royal Dutch Shell plc | Integrated Oil & Gas | 2.0 |
| BP plc | Integrated Oil & Gas | 1.9 |
| Sanofi | Pharmaceuticals | 1.7 |
| DBS Group Holdings | ||
| Ltd. | Diversified Banks | 1.6 |
| Sumitomo Mitsui | ||
| Financial Group Inc. | Diversified Banks | 1.5 |
| TOTAL SA | Integrated Oil & Gas | 1.5 |
| Taiwan Semiconductor | ||
| Manufacturing Co. Ltd. | Semiconductors | 1.3 |
| Panasonic Corp. | Consumer | |
| Electronics | 1.3 | |
| Top Ten | 17.0% | |
The holdings listed exclude any temporary cash investments and equity index products.
Allocation by Region (% of equity exposure)

1 The expense ratio shown is from the prospectus dated February 23, 2017, and represents estimated costs for the current fiscal year. For the fiscal year ended October 31, 2017, the expense ratio was 0.40%.
11
International Value Fund
| Market Diversification (% of equity exposure) | ||
| MSCI AC | ||
| World | ||
| Index | ||
| Fund | ex USA | |
| Europe | ||
| United Kingdom | 18.2% | 12.3% |
| France | 7.8 | 7.4 |
| Switzerland | 5.7 | 5.5 |
| Germany | 5.3 | 6.7 |
| Spain | 3.3 | 2.4 |
| Norway | 2.0 | 0.5 |
| Netherlands | 1.9 | 2.6 |
| Finland | 1.4 | 0.7 |
| Sweden | 1.1 | 2.0 |
| Belgium | 1.1 | 0.8 |
| Other | 1.7 | 3.7 |
| Subtotal | 49.5% | 44.6% |
| Pacific | ||
| Japan | 21.5% | 16.5% |
| Hong Kong | 3.3 | 2.4 |
| South Korea | 2.3 | 3.8 |
| Singapore | 1.8 | 0.9 |
| Australia | 1.4 | 4.7 |
| Subtotal | 30.3% | 28.3% |
| Emerging Markets | ||
| China | 4.3% | 7.3% |
| Taiwan | 2.0 | 2.9 |
| India | 1.7 | 2.1 |
| Brazil | 1.6 | 1.7 |
| Indonesia | 1.4 | 0.5 |
| Thailand | 1.2 | 0.5 |
| Russia | 1.0 | 0.8 |
| Other | 1.8 | 4.5 |
| Subtotal | 15.0% | 20.3% |
| North America | ||
| United States | 3.3% | 0.0% |
| Canada | 1.9 | 6.5 |
| Subtotal | 5.2% | 6.5% |
| Middle East | ||
| Other | 0.0% | 0.3% |
12
International Value Fund
Performance Summary
All of the returns in this report represent past performance, which is not a guarantee of future results that may be achieved by the fund. (Current performance may be lower or higher than the performance data cited. For performance data current to the most recent month-end, visit our website at vanguard.com/performance.) Note, too, that both investment returns and principal value can fluctuate widely, so an investor’s shares, when sold, could be worth more or less than their original cost. The returns shown do not reflect taxes that a shareholder would pay on fund distributions or on the sale of fund shares.
Cumulative Performance: October 31, 2007, Through October 31, 2017
Initial Investment of $10,000

| Average Annual Total Returns | ||||
| Periods Ended October 31, 2017 | ||||
| Final Value | ||||
| One | Five | Ten | of a $10,000 | |
| Year | Years | Years | Investment | |
| International Value Fund | 24.33% | 8.16% | 1.06% | $11,107 |
| Spliced International Index | 23.64 | 7.29 | 0.36 | 10,368 |
| International Funds Average | 23.19 | 7.97 | 0.84 | 10,870 |
For a benchmark description, see the Glossary.
International Funds Average: Derived from data provided by Lipper, a Thomson Reuters Company.
See Financial Highlights for dividend and capital gains information.
13
International Value Fund
Fiscal-Year Total Returns (%): October 31, 2007, Through October 31, 2017

Average Annual Total Returns: Periods Ended September 30, 2017
This table presents returns through the latest calendar quarter—rather than through the end of the fiscal period.
Securities and Exchange Commission rules require that we provide this information.
| Inception | One | Five | Ten | |
| Date | Year | Years | Years | |
| International Value Fund | 5/16/1983 | 20.63% | 8.03% | 1.35% |
International Value Fund
Financial Statements
Statement of Net Assets
As of October 31, 2017
The fund reports a complete list of its holdings in regulatory filings four times in each fiscal year, at the quarter-ends. For the second and fourth fiscal quarters, the lists appear in the fund’s semiannual and annual reports to shareholders. For the first and third fiscal quarters, the fund files the lists with the Securities and Exchange Commission on Form N-Q. Shareholders can look up the fund’s Forms N-Q on the SEC’s website at sec.gov. Forms N-Q may also be reviewed and copied at the SEC’s Public Reference Room (see the back cover of this report for further information).
| Market | |||
| Value• | |||
| Shares | ($000) | ||
| Common Stocks (96.0%)1 | |||
| Australia (1.3%) | |||
| BHP Billiton Ltd. | 3,343,135 | 68,831 | |
| QBE Insurance Group | |||
| Ltd. | 5,373,993 | 44,066 | |
| Woodside Petroleum | |||
| Ltd. | 940,284 | 22,165 | |
| 135,062 | |||
| Belgium (1.0%) | |||
| Anheuser-Busch | |||
| InBev SA | 621,651 | 76,229 | |
| Ageas | 550,384 | 26,691 | |
| 102,920 | |||
| Brazil (1.6%) | |||
| BB Seguridade | |||
| Participacoes SA | 6,198,700 | 52,545 | |
| * | Petroleo Brasileiro | ||
| SA ADR | 3,731,900 | 39,745 | |
| Cielo SA | 5,170,520 | 35,373 | |
| Cia de Saneamento | |||
| Basico do Estado de | |||
| Sao Paulo | 2,992,800 | 27,263 | |
| * | Petroleo Brasileiro | ||
| SA ADR Preference | |||
| Shares | 163,340 | 1,674 | |
| 156,600 | |||
| Canada (1.8%) | |||
| Canadian Natural | |||
| Resources Ltd. | 2,054,300 | 71,688 | |
| Suncor Energy Inc. | 1,728,600 | 58,687 | |
| Canadian National | |||
| Railway Co. | 640,900 | 51,571 | |
| 181,946 | |||
| China (4.1%) | |||
| * | Baidu Inc. ADR | 848,100 | 206,886 |
| Tencent Holdings Ltd. | 2,296,700 | 103,225 | |
| Shanghai Fosun | |||
| Pharmaceutical | |||
| Group Co. Ltd. | 14,844,000 | 74,151 | |
| Market | |||
| Value• | |||
| Shares | ($000) | ||
| Lenovo Group Ltd. | 50,174,000 | 29,105 | |
| * | Tencent Holdings | ||
| Ltd. Rights Exp. | |||
| 12/31/2049 | 1,807 | 1 | |
| 413,368 | |||
| Denmark (0.7%) | |||
| Carlsberg Class B | 593,070 | 67,753 | |
| Finland (1.3%) | |||
| Sampo Oyj Class A | 1,524,747 | 79,791 | |
| Nokia Oyj | 10,546,558 | 51,868 | |
| 131,659 | |||
| France (7.4%) | |||
| Sanofi | 1,812,753 | 171,646 | |
| TOTAL SA | 2,706,117 | 150,836 | |
| BNP Paribas SA | 1,340,391 | 104,618 | |
| ^ | Vinci SA | 800,021 | 78,385 |
| Valeo SA | 1,050,202 | 71,104 | |
| Cie Generale des | |||
| Etablissements | |||
| Michelin | 387,759 | 56,127 | |
| ArcelorMittal | 1,343,988 | 38,486 | |
| AXA SA | 857,109 | 25,875 | |
| Schneider Electric SE | 291,049 | 25,572 | |
| ^ | Engie SA | 965,914 | 16,326 |
| 738,975 | |||
| Germany (5.0%) | |||
| SAP SE | 976,419 | 111,569 | |
| * | Commerzbank AG | 7,759,580 | 107,534 |
| E.ON SE | 6,285,881 | 74,454 | |
| Bayer AG | 515,056 | 66,999 | |
| Muenchener | |||
| Rueckversicherungs- | |||
| Gesellschaft AG in | |||
| Muenchen | 249,902 | 56,104 | |
| Continental AG | 176,015 | 44,795 | |
| Deutsche Post AG | 756,392 | 34,674 | |
| 496,129 | |||
15
International Value Fund
| Market | |||
| Value• | |||
| Shares | ($000) | ||
| Hong Kong (3.2%) | |||
| Galaxy Entertainment | |||
| Group Ltd. | 17,676,000 | 120,539 | |
| CK Hutchison | |||
| Holdings Ltd. | 5,040,692 | 64,026 | |
| Swire Pacific Ltd. | |||
| Class A | 6,451,850 | 63,758 | |
| Melco Resorts & | |||
| Entertainment Ltd. | |||
| ADR | 1,917,100 | 48,464 | |
| Li & Fung Ltd. | 38,162,000 | 19,233 | |
| 316,020 | |||
| India (1.6%) | |||
| ICICI Bank Ltd. ADR | 13,058,800 | 119,488 | |
| Infosys Ltd. ADR | 3,037,600 | 45,108 | |
| 164,596 | |||
| Indonesia (1.3%) | |||
| Bank Negara Indonesia | |||
| Persero Tbk PT | 119,284,300 | 66,867 | |
| Telekomunikasi | |||
| Indonesia Persero | |||
| Tbk PT ADR | 2,181,238 | 65,525 | |
| 132,392 | |||
| Ireland (0.4%) | |||
| * | Ryanair Holdings | ||
| plc ADR | 332,754 | 37,305 | |
| Italy (0.4%) | |||
| * | UniCredit SPA | 1,132,170 | 21,637 |
| Banca Mediolanum SPA | 2,209,445 | 18,825 | |
| 40,462 | |||
| Japan (20.5%) | |||
| Sumitomo Mitsui | |||
| Financial Group Inc. | 3,776,900 | 151,313 | |
| Panasonic Corp. | 8,435,300 | 127,368 | |
| Omron Corp. | 2,189,200 | 122,673 | |
| Daiwa House Industry | |||
| Co. Ltd. | 2,857,800 | 104,747 | |
| East Japan Railway Co. | 941,200 | 91,277 | |
| Sumitomo Mitsui Trust | |||
| Holdings Inc. | 2,118,800 | 83,629 | |
| Mitsubishi Corp. | 3,537,200 | 82,834 | |
| Nippon Telegraph & | |||
| Telephone Corp. | 1,712,600 | 82,800 | |
| Makita Corp. | 1,849,400 | 77,506 | |
| Ryohin Keikaku Co. Ltd. | 259,800 | 76,640 | |
| Japan Tobacco Inc. | 2,295,300 | 75,975 | |
| Sumitomo Electric | |||
| Industries Ltd. | 4,439,000 | 75,575 | |
| Nomura Holdings Inc. | 12,169,400 | 69,643 | |
| Takashimaya Co. Ltd. | 7,429,000 | 68,354 | |
| Nidec Corp. | 508,700 | 67,648 | |
| DeNA Co. Ltd. | 2,726,500 | 64,120 | |
| Hino Motors Ltd. | 4,623,900 | 59,514 | |
| Yahoo Japan Corp. | 13,049,500 | 58,342 | |
| Alps Electric Co. Ltd. | 1,760,400 | 53,875 | |
| Tokyo Electron Ltd. | 272,000 | 47,894 | |
| Sumitomo Realty & | |||
| Development Co. Ltd. | 1,417,877 | 47,488 | |
| Sony Corp. | 1,096,600 | 45,876 | |
| KDDI Corp. | 1,454,500 | 38,752 | |
| NSK Ltd. | 2,421,800 | 34,870 | |
| FANUC Corp. | 136,900 | 32,010 | |
| Kao Corp. | 506,700 | 30,622 | |
| Teijin Ltd. | 1,227,300 | 25,976 | |
| Honda Motor Co. Ltd. | 827,700 | 25,938 | |
| Astellas Pharma Inc. | 1,625,500 | 21,634 | |
| Toyota Motor Corp. | 345,709 | 21,443 | |
| Daiwa Securities | |||
| Group Inc. | 3,414,000 | 21,405 | |
| Yamato Kogyo Co. Ltd. | 701,000 | 18,751 | |
| Dentsu Inc. | 407,600 | 17,435 | |
| Japan Post Holdings | |||
| Co. Ltd. | 1,379,700 | 15,961 | |
| 2,039,888 | |||
| Netherlands (1.8%) | |||
| Wolters Kluwer NV | 1,593,654 | 78,110 | |
| Gemalto NV | 859,496 | 34,015 | |
| 2 | ABN AMRO Group NV | 1,045,350 | 32,285 |
| Aegon NV | 5,312,997 | 31,368 | |
| 175,778 | |||
| Norway (1.9%) | |||
| DNB ASA | 3,735,270 | 72,088 | |
| ^ | Statoil ASA | 2,861,765 | 58,144 |
| ^ | Telenor ASA | 2,403,983 | 51,046 |
| TGS NOPEC | |||
| Geophysical Co. ASA | 470,284 | 10,812 | |
| 192,090 | |||
| Other (0.4%) | |||
| 3 | Vanguard FTSE All- | ||
| World ex-US ETF | 718,406 | 38,607 | |
| * | Banco Santander Rights | ||
| Temp Line | 76,292 | 518 | |
| 39,125 | |||
| Philippines (0.2%) | |||
| * | Alliance Global | ||
| Group Inc. | 79,231,900 | 24,577 | |
| Russia (1.0%) | |||
| Gazprom PJSC ADR | |||
| (London Shares) | 9,420,057 | 40,463 | |
| * | Yandex NV Class A | 1,090,015 | 36,875 |
| Lukoil PJSC ADR | 385,850 | 20,496 | |
| Gazprom PJSC ADR | 740,167 | 3,172 | |
| 101,006 | |||
16
International Value Fund
| Market | ||
| Value• | ||
| Shares | ($000) | |
| Singapore (1.7%) | ||
| DBS Group | ||
| Holdings Ltd. | 9,560,000 | 159,638 |
| Genting Singapore plc | 12,351,700 | 11,056 |
| 170,694 | ||
| South Africa (0.6%) | ||
| Sanlam Ltd. | 8,133,795 | 40,712 |
| Mr Price Group Ltd. | 1,485,432 | 18,411 |
| 59,123 | ||
| South Korea (2.3%) | ||
| Samsung Electronics | ||
| Co. Ltd. | 40,968 | 100,991 |
| Hana Financial Group Inc. | 984,207 | 42,123 |
| E-MART Inc. | 178,078 | 35,648 |
| Shinhan Financial | ||
| Group Co. Ltd. | 561,096 | 25,203 |
| Kia Motors Corp. | 675,146 | 21,370 |
| 225,335 | ||
| Spain (3.2%) | ||
| Telefonica SA | 7,018,821 | 73,596 |
| Banco Santander SA | 10,833,517 | 73,445 |
| Banco Bilbao Vizcaya | ||
| Argentaria SA | 7,576,533 | 66,254 |
| Banco de Sabadell SA | 28,956,274 | 57,977 |
| Red Electrica Corp. SA | 2,066,561 | 45,759 |
| 317,031 | ||
| Sweden (1.1%) | ||
| Assa Abloy AB Class B | 3,350,197 | 70,632 |
| Nordea Bank AB | 3,006,444 | 36,332 |
| 106,964 | ||
| Switzerland (5.5%) | ||
| Novartis AG | 2,564,602 | 211,526 |
| Roche Holding AG | 457,969 | 105,851 |
| Adecco Group AG | 1,221,508 | 96,911 |
| LafargeHolcim Ltd. | 969,556 | 54,746 |
| Credit Suisse Group AG | 2,906,412 | 45,802 |
| Cie Financiere | ||
| Richemont SA | 349,929 | 32,259 |
| 547,095 | ||
| Taiwan (2.0%) | ||
| Taiwan Semiconductor | ||
| Manufacturing | ||
| Co. Ltd. | 15,798,704 | 127,722 |
| ^ Silicon Motion | ||
| Technology Corp. | ||
| ADR | 1,412,526 | 68,394 |
| 196,116 | ||
| Thailand (1.2%) | ||
| Bangkok Bank PCL | 13,166,800 | 76,495 |
| Kasikornbank PCL | ||
| (Foreign) | 5,936,400 | 40,748 |
| 117,243 |
| Turkey (0.9%) | |||
| Turkcell Iletisim | |||
| Hizmetleri AS | 16,740,968 | 62,733 | |
| KOC Holding AS | 5,419,549 | 24,268 | |
| 87,001 | |||
| United Kingdom (17.4%) | |||
| Royal Dutch Shell plc | |||
| Class A (Amsterdam | |||
| Shares) | 4,355,916 | 137,160 | |
| Prudential plc | 4,868,130 | 119,491 | |
| BP plc | 14,362,003 | 97,413 | |
| British American | |||
| Tobacco plc | 1,488,119 | 96,148 | |
| BP plc ADR | 2,362,200 | 96,071 | |
| AstraZeneca plc | 1,396,938 | 94,519 | |
| Unilever plc | 1,604,904 | 90,957 | |
| Barclays plc | 34,772,348 | 85,809 | |
| Tesco plc | 34,454,090 | 83,021 | |
| Shire plc | 1,553,657 | 76,527 | |
| * | Compass Group plc | 2,964,465 | 65,083 |
| Kingfisher plc | 15,385,104 | 63,966 | |
| Royal Dutch Shell | |||
| plc Class A (London | |||
| Shares) | 1,998,307 | 62,907 | |
| Wolseley plc | 890,699 | 62,287 | |
| HSBC Holdings plc | 5,877,471 | 57,395 | |
| * | Royal Bank of Scotland | ||
| Group plc | 14,611,000 | 54,888 | |
| RELX NV | 2,252,982 | 51,844 | |
| Associated British | |||
| Foods plc | 1,127,008 | 49,881 | |
| London Stock | |||
| Exchange Group plc | 935,437 | 46,715 | |
| ITV plc | 20,800,476 | 45,468 | |
| Whitbread plc | 926,618 | 45,448 | |
| Ashtead Group plc | 1,684,172 | 43,384 | |
| Lloyds Banking | |||
| Group plc | 41,473,540 | 37,593 | |
| Johnson Matthey plc | 571,511 | 25,659 | |
| Babcock International | |||
| Group plc | 2,143,115 | 23,109 | |
| 2 | ConvaTec Group plc | 7,723,072 | 20,094 |
| Rolls-Royce | |||
| Holdings plc | 59,278 | 766 | |
| 1,733,603 | |||
17
International Value Fund
| Market | |||
| Value• | |||
| Shares | ($000) | ||
| United States (3.2%) | |||
| Accenture plc Class A | 619,190 | 88,148 | |
| Aon plc | 501,055 | 71,866 | |
| Medtronic plc | 942,585 | 75,897 | |
| * | Michael Kors | ||
| Holdings Ltd. | 1,231,200 | 60,095 | |
| ^ | Signet Jewelers Ltd. | 375,849 | 24,644 |
| 320,650 | |||
| Total Common Stocks | |||
| (Cost $8,400,708) | 9,568,506 | ||
| Temporary Cash Investments (5.2%)1 | |||
| Money Market Fund (5.1%) | |||
| 4,5 | Vanguard Market | ||
| Liquidity Fund, | |||
| 1.246% | 5,030,836 | 503,134 | |
| Face | |||
| Amount | |||
| ($000) | |||
| U. S. Government and Agency Obligations (0.1%) | |||
| United States | |||
| Treasury Bill, | |||
| 1.038%, 11/2/17 | 3,000 | 3,000 | |
| 6 | United States | ||
| Treasury Bill, | |||
| 1.046%–1.056%, | |||
| 11/9/17 | 2,500 | 2,499 | |
| 6 | United States | ||
| Treasury Bill, | |||
| 1.052%, 11/24/17 | 3,000 | 2,998 | |
| United States | |||
| Treasury Bill, | |||
| 1.099%, 2/1/18 | 5,000 | 4,986 | |
| 13,483 | |||
| Total Temporary Cash Investments | |||
| (Cost $516,653) | 516,617 | ||
| Total Investments (101.2%) | |||
| (Cost $8,917,361) | 10,085,123 | ||
| Other Assets and Liabilities (-1.2%) | |||
| Other Assets7 | 119,611 | ||
| Liabilities 5 | (240,425) | ||
| (120,814) | |||
| Net Assets (100%) | |||
| Applicable to 253,797,799 outstanding | |||
| $.001 par value shares of beneficial | |||
| interest (unlimited authorization) | 9,964,309 | ||
| Net Asset Value Per Share | $39.26 | ||
| Statement of Assets and Liabilities | |
| Assets | |
| Investments in Securities, at Value | |
| Unaffiliated Issuers | 9,538,534 |
| Collateral for Futures Contracts | 4,848 |
| Total Unaffiliated Issuers | 9,543,382 |
| Affiliated Vanguard Funds | 541,741 |
| Total Investments in Securities | 10,085,123 |
| Investment in Vanguard | 607 |
| Receivables for Investment | |
| Securities Sold | 11,771 |
| Receivables for Accrued Income | 31,035 |
| Receivables for Capital Shares Issued | 10,167 |
| Variation Margin Receivable— | |
| Futures Contracts | 126 |
| Unrealized Appreciation— | |
| Forward Currency Contracts | 270 |
| Other Assets7 | 65,635 |
| Total Assets | 10,204,734 |
| Liabilities | |
| Payables for Investment | |
| Securities Purchased | 5,337 |
| Collateral for Securities on Loan | 209,436 |
| Payables to Investment Advisor | 3,988 |
| Payables for Capital Shares Redeemed | 2,064 |
| Payables to Vanguard | 15,811 |
| Variation Margin Payable— | |
| Futures Contracts | 4 |
| Unrealized Depreciation— | |
| Forward Currency Contracts | 3,741 |
| Other Liabilities | 44 |
| Total Liabilities | 240,425 |
| Net Assets | 9,964.309 |
18
International Value Fund
| At October 31, 2017, net assets consisted of: | |
| Amount | |
| ($000) | |
| Paid-in Capital | 8,637,432 |
| Undistributed Net Investment Income | 157,993 |
| Accumulated Net Realized Gains | 1,600 |
| Unrealized Appreciation (Depreciation) | |
| Investment Securities | 1,167,762 |
| Futures Contracts | 4,615 |
| Forward Currency Contracts | (3,471) |
| Foreign Currencies | (1,622) |
| Net Assets | 9,964,309 |
• See Note A in Notes to Financial Statements.
* Non-income-producing security.
^ Includes partial security positions on loan to broker-dealers.
The total value of securities on loan is $173,487,000.
1 The fund invests a portion of its cash reserves in equity markets through the use of index futures contracts. After giving effect to futures investments, the fund’s effective common stock and temporary cash investment positions represent 96.9% and 4.3%, respectively, of net assets.
2 Security exempt from registration under Rule 144A of the Securities Act of 1933. Such securities may be sold in transactions exempt from registration, normally to qualified institutional buyers. At October 31, 2017, the aggregate value of these securities was $52,379,000, representing 0.5% of net assets.
3 Considered an affiliated company of the fund as the issuer is another member of The Vanguard Group.
4 Affiliated money market fund available only to Vanguard funds and certain trusts and accounts managed by Vanguard. Rate shown is the 7-day yield.
5 Includes $209,436,000 of collateral received for securities on loan.
6 Securities with a value of $4,848,000 have been segregated as initial margin for open futures contracts.
7 Cash of $1,995,000 has been segregated as collateral for open forward currency contracts.
ADR—American Depositary Receipt.
19
| International Value Fund | ||||
| Derivative Financial Instruments Outstanding as of Period End | ||||
| Futures Contracts | ||||
| ($000) | ||||
| Value and | ||||
| Number of | Unrealized | |||
| Long (Short) | Notional | Appreciation | ||
| Expiration | Contracts | Amount | (Depreciation) | |
| Long Futures Contracts | ||||
| Dow Jones EURO STOXX 50 Index | December 2017 | 819 | 35,092 | 1,515 |
| Topix Index | December 2017 | 174 | 26,997 | 2,449 |
| FTSE 100 Index | December 2017 | 165 | 16,362 | 261 |
| S&P ASX 200 Index | December 2017 | 118 | 13,318 | 390 |
| 4,615 | ||||
Unrealized appreciation (depreciation) on open Dow Jones EURO STOXX 50 Index and FTSE 100 Index futures contracts is required to be treated as realized gain (loss) for tax purposes.
20
International Value Fund
| Forward Currency Contracts | ||||||
| Unrealized | ||||||
| Contract | Contract Amount (000) | Appreciation | ||||
| Settlement | (Depreciation) | |||||
| Counterparty | Date | Receive | Deliver | ($000) | ||
| BNP Paribas | 12/12/17 | JPY | 2,196,008 | USD | 20,340 | (987) |
| JPMorgan Chase Bank N.A. | 12/20/17 | EUR | 14,860 | USD | 17,793 | (432) |
| Credit Suisse International | 12/20/17 | EUR | 12,966 | USD | 15,572 | (424) |
| BNP Paribas | 12/28/17 | AUD | 19,397 | USD | 15,450 | (612) |
| Barclays Bank plc | 12/20/17 | EUR | 9,643 | USD | 11,586 | (319) |
| Toronto Dominion Securities | 12/20/17 | GBP | 6,955 | USD | 9,260 | (8) |
| JPMorgan Chase Bank N.A. | 12/20/17 | GBP | 5,600 | USD | 7,520 | (69) |
| Toronto Dominion Securities | 12/28/17 | AUD | 9,117 | USD | 7,291 | (318) |
| Credit Suisse International | 12/12/17 | JPY | 702,405 | USD | 6,509 | (319) |
| Goldman Sachs International | 12/20/17 | EUR | 1,758 | USD | 2,095 | (41) |
| Citibank, N.A. | 12/12/17 | JPY | 217,880 | USD | 1,938 | (18) |
| Citibank, N.A. | 12/20/17 | EUR | 1,496 | USD | 1,800 | (52) |
| Goldman Sachs International | 12/12/17 | JPY | 193,920 | USD | 1,768 | (59) |
| JPMorgan Chase Bank N.A. | 12/12/17 | JPY | 152,775 | USD | 1,363 | (17) |
| Citibank, N.A. | 12/20/17 | GBP | 880 | USD | 1,170 | — |
| Deutsche Bank AG | 12/20/17 | GBP | 675 | USD | 896 | 2 |
| Barclays Bank plc | 12/20/17 | GBP | 42 | USD | 55 | — |
| Barclays Bank plc | 12/20/17 | USD | 8,220 | EUR | 6,950 | 101 |
| Goldman Sachs International | 12/28/17 | USD | 6,416 | AUD | 8,187 | 153 |
| BNP Paribas | 12/20/17 | USD | 6,140 | EUR | 5,263 | (8) |
| Goldman Sachs International | 12/12/17 | USD | 5,709 | JPY | 650,090 | (20) |
| Morgan Stanley Capital Services Inc. | 12/20/17 | USD | 2,723 | GBP | 2,076 | (38) |
| Citibank, N.A. | 12/28/17 | USD | 2,709 | AUD | 3,539 | 3 |
| JPMorgan Chase Bank N.A. | 12/12/17 | USD | 1,046 | JPY | 117,425 | 11 |
| (3,471) | ||||||
| AUD—Australian dollar. | ||||||
| EUR—Euro. | ||||||
| GBP—British pound. | ||||||
| JPY—Japanese yen. | ||||||
| USD—U.S. dollar. | ||||||
Unrealized appreciation (depreciation) on open forward currency contracts is treated as realized gain (loss) for tax purposes.
See accompanying Notes, which are an integral part of the Financial Statements.
21
International Value Fund
| Statement of Operations | |
| Year Ended | |
| October 31, 2017 | |
| ($000) | |
| Investment Income | |
| Income | |
| Dividends1,2 | 222,700 |
| Interest 2 | 4,250 |
| Securities Lending—Net | 4,019 |
| Total Income | 230,969 |
| Expenses | |
| Investment Advisory Fees—Note B | |
| Basic Fee | 14,719 |
| Performance Adjustment | 285 |
| The Vanguard Group—Note C | |
| Management and Administrative | 17,413 |
| Marketing and Distribution | 1,320 |
| Custodian Fees | 1,188 |
| Auditing Fees | 50 |
| Shareholders’ Reports and Proxy | 373 |
| Trustees’ Fees and Expenses | 18 |
| Total Expenses | 35,366 |
| Net Investment Income | 195,603 |
| Realized Net Gain (Loss) | |
| Investment Securities Sold 2 | 240,568 |
| Futures Contracts | 20,945 |
| Foreign Currencies and Forward Currency Contracts | (1,084) |
| Realized Net Gain (Loss) | 260,429 |
| Change in Unrealized Appreciation (Depreciation) | |
| Investment Securities 2 | 1,472,623 |
| Futures Contracts | 2,029 |
| Foreign Currencies and Forward Currency Contracts | (826) |
| Change in Unrealized Appreciation (Depreciation) | 1,473,826 |
| Net Increase (Decrease) in Net Assets Resulting from Operations | 1,929,858 |
1 Dividends are net of foreign withholding taxes of $14,521,000.
2 Dividend income, interest income, realized net gain (loss), and change in unrealized appreciation (depreciation) from affiliated
companies of the fund were $982,000, $3,652,000, $47,000, and ($6,483,000), respectively.
See accompanying Notes, which are an integral part of the Financial Statements.
22
International Value Fund
| Statement of Changes in Net Assets | ||
| Year Ended October 31, | ||
| 2017 | 2016 | |
| ($000) | ($000) | |
| Increase (Decrease) in Net Assets | ||
| Operations | ||
| Net Investment Income | 195,603 | 175,609 |
| Realized Net Gain (Loss) | 260,429 | (244,554) |
| Change in Unrealized Appreciation (Depreciation) | 1,473,826 | 25,943 |
| Net Increase (Decrease) in Net Assets Resulting from Operations | 1,929,858 | (43,002) |
| Distributions | ||
| Net Investment Income | (177,654) | (158,648) |
| Realized Capital Gain | — | — |
| Total Distributions | (177,654) | (158,648) |
| Capital Share Transactions | ||
| Issued | 1,229,424 | 1,245,725 |
| Issued in Lieu of Cash Distributions | 167,198 | 150,128 |
| Redeemed | (1,057,330) | (1,252,986) |
| Net Increase (Decrease) from Capital Share Transactions | 339,292 | 142,867 |
| Total Increase (Decrease) | 2,091,496 | (58,783) |
| Net Assets | ||
| Beginning of Period | 7,872,813 | 7,931,596 |
| End of Period1 | 9,964,309 | 7,872,813 |
1 Net Assets—End of Period includes undistributed (overdistributed) net investment income of $157,993,000 and $139,918,000.
See accompanying Notes, which are an integral part of the Financial Statements.
23
International Value Fund
| Financial Highlights | |||||
| For a Share Outstanding | Year Ended October 31, | ||||
| Throughout Each Period | 2017 | 2016 | 2015 | 2014 | 2013 |
| Net Asset Value, Beginning of Period | $32.30 | $33.22 | $36.87 | $37.12 | $29.78 |
| Investment Operations | |||||
| Net Investment Income | .7811 | .721 | .669 | .9772 | .757 |
| Net Realized and Unrealized Gain (Loss) | |||||
| on Investments | 6.905 | (.979) | (3.373) | (.530) | 7.402 |
| Total from Investment Operations | 7.686 | (.258) | (2.704) | .447 | 8.159 |
| Distributions | |||||
| Dividends from Net Investment Income | (.726) | (. 662) | (. 946) | (. 697) | (. 819) |
| Distributions from Realized Capital Gains | — | — | — | — | — |
| Total Distributions | (.726) | (. 662) | (. 946) | (. 697) | (. 819) |
| Net Asset Value, End of Period | $39.26 | $32.30 | $33.22 | $36.87 | $37.12 |
| Total Return3 | 24.33% | -0.67% | -7.43% | 1.20% | 27.94% |
| Ratios/Supplemental Data | |||||
| Net Assets, End of Period (Millions) | $9,964 | $7,873 | $7,932 | $8,271 | $8,028 |
| Ratio of Total Expenses to Average Net Assets4 | 0.40% | 0.43% | 0.46% | 0.44% | 0.43% |
| Ratio of Net Investment Income to | |||||
| Average Net Assets | 2.21% | 2.29% | 1.95% | 2.64%2 | 2.24% |
| Portfolio Turnover Rate | 34% | 30% | 36% | 37% | 52% |
1 Calculated based on average shares outstanding.
2 Net investment income per share and the ratio of net investment income to average net assets include $.175 and 0.47%, respectively, resulting from income received from Vodafone Group plc in the form of cash and shares in Verizon Communications Inc. in February 2014.
3 Total returns do not include account service fees that may have applied in the periods shown. Fund prospectuses provide information about any applicable account service fees.
4 Includes performance-based investment advisory fee increases (decreases) of 0.00%, 0.03%, 0.04%, 0.03%, and 0.01%.
See accompanying Notes, which are an integral part of the Financial Statements.
24
International Value Fund
Notes to Financial Statements
Vanguard International Value Fund is registered under the Investment Company Act of 1940 as an open-end investment company, or mutual fund. The fund invests in securities of foreign issuers, which may subject it to investment risks not normally associated with investing in securities of U.S. corporations.
A. The following significant accounting policies conform to generally accepted accounting principles for U.S. investment companies. The fund consistently follows such policies in preparing its financial statements.
1. Security Valuation: Securities are valued as of the close of trading on the New York Stock Exchange (generally 4 p.m., Eastern time) on the valuation date. Equity securities are valued at the latest quoted sales prices or official closing prices taken from the primary market in which each security trades; such securities not traded on the valuation date are valued at the mean of the latest quoted bid and asked prices. Securities for which market quotations are not readily available, or whose values have been affected by events occurring before the fund’s pricing time but after the close of the securities’ primary markets, are valued at their fair values calculated according to procedures adopted by the board of trustees. These procedures include obtaining quotations from an independent pricing service, monitoring news to identify significant market-or security-specific events, and evaluating changes in the values of foreign market proxies (for example, ADRs, futures contracts, or exchange-traded funds), between the time the foreign markets close and the fund’s pricing time. When fair-value pricing is employed, the prices of securities used by a fund to calculate its net asset value may differ from quoted or published prices for the same securities. Investments in Vanguard Market Liquidity Fund are valued at that fund’s net asset value. Temporary cash investments are valued using the latest bid prices or using valuations based on a matrix system (which considers such factors as security prices, yields, maturities, and ratings), both as furnished by independent pricing services.
2. Foreign Currency: Securities and other assets and liabilities denominated in foreign currencies are translated into U.S. dollars using exchange rates obtained from an independent third party as of the fund’s pricing time on the valuation date. Realized gains (losses) and unrealized appreciation (depreciation) on investment securities include the effects of changes in exchange rates since the securities were purchased, combined with the effects of changes in security prices. Fluctuations in the value of other assets and liabilities resulting from changes in exchange rates are recorded as unrealized foreign currency gains (losses) until the assets or liabilities are settled in cash, at which time they are recorded as realized foreign currency gains (losses).
3. Futures and Forward Currency Contracts: The fund uses index futures contracts to a limited extent, with the objective of maintaining full exposure to the stock market while maintaining liquidity. The fund may purchase or sell futures contracts to achieve a desired level of investment, whether to accommodate portfolio turnover or cash flows from capital share transactions. The primary risks associated with the use of futures contracts are imperfect correlation between changes in market values of stocks held by the fund and the prices of futures contracts, and the possibility of an illiquid market. Counterparty risk involving futures is mitigated because a regulated clearinghouse is the counterparty instead of the clearing broker. To further mitigate counterparty risk, the fund trades futures contracts on an exchange, monitors the financial strength of its clearing brokers and clearinghouse, and has entered into clearing agreements with its clearing brokers. The clearinghouse imposes initial margin requirements to secure the fund’s performance and requires daily settlement of variation margin representing changes in the market value of each contract.
25
International Value Fund
The fund enters into forward currency contracts to provide the appropriate currency exposure related to any open futures contracts or to protect the value of securities and related receivables and payables against changes in foreign exchange rates. The fund’s risks in using these contracts include movement in the values of the foreign currencies relative to the U.S. dollar and the ability of the counterparties to fulfill their obligations under the contracts. The fund mitigates its counterparty risk by entering into forward currency contracts only with a diverse group of prequalified counterparties, monitoring their financial strength, entering into master netting arrangements with its counterparties, and requiring its counterparties to transfer collateral as security for their performance. In the absence of a default, the collateral pledged or received by the fund cannot be repledged, resold, or rehypothecated. The master netting arrangements provide that, in the event of a counterparty’s default (including bankruptcy), the fund may terminate the forward currency contracts, determine the net amount owed by either party in accordance with its master netting arrangements, and sell or retain any collateral held up to the net amount owed to the fund under the master netting arrangements. The forward currency contracts contain provisions whereby a counterparty may terminate open contracts if the fund’s net assets decline below a certain level, triggering a payment by the fund if the fund is in a net liability position at the time of the termination. The payment amount would be reduced by any collateral the fund has pledged. Any assets pledged as collateral for open contracts are noted in the Statement of Net Assets. The value of collateral received or pledged is compared daily to the value of the forward currency contracts exposure with each counterparty, and any difference, if in excess of a specified minimum transfer amount, is adjusted and settled within two business days.
Futures contracts are valued at their quoted daily settlement prices. Forward currency contracts are valued at their quoted daily prices obtained from an independent third party, adjusted for currency risk based on the expiration date of each contract. The notional amounts of the contracts are not recorded in the Statement of Net Assets. Fluctuations in the value of the contracts are recorded in the Statement of Assets and Liabilities as an asset (liability) and in the Statement of Operations as unrealized appreciation (depreciation) until the contracts are closed, when they are recorded as realized gains (losses) on futures or forward currency contracts.
During the year ended October 31, 2017, the fund’s average investments in long and short futures contracts represented 2% and 0% of net assets, respectively, based on the average of the notional amounts at each quarter-end during the period. The fund’s average investment in forward currency contracts represented 3% of net assets, based on the average of the notional amounts at each quarter-end during the period.
4. Federal Income Taxes: The fund intends to continue to qualify as a regulated investment company and distribute all of its taxable income. Management has analyzed the fund’s tax positions taken for all open federal income tax years (October 31, 2014–2017), and has concluded that no provision for federal income tax is required in the fund’s financial statements.
5. Distributions: Distributions to shareholders are recorded on the ex-dividend date.
6. Securities Lending: To earn additional income, the fund lends its securities to qualified institutional borrowers. Security loans are subject to termination by the fund at any time, and are required to be secured at all times by collateral in an amount at least equal to the market value of securities loaned. Daily market fluctuations could cause the value of loaned securities to be more or less than the value of the collateral received. When this occurs, the collateral is adjusted and settled on the next business day. The fund further mitigates its counterparty risk by entering into securities lending transactions only with a diverse group of prequalified 26
International Value Fund
counterparties, monitoring their financial strength, and entering into master securities lending agreements with its counterparties. The master securities lending agreements provide that, in the event of a counterparty’s default (including bankruptcy), the fund may terminate any loans with that borrower, determine the net amount owed, and sell or retain the collateral up to the net amount owed to the fund; however, such actions may be subject to legal proceedings. While collateral mitigates counterparty risk, in the event of a default, the fund may experience delays and costs in recovering the securities loaned. The fund invests cash collateral received in Vanguard Market Liquidity Fund, and records a liability in the Statement of Assets and Liabilities for the return of the collateral, during the period the securities are on loan. Securities lending income represents fees charged to borrowers plus income earned on invested cash collateral, less expenses associated with the loan. During the term of the loan, the fund is entitled to all distributions made on or in respect of the loaned securities.
7. Credit Facility: The fund and certain other funds managed by The Vanguard Group (“Vanguard”) participate in a $3.1 billion committed credit facility provided by a syndicate of lenders pursuant to a credit agreement that may be renewed annually; each fund is individually liable for its borrowings, if any, under the credit facility. Borrowings may be utilized for temporary and emergency purposes, and are subject to the fund’s regulatory and contractual borrowing restrictions. The participating funds are charged administrative fees and an annual commitment fee of 0.10% of the undrawn amount of the facility; these fees are allocated to the funds based on a method approved by the fund’s board of trustees and included in Management and Administrative expenses on the fund’s Statement of Operations. Any borrowings under this facility bear interest at a rate based upon the higher of the one-month London Interbank Offered Rate, federal funds effective rate, or overnight bank funding rate plus an agreed-upon spread.
The fund had no borrowings outstanding at October 31, 2017, or at any time during the period then ended.
8. Other: Dividend income is recorded on the ex-dividend date. Interest income includes income distributions received from Vanguard Market Liquidity Fund and is accrued daily. Premiums and discounts on debt securities purchased are amortized and accreted, respectively, to interest income over the lives of the respective securities. Security transactions are accounted for on the date securities are bought or sold. Costs used to determine realized gains (losses) on the sale of investment securities are those of the specific securities sold.
Withholding taxes on foreign dividends and capital gains have been provided for in accordance with the fund’s understanding of the applicable countries’ tax rules and rates. The fund has filed tax reclaims for previously withheld taxes on dividends earned in certain European Union countries. These filings are subject to various administrative and judicial proceedings within these countries. Such tax reclaims received during the year, if any, are included in dividend income. No other amounts for additional tax reclaims are reflected in the financial statements due to the uncertainty as to the ultimate resolution of proceedings, the likelihood of receipt of these reclaims, and the potential timing of payment.
B. The investment advisory firms Lazard Asset Management LLC, Edinburgh Partners Limited, and ARGA Investment Management, LP, each provide investment advisory services to a portion of the fund for a fee calculated at an annual percentage rate of average net assets managed by the advisor. The basic fee of Lazard Asset Management LLC is subject to quarterly adjustments based on performance relative to the MSCI All Country World Index ex US for the preceding five years. The basic fee of Edinburgh Partners Limited is subject to quarterly adjustments based on 27
International Value Fund
performance relative to the MSCI All Country World Index ex US for the preceding three years. The basic fee of ARGA Investment Management, LP, is subject to quarterly adjustments based on performance relative to the MSCI All Country World Index ex US for the preceding five years.
Vanguard manages the cash reserves of the fund as described below.
For the year ended October 31, 2017, the aggregate investment advisory fee represented an effective annual basic rate of 0.17% of the fund’s average net assets, before an increase of $285,000 (0.00%) based on performance.
C. In accordance with the terms of a Funds’ Service Agreement (the “FSA”) between Vanguard and the fund, Vanguard furnishes to the fund corporate management, administrative, marketing, distribution, and cash management services at Vanguard’s cost of operations (as defined by the FSA). These costs of operations are allocated to the fund based on methods and guidelines approved by the board of trustees. Vanguard does not require reimbursement in the current period for certain costs of operations (such as deferred compensation/benefits and risk/insurance costs); the fund’s liability for these costs of operations is included in Payables to Vanguard on the Statement of Assets and Liabilities.
Upon the request of Vanguard, the fund may invest up to 0.40% of its net assets as capital in Vanguard. At October 31, 2017, the fund had contributed to Vanguard capital in the amount of $607,000, representing 0.01% of the fund’s net assets and 0.24% of Vanguard’s capitalization. The fund’s trustees and officers are also directors and employees, respectively, of Vanguard.
D. Various inputs may be used to determine the value of the fund’s investments. These inputs are summarized in three broad levels for financial statement purposes. The inputs or methodologies used to value securities are not necessarily an indication of the risk associated with investing in those securities.
Level 1—Quoted prices in active markets for identical securities.
Level 2—Other significant observable inputs (including quoted prices for similar securities, interest rates, prepayment speeds, credit risk, etc.).
Level 3—Significant unobservable inputs (including the fund’s own assumptions used to determine the fair value of investments). Any investments valued with significant unobservable inputs are noted on the Statement of Net Assets.
The following table summarizes the market value of the fund’s investments as of October 31, 2017, based on the inputs used to value them:
| Level 1 | Level 2 | Level 3 | |
| Investments | ($000) | ($000) | ($000) |
| Common Stocks | 1,425,091 | 8,143,415 | — |
| Temporary Cash Investments | 503,134 | 13,483 | — |
| Futures Contracts—Assets1 | 126 | — | — |
| Futures Contracts—Liabilities1 | (4) | — | — |
| Forward Currency Contracts—Assets | — | 270 | — |
| Forward Currency Contracts—Liabilities | — | (3,741) | — |
| Total | 1,928,347 | 8,153,427 | — |
| 1 Represents variation margin on the last day of the reporting period. |
28
International Value Fund
Securities in certain countries may transfer between Level 1 and Level 2 because of differences in stock market closure times that may result from transitions between standard and daylight saving time in those countries and the United States. Based on values on the date of transfer, securities valued at $134,107,000 based on Level 2 inputs were transferred from Level 1 during the fiscal period. Additionally, based on values on the date of transfer, securities valued at $131,550,000 based on Level 1 inputs were transferred from Level 2 during the fiscal period.
E. At October 31, 2017, the fair values of derivatives were reflected in the Statement of Assets and Liabilities as follows:
| Foreign | |||
| Equity | Exchange | ||
| Contracts | Contracts | Total | |
| Statement of Assets and Liabilities Caption | ($000) | ($000) | ($000) |
| Other Assets | 126 | 270 | 396 |
| Other Liabilities | (4) | (3,741) | (3,745) |
Realized net gain (loss) and the change in unrealized appreciation (depreciation) on derivatives for the year ended October 31, 2017, were:
| Foreign | |||
| Equity | Exchange | ||
| Contracts | Contracts | Total | |
| Realized Net Gain (Loss) on Derivatives | ($000) | ($000) | ($000) |
| Futures Contracts | 20,945 | — | 20,945 |
| Forward Currency Contracts | — | 2,663 | 2,663 |
| Realized Net Gain (Loss) on Derivatives | 20,945 | 2,663 | 23,608 |
| Change in Unrealized Appreciation (Depreciation) on Derivatives | |||
| Futures Contracts | 2,029 | — | 2,029 |
| Forward Currency Contracts | — | (502) | (502) |
| Change in Unrealized Appreciation | |||
| (Depreciation) on Derivatives | 2,029 | (502) | 1,527 |
29
International Value Fund
F. Distributions are determined on a tax basis and may differ from net investment income and realized capital gains for financial reporting purposes. Differences may be permanent or temporary. Permanent differences are reclassified among capital accounts in the financial statements to reflect their tax character. Temporary differences arise when certain items of income, expense, gain, or loss are recognized in different periods for financial statement and tax purposes. These differences will reverse at some time in the future. Differences in classification may also result from the treatment of short-term gains as ordinary income for tax purposes.
The fund used capital loss carryforwards of $259,416,000 to offset taxable capital gains realized during the year ended October 31, 2017, reducing the amount of capital gains that would otherwise be available to distribute to shareholders. Capital loss carryforwards of $33,680,000 expired on October 31, 2017; accordingly, such losses have been reclassified from accumulated net realized gains to paid-in capital. For tax purposes, at October 31, 2017, the fund had $172,521,000 of ordinary income available for distribution.
At October 31, 2017, the cost of investment securities for tax purposes was $8,917,361,000. Net unrealized appreciation of investment securities for tax purposes was $1,167,762,000, consisting of unrealized gains of $1,718,771,000 on securities that had risen in value since their purchase and $551,009,000 in unrealized losses on securities that had fallen in value since their purchase.
G. During the year ended October 31, 2017, the fund purchased $3,222,576,000 of investment securities and sold $2,905,072,000 of investment securities, other than temporary cash investments.
H. Capital shares issued and redeemed were:
| Year Ended October 31, | ||
| 2017 | 2016 | |
| Shares | Shares | |
| (000) | (000) | |
| Issued | 34,979 | 40,253 |
| Issued in Lieu of Cash Distributions | 5,264 | 4,906 |
| Redeemed | (30,193) | (40,193) |
| Net Increase (Decrease) in Shares Outstanding | 10,050 | 4,966 |
I. Management has determined that no material events or transactions occurred subsequent to October 31, 2017, that would require recognition or disclosure in these financial statements.
30
Report of Independent Registered Public Accounting Firm
To the Board of Trustees of Vanguard Trustees’ Equity Fund and the Shareholders of Vanguard International Value Fund
In our opinion, the accompanying statement of net assets and statement of assets and liabilities, and the related statements of operations and of changes in net assets and the financial highlights present fairly, in all material respects, the financial position of Vanguard International Value Fund (constituting a separate portfolio of Vanguard Trustees’ Equity Fund, hereafter referred to as the “Fund”) as of October 31, 2017, the results of its operations for the year then ended, the changes in its net assets for each of the two years in the period then ended and the financial highlights for each of the five years in the period then ended, in conformity with accounting principles generally accepted in the United States of America. These financial statements and financial highlights (hereafter referred to as “financial statements”) are the responsibility of the Fund’s management. Our responsibility is to express an opinion on these financial statements based on our audits. We conducted our audits of these financial statements in accordance with the standards of the Public Company Accounting Oversight Board (United States). Those standards require that we plan and perform the audit to obtain reasonable assurance about whether the financial statements are free of material misstatement. An audit includes examining, on a test basis, evidence supporting the amounts and disclosures in the financial statements, assessing the accounting principles used and significant estimates made by management, and evaluating the overall financial statement presentation. We believe that our audits, which included confirmation of securities as of October 31, 2017 by correspondence with the custodian and brokers and by agreement to the underlying ownership records of the transfer agent, provide a reasonable basis for our opinion.
/s/PricewaterhouseCoopers LLP
Philadelphia, Pennsylvania
December 19, 2017
Special 2017 tax information (unaudited) for Vanguard International Value Fund
This information for the fiscal year ended October 31, 2017, is included pursuant to provisions of the Internal Revenue Code.
The fund distributed $162,533,000 of qualified dividend income to shareholders during the fiscal year.
The fund designates to shareholders foreign source income of $191,931,000 and foreign taxes paid of $14,864,000. Shareholders will receive more detailed information with their Form 1099-DIV in January 2018 to determine the calendar-year amounts to be included on their 2017 tax returns.
31
Your Fund’s After-Tax Returns
This table presents returns for your fund both before and after taxes. The after-tax returns are shown in two ways: (1) assuming that an investor owned the fund during the entire period and paid taxes on the fund’s distributions, and (2) assuming that an investor paid taxes on the fund’s distributions and sold all shares at the end of each period.
Calculations are based on the highest individual federal income tax and capital gains tax rates in effect at the times of the distributions and the hypothetical sales. State and local taxes were not considered. After-tax returns reflect any qualified dividend income, using actual prior-year figures and estimates for 2017. (In the example, returns after the sale of fund shares may be higher than those assuming no sale. This occurs when the sale would have produced a capital loss. The calculation assumes that the investor received a tax deduction for the loss.)
Please note that your actual after-tax returns will depend on your tax situation and may differ from those shown. Also note that if you own the fund in a tax-deferred account, such as an individual retirement account or a 401(k) plan, this information does not apply to you. Such accounts are not subject to current taxes.
Finally, keep in mind that a fund’s performance—whether before or after taxes—does not guarantee future results.
| Average Annual Total Returns: International Value Fund | |||
| Periods Ended October 31, 2017 | |||
| One | Five | Ten | |
| Year | Years | Years | |
| Returns Before Taxes | 24.33% | 8.16% | 1.06% |
| Returns After Taxes on Distributions | 23.74 | 7.61 | 0.48 |
| Returns After Taxes on Distributions and Sale of Fund Shares | 14.21 | 6.37 | 0.81 |
32
About Your Fund’s Expenses
As a shareholder of the fund, you incur ongoing costs, which include costs for portfolio management, administrative services, and shareholder reports (like this one), among others. Operating expenses, which are deducted from a fund’s gross income, directly reduce the investment return of the fund.
A fund’s expenses are expressed as a percentage of its average net assets. This figure is known as the expense ratio. The following examples are intended to help you understand the ongoing costs (in dollars) of investing in your fund and to compare these costs with those of other mutual funds. The examples are based on an investment of $1,000 made at the beginning of the period shown and held for the entire period.
The accompanying table illustrates your fund’s costs in two ways:
• Based on actual fund return. This section helps you to estimate the actual expenses that you paid over the period. The ”Ending Account Value“ shown is derived from the fund‘s actual return, and the third column shows the dollar amount that would have been paid by an investor who started with $1,000 in the fund. You may use the information here, together with the amount you invested, to estimate the expenses that you paid over the period.
To do so, simply divide your account value by $1,000 (for example, an $8,600 account value divided by $1,000 = 8.6), then multiply the result by the number given for your fund under the heading ”Expenses Paid During Period.“
• Based on hypothetical 5% yearly return. This section is intended to help you compare your fund‘s costs with those of other mutual funds. It assumes that the fund had a yearly return of 5% before expenses, but that the expense ratio is unchanged. In this case—because the return used is not the fund’s actual return—the results do not apply to your investment. The example is useful in making comparisons because the Securities and Exchange Commission requires all mutual funds to calculate expenses based on a 5% return. You can assess your fund’s costs by comparing this hypothetical example with the hypothetical examples that appear in shareholder reports of other funds.
Note that the expenses shown in the table are meant to highlight and help you compare ongoing costs only and do not reflect transaction costs incurred by the fund for buying and selling securities. Further, the expenses do not include any purchase, redemption, or account service fees described in the fund prospectus. If such fees were applied to your account, your costs would be higher. Your fund does not carry a “sales load.”
The calculations assume no shares were bought or sold during the period. Your actual costs may have been higher or lower, depending on the amount of your investment and the timing of any purchases or redemptions.
You can find more information about the fund’s expenses, including annual expense ratios, in the Financial Statements section of this report. For additional information on operating expenses and other shareholder costs, please refer to your fund’s current prospectus.
33
| Six Months Ended October 31, 2017 | |||
| Beginning | Ending | Expenses | |
| Account Value | Account Value | Paid During | |
| International Value Fund | 4/30/2017 | 10/31/2017 | Period |
| Based on Actual Fund Return | $1,000.00 | $1,115.02 | $2.08 |
| Based on Hypothetical 5% Yearly Return | 1,000.00 | 1,023.24 | 1.99 |
The calculations are based on expenses incurred in the most recent six-month period. The fund’s annualized six-month expense ratio for that period is 0.39%. The dollar amounts shown as “Expenses Paid” are equal to the annualized expense ratio multiplied by the average account value over the period, multiplied by the number of days in the most recent six-month period, then divided by the number of days in the most recent 12-month period (184/365).
34
Glossary
Beta. A measure of the magnitude of a fund’s past share-price fluctuations in relation to the ups and downs of a given market index. The index is assigned a beta of 1.00. Compared with a given index, a fund with a beta of 1.20 typically would have seen its share price rise or fall by 12% when the index rose or fell by 10%. For this report, beta is based on returns over the past 36 months for both the fund and the index. Note that a fund’s beta should be reviewed in conjunction with its R-squared (see definition). The lower the R-squared, the less correlation there is between the fund and the index, and the less reliable beta is as an indicator of volatility.
Dividend Yield. Dividend income earned by stocks, expressed as a percentage of the aggregate market value (or of net asset value, for a fund). The yield is determined by dividing the amount of the annual dividends by the aggregate value (or net asset value) at the end of the period. For a fund, the dividend yield is based solely on stock holdings and does not include any income produced by other investments.
Earnings Growth Rate. The average annual rate of growth in earnings over the past five years for the stocks now in a fund.
Equity Exposure. A measure that reflects a fund’s investments in stocks and stock futures. Any holdings in short-term reserves are excluded.
Expense Ratio. A fund’s total annual operating expenses expressed as a percentage of the fund’s average net assets. The expense ratio includes management and administrative expenses, but does not include the transaction costs of buying and selling portfolio securities.
Inception Date. The date on which the assets of a fund (or one of its share classes) are first invested in accordance with the fund’s investment objective. For funds with a subscription period, the inception date is the day after that period ends. Investment performance is measured from the inception date.
Median Market Cap. An indicator of the size of companies in which a fund invests; the midpoint of market capitalization (market price x shares outstanding) of a fund’s stocks, weighted by the proportion of the fund’s assets invested in each stock. Stocks representing half of the fund’s assets have market capitalizations above the median, and the rest are below it.
Price/Book Ratio. The share price of a stock divided by its net worth, or book value, per share. For a fund, the weighted average price/book ratio of the stocks it holds.
Price/Earnings Ratio. The ratio of a stock’s current price to its per-share earnings over the past year. For a fund, the weighted average P/E of the stocks it holds. P/E is an indicator of market expectations about corporate prospects; the higher the P/E, the greater the expectations for a company’s future growth.
R-Squared. A measure of how much of a fund’s past returns can be explained by the returns from the market in general, as measured by a given index. If a fund’s total returns were precisely synchronized with an index’s returns, its R-squared would be 1.00. If the fund’s returns bore no relationship to the index’s returns, its R-squared would be 0. For this report, R-squared is based on returns over the past 36 months for both the fund and the index.
35
Return on Equity. The annual average rate of return generated by a company during the past five years for each dollar of shareholder’s equity (net income divided by shareholder’s equity). For a fund, the weighted average return on equity for the companies whose stocks it holds.
Short-Term Reserves. The percentage of a fund invested in highly liquid, short-term securities that can be readily converted to cash.
Turnover Rate. An indication of the fund’s trading activity. Funds with high turnover rates incur higher transaction costs and may be more likely to distribute capital gains (which may be taxable to investors). The turnover rate excludes in-kind transactions, which have minimal impact on costs.
Benchmark Information
Spliced International Index: MSCI EAFE Index through May 31, 2010; MSCI All Country World Index ex USA thereafter.

The Global Industry Classification Standard (“GICS”) was developed by and is the exclusive property and a service mark of MSCI Inc. (“MSCI”) and Standard and Poor’s, a division of McGraw-Hill Companies, Inc. (“S&P”), and is licensed for use by Vanguard. Neither MSCI, S&P nor any third party involved in making or compiling the GICS or any GICS classification makes any express or implied warranties or representations with respect to such standard or classification (or the results to be obtained by the use thereof), and all such parties hereby expressly disclaim all warranties of originality, accuracy, completeness, merchantability or fitness for a particular purpose with respect to any such standard or classification. Without limiting any of the foregoing, in no event shall MSCI, S&P, any of its affiliates or any third party involved in making or compiling the GICS or any GICS classification have any liability for any direct, indirect, special, punitive, consequential or any other damages (including lost profits) even if notified of the possibility of such damages.
37
This page intentionally left blank.
The People Who Govern Your Fund
The trustees of your mutual fund are there to see that the fund is operated and managed in your best interests since, as a shareholder, you are a part owner of the fund. Your fund’s trustees also serve on the board of directors of The Vanguard Group, Inc., which is owned by the Vanguard funds and provides services to them on an at-cost basis.
A majority of Vanguard’s board members are independent, meaning that they have no affiliation with Vanguard or the funds they oversee, apart from the sizable personal investments they have made as private individuals. The independent board members have distinguished backgrounds in business, academia, and public service. Each of the trustees and executive officers oversees 200 Vanguard funds.
Information for each trustee and executive officer of the fund appears below. The mailing address of the trustees and officers is P.O. Box 876, Valley Forge, PA 19482. More information about the trustees is in the Statement of Additional Information, which can be obtained, without charge, by contacting Vanguard at 800-662-7447, or online at vanguard.com.
Interested Trustee1
F. William McNabb III
Born 1957. Trustee Since July 2009. Chairman of the Board. Principal Occupation(s) During the Past Five Years and Other Experience: Chairman of the Board of The Vanguard Group, Inc., and of each of the investment companies served by The Vanguard Group, since January 2010; Chief Executive Officer and Director of The Vanguard Group and President and Chief Executive Officer of each of the investment companies served by The Vanguard Group, since 2008; Director of Vanguard Marketing Corporation; President of The Vanguard Group (2008–2017); Managing Director of The Vanguard Group (1995–2008).
Independent Trustees
Emerson U. Fullwood
Born 1948. Trustee Since January 2008. Principal Occupation(s) During the Past Five Years and Other Experience: Executive Chief Staff and Marketing Officer for North America and Corporate Vice President (retired 2008) of Xerox Corporation (document management products and services);
Executive in Residence and 2009–2010 Distinguished Minett Professor at the Rochester Institute of Technology; Lead Director of SPX FLOW, Inc. (multi-industry manufacturing); Director of the United Way of Rochester, the University of Rochester Medical Center, Monroe Community College Foundation, North Carolina A&T University, and Roberts Wesleyan College; Trustee of the University of Rochester.
Rajiv L. Gupta
Born 1945. Trustee Since December 2001.2 Principal Occupation(s) During the Past Five Years and Other Experience: Chairman and Chief Executive Officer (retired 2009) and President (2006–2008) of Rohm and Haas Co. (chemicals); Director of Arconic Inc. (diversified manufacturer), HP Inc. (printer and personal computer manufacturing), and Delphi Automotive plc (automotive components); Senior Advisor at New Mountain Capital.
Amy Gutmann
Born 1949. Trustee Since June 2006. Principal Occupation(s) During the Past Five Years and Other Experience: President of the University of Pennsylvania; Christopher H. Browne
1 Mr. McNabb is considered an “interested person,” as defined in the Investment Company Act of 1940, because he is an officer of the Vanguard funds.
2 December 2002 for Vanguard Equity Income Fund, the Vanguard Municipal Bond Funds, and the Vanguard State Tax-Exempt Funds.
Distinguished Professor of Political Science, School of Arts and Sciences, and Professor of Communication, Annenberg School for Communication, with secondary faculty appointments in the Department of Philosophy, School of Arts and Sciences, and at the Graduate School of Education, University of Pennsylvania; Trustee of the National Constitution Center.
JoAnn Heffernan Heisen
Born 1950. Trustee Since July 1998. Principal Occupation(s) During the Past Five Years and Other Experience: Corporate Vice President and Member of the Executive Committee (1997–2008), Chief Global Diversity Officer (retired 2008), Vice President and Chief Information Officer (1997–2006), Controller (1995–1997), Treasurer (1991–1995), and Assistant Treasurer (1989–1991) of Johnson & Johnson (pharmaceuticals/medical devices/ consumer products); Director of Skytop Lodge Corporation (hotels) and the Robert Wood Johnson Foundation; Member of the Advisory Board of the Institute for Women’s Leadership at Rutgers University.
F. Joseph Loughrey
Born 1949. Trustee Since October 2009. Principal Occupation(s) During the Past Five Years and Other Experience: President and Chief Operating Officer (retired 2009) of Cummins Inc. (industrial machinery); Chairman of the Board of Hillenbrand, Inc. (specialized consumer services), Oxfam America, and the Lumina Foundation for Education; Director of the V Foundation for Cancer Research; Member of the Advisory Council for the College of Arts and Letters and Chair of the Advisory Board to the Kellogg Institute for International Studies, both at the University of Notre Dame.
Mark Loughridge
Born 1953. Trustee Since March 2012. Principal Occupation(s) During the Past Five Years and Other Experience: Senior Vice President and Chief Financial Officer (retired 2013) at IBM (information technology services); Fiduciary Member of IBM’s Retirement Plan Committee (2004–2013); Member of the Council on Chicago Booth.
Scott C. Malpass
Born 1962. Trustee Since March 2012. Principal Occupation(s) During the Past Five Years and Other Experience: Chief Investment Officer and Vice President at the University of Notre Dame; Assistant Professor of Finance at the Mendoza College of Business at Notre Dame; Member of the Notre Dame 403(b) Investment Committee, the Board of Advisors for Spruceview Capital Partners, the Board of Catholic Investment Services, Inc. (investment advisor), and the Board of Superintendence of the Institute for the Works of Religion; Chairman of the Board of TIFF Advisory Services, Inc. (investment advisor).
André F. Perold
Born 1952. Trustee Since December 2004. Principal Occupation(s) During the Past Five Years and Other Experience: George Gund Professor of Finance and Banking, Emeritus at the Harvard Business School (retired 2011); Chief Investment Officer and Co-Managing Partner of HighVista Strategies LLC (private investment firm); Overseer of the Museum of Fine Arts Boston.
Peter F. Volanakis
Born 1955. Trustee Since July 2009. Principal Occupation(s) During the Past Five Years and Other Experience: President and Chief Operating Officer (retired 2010) of Corning Incorporated (communications equipment); Chairman of the Board of Trustees of Colby-Sawyer College; Member of the Board of Hypertherm, Inc. (industrial cutting systems, software, and consumables).
Executive Officers
Glenn Booraem
Born 1967. Investment Stewardship Officer Since February 2017. Principal Occupation(s) During the Past Five Years and Other Experience: Principal of The Vanguard Group, Inc.; Treasurer (2015–2017), Controller (2010–2015), and Assistant Controller (2001–2010) of each of the investment companies served by The Vanguard Group.
Thomas J. Higgins
Born 1957. Chief Financial Officer Since September 2008. Principal Occupation(s) During the Past Five Years and Other Experience: Principal of The Vanguard Group, Inc.; Chief Financial Officer of each of the investment companies served by The Vanguard Group; Treasurer of each of the investment companies served by The Vanguard Group (1998–2008).
Peter Mahoney
Born 1974. Controller Since May 2015. Principal Occupation(s) During the Past Five Years and Other Experience: Principal of The Vanguard Group, Inc.; Controller of each of the investment companies served by The Vanguard Group; Head of International Fund Services at The Vanguard Group (2008–2014).
Anne E. Robinson
Born 1970. Secretary Since September 2016. Principal Occupation(s) During the Past Five Years and Other Experience: Managing Director of The Vanguard Group, Inc.; General Counsel of The Vanguard Group; Secretary of The Vanguard Group and of each of the investment companies served by The Vanguard Group; Director and Senior Vice President of Vanguard Marketing Corporation; Managing Director and General Counsel of Global Cards and Consumer Services at Citigroup (2014–2016); Counsel at American Express (2003–2014).
Michael Rollings
Born 1963. Treasurer Since February 2017. Principal Occupation(s) During the Past Five Years and Other Experience: Managing Director of The Vanguard Group, Inc.; Treasurer of each of the investment companies served by The Vanguard Group; Director of Vanguard Marketing Corporation; Executive Vice President and Chief Financial Officer of MassMutual Financial Group (2006–2016).
| Vanguard Senior Management Team | |
| Mortimer J. Buckley | Chris D. McIsaac |
| Gregory Davis | James M. Norris |
| John James | Thomas M. Rampulla |
| Martha G. King | Karin A. Risi |
| John T. Marcante | |
| Chairman Emeritus and Senior Advisor | |
| John J. Brennan | |
| Chairman, 1996–2009 | |
| Chief Executive Officer and President, 1996–2008 | |
| Founder | |
| John C. Bogle | |
| Chairman and Chief Executive Officer, 1974–1996 | |
 | |
P.O. Box 2600 | |
Connect with Vanguard® > vanguard.com | |
| Fund Information > 800-662-7447 | CFA® is a registered trademark owned by CFA Institute. |
| Direct Investor Account Services > 800-662-2739 | |
| Institutional Investor Services > 800-523-1036 | |
| Text Telephone for People | |
| Who Are Deaf or Hard of Hearing> 800-749-7273 | |
| This material may be used in conjunction | |
| with the offering of shares of any Vanguard | |
| fund only if preceded or accompanied by | |
| the fund’s current prospectus. | |
| All comparative mutual fund data are from Lipper, a | |
| Thomson Reuters Company, or Morningstar, Inc., unless | |
| otherwise noted. | |
| You can obtain a free copy of Vanguard’s proxy voting | |
| guidelines by visiting vanguard.com/proxyreporting or by | |
| calling Vanguard at 800-662-2739. The guidelines are | |
| also available from the SEC’s website, sec.gov. In | |
| addition, you may obtain a free report on how your fund | |
| voted the proxies for securities it owned during the 12 | |
| months ended June 30. To get the report, visit either | |
| vanguard.com/proxyreporting or sec.gov. | |
| You can review and copy information about your fund at | |
| the SEC’s Public Reference Room in Washington, D.C. To | |
| find out more about this public service, call the SEC at | |
| 202-551-8090. Information about your fund is also | |
| available on the SEC’s website, and you can receive | |
| copies of this information, for a fee, by sending a | |
| request in either of two ways: via email addressed to | |
| publicinfo@sec.gov or via regular mail addressed to the | |
| Public Reference Section, Securities and Exchange | |
| Commission, Washington, DC 20549-1520. | |
| © 2017 The Vanguard Group, Inc. | |
| All rights reserved. | |
| Vanguard Marketing Corporation, Distributor. | |
| Q460 122017 | |
| Annual Report | October 31, 2017 |
| Vanguard Diversified Equity Fund |
Vanguard’s Principles for Investing Success
We want to give you the best chance of investment success. These
principles, grounded in Vanguard’s research and experience, can put you on
the right path.
Goals. Create clear, appropriate investment goals.
Balance. Develop a suitable asset allocation using broadly diversified funds.
Cost. Minimize cost.
Discipline. Maintain perspective and long-term discipline.
A single theme unites these principles: Focus on the things you can control.
We believe there is no wiser course for any investor.
| Contents | |
| Your Fund’s Performance at a Glance. | 1 |
| Chairman’s Perspective. | 3 |
| Fund Profile. | 6 |
| Performance Summary. | 7 |
| Financial Statements. | 9 |
| Your Fund’s After-Tax Returns. | 18 |
| About Your Fund’s Expenses. | 19 |
| Glossary. | 21 |
Please note: The opinions expressed in this report are just that—informed opinions. They should not be considered promises or advice. Also, please keep in mind that the information and opinions cover the period through the date on the front of this report. Of course, the risks of investing in your fund are spelled out in the prospectus.
See the Glossary for definitions of investment terms used in this report.
About the cover: Nautical images have been part of Vanguard’s rich heritage since its start in 1975. For an incoming ship, a lighthouse offers a beacon and safe path to shore. You can similarly depend on Vanguard to put you first––and light the way––as you strive to meet your financial goals. Our client focus and low costs, stemming from our unique ownership structure, assure that your interests are paramount.
Your Fund’s Performance at a Glance
• For the 12 months ended October 31, 2017, Vanguard Diversified Equity Fund returned 24.47%, slightly surpassing the 23.94% return of its benchmark, the MSCI US Broad Market Index.
• As a “fund of funds,” Diversified Equity invests in eight actively managed Vanguard funds selected to provide broad exposure to all segments of the U.S. equity market. Together, the funds cover the style and capitalization spectrum, investing in growth and value stocks of small-, mid-, and large-cap companies.
• For the fiscal year, growth stocks surpassed value, and small-caps outpaced large- and mid-caps.
• Results for the underlying funds ranged from more than 29% for Vanguard Morgan Growth Fund to about 17% for Vanguard Capital Value Fund. Only Vanguard Windsor and Windsor II were ahead of their benchmarks.
| Total Returns: Fiscal Year Ended October 31, 2017 | |
| Total | |
| Returns | |
| Vanguard Diversified Equity Fund | 24.47% |
| MSCI US Broad Market Index | 23.94 |
| Multi-Cap Core Funds Average | 21.54 |
| Multi-Cap Core Funds Average: Derived from data provided by Lipper, a Thomson Reuters Company. |
| Total Returns: Ten Years Ended October 31, 2017 | |
| Average | |
| Annual Return | |
| Diversified Equity Fund | 7.14% |
| MSCI US Broad Market Index | 7.75 |
| Multi-Cap Core Funds Average | 5.76 |
| Multi-Cap Core Funds Average: Derived from data provided by Lipper, a Thomson Reuters Company. |
The figures shown represent past performance, which is not a guarantee of future results. (Current performance may be lower or higher than the performance data cited. For performance data current to the most recent month-end, visit our website at vanguard.com/performance.) Note, too, that both investment returns and principal value can fluctuate widely, so an investor’s shares, when sold, could be worth more or less than their original cost.
1
| Expense Ratios | ||
| Your Fund Compared With Its Peer Group | ||
| Acquired Fund Fees | Peer Group | |
| and Expenses | Average | |
| Diversified Equity Fund | 0.36% | 1.12% |
The acquired fund fees and expenses—drawn from the prospectus dated February 23, 2017—represent an estimate of the weighted average of the expense ratios and any transaction fees charged by the underlying mutual funds (the ”acquired” funds) in which the Diversified Equity Fund invests. The Diversified Equity Fund does not charge any expenses or fees of its own. For the fiscal year ended October 31, 2017, the annualized acquired fund fees and expenses were 0.36%. The peer-group expense ratio is derived from data provided by Lipper, a Thomson Reuters Company, and captures information through year-end 2016.
Peer group: Multi-Cap Core Funds.
| Underlying Funds: Allocations and Returns | ||
| Twelve Months Ended October 31, 2017 | ||
| Percentage of | ||
| Diversified Equity Fund | ||
| Vanguard Fund | Assets | Total Returns |
| Vanguard Growth and Income Fund Investor Shares | 20.0% | 23.13% |
| Vanguard U.S. Growth Fund Investor Shares | 15.1 | 27.26 |
| Vanguard Morgan™ Growth Fund Investor Shares | 15.1 | 29.45 |
| Vanguard Windsor™ II Fund Investor Shares | 15.0 | 19.60 |
| Vanguard Windsor Fund Investor Shares | 14.9 | 24.53 |
| Vanguard Explorer™ Fund Investor Shares | 10.0 | 27.10 |
| Vanguard Mid-Cap Growth Fund | 5.0 | 22.69 |
| Vanguard Capital Value Fund | 4.9 | 17.29 |
| Combined | 100.0% | 24.47% |
2
Chairman’s Perspective

Bill McNabb
Chairman and Chief Executive Officer
Dear Shareholder,
When I find outstanding products or services, I’m likely to be loyal to them. And my loyalty usually gets rewarded as I experience consistently high quality––whether it’s from a favorite restaurant or a favorite author. What’s past, in most cases, is prologue.
As tempting as it is to apply this rationale to investing—for example, if technology stocks have done well this year, they’re bound to do well the next—it’s not all that helpful and can actually be counterproductive. You’ve heard it many times: Past performance cannot be used to predict future returns.
Taking a new approach
The caution about past performance is so familiar that investors are apt to treat it as mere background noise. That’s why past-performance bias merited a fresh look from Vanguard’s Investment Strategy Group, which tackled the issue last year in a research paper. (I encourage you to read the full paper, Reframing Investor Choices: Right Mindset, Wrong Market, at vanguard.com/research.)
Our strategists were hardly the first to delve into the topic, but they approached it in a new way. They started with the premise that it’s perfectly understandable for investors to lean heavily on past performance, because that works well in many areas of life. After all, as the paper describes, in lots of other industries and realms, performance from one time period
3
to another is extremely consistent. The researchers looked at everything from cars to fine restaurants to heart surgeons, and in all these examples, past performance was a good predictor of later outcomes.
It’s different with investing
In a nutshell, our brains typically are rewarded and our satisfaction is boosted when we use past performance as a guide for navigating decisions, big and small. But when applied to investing, this method breaks down.
Why? Among other reasons, top-performing asset classes one year tend not to repeat as leaders the next. Strong past performance leads to higher
valuations, making an investment, all else being equal, less attractive in the future. The data are quite overwhelming in this regard.
By allowing past performance to inform their decisions, individual and institutional investors inadvertently end up as momentum investors, putting them on a treadmill of buying high and selling low.
A path to better decision-making
Of course, many investors are already aware of the pitfalls of projecting past performance into the future. The real question is, what can we all do about it? What does it take to go from having a general awareness to actually changing our behavior?
| Market Barometer | |||
| Average Annual Total Returns | |||
| Periods Ended October 31, 2017 | |||
| One Year | Three Years | Five Years | |
| Stocks | |||
| Russell 1000 Index (Large-caps) | 23.67% | 10.58% | 15.18% |
| Russell 2000 Index (Small-caps) | 27.85 | 10.12 | 14.49 |
| Russell 3000 Index (Broad U.S. market) | 23.98 | 10.53 | 15.12 |
| FTSE All-World ex US Index (International) | 23.48 | 6.12 | 7.67 |
| Bonds | |||
| Bloomberg Barclays U.S. Aggregate Bond Index | |||
| (Broad taxable market) | 0.90% | 2.40% | 2.04% |
| Bloomberg Barclays Municipal Bond Index | |||
| (Broad tax-exempt market) | 2.19 | 3.04 | 3.00 |
| Citigroup Three-Month U.S. Treasury Bill Index | 0.71 | 0.31 | 0.20 |
| CPI | |||
| Consumer Price Index | 2.04% | 1.28% | 1.29% |
4
Acknowledging that such change isn’t easy, our strategists offered a few ideas for reframing how investors approach their decisions. These recommendations were targeted at advisors working with clients, but they apply equally to individuals and institutions:
• Educate yourself. The more investors understand why a method that works so well in other areas of life—relying on past performance to drive decisions—doesn’t carry over to investing, the better off they’ll be.
• Be disciplined. The bias toward past performance is ingrained in everybody, professionals included, and shifting away from it can be difficult. But the long-term benefits make the effort worthwhile.
• Focus on what you can control. It’s always most constructive for investors to concentrate on what’s actually within their control, such as setting goals, following long-term portfolio construction principles, selecting low-cost investments, and rebalancing periodically.
Here’s to keeping the past in the rearview mirror. And, as always, thank you for investing with Vanguard.
Sincerely,

F. William McNabb III
Chairman and Chief Executive Officer
November 14, 2017
5
Diversified Equity Fund
Fund Profile
As of October 31, 2017
| Portfolio Characteristics | ||
| MSCI US | ||
| Broad Market | ||
| Fund | Index | |
| Number of Stocks | 1,458 | 3,070 |
| Median Market Cap | $41.8B | $62.0B |
| Price/Earnings Ratio | 22.9x | 22.5x |
| Price/Book Ratio | 3.0x | 3.0x |
| Return on Equity | 15.1% | 15.1% |
| Earnings Growth | ||
| Rate | 10.7% | 9.8% |
| Dividend Yield | 1.4% | 1.8% |
| Turnover Rate | 5% | — |
| Ticker Symbol | VDEQX | — |
| Acquired Fund Fees | ||
| and Expenses1 | 0.36% | — |
| 30-Day SEC Yield | 1.23% | — |
| Allocation to Underlying Vanguard Funds | |
| Vanguard Growth and Income Fund | |
| Investor Shares | 20.0% |
| Vanguard U.S. Growth Fund | |
| Investor Shares | 15.1 |
| Vanguard Morgan Growth Fund | |
| Investor Shares | 15.1 |
| Vanguard Windsor II Fund Investor | |
| Shares | 15.0 |
| Vanguard Windsor Fund Investor | |
| Shares | 14.9 |
| Vanguard Explorer Fund Investor | |
| Shares | 10.0 |
| Vanguard Mid-Cap Growth Fund | 5.0 |
| Vanguard Capital Value Fund | 4.9 |
| Volatility Measures | |
| MSCI US | |
| Broad Market | |
| Index | |
| R-Squared | 0.98 |
| Beta | 1.04 |
These measures show the degree and timing of the fund’s fluctuations compared with the index over 36 months.
| Sector Diversification (% of equity exposure) | ||
| MSCI US | ||
| Broad Market | ||
| Fund | Index | |
| Consumer Discretionary | 11.8% | 12.4% |
| Consumer Staples | 4.9 | 7.1 |
| Energy | 5.0 | 5.6 |
| Financials | 14.1 | 14.7 |
| Health Care | 13.7 | 13.5 |
| Industrials | 10.9 | 10.8 |
| Information Technology | 29.9 | 23.5 |
| Materials | 3.3 | 3.5 |
| Real Estate | 2.8 | 3.9 |
| Telecommunication Services | 1.2 | 1.8 |
| Utilities | 1.4 | 3.2 |
| Other | 1.0 | 0.0 |
Sector categories are based on the Global Industry Classification Standard (“GICS”), except for the “Other” category (if applicable), which includes securities that have not been provided a GICS classification as of the effective reporting period. Fund percentages reflect holdings of underlying funds.
1 This figure—drawn from the prospectus dated February 23, 2017—represents an estimate of the weighted average of the expense ratios and any transaction fees charged by the underlying mutual funds (the ”acquired” funds) in which the Diversified Equity Fund invests. The Diversified Equity Fund does not charge any expenses or fees of its own. For the fiscal year ended October 31, 2017, the annualized acquired fund fees and expenses were 0.36%.
6
Diversified Equity Fund
Performance Summary
All of the returns in this report represent past performance, which is not a guarantee of future results that may be achieved by the fund. (Current performance may be lower or higher than the performance data cited. For performance data current to the most recent month-end, visit our website at vanguard.com/performance.) Note, too, that both investment returns and principal value can fluctuate widely, so an investor’s shares, when sold, could be worth more or less than their original cost. The returns shown do not reflect taxes that a shareholder would pay on fund distributions or on the sale of fund shares.
Cumulative Performance: October 31, 2007, Through October 31, 2017
Initial Investment of $10,000
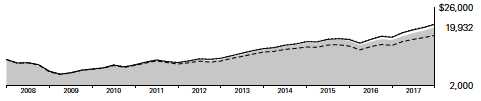
| Average Annual Total Returns | ||||
| Periods Ended October 31, 2017 | ||||
| Final Value | ||||
| One | Five | Ten | of a $10,000 | |
| Year | Years | Years | Investment | |
| Diversified Equity Fund | 24.47% | 14.92% | 7.14% | $19,932 |
| MSCI US Broad Market Index | 23.94 | 15.16 | 7.75 | 21,101 |
| Multi-Cap Core Funds Average | 21.54 | 12.91 | 5.76 | 17,505 |
Multi-Cap Core Funds Average: Derived from data provided by Lipper, a Thomson Reuters Company.
See Financial Highlights for dividend and capital gains information.
7
Diversified Equity Fund
Fiscal-Year Total Returns (%): October 31, 2007, Through October 31, 2017
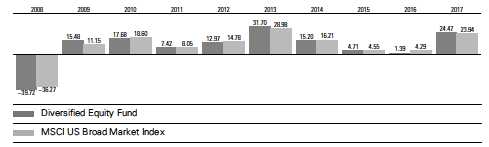
Average Annual Total Returns: Periods Ended September 30, 2017
This table presents returns through the latest calendar quarter—rather than through the end of the fiscal period.
Securities and Exchange Commission rules require that we provide this information.
| Inception | One | Five | Ten | |
| Date | Year | Years | Years | |
| Diversified Equity Fund | 6/10/2005 | 18.83% | 14.02% | 7.05% |
8
Diversified Equity Fund
Financial Statements
Statement of Net Assets
As of October 31, 2017
The fund reports a complete list of its holdings in regulatory filings four times in each fiscal year, at the quarter-ends. For the second and fourth fiscal quarters, the lists appear in the fund’s semiannual and annual reports to shareholders. For the first and third fiscal quarters, the fund files the lists with the Securities and Exchange Commission on Form N-Q. Shareholders can look up the fund’s Forms N-Q on the SEC’s website at sec.gov. Forms N-Q may also be reviewed and copied at the SEC’s Public Reference Room (see the back cover of this report for further information).
| Market | ||
| Value• | ||
| Shares | ($000) | |
| Investment Companies (100.0%) | ||
| U.S. Stock Funds (100.0%) | ||
| Vanguard Growth and Income Fund Investor Shares | 6,046,918 | 287,833 |
| Vanguard U.S. Growth Fund Investor Shares | 5,830,999 | 217,205 |
| Vanguard Morgan Growth Fund Investor Shares | 7,038,232 | 217,059 |
| Vanguard Windsor II Fund Investor Shares | 5,534,749 | 214,804 |
| Vanguard Windsor Fund Investor Shares | 9,177,634 | 214,573 |
| Vanguard Explorer Fund Investor Shares | 1,414,576 | 144,428 |
| Vanguard Mid-Cap Growth Fund | 2,736,962 | 72,557 |
| Vanguard Capital Value Fund | 5,458,598 | 70,852 |
| Total Investment Companies (Cost $873,290) | 1,439,311 | |
| Other Assets and Liabilities (0.0%) | ||
| Other Assets | 594 | |
| Liabilities | (940) | |
| Total Other Assets and Liabilities | (346) | |
| Net Assets (100%) | ||
| Applicable to 40,452,612 outstanding $.001 par value shares of | ||
| beneficial interest (unlimited authorization) | 1,438,965 | |
| Net Asset Value Per Share | $35.57 | |
| Amount | ||
| ($000) | ||
| Statement of Assets and Liabilities | ||
| Assets | ||
| Investments in Securities, at Value—Affiliated Vanguard Funds | 1,439,311 | |
| Receivables for Investment Securities Sold | 283 | |
| Receivables for Capital Shares Issued | 311 | |
| Total Assets | 1,439,905 | |
| Liabilities | ||
| Payables for Capital Shares Redeemed | 797 | |
| Other Liabilities | 143 | |
| Total Liabilities | 940 | |
| Net Assets | 1,438,965 | |
9
Diversified Equity Fund
| At October 31, 2017, net assets consisted of: | |
| Amount | |
| ($000) | |
| Paid-in Capital | 811,813 |
| Undistributed Net Investment Income | 4,207 |
| Accumulated Net Realized Gains | 56,924 |
| Unrealized Appreciation (Depreciation) | 566,021 |
| Net Assets | 1,438,965 |
| • See Note A in Notes to Financial Statements. |
See accompanying Notes, which are an integral part of the Financial Statements.
10
Diversified Equity Fund
| Statement of Operations | |
| Year Ended | |
| October 31, 2017 | |
| ($000) | |
| Investment Income | |
| Income | |
| Income Distributions Received from Affiliated Funds | 17,822 |
| Net Investment Income—Note B | 17,822 |
| Realized Net Gain (Loss) | |
| Capital Gain Distributions Received from Affiliated Funds | 44,299 |
| Affiliated Investment Securities Sold | 18,965 |
| Realized Net Gain (Loss) | 63,264 |
| Change in Unrealized Appreciation (Depreciation) of Investment Securities | 215,205 |
| Net Increase (Decrease) in Net Assets Resulting from Operations | 296,291 |
See accompanying Notes, which are an integral part of the Financial Statements.
11
Diversified Equity Fund
| Statement of Changes in Net Assets | ||
| Year Ended October 31, | ||
| 2017 | 2016 | |
| ($000) | ($000) | |
| Increase (Decrease) in Net Assets | ||
| Operations | ||
| Net Investment Income | 17,822 | 16,847 |
| Realized Net Gain (Loss) | 63,264 | 97,394 |
| Change in Unrealized Appreciation (Depreciation) | 215,205 | (100,060) |
| Net Increase (Decrease) in Net Assets Resulting from Operations | 296,291 | 14,181 |
| Distributions | ||
| Net Investment Income | (16,846) | (15,681) |
| Realized Capital Gain1 | (77,095) | (106,084) |
| Total Distributions | (93,941) | (121,765) |
| Capital Share Transactions | ||
| Issued | 107,815 | 71,521 |
| Issued in Lieu of Cash Distributions | 89,282 | 116,441 |
| Redeemed | (236,646) | (259,810) |
| Net Increase (Decrease) from Capital Share Transactions | (39,549) | (71,848) |
| Total Increase (Decrease) | 162,801 | (179,432) |
| Net Assets | ||
| Beginning of Period | 1,276,164 | 1,455,596 |
| End of Period2 | 1,438,965 | 1,276,164 |
1 Includes fiscal 2017 and 2016 short-term gain distributions totaling $1,082,000 and $9,876,000, respectively. Short-term gain distributions are treated as ordinary income dividends for tax purposes.
2 Net Assets—End of Period includes undistributed (overdistributed) net investment income of $4,207,000 and $4,732,000.
See accompanying Notes, which are an integral part of the Financial Statements.
12
Diversified Equity Fund
Financial Highlights
| For a Share Outstanding | Year Ended October 31, | ||||
| Throughout Each Period | 2017 | 2016 | 2015 | 2014 | 2013 |
| Net Asset Value, Beginning of Period | $30.76 | $33.15 | $33.18 | $29.43 | $22.70 |
| Investment Operations | |||||
| Net Investment Income | . 4281 | .397 | .394 | .3221 | .332 |
| Capital Gain Distributions Received | 1.0641 | .860 | 2.606 | .8481 | .131 |
| Net Realized and Unrealized Gain (Loss) | |||||
| on Investments | 5.627 | (.836) | (1.453) | 3.243 | 6.626 |
| Total from Investment Operations | 7.119 | .421 | 1.547 | 4.413 | 7.089 |
| Distributions | |||||
| Dividends from Net Investment Income | (. 414) | (. 362) | (. 342) | (. 283) | (. 344) |
| Distributions from Realized Capital Gains | (1.895) | (2.449) | (1.235) | (.380) | (.015) |
| Total Distributions | (2.309) | (2.811) | (1.577) | (.663) | (.359) |
| Net Asset Value, End of Period | $35.57 | $30.76 | $33.15 | $33.18 | $29.43 |
| Total Return2 | 24.47% | 1.39% | 4.71% | 15.20% | 31.70% |
| Ratios/Supplemental Data | |||||
| Net Assets, End of Period (Millions) | $1,439 | $1,276 | $1,456 | $1,513 | $1,420 |
| Ratio of Total Expenses to Average Net Assets | — | — | — | — | — |
| Acquired Fund Fees and Expenses | 0.36% | 0.36% | 0.40% | 0.41% | 0.40% |
| Ratio of Net Investment Income to | |||||
| Average Net Assets | 1.31% | 1.26% | 1.16% | 1.03% | 1.27% |
| Portfolio Turnover Rate | 5% | 9% | 10% | 5% | 5% |
1 Calculated based on average shares outstanding.
2 Total returns do not include account service fees that may have applied in the periods shown. Fund prospectuses provide information about any applicable account service fees.
See accompanying Notes, which are an integral part of the Financial Statements.
13
Diversified Equity Fund
Notes to Financial Statements
Vanguard Diversified Equity Fund is registered under the Investment Company Act of 1940 as an open-end investment company, or mutual fund. The fund invests in selected Vanguard actively managed U.S. stock funds. Financial statements and other information about each underlying fund are available on vanguard.com.
A. The following significant accounting policies conform to generally accepted accounting principles for U.S. investment companies. The fund consistently follows such policies in preparing its financial statements.
1. Security Valuation: Investments are valued at the net asset value of each underlying Vanguard fund determined as of the close of the New York Stock Exchange (generally 4 p.m., Eastern time) on the valuation date.
2. Federal Income Taxes: The fund intends to continue to qualify as a regulated investment company and distribute all of its taxable income. Management has analyzed the fund’s tax positions taken for all open federal income tax years (October 31, 2014–2017), and has concluded that no provision for federal income tax is required in the fund’s financial statements.
3. Distributions: Distributions to shareholders are recorded on the ex-dividend date.
4. Credit Facility: The fund and certain other funds managed by The Vanguard Group (“Vanguard”) participate in a $3.1 billion committed credit facility provided by a syndicate of lenders pursuant to a credit agreement that may be renewed annually; each fund is individually liable for its borrowings, if any, under the credit facility. Borrowings may be utilized for temporary and emergency purposes, and are subject to the fund’s regulatory and contractual borrowing restrictions. The participating funds are charged administrative fees and an annual commitment fee of 0.10% of the undrawn amount of the facility; these fees are allocated to the funds based on a method approved by the fund’s board of trustees and borne by the funds in which the fund invests (see Note B). Any borrowings under this facility bear interest at a rate based upon the higher of the one-month London Interbank Offered Rate, federal funds effective rate, or overnight bank funding rate plus an agreed-upon spread.
The fund had no borrowings outstanding at October 31, 2017, or at any time during the period then ended.
5. Other: Income and capital gain distributions received are recorded on the ex-dividend date. Security transactions are accounted for on the date securities are bought or sold. Costs used to determine realized gains (losses) on the sale of investment securities are those of the specific securities sold.
B. In accordance with the terms of a Funds’ Service Agreement (the “FSA”) between Vanguard and the fund, Vanguard furnishes to the fund investment advisory, corporate management, administrative, marketing, and distribution services at Vanguard’s cost of operations (as defined by the FSA). These costs of operations are allocated to the fund based on methods and guidelines approved by the board of trustees. The FSA provides that expenses otherwise allocable to Vanguard funds-of-funds may be reduced or eliminated to the extent of savings realized by the underlying Vanguard funds by virtue of being part of a fund-of-funds. Accordingly, all expenses for services provided by Vanguard to the fund and all other expenses incurred by the fund during the period ended October 31, 2017, were borne by the underlying Vanguard funds in which the fund invests. The fund’s trustees and officers are also trustees and officers, respectively, of the underlying Vanguard funds, as well as directors and employees, respectively, of Vanguard.
14
Diversified Equity Fund
C. Various inputs may be used to determine the value of the fund’s investments. These inputs are summarized in three broad levels for financial statement purposes. The inputs or methodologies used to value securities are not necessarily an indication of the risk associated with investing in those securities.
Level 1—Quoted prices in active markets for identical securities.
Level 2—Other significant observable inputs (including quoted prices for similar securities, interest rates, prepayment speeds, credit risk, etc.).
Level 3—Significant unobservable inputs (including the fund’s own assumptions used to determine the fair value of investments). Any investments valued with significant unobservable inputs are noted on the Statement of Net Assets.
At October 31, 2017, 100% of the market value of the fund’s investments was determined based on Level 1 inputs.
D. Distributions are determined on a tax basis and may differ from net investment income and realized capital gains for financial reporting purposes. Differences may be permanent or temporary. Permanent differences are reclassified among capital accounts in the financial statements to reflect their tax character. Temporary differences arise when certain items of income, expense, gain, or loss are recognized in different periods for financial statement and tax purposes. These differences will reverse at some time in the future. Differences in classification may also result from the treatment of short-term gains as ordinary income for tax purposes.
The fund used a tax accounting practice to treat a portion of the price of capital shares redeemed during the year as distributions from net investment income and realized capital gains. Accordingly, the fund has reclassified $1,501,000 from undistributed net investment income and $5,238,000 from accumulated net realized gains to paid-in capital.
For tax purposes, at October 31, 2017, the fund had $5,802,000 of ordinary income and $55,330,000 of long-term capital gains available for distribution.
At October 31, 2017, the cost of investment securities for tax purposes was $873,290,000. Net unrealized appreciation of investment securities for tax purposes was $566,021,000, consisting entirely of unrealized gains on securities that had risen in value since their purchase.
E. Capital shares issued and redeemed were:
| Year Ended October 31, | ||
| 2017 | 2016 | |
| Shares | Shares | |
| (000) | (000) | |
| Issued | 3,295 | 2,380 |
| Issued in Lieu of Cash Distributions | 2,953 | 3,838 |
| Redeemed | (7,286) | (8,643) |
| Net Increase (Decrease) in Shares Outstanding | (1,038) | (2,425) |
15
Diversified Equity Fund
F. Transactions during the period in affiliated underlying Vanguard funds were as follows:
| Current Period Transactions | ||||||||
| Oct. 31, | Proceeds | Realized | Oct. 31, | |||||
| 2016 | from | Net | Change in | Capital Gain | 2017 | |||
| Market | Purchases | Securities | Gain | Unrealized | Distributions | Market | ||
| Value | at Cost | Sold | (Loss) | App. (Dep.) | Income | Received | Value | |
| ($000) | ($000) | ($000) | ($000) | ($000) | ($000) | ($000) | ($000) | |
| Vanguard Capital | ||||||||
| Value Fund | 63,618 | 1,636 | 3,944 | (253) | 9,795 | 1,103 | — | 70,852 |
| Vanguard Explorer | ||||||||
| Fund | 125,724 | 6,533 | 14,524 | 696 | 25,999 | 476 | 5,344 | 144,428 |
| Vanguard Growth | ||||||||
| and Income Fund | 255,676 | 18,805 | 26,186 | 2,023 | 37,515 | 4,845 | 12,014 | 287,833 |
| Vanguard Mid-Cap | ||||||||
| Growth Fund | 63,956 | 657 | 5,603 | 312 | 13,235 | 442 | — | 72,557 |
| Vanguard Morgan | ||||||||
| Growth Fund | 191,983 | 10,758 | 27,961 | 5,192 | 37,087 | 1,586 | 8,958 | 217,059 |
| Vanguard U.S. | ||||||||
| Growth Fund | 191,416 | 3,778 | 24,585 | 9,171 | 37,425 | 782 | 2,071 | 217,205 |
| Vanguard Windsor | ||||||||
| Fund | 191,946 | 12,507 | 24,704 | 1,610 | 33,214 | 4,019 | 5,527 | 214,573 |
| Vanguard Windsor II | ||||||||
| Fund | 192,005 | 18,660 | 17,010 | 214 | 20,935 | 4,569 | 10,385 | 214,804 |
| Total | 1,276,324 | 73,334 | 144,517 | 18,965 | 215,205 | 17,822 | 44,299 | 1,439,311 |
G. Management has determined that no material events or transactions occurred subsequent to October 31, 2017, that would require recognition or disclosure in these financial statements.
16
Report of Independent Registered Public Accounting Firm
To the Board of Trustees of Vanguard Trustees’ Equity Fund and the Shareholders of Vanguard Diversified Equity Fund
In our opinion, the accompanying statement of net assets and statement of assets and liabilities, and the related statements of operations and of changes in net assets and the financial highlights present fairly, in all material respects, the financial position of Vanguard Diversified Equity Fund (constituting a separate portfolio of Vanguard Trustees’ Equity Fund, hereafter referred to as the “Fund”) as of October 31, 2017, the results of its operations for the year then ended, the changes in its net assets for each of the two years in the period then ended and the financial highlights for each of the five years in the period then ended, in conformity with accounting principles generally accepted in the United States of America. These financial statements and financial highlights (hereafter referred to as “financial statements”) are the responsibility of the Fund’s management. Our responsibility is to express an opinion on these financial statements based on our audits. We conducted our audits of these financial statements in accordance with the standards of the Public Company Accounting Oversight Board (United States). Those standards require that we plan and perform the audit to obtain reasonable assurance about whether the financial statements are free of material misstatement. An audit includes examining, on a test basis, evidence supporting the amounts and disclosures in the financial statements, assessing the accounting principles used and significant estimates made by management, and evaluating the overall financial statement presentation. We believe that our audits, which included confirmation of securities as of October 31, 2017 by agreement to the underlying ownership records of the transfer agent, provide a reasonable basis for our opinion.
/s/PricewaterhouseCoopers LLP
Philadelphia, Pennsylvania
December 13, 2017
Special 2017 tax information (unaudited) for Vanguard Diversified Equity Fund
This information for the fiscal year ended October 31, 2017, is included pursuant to provisions of the Internal Revenue Code.
The fund distributed $81,104,000 as capital gain dividends (20% rate gain distributions) to shareholders during the fiscal year.
For nonresident alien shareholders, 100% of short-term capital gain dividends distributed by the fund are qualified short-term capital gains.
The fund distributed $17,435,000 of qualified dividend income to shareholders during the fiscal year.
For corporate shareholders, 60.0% of investment income (dividend income plus short-term gains, if any) qualifies for the dividends-received deduction.
17
Your Fund’s After-Tax Returns
This table presents returns for your fund both before and after taxes. The after-tax returns are shown in two ways: (1) assuming that an investor owned the fund during the entire period and paid taxes on the fund’s distributions, and (2) assuming that an investor paid taxes on the fund’s distributions and sold all shares at the end of each period.
Calculations are based on the highest individual federal income tax and capital gains tax rates in effect at the times of the distributions and the hypothetical sales. State and local taxes were not considered. After-tax returns reflect any qualified dividend income, using actual prior-year figures and estimates for 2017. (In the example, returns after the sale of fund shares may be higher than those assuming no sale. This occurs when the sale would have produced a capital loss. The calculation assumes that the investor received a tax deduction for the loss.)
Please note that your actual after-tax returns will depend on your tax situation and may differ from those shown. Also note that if you own the fund in a tax-deferred account, such as an individual retirement account or a 401(k) plan, this information does not apply to you. Such accounts are not subject to current taxes.
Finally, keep in mind that a fund’s performance—whether before or after taxes—does not guarantee future results.
| Average Annual Total Returns: Diversified Equity Fund | |||
| Periods Ended October 31, 2017 | |||
| One | Five | Ten | |
| Year | Years | Years | |
| Returns Before Taxes | 24.47% | 14.92% | 7.14% |
| Returns After Taxes on Distributions | 22.36 | 13.55 | 6.26 |
| Returns After Taxes on Distributions and Sale of Fund Shares | 15.13 | 11.69 | 5.54 |
18
About Your Fund’s Expenses
As a shareholder of the fund, you incur ongoing costs, which include costs for portfolio management, administrative services, and shareholder reports (like this one), among others. Operating expenses, which are deducted from a fund’s gross income, directly reduce the investment return of the fund.
A typical fund’s expenses are expressed as a percentage of its average net assets. The Diversified Equity Fund has no direct expenses, but bears its proportionate share of the costs for the underlying funds in which it invests. These indirect expenses make up the acquired fund fees and expenses, also expressed as a percentage of average net assets.
The following examples are intended to help you understand the ongoing cost (in dollars) of investing in your fund and to compare these costs with those of other mutual funds. The examples are based on an investment of $1,000 made at the beginning of the period shown and held for the entire period. The costs were calculated using the acquired fund fees and expenses for the Diversified Equity Fund.
The accompanying table illustrates your fund’s costs in two ways:
• Based on actual fund return. This section helps you to estimate the actual expenses that you paid over the period. The ”Ending Account Value“ shown is derived from the fund‘s actual return, and the third column shows the dollar amount that would have been paid by an investor who started with $1,000 in the fund. You may use the information here, together with the amount you invested, to estimate the expenses that you paid over the period.
To do so, simply divide your account value by $1,000 (for example, an $8,600 account value divided by $1,000 = 8.6), then multiply the result by the number given for your fund under the heading ”Expenses Paid During Period.“
• Based on hypothetical 5% yearly return. This section is intended to help you compare your fund‘s costs with those of other mutual funds. It assumes that the fund had a yearly return of 5% before expenses, but that the expense ratio is unchanged. In this case—because the return used is not the fund’s actual return—the results do not apply to your investment. The example is useful in making comparisons because the Securities and Exchange Commission requires all mutual funds to calculate expenses based on a 5% return. You can assess your fund’s costs by comparing this hypothetical example with the hypothetical examples that appear in shareholder reports of other funds.
Note that the expenses shown in the table are meant to highlight and help you compare ongoing costs only and do not reflect transaction costs incurred by the fund for buying and selling securities. Further, the expenses do not include any purchase, redemption, or account service fees described in the fund prospectus. If such fees were applied to your account, your costs would be higher. Your fund does not carry a “sales load.”
The calculations assume no shares were bought or sold during the period. Your actual costs may have been higher or lower, depending on the amount of your investment and the timing of any purchases or redemptions.
You can find more information about the fund’s expenses, including annual expense ratios, in the Financial Statements section of this report. For additional information on operating expenses and other shareholder costs, please refer to your fund’s current prospectus.
19
| Six Months Ended October 31, 2017 | |||
| Beginning | Ending | Expenses | |
| Account Value | Account Value | Paid During | |
| Diversified Equity Fund | 4/30/2017 | 10/31/2017 | Period |
| Based on Actual Fund Return | $1,000.00 | $1,097.50 | $1.90 |
| Based on Hypothetical 5% Yearly Return | 1,000.00 | 1,023.39 | 1.84 |
The calculations are based on acquired fund fees and expenses charged by the underlying mutual funds in which the Diversified Equity Fund invests. The Diversified Equity Fund’s annualized expense figure for the period is 0.36%. The dollar amounts shown as ”Expenses Paid” are equal to the annualized average weighted expense ratio for the underlying funds multiplied by the average account value over the period, multiplied by the number of days in the most recent six-month period, then divided by the number of days in the most recent 12-month period (184/365).
20
Glossary
30-Day SEC Yield. A fund’s 30-day SEC yield is derived using a formula specified by the U.S. Securities and Exchange Commission. Under the formula, data related to the fund’s security holdings in the previous 30 days are used to calculate the fund’s hypothetical net income for that period, which is then annualized and divided by the fund’s estimated average net assets over the calculation period. For the purposes of this calculation, a security’s income is based on its current market yield to maturity (for bonds), its actual income (for asset-backed securities), or its projected dividend yield (for stocks). Because the SEC yield represents hypothetical annualized income, it will differ—at times significantly—from the fund’s actual experience. As a result, the fund’s income distributions may be higher or lower than implied by the SEC yield.
Acquired Fund Fees and Expenses. Funds that invest in other Vanguard funds incur no direct expenses, but they do bear proportionate shares of the operating, administrative, and advisory expenses of the underlying funds, and they must pay any fees charged by those funds. The figure for acquired fund fees and expenses represents a weighted average of these underlying costs. Acquired is a term that the Securities and Exchange Commission applies to any mutual fund whose shares are owned by another fund.
Beta. A measure of the magnitude of a fund’s past share-price fluctuations in relation to the ups and downs of a given market index. The index is assigned a beta of 1.00. Compared with a given index, a fund with a beta of 1.20 typically would have seen its share price rise or fall by 12% when the index rose or fell by 10%. For this report, beta is based on returns over the past 36 months for both the fund and the index. Note that a fund’s beta should be reviewed in conjunction with its R-squared (see definition). The lower the R-squared, the less correlation there is between the fund and the index, and the less reliable beta is as an indicator of volatility.
Dividend Yield. Dividend income earned by stocks, expressed as a percentage of the aggregate market value (or of net asset value, for a fund). The yield is determined by dividing the amount of the annual dividends by the aggregate value (or net asset value) at the end of the period. For a fund, the dividend yield is based solely on stock holdings and does not include any income produced by other investments.
Earnings Growth Rate. The average annual rate of growth in earnings over the past five years for the stocks now in a fund.
Equity Exposure. A measure that reflects a fund’s investments in stocks and stock futures. Any holdings in short-term reserves are excluded.
Expense Ratio. A fund’s total annual operating expenses expressed as a percentage of the fund’s average net assets. The expense ratio includes management and administrative expenses, but does not include the transaction costs of buying and selling portfolio securities.
Foreign Holdings. The percentage of a fund represented by securities or depositary receipts of companies based outside the United States.
Inception Date. The date on which the assets of a fund (or one of its share classes) are first invested in accordance with the fund’s investment objective. For funds with a subscription period, the inception date is the day after that period ends. Investment performance is measured from the inception date.
21
Median Market Cap. An indicator of the size of companies in which a fund invests; the midpoint of market capitalization (market price x shares outstanding) of a fund’s stocks, weighted by the proportion of the fund’s assets invested in each stock. Stocks representing half of the fund’s assets have market capitalizations above the median, and the rest are below it.
Price/Book Ratio. The share price of a stock divided by its net worth, or book value, per share. For a fund, the weighted average price/book ratio of the stocks it holds.
Price/Earnings Ratio. The ratio of a stock’s current price to its per-share earnings over the past year. For a fund, the weighted average P/E of the stocks it holds. P/E is an indicator of market expectations about corporate prospects; the higher the P/E, the greater the expectations for a company’s future growth.
R-Squared. A measure of how much of a fund’s past returns can be explained by the returns from the market in general, as measured by a given index. If a fund’s total returns were precisely synchronized with an index’s returns, its R-squared would be 1.00. If the fund’s returns bore no relationship to the index’s returns, its R-squared would be 0. For this report, R-squared is based on returns over the past 36 months for both the fund and the index.
Return on Equity. The annual average rate of return generated by a company during the past five years for each dollar of shareholder’s equity (net income divided by shareholder’s equity). For a fund, the weighted average return on equity for the companies whose stocks it holds.
22
The Global Industry Classification Standard (“GICS”) was developed by and is the exclusive property and a service mark of MSCI Inc. (“MSCI”) and Standard and Poor’s, a division of McGraw-Hill Companies, Inc. (“S&P”), and is licensed for use by Vanguard. Neither MSCI, S&P nor any third party involved in making or compiling the GICS or any GICS classification makes any express or implied warranties or representations with respect to such standard or classification (or the results to be obtained by the use thereof), and all such parties hereby expressly disclaim all warranties of originality, accuracy, completeness, merchantability or fitness for a particular purpose with respect to any such standard or classification. Without limiting any of the foregoing, in no event shall MSCI, S&P, any of its affiliates or any third party involved in making or compiling the GICS or any GICS classification have any liability for any direct, indirect, special, punitive, consequential or any other damages (including lost profits) even if notified of the possibility of such damages.
23
This page intentionally left blank.
This page intentionally left blank.
This page intentionally left blank.
The People Who Govern Your Fund
The trustees of your mutual fund are there to see that the fund is operated and managed in your best interests since, as a shareholder, you are a part owner of the fund. Your fund’s trustees also serve on the board of directors of The Vanguard Group, Inc., which is owned by the Vanguard funds and provides services to them on an at-cost basis.
A majority of Vanguard’s board members are independent, meaning that they have no affiliation with Vanguard or the funds they oversee, apart from the sizable personal investments they have made as private individuals. The independent board members have distinguished backgrounds in business, academia, and public service. Each of the trustees and executive officers oversees 200 Vanguard funds.
Information for each trustee and executive officer of the fund appears below. The mailing address of the trustees and officers is P.O. Box 876, Valley Forge, PA 19482. More information about the trustees is in the Statement of Additional Information, which can be obtained, without charge, by contacting Vanguard at 800-662-7447, or online at vanguard.com.
Interested Trustee1
F. William McNabb III
Born 1957. Trustee Since July 2009. Chairman of the Board. Principal Occupation(s) During the Past Five Years and Other Experience: Chairman of the Board of The Vanguard Group, Inc., and of each of the investment companies served by The Vanguard Group, since January 2010; Chief Executive Officer and Director of The Vanguard Group and President and Chief Executive Officer of each of the investment companies served by The Vanguard Group, since 2008; Director of Vanguard Marketing Corporation; President of The Vanguard Group (2008–2017); Managing Director of The Vanguard Group (1995–2008).
Independent Trustees
Emerson U. Fullwood
Born 1948. Trustee Since January 2008. Principal Occupation(s) During the Past Five Years and Other Experience: Executive Chief Staff and Marketing Officer for North America and Corporate Vice President (retired 2008) of Xerox Corporation (document management products and services);
Executive in Residence and 2009–2010 Distinguished Minett Professor at the Rochester Institute of Technology; Lead Director of SPX FLOW, Inc. (multi-industry manufacturing); Director of the United Way of Rochester, the University of Rochester Medical Center, Monroe Community College Foundation, North Carolina A&T University, and Roberts Wesleyan College; Trustee of the University of Rochester.
Rajiv L. Gupta
Born 1945. Trustee Since December 2001.2 Principal Occupation(s) During the Past Five Years and Other Experience: Chairman and Chief Executive Officer (retired 2009) and President (2006–2008) of Rohm and Haas Co. (chemicals); Director of Arconic Inc. (diversified manufacturer), HP Inc. (printer and personal computer manufacturing), and Delphi Automotive plc (automotive components); Senior Advisor at New Mountain Capital.
Amy Gutmann
Born 1949. Trustee Since June 2006. Principal Occupation(s) During the Past Five Years and Other Experience: President of the University of Pennsylvania; Christopher H. Browne
1 Mr. McNabb is considered an “interested person,” as defined in the Investment Company Act of 1940, because he is an officer of the
Vanguard funds.
2 December 2002 for Vanguard Equity Income Fund, the Vanguard Municipal Bond Funds, and the Vanguard State Tax-Exempt Funds.
Distinguished Professor of Political Science, School of Arts and Sciences, and Professor of Communication, Annenberg School for Communication, with secondary faculty appointments in the Department of Philosophy, School of Arts and Sciences, and at the Graduate School of Education, University of Pennsylvania; Trustee of the National Constitution Center.
JoAnn Heffernan Heisen
Born 1950. Trustee Since July 1998. Principal Occupation(s) During the Past Five Years and Other Experience: Corporate Vice President and Member of the Executive Committee (1997–2008), Chief Global Diversity Officer (retired 2008), Vice President and Chief Information Officer (1997–2006), Controller (1995–1997), Treasurer (1991–1995), and Assistant Treasurer (1989–1991) of Johnson & Johnson (pharmaceuticals/medical devices/ consumer products); Director of Skytop Lodge Corporation (hotels) and the Robert Wood Johnson Foundation; Member of the Advisory Board of the Institute for Women’s Leadership at Rutgers University.
F. Joseph Loughrey
Born 1949. Trustee Since October 2009. Principal Occupation(s) During the Past Five Years and Other Experience: President and Chief Operating Officer (retired 2009) of Cummins Inc. (industrial machinery); Chairman of the Board of Hillenbrand, Inc. (specialized consumer services), Oxfam America, and the Lumina Foundation for Education; Director of the V Foundation for Cancer Research; Member of the Advisory Council for the College of Arts and Letters and Chair of the Advisory Board to the Kellogg Institute for International Studies, both at the University of Notre Dame.
Mark Loughridge
Born 1953. Trustee Since March 2012. Principal Occupation(s) During the Past Five Years and Other Experience: Senior Vice President and Chief Financial Officer (retired 2013) at IBM (information technology services); Fiduciary Member of IBM’s Retirement Plan Committee (2004–2013); Member of the Council on Chicago Booth.
Scott C. Malpass
Born 1962. Trustee Since March 2012. Principal Occupation(s) During the Past Five Years and Other Experience: Chief Investment Officer and Vice President at the University of Notre Dame; Assistant Professor of Finance at the Mendoza College of Business at Notre Dame; Member of the Notre Dame 403(b) Investment Committee, the Board of Advisors for Spruceview Capital Partners, the Board of Catholic Investment Services, Inc. (investment advisor), and the Board of Superintendence of the Institute for the Works of Religion; Chairman of the Board of TIFF Advisory Services, Inc. (investment advisor).
André F. Perold
Born 1952. Trustee Since December 2004. Principal Occupation(s) During the Past Five Years and Other Experience: George Gund Professor of Finance and Banking, Emeritus at the Harvard Business School (retired 2011); Chief Investment Officer and Co-Managing Partner of HighVista Strategies LLC (private investment firm); Overseer of the Museum of Fine Arts Boston.
Peter F. Volanakis
Born 1955. Trustee Since July 2009. Principal Occupation(s) During the Past Five Years and Other Experience: President and Chief Operating Officer (retired 2010) of Corning Incorporated (communications equipment); Chairman of the Board of Trustees of Colby-Sawyer College; Member of the Board of Hypertherm, Inc. (industrial cutting systems, software, and consumables).
Executive Officers
Glenn Booraem
Born 1967. Investment Stewardship Officer Since February 2017. Principal Occupation(s) During the Past Five Years and Other Experience: Principal of The Vanguard Group, Inc.; Treasurer (2015–2017), Controller (2010–2015), and Assistant Controller (2001–2010) of each of the investment companies served by The Vanguard Group.
Thomas J. Higgins
Born 1957. Chief Financial Officer Since September 2008. Principal Occupation(s) During the Past Five Years and Other Experience: Principal of The Vanguard Group, Inc.; Chief Financial Officer of each of the investment companies served by The Vanguard Group; Treasurer of each of the investment companies served by The Vanguard Group (1998–2008).
Peter Mahoney
Born 1974. Controller Since May 2015. Principal Occupation(s) During the Past Five Years and Other Experience: Principal of The Vanguard Group, Inc.; Controller of each of the investment companies served by The Vanguard Group; Head of International Fund Services at The Vanguard Group (2008–2014).
Anne E. Robinson
Born 1970. Secretary Since September 2016. Principal Occupation(s) During the Past Five Years and Other Experience: Managing Director of The Vanguard Group, Inc.; General Counsel of The Vanguard Group; Secretary of The Vanguard Group and of each of the investment companies served by The Vanguard Group; Director and Senior Vice President of Vanguard Marketing Corporation; Managing Director and General Counsel of Global Cards and Consumer Services at Citigroup (2014–2016); Counsel at American Express (2003–2014).
Michael Rollings
Born 1963. Treasurer Since February 2017. Principal Occupation(s) During the Past Five Years and Other Experience: Managing Director of The Vanguard Group, Inc.; Treasurer of each of the investment companies served by The Vanguard Group; Director of Vanguard Marketing Corporation; Executive Vice President and Chief Financial Officer of MassMutual Financial Group (2006–2016).
| Vanguard Senior Management Team | |
| Mortimer J. Buckley | Chris D. McIsaac |
| Gregory Davis | James M. Norris |
| John James | Thomas M. Rampulla |
| Martha G. King | Karin A. Risi |
| John T. Marcante | |
Chairman Emeritus and Senior Advisor
John J. Brennan
Chairman, 1996–2009
Chief Executive Officer and President, 1996–2008
Founder
John C. Bogle
Chairman and Chief Executive Officer, 1974–1996
 | |
P.O. Box 2600 | |
Connect with Vanguard® > vanguard.com | |
| Fund Information > 800-662-7447 | |
| Direct Investor Account Services > 800-662-2739 | |
| Institutional Investor Services > 800-523-1036 | |
| Text Telephone for People | |
| Who Are Deaf or Hard of Hearing> 800-749-7273 | |
| This material may be used in conjunction | |
| with the offering of shares of any Vanguard | |
| fund only if preceded or accompanied by | |
| the fund’s current prospectus. | |
| All comparative mutual fund data are from Lipper, a | |
| Thomson Reuters Company, or Morningstar, Inc., unless | |
| otherwise noted. | |
| You can obtain a free copy of Vanguard’s proxy voting | |
| guidelines by visiting vanguard.com/proxyreporting or by | |
| calling Vanguard at 800-662-2739. The guidelines are | |
| also available from the SEC’s website, sec.gov. In | |
| addition, you may obtain a free report on how your fund | |
| voted the proxies for securities it owned during the 12 | |
| months ended June 30. To get the report, visit either | |
| vanguard.com/proxyreporting or sec.gov. | |
| You can review and copy information about your fund at | |
| the SEC’s Public Reference Room in Washington, D.C. To | |
| find out more about this public service, call the SEC at | |
| 202-551-8090. Information about your fund is also | |
| available on the SEC’s website, and you can receive | |
| copies of this information, for a fee, by sending a | |
| request in either of two ways: via email addressed to | |
| publicinfo@sec.gov or via regular mail addressed to the | |
| Public Reference Section, Securities and Exchange | |
| Commission, Washington, DC 20549-1520. | |
| © 2017 The Vanguard Group, Inc. | |
| All rights reserved. | |
| Vanguard Marketing Corporation, Distributor. | |
| Q6080 122017 | |
| Annual Report | October 31, 2017 |
| Vanguard Emerging Markets Select |
| Stock Fund |
Vanguard’s Principles for Investing Success
We want to give you the best chance of investment success. These
principles, grounded in Vanguard’s research and experience, can put you on
the right path.
Goals. Create clear, appropriate investment goals.
Balance. Develop a suitable asset allocation using broadly diversified funds.
Cost. Minimize cost.
Discipline. Maintain perspective and long-term discipline.
A single theme unites these principles: Focus on the things you can control.
We believe there is no wiser course for any investor.
| Contents | |
| Your Fund’s Performance at a Glance. | 1 |
| Chairman’s Perspective. | 3 |
| Advisors’ Report. | 6 |
| Fund Profile. | 11 |
| Performance Summary. | 13 |
| Financial Statements. | 15 |
| Your Fund’s After-Tax Returns. | 31 |
| About Your Fund’s Expenses. | 32 |
| Glossary. | 34 |
Please note: The opinions expressed in this report are just that—informed opinions. They should not be considered promises or advice. Also, please keep in mind that the information and opinions cover the period through the date on the front of this report. Of course, the risks of investing in your fund are spelled out in the prospectus.
See the Glossary for definitions of investment terms used in this report.
About the cover: Nautical images have been part of Vanguard’s rich heritage since its start in 1975. For an incoming ship, a lighthouse offers a beacon and safe path to shore. You can similarly depend on Vanguard to put you first––and light the way––as you strive to meet your financial goals. Our client focus and low costs, stemming from our unique ownership structure, assure that your interests are paramount.
Your Fund’s Performance at a Glance
• For the 12 months ended October 31, 2017, Vanguard Emerging Markets Select Stock Fund returned 25.28%. That performance exceeded the 21.44% return of the benchmark, the FTSE Emerging Index, and the 23.24% average return of peer funds.
• Among the emerging markets countries represented in the fund, Brazil, India, Malaysia, and Taiwan produced some of the strongest returns on a relative basis. China, Poland, and the Philippines were among those countries that detracted from performance.
• Stock selection was positive in 10 of the fund’s 11 industry sectors. Stocks in the information technology, consumer staples, and materials sectors drove the fund’s relative performance for the period, while real estate was a weak spot.
• From its June 27, 2011, inception through October 31, 2017, the fund had an average annual return of 3.11% and outperformed both its benchmark and the average performance of its industry peers.
| Total Returns: Fiscal Year Ended October 31, 2017 | |
| Total | |
| Returns | |
| Vanguard Emerging Markets Select Stock Fund | 25.28% |
| FTSE Emerging Index | 21.44 |
| Emerging Markets Funds Average | 23.24 |
| Emerging Markets Funds Average: Derived from data provided by Lipper, a Thomson Reuters Company. |
| Total Returns: Inception Through October 31, 2017 | |
| Average | |
| Annual Return | |
| Emerging Markets Select Stock Fund (Returns since inception: 6/27/2011) | 3.11% |
| FTSE Emerging Index | 2.42 |
| Emerging Markets Funds Average | 1.94 |
| Emerging Markets Funds Average: Derived from data provided by Lipper, a Thomson Reuters Company. |
The figures shown represent past performance, which is not a guarantee of future results. (Current performance may be lower or higher than the performance data cited. For performance data current to the most recent month-end, visit our website at vanguard.com/performance.) Note, too, that both investment returns and principal value can fluctuate widely, so an investor’s shares, when sold, could be worth more or less than their original cost.
1
| Expense Ratios | ||
| Your Fund Compared With Its Peer Group | ||
| Peer Group | ||
| Fund | Average | |
| Emerging Markets Select Stock Fund | 0.90% | 1.50% |
The fund expense ratio shown is from the prospectus dated February 23, 2017, and represents estimated costs for the current fiscal year. For the fiscal year ended October 31, 2017, the fund’s expense ratio was 0.92%. The peer-group expense ratio is derived from data provided by Lipper, a Thomson Reuters Company, and captures information through year-end 2016.
Peer group: Emerging Markets Funds.
2
Chairman’s Perspective

Bill McNabb
Chairman and Chief Executive Officer
Dear Shareholder,
When I find outstanding products or services, I’m likely to be loyal to them. And my loyalty usually gets rewarded as I experience consistently high quality––whether it’s from a favorite restaurant or a favorite author. What’s past, in most cases, is prologue.
As tempting as it is to apply this rationale to investing—for example, if technology stocks have done well this year, they’re bound to do well the next—it’s not all that helpful and can actually be counterproductive. You’ve heard it many times: Past performance cannot be used to predict future returns.
Taking a new approach
The caution about past performance is so familiar that investors are apt to treat it as mere background noise. That’s why past-performance bias merited a fresh look from Vanguard’s Investment Strategy Group, which tackled the issue last year in a research paper. (I encourage you to read the full paper, Reframing Investor Choices: Right Mindset, Wrong Market, at vanguard.com/research.)
Our strategists were hardly the first to delve into the topic, but they approached it in a new way. They started with the premise that it’s perfectly understandable for investors to lean heavily on past performance, because that works well in many areas of life. After all, as the paper describes, in lots of other industries and realms, performance from one time period
3
to another is extremely consistent. The researchers looked at everything from cars to fine restaurants to heart surgeons, and in all these examples, past performance was a good predictor of later outcomes.
It’s different with investing
In a nutshell, our brains typically are rewarded and our satisfaction is boosted when we use past performance as a guide for navigating decisions, big and small. But when applied to investing, this method breaks down.
Why? Among other reasons, top-performing asset classes one year tend not to repeat as leaders the next. Strong past performance leads to higher
valuations, making an investment, all else being equal, less attractive in the future. The data are quite overwhelming in this regard.
By allowing past performance to inform their decisions, individual and institutional investors inadvertently end up as momentum investors, putting them on a treadmill of buying high and selling low.
A path to better decision-making
Of course, many investors are already aware of the pitfalls of projecting past performance into the future. The real question is, what can we all do about it? What does it take to go from having a general awareness to actually changing our behavior?
| Market Barometer | |||
| Average Annual Total Returns | |||
| Periods Ended October 31, 2017 | |||
| One Year | Three Years | Five Years | |
| Stocks | |||
| Russell 1000 Index (Large-caps) | 23.67% | 10.58% | 15.18% |
| Russell 2000 Index (Small-caps) | 27.85 | 10.12 | 14.49 |
| Russell 3000 Index (Broad U.S. market) | 23.98 | 10.53 | 15.12 |
| FTSE All-World ex US Index (International) | 23.48 | 6.12 | 7.67 |
| Bonds | |||
| Bloomberg Barclays U.S. Aggregate Bond Index | |||
| (Broad taxable market) | 0.90% | 2.40% | 2.04% |
| Bloomberg Barclays Municipal Bond Index | |||
| (Broad tax-exempt market) | 2.19 | 3.04 | 3.00 |
| Citigroup Three-Month U.S. Treasury Bill Index | 0.71 | 0.31 | 0.20 |
| CPI | |||
| Consumer Price Index | 2.04% | 1.28% | 1.29% |
4
Acknowledging that such change isn’t easy, our strategists offered a few ideas for reframing how investors approach their decisions. These recommendations were targeted at advisors working with clients, but they apply equally to individuals and institutions:
• Educate yourself. The more investors understand why a method that works so well in other areas of life—relying on past performance to drive decisions—doesn’t carry over to investing, the better off they’ll be.
• Be disciplined. The bias toward past performance is ingrained in everybody, professionals included, and shifting away from it can be difficult. But the long-term benefits make the effort worthwhile.
• Focus on what you can control. It’s always most constructive for investors to concentrate on what’s actually within their control, such as setting goals, following long-term portfolio construction principles, selecting low-cost investments, and rebalancing periodically.
Here’s to keeping the past in the rearview mirror. And, as always, thank you for investing with Vanguard.
Sincerely,

F. William McNabb III
Chairman and Chief Executive Officer
November 14, 2017
5
Advisors’ Report
For the 12 months ended October 31, 2017, Vanguard Emerging Markets Select Stock Fund returned 25.28%. Your fund is managed by four independent advisors, a strategy that enhances the fund’s diversification by providing exposure to distinct yet complementary investment approaches. It’s not uncommon for different advisors to have different views about individual securities or the broader investment environment.
The advisors, the percentage of fund assets each manages, and brief descriptions of their investment strategies are presented in the accompanying table. The advisors have also prepared a discussion of the investment environment that existed during the fiscal year and of how their portfolio positioning reflects this assessment.
These comments were prepared on November 17, 2017.
Pzena Investment Management, LLC
Portfolio Managers: Caroline Cai, CFA, Principal Allison Fisch, Principal
John P. Goetz, Managing Principal and Co-Chief Investment Officer
Over the past year, emerging-market equities were up strongly. In our portfolio, information technology, materials, and financials were the strongest absolute contributors, while health care detracted. From a country standpoint, positions in China and India contributed significantly on an absolute basis.
The largest individual contributor was Antofagasta, the U.K.-based copper mining group. Antofagasta rose on improving production growth and optimism about copper prices, as well as better cost performance. Indian conglomerate Reliance Industries benefited from its telecommunications business as it continues to acquire more customers and monetize its business through increased pricing.
The largest individual detractor was China Mobile, the leading telecommunication service provider in China, which was hurt by a slowdown in additional 4G subscribers. Sabesp, the Brazilian water utility, was weak in light of uncertainty about an upcoming rate case and its announcement that it was issuing stock to fund higher capital expenditures. Chinese PC manufacturer Lenovo Group was weak in spite of its strong PC business performance as it continues to restructure its money-losing mobile and server businesses.
The portfolio’s largest exposures are to financials, information technology, consumer discretionary, and energy, and its smallest weightings are in real estate and health care.
6
M&G Investment Management Limited
Portfolio Manager:
Matthew Vaight, UKSIP
Investors became increasingly enthusiastic about emerging-market companies during the 12 months under review and share prices rallied.
Information technology stocks were the stand-out performers; the fund’s allocation to this sector had a significant impact on relative performance. SK Hynix, a semiconductor company, and Samsung Electronics, a maker of mobile phones and memory chips, were notable contributors. Baidu, a Chinese internet search firm often referred to as China’s Google, also added value after it reported encouraging results.
Results were held back by disappointing performance from Delta Electronics, a manufacturer of power supplies from Taiwan, and Luxoft, a Russian software engineering company. Not owning shares of Tencent, a Chinese internet company, also detracted as the large index constituent’s share price rallied.
Stock selection in industrials also detracted. Alfa, a Mexican conglomerate that joined the portfolio during the period, declined on concerns about potential changes to Mexico’s trade relationship with the United States.
In the energy sector, Tupras, a Turkish oil refiner, made a positive contribution. However, Petrofac, a U.K.-listed oil services firm, was a notable detractor as the stock fell on news of a fraud investigation. The oil market’s gradual recovery increased confidence in the Russian economy and our holding in Sberbank, a Russian bank, made a positive contribution.
From a style perspective, investors’ preference for growth stocks during the period was a headwind for the fund’s value-oriented approach. However, we remain optimistic about the prospects for value stocks in emerging markets. These stocks currently are attractively valued, particularly relative to growth stocks, and could benefit from the healthy macroeconomic environment and improving company fundamentals.
Wellington Management Company llp
Portfolio Managers:
Cheryl M. Duckworth, CFA, Senior Managing Director and Associate Director, Global Industry Research
Mark Mandel, CFA, Senior Managing Director and Director, Global Industry Research
Emerging-market equities rose in U.S. dollar terms, as measured by the FTSE Emerging Markets Index, during the 12-month period. All 11 sectors in the index posted positive returns, led by the information technology, real estate, and materials sectors. Health care, consumer staples, and telecommunication services were the weakest sectors.
7
Positive stock selection in information technology, telecommunication services, health care, and consumer staples drove relative performance. GlobalWafers, a Taiwan-based silicon wafer supplier, Alibaba, China’s largest e-commerce company, and KAZ Minerals, a U.K.-based copper company, were the top relative contributors.
GlobalWafers’ stock price rose on expectations that silicon wafer price increases would continue. In addition, there is optimism about potential synergies from the recent acquisition of SunEdison Semiconductor, as GlobalWafers has made several value-accretive acquisitions in recent years.
Alibaba’s stock price advanced after the company reported strong second-quarter results driven primarily by strength in its core e-commerce and cloud businesses.
KAZ Minerals operates in Kazakhstan but is listed in the United Kingdom. The stock advanced as a result of a combination of higher copper prices and good project execution by the company. We believe there is potential for more value in the company as it reduces debt on its balance sheet and ramps up the production of growth projects.
Weak security selection in consumer discretionary, energy, and real estate partly weighed on results. Naspers, a South African multinational internet and media group that owns a 33% stake in Hong Kong-listed Tencent, was a top detractor.
The portfolio also held a position in Tencent during the period, and our investment in Naspers was a way to increase exposure to Tencent’s underlying core businesses—PC gaming, social networking, and advertising. Our position in Tencent aided relative results as it outperformed Naspers; however, we believe that Tencent’s strong performance left the residual value of Naspers trading at a discount. We added to our position in Naspers and maintain a position in Tencent.
Petrobras, a Brazil-based integrated oil and gas producer, was another key detractor. We exited the position because of falling oil prices and the company’s ongoing dispute with the Brazilian government.
Finally, our decision not to own China-based real estate companies China Evergrande, Sunac China, and Country Garden weighed on relative results as each company performed strongly over the period.
Oaktree Capital Management, L.P.
Portfolio Managers:
Frank J. Carroll III, Managing Director and Co-Head of Emerging Markets Equities
Timothy D. Jensen, Managing Director and Co-Head of Emerging Markets Equities
Emerging markets generated strong returns during the 12 months ended October 31, 2017. Better-than-expected economic growth, rising earnings expectations, strengthening currencies,
8
and several individual country factors contributed to the performance of emerging markets equities.
President Trump’s victory initially triggered a dollar rally and some markets fell; however, the dollar peaked in December and subsequently declined relative to developed and most emerging markets currencies.
China’s markets performed well thanks to strong economic and company data, slowing capital outflows, and a stable currency. India’s markets fell sharply in November after the government demonetized large currency notes in an effort to tax its informal economy, but recovered nicely as the growth impact of demonetization was less than feared and after the ruling BJP party’s victories in state elections.
Russia’s markets rallied strongly early in the period on oil-price strength and potentially better relations with the United States under a Trump administration, but this performance trailed off after oil prices faded and a stronger ruble crimped exporters’ profit margins.
Consensus 2017 earnings estimates for emerging markets companies were raised steadily during this period, largely on the back of upward revisions related to information technology, materials, and energy companies. The information technology sector was the clear market leader during this period.
Consistent with our bottom-up investment process, stock selection explained the bulk of our performance. Relative performance was helped primarily by strong stock selection in Brazil, Russia, and Mexico. Positive stock selection in information technology, consumer discretionary, energy, and financials contributed to performance while selection in real estate, materials, and industrials detracted.
We remain optimistic about the long-term prospects for emerging markets equities. We currently have a portfolio of stocks that we believe are attractively valued, have strong balance sheets, and generate strong free cash flows.
9
Vanguard Emerging Markets Select Stock Fund Investment Advisors
| Fund Assets Managed | |||
| Investment Advisor | % | $ Million | Investment Strategy |
| Pzena Investment | 24 | 155 | Uses a deep-value approach that focuses on the most |
| Management, LLC | undervalued companies based on price-to-normalized | ||
| earnings. The firm believes that this value philosophy | |||
| works well globally and is especially effective in | |||
| emerging markets because of generally wider | |||
| valuation spreads. | |||
| M&G Investment Management | 24 | 155 | Seeks to identify companies that can handle capital |
| Limited | with discipline, generate returns above the cost of | ||
| capital, and stay focused on creating value. M&G | |||
| attempts to take advantage of pricing deviations | |||
| created by short-term investors. | |||
| Wellington Management | 24 | 153 | Allocates the assets in its portion of the fund to a |
| Company LLP | team of global analysts who seek to add value through | ||
| in-depth fundamental research and understanding of | |||
| their industries. By covering the same companies over | |||
| a period of many years, these investment | |||
| professionals gain comprehensive insight to guide | |||
| decisions for their subportfolios. | |||
| Oaktree Capital Management, | 24 | 153 | Seeks securities that have been undervalued by |
| L.P. | investors. Oaktree’s investment process is driven by | ||
| bottom-up research, which includes extensive travel | |||
| to meet company management and maintaining | |||
| in-house models focused on deriving reliable | |||
| cash-flow projections. | |||
| Cash Investments | 4 | 30 | These short-term reserves are invested by Vanguard |
| in equity index products to simulate investment in | |||
| stocks. Each advisor may also maintain a modest cash | |||
| position. | |||
10
Emerging Markets Select Stock Fund
Fund Profile
As of October 31, 2017
| Portfolio Characteristics | |||
| MSCI | |||
| AC | |||
| FTSE | World | ||
| Emerging | Index | ||
| Fund | Index | ex USA | |
| Number of Stocks | 298 | 1,024 | 1,858 |
| Median Market Cap | $22.7B | $19.6B | $37.0B |
| Price/Earnings Ratio | 14.3x | 14.8x | 16.5x |
| Price/Book Ratio | 1.5x | 1.8x | 1.8x |
| Return on Equity | 14.3% | 16.1% | 12.3% |
| Earnings Growth | |||
| Rate | 5.2% | 11.5% | 7.1% |
| Dividend Yield | 2.5% | 2.5% | 2.7% |
| Turnover Rate | 44% | — | — |
| Ticker Symbol | VMMSX | — | — |
| Expense Ratio1 | 0.90% | — | — |
| Short-Term Reserves | 2.1% | — | — |
| Sector Diversification (% of equity exposure) | |||
| MSCI AC | |||
| FTSE | World | ||
| Emerging | Index | ||
| Fund | Index | ex USA | |
| Consumer Discretionary | 9.3% | 9.2% | 11.3% |
| Consumer Staples | 4.7 | 6.5 | 9.5 |
| Energy | 9.7 | 8.9 | 6.7 |
| Financials | 26.8 | 26.7 | 23.0 |
| Health Care | 0.9 | 2.5 | 7.6 |
| Industrials | 5.6 | 6.2 | 11.9 |
| Information Technology | 24.1 | 18.9 | 11.7 |
| Materials | 8.5 | 8.2 | 7.9 |
| Real Estate | 1.6 | 3.8 | 3.2 |
| Telecommunication | |||
| Services | 4.6 | 5.8 | 4.1 |
| Utilities | 4.2 | 3.3 | 3.1 |
Sector categories are based on the Global Industry Classification Standard (“GICS”), except for the “Other” category (if applicable), which includes securities that have not been provided a GICS classification as of the effective reporting period.
| Volatility Measures | ||
| MSCI AC | ||
| FTSE | World | |
| Emerging | Index | |
| Index | ex USA | |
| R-Squared | 0.97 | 0.76 |
| Beta | 1.01 | 1.15 |
These measures show the degree and timing of the fund’s fluctuations compared with the indexes over 36 months.
| Ten Largest Holdings (% of total net assets) | ||
| Taiwan Semiconductor | ||
| Manufacturing Co. Ltd. | Semiconductors | 4.9% |
| Tencent Holdings Ltd. | Internet Software & | |
| Services | 3.1 | |
| LUKOIL PJSC | Integrated Oil & Gas | 1.9 |
| Sberbank of Russia | ||
| PJSC | Diversified Banks | 1.7 |
| China Construction Bank | ||
| Corp. | Diversified Banks | 1.6 |
| Alibaba Group Holding | Internet Software & | |
| Ltd. | Services | 1.6 |
| Baidu Inc. | Internet Software & | |
| Services | 1.6 | |
| Reliance Industries Ltd. | Oil & Gas Refining & | |
| Marketing | 1.4 | |
| Itau Unibanco Holding | ||
| SA | Diversified Banks | 1.4 |
| Rosneft Oil Co. PJSC | Integrated Oil & Gas | 1.2 |
| Top Ten | 20.4% | |
The holdings listed exclude any temporary cash investments and equity index products.
Allocation by Region (% of equity exposure)
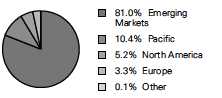
1 The expense ratio shown is from the prospectus dated February 23, 2017, and represents estimated costs for the current fiscal year. For the fiscal year ended October 31, 2017, the fund’s expense ratio was 0.92%.
11
Emerging Markets Select Stock Fund
| Market Diversification (% of equity exposure) | |||
| MSCI AC | |||
| FTSE | World | ||
| Emerging | Index | ||
| Fund | Index | ex USA | |
| Europe | |||
| United Kingdom | 2.4% | 0.0% | 12.2% |
| Other | 0.9 | 0.4 | 31.7 |
| Subtotal | 3.3% | 0.4% | 43.9% |
| Pacific | |||
| South Korea | 6.9% | 0.0% | 3.8% |
| Hong Kong | 2.5 | 0.0 | 2.5 |
| Other | 1.0 | 0.0 | 22.1 |
| Subtotal | 10.4% | 0.0% | 28.4% |
| Emerging Markets | |||
| China | 27.6% | 29.3% | 7.0% |
| Taiwan | 12.1 | 14.2 | 2.9 |
| Brazil | 9.1 | 8.9 | 1.7 |
| India | 8.9 | 12.2 | 2.1 |
| Russia | 6.6 | 4.2 | 0.7 |
| South Africa | 5.2 | 8.1 | 1.5 |
| Indonesia | 2.7 | 2.4 | 0.5 |
| Mexico | 2.5 | 3.9 | 0.8 |
| Thailand | 1.8 | 3.6 | 0.5 |
| Turkey | 1.3 | 1.3 | 0.3 |
| Other | 3.2 | 11.5 | 2.6 |
| Subtotal | 81.0% | 99.6% | 20.6% |
| North America | |||
| United States | 4.9% | 0.0% | 0.4% |
| Other | 0.3 | 0.0 | 6.5 |
| Subtotal | 5.2% | 0.0% | 6.9% |
| Middle East | 0.0% | 0.0% | 0.2% |
| Other | 0.1% | 0.0% | 0.0% |
12
Emerging Markets Select Stock Fund
Performance Summary
All of the returns in this report represent past performance, which is not a guarantee of future results that may be achieved by the fund. (Current performance may be lower or higher than the performance data cited. For performance data current to the most recent month-end, visit our website at vanguard.com/performance.) Note, too, that both investment returns and principal value can fluctuate widely, so an investor’s shares, when sold, could be worth more or less than their original cost. The returns shown do not reflect taxes that a shareholder would pay on fund distributions or on the sale of fund shares.
Cumulative Performance: June 27, 2011, Through October 31, 2017
Initial Investment of $10,000
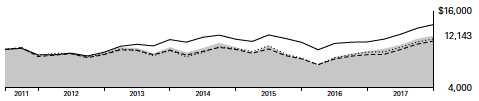
| Average Annual Total Returns | ||||
| Periods Ended October 31, 2017 | ||||
| Since | Final Value | |||
| One | Five | Inception | of a $10,000 | |
| Year | Years | (6/27/2011) | Investment | |
| Emerging Markets Select Stock Fund | 25.28% | 5.30% | 3.11% | $12,143 |
| FTSE Emerging Index | 21.44 | 4.58 | 2.42 | 11,638 |
| Emerging Markets Funds Average | 23.24 | 4.21 | 1.94 | 11,299 |
| MSCI All Country World Index ex USA | 24.20 | 7.77 | 5.30 | 13,881 |
Emerging Markets Funds Average: Derived from data provided by Lipper, a Thomson Reuters Company.
"Since Inception" performance is calculated from the inception date for both the fund and its comparative standards.
See Financial Highlights for dividend and capital gains information.
13
Emerging Markets Select Stock Fund
Fiscal-Year Total Returns (%): June 27, 2011, Through October 31, 2017
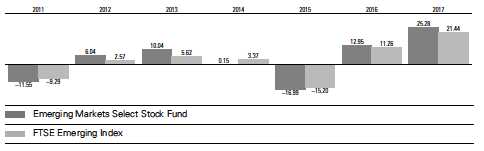
Average Annual Total Returns: Periods Ended September 30, 2017
This table presents returns through the latest calendar quarter—rather than through the end of the fiscal period.
Securities and Exchange Commission rules require that we provide this information.
| Inception | One | Five | Since | |
| Date | Year | Years | Inception | |
| Emerging Markets Select Stock | ||||
| Fund | 6/27/2011 | 22.54% | 4.71% | 2.71% |
14
Emerging Markets Select Stock Fund
Financial Statements
Statement of Net Assets
As of October 31, 2017
The fund reports a complete list of its holdings in regulatory filings four times in each fiscal year, at the quarter-ends. For the second and fourth fiscal quarters, the lists appear in the fund’s semiannual and annual reports to shareholders. For the first and third fiscal quarters, the fund files the lists with the Securities and Exchange Commission on Form N-Q. Shareholders can look up the fund’s Forms N-Q on the SEC’s website at sec.gov. Forms N-Q may also be reviewed and copied at the SEC’s Public Reference Room (see the back cover of this report for further information).
| Market | |||
| Value• | |||
| Shares | ($000) | ||
| Common Stocks (93.8%)1 | |||
| Argentina (0.3%) | |||
| YPF SA ADR | 70,277 | 1,726 | |
| Brazil (8.5%) | |||
| Itau Unibanco Holding SA | |||
| ADR | 489,675 | 6,273 | |
| Ambev SA | 846,424 | 5,408 | |
| Vale SA Class B ADR | |||
| Common Shares | 468,744 | 4,589 | |
| * | Petroleo Brasileiro SA | ||
| ADR | 359,550 | 3,685 | |
| Banco Bradesco SA | |||
| Preference Shares | 321,201 | 3,405 | |
| Telefonica Brasil SA ADR | 190,912 | 2,940 | |
| * | BRF SA ADR | 207,314 | 2,793 |
| TOTVS SA | 263,293 | 2,622 | |
| Itau Unibanco Holding SA | |||
| Preference Shares | 190,748 | 2,452 | |
| Cia de Saneamento Basico | |||
| do Estado de Sao Paulo | 267,389 | 2,436 | |
| Ambev SA ADR | 309,805 | 1,961 | |
| CVC Brasil Operadora e | |||
| Agencia de Viagens SA | 146,401 | 1,933 | |
| EDP - Energias do Brasil | |||
| SA | 439,165 | 1,933 | |
| MRV Engenharia e | |||
| Participacoes SA | 487,689 | 1,886 | |
| Cia de Saneamento do | |||
| Parana Preference | |||
| Shares | 447,800 | 1,485 | |
| Telefonica Brasil SA | |||
| Preference Shares | 95,600 | 1,476 | |
| Cyrela Brazil Realty SA | |||
| Empreendimentos e | |||
| Participacoes | 364,726 | 1,427 | |
| * | Usinas Siderurgicas de | ||
| Minas Gerais SA | |||
| Preference Shares | 453,900 | 1,222 | |
| CCR SA | 204,811 | 1,139 | |
| Randon Participacoes | |||
| SA Preference Shares | 427,088 | 910 | |
| * | Petroleo Brasileiro SA | ||
| Preference Shares | 174,100 | 893 | |
| Lojas Renner SA | 76,545 | 807 | |
| * | Braskem SA Preference | ||
| Shares | 37,700 | 603 | |
| Gerdau SA Preference | |||
| Shares | 91,000 | 305 | |
| * | Atacadao Distribuicao | ||
| Comercio e Industria | |||
| Ltda | 55,600 | 273 | |
| * | Biotoscana | ||
| Investments SA | 27,500 | 198 | |
| 55,054 | |||
| Canada (0.3%) | |||
| First Quantum | |||
| Minerals Ltd. | 168,007 | 1,879 | |
| * | Kinross Gold Corp. | 55,642 | 220 |
| 2,099 | |||
| China (25.4%) | |||
| Tencent Holdings Ltd. | 442,775 | 19,901 | |
| China Construction | |||
| Bank Corp. | 11,633,450 | 10,397 | |
| * | Alibaba Group Holding | ||
| Ltd. ADR | 55,547 | 10,270 | |
| * | Baidu Inc. ADR | 41,524 | 10,129 |
| Lenovo Group Ltd. | 10,684,000 | 6,197 | |
| China Mobile Ltd. | 582,500 | 5,859 | |
| Industrial & | |||
| Commercial Bank of | |||
| China Ltd. | 7,360,780 | 5,857 | |
| China Resources | |||
| Power Holdings Co. | |||
| Ltd. | 2,765,683 | 5,319 | |
| CNOOC Ltd. | 3,732,567 | 5,096 | |
| China Pacific Insurance | |||
| Group Co. Ltd. | 978,020 | 4,829 | |
15
Emerging Markets Select Stock Fund
| Market | |||
| Value• | |||
| Shares | ($000) | ||
| China Telecom Corp. | |||
| Ltd. | 8,940,000 | 4,483 | |
| * | Ctrip.com International | ||
| Ltd. ADR | 91,472 | 4,381 | |
| China Overseas Land & | |||
| Investment Ltd. | 1,258,000 | 4,085 | |
| Dongfeng Motor Group | |||
| Co. Ltd. | 2,408,000 | 3,305 | |
| China Shenhua Energy | |||
| Co. Ltd. | 1,380,500 | 3,302 | |
| China Agri-Industries | |||
| Holdings Ltd. | 6,516,000 | 3,184 | |
| Far East Horizon Ltd. | 3,173,000 | 3,153 | |
| PICC Property & | |||
| Casualty Co. Ltd. | 1,556,040 | 3,088 | |
| China Dongxiang | |||
| Group Co. Ltd. | 16,082,000 | 2,991 | |
| * | China Unicom Hong | ||
| Kong Ltd. | 2,095,973 | 2,974 | |
| Ping An Insurance | |||
| Group Co. of China Ltd. | 333,130 | 2,928 | |
| China Longyuan Power | |||
| Group Corp. Ltd. | 3,927,580 | 2,913 | |
| Anhui Conch Cement | |||
| Co. Ltd. | 605,500 | 2,594 | |
| China Lesso Group | |||
| Holdings Ltd. | 3,879,000 | 2,592 | |
| Brilliance China | |||
| Automotive Holdings | |||
| Ltd. | 996,000 | 2,524 | |
| Greatview Aseptic | |||
| Packaging Co. Ltd. | 4,005,000 | 2,506 | |
| * | Grand Baoxin Auto | ||
| Group Ltd. | 4,369,500 | 2,353 | |
| China Merchants Bank | |||
| Co. Ltd. | 512,500 | 1,957 | |
| * | Li Ning Co. Ltd. | 2,085,000 | 1,822 |
| China Life Insurance | |||
| Co. Ltd. | 509,000 | 1,687 | |
| CNOOC Ltd. ADR | 11,782 | 1,611 | |
| China Railway Group | |||
| Ltd. | 1,980,000 | 1,592 | |
| China Shineway | |||
| Pharmaceutical Group | |||
| Ltd. | 1,690,000 | 1,584 | |
| * | Datang International | ||
| Power Generation Co. | |||
| Ltd. | 4,638,300 | 1,564 | |
| 2 | China Galaxy Securities | ||
| Co. Ltd. | 1,466,500 | 1,279 | |
| ENN Energy Holdings | |||
| Ltd. | 163,012 | 1,196 | |
| Longfor Properties Co. | |||
| Ltd. | 463,347 | 1,082 |
| Sunny Optical | |||
| Technology Group Co. | |||
| Ltd. | 71,800 | 1,053 | |
| China Oilfield Services | |||
| Ltd. | 1,130,000 | 1,003 | |
| Shimao Property | |||
| Holdings Ltd. | 457,500 | 959 | |
| Dah Chong Hong | |||
| Holdings Ltd. | 1,945,106 | 913 | |
| Guangdong Investment | |||
| Ltd. | 580,848 | 842 | |
| * | West China Cement | ||
| Ltd. | 4,818,000 | 766 | |
| Huadian Power | |||
| International Corp. Ltd. | 1,802,000 | 749 | |
| Weichai Power Co. Ltd. | 571,000 | 711 | |
| *,2,3Tianhe Chemicals | |||
| Group Ltd. | 4,142,000 | 621 | |
| * | JD.com Inc. ADR | 14,234 | 534 |
| Shanghai Fosun | |||
| Pharmaceutical Group | |||
| Co. Ltd. | 82,572 | 412 | |
| Tongda Group Holdings | |||
| Ltd. | 1,394,684 | 396 | |
| * | SINA Corp. | 3,618 | 389 |
| CSPC Pharmaceutical | |||
| Group Ltd. | 210,800 | 367 | |
| Sino Biopharmaceutical | |||
| Ltd. | 288,274 | 337 | |
| Fosun International Ltd. | 100,500 | 249 | |
| China Traditional Chinese | |||
| Medicine Holdings Co. | |||
| Ltd. | 382,500 | 219 | |
| China Resources Phoenix | |||
| Healthcare Holdings Co. | |||
| Ltd. | 149,000 | 196 | |
| * | Aluminum Corp. of | ||
| China Ltd. | 243,500 | 196 | |
| New Oriental Education | |||
| & Technology Group | |||
| Inc. ADR | 2,349 | 196 | |
| Shandong Weigao | |||
| Group Medical Polymer | |||
| Co. Ltd. | 261,800 | 188 | |
| TAL Education Group | |||
| ADR | 6,099 | 168 | |
| Yestar Healthcare | |||
| Holdings Co. Ltd. | 307,500 | 126 | |
| ANTA Sports Products | |||
| Ltd. | 26,891 | 120 | |
| * | Tencent Holdings Ltd. | ||
| Rights | 352 | — | |
| 164,294 | |||
16
Emerging Markets Select Stock Fund
| Market | |||
| Value• | |||
| Shares | ($000) | ||
| Colombia (0.2%) | |||
| * | CEMEX Latam Holdings | ||
| SA | 267,989 | 950 | |
| Cementos Argos SA | 27,572 | 100 | |
| 1,050 | |||
| Czech Republic (0.3%) | |||
| Komercni banka as | 33,280 | 1,431 | |
| CEZ AS | 16,428 | 360 | |
| 1,791 | |||
| Egypt (0.0%) | |||
| Commercial International | |||
| Bank Egypt SAE GDR | 52,890 | 241 | |
| Greece (0.8%) | |||
| * | Alpha Bank AE | 1,242,474 | 2,477 |
| * | Bank of Cyprus Holdings | ||
| plc | 359,070 | 1,200 | |
| Hellenic | |||
| Telecommunications | |||
| Organization SA | 71,008 | 844 | |
| * | National Bank of Greece | ||
| SA | 1,634,001 | 540 | |
| Hellenic Petroleum SA | 16,884 | 149 | |
| 5,210 | |||
| Hong Kong (2.5%) | |||
| AIA Group Ltd. | 757,301 | 5,706 | |
| Stella International | |||
| Holdings Ltd. | 1,248,500 | 2,034 | |
| First Pacific Co. Ltd. | 2,324,000 | 1,771 | |
| * | Pacific Basin Shipping | ||
| Ltd. | 6,020,975 | 1,375 | |
| Sands China Ltd. | 234,450 | 1,106 | |
| Texwinca Holdings Ltd. | 1,669,000 | 1,008 | |
| AMVIG Holdings Ltd. | 2,907,578 | 823 | |
| United Co. RUSAL plc | 1,218,000 | 786 | |
| Samsonite International | |||
| SA | 164,555 | 687 | |
| Melco Resorts & | |||
| Entertainment Ltd. ADR | 13,405 | 339 | |
| AAC Technologies | |||
| Holdings Inc. | 17,779 | 326 | |
| Microport Scientific Corp. | 105,000 | 104 | |
| 16,065 | |||
| Hungary (0.8%) | |||
| OTP Bank plc | 107,869 | 4,349 | |
| Magyar Telekom | |||
| Telecommunications plc | 349,700 | 607 | |
| 4,956 | |||
| India (8.2%) | |||
| Reliance Industries Ltd. | 605,158 | 8,798 | |
| State Bank of India | 1,181,500 | 5,580 | |
| ICICI Bank Ltd. ADR | 468,568 | 4,287 | |
| NTPC Ltd. | 1,394,156 | 3,904 | |
| Axis Bank Ltd. | 373,586 | 3,020 | |
| ICICI Bank Ltd. | 625,372 | 2,932 | |
| Bank of Baroda | 1,107,920 | 2,907 | |
| Bharti Infratel Ltd. | 343,765 | 2,350 | |
| Tata Consultancy | |||
| Services Ltd. | 51,366 | 2,082 | |
| Indiabulls Housing | |||
| Finance Ltd. | 82,852 | 1,593 | |
| NHPC Ltd. | 2,974,350 | 1,312 | |
| Godrej Consumer | |||
| Products Ltd. | 82,796 | 1,195 | |
| 2 | L&T Technology | ||
| Services Ltd. | 87,438 | 1,125 | |
| * | Punjab National Bank | 360,203 | 1,098 |
| Ambuja Cements Ltd. | 251,343 | 1,093 | |
| ACC Ltd. | 38,557 | 1,078 | |
| * | Tata Motors Ltd. Class A | 274,468 | 1,021 |
| UltraTech Cement Ltd. | 13,867 | 943 | |
| Indian Oil Corp. Ltd. | 142,287 | 914 | |
| Bharat Electronics Ltd. | 280,205 | 799 | |
| HDFC Bank Ltd. ADR | 7,612 | 703 | |
| Marico Ltd. | 137,956 | 672 | |
| ITC Ltd. | 157,225 | 645 | |
| Power Grid Corp. of | |||
| India Ltd. | 194,040 | 635 | |
| Adani Ports & Special | |||
| Economic Zone Ltd. | 91,938 | 611 | |
| * | Jammu & Kashmir Bank | ||
| Ltd. | 436,582 | 558 | |
| TAKE Solutions Ltd. | 160,216 | 429 | |
| *,2 | Avenue Supermarts Ltd. | 22,802 | 402 |
| LIC Housing Finance Ltd. | 36,815 | 341 | |
| * | Westlife Development | ||
| Ltd. | 50,942 | 196 | |
| 53,223 | |||
| Indonesia (2.5%) | |||
| Bank Mandiri Persero | |||
| Tbk PT | 9,078,100 | 4,715 | |
| Bank Central Asia Tbk | |||
| PT | 1,601,200 | 2,467 | |
| Bank Rakyat Indonesia | |||
| Persero Tbk PT | 1,904,600 | 2,191 | |
| Semen Indonesia | |||
| Persero Tbk PT | 1,519,100 | 1,220 | |
| Hanjaya Mandala | |||
| Sampoerna Tbk PT | 4,030,800 | 1,182 | |
| Telekomunikasi | |||
| Indonesia Persero | |||
| Tbk PT | 3,825,810 | 1,142 | |
| Bank Danamon | |||
| Indonesia Tbk PT | 2,950,300 | 1,110 | |
| Mitra Adiperkasa Tbk PT | 1,205,124 | 582 | |
| Bank Tabungan | |||
| Pensiunan Nasional | |||
| Tbk PT | 2,960,238 | 556 | |
17
Emerging Markets Select Stock Fund
| Market | ||
| Value• | ||
| Shares | ($000) | |
| Sarana Menara | ||
| Nusantara Tbk PT | 1,601,700 | 484 |
| Ace Hardware Indonesia | ||
| Tbk PT | 3,988,500 | 369 |
| Pakuwon Jati Tbk PT | 7,333,438 | 341 |
| 16,359 | ||
| Japan (0.1%) | ||
| * Nexon Co. Ltd. | 26,680 | 718 |
| Kenya (0.2%) | ||
| Safaricom Ltd. | 5,281,665 | 1,299 |
| Equity Group Holdings | ||
| Ltd. | 713,500 | 261 |
| 1,560 | ||
| Malaysia (0.3%) | ||
| Genting Malaysia Bhd. | 1,255,800 | 1,492 |
| Inari Amertron Bhd. | 422,966 | 281 |
| 1,773 | ||
| Mexico (2.2%) | ||
| Grupo Financiero | ||
| Banorte SAB de CV | 547,923 | 3,252 |
| * Cemex SAB de CV ADR | 391,980 | 3,179 |
| Alfa SAB de CV Class A | 2,628,370 | 2,746 |
| Alpek SAB de CV | 1,880,371 | 1,966 |
| Grupo Cementos de | ||
| Chihuahua SAB de CV | 209,678 | 1,001 |
| Wal-Mart de Mexico | ||
| SAB de CV | 285,800 | 639 |
| Grupo Financiero | ||
| Santander Mexico SAB | ||
| de CV ADR | 72,538 | 611 |
| Prologis Property Mexico | ||
| SA de CV | 279,266 | 547 |
| Mexichem SAB de CV | 198,615 | 511 |
| 14,452 | ||
| Netherlands (0.1%) | ||
| *,2 DP Eurasia NV | 117,606 | 359 |
| Pakistan (0.2%) | ||
| United Bank Ltd. | 556,205 | 945 |
| Peru (0.3%) | ||
| Credicorp Ltd. | 8,571 | 1,795 |
| Philippines (0.4%) | ||
| International Container | ||
| Terminal Services Inc. | 561,900 | 1,151 |
| Pilipinas Shell Petroleum | ||
| Corp. | 745,631 | 899 |
| Energy Development | ||
| Corp. | 3,024,129 | 338 |
| Jollibee Foods Corp. | 48,790 | 236 |
| LT Group Inc. | 568,500 | 198 |
| 2,822 | ||
| Poland (0.3%) | |||
| Cyfrowy Polsat SA | 236,717 | 1,649 | |
| Russia (6.3%) | |||
| Lukoil PJSC ADR | |||
| (London Shares) | 220,200 | 11,697 | |
| Rosneft Oil Co. PJSC | |||
| GDR | 1,423,731 | 7,806 | |
| Sberbank of Russia | |||
| PJSC ADR (London | |||
| Shares) | 370,590 | 5,319 | |
| Sberbank of Russia | |||
| PJSC | 1,131,233 | 3,749 | |
| MMC Norilsk Nickel | |||
| PJSC ADR | 183,451 | 3,376 | |
| Sberbank of Russia | |||
| PJSC ADR (OTC Shares) | 126,684 | 1,817 | |
| PhosAgro PJSC GDR | 109,748 | 1,509 | |
| Etalon Group Ltd. GDR | 323,439 | 1,308 | |
| Gazprom PJSC ADR | 231,938 | 996 | |
| O’Key Group SA GDR | 301,758 | 724 | |
| Lukoil PJSC ADR (OTC | |||
| Shares) | 13,572 | 720 | |
| 2 | Polyus PJSC GDR | 17,205 | 708 |
| Inter RAO UES PJSC | 6,753,232 | 413 | |
| Polyus PJSC GDR | 6,108 | 251 | |
| 40,393 | |||
| Singapore (0.9%) | |||
| Wilmar International Ltd. | 1,242,900 | 3,093 | |
| Sembcorp Industries Ltd. | 808,500 | 1,958 | |
| *,3 | Ezion Holdings Ltd. | 3,737,460 | 540 |
| *,3 | Ezion Holdings Ltd. | ||
| Warrants Expire | |||
| 04/15/2020 | 372,164 | 6 | |
| 5,597 | |||
| South Africa (4.7%) | |||
| Sasol Ltd. | 177,117 | 5,175 | |
| Naspers Ltd. | 19,429 | 4,733 | |
| Barclays Africa Group | |||
| Ltd. | 433,524 | 4,294 | |
| Barloworld Ltd. | 318,753 | 3,007 | |
| Imperial Holdings Ltd. | 197,295 | 2,830 | |
| Reunert Ltd. | 555,245 | 2,730 | |
| Sanlam Ltd. | 475,314 | 2,379 | |
| AngloGold Ashanti Ltd. | |||
| ADR | 168,555 | 1,568 | |
| Mr Price Group Ltd. | 119,819 | 1,485 | |
| FirstRand Ltd. | 228,977 | 831 | |
| * | Nampak Ltd. | 521,736 | 687 |
| Aspen Pharmacare | |||
| Holdings Ltd. | 16,721 | 378 | |
| Steinhoff International | |||
| Holdings NV | 71,970 | 312 | |
| 30,409 | |||
18
Emerging Markets Select Stock Fund
| Market | |||
| Value• | |||
| Shares | ($000) | ||
| South Korea (6.1%) | |||
| Samsung Electronics | |||
| Co. Ltd. | 3,059 | 7,541 | |
| Hyundai Motor Co. | 47,021 | 6,765 | |
| Hana Financial Group Inc. | 114,309 | 4,892 | |
| * | Hyundai Heavy | ||
| Industries Co. Ltd. | 29,812 | 4,170 | |
| POSCO | 11,789 | 3,436 | |
| Dongbu Insurance | |||
| Co. Ltd. | 37,420 | 2,356 | |
| SK Hynix Inc. | 29,101 | 2,146 | |
| Amorepacific Corp. | 7,297 | 2,047 | |
| KB Financial Group Inc. | 35,420 | 1,852 | |
| Shinhan Financial Group | |||
| Co. Ltd. | 24,070 | 1,081 | |
| Kia Motors Corp. | 31,159 | 986 | |
| LG Electronics Inc. | 11,191 | 911 | |
| *,2 | CEMEX Holdings | ||
| Philippines Inc. | 7,177,800 | 636 | |
| Koh Young Technology | |||
| Inc. | 4,845 | 332 | |
| * | Hugel Inc. | 522 | 200 |
| 39,351 | |||
| Sweden (0.0%) | |||
| * | Vostok Emerging | ||
| Finance Ltd. | 931,339 | 204 | |
| Taiwan (11.2%) | |||
| Taiwan Semiconductor | |||
| Manufacturing Co. Ltd. | |||
| ADR | 459,858 | 19,466 | |
| Taiwan Semiconductor | |||
| Manufacturing Co. Ltd. | 1,545,266 | 12,492 | |
| Hon Hai Precision | |||
| Industry Co. Ltd. | 1,502,607 | 5,585 | |
| Compal Electronics Inc. | 6,329,000 | 4,660 | |
| Delta Electronics Inc. | 805,245 | 3,875 | |
| Catcher Technology Co. | |||
| Ltd. | 343,833 | 3,659 | |
| Chicony Electronics Co. | |||
| Ltd. | 1,369,174 | 3,429 | |
| United Microelectronics | |||
| Corp. | 5,936,600 | 3,064 | |
| Cathay Financial Holding | |||
| Co. Ltd. | 1,368,000 | 2,260 | |
| Casetek Holdings Ltd. | 536,000 | 2,010 | |
| Globalwafers Co. Ltd. | 172,759 | 2,004 | |
| Teco Electric and | |||
| Machinery Co. Ltd. | 2,062,000 | 1,926 | |
| eMemory Technology | |||
| Inc. | 148,000 | 1,814 | |
| Largan Precision Co. Ltd. | 5,669 | 1,075 | |
| Wan Hai Lines Ltd. | 1,442,982 | 874 | |
| E.Sun Financial Holding | |||
| Co. Ltd. | 1,068,541 | 650 | |
| Sino-American Silicon | |||
| Products Inc. | 195,382 | 546 | |
| Gourmet Master Co. Ltd. | 27,600 | 317 | |
| Silergy Corp. | 12,369 | 267 | |
| Chroma ATE Inc. | 52,000 | 254 | |
| Land Mark | |||
| Optoelectronics Corp. | 17,446 | 223 | |
| Realtek Semiconductor | |||
| Corp. | 57,930 | 218 | |
| Airtac International Group | 12,940 | 210 | |
| Elite Material Co. Ltd. | 50,000 | 199 | |
| Advanced Ceramic X Corp. 17,717 | 195 | ||
| Bizlink Holding Inc. | 18,399 | 185 | |
| ASPEED Technology Inc. | 7,086 | 164 | |
| Kingpak Technology Inc. | 17,698 | 159 | |
| Chunghwa Precision | |||
| Test Tech Co. Ltd. | 4,047 | 147 | |
| Global Unichip Corp. | 14,181 | 141 | |
| Hota Industrial | |||
| Manufacturing Co. Ltd. | 28,979 | 135 | |
| Getac Technology Corp. | 96,000 | 134 | |
| Voltronic Power | |||
| Technology Corp. | 6,430 | 121 | |
| Hu Lane Associate Inc. | 14,680 | 84 | |
| 72,542 | |||
| Thailand (1.6%) | |||
| Bangkok Bank PCL | 792,600 | 4,605 | |
| Charoen Pokphand | |||
| Foods PCL (Foreign) | 1,938,400 | 1,516 | |
| Bangkok Airways PCL | 1,855,438 | 1,027 | |
| PTT PCL (Foreign) | 77,500 | 980 | |
| CP ALL PCL (Foreign) | 384,700 | 811 | |
| * | Precious Shipping PCL | 1,541,077 | 497 |
| Supalai PCL | 539,916 | 399 | |
| Central Pattana PCL | 136,800 | 328 | |
| * | Supalai PCL Warrants | ||
| Exp. 10/20/2018 | 134,979 | 84 | |
| 10,247 | |||
| Turkey (1.3%) | |||
| Akbank TAS | 1,444,684 | 3,822 | |
| Haci Omer Sabanci | |||
| Holding AS (Bearer) | 895,987 | 2,494 | |
| Turkiye Halk Bankasi AS | 589,961 | 1,723 | |
| 8,039 | |||
| United Arab Emirates (0.7%) | |||
| Union National Bank | |||
| PJSC | 2,965,851 | 3,474 | |
| * | Dubai Financial Market | ||
| PJSC | 3,985,247 | 1,258 | |
| 4,732 | |||
| United Kingdom (2.3%) | |||
| * | Standard Chartered plc | ||
| (London Shares) | 447,364 | 4,456 | |
19
67524
Emerging Markets Select Stock Fund
| Market | |||
| Value• | |||
| Shares | ($000) | ||
| * | Standard Chartered | ||
| plc (Hong Kong Shares) | 243,057 | 2,413 | |
| * | KAZ Minerals plc | 183,851 | 1,985 |
| * | Tullow Oil plc | 724,891 | 1,754 |
| Antofagasta plc | 114,474 | 1,451 | |
| Coca-Cola HBC AG | 33,913 | 1,146 | |
| Petrofac Ltd. | 152,191 | 848 | |
| * | Ophir Energy plc | 873,700 | 757 |
| Hikma Pharmaceuticals | |||
| plc | 7,073 | 109 | |
| 14,919 | |||
| United States (4.8%) | |||
| 4 | Vanguard FTSE Emerging | ||
| Markets ETF | 162,414 | 7,249 | |
| Hollysys Automation | |||
| Technologies Ltd. | 170,149 | 3,820 | |
| Genpact Ltd. | 91,573 | 2,788 | |
| Cosan Ltd. | 314,418 | 2,732 | |
| Millicom International | |||
| Cellular SA | 41,732 | 2,669 | |
| * | Luxoft Holding Inc. | ||
| Class A | 44,048 | 2,050 | |
| Cognizant Technology | |||
| Solutions Corp. Class A | 26,803 | 2,028 | |
| * | Kosmos Energy Ltd. | 227,543 | 1,748 |
| Southern Copper Corp. | 36,857 | 1,583 | |
| * | Azul SA ADR | 60,581 | 1,532 |
| * | Flex Ltd. | 73,273 | 1,304 |
| * | BeiGene Ltd. ADR | 7,948 | 734 |
| * | Yandex NV Class A | 12,884 | 436 |
| * | Despegar.com Corp. | 8,862 | 273 |
| * | Sea Ltd. ADR | 7,621 | 115 |
| 31,061 | |||
| Total Common Stocks | |||
| (Cost $516,477) | 605,635 | ||
| Temporary Cash Investments (6.2%)1 | |||
| Money Market Fund (5.8%) | |||
| 5,6 | Vanguard Market | ||
| Liquidity Fund, | |||
| 1.246% | 373,904 | 37,394 | |
| U. S. Government and Agency Obligations (0.4%) | |||
| 6 | United States Cash | ||
| Management Bill, | |||
| 1.028%, 1/2/18 | 2,000 | 1,996 | |
| 6 | United States Treasury Bill, | ||
| 1.044%–1.052%, 11/24/17 | 700 | 700 | |
| 6 | United States Treasury | ||
| Bill, 1.169%, 3/22/18 | 100 | 100 | |
| 2,796 | |||
| Total Temporary Cash Investments | |||
| (Cost $40,188) | 40,190 | ||
| Total Investments (100.0%) | |||
| (Cost $556,665) | 645,825 | ||
| Other Assets and Liabilities (0.0%) | |||
| Other Assets | 7,841 | ||
| Liabilities | (7,823) | ||
| 18 | |||
| Net Assets (100%) | |||
| Applicable to 28,629,915 outstanding | |||
| $.001 par value shares of beneficial | |||
| interest (unlimited authorization) | 645,843 | ||
| Net Asset Value Per Share | $22.56 | ||
20
Emerging Markets Select Stock Fund
| Amount | |
| ($000) | |
| Statement of Assets and Liabilities | |
| Assets | |
| Investments in Securities, at Value | |
| Unaffiliated Issuers (excluding | |
| Segregated Securities) | 600,034 |
| Collateral for Futures Contracts | 1,148 |
| Total Unaffiliated Issuers | 601,182 |
| Affiliated Vanguard Funds | 44,643 |
| Total Investments in Securities | 645,825 |
| Investment in Vanguard | 38 |
| Receivables for Investment Securities Sold | 3,876 |
| Receivables for Accrued Income | 489 |
| Receivables for Capital Shares Issued | 1,003 |
| Variation Margin Receivable – | |
| Futures Contracts | 230 |
| Other Assets | 2,205 |
| Total Assets | 653,666 |
| Liabilities | |
| Payables for Investment Securities | |
| Purchased | 5,906 |
| Payables to Investment Advisor | 819 |
| Payables for Capital Shares Redeemed | 647 |
| Payables to Vanguard | 451 |
| Total Liabilities | 7,823 |
| Net Assets | 645,843 |
| At October 31, 2017, net assets consisted of: | |
| Amount | |
| ($000) | |
| Paid-in Capital | 561,898 |
| Undistributed Net Investment Income | 8,860 |
| Accumulated Net Realized Losses | (14,409) |
| Unrealized Appreciation (Depreciation) | |
| Investment Securities | 89,160 |
| Futures Contracts | 333 |
| Foreign Currencies | 1 |
| Net Assets | 645,843 |
• See Note A in Notes to Financial Statements.
* Non-income-producing security.
1 The fund invests a portion of its cash reserves in equity markets through the use of index futures contracts. After giving effect to futures investments, the fund’s effective common stock and temporary cash investment positions represent 97.9% and 2.1%, respectively, of net assets.
2 Security exempt from registration under Rule 144A of the Securities Act of 1933. Such securities may be sold in transactions exempt from registration, normally to qualified institutional buyers. At October 31, 2017, the aggregate value of these securities was $5,130,000, representing 0.8% of net assets.
3 Security value determined using significant unobservable inputs.
4 Considered an affiliated company of the fund as the issuer is another member of The Vanguard Group.
5 Affiliated money market fund available only to Vanguard funds and certain trusts and accounts managed by Vanguard. Rate shown is the 7-day yield.
6 Securities with a value of $1,148,000 have been segregated as initial margin for open futures contracts.
ADR—American Depositary Receipt.
GDR—Global Depositary Receipt.
| Derivative Financial Instruments Outstanding as of Period End | ||||
| Futures Contracts | ||||
| ($000) | ||||
| Value and | ||||
| Number of | Unrealized | |||
| Long (Short) | Notional | Appreciation | ||
| Expiration | Contracts | Amount | (Depreciation) | |
| Long Futures Contracts | ||||
| MSCI Emerging Markets Index | December 2017 | 475 | 26,700 | 333 |
Unrealized appreciation (depreciation) on open futures contracts is required to be treated as realized gain (loss) for tax purposes.
See accompanying Notes, which are an integral part of the Financial Statements.
21
Emerging Markets Select Stock Fund
| Statement of Operations | |
| Year Ended | |
| October 31, 2017 | |
| ($000) | |
| Investment Income | |
| Income | |
| Dividends1,2 | 13,722 |
| Interest 2 | 284 |
| Securities Lending—Net | 14 |
| Total Income | 14,020 |
| Expenses | |
| Investment Advisory Fees—Note B | |
| Basic Fee | 2,480 |
| Performance Adjustment | (27) |
| The Vanguard Group—Note C | |
| Management and Administrative | 1,204 |
| Marketing and Distribution | 78 |
| Custodian Fees | 531 |
| Auditing Fees | 42 |
| Shareholders’ Reports and Proxy | 38 |
| Trustees’ Fees and Expenses | 1 |
| Total Expenses | 4,347 |
| Net Investment Income | 9,673 |
| Realized Net Gain (Loss) | |
| Investment Securities Sold 2 | 16,079 |
| Futures Contracts | 3,004 |
| Foreign Currencies | (218) |
| Realized Net Gain (Loss) | 18,865 |
| Change in Unrealized Appreciation (Depreciation) | |
| Investment Securities 2 | 79,145 |
| Futures Contracts | 526 |
| Foreign Currencies | (1) |
| Change in Unrealized Appreciation (Depreciation) | 79,670 |
| Net Increase (Decrease) in Net Assets Resulting from Operations | 108,208 |
1 Dividends are net of foreign withholding taxes of $1,333,000.
2 Dividend income, interest income, realized net gain (loss), and change in unrealized appreciation (depreciation) from affiliated companies of the fund were $116,000, $274,000, $152,000, and $473,000, respectively.
See accompanying Notes, which are an integral part of the Financial Statements.
22
Emerging Markets Select Stock Fund
| Statement of Changes in Net Assets | ||
| Year Ended October 31, | ||
| 2017 | 2016 | |
| ($000) | ($000) | |
| Increase (Decrease) in Net Assets | ||
| Operations | ||
| Net Investment Income | 9,673 | 4,208 |
| Realized Net Gain (Loss) | 18,865 | (20,561) |
| Change in Unrealized Appreciation (Depreciation) | 79,670 | 50,352 |
| Net Increase (Decrease) in Net Assets Resulting from Operations | 108,208 | 33,999 |
| Distributions | ||
| Net Investment Income | (4,709) | (4,421) |
| Realized Capital Gain | — | — |
| Total Distributions | (4,709) | (4,421) |
| Capital Share Transactions | ||
| Issued | 336,874 | 136,138 |
| Issued in Lieu of Cash Distributions | 4,315 | 4,158 |
| Redeemed | (138,023) | (89,617) |
| Net Increase (Decrease) from Capital Share Transactions | 203,166 | 50,679 |
| Total Increase (Decrease) | 306,665 | 80,257 |
| Net Assets | ||
| Beginning of Period | 339,178 | 258,921 |
| End of Period1 | 645,843 | 339,178 |
| 1 Net Assets—End of Period includes undistributed (overdistributed) net investment income of $8,860,000 and $3,964,000. | ||
See accompanying Notes, which are an integral part of the Financial Statements.
23
Emerging Markets Select Stock Fund
Financial Highlights
| For a Share Outstanding | Year Ended October 31, | ||||
| Throughout Each Period | 2017 | 2016 | 2015 | 2014 | 2013 |
| Net Asset Value, Beginning of Period | $18.27 | $16.48 | $20.13 | $20.37 | $18.73 |
| Investment Operations | |||||
| Net Investment Income | . 4131 | .234 | .290 | .264 | .3031 |
| Net Realized and Unrealized Gain (Loss) | |||||
| on Investments | 4.129 | 1.840 | (3.685) | (.242) | 1.567 |
| Total from Investment Operations | 4.542 | 2.074 | (3.395) | .022 | 1.870 |
| Distributions | |||||
| Dividends from Net Investment Income | (. 252) | (. 284) | (. 255) | (. 262) | (. 230) |
| Distributions from Realized Capital Gains | — | — | — | — | — |
| Total Distributions | (. 252) | (. 284) | (. 255) | (. 262) | (. 230) |
| Net Asset Value, End of Period | $22.56 | $18.27 | $16.48 | $20.13 | $20.37 |
| Total Return2 | 25.28% | 12.95% | -16.99% | 0.15% | 10.04% |
| Ratios/Supplemental Data | |||||
| Net Assets, End of Period (Millions) | $646 | $339 | $259 | $311 | $223 |
| Ratio of Total Expenses to Average Net Assets3 | 0.92% | 0.90% | 0.93% | 0.96% | 0.94% |
| Ratio of Net Investment Income | |||||
| to Average Net Assets | 2.04% | 1.57% | 1.59% | 1.53% | 1.55% |
| Portfolio Turnover Rate | 44% | 46% | 49% | 54% | 54% |
1 Calculated based on average shares outstanding.
2 Total returns do not include transaction or account service fees that may have applied in the periods shown. Fund prospectuses provide information about any applicable transaction and account service fees.
3 Includes performance-based investment advisory fee increases (decreases) of (0.01%), (0.03%), 0.00%, 0.04%, and 0.02%.
See accompanying Notes, which are an integral part of the Financial Statements.
24
Emerging Markets Select Stock Fund
Notes to Financial Statements
Vanguard Emerging Markets Select Stock Fund is registered under the Investment Company Act of 1940 as an open-end investment company, or mutual fund. The fund invests in securities of foreign issuers, which may subject it to investment risks not normally associated with investing in securities of U.S. corporations.
A. The following significant accounting policies conform to generally accepted accounting principles for U.S. investment companies. The fund consistently follows such policies in preparing its financial statements.
1. Security Valuation: Securities are valued as of the close of trading on the New York Stock Exchange (generally 4 p.m., Eastern time) on the valuation date. Equity securities are valued at the latest quoted sales prices or official closing prices taken from the primary market in which each security trades; such securities not traded on the valuation date are valued at the mean of the latest quoted bid and asked prices. Securities for which market quotations are not readily available, or whose values have been affected by events occurring before the fund’s pricing time but after the close of the securities’ primary markets, are valued at their fair values calculated according to procedures adopted by the board of trustees. These procedures include obtaining quotations from an independent pricing service, monitoring news to identify significant market-or security-specific events, and evaluating changes in the values of foreign market proxies (for example, ADRs, futures contracts, or exchange-traded funds), between the time the foreign markets close and the fund’s pricing time. When fair-value pricing is employed, the prices of securities used by a fund to calculate its net asset value may differ from quoted or published prices for the same securities. Investments in Vanguard Market Liquidity Fund are valued at that fund’s net asset value. Temporary cash investments are valued using the latest bid prices or using valuations based on a matrix system (which considers such factors as security prices, yields, maturities, and ratings), both as furnished by independent pricing services.
2. Foreign Currency: Securities and other assets and liabilities denominated in foreign currencies are translated into U.S. dollars using exchange rates obtained from an independent third party as of the fund’s pricing time on the valuation date. Realized gains (losses) and unrealized appreciation (depreciation) on investment securities include the effects of changes in exchange rates since the securities were purchased, combined with the effects of changes in security prices. Fluctuations in the value of other assets and liabilities resulting from changes in exchange rates are recorded as unrealized foreign currency gains (losses) until the assets or liabilities are settled in cash, at which time they are recorded as realized foreign currency gains (losses).
3. Futures Contracts: The fund uses index futures contracts to a limited extent, with the objective of maintaining full exposure to the stock market while maintaining liquidity. The fund may purchase or sell futures contracts to achieve a desired level of investment, whether to accommodate portfolio turnover or cash flows from capital share transactions. The primary risks associated with the use of futures contracts are imperfect correlation between changes in market values of stocks held by the fund and the prices of futures contracts, and the possibility of an illiquid market. Counterparty risk involving futures is mitigated because a regulated clearinghouse is the counterparty instead of the clearing broker. To further mitigate counterparty risk, the fund trades futures contracts on an exchange, monitors the financial strength of its clearing brokers and clearinghouse, and has entered into clearing agreements with its clearing brokers. The clearinghouse imposes initial margin requirements to secure the fund’s performance and requires daily settlement of variation margin representing changes in the market value of each contract.
25
Emerging Markets Select Stock Fund
Futures contracts are valued at their quoted daily settlement prices. The notional amounts of the contracts are not recorded in the Statement of Assets and Liabilities. Fluctuations in the value of the contracts are recorded in the Statement of Assets and Liabilities as an asset (liability) and in the Statement of Operations as unrealized appreciation (depreciation) until the contracts are closed, when they are recorded as realized futures gains (losses).
During the year ended October 31, 2017, the fund’s average investments in long and short futures contracts represented 5% and 0% of net assets, respectively, based on the average of the notional amounts at each quarter-end during the period.
4. Federal Income Taxes: The fund intends to continue to qualify as a regulated investment company and distribute all of its taxable income. Management has analyzed the fund’s tax positions taken for all open federal income tax years (October 31, 2014–2017), and has concluded that no provision for federal income tax is required in the fund’s financial statements.
5. Distributions: Distributions to shareholders are recorded on the ex-dividend date.
6. Securities Lending: To earn additional income, the fund lends its securities to qualified institutional borrowers. Security loans are subject to termination by the fund at any time, and are required to be secured at all times by collateral in an amount at least equal to the market value of securities loaned. Daily market fluctuations could cause the value of loaned securities to be more or less than the value of the collateral received. When this occurs, the collateral is adjusted and settled on the next business day. The fund further mitigates its counterparty risk by entering into securities lending transactions only with a diverse group of prequalified counterparties, monitoring their financial strength, and entering into master securities lending agreements with its counterparties. The master securities lending agreements provide that, in the event of a counterparty’s default (including bankruptcy), the fund may terminate any loans with that borrower, determine the net amount owed, and sell or retain the collateral up to the net amount owed to the fund; however, such actions may be subject to legal proceedings. While collateral mitigates counterparty risk, in the event of a default, the fund may experience delays and costs in recovering the securities loaned. The fund invests cash collateral received in Vanguard Market Liquidity Fund, and records a liability in the Statement of Assets and Liabilities for the return of the collateral, during the period the securities are on loan. Securities lending income represents fees charged to borrowers plus income earned on invested cash collateral, less expenses associated with the loan. During the term of the loan, the fund is entitled to all distributions made on or in respect of the loaned securities.
7. Credit Facility: The fund and certain other funds managed by The Vanguard Group (“Vanguard”) participate in a $3.1 billion committed credit facility provided by a syndicate of lenders pursuant to a credit agreement that may be renewed annually; each fund is individually liable for its borrowings, if any, under the credit facility. Borrowings may be utilized for temporary and emergency purposes, and are subject to the fund’s regulatory and contractual borrowing restrictions. The participating funds are charged administrative fees and an annual commitment fee of 0.10% of the undrawn amount of the facility; these fees are allocated to the funds based on a method approved by the fund’s board of trustees and included in Management and Administrative expenses on the fund’s Statement of Operations. Any borrowings under this facility bear interest at a rate based upon the higher of the one-month London Interbank Offered Rate, federal funds effective rate, or overnight bank funding rate plus an agreed-upon spread.
The fund had no borrowings outstanding at October 31, 2017, or at any time during the period then ended.
26
Emerging Markets Select Stock Fund
8. Other: Dividend income is recorded on the ex-dividend date. Interest income includes income distributions received from Vanguard Market Liquidity Fund and is accrued daily. Premiums and discounts on debt securities purchased are amortized and accreted, respectively, to interest income over the lives of the respective securities. Security transactions are accounted for on the date securities are bought or sold. Costs used to determine realized gains (losses) on the sale of investment securities are those of the specific securities sold.
B. The investment advisory firms Pzena Investment Management, LLC, M&G Investment Management Limited, Wellington Management Company LLP, and Oaktree Capital Management L.P., each provide investment advisory services to a portion of the fund for a fee calculated at an annual percentage rate of average net assets managed by the advisor. The basic fee of Pzena Investment Management LLC, M&G Investment Management Limited, Wellington Management Company LLP, and Oaktree Capital Management L.P., are subject to quarterly adjustments based on performance relative to the MSCI Emerging Markets Index for the preceding three years.
Vanguard manages the cash reserves of the fund as described below.
For the year ended October 31, 2017, the aggregate investment advisory fee represented an effective annual basic rate of 0.52% of the fund’s average net assets, before a decrease of $27,000 (0.01%) based on performance.
C. In accordance with the terms of a Funds’ Service Agreement (the “FSA”) between Vanguard and the fund, Vanguard furnishes to the fund corporate management, administrative, marketing, distribution, and cash management services at Vanguard’s cost of operations (as defined by the FSA). These costs of operations are allocated to the fund based on methods and guidelines approved by the board of trustees. Vanguard does not require reimbursement in the current period for certain costs of operations (such as deferred compensation/benefits and risk/insurance costs); the fund’s liability for these costs of operations is included in Payables to Vanguard on the Statement of Assets and Liabilities.
Upon the request of Vanguard, the fund may invest up to 0.40% of its net assets as capital in Vanguard. At October 31, 2017, the fund had contributed to Vanguard capital in the amount of $38,000, representing 0.01% of the fund’s net assets and 0.02% of Vanguard’s capitalization. The fund’s trustees and officers are also directors and employees, respectively, of Vanguard.
D. Various inputs may be used to determine the value of the fund’s investments. These inputs are summarized in three broad levels for financial statement purposes. The inputs or methodologies used to value securities are not necessarily an indication of the risk associated with investing in those securities.
Level 1—Quoted prices in active markets for identical securities.
Level 2—Other significant observable inputs (including quoted prices for similar securities, interest rates, prepayment speeds, credit risk, etc.).
Level 3—Significant unobservable inputs (including the fund’s own assumptions used to determine the fair value of investments). Any investments valued with significant unobservable inputs are noted on the Statement of Net Assets.
27
Emerging Markets Select Stock Fund
The following table summarizes the market value of the fund’s investments as of October 31, 2017, based on the inputs used to value them:
| Level 1 | Level 2 | Level 3 | |
| Investments | ($000) | ($000) | ($000) |
| Common Stocks—North and South America | 104,568 | 2,669 | — |
| Common Stocks—Other | 56,578 | 440,653 | 1,167 |
| Temporary Cash Investments | 37,394 | 2,796 | — |
| Futures Contracts—Assets1 | 230 | — | — |
| Total | 198,770 | 446,118 | 1,167 |
| 1 Represents variation margin on the last day of the reporting period. |
Securities in certain countries may transfer between Level 1 and Level 2 because of differences in stock market closure times that may result from transitions between standard and daylight saving time in those countries and the United States. Based on values on the date of transfer, securities valued at $21,725,000 based on Level 2 inputs were transferred from Level 1 during the fiscal period.
Additionally, based on values on the date of transfer, securities valued at $27,376,000 based on Level 1 inputs were transferred from Level 2 during the fiscal period.
E. Distributions are determined on a tax basis and may differ from net investment income and realized capital gains for financial reporting purposes. Differences may be permanent or temporary. Permanent differences are reclassified among capital accounts in the financial statements to reflect their tax character. Temporary differences arise when certain items of income, expense, gain, or loss are recognized in different periods for financial statement and tax purposes. These differences will reverse at some time in the future. Differences in classification may also result from the treatment of short-term gains as ordinary income for tax purposes.
During the year ended October 31, 2017, the fund realized net foreign currency losses of $218,000, which decreased distributable net income for tax purposes; accordingly, such losses have been reclassified from accumulated net realized losses to undistributed net investment income.
The fund realized gains on the sale of securities that were subject to capital gains tax in certain foreign countries. Capital gains taxes reduce realized gains for financial statement purposes but are treated as an expense for tax purposes. Accordingly, $177,000 of capital gains tax has been reclassified from accumulated net realized losses to undistributed net investment income. Certain of the fund’s investments are in securities considered to be passive foreign investment companies, for which any unrealized appreciation and/or realized gains are required to be included in distributable net income for tax purposes. During the year ended October 31, 2017, the fund realized gains on the sale of passive foreign investment companies of $327,000, which have been included in current and prior periods’ taxable income; accordingly, such gains have been reclassified from accumulated net realized losses to undistributed net investment income. Passive foreign investment companies held at October 31, 2017, had unrealized appreciation of $669,000, of which all has been distributed and is reflected in the balance of undistributed net investment income.
28
Emerging Markets Select Stock Fund
For tax purposes, at October 31, 2017, the fund had $9,853,000 of ordinary income available for distribution. The fund used capital loss carryforwards of $18,376,000 to offset taxable capital gains realized during the year ended October 31, 2017. At October 31, 2017, the fund had available capital losses totaling $13,788,000 that may be carried forward indefinitely to offset future net capital gains.
At October 31, 2017, the cost of investment securities for tax purposes was $557,621,000. Net unrealized appreciation of investment securities for tax purposes was $88,204,000, consisting of unrealized gains of $107,865,000 on securities that had risen in value since their purchase and $19,661,000 in unrealized losses on securities that had fallen in value since their purchase.
F. During the year ended October 31, 2017, the fund purchased $386,665,000 of investment securities and sold $195,394,000 of investment securities, other than temporary cash investments.
G. Capital shares issued and redeemed were:
| Year Ended October 31, | ||
| 2017 | 2016 | |
| Shares | Shares | |
| (000) | (000) | |
| Issued | 16,819 | 8,256 |
| Issued in Lieu of Cash Distributions | 250 | 276 |
| Redeemed | (7,006) | (5,674) |
| Net Increase (Decrease) in Shares Outstanding | 10,063 | 2,858 |
H. Management has determined that no material events or transactions occurred subsequent to October 31, 2017, that would require recognition or disclosure in these financial statements.
29
Report of Independent Registered Public Accounting Firm
To the Board of Trustees of Vanguard Trustees’ Equity Fund and the Shareholders of Vanguard Emerging Markets Select Stock Fund
In our opinion, the accompanying statement of net assets and statement of assets and liabilities, and the related statements of operations and of changes in net assets and the financial highlights present fairly, in all material respects, the financial position of Vanguard Emerging Markets Select Stock Fund (constituting a separate portfolio of Vanguard Trustees’ Equity Fund, hereafter referred to as the “Fund”) as of October 31, 2017, the results of its operations for the year then ended, the changes in its net assets for each of the two years in the period then ended and the financial highlights for each of the five years in the period then ended, in conformity with accounting principles generally accepted in the United States of America. These financial statements and financial highlights (hereafter referred to as “financial statements”) are the responsibility of the Fund’s management. Our responsibility is to express an opinion on these financial statements based on our audits. We conducted our audits of these financial statements in accordance with the standards of the Public Company Accounting Oversight Board (United States). Those standards require that we plan and perform the audit to obtain reasonable assurance about whether the financial statements are free of material misstatement. An audit includes examining, on a test basis, evidence supporting the amounts and disclosures in the financial statements, assessing the accounting principles used and significant estimates made by management, and evaluating the overall financial statement presentation. We believe that our audits, which included confirmation of securities as of October 31, 2017 by correspondence with the custodian and brokers and by agreement to the underlying ownership records of the transfer agent, provide a reasonable basis for our opinion.
/s/PricewaterhouseCoopers LLP
Philadelphia, Pennsylvania
December 13, 2017
Special 2017 tax information (unaudited) for Vanguard Emerging Markets Select Stock Fund
This information for the fiscal year ended October 31, 2017, is included pursuant to provisions of the Internal Revenue Code.
The fund distributed $3,636,000 of qualified dividend income to shareholders during the fiscal year.
The fund designates to shareholders foreign source income of $14,764,000 and foreign taxes paid of $1,446,000. Shareholders will receive more detailed information with their Form 1099-DIV in January 2018 to determine the calendar-year amounts to be included on their 2017 tax returns.
30
Your Fund’s After-Tax Returns
This table presents returns for your fund both before and after taxes. The after-tax returns are shown in two ways: (1) assuming that an investor owned the fund during the entire period and paid taxes on the fund’s distributions, and (2) assuming that an investor paid taxes on the fund’s distributions and sold all shares at the end of each period.
Calculations are based on the highest individual federal income tax and capital gains tax rates in effect at the times of the distributions and the hypothetical sales. State and local taxes were not considered. After-tax returns reflect any qualified dividend income, using actual prior-year figures and estimates for 2017. (In the example, returns after the sale of fund shares may be higher than those assuming no sale. This occurs when the sale would have produced a capital loss. The calculation assumes that the investor received a tax deduction for the loss.)
Please note that your actual after-tax returns will depend on your tax situation and may differ from those shown. Also note that if you own the fund in a tax-deferred account, such as an individual retirement account or a 401(k) plan, this information does not apply to you. Such accounts are not subject to current taxes.
Finally, keep in mind that a fund’s performance—whether before or after taxes—does not guarantee future results.
| Average Annual Total Returns: Emerging Markets Select Stock Fund | |||
| Periods Ended October 31, 2017 | |||
| Since | |||
| One | Five | Inception | |
| Year | Years | (6/27/2011) | |
| Returns Before Taxes | 25.28% | 5.30% | 3.11% |
| Returns After Taxes on Distributions | 24.92 | 5.02 | 2.89 |
| Returns After Taxes on Distributions and Sale of Fund Shares | 14.59 | 4.13 | 2.41 |
31
About Your Fund’s Expenses
As a shareholder of the fund, you incur ongoing costs, which include costs for portfolio management, administrative services, and shareholder reports (like this one), among others. Operating expenses, which are deducted from a fund’s gross income, directly reduce the investment return of the fund.
A fund’s expenses are expressed as a percentage of its average net assets. This figure is known as the expense ratio. The following examples are intended to help you understand the ongoing costs (in dollars) of investing in your fund and to compare these costs with those of other mutual funds. The examples are based on an investment of $1,000 made at the beginning of the period shown and held for the entire period.
The accompanying table illustrates your fund’s costs in two ways:
• Based on actual fund return. This section helps you to estimate the actual expenses that you paid over the period. The ”Ending Account Value“ shown is derived from the fund‘s actual return, and the third column shows the dollar amount that would have been paid by an investor who started with $1,000 in the fund. You may use the information here, together with the amount you invested, to estimate the expenses that you paid over the period.
To do so, simply divide your account value by $1,000 (for example, an $8,600 account value divided by $1,000 = 8.6), then multiply the result by the number given for your fund under the heading ”Expenses Paid During Period.“
• Based on hypothetical 5% yearly return. This section is intended to help you compare your fund‘s costs with those of other mutual funds. It assumes that the fund had a yearly return of 5% before expenses, but that the expense ratio is unchanged. In this case—because the return used is not the fund’s actual return—the results do not apply to your investment. The example is useful in making comparisons because the Securities and Exchange Commission requires all mutual funds to calculate expenses based on a 5% return. You can assess your fund’s costs by comparing this hypothetical example with the hypothetical examples that appear in shareholder reports of other funds.
Note that the expenses shown in the table are meant to highlight and help you compare ongoing costs only and do not reflect transaction costs incurred by the fund for buying and selling securities. Further, the expenses do not include any purchase, redemption, or account service fees described in the fund prospectus. If such fees were applied to your account, your costs would be higher. Your fund does not carry a “sales load.”
The calculations assume no shares were bought or sold during the period. Your actual costs may have been higher or lower, depending on the amount of your investment and the timing of any purchases or redemptions.
You can find more information about the fund’s expenses, including annual expense ratios, in the Financial Statements section of this report. For additional information on operating expenses and other shareholder costs, please refer to your fund’s current prospectus.
32
| Six Months Ended October 31, 2017 | |||
| Beginning | Ending | Expenses | |
| Account Value | Account Value | Paid During | |
| Emerging Markets Select Stock Fund | 4/30/2017 | 10/31/2017 | Period |
| Based on Actual Fund Return | $1,000.00 | $1,135.38 | $4.95 |
| Based on Hypothetical 5% Yearly Return | 1,000.00 | 1,020.57 | 4.69 |
The calculations are based on expenses incurred in the most recent six-month period. The fund’s annualized six-month expense ratio for that period is 0.92%. The dollar amounts shown as “Expenses Paid” are equal to the annualized expense ratio multiplied by the average account value over the period, multiplied by the number of days in the most recent six-month period, then divided by the number of days in the most recent 12-month period (184/365).
33
Glossary
Dividend Yield. Dividend income earned by stocks, expressed as a percentage of the aggregate market value (or of net asset value, for a fund). The yield is determined by dividing the amount of the annual dividends by the aggregate value (or net asset value) at the end of the period. For a fund, the dividend yield is based solely on stock holdings and does not include any income produced by other investments.
Earnings Growth Rate. The average annual rate of growth in earnings over the past five years for the stocks now in a fund.
Equity Exposure. A measure that reflects a fund’s investments in stocks and stock futures. Any holdings in short-term reserves are excluded.
Expense Ratio. A fund’s total annual operating expenses expressed as a percentage of the fund’s average net assets. The expense ratio includes management and administrative expenses, but does not include the transaction costs of buying and selling portfolio securities.
Inception Date. The date on which the assets of a fund (or one of its share classes) are first invested in accordance with the fund’s investment objective. For funds with a subscription period, the inception date is the day after that period ends. Investment performance is measured from the inception date.
Median Market Cap. An indicator of the size of companies in which a fund invests; the midpoint of market capitalization (market price x shares outstanding) of a fund’s stocks, weighted by the proportion of the fund’s assets invested in each stock. Stocks representing half of the fund’s assets have market capitalizations above the median, and the rest are below it.
Price/Book Ratio. The share price of a stock divided by its net worth, or book value, per share. For a fund, the weighted average price/book ratio of the stocks it holds.
Price/Earnings Ratio. The ratio of a stock’s current price to its per-share earnings over the past year. For a fund, the weighted average P/E of the stocks it holds. P/E is an indicator of market expectations about corporate prospects; the higher the P/E, the greater the expectations for a company’s future growth.
Return on Equity. The annual average rate of return generated by a company during the past five years for each dollar of shareholder’s equity (net income divided by shareholder’s equity). For a fund, the weighted average return on equity for the companies whose stocks it holds.
Short-Term Reserves. The percentage of a fund invested in highly liquid, short-term securities that can be readily converted to cash.
Turnover Rate. An indication of the fund’s trading activity. Funds with high turnover rates incur higher transaction costs and may be more likely to distribute capital gains (which may be taxable to investors). The turnover rate excludes in-kind transactions, which have minimal impact on costs.
34
The Global Industry Classification Standard (“GICS”) was developed by and is the exclusive property and a service mark of MSCI Inc. (“MSCI”) and Standard and Poor’s, a division of McGraw-Hill Companies, Inc. (“S&P”), and is licensed for use by Vanguard. Neither MSCI, S&P nor any third party involved in making or compiling the GICS or any GICS classification makes any express or implied warranties or representations with respect to such standard or classification (or the results to be obtained by the use thereof), and all such parties hereby expressly disclaim all warranties of originality, accuracy, completeness, merchantability or fitness for a particular purpose with respect to any such standard or classification. Without limiting any of the foregoing, in no event shall MSCI, S&P, any of its affiliates or any third party involved in making or compiling the GICS or any GICS classification have any liability for any direct, indirect, special, punitive, consequential or any other damages (including lost profits) even if notified of the possibility of such damages.
35
This page intentionally left blank.
This page intentionally left blank.
This page intentionally left blank.
The People Who Govern Your Fund
The trustees of your mutual fund are there to see that the fund is operated and managed in your best interests since, as a shareholder, you are a part owner of the fund. Your fund’s trustees also serve on the board of directors of The Vanguard Group, Inc., which is owned by the Vanguard funds and provides services to them on an at-cost basis.
A majority of Vanguard’s board members are independent, meaning that they have no affiliation with Vanguard or the funds they oversee, apart from the sizable personal investments they have made as private individuals. The independent board members have distinguished backgrounds in business, academia, and public service. Each of the trustees and executive officers oversees 200 Vanguard funds.
Information for each trustee and executive officer of the fund appears below. The mailing address of the trustees and officers is P.O. Box 876, Valley Forge, PA 19482. More information about the trustees is in the Statement of Additional Information, which can be obtained, without charge, by contacting Vanguard at 800-662-7447, or online at vanguard.com.
Interested Trustee1
F. William McNabb III
Born 1957. Trustee Since July 2009. Chairman of the Board. Principal Occupation(s) During the Past Five Years and Other Experience: Chairman of the Board of The Vanguard Group, Inc., and of each of the investment companies served by The Vanguard Group, since January 2010; Chief Executive Officer and Director of The Vanguard Group and President and Chief Executive Officer of each of the investment companies served by The Vanguard Group, since 2008; Director of Vanguard Marketing Corporation; President of The Vanguard Group (2008–2017); Managing Director of The Vanguard Group (1995–2008).
Independent Trustees
Emerson U. Fullwood
Born 1948. Trustee Since January 2008. Principal Occupation(s) During the Past Five Years and Other Experience: Executive Chief Staff and Marketing Officer for North America and Corporate Vice President (retired 2008) of Xerox Corporation (document management products and services);
Executive in Residence and 2009–2010 Distinguished Minett Professor at the Rochester Institute of Technology; Lead Director of SPX FLOW, Inc. (multi-industry manufacturing); Director of the United Way of Rochester, the University of Rochester Medical Center, Monroe Community College Foundation, North Carolina A&T University, and Roberts Wesleyan College; Trustee of the University of Rochester.
Rajiv L. Gupta
Born 1945. Trustee Since December 2001.2 Principal Occupation(s) During the Past Five Years and Other Experience: Chairman and Chief Executive Officer (retired 2009) and President (2006–2008) of Rohm and Haas Co. (chemicals); Director of Arconic Inc. (diversified manufacturer), HP Inc. (printer and personal computer manufacturing), and Delphi Automotive plc (automotive components); Senior Advisor at New Mountain Capital.
Amy Gutmann
Born 1949. Trustee Since June 2006. Principal Occupation(s) During the Past Five Years and Other Experience: President of the University of Pennsylvania; Christopher H. Browne
1 Mr. McNabb is considered an “interested person,” as defined in the Investment ompany Act of 1940, because he is an officer of the Vanguard funds.
2 December 2002 for Vanguard Equity Income Fund, the Vanguard Municipal Bond Funds, and the Vanguard State Tax-Exempt Funds.
Distinguished Professor of Political Science, School of Arts and Sciences, and Professor of Communication, Annenberg School for Communication, with secondary faculty appointments in the Department of Philosophy, School of Arts and Sciences, and at the Graduate School of Education, University of Pennsylvania; Trustee of the National Constitution Center.
JoAnn Heffernan Heisen
Born 1950. Trustee Since July 1998. Principal Occupation(s) During the Past Five Years and Other Experience: Corporate Vice President and Member of the Executive Committee (1997–2008), Chief Global Diversity Officer (retired 2008), Vice President and Chief Information Officer (1997–2006), Controller (1995–1997), Treasurer (1991–1995), and Assistant Treasurer (1989–1991) of Johnson & Johnson (pharmaceuticals/medical devices/ consumer products); Director of Skytop Lodge Corporation (hotels) and the Robert Wood Johnson Foundation; Member of the Advisory Board of the Institute for Women’s Leadership at Rutgers University.
F. Joseph Loughrey
Born 1949. Trustee Since October 2009. Principal Occupation(s) During the Past Five Years and Other Experience: President and Chief Operating Officer (retired 2009) of Cummins Inc. (industrial machinery); Chairman of the Board of Hillenbrand, Inc. (specialized consumer services), Oxfam America, and the Lumina Foundation for Education; Director of the V Foundation for Cancer Research; Member of the Advisory Council for the College of Arts and Letters and Chair of the Advisory Board to the Kellogg Institute for International Studies, both at the University of Notre Dame.
Mark Loughridge
Born 1953. Trustee Since March 2012. Principal Occupation(s) During the Past Five Years and Other Experience: Senior Vice President and Chief Financial Officer (retired 2013) at IBM (information technology services); Fiduciary Member of IBM’s Retirement Plan Committee (2004–2013); Member of the Council on Chicago Booth.
Scott C. Malpass
Born 1962. Trustee Since March 2012. Principal Occupation(s) During the Past Five Years and Other Experience: Chief Investment Officer and Vice President at the University of Notre Dame; Assistant Professor of Finance at the Mendoza College of Business at Notre Dame; Member of the Notre Dame 403(b) Investment Committee, the Board of Advisors for Spruceview Capital Partners, the Board of Catholic Investment Services, Inc. (investment advisor), and the Board of Superintendence of the Institute for the Works of Religion; Chairman of the Board of TIFF Advisory Services, Inc. (investment advisor).
André F. Perold
Born 1952. Trustee Since December 2004. Principal Occupation(s) During the Past Five Years and Other Experience: George Gund Professor of Finance and Banking, Emeritus at the Harvard Business School (retired 2011); Chief Investment Officer and Co-Managing Partner of HighVista Strategies LLC (private investment firm); Overseer of the Museum of Fine Arts Boston.
Peter F. Volanakis
Born 1955. Trustee Since July 2009. Principal Occupation(s) During the Past Five Years and Other Experience: President and Chief Operating Officer (retired 2010) of Corning Incorporated (communications equipment); Chairman of the Board of Trustees of Colby-Sawyer College; Member of the Board of Hypertherm, Inc. (industrial cutting systems, software, and consumables).
Executive Officers
Glenn Booraem
Born 1967. Investment Stewardship Officer Since February 2017. Principal Occupation(s) During the Past Five Years and Other Experience: Principal of The Vanguard Group, Inc.; Treasurer (2015–2017), Controller (2010–2015), and Assistant Controller (2001–2010) of each of the investment companies served by The Vanguard Group.
Thomas J. Higgins
Born 1957. Chief Financial Officer Since September 2008. Principal Occupation(s) During the Past Five Years and Other Experience: Principal of The Vanguard Group, Inc.; Chief Financial Officer of each of the investment companies served by The Vanguard Group; Treasurer of each of the investment companies served by The Vanguard Group (1998–2008).
Peter Mahoney
Born 1974. Controller Since May 2015. Principal Occupation(s) During the Past Five Years and Other Experience: Principal of The Vanguard Group, Inc.; Controller of each of the investment companies served by The Vanguard Group; Head of International Fund Services at The Vanguard Group (2008–2014).
Anne E. Robinson
Born 1970. Secretary Since September 2016. Principal Occupation(s) During the Past Five Years and Other Experience: Managing Director of The Vanguard Group, Inc.; General Counsel of The Vanguard Group; Secretary of The Vanguard Group and of each of the investment companies served by The Vanguard Group; Director and Senior Vice President of Vanguard Marketing Corporation; Managing Director and General Counsel of Global Cards and Consumer Services at Citigroup (2014–2016); Counsel at American Express (2003–2014).
Michael Rollings
Born 1963. Treasurer Since February 2017. Principal Occupation(s) During the Past Five Years and Other Experience: Managing Director of The Vanguard Group, Inc.; Treasurer of each of the investment companies served by The Vanguard Group; Director of Vanguard Marketing Corporation; Executive Vice President and Chief Financial Officer of MassMutual Financial Group (2006–2016).
| Vanguard Senior Management Team | |
| Mortimer J. Buckley | Chris D. McIsaac |
| Gregory Davis | James M. Norris |
| John James | Thomas M. Rampulla |
| Martha G. King | Karin A. Risi |
| John T. Marcante | |
Chairman Emeritus and Senior Advisor
John J. Brennan
Chairman, 1996–2009
Chief Executive Officer and President, 1996–2008
Founder
John C. Bogle
Chairman and Chief Executive Officer, 1974–1996
 | |
P.O. Box 2600 | |
Connect with Vanguard® > vanguard.com | |
| Fund Information > 800-662-7447 | CFA® is a registered trademark owned by CFA Institute. |
| Direct Investor Account Services > 800-662-2739 | |
| Institutional Investor Services > 800-523-1036 | |
| Text Telephone for People | |
| Who Are Deaf or Hard of Hearing> 800-749-7273 | |
| This material may be used in conjunction | |
| with the offering of shares of any Vanguard | |
| fund only if preceded or accompanied by | |
| the fund’s current prospectus. | |
| All comparative mutual fund data are from Lipper, a | |
| Thomson Reuters Company, or Morningstar, Inc., unless | |
| otherwise noted. | |
| You can obtain a free copy of Vanguard’s proxy voting | |
| guidelines by visiting vanguard.com/proxyreporting or by | |
| calling Vanguard at 800-662-2739. The guidelines are | |
| also available from the SEC’s website, sec.gov. In | |
| addition, you may obtain a free report on how your fund | |
| voted the proxies for securities it owned during the 12 | |
| months ended June 30. To get the report, visit either | |
| vanguard.com/proxyreporting or sec.gov. | |
| You can review and copy information about your fund at | |
| the SEC’s Public Reference Room in Washington, D.C. To | |
| find out more about this public service, call the SEC at | |
| 202-551-8090. Information about your fund is also | |
| available on the SEC’s website, and you can receive | |
| copies of this information, for a fee, by sending a | |
| request in either of two ways: via email addressed to | |
| publicinfo@sec.gov or via regular mail addressed to the | |
| Public Reference Section, Securities and Exchange | |
| Commission, Washington, DC 20549-1520. | |
| © 2017 The Vanguard Group, Inc. | |
| All rights reserved. | |
| Vanguard Marketing Corporation, Distributor. | |
| Q7520 122017 | |
| Annual Report | October 31, 2017 |
| Vanguard Alternative Strategies Fund |
Vanguard’s Principles for Investing Success
We want to give you the best chance of investment success. These
principles, grounded in Vanguard’s research and experience, can put you on
the right path.
Goals. Create clear, appropriate investment goals.
Balance. Develop a suitable asset allocation using broadly diversified funds.
Cost. Minimize cost.
Discipline. Maintain perspective and long-term discipline.
A single theme unites these principles: Focus on the things you can control.
We believe there is no wiser course for any investor.
| Contents | |
| Your Fund’s Performance at a Glance. | 1 |
| Chairman’s Perspective. | 2 |
| Advisor’s Report. | 5 |
| Fund Profile. | 8 |
| Performance Summary. | 10 |
| Consolidated Financial Statements. | 12 |
| Your Fund’s After-Tax Returns. | 34 |
| About Your Fund’s Expenses. | 35 |
| Glossary. | 37 |
Please note: The opinions expressed in this report are just that—informed opinions. They should not be considered promises
or advice. Also, please keep in mind that the information and opinions cover the period through the date on the front of this
report. Of course, the risks of investing in your fund are spelled out in the prospectus.
See the Glossary for definitions of investment terms used in this report.
About the cover: Nautical images have been part of Vanguard’s rich heritage since its start in 1975. For an
incoming ship, a lighthouse offers a beacon and safe path to shore. You can similarly depend on Vanguard to put
you first––and light the way––as you strive to meet your financial goals. Our client focus and low costs,
stemming from our unique ownership structure, assure that your interests are paramount.
Your Fund’s Performance at a Glance
• Vanguard Alternative Strategies Fund returned 0.11% during the 12 months
ended October 31, 2017. The FTSE 3-month U.S. T-Bill Index + 4% returned 4.90%.
• The fund seeks to generate returns using a combination of five alternative
strategies that are expected to have low correlation with traditional capital markets.
These strategies are: long/short equity, event-driven, fixed income, currencies, and
commodity-linked investments. The fund’s total return is expected to have lower
volatility than that of the overall U.S. stock market.
• The strongest driver of performance during the period was our positioning in
commodity-linked investments, which produced the biggest losses. Our long/short
and event-driven strategies were positive contributors.
• The diversification resulting from the fund’s variety of exposures helped reduce
overall volatility. On an annualized basis, the volatility of the fund’s daily returns
averaged 3.52%, versus 7.69% for those of the broad U.S. stock market.
| Total Returns: Fiscal Year Ended October 31, 2017 | |
| Total | |
| Returns | |
| Vanguard Alternative Strategies Fund | 0.11% |
| FTSE 3-month U.S. T-Bill Index + 4% | 4.90 |
1
Chairman’s Perspective

Bill McNabb
Chairman and Chief Executive Officer
Dear Shareholder,
When I find outstanding products or services, I’m likely to be loyal to them. And my loyalty usually gets rewarded as I experience consistently high quality––whether it’s from a favorite restaurant or a favorite author. What’s past, in most cases, is prologue.
As tempting as it is to apply this rationale to investing—for example, if technology stocks have done well this year, they’re bound to do well the next—it’s not all that helpful and can actually be counterproductive. You’ve heard it many times: Past performance cannot be used to predict future returns.
Taking a new approach
The caution about past performance is so familiar that investors are apt to treat it as mere background noise. That’s why past-performance bias merited a fresh look from Vanguard’s Investment Strategy Group, which tackled the issue last year in a research paper. (I encourage you to read the full paper, Reframing Investor Choices: Right Mindset, Wrong Market, at vanguard.com/research.)
Our strategists were hardly the first to delve into the topic, but they approached it in a new way. They started with the premise that it’s perfectly understandable for investors to lean heavily on past performance, because that works well in many areas of life. After all, as the paper describes, in lots of other industries and realms, performance from one time period
2
to another is extremely consistent. The researchers looked at everything from cars to fine restaurants to heart surgeons, and in all these examples, past performance was a good predictor of later outcomes.
It’s different with investing
In a nutshell, our brains typically are rewarded and our satisfaction is boosted when we use past performance as a guide for navigating decisions, big and small. But when applied to investing, this method breaks down.
Why? Among other reasons, top-performing asset classes one year tend not to repeat as leaders the next. Strong past performance leads to higher
valuations, making an investment, all else being equal, less attractive in the future. The data are quite overwhelming in this regard.
By allowing past performance to inform their decisions, individual and institutional investors inadvertently end up as momentum investors, putting them on a treadmill of buying high and selling low.
A path to better decision-making
Of course, many investors are already aware of the pitfalls of projecting past performance into the future. The real question is, what can we all do about it? What does it take to go from having a general awareness to actually changing our behavior?
| Market Barometer | |||
| Average Annual Total Returns | |||
| Periods Ended October 31, 2017 | |||
| One Year | Three Years | Five Years | |
| Stocks | |||
| Russell 1000 Index (Large-caps) | 23.67% | 10.58% | 15.18% |
| Russell 2000 Index (Small-caps) | 27.85 | 10.12 | 14.49 |
| Russell 3000 Index (Broad U.S. market) | 23.98 | 10.53 | 15.12 |
| FTSE All-World ex US Index (International) | 23.48 | 6.12 | 7.67 |
| Bonds | |||
| Bloomberg Barclays U.S. Aggregate Bond Index | |||
| (Broad taxable market) | 0.90% | 2.40% | 2.04% |
| Bloomberg Barclays Municipal Bond Index | |||
| (Broad tax-exempt market) | 2.19 | 3.04 | 3.00 |
| Citigroup Three-Month U.S. Treasury Bill Index | 0.71 | 0.31 | 0.20 |
| CPI | |||
| Consumer Price Index | 2.04% | 1.28% | 1.29% |
3
Acknowledging that such change isn’t easy, our strategists offered a few ideas for reframing how investors approach their decisions. These recommendations were targeted at advisors working with clients, but they apply equally to individuals and institutions:
• Educate yourself. The more investors understand why a method that works so well in other areas of life—relying on past performance to drive decisions—doesn’t carry over to investing, the better off they’ll be.
• Be disciplined. The bias toward past performance is ingrained in everybody, professionals included, and shifting away from it can be difficult. But the long-term benefits make the effort worthwhile.
• Focus on what you can control. It’s always most constructive for investors to concentrate on what’s actually within their control, such as setting goals, following long-term portfolio construction principles, selecting low-cost investments, and rebalancing periodically.
Here’s to keeping the past in the rearview mirror. And, as always, thank you for investing with Vanguard.
Sincerely,

F. William McNabb III
Chairman and Chief Executive Officer
November 14, 2017
4
Advisor’s Report
For the twelve months ended October 31, 2017, Vanguard Alternative Strategies Fund returned 0.11%, trailing the performance of its benchmark, the FTSE 3-month U.S.T-Bill Index + 4%.
Investment objective and strategy
The objective of the Alternative Strategies Fund is to generate positive returns that have a low correlation with the returns of more traditional asset classes such as stocks and bonds. The fund seeks to meet its objective by using a combination of five alternative investment strategies that span multiple asset classes: equities, fixed income, currencies, and commodities.
Each strategy can use long and short positions to try to minimize market exposure while attempting to capture attractive risk premiums. Individually, the strategies are expected to have low long-term correlation with one another and with traditional capital markets. This should produce a portfolio with lower volatility than that of the overall U.S. stock market.
In addition, the fund can use leverage as it seeks to match the expected risk profile for each strategy. Our leverage targets are subject to internal limits. The goal is to achieve a similar risk profile across the portfolio to maximize diversification and performance.
Although we are always evaluating potential new strategies, the fund currently employs five:
• Long/short equity: This approach focuses on building a long/short portfolio of equity securities based on their volatility characteristics by executing long positions in low-volatility stocks and short positions in high-volatility stocks. It seeks to capture a risk-adjusted spread by constructing positions to reduce the net market exposure of the overall portfolio to general market movements (beta).
• Event-driven: This strategy seeks to profit from the expectation that a specific event or catalyst (such as a merger/ acquisition deal closure) will affect the stock price of a U.S. or foreign company.
• Fixed income: This approach seeks to exploit the term premium of the Treasury yield curve that is created by investors’ desire to hold shorter-maturity bonds because they tend to be more liquid (trade easily) and less sensitive to growth and inflation risk. We try to capture this premium by investing in Treasury futures with longer times to maturity and borrowing those with short maturities.
• Currencies: The fund seeks to benefit from expected currency movements across countries by using long and short foreign currency exchange forward contracts. It does this by selling currencies of countries with poor fundamental characteristics and buying those of countries with strong ones.
5
• Commodity-linked investments:
This strategy seeks to capture the risk premium associated with inventory levels of commodities, which are reflected in the prices of their futures contracts. We take long positions in commodities whose prices are expected to rise because of limited inventory and short positions in those whose prices are expected to fall.
Investment environment
Overall global economic growth, though uncertain and mixed at times, combined with rising corporate earnings to support a strong performance by the U.S. stock market over the past twelve months. Stock valuations also climbed as investors embraced risk. U.S. economic fundamentals remained firm amid favorable consumer confidence, unemployment, and GDP data. The Federal Reserve acknowledged the economy’s strength, pushing the range of its federal funds target rate to 1%–1.25% with hikes in March and June.
The more optimistic outlook sapped overall demand for fixed income securities, causing their yields to increase. Over the twelve months, the yield of the 10-year U.S. Treasury note increased 54 basis points to 2.38%, and the 30-year yield rose 30 basis points to 2.88%.
In its September meeting, the Fed announced that the unwinding of its $4.5 trillion portfolio of government securities would begin in October. While keeping
interest rates unchanged in November, the Fed reinforced the market’s view that a December rate hike is very likely and reiterated that interest rates will probably rise at a gradual pace given the resilience of the economy.
Overseas, major central banks kept their monetary policies accommodative. Political uncertainty eased somewhat as voters in the Netherlands and France turned back nationalist candidates who were focused on dismantling the European Union. Stocks rose across Europe and Asia.
Successes and shortfalls
Although it’s important to understand the impact of macroeconomic factors on the markets, our process seeks to earn a positive absolute return regardless of market performance while controlling volatility. The correlations of the fund’s daily returns with the equity and bond markets were 0.13 and 0.18, respectively.
Our long/short and event-driven strategies aided performance, whereas our fixed income and currency positions produced modest losses.
The strongest driver of performance during the period was our positioning in commodity-linked investments, which led to the fund’s biggest losses. Despite the performance of these strategies, our exposure to commodities added diversification to the portfolio.
6
Although markets can be unpredictable, we are confident that our team of experienced managers and analysts can find opportunities to produce competitive returns over the long term at volatility levels lower than those of the market. We look forward to serving our investors in the future.
Portfolio Managers:
Anatoly Shtekhman, CFA
Fei Xu, CFA
Denis Chaves
Vanguard Quantitative Equity Group
November 14, 2017
7
Alternative Strategies Fund
Fund Profile
As of October 31, 2017
| Fund Characteristics | |
| Ticker Symbol | VASFX |
| Total Expense Ratio1 | 0.71% |
| Management Expenses | 0.26% |
| Dividend Expenses on Securities | |
| Sold Short² | 0.35% |
| Borrowing Expenses on Securities | |
| Sold Short² | 0.00% |
| Other Expenses | 0.06% |
| Turnover Rate | 125% |
| Short-Term Reserves | 22.9% |
| Portfolio Characteristics | ||
| Long | Short | |
| Portfolio | Portfolio | |
| Number of Stocks | 357 | 182 |
| Median Market Cap | $6.1B | $7.0B |
| Price/Earnings Ratio | 35.9x | 13.9x |
| Price/Book Ratio | 2.6x | 1.9x |
| Return on Equity | 10.6% | 8.0% |
| Earnings Growth | ||
| Rate | 8.4% | 9.6% |
| Foreign Holdings | 8.2% | 0.2% |
| Sector Diversification (% of equity exposure) | ||
| Long | Short | |
| Portfolio | Portfolio | |
| Consumer Discretionary | 12.0% | 15.7% |
| Consumer Staples | 4.2 | 2.5 |
| Energy | 2.0 | 13.8 |
| Financials | 14.5 | 24.1 |
| Health Care | 12.9 | 10.0 |
| Industrials | 10.6 | 9.1 |
| Information Technology | 18.1 | 10.6 |
| Materials | 6.8 | 5.7 |
| Real Estate | 5.7 | 4.2 |
| Telecommunication Services | 3.8 | 3.3 |
| Utilities | 9.4 | 1.0 |
Sector categories are based on the Global Industry Classification Standard (“GICS”), except for the “Other” category (if applicable), which includes securities that have not been provided a GICS classification as of the effective reporting period.
1 The total expense ratio shown is from the prospectus dated February 23, 2017, and represents estimated costs for the current fiscal year. For
the fiscal year ended October 31, 2017, the total expense ratio was 0.79%.
2 In connection with a short sale, the fund may receive income or be charged a fee based on the market value of the borrowed stock.
When a cash dividend is declared on a stock the fund has sold short, the fund is required to pay an amount equal to that dividend to the
party from which the fund borrowed the stock and to record the payment of the dividend as an expense.
8
Alternative Strategies Fund
| Ten Largest Holdings1 (% of total net assets) | |
| Long Portfolio | |
| Silver Spring Networks | |
| Inc. | 0.9% |
| Akorn Inc. | 0.9 |
| Orbital ATK Inc. | 0.9 |
| Avista Corp. | 0.9 |
| Calpine Corp. | 0.9 |
| NxStage Medical Inc. | 0.8 |
| Nets A/S | 0.8 |
| VWR Corp. | 0.8 |
| Rockwell Collins Inc. | 0.8 |
| Tribune Media Co. | 0.8 |
| Top Ten | 8.5% |
| Ten Largest Holdings1 (% of total net assets) | |
| Short Portfolio | |
| Columbia Banking | |
| System Inc. | 0.7% |
| First Horizon National | |
| Corp. | 0.7 |
| EQT Corp. | 0.6 |
| Liberty Interactive Corp. | |
| QVC Group | 0.6 |
| Invitation Homes Inc. | 0.4 |
| First Financial Bancorp | 0.4 |
| Sandy Spring Bancorp | |
| Inc. | 0.4 |
| Union Bankshares Corp. | 0.3 |
| AT&T Inc. | 0.3 |
| CenturyLink Inc. | 0.3 |
| Top Ten | 4.7% |
1 The holdings listed exclude any temporary cash investments and equity index products.
9
Alternative Strategies Fund
Performance Summary
All of the returns in this report represent past performance, which is not a guarantee of future results that may be achieved by the fund. (Current performance may be lower or higher than the performance data cited. For performance data current to the most recent month-end, visit our website at vanguard.com/performance.) Note, too, that both investment returns and principal value can fluctuate widely, so an investor’s shares, when sold, could be worth more or less than their original cost. The returns shown do not reflect taxes that a shareholder would pay on fund distributions or on the sale of fund shares.
Cumulative Performance: August 11, 2015, Through October 31, 2017
Initial Investment of $250,000

| Average Annual Total Returns | |||
| Periods Ended October 31, 2017 | |||
| Since | Final Value | ||
| One | Inception | of a $250,000 | |
| Year | (8/11/2015) | Investment | |
| Alternative Strategies Fund | 0.11% | 3.10% | $267,525 |
| FTSE 3-month U.S. T-Bill Index + 4% | 4.90 | 4.57 | 276,090 |
"Since Inception" performance is calculated from the inception date for both the fund and its comparative standards.
See Financial Highlights for dividend and capital gains information.
10
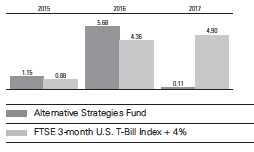
Average Annual Total Returns: Periods Ended September 30, 2017
This table presents returns through the latest calendar quarter—rather than through the end of the fiscal period.
Securities and Exchange Commission rules require that we provide this information.
| Inception | One | Since | |
| Date | Year | Inception | |
| Alternative Strategies Fund | 8/11/2015 | -2.09% | 2.89% |
11
Alternative Strategies Fund
Consolidated Financial Statements
Consolidated Statement of Net Assets
As of October 31, 2017
The fund reports a complete list of its holdings in regulatory filings four times in each fiscal year, at the quarter-ends. For the second and fourth fiscal quarters, the lists appear in the fund’s semiannual and annual reports to shareholders. For the first and third fiscal quarters, the fund files the lists with the Securities and Exchange Commission on Form N-Q. Shareholders can look up the fund’s Forms N-Q on the SEC’s website at sec.gov. Forms N-Q may also be reviewed and copied at the SEC’s Public Reference Room (see the back cover of this report for further information).
| Market | |||
| Value• | |||
| Shares | ($000) | ||
| Common Stocks—Long Positions (61.4%) | |||
| Consumer Discretionary (7.4%) | |||
| Tribune Media Co. | |||
| Class A | 59,000 | 2,415 | |
| Mantra Group Ltd. | 800,000 | 2,390 | |
| Scripps Networks | |||
| Interactive Inc. Class A | 27,000 | 2,249 | |
| Time Warner Inc. | 20,000 | 1,966 | |
| * | NYX Gaming Group Ltd. | 1,058,400 | 1,936 |
| HSN Inc. | 42,000 | 1,583 | |
| * | Sky plc | 117,835 | 1,476 |
| * | NVR Inc. | 101 | 332 |
| McDonald’s Corp. | 1,874 | 313 | |
| Yum! Brands Inc. | 4,100 | 305 | |
| * | Live Nation | ||
| Entertainment Inc. | 6,857 | 300 | |
| Home Depot Inc. | 1,809 | 300 | |
| * | Madison Square Garden | ||
| Co. Class A | 1,314 | 293 | |
| Carnival Corp. | 4,391 | 292 | |
| Graham Holdings Co. | |||
| Class B | 511 | 284 | |
| Pool Corp. | 2,351 | 284 | |
| Sirius XM Holdings Inc. | 52,042 | 283 | |
| Aramark | 6,249 | 273 | |
| Vail Resorts Inc. | 1,172 | 268 | |
| Cable One Inc. | 361 | 256 | |
| * | Liberty Expedia Holdings | ||
| Inc. Class A | 5,538 | 255 | |
| Comcast Corp. Class A | 6,956 | 251 | |
| Ross Stores Inc. | 3,765 | 239 | |
| TJX Cos. Inc. | 3,322 | 232 | |
| Walt Disney Co. | 2,364 | 231 | |
| Cinemark Holdings Inc. | 6,147 | 223 | |
| Choice Hotels | |||
| International Inc. | 3,202 | 223 | |
| Starbucks Corp. | 4,000 | 219 | |
| * | Mohawk Industries Inc. | 829 | 217 |
| Genuine Parts Co. | 2,366 | 209 | |
| Omnicom Group Inc. | 3,039 | 204 | |
| * | Ruby Tuesday Inc. | 86,100 | 204 |
| Service Corp. International | 5,743 | 204 | |
| Expedia Inc. | 1,587 | 198 | |
| Lowe’s Cos. Inc. | 2,414 | 193 | |
| John Wiley & Sons Inc. | |||
| Class A | 3,260 | 178 | |
| Leggett & Platt Inc. | 3,596 | 170 | |
| Twenty-First Century Fox | |||
| Inc. | 6,353 | 162 | |
| 21,610 | |||
| Consumer Staples (2.6%) | |||
| Omega Protein Corp. 1,032,000 | 701 | ||
| Estee Lauder Cos. Inc. | |||
| Class A | 2,839 | 317 | |
| Wal-Mart Stores Inc. | 3,471 | 303 | |
| Ingredion Inc. | 2,332 | 292 | |
| Hershey Co. | 2,708 | 288 | |
| Coca-Cola Co. | 6,203 | 285 | |
| General Mills Inc. | 5,088 | 264 | |
| Colgate-Palmolive Co. | 3,735 | 263 | |
| McCormick & Co. Inc. | 2,642 | 263 | |
| PepsiCo Inc. | 2,358 | 260 | |
| Philip Morris International | |||
| Inc. | 2,444 | 256 | |
| Kellogg Co. | 4,086 | 256 | |
| Mondelez International | |||
| Inc. Class A | 6,165 | 255 | |
| Campbell Soup Co. | 5,348 | 253 | |
| Procter & Gamble Co. | 2,916 | 252 | |
| * | US Foods Holding Corp. | 9,143 | 249 |
| Pinnacle Foods Inc. | 4,573 | 249 | |
| Altria Group Inc. | 3,758 | 241 | |
| Clorox Co. | 1,898 | 240 | |
| Brown-Forman Corp. | |||
| Class A | 4,171 | 239 | |
12
Alternative Strategies Fund
| Market | |||
| Value• | |||
| Shares | ($000) | ||
| Constellation Brands Inc. | |||
| Class A | 1,073 | 235 | |
| Kraft Heinz Co. | 2,987 | 231 | |
| JM Smucker Co. | 2,157 | 229 | |
| Church & Dwight Co. Inc. | 4,959 | 224 | |
| Dr Pepper Snapple Group | |||
| Inc. | 2,603 | 223 | |
| Conagra Brands Inc. | 6,321 | 216 | |
| Kimberly-Clark Corp. | 1,884 | 212 | |
| Sysco Corp. | 2,367 | 132 | |
| Walgreens Boots Alliance | |||
| Inc. | 1,612 | 107 | |
| Brown-Forman Corp. | |||
| Class B | 1,245 | 71 | |
| 7,606 | |||
| Energy (1.2%) | |||
| * | Rice Energy Inc. | 80,000 | 2,268 |
| Phillips 66 | 3,329 | 303 | |
| Chevron Corp. | 2,440 | 283 | |
| Exxon Mobil Corp. | 3,201 | 267 | |
| Occidental Petroleum Corp. | 3,971 | 256 | |
| Schlumberger Ltd. | 3,634 | 233 | |
| 3,610 | |||
| Financials (8.9%) | |||
| Capital Bank Financial | |||
| Corp. | 59,000 | 2,395 | |
| † | Fortress Investment | ||
| Group LLC Class A | 299,800 | 2,341 | |
| Pacific Continental Corp. | 74,300 | 2,080 | |
| State National Cos. Inc. | 90,000 | 1,892 | |
| Fidelity & Guaranty Life | 50,000 | 1,555 | |
| MainSource Financial | |||
| Group Inc. | 30,000 | 1,131 | |
| WashingtonFirst | |||
| Bankshares Inc. | 30,000 | 1,048 | |
| * | Xenith Bankshares Inc. | 30,000 | 959 |
| Sun Bancorp Inc. | 20,000 | 507 | |
| * | Paragon Commercial Corp. | 6,798 | 391 |
| Bank Mutual Corp. | 35,498 | 375 | |
| SEI Investments Co. | 5,141 | 332 | |
| RenaissanceRe Holdings | |||
| Ltd. | 2,224 | 308 | |
| American Financial Group | |||
| Inc. | 2,894 | 305 | |
| Arthur J Gallagher & Co. | 4,787 | 303 | |
| Reinsurance Group of | |||
| America Inc. Class A | 2,017 | 301 | |
| Torchmark Corp. | 3,574 | 301 | |
| * | Arch Capital Group Ltd. | 2,990 | 298 |
| Aon plc | 2,058 | 295 | |
| * | Berkshire Hathaway Inc. | ||
| Class B | 1,572 | 294 | |
| Allstate Corp. | 3,127 | 294 | |
| Travelers Cos. Inc. | 2,209 | 293 | |
| Chubb Ltd. | 1,923 | 290 | |
| Progressive Corp. | 5,895 | 287 | |
| Marsh & McLennan | |||
| Cos. Inc. | 3,542 | 287 | |
| S&P Global Inc. | 1,816 | 284 | |
| Hanover Insurance Group | |||
| Inc. | 2,872 | 283 | |
| Hartford Financial Services | |||
| Group Inc. | 5,087 | 280 | |
| Validus Holdings Ltd. | 5,333 | 278 | |
| * | Markel Corp. | 256 | 278 |
| Aflac Inc. | 3,307 | 277 | |
| Loews Corp. | 5,602 | 277 | |
| Two Harbors Investment | |||
| Corp. | 28,200 | 276 | |
| CBOE Holdings Inc. | 2,431 | 275 | |
| MFA Financial Inc. | 32,437 | 267 | |
| White Mountains | |||
| Insurance Group Ltd. | 298 | 265 | |
| Annaly Capital | |||
| Management Inc. | 23,028 | 264 | |
| AGNC Investment Corp. | 13,080 | 263 | |
| Old Republic | |||
| International Corp. | 12,716 | 258 | |
| WR Berkley Corp. | 3,709 | 254 | |
| Erie Indemnity Co. | |||
| Class A | 2,078 | 251 | |
| Starwood Property Trust | |||
| Inc. | 11,603 | 250 | |
| US Bancorp | 4,583 | 249 | |
| Nasdaq Inc. | 3,328 | 242 | |
| American International | |||
| Group Inc. | 3,742 | 242 | |
| XL Group Ltd. | 5,918 | 240 | |
| Willis Towers Watson plc | 1,473 | 237 | |
| Brown & Brown Inc. | 4,758 | 237 | |
| * | Alleghany Corp. | 413 | 234 |
| Axis Capital Holdings Ltd. | 3,983 | 217 | |
| ProAssurance Corp. | 3,659 | 205 | |
| Morningstar Inc. | 2,224 | 190 | |
| First American Financial | |||
| Corp. | 3,184 | 173 | |
| TFS Financial Corp. | 9,278 | 143 | |
| MSCI Inc. Class A | 370 | 43 | |
| 26,094 | |||
| Health Care (7.9%) | |||
| *,† | Akorn Inc. | 78,000 | 2,540 |
| * | NxStage Medical Inc. | 92,000 | 2,479 |
| * | VWR Corp. | 74,000 | 2,449 |
| † | CR Bard Inc. | 7,300 | 2,388 |
| * | PharMerica Corp. | 72,000 | 2,110 |
| * | Actelion Ltd. | 7,100 | 1,984 |
| Biotest AG | 31,650 | 1,001 | |
| * | Exactech Inc. | 13,077 | 547 |
13
Alternative Strategies Fund
| Market | |||
| Value• | |||
| Shares | ($000) | ||
| UnitedHealth Group Inc. | 1,554 | 327 | |
| * | Mettler-Toledo International | ||
| Inc. | 470 | 321 | |
| Stryker Corp. | 2,041 | 316 | |
| Danaher Corp. | 3,410 | 315 | |
| * | Intuitive Surgical Inc. | 828 | 311 |
| Anthem Inc. | 1,477 | 309 | |
| * | Varian Medical Systems | ||
| Inc. | 2,882 | 300 | |
| Baxter International Inc. | 4,649 | 300 | |
| Becton Dickinson and Co. | 1,428 | 298 | |
| Johnson & Johnson | 2,130 | 297 | |
| Zoetis Inc. | 4,566 | 291 | |
| Thermo Fisher Scientific | |||
| Inc. | 1,494 | 290 | |
| STERIS plc | 3,100 | 289 | |
| Cooper Cos. Inc. | 1,173 | 282 | |
| Agilent Technologies Inc. | 4,110 | 280 | |
| * | Bio-Rad Laboratories Inc. | ||
| Class A | 1,202 | 264 | |
| Medtronic plc | 3,097 | 249 | |
| Pfizer Inc. | 7,016 | 246 | |
| Quest Diagnostics Inc. | 2,562 | 240 | |
| * | Quintiles IMS Holdings Inc. | 2,149 | 232 |
| PerkinElmer Inc. | 3,195 | 231 | |
| Abbott Laboratories | 4,193 | 227 | |
| Bio-Techne Corp. | 1,729 | 227 | |
| * | Boston Scientific Corp. | 7,551 | 213 |
| * | Laboratory Corp. of | ||
| America Holdings | 1,375 | 211 | |
| Merck & Co. Inc. | 3,808 | 210 | |
| * | Henry Schein Inc. | 2,548 | 200 |
| * | HCA Healthcare Inc. | 2,456 | 186 |
| Dentsply Sirona Inc. | 3,006 | 184 | |
| * | Premier Inc. Class A | 1,499 | 49 |
| 23,193 | |||
| Industrials (6.5%) | |||
| Orbital ATK Inc. | 19,000 | 2,526 | |
| Rockwell Collins Inc. | 18,000 | 2,441 | |
| * | Sparton Corp. | 99,000 | 2,306 |
| Zodiac Aerospace | 69,200 | 1,978 | |
| CH Robinson Worldwide | |||
| Inc. | 4,099 | 322 | |
| 3M Co. | 1,397 | 322 | |
| Stanley Black & Decker Inc. | 1,949 | 315 | |
| Illinois Tool Works Inc. | 1,978 | 310 | |
| Roper Technologies Inc. | 1,195 | 308 | |
| Lockheed Martin Corp. | 979 | 302 | |
| Honeywell International Inc. | 2,091 | 301 | |
| BWX Technologies Inc. | 4,991 | 299 | |
| IDEX Corp. | 2,313 | 296 | |
| Rollins Inc. | 6,741 | 296 | |
| Northrop Grumman Corp. | 1,001 | 296 | |
| Waste Management Inc. | 3,593 | 295 | |
| Boeing Co. | 1,125 | 290 | |
| Raytheon Co. | 1,595 | 287 | |
| Allegion plc | 3,442 | 287 | |
| General Dynamics Corp. | 1,403 | 285 | |
| Republic Services Inc. | |||
| Class A | 4,303 | 280 | |
| United Technologies Corp. | 2,335 | 280 | |
| Macquarie Infrastructure | |||
| Corp. | 3,955 | 275 | |
| * | Verisk Analytics Inc. | ||
| Class A | 3,229 | 275 | |
| Hubbell Inc. Class B | 2,182 | 274 | |
| Toro Co. | 4,323 | 272 | |
| Expeditors International | |||
| of Washington Inc. | 4,638 | 271 | |
| * | Copart Inc. | 7,444 | 270 |
| Watsco Inc. | 1,609 | 268 | |
| United Parcel Service Inc. | |||
| Class B | 2,280 | 268 | |
| Xylem Inc. | 3,919 | 261 | |
| KAR Auction Services Inc. | 5,506 | 261 | |
| Huntington Ingalls | |||
| Industries Inc. | 1,119 | 260 | |
| * | IHS Markit Ltd. | 6,044 | 257 |
| Carlisle Cos. Inc. | 2,081 | 229 | |
| Snap-on Inc. | 1,429 | 225 | |
| JB Hunt Transport | |||
| Services Inc. | 2,013 | 214 | |
| AMETEK Inc. | 3,081 | 208 | |
| General Electric Co. | 8,792 | 177 | |
| Lennox International Inc. | 432 | 83 | |
| Fortive Corp. | 712 | 51 | |
| 19,021 | |||
| Information Technology (11.1%) | |||
| * | Silver Spring Networks | ||
| Inc. | 160,000 | 2,579 | |
| *,1 | Nets A/S | 96,000 | 2,451 |
| Brocade Communications | |||
| Systems Inc. | 201,000 | 2,342 | |
| * | Xcerra Corp. | 230,600 | 2,271 |
| * | Bankrate Inc. | 153,400 | 2,132 |
| * | NXP Semiconductors NV | 17,000 | 1,990 |
| * | Paysafe Group plc | 250,000 | 1,946 |
| * | Imagination Technologies | ||
| Group plc | 800,000 | 1,918 | |
| * | Exa Corp. | 73,000 | 1,770 |
| * | MoneyGram International | ||
| Inc. | 107,700 | 1,675 | |
| * | Adobe Systems Inc. | 1,976 | 346 |
| Maxim Integrated | |||
| Products Inc. | 6,495 | 341 | |
| * | VMware Inc. Class A | 2,734 | 327 |
| Amphenol Corp. Class A | 3,761 | 327 | |
| Visa Inc. Class A | 2,948 | 324 | |
14
Alternative Strategies Fund
| Market | |||
| Value• | |||
| Shares | ($000) | ||
| * | ANSYS Inc. | 2,349 | 321 |
| Mastercard Inc. Class A | 2,127 | 316 | |
| Genpact Ltd. | 10,375 | 316 | |
| Microsoft Corp. | 3,790 | 315 | |
| * | Facebook Inc. Class A | 1,744 | 314 |
| * | Synopsys Inc. | 3,601 | 312 |
| Intuit Inc. | 2,061 | 311 | |
| Oracle Corp. | 6,112 | 311 | |
| Accenture plc Class A | 2,185 | 311 | |
| Jack Henry & Associates | |||
| Inc. | 2,814 | 310 | |
| Intel Corp. | 6,759 | 307 | |
| Analog Devices Inc. | 3,366 | 307 | |
| * | salesforce.com Inc. | 2,986 | 306 |
| Broadridge Financial | |||
| Solutions Inc. | 3,511 | 302 | |
| National Instruments Corp. | 6,592 | 297 | |
| Harris Corp. | 2,126 | 296 | |
| Texas Instruments Inc. | 3,061 | 296 | |
| Apple Inc. | 1,726 | 292 | |
| Fidelity National | |||
| Information Services Inc. | 3,134 | 291 | |
| * | Fiserv Inc. | 2,218 | 287 |
| Corning Inc. | 9,165 | 287 | |
| International Business | |||
| Machines Corp. | 1,815 | 280 | |
| Amdocs Ltd. | 4,292 | 279 | |
| * | Tyler Technologies Inc. | 1,516 | 269 |
| Paychex Inc. | 4,128 | 263 | |
| Cisco Systems Inc. | 7,660 | 262 | |
| * | EchoStar Corp. Class A | 4,462 | 250 |
| * | Alphabet Inc. Class A | 239 | 247 |
| * | VeriSign Inc. | 2,287 | 246 |
| FLIR Systems Inc. | 5,174 | 242 | |
| * | Vantiv Inc. Class A | 3,438 | 241 |
| * | CoreLogic Inc. | 4,813 | 226 |
| CDK Global Inc. | 3,252 | 207 | |
| Western Union Co. | 8,834 | 175 | |
| * | Alphabet Inc. Class C | 58 | 59 |
| 32,390 | |||
| Materials (4.2%) | |||
| Monsanto Co. | 19,000 | 2,301 | |
| * | Polaris Materials Corp. | 750,900 | 1,979 |
| Calgon Carbon Corp. | 81,836 | 1,776 | |
| * | Tembec Inc. | 200,000 | 727 |
| Deltic Timber Corp. | 4,227 | 392 | |
| Avery Dennison Corp. | 3,055 | 324 | |
| Praxair Inc. | 2,209 | 323 | |
| 2 | Bloomage BioTechnology | ||
| Corp. Ltd. | 150,000 | 314 | |
| Ball Corp. | 7,119 | 306 | |
| WR Grace & Co. | 3,945 | 302 | |
| AptarGroup Inc. | 3,411 | 297 | |
| Eastman Chemical Co. | 3,250 | 295 | |
| Ashland Global Holdings | |||
| Inc. | 4,088 | 278 | |
| * | Crown Holdings Inc. | 4,594 | 276 |
| Ecolab Inc. | 2,100 | 274 | |
| Air Products & Chemicals | |||
| Inc. | 1,699 | 271 | |
| Scotts Miracle-Gro Co. | 2,595 | 259 | |
| Sonoco Products Co. | 4,951 | 256 | |
| NewMarket Corp. | 597 | 239 | |
| Sherwin-Williams Co. | 598 | 236 | |
| Silgan Holdings Inc. | 7,626 | 223 | |
| International Flavors | |||
| & Fragrances Inc. | 1,420 | 209 | |
| PPG Industries Inc. | 1,716 | 200 | |
| RPM International Inc. | 3,472 | 185 | |
| 12,242 | |||
| Other (0.0%) | |||
| *,2 | ‘Dyax Corp CVR | ||
| Exp. 12/31/2019 | 28,700 | 57 | |
| Real Estate (3.5%) | |||
| Global Logistic Properties | |||
| Ltd. | 800,000 | 1,949 | |
| Starwood Waypoint | |||
| Homes | 36,000 | 1,307 | |
| * | Howard Hughes Corp. | 2,437 | 311 |
| American Tower | |||
| Corporation | 2,102 | 302 | |
| Douglas Emmett Inc. | 7,454 | 297 | |
| Liberty Property Trust | 6,874 | 295 | |
| Equinix Inc. | 631 | 292 | |
| Park Hotels & Resorts Inc. | 10,102 | 291 | |
| Invitation Homes Inc. | 12,858 | 290 | |
| Welltower Inc. | 4,321 | 289 | |
| WP Carey Inc. | 4,152 | 283 | |
| Essex Property Trust Inc. | 1,047 | 275 | |
| UDR Inc. | 7,000 | 272 | |
| Crown Castle International | |||
| Corp. | 2,523 | 270 | |
| Sun Communities Inc. | 2,972 | 268 | |
| Gaming and Leisure | |||
| Properties Inc. | 7,145 | 261 | |
| Camden Property Trust | 2,838 | 259 | |
| Mid-America Apartment | |||
| Communities Inc. | 2,528 | 259 | |
| * | Equity Commonwealth | 8,392 | 252 |
| Equity Residential | 3,694 | 248 | |
| Duke Realty Corp. | 8,696 | 248 | |
| Apple Hospitality REIT Inc. | 12,839 | 243 | |
| AvalonBay Communities | |||
| Inc. | 1,336 | 242 | |
| Federal Realty Investment | |||
| Trust | 1,933 | 233 | |
| Highwoods Properties Inc. | 4,560 | 233 | |
15
Alternative Strategies Fund
| Market | |||
| Value• | |||
| Shares | ($000) | ||
| DCT Industrial Trust Inc. | 3,793 | 220 | |
| Equity LifeStyle Properties | |||
| Inc. | 2,293 | 203 | |
| Simon Property Group Inc. | 1,148 | 178 | |
| Lamar Advertising Co. | |||
| Class A | 1,583 | 112 | |
| Piedmont Office Realty | |||
| Trust Inc. Class A | 1,588 | 31 | |
| 10,213 | |||
| Telecommunication Services (2.3%) | |||
| * | Straight Path | ||
| Communications Inc. | |||
| Class B | 13,000 | 2,360 | |
| * | Lumos Networks Corp. | 109,554 | 1,967 |
| * | Level 3 Communications | ||
| Inc. | 32,200 | 1,727 | |
| * | T-Mobile US Inc. | 4,228 | 253 |
| Verizon Communications | |||
| Inc. | 4,572 | 219 | |
| AT&T Inc. | 5,852 | 197 | |
| * | Zayo Group Holdings Inc. | 1,248 | 45 |
| 6,768 | |||
| Utilities (5.8%) | |||
| Avista Corp. | 48,000 | 2,508 | |
| * | Calpine Corp. | 167,000 | 2,495 |
| WGL Holdings Inc. | 28,000 | 2,400 | |
| * | TerraForm Global Inc. | ||
| Class A | 441,000 | 2,150 | |
| Exelon Corp. | 7,528 | 303 | |
| CenterPoint Energy Inc. | 10,014 | 296 | |
| Duke Energy Corp. | 3,348 | 296 | |
| CMS Energy Corp. | 6,088 | 295 | |
| American Electric Power | |||
| Co. Inc. | 3,956 | 294 | |
| Westar Energy Inc. | |||
| Class A | 5,475 | 293 | |
| Hawaiian Electric | |||
| Industries Inc. | 7,961 | 290 | |
| Xcel Energy Inc. | 5,777 | 286 | |
| Southern Co. | 5,447 | 284 | |
| DTE Energy Co. | 2,566 | 283 | |
| Public Service Enterprise | |||
| Group Inc. | 5,676 | 279 | |
| Eversource Energy | 4,425 | 277 | |
| Dominion Energy Inc. | 3,200 | 260 | |
| PPL Corp. | 6,874 | 258 | |
| Sempra Energy | 2,140 | 251 | |
| UGI Corp. | 5,253 | 251 | |
| Ameren Corp. | 3,500 | 217 | |
| NextEra Energy Inc. | 1,382 | 214 | |
| Atmos Energy Corp. | 2,429 | 212 | |
| Alliant Energy Corp. | 4,860 | 210 | |
| WEC Energy Group Inc. | 3,045 | 205 | |
| Pinnacle West Capital Corp. | 2,316 | 203 | |
| American Water Works | |||
| Co. Inc. | 2,309 | 203 | |
| Edison International | 2,497 | 200 | |
| Consolidated Edison Inc. | 2,239 | 193 | |
| Entergy Corp. | 2,138 | 184 | |
| Aqua America Inc. | 5,158 | 183 | |
| PG&E Corp. | 2,801 | 162 | |
| Avangrid Inc. | 2,317 | 120 | |
| SCANA Corp. | 2,393 | 103 | |
| Vectren Corp. | 1,328 | 91 | |
| NiSource Inc. | 1,259 | 33 | |
| 16,782 | |||
| Total Common Stocks—Long Positions | |||
| (Cost $165,761) | 179,586 | ||
| Common Stocks Sold Short (-20.7%) | |||
| Consumer Discretionary (-3.2%) | |||
| * | Liberty Interactive Corp. | ||
| QVC Group Class A | (79,853) | (1,814) | |
| * | Discovery Communications | ||
| Inc. Class A | (32,659) | (617) | |
| Sinclair Broadcast Group | |||
| Inc. Class A | (13,570) | (430) | |
| Thor Industries Inc. | (2,581) | (352) | |
| * | Skechers U. S. A. Inc. | ||
| Class A | (10,189) | (325) | |
| * | Netflix Inc. | (1,600) | (314) |
| BorgWarner Inc. | (5,921) | (312) | |
| Ralph Lauren Corp. | |||
| Class A | (3,479) | (311) | |
| Wynn Resorts Ltd. | (2,105) | (310) | |
| * | Lululemon Athletica Inc. | (4,959) | (305) |
| * | Michael Kors Holdings Ltd. | (5,687) | (278) |
| Kohl’s Corp. | (6,564) | (274) | |
| Best Buy Co. Inc. | (4,763) | (267) | |
| Gap Inc. | (10,069) | (262) | |
| Dick’s Sporting Goods Inc. | (10,694) | (262) | |
| * | TripAdvisor Inc. | (6,931) | (260) |
| L Brands Inc. | (6,010) | (259) | |
| * | O’Reilly Automotive Inc. | (1,216) | (256) |
| Macy’s Inc. | (13,540) | (254) | |
| * | Murphy USA Inc. | (3,371) | (251) |
| * | Liberty Media Corp- | ||
| Liberty Formula One | (6,534) | (249) | |
| * | Michaels Cos. Inc. | (12,475) | (242) |
| Foot Locker Inc. | (7,830) | (236) | |
| Penske Automotive Group | |||
| Inc. | (4,715) | (220) | |
| H&R Block Inc. | (8,143) | (201) | |
| Advance Auto Parts Inc. | (2,329) | (190) | |
| Bed Bath & Beyond Inc. | (8,687) | (173) | |
| Viacom Inc. Class B | (6,182) | (149) | |
16
Alternative Strategies Fund
| Market | |||
| Value• | |||
| Shares | ($000) | ||
| Goodyear Tire | |||
| & Rubber Co. | (4,256) | (130) | |
| (9,503) | |||
| Consumer Staples (-0.5%) | |||
| Kroger Co. | (14,057) | (291) | |
| Bunge Ltd. | (3,921) | (270) | |
| * | Sprouts Farmers Market | ||
| Inc. | (14,440) | (267) | |
| Nu Skin Enterprises Inc. | |||
| Class A | (3,869) | (246) | |
| * | TreeHouse Foods Inc. | (2,900) | (193) |
| * | Rite Aid Corp. | (103,306) | (170) |
| * | Hain Celestial Group Inc. | (1,546) | (56) |
| (1,493) | |||
| Energy (-2.8%) | |||
| EQT Corp. | (29,600) | (1,851) | |
| SM Energy Co. | (17,400) | (371) | |
| * | Continental Resources Inc. | (8,212) | (334) |
| * | Whiting Petroleum Corp. | (55,454) | (333) |
| Marathon Oil Corp. | (22,718) | (323) | |
| * | QEP Resources Inc. | (33,837) | (303) |
| Patterson-UTI Energy Inc. | (15,062) | (298) | |
| * | Kosmos Energy Ltd. | (38,686) | (297) |
| HollyFrontier Corp. | (8,024) | (297) | |
| * | WPX Energy Inc. | (26,112) | (295) |
| * | CONSOL Energy Inc. | (18,217) | (294) |
| * | Diamondback Energy Inc. | (2,692) | (288) |
| * | Gulfport Energy Corp. | (20,057) | (275) |
| Hess Corp. | (6,202) | (274) | |
| Murphy Oil Corp. | (10,080) | (270) | |
| * | RSP Permian Inc. | (7,808) | (269) |
| * | Cheniere Energy Inc. | (5,534) | (259) |
| * | Southwestern Energy Co. | (46,583) | (259) |
| * | Laredo Petroleum Inc. | (21,680) | (258) |
| * | Energen Corp. | (4,958) | (256) |
| * | Newfield Exploration Co. | (7,873) | (242) |
| Nabors Industries Ltd. | (37,193) | (209) | |
| Devon Energy Corp. | (5,146) | (190) | |
| * | Parsley Energy Inc. | ||
| Class A | (6,483) | (172) | |
| National Oilwell Varco Inc. | (3,473) | (119) | |
| (8,336) | |||
| Financials (-5.0%) | |||
| Columbia Banking System | |||
| Inc. | (47,774) | (2,079) | |
| First Horizon National | |||
| Corp. | (101,448) | (1,904) | |
| First Financial Bancorp | (41,625) | (1,136) | |
| Sandy Spring Bancorp Inc. | (26,139) | (1,056) | |
| Union Bankshares Corp. | (28,062) | (968) | |
| OceanFirst Financial Corp. | (15,768) | (438) | |
| Towne Bank | (11,763) | (394) | |
| Associated Banc-Corp | (14,979) | (379) | |
| * | OneMain Holdings Inc. | ||
| Class A | (10,528) | (334) | |
| * | SVB Financial Group | (1,525) | (334) |
| * | Santander Consumer USA | ||
| Holdings Inc. | (20,030) | (333) | |
| Citizens Financial Group | |||
| Inc. | (7,932) | (301) | |
| TCF Financial Corp. | (16,351) | (298) | |
| * | Western Alliance Bancorp | (5,155) | (288) |
| PacWest Bancorp | (5,943) | (287) | |
| LPL Financial Holdings Inc. | (5,762) | (286) | |
| Ameriprise Financial Inc. | (1,800) | (282) | |
| Regions Financial Corp. | (17,743) | (275) | |
| Popular Inc. | (7,319) | (268) | |
| Webster Financial Corp. | (4,872) | (268) | |
| Pinnacle Financial Partners | |||
| Inc. | (4,032) | (267) | |
| Prosperity Bancshares Inc. | (3,948) | (260) | |
| East West Bancorp Inc. | (4,292) | (257) | |
| Bank of the Ozarks | (5,425) | (253) | |
| First Hawaiian Inc. | (8,364) | (245) | |
| Lincoln National Corp. | (3,069) | (233) | |
| * | SLM Corp. | (21,709) | (230) |
| * | Signature Bank | (1,764) | (229) |
| Navient Corp. | (17,751) | (221) | |
| TD Ameritrade Holding | |||
| Corp. | (4,111) | (206) | |
| * | E*TRADE Financial Corp. | (3,964) | (173) |
| Voya Financial Inc. | (2,993) | (120) | |
| Invesco Ltd. | (2,695) | (96) | |
| (14,698) | |||
| Health Care (-2.1%) | |||
| Becton Dickinson and Co. | (3,706) | (773) | |
| * | Seattle Genetics Inc. | (5,502) | (337) |
| * | Neurocrine Biosciences | ||
| Inc. | (5,055) | (314) | |
| * | Illumina Inc. | (1,459) | (299) |
| * | Exelixis Inc. | (12,004) | (298) |
| * | Mylan NV | (8,213) | (293) |
| * | DexCom Inc. | (6,437) | (290) |
| * | Incyte Corp. | (2,555) | (289) |
| Perrigo Co. plc | (3,498) | (283) | |
| * | Vertex Pharmaceuticals | ||
| Inc. | (1,842) | (269) | |
| * | Alexion Pharmaceuticals | ||
| Inc. | (2,116) | (253) | |
| * | Edwards Lifesciences | ||
| Corp. | (2,420) | (248) | |
| * | Brookdale Senior Living | ||
| Inc. | (23,765) | (238) | |
| * | Regeneron | ||
| Pharmaceuticals Inc. | (583) | (235) | |
| * | Alkermes plc | (4,607) | (225) |
17
Alternative Strategies Fund
| Market | |||
| Value• | |||
| Shares | ($000) | ||
| * | Bioverativ Inc. | (3,940) | (223) |
| * | BioMarin Pharmaceutical | ||
| Inc. | (2,707) | (222) | |
| * | Endo International plc | (34,150) | (218) |
| * | Mallinckrodt plc | (6,685) | (212) |
| * | Envision Healthcare Corp. | (4,600) | (196) |
| * | Biogen Inc. | (596) | (186) |
| * | Alnylam Pharmaceuticals | ||
| Inc. | (1,070) | (130) | |
| (6,031) | |||
| Industrials (-1.9%) | |||
| United Technologies Corp. | (6,780) | (812) | |
| Terex Corp. | (7,003) | (330) | |
| * | United Rentals Inc. | (2,281) | (323) |
| * | XPO Logistics Inc. | (4,494) | (312) |
| Trinity Industries Inc. | (9,434) | (307) | |
| * | WESCO International Inc. | (4,785) | (302) |
| * | HD Supply Holdings Inc. | (8,093) | (286) |
| * | Colfax Corp. | (6,841) | (285) |
| * | AECOM | (7,869) | (276) |
| Arconic Inc. | (10,859) | (273) | |
| MSC Industrial Direct | |||
| Co. Inc. Class A | (3,190) | (264) | |
| Timken Co. | (5,507) | (260) | |
| American Airlines Group | |||
| Inc. | (5,501) | (257) | |
| Pitney Bowes Inc. | (18,284) | (251) | |
| CSX Corp. | (4,855) | (245) | |
| * | United Continental | ||
| Holdings Inc. | (3,657) | (214) | |
| Acuity Brands Inc. | (1,225) | (205) | |
| * | Spirit Airlines Inc. | (4,473) | (166) |
| * | JetBlue Airways Corp. | (5,865) | (112) |
| (5,480) | |||
| Information Technology (-2.2%) | |||
| * | Micron Technology Inc. | (8,552) | (379) |
| * | Square Inc. | (10,123) | (377) |
| * | Twitter Inc. | (17,268) | (356) |
| NVIDIA Corp. | (1,657) | (343) | |
| * | ON Semiconductor Corp. | (16,070) | (343) |
| * | Autodesk Inc. | (2,611) | (326) |
| * | Tableau Software Inc. | ||
| Class A | (3,993) | (324) | |
| * | Workday Inc. Class A | (2,866) | (318) |
| DXC Technology Co. | (3,456) | (316) | |
| * | Palo Alto Networks Inc. | (2,123) | (313) |
| * | Akamai Technologies Inc. | (5,894) | (308) |
| * | Coherent Inc. | (1,134) | (298) |
| * | FleetCor Technologies Inc. | (1,794) | (297) |
| * | Cavium Inc. | (4,274) | (295) |
| * | FireEye Inc. | (17,212) | (291) |
| * | First Solar Inc. | (5,297) | (290) |
| Western Digital Corp. | (3,129) | (279) | |
| Universal Display Corp. | (1,857) | (272) | |
| * | Take-Two Interactive | ||
| Software Inc. | (2,381) | (263) | |
| * | ARRIS International plc | (9,016) | (257) |
| * | Zillow Group Inc. Class A | (2,758) | (114) |
| Skyworks Solutions Inc. | (531) | (60) | |
| (6,419) | |||
| Materials (-1.2%) | |||
| Chemours Co. | (5,684) | (322) | |
| * | Alcoa Corp. | (6,721) | (321) |
| CF Industries Holdings Inc. | (7,803) | (296) | |
| Steel Dynamics Inc. | (7,958) | (296) | |
| * | Freeport-McMoRan Inc. | (20,981) | (293) |
| Newmont Mining Corp. | (7,949) | (287) | |
| Nucor Corp. | (4,696) | (272) | |
| Mosaic Co. | (12,155) | (272) | |
| Royal Gold Inc. | (2,887) | (243) | |
| Tahoe Resources Inc. | (50,571) | (243) | |
| * | Platform Specialty | ||
| Products Corp. | (21,891) | (234) | |
| Rayonier Advanced | |||
| Materials Inc. | (15,160) | (218) | |
| Reliance Steel | |||
| & Aluminum Co. | (1,879) | (144) | |
| (3,441) | |||
| Real Estate (-0.9%) | |||
| Invitation Homes Inc. | (58,104) | (1,312) | |
| Potlatch Corp. | (7,608) | (394) | |
| CoreCivic Inc. | (10,031) | (247) | |
| Spirit Realty Capital Inc. | (29,656) | (247) | |
| DDR Corp. | (26,483) | (203) | |
| * | CBRE Group Inc. Class A | (3,418) | (134) |
| (2,537) | |||
| Telecommunication Services (-0.7%) | |||
| AT&T Inc. | (27,229) | (916) | |
| CenturyLink Inc. | (46,000) | (874) | |
| * | Sprint Corp. | (30,414) | (199) |
| (1,989) | |||
| Utilities (-0.2%) | |||
| NRG Energy Inc. | (11,702) | (292) | |
| * | Vistra Energy Corp. | (14,646) | (285) |
| (577) | |||
| Total Common Stocks Sold Short | |||
| (Proceeds $58,722) | (60,504) | ||
18
Alternative Strategies Fund
| Market | |||
| Value• | |||
| Shares | ($000) | ||
| Temporary Cash Investments (22.8%) | |||
| Money Market Fund (17.3%) | |||
| 3 | Vanguard Market Liquidity | ||
| Fund, 1.246% | 506,702 | 50,676 | |
| Face | |||
| Amount | |||
| ($000) | |||
| U. S. Government and Agency Obligations (5.5%) | |||
| United States Treasury Bill, | |||
| 1.099%, 11/2/17 | 1,300 | 1,300 | |
| 4 | United States Treasury Bill, | ||
| 1.084%, 2/1/18 | 1,300 | 1,296 | |
| 5 | United States Treasury Bill, | ||
| 1.098%, 2/1/18 | 4,000 | 3,989 | |
| 4,5 | United States Treasury Bill, | ||
| 1.087%, 3/1/18 | 1,500 | 1,494 | |
| United States Treasury Bill, | |||
| 1.169%, 3/22/18 | 1,200 | 1,194 | |
| 4,5 | United States Treasury Bill, | ||
| 1.169%, 3/22/18 | 6,700 | 6,669 | |
| 15,942 | |||
| Total Temporary Cash Investments | |||
| (Cost $66,617) | 66,618 | ||
| †Other Assets and Liabilities— | |||
| Net (36.5%) | 106,547 | ||
| Net Assets (100%) | |||
| Applicable to 14,282,699 outstanding | |||
| $.001 par value shares of beneficial | |||
| interest (unlimited authorization) | 292,247 | ||
| Net Asset Value Per Share | $20.46 | ||
| Consolidated Statement of Assets and Liabilities | |
| Assets | |
| Investments in Securities, | |
| Long Positions, at Value | |
| Unaffiliated Issuers | 185,156 |
| Collateral for Short Positions | 5,940 |
| Collateral for Futures Contracts | 4,432 |
| Total Unaffiliated Issuers | 195,528 |
| Affiliated Vanguard Funds | 50,676 |
| Total Long Positions | 246,204 |
| Investment in Vanguard | 20 |
| †Cash Segregated for Short Positions | 79,188 |
| Receivables for Investment Securities | |
| Sold | 3,521 |
| Receivables for Accrued Income | 129 |
| Receivables for Capital Shares Issued | 2 |
| Variation Margin Receivable— | |
| Futures Contracts | 1,147 |
| Unrealized Appreciation— | |
| Forward Currency Contracts | 1,718 |
| Other Assets | 26,022 |
| Total Assets | 357,951 |
| Liabilities | |
| Securities Sold Short, at Value | 60,504 |
| Payables for Investment Securities | |
| Purchased | 1,389 |
| Payables for Capital Shares Redeemed | 1,518 |
| Payables to Vanguard | 109 |
| Variation Margin Payable— | |
| Futures Contracts | 537 |
| Unrealized Depreciation— | |
| Forward Currency Contracts | 1,647 |
| Total Liabilities | 65,704 |
| Net Assets | 292,247 |
Alternative Strategies Fund
| At October 31, 2017, net assets consisted of: | |
| Amount | |
| ($000) | |
| Paid-in Capital | 280,702 |
| Undistributed Net Investment Income | 547 |
| Accumulated Net Realized Losses | (148) |
| Unrealized Appreciation (Depreciation) | |
| Investment Securities—Long Positions | 13,826 |
| Investment Securities Sold Short | (1,782) |
| Futures Contracts | (958) |
| Forward Currency Contracts | 71 |
| Foreign Currencies | (11) |
| Net Assets | 292,247 |
• See Note A in Notes to Financial Statements.
* Non-income-producing security.
† Long security positions with a value of $5,940,000 and cash of $79,188,000 are held in segregated accounts at the fund’s custodian bank and pledged to a broker-dealer as collateral for the fund’s obligation to return borrowed securities. For so long as such obligations continue, the fund’s access to these assets is subject to authorization from the broker-dealer.
1Security exempt from registration under Rule 144A of the Securities Act of 1933. Such securities may be sold in transactions exempt from registration, normally to qualified institutional buyers. At October 31, 2017, the value of this security represented 0.8% of net assets.
2 Security value determined using significant unobservable inputs.
3 Affiliated money market fund available only to Vanguard funds and certain trusts and accounts managed by Vanguard. Rate shown is the 7-day yield.
4 Securities with a value of $4,432,000 have been segregated as initial margin for open futures contracts.
5 Security is owned by the Vanguard ASF Portfolio, which is a wholly owned subsidiary of the Alternative Strategies Fund.
CVR—Contingent Value Rights.
REIT—Real Estate Investment Trust.
20
Alternative Strategies Fund
| Derivative Financial Instruments Outstanding as of Period End | ||||
| Futures Contracts | ||||
| ($000) | ||||
| Value and | ||||
| Number of | Unrealized | |||
| Long (Short) | Notional | Appreciation | ||
| Expiration | Contracts | Amount | (Depreciation) | |
| Long Futures Contracts | ||||
| 2-Year U.S. Treasury Note | December 2017 | 880 | 189,516 | (748) |
| 5-Year U.S. Treasury Note | December 2017 | 382 | 44,766 | (411) |
| 10-Year U.S. Treasury Note | December 2017 | 232 | 28,986 | (364) |
| RBOB Gasoline1 | November 2017 | 53 | 3,857 | 252 |
| LME Zinc1 | December 2017 | 46 | 3,784 | 25 |
| Low Sulphr Gas Oil1 | December 2017 | 69 | 3,779 | 67 |
| Soybean Oil1 | December 2017 | 178 | 3,711 | 105 |
| Soybean1 | January 2018 | 74 | 3,644 | (84) |
| LME Tin1 | December 2017 | 37 | 3,595 | (228) |
| Cotton No. 21 | December 2017 | 105 | 3,590 | (86) |
| LME Copper1 | December 2017 | 21 | 3,586 | (155) |
| (1,627) | ||||
| Short Futures Contracts | ||||
| Sugar #111 | February 2018 | (232) | (3,830) | (148) |
| Feeder Cattle1 | January 2018 | (48) | (3,829) | (152) |
| Coffee1 | December 2017 | (78) | (3,659) | 329 |
| LME Aluminium1 | December 2017 | (67) | (3,605) | — |
| Soybean Meal1 | December 2017 | (115) | (3,586) | 16 |
| Corn1 | December 2017 | (207) | (3,579) | 61 |
| Natural Gas1 | November 2017 | (121) | (3,504) | 226 |
| KC Hard Red Winter Wheat1 | December 2017 | (168) | (3,499) | 337 |
| 669 | ||||
| (958) | ||||
| 1 Security is owned by the subsidiary. | ||||
21
Alternative Strategies Fund
| Forward Currency Contracts | ||||||
| Unrealized | ||||||
| Contract | Appreciation | |||||
| Settlement | Contract Amount (000) | (Depreciation) | ||||
| Counterparty | Date | Receive | Deliver | ($000) | ||
| Bank of America, N.A. | 11/8/17 | CAD | 28,325 | USD | 22,653 | (697) |
| Bank of America, N.A. | 11/8/17 | AUD | 28,892 | USD | 22,573 | (464) |
| Bank of America, N.A. | 11/8/17 | NOK | 169,876 | USD | 21,284 | (485) |
| Bank of America, N.A. | 11/8/17 | USD | 24,357 | EUR | 20,675 | 262 |
| Bank of America, N.A. | 11/8/17 | USD | 21,706 | CHF | 21,017 | 630 |
| Bank of America, N.A. | 11/8/17 | USD | 21,404 | SEK | 174,594 | 541 |
| Bank of America, N.A. | 11/8/17 | USD | 5,885 | CAD | 7,362 | 180 |
| Bank of America, N.A. | 11/8/17 | USD | 5,271 | GBP | 3,967 | (1) |
| Bank of America, N.A. | 11/8/17 | USD | 3,634 | AUD | 4,648 | 75 |
| Bank of America, N.A. | 11/8/17 | USD | 3,032 | SGD | 4,129 | 4 |
| Bank of America, N.A. | 11/8/17 | USD | 2,472 | DKK | 15,610 | 26 |
| Bank of America, N.A. | 11/8/17 | USD | 306 | HKD | 2,391 | — |
| 71 | ||||||
| AUD—Australian dollar. | ||||||
| CAD—Canadian dollar. | ||||||
| CHF—Swiss franc. | ||||||
| DKK—Danish krone. | ||||||
| EUR—Euro. | ||||||
| GBP—British pound. | ||||||
| HKD—Hong Kong dollar. | ||||||
| NOK—Norwegian krone. | ||||||
| SEK—Swedish krona. | ||||||
| SGD—Singapore dollar. | ||||||
| USD—U.S. dollar. | ||||||
Unrealized appreciation (depreciation) on open forward currency contracts, except for Singapore dollar, Hong Kong dollar, and Danish krone contracts, is treated as realized gain (loss) for tax purposes.
See accompanying Notes, which are an integral part of the Financial Statements.
22
Alternative Strategies Fund
| Consolidated Statement of Operations | |
| Year Ended | |
| October 31, 2017 | |
| ($000) | |
| Investment Income | |
| Income | |
| Dividends1 | 3,251 |
| Interest 2 | 794 |
| Total Income | 4,045 |
| Expenses | |
| The Vanguard Group—Note B | |
| Investment Advisory Services | 346 |
| Management and Administrative | 376 |
| Marketing and Distribution | 47 |
| Custodian Fees | 58 |
| Auditing Fees | 66 |
| Shareholders’ Reports and Proxy | 5 |
| Trustees’ Fees and Expenses | 11 |
| Dividend Expense on Securities Sold Short | 1,163 |
| Total Expenses | 2,072 |
| Net Investment Income (Loss) | 1,973 |
| Realized Net Gain (Loss) | |
| Investment Securities—Long Positions 2 | 4,066 |
| Investment Securities Sold Short | (2,587) |
| Futures Contracts | (10,309) |
| Foreign Currencies and Forward Currency Contracts | (169) |
| Realized Net Gain (Loss) | (8,999) |
| Change in Unrealized Appreciation (Depreciation) | |
| Investment Securities—Long Positions 2 | 13,259 |
| Investment Securities Sold Short | (3,775) |
| Futures Contracts | (413) |
| Foreign Curriencies and Forward Currency Contracts | (1,048) |
| Change in Unrealized Appreciation (Depreciation) | 8,023 |
| Net Increase (Decrease) in Net Assets Resulting from Operations | 997 |
1 Dividends are net of foreign withholding taxes of $39,000.
2 Interest income, realized net gain (loss), and change in unrealized appreciation (depreciation) from an affiliated company of the fund were $562,000, $1,000, and ($2,000), respectively.
See accompanying Notes, which are an integral part of the Financial Statements.
23
Alternative Strategies Fund
| Consolidated Statement of Changes in Net Assets | ||
| Year Ended October 31, | ||
| 2017 | 2016 | |
| ($000) | ($000) | |
| Increase (Decrease) in Net Assets | ||
| Operations | ||
| Net Investment Income (Loss) | 1,973 | 886 |
| Realized Net Gain (Loss) | (8,999) | 8,396 |
| Change in Unrealized Appreciation (Depreciation) | 8,023 | (1,055) |
| Net Increase (Decrease) in Net Assets Resulting from Operations | 997 | 8,227 |
| Distributions | ||
| Net Investment Income | (1,072) | (746) |
| Realized Capital Gain1 | (8,751) | — |
| Total Distributions | (9,823) | (746) |
| Capital Share Transactions | ||
| Issued | 70,512 | 81,010 |
| Issued in Lieu of Cash Distributions | 9,823 | 746 |
| Redeemed | (14,643) | (12,647) |
| Net Increase (Decrease) from Capital Share Transactions | 65,692 | 69,109 |
| Total Increase (Decrease) | 56,866 | 76,590 |
| Net Assets | ||
| Beginning of Period | 235,381 | 158,791 |
| End of Period2 | 292,247 | 235,381 |
1 Includes fiscal 2017 and 2016 short-term gain distributions totaling $5,983,000 and $0, respectively. Short-term gain distributions are treated as ordinary income dividends for tax purposes.
2 Net Assets—End of Period includes undistributed (overdistributed) net investment income of $547,000 and $1,966,000.
See accompanying Notes, which are an integral part of the Financial Statements.
24
Alternative Strategies Fund
| Consolidated Financial Highlights | |||
| Aug. 11, | |||
| Year Ended | 20151 to | ||
| October 31, | Oct. 31, | ||
| For a Share Outstanding Throughout Each Period | 2017 | 2016 | 2015 |
| Net Asset Value, Beginning of Period | $21.28 | $20.23 | $20.00 |
| Investment Operations | |||
| Net Investment Income (Loss) | .153 2 | .106 | .004 |
| Net Realized and Unrealized Gain (Loss) on Investments | (.139) | 1.039 | .226 |
| Total from Investment Operations | .014 | 1.145 | .230 |
| Distributions | |||
| Dividends from Net Investment Income | (.093) | (.095) | — |
| Distributions from Realized Capital Gains | (.741) | — | — |
| Total Distributions | (.834) | (.095) | — |
| Net Asset Value, End of Period | $20.46 | $21.28 | $20.23 |
| Total Return3 | 0.11% | 5.68% | 1.15% |
| Ratios/Supplemental Data | |||
| Net Assets, End of Period (Millions) | $292 | $235 | $159 |
| Ratio of Total Expenses to Average Net Assets | |||
| Based on Total Expenses4,5 | 0.79% | 0.71% | 0.73%6 |
| Net of Dividend and Borrowing Expense on Securities Sold Short | 0.35% | 0.36% | 0.36%6 |
| Ratio of Net Investment Income (Loss) to Average Net Assets | 0.75% | 0.50% | 0.09%6 |
| Portfolio Turnover Rate | 125% | 120% | 25% |
1 Inception.
2 Calculated based on average shares outstanding.
3 Total returns do not include account service fees that may have applied in the periods shown. Fund prospectuses provide information about any applicable account service fees.
4 Includes dividend expense on securities sold short of 0.44%, 0.35%, and 0.34%, respectively.
5 Includes borrowing expense on securities sold short of 0.00%, 0.00%, and 0.03%, respectively.
6 Annualized.
See accompanying Notes, which are an integral part of the Financial Statements.
25
Alternative Strategies Fund
Notes to Consolidated Financial Statements
Vanguard Alternative Strategies Fund is registered under the Investment Company Act of 1940 as an open-end investment company, or mutual fund.
The Consolidated Financial Statements include Vanguard ASF Portfolio (“the subsidiary”), which commenced operations on August 11, 2015. The subsidiary is wholly owned by the fund and is a unit trust established in the Cayman Islands under the Trusts Law (2011 Revision) of the Cayman Islands, which is organized to invest in certain commodity-linked investments on behalf of the fund, consistent with the fund’s investment objectives and policies. The commodity-linked investments and other investments held by the subsidiary are subject to the same risks that apply to similar investments if held directly by the fund. As of October 31, 2017, the fund held $17,571,000 in the subsidiary, representing 6% of the fund’s net assets. All inter-fund transactions and balances (including the fund’s investment in the subsidiary) have been eliminated, and the Consolidated Financial Statements include all investments and other accounts of the subsidiary as if held directly by the fund. A summary of the subsidiary’s financial information is presented below.
| Amount | |
| Subsidiary Financial Statement Information | ($000) |
| Total Assets | 18,000 |
| Total Liabilities | (429) |
| Net Assets | 17,571 |
| Net Investment Income (Loss) | (33) |
| Realized Net Gain (Loss) | (9,184) |
| Change in Unrealized Appreciation (Depreciation) | 442 |
| Net Increase (Decrease) in Net Assets Resulting from Operations | (8,775) |
A. The following significant accounting policies conform to generally accepted accounting principles for U.S. investment companies. The fund consistently follows such policies in preparing its financial statements.
1. Security Valuation: Securities are valued as of the close of trading on the New York Stock Exchange (generally 4 p.m., Eastern time) on the valuation date. Equity securities are valued at the latest quoted sales prices or official closing prices taken from the primary market in which each security trades; such securities not traded on the valuation date are valued at the mean of the latest quoted bid and asked prices. Securities for which market quotations are not readily available, or whose values have been materially affected by events occurring before the fund’s pricing time but after the close of the securities’ primary markets, are valued by methods deemed by the board of trustees to represent fair value. Investments in Vanguard Market Liquidity Fund are valued at that fund’s net asset value. Temporary cash investments acquired are valued using the latest bid prices or using valuations based on a matrix system (which considers such factors as security prices, yields, maturities, and ratings), both as furnished by independent pricing services.
2. Foreign Currency: Securities and other assets and liabilities denominated in foreign currencies are translated into U.S. dollars using exchange rates obtained from an independent third party as of the fund’s pricing time on the valuation date. Realized gains (losses) and unrealized appreciation (depreciation) on investment securities include the effects of changes in exchange rates since the securities were purchased, combined with the effects of changes in security prices. Fluctuations
26
Alternative Strategies Fund
in the value of other assets and liabilities resulting from changes in exchange rates are recorded as unrealized foreign currency gains (losses) until the assets or liabilities are settled in cash, at which time they are recorded as realized foreign currency gains (losses).
3. Futures Contracts: The fund gains exposure to commodities through the subsidiary’s investment in exchange-traded commodity futures contracts. The primary risk associated with the use of commodity futures contracts is the chance the fund could lose all, or substantially all, of its investments in instruments linked to the returns of commodity futures. Commodity futures trading is volatile, and even a small movement in market prices could cause large losses. The fund also uses futures contracts to invest in fixed income asset classes with greater efficiency and lower cost than is possible through direct investment, to add value when these instruments are attractively priced, or to adjust sensitivity to changes in interest rates. The primary risks associated with the use of futures contracts are imperfect correlation between changes in market values of bonds held by the fund and the prices of futures contracts, and the possibility of an illiquid market. Counterparty risk involving futures is mitigated because a regulated clearinghouse is the counterparty instead of the clearing broker. To further mitigate counterparty risk, the fund trades futures contracts on an exchange, monitors the financial strength of its clearing brokers and clearinghouse, and has entered into clearing agreements with its clearing brokers. The clearinghouse imposes initial margin requirements to secure the fund’s performance and requires daily settlement of variation margin representing changes in the market value of each contract.
Futures contracts are valued at their quoted daily settlement prices. The notional amounts of the contracts are not recorded in the Consolidated Statement of Net Assets. Fluctuations in the value of the contracts are recorded in the Consolidated Statement of Assets and Liabilities as an asset (liability) and in the Consolidated Statement of Operations as unrealized appreciation (depreciation) until the contracts are closed, when they are recorded as realized futures gains (losses).
During the year ended October 31, 2017, the fund’s average investments in long and short futures contracts represented 103% and 14% of net assets, respectively.
4. Forward Currency Contracts: The fund enters into forward currency contracts to enhance returns and protect the value of securities and related receivables and payables against changes in future foreign exchange rates. The fund’s risks in using these contracts include movement in the values of the foreign currencies relative to the U.S. dollar and the ability of the counterparties to fulfill their obligations under the contracts. The fund mitigates its counterparty risk by entering into forward currency contracts only with a diverse group of prequalified counterparties, monitoring their financial strength, entering into master netting arrangements with its counterparties, and requiring its counter- parties to transfer collateral as security for their performance. In the absence of a default, the collateral pledged or received by the fund cannot be repledged, resold or rehypothecated. The master netting arrangements provide that, in the event of a counterparty’s default (including bankruptcy), the fund may terminate the forward currency contracts, determine the net amount owed by either party in accordance with its master netting arrangements, and sell or retain any collateral held up to the net amount owed to the fund under the master netting arrangements. The forward currency contracts contain provisions whereby a counterparty may terminate open contracts if the fund’s net assets decline below a certain level, triggering a payment by the fund if the fund is in a net liability position at the time of the termination. The payment amount would be reduced by any collateral the fund has pledged. Any assets pledged as collateral for open contracts are noted in the Consolidated Statement of Net Assets. The value of collateral
27
Alternative Strategies Fund
received or pledged is compared daily to the value of the forward currency contracts exposure with each counterparty, and any difference, if in excess of a specified minimum transfer amount, is adjusted and settled within two business days.
Forward currency contracts are valued at their quoted daily prices obtained from an independent third party, adjusted for currency risk based on the expiration date of each contract. The notional amounts of the contracts are not recorded in the Consolidated Statement of Net Assets. Fluctuations in the value of the contracts are recorded in the Consolidated Statement of Assets and Liabilities as an asset (liability) and in the Consolidated Statement of Operations as unrealized appreciation (depreciation) until the contracts are closed, when they are recorded as realized forward currency contract gains (losses).
During the year ended October 31, 2017, the fund’s average investment in forward currency contracts represented 5% of net assets, based on the average of notional amounts at each quarter-end during the period.
5. Short Sales: Short sales are the sales of securities that the fund does not own. The fund sells a security it does not own in anticipation of a decline in the value of that security. In order to deliver the security to the purchaser, the fund borrows the security from a broker-dealer. The fund must segregate, as collateral for its obligation to return the borrowed security, an amount of cash and long security positions at least equal to the market value of the security sold short, and in the absence of a default, such collateral cannot be repledged, resold, or rehypothecated. This results in the fund holding a significant portion of its assets in cash. The fund later closes out the position by returning the security to the lender, typically by purchasing the security in the open market.
A gain, limited to the price at which the fund sold the security short, or a loss, theoretically unlimited in size, is recognized upon the termination of the short sale. The fund may receive a portion of the income from the investment of collateral, or be charged a fee on borrowed securities, based on the market value of each borrowed security and a variable rate that is dependent upon the availability of such security. The net amounts of income or fees are recorded as interest income (for net income received) or borrowing expense on securities sold short (for net fees charged) on the Consolidated Statement of Operations. Dividends on securities sold short are reported as an expense in the Consolidated Statement of Operations. Cash collateral segregated for securities sold short is recorded as an asset in the Consolidated Statement of Assets and Liabilities. Long security positions segregated as collateral are shown in the Consolidated Statement of Net Assets.
6. Federal Income Taxes: The fund intends to continue to qualify as a regulated investment company and distribute all of its taxable income. The subsidiary is classified as a foreign corporation for U.S. tax purposes, and because it does not carry on a U.S. trade or business, is generally not subject to U.S. federal income tax. The subsidiary also complies with the Foreign Account Tax Compliance Act (“FATCA”) and thus will not be subject to 30% withholding under FATCA on any income from U.S. investments. In addition, the subsidiary is not subject to Cayman Islands income tax. The subsidiary will generally distribute any earnings and profits to the fund each year, and such income will be qualifying income to the fund. Management has analyzed the fund’s tax positions taken for all open federal income tax years (October 31, 2015–2017), and has concluded that no provision for federal income tax is required in the fund’s financial statements.
7. Distributions: Distributions to shareholders are recorded on the ex-dividend date.
28
Alternative Strategies Fund
8. Credit Facility: The fund and certain other funds managed by The Vanguard Group (“Vanguard”) participate in a $3.1 billion committed credit facility provided by a syndicate of lenders pursuant to a credit agreement that may be renewed annually; each fund is individually liable for its borrowings, if any, under the credit facility. Borrowings may be utilized for temporary and emergency purposes, and are subject to the fund’s regulatory and contractual borrowing restrictions. The participating funds are charged administrative fees and an annual commitment fee of 0.10% of the undrawn amount of the facility; these fees are allocated to the funds based on a method approved by the fund’s board of trustees and included in Management and Administrative expenses on the fund’s Consolidated Statement of Operations. Any borrowings under this facility bear interest at a rate based upon the higher of the one-month London Interbank Offered Rate, federal funds effective rate, or overnight bank funding rate plus an agreed-upon spread.
The fund had no borrowings outstanding at October 31, 2017, or at any time during the period then ended.
9. Other: Dividend income (or dividend expenses on short positions) is recorded on the ex-dividend date. Interest income includes income distributions received from Vanguard Market Liquidity Fund and is accrued daily. Premiums and discounts on debt securities purchased are amortized and accreted, respectively, to interest income over the lives of the respective securities. Security transactions are accounted for on the date securities are bought or sold. Costs used to determine realized gains (losses) on the sale of investment securities are those of the specific securities sold.
B. In accordance with the terms of a Funds’ Service Agreement (the “FSA”) between Vanguard and the fund, Vanguard furnishes to the fund investment advisory, corporate management, administrative, marketing, and distribution services at Vanguard’s cost of operations (as defined by the FSA). These costs of operations are allocated to the fund based on methods and guidelines approved by the board of trustees. Vanguard does not require reimbursement in the current period for certain costs of operations (such as deferred compensation/benefits and risk/insurance costs); the fund’s liability for these costs of operations is included in Payables to Vanguard on the Consolidated Statement of Assets and Liabilities.
Upon the request of Vanguard, the fund may invest up to 0.40% of its net assets as capital in Vanguard. At October 31, 2017, the fund had contributed to Vanguard capital in the amount of $20,000, representing 0.01% of the fund’s net assets and 0.01% of Vanguard’s capitalization. The fund’s trustees and officers are also directors and employees, respectively, of Vanguard.
C. Various inputs may be used to determine the value of the fund’s investments. These inputs are summarized in three broad levels for financial statement purposes. The inputs or methodologies used to value securities are not necessarily an indication of the risk associated with investing in those securities.
Level 1—Quoted prices in active markets for identical securities.
Level 2—Other significant observable inputs (including quoted prices for similar securities, interest rates, prepayment speeds, credit risk, etc.).
Level 3—Significant unobservable inputs (including the fund’s own assumptions used to determine the fair value of investments). Any investments valued with significant unobservable inputs are noted on the Consolidated Statement of Net Assets.
29
Alternative Strategies Fund
The following table summarizes the market value of the fund’s investments as of October 31, 2017, based on the inputs used to value them:
| Level 1 | Level 2 | Level 3 | |
| Investments | ($000) | ($000) | ($000) |
| Common Stocks—Long Positions | 162,122 | 17,093 | 371 |
| Common Stocks Sold Short | (60,504) | — | — |
| Temporary Cash Investments | 50,676 | 15,942 | — |
| Futures Contracts—Assets1 | 1,147 | — | — |
| Futures Contracts—Liabilities1 | (537) | — | — |
| Forward Currency Contracts—Assets | — | 1,718 | — |
| Forward Currency Contracts—Liabilities | — | (1,647) | — |
| Total | 152,904 | 33,106 | 371 |
| 1 Represents variation margin on the last day of the reporting period. |
D. At October 31, 2017, the fair values of derivatives were reflected in the Consolidated Statement of Assets and Liabilities as follows:
| Foreign | ||||
| Commodity | Interest Rate | Exchange | ||
| Consolidated Statement of | Contracts | Contracts | Contracts | Total |
| Assets and Liabilities Caption | ($000) | ($000) | ($000) | ($000) |
| Variation Margin Receivable— | ||||
| Futures Contracts | 1,147 | — | — | 1,147 |
| Unrealized Appreciation— | ||||
| Forward Currency Contracts | — | — | 1,718 | 1,718 |
| Variation Margin Payable— | ||||
| Futures Contracts | (423) | (114) | — | (537) |
| Unrealized Depreciation— | ||||
| Forward Currency Contracts | — | — | (1,647) | (1,647) |
Realized net gain (loss) and the change in unrealized appreciation (depreciation) on derivatives for the year ended October 31, 2017, were:
| Foreign | ||||
| Commodity | Interest Rate | Exchange | ||
| Contracts | Contracts | Contracts | Total | |
| Realized Net Gain (Loss) on Derivatives | ($000) | ($000) | ($000) | ($000) |
| Futures Contracts | (9,184) | (1,125) | — | (10,309) |
| Forward Currency Contracts | — | — | 161 | 161 |
| Realized Net Gain (Loss) on Derivatives | (9,184) | (1,125) | 161 | (10,148) |
| Change in Unrealized Appreciation (Depreciation) on Derivatives | ||||
| Futures Contracts | (857) | 444 | — | (413) |
| Forward Currency Contracts | — | — | (1,098) | (1,098) |
| Change in Unrealized Appreciation | ||||
| (Depreciation) on Derivatives | (857) | 444 | (1,098) | (1,511) |
30
Alternative Strategies Fund
The following table summarizes the fund’s derivative assets and liabilities by counterparty for derivatives subject to arrangements that provide for offsetting assets and liabilities. Exchange-traded derivatives are listed separately.
| Assets | Liabilities | Amounts Not Offset in | ||||
| Reflected in | Reflected in | the Consolidated | ||||
| Consolidated | Consolidated | Statement of Assets | ||||
| and Liabilities | Net | |||||
| Statement of | Statement of | Net Amount | Exposure3 | |||
| Assets and | Assets and | Receivable | Collateral | Collateral | (Not Less | |
| Liabilities1 | Liabilities1 | (Payable) | Pledged 2 | Received 2 | Than $0) | |
| ($000) | ($000) | ($000) | ($000) | ($000) | ($000) | |
| Forwards Subject to | ||||||
| Offsetting Arrangements, | ||||||
| by Counterparty | ||||||
| Bank of America, N.A. | 1,718 | (1,647) | 71 | — | — | 71 |
| Exchange—Traded | ||||||
| Commodity Futures Contracts | 1,147 | (423) | 724 | 3,335 | — | — |
| Exchange—Traded Interest | ||||||
| Rate Futures Contracts | — | (114) | (114) | 1,097 | — | — |
| Total | 2,865 | (2,184) | 681 | 4,432 | — | 71 |
1 Absent an event of default or early termination, derivative assets and liabilities are presented gross and not offset in the Consolidated Statement of Assets and Liabilities.
2 Securities or other assets pledged as collateral are noted in the Consolidated Statement of Assets and Liabilities. Securities or other assets received as collateral are held in a segregated account and not included in the fund’s security holdings in the Consolidated Statement of Assets and Liabilities.
3 Net Exposure represents the net amount receivable from the counterparty in the event of default. Counterparties may not exchange collateral if amount is below a specified minimum transfer amount.
E. Distributions are determined on a tax basis and may differ from net investment income and realized capital gains for financial reporting purposes. Differences may be permanent or temporary. Permanent differences are reclassified among capital accounts in the financial statements to reflect their tax character. Temporary differences arise when certain items of income, expense, gain, or loss are recognized in different periods for financial statement and tax purposes; such differences are primarily attributed to mark-to-market of open futures contracts. These differences will reverse at some time in the future. Differences in classification may also result from the treatment of short-term gains as ordinary income for tax purposes.
During the period, the fund reclassified $11,314,000 from accumulated net realized losses to undistributed net investment income and paid-in capital in the amounts of $9,979,000 and $1,335,000, respectively. The reclassifications are attributable to the characterization of income (losses) from the subsidiary for tax purposes.
Additionally, the subsidiary incurred a net operating loss of $7,921,000 which was reclassified from undistributed net investment income to paid-in-capital.
During the year ended October 31, 2017, the fund realized net foreign currency losses of $330,000, which decreased distributable net income for tax purposes; accordingly, such losses have been reclassified from accumulated net realized losses to undistributed net investment income.
31
Alternative Strategies Fund
For tax purposes, at October 31, 2017, the fund had $1,498,000 of ordinary income available for distribution. The fund had available capital losses totaling $1,448,000 that may be carried forward indefinitely to offset future net capital gains.
At October 31, 2017, the cost of long security positions for tax purposes was $232,510,000. Net unrealized appreciation of long security positions for tax purposes was $13,694,000, consisting of unrealized gains of $15,674,000 on securities that had risen in value since their purchase and $1,980,000 in unrealized losses on securities that had fallen in value since their purchase. Tax-basis net unrealized depreciation on securities sold short was $1,782,000, consisting of unrealized gains of $3,916,000 on securities that had fallen in value since their purchase and $5,698,000 in unrealized losses on securities that had risen in value since their purchase.
F. During the year ended October 31, 2017, the fund purchased $261,088,000 of investment securities and sold $208,987,000 of investment securities, other than temporary cash investments. The proceeds of short sales and the cost of purchases to cover short sales were $90,197,000 and $85,879,000, respectively.
G. Capital shares issued and redeemed were:
| Year Ended October 31, | ||
| 2017 | 2016 | |
| Shares | Shares | |
| (000) | (000) | |
| Issued | 3,467 | 3,774 |
| Issued in Lieu of Cash Distributions | 484 | 36 |
| Redeemed | (728) | (599) |
| Net Increase (Decrease) in Shares Outstanding | 3,223 | 3,211 |
At October 31, 2017, Vanguard Managed Payout Fund was the record or beneficial owner of 87% of the fund’s net assets.
H. Management has determined that no material events or transactions occurred subsequent to October 31, 2017, that would require recognition or disclosure in these financial statements.
32
Report of Independent Registered Public Accounting Firm
To the Board of Trustees of Vanguard Trustees’ Equity Fund and the Shareholders of Vanguard Alternative Strategies Fund
In our opinion, the accompanying consolidated statement of net assets and consolidated statement of assets and liabilities, and the related consolidated statements of operations and of changes in net assets and the consolidated financial highlights present fairly, in all material respects, the consolidated financial position of Vanguard Alternative Strategies Fund (constituting a separate portfolio of Vanguard Trustees’ Equity Fund, hereafter referred to as the “Fund”) as of October 31, 2017, the consolidated results of its operations for the year then ended, the consolidated changes in its net assets for each of the two years in the period then ended and the consolidated financial highlights for each of the periods indicated, in conformity with accounting principles generally accepted in the United States of America. These consolidated financial statements and consolidated financial highlights (hereafter referred to as “financial statements”) are the responsibility of the Fund’s management. Our responsibility is to express an opinion on these financial statements based on our audits. We conducted our audits of these financial statements in accordance with the standards of the Public Company Accounting Oversight Board (United States). Those standards require that we plan and perform the audit to obtain reasonable assurance about whether the financial statements are free of material misstatement. An audit includes examining, on a test basis, evidence supporting the amounts and disclosures in the financial statements, assessing the accounting principles used and significant estimates made by management, and evaluating the overall financial statement presentation. We believe that our audits, which included confirmation of securities as of October 31, 2017 by correspondence with the custodian and brokers and by agreement to the underlying ownership records of the transfer agent, provide a reasonable basis for our opinion.
/s/PricewaterhouseCoopers LLP
Philadelphia, Pennsylvania
December 19, 2017
Special 2017 tax information (unaudited) for Vanguard Alternative Strategies Fund
This information for the fiscal year ended October 31, 2017, is included pursuant to provisions of the Internal Revenue Code.
The fund distributed $2,827,000 as capital gain dividends (20% rate gain distributions) to shareholders during the fiscal year.
For nonresident alien shareholders, 100% of short-term capital gain dividends distributed by the funds are qualified short-term capital gains.
The fund distributed $1,804,000 of qualified dividend income to shareholders during the fiscal year.
For corporate shareholders, 100.0% of investment income (dividend income plus short-term gains, if any) qualifies for the dividends-received deduction.
33
Your Fund’s After-Tax Returns
This table presents returns for your fund both before and after taxes. The after-tax returns are shown in two ways: (1) assuming that an investor owned the fund during the entire period and paid taxes on the fund’s distributions, and (2) assuming that an investor paid taxes on the fund’s distributions and sold all shares at the end of each period.
Calculations are based on the highest individual federal income tax and capital gains tax rates in effect at the times of the distributions and the hypothetical sales. State and local taxes were not considered. After-tax returns reflect any qualified dividend income, using actual prior-year figures and estimates for 2017. (In the example, returns after the sale of fund shares may be higher than those assuming no sale. This occurs when the sale would have produced a capital loss. The calculation assumes that the investor received a tax deduction for the loss.)
Please note that your actual after-tax returns will depend on your tax situation and may differ from those shown. Also note that if you own the fund in a tax-deferred account, such as an individual retirement account or a 401(k) plan, this information does not apply to you. Such accounts are not subject to current taxes.
Finally, keep in mind that a fund’s performance—whether before or after taxes—does not guarantee future results.
| Average Annual Total Returns: Alternative Strategies Fund | ||
| Periods Ended October 31, 2017 | ||
| Since | ||
| One | Inception | |
| Year | (8/11/2015) | |
| Returns Before Taxes | 0.11% | 3.10% |
| Returns After Taxes on Distributions | -1.31 | 2.34 |
| Returns After Taxes on Distributions and Sale of Fund Shares | 0.36 | 2.10 |
34
About Your Fund’s Expenses
As a shareholder of the fund, you incur ongoing costs, which include costs for portfolio management, administrative services, and shareholder reports (like this one), among others. Operating expenses, which are deducted from a fund’s gross income, directly reduce the investment return of the fund.
A fund’s expenses are expressed as a percentage of its average net assets. This figure is known as the expense ratio. The following examples are intended to help you understand the ongoing costs (in dollars) of investing in your fund and to compare these costs with those of other mutual funds. The examples are based on an investment of $1,000 made at the beginning of the period shown and held for the entire period.
The accompanying table illustrates your fund’s costs in two ways:
• Based on actual fund return. This section helps you to estimate the actual expenses that you paid over the period. The ”Ending Account Value“ shown is derived from the fund‘s actual return, and the third column shows the dollar amount that would have been paid by an investor who started with $1,000 in the fund. You may use the information here, together with the amount you invested, to estimate the expenses that you paid over the period.
To do so, simply divide your account value by $1,000 (for example, an $8,600 account value divided by $1,000 = 8.6), then multiply the result by the number given for your fund under the heading ”Expenses Paid During Period.“
• Based on hypothetical 5% yearly return. This section is intended to help you compare your fund‘s costs with those of other mutual funds. It assumes that the fund had a yearly return of 5% before expenses, but that the expense ratio is unchanged. In this case—because the return used is not the fund’s actual return—the results do not apply to your investment. The example is useful in making comparisons because the Securities and Exchange Commission requires all mutual funds to calculate expenses based on a 5% return. You can assess your fund’s costs by comparing this hypothetical example with the hypothetical examples that appear in shareholder reports of other funds.
Note that the expenses shown in the table are meant to highlight and help you compare ongoing costs only and do not reflect transaction costs incurred by the fund for buying and selling securities. Further, the expenses do not include any purchase, redemption, or account service fees described in the fund prospectus. If such fees were applied to your account, your costs would be higher. Your fund does not carry a “sales load.”
The calculations assume no shares were bought or sold during the period. Your actual costs may have been higher or lower, depending on the amount of your investment and the timing of any purchases or redemptions.
You can find more information about the fund’s expenses, including annual expense ratios, in the Financial Statements section of this report. For additional information on operating expenses and other shareholder costs, please refer to your fund’s current prospectus.
35
| Six Months Ended October 31, 2017 | |||
| Beginning | Ending | Expenses | |
| Account Value | Account Value | Paid During | |
| Alternative Strategies Fund | 4/30/2017 | 10/31/2017 | Period |
| Based on Actual Fund Return | $1,000.00 | $1,017.74 | $3.71 |
| Based on Hypothetical 5% Yearly Return | 1,000.00 | 1,021.53 | 3.72 |
The calculations are based on expenses incurred in the most recent six-month period. The fund’s annualized six-month expense ratio for that period was 0.73%. The dollar amounts shown as “Expenses Paid” are equal to the annualized expense ratio multiplied by the average account value over the period, multiplied by the number of days in the most recent six-month period, then divided by the number of days in the most recent 12-month period (184/365).
36
Glossary
Earnings Growth Rate. The average annual rate of growth in earnings over the past five years for the stocks now in a fund.
Equity Exposure. A measure that reflects a fund’s investments in stocks and stock futures. Any holdings in short-term reserves are excluded.
Expense Ratio. A fund’s total annual operating expenses expressed as a percentage of the fund’s average net assets. The expense ratio includes management and administrative expenses, but does not include the transaction costs of buying and selling portfolio securities.
Foreign Holdings. The percentage of a fund represented by securities or depositary receipts of companies based outside the United States.
Inception Date. The date on which the assets of a fund (or one of its share classes) are first invested in accordance with the fund’s investment objective. For funds with a subscription period, the inception date is the day after that period ends. Investment performance is measured from the inception date.
Median Market Cap. An indicator of the size of companies in which a fund invests; the midpoint of market capitalization (market price x shares outstanding) of a fund’s stocks, weighted by the proportion of the fund’s assets invested in each stock. Stocks representing half of the fund’s assets have market capitalizations above the median, and the rest are below it.
Price/Book Ratio. The share price of a stock divided by its net worth, or book value, per share. For a fund, the weighted average price/book ratio of the stocks it holds.
Price/Earnings Ratio. The ratio of a stock’s current price to its per-share earnings over the past year. For a fund, the weighted average P/E of the stocks it holds. P/E is an indicator of market expectations about corporate prospects; the higher the P/E, the greater the expectations for a company’s future growth.
Return on Equity. The annual average rate of return generated by a company during the past five years for each dollar of shareholder’s equity (net income divided by shareholder’s equity). For a fund, the weighted average return on equity for the companies whose stocks it holds.
Short-Term Reserves. The percentage of a fund invested in highly liquid, short-term securities that can be readily converted to cash.
Turnover Rate. An indication of the fund’s trading activity. Funds with high turnover rates incur higher transaction costs and may be more likely to distribute capital gains (which may be taxable to investors). The turnover rate excludes in-kind transactions, which have minimal impact on costs.
37
The Global Industry Classification Standard (“GICS”) was developed by and is the exclusive property and a service mark of MSCI Inc. (“MSCI”) and Standard and Poor’s, a division of McGraw-Hill Companies, Inc. (“S&P”), and is licensed for use by Vanguard. Neither MSCI, S&P nor any third party involved in making or compiling the GICS or any GICS classification makes any express or implied warranties or representations with respect to such standard or classification (or the results to be obtained by the use thereof), and all such parties hereby expressly disclaim all warranties of originality, accuracy, completeness, merchantability or fitness for a particular purpose with respect to any such standard or classification. Without limiting any of the foregoing, in no event shall MSCI, S&P, any of its affiliates or any third party involved in making or compiling the GICS or any GICS classification have any liability for any direct, indirect, special, punitive, consequential or any other damages (including lost profits) even if notified of the possibility of such damages.
38
The People Who Govern Your Fund
The trustees of your mutual fund are there to see that the fund is operated and managed in your best interests since, as a shareholder, you are a part owner of the fund. Your fund’s trustees also serve on the board of directors of The Vanguard Group, Inc., which is owned by the Vanguard funds and provides services to them on an at-cost basis.
A majority of Vanguard’s board members are independent, meaning that they have no affiliation with Vanguard or the funds they oversee, apart from the sizable personal investments they have made as private individuals. The independent board members have distinguished backgrounds in business, academia, and public service. Each of the trustees and executive officers oversees 200 Vanguard funds.
Information for each trustee and executive officer of the fund appears below. The mailing address of the trustees and officers is P.O. Box 876, Valley Forge, PA 19482. More information about the trustees is in the Statement of Additional Information, which can be obtained, without charge, by contacting Vanguard at 800-662-7447, or online at vanguard.com.
Interested Trustee1
F. William McNabb III
Born 1957. Trustee Since July 2009. Chairman of the Board. Principal Occupation(s) During the Past Five Years and Other Experience: Chairman of the Board of The Vanguard Group, Inc., and of each of the investment companies served by The Vanguard Group, since January 2010; Chief Executive Officer and Director of The Vanguard Group and President and Chief Executive Officer of each of the investment companies served by The Vanguard Group, since 2008; Director of Vanguard Marketing Corporation; President of The Vanguard Group (2008–2017); Managing Director of The Vanguard Group (1995–2008).
Independent Trustees
Emerson U. Fullwood
Born 1948. Trustee Since January 2008. Principal Occupation(s) During the Past Five Years and Other Experience: Executive Chief Staff and Marketing Officer for North America and Corporate Vice President (retired 2008) of Xerox Corporation (document management products and services);
Executive in Residence and 2009–2010 Distinguished Minett Professor at the Rochester Institute of Technology; Lead Director of SPX FLOW, Inc. (multi-industry manufacturing); Director of the United Way of Rochester, the University of Rochester Medical Center, Monroe Community College Foundation, North Carolina A&T University, and Roberts Wesleyan College; Trustee of the University of Rochester.
Rajiv L. Gupta
Born 1945. Trustee Since December 2001.2 Principal Occupation(s) During the Past Five Years and Other Experience: Chairman and Chief Executive Officer (retired 2009) and President (2006–2008) of Rohm and Haas Co. (chemicals); Director of Arconic Inc. (diversified manufacturer), HP Inc. (printer and personal computer manufacturing), and Delphi Automotive plc (automotive components); Senior Advisor at New Mountain Capital.
Amy Gutmann
Born 1949. Trustee Since June 2006. Principal Occupation(s) During the Past Five Years and Other Experience: President of the University of Pennsylvania; Christopher H. Browne
1 Mr. McNabb is considered an “interested person,” as defined in the Investment Company Act of 1940, because he is an officer of the Vanguard funds.
2 December 2002 for Vanguard Equity Income Fund, the Vanguard Municipal Bond Funds, and the Vanguard State Tax-Exempt Funds.
Distinguished Professor of Political Science, School of Arts and Sciences, and Professor of Communication, Annenberg School for Communication, with secondary faculty appointments in the Department of Philosophy, School of Arts and Sciences, and at the Graduate School of Education, University of Pennsylvania; Trustee of the National Constitution Center.
JoAnn Heffernan Heisen
Born 1950. Trustee Since July 1998. Principal Occupation(s) During the Past Five Years and Other Experience: Corporate Vice President and Member of the Executive Committee (1997–2008), Chief Global Diversity Officer (retired 2008), Vice President and Chief Information Officer (1997–2006), Controller (1995–1997), Treasurer (1991–1995), and Assistant Treasurer (1989–1991) of Johnson & Johnson (pharmaceuticals/medical devices/ consumer products); Director of Skytop Lodge Corporation (hotels) and the Robert Wood Johnson Foundation; Member of the Advisory Board of the Institute for Women’s Leadership at Rutgers University.
F. Joseph Loughrey
Born 1949. Trustee Since October 2009. Principal Occupation(s) During the Past Five Years and Other Experience: President and Chief Operating Officer (retired 2009) of Cummins Inc. (industrial machinery); Chairman of the Board of Hillenbrand, Inc. (specialized consumer services), Oxfam America, and the Lumina Foundation for Education; Director of the V Foundation for Cancer Research; Member of the Advisory Council for the College of Arts and Letters and Chair of the Advisory Board to the Kellogg Institute for International Studies, both at the University of Notre Dame.
Mark Loughridge
Born 1953. Trustee Since March 2012. Principal Occupation(s) During the Past Five Years and Other Experience: Senior Vice President and Chief Financial Officer (retired 2013) at IBM (information technology services); Fiduciary Member of IBM’s Retirement Plan Committee (2004–2013); Member of the Council on Chicago Booth.
Scott C. Malpass
Born 1962. Trustee Since March 2012. Principal Occupation(s) During the Past Five Years and Other Experience: Chief Investment Officer and Vice President at the University of Notre Dame; Assistant Professor of Finance at the Mendoza College of Business at Notre Dame; Member of the Notre Dame 403(b) Investment Committee, the Board of Advisors for Spruceview Capital Partners, the Board of Catholic Investment Services, Inc. (investment advisor), and the Board of Superintendence of the Institute for the Works of Religion; Chairman of the Board of TIFF Advisory Services, Inc. (investment advisor).
André F. Perold
Born 1952. Trustee Since December 2004. Principal Occupation(s) During the Past Five Years and Other Experience: George Gund Professor of Finance and Banking, Emeritus at the Harvard Business School (retired 2011); Chief Investment Officer and Co-Managing Partner of HighVista Strategies LLC (private investment firm); Overseer of the Museum of Fine Arts Boston.
Peter F. Volanakis
Born 1955. Trustee Since July 2009. Principal Occupation(s) During the Past Five Years and Other Experience: President and Chief Operating Officer (retired 2010) of Corning Incorporated (communications equipment); Chairman of the Board of Trustees of Colby-Sawyer College; Member of the Board of Hypertherm, Inc. (industrial cutting systems, software, and consumables).
Executive Officers
Glenn Booraem
Born 1967. Investment Stewardship Officer Since February 2017. Principal Occupation(s) During the Past Five Years and Other Experience: Principal of The Vanguard Group, Inc.; Treasurer (2015–2017), Controller (2010–2015), and Assistant Controller (2001–2010) of each of the investment companies served by The Vanguard Group.
Thomas J. Higgins
Born 1957. Chief Financial Officer Since September 2008. Principal Occupation(s) During the Past Five Years and Other Experience: Principal of The Vanguard Group, Inc.; Chief Financial Officer of each of the investment companies served by The Vanguard Group; Treasurer of each of the investment companies served by The Vanguard Group (1998–2008).
Peter Mahoney
Born 1974. Controller Since May 2015. Principal Occupation(s) During the Past Five Years and Other Experience: Principal of The Vanguard Group, Inc.; Controller of each of the investment companies served by The Vanguard Group; Head of International Fund Services at The Vanguard Group (2008–2014).
Anne E. Robinson
Born 1970. Secretary Since September 2016. Principal Occupation(s) During the Past Five Years and Other Experience: Managing Director of The Vanguard Group, Inc.; General Counsel of The Vanguard Group; Secretary of The Vanguard Group and of each of the investment companies served by The Vanguard Group; Director and Senior Vice President of Vanguard Marketing Corporation; Managing Director and General Counsel of Global Cards and Consumer Services at Citigroup (2014–2016); Counsel at American Express (2003–2014).
Michael Rollings
Born 1963. Treasurer Since February 2017. Principal Occupation(s) During the Past Five Years and Other Experience: Managing Director of The Vanguard Group, Inc.; Treasurer of each of the investment companies served by The Vanguard Group; Director of Vanguard Marketing Corporation; Executive Vice President and Chief Financial Officer of MassMutual Financial Group (2006–2016).
| Vanguard Senior Management Team | |
| Mortimer J. Buckley | Chris D. McIsaac |
| Gregory Davis | James M. Norris |
| John James | Thomas M. Rampulla |
| Martha G. King | Karin A. Risi |
| John T. Marcante | |
| Chairman Emeritus and Senior Advisor | |
| John J. Brennan | |
| Chairman, 1996–2009 | |
| Chief Executive Officer and President, 1996–2008 | |
| Founder | |
| John C. Bogle | |
| Chairman and Chief Executive Officer, 1974–1996 | |
 | |
P.O. Box 2600 | |
Connect with Vanguard® > vanguard.com | |
| Fund Information > 800-662-7447 | CFA® is a registered trademark owned by CFA Institute. |
| Direct Investor Account Services > 800-662-2739 | |
| Institutional Investor Services > 800-523-1036 | |
| Text Telephone for People | |
| Who Are Deaf or Hard of Hearing> 800-749-7273 | |
| This material may be used in conjunction | |
| with the offering of shares of any Vanguard | |
| fund only if preceded or accompanied by | |
| the fund’s current prospectus. | |
| All comparative mutual fund data are from Lipper, a | |
| Thomson Reuters Company, or Morningstar, Inc., unless | |
| otherwise noted. | |
| You can obtain a free copy of Vanguard’s proxy voting | |
| guidelines by visiting vanguard.com/proxyreporting or by | |
| calling Vanguard at 800-662-2739. The guidelines are | |
| also available from the SEC’s website, sec.gov. In | |
| addition, you may obtain a free report on how your fund | |
| voted the proxies for securities it owned during the 12 | |
| months ended June 30. To get the report, visit either | |
| vanguard.com/proxyreporting or sec.gov. | |
| You can review and copy information about your fund at | |
| the SEC’s Public Reference Room in Washington, D.C. To | |
| find out more about this public service, call the SEC at | |
| 202-551-8090. Information about your fund is also | |
| available on the SEC’s website, and you can receive | |
| copies of this information, for a fee, by sending a | |
| request in either of two ways: via email addressed to | |
| publicinfo@sec.gov or via regular mail addressed to the | |
| Public Reference Section, Securities and Exchange | |
| Commission, Washington, DC 20549-1520. | |
| © 2017 The Vanguard Group, Inc. | |
| All rights reserved. | |
| Vanguard Marketing Corporation, Distributor. | |
| Q12980 122017 | |
Item 2: Code of Ethics. The Registrant has adopted a code of ethics that applies to the Registrant’s principal executive officer, principal financial officer, principal accounting officer or controller or persons performing similar functions. The Code of Ethics was amended during the reporting period covered by this report to make certain technical, non-material changes.
Item 3: Audit Committee Financial Expert. All members of the Audit Committee have been determined by the Registrant’s Board of Trustees to be Audit Committee Financial Experts and to be independent: Rajiv L. Gupta, JoAnn Heffernan Heisen, F. Joseph Loughrey, Mark Loughridge, and Peter F. Volanakis.
Item 4: Principal Accountant Fees and Services.
(a) Audit Fees.
Audit Fees of the Registrant
Fiscal Year Ended October 31, 2017: $159,000
Fiscal Year Ended October 31, 2016: $152,000
Aggregate Audit Fees of Registered Investment Companies in the Vanguard Group.
Fiscal Year Ended October 31, 2017: $8,424,459
Fiscal Year Ended October 31, 2016: $9,629,849
Includes fees billed in connection with audits of the Registrant, other registered investment companies in the Vanguard complex, The Vanguard Group, Inc. and Vanguard Marketing Corporation.
(b) Audit-Related Fees.
Fiscal Year Ended October 31, 2017: $3,194,093
Fiscal Year Ended October 31, 2016: $2,717,627
Includes fees billed in connection with assurance and related services provided to the Registrant, other registered investment companies in the Vanguard complex, The Vanguard Group, Inc., and Vanguard Marketing Corporation.
(c) Tax Fees.
Fiscal Year Ended October 31, 2017: $274,313
Fiscal Year Ended October 31, 2016: $254,050
Includes fees billed in connection with tax compliance, planning, and advice services provided to the Registrant, other registered investment companies in the Vanguard complex, The Vanguard Group, Inc., and Vanguard Marketing Corporation.
(d) All Other Fees.
Fiscal Year Ended October 31, 2017: $0
Fiscal Year Ended October 31, 2016: $214,225
Includes fees billed for services related to tax reported information provided to the Registrant, other registered investment companies in the Vanguard complex, The Vanguard Group, Inc., and Vanguard Marketing Corporation.
(e) (1) Pre-Approval Policies. The policy of the Registrant’s Audit Committee is to consider and, if appropriate, approve before the principal accountant is engaged for such services, all specific audit and non-audit services provided to: the Registrant, other registered investment companies in the Vanguard complex, The Vanguard Group, Inc., and entities controlled by The Vanguard Group, Inc. that provide ongoing services to the Registrant. In making a determination, the Audit Committee considers whether the services are consistent with maintaining the principal accountant’s independence.
In the event of a contingency situation in which the principal accountant is needed to provide services in between scheduled Audit Committee meetings, the Chairman of the Audit Committee would be called on to consider and, if appropriate, pre-approve audit or permitted non-audit services in an amount sufficient to complete services through the next Audit Committee meeting, and to determine if such services would be consistent with maintaining the accountant’s independence. At the next scheduled Audit Committee meeting, services and fees would be presented to the Audit Committee for formal consideration, and, if appropriate, approval by the entire Audit Committee. The Audit Committee would again consider whether such services and fees are consistent with maintaining the principal accountant’s independence.
The Registrant’s Audit Committee is informed at least annually of all audit and non-audit services provided by the principal accountant to the Vanguard complex, whether such services are provided to: the Registrant, other registered investment companies in the Vanguard complex, The Vanguard Group, Inc., or other entities controlled by The Vanguard Group, Inc. that provide ongoing services to the Registrant.
(2) No percentage of the principal accountant’s fees or services were approved pursuant to the waiver provision of paragraph (c)(7)(i)(C) of Rule 2-01 of Regulation S-X.
(f) For the most recent fiscal year, over 50% of the hours worked under the principal accountant’s engagement were not performed by persons other than full-time, permanent employees of the principal accountant.
(g) Aggregate Non-Audit Fees.
Fiscal Year Ended October 31, 2017: $274,313
Fiscal Year Ended October 31, 2016: $468,275
Includes fees billed for non-audit services provided to the Registrant, other registered investment companies in the Vanguard complex, The Vanguard Group, Inc., and Vanguard Marketing Corporation.
(h) For the most recent fiscal year, the Audit Committee has determined that the provision of all non-audit services was consistent with maintaining the principal accountant’s independence.
Item 5: Audit Committee of Listed Registrants.
Not Applicable.
Item 6: Investments.
Not Applicable.
Item 7: Disclosure of Proxy Voting Policies and Procedures for Closed-End Management
Investment Companies.
Not Applicable.
Item 8: Portfolio Managers of Closed-End Management Investment Companies.
Not Applicable.
Item 9: Purchase of Equity Securities by Closed-End Management Investment Company and
Affiliated Purchasers.
Not Applicable.
Item 10: Submission of Matters to a Vote of Security Holders.
Not Applicable.
Item 11: Controls and Procedures.
(a) Disclosure Controls and Procedures. The Principal Executive and Financial Officers concluded that the Registrant’s Disclosure Controls and Procedures are effective based on their evaluation of the Disclosure Controls and Procedures as of a date within 90 days of the filing date of this report.
(b) Internal Control Over Financial Reporting. There were no significant changes in Registrant’s Internal Control Over Financial Reporting or in other factors that could significantly affect this control subsequent to the date of the evaluation, including any corrective actions with regard to significant deficiencies and material weaknesses.
Item 12: Disclosure of Securities Lending Activities for Closed-End Management
Investment Companies.
Not Applicable.
Item 13: Exhibits.
(a) Code of Ethics.
(b) Certifications.
Pursuant to the requirements of the Securities Exchange Act of 1934 and the Investment Company Act of 1940, the registrant has duly caused this report to be signed on its behalf by the undersigned, thereunto duly authorized.
| VANGUARD TRUSTEES’ EQUITY FUND | |
| BY: | /s/ F. WILLIAM MCNABB III* |
| F. WILLIAM MCNABB III | |
| CHIEF EXECUTIVE OFFICER | |
| Date: December 21, 2017 | |
Pursuant to the requirements of the Securities Exchange Act of 1934 and the Investment Company Act of 1940, this report has been signed below by the following persons on behalf of the registrant and in the capacities and on the dates indicated.
| VANGUARD TRUSTEES’ EQUITY FUND | |
BY: | /s/ F. WILLIAM MCNABB III* |
| F. WILLIAM MCNABB III | |
| CHIEF EXECUTIVE OFFICER | |
| Date: December 21, 2017 | |
| VANGUARD TRUSTEES’ EQUITY FUND |
| BY: | /s/ THOMAS J. HIGGINS* |
| THOMAS J. HIGGINS | |
| CHIEF FINANCIAL OFFICER | |
| Date: December 21, 2017 | |
* By: /s/ Anne E. Robinson
Anne E. Robinson, pursuant to a Power of Attorney filed on October 4, 2016 see file Number
33-32548, Incorporated by Reference.