UNITED STATES
SECURITIES AND EXCHANGE COMMISSION
Washington, D.C. 20549
FORM N-CSR
CERTIFIED SHAREHOLDER REPORT OF REGISTERED MANAGEMENT
INVESTMENT COMPANIES
Investment Company Act file number 811-00945
Virtus Equity Trust
(Exact name of registrant as specified in charter)
101 Munson Street
Greenfield, MA 01301-9668
(Address of principal executive offices) (Zip code)
Kevin J. Carr, Esq.
Senior Vice President, Chief Legal Officer, Counsel and Secretary for Registrant
100 Pearl Street
Hartford, CT 06103-4506
(Name and address of agent for service)
Registrant’s telephone number, including area code: (800) 243-1574
Date of fiscal year end: March 31
Date of reporting period: March 31, 2017
Form N-CSR is to be used by management investment companies to file reports with the Commission not later than 10 days after the transmission to stockholders of any report that is required to be transmitted to stockholders under Rule 30e-1 under the Investment Company Act of 1940 (17 CFR 270.30e-1). The Commission may use the information provided on Form N-CSR in its regulatory, disclosure review, inspection, and policymaking roles.
A registrant is required to disclose the information specified by Form N-CSR, and the Commission will make this information public. A registrant is not required to respond to the collection of information contained in Form N-CSR unless the Form displays a currently valid Office of Management and Budget (“OMB”) control number. Please direct comments concerning the accuracy of the information collection burden estimate and any suggestions for reducing the burden to Secretary, Securities and Exchange Commission, 450 Fifth Street, NW, Washington, DC 20549-0609. The OMB has reviewed this collection of information under the clearance requirements of 44 U.S.C. § 3507.
Item 1. Reports to Stockholders.
The Report to Shareholders is attached herewith.

ANNUAL REPORT
Virtus Contrarian Value Fund
Virtus KAR Capital Growth Fund (f/k/a: Virtus Strategic Growth Fund)
Virtus KAR Global Quality Dividend Fund (f/k/a: Virtus Quality Large-Cap Value Fund)*
Virtus KAR Mid-Cap Core Fund (f/k/a: Virtus Mid-Cap Core Fund)
Virtus KAR Mid-Cap Growth Fund (f/k/a: Virtus Mid-Cap Growth Fund)
Virtus KAR Small-Cap Core Fund (f/k/a: Virtus Small-Cap Core Fund)
Virtus KAR Small-Cap Growth Fund (f/k/a: Virtus Small-Cap Sustainable Growth Fund)
Virtus KAR Small-Cap Value Fund (f/k/a: Virtus Quality Small-Cap Fund)
Virtus Rampart Enhanced Core Equity Fund (f/k/a: Virtus Enhanced Core Equity Fund)
Virtus Tactical Allocation Fund
|
|
March 31, 2017 TRUST NAME: VIRTUS EQUITY TRUST * Prospectus supplement applicable to this Fund appears at the back of this annual report. |
|
 |
Not FDIC Insured
No Bank Guarantee
May Lose Value
Table of Contents
Proxy Voting Procedures and Voting Record (Form N-PX)
The subadvisers vote proxies relating to portfolio securities in accordance with procedures that have been approved by the Board of Trustees of the Trust (“Trustees,” or the “Board”). You may obtain a description of these procedures, along with information regarding how the Funds voted proxies during the most recent 12-month period ended June 30, free of charge, by calling toll-free 1-800-243-1574. This information is also available through the Securities and Exchange Commission’s (the “SEC”) website at http://www.sec.gov.
Form N-Q Information
The Trust files a complete schedule of portfolio holdings for each Fund with the SEC for the first and third quarters of each fiscal year on Form N-Q. Form N-Q is available on the SEC’s website at http://www.sec.gov. Form N-Q may be reviewed and copied at the SEC’s Public Reference Room. Information on the operation of the SEC’s Public Reference Room can be obtained by calling toll-free 1-800-SEC-0330.
This report is not authorized for distribution to prospective investors in the Funds of Virtus Equity Trust unless preceded or accompanied by an effective prospectus which includes information concerning the sales charge, each Fund’s record and other pertinent information.
MESSAGE TO SHAREHOLDERS
To My Fellow Shareholders of Virtus Mutual Funds:
| | |
 | | I am pleased to present this report that reviews the performance of your fund for the 12 months ended March 31, 2017. Global markets both started and ended the fiscal year on a strong note. At the front end of the period, stabilizing oil prices and the Federal Reserve’s (“the Fed’) softened stance on rate hikes sparked an equity rally that lasted into the summer of 2016. The U.K.’s “Brexit” decision in June, followed by the U.S. presidential election in November, triggered short-lived market selloffs, but calm was restored by better-than-expected corporate earnings and an improving global economic picture. As the fiscal year drew to a |
close, equity markets continued to benefit from the post-election “Trump bump.” The Fed raised interest rates twice in the last few months – once in December, and again in March – a clear signal that it believes the U.S. economy is on a growth path. At the same time, other major central banks remained committed to monetary stimulus, adding reassurance to global markets. U.S. growth, as evidenced by strong jobs, housing, and consumer spending data, gives investors reason for optimism. Corporate earnings got off to a strong start for the first quarter of 2017. The pro-growth policies of the new administration, if implemented, could have a continued positive impact on earnings and the markets. For the 12 months, performance of U.S. large- and small-cap stocks surged, as measured by the 17.17% and 26.22% returns of the S&P 500® Index and Russell 2000® Index, respectively. Within international equities, emerging markets outpaced their developed peers, as the MSCI Emerging Markets Index (net) increased 17.22%, compared with the MSCI EAFE® Index (net), which returned 11.67%. Demand for U.S. Treasuries remained strong, driven by foreign investors seeking safe havens and yield in light of the negative interest rate environment in many international economies. On March 31, 2017, the benchmark 10-year U.S. Treasury yielded 2.40%, compared with 1.78% one year earlier. The broader U.S. fixed income market, as represented by the Bloomberg Barclays U.S. Aggregate Bond Index, which tracks Treasuries and other investment-grade debt securities, had a relatively flat return of 0.44% for the year, while non-investment grade bonds had a healthy return of 16.39%, as measured by the Bloomberg Barclays U.S. Corporate High Yield Bond Index. Market uncertainty is an ever-present reminder of the importance of portfolio diversification, including exposure to traditional and alternative asset classes. While diversification cannot guarantee a profit or prevent a loss, owning a variety of asset classes may cushion your portfolio against inevitable market fluctuations. Your financial advisor can help you ensure that your portfolio is adequately diversified across asset classes and investment strategies. On behalf of our investment affiliates, thank you for entrusting Virtus with your assets. Should you have questions about your account or require assistance, please visit our website at Virtus.com, or call our customer service team at 1-800-243-1574. We appreciate your business and remain committed to your long-term financial success. Sincerely, 
George R. Aylward President, Virtus Mutual Funds May 2017 |
Performance data quoted represents past results. Past performance is no guarantee of future results, and current performance may be higher or lower than the performance shown above.
1
VIRTUS EQUITY TRUST
DISCLOSURE OF FUND EXPENSES (Unaudited)
FOR THE SIX-MONTH PERIOD OF OCTOBER 1, 2016 TO MARCH 31, 2017
We believe it is important for you to understand the impact of costs on your investment. All mutual funds have operating expenses. As a shareholder of a Virtus Equity Trust Fund (each, a “Fund”), you may incur two types of costs: (1) transaction costs, including sales charges on purchases of Class A shares and contingent deferred sales charges on Class C shares; and (2) ongoing costs, including investment advisory fees, distribution and service fees, and other expenses. Class I shares and Class R6 shares are sold without sales charges and do not incur distribution and service fees. For further information regarding applicable sales charges, see Note 1 in the Notes to Financial Statements. These examples are intended to help you understand your ongoing costs (in dollars) of investing in a Fund and to compare these costs with the ongoing costs of investing in other mutual funds. These examples are based on an investment of $1,000 invested at the beginning of the period and held for the entire six-month period. The following Expense Table illustrates a Fund’s costs in two ways.
Actual Expenses
The first section of the accompanying table provides information about actual account values and actual expenses. You may use the information in this section, together with the amount you invested, to estimate the expenses that you paid over the period. Simply divide your account value by $1,000 (for example, an $8,600 account value divided by $1,000 = 8.6), then multiply the result by the number in the first section under the heading “Expenses Paid During Period” to estimate the expenses you paid on your account during the period.
Hypothetical Example for Comparison Purposes
The second section of the accompanying table provides information about hypothetical account values and hypothetical expenses based on each Fund’s actual expense ratio and an assumed rate of return of 5% per year before expenses, which is not your Fund’s actual return. The hypothetical account values and expenses may not be used to estimate the actual ending account balance or expenses you paid for the period. You may use this information to compare the ongoing costs of investing in your Fund and other funds. To do so, compare these 5% hypothetical examples with the 5% hypothetical examples that appear in the shareholder reports of the other funds.
Please note that the expenses shown in the accompanying table are meant to highlight your ongoing costs only and do not reflect any transactional costs, such as sales charges or contingent deferred sales charges. Therefore, the second section of the accompanying table is useful in comparing ongoing costs only, and will not help you determine the relative total costs of owning different funds. In addition, if these transactional costs were included, your costs would have been higher. The calculations assume no shares were bought or sold during the period. Your actual
costs may have been higher or lower, depending on the amount of your investment and the timing of any purchases or redemptions.
| | | | | | | | | | | | | | | | |
| Expense Table | |
| | | Beginning
Account Value
October 1, 2016 | | | Ending
Account Value
March 31, 2017 | | | Annualized
Expense
Ratio | | | Expenses Paid
During
Period* | |
Contrarian Value Fund | | | | | |
Actual | | | | | | | | | | | | | | | | |
Class A | | $ | 1,000.00 | | | $ | 1,046.60 | | | | 1.42 | % | | $ | 7.25 | |
Class C | | | 1,000.00 | | | | 1,042.60 | | | | 2.18 | | | | 11.10 | |
Class I | | | 1,000.00 | | | | 1,047.80 | | | | 1.17 | | | | 5.97 | |
Class R6 | | | 1,000.00 | | | | 1,048.60 | | | | 1.04 | | | | 5.31 | |
Hypothetical (5% return before expenses) | | | | | |
Class A | | | 1,000.00 | | | | 1,017.85 | | | | 1.42 | | | | 7.14 | |
Class C | | | 1,000.00 | | | | 1,014.06 | | | | 2.18 | | | | 10.95 | |
Class I | | | 1,000.00 | | | | 1,019.10 | | | | 1.17 | | | | 5.89 | |
Class R6 | | | 1,000.00 | | | | 1,019.75 | | | | 1.04 | | | | 5.24 | |
KAR Capital Growth Fund | | | | | |
Actual | | | | | | | | | | | | | | | | |
Class A | | $ | 1,000.00 | | | $ | 1,056.20 | | | | 1.31 | % | | $ | 6.72 | |
Class C | | | 1,000.00 | | | | 1,053.20 | | | | 2.06 | | | | 10.55 | |
Class I | | | 1,000.00 | | | | 1,058.20 | | | | 1.06 | | | | 5.44 | |
Hypothetical (5% return before expenses) | | | | | |
Class A | | | 1,000.00 | | | | 1,018.40 | | | | 1.31 | | | | 6.59 | |
Class C | | | 1,000.00 | | | | 1,014.66 | | | | 2.06 | | | | 10.35 | |
Class I | | | 1,000.00 | | | | 1,019.65 | | | | 1.06 | | | | 5.34 | |
KAR Global Quality Dividend Fund | | | | | |
Actual | | | | | | | | | | | | | | | | |
Class A | | $ | 1,000.00 | | | $ | 1,078.90 | | | | 1.34 | % | | $ | 6.95 | |
Class C | | | 1,000.00 | | | | 1,074.80 | | | | 2.09 | | | | 10.81 | |
Class I | | | 1,000.00 | | | | 1,080.20 | | | | 1.09 | | | | 5.65 | |
Hypothetical (5% return before expenses) | | | | | |
Class A | | | 1,000.00 | | | | 1,018.25 | | | | 1.34 | | | | 6.74 | |
Class C | | | 1,000.00 | | | | 1,014.51 | | | | 2.09 | | | | 10.50 | |
Class I | | | 1,000.00 | | | | 1,019.50 | | | | 1.09 | | | | 5.49 | |
KAR Mid-Cap Core Fund | | | | | |
Actual | | | | | | | | | | | | | | | | |
Class A | | $ | 1,000.00 | | | $ | 1,081.80 | | | | 1.20 | % | | $ | 6.23 | |
Class C | | | 1,000.00 | | | | 1,077.60 | | | | 1.95 | | | | 10.10 | |
Class I | | | 1,000.00 | | | | 1,082.90 | | | | 0.95 | | | | 4.93 | |
Hypothetical (5% return before expenses) | | | | | |
Class A | | | 1,000.00 | | | | 1,018.95 | | | | 1.20 | | | | 6.04 | |
Class C | | | 1,000.00 | | | | 1,015.21 | | | | 1.95 | | | | 9.80 | |
Class I | | | 1,000.00 | | | | 1,020.19 | | | | 0.95 | | | | 4.78 | |
KAR Mid-Cap Growth Fund | | | | | |
Actual | | | | | | | | | | | | | | | | |
Class A | | $ | 1,000.00 | | | $ | 1,066.10 | | | | 1.39 | % | | $ | 7.16 | |
Class C | | | 1,000.00 | | | | 1,062.20 | | | | 2.14 | | | | 11.00 | |
Class I | | | 1,000.00 | | | | 1,067.90 | | | | 1.14 | | | | 5.88 | |
Hypothetical (5% return before expenses) | | | | | |
Class A | | | 1,000.00 | | | | 1,018.00 | | | | 1.39 | | | | 6.99 | |
Class C | | | 1,000.00 | | | | 1,014.26 | | | | 2.14 | | | | 10.75 | |
Class I | | | 1,000.00 | | | | 1,019.25 | | | | 1.14 | | | | 5.74 | |
2
VIRTUS EQUITY TRUST
DISCLOSURE OF FUND EXPENSES (Unaudited) (Continued)
FOR THE SIX-MONTH PERIOD OF OCTOBER 1, 2016 TO MARCH 31, 2017
| | | | | | | | | | | | | | | | |
| Expense Table | |
| | | Beginning
Account Value
October 1, 2016 | | | Ending
Account Value
March 31, 2017 | | | Annualized
Expense
Ratio | | | Expenses Paid
During
Period* | |
KAR Small-Cap Core Fund | | | | | |
Actual | | | | | | | | | | | | | | | | |
Class A | | $ | 1,000.00 | | | $ | 1,126.00 | | | | 1.35 | % | | $ | 7.16 | |
Class C | | | 1,000.00 | | | | 1,121.90 | | | | 2.10 | | | | 11.11 | |
Class I | | | 1,000.00 | | | | 1,127.50 | | | | 1.10 | | | | 5.83 | |
Class R6 | | | 1,000.00 | | | | 1,127.70 | | | | 1.00 | | | | 5.30 | |
Hypothetical (5% return before expenses) | | | | | |
Class A | | | 1,000.00 | | | | 1,018.20 | | | | 1.35 | | | | 6.79 | |
Class C | | | 1,000.00 | | | | 1,014.46 | | | | 2.10 | | | | 10.55 | |
Class I | | | 1,000.00 | | | | 1,019.45 | | | | 1.10 | | | | 5.54 | |
Class R6 | | | 1,000.00 | | | | 1,019.95 | | | | 1.00 | | | | 5.04 | |
KAR Small-Cap Growth Fund | | | | | |
Actual | | | | | | | | | | | | | | | | |
Class A | | $ | 1,000.00 | | | $ | 1,102.60 | | | | 1.50 | % | | $ | 7.86 | |
Class C | | | 1,000.00 | | | | 1,098.30 | | | | 2.25 | | | | 11.77 | |
Class I | | | 1,000.00 | | | | 1,104.30 | | | | 1.25 | | | | 6.56 | |
Hypothetical (5% return before expenses) | | | | | |
Class A | | | 1,000.00 | | | | 1,017.45 | | | | 1.50 | | | | 7.54 | |
Class C | | | 1,000.00 | | | | 1,013.71 | | | | 2.25 | | | | 11.30 | |
Class I | | | 1,000.00 | | | | 1,018.70 | | | | 1.25 | | | | 6.29 | |
KAR Small-Cap Value Fund | | | | | |
Actual | | | | | | | | | | | | | | | | |
Class A | | $ | 1,000.00 | | | $ | 1,161.40 | | | | 1.31 | % | | $ | 7.06 | |
Class C | | | 1,000.00 | | | | 1,157.70 | | | | 2.06 | | | | 11.08 | |
Class I | | | 1,000.00 | | | | 1,163.40 | | | | 1.06 | | | | 5.72 | |
Class R6‡ | | | 1,000.00 | | | | 1,215.80 | | | | 0.98 | | | | 4.31 | |
Hypothetical (5% return before expenses) | | | | | |
Class A | | | 1,000.00 | | | | 1,018.40 | | | | 1.31 | | | | 6.59 | |
Class C | | | 1,000.00 | | | | 1,014.66 | | | | 2.06 | | | | 10.35 | |
Class I | | | 1,000.00 | | | | 1,019.65 | | | | 1.06 | | | | 5.34 | |
Class R6‡ | | | 1,000.00 | | | | 1,020.04 | | | | 0.98 | | | | 4.94 | |
Rampart Enhanced Core Equity Fund | | | | | |
Actual | | | | | | | | | | | | | | | | |
Class A | | $ | 1,000.00 | | | $ | 1,129.30 | | | | 1.26 | % | | $ | 6.69 | |
Class C | | | 1,000.00 | | | | 1,124.80 | | | | 2.00 | | | | 10.59 | |
Class I | | | 1,000.00 | | | | 1,130.90 | | | | 1.01 | | | | 5.37 | |
Hypothetical (5% return before expenses) | | | | | |
Class A | | | 1,000.00 | | | | 1,018.65 | | | | 1.26 | | | | 6.34 | |
Class C | | | 1,000.00 | | | | 1,014.96 | | | | 2.00 | | | | 10.05 | |
Class I | | | 1,000.00 | | | | 1,019.90 | | | | 1.01 | | | | 5.09 | |
Tactical Allocation Fund | | | | | |
Actual | | | | | | | | | | | | | | | | |
Class A | | $ | 1,000.00 | | | $ | 1,034.20 | | | | 1.36 | % | | $ | 6.90 | |
Class C | | | 1,000.00 | | | | 1,030.50 | | | | 2.11 | | | | 10.68 | |
Hypothetical (5% return before expenses) | | | | | |
Class A | | | 1,000.00 | | | | 1,018.15 | | | | 1.36 | | | | 6.84 | |
Class C | | | 1,000.00 | | | | 1,014.41 | | | | 2.11 | | | | 10.60 | |
| ‡ | November 7, 2016 is the date the class started accruing expenses. Expenses are equal to the Class’ annualized expense ratio, which is net of waived fees and reimbursed expenses, if applicable, multiplied by the average account value over the period, multiplied by the number of days (145 for actual and 182 for hypothetical) expenses were accrued in the most recent fiscal half-year, then divided by 365 to reflect the one-half year period. |
| * | Expenses are equal to the relevant Fund’s annualized expense ratio, which is net of waived fees and reimbursed expenses, if applicable, multiplied by the average |
| | account value over the period, multiplied by the number of days (182) expenses were accrued in the most recent fiscal half-year, then divided by 365 to reflect the one-half year period. |
For Funds which may invest in other funds, the annualized expense ratios noted above do not reflect fees and expenses associated with the underlying funds. If such fees and expenses had been included, the expenses would have been higher.
You can find more information about a Fund’s expenses in the Financial Statements section that follows. For additional information on operating expenses and other shareholder costs, refer to a Fund’s prospectus.
3
VIRTUS EQUITY TRUST
KEY INVESTMENT TERMS (Unaudited)
MARCH 31, 2017
American Depositary Receipt (ADR)
Represents shares of foreign companies traded in U.S. dollars on U.S. exchanges that are held by a U.S. bank or a trust. Foreign companies use ADRs in order to make it easier for Americans to buy their shares.
Bank of Japan (BOJ)
One of the world’s major central banks, the Bank of Japan is responsible for issuing the country’s currency, managing monetary policy, and maintaining financial system stability.
Bloomberg Barclays U.S. Aggregate Bond Index
The Bloomberg Barclays U.S. Aggregate Bond Index measures the U.S. investment-grade fixed-rate bond market. The index is calculated on a total return basis. The index is unmanaged, its returns do not reflect any fees, expenses, or sales charges, and it is not available for direct investment.
Bloomberg Barclays U.S. Corporate High Yield Bond Index
The Bloomberg Barclays U.S. Corporate High Yield Bond Index measures the U.S. dollar-denominated, high yield, fixed-rate corporate bond market. The index is calculated on a total return basis. The index is unmanaged, its returns do not reflect any fees, expenses, or sales charges, and it is not available for direct investment.
Brexit
A combination of the words “Britain” and “exit” which refers to Britain’s withdrawal from the European Union.
CBOE Volatility Index®
The CBOE Volatility Index® (“VIX®”) shows the market’s expectation of 30-day volatility. It is constructed using the implied volatilities of a wide range of S&P 500® Index options. This volatility is meant to be forward looking and is calculated from both calls and puts. The VIX® is a widely used measure of market risk and is often referred to as the “investor fear gauge.” The index is unmanaged, its returns do not reflect any fees, expenses, or sales charges, and it is not available for direct investment.
Department of Labor’s (DOL) Fiduciary Standard Rule
The Department of Labor (DOL) Fiduciary Rule, scheduled to be phased in beginning June 9, 2017, expands the “investment advice fiduciary” definition under the Employee Retirement Income Security Act (“ERISA”). The rule covers all financial professionals offering investment advice for retirement accounts and seeks to put their clients’ best interests ahead of their own profits. The rule has been hotly contested, and Labor Secretary Alexander Acosta has signaled that he is considering legal options to delay or stop implementation of the rule.
European Central Bank (ECB)
The European Central Bank (ECB) is responsible for conducting monetary policy for the euro area. The ECB was established as the core of the Euro-system and the European System of Central Banks (ESCB). The ESCB comprises the ECB and the National Central Banks (NCBs) of all 17 EU Member States whether they have adopted the Euro or not.
European Union (EU)
The European Union (EU) is a unique economic and political union of 28 European countries. The EU was created in the aftermath of the Second World War that has become a single market for goods and services and it created the single currency the euro.
Exchange-Traded Funds (ETF)
An open-end fund that is traded on a stock exchange. Most ETFs have a portfolio of stocks or bonds that track a specific market index.
Federal Reserve (the “Fed”)
The Central Bank of the United States, responsible for controlling the money supply, interest rates and credit with the goal of keeping the U.S. economy and currency stable. Governed by a seven-member board, the system includes 12 regional Federal Reserve Banks, 25 branches and all national and state banks that are part of the system.
4
VIRTUS EQUITY TRUST
KEY INVESTMENT TERMS (Unaudited) (Continued)
MARCH 31, 2017
Global Quality Dividend Linked Benchmark
The Global Quality Dividend Linked Benchmark consists of the Russell Developed Large Cap Index (net), a free-float market capitalization-weighted index constructed to provide a comprehensive and unbiased barometer for the large-cap segment in the developed world, calculated on a total return basis with net dividends reinvested. The index is unmanaged, its returns do not reflect any fees, expenses, or sales charges, and is not available for direct investment. Performance of the Global Quality Dividend Linked Benchmark prior to 2/1/2017 is that of the Russell 1000® Value Index.
MSCI EAFE® Index (net)
The MSCI EAFE® (Europe, Australasia, Far East) Index (net) is a free float-adjusted market capitalization-weighted index that measures developed foreign market equity performance, excluding the U.S. and Canada. The index is calculated on a total return basis with net dividends reinvested. The index is unmanaged, its returns do not reflect any fees, expenses, or sales charges, and it is not available for direct investment.
MSCI Emerging Markets Index (net)
The MSCI Emerging Markets Index (net) is a free float-adjusted market capitalization-weighted index designed to measure equity market performance in the global emerging markets. The index is calculated on a total return basis with net dividends reinvested. The index is unmanaged, its returns do not reflect any fees, expenses, or sales charges, and it is not available for direct investment.
Organization of the Petroleum Exporting Countries (OPEC)
The Organization of the Petroleum Exporting Countries is an intergovernmental organization that currently has 12 member countries. The organization’s objective is to coordinate and unify petroleum policies among member countries, in order to secure fair and stable prices for petroleum producers; an efficient, economic and regular supply of petroleum to consuming nations; and a fair return on capital to those investing in the industry.
Payment-in-Kind Security (PIK)
A bond which pays interest in the form of additional bonds, or preferred stock which pays dividends in the form of additional preferred stock.
Quantitative Easing (QE)
An unconventional monetary policy in which a central bank purchases government securities or other securities from the market in order to lower interest rates and increase the money supply. Quantitative easing increases the money supply by flooding financial institutions with capital in an effort to promote increased lending and liquidity. Quantitative easing is considered when short-term interest rates are at or approaching zero, and does not involve the printing of new banknotes.
Real Estate Investment Trust (REIT)
A publicly traded company that owns, develops and operates income-producing real estate such as apartments, office buildings, hotels, shopping centers and other commercial properties.
Russell 1000® Growth Index
The Russell 1000® Growth Index is a market capitalization-weighted index of growth-oriented stocks of the 1,000 largest companies in the Russell Universe, which comprises the 3,000 largest U.S. companies. The index is calculated on a total return basis with dividends reinvested. The index is unmanaged, its returns do not reflect any fees, expenses, or sales charges, and it is not available for direct investment.
Russell 1000® Value Index
The Russell 1000® Value Index is a market capitalization-weighted index of value-oriented stocks of the 1,000 largest companies in the Russell Universe, which comprises the 3,000 largest U.S. companies. The index is calculated on a total return basis with dividends reinvested. The index is unmanaged, its returns do not reflect any fees, expenses, or sales charges, and it is not available for direct investment.
Russell 2000® Growth Index
The Russell 2000® Growth Index is a market capitalization-weighted index of growth-oriented stocks of the smallest 2,000 companies in the Russell Universe, which comprises the 3,000 largest U.S. companies. The index is calculated on a total return basis with dividends reinvested. The index is unmanaged, its returns do not reflect any fees, expenses, or sales charges, and it is not available for direct investment.
5
VIRTUS EQUITY TRUST
KEY INVESTMENT TERMS (Unaudited) (Continued)
MARCH 31, 2017
Russell 2000® Index
The Russell 2000® Index is a market capitalization-weighted index of the 2,000 smallest companies in the Russell Universe, which comprises the 3,000 largest U.S. companies. The index is calculated on a total return basis with dividends reinvested. The index is unmanaged, its returns do not reflect any fees, expenses, or sales charges, and it is not available for direct investment.
Russell 2000® Value Index
The Russell 2000® Value Index is a market capitalization-weighted index of value-oriented stocks of the smallest 2,000 companies in the Russell Universe, which comprises the 3,000 largest U.S. companies. The index is calculated on a total return basis with dividends reinvested. The index is unmanaged, its returns do not reflect any fees, expenses, or sales charges, and it is not available for direct investment.
Russell Developed Large Cap Index (net)
The Russell Developed Large Cap Index (net) is a free-float market capitalization-weighted index constructed to provide a comprehensive and unbiased barometer for the large-cap segment in the developed world. The index is calculated on a total return basis with net dividends reinvested. The index is unmanaged, its returns do not reflect any fees, expenses, or sales charges, and it is not available for direct investment.
Russell Midcap® Growth Index
The Russell Midcap® Growth Index is a market capitalization-weighted index of medium-capitalization, growth-oriented stocks of U.S. companies. The index is calculated on a total return basis with dividends reinvested. The index is unmanaged, its returns do not reflect any fees, expenses, or sales charges, and it is not available for direct investment.
Russell Midcap® Index
The Russell Midcap® Index is a market capitalization-weighted index of medium-capitalization stocks of U.S. companies. The index is calculated on a total return basis with dividends reinvested. The index is unmanaged, its returns do not reflect any fees, expenses, or sales charges, and it is not available for direct investment.
Russell Midcap® Value Index
The Russell Midcap® Value Index is a market capitalization-weighted index of medium-capitalization, value-oriented stocks of U.S. companies. The index is calculated on a total return basis with dividends reinvested. The index is unmanaged, its returns do not reflect any fees, expenses, or sales charges, and it is not available for direct investment.
S&P 500® Index
The S&P 500® Index is a free-float market capitalization-weighted index of 500 of the largest U.S. companies. The index is calculated on a total return basis with dividends reinvested. The index is unmanaged, its returns do not reflect any fees, expenses, or sales charges, and it is not available for direct investment.
SPDR®
Represents shares of an open-end exchange-traded fund.
Sponsored ADR
An ADR which is issued with the cooperation of the company whose stock will underlie the ADR. Sponsored ADRs generally carry the same rights normally given to stockholders, such as voting rights. ADRs must be sponsored to be able to trade on a major U.S. exchange such as the New York Stock Exchange (“NYSE”).
Tactical Allocation Fund Linked Benchmark
The Tactical Allocation Fund Linked Benchmark consists of 45% Russell 1000® Growth Index (a market capitalization-weighted index of growth-oriented stocks of the 1,000 largest companies in the Russell Universe, which comprises the 3,000 largest U.S. companies, calculated on a total return basis with dividends reinvested), 15% MSCI EAFE® Index (a free float-adjusted market capitalization-weighted index that measures developed foreign market equity performance, excluding the U.S. and Canada, calculated on a total return basis with net dividends reinvested), and 40% Bloomberg Barclays U.S. Aggregate Bond Index (an index that measures the U.S. investment grade fixed rate bond market, calculated on a total return basis). The index is unmanaged, its returns do not reflect any fees, expenses, or sales charges, and is not available for direct investment. Performance of the Tactical Allocation Fund Linked Benchmark prior to 9/7/2016 represents an allocation consisting of 50% S&P 500® Index and 50% Bloomberg Barclays U.S. Aggregate Bond Index.
6
| | |
Contrarian Value Fund Fund Summary March 31, 2017 (Unaudited) | | Ticker Symbols: A Share: FMIVX C Share: FMICX I Share: PIMVX R6 Share: VMVRX |
Portfolio Manager Commentary by Sasco Capital, Inc.
| ⬛ | | Contrarian Value Fund (the “Fund”) is diversified and has an investment objective of long-term growth of capital. There is no guarantee that the Fund will achieve its objective. |
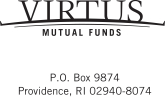
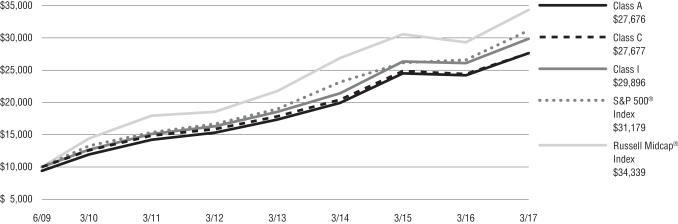
| ⬛ | | For the fiscal year ended March 31, 2017, the Fund’s Class A shares at NAV returned 15.07%, Class C shares returned 14.22%, Class I shares returned 15.36% and Class R6 shares returned 15.51%. For the same period, the Russell Midcap® Value Index, which serves as the Fund’s broad-based and style-specific benchmark appropriate for comparison, returned 19.82%. |
All performance figures assume reinvestment of distributions and exclude the effect of sales charges. Performance data quoted represents past results. Past performance is no guarantee of future results, and current performance may be higher or lower than the performance shown above. Investment return and principal value will fluctuate so your shares when redeemed may be worth more or less than their original cost. Please visit Virtus.com for performance data current to the most recent month-end.
How did the markets perform during the Fund’s fiscal year ended March 31, 2017?
The markets encountered two major surprises during the Fund’s fiscal year: Brexit, when the United Kingdom voted to leave the European Union, and the sweeping win by Donald Trump and the Republican Party in the U.S. elections. The first event was quickly shrugged off as the market continued to focus on low interest rates justifying high valuations, while the latter triggered a huge rally, setting a succession of new record highs before hitting a pause in March.
It was a period of immensely low volatility that started with markets favoring value stocks, and ended with a return to growth in favor and the technology sector regaining its leadership role, accounting for 30% of the return for the S&P 500® Index in the last quarter of the year. Financials enjoyed a very strong rally in the months following President Trump’s win, but traded lower thereafter. (Real estate equities were removed as a sub-sector of financials and started trading as an independent sector in September 2016.)
What factors affected the Fund’s performance during the fiscal year?
The Fund had a good year driven by a number of value-enhancing events in several positions. Relative performance was negatively impacted by the Fund’s historic style void in the financials and technology sectors, as these two sectors accounted for the lion’s share of the fiscal year return of the Fund’s benchmark, the Russell Midcap® Value Index. The Fund’s performance was buoyed by strong performance within its industrials, materials, and energy holdings, while its consumer discretionary holdings were pressured by negative sentiment surrounding the retail space in general.
Stocks that led performance were ONEOK (energy), FMC (materials), Devon (energy), Lamb Weston (consumer staples), and Republic Services (industrials). On the other side of the ledger, the two biggest stock detractors were Hertz Global, which was sold in the third fiscal quarter, and Target, which continues to face challenging headwinds as it undergoes operational restructuring.
The preceding information is the opinion of the portfolio management only through the end of the period of the report as stated on the cover. Any such opinions are subject to change at any time based upon market conditions and should not be relied upon as investment advice.
Equity Securities: The market price of equity securities may be adversely affected by financial market, industry, or issuer-specific events. Focus on a particular style or on small or medium-sized companies may enhance that risk.
Limited Number of Investments: Because the Fund has a limited number of securities, it may be more susceptible to factors adversely affecting its securities than a less concentrated fund.
Industry/Sector Concentration: A fund that focuses its investments in a particular industry or sector will be more sensitive to conditions that affect that industry or sector than a non-concentrated fund.
Prospectus: For additional information on risks, please see the Fund’s prospectus.
| | | | |
| |
| Asset Allocations | |
| |
The following table presents the portfolio holdings within certain sectors as a percentage of total investments attributable to each sector at March 31, 2017. | |
Materials | | | 27 | % |
Industrials | | | 26 | |
Consumer Discretionary | | | 12 | |
Consumer Staples | | | 11 | |
Energy | | | 10 | |
Utilities | | | 4 | |
Real Estate | | | 3 | |
Other (includes securities lending collateral) | | | 7 | |
| | | | | |
Total | | | 100 | % |
| | | | | |
For information regarding the indexes and certain investment terms, see the Key Investment Terms starting on page 4.
7
Contrarian Value Fund (Continued)
| | | | | | | | | | | | | | | | | | | | |
| Average Annual Total Returns1 for periods ended 3/31/17 | | | | |
| | | 1 year | | | 5 years | | | 10 years | | | Since
Inception | | | Inception
Date | |
| Class A Shares at NAV2 | | | 15.07 | % | | | 7.07 | % | | | 4.29 | % | | | — | | | | — | |
| Class A Shares at POP3,4 | | | 8.45 | | | | 5.81 | | | | 3.67 | | | | — | | | | — | |
| Class C Shares at NAV2 and with CDSC4 | | | 14.22 | | | | 6.27 | | | | 3.51 | | | | — | | | | — | |
| Class I Shares at NAV2 | | | 15.36 | | | | 7.33 | | | | — | | | | 7.08 | % | | | 3/10/08 | |
| Class R6 Shares at NAV2 | | | 15.51 | | | | — | | | | — | | | | -0.09 | | | | 11/12/14 | |
| Russell Midcap® Index* | | | 17.03 | | | | 13.09 | | | | 7.94 | | | | — | 5 | | | — | |
| Russell Midcap® Value Index* | | | 19.82 | | | | 14.07 | | | | 7.47 | | | | — | 6 | | | — | |
Fund Expense Ratios7: A Shares: 1.41%; C Shares: 2.16%; I Shares: 1.16%; R6 Shares: 0.99%.
All returns represent past performance which is no guarantee of future results. Current performance may be higher or lower than the performance shown. The investment return and principal value of an investment will fluctuate so that an investor’s shares, when redeemed, may be worth more or less than their original cost. The above table and graph below do not reflect the deduction of taxes that a shareholder would pay on fund distributions or the redemption of shares. Please visit Virtus.com for performance data current to the most recent month-end.
| 1 | Total returns are historical and include changes in share price and the reinvestment of both dividends and capital gain distributions. |
| 2 | “NAV” (Net Asset Value) total returns do not include the effect of any sales charge. |
| 3 | “POP” (Public Offering Price) total returns include the effect of the maximum front-end 5.75% sales charge. |
| 4 | “CDSC” (Contingent Deferred Sales Charge) is applied to redemptions of Class C shares that do not have a sales charge applied at the time of purchase. CDSC charges for certain redemptions of Class A shares made within 18 months of purchases in which a finder’s fee was paid and all redemptions of Class C shares within the first year are 1% and 0% thereafter. |
| 5 | The index returned 7.43% for Class R6 shares and 10.39% for Class I shares from the inception date of the respective share class. |
| 6 | The index returned 8.20% for Class R6 shares and 10.57% for Class I shares from the inception date of the respective share class. |
| 7 | The expense ratios of the Fund are set forth according to the prospectus for the Fund effective April 10, 2017, as supplemented and revised, and may differ from the expense ratios disclosed in the Financial Highlight tables in this report. See the Financial Highlights for more current expense ratios. Expense ratios include fees and expenses associated with the underlying funds. |
| * | The Russell Midcap® Value Index is an appropriate broad-based index. The Fund is no longer using the Russell Midcap® Index. |
Growth of $10,000 For periods ended 3/31
This chart assumes an initial investment of $10,000 made on March 31, 2007, for Class A and Class C shares including any applicable sales charges or fees. The performance of the other share classes will be greater or less than that shown based on differences in inception dates, fees and sales charges. Performance assumes reinvestment of dividends and capital gain distributions.
For information regarding the indexes and certain investment terms, see the Key Investment Terms starting on page 4.
8
| | |
KAR Capital Growth Fund Fund Summary March 31, 2017 (Unaudited) | | Ticker Symbols: A Share: PSTAX C Share: SSTFX I Share: PLXGX |
Portfolio Manager Commentary by Kayne Anderson Rudnick Investment Management, LLC
| ⬛ | | KAR Capital Growth Fund (the “Fund”) is diversified and has an investment objective of long-term capital growth. There is no guarantee that the Fund will meet its objective. |
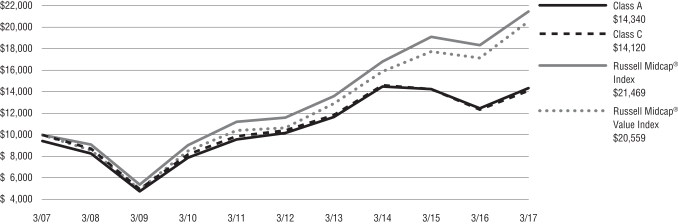
For the fiscal year ended March 31, 2017, the Fund’s Class A shares at NAV returned 12.26%*, Class C shares returned 11.47%, and Class I shares returned 12.61%. For the same period, the Russell 1000® Growth Index, which serves as the Fund’s broad-based and style-specific benchmark appropriate the comparison, returned 15.76%.
* See footnote 6 on page 11.
All performance figures assume reinvestment of distributions and exclude the effect of sales charges. Performance data quoted represents past results. Past performance is no guarantee of future results, and current performance may be higher or lower than the performance shown. Investment return and principal value will fluctuate so your shares when redeemed may be worth more or less than their original cost. Please visit Virtus.com for performance data current to the most recent month-end.
How did the markets perform during the Fund’s fiscal year ended March 31, 2017?
Despite a terrible start to 2016, equities enjoyed very solid returns for the one-year period ended March 31, 2017, with the S&P 500® Index up 17.17% and small stocks registering an even more impressive gain, advancing 26.22%, as measured by the Russell 2000® Index.
Investor risk appetites changed dramatically over the course of the year. The first half of the year was marked by disappointing economic growth, falling bond yields, and defensive fixed-income and equity positioning on the part of investors. After many commodities, particularly crude oil, finally found a bottom after two years of dramatic declines, investors adopted a much more aggressive risk appetite as the economy started to stabilize over the summer and improve into the fall. In November, President-elect Trump’s agenda of pro-business tax reforms and fewer regulatory burdens, further accentuated the outlook that economic growth would accelerate further.
Then, in the first quarter of 2017, the equity markets switched course again with a style rotation, as growth benchmarks outperformed value indexes, and large stocks outperformed small stocks – the opposite of what occurred in 2016. The asset classes and equity sectors that benefited the most from Donald Trump’s surprise election since cooled off and lagged materially through the first quarter of 2017.
What factors affected the Fund’s performance during the fiscal year?
The Fund underperformed the Russell 1000® Growth Index for the period. Performance was helped by strong stock selection in the financials sector and an underweight in the real estate sector. Negative stock selection in the consumer discretionary and information technology sectors were the biggest detractors from performance.
Holdings that contributed the most to performance during the year were Facebook and Amazon.com.
| ⬛ | | Facebook continued to grow advertising revenue and take share in the online digital marketing space. The company delivers an unprecedented global reach of 20% of the earth’s population to advertisers in a very measureable (ROI) way. Monetization of this audience has barely scratched the surface of its long-term potential. Future growth levers include untapped monetization of Messenger, WhatsApp, and video advertising along with Virtual Reality. Facebook sold off strongly following the U.S. election as it was a widely held, defensive long position as well as a perceived relative loser post the election, but the stock bounced strongly in the first quarter of 2017 buoyed by another stellar earnings report. |
| ⬛ | | Amazon has begun to see material operating efficiencies following years of immense investments into its e-commerce and web services businesses. In its most recent quarter, the company reported another multi-year high in revenue growth. Prime subscription service appears to be reaching critical mass, which is encouraging as Amazon Prime users convert 75% of the time and spend three times as much as non-Prime users. Amazon’s other growth engine, web services, has 10 times the capacity of all the other competitors combined and could grow to rival the size of the retail business over time. As the rest of North American retail |
| | | crumbles, more investors are seeing the long-term potential of the Amazon model. |
Holdings that contributed the least to performance were TripAdvisor and Apple.
| ⬛ | | TripAdvisor’s user engagement has decelerated and shifted to lower monetizing mobile at the same time that the company needs those cash flows to market its transition to a booking platform. After mounting concerns for the better part of a year, we sold the Fund’s position in TripAdvisor. |
| ⬛ | | Investors have had concerns that Apple’s iPhone product cycle is maturing and that margins might peak over the next year. Advances and innovation in the living room and car are still a long way off and won’t materially affect Apple’s income statement over the next three to five years. With uncertainty regarding the company’s ability to grow revenue going forward, we sold the Fund’s position in Apple. |
The preceding information is the opinion of portfolio management only through the end of the period of the report as stated on the cover. Any such opinions are subject to change at any time based upon market conditions and should not be relied upon as investment advice.
Equity Securities: The market price of equity securities may be adversely affected by financial market, industry, or issuer-specific events. Focus on a particular style or on small or medium-sized companies may enhance that risk.
Limited Number of Investments: Because the Fund has a limited number of securities, it may be more susceptible to factors adversely affecting its securities than a less concentrated fund.
Industry/Sector Concentration: A fund that focuses its investments in a particular industry or sector will be more sensitive to conditions that affect that industry or sector than a non-concentrated fund.
Prospectus: For additional information on risks, please see the Fund’s prospectus.
For information regarding the indexes and certain investment terms, see the Key Investment Terms starting on page 4.
9
| | |
| KAR Capital Growth Fund (Continued) | | |
| | | | |
| |
| Asset Allocations | |
| |
The following table presents the portfolio holdings within certain sectors as a percentage of total investments attributable to each sector at March 31, 2017. | |
Information Technology | | | 37 | % |
Consumer Discretionary | | | 27 | |
Health Care | | | 11 | |
Consumer Staples | | | 9 | |
Energy | | | 5 | |
Industrials | | | 5 | |
Financials | | | 4 | |
Other | | | 2 | |
| | | | | |
Total | | | 100 | % |
| | | | | |
For information regarding the indexes and certain investment terms, see the Key Investment Terms starting on page 4.
10
KAR Capital Growth Fund (Continued)
| | | | | | | | | | | | |
| Average Annual Total Returns1 for periods ended 3/31/17 | |
| | | 1 year | | | 5 years | | | 10 years | |
| Class A Shares at NAV2,6 | | | 12.26 | % | | | 10.73 | % | | | 6.13 | % |
| Class A Shares at POP3,4 | | | 5.80 | | | | 9.43 | | | | 5.50 | |
| Class C Shares at NAV2 and with CDSC4 | | | 11.47 | | | | 9.92 | | | | 5.33 | |
| Class I Shares at NAV2 | | | 12.61 | | | | 11.02 | | | | 6.40 | |
| S&P 500® Index* | | | 17.17 | | | | 13.30 | | | | 7.51 | |
| Russell 1000® Growth Index* | | | 15.76 | | | | 13.32 | | | | 9.13 | |
Fund Expense Ratios5: A Shares: 1.30%; C Shares: 2.05%; I Shares: 1.05%.
All returns represent past performance which is no guarantee of future results. Current performance may be higher or lower than the performance shown. The investment return and principal value of an investment will fluctuate so that an investor’s shares, when redeemed, may be worth more or less than their original cost. The above table and graph below do not reflect the deduction of taxes that a shareholder would pay on fund distributions or the redemption of fund shares. Please visit Virtus.com for performance data current to the most recent month-end.
| 1 | Total returns are historical and include changes in share price and the reinvestment of both dividends and capital gain distributions. |
| 2 | “NAV” (Net Asset Value) total returns do not include the effect of any sales charge. |
| 3 | “POP” (Public Offering Price) total returns include the effect of the maximum front-end 5.75% sales charge. |
| 4 | “CDSC” (Contingent Deferred Sales Charge) is applied to redemptions of Class C shares that do not have a sales charge applied at the time of purchase. CDSC charges for certain redemptions of Class A shares made within 18 months of purchases in which a finder’s fee was paid and all redemptions of Class C shares within the first year are 1% and 0% thereafter. |
| 5 | The expense ratios of the Fund are set forth according to the prospectus for the Fund effective April 10, 2017, as supplemented and revised, and may differ from the expense ratios disclosed in the Financial Highlights tables in this report. See the Financial Highlights for more current expense ratios. Expense ratios include fees and expenses associated with the underlying funds. |
| 6 | Total Return for the report period presented in the table differs from the return in the Financial Highlights. The total return presented in the above table is calculated based on the NAV at which shareholder transactions were processed. The total return presented in the Financial Highlights section of the report is calculated in the same manner, but also takes into account certain adjustments that are necessary under U.S. generally accepted accounting principles required in the annual report and semi-annual report. |
| * | The Russell 1000® Growth Index is an appropriate broad-based index. The Fund is no longer using the S&P 500® Index. |
Growth of $10,000 For periods ended 3/31
This chart assumes an initial investment of $10,000 made on March 31, 2007, for Class A and Class C shares including any applicable sales charges or fees. The performance of the other share class will be greater or less than that shown based on differences in inception date, fees and sales charges. Performance assumes reinvestment of dividends and capital gain distributions.
For information regarding the indexes and certain investment terms, see the Key Investment Terms starting on page 4.
11
| | |
KAR Global Quality Dividend Fund Fund Summary March 31, 2017 (Unaudited) | | Ticker Symbols: A Share: PPTAX C Share: PPTCX I Share: PIPTX |
Portfolio Manager Commentary by Kayne Anderson Rudnick Investment Management, LLC
| ⬛ | | KAR Global Quality Dividend Fund (the “Fund”) is diversified and has an investment objective of total return, consisting of both capital appreciation and current income. There is no guarantee that the Fund will meet its objective. |
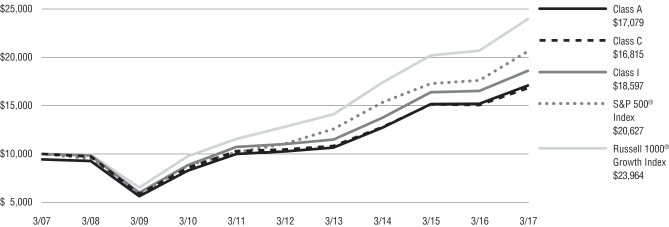
For the fiscal year ended March 31, 2017, the Fund’s Class A shares at NAV returned 12.42%, Class C shares returned 11.58% and Class I shares returned 12.74%*. For the same period, the Russell 1000® Value Index, the Fund’s former broad-based and style-specific benchmark appropriate for comparison, returned 19.22%, and the Russell Developed Large Cap Index (net), which serves as the Fund’s new broad-based and style-specific benchmark appropriate for comparison, returned 14.71%.
* See footnote 7 on page 13.
All performance figures assume reinvestment of distributions and exclude the effect of sales charges. Performance data quoted represents past results. Past performance is no guarantee of future results, and current performance may be higher or lower than the performance shown. Investment return and principal value will fluctuate so your shares when redeemed may be worth more or less than their original cost. Please visit Virtus.com for performance data current to the most recent month-end.
How did the markets perform during the Fund’s fiscal year ended March 31, 2017?
Despite a terrible start to 2016, equities enjoyed very solid returns for the one-year period ended March 31, 2017, with the S&P 500® Index up 17.17% and small stocks registering an even more impressive gain, advancing 26.22%, as measured by the Russell 2000® Index.
Investor risk appetites changed dramatically over the course of the year. The first half of the year was marked by disappointing economic growth, falling bond yields, and defensive fixed-income and equity positioning on the part of investors. After many commodities, particularly crude oil, finally found a bottom after two years of dramatic declines, investors adopted a much more aggressive risk appetite as the economy started to stabilize over the
summer and improve into the fall. In November, President-elect Trump’s agenda of pro-business tax reforms and fewer regulatory burdens, further accentuated the outlook that economic growth would accelerate further.
Then, in the first quarter of 2017, the equity markets switched course again with a style rotation, as growth benchmarks outperformed value indexes, and large stocks outperformed small stocks – the opposite of what occurred in 2016. The asset classes and equity sectors that benefited the most from Donald Trump’s surprise election since cooled off and lagged materially through the first quarter of 2017.
What factors affected the Fund’s performance during the fiscal year?
Holdings that made a positive contribution to performance during the period were PNC Financial Services Group and U.S. Bancorp. Expectations of higher interest rates, and an economic and regulatory environment expected to be favorable to financial services companies under a Trump presidency, drove interest rate-sensitive financial stocks higher in the second half of 2016. PNC Financial and U.S. Bancorp both benefited in this environment.
Holdings that contributed the least to performance were Hormel Foods and Apple. After a strong period of outperformance in 2015, Hormel Foods’ shares were weak in 2016. Management noted the recent high level of margins that the company had been achieving may not be maintained in the short term. However, the company’s long-term outlook and underlying fundamentals have not changed and remain quite positive. For Apple, as the iPhone has matured, unit growth and average-selling prices have started to come under pressure. The life cycle of the product appears to be extending and a mix shift towards lower-priced products are pressuring the company’s results.
The preceding information is the opinion of portfolio management only through the end of the period of the report as stated on the cover. Any such opinions are subject to change at any time based upon market conditions and should not be relied upon as investment advice.
Equity Securities: The market price of equity securities may be adversely affected by financial market, industry, or issuer-specific events. Focus on
a particular style or on small or medium-sized companies may enhance that risk.
Limited Number of Investments: Because the Fund has a limited number of securities, it may be more susceptible to factors adversely affecting its securities than a less concentrated fund.
Industry/Sector Concentration: A fund that focuses its investments in a particular industry or sector will be more sensitive to conditions that affect that industry or sector than a non-concentrated fund.
Prospectus: For additional information on risks, please see the Fund’s prospectus.
| | | | |
| |
| Asset Allocations | |
| |
The following table presents the portfolio holdings within certain sectors as a percentage of total investments attributable to each sector at March 31, 2017. | |
Financials | | | 16 | % |
Consumer Staples | | | 10 | |
Telecommunication Services | | | 10 | |
Utilities | | | 9 | |
Health Care | | | 9 | |
Energy | | | 8 | |
Consumer Discretionary | | | 8 | |
Other (includes securities lending collateral) | | | 30 | |
| | | | | |
Total | | | 100 | % |
| | | | | |
For information regarding the indexes and certain investment terms, see the Key Investment Terms starting on page 4.
12
KAR Global Quality Dividend Fund (Continued)
| | | | | | | | | | | | | | | | | | | | |
| Average Annual Total Returns1 for periods ended 3/31/17 | | | | | | | | | | |
| | | 1 year | | | 5 years | | | 10 years | | | Since
Inception | | | Inception
Date | |
| Class A Shares at NAV2 | | | 12.42 | % | | | 10.25 | % | | | 4.00 | % | | | — | | | | — | |
| Class A Shares at POP3,4 | | | 5.95 | | | | 8.95 | | | | 3.39 | | | | — | | | | — | |
| Class C Shares at NAV2 and with CDSC4 | | | 11.58 | | | | 9.43 | | | | 3.21 | | | | — | | | | — | |
| Class I Shares at NAV2,7 | | | 12.74 | | | | 10.53 | | | | — | | | | 6.18 | % | | | 6/6/08 | |
| S&P 500® Index* | | | 17.17 | | | | 13.30 | | | | 7.51 | | | | 8.80 | 5 | | | — | |
| Russell 1000® Value Index* | | | 19.22 | | | | 13.13 | | | | 5.93 | | | | 7.86 | 5 | | | — | |
| Russell Developed Large Cap Index (net)* | | | 14.71 | | | | 9.59 | | | | 4.43 | | | | 4.85 | 5 | | | — | |
| Global Quality Dividend Linked Benchmark | | | 20.72 | | | | 13.41 | | | | 6.06 | | | | 8.01 | 5 | | | — | |
Fund Expense Ratios6: A Shares: Gross 1.44%, Net 1.35%; C Shares: Gross 2.19%, Net 2.10%; I Shares: Gross 1.19%, Net 1.10%.
All returns represent past performance which is no guarantee of future results. Current performance may be higher or lower than the performance shown. The investment return and principal value of an investment will fluctuate so that an investor’s shares, when redeemed, may be worth more or less than their original cost. The above table and graph below do not reflect the deduction of taxes that a shareholder would pay on fund distributions or the redemption of fund shares. Please visit Virtus.com for performance data current to the most recent month-end.
| 1 | Total returns are historical and include changes in share price and the reinvestment of both dividends and capital gain distributions. |
| 2 | “NAV” (Net Asset Value) total returns do not include the effect of any sales charge. |
| 3 | “POP” (Public Offering Price) total returns include the effect of the maximum front-end 5.75% sales charge. |
| 4 | “CDSC” (Contingent Deferred Sales Charge) is applied to redemptions of Class C shares that do not have a sales charge applied at the time of purchase. CDSC charges for certain redemptions of Class A shares made within the first 18 months of purchases in which a finder’s fee was paid and all redemptions of Class C shares within the first year are 1% and 0% thereafter. |
| 5 | The index returns are from Class I shares’ inception date. |
| 6 | The expense ratios of the Fund are set forth according to the prospectus for the Fund effective April 10, 2017, as supplemented and revised, and may differ from the expense ratios disclosed in the Financial Highlights tables in this report. See the Financial Highlights for more current expense ratios. Net Expense: Expenses reduced by a contractual fee waiver, in effect through April 30, 2018. Gross Expense: Does not reflect the effect of the fee waiver. Expense ratios include fees and expenses associated with the underlying funds. |
| 7 | Total Return for the report period presented in the table differs from the return in the Financial Highlights. The total return presented in the above table is calculated based on the NAV at which shareholder transactions were processed. The total return presented in the Financial Highlights section of the report is calculated in the same manner, but also takes into account certain adjustments that are necessary under U.S. generally accepted accounting principles required in the annual report and semi-annual report. |
| * | The Russell Developed Large Cap Index (net) is an appropriate broad-based index. The Fund is no longer using the S&P 500® Index and the Russell 1000® Value Index. |
Growth of $10,000 For periods ended 3/31
This chart assumes an initial investment of $10,000 made on March 31, 2007, for Class A and Class C shares including any applicable sales charges or fees. The performance of the other share class will be greater or less than that shown based on differences in inception date, fees and sales charges. Performance assumes reinvestment of dividends and capital gain distributions.
For information regarding the indexes and certain investment terms, see the Key Investment Terms starting on page 4.
13
| | |
KAR Mid-Cap Core Fund Fund Summary March 31, 2017 (Unaudited) | | Ticker Symbols: A Share: VMACX C Share: VMCCX I Share: VIMCX |
Portfolio Manager Commentary by Kayne Anderson Rudnick Investment Management, LLC
| ⬛ | | KAR Mid-Cap Core Fund (the “Fund”) is diversified and has an investment objective of long-term capital appreciation. There is no guarantee that the Fund will meet its objective. |
For the fiscal year ended March 31, 2017, the Fund’s Class A shares at NAV returned 14.16%, Class C shares returned 13.35% and Class I shares returned 14.46%. For the same period, the Russell Midcap® Index, which serves as the Fund’s broad-based and style-specific benchmark appropriate for comparison, returned 17.03%.
All performance figures assume reinvestment of distributions and exclude the effect of sales charges. Performance data quoted represents past results. Past performance is no guarantee of future results, and current performance may be higher or lower than the performance shown. Investment return and principal value will fluctuate so your shares when redeemed may be worth more or less than their original cost. Please visit Virtus.com for performance data current to the most recent month-end.
How did the markets perform during the Fund’s fiscal year ended March 31, 2017?
Despite a terrible start to 2016, equities enjoyed very solid returns for the one-year period ended March 31, 2017, with the S&P 500® Index up 17.17% and small stocks registering an even more impressive gain, advancing 26.22%, as measured by the Russell 2000® Index.
Investor risk appetites changed dramatically over the course of the year. The first half of the year was marked by disappointing economic growth, falling bond yields, and defensive fixed-income and equity positioning on the part of investors. After many commodities, particularly crude oil, finally found a bottom after two years of dramatic declines, investors adopted a much more aggressive risk appetite as the economy started to stabilize over the summer and improve into the fall. In November, President-elect Trump’s agenda of pro-business tax reforms and fewer regulatory burdens, further accentuated the outlook that economic growth would accelerate further.
Then, in the first quarter of 2017, the equity markets switched course again with a style rotation, as growth benchmarks outperformed value indexes, and large stocks outperformed small stocks – the opposite of what occurred in 2016. The asset classes and equity sectors that benefited the most from Donald Trump’s surprise election since cooled off and lagged materially through the first quarter of 2017.
What factors affected the Fund’s performance during the fiscal period ended March 31, 2017?
The Fund underperformed the Russell Midcap® Index for the period. Performance was helped by an underweight in utilities and stock selection in the health care sector. Negative stock selection and an underweight in energy and negative stock selection in consumer discretionary were the biggest detractors from performance.
Holdings that contributed the most to performance were Nordson and Aspen Technology.
| ⬛ | | Nordson’s continued double-digit organic growth, led by its Advanced Technology Systems segment selling into the mobile electronic industry participants, led to stock price appreciation. |
| ⬛ | | With the relative stabilization in oil markets, investors have become more confident in Aspen’s long-term prospects. For its part, Aspen’s financial results weathered the downturn in oil prices quite well, thanks to its long-term contracts and mission-critical nature of its software. |
Holdings that contributed the least to performance were TripAdvisor and Sally Beauty Holdings.
| ⬛ | | TripAdvisor’s shares have been under pressure for several years as margins continued to decline due to increased marketing spend. In addition, the recent rollout of its Instant Book product negatively impacted revenue growth, which created additional pressure on margins. While uncertainty remains regarding TripAdvisor’s ability to get consumers to adopt Instant Book, the franchise value of its core travel review site appears to be intact. As Instant Book matures, it should allow TripAdvisor to further monetize the vast amount of traffic that visits its sites, which will sustain long-term revenue and profit growth. |
| ⬛ | | Sally Beauty Holdings continues to struggle through its retail turnaround, which to date has |
| | | been more disruptive than helpful to driving sales. The company has maintained its core loyal shoppers but is struggling to drive new traffic to the stores. The new management team continues to implement new initiatives, such as a new loyalty program, social media marketing, and product brands launches. The stock has also been pressured by fears that the core professional business could weaken. Management is working to ensure there is enough newness and core product to sustain its strong professional business. |
The preceding information is the opinion of portfolio management only through the end of the period of the report as stated on the cover. Any such opinions are subject to change at any time based upon market conditions and should not be relied upon as investment advice.
Equity Securities: The market price of equity securities may be adversely affected by financial market, industry, or issuer-specific events. Focus on a particular style or on small or medium-sized companies may enhance that risk.
Limited Number of Investments: Because the Fund has a limited number of securities, it may be more susceptible to factors adversely affecting its securities than a less concentrated fund.
Industry/Sector Concentration: A fund that focuses its investments in a particular industry or sector will be more sensitive to conditions that affect that industry or sector than a non-concentrated fund.
Prospectus: For additional information on risks, please see the Fund’s prospectus.
| | | | |
| |
| Asset Allocations | |
| |
The following table presents the portfolio holding within certain sectors as a percentage of total investments attributable to each sector at March 31, 2017. | |
Industrials | | | 23 | % |
Information Technology | | | 19 | |
Health Care | | | 17 | |
Financials | | | 14 | |
Consumer Discretionary | | | 9 | |
Consumer Staples | | | 6 | |
Materials | | | 5 | |
Other (includes securities lending collateral) | | | 7 | |
| | | | | |
Total | | | 100 | % |
| | | | | |
For information regarding the indexes and certain investment terms, see the Key Investment Terms starting on page 4.
14
KAR Mid-Cap Core Fund (Continued)
| | | | | | | | | | | | | | | | |
| Average Annual Total Returns1 for periods ended 3/31/17 | | | | | | | | | | | | |
| | | 1 year | | | 5 year | | | Since
Inception | | | Inception
Date | |
| Class A Shares at NAV2 | | | 14.16 | % | | | 12.55 | % | | | 14.85 | % | | | 6/22/09 | |
| Class A Shares at POP3,4 | | | 7.60 | | | | 11.22 | | | | 13.98 | | | | 6/22/09 | |
| Class C Shares at NAV2 and with CDSC4 | | | 13.35 | | | | 11.73 | | | | 13.98 | | | | 6/22/09 | |
| Class I Shares at NAV2 | | | 14.46 | | | | 12.84 | | | | 15.12 | | | | 6/22/09 | |
| S&P 500® Index* | | | 17.17 | | | | 13.30 | | | | 15.74 | 5 | | | — | |
| Russell Midcap® Index* | | | 17.03 | | | | 13.09 | | | | 17.19 | 5 | | | — | |
Fund Expense Ratios6: A Shares: Gross 1.64%, Net 1.20%; C Shares: Gross 2.39%, Net 1.95%; I Shares: Gross 1.39%, Net 0.95%.
All returns represent past performance which is no guarantee of future results. Current performance may be higher or lower than the performance shown. The investment return and principal value of an investment will fluctuate so that an investor’s shares, when redeemed, may be worth more or less than their original cost. The above table and graph below do not reflect the deduction of taxes that a shareholder would pay on fund distributions or the redemption of fund shares. Please visit Virtus.com for performance data current to the most recent month-end.
| 1 | Total returns are historical and include changes in share price and the reinvestment of both dividends and capital gain distributions. |
| 2 | “NAV” (Net Asset Value) total returns do not include the effect of any sales charge. |
| 3 | “POP” (Public Offering Price) total returns include the effect of the maximum front-end 5.75% sales charge. |
| 4 | “CDSC” (Contingent Deferred Sales Charge) is applied to redemptions of Class C shares that do not have a sales charge applied at the time of purchase. CDSC charges for certain redemptions of Class A shares made within the first 18 months of purchases in which a finder’s fee was paid and all redemptions of Class C shares within the first year are 1% and 0% thereafter. |
| 5 | The index returns are from the Fund’s inception date. |
| 6 | The expense ratios of the Fund are set forth according to the prospectus for the Fund effective April 10, 2017, as supplemented and revised, and may differ from the expense ratios disclosed in the Financial Highlights tables in this report. See the Financial Highlights for more current expense ratios. Net Expense: Expenses reduced by a contractual fee waiver, in effect through April 30, 2018. Gross Expense: Does not reflect the effect of the fee waiver. Expense ratios include fees and expenses associated with the underlying funds. |
| * | The Russell Midcap® Index is an appropriate broad-based index. The Fund is no longer using the S&P 500® Index. |
Growth of $10,000 For periods ended 3/31
This chart assumes an initial investment of $10,000 made on June 22, 2009 (inception date of the Fund), for Class A, Class C, and Class I shares including any applicable sales charges or fees. Performance assumes reinvestment of dividends and capital gain distributions.
For information regarding the indexes and certain investment terms, see the Key Investment Terms starting on page 4.
15
| | |
KAR Mid-Cap Growth Fund Fund Summary March 31, 2017 (Unaudited) | | Ticker Symbols: A Share: PHSKX C Share: PSKCX I Share: PICMX |
Portfolio Manager Commentary by Kayne Anderson Rudnick Investment Management, LLC
| ⬛ | | KAR Mid-Cap Growth Fund (the “Fund”) is diversified and has an investment objective of capital appreciation. There is no guarantee that the Fund will meet its objective. |
For the fiscal year ended March 31, 2017, the Fund’s Class A shares at NAV returned 13.86%*, Class C shares returned 13.03%, and Class I shares returned 14.13%. For the same period, the Russell Midcap® Growth Index, which serves as the Fund’s broad-based and style-specific benchmark appropriate for comparison, returned 14.07%.
* See footnote 7 on page 18.
All performance figures assume reinvestment of distributions and exclude the effect of sales charges. Performance data quoted represents past results. Past performance is no guarantee of future results, and current performance may be higher or lower than the performance shown. Investment return and principal value will fluctuate so your shares when redeemed may be worth more or less than their original cost. Please visit Virtus.com for performance data current to the most recent month-end.
How did the markets perform during the Fund’s fiscal year ended March 31, 2017?
Despite a terrible start to 2016, equities enjoyed very solid returns for the one-year period ended March 31, 2017, with the S&P 500® Index up 17.17% and small stocks registering an even more impressive gain, advancing 26.22%, as measured by the Russell 2000® Index.
Investor risk appetites changed dramatically over the course of the year. The first half of the year was marked by disappointing economic growth, falling bond yields, and defensive fixed-income and equity positioning on the part of investors. After many commodities, particularly crude oil, finally found a bottom after two years of dramatic declines, investors adopted a much more aggressive risk appetite as the economy started to stabilize over the summer and improve into the fall. In November, President-elect Trump’s agenda of pro-business tax
reforms and fewer regulatory burdens, further accentuated the outlook that economic growth would accelerate further.
Then, in the first quarter of 2017, the equity markets switched course again with a style rotation, as growth benchmarks outperformed value indexes, and large stocks outperformed small stocks – the opposite of what occurred in 2016. The asset classes and equity sectors that benefited the most from Donald Trump’s surprise election since cooled off and lagged materially through the first quarter of 2017.
What factors affected the Fund’s performance during the fiscal year ended March 31, 2017?
The Fund performed in line with the Russell Midcap® Growth Index for the period. Performance was helped by strong stock selection in the consumer discretionary sector and by strong stock selection and an overweight in financials. Negative stock selection and an overweight in consumer staples and negative stock selection in industrials were the biggest detractors from performance.
Holdings that contributed the most to performance were MercadoLibre and MarketAxess Holdings.
| ⬛ | | MercadoLibre’s shares appreciated meaningfully in 2016 as the company reported strong quarterly results throughout the year, including 40%+ growth in the number of items sold in its marketplace for the year. Given the fact that the company’s largest country by sales, Brazil, continued to be in a deep recession, these results were impressive. We retained the Fund’s position in MercadoLibre, due to the company’s strong network effect business and the long-term secular growth opportunity driven by a Latin American market with a combined population of 550 million people and one of the fastest growing Internet penetration rates in the world. |
| ⬛ | | MarketAxess holds a dominant share (~90%) of electronic trading volume. The company has evolved from a client-to-dealer focus to an all-to-all open trading model which has also facilitated growth in dealer-to-dealer trades. Heightened trading activity in the fourth quarter of 2016 led to another revenue beat as well as expansion of the company’s already healthy (>50%) operating margins. |
Holdings that contributed the least to performance were The Chefs’ Warehouse and Proto Labs.
| ⬛ | | Quarterly results were disappointing again for The Chefs’ Warehouse due mostly to issues integrating the recent Del Monte acquisition and margin pressure in the Allen Brothers prime beef business. As a result, management reduced its full-year profit guidance by over 20%, which sent shares sharply lower. The company’s numerous missteps have been mostly self-inflicted and the mix shift to protein has made the business more volatile. With confidence in management waning, we sold the Fund’s position in The Chefs’ Warehouse. |
| ⬛ | | Seeking greater cost efficiency and faster time to market for new products, demand from Proto Labs’ diversified customer base has driven the company’s rapid top-line growth. While research and development spending is one of the last things to get cut, the industrial recession is seemingly catching up with the company. Revenue growth in its core business has slowed from over 30% to mid-teens as layoffs curtailed demand at existing customers and follow-on production orders weakened. While Proto’s entry into additive manufacturing offers long-term upside, it is a less differentiated business than the core. With the business changing for the worse, we sold the Fund’s position in Proto Labs. |
The preceding information is the opinion of portfolio management only through the end of the period of the report as stated on the cover. Any such opinions are subject to change at any time based upon market conditions and should not be relied upon as investment advice.
Equity Securities: The market price of equity securities may be adversely affected by financial market, industry, or issuer-specific events. Focus on a particular style or on small or medium-sized companies may enhance that risk.
Limited Number of Investments: Because the Fund has a limited number of securities, it may be more susceptible to factors adversely affecting its securities than a less concentrated fund.
For information regarding the indexes and certain investment terms, see the Key Investment Terms starting on page 4.
16
| | |
| KAR Mid-Cap Growth Fund (Continued) | | |
Industry/Sector Concentration: A fund that focuses its investments in a particular industry or sector will be more sensitive to conditions that affect that industry or sector than a non-concentrated fund.
Prospectus: For additional information on risks, please see the Fund’s prospectus.
| | | | |
| |
| Asset Allocations | |
| |
The following table presents the portfolio holdings within certain sectors as a percentage of total investments attributable to each sector at March 31, 2017. | |
Consumer Discretionary | | | 28 | % |
Information Technology | | | 28 | |
Health Care | | | 11 | |
Industrials | | | 10 | |
Financials | | | 9 | |
Consumer Staples | | | 8 | |
Energy | | | 5 | |
Other | | | 1 | |
| | | | | |
Total | | | 100 | % |
| | | | | |
For information regarding the indexes and certain investment terms, see the Key Investment Terms starting on page 4.
17
KAR Mid-Cap Growth Fund (Continued)
| | | | | | | | | | | | | | | | | | | | |
| Average Annual Total Returns1 for periods ended 3/31/17 | | | | | | | | | | |
| | | 1 year | | | 5 years | | | 10 years | | | Since
Inception | | | Inception
Date | |
| Class A Shares at NAV2,7 | | | 13.86 | % | | | 8.42 | % | | | 4.33 | % | | | — | | | | — | |
| Class A Shares at POP3,4 | | | 7.32 | | | | 7.14 | | | | 3.71 | | | | — | | | | — | |
| Class C Shares at NAV2 and with CDSC4 | | | 13.03 | | | | 7.61 | | | | 3.55 | | | | — | | | | — | |
| Class I Shares at NAV2 | | | 14.13 | | | | 8.69 | | | | — | | | | 4.71 | % | | | 9/13/07 | |
| S&P 500® Index* | | | 17.17 | | | | 13.30 | | | | 7.51 | | | | 7.29 | 5 | | | — | |
| Russell Midcap® Growth Index* | | | 14.07 | | | | 11.95 | | | | 8.13 | | | | 7.97 | 5 | | | — | |
Fund Expense Ratios6: A Shares: Gross 1.49%, Net 1.40%; C Shares: Gross 2.24%, Net 2.15%; I Shares: Gross 1.24%, Net 1.15%.
All returns represent past performance which is no guarantee of future results. Current performance may be higher or lower than the performance shown. The investment return and principal value of an investment will fluctuate so that an investor’s shares, when redeemed, may be worth more or less than their original cost. The above table and graph below do not reflect the deduction of taxes that a shareholder would pay on fund distributions or the redemption of fund shares. Please visit Virtus.com for performance data current to the most recent month-end.
| 1 | Total returns are historical and include changes in share price and the reinvestment of both dividends and capital gain distributions. |
| 2 | “NAV” (Net Asset Value) total returns do not include the effect of any sales charge. |
| 3 | “POP” (Public Offering Price) total returns include the effect of the maximum front-end 5.75% sales charge. |
| 4 | “CDSC” (Contingent Deferred Sales Charge) is applied to redemptions of Class C shares that do not have a sales charge applied at the time of purchase. CDSC charges for certain redemptions of Class A shares made within the first 18 months of purchases in which a finder’s fee was paid and all redemptions of Class C shares within the first year are 1% and 0% thereafter. |
| 5 | The index returns are from Class I shares’ inception date. |
| 6 | The expense ratios of the Fund are set forth according to the prospectus for the Fund effective April 10, 2017, as supplemented and revised, and may differ from the expense ratios disclosed in the Financial Highlights tables in this report. See the Financial Highlights for more current expense ratios. Net Expense: Expenses reduced by a contractual fee waiver, in effect through April 30, 2018. Gross Expense: Does not reflect the effect of the fee waiver. Expense ratios include fees and expenses associated with the underlying funds. |
| 7 | Total Return for the report period presented in the table differs from the return in the Financial Highlights. The total return presented in the above table is calculated based on the NAV at which shareholder transactions were processed. The total return presented in the Financial Highlights section of the report is calculated in the same manner, but also takes into account certain adjustments that are necessary under U.S. generally accepted accounting principles required in the annual report and semi-annual report. |
| * | The Russell Midcap® Growth Index is appropriate broad-based index. The Fund is longer using the S&P 500® Index. |
Growth of $10,000 For periods ended 3/31
This chart assumes an initial investment of $10,000 made on March 31, 2007, for Class A and Class C shares including any applicable sales charges or fees. The performance of the other share class will be greater or less than that shown based on differences in inception date, fees and sales charges. Performance assumes reinvestment of dividends and capital gain distributions.
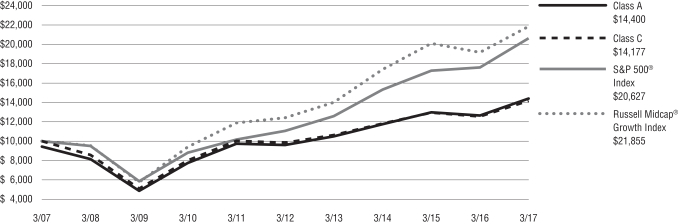
For information regarding the indexes and certain investment terms, see the Key Investment Terms starting on page 4.
18
| | |
KAR Small-Cap Core Fund Fund Summary March 31, 2017 (Unaudited) | | Ticker Symbols: A Share: PKSAX C Share: PKSCX I Share: PKSFX R6 Share: VSCRX |
Portfolio Manager Commentary by Kayne Anderson Rudnick Investment Management, LLC
| ⬛ | | KAR Small-Cap Core Fund (the “Fund”) is diversified and has an investment objective of long-term capital appreciation, with dividend income a secondary consideration. There is no guarantee that the Fund will meet its objective. |
For the fiscal year ended March 31, 2017, the Fund’s Class A shares at NAV returned 20.26%, Class C shares returned 19.39%, Class I shares returned 20.57%, and Class R6 shares returned 20.68%. For the same period, the Russell 2000® Index, which serves as the Fund’s broad-based and style-specific benchmark appropriate for comparison, returned 26.22%.
All performance figures assume reinvestment of distributions and exclude the effect of sales charges. Performance data quoted represents past results. Past performance is no guarantee of future results, and current performance may be higher or lower than the performance shown. Investment return and principal value will fluctuate so your shares when redeemed may be worth more or less than their original cost. Please visit Virtus.com for performance data current to the most recent month-end.
How did the markets perform during the Fund’s fiscal year ended March 31, 2017?
Despite a terrible start to 2016, equities enjoyed very solid returns for the one-year period ended March 31, 2017, with the S&P 500® Index up 17.17% and small stocks registering an even more impressive gain, advancing 26.22%, as measured by the Russell 2000® Index.
Investor risk appetites changed dramatically over the course of the year. The first half of the year was marked by disappointing economic growth, falling bond yields, and defensive fixed-income and equity positioning on the part of investors. After many commodities, particularly crude oil, finally found a bottom after two years of dramatic declines, investors adopted a much more aggressive risk appetite as the economy started to stabilize over the summer and improve into the fall. In November, President-elect Trump’s agenda of pro-business tax reforms and fewer
regulatory burdens, further accentuated the outlook that economic growth would accelerate further.
Then, in the first quarter of 2017, the equity markets switched course again with a style rotation, as growth benchmarks outperformed value indexes, and large stocks outperformed small stocks – the opposite of what occurred in 2016. The asset classes and equity sectors that benefited the most from Donald Trump’s surprise election since cooled off and lagged materially through the first quarter of 2017.
What factors affected the Fund’s performance during the fiscal year?
The Fund underperformed the Russell 2000® Index for the period. Performance was helped by strong stock selection in the producer durables and consumer discretionary sectors. Negative stock selection in the health care and energy sectors were the biggest detractors from performance.
Holdings that contributed the most to performance during the year were Primerica and MarketAxess Holdings.
| ⬛ | | Primerica’s shares were under pressure due to concern over how the Department of Labor’s fiduciary standard rule would impact the retirement investment account industry. While the final language of the rule was less onerous than feared, some questions had remained over the ultimate cost of implementation. The Trump administration has delayed implementation of the rule and caused speculation that it may never become effective. With this overhang thus removed from the stock, investors have refocused on the fundamentals of the business. |
| ⬛ | | MarketAxess’ network economics have enabled the company’s platform to persistently gain market share in its core high-grade fixed-income market. Additional meaningful opportunities for the company exist in other fixed income markets as well. |
Holdings that contributed the least to performance were Computer Programs and Systems and The Chefs’ Warehouse.
| ⬛ | | Computer Programs and Systems has seen its shares impacted by lower spending among their customers as the meaningful use mandate begins to subside and competition becomes more pronounced. |
| ⬛ | | The Chefs’ Warehouse’s shares increased meaningfully in the fourth quarter of 2016, along with many other small-cap stocks, following the results of the election. However, the share price has remained down over the last year due to earnings estimate misses and guidance cuts in previous quarters. More recently, the company gave weak guidance for 2017, which put further pressure on the share price. |
The preceding information is the opinion of portfolio management only through the end of the period of the report as stated on the cover. Any such opinions are subject to change at any time based upon market conditions and should not be relied upon as investment advice.
Equity Securities: The market price of equity securities may be adversely affected by financial market, industry, or issuer-specific events. Focus on a particular style or on small or medium-sized companies may enhance that risk.
Limited Number of Investments: Because the Fund has a limited number of securities, it may be more susceptible to factors adversely affecting its securities than a less concentrated fund.
Industry/Sector Concentration: A fund that focuses its investments in a particular industry or sector will be more sensitive to conditions that affect that industry or sector than a non-concentrated fund.
Prospectus: For additional information on risks, please see the Fund’s prospectus.
| | | | |
| |
| Asset Allocations | |
| |
The following table presents the portfolio holding within certain sectors as a percentage of total investments attributable to each sector at March 31, 2017. | |
Industrials | | | 29 | % |
Financials | | | 17 | |
Information Technology | | | 16 | |
Consumer Discretionary | | | 11 | |
Energy | | | 5 | |
Health Care | | | 4 | |
Consumer Staples | | | 3 | |
Other (includes short-term investment and securities lending collateral) | | | 15 | |
| | | | | |
Total | | | 100 | % |
| | | | | |
For information regarding the indexes and certain investment terms, see the Key Investment Terms starting on page 4.
19
KAR Small-Cap Core Fund (Continued)
| | | | | | | | | | | | | | | | | | | | |
| Average Annual Total Returns1 for periods ended 3/31/17 | | | | |
| | | 1 year | | | 5 years | | | 10 years | | | Since
Inception | | | Inception Date | |
| Class A Shares at NAV2 | | | 20.26 | % | | | 11.07 | % | | | 7.96 | % | | | — | | | | — | |
| Class A Shares at POP3,4 | | | 13.35 | | | | 9.77 | | | | 7.32 | | | | — | | | | — | |
| Class C Shares at NAV2 and with CDSC4 | | | 19.39 | | | | 10.26 | | | | 7.16 | | | | — | | | | — | |
| Class I Shares at NAV2 | | | 20.57 | | | | 11.35 | | | | 8.24 | | | | — | | | | — | |
| Class R6 Shares at NAV2 | | | 20.68 | | | | — | | | | — | | | | 11.00 | % | | | 11/12/14 | |
| S&P 500® Index* | | | 17.17 | | | | 13.30 | | | | 7.51 | | | | 8.68 | 5 | | | — | |
| Russell 2000® Index* | | | 26.22 | | | | 12.35 | | | | 7.12 | | | | 8.30 | 5 | | | — | |
Fund Expense Ratios6: A Shares: 1.37%; C Shares: 2.12%; I Shares: 1.12%; R6 Shares: 0.99%.
All returns represent past performance which is no guarantee of future results. Current performance may be higher or lower than the performance shown. The investment return and principal value of an investment will fluctuate so that an investor’s shares, when redeemed, may be worth more or less than their original cost. The above table and graph below do not reflect the deduction of taxes that a shareholder would pay on fund distributions or the redemption of fund shares. Please visit Virtus.com for performance data current to the most recent month-end.
| 1 | Total returns are historical and include changes in share price and the reinvestment of both dividends and capital gain distributions. |
| 2 | “NAV” (Net Asset Value) total returns do not include the effect of any sales charge. |
| 3 | “POP” (Public Offering Price) total returns include the effect of the maximum front-end 5.75% sales charge. |
| 4 | “CDSC” (Contingent Deferred Sales Charge) is applied to redemptions of Class C shares that do not have a sales charge applied at the time of purchase. CDSC charges for certain redemptions of Class A shares made with the first 18 months of purchases in which a finder’s fee was paid and all redemptions of Class C shares within the first year are 1% and 0% thereafter. |
| 5 | The index returns are from Class R6 shares’ inception date. |
| 6 | The expense ratios of the Fund are set forth according to the prospectus for the Fund effective April 10, 2017, as supplemented and revised, and may differ from the expense ratios disclosed in the Financial Highlights tables in this report. See the Financial Highlights for more current expense ratios. Expense ratios include fees and expenses associated with the underlying funds. |
| * | The Russell 2000® Index is an appropriate broad-based index. The Fund is no longer using the S&P 500® Index. |
Growth of $10,000 For periods ended 3/31
This chart assumes an initial investment of $10,000 made on March 31, 2007, for Class A, Class C, and Class I shares including any applicable sales charges or fees. Performance assumes reinvestment of dividends and capital gain distributions.
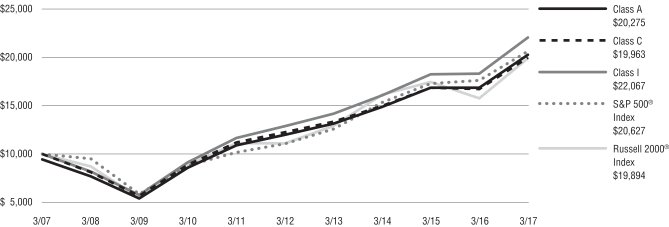
For information regarding the indexes and certain investment terms, see the Key Investment Terms starting on page 4.
20
| | |
KAR Small-Cap Growth Fund Fund Summary March 31, 2017 (Unaudited) | | Ticker Symbols: A Share: PSGAX C Share: PSGCX I Share: PXSGX |
Portfolio Manager Commentary by Kayne Anderson Rudnick Investment Management, LLC
| ⬛ | | KAR Small-Cap Growth Fund (the “Fund”) is diversified and has an investment objective of long-term capital appreciation. There is no guarantee that the Fund will meet its objective. |
For the fiscal year ended March 31, 2017, the Fund’s Class A shares at NAV returned 23.25%, Class C shares returned 22.38%*, and Class I shares returned 23.59%. For the same period, the Russell 2000® Growth Index, which serves as the Fund’s broad-based and style-specific benchmark appropriate for comparison, returned 23.03%.
* See footnote 6 on page 22.
All performance figures assume reinvestment of distributions and exclude the effect of sales charges. Performance data quoted represents past results. Past performance is no guarantee of future results, and current performance may be higher or lower than the performance shown. Investment return and principal value will fluctuate so your shares when redeemed may be worth more or less than their original cost. Please visit Virtus.com for performance data current to the most recent month-end.
How did the markets perform during the Fund’s fiscal year ended March 31, 2017?
Despite a terrible start to 2016, equities enjoyed very solid returns for the one-year period ended March 31, 2017, with the S&P 500® Index up 17.17% and small stocks registering an even more impressive gain, advancing 26.22%, as measured by the Russell 2000® Index.
Investor risk appetites changed dramatically over the course of the year. The first half of the year was marked by disappointing economic growth, falling bond yields, and defensive fixed-income and equity positioning on the part of investors. After many commodities, particularly crude oil, finally found a bottom after two years of dramatic declines, investors adopted a much more aggressive risk appetite as the economy started to stabilize over the summer and improve into the fall. In November, President-elect Trump’s agenda of pro-business tax reforms and fewer regulatory burdens, further accentuated the outlook that economic growth would accelerate further.
Then, in the first quarter of 2017, the equity markets switched course again with a style rotation, as growth benchmarks outperformed value indexes, and large stocks outperformed small stocks – the opposite of what occurred in 2016. The asset classes and equity sectors that benefited the most from Donald Trump’s surprise election since cooled off and lagged materially through the first quarter of 2017.
What factors affected the Fund’s performance during the fiscal year?
The Fund performed in line with the Russell 2000® Growth Index for the period. Performance was helped by strong stock selection in the consumer discretionary and producer durables sectors. Negative stock selection in the consumer staples and health care sectors were the biggest detractors from performance.
Holdings that contributed the most to performance during the year were Fox Factory Holding and Aspen Technology.
| ⬛ | | Fox Factory’s growth has accelerated due to new model specification wins in its mountain bike segment and the initiation of production of on-road sports trucks by its original equipment manufacturer customers. We believe Fox’s reputation in its distinctive markets is a healthy competitive advantage that will provide the company with enduring success. |
| ⬛ | | With the relative stabilization in oil markets, investors have become more confident in Aspen’s long-term prospects. For its part, Aspen’s financial results weathered the downturn in oil prices quite well, thanks to its long-term contracts and mission-critical nature of its software. Over the last few quarters, the company has established a new product roadmap to tackle equipment maintenance for customers. This greenfield opportunity would be entirely incremental for Aspen’s business and is a natural extension of its existing product suite. |
Holdings that contributed the least to performance were The Chefs’ Warehouse and Monro Muffler Brake.
| ⬛ | | The Chefs’ Warehouse’s shares increased meaningfully in the fourth quarter of 2016, along with many other small-cap stocks, following the results of the election. However, the share price has still |
| | | been down over the last year due to earnings estimate misses and guidance cuts in previous quarters. More recently, the company gave weak guidance for 2017, which further pressured the share price. |
| ⬛ | | Monro Muffler Brake continues to struggle with improving traffic into its stores and sales growth. The persistent compensation declines are having an outsized impact on margins, with deleverage on the company’s fixed costs. Management continues to blame its geographic exposure to the Northeast as the reason for its lagging peer performance. |
The preceding information is the opinion of portfolio management only through the end of the period of the report as stated on the cover. Any such opinions are subject to change at any time based upon market conditions and should not be relied upon as investment advice.
Equity Securities: The market price of equity securities may be adversely affected by financial market, industry, or issuer-specific events. Focus on a particular style or on small or medium-sized companies may enhance that risk.
Limited Number of Investments: Because the Fund has a limited number of securities, it may be more susceptible to factors adversely affecting its securities than a less concentrated fund.
Industry/Sector Concentration: A fund that focuses its investments in a particular industry or sector will be more sensitive to conditions that affect that industry or sector than a non-concentrated fund.
Prospectus: For additional information on risks, please see the Fund’s prospectus.
| | | | |
| |
| Asset Allocations | |
| |
The following table presents the portfolio holdings within certain sectors as a percentage of total investments attributable to each sector at March 31, 2017. | |
Information Technology | | | 23 | % |
Industrials | | | 19 | |
Consumer Discretionary | | | 16 | |
Financials | | | 14 | |
Consumer Staples | | | 8 | |
Health Care | | | 8 | |
Other (includes short-term investment) | | | 12 | |
| | | | | |
Total | | | 100 | % |
| | | | | |
For information regarding the indexes and certain investment terms, see the Key Investment Terms starting on page 4.
21
KAR Small-Cap Growth Fund (Continued)
| | | | | | | | | | | | |
| Average Annual Total Returns1 for periods ended 3/31/17 | | | | |
| | | 1 year | | | 5 years | | | 10 Years | |
| Class A Shares at NAV2 | | | 23.25 | % | | | 14.61 | % | | | 9.55 | % |
| Class A Shares at POP3,4 | | | 16.17 | | | | 13.26 | | | | 8.91 | |
| Class C Shares at NAV2,6 and with CDSC4 | | | 22.38 | | | | 13.75 | | | | 8.73 | |
| Class I Shares at NAV2 | | | 23.59 | | | | 14.91 | | | | 9.74 | |
| S&P 500® Index* | | | 17.17 | | | | 13.30 | | | | 7.51 | |
| Russell 2000® Growth Index* | | | 23.03 | | | | 12.10 | | | | 8.06 | |
Fund Expense Ratios5: A Shares: Gross 1.54%, Net 1.51%; C Shares: Gross 2.29%, Net 2.26%; I Shares: Gross 1.29%, Net 1.26%.
All returns represent past performance which is no guarantee of future results. Current performance may be higher or lower than the performance shown. The investment return and principal value of an investment will fluctuate so that an investor’s shares, when redeemed, may be worth more or less than their original cost. The above table and graph below do not reflect the deduction of taxes that a shareholder would pay on fund distributions or the redemption of fund shares. Please visit Virtus.com for performance data current to the most recent month-end.
| 1 | Total returns are historical and include changes in share price and the reinvestment of both dividends and capital gain distributions. |
| 2 | “NAV” (Net Asset Value) total returns do not include the effect of any sales charge. |
| 3 | “POP” (Public Offering Price) total returns include the effect of the maximum front-end 5.75% sales charge. |
| 4 | “CDSC” (Contingent Deferred Sales Charge) is applied to redemptions of Class C shares that do not have a sales charge applied at the time of purchase. CDSC charges for certain redemptions of Class A shares made within the first 18 months of purchases in which a finder’s fee was paid and all redemptions of Class C shares within the first year are 1% and 0% thereafter. |
| 5 | The expense ratios of the Fund are set forth according to the prospectus for the Fund effective April 10, 2017, as supplemented and revised, and may differ from the expense ratios disclosed in the Financial Highlights tables in this report. See the Financial Highlights for more current expense ratios. Net Expense: Expenses reduced by a contractual fee waiver, in effect through April 30, 2018. Gross Expense: Does not reflect the effect of the fee waiver. Expense ratios include fees and expenses associated with the underlying funds. |
| 6 | Total Return for the report period presented in the table differs from the return in the Financial Highlights. The total return presented in the above table is calculated based on the NAV at which shareholder transactions were processed. The total return presented in the Financial Highlights section of the report is calculated in the same manner, but also takes into account certain adjustments that are necessary under U.S. generally accepted accounting principles required in the annual report and semi-annual report. |
| * | The Russell 2000® Growth Index is an appropriate broad-based index. The Fund is no longer using the S&P 500® Index. |
Growth of $10,000 For periods ended 3/31
This chart assumes an initial investment of $10,000 made on March 31, 2007, for Class A, Class C, and Class I shares including any applicable sales charges or fees. Performance assumes reinvestment of dividends and capital gain distributions.
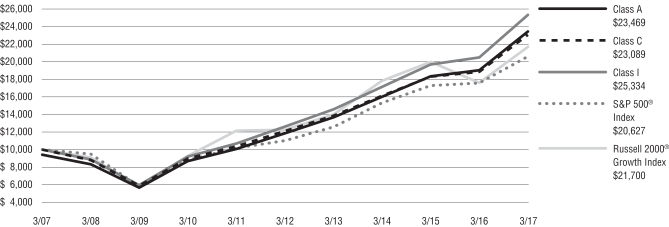
For information regarding the indexes and certain investment terms, see the Key Investment Terms starting on page 4.
22
| | |
KAR Small-Cap Value Fund Fund Summary March 31, 2017 (Unaudited) | | Ticker Symbols: A Share: PQSAX C Share: PQSCX I Share: PXQSX R6 Share: VQSRX |
Portfolio Manager Commentary by Kayne Anderson Rudnick Investment Management, LLC
| ⬛ | | KAR Small-Cap Value Fund (the “Fund”) is diversified and has an investment objective of long-term capital appreciation. There is no guarantee that the Fund will meet its objective. |
For the fiscal year ended March 31, 2017, the Fund’s Class A shares at NAV returned 22.86%, Class C shares returned 21.95%, and Class I shares returned 23.20%, and Class R6 shares from November 3, 2016 (inception date) through March 31, 2017, returned 21.58%*. For the same period, the Russell 2000® Value Index, which serves as the Fund’s broad-based and style-specific benchmark appropriate for comparison, returned 29.37%.
| * | Returns less than 1 year are not annualized. |
All performance figures assume reinvestment of distributions and exclude the effect of sales charges. Performance data quoted represents past results. Past performance is no guarantee of future results, and current performance may be higher or lower than the performance shown. Investment return and principal value will fluctuate so your shares when redeemed may be worth more or less than their original cost. Please visit Virtus.com for performance data current to the most recent month-end.
How did the markets perform during the Fund’s fiscal year ended March 31, 2017?
Despite a terrible start to 2016, equities enjoyed very solid returns for the one-year period ended March 31, 2017, with the S&P 500® Index up 17.17% and small stocks registering an even more impressive gain, advancing 26.22%, as measured by the Russell 2000® Index.
Investor risk appetites changed dramatically over the course of the year. The first half of the year was marked by disappointing economic growth, falling bond yields, and defensive fixed-income and equity positioning on the part of investors. After many commodities, particularly crude oil, finally found a bottom after two years of dramatic declines, investors adopted a much more aggressive risk appetite as the economy started to stabilize over the summer and improve into the fall. In November,
President-elect Trump’s agenda of pro-business tax reforms and fewer regulatory burdens, further accentuated the outlook that economic growth would accelerate further.
Then, in the first quarter of 2017, the equity markets switched course again with a style rotation, as growth benchmarks outperformed value indexes, and large stocks outperformed small stocks – the opposite of what occurred in 2016. The asset classes and equity sectors that benefited the most from Donald Trump’s surprise election since cooled off and lagged materially through the first quarter of 2017.
What factors affected the Fund’s performance during the fiscal year ended March 31, 2017?
The Fund underperformed the Russell 2000® Value Index for the period. The underperformance was primarily driven by poor stock selection in the technology and health care sectors. Performance was helped by positive stock selection in the consumer staples and consumer discretionary sectors.
Positions that contributed most positively to performance were National Beverage and Primerica.
| ⬛ | | While National Beverage’s carbonated soft drink brands were weak like the rest of the industry, these declines were more than offset by growth in its sparkling water portfolio, particularly the LaCroix brand. This was evident in the most recent quarter’s results. As the market began to price in the potential for LaCroix to be a billion dollar brand for National Beverage, the stock continued to move meaningfully higher. |
| ⬛ | | Primerica shares were under pressure for the first half of 2016 due to concern over how the Department of Labor’s fiduciary standard rule would impact the retirement investment account industry. While the final language of the rule was less onerous than feared, some questions had remained over the ultimate cost of implementation. The new Trump administration has delayed implementation of the rule and caused speculation it may never become effective. With this overhang thus removed from the stock, investors refocused on the fundamentals of the business. |
Positions that contributed most negatively to performance were Syntel and Sally Beauty Holdings.
| ⬛ | | Syntel again reported weak results, with sluggish end-market demand. Management commented that decision cycles continue to lengthen with persistent contract delays. Customer concentration has been an ongoing issue for the company and is a concern from the standpoint of long-term prospects and profitability. Following continued weakness in the business, we sold the Fund’s position in Syntel. |
| ⬛ | | Sally Beauty Holdings has maintained its core loyal shoppers but is struggling to drive new traffic to the stores. The new management team continues to implement new initiatives, such as a new loyalty program, social media marketing, and product brands launches. The stock has also been pressured by fears that the core professional business could weaken. Management is working to ensure there is enough newness and core product to sustain its strong professional business. |
The preceding information is the opinion of portfolio management only through the end of the period of the report as stated on the cover. Any such opinions are subject to change at any time based upon market conditions and should not be relied upon as investment advice.
Equity Securities: The market price of equity securities may be adversely affected by financial market, industry, or issuer-specific events. Focus on a particular style or on small or medium-sized companies may enhance that risk.
Limited Number of Investments: Because the Fund has a limited number of securities, it may be more susceptible to factors adversely affecting its securities than a less concentrated fund.
Industry/Sector Concentration: A fund that focuses its investments in a particular industry or sector will be more sensitive to conditions that affect that industry or sector than a non-concentrated fund.
Prospectus: For additional information on risks, please see the Fund’s prospectus.
For information regarding the indexes and certain investment terms, see the Key Investment Terms starting on page 4.
23
| | |
| KAR Small-Cap Value Fund (Continued) | | |
| | | | |
| |
| Asset Allocations | |
| |
The following table presents the portfolio holding within certain sectors as a percentage of total investments attributable to each sector at March 31, 2017. | |
Industrials | | | 20 | % |
Information Technology | | | 20 | |
Consumer Discretionary | | | 15 | |
Financials | | | 13 | |
Real Estate | | | 7 | |
Consumer Staples | | | 6 | |
Health Care | | | 6 | |
Other (includes short-term investment) | | | 13 | |
| | | | | |
Total | | | 100 | % |
| | | | | |
For information regarding the indexes and certain investment terms, see the Key Investment Terms starting on page 4.
24
KAR Small-Cap Value Fund (Continued)
| | | | | | | | | | | | | | | | | | | | |
| Average Annual Total Returns1 for periods ended 3/31/17 | |
| | | 1 year | | | 5 years | | | 10 years | | | Since
Inception | | | Inception
Date | |
| Class A Shares at NAV2 | | | 22.86 | % | | | 11.95 | % | | | 7.90 | % | | | — | | | | — | |
| Class A Shares at POP3,4 | | | 15.80 | | | | 10.63 | | | | 7.27 | | | | — | | | | — | |
| Class C Shares at NAV2 and with CDSC4 | | | 21.95 | | | | 11.10 | | | | 7.10 | | | | — | | | | — | |
| Class I Shares at NAV2 | | | 23.20 | | | | 12.22 | | | | 8.17 | | | | — | | | | — | |
| Class R6 Shares at NAV2 | | | — | | | | — | | | | — | | | | 21.58 | % | | | 11/3/16 | |
| S&P 500® Index* | | | 17.17 | | | | 13.30 | | | | 7.51 | | | | 14.12 | 5 | | | — | |
| Russell 2000® Value Index* | | | 29.37 | | | | 12.54 | | | | 6.09 | 1 | | | 20.89 | 5 | | | — | |
Fund Expense Ratios6: A Shares: 1.30%; C Shares: 2.05%; I Shares: 1.05%; R6 Shares: 0.94%.
All returns represent past performance which is no guarantee of future results. Current performance may be higher or lower than the performance shown. The investment return and principal value of an investment will fluctuate so that an investor’s shares, when redeemed, may be worth more or less than their original cost. The above table and graph below do not reflect the deduction of taxes that a shareholder would pay on fund distributions or the redemption of fund shares. Please visit Virtus.com for performance data current to the most recent month-end.
| 1 | Total returns are historical and include changes in share price and the reinvestment of both dividends and capital gain distributions. |
| 2 | “NAV” (Net Asset Value) total returns do not include the effect of any sales charge. |
| 3 | “POP” (Public Offering Price) total returns include the effect of the maximum front-end 5.75% sales charge. |
| 4 | “CDSC” (Contingent Deferred Sales Charge) is applied to redemptions of Class C shares that do not have a sales charge applied at the time of purchase. CDSC charges for certain redemptions of Class A shares made within the first 18 months of purchases in which a finder’s fee was paid and all redemptions of Class C shares within the first year are 1% and 0% thereafter. |
| 5 | The index returns are from Class R6 shares’ inception date. |
| 6 | The expense ratios of the Fund are set forth according to the prospectus for the Fund effective April 10, 2017, as supplemented and revised, and may differ from the expense ratios disclosed in the Financial Highlights tables in this report. See the Financial Highlights for more current expense ratios. Expense ratios include fees and expenses associated with the underlying funds. |
| * | The Russell 2000® Value Index is an appropriate broad-based index. The Fund is no longer using the S&P 500® Index. |
Growth of $10,000 For periods ended 3/31
This chart assumes an initial investment of $10,000 made on March 31, 2007, for Class A, Class C, and Class I shares including any applicable sales charges or fees. Performance assumes reinvestment of dividends and capital gain distributions.
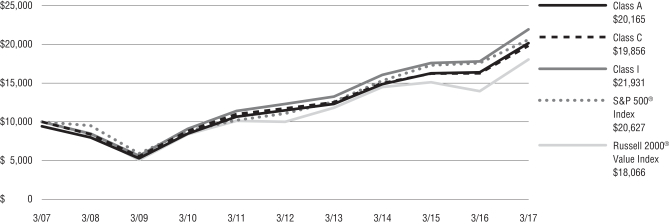
For information regarding the indexes and certain investment terms, see the Key Investment Terms starting on page 4.
25
| | |
Rampart Enhanced Core Equity Fund Fund Summary March 31, 2017 (Unaudited) | | Ticker Symbols: A Share: PDIAX C Share: PGICX I Share: PXIIX |
Portfolio Manager Commentary by Rampart Investment Management Company, LLC
| ⬛ | | Rampart Enhanced Core Equity Fund (the “Fund”) is diversified and has investment objectives of capital appreciation and current income. There is no guarantee that the Fund will meet its objectives. |
For the fiscal year ended March 31, 2017, the Fund’s Class A shares at NAV returned 15.85%, Class C shares returned 15.01% and Class I shares returned 16.16%. For the same period, the S&P 500® Index, which serves as the Fund’s broad-based and style-specific benchmark appropriate for comparison, returned 17.17%.
All performance figures assume reinvestment of distributions and exclude the effect of sales charges. Performance data quoted represents past results. Past performance is no guarantee of future results, and current performance may be higher or lower than the performance shown. Investment return and principal value will fluctuate so your shares when redeemed may be worth more or less than their original cost. Please visit Virtus.com for performance data current to the most recent month-end.
How did the markets perform during the Fund’s fiscal year ended March 31, 2017?
U.S. equity markets enjoyed a relatively low-volatility, steady climb higher during the 12-month fiscal period, with both realized and implied volatility levels below their long-term historical averages, and the annual total return of the S&P 500® Index (over 17%) higher than its average.
2016 was largely dominated by political stories, punctuated by the “Brexit” vote on June 23 – when the U.K. voted to leave the European Union – and the U.S. presidential election on November 8. On the night of the Brexit vote, S&P 500® Index futures dropped more than 5%, yet the market opened the next day at less than 3% below its prior close. By the end of the first week in July, previous market levels were regained. With the U.S. presidential election, a pre-election risk flare-up quickly resolved, leading to a low-volatility, post-election bull market that persisted into early 2017, but began to fade a bit as the Fund’s fiscal year came to an end.
Interestingly, even as implied volatility levels (meaning, the future volatility assumptions used to price options) were near historic lows, the actual price volatility of the U.S. equity market was significantly lower. We witnessed in recent memory both the market’s lowest short-term realized volatility level (below 5%) in the fall of 2016, and by early 2017, the longest run of days without an intra-day market move greater than 1%. This was of particular interest to us, as a significant driver of the Fund’s performance is our ability to trade the spread between implied and realized volatility in the options market.
The market dynamics, while positive overall, indicated general uncertainty. Investors appeared to have trouble sticking with one narrative, quickly discarding bad news in particular. This sentiment may be related to lingering monetary policy intervention by global central banks, and the relative non-competitiveness of fixed income assets, or perhaps signals of U.S. and global economic strength. Whatever the reason, the year’s story was a preference for risk over protection.
What factors affected the Fund’s performance during the fiscal year?
The Enhanced Core Equity strategy employed by the Fund has two main drivers of performance: a trend-based equity component and an income-focused option overlay component.
While the overall performance of the equity component for the year was strong, there were few strong overall upward or downward market trends established, there were a handful of outsized risk flare-ups, and strong sector leadership was lacking. Given these challenges, the trend-based equity component detracted just under 3.50% for the year.
The option overlay component seeks to generate additional income by extracting value from the difference between implied volatility, as measured by the CBOE Volatility Index®, and the volatility level that actually occurs in market performance. This is implemented with a risk-controlled trading technique using listed S&P 500® Index put and call credit spreads. For the period, this strategy added just over 3.50% for the year.
The portfolio management team made a decision late in the year to shift the portfolio’s risk allocation away from the trend-based equity component and more towards the option overlay component. We made this
decision based on our view of the relative risk-adjusted contributions that each component had the potential to make going forward.
The preceding information is the opinion of portfolio management only through the end of the period of the report as stated on the cover. Any such opinions are subject to change at any time based upon market conditions and should not be relied upon as investment advice.
Equity Securities: The market price of equity securities may be adversely affected by financial market, industry, or issuer-specific events. Focus on a particular style or on small or medium-sized companies may enhance that risk.
Call/Put Spreads: Buying and selling call and put option spreads on the S&P 500® Index risks the loss of the premium when buying, can limit upside participation and increase downside losses.
Fund of Funds: Because the Fund can invest in other funds, it indirectly bears its proportionate share of the operating expenses and management fees of the underlying fund(s).
Industry/Sector Concentration: A fund that focuses its investments in a particular industry or sector will be more sensitive to conditions that affect that industry or sector than a non-concentrated fund.
Portfolio Turnover: The Fund’s principal investments strategies will result in a consistently high portfolio turnover rate. A higher portfolio turnover rate may indicate higher transaction costs and may result in higher taxes when fund shares are held in a taxable account.
Prospectus: For additional information on risks, please see the Fund’s prospectus.
| | | | |
| |
| Asset Allocations | |
| |
The following table presents the portfolio holding within certain sectors as a percentage of total investments attributable to each sector at March 31, 2017. | |
Financials | | | 95 | % |
Information Technology | | | 2 | |
Health Care | | | 1 | |
Consumer Staples | | | 1 | |
Other (includes purchased and written options) | | | 1 | |
| | | | | |
Total | | | 100 | % |
| | | | | |
For information regarding the indexes and certain investment terms, see the Key Investment Terms starting on page 4.
26
Rampart Enhanced Core Equity Fund (Continued)
| | | | | | | | | | | | | | | | | | | | |
| Average Annual Total Returns1 for periods ended 3/31/17 | | | | |
| | | 1 year | | | 5 years | | | 10 years | | | Since
Inception | | | Inception
Date | |
| Class A Shares at NAV2 | | | 15.85 | % | | | 11.95 | % | | | 6.51 | % | | | — | | | | — | |
| Class A Shares at POP3,4 | | | 9.19 | | | | 10.63 | | | | 5.89 | | | | — | | | | — | |
| Class C Shares at NAV2 and with CDSC4 | | | 15.01 | | | | 11.10 | | | | 5.71 | | | | — | | | | — | |
| Class I Shares | | | 16.16 | | | | 12.21 | | | | — | | | | 6.63 | % | | | 11/13/07 | |
| S&P 500® Index | | | 17.17 | | | | 13.30 | | | | 7.51 | | | | 7.41 | 5 | | | — | |
Fund Expense Ratios6: A Shares: Gross 1.54%, Net 1.41%; C Shares: Gross 2.29%, Net 2.16%; I Shares: Gross 1.29%, Net 1.16%.
All returns represent past performance which is no guarantee of future results. Current performance may be higher or lower than the performance shown. The investment return and principal value of an investment will fluctuate so that an investor’s shares, when redeemed, may be worth more or less than their original cost. The above table and graph below do not reflect the deduction of taxes that a shareholder would pay on fund distributions or the redemption of fund shares. Please visit Virtus.com for performance data current to the most recent month-end.
| 1 | Total returns are historical and include changes in share price and the reinvestment of both dividends and capital gain distributions. |
| 2 | “NAV” (Net Asset Value) total returns do not include the effect of any sales charge. |
| 3 | “POP” (Public Offering Price) total returns include the effect of the maximum front-end 5.75% sales charge. |
| 4 | “CDSC” (Contingent Deferred Sales Charge) is applied to redemptions of Class C shares that do not have a sales charge applied at the time of purchase. CDSC charges for certain redemptions of Class A shares made within the first 18 months of purchases in which a finder’s fee was paid and all redemptions of Class C shares within the first year are 1% and 0% thereafter. |
| 5 | The index return is from class I shares’ inception date. |
| 6 | The expense ratios of the Fund are set forth according to the prospectus for the Fund effective April 10, 2017, as supplemented and revised, and may differ from the expense ratios disclosed in the Financial Highlights tables in this report. See the Financial Highlights for more current expense ratios. Net Expense: Expenses reduced by a contractual fee waiver, in effect through April 30, 2018. Gross Expense: Does not reflect the effect of the fee waiver. Expense ratios include fees and expenses associated with the underlying funds. |
Growth of $10,000 For periods ended 3/31
This chart assumes an initial investment of $10,000 made on March 31, 2007, for Class A and Class C shares including any applicable sales charges or fees. The performance of the other share class will be greater or less than that shown based on differences in inception date, fees and sales charges. Performance assumes reinvestment of dividends and capital gain distributions.
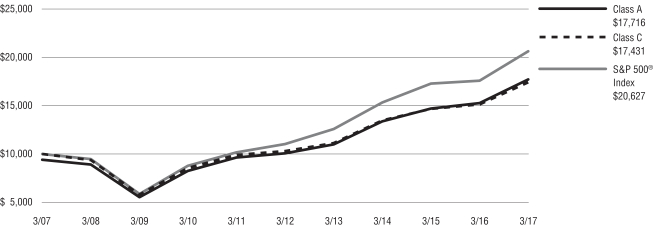
For information regarding the indexes and certain investment terms, see the Key Investment Terms starting on page 4.
27
| | |
Tactical Allocation Fund Fund Summary March 31, 2017 (Unaudited) | | Ticker Symbols: A Share: NAINX C Share: POICX |
Portfolio Managers Commentaries by
Duff & Phelps Investment Management Co.
(International Equity Portfolio),
Kayne Anderson Rudnick Investment Management, LLC
(Domestic Equity Portfolio) and
Newfleet Asset Management, LLC (Fixed Income Portfolio)
| ⬛ | | Tactical Allocation Fund (the “Fund”) is diversified and has investment objectives of capital appreciation and income. There is no guarantee that the Fund will meet its objectives. |
For the fiscal year ended March 31, 2017, the Fund’s Class A shares at NAV returned 9.20%, and Class C shares returned 8.37%. For the same period, the S&P 500® Index, a broad-based equity index, returned 17.17%; the Bloomberg Barclays U.S. Aggregate Bond Index, a broad-based fixed income index, returned 0.44%; and the Tactical Allocation Fund Linked Benchmark, the Fund’s style-specific benchmark, returned 9.19%.
All performance figures assume reinvestment of distributions and exclude the effect of sales charges. Performance data quoted represents past results. Past performance is no guarantee of future results, and current performance may be higher or lower than the performance shown. Investment return and principal value will fluctuate so your shares when redeemed may be worth more or less than their original cost. Please visit Virtus.com for performance data current to the most recent month-end.
Effective September 7, 2016, Kayne Anderson Rudnick Investment Management, LLC (“KAR”) became subadviser to the domestic equity portfolio of the Fund and Duff & Phelps Investment Management Co. (“DPIM”) became subadviser to the international equity portfolio. The following commentary includes the views of the KAR and DPIM for the periods they managed their respective portfolios. There was no change to the subadviser of the fixed income portfolio of the Fund, which continues to be managed by Newfleet Asset Management, LLC (“Newfleet”).
How did the markets perform during the Fund’s fiscal year ended March 31, 2017?
U.S. Equities
Despite a terrible start to 2016, equities enjoyed very solid returns for the one-year period ended March 31, 2017, with the S&P 500® Index up 17.17% and small stocks registering an even more impressive gain, advancing 26.22%, as measured by the Russell 2000® Index.
Investor risk appetites changed dramatically over the course of the year. The first half of the year was marked by disappointing economic growth, falling bond yields, and defensive fixed-income and equity positioning on the part of investors. After many commodities, particularly crude oil, finally found a bottom after two years of dramatic declines, investors adopted a much more aggressive risk appetite as the economy started to stabilize over the summer and improve into the fall. In November, President-elect Trump’s agenda of pro-business tax reforms and fewer regulatory burdens, further accentuated the outlook that economic growth would accelerate further.
Then, in the first quarter of 2017, the equity markets switched course again with a style rotation, as growth benchmarks outperformed value indexes, and large stocks outperformed small stocks – the opposite of what occurred in 2016. The asset classes and equity sectors that benefited the most from Donald Trump’s surprise election since cooled off and lagged materially through the first quarter of 2017.
International Equities
The international equity markets performed strongly during the year, with the MSCI EAFE® Index gaining 11.67% (net dividends). At the beginning of the Fund’s fiscal year, the consensus opinion regarding a potential economic slowdown in China and the potential damaging effects of zero interest rate policies in Japan and the European Union (“EU”) was turning more optimistic. Despite uncertainty generated by the unexpected “yes” Brexit vote in June, when the United Kingdom voted to leave the EU, the green shoots of a global economic expansion were visible in a steady drumbeat of positive reports including: purchasing manager surveys which measure the economic health of the manufacturing
sector; consumer sentiment indicators which track individuals’ attitudes about the economy and their financial situations; employment data which measures the health of the job market; upward earnings revisions that show healthy, growing companies; and steepening yield curves, which is when the difference between a country’s shorter maturity treasury bonds and its longer maturity treasury bonds widens, and is considered a positive economic signal.
As the Fund’s fiscal year drew to a close, the global economy continued to deliver solid performance and forced investors to take reflation seriously. Reform agendas in Japan and Brazil had begun bearing fruit, and the European Central Bank (“ECB”) reiterated a lower-for-longer stance on interest rates to further drive the reflation rally. That said, election uncertainty remained in France, and the growing threat from North Korea continued to be a concern.
Fixed Income
Most fixed income spread sectors outperformed U.S. Treasuries over the fiscal year. The rally that was sparked in the first quarter of 2016 by the U.S. Federal Reserve’s (the “Fed”) dovish stance toward interest rates continued through the end of March 2017.
Volatility returned to the markets briefly in late June, with fallout from the United Kingdom’s decision – dubbed “Brexit” – to leave the EU. Bond yields in the U.S., Japan, and across Europe fell to historic lows in early July as investors fled to the safety of bonds on global growth concerns fueled by the U.K.’s decision. Markets recovered rather quickly, however, from the initial shock of the Brexit vote. Easing by major central banks and a weaker U.S. dollar helped to improve global risk sentiment and stabilize markets.
September brought heightened concerns over the ability and willingness of global central banks to fight chronic low inflation and weak growth as the decision by the ECB to leave interest rates and its stimulus program unchanged was a precipitating factor in a widespread market sell-off, reinforced by fears that the Bank of Japan (“BOJ”) had run out of quantitative easing tools. Hawkish signals from the Fed added to the volatility. The BOJ subsequently decided not to change rates but to shift its focus to stabilizing rates
For information regarding the indexes and certain investment terms, see the Key Investment Terms starting on page 4.
28
| | |
| Tactical Allocation Fund (Continued) | | |
for longer maturity government bonds. This bolstered market sentiment, as did the Fed’s eventual decision to stand pat at its September meeting.
The unexpected election of Donald Trump as the 45th U.S. president sparked another bout of volatility in early November. President-elect Trump’s campaign, which focused on immigration, trade, tax cuts, and infrastructure spending, was largely perceived by the market as supportive of faster growth. Inflation expectations increased, causing the yield on the 10-year U.S. Treasury to rise 0.52% by the end of November. Also in late November, oil prices benefited from OPEC’s decision to cut oil production for the first time in eight years.
Post-election expectations of faster economic growth and rising inflation continued into the first quarter of 2017 as optimistic investors watched and waited for clarity on President Trump’s fiscal policies. As the quarter progressed, support for the “Trump trade” weakened as the new administration experienced bumps in the road with its aggressive agenda and visible opposition.
In moves that were widely telegraphed, on two separate occasions during the last 12 months, the Fed raised its target range for the federal funds rate by 25 basis points – in December 2016 to a range of 0.50% to 0.75%, and again in March 2017 to a range of 0.75% to 1.00%. Over the fiscal year, yields of U.S. Treasuries increased across maturities, particularly for shorter term Treasury bonds.
What factors affected the Fund’s performance during the fiscal year?
U.S. Equities
The U.S. equity portfolio of the Fund underperformed the large-cap U.S. equity market, as measured by the Russell 1000® Growth Index, for the period during the fiscal year that it was under the management of the new subadviser (September 7, 2016 through March 31, 2017).
Performance in the U.S. equity portfolio was helped by strong stock selection in the financials sector and an underweight in the real estate sector. Negative stock selection in the information technology and consumer discretionary sectors was the biggest detractor from performance.
Holdings that contributed the most to performance during the period were Netflix and Facebook.
| ⬛ | | Netflix embarked on two bold growth initiatives in recent years with the build-out of international infrastructure and a massive investment in original content. So far both look like home runs. The company added 3.2 million international subscribers in the most recent quarter (nearly nine times the amount added in the U.S.) and original content helped reduce customer churn. The company’s unmatched scale gives it the data and the financial firepower to deliver better content which drove another better-than-expected revenue and earnings performance. |
| ⬛ | | Facebook continued to grow advertising revenue and take share in the online digital marketing space. The company delivers an unprecedented global reach of 20% of the earth’s population to advertisers in a very measureable way. Monetization of this audience has barely scratched the surface of its long-term potential. Future growth levers include untapped monetization of Messenger, WhatsApp, and video advertising along with Virtual Reality. Facebook sold off strongly following the U.S. election as it was a widely held, defensive long position as well as a perceived relative loser post the election, but the stock bounced strongly in the first quarter of 2017 buoyed by another stellar earnings report. |
Holdings that contributed the least to performance were Monster Beverage and TripAdvisor.
| ⬛ | | Monster Beverage’s landmark 2015 agreement with Coca-Cola paved the way to higher margins and better global distribution through Coca-Cola channels. Since then, gross margins have expanded, and international revenue has risen to 25% of the total. Shares were relatively flat for the last two years as Monster digested uneven growth that resulted from the Coca-Cola distribution changes. However, in the most recent quarter, international sales outpaced expectations, highlighting the vast global opportunity. Additionally, the company is ramping up its innovation engine, launching both a Mountain Dew competitor, Mutant, and Hydro, an enhanced energy water. |
| ⬛ | | TripAdvisor’s user engagement has decelerated and shifted to lower monetizing mobile at the same |
| | | time that the company needs those cash flows to market its transition to a booking platform. After mounting concerns for the better part of a year, we sold the Fund’s position in TripAdvisor. |
International Equities
The Fund’s international equity portfolio posted positive performance in the fiscal year, but underperformed the international equity market, as measured by the MSCI EAFE® Index.
The international equity portfolio generated positive returns from its investments in seven out of the 11 major equity market sectors. Performance relative to the MSCI EAFE® benchmark, however, was hampered by both asset allocation and security selection. The overweight allocation to information technology, as well as underweight allocations to consumer staples and health care, were not sufficient to offset losses due to an underweight in financials, an overweight to telecommunications, and the performance drag of cash held for defensive purposes. Security selection also detracted from performance, as strong selections in consumer staples and industrials were not enough to offset weak stock selection in financials, materials, health care, and utilities.
On a country basis, weak security selection in the United Kingdom and Japan more than offset strong security selection in Australia and the Netherlands. From an allocation standpoint, having no holdings in the struggling Danish market was not enough to offset the detrimental effect of being overweight Israel and South Korea.
Fixed Income
The underperformance of U.S. Treasuries and agency mortgage-backed securities relative to most fixed income spread sectors was the key driver of the fixed income portfolio’s outperformance for the fiscal year.
Among fixed income sectors, the Fund’s allocations to the corporate high yield and residential mortgage-backed securities were the largest contributors to the performance during the fiscal year. Issue selection within emerging market high yield and corporate high quality sectors also had a meaningful impact on performance during the period.
For information regarding the indexes and certain investment terms, see the Key Investment Terms starting on page 4.
29
| | |
| Tactical Allocation Fund (Continued) | | |
The preceding information is the opinion of portfolio management only through the end of the period of the report as stated on the cover. Any such opinions are subject to change at any time based upon market conditions and should not be relied upon as investment advice.
Equity Securities: The market price of equity securities may be adversely affected by financial market, industry, or issuer-specific events. Focus on a particular style or on small or medium-sized companies may enhance that risk.
Credit & Interest: Debt securities are subject to various risks, the most prominent of which are credit and interest rate risk. The issuer of a debt security may fail to make interest and/or principal payments. Values of debt securities may rise or fall in response to changes in interest rates, and this risk may be enhanced with longer-term maturities.
Foreign & Emerging Markets: Investing internationally, especially in emerging markets, involves additional risks such as currency, political, accounting, economic, and market risk.
Allocation: The Fund’s exposure to different asset classes may not be optimal for market conditions at a given time. Asset allocation does not guarantee a profit or protect against a loss in declining markets.
High Yield-High Risk Fixed Income Securities: There is a greater level of credit risk and price volatility involved with high yield securities than investment grade securities.
Prospectus: For additional information on risks, please see the Fund’s prospectus.
| | | | | | | | |
| |
| Asset Allocations | |
| |
The following table presents the portfolio holdings within certain sectors as a percentage of total investments attributable to each sector at March 31, 2017. | |
Common Stocks | | | | | | | 61 | % |
Information Technology | | | 18 | % | | | | |
Consumer Discretionary | | | 15 | | | | | |
Healthcare | | | 6 | | | | | |
All Other Sectors in Common Stocks | | | 22 | | | | | |
Corporate Bonds and Notes | | | | | | | 21 | |
Energy | | | 5 | | | | | |
Financials | | | 4 | | | | | |
Materials | | | 3 | | | | | |
All Other Sectors in Corporate Bonds and Notes | | | 9 | | | | | |
Mortgage-Backed Securities | | | | | | | 5 | |
Foreign Government Securities | | | | | | | 5 | |
Loan Agreements | | | | | | | 4 | |
Other | | | | | | | 4 | |
| | | | | | | | | |
Total | | | | | | | 100 | % |
| | | | | | | | | |
For information regarding the indexes and certain investment terms, see the Key Investment Terms starting on page 4.
30
Tactical Allocation Fund (Continued)
| | | | | | | | | | | | |
| Average Annual Total Returns1 for periods ended 3/31/17 | | | | | | | | | |
| | | 1 year | | | 5 years | | | 10 years | |
| Class A Shares at NAV2 | | | 9.20 | % | | | 5.39 | % | | | 4.55 | % |
| Class A Shares at POP3,4 | | | 2.92 | | | | 4.14 | | | | 3.94 | |
| Class C Shares at NAV2 and with CDSC4 | | | 8.37 | | | | 4.58 | | | | 3.77 | |
| S&P 500® Index | | | 17.17 | | | | 13.30 | | | | 7.51 | |
| Bloomberg Barclays U.S. Aggregate Bond Index | | | 0.44 | | | | 2.34 | | | | 4.27 | |
| Tactical Allocation Fund Linked Benchmark | | | 9.19 | | | | 7.97 | | | | 6.27 | |
Fund Expense Ratios5: A Shares: 1.34%; C Shares: 2.09%.
All returns represent past performance which is no guarantee of future results. Current performance may be higher or lower than the performance shown. The investment return and principal value of an investment will fluctuate so that an investor’s shares, when redeemed, may be worth more or less than their original cost. The above table and graph below do not reflect the deduction of taxes that a shareholder would pay on fund distributions or the redemption of fund shares. Please visit Virtus.com for performance data current to the most recent month-end.
| 1 | Total returns are historical and include changes in share price and the reinvestment of both dividends and capital gain distributions. |
| 2 | “NAV” (Net Asset Value) total returns do not include the effect of any sales charge. |
| 3 | “POP” (Public Offering Price) total returns include the effect of the maximum front-end 5.75% sales charge. |
| 4 | “CDSC” (Contingent Deferred Sales Charge) is applied to redemptions of Class C shares that do not have a sales charge applied at the time of purchase. CDSC charges for certain redemptions of Class A shares made within the first 18 months of purchases in which a finder’s fee was paid and all redemptions of Class C shares within the first year are 1% and 0% thereafter. |
| 5 | The expense ratios of the Fund are set forth in the prospectus for the Fund effective April 10, 2017, as supplemented and revised, and may differ from the expense ratios disclosed in the Financial Highlights tables in this report. See the Financial Highlights for more current expense ratios. Expense ratios include fees and expenses associated with the underlying funds. |
Growth of $10,000 For periods ended 3/31
This chart assumes an initial investment of $10,000 made on March 31, 2007, for Class A and Class C shares including any applicable sales charges or fees. Performance assumes reinvestment of dividends and capital gain distributions.
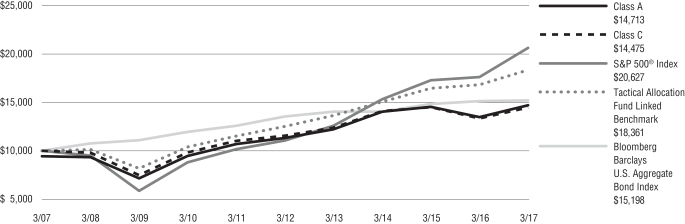
For information regarding the indexes and certain investment terms, see the Key Investment Terms starting on page 4.
31
VIRTUS CONTRARIAN VALUE FUND
SCHEDULE OF INVESTMENTS
MARCH 31, 2017
($ reported in thousands)
| | | | | | | | |
| | | SHARES | | | VALUE | |
| | | | | | | | |
| COMMON STOCKS—99.3% | |
|
| Consumer Discretionary—12.9% | |
Big Lots, Inc.(3) | | | 76,870 | | | $ | 3,742 | |
Macy’s, Inc. | | | 153,070 | | | | 4,537 | |
Mattel, Inc. | | | 140,570 | | | | 3,600 | |
Target Corp. | | | 108,330 | | | | 5,979 | |
TJX Cos., Inc. (The) | | | 88,770 | | | | 7,020 | |
| | | | | | | | |
| | | | 24,878 | |
| | | | | | | | |
|
| Consumer Staples—11.5% | |
Conagra Brands, Inc. | | | 232,020 | | | | 9,360 | |
Koninklijke Ahold Delhaize N.V. Sponsored ADR | | | 296,126 | | | | 6,349 | |
Lamb Weston Holdings, Inc. | | | 155,170 | | | | 6,526 | |
| | | | | | | | |
| | | | 22,235 | |
| | | | | | | | |
|
| Energy—10.8% | |
Devon Energy Corp. | | | 130,240 | | | | 5,433 | |
Occidental Petroleum Corp. | | | 117,460 | | | | 7,442 | |
ONEOK, Inc. | | | 143,500 | | | | 7,956 | |
| | | | | | | | |
| | | | 20,831 | |
| | | | | | | | |
|
| Health Care—2.2% | |
Perrigo Co. plc | | | 63,640 | | | | 4,225 | |
| | | | | | | | |
|
| Industrials—26.7% | |
Arconic, Inc. | | | 276,050 | | | | 7,271 | |
Emerson Electric Co. | | | 80,659 | | | | 4,828 | |
HD Supply Holdings, Inc.(2) | | | 164,360 | | | | 6,759 | |
Johnson Controls International plc | | | 166,603 | | | | 7,018 | |
Owens Corning, Inc. | | | 94,740 | | | | 5,814 | |
Raytheon Co. | | | 50,890 | | | | 7,761 | |
Republic Services, Inc. | | | 107,612 | | | | 6,759 | |
USG Corp.(2) | | | 165,400 | | | | 5,260 | |
| | | | | | | | |
| | | | 51,470 | |
| | | | | | | | |
| | | | | | | | |
| | | SHARES | | | VALUE | |
| | | | | | | | |
| Materials—27.9% | |
Alcoa Corp. | | | 1 | | | $ | — | (6) |
Allegheny Technologies, Inc.(3) | | | 273,370 | | | | 4,910 | |
Ball Corp. | | | 81,410 | | | | 6,045 | |
Crown Holdings, Inc.(2) | | | 131,030 | | | | 6,938 | |
Dow Chemical Co. (The) | | | 111,350 | | | | 7,075 | |
FMC Corp. | | | 83,500 | | | | 5,811 | |
International Paper Co. | | | 116,016 | | | | 5,891 | |
Owens-Illinois, Inc.(2) | | | 557,150 | | | | 11,355 | |
Sealed Air Corp. | | | 130,370 | | | | 5,682 | |
| | | | | | | | |
| | | | 53,707 | |
| | | | | | | | |
|
| Real Estate—3.4% | |
Weyerhaeuser Co. | | | 193,720 | | | | 6,583 | |
| | | | | | | | |
|
| Utilities—3.9% | |
Dominion Resources, Inc. | | | 98,200 | | | | 7,617 | |
TOTAL COMMON STOCKS
(Identified Cost $123,376) | | | | | | | 191,546 | |
| TOTAL LONG TERM INVESTMENTS—99.3% | |
| (Identified Cost $123,376) | | | | | | | 191,546 | |
|
| SECURITIES LENDING COLLATERAL—4.6% | |
INVESCO Trust Short-Term Investments Liquid Assets Portfolio (The) – Institutional Shares (seven-day effective yield 0.910%)(4)(5) | | | 8,825,990 | | | | 8,826 | |
| TOTAL SECURITIES LENDING COLLATERAL | |
| (Identified Cost $8,826) | | | | | | | 8,826 | |
TOTAL INVESTMENTS—103.9%
(Identified Cost $132,202) | | | | 200,372 | (1) |
Other assets and liabilities, net—(3.9)% | | | | (7,543 | ) |
| | | | | | | | |
| NET ASSETS—100.0% | | | | | | $ | 192,829 | |
| | | | | | | | |
Abbreviation:
| ADR | American Depositary Receipt |
Footnote Legend:
| (1) | Federal Income Tax Information: For tax information at March 31, 2017, see Note 10 Federal Income Tax Information in the Notes to Financial Statements. |
| (2) | Non-income producing. |
| (3) | All or a portion of security is on loan. |
| (4) | Represents security purchased with cash collateral received for securities on loan. |
| (5) | Shares of this fund are publicly offered and its prospectus and annual report are publicly available. |
| (6) | Amount is less than $500. |
| | | | |
| Country Weightings (Unaudited)† | | | |
United States | | | 93 | % |
Ireland | | | 4 | |
Netherlands | | | 3 | |
Total | | | 100 | % |
† % of total investments as of March 31, 2017. | |
The following table provides a summary of inputs used to value the Fund’s investments as of March 31, 2017 (See Security Valuation Note 2A in the Notes to Financial Statements):
| | | | | | | | |
| | | Total
Value at
March 31, 2017 | | | Level 1
Quoted
Prices | |
Equity Securities: | | | | | | | | |
Common Stocks | | $ | 191,546 | | | $ | 191,546 | |
Securities Lending Collateral | | | 8,826 | | | | 8,826 | |
| | | | | | | | |
Total Investments | | $ | 200,372 | | | $ | 200,372 | |
| | | | | | | | |
There are no Level 2 (significant observable inputs) or Level 3 (significant unobservable inputs) priced securities as of March 31, 2017.
There were no transfers between Level 1 and Level 2 related to securities held at March 31, 2017.
See Notes to Financial Statements
32
VIRTUS KAR CAPITAL GROWTH FUND
SCHEDULE OF INVESTMENTS
MARCH 31, 2017
($ reported in thousands)
| | | | | | | | |
| | | SHARES | | | VALUE | |
| | | | | | | | |
| COMMON STOCKS—99.2% | |
|
| Consumer Discretionary—27.1% | |
Amazon.com, Inc.(2) | | | 20,942 | | | $ | 18,566 | |
Ctrip.com International Ltd. ADR(2) | | | 134,970 | | | | 6,634 | |
Home Depot, Inc. (The) | | | 61,555 | | | | 9,038 | |
Las Vegas Sands Corp. | | | 226,613 | | | | 12,933 | |
Netflix, Inc.(2) | | | 73,140 | | | | 10,811 | |
NIKE, Inc. Class B | | | 205,800 | | | | 11,469 | |
Priceline Group, Inc. (The)(2) | | | 8,666 | | | | 15,425 | |
Ross Stores, Inc. | | | 164,196 | | | | 10,815 | |
Starbucks Corp. | | | 263,501 | | | | 15,386 | |
Walt Disney Co. (The) | | | 37,540 | | | | 4,257 | |
| | | | | | | | |
| | | | 115,334 | |
| | | | | | | | |
|
| Consumer Staples—8.4% | |
Costco Wholesale Corp. | | | 52,277 | | | | 8,766 | |
Monster Beverage Corp.(2) | | | 315,903 | | | | 14,585 | |
Philip Morris International, Inc. | | | 111,997 | | | | 12,645 | |
| | | | | | | | |
| | | | 35,996 | |
| | | | | | | | |
|
| Energy—5.4% | |
Cabot Oil & Gas Corp. | | | 161,091 | | | | 3,852 | |
Core Laboratories N.V. | | | 55,339 | | | | 6,393 | |
Pioneer Natural Resources Co. | | | 34,240 | | | | 6,376 | |
Schlumberger Ltd. | | | 79,705 | | | | 6,225 | |
| | | | | | | | |
| | | | 22,846 | |
| | | | | | | | |
|
| Financials—4.4% | |
Bank of America Corp. | | | 520,710 | | | | 12,284 | |
Charles Schwab Corp. (The) | | | 155,088 | | | | 6,329 | |
| | | | | | | | |
| | | | 18,613 | |
| | | | | | | | |
| | | | | | | | |
| | | SHARES | | | VALUE | |
| Health Care—10.4% | |
BioMarin Pharmaceutical, Inc.(2) | | | 82,236 | | | $ | 7,219 | |
Bristol-Myers Squibb Co. | | | 80,476 | | | | 4,376 | |
Celgene Corp.(2) | | | 120,282 | | | | 14,967 | |
Danaher Corp. | | | 84,222 | | | | 7,203 | |
HealthEquity, Inc.(2) | | | 58,890 | | | | 2,500 | |
Zoetis, Inc. | | | 150,777 | | | | 8,047 | |
| | | | | | | | |
| | | | 44,312 | |
| | | | | | | | |
|
| Industrials—5.0% | |
Rockwell Automation, Inc. | | | 26,840 | | | | 4,179 | |
Roper Technologies, Inc. | | | 39,419 | | | | 8,139 | |
Union Pacific Corp. | | | 47,760 | | | | 5,059 | |
Westinghouse Air Brake Technologies Corporation | | | 50,510 | | | | 3,940 | |
| | | | | | | | |
| | | | 21,317 | |
| | | | | | | | |
|
| Information Technology—36.7% | |
Accenture plc Class A | | | 58,938 | | | | 7,066 | |
Activision Blizzard, Inc. | | | 140,810 | | | | 7,021 | |
Alibaba Group Holding Ltd. Sponsored ADR(2) | | | 179,730 | | | | 19,380 | |
Alphabet, Inc. Class A(2) | | | 13,757 | | | | 11,663 | |
Amphenol Corp. Class A | | | 179,328 | | | | 12,763 | |
CoStar Group, Inc.(2) | | | 33,861 | | | | 7,017 | |
Facebook, Inc. Class A(2) | | | 310,020 | | | | 44,038 | |
Gartner, Inc.(2) | | | 26,550 | | | | 2,867 | |
NVIDIA Corp. | | | 47,260 | | | | 5,148 | |
Paycom Software, Inc.(2) | | | 113,952 | | | | 6,554 | |
Visa, Inc. Class A | | | 180,514 | | | | 16,042 | |
Workday, Inc. Class A(2) | | | 102,471 | | | | 8,534 | |
Yandex N.V. Class A(2) | | | 375,574 | | | | 8,236 | |
| | | | | | | | |
| | | | 156,329 | |
| | | | | | | | |
| | | | | | | | |
| | | SHARES | | | VALUE | |
| Materials—1.8% | |
Ecolab, Inc. | | | 61,386 | | | $ | 7,694 | |
TOTAL COMMON STOCKS
(Identified Cost $251,182) | | | | 422,441 | |
| TOTAL LONG TERM INVESTMENTS—99.2% | |
| (Identified Cost $251,182) | | | | 422,441 | |
TOTAL INVESTMENTS—99.2%
(Identified Cost $251,182) | | | | 422,441 | (1) |
Other assets and liabilities, net—0.8% | | | | 3,202 | |
| | | | | | | | |
| NET ASSETS—100.0% | | | $ | 425,643 | |
| | | | | | | | |
Abbreviation:
| ADR | American Depositary Receipt |
Footnote Legend:
| (1) | Federal Income Tax Information: For tax information at March 31, 2017, see Note 10 Federal Income Tax Information in the Notes to Financial Statements. |
| (2) | Non-income producing. |
| | | | |
| Country Weightings (Unaudited)† | | | |
United States | | | 92 | % |
China | | | 6 | |
Russia | | | 2 | |
Total | | | 100 | % |
† % of total investments as of March 31, 2017. | |
The following table provides a summary of inputs used to value the Fund’s investments as of March 31, 2017 (See Security Valuation Note 2A in the Notes to Financial Statements):
| | | | | | | | |
| | | Total
Value at
March 31, 2017 | | | Level 1
Quoted
Prices | |
Equity Securities: | | | | | | | | |
Common Stocks | | $ | 422,441 | | | $ | 422,441 | |
| | | | | | | | |
There are no Level 2 (significant observable inputs) or Level 3 (significant unobservable inputs) priced securities as of March 31, 2017.
There were no transfers between Level 1 and Level 2 related to securities held at March 31, 2017.
See Notes to Financial Statements
33
VIRTUS KAR GLOBAL QUALITY DIVIDEND FUND
SCHEDULE OF INVESTMENTS
MARCH 31, 2017
($ reported in thousands)
| | | | | | | | |
| | | SHARES | | | VALUE | |
| | | | | | | | |
| COMMON STOCKS—98.1% | |
|
| Consumer Discretionary—8.7% | |
Compass Group plc Sponsored ADR | | | 30,710 | | | $ | 592 | |
Las Vegas Sands Corp. | | | 38,690 | | | | 2,208 | |
Leggett & Platt, Inc. | | | 21,750 | | | | 1,094 | |
Meredith Corp. | | | 21,850 | | | | 1,412 | |
| | | | | | | | |
| | | | 5,306 | |
| | | | | | | | |
|
| Consumer Staples—11.0% | |
Altria Group, Inc. | | | 39,470 | | | | 2,819 | |
Kimberly-Clark Corp. | | | 5,020 | | | | 661 | |
Reynolds American, Inc. | | | 42,300 | | | | 2,666 | |
Unilever plc Sponsored ADR | | | 11,120 | | | | 548 | |
| | | | | | | | |
| | | | 6,694 | |
| | | | | | | | |
|
| Energy—9.4% | |
Royal Dutch Shell plc Class B Sponsored ADR(2) | | | 42,920 | | | | 2,396 | |
TOTAL S.A. Sponsored ADR(2) | | | 30,420 | | | | 1,534 | |
Vermilion Energy, Inc. | | | 47,290 | | | | 1,774 | |
| | | | | | | | |
| | | | 5,704 | |
| | | | | | | | |
|
| Financials—17.7% | |
Bank of Hawaii Corp. | | | 10,040 | | | | 827 | |
CI Financial Corp. | | | 44,590 | | | | 891 | |
Cincinnati Financial Corp. | | | 8,753 | | | | 633 | |
HSBC Holdings plc Sponsored ADR | | | 44,100 | | | | 1,800 | |
Royal Bank of Canada | | | 27,560 | | | | 2,009 | |
SCOR SE Sponsored ADR | | | 613,700 | | | | 2,348 | |
Zurich Insurance Group AG ADR | | | 84,070 | | | | 2,242 | |
| | | | | | | | |
| | | | 10,750 | |
| | | | | | | | |
|
| Health Care—9.9% | |
AstraZeneca plc Sponsored ADR(2) | | | 59,160 | | | | 1,842 | |
Coloplast A/S ADR | | | 90,470 | | | | 703 | |
GlaxoSmithKline plc Sponsored ADR | | | 50,400 | | | | 2,125 | |
Sonic Healthcare Ltd. ADR | | | 54,730 | | | | 923 | |
Takeda Pharmaceutical Co., Ltd. Sponsored ADR | | | 17,820 | | | | 421 | |
| | | | | | | | |
| | | | 6,014 | |
| | | | | | | | |
| | | | | | | | |
| | | SHARES | | | VALUE | |
| Industrials—6.2% | |
BAE Systems plc Sponsored ADR | | | 49,910 | | | $ | 1,620 | |
Fastenal Co. | | | 18,010 | | | | 928 | |
Waste Management, Inc. | | | 16,460 | | | | 1,200 | |
| | | | | | | | |
| | | | 3,748 | |
| | | | | | | | |
|
| Information Technology—5.0% | |
Analog Devices, Inc. | | | 9,250 | | | | 758 | |
Cisco Systems, Inc. | | | 28,550 | | | | 965 | |
Microchip Technology, Inc. | | | 9,060 | | | | 668 | |
Paychex, Inc. | | | 11,220 | | | | 661 | |
| | | | | | | | |
| | | | 3,052 | |
| | | | | | | | |
|
| Materials—3.3% | |
BASF SE Sponsored ADR | | | 10,730 | | | | 1,064 | |
RPM International, Inc. | | | 16,730 | | | | 921 | |
| | | | | | | | |
| | | | 1,985 | |
| | | | | | | | |
|
| Real Estate—6.1% | |
Crown Castle International Corp. | | | 20,020 | | | | 1,891 | |
Realty Income Corp. | | | 30,220 | | | | 1,799 | |
| | | | | | | | |
| | | | 3,690 | |
| | | | | | | | |
|
| Telecommunication Services—10.7% | |
AT&T, Inc. | | | 52,739 | | | | 2,191 | |
BCE, Inc. | | | 45,580 | | | | 2,018 | |
Vodafone Group plc Sponsored ADR | | | 86,230 | | | | 2,279 | |
| | | | | | | | |
| | | | 6,488 | |
| | | | | | | | |
| Utilities—10.1% | |
National Grid plc Sponsored ADR(2) | | | 37,002 | | | | 2,349 | |
PPL Corp. | | | 65,170 | | | | 2,437 | |
WEC Energy Group, Inc. | | | 22,110 | | | | 1,340 | |
| | | | | | | | |
| | | | | 6,126 | |
TOTAL COMMON STOCKS
(Identified Cost $56,794) | | | | 59,557 | |
| TOTAL LONG TERM INVESTMENTS—98.1% | |
| (Identified Cost $56,794) | | | | 59,557 | |
| | | | | | | | |
| | | SHARES | | | VALUE | |
| SECURITIES LENDING COLLATERAL—12.4% | |
INVESCO Trust Short-Term Investments Liquid Assets Portfolio (The) – Institutional Shares (seven-day effective yield 0.910%)(3)(4) | | | 7,552,427 | | | $ | 7,552 | |
TOTAL SECURITIES LENDING
COLLATERAL
(Identified Cost $7,552) | | | | 7,552 | |
TOTAL INVESTMENTS—110.5%
(Identified Cost $64,346) | | | | 67,109 | (1) |
Other assets and liabilities, net—(10.5)% | | | | (6,393 | ) |
| | | | | | | | |
| NET ASSETS—100.0% | | | | | | $ | 60,716 | |
| | | | | | | | |
Abbreviation:
| ADR | American Depositary Receipt |
Footnote Legend:
| (1) | Federal Income Tax Information: For tax information at March 31, 2017, see Note 10 Federal Income Tax Information in the Notes to Financial Statements. |
| (2) | All or a portion of security is on loan. |
| (3) | Represents security purchased with cash collateral received for securities on loan. |
| (4) | Shares of this fund are publicly offered and its prospectus and annual report are publicly available. |
| | | | |
| Country Weightings (Unaudited)† | |
United States | | | 53 | % |
United Kingdom | | | 23 | |
Canada | | | 10 | |
France | | | 6 | |
Switzerland | | | 3 | |
Germany | | | 2 | |
Australia | | | 1 | |
Other | | | 2 | |
Total | | | 100 | % |
† % of total investments as of March 31, 2017. | |
The following table provides a summary of inputs used to value the Fund’s investments as of March 31, 2017 (See Security Valuation Note 2A in the Notes to Financial Statements):
| | | | | | | | |
| | | Total
Value at
March 31, 2017 | | | Level 1
Quoted
Prices | |
Equity Securities: | | | | | | | | |
Common Stocks | | $ | 59,557 | | | $ | 59,557 | |
Securities Lending Collateral | | | 7,552 | | | | 7,552 | |
| | | | | | | | |
Total Investments | | $ | 67,109 | | | $ | 67,109 | |
| | | | | | | | |
There are no Level 2 (significant observable inputs) or Level 3 (significant unobservable inputs) priced securities as of March 31, 2017.
There were no transfers between Level 1 and Level 2 related to securities held at March 31, 2017.
See Notes to Financial Statements
34
VIRTUS KAR MID-CAP CORE FUND
SCHEDULE OF INVESTMENTS
MARCH 31, 2017
($ reported in thousands)
| | | | | | | | |
| | | SHARES | | | VALUE | |
| | | | | | | | |
| COMMON STOCKS—96.1% | |
|
| Consumer Discretionary—9.2% | |
Ross Stores, Inc. | | | 37,604 | | | $ | 2,477 | |
Sally Beauty Holdings, Inc.(2) | | | 83,575 | | | | 1,708 | |
TripAdvisor, Inc.(2) | | | 38,114 | | | | 1,645 | |
Wynn Resorts Ltd. | | | 17,922 | | | | 2,054 | |
| | | | | | | | |
| | | | 7,884 | |
| | | | | | | | |
|
| Consumer Staples—5.9% | |
Church & Dwight Co., Inc. | | | 33,548 | | | | 1,673 | |
Monster Beverage Corp.(2) | | | 73,449 | | | | 3,391 | |
| | | | | | | | |
| | | | 5,064 | |
| | | | | | | | |
|
| Energy—4.5% | |
Core Laboratories N.V. | | | 19,345 | | | | 2,235 | |
Dril-Quip, Inc.(2) | | | 30,455 | | | | 1,661 | |
| | | | | | | | |
| | | | 3,896 | |
| | | | | | | | |
|
| Financials—14.2% | |
Bank of The Ozarks, Inc. | | | 66,350 | | | | 3,451 | |
First Financial Bankshares, Inc.(3) | | | 45,765 | | | | 1,835 | |
Moody’s Corp. | | | 14,825 | | | | 1,661 | |
RLI Corp. | | | 26,309 | | | | 1,579 | |
Signature Bank(2) | | | 24,454 | | | | 3,629 | |
| | | | | | | | |
| | | | 12,155 | |
| | | | | | | | |
|
| Health Care—16.8% | |
Cooper Cos, Inc. (The) | | | 13,998 | | | | 2,798 | |
DENTSPLY SIRONA, Inc. | | | 35,743 | | | | 2,232 | |
Globus Medical, Inc. Class A(2) | | | 149,210 | | | | 4,420 | |
West Pharmaceutical Services, Inc. | | | 20,600 | | | | 1,681 | |
Zoetis, Inc. | | | 61,524 | | | | 3,283 | |
| | | | | | | | |
| | | | 14,414 | |
| | | | | | | | |
| | | | | | | | |
| | | SHARES | | | VALUE | |
| Industrials—22.8% | |
AMETEK, Inc. | | | 74,150 | | | $ | 4,010 | |
Equifax, Inc. | | | 14,329 | | | | 1,959 | |
Exponent, Inc. | | | 42,040 | | | | 2,503 | |
Graco, Inc. | | | 28,805 | | | | 2,712 | |
Lennox International, Inc. | | | 9,770 | | | | 1,635 | |
Nordson Corp. | | | 26,737 | | | | 3,284 | |
WABCO Holdings, Inc.(2) | | | 29,455 | | | | 3,459 | |
| | | | | | | | |
| | | | 19,562 | |
| | | | | | | | |
|
| Information Technology—18.2% | |
Amphenol Corp. Class A | | | 48,133 | | | | 3,426 | |
Aspen Technology, Inc.(2) | | | 58,942 | | | | 3,473 | |
Broadridge Financial Solutions, Inc. | | | 40,310 | | | | 2,739 | |
Intuit, Inc. | | | 21,681 | | | | 2,515 | |
Skyworks Solutions, Inc. | | | 35,610 | | | | 3,489 | |
| | | | | | | | |
| | | | 15,642 | |
| | | | | | | | |
|
| Materials—4.5% | |
Axalta Coating Systems Ltd.(2) | | | 60,200 | | | | 1,938 | |
International Flavors & Fragrances, Inc. | | | 14,839 | | | | 1,967 | |
| | | | | | | | |
| | | | | 3,905 | |
TOTAL COMMON STOCKS
(Identified Cost $72,177) | | | | | | | 82,522 | |
| TOTAL LONG TERM INVESTMENTS—96.1% | |
| (Identified Cost $72,177) | | | | | | | 82,522 | |
| | | | | | | | |
| | | SHARES | | | VALUE | |
| SECURITIES LENDING COLLATERAL—2.2% | |
INVESCO Trust Short-Term Investments Liquid Assets Portfolio (The) – Institutional Shares (seven-day effective yield 0.910%)(4)(5) | | | 1,866,360 | | | $ | 1,866 | |
| TOTAL SECURITIES LENDING COLLATERAL | |
| (Identified Cost $1,866) | | | | | | | 1,866 | |
TOTAL INVESTMENTS—98.3%
(Identified Cost $74,043) | | | | 84,388 | (1) |
Other assets and liabilities, net—1.7% | | | | 1,428 | |
| | | | | | | | |
| NET ASSETS—100.0% | | | | | | $ | 85,816 | |
| | | | | | | | |
Footnote Legend:
| (1) | Federal Income Tax Information: For tax information at March 31, 2017, see Note 10 Federal Income Tax Information in the Notes to Financial Statements. |
| (2) | Non-income producing. |
| (3) | All or a portion of security is on loan. |
| (4) | Represents security purchased with cash collateral received for securities on loan. |
| (5) | Shares of this fund are publicly offered and its prospectus and annual report are publicly available. |
The following table provides a summary of inputs used to value the Fund’s investments as of March 31, 2017 (See Security Valuation Note 2A in the Notes to Financial Statements):
| | | | | | | | |
| | | Total
Value at
March 31, 2017 | | | Level 1
Quoted
Prices | |
Equity Securities: | | | | | | | | |
Common Stocks | | $ | 82,522 | | | $ | 82,522 | |
Securities Lending Collateral | | | 1,866 | | | | 1,866 | |
| | | | | | | | |
Total Investments | | $ | 84,388 | | | $ | 84,388 | |
| | | | | | | | |
There are no Level 2 (significant observable inputs) or Level 3 (significant unobservable inputs) priced securities as of March 31, 2017.
There were no transfers between Level 1 and Level 2 related to securities held at March 31, 2017.
See Notes to Financial Statements
35
VIRTUS KAR MID-CAP GROWTH FUND
SCHEDULE OF INVESTMENTS
MARCH 31, 2017
($ reported in thousands)
| | | | | | | | |
| | | SHARES | | | VALUE | |
| | | | | | | | |
| COMMON STOCKS—99.4% | |
|
| Consumer Discretionary—27.5% | |
Ctrip.com International Ltd. ADR(2) | | | 42,765 | | | $ | 2,102 | |
Discovery Communications, Inc. Class A(2) | | | 47,620 | | | | 1,385 | |
Domino’s Pizza, Inc. | | | 20,685 | | | | 3,812 | |
Expedia, Inc. | | | 12,381 | | | | 1,562 | |
MercadoLibre, Inc. | | | 19,255 | | | | 4,072 | |
Netflix, Inc.(2) | | | 25,330 | | | | 3,744 | |
Pool Corp. | | | 26,795 | | | | 3,198 | |
Ross Stores, Inc. | | | 31,305 | | | | 2,062 | |
Wynn Resorts Ltd. | | | 24,420 | | | | 2,799 | |
| | | | | | | | |
| | | | 24,736 | |
| | | | | |
|
| Consumer Staples—8.6% | |
Brown-Forman Corp. Class B | | | 43,720 | | | | 2,019 | |
McCormick & Co., Inc. | | | 20,280 | | | | 1,978 | |
Monster Beverage Corp.(2) | | | 80,150 | | | | 3,701 | |
| | | | | |
| | | | 7,698 | |
| | | | | |
|
| Energy—4.7% | |
Cabot Oil & Gas Corp. | | | 61,045 | | | | 1,459 | |
Core Laboratories N.V. | | | 15,250 | | | | 1,762 | |
Oceaneering International, Inc. | | | 36,035 | | | | 976 | |
| | | | | |
| | | | 4,197 | |
| | | | | |
|
| Financials—9.3% | |
Financial Engines, Inc. | | | 48,825 | | | | 2,126 | |
MarketAxess Holdings, Inc. | | | 19,510 | | | | 3,658 | |
Northern Trust Corp. | | | 18,870 | | | | 1,634 | |
Vantiv, Inc. Class A(2) | | | 14,160 | | | | 908 | |
| | | | | |
| | | | 8,326 | |
| | | | | |
| | | | | | | | |
| | | SHARES | | | VALUE | |
| Health Care—11.0% | |
BioMarin Pharmaceutical, Inc.(2) | | | 18,310 | | | $ | 1,607 | |
DENTSPLY SIRONA, Inc. | | | 19,525 | | | | 1,219 | |
Diplomat Pharmacy, Inc.(2) | | | 24,700 | | | | 394 | |
HealthEquity, Inc.(2) | | | 62,630 | | | | 2,659 | |
Illumina, Inc.(2) | | | 6,040 | | | | 1,031 | |
Kite Pharma, Inc.(2) | | | 15,100 | | | | 1,185 | |
Zoetis, Inc. | | | 33,750 | | | | 1,801 | |
| | | | | |
| | | | 9,896 | |
| | | | | |
|
| Industrials—9.9% | |
Kansas City Southern | | | 14,200 | | | | 1,218 | |
Middleby Corp. (The)(2) | | | 15,570 | | | | 2,125 | |
MSC Industrial Direct Co., Inc. Class A | | | 21,255 | | | | 2,184 | |
Rockwell Automation, Inc. | | | 5,680 | | | | 884 | |
Roper Technologies, Inc. | | | 8,190 | | | | 1,691 | |
Westinghouse Air Brake Technologies Corporation | | | 10,580 | | | | 825 | |
| | | | | |
| | | | 8,927 | |
| | | | | |
|
| Information Technology—27.5% | |
Amphenol Corp. Class A | | | 42,175 | | | | 3,002 | |
Autohome, Inc. ADR(2) | | | 51,270 | | | | 1,629 | |
CoStar Group, Inc.(2) | | | 10,010 | | | | 2,074 | |
Ellie Mae, Inc.(2) | | | 41,650 | | | | 4,176 | |
Fair Isaac Corp. | | | 11,030 | | | | 1,422 | |
FleetCor Technologies, Inc.(2) | | | 5,650 | | | | 856 | |
Gartner, Inc.(2) | | | 25,185 | | | | 2,720 | |
Mulesoft, Inc. Class A(2) | | | 17,928 | | | | 436 | |
Paycom Software, Inc.(2) | | | 33,400 | | | | 1,921 | |
Teradyne, Inc. | | | 29,970 | | | | 932 | |
Workday, Inc. Class A(2) | | | 25,770 | | | | 2,146 | |
Yandex N.V. Class A(2) | | | 90,845 | | | | 1,992 | |
Yelp, Inc.(2) | | | 43,380 | | | | 1,421 | |
| | | | | |
| | | | 24,727 | |
| | | | | |
| | | | | | | | |
| | | SHARES | | | VALUE | |
| Materials—0.9% | |
Ball Corp. | | | 10,670 | | | $ | 792 | |
TOTAL COMMON STOCKS
(Identified Cost $58,449) | | | | 89,299 | |
| TOTAL LONG TERM INVESTMENTS—99.4% | |
| (Identified Cost $58,449) | | | | | | | 89,299 | |
TOTAL INVESTMENTS—99.4%
(Identified Cost $58,449) | | | | 89,299 | (1) |
Other assets and liabilities, net—0.6% | | | | 571 | |
| | | | | | | | |
| NET ASSETS—100.0% | | | $ | 89,870 | |
| | | | | | | | |
Abbreviation:
| ADR | American Depositary Receipt |
Footnote Legend:
| (1) | Federal Income Tax Information: For tax information at March 31, 2017, see Note 10 Federal Income Tax Information in the Notes to Financial Statements. |
| (2) | Non-income producing. |
| | | | |
| Country Weightings (Unaudited)† | | | |
United States | | | 94 | % |
China | | | 4 | |
Russia | | | 2 | |
Total | | | 100 | % |
† % of total investments as of March 31, 2017. | |
The following table provides a summary of inputs used to value the Fund’s investments as of March 31, 2017 (See Security Valuation Note 2A in the Notes to Financial Statements):
| | | | | | | | |
| | | Total
Value at
March 31, 2017 | | | Level 1
Quoted
Prices | |
Equity Securities: | | | | | | | | |
Common Stocks | | $ | 89,299 | | | $ | 89,299 | |
| | | | | | | | |
There are no Level 2 (significant observable inputs) or Level 3 (significant unobservable inputs) priced securities as of March 31, 2017.
There were no transfers between Level 1 and Level 2 related to securities held at March 31, 2017.
See Notes to Financial Statements
36
VIRTUS KAR SMALL-CAP CORE FUND
SCHEDULE OF INVESTMENTS
MARCH 31, 2017
($ reported in thousands)
| | | | | | | | |
| | | SHARES | | | VALUE | |
| COMMON STOCKS—89.5% | |
|
| Consumer Discretionary—11.1% | |
Fox Factory Holding Corp.(2) | | | 536,637 | | | $ | 15,402 | |
NVR, Inc.(2) | | | 6,916 | | | | 14,571 | |
Polaris Industries, Inc.(3) | | | 151,090 | | | | 12,661 | |
Pool Corp. | | | 85,700 | | | | 10,227 | |
| | | | | | | | |
| | | | 52,861 | |
| | | | | | | | |
|
| Consumer Staples—3.1% | |
Chefs’ Warehouse, Inc. (The)(2) | | | 96,497 | | | | 1,341 | |
PriceSmart, Inc. | | | 146,300 | | | | 13,489 | |
| | | | | | | | |
| | | | 14,830 | |
| | | | | | | | |
|
| Energy—5.2% | |
Core Laboratories N.V. | | | 87,400 | | | | 10,096 | |
Dril-Quip, Inc.(2) | | | 264,600 | | | | 14,434 | |
| | | | | | | | |
| | | | 24,530 | |
| | | | | | | | |
|
| Financials—16.6% | |
Artisan Partners Asset Management, Inc. Class A | | | 417,700 | | | | 11,528 | |
FactSet Research Systems, Inc. | | | 96,840 | | | | 15,970 | |
MarketAxess Holdings, Inc. | | | 96,132 | | | | 18,024 | |
Primerica, Inc. | | | 323,100 | | | | 26,559 | |
RLI Corp. | | | 120,908 | | | | 7,257 | |
| | | | | | | | |
| | | | 79,338 | |
| | | | | | | | |
|
| Health Care—3.8% | |
Abaxis, Inc. | | | 370,600 | | | | 17,974 | |
| | | | | | | | |
|
| Industrials—29.7% | |
Copart, Inc.(2) | | | 369,700 | | | | 22,895 | |
Donaldson Co., Inc. | | | 266,100 | | | | 12,113 | |
Graco, Inc. | | | 171,700 | | | | 16,164 | |
Old Dominion Freight Line, Inc. | | | 232,030 | | | | 19,855 | |
| | | | | | | | |
| | | SHARES | | | VALUE | |
| Industrials—continued | |
RBC Bearings, Inc.(2) | | | 136,748 | | | $ | 13,277 | |
Teledyne Technologies, Inc.(2) | | | 181,700 | | | | 22,978 | |
Toro Co. (The) | | | 183,680 | | | | 11,472 | |
WABCO Holdings, Inc.(2) | | | 195,050 | | | | 22,903 | |
| | | | | | | | |
| | | | 141,657 | |
| | | | | | | | |
|
| Information Technology—16.2% | |
Aspen Technology, Inc.(2) | | | 317,400 | | | | 18,701 | |
Autohome, Inc. ADR(2) | | | 752,210 | | | | 23,898 | |
CDW Corp. | | | 399,300 | | | | 23,044 | |
Jack Henry & Associates, Inc. | | | 122,100 | | | | 11,367 | |
| | | | | | | | |
| | | | 77,010 | |
| | | | | | | | |
|
| Materials—1.6% | |
AptarGroup, Inc. | | | 101,400 | | | | 7,807 | |
| | | | | | | | |
|
| Real Estate—2.2% | |
HFF, Inc. Class A | | | 378,800 | | | | 10,482 | |
TOTAL COMMON STOCKS
(Identified Cost $314,765) | | | | 426,489 | |
| TOTAL LONG TERM INVESTMENTS—89.5% | |
| (Identified Cost $314,765) | | | | 426,489 | |
|
| SHORT-TERM INVESTMENT—8.9% | |
|
| Money Market Mutual Fund—8.9% | |
JPMorgan U.S. Government Money Market Fund – Institutional Shares (seven-day effective yield 0.630%)(5) | | | 42,555,166 | | | | 42,555 | |
TOTAL SHORT-TERM INVESTMENT
(Identified Cost $42,555) | | | | 42,555 | |
| | | | | | | | |
| | | SHARES | | | VALUE | |
| SECURITIES LENDING COLLATERAL—2.3% | |
INVESCO Trust Short-Term Investments Liquid Assets Portfolio (The) – Institutional Shares (seven-day effective yield 0.910%)(4)(5) | | | 11,113,908 | | | $ | 11,114 | |
| TOTAL SECURITIES LENDING COLLATERAL | |
| (Identified Cost $11,114) | | | | | | | 11,114 | |
TOTAL INVESTMENTS—100.7%
(Identified Cost $368,434) | | | | 480,158 | (1) |
Other assets and liabilities, net—(0.7)% | | | | (3,418 | ) |
| | | | | | | | |
| NET ASSETS—100.0% | | | | | | $ | 476,740 | |
| | | | | | | | |
Abbreviation:
| ADR | American Depositary Receipt |
Footnote Legend:
| (1) | Federal Income Tax Information: For tax information at March 31, 2017, see Note 10 Federal Income Tax Information in the Notes to Financial Statements. |
| (3) | All or a portion of security is on loan. |
| (4) | Represents security purchased with cash collateral received for securities on loan. |
| (5) | Shares of this fund are publicly offered and its prospectus and annual report are publicly available. |
The following table provides a summary of inputs used to value the Fund’s investments as of March 31, 2017 (See Security Valuation Note 2A in the Notes to Financial Statements):
| | | | | | | | |
| | | Total
Value at
March 31, 2017 | | | Level 1
Quoted
Prices | |
Equity Securities: | | | | | | | | |
Common Stocks | | $ | 426,489 | | | $ | 426,489 | |
Securities Lending Collateral | | | 11,114 | | | | 11,114 | |
Short-Term Investment | | | 42,555 | | | | 42,555 | |
| | | | | | | | |
Total Investments | | $ | 480,158 | | | $ | 480,158 | |
| | | | | | | | |
There are no Level 2 (significant observable inputs) or Level 3 (significant unobservable inputs) priced securities as of March 31, 2017.
There were no transfers between Level 1 and Level 2 related to securities held at March 31, 2017.
See Notes to Financial Statements
37
VIRTUS KAR SMALL-CAP GROWTH FUND
SCHEDULE OF INVESTMENTS
MARCH 31, 2017
($ reported in thousands)
| | | | | | | | |
| | | SHARES | | | VALUE | |
| COMMON STOCKS—86.7% | |
|
| Consumer Discretionary—15.7% | |
Fox Factory Holding Corp.(2) | | | 1,494,473 | | | $ | 42,891 | |
MercadoLibre, Inc. | | | 133,800 | | | | 28,295 | |
Ollie’s Bargain Outlet Holdings, Inc.(2) | | | 1,304,800 | | | | 43,711 | |
| | | | | | | | |
| | | | 114,897 | |
| | | | | | | | |
|
| Consumer Staples—8.2% | |
Chefs’ Warehouse, Inc. (The)(2) | | | 2,315,700 | | | | 32,188 | |
PriceSmart, Inc. | | | 301,100 | | | | 27,761 | |
| | | | | | | | |
| | | | 59,949 | |
| | | | | | | | |
|
| Financials—13.9% | |
FactSet Research Systems, Inc. | | | 138,950 | | | | 22,914 | |
Financial Engines, Inc. | | | 204,251 | | | | 8,895 | |
Interactive Brokers Group, Inc. Class A | | | 763,600 | | | | 26,512 | |
MarketAxess Holdings, Inc. | | | 124,600 | | | | 23,362 | |
Morningstar, Inc. | | | 252,428 | | | | 19,841 | |
| | | | | | | | |
| | | | 101,524 | |
| | | | | | | | |
|
| Health Care—8.1% | |
Abaxis, Inc. | | | 613,400 | | | | 29,750 | |
National Research Corp. Class A | | | 1,484,034 | | | | 29,235 | |
| | | | | | | | |
| | | | 58,985 | |
| | | | | | | | |
|
| Industrials—18.4% | |
AAON, Inc. | | | 540,800 | | | | 19,117 | |
Copart, Inc.(2) | | | 470,450 | | | | 29,135 | |
HEICO Corp. Class A | | | 492,533 | | | | 36,940 | |
| | | | | | | | |
| | | SHARES | | | VALUE | |
| Industrials—continued | |
Old Dominion Freight Line, Inc. | | | 380,300 | | | $ | 32,542 | |
Omega Flex, Inc. | | | 356,214 | | | | 17,024 | |
| | | | | | | | |
| | | | 134,758 | |
| | | | | | | | |
|
| Information Technology—22.4% | |
ANSYS, Inc.(2) | | | 177,900 | | | | 19,012 | |
Aspen Technology, Inc.(2) | | | 541,400 | | | | 31,900 | |
Autohome, Inc. ADR(2) | | | 1,221,000 | | | | 38,791 | |
Ellie Mae, Inc.(2) | | | 226,650 | | | | 22,726 | |
Mesa Laboratories, Inc. | | | 47,100 | | | | 5,779 | |
NVE Corp. | | | 428,252 | | | | 35,455 | |
Paycom Software, Inc.(2) | | | 184,000 | | | | 10,582 | |
| | | | | | | | |
| | | | | 164,245 | |
TOTAL COMMON STOCKS
(Identified Cost $507,234) | | | | 634,358 | |
| TOTAL LONG TERM INVESTMENTS—86.7% | |
| (Identified Cost $507,234) | | | | 634,358 | |
|
| SHORT-TERM INVESTMENT—12.4% | |
|
| Money Market Mutual Fund—12.4% | |
JPMorgan U.S. Government Money Market Fund – Institutional Shares (seven-day effective yield 0.630%)(3) | | | 91,017,028 | | | | 91,017 | |
TOTAL SHORT-TERM INVESTMENT
(Identified Cost $91,017) | | | | 91,017 | |
TOTAL INVESTMENTS—99.1%
(Identified Cost $598,251) | | | | 725,375 | (1) |
Other assets and liabilities, net—0.9% | | | | 6,847 | |
| | | | | | | | |
| NET ASSETS—100.0% | | | $ | 732,222 | |
| | | | | | | | |
Abbreviation:
| ADR | American Depositary Receipt |
Footnote Legend:
| (1) | Federal Income Tax Information: For tax information at March 31, 2017, see Note 10 Federal Income Tax Information in the Notes to Financial Statements. |
| (3) | Shares of this fund are publicly offered and its prospectus and annual report are publicly available. |
| | | | |
| Country Weightings (Unaudited)† | | | |
United States | | | 95 | % |
China | | | 5 | |
Total | | | 100 | % |
† % of total investments as of March 31, 2017. | |
The following table provides a summary of inputs used to value the Fund’s investments as of March 31, 2017 (See Security Valuation Note 2A in the Notes to Financial Statements):
| | | | | | | | |
| | | Total
Value at
March 31, 2017 | | | Level 1
Quoted
Prices | |
Equity Securities: | | | | | | | | |
Common Stocks | | $ | 634,358 | | | $ | 634,358 | |
Short-Term Investment | | | 91,017 | | | | 91,017 | |
| | | | | | | | |
Total Investments | | $ | 725,375 | | | $ | 725,375 | |
| | | | | | | | |
There are no Level 2 (significant observable inputs) or Level 3 (significant unobservable inputs) priced securities as of March 31, 2017.
There were no transfers between Level 1 and Level 2 related to securities held at March 31, 2017.
See Notes to Financial Statements
38
VIRTUS KAR SMALL-CAP VALUE FUND
SCHEDULE OF INVESTMENTS
MARCH 31, 2017
($ reported in thousands)
| | | | | | | | |
| | | SHARES | | | VALUE | |
| COMMON STOCKS—92.8% | |
|
| Consumer Discretionary—14.5% | |
Cheesecake Factory, Inc. (The) | | | 207,700 | | | $ | 13,160 | |
Cinemark Holdings, Inc. | | | 357,800 | | | | 15,865 | |
Sally Beauty Holdings, Inc.(2) | | | 482,000 | | | | 9,852 | |
Thor Industries, Inc. | | | 141,200 | | | | 13,573 | |
| | | | | | | | |
| | | | 52,450 | |
| | | | | | | | |
|
| Consumer Staples—6.1% | |
National Beverage Corp. | | | 173,004 | | | | 14,624 | |
WD-40 Co. | | | 67,654 | | | | 7,371 | |
| | | | | | | | |
| | | | 21,995 | |
| | | | | | | | |
|
| Energy—3.8% | |
Core Laboratories N.V. | | | 117,600 | | | | 13,585 | |
| | | | | | | | |
|
| Financials—13.1% | |
Artisan Partners Asset Management, Inc. Class A | | | 291,900 | | | | 8,056 | |
Bank of Hawaii Corp. | | | 162,100 | | | | 13,350 | |
First Financial Bankshares, Inc. | | | 138,600 | | | | 5,558 | |
Primerica, Inc. | | | 131,163 | | | | 10,782 | |
RLI Corp. | | | 161,312 | | | | 9,682 | |
| | | | | | | | |
| | | | 47,428 | |
| | | | | | | | |
|
| Health Care—5.6% | |
Anika Therapeutics, Inc.(2) | | | 207,600 | | | | 9,018 | |
Patterson Cos., Inc. | | | 245,900 | | | | 11,122 | |
| | | | | | | | |
| | | | 20,140 | |
| | | | | | | | |
|
| Industrials—19.6% | |
Graco, Inc. | | | 147,417 | | | | 13,878 | |
Landstar System, Inc. | | | 114,928 | | | | 9,844 | |
Lincoln Electric Holdings, Inc. | | | 93,910 | | | | 8,157 | |
| | | | | | | | |
| | | SHARES | | | VALUE | |
| Industrials—continued | |
RBC Bearings, Inc.(2) | | | 132,500 | | | $ | 12,864 | |
SiteOne Landscape Supply, Inc.(2) | | | 277,960 | | | | 13,456 | |
Sun Hydraulics Corp. | | | 164,000 | | | | 5,922 | |
Watsco, Inc. | | | 46,323 | | | | 6,633 | |
| | | | | | | | |
| | | | 70,754 | |
| | | | | | | | |
|
| Information Technology—19.5% | |
American Software, Inc. Class A | | | 459,391 | | | | 4,722 | |
Badger Meter, Inc. | | | 309,634 | | | | 11,379 | |
Cabot Microelectronics Corp. | | | 146,700 | | | | 11,239 | |
Cass Information Systems, Inc. | | | 201,119 | | | | 13,294 | |
Cognex Corp. | | | 86,786 | | | | 7,286 | |
Jack Henry & Associates, Inc. | | | 125,700 | | | | 11,703 | |
Monotype Imaging Holdings, Inc. | | | 532,599 | | | | 10,705 | |
| | | | | | | | |
| | | | 70,328 | |
| | | | | | | | |
|
| Materials—3.3% | |
Scotts Miracle-Gro Co. (The) Class A | | | 127,531 | | | | 11,910 | |
| | | | | | | | |
|
| Real Estate—7.3% | |
HFF, Inc. Class A | | | 329,900 | | | | 9,128 | |
RE/MAX Holdings, Inc. Class A | | | 290,620 | | | | 17,278 | |
| | | | | | | | |
| | | | | 26,406 | |
TOTAL COMMON STOCKS
(Identified Cost $240,280) | | | | 334,996 | |
| TOTAL LONG TERM INVESTMENTS—92.8% | |
| (Identified Cost $240,280) | | | | 334,996 | |
| | | | | | | | |
| | | SHARES | | | VALUE | |
| SHORT-TERM INVESTMENT—5.8% | |
|
| Money Market Mutual Fund—5.8% | |
JPMorgan U.S. Government Money Market Fund – Institutional Shares (seven-day effective yield 0.630%)(3) | | | 21,047,920 | | | $ | 21,048 | |
TOTAL SHORT-TERM INVESTMENT
(Identified Cost $21,048) | | | | 21,048 | |
TOTAL INVESTMENTS—98.6%
(Identified Cost $261,328) | | | | 356,044 | (1) |
Other assets and liabilities, net—1.4% | | | | 5,205 | |
| | | | | | | | |
| NET ASSETS—100.0% | | | $ | 361,249 | |
| | | | | | | | |
Footnote Legend:
| (1) | Federal Income Tax Information: For tax information at March 31, 2017, see Note 10 Federal Income Tax Information in the Notes to Financial Statements. |
| (3) | Shares of this fund are publicly offered and its prospectus and annual report are publicly available. |
The following table provides a summary of inputs used to value the Fund’s investments as of March 31, 2017 (See Security Valuation Note 2A in the Notes to Financial Statements):
| | | | | | | | |
| | | Total
Value at
March 31, 2017 | | | Level 1
Quoted
Prices | |
Equity Securities: | | | | | | | | |
Common Stocks | | $ | 334,996 | | | $ | 334,996 | |
Short-Term Investment | | | 21,048 | | | | 21,048 | |
| | | | | | | | |
Total Investments | | $ | 356,044 | | | $ | 356,044 | |
| | | | | | | | |
There are no Level 2 (significant observable inputs) or Level 3 (significant unobservable inputs) priced securities as of March 31, 2017.
There were no transfers between Level 1 and Level 2 related to securities held at March 31, 2017.
See Notes to Financial Statements
39
VIRTUS RAMPART ENHANCED CORE EQUITY FUND
SCHEDULE OF INVESTMENTS
MARCH 31, 2017
($ reported in thousands)
| | | | | | | | |
| | | SHARES | | | VALUE | |
| | | | | | | | |
| EXCHANGE-TRADED FUNDS(2)—99.0% | |
Consumer Staples Select Sector SPDR Fund | | | 29,414 | | | $ | 1,605 | |
Financial Select Sector SPDR Fund | | | 104,017 | | | | 2,468 | |
Health Care Select Sector SPDR Fund | | | 31,938 | | | | 2,375 | |
PowerShares S&P 500 Low Volatility Portfolio | | | 126,902 | | | | 5,517 | |
SPDR S&P 500® ETF Trust | | | 391,524 | | | | 92,298 | |
Technology Select Sector SPDR Fund | | | 70,845 | | | | 3,777 | |
Utilities Select Sector SPDR Fund | | | 11,442 | | | | 587 | |
Vanguard S&P 500 ETF(3) | | | 283,485 | | | | 61,332 | |
TOTAL EXCHANGE-TRADED FUNDS
(Identified Cost $161,630) | | | | 169,959 | |
| | |
| | | CONTRACTS | | | | |
| PURCHASED OPTIONS—0.1% | |
|
| Call Options—0.0% | |
S&P 500® Index expiration 4/5/17 strike price $2,465 | | | 342 | | | | 2 | |
S&P 500® Index expiration 4/7/17 strike price $2,475 | | | 342 | | | | 3 | |
S&P 500® Index expiration 4/10/17 strike price $2,465 | | | 342 | | | | 3 | |
S&P 500® Index expiration 4/12/17 strike price $2,465 | | | 343 | | | | 0 | |
S&P 500® Index expiration 4/13/17 strike price $2,470 | | | 345 | | | | 7 | |
| | | | | | | | |
| | | | 15 | |
| | | | | | | | |
|
| Put Options—0.1% | |
S&P 500® Index expiration 4/5/17 strike price $2,200 | | | 342 | | | | 9 | |
| | | | | | | | |
| | | CONTRACTS | | | VALUE | |
| Put Options—continued | |
S&P 500® Index expiration 4/7/17 strike price $2,200 | | | 342 | | | $ | 12 | |
S&P 500® Index expiration 4/10/17 strike price $2,240 | | | 342 | | | | 24 | |
S&P 500® Index expiration 4/12/17 strike price $2,245 | | | 343 | | | | 34 | |
S&P 500® Index expiration 4/13/17 strike price $2,255 | | | 345 | | | | 47 | |
| | | | | | | | |
| | | | | 126 | |
TOTAL PURCHASED OPTIONS
| |
| (Premiums Paid $321) | | | | 141 | |
| TOTAL INVESTMENTS, BEFORE WRITTEN OPTIONS—99.1% | |
| (Identified Cost $161,951) | | | | 170,100 | (1) |
|
| WRITTEN OPTIONS—(0.2)% | |
|
| Call Options—(0.1)% | |
S&P 500® Index expiration 4/5/17 strike price $2,415 | | | 342 | | | | (3 | ) |
S&P 500® Index expiration 4/7/17 strike price $2,425 | | | 342 | | | | (7 | ) |
S&P 500® Index expiration 4/10/17 strike price $2,415 | | | 342 | | | | (15 | ) |
S&P 500® Index expiration 4/12/17 strike price $2,415 | | | 343 | | | | (27 | ) |
S&P 500® Index expiration 4/13/17 strike price $2,420 | | | 345 | | | | (26 | ) |
| | | | | | | | |
| | | | (78 | ) |
| | | | | | | | |
|
| Put Options—(0.1)% | |
S&P 500® Index expiration 4/5/17 strike price $2,250 | | | 342 | | | | (9 | ) |
S&P 500® Index expiration 4/7/17 strike price $2,250 | | | 342 | | | | (17 | ) |
| | | | | | | | |
| | | CONTRACTS | | | VALUE | |
| Put Options—continued | |
S&P 500® Index expiration 4/10/17 strike price $2,290 | | | 342 | | | $ | (36 | ) |
S&P 500® Index expiration 4/12/17 strike price $2,295 | | | 343 | | | | (62 | ) |
S&P 500® Index expiration 4/13/17 strike price $2,305 | | | 345 | | | | (107 | ) |
| | | | | | | | |
| | | | | | | | (231 | ) |
TOTAL WRITTEN OPTIONS—(0.2)%
(Premiums Received $658) | | | | (309 | )(1) |
| TOTAL INVESTMENTS, NET OF WRITTEN OPTIONS—98.9% | |
| (Identified Cost $161,293) | | | | 169,791 | |
Other assets and liabilities, net—1.1% | | | | 1,931 | |
| | | | | | | | |
| NET ASSETS—100.0% | | | $ | 171,722 | |
| | | | | | | | |
Abbreviations:
| SPDR | S&P Depositary Receipt |
Footnote Legend:
| (1) | Federal Income Tax Information: For tax information at March 31, 2017, see Note 10 Federal Income Tax Information in the Notes to Financial Statements. |
| (2) | Shares of these funds are publicly offered and the prospectus and annual reports of each are publicly available. |
| (3) | All or a portion of the security is segregated as collateral for written options. |
The following table provides a summary of inputs used to value the Fund’s investments as of March 31, 2017 (See Security Valuation Note 2A in the Notes to Financial Statements):
| | | | | | | | | | | | |
| | | Total
Value at
March 31, 2017 | | | Level 1
Quoted
Prices | | | Level 2
Quoted
Prices | |
Equity Securities: | | | | | | | | | | | | |
Exchange-Traded Funds | | $ | 169,959 | | | $ | 169,959 | | | $ | 0 | |
Purchased Options* | | | 141 | | | | 141 | | | | 0 | |
| | | | | | | | | | | | |
Total Investments before Written Options | | $ | 170,100 | | | $ | 170,100 | | | $ | 0 | |
| | | | | | | | | | | | |
Liabilities: | | | | | | | | | | | | |
Equity Securities: | | | | | | | | | | | | |
Written Options | | $ | (309 | ) | | $ | (309 | ) | | $ | 0 | |
| | | | | | | | | | | | |
Total Investments net of Written Options | | $ | 169,791 | | | $ | 169,791 | | | $ | 0 | |
| | | | | | | | | | | | |
| * | Purchased options valued at zero above are considered to be Level 2 investments in this table. |
There are no Level 3 (significant unobservable inputs) priced securities as of March 31, 2017.
There were no transfers between Level 1 and Level 2 related to securities held at March 31, 2017.
Security abbreviation definitions are located under the Key Investment Terms starting on page 4.
See Notes to Financial Statements
40
VIRTUS TACTICAL ALLOCATION FUND
SCHEDULE OF INVESTMENTS
MARCH 31, 2017
($ reported in thousands)
| | | | | | | | |
| | | PAR
VALUE | | | VALUE | |
| FOREIGN GOVERNMENT SECURITIES—5.0% | |
Argentine Republic | | | | | | | | |
144A 5.625%, 1/26/22(4) | | $ | 85 | | | $ | 87 | |
144A 7.500%, 4/22/26(4) | | | 500 | | | | 532 | |
144A 6.875%, 1/26/27(4) | | | 115 | | | | 117 | |
Series NY
8.280%, 12/31/33 | | | 294 | | | | 316 | |
144A 7.125%, 7/6/36(4) | | | 150 | | | | 145 | |
Bolivarian Republic of Venezuela | | | | | | | | |
7.000%, 12/1/18 | | | 35 | | | | 24 | |
RegS 7.750%, 10/13/19(5) | | | 34 | | | | 19 | |
RegS 8.250%, 10/13/24(5) | | | 40 | | | | 18 | |
RegS 7.650%, 4/21/25(5) | | | 320 | | | | 134 | |
9.375%, 1/13/34 | | | 245 | | | | 112 | |
Dominican Republic 144A
6.875%,
1/29/26(4) | | | 100 | | | | 110 | |
Federative Republic of Brazil | | | | | | | | |
12.500%, 1/5/22 | | | 475 | BRL | | | 168 | |
8.500%, 1/5/24 | | | 390 | BRL | | | 118 | |
5.625%, 1/7/41 | | | 140 | | | | 137 | |
Federative Republic of Brazil Treasury Note | | | | | | | | |
Series F, | | | | | | | | |
10.000%, 1/1/23 | | | 570 | BRL | | | 187 | |
10.000%, 1/1/25 | | | 230 | BRL | | | 75 | |
Kingdom of Bahrain 144A
7.000%, 10/12/28(4) | | | 200 | | | | 209 | |
Kingdom of Jordan 144A
5.750%, 1/31/27(4) | | | 200 | | | | 196 | |
Kingdom of Morocco 144A
5.500%,
12/11/42(4) | | | 200 | | | | 214 | |
Provincia de Buenos Aires 144A
9.125%, 3/16/24(4) | | | 150 | | | | 167 | |
Provincia de Buenos Aires Argentina 144A
7.875%, 6/15/27(4) | | | 235 | | | | 239 | |
Republic of Chile 5.500%, 8/5/20 | | | 95,000 | CLP | | | 152 | |
Republic of Colombia | | | | | | | | |
4.375%, 3/21/23 | | | 722,000 | COP | | | 229 | |
9.850%, 6/28/27 | | | 157,000 | COP | | | 69 | |
Republic of Costa Rica 144A
7.000%, 4/4/44(4) | | | 200 | | | | 202 | |
Republic of Ecuador 144A
9.650%,
12/13/26(4) | | | 200 | | | | 208 | |
Republic of El Salvador 144A
6.375%,
1/18/27(4) | | | 260 | | | | 234 | |
Republic of Indonesia | | | | | | | | |
Series FR70, 8.375%, 3/15/24 | | | 1,670,000 | IDR | | | 133 | |
Series FR56, 8.375%, 9/15/26 | | | 2,683,000 | IDR | | | 219 | |
Republic of South Africa | | | | | | | | |
Series R203,
8.250%, 9/15/17 | | | 1,125 | ZAR | | | 84 | |
Series R208, 6.750%, 3/31/21 | | | 910 | ZAR | | | 65 | |
4.300%, 10/12/28 | | | 200 | | | | 188 | |
Republic of Turkey | | | | | | | | |
6.250%, 9/26/22 | | | 200 | | | | 214 | |
4.875%, 10/9/26 | | | 485 | | | | 468 | |
6.000%, 3/25/27 | | | 200 | | | | 208 | |
4.875%, 4/16/43 | | | 200 | | | | 172 | |
| | | | | | | | |
| | | PAR
VALUE | | | VALUE | |
| FOREIGN GOVERNMENT SECURITIES—continued | |
Russian Federation
144A 7.850%,
3/10/18(4) | | | 10,000 | RUB | | $ | 176 | |
6.700%, 5/15/19 | | | 10,000 | RUB | | | 172 | |
Sultanate of Oman 144A
4.750%, 6/15/26(4) | | $ | 235 | | | | 237 | |
Ukraine 144A
7.750%, 9/1/26(4) | | | 160 | | | | 147 | |
United Mexican States | | | | | | | | |
Series M,
6.500%, 6/9/22 | | | 2,041 | MXN | | | 107 | |
4.750%, 3/8/44 | | | 70 | | | | 68 | |
| TOTAL FOREIGN GOVERNMENT SECURITIES | |
| (Identified Cost $7,372) | | | | 7,076 | |
|
| MORTGAGE-BACKED SECURITIES—5.2% | |
|
| Agency—0.8% | |
FHLMC
3.500%, 4/1/46 | | | 231 | | | | 236 | |
FNMA | | | | | | | | |
3.500%, 12/1/42 | | | 217 | | | | 223 | |
4.000%, 10/1/44 | | | 220 | | | | 231 | |
3.500%, 1/1/45 | | | 159 | | | | 163 | |
3.500%, 12/1/45 | | | 152 | | | | 156 | |
3.500%, 1/1/46 | | | 88 | | | | 90 | |
3.000%, 2/1/46 | | | 66 | | | | 66 | |
| | | | | | | | |
| | | | | | | 1,165 | |
| | | | | | | | |
| | |
| Non-Agency—4.4% | | | | | | | | |
American Homes 4 Rent Trust | | | | | | | | |
14-SFR2, C 144A 4.705%, 10/17/36(4) | | | 180 | | | | 188 | |
15-SFR2, C 144A 4.691%, 10/17/45(4) | | | 205 | | | | 213 | |
15-SFR1, A 144A
3.467%, 4/17/52(4) | | | 140 | | | | 142 | |
Ameriquest Mortgage Securities, Inc. 03-AR3, M4
4.800%, 6/25/33(3) | | | 115 | | | | 114 | |
AMSR Trust 16-SFR1, D 144A
3.343%,
11/17/33(3)(4) | | | 145 | | | | 146 | |
Banc of America Funding Trust 05-1, 1A1
5.500%, 2/25/35 | | | 30 | | | | 30 | |
Bank of America (Countrywide) Asset-Backed Certificates | | | | | | | | |
05-1, AF5A
5.102%, 7/25/35(3) | | | 164 | | | | 170 | |
05-12, 2A4
5.575%, 2/25/36(3) | | | 5 | | | | 5 | |
Bank of America (Merrill Lynch – Countrywide) Alternative Loan Trust 04-22CB, 1A1
6.000%, 10/25/34 | | | 139 | | | | 143 | |
Bank of America (Merrill Lynch) Commercial Mortgage Securities Trust 15-200P, A 144A
3.218%, 4/14/33(4) | | | 120 | | | | 121 | |
| | | | | | | | |
| | | PAR
VALUE | | | VALUE | |
| Non-Agency—continued | | | | | | | | |
Bayview Opportunity Master Fund IVa Trust | | | | | | | | |
04-A Trust, 16-SPL1, B1 144A
4.250%, 4/28/55(4) | | $ | 120 | | | $ | 123 | |
04-A Trust, 17-SPL1, B1 144A
4.250%, 10/28/64(3)(4) | | | 100 | | | | 103 | |
Bayview Opportunity Master Fund IVb Trust 04-B Trust, 16-SPL2, B1 144A
4.250%, 6/28/53(3)(4) | | | 100 | | | | 103 | |
Citigroup Mortgage Loan Trust, Inc. | | | | | | | | |
05-5, 2A3
5.000%, 8/25/35 | | | 43 | | | | 43 | |
15-A, A1 144A
3.500%, 6/25/58(3)(4) | | | 118 | | | | 119 | |
Colony American Finance Ltd.
15-1, A 144A
2.896%, 10/15/47(4) | | | 118 | | | | 118 | |
Colony Starwood Homes Trust 16-2A, C 144A
3.093%, 12/17/33(3)(4) | | | 145 | | | | 145 | |
Credit Suisse Commercial Mortgage-Backed Trust | | | | | | | | |
06-08, 3A1
6.000%, 10/25/21 | | | 59 | | | | 55 | |
07-C5, A1AM
5.870%, 9/15/40(3) | | | 174 | | | | 165 | |
CSMLT Trust
15-1, B4 144A
3.892%, 5/25/45(3)(4) | | | 97 | | | | 89 | |
GAHR Commercial Mortgage Trust 15-NRF, CFX 144A
3.382%, 12/15/34(3)(4) | | | 130 | | | | 132 | |
GSAA Home Equity Trust
05-12, AF3W
4.999%, 9/25/35(3) | | | 51 | | | | 52 | |
GSR Mortgage Loan Trust
06-1F, 2A4
6.000%, 2/25/36 | | | 55 | | | | 47 | |
Home Equity Loan Trust | |
03-HS3, AI4
5.550%, 9/25/33(3) | | | 29 | | | | 29 | |
06-HI1, M1
6.010%, 2/25/36(3) | | | 26 | | | | 26 | |
JPMorgan Chase Commercial Mortgage Securities Trust
07-LDPX, AM
5.464%, 1/15/49(3) | | | 113 | | | | 113 | |
JPMorgan Chase Mortgage Trust | | | | | | | | |
14-1, 1A1 144A
4.000%, 1/25/44(3)(4) | | | 109 | | | | 112 | |
16-1, M2 144A
3.750%, 4/25/45(3)(4) | | | 110 | | | | 110 | |
16-2, M2 144A
3.750%, 12/25/45(3)(4) | | | 211 | | | | 211 | |
11-C4, A4, 144A
4.388%, 7/15/46(4) | | | 120 | | | | 128 | |
16-5, A1 144A
2.602%, 12/25/46(3)(4) | | | 241 | | | | 240 | |
See Notes to Financial Statements
41
VIRTUS TACTICAL ALLOCATION FUND
SCHEDULE OF INVESTMENTS (Continued)
MARCH 31, 2017
($ reported in thousands)
| | | | | | | | |
| | | PAR
VALUE | | | VALUE | |
| Non-Agency—continued | | | | | | | | |
MASTR Alternative Loan Trust | | | | | | | | |
05-5, 2A3
5.500%, 7/25/25 | | $ | 109 | | | $ | 109 | |
04-6, 7A1
6.000%, 7/25/34 | | | 185 | | | | 183 | |
05-2, 2A1
6.000%, 1/25/35 | | | 95 | | | | 98 | |
MASTR Reperforming Loan Trust 05-1, 1A5 144A
8.000%, 8/25/34(4) | | | 148 | | | | 153 | |
MASTR Specialized Loan Trust 05-3, A2 144A
5.704%, 11/25/35(3)(4) | | | 52 | | | | 53 | |
Mill City Mortgage Loan Trust
16-1, M1 144A
3.150%, 4/25/57(3)(4) | | | 105 | | | | 102 | |
Morgan Stanley Capital I Trust 07-IQ14, AM
5.778%, 4/15/49(3) | | | 205 | | | | 205 | |
Motel 6 Trust 15-MTL6,
D 144A
4.532%, 2/5/30(4) | | | 100 | | | | 101 | |
One Market Plaza Trust
17-1MKT, A 144A
3.614%, 2/10/32(4) | | | 110 | | | | 114 | |
Resecuritization Pass-Through Trust 05-8R, A5
6.000%, 10/25/34 | | | 62 | | | | 62 | |
Residential Asset Mortgage Products Trust 05-SL2, A4
7.500%, 2/25/32 | | | 71 | | | | 70 | |
Residential Asset Securitization Trust 05-A1, A3
5.500%, 4/25/35 | | | 117 | | | | 117 | |
Sequoia Mortgage Trust
13-8, B1
3.535%, 6/25/43(3) | | | 100 | | | | 101 | |
Towd Point Mortgage Trust | |
15-1, A2 144A
3.250%, 10/25/53(3)(4) | | | 115 | | | | 112 | |
15-3, A1B 144A
3.000%, 3/25/54(3)(4) | | | 139 | | | | 140 | |
15-6, M1 144A
3.750%, 4/25/55(3)(4) | | | 100 | | | | 97 | |
15-5, A2 144A
3.500%, 5/25/55(3)(4) | | | 100 | | | | 101 | |
15-2, 1M1 144A
3.250%, 11/25/60(3)(4) | | | 345 | | | | 342 | |
Vericrest Opportunity Loan Trust LLC | | | | | | | | |
15-NPL2, A1 144A
3.375%, 2/25/55(3)(4) | | | 60 | | | | 60 | |
15-NPL3, A1 144A 3.375%, 10/25/58(3)(4) | | | 58 | | | | 58 | |
Vericrest Opportunity Loan Trust XXXV LLC
16-NPL9, A1 144A
3.500%, 9/25/46(3)(4) | | | 88 | | | | 88 | |
| | | | | | | | |
| | | PAR
VALUE | | | VALUE | |
| Non-Agency—continued | | | | | | | | |
Vericrest Opportunity Loan Trust XXXVII LLC 15-NP11, A1 144A
3.625%, 7/25/45(3)(4) | | $ | 74 | | | $ | 74 | |
Wells Fargo Commercial Mortgage Trust 15-LC20, B
3.719%, 4/15/50 | | | 165 | | | | 164 | |
| | | | | | | | |
| | | | | | | | 6,239 | |
| TOTAL MORTGAGE-BACKED SECURITIES | |
| (Identified Cost $7,400) | | | | 7,404 | |
|
| ASSET-BACKED SECURITIES—1.0% | |
Carnow Auto Receivables Trust 16-1A, D 144A
7.340%, 11/15/21(4) | | | 140 | | | | 140 | |
Citi Held For Asset Issuance
15-PM3, B 144A
4.310%, 5/16/22(4) | | | 145 | | | | 147 | |
DB Master Finance LLC
15-A1, A2II 144A
3.980%, 2/20/45(4) | | | 49 | | | | 50 | |
Exeter Automobile Receivables Trust | | | | | | | | |
14-1A, C 144A
3.570%, 7/15/19(4) | | | 140 | | | | 141 | |
15-2A, C 144A
3.900%, 3/15/21(4) | | | 175 | | | | 178 | |
Fairway Outdoor Funding LLC
12-1A, A2 144A
4.212%, 10/15/42(4) | | | 232 | | | | 232 | |
First Investors Auto Owner Trust 15-2A, E 144A
5.590%, 11/15/22(4) | | | 170 | | | | 170 | |
Flagship Credit Auto Trust 14-1, E 144A
5.710%, 8/16/21(4) | | | 130 | | | | 134 | |
Leaf Receivables Funding 10 LLC 15-1, E2 144A
6.000%, 6/15/23(4) | | | 105 | | | | 103 | |
TGIF Funding LLC 17-1A, A2 144A
6.202%, 4/30/47(4) | | | 140 | | | | 137 | |
TOTAL ASSET-BACKED SECURITIES
(Identified Cost $1,424) | | | | 1,432 | |
|
| CORPORATE BONDS AND NOTES—20.7% | |
|
| Consumer Discretionary—2.3% | |
American Greetings Corp. 144A
7.875%, 2/15/25(4) | | | 55 | | | | 58 | |
Beazer Homes USA, Inc.
5.750%, 6/15/19 | | | 95 | | | | 100 | |
Brookfield Residential Properties, Inc. 144A
6.125%, 7/1/22(4) | | | 55 | | | | 57 | |
Cablevision Systems Corp.
5.875%, 9/15/22 | | | 160 | | | | 162 | |
Caesars Entertainment Operating Co., Inc.
9.000%, 2/15/20(14) | | | 39 | | | | 46 | |
| | | | | | | | |
| | | PAR
VALUE | | | VALUE | |
| Consumer Discretionary—continued | |
Caesars Entertainment Resort Properties LLC
8.000%, 10/1/20 | | $ | 65 | | | $ | 68 | |
Caesars Growth Properties Holdings LLC
9.375%, 5/1/22 | | | 150 | | | | 162 | |
CalAtlantic Group, Inc.
5.250%, 6/1/26 | | | 65 | | | | 65 | |
Clear Channel Worldwide Holdings, Inc.
Series B
7.625%, 3/15/20 | | | 205 | | | | 208 | |
Cooper-Standard Automotive, Inc. 144A
5.625%, 11/15/26(4) | | | 105 | | | | 105 | |
Dana Financing Luxembourg S.a.r.l. 144A
5.750%, 4/15/25(4) | | | 65 | | | | 66 | |
Diamond Resorts International, Inc. 144A
7.750%, 9/1/23(4) | | | 10 | | | | 11 | |
Eagle II Acquisition Co., LLC 144A
6.000%, 4/1/25(4) | | | 20 | | | | 21 | |
Gateway Casinos & Entertainment Ltd. 144A
8.250%, 3/1/24(4) | | | 60 | | | | 61 | |
Goodyear Tire & Rubber Co. (The)
4.875%, 3/15/27 | | | 80 | | | | 80 | |
Hilton Worldwide Finance LLC | |
144A 4.625%, 4/1/25(4) | | | 25 | | | | 25 | |
144A 4.875%, 4/1/27(4) | | | 25 | | | | 25 | |
Horton (D.R.), Inc.
4.750%, 2/15/23 | | | 85 | | | | 90 | |
iHeartCommunications, Inc. | |
9.000%, 12/15/19 | | | 70 | | | | 60 | |
9.000%, 3/1/21 | | | 35 | | | | 27 | |
Landry’s, Inc. 144A
6.750%, 10/15/24(4) | | | 45 | | | | 47 | |
M/I Homes, Inc.
6.750%, 1/15/21 | | | 90 | | | | 95 | |
MDC Holdings, Inc.
5.500%, 1/15/24 | | | 155 | | | | 160 | |
Meritor, Inc.
6.750%, 6/15/21 | | | 60 | | | | 62 | |
NCL Corp., Ltd. 144A
4.750%, 12/15/21(4) | | | 125 | | | | 127 | |
New York University
4.142%, 7/1/48 | | | 105 | | | | 99 | |
Pinnacle Entertainment, Inc. 144A
5.625%, 5/1/24(4) | | | 65 | | | | 66 | |
QVC, Inc.
5.125%, 7/2/22 | | | 135 | | | | 142 | |
Scientific Games International, Inc. | | | | | | | | |
6.625%, 5/15/21 | | | 110 | | | | 104 | |
144A 7.000%, 1/1/22(4) | | | 110 | | | | 118 | |
Signet UK Finance plc
4.700%, 6/15/24 | | | 135 | | | | 131 | |
TI Group Automotive Systems LLC 144A
8.750%, 7/15/23(4) | | | 95 | | | | 101 | |
See Notes to Financial Statements
42
VIRTUS TACTICAL ALLOCATION FUND
SCHEDULE OF INVESTMENTS (Continued)
MARCH 31, 2017
($ reported in thousands)
| | | | | | | | |
| | | PAR
VALUE | | | VALUE | |
| Consumer Discretionary—continued | |
Toll Brothers Finance Corp. | |
5.625%, 1/15/24 | | $ | 40 | | | $ | 42 | |
4.875%, 11/15/25 | | | 30 | | | | 30 | |
TRI Pointe Group, Inc.
5.875%, 6/15/24 | | | 80 | | | | 83 | |
VTR Finance BV 144A
6.875%, 1/15/24(4) | | | 200 | | | | 208 | |
Wyndham Worldwide Corp.
4.500%, 4/1/27 | | | 35 | | | | 35 | |
Ziggo Secured Finance BV 144A
5.500%, 1/15/27(4) | | | 150 | | | | 150 | |
| | | | | | | | |
| | | | | | | 3,297 | |
| | | | | | | | |
|
| Consumer Staples—0.8% | |
Dole Food Co., Inc. | |
144A 7.250%, 5/1/19(4) | | | 100 | | | | 102 | |
144A 7.250%, 6/15/25(4) | | | 100 | | | | 100 | |
ESAL GmbH 144A
6.250%, 2/5/23(4) | | | 200 | | | | 201 | |
Kronos Acquisition Holdings, Inc. 144A
9.000%, 8/15/23(4) | | | 85 | | | | 87 | |
MARB BondCo plc 144A
7.000%, 3/15/24(4) | | | 200 | | | | 199 | |
Pilgrim’s Pride Corp. 144A
5.750%, 3/15/25(4) | | | 65 | | | | 66 | |
Post Holdings, Inc. | |
144A 5.000%, 8/15/26(4) | | | 100 | | | | 96 | |
144A 5.750%, 3/1/27(4) | | | 35 | | | | 35 | |
Safeway, Inc.
7.250%, 2/1/31 | | | 95 | | | | 93 | |
Tops Holding LLC 144A
8.000%, 6/15/22(4) | | | 175 | | | | 144 | |
| | | | | | | | |
| | | | | | | 1,123 | |
| | | | | | | | |
|
| Energy—5.2% | |
Alberta Energy Co., Ltd.
8.125%, 9/15/30 | | | 65 | | | | 83 | |
Alta Mesa Holdings LP 144A
7.875%, 12/15/24(4) | | | 85 | | | | 89 | |
American Midstream Partners LP 144A
8.500%, 12/15/21(4) | | | 70 | | | | 72 | |
Anadarko Finance Co.
Series B
7.500%, 5/1/31 | | | 45 | | | | 57 | |
Anadarko Petroleum Corp.
6.600%, 3/15/46 | | | 85 | | | | 103 | |
Antero Resources Corp.
5.625%, 6/1/23 | | | 90 | | | | 92 | |
Archrock Partners LP
6.000%, 10/1/22 | | | 120 | | | | 119 | |
Blue Racer Midstream LLC 144A
6.125%, 11/15/22(4) | | | 60 | | | | 61 | |
Callon Petroleum Co. 144A
6.125%, 10/1/24(4) | | | 50 | | | | 52 | |
Carrizo Oil & Gas, Inc.
6.250%, 4/15/23 | | | 120 | | | | 121 | |
Cheniere Corpus Christi Holdings LLC 144A
7.000%, 6/30/24(4) | | | 145 | | | | 160 | |
| | | | | | | | |
| | | PAR
VALUE | | | VALUE | |
| Energy—continued | |
Chesapeake Energy Corp.
6.625%, 8/15/20 | | $ | 80 | | | $ | 80 | |
Compagnie Generale de Geophysique-Veritas
6.500%, 6/1/21(12) | | | 190 | | | | 89 | |
CONSOL Energy, Inc.
5.875%, 4/15/22 | | | 65 | | | | 65 | |
Continental Resources, Inc.
4.500%, 4/15/23 | | | 60 | | | | 59 | |
Crestwood Midstream Partners LP 144A
5.750%, 4/1/25(4) | | | 70 | | | | 72 | |
Denbury Resources, Inc.
5.500%, 5/1/22 | | | 65 | | | | 51 | |
Diamondback Energy, Inc. 144A
5.375%, 5/31/25(4) | | | 80 | | | | 82 | |
Ecopetrol S.A.
5.375%, 6/26/26 | | | 170 | | | | 174 | |
Encana Corp.
3.900%, 11/15/21 | | | 60 | | | | 61 | |
Energy Transfer Equity LP
5.875%, 1/15/24 | | | 75 | | | | 80 | |
EnQuest plc PIK Interest Capitalization,
7.000%, 4/15/22(17) | | | 208 | | | | 163 | |
EP Energy LLC | |
9.375%, 5/1/20 | | | 30 | | | | 28 | |
6.375%, 6/15/23 | | | 90 | | | | 70 | |
144A 8.000%, 11/29/24(4) | | | 95 | | | | 100 | |
144A 8.000%, 2/15/25(4) | | | 50 | | | | 47 | |
FTS International, Inc.
6.250%, 5/1/22 | | | 90 | | | | 79 | |
Gazprom Neft OAO 144A
6.000%, 11/27/23(4)(7) | | | 200 | | | | 217 | |
Helmerich & Payne International Drilling Co.
4.650%, 3/15/25 | | | 95 | | | | 99 | |
Holly Energy Partners LP 144A
6.000%, 8/1/24(4) | | | 15 | | | | 16 | |
HollyFrontier Corp.
5.875%, 4/1/26 | | | 155 | | | | 165 | |
KazMunayGas National Co. 144A
6.375%, 4/9/21(4) | | | 200 | | | | 220 | |
Kinder Morgan, Inc.
7.750%, 1/15/32 | | | 165 | | | | 206 | |
Laredo Petroleum, Inc.
7.375%, 5/1/22 | | | 115 | | | | 120 | |
Lukoil International Finance BV 144A
4.563%, 4/24/23(4) | | | 200 | | | | 205 | |
Matador Resources Co. 144A
6.875%, 4/15/23(4) | | | 170 | | | | 179 | |
MEG Energy Corp. 144A
6.500%, 1/15/25(4) | | | 80 | | | | 80 | |
MPLX LP
4.875%, 12/1/24 | | | 155 | | | | 163 | |
NGL Energy Partners LP
5.125%, 7/15/19 | | | 160 | | | | 161 | |
Noble Holding International Ltd.
7.750%, 1/15/24 | | | 75 | | | | 72 | |
| | | | | | | | |
| | | PAR
VALUE | | | VALUE | |
| Energy—continued | |
Odebrecht Offshore Drilling Finance Ltd. 144A
6.750%, 10/1/22(4) | | $ | 207 | | | $ | 78 | |
Parker Drilling Co.
7.500%, 8/1/20 | | | 190 | | | | 179 | |
Parsley Energy LLC 144A
6.250%, 6/1/24(4) | | | 50 | | | | 53 | |
Peabody Securities Finance Corp. 144A
6.000%, 3/31/22(4) | | | 15 | | | | 15 | |
Petrobras Global Finance BV | |
5.375%, 1/27/21 | | | 120 | | | | 124 | |
8.375%, 5/23/21 | | | 60 | | | | 68 | |
8.750%, 5/23/26 | | | 310 | | | | 360 | |
Petroleos de Venezuela S.A. | |
RegS 8.500%, 11/2/17(5) | | | 30 | | | | 25 | |
144A 6.000%,
5/16/24(4) | | | 355 | | | | 131 | |
Petroleos Mexicanos | |
6.875%, 8/4/26 | | | 155 | | | | 172 | |
6.500%, 6/2/41 | | | 195 | | | | 193 | |
PHI, Inc.
5.250%, 3/15/19 | | | 70 | | | | 67 | |
QEP Resources, Inc. | |
6.875%, 3/1/21 | | | 75 | | | | 80 | |
5.250%, 5/1/23 | | | 107 | | | | 105 | |
Range Resources Corp. 144A
5.000%, 3/15/23(4) | | | 155 | | | | 153 | |
Regency Energy Partners LP | |
5.875%, 3/1/22 | | | 75 | | | | 82 | |
5.000%, 10/1/22 | | | 45 | | | | 48 | |
Rosneft Oil Co. 144A
4.199%, 3/6/22(4)(7) | | | 200 | | | | 201 | |
RSP Permian, Inc. 144A
5.250%, 1/15/25(4) | | | 90 | | | | 91 | |
Sabine Oil & Gas Corp.
7.250%, 6/15/19(12)(13)(18) | | | 185 | | | | — | (16) |
SM Energy Co. | |
6.125%, 11/15/22 | | | 70 | | | | 71 | |
6.500%, 1/1/23 | | | 70 | | | | 71 | |
State Oil Co. of the Azerbaijan Republic
6.950%, 3/18/30 | | | 200 | | | | 211 | |
Summit Midstream Holdings LLC
5.750%, 4/15/25 | | | 25 | | | | 25 | |
Sunoco LP
6.375%, 4/1/23 | | | 240 | | | | 245 | |
Transocean, Inc. | |
144A 9.000%,
7/15/23(4) | | | 75 | | | | 80 | |
6.800%, 3/15/38 | | | 45 | | | | 37 | |
Weatherford International Ltd. 144A
9.875%, 2/15/24(4) | | | 45 | | | | 52 | |
Whiting Petroleum Corp.
6.250%, 4/1/23 | | | 55 | | | | 55 | |
YPF S.A. 144A
8.500%, 3/23/21(4) | | | 95 | | | | 104 | |
| | | | | | | | |
| | | | | | | 7,388 | |
| | | | | | | | |
|
| Financials—4.0% | |
Akbank TAS 144A
7.500%, 2/5/18(4) | | | 600 | TRY | | | 159 | |
See Notes to Financial Statements
43
VIRTUS TACTICAL ALLOCATION FUND
SCHEDULE OF INVESTMENTS (Continued)
MARCH 31, 2017
($ reported in thousands)
| | | | | | | | |
| | | PAR
VALUE | | | VALUE | |
| Financials—continued | |
Allstate Corp. (The)
5.750%, 8/15/53(3)(6) | | $ | 125 | | | $ | 134 | |
Ally Financial, Inc.
5.750%, 11/20/25 | | | 90 | | | | 92 | |
Ares Capital Corp.
3.625%, 1/19/22 | | | 90 | | | | 89 | |
Australia & New Zealand Banking Group Ltd. 144A
4.400%, 5/19/26(4) | | | 200 | | | | 205 | |
Banco Bilbao Vizcaya Argentaria Bancomer S.A. 144A
6.500%, 3/10/21(4) | | | 200 | | | | 219 | |
Banco de Bogota S.A. 144A
6.250%, 5/12/26(4) | | | 200 | | | | 209 | |
Banco de Credito del Peru 144A
6.125%, 4/24/27(3)(4) | | | 190 | | | | 208 | |
Banco Internacional del Peru SAA Interbank 144A
6.625%, 3/19/29(3)(4) | | | 65 | | | | 71 | |
Bancolombia S.A.
5.125%, 9/11/22 | | | 215 | | | | 225 | |
Bank of America Corp.
4.200%, 8/26/24 | | | 167 | | | | 170 | |
Bonos del Banco Central de Chile en Pesos
4.500%, 6/1/20 | | | 35,000 | CLP | | | 55 | |
Brookfield Finance LLC
4.000%, 4/1/24 | | | 100 | | | | 101 | |
Citizens Financial Group, Inc.
5.500%(3)(8) | | | 175 | | | | 180 | |
Compass Bank
3.875%, 4/10/25 | | | 250 | | | | 245 | |
Drawbridge Special Opportunities Fund LP 144A
5.000%, 8/1/21(4) | | | 250 | | | | 246 | |
Eurasian Development Bank 144A
4.767%, 9/20/22(4) | | | 200 | | | | 208 | |
FS Investment Corp.
4.750%, 5/15/22 | | | 130 | | | | 133 | |
Genworth Holdings, Inc.
4.900%, 8/15/23 | | | 105 | | | | 88 | |
GrupoSura Finance S.A. 144A
5.500%, 4/29/26(4) | | | 200 | | | | 211 | |
Icahn Enterprises LP | |
6.000%, 8/1/20 | | | 70 | | | | 72 | |
5.875%, 2/1/22 | | | 100 | | | | 102 | |
ICAHN Enterprises LP 144A
6.250%, 2/1/22(4) | | | 25 | | | | 25 | |
ING Groep N.V.
6.000%(3)(6)(8) | | | 200 | | | | 200 | |
iStar, Inc.
5.000%, 7/1/19 | | | 100 | | | | 101 | |
6.000%, 4/1/22 | | | 25 | | | | 26 | |
Jefferies Group LLC
4.850%, 1/15/27 | | | 40 | | | | 41 | |
Kazakhstan Temir Zholy Finance BV 144A
6.950%, 7/10/42(4) | | | 200 | | | | 211 | |
| | | | | | | | |
| | | PAR
VALUE | | | VALUE | |
| Financials—continued | |
Leucadia National Corp.
5.500%, 10/18/23 | | $ | 70 | | | $ | 75 | |
Morgan Stanley 144A
10.090%, 5/3/17(4) | | | 300 | BRL | | | 96 | |
Navient Corp. | |
6.500%, 6/15/22 | | | 68 | | | | 69 | |
7.250%, 9/25/23 | | | 35 | | | | 35 | |
OM Asset Management plc
4.800%, 7/27/26 | | | 150 | | | | 149 | |
Physicians Realty LP
4.300%, 3/15/27 | | | 49 | | | | 49 | |
Powszechna Kasa Oszczednosci Bank Polski S.A. 144A
4.630%, 9/26/22(4)(7) | | | 240 | | | | 253 | |
Prudential Financial, Inc. | |
5.875%, 9/15/42(3) | | | 100 | | | | 109 | |
5.625%, 6/15/43(3)(6) | | | 75 | | | | 80 | |
Sberbank of Russia 144A
5.500%, 2/26/24(3)(4)(7) | | | 200 | | | | 206 | |
Springleaf Finance Corp.
5.250%, 12/15/19 | | | 75 | | | | 76 | |
Teachers Insurance & Annuity Association of America 144A
4.375%, 9/15/54(3)(4) | | | 150 | | | | 148 | |
Tervita Escrow Corp. 144A
7.625%, 12/1/21(4) | | | 25 | | | | 26 | |
Toronto-Dominion Bank (The)
3.625%, 9/15/31(3) | | | 60 | | | | 59 | |
Voya Financial, Inc.
5.650%, 5/15/53(3) | | | 155 | | | | 158 | |
| | | | | | | | |
| | | | | | | 5,614 | |
| | | | | | | | |
|
| Health Care—1.2% | |
Change Healthcare Holdings LLC 144A
5.750%, 3/1/25(4) | | | 25 | | | | 26 | |
Community Health Systems, Inc. | | | | | | | | |
5.125%, 8/1/21 | | | 30 | | | | 30 | |
6.875%, 2/1/22 | | | 65 | | | | 56 | |
Concordia International Corp. | | | | | | | | |
144A 9.000%, 4/1/22(4) | | | 35 | | | | 25 | |
144A 7.000%, 4/15/23(4) | | | 35 | | | | 7 | |
Endo Finance LLC 144A
6.000%, 7/15/23(4) | | | 140 | | | | 123 | |
Envision Healthcare Corp. 144A
6.250%, 12/1/24(4) | | | 30 | | | | 32 | |
HCA, Inc.
5.250%, 6/15/26 | | | 55 | | | | 58 | |
Hill-Rom Holdings, Inc. 144A
5.000%, 2/15/25(4) | | | 86 | | | | 86 | |
IASIS Healthcare LLC
8.375%, 5/15/19 | | | 105 | | | | 101 | |
inVentiv Group Holdings, Inc. 144A
7.500%, 10/1/24(4) | | | 60 | | | | 62 | |
MEDNAX, Inc. 144A
5.250%, 12/1/23(4) | | | 75 | | | | 77 | |
MPH Acquisition Holdings LLC 144A
7.125%, 6/1/24(4) | | | 120 | | | | 129 | |
| | | | | | | | |
| | | PAR
VALUE | | | VALUE | |
| Health Care—continued | |
Ortho-Clinical Diagnostics, Inc. 144A
6.625%, 5/15/22(4) | | $ | 120 | | | $ | 112 | |
Surgery Center Holdings, Inc. 144A
8.875%, 4/15/21(4) | | | 115 | | | | 122 | |
Surgical Care Affiliates, Inc. 144A
6.000%, 4/1/23(4) | | | 167 | | | | 180 | |
Team Health Holdings, Inc. 144A
6.375%, 2/1/25(4) | | | 85 | | | | 84 | |
Tenet Healthcare Corp. | | | | | | | | |
5.500%, 3/1/19 | | | 40 | | | | 41 | |
4.500%, 4/1/21 | | | 60 | | | | 60 | |
144A 7.500%, 1/1/22(4) | | | 5 | | | | 5 | |
8.125%, 4/1/22 | | | 40 | | | | 42 | |
Valeant Pharmaceuticals International, Inc. | | | | | | | | |
144A 6.375%, 10/15/20(4) | | | 60 | | | | 55 | |
144A 7.500%, 7/15/21(4) | | | 5 | | | | 4 | |
144A 5.625%, 12/1/21(4) | | | 5 | | | | 4 | |
144A 6.500%, 3/15/22(4) | | | 10 | | | | 10 | |
144A 7.250%, 7/15/22(4) | | | 105 | | | | 90 | |
144A 7.000%, 3/15/24(4) | | | 15 | | | | 15 | |
| | | | | | | | |
| | | | | | | 1,636 | |
| | | | | | | | |
|
| Industrials—1.7% | |
Advanced Disposal Services, Inc. 144A
5.625%, 11/15/24(4) | | | 20 | | | | 20 | |
Bombardier, Inc. 144A
6.125%, 1/15/23(4) | | | 80 | | | | 79 | |
CEB, Inc. 144A
5.625%, 6/15/23(4) | | | 120 | | | | 131 | |
Cemex Finance LLC 144A
6.000%, 4/1/24(4) | | | 200 | | | | 211 | |
Continental Airlines Pass-Through-Trust | | | | | | | | |
99-2, C2 AMBC
6.236%, 3/15/20 | | | 67 | | | | 70 | |
01-1, A1
6.703%, 6/15/21 | | | 61 | | | | 64 | |
DP World Ltd. 144A
6.850%, 7/2/37(4) | | | 100 | | | | 115 | |
Embraer Netherlands Finance BV
5.400%, 2/1/27 | | | 65 | | | | 67 | |
GATX Corp.
3.250%, 9/15/26 | | | 25 | | | | 24 | |
Harland Clarke Holdings Corp. | | | | | | | | |
144A 6.875%, 3/1/20(4) | | | 115 | | | | 117 | |
144A 8.375%, 8/15/22(4) | | | 15 | | | | 15 | |
Hawaiian Airlines Pass-Through Certificates 13-1, B
4.950%, 1/15/22 | | | 138 | | | | 138 | |
Masco Corp.
5.950%, 3/15/22 | | | 130 | | | | 146 | |
Navistar International Corp.
8.250%, 11/1/21 | | | 105 | | | | 105 | |
New Enterprise Stone & Lime Co., Inc. 144A
10.125%, 4/1/22(4) | | | 10 | | | | 11 | |
See Notes to Financial Statements
44
VIRTUS TACTICAL ALLOCATION FUND
SCHEDULE OF INVESTMENTS (Continued)
MARCH 31, 2017
($ reported in thousands)
| | | | | | | | |
| | | PAR
VALUE | | | VALUE | |
| Industrials—continued | |
Owens Corning
3.400%, 8/15/26 | | $ | 120 | | | $ | 116 | |
Park Aerospace Holdings Ltd. 144A
5.500%, 2/15/24(4) | | | 65 | | | | 68 | |
Pelabuhan Indonesia II PT 144A
4.250%, 5/5/25(4) | | | 200 | | | | 199 | |
Prime Security Services Borrower LLC 144A
9.250%, 5/15/23(4) | | | 60 | | | | 66 | |
Standard Industries, Inc. 144A
5.500%, 2/15/23(4) | | | 40 | | | | 41 | |
TransDigm, Inc. | | | | | | | | |
6.000%, 7/15/22 | | | 105 | | | | 107 | |
6.500%, 5/15/25 | | | 50 | | | | 50 | |
UAL Pass-Through-Trust 07-01, A
6.636%, 7/2/22 | | | 151 | | | | 163 | |
United Airlines Pass-Through-Trust 14-1, B
4.750%, 4/11/22 | | | 82 | | | | 83 | |
Wheels Up Finance I LLC
7.555%, 6/1/24(3)(13) | | | 172 | | | | 171 | |
| | | | | | | | |
| | | | | | | 2,377 | |
| | | | | | | | |
|
| Information Technology—0.6% | |
Blackboard, Inc. 144A
9.750%, 10/15/21(4) | | | 98 | | | | 98 | |
Broadcom Corp. | |
144A 3.000%, 1/15/22(4) | | | 45 | | | | 45 | |
144A 3.625%, 1/15/24(4) | | | 110 | | | | 111 | |
CDW LLC
5.000%, 9/1/25 | | | 30 | | | | 31 | |
CommScope Technologies LLC 144A
5.000%, 3/15/27(4) | | | 25 | | | | 25 | |
Diamond 1 Finance Corp. | |
144A 5.450%, 6/15/23(4) | | | 30 | | | | 32 | |
144A 6.020%, 6/15/26(4) | | | 30 | | | | 33 | |
144A 8.100%, 7/15/36(4) | | | 60 | | | | 75 | |
DXC Technology Co. 144A
4.250%, 4/15/24(4) | | | 31 | | | | 31 | |
Rackspace Hosting, Inc. 144A
8.625%, 11/15/24(4) | | | 260 | | | | 275 | |
Radiate Holdco LLC 144A 6.625%, 2/15/25(4) | | | 165 | | | | 163 | |
| | | | | | | | |
| | | | | | | 919 | |
| | | | | | | | |
|
| Materials—2.7% | |
AK Steel Corp. | |
7.500%, 7/15/23 | | | 80 | | | | 87 | |
7.000%, 3/15/27 | | | 110 | | | | 110 | |
Aleris International, Inc. 144A
9.500%, 4/1/21(4) | | | 70 | | | | 76 | |
Alpek SAB de C.V. 144A
5.375%, 8/8/23(4) | | | 260 | | | | 272 | |
Alpha 3 BV 144A
6.250%, 2/1/25(4) | | | 25 | | | | 25 | |
| | | | | | | | |
| | | PAR
VALUE | | | VALUE | |
| Materials—continued | |
ArcelorMittal
6.125%, 6/1/25 | | $ | 175 | | | $ | 195 | |
Ardagh Packaging Finance plc 144A
6.000%, 2/15/25(4) | | | 200 | | | | 203 | |
Berry Plastics Corp.
5.125%, 7/15/23 | | | 110 | | | | 113 | |
BHP Billiton Finance USA Ltd. 144A
6.750%, 10/19/75(3)(4)(6) | | | 205 | | | | 232 | |
BlueScope Steel Finance Ltd. 144A
6.500%, 5/15/21(4) | | | 85 | | | | 90 | |
Eldorado Gold Corp. 144A
6.125%, 12/15/20(4) | | | 70 | | | | 72 | |
Equate Petrochemical BV 144A
4.250%, 11/3/26(4) | | | 200 | | | | 200 | |
Fortescue Metals Group (FMG) Resources August 2006 Pty Ltd. 144A
9.750%, 3/1/22(4) | | | 60 | | | | 69 | |
Freeport-McMoRan, Inc. | |
3.550%, 3/1/22 | | | 55 | | | | 51 | |
3.875%, 3/15/23 | | | 80 | | | | 74 | |
Gerdau Holdings, Inc. 144A
7.000%, 1/20/20(4) | | | 100 | | | | 109 | |
Glencore Funding LLC 144A 4.000%, 3/27/27(4) | | | 165 | | | | 163 | |
INEOS Group Holdings S.A. 144A
5.625%, 8/1/24(4) | | | 200 | | | | 201 | |
Kraton Polymers LLC 144A
7.000%, 4/15/25(4) | | | 195 | | | | 198 | |
Novelis Corp. | |
144A 6.250%, 8/15/24(4) | | | 10 | | | | 11 | |
144A 5.875%, 9/30/26(4) | | | 120 | | | | 123 | |
Owens-Brockway Glass Container, Inc. 144A
6.375%, 8/15/25(4) | | | 110 | | | | 118 | |
Reynolds Group Issuer, Inc. | |
144A 5.125%, 7/15/23(4) | | | 30 | | | | 31 | |
144A 7.000%, 7/15/24(4) | | | 5 | | | | 5 | |
Rusal Capital DAC 144A
5.125%, 2/2/22(4) | | | 200 | | | | 201 | |
Severstal Oao Via Steel Capital S.A. 144A
3.850%, 8/27/21(4)(7) | | | 200 | | | | 200 | |
Silgan Holdings, Inc. 144A
4.750%, 3/15/25(4) | | | 25 | | | | 25 | |
Standard Industries, Inc. 144A
6.000%, 10/15/25(4) | | | 95 | | | | 98 | |
Vale Overseas Ltd. | |
5.875%, 6/10/21 | | | 105 | | | | 113 | |
6.250%, 8/10/26 | | | 85 | | | | 92 | |
Vedanta Resources plc 144A
6.000%, 1/31/19(4) | | | 200 | | | | 206 | |
| | | | | | | | |
| | | | | | | 3,763 | |
| | | | | | | | |
|
| Real Estate—0.5% | |
CyrusOne LP 144A
5.375%, 3/15/27(4) | | | 30 | | | | 30 | |
| | | | | | | | |
| | | PAR
VALUE | | | VALUE | |
| Real Estate—continued | |
EPR Properties
4.750%, 12/15/26 | | $ | 60 | | | $ | 60 | |
ESH Hospitality, Inc. 144A
5.250%, 5/1/25(4) | | | 120 | | | | 121 | |
Hospitality Properties Trust
4.950%, 2/15/27 | | | 85 | | | | 87 | |
MPT Operating Partnership LP
5.500%, 5/1/24 | | | 90 | | | | 92 | |
Select Income REIT
4.500%, 2/1/25 | | | 165 | | | | 166 | |
Uniti Group, Inc. 144A
7.125%, 12/15/24(4) | | | 170 | | | | 173 | |
| | | | | | | | |
| | | | | | | 729 | |
| | | | | | | | |
|
| Telecommunication Services—1.0% | |
America Movil SAB de C.V. Series 12
6.450%, 12/5/22 | | | 2,000 | MXN | | | 100 | |
AT&T, Inc. | |
4.250%, 3/1/27 | | | 85 | | | | 86 | |
5.250%, 3/1/37 | | | 30 | | | | 30 | |
4.800%, 6/15/44 | | | 110 | | | | 103 | |
5.650%, 2/15/47 | | | 55 | | | | 58 | |
Digicel Group Ltd. 144A
8.250%, 9/30/20(4) | | | 200 | | | | 173 | |
Frontier Communications Corp. | |
6.250%, 9/15/21 | | | 75 | | | | 70 | |
10.500%, 9/15/22 | | | 130 | | | | 132 | |
GTH Finance BV 144A
7.250%, 4/26/23(4) | | | 200 | | | | 221 | |
Qwest Corp.
7.250%, 9/15/25 | | | 80 | | | | 88 | |
Sprint Communications, Inc.
6.000%, 11/15/22 | | | 150 | | | | 154 | |
T-Mobile USA, Inc.
6.375%, 3/1/25 | | | 80 | | | | 86 | |
Windstream Corp.
7.750%, 10/1/21 | | | 85 | | | | 84 | |
Zayo Group LLC | |
6.375%, 5/15/25 | | | 55 | | | | 60 | |
144A 5.750%, 1/15/27(4) | | | 5 | | | | 5 | |
| | | | | | | | |
| | | | | | | 1,450 | |
| | | | | | | | |
|
| Utilities—0.7% | |
AmeriGas Partners LP
5.500%, 5/20/25 | | | 65 | | | | 65 | |
Dynegy, Inc.
7.375%, 11/1/22 | | | 130 | | | | 129 | |
Eskom Holdings SOC Ltd. 144A
7.125%, 2/11/25(4) | | | 200 | | | | 203 | |
Ferrellgas LP 144A
8.625%, 6/15/20(4) | | | 25 | | | | 24 | |
Lamar Funding Ltd. 144A 3.958%, 5/7/25(4) | | | 200 | | | | 190 | |
Majapahit Holding BV 144A
7.750%, 1/20/20(4) | | | 145 | | | | 164 | |
Talen Energy Supply LLC 144A
4.625%, 7/15/19(4) | | | 120 | | | | 123 | |
See Notes to Financial Statements
45
VIRTUS TACTICAL ALLOCATION FUND
SCHEDULE OF INVESTMENTS (Continued)
MARCH 31, 2017
($ reported in thousands)
| | | | | | | | |
| | | PAR
VALUE | | | VALUE | |
| Utilities—continued | |
TerraForm Power Operating LLC 144A
6.375%, 2/1/23(3)(4) | | $ | 160 | | | $ | 167 | |
| | | | | | | | |
| | | | | | | | 1,065 | |
TOTAL CORPORATE BONDS AND NOTES
(Identified Cost $29,437) | | | | 29,361 | |
|
| LOAN AGREEMENTS(3)—3.7% | |
|
| Consumer Discretionary—0.8% | |
Advantage Sales & Marketing, Inc. Tranche, Second Lien,
7.500%, 7/25/22 | | | 53 | | | | 52 | |
Bass Pro Group LLC
6.147%, 12/15/23 | | | 175 | | | | 169 | |
Caesars Entertainment Operating Co., Inc. | | | | | | | | |
Tranche B-4, 1.500%, 10/31/17(14) | | | 45 | | | | 56 | |
Tranche B-6, 1.500%, 3/1/20(14) | | | 37 | | | | 43 | |
Caesars Entertainment Resort Properties LLC Tranche B,
7.000%, 10/11/20 | | | 149 | | | | 150 | |
Caesars Growth Properties Holdings LLC Tranche B,
First Lien,
6.250%, 5/8/21 | | | 72 | | | | 73 | |
Floor & Decor Outlets of America, Inc. Replacement
Tranche B-1,
4.500%, 4/28/17 | | | 97 | | | | 97 | |
Gateway Casinos & Entertainment Ltd. Tranche B-1,
4.800%, 2/22/23 | | | 25 | | | | 25 | |
Graton Resort & Casino
Tranche B,
5.405%, 9/1/22 | | | 43 | | | | 43 | |
Harbor Freight Tools USA, Inc.
4.232%, 8/18/23 | | | 68 | | | | 68 | |
Laureare Education, Inc.
2021 Extended,
8.509%, 3/17/21 | | | 87 | | | | 87 | |
Leslies Poolmart, Inc.
Tranche B-1,
4.774%, 8/16/23 | | | 61 | | | | 61 | |
Transtar Holding Co.
Second Lien,
12.00%, 10/9/19(12)(13) | | | 77 | | | | 1 | |
UFC Holdings LLC
First Lien
4.250%, 8/18/23 | | | 72 | | | | 72 | |
U.S. Farathane LLC
Tranche B-3,
5.147%, 12/23/21 | | | 92 | | | | 93 | |
| | | | | | | | |
| | | | | | | 1,090 | |
| | | | | | | | |
| | | | | | | | |
| | | PAR
VALUE | | | VALUE | |
| Consumer Staples—0.3% | |
Albertson’s LLC Tranche B-4
3.982%, 8/25/21 | | $ | 128 | | | $ | 129 | |
Chobani LLC First Lien,
5.250%, 10/9/23 | | | 28 | | | | 28 | |
Coty, Inc. Tranche B,
3.311%, 10/27/22 | | | 22 | | | | 22 | |
Galleria Co. Tranche B,
3.813%, 9/29/23 | | | 44 | | | | 44 | |
JBS USA Lux S.A.
3.289%, 10/30/22 | | | 40 | | | | 40 | |
Kronos, Inc. Second Lien,
9.284%, 11/1/24 | | | 38 | | | | 39 | |
Milk Specialties Co.
5.147%, 8/16/23 | | | 111 | | | | 113 | |
TKC Holdings, Inc. First Lien,
4.750%, 2/1/23 | | | 50 | | | | 51 | |
| | | | | | | | |
| | | | | | | 466 | |
| | | | | | | | |
|
| Energy—0.3% | |
California Resources Corp.
11.375%, 12/31/21 | | | 80 | | | | 89 | |
Chesapeake Energy Corp. Trance A,
8.553%, 8/23/21 | | | 24 | | | | 26 | |
Contura Energy, Inc.
6.000%, 3/18/24 | | | 140 | | | | 139 | |
Jonah Energy LLC Second Lien,
7.500%, 5/12/21 | | | 106 | | | | 102 | |
Peabody Energy Corp.
First Lien,
5.500%, 2/8/22 | | | 70 | | | | 70 | |
Seadrill Operating LP
4.147%, 2/21/21 | | | 101 | | | | 69 | |
| | | | | | | | |
| | | | | | | 495 | |
| | | | | | | | |
|
| Financials—0.1% | |
Avolon TLB Borrower 1 (US) LLC Tranche B-2,
0.000%, 3/21/22(9) | | | 5 | | | | 5 | |
Lonestar Intermediate Super Holdings LLC
10.000%, 8/31/21 | | | 90 | | | | 94 | |
Walter Investment Management Corp. Tranche B,
4.750%, 12/18/20 | | | 128 | | | | 111 | |
| | | | | | | | |
| | | | | | | 210 | |
| | | | | | | | |
|
| Health Care—0.5% | |
21st Century Oncology Holdings, Inc. Tranche B,
7.275%, 4/30/22(19) | | | 31 | | | | 28 | |
American Renal Holdings, Inc. Tranche B, First Lien,
4.750%, 8/20/19 | | | 33 | | | | 33 | |
Change Healthcare Holdings, Inc.
3.750%, 3/1/24 | | | 60 | | | | 60 | |
| | | | | | | | |
| | | PAR
VALUE | | | VALUE | |
| Health Care—continued | | | | | | | | |
CHG Healthcare Services, Inc. First Lien,
4.750%, 6/7/23 | | $ | 97 | | | $ | 99 | |
HLF Financing S.a.r.l.
Senior Lien,
6.482%, 2/15/23 | | | 40 | | | | 40 | |
Inventiv Group Holdings, Inc.
4.804%, 11/9/23 | | | 43 | | | | 43 | |
MMM Holdings, Inc.
10.250%, 6/30/19 | | | 40 | | | | 39 | |
MPH Acquisition Holdings LLC
4.897%, 6/7/23 | | | 40 | | | | 41 | |
MSO of Puerto Rico, Inc.
10.250%, 6/30/19 | | | 29 | | | | 29 | |
NVA Holdings, Inc.
Second Lien,
8.147%, 8/14/22 | | | 110 | | | | 111 | |
Quorum Health Corp.
6.789%, 4/29/22 | | | 48 | | | | 47 | |
U.S. Renal Care, Inc.
First Lien,
5.397%, 12/30/22 | | | 119 | | | | 112 | |
| | | | | | | | |
| | | | | | | 682 | |
| | | | | | | | |
|
| Industrials—0.4% | |
84 Lumber Co.
6.750%, 10/25/23 | | | 144 | | | | 146 | |
Coinstar LLC Tranche B, First Lien
5.250%, 9/27/23 | | | 54 | | | | 54 | |
Navistar, Inc. Tranche B,
5.000%, 8/7/20 | | | 90 | | | | 91 | |
PAE Holding Corp. First Lien,
6.500%, 10/20/22 | | | 45 | | | | 46 | |
Quikrete International, Inc. First Lien,
4.232%, 11/15/23 | | | 15 | | | | 15 | |
Sedgwick Claims Management Services, Inc. Second Lien,
6.804%, 2/28/22 | | | 210 | | | | 211 | |
Zodiac Pool Solutions LLC First Lien,
5.647%, 12/20/23 | | | 40 | | | | 40 | |
| | | | | | | | |
| | | | | | | 603 | |
| | | | | | | | |
|
| Information Technology—0.6% | |
Applied Systems, Inc.
Second Lien,
7.647%, 1/24/22 | | | 51 | | | | 51 | |
8.500%, 1/24/18 | | | 45 | | | | 46 | |
Blackboard, Inc. Tranche B-4, First Lien,
6.023%, 6/30/21 | | | 111 | | | | 111 | |
Donnelley Financial Solutions, Inc. Tranche B,
5.000%, 9/29/23 | | | 33 | | | | 33 | |
First Data Corp. Tranche 2022-C,
3.984%, 7/8/22 | | | 146 | | | | 148 | |
See Notes to Financial Statements
46
VIRTUS TACTICAL ALLOCATION FUND
SCHEDULE OF INVESTMENTS (Continued)
MARCH 31, 2017
($ reported in thousands)
| | | | | | | | |
| | | PAR
VALUE | | | VALUE | |
| Information Technology—continued | |
Mitchell International, Inc.
Second Lien,
8.539%, 10/11/21 | | $ | 77 | | | $ | 77 | |
Presidio LLC Tranche B,
First Lien,
4.250%, 2/2/22 | | | 99 | | | | 100 | |
Rackspace Hosting, Inc. Tranche B, First Lien,
4.535%, 11/3/23 | | | 53 | | | | 53 | |
Sungard Availability Services Capital, Inc. Tranche B,
6.000%, 3/29/19 | | | 110 | | | | 107 | |
Veritas US, Inc. Tranche B-1,
6.772%, 1/27/23 | | | 149 | | | | 149 | |
| | | | | | | | |
| | | | | | | 875 | |
| | | | | | | | |
|
| Materials—0.4% | |
Anchor Glass Container Corp. | | | | | | | | |
First Lien,
4.250%, 12/7/23 | | | 35 | | | | 35 | |
Second Lien,
8.750%, 12/7/24 | | | 38 | | | | 39 | |
CPI Card, Inc. First Lien,
5.834%, 8/17/22 | | | 152 | | | | 142 | |
DuBois Chemicals, Inc. | | | | | | | | |
First Lien,
1.000%, 3/15/24 | | | 5 | | | | 5 | |
First Lien,
4.881%, 3/15/24 | | | 20 | | | | 20 | |
Ineos U.S. Finance LLC
Tranche 2022
3.732%, 3/31/22 | | | 11 | | | | 11 | |
MacDermid, Inc. Tranche B-5,
4.500%, 6/7/20 | | | 85 | | | | 86 | |
New Arclin U.S. Holdings Corp. First Lien,
5.670%, 2/14/24 | | | 30 | | | | 30 | |
Omnova Solutions, Inc.
Tranche B-2,
5.250%, 8/25/23 | | | 118 | | | | 120 | |
PQ Corp. Tranche B-1,
5.289%, 11/4/22 | | | 24 | | | | 24 | |
| | | | | | | | |
| | | | | | | 512 | |
| | | | | | | | |
|
| Real Estate—0.0% | |
Capital Automotive LP
Tranche B, Second Lien,
7.000%, 3/24/25 | | | 40 | | | | 40 | |
| | | | | | | | |
|
| Telecommunication Services—0.1% | |
Neustar, Inc. | | | | | | | | |
Tranche B2,
0.000%, 3/1/24(9) | | | 35 | | | | 35 | |
Tranche B,
Second Lien,
9.00%, 2/28/25 | | | 45 | | | | 46 | |
| | | | | | | | |
| | | | | | | 81 | |
| | | | | | | | |
| | | | | | | | |
| | | PAR
VALUE | | | VALUE | |
| Utilities—0.2% | |
APLP Holdings LP
6.000%, 4/13/23 | | $ | 132 | | | $ | 133 | |
Helix Gen Funding LLC Tranche
0.000%, 3/9/24(9) | | | 5 | | | | 5 | |
Vistra Operations Company LLC | | | | | | | | |
3.732%, 8/4/23 | | | 64 | | | | 64 | |
Tranche C,
3.732%, 8/4/23 | | | 15 | | | | 15 | |
| | | | | | | | |
| | | | | | | | 217 | |
TOTAL LOAN AGREEMENTS
(Identified Cost $5,309) | | | | 5,271 | |
| | |
| | | SHARES | | | | |
| PREFERRED STOCKS—1.3% | |
|
| Energy—0.1% | |
PTT Exploration & Production PCL 144A,
4.875%(3)(4) | | | 200 | (10) | | | 205 | |
| | | | | | | | |
|
| Financials—1.0% | |
Citigroup, Inc. Series J,
7.125%(2) | | | 7,400 | | | | 214 | |
Citigroup, Inc. Series T,
6.250%(3) | | | 150 | (10) | | | 162 | |
JPMorgan Chase & Co. Series V, 5.000%(3) | | | 80 | (10) | | | 81 | |
JPMorgan Chase & Co. Series Z, 5.300%(3) | | | 35 | (10) | | | 36 | |
KeyCorp Series D,
5.000%(3) | | | 145 | (10) | | | 144 | |
M&T Bank Corp. Series F, 5.125%(3) | | | 70 | (10) | | | 70 | |
PNC Financial Services Group, Inc. (The)
Series R,
4.850%(3) | | | 155 | (10) | | | 154 | |
PNC Financial Services Group, Inc. (The) Series S,
5.000%(3) | | | 145 | (10) | | | 144 | |
SunTrust Bank, Inc.
5.625%(3) | | | 55 | (10) | | | 57 | |
Wells Fargo & Co.
Series K,
7.980%(3) | | | 165 | (10) | | | 172 | |
Zions Bancorp
6.950%(2) | | | 6,400 | | | | 187 | |
| | | | | | | | |
| | | | | | | 1,421 | |
| | | | | | | | |
|
| Industrials—0.2% | |
General Electric Co. Series D, 5.000%(3) | | | 227 | (10) | | | 239 | |
TOTAL PREFERRED STOCKS
(Identified Cost $1,780) | | | | 1,865 | |
| | | | | | | | |
| | |
SHARES | | | VALUE | |
| COMMON STOCKS—61.0% | |
|
| Consumer Discretionary—14.5% | |
Amazon.com, Inc.(2) | | | 3,190 | | | $ | 2,828 | |
Bayerische Motoren Werke AG Sponsored ADR(2) | | | 21,595 | | | | 657 | |
Ctrip.com International Ltd. ADR(2) | | | 20,200 | | | | 993 | |
Fuji Heavy Industries Ltd. ADR | | | 35,245 | | | | 647 | |
Home Depot, Inc. (The) | | | 9,190 | | | | 1,349 | |
IMAX Corp.(2) | | | 22,900 | | | | 779 | |
Kroton Educacional S.A. ADR | | | 107,810 | | | | 455 | |
Las Vegas Sands Corp. | | | 33,990 | | | | 1,940 | |
Netflix, Inc.(2) | | | 10,980 | | | | 1,623 | |
NIKE, Inc. Class B | | | 30,770 | | | | 1,715 | |
Priceline Group, Inc.
(The)(2) | | | 1,280 | | | | 2,278 | |
Ross Stores, Inc. | | | 24,620 | | | | 1,622 | |
Sony Corp. Sponsored ADR | | | 22,315 | | | | 753 | |
Starbucks Corp. | | | 39,540 | | | | 2,309 | |
Walt Disney Co. (The) | | | 5,650 | | | | 641 | |
| | | | | | | | |
| | | | | | | 20,589 | |
| | | | | | | | |
|
| Consumer Staples—5.2% | |
British American Tobacco plc Sponsored ADR | | | 9,790 | | | | 649 | |
Companhia Brasileira de Distribuicao Grupo Pao de Acucar Sponsored ADR | | | 35,150 | | | | 675 | |
Costco Wholesale Corp. | | | 7,910 | | | | 1,326 | |
Marine Harvest ASA Sponsored ADR(2) | | | 38,720 | | | | 593 | |
Monster Beverage Corp.(2) | | | 47,790 | | | | 2,207 | |
Philip Morris International, Inc. | | | 16,800 | | | | 1,897 | |
| | | | | | | | |
| | | | | | | 7,347 | |
| | | | | | | | |
|
| Energy—3.9% | |
Cabot Oil & Gas Corp. | | | 23,980 | | | | 573 | |
Core Laboratories N.V. | | | 8,260 | | | | 954 | |
Linn Energy, Inc.(2) | | | 2,653 | | | | 77 | |
Pacific Exploration and Production Corp.(2) | | | 920 | | | | 29 | |
Petroleo Brasileiro S.A. Sponsored ADR(2) | | | 70,811 | | | | 686 | |
Pioneer Natural Resources Co. | | | 5,180 | | | | 965 | |
Schlumberger Ltd. | | | 11,990 | | | | 936 | |
Statoil ASA Sponsored ADR | | | 36,875 | | | | 634 | |
TechnipFMC plc | | | 19,455 | | | | 632 | |
| | | | | | | | |
| | | | | | | 5,486 | |
| | | | | | | | |
|
| Financials—5.5% | |
Bank of America Corp. | | | 77,850 | | | | 1,837 | |
Barclays plc Sponsored ADR | | | 63,575 | | | | 715 | |
BNP Paribas S.A. ADR | | | 21,370 | | | | 711 | |
Charles Schwab Corp. (The) | | | 23,360 | | | | 953 | |
DBS Group Holdings Ltd. Sponsored ADR | | | 15,980 | | | | 890 | |
ING Groep N.V. Sponsored ADR | | | 45,504 | | | | 687 | |
See Notes to Financial Statements
47
VIRTUS TACTICAL ALLOCATION FUND
SCHEDULE OF INVESTMENTS (Continued)
MARCH 31, 2017
($ reported in thousands)
| | | | | | | | |
| | | SHARES | | | VALUE | |
| Financials—continued | | | | | | | | |
Mizuho Financial Group, Inc. ADR | | | 181,690 | | | $ | 670 | |
ORIX Corp. Sponsored ADR | | | 8,495 | | | | 631 | |
Societe Generale S.A. Sponsored ADR | | | 74,045 | | | | 747 | |
| | | | | | | | |
| | | | 7,841 | |
| | | | | |
|
| Health Care—6.2% | |
Allergan plc | | | 2,946 | | | | 704 | |
BioMarin Pharmaceutical, Inc.(2) | | | 12,360 | | | | 1,085 | |
Bristol-Myers Squibb Co. | | | 12,010 | | | | 653 | |
Celgene Corp.(2) | | | 18,090 | | | | 2,251 | |
Danaher Corp. | | | 12,630 | | | | 1,080 | |
HealthEquity, Inc.(2) | | | 8,900 | | | | 378 | |
Icon plc | | | 8,657 | | | | 690 | |
Shire plc ADR | | | 3,870 | | | | 674 | |
Zoetis, Inc. | | | 22,710 | | | | 1,212 | |
| | | | | |
| | | | 8,727 | |
| | | | | |
|
| Industrials—4.8% | |
Airbus SE ADR | | | 42,010 | | | | 800 | |
Ashtead Group plc ADR | | | 10,570 | | | | 887 | |
Hitachi Ltd. ADR | | | 10,215 | | | | 555 | |
Nidec Corp. Sponsored ADR | | | 32,070 | | | | 767 | |
RELX plc Sponsored ADR | | | 32,815 | | | | 650 | |
Rockwell Automation, Inc. | | | 4,050 | | | | 631 | |
Roper Technologies, Inc. | | | 5,910 | | | | 1,220 | |
Union Pacific Corp. | | | 7,200 | | | | 763 | |
Westinghouse Air Brake Technologies Corporation | | | 7,623 | | | | 594 | |
| | | | | |
| | | | 6,867 | |
| | | | | |
|
| Information Technology—18.1% | |
Accenture plc Class A | | | 8,900 | | | | 1,067 | |
Activision Blizzard, Inc. | | | 21,080 | | | | 1,051 | |
Alibaba Group Holding Ltd. Sponsored ADR(2) | | | 26,990 | | | | 2,910 | |
Alphabet, Inc. Class A(2) | | | 2,110 | | | | 1,789 | |
Amphenol Corp. Class A | | | 26,900 | | | | 1,914 | |
Broadcom Ltd. | | | 3,305 | | | | 724 | |
Check Point Software Technologies Ltd. | | | 6,450 | | | | 662 | |
CoStar Group, Inc.(2) | | | 5,090 | | | | 1,055 | |
Facebook, Inc. Class A(2) | | | 46,510 | | | | 6,607 | |
Gartner, Inc.(2) | | | 3,990 | | | | 431 | |
NVIDIA Corp. | | | 7,150 | | | | 779 | |
Paycom Software, Inc.(2) | | | 17,180 | | | | 988 | |
SAP SE Sponsored ADR | | | 7,930 | | | | 778 | |
Visa, Inc. Class A | | | 27,070 | | | | 2,406 | |
Workday, Inc. Class A(2) | | | 15,350 | | | | 1,278 | |
Yandex N.V. Class A(2) | | | 56,620 | | | | 1,242 | |
| | | | | | | | |
| | | | | | | 25,681 | |
| | | | | | | | |
|
| Materials—1.7% | |
Ecolab, Inc. | | | 9,160 | | | | 1,148 | |
Fortescue Metals Group Ltd. Sponsored ADR | | | 55,745 | | | | 532 | |
Toray Industries, Inc. ADR | | | 38,613 | | | | 686 | |
| | | | | | | | |
| | | | 2,366 | |
| | | | | | | | |
| | | | | | | | |
| | | SHARES | | | VALUE | |
| Real Estate—0.6% | |
Lendlease Group Sponsored ADR | | | 65,985 | | | $ | 800 | |
| | | | | | | | |
|
| Telecommunication Services—0.5% | |
Nippon Telegraph & Telephone Corp. ADR | | | 16,260 | | | | 696 | |
TOTAL COMMON STOCKS
(Identified Cost $77,945) | | | | 86,400 | |
|
| AFFILIATED MUTUAL FUND—1.3% | |
Virtus Credit Opportunities Fund Class R6(11) | | | 177,261 | | | | 1,771 | |
TOTAL AFFILIATED MUTUAL FUND
(Identified Cost $1,772) | | | | 1,771 | |
| TOTAL LONG TERM INVESTMENTS—99.2% | |
| (Identified Cost $132,439) | | | | | | | 140,580 | (15) |
TOTAL INVESTMENTS—99.2%
(Identified Cost $132,439) | | | | 140,580 | (1) |
Other assets and liabilities, net—0.8% | | | | 1,186 | |
| | | | | | | | |
| NET ASSETS—100.0% | | | $ | 141,766 | |
| | | | | | | | |
Abbreviations:
| ADR | American Depositary Receipt |
| FHLMC | Federal Home Loan Mortgage Corporation (“Freddie Mac”) |
| FNMA | Federal National Mortgage Association (“Fannie Mae”) |
| PIK | Payment-in-Kind Security |
| REIT | Real Estate Investment Trust |
Foreign Currencies
Footnote Legend:
| (1) | Federal Income Tax Information: For tax information at March 31, 2017, see Note 10 Federal Income Tax Information in the Notes to Financial Statements. |
| (2) | Non-income producing. |
| (3) | Variable or step coupon security; interest rate shown reflects the rate in effect at March 31, 2017. |
| (4) | Security exempt from registration under Rule 144A of the Securities Act of 1933. These securities may be resold in transactions exempt from registration, normally to qualified institutional buyers. At March 31, 2017, these securities amounted to a value of $24,313 or 17.2% of net assets. |
| (5) | Regulation S security. Security is offered and sold outside of the United States, therefore, it is exempt from registration with the SEC under Rules 903 and 904 of the Securities Act of 1933. |
| (6) | Interest payments may be deferred. |
| (7) | This Note was issued for the sole purpose of funding a loan agreement between the issuer and the borrower. As the credit risk for this security lies solely with the borrower, the name represented here is that of the borrower. |
| (8) | No contractual maturity date. |
| (9) | This loan will settle after March 31, 2017, at which time the interest rate, based on the London Interbank Offered Rate (“LIBOR”) and the agreed upon spread on trade date, will be reflected. |
| (10) | Value shown as par value. |
| (11) | Shares of this fund are publicly offered and its prospectus and annual report are publicly available. |
| (12) | Security in default, no interest payments are being received during the bankruptcy proceedings. |
| (14) | Security in default, a portion of the interest payments are being received during the bankruptcy proceedings. |
| (15) | All or a portion of the Fund’s assets have been segregated for delayed delivery security. |
| (16) | Amount is less than $500. |
| (17) | 100% of the income received was in cash. |
| (18) | Security valued at fair value as determined in good faith by or under the direction of the Trustees. This security is disclosed as a Level 3 security in the disclosure table located after the Schedule of Investments. |
| (19) | Security in default, interest payments are being received during the bankruptcy proceedings. |
| | | | |
| Country Weightings (Unaudited)† | |
United States | | | 66 | % |
Japan | | | 4 | |
United Kingdom | | | 3 | |
China | | | 3 | |
Brazil | | | 2 | |
France | | | 2 | |
Russia | | | 2 | |
Other | | | 18 | |
Total | | | 100 | % |
† % of total investments as of March 31, 2017. | |
See Notes to Financial Statements
48
VIRTUS TACTICAL ALLOCATION FUND
SCHEDULE OF INVESTMENTS (Continued)
MARCH 31, 2017
($ reported in thousands)
The following table provides a summary of inputs used to value the Fund’s investments as of March 31, 2017 (See Security Valuation Note 2A in the Notes to Financial Statements):
| | | | | | | | | | | | | | | | |
| | | Total
Value at
March 31,
2017 | | | Level 1
Quoted
Prices | | | Level 2
Significant
Observable
Inputs | | | Level 3
Significant
Unobservable
Inputs | |
Debt Securities: | | | | | | | | | | | | | | | | |
Asset-Backed Securities | | $ | 1,432 | | | $ | — | | | $ | 1,432 | | | $ | — | |
Corporate Bonds and Notes | | | 29,361 | | | | — | | | | 29,190 | | | | 171 | |
Foreign Government Securities | | | 7,076 | | | | — | | | | 7,076 | | | | — | |
Loan Agreements | | | 5,271 | | | | — | | | | 5,124 | | | | 147 | |
Mortgage-Backed Securities | | | 7,404 | | | | — | | | | 7,404 | | | | — | |
Equity Securities: | | | | | | | | | | | | | | | | |
Affiliated Mutual Fund | | | 1,771 | | | | 1,771 | | | | — | | | | — | |
Common Stocks | | | 86,400 | | | | 86,400 | | | | — | | | | — | |
Preferred Stocks | | | 1,865 | | | | 401 | | | | 1,464 | | | | — | |
| | | | | | | | | | | | | | | | |
Total Investments | | $ | 140,580 | | | $ | 88,572 | | | $ | 51,690 | | | $ | 318 | |
| | | | | | | | | | | | | | | | |
There were no transfers between Level 1 and Level 2 related to securities held at March 31, 2017.
The following is a reconciliation of assets of the Fund for Level 3 investments for which significant unobservable inputs were used to determine fair value.
| | | | | | | | | | | | |
| | | Total
Value | | | Corporate
Bonds and
Notes | | | Loan
Agreements | |
Investments in Securities | | | | | | | | | | | | |
Balance as of March 31, 2016: | | $ | 294 | | | $ | — | | | $ | 294 | |
Accrued discount/(premium) | | | — | (c) | | | — | (c) | | | — | (c) |
Realized gain (loss) | | | — | (c) | | | — | (c) | | | — | (c) |
Change in unrealized appreciation/(depreciation)(d) | | | 11 | | | | 1 | | | | 10 | |
Purchases | | | 321 | | | | 178 | | | | 143 | |
Sales(b) | | | (206 | ) | | | (8 | ) | | | (198 | ) |
Transfers into Level 3(a)(e) | | | — | (c) | | | — | (c) | | | — | |
Transfers from Level 3(a)(f) | | | (102 | ) | | | — | | | | (102 | ) |
| | | | | | | | | | | | |
Balance as of March 31, 2017 | | $ | 318 | | | $ | 171 | | | $ | 147 | |
| | | | | | | | | | | | |
| (a) | “Transfers into and/or from” represent the ending value as of March 31, 2017, for any investment security where a change in the pricing level occurred from the beginning to the end of the period. |
| (b) | Includes paydowns on securities. |
| (c) | Amount is less than $500. |
| (d) | Included in the related net change in unrealized appreciation (depreciation) on investments in the Statement of Operations. The change in unrealized appreciation (depreciation) on investments still held as of March 31, 2017 was $(150). |
| (e) | The transfers into Level 3 is due to a security default. |
| (f) | The transfers from Level 3 are due to an increase in trading activities at period end. |
The Fund’s investments that are categorized as Level 3 were valued utilizing third party pricing information without adjustment. Such valuations are based on unobservable inputs. A significant change in third party information inputs could result in significantly lower or higher value of such Level 3 investments.
See Notes to Financial Statements
49
VIRTUS EQUITY TRUST
STATEMENTS OF ASSETS AND LIABILITIES
MARCH 31, 2017
(Reported in thousands except shares and per share amounts)
| | | | | | | | | | | | | | | | | | | | |
| | | | | | | | | | | | | | | | | | | | |
| | | Contrarian
Value Fund | | | KAR Capital
Growth Fund | | | KAR Global Quality
Dividend Fund | | | KAR Mid-Cap
Core Fund | | | KAR Mid-Cap
Growth Fund | |
| Assets | | | | | | | | | | | | | | | | | | | | |
Investment in unaffiliated securities at value(1)(2) | | $ | 200,372 | | | $ | 422,441 | | | $ | 67,109 | | | $ | 84,388 | | | $ | 89,299 | |
Cash | | | 1,852 | | | | 4,606 | | | | 1,012 | | | | 2,699 | | | | 3 | |
Receivables | | | | | | | | | | | | | | | | | | | | |
Investment securities sold | | | — | | | | — | | | | — | | | | — | | | | 847 | |
Fund shares sold | | | 88 | | | | 152 | | | | 17 | | | | 694 | | | | — | |
Dividends and interest | | | 307 | | | | 316 | | | | 314 | | | | 47 | | | | 40 | |
Securities lending | | | 1 | | | | — | (3) | | | 1 | | | | — | (3) | | | 1 | |
Prepaid expenses | | | 33 | | | | 32 | | | | 24 | | | | 42 | | | | 28 | |
Prepaid trustee retainer | | | 6 | | | | 12 | | | | 2 | | | | 2 | | | | 2 | |
Other assets | | | 7 | | | | 16 | | | | 2 | | | | 3 | | | | 3 | |
| | | | | | | | | | | | | | | | | | | | |
Total assets | | | 202,666 | | | | 427,575 | | | | 68,481 | | | | 87,875 | | | | 90,223 | |
| | | | | | | | | | | | | | | | | | | | |
| Liabilities | | | | | | | | | | | | | | | | | | | | |
Payables | | | | | | | | | | | | | | | | | | | | |
Fund shares repurchased | | | 724 | | | | 1,307 | | | | 111 | | | | 83 | | | | 202 | |
Collateral on securities loaned | | | 8,826 | | | | — | | | | 7,552 | | | | 1,866 | | | | — | |
Investment advisory fees | | | 125 | | | | 254 | | | | 31 | | | | 37 | | | | 54 | |
Distribution and service fees | | | 45 | | | | 97 | | | | 16 | | | | 17 | | | | 22 | |
Administration fees | | | 21 | | | | 44 | | | | 7 | | | | 9 | | | | 10 | |
Transfer agent fees and expenses | | | 57 | | | | 167 | | | | 21 | | | | 17 | | | | 34 | |
Trustees’ fees and expenses | | | — | (3) | | | 1 | | | | — | (3) | | | — | (3) | | | — | (3) |
Professional fees | | | 25 | | | | 26 | | | | 23 | | | | 23 | | | | 25 | |
Trustee deferred compensation plan | | | 7 | | | | 16 | | | | 2 | | | | 3 | | | | 3 | |
Other accrued expenses | | | 7 | | | | 20 | | | | 2 | | | | 4 | | | | 3 | |
| | | | | | | | | | | | | | | | | | | | |
Total liabilities | | | 9,837 | | | | 1,932 | | | | 7,765 | | | | 2,059 | | | | 353 | |
| | | | | | | | | | | | | | | | | | | | |
| Net Assets | | $ | 192,829 | | | $ | 425,643 | | | $ | 60,716 | | | $ | 85,816 | | | $ | 89,870 | |
| | | | | | | | | | | | | | | | | | | | |
| Net Assets Consist of: | | | | | | | | | | | | | | | | | | | | |
Capital paid in on shares of beneficial interest | | $ | 136,131 | | | $ | 250,680 | | | $ | 53,713 | | | $ | 75,697 | | | $ | 58,836 | |
Accumulated undistributed net investment income (loss) | | | 1,686 | | | | (118 | ) | | | 711 | | | | (64 | ) | | | (128 | ) |
Accumulated undistributed net realized gain (loss) | | | (13,158 | ) | | | 3,822 | | | | 3,529 | | | | (162 | ) | | | 312 | |
Net unrealized appreciation (depreciation) on investments | | | 68,170 | | | | 171,259 | | | | 2,763 | | | | 10,345 | | | | 30,850 | |
| | | | | | | | | | | | | | | | | | | | |
| Net Assets | | $ | 192,829 | | | $ | 425,643 | | | $ | 60,716 | | | $ | 85,816 | | | $ | 89,870 | |
| | | | | | | | | | | | | | | | | | | | |
| Class A | | | | | | | | | | | | | | | | | | | | |
Net asset value (net assets/shares outstanding) per share | | $ | 35.96 | | | $ | 14.10 | | | $ | 16.81 | | | $ | 25.80 | | | $ | 24.56 | |
Maximum offering price per share NAV/(1–5.75%) | | $ | 38.15 | | | $ | 14.96 | | | $ | 17.84 | | | $ | 27.37 | | | $ | 26.06 | |
Shares of beneficial interest outstanding, no par value, unlimited authorization | | | 2,209,787 | | | | 28,529,060 | | | | 2,775,539 | | | | 799,053 | | | | 3,283,137 | |
Net Assets | | $ | 79,463 | | | $ | 402,118 | | | $ | 46,670 | | | $ | 20,615 | | | $ | 80,648 | |
| Class C | | | | | | | | | | | | | | | | | | | | |
Net asset value (net assets/shares outstanding) and offering price per share | | $ | 34.26 | | | $ | 11.32 | | | $ | 16.38 | | | $ | 24.45 | | | $ | 20.06 | |
Shares of beneficial interest outstanding, no par value, unlimited authorization | | | 921,962 | | | | 1,178,993 | | | | 424,261 | | | | 584,054 | | | | 266,744 | |
Net Assets | | $ | 31,587 | | | $ | 13,345 | | | $ | 6,950 | | | $ | 14,279 | | | $ | 5,350 | |
| Class I | | | | | | | | | | | | | | | | | | | | |
Net asset value (net assets/shares outstanding) and offering price per share | | $ | 35.98 | | | $ | 14.52 | | | $ | 16.84 | | | $ | 26.12 | | | $ | 25.20 | |
Shares of beneficial interest outstanding, no par value, unlimited authorization | | | 2,187,959 | | | | 701,316 | | | | 421,238 | | | | 1,949,464 | | | | 153,655 | |
Net Assets | | $ | 78,732 | | | $ | 10,180 | | | $ | 7,096 | | | $ | 50,922 | | | $ | 3,872 | |
| Class R6 | | | | | | | | | | | | | | | | | | | | |
Net asset value (net assets/shares outstanding) and offering price per share | | $ | 36.01 | | | $ | — | | | $ | — | | | $ | — | | | $ | — | |
Shares of beneficial interest outstanding, no par value, unlimited authorization | | | 84,599 | | | | — | | | | — | | | | — | | | | — | |
Net Assets | | $ | 3,047 | | | $ | — | | | $ | — | | | $ | — | | | $ | — | |
| | | | | |
(1) Investment in unaffiliated securities at cost | | $ | 132,202 | | | $ | 251,182 | | | $ | 64,346 | | | $ | 74,043 | | | $ | 58,449 | |
(2) Market value of securities on loan | | $ | 8,565 | | | $ | — | | | $ | 7,416 | | | $ | 1,817 | | | $ | — | |
(3) Amount is less than $500. | | | | | | | | | | | | | | | | | | | | |
See Notes to Financial Statements
50
VIRTUS EQUITY TRUST
STATEMENTS OF ASSETS AND LIABILITIES (Continued)
MARCH 31, 2017
(Reported in thousands except shares and per share amounts)
| | | | | | | | | | | | | | | | | | | | |
| | | | | | | | | | | | | | | | | | | | |
| | | KAR Small-Cap
Core Fund | | | KAR Small-Cap
Growth Fund | | | KAR Small-Cap
Value Fund | | | Rampart Enhanced
Core Equity Fund | | | Tactical
Allocation Fund | |
| | | | | | | | | | | | | | | | |
| Assets | | | | | | | | | | | | | | | | | | | | |
Investment in unaffiliated securities at value(1)(2) | | $ | 480,158 | | | $ | 725,375 | | | $ | 356,044 | | | $ | 170,100 | | | $ | 138,809 | |
Investment in affiliated fund at value(3) | | | — | | | | — | | | | — | | | | — | | | | 1,771 | |
Cash | | | 6,000 | | | | 4,200 | | | | 5,250 | | | | 789 | | | | 555 | |
Foreign currency, at value(4) | | | — | | | | — | | | | — | | | | — | | | | — | (6) |
Deposits with broker | | | — | | | | — | | | | — | | | | 1,270 | | | | — | |
Receivables | | | | | | | | | | | | | | | | | | | | |
Investment securities sold | | | — | | | | — | | | | — | | | | 117 | | | | 840 | |
Fund shares sold | | | 4,840 | | | | 5,737 | | | | 1,383 | | | | 143 | | | | 7 | |
Dividends and interest | | | 55 | | | | 229 | | | | 221 | | | | 149 | | | | 773 | |
Tax reclaims | | | — | | | | — | | | | — | | | | — | (6) | | | 2 | |
Securities lending | | | 17 | | | | 1 | | | | — | | | | — | | | | — | |
Prepaid expenses | | | 46 | | | | 79 | | | | 67 | | | | 26 | | | | 23 | |
Prepaid trustee retainer | | | 13 | | | | 18 | | | | 10 | | | | 5 | | | | 4 | |
Other assets | | | 18 | | | | 27 | | | | 13 | | | | 6 | | | | 5 | |
| | | | | | | | | | | | | | | | | | | | |
Total assets | | | 491,147 | | | | 735,666 | | | | 362,988 | | | | 172,605 | | | | 142,789 | |
| | | | | | | | | | | | | | | | | | | | |
| Liabilities | | | | | | | | | | | | | | | | | | | | |
Written options at value(5) | | | — | | | | — | | | | — | | | | 309 | | | | — | |
Payables | | | | | | | | | | | | | | | | | | | | |
Fund shares repurchased | | | 2,738 | | | | 2,289 | | | | 580 | | | | 263 | | | | 83 | |
Investment securities purchased | | | — | | | | 228 | | | | 735 | | | | 57 | | | | 719 | |
Collateral on securities loaned | | | 11,114 | | | | — | | | | — | | | | — | | | | — | |
Investment advisory fees | | | 301 | | | | 525 | | | | 209 | | | | 101 | | | | 84 | |
Distribution and service fees | | | 52 | | | | 92 | | | | 44 | | | | 54 | | | | 33 | |
Administration fees | | | 49 | | | | 75 | | | | 37 | | | | 18 | | | | 16 | |
Transfer agent fees and expenses | | | 84 | | | | 152 | | | | 76 | | | | 51 | | | | 42 | |
Trustees’ fees and expenses | | | 1 | | | | 1 | | | | 1 | | | | — | (6) | | | — | (6) |
Professional fees | | | 25 | | | | 25 | | | | 25 | | | | 17 | | | | 30 | |
Trustee deferred compensation plan | | | 18 | | | | 27 | | | | 13 | | | | 6 | | | | 5 | |
Other accrued expenses | | | 25 | | | | 30 | | | | 19 | | | | 7 | | | | 11 | |
| | | | | | | | | | | | | | | | | | | | |
Total liabilities | | | 14,407 | | | | 3,444 | | | | 1,739 | | | | 883 | | | | 1,023 | |
| | | | | | | | | | | | | | | | | | | | |
| Net Assets | | $ | 476,740 | | | $ | 732,222 | | | $ | 361,249 | | | $ | 171,722 | | | $ | 141,766 | |
| | | | | | | | | | | | | | | | | | | | |
| Net Assets Consist of: | | | | | | | | | | | | | | | | | | | | |
Capital paid in on shares of beneficial interest | | $ | 364,795 | | | $ | 609,091 | | | $ | 252,822 | | | $ | 150,372 | | | $ | 134,133 | |
Accumulated undistributed net investment income (loss) | | | (17 | ) | | | (1,112 | ) | | | 253 | | | | 426 | | | | (9 | ) |
Accumulated undistributed net realized gain (loss) | | | 238 | | | | (2,881 | ) | | | 13,458 | | | | 12,426 | | | | (499 | ) |
Net unrealized appreciation (depreciation) on investments | | | 111,724 | | | | 127,124 | | | | 94,716 | | | | 8,149 | | | | 8,141 | |
Net unrealized appreciation (depreciation) on written options | | | — | | | | — | | | | — | | | | 349 | | | | — | |
| | | | | | | | | | | | | | | | | | | | |
| Net Assets | | $ | 476,740 | | | $ | 732,222 | | | $ | 361,249 | | | $ | 171,722 | | | $ | 141,766 | |
| | | | | | | | | | | | | | | | | | | | |
| Class A | | | | | | | | | | | | | | | | | | | | |
Net asset value (net assets/shares outstanding) per share | | $ | 24.21 | | | $ | 21.12 | | | $ | 17.61 | | | $ | 20.27 | | | $ | 8.33 | |
Maximum offering price per share NAV/(1–5.75%) | | $ | 25.69 | | | $ | 22.41 | | | $ | 18.68 | | | $ | 21.51 | | | $ | 8.84 | |
Shares of beneficial interest outstanding, no par value, unlimited authorization | | | 2,565,638 | | | | 8,724,933 | | | | 5,056,224 | | | | 5,596,364 | | | | 16,489,497 | |
Net Assets | | $ | 62,122 | | | $ | 184,302 | | | $ | 89,050 | | | $ | 113,442 | | | $ | 137,388 | |
| Class C | | | | | | | | | | | | | | | | | | | | |
Net asset value (net assets/shares outstanding) and offering price per share | | $ | 20.71 | | | $ | 19.28 | | | $ | 17.35 | | | $ | 18.44 | | | $ | 8.55 | |
Shares of beneficial interest outstanding, no par value, unlimited authorization | | | 2,162,821 | | | | 3,025,405 | | | | 1,695,162 | | | | 2,021,521 | | | | 511,756 | |
Net Assets | | $ | 44,789 | | | $ | 58,327 | | | $ | 29,416 | | | $ | 37,269 | | | $ | 4,378 | |
| Class I | | | | | | | | | | | | | | | | | | | | |
Net asset value (net assets/shares outstanding) and offering price per share | | $ | 25.37 | | | $ | 21.45 | | | $ | 17.62 | | | $ | 20.22 | | | $ | — | |
Shares of beneficial interest outstanding, no par value, unlimited authorization | | | 13,340,450 | | | | 22,828,383 | | | | 13,771,415 | | | | 1,039,142 | | | | — | |
Net Assets | | $ | 338,491 | | | $ | 489,593 | | | $ | 242,661 | | | $ | 21,011 | | | $ | — | |
| Class R6 | | | | | | | | | | | | | | | | | | | | |
Net asset value (net assets/shares outstanding) and offering price per share | | $ | 25.44 | | | $ | — | | | $ | 17.63 | | | $ | — | | | $ | — | |
Shares of beneficial interest outstanding, no par value, unlimited authorization | | | 1,231,999 | | | | — | | | | 6,896 | | | | — | | | | — | |
Net Assets | | $ | 31,338 | | | $ | — | | | $ | 122 | | | $ | — | | | $ | — | |
| | | | | |
(1) Investment in unaffiliated securities at cost | | $ | 368,434 | | | $ | 598,251 | | | $ | 261,328 | | | $ | 161,951 | | | $ | 130,667 | |
(2) Market value of securities on loan | | $ | 10,918 | | | $ | — | | | $ | — | | | $ | — | | | $ | — | |
(3) Investment in affiliated fund at cost | | $ | — | | | $ | — | | | $ | — | | | $ | — | | | $ | 1,772 | |
(4) Foreign currency at cost | | $ | — | | | $ | — | | | $ | — | | | $ | — | | | | — | (6) |
(5) Written options premiums received | | $ | — | | | $ | — | | | $ | — | | | $ | 658 | | | $ | — | |
(6) Amount is less than $500. | | | | | | | | | | | | | | | | | | | | |
See Notes to Financial Statements
51
VIRTUS EQUITY TRUST
STATEMENTS OF OPERATIONS
YEAR ENDED MARCH 31, 2017
($ reported in thousands)
| | | | | | | | | | | | | | | | | | | | |
| | | | | | | | | | | | | | | | | | | | |
| | | Contrarian
Value Fund | | | KAR Capital
Growth Fund | | | KAR Global Quality
Dividend Fund | | | KAR Mid-Cap
Core Fund | | | KAR Mid-Cap
Growth Fund | |
| Investment Income | | | | | | | | | | | | | | | | | | | | |
Dividends | | $ | 5,346 | | | $ | 3,897 | | | $ | 1,716 | | | $ | 535 | | | $ | 544 | |
Interest | | | — | | | | 10 | | | | — | | | | 7 | | | | — | |
Security lending, net of fees | | | 30 | | | | 17 | | | | 6 | | | | 6 | | | | 24 | |
Foreign taxes withheld | | | (36 | ) | | | (20 | ) | | | (30 | ) | | | (4 | ) | | | (5 | ) |
| | | | | | | | | | | | | | | | | | | | |
Total investment income | | | 5,340 | | | | 3,904 | | | | 1,692 | | | | 544 | | | | 563 | |
| | | | | | | | | | | | | | | | | | | | |
| Expenses | | | | | | | | | | | | | | | | | | | | |
Investment advisory fees | | | 1,673 | | | | 2,954 | | | | 478 | | | | 455 | | | | 688 | |
Service fees, Class A | | | 238 | | | | 992 | | | | 125 | | | | 59 | | | | 193 | |
Distribution and service fees, Class B | | | — | | | | 9 | | | | — | | | | — | | | | 2 | |
Distribution and service fees, Class C | | | 354 | | | | 159 | | | | 75 | | | | 96 | | | | 52 | |
Administration fees | | | 284 | | | | 536 | | | | 81 | | | | 72 | | | | 109 | |
Transfer agent fees and expenses | | | 441 | | | | 772 | | | | 109 | | | | 95 | | | | 156 | |
Registration fees | | | 66 | | | | 66 | | | | 45 | | | | 46 | | | | 58 | |
Printing fees and expenses | | | 68 | | | | 113 | | | | 18 | | | | 18 | | | | 23 | |
Custodian fees | | | 17 | | | | 12 | | | | 4 | | | | 3 | | | | 4 | |
Professional fees | | | 33 | | | | 43 | | | | 31 | | | | 27 | | | | 33 | |
Trustees’ fees and expenses | | | 26 | | | | 47 | | | | 7 | | | | 6 | | | | 10 | |
Miscellaneous expenses | | | 21 | | | | 41 | | | | 8 | | | | 6 | | | | 10 | |
| | | | | | | | | | | | | | | | | | | | |
Total expenses | | | 3,221 | | | | 5,744 | | | | 981 | | | | 883 | | | | 1,338 | |
Less expenses reimbursed and/or waived by investment adviser | | | — | | | | — | | | | (72 | ) | | | (158 | ) | | | (91 | ) |
Earnings credit from custodian | | | (6 | ) | | | (1 | ) | | | (2 | ) | | | — | (1) | | | (2 | ) |
Low balance account fees | | | — | (1) | | | (28 | ) | | | (1 | ) | | | — | (1) | | | (4 | ) |
Custody fees reimbursed (Note 13) | | | (9 | ) | | | (254 | ) | | | — | | | | — | | | | (42 | ) |
| | | | | | | | | | | | | | | | | | | | |
Net expenses | | | 3,206 | | | | 5,461 | | | | 906 | | | | 725 | | | | 1,199 | |
| | | | | | | | | | | | | | | | | | | | |
Net investment income (loss) | | | 2,134 | | | | (1,557 | ) | | | 786 | | | | (181 | ) | | | (636 | ) |
| | | | | | | | | | | | | | | | | | | | |
| Net Realized and Unrealized Gain (Loss) | | | | | | | | | | | | | | | | | | | | |
Net realized gain (loss) on investments | | | 6,706 | | | | 37,319 | | | | 18,741 | | | | 369 | | | | 2,053 | |
Net change in unrealized appreciation (depreciation) on investments | | | 23,948 | | | | 12,779 | | | | (12,232 | ) | | | 7,696 | | | | 9,805 | |
| | | | | | | | | | | | | | | | | | | | |
| Net realized and unrealized gain (loss) | | | 30,654 | | | | 50,098 | | | | 6,509 | | | | 8,065 | | | | 11,858 | |
| | | | | | | | | | | | | | | | | | | | |
Net increase (decrease) in net assets resulting from operations | | $ | 32,788 | | | $ | 48,541 | | | $ | 7,295 | | | $ | 7,884 | | | $ | 11,222 | |
| | | | | | | | | | | | | | | | | | | | |
(1) Amount is less than $500.
See Notes to Financial Statements
52
VIRTUS EQUITY TRUST
STATEMENTS OF OPERATIONS (Continued)
YEAR ENDED MARCH 31, 2017
($ reported in thousands)
| | | | | | | | | | | | | | | | | | | | |
| | | | | | | | | | | | | | | | | | | | |
| | | KAR Small-Cap
Core Fund | | | KAR Small-Cap
Growth Fund | | | KAR Small-Cap
Value Fund | | | Rampart Enhanced
Core Equity Fund | | | Tactical
Allocation Fund | |
| | | | | | | | | | | | | | | | |
| Investment Income | | | | | | | | | | | | | | | | | | | | |
Dividends | | $ | 3,705 | | | $ | 3,001 | | | $ | 7,961 | | | $ | 3,332 | | | $ | 1,546 | |
Dividends from affiliated fund | | | — | | | | — | | | | — | | | | — | | | | 74 | |
Interest | | | 18 | | | | 13 | | | | 16 | | | | — | | | | 3,182 | |
Security lending, net of fees | | | 222 | | | | 112 | | | | — | | | | — | | | | 6 | |
Foreign Taxes withheld | | | (31 | ) | | | — | | | | (29 | ) | | | — | | | | (41 | ) |
| | | | | | | | | | | | | | | | | | | | |
Total investment income | | | 3,914 | | | | 3,126 | | | | 7,948 | | | | 3,332 | | | | 4,767 | |
| | | | | | | | | | | | | | | | | | | | |
| Expenses | | | | | | | | | | | | | | | | | | | | |
Investment advisory fees | | | 2,886 | | | | 3,645 | | | | 2,068 | | | | 1,208 | | | | 1,033 | |
Service fees, Class A | | | 155 | | | | 386 | | | | 198 | | | | 263 | | | | 357 | |
Distribution and service fees, Class B | | | — | | | | — | | | | — | | | | — | | | | 1 | |
Distribution and service fees, Class C | | | 366 | | | | 341 | | | | 263 | | | | 374 | | | | 48 | |
Administration fees | | | 487 | | | | 516 | | | | 374 | | | | 204 | | | | 207 | |
Transfer agent fees and expenses | | | 580 | | | | 707 | | | | 475 | | | | 275 | | | | 216 | |
Registration fees | | | 98 | | | | 72 | | | | 69 | | | | 53 | | | | 45 | |
Printing fees and expenses | | | 99 | | | | 85 | | | | 75 | | | | 45 | | | | 43 | |
Custodian fees | | | 20 | | | | 21 | | | | 5 | | | | 4 | | | | 44 | |
Professional fees | | | 39 | | | | 39 | | | | 38 | | | | 27 | | | | 42 | |
Trustees’ fees and expenses | | | 41 | | | | 38 | | | | 32 | | | | 18 | | | | 17 | |
Miscellaneous expenses | | | 30 | | | | 26 | | | | 24 | | | | 15 | | | | 17 | |
| | | | | | | | | | | | | | | | | | | | |
Total expenses | | | 4,801 | | | | 5,876 | | | | 3,621 | | | | 2,486 | | | | 2,070 | |
Less expenses reimbursed and/or waived by investment adviser | | | — | | | | (7 | ) | | | — | | | | (218 | ) | | | (12 | ) |
Earnings credit from custodian | | | (1 | ) | | | (1 | ) | | | (1 | ) | | | (5 | ) | | | (1 | ) |
Low balance account fees | | | — | (1) | | | (4 | ) | | | (1 | ) | | | (2 | ) | | | (6 | ) |
Custody fees reimbursed (Note 13) | | | (4 | ) | | | (6 | ) | | | — | | | | (2 | ) | | | (119 | ) |
| | | | | | | | | | | | | | | | | | | | |
Net expenses | | | 4,796 | | | | 5,858 | | | | 3,619 | | | | 2,259 | | | | 1,932 | |
| | | | | | | | | | | | | | | | | | | | |
| Net investment income (loss) | | | (882 | ) | | | (2,732 | ) | | | 4,329 | | | | 1,073 | | | | 2,835 | |
| | | | | | | | | | | | | | | | | | | | |
| Net Realized and Unrealized Gain (Loss) | | | | | | | | | | | | | | | | | | | | |
Net realized gain (loss) on unaffiliated investments | | | 13,272 | | | | (530 | ) | | | 22,843 | | | | 13,170 | | | | 11,066 | |
Net realized gain (loss) on foreign currency transactions | | | — | | | | — | | | | — | | | | — | | | | (5 | ) |
Net realized gain (loss) on written options | | | — | | | | — | | | | — | | | | 10,710 | | | | — | |
Net change in unrealized appreciation (depreciation) on unaffiliated investments | | | 58,696 | | | | 89,239 | | | | 35,164 | | | | (1,346 | ) | | | (1,092 | ) |
Net change in unrealized appreciation (depreciation) on affiliated fund | | | — | | | | — | | | | — | | | | — | | | | 76 | |
Net change in unrealized appreciation (depreciation) on written options | | | — | | | | — | | | | — | | | | 28 | | | | — | |
Net change in unrealized appreciation (depreciation) on foreign currency transaction | | | — | | | | — | | | | — | | | | — | | | | — | (1) |
| | | | | | | | | | | | | | | | | | | | |
| Net realized and unrealized gain (loss) | | | 71,968 | | | | 88,709 | | | | 58,007 | | | | 22,562 | | | | 10,045 | |
| | | | | | | | | | | | | | | | | | | | |
| Net increase (decrease) in net assets resulting from operations | | $ | 71,086 | | | $ | 85,977 | | | $ | 62,336 | | | $ | 23,635 | | | $ | 12,880 | |
| | | | | | | | | | | | | | | | | | | | |
(1) Amount is less than $500.
See Notes to Financial Statements
53
VIRTUS EQUITY TRUST
STATEMENTS OF CHANGES IN NET ASSETS
($ reported in thousands)
| | | | | | | | | | | | | | | | |
| | | | | | | | |
| | | Contrarian Value Fund | | | KAR Capital Growth Fund | |
| | | Year Ended
March 31,
2017 | | | Year Ended
March 31,
2016 | | | Year Ended
March 31,
2017 | | | Year Ended
March 31,
2016 | |
| INCREASE/(DECREASE) IN NET ASSETS | | | | | | | | | | | | | | | | |
| From Operations | | | | | | | | | | | | | | | | |
Net investment income (loss) | | $ | 2,134 | | | $ | 1,694 | | | $ | (1,557 | ) | | $ | (1,556 | ) |
Net realized gain (loss) | | | 6,706 | | | | 13,049 | | | | 37,319 | | | | 13,349 | |
Net change in unrealized appreciation (depreciation) | | | 23,948 | | | | (65,956 | ) | | | 12,779 | | | | (10,272 | ) |
| | | | | | | | | | | | | | | | |
| Increase (decrease) in net assets resulting from operations | | | 32,788 | | | | (51,213 | ) | | | 48,541 | | | | 1,521 | |
| | | | | | | | | | | | | | | | |
| From Distributions to Shareholders | | | | | | | | | | | | | | | | |
Net investment income, Class A | | | (759 | ) | | | (784 | ) | | | — | | | | — | |
Net investment income, Class C | | | (6 | ) | | | (46 | ) | | | — | | | | — | |
Net investment income, Class I | | | (985 | ) | | | (954 | ) | | | — | | | | — | |
Net investment income, Class R6 | | | (45 | ) | | | (17 | ) | | | — | | | | — | |
Net realized long-term gains, Class A | | | — | | | | — | | | | (31,380 | ) | | | (19,039 | ) |
Net realized long-term gains, Class B | | | — | | | | — | | | | (68 | ) | | | (99 | ) |
Net realized long-term gains, Class C | | | — | | | | — | | | | (1,402 | ) | | | (946 | ) |
Net realized long-term gains, Class I | | | — | | | | — | | | | (670 | ) | | | (378 | ) |
| | | | | | | | | | | | | | | | |
| Decrease in net assets from distributions to shareholders | | | (1,795 | ) | | | (1,801 | ) | | | (33,520 | ) | | | (20,462 | ) |
| | | | | | | | | | | | | | | | |
| From Share Transactions (See Note 6) | | | | | | | | | | | | | | | | |
Change in net assets from share transactions, Class A | | | (41,643 | ) | | | (59,464 | ) | | | (13,975 | ) | | | (14,810 | ) |
Change in net assets from share transactions, Class B | | | — | | | | — | | | | (1,437 | ) | | | (684 | ) |
Change in net assets from share transactions, Class C | | | (10,176 | ) | | | (16,162 | ) | | | (6,689 | ) | | | 9,105 | |
Change in net assets from share transactions, Class I | | | (38,690 | ) | | | (49,583 | ) | | | 1,623 | | | | (4 | ) |
Change in net assets from share transactions, Class R6 | | | (2,250 | ) | | | 5,005 | | | | — | | | | — | |
| | | | | | | | | | | | | | | | |
| Increase (decrease) in net assets from share transactions | | | (92,759 | ) | | | (120,204 | ) | | | (20,478 | ) | | | (6,393 | ) |
| | | | | | | | | | | | | | | | |
| | | | |
| Net increase (decrease) in net assets | | | (61,766 | ) | | | (173,218 | ) | | | (5,457 | ) | | | (25,334 | ) |
| | | | |
| Net Assets | | | | | | | | | | | | | | | | |
Beginning of period | | | 254,595 | | | | 427,813 | | | | 431,100 | | | | 456,434 | |
| | | | | | | | | | | | | | | | |
| End of period | | $ | 192,829 | | | $ | 254,595 | | | $ | 425,643 | | | $ | 431,100 | |
| | | | | | | | | | | | | | | | |
Accumulated undistributed net investment income (loss) at end of period | | $ | 1,686 | | | $ | 1,347 | | | $ | (118 | ) | | $ | — | |
(1) Amount is less than $500.
See Notes to Financial Statements
54
VIRTUS EQUITY TRUST
STATEMENTS OF CHANGES IN NET ASSETS (Continued)
($ reported in thousands)
| | | | | | | | | | | | | | | | |
| | | | | | | | |
| | | KAR Global Quality Dividend Fund | | | KAR Mid-Cap Core Fund | |
| | | Year Ended
March 31,
2017 | | | Year Ended
March 31,
2016 | | | Year Ended
March 31,
2017 | | | Year Ended
March 31,
2016 | |
| INCREASE/(DECREASE) IN NET ASSETS | | | | | | | | | | | | | | | | |
| From Operations | | | | | | | | | | | | | | | | |
Net investment income (loss) | | $ | 786 | | | $ | 572 | | | $ | (181 | ) | | $ | (106 | ) |
Net realized gain (loss) | | | 18,741 | | | | 2,873 | | | | 369 | | | | (514 | ) |
Net change in unrealized appreciation (depreciation) | | | (12,232 | ) | | | (5,126 | ) | | | 7,696 | | | | 402 | |
| | | | | | | | | | | | | | | | |
| Increase (decrease) in net assets resulting from operations | | | 7,295 | | | | (1,681 | ) | | | 7,884 | | | | (218 | ) |
| | | | | | | | | | | | | | | | |
| From Distributions to Shareholders | | | | | | | | | | | | | | | | |
Net investment income, Class A | | | (462 | ) | | | (254 | ) | | | — | | | | — | |
Net investment income, Class C | | | — | | | | (13 | ) | | | — | | | | — | |
Net investment income, Class I | | | (73 | ) | | | (58 | ) | | | — | | | | — | |
Net realized long-term gains, Class A | | | — | | | | — | | | | — | | | | (95 | ) |
Net realized long-term gains, Class C | | | — | | | | — | | | | — | | | | (36 | ) |
Net realized long-term gains, Class I | | | — | | | | — | | | | — | | | | (40 | ) |
| | | | | | | | | | | | | | | | |
| Decrease in net assets from distributions to shareholders | | | (535 | ) | | | (325 | ) | | | — | | | | (171 | ) |
| | | | | | | | | | | | | | | | |
| From Share Transactions (See Note 6) | | | | | | | | | | | | | | | | |
Change in net assets from share transactions, Class A | | | (8,659 | ) | | | (4,218 | ) | | | (3,230 | ) | | | 7,752 | |
Change in net assets from share transactions, Class C | | | (2,075 | ) | | | (11,309 | ) | | | 6,343 | | | | 2,460 | |
Change in net assets from share transactions, Class I | | | (98 | ) | | | (3,053 | ) | | | 39,940 | | | | 2,809 | |
| | | | | | | | | | | | | | | | |
| Increase (decrease) in net assets from share transactions | | | (10,832 | ) | | | (18,580 | ) | | | 43,053 | | | | 13,021 | |
| | | | | | | | | | | | | | | | |
| | | | |
| Net increase (decrease) in net assets | | | (4,072 | ) | | | (20,586 | ) | | | 50,937 | | | | 12,632 | |
| | | | |
| Net Assets | | | | | | | | | | | | | | | | |
Beginning of period | | | 64,788 | | | | 85,374 | | | | 34,879 | | | | 22,247 | |
| | | | | | | | | | | | | | | | |
| End of period | | $ | 60,716 | | | $ | 64,788 | | | $ | 85,816 | | | $ | 34,879 | |
| | | | | | | | | | | | | | | | |
Accumulated undistributed net investment income (loss) at end of period | | $ | 711 | | | $ | 463 | | | $ | (64 | ) | | $ | (27 | ) |
See Notes to Financial Statements
55
VIRTUS EQUITY TRUST
STATEMENTS OF CHANGES IN NET ASSETS (Continued)
($ reported in thousands)
| | | | | | | | | | | | | | | | |
| | | | | | | | |
| | | KAR Mid-Cap Growth Fund | | | KAR Small-Cap Core Fund | |
| | | Year Ended
March 31,
2017 | | | Year Ended
March 31,
2016 | | | Year Ended
March 31,
2017 | | | Year Ended
March 31,
2016 | |
| INCREASE/(DECREASE) IN NET ASSETS | | | | | | | | | | | | | | | | |
| From Operations | | | | | | | | | | | | | | | | |
Net investment income (loss) | | $ | (636 | ) | | $ | (785 | ) | | $ | (882 | ) | | $ | (312 | ) |
Net realized gain (loss) | | | 2,053 | | | | (350 | ) | | | 13,272 | | | | 47,444 | |
Net change in unrealized appreciation (depreciation) | | | 9,805 | | | | (1,345 | ) | | | 58,696 | | | | (49,195 | ) |
| | | | | | | | | | | | | | | | |
| Increase (decrease) in net assets resulting from operations | | | 11,222 | | | | (2,480 | ) | | | 71,086 | | | | (2,063 | ) |
| | | | | | | | | | | | | | | | |
| From Distributions to Shareholders | | | | | | | | | | | | | | | | |
Net investment income, Class A | | | — | | | | — | | | | — | | | | (123 | ) |
Net investment income, Class I | | | — | | | | — | | | | — | | | | (1,198 | ) |
Net investment income, Class R6 | | | — | | | | — | | | | — | | | | (1 | ) |
Net realized long-term gains, Class A | | | (1,177 | ) | | | (1,219 | ) | | | (3,619 | ) | | | (10,241 | ) |
Net realized long-term gains, Class B | | | (3 | ) | | | (10 | ) | | | — | | | | — | |
Net realized long-term gains, Class C | | | (100 | ) | | | (111 | ) | | | (2,464 | ) | | | (6,194 | ) |
Net realized long-term gains, Class I | | | (50 | ) | | | (52 | ) | | | (14,391 | ) | | | (34,727 | ) |
Net realized long-term gains, Class R6 | | | — | | | | — | | | | (1,436 | ) | | | (2,113 | ) |
| | | | | | | | | | | | | | | | |
| Decrease in net assets from distributions to shareholders | | | (1,330 | ) | | | (1,392 | ) | | | (21,910 | ) | | | (54,597 | ) |
| | | | | | | | | | | | | | | | |
| From Share Transactions (See Note 6) | | | | | | | | | | | | | | | | |
Change in net assets from share transactions, Class A | | | (4,977 | ) | | | (3,178 | ) | | | 669 | | | | (2,924 | ) |
Change in net assets from share transactions, Class B | | | (349 | ) | | | (253 | ) | | | — | | | | — | |
Change in net assets from share transactions, Class C | | | (466 | ) | | | (287 | ) | | | 9,088 | | | | 4,489 | |
Change in net assets from share transactions, Class I | | | 501 | | | | (171 | ) | | | 115,257 | | | | (22,527 | ) |
Change in net assets from share transactions, Class R6 | | | — | | | | — | | | | 7,139 | | | | 22,563 | |
| | | | | | | | | | | | | | | | |
| Increase (decrease) in net assets from share transactions | | | (5,291 | ) | | | (3,889 | ) | | | 132,153 | | | | 1,601 | |
| | | | | | | | | | | | | | | | |
| | | | |
| Net increase (decrease) in net assets | | | 4,601 | | | | (7,761 | ) | | | 181,329 | | | | (55,059 | ) |
| | | | |
| Net Assets | | | | | | | | | | | | | | | | |
Beginning of period | | | 85,269 | | | | 93,030 | | | | 295,411 | | | | 350,470 | |
| | | | | | | | | | | | | | | | |
| End of period | | $ | 89,870 | | | $ | 85,269 | | | $ | 476,740 | | | $ | 295,411 | |
| | | | | | | | | | | | | | | | |
Accumulated undistributed net investment income (loss) at end of period | | $ | (128 | ) | | $ | (161 | ) | | $ | (17 | ) | | $ | — | |
See Notes to Financial Statements
56
VIRTUS EQUITY TRUST
STATEMENTS OF CHANGES IN NET ASSETS (Continued)
($ reported in thousands)
| | | | | | | | | | | | | | | | |
| | | | | | | | |
| | | KAR Small-Cap Growth Fund | | | KAR Small-Cap Value Fund | |
| | | Year Ended
March 31,
2017 | | | Year Ended
March 31,
2016 | | | Year Ended
March 31,
2017 | | | Year Ended
March 31,
2016 | |
| | | | | | | | | | | | | |
| INCREASE/(DECREASE) IN NET ASSETS | | | | | | | | | | | | | | | | |
| From Operations | | | | | | | | | | | | | | | | |
Net investment income (loss) | | $ | (2,732 | ) | | $ | (866 | ) | | $ | 4,329 | | | $ | 1,346 | |
Net realized gain (loss) | | | (530 | ) | | | 9,922 | | | | 22,843 | | | | 22,424 | |
Net change in unrealized appreciation (depreciation) | | | 89,239 | | | | (317 | ) | | | 35,164 | | | | (22,928 | ) |
| | | | | | | | | | | | | | | | |
| Increase (decrease) in net assets resulting from operations | | | 85,977 | | | | 8,739 | | | | 62,336 | | | | 842 | |
| | | | | | | | | | | | | | | | |
| From Distributions to Shareholders | | | | | | | | | | | | | | | | |
Net investment income, Class A | | | — | | | | — | | | | (1,269 | ) | | | (461 | ) |
Net investment income, Class C | | | — | | | | — | | | | (219 | ) | | | — | |
Net investment income, Class I | | | — | | | | — | | | | (3,715 | ) | | | (1,433 | ) |
Net investment income, Class R6 | | | — | | | | — | | | | (1 | ) | | | — | |
Net realized long-term gains, Class A | | | (3,423 | ) | | | (2,379 | ) | | | (5,493 | ) | | | (4,360 | ) |
Net realized long-term gains, Class C | | | (815 | ) | | | (518 | ) | | | (1,848 | ) | | | (1,502 | ) |
Net realized long-term gains, Class I | | | (3,649 | ) | | | (1,712 | ) | | | (12,527 | ) | | | (9,351 | ) |
Net realized long-term gains, Class R6 | | | — | | | | — | | | | (2 | ) | | | — | |
| | | | | | | | | | | | | | | | |
| Decrease in net assets from distributions to shareholders | | | (7,887 | ) | | | (4,609 | ) | | | (25,074 | ) | | | (17,107 | ) |
| | | | | | | | | | | | | | | | |
| From Share Transactions (See Note 6) | | | | | | | | | | | | | | | | |
Change in net assets from share transactions, Class A | | | 66,312 | | | | 4,385 | | | | 8,100 | | | | 889 | |
Change in net assets from share transactions, Class C | | | 32,713 | | | | 3,875 | | | | 2,713 | | | | (482 | ) |
Change in net assets from share transactions, Class I | | | 348,597 | | | | 59,857 | | | | 73,702 | | | | (8,227 | ) |
Change in net assets from share transactions, Class R6 | | | — | | | | — | | | | 103 | | | | — | |
| | | | | | | | | | | | | | | | |
| Increase (decrease) in net assets from share transactions | | | 447,622 | | | | 68,117 | | | | 84,618 | | | | (7,820 | ) |
| | | | | | | �� | | | | | | | | | |
| | | | |
| Net increase (decrease) in net assets | | | 525,712 | | | | 72,247 | | | | 121,880 | | | | (24,085 | ) |
| | | | |
| Net Assets | | | | | | | | | | | | | | | | |
Beginning of period | | | 206,510 | | | | 134,263 | | | | 239,369 | | | | 263,454 | |
| | | | | | | | | | | | | | | | |
| End of period | | $ | 732,222 | | | $ | 206,510 | | | $ | 361,249 | | | $ | 239,369 | |
| | | | | | | | | | | | | | | | |
Accumulated undistributed net investment income (loss) at end of period | | $ | (1,112 | ) | | $ | (245 | ) | | $ | 253 | | | $ | 1,130 | |
See Notes to Financial Statements
57
VIRTUS EQUITY TRUST
STATEMENTS OF CHANGES IN NET ASSETS (Continued)
($ reported in thousands)
| | | | | | | | | | | | | | | | |
| | | | | | | | |
| | | Rampart Enhanced Core Equity Fund | | | Tactical Allocation Fund | |
| | | Year Ended
March 31,
2017 | | | Year Ended
March 31,
2016 | | | Year Ended
March 31,
2017
| | | Year Ended
March 31,
2016 | |
| | | | | | | | | | | | | |
| INCREASE/(DECREASE) IN NET ASSETS | | | | | | | | | | | | | | | | |
| From Operations | | | | | | | | | | | | | | | | |
Net investment income (loss) | | $ | 1,073 | | | $ | 913 | | | $ | 2,835 | | | $ | 3,796 | |
Net realized gain (loss) | | | 23,880 | | | | (5,847 | ) | | | 11,061 | | | | 143 | |
Net change in unrealized appreciation (depreciation) | | | (1,318 | ) | | | 9,531 | | | | (1,016 | ) | | | (17,346 | ) |
| | | | | | | | | | | | | | | | |
| Increase (decrease) in net assets resulting from operations | | | 23,635 | | | | 4,597 | | | | 12,880 | | | | (13,407 | ) |
| | | | | | | | | | | | | | | | |
| From Distributions to Shareholders | | | | | | | | | | | | | | | | |
Net investment income, Class A | | | (1,189 | ) | | | (809 | ) | | | (2,473 | ) | | | (3,132 | ) |
Net investment income, Class B | | | — | | | | — | | | | (1 | ) | | | (3 | ) |
Net investment income, Class C | | | (23 | ) | | | (147 | ) | | | (43 | ) | | | (81 | ) |
Net investment income, Class I | | | (299 | ) | | | (81 | ) | | | — | | | | — | |
Net realized short-term gains, Class A | | | (1,298 | ) | | | (8,350 | ) | | | (1,595 | ) | | | — | |
Net realized short-term gains, Class B | | | — | | | | — | | | | (1 | ) | | | — | |
Net realized short-term gains, Class C | | | (470 | ) | | | (3,086 | ) | | | (51 | ) | | | — | |
Net realized short-term gains, Class I | | | (223 | ) | | | (658 | ) | | | — | | | | — | |
Net realized long-term gains, Class A | | | (1,411 | ) | | | (10,127 | ) | | | (9,420 | ) | | | (8,371 | ) |
Net realized long-term gains, Class B | | | — | | | | — | | | | (9 | ) | | | (16 | ) |
Net realized long-term gains, Class C | | | (511 | ) | | | (3,756 | ) | | | (298 | ) | | | (388 | ) |
Net realized long-term gains, Class I | | | (242 | ) | | | (803 | ) | | | — | | | | — | |
| | | | | | | | | | | | | | | | |
| Decrease in net assets from distributions to shareholders | | | (5,666 | ) | | | (27,817 | ) | | | (13,891 | ) | | | (11,991 | ) |
| | | | | | | | | | | | | | | | |
| From Share Transactions (See Note 6) | | | | | | | | | | | | | | | | |
Change in net assets from share transactions, Class A | | | 524 | | | | 503 | | | | (9,161 | ) | | | (8,747 | ) |
Change in net assets from share transactions, Class B | | | — | | | | — | | | | (208 | ) | | | (126 | ) |
Change in net assets from share transactions, Class C | | | (3,110 | ) | | | 4,969 | | | | (1,069 | ) | | | 344 | |
Change in net assets from share transactions, Class I | | | 6,999 | | | | 4,082 | | | | — | | | | — | |
| | | | | | | | | | | | | | | | |
| Increase (decrease) in net assets from share transactions | | | 4,413 | | | | 9,554 | | | | (10,438 | ) | | | (8,529 | ) |
| | | | | | | | | | | | | | | | |
| | | | |
| Net increase (decrease) in net assets | | | 22,382 | | | | (13,666 | ) | | | (11,449 | ) | | | (33,927 | ) |
| | | | |
| Net Assets | | | | | | | | | | | | | | | | |
Beginning of period | | | 149,340 | | | | 163,006 | | | | 153,215 | | | | 187,142 | |
| | | | | | | | | | | | | | | | |
| End of period | | $ | 171,722 | | | $ | 149,340 | | | $ | 141,766 | | | $ | 153,215 | |
| | | | | | | | | | | | | | | | |
Accumulated undistributed net investment income (loss) at end of period | | $ | 426 | | | $ | 866 | | | $ | (9 | ) | | $ | (159 | ) |
See Notes to Financial Statements
58
VIRTUS EQUITY TRUST
FINANCIAL HIGHLIGHTS
SELECTED PER SHARE DATA AND RATIOS FOR A SHARE OUTSTANDING
THROUGHOUT EACH PERIOD
| | | | | | | | | | | | | | | | | | | | | | | | | | | | | | | | | | | | | | | | | | | | | | | | | | | | | | | | | | | | | | | | | | | | | | | | | | | | | |
| | | | Net Asset Value,
Beginning of Period | | Net Investment Income (Loss)(2) | | Net Realized and
Unrealized Gain (Loss) | | Total from Investment Operations | | Dividends from
Net Investment Income | | Distributions from
Net Realized Gains | | Total Distributions | | Change in Net Asset Value | | Net Asset Value, End of Period | | Total
Return(1) | | Net Assets, End of Period
(in thousands) | | Ratio of Net Expenses to
Average Net Assets(10) | | Ratio of Gross Expenses to Average
Net Assets (before waivers and
reimbursements)(10) | | Ratio of Net Investment Income
(Loss) to Average Net Assets | | Portfolio Turnover Rate |
| Contrarian Value | | | | | | | | | | | | | | | | | | | | | | | | | | | | | | | | | | | | | | | | | | | | | | | | | | | | | | | | | | | | | | | | | | | | | | | | | | | | | |
Fund | | | | | | | | | | | | | | | | | | | | | | | | | | | | | | | | | | | | | | | | | | | | | | | | | | | | | | | | | | | | | | | | | | | | | | | | | | | | | |
Class A | | | | | | | | | | | | | | | | | | | | | | | | | | | | | | | | | | | | | | | | | | | | | | | | | | | | | | | | | | | | | | | | | | | | | | | | | | | | | |
4/1/16 to 3/31/17 | | | | | $ | 31.48 | | | | | 0.33 | | | | | 4.40 | | | | | 4.73 | | | | | (0.25 | ) | | | | — | | | | | (0.25 | ) | | | | 4.48 | | | | $ | 35.96 | | | | | 15.07 | %(14) | | | $ | 79,463 | | | | | 1.43 | %(9)(12)(14) | | | | 1.43 | % | | | | 0.96 | %(14) | | | | 15 | % |
4/1/15 to 3/31/16 | | | | | | 36.18 | | | | | 0.17 | | | | | (4.71 | ) | | | | (4.54 | ) | | | | (0.16 | ) | | | | — | | | | | (0.16 | ) | | | | (4.70 | ) | | | | 31.48 | | | | | (12.60 | ) | | | | 107,958 | | | | | 1.41 | (12) | | | | 1.41 | | | | | 0.52 | | | | | 13 | |
4/1/14 to 3/31/15 | | | | | | 37.12 | | | | | 0.34 | | | | | (0.97 | ) | | | | (0.63 | ) | | | | (0.31 | ) | | | | — | | | | | (0.31 | ) | | | | (0.94 | ) | | | | 36.18 | | | | | (1.73 | ) | | | | 190,896 | | | | | 1.37 | (12) | | | | 1.37 | | | | | 0.92 | | | | | 34 | |
4/1/13 to 3/31/14 | | | | | | 29.97 | | | | | 0.16 | | | | | 7.07 | | | | | 7.23 | | | | | (0.08 | ) | | | | — | | | | | (0.08 | ) | | | | 7.15 | | | | | 37.12 | | | | | 24.20 | | | | | 251,498 | | | | | 1.39 | (12) | | | | 1.39 | | | | | 0.51 | | | | | 15 | |
4/1/12 to 3/31/13 | | | | | | 26.21 | | | | | 0.10 | | | | | 3.72 | | | | | 3.82 | | | | | (0.06 | ) | | | | — | | | | | (0.06 | ) | | | | 3.76 | | | | | 29.97 | | | | | 14.64 | | | | | 240,250 | | | | | 1.41 | (12) | | | | 1.41 | | | | | 0.38 | | | | | 19 | |
| | | | | | | | | | | | | | | | |
Class C | | | | | | | | | | | | | | | | | | | | | | | | | | | | | | | | | | | | | | | | | | | | | | | | | | | | | | | | | | | | | | | | | | | | | | | | | | | | | |
4/1/16 to 3/31/17 | | | | | $ | 30.00 | | | | | 0.07 | | | | | 4.20 | | | | | 4.27 | | | | | (0.01 | ) | | | | — | | | | | (0.01 | ) | | | | 4.26 | | | | $ | 34.26 | | | | | 14.22 | %(14) | | | $ | 31,587 | | | | | 2.18 | %(9)(12)(14) | | | | 2.18 | % | | | | 0.21 | %(14) | | | | 15 | % |
4/1/15 to 3/31/16 | | | | | | 34.62 | | | | | (0.07 | ) | | | | (4.52 | ) | | | | (4.59 | ) | | | | (0.03 | ) | | | | — | | | | | (0.03 | ) | | | | (4.62 | ) | | | | 30.00 | | | | | (13.27 | ) | | | | 36,977 | | | | | 2.16 | (12) | | | | 2.16 | | | | | (0.23 | ) | | | | 13 | |
4/1/14 to 3/31/15 | | | | | | 35.55 | | | | | 0.05 | | | | | (0.92 | ) | | | | (0.87 | ) | | | | (0.06 | ) | | | | — | | | | | (0.06 | ) | | | | (0.93 | ) | | | | 34.62 | | | | | (2.44 | ) | | | | 60,813 | | | | | 2.12 | (12) | | | | 2.12 | | | | | 0.14 | | | | | 34 | |
4/1/13 to 3/31/14 | | | | | | 28.84 | | | | | (0.07 | ) | | | | 6.78 | | | | | 6.71 | | | | | — | | | | | — | | | | | — | | | | | 6.71 | | | | | 35.55 | | | | | 23.23 | | | | | 62,738 | | | | | 2.14 | (12) | | | | 2.14 | | | | | (0.24 | ) | | | | 15 | |
4/1/12 to 3/31/13 | | | | | | 25.34 | | | | | (0.09 | ) | | | | 3.59 | | | | | 3.50 | | | | | — | | | | | — | | | | | — | | | | | 3.50 | | | | | 28.84 | | | | | 13.81 | | | | | 54,236 | | | | | 2.16 | (12) | | | | 2.16 | | | | | (0.37 | ) | | | | 19 | |
| | | | | | | | | | | | | | | | |
Class I | | | | | | | | | | | | | | | | | | | | | | | | | | | | | | | | | | | | | | | | | | | | | | | | | | | | | | | | | | | | | | | | | | | | | | | | | | | | | |
4/1/16 to 3/31/17 | | | | | $ | 31.51 | | | | | 0.42 | | | | | 4.39 | | | | | 4.81 | | | | | (0.34 | ) | | | | — | | | | | (0.34 | ) | | | | 4.47 | | | | $ | 35.98 | | | | | 15.36 | %(14) | | | $ | 78,732 | | | | | 1.18 | %(9)(12(14) | | | | 1.18 | % | | | | 1.22 | %(14) | | | | 15 | % |
4/1/15 to 3/31/16 | | | | | | 36.18 | | | | | 0.25 | | | | | (4.71 | ) | | | | (4.46 | ) | | | | (0.21 | ) | | | | — | | | | | (0.21 | ) | | | | (4.67 | ) | | | | 31.51 | | | | | (12.40 | ) | | | | 104,879 | | | | | 1.16 | (12) | | | | 1.16 | | | | | 0.77 | | | | | 13 | |
4/1/14 to 3/31/15 | | | | | | 37.11 | | | | | 0.40 | | | | | (0.92 | ) | | | | (0.52 | ) | | | | (0.41 | ) | | | | — | | | | | (0.41 | ) | | | | (0.93 | ) | | | | 36.18 | | | | | (1.48 | ) | | | | 176,005 | | | | | 1.12 | (12) | | | | 1.12 | | | | | 1.08 | | | | | 34 | |
4/1/13 to 3/31/14 | | | | | | 29.97 | | | | | 0.25 | | | | | 7.05 | | | | | 7.30 | | | | | (0.16 | ) | | | | — | | | | | (0.16 | ) | | | | 7.14 | | | | | 37.11 | | | | | 24.52 | | | | | 145,115 | | | | | 1.14 | (12) | | | | 1.14 | | | | | 0.77 | | | | | 15 | |
4/1/12 to 3/31/13 | | | | | | 26.25 | | | | | 0.17 | | | | | 3.71 | | | | | 3.88 | | | | | (0.16 | ) | | | | — | | | | | (0.16 | ) | | | | 3.72 | | | | | 29.97 | | | | | 14.89 | | | | | 108,736 | | | | | 1.16 | (12) | | | | 1.16 | | | | | 0.63 | | | | | 19 | |
| | | | | | | | | | | | | | | | |
Class R6 | | | | | | | | | | | | | | | | | | | | | | | | | | | | | | | | | | | | | | | | | | | | | | | | | | | | | | | | | | | | | | | | | | | | | | | | | | | | | |
4/1/16 to 3/31/17 | | | | | $ | 31.56 | | | | | 0.46 | | | | | 4.40 | | | | | 4.86 | | | | | (0.41 | ) | | | | — | | | | | (0.41 | ) | | | | 4.45 | | | | $ | 36.01 | | | | | 15.51 | %(14) | | | $ | 3,047 | | | | | 1.02 | %(9)(12)(14) | | | | 1.03 | % | | | | 1.35 | %(14) | | | | 15 | % |
4/1/15 to 3/31/16 | | | | | | 36.20 | | | | | 0.29 | | | | | (4.69 | ) | | | | (4.40 | ) | | | | (0.24 | ) | | | | — | | | | | (0.24 | ) | | | | (4.64 | ) | | | | 31.56 | | | | | (12.24 | ) | | | | 4,781 | | | | | 0.99 | (12) | | | | 0.99 | | | | | 0.95 | | | | | 13 | |
11/12/14(7) to 3/31/15 | | | | | | 36.99 | | | | | 0.08 | | | | | (0.66 | ) | | | | (0.58 | ) | | | | (0.21 | ) | | | | — | | | | | (0.21 | ) | | | | (0.79 | ) | | | | 36.20 | | | | | (1.57 | ) | | | | 98 | | | | | 0.99 | (3) | | | | 0.99 | (3) | | | | 0.56 | (3) | | | | 34 | (13) |
KAR Capital Growth Fund | | | | | | | | | | | | | | | | | | | | | | | | | | | | | | | | | | | | | | | | | | | | | | | | | | | | | | | | | | | | | | | | | | | | | | | | | | | | | |
Class A | | | | | | | | | | | | | | | | | | | | | | | | | | | | | | | | | | | | | | | | | | | | | | | | | | | | | | | | | | | | | | | | | | | | | | | | | | | | | |
4/1/16 to 3/31/17 | | | | | $ | 13.66 | | | | | (0.05 | ) | | | | 1.64 | | | | | 1.59 | | | | | — | | | | | (1.15 | ) | | | | (1.15 | ) | | | | 0.44 | | | | $ | 14.10 | | | | | 12.34 | %(14) | | | $ | 402,118 | | | | | 1.33 | %(9)(12)(14) | | | | 1.34 | % | | | | (0.40 | )%(14) | | | | 21 | % |
4/1/15 to 3/31/16 | | | | | | 14.23 | | | | | (0.05 | ) | | | | 0.13 | | | | | 0.08 | | | | | — | | | | | (0.65 | ) | | | | (0.65 | ) | | | | (0.57 | ) | | | | 13.66 | | | | | 0.39 | | | | | 401,617 | | | | | 1.30 | (12) | | | | 1.30 | | | | | (0.32 | ) | | | | 20 | |
4/1/14 to 3/31/15 | | | | | | 12.41 | | | | | (0.03 | ) | | | | 2.40 | | | | | 2.37 | | | | | — | | | | | (0.55 | ) | | | | (0.55 | ) | | | | 1.82 | | | | | 14.23 | | | | | 19.29 | | | | | 433,635 | | | | | 1.28 | (12) | | | | 1.28 | | | | | (0.22 | ) | | | | 28 | |
4/1/13 to 3/31/14 | | | | | | 10.45 | | | | | (0.01 | ) | | | | 2.00 | | | | | 1.99 | | | | | (0.03 | ) | | | | — | | | | | (0.03 | ) | | | | 1.96 | | | | | 12.41 | | | | | 19.11 | | | | | 399,131 | | | | | 1.28 | (12) | | | | 1.28 | | | | | (0.11 | ) | | | | 26 | |
4/1/12 to 3/31/13 | | | | | | 10.05 | | | | | 0.03 | | | | | 0.37 | | | | | 0.40 | | | | | — | | | | | — | | | | | — | | | | | 0.40 | | | | | 10.45 | | | | | 3.98 | | | | | 373,069 | | | | | 1.34 | (12) | | | | 1.34 | | | | | 0.31 | | | | | 20 | |
| | | | | | | | | | | | | | | | |
Class C | | | | | | | | | | | | | | | | | | | | | | | | | | | | | | | | | | | | | | | | | | | | | | | | | | | | | | | | | | | | | | | | | | | | | | | | | | | | | |
4/1/16 to 3/31/17 | | | | | $ | 11.27 | | | | | (0.13 | ) | | | | 1.33 | | | | | 1.20 | | | | | — | | | | | (1.15 | ) | | | | (1.15 | ) | | | | 0.05 | | | | $ | 11.32 | | | | | 11.47 | %(14) | | | $ | 13,345 | | | | | 2.08 | %(9)(12)(14) | | | | 2.09 | % | | | | (1.16 | )%(14) | | | | 21 | % |
4/1/15 to 3/31/16 | | | | | | 11.93 | | | | | (0.12 | ) | | | | 0.11 | | | | | (0.01 | ) | | | | — | | | | | (0.65 | ) | | | | (0.65 | ) | | | | (0.66 | ) | | | | 11.27 | | | | | (0.31 | ) | | | | 19,832 | | | | | 2.05 | (12) | | | | 2.06 | | | | | (1.07 | ) | | | | 20 | |
4/1/14 to 3/31/15 | | | | | | 10.57 | | | | | (0.11 | ) | | | | 2.02 | | | | | 1.91 | | | | | — | | | | | (0.55 | ) | | | | (0.55 | ) | | | | 1.36 | | | | | 11.93 | | | | | 18.28 | | | | | 11,999 | | | | | 2.02 | (12) | | | | 2.02 | | | | | (0.97 | ) | | | | 28 | |
4/1/13 to 3/31/14 | | | | | | 8.94 | | | | | (0.08 | ) | | | | 1.71 | | | | | 1.63 | | | | | — | | | | | — | | | | | — | | | | | 1.63 | | | | | 10.57 | | | | | 18.23 | | | | | 6,329 | | | | | 2.03 | (12) | | | | 2.03 | | | | | (0.86 | ) | | | | 26 | |
4/1/12 to 3/31/13 | | | | | | 8.66 | | | | | (0.04 | ) | | | | 0.32 | | | | | 0.28 | | | | | — | | | | | — | | | | | — | | | | | 0.28 | | | | | 8.94 | | | | | 3.23 | | | | | 5,993 | | | | | 2.09 | (12) | | | | 2.09 | | | | | (0.44 | ) | | | | 20 | |
The footnote legend is at the end of the Financial Highlights.
See Notes to Financial Statements
59
VIRTUS EQUITY TRUST
FINANCIAL HIGHLIGHTS
SELECTED PER SHARE DATA AND RATIOS FOR A SHARE OUTSTANDING
THROUGHOUT EACH PERIOD
| | | | | | | | | | | | | | | | | | | | | | | | | | | | | | | | | | | | | | | | | | | | | | | | | | | | | | | | | | | | | | | | | | | | | | | | | | | | | |
| | | | Net Asset Value,
Beginning of Period | | Net Investment Income (Loss)(2) | | Net Realized and
Unrealized Gain (Loss) | | Total from Investment Operations | | Dividends from
Net Investment Income | | Distributions from
Net Realized Gains | | Total Distributions | | Change in Net Asset Value | | Net Asset Value, End of Period | | Total
Return(1) | | Net Assets, End of Period
(in thousands) | | Ratio of Net Expenses to
Average Net Assets(10) | | Ratio of Gross Expenses to Average
Net Assets (before waivers and
reimbursements)(10) | | Ratio of Net Investment Income
(Loss) to Average Net Assets | | Portfolio Turnover Rate |
| KAR Capital Growth | | | | | | | | | | | | | | | | | | | | | | | | | | | | | | | | | | | | | | | | | | | | | | | | | | | | | | | | | | | | | | | | | | | | | | | | | | | | | |
Fund (Continued) | | | | | | | | | | | | | | | | | | | | | | | | | | | | | | | | | | | | | | | | | | | | | | | | | | | | | | | | | | | | | | | | | | | | | | | | | | | | | |
Class I | | | | | | | | | | | | | | | | | | | | | | | | | | | | | | | | | | | | | | | | | | | | | | | | | | | | | | | | | | | | | | | | | | | | | | | | | | | | | |
4/1/16 to 3/31/17 | | | | | $ | 14.00 | | | | | (0.01 | ) | | | | 1.68 | | | | | 1.67 | | | | | — | | | | | (1.15 | ) | | | | (1.15 | ) | | | | 0.52 | | | | $ | 14.52 | | | | | 12.61 | %(14) | | | $ | 10,180 | | | | | 1.08 | %(9)(12)(14) | | | | 1.09 | % | | | | (0.15 | )%(14) | | | | 21 | % |
4/1/15 to 3/31/16 | | | | | | 14.53 | | | | | (0.01 | ) | | | | 0.13 | | | | | 0.12 | | | | | — | | | | | (0.65 | ) | | | | (0.65 | ) | | | | (0.53 | ) | | | | 14.00 | | | | | 0.66 | | | | | 8,227 | | | | | 1.05 | (12) | | | | 1.05 | | | | | (0.07 | ) | | | | 20 | |
4/1/14 to 3/31/15 | | | | | | 12.64 | | | | | — | (5) | | | | 2.44 | | | | | 2.44 | | | | | — | | | | | (0.55 | ) | | | | (0.55 | ) | | | | 1.89 | | | | | 14.53 | | | | | 19.50 | | | | | 8,595 | | | | | 1.02 | (12) | | | | 1.02 | | | | | 0.03 | | | | | 28 | |
4/1/13 to 3/31/14 | | | | | | 10.64 | | | | | 0.02 | | | | | 2.04 | | | | | 2.06 | | | | | (0.06 | ) | | | | — | | | | | (0.06 | ) | | | | 2.00 | | | | | 12.64 | | | | | 19.45 | | | | | 5,532 | | | | | 1.03 | (12) | | | | 1.03 | | | | | 0.14 | | | | | 26 | |
4/1/12 to 3/31/13 | | | | | | 10.21 | | | | | 0.06 | | | | | 0.37 | | | | | 0.43 | | | | | — | | | | | — | | | | | — | | | | | 0.43 | | | | | 10.64 | | | | | 4.21 | | | | | 5,650 | | | | | 1.09 | (12) | | | | 1.09 | | | | | 0.57 | | | | | 20 | |
| KAR Global Quality | | | | | | | | | | | | | | | | | | | | | | | | | | | | | | | | | | | | | | | | | | | | | | | | | | | | | | | | | | | | | | | | | | | | | | | | | | | | | |
Dividend Fund | | | | | | | | | | | | | | | | | | | | | | | | | | | | | | | | | | | | | | | | | | | | | | | | | | | | | | | | | | | | | | | | | | | | | | | | | | | | | |
Class A | | | | | | | | | | | | | | | | | | | | | | | | | | | | | | | | | | | | | | | | | | | | | | | | | | | | | | | | | | | | | | | | | | | | | | | | | | | | | |
4/1/16 to 3/31/17 | | | | | $ | 15.09 | | | | | 0.20 | | | | | 1.66 | | | | | 1.86 | | | | | (0.14 | ) | | | | — | | | | | (0.14 | ) | | | | 1.72 | | | | $ | 16.81 | | | | | 12.42 | % | | | $ | 46,670 | | | | | 1.36 | %(9) | | | | 1.48 | % | | | | 1.29 | % | | | | 119 | % |
4/1/15 to 3/31/16 | | | | | | 15.40 | | | | | 0.14 | | | | | (0.37 | ) | | | | (0.23 | ) | | | | (0.08 | ) | | | | — | | | | | (0.08 | ) | | | | (0.31 | ) | | | | 15.09 | | | | | (1.53 | ) | | | | 50,081 | | | | | 1.35 | | | | | 1.44 | | | | | 0.94 | | | | | 25 | |
4/1/14 to 3/31/15 | | | | | | 13.93 | | | | | 0.10 | | | | | 1.49 | | | | | 1.59 | | | | | (0.12 | ) | | | | — | | | | | (0.12 | ) | | | | 1.47 | | | | | 15.40 | | | | | 11.45 | | | | | 55,215 | | | | | 1.35 | | | | | 1.42 | | | | | 0.71 | | | | | 56 | |
4/1/13 to 3/31/14 | | | | | | 11.96 | | | | | 0.10 | | | | | 1.98 | | | | | 2.08 | | | | | (0.11 | ) | | | | — | | | | | (0.11 | ) | | | | 1.97 | | | | | 13.93 | | | | | 17.50 | | | | | 49,275 | | | | | 1.35 | | | | | 1.43 | | | | | 0.81 | | | | | 23 | |
4/1/12 to 3/31/13 | | | | | | 10.76 | | | | | 0.13 | | | | | 1.18 | | | | | 1.31 | | | | | (0.11 | ) | | | | — | | | | | (0.11 | ) | | | | 1.20 | | | | | 11.96 | | | | | 12.36 | | | | | 48,193 | | | | | 1.35 | | | | | 1.47 | | | | | 1.19 | | | | | 32 | |
| | | | | | | | | | | | | | | | |
Class C | | | | | | | | | | | | | | | | | | | | | | | | | | | | | | | | | | | | | | | | | | | | | | | | | | | | | | | | | | | | | | | | | | | | | | | | | | | | | |
4/1/16 to 3/31/17 | | | | | $ | 14.68 | | | | | 0.08 | | | | | 1.62 | | | | | 1.70 | | | | | — | | | | | — | | | | | — | | | | | 1.70 | | | | $ | 16.38 | | | | | 11.58 | % | | | $ | 6,950 | | | | | 2.11 | %(9) | | | | 2.23 | % | | | | 0.54 | % | | | | 119 | % |
4/1/15 to 3/31/16 | | | | | | 15.03 | | | | | 0.01 | | | | | (0.35 | ) | | | | (0.34 | ) | | | | (0.01 | ) | | | | — | | | | | (0.01 | ) | | | | (0.35 | ) | | | | 14.68 | | | | | (2.26 | ) | | | | 8,211 | | | | | 2.10 | | | | | 2.18 | | | | | 0.10 | | | | | 25 | |
4/1/14 to 3/31/15 | | | | | | 13.67 | | | | | 0.01 | | | | | 1.43 | | | | | 1.44 | | | | | (0.08 | ) | | | | — | | | | | (0.08 | ) | | | | 1.36 | | | | | 15.03 | | | | | 10.64 | | | | | 20,383 | | | | | 2.10 | | | | | 2.16 | | | | | 0.07 | | | | | 56 | |
4/1/13 to 3/31/14 | | | | | | 11.77 | | | | | 0.01 | | | | | 1.94 | | | | | 1.95 | | | | | (0.05 | ) | | | | — | | | | | (0.05 | ) | | | | 1.90 | | | | | 13.67 | | | | | 16.56 | | | | | 3,803 | | | | | 2.10 | | | | | 2.18 | | | | | 0.05 | | | | | 23 | |
4/1/12 to 3/31/13 | | | | | | 10.60 | | | | | 0.04 | | | | | 1.18 | | | | | 1.22 | | | | | (0.05 | ) | | | | — | | | | | (0.05 | ) | | | | 1.17 | | | | | 11.77 | | | | | 11.57 | | | | | 3,452 | | | | | 2.10 | | | | | 2.23 | | | | | 0.42 | | | | | 32 | |
| | | | | | | | | | | | | | | | |
Class I | | | | | | | | | | | | | | | | | | | | | | | | | | | | | | | | | | | | | | | | | | | | | | | | | | | | | | | | | | | | | | | | | | | | | | | | | | | | | |
4/1/16 to 3/31/17 | | | | | $ | 15.12 | | | | | 0.25 | | | | | 1.65 | | | | | 1.90 | | | | | (0.18 | ) | | | | — | | | | | (0.18 | ) | | | | 1.72 | | | | $ | 16.84 | | | | | 12.66 | % | | | $ | 7,096 | | | | | 1.11 | %(9) | | | | 1.23 | % | | | | 1.59 | % | | | | 119 | % |
4/1/15 to 3/31/16 | | | | | | 15.40 | | | | | 0.17 | | | | | (0.35 | ) | | | | (0.18 | ) | | | | (0.10 | ) | | | | — | | | | | (0.10 | ) | | | | (0.28 | ) | | | | 15.12 | | | | | (1.21 | ) | | | | 6,496 | | | | | 1.10 | | | | | 1.18 | | | | | 1.15 | | | | | 25 | |
4/1/14 to 3/31/15 | | | | | | 13.93 | | | | | 0.14 | | | | | 1.49 | | | | | 1.63 | | | | | (0.16 | ) | | | | — | | | | | (0.16 | ) | | | | 1.47 | | | | | 15.40 | | | | | 11.72 | | | | | 9,776 | | | | | 1.10 | | | | | 1.17 | | | | | 0.96 | | | | | 56 | |
4/1/13 to 3/31/14 | | | | | | 11.97 | | | | | 0.13 | | | | | 1.97 | | | | | 2.10 | | | | | (0.14 | ) | | | | — | | | | | (0.14 | ) | | | | 1.96 | | | | | 13.93 | | | | | 17.70 | | | | | 9,546 | | | | | 1.10 | | | | | 1.18 | | | | | 0.99 | | | | | 23 | |
4/1/12 to 3/31/13 | | | | | | 10.76 | | | | | 0.20 | | | | | 1.15 | | | | | 1.35 | | | | | (0.14 | ) | | | | — | | | | | (0.14 | ) | | | | 1.21 | | | | | 11.97 | | | | | 12.73 | | | | | 30,360 | | | | | 1.10 | | | | | 1.12 | | | | | 1.73 | | | | | 32 | |
KAR Mid-Cap Core Fund | | | | | | | | | | | | | | | | | | | | | | | | | | | | | | | | | | | | | | | | | | | | | | | | | | | | | | | | | | | | | | | | | | | | | | | | | | | | | |
Class A | | | | | | | | | | | | | | | | | | | | | | | | | | | | | | | | | | | | | | | | | | | | | | | | | | | | | | | | | | | | | | | | | | | | | | | | | | | | | |
4/1/16 to 3/31/17 | | | | | $ | 22.60 | | | | | (0.08 | ) | | | | 3.28 | | | | | 3.20 | | | | | — | | | | | — | | | | | — | | | | | 3.20 | | | | $ | 25.80 | | | | | 14.16 | % | | | $ | 20,615 | | | | | 1.26 | %(8)(9) | | | | 1.55 | % | | | | (0.32 | )% | | | | 28 | % |
4/1/15 to 3/31/16 | | | | | | 23.00 | | | | | (0.06 | ) | | | | (0.20 | ) | | | | (0.26 | ) | | | | — | | | | | (0.14 | ) | | | | (0.14 | ) | | | | (0.40 | ) | | | | 22.60 | | | | | (1.14 | ) | | | | 20,639 | | | | | 1.35 | | | | | 1.64 | | | | | (0.27 | ) | | | | 21 | |
4/1/14 to 3/31/15 | | | | | | 19.80 | | | | | (0.07 | ) | | | | 4.47 | | | | | 4.40 | | | | | — | | | | | (1.20 | ) | | | | (1.20 | ) | | | | 3.20 | | | | | 23.00 | | | | | 22.75 | | | | | 13,080 | | | | | 1.35 | | | | | 2.46 | | | | | (0.34 | ) | | | | 26 | |
4/1/13 to 3/31/14 | | | | | | 17.49 | | | | | (0.06 | ) | | | | 2.68 | | | | | 2.62 | | | | | — | | | | | (0.31 | ) | | | | (0.31 | ) | | | | 2.31 | | | | | 19.80 | | | | | 15.17 | | | | | 3,027 | | | | | 1.35 | | | | | 3.08 | | | | | (0.31 | ) | | | | 30 | |
4/1/12 to 3/31/13 | | | | | | 15.80 | | | | | 0.19 | | | | | 1.86 | | | | | 2.05 | | | | | (0.25 | ) | | | | (0.11 | ) | | | | (0.36 | ) | | | | 1.69 | | | | | 17.49 | | | | | 13.21 | | | | | 1,691 | | | | | 1.35 | | | | | 3.92 | | | | | 1.20 | | | | | 62 | |
| | | | | | | | | | | | | | | | |
Class C | | | | | | | | | | | | | | | | | | | | | | | | | | | | | | | | | | | | | | | | | | | | | | | | | | | | | | | | | | | | | | | | | | | | | | | | | | | | | |
4/1/16 to 3/31/17 | | | | | $ | 21.57 | | | | | (0.24 | ) | | | | 3.12 | | | | | 2.88 | | | | | — | | | | | — | | | | | — | | | | | 2.88 | | | | $ | 24.45 | | | | | 13.35 | % | | | $ | 14,279 | | | | | 2.00 | %(8)(9) | | | | 2.28 | % | | | | (1.04 | )% | | | | 28 | % |
4/1/15 to 3/31/16 | | | | | | 22.12 | | | | | (0.22 | ) | | | | (0.19 | ) | | | | (0.41 | ) | | | | — | | | | | (0.14 | ) | | | | (0.14 | ) | | | | (0.55 | ) | | | | 21.57 | | | | | (1.91 | ) | | | | 6,670 | | | | | 2.10 | | | | | 2.38 | | | | | (1.03 | ) | | | | 21 | |
4/1/14 to 3/31/15 | | | | | | 19.23 | | | | | (0.23 | ) | | | | 4.32 | | | | | 4.09 | | | | | — | | | | | (1.20 | ) | | | | (1.20 | ) | | | | 2.89 | | | | | 22.12 | | | | | 21.84 | | | | | 4,363 | | | | | 2.10 | | | | | 2.83 | | | | | (1.10 | ) | | | | 26 | |
4/1/13 to 3/31/14 | | | | | | 17.12 | | | | | (0.18 | ) | | | | 2.60 | | | | | 2.42 | | | | | — | | | | | (0.31 | ) | | | | (0.31 | ) | | | | 2.11 | | | | | 19.23 | | | | | 14.32 | | | | | 209 | | | | | 2.10 | | | | | 3.84 | | | | | (1.01 | ) | | | | 30 | |
4/1/12 to 3/31/13 | | | | | | 15.50 | | | | | 0.06 | | | | | 1.83 | | | | | 1.89 | | | | | (0.16 | ) | | | | (0.11 | ) | | | | (0.27 | ) | | | | 1.62 | | | | | 17.12 | | | | | 12.42 | | | | | 226 | | | | | 2.10 | | | | | 4.70 | | | | | 0.36 | | | | | 62 | |
The footnote legend is at the end of the Financial Highlights.
See Notes to Financial Statements
60
VIRTUS EQUITY TRUST
FINANCIAL HIGHLIGHTS
SELECTED PER SHARE DATA AND RATIOS FOR A SHARE OUTSTANDING
THROUGHOUT EACH PERIOD
| | | | | | | | | | | | | | | | | | | | | | | | | | | | | | | | | | | | | | | | | | | | | | | | | | | | | | | | | | | | | | | | | | | | | | | | | | | | | |
| | | | Net Asset Value,
Beginning of Period | | Net Investment Income (Loss)(2) | | Net Realized and
Unrealized Gain (Loss) | | Total from Investment Operations | | Dividends from
Net Investment Income | | Distributions from
Net Realized Gains | | Total Distributions | | Change in Net Asset Value | | Net Asset Value, End of Period | | Total
Return(1) | | Net Assets, End of Period
(in thousands) | | Ratio of Net Expenses to
Average Net Assets(10) | | Ratio of Gross Expenses to Average
Net Assets (before waivers and
reimbursements)(10) | | Ratio of Net Investment Income
(Loss) to Average Net Assets | | Portfolio Turnover Rate |
| KAR Mid-Cap Core | | | | | | | | | | | | | | | | | | | | | | | | | | | | | | | | | | | | | | | | | | | | | | | | | | | | | | | | | | | | | | | | | | | | | | | | | | | | | |
Fund (Continued) | | | | | | | | | | | | | | | | | | | | | | | | | | | | | | | | | | | | | | | | | | | | | | | | | | | | | | | | | | | | | | | | | | | | | | | | | | | | | |
Class I | | | | | | | | | | | | | | | | | | | | | | | | | | | | | | | | | | | | | | | | | | | | | | | | | | | | | | | | | | | | | | | | | | | | | | | | | | | | | |
4/1/16 to 3/31/17 | | | | | $ | 22.82 | | | | | (0.01 | ) | | | | 3.31 | | | | | 3.30 | | | | | — | | | | | — | | | | | — | | | | | 3.30 | | | | $ | 26.12 | | | | | 14.46 | % | | | $ | 50,922 | | | | | 0.99 | %(8)(9) | | | | 1.26 | % | | | | (0.02 | )% | | | | 28 | % |
4/1/15 to 3/31/16 | | | | | | 23.17 | | | | | (0.01 | ) | | | | (0.20 | ) | | | | (0.21 | ) | | | | — | | | | | (0.14 | ) | | | | (0.14 | ) | | | | (0.35 | ) | | | | 22.82 | | | | | (0.92 | ) | | | | 7,570 | | | | | 1.10 | | | | | 1.38 | | | | | (0.03 | ) | | | | 21 | |
4/1/14 to 3/31/15 | | | | | | 19.89 | | | | | (0.03 | ) | | | | 4.51 | | | | | 4.48 | | | | | — | | | | | (1.20 | ) | | | | (1.20 | ) | | | | 3.28 | | | | | 23.17 | | | | | 23.05 | | | | | 4,804 | | | | | 1.10 | | | | | 2.17 | | | | | (0.16 | ) | | | | 26 | |
4/1/13 to 3/31/14 | | | | | | 17.52 | | | | | (0.01 | ) | | | | 2.69 | | | | | 2.68 | | | | | — | | | | | (0.31 | ) | | | | (0.31 | ) | | | | 2.37 | | | | | 19.89 | | | | | 15.48 | | | | | 1,178 | | | | | 1.10 | | | | | 2.85 | | | | | (0.08 | ) | | | | 30 | |
4/1/12 to 3/31/13 | | | | | | 15.84 | | | | | 0.25 | | | | | 1.84 | | | | | 2.09 | | | | | (0.30 | ) | | | | (0.11 | ) | | | | (0.41 | ) | | | | 1.68 | | | | | 17.52 | | | | | 13.50 | | | | | 1,316 | | | | | 1.10 | | | | | 3.65 | | | | | 1.56 | | | | | 62 | |
KAR Mid-Cap Growth Fund | | | | | | | | | | | | | | | | | | | | | | | | | | | | | | | | | | | | | | | | | | | | | | | | | | | | | | | | | | | | | | | | | | | | | | | | | | | | | |
Class A | | | | | | | | | | | | | | | | | | | | | | | | | | | | | | | | | | | | | | | | | | | | | | | | | | | | | | | | | | | | | | | | | | | | | | | | | | | | | |
4/1/16 to 3/31/17 | | | | | $ | 21.92 | | | | | (0.16 | ) | | | | 3.15 | | | | | 2.99 | | | | | — | | | | | (0.35 | ) | | | | (0.35 | ) | | | | 2.64 | | | | $ | 24.56 | | | | | 13.81 | %(14) | | | $ | 80,648 | | | | | 1.41 | %(9)(14) | | | | 1.52 | % | | | | (0.75 | )%(14) | | | | 20 | % |
4/1/15 to 3/31/16 | | | | | | 22.80 | | | | | (0.18 | ) | | | | (0.36 | ) | | | | (0.54 | ) | | | | — | | | | | (0.34 | ) | | | | (0.34 | ) | | | | (0.88 | ) | | | | 21.92 | | | | | (2.51 | ) | | | | 76,660 | | | | | 1.39 | | | | | 1.49 | | | | | (0.84 | ) | | | | 26 | |
4/1/14 to 3/31/15 | | | | | | 21.30 | | | | | (0.15 | ) | | | | 2.34 | | | | | 2.19 | | | | | — | | | | | (0.69 | ) | | | | (0.69 | ) | | | | 1.50 | | | | | 22.80 | | | | | 10.50 | | | | | 83,158 | | | | | 1.43 | (8) | | | | 1.46 | | | | | (0.71 | ) | | | | 27 | |
4/1/13 to 3/31/14 | | | | | | 19.02 | | | | | (0.15 | ) | | | | 2.43 | | | | | 2.28 | | | | | — | | | | | — | | | | | — | | | | | 2.28 | | | | | 21.30 | | | | | 11.99 | | | | | 81,016 | | | | | 1.45 | | | | | 1.44 | | | | | (0.74 | ) | | | | 32 | |
4/1/12 to 3/31/13 | | | | | | 17.44 | | | | | (0.08 | ) | | | | 1.66 | | | | | 1.58 | | | | | — | | | | | — | | | | | — | | | | | 1.58 | | | | | 19.02 | | | | | 9.06 | | | | | 79,561 | | | | | 1.45 | | | | | 1.51 | | | | | (0.49 | ) | | | | 35 | |
| | | | | | | | | | | | | | | | |
Class C | | | | | | | | | | | | | | | | | | | | | | | | | | | | | | | | | | | | | | | | | | | | | | | | | | | | | | | | | | | | | | | | | | | | | | | | | | | | | |
4/1/16 to 3/31/17 | | | | | $ | 18.09 | | | | | (0.27 | ) | | | | 2.59 | | | | | 2.32 | | | | | — | | | | | (0.35 | ) | | | | (0.35 | ) | | | | 1.97 | | | | $ | 20.06 | | | | | 13.03 | %(14) | | | $ | 5,350 | | | | | 2.16 | %(9)(14) | | | | 2.27 | % | | | | (1.50 | )%(14) | | | | 20 | % |
4/1/15 to 3/31/16 | | | | | | 19.02 | | | | | (0.29 | ) | | | | (0.30 | ) | | | | (0.59 | ) | | | | — | | | | | (0.34 | ) | | | | (0.34 | ) | | | | (0.93 | ) | | | | 18.09 | | | | | (3.23 | ) | | | | 5,319 | | | | | 2.14 | | | | | 2.24 | | | | | (1.60 | ) | | | | 26 | |
4/1/14 to 3/31/15 | | | | | | 18.01 | | | | | (0.26 | ) | | | | 1.96 | | | | | 1.70 | | | | | — | | | | | (0.69 | ) | | | | (0.69 | ) | | | | 1.01 | | | | | 19.02 | | | | | 9.68 | | | | | 5,976 | | | | | 2.18 | (8) | | | | 2.21 | | | | | (1.46 | ) | | | | 27 | |
4/1/13 to 3/31/14 | | | | | | 16.21 | | | | | (0.26 | ) | | | | 2.06 | | | | | 1.80 | | | | | — | | | | | — | | | | | — | | | | | 1.80 | | | | | 18.01 | | | | | 11.10 | | | | | 5,233 | | | | | 2.20 | | | | | 2.19 | | | | | (1.49 | ) | | | | 32 | |
4/1/12 to 3/31/13 | | | | | | 14.97 | | | | | (0.18 | ) | | | | 1.42 | | | | | 1.24 | | | | | — | | | | | — | | | | | — | | | | | 1.24 | | | | | 16.21 | | | | | 8.28 | | | | | 4,850 | | | | | 2.20 | | | | | 2.26 | | | | | (1.24 | ) | | | | 35 | |
| | | | | | | | | | | | | | | | |
Class I | | | | | | | | | | | | | | | | | | | | | | | | | | | | | | | | | | | | | | | | | | | | | | | | | | | | | | | | | | | | | | | | | | | | | | | | | | | | | |
4/1/16 to 3/31/17 | | | | | $ | 22.42 | | | | | (0.11 | ) | | | | 3.24 | | | | | 3.13 | | | | | — | | | | | (0.35 | ) | | | | (0.35 | ) | | | | 2.78 | | | | $ | 25.20 | | | | | 14.13 | %(14) | | | $ | 3,872 | | | | | 1.16 | %(9)(14) | | | | 1.27 | % | | | | (0.50 | )%(14) | | | | 20 | % |
4/1/15 to 3/31/16 | | | | | | 23.26 | | | | | (0.13 | ) | | | | (0.37 | ) | | | | (0.50 | ) | | | | — | | | | | (0.34 | ) | | | | (0.34 | ) | | | | (0.84 | ) | | | | 22.42 | | | | | (2.24 | ) | | | | 2,961 | | | | | 1.14 | | | | | 1.24 | | | | | (0.60 | ) | | | | 26 | |
4/1/14 to 3/31/15 | | | | | | 21.66 | | | | | (0.10 | ) | | | | 2.39 | | | | | 2.29 | | | | | — | | | | | (0.69 | ) | | | | (0.69 | ) | | | | 1.60 | | | | | 23.26 | | | | | 10.79 | | | | | 3,288 | | | | | 1.18 | (8) | | | | 1.21 | | | | | (0.46 | ) | | | | 27 | |
4/1/13 to 3/31/14 | | | | | | 19.30 | | | | | (0.10 | ) | | | | 2.46 | | | | | 2.36 | | | | | — | | | | | — | | | | | — | | | | | 2.36 | | | | | 21.66 | | | | | 12.23 | | | | | 2,324 | | | | | 1.20 | | | | | 1.19 | | | | | (0.49 | ) | | | | 32 | |
4/1/12 to 3/31/13 | | | | | | 17.65 | | | | | (0.04 | ) | | | | 1.69 | | | | | 1.65 | | | | | — | | | | | — | | | | | — | | | | | 1.65 | | | | | 19.30 | | | | | 9.35 | | | | | 1,932 | | | | | 1.20 | | | | | 1.26 | | | | | (0.24 | ) | | | | 35 | |
KAR Small-Cap Core Fund | | | | | | | | | | | | | | | | | | | | | | | | | | | | | | | | | | | | | | | | | | | | | | | | | | | | | | | | | | | | | | | | | | | | | | | | | | | | | |
Class A | | | | | | | | | | | | | | | | | | | | | | | | | | | | | | | | | | | | | | | | | | | | | | | | | | | | | | | | | | | | | | | | | | | | | | | | | | | | | |
4/1/16 to 3/31/17 | | | | | $ | 21.39 | | | | | (0.07 | ) | | | | 4.26 | | | | | 4.19 | | | | | — | | | | | (1.37 | ) | | | | (1.37 | ) | | | | 2.82 | | | | $ | 24.21 | | | | | 20.26 | %(14) | | | $ | 62,122 | | | | | 1.37 | %(9)(14) | | | | 1.37 | % | | | | (0.31 | )%(14) | | | | 24 | % |
4/1/15 to 3/31/16 | | | | | | 25.65 | | | | | (0.05 | ) | | | | 0.01 | | | | | (0.04 | ) | | | | (0.05 | ) | | | | (4.17 | ) | | | | (4.22 | ) | | | | (4.26 | ) | | | | 21.39 | | | | | 0.02 | | | | | 53,722 | | | | | 1.37 | | | | | 1.37 | | | | | (0.21 | ) | | | | 33 | |
4/1/14 to 3/31/15 | | | | | | 24.19 | | | | | 0.03 | | | | | 3.07 | | | | | 3.10 | | | | | — | | | | | (1.64 | ) | | | | (1.64 | ) | | | | 1.46 | | | | | 25.65 | | | | | 13.28 | | | | | 67,696 | | | | | 1.34 | | | | | 1.34 | | | | | 0.12 | | | | | 28 | |
4/1/13 to 3/31/14 | | | | | | 21.41 | | | | | (0.02 | ) | | | | 2.84 | | | | | 2.82 | | | | | (0.03 | ) | | | | (0.01 | ) | | | | (0.04 | ) | | | | 2.78 | | | | | 24.19 | | | | | 13.17 | | | | | 162,302 | | | | | 1.39 | | | | | 1.39 | | | | | (0.09 | ) | | | | 31 | |
4/1/12 to 3/31/13 | | | | | | 20.07 | | | | | 0.10 | | | | | 1.75 | | | | | 1.85 | | | | | (0.18 | ) | | | | (0.33 | ) | | | | (0.51 | ) | | | | 1.34 | | | | | 21.41 | | | | | 9.64 | | | | | 143,293 | | | | | 1.37 | | | | | 1.37 | | | | | 0.52 | | | | | 15 | (11) |
The footnote legend is at the end of the Financial Highlights.
See Notes to Financial Statements
61
VIRTUS EQUITY TRUST
FINANCIAL HIGHLIGHTS
SELECTED PER SHARE DATA AND RATIOS FOR A SHARE OUTSTANDING
THROUGHOUT EACH PERIOD
| | | | | | | | | | | | | | | | | | | | | | | | | | | | | | | | | | | | | | | | | | | | | | | | | | | | | | | | | | | | | | | | | | | | | | | | | | | | | |
| | | | Net Asset Value,
Beginning of Period | | Net Investment Income (Loss)(2) | | Net Realized and
Unrealized Gain (Loss) | | Total from Investment Operations | | Dividends from
Net Investment Income | | Distributions from
Net Realized Gains | | Total Distributions | | Change in Net Asset Value | | Net Asset Value, End of Period | | Total
Return(1) | | Net Assets, End of Period
(in thousands) | | Ratio of Net Expenses to
Average Net Assets(10) | | Ratio of Gross Expenses to Average
Net Assets (before waivers and
reimbursements)(10) | | Ratio of Net Investment Income
(Loss) to Average Net Assets | | Portfolio Turnover Rate |
KAR Small-Cap Core Fund (Continued) | | | | | | | | | | | | | | | | | | | | | | | | | | | | | | | | | | | | | | | | | | | | | | | | | | | | | | | | | | | | | | | | | | | | | | | | | | | | | |
Class C | | | | | | | | | | | | | | | | | | | | | | | | | | | | | | | | | | | | | | | | | | | | | | | | | | | | | | | | | | | | | | | | | | | | | | | | | | | | | |
4/1/16 to 3/31/17 | | | | | $ | 18.61 | | | | | (0.21 | ) | | | | 3.68 | | | | | 3.47 | | | | | — | | | | | (1.37 | ) | | | | (1.37 | ) | | | | 2.10 | | | | $ | 20.71 | | | | | 19.39 | %(14) | | | $ | 44,789 | | | | | 2.12 | %(9)(14) | | | | 2.12 | % | | | | (1.10 | )%(14) | | | | 24 | % |
4/1/15 to 3/31/16 | | | | | | 22.98 | | | | | (0.19 | ) | | | | (0.01 | ) | | | | (0.20 | ) | | | | — | | | | | (4.17 | ) | | | | (4.17 | ) | | | | (4.37 | ) | | | | 18.61 | | | | | (0.73 | ) | | | | 31,711 | | | | | 2.12 | | | | | 2.12 | | | | | (0.95 | ) | | | | 33 | |
4/1/14 to 3/31/15 | | | | | | 21.99 | | | | | (0.11 | ) | | | | 2.74 | | | | | 2.63 | | | | | — | | | | | (1.64 | ) | | | | (1.64 | ) | | | | 0.99 | | | | | 22.98 | | | | | 12.44 | | | | | 33,735 | | | | | 2.09 | | | | | 2.09 | | | | | (0.50 | ) | | | | 28 | |
4/1/13 to 3/31/14 | | | | | | 19.58 | | | | | (0.18 | ) | | | | 2.60 | | | | | 2.42 | | | | | — | (5) | | | | (0.01 | ) | | | | (0.01 | ) | | | | 2.41 | | | | | 21.99 | | | | | 12.35 | | | | | 33,437 | | | | | 2.14 | | | | | 2.14 | | | | | (0.84 | ) | | | | 31 | |
4/1/12 to 3/31/13 | | | | | | 18.38 | | | | | (0.04 | ) | | | | 1.61 | | | | | 1.57 | | | | | (0.04 | ) | | | | (0.33 | ) | | | | (0.37 | ) | | | | 1.20 | | | | | 19.58 | | | | | 8.84 | | | | | 27,641 | | | | | 2.12 | | | | | 2.12 | | | | | (0.23 | ) | | | | 15 | (11) |
| | | | | | | | | | | | | | | | |
Class I | | | | | | | | | | | | | | | | | | | | | | | | | | | | | | | | | | | | | | | | | | | | | | | | | | | | | | | | | | | | | | | | | | | | | | | | | | | | | |
4/1/16 to 3/31/17 | | | | | $ | 22.30 | | | | | (0.03 | ) | | | | 4.47 | | | | | 4.44 | | | | | — | | | | | (1.37 | ) | | | | (1.37 | ) | | | | 3.07 | | | | $ | 25.37 | | | | | 20.57 | %(14) | | | $ | 338,491 | | | | | 1.12 | %(9)(14) | | | | 1.12 | % | | | | (0.11 | )%(14) | | | | 24 | % |
4/1/15 to 3/31/16 | | | | | | 26.58 | | | | | 0.01 | | | | | 0.01 | | | | | 0.02 | | | | | (0.13 | ) | | | | (4.17 | ) | | | | (4.30 | ) | | | | (4.28 | ) | | | | 22.30 | | | | | 0.28 | | | | | 189,167 | | | | | 1.12 | | | | | 1.12 | | | | | 0.04 | | | | | 33 | |
4/1/14 to 3/31/15 | | | | | | 24.95 | | | | | 0.13 | | | | | 3.14 | | | | | 3.27 | | | | | — | | | | | (1.64 | ) | | | | (1.64 | ) | | | | 1.63 | | | | | 26.58 | | | | | 13.57 | | | | | 248,933 | | | | | 1.08 | | | | | 1.08 | | | | | 0.53 | | | | | 28 | |
4/1/13 to 3/31/14 | | | | | | 22.04 | | | | | 0.04 | | | | | 2.92 | | | | | 2.96 | | | | | (0.04 | ) | | | | (0.01 | ) | | | | (0.05 | ) | | | | 2.91 | | | | | 24.95 | | | | | 13.44 | | | | | 242,400 | | | | | 1.14 | | | | | 1.14 | | | | | 0.19 | | | | | 31 | |
4/1/12 to 3/31/13 | | | | | | 20.65 | | | | | 0.13 | | | | | 1.83 | | | | | 1.96 | | | | | (0.24 | ) | | | | (0.33 | ) | | | | (0.57 | ) | | | | 1.39 | | | | | 22.04 | | | | | 9.92 | | | | | 164,483 | | | | | 1.12 | | | | | 1.12 | | | | | 0.63 | | | | | 15 | (11) |
| | | | | | | | | | | | | | | | |
Class R6 | | | | | | | | | | | | | | | | | | | | | | | | | | | | | | | | | | | | | | | | | | | | | | | | | | | | | | | | | | | | | | | | | | | | | | | | | | | | | |
4/1/16 to 3/31/17 | | | | | $ | 22.33 | | | | | — | (5) | | | | 4.48 | | | | | 4.48 | | | | | — | | | | | (1.37 | ) | | | | (1.37 | ) | | | | 3.11 | | | | $ | 25.44 | | | | | 20.68 | %(14) | | | $ | 31,338 | | | | | 1.01 | %(9)(14) | | | | 1.01 | % | | | | 0.01 | %(14) | | | | 24 | % |
4/1/15 to 3/31/16 | | | | | | 26.59 | | | | | 0.07 | | | | | (0.01 | ) | | | | 0.06 | | | | | (0.15 | ) | | | | (4.17 | ) | | | | (4.32 | ) | | | | (4.26 | ) | | | | 22.33 | | | | | 0.41 | | | | | 20,811 | | | | | 1.01 | | | | | 1.02 | | | | | 0.33 | | | | | 33 | |
11/12/14(7) to 3/31/15 | | | | | | 25.99 | | | | | 0.12 | | | | | 1.36 | | | | | 1.48 | | | | | — | | | | | (0.88 | ) | | | | (0.88 | ) | | | | 0.60 | | | | | 26.59 | | | | | 5.83 | (4) | | | | 106 | | | | | 0.97 | (3) | | | | 0.97 | (3) | | | | 1.18 | (3) | | | | 28 | (13) |
| KAR Small-Cap Growth | | | | | | | | | | | | | | | | | | | | | | | | | | | | | | | | | | | | | | | | | | | | | | | | | | | | | | | | | | | | | | | | | | | | | | | | | | | | | |
Fund | | | | | | | | | | | | | | | | | | | | | | | | | | | | | | | | | | | | | | | | | | | | | | | | | | | | | | | | | | | | | | | | | | | | | | | | | | | | | |
Class A | | | | | | | | | | | | | | | | | | | | | | | | | | | | | | | | | | | | | | | | | | | | | | | | | | | | | | | | | | | | | | | | | | | | | | | | | | | | | |
4/1/16 to 3/31/17 | | | | | $ | 17.67 | | | | | (0.14 | ) | | | | 4.14 | | | | | 4.00 | | | | | — | | | | | (0.55 | ) | | | | (0.55 | ) | | | | 3.45 | | | | $ | 21.12 | | | | | 23.25 | %(14) | | | $ | 184,302 | | | | | 1.50 | %(9)(14) | | | | 1.51 | % | | | | (0.73 | )%(14) | | | | 21 | % |
4/1/15 to 3/31/16 | | | | | | 17.54 | | | | | (0.10 | ) | | | | 0.73 | | | | | 0.63 | | | | | — | | | | | (0.50 | ) | | | | (0.50 | ) | | | | 0.13 | | | | | 17.67 | | | | | 3.69 | | | | | 88,715 | | | | | 1.49 | | | | | 1.53 | | | | | (0.59 | ) | | | | 27 | |
4/1/14 to 3/31/15 | | | | | | 16.97 | | | | | (0.13 | ) | | | | 2.46 | | | | | 2.33 | | | | | — | | | | | (1.76 | ) | | | | (1.76 | ) | | | | 0.57 | | | | | 17.54 | | | | | 14.56 | | | | | 83,611 | | | | | 1.50 | | | | | 1.57 | | | | | (0.76 | ) | | | | 27 | |
4/1/13 to 3/31/14 | | | | | | 14.92 | | | | | (0.15 | ) | | | | 2.68 | | | | | 2.53 | | | | | — | | | | | (0.48 | ) | | | | (0.48 | ) | | | | 2.05 | | | | | 16.97 | | | | | 17.15 | | | | | 94,902 | | | | | 1.50 | | | | | 1.56 | | | | | (0.93 | ) | | | | 23 | |
4/1/12 to 3/31/13 | | | | | | 12.95 | | | | | (0.03 | ) | | | | 2.00 | | | | | 1.97 | | | | | — | | | | | — | | | | | — | | | | | 1.97 | | | | | 14.92 | | | | | 15.21 | | | | | 70,107 | | | | | 1.61 | (8) | | | | 1.67 | | | | | (0.24 | ) | | | | 24 | |
| | | | | | | | | | | | | | | | |
Class C | | | | | | | | | | | | | | | | | | | | | | | | | | | | | | | | | | | | | | | | | | | | | | | | | | | | | | | | | | | | | | | | | | | | | | | | | | | | | |
4/1/16 to 3/31/17 | | | | | $ | 16.30 | | | | | (0.26 | ) | | | | 3.79 | | | | | 3.53 | | | | | — | | | | | (0.55 | ) | | | | (0.55 | ) | | | | 2.98 | | | | $ | 19.28 | | | | | 22.30 | %(14) | | | $ | 58,327 | | | | | 2.26 | %(9)(14) | | | | 2.26 | % | | | | (1.49 | )%(14) | | | | 21 | % |
4/1/15 to 3/31/16 | | | | | | 16.33 | | | | | (0.21 | ) | | | | 0.68 | | | | | 0.47 | | | | | — | | | | | (0.50 | ) | | | | (0.50 | ) | | | | (0.03 | ) | | | | 16.30 | | | | | 2.97 | | | | | 19,525 | | | | | 2.25 | | | | | 2.28 | | | | | (1.34 | ) | | | | 27 | |
4/1/14 to 3/31/15 | | | | | | 16.03 | | | | | (0.24 | ) | | | | 2.30 | | | | | 2.06 | | | | | — | | | | | (1.76 | ) | | | | (1.76 | ) | | | | 0.30 | | | | | 16.33 | | | | | 13.68 | | | | | 15,594 | | | | | 2.25 | | | | | 2.32 | | | | | (1.51 | ) | | | | 27 | |
4/1/13 to 3/31/14 | | | | | | 14.22 | | | | | (0.26 | ) | | | | 2.55 | | | | | 2.29 | | | | | — | | | | | (0.48 | ) | | | | (0.48 | ) | | | | 1.81 | | | | | 16.03 | | | | | 16.29 | | | | | 13,298 | | | | | 2.25 | | | | | 2.31 | | | | | (1.68 | ) | | | | 23 | |
4/1/12 to 3/31/13 | | | | | | 12.44 | | | | | (0.12 | ) | | | | 1.90 | | | | | 1.78 | | | | | — | | | | | — | | | | | — | | | | | 1.78 | | | | | 14.22 | | | | | 14.31 | | | | | 7,555 | | | | | 2.36 | (8) | | | | 2.42 | | | | | (0.96 | ) | | | | 24 | |
| | | | | | | | | | | | | | | | |
Class I | | | | | | | | | | | | | | | | | | | | | | | | | | | | | | | | | | | | | | | | | | | | | | | | | | | | | | | | | | | | | | | | | | | | | | | | | | | | | |
4/1/16 to 3/31/17 | | | | | $ | 17.89 | | | | | (0.10 | ) | | | | 4.21 | | | | | 4.11 | | | | | — | | | | | (0.55 | ) | | | | (0.55 | ) | | | | 3.56 | | | | $ | 21.45 | | | | | 23.59 | %(14) | | | $ | 489,593 | | | | | 1.26 | %(9)(14) | | | | 1.26 | % | | | | (0.50 | )%(14) | | | | 21 | % |
4/1/15 to 3/31/16 | | | | | | 17.70 | | | | | (0.05 | ) | | | | 0.74 | | | | | 0.69 | | | | | — | | | | | (0.50 | ) | | | | (0.50 | ) | | | | 0.19 | | | | | 17.89 | | | | | 4.00 | | | | | 98,270 | | | | | 1.25 | | | | | 1.29 | | | | | (0.31 | ) | | | | 27 | |
4/1/14 to 3/31/15 | | | | | | 17.08 | | | | | (0.08 | ) | | | | 2.46 | | | | | 2.38 | | | | | — | | | | | (1.76 | ) | | | | (1.76 | ) | | | | 0.62 | | | | | 17.70 | | | | | 14.83 | | | | | 35,058 | | | | | 1.25 | | | | | 1.32 | | | | | (0.47 | ) | | | | 27 | |
4/1/13 to 3/31/14 | | | | | | 14.98 | | | | | (0.11 | ) | | | | 2.69 | | | | | 2.58 | | | | | — | | | | | (0.48 | ) | | | | (0.48 | ) | | | | 2.10 | | | | | 17.08 | | | | | 17.42 | | | | | 20,685 | | | | | 1.25 | | | | | 1.30 | | | | | (0.68 | ) | | | | 23 | |
4/1/12 to 3/31/13 | | | | | | 12.96 | | | | | (0.01 | ) | | | | 2.03 | | | | | 2.02 | | | | | — | | | | | — | | | | | — | | | | | 2.02 | | | | | 14.98 | | | | | 15.59 | | | | | 10,026 | | | | | 1.36 | (8) | | | | 1.42 | | | | | (0.04 | ) | | | | 24 | |
The footnote legend is at the end of the Financial Highlights.
See Notes to Financial Statements
62
VIRTUS EQUITY TRUST
FINANCIAL HIGHLIGHTS
SELECTED PER SHARE DATA AND RATIOS FOR A SHARE OUTSTANDING
THROUGHOUT EACH PERIOD
| | | | | | | | | | | | | | | | | | | | | | | | | | | | | | | | | | | | | | | | | | | | | | | | | | | | | | | | | | | | | | | | | | | | | | | | | | | | | |
| | | | Net Asset Value,
Beginning of Period | | Net Investment Income (Loss)(2) | | Net Realized and
Unrealized Gain (Loss) | | Total from Investment Operations | | Dividends from
Net Investment Income | | Distributions from
Net Realized Gains | | Total Distributions | | Change in Net Asset Value | | Net Asset Value, End of Period | | Total
Return(1) | | Net Assets, End of Period
(in thousands) | | Ratio of Net Expenses to
Average Net Assets(10) | | Ratio of Gross Expenses to Average
Net Assets (before waivers and
reimbursements)(10) | | Ratio of Net Investment Income
(Loss) to Average Net Assets | | Portfolio Turnover Rate |
| KAR Small-Cap Value | | | | | | | | | | | | | | | | | | | | | | | | | | | | | | | | | | | | | | | | | | | | | | | | | | | | | | | | | | | | | | | | | | | | | | | | | | | | | |
Fund | | | | | | | | | | | | | | | | | | | | | | | | | | | | | | | | | | | | | | | | | | | | | | | | | | | | | | | | | | | | | | | | | | | | | | | | | | | | | |
Class A | | | | | | | | | | | | | | | | | | | | | | | | | | | | | | | | | | | | | | | | | | | | | | | | | | | | | | | | | | | | | | | | | | | | | | | | | | | | | |
4/1/16 to 3/31/17 | | | | | $ | 15.67 | | | | | 0.22 | | | | | 3.16 | | | | | 3.38 | | | | | (0.26 | ) | | | | (1.18 | ) | | | | (1.44 | ) | | | | 1.94 | | | | $ | 17.61 | | | | | 22.86 | % | | | $ | 89,050 | | | | | 1.32 | %(9)(12) | | | | 1.32 | % | | | | 1.35 | % | | | | 22 | % |
4/1/15 to 3/31/16 | | | | | | 16.61 | | | | | 0.07 | | | | | 0.07 | | | | | 0.14 | | | | | (0.10 | ) | | | | (0.98 | ) | | | | (1.08 | ) | | | | (0.94 | ) | | | | 15.67 | | | | | 0.94 | | | | | 71,280 | | | | | 1.30 | (12) | | | | 1.30 | | | | | 0.49 | | | | | 15 | |
4/1/14 to 3/31/15 | | | | | | 16.74 | | | | | 0.09 | | | | | 1.38 | | | | | 1.47 | | | | | (0.03 | ) | | | | (1.57 | ) | | | | (1.60 | ) | | | | (0.13 | ) | | | | 16.61 | | | | | 9.33 | | | | | 74,738 | | | | | 1.28 | (6) | | | | 1.28 | | | | | 0.54 | | | | | 24 | |
4/1/13 to 3/31/14 | | | | | | 13.91 | | | | | 0.04 | | | | | 2.84 | | | | | 2.88 | | | | | (0.05 | ) | | | | — | | | | | (0.05 | ) | | | | 2.83 | | | | | 16.74 | | | | | 20.78 | | | | | 137,496 | | | | | 1.32 | (6) | | | | 1.32 | | | | | 0.24 | | | | | 24 | |
4/1/12 to 3/31/13 | | | | | | 13.22 | | | | | 0.16 | | | | | 0.78 | | | | | 0.94 | | | | | (0.25 | ) | | | | — | | | | | (0.25 | ) | | | | 0.69 | | | | | 13.91 | | | | | 7.37 | | | | | 118,376 | | | | | 1.42 | (6) | | | | 1.34 | | | | | 1.29 | | | | | 16 | (11) |
| | | | | | | | | | | | | | | | |
Class C | | | | | | | | | | | | | | | | | | | | | | | | | | | | | | | | | | | | | | | | | | | | | | | | | | | | | | | | | | | | | | | | | | | | | | | | | | | | | |
4/1/16 to 3/31/17 | | | | | $ | 15.45 | | | | | 0.10 | | | | | 3.11 | | | | | 3.21 | | | | | (0.13 | ) | | | | (1.18 | ) | | | | (1.31 | ) | | | | 1.90 | | | | $ | 17.35 | | | | | 21.95 | % | | | $ | 29,416 | | | | | 2.07 | %(9)(12) | | | | 2.07 | % | | | | 0.65 | % | | | | 22 | % |
4/1/15 to 3/31/16 | | | | | | 16.41 | | | | | (0.04 | ) | | | | 0.06 | | | | | 0.02 | | | | | — | | | | | (0.98 | ) | | | | (0.98 | ) | | | | (0.96 | ) | | | | 15.45 | | | | | 0.17 | | | | | 23,602 | | | | | 2.05 | (12) | | | | 2.05 | | | | | (0.26 | ) | | | | 15 | |
4/1/14 to 3/31/15 | | | | | | 16.65 | | | | | (0.02 | ) | | | | 1.35 | | | | | 1.33 | | | | | — | | | | | (1.57 | ) | | | | (1.57 | ) | | | | (0.24 | ) | | | | 16.41 | | | | | 8.49 | | | | | 25,634 | | | | | 2.03 | (6) | | | | 2.03 | | | | | (0.12 | ) | | | | 24 | |
4/1/13 to 3/31/14 | | | | | | 13.89 | | | | | (0.08 | ) | | | | 2.84 | | | | | 2.76 | | | | | — | | | | | — | | | | | — | | | | | 2.76 | | | | | 16.65 | | | | | 19.87 | | | | | 27,132 | | | | | 2.07 | (6) | | | | 2.07 | | | | | (0.52 | ) | | | | 24 | |
4/1/12 to 3/31/13 | | | | | | 13.20 | | | | | 0.07 | | | | | 0.77 | | | | | 0.84 | | | | | (0.15 | ) | | | | — | | | | | (0.15 | ) | | | | 0.69 | | | | | 13.89 | | | | | 6.57 | | | | | 23,793 | | | | | 2.17 | (6) | | | | 2.09 | | | | | 0.56 | | | | | 16 | (11) |
| | | | | | | | | | | | | | | | |
Class I | | | | | | | | | | | | | | | | | | | | | | | | | | | | | | | | | | | | | | | | | | | | | | | | | | | | | | | | | | | | | | | | | | | | | | | | | | | | | |
4/1/16 to 3/31/17 | | | | | $ | 15.69 | | | | | 0.26 | | | | | 3.17 | | | | | 3.43 | | | | | (0.32 | ) | | | | (1.18 | ) | | | | (1.50 | ) | | | | 1.93 | | | | $ | 17.62 | | | | | 23.20 | % | | | $ | 242,661 | | | | | 1.07 | %(9)(12) | | | | 1.07 | % | | | | 1.63 | % | | | | 22 | % |
4/1/15 to 3/31/16 | | | | | | 16.64 | | | | | 0.11 | | | | | 0.07 | | | | | 0.18 | | | | | (0.15 | ) | | | | (0.98 | ) | | | | (1.13 | ) | | | | (0.95 | ) | | | | 15.69 | | | | | 1.17 | | | | | 144,487 | | | | | 1.05 | (12) | | | | 1.05 | | | | | 0.74 | | | | | 15 | |
4/1/14 to 3/31/15 | | | | | | 16.77 | | | | | 0.16 | | | | | 1.35 | | | | | 1.51 | | | | | (0.07 | ) | | | | (1.57 | ) | | | | (1.64 | ) | | | | (0.13 | ) | | | | 16.64 | | | | | 9.59 | | | | | 163,082 | | | | | 1.03 | (6) | | | | 1.03 | | | | | 0.97 | | | | | 24 | |
4/1/13 to 3/31/14 | | | | | | 13.92 | | | | | 0.08 | | | | | 2.84 | | | | | 2.92 | | | | | (0.07 | ) | | | | — | | | | | (0.07 | ) | | | | 2.85 | | | | | 16.77 | | | | | 21.06 | | | | | 104,149 | | | | | 1.07 | (6) | | | | 1.07 | | | | | 0.49 | | | | | 24 | |
4/1/12 to 3/31/13 | | | | | | 13.23 | | | | | 0.15 | | | | | 0.82 | | | | | 0.97 | | | | | (0.28 | ) | | | | — | | | | | (0.28 | ) | | | | 0.69 | | | | | 13.92 | | | | | 7.64 | | | | | 91,502 | | | | | 1.17 | (6) | | | | 1.10 | | | | | 1.19 | | | | | 16 | (11) |
| | | | | | | | | | | | | | | | |
Class R6 | | | | | | | | | | | | | | | | | | | | | | | | | | | | | | | | | | | | | | | | | | | | | | | | | | | | | | | | | | | | | | | | | | | | | | | | | | | | | |
11/3/16(7) to 3/31/17 | | | | | $ | 14.90 | | | | | 0.05 | | | | | 3.15 | | | | | 3.20 | | | | | (0.22 | ) | | | | (0.25 | ) | | | | (0.47 | ) | | | | 2.73 | | | | $ | 17.63 | | | | | 21.58 | %(4) | | | $ | 122 | | | | | 0.98 | %(3)(12) | | | | 0.98 | %(3) | | | | 0.68 | %(3) | | | | 22 | %(15) |
| Rampart Enhanced | | | | | | | | | | | | | | | | | | | | | | | | | | | | | | | | | | | | | | | | | | | | | | | | | | | | | | | | | | | | | | | | | | | | | | | | | | | | | |
Core Equity Fund | | | | | | | | | | | | | | | | | | | | | | | | | | | | | | | | | | | | | | | | | | | | | | | | | | | | | | | | | | | | | | | | | | | | | | | | | | | | | |
Class A | | | | | | | | | | | | | | | | | | | | | | | | | | | | | | | | | | | | | | | | | | | | | | | | | | | | | | | | | | | | | | | | | | | | | | | | | | | | | |
4/1/16 to 3/31/17 | | | | | $ | 18.14 | | | | | 0.15 | | | | | 2.68 | | | | | 2.83 | | | | | (0.22 | ) | | | | (0.48 | ) | | | | (0.70 | ) | | | | 2.13 | | | | $ | 20.27 | | | | | 15.85 | %(14) | | | $ | 113,442 | | | | | 1.26 | %(9)(14) | | | | 1.40 | % | | | | 0.81 | %(14) | | | | 496 | % |
4/1/15 to 3/31/16 | | | | | | 20.97 | | | | | 0.14 | | | | | 0.56 | | | | | 0.70 | | | | | (0.15 | ) | | | | (3.38 | ) | | | | (3.53 | ) | | | | (2.83 | ) | | | | 18.14 | | | | | 4.02 | | | | | 101,113 | | | | | 1.25 | | | | | 1.38 | | | | | 0.74 | | | | | 312 | |
4/1/14 to 3/31/15 | | | | | | 21.94 | | | | | 0.17 | | | | | 1.84 | | | | | 2.01 | | | | | (0.08 | ) | | | | (2.90 | ) | | | | (2.98 | ) | | | | (0.97 | ) | | | | 20.97 | | | | | 9.75 | | | | | 116,725 | | | | | 1.25 | | | | | 1.36 | | | | | 0.82 | | | | | 345 | |
4/1/13 to 3/31/14 | | | | | | 19.51 | | | | | 0.14 | | | | | 4.02 | | | | | 4.16 | | | | | (0.10 | ) | | | | (1.63 | ) | | | | (1.73 | ) | | | | 2.43 | | | | | 21.94 | | | | | 21.84 | | | | | 111,074 | | | | | 1.25 | | | | | 1.39 | | | | | 0.66 | | | | | 283 | |
4/1/12 to 3/31/13 | | | | | | 17.93 | | | | | 0.09 | | | | | 1.53 | | | | | 1.62 | | | | | (0.04 | ) | | | | — | | | | | (0.04 | ) | | | | 1.58 | | | | | 19.51 | | | | | 9.12 | | | | | 100,976 | | | | | 1.25 | | | | | 1.44 | | | | | 0.52 | | | | | 65 | |
| | | | | | | | | | | | | | | | |
Class C | | | | | | | | | | | | | | | | | | | | | | | | | | | | | | | | | | | | | | | | | | | | | | | | | | | | | | | | | | | | | | | | | | | | | | | | | | | | | |
4/1/16 to 3/31/17 | | | | | $ | 16.48 | | | | | 0.01 | | | | | 2.44 | | | | | 2.45 | | | | | (0.01 | ) | | | | (0.48 | ) | | | | (0.49 | ) | | | | 1.96 | | | | $ | 18.44 | | | | | 15.01 | %(14) | | | $ | 37,269 | | | | | 2.00 | %(9)(14) | | | | 2.15 | % | | | | 0.04 | %(14) | | | | 496 | % |
4/1/15 to 3/31/16 | | | | | | 19.42 | | | | | — | (5) | | | | 0.51 | | | | | 0.51 | | | | | (0.07 | ) | | | | (3.38 | ) | | | | (3.45 | ) | | | | (2.94 | ) | | | | 16.48 | | | | | 3.27 | | | | | 36,236 | | | | | 2.00 | | | | | 2.13 | | | | | 0.01 | | | | | 312 | |
4/1/14 to 3/31/15 | | | | | | 20.60 | | | | | 0.01 | | | | | 1.72 | | | | | 1.73 | | | | | (0.01 | ) | | | | (2.90 | ) | | | | (2.91 | ) | | | | (1.18 | ) | | | | 19.42 | | | | | 8.91 | | | | | 37,312 | | | | | 2.00 | | | | | 2.12 | | | | | 0.06 | | | | | 345 | |
4/1/13 to 3/31/14 | | | | | | 18.46 | | | | | (0.02 | ) | | | | 3.81 | | | | | 3.79 | | | | | (0.02 | ) | | | | (1.63 | ) | | | | (1.65 | ) | | | | 2.14 | | | | | 20.60 | | | | | 20.93 | | | | | 27,930 | | | | | 2.00 | | | | | 2.14 | | | | | (0.09 | ) | | | | 283 | |
4/1/12 to 3/31/13 | | | | | | 17.05 | | | | | (0.04 | ) | | | | 1.45 | | | | | 1.41 | | | | | — | | | | | — | | | | | — | | | | | 1.41 | | | | | 18.46 | | | | | 8.27 | | | | | 24,782 | | | | | 2.00 | | | | | 2.19 | | | | | (0.23 | ) | | | | 65 | |
| | | | | | | | | | | | | | | | |
Class I | | | | | | | | | | | | | | | | | | | | | | | | | | | | | | | | | | | | | | | | | | | | | | | | | | | | | | | | | | | | | | | | | | | | | | | | | | | | | |
4/1/16 to 3/31/17 | | | | | $ | 18.13 | | | | | 0.21 | | | | | 2.66 | | | | | 2.87 | | | | | (0.30 | ) | | | | (0.48 | ) | | | | (0.78 | ) | | | | 2.09 | | | | $ | 20.22 | | | | | 16.16 | %(14) | | | $ | 21,011 | | | | | 1.01 | %(9)(14) | | | | 1.15 | % | | | | 1.13 | %(14) | | | | 496 | % |
4/1/15 to 3/31/16 | | | | | | 20.96 | | | | | 0.21 | | | | | 0.53 | | | | | 0.74 | | | | | (0.19 | ) | | | | (3.38 | ) | | | | (3.57 | ) | | | | (2.83 | ) | | | | 18.13 | | | | | 4.25 | | | | | 11,991 | | | | | 1.00 | | | | | 1.13 | | | | | 1.13 | | | | | 312 | |
4/1/14 to 3/31/15 | | | | | | 21.90 | | | | | 0.22 | | | | | 1.85 | | | | | 2.07 | | | | | (0.11 | ) | | | | (2.90 | ) | | | | (3.01 | ) | | | | (0.94 | ) | | | | 20.96 | | | | | 10.06 | | | | | 8,969 | | | | | 1.00 | | | | | 1.11 | | | | | 1.05 | | | | | 345 | |
4/1/13 to 3/31/14 | | | | | | 19.48 | | | | | 0.19 | | | | | 4.01 | | | | | 4.20 | | | | | (0.15 | ) | | | | (1.63 | ) | | | | (1.78 | ) | | | | 2.42 | | | | | 21.90 | | | | | 22.12 | | | | | 11,291 | | | | | 1.00 | | | | | 1.14 | | | | | 0.90 | | | | | 283 | |
4/1/12 to 3/31/13 | | | | | | 17.91 | | | | | 0.14 | | | | | 1.51 | | | | | 1.65 | | | | | (0.08 | ) | | | | — | | | | | (0.08 | ) | | | | 1.57 | | | | | 19.48 | | | | | 9.28 | | | | | 11,589 | | | | | 1.00 | | | | | 1.17 | | | | | 0.78 | | | | | 65 | |
The footnote legend is at the end of the Financial Highlights.
See Notes to Financial Statements
63
VIRTUS EQUITY TRUST
FINANCIAL HIGHLIGHTS
SELECTED PER SHARE DATA AND RATIOS FOR A SHARE OUTSTANDING
THROUGHOUT EACH PERIOD
| | | | | | | | | | | | | | | | | | | | | | | | | | | | | | | | | | | | | | | | | | | | | | | | | | | | | | | | | | | | | | | | | | | | | | | | | | | | | |
| | | | Net Asset Value,
Beginning of Period | | Net Investment Income (Loss)(2) | | Net Realized and
Unrealized Gain (Loss) | | Total from Investment Operations | | Dividends from
Net Investment Income | | Distributions from
Net Realized Gains | | Total Distributions | | Change in Net Asset Value | | Net Asset Value, End of Period | | Total
Return(1) | | Net Assets, End of Period
(in thousands) | | Ratio of Net Expenses to
Average Net Assets(10) | | Ratio of Gross Expenses to Average
Net Assets (before waivers and
reimbursements)(10) | | Ratio of Net Investment Income
(Loss) to Average Net Assets | | Portfolio Turnover Rate |
Tactical Allocation Fund | | | | | | | | | | | | | | | | | | | | | | | | | | | | | | | | | | | | | | | | | | | | | | | | | | | | | | | | | | | | | | | | | | | | | | | | | | | | | |
Class A | | | | | | | | | | | | | | | | | | | | | | | | | | | | | | | | | | | | | | | | | | | | | | | | | | | | | | | | | | | | | | | | | | | | | | | | | | | | | |
4/1/16 to 3/31/17 | | | | | $ | 8.44 | | | | | 0.17 | | | | | 0.56 | | | | | 0.73 | | | | | (0.15 | ) | | | | (0.69 | ) | | | | (0.84 | ) | | | | (0.11 | ) | | | $ | 8.33 | | | | | 9.20 | %(14) | | | $ | 137,388 | | | | | 1.37 | %(9)(14) | | | | 1.38 | % | | | | 1.86 | %(14) | | | | 104 | % |
4/1/15 to 3/31/16 | | | | | | 9.75 | | | | | 0.20 | | | | | (0.88 | ) | | | | (0.68 | ) | | | | (0.17 | ) | | | | (0.46 | ) | | | | (0.63 | ) | | | | (1.31 | ) | | | | 8.44 | | | | | (7.36 | ) | | | | 147,546 | | | | | 1.32 | | | | | 1.33 | | | | | 2.25 | | | | | 81 | |
4/1/14 to 3/31/15 | | | | | | 10.06 | | | | | 0.21 | | | | | 0.15 | | | | | 0.36 | | | | | (0.20 | ) | | | | (0.47 | ) | | | | (0.67 | ) | | | | (0.31 | ) | | | | 9.75 | | | | | 3.60 | | | | | 180,435 | | | | | 1.30 | | | | | 1.30 | | | | | 2.09 | | | | | 69 | |
4/1/13 to 3/31/14 | | | | | | 9.88 | | | | | 0.22 | | | | | 1.13 | | | | | 1.35 | | | | | (0.21 | ) | | | | (0.96 | ) | | | | (1.17 | ) | | | | 0.18 | | | | | 10.06 | | | | | 14.84 | | | | | 195,509 | | | | | 1.29 | | | | | 1.29 | | | | | 2.22 | | | | | 61 | |
4/1/12 to 3/31/13 | | | | | | 9.47 | | | | | 0.21 | | | | | 0.53 | | | | | 0.74 | | | | | (0.22 | ) | | | | (0.11 | ) | | | | (0.33 | ) | | | | 0.41 | | | | | 9.88 | | | | | 8.00 | | | | | 186,662 | | | | | 1.30 | | | | | 1.30 | | | | | 2.26 | | | | | 94 | |
| | | | | | | | | | | | | | | | |
Class C | | | | | | | | | | | | | | | | | | | | | | | | | | | | | | | | | | | | | | | | | | | | | | | | | | | | | | | | | | | | | | | | | | | | | | | | | | | | | |
4/1/16 to 3/31/17 | | | | | $ | 8.64 | | | | | 0.11 | | | | | 0.57 | | | | | 0.68 | | | | | (0.08 | ) | | | | (0.69 | ) | | | | (0.77 | ) | | | | (0.09 | ) | | | $ | 8.55 | | | | | 8.37 | %(14) | | | $ | 4,378 | | | | | 2.11 | %(9)(14) | | | | 2.13 | % | | | | 1.13 | %(14) | | | | 104 | % |
4/1/15 to 3/31/16 | | | | | | 9.96 | | | | | 0.14 | | | | | (0.90 | ) | | | | (0.76 | ) | | | | (0.10 | ) | | | | (0.46 | ) | | | | (0.56 | ) | | | | (1.32 | ) | | | | 8.64 | | | | | (8.02 | ) | | | | 5,460 | | | | | 2.07 | | | | | 2.08 | | | | | 1.51 | | | | | 81 | |
4/1/14 to 3/31/15 | | | | | | 10.27 | | | | | 0.13 | | | | | 0.16 | | | | | 0.29 | | | | | (0.13 | ) | | | | (0.47 | ) | | | | (0.60 | ) | | | | (0.31 | ) | | | | 9.96 | | | | | 2.81 | | | | | 6,328 | | | | | 2.04 | | | | | 2.04 | | | | | 1.29 | | | | | 69 | |
4/1/13 to 3/31/14 | | | | | | 10.07 | | | | | 0.15 | | | | | 1.15 | | | | | 1.30 | | | | | (0.14 | ) | | | | (0.96 | ) | | | | (1.10 | ) | | | | 0.20 | | | | | 10.27 | | | | | 13.90 | | | | | 3,785 | | | | | 2.04 | | | | | 2.04 | | | | | 1.46 | | | | | 61 | |
4/1/12 to 3/31/13 | | | | | | 9.65 | | | | | 0.15 | | | | | 0.53 | | | | | 0.68 | | | | | (0.15 | ) | | | | (0.11 | ) | | | | (0.26 | ) | | | | 0.42 | | | | | 10.07 | | | | | 7.17 | | | | | 3,021 | | | | | 2.05 | | | | | 2.05 | | | | | 1.51 | | | | | 94 | |
Footnote Legend:
| (1) | Sales charges, where applicable, are not reflected in the total return calculation. |
| (2) | Computed using average shares outstanding. |
| (5) | Amount is less than $0.005 per share. |
| (6) | See Note 3D in the Notes to Financial Statements for information on recapture of expenses previously waived. |
| (8) | Represents a blended ratio. |
| (9) | Net expense ratio includes extraordinary proxy expenses. |
| (10) | Each Fund will also indirectly bear its prorated share of expenses of any underlying funds in which it invests. Such expenses are not included in the calculation of this ratio. |
| (11) | Portfolio turnover calculation excludes security transactions distributed as a result of a redemption-in-kind. |
| (12) | The Fund is currently under its expense limitation. |
| (13) | Portfolio turnover is representative of the Fund for the entire year ended March 31, 2015. |
| (14) | Custody fees reimbursed were excluded from the Ratio of Net Expenses to Average Net Assets and Ratio of Net Investment Income (Loss) to Average Net Assets. If included the impact would have been to lower the Ratio of Net Expenses to Average Net Assets and increase the Ratio of Net Investment Income (Loss) to Average Net Assets as follows: |
| | | | | | | | | | | | | | | | |
| | | Class A | | | Class C | | | Class I | | | Class R6 | |
Contrarian Value Fund* | | | — | | | | — | | | | — | | | | — | |
KAR Capital Growth Fund | | | 0.06 | % | | | 0.05 | % | | | 0.06 | % | | | N/A | |
KAR Mid-Cap Growth Fund | | | 0.05 | % | | | 0.05 | % | | | 0.05 | % | | | N/A | |
KAR Small-Cap Core Fund* | | | — | | | | — | | | | — | | | | — | |
KAR Small-Cap Growth Fund* | | | — | | | | — | | | | — | | | | N/A | |
Rampart Enhanced Core Equity Fund* | | | — | | | | — | | | | — | | | | N/A | |
Tactical Allocation Fund | | | 0.08 | % | | | 0.08 | % | | | N/A | | | | N/A | |
| | * | Amount is less than 0.005% |
The footnote legend is at the end of the Financial Highlights.
See Notes to Financial Statements
64
VIRTUS EQUITY TRUST
FINANCIAL HIGHLIGHTS
SELECTED PER SHARE DATA AND RATIOS FOR A SHARE OUTSTANDING
THROUGHOUT EACH PERIOD
Custody fees reimbursed were included in Total Return. If excluded the impact would have been to lower the Total Return as follows:
| | | | | | | | | | | | | | | | |
| | | Class A | | | Class C | | | Class I | | | Class R6 | |
Contrarian Value Fund* | | | — | | | | — | | | | — | | | | — | |
KAR Capital Growth Fund | | | 0.06 | % | | | 0.06 | % | | | 0.06 | % | | | N/A | |
KAR Mid-Cap Growth Fund | | | 0.05 | % | | | 0.05 | % | | | 0.05 | % | | | N/A | |
KAR Small-Cap Core Fund* | | | — | | | | — | | | | — | | | | — | |
KAR Small-Cap Growth Fund* | | | — | | | | — | | | | — | | | | N/A | |
Rampart Enhanced Core Equity Fund* | | | — | | | | — | | | | — | | | | N/A | |
Tactical Allocation Fund | | | 0.08 | % | | | 0.08 | % | | | N/A | | | | N/A | |
| | * | Amount is less than 0.005% |
See Note 13 in Notes to Financial Statements for a further explanation on the custody fees reimbursed.
| (15) | Portfolio turnover is representative of the Fund for the entire year ended March 31, 2017. |
See Notes to Financial Statements
65
VIRTUS EQUITY TRUST
NOTES TO FINANCIAL STATEMENTS
MARCH 31, 2017
Virtus Equity Trust (the “Trust”) is organized as a Delaware statutory trust and is registered under the Investment Company Act of 1940, as amended (the “1940 Act”), as an open-end management investment company.
As of the date of this report, 11 diversified funds of the Trust are offered for sale, of which 10 (the “Funds”) are reported in this annual report. Each Fund’s investment objective is outlined on the respective Fund’s summary page. There is no guarantee that the Funds will achieve their objectives.
All of the Funds offer Class A shares and Class C shares. All Funds with the exception of the Tactical Allocation Fund offer Class I shares. Class R6 shares are offered by the Contrarian Value Fund, KAR Small-Cap Core Fund and KAR Small-Cap Value Fund. Effective March 6, 2017, all Class B shares were converted to Class A shares. Prior to March 6, 2017, Class B shares could be purchased by existing shareholders through qualifying transactions.
Class A shares are sold with a front-end sales charge of up to 5.75% with some exceptions. Generally, Class A shares are not subject to any charges by the Funds when redeemed; however, a 1% contingent deferred sales charge (“CDSC”) may be imposed on certain redemptions made within a certain period following purchases on which a finder’s fee has been paid. The period for which the CDSC applies for the Funds is 18 months. The CDSC period begins on the last day of the month preceding the month in which the purchase was made.
Prior to March 6, 2017, Class B shares were sold with a CDSC, which declined from 5% to zero depending on the period of time the shares were held. Class C shares are generally sold with a 1% CDSC, applicable if redeemed within one year of purchase. Class I shares and Class R6 shares are sold without a front-end sales charge or CDSC. Class R6 shares are only available to participants in employer-sponsored retirement plans, such as 401(k) plans, profit-sharing plans, defined benefit plans and other employer-directed plans. Class R6 shares do not carry sales commissions or pay Rule 12b-1 fees. No compensation, administrative payments, sub-transfer agency payments or service payments are paid to brokers or other entities from Fund assets or the Fund’s distributor’s or an affiliate’s resources on sales of or investments in Class R6 shares.
Virtus Mutual Funds may impose an annual fee on accounts having balances of less than $2,500. The small account fee may be waived in certain circumstances, as disclosed in the prospectuses and/or statements of additional information. The fees collected will be used to offset certain expenses of the Funds. These fees are reflected as “Low balance account fees” in each Fund’s Statements of Operations for the period, as applicable.
Each Class of shares has identical voting, dividend, liquidation and other rights and the same terms and conditions, except that each Class bears different distribution and/or service (12b-1) fees under a Rule 12b-1 and/or shareholder service plan (“12b-1 Plan”) approved by the Board and has exclusive voting rights with respect to such plans. Class I shares and Class R6 shares are not subject to a 12b-1 Plan. Income and other expenses as well as realized and unrealized gains and losses of each Fund are borne pro rata by the holders of each Class of shares.
| Note | 2. Significant Accounting Policies |
The significant accounting policies consistently followed by the Trust in the preparation of its financial statements are summarized below and for derivatives, included in Note 3 below. The preparation of financial statements in conformity with U.S. generally accepted accounting principles (“U.S. GAAP”) requires management to make estimates and assumptions that affect the reported amounts of assets and liabilities, and disclosure of contingent assets and liabilities at the date of the financial statements and the reported amounts of increases and decreases in net assets from operations during the reporting period. Actual results could differ from those estimates, and those differences could be significant.
Security valuation procedures for each Fund, which include nightly price variance, as well as back-testing items such as bi-weekly unchanged price, monthly secondary source and transaction analysis, have been approved by the Board. All internally fair valued securities are approved by a valuation committee appointed by the Board (the “Valuation Committee”). The Valuation Committee is comprised of certain members of management as identified to the Board and convenes independently from portfolio management. All internally fair valued securities are updated daily and reviewed in detail by the Valuation Committee monthly unless changes occur within the period. The Valuation Committee reviews the validity of the model inputs and any changes to the model. Fair valuations are reviewed quarterly by the Board.
Each Fund utilizes a fair value hierarchy which prioritizes the inputs to valuation techniques used to measure fair value into three broad levels. The Funds’ policy is to recognize transfers between levels at the end of the reporting period.
| | • Level 1 – | quoted prices in active markets for identical securities (security types generally include listed equities). |
| | • Level 2 – | prices determined using other significant observable inputs (including quoted prices for similar securities, interest rates, prepayment speeds, credit risk, etc.). |
| | • Level 3 – | prices determined using significant unobservable inputs (including the Valuation Committee’s own assumptions in determining the fair value of investments). |
A description of the valuation techniques applied to a Fund’s major categories of assets and liabilities measured at fair value on a recurring basis is as follows:
Equity securities are valued at the official closing price (typically last sale) on the exchange on which the securities are primarily traded or, if no closing price is available, at the last bid price and are categorized as Level 1 in the hierarchy. Restricted equity securities and private placements that are not widely traded, are illiquid, or are internally fair valued by the Valuation Committee, are generally categorized as Level 3 in the hierarchy.
Certain non-U.S. securities may be fair valued in cases where closing prices are not readily available or are deemed not reflective of readily available market prices. For example, significant events (such as movement in the U.S. securities market, or other regional and local developments) may occur between the time that non-U.S. markets close (where the security is principally traded) and the time that a Fund calculates its net asset value (“NAV”) (at the close of regular trading on the NYSE, generally 4 p.m. Eastern time) that may impact the value of
66
VIRTUS EQUITY TRUST
NOTES TO FINANCIAL STATEMENTS (Continued)
MARCH 31, 2017
securities traded in these non-U.S. markets. In such cases the Funds fair value non-U.S. securities using an independent pricing service which considers the correlation of the trading patterns of the non-U.S. security to the intraday trading in the U.S. markets for investments such as ADRs, financial futures, ETFs, and certain indexes, as well as prices for similar securities. Such fair valuations are categorized as Level 2 in the hierarchy. Because the frequency of significant events is not predictable, fair valuation of certain non-U.S. common stocks may occur on a frequent basis.
Debt securities, including restricted securities, are valued based on evaluated quotations received from independent pricing services or from dealers who make markets in such securities. For most bond types, the pricing service utilizes matrix pricing that considers one or more of the following factors: yield or price of bonds of comparable quality, coupon, maturity, current cash flows, type, and current day trade information, as well as dealer supplied prices. These valuations are generally categorized as Level 2 in the hierarchy. Structured debt instruments, such as mortgage-backed and asset-backed securities, may also incorporate collateral analysis and utilize cash flow models for valuation and are generally categorized as Level 2 in the hierarchy. Pricing services do not provide pricing for all securities and therefore indicative bids from dealers are utilized which are based on pricing models used by market makers in the security and are generally categorized as Level 2 in the hierarchy. Debt securities that are not widely traded, are illiquid, or are internally fair valued by the Valuation Committee, are generally categorized as Level 3 in the hierarchy.
Listed derivatives, such as options, that are actively traded are valued based on quoted prices from the exchange and are categorized as Level 1 in the hierarchy. Over-the-counter derivative contracts, which include forward currency contracts and equity-linked instruments, do not require material subjectivity as pricing inputs are observed from actively quoted markets and are categorized as Level 2 in the hierarchy.
Investments in open-end mutual funds are valued at NAV. Investments in closed-end funds are valued as of the close of regular trading on the NYSE each business day. Both are categorized as Level 1 in the hierarchy.
A summary of the inputs used to value a Fund’s net assets by each major security type is disclosed at the end of the Schedule of Investments for each Fund. The inputs or methodologies used for valuing securities are not necessarily an indication of the risk associated with investing in those securities.
| | B. | Security Transactions and Investment Income |
Security transactions are recorded on the trade date. Realized gains and losses from the sales of securities are determined on the identified cost basis. Dividend income is recognized on the ex-dividend date or, in the case of certain foreign securities, as soon as a Fund is notified. Interest income is recorded on the accrual basis. Each Fund amortizes premiums and accretes discounts using the effective interest method. Any distributions from underlying funds are recorded in accordance with the character of the distributions as designated by the underlying funds.
Dividend income from REIT investments is recorded using management’s estimate of the income included in distributions received from the REIT investments. Distributions received in excess of this estimated amount are recorded as a reduction of the cost of investments or reclassified to capital gains. The actual amounts of income, return of capital, and capital gains are only determined by each REIT after its fiscal year-end, and may differ from the estimated amounts.
Each Fund is treated as a separate taxable entity. It is the intention of each Fund to comply with the requirements of Subchapter M of the Internal Revenue Code and to distribute substantially all of its taxable income to its shareholders. Therefore, no provision for federal income taxes or excise taxes has been made.
Certain Funds may be subject to foreign taxes on income, gains on investments or currency repatriation, a portion of which may be recoverable. Each Fund will accrue such taxes and recoveries as applicable based upon current interpretations of the tax rules and regulations that exist in the markets in which it invests.
Management of the Funds has concluded that there are no significant uncertain tax positions that would require recognition in the financial statements. As of March 31, 2017, the tax years that remain subject to examination by the major tax jurisdictions under the statute of limitations are from the year 2014 forward (with limited exceptions).
| | D. | Distributions to Shareholders |
Distributions are recorded by each Fund on the ex-dividend date. Income and capital gain distributions are determined in accordance with income tax regulations that may differ from U.S. GAAP.
Expenses incurred together by a Fund and other affiliated mutual funds are allocated in proportion to the net assets of each such fund, except where allocation of direct expenses to each fund or an alternative allocation method can be more appropriately used.
In addition to the net annual operating expenses that a Fund bears directly, the shareholders of a Fund indirectly bear each Fund’s pro-rata expenses of any underlying mutual funds in which the Fund invests.
| | F. | Foreign Currency Translation |
Non-U.S. investment securities and other assets and liabilities denominated in foreign currencies are translated into U.S. dollar amounts at the foreign currency exchange rate effective at the end of the reporting period. Cost of investments is translated at the currency exchange rate effective at the trade date. The gain or loss resulting from a change in currency exchange rates between the trade and settlement date of a portfolio transaction is treated as a gain or loss on foreign currency. Likewise, the gain or loss resulting from a change in currency exchange rates between the date income is accrued and the date it is paid is treated as a gain or loss on foreign currency. The Funds do not isolate that portion of the results of operations arising from changes in foreign exchange rates on investments from the fluctuations arising from changes in the market prices of securities held. Such fluctuations are included with the net realized and unrealized gain or loss on investments.
67
VIRTUS EQUITY TRUST
NOTES TO FINANCIAL STATEMENTS (Continued)
MARCH 31, 2017
Certain Funds may invest in direct debt instruments which are interests in amounts owed by a corporate, governmental, or other borrower to lenders or lending syndicates. Loan agreements are generally non-investment grade and often involve borrowers that are highly leveraged. The Funds may invest in obligations of borrowers who are in bankruptcy proceedings. Loan agreements are typically senior in the corporate capital structure of the borrower. A loan is often administered by a bank or other financial institution (the “lender”) that acts as agent for all holders. The agent administers the terms of the loan, as specified in the loan agreement. A Fund’s investments in loans may be in the form of participations in loans or assignments of all or a portion of loans from third parties. When investing in loan participations, a Fund has the right to receive payments of principal, interest and any fees to which it is entitled only from the lender selling the loan participation and only upon receipt by the lender of payments from the borrower. A Fund generally has no right to enforce compliance with the terms of the loan agreement with the borrower. As a result, a Fund may be subject to the credit risk of both the borrower and the lender that is selling the loan agreement. When a Fund purchases assignments from lenders it acquires direct rights against the borrower on the loan.
A Fund may invest in multiple series or tranches of a loan, which may have varying terms and carry different associated risks. Loan agreements may involve foreign borrowers and investments may be denominated in foreign currencies. Direct indebtedness of emerging countries involves a risk that the government entities responsible for the repayment of the debt may be unable, or unwilling, to pay the principal and interest when due.
The loan agreements have floating rate loan interests which generally pay interest at rates that are periodically determined by reference to a base lending rate plus a premium. The base lending rates are generally London Interbank Offered Rate (“LIBOR”), the prime rate offered by one or more U.S. banks or the certificate of deposit rate. When a loan agreement is purchased a Fund may pay an assignment fee. On an ongoing basis, a Fund may receive a commitment fee based on the undrawn portion of the underlying line of credit portion of a loan agreement. Prepayment penalty fees are received upon the prepayment of a loan agreement by a borrower. Prepayment penalty, facility, commitment, consent and amendment fees are recorded to income as earned or paid.
At March 31, 2017, all loan agreements held by the Funds are assignment loans.
| | H. | When-Issued and Forward Commitments (Delayed Delivery) |
Certain Funds may engage in when-issued or forward commitment transactions. Securities purchased on a when-issued or forward commitment basis are also known as delayed delivery transactions. Delayed delivery transactions involve a commitment by a Fund to purchase or sell a security at a future date (ordinarily up to 90 days later). When-issued or forward commitments enable a Fund to lock in what is believed to be an attractive price or yield on a particular security for a period of time, regardless of future changes in interest rates. Each Fund records when-issued and delayed delivery securities on the trade date. Each Fund maintains collateral for the securities purchased. Securities purchased on a when-issued or delayed delivery basis begin earning interest on the settlement date.
($ reported in thousands)
Certain Funds may loan securities to qualified brokers through an agreement with Brown Brothers Harriman (“BBH”), as a third party lending agent. Under the terms of the agreement, a Fund doing so is required to maintain collateral with a market value not less than 100% of the market value of loaned securities. Collateral is adjusted daily in connection with changes in the market value of securities on loan. Collateral may consist of cash and securities issued by the U.S. Government or its agencies. Cash collateral is invested in a short-term money market fund. Dividends earned on the collateral and premiums paid by the broker are recorded as income by a Fund net of fees and rebates charged by BBH for its services as securities lending agent and in connection with this securities lending program. Lending portfolio securities involves a risk of delay in the recovery of the loaned securities or in the declining value of the collateral.
At March 31, 2017, the following Funds had securities on loan:
| | | | | | | | |
| | | Market Value | | | Cash Collateral | |
Contrarian Value Fund | | $ | 8,565 | | | $ | 8,826 | |
KAR Global Quality Dividend Fund | | | 7,416 | | | | 7,552 | |
KAR Mid-Cap Core Fund | | | 1,817 | | | | 1,866 | |
KAR Small-Cap Core Fund | | | 10,918 | | | | 11,114 | |
At March 31, 2017, the KAR Capital Growth Fund, KAR Mid-Cap Growth Fund, KAR Small-Cap Growth Fund, and Tactical Allocation Fund did not have any securities on loan.
| | J. | Earnings Credit and Interest |
Through arrangements with each Fund’s custodian, each Fund either receives an earnings credit or interest on agreed upon target un-invested cash balances to reduce each Fund’s custody expenses. The credits are reflected as “Earnings credit from custodian” and the interest is reflected under “Interest income” in each Fund’s Statements of Operations for the period, as applicable.
| Note | 3. Derivative Financial Instruments and Transactions |
($ reported in thousands)
Disclosures about derivative instruments and hedging activities are intended to enable investors to understand how and why a Fund uses derivatives, how derivatives are accounted for, and how derivative instruments affect a Fund’s results of operations and financial position. Summarized below is a specific type of derivative instrument used by certain Funds.
Options Contracts: An options contract provides the purchaser with the right, but not the obligation, to buy (call option) or sell (put option) a financial instrument at an agreed-upon price. Certain Funds may purchase or write both put and call options on portfolio securities for hedging purposes or to facilitate the rapid implementation of investment strategies if the Fund anticipates a significant market or sector advance. The Funds are subject to equity price risk in the normal course of pursuing their investment objectives. The Funds may use options contracts to hedge against changes in the values of equities.
68
VIRTUS EQUITY TRUST
NOTES TO FINANCIAL STATEMENTS (Continued)
MARCH 31, 2017
When a Fund purchases an option, it pays a premium and an amount equal to that premium is recorded as an asset. When a Fund writes an option, it receives a premium and an amount equal to that premium is recorded as a liability. The asset or liability is adjusted daily to reflect the current market value of the option. Holdings of the Fund designated to cover outstanding written options are noted in the Schedules of Investments. Purchased options are reported as an asset within “Investment in unaffiliated securities at value” in the Statements of Assets and Liabilities. Options written are reported as a liability within “Written options at value.” Changes in value of the purchased option are included in “Net change in unrealized appreciation (depreciation) on unaffiliated investments” in the Statements of Operations. Changes in value of written options are included in “Net change in unrealized appreciation (depreciation) on written options” in the Statements of Operations.
If an option expires unexercised, the Fund realizes a gain or loss to the extent of the premium received or paid. If an option is exercised, the premium received or paid is recorded as an adjustment to the proceeds from the sale or the cost basis of the purchase. The difference between the premium and the amount received or paid on effecting a closing purchase or sale transaction is also treated as a realized gain or loss. Gain or loss on purchased options is included in “Net realized gain (loss) on unaffiliated investments” in the Statements of Operations. Gain or loss on written options is presented separately as “Net realized gain (loss) on written options” in the Statements of Operations.
The risk in writing call options is that the Fund gives up the opportunity for profit if the market price of the security increases and the option is exercised. The risk in writing put options is that the Fund may incur a loss if the market price of the security decreases and the option is exercised. The risk in buying options is that the Fund pays a premium whether or not the option is exercised. The use of such instruments may involve certain additional risks as a result of unanticipated movements in the market. Writers (sellers) of options are subject to unlimited risk of loss, as the seller will be obligated to deliver or take delivery of the security at a predetermined price which may, upon exercise of the option, be significantly different from the then-market value.
The Rampart Enhanced Core Equity Fund invests in written covered call options contracts in an attempt to manage equity price risk and with the purpose of generating realized gains.
Written options transactions held by Rampart Enhanced Core Equity Fund, during the period ended March 31, 2017, were as follows:
| | | | | | | | | | | | | | | | |
| | | Calls | | | Puts | |
| | | Number of Contracts | | | Premiums received | | | Number of Contracts | | | Premiums received | |
Written Options outstanding at March 31, 2016 | | | 992 | | | $ | 45 | | | | 992 | | | $ | 325 | |
Options written | | | 32,878 | | | | 2,026 | | | | 32,878 | | | | 10,439 | |
Options closed | | | (26,014 | ) | | | (1,545 | ) | | | (24,679 | ) | | | (7,951 | ) |
Options expired | | | (6,142 | ) | | | (396 | ) | | | (7,477 | ) | | | (2,285 | ) |
Options exercised | | | — | | | | — | | | | — | | | | — | |
| | | | | | | | | | | | | | | | |
Written Options outstanding at March 31, 2017 | | | 1,714 | | | $ | 130 | | | | 1,714 | | | $ | 528 | |
| | | | | | | | | | | | | | | | |
The following is a summary of the Rampart Enhanced Core Equity Fund’s derivative instrument holdings categorized by primary risk exposure (equity contracts) in the financial statements as of March 31, 2017:
| | | | |
Statements of Assets and Liabilities | |
| | | Enhanced
Core Equity | |
Assets: Purchased options at value | | $ | 141 | (1) |
Liabilities: Written options at value | | | (309 | ) |
| | | | |
Net asset (liability) balance | | $ | (168 | ) |
| | | | |
| | | | |
Statements of Operations | |
| | | Enhanced
Core Equity | |
Net realized gain (loss) on purchased options | | $ | (5,243 | )(2) |
Net realized gain (loss) on written options | | | 10,710 | |
Net change in unrealized appreciation (depreciation) on purchased options | | | (70 | )(3) |
Net change in unrealized appreciation (depreciation) on written options | | | 28 | |
| | | | |
Total net realized and unrealized gain (loss) on purchased and written options | | $ | 5,425 | |
| | | | |
| | (1) | Amount included in Investment in unaffiliated securities at value. |
| | (2) | Amount included in Net realized gain (loss) on unaffiliated investments. |
| | (3) | Amount included in Net change in unrealized appreciation (depreciation) on unaffiliated investments. |
For the period ended March 31, 2017, the average daily premiums paid by the Rampart Enhanced Core Equity Fund for purchased options were $165 and the average daily premiums received for written call options by the Rampart Enhanced Core Equity Fund were $(380).
| Note | 4. Investment Advisory Fees and Related Party Transactions |
($ reported in thousands except as noted)
Virtus Investment Advisers, Inc. (the “Adviser”), an indirect, wholly owned subsidiary of Virtus Investment Partners, Inc. (“Virtus”), is the investment adviser to the Trust. The Adviser manages the Funds’ investment programs and general operations of the Funds, including oversight of the Funds’ subadvisers.
69
VIRTUS EQUITY TRUST
NOTES TO FINANCIAL STATEMENTS (Continued)
MARCH 31, 2017
As compensation for its services to the Funds, the Adviser is entitled to a fee based upon the following annual rates as a percentage of the average daily net assets of each Fund:
| | | | |
KAR Small-Cap Core Fund | | | 0.75 | % |
KAR Small-Cap Value Fund | | | 0.70 | |
| | | | | | | | | | | | |
| | | First $1 Billion | | | $1+ Billion through $2 Billion | | | $2+ Billion | |
KAR Capital Growth Fund | | | 0.70 | % | | | 0.65 | % | | | 0.60 | % |
KAR Global Quality Dividend Fund | | | 0.75 | | | | 0.70 | | | | 0.65 | |
KAR Mid-Cap Core Fund | | | 0.80 | | | | 0.75 | | | | 0.70 | |
Rampart Enhanced Core Equity Fund | | | 0.75 | | | | 0.70 | | | | 0.65 | |
Tactical Allocation Fund | | | 0.70 | | | | 0.65 | | | | 0.60 | |
| | | |
| | | First $400 Million | | | $400+ Million through $1 Billion | | | $1+ Billion | |
KAR Small-Cap Growth Fund | | | 0.90% | | | | 0.85% | | | | 0.80% | |
| | | |
| | | First $500 Million | | | Over $500 Million | | | | |
KAR Mid-Cap Growth Fund | | | 0.80% | | | | 0.70% | | | | | |
| | | |
| | | First $1 Billion | | | Over $1 Billion | | | | |
Contrarian Value Fund | | | 0.75% | | | | 0.70% | | | | | |
During the period covered by these financial statements, the Tactical Allocation Fund invested a portion of its assets in Virtus Credit Opportunities Fund, an affiliated mutual fund. In order to avoid any duplication of advisory fees, the Adviser has voluntarily waived its advisory fees in an amount equal to that which would otherwise be paid by the Fund on the assets invested in the Virtus Credit Opportunities Fund. For the period covered by these financial statements, the waiver amounted to $12. This waiver is in addition to the expense limitation and/or fee waiver covered elsewhere in these financial statements and is included in “Less expenses reimbursed and/or waived by investment adviser” in the Statements of Operations.
The subadvisers manage the investments of each Fund for which they are paid a fee by the Adviser. A list of the subadvisers and the Funds they serve as of the end of the period is as follows:
| | | | | | |
Fund | | Subadviser | | Fund | | Subadviser |
| Contrarian Value Fund | | Sasco Capital, Inc. | | KAR Small-Cap Growth Fund | | Kayne(1)(2) |
KAR Capital Growth Fund | | Kayne(1)(2) | | KAR Small-Cap Value Fund | | Kayne(1)(2) |
| KAR Global Quality Dividend Fund | | Kayne(1)(2) | | Rampart Enhanced Core Equity Fund | | Rampart Investment Management Company, LLC(2) |
KAR Mid-Cap Core Fund | | Kayne(1)(2) | | Tactical Allocation Fund (Domestic Equity Portfolio) | | Kayne(1)(2)(4) |
KAR Mid-Cap Growth Fund | | Kayne(1)(2) | | Tactical Allocation Fund (International Equity Portfolio) | | DPIM(2)(3)(4) |
| KAR Small-Cap Core Fund | | Kayne(1)(2) | | Tactical Allocation Fund (Fixed Income Portfolio) | | Newfleet Asset Management, LLC(2) |
| | (1) | Kayne Anderson Rudnick Investment Management, LLC. |
| | (2) | An indirect, wholly owned subsidiary of Virtus. |
| | (3) | Duff & Phelps Investment Management Co. |
| | (4) | Prior to September 7, 2016, subadviser was Euclid Advisors LLC. |
| | C. | Expense Limits and Fee Waivers |
The Adviser has contractually agreed to limit certain Funds’ total operating expenses (excluding front-end or contingent deferred loads, taxes, leverage expenses, interest, brokerage commissions, expenses incurred in connection with any merger or reorganization, unusual or infrequently occurring expenses (such as litigation), acquired fund fees and expenses, and dividend expenses, if any), so that such expenses do not exceed the following percentages of the average annual daily net asset values for the following Funds.
| | | | | | | | | | | | | | | | | | | | |
| | | Class A | | | Class C | | | Class I | | | Class R6 | | | Through
Date | |
Contrarian Value Fund‡ | | | 1.48 | % | | | 2.23 | % | | | 1.23 | % | | | 1.06 | %** | | | 4/30/18 | |
KAR Capital Growth Fund‡ | | | 1.47 | | | | 2.22 | | | | 1.22 | | | | N/A | | | | 4/30/18 | |
KAR Global Quality Dividend Fund | | | 1.35 | | | | 2.10 | | | | 1.10 | | | | N/A | | | | 4/30/18 | |
KAR Mid-Cap Core Fund* | | | 1.20 | | | | 1.95 | | | | 0.95 | | | | N/A | | | | 4/30/18 | |
KAR Mid-Cap Growth Fund | | | 1.40 | | | | 2.15 | | | | 1.15 | | | | N/A | | | | 4/30/18 | |
KAR Small-Cap Growth Fund | | | 1.50 | | | | 2.25 | | | | 1.25 | | | | N/A | | | | 4/30/18 | |
KAR Small-Cap Value Fund‡ | | | 1.42 | | | | 2.17 | | | | 1.17 | | | | 1.06 | | | | 4/30/18 | |
Rampart Enhanced Core Equity Fund | | | 1.25 | | | | 2.00 | | | | 1.00 | | | | N/A | | | | 4/30/18 | |
| | * | Effective July 29, 2016. For the period of September 1, 2015 to July 28, 2016, the expense cap were as follows for Class A, Class C, and Class I respectively: 1.35%, 2.10%, and 1.10%. |
| | ** | Prior to November 1, 2016, the expense cap was 1.10%. |
| | ‡ | Fund expenses are currently below the capped level. |
70
VIRTUS EQUITY TRUST
NOTES TO FINANCIAL STATEMENTS (Continued)
MARCH 31, 2017
For certain Funds, the Adviser may recapture operating expenses waived or reimbursed under these arrangements, within three years after the date in which such waiver or reimbursement occurred. A Fund must pay its ordinary operating expenses before the Adviser is entitled to any reimbursement and must remain in compliance with any applicable expense limitations or, if none, the expense limitation in effect at the time of the waiver or reimbursement. All or a portion of the following Adviser reimbursed expenses may be recaptured as follows:
| | | | | | | | | | | | | | | | |
| | | Fiscal Year Ended | |
| | | 2018 | | | 2019 | | | 2020 | | | Total | |
KAR Global Quality Dividend Fund | | $ | 45 | | | $ | 62 | | | | 72 | | | $ | 179 | |
KAR Mid-Cap Core Fund | | | 77 | | | | 79 | | | | 158 | | | | 314 | |
KAR Mid-Cap Growth Fund | | | 24 | | | | 76 | | | | 91 | | | | 191 | |
KAR Small-Cap Growth Fund | | | 73 | | | | 53 | | | | 51 | | | | 177 | |
Rampart Enhanced Core Equity Fund | | | 175 | | | | 202 | | | | 215 | | | | 592 | |
VP Distributors, LLC (“VP Distributors”), an indirect, wholly owned subsidiary of Virtus, serves as the distributor of each Fund’s shares. VP Distributors has advised the Funds that for the fiscal year (the “period”) ended March 31, 2017, it retained net commissions of $1,771 for Class A shares and CDSC of $10, —(1) and $16 for Class A shares, Class B and Class C shares, respectively.
In addition, each Fund pays VP Distributors 12b-1 fees under a 12b-1 Plan as a percentage of the average daily net assets of each respective class at the annual rates as follows: Class A shares 0.25%; Class C shares 1.00%; Class I shares and Class R6 shares are not subject to a 12b-1 Plan.
Under certain circumstances, shares of certain Virtus Mutual Funds may be exchanged for shares of the same class of certain other Virtus Mutual Funds on the basis of the relative NAV per share at the time of the exchange. On exchanges with share classes that carry a CDSC, the CDSC schedule of the original shares purchased continues to apply.
| | (1) | Amount is less than $500. |
| | F. | Administrator and Transfer Agent |
Virtus Fund Services, LLC, an indirect, wholly owned subsidiary of Virtus, serves as the administrator and transfer agent to the Trust.
For the period ended March 31, 2017, the Funds incurred administration fees totaling $2,200 which are included in the Statements of Operations.
For the period ended March 31, 2017, the Funds incurred transfer agent fees totaling $2,827 which are included in the Statements of Operations. A portion of these fees was paid to outside entities that also provide services to the Trust.
| | G. | Affiliated Shareholders |
($ reported in thousands)
At March 31, 2017, Virtus and its affiliates held shares of certain Funds which may be redeemed at any time that aggregated the following:
| | | | | | | | |
| | | Shares | | | Aggregate Net
Asset Value | |
| KAR Capital Growth Fund | | | | | | | | |
Class A | | | 13 | | | $ | — | (1) |
| KAR Small-Cap Value Fund | | | | | | | | |
Class R6 | | | 6,896 | | | | 122 | |
| | (1) | Amount is less than $500. |
| | H. | Investments in Affiliates |
A summary of the Tactical Allocation Fund’s total long-term and short-term purchases and sales of the affiliated underlying fund during the period ended March 31, 2017, is as follows:
| | | | | | | | | | | | | | | | | | | | | | | | |
| | | Value,
beginning
of period | | | Purchases | | | Sales | | | Value, end
of period | | | Dividend
Income | | | Distributions
of Realized
Gains | |
| Virtus Credit Opportunities Fund | | $ | 1,695 | | | $ | — | | | $ | — | | | $ | 1,771 | | | $ | 74 | | | $ | — | |
The Trust provides a deferred compensation plan for its Trustees who receive compensation from the Trust. Under the deferred compensation plan, Trustees may elect to defer all or a portion of their compensation. Amounts deferred are retained by the Trust, and then, to the extent permitted by the 1940 Act, in turn, may be invested in the shares of affiliated or unaffiliated mutual funds selected by the participating Trustees. Investments in such instruments are included in “Other assets” in the Statements of Assets and Liabilities at March 31, 2017.
71
VIRTUS EQUITY TRUST
NOTES TO FINANCIAL STATEMENTS (Continued)
MARCH 31, 2017
| Note | 5. Purchases and Sales of Securities |
($ reported in thousands)
Purchases and sales of securities (excluding U.S. Government and agency securities, written options, and short-term securities) during the period ended March 31, 2017, were as follows:
| | | | | | | | |
| | | Purchases | | | Sales | |
Contrarian Value Fund | | $ | 33,412 | | | $ | 131,860 | |
KAR Capital Growth Fund | | | 89,625 | | | | 148,467 | |
KAR Global Quality Dividend Fund | | | 74,426 | | | | 85,047 | |
KAR Mid-Cap Core Fund | | | 56,462 | | | | 15,648 | |
KAR Mid-Cap Growth Fund | | | 17,155 | | | | 24,530 | |
KAR Small-Cap Core Fund | | | 155,745 | | | | 84,041 | |
KAR Small-Cap Growth Fund | | | 431,249 | | | | 76,818 | |
KAR Small-Cap Value Fund | | | 126,573 | | | | 61,328 | |
Rampart Enhanced Core Equity Fund | | | 792,847 | | | | 788,333 | |
Tactical Allocation Fund | | | 148,538 | | | | 164,474 | |
The Tactical Allocation Fund had purchases of $2,467 and sales of $4,788 of long-term U.S. Government and agency securities during the period ended March 31, 2017.
| Note | 6. Capital Share Transactions |
(reported in thousands)
Transactions in shares of capital stock, during the periods ended as indicated below, were as follows:
| | | | | | | | | | | | | | | | | | | | | | | | | | | | | | | | |
| | | Contrarian Value Fund | | | KAR Capital Growth Fund | |
| | | Year Ended
March 31, 2017 | | | Year Ended
March 31, 2016 | | | Year Ended
March 31, 2017 | | | Year Ended
March 31, 2016 | |
| | | SHARES | | | AMOUNT | | | SHARES | | | AMOUNT | | | SHARES | | | AMOUNT | | | SHARES | | | AMOUNT | |
| | | | | | | | | | | | | | | | | | | | | | | | | | | | | | | | |
| Class A | | | | | | | | | | | | | | | | | | | | | | | | | | | | | | | | |
| Sale of shares | | | 235 | | | $ | 7,988 | | | | 497 | | | $ | 16,061 | | | | 403 | | | $ | 5,482 | | | | 692 | | | $ | 9,635 | |
| Conversion from Class B shares(3) | | | — | | | | — | | | | — | | | | — | | | | 43 | | | | 602 | | | | — | | | | — | |
| Reinvestment of distributions | | | 17 | | | | 559 | | | | 17 | | | | 628 | | | | 2,208 | | | | 28,727 | | | | 1,224 | | | | 17,438 | |
| Shares repurchased | | | (1,471 | ) | | | (50,190 | ) | | | (2,361 | ) | | | (76,153 | ) | | | (3,521 | ) | | | (48,786 | ) | | | (3,003 | ) | | | (41,883 | ) |
| | | | | | | | | | | | | | | | | | | | | | | | | | | | | | | | |
| Net Increase / (Decrease) | | | (1,219 | ) | | $ | (41,643 | ) | | | (1,847 | ) | | $ | (59,464 | ) | | | (867 | ) | | $ | (13,975 | ) | | | (1,087 | ) | | $ | (14,810 | ) |
| | | | | | | | | | | | | | | | | | | | | | | | | | | | | | | | |
| Class B | | | | | | | | | | | | | | | | | | | | | | | | | | | | | | | | |
| Sale of shares | | | — | | | $ | — | | | | — | | | $ | — | | | | — | (1) | | | — | (2) | | | 2 | | | $ | 17 | |
| Reinvestment of distributions | | | — | | | | — | | | | — | | | | — | | | | 6 | | | | 67 | | | | 8 | | | | 98 | |
| Shares repurchased | | | — | | | | — | | | | — | | | | — | | | | (78 | ) | | | (902 | ) | | | (69 | ) | | | (799 | ) |
| Conversion to Class A shares(3) | | | — | | | | — | | | | — | | | | — | | | | (54 | ) | | | (602 | ) | | | — | | | | — | |
| | | | | | | | | | | | | | | | | | | | | | | | | | | | | | | | |
| Net Increase / (Decrease) | | | — | | | $ | — | | | | — | | | $ | — | | | | (126 | ) | | $ | (1,437 | ) | | | (59 | ) | | $ | (684 | ) |
| | | | | | | | | | | | | | | | | | | | | | | | | | | | | | | | |
| Class C | | | | | | | | | | | | | | | | | | | | | | | | | | | | | | | | |
| Sale of shares | | | 28 | | | $ | 920 | | | | 38 | | | $ | 1,236 | | | | 88 | | | $ | 972 | | | | 1,249 | | | $ | 14,657 | |
| Reinvestment of distributions | | | — | (1) | | | 5 | | | | 1 | | | | 38 | | | | 109 | | | | 1,140 | | | | 68 | | | | 810 | |
| Shares repurchased | | | (338 | ) | | | (11,101 | ) | | | (564 | ) | | | (17,436 | ) | | | (777 | ) | | | (8,801 | ) | | | (564 | ) | | | (6,362 | ) |
| | | | | | | | | | | | | | | | | | | | | | | | | | | | | | | | |
| Net Increase / (Decrease) | | | (310 | ) | | $ | (10,176 | ) | | | (525 | ) | | $ | (16,162 | ) | | | (580 | ) | | $ | (6,689 | ) | | | 753 | | | $ | 9,105 | |
| | | | | | | | | | | | | | | | | | | | | | | | | | | | | | | | |
| Class I | | | | | | | | | | | | | | | | | | | | | | | | | | | | | | | | |
| Sale of shares | | | 478 | | | $ | 16,400 | | | | 657 | | | $ | 21,130 | | | | 272 | | | $ | 3,894 | | | | 171 | | | $ | 2,422 | |
| Reinvestment of distributions | | | 28 | | | | 945 | | | | 25 | | | | 890 | | | | 47 | | | | 637 | | | | 23 | | | | 338 | |
| Shares repurchased | | | (1,646 | ) | | | (56,035 | ) | | | (2,219 | ) | | | (71,603 | ) | | | (206 | ) | | | (2,908 | ) | | | (198 | ) | | | (2,764 | ) |
| | | | | | | | | | | | | | | | | | | | | | | | | | | | | | | | |
| Net Increase / (Decrease) | | | (1,140 | ) | | $ | (38,690 | ) | | | (1,537 | ) | | $ | (49,583 | ) | | | 113 | | | $ | 1,623 | | | | (4 | ) | | $ | (4 | ) |
| | | | | | | | | | | | | | | | | | | | | | | | | | | | | | | | |
| Class R6 | | | | | | | | | | | | | | | | | | | | | | | | | | | | | | | | |
| Sale of shares | | | 28 | | | $ | 935 | | | | 176 | | | $ | 5,841 | | | | — | | | $ | — | | | | — | | | $ | — | |
| Reinvestment of distributions | | | 1 | | | | 45 | | | | — | (1) | | | 17 | | | | — | | | | — | | | | — | | | | — | |
| Shares repurchased | | | (96 | ) | | | (3,230 | ) | | | (27 | ) | | | (853 | ) | | | — | | | | — | | | | — | | | | — | |
| | | | | | | | | | | | | | | | | | | | | | | | | | | | | | | | |
| Net Increase / (Decrease) | | | (67 | ) | | $ | (2,250 | ) | | | 149 | | | $ | 5,005 | | | | — | | | $ | — | | | | — | | | $ | — | |
| | | | | | | | | | | | | | | | | | | | | | | | | | | | | | | | |
| (1) | Amount is less than 500 shares. |
| (2) | Amount is less than $500. |
| (3) | See Note 1 in Notes to Financial Statements for more information. |
72
VIRTUS EQUITY TRUST
NOTES TO FINANCIAL STATEMENTS (Continued)
MARCH 31, 2017
| | | | | | | | | | | | | | | | | | | | | | | | | | | | | | | | |
| | | KAR Global Quality Dividend Fund | | | KAR Mid-Cap Core Fund | |
| | | Year Ended
March 31, 2017 | | | Year Ended
March 31, 2016 | | | Year Ended
March 31, 2017 | | | Year Ended
March 31, 2016 | |
| | | SHARES | | | AMOUNT | | | SHARES | | | AMOUNT | | | SHARES | | | AMOUNT | | | SHARES | | | AMOUNT | |
| | | | | | | | | | | | | | | | | | | | | | | | | | | | | | | | |
| Class A | | | | | | | | | | | | | | | | | | | | | | | | | | | | | | | | |
| Sale of shares | | | 128 | | | $ | 1,985 | | | | 328 | | | $ | 4,631 | | | | 860 | | | $ | 20,379 | | | | 557 | | | $ | 12,394 | |
| Reinvestment of distributions | | | 29 | | | | 451 | | | | 16 | | | | 245 | | | | — | | | | — | | | | 4 | | | | 95 | |
| Shares repurchased | | | (700 | ) | | | (11,095 | ) | | | (611 | ) | | | (9,094 | ) | | | (974 | ) | | | (23,609 | ) | | | (217 | ) | | | (4,737 | ) |
| | | | | | | | | | | | | | | | | | | | | | | | | | | | | | | | |
| Net Increase / (Decrease) | | | (543 | ) | | $ | (8,659 | ) | | | (267 | ) | | $ | (4,218 | ) | | | (114 | ) | | $ | (3,230 | ) | | | 344 | | | $ | 7,752 | |
| | | | | | | | | | | | | | | | | | | | | | | | | | | | | | | | |
| Class C | | | | | | | | | | | | | | | | | | | | | | | | | | | | | | | | |
| Sale of shares | | | 59 | | | $ | 906 | | | | 116 | | | $ | 1,660 | | | | 409 | | | $ | 9,372 | | | | 195 | | | $ | 4,179 | |
| Reinvestment of distributions | | | — | | | | — | | | | 1 | | | | 11 | | | | — | | | | — | | | | 2 | | | | 35 | |
| Shares repurchased | | | (194 | ) | | | (2,981 | ) | | | (914 | ) | | | (12,980 | ) | | | (134 | ) | | | (3,029 | ) | | | (85 | ) | | | (1,754 | ) |
| | | | | | | | | | | | | | | | | | | | | | | | | | | | | | | | |
| Net Increase / (Decrease) | | | (135 | ) | | $ | (2,075 | ) | | | (797 | ) | | $ | (11,309 | ) | | | 275 | | | $ | 6,343 | | | | 112 | | | $ | 2,460 | |
| | | | | | | | | | | | | | | | | | | | | | | | | | | | | | | | |
| Class I | | | | | | | | | | | | | | | | | | | | | | | | | | | | | | | | |
| Sale of shares | | | 94 | | | $ | 1,535 | | | | 45 | | | $ | 667 | | | | 1,943 | | | $ | 47,890 | | | | 279 | | | $ | 6,180 | |
| Reinvestment of distributions | | | 4 | | | | 68 | | | | 3 | | | | 52 | | | | — | | | | — | | | | 2 | | | | 41 | |
| Shares repurchased | | | (107 | ) | | | (1,701 | ) | | | (253 | ) | | | (3,772 | ) | | | (325 | ) | | | (7,950 | ) | | | (156 | ) | | | (3,412 | ) |
| | | | | | | | | | | | | | | | | | | | | | | | | | | | | | | | |
| Net Increase / (Decrease) | | | (9 | ) | | $ | (98 | ) | | | (205 | ) | | $ | (3,053 | ) | | | 1,618 | | | $ | 39,940 | | | | 125 | | | $ | 2,809 | |
| | | | | | | | | | | | | | | | | | | | | | | | | | | | | | | | |
| | |
| | | KAR Mid-Cap Growth Fund | | | KAR Small-Cap Core Fund | |
| | | Year Ended
March 31, 2017 | | | Year Ended
March 31, 2016 | | | Year Ended
March 31, 2017 | | | Year Ended
March 31, 2016 | |
| | | SHARES | | | | AMOUNT | | | | SHARES | | | | AMOUNT | | | | SHARES | | | | AMOUNT | | | | SHARES | | | | AMOUNT | |
| | | | | | | | | | | | | | | | | | | | | | | | | |
| Class A | | | | | | | | | | | | | | | | | | | | | | | | | | | | | | | | |
| Sale of shares | | | 127 | | | $ | 2,897 | | | | 134 | | | $ | 2,958 | | | | 1,507 | | | $ | 34,529 | | | | 436 | | | $ | 9,529 | |
| Conversion from Class B shares(3) | | | 6 | | | | 156 | | | | — | | | | — | | | | — | | | | — | | | | — | | | | — | |
| Reinvestment of distributions | | | 48 | | | | 1,082 | | | | 49 | | | | 1,143 | | | | 153 | | | | 3,396 | | | | 443 | | | | 9,802 | |
| Shares repurchased | | | (396 | ) | | | (9,112 | ) | | | (332 | ) | | | (7,279 | ) | | | (1,606 | ) | | | (37,256 | ) | | | (1,006 | ) | | | (22,255 | ) |
| | | | | | | | | | | | | | | | | | | | | | | | | | | | | | | | |
| Net Increase / (Decrease) | | | (215 | ) | | $ | (4,977 | ) | | | (149 | ) | | $ | (3,178 | ) | | | 54 | | | $ | 669 | | | | (127 | ) | | $ | (2,924 | ) |
| | | | | | | | | | | | | | | | | | | | | | | | | | | | | | | | |
| Class B | | | | | | | | | | | | | | | | | | | | | | | | | | | | | | | | |
| Sale of shares | | | — | | | | — | (2) | | | — | (1) | | $ | — | (2) | | | — | | | $ | — | | | | — | | | $ | — | |
| Reinvestment of distributions | | | — | (1) | | | 3 | | | | — | (1) | | | 9 | | | | — | | | | — | | | | — | | | | — | |
| Shares repurchased | | | (10 | ) | | | (196 | ) | | | (14 | ) | | | (262 | ) | | | — | | | | — | | | | — | | | | — | |
| Conversion to Class A shares(3) | | | (8 | ) | | | (156 | ) | | | — | | | | — | | | | — | | | | — | | | | — | | | | — | |
| | | | | | | | | | | | | | | | | | | | | | | | | | | | | | | | |
| Net Increase / (Decrease) | | | (18 | ) | | $ | (349 | ) | | | (14 | ) | | $ | (253 | ) | | | — | | | $ | — | | | | — | | | $ | — | |
| | | | | | | | | | | | | | | | | | | | | | | | | | | | | | | | |
| Class C | | | | | | | | | | | | | | | | | | | | | | | | | | | | | | | | |
| Sale of shares | | | 89 | | | $ | 1,704 | | | | 71 | | | $ | 1,340 | | | | 778 | | | $ | 15,284 | | | | 295 | | | $ | 5,978 | |
| Reinvestment of distributions | | | 5 | | | | 89 | | | | 5 | | | | 94 | | | | 123 | | | | 2,351 | | | | 301 | | | | 5,822 | |
| Shares repurchased | | | (121 | ) | | | (2,259 | ) | | | (96 | ) | | | (1,721 | ) | | | (442 | ) | | | (8,547 | ) | | | (360 | ) | | | (7,311 | ) |
| | | | | | | | | | | | | | | | | | | | | | | | | | | | | | | | |
| Net Increase / (Decrease) | | | (27 | ) | | $ | (466 | ) | | | (20 | ) | | $ | (287 | ) | | | 459 | | | $ | 9,088 | | | | 236 | | | $ | 4,489 | |
| | | | | | | | | | | | | | | | | | | | | | | | | | | | | | | | |
| Class I | | | | | | | | | | | | | | | | | | | | | | | | | | | | | | | | |
| Sale of shares | | | 47 | | | $ | 1,092 | | | | 25 | | | $ | 586 | | | | 7,980 | | | $ | 188,854 | | | | 1,981 | | | $ | 46,483 | |
| Reinvestment of distributions | | | 2 | | | | 47 | | | | 2 | | | | 49 | | | | 571 | | | | 13,259 | | | | 1,417 | | | | 32,670 | |
| Shares repurchased | | | (27 | ) | | | (638 | ) | | | (36 | ) | | | (806 | ) | | | (3,695 | ) | | | (86,856 | ) | | | (4,279 | ) | | | (101,680 | ) |
| | | | | | | | | | | | | | | | | | | | | | | | | | | | | | | | |
| Net Increase / (Decrease) | | | 22 | | | $ | 501 | | | | (9 | ) | | $ | (171 | ) | | | 4,856 | | | $ | 115,257 | | | | (881 | ) | | $ | (22,527 | ) |
| | | | | | | | | | | | | | | | | | | | | | | | | | | | | | | | |
| Class R6 | | | | | | | | | | | | | | | | | | | | | | | | | | | | | | | | |
| Sale of shares | | | — | | | $ | — | | | | — | | | $ | — | | | | 446 | | | $ | 10,598 | | | | 890 | | | $ | 21,755 | |
| Reinvestment of distributions | | | — | | | | — | | | | — | | | | — | | | | 62 | | | | 1,435 | | | | 97 | | | | 2,115 | |
| Shares repurchased | | | — | | | | — | | | | — | | | | — | | | | (208 | ) | | | (4,894 | ) | | | (59 | ) | | | (1,307 | ) |
| | | | | | | | | | | | | | | | | | | | | | | | | | | | | | | | |
| Net Increase/ (Decrease) | | | — | | | $ | — | | | | — | | | $ | — | | | | 300 | | | $ | 7,139 | | | | 928 | | | $ | 22,563 | |
| | | | | | | | | | | | | | | | | | | | | | | | | | | | | | | | |
| (1) | Amount is less than 500 shares. |
| (2) | Amount is less than $500. |
| (3) | See Note 1 in Notes to Financial Statement for more information. |
73
VIRTUS EQUITY TRUST
NOTES TO FINANCIAL STATEMENTS (Continued)
MARCH 31, 2017
| | | | | | | | | | | | | | | | | | | | | | | | | | | | | | | | |
| | | KAR Small-Cap Growth Fund | | | KAR Small-Cap Value Fund | |
| | | Year Ended
March 31, 2017 | | | Year Ended
March 31, 2016 | | | Year Ended
March 31, 2017 | | | Year Ended
March 31, 2016 | |
| | | SHARES | | | AMOUNT | | | SHARES | | | AMOUNT | | | SHARES | | | AMOUNT | | | SHARES | | | AMOUNT | |
| | | | | | | | | | | | | | | | | | | | | | | | | | | | | | | | |
| Class A | | | | | | | | | | | | | | | | | | | | | | | | | | | | | | | | |
| Sale of shares | | | 9,213 | | | $ | 178,982 | | | | 1,110 | | | $ | 18,446 | | | | 1,626 | | | $ | 26,711 | | | | 572 | | | $ | 8,621 | |
| Reinvestment of distributions | | | 186 | | | | 3,272 | | | | 129 | | | | 2,236 | | | | 396 | | | | 6,244 | | | | 285 | | | | 4,445 | |
| Shares repurchased | | | (5,694 | ) | | | (115,942 | ) | | | (987 | ) | | | (16,297 | ) | | | (1,515 | ) | | | (24,855 | ) | | | (808 | ) | | | (12,177 | ) |
| | | | | | | | | | | | | | | | | | | | | | | | | | | | | | | | |
| Net Increase / (Decrease) | | | 3,705 | | | $ | 66,312 | | | | 252 | | | $ | 4,385 | | | | 507 | | | $ | 8,100 | | | | 49 | | | $ | 889 | |
| | | | | | | | | | | | | | | | | | | | | | | | | | | | | | | | |
| Class C | | | | | | | | | | | | | | | | | | | | | | | | | | | | | | | | |
| Sale of shares | | | 2,108 | | | $ | 37,801 | | | | 377 | | | $ | 5,896 | | | | 417 | | | $ | 6,683 | | | | 95 | | | $ | 1,426 | |
| Reinvestment of distributions | | | 44 | | | | 711 | | | | 29 | | | | 470 | | | | 123 | | | | 1,918 | | | | 88 | | | | 1,357 | |
| Shares repurchased | | | (325 | ) | | | (5,799 | ) | | | (163 | ) | | | (2,491 | ) | | | (373 | ) | | | (5,888 | ) | | | (217 | ) | | | (3,265 | ) |
| | | | | | | | | | | | | | | | | | | | | | | | | | | | | | | | |
| Net Increase / (Decrease) | | | 1,827 | | | $ | 32,713 | | | | 243 | | | $ | 3,875 | | | | 167 | | | $ | 2,713 | | | | (34 | ) | | $ | (482 | ) |
| | | | | | | | | | | | | | | | | | | | | | | | | | | | | | | | |
| Class I | | | | | | | | | | | | | | | | | | | | | | | | | | | | | | | | |
| Sale of shares | | | 22,582 | | | $ | 452,219 | | | | 4,526 | | | $ | 76,763 | | | | 8,261 | | | $ | 134,255 | | | | 2,300 | | | $ | 34,828 | |
| Reinvestment of distributions | | | 170 | | | | 3,037 | | | | 60 | | | | 1,032 | | | | 1,006 | | | | 15,898 | | | | 680 | | | | 10,585 | |
| Shares repurchased | | | (5,416 | ) | | | (106,659 | ) | | | (1,075 | ) | | | (17,938 | ) | | | (4,704 | ) | | | (76,451 | ) | | | (3,573 | ) | | | (53,640 | ) |
| | | | | | | | | | | | | | | | | | | | | | | | | | | | | | | | |
| Net Increase / (Decrease) | | | 17,336 | | | $ | 348,597 | | | | 3,511 | | | $ | 59,857 | | | | 4,563 | | | $ | 73,702 | | | | (593 | ) | | $ | (8,227 | ) |
| | | | | | | | | | | | | | | | | | | | | | | | | | | | | | | | |
| Class R6 | | | | | | | | | | | | | | | | | | | | | | | | | | | | | | | | |
| Sale of Shares | | | — | | | $ | — | | | | — | | | $ | — | | | | 7 | | | $ | 100 | | | | — | | | $ | — | |
| Reinvestment of distributions | | | — | | | | — | | | | — | | | | — | | | | — | (1) | | | 3 | | | | — | | | | — | |
| Shares repurchased | | | — | | | | — | | | | — | | | | — | | | | — | | | | — | | | | — | | | | — | |
| | | | | | | | | | | | | | | | | | | | | | | | | | | | | | | | |
| Net Increase / (Decrease) | | | — | | | $ | — | | | | — | | | $ | — | | | | 7 | | | $ | 103 | | | | — | | | $ | — | |
| | | | | | | | | | | | | | | | | | | | | | | | | | | | | | | | |
| | |
| | | Rampart Enhanced Core Equity Fund | | | Tactical Allocation Fund | |
| | | Year Ended
March 31, 2017 | | | Year Ended
March 31, 2016 | | | Year Ended
March 31, 2017 | | | Year Ended
March 31, 2016 | |
| | | SHARES | | | AMOUNT | | | SHARES | | | AMOUNT | | | SHARES | | | AMOUNT | | | SHARES | | | AMOUNT | |
| | | | | | | | | | | | | | | | | | | | | | | | | | | | | | | | |
| Class A | | | | | | | | | | | | | | | | | | | | | | | | | | | | | | | | |
| Sale of shares | | | 750 | | | $ | 14,419 | | | | 681 | | | $ | 12,511 | | | | 131 | | | $ | 1,089 | | | | 403 | | | $ | 3,817 | |
| Conversion from Class B shares(3) | | | — | | | | — | | | | — | | | | — | | | | 12 | | | | 97 | | | | — | | | | — | |
| Reinvestment of distributions | | | 191 | | | | 3,644 | | | | 1,027 | | | | 18,016 | | | | 1,531 | | | | 12,254 | | | | 1,131 | | | | 10,398 | |
| Shares repurchased | | | (920 | ) | | | (17,539 | ) | | | (1,698 | ) | | | (30,024 | ) | | | (2,669 | ) | | | (22,601 | ) | | | (2,565 | ) | | | (22,962 | ) |
| | | | | | | | | | | | | | | | | | | | | | | | | | | | | | | | |
| Net Increase / (Decrease) | | | 21 | | | $ | 524 | | | | 10 | | | $ | 503 | | | | (995 | ) | | $ | (9,161 | ) | | | (1,031 | ) | | $ | (8,747 | ) |
| | | | | | | | | | | | | | | | | | | | | | | | | | | | | | | | |
| Class B | | | | | | | | | | | | | | | | | | | | | | | | | | | | | | | | |
| Sale of shares | | | — | | | $ | — | | | | — | | | $ | — | | | | — | (1) | | | — | (2) | | | — | (1) | | $ | — | (2) |
| Reinvestment of distributions | | | — | | | | — | | | | — | | | | — | | | | 1 | | | | 11 | | | | 2 | | | | 19 | |
| Shares repurchased | | | — | | | | — | | | | — | | | | — | | | | (13 | ) | | | (122 | ) | | | (16 | ) | | | (145 | ) |
| Conversion to Class A shares(3) | | | — | | | | — | | | | — | | | | — | | | | (12 | ) | | | (97 | ) | | | — | | | | — | |
| | | | | | | | | | | | | | | | | | | | | | | | | | | | | | | | |
| Net Increase / (Decrease) | | | — | | | $ | — | | | | — | | | $ | — | | | | (24 | ) | | $ | (208 | ) | | | (14 | ) | | $ | (126 | ) |
| | | | | | | | | | | | | | | | | | | | | | | | | | | | | | | | |
| Class C | | | | | | | | | | | | | | | | | | | | | | | | | | | | | | | | |
| Sale of shares | | | 402 | | | $ | 6,824 | | | | 769 | | | $ | 13,346 | | | | 63 | | | $ | 536 | | | | 437 | | | $ | 4,258 | |
| Reinvestment of distributions | | | 51 | | | | 887 | | | | 387 | | | | 6,208 | | | | 45 | | | | 367 | | | | 47 | | | | 443 | |
| Shares repurchased | | | (630 | ) | | | (10,821 | ) | | | (878 | ) | | | (14,585 | ) | | | (228 | ) | | | (1,972 | ) | | | (487 | ) | | | (4,357 | ) |
| | | | | | | | | | | | | | | | | | | | | | | | | | | | | | | | |
| Net Increase / (Decrease) | | | (177 | ) | | $ | (3,110 | ) | | | 278 | | | $ | 4,969 | | | | (120 | ) | | $ | (1,069 | ) | | | (3 | ) | | $ | 344 | |
| | | | | | | | | | | | | | | | | | | | | | | | | | | | | | | | |
| Class I | | | | | | | | | | | | | | | | | | | | | | | | | | | | | | | | |
| Sale of shares | | | 671 | | | $ | 12,576 | | | | 318 | | | $ | 5,626 | | | | — | | | $ | — | | | | — | | | $ | — | |
| Reinvestment of distributions | | | 38 | | | | 713 | | | | 80 | | | | 1,413 | | | | — | | | | — | | | | — | | | | — | |
| Shares repurchased | | | (331 | ) | | | (6,290 | ) | | | (165 | ) | | | (2,957 | ) | | | — | | | | — | | | | — | | | | — | |
| | | | | | | | | | | | | | | | | | | | | | | | | | | | | | | | |
| Net Increase / (Decrease) | | | 378 | | | $ | 6,999 | | | | 233 | | | $ | 4,082 | | | | — | | | $ | — | | | | — | | | $ | — | |
| | | | | | | | | | | | | | | | | | | | | | | | | | | | | | | | |
| (1) | Amount is less than 500 shares. |
| (2) | Amount is less than $500. |
| (3) | See Note 1 in Notes to Financial Statements for more information. |
74
VIRTUS EQUITY TRUST
NOTES TO FINANCIAL STATEMENTS (Continued)
MARCH 31, 2017
($ reported in thousands)
On June 29, 2016, the Funds and other affiliated funds renewed a $50,000 secured line of credit. The Credit Agreement (the “Agreement”) is with a commercial bank (the “Bank”) that allows the Funds to borrow cash from the Bank to manage large unexpected redemptions and trade fails, up to a limit of one-third of each Fund’s total net assets in accordance with the Agreement. The Agreement has a term of 364 days and is renewable by the Fund with the Bank’s consent and approval of the Board. Interest is charged at the higher of the LIBOR or the Federal Funds rate plus an additional percentage rate on the amount borrowed. Commitment fees are charged on the undrawn balance. The Funds and other affiliated funds are individually, and not jointly, liable for their particular advances, if any, under the line of credit. The Bank has the ability to require repayment of outstanding borrowings under the Agreement upon certain circumstances such as an event of default.
The Funds had no outstanding borrowings at any time during the period ended March 31, 2017.
At March 31, 2017, certain Funds had individual shareholder account(s), and/or omnibus shareholder account(s) (comprised of a group of individual shareholders), which individually amounted to more than 10% of the total shares outstanding of each such Fund as detailed below:
| | | | | | | | |
| | | % of Shares
Outstanding | | | Number of
Accounts | |
Contrarian Value Fund | | | 16 | % | | | 1* | |
KAR Mid-Cap Core Fund | | | 37 | | | | 2* | |
KAR Small-Cap Core Fund | | | 21 | | | | 1* | |
KAR Small-Cap Growth Fund | | | 15 | | | | 1* | |
KAR Small-Cap Value Fund | | | 41 | | | | 2* | |
| | * | None of the accounts are affiliated. |
Under the Trust’s organizational documents and in separate agreements between each Trustee and the Trust, its Trustees and officers are indemnified against certain liabilities arising out of the performance of their duties to the Trust and its funds. In addition, in the normal course of business, the Funds enter into contracts that provide a variety of indemnifications to other parties. The Funds’ maximum exposure under these arrangements is unknown as this would involve future claims that may be made against the Funds and that have not occurred. However, the Funds have not had prior claims or losses pursuant to these arrangements and expect the risk of loss to be remote.
| Note | 10. Federal Income Tax Information |
($ reported in thousands)
At March 31, 2017, federal tax cost and aggregate gross unrealized appreciation (depreciation) of securities held by the Funds were as follows:
| | | | | | | | | | | | | | | | |
Fund | | Federal
Tax Cost | | | Unrealized
Appreciation | | | Unrealized
(Depreciation) | | | Net Unrealized
Appreciation
(Depreciation) | |
Contrarian Value Fund | | $ | 132,326 | | | $ | 76,865 | | | $ | (8,819 | ) | | $ | 68,046 | |
KAR Capital Growth Fund | | | 252,017 | | | | 172,368 | | | | (1,944 | ) | | | 170,424 | |
KAR Global Quality Dividend Fund | | | 64,364 | | | | 3,317 | | | | (572 | ) | | | 2,745 | |
KAR Mid-Cap Core Fund | | | 74,526 | | | | 11,449 | | | | (1,587 | ) | | | 9,862 | |
KAR Mid-Cap Growth Fund | | | 58,577 | | | | 32,883 | | | | (2,161 | ) | | | 30,722 | |
KAR Small-Cap Core Fund | | | 368,434 | | | | 123,821 | | | | (12,097 | ) | | | 111,724 | |
KAR Small-Cap Growth Fund | | | 598,251 | | | | 131,612 | | | | (4,488 | ) | | | 127,124 | |
KAR Small-Cap Value Fund | | | 261,328 | | | | 104,331 | | | | (9,615 | ) | | | 94,716 | |
Rampart Enhanced Core Equity Fund – Investments (including Purchased Options) | | | 163,572 | | | | 6,613 | | | | (85 | ) | | | 6,528 | |
Rampart Enhanced Core Equity Fund – Written Options | | | (309 | ) | | | — | | | | — | | | | — | |
Tactical Allocation Fund | | | 132,638 | | | | 10,524 | | | | (2,582 | ) | | | 7,942 | |
Certain Funds have capital loss carryovers available to offset future realized capital gains, through the indicated expiration dates shown below:
| | | | | | | | | | | | |
| | | Short-Term
Capital Losses
Expiring | | | | |
| | | 2018 | | | 2019 | | | Total | |
Contrarian Value Fund | | $ | 6,080 | | | $ | 6,954 | | | $ | 13,034 | |
KAR Small-Cap Growth Fund | | | 191 | | | | — | | | | 191 | |
The Trust may not realize the benefit of these losses to the extent each Fund does not realize gains on investments prior to the expiration of the capital loss carryovers. KAR Small-Cap Growth Fund’s amounts include losses acquired in connection with prior year mergers. Utilization of these capital loss carryovers is subject to annual limitations.
Under the Regulated Investment Company Modernization Act of 2010 (the “Act”), net capital losses recognized for tax years beginning after December 22, 2010, may be carried forward indefinitely, and their character is retained as short-term and/or long-term losses. Previously, net capital losses were carried forward for eight years and treated as short-term losses. As a transition rule, the Act requires that post-enactment net capital losses be used before pre-enactment net capital losses. Capital loss carryover may be subject to limits on use of losses.
75
VIRTUS EQUITY TRUST
NOTES TO FINANCIAL STATEMENTS (Continued)
MARCH 31, 2017
For the period ended March 31, 2017, the following Funds utilized losses deferred in prior years against current year capital gains:
| | | | |
Fund | | | |
Contrarian Value Fund | | $ | 3,164 | |
KAR Global Quality Dividend Fund | | | 15,211 | |
KAR Mid-Cap Core Fund | | | 132 | |
KAR Small-Cap Core Fund | | | 2,681 | |
KAR Small-Cap Growth Fund | | | 192 | |
KAR Small-Cap Value Fund | | | 4,655 | |
Capital losses realized after October 31 and certain late year ordinary losses may be deferred and treated as occurring on the first day of the following fiscal year. For the period ended March 31, 2017, the following Funds deferred and recognized qualified late year ordinary and captial losses:
| | | | | | | | | | | | | | | | |
| | | Late Year
Ordinary
Losses
Deferred | | | Late Year
Ordinary
Losses
Recognized | | | Capital
Losses
Deferred | | | Capital
Losses
Recognized | |
Contrarian Value Fund | | $ | — | | | $ | — | | | $ | — | | | $ | 3,167 | |
KAR Capital Growth Fund | | | 102 | | | | — | | | | — | | | | 505 | |
KAR Mid-Cap Core Fund | | | 61 | | | | 27 | | | | — | | | | 381 | |
KAR Mid-Cap Growth Fund | | | 125 | | | | 161 | | | | — | | | | 312 | |
KAR Small-Cap Growth Fund | | | 1,088 | | | | 245 | | | | 2,700 | | | | — | |
Rampart Enhanced Core Equity Fund | | | — | | | | — | | | | — | | | | 5,455 | |
Tactical Allocation Fund | | | — | | | | 96 | | | | 611 | | | | — | |
The components of distributable earnings on a tax basis (excluding unrealized appreciation (depreciation) which is disclosed in the beginning of this note) consist of the following:
| | | | | | | | |
| | | Undistributed
Ordinary
Income | | | Undistributed
Long-Term
Capital Gains | |
Contrarian Value Fund | | $ | 1,694 | | | $ | — | |
KAR Capital Growth Fund | | | — | | | | 4,658 | |
KAR Global Quality Dividend Fund | | | 713 | | | | 3,547 | |
KAR Mid-Cap Core Fund | | | — | | | | 321 | |
KAR Mid-Cap Growth Fund | | | — | | | | 440 | |
KAR Small-Cap Core Fund | | | — | | | | 238 | |
KAR Small-Cap Growth Fund | | | — | | | | 10 | |
KAR Small-Cap Value Fund | | | 266 | | | | 13,457 | |
Rampart Enhanced Core Equity Fund | | | 13,638 | | | | 1,191 | |
Tactical Allocation Fund | | | 48 | | | | 259 | |
The differences between the book and tax basis components of distributable earnings relate principally to the timing of recognition of income and gains for federal income tax purposes. These differences may include the treatment of non-taxable dividends, foreign currency gain or loss, derivatives, passive foreign investment companies, partnerships, losses deferred due to wash sales and other differences.
Short-term gain distributions reported in the Statements of Changes in Net Assets, if any, are reported as ordinary income for federal tax purposes. Distributions are determined on a tax basis and may differ from net investment income and realized capital gains for financial reporting purposes. The tax character of dividends and distributions paid during the period ended March 31, 2017 and 2016 was as follows:
| | | | | | | | | | | | | | | | |
| | | | | | Ordinary
Income | | | Long-Term
Capital Gains | | | Total | |
Contrarian Value Fund | | | 2017 | | | $ | 1,795 | | | $ | — | | | $ | 1,795 | |
| | | 2016 | | | | 1,801 | | | | — | | | | 1,801 | |
KAR Capital Growth Fund | | | 2017 | | | | — | | | | 33,520 | | | | 33,520 | |
| | | 2016 | | | | — | | | | 20,462 | | | | 20,462 | |
KAR Global Quality Dividend Fund | | | 2017 | | | | 535 | | | | — | | | | 535 | |
| | | 2016 | | | | 325 | | | | — | | | | 325 | |
KAR Mid-Cap Core Fund | | | 2017 | | | | — | | | | — | | | | — | |
| | | 2016 | | | | — | | | | 171 | | | | 171 | |
KAR Mid-Cap Growth Fund | | | 2017 | | | | — | | | | 1,330 | | | | 1,330 | |
| | | 2016 | | | | — | | | | 1,392 | | | | 1,392 | |
KAR Small-Cap Core Fund | | | 2017 | | | | — | | | | 21,910 | | | | 21,910 | |
| | | 2016 | | | | 1,322 | | | | 53,275 | | | | 54,597 | |
KAR Small-Cap Growth Fund | | | 2017 | | | | — | | | | 7,887 | | | | 7,887 | |
| | | 2016 | | | | — | | | | 4,609 | | | | 4,609 | |
KAR Small-Cap Value Fund | | | 2017 | | | | 5,204 | | | | 19,870 | | | | 25,074 | |
| | | 2016 | | | | 1,894 | | | | 15,213 | | | | 17,107 | |
Rampart Enhanced Core Equity Fund | | | 2017 | | | | 3,502 | | | | 2,164 | | | | 5,666 | |
| | | 2016 | | | | 13,131 | | | | 14,686 | | | | 27,817 | |
Tactical Allocation Fund | | | 2017 | | | | 4,164 | | | | 9,727 | | | | 13,891 | |
| | | 2016 | | | | 3,216 | | | | 8,775 | | | | 11,991 | |
76
VIRTUS EQUITY TRUST
NOTES TO FINANCIAL STATEMENTS (Continued)
MARCH 31, 2017
For financial reporting purposes, book basis capital accounts are adjusted to reflect the tax character of permanent book/tax differences. Permanent reclassifications can arise from differing treatment of certain income and gain transactions, nondeductible current year net operating losses, expiring capital loss carryovers and investments in passive foreign investment companies. Permanent book and tax basis differences relating to shareholder distributions will result in reclassifications to capital paid in on shares of beneficial interest. The reclassifications have no impact on the net assets or NAV of the Funds. As of March 31, 2017, the Funds recorded reclassifications to increase (decrease) the accounts as listed below:
| | | | | | | | | | | | |
| | | Capital Paid in on
Shares of
Beneficial Interest | | | Undistributed
Net Investment
Income (Loss) | | | Accumulated
Net Realized
Gain (Loss) | |
KAR Capital Growth Fund | | $ | (1,439 | ) | | $ | 1,439 | | | $ | — | (1) |
KAR Global Quality Dividend Fund | | | — | (1) | | | (3 | ) | | | 3 | |
KAR Mid-Cap Core Fund | | | (144 | ) | | | 144 | | | | — | (1) |
KAR Mid-Cap Growth Fund | | | (669 | ) | | | 669 | | | | — | |
KAR Small-Cap Core Fund | | | (866 | ) | | | 865 | | | | 1 | |
KAR Small-Cap Growth Fund | | | (618 | ) | | | 1,865 | | | | (1,247 | ) |
KAR Small-Cap Value Fund | | | — | (1) | | | (2 | ) | | | 2 | |
Rampart Enhanced Core Equity Fund | | | — | (1) | | | (2 | ) | | | 2 | |
Tactical Allocation Fund | | | — | (1) | | | (168 | ) | | | 168 | |
| | (1) | Amount is less than $500. |
| Note | 11. Illiquid and Restricted Securities |
Investments are generally considered illiquid if they cannot be disposed of within seven days in the ordinary course of business at the approximate amount at which such securities have been valued by a Fund. Additionally, the following information is also considered in determining liquidity: the frequency of trades and quotes for the investment, whether the investment is listed for trading on a recognized domestic exchange and/or whether two or more brokers are willing to purchase or sell the security at a comparable price, the extent of market making activity in the investment and the nature of the market for investment. Illiquid securities are footnoted as such at the end of each Fund’s Schedule of Investments, where applicable. However, a portion of such footnoted securities could be liquid where it is determined that some, though not all, of the position could be disposed of within seven days in the ordinary course of business at the approximate amount at which such securities have been valued by the applicable Fund.
Restricted securities are illiquid securities, as defined above, not registered under the Securities Act of 1933, as amended (the “1933 Act”). Generally, 144A securities are excluded from this category, except where defined as illiquid.
Each Fund will bear any costs, including those involved in registration under the 1933 Act, in connection with the disposition of such securities.
At March 31, 2017, the Tactical Allocation Fund’s aggregate value of illiquid securities was $172 or 0.1% of the Fund’s net assets. These securities have been identified on the Schedule of Investments.
At March 31, 2017, the Funds did not hold any securities that were both illiquid and restricted.
| Note | 12. Credit Risk and Asset Concentration |
In countries with limited or developing markets, investments may present greater risks than in more developed markets and the prices of such investments may be volatile. The consequences of political, social or economic changes in these markets may have disruptive effects on the market prices of these investments and the income they generate, as well as a Fund’s ability to repatriate such amounts.
High-yield/high-risk securities typically entail greater price volatility and/or principal and interest rate risk. There is a greater chance that an issuer will not be able to make principal and interest payments on time. Analysis of the creditworthiness of issuers of high-yield/high-risk securities may be complex, and as a result, it may be more difficult for the Adviser and/or subadviser to accurately predict risk.
Certain Funds may invest a high percentage of their assets in specific sectors of the market in the pursuit of their investment objectives. Fluctuations in these sectors of concentration may have a greater impact on a Fund, positive or negative, than if a Fund did not concentrate its investments in such sectors.
At March 31, 2017, the following Funds held securities issued by various companies in specific sectors as detailed below:
| | | | | | |
Fund | | Sector | | Percentage of Total
Investments | |
| Contrarian Value Fund | | Materials | | | 27 | % |
| Contrarian Value Fund | | Industrials | | | 26 | |
| KAR Capital Growth Fund | | Information Technology | | | 37 | |
| KAR Capital Growth Fund | | Consumer Discretionary | | | 27 | |
| KAR Mid-Cap Growth Fund | | Consumer Discretionary | | | 28 | |
| KAR Mid-Cap Growth Fund | | Information Technology | | | 28 | |
| KAR Small-Cap Core Fund | | Industrials | | | 29 | |
| Rampart Enhanced Core Equity Fund | | Financials | | | 95 | |
| Note | 13. Custody Fees Reimbursed |
State Street Bank & Trust, custodian for some of the Funds through January 29, 2010, reimbursed the Funds for out-of-pocket custody expenses overbilled for the period 1998 through January 29, 2010. The amounts reimbursed, including interest, are shown in the Statements of Operations under “Custody fees reimbursed”.
77
VIRTUS EQUITY TRUST
NOTES TO FINANCIAL STATEMENTS (Continued)
MARCH 31, 2017
| Note | 14. Regulatory Matters and Litigation |
From time to time, the Trust, the Funds’ Adviser and/or subadvisers and/or their affiliates may be involved in litigation and arbitration as well as examinations and investigations by various regulatory bodies, including the SEC, involving compliance with, among other things, securities laws, client investment guidelines, laws governing the activities of broker-dealers and other laws and regulations affecting their products and other activities. At this time, the Funds’ Adviser believes that the outcomes of such matters are not likely, either individually or in the aggregate, to be material to these financial statements.
| Note | 15. New Accounting Pronouncements |
On October 13, 2016, the SEC amended existing rules intended to modernize reporting and disclosure of information. Certain of these amendments relate to Regulation S-X which sets forth the requisite form and content of financial statements. At this time, management is evaluating the implications of adopting these amendments and their impact on the financial statements and accompanying notes.
| Note | 16. Subsequent Events |
Management has evaluated the impact of all subsequent events on the Funds through the date the financial statements were issued and has determined that there are no subsequent events requiring recognition or disclosure in these financial statements.
78

REPORT OF INDEPENDENT REGISTERED PUBLIC ACCOUNTING FIRM
To the Board of Trustees of Virtus Equity Trust and Shareholders of the Funds:
In our opinion, the accompanying statements of assets and liabilities, including the schedules of investments, and the related statements of operations and of changes in net assets and the financial highlights present fairly, in all material respects, the financial position of Virtus Contrarian Value Fund, Virtus KAR Capital Growth Fund, Virtus KAR Global Quality Dividend Fund, Virtus KAR Mid-Cap Core Fund, Virtus KAR Mid-Cap Growth Fund, Virtus KAR Small-Cap Core Fund, Virtus KAR Small-Cap Growth Fund, Virtus KAR Small-Cap Value Fund, Virtus Rampart Enhanced Core Equity Fund, and Virtus Tactical Allocation Fund (each a fund of Virtus Equity Trust, hereafter referred to as the “Funds”) as of March 31, 2017, the results of each of their operations for the year then ended, the changes in each of their net assets for each of the two years in the period then ended and the financial highlights for each of the periods indicated, in conformity with accounting principles generally accepted in the United States of America. These financial statements and financial highlights (hereafter referred to as “financial statements”) are the responsibility of the Funds’ management. Our responsibility is to express an opinion on these financial statements based on our audits. We conducted our audits of these financial statements in accordance with the standards of the Public Company Accounting Oversight Board (United States). Those standards require that we plan and perform the audit to obtain reasonable assurance about whether the financial statements are free of material misstatement. An audit includes examining, on a test basis, evidence supporting the amounts and disclosures in the financial statements, assessing the accounting principles used and significant estimates made by management, and evaluating the overall financial statement presentation. We believe that our audits, which included confirmation of securities as of March 31, 2017 by correspondence with the custodian, brokers and transfer agent of the investee funds, provide a reasonable basis for our opinion.
PricewaterhouseCoopers LLP
Philadelphia, Pennsylvania
May 23, 2017
79
VIRTUS EQUITY TRUST
TAX INFORMATION NOTICE (Unaudited)
MARCH 31, 2017
For the fiscal year ended March 31, 2017, the Funds make the following disclosures for federal income tax purposes. Below is listed the percentages, or the maximum amount allowable, of its ordinary income dividends (“QDI”) to qualify for the lower tax rates applicable to individual shareholders, and the percentage of ordinary income dividends earned by the Funds which qualifies for the dividends received deduction (“DRD”) for corporate shareholders. The actual percentage of QDI and DRD for the calendar year will be designated in year-end tax statements. The Funds designate the amounts below as long-term capital gains dividends (“LTCG”) taxable at a 20% rate, or lower depending on the shareholder’s income ($ reported in thousands). LTCG amounts, if subsequently different, will be designated in the next annual report.
| | | | | | | | | | | | |
| | | QDI | | | DRD | | | LTCG | |
Contrarian Value Fund | | | 100 | % | | | 100 | % | | $ | — | |
KAR Capital Growth Fund | | | — | | | | — | | | | 37,114 | |
KAR Global Quality Dividend Fund | | | 100 | | | | 100 | | | | 3,547 | |
KAR Mid-Cap Core Fund | | | — | | | | — | | | | 321 | |
KAR Mid-Cap Growth Fund | | | — | | | | — | | | | 1,770 | |
KAR Small-Cap Core Fund | | | — | | | | — | | | | 10,307 | |
KAR Small-Cap Growth Fund | | | — | | | | — | | | | 732 | |
KAR Small-Cap Value Fund | | | 100 | | | | 100 | | | | 18,190 | |
Rampart Enhanced Core Equity Fund | | | 13 | | | | 14 | | | | 3,355 | |
Tactical Allocation Fund | | | 35 | | | | 24 | | | | 9,836 | |
For the fiscal year ended March 31, 2017, the KAR Global Quality Dividend Fund recognized $424 ($ reported in thousands), of foreign source income on which the KAR Global Quality Dividend Fund paid foreign taxes of $30 ($ reported in thousands). This information is being furnished to you pursuant to notice requirements of Section 853(a) and 855(d) of the Internal Revenue Code, as amended, and the Treasury Regulations thereunder.
80
CONSIDERATION OF ADVISORY AND SUBADVISORY AGREEMENTS
BY THE BOARD OF TRUSTEES (Unaudited)
The Board of Trustees (the “Board”) of Virtus Equity Trust (the “Trust”) is responsible for determining whether to approve the continuation of the investment advisory agreement (the “Advisory Agreement”) between the Trust and Virtus Investment Advisers, Inc. (“VIA”) and of each subadvisory agreement (each, a “Subadvisory Agreement” and collectively, the “Subadvisory Agreements”) (together with the Advisory Agreement, the “Agreements”) with respect to the funds of the Trust, including Virtus Contrarian Value Fund, Virtus Enhanced Core Equity Fund (formerly known as Virtus Growth & Income Fund), Virtus Global Quality Dividend Fund (formerly known as Virtus Quality Large-Cap Value Fund), Virtus Mid-Cap Core Fund, Virtus Mid-Cap Growth Fund, Virtus Quality Small-Cap Fund, Virtus Small-Cap Core Fund, Virtus Small-Cap Sustainable Growth Fund, Virtus Strategic Growth Fund, and Virtus Tactical Allocation Fund (individually and collectively, the “Funds”) of the Trust. At in-person meetings held on November 2, 2016 and November 16-17, 2016 (the “Meetings”), the Board, including a majority of the Trustees who are not interested persons of the Trust as defined in Section 2(a)(19) of the Investment Company Act of 1940, as amended (such Act, the “1940 Act” and such Trustees, the “Independent Trustees”), considered and approved the continuation of each Agreement due for renewal, as further discussed below. In addition, prior to the Meetings, the Independent Trustees met with their independent legal counsel to discuss and consider the information provided by management and submitted questions to management, and they considered the responses provided.
In connection with the approval of the Agreements, the Board requested and evaluated information provided by VIA and each subadviser (each, a “Subadviser” and collectively, the “Subadvisers”) which, in the Board’s view, constituted information necessary for the Board to form a judgment as to whether the renewal of each of the Agreements would be in the best interests of each applicable Fund and its respective shareholders. The Board also considered information furnished throughout the year at regular Board meetings with respect to the services provided by VIA and the Subadvisers, including quarterly performance reports prepared by management containing reviews of investment results and periodic presentations from the Subadvisers with respect to the Fund(s) they manage. The Board noted the affiliation of certain of the Subadvisers with VIA and any potential conflicts of interest.
The Board was separately advised by independent legal counsel throughout the process. For each Agreement, the Board considered all the criteria separately with respect to the applicable Fund and its shareholders. In their deliberations, the Board considered various factors, including those discussed below, none of which were controlling, and each Trustee may have attributed different weights to the various factors. The Independent Trustees also discussed the proposed approval of the Agreements in private sessions with their independent legal counsel at which no representatives of management were present.
In considering whether to approve the renewal of the Agreements with respect to each Fund, the Board reviewed and analyzed the factors it deemed relevant, including: (1) the nature, extent and quality of the services to be provided to the Funds by VIA and each of the Subadvisers; (2) the performance of the Funds as compared to an appropriate peer group and an appropriate index; (3) the level and method of computing each Fund’s advisory and subadvisory fees, and comparisons of the Funds’ advisory fee rates with those of a group of funds with similar investment objective(s); (4) the profitability of VIA under the Advisory Agreement; (5) any “fall-out” benefits to VIA, the Subadvisers and their affiliates (i.e., ancillary benefits realized by VIA, the Subadvisers or their affiliates from VIA’s or the applicable Subadviser’s relationship with the Trust); (6) the anticipated effect of growth in size on each Fund’s performance and expenses; (7) fees paid to VIA and the Subadvisers by comparable accounts, as applicable; (8) possible conflicts of interest; and (9) the terms of the Agreements.
Nature, Extent and Quality of Services
The Trustees received in advance of the Meetings information provided by VIA and each Subadviser, including completed questionnaires concerning a number of topics, including such company’s investment philosophy, resources, operations and compliance structure. The Trustees also received a presentation by VIA’s senior management personnel, during which among other items, VIA’s history, investment process, investment strategies, personnel, compliance procedures and the firm’s overall performance were reviewed and discussed. The Trustees noted that the Funds are managed using a “manager of managers” structure that generally involves the use of one or more subadvisers to manage some or all of a Fund’s portfolio. Under this structure, VIA is responsible for the management of the Funds’ investment programs and for evaluating and selecting subadvisers on an ongoing basis and making any recommendations to the Board regarding hiring, retaining or replacing subadvisers. In considering the Advisory Agreement with VIA, the Board considered VIA’s process for supervising and managing the Funds’ subadvisers, including (a) VIA’s ability to select and monitor the subadvisers; (b) VIA’s ability to provide the services necessary to monitor the subadvisers’ compliance with the Funds’ respective investment objectives, policies and restrictions as well as provide other oversight activities; and (c) VIA’s ability and willingness to identify instances in which a subadviser should be replaced and to carry out the required changes. The Trustees also considered: (a) the experience and capability of VIA’s management and other personnel; (b) the financial condition of VIA, and whether it had the financial wherewithal to provide a high level and quality of services to the Funds; (c) the quality of VIA’s own regulatory and legal compliance policies, procedures and systems; (d) the nature, extent and quality of administrative, transfer agency and other services provided by VIA and its affiliates to the Funds; (e) VIA’s supervision of the Funds’ other service providers; and (f) VIA’s risk management processes. It was noted that affiliates of VIA serve as administrator, transfer agent and distributor to the Funds. The Board also took into account its knowledge of VIA’s management and the quality of the performance of VIA’s duties through Board meetings, discussions and reports during the preceding year, as well as information from the Trust’s Chief Compliance Officer regarding the Funds’ compliance policies and procedures established pursuant to Rule 38a-1 under the 1940 Act.
With respect to the services provided by each of the Subadvisers, the Board considered information provided to the Board by each Subadviser, including each Subadviser’s Form ADV, as well as information provided throughout the past year. With respect to the Subadvisory Agreements, the Board noted that each Subadviser provided portfolio management, compliance with the respective Funds’ investment policies and procedures, compliance with applicable securities laws and assurances thereof. The Board also noted that VIA’s and the Subadvisers’ management of the Funds is subject to the oversight of the Board and must be carried out in accordance with the investment objective(s), policies and restrictions set forth in the Funds’ prospectuses and statement of additional information. In considering the renewal of the Subadvisory Agreements, the Board also considered each Subadviser’s investment management process, including (a) the experience and capability of the Subadviser’s management and other personnel committed by the Subadviser to the respective Fund(s); (b) the financial condition of the Subadviser; (c) the quality of the Subadviser’s regulatory and legal compliance policies, procedures and systems; and (d) the Subadviser’s brokerage and trading practices, including with respect to best execution and soft dollars. The Board also took into account each Subadviser’s risk assessment and monitoring process. The Board noted each Subadviser’s regulatory history, including whether it was currently involved in any regulatory actions or investigations as well as material litigation, and any settlements and amelioratory actions undertaken, as appropriate.
After considering all of the information provided to them, the Trustees concluded that the nature, extent and quality of the services provided by VIA and each Subadviser were satisfactory and that there was a reasonable basis on which to conclude that each would continue to provide a high quality of investment services to the applicable Fund(s).
81
CONSIDERATION OF ADVISORY AND SUBADVISORY AGREEMENTS
BY THE BOARD OF TRUSTEES (Unaudited) (Continued)
Investment Performance
The Board considered performance reports and discussions at Board meetings throughout the year, as well as a report (the “Lipper Report”) for the Funds prepared by Broadridge, an independent third party provider of investment company data, furnished in connection with the contract renewal process. The Lipper Report presented each Fund’s performance relative to a peer group of other mutual funds (the “Performance Universe”) and relevant indexes, as selected by Broadridge. The Board also considered performance information presented by management and took into account management’s discussion of the same, including the effect of market conditions on each Fund’s performance. The Board evaluated each Fund’s performance in the context of the considerations that a “manager of managers” structure requires. The Board noted that it also reviews on a quarterly basis detailed information about both the Funds’ performance results and portfolio composition, as well as each Subadviser’s investment strategy. The Board noted VIA’s expertise and resources in monitoring the performance, investment style and risk-adjusted performance of each Subadviser. The Board also noted each Subadviser’s performance record with respect to a Fund. The Board was mindful of VIA’s focus on each Subadviser’s performance and noted VIA’s performance in monitoring and responding to any performance issues with respect to the Funds. The Board also took into account its discussions with management regarding factors that contributed to the performance of each Fund.
The Board considered, among other performance data, the information set forth below with respect to the performance of each Fund for the period ended June 30, 2016.
Virtus Contrarian Value Fund. The Board noted that the Fund underperformed the median of its Performance Universe for the 1-, 3-, and 5-year periods and outperformed the median of its Performance Universe for the 10-year period. The Board also noted that the Fund underperformed its benchmark for the 1-, 3-, 5- and 10-year periods.
Virtus Enhanced Core Equity Fund. The Board noted that the Fund underperformed the median of its Performance Universe for the 5-year period and outperformed the median of its Performance Universe for the 1-, 3- and 10-year periods. The Board also noted that the Fund underperformed its benchmark for the 3-, 5- and 10- year periods and outperformed the median of its Performance Universe for the 1-year period.
Virtus Mid-Cap Core Fund. The Board noted that the Fund outperformed the median of its Performance Universe and outperformed its benchmark for the 1-, 3- and 5-year periods.
Virtus Mid-Cap Growth Fund. The Board noted that the Fund outperformed the median of its Performance Universe for the 1-year period and underperformed the median of its Performance Universe for the 3-, 5- and 10-year periods. The Board also noted that the Fund underperformed its benchmark for the 1-, 3-, 5- and 10-year periods.
Virtus Global Quality Dividend Fund. The Board noted that the Fund underperformed the median of its Performance Universe and underperformed its benchmark for the 3-, 5- and 10-year periods. The Board also noted that the Fund outperformed the median of its Performance Universe and outperformed its benchmark for the 1-year period.
Virtus Quality Small-Cap Fund. The Board noted that the Fund outperformed the median of its Performance Universe and outperformed its benchmark for the 1-, 3-, 5- and 10-year periods.
Virtus Small-Cap Core Fund. The Board noted that the Fund outperformed the median of its Performance Universe and outperformed its benchmark for the 1-, 3-, 5- and 10-year periods.
Virtus Small-Cap Sustainable Growth Fund. The Board noted that the Fund outperformed the median of its Performance Universe and outperformed its benchmark for the 1-, 3-, 5- and 10-year periods.
Virtus Strategic Growth Fund. The Board noted that the Fund underperformed the median of its Performance Universe for the 5- and 10-year periods and outperformed the median of its Performance Universe for the 1- and 3-year periods. The Board also noted that the Fund underperformed its benchmark for the 1-, 3-, 5- and 10-year periods.
Virtus Tactical Allocation Fund. The Board noted that the Fund underperformed the median of its Performance Universe and underperformed its benchmark for the 1-, 3-, 5- and 10-year periods.
With respect to certain Funds, including Virtus Contrarian Value Fund, Virtus Enhanced Core Equity Fund, Virtus Mid-Cap Growth Fund, Virtus Global Quality Dividend Fund, Virtus Strategic Growth Fund, and Virtus Tactical Allocation Fund, the Board also considered management’s discussion about the reasons for each Fund’s underperformance relative to its peer group or benchmark. With respect to Virtus Global Quality Dividend Fund, the Board also considered management’s proposed changes to the Fund’s strategy. With respect to the Virtus Tactical Allocation Fund, the Board also considered that the Fund had recently replaced one of the subadvisers, so that the performance shown included that of a prior subadviser. After reviewing these and related factors, the Board concluded that each Fund’s overall performance, or reasons for or plans discussed to address underperformance, was satisfactory.
Management Fees and Total Expenses
The Board considered the fees charged to the Funds for advisory services as well as the total expense levels of the Funds. This information included comparisons of each Fund’s net management fee and total expense level to those of its peer group (the “Expense Group”). In comparing each Fund’s net management fee to that of comparable funds, the Board noted that in the materials presented such fee included both advisory and administrative fees. The Board also noted that certain of the Funds had fee waivers and/or expense caps in place to limit the total expenses incurred by those Funds and their shareholders. The Board also noted that the subadvisory fees were paid by VIA out of its management fees rather than paid separately by the Funds. In this regard, the Board took into account management’s discussion with respect to the advisory/subadvisory fee structure, including the amount of the advisory fee retained by VIA after payment of the subadvisory fee. The Board also took into account the size of each of the Funds and the impact on expenses. The Subadvisers provided, and the Board considered, expense information of comparable accounts managed by the Subadvisers, as applicable.
In addition to the foregoing, the Board considered, among other data, the information set forth below with respect to each Fund’s fees and expenses. In each case, the Board took into account management’s discussion of the Fund’s expenses, including the type and size of the Fund relative to the other funds in its Expense Group.
Virtus Contrarian Value Fund. The Board considered that the Fund’s net management fee and net total expenses after waivers were above the median of the Expense Group.
82
CONSIDERATION OF ADVISORY AND SUBADVISORY AGREEMENTS
BY THE BOARD OF TRUSTEES (Unaudited) (Continued)
Virtus Enhanced Core Equity Fund. The Board considered that the Fund’s net management fee and net total expenses after waivers were above the median of the Expense Group.
Virtus Mid-Cap Core Fund. The Board considered that the Fund’s net management fee and net total expenses after waivers were below the median of the Expense Group.
Virtus Mid-Cap Growth Fund. The Board considered that the Fund’s net management fee and net total expenses after waivers were above the median of the Expense Group.
Virtus Global Quality Dividend Fund. The Board considered that the Fund’s net management fee and net total expenses after waivers were above the median of the Expense Group.
Virtus Quality Small-Cap Fund. The Board considered that the Fund’s net management fee and net total expenses were below the median of the Expense Group.
Virtus Small-Cap Core Fund. The Board considered that the Fund’s net management fee and net total expenses were above the median of the Expense Group.
Virtus Small-Cap Sustainable Growth Fund. The Board considered that the Fund’s net management fee and net total expenses after waivers were above the median of the Expense Group.
Virtus Strategic Growth Fund. The Board considered that the Fund’s net management fee and net total expenses were above the median of the Expense Group.
Virtus Tactical Allocation Fund. The Board considered that the Fund’s net management fee and net total expenses were above the median of the Expense Group.
The Board concluded that the advisory and subadvisory fees for each Fund, including with any proposed amendments, were fair and reasonable in light of the usual and customary charges made for services of the same nature and quality and the other factors considered.
Profitability
The Board also considered certain information relating to profitability that had been provided by VIA. In this regard, the Board considered information regarding the overall profitability, as well as on a Fund-by-Fund basis, of VIA for its management of the Funds and the other funds of the Trust, as well as its profits and those of its affiliates for managing and providing other services to the Trust, such as distribution, transfer agency and administrative services provided to the Funds by a VIA affiliate. In addition to the fees paid to VIA and its affiliates, including the applicable Subadvisers, the Board considered any other benefits derived by VIA or its affiliates from their relationships with the Funds. The Board reviewed the methodology used to allocate costs to each Fund, taking into account the fact that allocation methodologies are inherently subjective and various allocation methodologies may each be reasonable while producing different results. The Board concluded that the profitability to VIA and its affiliates from each Fund was reasonable in light of the quality of the services rendered to the Funds by VIA and its affiliates.
In considering the profitability to the Subadvisers in connection with their relationship to the Funds, the Board noted that the fees under the Subadvisory Agreements are paid by VIA out of the fees that VIA receives under the Advisory Agreement, so that Fund shareholders are not directly impacted by those fees. In considering the reasonableness of the fees payable by VIA to the affiliated Subadvisers, the Board noted that, because such Subadvisers are affiliates of VIA, such profitability might be directly or indirectly shared by VIA. In addition, with respect to Sasco Capital, Inc., the unaffiliated Subadviser, the Board relied on the ability of VIA to negotiate the Subadvisory Agreement and the fees thereunder at arm’s length. For each of the above reasons, the Board concluded that the profitability to the Subadvisers and their affiliates from their relationship with the Funds was not a material factor in approval of the Subadvisory Agreements.
Economies of Scale
The Board received and discussed information concerning whether VIA realizes economies of scale as the Funds’ assets grow. The Board noted that the management fees for several of the Funds included breakpoints based on assets under management, and that fee waivers and/or expense caps were also in place for certain Funds. The Board also took into account management’s discussion of the Funds’ management fee and subadvisory fee structure, including with respect to the Funds that do not currently have breakpoints. The Board also took into account the current size of the Funds. The Board concluded that no changes to the advisory fee structure of the Funds were necessary at this time. The Board noted that VIA and the Funds may realize certain economies of scale if the assets of the Funds were to increase, particularly in relationship to certain fixed costs, and that shareholders of the Funds would have an opportunity to benefit from these economies of scale.
For similar reasons as stated above with respect to the Subadvisers’ profitability, and based upon the current size of the Funds managed by each Subadviser, the Board concluded that the potential for economies of scale in the Subadvisers’ management of the Funds was not a material factor in the approval of the Subadvisory Agreements at this time.
Other Factors. The Board considered other benefits that may be realized by VIA and each Subadviser and their respective affiliates from their relationships with the applicable Fund. Among them, the Board recognized that VP Distributors, LLC, an affiliate of VIA, serves as the distributor for the Trust, and, as such, receives payments pursuant to Rule 12b-1 from the Funds to compensate it for providing selling activities, which could lead to growth in the Trust’s assets and corresponding benefits from such growth, including economies of scale. The Board noted that an affiliate of VIA also provides administrative and transfer agency services to the Trust. The Board noted management’s discussion of the fact that, while certain of the Subadvisers are affiliates of VIA, there are no other direct benefits to the Subadvisers or VIA in providing investment advisory services to the Funds, other than the fee to be earned under the applicable Agreement(s). There may be certain indirect benefits gained, including to the extent that serving the Funds could provide the opportunity to provide advisory services to additional portfolios of the Trust or certain reputational benefits.
Based on all of the foregoing considerations, the Board, including a majority of the Independent Trustees, determined that approval of each Agreement, as amended, was in the best interests of each applicable Fund and its respective shareholders. Accordingly, the Board, and the Independent Trustees voting separately, approved the Agreements, as amended, with respect to each Fund.
83
FUND MANAGEMENT TABLES (Unaudited)
Information pertaining to the Trustees and officers of the Trust as of March 31, 2017, is set forth below. The statement of additional information (SAI) includes additional information about the Trustees and is available without charge, upon request, by calling (800) 243-4361.
The address of each individual, unless otherwise noted, is c/o Virtus Equity Trust, 101 Munson Street, Greenfield, MA 01301. There is no stated term of office for Trustees or officers of the Trust.
Independent Trustees
| | |
| | |
Name,
Year of Birth,
Length of Time Served and
Number of Portfolios in Complex | | Principal Occupation(s) During Past 5 Years and
Other Directorships Held by Trustee |
Brown, Thomas J.
YOB: 1945
Served Since: 2016
63 Portfolios | | Retired. Trustee (since 2016), Virtus Mutual Fund Complex (50 portfolios) and Virtus Alternative Solutions Trust (4 portfolios); Trustee (since 2011), Virtus Variable Insurance Trust (9 portfolios); Director (since 2010), D’Youville Senior Care Center; and Director (since 2005), VALIC Company Funds (49 portfolios). |
Burke, Donald C.
YOB: 1960
Served Since: 2016
67 Portfolios | | Retired. Trustee (since 2016), Virtus Mutual Fund Complex (50 portfolios), Virtus Variable Insurance Trust (9 portfolios) and Virtus Alternative Solutions Trust (4 portfolios); Director (since 2014) closed-end funds managed by Duff & Phelps Investment Management Co. (4 funds); Director, Avista Corp. (energy company) (since 2011); Trustee, Goldman Sachs Fund Complex (2010 to 2014); and Director, BlackRock Luxembourg and Cayman Funds (2006 to 2010). |
Gelfenbien, Roger A.
YOB: 1943
Served Since: 2016
63 Portfolios | | Retired. Trustee (since 2016), Virtus Mutual Fund Complex (50 portfolios) and Virtus Alternative Solutions Trust (4 portfolios); Trustee (since 2000), Virtus Variable Insurance Trust (9 portfolios); and Director (since 1999), USAllianz Variable Insurance Product Trust (42 portfolios). |
Mallin, John R.
YOB: 1950
Served Since: 2016
63 Portfolios | | Partner/Attorney (since 2003), McCarter & English LLP (law firm), Real Property Practice Group; and Member (since 2014), Counselors of Real Estate. Trustee (since 2016), Virtus Mutual Fund Complex (50 portfolios) and Virtus Alternative Solutions Trust (4 portfolios); Director (since 2013), Horizons, Inc. (non-profit); and Trustee (since 1999), Virtus Variable Insurance Trust (9 portfolios). |
McClellan, Hassell H.
YOB: 1945
Served Since: 2015
63 Portfolios | | Retired (since 2013); and Professor (1984 to 2013), Wallace E. Carroll School of Management, Boston College. Trustee (since 2016), Virtus Alternative Solutions Trust (4 portfolios); Trustee (since 2015), Virtus Mutual Fund Complex (50 portfolios); and Director (since 2010), Barnes Group, Inc. (diversified global components manufacturer and logistical services company); Trustee, Virtus Variable Insurance Trust (9 portfolios) (since 2008); and Trustee, John Hancock Fund Complex (since 2000) (collectively, 228 portfolios). |
McLoughlin, Philip
YOB: 1946
Served Since: 1996
72 Portfolios | | Retired. Director and Chairman (since 2016), The Zweig Fund Inc. and Virtus Global Dividend & Income Fund Inc.; Trustee and Chairman (since 2013), Virtus Alternative Solutions Trust (4 portfolios); Trustee/Director and Chairman (since 2011), Virtus Closed-End Funds (3 funds); Chairman and Trustee (since 2003), Virtus Variable Insurance Trust (9 portfolios); Director (since 1995), closed-end funds managed by Duff & Phelps Investment Management Co. (4 funds); Director (since 1991) and Chairman (since 2010), Lazard World Trust Fund (closed-end investment firm in Luxembourg); and Trustee (since 1989) and Chairman (since 2002), Virtus Mutual Fund Complex (50 portfolios). |
McNamara, Geraldine M.
YOB: 1951
Served Since: 2001
67 Portfolios | | Retired. Trustee (since 2016) Virtus Alternative Solutions Trust (4 portfolios); Trustee (since 2015), Virtus Variable Insurance Trust (9 portfolios); Director (since 2003), closed-end funds managed by Duff & Phelps Investment Management Co. (4 funds); and Trustee (since 2001), Virtus Mutual Fund Complex (50 portfolios). |
Oates, James M.
YOB: 1946
Served Since: 1996
68 Portfolios | | Managing Director (since 1994), Wydown Group (consulting firm). Director (since 2016), The Zweig Fund, Inc. and Virtus Global Dividend & Income Fund Inc.; Trustee (since 2016) Virtus Variable Insurance Trust (9 portfolios); Trustee/Director (since 2013), Virtus Closed-End Funds (3 funds); Trustee (since 2013), Virtus Alternative Solutions Trust (4 portfolios); Chairman and Trustee (since 2005), John Hancock Fund Complex (228 portfolios); Director (2002 to 2014), New Hampshire Trust Company; Chairman (2000 to 2016), Emerson Investment Management, Inc.; Non-Executive Chairman (2000 to 2014), Hudson Castle Group, Inc. (formerly IBEX Capital Markets, Inc.) (financial services); Chairman and Director (1999 to 2014), Connecticut River Bank; Director (since 1996), Stifel Financial; and Trustee (since 1987), Virtus Mutual Fund Complex (50 portfolios). |
Segerson, Richard E.
YOB: 1948
Served Since: 1996
63 Portfolios | | Retired; and Managing Director (1998 to 2013), Northway Management Company. Trustee (since 2016) Virtus Alternative Solutions Trust (4 portfolios) and Virtus Variable Insurance Trust (9 portfolios); and Trustee (since 1983), Virtus Mutual Fund Complex (50 portfolios). |
Verdonck, Ferdinand L.J.
YOB: 1942
Served Since: 2006
63 Portfolios | | Director (1998 to 2015), The J.P. Morgan Continental European Investment Trust; Director (2005 to 2013), Galapagos N.V. (biotechnology); Director (1998 to 2015) Groupe SNEF; Vice Chairman (since 2014), Affirmed Therapeutics (biotechnology); and Mr. Verdonck is also a director of several non-U.S. companies. Trustee (since 2016) Virtus Variable Insurance Trust (9 portfolios) and Virtus Alternative Solutions Trust (4 portfolios); and Trustee (since 2002), Virtus Mutual Fund Complex (50 portfolios). |
84
FUND MANAGEMENT TABLES (Unaudited) (Continued)
Interested Trustee
| | |
| | |
Name,
Year of Birth,
Year Elected and
Number of Funds Overseen | | Principal Occupation(s) During Past 5 Years and
Other Directorships Held by Trustee |
Aylward, George R.*
Trustee and President
YOB: 1964
Elected: 2006
69 Portfolios | | Director, President and Chief Executive Officer (since 2008), Virtus Investment Partners, Inc. and/or certain of its subsidiaries; various senior officer positions with Virtus affiliates (since 2005). Chairman and Trustee (since 2015), Virtus ETF Trust II (1 fund); Trustee and President (since 2013), Virtus Alternative Solutions Trust (4 portfolios); Director (since 2013), Virtus Global Funds, PLC (2 portfolios); Trustee (since 2012) and President (since 2010), Virtus Variable Insurance Trust (9 portfolios); Trustee and President (since 2011), Virtus Closed-End Funds (3 funds); Trustee (since 2006), Virtus Mutual Funds (50 portfolios); and Director, President and Chief Executive Officer (since 2006), The Zweig Fund, Inc. and Virtus Global Dividend & Income Fund Inc. |
* Mr. Aylward is an “interested person,” as defined in the 1940 Act, by reason of his position as President and Chief Executive Officer of Virtus Investment Partners, Inc. (“Virtus”), the ultimate parent company of the Adviser, and various positions with its affiliates, including the Adviser.
Officers
| | | | |
| | | |
Name, Address and
Year of Birth | | Position(s) Held with Trust and
Length of Time Served | | Principal Occupation(s)
During Past 5 Years |
Bradley, W. Patrick
YOB: 1972 | | Executive Vice President (since 2013); Senior Vice President (2013 to 2016); Vice President (2011 to 2013); Chief Financial Officer and Treasurer (since 2006). | | Executive Vice President, Fund Services (since 2016), Senior Vice President, Fund Services (2010 to 2016), Virtus Investment Partners, Inc. and/or certain of its subsidiaries; various officer positions (since 2006) with Virtus affiliates; Executive Vice President (since 2016), Senior Vice President (2013 to 2016), Vice President (2011 to 2013), Chief Financial Officer and Treasurer (since 2004), Virtus Variable Insurance Trust; Executive Vice President (since 2016), Senior Vice President (2013 to 2016), Vice President (2011 to 2013), Chief Financial Officer and Treasurer (since 2006), Virtus Mutual Fund Complex; Executive Vice President (since 2016), Senior Vice President (2013 to 2016), Vice President (2012 to 2013) and Treasurer and Chief Financial Officer (since 2007), The Zweig Fund, Inc. and Virtus Global Dividend & Income Fund Inc.; Executive Vice President (since 2016), Senior Vice President (2013 to 2016), Vice President (2011 to 2013), Chief Financial Officer and Treasurer (since 2011), Virtus Closed-End Funds; Vice President and Assistant Treasurer (since 2011), Duff & Phelps Global Utility Income Fund Inc.; Director (since 2013), Virtus Global Funds, PLC; and Executive Vice President (since 2016), Senior Vice President, Chief Financial Officer and Treasurer (2013 to 2016), Virtus Alternative Solutions Trust. |
Carr, Kevin J.
YOB: 1954 | | Senior Vice President (since 2013); Vice President (2005 to 2013); Chief Legal Officer, Counsel and Secretary (since 2005). | | Senior Vice President (since 2009), Vice President, Counsel and Secretary (2008 to 2009), Virtus Investment Partners, Inc. and/or certain of its subsidiaries; various senior officer positions (since 2005) with Virtus affiliates; Senior Vice President (since 2013), Vice President (2005 to 2013), Chief Legal Officer, Counsel and Secretary (since 2005), Virtus Mutual Fund Complex; Senior Vice President (2013 to 2014), Vice President (2012 to 2013) and Assistant Secretary (since 2012), Secretary and Chief Legal Officer (2005 to 2012), The Zweig Fund, Inc. and Virtus Global Dividend & Income Fund Inc.; Assistant Secretary (since 2013), Vice President, Chief Legal Officer, Counsel and Secretary (2010 to 2013), Virtus Variable Insurance Trust; Vice President and Assistant Secretary (since 2011), Duff & Phelps Global Utility Income Fund Inc.; Senior Vice President and Assistant Secretary (2013 to 2014), Vice President and Assistant Secretary (2012 to 2013), Vice President, Chief Legal Officer, Counsel and Secretary (2011 to 2012), Virtus Closed-End Funds; and Assistant Secretary (since 2013), Virtus Alternative Solutions Trust. |
Engberg, Nancy J.
YOB: 1956 | | Vice President and Chief Compliance Officer since 2011. | | Vice President (since 2008) and Chief Compliance Officer (2008 to 2011 and since 2016), Virtus Investment Partners, Inc. and/or certain of its subsidiaries; various officer positions (since 2003) with Virtus affiliates; Vice President and Chief Compliance Officer (since 2011), Virtus Mutual Fund Complex; Vice President (since 2010) and Chief Compliance Officer (since 2011), Virtus Variable Insurance Trust; Vice President and Chief Compliance Officer (since 2011), Virtus Closed-End Funds; Vice President and Chief Compliance Officer (since 2012), The Zweig Fund, Inc. and Virtus Global Dividend & Income Fund Inc.; Vice President and Chief Compliance Officer (since 2013), Virtus Alternative Solutions Trust; Chief Compliance Officer (since 2015), ETFis Series Trust I; and Chief Compliance Officer (since 2015), Virtus ETF Trust II. |
Waltman, Francis G.
YOB: 1962 | | Executive Vice President (since 2013); Senior Vice President (2008-2013). | | Executive Vice President, Product Development (since 2009), Virtus Investment Partners, Inc. and/or certain of its subsidiaries; various senior officer positions (since 2006) with Virtus affiliates; Executive Vice President (since 2013), Senior Vice President (2008 to 2013), Virtus Mutual Fund Complex; Executive Vice President (since 2013), Senior Vice President (2010 to 2013), Virtus Variable Insurance Trust; Executive Vice President (since 2013), Senior Vice President (2011 to 2013), Virtus Closed-End Funds; Director (since 2013), Virtus Global Funds PLC; and Executive Vice President (since 2013), Virtus Alternative Solutions Trust. |
85
Virtus Global Quality Dividend Fund
(formerly, Virtus KAR Global Quality Dividend Fund),
a series of Virtus Equity Trust
Supplement dated February 1, 2017 to the
Summary and Statutory Prospectuses dated July 29, 2016, as supplemented
IMPORTANT NOTICETO INVESTORS
Effective February 1, 2017, the fund’s new primary benchmark is the Russell Developed Large Cap Index (net). The fund believes that the Russell Developed Large Cap Index (net) provides a better measure for the fund’s performance as it is more closely aligned with the characteristics of the fund going forward in light of changes to the fund’s principal investment strategies, also effective February 1, 2017 and previously announced by prospectus supplement dated November 18, 2016. Also effective February 1, 2017, the fund is adding the Global Quality Dividend Linked Benchmark. Performance of the Global Quality Dividend Linked benchmark prior to February 1, 2017 is that of the Russell 1000® Value Index and beginning February 1, 2017 it is that of the Russell Developed Large Cap Index (net). The fund will no longer use the Russell 1000® Value Index as an index for performance comparisons.
Additional Information About the Russell Developed Large Cap Index (net)
The Russell Developed Large Cap Index (net) is a free-float market capitalization-weighted index constructed to provide a comprehensive and unbiased barometer for the large-cap segment in the developed world. The index is calculated on a total return basis with net dividends reinvested; it is unmanaged; its returns do not reflect any fees, expenses or sales charges; and it is not available for direct investment.
Investors should retain this supplement with the Prospectuses for future reference.
VET 8019 GQDBenchmark (2/2017)
VIRTUS EQUITY TRUST
101 Munson Street
Greenfield, MA 01301-9668
Trustees
George R. Aylward
Thomas J. Brown
Donald C. Burke
Roger A. Gelfenbien
John R. Mallin
Hassell H. McClellan
Philip R. McLoughlin, Chairman
Geraldine M. McNamara
James M. Oates
Richard E. Segerson
Ferdinand L.J. Verdonck
Officers
George R. Aylward, President
Francis G. Waltman, Executive Vice President
W. Patrick Bradley, Executive Vice President, Chief Financial Officer and Treasurer
Kevin J. Carr, Senior Vice President, Chief Legal Officer, Counsel and Secretary
Nancy J. Engberg, Vice President and Chief Compliance Officer
Investment Adviser
Virtus Investment Advisers, Inc.
100 Pearl Street
Hartford, CT 06103-4506
Principal Underwriter
VP Distributors, LLC
100 Pearl Street
Hartford, CT 06103-4506
Administrator and Transfer Agent
Virtus Fund Services, LLC
100 Pearl Street
Hartford, CT 06103-4506
Custodian
JPMorgan Chase Bank, NA
1 Chase Manhattan Plaza
New York, NY 10005-1401
Independent Registered Public
Accounting Firm
PricewaterhouseCoopers LLP
2001 Market Street
Philadelphia, PA 19103-7042
How to Contact Us
| | |
Mutual Fund Services | | 1-800-243-1574 |
Adviser Consulting Group | | 1-800-243-4361 |
Website | | Virtus.com |
Important Notice to Shareholders
The Securities and Exchange Commission has modified mailing regulations for semiannual and annual shareholder fund reports to allow mutual fund companies to send a single copy of these reports to shareholders who share the same mailing address. If you would like additional copies, please call Mutual Fund Services at 1-800-243-1574.
| | |

| | |
P.O. Box 9874 Providence, RI 02940-8074 | | |
For more information about Virtus Mutual Funds,
please call your financial representative, or contact us
at 1-800-243-1574 or Virtus.com.

ANNUAL REPORT
Virtus Strategic Allocation Fund
March 31, 2017
TRUST NAME: VIRTUS EQUITY TRUST
Prospectus supplement applicable to this Fund appears at the back of this annual report.
Not FDIC Insured
No Bank Guarantee
May Lose Value

Table of Contents
Virtus Strategic Allocation Fund
(“Strategic Allocation Fund”)
PROXY VOTING PROCEDURES AND VOTING RECORD (FORM N-PX)
The subadviser votes proxies relating to portfolio securities in accordance with procedures that have been approved by the Board of Trustees of the Trust (“Trustees,” or the “Board”). You may obtain a description of these procedures, along with information regarding how the Fund voted proxies during the most recent 12-month period ended June 30, free of charge, by calling toll-free 1-800-243-1574. This information is also available through the Securities and Exchange Commission’s (the “SEC”) website at http://www.sec.gov.
FORM N-Q INFORMATION
The Trust files a complete schedule of portfolio holdings for the Fund with the SEC for the first and third quarters of each fiscal year on Form N-Q. Form N-Q is available on the SEC’s website at http://www.sec.gov. Form N-Q may be reviewed and copied at the SEC’s Public Reference Room. Information on the operation of the SEC’s Public Reference Room can be obtained by calling toll-free 1-800-SEC-0330.
This report is not authorized for distribution to prospective investors in the Strategic Allocation Fund unless preceded or accompanied by an effective prospectus which includes information concerning the sales charge, the Fund’s record and other pertinent information.
MESSAGE TO SHAREHOLDERS
To My Fellow Shareholders of Virtus Mutual Funds:
| | |
 | | I am pleased to present this report that reviews the performance of your fund for the 12 months ended March 31, 2017. Global markets both started and ended the fiscal year on a strong note. At the front end of the period, stabilizing oil prices and the Federal Reserve’s (“the Fed’) softened stance on rate hikes sparked an equity rally that lasted into the summer of 2016. The U.K.’s “Brexit” decision in June, followed by the U.S. presidential election in November, triggered short-lived market selloffs, but calm was restored by better-than-expected corporate earnings and an improving global economic picture. As the fiscal year drew to a close, equity markets continued to benefit from the post-election “Trump bump.” The Fed raised interest rates twice in the last few months – once in December, and again in March – a clear signal that |
it believes the U.S. economy is on a growth path. At the same time, other major central banks remained committed to monetary stimulus, adding reassurance to global markets. U.S. growth, as evidenced by strong jobs, housing, and consumer spending data, gives investors reason for optimism. Corporate earnings got off to a strong start for the first quarter of 2017. The pro-growth policies of the new administration, if implemented, could have a continued positive impact on earnings and the markets. For the 12 months, performance of U.S. large- and small-cap stocks surged, as measured by the 17.17% and 26.22% returns of the S&P 500® Index and Russell 2000® Index, respectively. Within international equities, emerging markets outpaced their developed peers, as the MSCI Emerging Markets Index (net) increased 17.22%, compared with the MSCI EAFE® Index (net), which returned 11.67%. Demand for U.S. Treasuries remained strong, driven by foreign investors seeking safe havens and yield in light of the negative interest rate environment in many international economies. On March 31, 2017, the benchmark 10-year U.S. Treasury yielded 2.40%, compared with 1.78% one year earlier. The broader U.S. fixed income market, as represented by the Bloomberg Barclays U.S. Aggregate Bond Index, which tracks Treasuries and other investment-grade debt securities, had a relatively flat return of 0.44% for the year, while non-investment grade bonds had a healthy return of 16.39%, as measured by the Bloomberg Barclays U.S. Corporate High Yield Bond Index. Market uncertainty is an ever-present reminder of the importance of portfolio diversification, including exposure to traditional and alternative asset classes. While diversification cannot guarantee a profit or prevent a loss, owning a variety of asset classes may cushion your portfolio against inevitable market fluctuations. Your financial advisor can help you ensure that your portfolio is adequately diversified across asset classes and investment strategies. On behalf of our investment affiliates, thank you for entrusting Virtus with your assets. Should you have questions about your account or require assistance, please visit our website at Virtus.com, or call our customer service team at 1-800-243-1574. We appreciate your business and remain committed to your long-term financial success. |
Sincerely,

George R. Aylward
President, Virtus Mutual Funds
May 2017
Performance data quoted represents past results. Past performance is no guarantee of future results, and current performance may be higher or lower than the performance shown above.
1
VIRTUS STRATEGIC ALLOCATION FUND
DISCLOSURE OF FUND EXPENSES (Unaudited)
FOR THE SIX-MONTH PERIOD OF OCTOBER 1, 2016 TO MARCH 31, 2017
We believe it is important for you to understand the impact of costs on your investment. All mutual funds have operating expenses. As a shareholder of the Strategic Allocation Fund (the “Fund”), you may incur two types of costs: (1) transaction costs, including sales charges on purchases of Class A shares and contingent deferred sales charges on Class C shares; and (2) ongoing costs, including investment advisory fees, distribution and service fees, and other expenses. For further information regarding applicable sales charges, see Note 1 in the Notes to Financial Statements. These examples are intended to help you understand your ongoing costs (in dollars) of investing in the Fund and to compare these costs with the ongoing costs of investing in other mutual funds. These examples are based on an investment of $1,000 invested at the beginning of the period and held for the entire six-month period. The following Expense Table illustrates the Fund’s costs in two ways.
Actual Expenses
The first section of the accompanying table provides information about actual account values and actual expenses. You may use the information in this section, together with the amount you invested, to estimate the expenses that you paid over the period. Simply divide your account value by $1,000 (for example, an $8,600 account value divided by $1,000 = 8.6), then multiply the result by the number in the first section under the heading “Expenses Paid During Period” to estimate the expenses you paid on your account during the period.
Hypothetical Example for Comparison Purposes
The second section of the accompanying table provides information about hypothetical account values and hypothetical expenses based on the Fund’s actual expense ratio and an assumed rate of return of 5% per year before expenses, which is not your Fund’s actual return. The hypothetical account values and expenses may not be used to estimate the actual ending account balance or expenses you paid for the period. You may use this information to compare the ongoing costs of investing in your Fund and other funds. To do so, compare these 5% hypothetical examples with the 5% hypothetical examples that appear in the shareholder reports of the other funds.
Please note that the expenses shown in the accompanying table are meant to highlight your ongoing costs only and do not reflect any transactional costs, such as sales charges or contingent deferred sales charges. Therefore, the second section of the accompanying table is useful in comparing ongoing costs only, and will not help you determine the relative total costs of owning different funds. In addition, if these transactional costs were included, your costs would have been higher. The calculations assume no shares were bought or sold during the period. Your actual costs may have been higher or lower, depending on the amount of your investment and timing of any purchases or redemptions.
2
VIRTUS STRATEGIC ALLOCATION FUND
DISCLOSURE OF FUND EXPENSES (Unaudited) (Continued)
FOR THE SIX-MONTH PERIOD OF OCTOBER 1, 2016 TO MARCH 31, 2017
| | | | | | | | | | | | | | | | |
| Expense Table | | | | | | | | | | |
| | | Beginning Account Value October 1, 2016 | | | Ending Account Value March 31, 2017 | | | Annualized Expense Ratio | | | Expenses Paid During Period* | |
Actual | | | | | | | | | | | | | | | | |
| Class A | | $ | 1,000.00 | | | $ | 1,026.00 | | | | 1.16 | % | | $ | 5.86 | |
| Class C | | | 1,000.00 | | | | 1,021.80 | | | | 1.91 | | | | 9.63 | |
|
Hypothetical (5% return before expenses) | |
| Class A | | | 1,000.00 | | | | 1,019.15 | | | | 1.16 | | | | 5.84 | |
| Class C | | | 1,000.00 | | | | 1,015,41 | | | | 1.91 | | | | 9.60 | |
| * | Expenses are equal to the Fund’s annualized expense ratio, which is net of waived fees and reimbursed expenses, if applicable, multiplied by the average account value over the period, multiplied by the number of days (182) expenses were accrued in the most recent fiscal half-year, then divided by 365 to reflect the one-half year period. |
| | The Fund may invest in other funds, and the annualized expense ratios noted above do not reflect fees and expenses associated with the underlying funds. If such fees and expenses had been included, the expenses would have been higher. |
| | You can find more information about the Fund’s expenses in the Financial Statements section that follows. For additional information on operating expenses and other shareholder costs, refer to the Fund’s prospectus. |
3
VIRTUS STRATEGIC ALLOCATION FUND
KEY INVESTMENT TERMS (Unaudited)
MARCH 31, 2017
American Depositary Receipt (ADR)
Represents shares of foreign companies traded in U.S. dollars on U.S. exchanges that are held by a U.S. bank or a trust. Foreign companies use ADRs in order to make it easier for Americans to buy their shares.
Bank of Japan (BOJ)
One of the world’s major central banks, the Bank of Japan is responsible for issuing the country’s currency, managing monetary policy, and maintaining financial system stability.
Bloomberg Barclays U.S. Aggregate Bond Index
The Bloomberg Barclays U.S. Aggregate Bond Index measures the U.S. investment-grade fixed-rate bond market. The index is calculated on a total return basis. The index is unmanaged, its returns do not reflect any fees, expenses, or sales charges, and it is not available for direct investment.
Bloomberg Barclays U.S. Corporate High Yield Bond Index
The Bloomberg Barclays U.S. Corporate High Yield Bond Index measures the U.S. dollar-denominated, high yield, fixed-rate corporate bond market. The index is calculated on a total return basis. The index is unmanaged, its returns do not reflect any fees, expenses, or sales charges, and it is not available for direct investment.
Brexit
A combination of the words “Britain” and “exit” which refers to Britain’s withdrawal from the European Union.
European Central Bank (ECB)
The European Central Bank (ECB) is responsible for conducting monetary policy for the euro area. The ECB was established as the core of the Euro-system and the European System of Central Banks (ESCB). The ESCB comprises the ECB and the National Central Banks (NCBs) of all 17 EU Member States whether they have adopted the Euro or not.
Federal Reserve (the “Fed”)
The Central Bank of the United States, responsible for controlling the money supply, interest rates and credit with the goal of keeping the U.S. economy and currency stable. Governed by a seven-member board, the system includes 12 regional Federal Reserve Banks, 25 branches and all national and state banks that are part of the system.
MSCI EAFE® Index (net)
The MSCI EAFE® (Europe, Australasia, Far East) Index (net) is a free float-adjusted market capitalization-weighted index that measures developed foreign market equity performance, excluding the U.S. and Canada. The index is calculated on a total return basis with net dividends reinvested. The index is unmanaged, its returns do not reflect any fees, expenses, or sales charges, and it is not available for direct investment.
MSCI Emerging Markets Index (net)
The MSCI Emerging Markets Index (net) is a free float-adjusted market capitalization-weighted index designed to measure equity market performance in the global emerging markets. The index is calculated on a total return basis with net dividends reinvested. The index is unmanaged, its returns do not reflect any fees, expenses, or sales charges, and is not available for direct investment.
4
VIRTUS STRATEGIC ALLOCATION FUND
KEY INVESTMENT TERMS (Unaudited) (Continued)
MARCH 31, 2017
Organization of the Petroleum Exporting Countries (OPEC)
The Organization of the Petroleum Exporting Countries is an intergovernmental organization that currently has 12 member countries. The organization’s objective is to coordinate and unify petroleum policies among member countries, in order to secure fair and stable prices for petroleum producers; an efficient, economic and regular supply of petroleum to consuming nations; and a fair return on capital to those investing in the industry.
Quantitative Easing (QE)
An unconventional monetary policy in which a central bank purchases government securities or other securities from the market in order to lower interest rates and increase the money supply. Quantitative easing increases the money supply by flooding financial institutions with capital in an effort to promote increased lending and liquidity. Quantitative easing is considered when short-term interest rates are at or approaching zero, and does not involve the printing of new banknotes.
Real Estate Investment Trust (REIT)
A publicly traded company that owns, develops and operates income-producing real estate such as apartments, office buildings, hotels, shopping centers and other commercial properties.
Russell 2000® Index
The Russell 2000® Index is a market capitalization-weighted index of the 2,000 smallest companies in the Russell Universe, which comprises the 3,000 largest U.S. companies. The index is calculated on a total return basis with dividends reinvested. The index is unmanaged, its returns do not reflect any fees, expenses, or sales charges, and is not available for direct investment.
S&P 500® Index
The S&P 500® Index is a free-float market capitalization-weighted index of 500 of the largest U.S. companies. The index is calculated on a total return basis with dividends reinvested. The index is unmanaged, its returns do not reflect any fees, expenses, or sales charges, and it is not available for direct investment.
Sponsored ADR
An ADR which is issued with the cooperation of the company whose stock will underlie the ADR. Sponsored ADRs generally carry the same rights normally given to stockholders, such as voting rights. ADRs must be sponsored to be able to trade on a major U.S. exchange such as the New York Stock Exchange (“NYSE”).
Strategic Allocation Fund Linked Benchmark
The Strategic Allocation Fund Linked Benchmark consists of 45% Russell 1000® Growth Index (a market capitalization-weighted index of growth-oriented stocks of the 1,000 largest companies in the Russell Universe, which comprises the 3,000 largest U.S. companies, calculated on a total return basis with dividends reinvested), 15% MSCI EAFE® Index (a free float-adjusted market capitalization-weighted index that measures developed foreign market equity performance, excluding the U.S. and Canada, calculated on a total return basis with net dividends reinvested) and 40% Bloomberg Barclays U.S. Aggregate Bond Index (an index that measures the U.S. investment grade fixed rate bond market, calculated on a total return basis). The index is unmanaged, its returns do not reflect any fees, expenses, or sales charges, and is not available for direct investment. Performance of the Strategic Allocation Fund Linked Benchmark prior to 9/7/2016 represents an allocation consisting of 60% S&P 500® Index and 40% Bloomberg Barclays U.S. Aggregate Bond Index.
5
| | |
VIRTUS STRATEGIC ALLOCATION FUND Fund Summary March 31, 2017 (Unaudited) Portfolio Management Commentaries by Duff & Phelps Investment Management Co. (International Equity Portfolio), Kayne Anderson Rudnick Investment Management, LLC (Domestic Equity Portfolio), and Newfleet Asset Management, LLC (Fixed Income Portfolio) | | Ticker Symbols: A Share: PHBLX C Share: PSBCX |
| ⬛ | | Strategic Allocation Fund (the “Fund”) is diversified and has investment objectives of reasonable income, long-term capital growth and conservation of capital. There is no guarantee the Fund will achieve its objectives. |
| ⬛ | | For the fiscal year ended March 31, 2017, the Fund’s Class A shares at NAV returned 7.13%, and Class C shares returned 6.33%. For the same period, the S&P 500® Index, a broad-based equity index, returned 17.17%; the Bloomberg Barclays U.S. Aggregate Bond Index, a broad-based fixed income index, returned 0.44%; and the Strategic Allocation Fund Linked Benchmark, which is the Fund’s style-specific index appropriate for comparison, returned 9.64%. |
All performance figures assume reinvestment of distributions and exclude the effect of sales charges. Performance data quoted represents past results. Past performance is no guarantee of future results, and current performance may be higher or lower than the performance shown above. Investment return and principal value will fluctuate so your shares when redeemed may be worth more or less than their original cost. Please visit Virtus.com for performance data current to the most recent month-end.
Effective September 7, 2016, Kayne Anderson Rudnick Investment Management, LLC (“KAR”) became subadviser to the domestic equity portfolio of the Fund and Duff & Phelps Investment Management Co. (“DPIM”) became subadviser to the international equity portfolio. The following commentary includes the views of the KAR and DPIM for the periods they managed their respective portfolios. There was no change
to the subadviser of the fixed income portfolio of the Fund, which continues to be managed by Newfleet Asset Management, LLC (“Newfleet”).
How did the markets perform during the Fund’s fiscal year ended March 31, 2017?
U.S. Equities
Despite a terrible start to 2016, equities enjoyed very solid returns for the one-year period ended March 31, 2017, with the S&P 500® Index up 17.17% and small stocks registering an even more impressive gain, advancing 26.22%, as measured by the Russell 2000® Index.
Investor risk appetites changed dramatically over the course of the year. The first half of the year was marked by disappointing economic growth, falling bond yields, and defensive fixed-income and equity positioning on the part of investors. After many commodities, particularly crude oil, finally found a bottom after two years of dramatic declines, investors adopted a much more aggressive risk appetite as the economy started to stabilize over the summer and improve into the fall. In November, President-elect Trump’s agenda of pro-business tax reforms and fewer regulatory burdens, further accentuated the outlook that economic growth would accelerate further.
Then, in the first quarter of 2017, the equity markets switched course again with a style rotation, as growth benchmarks outperformed value indexes, and large stocks outperformed small stocks – the opposite of what occurred in 2016. The asset classes and equity sectors that benefited the most from Donald Trump’s surprise election since cooled off and lagged materially through the first quarter of 2017.
For information regarding the indexes and certain investment terms, see the Key Investment Terms on page 4.
6
| | |
| VIRTUS STRATEGIC ALLOCATION FUND (Continued) | | |
International Equities
The international equity markets performed strongly during the year, with the MSCI EAFE® Index gaining 11.67% (net dividends). At the beginning of the Fund’s fiscal year, the consensus opinion regarding a potential economic slowdown in China and the potential damaging effects of zero interest rate policies in Japan and the European Union (“EU”) was turning more optimistic. Despite uncertainty generated by the unexpected “yes” Brexit vote in June, when the United Kingdom voted to leave the EU, the green shoots of a global economic expansion were visible in a steady drumbeat of positive reports including: purchasing manager surveys which measure the economic health of the manufacturing sector; consumer sentiment indicators which track individuals’ attitudes about the economy and their financial situations; employment data which measures the health of the job market; upward earnings revisions that show healthy, growing companies; and steepening yield curves, which is when the difference between a country’s shorter maturity treasury bonds and its longer maturity treasury bonds widens, and is considered a positive economic signal.
As the Fund’s fiscal year drew to a close, the global economy continued to deliver solid performance and forced investors to take reflation seriously. Reform agendas in Japan and Brazil had begun bearing fruit, and the European Central Bank (“ECB”) reiterated a lower-for-longer stance on interest rates to further drive the reflation rally. That said, election uncertainty remained in France, and the growing threat from North Korea continued to be a concern.
Fixed Income
Most fixed income spread sectors outperformed U.S. Treasuries over the fiscal year. The rally that was sparked in the first quarter of 2016 by the U.S. Federal Reserve’s (the “Fed”) dovish stance toward interest rates continued through the end of March 2017.
Volatility returned to the markets briefly in late June, with fallout from the United Kingdom’s decision – dubbed “Brexit” – to leave the EU. Bond yields in the U.S., Japan, and across Europe fell to historic lows in early July as investors fled to the safety of bonds on global growth concerns fueled by the U.K.’s decision. Markets recovered rather quickly, however, from the initial shock of the Brexit vote. Easing by major central banks and a weaker U.S. dollar helped to improve global risk sentiment and stabilize markets.
September brought heightened concerns over the ability and willingness of global central banks to fight chronic low inflation and weak growth as the decision by the ECB to leave interest rates and its stimulus program unchanged was a precipitating factor in a widespread market sell-off, reinforced by fears that the Bank of Japan (“BOJ”) had run out of quantitative easing tools. Hawkish signals from the Fed added to the volatility. The BOJ subsequently decided not to change rates but to shift its focus to stabilizing rates for longer maturity government bonds. This bolstered market sentiment, as did the Fed’s eventual decision to stand pat at its September meeting.
The unexpected election of Donald Trump as the 45th U.S. president sparked another bout of volatility in early November. President-elect Trump’s campaign, which focused on immigration, trade, tax cuts, and infrastructure spending, was largely perceived by the market as supportive of faster growth. Inflation expectations increased, causing the yield on the 10-year U.S. Treasury to rise 0.52% by the end of November. Also in late November, oil prices benefited from OPEC’s decision to cut oil production for the first time in eight years.
Post-election expectations of faster economic growth and rising inflation continued into the first quarter of 2017 as optimistic investors watched and waited for clarity on President Trump’s fiscal policies. As the quarter progressed, support for the “Trump trade”
For information regarding the indexes and certain investment terms, see the Key Investment Terms on page 4.
7
| | |
| VIRTUS STRATEGIC ALLOCATION FUND (Continued) | | |
weakened as the new administration experienced bumps in the road with its aggressive agenda and visible opposition.
In a largely anticipated move, the Fed raised its target rate 0.25% on two separate occasions during the last 12 months to a target range of 0.75% to 1.00%. Over the fiscal year, yields of U.S. Treasuries increased across maturities, particularly for shorter term Treasury bonds.
What factors affected the Fund’s performance during the fiscal year?
U.S. Equities
The U.S. equity portfolio of the Fund underperformed the large-cap U.S. equity market, as measured by the Russell 1000® Growth Index, for the period during the fiscal year that it was under the management of the new subadviser (September 7, 2016 through March 31, 2017).
Performance in the U.S. equity portfolio was helped by strong stock selection in the financials sector and an underweight in the real estate sector. Negative stock selection in the information technology and consumer discretionary sectors was the biggest detractor from performance.
Holdings that contributed the most to performance during the period were Netflix and Facebook.
| ⬛ | | Netflix embarked on two bold growth initiatives in recent years with the build-out of international infrastructure and a massive investment in original content. So far both look like home runs. The company added 3.2 million international subscribers in the most recent quarter (nearly nine times the amount added in the U.S.) and original content helped reduce customer churn. The company’s unmatched scale gives it the data and the financial firepower to deliver better content which drove another better-than-expected revenue and earnings performance. |
| ⬛ | | Facebook continued to grow advertising revenue and take share in the online digital marketing space. The company delivers an unprecedented global reach of 20% of the earth’s population to advertisers in a very measureable way. Monetization of this audience has barely scratched the surface of its long-term potential. Future growth levers include untapped monetization of Messenger, WhatsApp, and video advertising along with Virtual Reality. Facebook sold off strongly following the U.S. election as it was a widely held, defensive long position as well as a perceived relative loser post the election, but the stock bounced strongly in the first quarter of 2017 buoyed by another stellar earnings report. |
Holdings that contributed the least to performance were Monster Beverage and TripAdvisor.
| ⬛ | | Monster Beverage’s landmark 2015 agreement with Coca-Cola paved the way to higher margins and better global distribution through Coca-Cola channels. Since then, gross margins have expanded, and international revenue has risen to 25% of the total. Shares were relatively flat for the last two years as Monster digested uneven growth that resulted from the Coca-Cola distribution changes. However, in the most recent quarter, international sales outpaced expectations, highlighting the vast global opportunity. Additionally, the company is ramping up its innovation engine, launching both a Mountain Dew competitor, Mutant, and Hydro, an enhanced energy water. |
| ⬛ | | TripAdvisor’s user engagement has decelerated and shifted to lower monetizing mobile at the same time that the company needs those cash flows to market its transition to a booking platform. After mounting concerns for the better part of a year, we sold the Fund’s position in TripAdvisor. |
For information regarding the indexes and certain investment terms, see the Key Investment Terms starting on page 4.
8
| | |
| VIRTUS STRATEGIC ALLOCATION FUND (Continued) | | |
International Equities
The Fund’s international equity portfolio posted positive performance in the fiscal year, but underperformed the international equity market, as measured by the MSCI EAFE® Index.
The international equity portfolio generated positive returns from its investments in seven out of the 11 major equity market sectors. Performance relative to the MSCI EAFE® benchmark, however, was hampered by both asset allocation and security selection. The overweight allocation to information technology, as well as underweight allocations to consumer staples and health care, were not sufficient to offset losses due to an underweight in financials, an overweight to telecommunications, and the performance drag of cash held for defensive purposes. Security selection also detracted from performance, as strong selections in consumer staples and industrials were not enough to offset weak stock selection in financials, materials, health care, and utilities.
On a country basis, weak security selection in the United Kingdom and Japan more than offset strong security selection in Australia and the Netherlands. From an allocation standpoint, having no holdings in the struggling Danish market was not enough to offset the detrimental effect of being overweight Israel and South Korea.
Fixed Income
The underperformance of U.S. Treasuries and agency mortgage-backed securities (“MBS”) relative to most fixed income spread sectors was the key driver of the fixed income portfolio’s outperformance for the fiscal year.
Among fixed income sectors, the Fund’s allocations to corporate high yield and residential MBS were the largest contributors to performance during the fiscal year. Issue selection within the corporate high quality sector also had a meaningful impact on performance during the period.
The preceding information is the opinion of portfolio management only through the end of the period of the report as stated on the cover. Any such opinions are subject to change at any time based upon market conditions and should not be relied upon as investment advice.
Equity Securities: The market price of equity securities may be adversely affected by financial market, industry, or issuerspecific events. Focus on a particular style or on small or medium-sized companies may enhance that risk.
Credit & Interest: Debt securities are subject to various risks, the most prominent of which are credit and interest rate risk. The issuer of a debt security may fail to make interest and/or principal payments. Values of debt securities may rise or fall in response to changes in interest rates, and this risk may be enhanced with longer-term maturities.
Foreign & Emerging Markets: Investing internationally, especially in emerging markets, involves additional risks such as currency, political, accounting, economic, and market risk.
Allocation: The Fund’s exposure to different asset classes may not be optimal for market conditions at a given time. Asset allocation does not guarantee a profit or protect against a loss in declining markets.
High Yield-High Risk Fixed Income Securities: There is a greater level of credit risk and price volatility involved with high-yield securities than investment grade securities.
Prospectus: For additional information on risks, please see the Fund’s prospectus.
For information regarding the indexes and certain investment terms, see the Key Investment Terms starting on page 4.
9
| | |
| VIRTUS STRATEGIC ALLOCATION FUND (Continued) | | |
| | | | | | | | |
| |
| Asset Allocations | |
| |
The following table presents the portfolio holdings within certain sectors as a percentage of total investments attributable to each sector at March 31, 2017. | |
Common Stocks | | | | | | | 62 | % |
Information Technology | | | 19 | % | | | | |
Consumer Discretionary | | | 15 | | | | | |
Healthcare | | | 6 | | | | | |
All Other Sectors in Common Stocks | | | 22 | | | | | |
Corporate Bonds and Notes | | | | | | | 19 | |
Financials | | | 6 | | | | | |
Consumer Discretionary | | | 2 | | | | | |
Real Estate | | | 2 | | | | | |
All Other Sectors in Corporate Bonds and Notes | | | 9 | | | | | |
Mortgage-Backed Securities | | | | | | | 8 | |
U.S. Government Securities | | | | | | | 3 | |
Asset-Backed Securities | | | | | | | 2 | |
Loan Agreements | | | | | | | 2 | |
Other | | | | | | | 4 | |
| | | | | | | | | |
Total | | | | | | | 100 | % |
| | | | | | | | | |
For information regarding the indexes and certain investment terms, see the Key Investment Terms starting on page 4.
10
| | |
| VIRTUS STRATEGIC ALLOCATION FUND (Continued) | | |
| | | | | | | | | | | | |
| Average Annual Total Returns1 for periods ended 3/31/17 | |
| | | 1
Year | | | 5
Years | | | 10
Years | |
| Class A shares at NAV 2 | | | 7.13 | % | | | 4.87 | % | | | 4.20 | % |
| Class A shares at POP 3,4 | | | 0.97 | | | | 3.64 | | | | 3.58 | |
| Class C shares at NAV 2 and with CDSC 4 | | | 6.33 | | | | 4.07 | | | | 3.41 | |
| S&P 500® Index | | | 17.17 | | | | 13.30 | | | | 7.51 | |
| Bloomberg Barclays U.S. Aggregate Bond Index | | | 0.44 | | | | 2.34 | | | | 4.27 | |
| Strategic Allocation Fund Linked Benchmark | | | 9.64 | | | | 8.82 | | | | 6.46 | |
Fund Expense Ratios5: A Shares: 1.14%; C Shares: 1.89%.
All returns represent past performance which is no guarantee of future results. Current performance may be higher or lower than the performance shown. The investment return and principal value of an investment will fluctuate so that an investor’s shares, when redeemed, may be worth more or less than their original cost. The above table and graph below do not reflect the deduction of taxes that a shareholder would pay on fund distributions or the redemption of fund shares. Please visit Virtus.com for performance data current to the most recent month-end.
| 1 | Total returns are historical and include changes in share price and the reinvestment of both dividends and capital gain distributions. |
| 2 | “NAV” (Net Asset Value) total returns do not include the effect of any sales charge. |
| 3 | “POP” (Public Offering Price) total returns include the effect of the maximum front-end 5.75% sales charge. |
| 4 | “CDSC” (contingent deferred sales charge) is applied to redemptions of Class C shares that do not have a sales charge applied at the time of purchase. CDSC charges for certain redemptions of Class A shares made within 18 months of purchases in which a finder’s fee was paid and all redemptions of Class C shares within the first year are 1% and 0% thereafter. |
| 5 | The expense ratios of the Fund are set forth according to the prospectus for the Fund effective April 10, 2017, as supplemented and revised, and may differ from the expense ratios disclosed in the Financial Highlights tables in this report. See the Financial Highlights for more current expense ratios. Expense ratios include fees and expenses associated with the underlying funds. |
Growth of $10,000 for periods ended 3/31
This chart assumes an initial investment of $10,000 made on March 31, 2007, for Class A, and Class C shares including any applicable sales charges or fees. The performance of Class C shares will be greater or less than that shown based on differences in inception dates, fees, and sales charges. Performance assumes reinvestment of dividends and capital gain distributions.
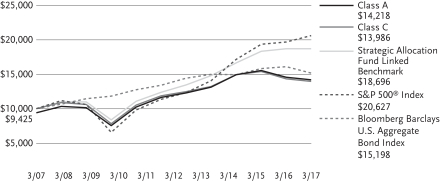
For information regarding the indexes and certain investment terms, see Key Investment Terms on page 4.
11
VIRTUS STRATEGIC ALLOCATION FUND
SCHEDULE OF INVESTMENTS
MARCH 31, 2017
($ reported in thousands)
| | | | | | | | |
| | | PAR VALUE | | | VALUE | |
| U.S. GOVERNMENT SECURITIES—2.5% | |
U.S. Treasury Bond 2.500%, 2/15/46 | | $ | 12,820 | | | $ | 11,485 | |
TOTAL U.S. GOVERNMENT SECURITIES
(Identified Cost $12,371) | | | | 11,485 | |
| MUNICIPAL BONDS—0.9% | |
| California—0.4% | |
State of California, Build America Bonds Taxable 7.600%, 11/1/40 | | | 1,275 | | | | 1,901 | |
| | | | | | | | |
| Georgia—0.1% | |
Rockdale County Water & Sewerage Authority Revenue Taxable 3.060%, 7/1/24 | | | 600 | | | | 609 | |
| | | | | | | | |
| New York—0.4% | |
New York City Transitional Finance Authority Tax Secured Revenue 5.000%, 5/1/40 | | | 1,635 | | | | 1,855 | |
TOTAL MUNICIPAL BONDS
(Identified Cost $4,574) | | | | 4,365 | |
| FOREIGN GOVERNMENT SECURITIES—1.3% | |
Argentine Republic | | | | | | | | |
144A 7.500%, 4/22/26(4) | | | 505 | | | | 537 | |
144A 6.875%, 1/26/27(4) | | | 475 | | | | 481 | |
144A 7.625%, 4/22/46(4) | | | 195 | | | | 199 | |
Dominican Republic
144A 6.600%, 1/28/24(4) | | | 335 | | | | 365 | |
Federative Republic of Brazil
6.000%, 4/7/26 | | | 410 | | | | 447 | |
Kingdom of Bahrain
144A 7.000%, 10/12/28(4) | | | 485 | | | | 507 | |
Kingdom of Jordan
144A 5.750%, 1/31/27(4) | | | 505 | | | | 496 | |
Republic of Colombia 3.875%, 4/25/27 | | | 460 | | | | 458 | |
Republic of Costa Rica | | | | | | | | |
144A 4.375%, 4/30/25(4) | | | 265 | | | | 250 | |
144A 7.000%, 4/4/44(4) | | | 335 | | | | 339 | |
Republic of Indonesia 144A 3.700%, 1/8/22(4) | | | 265 | | | | 270 | |
| | | | | | | | |
| | | | | | | | |
| | | PAR VALUE | | | VALUE | |
| FOREIGN GOVERNMENT SECURITIES (continued) | |
Republic of Panama 3.875%, 3/17/28 | | $ | 495 | | | $ | 503 | |
Republic of Turkey 4.875%, 10/9/26 | | | 950 | | | | 917 | |
Sultanate of Oman 144A 4.750%, 6/15/26(4) | | | 250 | | | | 252 | |
TOTAL FOREIGN GOVERNMENT SECURITIES
(Identified Cost $5,999) | | | | 6,021 | |
| MORTGAGE-BACKED SECURITIES—8.2% | |
| Agency—2.8% | |
FHLMC | | | | | | | | |
5.000%, 7/1/35 | | | 200 | | | | 220 | |
5.000%, 12/1/35 | | | 570 | | | | 634 | |
6.000%, 6/1/37 | | | 270 | | | | 312 | |
3.500%, 11/1/44 | | | 523 | | | | 536 | |
4.000%, 2/1/45 | | | 537 | | | | 564 | |
3.500%, 3/1/45 | | | 457 | | | | 469 | |
3.000%, 5/1/45 | | | 420 | | | | 417 | |
3.500%, 4/1/46 | | | 745 | | | | 763 | |
FNMA | | | | | | | | |
4.000%, 7/1/19 | | | 4 | | | | 4 | |
6.000%, 12/1/32 | | | 45 | | | | 51 | |
6.000%, 11/1/34 | | | 371 | | | | 422 | |
5.500%, 4/1/36 | | | 6 | | | | 6 | |
5.500%, 9/1/36 | | | 185 | | | | 207 | |
6.500%, 5/1/37 | | | 312 | | | | 359 | |
6.000%, 9/1/37 | | | 14 | | | | 16 | |
5.000%, 3/1/38 | | | 218 | | | | 243 | |
5.500%, 4/1/38 | | | 165 | | | | 192 | |
5.500%, 6/1/38 | | | 220 | | | | 248 | |
6.000%, 8/1/38 | | | 92 | | | | 106 | |
5.000%, 9/1/39 | | | 237 | | | | 263 | |
5.500%, 9/1/39 | | | 1,197 | | | | 1,336 | |
4.500%, 9/1/40 | | | 493 | | | | 535 | |
3.500%, 8/1/42 | | | 727 | | | | 748 | |
3.500%, 12/1/42 | | | 723 | | | | 743 | |
3.000%, 5/1/43 | | | 375 | | | | 374 | |
3.500%, 8/1/45 | | | 899 | | | | 920 | |
3.500%, 8/1/45 | | | 407 | | | | 417 | |
3.500%, 12/1/45 | | | 160 | | | | 164 | |
3.500%, 1/1/46 | | | 805 | | | | 824 | |
4.000%, 1/1/46 | | | 699 | | | | 733 | |
| | | | | | | | |
| | | | | | | 12,826 | |
| | | | | | | | |
See Notes to Financial Statements
12
VIRTUS STRATEGIC ALLOCATION FUND
SCHEDULE OF INVESTMENTS (Continued)
MARCH 31, 2017
($ reported in thousands)
| | | | | | | | |
| | | PAR VALUE | | | VALUE | |
| | | | | | | | |
| MORTGAGE-BACKED SECURITIES (continued) | |
| Non-Agency—5.4% | |
American Homes 4 Rent Trust | | | | | | | | |
14-SFR2, C
144A 4.705%, 10/17/36(4) | | $ | 615 | | | $ | 642 | |
15-SFR1, A
144A 3.467%, 4/17/52(4) | | | 898 | | | | 910 | |
Ameriquest Mortgage Securities, Inc. 03-AR3, M4
4.800%, 6/25/33(3) | | | 410 | | | | 407 | |
AMSR Trust 16-SFR1, C 144A 3.193%, 11/17/33(3)(4) | | | 243 | | | | 244 | |
Aventura Mall Trust 13-AVM, C
144A 3.743%, 12/5/32(3)(4) | | | 580 | | | | 597 | |
Banc of America Funding Trust | | | | | | | | |
04-B, 2A1 3.439%, 11/20/34(3) | | | 167 | | | | 165 | |
05-1, 1A1 5.500%, 2/25/35 | | | 255 | | | | 255 | |
Banc of America Mortgage Trust 05-3, 1A15 5.500%, 4/25/35 | | | 148 | | | | 150 | |
Bank of America (Merrill Lynch – Countrywide) Home Loan Mortgage Pass-Through-Trust 04-6, 1A2
3.051%, 5/25/34(3) | | | 457 | | | | 453 | |
Barclays (Lehman Brothers) – UBS Commercial Mortgage Trust 07-C7, A3 5.866%, 9/15/45(3) | | | 1,304 | | | | 1,324 | |
Bayview Opportunity Master Fund IVa Trust | | | | | | | | |
04-A Trust, 16-SPL1, B1 144A 4.250%, 4/28/55(4) | | | 390 | | | | 401 | |
04-A Trust, 17-SPL1, B1 144A 4.250%, 10/28/64(3)(4) | | | 277 | | | | 285 | |
Bayview Opportunity Master Fund IVb Trust 04-B Trust, 16-SPL2, B1
144A 4.250%, 6/28/53(3)(4) | | | 145 | | | | 149 | |
Colony Starwood Homes Trust 16-2A, C
144A 3.093%, 12/17/33(3)(4) | | | 485 | | | | 487 | |
| | | | | | | | |
| | | PAR VALUE | | | VALUE | |
| Non-Agency (continued) | |
Credit Suisse Commercial Mortgage-Backed Trust 06-08, 3A1 6.000%, 10/25/21 | | $ | 205 | | | $ | 193 | |
| | | | | | | | |
CSMLT Trust 15-1, B4
144A 3.892%, 5/25/45(3)(4) | | | 189 | | | | 174 | |
Freddie Mac Structured Agency Credit Risk Debt Notes 16-DNA2, M2 3.182%, 10/25/28(3) | | | 560 | | | | 570 | |
Galton Funding Mortgage Trust 17-1, A21
144A 3.500%, 7/25/56(4) | | | 353 | | | | 357 | |
Goldman Sachs Mortgage Securities Trust 07-GG10, A1A
5.949%, 8/10/45(3) | | | 218 | | | | 219 | |
GSAA Home Equity Trust 05-12, AF3W 4.999%, 9/25/35(3) | | | 137 | | | | 139 | |
GSR Mortgage Loan Trust 06-1F, 2A4 6.000%, 2/25/36 | | | 429 | | | | 371 | |
Jefferies Resecuritization Trust 14-R1, 1A1
144A 4.000%, 12/27/37(4) | | | 116 | | | | 116 | |
JPMorgan Chase (Bear Stearns) Commercial Mortgage Securities Trust 07- PW17, A4 5.694%, 6/11/50(3) | | | 1,212 | | | | 1,221 | |
JPMorgan Chase (WaMu) Mortgage Pass-Through Certificates 03-S11, 3A5 5.950%, 11/25/33 | | | 382 | | | | 398 | |
JPMorgan Chase Mortgage Trust | | | | | | | | |
04-A4, 2A1 3.197%, 9/25/34(3) | | | 394 | | | | 398 | |
14-1, 1A1 144A 4.000%, 1/25/44(3)(4) | | | 278 | | | | 287 | |
16-1, M2 144A 3.750%, 4/25/45(3)(4) | | | 400 | | | | 399 | |
15-4, 1A4 144A 3.500%, 6/25/45(3)(4) | | | 281 | | | | 283 | |
16-2, M2 144A 3.750%, 12/25/45(3)(4) | | | 417 | | | | 417 | |
16-1, A3 144A 3.500%, 5/25/46(4) | | | 1,117 | | | | 1,127 | |
See Notes to Financial Statements
13
VIRTUS STRATEGIC ALLOCATION FUND
SCHEDULE OF INVESTMENTS (Continued)
MARCH 31, 2017
($ reported in thousands)
| | | | | | | | |
| | | PAR VALUE | | | VALUE | |
| MORTGAGE-BACKED SECURITIES (continued) | |
| Non-Agency (continued) | |
16-5, A1 144A 2.602%, 12/25/46(3)(4) | | $ | 800 | | | $ | 797 | |
| | | | | | | | |
MASTR Alternative Loan Trust 05-5, 2A3 5.500%, 7/25/25 | | | 230 | | | | 229 | |
MASTR Specialized Loan Trust 05-3, A2 144A 5.704%, 11/25/35(3)(4) | | | 302 | | | | 304 | |
Morgan Stanley – Bank of America (Merrill Lynch) Trust | | | | | | | | |
13-C13, AS 4.266%, 11/15/46 | | | 275 | | | | 291 | |
15-C22, AS 3.561%, 4/15/48 | | | 685 | | | | 685 | |
Morgan Stanley Capital Barclays Bank Trust 16-MART, A
144A 2.200%, 9/13/31(4) | | | 350 | | | | 344 | |
Morgan Stanley Capital I Trust | | | | | | | | |
07-T27, A4 5.791%, 6/11/42(3) | | | 569 | | | | 570 | |
08-T29, A4 6.301%, 1/11/43(3) | | | 1,351 | | | | 1,384 | |
07-IQ14, AM 5.778%, 4/15/49(3) | | | 441 | | | | 440 | |
Motel 6 Trust 15-MTL6, D 144A 4.532%, 2/5/30(4) | | | 470 | | | | 473 | |
New Residential Mortgage Loan Trust | | | | | | | | |
14-1A, A
144A 3.750%, 1/25/54(3)(4) | | | 441 | | | | 451 | |
15-2A, A1
144A 3.750%, 8/25/55(3)(4) | | | 445 | | | | 455 | |
16-1A, A1
144A 3.750%, 3/25/56(3)(4) | | | 224 | | | | 226 | |
16-4A, B1A
144A 4.500%, 11/25/56(4) | | | 444 | | | | 458 | |
NovaStar Mortgage Funding Trust Series 04-4, M5 2.707%, 3/25/35(3) | | | 545 | | | | 533 | |
One Market Plaza Trust 17-1MKT, A
144A 3.614%, 2/10/32(4) | | | 360 | | | | 372 | |
| | | | | | | | |
| | | PAR VALUE | | | VALUE | |
| Non-Agency (continued) | |
Residential Asset Securitization Trust 05-A1, A3 5.500%, 4/25/35 | | $ | 402 | | | $ | 403 | |
Sequoia Mortgage Trust | | | | | | | | |
13-8, B1 3.535%, 6/25/43(3) | | | 178 | | | | 178 | |
| | | | | | | | |
14-2, A1
144A 4.000%, 7/25/44(3)(4) | | | 209 | | | | 212 | |
Towd Point Mortgage Trust | | | | | | | | |
15-1, A2 144A 3.250%, 10/25/53(3)(4) | | | 385 | | | | 375 | |
16-1, A1B, 144A 2.750%, 2/25/55(3)(4) | | | 140 | | | | 140 | |
15-5, A2 144A 3.500%, 5/25/55(3)(4) | | | 480 | | | | 484 | |
15-2, 1M1 144A 3.250%, 11/25/60(3)(4) | | | 1,245 | | | | 1,235 | |
Vericrest Opportunity Loan Transfer LI LLC 16-NP11, A1
144A 3.500%, 10/25/46(3)(4) | | | 238 | | | | 240 | |
Vericrest Opportunity Loan Transfer XXII LLC 15-NPL4, A1
144A 3.500%, 2/25/55(3)(4) | | | 233 | | | | 235 | |
Vericrest Opportunity Loan Transfer XXXVII LLC 15-NP11, A1
144A 3.625%, 7/25/45(3)(4) | | | 254 | | | | 255 | |
Wells Fargo Commercial Mortgage Trust 15-LC20, B
3.719%, 4/15/50 | | | 460 | | | | 456 | |
| | | | | | | | |
| | | | | | | | 25,363 | |
| TOTAL MORTGAGE-BACKED SECURITIES | |
| (Identified Cost $37,669) | | | | | | | 38,189 | |
| ASSET-BACKED SECURITIES—2.0% | |
AmeriCredit Automobile Receivables Trust 14-1, D 2.540%, 6/8/20 | | | 705 | | | | 710 | |
Avis Budget Rental Car Funding LLC (AESOP) 16-1A, A
144A 2.990%, 6/20/22(4) | | | 500 | | | | 506 | |
See Notes to Financial Statements
14
VIRTUS STRATEGIC ALLOCATION FUND
SCHEDULE OF INVESTMENTS (Continued)
MARCH 31, 2017
($ reported in thousands)
| | | | | | | | |
| | | PAR VALUE | | | VALUE | |
| ASSET-BACKED SECURITIES (continued) | |
CarMax Auto Owner Trust 15-2, C
2.390%, 3/15/21 | | $ | 715 | | | $ | 717 | |
Centre Point Funding LLC 12-2A,1
144A 2.610%, 8/20/21(4) | | | 425 | | | | 419 | |
Drive Auto Receivables Trust 15-DA, C
144A 3.380%, 11/15/21(4) | | | 760 | | | | 768 | |
| | | | | | | | |
Drug Royalty II LP 2 14-1, A2
144A 3.484%, 7/15/23(4) | | | 395 | | | | 391 | |
DT Auto Owner Trust 16-4A, C
144A 2.740%, 10/17/22(4) | | | 585 | | | | 587 | |
Exeter Automobile Receivables Trust 13-1A, C 144A 3.520%, 2/15/19(4) | | | 331 | | | | 332 | |
Fairway Outdoor Funding LLC 12-1A, A2
144A 4.212%, 10/15/42(4) | | | 315 | | | | 315 | |
Mariner Finance Issuance Trust 17-AA, A
144A 3.620%, 2/20/29(4) | | | 450 | | | | 452 | |
MVW Owner Trust 16-1A, A
144A 2.250%,��12/20/33(4) | | | 534 | | | | 527 | |
Navistar Financial Dealer Note Master Owner Trust II 16-1, B
144A 2.732%, 9/27/21(3)(4) | | | 780 | | | | 782 | |
Sierra Timeshare Receivables Funding LLC 12-3A, A
144A 1.870%, 8/20/29(4) | | | 152 | | | | 152 | |
Silverleaf Finance XV LLC 12-D, A
144A 3.000%, 3/17/25(4) | | | 50 | | | | 50 | |
SoFi Professional Loan Program LLC 15-A, A2 144A 2.420%, 3/25/30(4) | | | 248 | | | | 248 | |
Taco Bell Funding LLC 16-1A, A21
144A 3.832%, 5/25/46(4) | | | 602 | | | | 610 | |
TGIF Funding LLC 17-1A, A2
144A 6.202%, 4/30/47(4) | | | 450 | | | | 442 | |
Trip Rail Master Funding LLC 14-1A, A1
144A 2.863%, 4/15/44(4) | | | 566 | | | | 554 | |
| | | | | | | | |
| | | PAR VALUE | | | VALUE | |
| ASSET-BACKED SECURITIES (continued) | |
U-Haul S Fleet LLC 10-BT1A, 1
144A 4.899%, 10/25/23(4) | | $ | 651 | | | $ | 654 | |
| TOTAL ASSET-BACKED SECURITIES | |
| (Identified Cost $9,216) | | | | | | | 9,216 | |
| CORPORATE BONDS AND NOTES—18.8% | |
| Consumer Discretionary—2.1% | |
American Greetings Corp. 144A 7.875%, 2/15/25(4) | | | 5 | | | | 5 | |
Beazer Homes USA, Inc. 144A 6.750%, 3/15/25(4) | | | 425 | | | | 428 | |
| | | | | | | | |
Caesars Entertainment Operating Co., Inc. 9.000%, 2/15/20(6) | | | 207 | | | | 241 | |
Caesars Growth Properties Holdings LLC 9.375%, 5/1/22 | | | 190 | | | | 205 | |
CalAtlantic Group, Inc. 5.250%, 6/1/26 | | | 305 | | | | 305 | |
Cequel Communications Holdings I LLC | | | | | | | | |
144A 5.125%, 12/15/21(4) | | | 145 | | | | 148 | |
144A 5.125%, 12/15/21(4) | | | 345 | | | | 351 | |
Clear Channel Worldwide Holdings, Inc. Series B 7.625%, 3/15/20 | | | 410 | | | | 415 | |
Cooper-Standard Automotive, Inc. 144A 5.625%, 11/15/26(4) | | | 385 | | | | 386 | |
Diamond Resorts International, Inc. 144A 7.750%, 9/1/23(4) | | | 35 | | | | 37 | |
Eagle II Acquisition Co., LLC
144A 6.000%, 4/1/25(4) | | | 55 | | | | 57 | |
Gateway Casinos & Entertainment Ltd.
144A 8.250%, 3/1/24(4) | | | 155 | | | | 157 | |
Hilton Worldwide Finance LLC
144A 4.875%, 4/1/27(4) | | | 100 | | | | 101 | |
Horton (D.R.), Inc.
4.750%, 2/15/23 | | | 550 | | | | 585 | |
Landry’s, Inc.
144A 6.750%, 10/15/24(4) | | | 120 | | | | 125 | |
M/I Homes, Inc.
6.750%, 1/15/21 | | | 265 | | | | 279 | |
See Notes to Financial Statements
15
VIRTUS STRATEGIC ALLOCATION FUND
SCHEDULE OF INVESTMENTS (Continued)
MARCH 31, 2017
($ reported in thousands)
| | | | | | | | |
| | | PAR VALUE | | | VALUE | |
| CORPORATE BONDS AND NOTES (continued) | |
| Consumer Discretionary (continued) | |
MDC Holdings, Inc.
5.500%, 1/15/24 | | $ | 540 | | | $ | 559 | |
MPG Holdco I, Inc.
7.375%, 10/15/22 | | | 435 | | | | 473 | |
NCL Corp., Ltd.
144A 4.750%, 12/15/21(4) | | | 275 | | | | 280 | |
New York University
4.142%, 7/1/48 | | | 235 | | | | 222 | |
Pinnacle Entertainment, Inc.
144A 5.625%, 5/1/24(4) | | | 145 | | | | 147 | |
Priceline Group, Inc. (The)
3.650%, 3/15/25 | | | 605 | | | | 609 | |
QVC, Inc.
4.375%, 3/15/23 | | | 600 | | | | 602 | |
Scientific Games International, Inc.
6.625%, 5/15/21 | | | 295 | | | | 278 | |
SFR (Numericable) Group S.A.
144A 7.375%, 5/1/26(4) | | | 465 | | | | 481 | |
Signet UK Finance plc
4.700%, 6/15/24 | | | 630 | | | | 610 | |
Taylor Morrison Communities, Inc.
144A 5.625%, 3/1/24(4) | | | 95 | | | | 99 | |
TI Group Automotive Systems LLC
144A 8.750%, 7/15/23(4) | | | 215 | | | | 229 | |
Toll Brothers Finance Corp.
5.625%, 1/15/24 | | | 25 | | | | 26 | |
TRI Pointe Group, Inc.
5.875%, 6/15/24 | | | 465 | | | | 481 | |
Wyndham Worldwide Corp. | | | | | | | | |
5.100%, 10/1/25 | | | 560 | | | | 596 | |
4.500%, 4/1/27 | | | 120 | | | | 121 | |
| | | | | | | | |
| | | | | | | 9,638 | |
| | | | | | | | |
| Consumer Staples—0.7% | | | | | | |
Anheuser-Busch InBev Finance, Inc.
3.650%, 2/1/26 | | | 525 | | | | 531 | |
CVS Health Corp.
2.875%, 6/1/26 | | | 645 | | | | 615 | |
Flowers Foods, Inc.
4.375%, 4/1/22 | | | 600 | | | | 636 | |
Post Holdings, Inc.
144A 5.750%, 3/1/27(4) | | | 230 | | | | 231 | |
| | | | | | | | |
| | | PAR VALUE | | | VALUE | |
| Consumer Staples (continued) | |
Safeway, Inc.
7.250%, 2/1/31 | | $ | 335 | | | $ | 326 | |
Smithfield Foods, Inc.
144A 4.250%, 2/1/27(4) | | | 123 | | | | 124 | |
Tops Holding LLC 144A
8.000%, 6/15/22(4) | | | 475 | | | | 392 | |
Whole Foods Market, Inc.
5.200%, 12/3/25 | | | 420 | | | | 446 | |
| | | | | | | | |
| | | | | | | 3,301 | |
| | | | | | | | |
| Energy—1.7% | | | | | | |
Alta Mesa Holdings LP
144A 7.875%, 12/15/24(4) | | | 185 | | | | 193 | |
Antero Resources Corp.
5.625%, 6/1/23 | | | 255 | | | | 262 | |
Blue Racer Midstream LLC
144A 6.125%, 11/15/22(4) | | | 130 | | | | 132 | |
Cheniere Corpus Christi Holdings LLC
144A 5.875%, 3/31/25(4) | | | 280 | | | | 293 | |
Crestwood Midstream Partners LP
144A 5.750%, 4/1/25(4) | | | 310 | | | | 317 | |
Enbridge Energy Partners LP
4.375%, 10/15/20 | | | 90 | | | | 95 | |
Energy Transfer Partners LP | | | | | | | | |
4.200%, 4/15/27 | | | 185 | | | | 183 | |
6.500%, 2/1/42 | | | 355 | | | | 383 | |
EP Energy LLC
144A 8.000%, 11/29/24(4) | | | 45 | | | | 48 | |
FTS International, Inc.
6.250%, 5/1/22 | | | 185 | | | | 163 | |
Helmerich & Payne International Drilling Co.
4.650%, 3/15/25 | | | 340 | | | | 353 | |
Holly Energy Partners LP
144A 6.000%, 8/1/24(4) | | | 35 | | | | 37 | |
HollyFrontier Corp.
5.875%, 4/1/26 | | | 475 | | | | 504 | |
Kinder Morgan Energy Partners LP
7.500%, 11/15/40 | | | 595 | | | | 718 | |
See Notes to Financial Statements
16
VIRTUS STRATEGIC ALLOCATION FUND
SCHEDULE OF INVESTMENTS (Continued)
MARCH 31, 2017
($ reported in thousands)
| | | | | | | | |
| | | PAR VALUE | | | VALUE | |
| CORPORATE BONDS AND NOTES (continued) | |
| Energy (continued) | | | | | | |
Matador Resources Co.
144A 6.875%, 4/15/23(4) | | $ | 300 | | | $ | 315 | |
MPLX LP
4.875%, 12/1/24 | | | 785 | | | | 826 | |
NGL Energy Partners LP
5.125%, 7/15/19 | | | 460 | | | | 464 | |
Noble Holding International Ltd. 7.750%, 1/15/24 | | | 230 | | | | 222 | |
Pertamina Persero PT
144A 4.875%, 5/3/22(4) | | | 225 | | | | 239 | |
Petrobras Global Finance BV | | | | | | | | |
8.750%, 5/23/26 | | | 225 | | | | 261 | |
7.375%, 1/17/27 | | | 75 | | | | 80 | |
Petroleos Mexicanos
6.875%, 8/4/26 | | | 430 | | | | 477 | |
QEP Resources, Inc.
5.250%, 5/1/23 | | | 140 | | | | 138 | |
Sabine Oil & Gas Corp.
7.250%, 6/15/19(5)(11)(15) | | | 510 | | | | 1 | |
Sabine Pass Liquefaction LLC
6.250%, 3/15/22 | | | 425 | | | | 471 | |
Summit Midstream Holdings LLC
5.750%, 4/15/25 | | | 65 | | | | 65 | |
Sunoco LP
6.375%, 4/1/23 | | | 430 | | | | 439 | |
Transocean, Inc.
144A 9.000%, 7/15/23(4) | | | 240 | | | | 257 | |
| | | | | | | | |
| | | | | | | 7,936 | |
| | | | | | | | |
| Financials—5.9% | | | | | | |
Allstate Corp. (The)
5.750%, 8/15/53(3)(8) | | | 455 | | | | 488 | |
Ally Financial, Inc.
5.750%, 11/20/25 | | | 295 | | | | 303 | |
Apollo Management Holdings LP
144A 4.000%, 5/30/24(4) | | | 590 | | | | 592 | |
Ares Capital Corp. | | | | | | | | |
4.875%, 11/30/18 | | | 80 | | | | 83 | |
3.875%, 1/15/20 | | | 221 | | | | 225 | |
| | | | | | | | |
| | | PAR VALUE | | | VALUE | |
| Financials (continued) | | | | | | |
Ares Finance Co., LLC
144A 4.000%, 10/8/24(4) | | $ | 595 | | | $ | 557 | |
Banco de Credito del Peru
144A 6.125%, 4/24/27(3)(4) | | | 440 | | | | 481 | |
Banco de Credito e Inversiones
144A 4.000%, 2/11/23(4) | | | 600 | | | | 615 | |
Banco Inbursa S.A. Institucion de Banca Multiple
144A 4.125%, 6/6/24(4) | | | 490 | | | | 490 | |
Banco Internacional del Peru SAA Interbank
144A 6.625%, 3/19/29(3)(4) | | | 465 | | | | 510 | |
Banco Nacional de Comercio Exterior SNC
144A 4.375%, 10/14/25(4) | | | 340 | | | | 345 | |
Banco Santander Chile
144A 3.875%, 9/20/22(4) | | | 430 | | | | 445 | |
Bancolombia S.A.
5.125%, 9/11/22 | | | 580 | | | | 606 | |
Bank of America Corp. | | | | | | | | |
5.625%, 7/1/20 | | | 715 | | | | 784 | |
4.200%, 8/26/24 | | | 475 | | | | 484 | |
Brookfield Finance LLC
4.000%, 4/1/24 | | | 386 | | | | 388 | |
Capital One Financial Corp. | | | | | | | | |
4.200%, 10/29/25 | | | 540 | | | | 542 | |
3.750%, 7/28/26 | | | 495 | | | | 479 | |
Citigroup, Inc.
4.050%, 7/30/22 | | | 600 | | | | 625 | |
Compass Bank
3.875%, 4/10/25 | | | 705 | | | | 692 | |
Development Bank of Kazakhstan JSC
144A 4.125%, 12/10/22(4) | | | 640 | | | | 633 | |
Discover Financial Services
3.950%, 11/6/24 | | | 570 | | | | 571 | |
Drawbridge Special Opportunities Fund LP
144A 5.000%, 8/1/21(4) | | | 485 | | | | 477 | |
Ford Motor Credit Co., LLC
5.750%, 2/1/21 | | | 535 | | | | 589 | |
See Notes to Financial Statements
17
VIRTUS STRATEGIC ALLOCATION FUND
SCHEDULE OF INVESTMENTS (Continued)
MARCH 31, 2017
($ reported in thousands)
| | | | | | | | |
| | | PAR VALUE | | | VALUE | |
| CORPORATE BONDS AND NOTES (continued) | |
| Financials (continued) | | | | | | |
FS Investment Corp. | | | | | | | | |
4.250%, 1/15/20 | | $ | 525 | | | $ | 529 | |
4.750%, 5/15/22 | | | 115 | | | | 118 | |
General Motors Financial Co., Inc. | | | | | | | | |
4.200%, 3/1/21 | | | 235 | | | | 245 | |
3.450%, 4/10/22 | | | 85 | | | | 85 | |
Goldman Sachs Group, Inc. (The) | | | | | | | | |
Series D, 6.000%, 6/15/20 | | | 595 | | | | 658 | |
5.750%, 1/24/22 | | | 875 | | | | 985 | |
Hutchison Whampoa International Ltd. Series 12
144A 6.000%(3)(4)(7)(8) | | | 680 | | | | 682 | |
Icahn Enterprises LP
5.875%, 2/1/22 | | | 175 | | | | 178 | |
144A 6.250%, 2/1/22(4) | | | 90 | | | | 92 | |
ING Groep N.V. 6.000%(3)(7)(8) | | | 445 | | | | 444 | |
iStar, Inc.
6.000%, 4/1/22 | | | 90 | | | | 92 | |
Jefferies Group LLC | | | | | | | | |
5.125%, 1/20/23 | | | 260 | | | | 279 | |
4.850%, 1/15/27 | | | 255 | | | | 260 | |
Kazakhstan Temir Zholy Finance BV
144A 6.950%, 7/10/42(4) | | | 480 | | | | 506 | |
Leucadia National Corp.
5.500%, 10/18/23 | | | 460 | | | | 490 | |
Liberty Mutual Group, Inc.
144A 4.250%, 6/15/23(4) | | | 590 | | | | 620 | |
Lincoln National Corp.
4.200%, 3/15/22 | | | 915 | | | | 966 | |
Macquarie Group Ltd.
144A 6.250%, 1/14/21(4) | | | 490 | | | | 544 | |
Manulife Financial Corp.
4.150%, 3/4/26 | | | 490 | | | | 516 | |
Morgan Stanley | | | | | | | | |
5.500%, 7/28/21 | | | 300 | | | | 333 | |
4.350%, 9/8/26 | | | 585 | | | | 595 | |
6.375%, 7/24/42 | | | 610 | | | | 783 | |
Navient Corp. | | | | | | | | |
6.500%, 6/15/22 | | | 183 | | | | 185 | |
7.250%, 9/25/23 | | | 100 | | | | 101 | |
| | | | | | | | |
| | | PAR VALUE | | | VALUE | |
| Financials (continued) | | | | | | |
OM Asset Management plc
4.800%, 7/27/26 | | $ | 500 | | | $ | 498 | |
Powszechna Kasa Oszczednosci Bank Polski S.A.
144A 4.630%, 9/26/22(4)(13) | | | 375 | | | | 395 | |
Prudential Financial, Inc.
5.625%, 6/15/43(3)(8) | | | 585 | | | | 627 | |
S&P Global, Inc.
4.000%, 6/15/25 | | | 570 | | | | 586 | |
Santander Holdings USA, Inc
144A 3.700%, 3/28/22(4) | | | 445 | | | | 446 | |
Societe Generale S.A.
144A 4.750%, 11/24/25(4) | | | 535 | | | | 538 | |
Starwood Property Trust, Inc.
144A 5.000%, 12/15/21(4) | | | 55 | | | | 57 | |
Teachers Insurance & Annuity Association of America
144A 4.375%, 9/15/54(3)(4) | | | 510 | | | | 504 | |
Tervita Escrow Corp.
144A 7.625%, 12/1/21(4) | | | 35 | | | | 36 | |
Trinity Acquisition plc | | | | | | | | |
3.500%, 9/15/21 | | | 40 | | | | 41 | |
4.400%, 3/15/26 | | | 195 | | | | 200 | |
UBS AG
7.625%, 8/17/22 | | | 500 | | | | 578 | |
Vnesheconombank Via VEB Finance plc
144A 6.025%, 7/5/22(4) | | | 440 | | | | 473 | |
Wells Fargo & Co.
3.069%, 1/24/23 | | | 240 | | | | 241 | |
| | | | | | | | |
| | | | | | | 27,510 | |
| | | | | | | | |
| Health Care—1.5% | | | | | | |
Abbott Laboratories | | | | | | | | |
3.400%, 11/30/23 | | | 105 | | | | 106 | |
3.750%, 11/30/26 | | | 370 | | | | 370 | |
AbbVie, Inc. | | | | | | | | |
2.850%, 5/14/23 | | | 300 | | | | 294 | |
3.600%, 5/14/25 | | | 200 | | | | 200 | |
3.200%, 5/14/26 | | | 300 | | | | 288 | |
Cardinal Health, Inc. | | | | | | | | |
3.200%, 3/15/23 | | | 300 | | | | 303 | |
3.750%, 9/15/25 | | | 485 | | | | 500 | |
See Notes to Financial Statements
18
VIRTUS STRATEGIC ALLOCATION FUND
SCHEDULE OF INVESTMENTS (Continued)
MARCH 31, 2017
($ reported in thousands)
| | | | | | | | |
| | | PAR VALUE | | | VALUE | |
| CORPORATE BONDS AND NOTES (continued) | |
| Health Care (continued) | | | | | | |
Community Health Systems, Inc. | | | | | | | | |
5.125%, 8/1/21 | | $ | 100 | | | $ | 99 | |
6.250%, 3/31/23 | | | 90 | | | | 92 | |
Envision Healthcare Corp.
144A 6.250%, 12/1/24(4) | | | 85 | | | | 90 | |
Forest Laboratories LLC
144A 4.875%, 2/15/21(4) | | | 485 | | | | 522 | |
Fresenius U.S. Finance II, Inc.
144A 4.500%, 1/15/23(4) | | | 100 | | | | 104 | |
HCA, Inc. | | | | | | | | |
5.375%, 2/1/25 | | | 265 | | | | 276 | |
5.250%, 6/15/26 | | | 190 | | | | 199 | |
Hill-Rom Holdings, Inc.
144A 5.000%, 2/15/25(4) | | | 211 | | | | 211 | |
IASIS Healthcare LLC
8.375%, 5/15/19 | | | 240 | | | | 231 | |
MEDNAX, Inc.
144A 5.250%, 12/1/23(4) | | | 255 | | | | 260 | |
Mylan N.V. | | | | | | | | |
3.000%, 12/15/18 | | | 150 | | | | 152 | |
3.150%, 6/15/21 | | | 135 | | | | 136 | |
Ortho-Clinical Diagnostics, Inc.
144A 6.625%, 5/15/22(4) | | | 365 | | | | 341 | |
Owens & Minor, Inc.
3.875%, 9/15/21 | | | 110 | | | | 112 | |
Shire Acquisitions Investments
2.400%, 9/23/21 | | | 195 | | | | 191 | |
Surgery Center Holdings, Inc.
144A 8.875%, 4/15/21(4) | | | 295 | | | | 313 | |
Surgical Care Affiliates, Inc.
144A 6.000%, 4/1/23(4) | | | 478 | | | | 515 | |
Team Health Holdings, Inc.
144A 6.375%, 2/1/25(4) | | | 230 | | | | 226 | |
Tenet Healthcare Corp. | | | | | | | | |
4.631%, 6/15/20(3) | | | 115 | | | | 116 | |
4.500%, 4/1/21 | | | 330 | | | | 332 | |
Teva Pharmaceutical Finance III BV
3.150%, 10/1/26 | | | 295 | | | | 272 | |
Valeant Pharmaceuticals International, Inc. | | | | | | | | |
144A 7.500%, 7/15/21(4) | | | 60 | | | | 53 | |
| | | | | | | | |
| | | PAR VALUE | | | VALUE | |
| Health Care (continued) | | | | | | |
144A 6.500%, 3/15/22(4) | | $ | 25 | | | $ | 26 | |
144A 5.500%, 3/1/23(4) | | | 155 | | | | 120 | |
144A 7.000%, 3/15/24(4) | | | 45 | | | | 46 | |
| | | | | | | | |
| | | | | | | 7,096 | |
| | | | | | | | |
| Industrials—1.0% | | | | | | |
Carpenter Technology Corp.
4.450%, 3/1/23 | | | 560 | | | | 569 | |
Continental Airlines Pass-Through-Trust | | | | | | | | |
99-2, C2 AMBC 6.236%, 3/15/20 | | | 235 | | | | 243 | |
00-1, A1 8.048%, 11/1/20 | | | 556 | | | | 608 | |
Doric Nimrod Air Alpha Pass-Through-Trust 13-1, A
144A 5.250%, 5/30/25(4) | | | 415 | | | | 432 | |
GATX Corp.
3.250%, 9/15/26 | | | 80 | | | | 76 | |
Harland Clarke Holdings Corp.
144A 8.375%, 8/15/22(4) | | | 85 | | | | 87 | |
Masco Corp. | | | | | | | | |
5.950%, 3/15/22 | | | 330 | | | | 371 | |
4.450%, 4/1/25 | | | 190 | | | | 198 | |
Owens Corning
3.400%, 8/15/26 | | | 500 | | | | 484 | |
Park Aerospace Holdings Ltd.
144A 5.500%, 2/15/24(4) | | | 220 | | | | 229 | |
Penske Truck Leasing Co., LP
144A 3.375%, 2/1/22(4) | | | 225 | | | | 228 | |
Prime Security Services Borrower LLC
144A 9.250%, 5/15/23(4) | | | 200 | | | | 220 | |
TransDigm, Inc. | | | | | | | | |
6.000%, 7/15/22 | | | 345 | | | | 350 | |
6.500%, 5/15/25 | | | 140 | | | | 142 | |
Wheels Up Finance I LLC
7.555%, 6/30/24(3)(11) | | | 559 | | | | 556 | |
| | | | | | | | |
| | | | | | | 4,793 | |
| | | | | | | | |
| Information Technology—0.8% | |
Broadcom Corp. | | | | | | | | |
144A 3.000%, 1/15/22(4) | | | 195 | | | | 194 | |
144A 3.625%, 1/15/24(4) | | | 370 | | | | 373 | |
See Notes to Financial Statements
19
VIRTUS STRATEGIC ALLOCATION FUND
SCHEDULE OF INVESTMENTS (Continued)
MARCH 31, 2017
($ reported in thousands)
| | | | | | | | |
| | | PAR VALUE | | | VALUE | |
| | | | | | | | |
| CORPORATE BONDS AND NOTES (continued) | |
| Information Technology (continued) | |
CDW LLC
5.000%, 9/1/25 | | $ | 70 | | | $ | 71 | |
CommScope Technologies LLC
144A 5.000%, 3/15/27(4) | | | 75 | | | | 75 | |
Diamond 1 Finance Corp. | | | | | | | | |
144A 5.450%, 6/15/23(4) | | | 105 | | | | 113 | |
144A 6.020%, 6/15/26(4) | | | 100 | | | | 109 | |
144A 8.100%, 7/15/36(4) | | | 210 | | | | 264 | |
Dun & Bradstreet Corp. (The)
4.625%, 12/1/22 | | | 625 | | | | 647 | |
DXC Technology Co.
144A 4.250%, 4/15/24(4) | | | 120 | | | | 122 | |
Flex Ltd.
4.750%, 6/15/25 | | | 595 | | | | 625 | |
Hewlett Packard Enterprise Co.
4.900%, 10/15/25 | | | 335 | | | | 348 | |
Radiate Holdco LLC
144A 6.625%, 2/15/25(4) | | | 235 | | | | 233 | |
Verisk Analytics, Inc.
4.000%, 6/15/25 | | | 585 | | | | 594 | |
| | | | | | | | |
| | | | | | | 3,768 | |
| | | | | | | | |
| Materials—1.5% | | | | | | |
Alpek SAB de C.V.
144A 5.375%, 8/8/23(4) | | | 810 | | | | 848 | |
Eldorado Gold Corp.
144A 6.125%, 12/15/20(4) | | | 210 | | | | 216 | |
Equate Petrochemical BV
144A 4.250%, 11/3/26(4) | | | 485 | | | | 485 | |
Freeport-McMoRan, Inc.
3.875%, 3/15/23 | | | 190 | | | | 176 | |
Glencore Funding LLC
144A 4.000%, 3/27/27(4) | | | 445 | | | | 439 | |
INEOS Group Holdings S.A.
144A 5.625%, 8/1/24(4) | | | 495 | | | | 498 | |
Inversiones CMPC S.A.
144A 4.375%, 5/15/23(4) | | | 850 | | | | 870 | |
NewMarket Corp.
4.100%, 12/15/22 | | | 649 | | | | 661 | |
Novelis Corp. | | | | | | | | |
144A 6.250%, 8/15/24(4) | | | 25 | | | | 26 | |
144A 5.875%, 9/30/26(4) | | | 370 | | | | 378 | |
| | | | | | | | |
| | | PAR VALUE | | | VALUE | |
| | | | | | | | |
| Materials (continued) | | | | | | |
OCP S.A.
144A 5.625%, 4/25/24(4) | | $ | 485 | | | $ | 516 | |
Rusal Capital DAC
144A 5.125%, 2/2/22(4) | | | 455 | | | | 458 | |
Severstal Oao Via Steel Capital S.A.
144A 3.850%, 8/27/21(4)(13) | | | 540 | | | | 541 | |
Silgan Holdings, Inc.
144A 4.750%, 3/15/25(4) | | | 85 | | | | 86 | |
Standard Industries, Inc.
144A 6.000%, 10/15/25(4) | | | 365 | | | | 377 | |
Vulcan Materials Co.
3.900%, 4/1/27 | | | 445 | | | | 449 | |
| | | | | | | | |
| | | | | | | 7,024 | |
| | | | | | | | |
| Real Estate—2.0% | | | | | | |
Alexandria Real Estate Equities, Inc.
3.950%, 1/15/27 | | | 295 | | | | 295 | |
Brixmor Operating Partnership LP
3.875%, 8/15/22 | | | 160 | | | | 164 | |
CoreCivic, Inc.
5.000%, 10/15/22 | | | 465 | | | | 482 | |
Corporate Office Properties LP
3.600%, 5/15/23 | | | 610 | | | | 593 | |
CyrusOne LP
144A 5.375%, 3/15/27(4) | | | 100 | | | | 101 | |
DDR Corp. | | | | | | | | |
7.875%, 9/1/20 | | | 475 | | | | 549 | |
3.500%, 1/15/21 | | | 385 | | | | 389 | |
Digital Realty Trust LP
5.250%, 3/15/21 | | | 540 | | | | 586 | |
Education Realty Operating Partnership LP
4.600%, 12/1/24 | | | 595 | | | | 599 | |
EPR Properties
4.750%, 12/15/26 | | | 615 | | | | 619 | |
Healthcare Realty Trust, Inc.
3.875%, 5/1/25 | | | 375 | | | | 371 | |
Hospitality Properties Trust
4.950%, 2/15/27 | | | 550 | | | | 565 | |
Kilroy Realty LP
4.375%, 10/1/25 | | | 550 | | | | 574 | |
Kimco Realty Corp.
3.400%, 11/1/22 | | | 535 | | | | 540 | |
See Notes to Financial Statements
20
VIRTUS STRATEGIC ALLOCATION FUND
SCHEDULE OF INVESTMENTS (Continued)
MARCH 31, 2017
($ reported in thousands)
| | | | | | | | |
| | | PAR VALUE | | | VALUE | |
| CORPORATE BONDS AND NOTES (continued) | |
| Real Estate (continued) | |
LifeStorage LP
3.500%, 7/1/26 | | $ | 295 | | | $ | 282 | |
MPT Operating Partnership LP | | | | | | | | |
6.375%, 3/1/24 | | | 55 | | | | 59 | |
5.500%, 5/1/24 | | | 275 | | | | 280 | |
National Retail Properties, Inc.
4.000%, 11/15/25 | | | 170 | | | | 173 | |
Retail Opportunity Investments Partnership LP
4.000%, 12/15/24 | | | 485 | | | | 465 | |
Select Income REIT
4.500%, 2/1/25 | | | 590 | | | | 593 | |
Uniti Group, Inc.
144A 7.125%, 12/15/24(4) | | | 370 | | | | 377 | |
Welltower, Inc.
4.000%, 6/1/25 | | | 625 | | | | 633 | |
| | | | | | | | |
| | | | | | | 9,289 | |
| | | | | | | | |
| Telecommunication Services—0.8% | |
Altice Financing S.A.
144A 6.625%, 2/15/23(4) | | | 200 | | | | 209 | |
AT&T, Inc.
3.875%, 8/15/21 | | | 1,185 | | | | 1,233 | |
Frontier Communications Corp.
10.500%, 9/15/22 | | | 370 | | | | 376 | |
Qwest Corp.
7.250%, 9/15/25 | | | 360 | | | | 394 | |
Sprint Spectrum Co., LLC
144A 3.360%, 9/20/21(4) | | | 200 | | | | 200 | |
T-Mobile USA, Inc.
6.375%, 3/1/25 | | | 265 | | | | 286 | |
Telefonica Emisiones SAU
4.570%, 4/27/23 | | | 510 | | | | 545 | |
Verizon Communications, Inc.
4.125%, 3/16/27 | | | 450 | | | | 458 | |
Zayo Group LLC | | | | | | | | |
6.375%, 5/15/25 | | | 190 | | | | 206 | |
144A 5.750%, 1/15/27(4) | | | 20 | | | | 21 | |
| | | | | | | | |
| | | | | | | 3,928 | |
| | | | | | | | |
| | | | | | | | |
| | | PAR VALUE | | | VALUE | |
| Utilities—0.8% | | | | | | |
Dominion Resources, Inc.
2.962%, 7/1/19(3) | | $ | 50 | | | $ | 51 | |
Duke Energy Corp.
2.650%, 9/1/26 | | | 515 | | | | 478 | |
Dynegy, Inc.
7.375%, 11/1/22 | | | 405 | | | | 403 | |
Eskom Holdings SOC Ltd.
144A 7.125%, 2/11/25(4) | | | 440 | | | | 445 | |
FirstEnergy Transmission LLC
144A 4.350%, 1/15/25(4) | | | 630 | | | | 656 | |
Southern Power Co.
4.150%, 12/1/25 | | | 665 | | | | 687 | |
State Grid Overseas Investment 2014 Ltd.
144A 4.125%, 5/7/24(4) | | | 610 | | | | 645 | |
TerraForm Power Operating LLC
144A 6.375%, 2/1/23(3)(4) | | | 455 | | | | 475 | |
| | | | | | | | |
| | | | | | | | 3,840 | |
| TOTAL CORPORATE BONDS AND NOTES | |
(Identified Cost $86,800)
| | | | 88,123 | |
| LOAN AGREEMENTS(3)—1.6% | |
| Consumer Discretionary—0.4% | |
Boyd Gaming Corp. Refinancing Tranche B, 3.50%, 9/15/23 | | | 85 | | | | 86 | |
Caesars Entertainment Resort Properties LLC Tranche B,
7.000%, 10/11/20 | | | 392 | | | | 395 | |
Caesars Growth Properties Holdings LLC Tranche B, First Lien,
6.250%, 5/8/21 | | | 180 | | | | 181 | |
Floor & Decor Outlets of America, Inc.
5.250%, 9/30/23 | | | 192 | | | | 193 | |
Laureare Education, Inc. 2021 Extended,
8.509%, 3/17/21 | | | 193 | | | | 195 | |
UFC Holdings LLC First Lien
4.250%, 8/18/23 | | | 226 | | | | 227 | |
See Notes to Financial Statements
21
VIRTUS STRATEGIC ALLOCATION FUND
SCHEDULE OF INVESTMENTS (Continued)
MARCH 31, 2017
($ reported in thousands)
| | | | | | | | |
| | | PAR VALUE | | | VALUE | |
| LOAN AGREEMENTS(3) (continued) | |
| Consumer Discretionary (continued) | |
U.S. Farathane LLC Tranche B-3, 5.147%, 12/23/21 | | $ | 318 | | | $ | 322 | |
| | | | | | | | |
| | | | | | | 1,599 | |
| | | | | | | | |
| Consumer Staples—0.1% | |
Albertson’s LLC Tranche B-4
3.982%, 8/25/21 | | | 352 | | | | 353 | |
JBS USA Lux S.A.
3.289%, 10/30/22 | | | 125 | | | | 126 | |
TKC Holdings, Inc. First Lien,
4.750%, 2/1/23 | | | 105 | | | | 106 | |
| | | | | | | | |
| | | | | | | 585 | |
| | | | | | | | |
| Energy—0.1% | |
Jonah Energy LLC Second Lien,
7.500%, 5/12/21 | | | 285 | | | | 274 | |
| | | | | | | | |
| Financials—0.0% | |
Avolon TLB Borrower 1 (US) LLC Tranche B-2,
0.000%, 3/21/22(14) | | | 10 | | | | 10 | |
UPC Financing Partnership
3.662%, 4/15/25 | | | 150 | | | | 151 | |
| | | | | | | | |
| | | | | | | 161 | |
| | | | | | | | |
| Health Care—0.3% | |
CHG Healthcare Services, Inc. First Lien,
4.750%, 6/7/23 | | | 250 | | | | 254 | |
Community Health Systems, Inc. 2021 Tranche H,
4.027%, 1/27/21 | | | 280 | | | | 277 | |
Grifols Worldwide Operations Ltd. Tranche B,
3.194%, 1/31/25 | | | 75 | | | | 75 | |
HLF Financing S.a.r.l. Senior Lien,
6.482%, 2/15/23 | | | 95 | | | | 95 | |
| | | | | | | | |
| | | PAR VALUE | | | VALUE | |
| Health Care (continued) | |
Inventiv Group Holdings, Inc.
4.804%, 11/9/23 | | $ | 146 | | | $ | 146 | |
MMM Holdings, Inc.
10.250%, 6/30/19 | | | 91 | | | | 90 | |
MPH Acquisition Holdings LLC
4.897%, 6/7/23 | | | 110 | | | | 112 | |
MSO of Puerto Rico, Inc.
10.250%, 6/30/19 | | | 66 | | | | 66 | |
NVA Holdings, Inc. Second Lien,
8.147%, 8/14/22 | | | 214 | | | | 216 | |
Quorum Health Corp.
6.789%, 4/29/22 | | | 223 | | | | 219 | |
| | | | | | | | |
| | | | | | | 1,550 | |
| | | | | | | | |
| Industrials—0.3% | |
84 Lumber Co.
6.750%, 10/25/23 | | | 293 | | | | 297 | |
Advanced Disposal Services, Inc.
3.698%, 11/10/23 | | | 41 | | | | 42 | |
Navistar, Inc. Tranche B,
5.000%, 8/7/20 | | | 294 | | | | 297 | |
Sedgwick Claims Management Services, Inc. Second Lien,
6.804%, 2/28/22 | | | 355 | | | | 356 | |
Zodiac Pool Solutions LLC First Lien,
5.647%, 12/20/23 | | | 254 | | | | 256 | |
| | | | | | | | |
| | | | | | | 1,248 | |
| | | | | | | | |
| Information Technology—0.1% | |
Donnelley Financial Solutions, Inc. Tranche B,
5.000%, 9/29/23 | | | 88 | | | | 89 | |
First Data Corp. Tranche 2022-C,
3.984%, 7/8/22 | | | 337 | | | | 340 | |
Rackspace Hosting, Inc. Tranche B, First Lien,
4.535%, 11/3/23 | | | 86 | | | | 87 | |
See Notes to Financial Statements
22
VIRTUS STRATEGIC ALLOCATION FUND
SCHEDULE OF INVESTMENTS (Continued)
MARCH 31, 2017
($ reported in thousands)
| | | | | | | | |
| | | PAR VALUE | | | VALUE | |
| LOAN AGREEMENTS(3) (continued) | |
| Information Technology (continued) | |
SS&C Technologies Holdings, Inc. | | | | | | | | |
2017 Refinancing Tranche B-2
3.232%, 7/8/22 | | $ | 10 | | | $ | 10 | |
2017 Refinancing Tranche B-1
3.232%, 7/8/22 | | | 121 | | | | 122 | |
| | | | | | | | |
| | | | | | | 648 | |
| | | | | | | | |
| Materials—0.1% | |
Anchor Glass Container Corp. First Lien,
4.250%, 12/7/23 | | | 43 | | | | 43 | |
CPI Card, Inc. First Lien,
5.834%, 8/17/22 | | | 395 | | | | 369 | |
Ineos U.S. Finance LLC Tranche 2022
3.732%, 3/31/22 | | | 15 | | | | 15 | |
| | | | | | | | |
| | | | | | | 427 | |
| | | | | | | | |
| Real Estate—0.0% | |
Capital Automotive LP Tranche B-2, First Lien
4.000%, 3/21/24 | | | 50 | | | | 51 | |
| | | | | | | | |
| Telecommunication Services—0.0% | |
Neustar, Inc. Tranche B2,
0.000%, 3/1/24(14) | | | 140 | | | | 142 | |
| | | | | | | | |
| Utilities—0.2% | |
Helix Gen Funding LLC Tranche
0.000%, 3/9/24(14) | | | 10 | | | | 10 | |
NRG Energy, Inc.
3.232%, 6/30/23 | | | 606 | | | | 609 | |
Vistra Operations Company LLC | | | | | | | | |
3.732%, 8/4/23 | | | 169 | | | | 170 | |
Tranche C,
3.732%, 8/4/23 | | | 38 | | | | 38 | |
| | | | | | | | |
| | | | | | | | 827 | |
| TOTAL LOAN AGREEMENTS | | | | | |
| (Identified Cost $7,446) | | | | | | | 7,512 | |
| | | | | | | | |
| | | SHARES | | | VALUE | |
| | | | | | | | |
| PREFERRED STOCKS—1.4% | |
| Energy—0.1% | |
PTT Exploration & Production PCL
144A, 4.875%(3)(4) | | | 610 | (9) | | $ | 624 | |
| | | | | | | | |
| Financials—1.0% | |
Bank of New York Mellon Corp. (The) Series E, 4.950%(3) | | | 450 | (9) | | | 464 | |
Citigroup, Inc. Series T, 6.250%(3) | | | 605 | (9) | | | 653 | |
JPMorgan Chase & Co. Series Z, 5.300%(3) | | | 110 | (9) | | | 114 | |
KeyCorp Series D,
5.000%(3) | | | 490 | (9) | | | 486 | |
M&T Bank Corp. Series F, 5.125%(3) | | | 490 | (9) | | | 488 | |
PNC Financial Services Group, Inc. (The) Series R, 4.850%(3) | | | 490 | (9) | | | 487 | |
PNC Financial Services Group, Inc. (The) Series S, 5.000%(3) | | | 490 | (9) | | | 488 | |
Wells Fargo & Co. Series K, 7.980%(3) | | | 730 | (9) | | | 760 | |
Zions Bancorp
6.950%(2) | | | 23,200 | | | | 677 | |
| | | | | | | | |
| | | | | | | 4,617 | |
| | | | | | | | |
| Industrials—0.3% | |
General Electric Co. Series D, 5.000%(3) | | | 1,273 | (9) | | | 1,342 | |
| TOTAL PREFERRED STOCKS | |
| (Identified Cost $6,195) | | | | 6,583 | |
| COMMON STOCKS—61.3% | |
| Consumer Discretionary—14.8% | |
Amazon.com, Inc.(2) | | | 10,680 | | | | 9,468 | |
Bayerische Motoren Werke AG Sponsored ADR(2) | | | 66,440 | | | | 2,023 | |
Ctrip.com International Ltd. ADR(2) | | | 69,050 | | | | 3,394 | |
Fuji Heavy Industries Ltd. ADR | | | 107,710 | | | | 1,979 | |
Home Depot, Inc. (The) | | | 31,480 | | | | 4,622 | |
IMAX Corp.(2) | | | 70,385 | | | | 2,393 | |
Kroton Educacional S.A. ADR | | | 328,095 | | | | 1,386 | |
Las Vegas Sands Corp. | | | 116,180 | | | | 6,630 | |
See Notes to Financial Statements
23
VIRTUS STRATEGIC ALLOCATION FUND
SCHEDULE OF INVESTMENTS (Continued)
MARCH 31, 2017
($ reported in thousands)
| | | | | | | | |
| | | SHARES | | | VALUE | |
| COMMON STOCKS (continued) | |
| Consumer Discretionary (continued) | |
Netflix, Inc.(2) | | | 37,580 | | | $ | 5,555 | |
NIKE, Inc. Class B | | | 105,210 | | | | 5,863 | |
Priceline Group, Inc. (The)(2) | | | 4,440 | | | | 7,903 | |
| | | | | | | | |
Ross Stores, Inc. | | | 83,980 | | | | 5,532 | |
Sony Corp. Sponsored ADR | | | 67,610 | | | | 2,281 | |
Starbucks Corp. | | | 135,110 | | | | 7,889 | |
Walt Disney Co. (The) | | | 19,230 | | | | 2,181 | |
| | | | | | | | |
| | | | | | | 69,099 | |
| | | | | | | | |
| Consumer Staples—5.2% | |
British American Tobacco plc Sponsored ADR | | | 29,930 | | | | 1,985 | |
Companhia Brasileira de Distribuicao Grupo Pao de Acucar Sponsored ADR | | | 108,310 | | | | 2,080 | |
Costco Wholesale Corp. | | | 26,820 | | | | 4,497 | |
Marine Harvest ASA Sponsored ADR(2) | | | 118,485 | | | | 1,815 | |
Monster Beverage Corp.(2) | | | 161,750 | | | | 7,468 | |
Philip Morris International, Inc. | | | 57,440 | | | | 6,485 | |
| | | | | | | | |
| | | | | | | 24,330 | |
| | | | | | | | |
| Energy—3.8% | |
Cabot Oil & Gas Corp. | | | 81,940 | | | | 1,959 | |
Core Laboratories N.V. | | | 28,300 | | | | 3,269 | |
Petroleo Brasileiro S.A. Sponsored ADR(2) | | | 215,486 | | | | 2,088 | |
Pioneer Natural Resources Co. | | | 17,540 | | | | 3,267 | |
Schlumberger Ltd. | | | 40,910 | | | | 3,195 | |
Statoil ASA Sponsored ADR | | | 112,250 | | | | 1,928 | |
TechnipFMC plc | | | 59,232 | | | | 1,925 | |
| | | | | | | | |
| | | | | | | 17,631 | |
| | | | | | | | |
| Financials—5.4% | |
Bank of America Corp. | | | 266,230 | | | | 6,280 | |
Barclays plc Sponsored ADR | | | 193,480 | | | | 2,175 | |
BNP Paribas S.A. ADR | | | 65,090 | | | | 2,166 | |
Charles Schwab Corp. (The) | | | 79,620 | | | | 3,249 | |
DBS Group Holdings Ltd. Sponsored ADR | | | 48,925 | | | | 2,724 | |
ING Groep N.V. Sponsored ADR | | | 138,525 | | | | 2,090 | |
Mizuho Financial Group, Inc. ADR | | | 559,080 | | | | 2,063 | |
ORIX Corp. Sponsored ADR | | | 26,140 | | | | 1,943 | |
| | | | | | | | |
| | | SHARES | | | VALUE | |
| Financials (Continued) | |
Societe Generale S.A. Sponsored ADR | | | 227,525 | | | $ | 2,296 | |
| | | | | | | | |
| | | | | | | 24,986 | |
| | | | | | | | |
| Health Care—6.2% | |
Allergan plc | | | 8,965 | | | | 2,142 | |
BioMarin Pharmaceutical, Inc.(2) | | | 42,220 | | | | 3,706 | |
Bristol-Myers Squibb Co. | | | 41,010 | | | | 2,230 | |
Celgene Corp.(2) | | | 61,710 | | | | 7,678 | |
Danaher Corp. | | | 43,150 | | | | 3,691 | |
HealthEquity, Inc.(2) | | | 30,120 | | | | 1,279 | |
Icon plc | | | 26,568 | | | | 2,118 | |
Shire plc ADR | | | 11,780 | | | | 2,052 | |
Zoetis, Inc. | | | 77,480 | | | | 4,135 | |
| | | | | | | | |
| | | | | | | 29,031 | |
| | | | | | | | |
| Industrials—4.7% | |
Airbus SE ADR | | | 126,550 | | | | 2,411 | |
Ashtead Group plc ADR | | | 32,355 | | | | 2,715 | |
Hitachi Ltd. ADR | | | 31,000 | | | | 1,684 | |
Nidec Corp. Sponsored ADR | | | 98,670 | | | | 2,360 | |
RELX plc Sponsored ADR | | | 101,140 | | | | 2,003 | |
Rockwell Automation, Inc. | | | 13,760 | | | | 2,143 | |
Roper Technologies, Inc. | | | 20,230 | | | | 4,177 | |
Union Pacific Corp. | | | 24,630 | | | | 2,609 | |
Westinghouse Air Brake Technologies Corporation | | | 26,132 | | | | 2,038 | |
| | | | | | | | |
| | | | | | | 22,140 | |
| | | | | | | | |
| Information Technology—18.6% | |
Accenture plc Class A | | | 30,250 | | | | 3,626 | |
Activision Blizzard, Inc. | | | 72,100 | | | | 3,595 | |
Alibaba Group Holding Ltd. Sponsored ADR(2) | | | 92,130 | | | | 9,934 | |
Alphabet, Inc. Class A(2) | | | 7,040 | | | | 5,969 | |
Amphenol Corp. Class A | | | 91,790 | | | | 6,533 | |
Broadcom Ltd. | | | 10,060 | | | | 2,203 | |
Check Point Software Technologies Ltd. | | | 19,600 | | | | 2,012 | |
CoStar Group, Inc.(2) | | | 17,360 | | | | 3,597 | |
Facebook, Inc. Class A(2) | | | 158,970 | | | | 22,582 | |
Gartner, Inc.(2) | | | 13,590 | | | | 1,468 | |
NVIDIA Corp. | | | 24,000 | | | | 2,614 | |
Paycom Software, Inc.(2) | | | 58,730 | | | | 3,378 | |
SAP SE Sponsored ADR | | | 25,925 | | | | 2,545 | |
Visa, Inc. Class A | | | 92,530 | | | | 8,223 | |
Workday, Inc. Class A(2) | | | 52,430 | | | | 4,366 | |
Yandex N.V. Class A(2) | | | 193,390 | | | | 4,241 | |
| | | | | | | | |
| | | | | | | 86,886 | |
| | | | | | | | |
See Notes to Financial Statements
24
VIRTUS STRATEGIC ALLOCATION FUND
SCHEDULE OF INVESTMENTS (Continued)
MARCH 31, 2017
($ reported in thousands)
| | | | | | | | |
| | | SHARES | | | VALUE | |
| COMMON STOCKS (continued) | |
| Materials—1.6% | |
Ecolab, Inc. | | | 31,460 | | | $ | 3,944 | |
Fortescue Metals Group Ltd. Sponsored ADR | | | 169,650 | | | | 1,620 | |
Toray Industries, Inc. ADR | | | 118,489 | | | | 2,103 | |
| | | | | | | | |
| | | | | | | 7,667 | |
| | | | | | | | |
| Real Estate—0.5% | |
Lendlease Group Sponsored ADR | | | 200,805 | | | | 2,434 | |
| | | | | | | | |
| Telecommunication Services—0.5% | |
Nippon Telegraph & Telephone Corp. ADR | | | 49,495 | | | | 2,120 | |
| TOTAL COMMON STOCKS | | | | | | | | |
| (Identified Cost $258,609) | | | | | | | 286,324 | |
| AFFILIATED MUTUAL FUND—0.8% | |
Virtus Credit Opportunities Fund Class R6(10) | | | 357,054 | | | | 3,567 | |
| TOTAL AFFILIATED MUTUAL FUND | |
| (Identified Cost $3,569) | | | | | | | 3,567 | |
| TOTAL LONG TERM INVESTMENTS—98.8% | |
| (Identified Cost $432,448) | | | | | | | 461,385 | (12) |
TOTAL INVESTMENTS—98.8%
(Identified Cost $432,448) | | | 461,385(1) | |
Other assets and liabilities, net—1.2% | | | | | | | 5,640 | |
| | | | | | | | |
| NET ASSETS—100.0% | | | | | $467,025 | |
| | | | | | | | |
Abbreviations:
| ADR | American Depositary Receipt |
| FHLMC | Federal Home Loan Mortgage Corporation (“Freddie Mac”) |
| FNMA | Federal National Mortgage Association (“Fannie Mae”) |
| REIT | Real Estate Investment Trust |
FOOTNOTE LEGEND:
| (1) | Federal Income Tax Information: For tax information at March 31, 2017, see Note 7 Federal Income Tax Information in the Notes to Financial Statements. |
| (3) | Variable or step coupon security; interest rate shown reflects the rate in effect at March 31, 2017. |
| (4) | Security exempt from registration under Rule 144A of the Securities Act of 1933. These securities may be resold in transactions exempt from registration, normally to qualified institutional buyers. At March 31, 2017, these securities amounted to a value of $56,060 or 12.0% of net assets. |
| (5) | Security in default, no interest payments are being received during the bankruptcy proceedings. |
| (6) | Security in default, a portion of the interest payments are being received during the bankruptcy proceedings. |
| (7) | No contractual maturity date. |
| (8) | Interest payments may be deferred. |
| (9) | Value shown as par value. |
| (10) | Shares of this fund are publicly offered and its prospectus and annual report are publicly available. |
| (12) | All or a portion of the Fund’s assets have been segregated for delayed delivery security. |
| (13) | This Note was issued for the sole purpose of funding a loan agreement between the issuer and the borrower. As the credit risk for this security lies solely with the borrower, the name represented here is that of the borrower. |
| (14) | This loan will settle after March 31, 2017, at which time the interest rate, based on the London Interbank Offered Rate (“LIBOR”) and the agreed upon spread on trade date, will be reflected. |
| (15) | Security valued at fair value as determined in good faith by or under the direction of the Trustees. This security is disclosed as a Level 3 security in the disclosure table located after the Schedule of Investments. |
| | | | |
Country Weightings (Unaudited)† | | | |
United States | | | 75 | % |
Japan | | | 4 | |
China | | | 3 | |
United Kingdom | | | 3 | |
France | | | 2 | |
Brazil | | | 1 | |
Singapore | | | 1 | |
Other | | | 11 | |
Total | | | 100 | % |
| † | % of total investments as of March 31, 2017. |
See Notes to Financial Statements
25
VIRTUS STRATEGIC ALLOCATION FUND
SCHEDULE OF INVESTMENTS (Continued)
MARCH 31, 2017
($ reported in thousands)
The following table provides a summary of inputs used to value the Fund’s investments as of March 31, 2017 (See Security Valuation Note 2A in the Notes to Financial Statements):
| | | | | | | | | | | | | | | | |
| | | Total Value at
March 31, 2017 | | | Level 1
Quoted Prices | | | Level 2
Significant
Observable
Inputs | | | Level 3
Significant
Unobservable
Inputs | |
Debt Securities: | | | | | | | | | | | | | | | | |
Asset-Backed Securities | | $ | 9,216 | | | $ | — | | | $ | 9,216 | | | $ | — | |
Corporate Bonds and Notes | | | 88,123 | | | | — | | | | 87,566 | | | | 557 | |
Foreign Government Securities | | | 6,021 | | | | — | | | | 6,021 | | | | — | |
Loan Agreements | | | 7,512 | | | | — | | | | 7,215 | | | | 297 | |
Mortgage-Backed Securities | | | 38,189 | | | | — | | | | 38,189 | | | | — | |
Municipal Bonds | | | 4,365 | | | | — | | | | 4,365 | | | | — | |
U.S. Government Securities | | | 11,485 | | | | — | | | | 11,485 | | | | — | |
Equity Securities: | | | | | | | | | | | | | | | | |
Affiliated Mutual Fund | | | 3,567 | | | | 3,567 | | | | — | | | | — | |
Common Stocks | | | 286,324 | | | | 286,324 | | | | — | | | | — | |
Preferred Stocks | | | 6,583 | | | | 677 | | | | 5,906 | | | | — | |
| | | | | | | | | | | | | | | | |
Total Investments | | $ | 461,385 | | | $ | 290,568 | | | $ | 169,963 | | | $ | 854 | |
| | | | | | | | | | | | | | | | |
There were no transfers between Level 1 and Level 2 related to securities held as of March 31, 2017.
See Notes to Financial Statements
26
VIRTUS STRATEGIC ALLOCATION FUND
SCHEDULE OF INVESTMENTS (Continued)
MARCH 31, 2017
($ reported in thousands)
The following is a reconciliation of assets of the Fund for Level 3 investments for which significant unobservable inputs were used to determine fair value.
| | | | | | | | | | | | |
| Investments in Securities | | Total Value | | | Corporate Bonds
and Notes | | | Loan
Agreements | |
Balance as of March 31, 2016 | | $ | 694 | | | $ | — | | | $ | 694 | |
Accrued discount/(premium) | | | 1 | | | | 1 | | | | — | (c) |
Realized gain (loss) | | | 1 | | | | — | (c) | | | 1 | |
Change in unrealized appreciation/(depreciation)(d) | | | 133 | | | | 2 | | | | 131 | |
Purchases | | | 870 | | | | 579 | | | | 291 | |
Sales(b) | | | (572 | ) | | | (26 | ) | | | (546 | ) |
Transfers into Level 3(a)(e) | | | 1 | | | | 1 | | | | — | |
Transfers from Level 3(a)(f) | | | (274 | ) | | | — | | | | (274 | ) |
| | | | | | | | | | | | |
Balance as of March 31, 2017 | | | 854 | | | | 557 | | | $ | 297 | |
| | | | | | | | | | | | |
| (a) | “Transfers into and/or from” represent the ending value as of March 31, 2017, for any investment security where a change in the pricing level occurred from the beginning to the end of the period. |
| (b) | Includes paydowns on securities. |
| (c) | Amount is less than $500. |
| (d) | Included in the related net change in unrealized appreciation (depreciation) on investments in the Statement of Operations. The change in unrealized appreciation (depreciation) on investments still held as of March 31, 2017 was $(311). |
| (e) | The transfers into Level 3 is due to a security default. |
| (f) | The transfers from Level 3 are due to an increase in trading activities at period end. |
The Fund’s investments that are categorized as Level 3 were valued utilizing third party pricing information without adjustment. Such valuations are based on unobservable inputs. A significant change in third party information inputs could result in a significantly lower or higher value of such Level 3 investments.
See Notes to Financial Statements
27
VIRTUS STRATEGIC ALLOCATION FUND
STATEMENT OF ASSETS AND LIABILITIES
MARCH 31, 2017
(Reported in thousands except shares and per share amounts)
| | | | |
| Assets | | | | |
Investment in unaffiliated securities at value(1) | | $ | 457,818 | |
Investment in affiliated fund at value(2) | | | 3,567 | |
Cash | | | 4,757 | |
| Receivables | | | | |
Investment securities sold | | | 1,398 | |
Fund shares sold | | | 33 | |
Dividends and interest | | | 1,938 | |
Tax reclaims | | | 21 | |
Prepaid expenses | | | 32 | |
Prepaid trustee retainer | | | 12 | |
Other assets | | | 17 | |
| | | | |
Total assets | | | 469,593 | |
| | | | |
| Liabilities | | | | |
| Payables | | | | |
Fund shares repurchased | | | 841 | |
Investment securities purchased | | | 1,127 | |
Investment advisory fees | | | 217 | |
Distribution and service fees | | | 120 | |
Administration fees | | | 49 | |
Transfer agent fees and expenses | | | 135 | |
Trustees’ fees and expenses | | | 1 | |
Professional fees | | | 32 | |
Trustee deferred compensation plan | | | 17 | |
Other accrued expenses | | | 29 | |
| | | | |
Total liabilities | | | 2,568 | |
| | | | |
| Net Assets | | $ | 467,025 | |
| | | | |
| |
| Net Assets Consist of: | | | | |
Capital paid in on shares of beneficial interest | | $ | 440,970 | |
Accumulated undistributed net investment income (loss) | | | (129 | ) |
Accumulated undistributed net realized gain (loss) | | | (2,753 | ) |
Net unrealized appreciation (depreciation) on investments | | | 28,937 | |
| | | | |
| Net Assets | | $ | 467,025 | |
| | | | |
| Class A | | | | |
Net asset value (net assets/shares outstanding) per share | | $ | 13.17 | |
Maximum offering price per share NAV/(1–5.75%) | | $ | 13.97 | |
Shares of beneficial interest outstanding, no par value, unlimited authorization | | | 33,013,926 | |
Net Assets | | $ | 434,712 | |
| Class C | | | | |
Net asset value (net assets/shares outstanding) and offering price per share | | $ | 13.04 | |
Shares of beneficial interest outstanding, no par value, unlimited authorization | | | 2,478,029 | |
Net Assets | | $ | 32,313 | |
| |
(1) Investment in unaffiliated securities at cost | | $ | 428,879 | |
| |
(2) Investment in affiliated fund at cost | | $ | 3,569 | |
See Notes to Financial Statements
28
VIRTUS STRATEGIC ALLOCATION FUND
STATEMENT OF OPERATIONS
YEAR ENDED MARCH 31, 2017
($ reported in thousands)
| | | | |
| Investment Income | | | | |
Dividends | | $ | 4,900 | |
Dividends from affiliated fund | | | 150 | |
Interest | | | 7,707 | |
Security lending, net of fees | | | 28 | |
Foreign taxes withheld | | | (120 | ) |
| | | | |
Total investment income | | | 12,665 | |
| | | | |
| Expenses | | | | |
Investment advisory fees | | | 2,666 | |
Service fees, Class A | | | 1,121 | |
Distribution and service fees, Class B | | | 4 | |
Distribution and service fees, Class C | | | 357 | |
Administration fees | | | 636 | |
Transfer agent fees and expenses | | | 688 | |
Registration fees | | | 55 | |
Printing fees and expenses | | | 130 | |
Custodian fees | | | 97 | |
Professional fees | | | 57 | |
Trustees’ fees and expenses | | | 55 | |
Miscellaneous expenses | | | 47 | |
| | | | |
Total expenses | | | 5,913 | |
Less expenses reimbursed and/or waived by investment adviser | | | (19 | ) |
Earnings credit from custodian | | | (2 | ) |
Low balance account fees | | | (13 | ) |
Custody fees reimbursed (Note 10) | | | (436 | ) |
| | | | |
Net expenses | | | 5,443 | |
| | | | |
| Net investment income (loss) | | | 7,222 | |
| | | | |
| Net Realized and Unrealized Gain (Loss) | | | | |
Net realized gain (loss) on unaffiliated investments | | | 34,480 | |
Net change in unrealized appreciation (depreciation) on unaffiliated investments | | | (9,294 | ) |
Net change in unrealized appreciation (depreciation) on affiliated fund | | | 153 | |
| | | | |
| Net realized and unrealized gain (loss) | | | 25,339 | |
| | | | |
| Net increase (decrease) in net assets resulting from operations | | $ | 32,561 | |
| | | | |
See Notes to Financial Statements
29
VIRTUS STRATEGIC ALLOCATION FUND
STATEMENTS OF CHANGES IN NET ASSETS
(Reported in thousands)
| | | | | | | | |
| | | Year Ended
March 31, 2017 | | | Year Ended
March 31, 2016 | |
| INCREASE/(DECREASE) IN NET ASSETS | | | | | | | | |
| From Operations | | | | | | | | |
Net investment income (loss) | | $ | 7,222 | | | $ | 10,818 | |
Net realized gain (loss) | | | 34,480 | | | | 264 | |
Net change in unrealized appreciation (depreciation) | | | (9,141 | ) | | | (47,912 | ) |
| | | | | | | | |
| Increase (decrease) in net assets resulting from operations | | | 32,561 | | | | (36,830 | ) |
| | | | | | | | |
| From Distributions to Shareholders | | | | | | | | |
Net investment income, Class A | | | (6,925 | ) | | | (8,862 | ) |
Net investment income, Class B | | | (3 | ) | | | (7 | ) |
Net investment income, Class C | | | (322 | ) | | | (456 | ) |
Net realized short-term gains, Class A | | | (4,563 | ) | | | — | |
Net realized short-term gains, Class B | | | (4 | ) | | | — | |
Net realized short-term gains, Class C | | | (360 | ) | | | — | |
Net realized long-term gains, Class A | | | (29,407 | ) | | | (15,612 | ) |
Net realized long-term gains, Class B | | | (23 | ) | | | (22 | ) |
Net realized long-term gains, Class C | | | (2,326 | ) | | | (1,441 | ) |
| | | | | | | | |
| Decrease in net assets from distributions to shareholders | | | (43,933 | ) | | | (26,400 | ) |
| | | | | | | | |
| From Share Transactions | | | | | | | | |
| Sale of shares | | | | | | | | |
Class A (485 and 888 shares, respectively) | | | 6,467 | | | | 12,687 | |
Class B (—(1) and —(1) shares, respectively) | | | — | (2) | | | 2 | |
Class C (66 and 419 shares, respectively) | | | 874 | | | | 6,083 | |
| | |
| Reinvestment of distributions | | | | | | | | |
Class A (3,012 and 1,572 shares, respectively) | | | 38,224 | | | | 22,775 | |
Class B (2 and 2 shares, respectively) | | | 30 | | | | 29 | |
Class C (212 and 117 shares, respectively) | | | 2,658 | | | | 1,694 | |
| | |
| Conversion of shares(3) | | | | | | | | |
To Class A (21 and — shares, respectively) | | | 279 | | | | — | |
From Class B (21 and — shares, respectively) | | | (279 | ) | | | — | |
| | |
| Shares repurchased | | | | | | | | |
Class A (4,545 and 4,115 shares, respectively) | | | (61,067 | ) | | | (58,177 | ) |
Class B (21 and 18 shares, respectively) | | | (284 | ) | | | (258 | ) |
Class C (694 and 770 shares, respectively) | | | (9,236 | ) | | | (10,671 | ) |
| | | | | | | | |
| Increase (decrease) in net assets from share transactions | | | (22,334 | ) | | | (25,836 | ) |
| | | | | | | | |
| Net increase (decrease) in net assets | | | (33,706 | ) | | | (89,066 | ) |
| | |
| Net Assets | | | | | | | | |
Beginning of period | | | 500,731 | | | | 589,797 | |
| | | | | | | | |
| End of period | | $ | 467,025 | | | $ | 500,731 | |
| | | | | | | | |
Accumulated undistributed net investment income (loss) at end of period | | $ | (129 | ) | | $ | (287 | ) |
| (1) | Amount is less than 500 shares. |
| (2) | Amount is less than $500. |
| (3) | See Note 1 in Notes to Financial Statements for more information. |
See Notes to Financial Statements
30
VIRTUS STRATEGIC ALLOCATION FUND
FINANCIAL HIGHLIGHTS
SELECTED PER SHARE DATA AND RATIOS FOR A SHARE OUTSTANDING
THROUGHOUT EACH PERIOD
| | | | | | | | | | | | | | | | | | | | | | | | | | | | | | | | | | | | | | | | | | | | | | | | | | | | | | | | | | | | | | | | | | | | | | | | | | | | | | | | |
| | | Net Asset Value,
Beginning of Period | | Net Investment Income (Loss)(1) | | Net Realized and Unrealized Gain (Loss) | | Total from Investment Operations | | Dividends from Net Investment Income | | Distributions from Net Realized Gains | | Total Distributions | | Payments from Affiliates | | Change in Net Asset Value | | Net Asset Value, End of Period | | Total Return(2) | | Net Assets, End of Period (in thousands) | | Ratio of Net Expenses to Average Net Assets(3) | | Ratio of Gross Expenses to Average Net Assets (before
waivers and reimbursements)(3) | | Ratio of Net Investment Income (Loss) to Average Net Assets | | Portfolio Turnover Rate |
Class A | | | | | | | | | | | | | | | | | | | | | | | | | | | | | | | | | | | | | | | | | | | | | | | | | | | | | | | | | | | | | | | | | | | | | | | | | | | | | | | | |
4/1/16 to 3/31/17 | | | $ | 13.55 | | | | | 0.21 | | | | | 0.69 | | | | | 0.90 | | | | | (0.21 | ) | | | | (1.07 | ) | | | | (1.28 | ) | | | | — | | | | | (0.38 | ) | | | $ | 13.17 | | | | | 7.13 | %(6) | | | $ | 434,712 | | | | | 1.16 | %(5)(6) | | | | 1.16 | % | | | | 1.46 | %(6) | | | | 100 | % |
4/1/15 to 3/31/16 | | | | 15.18 | | | | | 0.29 | | | | | (1.22 | ) | | | | (0.93 | ) | | | | (0.25 | ) | | | | (0.45 | ) | | | | (0.70 | ) | | | | — | (4) | | | | (1.63 | ) | | | | 13.55 | | | | | (6.37 | ) | | | | 461,276 | | | | | 1.12 | | | | | 1.13 | | | | | 2.05 | | | | | 75 | |
4/1/14 to 3/31/15 | | | | 15.54 | | | | | 0.29 | | | | | 0.33 | | | | | 0.62 | | | | | (0.30 | ) | | | | (0.68 | ) | | | | (0.98 | ) | | | | — | | | | | (0.36 | ) | | | | 15.18 | | | | | 4.08 | | | | | 541,818 | | | | | 1.10 | | | | | 1.10 | | | | | 1.89 | | | | | 62 | |
4/1/13 to 3/31/14 | | | | 15.35 | | | | | 0.30 | | | | | 1.65 | | | | | 1.95 | | | | | (0.29 | ) | | | | (1.47 | ) | | | | (1.76 | ) | | | | — | | | | | 0.19 | | | | | 15.54 | | | | | 13.79 | | | | | 570,784 | | | | | 1.10 | | | | | 1.10 | | | | | 1.97 | | | | | 57 | |
4/1/12 to 3/31/13 | | | | 14.58 | | | | | 0.20 | | | | | 0.78 | | | | | 0.98 | | | | | (0.21 | ) | | | | — | | | | | (0.21 | ) | | | | — | | | | | 0.77 | | | | | 15.35 | | | | | 6.77 | | | | | 559,955 | | | | | 1.10 | | | | | 1.10 | | | | | 1.39 | | | | | 121 | |
Class C | | | | | | | | | | | | | | | | | | | | | | | | | | | | | | | | | | | | | | | | | | | | | | | | | | | | | | | | | | | | | | | | | | | | | | | | | | | | | | | | |
4/1/16 to 3/31/17 | | | $ | 13.44 | | | | | 0.11 | | | | | 0.68 | | | | | 0.79 | | | | | (0.12 | ) | | | | (1.07 | ) | | | | (1.19 | ) | | | | — | | | | | (0.40 | ) | | | $ | 13.04 | | | | | 6.33 | %(6) | | | $ | 32,313 | | | | | 1.91 | %(5)(6) | | | | 1.91 | % | | | | 0.71 | %(6) | | | | 100 | % |
4/1/15 to 3/31/16 | | | | 15.06 | | | | | 0.18 | | | | | (1.21 | ) | | | | (1.03 | ) | | | | (0.14 | ) | | | | (0.45 | ) | | | | (0.59 | ) | | | | — | (4) | | | | (1.62 | ) | | | | 13.44 | | | | | (7.06 | ) | | | | 38,913 | | | | | 1.87 | | | | | 1.88 | | | | | 1.31 | | | | | 75 | |
4/1/14 to 3/31/15 | | | | 15.43 | | | | | 0.17 | | | | | 0.33 | | | | | 0.50 | | | | | (0.19 | ) | | | | (0.68 | ) | | | | (0.87 | ) | | | | — | | | | | (0.37 | ) | | | | 15.06 | | | | | 3.29 | | | | | 47,131 | | | | | 1.85 | | | | | 1.85 | | | | | 1.12 | | | | | 62 | |
4/1/13 to 3/31/14 | | | | 15.26 | | | | | 0.18 | | | | | 1.63 | | | | | 1.81 | | | | | (0.17 | ) | | | | (1.47 | ) | | | | (1.64 | ) | | | | — | | | | | 0.17 | | | | | 15.43 | | | | | 12.89 | | | | | 41,713 | | | | | 1.85 | | | | | 1.85 | | | | | 1.22 | | | | | 57 | |
4/1/12 to 3/31/13 | | | | 14.50 | | | | | 0.09 | | | | | 0.77 | | | | | 0.86 | | | | | (0.10 | ) | | | | — | | | | | (0.10 | ) | | | | — | | | | | 0.76 | | | | | 15.26 | | | | | 5.95 | | | | | 40,937 | | | | | 1.85 | | | | | 1.85 | | | | | 0.64 | | | | | 121 | |
| (1) | Computed using average shares outstanding. |
| (2) | Sales charges, where applicable, are not reflected in total return calculation. |
| (3) | The Fund will also indirectly bear its prorated share of expenses of any underlying funds in which it invests. Such expenses are not included in the calculation of this ratio. |
| (4) | Amount is less than $0.005 per share. |
| (5) | Net expense ratios includes extraordinary proxy expenses. |
| (6) | Custody fees reimbursed were excluded from the Ratio of Net Expenses to Average Net Assets and Ratio of Net Investment Income (Loss) to Average Net Assets. If included the impact would have been to lower the Ratio of Net Expenses to Average Net Assets and increase the Ratio of Net Investment Income (Loss) to Average Net Assets by 0.09% (Class A) and 0.09% (Class C). |
| | Custody fees reimbursed were included in Total Return. If excluded the impact would have been to lower the Total Return by 0.09% (Class A) and 0.09% (Class C). |
| | See Note 10 in Notes to Financial Statements for a further explanation on the custody fees reimbursed. |
See Notes to Financial Statements
31
VIRTUS STRATEGIC ALLOCATION FUND
NOTES TO FINANCIAL STATEMENTS
MARCH 31, 2017
Note 1. Organization
Virtus Equity Trust (the “Trust”) is organized as a Delaware statutory trust and is registered under the Investment Company Act of 1940, as amended (the “1940 Act”), as an open-end management investment company.
As of the date of this report, 11 diversified funds of the Trust are offered for sale, of which the Virtus Strategic Allocation Fund (the “Fund”) is reported in this annual report. The Fund’s investment objectives are outlined on the Fund’s summary page. There is no guarantee that the Fund will achieve its objectives.
The Fund offers Class A shares and Class C shares. Effective March 6, 2017, all Class B shares were converted to Class A shares. Prior to March 6, 2017, Class B shares could be purchased by existing shareholders through qualifying transactions.
Class A shares are sold with a front-end sales charge of up to 5.75% with some exceptions. Generally, Class A shares are not subject to any charges by the Fund when redeemed; however, a 1% contingent deferred sales charge (“CDSC”) may be imposed on certain redemptions made within a certain period following purchases on which a finder’s fee has been paid. The period for which the CDSC applies for the Fund is 18 months. The CDSC period begins on the last day of the month preceding the month in which the purchase was made.
Prior to March 6, 2017, Class B shares were sold with a CDSC, which declined from 5% to zero depending on the period of time the shares were held. Class C shares are generally sold with a 1% CDSC, applicable if redeemed within one year of purchase.
Virtus Mutual Funds may impose an annual fee on accounts having balances of less than $2,500. The small account fee may be waived in certain circumstances, as disclosed in the prospectus and/or statement of additional information. The fees collected will be used to offset certain expenses of the Fund. These fees are reflected as “Low balance account fees” in the Fund’s Statement of Operations for the period, as applicable.
Each Class of shares has identical voting, dividend, liquidation and other rights and the same terms and conditions, except that each Class bears different distribution and/or service (12b-1) fees under a Rule 12b-1 and/or shareholder service plan (“12b-1 Plan”) approved by the Board and has exclusive voting rights with respect to such plan. Income and other expenses as well as realized and unrealized gains and losses of the Fund are borne pro rata by the holders of each Class of shares.
Note 2. Significant Accounting Policies
The following is a summary of significant accounting policies consistently followed by the Trust in the preparation of its financial statements. The preparation of financial statements in conformity with U.S. generally accepted accounting principles (“U.S. GAAP”) requires management to make estimates and assumptions that affect the reported amounts of assets and liabilities, and disclosure of contingent assets and liabilities at the date of the financial statements and the reported amounts of increases and decreases in net assets from operations during the reporting period. Actual results could differ from those estimates, and those differences could be significant.
Security valuation procedures for the Fund, which include nightly price variance, as well as back-testing items such as bi-weekly unchanged price, monthly secondary source and transaction analysis, have been approved by the Board. All internally fair valued
32
VIRTUS STRATEGIC ALLOCATION FUND
NOTES TO FINANCIAL STATEMENTS (Continued)
MARCH 31, 2017
securities are approved by a valuation committee appointed by the Board (the “Valuation Committee”). The Valuation Committee is comprised of certain members of management as identified to the Board and convenes independently from portfolio management. All internally fair valued securities are updated daily and reviewed in detail by the Valuation Committee monthly unless changes occur within the period. The Valuation Committee reviews the validity of the model inputs and any changes to the model. Fair valuations are reviewed quarterly by the Board.
The Fund utilizes a fair value hierarchy which prioritizes the inputs to valuation techniques used to measure fair value into three broad levels. The Fund’s policy is to recognize transfers between levels at the end of the reporting period.
| | • Level 1 – | quoted prices in active markets for identical securities (security types generally include listed equities). |
| | • Level 2 – | prices determined using other significant observable inputs (including quoted prices for similar securities, interest rates, prepayment speeds, credit risk, etc.). |
| | • Level 3 – | prices determined using significant unobservable inputs (including the Valuation Committee’s own assumptions in determining the fair value of investments). |
A description of the valuation techniques applied to the Fund’s major categories of assets and liabilities measured at fair value on a recurring basis is as follows:
Equity securities are valued at the official closing price (typically last sale) on the exchange on which the securities are primarily traded or, if no closing price is available, at the last bid price and are categorized as Level 1 in the hierarchy. Restricted equity securities and private placements that are not widely traded, are illiquid, or are internally fair valued by the Valuation Committee, are generally categorized as Level 3 in the hierarchy.
Certain non-U.S. securities may be fair valued in cases where closing prices are not readily available or are deemed not reflective of readily available market prices. For example, significant events (such as movement in the U.S. securities market, or other regional and local developments) may occur between the time that non-U.S. markets close (where the security is principally traded) and the time that the Fund calculates its net asset value (“NAV”) (at the close of regular trading on the NYSE, generally 4 p.m. Eastern time) that may impact the value of securities traded in these non-U.S. markets. In such cases the Fund fair values non-U.S. securities using an independent pricing service which considers the correlation of the trading patterns of the non-U.S. security to the intraday trading in the U.S. markets for investments such as ADRs, financial futures, exchange-traded funds (“ETFs”), and certain indexes, as well as prices for similar securities. Such fair valuations are categorized as Level 2 in the hierarchy. Because the frequency of significant events is not predictable, fair valuation of certain non-U.S. common stocks may occur on a frequent basis.
Debt securities, including restricted securities, are valued based on evaluated quotations received from independent pricing services or from dealers who make markets in such securities. For most bond types, the pricing service utilizes matrix pricing that considers one or more of the following factors: yield or price of bonds of comparable quality, coupon, maturity, current cash flows, type, and current day trade information, as well as dealer supplied prices. These valuations are generally
33
VIRTUS STRATEGIC ALLOCATION FUND
NOTES TO FINANCIAL STATEMENTS (Continued)
MARCH 31, 2017
categorized as Level 2 in the hierarchy. Structured debt instruments, such as mortgage-backed and asset-backed securities, may also incorporate collateral analysis and utilize cash flow models for valuation and are generally categorized as Level 2 in the hierarchy. Pricing services do not provide pricing for all securities and therefore indicative bids from dealers are utilized which are based on pricing models used by market makers in the security and are generally categorized as Level 2 in the hierarchy. Debt securities that are not widely traded, are illiquid, or are internally fair valued by the Valuation Committee, are generally categorized as Level 3 in the hierarchy.
Listed derivatives, such as options, that are actively traded are valued based on quoted prices from the exchange and are categorized as Level 1 in the hierarchy. Over-the-counter derivative contracts, which include forward currency contracts and equity-linked instruments, do not require material subjectivity as pricing inputs are observed from actively quoted markets and are categorized as Level 2 in the hierarchy.
Investments in open-end mutual funds are valued at NAV. Investments in closed-end funds are valued as of the close of regular trading on the NYSE each business day. Both are categorized as Level 1 in the hierarchy.
A summary of the inputs used to value the Fund’s net assets by each major security type is disclosed at the end of the Schedule of Investments for the Fund. The inputs or methodologies used for valuing securities are not necessarily an indication of the risk associated with investing in those securities.
| | B. | Security Transactions and Investment Income |
Security transactions are recorded on the trade date. Realized gains and losses from sales of securities are determined on the identified cost basis. Dividend income is recognized on the ex-dividend date or, in the case of certain foreign securities, as soon as the Fund is notified. Interest income is recorded on the accrual basis. The Fund amortizes premiums and accretes discounts using the effective interest method. Any distributions from underlying funds are recorded in accordance with the character of the distributions as designated by the underlying funds.
Dividend income from REIT investments is recorded using management’s estimate of the income included in distributions received from the REIT investments. Distributions received in excess of this estimated amount are recorded as a reduction of the cost of investments or reclassified to capital gains. The actual amounts of income, return of capital, and capital gains are only determined by each REIT after its fiscal year-end, and may differ from the estimated amounts.
The Fund is treated as a separate taxable entity. It is the intention of the Fund to comply with the requirements of Subchapter M of the Internal Revenue Code and to distribute substantially all of its taxable income to its shareholders. Therefore, no provision for federal income taxes or excise taxes has been made.
The Fund may be subject to foreign taxes on income, gains on investments or currency repatriation, a portion of which may be recoverable. The Fund will accrue such taxes and recoveries as applicable based upon current interpretations of the tax rules and regulations that exist in the markets in which it invests.
34
VIRTUS STRATEGIC ALLOCATION FUND
NOTES TO FINANCIAL STATEMENTS (Continued)
MARCH 31, 2017
Management of the Fund has concluded that there are no significant uncertain tax positions that would require recognition in the financial statements. As of March 31, 2017, the tax years that remain subject to examination by the major tax jurisdictions under the statute of limitations are from the year 2014 forward (with limited exceptions).
| | D. | Distributions to Shareholders |
Distributions are recorded by the Fund on the ex-dividend date. Income and capital gain distributions are determined in accordance with income tax regulations that may differ from U.S. GAAP.
Expenses incurred together by the Fund and other affiliated mutual funds are allocated in proportion to the net assets of each such fund, except where allocation of direct expenses to each fund or an alternative allocation method can be more appropriately used.
In addition to the net annual operating expenses that the Fund bears directly, the shareholders of the Fund indirectly bear the Fund’s pro-rata expenses of any underlying mutual funds in which the Fund invests.
| | F. | Foreign Currency Translation |
Non-U.S. investment securities and other assets and liabilities denominated in foreign currencies are translated into U.S. dollar amounts at the foreign currency exchange rate effective at the end of the reporting period. Cost of investments is translated at the currency exchange rate effective at the trade date. The gain or loss resulting from a change in currency exchange rates between the trade and settlement date of a portfolio transaction is treated as a gain or loss on foreign currency. Likewise, the gain or loss resulting from a change in currency exchange rates between the date income is accrued and the date it is paid is treated as a gain or loss on foreign currency. The Fund does not isolate that portion of the results of operations arising from changes in foreign exchange rates on investments from the fluctuations arising from changes in the market prices of securities held. Such fluctuations are included with the net realized and unrealized gain or loss on investments.
The Fund may invest in direct debt instruments which are interests in amounts owed by a corporate, governmental, or other borrower to lenders or lending syndicates. Loan agreements are generally non-investment grade and often involve borrowers that are highly leveraged. The Fund may invest in obligations of borrowers who are in bankruptcy proceedings. Loan agreements are typically senior in the corporate capital structure of the borrower. A loan is often administered by a bank or other financial institution (the “lender”) that acts as agent for all holders. The agent administers the terms of the loan, as specified in the loan agreement. The Fund’s investments in loans may be in the form of participations in loans or assignments of all or a portion of loans from third parties. When investing in loan participations, the Fund has the right to receive payments of principal, interest and any fees to which it is entitled only from the lender selling the loan participation and only upon receipt by the lender of payments from the borrower. The Fund generally has no right to enforce compliance with the terms of the loan agreement with the borrower. As a result, the Fund may be subject to
35
VIRTUS STRATEGIC ALLOCATION FUND
NOTES TO FINANCIAL STATEMENTS (Continued)
MARCH 31, 2017
the credit risk of both the borrower and the lender that is selling the loan agreement. When the Fund purchases assignments from lenders it acquires direct rights against the borrower on the loan.
The Fund may invest in multiple series or tranches of a loan, which may have varying terms and carry different associated risks. Loan agreements may involve foreign borrowers and investments may be denominated in foreign currencies. Direct indebtedness of emerging countries involves a risk that the government entities responsible for the repayment of the debt may be unable, or unwilling, to pay the principal and interest when due.
The loan agreements have floating rate loan interests which generally pay interest at rates that are periodically determined by reference to a base lending rate plus a premium. The base lending rates are generally London Interbank Offered Rate (“LIBOR”), the prime rate offered by one or more U.S. banks or the certificate of deposit rate. When a loan agreement is purchased the Fund may pay an assignment fee. On an ongoing basis, the Fund may receive a commitment fee based on the undrawn portion of the underlying line of credit portion of a loan agreement. Prepayment penalty fees are received upon the prepayment of a loan agreement by a borrower. Prepayment penalty, facility, commitment, consent and amendment fees are recorded to income as earned or paid.
At March 31, 2017, all loan agreements held by the Fund are assignment loans.
| | H. | When-issued and Forward Commitments (Delayed Delivery) |
The Fund may engage in when-issued or forward commitment transactions. Securities purchased on a when-issued or forward commitment basis are known as delayed delivery transactions. Delayed delivery transactions involve a commitment by the Fund to purchase or sell a security at a future date (ordinarily up to 90 days later). When-issued or forward commitments enable the Fund to lock in what is believed to be an attractive price or yield on a particular security for a period of time, regardless of future changes in interest rates. The Fund records when-issued and delayed delivery securities on the trade date. The Fund maintains collateral for the securities purchased. Securities purchased on a when-issued or delayed delivery basis begin earning interest on the settlement date.
The Fund may loan securities to qualified brokers through an agreement with Brown Brothers Harriman (“BBH”), as a third party lending agent. Under the terms of the agreement, the Fund is required to maintain collateral with a market value not less than 100% of the market value of loaned securities. Collateral is adjusted daily in connection with changes in the market value of securities on loan. Collateral may consist of cash and securities issued by the U.S. Government or its agencies. Cash collateral is invested in a short-term money market fund. Dividends earned on the collateral and premiums paid by the broker are recorded as income by the Fund net of fees and rebates charged by BBH for its services as securities lending agent and in connection with this securities lending program. Lending portfolio securities involves a risk of delay in the recovery of the loaned securities or in the declining value of the collateral. At March 31, 2017, the Fund did not have any securities on loan.
36
VIRTUS STRATEGIC ALLOCATION FUND
NOTES TO FINANCIAL STATEMENTS (Continued)
MARCH 31, 2017
| | J. | Earnings Credit and Interest |
Through arrangements with the Fund’s custodian, the Fund either receives an earnings credit or interest on agreed upon target un-invested cash balances to reduce the Fund’s custody expenses. The credits are reflected as “Earnings credit from custodian” and the interest is reflected under “Interest income” in the Fund’s Statement of Operations for the period, as applicable.
Note 3. Investment Advisory Fees and Related Party Transactions
($ reported in thousands except as noted)
Virtus Investment Advisers, Inc. (the “Adviser”), an indirect, wholly owned subsidiary of Virtus Investment Partners, Inc. (“Virtus”), is the investment adviser to the Fund. The Adviser manages the Fund’s investment program and general operations of the Fund, including oversight of the Fund’s subadvisers.
As compensation for its services to the Fund, the Adviser is entitled to a fee based upon the annual rate: 0.55% of the Fund’s first $1 billion of average daily net assets; 0.50% of the Fund’s $1+ billion through $2 billion of average daily net assets; and 0.45% of the Fund’s average daily net assets in excess of $2 billion.
During the period covered by these financial statements, the Fund invested a portion of its assets in Virtus Credit Opportunities Fund, an affiliated mutual fund. In order to avoid any duplication of advisory fees, the Adviser has voluntarily waived its advisory fees in an amount equal to that which would otherwise be paid by the Fund on the assets invested in the Virtus Credit Opportunities Fund. For the period covered by these financial statements, the waiver amounted to $19. This waiver is included in “Less expenses reimbursed and/or waived by investment adviser” in the Statement of Operations.
The subadvisers manage the investments of the Fund for which they are paid a fee by the Adviser.
Newfleet Asset Management, LLC, an indirect, wholly owned subsidiary of Virtus, is the subadviser to the Fund’s fixed income portfolio. As of the end of the period, Kayne Anderson Rudnick Investment Management, LLC, an indirect, wholly owned subsidiary of Virtus, is the subadviser to the Fund’s domestic equity portfolio and Duff & Phelps Investment Management Co., an indirect, wholly owned subsidiary of Virtus, is the subadviser to the Fund’s international equity portfolio. Prior to September 7, 2016, Euclid Advisors LLC was the subadviser to the Fund’s equity portfolio.
VP Distributors, LLC (“VP Distributors”), an indirect, wholly owned subsidiary of Virtus, serves as the distributor of the Fund’s shares. VP Distributors has advised the Fund that for the fiscal year (the “period”) ended March 31, 2017, it retained net commissions of $106 for Class A shares and CDSC of $— and $(18) for Class A shares and Class C shares, respectively.
In addition, the Fund pays VP Distributors 12b-1 fees under a 12b-1 Plan as a percentage of the average daily net assets of each respective class at the annual rates as follows: Class A shares 0.25%; and Class C shares 1.00%.
37
VIRTUS STRATEGIC ALLOCATION FUND
NOTES TO FINANCIAL STATEMENTS (Continued)
MARCH 31, 2017
Under certain circumstances, shares of certain Virtus Mutual Funds may be exchanged for shares of the same class of certain other Virtus Mutual Funds on the basis of the relative NAV per share at the time of the exchange. On exchanges with share classes that carry a CDSC, the CDSC schedule of the original shares purchased continues to apply.
| | D. | Administrator and Transfer Agent |
Virtus Fund Services, LLC, an indirect, wholly owned subsidiary of Virtus, serves as the administrator and transfer agent to the Trust.
For the period ended March 31, 2017, the Fund incurred administration fees totaling $474 which are included in the Statement of Operations.
For the period ended March 31, 2017, the Fund incurred transfer agent fees totaling $395 which are included in the Statement of Operations. A portion of these fees was paid to outside entities that also provide services to the Trust.
| | E. | Investments in Affiliates |
A summary of total long-term and short-term purchases and sales of the affiliated underlying fund, Virtus Credit Opportunities Fund, during the period ended March 31, 2017, is as follows:
| | | | | | | | | | |
Value,
beginning of
period | | Purchases | | Sales | | Value, end
of period | | Dividend
Income | | Distributions
of Realized
Gains |
| $3,414 | | $— | | $— | | $3,567 | | $150 | | $— |
The Trust provides a deferred compensation plan for its Trustees who receive compensation from the Trust. Under the deferred compensation plan, Trustees may elect to defer all or a portion of their compensation. Amounts deferred are retained by the Trust, and then, to the extent permitted by the 1940 Act, in turn, may be invested in the shares of affiliated or unaffiliated mutual funds selected by the participating Trustees. Investments in such instruments are included in “Other assets” in the Statement of Assets and Liabilities at March 31, 2017.
Note 4. Purchases and Sales of Securities
($ reported in thousands)
Purchases and sales of securities (excluding U.S. Government and agency securities and short-term securities) during the period ended March 31, 2017, were as follows:
| | | | | | | | |
| | | Purchases | | | Sales | |
| | $ | 443,661 | | | $ | 490,935 | |
Purchases and sales of long-term U.S. Government and agency securities during the period ended March 31, 2017, were as follows:
| | | | | | | | |
| | | Purchases | | | Sales | |
| | $ | 33,001 | | | $ | 32,795 | |
38
VIRTUS STRATEGIC ALLOCATION FUND
NOTES TO FINANCIAL STATEMENTS (Continued)
MARCH 31, 2017
Note 5. Borrowings
($ reported in thousands)
On June 29, 2016, the Fund and other affiliated funds renewed a $50,000 secured line of credit. The Credit Agreement (the “Agreement”) is with a commercial bank (the “Bank”) that allows the Fund to borrow cash from the Bank to manage large unexpected redemptions and trade fails, up to a limit of one-third of the Fund’s total net assets in accordance with the Agreement. The Agreement has a term of 364 days and is renewable by the Fund with the Bank’s consent and approval of the Board. Interest is charged at the higher of the LIBOR or the Federal Funds rate plus an additional percentage rate on the amount borrowed. Commitment fees are charged on the undrawn balance. The Fund and other affiliated funds are individually, and not jointly, liable for their particular advances, if any, under the line of credit. The Bank has the ability to require repayment of outstanding borrowings under the Agreement upon certain circumstances such as an event of default.
The Fund had no outstanding borrowings at any time during the period ended March 31, 2017.
Note 6. Indemnifications
Under the Trust’s organizational documents and in separate agreements between each Trustee and the Trust, its Trustees and officers are indemnified against certain liabilities arising out of the performance of their duties to the Trust and its funds. In addition, in the normal course of business, the Fund enters into contracts that provide a variety of indemnifications to other parties. The Fund’s maximum exposure under these arrangements is unknown as this would involve future claims that may be made against the Fund and that have not occurred. However, the Fund has not had prior claims or losses pursuant to these arrangements and expects the risk of loss to be remote.
Note 7. Federal Income Tax Information
($ reported in thousands)
At March 31, 2017, federal tax cost and aggregate gross unrealized appreciation (depreciation) of securities held by the Fund were as follows:
| | | | | | |
Federal
Tax Cost | | Unrealized
Appreciation | | Unrealized
(Depreciation) | | Net Unrealized
Appreciation
(Depreciation) |
$433,080 | | $33,306 | | $(5,001) | | $28,305 |
The components of distributable earnings on a tax basis (excluding unrealized appreciation (depreciation) which is disclosed in the first table above) consist of undistributed ordinary income and undistributed long-term capital gains of $17 and $8, respectively.
Capital losses realized after October 31 and certain late year ordinary losses may be deferred and treated as occurring on the first day of the following fiscal year. For the period ended March 31, 2017, the Fund deferred capital loss and recognized qualified late year ordinary losses of $2,256 and $205, respectively.
The differences between the book and tax basis components of distributable earnings relate principally to the timing of recognition of income and gains for federal income tax purposes. These differences may include the treatment of non-taxable dividends, foreign currency gain or loss, derivatives, passive foreign investment companies, partnerships, losses deferred due to wash sales and other differences.
39
VIRTUS STRATEGIC ALLOCATION FUND
NOTES TO FINANCIAL STATEMENTS (Continued)
MARCH 31, 2017
Short-term gain distributions reported in the Statements of Changes in Net Assets, if any, are reported as ordinary income for federal tax purposes. Distributions are determined on a tax basis and may differ from net investment income and realized capital gains for financial reporting purposes. The tax character of dividends and distributions paid during the period ended March 31, 2017, and 2016 was as follows:
| | | | | | | | |
| | | 2017 | | | 2016 | |
| Ordinary Income | | $ | 12,177 | | | $ | 9,325 | |
| Long-Term Capital Gains | | | 31,756 | | | | 17,075 | |
| | | | | | | | |
| Total | | $ | 43,933 | | | $ | 26,400 | |
| | | | | | | | |
For financial reporting purposes, book basis capital accounts are adjusted to reflect the tax character of permanent book/tax differences. Permanent reclassifications can arise from differing treatment of certain income and gain transactions, nondeductible current year net operating losses, expiring capital loss carryovers and investments in passive foreign investment companies. Permanent book and tax basis differences relating to shareholder distributions will result in reclassifications to capital paid in on shares of beneficial interest. The reclassifications have no impact on the net assets or NAV of the Fund. As of March 31, 2017, the Fund recorded reclassifications to increase (decrease) the accounts as listed below:
| | | | |
Capital Paid
in on Shares of
Beneficial
Interest | | Undistributed
Net Investment
Income (Loss) | | Accumulated
Net Realized
Gain (Loss) |
| $(1) | | $186 | | $(185) |
Note 8. Illiquid and Restricted Securities
Investments are generally considered illiquid if they cannot be disposed of within seven days in the ordinary course of business at the approximate amount at which such securities have been valued by the Fund. Additionally, the following information is also considered in determining liquidity; the frequency of trades and quotes for the investment, whether the investment is listed for trading on a recognized domestic exchange and/or whether two or more brokers are willing to purchase or sell the security at a comparable price, the extent of market making activity in the investment and the nature of the market for investment. Illiquid securities are footnoted as such at the end of the Fund’s Schedule of Investments, where applicable. However, a portion of such footnoted securities could be liquid where it is determined that some, though not all, of the position could be disposed of within seven days in the ordinary course of business at the approximate amount at which such securities have been valued by the Fund.
Restricted securities are illiquid securities, as defined above, not registered under the Securities Act of 1933, as amended (the “1933 Act”). Generally, 144A securities are excluded from this category, except where defined as illiquid.
The Fund will bear any costs, including those involved in registration under the 1933 Act, in connection with the disposition of such securities.
At March 31, 2017, the Fund’s aggregate value of illiquid securities was $557 or 0.1% of the Fund’s net assets. These securities have been identified on the Schedule of Investments.
At March 31, 2017, the Fund did not hold any securities that were both illiquid and restricted.
40
VIRTUS STRATEGIC ALLOCATION FUND
NOTES TO FINANCIAL STATEMENTS (Continued)
MARCH 31, 2017
Note 9. Credit Risk and Asset Concentration
In countries with limited or developing markets, investments may present greater risks than in more developed markets and the prices of such investments may be volatile. The consequences of political, social or economic changes in these markets may have disruptive effects on the market prices of these investments and the income they generate, as well as the Fund’s ability to repatriate such amounts.
High-yield/high-risk securities typically entail greater price volatility and/or principal and interest rate risk. There is a greater chance that an issuer will not be able to make principal and interest payments on time. Analysis of the creditworthiness of issuers of high-yield/high-risk securities may be complex, and as a result, it may be more difficult for the Adviser and/or subadvisers to accurately predict risk.
The Fund may invest a high percentage of its assets in specific sectors of the market in the pursuit of its investment objectives. Fluctuations in these sectors of concentration may have a greater impact on the Fund, positive or negative, than if the Fund did not concentrate its investments in such sectors.
Note 10. Custody Fees Reimbursed
State Street Bank & Trust, custodian for the Fund through January 29, 2010, reimbursed the Fund for out-of-pocket custody expenses overbilled for the period 1998 through January 29, 2010. The amount reimbursed, including interest, is shown in the Statement of Operations under “Custody fees reimbursed.”
Note 11. Regulatory Matters and Litigation
From time to time, the Trust, the Fund’s Adviser and/or subadvisers and/or their affiliates may be involved in litigation and arbitration as well as examinations and investigations by various regulatory bodies, including the SEC, involving compliance with, among other things, securities laws, client investment guidelines, laws governing the activities of broker-dealers and other laws and regulations affecting their products and other activities. At this time, the Fund’s Adviser believes that the outcomes of such matters are not likely, either individually or in the aggregate, to be material to these financial statements.
Note 12. New Accounting Pronouncements
On October 13, 2016, the SEC amended existing rules intended to modernize reporting and disclosure of information. Certain of these amendments relate to Regulation S-X which sets forth the requisite form and content of financial statements. At this time, management is evaluating the implications of adopting these amendments and their impact on the financial statements and accompanying notes.
Note 13. Subsequent Events
Management has evaluated the impact of all subsequent events on the Fund through the date the financial statements were issued and has determined that there are no subsequent events requiring recognition or disclosure in these financial statements.
41

Report of Independent Registered Public
Accounting Firm
To the Board of Trustees of
Virtus Equity Trust and Shareholders of
Virtus Strategic Allocation Fund:
In our opinion, the accompanying statement of assets and liabilities, including the schedule of investments, and the related statements of operations and of changes in net assets and the financial highlights present fairly, in all material respects, the financial position of Virtus Strategic Allocation Fund (a fund of Virtus Equity Trust, hereafter referred to as the “Fund”) as of March 31, 2017, the results of its operations for the year then ended, the changes in its net assets for each of the two years in the period then ended and the financial highlights for each of the five years in the period then ended, in conformity with accounting principles generally accepted in the United States of America. These financial statements and financial highlights (hereafter referred to as “financial statements”) are the responsibility of the Fund’s management. Our responsibility is to express an opinion on these financial statements based on our audits. We conducted our audits of these financial statements in accordance with the standards of the Public Company Accounting Oversight Board (United States). Those standards require that we plan and perform the audit to obtain reasonable assurance about whether the financial statements are free of material misstatement. An audit includes examining, on a test basis, evidence supporting the amounts and disclosures in the financial statements, assessing the accounting principles used and significant estimates made by management, and evaluating the overall financial statement presentation. We believe that our audits, which included confirmation of securities as of March 31, 2017 by correspondence with the custodian, brokers, and transfer agent of the investee funds, provide a reasonable basis for our opinion.
PricewaterhouseCoopers LLP
Philadelphia, Pennsylvania
May 23, 2017
42
VIRTUS STRATEGIC ALLOCATION FUND
TAX INFORMATION NOTICE (Unaudited)
MARCH 31, 2017
For the fiscal year ended March 31, 2017, the Fund makes the following disclosures for federal income tax purposes. Below is listed the percentages, or the maximum amount allowable, of its ordinary income dividends (“QDI”) to qualify for the lower tax rates applicable to individual shareholders, and the percentage of ordinary income dividends earned by the Fund which qualifies for the dividends received deduction (“DRD”) for corporate shareholders. The actual percentage of QDI and DRD for the calendar year will be designated in year-end tax statements. The Fund designates the amount below as long-term capital gains dividends (“LTCG”) taxable at a 20% rate, or lower depending on the shareholder’s income ($ reported in thousands). LTCG amount, if subsequently different, will be designated in the next annual report.
| | | | |
QDI | | DRD | | LTCG |
| 39% | | 27% | | $31,086 |
43
CONSIDERATION OF ADVISORY AND SUBADVISORY AGREEMENTS
BY THE BOARD OF TRUSTEES (Unaudited)
The Board of Trustees (the “Board”) of Virtus Equity Trust (the “Trust”) is responsible for determining whether to approve the continuation of the investment advisory agreement (the “Advisory Agreement”) between the Trust and Virtus Investment Advisers, Inc. (“VIA”) and of each subadvisory agreement (each, a “Subadvisory Agreement” and collectively, the “Subadvisory Agreements”) (together with the Advisory Agreement, the “Agreements”) with respect to the funds of the Trust, including Virtus Strategic Allocation Fund (formerly known as Virtus Balanced Fund) (the “Fund”). At in-person meetings held on November 2, 2016 and November 16-17, 2016 (the “Meetings”), the Board, including a majority of the Trustees who are not interested persons of the Trust as defined in Section 2(a)(19) of the Investment Company Act of 1940, as amended (such Act, the “1940 Act” and such Trustees, the “Independent Trustees”), considered and approved the continuation of each Agreement due for renewal, as further discussed below. In addition, prior to the Meetings, the Independent Trustees met with their independent legal counsel to discuss and consider the information provided by management and submitted questions to management, and they considered the responses provided.
In connection with the approval of the Agreements, the Board requested and evaluated information provided by VIA and each subadviser (each, a “Subadviser” and collectively, the “Subadvisers”) which, in the Board’s view, constituted information necessary for the Board to form a judgment as to whether the renewal of each of the Agreements would be in the best interests of the Fund and its shareholders. The Board also considered information furnished throughout the year at regular Board meetings with respect to the services provided by VIA and the Subadvisers, including quarterly performance reports prepared by management containing reviews of investment results and periodic presentations from the Subadvisers with respect to the Fund. The Board noted the affiliation of the Subadvisers with VIA and any potential conflicts of interest.
The Board was separately advised by independent legal counsel throughout the process. For each Agreement, the Board considered all the criteria separately with respect to the Fund and its shareholders. In their deliberations, the Board considered various factors, including those discussed below, none of which were controlling, and each Trustee may have attributed different weights to the various factors. The Independent Trustees also discussed the proposed approval of the Agreements in private sessions with their independent legal counsel at which no representatives of management were present.
In considering whether to approve the renewal of the Agreements, the Board reviewed and analyzed the factors it deemed relevant, including: (1) the nature, extent and quality of the services to be provided to the Fund by VIA and each of the Subadvisers; (2) the performance of the Fund as compared to an appropriate peer group and an appropriate index; (3) the level and method of computing the Fund’s advisory and subadvisory fees, and comparisons of the Fund’s advisory fee rates with those of a group of funds with similar investment objective(s); (4) the profitability of VIA under the Advisory Agreement; (5) any “fall-out” benefits to VIA, the Subadvisers and their affiliates (i.e., ancillary benefits realized by VIA, the Subadvisers or their affiliates from VIA’s or the applicable Subadviser’s relationship with the Trust); (6) the anticipated effect of growth in size on the Fund’s performance and expenses; (7) fees paid to VIA and the Subadvisers by comparable accounts, as applicable; (8) possible conflicts of interest; and (9) the terms of the Agreements.
Nature, Extent and Quality of Services
The Trustees received in advance of the Meetings information from VIA and each Subadviser, including completed questionnaires concerning a number of topics, including such company’s
44
CONSIDERATION OF ADVISORY AND SUBADVISORY AGREEMENTS
BY THE BOARD OF TRUSTEES (Unaudited) (Continued)
investment philosophy, resources, operations and compliance structure. The Trustees also received a presentation by VIA’s senior management personnel, during which among other items, VIA’s history, investment process, investment strategies, personnel, compliance procedures and the firm’s overall performance were reviewed and discussed. The Trustees noted that the Fund is managed using a “manager of managers” structure that generally involves the use of one or more subadvisers to manage some or all of the Fund’s portfolio. Under this structure, VIA is responsible for the management of the Fund’s investment programs and for evaluating and selecting subadvisers on an ongoing basis and making any recommendations to the Board regarding hiring, retaining or replacing subadvisers. In considering the Advisory Agreement with VIA, the Board considered VIA’s process for supervising and managing the Fund’s subadvisers, including (a) VIA’s ability to select and monitor the subadvisers; (b) VIA’s ability to provide the services necessary to monitor the subadvisers’ compliance with the Fund’s investment objectives, policies and restrictions as well as provide other oversight activities; and (c) VIA’s ability and willingness to identify instances in which a subadviser should be replaced and to carry out the required changes. The Trustees also considered: (a) the experience and capability of VIA’s management and other personnel; (b) the financial condition of VIA, and whether it had the financial wherewithal to provide a high level and quality of services to the Fund; (c) the quality of VIA’s own regulatory and legal compliance policies, procedures and systems; (d) the nature, extent and quality of administrative, transfer agency and other services provided by VIA and its affiliates to the Fund; (e) VIA’s supervision of the Fund’s other service providers; and (f) VIA’s risk management processes. It was noted that affiliates of VIA serve as administrator, transfer agent and distributor to the Fund. The Board also took into account its knowledge of VIA’s management and the quality of the performance of VIA’s duties through Board meetings, discussions and reports during the preceding year, as well as information from the Trust’s Chief Compliance Officer regarding the Fund’s compliance policies and procedures established pursuant to Rule 38a-1 under the 1940 Act.
With respect to the services provided by each of the Subadvisers, the Board considered information provided to the Board by each Subadviser, including each Subadviser’s Form ADV, as well as information provided throughout the past year. With respect to the Subadvisory Agreements, the Board noted that each Subadviser provided portfolio management, compliance with the Fund’s investment policies and procedures, compliance with applicable securities laws and assurances thereof. The Board also noted that VIA’s and the Subadvisers’ management of the Fund is subject to the oversight of the Board and must be carried out in accordance with the investment objective(s), policies and restrictions set forth in the Fund’s prospectus and statement of additional information. In considering the renewal of the Subadvisory Agreements, the Board also considered each Subadviser’s investment management process, including (a) the experience and capability of the Subadviser’s management and other personnel committed by the Subadviser to the Fund; (b) the financial condition of the Subadviser; (c) the quality of the Subadviser’s regulatory and legal compliance policies, procedures and systems; and (d) the Subadviser’s brokerage and trading practices, including with respect to best execution and soft dollars. The Board also took into account each Subadviser’s risk assessment and monitoring process. The Board noted each Subadviser’s regulatory history, including whether it was currently involved in any regulatory actions or investigations as well as material litigation, and any settlements and amelioratory actions undertaken, as appropriate.
After considering all of the information provided to them, the Trustees concluded that the nature, extent and quality of the services provided by VIA and each Subadviser were satisfactory and that there was a reasonable basis on which to conclude that each would continue to provide a high quality of investment services to the Fund.
45
CONSIDERATION OF ADVISORY AND SUBADVISORY AGREEMENTS
BY THE BOARD OF TRUSTEES (Unaudited) (Continued)
Investment Performance
The Board considered performance reports and discussions at Board meetings throughout the year, as well as a report (the “Lipper Report”) for the Fund prepared by Broadridge, an independent third party provider of investment company data, furnished in connection with the contract renewal process. The Lipper Report presented the Fund’s performance relative to a peer group of other mutual funds (the “Performance Universe”) and relevant indexes, as selected by Broadridge. The Board also considered performance information presented by management and took into account management’s discussion of the same, including the effect of market conditions on the Fund’s performance. The Board evaluated the Fund’s performance in the context of the considerations that a “manager of managers” structure requires. The Board noted that it also reviews on a quarterly basis detailed information about both the Fund’s performance results and portfolio composition, as well as each Subadviser’s investment strategy. The Board noted VIA’s expertise and resources in monitoring the performance, investment style and risk-adjusted performance of each Subadviser. The Board also noted each Subadviser’s performance record with respect to the Fund. The Board was mindful of VIA’s focus on each Subadviser’s performance and noted VIA’s performance in monitoring and responding to any performance issues with respect to the Fund. The Board also took into account its discussions with management regarding factors that contributed to the performance of the Fund.
The Board considered, among other performance data, the information set forth below with respect to the performance of the Fund for the period ended June 30, 2016.
The Board noted that the Fund underperformed the median of its Performance Universe and underperformed its benchmark for the 1- 3-, 5- and 10- year periods.
The Board considered that the Fund had recently replaced one of the Subadvisers, so that the performance shown included that of the prior subadviser, as well as management’s discussion about the reasons for the Fund’s underperformance. After reviewing these and related factors, the Board concluded that the Fund’s overall performance, or reasons discussed for underperformance, were satisfactory.
Management Fees and Total Expenses
The Board considered the fees charged to the Fund for advisory services as well as the total expense levels of the Fund. This information included comparisons of the Fund’s net management fee and total expense level to those of its peer group (the “Expense Group”). In comparing the Fund’s net management fee to that of comparable funds, the Board noted that in the materials presented such fee included both advisory and administrative fees. The Board also noted that the subadvisory fees were paid by VIA out of its management fees rather than paid separately by the Fund. In this regard, the Board took into account management’s discussion with respect to the advisory/subadvisory fee structure, including the amount of the advisory fee retained by VIA after payment of the subadvisory fee. The Board also took into account the size of the Fund and the impact on expenses. The Subadvisers provided, and the Board considered, fee information of comparable accounts managed by the Subadvisers, as applicable.
In addition to the foregoing, the Board considered, among other data, the information set forth below with respect to the Fund’s fees and expenses. In each case, the Board took into account management’s discussion of the Fund’s expenses, including the type and size of the Fund relative to the other funds in its Expense Group.
46
CONSIDERATION OF ADVISORY AND SUBADVISORY AGREEMENTS
BY THE BOARD OF TRUSTEES (Unaudited) (Continued)
The Board considered that the Fund’s net management fee was higher than the median of the Expense Group, while the Fund’s net total expenses were below the median of the Expense Group.
The Board concluded that the advisory and subadvisory fees, including with any proposed amendments, were fair and reasonable in light of the usual and customary charges made for services of the same nature and quality and the other factors considered.
Profitability
The Board also considered certain information relating to profitability that had been provided by VIA. In this regard, the Board considered information regarding the overall profitability, as well as on a Fund-by-Fund basis, of VIA for its management of the Fund and other funds of the Trust, as well as its profits and those of its affiliates for managing and providing other services to the Trust, such as distribution, transfer agency and administrative services provided to the Fund by a VIA affiliate. In addition to the fees paid to VIA and its affiliates, including the Subadvisers, the Board considered any other benefits derived by VIA or its affiliates from their relationships with the Fund. The Board reviewed the methodology used to allocate costs to the Fund, taking into account the fact that allocation methodologies are inherently subjective and various allocation methodologies may each be reasonable while producing different results. The Board concluded that the profitability to VIA and its affiliates from the Fund was reasonable in light of the quality of the services rendered to the Fund by VIA and its affiliates.
In considering the profitability to the Subadvisers in connection with their relationship to the Fund, the Board noted that the fees under the Subadvisory Agreements are paid by VIA out of the fees that VIA receives under the Advisory Agreement, so that Fund shareholders are not directly impacted by those fees. In considering the reasonableness of the fees payable by VIA to the affiliated Subadvisers, the Board noted that, because the Subadvisers are affiliates of VIA, such profitability might be directly or indirectly shared by VIA. For each of the above reasons, the Board concluded that the profitability to the Subadvisers and their affiliates from their relationship with the Fund was not a material factor in approval of the Subadvisory Agreements.
Economies of Scale
The Board received and discussed information concerning whether VIA realizes economies of scale as the Fund’s assets grow. The Board noted that the management fee for the Fund included breakpoints based on assets under management. The Board also took into account management’s discussion of the Fund’s management fee and subadvisory fee structure. The Board also took into account the current size of the Fund. The Board concluded that no change to the advisory fee structure of the Fund was necessary at this time. The Board noted that VIA and the Fund may realize certain economies of scale if the assets of the Fund were to increase, particularly in relationship to certain fixed costs, and that shareholders of the Fund would have an opportunity to benefit from these economies of scale.
For similar reasons as stated above with respect to the Subadvisers’ profitability, and based upon the current size of the portion of the Fund managed by each Subadviser, the Board concluded that the potential for economies of scale in the Subadvisers’ management of the Fund was not a material factor in the approval of the Subadvisory Agreements at this time.
Other Factors. The Board considered other benefits that may be realized by VIA and each Subadviser and their respective affiliates from their relationships with the Fund. Among them, the Board recognized that VP Distributors, LLC, an affiliate of VIA, serves as the distributor for the Trust, and, as such, receives payments pursuant to Rule 12b-1 from the Fund to compensate it
47
CONSIDERATION OF ADVISORY AND SUBADVISORY AGREEMENTS
BY THE BOARD OF TRUSTEES (Unaudited) (Continued)
for performing selling activities, which could lead to growth in the Trust’s assets and corresponding benefits from such growth, including economies of scale. The Board noted that an affiliate of VIA also provides administrative and transfer agency services to the Trust. The Board noted management’s discussion of the fact that, while the Subadvisers are affiliates of VIA, there are no other direct benefits to the Subadvisers or VIA in providing investment advisory services to the Fund, other than the fee to be earned under the applicable Agreement. There may be certain indirect benefits gained, including to the extent that serving the Fund could provide the opportunity to provide advisory services to additional portfolios of the Trust or certain reputational benefits.
Based on all of the foregoing considerations, the Board, including a majority of the Independent Trustees, determined that approval of each Agreement, as amended, was in the best interests of the Fund and its shareholders. Accordingly, the Board, and the Independent Trustees voting separately, approved the Agreements, as amended, with respect to the Fund.
48
FUND MANAGEMENT TABLES (Unaudited)
Information pertaining to the Trustees and officers of the Trust as of March 31, 2017, is set forth below. The statement of additional information (SAI) includes additional information about the Trustees and is available without charge, upon request, by calling (800) 243-4361.
The address of each individual, unless otherwise noted, is c/o Virtus Equity Trust, 101 Munson Street, Greenfield, MA 01301. There is no stated term of office for Trustees or officers of the Trust.
Independent Trustees
| | |
Name, Year of Birth,
Length of Time Served
and Number of
Portfolios in Complex | | Principal Occupation(s)
During Past 5 Years and
Other Directorships Held by Trustee |
Brown, Thomas J.
YOB: 1945
Served Since: 2016
63 Portfolios | | Retired. Trustee (since 2016), Virtus Mutual Fund Complex (50 portfolios) and Virtus Alternative Solutions Trust (4 portfolios); Trustee (since 2011), Virtus Variable Insurance Trust (9 portfolios); Director (since 2010), D’Youville Senior Care Center; and Director (since 2005), VALIC Company Funds (49 portfolios). |
Burke, Donald C.
YOB: 1960
Served Since: 2016
67 Portfolios | | Retired. Trustee (since 2016), Virtus Mutual Fund Complex (50 portfolios), Virtus Variable Insurance Trust (9 portfolios) and Virtus Alternative Solutions Trust (4 portfolios); Director (since 2014) closed-end funds managed by Duff & Phelps Investment Management Co. (4 funds); Director, Avista Corp. (energy company) (since 2011); Trustee, Goldman Sachs Fund Complex (2010 to 2014); and Director, BlackRock Luxembourg and Cayman Funds (2006 to 2010). |
Gelfenbien, Roger A.
YOB: 1943
Served Since: 2016
63 Portfolios | | Retired. Trustee (since 2016), Virtus Mutual Fund Complex (50 portfolios) and Virtus Alternative Solutions Trust (4 portfolios); Trustee (since 2000), Virtus Variable Insurance Trust (9 portfolios); and Director (since 1999), USAllianz Variable Insurance Product Trust (42 portfolios). |
Mallin, John R.
YOB: 1950
Served Since: 2016
63 Portfolios | | Partner/Attorney (since 2003), McCarter & English LLP (law firm), Real Property Practice Group; and Member (since 2014), Counselors of Real Estate. Trustee (since 2016), Virtus Mutual Fund Complex (50 portfolios) and Virtus Alternative Solutions Trust (4 portfolios); Director (since 2013), Horizons, Inc. (non-profit); and Trustee (since 1999), Virtus Variable Insurance Trust (9 portfolios). |
McClellan, Hassell H.
YOB: 1945
Served Since: 2015
63 Portfolios | | Retired (since 2013); and Professor (1984 to 2013), Wallace E. Carroll School of Management, Boston College. Trustee (since 2016), Virtus Alternative Solutions Trust (4 portfolios); Trustee (since 2015), Virtus Mutual Fund Complex (50 portfolios); and Director (since 2010), Barnes Group, Inc. (diversified global components manufacturer and logistical services company); Trustee, Virtus Variable Insurance Trust (9 portfolios) (since 2008); and Trustee, John Hancock Fund Complex (since 2000) (collectively, 228 portfolios). |
McLoughlin, Philip
YOB: 1946
Served Since: 1996
72 Portfolios
| | Retired. Director and Chairman (since 2016), The Zweig Fund Inc. and Virtus Global Dividend & Income Fund Inc.; Trustee and Chairman (since 2013), Virtus Alternative Solutions Trust (4 portfolios); Trustee/Director and Chairman (since 2011), Virtus Closed-End Funds (3 funds); Chairman and Trustee (since 2003), Virtus Variable Insurance Trust (9 portfolios); Director (since 1995), closed-end funds managed by Duff & Phelps Investment Management Co. (4 funds); Director (since 1991) and Chairman (since 2010), Lazard World Trust Fund (closed-end investment firm in Luxembourg); and Trustee (since 1989) and Chairman (since 2002), Virtus Mutual Fund Complex (50 portfolios). |
McNamara, Geraldine M.
YOB: 1951
Served Since: 2001
67 Portfolios
| | Retired. Trustee (since 2016) Virtus Alternative Solutions Trust (4 portfolios); Trustee (since 2015), Virtus Variable Insurance Trust (9 portfolios); Director (since 2003), closed-end funds managed by Duff & Phelps Investment Management Co. (4 funds); and Trustee (since 2001), Virtus Mutual Fund Complex (50 portfolios). |
49
FUND MANAGEMENT TABLES (Unaudited) (Continued)
Independent Trustees (Continued)
| | |
Name, Year of Birth,
Length of Time Served
and Number of
Portfolios in Complex | | Principal Occupation(s)
During Past 5 Years and
Other Directorships Held by Trustee |
Oates, James M.
YOB: 1946
Served Since: 1996
68 Portfolios
| | Managing Director (since 1994), Wydown Group (consulting firm). Director (since 2016), The Zweig Fund, Inc. and Virtus Global Dividend & Income Fund Inc.; Trustee (since 2016) Virtus Variable Insurance Trust (9 portfolios); Trustee/Director (since 2013), Virtus Closed-End Funds (3 funds); Trustee (since 2013), Virtus Alternative Solutions Trust (4 portfolios); Chairman and Trustee (since 2005), John Hancock Fund Complex (228 portfolios); Director (2002 to 2014), New Hampshire Trust Company; Chairman (2000 to 2016), Emerson Investment Management, Inc.; Non-Executive Chairman (2000 to 2014), Hudson Castle Group, Inc. (formerly IBEX Capital Markets, Inc.) (financial services); Chairman and Director (1999 to 2014), Connecticut River Bank; Director (since 1996), Stifel Financial; and Trustee (since 1987), Virtus Mutual Fund Complex (50 portfolios). |
Segerson, Richard E.
YOB: 1948
Served Since: 1996
63 Portfolios
| | Retired; and Managing Director (1998 to 2013), Northway Management Company. Trustee (since 2016) Virtus Alternative Solutions Trust (4 portfolios) and Virtus Variable Insurance Trust (9 portfolios); and Trustee (since 1983), Virtus Mutual Fund Complex (50 portfolios). |
Verdonck, Ferdinand L.J.
YOB: 1942
Served Since: 2006
63 Portfolios
| | Director (1998 to 2015), The J.P. Morgan Continental European Investment Trust; Director (2005 to 2013), Galapagos N.V. (biotechnology); Director (1998 to 2015) Groupe SNEF; Vice Chairman (since 2014), Affirmed Therapeutics (biotechnology); and Mr. Verdonck is also a director of several non-U.S. companies. Trustee (since 2016) Virtus Variable Insurance Trust (9 portfolios) and Virtus Alternative Solutions Trust (4 portfolios); and Trustee (since 2002), Virtus Mutual Fund Complex (50 portfolios). |
Interested Trustee
| | |
Name, Year of Birth,
Year Elected and
Number of Funds
Overseen | | Principal Occupation(s)
During Past 5 Years and
Other Directorships Held by Trustee |
Aylward, George R.*
Trustee and President
YOB: 1964
Elected: 2006
69 Portfolios | | Director, President and Chief Executive Officer (since 2008), Virtus Investment Partners, Inc. and/or certain of its subsidiaries; various senior officer positions with Virtus affiliates (since 2005). Chairman and Trustee (since 2015), Virtus ETF Trust II (1 fund); Trustee and President (since 2013), Virtus Alternative Solutions Trust (4 portfolios); Director (since 2013), Virtus Global Funds, PLC (2 portfolios); Trustee (since 2012) and President (since 2010), Virtus Variable Insurance Trust (9 portfolios); Trustee and President (since 2011), Virtus Closed-End Funds (3 funds); Trustee (since 2006), Virtus Mutual Funds (50 portfolios); and Director, President and Chief Executive Officer (since 2006), The Zweig Fund, Inc. and Virtus Global Dividend & Income Fund Inc. |
| * | Mr. Aylward is an “interested person,” as defined in the 1940 Act, by reason of his position as President and Chief Executive Officer of Virtus Investment Partners, Inc. (“Virtus”), the ultimate parent company of the Adviser, and various positions with its affiliates, including the Adviser. |
50
FUND MANAGEMENT TABLES (Unaudited) (Continued)
Officers
| | | | |
Name, Address and
Year of Birth | | Position(s) Held with
Trust and Length of Time Served | | Principal Occupation(s)
During Past 5 Years |
Bradley, W. Patrick
YOB: 1972 | | Executive Vice President (since 2013); Senior Vice President (2013 to 2016); Vice President (2011 to 2013); Chief Financial Officer and Treasurer (since 2006). | | Executive Vice President, Fund Services (since 2016), Senior Vice President, Fund Services (2010 to 2016), Virtus Investment Partners, Inc. and/or certain of its subsidiaries; various officer positions (since 2006) with Virtus affiliates; Executive Vice President (since 2016), Senior Vice President (2013 to 2016), Vice President (2011 to 2013), Chief Financial Officer and Treasurer (since 2004), Virtus Variable Insurance Trust; Executive Vice President (since 2016), Senior Vice President (2013 to 2016), Vice President (2011 to 2013), Chief Financial Officer and Treasurer (since 2006), Virtus Mutual Fund Complex; Executive Vice President (since 2016), Senior Vice President (2013 to 2016), Vice President (2012 to 2013) and Treasurer and Chief Financial Officer (since 2007), The Zweig Fund, Inc. and Virtus Global Dividend & Income Fund Inc.; Executive Vice President (since 2016), Senior Vice President (2013 to 2016), Vice President (2011 to 2013), Chief Financial Officer and Treasurer (since 2011), Virtus Closed-End Funds; Vice President and Assistant Treasurer (since 2011), Duff & Phelps Global Utility Income Fund Inc.; Director (since 2013), Virtus Global Funds, PLC; and Executive Vice President (since 2016), Senior Vice President, Chief Financial Officer and Treasurer (2013 to 2016), Virtus Alternative Solutions Trust. |
Carr, Kevin J.
YOB: 1954 | | Senior Vice President (since 2013); Vice President (2005 to 2013); Chief Legal Officer, Counsel and Secretary (since 2005). | | Senior Vice President (since 2009), Vice President, Counsel and Secretary (2008 to 2009), Virtus Investment Partners, Inc. and/or certain of its subsidiaries; various senior officer positions (since 2005) with Virtus affiliates; Senior Vice President (since 2013), Vice President (2005 to 2013), Chief Legal Officer, Counsel and Secretary (since 2005), Virtus Mutual Fund Complex; Senior Vice President (2013 to 2014), Vice President (2012 to 2013) and Assistant Secretary (since 2012), Secretary and Chief Legal Officer (2005 to 2012), The Zweig Fund, Inc. and Virtus Global Dividend & Income Fund Inc.; Assistant Secretary (since 2013), Vice President, Chief Legal Officer, Counsel and Secretary (2010 to 2013), Virtus Variable Insurance Trust; Vice President and Assistant Secretary (since 2011), Duff & Phelps Global Utility Income Fund Inc.; Senior Vice President and Assistant Secretary (2013 to 2014), Vice President and Assistant Secretary (2012 to 2013), Vice President, Chief Legal Officer, Counsel and Secretary (2011 to 2012), Virtus Closed-End Funds; and Assistant Secretary (since 2013), Virtus Alternative Solutions Trust. |
51
FUND MANAGEMENT TABLES (Unaudited) (Continued)
Officers (Continued)
| | | | |
Name, Address and
Year of Birth | | Position(s) Held with
Trust and Length of Time Served | | Principal Occupation(s)
During Past 5 Years |
Engberg, Nancy J.
YOB: 1956 | | Vice President
and Chief Compliance
Officer since 2011. | | Vice President (since 2008) and Chief Compliance Officer (2008 to 2011 and since 2016), Virtus Investment Partners, Inc. and/or certain of its subsidiaries; various officer positions (since 2003) with Virtus affiliates; Vice President and Chief Compliance Officer (since 2011), Virtus Mutual Fund Complex; Vice President (since 2010) and Chief Compliance Officer (since 2011), Virtus Variable Insurance Trust; Vice President and Chief Compliance Officer (since 2011), Virtus Closed-End Funds; Vice President and Chief Compliance Officer (since 2012), The Zweig Fund, Inc. and Virtus Global Dividend & Income Fund Inc.; Vice President and Chief Compliance Officer (since 2013), Virtus Alternative Solutions Trust; Chief Compliance Officer (since 2015), ETFis Series Trust I; and Chief Compliance Officer (since 2015), Virtus ETF Trust II. |
Waltman, Francis G.
YOB: 1962 | | Executive Vice President (since 2013); Senior Vice President (2008-2013). | | Executive Vice President, Product Development (since 2009), Virtus Investment Partners, Inc. and/or certain of its subsidiaries; various senior officer positions (since 2006) with Virtus affiliates; Executive Vice President (since 2013), Senior Vice President (2008 to 2013), Virtus Mutual Fund Complex; Executive Vice President (since 2013), Senior Vice President (2010 to 2013), Virtus Variable Insurance Trust; Executive Vice President (since 2013), Senior Vice President (2011 to 2013), Virtus Closed-End Funds; Director (since 2013), Virtus Global Funds PLC; and Executive Vice President (since 2013), Virtus Alternative Solutions Trust. |
52
Virtus Strategic Allocation Fund
a series of Virtus Equity Trust
Supplement dated March 24, 2017 to the Summary Prospectus and the Virtus Equity Trust
Statutory Prospectus, each dated July 29, 2016, as supplemented
IMPORTANT NOTICETO INVESTORS
Effective April 30, 2017, Christopher Kelleher will retire from Newfleet and will no longer be a portfolio manager for the Virtus Strategic Allocation Fund, and Stephen H. Hooker will be added as a portfolio manager to the fund. The resulting disclosure changes to the fund’s prospectuses that will be effective on April 30, 2017 are described below.
The disclosure under “Portfolio Management” in the fund’s summary prospectus and in the summary section of fund’s statutory prospectus will be replaced in its entirety with the following:
| | > | David L. Albrycht, CFA, President and Chief Investment Officer at Newfleet. Mr. Albrycht has served as a Portfolio Manager of the fund since 2012. |
| | > | Frederick A. Brimberg, Senior Managing Director and International Equity Portfolio Manager at Duff & Phelps. Mr. Brimberg has served as a Portfolio Manager of the fund since 2012. |
| | > | Doug Foreman, CFA, Chief Investment Officer at Kayne Anderson Rudnick. Mr. Foreman has served as a Portfolio Manager of the fund since September 2016. |
| | > | Stephen H, Hooker, CFA, Managing Director and Portfolio Manager at Newfleet. Mr. Hooker has served as a Portfolio Manager of the fund since April 2017. |
The row for the fund in the table under “Newfleet” on page 72 of the fund’s statutory prospectus will be replaced with the following:
| | |
| Virtus Strategic Allocation Fund (fixed income portion only) | | David L. Albrycht, CFA (since 2012) Stephen H. Hooker, CFA (since April 2017) |
The narrative under the referenced table with respect to the portfolio managers of the fund will be replaced in its entirety with the following:
David L. Albrycht, CFA. Mr. Albrycht is President and Chief Investment Officer at Newfleet (since June 2011). Until June 2011, he was executive managing director (2008 to 2011) and vice president (2005 to 2008), fixed income, of Goodwin Capital Advisers, Inc. (“Goodwin”). Previously, he was associated with VIA, at which time it was an affiliate of Goodwin. He managed fixed income portfolios for Goodwin affiliates beginning in 1991.
Stephen H. Hooker, CFA. Mr. Hooker is a Managing Director Portfolio Manager at Newfleet (since 2011). He is responsible for the paper and packaging and chemicals industry sectors, and the Eastern Europe, Middle East, and Africa sovereign credit sector. From 2005 until 2011, Mr. Hooker was vice president,
senior credit analyst at Aladdin Capital Management and Global Plus Investment Management, respectively, both of which specialize in high yield and structured credit products. Prior to 2005, he was at Goodwin for 12 years, serving in various capacities, including as a senior credit analyst and emerging markets sector manager on its fixed income team.
Investors should retain this supplement with the
Prospectuses for future reference.
VET 8019/StratAllocation PMs (3/2017)
VIRTUS EQUITY TRUST
101 Munson Street
Greenfield, MA 01301-9668
Trustees
George R. Aylward
Thomas J. Brown
Donald C. Burke
Roger A. Gelfenbien
John R. Mallin
Hassell H. McClellan
Philip R. McLoughlin, Chairman
Geraldine M. McNamara
James M. Oates
Richard E. Segerson
Ferdinand L.J. Verdonck
Officers
George R. Aylward, President
Francis G. Waltman, Executive Vice President
W. Patrick Bradley, Executive Vice President, Chief Financial Officer and Treasurer
Kevin J. Carr, Senior Vice President, Chief Legal Officer, Counsel and Secretary
Nancy J. Engberg, Vice President and Chief Compliance Officer
Investment Adviser
Virtus Investment Advisers, Inc.
100 Pearl Street
Hartford, CT 06103-4506
Principal Underwriter
VP Distributors, LLC
100 Pearl Street
Hartford, CT 06103-4506
Administrator and Transfer Agent
Virtus Fund Services, LLC
100 Pearl Street
Hartford, CT 06103-4506
Custodian
JPMorgan Chase Bank, NA
1 Chase Manhattan Plaza
New York, NY 10005-1401
Independent Registered Public
Accounting Firm
PricewaterhouseCoopers LLP
2001 Market Street
Philadelphia, PA 19103-7042
How to Contact Us
Mutual Fund Services 1-800-243-1574
Adviser Consulting Group 1-800-243-4361
Website Virtus.com
Important Notice to Shareholders
The Securities and Exchange Commission has modified mailing regulations for semiannual and annual shareholder fund reports to allow mutual fund companies to send a single copy of these reports to shareholders who share the same mailing address. If you would like additional copies, please call Mutual Fund Services at 1-800-243-1574.
For more information about
Virtus Mutual Funds, please call
your financial representative, or
contact us at 1-800-243-1574
or Virtus.com.
Item 2. Code of Ethics.
| (a) | The registrant, as of the end of the period covered by this report, has adopted a code of ethics that applies to the registrant’s principal executive officer, principal financial officer, principal accounting officer or controller, or persons performing similar functions, regardless of whether these individuals are employed by the registrant or a third party. |
| (c) | There have been no amendments, during the period covered by this report, to a provision of the code of ethics that applies to the registrant’s principal executive officer, principal financial officer, principal accounting officer or controller, or persons performing similar functions, regardless of whether these individuals are employed by the registrant or a third party, and that relates to any element of the code of ethics described in Item 2(b) of the instructions for completion of Form N-CSR. |
| (d) | The registrant has not granted any waivers, during the period covered by this report, including an implicit waiver, from a provision of the code of ethics that applies to the registrant’s principal executive officer, principal financial officer, principal accounting officer or controller, or persons performing similar functions, regardless of whether these individuals are employed by the registrant or a third party, that relates to one or more of the items set forth in paragraph (b) of the instructions for completion of this Item. |
Item 3. Audit Committee Financial Expert.
| (a)(1) | The Registrant’s Board of Trustees has determined that the Registrant has an “audit committee financial expert” serving on its Audit Committee. |
| (a)(2) | The Registrant’s Board of Trustees has determined that Donald C. Burke, Thomas J. Brown and Richard E. Segerson each possess the technical attributes identified in Instruction 2(b) of Item 3 to Form N-CSR to qualify as an “audit committee financial expert.” Each of Mr. Burke, Mr. Brown and Mr. Segerson is an “independent” trustee pursuant to paragraph (a)(2) of Item 3 to Form N-CSR. |
Item 4. Principal Accountant Fees and Services.
Audit Fees
| (a) | The aggregate fees billed for each of the last two fiscal years for professional services rendered by the principal accountant for the audit of the registrant’s annual financial statements or services that are normally provided by the accountant in connection with statutory and regulatory filings or engagements for fiscal years ended March 31, 2016 and March 31, 2017 are $256,371 and $261,865, respectively. |
Audit-Related Fees
| (b) | The aggregate fees billed in each of the last two fiscal years for assurance and related services by the principal accountant that are reasonably related to the performance of the audit of the registrant’s financial statements and are not reported under paragraph (a) of this Item for fiscal years ended March 31, 2016 and March 31, 2017 are $16,982 and $11,813, respectively. Such audit-related fees include out of pocket expenses, and cross fund fees. |
Tax Fees
| (c) | The aggregate fees billed in each of the last two fiscal years for professional services rendered by the principal accountant for tax compliance, tax advice, and tax planning for fiscal years ended March 31, 2016 and March 31, 2017 are $48,100 and $55,600, respectively. |
“Tax Fees” are those primarily associated with review of the Trust’s tax provision and qualification as a regulated investment company (RIC) in connection with audits of the Trust’s financial statement, review of year-end distributions by the Fund to avoid excise tax for the Trust, periodic discussion with management on tax issues affecting the Trust, and reviewing and signing the Fund’s federal income tax returns.
All Other Fees
| (d) | The aggregate fees billed in each of the last two fiscal years for products and services provided by the principal accountant, other than the services reported in paragraphs (a) through (c) of this Item are for fiscal years ended March 31, 2016 and March 31, 2017 are $0 and $0, respectively. |
| (e)(1) | Disclose the audit committee’s pre-approval policies and procedures described in paragraph (c)(7) of Rule 2-01 of Regulation S-X. |
The Board of Trustees of Virtus Equity Trust (the “Fund”) has adopted policies and procedures with regard to the pre-approval of services provided by its independent auditors. Audit, audit-related and tax compliance services provided to the Fund on an annual basis require specific pre-approval by the Audit Committee. The Audit Committee must also approve other non-audit services provided to the Fund and those non-audit services provided to the Fund’s Affiliated Service Providers that relate directly to the operations and financial reporting of the Fund. Certain of these non-audit services that the Audit Committee believes are a) consistent with the SEC’s auditor independence rules and b) routine and recurring services that will not impair the
independence of the independent auditors may be approved by the Audit Committee without consideration on a specific case-by-case basis (“general pre-approval”).
The Audit Committee has determined that Mr. Thomas J. Brown, Chair of the Audit Committee, may provide pre-approval for such services that meet the above requirements in the event such approval is sought between regularly scheduled meetings. In any event, the Audit Committee is informed of each service approved subject to general pre-approval at the next regularly scheduled in-person Audit Committee meeting.
| (e)(2) | The percentage of services described in each of paragraphs (b) through (d) of this Item that were approved by the audit committee pursuant to paragraph (c)(7)(i)(C) of Rule 2-01 of Regulation S-X are as follows: |
(b) 0%
(c) 0%
(d) N/A
| (f) | The percentage of hours expended on the principal accountant’s engagement to audit the registrant’s financial statements for the most recent fiscal year that were attributed to work performed by persons other than the principal accountant’s full-time, permanent employees was less than fifty percent. |
| (g) | The aggregate non-audit fees billed by the registrant’s accountant for services rendered to the registrant, and rendered to the registrant’s investment adviser (not including any sub-adviser whose role is primarily portfolio management and is subcontracted with or overseen by another investment adviser), and any entity controlling, controlled by, or under common control with the adviser that provides ongoing services to the registrant for fiscal years ended March 31, 2016 and March 31, 2017 are $650,265 and $482,558, respectively. |
| (h) | The registrant’s audit committee of the board of directors has considered whether the provision of non-audit services that were rendered to the registrant’s investment adviser (not including any sub-adviser whose role is primarily portfolio management and is subcontracted with or overseen by another investment adviser), and any entity controlling, controlled by, or under common control with the investment adviser that provides ongoing services to the registrant that were not pre-approved pursuant to paragraph (c)(7)(ii) of Rule 2-01 of Regulation S-X is compatible with maintaining the principal accountant’s independence. |
Item 5. Audit Committee of Listed Registrants.
Not applicable.
Item 6. Investments.
| (a) | Schedule of Investments in securities of unaffiliated issuers as of the close of the reporting period is included as part of the report to shareholders filed under Item 1 of this form. |
(b) Not applicable.
| Item 7. | Disclosure of Proxy Voting Policies and Procedures for Closed-End Management Investment Companies. |
Not applicable.
Item 8. Portfolio Managers of Closed-End Management Investment Companies.
Not applicable.
| Item 9. | Purchases of Equity Securities by Closed-End Management Investment Company and Affiliated Purchasers. |
Not applicable.
Item 10. Submission of Matters to a Vote of Security Holders.
There have been no material changes to the procedures by which the shareholders may recommend nominees to the registrant’s board of trustees, where those changes were implemented after the registrant last provided disclosure in response to the requirements of Item 407(c)(2)(iv) of Regulation S-K (17 CFR 229.407) (as required by Item 22(b)(15) of Schedule 14A (17 CFR 240.14a-101)), or this Item.
Item 11. Controls and Procedures.
| (a) | The registrant’s principal executive and principal financial officers, or persons performing similar functions, have concluded that the registrant’s disclosure controls and procedures (as defined in Rule 30a-3(c) under the Investment Company Act of 1940, as amended (the “1940 Act”) (17 CFR 270.30a-3(c))) are effective, as of a date within 90 days of the filing date of the report that includes the disclosure required by this paragraph, based on their evaluation of these controls and procedures required by Rule 30a-3(b) under the 1940 Act (17 CFR 270.30a-3(b)) and Rules 13a-15(b) or 15d-15(b) under the Securities Exchange Act of 1934, as amended (17 CFR 240.13a-15(b) or 240.15d-15(b)). |
| (b) | There were no changes in the registrant’s internal control over financial reporting (as defined in Rule 30a-3(d) under the 1940 Act (17 CFR 270.30a-3(d))) that occurred during the registrant’s second fiscal quarter of the period covered by this report that has materially affected, or is reasonably likely to materially affect, the registrant’s internal control over financial reporting. |
| | (a)(1) | Code of ethics, or any amendment thereto, that is the subject of disclosure required by Item 2 is attached hereto. |
| | (a)(2) | Certifications pursuant to Rule 30a-2(a) under the 1940 Act and Section 302 of the Sarbanes-Oxley Act of 2002 are attached hereto. |
| | (b) | Certifications pursuant to Rule 30a-2(b) under the 1940 Act and Section 906 of the Sarbanes- Oxley Act of 2002 are attached hereto. |
(12.other) Not applicable.
SIGNATURES
Pursuant to the requirements of the Securities Exchange Act of 1934 and the Investment Company Act of 1940, the registrant has duly caused this report to be signed on its behalf by the undersigned, thereunto duly authorized.
| | | | |
| (Registrant) | | Virtus Equity Trust | | |
| | | | |
| | |
| By (Signature and Title)* | | /s/ George R. Aylward | | |
| | George R. Aylward, President | | |
| | (principal executive officer) | | |
Pursuant to the requirements of the Securities Exchange Act of 1934 and the Investment Company Act of 1940, this report has been signed below by the following persons on behalf of the registrant and in the capacities and on the dates indicated.
| | | | |
| By (Signature and Title)* | | /s/ George R. Aylward | | |
| | George R. Aylward, President | | |
| | (principal executive officer) | | |
| | | | |
| By (Signature and Title)* | | /s/ W. Patrick Bradley | | |
| | W. Patrick Bradley, Executive Vice President, Chief Financial Officer, and Treasurer |
| | (principal financial officer) | | |
* Print the name and title of each signing officer under his or her signature.