UNITED STATES
SECURITIES AND EXCHANGE COMMISSION
Washington, D.C. 20549
FORM N-CSR
CERTIFIED SHAREHOLDER REPORT OF REGISTERED MANAGEMENT
INVESTMENT COMPANIES
Investment Company Act file number 811-00945
Virtus Equity Trust
(Exact name of registrant as specified in charter)
101 Munson Street
Greenfield, MA 01301-9668
(Address of principal executive offices) (Zip code)
Kevin J. Carr, Esq.
Senior Vice President, Chief Legal Officer, Counsel and Secretary for Registrant
100 Pearl Street
Hartford, CT 06103-4506
(Name and address of agent for service)
Registrant’s telephone number, including area code: (800) 243-1574
Date of fiscal year end: September 30
Date of reporting period: September 30, 2017
Form N-CSR is to be used by management investment companies to file reports with the Commission not later than 10 days after the transmission to stockholders of any report that is required to be transmitted to stockholders under Rule 30e-1 under the Investment Company Act of 1940 (17 CFR 270.30e-1). The Commission may use the information provided on Form N-CSR in its regulatory, disclosure review, inspection, and policymaking roles.
A registrant is required to disclose the information specified by Form N-CSR, and the Commission will make this information public. A registrant is not required to respond to the collection of information contained in Form N-CSR unless the Form displays a currently valid Office of Management and Budget (“OMB”) control number. Please direct comments concerning the accuracy of the information collection burden estimate and any suggestions for reducing the burden to Secretary, Securities and Exchange Commission, 450 Fifth Street, NW, Washington, DC 20549-0609. The OMB has reviewed this collection of information under the clearance requirements of 44 U.S.C. § 3507.
Item 1. Reports to Stockholders.
The Report to Shareholders is attached herewith.
| | |
ANNUAL REPORT VIRTUS EQUITY TRUST | |  |
September 30, 2017
|
Virtus Contrarian Value Fund |
|
Virtus KAR Capital Growth Fund |
|
Virtus KAR Global Quality Dividend Fund |
|
Virtus KAR Mid-Cap Core Fund |
|
Virtus KAR Mid-Cap Growth Fund |
|
Virtus KAR Small-Cap Core Fund |
|
Virtus KAR Small-Cap Growth Fund |
|
Virtus KAR Small-Cap Value Fund |
|
Virtus Rampart Enhanced Core Equity Fund |
|
Virtus Tactical Allocation Fund |
Not FDIC Insured
No Bank Guarantee
May Lose Value

Table of Contents
Proxy Voting Procedures and Voting Record (Form N-PX)
The subadvisers vote proxies relating to portfolio securities in accordance with procedures that have been approved by the Board of Trustees of the Trust (“Trustees,” or the “Board”). You may obtain a description of these procedures, along with information regarding how the Funds voted proxies during the most recent 12-month period ended June 30, free of charge, by calling toll-free 1-800-243-1574. This information is also available through the Securities and Exchange Commission’s (the “SEC”) website at http://www.sec.gov.
Form N-Q Information
The Trust files a complete schedule of portfolio holdings for each Fund with the SEC for the first and third quarters of each fiscal period on Form N-Q. Form N-Q is available on the SEC’s website at http://www.sec.gov. Form N-Q may be reviewed and copied at the SEC’s Public Reference Room. Information on the operation of the SEC’s Public Reference Room can be obtained by calling toll-free 1-800-SEC-0330.
This report is not authorized for distribution to prospective investors in the Funds of Virtus Equity Trust unless preceded or accompanied by an effective prospectus which includes information concerning the sales charge, each Fund’s record and other pertinent information.
MESSAGE TO SHAREHOLDERS
To My Fellow Shareholders of Virtus Mutual Funds:
| | |
 | | I am pleased to present the annual report for your fund, covering a partial, six-month period from April 1, 2017 through September 30, 2017 following the change in fiscal year-end from March 31 to September 30. The fund’s last annual report was for the 12 months ended March 31, 2017. During the past six months, the Federal Reserve (“the Fed”) raised interest rates for the third time since last December, and in October 2017 began the process of unwinding the balance sheet debt it had accumulated since 2008 in its efforts to stimulate the economy – a clear signal that it believes the U.S. is back on a growth path. Global economic growth also strengthened, with other major central banks |
preparing to taper their own stimulus policies. Rounding out the optimistic picture, corporate earnings were generally strong during the period. Against this positive backdrop, equity markets have surged. U.S. large- and small-cap stocks returned 7.71% and 8.27%, as measured by the performance of the S&P 500® Index and Russell 2000® Index, respectively. Within international equities, emerging markets outperformed their developed peers, with the MSCI Emerging Markets Index (net) up 14.66%, compared with the MSCI EAFE® Index (net), which returned 11.86%. Demand for U.S. Treasuries also remained strong, driven by foreign investors who favored their yield advantage and credit quality over many foreign government bonds. On September 30, 2017, the benchmark 10-year U.S. Treasury yielded 2.33%, compared with 2.31% six months earlier. The broader U.S. fixed income market, as represented by the Bloomberg Barclays U.S. Aggregate Bond Index, which tracks Treasuries and other investment-grade debt securities, increased 2.31% for the six months, while non-investment grade bonds gained 4.19%, as measured by the Bloomberg Barclays U.S. Corporate High Yield Bond Index. Market uncertainty is an ever-present reminder of the importance of portfolio diversification, including exposure to traditional and alternative asset classes. While diversification cannot guarantee a profit or prevent a loss, owning a variety of asset classes may cushion your portfolio against inevitable market fluctuations. Your financial advisor can help you ensure that your portfolio is adequately diversified across asset classes and investment strategies. The Virtus Funds have even more investment options following Virtus Investment Partners’ (“Virtus”) acquisition of RidgeWorth Investments. We now offer 26 additional funds, including equity, fixed income, international, and asset allocation strategies from three new Virtus affiliates – Ceredex Value Advisors, Seix Investment Advisors, and Silvant Capital Management – and from subadvisers WCM Investment Management and Zevenbergen Capital Investments. I invite you to learn more about our growing family of managers and funds at Virtus.com. On behalf of our investment affiliates, thank you for entrusting the Virtus Funds with your assets. Should you have questions about your account or require assistance, please visit Virtus.com, or call our customer service team at 1-800-243-1574. We appreciate your business and remain committed to your long-term financial success. Sincerely, 
George R. Aylward President, Virtus Mutual Funds October 2017 |
Performance data quoted represents past results. Past performance is no guarantee of future results, and current performance may be higher or lower than the performance shown above.
1
VIRTUS EQUITY TRUST
DISCLOSURE OF FUND EXPENSES (Unaudited)
FOR THE SIX-MONTH PERIOD OF APRIL 1, 2017 TO SEPTEMBER 30, 2017
We believe it is important for you to understand the impact of costs on your investment. All mutual funds have operating expenses. As a shareholder of a Virtus Equity Trust Fund (each, a “Fund”), you may incur two types of costs: (1) transaction costs, including sales charges on purchases of Class A shares and contingent deferred sales charges on Class C shares; and (2) ongoing costs, including investment advisory fees, distribution and service fees, and other expenses. Class I shares and Class R6 shares are sold without sales charges and do not incur distribution and service fees. For further information regarding applicable sales charges, see Note 1 in the Notes to Financial Statements. These examples are intended to help you understand your ongoing costs (in dollars) of investing in a Fund and to compare these costs with the ongoing costs of investing in other mutual funds. These examples are based on an investment of $1,000 invested at the beginning of the period and held for the entire six-month period. The Annualized Expense Ratios may be different from the expense ratios in the Financial Highlights which is for the fiscal period ended September 30, 2017. The following Expense Table illustrates a Fund’s costs in two ways.
Actual Expenses
The first section of the accompanying table provides information about actual account values and actual expenses. You may use the information in this section, together with the amount you invested, to estimate the expenses that you paid over the period. Simply divide your account value by $1,000 (for example, an $8,600 account value divided by $1,000 = 8.6), then multiply the result by the number in the first section under the heading “Expenses Paid During Period” to estimate the expenses you paid on your account during the period.
Hypothetical Example for Comparison Purposes
The second section of the accompanying table provides information about hypothetical account values and hypothetical expenses based on each Fund’s actual expense ratio and an assumed rate of return of 5% per year before expenses, which is not your Fund’s actual return. The hypothetical account values and expenses may not be used to estimate the actual ending account balance or expenses you paid for the period. You may use this information to compare the ongoing costs of investing in your Fund and other funds. To do so, compare these 5% hypothetical examples with the 5% hypothetical examples that appear in the shareholder reports of the other funds.
Please note that the expenses shown in the accompanying table are meant to highlight your ongoing costs only and do not reflect any transactional costs, such as sales charges or contingent deferred sales charges. Therefore, the second section of the accompanying table is useful in comparing ongoing costs only, and will not help you determine the relative total costs of owning different funds. In addition, if these transactional costs were included, your costs would have been higher. The calculations assume no shares were
bought or sold during the period. Your actual costs may have been higher or lower, depending on the amount of your investment and the timing of any purchases or redemptions.
| | | | | | | | | | | | | | | | |
| Expense Table | |
| | | Beginning
Account Value
April 1, 2017 | | | Ending
Account Value
September 30, 2017 | | | Annualized
Expense
Ratio | | | Expenses Paid
During
Period* | |
Contrarian Value Fund | | | | | |
Actual | | | | | | | | | | | | | | | | |
Class A | | $ | 1,000.00 | | | $ | 1,041.90 | | | | 1.46 | % | | $ | 7.47 | |
Class C | | | 1,000.00 | | | | 1,038.20 | | | | 2.20 | | | | 11.24 | |
Class I | | | 1,000.00 | | | | 1,043.50 | | | | 1.19 | | | | 6.10 | |
Class R6 | | | 1,000.00 | | | | 1,044.00 | | | | 1.07 | | | | 5.48 | |
Hypothetical (5% return before expenses) | | | | | |
Class A | | | 1,000.00 | | | | 1,017.75 | | | | 1.46 | | | | 7.38 | |
Class C | | | 1,000.00 | | | | 1,014.04 | | | | 2.20 | | | | 11.11 | |
Class I | | | 1,000.00 | | | | 1,019.10 | | | | 1.19 | | | | 6.02 | |
Class R6 | | | 1,000.00 | | | | 1,019.70 | | | | 1.07 | | | | 5.42 | |
KAR Capital Growth Fund | | | | | |
Actual | | | | | | | | | | | | | | | | |
Class A | | $ | 1,000.00 | | | $ | 1,160.10 | | | | 1.30 | % | | $ | 7.04 | |
Class C | | | 1,000.00 | | | | 1,155.10 | | | | 2.08 | | | | 11.24 | |
Class I | | | 1,000.00 | | | | 1,160.90 | | | | 1.08 | | | | 5.85 | |
Hypothetical (5% return before expenses) | | | | | |
Class A | | | 1,000.00 | | | | 1,018.55 | | | | 1.30 | | | | 6.58 | |
Class C | | | 1,000.00 | | | | 1,014.64 | | | | 2.08 | | | | 10.50 | |
Class I | | | 1,000.00 | | | | 1,019.65 | | | | 1.08 | | | | 5.47 | |
KAR Global Quality Dividend Fund | | | | | |
Actual | | | | | | | | | | | | | | | | |
Class A | | $ | 1,000.00 | | | $ | 1,043.10 | | | | 1.35 | % | | $ | 6.91 | |
Class C | | | 1,000.00 | | | | 1,038.60 | | | | 2.10 | | | | 10.73 | |
Class I | | | 1,000.00 | | | | 1,044.10 | | | | 1.10 | | | | 5.64 | |
Hypothetical (5% return before expenses) | | | | | |
Class A | | | 1,000.00 | | | | 1,018.30 | | | | 1.35 | | | | 6.83 | |
Class C | | | 1,000.00 | | | | 1,014.54 | | | | 2.10 | | | | 10.61 | |
Class I | | | 1,000.00 | | | | 1,019.55 | | | | 1.10 | | | | 5.57 | |
KAR Mid-Cap Core Fund | | | | | |
Actual | | | | | | | | | | | | | | | | |
Class A | | $ | 1,000.00 | | | $ | 1,087.00 | | | | 1.20 | % | | $ | 6.28 | |
Class C | | | 1,000.00 | | | | 1,082.80 | | | | 1.95 | | | | 10.18 | |
Class I | | | 1,000.00 | | | | 1,088.20 | | | | 0.95 | | | | 4.97 | |
Hypothetical (5% return before expenses) | | | | | |
Class A | | | 1,000.00 | | | | 1,019.05 | | | | 1.20 | | | | 6.07 | |
Class C | | | 1,000.00 | | | | 1,015.29 | | | | 1.95 | | | | 9.85 | |
Class I | | | 1,000.00 | | | | 1,020.31 | | | | 0.95 | | | | 4.81 | |
KAR Mid-Cap Growth Fund | | | | | |
Actual | | | | | | | | | | | | | | | | |
Class A | | $ | 1,000.00 | | | $ | 1,134.80 | | | | 1.40 | % | | $ | 7.49 | |
Class C | | | 1,000.00 | | | | 1,130.10 | | | | 2.15 | | | | 11.48 | |
Class I | | | 1,000.00 | | | | 1,135.80 | | | | 1.15 | | | | 6.16 | |
Hypothetical (5% return before expenses) | | | | | |
Class A | | | 1,000.00 | | | | 1,018.05 | | | | 1.40 | | | | 7.08 | |
Class C | | | 1,000.00 | | | | 1,014.29 | | | | 2.15 | | | | 10.86 | |
Class I | | | 1,000.00 | | | | 1,019.30 | | | | 1.15 | | | | 5.82 | |
2
VIRTUS EQUITY TRUST
DISCLOSURE OF FUND EXPENSES (Unaudited) (Continued)
FOR THE SIX-MONTH PERIOD OF APRIL 1, 2017 TO SEPTEMBER 30, 2017
| | | | | | | | | | | | | | | | |
| Expense Table | |
| | | Beginning
Account Value
April 1, 2017 | | | Ending
Account Value
September 30, 2017 | | | Annualized
Expense
Ratio | | | Expenses Paid
During
Period* | |
KAR Small-Cap Core Fund | | | | | |
Actual | | | | | | | | | | | | | | | | |
Class A | | $ | 1,000.00 | | | $ | 1,159.20 | | | | 1.33 | % | | $ | 7.20 | |
Class C | | | 1,000.00 | | | | 1,154.70 | | | | 2.08 | | | | 11.24 | |
Class I | | | 1,000.00 | | | | 1,161.00 | | | | 1.08 | | | | 5.85 | |
Class R6 | | | 1,000.00 | | | | 1,161.40 | | | | 0.99 | | | | 5.36 | |
Hypothetical (5% return before expenses) | | | | | |
Class A | | | 1,000.00 | | | | 1,018.40 | | | | 1.33 | | | | 6.73 | |
Class C | | | 1,000.00 | | | | 1,014.64 | | | | 2.08 | | | | 10.50 | |
Class I | | | 1,000.00 | | | | 1,019.65 | | | | 1.08 | | | | 5.47 | |
Class R6 | | | 1,000.00 | | | | 1,020.10 | | | | 0.99 | | | | 5.01 | |
KAR Small-Cap Growth Fund | | | | | |
Actual | | | | | | | | | | | | | | | | |
Class A | | $ | 1,000.00 | | | $ | 1,204.10 | | | | 1.50 | % | | $ | 8.29 | |
Class C | | | 1,000.00 | | | | 1,199.20 | | | | 2.25 | | | | 12.40 | |
Class I | | | 1,000.00 | | | | 1,205.10 | | | | 1.25 | | | | 6.91 | |
Hypothetical (5% return before expenses) | | | | | |
Class A | | | 1,000.00 | | | | 1,017.55 | | | | 1.50 | | | | 7.59 | |
Class C | | | 1,000.00 | | | | 1,013.79 | | | | 2.25 | | | | 11.36 | |
Class I | | | 1,000.00 | | | | 1,018.80 | | | | 1.25 | | | | 6.33 | |
KAR Small-Cap Value Fund | | | | | |
Actual | | | | | | | | | | | | | | | | |
Class A | | $ | 1,000.00 | | | $ | 1,085.60 | | | | 1.32 | % | | $ | 6.90 | |
Class C | | | 1,000.00 | | | | 1,081.70 | | | | 2.06 | | | | 10.75 | |
Class I | | | 1,000.00 | | | | 1,087.20 | | | | 1.07 | | | | 5.60 | |
Class R6 | | | 1,000.00 | | | | 1,087.80 | | | | 1.01 | | | | 5.29 | |
Hypothetical (5% return before expenses) | | | | | |
Class A | | | 1,000.00 | | | | 1,018.45 | | | | 1.32 | | | | 6.68 | |
Class C | | | 1,000.00 | | | | 1,014.74 | | | | 2.06 | | | | 10.40 | |
Class I | | | 1,000.00 | | | | 1,019.70 | | | | 1.07 | | | | 5.42 | |
Class R6 | | | 1,000.00 | | | | 1,020.00 | | | | 1.01 | | | | 5.11 | |
Rampart Enhanced Core Equity Fund | | | | | |
Actual | | | | | | | | | | | | | | | | |
Class A | | $ | 1,000.00 | | | $ | 1,092.60 | | | | 1.23 | % | | $ | 6.45 | |
Class C | | | 1,000.00 | | | | 1,089.10 | | | | 1.98 | | | | 10.37 | |
Class I | | | 1,000.00 | | | | 1,094.10 | | | | 0.98 | | | | 5.14 | |
Hypothetical (5% return before expenses) | | | | | |
Class A | | | 1,000.00 | | | | 1,018.90 | | | | 1.23 | | | | 6.23 | |
Class C | | | 1,000.00 | | | | 1,015.14 | | | | 1.98 | | | | 10.00 | |
Class I | | | 1,000.00 | | | | 1,020.16 | | | | 0.98 | | | | 4.96 | |
Tactical Allocation Fund | | | | | |
Actual | | | | | | | | | | | | | | | | |
Class A | | $ | 1,000.00 | | | $ | 1,092.50 | | | | 1.36 | % | | $ | 7.13 | |
Class C | | | 1,000.00 | | | | 1,088.00 | | | | 2.11 | | | | 11.04 | |
Hypothetical (5% return before expenses) | | | | | |
Class A | | | 1,000.00 | | | | 1,018.25 | | | | 1.36 | | | | 6.88 | |
Class C | | | 1,000.00 | | | | 1,014.49 | | | | 2.11 | | | | 10.66 | |
| * | Expenses are equal to the relevant Fund’s annualized expense ratio, which is net of waived fees and reimbursed expenses, if applicable, multiplied by the average account value over the period, multiplied by the number of days (183) expenses were accrued in the most recent fiscal half-year, then divided by 365 to reflect the one-half year period. |
For Funds which may invest in other funds, the annualized expense ratios noted above do not reflect fees and expenses associated with the underlying funds. If such fees and expenses had been included, the expenses would have been higher.
You can find more information about a Fund’s expenses in the Financial Statements section that follows. For additional information on operating expenses and other shareholder costs, refer to a Fund’s prospectus.
3
VIRTUS EQUITY TRUST
KEY INVESTMENT TERMS (Unaudited)
SEPTEMBER 30, 2017
American Depositary Receipt (“ADR”)
Represents shares of foreign companies traded in U.S. dollars on U.S. exchanges that are held by a U.S. bank or a trust. Foreign companies use ADRs in order to make it easier for Americans to buy their shares.
Bloomberg Barclays U.S. Aggregate Bond Index
The Bloomberg Barclays U.S. Aggregate Bond Index measures the U.S. investment-grade fixed-rate bond market. The index is calculated on a total return basis. The index is unmanaged, its returns do not reflect any fees, expenses, or sales charges, and it is not available for direct investment.
Bloomberg Barclays U.S. Corporate High Yield Bond Index
The Bloomberg Barclays U.S. Corporate High Yield Bond Index measures the U.S. dollar-denominated, high yield, fixed-rate corporate bond market. The index is calculated on a total return basis. The index is unmanaged, its returns do not reflect any fees, expenses, or sales charges, and it is not available for direct investment.
Chicago Board Options Exchange Volatility Index® (“CBOE VIX®”)
The CBOE VIX® shows the market’s expectation of 30-day volatility. It is constructed using the implied volatilities of a wide range of S&P 500® Index options. This volatility is meant to be forward looking and is calculated from both calls and puts. The CBOE VIX® is a widely used measure of market risk and is often referred to as the “investor fear gauge.” The index is unmanaged, its returns do not reflect any fees, expenses, or sales charges, and it is not available for direct investment
Exchange-Traded Funds (“ETF”)
An open-end fund that is traded on a stock exchange. Most ETFs have a portfolio of stocks or bonds that track a specific market index.
Federal Reserve (the “Fed”)
The Central Bank of the U.S., the Fed is responsible for controlling money supply, interest rates and credit with the goal of keeping the U.S. economy and currency stable. Governed by a seven-member board, the system includes 12 regional Federal Reserve Banks, 25 Branches and all national and state banks that are part of the system.
Global Quality Dividend Linked Benchmark
The Global Quality Dividend Linked Benchmark consists of the Russell Developed Large Cap Index (net), a free-float market capitalization-weighted index constructed to provide a comprehensive and unbiased barometer for the large-cap segment in the developed world, calculated on a total return basis with net dividends reinvested. The index is unmanaged, its returns do not reflect any fees, expenses, or sales charges, and is not available for direct investment. Performance of the Global Quality Dividend Linked Benchmark prior to 2/1/2017 is that of the Russell 1000® Value Index.
Gross Domestic Product (“GDP”)
The gross domestic product represents the market value of all goods and services produced by the economy during the period measured, including personal consumption, government purchases, private inventories, paid-in construction costs and the foreign trade balance.
MSCI EAFE® Index (net)
The MSCI EAFE® (“Europe, Australasia, Far East”) Index (net) is a free float-adjusted market capitalization-weighted index that measures developed foreign market equity performance, excluding the U.S. and Canada. The index is calculated on a total return basis with net dividends reinvested. The index is unmanaged, its returns do not reflect any fees, expenses, or sales charges, and it is not available for direct investment.
MSCI Emerging Markets Index (net)
The MSCI Emerging Markets Index (net) is a free float-adjusted market capitalization-weighted index designed to measure equity market performance in the global emerging markets. The index is calculated on a total return basis with net dividends reinvested. The index is unmanaged, its returns do not reflect any fees, expenses, or sales charges, and it is not available for direct investment.
4
VIRTUS EQUITY TRUST
KEY INVESTMENT TERMS (Unaudited) (Continued)
SEPTEMBER 30, 2017
Payment-in-Kind Security (“PIK”)
A bond which pays interest in the form of additional bonds, or preferred stock which pays dividends in the form of additional preferred stock.
Real Estate Investment Trust (“REIT”)
A publicly traded company that owns, develops and operates income-producing real estate such as apartments, office buildings, hotels, shopping centers and other commercial properties.
Russell 1000® Growth Index
The Russell 1000® Growth Index is a market capitalization-weighted index of growth-oriented stocks of the 1,000 largest companies in the Russell Universe, which comprises the 3,000 largest U.S. companies. The index is calculated on a total return basis with dividends reinvested. The index is unmanaged, its returns do not reflect any fees, expenses, or sales charges, and it is not available for direct investment.
Russell 1000® Value Index
The Russell 1000® Value Index is a market capitalization-weighted index of value-oriented stocks of the 1,000 largest companies in the Russell Universe, which comprises the 3,000 largest U.S. companies. The index is calculated on a total return basis with dividends reinvested. The index is unmanaged, its returns do not reflect any fees, expenses, or sales charges, and it is not available for direct investment.
Russell 2000® Growth Index
The Russell 2000® Growth Index is a market capitalization-weighted index of growth-oriented stocks of the smallest 2,000 companies in the Russell Universe, which comprises the 3,000 largest U.S. companies. The index is calculated on a total return basis with dividends reinvested. The index is unmanaged, its returns do not reflect any fees, expenses, or sales charges, and it is not available for direct investment.
Russell 2000® Index
The Russell 2000® Index is a market capitalization-weighted index of the 2,000 smallest companies in the Russell Universe, which comprises the 3,000 largest U.S. companies. The index is calculated on a total return basis with dividends reinvested. The index is unmanaged, its returns do not reflect any fees, expenses, or sales charges, and it is not available for direct investment.
Russell 2000® Value Index
The Russell 2000® Value Index is a market capitalization-weighted index of value-oriented stocks of the smallest 2,000 companies in the Russell Universe, which comprises the 3,000 largest U.S. companies. The index is calculated on a total return basis with dividends reinvested. The index is unmanaged, its returns do not reflect any fees, expenses, or sales charges, and it is not available for direct investment.
Russell Developed Large Cap Index (net)
The Russell Developed Large Cap Index (net) is a free-float market capitalization-weighted index constructed to provide a comprehensive and unbiased barometer for the large-cap segment in the developed world. The index is calculated on a total return basis with net dividends reinvested. The index is unmanaged, its returns do not reflect any fees, expenses, or sales charges, and it is not available for direct investment.
Russell Midcap® Growth Index
The Russell Midcap® Growth Index is a market capitalization-weighted index of medium-capitalization, growth-oriented stocks of U.S. companies. The index is calculated on a total return basis with dividends reinvested. The index is unmanaged, its returns do not reflect any fees, expenses, or sales charges, and it is not available for direct investment.
Russell Midcap® Index
The Russell Midcap® Index is a market capitalization-weighted index of medium-capitalization stocks of U.S. companies. The index is calculated on a total return basis with dividends reinvested. The index is unmanaged, its returns do not reflect any fees, expenses, or sales charges, and it is not available for direct investment.
5
VIRTUS EQUITY TRUST
KEY INVESTMENT TERMS (Unaudited) (Continued)
SEPTEMBER 30, 2017
Russell Midcap® Value Index
The Russell Midcap® Value Index is a market capitalization-weighted index of medium-capitalization, value-oriented stocks of U.S. companies. The index is calculated on a total return basis with dividends reinvested. The index is unmanaged, its returns do not reflect any fees, expenses, or sales charges, and it is not available for direct investment.
S&P 500® Index
The S&P 500® Index is a free-float market capitalization-weighted index of 500 of the largest U.S. companies. The index is calculated on a total return basis with dividends reinvested. The index is unmanaged, its returns do not reflect any fees, expenses, or sales charges, and it is not available for direct investment.
SPDR
Represents shares of an open-end exchange-traded fund.
Sponsored ADR (“American Depositary Receipt”)
An ADR which is issued with the cooperation of the company whose stock will underlie the ADR. Sponsored ADRs generally carry the same rights normally given to stockholders, such as voting rights. ADRs must be sponsored to be able to trade on a major U.S. exchange such as the New York Stock Exchange (“NYSE”).
Tactical Allocation Fund Linked Benchmark
The Tactical Allocation Fund Linked Benchmark consists of 45% Russell 1000® Growth Index (a market capitalization-weighted index of growth-oriented stocks of the 1,000 largest companies in the Russell Universe, which comprises the 3,000 largest U.S. companies, calculated on a total return basis with dividends reinvested), 15% MSCI EAFE® Index (a free float-adjusted market capitalization-weighted index that measures developed foreign market equity performance, excluding the U.S. and Canada, calculated on a total return basis with net dividends reinvested), and 40% Bloomberg Barclays U.S. Aggregate Bond Index (an index that measures the U.S. investment grade fixed rate bond market, calculated on a total return basis). The index is unmanaged, its returns do not reflect any fees, expenses, or sales charges, and is not available for direct investment. Performance of the Tactical Allocation Fund Linked Benchmark prior to 9/7/2016 represents an allocation consisting of 50% S&P 500® Index and 50% Bloomberg Barclays U.S. Aggregate Bond Index.
6
| | |
Contrarian Value Fund Fund Summary (Unaudited) | | Ticker Symbols: A Share: FMIVX C Share: FMICX I Share: PIMVX R6 Share: VMVRX |
Portfolio Manager Commentary by Sasco Capital, Inc.
| ⬛ | | The Fund is diversified and has an investment objective of long-term growth of capital. There is no guarantee that the Fund will achieve its objective. |
| ⬛ | | Effective September 21, 2017 the Fund changed its fiscal year end from March 31 to September 30. As a result, the commentary addresses six months of performance from April 1, 2017 to September 30, 2017. |
| ⬛ | | For the fiscal period April 1 through September 30, 2017, the Fund’s Class A shares at NAV returned 4.19%*, Class C shares at NAV returned 3.82%*, Class I shares at NAV returned 4.35%* and Class R6 shares at NAV returned 4.40%*. For the same period, the Russell Midcap® Value Index, which serves as the Fund’s broad-based and style-specific benchmark appropriate for comparison, returned 3.54%*. |
* Returns less than 1 year are not annualized.
All performance figures assume reinvestment of distributions and exclude the effect of sales changes. Performance data quoted represents past results. Past performance is no guarantee of future results, and current performance may be higher or lower than the performance shown above. Investment return and principal value will fluctuate so your shares, when redeemed, may be worth more or less than their original cost. Please visit Virtus.com for performance data current to the most recent month-end.
How did the markets perform during the six-month fiscal period ended September 30, 2017?
| ⬛ | | The bull market continued to charge ahead during the six months, setting new records as markets remained resilient in the face of rate hikes by the Federal Reserve (Fed), natural disasters, and the war of words with North Korea. Performance was varied among the economic sectors. Earnings reports were generally favorable, which lifted a number of economically sensitive holdings. Oil and commodity prices rose, which helped these types of stocks. Interest rates hit bottom at the height of the North Korea fears, which favored utilities. Investors apparently looked beyond the tragic hurricanes of late August and early |
| | | September 2017 and saw rebuilding potential, which drove infrastructure stocks higher. Technology was by far the best-performing sector, while consumer stocks continued to languish under the weight of the online retailing threat. |
| ⬛ | | By mid-September 2017, the economy was looking good enough for the Fed to not only start tapering its balance sheet holdings, but also signal that higher interest rates were forthcoming by year end, with three more rate rises to follow in 2018. The 10-year Treasury yield jumped from a low of 2.04% in early September 2017 to 2.31% by the end of the month, thus driving financials higher. Growth stocks had the edge early in the six-month period, but by the end of September 2017, value stocks managed to finish slightly ahead. The market broadened considerably during the third quarter of 2017, which helped propel many benchmarks to new highs. |
What factors affected the Fund’s performance during the fiscal period?
| ⬛ | | The Fund posted solid performance for the six-month fiscal period ended September 30, 2017. As the market continued to move higher, a number of the Fund’s holdings were rewarded for their restructuring efforts. The Fund outperformed the Russell Midcap® Value Index for the six months despite the headwind of not owning the strong performing financials and information technology sectors. |
| ⬛ | | The most significant contribution to Fund returns came from Owens Illinois, FMC, Allegheny Technologies, Raytheon, and Owens Corning. Materials and industrials were the top-performing sectors, while the Fund’s consumer staples stocks continued to languish under the cloud of Amazon.com’s penetration into groceries with its acquisition of Whole Foods. The only significant underperformer was the Fund’s small position in Mattel, which continued to face challenges as new leadership took charge. |
The preceding information is the opinion of portfolio management only through the end of the period stated on the cover. Any such opinions are subject to change at any time based upon market or other conditions and should not be relied upon as investment advice. Past performance is no guarantee of future
results, and there is no guarantee that market forecasts will be realized.
Equity Securities: The market price of equity securities may be adversely affected by financial market, industry, or issuer-specific events. Focus on a particular style or on small or medium-sized companies may enhance that risk.
Limited Number of Investments: Because the Fund has a limited number of securities, it may be more susceptible to factors adversely affecting its securities than a less concentrated fund.
Industry/Sector Concentration: A fund that focuses its investments in a particular industry or sector will be more sensitive to conditions that affect that industry or sector than a non-concentrated fund.
Prospectus: For additional information on risks, please see the Fund’s prospectus.
| | | | |
| |
| Asset Allocations | |
| |
The following table presents the portfolio holdings within certain sectors as a percentage of total investments attributable to each sector at September 30, 2017. | |
Materials | | | 28 | % |
Industrials | | | 24 | |
Consumer Discretionary | | | 13 | |
Energy | | | 11 | |
Consumer Staples | | | 10 | |
Real Estate | | | 6 | |
Utilities | | | 4 | |
Other (includes short-term investments) | | | 4 | |
| | | | | |
Total | | | 100 | % |
| | | | | |
For information regarding the indexes and certain investment terms, see the Key Investment Terms starting on page 4.
7
Contrarian Value Fund (Continued)
| | | | | | | | | | | | | | | | | | | | |
| Average Annual Total Returns1 for periods ended 9/30/17 | | | | |
| | | 1 year | | | 5 years | | | 10 years | | | Since
Inception | | | Inception
Date | |
| Class A shares at NAV2 | | | 9.04 | % | | | 8.16 | % | | | 4.73 | % | | | — | | | | — | |
| Class A shares at POP3,4 | | | 2.77 | | | | 6.89 | | | | 4.11 | | | | — | | | | — | |
| Class C shares at NAV2 and with CDSC4 | | | 8.24 | | | | 7.36 | | | | 3.95 | | | | — | | | | — | |
| Class I shares at NAV2 | | | 9.33 | | | | 8.43 | | | | — | | | | 7.18 | % | | | 3/10/08 | |
| Class R6 shares at NAV2 | | | 9.48 | | | | — | | | | — | | | | 1.43 | | | | 11/12/14 | |
| Russell Midcap® Value Index | | | 13.37 | | | | 14.33 | | | | 7.85 | | | | — | 5 | | | — | |
Fund Expense Ratios6: Class A shares: 1.43%; Class C shares: 2.14%; Class I shares: 1.11%; Class R6 shares: 0.99%.
All returns represent past performance which is no guarantee of future results. Current performance may be higher or lower than the performance shown. The investment return and principal value of an investment will fluctuate so that an investor’s shares, when redeemed, may be worth more or less than their original cost. The above table and graph below do not reflect the deduction of taxes that a shareholder would pay on fund distributions or the redemption of shares. Please visit Virtus.com for performance data current to the most recent month-end.
| 1 | Total returns are historical and include changes in share price and the reinvestment of both dividends and capital gain distributions. |
| 2 | “NAV” (Net Asset Value) total returns do not include the effect of any sales charge. |
| 3 | “POP” (Public Offering Price) total returns include the effect of the maximum front-end 5.75% sales charge. |
| 4 | “CDSC” (contingent deferred sales charge) is applied to redemptions of certain classes of shares that do not have a sales charge applied at the time of purchase. CDSC charges for certain redemptions of Class A shares made within 18 months of a finder’s fee being paid and all Class C shares are 1% within the first year and 0% thereafter. |
| 5 | The index returned 10.40% for Class I shares and 8.03% for Class R6 shares from the inception date of the respective share class. |
| 6 | The expense ratios of the Fund are set forth according to the prospectus for the Fund effective July 31, 2017, as supplemented and revised, and may differ from the expense ratios disclosed in the Financial Highlight tables in this report. See the Financial Highlights for more current expense ratios. Expense ratios include fees and expenses associated with the underlying funds. |
Growth of $10,000 For periods ended 9/30
This chart assumes an initial investment of $10,000 made on September 30, 2007, for Class A shares and Class C shares including any applicable sales charges or fees. The performance of the other share classes may be greater or less than that shown based on differences in inception dates, fees and sales charges. Performance assumes reinvestment of dividends and capital gain distributions.
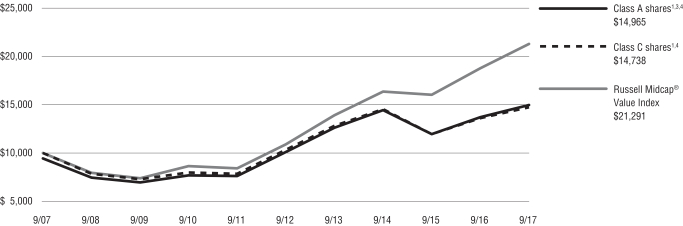
The index is unmanaged and not available for direct investment; therefore, its performance does not reflect the expenses associated with active management of an actual portfolio.
For information regarding the indexes and certain investment terms, see the Key Investment Terms starting on page 4.
8
| | |
KAR Capital Growth Fund Fund Summary (Unaudited) | | Ticker Symbols: A Share: PSTAX C Share: SSTFX I Share: PLXGX |
Portfolio Manager Commentary by Kayne Anderson Rudnick Investment Management, LLC
| ⬛ | | The Fund is diversified and has an investment objective of long-term capital growth. There is no guarantee that the Fund will meet its objective. |
| ⬛ | | Effective September 21, 2017 the Fund changed its fiscal year end from March 31 to September 30. As a result, the commentary addresses six months of performance from April 1, 2017 to September 30, 2017. |
| ⬛ | | For the fiscal period April 1 through September 30, 2017, the Fund’s Class A shares at NAV returned 16.01%*++, Class C shares at NAV returned 15.51%*, and Class I shares at NAV returned 16.09%*. For the same period, the Russell 1000® Growth Index, which serves as the Fund’s broad-based and style-specific benchmark appropriate the comparison, returned 10.84%*. |
* Returns less than 1 year are not annualized.
++ See footnote 6 on page 11.
All performance figures assume reinvestment of distributions and exclude the effect of sales changes. Performance data quoted represents past results. Past performance is no guarantee of future results, and current performance may be higher or lower than the performance shown above. Investment return and principal value will fluctuate so your shares, when redeemed, may be worth more or less than their original cost. Please visit Virtus.com for performance data current to the most recent month-end.
How did the markets perform during the six-month fiscal period ended September 30, 2017?
| ⬛ | | The six-month fiscal period was a good environment for the U.S. stock market overall. Smaller-capitalization stocks outperformed their larger counterparts, with the Russell 2000® Index up 8.27% versus the S&P 500® Index return of 7.71% for the six months. Growth stocks continued to outpace value stocks, with the Russell 1000® Growth Index up 10.84% and the Russell 1000® Value Index advancing 4.50%. Lower quality businesses, as measured by S&P Stock Rankings, outperformed their higher quality counterparts. |
| ⬛ | | During the fiscal period, the best performing sectors in the Russell 1000 Growth® Index were |
| | | utilities, information technology, and health care. The worst performing sectors were energy, consumer staples, and telecommunication services. |
| ⬛ | | Despite being in the midst of a raging bull market, we were dealing with a multitude of negative issues including historic natural disasters, potential nuclear war, deadly violence over Civil War monuments, senseless mass shootings, and rigged elections the world over, all of which provided seemingly endless sources of unease. Yet the S&P 500® Index put up its eighth straight quarterly advance, with a serene average daily change of just 0.3%, the lowest since 1968. |
| ⬛ | | A number of factors continued to paint a positive backdrop for equities. Interest rates remained subdued as the lack of inflation weighed on long-term rates and limited what the Federal Reserve (Fed) could do with short-term rates. Domestic unemployment remained low, wages were on the rise, and home prices continued to appreciate, putting the consumer on solid footing. A synchronized global pickup reduced the risk of contagion from weakness elsewhere in the world. |
What factors affected the Fund’s performance during the fiscal period?
| ⬛ | | The Fund outperformed the Russell 1000® Growth Index for the six-month fiscal period ending September 30, 2017. The outperformance was driven by strong stock selection in the information technology and consumer staples sectors. Negative stock selection and an overweight exposure in the energy sector; and negative stock selection and an underweight in the health care sector detracted from performance. |
For the reporting period, the largest contributors to performance were Alibaba and Facebook.
| ⬛ | | Alibaba’s two marketplaces, Taobao and Tmall.com, combine to form the largest online commerce company in the world. Management has committed to a number of social initiatives to further improve mobile monetization over time. Alibaba’s marketplaces have huge network effects, and the company made efforts to foster the ecosystem with investments in payments and logistics partnerships. Taobao, in particular, has become a destination for consumers, merchants, and key opinion leaders to interact and engage in what Alibaba calls social commerce. E-commerce |
| | | penetration, mobile usage, and growth in Chinese consumer spending power were all durable long-term tailwinds benefitting the company during the fiscal period. Alibaba has attempted to seize the opportunity by using data to improve targeting and increasingly consummating transactions through Alipay, its leading mobile payment offering. |
| ⬛ | | Facebook continued to grow advertising revenue and take share in the online digital marketing space. The company delivered an unprecedented global reach of approximately 30% of the earth’s population to advertisers in a measurable way. Facebook’s user growth remained stunning despite its scale, and Instagram’s Stories format was a resounding success in fighting off competitors like Snapchat. |
The largest detractors from performance were Pioneer National Resources Company and Core Laboratories.
| ⬛ | | Pioneer National Resources has amassed valuable, contiguous acreage in the Midland Basin which, with the discovery of fracking and horizontal drilling techniques, has become one of the most prolific and lowest cost basins in the U.S. With upwards of eight billion barrels of oil equivalent in reserves, Pioneer has decades of inventory to drill and had one of the strongest balance sheets in the energy complex for the fiscal period, with investment grade debt and an industry-low debt-to-equity ratio. Early in the third quarter, the company reported issues with pressure in larger fields which required additional per-well development costs and weighed on the shares. While it does not change the ultimate size of the asset, the additional costs and delays forced Pioneer to trim guidance for the current year. |
| ⬛ | | Core Laboratories’ shares suffered from lower commodity prices and from a short seller’s report claiming the company misrepresented its end-market exposure and its cyclicality. |
The preceding information is the opinion of portfolio management only through the end of the period stated on the cover. Any such opinions are subject to change at any time based upon market or other conditions and should not be relied upon as investment advice. Past performance is no guarantee of future results, and there is no guarantee that market forecasts will be realized.
For information regarding the indexes and certain investment terms, see the Key Investment Terms starting on page 4.
9
| | |
| KAR Capital Growth Fund (Continued) | | |
Equity Securities: The market price of equity securities may be adversely affected by financial market, industry, or issuer-specific events. Focus on a particular style or on small or medium-sized companies may enhance that risk.
Limited Number of Investments: Because the Fund has a limited number of securities, it may be more susceptible to factors adversely affecting its securities than a less concentrated fund.
Industry/Sector Concentration: A fund that focuses its investments in a particular industry or sector will be more sensitive to conditions that affect that industry or sector than a non-concentrated fund.
Prospectus: For additional information on risks, please see the Fund’s prospectus.
| | | | |
| |
| Asset Allocations | |
| |
The following table presents the portfolio holdings within certain sectors as a percentage of total investments attributable to each sector at September 30, 2017. | |
Information Technology | | | 42 | % |
Consumer Discretionary | | | 24 | |
Health Care | | | 11 | |
Consumer Staples | | | 7 | |
Industrials | | | 6 | |
Financials | | | 5 | |
Energy | | | 3 | |
Other (includes short-term investments) | | | 2 | |
| | | | | |
Total | | | 100 | % |
| | | | | |
For information regarding the indexes and certain investment terms, see the Key Investment Terms starting on page 4.
10
KAR Capital Growth Fund (Continued)
| | | | | | | | | | | | |
| Average Annual Total Returns1 for periods ended 9/30/17 | |
| | | 1 year | | | 5 years | | | 10 years | |
| Class A shares at NAV2 | | | 22.53 | % | | | 14.51 | % | | | 6.39 | % |
| Class A shares at POP3,4 | | | 15.48 | | | | 13.16 | | | | 5.76 | |
| Class C shares at NAV2 and with CDSC4 | | | 21.65 | | | | 13.63 | | | | 5.60 | |
| Class I shares at NAV2 | | | 22.85 | | | | 14.79 | | | | 6.67 | |
| Russell 1000® Growth Index | | | 21.94 | | | | 15.26 | | | | 9.08 | |
Fund Expense Ratios5: Class A Shares: 1.30%; Class C Shares: 2.11%; Class I Shares: 1.06%.
All returns represent past performance which is no guarantee of future results. Current performance may be higher or lower than the performance shown. The investment return and principal value of an investment will fluctuate so that an investor’s shares, when redeemed, may be worth more or less than their original cost. The above table and graph below do not reflect the deduction of taxes that a shareholder would pay on fund distributions or the redemption of fund shares. Please visit Virtus.com for performance data current to the most recent month-end.
| 1 | Total returns are historical and include changes in share price and the reinvestment of both dividends and capital gain distributions. |
| 2 | “NAV” (Net Asset Value) total returns do not include the effect of any sales charge. |
| 3 | “POP” (Public Offering Price) total returns include the effect of the maximum front-end 5.75% sales charge. |
| 4 | “CDSC” (contingent deferred sales charge) is applied to redemptions of certain classes of shares that do not have a sales charge applied at the time of purchase. CDSC charges for certain redemptions of Class A shares made within 18 months of a finder’s fee being paid and all Class C shares are 1% within the first year and 0% thereafter. |
| 5 | The expense ratios of the Fund are set forth according to the prospectus for the Fund effective July 31, 2017, as supplemented and revised, and may differ from the expense ratios disclosed in the Financial Highlights tables in this report. See the Financial Highlights for more current expense ratios. Expense ratios include fees and expenses associated with the underlying funds. |
| 6 | The total return for Class A presented in the Financial Highlights section of the report differs from that presented on page 9. The total return for the Financial Highlights is calculated based on the NAV at which shareholder transactions were processed, but also takes into account certain adjustments that are necessary under U.S. generally accepted accounting principles required in the annual report and semi-annual report. |
Growth of $10,000 For periods ended 9/30
This chart assumes an initial investment of $10,000 made on September 30, 2007, for Class A shares, Class C shares, and Class I shares including any applicable sales charges or fees. Performance assumes reinvestment of dividends and capital gain distributions.
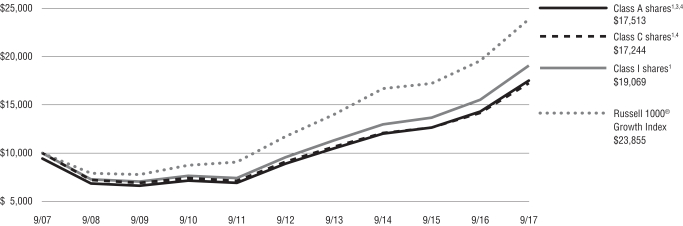
The index is unmanaged and not available for direct investment; therefore, its performance does not reflect the expenses associated with active management of an actual portfolio.
For information regarding the indexes and certain investment terms, see the Key Investment Terms starting on page 4.
11
| | |
KAR Global Quality Dividend Fund Fund Summary (Unaudited) | | Ticker Symbols: A Share: PPTAX C Share: PPTCX I Share: PIPTX |
Portfolio Manager Commentary by Kayne Anderson Rudnick Investment Management, LLC
| ⬛ | | The Fund is diversified and has an investment objective of total return, consisting of both capital appreciation and current income. There is no guarantee that the Fund will meet its objective. |
| ⬛ | | Effective September 21, 2017 the Fund changed its fiscal year end from March 31 to September 30. As a result, the commentary addresses six months of performance from April 1, 2017 to September 30, 2017. |
| ⬛ | | For the fiscal period April 1 through September 30, 2017, the Fund’s Class A shares at NAV returned 4.31%*, Class C shares at NAV returned 3.86%* and Class I shares at NAV returned 4.41%*. For the same period, the Russell Developed Large Cap Index (net), which serves as the Fund’s broad-based and style-specific benchmark appropriate for comparison, returned 9.12%*. |
* Returns less than 1 year are not annualized.
All performance figures assume reinvestment of distributions and exclude the effect of sales changes. Performance data quoted represents past results. Past performance is no guarantee of future results, and current performance may be higher or lower than the performance shown above. Investment return and principal value will fluctuate so your shares, when redeemed, may be worth more or less than their original cost. Please visit Virtus.com for performance data current to the most recent month-end.
How did the markets perform during the six-month fiscal period ended September 30, 2017?
| ⬛ | | The six-month fiscal period was a good environment for stock markets overall. Domestically, smaller-capitalization stocks outperformed their larger counterparts, with the Russell 2000® Index up 8.27% versus the S&P 500® Index return of 7.71% for the six months. Growth stocks continued to outpace value stocks, with the Russell 1000® Growth Index up 10.84% and the Russell 1000® Value Index advancing 4.50%. International markets were stronger than the U.S. during the period, with the MSCI EAFE® Index (net) up 12.18% and the MSCI Emerging Markets Index up 14.93%. |
| ⬛ | | During the fiscal period, the best performing sectors in the Russell Developed Large Cap Index were information technology, materials, and industrials. The worst performing sectors were energy, consumer staples, and telecommunication services. |
| ⬛ | | Despite being in the midst of a raging bull market, we were dealing with a multitude of negative issues including historic natural disasters, potential nuclear war, deadly violence over Civil War monuments, senseless mass shootings, and rigged elections the world over, all of which provided seemingly endless sources of unease. Yet the S&P 500® Index put up its eighth straight quarterly advance, with a serene average daily change of just 0.3%, the lowest since 1968. |
| ⬛ | | A number of factors continued to paint a positive backdrop for equities. Interest rates remained subdued as the lack of inflation weighed on long-term rates and limited what the Federal Reserve (Fed) could do with short-term rates. Domestic unemployment remained low, wages were on the rise, and home prices continued to appreciate, putting the consumer on solid footing. A synchronized global pickup reduced the risk of contagion from weakness elsewhere in the world. |
What factors affected the Fund’s performance during the fiscal period?
| ⬛ | | The Fund underperformed the Russell Developed Large Cap Index for the six-month fiscal period ended September 30, 2017. The underperformance was driven by negative stock selection in the consumer staples sector, and by negative stock selection and an underweight exposure in the information technology sector. Positive stock selection in financials and energy contributed to performance. |
For the reporting period, the largest contributors to performance were HSBC and Royal Dutch Shell.
| ⬛ | | HSBC performed well as an improving global economy led to strong demand for loans and to higher interest rates, which both contributed to strong revenue growth. |
| ⬛ | | Royal Dutch Shell outperformed as energy prices rose during the period, and contributed to the strong performance. |
The largest detractors from performance during the period were Altria Group and Meredith.
| ⬛ | | Altria Group was negatively impacted by a U.S. Food and Drug Administration (FDA) announcement regarding nicotine levels in cigarettes. |
| ⬛ | | Meredith’s shares suffered during the period as many investors had anticipated that its acquisition of TIME, Inc. would be a positive for the company. However, in April 2017, TIME announced that it was no longer for sale. |
The preceding information is the opinion of portfolio management only through the end of the period stated on the cover. Any such opinions are subject to change at any time based upon market or other conditions and should not be relied upon as investment advice. Past performance is no guarantee of future results, and there is no guarantee that market forecasts will be realized.
Equity Securities: The market price of equity securities may be adversely affected by financial market, industry, or issuer-specific events. Focus on a particular style or on small or medium-sized companies may enhance that risk.
Limited Number of Investments: Because the Fund has a limited number of securities, it may be more susceptible to factors adversely affecting its securities than a less concentrated fund.
Industry/Sector Concentration: A fund that focuses its investments in a particular industry or sector will be more sensitive to conditions that affect that industry or sector than a non-concentrated fund.
Prospectus: For additional information on risks, please see the Fund’s prospectus.
| | | | |
| |
| Asset Allocations | |
| |
The following table presents the portfolio holdings within certain sectors as a percentage of total investments attributable to each sector at September 30, 2017. | |
Financials | | | 18 | % |
Telecommunication Services | | | 14 | |
Utilities | | | 10 | |
Energy | | | 9 | |
Consumer Staples | | | 9 | |
Health Care | | | 9 | |
Real Estate | | | 8 | |
Other (includes short-term investment) | | | 23 | |
| | | | | |
Total | | | 100 | % |
| | | | | |
For information regarding the indexes and certain investment terms, see the Key Investment Terms starting on page 4.
12
KAR Global Quality Dividend Fund (Continued)
| | | | | | | | | | | | | | | | | | | | |
| Average Annual Total Returns1 for periods ended 9/30/17 | | | | | | | | | | |
| | | | | |
| | | 1 year | | | 5 years | | | 10 years | | | Since
Inception | | | Inception
Date | |
| Class A shares at NAV2 | | | 12.54 | % | | | 10.65 | % | | | 3.92 | % | | | — | | | | — | |
| Class A shares at POP3,4 | | | 6.07 | | | | 9.34 | | | | 3.31 | | | | — | | | | — | |
| Class C shares at NAV2 and with CDSC4 | | | 11.62 | | | | 9.80 | | | | 3.13 | | | | — | | | | — | |
| Class I shares at NAV2 | | | 12.78 | | | | 10.90 | | | | — | | | | 6.33 | % | | | 6/6/08 | |
| Russell Developed Large Cap Index (net) | | | 18.28 | | | | 11.23 | | | | 4.44 | | | | 8.58 | 5 | | | — | |
| Global Quality Dividend Linked Benchmark | | | 21.72 | | | | 14.47 | | | | 6.51 | | | | 5.57 | 5 | | | — | |
Fund Expense Ratios6: Class A Shares: Gross 1.44%, Net 1.35%; Class C Shares: Gross 2.21%, Net 2.10%; Class I Shares: Gross 1.21%, Net 1.10%.
All returns represent past performance which is no guarantee of future results. Current performance may be higher or lower than the performance shown. The investment return and principal value of an investment will fluctuate so that an investor’s shares, when redeemed, may be worth more or less than their original cost. The above table and graph below do not reflect the deduction of taxes that a shareholder would pay on fund distributions or the redemption of fund shares. Please visit Virtus.com for performance data current to the most recent month-end.
| 1 | Total returns are historical and include changes in share price and the reinvestment of both dividends and capital gain distributions. |
| 2 | “NAV” (Net Asset Value) total returns do not include the effect of any sales charge. |
| 3 | “POP” (Public Offering Price) total returns include the effect of the maximum front-end 5.75% sales charge. |
| 4 | “CDSC” (contingent deferred sales charge) is applied to redemptions of certain classes of shares that do not have a sales charge applied at the time of purchase. CDSC charges for certain redemptions of Class A shares made within 18 months of a finder’s fee being paid and all Class C shares are 1% within the first year and 0% thereafter. |
| 5 | The index returns are from Class I shares’ inception date. |
| 6 | The expense ratios of the Fund are set forth according to the prospectus for the Fund effective July 31, 2017, as supplemented and revised, and may differ from the expense ratios disclosed in the Financial Highlights tables in this report. See the Financial Highlights for more current expense ratios. Net Expense: Expenses reduced by a contractual fee waiver, in effect through July 31, 2018. Gross Expense: Does not reflect the effect of the fee waiver. Expense ratios include fees and expenses associated with the underlying funds. |
Growth of $10,000 For periods ended 9/30
This chart assumes an initial investment of $10,000 made on September 30, 2007, for Class A shares and Class C shares including any applicable sales charges or fees. The performance of the other share class may be greater or less than that shown based on differences in inception date, fees and sales charges. Performance assumes reinvestment of dividends and capital gain distributions.

The index is unmanaged and not available for direct investment; therefore, its performance does not reflect the expenses associated with active management of an actual portfolio.
For information regarding the indexes and certain investment terms, see the Key Investment Terms starting on page 4.
13
| | |
KAR Mid-Cap Core Fund Fund Summary (Unaudited) | | Ticker Symbols: A Share: VMACX C Share: VMCCX I Share: VIMCX |
Portfolio Manager Commentary by Kayne Anderson Rudnick Investment Management, LLC
| ⬛ | | The Fund is diversified and has an investment objective of long-term capital appreciation. There is no guarantee that the Fund will meet its objective. |
| ⬛ | | Effective September 21, 2017 the Fund changed its fiscal year end from March 31 to September 30. As a result, the commentary addresses six months of performance from April 1, 2017 to September 30, 2017. |
| ⬛ | | For the fiscal period April 1 through September 30, 2017, the Fund’s Class A shares at NAV returned 8.70%*, Class C shares at NAV returned 8.28%* and Class I shares at NAV returned 8.82%*. For the same period, the Russell Midcap® Index, which serves as the Fund’s broad-based and style-specific benchmark appropriate for comparison, returned 6.27%*. |
* Returns less than 1 year are not annualized.
All performance figures assume reinvestment of distributions and exclude the effect of sales changes. Performance data quoted represents past results. Past performance is no guarantee of future results, and current performance may be higher or lower than the performance shown above. Investment return and principal value will fluctuate so your shares, when redeemed, may be worth more or less than their original cost. Please visit Virtus.com for performance data current to the most recent month-end.
How did the markets perform during the six-month fiscal period ended September 30, 2017?
| ⬛ | | The six-month fiscal period was a good environment for the U.S. stock market overall. Smaller-capitalization stocks outperformed their larger counterparts, with the Russell 2000® Index up 8.27% versus the S&P 500® Index return of 7.71% and the Russell Midcap® Index return of 6.27% for the six months. Growth stocks continued to outpace value stocks, with the Russell Midcap® Growth Index up 9.72% and the Russell Midcap® Value Index advancing 3.54%. Lower quality businesses, as measured by S&P Stock Rankings, outperformed their higher quality counterparts. |
| ⬛ | | During the fiscal period, the best performing sectors in the Russell Midcap® Index were technology, producer durables, and health care. The worst |
| | performing sectors were energy, consumer staples, and consumer discretionary. |
| ⬛ | | Despite the change of administration in Washington, D.C., there was no substantial legislation from the Republican-controlled White House and Congress. The repeal of the Affordable Care Act was pushed aside to focus on tax reform. The market reacted positively to tax plan outlines put forth by the White House. |
What factors affected the Fund’s performance during the fiscal period?
| ⬛ | | The Fund outperformed the Russell Midcap® Index for the six-month fiscal period ended September 30, 2017. The outperformance was driven by strong stock selection in the consumer discretionary and producer durables sectors. Negative stock selection in financials and materials and processing detracted from performance. |
For the reporting period, the largest contributors to performance were AMETEK and WABCO Holdings.
| ⬛ | | AMETEK’s stock outperformed due to improving energy and industrial end markets. The company benefited from a differentiated, technical product portfolio and superior capital allocation. |
| ⬛ | | WABCO Holdings’ shares increased during the period after the company reported sales results that were above expectations and management increased its profit guidance for the year. WABCO benefited from new safety standards that were implemented in key markets like the U.S. and China, and from an improving economy in Europe. |
The largest detractors from performance were Signature Bank and Bank of the Ozarks.
| ⬛ | | Signature Bank’s shares came under pressure as short-term interest rate increases by the Federal Reserve (Fed) and low long-term rates compressed the bank’s net interest margin. In addition, increased loan prepayments made management cautious about hitting their net loan growth targets for the year. Despite these near-term headwinds, we view Signature Bank as one of the most efficient banks in the U.S. due to its loan growth and profitability metrics. |
| ⬛ | | Bank of the Ozarks’ shares suffered from a slower-than-expected rolling back of regulations for financial institutions. In addition, the Fed did not appear |
| | | ready to accelerate its schedule of short-term rate hikes while long-term rates remained low. While these macro issues pressured all bank stocks, Bank of the Ozarks also struggled with the continuation of a multi-quarter slowdown in loan volumes. While slower loan growth disappointed some investors, we remain focused on credit metrics and profitability – both of which remain well above peers. |
The preceding information is the opinion of portfolio management only through the end of the period stated on the cover. Any such opinions are subject to change at any time based upon market or other conditions and should not be relied upon as investment advice. Past performance is no guarantee of future results, and there is no guarantee that market forecasts will be realized.
Equity Securities: The market price of equity securities may be adversely affected by financial market, industry, or issuer-specific events. Focus on a particular style or on small or medium-sized companies may enhance that risk.
Limited Number of Investments: Because the Fund has a limited number of securities, it may be more susceptible to factors adversely affecting its securities than a less concentrated fund.
Industry/Sector Concentration: A fund that focuses its investments in a particular industry or sector will be more sensitive to conditions that affect that industry or sector than a non-concentrated fund.
Prospectus: For additional information on risks, please see the Fund’s prospectus.
| | | | |
| |
| Asset Allocations | |
| |
The following table presents the portfolio holding within certain sectors as a percentage of total investments attributable to each sector at September 30, 2017. | |
Industrials | | | 22 | % |
Information Technology | | | 19 | |
Health Care | | | 14 | |
Financials | | | 13 | |
Consumer Discretionary | | | 10 | |
Consumer Staples | | | 7 | |
Materials | | | 4 | |
Other (includes short-term investments) | | | 11 | |
| | | | | |
Total | | | 100 | % |
| | | | | |
For information regarding the indexes and certain investment terms, see the Key Investment Terms starting on page 4.
14
KAR Mid-Cap Core Fund (Continued)
| | | | | | | | | | | | | | | | |
| Average Annual Total Returns1 for periods ended 9/30/17 | | | | | | | | | | | | |
| | | 1 year | | | 5 year | | | Since
Inception | | | Inception
Date | |
| Class A shares at NAV2 | | | 17.58 | % | | | 14.38 | % | | | 15.05 | % | | | 6/22/09 | |
| Class A shares at POP3,4 | | | 10.82 | | | | 13.03 | | | | 14.23 | | | | 6/22/09 | |
| Class C shares at NAV2 and with CDSC4 | | | 16.68 | | | | 13.53 | | | | 14.18 | | | | 6/22/09 | |
| Class I shares at NAV2 | | | 17.84 | | | | 14.65 | | | | 15.32 | | | | 6/22/09 | |
| Russell Midcap® Index | | | 15.32 | | | | 14.26 | | | | 16.93 | 5 | | | — | |
Fund Expense Ratios6: Class A shares: Gross 1.51%, Net 1.20%; Class C shares: Gross 2.29%, Net 1.95%; Class I shares: Gross 1.28%, Net 0.95%.
All returns represent past performance which is no guarantee of future results. Current performance may be higher or lower than the performance shown. The investment return and principal value of an investment will fluctuate so that an investor’s shares, when redeemed, may be worth more or less than their original cost. The above table and graph below do not reflect the deduction of taxes that a shareholder would pay on fund distributions or the redemption of fund shares. Please visit Virtus.com for performance data current to the most recent month-end.
| 1 | Total returns are historical and include changes in share price and the reinvestment of both dividends and capital gain distributions. |
| 2 | “NAV” (Net Asset Value) total returns do not include the effect of any sales charge. |
| 3 | “POP” (Public Offering Price) total returns include the effect of the maximum front-end 5.75% sales charge. |
| 4 | “CDSC” (contingent deferred sales charge) is applied to redemptions of certain classes of shares that do not have a sales charge applied at the time of purchase. CDSC charges for certain redemptions of Class A shares made within 18 months of a finder’s fee being paid and all Class C shares are 1% within the first year and 0% thereafter. |
| 5 | The index returns are from the Fund’s inception date. |
| 6 | The expense ratios of the Fund are set forth according to the prospectus for the Fund effective July 31, 2017, as supplemented and revised, and may differ from the expense ratios disclosed in the Financial Highlights tables in this report. See the Financial Highlights for more current expense ratios. Net Expense: Expenses reduced by a contractual fee waiver, in effect through July 31, 2018. Gross Expense: Does not reflect the effect of the fee waiver. Expense ratios include fees and expenses associated with the underlying funds. |
Growth of $10,000 For periods ended 9/30
This chart assumes an initial investment of $10,000 made on June 22, 2009 (inception date of the Fund), for Class A shares, Class C shares, and Class I shares including any applicable sales charges or fees. Performance assumes reinvestment of dividends and capital gain distributions.
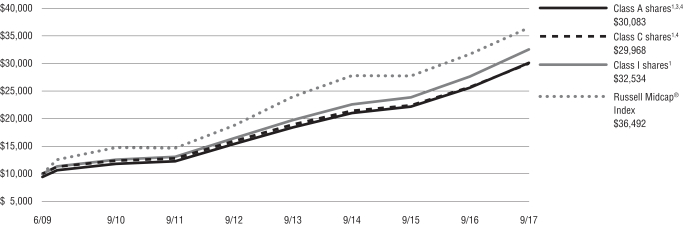
The index is unmanaged and not available for direct investment; therefore, its performance does not reflect the expenses associated with active management of an actual portfolio.
For information regarding the indexes and certain investment terms, see the Key Investment Terms starting on page 4.
15
| | |
KAR Mid-Cap Growth Fund Fund Summary (Unaudited) | | Ticker Symbols: A Share: PHSKX C Share: PSKCX I Share: PICMX |
Portfolio Manager Commentary by Kayne Anderson Rudnick Investment Management, LLC
| ⬛ | | The Fund is diversified and has an investment objective of capital appreciation. There is no guarantee that the Fund will meet its objective. |
| ⬛ | | Effective September 21, 2017 the Fund changed its fiscal year end from March 31 to September 30. As a result, the commentary addresses six months of performance from April 1, 2017 to September 30, 2017. |
| ⬛ | | For the fiscal period April 1 through September 30, 2017, the Fund’s Class A shares at NAV returned 13.48%*, Class C shares at NAV returned 13.01%*, and Class I shares at NAV returned 13.58%*. For the same period, the Russell Midcap® Growth Index, which serves as the Fund’s broad-based and style-specific benchmark appropriate for comparison, returned 9.72%*. |
* Returns less than 1 year are not annualized.
All performance figures assume reinvestment of distributions and exclude the effect of sales changes. Performance data quoted represents past results. Past performance is no guarantee of future results, and current performance may be higher or lower than the performance shown above. Investment return and principal value will fluctuate so your shares, when redeemed, may be worth more or less than their original cost. Please visit Virtus.com for performance data current to the most recent month-end.
How did the markets perform during the six-month fiscal period ended September 30, 2017?
| ⬛ | | The six-month fiscal period was a good environment for the U.S stock market overall. Smaller-capitalization stocks outperformed their larger counterparts, with the Russell 2000® Index up 8.27% versus the S&P 500® Index return of 7.71% and the Russell Midcap® Index return of 6.27% for the six months. Growth stocks continued to outpace value stocks, with the Russell Midcap® Growth Index up 9.72% and the Russell Midcap® Value Index advancing 3.54%. Lower quality businesses, as measured by S&P Stock Rankings, outperformed their higher quality counterparts. |
| ⬛ | | During the fiscal period, the best performing sectors in the Russell Midcap® Growth Index were |
| | | utilities, information technology, and financials. The worst performing sectors were energy, consumer staples, and consumer discretionary. |
| ⬛ | | Despite being in the midst of a raging bull market, we were dealing with a multitude of negative issues including historic natural disasters, potential nuclear war, deadly violence over Civil War monuments, senseless mass shootings, and rigged elections the world over, all of which provided seemingly endless sources of unease. Yet the S&P 500® Index put up its eighth straight quarterly advance, with a serene average daily change of just 0.3%, the lowest since 1968. |
| ⬛ | | A number of factors continued to paint a positive backdrop for equities. Interest rates remained subdued as the lack of inflation weighed on long-term rates and limited what the Federal Reserve (Fed) could do with short-term rates. Domestic unemployment remained low, wages were on the rise, and home prices continued to appreciate, putting the consumer on solid footing. A synchronized global pickup reduced the risk of contagion from weakness elsewhere in the world. |
What factors affected the Fund’s performance during the fiscal period?
| ⬛ | | The Fund outperformed the Russell Midcap® Growth Index for the six-month fiscal period ended September 30, 2017. The outperformance was driven by strong stock selection and an overweight exposure in the information technology sector, as well as strong stock selection in the consumer discretionary sector. Negative stock selection in the financials sector and an overweight exposure to energy detracted from performance. |
For the reporting period, the largest contributors to performance were Autohome and Kite Pharma.
| ⬛ | | Autohome reported robust revenue growth and profit improvement that surpassed expectations, as its financial results continued to benefit from the secular shift of advertising budgets from offline to online media. It is worth noting that just before the end of the fiscal period, two senior executives at Autohome resigned for personal reasons. Based on follow-up conversations we had with the company, these departures were not related to the fundamentals of the business, and management planned to maintain the current corporate strategy. |
| | | Therefore, given Autohome’s strong competitive positioning, improved capital allocation and the expected long-term growth of the Chinese car market, the Fund remained invested in the business as of the end of the period. |
| ⬛ | | Kite Pharma was acquired by Gilead Sciences in the third quarter of 2017 at a 29% premium to the previous closing price. Shares tripled from the start of 2017 through September 30, 2017. |
The largest detractors from performance were Ellie Mae and MSC Industrial Direct.
| ⬛ | | Ellie Mae reported slightly weaker-than-expected results and lowered guidance for 2017. The company underestimated the impact of the material drop-off in refinance loan volume in 2017 and the associated impact on closed-loan fees. Additionally, Ellie Mae saw delayed revenue due to longer implementation times for recent deals with larger customers. |
| ⬛ | | MSC Industrial, as with all industrial distributors, benefits greatly from inflation, which helps to create pricing power. Not only was inflation absent during the fiscal period, increasingly transparent online models created an environment of price deflation within the group. |
The preceding information is the opinion of portfolio management only through the end of the period stated on the cover. Any such opinions are subject to change at any time based upon market or other conditions and should not be relied upon as investment advice. Past performance is no guarantee of future results, and there is no guarantee that market forecasts will be realized.
Equity Securities: The market price of equity securities may be adversely affected by financial market, industry, or issuer-specific events. Focus on a particular style or on small or medium-sized companies may enhance that risk.
Limited Number of Investments: Because the Fund has a limited number of securities, it may be more susceptible to factors adversely affecting its securities than a less concentrated fund.
Industry/Sector Concentration: A fund that focuses its investments in a particular industry or sector will be more sensitive to conditions that affect that industry or sector than a non-concentrated fund.
For information regarding the indexes and certain investment terms, see the Key Investment Terms starting on page 4.
16
| | |
| KAR Mid-Cap Growth Fund (Continued) | | |
Prospectus: For additional information on risks, please see the Fund’s prospectus.
| | | | |
| |
| Asset Allocations | |
| |
The following table presents the portfolio holdings within certain sectors as a percentage of total investments attributable to each sector at September 30, 2017. | |
Information Technology | | | 32 | % |
Consumer Discretionary | | | 25 | |
Health Care | | | 14 | |
Consumer Staples | | | 8 | |
Financials | | | 8 | |
Industrials | | | 7 | |
Energy | | | 3 | |
Other (includes short-term investment) | | | 3 | |
| | | | | |
Total | | | 100 | % |
| | | | | |
For information regarding the indexes and certain investment terms, see the Key Investment Terms starting on page 4.
17
KAR Mid-Cap Growth Fund (Continued)
| | | | | | | | | | | | |
| Average Annual Total Returns1 for periods ended 9/30/17 | | | | |
| | | 1 year | | | 5 years | | | 10 years | |
| Class A shares at NAV2 | | | 20.99 | % | | | 11.57 | % | | | 5.20 | % |
| Class A shares at POP3,4 | | | 14.03 | | | | 10.26 | | | | 4.58 | |
| Class C shares at NAV2 and with CDSC4 | | | 20.04 | | | | 10.74 | | | | 4.42 | |
| Class I shares at NAV2 | | | 21.29 | | | | 11.85 | | | | 5.47 | |
| Russell Midcap® Growth Index | | | 17.82 | | | | 14.18 | | | | 8.20 | |
Fund Expense Ratios5: Class A shares: Gross 1.49%, Net 1.40%; Class C shares: Gross 2.34%, Net 2.15%; Class I shares: Gross 1.27%, Net 1.15%.
All returns represent past performance which is no guarantee of future results. Current performance may be higher or lower than the performance shown. The investment return and principal value of an investment will fluctuate so that an investor’s shares, when redeemed, may be worth more or less than their original cost. The above table and graph below do not reflect the deduction of taxes that a shareholder would pay on fund distributions or the redemption of fund shares. Please visit Virtus.com for performance data current to the most recent month-end.
| 1 | Total returns are historical and include changes in share price and the reinvestment of both dividends and capital gain distributions. |
| 2 | “NAV” (Net Asset Value) total returns do not include the effect of any sales charge. |
| 3 | “POP” (Public Offering Price) total returns include the effect of the maximum front-end 5.75% sales charge. |
| 4 | “CDSC” (contingent deferred sales charge) is applied to redemptions of certain classes of shares that do not have a sales charge applied at the time of purchase. CDSC charges for certain redemptions of Class A shares made within 18 months of a finder’s fee being paid and all Class C shares are 1% within the first year and 0% thereafter. |
| 5 | The expense ratios of the Fund are set forth according to the prospectus for the Fund effective July 31, 2017, as supplemented and revised, and may differ from the expense ratios disclosed in the Financial Highlights tables in this report. See the Financial Highlights for more current expense ratios. Net Expense: Expenses reduced by a contractual fee waiver, in effect through July 31, 2018. Gross Expense: Does not reflect the effect of the fee waiver. Expense ratios include fees and expenses associated with the underlying funds. |
Growth of $10,000 For periods ended 9/30
This chart assumes an initial investment of $10,000 made on September 30, 2007, for Class A shares, Class C shares and Class I shares including any applicable sales charges or fees. Performance assumes reinvestment of dividends and capital gain distributions.

The index is unmanaged and not available for direct investment; therefore, its performance does not reflect the expenses associated with active management of an actual portfolio.
For information regarding the indexes and certain investment terms, see the Key Investment Terms starting on page 4.
18
| | |
KAR Small-Cap Core Fund Fund Summary (Unaudited) | | Ticker Symbols: A Share: PKSAX C Share: PKSCX I Share: PKSFX R6 Share: VSCRX |
Portfolio Manager Commentary by Kayne Anderson Rudnick Investment Management, LLC
| ⬛ | | The Fund is diversified and has an investment objective of long-term capital appreciation, with dividend income a secondary consideration. There is no guarantee that the Fund will meet its objective. |
| ⬛ | | Effective September 21, 2017 the Fund changed its fiscal year end from March 31 to September 30. As a result, the commentary addresses six months of performance from April 1, 2017 to September 30, 2017. |
| ⬛ | | For the fiscal period April 1 through September 30, 2017, the Fund’s Class A shares at NAV returned 15.92%*, Class C shares at NAV returned 15.47%*, Class I shares at NAV returned 16.10%*, and Class R6 shares at NAV returned 16.14%*. For the same period, the Russell 2000® Index, which serves as the Fund’s broad-based and style-specific benchmark appropriate for comparison, returned 8.27%*. |
* Returns less than 1 year are not annualized.
All performance figures assume reinvestment of distributions and exclude the effect of sales changes. Performance data quoted represents past results. Past performance is no guarantee of future results, and current performance may be higher or lower than the performance shown above. Investment return and principal value will fluctuate so your shares, when redeemed, may be worth more or less than their original cost. Please visit Virtus.com for performance data current to the most recent month-end.
How did the markets perform during the six-month fiscal period ended September 30, 2017?
| ⬛ | | The six-month fiscal period was a good environment for the U.S. stock market overall. Smaller-capitalization stocks outperformed their larger counterparts, with the Russell 2000® Index up 8.27% versus the S&P 500® Index return of 7.71%. Growth stocks continued to outpace value stocks, with the Russell 2000® Growth Index up 10.88% and the Russell 2000® Value Index advancing 5.81%. Lower quality businesses, as measured by S&P Stock Rankings, outperformed their higher quality counterparts. |
| ⬛ | | During the fiscal period, the best performing sectors in the Russell 2000® Index were health care, producer durables, and technology. The worst performing sectors were energy, consumer staples, and materials and processing. |
| ⬛ | | Despite the change of administration in Washington, D.C., there was no substantial legislation from the Republican-controlled White House and Congress. The repeal of the Affordable Care Act was pushed aside to focus on tax reform. The market reacted positively to tax plan outlines put forth by the White House. |
What factors affected the Fund’s performance during the fiscal period?
| ⬛ | | The Fund outperformed the Russell 2000® Index for the six-month period ended September 30, 2017. The outperformance was driven by strong stock selection in the technology and consumer discretionary sectors. Negative stock selection and an underweight exposure in health care, as well as an underweight exposure in energy, detracted from performance. |
For the reporting period, the largest contributors to performance were Autohome and Fox Factory Holding.
| ⬛ | | Autohome reported robust revenue growth and profit improvement that surpassed expectations, as its financial results continued to benefit from the secular shift of advertising budgets from offline to online media. It is worth noting that just before the end of the period, two senior executives at Autohome resigned for personal reasons. Based on follow-up conversations we had with the company, these departures were not related to the fundamentals of the business, and management planned to maintain the current corporate strategy. Therefore, given Autohome’s strong competitive positioning, improved capital allocation, and the expected long-term growth of the Chinese car market, the Fund remained invested in the business as of the end of the period. |
| ⬛ | | Fox Factory’s growth accelerated due to new model specification wins in its mountain bike segment and the initiation of production of on-road sports trucks by its original equipment manufacturer customers. |
The largest detractors from performance were Dril-Quip and Core Laboratories.
| ⬛ | | Dril-Quip’s shares lagged, driven by continuous weakness in deep water drilling activity due to depressed crude oil prices. Our favorable view of the company’s competitive positioning remained intact, however. Dril-Quip has a long-term track record of disciplined capital allocation, with a focus on organic growth and returning excess cash to shareholders, and the company’s balance sheet was debt-free during the period. |
| ⬛ | | Core Labs’ shares lagged due to challenging operating conditions resulting from lower crude oil prices. However, we continued to believe in the company’s long-term market positioning. Core Labs, which has been recognized as the industry’s innovation leader, introduced a number of revolutionary products during the period. The company remained a strong free-cash-flow generator, as it returned excess cash to shareholders in the form of cash dividends and share repurchases. |
The preceding information is the opinion of portfolio management only through the end of the period stated on the cover. Any such opinions are subject to change at any time based upon market or other conditions and should not be relied upon as investment advice. Past performance is no guarantee of future results, and there is no guarantee that market forecasts will be realized.
Equity Securities: The market price of equity securities may be adversely affected by financial market, industry, or issuer-specific events. Focus on a particular style or on small or medium-sized companies may enhance that risk.
Limited Number of Investments: Because the Fund has a limited number of securities, it may be more susceptible to factors adversely affecting its securities than a less concentrated fund.
Industry/Sector Concentration: A fund that focuses its investments in a particular industry or sector will be more sensitive to conditions that affect that industry or sector than a non-concentrated fund.
Prospectus: For additional information on risks, please see the Fund’s prospectus.
| | | | |
| |
| Asset Allocations | |
| |
| The following table presents the portfolio holding within certain sectors as a percentage of total investments attributable to each sector at September 30, 2017. | |
Industrials | | | 30 | % |
Information Technology | | | 20 | |
Financials | | | 15 | |
Consumer Discretionary | | | 12 | |
Energy | | | 5 | |
Real Estate | | | 4 | |
Health Care | | | 3 | |
Other (includes short-term investment) | | | 11 | |
| | | | | |
Total | | | 100 | % |
| | | | | |
For information regarding the indexes and certain investment terms, see the Key Investment Terms starting on page 4.
19
KAR Small-Cap Core Fund (Continued)
| | | | | | | | | | | | | | | | | | | | |
| Average Annual Total Returns1 for periods ended 9/30/17 | | | | |
| | | 1 year | | | 5 years | | | 10 years | | | Since
Inception | | | Inception Date | |
| Class A shares at NAV2 | | | 30.53 | % | | | 14.65 | % | | | 9.40 | % | | | — | | | | — | |
| Class A shares at POP3,4 | | | 23.02 | | | | 13.30 | | | | 8.76 | | | | — | | | | — | |
| Class C shares at NAV2 and with CDSC4 | | | 29.55 | | | | 13.80 | | | | 8.59 | | | | — | | | | — | |
| Class I shares at NAV2 | | | 30.90 | | | | 14.93 | | | | 9.69 | | | | — | | | | — | |
| Class R6 shares at NAV2 | | | 30.97 | | | | — | | | | — | | | | 14.82 | % | | | 11/12/14 | |
| Russell 2000® Index | | | 20.74 | | | | 13.79 | | | | 7.85 | | | | 9.80 | 5 | | | — | |
Fund Expense Ratios6: Class A shares: 1.37%; Class C shares: 2.11%; Class I shares: 1.10%; Class R6 shares: 1.00%.
All returns represent past performance which is no guarantee of future results. Current performance may be higher or lower than the performance shown. The investment return and principal value of an investment will fluctuate so that an investor’s shares, when redeemed, may be worth more or less than their original cost. The above table and graph below do not reflect the deduction of taxes that a shareholder would pay on fund distributions or the redemption of fund shares. Please visit Virtus.com for performance data current to the most recent month-end.
| 1 | Total returns are historical and include changes in share price and the reinvestment of both dividends and capital gain distributions. |
| 2 | “NAV” (Net Asset Value) total returns do not include the effect of any sales charge. |
| 3 | “POP” (Public Offering Price) total returns include the effect of the maximum front-end 5.75% sales charge. |
| 4 | “CDSC” (contingent deferred sales charge) is applied to redemptions of certain classes of shares that do not have a sales charge applied at the time of purchase. CDSC charges for certain redemptions of Class A shares made within 18 months of a finder’s fee being paid and all Class C shares are 1% within the first year and 0% thereafter. |
| 5 | The index returns are from Class R6 shares’ inception date. |
| 6 | The expense ratios of the Fund are set forth according to the prospectus for the Fund effective July 31, 2017, as supplemented and revised, and may differ from the expense ratios disclosed in the Financial Highlights tables in this report. See the Financial Highlights for more current expense ratios. Expense ratios include fees and expenses associated with the underlying funds. |
Growth of $10,000 For periods ended 9/30
This chart assumes an initial investment of $10,000 made on September 30, 2007, for Class A shares, Class C shares, and Class I shares including any applicable sales charges or fees. The performance of the other share class may be greater or less than that shown based on differences in inception dates, fees, and sales charges. Performance assumes reinvestment of dividends and capital gain distributions.
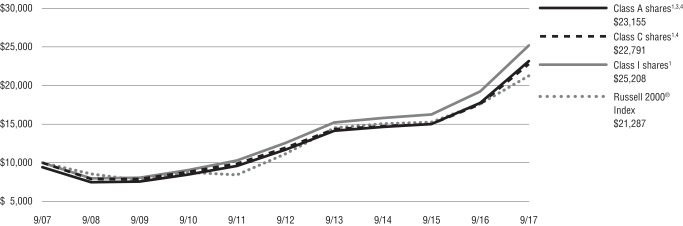
The index is unmanaged and not available for direct investment; therefore, its performance does not reflect the expenses associated with active management of an actual portfolio.
For information regarding the indexes and certain investment terms, see the Key Investment Terms starting on page 4.
20
| | |
KAR Small-Cap Growth Fund Fund Summary (Unaudited) | | Ticker Symbols: A Share: PSGAX C Share: PSGCX I Share: PXSGX |
Portfolio Manager Commentary by Kayne Anderson Rudnick Investment Management, LLC
| ⬛ | | The Fund is diversified and has an investment objective of long-term capital appreciation. There is no guarantee that the Fund will meet its objective. |
| ⬛ | | Effective September 21, 2017 the Fund changed its fiscal year end from March 31 to September 30. As a result, the commentary addresses six months of performance from April 1, 2017 to September 30, 2017. |
| ⬛ | | For the fiscal period April 1 through September 30, 2017, the Fund’s Class A shares at NAV returned Class C shares at NAV returned 19.92%*++, and Class I shares at NAV returned 20.51%*++. For the same period, the Russell 2000® Growth Index, which serves as the Fund’s broad-based and style-specific benchmark appropriate for comparison, returned 10.88%*. |
++ See footnote 6 on page 22.
* Returns less 1 year are not annualized
All performance figures assume reinvestment of distributions and exclude the effect of sales changes. Performance data quoted represents past results. Past performance is no guarantee of future results, and current performance may be higher or lower than the performance shown above. Investment return and principal value will fluctuate so your shares, when redeemed, may be worth more or less than their original cost. Please visit Virtus.com for performance data current to the most recent month-end.
How did the markets perform during the six-month fiscal period ended September 30, 2017?
| ⬛ | | The six-month fiscal period was a good environment for the U.S. stock market overall. Smaller-capitalization stocks outperformed their larger counterparts, with the Russell 2000® Index up 8.27% versus the S&P 500® Index return of 7.71%. Growth stocks continued to outpace value stocks, with the Russell 2000® Growth Index up 10.88% and the Russell 2000® Value Index advancing 5.81%. Lower quality businesses, as measured by S&P Stock Rankings, outperformed their higher quality counterparts. |
| ⬛ | | During the fiscal period, the best performing sectors in the Russell 2000® Growth Index were health care, utilities, and producer durables. The |
| | | worst performing sectors were energy, consumer staples, and materials and processing. |
| ⬛ | | Despite the change of administration in Washington, D.C., there was no substantial legislation from the Republican-controlled White House and Congress. The repeal of the Affordable Care Act was pushed aside to focus on tax reform. The market reacted positively to tax plan outlines put forth by the White House. |
What factors affected the Fund’s performance during the fiscal period?
| ⬛ | | The Fund outperformed the Russell 2000® Growth Index for the six-month period ended September 30, 2017. The outperformance was driven by strong stock selection in the consumer discretionary and technology sectors. An underweight exposure in utilities detracted slightly from performance. |
For the reporting period, the largest contributors to performance were Autohome and National Research.
| ⬛ | | Autohome reported robust revenue growth and profit improvement that surpassed expectations, as its financial results continued to benefit from the secular shift of advertising budgets from offline to online media. It is worth noting that just before the end of the period, two senior executives at Autohome resigned for personal reasons. Based on follow-up conversations we had with the company, these departures were not related to the fundamentals of the business, and management planned to maintain the current corporate strategy. Therefore, given Autohome’s strong competitive positioning, improved capital allocation, and the expected long-term growth of the Chinese car market, the Fund remained invested in the business as of the end of the period. |
| ⬛ | | National Research’s shares increased after the company reported solid financial results, driven by new client wins and higher contracts with existing clients. |
The largest detractors from performance were Ellie Mae and Financial Engines.
| ⬛ | | Ellie Mae reported slightly weaker-than-expected results and lowered guidance for 2017. The company underestimated the impact of the material drop-off in refinance loan volume in 2017 and the |
| | | associated impact on closed-loan fees. Additionally, Ellie Mae saw delayed revenue due to longer implementation times for recent deals with larger customers. |
| ⬛ | | Financial Engine’s shares suffered due to lower fee rates, higher spending on a new service offering, and moderating asset flows as withdrawals have begun to exceed contributions in the overall 401(k) retirement plan market due to the aging of the U.S. population. |
The preceding information is the opinion of portfolio management only through the end of the period stated on the cover. Any such opinions are subject to change at any time based upon market or other conditions and should not be relied upon as investment advice. Past performance is no guarantee of future results, and there is no guarantee that market forecasts will be realized.
Equity Securities: The market price of equity securities may be adversely affected by financial market, industry, or issuer-specific events. Focus on a particular style or on small or medium-sized companies may enhance that risk.
Limited Number of Investments: Because the Fund has a limited number of securities, it may be more susceptible to factors adversely affecting its securities than a less concentrated fund.
Industry/Sector Concentration: A fund that focuses its investments in a particular industry or sector will be more sensitive to conditions that affect that industry or sector than a non-concentrated fund.
Prospectus: For additional information on risks, please see the Fund’s prospectus.
| | | | |
| |
| Asset Allocations | |
| |
The following table presents the portfolio holdings within certain sectors as a percentage of total investments attributable to each sector at September 30, 2017. | |
Information Technology | | | 21 | % |
Consumer Discretionary | | | 20 | |
Industrials | | | 18 | |
Financials | | | 14 | |
Health Care | | | 7 | |
Consumer Staples | | | 6 | |
Other (includes short-term investment) | | | 14 | |
| | | | | |
Total | | | 100 | % |
| | | | | |
For information regarding the indexes and certain investment terms, see the Key Investment Terms starting on page 4.
21
KAR Small-Cap Growth Fund (Continued)
| | | | | | | | | | | | |
| Average Annual Total Returns1 for periods ended 9/30/17 | | | | |
| | | 1 year | | | 5 years | | | 10 Years | |
| Class A shares at NAV2 | | | 32.77 | % | | | 19.00 | % | | | 11.32 | % |
| Class A shares at POP3,4 | | | 25.13 | | | | 17.60 | | | | 10.66 | |
| Class C shares at NAV2 and with CDSC4 | | | 31.71 | | | | 18.11 | | | | 10.48 | |
| Class I shares at NAV2 | | | 33.08 | | | | 19.29 | | | | 11.50 | |
| Russell 2000® Growth Index | | | 20.98 | | | | 14.28 | | | | 8.47 | |
Fund Expense Ratios5: Class A shares: 1.49%; Class C shares: 2.25%; Class I shares: 1.25%.
All returns represent past performance which is no guarantee of future results. Current performance may be higher or lower than the performance shown. The investment return and principal value of an investment will fluctuate so that an investor’s shares, when redeemed, may be worth more or less than their original cost. The above table and graph below do not reflect the deduction of taxes that a shareholder would pay on fund distributions or the redemption of fund shares. Please visit Virtus.com for performance data current to the most recent month-end.
| 1 | Total returns are historical and include changes in share price and the reinvestment of both dividends and capital gain distributions. |
| 2 | “NAV” (Net Asset Value) total returns do not include the effect of any sales charge. |
| 3 | “POP” (Public Offering Price) total returns include the effect of the maximum front-end 5.75% sales charge. |
| 4 | “CDSC” (contingent deferred sales charge) is applied to redemptions of certain classes of shares that do not have a sales charge applied at the time of purchase. CDSC charges for certain redemptions of Class A shares made within 18 months of a finder’s fee being paid and all Class C shares are 1% within the first year and 0% thereafter. |
| 5 | The expense ratios of the Fund are set forth according to the prospectus for the Fund effective July 31, 2017, as supplemented and revised, and may differ from the expense ratios disclosed in the Financial Highlights tables in this report. See the Financial Highlights for more current expense ratios. Expense ratios include fees and expenses associated with the underlying funds. |
| 6 | The total return for Class C and Class I presented in the Financial Highlights section of the report differs from that presented on page 21 . The total return for the Financial Highlights is calculated based on the NAV at which shareholder transactions were processed, but also takes into account certain adjustments that are necessary under U.S. generally accepted accounting principles required in the annual report and semi-annual report. |
Growth of $10,000 For periods ended 9/30
This chart assumes an initial investment of $10,000 made on September 30, 2007, for Class A shares, Class C shares, and Class I shares including any applicable sales charges or fees. Performance assumes reinvestment of dividends and capital gain distributions.
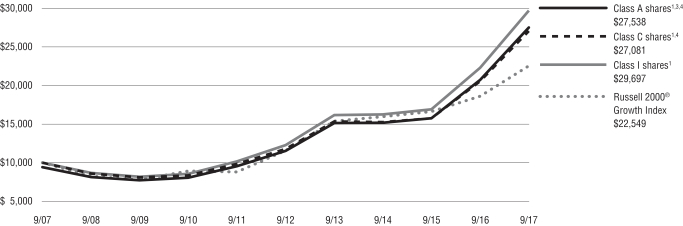
The index is unmanaged and not available for direct investment; therefore, its performance does not reflect the expenses associated with active management of an actual portfolio.
For information regarding the indexes and certain investment terms, see the Key Investment Terms starting on page 4.
22
| | |
KAR Small-Cap Value Fund Fund Summary (Unaudited) | | Ticker Symbols: A Share: PQSAX C Share: PQSCX I Share: PXQSX R6 Share: VQSRX |
Portfolio Manager Commentary by Kayne Anderson Rudnick Investment Management, LLC
| ⬛ | | The Fund is diversified and has an investment objective of long-term capital appreciation. There is no guarantee that the Fund will meet its objective. |
| ⬛ | | Effective September 21, 2017 the Fund changed its fiscal year end from March 31 to September 30. As a result, the commentary addresses six months of performance from April 1, 2017 to September 30, 2017. |
| ⬛ | | For the fiscal period April 1 through September 30, 2017, the Fund’s Class A shares at NAV returned 8.56%*, Class C shares at NAV returned 8.17%*, Class I shares at NAV returned 8.72%*, and Class R6 shares, returned 8.78%*. For the same period, the Russell 2000® Value Index, which serves as the Fund’s broad-based and style-specific benchmark appropriate for comparison, returned 5.81%*. |
* Returns less than 1 year are not annualized.
All performance figures assume reinvestment of distributions and exclude the effect of sales changes. Performance data quoted represents past results. Past performance is no guarantee of future results, and current performance may be higher or lower than the performance shown above. Investment return and principal value will fluctuate so your shares, when redeemed, may be worth more or less than their original cost. Please visit Virtus.com for performance data current to the most recent month-end.
How did the markets perform during the six-month fiscal period ended September 30, 2017?
| ⬛ | | The six-month fiscal period was a good environment for the U.S. stock market overall. Smaller-capitalization stocks outperformed their larger counterparts, with the Russell 2000® Index up 8.27% versus the S&P 500® Index return of 7.71%. Growth stocks continued to outpace value stocks, with the Russell 2000® Growth Index up 10.88% and the Russell 2000® Value Index advancing 5.81%. Lower quality businesses, as measured by S&P Stock Rankings, outperformed their higher quality counterparts. |
| ⬛ | | During the fiscal period, the best performing sectors in the Russell 2000® Value Index were health |
| | | care, producer durables, and consumer discretionary. The worst performing sectors were energy, consumer staples, and materials and processing. |
| ⬛ | | Despite the change of administration in Washington, D.C., there was no substantial legislation from the Republican-controlled White House and Congress. The repeal of the Affordable Care Act was pushed aside to focus on tax reform. The market reacted positively to tax plan outlines put forth by the White House. |
What factors affected the Fund’s performance during the fiscal period?
| ⬛ | | The Fund outperformed the Russell 2000® Value Index for the six-month period ended September 30, 2017. The outperformance was driven by strong stock selection in the consumer staples and producer durables sectors. Negative stock selection in consumer discretionary and health care detracted from performance. |
For the reporting period, the largest contributors to performance were National Beverage and Thor Industries.
| ⬛ | | Robust sales of National Beverage’s La Croix brand fueled positive performance, as the company reported strong growth in consolidated revenue and earnings per share in the third quarter of 2017. |
| ⬛ | | Thor’s stock increased as sales for both Thor and the recreational vehicle industry surpassed the prior peak, which was reached in 2006. Shares also benefited from positive reactions to the company’s acquisition of competitor Jayco. That acquisition was reasonably priced, gave Thor additional scale, and increased its mix in the fast-growing towable segment. |
The largest detractors from performance were Cheesecake Factory and Cinemark Holdings.
| ⬛ | | Cheesecake Factory reported somewhat weaker-than-expected results in the third quarter of 2017. The company experienced weakness in its lunch business, which may have stemmed from the challenges in mall traffic. We met with management and were impressed with the company’s operating improvements, as well as incremental opportunities to drive top-line growth. |
| ⬛ | | Cinemark’s underperformance was driven by a generally weaker slate of films in 2017 relative to the record performance in 2016. Cinemark delivered box office growth in excess of the industry, which drove strong growth in concession sales. But investors were concerned about recent discussions surrounding shrinking windows, which give exhibitors exclusive rights to show a film in a set period. |
The preceding information is the opinion of portfolio management only through the end of the period stated on the cover. Any such opinions are subject to change at any time based upon market or other conditions and should not be relied upon as investment advice. Past performance is no guarantee of future results, and there is no guarantee that market forecasts will be realized.
Equity Securities: The market price of equity securities may be adversely affected by financial market, industry, or issuer-specific events. Focus on a particular style or on small or medium-sized companies may enhance that risk.
Limited Number of Investments: Because the Fund has a limited number of securities, it may be more susceptible to factors adversely affecting its securities than a less concentrated fund.
Industry/Sector Concentration: A fund that focuses its investments in a particular industry or sector will be more sensitive to conditions that affect that industry or sector than a non-concentrated fund.
Prospectus: For additional information on risks, please see the Fund’s prospectus.
| | | | |
| |
| Asset Allocations | |
| |
The following table presents the portfolio holding within certain sectors as a percentage of total investments attributable to each sector at September 30, 2017. | |
Industrials | | | 19 | % |
Consumer Discretionary | | | 14 | |
Financials | | | 14 | |
Information Technology | | | 14 | |
Real Estate | | | 12 | |
Consumer Staples | | | 7 | |
Health Care | | | 6 | |
Other (includes short-term investment) | | | 14 | |
| | | | | |
Total | | | 100 | % |
| | | | | |
For information regarding the indexes and certain investment terms, see the Key Investment Terms starting on page 4.
23
KAR Small-Cap Value Fund (Continued)
| | | | | | | | | | | | | | | | | | | | |
| Average Annual Total Returns1 for periods ended 9/30/17 | |
| | | 1 year | | | 5 years | | | 10 years | | | Since
Inception | | | Inception
Date | |
| Class A shares at NAV2 | | | 26.08 | % | | | 15.40 | % | | | 8.24 | % | | | — | | | | — | |
| Class A shares at POP3,4 | | | 18.83 | | | | 14.04 | | | | 7.60 | | | | — | | | | — | |
| Class C shares at NAV2 and with CDSC4 | | | 25.22 | | | | 14.55 | | | | 7.44 | | | | — | | | | — | |
| Class I shares at NAV2 | | | 26.48 | | | | 15.70 | | | | 8.52 | | | | — | | | | — | |
| Class R6 shares at NAV2 | | | — | | | | — | | | | — | | | | 32.25 | % | | | 11/3/16 | |
| Russell 2000® Value Index | | | 20.55 | | | | 13.27 | | | | 7.14 | | | | 27.87 | 5 | | | — | |
Fund Expense Ratios6: Class A shares: 1.34%; Class C shares: 2.06%; Class I shares: 1.05%; Class R6 shares: 0.96%.
All returns represent past performance which is no guarantee of future results. Current performance may be higher or lower than the performance shown. The investment return and principal value of an investment will fluctuate so that an investor’s shares, when redeemed, may be worth more or less than their original cost. The above table and graph below do not reflect the deduction of taxes that a shareholder would pay on fund distributions or the redemption of fund shares. Please visit Virtus.com for performance data current to the most recent month-end.
| 1 | Total returns are historical and include changes in share price and the reinvestment of both dividends and capital gain distributions. |
| 2 | “NAV” (Net Asset Value) total returns do not include the effect of any sales charge. |
| 3 | “POP” (Public Offering Price) total returns include the effect of the maximum front-end 5.75% sales charge. |
| 4 | “CDSC” (contingent deferred sales charge) is applied to redemptions of certain classes of shares that do not have a sales charge applied at the time of purchase. CDSC charges for certain redemptions of Class A shares made within 18 months of a finder’s fee being paid and all Class C shares are 1% within the first year and 0% thereafter. |
| 5 | The index return is from Class R6 shares’ inception date. |
| 6 | The expense ratios of the Fund are set forth according to the prospectus for the Fund effective July 31, 2017, as supplemented and revised, and may differ from the expense ratios disclosed in the Financial Highlights tables in this report. See the Financial Highlights for more current expense ratios. Expense ratios include fees and expenses associated with the underlying funds. |
Growth of $10,000 For periods ended 9/30
This chart assumes an initial investment of $10,000 made on September 30, 2007, for Class A shares, Class C shares, and Class I shares including any applicable sales charges or fees. The performance of the other share class may be greater or less than that shown based on differences in inception dates, fees, and sales charges. Performance assumes reinvestment of dividends and capital gain distributions.

The index is unmanaged and not available for direct investment; therefore, its performance does not reflect the expenses associated with active management of an actual portfolio.
For information regarding the indexes and certain investment terms, see the Key Investment Terms starting on page 4.
24
| | |
Rampart Enhanced Core Equity Fund Fund Summary (Unaudited) | | Ticker Symbols: A Share: PDIAX C Share: PGICX I Share: PXIIX |
Portfolio Manager Commentary by Rampart Investment Management Company, LLC
| ⬛ | | Rampart Enhanced Core Equity Fund (the “Fund”) is diversified and has investment objectives of capital appreciation and current income. There is no guarantee that the Fund will meet its objectives. |
| ⬛ | | Effective September 21, 2017 the Fund changed its fiscal year end from March 31 to September 30. As a result, the commentary addresses six months of performance from April 1, 2017 to September 30, 2017. |
| ⬛ | | For the fiscal period April 1 through September 30, 2017, the Fund’s Class A shares at NAV returned 9.26%*, Class C shares returned 8.91%*++ and Class I shares returned 9.41%*. For the same period, the S&P 500® Index, which serves as the Fund’s broad-based and style-specific benchmark appropriate for comparison, returned 7.71%*. |
* Returns less than 1 year are not annualized.
++ See footnote 7 on page 26.
All performance figures assume reinvestment of distributions and exclude the effect of sales changes. Performance data quoted represents past results. Past performance is no guarantee of future results, and current performance may be higher or lower than the performance shown above. Investment return and principal value will fluctuate so your shares, when redeemed, may be worth more or less than their original cost. Please visit Virtus.com for performance data current to the most recent month-end.
How did the markets perform during the six-month fiscal period ended September 30, 2017?
| ⬛ | | The six months ended September 30, 2017, stand as a textbook example of a bull market for U.S. large-cap equities. The total return for the S&P 500® Index over the time period was nearly 8% – about double the historical average – and volatility was less than half the historical average. |
| ⬛ | | The U.S. stock market has shown an uncanny ability to shrug off or ignore potential catalysts for selling. The market has absorbed, in no particular order, several devastating hurricanes, an extremely tense domestic political environment, a series of legislative stalemates, and the outright threat of nuclear war. In our historical research, and in our practical experience, we find that there is a self-reinforcing mechanism that tends to perpetuate risk states. In stressed market environments, relatively mundane events can contribute to an overall sense of unease, leading to a continuing cascade of selling and reducing risk, which can become a |
| | | self-perpetuating cycle. Similarly, in a low volatility environment, market reactions to otherwise serious events can become muted. In the current market, however, the weekly (if not daily) drip of potentially market-moving events has largely been ignored. |
| ⬛ | | There are numerous theories that seek to explain the strength and resilience of the current bull market – which is currently older than most third-grade students. Our belief is that the forthcoming activity by the Federal Reserve (“the Fed”) has the potential to shape the stock market landscape for years to come, making it a more important factor than others such as the political climate. The track record of bull markets during rising interest rate environments is not a good one. While rising rates is neither a necessary nor sufficient factor for a bear market, it is one more hurdle for an aging bull market to clear. |
What factors affected the Fund’s performance during the fiscal period?
| ⬛ | | The Fund outperformed the S&P 500® Index by 1.71% for the six-month fiscal period ended September 30, 2017, gaining 9.41% versus 7.71% for the index. This relative outperformance was driven by a continuing series of successful volatility investments during the period. |
| ⬛ | | The Fund has two performance drivers. The first is an equity portfolio that is intended to closely track the S&P 500® Index, with occasional small tactical tilts at the sector level. As expected, during the six-month period, the equity portfolio neither added to nor detracted from performance relative to the index. |
| ⬛ | | The second performance driver – and the only expected source of outperformance – is the Fund’s volatility trading strategy. This strategy seeks to generate additional income by extracting value from the difference between implied volatility, as measured by the CBOE Volatility Index®, and the volatility level that actually occurs in market performance. The Fund therefore sells short-dated S&P 500® Index-linked put and call spreads several times each week. The short option in each spread earns an upfront cash premium. A portion of this cash is used to buy additional options that seek to contain losses during extreme market events. This strategy effectively monetizes the widely observed premium that the broader market is willing to pay for certain index options. |
| ⬛ | | During the fiscal period, the Fund’s options trading strategy provided consistent outperformance over the index. While we expect the Fund to experience |
| | | occasional larger losses, the vast majority of options trades that expired during the six-month period were successful, and the few losses were relatively small. |
The preceding information is the opinion of portfolio management only through the end of the period stated on the cover. Any such opinions are subject to change at any time based upon market or other conditions and should not be relied upon as investment advice. Past performance is no guarantee of future results, and there is no guarantee that market forecasts will be realized.
Equity Securities: The market price of equity securities may be adversely affected by financial market, industry, or issuer-specific events. Focus on a particular style or on small or medium-sized companies may enhance that risk.
Call/Put Spreads: Buying and selling call and put option spreads on the S&P 500® Index risks the loss of the premium when buying, can limit upside participation and increase downside losses.
Fund of Funds: Because the Fund can invest in other funds, it indirectly bears its proportionate share of the operating expenses and management fees of the underlying fund(s).
Industry/Sector Concentration: A fund that focuses its investments in a particular industry or sector will be more sensitive to conditions that affect that industry or sector than a non-concentrated fund.
Portfolio Turnover: The Fund’s principal investments strategies will result in a consistently high portfolio turnover rate. A higher portfolio turnover rate may indicate higher transaction costs and may result in higher taxes when fund shares are held in a taxable account.
Prospectus: For additional information on risks, please see the Fund’s prospectus.
| | | | |
| |
| Asset Allocations | |
| |
The following table presents the portfolio holding within certain sectors as a percentage of total investments attributable to each sector at September 30, 2017. | |
Information Technology | | | 23 | % |
Financials | | | 17 | |
Health Care | | | 15 | |
Consumer Discretionary | | | 11 | |
Industrials | | | 9 | |
Consumer Staples | | | 8 | |
Energy | | | 6 | |
Other (includes purchased and written options) | | | 11 | |
| | | | | |
Total | | | 100 | % |
| | | | | |
For information regarding the indexes and certain investment terms, see the Key Investment Terms starting on page 4.
25
Rampart Enhanced Core Equity Fund (Continued)
| | | | | | | | | | | | | | | | | | | | |
| Average Annual Total Returns1 for periods ended 9/30/17 | | | | |
| | | 1 year | | | 5 years | | | 10 years | | | Since
Inception | | | Inception
Date | |
| Class A shares at NAV2 | | | 23.39 | % | | | 13.76 | % | | | 6.70 | % | | | — | | | | — | |
| Class A shares at POP3,4 | | | 16.29 | | | | 12.42 | | | | 6.07 | | | | — | | | | — | |
| Class C shares at NAV2 and with CDSC4 | | | 22.50 | | | | 12.91 | | | | 5.90 | | | | — | | | | — | |
| Class I shares | | | 23.74 | | | | 14.02 | | | | — | | | | 7.26 | % | | | 11/13/07 | |
| S&P 500® Index | | | 18.61 | | | | 14.22 | | | | 7.44 | | | | 7.83 | 5 | | | — | |
Fund Expense Ratios6: Class A shares: Gross 1.37%, Net 1.21%; Class C shares: Gross 2.14%, Net 1.96%; Class I shares: Gross 1.13%, Net 0.96%.
All returns represent past performance which is no guarantee of future results. Current performance may be higher or lower than the performance shown. The investment return and principal value of an investment will fluctuate so that an investor’s shares, when redeemed, may be worth more or less than their original cost. The above table and graph below do not reflect the deduction of taxes that a shareholder would pay on fund distributions or the redemption of fund shares. Please visit Virtus.com for performance data current to the most recent month-end.
| 1 | Total returns are historical and include changes in share price and the reinvestment of both dividends and capital gain distributions. |
| 2 | “NAV” (Net Asset Value) total returns do not include the effect of any sales charge. |
| 3 | “POP” (Public Offering Price) total returns include the effect of the maximum front-end 5.75% sales charge. |
| 4 | “CDSC” (contingent deferred sales charge) is applied to redemptions of certain classes of shares that do not have a sales charge applied at the time of purchase. CDSC charges for certain redemptions of Class A shares made within 18 months of a finder’s fee being paid and all Class C shares are 1% within the first year and 0% thereafter. |
| 5 | The index return is from class I shares’ inception date. |
| 6 | The expense ratios of the Fund are set forth according to the prospectus for the Fund effective July 31, 2017, as supplemented and revised, and may differ from the expense ratios disclosed in the Financial Highlights tables in this report. See the Financial Highlights for more current expense ratios. Net Expense: Expenses reduced by a contractual fee waiver, in effect through July 31, 2018. Gross Expense: Does not reflect the effect of the fee waiver. Expense ratios include fees and expenses associated with the underlying funds. |
| 7 | The total return for Class C presented in the Financial Highlights section of the report differs from that presented on page 25 . The total return for the Financial Highlights is calculated based on the NAV at which shareholder transactions were processed, but also takes into account certain adjustments that are necessary under U.S. generally accepted accounting principles required in the annual report and semi-annual report. |
Growth of $10,000 For periods ended 9/31
This chart assumes an initial investment of $10,000 made on September 30, 2007, for Class A shares and Class C shares including any applicable sales charges or fees. The performance of the other share class may be greater or less than that shown based on differences in inception date, fees and sales charges. Performance assumes reinvestment of dividends and capital gain distributions.

The index is unmanaged and not available for direct investment; therefore, its performance does not reflect the expenses associated with active management of an actual portfolio.
For information regarding the indexes and certain investment terms, see the Key Investment Terms starting on page 4.
26
| | |
Tactical Allocation Fund Fund Summary (Unaudited) | | Ticker Symbols: A Share: NAINX C Share: POICX |
Portfolio Managers Commentaries by
Duff & Phelps Investment Management Co.
(International Equity Portfolio),
Kayne Anderson Rudnick Investment Management, LLC
(Domestic Equity Portfolio) and
Newfleet Asset Management, LLC (Fixed Income Portfolio)
| ⬛ | | The Fund is diversified and has investment objectives of capital appreciation and income. There is no guarantee that the Fund will meet its objectives. |
| ⬛ | | Effective September 21, 2017 the Fund changed its fiscal year end from March 31 to September 30. As a result, the commentary addresses six months of performance from April 1, 2017 to September 30, 2017. |
| ⬛ | | For the fiscal period April 1 through September 30, 2017, the Fund’s Class A shares at NAV returned 9.25%*, and Class C shares at NAV returned 8.80%*. For the same period, the Russell 1000® Growth Index, a broad-based U.S. equity index, returned 10.84%*; the MSCI EAFE® Index (net) a broad-based International Index returned 11.86%*; the Bloomberg Barclays U.S. Aggregate Bond Index, a broad-based fixed income index, returned 2.31%*; and the Tactical Allocation Fund Linked Benchmark, the Fund’s style-specific benchmark, returned 7.52%*. |
* Returns less than 1 year are not annualized.
All performance figures assume reinvestment of distributions and exclude the effect of sales changes. Performance data quoted represents past results. Past performance is no guarantee of future results, and current performance may be higher or lower than the performance shown above. Investment return and principal value will fluctuate so your shares, when redeemed, may be worth more or less than their original cost. Please visit Virtus.com for performance data current to the most recent month-end.
How did the markets perform during the six-month fiscal period ended September 30, 2017?
U.S. Equities
| ⬛ | | The six-month fiscal period was a good environment for the U.S. stock market overall. |
| | | Smaller-capitalization stocks outperformed their larger counterparts, with the Russell 2000® Index up 8.27% versus the S&P 500® Index return of 7.71% for the six months. Growth stocks continued to outpace value stocks, with the Russell 1000® Growth Index up 10.84% and the Russell 1000® Value Index advancing 4.50%. Lower quality businesses, as measured by S&P Stock Rankings, outperformed their higher quality counterparts. |
| ⬛ | | During the fiscal period, the best performing sectors in the Russell 1000® Growth Index were utilities, information technology, and health care. The worst performing sectors were energy, consumer staples, and telecommunication services. |
| ⬛ | | Despite being in the midst of a raging bull market, we were dealing with a multitude of negative issues including historic natural disasters, potential nuclear war, deadly violence over Civil War monuments, senseless mass shootings, and rigged elections the world over, all of which provided seemingly endless sources of unease. Yet the S&P 500® Index put up its eighth straight quarterly advance, with a serene average daily change of just 0.3%, the lowest since 1968. |
| ⬛ | | A number of factors continued to paint a positive backdrop for equities. Interest rates remained subdued as the lack of inflation weighed on long-term rates and limited what the Federal Reserve (Fed) could do with short-term rates. Domestic unemployment remained low, wages were on the rise, and home prices continued to appreciate, putting the consumer on solid footing. A synchronized global pickup reduced the risk of contagion from weakness elsewhere in the world. |
International Equities
| ⬛ | | The international equity markets performed strongly during the six-month fiscal period ended September 30, 2017, with the MSCI EAFE® Index gaining 11.86%. Markets displayed ongoing resilience, posting two consecutive quarters with returns in excess of 5%. Mounting evidence of measured but steady global gross domestic product (GDP) growth was enough to overcome potentially disruptive events such as a weak U.S. dollar, natural disasters, and a tense situation in North Korea. The markets’ resiliency in the face of such challenges underscores just how comfortable investors have become with being uncomfortable. |
| ⬛ | | Every sector in the MSCI EAFE® Index posted positive returns. The top performing sectors were information technology, materials, and industrials. The weakest performing sectors were telecommunications, real estate, and consumer staples. Broadly speaking, cyclical sectors led the charge over defensive sectors as markets marched higher. This reflected the positive trends in GDP growth. |
Fixed Income
| ⬛ | | Most spread sectors outperformed U.S. Treasuries during the six-month fiscal period ended September 30, 2017 as spreads tightened. The global growth outlook remained favorable and the search for yield persisted. Within most fixed income sectors, longer duration and lower quality assets were key drivers of performance. |
| ⬛ | | Still-accommodative monetary policy by the major central banks, a favorable global growth outlook, and better-than-expected Chinese data all provided a positive backdrop. Moderate economic growth in the U.S., good and modestly improving fundamentals, and strong technical factors also supported spread sector outperformance, as did the persistence of the global demand for yield. Periods of weakness within spread sectors were brief as investors waiting on the sidelines took advantage of any meaningful drop in prices to buy in, quickly reversing the declines. |
| ⬛ | | As anticipated, the Federal Reserve (Fed) raised its target rate 0.25% during the last six months to a range of 1.00% to 1.25%. During its September 2017 meeting, the Fed announced the start of its balance sheet reduction plan. |
| ⬛ | | Over the last six months, short-term interest rates rose more than long-term rates. This was due to the Fed rate hike and U.S. inflation data that was generally below expectations. |
What factors affected the Fund’s performance during the fiscal period?
U.S. Equities
| ⬛ | | The U.S. equity portfolio of the Fund underperformed the Russell 1000 Growth® Index for the six-month fiscal period ending September 30, 2017. The underperformance was driven by negative stock selection and an overweight exposure |
For information regarding the indexes and certain investment terms, see the Key Investment Terms starting on page 4.
27
| | |
| Tactical Allocation Fund (Continued) | | |
| | | to the energy sector, and negative stock selection and an underweight exposure in health care. Strong stock selection in the information technology and consumer staples sectors contributed positively to performance. |
| ⬛ | | For the reporting period, the largest contributors to performance were Alibaba and Facebook. |
| ⬛ | | Alibaba’s two marketplaces, Taobao and Tmall.com, combine to form the largest online commerce company in the world. Management has committed to a number of social initiatives to further improve mobile monetization over time. Alibaba’s marketplaces have huge network effects, and the company made efforts to foster the ecosystem with investments in payments and logistics partnerships. Taobao, in particular, has become a destination for consumers, merchants, and key opinion leaders to interact and engage in what Alibaba calls social commerce. E-commerce penetration, mobile usage, and growth in Chinese consumer spending power were all durable long-term tailwinds benefitting the company during the fiscal period. Alibaba has attempted to seize the opportunity by using data to improve targeting and increasingly consummating transactions through Alipay, its leading mobile payment offering. |
| ⬛ | | Facebook continued to grow advertising revenue and take share in the online digital marketing space. The company delivered an unprecedented global reach of approximately 30% of the earth’s population to advertisers in a measurable way. Facebook’s user growth remained stunning despite its scale, and Instagram’s Stories format was a resounding success in fighting off competitors like Snapchat. |
| ⬛ | | The largest detractors from performance were Pioneer National Resources Company and Core Laboratories. |
| ⬛ | | Pioneer National Resources has amassed valuable, contiguous acreage in the Midland Basin which, with the discovery of fracking and horizontal drilling techniques, has become one of the most prolific and lowest cost basins in the U.S. With upwards of eight billion barrels of oil equivalent in reserves, Pioneer has decades of inventory to drill and had one of the strongest balance sheets in the energy complex for the fiscal period, with investment grade debt and an industry-low |
| | | debt-to-equity ratio. Early in the third quarter, the company reported issues with pressure in larger fields which required additional per-well development costs and weighed on the shares. While it does not change the ultimate size of the asset, the additional costs and delays forced Pioneer to trim guidance for the current year. |
| ⬛ | | Core Laboratories’ shares suffered from lower commodity prices and from a short seller’s report claiming the company misrepresented its end-market exposure and its cyclicality. |
International Equities
| ⬛ | | The Fund’s international equity portfolio posted positive performance during the six-month fiscal period, but underperformed the international equity market, as measured by the MSCI EAFE® Index. Stock selection was the primary detractor from relative returns, while sector allocations had a modestly positive impact. |
| ⬛ | | Stock selection within energy, consumer discretionary, and materials weighed most heavily on the international portfolio’s performance. Shares of specialty motion picture company IMAX Corp. fell more than 33% during the period, which resulted in the largest negative stock-level impact. We continued to own shares of IMAX in the portfolio though the end of the fiscal period, as we believe the selloff was not justified. Stock selection within the industrials, financials, and real estate sectors made a positive contribution, but it was not enough to offset the drag from elsewhere. The largest single-stock contribution to relative returns came from Irish clinical research organization Icon PLC, which rose more than 42% during the period. |
| ⬛ | | The sector allocations that contributed the most to the portfolio’s relative performance were an overweight exposure to information technology, and underweight exposures to consumer staples and materials. However, the portfolio’s underweight to the utilities and financials sectors, along with an overweight exposure to industrials, detracted modestly from sector allocation results. |
| ⬛ | | Two straight quarters of strong returns for the MSCI EAFE® Index created a challenging relative performance environment for the portfolio, given our core relative value style. We maintain our disciplined approach despite the headwinds. |
Fixed Income
| ⬛ | | The underperformance of U.S. Treasuries relative to most fixed income spread sectors was the key driver of the portfolio’s outperformance for the period. |
| ⬛ | | Among fixed income sectors the portfolio’s allocations to the corporate high yield and emerging markets high yield sectors were the largest positive contributors to performance for the fiscal period. |
| ⬛ | | During the period, the portfolio’s allocations to corporate high quality and high yield bank loans were the largest detractors from performance. |
The preceding information is the opinion of portfolio management only through the end of the period stated on the cover. Any such opinions are subject to change at any time based upon market or other conditions and should not be relied upon as investment advice. Past performance is no guarantee of future results, and there is no guarantee that market forecasts will be realized.
Equity Securities: The market price of equity securities may be adversely affected by financial market, industry, or issuer-specific events. Focus on a particular style or on small or medium-sized companies may enhance that risk.
Credit & Interest: Debt securities are subject to various risks, the most prominent of which are credit and interest rate risk. The issuer of a debt security may fail to make interest and/or principal payments. Values of debt securities may rise or fall in response to changes in interest rates, and this risk may be enhanced with longer-term maturities.
Foreign & Emerging Markets: Investing internationally, especially in emerging markets, involves additional risks such as currency, political, accounting, economic, and market risk.
Allocation: The Fund’s exposure to different asset classes may not be optimal for market conditions at a given time. Asset allocation does not guarantee a profit or protect against a loss in declining markets.
High Yield-High Risk Fixed Income Securities: There is a greater level of credit risk and price volatility involved with high yield securities than investment grade securities.
For information regarding the indexes and certain investment terms, see the Key Investment Terms starting on page 4.
28
| | |
| Tactical Allocation Fund (Continued) | | |
Prospectus: For additional information on risks, please see the Fund’s prospectus.
| | | | | | | | |
| |
| Asset Allocations | |
| |
The following table presents the portfolio holdings within certain sectors as a percentage of total investments attributable to each sector at September 30, 2017. | |
Common Stocks | | | | | | | 63 | % |
Information Technology | | | 22 | % | | | | |
Consumer Discretionary | | | 13 | | | | | |
Healthcare | | | 6 | | | | | |
All Other Sectors in Common Stocks | | | 22 | | | | | |
Corporate Bonds and Notes | | | | | | | 20 | |
Energy | | | 4 | | | | | |
Financials | | | 4 | | | | | |
Consumer Discretionary | | | 3 | | | | | |
All Other Sectors in Corporate Bonds and Notes | | | 9 | | | | | |
Mortgage-Backed Securities | | | | | | | 5 | |
Foreign Government Securities | | | | | | | 4 | |
Loan Agreements | | | | | | | 3 | |
Other | | | | | | | 5 | |
| | | | | | | | | |
Total | | | | | | | 100 | % |
| | | | | | | | | |
For information regarding the indexes and certain investment terms, see the Key Investment Terms starting on page 4.
29
Tactical Allocation Fund (Continued)
| | | | | | | | | | | | |
| Average Annual Total Returns1 for periods ended 9/30/17 | | | | | | | | | |
| | | 1 year | | | 5 years | | | 10 years | |
| Class A Shares at NAV2 | | | 12.99 | % | | | 6.76 | % | | | 5.03 | % |
| Class A Shares at POP3,4 | | | 6.49 | | | | 5.50 | | | | 4.41 | |
| Class C Shares at NAV2 and with CDSC4 | | | 12.13 | | | | 5.94 | | | | 4.25 | |
| Bloomberg Barclays U.S. Aggregate Bond Index | | | 0.07 | | | | 2.07 | | | | 4.27 | |
| MSCI EAFE® Index (net) | | | 19.10 | | | | 8.38 | | | | 1.34 | |
| Russell 1000® Growth Index | | | 21.94 | | | | 15.26 | | | | 9.08 | |
| S&P 500® Index* | | | 18.61 | | | �� | 14.22 | | | | 7.44 | |
| Tactical Allocation Fund Linked Benchmark* | | | 12.37 | | | | 8.76 | | | | 6.48 | |
Fund Expense Ratios5: Class A Shares: 1.36%; Class C Shares: 2.13%.
All returns represent past performance which is no guarantee of future results. Current performance may be higher or lower than the performance shown. The investment return and principal value of an investment will fluctuate so that an investor’s shares, when redeemed, may be worth more or less than their original cost. The above table and graph below do not reflect the deduction of taxes that a shareholder would pay on fund distributions or the redemption of fund shares. Please visit Virtus.com for performance data current to the most recent month-end.
| 1 | Total returns are historical and include changes in share price and the reinvestment of both dividends and capital gain distributions. |
| 2 | “NAV” (Net Asset Value) total returns do not include the effect of any sales charge. |
| 3 | “POP” (Public Offering Price) total returns include the effect of the maximum front-end 5.75% sales charge. |
| 4 | “CDSC” (contingent deferred sales charge) is applied to redemptions of certain classes of shares that do not have a sales charge applied at the time of purchase. CDSC charges for certain redemptions of Class A shares made within 18 months of a finder’s fee being paid and all Class C shares are 1% within the first year and 0% thereafter. |
| 5 | The expense ratios of the Fund are set forth in the prospectus for the Fund effective July 31, 2017, as supplemented and revised, and may differ from the expense ratios disclosed in the Financial Highlights tables in this report. See the Financial Highlights for more current expense ratios. Expense ratios include fees and expenses associated with the underlying funds. |
| * | The Tactical Allocation Fund Linked Benchmark no longer includes the S&P 500® Index. |
Growth of $10,000 For periods ended 9/30
This chart assumes an initial investment of $10,000 made on September 30, 2007, for Class A shares and Class C shares including any applicable sales charges or fees. Performance assumes reinvestment of dividends and capital gain distributions.
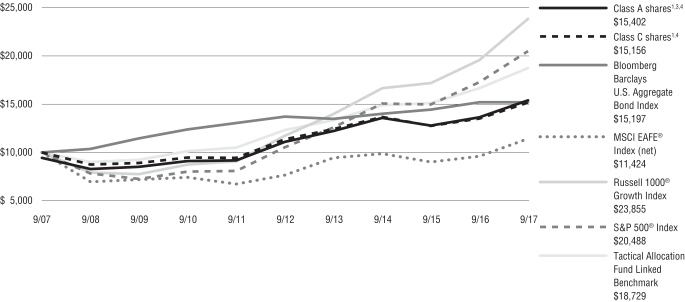
The indexes are unmanaged and not available for direct investment; therefore, their performance does not reflect the expenses associated with active management of an actual portfolio.
For information regarding the indexes and certain investment terms, see the Key Investment Terms starting on page 4.
30
VIRTUS CONTRARIAN VALUE FUND
SCHEDULE OF INVESTMENTS
SEPTEMBER 30, 2017
($ reported in thousands)
| | | | | | | | |
| | | SHARES | | | VALUE | |
| COMMON STOCKS—100.2% | |
|
| Consumer Discretionary—12.7% | |
Big Lots, Inc. | | | 76,870 | | | $ | 4,118 | |
Hanesbrands, Inc. | | | 151,980 | | | | 3,745 | |
Mattel, Inc. | | | 140,570 | | | | 2,176 | |
Target Corp. | | | 101,320 | | | | 5,979 | |
TJX Cos., Inc. (The) | | | 78,780 | | | | 5,808 | |
| | | | | | | | |
| | | | 21,826 | |
| | | | | | | | |
|
| Consumer Staples—10.6% | |
Conagra Brands, Inc. | | | 232,020 | | | | 7,828 | |
Koninklijke Ahold Delhaize N.V. Sponsored ADR | | | 296,126 | | | | 5,529 | |
Lamb Weston Holdings, Inc. | | | 102,370 | | | | 4,800 | |
| | | | | | | | |
| | | | 18,157 | |
| | | | | | | | |
|
| Energy—11.4% | |
Devon Energy Corp. | | | 130,240 | | | | 4,781 | |
Occidental Petroleum Corp. | | | 117,460 | | | | 7,542 | |
ONEOK, Inc. | | | 130,170 | | | | 7,213 | |
| | | | | | | | |
| | | | 19,536 | |
| | | | | | | | |
|
| Health Care—3.1% | |
Perrigo Co., plc | | | 63,640 | | | | 5,387 | |
| | | | | | | | |
|
| Industrials—24.6% | |
Arconic, Inc. | | | 151,950 | | | | 3,781 | |
Emerson Electric Co. | | | 40,709 | | | | 2,558 | |
HD Supply Holdings, Inc.(2) | | | 154,360 | | | | 5,568 | |
Johnson Controls International plc | | | 166,603 | | | | 6,712 | |
| | | | | | | | |
| | | SHARES | | | VALUE | |
| Industrials—continued | |
Owens Corning | | | 57,690 | | | $ | 4,462 | |
Raytheon Co. | | | 40,310 | | | | 7,521 | |
Republic Services, Inc. | | | 107,612 | | | | 7,109 | |
USG Corp.(2) | | | 141,200 | | | | 4,610 | |
| | | | | | | | |
| | | | 42,321 | |
| | | | | | | | |
| Materials—27.7% | |
Allegheny Technologies, Inc.(2) | | | 225,570 | | | | 5,391 | |
Ball Corp. | | | 135,998 | | | | 5,617 | |
Crown Holdings, Inc.(2) | | | 109,760 | | | | 6,555 | |
DowDuPont, Inc. | | | 98,450 | | | | 6,816 | |
FMC Corp. | | | 59,930 | | | | 5,352 | |
International Paper Co. | | | 95,676 | | | | 5,436 | |
Owens-Illinois, Inc.(2) | | | 255,310 | | | | 6,424 | |
Sealed Air Corp. | | | 142,870 | | | | 6,103 | |
| | | | | | | | |
| | | | 47,694 | |
| | | | | | | | |
|
| Real Estate—6.2% | |
GGP, Inc. | | | 125,990 | | | | 2,617 | |
Macerich Co. (The) | | | 48,520 | | | | 2,667 | |
Weyerhaeuser Co. | | | 160,720 | | | | 5,469 | |
| | | | | | | | |
| | | | 10,753 | |
| | | | | | | | |
|
| Utilities—3.9% | |
Dominion Energy, Inc. | | | 86,330 | | | | 6,642 | |
TOTAL COMMON STOCKS
(Identified Cost $106,668) | | | | 172,316 | |
| TOTAL LONG TERM INVESTMENTS—100.2% | |
| (Identified Cost $106,668) | | | | | | | 172,316 | |
| | | | | | | | |
| | | SHARES | | | VALUE | |
| SHORT-TERM INVESTMENT—0.4% | |
|
| Money Market Mutual Fund—0.4% | |
Dreyfus Government Cash Management Fund – Institutional Shares (seven-day effective yield 0.920%)(3) | | | 642,912 | | | $ | 643 | |
TOTAL SHORT-TERM INVESTMENT
(Identified Cost $643) | | | | 643 | |
TOTAL INVESTMENTS—100.6%
(Identified Cost $107,311) | | | | 172,959 | (1) |
Other assets and liabilities, net—(0.6)% | | | | (1,087 | ) |
| | | | | | | | |
| NET ASSETS—100.0% | | | $ | 171,872 | |
| | | | | | | | |
Abbreviation:
| ADR | American Depositary Receipt |
Footnote Legend:
| (1) | Federal Income Tax Information: For tax information at September 30, 2017, see Note 10 Federal Income Tax Information in the Notes to Financial Statements. |
| (2) | Non-income producing. |
| (3) | Shares of this fund are publicly offered and its prospectus and annual report are publicly available. |
| | | | |
| Country Weightings† | |
United States | | | 93 | % |
Ireland | | | 4 | |
Netherlands | | | 3 | |
Total | | | 100 | % |
† % of total investments as of September 30, 2017. | |
The following table provides a summary of inputs used to value the Fund’s investments as of September 30, 2017 (See Security Valuation Note 2A in the Notes to Financial Statements):
| | | | | | | | |
| | | Total
Value at
September 30, 2017 | | | Level 1
Quoted
Prices | |
Equity Securities: | | | | | | | | |
Common Stocks | | $ | 172,316 | | | $ | 172,316 | |
Short-Term Investment | | | 643 | | | | 643 | |
| | | | | | | | |
Total Investments | | $ | 172,959 | | | $ | 172,959 | |
| | | | | | | | |
There were no Level 2 (significant observable inputs) or Level 3 (significant unobservable inputs) priced securities as of September 30, 2017.
There were no transfers between Level 1 and Level 2 related to securities held at September 30, 2017.
Security abbreviation definitions are located under the Key Investment Terms starting on page 4.
See Notes to Financial Statements
31
VIRTUS KAR CAPITAL GROWTH FUND
SCHEDULE OF INVESTMENTS
SEPTEMBER 30, 2017
($ reported in thousands)
| | | | | | | | |
| | | SHARES | | | VALUE | |
| COMMON STOCKS—99.6% | |
|
| Consumer Discretionary—23.7% | |
Amazon.com, Inc.(2) | | | 20,142 | | | $ | 19,364 | |
Ctrip.com International Ltd. ADR(2) | | | 175,890 | | | | 9,276 | |
Home Depot, Inc. (The) | | | 59,765 | | | | 9,775 | |
Las Vegas Sands Corp. | | | 220,573 | | | | 14,152 | |
McDonald’s Corp. | | | 44,490 | | | | 6,971 | |
MercadoLibre, Inc. | | | 8,800 | | | | 2,279 | |
Netflix, Inc.(2) | | | 69,580 | | | | 12,618 | |
NIKE, Inc. Class B | | | 157,260 | | | | 8,154 | |
Priceline Group, Inc. (The)(2) | | | 8,256 | | | | 15,115 | |
Ross Stores, Inc. | | | 120,816 | | | | 7,801 | |
Starbucks Corp. | | | 127,371 | | | | 6,841 | |
| | | | | | | | |
| | | | 112,346 | |
| | | | | | | | |
|
| Consumer Staples—6.9% | |
Costco Wholesale Corp. | | | 22,547 | | | | 3,704 | |
Monster Beverage Corp.(2) | | | 305,943 | | | | 16,904 | |
Philip Morris International, Inc. | | | 108,917 | | | | 12,091 | |
| | | | | | | | |
| | | | 32,699 | |
| | | | | | | | |
|
| Energy—3.4% | |
Cabot Oil & Gas Corp. | | | 156,631 | | | | 4,190 | |
Core Laboratories N.V. | | | 51,449 | | | | 5,078 | |
Pioneer Natural Resources Co. | | | 45,630 | | | | 6,732 | |
| | | | | | | | |
| | | | 16,000 | |
| | | | | | | | |
|
| Financials—4.6% | |
Bank of America Corp. | | | 503,090 | | | | 12,748 | |
Charles Schwab Corp. (The) | | | 151,268 | | | | 6,617 | |
MarketAxess Holdings, Inc. | | | 11,860 | | | | 2,188 | |
| | | | | | | | |
| | | | 21,553 | |
| | | | | | | | |
|
| Health Care—11.2% | |
BioMarin Pharmaceutical, Inc.(2) | | | 79,756 | | | | 7,423 | |
Celgene Corp.(2) | | | 116,942 | | | | 17,053 | |
| | | | | | | | |
| | | SHARES | | | VALUE | |
| Health Care—continued | |
Danaher Corp. | | | 82,012 | | | $ | 7,035 | |
HealthEquity, Inc.(2) | | | 99,730 | | | | 5,044 | |
Illumina, Inc.(2) | | | 36,930 | | | | 7,356 | |
Zoetis, Inc. | | | 145,307 | | | | 9,265 | |
| | | | | | | | |
| | | | 53,176 | |
| | | | | | | | |
|
| Industrials—5.8% | |
Caterpillar, Inc. | | | 66,710 | | | | 8,319 | |
Kansas City Southern | | | 45,670 | | | | 4,964 | |
Rockwell Automation, Inc. | | | 25,790 | | | | 4,596 | |
Roper Technologies, Inc. | | | 38,329 | | | | 9,329 | |
| | | | | | | | |
| | | | 27,208 | |
| | | | | | | | |
|
| Information Technology—42.4% | |
Accenture plc Class A | | | 56,848 | | | | 7,678 | |
Activision Blizzard, Inc. | | | 133,870 | | | | 8,636 | |
Alibaba Group Holding Ltd. Sponsored ADR(2) | | | 174,930 | | | | 30,212 | |
Alphabet, Inc. Class A(2) | | | 8,027 | | | | 7,816 | |
Amphenol Corp. Class A | | | 172,708 | | | | 14,618 | |
CoStar Group, Inc.(2) | | | 23,731 | | | | 6,366 | |
Facebook, Inc. Class A(2) | | | 268,210 | | | | 45,829 | |
Gartner, Inc.(2) | | | 44,620 | | | | 5,551 | |
NVIDIA Corp. | | | 85,350 | | | | 15,258 | |
Paycom Software, Inc.(2) | | | 108,892 | | | | 8,163 | |
Tencent Holdings Ltd. ADR | | | 217,400 | | | | 9,547 | |
Visa, Inc. Class A | | | 174,834 | | | | 18,400 | |
Workday, Inc. Class A(2) | | | 98,371 | | | | 10,367 | |
Yandex N.V. Class A(2) | | | 364,304 | | | | 12,004 | |
| | | | | | | | |
| | | | 200,445 | |
| | | | | | | | |
|
| Materials—1.6% | |
Ecolab, Inc. | | | 59,656 | | | | 7,672 | |
TOTAL COMMON STOCKS
(Identified Cost $258,209) | | | | 471,099 | |
| TOTAL LONG TERM INVESTMENTS—99.6% | |
| (Identified Cost $258,209) | | | | 471,099 | |
| | | | | | | | |
| | | SHARES | | | VALUE | |
| SHORT-TERM INVESTMENT—0.5% | |
|
| Money Market Mutual Fund—0.5% | |
Dreyfus Government Cash Management Fund – Institutional Shares (seven-day effective yield 0.920%)(3) | | | 2,533,675 | | | $ | 2,534 | |
TOTAL SHORT-TERM INVESTMENT
(Identified Cost $2,534) | | | | 2,534 | |
TOTAL INVESTMENTS—100.1%
(Identified Cost $260,743) | | | | 473,633 | (1) |
Other assets and liabilities, net—(0.1)% | | | | (395 | ) |
| | | | | | | | |
| NET ASSETS—100.0% | | | $ | 473,238 | |
| | | | | | | | |
Abbreviation:
| ADR | American Depositary Receipt |
Footnote Legend:
| (1) | Federal Income Tax Information: For tax information at September 30, 2017, see Note 10 Federal Income Tax Information in the Notes to Financial Statements. |
| (2) | Non-income producing. |
| (3) | Shares of this fund are publicly offered and its prospectus and annual report are publicly available. |
| | | | |
| Country Weightings (Unaudited)† | |
United States | | | 87 | % |
China | | | 8 | |
Russia | | | 3 | |
Hong Kong | | | 2 | |
Total | | | 100 | % |
† % of total investments as of September 30, 2017 | |
The following table provides a summary of inputs used to value the Fund’s investments as of September 30, 2017 (See Security Valuation Note 2A in the Notes to Financial Statements):
| | | | | | | | |
| | | Total
Value at
September 30, 2017 | | | Level 1
Quoted
Prices | |
Equity Securities: | | | | | | | | |
Common Stocks | | $ | 471,099 | | | $ | 471,099 | |
Short-Term Investment | | | 2,534 | | | | 2,534 | |
| | | | | | | | |
Total Investment | | $ | 473,633 | | | $ | 473,633 | |
| | | | | | | | |
There were no Level 2 (significant observable inputs) or Level 3 (significant unobservable inputs) priced securities as of September 30, 2017.
There were no transfers between Level 1 and Level 2 related to securities held at September 30, 2017.
Security abbreviation definitions are located under the Key Investment Terms starting on page 4.
See Notes to Financial Statements
32
VIRTUS KAR GLOBAL QUALITY DIVIDEND FUND
SCHEDULE OF INVESTMENTS
SEPTEMBER 30, 2017
($ reported in thousands)
| | | | | | | | |
| | | SHARES | | | VALUE | |
| COMMON STOCKS—99.2% | |
|
| Consumer Discretionary—7.1% | |
Compass Group plc Sponsored ADR | | | 29,528 | | | $ | 638 | |
Las Vegas Sands Corp. | | | 35,190 | | | | 2,258 | |
Meredith Corp. | | | 20,290 | | | | 1,126 | |
| | | | | | | | |
| | | | 4,022 | |
| | | | | | | | |
|
| Consumer Staples—8.7% | |
Altria Group, Inc. | | | 31,440 | | | | 1,994 | |
British American Tobacco plc Sponsored ADR | | | 12,600 | | | | 787 | |
Coca-Cola Co. (The) | | | 18,300 | | | | 824 | |
Imperial Brands plc Sponsored ADR | | | 30,740 | | | | 1,330 | |
| | | | | | | | |
| | | | 4,935 | |
| | | | | | | | |
|
| Energy—9.4% | |
Royal Dutch Shell plc Class B Sponsored ADR | | | 39,440 | | | | 2,467 | |
TOTAL S.A. Sponsored ADR | | | 25,920 | | | | 1,387 | |
Vermilion Energy, Inc. | | | 41,940 | | | | 1,492 | |
| | | | | | | | |
| | | | 5,346 | |
| | | | | | | | |
|
| Financials—18.4% | |
Bank of Hawaii Corp. | | | 9,079 | | | | 757 | |
CI Financial Corp. | | | 40,387 | | | | 878 | |
Cincinnati Financial Corp. | | | 7,953 | | | | 609 | |
HSBC Holdings plc Sponsored ADR | | | 40,290 | | | | 1,991 | |
Royal Bank of Canada | | | 24,530 | | | | 1,897 | |
SCOR SE Sponsored ADR | | | 472,740 | | | | 2,005 | |
Zurich Insurance Group AG ADR | | | 76,457 | | | | 2,340 | |
| | | | | | | | |
| | | | 10,477 | |
| | | | | | | | |
|
| Health Care—8.7% | |
AstraZeneca plc Sponsored ADR | | | 52,160 | | | | 1,767 | |
GlaxoSmithKline plc Sponsored ADR | | | 45,256 | | | | 1,837 | |
Sonic Healthcare Ltd. Sponsored ADR | | | 49,960 | | | | 828 | |
Takeda Pharmaceutical Co., Ltd. Sponsored ADR | | | 17,820 | | | | 494 | |
| | | | | | | | |
| | | | 4,926 | |
| | | | | | | | |
| | | | | | | | |
| | | SHARES | | | VALUE | |
| Industrials—6.4% | |
ABB Ltd. Registered Shares | | | 35,000 | | | $ | 865 | |
BAE Systems plc Sponsored ADR | | | 46,280 | | | | 1,597 | |
Waste Management, Inc. | | | 15,388 | | | | 1,204 | |
| | | | | | | | |
| | | | 3,666 | |
| | | | | | | | |
|
| Information Technology—5.3% | |
Analog Devices, Inc. | | | 8,580 | | | | 739 | |
Cisco Systems, Inc. | | | 25,920 | | | | 872 | |
Microchip Technology, Inc. | | | 8,230 | | | | 739 | |
Paychex, Inc. | | | 11,220 | | | | 673 | |
| | | | | | | | |
| | | | 3,023 | |
| | | | | | | | |
|
| Materials—3.0% | |
BASF SE Sponsored ADR | | | 8,730 | | | | 930 | |
RPM International, Inc. | | | 14,610 | | | | 750 | |
| | | | | | | | |
| | | | 1,680 | |
| | | | | | | | |
|
| Real Estate—8.5% | |
Crown Castle International Corp. | | | 18,860 | | | | 1,885 | |
Lamar Advertising Co. Class A | | | 20,310 | | | | 1,392 | |
Realty Income Corp. | | | 27,590 | | | | 1,578 | |
| | | | | | | | |
| | | | 4,855 | |
| | | | | | | | |
|
| Telecommunication Services—13.9% | |
AT&T, Inc. | | | 47,739 | | | | 1,870 | |
BCE, Inc. | | | 43,080 | | | | 2,017 | |
Spark New Zealand Ltd. | | | 705,000 | | | | 1,859 | |
Vodafone Group plc Sponsored ADR | | | 75,166 | | | | 2,139 | |
| | | | | | | | |
| | | | 7,885 | |
| | | | | | | | |
|
| Utilities—9.8% | |
National Grid plc Sponsored ADR | | | 30,418 | | | | 1,908 | |
PPL Corp. | | | 59,300 | | | | 2,250 | |
WEC Energy Group, Inc. | | | 22,110 | | | | 1,388 | |
| | | | | | | | |
| | | | | | | | 5,546 | |
TOTAL COMMON STOCKS
(Identified Cost $53,119) | | | | 56,361 | |
| TOTAL LONG TERM INVESTMENTS—99.2% | |
| (Identified Cost $53,119) | | | | | | | 56,361 | |
| | | | | | | | |
| | | SHARES | | | VALUE | |
| SHORT-TERM INVESTMENT—0.7% | |
|
| Money Market Mutual Fund—0.7% | |
Dreyfus Government Cash Management Fund – Institutional Shares (seven-day effective yield 0.920%)(2) | | | 411,303 | | | $ | 411 | |
TOTAL SHORT-TERM INVESTMENT
(Identified Cost $411) | | | | 411 | |
| TOTAL INVESTMENTS—99.9% | |
| (Identified Cost $53,530) | | | 56,772(1) | |
Other assets and liabilities, net—0.1% | | | | 47 | |
| | | | | | | | |
| NET ASSETS—100.0% | | | $ | 56,819 | |
| | | | | | | | |
Abbreviation:
| ADR | American Depositary Receipt |
Footnote Legend:
| (1) | Federal Income Tax Information: For tax information at September 30, 2017, see Note 10 Federal Income Tax Information in the Notes to Financial Statements. |
| (2) | Shares of this fund are publicly offered and its prospectus and annual report are publicly available. |
| | | | |
| Country Weightings (Unaudited)† | |
United States | | | 41 | % |
United Kingdom | | | 29 | |
Canada | | | 11 | |
France | | | 6 | |
Switzerland | | | 6 | |
New Zealand | | | 3 | |
Germany | | | 2 | |
Other | | | 2 | |
Total | | | 100 | % |
† % of total investments as of September 30, 2017. | |
The following table provides a summary of inputs used to value the Fund’s investments as of September 30, 2017 (See Security Valuation Note 2A in the Notes to Financial Statements):
| | | | | | | | |
| | | Total
Value at
September 30, 2017 | | | Level 1
Quoted
Prices | |
Equity Securities: | | | | | | | | |
Common Stocks | | $ | 56,361 | | | $ | 56,361 | |
Short-Term Investment | | | 411 | | | | 411 | |
| | | | | | | | |
Total Investments | | $ | 56,772 | | | $ | 56,772 | |
| | | | | | | | |
There were no Level 2 (significant observable inputs) or Level 3 (significant unobservable inputs) priced securities as of September 30, 2017.
There were no transfers between Level 1 and Level 2 related to securities held at September 30, 2017.
Security abbreviation definitions are located under the Key Investment Terms starting on page 4.
See Notes to Financial Statements
33
VIRTUS KAR MID-CAP CORE FUND
SCHEDULE OF INVESTMENTS
SEPTEMBER 30, 2017
($ reported in thousands)
| | | | | | | | |
| | | SHARES | | | VALUE | |
| COMMON STOCKS—92.3% | |
|
| Consumer Discretionary—9.8% | |
Ross Stores, Inc. | | | 45,954 | | | $ | 2,967 | |
Tractor Supply Co. | | | 83,400 | | | | 5,279 | |
Wynn Resorts Ltd. | | | 19,822 | | | | 2,952 | |
| | | | | | | | |
| | | | 11,198 | |
| | | | | | | | |
|
| Consumer Staples—7.1% | |
Church & Dwight Co., Inc. | | | 44,148 | | | | 2,139 | |
Monster Beverage Corp.(2) | | | 108,949 | | | | 6,019 | |
| | | | | | | | |
| | | | 8,158 | |
| | | | | | | | |
|
| Energy—3.1% | |
Core Laboratories N.V. | | | 35,935 | | | | 3,547 | |
| | | | | | | | |
|
| Financials—13.0% | |
Bank of The Ozarks, Inc. | | | 82,850 | | | | 3,981 | |
First Financial Bankshares, Inc. | | | 56,965 | | | | 2,575 | |
Moody’s Corp. | | | 18,185 | | | | 2,531 | |
RLI Corp. | | | 34,809 | | | | 1,997 | |
Signature Bank(2) | | | 28,854 | | | | 3,694 | |
| | | | | | | | |
| | | | 14,778 | |
| | | | | | | | |
|
| Health Care—14.4% | |
Cooper Cos., Inc. (The) | | | 17,258 | | | | 4,092 | |
Globus Medical, Inc. Class A(2) | | | 176,310 | | | | 5,240 | |
West Pharmaceutical Services, Inc. | | | 24,350 | | | | 2,344 | |
Zoetis, Inc. | | | 74,424 | | | | 4,745 | |
| | | | | | | | |
| | | | 16,421 | |
| | | | | | | | |
| | | | | | | | |
| | | SHARES | | | VALUE | |
| Industrials—21.9% | |
AMETEK, Inc. | | | 89,850 | | | $ | 5,934 | |
Exponent, Inc. | | | 29,740 | | | | 2,198 | |
Graco, Inc. | | | 35,455 | | | | 4,385 | |
Lennox International, Inc. | | | 18,700 | | | | 3,347 | |
Nordson Corp. | | | 32,067 | | | | 3,800 | |
WABCO Holdings, Inc.(2) | | | 36,155 | | | | 5,351 | |
| | | | | | | | |
| | | | 25,015 | |
| | | | | | | | |
|
| Information Technology—18.8% | |
Amphenol Corp. Class A | | | 58,433 | | | | 4,946 | |
Aspen Technology, Inc.(2) | | | 73,042 | | | | 4,588 | |
Broadridge Financial Solutions, Inc. | | | 47,710 | | | | 3,856 | |
Intuit, Inc. | | | 24,681 | | | | 3,508 | |
Skyworks Solutions, Inc. | | | 44,510 | | | | 4,535 | |
| | | | | | | | |
| | | | 21,433 | |
| | | | | | | | |
|
| Materials—4.2% | |
Axalta Coating Systems Ltd.(2) | | | 76,400 | | | | 2,210 | |
International Flavors & Fragrances, Inc. | | | 17,839 | | | | 2,549 | |
| | | | | | | | |
| | | | | | | | 4,759 | |
TOTAL COMMON STOCKS
(Identified Cost $85,306) | | | | 105,309 | |
| TOTAL LONG TERM INVESTMENTS—92.3% | |
| (Identified Cost $85,306) | | | | | | | 105,309 | |
| | | | | | | | |
| | | SHARES | | | VALUE | |
| SHORT-TERM INVESTMENT—7.4% | |
|
| Money Market Mutual Fund—7.4% | |
Dreyfus Government Cash Management Fund – Institutional Shares (seven-day effective yield 0.920%)(3) | | | 8,422,459 | | | $ | 8,422 | |
TOTAL SHORT-TERM INVESTMENT
(Identified Cost $8,422) | | | | 8,422 | |
| TOTAL INVESTMENTS—99.7% (Identified Cost $93,728) | | | | 113,731 | (1) |
Other assets and liabilities, net—0.3% | | | | 332 | |
| | | | | | | | |
| NET ASSETS—100.0% | | | | | | $ | 114,063 | |
| | | | | | | | |
Footnote Legend:
| (1) | Federal Income Tax Information: For tax information at September 30, 2017, see Note 10 Federal Income Tax Information in the Notes to Financial Statements. |
| (2) | Non-income producing. |
| (3) | Shares of this fund are publicly offered and its prospectus and annual report are publicly available. |
The following table provides a summary of inputs used to value the Fund’s investments as of September 30, 2017 (See Security Valuation Note 2A in the Notes to Financial Statements):
| | | | | | | | |
| | | Total
Value at
September 30, 2017 | | | Level 1
Quoted
Prices | |
Equity Securities: | | | | | | | | |
Common Stocks | | $ | 105,309 | | | $ | 105,309 | |
Short-Term Investment | | | 8,422 | | | | 8,422 | |
| | | | | | | | |
Total Investments | | $ | 113,731 | | | $ | 113,731 | |
| | | | | | | | |
There were no Level 2 (significant observable inputs) or Level 3 (significant unobservable inputs) priced securities as of September 30, 2017.
There were no transfers between Level 1 and Level 2 related to securities held at September 30, 2017.
See Notes to Financial Statements
34
VIRTUS KAR MID-CAP GROWTH FUND
SCHEDULE OF INVESTMENTS
SEPTEMBER 30, 2017
($ reported in thousands)
| | | | | | | | |
| | | SHARES | | | VALUE | |
| COMMON STOCKS—99.1% | |
|
| Consumer Discretionary—25.4% | |
Ctrip.com International Ltd. ADR(2) | | | 48,365 | | | $ | 2,551 | |
Domino’s Pizza, Inc. | | | 14,185 | | | | 2,816 | |
Expedia, Inc. | | | 11,511 | | | | 1,657 | |
MercadoLibre, Inc. | | | 17,915 | | | | 4,639 | |
Netflix, Inc.(2) | | | 23,580 | | | | 4,276 | |
Pool Corp. | | | 24,935 | | | | 2,697 | |
Ross Stores, Inc. | | | 29,125 | | | | 1,881 | |
Wynn Resorts Ltd. | | | 22,720 | | | | 3,383 | |
| | | | | | | | |
| | | | 23,900 | |
| | | | | | | | |
|
| Consumer Staples—8.3% | |
Brown-Forman Corp. Class B | | | 40,670 | | | | 2,208 | |
McCormick & Co., Inc. | | | 14,560 | | | | 1,495 | |
Monster Beverage Corp.(2) | | | 74,580 | | | | 4,121 | |
| | | | | | | | |
| | | | 7,824 | |
| | | | | | | | |
|
| Energy—3.1% | |
Cabot Oil & Gas Corp. | | | 56,815 | | | | 1,520 | |
Core Laboratories N.V. | | | 14,190 | | | | 1,401 | |
| | | | | | | | |
| | | | 2,921 | |
| | | | | | | | |
|
| Financials—7.6% | |
Financial Engines, Inc. | | | 20,885 | | | | 726 | |
MarketAxess Holdings, Inc. | | | 18,160 | | | | 3,351 | |
Northern Trust Corp. | | | 17,550 | | | | 1,613 | |
Vantiv, Inc. Class A(2) | | | 21,500 | | | | 1,515 | |
| | | | | | | | |
| | | | 7,205 | |
| | | | | | | | |
|
| Health Care—14.1% | |
BioMarin Pharmaceutical, Inc.(2) | | | 17,050 | | | | 1,587 | |
Diplomat Pharmacy, Inc.(2) | | | 75,180 | | | | 1,557 | |
HealthEquity, Inc.(2) | | | 58,280 | | | | 2,948 | |
Illumina, Inc.(2) | | | 10,475 | | | | 2,087 | |
Juno Therapeutics, Inc.(2) | | | 31,540 | | | | 1,415 | |
Mettler-Toledo International, Inc.(2) | | | 1,540 | | | | 964 | |
| | | | | | | | |
| | | SHARES | | | VALUE | |
| Health Care—continued | |
Teladoc, Inc.(2) | | | 20,830 | | | $ | 690 | |
Zoetis, Inc. | | | 31,400 | | | | 2,002 | |
| | | | | | | | |
| | | | 13,250 | |
| | | | | | | | |
|
| Industrials—7.0% | |
Kansas City Southern | | | 13,200 | | | | 1,435 | |
Middleby Corp. (The)(2) | | | 14,480 | | | | 1,856 | |
Rockwell Automation, Inc. | | | 8,100 | | | | 1,443 | |
Roper Technologies, Inc. | | | 7,610 | | | | 1,852 | |
| | | | | | | | |
| | | | 6,586 | |
| | | | | | | | |
|
| Information Technology—31.7% | |
Amphenol Corp. Class A | | | 39,245 | | | | 3,322 | |
Appian Corp.(2) | | | 27,000 | | | | 768 | |
Autohome, Inc. ADR(2) | | | 47,700 | | | | 2,866 | |
CoStar Group, Inc.(2) | | | 5,530 | | | | 1,483 | |
Ellie Mae, Inc.(2) | | | 35,480 | | | | 2,914 | |
Fair Isaac Corp. | | | 10,260 | | | | 1,442 | |
FleetCor Technologies, Inc.(2) | | | 8,390 | | | | 1,298 | |
Gartner, Inc.(2) | | | 23,435 | | | | 2,916 | |
MuleSoft, Inc. Class A(2) | | | 39,638 | | | | 798 | |
Okta, Inc.(2) | | | 43,925 | | | | 1,239 | |
Paycom Software, Inc.(2) | | | 31,080 | | | | 2,330 | |
Teradyne, Inc. | | | 27,880 | | | | 1,040 | |
Workday, Inc. Class A(2) | | | 23,960 | | | | 2,525 | |
Yandex N.V. Class A(2) | | | 84,535 | | | | 2,785 | |
Yelp, Inc.(2) | | | 50,990 | | | | 2,208 | |
| | | | | | | | |
| | | | 29,934 | |
| | | | | | | | |
|
| Materials—1.9% | |
Ball Corp. | | | 43,640 | | | | 1,802 | |
TOTAL COMMON STOCKS
(Identified Cost $55,979) | | | | 93,422 | |
| TOTAL LONG TERM INVESTMENTS—99.1% | |
| (Identified Cost $55,979) | | | | | | | 93,422 | |
| | | | | | | | |
| | | SHARES | | | VALUE | |
| SHORT-TERM INVESTMENT—1.0% | |
|
| Money Market Mutual Fund—1.0% | |
Dreyfus Government Cash Management Fund – Institutional Shares (seven-day effective yield 0.920%)(3) | | | 938,220 | | | $ | 938 | |
TOTAL SHORT-TERM INVESTMENT
(Identified Cost $938) | | | | 938 | |
| TOTAL INVESTMENTS—100.1% | |
| (Identified Cost $56,917) | | | 94,360(1) | |
Other assets and liabilities, net—(0.1)% | | | | (58 | ) |
| | | | | | | | |
| NET ASSETS—100.0% | | | | | | $ | 94,302 | |
| | | | | | | | |
Abbreviation:
| ADR | American Depositary Receipt |
Footnote Legend:
| (1) | Federal Income Tax Information: For tax information at September 30, 2017, see Note 10 Federal Income Tax Information in the Notes to Financial Statements. |
| (2) | Non-income producing. |
| (3) | Shares of this fund are publicly offered and its prospectus and annual report are publicly available. |
| | | | |
| Country Weightings (Unaudited)† | |
United States | | | 91 | % |
China | | | 6 | |
Russia | | | 3 | |
Total | | | 100 | % |
† % of total investments as of September 30, 2017 | |
The following table provides a summary of inputs used to value the Fund’s investments as of September 30, 2017 (See Security Valuation Note 2A in the Notes to Financial Statements):
| | | | | | | | |
| | | Total
Value at
September 30, 2017 | | | Level 1
Quoted
Prices | |
Equity Securities: | | | | | | | | |
Common Stocks | | $ | 93,422 | | | $ | 93,422 | |
Short-Term Investment | | | 938 | | | | 938 | |
| | | | | | | | |
Total Investments | | $ | 94,360 | | | $ | 94,360 | |
| | | | | | | | |
There were no Level 2 (significant observable inputs) or Level 3 (significant unobservable inputs) priced securities as of September 30, 2017.
There were no transfers between Level 1 and Level 2 related to securities held at September 30, 2017.
Security abbreviation definitions are located under the Key Investment Terms starting on page 4.
See Notes to Financial Statements
35
VIRTUS KAR SMALL-CAP CORE FUND
SCHEDULE OF INVESTMENTS
SEPTEMBER 30, 2017
($ reported in thousands)
| | | | | | | | |
| | | SHARES | | | VALUE | |
| COMMON STOCKS—92.2% | |
|
| Consumer Discretionary—12.0% | |
Fox Factory Holding Corp.(2) | | | 633,437 | | | $ | 27,301 | |
NVR, Inc.(2) | | | 8,058 | | | | 23,006 | |
Polaris Industries, Inc. | | | 84,040 | | | | 8,793 | |
Pool Corp. | | | 181,490 | | | | 19,632 | |
| | | | | | | | |
| | | | 78,732 | |
| | | | | | | | |
|
| Consumer Staples—2.4% | |
PriceSmart, Inc. | | | 175,900 | | | | 15,699 | |
| | | | | | | | |
|
| Energy—4.6% | |
Core Laboratories N.V. | | | 87,700 | | | | 8,656 | |
Dril-Quip, Inc.(2) | | | 485,440 | | | | 21,432 | |
| | | | | | | | |
| | | | 30,088 | |
| | | | | | | | |
|
| Financials—15.2% | |
Artisan Partners Asset Management, Inc. Class A | | | 521,200 | | | | 16,991 | |
FactSet Research Systems, Inc. | | | 116,240 | | | | 20,936 | |
MarketAxess Holdings, Inc. | | | 115,632 | | | | 21,335 | |
Primerica, Inc. | | | 387,800 | | | | 31,625 | |
RLI Corp. | | | 146,508 | | | | 8,404 | |
| | | | | | | | |
| | | | 99,291 | |
| | | | | | | | |
|
| Health Care—3.0% | |
Abaxis, Inc. | | | 446,400 | | | | 19,932 | |
| | | | | | | | |
|
| Industrials—29.8% | |
Copart, Inc.(2) | | | 884,400 | | | | 30,397 | |
Donaldson Co., Inc. | | | 315,900 | | | | 14,512 | |
Graco, Inc. | | | 195,400 | | | | 24,169 | |
Old Dominion Freight Line, Inc. | | | 264,030 | | | | 29,072 | |
RBC Bearings, Inc.(2) | | | 162,548 | | | | 20,343 | |
Teledyne Technologies, Inc.(2) | | | 201,800 | | | | 32,123 | |
Toro Co. (The) | | | 200,480 | | | | 12,442 | |
WABCO Holdings, Inc.(2) | | | 218,350 | | | | 32,316 | |
| | | | | | | | |
| | | | 195,374 | |
| | | | | | | | |
| | | | | | | | |
| | | SHARES | | | VALUE | |
| Information Technology—19.7% | |
Aspen Technology, Inc.(2) | | | 391,600 | | | $ | 24,596 | |
Autohome, Inc. ADR(2) | | | 842,210 | | | | 50,600 | |
CDW Corp. | | | 470,800 | | | | 31,073 | |
Jack Henry & Associates, Inc. | | | 139,800 | | | | 14,370 | |
Manhattan Associates,
Inc.(2) | | | 202,220 | | | | 8,406 | |
| | | | | | | | |
| | | | 129,045 | |
| | | | | | | | |
|
| Materials—1.7% | |
AptarGroup, Inc. | | | 130,300 | | | | 11,246 | |
| | | | | | | | |
|
| Real Estate—3.8% | |
HFF, Inc. Class A | | | 630,000 | | | | 24,923 | |
TOTAL COMMON STOCKS
(Identified Cost $410,057) | | | | | | | 604,330 | |
| TOTAL LONG TERM INVESTMENTS—92.2% | |
| (Identified Cost $410,057) | | | | | | | 604,330 | |
|
| SHORT-TERM INVESTMENT—7.4% | |
|
| Money Market Mutual Fund—7.4% | |
Dreyfus Government Cash Management Fund – Institutional Shares (seven-day effective
yield 0.920%)(3) | | | 48,402,839 | | | | 48,403 | |
TOTAL SHORT-TERM INVESTMENT
(Identified Cost $48,403) | | | | 48,403 | |
TOTAL INVESTMENTS—99.6%
(Identified Cost $458,460) | | | | 652,733 | (1) |
Other assets and liabilities, net—0.4% | | | | 2,662 | |
| | | | | | | | |
| NET ASSETS—100.0% | | | $ | 655,395 | |
| | | | | | | | |
Abbreviation:
| ADR | American Depositary Receipt |
Footnote Legend:
| (1) | Federal Income Tax Information: For tax information at September 30, 2017, see Note 10 Federal Income Tax Information in the Notes to Financial Statements. |
| (2) | Non-income producing. |
| (3) | Shares of this fund are publicly offered and its prospectus and annual report are publicly available. |
| | | | |
| Country Weightings (Unaudited)† | |
United States | | | 92 | % |
China | | | 8 | |
Total | | | 100 | % |
† % of total investments as of September 30, 2017. | |
The following table provides a summary of inputs used to value the Fund’s investments as of September 30, 2017 (See Security Valuation Note 2A in the Notes to Financial Statements):
| | | | | | | | |
| | | Total
Value at
September 30, 2017 | | | Level 1
Quoted
Prices | |
Equity Securities: | | | | | | | | |
Common Stocks | | $ | 604,330 | | | $ | 604,330 | |
Short-Term Investment | | | 48,403 | | | | 48,403 | |
| | | | | | | | |
Total Investments | | $ | 652,733 | | | $ | 652,733 | |
| | | | | | | | |
There were no Level 2 (significant observable inputs) or Level 3 (significant unobservable inputs) priced securities as of September 30, 2017.
There were no transfers between Level 1 and Level 2 related to securities held at September 30, 2017.
Security abbreviation definitions are located under the Key Investment Terms starting on page 4.
See Notes to Financial Statements
36
VIRTUS KAR SMALL-CAP GROWTH FUND
SCHEDULE OF INVESTMENTS
SEPTEMBER 30, 2017
($ reported in thousands)
| | | | | | | | |
| | | SHARES | | | VALUE | |
| COMMON STOCKS—86.8% | |
|
| Consumer Discretionary—20.3% | |
Emerald Expositions Events, Inc. | | | 1,600,700 | | | $ | 37,200 | |
Fox Factory Holding Corp.(2) | | | 2,380,878 | | | | 102,616 | |
MercadoLibre, Inc. | | | 212,800 | | | | 55,100 | |
Ollie’s Bargain Outlet Holdings, Inc.(2) | | | 2,110,616 | | | | 97,933 | |
| | | | | | | | |
| | | | 292,849 | |
| | | | | | | | |
|
| Consumer Staples—6.4% | |
Chefs’ Warehouse, Inc. (The)(2) | | | 2,615,700 | | | | 50,483 | |
PriceSmart, Inc. | | | 473,200 | | | | 42,233 | |
| | | | | | | | |
| | | | 92,716 | |
| | | | | | | | |
|
| Financials—14.2% | |
FactSet Research Systems, Inc. | | | 235,950 | | | | 42,497 | |
Financial Engines, Inc. | | | 294,651 | | | | 10,239 | |
Interactive Brokers Group, Inc. Class A | | | 1,534,200 | | | | 69,100 | |
MarketAxess Holdings, Inc. | | | 190,900 | | | | 35,223 | |
Morningstar, Inc. | | | 575,593 | | | | 48,920 | |
| | | | | | | | |
| | | | 205,979 | |
| | | | | | | | |
|
| Health Care—6.9% | |
Abaxis, Inc. | | | 958,800 | | | | 42,811 | |
National Research Corp. Class A | | | 1,494,034 | | | | 56,325 | |
| | | | | | | | |
| | | | 99,136 | |
| | | | | | | | |
|
| Industrials—17.8% | |
AAON, Inc. | | | 874,100 | | | | 30,135 | |
Copart, Inc.(2) | | | 1,502,400 | | | | 51,637 | |
| | | | | | | | |
| | | SHARES | | | VALUE | |
| Industrials—continued | |
HEICO Corp. Class A | | | 856,666 | | | $ | 65,278 | |
Old Dominion Freight Line, Inc. | | | 615,600 | | | | 67,784 | |
Omega Flex, Inc. | | | 587,389 | | | | 42,198 | |
| | | | | | | | |
| | | | 257,032 | |
| | | | | | | | |
|
| Information Technology—21.2% | |
ANSYS, Inc.(2) | | | 276,300 | | | | 33,910 | |
Aspen Technology, Inc.(2) | | | 849,000 | | | | 53,326 | |
Autohome, Inc. ADR(2) | | | 1,999,000 | | | | 120,100 | |
Ellie Mae, Inc.(2) | | | 397,250 | | | | 32,626 | |
Mesa Laboratories, Inc. | | | 47,100 | | | | 7,033 | |
NVE Corp. | | | 483,690 | | | | 38,197 | |
Paycom Software, Inc.(2) | | | 282,300 | | | | 21,161 | |
| | | | | | | | |
| | | | | 306,353 | |
TOTAL COMMON STOCKS
(Identified Cost $933,967) | | | | 1,254,065 | |
| TOTAL LONG TERM INVESTMENTS—86.8% | |
| (Identified Cost $933,967) | | | | 1,254,065 | |
|
| SHORT-TERM INVESTMENT—13.7% | |
|
| Money Market Mutual Fund—13.7% | |
Dreyfus Government Cash Management Fund – Institutional Shares (seven-day effective yield 0.920%)(3) | | | 197,593,398 | | | | 197,593 | |
TOTAL SHORT-TERM INVESTMENT
(Identified Cost $197,593) | | | | 197,593 | |
TOTAL INVESTMENTS—100.5%
(Identified Cost $1,131,560) | | | | 1,451,658 | (1) |
Other assets and liabilities, net—(0.5)% | | | | (7,387 | ) |
| | | | | | | | |
| NET ASSETS—100.0% | | | | | | $ | 1,444,271 | |
| | | | | | | | |
Abbreviation:
| ADR | American Depositary Receipt |
Footnote Legend:
| (1) | Federal Income Tax Information: For tax information at September 30, 2017, see Note 10 Federal Income Tax Information in the Notes to Financial Statements. |
| (2) | Non-income producing. |
| (3) | Shares of this fund are publicly offered and its prospectus and annual report are publicly available. |
| | | | |
| Country Weightings (Unaudited)† | |
United States | | | 92 | % |
China | | | 8 | |
Total | | | 100 | % |
† % of total investments as of September 30, 2017. | |
The following table provides a summary of inputs used to value the Fund’s investments as of September 30, 2017 (See Security Valuation Note 2A in the Notes to Financial Statements):
| | | | | | | | |
| | | Total
Value at
September 30, 2017 | | | Level 1
Quoted
Prices | |
Equity Securities: | | | | | | | | |
Common Stocks | | $ | 1,254,065 | | | $ | 1,254,065 | |
Short-Term Investment | | | 197,593 | | | | 197,593 | |
| | | | | | | | |
Total Investments | | $ | 1,451,658 | | | $ | 1,451,658 | |
| | | | | | | | |
There were no Level 2 (significant observable inputs) or Level 3 (significant unobservable inputs) priced securities as of September 30, 2017.
There were no transfers between Level 1 and Level 2 related to securities held at September 30, 2017.
Security abbreviation definitions are located under the Key Investment Terms starting on page 4.
See Notes to Financial Statements
37
VIRTUS KAR SMALL-CAP VALUE FUND
SCHEDULE OF INVESTMENTS
SEPTEMBER 30, 2017
($ reported in thousands)
| | | | | | | | |
| | | SHARES | | | VALUE | |
| COMMON STOCKS—93.8% | | | | | | |
|
| Consumer Discretionary—14.3% | |
Cheesecake Factory, Inc. (The) | | | 407,700 | | | $ | 17,172 | |
Cinemark Holdings, Inc. | | | 407,800 | | | | 14,767 | |
Sally Beauty Holdings, Inc.(2) | | | 535,000 | | | | 10,475 | |
Thor Industries, Inc. | | | 150,300 | | | | 18,924 | |
| | | | | | | | |
| | | | | | | 61,338 | |
| | | | | | | | |
|
| Consumer Staples—6.8% | |
National Beverage Corp. | | | 173,004 | | | | 21,461 | |
WD-40 Co. | | | 67,654 | | | | 7,571 | |
| | | | | | | | |
| | | | | | | 29,032 | |
| | | | | | | | |
| | |
| Energy—3.4% | | | | | | |
Core Laboratories N.V. | | | 148,000 | | | | 14,607 | |
| | | | | | | | |
| | |
| Financials—14.1% | | | | | | |
Artisan Partners Asset Management, Inc. Class A | | | 326,900 | | | | 10,657 | |
Bank of Hawaii Corp. | | | 192,660 | | | | 16,060 | |
First Financial Bankshares, Inc. | | | 234,360 | | | | 10,593 | |
Primerica, Inc. | | | 146,963 | | | | 11,985 | |
RLI Corp. | | | 189,312 | | | | 10,859 | |
| | | | | | | | |
| | | | | | | 60,154 | |
| | | | | | | | |
| | |
| Health Care—6.3% | | | | | | |
Anika Therapeutics, Inc.(2) | | | 279,790 | | | | 16,228 | |
Patterson Cos., Inc. | | | 274,900 | | | | 10,625 | |
| | | | | | | | |
| | | | | | | 26,853 | |
| | | | | | | | |
| | |
| Industrials—19.4% | | | | | | |
Graco, Inc. | | | 99,027 | | | | 12,249 | |
Landstar System, Inc. | | | 129,028 | | | | 12,858 | |
| | | | | | | | |
| | | SHARES | | | VALUE | |
| Industrials—continued | | | | | | | | |
Lincoln Electric Holdings, Inc. | | | 102,610 | | | $ | 9,407 | |
RBC Bearings, Inc.(2) | | | 138,100 | | | | 17,283 | |
SiteOne Landscape Supply, Inc.(2) | | | 293,460 | | | | 17,050 | |
Watsco, Inc. | | | 86,633 | | | | 13,954 | |
| | | | | | | | |
| | | | | | | 82,801 | |
| | | | | | | | |
|
| Information Technology—14.0% | |
American Software, Inc. Class A | | | 459,391 | | | | 5,219 | |
Badger Meter, Inc. | | | 309,634 | | | | 15,172 | |
Cass Information Systems, Inc. | | | 201,119 | | | | 12,759 | |
Cognex Corp. | | | 86,786 | | | | 9,571 | |
Jack Henry & Associates, Inc. | | | 104,750 | | | | 10,767 | |
Manhattan Associates, Inc.(2) | | | 152,120 | | | | 6,323 | |
| | | | | | | | |
| | | | | | | 59,811 | |
| | | | | | | | |
| | |
| Materials—3.9% | | | | | | |
Scotts Miracle-Gro Co. (The) | | | 173,201 | | | | 16,859 | |
| | | | | | | | |
| | |
| Real Estate—11.6% | | | | | | |
HFF, Inc. Class A | | | 329,900 | | | | 13,051 | |
MGM Growth Properties LLC Class A | | | 547,480 | | | | 16,539 | |
RE/MAX Holdings, Inc. Class A | | | 313,920 | | | | 19,950 | |
| | | | | | | | |
| | | | | | | | 49,540 | |
TOTAL COMMON STOCKS
(Identified Cost $281,191) | | | | 400,995 | |
| TOTAL LONG TERM INVESTMENTS—93.8% | |
| (Identified Cost $281,191) | | | | 400,995 | |
| | | | | | | | |
| | | SHARES | | | VALUE | |
| SHORT-TERM INVESTMENT—6.0% | |
|
| Money Market Mutual Fund—6.0% | |
Dreyfus Government Cash Management Fund – Institutional Shares (seven-day effective yield 0.920%)(3) | | | 25,601,602 | | | $ | 25,602 | |
TOTAL SHORT-TERM INVESTMENT
(Identified Cost $25,602) | | | | 25,602 | |
TOTAL INVESTMENTS—99.8%
(Identified Cost $306,793) | | | | 426,597 | (1) |
Other assets and liabilities, net—0.2% | | | | 1,021 | |
| | | | | | | | |
| NET ASSETS—100.0% | | | $ | 427,618 | |
| | | | | | | | |
Footnote Legend:
| (1) | Federal Income Tax Information: For tax information at September 30, 2017, see Note 10 Federal Income Tax Information in the Notes to Financial Statements. |
| (3) | Shares of this fund are publicly offered and its prospectus and annual report are publicly available. |
The following table provides a summary of inputs used to value the Fund’s investments as of September 30, 2017 (See Security Valuation Note 2A in the Notes to Financial Statements):
| | | | | | | | |
| | | Total
Value at
September 30, 2017 | | | Level 1
Quoted
Prices | |
Equity Securities: | | | | | | | | |
Common Stocks | | $ | 400,995 | | | $ | 400,995 | |
Short-Term Investment | | | 25,602 | | | | 25,602 | |
| | | | | | | | |
Total Investments | | $ | 426,597 | | | $ | 426,597 | |
| | | | | | | | |
There were no Level 2 (significant observable inputs) or Level 3 (significant unobservable inputs) priced securities as of September 30, 2017.
There were no transfers between Level 1 and Level 2 related to securities held at September 30, 2017.
See Notes to Financial Statements
38
VIRTUS RAMPART ENHANCED CORE EQUITY FUND
SCHEDULE OF INVESTMENTS
SEPTEMBER 30, 2017
($ reported in thousands)
| | | | | | | | |
| | | SHARES | | | VALUE | |
| COMMON STOCKS—95.3% | |
|
| Consumer Discretionary—10.8% | |
Advance Auto Parts, Inc.(3) | | | 590 | | | $ | 58 | |
Amazon.com, Inc.(2)(3) | | | 3,088 | | | | 2,969 | |
AutoZone, Inc.(2)(3) | | | 216 | | | | 129 | |
Best Buy Co., Inc.(3) | | | 2,034 | | | | 116 | |
BorgWarner, Inc.(3) | | | 1,594 | | | | 82 | |
CarMax, Inc.(2)(3) | | | 1,480 | | | | 112 | |
Carnival Corp.(3) | | | 3,268 | | | | 211 | |
CBS Corp. Class B(3) | | | 2,858 | | | | 166 | |
Charter Communications, Inc. Class A(2)(3) | | | 1,676 | | | | 609 | |
Chipotle Mexican Grill, Inc.(2)(3) | | | 229 | | | | 70 | |
Coach, Inc.(3) | | | 2,247 | | | | 90 | |
Comcast Corp. Class A(3) | | | 37,148 | | | | 1,429 | |
Darden Restaurants, Inc.(3) | | | 994 | | | | 78 | |
Delphi Automotive plc(3) | | | 2,091 | | | | 206 | |
Discovery Communications, Inc. Class A(2)(3) | | | 1,229 | | | | 26 | |
Discovery Communications, Inc. Class C(2)(3) | | | 1,685 | | | | 34 | |
DISH Network Corp.
Class A(2)(3) | | | 1,818 | | | | 99 | |
Dollar General Corp.(3) | | | 1,951 | | | | 158 | |
Dollar Tree, Inc.(2)(3) | | | 1,830 | | | | 159 | |
Expedia, Inc.(3) | | | 936 | | | | 135 | |
Foot Locker, Inc.(3) | | | 1,049 | | | | 37 | |
Ford Motor Co.(3) | | | 30,540 | | | | 366 | |
Gap, Inc. (The)(3) | | | 1,759 | | | | 52 | |
Garmin Ltd.(3) | | | 917 | | | | 49 | |
General Motors Co.(3) | | | 10,735 | | | | 433 | |
Genuine Parts Co.(3) | | | 1,178 | | | | 113 | |
Goodyear Tire & Rubber Co. (The)(3) | | | 2,012 | | | | 67 | |
H&R Block, Inc.(3) | | | 1,656 | | | | 44 | |
Hanesbrands, Inc.(3) | | | 2,910 | | | | 72 | |
Harley-Davidson, Inc.(3) | | | 1,399 | | | | 67 | |
Hasbro, Inc.(3) | | | 899 | | | | 88 | |
Hilton Worldwide Holdings,
Inc.(3) | | | 1,637 | | | | 114 | |
Home Depot, Inc. (The)(3) | | | 9,316 | | | | 1,524 | |
Horton (D.R.), Inc.(3) | | | 2,731 | | | | 109 | |
Interpublic Group of Cos., Inc. (The)(3) | | | 3,158 | | | | 66 | |
Kohl’s Corp.(3) | | | 1,362 | | | | 62 | |
L Brands, Inc.(3) | | | 1,926 | | | | 80 | |
Leggett & Platt, Inc.(3) | | | 1,057 | | | | 50 | |
Lennar Corp. Class A(3) | | | 1,624 | | | | 86 | |
LKQ Corp.(2)(3) | | | 2,464 | | | | 89 | |
Lowe’s Cos., Inc.(3) | | | 6,720 | | | | 537 | |
Macy’s, Inc.(3) | | | 2,433 | | | | 53 | |
Marriott International, Inc. Class A(3) | | | 2,419 | | | | 267 | |
Mattel, Inc.(3) | | | 2,738 | | | | 42 | |
McDonald’s Corp.(3) | | | 6,348 | | | | 995 | |
MGM Resorts International(3) | | | 3,701 | | | | 121 | |
Michael Kors Holdings Ltd.(2)(3) | | | 1,245 | | | | 60 | |
Mohawk Industries, Inc.(2)(3) | | | 485 | | | | 120 | |
Netflix, Inc.(2)(3) | | | 3,340 | | | | 606 | |
Newell Brands, Inc.(3) | | | 3,745 | | | | 160 | |
News Corp. Class A(3) | | | 3,054 | | | | 40 | |
News Corp. Class B(3) | | | 957 | | | | 13 | |
NIKE, Inc. Class B(3) | | | 10,343 | | | | 536 | |
Nordstrom, Inc.(3) | | | 889 | | | | 42 | |
O’Reilly Automotive, Inc.(2)(3) | | | 703 | | | | 151 | |
| | | | | | | | |
| | | SHARES | | | VALUE | |
| Consumer Discretionary—continued | |
Omnicom Group, Inc.(3) | | | 1,791 | | | $ | 133 | |
Priceline Group, Inc. (The)(2)(3) | | | 384 | | | | 703 | |
PulteGroup, Inc.(3) | | | 2,269 | | | | 62 | |
PVH Corp.(3) | | | 623 | | | | 78 | |
Ralph Lauren Corp.(3) | | | 440 | | | | 39 | |
Ross Stores, Inc.(3) | | | 3,050 | | | | 197 | |
Royal Caribbean Cruises Ltd.(3) | | | 1,299 | | | | 154 | |
Scripps Networks Interactive, Inc. Class A(3) | | | 766 | | | | 66 | |
Signet Jewelers Ltd.(3) | | | 547 | | | | 36 | |
Starbucks Corp.(3) | | | 11,316 | | | | 608 | |
Target Corp.(3) | | | 4,303 | | | | 254 | |
Tiffany & Co.(3) | | | 857 | | | | 79 | |
Time Warner, Inc.(3) | | | 6,065 | | | | 621 | |
TJX Cos., Inc. (The)(3) | | | 5,018 | | | | 370 | |
Tractor Supply Co.(3) | | | 1,027 | | | | 65 | |
TripAdvisor, Inc.(2)(3) | | | 883 | | | | 36 | |
Twenty-First Century Fox, Inc. Class A(3) | | | 8,218 | | | | 217 | |
Twenty-First Century Fox, Inc. Class B(3) | | | 3,893 | | | | 100 | |
Ulta Salon Cosmetics & Fragrance, Inc.(2)(3) | | | 443 | | | | 100 | |
Under Armour, Inc. Class A(2)(3) | | | 1,476 | | | | 24 | |
Under Armour, Inc. Class C(2)(3) | | | 1,473 | | | | 22 | |
VF Corp.(3) | | | 2,479 | | | | 158 | |
Viacom, Inc. Class B(3) | | | 2,815 | | | | 78 | |
Walt Disney Co. (The)(3) | | | 11,369 | | | | 1,121 | |
Whirlpool Corp.(3) | | | 561 | | | | 103 | |
Wyndham Worldwide Corp.(3) | | | 834 | | | | 88 | |
Wynn Resorts Ltd.(3) | | | 638 | | | | 95 | |
Yum! Brands, Inc.(3) | | | 2,577 | | | | 190 | |
| | | | | | | | |
| | | | | | | 20,044 | |
| | | | | | | | |
|
| Consumer Staples—7.5% | |
Altria Group, Inc.(3) | | | 15,169 | | | | 962 | |
Archer-Daniels-Midland Co.(3) | | | 4,445 | | | | 189 | |
Brown-Forman Corp. Class B(3) | | | 1,414 | | | | 77 | |
Campbell Soup Co.(3) | | | 1,532 | | | | 72 | |
Church & Dwight Co., Inc.(3) | | | 1,992 | | | | 96 | |
Clorox Co. (The)(3) | | | 992 | | | | 131 | |
Coca-Cola Co. (The)(3) | | | 30,026 | | | | 1,351 | |
Colgate-Palmolive Co.(3) | | | 6,906 | | | | 503 | |
Conagra Brands, Inc.(3) | | | 3,230 | | | | 109 | |
Constellation Brands, Inc. Class A(3) | | | 1,339 | | | | 267 | |
Costco Wholesale Corp.(3) | | | 3,428 | | | | 563 | |
Coty, Inc. Class A(3) | | | 3,764 | | | | 62 | |
CVS Health Corp.(3) | | | 7,968 | | | | 648 | |
Dr. Pepper Snapple Group, Inc.(3) | | | 1,414 | | | | 125 | |
Estee Lauder Cos., Inc. (The) Class A(3) | | | 1,742 | | | | 188 | |
General Mills, Inc.(3) | | | 4,504 | | | | 233 | |
Hershey Co. (The)(3) | | | 1,073 | | | | 117 | |
Hormel Foods Corp.(3) | | | 2,156 | | | | 69 | |
J.M. Smucker Co. (The)(3) | | | 930 | | | | 98 | |
Kellogg Co.(3) | | | 1,941 | | | | 121 | |
Kimberly-Clark Corp.(3) | | | 2,771 | | | | 326 | |
Kraft Heinz Co.(The)(3) | | | 4,677 | | | | 363 | |
Kroger Co. (The)(3) | | | 7,061 | | | | 142 | |
McCormick & Co., Inc.(3) | | | 905 | | | | 93 | |
Molson Coors Brewing Co. Class B(3) | | | 1,418 | | | | 116 | |
| | | | | | | | |
| | | SHARES | | | VALUE | |
| Consumer Staples—continued | |
Mondelez International, Inc. Class A(3) | | | 11,858 | | | $ | 482 | |
Monster Beverage Corp.(2)(3) | | | 3,133 | | | | 173 | |
PepsiCo, Inc.(3) | | | 11,138 | | | | 1,241 | |
Philip Morris International, Inc.(3) | | | 12,137 | | | | 1,347 | |
Procter & Gamble Co. (The)(3) | | | 20,012 | | | | 1,821 | |
Sysco Corp.(3) | | | 3,841 | | | | 207 | |
Tyson Foods, Inc. Class A(3) | | | 2,228 | | | | 157 | |
Wal-Mart Stores, Inc.(3) | | | 11,563 | | | | 904 | |
Walgreens Boots Alliance,
Inc.(3) | | | 6,659 | | | | 514 | |
| | | | | | | | |
| | | | | | | 13,867 | |
| | | | | | | | |
|
| Energy—5.6% | |
Anadarko Petroleum Corp.(3) | | | 4,362 | | | | 213 | |
Andeavor(3) | | | 1,159 | | | | 120 | |
Apache Corp.(3) | | | 3,040 | | | | 139 | |
Baker Hughes a GE Co.(3) | | | 3,264 | | | | 120 | |
Cabot Oil & Gas Corp.(3) | | | 3,720 | | | | 100 | |
Chesapeake Energy Corp.(2)(3) | | | 6,096 | | | | 26 | |
Chevron Corp.(3) | | | 14,836 | | | | 1,743 | |
Cimarex Energy Co.(3) | | | 760 | | | | 86 | |
Concho Resources, Inc.(2)(3) | | | 1,143 | | | | 151 | |
ConocoPhillips(3) | | | 9,717 | | | | 486 | |
Devon Energy Corp.(3) | | | 4,201 | | | | 154 | |
EOG Resources, Inc.(3) | | | 4,539 | | | | 439 | |
EQT Corp.(3) | | | 1,385 | | | | 90 | |
Exxon Mobil Corp.(3) | | | 33,223 | | | | 2,724 | |
Halliburton Co.(3) | | | 6,771 | | | | 312 | |
Helmerich & Payne, Inc.(3) | | | 868 | | | | 45 | |
Hess Corp.(3) | | | 2,160 | | | | 101 | |
Kinder Morgan, Inc.(3) | | | 15,020 | | | | 288 | |
Marathon Oil Corp.(3) | | | 6,793 | | | | 92 | |
Marathon Petroleum Corp.(3) | | | 4,046 | | | | 227 | |
National Oilwell Varco, Inc.(3) | | | 3,037 | | | | 109 | |
Newfield Exploration Co.(2)(3) | | | 1,592 | | | | 47 | |
Noble Energy, Inc.(3) | | | 3,638 | | | | 103 | |
Occidental Petroleum Corp.(3) | | | 5,984 | | | | 384 | |
ONEOK, Inc.(3) | | | 2,947 | | | | 163 | |
Phillips 66(3) | | | 3,431 | | | | 314 | |
Pioneer Natural Resources
Co.(3) | | | 1,322 | | | | 195 | |
Range Resources Corp.(3) | | | 1,504 | | | | 30 | |
Schlumberger Ltd.(3) | | | 10,880 | | | | 759 | |
TechnipFMC plc(2)(3) | | | 3,729 | | | | 104 | |
Valero Energy Corp.(3) | | | 3,492 | | | | 269 | |
Williams Cos., Inc. (The)(3) | | | 6,437 | | | | 193 | |
| | | | | | | | |
| | | | | | | 10,326 | |
| | | | | | | | |
|
| Financials—13.3% | |
Affiliated Managers Group,
Inc.(3) | | | 442 | | | | 84 | |
Aflac, Inc.(3) | | | 3,101 | | | | 252 | |
Allstate Corp. (The)(3) | | | 2,843 | | | | 261 | |
American Express Co.(3) | | | 5,867 | | | | 531 | |
American International Group, Inc.(3) | | | 6,869 | | | | 422 | |
Ameriprise Financial, Inc.(3) | | | 1,190 | | | | 177 | |
AON plc(3) | | | 2,048 | | | | 299 | |
Assurant, Inc.(3) | | | 426 | | | | 41 | |
Bank of America Corp.(3) | | | 77,490 | | | | 1,964 | |
Bank of New York Mellon Corp. (The)(3) | | | 8,108 | | | | 430 | |
BB&T Corp.(3) | | | 6,328 | | | | 297 | |
Berkshire Hathaway, Inc. Class B(2)(3) | | | 14,792 | | | | 2,712 | |
See Notes to Financial Statements
39
VIRTUS RAMPART ENHANCED CORE EQUITY FUND
SCHEDULE OF INVESTMENTS (Continued)
SEPTEMBER 30, 2017
($ reported in thousands)
| | | | | | | | |
| | | SHARES | | | VALUE | |
| Financials—continued | |
BlackRock, Inc.(3) | | | 948 | | | $ | 424 | |
Brighthouse Financial, Inc.(2)(3) | | | 759 | | | | 46 | |
Capital One Financial Corp.(3) | | | 3,761 | | | | 318 | |
CBOE Holdings, Inc.(3) | | | 718 | | | | 77 | |
Charles Schwab Corp. (The)(3) | | | 9,476 | | | | 415 | |
Chubb Ltd.(3) | | | 3,658 | | | | 521 | |
Cincinnati Financial Corp.(3) | | | 1,167 | | | | 89 | |
Citigroup, Inc.(3) | | | 21,430 | | | | 1,559 | |
Citizens Financial Group, Inc.(3) | | | 3,956 | | | | 150 | |
CME Group, Inc.(3) | | | 2,663 | | | | 361 | |
Comerica, Inc.(3) | | | 1,380 | | | | 105 | |
Discover Financial Services(3) | | | 2,968 | | | | 191 | |
E*Trade Financial Corp.(2)(3) | | | 2,123 | | | | 93 | |
Everest Re Group Ltd.(3) | | | 320 | | | | 73 | |
Fifth Third Bancorp(3) | | | 5,857 | | | | 164 | |
Franklin Resources, Inc.(3) | | | 2,669 | | | | 119 | |
Gallagher (Arthur J.) & Co.(3) | | | 1,404 | | | | 86 | |
Goldman Sachs Group, Inc. (The)(3) | | | 2,847 | | | | 675 | |
Hartford Financial Services Group, Inc. (The)(3) | | | 2,866 | | | | 159 | |
Huntington Bancshares, Inc.(3) | | | 8,483 | | | | 118 | |
Intercontinental Exchange,
Inc.(3) | | | 4,629 | | | | 318 | |
Invesco Ltd.(3) | | | 3,172 | | | | 111 | |
JPMorgan Chase & Co.(3) | | | 27,660 | | | | 2,642 | |
KeyCorp(3) | | | 8,557 | | | | 161 | |
Leucadia National Corp.(3) | | | 2,523 | | | | 64 | |
Lincoln National Corp.(3) | | | 1,744 | | | | 128 | |
Loews Corp.(3) | | | 2,153 | | | | 103 | |
M&T Bank Corp.(3) | | | 1,197 | | | | 193 | |
Marsh & McLennan Cos., Inc.(3) | | | 4,027 | | | | 338 | |
MetLife, Inc.(3) | | | 8,444 | | | | 439 | |
Moody’s Corp.(3) | | | 1,300 | | | | 181 | |
Morgan Stanley(3) | | | 11,081 | | | | 534 | |
Nasdaq, Inc.(3) | | | 890 | | | | 69 | |
Navient Corp.(3) | | | 2,162 | | | | 32 | |
Northern Trust Corp.(3) | | | 1,680 | | | | 154 | |
People’s United Financial, Inc.(3) | | | 2,682 | | | | 49 | |
PNC Financial Services Group, Inc. (The)(3) | | | 3,771 | | | | 508 | |
Principal Financial Group, Inc.(3) | | | 2,086 | | | | 134 | |
Progressive Corp. (The)(3) | | | 4,525 | | | | 219 | |
Prudential Financial, Inc.(3) | | | 3,341 | | | | 355 | |
Raymond James Financial,
Inc.(3) | | | 999 | | | | 84 | |
Regions Financial Corp.(3) | | | 9,377 | | | | 143 | |
S&P Global, Inc.(3) | | | 2,015 | | | | 315 | |
State Street Corp.(3) | | | 2,761 | | | | 264 | |
SunTrust Banks, Inc.(3) | | | 3,761 | | | | 225 | |
Synchrony Financial(3) | | | 6,020 | | | | 187 | |
T. Rowe Price Group, Inc.(3) | | | 1,885 | | | | 171 | |
Torchmark Corp.(3) | | | 848 | | | | 68 | |
Travelers Cos., Inc. (The)(3) | | | 2,178 | | | | 267 | |
U.S. Bancorp(3) | | | 12,371 | | | | 663 | |
Unum Group(3) | | | 1,780 | | | | 91 | |
Wells Fargo & Co.(3) | | | 35,129 | | | | 1,937 | |
Willis Towers Watson plc(3) | | | 993 | | | | 153 | |
XL Group Ltd.(3) | | | 2,035 | | | | 80 | |
Zions Bancorporation(3) | | | 1,586 | | | | 75 | |
| | | | | | | | |
| | | | | | | 24,668 | |
| | | | | | | | |
|
| Health Care—14.6% | |
Abbott Laboratories(3) | | | 14,795 | | | | 789 | |
AbbVie, Inc.(3) | | | 13,788 | | | | 1,225 | |
| | | | | | | | |
| | | SHARES | | | VALUE | |
| Health Care—continued | |
Aetna, Inc.(3) | | | 2,881 | | | $ | 458 | |
Agilent Technologies, Inc.(3) | | | 2,770 | | | | 178 | |
Alexion Pharmaceuticals, Inc.(2)(3) | | | 1,948 | | | | 273 | |
Align Technology, Inc.(2)(3) | | | 640 | | | | 119 | |
Allergan plc(3) | | | 2,912 | | | | 597 | |
AmerisourceBergen Corp.(3) | | | 1,409 | | | | 117 | |
Amgen, Inc.(3) | | | 6,384 | | | | 1,190 | |
Anthem, Inc.(3) | | | 2,294 | | | | 436 | |
Bard (C.R.), Inc.(3) | | | 627 | | | | 201 | |
Baxter International, Inc.(3) | | | 4,225 | | | | 265 | |
Becton, Dickinson & Co.(3) | | | 1,969 | | | | 386 | |
Biogen, Inc.(2)(3) | | | 1,859 | | | | 582 | |
Boston Scientific Corp.(2)(3) | | | 11,850 | | | | 346 | |
Bristol-Myers Squibb Co.(3) | | | 14,273 | | | | 910 | |
Cardinal Health, Inc.(3) | | | 2,718 | | | | 182 | |
Celgene Corp.(2)(3) | | | 6,748 | | | | 984 | |
Centene Corp.(2)(3) | | | 1,521 | | | | 147 | |
Cerner Corp.(2)(3) | | | 2,525 | | | | 180 | |
Cigna Corp.(3) | | | 2,226 | | | | 416 | |
Cooper Cos., Inc. (The)(3) | | | 431 | | | | 102 | |
Danaher Corp.(3) | | | 5,281 | | | | 453 | |
DaVita, Inc.(2)(3) | | | 1,375 | | | | 82 | |
DENTSPLY SIRONA, Inc.(3) | | | 2,024 | | | | 121 | |
Edwards Lifesciences Corp.(2)(3) | | | 1,808 | | | | 198 | |
Eli Lilly & Co.(3) | | | 8,412 | | | | 720 | |
Envision Healthcare Corp.(2)(3) | | | 1,045 | | | | 47 | |
Express Scripts Holding Co.(2)(3) | | | 5,169 | | | | 327 | |
Gilead Sciences, Inc.(3) | | | 11,311 | | | | 916 | |
HCA Healthcare, Inc.(2)(3) | | | 2,463 | | | | 196 | |
Henry Schein, Inc.(2)(3) | | | 1,341 | | | | 110 | |
Hologic, Inc.(2)(3) | | | 2,473 | | | | 91 | |
Humana, Inc.(3) | | | 1,254 | | | | 306 | |
IDEXX Laboratories, Inc.(2)(3) | | | 784 | | | | 122 | |
Illumina, Inc.(2)(3) | | | 1,261 | | | | 251 | |
Incyte Corp.(2)(3) | | | 1,458 | | | | 170 | |
Intuitive Surgical, Inc.(2)(3) | | | 318 | | | | 333 | |
Johnson & Johnson(3) | | | 23,351 | | | | 3,036 | |
Laboratory Corporation of America Holdings(2)(3) | | | 870 | | | | 131 | |
McKesson Corp.(3) | | | 1,826 | | | | 280 | |
Medtronic plc(3) | | | 11,824 | | | | 920 | |
Merck & Co., Inc.(3) | | | 23,721 | | | | 1,519 | |
Mettler-Toledo International,
Inc.(2)(3) | | | 220 | | | | 138 | |
Mylan NV(2)(3) | | | 3,914 | | | | 123 | |
Patterson Cos., Inc.(3) | | | 721 | | | | 28 | |
PerkinElmer, Inc.(3) | | | 972 | | | | 67 | |
Perrigo Co., plc(3) | | | 1,209 | | | | 102 | |
Pfizer, Inc.(3) | | | 51,732 | | | | 1,847 | |
Quest Diagnostics, Inc.(3) | | | 1,165 | | | | 109 | |
Quintiles IMS Holdings, Inc.(2)(3) | | | 1,188 | | | | 113 | |
Regeneron Pharmaceuticals,
Inc.(2)(3) | | | 658 | | | | 294 | |
ResMed, Inc.(3) | | | 1,252 | | | | 96 | |
Stryker Corp.(3) | | | 2,687 | | | | 382 | |
Thermo Fisher Scientific, Inc.(3) | | | 3,378 | | | | 639 | |
UnitedHealth Group, Inc.(3) | | | 8,352 | | | | 1,636 | |
Universal Health Services, Inc. Class B(3) | | | 790 | | | | 88 | |
Varian Medical Systems, Inc.(2)(3) | | | 812 | | | | 81 | |
Vertex Pharmaceuticals, Inc.(2)(3) | | | 2,160 | | | | 328 | |
Waters Corp.(2)(3) | | | 680 | | | | 122 | |
Zimmer Biomet Holdings, Inc.(3) | | | 1,736 | | | | 203 | |
| | | | | | | | |
| | | SHARES | | | VALUE | |
| Health Care—continued | |
Zoetis, Inc.(3) | | | 4,252 | | | $ | 271 | |
| | | | | | | | |
| | | | | | | 27,079 | |
| | | | | | | | |
|
| Industrials—9.3% | |
3M Co.(3) | | | 4,670 | | | | 980 | |
A.O. Smith Corp.(3) | | | 1,177 | | | | 70 | |
Acuity Brands, Inc.(3) | | | 352 | | | | 60 | |
Alaska Air Group, Inc.(3) | | | 988 | | | | 75 | |
Allegion plc(3) | | | 761 | | | | 66 | |
American Airlines Group, Inc.(3) | | | 3,828 | | | | 182 | |
AMETEK, Inc.(3) | | | 1,762 | | | | 116 | |
Arconic, Inc.(3) | | | 3,522 | | | | 88 | |
Boeing Co. (The)(3) | | | 4,370 | | | | 1,111 | |
Caterpillar, Inc.(3) | | | 4,517 | | | | 563 | |
Cintas Corp.(3) | | | 690 | | | | 100 | |
CSX Corp.(3) | | | 7,210 | | | | 391 | |
Cummins, Inc.(3) | | | 1,204 | | | | 202 | |
Deere & Co.(3) | | | 2,299 | | | | 289 | |
Delta Air Lines, Inc.(3) | | | 5,746 | | | | 277 | |
Dover Corp.(3) | | | 1,188 | | | | 109 | |
Eaton Corp. plc(3) | | | 3,496 | | | | 268 | |
Emerson Electric Co.(3) | | | 5,033 | | | | 316 | |
Equifax, Inc.(3) | | | 961 | | | | 102 | |
Expeditors International of Washington, Inc.(3) | | | 1,440 | | | | 86 | |
Fastenal Co.(3) | | | 2,312 | | | | 105 | |
FedEx Corp.(3) | | | 1,920 | | | | 433 | |
Flowserve Corp.(3) | | | 1,044 | | | | 45 | |
Fluor Corp.(3) | | | 1,117 | | | | 47 | |
Fortive Corp.(3) | | | 2,338 | | | | 166 | |
Fortune Brands Home & Security, Inc.(3) | | | 1,229 | | | | 83 | |
General Dynamics Corp.(3) | | | 2,207 | | | | 454 | |
General Electric Co.(3) | | | 68,032 | | | | 1,645 | |
Honeywell International, Inc.(3) | | | 5,958 | | | | 845 | |
Hunt (JB) Transport Services, Inc.(3) | | | 686 | | | | 76 | |
IHS Markit Ltd.(2)(3) | | | 2,430 | | | | 107 | |
Illinois Tool Works, Inc.(3) | | | 2,425 | | | | 359 | |
Ingersoll-Rand plc(3) | | | 1,990 | | | | 177 | |
Jacobs Engineering Group,
Inc.(3) | | | 962 | | | | 56 | |
Johnson Controls International plc(3) | | | 7,331 | | | | 295 | |
Kansas City Southern(3) | | | 848 | | | | 92 | |
L3 Technologies, Inc.(3) | | | 622 | | | | 117 | |
Lockheed Martin Corp.(3) | | | 1,942 | | | | 603 | |
Masco Corp.(3) | | | 2,557 | | | | 100 | |
Nielsen Holdings plc(3) | | | 2,558 | | | | 106 | |
Norfolk Southern Corp.(3) | | | 2,258 | | | | 299 | |
Northrop Grumman Corp.(3) | | | 1,365 | | | | 393 | |
PACCAR, Inc.(3) | | | 2,735 | | | | 198 | |
Parker-Hannifin Corp.(3) | | | 1,034 | | | | 181 | |
Pentair plc(3) | | | 1,340 | | | | 91 | |
Quanta Services, Inc.(2)(3) | | | 1,184 | | | | 44 | |
Raytheon Co.(3) | | | 2,275 | | | | 425 | |
Republic Services, Inc.(3) | | | 1,837 | | | | 121 | |
Robert Half International,
Inc.(3) | | | 1,016 | | | | 51 | |
Robinson (C.H.) Worldwide, Inc.(3) | | | 1,126 | | | | 86 | |
Rockwell Automation, Inc.(3) | | | 1,001 | | | | 178 | |
Rockwell Collins, Inc.(3) | | | 1,259 | | | | 165 | |
Roper Technologies, Inc.(3) | | | 794 | | | | 193 | |
Snap-on, Inc.(3) | | | 463 | | | | 69 | |
See Notes to Financial Statements
40
VIRTUS RAMPART ENHANCED CORE EQUITY FUND
SCHEDULE OF INVESTMENTS (Continued)
SEPTEMBER 30, 2017
($ reported in thousands)
| | | | | | | | |
| | | SHARES | | | VALUE | |
| Industrials—continued | |
Southwest Airlines Co.(3) | | | 4,717 | | | $ | 264 | |
Stanley Black & Decker, Inc.(3) | | | 1,188 | | | | 179 | |
Stericycle, Inc.(2)(3) | | | 681 | | | | 49 | |
Textron, Inc.(3) | | | 2,042 | | | | 110 | |
TransDigm Group, Inc.(3) | | | 371 | | | | 95 | |
Union Pacific Corp.(3) | | | 6,310 | | | | 732 | |
United Continental Holdings, Inc.(2)(3) | | | 2,168 | | | | 132 | |
United Parcel Service, Inc. Class B(3) | | | 5,381 | | | | 646 | |
United Rentals, Inc.(2)(3) | | | 675 | | | | 94 | |
United Technologies Corp.(3) | | | 5,807 | | | | 674 | |
Verisk Analytics, Inc.(2)(3) | | | 1,229 | | | | 102 | |
W.W. Grainger, Inc.(3) | | | 429 | | | | 77 | |
Waste Management, Inc.(3) | | | 3,172 | | | | 248 | |
Xylem, Inc.(3) | | | 1,436 | | | | 90 | |
| | | | | | | | |
| | | | | | | 17,348 | |
| | | | | | | | |
|
| Information Technology—23.1% | |
Accenture plc Class A(3) | | | 5,323 | | | | 719 | |
Activision Blizzard, Inc.(3) | | | 5,984 | | | | 386 | |
Adobe Systems, Inc.(2)(3) | | | 4,246 | | | | 633 | |
Advanced Micro Devices, Inc.(2)(3) | | | 6,478 | | | | 83 | |
Akamai Technologies, Inc.(2)(3) | | | 1,522 | | | | 74 | |
Alliance Data Systems Corp.(3) | | | 490 | | | | 109 | |
Alphabet, Inc. Class A(2)(3) | | | 2,559 | | | | 2,492 | |
Alphabet, Inc. Class C(2)(3) | | | 2,565 | | | | 2,460 | |
Amphenol Corp. Class A(3) | | | 2,624 | | | | 222 | |
Analog Devices, Inc.(3) | | | 3,128 | | | | 270 | |
ANSYS, Inc.(2)(3) | | | 749 | | | | 92 | |
Apple, Inc.(3) | | | 44,729 | | | | 6,894 | |
Applied Materials, Inc.(3) | | | 9,104 | | | | 474 | |
Autodesk, Inc.(2)(3) | | | 1,662 | | | | 187 | |
Automatic Data Processing,
Inc.(3) | | | 3,849 | | | | 421 | |
Broadcom Ltd.(3) | | | 3,442 | | | | 835 | |
CA, Inc.(3) | | | 2,760 | | | | 92 | |
Cisco Systems, Inc.(3) | | | 43,138 | | | | 1,451 | |
Citrix Systems, Inc.(2)(3) | | | 1,329 | | | | 102 | |
Cognizant Technology Solutions Corp. Class A(3) | | | 5,062 | | | | 367 | |
Corning, Inc.(3) | | | 7,892 | | | | 236 | |
CSRA, Inc.(3) | | | 1,294 | | | | 42 | |
DXC Technology Co.(3) | | | 2,421 | | | | 208 | |
eBay, Inc.(2)(3) | | | 8,689 | | | | 334 | |
Electronic Arts, Inc.(2)(3) | | | 2,664 | | | | 314 | |
F5 Networks, Inc.(2)(3) | | | 571 | | | | 69 | |
Facebook, Inc. Class A(2)(3) | | | 20,292 | | | | 3,467 | |
Fidelity National Information Services, Inc.(3) | | | 2,843 | | | | 265 | |
Fiserv, Inc.(2)(3) | | | 1,823 | | | | 235 | |
FLIR Systems, Inc.(3) | | | 1,210 | | | | 47 | |
Gartner, Inc.(2)(3) | | | 792 | | | | 99 | |
Global Payments, Inc.(3) | | | 1,290 | | | | 123 | |
Harris Corp.(3) | | | 1,033 | | | | 136 | |
Hewlett Packard Enterprise
Co.(3) | | | 14,237 | | | | 209 | |
HP, Inc.(3) | | | 14,502 | | | | 289 | |
Intel Corp.(3) | | | 40,514 | | | | 1,543 | |
International Business Machines Corp.(3) | | | 7,348 | | | | 1,066 | |
Intuit, Inc.(3) | | | 2,096 | | | | 298 | |
Juniper Networks, Inc.(3) | | | 3,369 | | | | 94 | |
KLA-Tencor Corp.(3) | | | 1,328 | | | | 141 | |
| | | | | | | | |
| | | SHARES | | | VALUE | |
| Information Technology—continued | |
Lam Research Corp.(3) | | | 1,384 | | | $ | 256 | |
Mastercard, Inc. Class A(3) | | | 8,067 | | | | 1,139 | |
Microchip Technology, Inc.(3) | | | 1,963 | | | | 176 | |
Micron Technology, Inc.(2)(3) | | | 8,866 | | | | 349 | |
Microsoft Corp.(3) | | | 66,364 | | | | 4,943 | |
Motorola Solutions, Inc.(3) | | | 1,380 | | | | 117 | |
NetApp, Inc.(3) | | | 2,391 | | | | 105 | |
NVIDIA Corp.(3) | | | 4,981 | | | | 890 | |
Oracle Corp.(3) | | | 25,657 | | | | 1,240 | |
Paychex, Inc.(3) | | | 2,721 | | | | 163 | |
PayPal Holdings, Inc.(2)(3) | | | 9,609 | | | | 615 | |
Qorvo, Inc.(2)(3) | | | 1,122 | | | | 79 | |
QUALCOMM, Inc.(3) | | | 12,691 | | | | 658 | |
Red Hat, Inc.(2)(3) | | | 1,516 | | | | 168 | |
salesforce.com, Inc.(2)(3) | | | 5,729 | | | | 535 | |
Seagate Technology plc(3) | | | 2,621 | | | | 87 | |
Skyworks Solutions, Inc.(3) | | | 1,577 | | | | 161 | |
Symantec Corp.(3) | | | 5,199 | | | | 171 | |
Synopsys, Inc.(2)(3) | | | 1,317 | | | | 106 | |
TE Connectivity Ltd.(3) | | | 3,055 | | | | 254 | |
Texas Instruments, Inc.(3) | | | 8,560 | | | | 767 | |
Total System Services, Inc.(3) | | | 1,459 | | | | 96 | |
VeriSign, Inc.(2)(3) | | | 778 | | | | 83 | |
Visa, Inc. Class A(3) | | | 15,848 | | | | 1,668 | |
Western Digital Corp.(3) | | | 2,504 | | | | 216 | |
Western Union Co. (The)(3) | | | 4,151 | | | | 80 | |
Xerox Corp.(3) | | | 1,881 | | | | 63 | |
Xilinx, Inc.(3) | | | 2,109 | | | | 149 | |
| | | | | | | | |
| | | | | | | 42,912 | |
| | | | | | | | |
|
| Materials—2.9% | |
Air Products & Chemicals, Inc.(3) | | | 1,870 | | | | 283 | |
Albemarle Corp.(3) | | | 954 | | | | 130 | |
Avery Dennison Corp.(3) | | | 769 | | | | 76 | |
Ball Corp.(3) | | | 3,035 | | | | 125 | |
CF Industries Holdings, Inc.(3) | | | 2,013 | | | | 71 | |
DowDuPont, Inc.(3) | | | 17,863 | | | | 1,237 | |
Eastman Chemical Co.(3) | | | 1,271 | | | | 115 | |
Ecolab, Inc.(3) | | | 2,267 | | | | 291 | |
FMC Corp.(3) | | | 1,160 | | | | 104 | |
Freeport-McMoRan, Inc.(2)(3) | | | 11,536 | | | | 162 | |
International Flavors & Fragrances, Inc.(3) | | | 687 | | | | 98 | |
International Paper Co.(3) | | | 3,572 | | | | 203 | |
LyondellBasell Industries N.V. Class A(3) | | | 2,834 | | | | 281 | |
Martin Marietta Materials, Inc.(3) | | | 543 | | | | 112 | |
Monsanto Co.(3) | | | 3,807 | | | | 456 | |
Mosaic Co. (The)(3) | | | 3,056 | | | | 66 | |
Newmont Mining Corp.(3) | | | 4,671 | | | | 175 | |
Nucor Corp.(3) | | | 2,772 | | | | 155 | |
Packaging Corp. of America(3) | | | 816 | | | | 93 | |
PPG Industries, Inc.(3) | | | 2,232 | | | | 242 | |
Praxair, Inc.(3) | | | 2,476 | | | | 346 | |
Sealed Air Corp.(3) | | | 1,702 | | | | 73 | |
Sherwin-Williams Co. (The)(3) | | | 704 | | | | 252 | |
Vulcan Materials Co.(3) | | | 1,151 | | | | 138 | |
WestRock Co.(3) | | | 2,185 | | | | 124 | |
| | | | | | | | |
| | | | | | | 5,408 | |
| | | | | | | | |
|
| Real Estate—2.9% | |
Alexandria Real Estate Equities, Inc.(3) | | | 791 | | | | 94 | |
| | | | | | | | |
| | | SHARES | | | VALUE | |
| Real Estate—continued | |
American Tower Corp.(3) | | | 3,700 | | | $ | 506 | |
Apartment Investment & Management Co. Class A(3) | | | 1,367 | | | | 60 | |
AvalonBay Communities, Inc.(3) | | | 1,197 | | | | 214 | |
Boston Properties, Inc.(3) | | | 1,341 | | | | 165 | |
CBRE Group, Inc. Class A(2)(3) | | | 2,605 | | | | 99 | |
Crown Castle International
Corp.(3) | | | 3,506 | | | | 350 | |
Digital Realty Trust, Inc.(3) | | | 1,390 | | | | 164 | |
Duke Realty Corp.(3) | | | 3,093 | | | | 89 | |
Equinix, Inc.(3) | | | 677 | | | | 302 | |
Equity Residential(3) | | | 3,198 | | | | 211 | |
Essex Property Trust, Inc.(3) | | | 570 | | | | 145 | |
Extra Space Storage, Inc.(3) | | | 1,101 | | | | 88 | |
Federal Realty Investment
Trust(3) | | | 630 | | | | 78 | |
GGP, Inc.(3) | | | 5,070 | | | | 105 | |
HCP, Inc.(3) | | | 4,082 | | | | 114 | |
Host Hotels & Resorts, Inc.(3) | | | 6,424 | | | | 119 | |
Iron Mountain, Inc.(3) | | | 2,133 | | | | 83 | |
Kimco Realty Corp.(3) | | | 3,712 | | | | 73 | |
Macerich Co. (The)(3) | | | 1,043 | | | | 57 | |
Mid-America Apartment Communities, Inc.(3) | | | 988 | | | | 106 | |
Prologis, Inc.(3) | | | 4,617 | | | | 293 | |
Public Storage(3) | | | 1,299 | | | | 278 | |
Realty Income Corp. (3) | | | 2,380 | | | | 136 | |
Regency Centers Corp.(3) | | | 1,275 | | | | 79 | |
Simon Property Group, Inc.(3) | | | 2,725 | | | | 439 | |
SL Green Realty Corp.(3) | | | 886 | | | | 90 | |
UDR, Inc.(3) | | | 2,326 | | | | 88 | |
Ventas, Inc.(3) | | | 3,090 | | | | 201 | |
Vornado Realty Trust(3) | | | 1,494 | | | | 115 | |
Welltower, Inc.(3) | | | 3,189 | | | | 224 | |
Weyerhaeuser Co.(3) | | | 6,534 | | | | 222 | |
| | | | | | | | |
| | | | | | | 5,387 | |
| | | | | | | | |
|
| Telecommunication Services—2.2% | |
AT&T, Inc.(3) | | | 52,826 | | | | 2,069 | |
CenturyLink, Inc.(3) | | | 4,823 | | | | 91 | |
Level 3 Communications,
Inc.(2)(3) | | | 2,479 | | | | 132 | |
Verizon Communications, Inc.(3) | | | 34,446 | | | | 1,705 | |
| | | | | | | | |
| | | | | | | 3,997 | |
| | | | | | | | |
|
| Utilities—3.1% | |
AES Corp.(3) | | | 5,716 | | | | 63 | |
Alliant Energy Corp.(3) | | | 1,973 | | | | 82 | |
Ameren Corp.(3) | | | 2,104 | | | | 122 | |
American Electric Power Co., Inc.(3) | | | 4,255 | | | | 299 | |
American Water Works Co.,
Inc.(3) | | | 1,543 | | | | 125 | |
CenterPoint Energy, Inc.(3) | | | 3,742 | | | | 109 | |
CMS Energy Corp.(3) | | | 2,440 | | | | 113 | |
Consolidated Edison, Inc.(3) | | | 2,644 | | | | 213 | |
Dominion Energy, Inc.(3) | | | 5,446 | | | | 419 | |
DTE Energy Co.(3) | | | 1,559 | | | | 167 | |
Duke Energy Corp.(3) | | | 6,015 | | | | 505 | |
Edison International(3) | | | 2,832 | | | | 219 | |
Entergy Corp.(3) | | | 1,558 | | | | 119 | |
Eversource Energy(3) | | | 2,758 | | | | 167 | |
Exelon Corp.(3) | | | 8,028 | | | | 302 | |
FirstEnergy Corp.(3) | | | 3,842 | | | | 119 | |
See Notes to Financial Statements
41
VIRTUS RAMPART ENHANCED CORE EQUITY FUND
SCHEDULE OF INVESTMENTS (Continued)
SEPTEMBER 30, 2017
($ reported in thousands)
| | | | | | | | |
| | | SHARES | | | VALUE | |
| Utilities—continued | |
NextEra Energy, Inc.(3) | | | 4,073 | | | $ | 597 | |
NiSource, Inc.(3) | | | 2,805 | | | | 72 | |
NRG Energy, Inc.(3) | | | 2,745 | | | | 70 | |
PG&E Corp.(3) | | | 4,425 | | | | 301 | |
Pinnacle West Capital Corp.(3) | | | 969 | | | | 82 | |
PPL Corp.(3) | | | 5,925 | | | | 225 | |
Public Service Enterprise Group, Inc.(3) | | | 4,381 | | | | 203 | |
SCANA Corp.(3) | | | 1,244 | | | | 60 | |
Sempra Energy(3) | | | 2,175 | | | | 248 | |
Southern Co. (The)(3) | | | 8,611 | | | | 423 | |
WEC Energy Group, Inc.(3) | | | 2,737 | | | | 172 | |
Xcel Energy, Inc.(3) | | | 4,400 | | | | 208 | |
| | | | | | | | |
| | | | | | | | 5,804 | |
TOTAL COMMON STOCKS
(Identified Cost $166,819) | | | | 176,840 | |
|
| EXCHANGE-TRADED FUND—3.6% | |
PowerShares S&P 500 Low Volatility Portfolio(3)(4) | | | 144,618 | | | | 6,622 | |
TOTAL EXCHANGE-TRADED FUND
(Identified Cost $6,638) | | | | 6,622 | |
| | | | | | | | |
| | | CONTRACTS | | | VALUE | |
| PURCHASED OPTIONS—0.0% | |
|
See the table below for the detailed information | |
|
| Call Options—0.0% | |
| | |
| Put Options—0.0% | | | | | | | | |
TOTAL PURCHASED OPTIONS—0.0%
(Premiums Paid $266) | | | $ | 90 | |
| TOTAL LONG TERM INVESTMENTS—98.9% | |
| (Identified Cost $173,723) | | | | 183,552 | |
| TOTAL INVESTMENTS, BEFORE WRITTEN OPTIONS—98.9% | |
| (Identified Cost $173,723) | | | | 183,552 | (1) |
|
| WRITTEN OPTIONS—(0.2)% | |
|
See the table on page 44 for the detailed information | |
|
| Call Options—(0.1)% | |
| | |
| Put Options—(0.1)% | | | | | | | | |
TOTAL WRITTEN OPTIONS—(0.2)%
(Premiums Received $(505)) | | | | (265 | )(1) |
| TOTAL INVESTMENTS, NET OF WRITTEN OPTIONS—98.7% | |
| (Identified Cost $173,218) | | | 183,287 | |
Other assets and liabilities, net—1.3% | | | | 2,353 | |
| | | | | | | | |
| NET ASSETS—100.0% | | | $ | 185,640 | |
| | | | | | | | |
Footnote Legend:
| (1) | Federal Income Tax Information: For tax information at September 30, 2017, see Note 10 Federal Income Tax Information in the Notes to Financial Statements. |
| (3) | All or a portion of the security is segregated as collateral for written options. |
| (4) | Shares of this fund are publicly offered and its prospectus and annual report are publicly available. |
| (5) | Amount is less than $500. |
| | | | | | | | | | | | | | | | | | | | |
| Open Purchased Options—0.0% | |
Description | | Contracts | | | Exercise
Price | | | Expiration
Date | | | Notional
Amount | | | Value | |
Call Options—0.0% | |
S&P 500® Index | | | 184 | | | $ | 2,600 | | | | 10/02/17 | | | $ | 47,840 | | | $ | 1 | |
S&P 500® Index | | | 246 | | | | 2,610 | | | | 10/04/17 | | | | 64,206 | | | | — | (5) |
S&P 500® Index | | | 246 | | | | 2,600 | | | | 10/06/17 | | | | 63,960 | | | | 2 | |
S&P 500® Index | | | 368 | | | | 2,585 | | | | 10/09/17 | | | | 95,128 | | | | 2 | |
S&P 500® Index | | | 367 | | | | 2,600 | | | | 10/11/17 | | | | 95,420 | | | | 2 | |
S&P 500® Index | | | 369 | | | | 2,615 | | | | 10/13/17 | | | | 96,494 | | | | 6 | |
| | | | | | | | | | | | | | | | | | | | |
| | | | | | | | | | | | | | | | | | | 13 | |
| | | | | | | | | | | | | | | | | | | | |
Put Options—0.0% | |
S&P 500® Index | | | 184 | | | | 2,380 | | | | 10/02/17 | | | | 43,792 | | | | 1 | |
S&P 500® Index | | | 246 | | | | 2,375 | | | | 10/04/17 | | | | 58,425 | | | | 2 | |
S&P 500® Index | | | 246 | | | | 2,375 | | | | 10/06/17 | | | | 58,425 | | | | 7 | |
S&P 500® Index | | | 368 | | | | 2,355 | | | | 10/09/17 | | | | 86,664 | | | | 11 | |
S&P 500® Index | | | 367 | | | | 2,370 | | | | 10/11/17 | | | | 86,979 | | | | 26 | |
S&P 500® Index | | | 369 | | | | 2,375 | | | | 10/13/17 | | | | 87,638 | | | | 30 | |
| | | | | | | | | | | | | | | | | | | | |
| | | | | | | | | | | | | | | | | | | 77 | |
| | | | | | | | | | | | | | | | | | | | |
| | | | | | | | | | | | | | | | | | $ | 90 | |
| | | | | | | | | | | | | | | | | | | | |
See Notes to Financial Statements
42
VIRTUS RAMPART ENHANCED CORE EQUITY FUND
SCHEDULE OF INVESTMENTS (Continued)
SEPTEMBER 30, 2017
($ reported in thousands)
| | | | | | | | | | | | | | | | | | | | |
| Open Written Options—(0.2)% | |
Description | | Contracts | | | Exercise
Price | | | Expiration
Date | | | Notional
Amount | | | Value | |
Call Options—(0.1)% | | | | | | | | | | | | | | | | | | | | |
S&P 500® Index | | | 184 | | | $ | 2,550 | | | | 10/02/17 | | | $ | (46,920 | ) | | $ | (3 | ) |
S&P 500® Index | | | 246 | | | | 2,560 | | | | 10/04/17 | | | | (62,976 | ) | | | (4 | ) |
S&P 500® Index | | | 246 | | | | 2,550 | | | | 10/06/17 | | | | (62,730 | ) | | | (13 | ) |
S&P 500® Index | | | 368 | | | | 2,545 | | | | 10/09/17 | | | | (93,656 | ) | | | (43 | ) |
S&P 500® Index | | | 367 | | | | 2,550 | | | | 10/11/17 | | | | (93,585 | ) | | | (44 | ) |
S&P 500® Index | | | 369 | | | | 2,565 | | | | 10/13/17 | | | | (94,649 | ) | | | (24 | ) |
| | | | | | | | | | | | | | | | | | | | |
| | | | | | | | | | | | | | | | | | | (131 | ) |
| | | | | | | | | | | | | | | | | | | | |
Put Options—(0.1)% | | | | | | | | | | | | | | | | | | | | |
S&P 500® Index | | | 184 | | | | 2,430 | | | | 10/02/17 | | | | (44,712 | ) | | | (2 | ) |
S&P 500® Index | | | 246 | | | | 2,425 | | | | 10/04/17 | | | | (59,655 | ) | | | (8 | ) |
S&P 500® Index | | | 246 | | | | 2,425 | | | | 10/06/17 | | | | (59,655 | ) | | | (10 | ) |
S&P 500® Index | | | 368 | | | | 2,405 | | | | 10/09/17 | | | | (88,504 | ) | | | (20 | ) |
S&P 500® Index | | | 367 | | | | 2,420 | | | | 10/11/17 | | | | (88,814 | ) | | | (46 | ) |
S&P 500® Index | | | 369 | | | | 2,425 | | | | 10/13/17 | | | | (89,483 | ) | | | (48 | ) |
| | | | | | | | | | | | | | | | | | | | |
| | | | | | | | | | | | | | | | | | | (134 | ) |
| | | | | | | | | | | | | | | | | | | | |
| | | | | | | | | | | | | | | | | | $ | (265 | ) |
| | | | | | | | | | | | | | | | | | | | |
The following table provides a summary of inputs used to value the Fund’s investments as of September 30, 2017 (See Security Valuation Note 2A in the Notes to Financial Statements):
| | | | | | | | | | | | |
| | | Total
Value at
September 30, 2017 | | | Level 1
Quoted
Prices | | | Level 2
Quoted
Prices | |
Equity Securities: | | | | | | | | | | | | |
Common Stocks | | $ | 176,840 | | | $ | 176,840 | | | $ | — | |
Exchange-Traded Funds | | | 6,622 | | | | 6,622 | | | | — | |
Purchased Options | | | 90 | | | | 73 | | | | 17 | |
| | | | | | | | | | | | |
Total Investments before Written Options | | $ | 183,552 | | | $ | 183,535 | | | $ | 17 | |
| | | | | | | | | | | | |
Liabilities: | | | | | | | | | | | | |
Equity Securities: | | | | | | | | | | | | |
Written Options | | $ | (265 | ) | | $ | (265 | ) | | $ | — | |
| | | | | | | | | | | | |
Total Investments net of Written Options | | $ | (265 | ) | | $ | (265 | ) | | $ | — | |
| | | | | | | | | | | | |
There were no Level 3 (significant unobservable inputs) priced securities as of September 30, 2017.
There were no transfers between Level 1 and Level 2 related to securities held at September 30, 2017.
See Notes to Financial Statements
43
VIRTUS TACTICAL ALLOCATION FUND
SCHEDULE OF INVESTMENTS
SEPTEMBER 30, 2017
($ reported in thousands)
| | | | | | | | |
| | | PAR
VALUE | | | VALUE | |
| U.S. GOVERNMENT SECURITIES—0.3% | |
U.S. Treasury Note | |
1.625%, 2/15/26 | | $ | 285 | | | $ | 271 | |
2.250%, 8/15/27 | | | 200 | | | | 198 | |
TOTAL U.S. GOVERNMENT SECURITIES
(Identified Cost $474) | | | | 469 | |
|
| FOREIGN GOVERNMENT SECURITIES—4.1% | |
Argentine Republic | | | | | | | | |
7.500%, 4/22/26 | | | 305 | | | | 342 | |
Series NY, 8.280%, 12/31/33 | | | 294 | | | | 342 | |
Bolivarian Republic of Venezuela | | | | | | | | |
RegS, 8.250%, 10/13/24(5) | | | 40 | | | | 14 | |
RegS, 7.650%, 4/21/25(5) | | | 320 | | | | 109 | |
9.375%, 1/13/34 | | | 130 | | | | 46 | |
Dominican Republic 144A
6.875%, 1/29/26(4) | | | 100 | | | | 114 | |
Federative Republic of Brazil | | | | | | | | |
12.500%, 1/5/22 | | | 475 | BRL | | | 171 | |
Treasury Note Series F,
10.000%, 1/1/23 | | | 570 | BRL | | | 190 | |
8.500%, 1/5/24 | | | 390 | BRL | | | 125 | |
Treasury Note Series F,
10.000%, 1/1/25 | | | 230 | BRL | | | 77 | |
5.625%, 1/7/41 | | | 140 | | | | 141 | |
Kingdom of Bahrain 144A
7.000%, 10/12/28(4) | | | 200 | | | | 204 | |
Kingdom of Morocco 144A
5.500%, 12/11/42(4) | | | 200 | | | | 223 | |
Provincia de Buenos Aires | | | | | | | | |
144A, 9.125%, 3/16/24(4) | | | 150 | | | | 173 | |
144A, 7.875%, 6/15/27(4) | | | 235 | | | | 255 | |
Republic of Chile
5.500%, 8/5/20 | | | 95,000 | CLP | | | 158 | |
Republic of Colombia | | | | | | | | |
4.375%, 3/21/23 | | | 527,000 | COP | | | 171 | |
9.850%, 6/28/27 | | | 157,000 | COP | | | 67 | |
Republic of Costa Rica 144A
7.000%, 4/4/44(4) | | | 200 | | | | 213 | |
Republic of El Salvador 144A
6.375%, 1/18/27(4) | | | 260 | | | | 257 | |
Republic of Indonesia | | | | | | | | |
Series FR70, 8.375%, 3/15/24 | | | 1,670,000 | IDR | | | 137 | |
Series FR56, 8.375%, 9/15/26 | | | 1,813,000 | IDR | | | 152 | |
144A, 4.350%, 1/8/27(4) | | | 200 | | | | 212 | |
Republic of South Africa | | | | | | | | |
Series R208, 6.750%, 3/31/21 | | | 1,460 | ZAR | | | 105 | |
4.300%, 10/12/28 | | | 200 | | | | 189 | |
Republic of Turkey | | | | | | | | |
6.250%, 9/26/22 | | | 200 | | | | 219 | |
7.375%, 2/5/25 | | | 75 | | | | 87 | |
4.875%, 10/9/26 | | | 270 | | | | 268 | |
6.000%, 3/25/27 | | | 200 | | | | 215 | |
4.875%, 4/16/43 | | | 200 | | | | 178 | |
Russian Federation | | | | | | | | |
144A, 7.850%, 3/10/18(4) | | | 10,000 | RUB | | | 174 | |
Series 6216, 6.700%, 5/15/19 | | | 6,775 | RUB | | | 116 | |
Sultanate of Oman 144A
4.750%, 6/15/26(4) | | | 235 | | | | 232 | |
Ukraine | | | | | | | | |
144A, 7.750%, 9/1/22(4) | | | 120 | | | | 127 | |
144A, 7.750%, 9/1/26(4) | | | 160 | | | | 165 | |
| | | | | | | | |
| | | PAR
VALUE | | | VALUE | |
| FOREIGN GOVERNMENT SECURITIES—continued | |
United Mexican States | | | | | | | | |
Series M, 6.500%, 6/9/22 | | | 1,091 | MXN | | $ | 60 | |
4.750%, 3/8/44 | | $ | 70 | | | | 72 | |
TOTAL FOREIGN GOVERNMENT SECURITIES
(Identified Cost $6,099) | | | | 6,100 | |
|
| MORTGAGE-BACKED SECURITIES—4.8% | |
| | |
| Agency—1.1% | | | | | | |
FHLMC
3.500%, 4/1/46 | | | 216 | | | | 223 | |
FNMA | | | | | | | | |
3.500%, 12/1/42 | | | 206 | | | | 213 | |
4.000%, 10/1/44 | | | 197 | | | | 208 | |
3.500%, 12/1/45 | | | 142 | | | | 147 | |
3.500%, 1/1/46 | | | 83 | | | | 86 | |
3.000%, 2/1/46 | | | 63 | | | | 63 | |
3.500%, 7/1/47 | | | 198 | | | | 205 | |
4.000%, 7/1/47 | | | 256 | | | | 269 | |
4.000%, 8/1/47 | | | 193 | | | | 203 | |
| | | | | | | | |
| | | | | | | 1,617 | |
| | | | | | | | |
| | |
| Non-Agency—3.7% | | | | | | |
American Homes 4 Rent Trust | | | | | | | | |
14-SFR2, C 144A,
4.705%, 10/17/36(4) | | | 180 | | | | 193 | |
15-SFR2, C 144A,
4.691%, 10/17/45(4) | | | 205 | | | | 221 | |
15-SFR1, A 144A,
3.467%, 4/17/52(4) | | | 139 | | | | 143 | |
Ameriquest Mortgage Securities, Inc. Pass-Through Certificates, 03-AR3, M4 , (5.850% minus 1 month LIBOR)
4.286%, 6/25/33(3) | | | 115 | | | | 114 | |
AMSR Trust 16-SFR1, D 144A , (1 month LIBOR + 2.400%)
3.634%, 11/17/33(3)(4) | | | 145 | | | | 147 | |
Banc of America Funding Trust
05-1, 1A1
5.500%, 2/25/35 | | | 27 | | | | 27 | |
Bank of America (Countrywide) Asset-Backed Certificates 05-1, AF5A
5.090%, 7/25/35(3) | | | 147 | | | | 152 | |
Bank of America (Merrill Lynch – Countrywide) Alternative Loan Trust 04-22CB, 1A1
6.000%, 10/25/34 | | | 126 | | | | 129 | |
Bank of America (Merrill Lynch) Commercial Mortgage Securities Trust 15-200P, A 144A
3.218%, 4/14/33(4) | | | 120 | | | | 121 | |
Bayview Opportunity Master Fund IIIb Trust
17-RN2, A1 144A
3.475%, 4/28/32(3)(4) | | | 62 | | | | 62 | |
Bayview Opportunity Master Fund IVa Trust | | | | | | | | |
16-SPL1, B1 144A,
4.250%, 4/28/55(4) | | | 120 | | | | 124 | |
17-SPL1, B1 144A,
4.250%, 10/28/64(3)(4) | | | 100 | | | | 104 | |
Bayview Opportunity Master Fund IVb Trust | | | | | | | | |
16-SPL2, B1 144A,
4.250%, 6/28/53(3)(4) | | | 100 | | | | 103 | |
17-SPL3, B1 144A,
4.250%, 11/28/53(3)(4) | | | 110 | | | | 115 | |
See Notes to Financial Statements
44
VIRTUS TACTICAL ALLOCATION FUND
SCHEDULE OF INVESTMENTS (Continued)
SEPTEMBER 30, 2017
($ reported in thousands)
| | | | | | | | |
| | | PAR
VALUE | | | VALUE | |
| Non-Agency—continued | | | | | | |
Citigroup Mortgage Loan Trust, Inc. | | | | | | | | |
05-5, 2A3,
5.000%, 8/25/35 | | $ | 34 | | | $ | 33 | |
15-A, A1 144A, 3.500%, 6/25/58(3)(4) | | | 97 | | | | 98 | |
Colony American Finance Ltd.
15-1, A 144A
2.896%, 10/15/47(4) | | | 109 | | | | 110 | |
Colony Starwood Homes Trust
16-2A, C 144A , (1 month LIBOR + 2.150%)
3.384%, 12/17/33(3)(4) | | | 145 | | | | 145 | |
Credit Suisse Commercial Mortgage Trust
14-LVR2, A2 144A
3.821%, 4/25/44(3)(4) | | | 52 | | | | 53 | |
Credit Suisse Commercial Mortgage-Backed Trust 06-08, 3A1
6.000%, 10/25/21 | | | 50 | | | | 48 | |
Deephaven Residential Mortgage Trust
17-1A, A2 144A
2.928%, 12/26/46(3)(4) | | | 77 | | | | 77 | |
GAHR Commercial Mortgage Trust
15-NRF, CFX 144A
3.495%, 12/15/34(3)(4) | | | 130 | | | | 132 | |
GSAA Home Equity Trust
05-12, AF3W
4.999%, 9/25/35(3) | | | 47 | | | | 47 | |
GSR Mortgage Loan Trust
06-1F, 2A4
6.000%, 2/25/36 | | | 50 | | | | 45 | |
Home Equity Loan Trust | | | | | | | | |
03-HS3, AI4,
5.550%, 9/25/33(3) | | | 20 | | | | 20 | |
06-HI1, M1,
6.010%, 2/25/36(3) | | | 26 | | | | 26 | |
JPMorgan Chase Commercial Mortgage Securities Trust 07-LDPX, AM
5.464%, 1/15/49(3) | | | 37 | | | | 37 | |
JPMorgan Chase Mortgage Trust | | | | | | | | |
14-1, 1A1 144A,
4.000%, 1/25/44(3)(4) | | | 99 | | | | 102 | |
16-1, M2 144A,
3.750%, 4/25/45(3)(4) | | | 103 | | | | 105 | |
16-2, M2 144A,
3.750%, 12/25/45(3)(4) | | | 199 | | | | 202 | |
11-C4, A4 144A,
4.388%, 7/15/46(4) | | | 120 | | | | 127 | |
16-5, A1 144A,
2.609%, 12/25/46(3)(4) | | | 226 | | | | 227 | |
MASTR Alternative Loan Trust | | | | | | | | |
05-5, 2A3,
5.500%, 7/25/25 | | | 94 | | | | 89 | |
04-6, 7A1,
6.000%, 7/25/34 | | | 178 | | | | 174 | |
05-2, 2A1,
6.000%, 1/25/35 | | | 86 | | | | 89 | |
MASTR Specialized Loan Trust
05-3, A2 144A
5.704%, 11/25/35(3)(4) | | | 47 | | | | 49 | |
New Residential Mortgage Loan Trust
17-2A, A3 144A
4.000%, 3/25/57(3)(4) | | | 88 | | | | 92 | |
One Market Plaza Trust
17-1MKT, A
144A 3.614%, 2/10/32(4) | | | 110 | | | | 114 | |
| | | | | | | | |
| | | PAR
VALUE | | | VALUE | |
| Non-Agency—continued | | | | | | |
Resecuritization Pass-Through Trust
05-8R, A5
6.000%, 10/25/34 | | $ | 54 | | | $ | 55 | |
Residential Asset Mortgage Products Trust
05-SL2, A4
7.500%, 2/25/32 | | | 66 | | | | 66 | |
Residential Asset Securitization Trust
05-A1, A3
5.500%, 4/25/35 | | | 111 | | | | 113 | |
Sequoia Mortgage Trust
13-8, B1
3.532%, 6/25/43(3) | | | 99 | | | | 100 | |
Towd Point Mortgage Trust | | | | | | | | |
15-1, A2 144A,
3.250%, 10/25/53(3)(4) | | | 115 | | | | 117 | |
15-3, A1B 144A,
3.000%, 3/25/54(3)(4) | | | 119 | | | | 120 | |
15-6, M1 144A,
3.750%, 4/25/55(3)(4) | | | 100 | | | | 104 | |
15-5, A2 144A,
3.500%, 5/25/55(3)(4) | | | 100 | | | | 103 | |
15-2, 1M1 144A,
3.250%, 11/25/60(3)(4) | | | 345 | | | | 351 | |
Vericrest Opportunity Loan Trust LVI LLC,
17-NPL3, A1 144A
3.500%, 3/25/47(3)(4) | | | 95 | | | | 95 | |
Wells Fargo Commercial Mortgage Trust
15-LC20, B
3.719%, 4/15/50 | | | 165 | | | | 166 | |
| | | | | | | | |
| | | | | | | | 5,386 | |
TOTAL MORTGAGE-BACKED SECURITIES
(Identified Cost $6,925) | | | | | | | 7,003 | |
| | |
| ASSET-BACKED SECURITIES—1.8% | | | | | | |
AmeriCredit Automobile Receivables Trust
17-3, D
3.180%, 7/18/23 | | | 160 | | | | 160 | |
Carnow Auto Receivables Trust
16-1A, D 144A
7.340%, 11/15/21(4) | | | 140 | | | | 140 | |
Chrysler Capital Auto Receivables Trust
16-BA, D 144A
3.510%, 9/15/23(4) | | | 135 | | | | 135 | |
Club Credit Trust
17-NP1, B 144A
3.560%, 9/15/23(4) | | | 110 | | | | 110 | |
DB Master Finance LLC
17-1A, A2I 144A
3.629%, 11/20/47(4) | | | 135 | | | | 135 | |
Drive Auto Receivables Trust
17-2, C
2.750%, 9/15/23 | | | 165 | | | | 165 | |
Drug Royalty III LP 1
16-1A, A 144A
3.979%, 4/15/27(4) | | | 182 | | | | 183 | |
Exeter Automobile Receivables Trust | | | | | | | | |
15-2A, C 144A,
3.900%, 3/15/21(4) | | | 175 | | | | 178 | |
14-3A, D 144A,
5.690%, 4/15/21(4) | | | 165 | | | | 171 | |
First Investors Auto Owner Trust
15-2A, E 144A
5.590%, 11/15/22(4) | | | 170 | | | | 171 | |
See Notes to Financial Statements
45
VIRTUS TACTICAL ALLOCATION FUND
SCHEDULE OF INVESTMENTS (Continued)
SEPTEMBER 30, 2017
($ reported in thousands)
| | | | | | | | |
| | | PAR
VALUE | | | VALUE | |
| ASSET-BACKED SECURITIES—continued | | | | | | |
Flagship Credit Auto Trust | | | | | | | | |
15-1, D 144A,
5.260%, 7/15/21(4) | | $ | 200 | | | $ | 206 | |
14-1, E 144A,
5.710%, 8/16/21(4) | | | 130 | | | | 133 | |
HOA Funding LLC
14-1A, A2 144A
4.846%, 8/20/44(4) | | | 155 | | | | 145 | |
Prosper Marketplace Issuance Trust | | | | | | | | |
17-1A, B 144A,
3.650%, 6/15/23(4) | | | 137 | | | | 138 | |
17-2A, B 144A,
3.480%, 9/15/23(4) | | | 110 | | | | 110 | |
Santander Drive Auto Receivables Trust 17-2, D
3.490%, 7/17/23 | | | 165 | | | | 167 | |
TGIF Funding LLC 17-1A, A2 144A
6.202%, 4/30/47(4) | | | 139 | | | | 141 | |
TOTAL ASSET-BACKED SECURITIES
(Identified Cost $2,575) | | | | 2,588 | |
|
| CORPORATE BONDS AND NOTES—20.0% | |
| | |
| Consumer Discretionary—2.8% | | | | | | |
Beazer Homes USA, Inc. | | | | | | | | |
5.750%, 6/15/19 | | | 95 | | | | 100 | |
144A, 5.875%, 10/15/27(4) | | | 135 | | | | 135 | |
Cablevision Systems Corp.
5.875%, 9/15/22 | | | 160 | | | | 166 | |
Caesars Entertainment Operating Co., Inc.
9.000%, 2/15/20(13) | | | 39 | | | | 52 | |
Caesars Entertainment Resort Properties LLC
8.000%, 10/1/20 | | | 65 | | | | 67 | |
Caesars Growth Properties Holdings LLC
9.375%, 5/1/22 | | | 150 | | | | 162 | |
CalAtlantic Group, Inc. | | | | | | | | |
5.250%, 6/1/26 | | | 80 | | | | 83 | |
5.000%, 6/15/27 | | | 85 | | | | 86 | |
Charter Communications Operating LLC
4.908%, 7/23/25 | | | 135 | | | | 144 | |
Clear Channel Worldwide Holdings, Inc. Series B
7.625%, 3/15/20 | | | 90 | | | | 89 | |
Cooper-Standard Automotive, Inc. 144A
5.625%, 11/15/26(4) | | | 105 | | | | 107 | |
CRC Escrow Issuer LLC 144A
5.250%, 10/15/25(4) | | | 60 | | | | 60 | |
Discovery Communications LLC
3.950%, 3/20/28 | | | 130 | | | | 130 | |
Eldorado Resorts, Inc.
6.000%, 4/1/25 | | | 65 | | | | 68 | |
Gateway Casinos & Entertainment Ltd. 144A
8.250%, 3/1/24(4) | | | 115 | | | | 121 | |
Goodyear Tire & Rubber Co. (The)
4.875%, 3/15/27 | | | 80 | | | | 82 | |
Horton (D.R.), Inc.
4.750%, 2/15/23 | | | 85 | | | | 92 | |
iHeartCommunications, Inc.
9.000%, 12/15/19 | | | 70 | | | | 53 | |
Laureate Education, Inc. 144A
8.250%, 5/1/25(4) | | | 30 | | | | 32 | |
Lear Corp.
3.800%, 9/15/27 | | | 160 | | | | 159 | |
M/I Homes, Inc. 144A
5.625%, 8/1/25(4) | | | 110 | | | | 112 | |
| | | | | | | | |
| | | PAR
VALUE | | | VALUE | |
| Consumer Discretionary—continued | | | | | | |
McGraw-Hill Global Education Holdings LLC 144A
7.875%, 5/15/24(4) | | $ | 115 | | | $ | 113 | |
MDC Holdings, Inc.
5.500%, 1/15/24 | | | 160 | | | | 172 | |
Meritor, Inc.
6.750%, 6/15/21 | | | 38 | | | | 39 | |
PetSmart, Inc. 144A
8.875%, 6/1/25(4) | | | 75 | | | | 60 | |
Pinnacle Entertainment, Inc.
5.625%, 5/1/24 | | | 65 | | | | 67 | |
QVC, Inc.
5.125%, 7/2/22 | | | 135 | | | | 144 | |
Scientific Games International, Inc. | | | | | | | | |
6.625%, 5/15/21 | | | 110 | | | | 113 | |
144A, 7.000%, 1/1/22(4) | | | 110 | | | | 117 | |
Signet UK Finance plc
4.700%, 6/15/24 | | | 135 | | | | 134 | |
Station Casinos LLC 144A
5.000%, 10/1/25(4) | | | 35 | | | | 35 | |
TI Group Automotive Systems LLC 144A
8.750%, 7/15/23(4) | | | 95 | | | | 101 | |
Toll Brothers Finance Corp.
4.875%, 11/15/25 | | | 30 | | | | 31 | |
TRI Pointe Group, Inc.
5.875%, 6/15/24 | | | 140 | | | | 150 | |
Viking Cruises Ltd. 144A
5.875%, 9/15/27(4) | | | 135 | | | | 136 | |
Vista Outdoor, Inc.
5.875%, 10/1/23 | | | 140 | | | | 144 | |
Weekley Homes LLC 144A
6.625%, 8/15/25(4) | | | 135 | | | | 131 | |
Wyndham Worldwide Corp.
4.500%, 4/1/27 | | | 135 | | | | 135 | |
Ziggo Secured Finance BV 144A
5.500%, 1/15/27(4) | | | 150 | | | | 154 | |
| | | | | | | | |
| | | | | | | 4,076 | |
| | | | | | | | |
| | |
| Consumer Staples—0.7% | | | | | | |
Anheuser-Busch InBev Finance, Inc.
3.650%, 2/1/26 | | | 80 | | | | 83 | |
BAT Capital Corp. | | | | | | | | |
144A, 3.222%, 8/15/24(4) | | | 80 | | | | 80 | |
144A, 3.557%, 8/15/27(4) | | | 110 | | | | 110 | |
Cumberland Farms, Inc. 144A
6.750%, 5/1/25(4) | | | 70 | | | | 74 | |
Kronos Acquisition Holdings, Inc. 144A
9.000%, 8/15/23(4) | | | 85 | | | | 83 | |
MARB BondCo plc 144A
7.000%, 3/15/24(4) | | | 200 | | | | 197 | |
Post Holdings, Inc. | | | | | | | | |
144A, 5.000%, 8/15/26(4) | | | 100 | | | | 100 | |
144A, 5.750%, 3/1/27(4) | | | 35 | | | | 36 | |
Rite Aid Corp. 144A
6.125%, 4/1/23(4) | | | 120 | | | | 117 | |
Safeway, Inc.
7.250%, 2/1/31 | | | 95 | | | | 82 | |
Smithfield Foods, Inc. 144A
2.650%, 10/3/21(4) | | | 5 | | | | 5 | |
Tops Holding LLC 144A
8.000%, 6/15/22(4) | | | 120 | | | | 80 | |
| | | | | | | | |
| | | | | | | 1,047 | |
| | | | | | | | |
See Notes to Financial Statements
46
VIRTUS TACTICAL ALLOCATION FUND
SCHEDULE OF INVESTMENTS (Continued)
SEPTEMBER 30, 2017
($ reported in thousands)
| | | | | | | | |
| | | PAR
VALUE | | | VALUE | |
| Energy—4.4% | | | | | | |
Alliance Resource Operating Partners LP 144A
7.500%, 5/1/25(4) | | $ | 110 | | | $ | 114 | |
Alta Mesa Holdings LP 144A
7.875%, 12/15/24(4) | | | 85 | | | | 92 | |
American Midstream Partners LP 144A
8.500%, 12/15/21(4) | | | 70 | | | | 72 | |
Anadarko Finance Co. Series B
7.500%, 5/1/31 | | | 45 | | | | 56 | |
Anadarko Petroleum Corp.
6.600%, 3/15/46 | | | 85 | | | | 105 | |
Antero Resources Corp.
5.625%, 6/1/23 | | | 90 | | | | 94 | |
Archrock Partners LP
6.000%, 10/1/22 | | | 120 | | | | 117 | |
Blue Racer Midstream LLC 144A
6.125%, 11/15/22(4) | | | 70 | | | | 73 | |
Callon Petroleum Co.
6.125%, 10/1/24 | | | 125 | | | | 131 | |
Carrizo Oil & Gas, Inc.
6.250%, 4/15/23 | | | 120 | | | | 122 | |
Cheniere Corpus Christi Holdings LLC
7.000%, 6/30/24 | | | 145 | | | | 165 | |
Chesapeake Energy Corp. 144A
8.000%, 6/15/27(4) | | | 135 | | | | 134 | |
Compagnie Generale de Geophysique-Veritas SA
6.500%, 6/1/21(12) | | | 190 | | | | 86 | |
Continental Resources, Inc.
4.500%, 4/15/23 | | | 60 | | | | 60 | |
Crestwood Midstream Partners LP
5.750%, 4/1/25 | | | 70 | | | | 71 | |
Denbury Resources, Inc.
5.500%, 5/1/22 | | | 65 | | | | 37 | |
Ecopetrol S.A.
5.375%, 6/26/26 | | | 300 | | | | 319 | |
Encana Corp. | | | | | | | | |
3.900%, 11/15/21 | | | 60 | | | | 62 | |
8.125%, 9/15/30 | | | 65 | | | | 84 | |
Energy Transfer Equity LP | | | | | | | | |
5.000%, 10/1/22 | | | 45 | | | | 49 | |
5.875%, 1/15/24 | | | 75 | | | | 81 | |
Energy Transfer LP 5.
875%, 3/1/22 | | | 75 | | | | 83 | |
EP Energy LLC | | | | | | | | |
6.375%, 6/15/23 | | | 90 | | | | 56 | |
144A, 8.000%, 11/29/24(4) | | | 95 | | | | 96 | |
EQT Corp.
3.900%, 10/1/27 | | | 46 | | | | 46 | |
FTS International, Inc.
6.250%, 5/1/22 | | | 90 | | | | 82 | |
Helmerich & Payne International Drilling Co.
4.650%, 3/15/25 | | | 95 | | | | 100 | |
HollyFrontier Corp.
5.875%, 4/1/26 | | | 155 | | | | 169 | |
KazMunayGas National Co. 144A
6.375%, 4/9/21(4) | | | 200 | | | | 219 | |
Kinder Morgan, Inc.
7.750%, 1/15/32 | | | 205 | | | | 263 | |
Matador Resources Co.
6.875%, 4/15/23 | | | 120 | | | | 127 | |
MEG Energy Corp. 144A
6.500%, 1/15/25(4) | | | 80 | | | | 78 | |
MPLX LP
4.875%, 12/1/24 | | | 155 | | | | 167 | |
| | | | | | | | |
| | | PAR
VALUE | | | VALUE | |
| Energy—continued | | | | | | |
Nabors Industries, Inc.
5.500%, 1/15/23 | | $ | 165 | | | $ | 162 | |
NuStar Logistics LP
5.625%, 4/28/27 | | | 60 | | | | 63 | |
Oasis Petroleum, Inc.
6.875%, 1/15/23 | | | 160 | | | | 162 | |
Odebrecht Offshore Drilling Finance Ltd. 144A
6.750%, 10/1/22(4)(12) | | | 207 | | | | 74 | |
Parker Drilling Co.
7.500%, 8/1/20 | | | 190 | | | | 169 | |
Peabody Energy Corp. | | | | | | | | |
144A, 6.000%, 3/31/22(4) | | | 15 | | | | 15 | |
144A, 6.375%, 3/31/25(4) | | | 50 | | | | 51 | |
Petrobras Global Finance BV | | | | | | | | |
144A, 5.299%, 1/27/25(4) | | | 127 | | | | 127 | |
7.375%, 1/17/27 | | | 325 | | | | 358 | |
5.999%, 1/27/28 | | | 70 | | | | 70 | |
Petroleos de Venezuela S.A. 144A
6.000%, 5/16/24(4) | | | 255 | | | | 77 | |
Petroleos Mexicanos | | | | | | | | |
6.875%, 8/4/26 | | | 290 | | | | 330 | |
6.500%, 6/2/41 | | | 195 | | | | 204 | |
RSP Permian, Inc. 144A
5.250%, 1/15/25(4) | | | 130 | | | | 132 | |
SESI LLC 144A
7.750%, 9/15/24(4) | | | 100 | | | | 103 | |
Seven Generations Energy Ltd. 144A
5.375%, 9/30/25(4) | | | 135 | | | | 136 | |
State Oil Co. of the Azerbaijan Republic
6.950%, 3/18/30 | | | 200 | | | | 218 | |
Transocean, Inc. | | | | | | | | |
144A, 9.000%, 7/15/23(4) | | | 75 | | | | 81 | |
6.800%, 3/15/38 | | | 45 | | | | 37 | |
Ultra Resources, Inc. | | | | | | | | |
144A, 6.875%, 4/15/22(4) | | | 6 | | | | 6 | |
144A, 7.125%, 4/15/25(4) | | | 30 | | | | 30 | |
Weatherford International Ltd. 144A
9.875%, 2/15/24(4) | | | 45 | | | | 49 | |
YPF S.A. | | | | | | | | |
144A, 8.500%, 3/23/21(4) | | | 95 | | | | 107 | |
144A, 6.950%, 7/21/27(4) | | | 145 | | | | 154 | |
| | | | | | | | |
| | | | | | | 6,525 | |
| | | | | | | | |
| | |
| Financials—4.3% | | | | | | |
Akbank TAS 144A
7.500%, 2/5/18(4) | | | 600 | TRY | | | 166 | |
Allstate Corp. (The)
5.750%, 8/15/53(6) | | | 125 | | | | 137 | |
Ally Financial, Inc.
5.750%, 11/20/25 | | | 90 | | | | 98 | |
Ares Capital Corp. | | | | | | | | |
3.625%, 1/19/22 | | | 90 | | | | 91 | |
3.500%, 2/10/23 | | | 55 | | | | 54 | |
Australia & New Zealand Banking Group Ltd. 144A
4.400%, 5/19/26(4) | | | 200 | | | | 208 | |
Banco Bilbao Vizcaya Argentaria Bancomer S.A. 144A
6.500%, 3/10/21(4) | | | 200 | | | | 221 | |
Banco de Bogota S.A. 144A
6.250%, 5/12/26(4) | | | 200 | | | | 218 | |
Banco de Credito del Peru 144A
6.125%, 4/24/27(4) | | | 190 | | | | 210 | |
See Notes to Financial Statements
47
VIRTUS TACTICAL ALLOCATION FUND
SCHEDULE OF INVESTMENTS (Continued)
SEPTEMBER 30, 2017
($ reported in thousands)
| | | | | | | | |
| | | PAR
VALUE | | | VALUE | |
| Financials—continued | | | | | | |
Banco Internacional del Peru SAA Interbank 144A
6.625%, 3/19/29(4) | | $ | 65 | | | $ | 73 | |
Bank of America Corp.
4.200%, 8/26/24 | | | 167 | | | | 175 | |
Brighthouse Financial, Inc. 144A
3.700%, 6/22/27(4) | | | 170 | | | | 167 | |
Brookfield Finance LLC
4.000%, 4/1/24 | | | 100 | | | | 103 | |
Capital One Financial Corp.
3.750%, 7/28/26 | | | 135 | | | | 134 | |
Compass Bank 3.875%, 4/10/25 | | | 250 | | | | 249 | |
Drawbridge Special Opportunities Fund LP 144A
5.000%, 8/1/21(4) | | | 250 | | | | 255 | |
Eurasian Development Bank 144A
4.767%, 9/20/22(4) | | | 200 | | | | 208 | |
FS Investment Corp.
4.750%, 5/15/22 | | | 130 | | | | 135 | |
Genworth Holdings, Inc.
4.900%, 8/15/23 | | | 105 | | | | 90 | |
GrupoSura Finance S.A. 144A
5.500%, 4/29/26(4) | | | 200 | | | | 218 | |
ICAHN Enterprises LP
6.000%, 8/1/20 | | | 70 | | | | 72 | |
ING Groep N.V.
6.000%(6)(8) | | | 200 | | | | 206 | |
iStar, Inc. | | | | | | | | |
5.000%, 7/1/19 | | | 70 | | | | 71 | |
6.000%, 4/1/22 | | | 50 | | | | 52 | |
5.250%, 9/15/22 | | | 60 | | | | 61 | |
Jefferies Group LLC
4.850%, 1/15/27 | | | 40 | | | | 42 | |
JPMorgan Chase & Co. | | | | | | | | |
3.300%, 4/1/26 | | | 135 | | | | 135 | |
2.950%, 10/1/26 | | | 80 | | | | 78 | |
Kazakhstan Temir Zholy Finance BV 144A
6.950%, 7/10/42(4) | | | 200 | | | | 223 | |
Leucadia National Corp.
5.500%, 10/18/23 | | | 70 | | | | 75 | |
Navient Corp. | | | | | | | | |
7.250%, 9/25/23 | | | 35 | | | | 38 | |
6.750%, 6/25/25 | | | 90 | | | | 94 | |
OM Asset Management plc
4.800%, 7/27/26 | | | 150 | | | | 155 | |
Powszechna Kasa Oszczednosci Bank Polski S.A. 144A
4.630%, 9/26/22(4)(7) | | | 240 | | | | 258 | |
Prudential Financial, Inc. | | | | | | | | |
5.875%, 9/15/42 | | | 100 | | | | 111 | |
5.625%, 6/15/43(6) | | | 75 | | | | 82 | |
Santander Holdings USA, Inc. 144A
4.400%, 7/13/27(4) | | | 135 | | | | 138 | |
Sberbank of Russia 144A
5.500%, 2/26/24(4)(7) | | | 200 | | | | 204 | |
Springleaf Finance Corp.
6.125%, 5/15/22 | | | 50 | | | | 53 | |
Teachers Insurance & Annuity Association of America 144A
4.375%, 9/15/54(4) | | | 150 | | | | 151 | |
Toronto-Dominion Bank (The)
3.625%, 9/15/31 | | | 60 | | | | 60 | |
Turkiye Vakiflar Bankasi TAO 144A
5.625%, 5/30/22(4) | | | 200 | | | | 203 | |
Voya Financial, Inc.
5.650%, 5/15/53 | | | 155 | | | | 165 | |
| | | | | | | | |
| | | PAR
VALUE | | | VALUE | |
| Financials—continued | | | | | | |
Wells Fargo & Co. | | | | | | | | |
3.550%, 9/29/25 | | $ | 135 | | | $ | 138 | |
5.900%, 12/29/49 | | | 190 | | | | 207 | |
| | | | | | | | |
| | | | | | | 6,282 | |
| | | | | | | | |
| | |
| Health Care—1.2% | | | | | | |
Abbott Laboratories
3.750%, 11/30/26 | | | 135 | | | | 138 | |
Becton Dickinson & Co. | | | | | | | | |
3.363%, 6/6/24 | | | 29 | | | | 29 | |
3.700%, 6/6/27 | | | 170 | | | | 171 | |
Change Healthcare Holdings LLC 144A
5.750%, 3/1/25(4) | | | 25 | | | | 25 | |
Community Health Systems, Inc. | | | | | | | | |
6.875%, 2/1/22 | | | 65 | | | | 51 | |
6.250%, 3/31/23 | | | 20 | | | | 20 | |
Concordia International Corp. 144A
9.000%, 4/1/22(4) | | | 35 | | | | 27 | |
DJO Finco, Inc. 144A
8.125%, 6/15/21(4) | | | 55 | | | | 53 | |
Eagle Holding Co. II, LLC PIK Interest Capitalization, 144A
7.625%, 5/15/22(4)(15) | | | 80 | | | | 83 | |
Endo Dac 144A
6.000%, 7/15/23(4) | | | 140 | | | | 115 | |
Envision Healthcare Corp. 144A
6.250%, 12/1/24(4) | | | 30 | | | | 32 | |
HCA, Inc.
5.250%, 6/15/26 | | | 55 | | | | 59 | |
MEDNAX, Inc. 144A
5.250%, 12/1/23(4) | | | 75 | | | | 79 | |
MPH Acquisition Holdings LLC 144A
7.125%, 6/1/24(4) | | | 120 | | | | 129 | |
Ortho-Clinical Diagnostics, Inc. 144A
6.625%, 5/15/22(4) | | | 120 | | | | 118 | |
SP Finco LLC 144A
6.750%, 7/1/25(4) | | | 20 | | | | 19 | |
Surgery Center Holdings, Inc. 144A
8.875%, 4/15/21(4) | | | 115 | | | | 121 | |
Team Health Holdings, Inc. 144A
6.375%, 2/1/25(4) | | | 85 | | | | 81 | |
Tenet Healthcare Corp. | | | | | | | | |
4.500%, 4/1/21 | | | 60 | | | | 61 | |
144A, 5.125%, 5/1/25(4) | | | 35 | | | | 35 | |
144A, 7.000%, 8/1/25(4) | | | 115 | | | | 108 | |
Valeant Pharmaceuticals International, Inc. | | | | | | | | |
144A, 6.375%, 10/15/20(4) | | | 60 | | | | 60 | |
144A, 7.500%, 7/15/21(4) | | | 5 | | | | 5 | |
144A, 5.625%, 12/1/21(4) | | | 5 | | | | 5 | |
144A, 6.500%, 3/15/22(4) | | | 10 | | | | 11 | |
144A, 7.250%, 7/15/22(4) | | | 105 | | | | 102 | |
144A, 7.000%, 3/15/24(4) | | | 15 | | | | 16 | |
West Street Merger Sub, Inc. 144A
6.375%, 9/1/25(4) | | | 80 | | | | 80 | |
| | | | | | | | |
| | | | | | | 1,833 | |
| | | | | | | | |
| Industrials—1.4% | | | | | | |
Avantor, Inc. 144A
6.000%, 10/1/24(4) | | | 60 | | | | 61 | |
Bombardier, Inc. 144A
6.125%, 1/15/23(4) | | | 80 | | | | 78 | |
CNH Industrial N.V.
4.500%, 8/15/23 | | | 112 | | | | 119 | |
See Notes to Financial Statements
48
VIRTUS TACTICAL ALLOCATION FUND
SCHEDULE OF INVESTMENTS (Continued)
SEPTEMBER 30, 2017
($ reported in thousands)
| | | | | | | | |
| | | PAR
VALUE | | | VALUE | |
| Industrials—continued | | | | | | |
Continental Airlines Pass-Through-Trust | | | | | | | | |
99-2, C2 Series AMBC,
6.236%, 3/15/20 | | $ | 63 | | | $ | 65 | |
01-1, A1, 6.703%, 6/15/21 | | | 46 | | | | 48 | |
DP World Ltd. 144A
6.850%, 7/2/37(4) | | | 100 | | | | 123 | |
Embraer Netherlands Finance BV
5.400%, 2/1/27 | | | 65 | | | | 70 | |
ESAL GmbH 144A
6.250%, 2/5/23(4) | | | 200 | | | | 194 | |
GATX Corp.
3.250%, 9/15/26 | | | 25 | | | | 25 | |
Hawaiian Airlines Pass-Through Certificates 13-1, B
4.950%, 1/15/22 | | | 133 | | | | 137 | |
Hillman Group, Inc. (The) 144A
6.375%, 7/15/22(4) | | | 65 | | | | 65 | |
Latam Finance Ltd. 144A
6.875%, 4/11/24(4) | | | 200 | | | | 212 | |
Masco Corp.
5.950%, 3/15/22 | | | 99 | | | | 112 | |
New Enterprise Stone & Lime Co., Inc. 144A
10.125%, 4/1/22(4) | | | 10 | | | | 11 | |
Owens Corning
3.400%, 8/15/26 | | | 150 | | | | 148 | |
Pitney Bowes, Inc.
3.875%, 5/15/22 | | | 157 | | | | 154 | |
Prime Security Services Borrower LLC 144A
9.250%, 5/15/23(4) | | | 60 | | | | 66 | |
Standard Industries, Inc. 144A
5.500%, 2/15/23(4) | | | 40 | | | | 42 | |
TransDigm, Inc.
6.500%, 5/15/25 | | | 50 | | | | 52 | |
UAL Pass-Through-Trust
07-01, A
6.636%, 7/2/22 | | | 143 | | | | 156 | |
Wrangler Buyer Corp. 144A
6.000%, 10/1/25(4) | | | 89 | | | | 91 | |
| | | | | | | | |
| | | | | | | 2,029 | |
| | | | | | | | |
|
| Information Technology—0.7% | |
Arrow Electronics, Inc.
3.875%, 1/12/28 | | | 135 | | | | 135 | |
Blackboard, Inc. 144A
9.750%, 10/15/21(4) | | | 53 | | | | 47 | |
Broadcom Corp. | | | | | | | | |
144A, 3.000%, 1/15/22(4) | | | 45 | | | | 46 | |
144A, 3.625%, 1/15/24(4) | | | 165 | | | | 169 | |
Dell International LLC | | | | | | | | |
144A, 5.450%, 6/15/23(4) | | | 30 | | | | 33 | |
144A, 8.100%, 7/15/36(4) | | | 60 | | | | 75 | |
Rackspace Hosting, Inc. 144A
8.625%, 11/15/24(4) | | | 160 | | | | 171 | |
Radiate Holdco LLC 144A
6.625%, 2/15/25(4) | | | 165 | | | | 161 | |
ViaSat, Inc. 144A
5.625%, 9/15/25(4) | | | 10 | | | | 10 | |
VMware, Inc. | | | | | | | | |
2.950%, 8/21/22 | | | 87 | | | | 87 | |
3.900%, 8/21/27 | | | 93 | | | | 94 | |
| | | | | | | | |
| | | | | | | 1,028 | |
| | | | | | | | |
| | | | | | | | |
| | | PAR
VALUE | | | VALUE | |
| Materials—2.0% | | | | | | |
AK Steel Corp. | | | | | | | | |
7.500%, 7/15/23 | | | 80 | | | | 87 | |
7.000%, 3/15/27 | | | 110 | | | | 112 | |
Aleris International, Inc. 144A
9.500%, 4/1/21(4) | | | 70 | | | | 75 | |
Alpek SAB de C.V. 144A
5.375%, 8/8/23(4) | | | 260 | | | | 276 | |
Anglo American Capital plc 144A
4.000%, 9/11/27(4) | | | 200 | | | | 198 | |
ArcelorMittal
6.125%, 6/1/25 | | | 175 | | | | 201 | |
BHP Billiton Finance USA Ltd. 144A
6.750%, 10/19/75(4)(6) | | | 205 | | | | 241 | |
BlueScope Steel Finance Ltd. 144A
6.500%, 5/15/21(4) | | | 85 | | | | 89 | |
FMG Resources August 2006 Pty Ltd. 144A
9.750%, 3/1/22(4) | | | 60 | | | | 67 | |
Gerdau Holdings, Inc. 144A
7.000%, 1/20/20(4) | | | 100 | | | | 108 | |
Glencore Funding LLC 144A
4.000%, 3/27/27(4) | | | 165 | | | | 166 | |
Kraton Polymers LLC 144A
7.000%, 4/15/25(4) | | | 155 | | | | 166 | |
NOVA Chemicals Corp. | | | | | | | | |
144A, 4.875%, 6/1/24(4) | | | 60 | | | | 61 | |
144A, 5.000%, 5/1/25(4) | | | 130 | | | | 132 | |
Owens-Brockway Glass Container, Inc. 144A
6.375%, 8/15/25(4) | | | 110 | | | | 124 | |
Rusal Capital DAC 144A
5.125%, 2/2/22(4) | | | 200 | | | | 203 | |
Severstal OAO Via Steel Capital S.A. 144A
3.850%, 8/27/21(4)(7) | | | 200 | | | | 205 | |
Standard Industries, Inc. 144A
6.000%, 10/15/25(4) | | | 95 | | | | 104 | |
Tronox Finance plc 144A
5.750%, 10/1/25(4) | | | 25 | | | | 26 | |
Vale Overseas Ltd. | | | | | | | | |
5.875%, 6/10/21 | | | 105 | | | | 116 | |
6.250%, 8/10/26 | | | 85 | | | | 97 | |
Venator Finance S.a.r.l. 144A
5.750%, 7/15/25(4) | | | 25 | | | | 26 | |
| | | | | | | | |
| | | | | | | 2,880 | |
| | | | | | | | |
| | |
| Real Estate—0.7% | | | | | | |
EPR Properties | | | | | | | | |
4.750%, 12/15/26 | | | 60 | | | | 62 | |
4.500%, 6/1/27 | | | 75 | | | | 76 | |
ESH Hospitality, Inc. 144A
5.250%, 5/1/25(4) | | | 120 | | | | 124 | |
Healthcare Trust of America Holdings LP
3.750%, 7/1/27 | | | 70 | | | | 70 | |
Hospitality Properties Trust
4.950%, 2/15/27 | | | 85 | | | | 89 | |
MPT Operating Partnership LP | | | | | | | | |
5.500%, 5/1/24 | | | 90 | | | | 94 | |
5.000%, 10/15/27 | | | 65 | | | | 67 | |
Physicians Realty LP
4.300%, 3/15/27 | | | 140 | | | | 143 | |
Select Income REIT
4.500%, 2/1/25 | | | 165 | | | | 167 | |
See Notes to Financial Statements
49
VIRTUS TACTICAL ALLOCATION FUND
SCHEDULE OF INVESTMENTS (Continued)
SEPTEMBER 30, 2017
($ reported in thousands)
| | | | | | | | |
| | | PAR
VALUE | | | VALUE | |
| Real Estate—continued | | | | | | |
Uniti Group, Inc. 144A
7.125%, 12/15/24(4) | | $ | 170 | | | $ | 143 | |
| | | | | | | | |
| | | | | | | 1,035 | |
| | | | | | | | |
|
| Telecommunication Services—0.9% | |
America Movil SAB de C.V. Series 12
6.450%, 12/5/22 | | | 2,000 | MXN | | | 105 | |
AT&T, Inc. | | | | | | | | |
3.400%, 8/14/24 | | | 109 | | | | 109 | |
4.250%, 3/1/27 | | | 85 | | | | 87 | |
3.900%, 8/14/27 | | | 120 | | | | 120 | |
5.250%, 3/1/37 | | | 30 | | | | 32 | |
4.800%, 6/15/44 | | | 110 | | | | 107 | |
5.650%, 2/15/47 | | | 55 | | | | 60 | |
Digicel Group Ltd. 144A
8.250%, 9/30/20(4) | | | 200 | | | | 195 | |
Frontier Communications Corp. | | | | | | | | |
6.250%, 9/15/21 | | | 75 | | | | 62 | |
10.500%, 9/15/22 | | | 130 | | | | 113 | |
GTH Finance BV 144A
7.250%, 4/26/23(4) | | | 200 | | | | 227 | |
Qwest Corp.
7.250%, 9/15/25 | | | 80 | | | | 89 | |
Windstream Corp.
7.750%, 10/1/21 | | | 85 | | | | 63 | |
| | | | | | | | |
| | | | | | | 1,369 | |
| | | | | | | | |
| | |
| Utilities—0.9% | | | | | | |
AmeriGas Partners LP
5.500%, 5/20/25 | | | 65 | | | | 67 | |
Dynegy, Inc.
7.375%, 11/1/22 | | | 130 | | | | 136 | |
Eskom Holdings SOC Ltd. 144A
7.125%, 2/11/25(4) | | | 200 | | | | 207 | |
Exelon Corp.
3.497%, 6/1/22 | | | 160 | | | | 165 | |
Ferrellgas Partners LP | | | | | | | | |
8.625%, 6/15/20 | | | 25 | | | | 24 | |
6.750%, 6/15/23 | | | 135 | | | | 130 | |
Lamar Funding Ltd. 144A
3.958%, 5/7/25(4) | | | 200 | | | | 188 | |
Majapahit Holding BV 144A
7.750%, 1/20/20(4) | | | 145 | | | | 161 | |
Talen Energy Supply LLC 144A
4.625%, 7/15/19(4) | | | 22 | | | | 22 | |
TerraForm Power Operating LLC 144A
6.375%, 2/1/23(4) | | | 160 | | | | 166 | |
| | | | | | | | |
| | | | | | | | 1,266 | |
TOTAL CORPORATE BONDS AND NOTES
(Identified Cost $29,224) | | | | 29,370 | |
| | |
| LOAN AGREEMENTS(3)—3.3% | | | | | | |
| | |
| Consumer Discretionary—0.6% | | | | | | |
Advantage Sales & Marketing, Inc. | | | | | | | | |
Tranche B-2, First Lien, (3 month LIBOR + 3.250%)
4.561%, 7/23/21 | | | 60 | | | | 56 | |
Second Lien, (1 month LIBOR + 6.500%)
7.735%, 7/25/22 | | | 113 | | | | 101 | |
| | | | | | | | |
| | | PAR
VALUE | | | VALUE | |
| Consumer Discretionary—continued | | | | | | |
Caesars Entertainment Operating Co., Inc. | | | | | | | | |
Tranche B-4, 1.500%, 10/31/17(13) | | $ | 42 | | | $ | 55 | |
Tranche B-6, 1.500%, 3/1/20(13) | | | 37 | | | | 45 | |
Caesars Entertainment Resort Properties LLC Tranche B, First Lien , (1 month LIBOR + 3.500%)
4.735%, 10/11/20 | | | 148 | | | | 148 | |
Caesars Growth Properties Holdings LLC 2017, First Lien , (1 month LIBOR + 3.000%) 4.235%, 5/8/21 | | | 72 | | | | 72 | |
Gateway Casinos & Entertainment Ltd. Tranche B-1 , (3 month LIBOR + 3.750%) 5.083%, 2/22/23 | | | 25 | | | | 25 | |
Hoya Midco LLC First Lien , (1 month LIBOR + 4.000%)
5.235%, 6/30/24 | | | 40 | | | | 40 | |
Laureate Education, Inc. 2024 , (1 month LIBOR + 4.500%)
5.735%, 4/26/24 | | | 96 | | | | 97 | |
Playa Resorts Holding B.V. , (3 month LIBOR + 3.000%)
4.320%, 4/29/24 | | | 20 | | | | 20 | |
Scientific Games International, Inc. Tranche B-4 , (1 month LIBOR + 3.250%) 4.504%, 8/14/24 | | | 35 | | | | 35 | |
Seminole Tribe of Florida Tranche B , (3 month LIBOR + 2.000%) 3.456%, 7/8/24 | | | 85 | | | | 85 | |
U.S. Farathane LLC , (weekly LIBOR + 3.500%)
4.833%, 12/31/21 | | | 90 | | | | 90 | |
UFC Holdings LLC First Lien , (1 month LIBOR + 3.250%)
4.490%, 8/18/23 | | | 77 | | | | 78 | |
| | | | | | | | |
| | | | | | | 947 | |
| | | | | | | | |
| | |
| Consumer Staples—0.3% | | | | | | |
Albertson’s LLC 2017-1, Tranche B-4 , (1 month LIBOR + 2.750%)
3.985%, 8/25/21 | | | 118 | | | | 114 | |
Chobani LLC Tranche B , (3 month LIBOR + 3.500%) | | | | | | | | |
0.000%, 10/7/23(9) | | | 25 | | | | 25 | |
First Lien, (1 month LIBOR + 4.250%)
5.485%, 10/10/23 | | | 28 | | | | 28 | |
Galleria Co. Tranche B , (1 month LIBOR + 3.000%)
4.250%, 9/29/23 | | | 44 | | | | 44 | |
JBS USA Lux S.A. , (3 month LIBOR + 2.500%)
3.804%, 10/30/22 | | | 40 | | | | 40 | |
Parfums Holdings Co., Inc. First Lien , (3 month LIBOR + 4.750%)
6.083%, 6/30/24 | | | 55 | | | | 55 | |
TKC Holdings, Inc. First Lien , (2 month LIBOR + 4.250%)
5.522%, 2/1/23 | | | 80 | | | | 80 | |
| | | | | | | | |
| | | | | | | 386 | |
| | | | | | | | |
| | |
| Energy—0.4% | | | | | | |
California Resources Corp. , (1 month LIBOR + 10.375%)
11.609%, 12/31/21 | | | 80 | | | | 85 | |
Chesapeake Energy Corp. Tranche A , (3 month LIBOR + 7.500%) 8.814%, 8/23/21 | | | 24 | | | | 26 | |
Contura Energy, Inc. , (2 month LIBOR + 5.000%)
6.280%, 3/18/24 | | | 82 | | | | 81 | |
Jonah Energy LLC Second Lien , (3 month PRIME + 5.500%) 9.750%, 5/12/21 | | | 106 | | | | 106 | |
Peabody Energy Corp. 2017 , (1 month LIBOR + 3.500%)
4.735%, 3/31/22 | | | 48 | | | | 48 | |
Seadrill Operating LP , (3 month LIBOR + 3.000%)
4.333%, 2/21/21 | | | 100 | | | | 73 | |
Traverse Midstream Partners LLC , (3 month LIBOR + 4.000%) 5.330%, 9/21/24 | | | 80 | | | | 81 | |
See Notes to Financial Statements
50
VIRTUS TACTICAL ALLOCATION FUND
SCHEDULE OF INVESTMENTS (Continued)
SEPTEMBER 30, 2017
($ reported in thousands)
| | | | | | | | |
| | | PAR
VALUE | | | VALUE | |
| Energy—continued | | | | | | |
Ultra Resources, Inc. , (3 month LIBOR + 3.000%)
4.309%, 4/12/24 | | $ | 75 | | | $ | 75 | |
| | | | | | | | |
| | | | | | | 575 | |
| | | | | | | | |
| | |
| Financials—0.2% | | | | | | |
Asurion LLC Tranche B-2, Second Lien , (1 month LIBOR + 6.000%) 7.235%, 8/4/25 | | | 127 | | | | 130 | |
Focus Financial Partners LLC First Lien , (3 month LIBOR + 3.250%) 4.549%, 7/3/24 | | | 15 | | | | 15 | |
Walter Investment Management Corp. Tranche B , (1 month LIBOR + 3.750%) 4.985%, 12/18/20 | | | 119 | | | | 109 | |
| | | | | | | | |
| | | | | | | 254 | |
| | | | | | | | |
| | |
| Health Care—0.3% | | | | | | |
21st Century Oncology Holdings, Inc. Tranche B , (3 month LIBOR + 6.125%) 7.465%, 4/30/22(13) | | | 31 | | | | 29 | |
Change Healthcare Holdings, Inc. , (1 month LIBOR + 2.750%) 3.985%, 3/1/24 | | | 60 | | | | 60 | |
Endo Luxembourg Finance Co. S.a.r.l. , (1 month LIBOR + 4.250%) 5.500%, 4/29/24 | | | 40 | | | | 40 | |
Envision Healthcare Corp. , (1 month LIBOR + 3.000%)
4.240%, 12/1/23 | | | 15 | | | | 15 | |
HLF Financing S.a.r.l. Senior Lien , (1 month LIBOR + 5.500%) 6.735%, 2/15/23 | | | 39 | | | | 39 | |
MMM Holdings, Inc. , (3 month LIBOR + 8.750%)
10.250%, 6/30/19 | | | 39 | | | | 39 | |
MSO of Puerto Rico, Inc. , (3 month LIBOR + 8.750%)
10.250%, 6/30/19 | | | 28 | | | | 28 | |
NVA Holdings, Inc. Second Lien , (3 month LIBOR + 7.000%) 8.333%, 8/14/22 | | | 110 | | | | 110 | |
PharMerica Corp. Second Lien (3 month LIBOR + 8.250%)
0.000%, 9/26/25(9) | | | 10 | | | | 10 | |
U.S. Renal Care, Inc. First Lien , (3 month LIBOR + 4.250%)
5.583%, 12/30/22 | | | 54 | | | | 52 | |
| | | | | | | | |
| | | | | | | 422 | |
| | | | | | | | |
| | |
| Industrials—0.4% | | | | | | |
84 Lumber Co. , (1 month LIBOR + 5.750%)
6.987%, 10/25/23 | | | 78 | | | | 79 | |
Accudyne Industries LLC , (3 month LIBOR + 3.750%)
5.083%, 8/18/24 | | | 15 | | | | 15 | |
Hayward Industries, Inc. First Lien , (1 month LIBOR + 3.500%) 4.735%, 8/5/24 | | | 15 | | | | 15 | |
Navistar, Inc. Tranche B , (1 month LIBOR + 4.000%)
5.240%, 8/7/20 | | | 89 | | | | 89 | |
PAE Holding Corp. First Lien , (1 month LIBOR + 5.500%)
6.735%, 10/20/22 | | | 49 | | | | 49 | |
Sedgwick Claims Management Services, Inc. Second Lien , (3 month LIBOR + 5.750%) 7.067%, 2/28/22 | | | 210 | | | | 212 | |
TransDigm, Inc. Tranche F , (3 month LIBOR + 3.000%)
4.269%, 6/9/23 | | | 110 | | | | 110 | |
| | | | | | | | |
| | | | | | | 569 | |
| | | | | | | | |
| | |
| Information Technology—0.3% | | | | | | |
Applied Systems, Inc. Second Lien , (3 month LIBOR + 7.000%) 8.324%, 9/12/25 | | | 15 | | | | 16 | |
Blackboard, Inc. Tranche B-4, First Lien , (3 month LIBOR + 5.000%) 6.304%, 6/30/21 | | | 31 | | | | 29 | |
Everi Payments, Inc. Tranche B , (1 month LIBOR + 4.500%) 5.735%, 5/9/24 | | | 35 | | | | 35 | |
| | | | | | | | |
| | | PAR
VALUE | | | VALUE | |
| Information Technology—continued | | | | | | |
Kronos, Inc. Second Lien , (3 month LIBOR + 8.250%)
9.561%, 11/1/24 | | $ | 38 | | | $ | 39 | |
NAB Holdings LLC , (3 month LIBOR + 3.500%)
4.833%, 7/1/24 | | | 50 | | | | 50 | |
Presidio LLC Tranche B , (1 month LIBOR + 3.250%)
4.549%, 2/2/22 | | | 91 | | | | 92 | |
Sungard Availability Services Capital, Inc. 2021, Tranche B , (1 month LIBOR + 7.000%) 8.235%, 9/30/21 | | | 110 | | | | 102 | |
Veritas US, Inc. Tranche B , (3 month LIBOR + 4.500%)
5.833%, 1/27/23 | | | 124 | | | | 125 | |
| | | | | | | | |
| | | | | | | 488 | |
| | | | | | | | |
| | |
| Materials—0.4% | | | | | | |
Anchor Glass Container Corp. | | | | | | | | |
2017, First Lien, (3 month LIBOR + 2.750%)
4.024%, 12/7/23 | | | 35 | | | | 35 | |
Second Lien, (3 month LIBOR + 7.750%)
9.067%, 12/7/24 | | | 38 | | | | 38 | |
CPG International LLC , (3 month LIBOR + 3.750%)
5.083%, 5/5/24 | | | 90 | | | | 90 | |
CPI Acquisition, Inc. First Lien , (3 month LIBOR + 4.500%)
5.962%, 8/17/22 | | | 152 | | | | 107 | |
Ineos U.S. Finance LLC 2022 , (1 month LIBOR + 2.750%)
3.985%, 3/31/22 | | | 11 | | | | 11 | |
KMG Chemicals, Inc. , (1 month LIBOR + 4.250%)
5.485%, 6/15/24 | | | 24 | | | | 25 | |
MacDermid, Inc. | | | | | | | | |
Tranche B, (1 month LIBOR + 2.500%)
4.735%, 6/7/20 | | | 15 | | | | 15 | |
Tranche B-5, (1 month LIBOR + 3.500%)
4.735%, 6/7/20 | | | 84 | | | | 84 | |
New Arclin U.S. Holdings Corp. First Lien , (3 month LIBOR + 4.250%) 5.583%, 2/14/24 | | | 55 | | | | 55 | |
Omnova Solutions, Inc. Tranche B-2 , (1 month LIBOR + 4.250%) 5.485%, 8/25/23 | | | 118 | | | | 119 | |
PQ Corp. Tranche B-1 , (3 month LIBOR + 3.250%)
4.562%, 11/4/22 | | | 24 | | | | 24 | |
| | | | | | | | |
| | | | | | | 603 | |
| | | | | | | | |
| | |
| Real Estate—0.0% | | | | | | |
Capital Automotive LP Tranche B, Second Lien , (1 month LIBOR + 6.000%) 7.240%, 3/24/25 | | | 39 | | | | 40 | |
| | | | | | | | |
|
| Telecommunication Services—0.1% | |
Securus Technologies Holdings, Inc. (3 month LIBOR + 4.500%) 0.000%, 6/20/24(9) | | | 110 | | | | 111 | |
Second Lien, (3 month LIBOR + 8.250%)
0.000%, 6/20/25(9) | | | 60 | | | | 60 | |
| | | | | | | | |
| | | | | | | 171 | |
| | | | | | | | |
| | |
| Utilities—0.3% | | | | | | |
APLP Holdings LP , (1 month LIBOR + 4.250%)
5.485%, 4/13/23 | | | 121 | | | | 122 | |
Energy Future Intermediate Holding Co. LLC , (1 month LIBOR + 3.000%) 4.235%, 6/30/18 | | | 100 | | | | 100 | |
Talen Energy Supply LLC , (1 month LIBOR + 4.000%)
5.235%, 4/15/24 | | | 70 | | | | 68 | |
See Notes to Financial Statements
51
VIRTUS TACTICAL ALLOCATION FUND
SCHEDULE OF INVESTMENTS (Continued)
SEPTEMBER 30, 2017
($ reported in thousands)
| | | | | | | | |
| | | PAR
VALUE | | | VALUE | |
| Utilities—continued | | | | | | |
Vistra Operations Company LLC | | | | | | | | |
Tranche C, (1 month LIBOR + 2.750%)
3.982%, 8/4/23 | | $ | 15 | | | $ | 15 | |
(1 month LIBOR + 2.750%) 3.983%, 8/4/23 | | | 64 | | | | 64 | |
| | | | | | | | |
| | | | | | | | 369 | |
TOTAL LOAN AGREEMENTS
(Identified Cost $4,851) | | | | 4,824 | |
| | |
| | | SHARES | | | | |
| PREFERRED STOCKS—0.9% | | | | | | |
| | |
| Financials—0.7% | | | | | | |
Citigroup, Inc. Series J, 7.125% | | | 7,400 | | | | 215 | |
JP Morgan Chase & Co. | | | | | | | | |
Series V 5.000% | | | 80 | (10) | | | 81 | |
Series Z 5.300% | | | 35 | (10) | | | 36 | |
KeyCorp Series D, 5.000% | | | 145 | (10) | | | 150 | |
M&T Bank Corp. Series F, 5.125% | | | 70 | (10) | | | 74 | |
PNC Financial Services Group, Inc. | | | | | | | | |
Series R 4.850% | | | 155 | (10) | | | 159 | |
Series S 5.000% | | | 145 | (10) | | | 152 | |
Zions Bancorp 6.950% | | | 6,400 | | | | 191 | |
| | | | | | | | |
| | | | | | | 1,058 | |
| | | | | | | | |
| Industrials—0.2% | | | | | | |
General Electric Co. Series D, 5.000% | | | 227 | (10) | | | 240 | |
TOTAL PREFERRED STOCKS
(Identified Cost $1,203) | | | | 1,298 | |
| |
| COMMON STOCKS—63.0% | | | | |
|
| Consumer Discretionary—12.9% | |
Amazon.com, Inc.(2) | | | 2,930 | | | | 2,817 | |
Ctrip.com International Ltd. ADR(2) | | | 39,312 | | | | 2,073 | |
Home Depot, Inc. (The) | | | 8,770 | | | | 1,434 | |
IMAX Corp.(2) | | | 21,915 | | | | 496 | |
Kroton Educacional S.A. Sponsored ADR | | | 103,165 | | | | 648 | |
Las Vegas Sands Corp. | | | 31,710 | | | | 2,035 | |
McDonald’s Corp. | | | 6,520 | | | | 1,022 | |
MercadoLibre, Inc. | | | 1,270 | | | | 329 | |
Netflix, Inc.(2) | | | 10,120 | | | | 1,835 | |
NIKE, Inc. Class B | | | 22,880 | | | | 1,186 | |
Priceline Group, Inc. (The)(2) | | | 1,200 | | | | 2,197 | |
Ross Stores, Inc. | | | 17,580 | | | | 1,135 | |
Sony Corp. Sponsored ADR | | | 16,953 | | | | 633 | |
Starbucks Corp. | | | 18,520 | | | | 995 | |
| | | | | | | | |
| | | | | | | 18,835 | |
| | | | | | | | |
| | |
| Consumer Staples—4.2% | | | | | | |
Costco Wholesale Corp. | | | 3,318 | | | | 545 | |
Fomento Economico Mexicano SAB de C.V. ADR | | | 7,248 | | | | 693 | |
Marine Harvest ASA Sponsored ADR(2) | | | 32,750 | | | | 650 | |
Monster Beverage Corp.(2) | | | 44,510 | | | | 2,459 | |
Philip Morris International, Inc. | | | 15,930 | | | | 1,768 | |
| | | | | | | | |
| | | | | | | 6,115 | |
| | | | | | | | |
| | |
| Energy—2.6% | | | | | | |
Cabot Oil & Gas Corp. | | | 22,970 | | | | 615 | |
Core Laboratories N.V. | | | 7,480 | | | | 738 | |
Frontera Energy Corp.(2) | | | 920 | | | | 32 | |
| | | | | | | | |
| | |
SHARES | | | VALUE | |
| Energy—continued | | | | | | |
Pioneer Natural Resources Co. | | | 6,660 | | | $ | 983 | |
Statoil ASA Sponsored ADR | | | 38,668 | | | | 777 | |
TechnipFMC plc(2) | | | 25,366 | | | | 708 | |
| | | | | | | | |
| | | | | | | 3,853 | |
| | | | | | | | |
| | |
| Financials—6.1% | | | | | | |
Bank of America Corp. | | | 73,170 | | | | 1,854 | |
BNP Paribas S.A. ADR | | | 20,450 | | | | 827 | |
BOC Hong Kong Holdings Ltd. Sponsored ADR | | | 4,877 | | | | 471 | |
CaixaBank S.A. ADR | | | 457,863 | | | | 760 | |
Charles Schwab Corp. (The) | | | 21,990 | | | | 962 | |
DBS Group Holdings Ltd. Sponsored ADR | | | 12,523 | | | | 771 | |
ING Groep N.V. Sponsored ADR | | | 43,544 | | | | 802 | |
MarketAxess Holdings, Inc. | | | 1,710 | | | | 316 | |
ORIX Corp. Sponsored ADR | | | 9,450 | | | | 765 | |
UBS Group AG Registered Shares | | | 43,408 | | | | 744 | |
Zurich Insurance Group AG ADR | | | 23,106 | | | | 707 | |
| | | | | | | | |
| | | | | | | 8,979 | |
| | | | | | | | |
| | |
| Health Care—6.3% | | | | | | |
Allergan plc | | | 2,950 | | | | 605 | |
BioMarin Pharmaceutical, Inc.(2) | | | 11,600 | | | | 1,080 | |
Celgene Corp.(2) | | | 17,010 | | | | 2,480 | |
Danaher Corp. | | | 11,930 | | | | 1,023 | |
HealthEquity, Inc.(2) | | | 14,520 | | | | 734 | |
ICON plc(2) | | | 8,287 | | | | 944 | |
Illumina, Inc.(2) | | | 5,370 | | | | 1,070 | |
Zoetis, Inc. | | | 21,140 | | | | 1,348 | |
| | | | | | | | |
| | | | | | | 9,284 | |
| | | | | | | | |
| Industrials—4.9% | | | | | | |
Airbus SE ADR | | | 32,313 | | | | 765 | |
Ashtead Group plc ADR | | | 7,991 | | | | 771 | |
Caterpillar, Inc. | | | 9,700 | | | | 1,210 | |
Kansas City Southern | | | 6,620 | | | | 719 | |
Nidec Corp. Sponsored ADR | | | 30,690 | | | | 942 | |
RELX plc Sponsored ADR | | | 31,405 | | | | 702 | |
Rockwell Automation, Inc. | | | 3,780 | | | | 673 | |
Roper Technologies, Inc. | | | 5,570 | | | | 1,356 | |
| | | | | | | | |
| | | | | | | 7,138 | |
| | | | | | | | |
|
| Information Technology—21.9% | |
Accenture plc Class A | | | 8,270 | | | | 1,117 | |
Activision Blizzard, Inc. | | | 19,480 | | | | 1,257 | |
Alibaba Group Holding Ltd. Sponsored ADR(2) | | | 25,440 | | | | 4,394 | |
Alphabet, Inc. Class A(2) | | | 1,170 | | | | 1,139 | |
Amphenol Corp. Class A | | | 25,060 | | | | 2,121 | |
Broadcom Ltd. | | | 2,842 | | | | 689 | |
Check Point Software Technologies Ltd.(2) | | | 6,175 | | | | 704 | |
CoStar Group, Inc.(2) | | | 3,450 | | | | 926 | |
Facebook, Inc. Class A(2) | | | 38,980 | | | | 6,661 | |
Gartner, Inc.(2) | | | 6,490 | | | | 807 | |
Hitachi Ltd. ADR | | | 11,740 | | | | 829 | |
NVIDIA Corp. | | | 12,420 | | | | 2,220 | |
Paycom Software, Inc.(2) | | | 15,840 | | | | 1,187 | |
SAP SE Sponsored ADR | | | 6,402 | | | | 702 | |
Tencent Holdings Ltd. ADR | | | 31,840 | | | | 1,398 | |
Visa, Inc. Class A | | | 25,430 | | | | 2,676 | |
Workday, Inc. Class A(2) | | | 14,300 | | | | 1,507 | |
Yandex N.V. Class A(2) | | | 52,980 | | | | 1,746 | |
| | | | | | | | |
| | | | | | | 32,080 | |
| | | | | | | | |
See Notes to Financial Statements
52
VIRTUS TACTICAL ALLOCATION FUND
SCHEDULE OF INVESTMENTS (Continued)
SEPTEMBER 30, 2017
($ reported in thousands)
| | | | | | | | |
| | | SHARES | | | VALUE | |
| Materials—2.6% | | | | | | |
Anhui Conch Cement Co., Ltd. ADR | | | 37,047 | | | $ | 745 | |
Ecolab, Inc. | | | 8,650 | | | | 1,112 | |
Fortescue Metals Group Ltd. Sponsored ADR | | | 68,160 | | | | 552 | |
Heidelbergcement AG ADR | | | 34,325 | | | | 706 | |
Toray Industries, Inc. ADR | | | 36,953 | | | | 738 | |
| | | | | | | | |
| | | | | | | 3,853 | |
| | | | | | | | |
| | |
| Real Estate—0.6% | | | | | | |
Lendlease Group Sponsored ADR | | | 63,140 | | | | 890 | |
| | | | | | | | |
|
| Telecommunication Services—0.4% | |
Telekomunikasi Indonesia Persero Tbk PT Sponsored ADR | | | 17,193 | | | | 590 | |
| | | | | | | | |
| | |
| Utilities—0.5% | | | | | | |
Veolia Environnement S.A. ADR | | | 28,639 | | | | 659 | |
TOTAL COMMON STOCKS
(Identified Cost $74,539) | | | | 92,276 | |
|
| AFFILIATED MUTUAL FUND(11)—0.9% | |
Virtus Newfleet Credit Opportunities Fund Class R6 | | | 132,261 | | | | 1,295 | |
TOTAL AFFILIATED MUTUAL FUND
(Identified Cost $1,322) | | | | 1,295 | |
| TOTAL LONG TERM INVESTMENTS—99.1% | |
| (Identified Cost $127,212) | | | | 145,223 | (14) |
|
| SHORT-TERM INVESTMENT—1.1% | |
|
| Money Market Mutual Fund(11)—1.1% | |
Dreyfus Government Cash Management Fund – Institutional Shares (seven-day effective yield 0.920%) | | | 1,545,752 | | | | 1,546 | |
TOTAL SHORT-TERM INVESTMENT
(Identified Cost $1,546) | | | | 1,546 | |
TOTAL INVESTMENTS—100.2%
(Identified Cost $128,758) | | | | 146,769 | (1) |
Other assets and liabilities, net—(0.2)% | | | | (234 | ) |
| | | | | | | | |
| NET ASSETS—100.0% | | | $ | 146,535 | |
| | | | | | | | |
Abbreviations:
| ADR | American Depositary Receipt |
| FHLMC | Federal Home Loan Mortgage Corporation (“Freddie Mac”) |
| FNMA | Federal National Mortgage Association (“Fannie Mae”) |
| PIK | Payment-in-Kind Security |
| REIT | Real Estate Investment Trust |
Foreign Currencies
Footnote Legend:
| (1) | Federal Income Tax Information: For tax information at September 30, 2017, see Note 10 Federal Income Tax Information in the Notes to Financial Statements. |
| (3) | Variable security. Rate disclosed is as of September 30, 2017. For loan agreements, the rate shown may represent a weighted average interest rate. Information in parenthesis represents benchmark and reference rate for each security. Certain variable rate securities are not based on a published reference rate and spread but are determined by the issuer or agent and are based on current market conditions, or, for mortgage-backed securities, are impacted by the individual mortgages which are paying off over time. These securities do not indicate a reference rate and spread in their descriptions above. |
| (4) | Security exempt from registration under Rule 144A of the Securities Act of 1933. These securities may be resold in transactions exempt from registration, normally to qualified institutional buyers. At September 30, 2017, these securities amounted to a value of $22,397 or 15.3% of net assets. |
| (5) | Regulation S security. Security is offered and sold outside of the United States, therefore, it is exempt from registration with the SEC under Rules 903 and 904 of the Securities Act of 1933. |
| (6) | Interest payments may be deferred. |
| (7) | This Note was issued for the sole purpose of funding a loan agreement between the issuer and the borrower. As the credit risk for this security lies solely with the borrower, the name represented here is that of the borrower. |
| (8) | No contractual maturity date. |
| (9) | This loan will settle after September 30, 2017, at which time the interest rate, based on the London Interbank Offered Rate (“LIBOR”) and the agreed upon spread on trade date, will be reflected. |
| (10) | Value shown as par value. |
| (11) | Shares of these funds are publicly offered and the prospectus and annual reports of each are publicly available. |
| (12) | Security in default, no interest payments are being received during the bankruptcy proceedings. |
| (13) | Security in default, a portion of the interest payments are being received during the bankruptcy proceedings. |
| (14) | All or a portion of the Fund’s assets have been segregated for delayed delivery security. |
| (15) | 100% of the income received was in cash. |
| | | | |
| Country Weightings (Unaudited)† | |
United States | | | 66 | % |
China | | | 6 | |
Japan | | | 3 | |
France | | | 2 | |
Netherlands | | | 2 | |
Australia | | | 1 | |
Russia | | | 1 | |
Other | | | 19 | |
Total | | | 100 | % |
† % of total investments as of September 30, 2017 | |
Security abbreviation definitions are located under the Key Investment Terms starting on page 4.
See Notes to Financial Statements
53
VIRTUS TACTICAL ALLOCATION FUND
SCHEDULE OF INVESTMENTS (Continued)
SEPTEMBER 30, 2017
($ reported in thousands)
The following table provides a summary of inputs used to value the Fund’s investments as of September 30, 2017 (See Security Valuation Note 2A in the Notes to Financial Statements):
| | | | | | | | | | | | |
| | | Total
Value at
September 30,
2017 | | | Level 1
Quoted
Prices | | | Level 2
Significant
Observable
Inputs | |
Debt Securities: | | | | | | | | | | | | |
Asset-Backed Securities | | $ | 2,588 | | | $ | — | | | $ | 2,588 | |
Corporate Bonds and Notes | | | 29,370 | | | | — | | | | 29,370 | |
Foreign Government Securities | | | 6,100 | | | | — | | | | 6,100 | |
Loan Agreements | | | 4,824 | | | | — | | | | 4,824 | |
Mortgage-Backed Securities | | | 7,003 | | | | — | | | | 7,003 | |
U.S. Government Securities | | | 469 | | | | — | | | | 469 | |
Equity Securities: | | | | | | | | | | | | |
Affiliated Mutual Fund | | | 1,295 | | | | 1,295 | | | | — | |
Common Stocks | | | 92,276 | | | | 92,276 | | | | — | |
Preferred Stocks | | | 1,298 | | | | 405 | | | | 893 | |
Short-Term Investment | | | 1,546 | | | | 1,546 | | | | — | |
| | | | | | | | | | | | |
Total Investments | | $ | 146,769 | | | $ | 95,522 | | | $ | 51,247 | |
| | | | | | | | | | | | |
There are no Level 3 (Significant Unobservable Inputs) priced securities.
There were no transfers between Level 1 and Level 2 related to securities held at September 30, 2017.
The following is a reconciliation of assets of the Fund for Level 3 investments for which significant unobservable inputs were used to determine fair value.
| | | | | | | | | | | | |
| | | Total
Value | | | Corporate
Bonds and
Notes | | | Loan
Agreements | |
Investments in Securities | | | | | | | | | | | | |
Balance as of March 31, 2017: | | $ | 318 | | | $ | 171 | | | $ | 147 | |
Accrued discount/(premium) | | | — | (c) | | | — | (c) | | | — | |
Realized gain (loss) | | | (241 | ) | | | (166 | ) | | | (75 | ) |
Change in unrealized appreciation/(depreciation)(d) | | | 239 | | | | 165 | | | | 74 | |
Purchases | | | — | | | | — | | | | — | |
Sales(b) | | | (237 | ) | | | (170 | ) | | | (67 | ) |
Transfers into Level 3(a) | | | — | | | | — | | | | — | |
Transfers from Level 3(a)(e) | | | (79 | ) | | | — | | | | (79 | ) |
| | | | | | | | | | | | |
Balance as of September 30, 2017 | | $ | — | | | $ | — | | | $ | — | |
| | | | | | | | | | | | |
| (a) | “Transfers into and/or from” represent the ending value as of September 30, 2017, for any investment security where a change in the pricing level occurred from the beginning to the end of the period. |
| (b) | Includes paydowns on securities. |
| (c) | Amount is less than $500. |
| (d) | Included in the related net change in unrealized appreciation (depreciation) on investments in the Statement of Operations. |
| (e) | Transfers from Level 3 are due to an increase in trading activity. |
The Fund’s investments that are categorized as Level 3 were valued utilizing third party pricing information without adjustment. Such valuations are based on unobservable inputs. A significant change in third party information inputs could result in significantly lower or higher value of such Level 3 investments.
See Notes to Financial Statements
54
THIS PAGE INTENTIONALLY BLANK.
VIRTUS EQUITY TRUST
STATEMENTS OF ASSETS AND LIABILITIES
SEPTEMBER 30, 2017
(Reported in thousands except shares and per share amounts)
| | | | | | | | | | | | | | | | | | | | |
| | | Contrarian
Value Fund | | | KAR Capital
Growth Fund | | | KAR Global Quality
Dividend Fund | | | KAR Mid-Cap
Core Fund | | | KAR Mid-Cap
Growth Fund | |
| Assets | | | | | | | | | | | | | | | | | | | | |
Investment in unaffiliated securities at value(1) | | $ | 172,959 | | | $ | 473,633 | | | $ | 56,772 | | | $ | 113,731 | | | $ | 94,360 | |
Foreign currency at value(2) | | | — | | | | — | | | | — | (3) | | | — | | | | — | |
Cash | | | — | | | | 80 | | | | — | | | | 7 | | | | 7 | |
Receivables | | | | | | | | | | | | | | | | | | | | |
Fund shares sold | | | 11 | | | | 28 | | | | 4 | | | | 424 | | | | 38 | |
Dividends and interest | | | 235 | | | | 238 | | | | 233 | | | | 67 | | | | 32 | |
Tax reclaims | | | — | | | | — | | | | 5 | | | | — | | | | — | |
Prepaid expenses | | | 37 | | | | 36 | | | | 28 | | | | 36 | | | | 27 | |
Prepaid trustee retainer | | | 2 | | | | 5 | | | | 1 | | | | 1 | | | | 1 | |
Other assets | | | 6 | | | | 16 | | | | 2 | | | | 4 | | | | 3 | |
| | | | | | | | | | | | | | | | | | | | |
Total assets | | | 173,250 | | | | 474,036 | | | | 57,045 | | | | 114,270 | | | | 94,468 | |
| | | | | | | | | | | | | | | | | | | | |
| Liabilities | | | | | | | | | | | | | | | | | | | | |
Cash overdraft | | | 18 | | | | — | | | | — | (3) | | | — | | | | — | |
Payables | | | | | | | | | | | | | | | | | | | | |
Fund shares repurchased | | | 1,087 | | | | 134 | | | | 139 | | | | 84 | | | | 20 | |
Investment advisory fees | | | 106 | | | | 271 | | | | 17 | | | | 34 | | | | 47 | |
Distribution and service fees | | | 35 | | | | 103 | | | | 14 | | | | 20 | | | | 21 | |
Administration fees | | | 18 | | | | 48 | | | | 6 | | | | 11 | | | | 10 | |
Transfer agent fees and expenses | | | 47 | | | | 159 | | | | 19 | | | | 23 | | | | 31 | |
Professional fees | | | 44 | | | | 22 | | | | 21 | | | | 21 | | | | 21 | |
Trustee deferred compensation plan | | | 6 | | | | 16 | | | | 2 | | | | 4 | | | | 3 | |
Other accrued expenses | | | 17 | | | | 45 | | | | 8 | | | | 10 | | | | 13 | |
| | | | | | | | | | | | | | | | | | | | |
Total liabilities | | | 1,378 | | | | 798 | | | | 226 | | | | 207 | | | | 166 | |
| | | | | | | | | | | | | | | | | | | | |
| Net Assets | | $ | 171,872 | | | $ | 473,238 | | | $ | 56,819 | | | $ | 114,063 | | | $ | 94,302 | |
| | | | | | | | | | | | | | | | | | | | |
| Net Assets Consist of: | | | | | | | | | | | | | | | | | | | | |
Capital paid in on shares of beneficial interest | | $ | 110,356 | | | $ | 236,208 | | | $ | 51,767 | | | $ | 95,634 | | | $ | 51,733 | |
Accumulated undistributed net investment income (loss) | | | 238 | | | | (20 | ) | | | 870 | | | | (4 | ) | | | (4 | ) |
Accumulated undistributed net realized gain (loss) | | | (4,370 | ) | | | 24,160 | | | | 940 | | | | (1,570 | ) | | | 5,130 | |
Net unrealized appreciation (depreciation) on investments | | | 65,648 | | | | 212,890 | | | | 3,242 | | | | 20,003 | | | | 37,443 | |
| | | | | | | | | | | | | | | | | | | | |
| Net Assets | | $ | 171,872 | | | $ | 473,238 | | | $ | 56,819 | | | $ | 114,063 | | | $ | 94,302 | |
| | | | | | | | | | | | | | | | | | | | |
| Class A | | | | | | | | | | | | | | | | | | | | |
Net asset value (net assets/shares outstanding) per share | | $ | 37.04 | | | $ | 16.18 | | | $ | 16.20 | | | $ | 27.95 | | | $ | 27.74 | |
Maximum offering price per share NAV/(1–5.75%) | | $ | 39.30 | | | $ | 17.17 | | | $ | 17.19 | | | $ | 29.66 | | | $ | 29.43 | |
Shares of beneficial interest outstanding, no par value, unlimited authorization | | | 1,971,091 | | | | 27,604,237 | | | | 2,728,123 | | | | 938,757 | | | | 3,061,018 | |
Net Assets | | $ | 73,007 | | | $ | 446,720 | | | $ | 44,188 | | | $ | 26,238 | | | $ | 84,912 | |
| Class C | | | | | | | | | | | | | | | | | | | | |
Net asset value (net assets/shares outstanding) and offering price per share | | $ | 35.51 | | | $ | 12.91 | | | $ | 15.82 | | | $ | 26.38 | | | $ | 22.54 | |
Shares of beneficial interest outstanding, no par value, unlimited authorization | | | 696,854 | | | | 1,088,353 | | | | 385,919 | | | | 677,305 | | | | 220,510 | |
Net Assets | | $ | 24,742 | | | $ | 14,052 | | | $ | 6,107 | | | $ | 17,870 | | | $ | 4,971 | |
| Class I | | | | | | | | | | | | | | | | | | | | |
Net asset value (net assets/shares outstanding) and offering price per share | | $ | 37.01 | | | $ | 16.69 | | | $ | 16.20 | | | $ | 28.34 | | | $ | 28.49 | |
Shares of beneficial interest outstanding, no par value, unlimited authorization | | | 1,919,253 | | | | 746,890 | | | | 402,658 | | | | 2,468,826 | | | | 155,074 | |
Net Assets | | $ | 71,026 | | | $ | 12,466 | | | $ | 6,524 | | | $ | 69,955 | | | $ | 4,419 | |
| Class R6 | | | | | | | | | | | | | | | | | | | | |
Net asset value (net assets/shares outstanding) and offering price per share | | $ | 37.00 | | | $ | — | | | $ | — | | | $ | — | | | $ | — | |
Shares of beneficial interest outstanding, no par value, unlimited authorization | | | 83,724 | | | | — | | | | — | | | | — | | | | — | |
Net Assets | | $ | 3,097 | | | $ | — | | | $ | — | | | $ | — | | | $ | — | |
| | | | | |
(1) Investment in unaffiliated securities at cost | | $ | 107,311 | | | $ | 260,743 | | | $ | 53,530 | | | $ | 93,728 | | | $ | 56,917 | |
(2) Foreign currency at cost | | | — | | | | — | | | | — | (3) | | | — | | | | — | |
(3) Amount is less than $500. | | | | | | | | | | | | | | | | | | | | |
See Notes to Financial Statements
56
VIRTUS EQUITY TRUST
STATEMENTS OF ASSETS AND LIABILITIES (Continued)
SEPTEMBER 30, 2017
(Reported in thousands except shares and per share amounts)
| | | | | | | | | | | | | | | | | | | | |
| | | KAR Small-Cap
Core Fund | | | KAR Small-Cap
Growth Fund | | | KAR Small-Cap
Value Fund | | | Rampart Enhanced
Core Equity Fund | | | Tactical
Allocation Fund | |
| | | | | | | | | | | | | | | | |
| Assets | | | | | | | | | | | | | | | | | | | | |
Investment in unaffiliated securities at value(1) | | $ | 652,733 | | | $ | 1,451,658 | | | $ | 426,597 | | | $ | 183,552 | | | $ | 145,474 | |
Investment in affiliated fund at value(2) | | | — | | | | — | | | | — | | | | — | | | | 1,295 | |
Cash | | | 43 | | | | — | (5) | | | 32 | | | | 1,382 | | | | 856 | |
Foreign currency, at value(3) | | | — | | | | — | | | | — | | | | — | | | | — | (5) |
Deposits with broker | | | — | | | | — | | | | — | | | | 968 | | | | — | |
Receivables | | | | | | | | | | | | | | | | | | | | |
Investment securities sold | | | 8,772 | | | | — | | | | — | | | | 85 | | | | 516 | |
Fund shares sold | | | 4,013 | | | | 17,475 | | | | 1,495 | | | | 16 | | | | 1 | |
Dividends and interest | | | 71 | | | | 480 | | | | 320 | | | | 173 | | | | 694 | |
Tax reclaims | | | — | | | | — | | | | — | | | | — | | | | 2 | |
Prepaid expenses | | | 55 | | | | 103 | | | | 50 | | | | 33 | | | | 20 | |
Prepaid trustee retainer | | | 7 | | | | 17 | | | | 5 | | | | 2 | | | | 2 | |
Other assets | | | 21 | | | | 45 | | | | 14 | | | | 6 | | | | 5 | |
| | | | | | | | | | | | | | | | | | | | |
Total assets | | | 665,715 | | | | 1,469,778 | | | | 428,513 | | | | 186,217 | | | | 148,865 | |
| | | | | | | | | | | | | | | | | | | | |
| Liabilities | | | | | | | | | | | | | | | | | | | | |
Written options at value(4) | | | — | | | | — | | | | — | | | | 265 | | | | — | |
Payables | | | | | | | | | | | | | | | | | | | | |
Fund shares repurchased | | | 493 | | | | 763 | | | | 434 | | | | 43 | | | | 18 | |
Investment securities purchased | | | 9,146 | | | | 23,150 | | | | — | | | | 44 | | | | 2,087 | |
Investment advisory fees | | | 384 | | | | 930 | | | | 232 | | | | 67 | | | | 83 | |
Distribution and service fees | | | 60 | | | | 124 | | | | 41 | | | | 48 | | | | 33 | |
Administration fees | | | 63 | | | | 133 | | | | 41 | | | | 19 | | | | 16 | |
Transfer agent fees and expenses | | | 89 | | | | 257 | | | | 81 | | | | 48 | | | | 40 | |
Professional fees | | | 23 | | | | 23 | | | | 22 | | | | 18 | | | | 28 | |
Trustee deferred compensation plan | | | 21 | | | | 45 | | | | 14 | | | | 6 | | | | 5 | |
Other accrued expenses | | | 41 | | | | 82 | | | | 30 | | | | 19 | | | | 20 | |
| | | | | | | | | | | | | | | | | | | | |
Total liabilities | | | 10,320 | | | | 25,507 | | | | 895 | | | | 577 | | | | 2,330 | |
| | | | | | | | | | | | | | | | | | | | |
| Net Assets | | $ | 655,395 | | | $ | 1,444,271 | | | $ | 427,618 | | | $ | 185,640 | | | $ | 146,535 | |
| | | | | | | | | | | | | | | | | | | | |
| Net Assets Consist of: | | | | | | | | | | | | | | | | | | | | |
Capital paid in on shares of beneficial interest | | $ | 460,599 | | | $ | 1,127,094 | | | $ | 300,314 | | | $ | 163,591 | | | $ | 127,752 | |
Accumulated undistributed net investment income (loss) | | | (23 | ) | | | (42 | ) | | | 325 | | | | 436 | | | | (150 | ) |
Accumulated undistributed net realized gain (loss) | | | 546 | | | | (2,879 | ) | | | 7,175 | | | | 11,544 | | | | 922 | |
Net unrealized appreciation (depreciation) on investments | | | 194,273 | | | | 320,098 | | | | 119,804 | | | | 9,829 | | | | 18,011 | |
Net unrealized appreciation (depreciation) on written options | | | — | | | | — | | | | — | | | | 240 | | | | — | |
| | | | | | | | | | | | | | | | | | | | |
| Net Assets | | $ | 655,395 | | | $ | 1,444,271 | | | $ | 427,618 | | | $ | 185,640 | | | $ | 146,535 | |
| | | | | | | | | | | | | | | | | | | | |
| Class A | | | | | | | | | | | | | | | | | | | | |
Net asset value (net assets/shares outstanding) per share | | $ | 28.05 | | | $ | 25.43 | | | $ | 18.41 | | | $ | 20.26 | | | $ | 9.00 | |
Maximum offering price per share NAV/(1–5.75%) | | $ | 29.76 | | | $ | 26.98 | | | $ | 19.53 | | | $ | 21.50 | | | $ | 9.55 | |
Shares of beneficial interest outstanding, no par value, unlimited authorization | | | 2,842,727 | | | | 10,351,718 | | | | 4,748,344 | | | | 5,944,836 | | | | 15,832,690 | |
Net Assets | | $ | 79,752 | | | $ | 263,281 | | | $ | 87,399 | | | $ | 120,445 | | | $ | 142,481 | |
| Class C | | | | | | | | | | | | | | | | | | | | |
Net asset value (net assets/shares outstanding) and offering price per share | | $ | 23.90 | | | $ | 23.13 | | | $ | 18.08 | | | $ | 18.23 | | | $ | 9.24 | |
Shares of beneficial interest outstanding, no par value, unlimited authorization | | | 2,364,888 | | | | 4,045,718 | | | | 1,648,286 | | | | 1,794,542 | | | | 438,567 | |
Net Assets | | $ | 56,526 | | | $ | 93,560 | | | $ | 29,795 | | | $ | 32,710 | | | $ | 4,054 | |
| Class I | | | | | | | | | | | | | | | | | | | | |
Net asset value (net assets/shares outstanding) and offering price per share | | $ | 29.44 | | | $ | 25.86 | | | $ | 18.41 | | | $ | 20.22 | | | $ | — | |
Shares of beneficial interest outstanding, no par value, unlimited authorization | | | 16,120,757 | | | | 42,058,761 | | | | 16,306,712 | | | | 1,606,866 | | | | — | |
Net Assets | | $ | 474,552 | | | $ | 1,087,430 | | | $ | 300,259 | | | $ | 32,485 | | | $ | — | |
| Class R6 | | | | | | | | | | | | | | | | | | | | |
Net asset value (net assets/shares outstanding) and offering price per share | | $ | 29.52 | | | $ | — | | | $ | 18.42 | | | $ | — | | | $ | — | |
Shares of beneficial interest outstanding, no par value, unlimited authorization | | | 1,509,440 | | | | — | | | | 551,844 | | | | — | | | | — | |
Net Assets | | $ | 44,565 | | | $ | — | | | $ | 10,165 | | | $ | — | | | $ | — | |
| | | | | |
(1) Investment in unaffiliated securities at cost | | $ | 458,460 | | | $ | 1,131,560 | | | $ | 306,793 | | | $ | 173,723 | | | $ | 127,436 | |
(2) Investment in affiliated fund at cost | | | — | | | | — | | | | — | | | | — | | | | 1,322 | |
(3) Foreign currency at cost | | | — | | | | — | | | | — | | | | — | | | | — | (5) |
(4) Written options premiums received | | | — | | | | — | | | | — | | | | 505 | | | | — | |
(5) Amount is less than $500. | | | | | | | | | | | | | | | | | | | | |
See Notes to Financial Statements
57
VIRTUS EQUITY TRUST
STATEMENTS OF OPERATIONS
($ reported in thousands)
| | | | | | | | | | | | | | | | |
| | | Contrarian Value Fund | | | KAR Capital Growth Fund | |
| | | Fiscal Period
Ending
September 30,
2017(2) | | | Year Ended
March 31,
2017 | | | Fiscal Period
Ending
September 30,
2017(2) | | | Year Ended
March 31,
2017 | |
| | | | | | | | | | | | | |
| Investment Income | | | | | | | | | | | | | | | | |
Dividends | | $ | 1,872 | | | $ | 5,346 | | | $ | 2,041 | | | $ | 3,897 | |
Interest | | | 3 | | | | — | | | | 12 | | | | 10 | |
Security lending, net of fees | | | 4 | | | | 30 | | | | 1 | | | | 17 | |
Foreign taxes withheld | | | (27 | ) | | | (36 | ) | | | (9 | ) | | | (20 | ) |
| | | | | | | | | | | | | | | | |
Total investment income | | | 1,852 | | | | 5,340 | | | | 2,045 | | | | 3,904 | |
| | | | | | | | | | | | | | | | |
| Expenses | | | | | | | | | | | | | | | | |
Investment advisory fees | | | 675 | | | | 1,673 | | | | 1,593 | | | | 2,954 | |
Distribution and service fees Class A | | | 95 | | | | 238 | | | | 537 | | | | 992 | |
Distribution and service fees, Class B | | | — | | | | — | | | | — | | | | 9 | |
Distribution and service fees, Class C | | | 135 | | | | 354 | | | | 69 | | | | 159 | |
Administration fees | | | 113 | | | | 284 | | | | 285 | | | | 536 | |
Transfer agent fees and expenses | | | 164 | | | | 441 | | | | 347 | | | | 772 | |
Registration fees | | | 31 | | | | 66 | | | | 32 | | | | 66 | |
Printing fees and expenses | | | 20 | | | | 68 | | | | 58 | | | | 113 | |
Custodian fees | | | 9 | | | | 17 | | | | 10 | | | | 12 | |
Professional fees | | | 45 | | | | 33 | | | | 26 | | | | 43 | |
Trustees’ fees and expenses | | | 12 | | | | 26 | | | | 27 | | | | 47 | |
Miscellaneous expenses | | | 11 | | | | 21 | | | | 22 | | | | 41 | |
| | | | | | | | | | | | | | | | |
Total expenses | | | 1,310 | | | | 3,221 | | | | 3,006 | | | | 5,744 | |
Less expenses reimbursed and/or waived by investment adviser | | | — | | | | — | | | | — | | | | — | |
Earnings credit from custodian | | | (3 | ) | | | (6 | ) | | | — | | | | (1 | ) |
Low balance account fees | | | — | | | | — | (1) | | | — | | | | (28 | ) |
Custody fees reimbursed (Note 14) | | | — | | | | (9 | ) | | | — | | | | (254 | ) |
| | | | | | | | | | | | | | | | |
Net expenses | | | 1,307 | | | | 3,206 | | | | 3,006 | | | | 5,461 | |
| | | | | | | | | | | | | | | | |
Net investment income (loss) | | | 545 | | | | 2,134 | | | | (961 | ) | | | (1,557 | ) |
| | | | | | | | | | | | | | | | |
| Net Realized and Unrealized Gain (Loss) on Investments | | | | | | | | | | | | | | | | |
Net realized gain (loss) on investments | | | 8,788 | | | | 6,706 | | | | 26,076 | | | | 37,319 | |
Net change in unrealized appreciation (depreciation) on investments | | | (2,522 | ) | | | 23,948 | | | | 41,631 | | | | 12,779 | |
| | | | | | | | | | | | | | | | |
| Net realized and unrealized gain (loss) | | | 6,266 | | | | 30,654 | | | | 67,707 | | | | 50,098 | |
| | | | | | | | | | | | | | | | |
Net increase (decrease) in net assets resulting from operations | | $ | 6,811 | | | $ | 32,788 | | | $ | 66,746 | | | $ | 48,541 | |
| | | | | | | | | | | | | | | | |
(1) Amount is less than $500.
(2) The Fund changed its fiscal period end to September 30 during the period.
See Notes to Financial Statements
58
VIRTUS EQUITY TRUST
STATEMENTS OF OPERATIONS (Continued)
($ reported in thousands)
| | | | | | | | | | | | | | | | |
| | | KAR Global Quality Dividend Fund | | | KAR Mid-Cap Core Fund | |
| | | Fiscal Period
Ending
September 30,
2017(2) | | | Year Ended
March 31,
2017 | | | Fiscal Period
Ending
September 30,
2017(2) | | | Year Ended
March 31,
2017 | |
| | | | | | | | | | | | | |
| Investment Income | | | | | | | | | | | | | | | | |
Dividends | | $ | 1,527 | | | $ | 1,716 | | | $ | 409 | | | $ | 535 | |
Interest | | | 1 | | | | — | | | | 11 | | | | 7 | |
Security lending, net of fees | | | 9 | | | | 6 | | | | 1 | | | | 6 | |
Foreign taxes withheld | | | (83 | ) | | | (30 | ) | | | (3 | ) | | | (4 | ) |
| | | | | | | | | | | | | | | | |
Total investment income | | | 1,454 | | | | 1,692 | | | | 418 | | | | 544 | |
| | | | | | | | | | | | | | | | |
| Expenses | | | | | | | | | | | | | | | | |
Investment advisory fees | | | 220 | | | | 478 | | | | 395 | | | | 455 | |
Distribution and service fees Class A | | | 57 | | | | 125 | | | | 30 | | | | 59 | |
Distribution and service fees, Class C | | | 33 | | | | 75 | | | | 80 | | | | 96 | |
Administration fees | | | 37 | | | | 81 | | | | 62 | | | | 72 | |
Transfer agent fees and expenses | | | 44 | | | | 109 | | | | 81 | | | | 95 | |
Registration fees | | | 26 | | | | 45 | | | | 30 | | | | 46 | |
Printing fees and expenses | | | 9 | | | | 18 | | | | 13 | | | | 18 | |
Custodian fees | | | 19 | | | | 4 | | | | 1 | | | | 3 | |
Professional fees | | | 23 | | | | 31 | | | | 23 | | | | 27 | |
Trustees’ fees and expenses | | | 4 | | | | 7 | | | | 6 | | | | 6 | |
Miscellaneous expenses | | | 4 | | | | 8 | | | | 5 | | | | 6 | |
| | | | | | | | | | | | | | | | |
Total expenses | | | 476 | | | | 981 | | | | 726 | | | | 883 | |
Less expenses reimbursed and/or waived by investment adviser | | | (63 | ) | | | (72 | ) | | | (147 | ) | | | (158 | ) |
Earnings credit from custodian | | | (1 | ) | | | (2 | ) | | | — | | | | — | (1) |
Low balance account fees | | | — | | | | (1 | ) | | | — | | | | — | (1) |
Custody fees reimbursed (Note 14) | | | — | | | | — | | | | — | | | | — | |
| | | | | | | | | | | | | | | | |
Net expenses | | | 412 | | | | 906 | | | | 579 | | | | 725 | |
| | | | | | | | | | | | | | | | |
Net investment income (loss) | | | 1,042 | | | | 786 | | | | (161 | ) | | | (181 | ) |
| | | | | | | | | | | | | | | | |
| Net Realized and Unrealized Gain (Loss) on Investments | | | | | | | | | | | | | | | | |
Net realized gain (loss) on investments | | | 968 | | | | 18,741 | | | | (1,087 | ) | | | 369 | |
Net realized gain (loss) on foreign currency transactions | | | (2 | ) | | | — | | | | — | | | | — | |
Net change in unrealized appreciation (depreciation) on investments | | | 480 | | | | (12,232 | ) | | | 9,658 | | | | 7,696 | |
Net change in unrealized appreciation (depreciation) on foreign currency translation | | | (1 | ) | | | — | | | | — | | | | — | |
| | | | | | | | | | | | | | | | |
| Net realized and unrealized gain (loss) | | | 1,445 | | | | 6,509 | | | | 8,571 | | | | 8,065 | |
| | | | | | | | | | | | | | | | |
Net increase (decrease) in net assets resulting from operations | | $ | 2,487 | | | $ | 7,295 | | | $ | 8,410 | | | $ | 7,884 | |
| | | | | | | | | | | | | | | | |
(1) Amount is less than $500.
(2) The Fund changed its fiscal period end to September 30 during the period.
See Notes to Financial Statements
59
VIRTUS EQUITY TRUST
STATEMENTS OF OPERATIONS (Continued)
($ reported in thousands)
| | | | | | | | | | | | | | | | |
| | | KAR Mid-Cap Growth Fund | | | KAR Small-Cap Core Fund | |
| | | Fiscal Period
Ending
September 30,
2017(2) | | | Year Ended
March 31,
2017 | | | Fiscal Period
Ending
September 30,
2017(2) | | | Year Ended
March 31,
2017 | |
| | | | | | | | | | | | | |
| Investment Income | | | | | | | | | | | | | | | | |
Dividends | | $ | 239 | | | $ | 544 | | | $ | 2,213 | | | $ | 3,705 | |
Interest | | | 2 | | | | — | | | | 36 | | | | 18 | |
Security lending, net of fees | | | 3 | | | | 24 | | | | 54 | | | | 222 | |
Foreign taxes withheld | | | (2 | ) | | | (5 | ) | | | (14 | ) | | | (31 | ) |
| | | | | | | | | | | | | | | | |
Total investment income | | | 242 | | | | 563 | | | | 2,289 | | | | 3,914 | |
| | | | | | | | | | | | | | | | |
| Expenses | | | | | | | | | | | | | | | | |
Investment advisory fees | | | 371 | | | | 688 | | | | 2,031 | | | | 2,886 | |
Distribution and service fees Class A | | | 104 | | | | 193 | | | | 84 | | | | 155 | |
Distribution and service fees, Class B | | | — | | | | 2 | | | | — | | | | — | |
Distribution and service fees, Class C | | | 26 | | | | 52 | | | | 250 | | | | 366 | |
Administration fees | | | 58 | | | | 109 | | | | 339 | | | | 487 | |
Transfer agent fees and expenses | | | 71 | | | | 156 | | | | 343 | | | | 580 | |
Registration fees | | | 26 | | | | 58 | | | | 50 | | | | 98 | |
Printing fees and expenses | | | 14 | | | | 23 | | | | 58 | | | | 99 | |
Custodian fees | | | 3 | | | | 4 | | | | 5 | | | | 20 | |
Professional fees | | | 22 | | | | 33 | | | | 25 | | | | 39 | |
Trustees’ fees and expenses | | | 6 | | | | 10 | | | | 31 | | | | 41 | |
Miscellaneous expenses | | | 7 | | | | 10 | | | | 22 | | | | 30 | |
| | | | | | | | | | | | | | | | |
Total expenses | | | 708 | | | | 1,338 | | | | 3,238 | | | | 4,801 | |
Less expenses reimbursed and/or waived by investment adviser | | | (44 | ) | | | (91 | ) | | | — | | | | — | |
Earnings credit from custodian | | | (1 | ) | | | (2 | ) | | | — | | | | (1 | ) |
Low balance account fees | | | — | | | | (4 | ) | | | — | | | | — | (1) |
Custody fees reimbursed (Note 14) | | | — | | | | (42 | ) | | | — | | | | (4 | ) |
| | | | | | | | | | | | | | | | |
Net expenses | | | 663 | | | | 1,199 | | | | 3,238 | | | | 4,796 | |
| | | | | | | | | | | | | | | | |
Net investment income (loss) | | | (421 | ) | | | (636 | ) | | | (949 | ) | | | (882 | ) |
| | | | | | | | | | | | | | | | |
| Net Realized and Unrealized Gain (Loss) on Investments | | | | | | | | | | | | | | | | |
Net realized gain (loss) on investments | | | 5,473 | | | | 2,053 | | | | 977 | | | | 13,272 | |
Net change in unrealized appreciation (depreciation) on investments | | | 6,593 | | | | 9,805 | | | | 82,548 | | | | 58,696 | |
| | | | | | | | | | | | | | | | |
| Net realized and unrealized gain (loss) | | | 12,066 | | | | 11,858 | | | | 83,525 | | | | 71,968 | |
| | | | | | | | | | | | | | | | |
Net increase (decrease) in net assets resulting from operations | | $ | 11,645 | | | $ | 11,222 | | | $ | 82,576 | | | $ | 71,086 | |
| | | | | | | | | | | | | | | | |
(1) Amount is less than $500.
(2) The Fund changed its fiscal period end to September 30 during the period.
See Notes to Financial Statements
60
VIRTUS EQUITY TRUST
STATEMENTS OF OPERATIONS (Continued)
($ reported in thousands)
| | | | | | | | | | | | | | | | |
| | | KAR Small-Cap Growth Fund | | | KAR Small-Cap Value Fund | |
| | | Fiscal Period
Ending
September 30,
2017(1) | | | Year Ended
March 31,
2017 | | | Fiscal Period
Ending
September 30,
2017(1) | | | Year Ended
March 31,
2017 | |
| | | | | | | | | | | | | |
| Investment Income | | | | | | | | | | | | | | | | |
Dividends | | $ | 3,449 | | | $ | 3,001 | | | $ | 3,023 | | | $ | 7,961 | |
Dividends from affiliated fund | | | — | | | | — | | | | — | | | | — | |
Interest | | | 46 | | | | 13 | | | | 30 | | | | 16 | |
Security lending, net of fees | | | 21 | | | | 112 | | | | — | | | | — | |
Foreign Taxes withheld | | | — | | | | — | | | | (19 | ) | | | (29 | ) |
| | | | | | | | | | | | | | | | |
Total investment income | | | 3,516 | | | | 3,126 | | | | 3,034 | | | | 7,948 | |
| | | | | | | | | | | | | | | | |
| Expenses | | | | | | | | | | | | | | | | |
Investment advisory fees | | | 4,384 | | | | 3,645 | | | | 1,317 | | | | 2,068 | |
Distribution and service fees Class A | | | 270 | | | | 386 | | | | 108 | | | | 198 | |
Distribution and service fees, Class B | | | — | | | | — | | | | — | | | | — | |
Distribution and service fees, Class C | | | 369 | | | | 341 | | | | 144 | | | | 263 | |
Administration fees | | | 633 | | | | 516 | | | | 236 | | | | 374 | |
Transfer agent fees and expenses | | | 813 | | | | 707 | | | | 289 | | | | 475 | |
Registration fees | | | 70 | | | | 72 | | | | 51 | | | | 69 | |
Printing fees and expenses | | | 127 | | | | 85 | | | | 45 | | | | 75 | |
Custodian fees | | | 8 | | | | 21 | | | | 3 | | | | 5 | |
Professional fees | | | 30 | | | | 39 | | | | 26 | | | | 38 | |
Trustees’ fees and expenses | | | 49 | | | | 38 | | | | 23 | | | | 32 | |
Miscellaneous expenses | | | 30 | | | | 26 | | | | 16 | | | | 24 | |
| | | | | | | | | | | | | | | | |
Total expenses | | | 6,783 | | | | 5,876 | | | | 2,258 | | | | 3,621 | |
Less expenses reimbursed, waived and/or recouped by investment adviser | | | 178 | | | | (7 | ) | | | — | | | | — | |
Earnings credit from custodian | | | — | | | | (1 | ) | | | — | | | | (1 | ) |
Low balance account fees | | | — | | | | (4 | ) | | | — | | | | (1 | ) |
Custody fees reimbursed (Note 14) | | | — | | | | (6 | ) | | | — | | | | — | |
| | | | | | | | | | | | | | | | |
Net expenses | | | 6,961 | | | | 5,858 | | | | 2,258 | | | | 3,619 | |
| | | | | | | | | | | | | | | | |
Net investment income (loss) | | | (3,445 | ) | | | (2,732 | ) | | | 776 | | | | 4,329 | |
| | | | | | | | | | | | | | | | |
| Net Realized and Unrealized Gain (Loss) on Investments | | | | | | | | | | | | | | | | |
Net realized gain (loss) on investments | | | (179 | ) | | | (530 | ) | | | 7,206 | | | | 22,843 | |
Net change in unrealized appreciation (depreciation) on investments | | | 192,974 | | | | 89,239 | | | | 25,088 | | | | 35,164 | |
| | | | | | | | | | | | | | | | |
| Net realized and unrealized gain (loss) | | | 192,795 | | | | 88,709 | | | | 32,294 | | | | 58,007 | |
| | | | | | | | | | | | | | | | |
| Net increase (decrease) in net assets resulting from operations | | $ | 189,350 | | | $ | 85,977 | | | $ | 33,070 | | | $ | 62,336 | |
| | | | | | | | | | | | | | | | |
(1) The Fund changed its fiscal period end to September 30 during the period.
See Notes to Financial Statements
61
VIRTUS EQUITY TRUST
STATEMENTS OF OPERATIONS (Continued)
($ reported in thousands)
| | | | | | | | | | | | | | | | |
| | | Rampart Enhanced Core Equity Fund | | | Tactical Allocation Fund | |
| | | Fiscal Period
Ending
September 30,
2017(2) | | | Year Ended
March 31,
2017 | | | Fiscal Period
Ending
September 30,
2017(2) | | | Year Ended
March 31,
2017 | |
| | | | | | | | | | | | | |
| Investment Income | | | | | | | | | | | | | | | | |
Dividends | | $ | 1,627 | | | $ | 3,332 | | | $ | 754 | | | $ | 1,546 | |
Dividends from affiliated fund | | | — | | | | — | | | | 49 | | | | 74 | |
Interest | | | 8 | | | | — | | | | 1,546 | | | | 3,182 | |
Security lending, net of fees | | | — | | | | — | | | | — | (1) | | | 6 | |
Foreign Taxes withheld | | | — | | | | — | | | | (39 | ) | | | (41 | ) |
| | | | | | | | | | | | | | | | |
Total investment income | | | 1,635 | | | | 3,332 | | | | 2,310 | | | | 4,767 | |
| | | | | | | | | | | | | | | | |
| Expenses | | | | | | | | | | | | | | | | |
Investment advisory fees | | | 662 | | | | 1,208 | | | | 508 | | | | 1,033 | |
Distribution and service fees Class A | | | 146 | | | | 263 | | | | 176 | | | | 357 | |
Distribution and service fees, Class B | | | — | | | | — | | | | — | | | | 1 | |
Distribution and service fees, Class C | | | 172 | | | | 374 | | | | 21 | | | | 48 | |
Administration fees | | | 111 | | | | 204 | | | | 100 | | | | 207 | |
Transfer agent fees and expenses | | | 128 | | | | 275 | | | | 96 | | | | 216 | |
Registration fees | | | 29 | | | | 53 | | | | 21 | | | | 45 | |
Printing fees and expenses | | | 23 | | | | 45 | | | | 19 | | | | 43 | |
Custodian fees | | | 14 | | | | 4 | | | | 31 | | | | 44 | |
Professional fees | | | 20 | | | | 27 | | | | 30 | | | | 42 | |
Trustees’ fees and expenses | | | 11 | | | | 18 | | | | 9 | | | | 17 | |
Miscellaneous expenses | | | 9 | | | | 15 | | | | 9 | | | | 17 | |
| | | | | | | | | | | | | | | | |
Total expenses | | | 1,325 | | | | 2,486 | | | | 1,020 | | | | 2,070 | |
Less expenses reimbursed and/or waived by investment adviser | | | (140 | ) | | | (218 | ) | | | (5 | ) | | | (12 | ) |
Earnings credit from custodian | | | (2 | ) | | | (5 | ) | | | — | | | | (1 | ) |
Low balance account fees | | | — | | | | (2 | ) | | | — | | | | (6 | ) |
Custody fees reimbursed (Note 14) | | | — | | | | (2 | ) | | | — | | | | (119 | ) |
| | | | | | | | | | | | | | | | |
Net expenses | | | 1,183 | | | | 2,259 | | | | 1,015 | | | | 1,932 | |
| | | | | | | | | | | | | | | | |
Net investment income (loss) | | | 452 | | | | 1,073 | | | | 1,295 | | | | 2,835 | |
| | | | | | | | | | | | | | | | |
| Net Realized and Unrealized Gain (Loss) on Investments | | | | | | | | | | | | | | | | |
Net realized gain (loss) on unaffiliated investments | | | 5,301 | | | | 13,170 | | | | 1,586 | | | | 11,066 | |
Net realized gain (loss) on affiliated investments | | | — | | | | — | | | | (3 | ) | | | — | |
Net realized gain (loss) on foreign currency transactions | | | — | | | | — | | | | (1 | ) | | | (5 | ) |
Net realized gain (loss) on written options | | | 8,230 | | | | 10,710 | | | | — | | | | — | |
Net change in unrealized appreciation (depreciation) on unaffiliated investments | | | 1,680 | | | | (1,346 | ) | | | 9,896 | | | | (1,092 | ) |
Net change in unrealized appreciation (depreciation) on affiliated investments | | | — | | | | — | | | | (26 | ) | | | — | |
Net change in unrealized appreciation (depreciation) on affiliated fund | | | — | | | | — | | | | — | | | | 76 | |
Net change in unrealized appreciation (depreciation) on written options | | | (109 | ) | | | 28 | | | | — | | | | — | |
Net change in unrealized appreciation (depreciation) on foreign currency transaction | | | — | | | | — | | | | — | | | | — | (1) |
| | | | | | | | | | | | | | | | |
| Net realized and unrealized gain (loss) | | | 15,102 | | | | 22,562 | | | | 11,452 | | | | 10,045 | |
| | | | | | | | | | | | | | | | |
| Net increase (decrease) in net assets resulting from operations | | $ | 15,554 | | | $ | 23,635 | | | $ | 12,747 | | | $ | 12,880 | |
| | | | | | | | | | | | | | | | |
(1) Amount is less than $500.
(2) The Fund changed its fiscal period end to September 30 during the period.
See Notes to Financial Statements
62
VIRTUS EQUITY TRUST
STATEMENTS OF CHANGES IN NET ASSETS
($ reported in thousands)
| | | | | | | | | | | | | | | | | | | | | | | | |
| | | Contrarian Value Fund | | | KAR Capital Growth Fund | |
| | | Fiscal
Period Ended
September 30,
2017(2) | | | Year Ended
March 31,
2017 | | | Year Ended
March 31,
2016 | | | Fiscal
Period Ended
September 30,
2017(2) | | | Year Ended
March 31,
2017 | | | Year Ended
March 31,
2016 | |
| | | | | | | | | | | | | | | | | | | |
| INCREASE (DECREASE) IN NET ASSETS | | | | | | | | | | | | | | | | | | | | | | | | |
| From Operations | | | | | | | | | | | | | | | | | | | | | | | | |
Net investment income (loss) | | $ | 545 | | | $ | 2,134 | | | $ | 1,694 | | | $ | (961 | ) | | $ | (1,557 | ) | | $ | (1,556 | ) |
Net realized gain (loss) | | | 8,788 | | | | 6,706 | | | | 13,049 | | | | 26,076 | | | | 37,319 | | | | 13,349 | |
Net change in unrealized appreciation (depreciation) | | | (2,522 | ) | | | 23,948 | | | | (65,956 | ) | | | 41,631 | | | | 12,779 | | | | (10,272 | ) |
| | | | | | | | | | | | | | | | | | | | | | | | |
| Increase (decrease) in net assets resulting from operations | | | 6,811 | | | | 32,788 | | | | (51,213 | ) | | | 66,746 | | | | 48,541 | | | | 1,521 | |
| | | | | | | | | | | | | | | | | | | | | | | | |
| From Distributions to Shareholders | | | | | | | | | | | | | | | | | | | | | | | | |
Net investment income, Class A | | | (870 | ) | | | (759 | ) | | | (784 | ) | | | — | | | | — | | | | — | |
Net investment income, Class C | | | (42 | ) | | | (6 | ) | | | (46 | ) | | | — | | | | — | | | | — | |
Net investment income, Class I | | | (1,057 | ) | | | (985 | ) | | | (954 | ) | | | — | | | | — | | | | — | |
Net investment income, Class R6 | | | (46 | ) | | | (45 | ) | | | (17 | ) | | | — | | | | — | | | | — | |
Net realized long-term gains, Class A | | | — | | | | — | | | | — | | | | (4,395 | ) | | | (31,380 | ) | | | (19,039 | ) |
Net realized long-term gains, Class B | | | — | | | | — | | | | — | | | | — | | | | (68 | ) | | | (99 | ) |
Net realized long-term gains, Class C | | | — | | | | — | | | | — | | | | (170 | ) | | | (1,402 | ) | | | (946 | ) |
Net realized long-term gains, Class I | | | — | | | | — | | | | — | | | | (114 | ) | | | (670 | ) | | | (378 | ) |
| | | | | | | | | | | | | | | | | | | | | | | | |
| Decrease in net assets from distributions to shareholders | | | (2,015 | ) | | | (1,795 | ) | | | (1,801 | ) | | | (4,679 | ) | | | (33,520 | ) | | | (20,462 | ) |
| | | | | | | | | | | | | | | | | | | | | | | | |
| From Share Transactions (See Note 6) | | | | | | | | | | | | | | | | | | | | | | | | |
Change in net assets from share transactions, Class A | | | (8,548 | ) | | | (41,643 | ) | | | (59,464 | ) | | | (14,052 | ) | | | (13,975 | ) | | | (14,810 | ) |
Change in net assets from share transactions, Class B | | | — | | | | — | | | | — | | | | — | | | | (1,437 | ) | | | (684 | ) |
Change in net assets from share transactions, Class C | | | (7,692 | ) | | | (10,176 | ) | | | (16,162 | ) | | | (1,139 | ) | | | (6,689 | ) | | | 9,105 | |
Change in net assets from share transactions, Class I | | | (9,479 | ) | | | (38,690 | ) | | | (49,583 | ) | | | 719 | | | | 1,623 | | | | (4 | ) |
Change in net assets from share transactions, Class R6 | | | (34 | ) | | | (2,250 | ) | | | 5,005 | | | | — | | | | — | | | | — | |
| | | | | | | | | | | | | | | | | | | | | | | | |
| Increase (decrease) in net assets from share transactions | | | (25,753 | ) | | | (92,759 | ) | | | (120,204 | ) | | | (14,472 | ) | | | (20,478 | ) | | | (6,393 | ) |
| | | | | | | | | | | | | | | | | | | | | | | | |
| | | | | | |
| Net increase (decrease) in net assets | | | (20,957 | ) | | | (61,766 | ) | | | (173,218 | ) | | | 47,595 | | | | (5,457 | ) | | | (25,334 | ) |
| | | | | | |
| Net Assets | | | | | | | | | | | | | | | | | | | | | | | | |
Beginning of period | | | 192,829 | | | | 254,595 | | | | 427,813 | | | | 425,643 | | | | 431,100 | | | | 456,434 | |
| | | | | | | | | | | | | | | | | | | | | | | | |
| End of period | | $ | 171,872 | | | $ | 192,829 | | | $ | 254,595 | | | $ | 473,238 | | | $ | 425,643 | | | $ | 431,100 | |
| | | | | | | | | | | | | | | | | | | | | | | | |
Accumulated undistributed net investment income (loss) at end of period | | | 238 | | | $ | 1,686 | | | $ | 1,347 | | | | (20 | ) | | $ | (118 | ) | | $ | — | |
(1) Amount is less than $500.
(2) The Fund changed its fiscal period end to September 30 during the period.
See Notes to Financial Statements
63
VIRTUS EQUITY TRUST
STATEMENTS OF CHANGES IN NET ASSETS (Continued)
($ reported in thousands)
| | | | | | | | | | | | | | | | | | | | | | | | |
| | | KAR Global Quality Dividend Fund | | | KAR Mid-Cap Core Fund | |
| | | Fiscal
Period Ended
September 30,
2017(1) | | | Year Ended
March 31,
2017 | | | Year Ended
March 31,
2016 | | | Fiscal
Period Ended
September 30,
2017(1) | | | Year Ended
March 31,
2017 | | | Year Ended
March 31,
2016 | |
| | | | | | | | | | | | | | | | | | | |
| INCREASE (DECREASE) IN NET ASSETS | | | | | | | | | | | | | | | | | | | | | | | | |
| From Operations | | | | | | | | | | | | | | | | | | | | | | | | |
Net investment income (loss) | | $ | 1,042 | | | $ | 786 | | | $ | 572 | | | $ | (161 | ) | | $ | (181 | ) | | $ | (106 | ) |
Net realized gain (loss) | | | 966 | | | | 18,741 | | | | 2,873 | | | | (1,087 | ) | | | 369 | | | | (514 | ) |
Net change in unrealized appreciation (depreciation) | | | 479 | | | | (12,232 | ) | | | (5,126 | ) | | | 9,658 | | | | 7,696 | | | | 402 | |
| | | | | | | | | | | | | | | | | | | | | | | | |
| Increase (decrease) in net assets resulting from operations | | | 2,487 | | | | 7,295 | | | | (1,681 | ) | | | 8,410 | | | | 7,884 | | | | (218 | ) |
| | | | | | | | | | | | | | | | | | | | | | | | |
| From Distributions to Shareholders | | | | | | | | | | | | | | | | | | | | | | | | |
Net investment income, Class A | | | (702 | ) | | | (462 | ) | | | (254 | ) | | | — | | | | — | | | | — | |
Net investment income, Class C | | | (52 | ) | | | — | | | | (13 | ) | | | — | | | | — | | | | — | |
Net investment income, Class I | | | (126 | ) | | | (73 | ) | | | (58 | ) | | | — | | | | — | | | | — | |
Net realized long-term gains, Class A | | | (2,728 | ) | | | — | | | | — | | | | (81 | ) | | | — | | | | (95 | ) |
Net realized long-term gains, Class C | | | (413 | ) | | | — | | | | — | | | | (56 | ) | | | — | | | | (36 | ) |
Net realized long-term gains, Class I | | | (417 | ) | | | — | | | | — | | | | (196 | ) | | | — | | | | (40 | ) |
| | | | | | | | | | | | | | | | | | | | | | | | |
| Decrease in net assets from distributions to shareholders | | | (4,438 | ) | | | (535 | ) | | | (325 | ) | | | (333 | ) | | | — | | | | (171 | ) |
| | | | | | | | | | | | | | | | | | | | | | | | |
| From Share Transactions (See Note 6) | | | | | | | | | | | | | | | | | | | | | | | | |
Change in net assets from share transactions, Class A | | | (999 | ) | | | (8,659 | ) | | | (4,218 | ) | | | 3,725 | | | | (3,230 | ) | | | 7,752 | |
Change in net assets from share transactions, Class C | | | (626 | ) | | | (2,075 | ) | | | (11,309 | ) | | | 2,347 | | | | 6,343 | | | | 2,460 | |
Change in net assets from share transactions, Class I | | | (321 | ) | | | (98 | ) | | | (3,053 | ) | | | 14,098 | | | | 39,940 | | | | 2,809 | |
| | | | | | | | | | | | | | | | | | | | | | | | |
| Increase (decrease) in net assets from share transactions | | | (1,946 | ) | | | (10,832 | ) | | | (18,580 | ) | | | 20,170 | | | | 43,053 | | | | 13,021 | |
| | | | | | | | | | | | | | | | | | | | | | | | |
| | | | | | |
| Net increase (decrease) in net assets | | | (3,897 | ) | | | (4,072 | ) | | | (20,586 | ) | | | 28,247 | | | | 50,937 | | | | 12,632 | |
| | | | | | |
| Net Assets | | | | | | | | | | | | | | | | | | | | | | | | |
Beginning of period | | | 60,716 | | | | 64,788 | | | | 85,374 | | | | 85,816 | | | | 34,879 | | | | 22,247 | |
| | | | | | | | | | | | | | | | | | | | | | | | |
| End of period | | $ | 56,819 | | | $ | 60,716 | | | $ | 64,788 | | | $ | 114,063 | | | $ | 85,816 | | | $ | 34,879 | |
| | | | | | | | | | | | | | | | | | | | | | | | |
Accumulated undistributed net investment income (loss) at end of period | | | 870 | | | $ | 711 | | | $ | 463 | | | | (4 | ) | | $ | (64 | ) | | $ | (27 | ) |
(1) The Fund changed its fiscal period end to September 30 during the period.
See Notes to Financial Statements
64
VIRTUS EQUITY TRUST
STATEMENTS OF CHANGES IN NET ASSETS (Continued)
($ reported in thousands)
| | | | | | | | | | | | | | | | | | | | | | | | |
| | | KAR Mid-Cap Growth Fund | | | KAR Small-Cap Core Fund | |
| | | Fiscal
Period Ended
September 30,
2017(1) | | | Year Ended
March 31,
2017 | | | Year Ended
March 31,
2016 | | | Fiscal
Period Ended
September 30,
2017(1) | | | Year Ended
March 31,
2017 | | | Year Ended
March 31,
2016 | |
| | | | | | | | | | | | | | | | | | | |
| INCREASE (DECREASE) IN NET ASSETS | | | | | | | | | | | | | | | | | | | | | | | | |
| From Operations | | | | | | | | | | | | | | | | | | | | | | | | |
Net investment income (loss) | | $ | (421 | ) | | $ | (636 | ) | | $ | (785 | ) | | $ | (949 | ) | | $ | (882 | ) | | $ | (312 | ) |
Net realized gain (loss) | | | 5,473 | | | | 2,053 | | | | (350 | ) | | | 977 | | | | 13,272 | | | | 47,444 | |
Net change in unrealized appreciation (depreciation) | | | 6,593 | | | | 9,805 | | | | (1,345 | ) | | | 82,548 | | | | 58,696 | | | | (49,195 | ) |
| | | | | | | | | | | | | | | | | | | | | | | | |
| Increase (decrease) in net assets resulting from operations | | | 11,645 | | | | 11,222 | | | | (2,480 | ) | | | 82,576 | | | | 71,086 | | | | (2,063 | ) |
| | | | | | | | | | | | | | | | | | | | | | | | |
| From Distributions to Shareholders | | | | | | | | | | | | | | | | | | | | | | | | |
Net investment income, Class A | | | — | | | | — | | | | — | | | | — | | | | — | | | | (123 | ) |
Net investment income, Class I | | | — | | | | — | | | | — | | | | — | | | | — | | | | (1,198 | ) |
Net investment income, Class R6 | | | — | | | | — | | | | — | | | | — | | | | — | | | | (1 | ) |
Net realized long-term gains, Class A | | | (402 | ) | | | (1,177 | ) | | | (1,219 | ) | | | (33 | ) | | | (3,619 | ) | | | (10,241 | ) |
Net realized long-term gains, Class B | | | — | | | | (3 | ) | | | (10 | ) | | | — | | | | — | | | | — | |
Net realized long-term gains, Class C | | | (29 | ) | | | (100 | ) | | | (111 | ) | | | (29 | ) | | | (2,464 | ) | | | (6,194 | ) |
Net realized long-term gains, Class I | | | (20 | ) | | | (50 | ) | | | (52 | ) | | | (183 | ) | | | (14,391 | ) | | | (34,727 | ) |
Net realized long-term gains, Class R6 | | | — | | | | — | | | | — | | | | (16 | ) | | | (1,436 | ) | | | (2,113 | ) |
| | | | | | | | | | | | | | | | | | | | | | | | |
| Decrease in net assets from distributions to shareholders | | | (451 | ) | | | (1,330 | ) | | | (1,392 | ) | | | (261 | ) | | | (21,910 | ) | | | (54,597 | ) |
| | | | | | | | | | | | | | | | | | | | | | | | |
| From Share Transactions (See Note 6) | | | | | | | | | | | | | | | | | | | | | | | | |
Change in net assets from share transactions, Class A | | | (5,804 | ) | | | (4,977 | ) | | | (3,178 | ) | | | 7,469 | | | | 669 | | | | (2,924 | ) |
Change in net assets from share transactions, Class B | | | — | | | | (349 | ) | | | (253 | ) | | | — | | | | — | | | | — | |
Change in net assets from share transactions, Class C | | | (990 | ) | | | (466 | ) | | | (287 | ) | | | 4,421 | | | | 9,088 | | | | 4,489 | |
Change in net assets from share transactions, Class I | | | 32 | | | | 501 | | | | (171 | ) | | | 76,745 | | | | 115,257 | | | | (22,527 | ) |
Change in net assets from share transactions, Class R6 | | | — | | | | — | | | | — | | | | 7,704 | | | | 7,139 | | | | 22,563 | |
| | | | | | | | | | | | | | | | | | | | | | | | |
| Increase (decrease) in net assets from share transactions | | | (6,762 | ) | | | (5,291 | ) | | | (3,889 | ) | | | 96,339 | | | | 132,153 | | | | 1,601 | |
| | | | | | | | | | | | | | | | | | | | | | | | |
| | | | | | |
| Net increase (decrease) in net assets | | | 4,432 | | | | 4,601 | | | | (7,761 | ) | | | 178,655 | | | | 181,329 | | | | (55,059 | ) |
| | | | | | |
| Net Assets | | | | | | | | | | | | | | | | | | | | | | | | |
Beginning of period | | | 89,870 | | | | 85,269 | | | | 93,030 | | | | 476,740 | | | | 295,411 | | | | 350,470 | |
| | | | | | | | | | | | | | | | | | | | | | | | |
| End of period | | $ | 94,302 | | | $ | 89,870 | | | $ | 85,269 | | | $ | 655,395 | | | $ | 476,740 | | | $ | 295,411 | |
| | | | | | | | | | | | | | | | | | | | | | | | |
Accumulated undistributed net investment income (loss) at end of period | | $ | (4 | ) | | $ | (128 | ) | | $ | (161 | ) | | $ | (23 | ) | | $ | (17 | ) | | $ | — | |
(1) The Fund changed its fiscal period end to September 30 during the period.
See Notes to Financial Statements
65
VIRTUS EQUITY TRUST
STATEMENTS OF CHANGES IN NET ASSETS (Continued)
($ reported in thousands)
| | | | | | | | | | | | | | | | | | | | | | | | |
| | | KAR Small-Cap Growth Fund | | | KAR Small-Cap Value Fund | |
| | | Fiscal
Period Ended
September 30,
2017(1) | | | Year Ended
March 31,
2017 | | | Year Ended
March 31,
2016 | | | Fiscal
Period Ended
September 30,
2017(1) | | | Year Ended
March 31,
2017 | | | Year Ended
March 31,
2016 | |
| | | | | | | | | | | | | | | | | | | |
| INCREASE (DECREASE) IN NET ASSETS | | | | | | | | | | | | | | | | | | | | | | | | |
| From Operations | | | | | | | | | | | | | | | | | | | | | | | | |
Net investment income (loss) | | $ | (3,445 | ) | | $ | (2,732 | ) | | $ | (866 | ) | | $ | 776 | | | $ | 4,329 | | | $ | 1,346 | |
Net realized gain (loss) | | | (179 | ) | | | (530 | ) | | | 9,922 | | | | 7,206 | | | | 22,843 | | | | 22,424 | |
Net change in unrealized appreciation (depreciation) | | | 192,974 | | | | 89,239 | | | | (317 | ) | | | 25,088 | | | | 35,164 | | | | (22,928 | ) |
| | | | | | | | | | | | | | | | | | | | | | | | |
| Increase (decrease) in net assets resulting from operations | | | 189,350 | | | | 85,977 | | | | 8,739 | | | | 33,070 | | | | 62,336 | | | | 842 | |
| | | | | | | | | | | | | | | | | | | | | | | | |
| From Distributions to Shareholders | | | | | | | | | | | | | | | | | | | | | | | | |
Net investment income, Class A | | | — | | | | — | | | | — | | | | (85 | ) | | | (1,269 | ) | | | (461 | ) |
Net investment income, Class C | | | — | | | | — | | | | — | | | | — | | | | (219 | ) | | | — | |
Net investment income, Class I | | | — | | | | — | | | | — | | | | (607 | ) | | | (3,715 | ) | | | (1,433 | ) |
Net investment income, Class R6 | | | — | | | | — | | | | — | | | | (12 | ) | | | (1 | ) | | | — | |
Net realized long-term gains, Class A | | | (4 | ) | | | (3,423 | ) | | | (2,379 | ) | | | (3,083 | ) | | | (5,493 | ) | | | (4,360 | ) |
Net realized long-term gains, Class C | | | (1 | ) | | | (815 | ) | | | (518 | ) | | | (1,062 | ) | | | (1,848 | ) | | | (1,502 | ) |
Net realized long-term gains, Class I | | | (11 | ) | | | (3,649 | ) | | | (1,712 | ) | | | (9,201 | ) | | | (12,527 | ) | | | (9,351 | ) |
Net realized long-term gains, Class R6 | | | — | | | | — | | | | — | | | | (143 | ) | | | (2 | ) | | | — | |
| | | | | | | | | | | | | | | | | | | | | | | | |
| Decrease in net assets from distributions to shareholders | | | (16 | ) | | | (7,887 | ) | | | (4,609 | ) | | | (14,193 | ) | | | (25,074 | ) | | | (17,107 | ) |
| | | | | | | | | | | | | | | | | | | | | | | | |
| From Share Transactions (See Note 6) | | | | | | | | | | | | | | | | | | | | | | | | |
Change in net assets from share transactions, Class A | | | 39,060 | | | | 66,312 | | | | 4,385 | | | | (5,537 | ) | | | 8,100 | | | | 889 | |
Change in net assets from share transactions, Class C | | | 21,772 | | | | 32,713 | | | | 3,875 | | | | (823 | ) | | | 2,713 | | | | (482 | ) |
Change in net assets from share transactions, Class I | | | 461,883 | | | | 348,597 | | | | 59,857 | | | | 44,299 | | | | 73,702 | | | | (8,227 | ) |
Change in net assets from share transactions, Class R6 | | | — | | | | — | | | | — | | | | 9,553 | | | | 103 | | | | — | |
| | | | | | | | | | | | | | | | | | | | | | | | |
| Increase (decrease) in net assets from share transactions | | | 522,715 | | | | 447,622 | | | | 68,117 | | | | 47,492 | | | | 84,618 | | | | (7,820 | ) |
| | | | | | | | | | | | | | | | | | | | | | | | |
| | | | | | |
| Net increase (decrease) in net assets | | | 712,049 | | | | 525,712 | | | | 72,247 | | | | 66,369 | | | | 121,880 | | | | (24,085 | ) |
| | | | | | |
| Net Assets | | | | | | | | | | | | | | | | | | | | | | | | |
Beginning of period | | | 732,222 | | | | 206,510 | | | | 134,263 | | | | 361,249 | | | | 239,369 | | | | 263,454 | |
| | | | | | | | | | | | | | | | | | | | | | | | |
| End of period | | $ | 1,444,271 | | | $ | 732,222 | | | $ | 206,510 | | | $ | 427,618 | | | $ | 361,249 | | | $ | 239,369 | |
| | | | | | | | | | | | | | | | | | | | | | | | |
Accumulated undistributed net investment income (loss) at end of period | | $ | (42 | ) | | $ | (1,112 | ) | | $ | (245 | ) | | $ | 325 | | | $ | 253 | | | $ | 1,130 | |
(1) The Fund changed its fiscal period end to September 30 during the period.
See Notes to Financial Statements
66
VIRTUS EQUITY TRUST
STATEMENTS OF CHANGES IN NET ASSETS (Continued)
($ reported in thousands)
| | | | | | | | | | | | | | | | | | | | | | | | |
| | | Rampart Enhanced Core Equity Fund | | | Tactical Allocation Fund | |
| | | Fiscal
Period Ended
September 30,
2017(1) | | | Year Ended
March 31,
2017 | | | Year Ended
March 31,
2016 | | | Fiscal
Period Ended
September 30,
2017(1) | | | Year Ended
March 31,
2017
| | | Year Ended
March 31,
2016 | |
| | | | | | | | | | | | | | | | | | | |
| INCREASE (DECREASE) IN NET ASSETS | | | | | | | | | | | | | | | | | | | | | | | | |
| From Operations | | | | | | | | | | | | | | | | | | | | | | | | |
Net investment income (loss) | | $ | 452 | | | $ | 1,073 | | | $ | 913 | | | $ | 1,295 | | | $ | 2,835 | | | $ | 3,796 | |
Net realized gain (loss) | | | 13,531 | | | | 23,880 | | | | (5,847 | ) | | | 1,582 | | | | 11,061 | | | | 143 | |
Net change in unrealized appreciation (depreciation) | | | 1,571 | | | | (1,318 | ) | | | 9,531 | | | | 9,870 | | | | (1,016 | ) | | | (17,346 | ) |
| | | | | | | | | | | | | | | | | | | | | | | | |
| Increase (decrease) in net assets resulting from operations | | | 15,554 | | | | 23,635 | | | | 4,597 | | | | 12,747 | | | | 12,880 | | | | (13,407 | ) |
| | | | | | | | | | | | | | | | | | | | | | | | |
| From Distributions to Shareholders | | | | | | | | | | | | | | | | | | | | | | | | |
Net investment income, Class A | | | (334 | ) | | | (1,189 | ) | | | (809 | ) | | | (1,295 | ) | | | (2,473 | ) | | | (3,132 | ) |
Net investment income, Class B | | | — | | | | — | | | | — | | | | — | | | | (1 | ) | | | (3 | ) |
Net investment income, Class C | | | (33 | ) | | | (23 | ) | | | (147 | ) | | | (20 | ) | | | (43 | ) | | | (81 | ) |
Net investment income, Class I | | | (75 | ) | | | (299 | ) | | | (81 | ) | | | — | | | | — | | | | — | |
Net realized short-term gains, Class A | | | (8,813 | ) | | | (1,298 | ) | | | (8,350 | ) | | | — | | | | (1,595 | ) | | | — | |
Net realized short-term gains, Class B | | | — | | | | — | | | | — | | | | — | | | | (1 | ) | | | — | |
Net realized short-term gains, Class C | | | (2,764 | ) | | | (470 | ) | | | (3,086 | ) | | | — | | | | (51 | ) | | | — | |
Net realized short-term gains, Class I | | | (1,635 | ) | | | (223 | ) | | | (658 | ) | | | — | | | | — | | | | — | |
Net realized long-term gains, Class A | | | (801 | ) | | | (1,411 | ) | | | (10,127 | ) | | | (274 | ) | | | (9,420 | ) | | | (8,371 | ) |
Net realized long-term gains, Class B | | | — | | | | — | | | | — | | | | — | | | | (9 | ) | | | (16 | ) |
Net realized long-term gains, Class C | | | (251 | ) | | | (511 | ) | | | (3,756 | ) | | | (8 | ) | | | (298 | ) | | | (388 | ) |
Net realized long-term gains, Class I | | | (149 | ) | | | (242 | ) | | | (803 | ) | | | — | | | | — | | | | — | |
| | | | | | | | | | | | | | | | | | | | | | | | |
| Decrease in net assets from distributions to shareholders | | | (14,855 | ) | | | (5,666 | ) | | | (27,817 | ) | | | (1,597 | ) | | | (13,891 | ) | | | (11,991 | ) |
| | | | | | | | | | | | | | | | | | | | | | | | |
| From Share Transactions (See Note 6) | | | | | | | | | | | | | | | | | | | | | | | | |
Change in net assets from share transactions, Class A | | | 6,623 | | | | 524 | | | | 503 | | | | (5,732 | ) | | | (9,161 | ) | | | (8,747 | ) |
Change in net assets from share transactions, Class B | | | — | | | | — | | | | — | | | | — | | | | (208 | ) | | | (126 | ) |
Change in net assets from share transactions, Class C | | | (4,434 | ) | | | (3,110 | ) | | | 4,969 | | | | (649 | ) | | | (1,069 | ) | | | 344 | |
Change in net assets from share transactions, Class I | | | 11,030 | | | | 6,999 | | | | 4,082 | | | | — | | | | — | | | | — | |
| | | | | | | | | | | | | | | | | | | | | | | | |
| Increase (decrease) in net assets from share transactions | | | 13,219 | | | | 4,413 | | | | 9,554 | | | | (6,381 | ) | | | (10,438 | ) | | | (8,529 | ) |
| | | | | | | | | | | | | | | | | | | | | | | | |
| | | | | | |
| Net increase (decrease) in net assets | | | 13,918 | | | | 22,382 | | | | (13,666 | ) | | | 4,769 | | | | (11,449 | ) | | | (33,927 | ) |
| | | | | | |
| Net Assets | | | | | | | | | | | | | | | | | | | | | | | | |
Beginning of period | | | 171,722 | | | | 149,340 | | | | 163,006 | | | | 141,766 | | | | 153,215 | | | | 187,142 | |
| | | | | | | | | | | | | | | | | | | | | | | | |
| End of period | | $ | 185,640 | | | $ | 171,722 | | | $ | 149,340 | | | $ | 146,535 | | | $ | 141,766 | | | $ | 153,215 | |
| | | | | | | | | | | | | | | | | | | | | | | | |
Accumulated undistributed net investment income (loss) at end of period | | $ | 436 | | | $ | 426 | | | $ | 866 | | | $ | (150 | ) | | $ | (9 | ) | | $ | (159 | ) |
(1) The Fund changed its fiscal period end to September 30 during the period.
See Notes to Financial Statements
67
VIRTUS EQUITY TRUST
FINANCIAL HIGHLIGHTS
SELECTED PER SHARE DATA AND RATIOS FOR A SHARE OUTSTANDING
THROUGHOUT EACH PERIOD
| | | | | | | | | | | | | | | | | | | | | | | | | | | | | | | | | | | | | | | | | | | | | | | | | | | | | | | | | | | | | | | | | | | | | | | | | | | | | |
| | | | Net Asset Value,
Beginning of Period | | Net Investment Income (Loss)(2) | | Net Realized and
Unrealized Gain (Loss) | | Total from Investment Operations | | Dividends from
Net Investment Income | | Distributions from
Net Realized Gains | | Total Distributions | | Change in Net Asset Value | | Net Asset Value, End of Period | | Total
Return(1) | | Net Assets, End of Period
(in thousands) | | Ratio of Net Expenses to
Average Net Assets(10) | | Ratio of Gross Expenses to Average
Net Assets (before waivers and
reimbursements)(10) | | Ratio of Net Investment Income
(Loss) to Average Net Assets | | Portfolio Turnover Rate |
| Contrarian Value | | | | | | | | | | | | | | | | | | | | | | | | | | | | | | | | | | | | | | | | | | | | | | | | | | | | | | | | | | | | | | | | | | | | | | | | | | | | | |
Fund | | | | | | | | | | | | | | | | | | | | | | | | | | | | | | | | | | | | | | | | | | | | | | | | | | | | | | | | | | | | | | | | | | | | | | | | | | | | | |
Class A | | | | | | | | | | | | | | | | | | | | | | | | | | | | | | | | | | | | | | | | | | | | | | | | | | | | | | | | | | | | | | | | | | | | | | | | | | | | | |
4/1/17 to 9/30/17(16) | | | | | $ | 35.96 | | | | | 0.11 | | | | | 1.37 | | | | | 1.48 | | | | | (0.40 | ) | | | | — | | | | | (0.40 | ) | | | | 1.08 | | | | $ | 37.04 | | | | | 4.19 | %(4) | | | $ | 73,007 | | | | | 1.46 | %(3)(12) | | | | 1.47 | %(3) | | | | 0.61 | %(3) | | | | 6 | %(4) |
4/1/16 to 3/31/17 | | | | | | 31.48 | | | | | 0.33 | | | | | 4.40 | | | | | 4.73 | | | | | (0.25 | ) | | | | — | | | | | (0.25 | ) | | | | 4.48 | | | | | 35.96 | | | | | 15.07 | (14) | | | | 79,463 | | | | | 1.43 | (9)(12)(14) | | | | 1.43 | | | | | 0.96 | (14) | | | | 15 | |
4/1/15 to 3/31/16 | | | | | | 36.18 | | | | | 0.17 | | | | | (4.71 | ) | | | | (4.54 | ) | | | | (0.16 | ) | | | | — | | | | | (0.16 | ) | | | | (4.70 | ) | | | | 31.48 | | | | | (12.60 | ) | | | | 107,958 | | | | | 1.41 | (12) | | | | 1.41 | | | | | 0.52 | | | | | 13 | |
4/1/14 to 3/31/15 | | | | | | 37.12 | | | | | 0.34 | | | | | (0.97 | ) | | | | (0.63 | ) | | | | (0.31 | ) | | | | — | | | | | (0.31 | ) | | | | (0.94 | ) | | | | 36.18 | | | | | (1.73 | ) | | | | 190,896 | | | | | 1.37 | (12) | | | | 1.37 | | | | | 0.92 | | | | | 34 | |
4/1/13 to 3/31/14 | | | | | | 29.97 | | | | | 0.16 | | | | | 7.07 | | | | | 7.23 | | | | | (0.08 | ) | | | | — | | | | | (0.08 | ) | | | | 7.15 | | | | | 37.12 | | | | | 24.20 | | | | | 251,498 | | | | | 1.39 | (12) | | | | 1.39 | | | | | 0.51 | | | | | 15 | |
4/1/12 to 3/31/13 | | | | | | 26.21 | | | | | 0.10 | | | | | 3.72 | | | | | 3.82 | | | | | (0.06 | ) | | | | — | | | | | (0.06 | ) | | | | 3.76 | | | | | 29.97 | | | | | 14.64 | | | | | 240,250 | | | | | 1.41 | (12) | | | | 1.41 | | | | | 0.38 | | | | | 19 | |
| | | | | | | | | | | | | | | | |
Class C | | | | | | | | | | | | | | | | | | | | | | | | | | | | | | | | | | | | | | | | | | | | | | | | | | | | | | | | | | | | | | | | | | | | | | | | | | | | | |
4/1/17 to 9/30/17(16) | | | | | $ | 34.26 | | | | | (0.02 | ) | �� | | | 1.33 | | | | | 1.31 | | | | | (0.06 | ) | | | | — | | | | | (0.06 | ) | | | | 1.25 | | | | $ | 35.51 | | | | | 3.82 | %(4) | | | $ | 24,742 | | | | | 2.20 | %(3)(12) | | | | 2.20 | %(3) | | | | (0.14 | )%(3) | | | | 6 | %(4) |
4/1/16 to 3/31/17 | | | | | | 30.00 | | | | | 0.07 | | | | | 4.20 | | | | | 4.27 | | | | | (0.01 | ) | | | | — | | | | | (0.01 | ) | | | | 4.26 | | | | | 34.26 | | | | | 14.22 | (14) | | | | 31,587 | | | | | 2.18 | (9)(12)(14) | | | | 2.18 | | | | | 0.21 | (14) | | | | 15 | |
4/1/15 to 3/31/16 | | | | | | 34.62 | | | | | (0.07 | ) | | | | (4.52 | ) | | | | (4.59 | ) | | | | (0.03 | ) | | | | — | | | | | (0.03 | ) | | | | (4.62 | ) | | | | 30.00 | | | | | (13.27 | ) | | | | 36,977 | | | | | 2.16 | (12) | | | | 2.16 | | | | | (0.23 | ) | | | | 13 | |
4/1/14 to 3/31/15 | | | | | | 35.55 | | | | | 0.05 | | | | | (0.92 | ) | | | | (0.87 | ) | | | | (0.06 | ) | | | | — | | | | | (0.06 | ) | | | | (0.93 | ) | | | | 34.62 | | | | | (2.44 | ) | | | | 60,813 | | | | | 2.12 | (12) | | | | 2.12 | | | | | 0.14 | | | | | 34 | |
4/1/13 to 3/31/14 | | | | | | 28.84 | | | | | (0.07 | ) | | | | 6.78 | | | | | 6.71 | | | | | — | | | | | — | | | | | — | | | | | 6.71 | | | | | 35.55 | | | | | 23.23 | | | | | 62,738 | | | | | 2.14 | (12) | | | | 2.14 | | | | | (0.24 | ) | | | | 15 | |
4/1/12 to 3/31/13 | | | | | | 25.34 | | | | | (0.09 | ) | | | | 3.59 | | | | | 3.50 | | | | | — | | | | | — | | | | | — | | | | | 3.50 | | | | | 28.84 | | | | | 13.81 | | | | | 54,236 | | | | | 2.16 | (12) | | | | 2.16 | | | | | (0.37 | ) | | | | 19 | |
| | | | | | | | | | | | | | | | |
Class I | | | | | | | | | | | | | | | | | | | | | | | | | | | | | | | | | | | | | | | | | | | | | | | | | | | | | | | | | | | | | | | | | | | | | | | | | | | | | |
4/1/17 to 9/30/17(16) | | | | | $ | 35.98 | | | | | 0.16 | | | | | 1.37 | | | | | 1.53 | | | | | (0.50 | ) | | | | — | | | | | (0.50 | ) | | | | 1.03 | | | | $ | 37.01 | | | | | 4.35 | %(4) | | | $ | 71,026 | | | | | 1.19 | %(3)(12) | | | | 1.19 | %(3) | | | | 0.89 | %(3) | | | | 6 | %(4) |
4/1/16 to 3/31/17 | | | | | | 31.51 | | | | | 0.42 | | | | | 4.39 | | | | | 4.81 | | | | | (0.34 | ) | | | | — | | | | | (0.34 | ) | | | | 4.47 | | | | | 35.98 | | | | | 15.36 | (14) | | | | 78,732 | | | | | 1.18 | (9)(12(14) | | | | 1.18 | | | | | 1.22 | (14) | | | | 15 | |
4/1/15 to 3/31/16 | | | | | | 36.18 | | | | | 0.25 | | | | | (4.71 | ) | | | | (4.46 | ) | | | | (0.21 | ) | | | | — | | | | | (0.21 | ) | | | | (4.67 | ) | | | | 31.51 | | | | | (12.40 | ) | | | | 104,879 | | | | | 1.16 | (12) | | | | 1.16 | | | | | 0.77 | | | | | 13 | |
4/1/14 to 3/31/15 | | | | | | 37.11 | | | | | 0.40 | | | | | (0.92 | ) | | | | (0.52 | ) | | | | (0.41 | ) | | | | — | | | | | (0.41 | ) | | | | (0.93 | ) | | | | 36.18 | | | | | (1.48 | ) | | | | 176,005 | | | | | 1.12 | (12) | | | | 1.12 | | | | | 1.08 | | | | | 34 | |
4/1/13 to 3/31/14 | | | | | | 29.97 | | | | | 0.25 | | | | | 7.05 | | | | | 7.30 | | | | | (0.16 | ) | | | | — | | | | | (0.16 | ) | | | | 7.14 | | | | | 37.11 | | | | | 24.52 | | | | | 145,115 | | | | | 1.14 | (12) | | | | 1.14 | | | | | 0.77 | | | | | 15 | |
4/1/12 to 3/31/13 | | | | | | 26.25 | | | | | 0.17 | | | | | 3.71 | | | | | 3.88 | | | | | (0.16 | ) | | | | — | | | | | (0.16 | ) | | | | 3.72 | | | | | 29.97 | | | | | 14.89 | | | | | 108,736 | | | | | 1.16 | (12) | | | | 1.16 | | | | | 0.63 | | | | | 19 | |
| | | | | | | | | | | | | | | | |
Class R6 | | | | | | | | | | | | | | | | | | | | | | | | | | | | | | | | | | | | | | | | | | | | | | | | | | | | | | | | | | | | | | | | | | | | | | | | | | | | | |
4/1/17 to 9/30/17(16) | | | | | $ | 36.01 | | | | | 0.18 | | | | | 1.37 | | | | | 1.55 | | | | | (0.56 | ) | | | | — | | | | | (0.56 | ) | | | | 0.99 | | | | $ | 37.00 | | | | | 4.40 | %(4) | | | $ | 3,097 | | | | | 1.07 | %(3)(12) | | | | 1.07 | %(3) | | | | 1.01 | %(3) | | | | 6 | %(4) |
4/1/16 to 3/31/17 | | | | | | 31.56 | | | | | 0.46 | | | | | 4.40 | | | | | 4.86 | | | | | (0.41 | ) | | | | — | | | | | (0.41 | ) | | | | 4.45 | | | | | 36.01 | | | | | 15.51 | (14) | | | | 3,047 | | | | | 1.02 | (9)(12)(14) | | | | 1.03 | | | | | 1.35 | (14) | | | | 15 | |
4/1/15 to 3/31/16 | | | | | | 36.20 | | | | | 0.29 | | | | | (4.69 | ) | | | | (4.40 | ) | | | | (0.24 | ) | | | | — | | | | | (0.24 | ) | | | | (4.64 | ) | | | | 31.56 | | | | | (12.24 | ) | | | | 4,781 | | | | | 0.99 | (12) | | | | 0.99 | | | | | 0.95 | | | | | 13 | |
11/12/14(7) to 3/31/15 | | | | | | 36.99 | | | | | 0.08 | | | | | (0.66 | ) | | | | (0.58 | ) | | | | (0.21 | ) | | | | — | | | | | (0.21 | ) | | | | (0.79 | ) | | | | 36.20 | | | | | (1.57 | ) | | | | 98 | | | | | 0.99 | (3) | | | | 0.99 | (3) | | | | 0.56 | (3) | | | | 34 | (13) |
KAR Capital Growth Fund | | | | | | | | | | | | | | | | | | | | | | | | | | | | | | | | | | | | | | | | | | | | | | | | | | | | | | | | | | | | | | | | | | | | | | | | | | | | | |
Class A | | | | | | | | | | | | | | | | | | | | | | | | | | | | | | | | | | | | | | | | | | | | | | | | | | | | | | | | | | | | | | | | | | | | | | | | | | | | | |
4/1/17 to 9/30/17(16) | | | | | $ | 14.10 | | | | | (0.03 | ) | | | | 2.27 | | | | | 2.24 | | | | | — | | | | | (0.16 | ) | | | | (0.16 | ) | | | | 2.08 | | | | $ | 16.18 | | | | | 15.93 | %(4) | | | $ | 446,720 | | | | | 1.30 | %(3)(12) | | | | 1.30 | %(3) | | | | (0.40 | )%(3) | | | | 13 | %(4) |
4/1/16 to 3/31/17 | | | | | | 13.66 | | | | | (0.05 | ) | | | | 1.64 | | | | | 1.59 | | | | | — | | | | | (1.15 | ) | | | | (1.15 | ) | | | | 0.44 | | | | | 14.10 | | | | | 12.34 | (14) | | | | 402,118 | | | | | 1.33 | (9)(12)(14) | | | | 1.34 | | | | | (0.40 | )(14) | | | | 21 | |
4/1/15 to 3/31/16 | | | | | | 14.23 | | | | | (0.05 | ) | | | | 0.13 | | | | | 0.08 | | | | | — | | | | | (0.65 | ) | | | | (0.65 | ) | | | | (0.57 | ) | | | | 13.66 | | | | | 0.39 | | | | | 401,617 | | | | | 1.30 | (12) | | | | 1.30 | | | | | (0.32 | ) | | | | 20 | |
4/1/14 to 3/31/15 | | | | | | 12.41 | | | | | (0.03 | ) | | | | 2.40 | | | | | 2.37 | | | | | — | | | | | (0.55 | ) | | | | (0.55 | ) | | | | 1.82 | | | | | 14.23 | | | | | 19.29 | | | | | 433,635 | | | | | 1.28 | (12) | | | | 1.28 | | | | | (0.22 | ) | | | | 28 | |
4/1/13 to 3/31/14 | | | | | | 10.45 | | | | | (0.01 | ) | | | | 2.00 | | | | | 1.99 | | | | | (0.03 | ) | | | | — | | | | | (0.03 | ) | | | | 1.96 | | | | | 12.41 | | | | | 19.11 | | | | | 399,131 | | | | | 1.28 | (12) | | | | 1.28 | | | | | (0.11 | ) | | | | 26 | |
4/1/12 to 3/31/13 | | | | | | 10.05 | | | | | 0.03 | | | | | 0.37 | | | | | 0.40 | | | | | — | | | | | — | | | | | — | | | | | 0.40 | | | | | 10.45 | | | | | 3.98 | | | | | 373,069 | | | | | 1.34 | (12) | | | | 1.34 | | | | | 0.31 | | | | | 20 | |
| | | | | | | | | | | | | | | | |
Class C | | | | | | | | | | | | | | | | | | | | | | | | | | | | | | | | | | | | | | | | | | | | | | | | | | | | | | | | | | | | | | | | | | | | | | | | | | | | | |
4/1/17 to 9/30/17(16) | | | | | $ | 11.32 | | | | | (0.07 | ) | | | | 1.82 | | | | | 1.75 | | | | | — | | | | | (0.16 | ) | | | | (0.16 | ) | | | | 1.59 | | | | $ | 12.91 | | | | | 15.51 | %(4) | | | $ | 14,052 | | | | | 2.08 | %(3)(12) | | | | 2.08 | %(3) | | | | (1.18 | )%(3) | | | | 13 | %(4) |
4/1/16 to 3/31/17 | | | | | | 11.27 | | | | | (0.13 | ) | | | | 1.33 | | | | | 1.20 | | | | | — | | | | | (1.15 | ) | | | | (1.15 | ) | | | | 0.05 | | | | | 11.32 | | | | | 11.47 | (14) | | | | 13,345 | | | | | 2.08 | (9)(12)(14) | | | | 2.09 | | | | | (1.16 | )(14) | | | | 21 | |
4/1/15 to 3/31/16 | | | | | | 11.93 | | | | | (0.12 | ) | | | | 0.11 | | | | | (0.01 | ) | | | | — | | | | | (0.65 | ) | | | | (0.65 | ) | | | | (0.66 | ) | | | | 11.27 | | | | | (0.31 | ) | | | | 19,832 | | | | | 2.05 | (12) | | | | 2.06 | | | | | (1.07 | ) | | | | 20 | |
4/1/14 to 3/31/15 | | | | | | 10.57 | | | | | (0.11 | ) | | | | 2.02 | | | | | 1.91 | | | | | — | | | | | (0.55 | ) | | | | (0.55 | ) | | | | 1.36 | | | | | 11.93 | | | | | 18.28 | | | | | 11,999 | | | | | 2.02 | (12) | | | | 2.02 | | | | | (0.97 | ) | | | | 28 | |
4/1/13 to 3/31/14 | | | | | | 8.94 | | | | | (0.08 | ) | | | | 1.71 | | | | | 1.63 | | | | | — | | | | | — | | | | | — | | | | | 1.63 | | | | | 10.57 | | | | | 18.23 | | | | | 6,329 | | | | | 2.03 | (12) | | | | 2.03 | | | | | (0.86 | ) | | | | 26 | |
4/1/12 to 3/31/13 | | | | | | 8.66 | | | | | (0.04 | ) | | | | 0.32 | | | | | 0.28 | | | | | — | | | | | — | | | | | — | | | | | 0.28 | | | | | 8.94 | | | | | 3.23 | | | | | 5,993 | | | | | 2.09 | (12) | | | | 2.09 | | | | | (0.44 | ) | | | | 20 | |
The footnote legend is at the end of the Financial Highlights.
See Notes to Financial Statements
68
VIRTUS EQUITY TRUST
FINANCIAL HIGHLIGHTS
SELECTED PER SHARE DATA AND RATIOS FOR A SHARE OUTSTANDING
THROUGHOUT EACH PERIOD
| | | | | | | | | | | | | | | | | | | | | | | | | | | | | | | | | | | | | | | | | | | | | | | | | | | | | | | | | | | | | | | | | | | | | | | | | | | | | |
| | | | Net Asset Value,
Beginning of Period | | Net Investment Income (Loss)(2) | | Net Realized and
Unrealized Gain (Loss) | | Total from Investment Operations | | Dividends from
Net Investment Income | | Distributions from
Net Realized Gains | | Total Distributions | | Change in Net Asset Value | | Net Asset Value, End of Period | | Total
Return(1) | | Net Assets, End of Period
(in thousands) | | Ratio of Net Expenses to
Average Net Assets(10) | | Ratio of Gross Expenses to Average
Net Assets (before waivers and
reimbursements)(10) | | Ratio of Net Investment Income
(Loss) to Average Net Assets | | Portfolio Turnover Rate |
| KAR Capital Growth | | | | | | | | | | | | | | | | | | | | | | | | | | | | | | | | | | | | | | | | | | | | | | | | | | | | | | | | | | | | | | | | | | | | | | | | | | | | | |
Fund (Continued) | | | | | | | | | | | | | | | | | | | | | | | | | | | | | | | | | | | | | | | | | | | | | | | | | | | | | | | | | | | | | | | | | | | | | | | | | | | | | |
Class I | | | | | | | | | | | | | | | | | | | | | | | | | | | | | | | | | | | | | | | | | | | | | | | | | | | | | | | | | | | | | | | | | | | | | | | | | | | | | |
4/1/17 to 9/30/17(16) | | | | | $ | 14.52 | | | | | (0.01 | ) | | | | 2.34 | | | | | 2.33 | | | | | — | | | | | (0.16 | ) | | | | (0.16 | ) | | | | 2.17 | | | | $ | 16.69 | | | | | 16.09 | %(4) | | | $ | 12,466 | | | | | 1.08 | %(3)(12) | | | | 1.08 | %(3) | | | | (0.18 | )%(3) | | | | 13 | %(4) |
4/1/16 to 3/31/17 | | | | | | 14.00 | | | | | (0.01 | ) | | | | 1.68 | | | | | 1.67 | | | | | — | | | | | (1.15 | ) | | | | (1.15 | ) | | | | 0.52 | | | | | 14.52 | | | | | 12.61 | (14) | | | | 10,180 | | | | | 1.08 | (9)(12)(14) | | | | 1.09 | | | | | (0.15 | )(14) | | | | 21 | |
4/1/15 to 3/31/16 | | | | | | 14.53 | | | | | (0.01 | ) | | | | 0.13 | | | | | 0.12 | | | | | — | | | | | (0.65 | ) | | | | (0.65 | ) | | | | (0.53 | ) | | | | 14.00 | | | | | 0.66 | | | | | 8,227 | | | | | 1.05 | (12) | | | | 1.05 | | | | | (0.07 | ) | | | | 20 | |
4/1/14 to 3/31/15 | | | | | | 12.64 | | | | | — | (5) | | | | 2.44 | | | | | 2.44 | | | | | — | | | | | (0.55 | ) | | | | (0.55 | ) | | | | 1.89 | | | | | 14.53 | | | | | 19.50 | | | | | 8,595 | | | | | 1.02 | (12) | | | | 1.02 | | | | | 0.03 | | | | | 28 | |
4/1/13 to 3/31/14 | | | | | | 10.64 | | | | | 0.02 | | | | | 2.04 | | | | | 2.06 | | | | | (0.06 | ) | | | | — | | | | | (0.06 | ) | | | | 2.00 | | | | | 12.64 | | | | | 19.45 | | | | | 5,532 | | | | | 1.03 | (12) | | | | 1.03 | | | | | 0.14 | | | | | 26 | |
4/1/12 to 3/31/13 | | | | | | 10.21 | | | | | 0.06 | | | | | 0.37 | | | | | 0.43 | | | | | — | | | | | — | | | | | — | | | | | 0.43 | | | | | 10.64 | | | | | 4.21 | | | | | 5,650 | | | | | 1.09 | (12) | | | | 1.09 | | | | | 0.57 | | | | | 20 | |
| KAR Global Quality | | | | | | | | | | | | | | | | | | | | | | | | | | | | | | | | | | | | | | | | | | | | | | | | | | | | | | | | | | | | | | | | | | | | | | | | | | | | | |
Dividend Fund | | | | | | | | | | | | | | | | | | | | | | | | | | | | | | | | | | | | | | | | | | | | | | | | | | | | | | | | | | | | | | | | | | | | | | | | | | | | | |
Class A | | | | | | | | | | | | | | | | | | | | | | | | | | | | | | | | | | | | | | | | | | | | | | | | | | | | | | | | | | | | | | | | | | | | | | | | | | | | | |
4/1/17 to 9/30/17(16) | | | | | $ | 16.81 | | | | | 0.30 | | | | | 0.41 | | | | | 0.71 | | | | | (0.27 | ) | | | | (1.05 | ) | | | | (1.32 | ) | | | | (0.61 | ) | | | $ | 16.20 | | | | | 4.31 | %(4) | | | $ | 44,188 | | | | | 1.35 | %(3) | | | | 1.56 | %(3) | | | | 3.65 | %(3) | | | | 13 | %(4) |
4/1/16 to 3/31/17 | | | | | | 15.09 | | | | | 0.20 | | | | | 1.66 | | | | | 1.86 | | | | | (0.14 | ) | | | | — | | | | | (0.14 | ) | | | | 1.72 | | | | | 16.81 | | | | | 12.42 | | | | | 46,670 | | | | | 1.36 | (9) | | | | 1.48 | | | | | 1.29 | | | | | 119 | |
4/1/15 to 3/31/16 | | | | | | 15.40 | | | | | 0.14 | | | | | (0.37 | ) | | | | (0.23 | ) | | | | (0.08 | ) | | | | — | | | | | (0.08 | ) | | | | (0.31 | ) | | | | 15.09 | | | | | (1.53 | ) | | | | 50,081 | | | | | 1.35 | | | | | 1.44 | | | | | 0.94 | | | | | 25 | |
4/1/14 to 3/31/15 | | | | | | 13.93 | | | | | 0.10 | | | | | 1.49 | | | | | 1.59 | | | | | (0.12 | ) | | | | — | | | | | (0.12 | ) | | | | 1.47 | | | | | 15.40 | | | | | 11.45 | | | | | 55,215 | | | | | 1.35 | | | | | 1.42 | | | | | 0.71 | | | | | 56 | |
4/1/13 to 3/31/14 | | | | | | 11.96 | | | | | 0.10 | | | | | 1.98 | | | | | 2.08 | | | | | (0.11 | ) | | | | — | | | | | (0.11 | ) | | | | 1.97 | | | | | 13.93 | | | | | 17.50 | | | | | 49,275 | | | | | 1.35 | | | | | 1.43 | | | | | 0.81 | | | | | 23 | |
4/1/12 to 3/31/13 | | | | | | 10.76 | | | | | 0.13 | | | | | 1.18 | | | | | 1.31 | | | | | (0.11 | ) | | | | — | | | | | (0.11 | ) | | | | 1.20 | | | | | 11.96 | | | | | 12.36 | | | | | 48,193 | | | | | 1.35 | | | | | 1.47 | | | | | 1.19 | | | | | 32 | |
| | | | | | | | | | | | | | | | |
Class C | | | | | | | | | | | | | | | | | | | | | | | | | | | | | | | | | | | | | | | | | | | | | | | | | | | | | | | | | | | | | | | | | | | | | | | | | | | | | |
4/1/17 to 9/30/17(16) | | | | | $ | 16.38 | | | | | 0.23 | | | | | 0.39 | | | | | 0.62 | | | | | (0.13 | ) | | | | (1.05 | ) | | | | (1.18 | ) | | | | (0.56 | ) | | | $ | 15.82 | | | | | 3.86 | %(4) | | | $ | 6,107 | | | | | 2.10 | %(3) | | | | 2.33 | %(3) | | | | 2.87 | %(3) | | | | 13 | %(4) |
4/1/16 to 3/31/17 | | | | | | 14.68 | | | | | 0.08 | | | | | 1.62 | | | | | 1.70 | | | | | — | | | | | — | | | | | — | | | | | 1.70 | | | | | 16.38 | | | | | 11.58 | | | | | 6,950 | | | | | 2.11 | (9) | | | | 2.23 | | | | | 0.54 | | | | | 119 | |
4/1/15 to 3/31/16 | | | | | | 15.03 | | | | | 0.01 | | | | | (0.35 | ) | | | | (0.34 | ) | | | | (0.01 | ) | | | | — | | | | | (0.01 | ) | | | | (0.35 | ) | | | | 14.68 | | | | | (2.26 | ) | | | | 8,211 | | | | | 2.10 | | | | | 2.18 | | | | | 0.10 | | | | | 25 | |
4/1/14 to 3/31/15 | | | | | | 13.67 | | | | | 0.01 | | | | | 1.43 | | | | | 1.44 | | | | | (0.08 | ) | | | | — | | | | | (0.08 | ) | | | | 1.36 | | | | | 15.03 | | | | | 10.64 | | | | | 20,383 | | | | | 2.10 | | | | | 2.16 | | | | | 0.07 | | | | | 56 | |
4/1/13 to 3/31/14 | | | | | | 11.77 | | | | | 0.01 | | | | | 1.94 | | | | | 1.95 | | | | | (0.05 | ) | | | | — | | | | | (0.05 | ) | | | | 1.90 | | | | | 13.67 | | | | | 16.56 | | | | | 3,803 | | | | | 2.10 | | | | | 2.18 | | | | | 0.05 | | | | | 23 | |
4/1/12 to 3/31/13 | | | | | | 10.60 | | | | | 0.04 | | | | | 1.18 | | | | | 1.22 | | | | | (0.05 | ) | | | | — | | | | | (0.05 | ) | | | | 1.17 | | | | | 11.77 | | | | | 11.57 | | | | | 3,452 | | | | | 2.10 | | | | | 2.23 | | | | | 0.42 | | | | | 32 | |
| | | | | | | | | | | | | | | | |
Class I | | | | | | | | | | | | | | | | | | | | | | | | | | | | | | | | | | | | | | | | | | | | | | | | | | | | | | | | | | | | | | | | | | | | | | | | | | | | | |
4/1/17 to 9/30/17(16) | | | | | $ | 16.84 | | | | | 0.29 | | | | | 0.44 | | | | | 0.73 | | | | | (0.32 | ) | | | | (1.05 | ) | | | | (1.37 | ) | | | | (0.64 | ) | | | $ | 16.20 | | | | | 4.41 | %(4) | | | $ | 6,524 | | | | | 1.10 | %(3) | | | | 1.33 | %(3) | | | | 3.53 | %(3) | | | | 13 | %(4) |
4/1/16 to 3/31/17 | | | | | | 15.12 | | | | | 0.25 | | | | | 1.65 | | | | | 1.90 | | | | | (0.18 | ) | | | | — | | | | | (0.18 | ) | | | | 1.72 | | | | | 16.84 | | | | | 12.66 | | | | | 7,096 | | | | | 1.11 | (9) | | | | 1.23 | | | | | 1.59 | | | | | 119 | |
4/1/15 to 3/31/16 | | | | | | 15.40 | | | | | 0.17 | | | | | (0.35 | ) | | | | (0.18 | ) | | | | (0.10 | ) | | | | — | | | | | (0.10 | ) | | | | (0.28 | ) | | | | 15.12 | | | | | (1.21 | ) | | | | 6,496 | | | | | 1.10 | | | | | 1.18 | | | | | 1.15 | | | | | 25 | |
4/1/14 to 3/31/15 | | | | | | 13.93 | | | | | 0.14 | | | | | 1.49 | | | | | 1.63 | | | | | (0.16 | ) | | | | — | | | | | (0.16 | ) | | | | 1.47 | | | | | 15.40 | | | | | 11.72 | | | | | 9,776 | | | | | 1.10 | | | | | 1.17 | | | | | 0.96 | | | | | 56 | |
4/1/13 to 3/31/14 | | | | | | 11.97 | | | | | 0.13 | | | | | 1.97 | | | | | 2.10 | | | | | (0.14 | ) | | | | — | | | | | (0.14 | ) | | | | 1.96 | | | | | 13.93 | | | | | 17.70 | | | | | 9,546 | | | | | 1.10 | | | | | 1.18 | | | | | 0.99 | | | | | 23 | |
4/1/12 to 3/31/13 | | | | | | 10.76 | | | | | 0.20 | | | | | 1.15 | | | | | 1.35 | | | | | (0.14 | ) | | | | — | | | | | (0.14 | ) | | | | 1.21 | | | | | 11.97 | | | | | 12.73 | | | | | 30,360 | | | | | 1.10 | | | | | 1.12 | | | | | 1.73 | | | | | 32 | |
KAR Mid-Cap Core Fund | | | | | | | | | | | | | | | | | | | | | | | | | | | | | | | | | | | | | | | | | | | | | | | | | | | | | | | | | | | | | | | | | | | | | | | | | | | | | |
Class A | | | | | | | | | | | | | | | | | | | | | | | | | | | | | | | | | | | | | | | | | | | | | | | | | | | | | | | | | | | | | | | | | | | | | | | | | | | | | |
4/1/17 to 9/30/17(16) | | | | | $ | 25.80 | | | | | (0.05 | ) | | | | 2.29 | | | | | 2.24 | | | | | — | | | | | (0.09 | ) | | | | (0.09 | ) | | | | 2.15 | | | | $ | 27.95 | | | | | 8.70 | %(4) | | | $ | 26,238 | | | | | 1.20 | %(3) | | | | 1.49 | %(3) | | | | (0.35 | )%(3) | | | | 11 | %(4) |
4/1/16 to 3/31/17 | | | | | | 22.60 | | | | | (0.08 | ) | | | | 3.28 | | | | | 3.20 | | | | | — | | | | | — | | | | | — | | | | | 3.20 | | | | | 25.80 | | | | | 14.16 | | | | | 20,615 | | | | | 1.26 | (8)(9) | | | | 1.55 | | | | | (0.32 | ) | | | | 28 | |
4/1/15 to 3/31/16 | | | | | | 23.00 | | | | | (0.06 | ) | | | | (0.20 | ) | | | | (0.26 | ) | | | | — | | | | | (0.14 | ) | | | | (0.14 | ) | | | | (0.40 | ) | | | | 22.60 | | | | | (1.14 | ) | | | | 20,639 | | | | | 1.35 | | | | | 1.64 | | | | | (0.27 | ) | | | | 21 | |
4/1/14 to 3/31/15 | | | | | | 19.80 | | | | | (0.07 | ) | | | | 4.47 | | | | | 4.40 | | | | | — | | | | | (1.20 | ) | | | | (1.20 | ) | | | | 3.20 | | | | | 23.00 | | | | | 22.75 | | | | | 13,080 | | | | | 1.35 | | | | | 2.46 | | | | | (0.34 | ) | | | | 26 | |
4/1/13 to 3/31/14 | | | | | | 17.49 | | | | | (0.06 | ) | | | | 2.68 | | | | | 2.62 | | | | | — | | | | | (0.31 | ) | | | | (0.31 | ) | | | | 2.31 | | | | | 19.80 | | | | | 15.17 | | | | | 3,027 | | | | | 1.35 | | | | | 3.08 | | | | | (0.31 | ) | | | | 30 | |
4/1/12 to 3/31/13 | | | | | | 15.80 | | | | | 0.19 | | | | | 1.86 | | | | | 2.05 | | | | | (0.25 | ) | | | | (0.11 | ) | | | | (0.36 | ) | | | | 1.69 | | | | | 17.49 | | | | | 13.21 | | | | | 1,691 | | | | | 1.35 | | | | | 3.92 | | | | | 1.20 | | | | | 62 | |
The footnote legend is at the end of the Financial Highlights.
See Notes to Financial Statements
69
VIRTUS EQUITY TRUST
FINANCIAL HIGHLIGHTS
SELECTED PER SHARE DATA AND RATIOS FOR A SHARE OUTSTANDING
THROUGHOUT EACH PERIOD
| | | | | | | | | | | | | | | | | | | | | | | | | | | | | | | | | | | | | | | | | | | | | | | | | | | | | | | | | | | | | | | | | | | | | | | | | | | | | |
| | | | Net Asset Value,
Beginning of Period | | Net Investment Income (Loss)(2) | | Net Realized and
Unrealized Gain (Loss) | | Total from Investment Operations | | Dividends from
Net Investment Income | | Distributions from
Net Realized Gains | | Total Distributions | | Change in Net Asset Value | | Net Asset Value, End of Period | | Total
Return(1) | | Net Assets, End of Period
(in thousands) | | Ratio of Net Expenses to
Average Net Assets(10) | | Ratio of Gross Expenses to Average
Net Assets (before waivers and
reimbursements)(10) | | Ratio of Net Investment Income
(Loss) to Average Net Assets | | Portfolio Turnover Rate |
| KAR Mid-Cap Core | | | | | | | | | | | | | | | | | | | | | | | | | | | | | | | | | | | | | | | | | | | | | | | | | | | | | | | | | | | | | | | | | | | | | | | | | | | | | |
Fund (Continued) | | | | | | | | | | | | | | | | | | | | | | | | | | | | | | | | | | | | | | | | | | | | | | | | | | | | | | | | | | | | | | | | | | | | | | | | | | | | | |
Class C | | | | | | | | | | | | | | | | | | | | | | | | | | | | | | | | | | | | | | | | | | | | | | | | | | | | | | | | | | | | | | | | | | | | | | | | | | | | | |
4/1/17 to 9/30/17(16) | | | | | $ | 24.45 | | | | | (0.14 | ) | | | | 2.16 | | | | | 2.02 | | | | | — | | | | | (0.09 | ) | | | | (0.09 | ) | | | | 1.93 | | | | $ | 26.38 | | | | | 8.28 | %(4) | | | $ | 17,870 | | | | | 1.95 | %(3) | | | | 2.25 | %(3) | | | | (1.10 | )%(3) | | | | 11 | %(4) |
4/1/16 to 3/31/17 | | | | | | 21.57 | | | | | (0.24 | ) | | | | 3.12 | | | | | 2.88 | | | | | — | | | | | — | | | | | — | | | | | 2.88 | | | | | 24.45 | | | | | 13.35 | | | | | 14,279 | | | | | 2.00 | (8)(9) | | | | 2.28 | | | | | (1.04 | ) | | | | 28 | |
4/1/15 to 3/31/16 | | | | | | 22.12 | | | | | (0.22 | ) | | | | (0.19 | ) | | | | (0.41 | ) | | | | — | | | | | (0.14 | ) | | | | (0.14 | ) | | | | (0.55 | ) | | | | 21.57 | | | | | (1.91 | ) | | | | 6,670 | | | | | 2.10 | | | | | 2.38 | | | | | (1.03 | ) | | | | 21 | |
4/1/14 to 3/31/15 | | | | | | 19.23 | | | | | (0.23 | ) | | | | 4.32 | | | | | 4.09 | | | | | — | | | | | (1.20 | ) | | | | (1.20 | ) | | | | 2.89 | | | | | 22.12 | | | | | 21.84 | | | | | 4,363 | | | | | 2.10 | | | | | 2.83 | | | | | (1.10 | ) | | | | 26 | |
4/1/13 to 3/31/14 | | | | | | 17.12 | | | | | (0.18 | ) | | | | 2.60 | | | | | 2.42 | | | | | — | | | | | (0.31 | ) | | | | (0.31 | ) | | | | 2.11 | | | | | 19.23 | | | | | 14.32 | | | | | 209 | | | | | 2.10 | | | | | 3.84 | | | | | (1.01 | ) | | | | 30 | |
4/1/12 to 3/31/13 | | | | | | 15.50 | | | | | 0.06 | | | | | 1.83 | | | | | 1.89 | | | | | (0.16 | ) | | | | (0.11 | ) | | | | (0.27 | ) | | | | 1.62 | | | | | 17.12 | | | | | 12.42 | | | | | 226 | | | | | 2.10 | | | | | 4.70 | | | | | 0.36 | | | | | 62 | |
| | | | | | | | | | | | | | | | |
Class I | | | | | | | | | | | | | | | | | | | | | | | | | | | | | | | | | | | | | | | | | | | | | | | | | | | | | | | | | | | | | | | | | | | | | | | | | | | | | |
4/1/17 to 9/30/17(16) | | | | | $ | 26.12 | | | | | (0.01 | ) | | | | 2.32 | | | | | 2.31 | | | | | — | | | | | (0.09 | ) | | | | (0.09 | ) | | | | 2.22 | | | | $ | 28.34 | | | | | 8.82 | %(4) | | | $ | 69,955 | | | | | 0.95 | %(3) | | | | 1.25 | %(3) | | | | (0.10 | )%(3) | | | | 11 | %(4) |
4/1/16 to 3/31/17 | | | | | | 22.82 | | | | | (0.01 | ) | | | | 3.31 | | | | | 3.30 | | | | | — | | | | | — | | | | | — | | | | | 3.30 | | | | | 26.12 | | | | | 14.46 | | | | | 50,922 | | | | | 0.99 | (8)(9) | | | | 1.26 | | | | | (0.02 | ) | | | | 28 | |
4/1/15 to 3/31/16 | | | | | | 23.17 | | | | | (0.01 | ) | | | | (0.20 | ) | | | | (0.21 | ) | | | | — | | | | | (0.14 | ) | | | | (0.14 | ) | | | | (0.35 | ) | | | | 22.82 | | | | | (0.92 | ) | | | | 7,570 | | | | | 1.10 | | | | | 1.38 | | | | | (0.03 | ) | | | | 21 | |
4/1/14 to 3/31/15 | | | | | | 19.89 | | | | | (0.03 | ) | | | | 4.51 | | | | | 4.48 | | | | | — | | | | | (1.20 | ) | | | | (1.20 | ) | | | | 3.28 | | | | | 23.17 | | | | | 23.05 | | | | | 4,804 | | | | | 1.10 | | | | | 2.17 | | | | | (0.16 | ) | | | | 26 | |
4/1/13 to 3/31/14 | | | | | | 17.52 | | | | | (0.01 | ) | | | | 2.69 | | | | | 2.68 | | | | | — | | | | | (0.31 | ) | | | | (0.31 | ) | | | | 2.37 | | | | | 19.89 | | | | | 15.48 | | | | | 1,178 | | | | | 1.10 | | | | | 2.85 | | | | | (0.08 | ) | | | | 30 | |
4/1/12 to 3/31/13 | | | | | | 15.84 | | | | | 0.25 | | | | | 1.84 | | | | | 2.09 | | | | | (0.30 | ) | | | | (0.11 | ) | | | | (0.41 | ) | | | | 1.68 | | | | | 17.52 | | | | | 13.50 | | | | | 1,316 | | | | | 1.10 | | | | | 3.65 | | | | | 1.56 | | | | | 62 | |
KAR Mid-Cap Growth Fund | | | | | | | | | | | | | | | | | | | | | | | | | | | | | | | | | | | | | | | | | | | | | | | | | | | | | | | | | | | | | | | | | | | | | | | | | | | | | |
Class A | | | | | | | | | | | | | | | | | | | | | | | | | | | | | | | | | | | | | | | | | | | | | | | | | | | | | | | | | | | | | | | | | | | | | | | | | | | | | |
4/1/17 to 9/30/17(16) | | | | | $ | 24.56 | | | | | (0.12 | ) | | | | 3.43 | | | | | 3.31 | | | | | — | | | | | (0.13 | ) | | | | (0.13 | ) | | | | 3.18 | | | | $ | 27.74 | | | | | 13.48 | %(4) | | | $ | 84,912 | | | | | 1.40 | %(3) | | | | 1.49 | %(3) | | | | (0.88 | )%(3) | | | | 12 | %(4) |
4/1/16 to 3/31/17 | | | | | | 21.92 | | | | | (0.16 | ) | | | | 3.15 | | | | | 2.99 | | | | | — | | | | | (0.35 | ) | | | | (0.35 | ) | | | | 2.64 | | | | | 24.56 | | | | | 13.81 | (14) | | | | 80,648 | | | | | 1.41 | (9)(14) | | | | 1.52 | | | | | (0.75 | )(14) | | | | 20 | |
4/1/15 to 3/31/16 | | | | | | 22.80 | | | | | (0.18 | ) | | | | (0.36 | ) | | | | (0.54 | ) | | | | — | | | | | (0.34 | ) | | | | (0.34 | ) | | | | (0.88 | ) | | | | 21.92 | | | | | (2.51 | ) | | | | 76,660 | | | | | 1.39 | | | | | 1.49 | | | | | (0.84 | ) | | | | 26 | |
4/1/14 to 3/31/15 | | | | | | 21.30 | | | | | (0.15 | ) | | | | 2.34 | | | | | 2.19 | | | | | — | | | | | (0.69 | ) | | | | (0.69 | ) | | | | 1.50 | | | | | 22.80 | | | | | 10.50 | | | | | 83,158 | | | | | 1.43 | (8) | | | | 1.46 | | | | | (0.71 | ) | | | | 27 | |
4/1/13 to 3/31/14 | | | | | | 19.02 | | | | | (0.15 | ) | | | | 2.43 | | | | | 2.28 | | | | | — | | | | | — | | | | | — | | | | | 2.28 | | | | | 21.30 | | | | | 11.99 | | | | | 81,016 | | | | | 1.45 | | | | | 1.44 | | | | | (0.74 | ) | | | | 32 | |
4/1/12 to 3/31/13 | | | | | | 17.44 | | | | | (0.08 | ) | | | | 1.66 | | | | | 1.58 | | | | | — | | | | | — | | | | | — | | | | | 1.58 | | | | | 19.02 | | | | | 9.06 | | | | | 79,561 | | | | | 1.45 | | | | | 1.51 | | | | | (0.49 | ) | | | | 35 | |
| | | | | | | | | | | | | | | | |
Class C | | | | | | | | | | | | | | | | | | | | | | | | | | | | | | | | | | | | | | | | | | | | | | | | | | | | | | | | | | | | | | | | | | | | | | | | | | | | | |
4/1/17 to 9/30/17(16) | | | | | $ | 20.06 | | | | | (0.17 | ) | | | | 2.78 | | | | | 2.61 | | | | | — | | | | | (0.13 | ) | | | | (0.13 | ) | | | | 2.48 | | | | $ | 22.54 | | | | | 13.01 | %(4) | | | $ | 4,971 | | | | | 2.15 | %(3) | | | | 2.28 | %(3) | | | | (1.63 | )%(3) | | | | 12 | %(4) |
4/1/16 to 3/31/17 | | | | | | 18.09 | | | | | (0.27 | ) | | | | 2.59 | | | | | 2.32 | | | | | — | | | | | (0.35 | ) | | | | (0.35 | ) | | | | 1.97 | | | | | 20.06 | | | | | 13.03 | (14) | | | | 5,350 | | | | | 2.16 | (9)(14) | | | | 2.27 | | | | | (1.50 | )(14) | | | | 20 | |
4/1/15 to 3/31/16 | | | | | | 19.02 | | | | | (0.29 | ) | | | | (0.30 | ) | | | | (0.59 | ) | | | | — | | | | | (0.34 | ) | | | | (0.34 | ) | | | | (0.93 | ) | | | | 18.09 | | | | | (3.23 | ) | | | | 5,319 | | | | | 2.14 | | | | | 2.24 | | | | | (1.60 | ) | | | | 26 | |
4/1/14 to 3/31/15 | | | | | | 18.01 | | | | | (0.26 | ) | | | | 1.96 | | | | | 1.70 | | | | | — | | | | | (0.69 | ) | | | | (0.69 | ) | | | | 1.01 | | | | | 19.02 | | | | | 9.68 | | | | | 5,976 | | | | | 2.18 | (8) | | | | 2.21 | | | | | (1.46 | ) | | | | 27 | |
4/1/13 to 3/31/14 | | | | | | 16.21 | | | | | (0.26 | ) | | | | 2.06 | | | | | 1.80 | | | | | — | | | | | — | | | | | — | | | | | 1.80 | | | | | 18.01 | | | | | 11.10 | | | | | 5,233 | | | | | 2.20 | | | | | 2.19 | | | | | (1.49 | ) | | | | 32 | |
4/1/12 to 3/31/13 | | | | | | 14.97 | | | | | (0.18 | ) | | | | 1.42 | | | | | 1.24 | | | | | — | | | | | — | | | | | — | | | | | 1.24 | | | | | 16.21 | | | | | 8.28 | | | | | 4,850 | | | | | 2.20 | | | | | 2.26 | | | | | (1.24 | ) | | | | 35 | |
| | | | | | | | | | | | | | | | |
Class I | | | | | | | | | | | | | | | | | | | | | | | | | | | | | | | | | | | | | | | | | | | | | | | | | | | | | | | | | | | | | | | | | | | | | | | | | | | | | |
4/1/17 to 9/30/17(16) | | | | | $ | 25.20 | | | | | (0.09 | ) | | | | 3.51 | | | | | 3.42 | | | | | — | | | | | (0.13 | ) | | | | (0.13 | ) | | | | 3.29 | | | | $ | 28.49 | | | | | 13.58 | %(4) | | | $ | 4,419 | | | | | 1.15 | %(3) | | | | 1.27 | %(3) | | | | (0.63 | )%(3) | | | | 12 | %(4) |
4/1/16 to 3/31/17 | | | | | | 22.42 | | | | | (0.11 | ) | | | | 3.24 | | | | | 3.13 | | | | | — | | | | | (0.35 | ) | | | | (0.35 | ) | | | | 2.78 | | | | | 25.20 | | | | | 14.13 | (14) | | | | 3,872 | | | | | 1.16 | (9)(14) | | | | 1.27 | | | | | (0.50 | )(14) | | | | 20 | |
4/1/15 to 3/31/16 | | | | | | 23.26 | | | | | (0.13 | ) | | | | (0.37 | ) | | | | (0.50 | ) | | | | — | | | | | (0.34 | ) | | | | (0.34 | ) | | | | (0.84 | ) | | | | 22.42 | | | | | (2.24 | ) | | | | 2,961 | | | | | 1.14 | | | | | 1.24 | | | | | (0.60 | ) | | | | 26 | |
4/1/14 to 3/31/15 | | | | | | 21.66 | | | | | (0.10 | ) | | | | 2.39 | | | | | 2.29 | | | | | — | | | | | (0.69 | ) | | | | (0.69 | ) | | | | 1.60 | | | | | 23.26 | | | | | 10.79 | | | | | 3,288 | | | | | 1.18 | (8) | | | | 1.21 | | | | | (0.46 | ) | | | | 27 | |
4/1/13 to 3/31/14 | | | | | | 19.30 | | | | | (0.10 | ) | | | | 2.46 | | | | | 2.36 | | | | | — | | | | | — | | | | | — | | | | | 2.36 | | | | | 21.66 | | | | | 12.23 | | | | | 2,324 | | | | | 1.20 | | | | | 1.19 | | | | | (0.49 | ) | | | | 32 | |
4/1/12 to 3/31/13 | | | | | | 17.65 | | | | | (0.04 | ) | | | | 1.69 | | | | | 1.65 | | | | | — | | | | | — | | | | | — | | | | | 1.65 | | | | | 19.30 | | | | | 9.35 | | | | | 1,932 | | | | | 1.20 | | | | | 1.26 | | | | | (0.24 | ) | | | | 35 | |
The footnote legend is at the end of the Financial Highlights.
See Notes to Financial Statements
70
VIRTUS EQUITY TRUST
FINANCIAL HIGHLIGHTS
SELECTED PER SHARE DATA AND RATIOS FOR A SHARE OUTSTANDING
THROUGHOUT EACH PERIOD
| | | | | | | | | | | | | | | | | | | | | | | | | | | | | | | | | | | | | | | | | | | | | | | | | | | | | | | | | | | | | | | | | | | | | | | | | | | | | |
| | | | Net Asset Value,
Beginning of Period | | Net Investment Income (Loss)(2) | | Net Realized and
Unrealized Gain (Loss) | | Total from Investment Operations | | Dividends from
Net Investment Income | | Distributions from
Net Realized Gains | | Total Distributions | | Change in Net Asset Value | | Net Asset Value, End of Period | | Total
Return(1) | | Net Assets, End of Period
(in thousands) | | Ratio of Net Expenses to
Average Net Assets(10) | | Ratio of Gross Expenses to Average
Net Assets (before waivers and
reimbursements)(10) | | Ratio of Net Investment Income
(Loss) to Average Net Assets | | Portfolio Turnover Rate |
KAR Small-Cap Core Fund | | | | | | | | | | | | | | | | | | | | | | | | | | | | | | | | | | | | | | | | | | | | | | | | | | | | | | | | | | | | | | | | | | | | | | | | | | | | | |
Class A | | | | | | | | | | | | | | | | | | | | | | | | | | | | | | | | | | | | | | | | | | | | | | | | | | | | | | | | | | | | | | | | | | | | | | | | | | | | | |
4/1/17 to 9/30/17(16) | | | | | $ | 24.21 | | | | | (0.06 | ) | | | | 3.91 | | | | | 3.85 | | | | | — | | | | | (0.01 | ) | | | | (0.01 | ) | | | | 3.84 | | | | $ | 28.05 | | | | | 15.92 | %(4) | | | $ | 79,752 | | | | | 1.33 | %(3) | | | | 1.33 | %(3) | | | | (0.49 | )%(3) | | | | 2 | %(4) |
4/1/16 to 3/31/17 | | | | | | 21.39 | | | | | (0.07 | ) | | | | 4.26 | | | | | 4.19 | | | | | — | | | | | (1.37 | ) | | | | (1.37 | ) | | | | 2.82 | | | | | 24.21 | | | | | 20.26 | (14) | | | | 62,122 | | | | | 1.37 | (9)(14) | | | | 1.37 | | | | | (0.31 | )(14) | | | | 24 | |
4/1/15 to 3/31/16 | | | | | | 25.65 | | | | | (0.05 | ) | | | | 0.01 | | | | | (0.04 | ) | | | | (0.05 | ) | | | | (4.17 | ) | | | | (4.22 | ) | | | | (4.26 | ) | | | | 21.39 | | | | | 0.02 | | | | | 53,722 | | | | | 1.37 | | | | | 1.37 | | | | | (0.21 | ) | | | | 33 | |
4/1/14 to 3/31/15 | | | | | | 24.19 | | | | | 0.03 | | | | | 3.07 | | | | | 3.10 | | | | | — | | | | | (1.64 | ) | | | | (1.64 | ) | | | | 1.46 | | | | | 25.65 | | | | | 13.28 | | | | | 67,696 | | | | | 1.34 | | | | | 1.34 | | | | | 0.12 | | | | | 28 | |
4/1/13 to 3/31/14 | | | | | | 21.41 | | | | | (0.02 | ) | | | | 2.84 | | | | | 2.82 | | | | | (0.03 | ) | | | | (0.01 | ) | | | | (0.04 | ) | | | | 2.78 | | | | | 24.19 | | | | | 13.17 | | | | | 162,302 | | | | | 1.39 | | | | | 1.39 | | | | | (0.09 | ) | | | | 31 | |
4/1/12 to 3/31/13 | | | | | | 20.07 | | | | | 0.10 | | | | | 1.75 | | | | | 1.85 | | | | | (0.18 | ) | | | | (0.33 | ) | | | | (0.51 | ) | | | | 1.34 | | | | | 21.41 | | | | | 9.64 | | | | | 143,293 | | | | | 1.37 | | | | | 1.37 | | | | | 0.52 | | | | | 15 | (11) |
| | | | | | | | | | | | | | | | |
Class C | | | | | | | | | | | | | | | | | | | | | | | | | | | | | | | | | | | | | | | | | | | | | | | | | | | | | | | | | | | | | | | | | | | | | | | | | | | | | |
4/1/17 to 9/30/17(16) | | | | | $ | 20.71 | | | | | (0.14 | ) | | | | 3.34 | | | | | 3.20 | | | | | — | | | | | (0.01 | ) | | | | (0.01 | ) | | | | 3.19 | | | | $ | 23.90 | | | | | 15.47 | %(4) | | | $ | 56,526 | | | | | 2.08 | %(3) | | | | 2.08 | %(3) | | | | (1.23 | )%(3) | | | | 2 | %(4) |
4/1/16 to 3/31/17 | | | | | | 18.61 | | | | | (0.21 | ) | | | | 3.68 | | | | | 3.47 | | | | | — | | | | | (1.37 | ) | | | | (1.37 | ) | | | | 2.10 | | | | | 20.71 | | | | | 19.39 | (14) | | | | 44,789 | | | | | 2.12 | (9)(14) | | | | 2.12 | | | | | (1.10 | )(14) | | | | 24 | |
4/1/15 to 3/31/16 | | | | | | 22.98 | | | | | (0.19 | ) | | | | (0.01 | ) | | | | (0.20 | ) | | | | — | | | | | (4.17 | ) | | | | (4.17 | ) | | | | (4.37 | ) | | | | 18.61 | | | | | (0.73 | ) | | | | 31,711 | | | | | 2.12 | | | | | 2.12 | | | | | (0.95 | ) | | | | 33 | |
4/1/14 to 3/31/15 | | | | | | 21.99 | | | | | (0.11 | ) | | | | 2.74 | | | | | 2.63 | | | | | — | | | | | (1.64 | ) | | | | (1.64 | ) | | | | 0.99 | | | | | 22.98 | | | | | 12.44 | | | | | 33,735 | | | | | 2.09 | | | | | 2.09 | | | | | (0.50 | ) | | | | 28 | |
4/1/13 to 3/31/14 | | | | | | 19.58 | | | | | (0.18 | ) | | | | 2.60 | | | | | 2.42 | | | | | — | (5) | | | | (0.01 | ) | | | | (0.01 | ) | | | | 2.41 | | | | | 21.99 | | | | | 12.35 | | | | | 33,437 | | | | | 2.14 | | | | | 2.14 | | | | | (0.84 | ) | | | | 31 | |
4/1/12 to 3/31/13 | | | | | | 18.38 | | | | | (0.04 | ) | | | | 1.61 | | | | | 1.57 | | | | | (0.04 | ) | | | | (0.33 | ) | | | | (0.37 | ) | | | | 1.20 | | | | | 19.58 | | | | | 8.84 | | | | | 27,641 | | | | | 2.12 | | | | | 2.12 | | | | | (0.23 | ) | | | | 15 | (11) |
| | | | | | | | | | | | | | | | |
Class I | | | | | | | | | | | | | | | | | | | | | | | | | | | | | | | | | | | | | | | | | | | | | | | | | | | | | | | | | | | | | | | | | | | | | | | | | | | | | |
4/1/17 to 9/30/17(16) | | | | | $ | 25.37 | | | | | (0.03 | ) | | | | 4.11 | | | | | 4.08 | | | | | — | | | | | (0.01 | ) | | | | (0.01 | ) | | | | 4.07 | | | | $ | 29.44 | | | | | 16.10 | %(4) | | | $ | 474,552 | | | | | 1.08 | %(3) | | | | 1.08 | %(3) | | | | (0.23 | )%(3) | | | | 2 | %(4) |
4/1/16 to 3/31/17 | | | | | | 22.30 | | | | | (0.03 | ) | | | | 4.47 | | | | | 4.44 | | | | | — | | | | | (1.37 | ) | | | | (1.37 | ) | | | | 3.07 | | | | | 25.37 | | | | | 20.57 | (14) | | | | 338,491 | | | | | 1.12 | (9)(14) | | | | 1.12 | | | | | (0.11 | )(14) | | | | 24 | |
4/1/15 to 3/31/16 | | | | | | 26.58 | | | | | 0.01 | | | | | 0.01 | | | | | 0.02 | | | | | (0.13 | ) | | | | (4.17 | ) | | | | (4.30 | ) | | | | (4.28 | ) | | | | 22.30 | | | | | 0.28 | | | | | 189,167 | | | | | 1.12 | | | | | 1.12 | | | | | 0.04 | | | | | 33 | |
4/1/14 to 3/31/15 | | | | | | 24.95 | | | | | 0.13 | | | | | 3.14 | | | | | 3.27 | | | | | — | | | | | (1.64 | ) | | | | (1.64 | ) | | | | 1.63 | | | | | 26.58 | | | | | 13.57 | | | | | 248,933 | | | | | 1.08 | | | | | 1.08 | | | | | 0.53 | | | | | 28 | |
4/1/13 to 3/31/14 | | | | | | 22.04 | | | | | 0.04 | | | | | 2.92 | | | | | 2.96 | | | | | (0.04 | ) | | | | (0.01 | ) | | | | (0.05 | ) | | | | 2.91 | | | | | 24.95 | | | | | 13.44 | | | | | 242,400 | | | | | 1.14 | | | | | 1.14 | | | | | 0.19 | | | | | 31 | |
4/1/12 to 3/31/13 | | | | | | 20.65 | | | | | 0.13 | | | | | 1.83 | | | | | 1.96 | | | | | (0.24 | ) | | | | (0.33 | ) | | | | (0.57 | ) | | | | 1.39 | | | | | 22.04 | | | | | 9.92 | | | | | 164,483 | | | | | 1.12 | | | | | 1.12 | | | | | 0.63 | | | | | 15 | (11) |
| | | | | | | | | | | | | | | | |
Class R6 | | | | | | | | | | | | | | | | | | | | | | | | | | | | | | | | | | �� | | | | | | | | | | | | | | | | | | | | | | | | | | | | | | | | | | | | | | | | | | | |
4/1/17 to 9/30/17(16) | | | | | $ | 25.44 | | | | | (0.02 | ) | | | | 4.11 | | | | | 4.09 | | | | | — | | | | | (0.01 | ) | | | | (0.01 | ) | | | | 4.08 | | | | $ | 29.52 | | | | | 16.14 | %(4) | | | $ | 44,565 | | | | | 0.99 | %(3) | | | | 0.99 | %(3) | | | | (0.14 | )%(3) | | | | 2 | %(4) |
4/1/16 to 3/31/17 | | | | | | 22.33 | | | | | — | (5) | | | | 4.48 | | | | | 4.48 | | | | | — | | | | | (1.37 | ) | | | | (1.37 | ) | | | | 3.11 | | | | | 25.44 | | | | | 20.68 | (14) | | | | 31,338 | | | | | 1.01 | (9)(14) | | | | 1.01 | | | | | 0.01 | (14) | | | | 24 | |
4/1/15 to 3/31/16 | | | | | | 26.59 | | | | | 0.07 | | | | | (0.01 | ) | | | | 0.06 | | | | | (0.15 | ) | | | | (4.17 | ) | | | | (4.32 | ) | | | | (4.26 | ) | | | | 22.33 | | | | | 0.41 | | | | | 20,811 | | | | | 1.01 | | | | | 1.02 | | | | | 0.33 | | | | | 33 | |
11/12/14(7) to 3/31/15 | | | | | | 25.99 | | | | | 0.12 | | | | | 1.36 | | | | | 1.48 | | | | | — | | | | | (0.88 | ) | | | | (0.88 | ) | | | | 0.60 | | | | | 26.59 | | | | | 5.83 | (4) | | | | 106 | | | | | 0.97 | (3) | | | | 0.97 | (3) | | | | 1.18 | (3) | | | | 28 | (13) |
| KAR Small-Cap Growth | | | | | | | | | | | | | | | | | | | | | | | | | | | | | | | | | | | | | | | | | | | | | | | | | | | | | | | | | | | | | | | | | | | | | | | | | | | | | |
Fund | | | | | | | | | | | | | | | | | | | | | | | | | | | | | | | | | | | | | | | | | | | | | | | | | | | | | | | | | | | | | | | | | | | | | | | | | | | | | |
Class A | | | | | | | | | | | | | | | | | | | | | | | | | | | | | | | | | | | | | | | | | | | | | | | | | | | | | | | | | | | | | | | | | | | | | | | | | | | | | |
4/1/17 to 9/30/17(16) | | | | | $ | 21.12 | | | | | (0.09 | ) | | | | 4.40 | | | | | 4.31 | | | | | — | (5) | | | | — | | | | | — | (5) | | | | 4.31 | | | | $ | 25.43 | | | | | 20.41 | %(4) | | | $ | 263,281 | | | | | 1.50 | %(3)(6) | | | | 1.46 | %(3) | | | | (0.81 | )%(3) | | | | 1 | %(4) |
4/1/16 to 3/31/17 | | | | | | 17.67 | | | | | (0.14 | ) | | | | 4.14 | | | | | 4.00 | | | | | — | | | | | (0.55 | ) | | | | (0.55 | ) | | | | 3.45 | | | | | 21.12 | | | | | 23.25 | (14) | | | | 184,302 | | | | | 1.50 | (9)(14) | | | | 1.51 | | | | | (0.73 | )(14) | | | | 21 | |
4/1/15 to 3/31/16 | | | | | | 17.54 | | | | | (0.10 | ) | | | | 0.73 | | | | | 0.63 | | | | | — | | | | | (0.50 | ) | | | | (0.50 | ) | | | | 0.13 | | | | | 17.67 | | | | | 3.69 | | | | | 88,715 | | | | | 1.49 | | | | | 1.53 | | | | | (0.59 | ) | | | | 27 | |
4/1/14 to 3/31/15 | | | | | | 16.97 | | | | | (0.13 | ) | | | | 2.46 | | | | | 2.33 | | | | | — | | | | | (1.76 | ) | | | | (1.76 | ) | | | | 0.57 | | | | | 17.54 | | | | | 14.56 | | | | | 83,611 | | | | | 1.50 | | | | | 1.57 | | | | | (0.76 | ) | | | | 27 | |
4/1/13 to 3/31/14 | | | | | | 14.92 | | | | | (0.15 | ) | | | | 2.68 | | | | | 2.53 | | | | | — | | | | | (0.48 | ) | | | | (0.48 | ) | | | | 2.05 | | | | | 16.97 | | | | | 17.15 | | | | | 94,902 | | | | | 1.50 | | | | | 1.56 | | | | | (0.93 | ) | | | | 23 | |
4/1/12 to 3/31/13 | | | | | | 12.95 | | | | | (0.03 | ) | | | | 2.00 | | | | | 1.97 | | | | | — | | | | | — | | | | | — | | | | | 1.97 | | | | | 14.92 | | | | | 15.21 | | | | | 70,107 | | | | | 1.61 | (8) | | | | 1.67 | | | | | (0.24 | ) | | | | 24 | |
| | | | | | | | | | | | | | | | |
Class C | | | | | | | | | | | | | | | | | | | | | | | | | | | | | | | | | | | | | | | | | | | | | | | | | | | | | | | | | | | | | | | | | | | | | | | | | | | | | |
4/1/17 to 9/30/17(16) | | | | | $ | 19.28 | | | | | (0.17 | ) | | | | 4.02 | | | | | 3.85 | | | | | — | (5) | | | | — | | | | | — | (5) | | | | 3.85 | | | | $ | 23.13 | | | | | 19.97 | %(4) | | | $ | 93,560 | | | | | 2.25 | %(3)(6) | | | | 2.21 | %(3) | | | | (1.56 | )%(3) | | | | 1 | %(4) |
4/1/16 to 3/31/17 | | | | | | 16.30 | | | | | (0.26 | ) | | | | 3.79 | | | | | 3.53 | | | | | — | | | | | (0.55 | ) | | | | (0.55 | ) | | | | 2.98 | | | | | 19.28 | | | | | 22.30 | (14) | | | | 58,327 | | | | | 2.26 | (9)(14) | | | | 2.26 | | | | | (1.49 | )(14) | | | | 21 | |
4/1/15 to 3/31/16 | | | | | | 16.33 | | | | | (0.21 | ) | | | | 0.68 | | | | | 0.47 | | | | | — | | | | | (0.50 | ) | | | | (0.50 | ) | | | | (0.03 | ) | | | | 16.30 | | | | | 2.97 | | | | | 19,525 | | | | | 2.25 | | | | | 2.28 | | | | | (1.34 | ) | | | | 27 | |
4/1/14 to 3/31/15 | | | | | | 16.03 | | | | | (0.24 | ) | | | | 2.30 | | | | | 2.06 | | | | | — | | | | | (1.76 | ) | | | | (1.76 | ) | | | | 0.30 | | | | | 16.33 | | | | | 13.68 | | | | | 15,594 | | | | | 2.25 | | | | | 2.32 | | | | | (1.51 | ) | | | | 27 | |
4/1/13 to 3/31/14 | | | | | | 14.22 | | | | | (0.26 | ) | | | | 2.55 | | | | | 2.29 | | | | | — | | | | | (0.48 | ) | | | | (0.48 | ) | | | | 1.81 | | | | | 16.03 | | | | | 16.29 | | | | | 13,298 | | | | | 2.25 | | | | | 2.31 | | | | | (1.68 | ) | | | | 23 | |
4/1/12 to 3/31/13 | | | | | | 12.44 | | | | | (0.12 | ) | | | | 1.90 | | | | | 1.78 | | | | | — | | | | | — | | | | | — | | | | | 1.78 | | | | | 14.22 | | | | | 14.31 | | | | | 7,555 | | | | | 2.36 | (8) | | | | 2.42 | | | | | (0.96 | ) | | | | 24 | |
The footnote legend is at the end of the Financial Highlights.
See Notes to Financial Statements
71
VIRTUS EQUITY TRUST
FINANCIAL HIGHLIGHTS
SELECTED PER SHARE DATA AND RATIOS FOR A SHARE OUTSTANDING
THROUGHOUT EACH PERIOD
| | | | | | | | | | | | | | | | | | | | | | | | | | | | | | | | | | | | | | | | | | | | | | | | | | | | | | | | | | | | | | | | | | | | | | | | | | | | | |
| | | | Net Asset Value,
Beginning of Period | | Net Investment Income (Loss)(2) | | Net Realized and
Unrealized Gain (Loss) | | Total from Investment Operations | | Dividends from
Net Investment Income | | Distributions from
Net Realized Gains | | Total Distributions | | Change in Net Asset Value | | Net Asset Value, End of Period | | Total
Return(1) | | Net Assets, End of Period
(in thousands) | | Ratio of Net Expenses to
Average Net Assets(10) | | Ratio of Gross Expenses to Average
Net Assets (before waivers and
reimbursements)(10) | | Ratio of Net Investment Income
(Loss) to Average Net Assets | | Portfolio Turnover Rate |
| KAR Small-Cap Growth | | | | | | | | | | | | | | | | | | | | | | | | | | | | | | | | | | | | | | | | | | | | | | | | | | | | | | | | | | | | | | | | | | | | | | | | | | | | | |
Fund (Continued) | | | | | | | | | | | | | | | | | | | | | | | | | | | | | | | | | | | | | | | | | | | | | | | | | | | | | | | | | | | | | | | | | | | | | | | | | | | | | |
Class I | | | | | | | | | | | | | | | | | | | | | | | | | | | | | | | | | | | | | | | | | | | | | | | | | | | | | | | | | | | | | | | | | | | | | | | | | | | | | |
4/1/17 to 9/30/17(16) | | | | | $ | 21.45 | | | | | (0.07 | ) | | | | 4.48 | | | | | 4.41 | | | | | — | (5) | | | | — | | | | | — | (5) | | | | 4.41 | | | | $ | 25.86 | | | | | 20.56 | %(4) | | | $ | 1,087,430 | | | | | 1.25 | %(3)(6) | | | | 1.21 | %(3) | | | | (0.55 | )%(3) | | | | 1 | %(4) |
4/1/16 to 3/31/17 | | | | | | 17.89 | | | | | (0.10 | ) | | | | 4.21 | | | | | 4.11 | | | | | — | | | | | (0.55 | ) | | | | (0.55 | ) | | | | 3.56 | | | | | 21.45 | | | | | 23.59 | (14) | | | | 489,593 | | | | | 1.26 | (9)(14) | | | | 1.26 | | | | | (0.50 | )(14) | | | | 21 | |
4/1/15 to 3/31/16 | | | | | | 17.70 | | | | | (0.05 | ) | | | | 0.74 | | | | | 0.69 | | | | | — | | | | | (0.50 | ) | | | | (0.50 | ) | | | | 0.19 | | | | | 17.89 | | | | | 4.00 | | | | | 98,270 | | | | | 1.25 | | | | | 1.29 | | | | | (0.31 | ) | | | | 27 | |
4/1/14 to 3/31/15 | | | | | | 17.08 | | | | | (0.08 | ) | | | | 2.46 | | | | | 2.38 | | | | | — | | | | | (1.76 | ) | | | | (1.76 | ) | | | | 0.62 | | | | | 17.70 | | | | | 14.83 | | | | | 35,058 | | | | | 1.25 | | | | | 1.32 | | | | | (0.47 | ) | | | | 27 | |
4/1/13 to 3/31/14 | | | | | | 14.98 | | | | | (0.11 | ) | | | | 2.69 | | | | | 2.58 | | | | | — | | | | | (0.48 | ) | | | | (0.48 | ) | | | | 2.10 | | | | | 17.08 | | | | | 17.42 | | | | | 20,685 | | | | | 1.25 | | | | | 1.30 | | | | | (0.68 | ) | | | | 23 | |
4/1/12 to 3/31/13 | | | | | | 12.96 | | | | | (0.01 | ) | | | | 2.03 | | | | | 2.02 | | | | | — | | | | | — | | | | | — | | | | | 2.02 | | | | | 14.98 | | | | | 15.59 | | | | | 10,026 | | | | | 1.36 | (8) | | | | 1.42 | | | | | (0.04 | ) | | | | 24 | |
| KAR Small-Cap Value | | | | | | | | | | | | | | | | | | | | | | | | | | | | | | | | | | | | | | | | | | | | | | | | | | | | | | | | | | | | | | | | | | | | | | | | | | | | | |
Fund | | | | | | | | | | | | | | | | | | | | | | | | | | | | | | | | | | | | | | | | | | | | | | | | | | | | | | | | | | | | | | | | | | | | | | | | | | | | | |
Class A | | | | | | | | | | | | | | | | | | | | | | | | | | | | | | | | | | | | | | | | | | | | | | | | | | | | | | | | | | | | | | | | | | | | | | | | | | | | | |
4/1/17 to 9/30/17(16) | | | | | $ | 17.61 | | | | | 0.03 | | | | | 1.44 | | | | | 1.47 | | | | | (0.02 | ) | | | | (0.65 | ) | | | | (0.67 | ) | | | | 0.80 | | | | $ | 18.41 | | | | | 8.56 | %(4) | | | $ | 87,399 | | | | | 1.32 | %(3)(12) | | | | 1.32 | %(3) | | | | 0.29 | %(3) | | | | 10 | %(4) |
4/1/16 to 3/31/17 | | | | | | 15.67 | | | | | 0.22 | | | | | 3.16 | | | | | 3.38 | | | | | (0.26 | ) | | | | (1.18 | ) | | | | (1.44 | ) | | | | 1.94 | | | | | 17.61 | | | | | 22.86 | | | | | 89,050 | | | | | 1.32 | (9)(12) | | | | 1.32 | | | | | 1.35 | | | | | 22 | |
4/1/15 to 3/31/16 | | | | | | 16.61 | | | | | 0.07 | | | | | 0.07 | | | | | 0.14 | | | | | (0.10 | ) | | | | (0.98 | ) | | | | (1.08 | ) | | | | (0.94 | ) | | | | 15.67 | | | | | 0.94 | | | | | 71,280 | | | | | 1.30 | (12) | | | | 1.30 | | | | | 0.49 | | | | | 15 | |
4/1/14 to 3/31/15 | | | | | | 16.74 | | | | | 0.09 | | | | | 1.38 | | | | | 1.47 | | | | | (0.03 | ) | | | | (1.57 | ) | | | | (1.60 | ) | | | | (0.13 | ) | | | | 16.61 | | | | | 9.33 | | | | | 74,738 | | | | | 1.28 | (6) | | | | 1.28 | | | | | 0.54 | | | | | 24 | |
4/1/13 to 3/31/14 | | | | | | 13.91 | | | | | 0.04 | | | | | 2.84 | | | | | 2.88 | | | | | (0.05 | ) | | | | — | | | | | (0.05 | ) | | | | 2.83 | | | | | 16.74 | | | | | 20.78 | | | | | 137,496 | | | | | 1.32 | (6) | | | | 1.32 | | | | | 0.24 | | | | | 24 | |
4/1/12 to 3/31/13 | | | | | | 13.22 | | | | | 0.16 | | | | | 0.78 | | | | | 0.94 | | | | | (0.25 | ) | | | | — | | | | | (0.25 | ) | | | | 0.69 | | | | | 13.91 | | | | | 7.37 | | | | | 118,376 | | | | | 1.42 | (6) | | | | 1.34 | | | | | 1.29 | | | | | 16 | (11) |
| | | | | | | | | | | | | | | | |
Class C | | | | | | | | | | | | | | | | | | | | | | | | | | | | | | | | | | | | | | | | | | | | | | | | | | | | | | | | | | | | | | | | | | | | | | | | | | | | | |
4/1/17 to 9/30/17(16) | | | | | $ | 17.35 | | | | | (0.04 | ) | | | | 1.42 | | | | | 1.38 | | | | | — | | | | | (0.65 | ) | | | | (0.65 | ) | | | | 0.73 | | | | $ | 18.08 | | | | | 8.17 | %(4) | | | $ | 29,795 | | | | | 2.06 | %(3)(12) | | | | 2.06 | %(3) | | | | (0.45 | )%(3) | | | | 10 | %(4) |
4/1/16 to 3/31/17 | | | | | | 15.45 | | | | | 0.10 | | | | | 3.11 | | | | | 3.21 | | | | | (0.13 | ) | | | | (1.18 | ) | | | | (1.31 | ) | | | | 1.90 | | | | | 17.35 | | | | | 21.95 | | | | | 29,416 | | | | | 2.07 | (9)(12) | | | | 2.07 | | | | | 0.65 | | | | | 22 | |
4/1/15 to 3/31/16 | | | | | | 16.41 | | | | | (0.04 | ) | | | | 0.06 | | | | | 0.02 | | | | | — | | | | | (0.98 | ) | | | | (0.98 | ) | | | | (0.96 | ) | | | | 15.45 | | | | | 0.17 | | | | | 23,602 | | | | | 2.05 | (12) | | | | 2.05 | | | | | (0.26 | ) | | | | 15 | |
4/1/14 to 3/31/15 | | | | | | 16.65 | | | | | (0.02 | ) | | | | 1.35 | | | | | 1.33 | | | | | — | | | | | (1.57 | ) | | | | (1.57 | ) | | | | (0.24 | ) | | | | 16.41 | | | | | 8.49 | | | | | 25,634 | | | | | 2.03 | (6) | | | | 2.03 | | | | | (0.12 | ) | | | | 24 | |
4/1/13 to 3/31/14 | | | | | | 13.89 | | | | | (0.08 | ) | | | | 2.84 | | | | | 2.76 | | | | | — | | | | | — | | | | | — | | | | | 2.76 | | | | | 16.65 | | | | | 19.87 | | | | | 27,132 | | | | | 2.07 | (6) | | | | 2.07 | | | | | (0.52 | ) | | | | 24 | |
4/1/12 to 3/31/13 | | | | | | 13.20 | | | | | 0.07 | | | | | 0.77 | | | | | 0.84 | | | | | (0.15 | ) | | | | — | | | | | (0.15 | ) | | | | 0.69 | | | | | 13.89 | | | | | 6.57 | | | | | 23,793 | | | | | 2.17 | (6) | | | | 2.09 | | | | | 0.56 | | | | | 16 | (11) |
| | | | | | | | | | | | | | | | |
Class I | | | | | | | | | | | | | | | | | | | | | | | | | | | | | | | | | | | | | | | | | | | | | | | | | | | | | | | | | | | | | | | | | | | | | | | | | | | | | |
4/1/17 to 9/30/17(16) | | | | | $ | 17.62 | | | | | 0.05 | | | | | 1.43 | | | | | 1.48 | | | | | (0.04 | ) | | | | (0.65 | ) | | | | (0.69 | ) | | | | 0.79 | | | | $ | 18.41 | | | | | 8.72 | %(4) | | | $ | 300,259 | | | | | 1.07 | %(3)(12) | | | | 1.07 | %(3) | | | | 0.55 | %(3) | | | | 10 | %(4) |
4/1/16 to 3/31/17 | | | | | | 15.69 | | | | | 0.26 | | | | | 3.17 | | | | | 3.43 | | | | | (0.32 | ) | | | | (1.18 | ) | | | | (1.50 | ) | | | | 1.93 | | | | | 17.62 | | | | | 23.20 | | | | | 242,661 | | | | | 1.07 | (9)(12) | | | | 1.07 | | | | | 1.63 | | | | | 22 | |
4/1/15 to 3/31/16 | | | | | | 16.64 | | | | | 0.11 | | | | | 0.07 | | | | | 0.18 | | | | | (0.15 | ) | | | | (0.98 | ) | | | | (1.13 | ) | | | | (0.95 | ) | | | | 15.69 | | | | | 1.17 | | | | | 144,487 | | | | | 1.05 | (12) | | | | 1.05 | | | | | 0.74 | | | | | 15 | |
4/1/14 to 3/31/15 | | | | | | 16.77 | | | | | 0.16 | | | | | 1.35 | | | | | 1.51 | | | | | (0.07 | ) | | | | (1.57 | ) | | | | (1.64 | ) | | | | (0.13 | ) | | | | 16.64 | | | | | 9.59 | | | | | 163,082 | | | | | 1.03 | (6) | | | | 1.03 | | | | | 0.97 | | | | | 24 | |
4/1/13 to 3/31/14 | | | | | | 13.92 | | | | | 0.08 | | | | | 2.84 | | | | | 2.92 | | | | | (0.07 | ) | | | | — | | | | | (0.07 | ) | | | | 2.85 | | | | | 16.77 | | | | | 21.06 | | | | | 104,149 | | | | | 1.07 | (6) | | | | 1.07 | | | | | 0.49 | | | | | 24 | |
4/1/12 to 3/31/13 | | | | | | 13.23 | | | | | 0.15 | | | | | 0.82 | | | | | 0.97 | | | | | (0.28 | ) | | | | — | | | | | (0.28 | ) | | | | 0.69 | | | | | 13.92 | | | | | 7.64 | | | | | 91,502 | | | | | 1.17 | (6) | | | | 1.10 | | | | | 1.19 | | | | | 16 | (11) |
| | | | | | | | | | | | | | | | |
Class R6 | | | | | | | | | | | | | | | | | | | | | | | | | | | | | | | | | | | | | | | | | | | | | | | | | | | | | | | | | | | | | | | | | | | | | | | | | | | | | |
4/1/17 to 9/30/17(16) | | | | | $ | 17.63 | | | | | 0.05 | | | | | 1.44 | | | | | 1.49 | | | | | (0.05 | ) | | | | (0.65 | ) | | | | (0.70 | ) | | | | 0.79 | | | | $ | 18.42 | | | | | 8.78 | %(4) | | | $ | 10,165 | | | | | 0.99 | %(3)(12) | | | | 0.99 | %(3) | | | | 0.52 | %(3) | �� | | | 10 | %(4) |
11/3/16(7) to 3/31/17 | | | | | | 14.90 | | | | | 0.05 | | | | | 3.15 | | | | | 3.20 | | | | | (0.22 | ) | | | | (0.25 | ) | | | | (0.47 | ) | | | | 2.73 | | | | | 17.63 | | | | | 21.58 | (4) | | | | 122 | | | | | 0.98 | (3)(12) | | | | 0.98 | (3) | | | | 0.68 | (3) | | | | 22 | (15) |
| Rampart Enhanced | | | | | | | | | | | | | | | | | | | | | | | | | | | | | | | | | | | | | | | | | | | | | | | | | | | | | | | | | | | | | | | | | | | | | | | | | | | | | |
Core Equity Fund | | | | | | | | | | | | | | | | | | | | | | | | | | | | | | | | | | | | | | | | | | | | | | | | | | | | | | | | | | | | | | | | | | | | | | | | | | | | | |
Class A | | | | | | | | | | | | | | | | | | | | | | | | | | | | | | | | | | | | | | | | | | | | | | | | | | | | | | | | | | | | | | | | | | | | | | | | | | | | | |
4/1/17 to 9/30/17(16) | | | | | $ | 20.27 | | | | | 0.06 | | | | | 1.72 | | | | | 1.78 | | | | | (0.06 | ) | | | | (1.73 | ) | | | | (1.79 | ) | | | | (0.01 | ) | | | $ | 20.26 | | | | | 9.26 | %(4) | | | $ | 120,445 | | | | | 1.23 | %(3)(8) | | | | 1.39 | %(3) | | | | 0.63 | %(3) | | | | 110 | %(4) |
4/1/16 to 3/31/17 | | | | | | 18.14 | | | | | 0.15 | | | | | 2.68 | | | | | 2.83 | | | | | (0.22 | ) | | | | (0.48 | ) | | | | (0.70 | ) | | | | 2.13 | | | | | 20.27 | | | | | 15.85 | (14) | | | | 113,442 | | | | | 1.26 | (9)(14) | | | | 1.40 | | | | | 0.81 | (14) | | | | 496 | |
4/1/15 to 3/31/16 | | | | | | 20.97 | | | | | 0.14 | | | | | 0.56 | | | | | 0.70 | | | | | (0.15 | ) | | | | (3.38 | ) | | | | (3.53 | ) | | | | (2.83 | ) | | | | 18.14 | | | | | 4.02 | | | | | 101,113 | | | | | 1.25 | | | | | 1.38 | | | | | 0.74 | | | | | 312 | |
4/1/14 to 3/31/15 | | | | | | 21.94 | | | | | 0.17 | | | | | 1.84 | | | | | 2.01 | | | | | (0.08 | ) | | | | (2.90 | ) | | | | (2.98 | ) | | | | (0.97 | ) | | | | 20.97 | | | | | 9.75 | | | | | 116,725 | | | | | 1.25 | | | | | 1.36 | | | | | 0.82 | | | | | 345 | |
4/1/13 to 3/31/14 | | | | | | 19.51 | | | | | 0.14 | | | | | 4.02 | | | | | 4.16 | | | | | (0.10 | ) | | | | (1.63 | ) | | | | (1.73 | ) | | | | 2.43 | | | | | 21.94 | | | | | 21.84 | | | | | 111,074 | | | | | 1.25 | | | | | 1.39 | | | | | 0.66 | | | | | 283 | |
4/1/12 to 3/31/13 | | | | | | 17.93 | | | | | 0.09 | | | | | 1.53 | | | | | 1.62 | | | | | (0.04 | ) | | | | — | | | | | (0.04 | ) | | | | 1.58 | | | | | 19.51 | | | | | 9.12 | | | | | 100,976 | | | | | 1.25 | | | | | 1.44 | | | | | 0.52 | | | | | 65 | |
The footnote legend is at the end of the Financial Highlights.
See Notes to Financial Statements
72
VIRTUS EQUITY TRUST
FINANCIAL HIGHLIGHTS
SELECTED PER SHARE DATA AND RATIOS FOR A SHARE OUTSTANDING
THROUGHOUT EACH PERIOD
| | | | | | | | | | | | | | | | | | | | | | | | | | | | | | | | | | | | | | | | | | | | | | | | | | | | | | | | | | | | | | | | | | | | | | | | | | | | | |
| | | | Net Asset Value,
Beginning of Period | | Net Investment Income (Loss)(2) | | Net Realized and
Unrealized Gain (Loss) | | Total from Investment Operations | | Dividends from
Net Investment Income | | Distributions from
Net Realized Gains | | Total Distributions | | Change in Net Asset Value | | Net Asset Value, End of Period | | Total
Return(1) | | Net Assets, End of Period
(in thousands) | | Ratio of Net Expenses to
Average Net Assets(10) | | Ratio of Gross Expenses to Average
Net Assets (before waivers and
reimbursements)(10) | | Ratio of Net Investment Income
(Loss) to Average Net Assets | | Portfolio Turnover Rate |
| Rampart Enhanced | | | | | | | | | | | | | | | | | | | | | | | | | | | | | | | | | | | | | | | | | | | | | | | | | | | | | | | | | | | | | | | | | | | | | | | | | | | | | |
Core Equity Fund (Continued) | | | | | | | | | | | | | | | | | | | | | | | | | | | | | | | | | | | | | | | | | | | | | | | | | | | | | | | | | | | | | | | | | | | | | | | | | | | | | |
Class C | | | | | | | | | | | | | | | | | | | | | | | | | | | | | | | | | | | | | | | | | | | | | | | | | | | | | | | | | | | | | | | | | | | | | | | | | | | | | |
4/1/17 to 9/30/17(16) | | | | | $ | 18.44 | | | | | (0.02 | ) | | | | 1.56 | | | | | 1.54 | | | | | (0.02 | ) | | | | (1.73 | ) | | | | (1.75 | ) | | | | (0.21 | ) | | | $ | 18.23 | | | | | 8.85 | %(4) | | | $ | 32,710 | | | | | 1.98 | %(3)(8) | | | | 2.15 | %(3) | | | | (0.17 | )%(3) | | | | 110 | %(4) |
4/1/16 to 3/31/17 | | | | | | 16.48 | | | | | 0.01 | | | | | 2.44 | | | | | 2.45 | | | | | (0.01 | ) | | | | (0.48 | ) | | | | (0.49 | ) | | | | 1.96 | | | | | 18.44 | | | | | 15.01 | (14) | | | | 37,269 | | | | | 2.00 | (9)(14) | | | | 2.15 | | | | | 0.04 | (14) | | | | 496 | |
4/1/15 to 3/31/16 | | | | | | 19.42 | | | | | — | (5) | | | | 0.51 | | | | | 0.51 | | | | | (0.07 | ) | | | | (3.38 | ) | | | | (3.45 | ) | | | | (2.94 | ) | | | | 16.48 | | | | | 3.27 | | | | | 36,236 | | | | | 2.00 | | | | | 2.13 | | | | | 0.01 | | | | | 312 | |
4/1/14 to 3/31/15 | | | | | | 20.60 | | | | | 0.01 | | | | | 1.72 | | | | | 1.73 | | | | | (0.01 | ) | | | | (2.90 | ) | | | | (2.91 | ) | | | | (1.18 | ) | | | | 19.42 | | | | | 8.91 | | | | | 37,312 | | | | | 2.00 | | | | | 2.12 | | | | | 0.06 | | | | | 345 | |
4/1/13 to 3/31/14 | | | | | | 18.46 | | | | | (0.02 | ) | | | | 3.81 | | | | | 3.79 | | | | | (0.02 | ) | | | | (1.63 | ) | | | | (1.65 | ) | | | | 2.14 | | | | | 20.60 | | | | | 20.93 | | | | | 27,930 | | | | | 2.00 | | | | | 2.14 | | | | | (0.09 | ) | | | | 283 | |
4/1/12 to 3/31/13 | | | | | | 17.05 | | | | | (0.04 | ) | | | | 1.45 | | | | | 1.41 | | | | | — | | | | | — | | | | | — | | | | | 1.41 | | | | | 18.46 | | | | | 8.27 | | | | | 24,782 | | | | | 2.00 | | | | | 2.19 | | | | | (0.23 | ) | | | | 65 | |
| | | | | | | | | | | | | | | | |
Class I | | | | | | | | | | | | | | | | | | | | | | | | | | | | | | | | | | | | | | | | | | | | | | | | | | | | | | | | | | | | | | | | | | | | | | | | | | | | | |
4/1/17 to 9/30/17(16) | | | | | $ | 20.22 | | | | | 0.09 | | | | | 1.71 | | | | | 1.80 | | | | | (0.07 | ) | | | | (1.73 | ) | | | | (1.80 | ) | | | | — | | | | $ | 20.22 | | | | | 9.41 | %(4) | | | $ | 32,485 | | | |
| 0.98
| %(3)(8)
| | | | 1.15 | %(3) | | | | 0.91 | %(3) | | | | 110 | %(4) |
4/1/16 to 3/31/17 | | | | | | 18.13 | | | | | 0.21 | | | | | 2.66 | | | | | 2.87 | | | | | (0.30 | ) | | | | (0.48 | ) | | | | (0.78 | ) | | | | 2.09 | | | | | 20.22 | | | | | 16.16 | (14) | | | | 21,011 | | | | | 1.01 | (9)(14) | | | | 1.15 | | | | | 1.13 | (14) | | | | 496 | |
4/1/15 to 3/31/16 | | | | | | 20.96 | | | | | 0.21 | | | | | 0.53 | | | | | 0.74 | | | | | (0.19 | ) | | | | (3.38 | ) | | | | (3.57 | ) | | | | (2.83 | ) | | | | 18.13 | | | | | 4.25 | | | | | 11,991 | | | | | 1.00 | | | | | 1.13 | | | | | 1.13 | | | | | 312 | |
4/1/14 to 3/31/15 | | | | | | 21.90 | | | | | 0.22 | | | | | 1.85 | | | | | 2.07 | | | | | (0.11 | ) | | | | (2.90 | ) | | | | (3.01 | ) | | | | (0.94 | ) | | | | 20.96 | | | | | 10.06 | | | | | 8,969 | | | | | 1.00 | | | | | 1.11 | | | | | 1.05 | | | | | 345 | |
4/1/13 to 3/31/14 | | | | | | 19.48 | | | | | 0.19 | | | | | 4.01 | | | | | 4.20 | | | | | (0.15 | ) | | | | (1.63 | ) | | | | (1.78 | ) | | | | 2.42 | | | | | 21.90 | | | | | 22.12 | | | | | 11,291 | | | | | 1.00 | | | | | 1.14 | | | | | 0.90 | | | | | 283 | |
4/1/12 to 3/31/13 | | | | | | 17.91 | | | | | 0.14 | | | | | 1.51 | | | | | 1.65 | | | | | (0.08 | ) | | | | — | | | | | (0.08 | ) | | | | 1.57 | | | | | 19.48 | | | | | 9.28 | | | | | 11,589 | | | | | 1.00 | | | | | 1.17 | | | | | 0.78 | | | | | 65 | |
| Tactical Allocation | | | | | | | | | | | | | | | | | | | | | | | | | | | | | | | | | | | | | | | | | | | | | | | | | | | | | | | | | | | | | | | | | | | | | | | | | | | | | |
Fund | | | | | | | | | | | | | | | | | | | | | | | | | | | | | | | | | | | | | | | | | | | | | | | | | | | | | | | | | | | | | | | | | | | | | | | | | | | | | |
Class A | | | | | | | | | | | | | | | | | | | | | | | | | | | | | | | | | | | | | | | | | | | | | | | | | | | | | | | | | | | | | | | | | | | | | | | | | | | | | |
4/1/17 to 9/30/17(16) | | | | | $ | 8.33 | | | | | 0.08 | | | | | 0.69 | | | | | 0.77 | | | | | (0.08 | ) | | | | (0.02 | ) | | | | (0.10 | ) | | | | 0.67 | | | | $ | 9.00 | | | | | 9.25 | %(4) | | | $ | 142,481 | | | | | 1.38 | %(3) | | | | 1.38 | %(3) | | | | 1.81 | %(3) | | | | 26 | %(4) |
4/1/16 to 3/31/17 | | | | | | 8.44 | | | | | 0.17 | | | | | 0.56 | | | | | 0.73 | | | | | (0.15 | ) | | | | (0.69 | ) | | | | (0.84 | ) | | | | (0.11 | ) | | | | 8.33 | | | | | 9.20 | (14) | | | | 137,388 | | | | | 1.37 | (9)(14) | | | | 1.38 | | | | | 1.86 | (14) | | | | 104 | |
4/1/15 to 3/31/16 | | | | | | 9.75 | | | | | 0.20 | | | | | (0.88 | ) | | | | (0.68 | ) | | | | (0.17 | ) | | | | (0.46 | ) | | | | (0.63 | ) | | | | (1.31 | ) | | | | 8.44 | | | | | (7.36 | ) | | | | 147,546 | | | | | 1.32 | | | | | 1.33 | | | | | 2.25 | | | | | 81 | |
4/1/14 to 3/31/15 | | | | | | 10.06 | | | | | 0.21 | | | | | 0.15 | | | | | 0.36 | | | | | (0.20 | ) | | | | (0.47 | ) | | | | (0.67 | ) | | | | (0.31 | ) | | | | 9.75 | | | | | 3.60 | | | | | 180,435 | | | | | 1.30 | | | | | 1.30 | | | | | 2.09 | | | | | 69 | |
4/1/13 to 3/31/14 | | | | | | 9.88 | | | | | 0.22 | | | | | 1.13 | | | | | 1.35 | | | | | (0.21 | ) | | | | (0.96 | ) | | | | (1.17 | ) | | | | 0.18 | | | | | 10.06 | | | | | 14.84 | | | | | 195,509 | | | | | 1.29 | | | | | 1.29 | | | | | 2.22 | | | | | 61 | |
4/1/12 to 3/31/13 | | | | | | 9.47 | | | | | 0.21 | | | | | 0.53 | | | | | 0.74 | | | | | (0.22 | ) | | | | (0.11 | ) | | | | (0.33 | ) | | | | 0.41 | | | | | 9.88 | | | | | 8.00 | | | | | 186,662 | | | | | 1.30 | | | | | 1.30 | | | | | 2.26 | | | | | 94 | |
| | | | | | | | | | | | | | | | |
Class C | | | | | | | | | | | | | | | | | | | | | | | | | | | | | | | | | | | | | | | | | | | | | | | | | | | | | | | | | | | | | | | | | | | | | | | | | | | | | |
4/1/17 to 9/30/17(16) | | | | | $ | 8.55 | | | | | 0.05 | | | | | 0.70 | | | | | 0.75 | | | | | (0.04 | ) | | | | (0.02 | ) | | | | (0.06 | ) | | | | 0.69 | | | | $ | 9.24 | | | | | 8.80 | %(4) | | | $ | 4,054 | | | | | 2.14 | %(3) | | | | 2.15 | %(3) | | | | 1.05 | %(3) | | | | 26 | %(4) |
4/1/16 to 3/31/17 | | | | | | 8.64 | | | | | 0.11 | | | | | 0.57 | | | | | 0.68 | | | | | (0.08 | ) | | | | (0.69 | ) | | | | (0.77 | ) | | | | (0.09 | ) | | | | 8.55 | | | | | 8.37 | (14) | | | | 4,378 | | | | | 2.11 | (9)(14) | | | | 2.13 | | | | | 1.13 | (14) | | | | 104 | |
4/1/15 to 3/31/16 | | | | | | 9.96 | | | | | 0.14 | | | | | (0.90 | ) | | | | (0.76 | ) | | | | (0.10 | ) | | | | (0.46 | ) | | | | (0.56 | ) | | | | (1.32 | ) | | | | 8.64 | | | | | (8.02 | ) | | | | 5,460 | | | | | 2.07 | | | | | 2.08 | | | | | 1.51 | | | | | 81 | |
4/1/14 to 3/31/15 | | | | | | 10.27 | | | | | 0.13 | | | | | 0.16 | | | | | 0.29 | | | | | (0.13 | ) | | | | (0.47 | ) | | | | (0.60 | ) | | | | (0.31 | ) | | | | 9.96 | | | | | 2.81 | | | | | 6,328 | | | | | 2.04 | | | | | 2.04 | | | | | 1.29 | | | | | 69 | |
4/1/13 to 3/31/14 | | | | | | 10.07 | | | | | 0.15 | | | | | 1.15 | | | | | 1.30 | | | | | (0.14 | ) | | | | (0.96 | ) | | | | (1.10 | ) | | | | 0.20 | | | | | 10.27 | | | | | 13.90 | | | | | 3,785 | | | | | 2.04 | | | | | 2.04 | | | | | 1.46 | | | | | 61 | |
4/1/12 to 3/31/13 | | | | | | 9.65 | | | | | 0.15 | | | | | 0.53 | | | | | 0.68 | | | | | (0.15 | ) | | | | (0.11 | ) | | | | (0.26 | ) | | | | 0.42 | | | | | 10.07 | | | | | 7.17 | | | | | 3,021 | | | | | 2.05 | | | | | 2.05 | | | | | 1.51 | | | | | 94 | |
Footnote Legend:
| (1) | Sales charges, where applicable, are not reflected in the total return calculation. |
| (2) | Computed using average shares outstanding. |
| (5) | Amount is less than $0.005 per share. |
| (6) | See Note 4D in the Notes to Financial Statements for information on recapture of expenses previously waived. |
| (8) | Represents a blended ratio. |
The footnote legend is at the end of the Financial Highlights.
See Notes to Financial Statements
73
VIRTUS EQUITY TRUST
FINANCIAL HIGHLIGHTS
SELECTED PER SHARE DATA AND RATIOS FOR A SHARE OUTSTANDING
THROUGHOUT EACH PERIOD
| (9) | Net expense ratio includes extraordinary proxy expenses. |
| (10) | Each Fund will also indirectly bear their prorated share of expenses of the underlying funds in which they invest. Such expenses are not included in the calculation of this ratio. |
| (11) | Portfolio turnover calculation excludes security transactions distributed as a result of a redemption-in-kind. |
| (12) | The Fund is currently under its expense limitation. |
| (13) | Portfolio turnover is representative of the Fund for the entire year ended March 31, 2015. |
| (14) | Custody fees reimbursed were excluded from the Ratio of Net Expenses to Average Net Assets and Ratio of Net Investment Income (Loss) to Average Net Assets. If included the impact would have been to lower the Ratio of Net Expenses to Average Net Assets and increase the Ratio of Net Investment Income (Loss) to Average Net Assets as follows: |
| | | | | | | | | | | | | | | | |
| | | Class A | | | Class C | | | Class I | | | Class R6 | |
Contrarian Value Fund* | | | — | | | | — | | | | — | | | | — | |
KAR Capital Growth Fund | | | 0.06 | % | | | 0.05 | % | | | 0.06 | % | | | N/A | |
KAR Mid-Cap Growth Fund | | | 0.05 | % | | | 0.05 | % | | | 0.05 | % | | | N/A | |
KAR Small-Cap Core Fund* | | | — | | | | — | | | | — | | | | — | |
KAR Small-Cap Growth Fund* | | | — | | | | — | | | | — | | | | N/A | |
Rampart Enhanced Core Equity Fund* | | | — | | | | — | | | | — | | | | N/A | |
Tactical Allocation Fund | | | 0.08 | % | | | 0.08 | % | | | N/A | | | | N/A | |
| | * | Amount is less than 0.005% |
Custody fees reimbursed were included in Total Return. If excluded the impact would have been to lower the Total Return as follows:
| | | | | | | | | | | | | | | | |
| | | Class A | | | Class C | | | Class I | | | Class R6 | |
Contrarian Value Fund* | | | — | | | | — | | | | — | | | | — | |
KAR Capital Growth Fund | | | 0.06 | % | | | 0.06 | % | | | 0.06 | % | | | N/A | |
KAR Mid-Cap Growth Fund | | | 0.05 | % | | | 0.05 | % | | | 0.05 | % | | | N/A | |
KAR Small-Cap Core Fund* | | | — | | | | — | | | | — | | | | — | |
KAR Small-Cap Growth Fund* | | | — | | | | — | | | | — | | | | N/A | |
Rampart Enhanced Core Equity Fund* | | | — | | | | — | | | | — | | | | N/A | |
Tactical Allocation Fund | | | 0.08 | % | | | 0.08 | % | | | N/A | | | | N/A | |
| | * | Amount is less than 0.005% |
See Note 14 in Notes to Financial Statements for a further explanation on the custody fees reimbursed.
| (15) | Portfolio turnover is representative of the Fund for the entire year ended March 31, 2017. |
| (16) | The Fund changed its fiscal period end to September 30 during the period. |
See Notes to Financial Statements
74
VIRTUS EQUITY TRUST
NOTES TO FINANCIAL STATEMENTS
SEPTEMBER 30, 2017
Virtus Equity Trust (the “Trust”) is organized as a Delaware statutory trust and is registered under the Investment Company Act of 1940, as amended (the “1940 Act”), as an open-end management investment company. Effective September 21, 2017 the Funds changed their fiscal year end from March 31 to September 30.
As of the date of this report, 11 diversified funds of the Trust are offered for sale, of which 10 (each a “Fund”) are reported in this annual report. The Funds’ investment objectives are outlined in each Fund’s summary page. There is no guarantee that the Funds will achieve their objectives.
All of the Funds offer Class A shares and Class C shares. All Funds with the exception of the Tactical Allocation Fund offer Class I shares. Class R6 shares are offered by the Contrarian Value Fund, KAR Small-Cap Core Fund and KAR Small-Cap Value Fund. Effective March 6, 2017, all Class B shares were converted to Class A shares. Prior to March 6, 2017, Class B shares could be purchased by existing shareholders through qualifying transactions.
Class A shares are sold with a front-end sales charge of up to 5.75% with some exceptions. Generally, Class A shares are not subject to any charges by the Funds when redeemed; however, a 1% contingent deferred sales charge (“CDSC”) may be imposed on certain redemptions made within a certain period following purchases on which a finder’s fee has been paid. The period for which the CDSC applies for the Funds is 18 months. The CDSC period begins on the last day of the month preceding the month in which the purchase was made.
Class C shares are generally sold with a 1% CDSC, applicable if redeemed within one year of purchase. Class I shares and Class R6 shares are sold without a front-end sales charge or CDSC.
Class R6 shares are available only to the following investors without a minimum initial investment or minimum additional purchases: certain employer-sponsored retirement plans, including Section 401(k), 403(b) and 457, profit-sharing, money purchase pension and defined benefit plans and nonqualified deferred compensation plans, in each case provided that plan level or omnibus accounts are held on the books of the fund. Other institutional investors may be permitted to purchase Class R6 shares subject to the fund’s determination of eligibility and may be subject to a minimum initial investment requirement. Class R6 shares do not carry sales commissions or pay Rule 12b-1 fees. No compensation, administrative payments, sub-transfer agency payments or service payments are paid to brokers or other entities from Fund assets or the Funds’ distributor’s or an affiliate’s resources on sales of or investments in Class R6 shares.
Virtus Mutual Funds may impose an annual fee on accounts having balances of less than $2,500. The small account fee may be waived in certain circumstances, as disclosed in the prospectuses and/or statements of additional information. The fees collected will be used to offset certain expenses of the Funds. These fees are reflected as “Low Balance Account Fees” in each Fund’s Statements of Operations for the period, as applicable.
Each Class of shares has identical voting, dividend, liquidation and other rights and the same terms and conditions, except that each Class bears different distribution and/or service fees under a Rule 12b-1 and/or shareholder service plan (“12b-1 Plan”) approved by the Board and has exclusive voting rights with respect to such plans. Class I shares and Class R6 shares are not subject to a 12b-1 Plan. Income and other expenses as well as realized and unrealized gains and losses of each Fund are borne pro-rata by the holders of each Class of shares.
| Note | 2. Significant Accounting Policies |
The following is a summary of the significant accounting policies consistently followed by the Funds in the preparation of their financial statements. The preparation of financial statements in conformity with U.S. generally accepted accounting principles (“U.S. GAAP”) requires management to make estimates and assumptions that affect the reported amounts of assets and liabilities, and disclosure of contingent assets and liabilities at the date of the financial statements and the reported amounts of increases and decreases in net assets from operations during the reporting period. Actual results could differ from those estimates and those differences could be significant.
Security valuation procedures for each Fund, which include nightly price variance, as well as back-testing items such as bi-weekly unchanged price, monthly secondary source and transaction analysis, have been approved by the Board. All internally fair valued securities are approved by a valuation committee appointed by the Board (the “Valuation Committee”). The Valuation Committee is comprised of certain members of management as identified to the Board and convenes independently from portfolio management. All internally fair valued securities are updated daily and reviewed in detail by the Valuation Committee monthly unless changes occur within the period. The Valuation Committee reviews the validity of the model inputs and any changes to the model. Fair valuations are reviewed by the Board at least quarterly.
Each Fund utilizes a fair value hierarchy which prioritizes the inputs to valuation techniques used to measure fair value into three broad levels. The Funds’ policy is to recognize transfers between levels at the end of the reporting period.
| | • Level 1 – | quoted prices in active markets for identical securities (security types generally include listed equities). |
| | • Level 2 – | prices determined using other significant observable inputs (including quoted prices for similar securities, interest rates, prepayment speeds, credit risk, etc.). |
| | • Level 3 – | prices determined using significant unobservable inputs (including the Valuation Committee’s own assumptions in determining the fair value of investments). |
A description of the valuation techniques applied to a Fund’s major categories of assets and liabilities measured at fair value on a recurring basis is as follows:
Equity securities are valued at the official closing price (typically last sale) on the exchange on which the securities are primarily traded or, if no closing price is available, at the last bid price and are categorized as Level 1 in the hierarchy. Restricted equity securities and private placements that are not widely traded, are illiquid, or are internally fair valued by the Valuation Committee, are generally categorized as Level 3 in the hierarchy.
75
VIRTUS EQUITY TRUST
NOTES TO FINANCIAL STATEMENTS (Continued)
SEPTEMBER 30, 2017
Certain non-U.S. securities may be fair valued in cases where closing prices are not readily available or are deemed not reflective of readily available market prices. For example, significant events (such as movement in the U.S. securities market, or other regional and local developments) may occur between the time that non-U.S. markets close (where the security is principally traded) and the time that a Fund calculates its net asset value (“NAV”) (at the close of regular trading on the NYSE, generally 4 p.m. Eastern time) that may impact the value of securities traded in these non-U.S. markets. In such cases the Funds fair value non-U.S. securities using an independent pricing service which considers the correlation of the trading patterns of the non-U.S. security to the intraday trading in the U.S. markets for investments such as ADRs, financial futures, ETFs, and certain indexes, as well as prices for similar securities. Such fair valuations are categorized as Level 2 in the hierarchy. Because the frequency of significant events is not predictable, fair valuation of certain non-U.S. common stocks may occur on a frequent basis.
Debt securities, including restricted securities, are valued based on evaluated quotations received from independent pricing services or from dealers who make markets in such securities. For most bond types, the pricing service utilizes matrix pricing that considers one or more of the following factors: yield or price of bonds of comparable quality, coupon, maturity, current cash flows, type, and current day trade information, as well as dealer- supplied prices. These valuations are generally categorized as Level 2 in the hierarchy. Structured debt instruments, such as mortgage-backed and asset-backed securities, may also incorporate collateral analysis and utilize cash flow models for valuation and are generally categorized as Level 2 in the hierarchy. Pricing services do not provide pricing for all securities and therefore indicative bids from dealers are utilized which are based on pricing models used by market makers in the security and are generally categorized as Level 2 in the hierarchy. Debt securities that are not widely traded, or are internally fair valued by the Valuation Committee, are generally categorized as Level 3 in the hierarchy.
Listed derivatives, such as options, that are actively traded are valued based on quoted prices from the exchange and are categorized as Level 1 in the hierarchy. Over-the-counter derivative contracts, which include forward currency contracts and equity-linked instruments, do not require material subjectivity as pricing inputs are observed from actively quoted markets and are categorized as Level 2 in the hierarchy.
Investments in open-end mutual funds are valued at NAV. Investments in closed-end funds are valued as of the close of regular trading on the NYSE each business day. Both are categorized as Level 1 in the hierarchy.
A summary of the inputs used to value a Fund’s net assets by each major security type is disclosed at the end of the Schedule of Investments for each Fund. The inputs or methodologies used for valuing securities are not necessarily an indication of the risk associated with investing in those securities.
| | B. | Security Transactions and Investment Income |
Security transactions are recorded on the trade date. Realized gains and losses from the sales of securities are determined on the identified cost basis. Dividend income is recognized on the ex-dividend date or, in the case of certain foreign securities, as soon as a Fund is notified. Interest income is recorded on the accrual basis. Each Fund amortizes premiums and accretes discounts using the effective interest method. Any distributions from underlying funds are recorded in accordance with the character of the distributions as designated by the underlying funds.
Dividend income from REIT investments is recorded using management’s estimate of the income included in distributions received from the REIT investments. Distributions received in excess of this estimated amount are recorded as a reduction of the cost of investments or reclassified to capital gains. The actual amounts of income, return of capital, and capital gains are only determined by each REIT after its fiscal period-end, and may differ from the estimated amounts.
Each Fund is treated as a separate taxable entity. It is the intention of each Fund to comply with the requirements of Subchapter M of the Internal Revenue Code and to distribute substantially all of its taxable income to its shareholders. Therefore, no provision for federal income taxes or excise taxes has been made.
Certain Funds may be subject to foreign taxes on income, gains on investments or currency repatriation, a portion of which may be recoverable. Each Fund will accrue such taxes and recoveries as applicable based upon current interpretations of the tax rules and regulations that exist in the markets in which it invests.
Management of the Funds has concluded that there are no significant uncertain tax positions that would require recognition in the financial statements. As of September 30, 2017, the tax years that remain subject to examination by the major tax jurisdictions under the statute of limitations are from the year 2014 forward (with limited exceptions).
| | D. | Distributions to Shareholders |
Distributions are recorded by each Fund on the ex-dividend date. Income and capital gain distributions are determined in accordance with income tax regulations that may differ from U.S. GAAP.
Expenses incurred together by a Fund and other affiliated mutual funds are allocated in proportion to the net assets of each such fund, except where allocation of direct expenses to each fund or an alternative allocation method can be more appropriately used.
In addition to the net annual operating expenses that a Fund bears directly, the shareholders of a Fund indirectly bear each Fund’s pro-rata expenses of any underlying mutual funds in which the Fund invests.
| | F. | Foreign Currency Translation |
Non-U.S. investment securities and other assets and liabilities denominated in foreign currencies are translated into U.S. dollar amounts at the foreign currency exchange rate effective at the end of the reporting period. Cost of investments is translated at the currency exchange rate effective at the trade date. The gain or loss resulting from a change in currency exchange rates between the trade and settlement date of a portfolio transaction is treated as a gain or loss on foreign currency. Likewise, the gain or loss resulting from a change in currency exchange rates between the date income is accrued and the date it is paid is treated as a gain or loss on foreign currency. The Funds do not isolate that portion of the
76
VIRTUS EQUITY TRUST
NOTES TO FINANCIAL STATEMENTS (Continued)
SEPTEMBER 30, 2017
results of operations arising from changes in foreign exchange rates on investments from the fluctuations arising from changes in the market prices of securities held. Such fluctuations are included with the net realized and unrealized gain or loss on investments.
Certain Funds may invest in direct debt instruments which are interests in amounts owed by a corporate, governmental, or other borrower to lenders or lending syndicates. Loan agreements are generally non-investment grade and often involve borrowers that are highly leveraged. The Funds may invest in obligations of borrowers who are in bankruptcy proceedings. Loan agreements are typically senior in the corporate capital structure of the borrower. A loan is often administered by a bank or other financial institution (the “lender”) that acts as agent for all holders. The agent administers the terms of the loan, as specified in the loan agreement. A Fund’s investments in loans may be in the form of participations in loans or assignments of all or a portion of loans from third parties. When investing in loan participations, a Fund has the right to receive payments of principal, interest and any fees to which it is entitled only from the lender selling the loan participation and only upon receipt by the lender of payments from the borrower. A Fund generally has no right to enforce compliance with the terms of the loan agreement with the borrower. As a result, a Fund may be subject to the credit risk of both the borrower and the lender that is selling the loan agreement. When a Fund purchases assignments from lenders it acquires direct rights against the borrower on the loan.
A Fund may invest in multiple series or tranches of a loan, which may have varying terms and carry different associated risks. Loan agreements may involve foreign borrowers and investments may be denominated in foreign currencies. Direct indebtedness of emerging countries involves a risk that the government entities responsible for the repayment of the debt may be unable, or unwilling, to pay the principal and interest when due.
The loan agreements have floating rate loan interests which generally pay interest at rates that are periodically determined by reference to a base lending rate plus a premium. The base lending rates are generally London Interbank Offered Rate (“LIBOR”), the prime rate offered by one or more U.S. banks or the certificate of deposit rate. When a loan agreement is purchased a Fund may pay an assignment fee. On an ongoing basis, a Fund may receive a commitment fee based on the undrawn portion of the underlying line of credit portion of a loan agreement. Prepayment penalty fees are received upon the prepayment of a loan agreement by a borrower. Prepayment penalty, facility, commitment, consent and amendment fees are recorded to income as earned or paid.
| | H. | When-Issued and Forward Commitments (Delayed Delivery) |
Certain Funds may engage in when-issued or forward commitment transactions. Securities purchased on a when-issued or forward commitment basis are also known as delayed delivery transactions. Delayed delivery transactions involve a commitment by a Fund to purchase or sell a security at a future date (ordinarily up to 90 days later). When-issued or forward commitments enable a Fund to lock in what is believed to be an attractive price or yield on a particular security for a period of time, regardless of future changes in interest rates. Each Fund records when-issued and delayed delivery securities on the trade date. Each Fund maintains collateral for the securities purchased. Securities purchased on a when-issued or delayed delivery basis begin earning interest on the settlement date.
($ reported in thousands)
During the period, certain Funds were permitted to loan securities to qualified brokers through an agreement with Brown Brothers Harriman (“BBH”), as a third party lending agent. Under the terms of the agreement, when doing so a Fund was required to maintain collateral with a market value not less than 100% of the market value of loaned securities. Collateral, consisting of cash and securities issued by the U.S. Government or its agencies, was adjusted daily in connection with changes in the market value of securities on loan. Cash collateral was invested in a short-term money market fund. Dividends earned on the collateral and premiums paid by the broker were recorded as income by a Fund net of fees and rebates charged by BBH for its services as securities lending agent and in connection with this securities lending program. Lending portfolio securities involves a risk of delay in the recovery of the loaned securities or in the declining value of the collateral. Effective July 31, 2017, securities lending was suspended on the Funds, and the agreement with BBH was terminated on August 14, 2017.
| | J. | Earnings Credit and Interest |
Through arrangements with each Fund’s previous custodian which ended in September 2017, each Fund receives either an earnings credit or interest on agreed upon target un-invested cash balances to reduce each Fund’s custody expenses. The credits are reflected as “Earnings credit from custodian” and the interest is reflected under “Interest income” in each Fund’s Statements of Operations for the period, as applicable.
| Note | 3. Derivative Financial Instruments and Transactions |
($ reported in thousands)
Disclosures about derivative instruments and hedging activities are intended to enable investors to understand how and why a Fund uses derivatives, how derivatives are accounted for, and how derivative instruments affect a Fund’s results of operations and financial position. Summarized below are such disclosures and accounting policies for each specific type of derivative instrument used by certain Funds.
Options Contracts: An options contract provides the purchaser with the right, but not the obligation, to buy (call option) or sell (put option) a financial instrument at an agreed-upon price. Certain Funds may purchase or write both put and call options on portfolio securities for hedging purposes or to facilitate the rapid implementation of investment strategies if the Fund anticipates a significant market or sector advance. The Funds are subject to equity price risk in the normal course of pursuing their investment objectives. The Funds may use options contracts to hedge against changes in the values of equities.
When a Fund purchases an option, it pays a premium and an amount equal to that premium is recorded as an asset. When a Fund writes an option, it receives a premium and an amount equal to that premium is recorded as a liability. The asset or liability is adjusted daily to reflect the current market value of the option. Holdings of the Fund designated to cover outstanding written options are noted in the Schedules of Investments. Purchased options are reported as an asset within “Investment in unaffiliated securities at value” in the Statements of Assets and Liabilities.
77
VIRTUS EQUITY TRUST
NOTES TO FINANCIAL STATEMENTS (Continued)
SEPTEMBER 30, 2017
Options written are reported as a liability within “Written options at value.” Changes in value of the purchased option are included in “Net change in unrealized appreciation (depreciation) on unaffiliated investments” in the Statements of Operations. Changes in value of written options are included in “Net change in unrealized appreciation (depreciation) on written options” in the Statements of Operations.
If an option expires unexercised, the Fund realizes a gain or loss to the extent of the premium received or paid. If an option is exercised, the premium received or paid is recorded as an adjustment to the proceeds from the sale or the cost basis of the purchase. The difference between the premium and the amount received or paid on effecting a closing purchase or sale transaction is also treated as a realized gain or loss. Gain or loss on purchased options is included in “Net realized gain (loss) on unaffiliated investments” in the Statements of Operations. Gain or loss on written options is presented separately as “Net realized gain (loss) on written options” in the Statements of Operations.
The risk in writing call options is that the Fund gives up the opportunity for profit if the market price of the security increases and the option is exercised. The risk in writing put options is that the Fund may incur a loss if the market price of the security decreases and the option is exercised. The risk in buying options is that the Fund pays a premium whether or not the option is exercised. The use of such instruments may involve certain additional risks as a result of unanticipated movements in the market. Writers (sellers) of options are subject to unlimited risk of loss, as the seller will be obligated to deliver or take delivery of the security at a predetermined price which may, upon exercise of the option, be significantly different from the then-market value.
The Rampart Enhanced Core Equity Fund invested in written covered call options contracts in an attempt to manage equity price risk and with the purpose of generating realized gains.
The following is a summary of the Fund’s options contracts as categorized equity risk, presented in the financial statements as of September 30, 2017:
| | | | |
Statements of Assets and Liabilities | |
| | | Enhanced
Core Equity | |
Assets: Purchased options at value | | $ | 90 | (1) |
Liabilities: Written options at value | | | (265 | ) |
| | | | |
Net asset (liability) balance | | $ | (175 | ) |
| | | | |
| | | | |
Statements of Operations | |
| | | Enhanced
Core Equity | |
Net realized gain (loss) on purchased options | | $ | (4,178 | )(2) |
Net realized gain (loss) on written options | | | 8,230 | |
Net change in unrealized appreciation (depreciation) on purchased options | | | 4 | (3) |
Net change in unrealized appreciation (depreciation) on written options | | | (109 | ) |
| | | | |
Total net realized and unrealized gain (loss) on purchased and written options | | $ | 3,947 | |
| | | | |
| | (1) | Amount included in Investment in unaffiliated securities at value. |
| | (2) | Included in net realized gain (loss) on unaffiliated investments. |
| | (3) | Included in net change in unrealized appreciation (depreciation) on unaffiliated investments. |
For the period ended September 30, 2017, the average daily premiums paid by the Rampart Enhanced Core Equity Fund for purchased options were $273 and the average daily premiums received for written call options by the Rampart Enhanced Core Equity Fund were $(558).
| Note | 4. Investment Advisory Fees and Related Party Transactions |
($ reported in thousands except as noted)
Virtus Investment Advisers, Inc. (the “Adviser”), an indirect, wholly-owned subsidiary of Virtus Investment Partners, Inc. (“Virtus”), is the investment adviser to the Trust. The Adviser manages the Funds’ investment programs and general operations of the Funds, including oversight of the Funds’ subadvisers.
As compensation for its services to the Funds, the Adviser is entitled to a fee based upon the following annual rates as a percentage of the average daily net assets of each Fund:
| | | | |
KAR Small-Cap Core Fund | | | 0.75 | % |
KAR Small-Cap Value Fund | | | 0.70 | |
| | | | | | | | | | | | |
| | | First $1 Billion | | | $1+ Billion through $2 Billion | | | $2+ Billion | |
KAR Capital Growth Fund | | | 0.70 | % | | | 0.65 | % | | | 0.60 | % |
KAR Global Quality Dividend Fund | | | 0.75 | | | | 0.70 | | | | 0.65 | |
KAR Mid-Cap Core Fund | | | 0.80 | | | | 0.75 | | | | 0.70 | |
Rampart Enhanced Core Equity Fund | | | 0.75 | | | | 0.70 | | | | 0.65 | |
Tactical Allocation Fund | | | 0.70 | | | | 0.65 | | | | 0.60 | |
| | | |
| | | First $400 Million | | | $400+ Million through $1 Billion | | | $1+ Billion | |
KAR Small-Cap Growth Fund | | | 0.90% | | | | 0.85% | | | | 0.80% | |
| | | |
| | | First $500 Million | | | Over $500 Million | | | | |
KAR Mid-Cap Growth Fund | | | 0.80% | | | | 0.70% | | | | | |
| | | |
| | | First $1 Billion | | | Over $1 Billion | | | | |
Contrarian Value Fund | | | 0.75% | | | | 0.70% | | | | | |
78
VIRTUS EQUITY TRUST
NOTES TO FINANCIAL STATEMENTS (Continued)
SEPTEMBER 30, 2017
During the period covered by these financial statements, the Tactical Allocation Fund invested a portion of its assets in Virtus Newfleet Credit Opportunities Fund, an affiliated mutual fund. In order to avoid any duplication of advisory fees, the Adviser has voluntarily waived its advisory fees in an amount equal to that which would otherwise be paid by the Fund on the assets invested in the Virtus Credit Opportunities Fund. For the period covered by these financial statements, the waiver amounted to $5. This waiver is in addition to the expense limitation and/or fee waiver covered elsewhere in these financial statements and is included in “Less expenses reimbursed and/or waived by investment adviser” in the Statements of Operations.
The subadvisers manage the investments of each Fund for which they are paid a fee by the Adviser. A list of the subadvisers and the Funds they serve as of the end of the period is as follows:
| | | | | | |
Fund | | Subadviser | | Fund | | Subadviser |
| Contrarian Value Fund | | Sasco Capital, Inc. | | KAR Small-Cap Growth Fund | | Kayne(1)(3) |
KAR Capital Growth Fund | | Kayne(1)(3) | | KAR Small-Cap Value Fund | | Kayne(1)(3) |
| KAR Global Quality Dividend Fund | | Kayne(1)(3) | | Rampart Enhanced Core Equity Fund | | Rampart Investment Management Company, LLC(3) |
KAR Mid-Cap Core Fund | | Kayne(1)(3) | | Tactical Allocation Fund (Domestic Equity Portfolio) | | Kayne(1)(3) |
KAR Mid-Cap Growth Fund | | Kayne(1)(3) | | Tactical Allocation Fund (International Equity Portfolio) | | DPIM(3)(2) |
| KAR Small-Cap Core Fund | | Kayne(1)(3) | | Tactical Allocation Fund (Fixed Income Portfolio) | | Newfleet Asset Management, LLC(3) |
| | (1) | Kayne Anderson Rudnick Investment Management, LLC. (“KAR”) |
| | (2) | Duff & Phelps Investment Management Co. (“DIPM”) |
| | (3) | An indirect, wholly-owned subsidiary of Virtus. |
| | C. | Expense Limits and Fee Waivers |
The Adviser has contractually agreed to limit certain Funds’ total operating expenses (excluding front-end or contingent deferred loads, taxes, leverage expenses, interest, brokerage commissions, expenses incurred in connection with any merger or reorganization, unusual or infrequently occurring expenses (such as litigation), acquired fund fees and expenses, and dividend expenses, if any), so that such expenses do not exceed the following percentages of the average annual daily net asset values for the following Funds.
| | | | | | | | | | | | | | | | | | | | |
| | | Class A | | | Class C | | | Class I | | | Class R6 | | | Through
Date | |
Contrarian Value Fund‡ | | | 1.48 | % | | | 2.23 | % | | | 1.23 | % | | | 1.09 | % | | | 7/31/18 | |
KAR Capital Growth Fund‡ | | | 1.47 | | | | 2.22 | | | | 1.22 | | | | N/A | | | | 7/31/18 | |
KAR Global Quality Dividend Fund | | | 1.35 | | | | 2.10 | | | | 1.10 | | | | N/A | | | | 7/31/18 | |
KAR Mid-Cap Core Fund | | | 1.20 | | | | 1.95 | | | | 0.95 | | | | N/A | | | | 7/31/18 | |
KAR Mid-Cap Growth Fund | | | 1.40 | | | | 2.15 | | | | 1.15 | | | | N/A | | | | 7/31/18 | |
KAR Small-Cap Growth Fund | | | 1.50 | | | | 2.25 | | | | 1.25 | | | | N/A | | | | 7/31/18 | |
KAR Small-Cap Value Fund‡ | | | 1.42 | | | | 2.17 | | | | 1.17 | | | | 1.07 | | | | 7/31/18 | |
Rampart Enhanced Core Equity Fund** | | | 1.20 | | | | 1.95 | | | | 0.95 | | | | N/A | | | | 7/31/18 | |
| | ‡ | Each share class is currently below its expense cap. |
| | ** | Effective July 31, 2017. For the period of April 1, 2017 to July 30, 2017 the expense caps were as follows for Class A, Class C and Class I respectively: 1.25%, 2.00%, and 1.00%. |
For certain Funds, the Adviser may recapture operating expenses waived or reimbursed under these arrangements, within three years after the date in which such waiver or reimbursement occurred. A Fund must pay its ordinary operating expenses before the Adviser is entitled to any reimbursement and must remain in compliance with any applicable expense limitations or, if none, the expense limitation in effect at the time of the waiver or reimbursement. All or a portion of the following Adviser reimbursed expenses may be recaptured as follows:
| | | | | | | | | | | | | | | | |
| | | Fiscal Period Ended | |
| | | 2018 | | | 2019 | | | 2020 | | | Total | |
KAR Global Quality Dividend Fund | | $ | 37 | | | $ | 83 | | | $ | 92 | | | $ | 212 | |
KAR Mid-Cap Core Fund | | | 63 | | | | 119 | | | | 235 | | | | 417 | |
KAR Mid-Cap Growth Fund | | | 38 | | | | 107 | | | | 80 | | | | 225 | |
Rampart Enhanced Core Equity Fund | | | 187 | | | | 217 | | | | 244 | | | | 648 | |
VP Distributors, LLC (“VP Distributors”), an indirect, wholly-owned subsidiary of Virtus, serves as the distributor of each Fund’s shares. VP Distributors has advised the Funds that for the fiscal period (the “period”) ended September 30, 2017, it retained net commissions of $1,232 for Class A shares and CDSC of $3, and $14 for Class A shares, and Class C shares, respectively.
In addition, each Fund pays VP Distributors 12b-1 fees under a 12b-1 Plan as a percentage of the average daily net assets of each respective class at the annual rates as follows: Class A shares 0.25%; Class C shares 1.00%; Class I shares and Class R6 shares are not subject to a 12b-1 Plan.
79
VIRTUS EQUITY TRUST
NOTES TO FINANCIAL STATEMENTS (Continued)
SEPTEMBER 30, 2017
Under certain circumstances, shares of certain Virtus Mutual Funds may be exchanged for shares of the same class of certain other Virtus Mutual Funds on the basis of the relative NAV per share at the time of the exchange. On exchanges with share classes that carry a CDSC, the CDSC schedule of the original shares purchased continues to apply.
| | F. | Administrator and Transfer Agent |
Virtus Fund Services, LLC, an indirect, wholly-owned subsidiary of Virtus, serves as the administrator and transfer agent to the Trust.
For the period ended September 30, 2017, the Funds incurred administration fees totaling $1,435 which are included in the Statements of Operations within the line item “Administration fees”.
For the period ended September 30, 2017, the Funds incurred transfer agent fees totaling $1,862 which are included in the Statements of Operations within the line item “Transfer agent fees and expenses”. A portion of these fees was paid to outside entities that also provide services to the Trust.
| | G. | Affiliated Shareholders |
($ reported in thousands)
At September 30, 2017, Virtus and its affiliates and the retirement plans of Virtus and its affiliates held shares of certain Funds which may be redeemed at any time that aggregated to the following:
| | | | | | | | |
| | | Shares | | | Aggregate Net
Asset Value | |
| KAR Capital Growth Fund | | | | | | | | |
Class A | | | 13 | | | $ | — | (1) |
| KAR Small-Cap Growth | | | | | | | | |
Class I | | | 177,519 | | | | 4,589 | |
| KAR Small-Cap Value Fund | | | | | | | | |
Class R6 | | | 312,290 | | | | 5,620 | |
| Rampart Enhance Core Equity Fund | | | | | | | | |
Class I | | | 405,504 | | | | 8,199 | |
| | (1) | Amount is less than $500. |
| | H. | Investments in Affiliates |
A summary of the Tactical Allocation Fund’s total long-term and short-term purchases and sales of the affiliated underlying fund during the period ended September 30, 2017, is as follows:
| | | | | | | | | | | | | | | | | | | | | | | | | | | | | | | | |
| | | Value,
beginning
of period | | | Purchases | | | Sales | | | Net Realized
gain (loss) | | | Net change in
unrealized
appreciation
(depreciation) | | | Value, end
of period | | | Dividend
Income | | | Distributions
of Realized
Gains | |
| Virtus Credit Opportunities Fund | | $ | 1,771 | | | $ | — | | | $ | (447 | ) | | | (3 | ) | | | (26 | ) | | $ | 1,295 | | | $ | 49 | | | $ | — | |
The Trust provides a deferred compensation plan for its Trustees who receive compensation from the Trust. Under the deferred compensation plan, Trustees may elect to defer all or a portion of their compensation. Amounts deferred are retained by the Trust, and then, to the extent permitted by the 1940 Act, in turn, may be invested in the shares of affiliated or unaffiliated mutual funds selected by the participating Trustees. Investments in such instruments are included in “Other assets” in the Statements of Assets and Liabilities at September 30, 2017.
80
VIRTUS EQUITY TRUST
NOTES TO FINANCIAL STATEMENTS (Continued)
SEPTEMBER 30, 2017
| Note | 5. Purchases and Sales of Securities |
($ reported in thousands)
Purchases and sales of securities (excluding U.S. Government and agency securities, short-term securities, and written options securities) during the period ended September 30, 2017, were as follows:
| | | | | | | | |
| | | Purchases | | | Sales | |
Contrarian Value Fund | | $ | 9,861 | | | $ | 35,250 | |
KAR Capital Growth Fund | | | 57,028 | | | | 68,033 | |
KAR Global Quality Dividend Fund | | | 7,591 | | | | 12,117 | |
KAR Mid-Cap Core Fund | | | 24,884 | | | | 10,668 | |
KAR Mid-Cap Growth Fund | | | 10,935 | | | | 18,878 | |
KAR Small-Cap Core Fund | | | 105,992 | | | | 11,676 | |
KAR Small-Cap Growth Fund | | | 436,456 | | | | 9,545 | |
KAR Small-Cap Value Fund | | | 69,093 | | | | 35,387 | |
Rampart Enhanced Core Equity Fund | | | 194,338 | | | | 192,207 | |
Tactical Allocation Fund | | | 34,433 | | | | 42,154 | |
The Tactical Allocation Fund had purchases of $2,309, and sales of $1,391 of long-term U.S. Government and agency securities during the period ended September 30, 2017.
| Note | 6. Capital Share Transactions |
(reported in thousands)
Transactions in shares of capital stock, during the periods ended as indicated below, were as follows:
| | | | | | | | | | | | | | | | | | | | | | | | |
| | | Contrarian Value Fund | |
| | | Fiscal Period Ended
September 30, 2017(2) | | | Year Ended
March 31, 2017 | | | Year Ended
March 31, 2016 | |
| | | SHARES | | | AMOUNT | | | SHARES | | | AMOUNT | | | SHARES | | | AMOUNT | |
| | | | | | | | | | | | | | | | | | | | | | | | |
| Class A | | | | | | | | | | | | | | | | | | | | | | | | |
| Sale of shares | | | 168 | | | $ | 6,004 | | | | 235 | | | $ | 7,988 | | | | 497 | | | $ | 16,061 | |
| Reinvestment of distributions | | | 20 | | | | 707 | | | | 17 | | | | 559 | | | | 17 | | | | 628 | |
| Shares repurchased | | | (427 | ) | | | (15,259 | ) | | | (1,471 | ) | | | (50,190 | ) | | | (2,361 | ) | | | (76,153 | ) |
| | | | | | | | | | | | | | | | | | | | | | | | |
| Net Increase / (Decrease) | | | (239 | ) | | $ | (8,548 | ) | | | (1,219 | ) | | $ | (41,643 | ) | | | (1,847 | ) | | $ | (59,464 | ) |
| | | | | | | | | | | | | | | | | | | | | | | | |
| Class C | | | | | | | | | | | | | | | | | | | | | | | | |
| Sale of shares | | | 4 | | | $ | 149 | | | | 28 | | | $ | 920 | | | | 38 | | | $ | 1,236 | |
| Reinvestment of distributions | | | 1 | | | | 39 | | | | — | (1) | | | 5 | | | | 1 | | | | 38 | |
| Shares repurchased | | | (231 | ) | | | (7,880 | ) | | | (338 | ) | | | (11,101 | ) | | | (564 | ) | | | (17,436 | ) |
| | | | | | | | | | | | | | | | | | | | | | | | |
| Net Increase / (Decrease) | | | (226 | ) | | $ | (7,692 | ) | | | (310 | ) | | $ | (10,176 | ) | | | (525 | ) | | $ | (16,162 | ) |
| | | | | | | | | | | | | | | | | | | | | | | | |
| Class I | | | | | | | | | | | | | | | | | | | | | | | | |
| Sale of shares | | | 104 | | | $ | 3,738 | | | | 478 | | | $ | 16,400 | | | | 657 | | | $ | 21,130 | |
| Reinvestment of distributions | | | 29 | | | | 1,022 | | | | 28 | | | | 945 | | | | 25 | | | | 890 | |
| Shares repurchased | | | (402 | ) | | | (14,239 | ) | | | (1,646 | ) | | | (56,035 | ) | | | (2,219 | ) | | | (71,603 | ) |
| | | | | | | | | | | | | | | | | | | | | | | | |
| Net Increase / (Decrease) | | | (269 | ) | | $ | (9,479 | ) | | | (1,140 | ) | | $ | (38,690 | ) | | | (1,537 | ) | | $ | (49,583 | ) |
| | | | | | | | | | | | | | | | | | | | | | | | |
| Class R6 | | | | | | | | | | | | | | | | | | | | | | | | |
| Sale of shares | | | 5 | | | $ | 181 | | | | 28 | | | $ | 935 | | | | 176 | | | $ | 5,841 | |
| Reinvestment of distributions | | | 1 | | | | 46 | | | | 1 | | | | 45 | | | | — | (1) | | | 17 | |
| Shares repurchased | | | (7 | ) | | | (261 | ) | | | (96 | ) | | | (3,230 | ) | | | (27 | ) | | | (853 | ) |
| | | | | | | | | | | | | | | | | | | | | | | | |
| Net Increase / (Decrease) | | | (1 | ) | | $ | (34 | ) | | | (67 | ) | | $ | (2,250 | ) | | | 149 | | | $ | 5,005 | |
| | | | | | | | | | | | | | | | | | | | | | | | |
| (1) | Amount is less than 500 shares. |
| (2) | The Fund changed its fiscal year end to September 30 during the period. |
81
VIRTUS EQUITY TRUST
NOTES TO FINANCIAL STATEMENTS (Continued)
SEPTEMBER 30, 2017
| | | | | | | | | | | | | | | | | | | | | | | | |
| | | KAR Capital Growth Fund | |
| | | Fiscal Period Ended
September 30, 2017(4) | | | Year Ended
March 31, 2017 | | | Year Ended
March 31, 2016 | |
| | | SHARES | | | AMOUNT | | | SHARES | | | AMOUNT | | | SHARES | | | AMOUNT | |
| | | | | | | | | | | | | | | | | | | | | | | | |
| Class A | | | | | | | | | | | | | | | | | | | | | | | | |
| Sale of shares | | | 209 | | | $ | 3,179 | | | | 403 | | | $ | 5,482 | | | | 692 | | | $ | 9,635 | |
| Conversion from Class B shares(3) | | | — | | | | — | | | | 43 | | | | 602 | | | | — | | | | — | |
| Reinvestment of distributions | | | 263 | | | | 4,031 | | | | 2,208 | | | | 28,727 | | | | 1,224 | | | | 17,438 | |
| Shares repurchased | | | (1,396 | ) | | | (21,262 | ) | | | (3,521 | ) | | | (48,786 | ) | | | (3,003 | ) | | | (41,883 | ) |
| | | | | | | | | | | | | | | | | | | | | | | | |
| Net Increase / (Decrease) | | | (924 | ) | | $ | (14,052 | ) | | | (867 | ) | | $ | (13,975 | ) | | | (1,087 | ) | | $ | (14,810 | ) |
| | | | | | | | | | | | | | | | | | | | | | | | |
| Class B | | | | | | | | | | | | | | | | | | | | | | | | |
| Sale of shares | | | — | | | $ | — | | | | — | (1) | | | — | (2) | | | 2 | | | $ | 17 | |
| Reinvestment of distributions | | | — | | | | — | | | | 6 | | | | 67 | | | | 8 | | | | 98 | |
| Shares repurchased | | | — | | | | — | | | | (78 | ) | | | (902 | ) | | | (69 | ) | | | (799 | ) |
| Conversion to Class A shares(3) | | | — | | | | — | | | | (54 | ) | | | (602 | ) | | | — | | | | — | |
| | | | | | | | | | | | | | | | | | | | | | | | |
| Net Increase / (Decrease) | | | — | | | $ | — | | | | (126 | ) | | $ | (1,437 | ) | | | (59 | ) | | $ | (684 | ) |
| | | | | | | | | | | | | | | | | | | | | | | | |
| Class C | | | | | | | | | | | | | | | | | | | | | | | | |
| Sale of shares | | | 77 | | | $ | 918 | | | | 88 | | | $ | 972 | | | | 1,249 | | | $ | 14,657 | |
| Reinvestment of distributions | | | 12 | | | | 152 | | | | 109 | | | | 1,140 | | | | 68 | | | | 810 | |
| Shares repurchased | | | (180 | ) | | | (2,209 | ) | | | (777 | ) | | | (8,801 | ) | | | (564 | ) | | | (6,362 | ) |
| | | | | | | | | | | | | | | | | | | | | | | | |
| Net Increase / (Decrease) | | | (91 | ) | | $ | (1,139 | ) | | | (580 | ) | | $ | (6,689 | ) | | | 753 | | | $ | 9,105 | |
| | | | | | | | | | | | | | | | | | | | | | | | |
| Class I | | | | | | | | | | | | | | | | | | | | | | | | |
| Sale of shares | | | 120 | | | $ | 1,893 | | | | 272 | | | $ | 3,894 | | | | 171 | | | $ | 2,422 | |
| Reinvestment of distributions | | | 6 | | | | 102 | | | | 47 | | | | 637 | | | | 23 | | | | 338 | |
| Shares repurchased | | | (81 | ) | | | (1,276 | ) | | | (206 | ) | | | (2,908 | ) | | | (198 | ) | | | (2,764 | ) |
| | | | | | | | | | | | | | | | | | | | | | | | |
| Net Increase / (Decrease) | | | 45 | | | $ | 719 | | | | 113 | | | $ | 1,623 | | | | (4 | ) | | $ | (4 | ) |
| | | | | | | | | | | | | | | | | | | | | | | | |
| |
| | | KAR Global Quality Dividend Fund | |
| | | Fiscal Period Ended
September 30, 2017(4) | | | Year Ended
March 31, 2017 | | | Year Ended
March 31, 2016 | |
| | | SHARES | | | AMOUNT | | | SHARES | | | AMOUNT | | | SHARES | | | AMOUNT | |
| | | | | | | | | | | | | | | | | | | | | | | | |
| Class A | | | | | | | | | | | | | | | | | | | | | | | | |
| Sale of shares | | | 44 | | | $ | 724 | | | | 128 | | | $ | 1,985 | | | | 328 | | | $ | 4,631 | |
| Reinvestment of distributions | | | 207 | | | | 3,317 | | | | 29 | | | | 451 | | | | 16 | | | | 245 | |
| Shares repurchased | | | (298 | ) | | | (5,040 | ) | | | (700 | ) | | | (11,095 | ) | | | (611 | ) | | | (9,094 | ) |
| | | | | | | | | | | | | | | | | | | | | | | | |
| Net Increase / (Decrease) | | | (47 | ) | | $ | (999 | ) | | | (543 | ) | | $ | (8,659 | ) | | | (267 | ) | | $ | (4,218 | ) |
| | | | | | | | | | | | | | | | | | | | | | | | |
| Class C | | | | | | | | | | | | | | | | | | | | | | | | |
| Sale of shares | | | 7 | | | $ | 116 | | | | 59 | | | $ | 906 | | | | 116 | | | $ | 1,660 | |
| Reinvestment of distributions | | | 26 | | | | 403 | | | | — | | | | — | | | | 1 | | | | 11 | |
| Shares repurchased | | | (71 | ) | | | (1,145 | ) | | | (194 | ) | | | (2,981 | ) | | | (914 | ) | | | (12,980 | ) |
| | | | | | | | | | | | | | | | | | | | | | | | |
| Net Increase / (Decrease) | | | (38 | ) | | $ | (626 | ) | | | (135 | ) | | $ | (2,075 | ) | | | (797 | ) | | $ | (11,309 | ) |
| | | | | | | | | | | | | | | | | | | | | | | | |
| Class I | | | | | | | | | | | | | | | | | | | | | | | | |
| Sale of shares | | | 38 | | | $ | 626 | | | | 94 | | | $ | 1,535 | | | | 45 | | | $ | 667 | |
| Reinvestment of distributions | | | 33 | | | | 522 | | | | 4 | | | | 68 | | | | 3 | | | | 52 | |
| Shares repurchased | | | (89 | ) | | | (1,469 | ) | | | (107 | ) | | | (1,701 | ) | | | (253 | ) | | | (3,772 | ) |
| | | | | | | | | | | | | | | | | | | | | | | | |
| Net Increase / (Decrease) | | | (18 | ) | | $ | (321 | ) | | | (9 | ) | | $ | (98 | ) | | | (205 | ) | | $ | (3,053 | ) |
| | | | | | | | | | | | | | | | | | | | | | | | |
| (1) | Amount is less than 500 shares. |
| (2) | Amount is less than $500. |
| (3) | See Note 1 in Notes to Financial Statements for more information. |
| (4) | The Fund changed its fiscal year end to September 30 during the period. |
82
VIRTUS EQUITY TRUST
NOTES TO FINANCIAL STATEMENTS (Continued)
SEPTEMBER 30, 2017
| | | | | | | | | | | | | | | | | | | | | | | | |
| | | KAR Mid-Cap Core Fund | |
| | | Fiscal Period Ended
September 30, 2017(4) | | | Year Ended
March 31, 2017 | | | Year Ended
March 31, 2016 | |
| | | SHARES | | | AMOUNT | | | SHARES | | | AMOUNT | | | SHARES | | | AMOUNT | |
| | | | | | | | | | | | | | | | | | | | | | | | |
| Class A | | | | | | | | | | | | | | | | | | | | | | | | |
| Sale of shares | | | 209 | | | $ | 5,573 | | | | 860 | | | $ | 20,379 | | | | 557 | | | $ | 12,394 | |
| Reinvestment of distributions | | | 3 | | | | 80 | | | | — | | | | — | | | | 4 | | | | 95 | |
| Shares repurchased | | | (72 | ) | | | (1,928 | ) | | | (974 | ) | | | (23,609 | ) | | | (217 | ) | | | (4,737 | ) |
| | | | | | | | | | | | | | | | | | | | | | | | |
| Net Increase / (Decrease) | | | 140 | | | $ | 3,725 | | | | (114 | ) | | $ | (3,230 | ) | | | 344 | | | $ | 7,752 | |
| | | | | | | | | | | | | | | | | | | | | | | | |
| Class C | | | | | | | | | | | | | | | | | | | | | | | | |
| Sale of shares | | | 138 | | | $ | 3,470 | | | | 409 | | | $ | 9,372 | | | | 195 | | | $ | 4,179 | |
| Reinvestment of distributions | | | 2 | | | | 56 | | | | — | | | | — | | | | 2 | | | | 35 | |
| Shares repurchased | | | (47 | ) | | | (1,179 | ) | | | (134 | ) | | | (3,029 | ) | | | (85 | ) | | | (1,754 | ) |
| | | | | | | | | | | | | | | | | | | | | | | | |
| Net Increase / (Decrease) | | | 93 | | | $ | 2,347 | | | | 275 | | | $ | 6,343 | | | | 112 | | | $ | 2,460 | |
| | | | | | | | | | | | | | | | | | | | | | | | |
| Class I | | | | | | | | | | | | | | | | | | | | | | | | |
| Sale of shares | | | 968 | | | $ | 26,148 | | | | 1,943 | | | $ | 47,890 | | | | 279 | | | $ | 6,180 | |
| Reinvestment of distributions | | | 7 | | | | 194 | | | | — | | | | — | | | | 2 | | | | 41 | |
| Shares repurchased | | | (456 | ) | | | (12,244 | ) | | | (325 | ) | | | (7,950 | ) | | | (156 | ) | | | (3,412 | ) |
| | | | | | | | | | | | | | | | | | | | | | | | |
| Net Increase / (Decrease) | | | 519 | | | $ | 14,098 | | | | 1,618 | | | $ | 39,940 | | | | 125 | | | $ | 2,809 | |
| | | | | | | | | | | | | | | | | | | | | | | | |
| |
| | | KAR Mid-Cap Growth Fund | |
| | | Fiscal Period Ended
September 30, 2017(4) | | | Year Ended
March 31, 2017 | | | Year Ended
March 31, 2016 | |
| | | SHARES | | | | AMOUNT | | | | SHARES | | | | AMOUNT | | | | SHARES | | | | AMOUNT | |
| | | | | | | | | | | | | | | | | | | | | | | | |
| Class A | | | | | | | | | | | | | | | | | | | | | | | | |
| Sale of shares | | | 55 | | | $ | 1,451 | | | | 127 | | | $ | 2,897 | | | | 134 | | | $ | 2,958 | |
| Conversion from Class B shares(3) | | | — | | | | — | | | | 6 | | | | 156 | | | | — | | | | — | |
| Reinvestment of distributions | | | 14 | | | | 370 | | | | 48 | | | | 1,082 | | | | 49 | | | | 1,143 | |
| Shares repurchased | | | (291 | ) | | | (7,625 | ) | | | (396 | ) | | | (9,112 | ) | | | (332 | ) | | | (7,279 | ) |
| | | | | | | | | | | | | | | | | | | | | | | | |
| Net Increase / (Decrease) | | | (222 | ) | | $ | (5,804 | ) | | | (215 | ) | | $ | (4,977 | ) | | | (149 | ) | | $ | (3,178 | ) |
| | | | | | | | | | | | | | | | | | | | | | | | |
| Class B | | | | | | | | | | | | | | | | | | | | | | | | |
| Sale of shares | | | — | | | $ | — | | | | — | | | | — | (2) | | | — | (1) | | $ | — | (2) |
| Reinvestment of distributions | | | — | | | | — | | | | — | (1) | | | 3 | | | | — | (1) | | | 9 | |
| Shares repurchased | | | — | | | | — | | | | (10 | ) | | | (196 | ) | | | (14 | ) | | | (262 | ) |
| Conversion to Class A shares(3) | | | — | | | | — | | | | (8 | ) | | | (156 | ) | | | — | | | | — | |
| | | | | | | | | | | | | | | | | | | | | | | | |
| Net Increase / (Decrease) | | | — | | | $ | — | | | | (18 | ) | | $ | (349 | ) | | | (14 | ) | | $ | (253 | ) |
| | | | | | | | | | | | | | | | | | | | | | | | |
| Class C | | | | | | | | | | | | | | | | | | | | | | | | |
| Sale of shares | | | 15 | | | $ | 330 | | | | 89 | | | $ | 1,704 | | | | 71 | | | $ | 1,340 | |
| Reinvestment of distributions | | | 1 | | | | 29 | | | | 5 | | | | 89 | | | | 5 | | | | 94 | |
| Shares repurchased | | | (63 | ) | | | (1,349 | ) | | | (121 | ) | | | (2,259 | ) | | | (96 | ) | | | (1,721 | ) |
| | | | | | | | | | | | | | | | | | | | | | | | |
| Net Increase / (Decrease) | | | (47 | ) | | $ | (990 | ) | | | (27 | ) | | $ | (466 | ) | | | (20 | ) | | $ | (287 | ) |
| | | | | | | | | | | | | | | | | | | | | | | | |
| Class I | | | | | | | | | | | | | | | | | | | | | | | | |
| Sale of shares | | | 14 | | | $ | 389 | | | | 47 | | | $ | 1,092 | | | | 25 | | | $ | 586 | |
| Reinvestment of distributions | | | 1 | | | | 19 | | | | 2 | | | | 47 | | | | 2 | | | | 49 | |
| Shares repurchased | | | (14 | ) | | | (376 | ) | | | (27 | ) | | | (638 | ) | | | (36 | ) | | | (806 | ) |
| | | | | | | | | | | | | | | | | | | | | | | | |
| Net Increase / (Decrease) | | | 1 | | | $ | 32 | | | | 22 | | | $ | 501 | | | | (9 | ) | | $ | (171 | ) |
| | | | | | | | | | | | | | | | | | | | | | | | |
| (1) | Amount is less than 500 shares. |
| (2) | Amount is less than $500. |
| (3) | See Note 1 in Notes to Financial Statement for more information. |
| (4) | The Fund changed its fiscal year end to September 30 during the period. |
83
VIRTUS EQUITY TRUST
NOTES TO FINANCIAL STATEMENTS (Continued)
SEPTEMBER 30, 2017
| | | | | | | | | | | | | | | | | | | | | | | | |
| | | KAR Small-Cap Core Fund | |
| | | Fiscal Period Ended
September 30, 2017(2) | | | Year Ended
March 31, 2017 | | | Year Ended
March 31, 2016 | |
| | | SHARES | | | AMOUNT | | | SHARES | | | AMOUNT | | | SHARES | | | AMOUNT | |
| Class A | | | | | | | | | | | | | | | | | | | | | | | | |
| Sale of shares | | | 608 | | | $ | 16,037 | | | | 1,507 | | | $ | 34,529 | | | | 436 | | | $ | 9,529 | |
| Reinvestment of distributions | | | 1 | | | | 30 | | | | 153 | | | | 3,396 | | | | 443 | | | | 9,802 | |
| Shares repurchased | | | (332 | ) | | | (8,598 | ) | | | (1,606 | ) | | | (37,256 | ) | | | (1,006 | ) | | | (22,255 | ) |
| | | | | | | | | | | | | | | | | | | | | | | | |
| Net Increase / (Decrease) | | | 277 | | | $ | 7,469 | | | | 54 | | | $ | 669 | | | | (127 | ) | | $ | (2,924 | ) |
| | | | | | | | | | | | | | | | | | | | | | | | |
| Class C | | | | | | | | | | | | | | | | | | | | | | | | |
| Sale of shares | | | 420 | | | $ | 9,214 | | | | 778 | | | $ | 15,284 | | | | 295 | | | $ | 5,978 | |
| Reinvestment of distributions | | | 1 | | | | 29 | | | | 123 | | | | 2,351 | | | | 301 | | | | 5,822 | |
| Shares repurchased | | | (220 | ) | | | (4,822 | ) | | | (442 | ) | | | (8,547 | ) | | | (360 | ) | | | (7,311 | ) |
| | | | | | | | | | | | | | | | | | | | | | | | |
| Net Increase / (Decrease) | | | 201 | | | $ | 4,421 | | | | 459 | | | $ | 9,088 | | | | 236 | | | $ | 4,489 | |
| | | | | | | | | | | | | | | | | | | | | | | | |
| Class I | | | | | | | | | | | | | | | | | | | | | | | | |
| Sale of shares | | | 4,161 | | | $ | 114,129 | | | | 7,980 | | | $ | 188,854 | | | | 1,981 | | | $ | 46,483 | |
| Reinvestment of distributions | | | 6 | | | | 167 | | | | 571 | | | | 13,259 | | | | 1,417 | | | | 32,670 | |
| Shares repurchased | | | (1,387 | ) | | | (37,551 | ) | | | (3,695 | ) | | | (86,856 | ) | | | (4,279 | ) | | | (101,680 | ) |
| | | | | | | | | | | | | | | | | | | | | | | | |
| Net Increase / (Decrease) | | | 2,780 | | | $ | 76,745 | | | | 4,856 | | | $ | 115,257 | | | | (881 | ) | | $ | (22,527 | ) |
| | | | | | | | | | | | | | | | | | | | | | | | |
| Class R6 | | | | | | | | | | | | | | | | | | | | | | | | |
| Sale of shares | | | 373 | | | $ | 10,312 | | | | 446 | | | $ | 10,598 | | | | 890 | | | $ | 21,755 | |
| Reinvestment of distributions | | | 1 | | | | 16 | | | | 62 | | | | 1,435 | | | | 97 | | | | 2,115 | |
| Shares repurchased | | | (97 | ) | | | (2,624 | ) | | | (208 | ) | | | (4,894 | ) | | | (59 | ) | | | (1,307 | ) |
| | | | | | | | | | | | | | | | | | | | | | | | |
| Net Increase/ (Decrease) | | | 277 | | | $ | 7,704 | | | | 300 | | | $ | 7,139 | | | | 928 | | | $ | 22,563 | |
| | | | | | | | | | | | | | | | | | | | | | | | |
| |
| | | KAR Small-Cap Growth Fund | |
| | | Fiscal Period Ended
September 30, 2017(2) | | | Year Ended
March 31, 2017 | | | Year Ended
March 31, 2016 | |
| | | SHARES | | | AMOUNT | | | SHARES | | | AMOUNT | | | SHARES | | | AMOUNT | |
| | | | | | | | | | | | | | | | | | | | | | | | |
| Class A | | | | | | | | | | | | | | | | | | | | | | | | |
| Sale of shares | | | 3,221 | | | $ | 75,203 | | | | 9,213 | | | $ | 178,982 | | | | 1,110 | | | $ | 18,446 | |
| Reinvestment of distributions | | | — | (1) | | | 3 | | | | 186 | | | | 3,272 | | | | 129 | | | | 2,236 | |
| Shares repurchased | | | (1,594 | ) | | | (36,146 | ) | | | (5,694 | ) | | | (115,942 | ) | | | (987 | ) | | | (16,297 | ) |
| | | | | | | | | | | | | | | | | | | | | | | | |
| Net Increase / (Decrease) | | | 1,627 | | | $ | 39,060 | | | | 3,705 | | | $ | 66,312 | | | | 252 | | | $ | 4,385 | |
| | | | | | | | | | | | | | | | | | | | | | | | |
| Class C | | | | | | | | | | | | | | | | | | | | | | | | |
| Sale of shares | | | 1,339 | | | $ | 28,543 | | | | 2,108 | | | $ | 37,801 | | | | 377 | | | $ | 5,896 | |
| Reinvestment of distributions | | | — | (1) | | | 1 | | | | 44 | | | | 711 | | | | 29 | | | | 470 | |
| Shares repurchased | | | (319 | ) | | | (6,772 | ) | | | (325 | ) | | | (5,799 | ) | | | (163 | ) | | | (2,491 | ) |
| | | | | | | | | | | | | | | | | | | | | | | | |
| Net Increase / (Decrease) | | | 1,020 | | | $ | 21,772 | | | | 1,827 | | | $ | 32,713 | | | | 243 | | | $ | 3,875 | |
| | | | | | | | | | | | | | | | | | | | | | | | |
| Class I | | | | | | | | | | | | | | | | | | | | | | | | |
| Sale of shares | | | 22,541 | | | $ | 539,222 | | | | 22,582 | | | $ | 452,219 | | | | 4,526 | | | $ | 76,763 | |
| Reinvestment of distributions | | | — | (1) | | | 10 | | | | 170 | | | | 3,037 | | | | 60 | | | | 1,032 | |
| Shares repurchased | | | (3,312 | ) | | | (77,349 | ) | | | (5,416 | ) | | | (106,659 | ) | | | (1,075 | ) | | | (17,938 | ) |
| | | | | | | | | | | | | | | | | | | | | | | | |
| Net Increase / (Decrease) | | | 19,229 | | | $ | 461,883 | | | | 17,336 | | | $ | 348,597 | | | | 3,511 | | | $ | 59,857 | |
| | | | | | | | | | | | | | | | | | | | | | | | |
| (1) | Amount is less than 500 shares. |
| (2) | The Fund changed its fiscal year end to September 30 during the period. |
84
VIRTUS EQUITY TRUST
NOTES TO FINANCIAL STATEMENTS (Continued)
SEPTEMBER 30, 2017
| | | | | | | | | | | | | | | | | | | | | | | | |
| | | KAR Small-Cap Value Fund | |
| | | Fiscal Period Ended
September 30, 2017(2) | | | Year Ended
March 31, 2017 | | | Year Ended
March 31, 2016 | |
| | | SHARES | | | AMOUNT | | | SHARES | | | AMOUNT | | | SHARES | | | AMOUNT | |
| | | | | | | | | | | | | | | | | | | | | | | | |
| Class A | | | | | | | | | | | | | | | | | | | | | | | | |
| Sale of shares | | | 318 | | | $ | 5,561 | | | | 1,626 | | | $ | 26,711 | | | | 572 | | | $ | 8,621 | |
| Reinvestment of distributions | | | 168 | | | | 2,887 | | | | 396 | | | | 6,244 | | | | 285 | | | | 4,445 | |
| Shares repurchased | | | (794 | ) | | | (13,985 | ) | | | (1,515 | ) | | | (24,855 | ) | | | (808 | ) | | | (12,177 | ) |
| | | | | | | | | | | | | | | | | | | | | | | | |
| Net Increase / (Decrease) | | | (308 | ) | | $ | (5,537 | ) | | | 507 | | | $ | 8,100 | | | | 49 | | | $ | 889 | |
| | | | | | | | | | | | | | | | | | | | | | | | |
| Class C | | | | | | | | | | | | | | | | | | | | | | | | |
| Sale of shares | | | 107 | | | $ | 1,853 | | | | 417 | | | $ | 6,683 | | | | 95 | | | $ | 1,426 | |
| Reinvestment of distributions | | | 61 | | | | 1,032 | | | | 123 | | | | 1,918 | | | | 88 | | | | 1,357 | |
| Shares repurchased | | | (215 | ) | | | (3,708 | ) | | | (373 | ) | | | (5,888 | ) | | | (217 | ) | | | (3,265 | ) |
| | | | | | | | | | | | | | | | | | | | | | | | |
| Net Increase / (Decrease) | | | (47 | ) | | $ | (823 | ) | | | 167 | | | $ | 2,713 | | | | (34 | ) | | $ | (482 | ) |
| | | | | | | | | | | | | | | | | | | | | | | | |
| Class I | | | | | | | | | | | | | | | | | | | | | | | | |
| Sale of shares | | | 4,212 | | | $ | 73,980 | | | | 8,261 | | | $ | 134,255 | | | | 2,300 | | | $ | 34,828 | |
| Reinvestment of distributions | | | 560 | | | | 9,602 | | | | 1,006 | | | | 15,898 | | | | 680 | | | | 10,585 | |
| Shares repurchased | | | (2,237 | ) | | | (39,283 | ) | | | (4,704 | ) | | | (76,451 | ) | | | (3,573 | ) | | | (53,640 | ) |
| | | | | | | | | | | | | | | | | | | | | | | | |
| Net Increase / (Decrease) | | | 2,535 | | | $ | 44,299 | | | | 4,563 | | | $ | 73,702 | | | | (593 | ) | | $ | (8,227 | ) |
| | | | | | | | | | | | | | | | | | | | | | | | |
| Class R6 | | | | | | | | | | | | | | | | | | | | | | | | |
| Sale of Shares | | | 559 | | | $ | 9,803 | | | | 7 | | | $ | 100 | | | | — | | | $ | — | |
| Reinvestment of distributions | | | 9 | | | | 155 | | | | — | (1) | | | 3 | | | | — | | | | — | |
| Shares repurchased | | | (23 | ) | | | (405 | ) | | | — | | | | — | | | | — | | | | — | |
| | | | | | | | | | | | | | | | | | | | | | | | |
| Net Increase / (Decrease) | | | 545 | | | $ | 9,553 | | | | 7 | | | $ | 103 | | | | — | | | $ | — | |
| | | | | | | | | | | | | | | | | | | | | | | | |
| |
| | | Rampart Enhanced Core Equity Fund | |
| | | Fiscal Period Ended
September 30, 2017(2) | | | Year Ended
March 31, 2017 | | | Year Ended
March 31, 2016 | |
| | | SHARES | | | AMOUNT | | | SHARES | | | AMOUNT | | | SHARES | | | AMOUNT | |
| | | | | | | | | | | | | | | | | | | | | | | | |
| Class A | | | | | | | | | | | | | | | | | | | | | | | | |
| Sale of shares | | | 296 | | | $ | 6,015 | | | | 750 | | | $ | 14,419 | | | | 681 | | | $ | 12,511 | |
| Reinvestment of distributions | | | 477 | | | | 9,158 | | | | 191 | | | | 3,644 | | | | 1,027 | | | | 18,016 | |
| Shares repurchased | | | (424 | ) | | | (8,550 | ) | | | (920 | ) | | | (17,539 | ) | | | (1,698 | ) | | | (30,024 | ) |
| | | | | | | | | | | | | | | | | | | | | | | | |
| Net Increase / (Decrease) | | | 349 | | | $ | 6,623 | | | | 21 | | | $ | 524 | | | | 10 | | | $ | 503 | |
| | | | | | | | | | | | | | | | | | | | | | | | |
| Class C | | | | | | | | | | | | | | | | | | | | | | | | |
| Sale of shares | | | 43 | | | $ | 773 | | | | 402 | | | $ | 6,824 | | | | 769 | | | $ | 13,346 | |
| Reinvestment of distributions | | | 169 | | | | 2,918 | | | | 51 | | | | 887 | | | | 387 | | | | 6,208 | |
| Shares repurchased | | | (438 | ) | | | (8,125 | ) | | | (630 | ) | | | (10,821 | ) | | | (878 | ) | | | (14,585 | ) |
| | | | | | | | | | | | | | | | | | | | | | | | |
| Net Increase / (Decrease) | | | (226 | ) | | $ | (4,434 | ) | | | (177 | ) | | $ | (3,110 | ) | | | 278 | | | $ | 4,969 | |
| | | | | | | | | | | | | | | | | | | | | | | | |
| Class I | | | | | | | | | | | | | | | | | | | | | | | | |
| Sale of shares | | | 664 | | | $ | 13,051 | | | | 671 | | | $ | 12,576 | | | | 318 | | | $ | 5,626 | |
| Reinvestment of distributions | | | 90 | | | | 1,722 | | | | 38 | | | | 713 | | | | 80 | | | | 1,413 | |
| Shares repurchased | | | (186 | ) | | | (3,743 | ) | | | (331 | ) | | | (6,290 | ) | | | (165 | ) | | | (2,957 | ) |
| | | | | | | | | | | | | | | | | | | | | | | | |
| Net Increase / (Decrease) | | | 568 | | | $ | 11,030 | | | | 378 | | | $ | 6,999 | | | | 233 | | | $ | 4,082 | |
| | | | | | | | | | | | | | | | | | | | | | | | |
| (1) | Amount is less than 500 shares. |
| (2) | The Fund changed its fiscal year end to September 30 during the period. |
85
VIRTUS EQUITY TRUST
NOTES TO FINANCIAL STATEMENTS (Continued)
SEPTEMBER 30, 2017
| | | | | | | | | | | | | | | | | | | | | | | | |
| | | Tactical Allocation Fund | |
| | | Fiscal Period Ended
September 30, 2017(4) | | | Year Ended
March 31, 2017 | | | Year Ended
March 31, 2016 | |
| | | SHARES | | | AMOUNT | | | SHARES | | | AMOUNT | | | SHARES | | | AMOUNT | |
| | | | | | | | | | | | | | | | | | | | | | | | |
| Class A | | | | | | | | | | | | | | | | | | | | | | | | |
| Sale of shares | | | 55 | | | $ | 472 | | | | 131 | | | $ | 1,089 | | | | 403 | | | $ | 3,817 | |
| Conversion from Class B shares(3) | | | — | | | | — | | | | 12 | | | | 97 | | | | — | | | | — | |
| Reinvestment of distributions | | | 161 | | | | 1,411 | | | | 1,531 | | | | 12,254 | | | | 1,131 | | | | 10,398 | |
| Shares repurchased | | | (873 | ) | | | (7,615 | ) | | | (2,669 | ) | | | (22,601 | ) | | | (2,565 | ) | | | (22,962 | ) |
| | | | | | | | | | | | | | | | | | | | | | | | |
| Net Increase / (Decrease) | | | (657 | ) | | $ | (5,732 | ) | | | (995 | ) | | $ | (9,161 | ) | | | (1,031 | ) | | $ | (8,747 | ) |
| | | | | | | | | | | | | | | | | | | | | | | | |
| Class B | | | | | | | | | | | | | | | | | | | | | | | | |
| Sale of shares | | | — | | | $ | — | | | | — | (1) | | | — | (2) | | | — | (1) | | $ | — | (2) |
| Reinvestment of distributions | | | — | | | | — | | | | 1 | | | | 11 | | | | 2 | | | | 19 | |
| Shares repurchased | | | — | | | | — | | | | (13 | ) | | | (122 | ) | | | (16 | ) | | | (145 | ) |
| Conversion to Class A shares(3) | | | — | | | | — | | | | (12 | ) | | | (97 | ) | | | — | | | | — | |
| | | | | | | | | | | | | | | | | | | | | | | | |
| Net Increase / (Decrease) | | | — | | | $ | — | | | | (24 | ) | | $ | (208 | ) | | | (14 | ) | | $ | (126 | ) |
| | | | | | | | | | | | | | | | | | | | | | | | |
| Class C | | | | | | | | | | | | | | | | | | | | | | | | |
| Sale of shares | | | 14 | | | $ | 127 | | | | 63 | | | $ | 536 | | | | 437 | | | $ | 4,258 | |
| Reinvestment of distributions | | | 3 | | | | 26 | | | | 45 | | | | 367 | | | | 47 | | | | 443 | |
| Shares repurchased | | | (90 | ) | | | (802 | ) | | | (228 | ) | | | (1,972 | ) | | | (487 | ) | | | (4,357 | ) |
| | | | | | | | | | | | | | | | | | | | | | | | |
| Net Increase / (Decrease) | | | (73 | ) | | $ | (649 | ) | | | (120 | ) | | $ | (1,069 | ) | | | (3 | ) | | $ | 344 | |
| | | | | | | | | | | | | | | | | | | | | | | | |
| (1) | Amount is less than 500 shares. |
| (2) | Amount is less than $500. |
| (3) | See Note 1 in Notes to Financial Statements for more information. |
| (4) | The Fund changed its fiscal year end to September 30 during the period. |
Under the Trust’s organizational documents and in separate agreements between each Trustee and the Trust, its Trustees and officers are indemnified against certain liabilities arising out of the performance of their duties to the Trust and its funds. In addition, in the normal course of business, the Funds enter into contracts that provide a variety of indemnifications to other parties. The Funds’ maximum exposure under these arrangements is unknown as this would involve future claims that may be made against the Funds and that have not occurred. However, the Funds have not had prior claims or losses pursuant to these arrangements and expect the risk of loss to be remote.
| Note | 8. Credit Risk and Asset Concentration |
In countries with limited or developing markets, investments may present greater risks than in more developed markets and the prices of such investments may be volatile. The consequences of political, social or economic changes in these markets may have disruptive effects on the market prices of these investments and the income they generate, as well as a Fund’s ability to repatriate such amounts.
High-yield/high-risk securities typically entail greater price volatility and/or principal and interest rate risk. There is a greater chance that an issuer will not be able to make principal and interest payments on time. Analysis of the creditworthiness of issuers of high-yield/high-risk securities may be complex, and as a result, it may be more difficult for the Adviser and/or subadviser to accurately predict risk.
Certain Funds may invest a high percentage of their assets in specific sectors of the market in the pursuit of their investment objectives. Fluctuations in these sectors of concentration may have a greater impact on a Fund, positive or negative, than if a Fund did not concentrate its investments in such sectors.
At September 30, 2017, the following Funds held securities issued by various companies in specific sectors as detailed below:
| | | | | | |
Fund | | Sector | | Percentage of Total
Investments | |
| Contrarian Value Fund | | Materials | | | 28 | % |
| KAR Capital Growth Fund | | Information Technology | | | 42 | |
| KAR Mid-Cap Growth Fund | | Information Technology | | | 32 | |
| KAR Mid-Cap Growth Fund | | Consumer Discretionary | | | 25 | |
| KAR Small-Cap Core Fund | | Industrials | | | 30 | |
At September 30, 2017, certain Funds had individual shareholder account(s), and/or omnibus shareholder account(s) (comprised of a group of individual shareholders), which individually amounted to more than 10% of the total shares outstanding of each such Fund as detailed below:
| | | | | | | | |
| | | % of Shares
Outstanding | | | Number of
Accounts | |
Contrarian Value Fund | | | 18 | % | | | 1* | |
KAR Mid-Cap Core Fund | | | 37 | | | | 2* | |
KAR Small-Cap Core Fund | | | 18 | | | | 1* | |
KAR Small-Cap Growth Fund | | | 27 | | | | 2* | |
KAR Small-Cap Value Fund | | | 43 | | | | 2* | |
| | * | None of the accounts are affiliated. |
86
VIRTUS EQUITY TRUST
NOTES TO FINANCIAL STATEMENTS (Continued)
SEPTEMBER 30, 2017
| Note | 10. Federal Income Tax Information |
($ reported in thousands)
At September 30, 2017, federal tax cost and aggregate gross unrealized appreciation (depreciation) of securities held by the Funds were as follows:
| | | | | | | | | | | | | | | | |
Fund | | Federal
Tax Cost | | | Unrealized
Appreciation | | | Unrealized
(Depreciation) | | | Net Unrealized
Appreciation
(Depreciation) | |
Contrarian Value Fund | | $ | 107,429 | | | $ | 71,048 | | | $ | (5,518 | ) | | $ | 65,530 | |
KAR Capital Growth Fund | | | 261,552 | | | | 214,267 | | | | (2,186 | ) | | | 212,081 | |
KAR Global Quality Dividend Fund | | | 53,547 | | | | 4,581 | | | | (1,356 | ) | | | 3,225 | |
KAR Mid-Cap Core Fund | | | 94,179 | | | | 20,020 | | | | (468 | ) | | | 19,552 | |
KAR Mid-Cap Growth Fund | | | 57,086 | | | | 38,012 | | | | (738 | ) | | | 37,274 | |
KAR Small-Cap Core Fund | | | 458,460 | | | | 203,274 | | | | (9,001 | ) | | | 194,273 | |
KAR Small-Cap Growth Fund | | | 1,131,598 | | | | 321,357 | | | | (1,297 | ) | | | 320,060 | |
KAR Small-Cap Value Fund | | | 306,793 | | | | 128,299 | | | | (8,495 | ) | | | 119,804 | |
Rampart Enhanced Core Equity Fund – Investments (including Purchased Options) | | | 173,840 | | | | 12,275 | | | | (2,563 | ) | | | 9,712 | |
Rampart Enhanced Core Equity Fund – Written Options | | | (265 | ) | | | — | | | | — | | | | — | |
Tactical Allocation Fund | | | 129,228 | | | | 19,909 | | | | (2,368 | ) | | | 17,541 | |
Certain Funds have capital loss carryovers available to offset future realized capital gains, through the indicated expiration dates shown below:
| | | | | | | | | | | | | | | | | | | | | | | | |
| | | 2018 | | | No Expiration | | | Total | |
| | | Short-Term | | | Long-Term | | | Short-Term | | | Long-Term | | | Short-Term | | | Long-Term | |
Contrarian Value Fund | | $ | 4,252 | | | $ | — | | | $ | — | | | $ | — | | | $ | 4,252 | | | $ | — | |
KAR Mid-Cap Core Fund | | | — | | | | — | | | | 970 | | | | 150 | | | | 970 | | | | 150 | |
KAR Small-Cap Growth Fund | | | — | | | | — | | | | 2,841 | | | | — | | | | 2,841 | | | | — | |
The Trust may not realize the benefit of these losses to the extent each Fund does not realize gains on investments prior to the expiration of the capital loss carryovers.
Under the Regulated Investment Company Modernization Act of 2010 (the “Act”), net capital losses recognized for tax years beginning after December 22, 2010, may be carried forward indefinitely, and their character is retained as short-term and/or long-term losses. Previously, net capital losses were carried forward for eight years and treated as short-term losses. As a transition rule, the Act requires that post-enactment net capital losses be used before pre-enactment net capital losses. Capital loss carryover may be subject to limits on use of losses.
For the period ended September 30, 2017, the following Funds utilized losses deferred in prior years against current year capital gains:
| | | | |
Fund | | | |
Contrarian Value Fund | | $ | 8,781 | |
The KAR Small-Cap Growth Fund had $192 of capital loss carryovers which expired during the fiscal year.
Capital losses realized after October 31 and certain late year ordinary losses may be deferred and treated as occurring on the first day of the following fiscal period. For the period ended September 30, 2017, the following Funds deferred and recognized qualified late year ordinary and capital losses:
| | | | | | | | | | | | | | | | |
| | | Late Year
Ordinary
Losses
Deferred | | | Late Year
Ordinary
Losses
Recognized | | | Capital
Loss
Deferred | | | Capital
Loss
Recognized | |
KAR Capital Growth Fund | | $ | — | | | $ | 102 | | | $ | — | | | $ | — | |
KAR Mid-Cap Core Fund | | | — | | | | 61 | | | | — | | | | — | |
KAR Mid-Cap Growth Fund | | | — | | | | 125 | | | | — | | | | — | |
KAR Small-Cap Growth Fund | | | — | | | | 1,088 | | | | — | | | | 2,700 | |
Tactical Allocation Fund | | | — | | | | — | | | | — | | | | 611 | |
The components of distributable earnings on a tax basis (excluding unrealized appreciation (depreciation) which is disclosed in the beginning of this note) consist of the following:
| | | | | | | | |
| | | Undistributed
Ordinary
Income | | | Undistributed
Long-Term
Capital Gains | |
Contrarian Value Fund | | $ | 245 | | | $ | — | |
KAR Capital Growth Fund | | | 6,234 | | | | 18,735 | |
KAR Global Quality Dividend Fund | | | 1,508 | | | | 323 | |
KAR Mid-Cap Growth Fund | | | — | | | | 5,299 | |
KAR Small-Cap Core Fund | | | — | | | | 546 | |
KAR Small-Cap Value Fund | | | 825 | | | | 6,691 | |
Rampart Enhanced Core Equity Fund | | | 4,042 | | | | 8,303 | |
Tactical Allocation Fund | | | 179 | | | | 1,069 | |
87
VIRTUS EQUITY TRUST
NOTES TO FINANCIAL STATEMENTS (Continued)
SEPTEMBER 30, 2017
The differences between the book and tax basis components of distributable earnings relate principally to the timing of recognition of income and gains for federal income tax purposes. These differences may include the treatment of non-taxable dividends, foreign currency gain or loss, derivatives, passive foreign investment companies, partnerships, losses deferred due to wash sales and other differences.
Short-term gain distributions reported in the Statements of Changes in Net Assets, if any, are reported as ordinary income for federal tax purposes. Distributions are determined on a tax basis and may differ from net investment income and realized capital gains for financial reporting purposes. The tax character of dividends and distributions paid during the periods ended September 30, 2017 and March 31, 2017 and 2016 respectively, was as follows:
| | | | | | | | | | | | | | | | |
| | | | | | Ordinary
Income | | | Long-Term
Capital Gains | | | Total | |
Contrarian Value Fund | | | 9/30/17 | | | $ | 2,015 | | | $ | — | | | $ | 2,015 | |
| | | 3/31/17 | | | | 1,795 | | | | — | | | | 1,795 | |
| | | 3/31/16 | | | | 1,801 | | | | — | | | | 1,801 | |
KAR Capital Growth Fund | | | 9/30/17 | | | | — | | | | 4,679 | | | | 4,679 | |
| | | 3/31/17 | | | | — | | | | 33,520 | | | | 33,520 | |
| | | 3/31/16 | | | | — | | | | 20,462 | | | | 20,462 | |
KAR Global Quality Dividend Fund | | | 9/30/17 | | | | 880 | | | | 3,558 | | | | 4,438 | |
| | | 3/31/17 | | | | 535 | | | | — | | | | 535 | |
| | | 3/31/16 | | | | 325 | | | | — | | | | 325 | |
KAR Mid-Cap Core Fund | | | 9/30/17 | | | | — | | | | 333 | | | | 333 | |
| | | 3/31/17 | | | | — | | | | — | | | | — | |
| | | 3/31/16 | | | | — | | | | 171 | | | | 171 | |
KAR Mid-Cap Growth Fund | | | 9/30/17 | | | | — | | | | 451 | | | | 451 | |
| | | 3/31/17 | | | | — | | | | 1,330 | | | | 1,330 | |
| | | 3/31/16 | | | | — | | | | 1,392 | | | | 1,392 | |
KAR Small-Cap Core Fund | | | 9/30/17 | | | | — | | | | 261 | | | | 261 | |
| | | 3/31/17 | | | | — | | | | 21,910 | | | | 21,910 | |
| | | 3/31/16 | | | | 1,322 | | | | 53,275 | | | | 54,597 | |
KAR Small-Cap Growth Fund | | | 9/30/17 | | | | — | | | | 16 | | | | 16 | |
| | | 3/31/17 | | | | — | | | | 7,887 | | | | 7,887 | |
| | | 3/31/16 | | | | — | | | | 4,609 | | | | 4,609 | |
KAR Small-Cap Value Fund | | | 9/30/17 | | | | 704 | | | | 13,489 | | | | 14,193 | |
| | | 3/31/17 | | | | 5,204 | | | | 19,870 | | | | 25,074 | |
| | | 3/31/16 | | | | 1,894 | | | | 15,213 | | | | 17,107 | |
Rampart Enhanced Core Equity Fund | | | 9/30/17 | | | | 13,655 | | | | 1,200 | | | | 14,855 | |
| | | 3/31/17 | | | | 3,502 | | | | 2,164 | | | | 5,666 | |
| | | 3/31/16 | | | | 13,131 | | | | 14,686 | | | | 27,817 | |
Tactical Allocation Fund | | | 9/30/17 | | | | 1,315 | | | | 282 | | �� | | 1,597 | |
| | | 3/31/17 | | | | 4,164 | | | | 9,727 | | | | 13,891 | |
| | | 3/31/16 | | | | 3,216 | | | | 8,775 | | | | 11,991 | |
For financial reporting purposes, book basis capital accounts are adjusted to reflect the tax character of permanent book/tax differences. Permanent reclassifications can arise from differing treatment of certain income and gain transactions, nondeductible current year net operating losses, expiring capital loss carryovers and investments in passive foreign investment companies. Permanent book and tax basis differences relating to shareholder distributions will result in reclassifications to capital paid in on shares of beneficial interest. The reclassifications have no impact on the net assets or NAV of the Funds. As of September 30, 2017, the Funds recorded reclassifications to increase (decrease) the accounts as listed below:
| | | | | | | | | | | | |
| | | Capital Paid in on
Shares of
Beneficial Interest | | | Undistributed
Net Investment
Income (Loss) | | | Accumulated
Net Realized
Gain (Loss) | |
Contrarian Value Fund | | $ | (22 | ) | | $ | 22 | | | $ | — | |
KAR Capital Growth Fund | | | — | | | | 1,059 | | | | (1,059 | ) |
KAR Global Quality Dividend Fund | | | — | | | | (3 | ) | | | 3 | |
KAR Mid-Cap Core Fund | | | (233 | ) | | | 221 | | | | 12 | |
KAR Mid-Cap Growth Fund | | | (341 | ) | | | 545 | | | | (204 | ) |
KAR Small-Cap Core Fund | | | (535 | ) | | | 943 | | | | (408 | ) |
KAR Small-Cap Growth Fund | | | (4,712 | ) | | | 4,515 | | | | 197 | |
Tactical Allocation Fund | | | — | | | | (121 | ) | | | 121 | |
($ reported in thousands)
On September 18, 2017, the Funds and other affiliated funds of the Trust entered into an $150,000 unsecured line of credit. This Credit Agreement is with a commercial bank that allows the Funds to borrow cash from the bank to manage large unexpected redemptions and trade fails, up to a limit of one-third or one-fifth of each Fund’s total net assets in accordance with the terms of the agreement. This Credit Agreement has a term of 364 days Interest is charged at the higher of the LIBOR (London Interbank Offered Rate) or the Federal Funds rate plus an additional percentage rate on the amount borrowed. Commitment fees are charged on the undrawn balance. The Funds and other affiliated funds that are parties are individually, and not jointly, liable for their particular advances, if any, under the line of credit. The lending bank has the ability to require repayment of outstanding borrowings under this Credit Agreement upon certain circumstances such as an event of default.
88
VIRTUS EQUITY TRUST
NOTES TO FINANCIAL STATEMENTS (Continued)
SEPTEMBER 30, 2017
On June 29, 2016, the Funds and other affiliated funds of the Trust renewed a $50,000 secured line of credit. This Credit Agreement was with a commercial bank that allowed the Funds to borrow cash from the bank to manage large unexpected redemptions and trade fails, up to a limit of one-third of each Fund’s total net assets in accordance with the terms of the agreement. This Credit Agreement had a term of 364 days and was renewable by the Funds with the bank’s consent and approval of the Board. Interest was charged at the higher of the LIBOR or the Federal Funds rate plus an additional percentage rate on the amount borrowed. Commitment fees were charged on the undrawn balance. The Funds and other affiliated funds that were parties were individually, and not jointly, liable for their particular advances, if any, under the line of credit. The lending bank had the ability to require repayment of outstanding borrowings under this Credit Agreement upon certain circumstances such as an event of default. On June 14, 2017, the term of this Credit Agreement was extended for an additional 90 days. Effective September 18, 2017, this Credit Agreement was terminated and replaced by a new credit facility.
The Funds had no outstanding borrowings at any time during the period.
| Note | 12. Illiquid and Restricted Securities |
Investments are generally considered illiquid if they cannot be disposed of within seven days in the ordinary course of business at the approximate amount at which such securities have been valued by a Fund. Additionally, the following information is also considered in determining liquidity: the frequency of trades and quotes for the investment, whether the investment is listed for trading on a recognized domestic exchange and/or whether two or more brokers are willing to purchase or sell the security at a comparable price, the extent of market making activity in the investment and the nature of the market for investment.
Restricted securities are illiquid securities, as defined above, not registered under the Securities Act of 1933, as amended (the “1933 Act”). Generally, 144A securities are excluded from this category, except where defined as illiquid.
Each Fund will bear any costs, including those involved in registration under the 1933 Act, in connection with the disposition of such securities.
The following Fund held securities considered to be illiquid at September 30, 2017:
| | | | | | | | |
| | | Aggregate value | | | % of Fund’s net
assets | |
Tactical Allocation Fund | | $ | 28 | | | | 0.02 | % |
At September 30, 2017, the Funds did not hold any securities that were illiquid or restricted except as noted in the table above.
| Note | 13. Regulatory Matters and Litigation |
From time to time, the Trust, the Funds’ Adviser and/or subadvisers and/or their affiliates may be involved in litigation and arbitration as well as examinations and investigations by various regulatory bodies, including the SEC, involving compliance with, among other things, securities laws, client investment guidelines, laws governing the activities of broker-dealers and other laws and regulations affecting their products and other activities. At this time, the Funds’ Adviser believes that the outcomes of such matters are not likely, either individually or in the aggregate, to be material to these financial statements.
| Note | 14. Custody Fees Reimbursed |
State Street Bank & Trust, custodian for some of the Funds through January 29, 2010, reimbursed the Funds for out-of-pocket custody expenses overbilled for the period 1998 through January 29, 2010. The amounts reimbursed, including interest, are shown in the Statements of Operations under “Custody fees reimbursed”.
| Note | 15. Recent Accounting Pronouncement |
In October 2016, the SEC released its Final Rule on Investment Company Reporting Modernization (the “Rule”). The Rule contains amendments to Regulation S-X which impact financial statement presentation, particularly the presentation of derivative investments. The financial statements presented are in compliance with the most recent Regulations S-X amendments.
| Note | 16. Subsequent Events |
Management has evaluated the impact of all subsequent events on the Funds through the date the financial statements were issued and has determined that there are no subsequent events requiring recognition or disclosure in these financial statements.
89

Report of Independent Registered Public Accounting Firm
To the Board of Trustees of Virtus Equity Trust and Shareholders of the Funds, as defined
In our opinion, the accompanying statements of assets and liabilities, including the schedules of investments and the related statements of operations and of changes in net assets and the financial highlights present fairly, in all material respects, the financial position of Virtus Contrarian Value Fund, Virtus KAR Capital Growth Fund, Virtus KAR Global Quality Dividend Fund, Virtus KAR Mid-Cap Core Fund, Virtus KAR Mid-Cap Growth Fund, Virtus KAR Small-Cap Core Fund, Virtus KAR Small-Cap Growth Fund, Virtus KAR Small-Cap Value Fund, Virtus Rampart Enhanced Core Equity Fund and Virtus Tactical Allocation Fund (constituting funds of Virtus Equity Trust, hereafter referred to as the “Funds”) as of September 30, 2017, and the results of each of their operations, the changes in each of their net assets and the financial highlights for each of the periods indicated, in conformity with accounting principles generally accepted in the United States of America. These financial statements and financial highlights (hereafter referred to as “financial statements”) are the responsibility of the Funds’ management. Our responsibility is to express an opinion on these financial statements based on our audits. We conducted our audits of these financial statements in accordance with the standards of the Public Company Accounting Oversight Board (United States). Those standards require that we plan and perform the audit to obtain reasonable assurance about whether the financial statements are free of material misstatement. We believe that our audits, which included confirmation of securities as of September 30, 2017 by correspondence with the custodians, brokers, transfer agent of the investee funds and the application of alternative procedures where securities purchased had not been received, provide a reasonable basis for the opinion expressed above.
PricewaterhouseCoopers LLP
Philadelphia, Pennsylvania
November 22, 2017
90
VIRTUS EQUITY TRUST
TAX INFORMATION NOTICE (Unaudited)
SEPTEMBER 30, 2017
For the fiscal period ended September 30, 2017, the Funds make the following disclosures for federal income tax purposes. Below is listed the percentages, or the maximum amount allowable, of its ordinary income dividends (“QDI”) to qualify for the lower tax rates applicable to individual shareholders, and the percentage of ordinary income dividends earned by the Funds which qualifies for the dividends received deduction (“DRD”) for corporate shareholders. The actual percentage of QDI and DRD for the calendar year will be designated in year-end tax statements. The Funds designate the amounts below as long-term capital gains dividends (“LTCG”) taxable at a 20% rate, or lower depending on the shareholder’s income ($ reported in thousands). LTCG amounts, if subsequently different, will be designated in the next annual report.
| | | | | | | | | | | | |
| | | QDI | | | DRD | | | LTCG | |
Contrarian Value Fund | | | 100 | % | | | 100 | % | | $ | — | |
KAR Capital Growth Fund | | | 33 | | | | 30 | | | | 18,755 | |
KAR Global Quality Dividend Fund | | | 83 | | | | 22 | | | | 335 | |
KAR Mid-Cap Growth Fund | | | — | | | | — | | | | 5,310 | |
KAR Small-Cap Core Fund | | | — | | | | — | | | | 569 | |
KAR Small-Cap Value Fund | | | 100 | | | | 100 | | | | 6,722 | |
Rampart Enhanced Core Equity Fund | | | 38 | | | | 36 | | | | 8,313 | |
Tactical Allocation Fund | | | 47 | | | | 20 | | | | 1,092 | |
For the fiscal period ended September 30, 2017, the KAR Global Quality Dividend Fund recognized $1,083 ($ reported in thousands), of foreign source income on which the KAR Global Quality Dividend Fund paid foreign taxes of $83 ($ reported in thousands). This information is being furnished to you pursuant to notice requirements of Section 853(a) and 855(d) of the Internal Revenue Code, as amended, and the Treasury Regulations thereunder.
91
FUND MANAGEMENT TABLES (Unaudited)
Information pertaining to the Trustees and officers of the Trust as of September 30, 2017, is set forth below. The statement of additional information (SAI) includes additional information about the Trustees and is available without charge, upon request, by calling (800) 243-4361.
The address of each individual, unless otherwise noted, is c/o Virtus Equity Trust, 100 Pearl Street, Hartford, CT 06103. There is no stated term of office for Trustees or officers of the Trust.
Independent Trustees
| | |
| | |
Name,
Year of Birth,
Length of Time Served and
Number of Portfolios in Complex | | Principal Occupation(s) During Past 5 Years and Other Directorships Held by Trustee |
Brown, Thomas J. YOB: 1945 Served Since: 2016 87 Portfolios | | Retired. Trustee (since 2016), Virtus Mutual Fund Family (75 portfolios) and Virtus Alternative Solutions Trust (3 portfolios); Trustee (since 2011), Virtus Variable Insurance Trust (9 portfolios); Director (since 2010), D’Youville Senior Care Center; and Director (since 2005), VALIC Company Funds (49 portfolios). |
Burke, Donald C. YOB: 1960 Served Since: 2016 91 Portfolios | | Retired. Trustee (since 2016), Virtus Mutual Fund Family (75 portfolios), Virtus Variable Insurance Trust (9 portfolios) and Virtus Alternative Solutions Trust (3 portfolios); Director (since 2014) closed-end funds managed by Duff & Phelps Investment Management Co. (4 funds); Director, Avista Corp. (energy company) (since 2011); Trustee, Goldman Sachs Fund Complex (2010 to 2014); and Director, BlackRock Luxembourg and Cayman Funds (2006 to 2010). |
Gelfenbien, Roger A. YOB: 1943 Served Since: 2016 87 Portfolios | | Retired. Trustee (since 2016), Virtus Mutual Fund Family (75 portfolios) and Virtus Alternative Solutions Trust (3 portfolios); Trustee (since 2000), Virtus Variable Insurance Trust (9 portfolios); and Director (since 1999), USAllianz Variable Insurance Product Trust (42 portfolios). |
Harris, Sidney E. YOB: 1949 Served Since: 2017 87 Portfolios | | Professor and Dean Emeritus (since April 2015), Professor (1997 to 2014), Dean (1997 to 2004), J. Mack Robinson College of Business, Georgia State University; Trustee (since 2017), Virtus Mutual Fund Family (75 portfolios), Virtus Variable Insurance Trust (9 portfolios), and Virtus Alternative Solutions Trust (3 portfolios); Trustee (since 2013), KIPP Metro Atlanta; Trustee (since 1999) Total System Services, Inc.; Trustee (2004 to 2017), RidgeWorth Funds; Trustee (2012 to 2017), International University of the Grand Bassam; and Trustee (2011 to 2015), Genspring Family Offices, LLC. |
Mallin, John R. YOB: 1950 Served Since: 2016 87 Portfolios | | Partner/Attorney (since 2003), McCarter & English LLP (law firm), Real Property Practice Group; and Member (since 2014), Counselors of Real Estate. Trustee (since 2016), Virtus Mutual Fund Family (75 portfolios) and Virtus Alternative Solutions Trust (3 portfolios); Director (since 2013), Horizons, Inc. (non-profit); and Trustee (since 1999), Virtus Variable Insurance Trust (9 portfolios). |
McClellan, Hassell H. YOB: 1945 Served Since: 2015 87 Portfolios | | Retired (since 2013); and Professor (1984 to 2013), Wallace E. Carroll School of Management, Boston College. Chairperson of the Board (since 2017) and Trustee (since 2000), John Hancock Fund Complex (collectively, 227 portfolios); Trustee (since 2016), Virtus Alternative Solutions Trust (3 portfolios); Trustee (since 2015), Virtus Mutual Fund Family (75 portfolios); Director (since 2010), Barnes Group, Inc. (diversified global components manufacturer and logistical services company); Trustee, Virtus Variable Insurance Trust (9 portfolios) (since 2008). |
McDaniel, Connie D. YOB: 1958 Served Since: 2017 87 Portfolios | | Retired. Trustee (since 2017), Virtus Mutual Fund Family (75 portfolios), Virtus Variable Insurance Trust (9 portfolios), and Virtus Alternative Solutions Trust (3 portfolios); Trustee (since 2014), Total System Services, Inc.; and Trustee (2005 to 2017), RidgeWorth Funds. |
McLoughlin, Philip YOB: 1946 Served Since: 1996 95 Portfolios | | Retired. Director and Chairman (since 2016), Virtus Total Return Fund Inc. and Virtus Global Dividend & Income Fund Inc.; Director and Chairman (since 2014) Duff & Phelps Select Energy MLP Fund Inc.; Trustee and Chairman (since 2013), Virtus Alternative Solutions Trust (3 portfolios); Trustee and Chairman (since 2011), Virtus Global Multi-Sector Income Fund; Chairman and Trustee (since 2003), Virtus Variable Insurance Trust (9 portfolios); Director (since 1995), closed-end funds managed by Duff & Phelps Investment Management Co. (4 funds); Director (since 1991) and Chairman (since 2010), Lazard World Trust Fund (closed-end investment firm in Luxembourg); and Trustee (since 1989) and Chairman (since 2002), Virtus Mutual Fund Family (75 portfolios). |
McNamara, Geraldine M. YOB: 1951 Served Since: 2001 91 Portfolios | | Retired. Trustee (since 2016) Virtus Alternative Solutions Trust (3 portfolios); Trustee (since 2015), Virtus Variable Insurance Trust (9 portfolios); Director (since 2003), closed-end funds managed by Duff & Phelps Investment Management Co. (4 funds); and Trustee (since 2001), Virtus Mutual Fund Family (75 portfolios). |
Oates, James M. YOB: 1946 Served Since: 1996 91 Portfolios | | Managing Director (since 1994), Wydown Group (consulting firm). Director (since 2016), Virtus Total Return Fund Inc. and Virtus Global Dividend & Income Fund Inc.; Trustee (since 2016) Virtus Variable Insurance Trust (9 portfolios); Director (since 2014), Duff & Phelps Select Energy MLP Fund Inc.; Trustee (since 2013), Virtus Alternative Solutions Trust (3 portfolios); Trustee (since 2011), Virtus Global Multi-Sector Income Fund; Chairman (2005 to 2017) and Trustee (since 2005), John Hancock Fund Complex (227 portfolios); Director (2002 to 2014), New Hampshire Trust Company; Chairman (2000 to 2016), Emerson Investment Management, Inc.; Non-Executive Chairman (2000 to 2014), Hudson Castle Group, Inc. (formerly IBEX Capital Markets, Inc.) (financial services); Chairman and Director (1999 to 2014), Connecticut River Bank; Director (since 1996), Stifel Financial; and Trustee (since 1987), Virtus Mutual Fund Family (75 portfolios). |
92
FUND MANAGEMENT TABLES (Unaudited) (Continued)
Independent Trustees (Continued)
| | |
| | |
Name,
Year of Birth,
Length of Time Served and
Number of Portfolios in Complex | | Principal Occupation(s) During Past 5 Years and Other Directorships Held by Trustee |
Segerson, Richard E. YOB: 1948 Served Since: 1996 87 Portfolios | | Retired; and Managing Director (1998 to 2013), Northway Management Company. Trustee (since 2016) Virtus Alternative Solutions Trust (3 portfolios) and Virtus Variable Insurance Trust (9 portfolios); and Trustee (since 1983), Virtus Mutual Fund Family (75 portfolios). |
Verdonck, Ferdinand L.J. YOB: 1942 Served Since: 2006 87 Portfolios | | Director (1998 to 2015), The J.P. Morgan Continental European Investment Trust; Director (2005 to 2013), Galapagos N.V. (biotechnology); Director (1998 to 2015) Groupe SNEF; Vice Chairman (since 2014), Affirmed Therapeutics (biotechnology); and Mr. Verdonck is also a director of several non-U.S. companies. Trustee (since 2016) Virtus Variable Insurance Trust (9 portfolios) and Virtus Alternative Solutions Trust (3 portfolios); and Trustee (since 2002), Virtus Mutual Fund Family (75 portfolios). |
Interested Trustee
| | |
| | |
Name,
Year of Birth,
Year Elected and
Number of Funds Overseen | | Principal Occupation(s) During Past 5 Years and
Other Directorships Held by Trustee |
Aylward, George R.* Trustee and President YOB: 1964 Elected: 2006 93 Portfolios | | Director, President and Chief Executive Officer (since 2008), Virtus Investment Partners, Inc. and/or certain of its subsidiaries; various senior officer positions with Virtus affiliates (since 2005). Chairman and Trustee (since 2015), Virtus ETF Trust II (2 funds); Trustee and President (since 2013), Virtus Alternative Solutions Trust (3 portfolios); Director (since 2013), Virtus Global Funds, PLC (2 portfolios); Trustee (since 2012) and President (since 2010), Virtus Variable Insurance Trust (9 portfolios); Director, President and Chief Executive Officer (since 2014), Duff & Phelps Select Energy MLP Fund Inc.; Trustee, President and Chief Executive Officer (since 2011), Virtus Global Multi-Sector Income Fund; Trustee and President (since 2006) and Executive Vice President (2004 to 2006), Virtus Mutual Fund Family (75 portfolios); and Director, President and Chief Executive Officer (since 2006), Virtus Global Dividend & Income Fund Inc. and Virtus Total Return Fund Inc. |
* Mr. Aylward is an “interested person,” as defined in the 1940 Act, by reason of his position as President and Chief Executive Officer of Virtus Investment Partners, Inc. (“Virtus”), the ultimate parent company of the Adviser, and various positions with its affiliates, including the Adviser.
93
FUND MANAGEMENT TABLES (Unaudited) (Continued)
Officers of the Trust Who Are Not Trustees
| | | | |
| | | |
Name, Address and Year of Birth | | Position(s) Held with Trust and
Length of Time Served | | Principal Occupation(s)
During Past 5 Years |
Bradley, W. Patrick YOB: 1972 | | Executive Vice President (since 2016); Senior Vice President (2013 to 2016); Vice President (2011 to 2013); Chief Financial Officer and Treasurer (since 2006). | | Executive Vice President, Fund Services (since 2016), Senior Vice President, Fund Services (2010 to 2016), Virtus Investment Partners, Inc. and/or certain of its subsidiaries; various officer positions (since 2006) with Virtus affiliates; Executive Vice President (since 2016), Senior Vice President (2013 to 2016), Vice President (2011 to 2013), Chief Financial Officer and Treasurer (since 2004), Virtus Variable Insurance Trust; Executive Vice President (since 2016), Senior Vice President (2013 to 2016), Vice President (2011 to 2013), Chief Financial Officer and Treasurer (since 2006), Virtus Mutual Fund Family; Executive Vice President (since 2016), Senior Vice President (2013 to 2016), Vice President (2012 to 2013) and Treasurer and Chief Financial Officer (since 2010), Virtus Total Return Fund Inc.. and Virtus Global Dividend & Income Fund Inc.; Executive Vice President (since 2016), Senior Vice President (2013 to 2016), Vice President (2011 to 2013), Chief Financial Officer and Treasurer (since 2011), Virtus Global Multi-Sector Income Fund; Vice President and Assistant Treasurer (since 2011), Duff & Phelps Global Utility Income Fund Inc.; Director (since 2013), Virtus Global Funds, PLC; and Executive Vice President (since 2016), Senior Vice President, Chief Financial Officer and Treasurer (2013 to 2016), Virtus Alternative Solutions Trust. |
Carr, Kevin J. YOB: 1954 | | Senior Vice President (since 2013); Vice President (2005 to 2013); Chief Legal Officer, Counsel and Secretary (since 2005). | | Senior Vice President (since 2009), Vice President, Counsel and Secretary (2008 to 2009), Virtus Investment Partners, Inc. and/or certain of its subsidiaries; various senior officer positions (since 2005) with Virtus affiliates; Senior Vice President (since 2013), Vice President (2005 to 2013), Chief Legal Officer, Counsel and Secretary (since 2005), Virtus Mutual Fund Family; Senior Vice President (2013 to 2014), Vice President (2012 to 2013) and Assistant Secretary (since 2012), Secretary and Chief Legal Officer (2005 to 2012), Virtus Total Return Fund Inc. and Virtus Global Dividend & Income Fund Inc.; Senior Vice President (since 2017), Assistant Secretary (since 2013), Vice President, Chief Legal Officer, Counsel and Secretary (2010 to 2013), Virtus Variable Insurance Trust; Vice President and Assistant Secretary (since 2011), Duff & Phelps Global Utility Income Fund Inc.; Senior Vice President and Assistant Secretary (2013 to 2014), Vice President and Assistant Secretary (2012 to 2013), Vice President, Chief Legal Officer, Counsel and Secretary (2011 to 2012), Virtus Closed-End Funds; Senior Vice President (since 2017) and Assistant Secretary (since 2013), Virtus Alternative Solutions Trust; Secretary (since 2015), ETFis Series Trust I; and Secretary (since 2015), Virtus ETF Trust II. |
Engberg, Nancy J. YOB: 1956 | | Senior Vice President and Chief Compliance Officer (since 2017); Vice President and Chief Compliance Officer (2011 to 2017). | | Senior Vice President (since 2017), Vice President (2008 to 2017) and Chief Compliance Officer (2008 to 2011 and since 2016), Virtus Investment Partners, Inc. and/or certain of its subsidiaries; various officer positions (since 2003) with Virtus affiliates; Senior Vice President (since 2017), Vice President (2011 to 2017) and Chief Compliance Officer (since 2011), Virtus Mutual Fund Family; Senior Vice President (since 2017), Vice President (2010 to 2016) and Chief Compliance Officer (since 2011), Virtus Variable Insurance Trust; Senior Vice President (since 2017), Vice President (2011 to 2016) and Chief Compliance Officer (since 2011), Virtus Global Multi-Sector Income Fund; Senior Vice President (since 2017), Vice President (2012 to 2016) and Chief Compliance Officer (since 2012), Virtus Total Return Fund Inc. and Virtus Global Dividend & Income Fund Inc.; Senior Vice President (since 2017), Vice President (2013 to 2016) and Chief Compliance Officer (since 2013), Virtus Alternative Solutions Trust; Vice President & Chief Compliance Officer (since 2014), Duff & Phelps Select Energy MLP Fund Inc.; Chief Compliance Officer (since 2015), ETFis Series Trust I; and Chief Compliance Officer (since 2015), Virtus ETF Trust II. |
Short, Julia R. YOB: 1972 | | Senior Vice President (since 2017) | | Senior Vice President, Product Development (since 2017), Virtus Investment Partners, Inc. and/or certain of its subsidiaries; Senior Vice President (since 2017), Virtus Mutual Fund Family; President and Chief Executive Officer, RidgeWorth Funds (2007 to 2017); and Managing Director, Product Manager, RidgeWorth Investments (2004 to 2017). |
Waltman, Francis G. YOB: 1962 | | Executive Vice President (since 2013); Senior Vice President (2008 to 2013). | | Executive Vice President, Product Development (since 2009), Virtus Investment Partners, Inc. and/or certain of its subsidiaries; various senior officer positions (since 2006) with Virtus affiliates; Executive Vice President (since 2013), Senior Vice President (2008 to 2013), Virtus Mutual Fund Family; Executive Vice President (since 2013), Senior Vice President (2010 to 2013), Virtus Variable Insurance Trust; Executive Vice President (since 2013), Senior Vice President (2011 to 2013), Virtus Global Multi-Sector Income Fund; Executive Vice President (since 2014), Duff & Phelps Select Energy MLP Fund Inc.; Director (since 2013), Virtus Global Funds PLC; and Executive Vice President (since 2013), Virtus Alternative Solutions Trust. |
94
VIRTUS EQUITY TRUST
101 Munson Street
Greenfield, MA 01301-9668
Trustees
George R. Aylward
Thomas J. Brown
Donald C. Burke
Roger A. Gelfenbien
Sidney E. Harris
John R. Mallin
Hassell H. McClellan
Connie D. McDaniel
Philip R. McLoughlin, Chairman
Geraldine M. McNamara
James M. Oates
Richard E. Segerson
Ferdinand L.J. Verdonck
Officers
George R. Aylward, President
Francis G. Waltman, Executive Vice President
W. Patrick Bradley, Executive Vice President, Chief Financial Officer and Treasurer
Kevin J. Carr, Senior Vice President, Chief Legal Officer, Counsel and Secretary
Nancy J. Engberg, Senior Vice President and Chief Compliance Officer
Julia R. Short, Senior Vice President
Investment Adviser
Virtus Investment Advisers, Inc.
100 Pearl Street
Hartford, CT 06103-4506
Principal Underwriter
VP Distributors, LLC
100 Pearl Street
Hartford, CT 06103-4506
Administrator and Transfer Agent
Virtus Fund Services, LLC
100 Pearl Street
Hartford, CT 06103-4506
Custodian
The Bank of New York Mellon
225 Liberty Street
New York, NY 10286-1048
Independent Registered Public
Accounting Firm
PricewaterhouseCoopers LLP
2001 Market Street
Philadelphia, PA 19103-7042
How to Contact Us
| | |
Mutual Fund Services | | 1-800-243-1574 |
Adviser Consulting Group | | 1-800-243-4361 |
Website | | Virtus.com |
Important Notice to Shareholders
The Securities and Exchange Commission has modified mailing regulations for semiannual and annual shareholder fund reports to allow mutual fund companies to send a single copy of these reports to shareholders who share the same mailing address. If you would like additional copies, please call Mutual Fund Services at 1-800-243-1574.
| | |

| | |
P.O. Box 9874 Providence, RI 02940-8074 | | |
For more information about Virtus Mutual Funds,
please call your financial representative, or contact us
at 1-800-243-1574 or Virtus.com.
| | |
ANNUAL REPORT VIRTUS EQUITY TRUST | |  |
September 30, 2017
|
Virtus Strategic Allocation Fund |
Not FDIC Insured
No Bank Guarantee
May Lose Value
Prospectus supplement applicable to this Fund appears at the back of this annual report.

Table of Contents
Virtus Strategic Allocation Fund
(“Strategic Allocation Fund”)
PROXY VOTING PROCEDURES AND VOTING RECORD (FORM N-PX)
The subadviser votes proxies relating to portfolio securities in accordance with procedures that have been approved by the Board of Trustees of the Trust (“Trustees,” or the “Board”). You may obtain a description of these procedures, along with information regarding how the Fund voted proxies during the most recent 12-month period ended June 30, free of charge, by calling toll-free 1-800-243-1574. This information is also available through the Securities and Exchange Commission’s (the “SEC”) website at http://www.sec.gov.
FORM N-Q INFORMATION
The Trust files a complete schedule of portfolio holdings for the Fund with the SEC for the first and third quarters of each fiscal period on Form N-Q. Form N-Q is available on the SEC’s website at http://www.sec.gov. Form N-Q may be reviewed and copied at the SEC’s Public Reference Room. Information on the operation of the SEC’s Public Reference Room can be obtained by calling toll-free 1-800-SEC-0330.
This report is not authorized for distribution to prospective investors in the Strategic Allocation Fund unless preceded or accompanied by an effective prospectus which includes information concerning the sales charge, the Fund’s record and other pertinent information.
MESSAGE TO SHAREHOLDERS
To My Fellow Shareholders of Virtus Mutual Funds:
| | |
 | | I am pleased to present the annual report for your fund, covering a partial, six-month period from April 1, 2017 through September 30, 2017 following the change in fiscal year-end from March 31 to September 30. The fund’s last annual report was for the 12 months ended March 31, 2017. During the past six months, the Federal Reserve (“the Fed”) raised interest rates for the third time since last December, and in October 2017 began the process of unwinding the balance sheet debt it had accumulated since 2008 in its efforts to stimulate the economy – a clear signal that it believes the U.S. is back on a growth path. Global economic growth also strengthened, with other major central banks preparing to taper their own stimulus policies. Rounding out the optimistic picture, |
corporate earnings were generally strong during the period. Against this positive backdrop, equity markets have surged. U.S. large- and small-cap stocks returned 7.71% and 8.27%, as measured by the performance of the S&P 500® Index and Russell 2000® Index, respectively. Within international equities, emerging markets outperformed their developed peers, with the MSCI Emerging Markets Index (net) up 14.66%, compared with the MSCI EAFE® Index (net), which returned 11.86%. Demand for U.S. Treasuries also remained strong, driven by foreign investors who favored their yield advantage and credit quality over many foreign government bonds. On September 30, 2017, the benchmark 10-year U.S. Treasury yielded 2.33%, compared with 2.31% six months earlier. The broader U.S. fixed income market, as represented by the Bloomberg Barclays U.S. Aggregate Bond Index, which tracks Treasuries and other investment-grade debt securities, increased 2.31% for the six months, while non-investment grade bonds gained 4.19%, as measured by the Bloomberg Barclays U.S. Corporate High Yield Bond Index. Market uncertainty is an ever-present reminder of the importance of portfolio diversification, including exposure to traditional and alternative asset classes. While diversification cannot guarantee a profit or prevent a loss, owning a variety of asset classes may cushion your portfolio against inevitable market fluctuations. Your financial advisor can help you ensure that your portfolio is adequately diversified across asset classes and investment strategies. The Virtus Funds have even more investment options following Virtus Investment Partners’ (“Virtus”) acquisition of RidgeWorth Investments. We now offer 26 additional funds, including equity, fixed income, international, and asset allocation strategies from three new Virtus affiliates – Ceredex Value Advisors, Seix Investment Advisors, and Silvant Capital Management – and from subadvisers WCM Investment Management and Zevenbergen Capital Investments. I invite you to learn more about our growing family of managers and funds at Virtus.com. On behalf of our investment affiliates, thank you for entrusting the Virtus Funds with your assets. Should you have questions about your account or require assistance, please visit Virtus.com, or call our customer service team at 1-800-243-1574. We appreciate your business and remain committed to your long-term financial success. |
Sincerely,

George R. Aylward
President, Virtus Mutual Funds
October 2017
Performance data quoted represents past results. Past performance is no guarantee of future results, and current performance may be higher or lower than the performance shown above.
1
VIRTUS STRATEGIC ALLOCATION FUND
DISCLOSURE OF FUND EXPENSES (Unaudited)
FOR THE SIX-MONTH PERIOD OF APRIL 1, 2017 TO SEPTEMBER 30, 2017
We believe it is important for you to understand the impact of costs on your investment. All mutual funds have operating expenses. As a shareholder of the Strategic Allocation Fund (the “Fund”), you may incur two types of costs: (1) transaction costs, including sales charges on purchases of Class A shares and contingent deferred sales charges on Class C shares; and (2) ongoing costs, including investment advisory fees, distribution and service fees, and other expenses. For further information regarding applicable sales charges, see Note 1 in the Notes to Financial Statements. These examples are intended to help you understand your ongoing costs (in dollars) of investing in the Fund and to compare these costs with the ongoing costs of investing in other mutual funds. These examples are based on an investment of $1,000 invested at the beginning of the period and held for the entire six-month period. The Annualized Expense Ratio may be different from the expense ratio in the Financial Highlights which is for the fiscal period ended September 30, 2017. The following Expense Table illustrates the Fund’s costs in two ways.
Actual Expenses
The first section of the accompanying table provides information about actual account values and actual expenses. You may use the information in this section, together with the amount you invested, to estimate the expenses that you paid over the period. Simply divide your account value by $1,000 (for example, an $8,600 account value divided by $1,000 = 8.6), then multiply the result by the number in the first section under the heading “Expenses Paid During Period” to estimate the expenses you paid on your account during the period.
Hypothetical Example for Comparison Purposes
The second section of the accompanying table provides information about hypothetical account values and hypothetical expenses based on the Fund’s actual expense ratio and an assumed rate of return of 5% per year before expenses, which is not your Fund’s actual return. The hypothetical account values and expenses may not be used to estimate the actual ending account balance or expenses you paid for the period. You may use this information to compare the ongoing costs of investing in your Fund and other funds. To do so, compare these 5% hypothetical examples with the 5% hypothetical examples that appear in the shareholder reports of the other funds.
Please note that the expenses shown in the accompanying table are meant to highlight your ongoing costs only and do not reflect any transactional costs, such as sales charges or contingent deferred sales charges. Therefore, the second section of the accompanying table is useful in comparing ongoing costs only, and will not help you determine the relative total costs of owning different funds. In addition, if these transactional costs were included, your costs would have been higher. The calculations assume no shares were bought or sold during the period. Your actual costs may have been higher or lower, depending on the amount of your investment and timing of any purchases or redemptions.
2
VIRTUS STRATEGIC ALLOCATION FUND
DISCLOSURE OF FUND EXPENSES (Unaudited) (Continued)
FOR THE SIX-MONTH PERIOD OF APRIL 1, 2017 TO SEPTEMBER 30, 2017
| | | | | | | | | | | | | | | | |
| Expense Table | | | | | | | | | | |
| | | Beginning Account Value April 1, 2017 | | | Ending Account Value September 30, 2017 | | | Annualized Expense Ratio | | | Expenses Paid During Period* | |
Actual | | | | | | | | | | | | | | | | |
| Class A | | $ | 1,000.00 | | | $ | 1,092.60 | | | | 1.15 | % | | $ | 6.03 | |
| Class C | | | 1,000.00 | | | | 1,089.10 | | | | 1.92 | | | | 10.06 | |
|
Hypothetical (5% return before expenses) | |
| Class A | | | 1,000.00 | | | | 1,019.30 | | | | 1.15 | | | | 5.82 | |
| Class C | | | 1,000.00 | | | | 1,015.44 | | | | 1.92 | | | | 9.70 | |
| * | Expenses are equal to the Fund’s annualized expense ratio, which is net of waived fees and reimbursed expenses, if applicable, multiplied by the average account value over the period, multiplied by the number of days (183) expenses were accrued in the most recent fiscal half-year, then divided by 365 to reflect the one-half year period. |
| | The Fund may invest in other funds, and the annualized expense ratios noted above do not reflect fees and expenses associated with the underlying funds. If such fees and expenses had been included, the expenses would have been higher. |
| | You can find more information about the Fund’s expenses in the Financial Statements section that follows. For additional information on operating expenses and other shareholder costs, refer to the Fund’s prospectus. |
3
VIRTUS STRATEGIC ALLOCATION FUND
KEY INVESTMENT TERMS (Unaudited)
SEPTEMBER 30, 2017
American Depositary Receipt (“ADR”)
Represents shares of foreign companies traded in U.S. dollars on U.S. exchanges that are held by a U.S. bank or a trust. Foreign companies use ADRs in order to make it easier for Americans to buy their shares.
Bloomberg Barclays U.S. Aggregate Bond Index
The Bloomberg Barclays U.S. Aggregate Bond Index measures the U.S. investment-grade fixed-rate bond market. The index is calculated on a total return basis. The index is unmanaged, its returns do not reflect any fees, expenses, or sales charges, and it is not available for direct investment.
Bloomberg Barclays U.S. Corporate High Yield Bond Index
The Bloomberg Barclays U.S. Corporate High Yield Bond Index measures the U.S. dollar-denominated, high yield, fixed-rate corporate bond market. The index is calculated on a total return basis. The index is unmanaged, its returns do not reflect any fees, expenses, or sales charges, and it is not available for direct investment.
Federal Reserve (the “Fed”)
The Central Bank of the U.S., responsible for controlling money supply, interest rates, and credit with the goal of keeping the U.S. economy and currency stable. Governed by a seven-member board, the system includes 12 regional Federal Reserve Banks, 25 Branches, and all national and state banks that are part of the system.
Gross Domestic Product (“GDP”)
The gross domestic product represents the market value of all goods and services produced by the economy during the period measured, including personal consumption, government purchases, private inventories, paid-in construction costs and the foreign trade balance.
MSCI EAFE® Index (net)
The MSCI EAFE® (Europe, Australasia, Far East) Index (net) is a free float-adjusted market capitalization-weighted index that measures developed foreign market equity performance, excluding the U.S. and Canada. The index is calculated on a total return basis with net dividends reinvested. The index is unmanaged, its returns do not reflect any fees, expenses, or sales charges, and it is not available for direct investment.
MSCI Emerging Markets Index (net)
The MSCI Emerging Markets Index (net) is a free float-adjusted market capitalization-weighted index designed to measure equity market performance in the global emerging markets. The index is calculated on a total return basis with net dividends reinvested. The index is unmanaged, its returns do not reflect any fees, expenses, or sales charges, and it is not available for direct investment.
Payment-in-Kind Security (“PIK”)
A bond which pays interest in the form of additional bonds, or preferred stock which pays dividends in the form of additional preferred stock.
Real Estate Investment Trust (“REIT”)
A publicly traded company that owns, develops and operates income-producing real estate such as apartments, office buildings, hotels, shopping centers and other commercial properties.
4
VIRTUS STRATEGIC ALLOCATION FUND
KEY INVESTMENT TERMS (Unaudited) (Continued)
SEPTEMBER 30, 2017
Russell 1000® Growth Index
The Russell 1000® Growth Index is a market capitalization-weighted index of growth-oriented stocks of the 1,000 largest companies in the Russell Universe, which comprises the 3,000 largest U.S. companies. The index is calculated on a total return basis with dividends reinvested. The index is unmanaged, its returns do not reflect any fees, expenses, or sales charges, and it is not available for direct investment.
Russell 1000® Value Index
The Russell 1000® Value Index is a market capitalization-weighted index of value-oriented stocks of the 1,000 largest companies in the Russell Universe, which comprises the 3,000 largest U.S. companies. The index is calculated on a total return basis with dividends reinvested. The index is unmanaged, its returns do not reflect any fees, expenses, or sales charges, and it is not available for direct investment.
Russell 2000® Index
The Russell 2000® Index is a market capitalization-weighted index of the 2,000 smallest companies in the Russell Universe, which comprises the 3,000 largest U.S. companies. The index is calculated on a total return basis with dividends reinvested. The index is unmanaged, its returns do not reflect any fees, expenses, or sales charges, and it is not available for direct investment.
S&P 500® Index
The S&P 500® Index is a free-float market capitalization-weighted index of 500 of the largest U.S. companies. The index is calculated on a total return basis with dividends reinvested. The index is unmanaged, its returns do not reflect any fees, expenses, or sales charges, and it is not available for direct investment.
Sponsored ADR (American Depositary Receipt)
An ADR which is issued with the cooperation of the company whose stock will underlie the ADR. Sponsored ADRs generally carry the same rights normally given to stockholders, such as voting rights. ADRs must be sponsored to be able to trade on a major U.S. exchange such as the New York Stock Exchange (“NYSE”).
Strategic Allocation Fund Linked Benchmark
The Strategic Allocation Fund Linked Benchmark consists of 45% Russell 1000® Growth Index (a market capitalization-weighted index of growth-oriented stocks of the 1,000 largest companies in the Russell Universe, which comprises the 3,000 largest U.S. companies, calculated on a total return basis with dividends reinvested), 15% MSCI EAFE® Index (a free float-adjusted market capitalization-weighted index that measures developed foreign market equity performance, excluding the U.S. and Canada, calculated on a total return basis with net dividends reinvested) and 40% Bloomberg Barclays U.S. Aggregate Bond Index (an index that measures the U.S. investment grade fixed rate bond market, calculated on a total return basis). The index is unmanaged, its returns do not reflect any fees, expenses, or sales charges, and is not available for direct investment. Performance of the Strategic Allocation Fund Linked Benchmark prior to 9/7/2016 represents an allocation consisting of 60% S&P 500® Index and 40% Bloomberg Barclays U.S. Aggregate Bond Index.
5
| | |
VIRTUS STRATEGIC ALLOCATION FUND Fund Summary (Unaudited) Portfolio Management Commentaries by Duff & Phelps Investment Management Co. (International Equity Portfolio), Kayne Anderson Rudnick Investment Management, LLC (Domestic Equity Portfolio), and Newfleet Asset Management, LLC (Fixed Income Portfolio) | | Ticker Symbols: A Share: PHBLX C Share: PSBCX |
| ⬛ | | Strategic Allocation Fund (the “Fund”) is diversified and has investment objectives of reasonable income, long-term capital growth and conservation of capital. There is no guarantee the Fund will achieve its objectives. |
Effective September 21, 2017 the Fund changed its fiscal year end from March 31 to September 30. As a result, the commentary addresses six months of performance from April 1, 2017 to September 30, 2017.
| ⬛ | | For the fiscal period April 1 through September 30, 2017, the Fund’s Class A shares at NAV returned 9.26%*, and Class C shares at NAV returned 8.91%*. For the same period, the Russell 1000® Growth Index, a broad-based equity index, returned 10.84%*; the Bloomberg Barclays U.S. Aggregate Bond Index, a broad-based fixed income index, returned 2.31%*; MSCI EAFE® Index (net) returned 11.86%* and the Strategic Allocation Fund Linked Benchmark, which is the Fund’s style-specific index appropriate for comparison, returned 7.52%*. |
| * | Returns less than 1 year are not annualized. |
All performance figures assume reinvestment of distributions and exclude the effect of sales changes. Performance data quoted represents past results. Past performance is no guarantee of future results, and current performance may be higher or lower than the performance shown above. Investment return and principal value will fluctuate so your shares, when redeemed, may be worth more or less than their original cost. Please visit Virtus.com for performance data current to the most recent month-end.
How did the markets perform during the six-month fiscal period ended September 30, 2017?
U.S. Equities
| ⬛ | | The six-month fiscal period was a good environment for the U.S. stock market overall. Smaller-capitalization stocks outperformed their larger counterparts, with the Russell 2000® Index up 8.27% versus the S&P 500® Index return of 7.71% for the six months. Growth stocks continued to outpace value stocks, with the Russell 1000® Growth Index up 10.84% and the Russell 1000® Value Index advancing 4.50%. Lower quality businesses, as measured by S&P Stock Rankings, outperformed their higher quality counterparts. |
During the fiscal period, the best performing sectors in the Russell 1000 Growth® Index were utilities, information technology, and health care. The worst performing sectors were energy, consumer staples, and telecommunication services.
| ⬛ | | Despite being in the midst of a raging bull market, we were dealing with a multitude of negative issues including historic natural disasters, potential nuclear war, deadly violence over Civil War monuments, senseless mass shootings, and rigged elections the world over, all of which provided seemingly endless sources of unease. Yet the S&P 500® Index put up its eighth straight quarterly advance, with a serene average daily change of just 0.3%, the lowest since 1968. |
| ⬛ | | A number of factors continued to paint a positive backdrop for equities. Interest rates remained subdued as the lack of inflation weighed on long-term rates and limited what the Federal Reserve (Fed) could do with short-term rates. Domestic unemployment remained |
For information regarding the indexes and certain investment terms, see the Key Investment Terms on page 4.
6
| | |
| VIRTUS STRATEGIC ALLOCATION FUND (Unaudited) (Continued) |
low, wages were on the rise, and home prices continued to appreciate, putting the consumer on solid footing. A synchronized global pickup reduced the risk of contagion from weakness elsewhere in the world. |
International Equities
| ⬛ | | The international equity markets performed strongly during the six-month fiscal period, with the MSCI EAFE® Index gaining 11.86%. Markets displayed ongoing resilience, posting two consecutive quarters with returns in excess of 5%. Mounting evidence of measured but steady global gross domestic product (GDP) growth was enough to overcome potentially disruptive events such as a weak U.S. dollar, natural disasters, and a tense situation in North Korea. The markets’ resiliency in the face of such challenges underscores just how comfortable investors have become with being uncomfortable. |
| ⬛ | | Every sector in the MSCI EAFE® Index posted positive returns. The top performing sectors were information technology, materials, and industrials. The weakest performing sectors were telecommunications, real estate, and consumer staples. Broadly speaking, cyclical sectors led the charge over defensive sectors as markets marched higher. This reflected the positive trends in GDP growth. |
Fixed Income
| ⬛ | | Most spread sectors outperformed U.S. Treasuries during the six-month fiscal period ended September 30, 2017 as spreads tightened. The global growth outlook remained favorable and the search for yield persisted through the end of the fiscal period. Within most fixed income sectors, longer duration and lower quality assets were key drivers of performance. |
| ⬛ | | Still-accommodative monetary policy by the major central banks, a favorable global growth outlook, and better-than-expected Chinese data all provided a positive backdrop. |
| | | Moderate economic growth in the U.S., good and modestly improving fundamentals, and strong technical factors also supported spread sector outperformance, as did the persistence of the global demand for yield. Periods of weakness within spread sectors were brief as investors waiting on the sidelines took advantage of any meaningful drop in prices to buy in, quickly reversing the declines. |
| ⬛ | | As anticipated, the Federal Reserve (Fed) raised its target rate 0.25% during the last six months to a range of 1.00% to 1.25%. During its September 2017 meeting, the Fed announced the start of its balance sheet reduction plan. |
| ⬛ | | Over the last six months, short-term interest rates rose more than long-term rates. This was due to the Fed rate hike and U.S. inflation data that was generally below expectations. |
What factors affected the Fund’s performance during the fiscal period?
U.S. Equities
| ⬛ | | The U.S. equity portfolio of the Fund underperformed the Russell 1000® Growth Index for the six-month fiscal period ending September 30, 2017. The underperformance was driven by negative stock selection and an overweight exposure to the energy sector, and negative stock selection and an underweight exposure in health care. Strong stock selection in the information technology and consumer staples sectors contributed positively to performance. |
For the reporting period, the largest contributors to performance were Alibaba and Facebook.
| ⬛ | | Alibaba’s two marketplaces, Taobao and Tmall.com, combine to form the largest online commerce company in the world. Management has committed to a number of social initiatives to further improve mobile monetization over time. Alibaba’s marketplaces have huge network effects, and the company made |
For information regarding the indexes and certain investment terms, see the Key Investment Terms on page 4.
7
| | |
| VIRTUS STRATEGIC ALLOCATION FUND (Unaudited) (Continued) |
| | | efforts to foster the ecosystem with investments in payments and logistics partnerships. Taobao, in particular, has become a destination for consumers, merchants, and key opinion leaders to interact and engage in what Alibaba calls social commerce. E-commerce penetration, mobile usage, and growth in Chinese consumer spending power were all durable long-term tailwinds benefitting the company during the fiscal period. Alibaba has attempted to seize the opportunity by using data to improve targeting and increasingly consummating transactions through Alipay, its leading mobile payment offering. |
| ⬛ | | Facebook continued to grow advertising revenue and take share in the online digital marketing space. The company delivered an unprecedented global reach of approximately 30% of the earth’s population to advertisers in a measurable way. Facebook’s user growth remained stunning despite its scale, and Instagram’s Stories format was a resounding success in fighting off competitors like Snapchat. |
The largest detractors from performance were Pioneer National Resources Company and Core Laboratories.
| ⬛ | | Pioneer National Resources has amassed valuable, contiguous acreage in the Midland Basin which, with the discovery of fracking and horizontal drilling techniques, has become one of the most prolific and lowest cost basins in the U.S. With upwards of eight billion barrels of oil equivalent in reserves, Pioneer has decades of inventory to drill and had one of the strongest balance sheets in the energy complex for the fiscal period, with investment grade debt and an industry-low debt-to-equity ratio. Early in the third quarter, the company reported issues with pressure in larger fields which required additional per-well development costs and weighed on the shares. While it does not change the ultimate size of the asset, the additional costs and delays forced |
| | | Pioneer to trim guidance for the current year. |
| ⬛ | | Core Laboratories’ shares suffered from lower commodity prices and from a short seller’s report claiming the company misrepresented its end-market exposure and its cyclicality. |
International Equities
| ⬛ | | The Fund’s international equity portfolio posted positive performance during the six-month fiscal period, but underperformed the international equity market, as measured by the MSCI EAFE® Index. Stock selection was the primary detractor from relative returns, while sector allocations had a modestly positive impact. |
| ⬛ | | Stock selection within energy, consumer discretionary, and materials weighed most heavily on the international portfolio’s performance. Shares of specialty motion picture company IMAX Corp. fell more than 33% during the period, which resulted in the largest negative stock-level impact. We continued to own shares of IMAX in the portfolio through the end of the fiscal period, as we believe the selloff was not justified. Stock selection within the industrials, financials, and real estate sectors made a positive contribution, but it was not enough to offset the drag from elsewhere. The largest single-stock contribution to relative returns came from Irish clinical research organization Icon PLC, which rose more than 42% during the period. |
| ⬛ | | The sector allocations that contributed the most to the portfolio’s relative performance were an overweight exposure to information technology, and underweight exposures to consumer staples and materials. However, the portfolio’s underweight exposures to the utilities and financials sectors, along with an overweight exposure to industrials, detracted modestly from sector allocation results. |
| ⬛ | | Two straight quarters of strong returns for the MSCI EAFE® Index created a challenging relative performance environment for the portfolio, |
For information regarding the indexes and certain investment terms, see the Key Investment Terms on page 4.
8
| | |
| VIRTUS STRATEGIC ALLOCATION FUND (Unaudited) (Continued) |
| | | given our core relative value style. We maintain our disciplined approach despite the headwinds. |
Fixed Income
| ⬛ | | The outperformance of most credit-sensitive sectors, such as investment grade and high yield corporate bonds, relative to U.S. Treasuries was the key positive contributor to performance for the Fund’s fixed income portfolio. |
| ⬛ | | In addition, the portfolio’s relative underweight to U.S. Treasuries and agency mortgage-backed securities positively impacted performance. |
| ⬛ | | The portfolio’s allocation to the corporate high yield sector had a meaningful positive impact on performance during the fiscal period. |
| ⬛ | | The portfolio’s allocation to asset-backed securities negatively impacted performance during the period. |
The preceding information is the opinion of portfolio management only through the end of the period stated on the cover. Any such opinions are subject to change at any time based upon market or other conditions and should not be relied upon as investment advice. Past performance is no guarantee of future results, and there is no guarantee that market forecasts will be realized.
Equity Securities: The market price of equity securities may be adversely affected by financial market, industry, or issuerspecific events. Focus on a particular style or on small or medium-sized companies may enhance that risk.
Credit & Interest: Debt securities are subject to various risks, the most prominent of which are credit and interest rate risk. The issuer of a debt security may fail to make interest and/or principal payments. Values of debt securities may rise or fall in response to changes in interest rates, and this risk may be enhanced with longer-term maturities.
Foreign & Emerging Markets: Investing internationally, especially in emerging markets, involves additional risks such as currency, political, accounting, economic, and market risk.
Allocation: The Fund’s exposure to different asset classes may not be optimal for market conditions at a given time. Asset allocation does not guarantee a profit or protect against a loss in declining markets.
High Yield-High Risk Fixed Income Securities: There is a greater level of credit risk and price volatility involved with high-yield securities than investment grade securities.
Prospectus: For additional information on risks, please see the Fund’s prospectus.
| | | | | | | | |
| |
| Asset Allocations | |
| |
The following table presents the portfolio holdings within certain sectors as a percentage of total investments attributable to each sector at September 30, 2017. | |
Common Stocks | | | | | | | 64 | % |
Information Technology | | | 23 | % | | | | |
Consumer Discretionary | | | 13 | | | | | |
Healthcare | | | 6 | | | | | |
All Other Sectors in Common Stocks | | | 22 | | | | | |
Corporate Bonds and Notes | | | | | | | 18 | |
Financials | | | 6 | | | | | |
Consumer Discretionary | | | 2 | | | | | |
Real Estate | | | 2 | | | | | |
All Other Sectors in Corporate Bonds and Notes | | | 8 | | | | | |
Mortgage-Backed Securities | | | | | | | 7 | |
Asset-Backed Securities | | | | | | | 3 | |
U.S. Government Securities | | | | | | | 2 | |
Loan Agreements | | | | | | | 2 | |
Other (includes short-term investments) | | | | | | | 4 | |
| | | | | | | | | |
Total | | | | | | | 100 | % |
| | | | | | | | | |
For information regarding the indexes and certain investment terms, see the Key Investment Terms on page 4.
9
| | |
| VIRTUS STRATEGIC ALLOCATION FUND (Unaudited) (Continued) |
| | | | | | | | | | | | |
| Average Annual Total Returns1 for periods ended 9/30/17 | |
| | | 1
Year | | | 5
Years | | | 10
Years | |
| Class A shares at NAV 2 | | | 12.09 | % | | | 6.23 | % | | | 4.61 | % |
| Class A shares at POP 3,4 | | | 5.65 | | | | 4.98 | | | | 4.00 | |
| Class C shares at NAV 2 and with CDSC 4 | | | 11.29 | | | | 5.44 | | | | 3.83 | |
| Bloomberg Barclays U.S. Aggregate Bond Index | | | 0.07 | | | | 2.07 | | | | 4.27 | |
| S&P 500® Index* | | | 18.61 | | | | 14.22 | | | | 7.44 | |
| MSCI EAFE® Index (net) | | | 19.10 | | | | 8.38 | | | | 1.34 | |
| Russell 1000® Growth Index | | | 21.94 | | | | 15.26 | | | | 9.08 | |
| Strategic Allocation Fund Linked Benchmark* | | | 12.37 | | | | 9.62 | | | | 6.61 | |
Fund Expense Ratios5: Class A Shares: 1.15%; Class C Shares: 1.93%.
All returns represent past performance which is no guarantee of future results. Current performance may be higher or lower than the performance shown. The investment return and principal value of an investment will fluctuate so that an investor’s shares, when redeemed, may be worth more or less than their original cost. The above table and graph below do not reflect the deduction of taxes that a shareholder would pay on fund distributions or the redemption of fund shares. Please visit Virtus.com for performance data current to the most recent month-end.
| 1 | Total returns are historical and include changes in share price and the reinvestment of both dividends and capital gain distributions. |
| 2 | “NAV” (Net Asset Value) total returns do not include the effect of any sales charge. |
| 3 | “POP” (Public Offering Price) total returns include the effect of the maximum front-end 5.75% sales charge. |
| 4 | “CDSC” (contingent deferred sales charge) is applied to redemptions of certain classes of shares that do not have a sales charge applied at the time of purchase. CDSC charges for certain redemptions of Class A shares made within 18 months of a finder’s fee being paid and all Class C shares are 1% within the first year and 0% thereafter. |
| 5 | The expense ratios of the Fund are set forth according to the prospectus for the Fund effective July 31, 2017, as supplemented and revised, and may differ from the expense ratios disclosed in the Financial Highlights tables in this report. See the Financial Highlights for more current expense ratios. Expense ratios include fees and expenses associated with the underlying funds. |
| * | The Strategic Allocation Fund Linked Benchmark no longer includes the S&P 500® Index effective September 7, 2016. |
The indexes are unmanaged and not available for direct investment; therefore their performance does not reflect the expenses associated with active management of an actual portfolio.
10
| | |
| VIRTUS STRATEGIC ALLOCATION FUND (Unaudited) (Continued) |
Growth of $10,000 for periods ended 9/30
This chart assumes an initial investment of $10,000 made on September 30, 2007, for Class A shares and Class C shares including any applicable sales charges or fees. Performance assumes reinvestment of dividends and capital gain distributions.

The indexes are unmanaged and not available for direct investment; therefore their performance does not reflect the expenses associated with active management of an actual portfolio.
For information regarding the indexes and certain investment terms, see Key Investment Terms on page 4.
11
VIRTUS STRATEGIC ALLOCATION FUND
SCHEDULE OF INVESTMENTS
SEPTEMBER 30, 2017
($ reported in thousands)
| | | | | | | | |
| | | PAR VALUE | | | VALUE | |
| | | | | | | | |
| U.S. GOVERNMENT SECURITIES—1.8% | |
U.S. Treasury Bond 2.500%, 2/15/46 | | $ | 8,380 | | | $ | 7,789 | |
U.S. Treasury Note 1.125%, 2/28/19 | | | 730 | | | | 727 | |
| TOTAL U.S. GOVERNMENT SECURITIES | |
| (Identified Cost $8,456) | | | | 8,516 | |
| MUNICIPAL BONDS—0.9% | | | | |
| California—0.4% | | | | | | |
State of California, Build America Bonds Taxable 7.600%, 11/1/40 | | | 1,275 | | | | 1,995 | |
| Georgia—0.1% | | | | | | |
Rockdale County
Water & Sewerage Authority Revenue Taxable
3.060%, 7/1/24 | | | 600 | | | | 603 | |
| New York—0.4% | | | | | | |
Port Authority of New York & New Jersey, Consolidated Bonds Revenue
5.000%, 4/15/57 | | | 1,560 | | | | 1,789 | |
TOTAL MUNICIPAL BONDS
(Identified Cost $4,417) | | | | 4,387 | |
| FOREIGN GOVERNMENT SECURITIES—1.0% | |
Argentine Republic | | | | | | | | |
7.500%, 4/22/26 | | | 505 | | | | 567 | |
7.625%, 4/22/46 | | | 195 | | | | 216 | |
Dominican Republic 144A
6.600%, 1/28/24(4) | | | 335 | | | | 377 | |
Kingdom of Bahrain 144A
7.000%, 10/12/28(4) | | | 485 | | | | 495 | |
Republic of Costa Rica | | | | | | | | |
144A, 4.375%, 4/30/25(4) | | | 265 | | | | 261 | |
144A, 7.000%, 4/4/44(4) | | | 335 | | | | 357 | |
Republic of Indonesia | | | | | | | | |
144A, 3.700%, 1/8/22(4) | | | 265 | | | | 275 | |
144A, 4.350%, 1/8/27(4) | | | 520 | | | | 552 | |
Republic of South Africa | | | | | | | | |
4.665%, 1/17/24 | | | 435 | | | | 445 | |
4.300%, 10/12/28 | | | 445 | | | | 419 | |
| | | | | | | | |
| | | PAR VALUE | | | VALUE | |
| | | | | | | | |
| FOREIGN GOVERNMENT SECURITIES (continued) | |
Republic of Turkey 7.375%, 2/5/25 | | $ | 355 | | | $ | 412 | |
Sultanate of Oman 144A 4.750%, 6/15/26(4) | | | 250 | | | | 247 | |
| TOTAL FOREIGN GOVERNMENT SECURITIES | |
| (Identified Cost $4,443) | | | | 4,623 | |
| MORTGAGE-BACKED SECURITIES—6.7% | |
| Agency—2.7% | |
FHLMC | | | | | | | | |
5.000%, 7/1/35 | | | 167 | | | | 183 | |
5.000%, 12/1/35 | | | 528 | | | | 587 | |
6.000%, 6/1/37 | | | 239 | | | | 275 | |
4.000%, 2/1/45 | | | 475 | | | | 500 | |
3.500%, 4/1/46 | | | 699 | | | | 721 | |
FNMA | | | | | | | | |
4.000%, 7/1/19 | | | 2 | | | | 3 | |
6.000%, 12/1/32 | | | 41 | | | | 46 | |
6.000%, 11/1/34 | | | 331 | | | | 378 | |
5.500%, 4/1/36 | | | 4 | | | | 4 | |
5.500%, 9/1/36 | | | 172 | | | | 193 | |
6.500%, 5/1/37 | | | 282 | | | | 328 | |
6.000%, 9/1/37 | | | 14 | | | | 16 | |
5.000%, 3/1/38 | | | 202 | | | | 225 | |
5.500%, 4/1/38 | | | 156 | | | | 179 | |
5.500%, 6/1/38 | | | 194 | | | | 217 | |
6.000%, 8/1/38 | | | 86 | | | | 100 | |
5.000%, 9/1/39 | | | 220 | | | | 244 | |
5.500%, 9/1/39 | | | 1,180 | | | | 1,313 | |
4.500%, 9/1/40 | | | 440 | | | | 482 | |
3.500%, 8/1/42 | | | 642 | | | | 665 | |
3.500%, 12/1/42 | | | 686 | | | | 710 | |
3.500%, 12/1/45 | | | 150 | | | | 155 | |
3.500%, 1/1/46 | | | 759 | | | | 783 | |
4.000%, 1/1/46 | | | 637 | | | | 671 | |
3.000%, 12/1/46 | | | 869 | | | | 872 | |
3.500%, 1/1/47 | | | 1,312 | | | | 1,353 | |
4.000%, 4/1/47 | | | 701 | | | | 738 | |
3.500%, 7/1/47 | | | 416 | | | | 429 | |
4.000%, 7/1/47 | | | 187 | | | | 197 | |
4.000%, 8/1/47 | | | 411 | | | | 433 | |
| | | | | | | | |
| | | | 13,000 | |
| | | | | | | | |
See Notes to Financial Statements
12
VIRTUS STRATEGIC ALLOCATION FUND
SCHEDULE OF INVESTMENTS (Continued)
SEPTEMBER 30, 2017
($ reported in thousands)
| | | | | | | | |
| | | PAR VALUE | | | VALUE | |
| | | | | | | | |
| MORTGAGE-BACKED SECURITIES (continued) | |
| Non-Agency—4.0% | |
American Homes 4 Rent Trust | | | | | | | | |
14-SFR2, C 144A, 4.705%, 10/17/36(4) | | $ | 615 | | | $ | 661 | |
15-SFR2, C 144A, 4.691%, 10/17/45(4) | | | 130 | | | | 140 | |
15-SFR1, A 144A, 3.467%, 4/17/52(4) | | | 889 | | | | 919 | |
Ameriquest Mortgage Securities, Inc. Pass-Through Certificates, 03-AR3, M4 , (5.850% minus 1 month LIBOR) 4.286%, 6/25/33(3) | | | 409 | | | | 406 | |
AMSR Trust 16-SFR1, C 144A , (1 month LIBOR + 2.250%)
3.484%, 11/17/33(3)(4) | | | 243 | | | | 247 | |
Aventura Mall Trust 13-AVM, C 144A
3.867%, 12/5/32(3)(4) | | | 580 | | | | 594 | |
Banc of America Funding Trust | | | | | | | | |
04-B, 2A1,
3.640%, 11/20/34(3) | | | 167 | | | | 168 | |
05-1, 1A1,
5.500%, 2/25/35 | | | 231 | | | | 231 | |
Banc of America Mortgage Trust 05-3, 1A15
5.500%, 4/25/35 | | | 121 | | | | 123 | |
Bank of America (Merrill Lynch – Countrywide) Home Loan Mortgage Pass-Through-Trust
04-6, 1A2
3.575%, 5/25/34(3) | | | 419 | | | | 418 | |
Bayview Opportunity Master Fund IVa Trust | | | | | | | | |
16-SPL1, B1 144A, 4.250%, 4/28/55(4) | | | 390 | | | | 403 | |
17-SLP5, B1 144A, 4.000%, 6/28/57(3)(4) | | | 100 | | | | 105 | |
17-SPL1, B1 144A, 4.250%, 10/28/64(3)(4) | | | 277 | | | | 289 | |
| | | | | | | | |
| | | PAR VALUE | | | VALUE | |
| | | | | | | | |
| Non-Agency (continued) | |
Bayview Opportunity Master Fund IVb Trust | | | | | | | | |
16-SPL2, B1 144A, 4.250%, 6/28/53(3)(4) | | $ | 145 | | | $ | 150 | |
17-SPL3, B1 144A, 4.250%, 11/28/53(3)(4) | | | 355 | | | | 371 | |
Colony Starwood Homes Trust 16-2A, C 144A , (1 month LIBOR + 2.150%)
3.384%, 12/17/33(3)(4) | | | 485 | | | | 485 | |
COLT Mortgage Loan Trust Funding LLC 17-1, A3 144A
3.074%, 5/27/47(3)(4) | | | 145 | | | | 147 | |
Credit Suisse Commercial Mortgage-Backed Trust 06-08, 3A1
6.000%, 10/25/21 | | | 174 | | | | 166 | |
Galton Funding Mortgage Trust 17-1, A21 144A 3.500%, 7/25/56(3)(4) | | | 294 | | | | 299 | |
GSAA Home Equity Trust 05-12, AF3W
4.999%, 9/25/35(3) | | | 124 | | | | 125 | |
GSR Mortgage Loan Trust 06-1F, 2A4 6.000%, 2/25/36 | | | 393 | | | | 352 | |
Jefferies Resecuritization Trust 14-R1, 1A1 144A 4.000%, 12/27/37(4) | | | 66 | | | | 66 | |
JPMorgan Chase (WaMu) Mortgage Pass-Through Certificates 03-S11, 3A5 5.950%, 11/25/33 | | | 355 | | | | 371 | |
JPMorgan Chase Commercial Mortgage Securities Trust 14-C22, A4
3.801%, 9/15/47 | | | 300 | | | | 316 | |
JPMorgan Chase Mortgage Trust | | | | | | | | |
04-A4, 2A1,
3.464%, 9/25/34(3) | | | 354 | | | | 361 | |
14-1, 1A1 144A, 4.000%, 1/25/44(3)(4) | | | 252 | | | | 260 | |
16-1, M2 144A, 3.750%, 4/25/45(3)(4) | | | 373 | | | | 380 | |
See Notes to Financial Statements
13
VIRTUS STRATEGIC ALLOCATION FUND
SCHEDULE OF INVESTMENTS (Continued)
SEPTEMBER 30, 2017
($ reported in thousands)
| | | | | | | | |
| | | PAR VALUE | | | VALUE | |
| | | | | | | | |
| MORTGAGE-BACKED SECURITIES (continued) | |
| Non-Agency (continued) | |
16-2, M2 144A, 3.750%, 12/25/45(3)(4) | | $ | 394 | | | $ | 401 | |
16-5, A1 144A,
2.609%, 12/25/46(3)(4) | | | 752 | | | | 753 | |
17-3, 2A2 144A, 2.500%, 8/25/47(3)(4) | | | 256 | | | | 255 | |
MASTR Alternative Loan Trust 05-5, 2A3 5.500%, 7/25/25 | | | 199 | | | | 187 | |
MASTR Specialized Loan Trust 05-3, A2 144A 5.704%, 11/25/35(3)(4) | | | 274 | | | | 282 | |
Morgan Stanley - Bank of America (Merrill Lynch) Trust | | | | | | | | |
13-C13, AS,
4.266%, 11/15/46 | | | 275 | | | | 292 | |
15-C22, AS,
3.561%, 4/15/48 | | | 685 | | | | 696 | |
Morgan Stanley Capital I Trust 08-T29, A4 6.498%, 1/11/43(3)(3A) | | | 828 | | | | 833 | |
Motel 6 Trust 17-MTL6, A 144A , (1 month + 0.920%)
2.154%, 8/15/34(3)(4) | | | 440 | | | | 441 | |
New Residential Mortgage Loan Trust | | | | | | | | |
14-1A, A 144A,
3.750%, 1/25/54(3)(4) | | | 390 | | | | 402 | |
15-2A, A1 144A, 3.750%, 8/25/55(3)(4) | | | 397 | | | | 410 | |
16-1A, A1 144A, 3.750%, 3/25/56(3)(4) | | | 194 | | | | 199 | |
16-4A, B1A 144A, 4.500%, 11/25/56(3)(4) | | | 436 | | | | 467 | |
NovaStar Mortgage Funding Trust Series 04-4, M5 , (1 month LIBOR + 1.725%) 2.962%, 3/25/35(3) | | | 545 | | | | 546 | |
One Market Plaza Trust 17-1MKT, A 144A 3.614%, 2/10/32(4) | | | 360 | | | | 374 | |
| | | | | | | | |
| | | PAR VALUE | | | VALUE | |
| | | | | | | | |
| Non-Agency (continued) | |
Residential Asset Securitization Trust
05-A1, A3
5.500%, 4/25/35 | | $ | 381 | | | $ | 391 | |
Sequoia Mortgage Trust 13-8, B1
3.532%, 6/25/43(3) | | | 175 | | | | 177 | |
Towd Point Mortgage Trust | | | | | | | | |
15-1, A2 144A,
3.250%, 10/25/53(3)(4) | | | 385 | | | | 391 | |
16-1, A1B 144A, 2.750%, 2/25/55(3)(4) | | | 118 | | | | 118 | |
15-5, A2 144A,
3.500%, 5/25/55(3)(4) | | | 480 | | | | 494 | |
15-2, 1M1 144A, 3.250%, 11/25/60(3)(4) | | | 1,245 | | | | 1,267 | |
Vericrest Opportunity Loan Trust LVI LLC,
17-NPL3, A1 144A
3.500%, 3/25/47(3)(4) | | | 322 | | | | 325 | |
Vericrest Opportunity Loan Trust LLC
15-NPL4, A1 144A
3.500%, 2/25/55(3)(4) | | | 194 | | | | 194 | |
Verus Securitization Trust 17-2A, A1 144A 2.485%, 7/25/47(3)(4) | | | 498 | | | | 498 | |
Wells Fargo Commercial Mortgage Trust
15-LC20, B
3.719%, 4/15/50 | | | 460 | | | | 463 | |
| | | | | | | | |
| | | | | 19,409 | |
| TOTAL MORTGAGE-BACKED SECURITIES | |
| (Identified Cost $31,612) | | | | 32,409 | |
| ASSET-BACKED SECURITIES—2.8% | |
American Credit Acceptance Receivables Trust 17-2, C 144A 2.860%, 6/12/23(4) | | | 445 | | | | 444 | |
AmeriCredit Automobile Receivables Trust
14-1, D
2.540%, 6/8/20 | | | 705 | | | | 709 | |
See Notes to Financial Statements
14
VIRTUS STRATEGIC ALLOCATION FUND
SCHEDULE OF INVESTMENTS (Continued)
SEPTEMBER 30, 2017
($ reported in thousands)
| | | | | | | | |
| | | PAR VALUE | | | VALUE | |
| | | | | | | | |
| ASSET-BACKED SECURITIES (continued) | |
Avis Budget Rental Car Funding LLC (AESOP) 16-1A, A 144A
2.990%, 6/20/22(4) | | $ | 500 | | | $ | 504 | |
CarMax Auto Owner Trust 15-2, C
2.390%, 3/15/21 | | | 715 | | | | 718 | |
Centre Point Funding LLC 12-2A,1 144A
2.610%, 8/20/21(4) | | | 378 | | | | 373 | |
DB Master Finance LLC 17-1A, A2I 144A 3.629%, 11/20/47(4) | | | 430 | | | | 430 | |
Drive Auto Receivables Trust | | | | | | | | |
15-DA, C 144A, 3.380%, 11/15/21(4) | | | 698 | | | | 704 | |
17-2, C,
2.750%, 9/15/23 | | | 525 | | | | 524 | |
Drug Royalty II LP 2 14-1, A2 144A
3.484%, 7/15/23(4) | | | 322 | | | | 322 | |
DT Auto Owner Trust
16-4A, C 144A
2.740%, 10/17/22(4) | | | 585 | | | | 586 | |
Exeter Automobile Receivables Trust | | | | | | | | |
13-1A, C 144A,
3.520%, 2/15/19(4) | | | 102 | | | | 102 | |
15-2A, C 144A,
3.900%, 3/15/21(4) | | | 615 | | | | 625 | |
Flagship Credit Auto Trust 17-3, C 144A
2.910%, 9/15/23(4) | | | 520 | | | | 520 | |
Foursight Capital Automobile Receivables Trust 17-1, B 144A 3.050%, 12/15/22(4) | | | 420 | | | | 420 | |
GLS Auto Receivables Trust 17-1A, B 144A 2.980%, 12/15/21(4) | | | 530 | | | | 529 | |
Laurel Road Prime Student Loan Trust
17-B, A2FX 144A
2.770%, 8/25/42(4) | | | 525 | | | | 524 | |
Mariner Finance Issuance Trust 17-AA, A 144A 3.620%, 2/20/29(4) | | | 450 | | | | 453 | |
| | | | | | | | |
| | | PAR VALUE | | | VALUE | |
| | | | | | | | |
| ASSET-BACKED SECURITIES (continued) | |
Murray Hill Marketplace Trust 16-LC1, A 144A
4.190%, 11/25/22(4) | | $ | 182 | | | $ | 183 | |
MVW Owner Trust | | | | | | | | |
16-1A, A 144A,
2.250%, 12/20/33(4) | | | 451 | | | | 444 | |
17-1A, A 144A,
2.420%, 12/20/34(4) | | | 520 | | | | 519 | |
Navistar Financial Dealer Note Master Owner Trust II 16-1, B 144A , (1 month LIBOR + 1.750%)
2.984%, 9/27/21(3)(4) | | | 780 | | | | 782 | |
Prestige Auto Receivables Trust 17-1A, C 144A
2.810%, 1/17/23(4) | | | 520 | | | | 521 | |
Prosper Marketplace Issuance Trust 17-2A, B 144A
3.480%, 9/15/23(4) | | | 440 | | | | 441 | |
Sierra Timeshare Receivables Funding LLC | | | | | | | | |
12-3A, A 144A,
1.870%, 8/20/29(4) | | | 123 | | | | 124 | |
13-1A, A 144A,
1.590%, 11/20/29(4) | | | 98 | | | | 98 | |
SoFi Professional Loan Program LLC 15-A, A2 144A
2.420%, 3/25/30(4) | | | 194 | | | | 194 | |
TGIF Funding LLC 17-1A, A2 144A
6.202%, 4/30/47(4) | | | 448 | | | | 454 | |
U-Haul S Fleet LLC
10-BT1A, 1 144A
4.899%, 10/25/23(4) | | | 589 | | | | 589 | |
Westlake Automobile Receivables Trust
17-2A, C 144A
2.590%, 12/15/22(4) | | | 525 | | | | 524 | |
| TOTAL ASSET-BACKED SECURITIES | |
| (Identified Cost $13,346) | | | | 13,360 | |
See Notes to Financial Statements
15
VIRTUS STRATEGIC ALLOCATION FUND
SCHEDULE OF INVESTMENTS (Continued)
SEPTEMBER 30, 2017
($ reported in thousands)
| | | | | | | | |
| | | PAR VALUE | | | VALUE | |
| | | | | | | | |
| CORPORATE BONDS AND NOTES—18.3% | |
| Consumer Discretionary—2.0% | |
Beazer Homes USA, Inc. 6.750%, 3/15/25 | | $ | 425 | | | $ | 448 | |
Caesars Entertainment Operating Co., Inc. 9.000%, 2/15/20(6) | | | 207 | | | | 275 | |
Caesars Growth Properties Holdings LLC 9.375%, 5/1/22 | | | 190 | | | | 205 | |
CalAtlantic Group, Inc. 5.250%, 6/1/26 | | | 380 | | | | 393 | |
Charter Communications Operating LLC
4.908%, 7/23/25 | | | 440 | | | | 470 | |
Cooper-Standard Automotive, Inc. 144A 5.625%, 11/15/26(4) | | | 385 | | | | 394 | |
Discovery Communications LLC 3.950%, 3/20/28 | | | 415 | | | | 414 | |
Eldorado Resorts, Inc. 6.000%, 4/1/25 | | | 195 | | | | 205 | |
Gateway Casinos & Entertainment Ltd. 144A 8.250%, 3/1/24(4) | | | 155 | | | | 163 | |
Horton (D.R.), Inc. 4.750%, 2/15/23 | | | 550 | | | | 596 | |
Lear Corp.
3.800%, 9/15/27 | | | 525 | | | | 523 | |
MDC Holdings, Inc. 5.500%, 1/15/24 | | | 540 | | | | 582 | |
Priceline Group, Inc. (The)
3.650%, 3/15/25 | | | 605 | | | | 623 | |
QVC, Inc.
4.375%, 3/15/23 | | | 600 | | | | 623 | |
Scientific Games International, Inc. 6.625%, 5/15/21 | | | 295 | | | | 302 | |
SFR Group S.A. 144A 7.375%, 5/1/26(4) | | | 465 | | | | 501 | |
Signet UK Finance plc 4.700%, 6/15/24 | | | 630 | | | | 624 | |
Sirius XM Radio, Inc. 144A 5.000%, 8/1/27(4) | | | 365 | | | | 372 | |
TI Group Automotive Systems LLC 144A 8.750%, 7/15/23(4) | | | 215 | | | | 228 | |
| | | | | | | | |
| | | PAR VALUE | | | VALUE | |
| | | | | | | | |
| Consumer Discretionary (continued) | |
TRI Pointe Group, Inc.
5.875%, 6/15/24 | | $ | 465 | | | $ | 497 | |
Vista Outdoor, Inc.
5.875%, 10/1/23 | | | 360 | | | | 370 | |
Wyndham Worldwide Corp. | | | | | | | | |
5.100%, 10/1/25 | | | 560 | | | | 586 | |
4.500%, 4/1/27 | | | 120 | | | | 120 | |
| | | | | | | | |
| | | | 9,514 | |
| | | | | | | | |
| Consumer Staples—0.7% | | | | |
Anheuser-Busch InBev Finance, Inc.
3.650%, 2/1/26 | | | 525 | | | | 543 | |
BAT Capital Corp. 144A
3.222%, 8/15/24(4) | | | 525 | | | | 526 | |
CVS Health Corp.
2.875%, 6/1/26 | | | 645 | | | | 623 | |
Flowers Foods, Inc.
4.375%, 4/1/22 | | | 600 | | | | 637 | |
Kraft Heinz Foods Co. (The)
3.000%, 6/1/26 | | | 435 | | | | 417 | |
Safeway, Inc.
7.250%, 2/1/31 | | | 335 | | | | 288 | |
Smithfield Foods, Inc. | | | | | | | | |
144A, 2.650%, 10/3/21(4) | | | 16 | | | | 16 | |
144A, 4.250%, 2/1/27(4) | | | 123 | | | | 127 | |
Tops Holding LLC 144A
8.000%, 6/15/22(4) | | | 475 | | | | 316 | |
| | | | | | | | |
| | | | 3,493 | |
| | | | | | | | |
| Energy—1.5% | | | | | | |
Alta Mesa Holdings LP 144A
7.875%, 12/15/24(4) | | | 185 | | | | 200 | |
Cheniere Corpus Christi Holdings LLC
5.875%, 3/31/25 | | | 280 | | | | 301 | |
Crestwood Midstream Partners LP
5.750%, 4/1/25 | | | 310 | | | | 317 | |
Enbridge Energy Partners LP | | | | | | | | |
4.375%, 10/15/20 | | | 90 | | | | 95 | |
5.875%, 10/15/25 | | | 355 | | | | 405 | |
See Notes to Financial Statements
16
VIRTUS STRATEGIC ALLOCATION FUND
SCHEDULE OF INVESTMENTS (Continued)
SEPTEMBER 30, 2017
($ reported in thousands)
| | | | | | | | |
| | | PAR VALUE | | | VALUE | |
| | | | | | | | |
| CORPORATE BONDS AND NOTES (continued) | |
| Energy (continued) | |
Energy Transfer Partners LP 4.200%, 4/15/27 | | $ | 185 | | | $ | 187 | |
EP Energy LLC 144A
8.000%, 11/29/24(4) | | | 175 | | | | 177 | |
FTS International, Inc.
6.250%, 5/1/22 | | | 185 | | | | 169 | |
Helmerich & Payne International
Drilling Co.
4.650%, 3/15/25 | | | 340 | | | | 359 | |
HollyFrontier Corp.
5.875%, 4/1/26 | | | 475 | | | | 517 | |
Kinder Morgan Energy Partners LP
7.500%, 11/15/40 | | | 595 | | | | 746 | |
MPLX LP
4.875%, 12/1/24 | | | 785 | | | | 846 | |
NGL Energy Partners LP 5.125%, 7/15/19 | | | 460 | | | | 460 | |
NuStar Logistics LP 5.625%, 4/28/27 | | | 150 | | | | 158 | |
Oasis Petroleum, Inc. 6.875%, 1/15/23 | | | 170 | | | | 172 | |
Petrobras Global Finance BV | | | | | | | | |
144A, 5.299%, 1/27/25(4) | | | 141 | | | | 141 | |
7.375%, 1/17/27 | | | 575 | | | | 633 | |
Petroleos Mexicanos | | | | | | | | |
6.875%, 8/4/26 | | | 430 | | | | 489 | |
144A, 6.500%, 3/13/27(4) | | | 265 | | | | 294 | |
PTTEP Treasury Center Co., Ltd. 144A ,4.875%,(4)(7) | | | 213 | | | | 217 | |
Sabine Pass Liquefaction LLC
6.250%, 3/15/22 | | | 425 | | | | 478 | |
| | | | | | | | |
| | | | 7,361 | |
| | | | | | | | |
| Financials—6.0% | | | | | | |
AerCap Ireland Capital DAC
3.650%, 7/21/27 | | | 570 | | | | 568 | |
Allstate Corp. (The),
5.750%, 8/15/53(8) | | | 455 | | | | 499 | |
| | | | | | | | |
| | | PAR VALUE | | | VALUE | |
| | | | | | | | |
| Financials (continued) | | | | |
Apollo Management Holdings LP 144A 4.000%, 5/30/24(4) | | $ | 590 | | | $ | 603 | |
Ares Capital Corp. | | | | | | | | |
4.875%, 11/30/18 | | | 80 | | | | 82 | |
3.875%, 1/15/20 | | | 221 | | | | 227 | |
3.500%, 2/10/23 | | | 180 | | | | 178 | |
Ares Finance Co., LLC 144A 4.000%, 10/8/24(4) | | | 595 | | | | 571 | |
Banco de Credito del Peru 144A ,
6.125%, 4/24/27(4) | | | 440 | | | | 486 | |
Banco de Credito e Inversiones 144A 4.000%, 2/11/23(4) | | | 600 | | | | 636 | |
Banco Internacional del Peru SAA Interbank 144A ,
6.625%, 3/19/29(4) | | | 465 | | | | 524 | |
Banco Santander Chile 144A 3.875%, 9/20/22(4) | | | 430 | | | | 452 | |
Bancolombia S.A. 5.125%, 9/11/22 | | | 580 | | | | 616 | |
Bank of America Corp. | | | | | | | | |
5.625%, 7/1/20 | | | 715 | | | | 779 | |
4.200%, 8/26/24 | | | 910 | | | | 956 | |
Brookfield Finance LLC 4.000%, 4/1/24 | | | 576 | | | | 596 | |
Capital One Financial Corp. | | | | | | | | |
4.200%, 10/29/25 | | | 540 | | | | 555 | |
3.750%, 7/28/26 | | | 495 | | | | 490 | |
Citigroup, Inc.
4.050%, 7/30/22 | | | 600 | | | | 628 | |
Compass Bank
3.875%, 4/10/25 | | | 705 | | | | 703 | |
Development Bank of Kazakhstan JSC 144A 4.125%, 12/10/22(4) | | | 640 | | | | 646 | |
Discover Financial Services
3.950%, 11/6/24 | | | 570 | | | | 583 | |
Ford Motor Credit Co., LLC
5.750%, 2/1/21 | | | 535 | | | | 587 | |
FS Investment Corp. | | | | | | | | |
4.250%, 1/15/20 | | | 525 | | | | 538 | |
4.750%, 5/15/22 | | | 115 | | | | 119 | |
See Notes to Financial Statements
17
VIRTUS STRATEGIC ALLOCATION FUND
SCHEDULE OF INVESTMENTS (Continued)
SEPTEMBER 30, 2017
($ reported in thousands)
| | | | | | | | |
| | | PAR VALUE | | | VALUE | |
| | | | | | | | |
| CORPORATE BONDS AND NOTES (continued) | |
| Financials (continued) | | | | |
General Motors Financial Co., Inc. | | | | | | | | |
4.200%, 3/1/21 | | $ | 235 | | | $ | 246 | |
3.450%, 4/10/22 | | | 85 | | | | 86 | |
Goldman Sachs Group, Inc. (The)
5.750%, 1/24/22 | | | 875 | | | | 982 | |
ING Groep N.V. , 6.000%(7)(8) | | | 445 | | | | 458 | |
iStar, Inc. | | | | | | | | |
6.000%, 4/1/22 | | | 165 | | | | 171 | |
5.250%, 9/15/22 | | | 120 | | | | 122 | |
Jefferies Group LLC | | | | | | | | |
5.125%, 1/20/23 | | | 260 | | | | 284 | |
4.850%, 1/15/27 | | | 255 | | | | 268 | |
JPMorgan Chase & Co. 3.300%, 4/1/26 | | | 875 | | | | 877 | |
Kazakhstan Temir Zholy Finance BV 144A 6.950%, 7/10/42(4) | | | 480 | | | | 537 | |
Kimco Realty Corp. 3.300%, 2/1/25 | | | 535 | | | | 534 | |
Leucadia National Corp. 5.500%, 10/18/23 | | | 460 | | | | 492 | |
Liberty Mutual Group, Inc. 144A
4.250%, 6/15/23(4) | | | 590 | | | | 630 | |
Lincoln National Corp. 4.200%, 3/15/22 | | | 915 | | | | 967 | |
Macquarie Group Ltd. 144A 6.250%, 1/14/21(4) | | | 490 | | | | 547 | |
Manulife Financial Corp. 4.150%, 3/4/26 | | | 490 | | | | 522 | |
Morgan Stanley | | | | | | | | |
3.125%, 7/27/26 | | | 620 | | | | 608 | |
6.375%, 7/24/42 | | | 610 | | | | 827 | |
Navient Corp. | | | | | | | | |
7.250%, 9/25/23 | | | 100 | | | | 109 | |
6.750%, 6/25/25 | | | 275 | | | | 286 | |
Nordea Bank AB 144A 2.125%, 5/29/20(4) | | | 300 | | | | 300 | |
OM Asset Management plc
4.800%, 7/27/26 | | | 500 | | | | 516 | |
Powszechna Kasa Oszczednosci Bank Polski S.A. 144A 4.630%, 9/26/22(4)(11) | | | 375 | | | | 402 | |
| | | | | | | | |
| | | PAR VALUE | | | VALUE | |
| | | | | | | | |
| Financials (continued) | | | | |
Prudential Financial, Inc. , 5.625%, 6/15/43(8) | | $ | 585 | | | $ | 638 | |
S&P Global, Inc.
4.000%, 6/15/25 | | | 570 | | | | 599 | |
Santander Holdings USA, Inc. | | | | | | | | |
144A, 3.700%, 3/28/22(4) | | | 445 | | | | 453 | |
144A, 4.400%, 7/13/27(4) | | | 175 | | | | 179 | |
Societe Generale S.A. 144A
4.750%, 11/24/25(4) | | | 535 | | | | 566 | |
TC Ziraat Bankasi AS 144A 5.125%, 5/3/22(4) | | | 200 | | | | 203 | |
Teachers Insurance & Annuity Association of America 144A ,
4.375%, 9/15/54(4) | | | 510 | | | | 515 | |
Trinity Acquisition plc | | | | | | | | |
3.500%, 9/15/21 | | | 40 | | | | 41 | |
4.400%, 3/15/26 | | | 195 | | | | 207 | |
Turkiye Vakiflar Bankasi TAO 144A
5.625%, 5/30/22(4) | | | 445 | | | | 452 | |
UBS AG
7.625%, 8/17/22 | | | 500 | | | | 589 | |
Wells Fargo & Co. | | | | | | | | |
3.069%, 1/24/23 | | | 240 | | | | 244 | |
5.900%, 8/15/27 | | | 615 | | | | 670 | |
| | | | | | | | |
| | | | 28,749 | |
| | | | | | | | |
| Health Care—1.4% | | | | | | |
Abbott Laboratories | | | | | | | | |
3.400%, 11/30/23 | | | 105 | | | | 108 | |
3.750%, 11/30/26 | | | 460 | | | | 472 | |
AbbVie, Inc. | | | | | | | | |
2.850%, 5/14/23 | | | 300 | | | | 302 | |
3.600%, 5/14/25 | | | 200 | | | | 207 | |
3.200%, 5/14/26 | | | 300 | | | | 300 | |
Becton Dickinson & Co. | | | | | | | | |
3.363%, 6/6/24 | | | 93 | | | | 94 | |
3.700%, 6/6/27 | | | 550 | | | | 554 | |
Cardinal Health, Inc. | | | | | | | | |
3.200%, 3/15/23 | | | 300 | | | | 305 | |
3.079%, 6/15/24 | | | 25 | | | | 25 | |
3.410%, 6/15/27 | | | 195 | | | | 196 | |
Community Health Systems, Inc.
6.250%, 3/31/23 | | | 225 | | | | 222 | |
See Notes to Financial Statements
18
VIRTUS STRATEGIC ALLOCATION FUND
SCHEDULE OF INVESTMENTS (Continued)
SEPTEMBER 30, 2017
($ reported in thousands)
| | | | | | | | |
| | | PAR VALUE | | | VALUE | |
| | | | | | | | |
| CORPORATE BONDS AND NOTES (continued) | |
| Health Care (continued) | |
Eagle Holding Co. II, LLC PIK Interest Capitalization, 144A 7.625%, 5/15/22(4)(5) | | $ | 50 | | | $ | 52 | |
Envision Healthcare Corp. 144A 6.250%, 12/1/24(4) | | | 85 | | | | 91 | |
Forest Laboratories LLC 144A 4.875%, 2/15/21(4) | | | 226 | | | | 243 | |
Fresenius U.S. Finance II, Inc. 144A
4.500%, 1/15/23(4) | | | 100 | | | | 106 | |
HCA, Inc.
5.375%, 2/1/25 | | | 265 | | | | 279 | |
MEDNAX, Inc. 144A 5.250%, 12/1/23(4) | | | 255 | | | | 267 | |
Mylan NV | | | | | | | | |
3.000%, 12/15/18 | | | 150 | | | | 152 | |
3.150%, 6/15/21 | | | 135 | | | | 137 | |
Ortho-Clinical Diagnostics, Inc. 144A 6.625%, 5/15/22(4) | | | 365 | | | | 358 | |
Owens & Minor, Inc. 3.875%, 9/15/21 | | | 110 | | | | 112 | |
Shire Acquisitions Investments Ireland DAC
2.400%, 9/23/21 | | | 195 | | | | 194 | |
Surgery Center Holdings, Inc. 144A
8.875%, 4/15/21(4) | | | 295 | | | | 310 | |
Team Health Holdings, Inc. 144A
6.375%, 2/1/25(4) | | | 230 | | | | 218 | |
Tenet Healthcare Corp. | | | | | | | | |
4.500%, 4/1/21 | | | 330 | | | | 337 | |
144A, 4.625%, 7/15/24(4) | | | 180 | | | | 178 | |
Valeant Pharmaceuticals International, Inc. | | | | | | | | |
144A, 7.500%, 7/15/21(4) | | | 60 | | | | 60 | |
144A, 6.500%, 3/15/22(4) | | | 25 | | | | 26 | |
144A, 5.500%, 3/1/23(4) | | | 155 | | | | 136 | |
144A, 7.000%, 3/15/24(4) | | | 45 | | | | 48 | |
Zimmer Biomet Holdings, Inc.
3.550%, 4/1/25 | | | 620 | | | | 626 | |
| | | | | | | | |
| | | | 6,715 | |
| | | | | | | | |
| | | | | | | | |
| | | PAR VALUE | | | VALUE | |
| | | | | | | | |
| Industrials—0.8% | | | | | | |
Carpenter Technology Corp.
4.450%, 3/1/23 | | $ | 560 | | | $ | 571 | |
CNH Industrial N.V. 4.500%, 8/15/23 | | | 366 | | | | 387 | |
Continental Airlines Pass-Through-Trust 99-2, C2 Series AMBC
6.236%, 3/15/20 | | | 219 | | | | 227 | |
Doric Nimrod Air Alpha Pass-Through-Trust
13-1, A 144A
5.250%, 5/30/25(4) | | | 387 | | | | 407 | |
GATX Corp.
3.250%, 9/15/26 | | | 80 | | | | 79 | |
Masco Corp. | | | | | | | | |
5.950%, 3/15/22 | | | 251 | | | | 283 | |
4.450%, 4/1/25 | | | 190 | | | | 203 | |
Owens Corning
3.400%, 8/15/26 | | | 500 | | | | 493 | |
Penske Truck Leasing Co., LP 144A
3.375%, 2/1/22(4) | | | 225 | | | | 231 | |
Pitney Bowes, Inc. 3.875%, 5/15/22 | | | 424 | | | | 417 | |
Prime Security Services Borrower LLC 144A 9.250%, 5/15/23(4) | | | 200 | | | | 221 | |
TransDigm, Inc. | | | | | | | | |
6.000%, 7/15/22 | | | 345 | | | | 358 | |
6.500%, 5/15/25 | | | 140 | | | | 144 | |
| | | | | | | | |
| | | | 4,021 | |
| | | | | | | | |
| Information Technology—0.9% | | | | |
Apple, Inc.
2.900%, 9/12/27 | | | 730 | | | | 724 | |
Arrow Electronics, Inc. 3.875%, 1/12/28 | | | 445 | | | | 444 | |
Broadcom Corp. | | | | | | | | |
144A, 3.000%, 1/15/22(4) | | | 195 | | | | 198 | |
144A, 3.625%, 1/15/24(4) | | | 370 | | | | 380 | |
Dell International LLC | | | | | | | | |
144A, 6.020%, 6/15/26(4) | | | 100 | | | | 111 | |
144A, 8.100%, 7/15/36(4) | | | 210 | | | | 263 | |
Flex Ltd. 4.750%, 6/15/25 | | | 595 | | | | 643 | |
Hewlett Packard Enterprise Co.
4.900%, 10/15/25 | | | 335 | | | | 354 | |
See Notes to Financial Statements
19
VIRTUS STRATEGIC ALLOCATION FUND
SCHEDULE OF INVESTMENTS (Continued)
SEPTEMBER 30, 2017
($ reported in thousands)
| | | | | | | | |
| | | PAR VALUE | | | VALUE | |
| | | | | | | | |
| CORPORATE BONDS AND NOTES (continued) | |
| Information Technology (continued) | | | | |
Verisk Analytics, Inc. 4.000%, 6/15/25 | | $ | 585 | | | $ | 612 | |
VMware, Inc. | | | | | | | | |
2.950%, 8/21/22 | | | 223 | | | | 224 | |
3.900%, 8/21/27 | | | 240 | | | | 242 | |
| | | | | | | | |
| | | | 4,195 | |
| | | | | | | | |
| Materials—1.6% | | | | |
Alpek SAB de C.V. 144A 5.375%, 8/8/23(4) | | | 405 | | | | 431 | |
Anglo American Capital plc 144A
4.000%, 9/11/27(4) | | | 540 | | | | 533 | |
BHP Billiton Finance USA Ltd. 144A
6.750%, 10/19/75(4)(8) | | | 450 | | | | 530 | |
CRH America Finance, Inc. 144A
3.400%, 5/9/27(4) | | | 440 | | | | 442 | |
Glencore Funding LLC 144A 4.000%, 3/27/27(4) | | | 445 | | | | 448 | |
INEOS Group Holdings S.A. 144A
5.625%, 8/1/24(4) | | | 495 | | | | 514 | |
Inversiones CMPC S.A. 144A 4.375%, 5/15/23(4) | | | 850 | | | | 879 | |
NewMarket Corp. 4.100%, 12/15/22 | | | 649 | | | | 674 | |
NOVA Chemicals Corp. | | | | | | | | |
144A, 4.875%, 6/1/24(4) | | | 185 | | | | 187 | |
144A, 5.000%, 5/1/25(4) | | | 250 | | | | 254 | |
OCP SA 144A
5.625%, 4/25/24(4) | | | 485 | | | | 522 | |
Rusal Capital DAC 144A 5.125%, 2/2/22(4) | | | 455 | | | | 463 | |
Severstal OAO Via Steel Capital S.A. 144A 3.850%, 8/27/21(4)(11) | | | 540 | | | | 552 | |
Standard Industries, Inc. 144A
6.000%, 10/15/25(4) | | | 365 | | | | 398 | |
Valvoline, Inc. 144A 4.375%, 8/15/25(4) | | | 365 | | | | 371 | |
Vulcan Materials Co. 3.900%, 4/1/27 | | | 445 | | | | 455 | |
| | | | | | | | |
| | | | 7,653 | |
| | | | | | | | |
| | | | | | | | |
| | | PAR VALUE | | | VALUE | |
| | | | | | | | |
| Real Estate—1.7% | | | | | | |
Alexandria Real Estate Equities, Inc.
3.950%, 1/15/27 | | $ | 295 | | | $ | 301 | |
Brixmor Operating Partnership LP
3.875%, 8/15/22 | | | 160 | | | | 165 | |
Corporate Office Properties LP
3.600%, 5/15/23 | | | 610 | | | | 612 | |
Digital Realty Trust LP 5.250%, 3/15/21 | | | 540 | | | | 586 | |
Education Realty Operating Partnership LP
4.600%, 12/1/24 | | | 595 | | | | 613 | |
EPR Properties
4.750%, 12/15/26 | | | 615 | | | | 636 | |
Healthcare Realty Trust, Inc.
3.875%, 5/1/25 | | | 375 | | | | 378 | |
Healthcare Trust of America Holdings LP 3.750%, 7/1/27 | | | 460 | | | | 459 | |
Hospitality Properties Trust
4.950%, 2/15/27 | | | 550 | | | | 576 | |
Kilroy Realty LP
4.375%, 10/1/25 | | | 550 | | | | 578 | |
LifeStorage LP
3.500%, 7/1/26 | | | 295 | | | | 284 | |
MPT Operating Partnership LP | | | | | | | | |
6.375%, 3/1/24 | | | 55 | | | | 59 | |
5.500%, 5/1/24 | | | 275 | | | | 288 | |
5.000%, 10/15/27 | | | 200 | | | | 205 | |
National Retail Properties, Inc.
4.000%, 11/15/25 | | | 170 | | | | 174 | |
Retail Opportunity Investments Partnership LP
4.000%, 12/15/24 | | | 485 | | | | 471 | |
Select Income REIT 4.500%, 2/1/25 | | | 590 | | | | 596 | |
Uniti Group, Inc. 144A 7.125%, 12/15/24(4) | | | 370 | | | | 313 | |
See Notes to Financial Statements
20
VIRTUS STRATEGIC ALLOCATION FUND
SCHEDULE OF INVESTMENTS (Continued)
SEPTEMBER 30, 2017
($ reported in thousands)
| | | | | | | | |
| | | PAR VALUE | | | VALUE | |
| | | | | | | | |
| CORPORATE BONDS AND NOTES (continued) | |
| Real Estate (continued) | | | | |
Welltower, Inc.
4.000%, 6/1/25 | | $ | 625 | | | $ | 651 | |
| | | | | | | | |
| | | | 7,945 | |
| | | | | | | | |
| Telecommunication Services—0.8% | | | | |
AT&T, Inc. | | | | | | | | |
3.875%, 8/15/21 | | | 1,185 | | | | 1,240 | |
3.900%, 8/14/27 | | | 195 | | | | 195 | |
Frontier Communications Corp.
10.500%, 9/15/22 | | | 370 | | | | 323 | |
Qwest Corp.
7.250%, 9/15/25 | | | 360 | | | | 398 | |
Sprint Spectrum Co., LLC 144A 3.360%, 3/20/23(4) | | | 200 | | | | 203 | |
Telefonica Emisiones SAU
4.570%, 4/27/23 | | | 510 | | | | 557 | |
Verizon Communications, Inc. | | | | | | | | |
2.946%, 3/15/22 | | | 525 | | | | 534 | |
4.125%, 3/16/27 | | | 450 | | | | 470 | |
| | | | | | | | |
| | | | 3,920 | |
| | | | | | | | |
| Utilities—0.9% | | | | | | |
Dominion Energy, Inc. 2.962%, 7/1/19 | | | 50 | | | | 51 | |
Duke Energy Corp. 2.650%, 9/1/26 | | | 515 | | | | 492 | |
Dynegy, Inc.
7.375%, 11/1/22 | | | 405 | | | | 423 | |
Eskom Holdings SOC Ltd. 144A 7.125%, 2/11/25(4) | | | 440 | | | | 456 | |
Exelon Corp.
3.497%, 6/1/22 | | | 620 | | | | 639 | |
FirstEnergy Transmission LLC 144A
4.350%, 1/15/25(4) | | | 630 | | | | 667 | |
Southern Power Co. 4.150%, 12/1/25 | | | 665 | | | | 699 | |
State Grid Overseas Investment 2014 Ltd. 144A 4.125%, 5/7/24(4) | | | 610 | | | | 651 | |
| | | | | | | | |
| | | PAR VALUE | | | VALUE | |
| | | | | | | | |
| Utilities (continued) | | | | | | |
TerraForm Power Operating LLC 144A 6.375%, 2/1/23(4) | | $ | 455 | | | $ | 473 | |
| | | | | | | | |
| | | | | 4,551 | |
| TOTAL CORPORATE BONDS AND NOTES | |
| (Identified Cost $85,670) | | | | 88,117 | |
| LOAN AGREEMENTS(3)—1.5% | | | | |
| Consumer Discretionary—0.3% | | | | |
Caesars Entertainment Resort Properties LLC Tranche B, First Lien , (1 month LIBOR + 3.500%)
4.735%, 10/11/20 | | | 390 | | | | 391 | |
Caesars Growth Properties Holdings LLC 2017, First Lien ,
(1 month LIBOR + 3.000%)
4.235%, 5/8/21 | | | 179 | | | | 179 | |
Playa Resorts Holding B.V. , (3 month LIBOR + 3.000%)
4.320%, 4/29/24 | | | 45 | | | | 45 | |
Scientific Games International, Inc. Tranche B-4 , (1 month LIBOR + 3.250%) 4.504%, 8/14/24 | | | 150 | | | | 150 | |
Seminole Tribe of Florida Tranche B , (3 month LIBOR + 2.000%) 3.456%, 7/8/24 | | | 285 | | | | 286 | |
U.S. Farathane LLC , (weekly LIBOR + 3.500%)
4.833%, 12/31/21 | | | 310 | | | | 311 | |
UFC Holdings LLC First Lien , (1 month LIBOR + 3.250%)
4.490%, 8/18/23 | | | 238 | | | | 239 | |
| | | | | | | | |
| | | | 1,601 | |
| | | | | | | | |
See Notes to Financial Statements
21
VIRTUS STRATEGIC ALLOCATION FUND
SCHEDULE OF INVESTMENTS (Continued)
SEPTEMBER 30, 2017
($ reported in thousands)
| | | | | | | | |
| | | PAR VALUE | | | VALUE | |
| | | | | | | | |
| LOAN AGREEMENTS(3) (continued) | | | | |
| Consumer Staples—0.2% | | | | |
Albertson’s LLC 2017-1, Tranche B-4 , (1 month LIBOR + 2.750%) 3.985%, 8/25/21 | | $ | 324 | | | $ | 312 | |
JBS USA Lux S.A. ,
(3 month LIBOR + 2.500%)
3.804%, 10/30/22 | | | 274 | | | | 270 | |
TKC Holdings, Inc. First Lien , (2 month LIBOR + 4.250%)
5.522%, 2/1/23 | | | 204 | | | | 206 | |
| | | | | | | | |
| | | | 788 | |
| | | | | | | | |
| Energy—0.1% | | | | | | |
Jonah Energy LLC Second Lien , (3 month PRIME + 5.500%) 9.750%, 5/12/21 | | | 285 | | | | 285 | |
Ultra Resources, Inc. ,
(3 month LIBOR + 3.000%)
4.309%, 4/12/24 | | | 290 | | | | 289 | |
| | | | | | | | |
| | | | 574 | |
| | | | | | | | |
| Health Care—0.3% | | | | | | |
CHG Healthcare Services, Inc. First Lien ,
(3 month LIBOR + 3.250%)
4.561%, 6/7/23 | | | 249 | | | | 252 | |
Endo Luxembourg Finance Co. S.a.r.l. ,
(1 month LIBOR + 4.250%)
5.500%, 4/29/24 | | | 130 | | | | 131 | |
Envision Healthcare Corp. , (1 month LIBOR + 3.000%)
4.240%, 12/1/23 | | | 49 | | | | 49 | |
HLF Financing S.a.r.l. Senior Lien , (1 month LIBOR + 5.500%) 6.735%, 2/15/23 | | | 91 | | | | 92 | |
| | | | | | | | |
| | | PAR VALUE | | | VALUE | |
| | | | | | | | |
| Health Care (continued) | | | | |
MMM Holdings, Inc. ,
(3 month LIBOR + 8.750%)
10.250%, 6/30/19 | | $ | 89 | | | $ | 89 | |
MSO of Puerto Rico,
Inc. , (3 month LIBOR + 8.750%)
10.250%, 6/30/19 | | | 65 | | | | 64 | |
NVA Holdings, Inc. Second Lien , (3 month LIBOR + 7.000%) 8.333%, 8/14/22 | | | 214 | | | | 215 | |
Parexel International Corp. Tranche B (3 month LIBOR + 3.000%) 0.000%, 9/27/24(13) | | | 55 | | | | 55 | |
Quorum Health Corp. ,
(3 month LIBOR + 6.750%)
8.026%, 4/29/22 | | | 222 | | | | 225 | |
| | | | | | | | |
| | | | 1,172 | |
| | | | | | | | |
| Industrials—0.2% | | | | | | |
Accudyne Industries
LLC , (3 month LIBOR + 3.750%)
5.083%, 8/18/24 | | | 200 | | | | 200 | |
Advanced Disposal Services, Inc. , (weekly LIBOR + 2.750%) 3.947%, 11/10/23 | | | 41 | | | | 41 | |
Navistar, Inc. Tranche B , (1 month LIBOR + 4.000%)
5.240%, 8/7/20 | | | 292 | | | | 293 | |
Sedgwick Claims Management Services, Inc. Second Lien ,
(3 month LIBOR + 5.750%)
7.067%, 2/28/22 | | | 355 | | | | 358 | |
Zodiac Pool Solutions LLC Tranche B-1, First Lien , (3 month LIBOR + 4.000%)
5.333%, 12/20/23 | | | 253 | | | | 256 | |
| | | | | | | | |
| | | | 1,148 | |
| | | | | | | | |
See Notes to Financial Statements
22
VIRTUS STRATEGIC ALLOCATION FUND
SCHEDULE OF INVESTMENTS (Continued)
SEPTEMBER 30, 2017
($ reported in thousands)
| | | | | | | | |
| | | PAR VALUE | | | VALUE | |
| | | | | | | | |
| LOAN AGREEMENTS(3) (continued) | | | | |
| Information Technology—0.1% | |
Rackspace Hosting, Inc. 2017 Refinancing Tranche B, First Lien , (3 month LIBOR + 3.000%)
4.311%, 11/3/23 | | $ | 305 | | | $ | 304 | |
| | | | | | | | |
| Materials—0.1% | | | | | | |
Anchor Glass Container Corp. 2017, First Lien , (3 month LIBOR + 2.750%)
4.024%, 12/7/23 | | | 43 | | | | 43 | |
CPI Acquisition, Inc. First Lien , (3 month LIBOR + 4.500%)
5.962%, 8/17/22 | | | 395 | | | | 279 | |
Ineos U.S. Finance LLC 2022 , (1 month LIBOR + 2.750%)
3.985%, 3/31/22 | | | 15 | | | | 15 | |
Tronox Finance LLC | | | | | | | | |
First Lien, (3 month LIBOR + 3.000%)
0.000%, 9/23/24(13) | | | 20 | | | | 20 | |
First Lien, (3 month LIBOR + 3.000%)
0.000%, 9/23/24(13) | | | 45 | | | | 45 | |
| | | | | | | | |
| | | | 402 | |
| | | | | | | | |
| Real Estate—0.0% | | | | | | |
Capital Automotive LP Tranche B-2, First Lien 4.240%, 3/25/24 | | | 49 | | | | 49 | |
| | | | | | | | |
| Telecommunication Services—0.1% | |
Level 3 Financing, Inc. 2024, Tranche B ,
(1 month LIBOR + 2.250%)
3.486%, 2/22/24 | | | 350 | | | | 350 | |
UPC Financing Partnership , (1 month LIBOR + 2.750%) 3.984%, 4/15/25 | | | 150 | | | | 150 | |
| | | | | | | | |
| | | | 500 | |
| | | | | | | | |
| | | | | | | | |
| | | PAR VALUE | | | VALUE | |
| | | | | | | | |
| Utilities—0.1% | | | | | | |
Energy Future Intermediate Holding Co. LLC , (1 month LIBOR + 3.000%) 4.235%, 6/30/18 | | $ | 210 | | | $ | 211 | |
NRG Energy, Inc. ,
(3 month LIBOR + 2.250%)
3.583%, 6/30/23 | | | 264 | | | | 265 | |
Vistra Operations Company LLC | | | | | | | | |
Tranche C, (1 month LIBOR + 2.750%) 3.982%, 8/4/23 | | | 38 | | | | 38 | |
(1 month LIBOR + 2.750%)
3.983%, 8/4/23 | | | 169 | | | | 169 | |
| | | | | | | | |
| | | | | 683 | |
TOTAL LOAN AGREEMENTS
(Identified Cost $7,288) | | | | 7,221 | |
| | | SHARES | | | | |
| PREFERRED STOCKS—1.2% | |
| Financials—0.9% | | | | | | |
Bank of New York Mellon Corp. (The)
Series E, 4.950% | | | 450 | (9) | | | 467 | |
Citigroup, Inc.
Series T, 6.250% | | | 605 | (9) | | | 681 | |
JPMorgan Chase & Co.
Series Z, 5.300% | | | 550 | (9) | | | 573 | |
KeyCorp
Series D, 5.000% | | | 490 | (9) | | | 507 | |
M&T Bank Corp.
Series F, 5.125% | | | 490 | (9) | | | 518 | |
PNC Financial Services Group, Inc. | | | | | | | | |
Series R, 4.850% | | | 490 | (9) | | | 504 | |
Series S, 5.000% | | | 490 | (9) | | | 513 | |
Zions Bancorp 6.950% | | | 23,200 | | | | 692 | |
| | | | | | | | |
| | | | 4,455 | |
| | | | | | | | |
| Industrials—0.3% | | | | | | |
General Electric Co.
Series D, 5.000% | | | 1,273 | (9) | | | 1,346 | |
TOTAL PREFERRED STOCKS
(Identified Cost $5,292) | | | | 5,801 | |
See Notes to Financial Statements
23
VIRTUS STRATEGIC ALLOCATION FUND
SCHEDULE OF INVESTMENTS (Continued)
SEPTEMBER 30, 2017
($ reported in thousands)
| | | | | | | | |
| | | SHARES | | | VALUE | |
| | | | | | | | |
| COMMON STOCKS—63.9% | |
| Consumer Discretionary—13.2% | |
Amazon.com, Inc.(2) | | | 10,030 | | | $ | 9,642 | |
Ctrip.com International Ltd. ADR(2) | | | 129,502 | | | | 6,830 | |
Home Depot, Inc. (The) | | | 29,750 | | | | 4,866 | |
IMAX Corp.(2) | | | 67,100 | | | | 1,520 | |
Kroton Educacional S.A. Sponsored ADR | | | 312,770 | | | | 1,964 | |
Las Vegas Sands Corp. | | | 109,810 | | | | 7,045 | |
McDonald’s Corp. | | | 22,150 | | | | 3,471 | |
MercadoLibre, Inc. | | | 4,340 | | | | 1,124 | |
Netflix, Inc.(2) | | | 34,640 | | | | 6,282 | |
NIKE, Inc. Class B | | | 78,290 | | | | 4,059 | |
Priceline Group, Inc. (The)(2) | | | 4,110 | | | | 7,525 | |
Ross Stores, Inc. | | | 60,140 | | | | 3,883 | |
Sony Corp. Sponsored ADR | | | 51,716 | | | | 1,931 | |
Starbucks Corp. | | | 63,470 | | | | 3,409 | |
| | | | | | | | |
| | | | 63,551 | |
| | | | | | | | |
| Consumer Staples—4.3% | |
Costco Wholesale Corp. | | | 11,240 | | | | 1,847 | |
Fomento Economico Mexicano SAB de C.V. ADR | | | 22,141 | | | | 2,115 | |
Marine Harvest ASA Sponsored ADR(2) | | | 100,146 | | | | 1,987 | |
Monster Beverage Corp.(2) | | | 152,300 | | | | 8,414 | |
Philip Morris International, Inc. | | | 54,560 | | | | 6,057 | |
| | | | | | | | |
| | | | 20,420 | |
| | | | | | | | |
| Energy—2.6% | | | | | | |
Cabot Oil & Gas Corp. | | | 77,970 | | | | 2,086 | |
Core Laboratories N.V. | | | 25,640 | | | | 2,531 | |
Pioneer Natural Resources Co. | | | 22,760 | | | | 3,358 | |
Statoil ASA Sponsored ADR | | | 117,949 | | | | 2,369 | |
TechnipFMC plc(2) | | | 77,376 | | | | 2,160 | |
| | | | | | | | |
| | | | 12,504 | |
| | | | | | | | |
| Financials—5.9% | | | | | | |
Bank of America Corp. | | | 250,450 | | | | 6,346 | |
BNP Paribas S.A. ADR | | | 62,050 | | | | 2,509 | |
| | | | | | | | |
| | | SHARES | | | VALUE | |
| | | | | | | | |
| Financials (continued) | |
BOC Hong Kong Holdings Ltd. Sponsored ADR | | | 14,900 | | | $ | 1,439 | |
CaixaBank S.A. ADR | | | 1,397,635 | | | | 2,320 | |
Charles Schwab Corp. (The) | | | 75,310 | | | | 3,294 | |
DBS Group Holdings Ltd. Sponsored ADR | | | 38,201 | | | | 2,353 | |
ING Groep N.V. Sponsored ADR | | | 132,050 | | | | 2,432 | |
MarketAxess Holdings, Inc. | | | 5,910 | | | | 1,090 | |
ORIX Corp. Sponsored ADR | | | 28,822 | | | | 2,333 | |
UBS Group AG Registered Shares | | | 132,466 | | | | 2,272 | |
Zurich Insurance Group AG ADR | | | 70,622 | | | | 2,161 | |
| | | | | | | | |
| | | | 28,549 | |
| | | | | | | | |
| Health Care—6.5% | | | | | | |
Allergan plc | | | 9,024 | | | | 1,850 | |
BioMarin Pharmaceutical, Inc.(2) | | | 39,710 | | | | 3,696 | |
Celgene Corp.(2) | | | 58,220 | | | | 8,490 | |
Danaher Corp. | | | 40,830 | | | | 3,502 | |
HealthEquity, Inc.(2) | | | 49,650 | | | | 2,511 | |
ICON plc(2) | | | 25,328 | | | | 2,884 | |
Illumina, Inc.(2) | | | 18,410 | | | | 3,667 | |
Zoetis, Inc. | | | 72,340 | | | | 4,613 | |
| | | | | | | | |
| | | | 31,213 | |
| | | | | | | | |
| Industrials—4.9% | | | | | | |
Airbus SE ADR | | | 98,628 | | | | 2,337 | |
Ashtead Group plc ADR | | | 24,368 | | | | 2,350 | |
Caterpillar, Inc. | | | 33,210 | | | | 4,142 | |
Kansas City Southern | | | 22,740 | | | | 2,471 | |
Nidec Corp. Sponsored ADR | | | 94,060 | | | | 2,887 | |
RELX plc Sponsored ADR | | | 96,415 | | | | 2,155 | |
Rockwell Automation, Inc. | | | 12,840 | | | | 2,288 | |
Roper Technologies, Inc. | | | 19,080 | | | | 4,644 | |
| | | | | | | | |
| | | | 23,274 | |
| | | | | | | | |
| Information Technology—22.6% | |
Accenture plc Class A | | | 28,300 | | | | 3,822 | |
Activision Blizzard, Inc. | | | 66,650 | | | | 4,300 | |
See Notes to Financial Statements
24
VIRTUS STRATEGIC ALLOCATION FUND
SCHEDULE OF INVESTMENTS (Continued)
SEPTEMBER 30, 2017
($ reported in thousands)
| | | | | | | | |
| | | SHARES | | | VALUE | |
| | | | | | | | |
COMMON STOCKS (continued) | |
| Information Technology (continued) | |
Alibaba Group Holding Ltd. Sponsored ADR(2) | | | 87,080 | | | $ | 15,040 | |
Alphabet, Inc. Class A(2) | | | 4,000 | | | | 3,895 | |
Amphenol Corp. Class A | | | 85,980 | | | | 7,277 | |
Broadcom Ltd. | | | 8,686 | | | | 2,107 | |
Check Point Software Technologies Ltd.(2) | | | 18,690 | | | | 2,131 | |
CoStar Group, Inc.(2) | | | 11,820 | | | | 3,171 | |
Facebook, Inc. Class A(2) | | | 133,390 | | | | 22,792 | |
Gartner, Inc.(2) | | | 22,210 | | | | 2,763 | |
Hitachi Ltd. ADR | | | 35,829 | | | | 2,529 | |
NVIDIA Corp. | | | 42,490 | | | | 7,596 | |
Paycom Software, Inc.(2) | | | 54,210 | | | | 4,064 | |
SAP SE Sponsored ADR | | | 19,576 | | | | 2,146 | |
Tencent Holdings Ltd. ADR | | | 108,140 | | | | 4,749 | |
Visa, Inc. Class A | | | 87,040 | | | | 9,160 | |
Workday, Inc. Class A(2) | | | 48,970 | | | | 5,161 | |
Yandex N.V. Class A(2) | | | 181,360 | | | | 5,976 | |
| | | | | | | | |
| | | | 108,679 | |
| | | | | | | | |
| Materials—2.5% | | | | | | |
Anhui Conch Cement Co., Ltd. ADR | | | 113,092 | | | | 2,274 | |
Ecolab, Inc. | | | 29,700 | | | | 3,820 | |
Fortescue Metals Group Ltd. Sponsored ADR | | | 207,934 | | | | 1,684 | |
Heidelbergcement AG ADR | | | 104,897 | | | | 2,157 | |
Toray Industries, Inc. ADR | | | 112,954 | | | | 2,255 | |
| | | | | | | | |
| | | | 12,190 | |
| | | | | | | | |
| Real Estate—0.6% | | | | | | |
Lendlease Group Sponsored ADR | | | 191,425 | | | | 2,699 | |
| | | | | | | | |
| Telecommunication Services—0.4% | |
Telekomunikasi Indonesia Persero Tbk PT Sponsored ADR | | | 52,607 | | | | 1,804 | |
| | | | | | | | |
| Utilities—0.4% | | | | | | |
Veolia Environnement S.A. ADR | | | 87,592 | | | | 2,016 | |
TOTAL COMMON STOCKS
(Identified Cost $247,852) | | | | 306,899 | |
| | | | | | | | |
| | | SHARES | | | VALUE | |
| | | | | | | | |
| AFFILIATED MUTUAL FUND(10)—0.6% | |
Virtus Newfleet Credit Opportunities Fund
Class R6(2) | | | 287,054 | | | $ | 2,810 | |
| TOTAL AFFILIATED MUTUAL FUND | |
| (Identified Cost $2,869) | | | | 2,810 | |
| TOTAL LONG TERM INVESTMENTS—98.7% | |
| (Identified Cost $411,245) | | | | 474,143 | (12) |
| SHORT-TERM INVESTMENT—0.7% | |
| Money Market Mutual Fund(10)—0.7% | |
Dreyfus Government Cash Management Fund - Institutional Shares (seven-day effective yield 0.920%) | | | 3,352,935 | | | | 3,353 | |
| TOTAL SHORT-TERM INVESTMENT (Identified Cost $3,353) | | | | 3,353 | |
TOTAL INVESTMENTS—99.4%
(Identified Cost $414,598) | | | 477,496(1) | |
Other assets and liabilities, net—0.6% | | | | 2,753 | |
| | | | | | | | |
| NET ASSETS—100.0% | | | $480,249 | |
| | | | | | | | |
Abbreviations:
| ADR | American Depositary Receipt |
| FHLMC | Federal Home Loan Mortgage Corporation (“Freddie Mac”) |
| FNMA | Federal National Mortgage Association (“Fannie Mae”) |
| PIK | Payment-in-Kind Security |
| REIT | Real Estate Investment Trust |
Footnote Legend:
| (1) | Federal Income Tax Information: For tax information at September 30, 2017, see Note 7 Federal Income Tax Information in the Notes to Financial Statements. |
| (2) | Non-income producing. |
| (3) | Variable rate security. Rate disclosed is as of September 30, 2017. For loan agreements, the rate shown may represent a weighted average interest rate. Information in parenthesis represents benchmark and reference rate for each security. Certain variable rate securities are |
See Notes to Financial Statements
25
VIRTUS STRATEGIC ALLOCATION FUND
SCHEDULE OF INVESTMENTS (Continued)
SEPTEMBER 30, 2017
($ reported in thousands)
| | not based on a published reference rate and spread but are determined by the issuer or agent and are based on current market conditions, or, for mortgage-backed securities, are impacted by the individual mortgages which are paying off over time. These securities do not indicate a reference rate and spread in their descriptions. |
| (4) | Security exempt from registration under Rule 144A of the Securities Act of 1933. These securities may be resold in transactions exempt from registration, normally to qualified institutional buyers. At September 30, 2017, these securities amounted to a value of $52,325 or 10.9% of net assets. |
| (5) | 100% of the income received was in cash. |
| (6) | Security in default, a portion of the interest payments are being received during the bankruptcy proceedings. |
| (7) | No contractual maturity date. |
| (8) | Interest payments may be deferred. |
| (9) | Value shown as par value. |
| (10) | Shares of these funds are publicly offered and the prospectus and annual reports of each are publicly available. |
| (11) | This Note was issued for the sole purpose of funding a loan agreement between the issuer and the borrower. As the credit risk for this security lies solely with the borrower, the name represented here is that of the borrower. |
| (12) | All or a portion of the Fund’s assets have been segregated for delayed delivery security. |
| (13) | This loan will settle after September 30, 2017, at which time the interest rate, based on the London Interbank Offered Rate (“LIBOR”) and the agreed upon spread on trade date, will be reflected. |
| | | | |
| Country Weightings (Unaudited)† | |
United States | | | 73 | % |
China | | | 6 | |
Japan | | | 3 | |
France | | | 2 | |
United Kingdom | | | 2 | |
Ireland | | | 1 | |
Russia | | | 1 | |
Other | | | 12 | |
Total | | | 100 | % |
| † | % of total investments as of September 30, 2017 |
See Notes to Financial Statements
26
VIRTUS STRATEGIC ALLOCATION FUND
SCHEDULE OF INVESTMENTS (Continued)
SEPTEMBER 30, 2017
($ reported in thousands)
The following table provides a summary of inputs used to value the Fund’s investments as of September 30, 2017 (See Security Valuation Note 2A in the Notes to Financial Statements):
| | | | | | | | | | | | |
| | | Total Value at
September 30, 2017 | | | Level 1
Quoted Prices | | | Level 2
Significant
Observable
Inputs | |
Debt Securities: | | | | | | | | | | | | |
Asset-Backed Securities | | $ | 13,360 | | | $ | — | | | $ | 13,360 | |
Corporate Bonds and Notes | | | 88,117 | | | | — | | | | 88,117 | |
Foreign Government Securities | | | 4,623 | | | | — | | | | 4,623 | |
Loan Agreements | | | 7,221 | | | | — | | | | 7,221 | |
Mortgage-Backed Securities | | | 32,409 | | | | — | | | | 32,409 | |
Municipal Bonds | | | 4,387 | | | | — | | | | 4,387 | |
U.S. Government Securities | | | 8,516 | | | | — | | | | 8,516 | |
Equity Securities: | | | | | | | | | | | | |
Affiliated Mutual Fund | | | 2,810 | | | | 2,810 | | | | — | |
Common Stocks | | | 306,899 | | | | 306,899 | | | | — | |
Preferred Stocks | | | 5,801 | | | | 692 | | | | 5,109 | |
Short-Term Investment | | | 3,353 | | | | 3,353 | | | | — | |
| | | | | | | | | | | | |
Total Investments | | $ | 477,496 | | | $ | 313,754 | | | $ | 163,742 | |
| | | | | | | | | | | | |
There are no Level 3 (significant unobservable inputs) priced securities.
There were no transfers between Level 1 and Level 2 related to securities held at September 30, 2017.
See Notes to Financial Statements
27
VIRTUS STRATEGIC ALLOCATION FUND
SCHEDULE OF INVESTMENTS (Continued)
SEPTEMBER 30, 2017
($ reported in thousands)
The following is a reconciliation of assets of the Fund for Level 3 investments for which significant unobservable inputs were used to determine fair value.
| | | | | | | | | | | | |
| Investments in Securities | | Total Value | | | Corporate Bonds
and Notes | | | Loan
Agreements | |
Balance as of March 31, 2017 | | $ | 854 | | | $ | 557 | | | $ | 297 | |
Accrued discount/(premium) | | | — | (c) | | | — | (c) | | | — | (c) |
Realized gain (loss) | | | (450 | ) | | | (457 | ) | | | 7 | |
Change in unrealized appreciation/(depreciation)(d) | | | 445 | | | | 453 | | | | (8 | ) |
Purchases | | | — | | | | — | | | | — | |
Sales(b) | | | (849 | ) | | | (553 | ) | | | (296 | ) |
Transfers into Level 3(a) | | | — | | | | — | | | | — | |
Transfers from Level 3(a) | | | — | | | | — | | | | — | |
| | | | | | | | | | | | |
Balance as of September 30, 2017 | | | — | | | | — | | | $ | — | |
| | | | | | | | | | | | |
| (a) | “Transfers into and/or from” represent the ending value as of September 30, 2017, for any investment security where a change in the pricing level occurred from the beginning to the end of the period. |
| (b) | Includes paydowns on securities. |
| (c) | Amount is less than $500. |
| (d) | Included in the related net change in unrealized appreciation (depreciation) on investments in the Statement of Operations. |
The Fund’s investments that were categorized as Level 3 were valued utilizing third party pricing information without adjustment. Such valuations are based on unobservable inputs. A significant change in third party information inputs could result in a significantly lower or higher value of such Level 3 investments.
See Notes to Financial Statements
28
VIRTUS STRATEGIC ALLOCATION FUND
STATEMENT OF ASSETS AND LIABILITIES
SEPTEMBER 30, 2017
(Reported in thousands except shares and per share amounts)
| | | | |
| Assets | | | | |
Investment in unaffiliated securities at value(1) | | $ | 474,686 | |
Investment in affiliated fund at value(2) | | | 2,810 | |
Cash | | | 2,429 | |
| Receivables | | | | |
Investment securities sold | | | 2,625 | |
Fund shares sold | | | 7 | |
Dividends and interest receivable | | | 1,775 | |
Tax reclaims | | | 23 | |
Prepaid expenses | | | 24 | |
Prepaid trustee retainer | | | 6 | |
Other assets | | | 16 | |
| | | | |
Total assets | | | 484,401 | |
| | | | |
| Liabilities | | | | |
| Payables | | | | |
Fund shares repurchased | | | 228 | |
Investment securities purchased | | | 3,316 | |
Investment advisory fees | | | 216 | |
Distribution and service fees | | | 117 | |
Administration fees | | | 49 | |
Transfer agent fees and expenses | | | 129 | |
Professional fees | | | 32 | |
Trustee deferred compensation plan | | | 16 | |
Other accrued expenses | | | 49 | |
| | | | |
Total liabilities | | | 4,152 | |
| | | | |
| Net Assets | | $ | 480,249 | |
| | | | |
| |
| Net Assets Consist of: | | | | |
Capital paid in on shares of beneficial interest | | $ | 415,267 | |
Accumulated undistributed net investment income (loss) | | | (242 | ) |
Accumulated undistributed net realized gain (loss) | | | 2,326 | |
Net unrealized appreciation (depreciation) on investments | | | 62,898 | |
| | | | |
| Net Assets | | $ | 480,249 | |
| | | | |
| Class A | | | | |
Net asset value (net assets/shares outstanding) per share | | $ | 14.29 | |
Maximum offering price per share NAV/(1–5.75%) | | $ | 15.16 | |
Shares of beneficial interest outstanding, no par value, unlimited authorization | | | 31,520,240 | |
Net Assets | | $ | 450,516 | |
| Class C | | | | |
Net asset value (net assets/shares outstanding) and offering price per share | | $ | 14.16 | |
Shares of beneficial interest outstanding, no par value, unlimited authorization | | | 2,100,415 | |
Net Assets | | $ | 29,733 | |
| |
(1) Investment in unaffiliated securities at cost | | $ | 411,729 | |
| |
(2) Investment in affiliated fund at cost | | $ | 2,869 | |
See Notes to Financial Statements
29
VIRTUS STRATEGIC ALLOCATION FUND
STATEMENTS OF OPERATIONS
($ reported in thousands)
| | | | | | | | |
| | | Fiscal
Period Ended
September 30, 2017(2) | | | Year Ended
March 31, 2017 | |
| Investment Income | | | | | | | | |
Dividends | | | 2,394 | | | $ | 4,900 | |
Dividends from affiliated fund | | | 97 | | | | 150 | |
Interest | | | 3,548 | | | | 7,707 | |
Security lending, net of fees | | | — | (1) | | | 28 | |
Foreign taxes withheld | | | (117 | ) | | | (120 | ) |
| | | | | | | | |
Total investment income | | | 5,922 | | | | 12,665 | |
| | | | | | | | |
| Expenses | | | | | | | | |
Investment advisory fees | | | 1,311 | | | | 2,666 | |
Distribution and service fees, Class A | | | 558 | | | | 1,121 | |
Distribution and service fees, Class B | | | — | | | | 4 | |
Distribution and service fees, Class C | | | 153 | | | | 357 | |
Administration fees | | | 308 | | | | 636 | |
Transfer agent fees and expenses | | | 303 | | | | 688 | |
Registration fees | | | 24 | | | | 55 | |
Printing fees and expenses | | | 46 | | | | 130 | |
Custodian fees | | | 82 | | | | 97 | |
Professional fees | | | 36 | | | | 57 | |
Trustees’ fees and expenses | | | 29 | | | | 55 | |
Miscellaneous expenses | | | 24 | | | | 47 | |
| | | | | | | | |
Total expenses | | | 2,874 | | | | 5,913 | |
Less expenses reimbursed and/or waived by investment adviser | | | (8 | ) | | | (19 | ) |
Earnings credit from custodian | | | — | | | | (2 | ) |
Custody fees reimbursed (Note 11) | | | — | | | | (436 | ) |
Low balance account fees | | | — | | | | (13 | ) |
| | | | | | | | |
Net expenses | | | 2,866 | | | | 5,443 | |
| | | | | | | | |
| Net investment income (loss) | | | 3,056 | | | | 7,222 | |
| | | | | | | | |
| Net Realized and Unrealized Gain (Loss) on Investments | | | | | | | | |
Net realized gain (loss) on unaffiliated investments | | | 5,109 | | | | 34,480 | |
Net realized gain (loss) on affiliated investment | | | (1 | ) | | | — | |
Net change in unrealized appreciation (depreciation) on unaffiliated investments | | | 34,018 | | | | (9,294 | ) |
Net change in unrealized appreciation (depreciation) on affiliated investment | | | (57 | ) | | | 153 | |
| | | | | | | | |
| Net realized and unrealized gain (loss) on Investments | | | 39,069 | | | | 25,339 | |
| | | | | | | | |
| Net increase (decrease) in net assets resulting from operations | | | 42,125 | | | $ | 32,561 | |
| | | | | | | | |
| (1) | Amount less than $500. |
| (2) | Fund changed its fiscal year end to September 30 during the period. |
See Notes to Financial Statements
30
VIRTUS STRATEGIC ALLOCATION FUND
STATEMENTS OF CHANGES IN NET ASSETS
(Reported in thousands)
| | | | | | | | | | | | |
| | | Fiscal
Period Ended
September 30, 2017(4) | | | Year Ended
March 31, 2017 | | | Year Ended
March 31, 2016 | |
| INCREASE/(DECREASE) IN NET ASSETS | | | | | | | | | | | | |
| From Operations | | | | | | | | | | | | |
Net investment income (loss) | | $ | 3,056 | | | $ | 7,222 | | | $ | 10,818 | |
Net realized gain (loss) | | | 5,108 | | | | 34,480 | | | | 264 | |
Net change in unrealized appreciation (depreciation) | | | 33,961 | | | | (9,141 | ) | | | (47,912 | ) |
| | | | | | | | | | | | |
| Increase (decrease) in net assets resulting from operations | | | 42,125 | | | | 32,561 | | | | (36,830 | ) |
| | | | | | | | | | | | |
| From Distributions to Shareholders | | | | | | | | | | | | |
Net investment income, Class A | | | (3,099 | ) | | | (6,925 | ) | | | (8,862 | ) |
Net investment income, Class B | | | — | | | | (3 | ) | | | (7 | ) |
Net investment income, Class C | | | (88 | ) | | | (322 | ) | | | (456 | ) |
Net realized short-term gains, Class A | | | — | | | | (4,563 | ) | | | — | |
Net realized short-term gains, Class B | | | — | | | | (4 | ) | | | — | |
Net realized short-term gains, Class C | | | — | | | | (360 | ) | | | — | |
Net realized long-term gains, Class A | | | (10 | ) | | | (29,407 | ) | | | (15,612 | ) |
Net realized long-term gains, Class B | | | — | | | | (23 | ) | | | (22 | ) |
Net realized long-term gains, Class C | | | (1 | ) | | | (2,326 | ) | | | (1,441 | ) |
| | | | | | | | | | | | |
| Decrease in net assets from distributions to shareholders | | | (3,198 | ) | | | (43,933 | ) | | | (26,400 | ) |
| | | | | | | | | | | | |
| From Share Transactions | | | | | | | | | | | | |
| Sale of shares | | | | | | | | | | | | |
Class A (382, 485 and 888 shares, respectively) | | | 5,244 | | | | 6,467 | | | | 12,687 | |
Class B (0, —(1) and —(1) shares, respectively) | | | — | | | | — | (2) | | | 2 | |
Class C (17, 66 and 419 shares, respectively) | | | 232 | | | | 874 | | | | 6,083 | |
| | | |
| Reinvestment of distributions | | | | | | | | | | | | |
Class A (204, 3,012 and 1,572 shares, respectively) | | | 2,852 | | | | 38,224 | | | | 22,775 | |
Class B (0, 2 and 2 shares, respectively) | | | — | | | | 30 | | | | 29 | |
Class C (6, 212 and 117 shares, respectively) | | | 86 | | | | 2,658 | | | | 1,694 | |
| | | |
| Conversion of shares(3) | | | | | | | | | | | | |
To Class A (0, 21 and 0 shares, respectively) | | | — | | | | 279 | | | | — | |
From Class B (0, 21 and 0 shares, respectively) | | | — | | | | (279 | ) | | | — | |
| | | |
| Shares repurchased | | | | | | | | | | | | |
Class A (2,079, 4,545 and 4,115 shares, respectively) | | | (28,665 | ) | | | (61,067 | ) | | | (58,177 | ) |
Class B (0, 21 and 18 shares, respectively) | | | — | | | | (284 | ) | | | (258 | ) |
Class C (401, 694 and 770 shares, respectively) | | | (5,452 | ) | | | (9,236 | ) | | | (10,671 | ) |
| | | | | | | | | | | | |
| Increase (decrease) in net assets from share transactions | | | (25,703 | ) | | | (22,334 | ) | | | (25,836 | ) |
| | | | | | | | | | | | |
| Net increase (decrease) in net assets | | | 13,224 | | | | (33,706 | ) | | | (89,066 | ) |
| | | |
| Net Assets | | | | | | | | | | | | |
Beginning of period | | | 467,025 | | | | 500,731 | | | | 589,797 | |
| | | | | | | | | | | | |
| End of period | | $ | 480,249 | | | $ | 467,025 | | | $ | 500,731 | |
| | | | | | | | | | | | |
Accumulated undistributed net investment income (loss) at end of period | | $ | (242 | ) | | $ | (129 | ) | | $ | (287 | ) |
| (1) | Amount is less than 500 shares. |
| (2) | Amount is less than $500. |
| (3) | See Note 1 in Notes to Financial Statements for more information. |
| (4) | Fund changed its fiscal year end to September 30 during the period. |
See Notes to Financial Statements
31
VIRTUS STRATEGIC ALLOCATION FUND
FINANCIAL HIGHLIGHTS
SELECTED PER SHARE DATA AND RATIOS FOR A SHARE OUTSTANDING
THROUGHOUT EACH PERIOD
| | | | | | | | | | | | | | | | | | | | | | | | | | | | | | | | | | | |
| | | Net Asset Value,
Beginning of Period | | Net Investment Income (Loss)(2) | | Net Realized and Unrealized Gain (Loss) | | Total from Investment Operations | | Dividends from Net Investment Income | | Distributions from Net Realized Gains | | Total Distributions |
Class A | | | | | | | | | | | | | | | | | | | | | | | | | | | | | | | | | | | |
4/1/17 to 9/30/17(7) | | | $ | 13.17 | | | | | 0.09 | | | | | 1.13 | | | | | 1.22 | | | | | (0.10 | ) | | | | — | (4) | | | | (0.10 | ) |
4/1/16 to 3/31/17 | | | | 13.55 | | | | | 0.21 | | | | | 0.69 | | | | | 0.90 | | | | | (0.21 | ) | | | | (1.07 | ) | | | | (1.28 | ) |
4/1/15 to 3/31/16 | | | | 15.18 | | | | | 0.29 | | | | | (1.22 | ) | | | | (0.93 | ) | | | | (0.25 | ) | | | | (0.45 | ) | | | | (0.70 | ) |
4/1/14 to 3/31/15 | | | | 15.54 | | | | | 0.29 | | | | | 0.33 | | | | | 0.62 | | | | | (0.30 | ) | | | | (0.68 | ) | | | | (0.98 | ) |
4/1/13 to 3/31/14 | | | | 15.35 | | | | | 0.30 | | | | | 1.65 | | | | | 1.95 | | | | | (0.29 | ) | | | | (1.47 | ) | | | | (1.76 | ) |
4/1/12 to 3/31/13 | | | | 14.58 | | | | | 0.20 | | | | | 0.78 | | | | | 0.98 | | | | | (0.21 | ) | | | | — | | | | | (0.21 | ) |
| | | | | | | |
Class C | | | | | | | | | | | | | | | | | | | | | | | | | | | | | | | | | | | |
4/1/17 to 9/30/17(7) | | | $ | 13.04 | | | | | 0.04 | | | | | 1.12 | | | | | 1.16 | | | | | (0.04 | ) | | | | — | (4) | | | | (0.04 | ) |
4/1/16 to 3/31/17 | | | | 13.44 | | | | | 0.11 | | | | | 0.68 | | | | | 0.79 | | | | | (0.12 | ) | | | | (1.07 | ) | | | | (1.19 | ) |
4/1/15 to 3/31/16 | | | | 15.06 | | | | | 0.18 | | | | | (1.21 | ) | | | | (1.03 | ) | | | | (0.14 | ) | | | | (0.45 | ) | | | | (0.59 | ) |
4/1/14 to 3/31/15 | | | | 15.43 | | | | | 0.17 | | | | | 0.33 | | | | | 0.50 | | | | | (0.19 | ) | | | | (0.68 | ) | | | | (0.87 | ) |
4/1/13 to 3/31/14 | | | | 15.26 | | | | | 0.18 | | | | | 1.63 | | | | | 1.81 | | | | | (0.17 | ) | | | | (1.47 | ) | | | | (1.64 | ) |
4/1/12 to 3/31/13 | | | | 14.50 | | | | | 0.09 | | | | | 0.77 | | | | | 0.86 | | | | | (0.10 | ) | | | | — | | | | | (0.10 | ) |
The footnote legend is at the end of the Financial Highlights.
See Notes to Financial Statements
32
VIRTUS STRATEGIC ALLOCATION FUND
FINANCIAL HIGHLIGHTS (Continued)
SELECTED PER SHARE DATA AND RATIOS FOR A SHARE OUTSTANDING
THROUGHOUT EACH PERIOD
| | | | | | | | | | | | | | | | | | | | | | | | | | | | | | | | | | | | | | | | | | | |
| Payments from Affiliates | | Change in Net Asset Value | | Net Asset Value, End of Period | | Total Return(1) | | Net Assets, End of Period (in thousands) | | Ratio of Net Expenses to Average Net Assets(3) | | Ratio of Gross Expenses to Average Net Assets (before
waivers and reimbursements)(3) | | Ratio of Net Investment Income (Loss) to Average Net Assets | | Portfolio Turnover Rate |
| | | | | | | | | | | | | | | | | | | | | | | | | | | | | | | | | | | | | | | | | | | | |
| | | — | | | | | 1.12 | | | | $ | 14.29 | | | | | 9.26 | %(9) | | | $ | 450,516 | | | | | 1.15 | %(8) | | | | 1.16 | %(8) | | | | 1.33 | %(8) | | | | 24 | %(9) |
| | | — | | | | | (0.38 | ) | | | | 13.17 | | | | | 7.13 | (6) | | | | 434,712 | | | | | 1.16 | (5)(6) | | | | 1.16 | | | | | 1.46 | (6) | | | | 100 | |
| | | — | (4) | | | | (1.63 | ) | | | | 13.55 | | | | | (6.37 | ) | | | | 461,276 | | | | | 1.12 | | | | | 1.13 | | | | | 2.05 | | | | | 75 | |
| | | — | | | | | (0.36 | ) | | | | 15.18 | | | | | 4.08 | | | | | 541,818 | | | | | 1.10 | | | | | 1.10 | | | | | 1.89 | | | | | 62 | |
| | | — | | | | | 0.19 | | | | | 15.54 | | | | | 13.79 | | | | | 570,784 | | | | | 1.10 | | | | | 1.10 | | | | | 1.97 | | | | | 57 | |
| | | — | | | | | 0.77 | | | | | 15.35 | | | | | 6.77 | | | | | 559,955 | | | | | 1.10 | | | | | 1.10 | | | | | 1.39 | | | | | 121 | |
| | | | | | | | |
| | | | | | | | | | | | | | | | | | | | | | | | | | | | | | | | | | | | | | | | | | | | |
| | | — | | | | | 1.12 | | | | $ | 14.16 | | | | | 8.91 | %(9) | | | $ | 29,733 | | | | | 1.92 | %(8) | | | | 1.92 | %(8) | | | | 0.58 | %(8) | | | | 24 | %(9) |
| | | — | | | | | (0.40 | ) | | | | 13.04 | | | | | 6.33 | (6) | | | | 32,313 | | | | | 1.91 | (5)(6) | | | | 1.91 | | | | | 0.71 | (6) | | | | 100 | |
| | | — | (4) | | | | (1.62 | ) | | | | 13.44 | | | | | (7.06 | ) | | | | 38,913 | | | | | 1.87 | | | | | 1.88 | | | | | 1.31 | | | | | 75 | |
| | | — | | | | | (0.37 | ) | | | | 15.06 | | | | | 3.29 | | | | | 47,131 | | | | | 1.85 | | | | | 1.85 | | | | | 1.12 | | | | | 62 | |
| | | — | | | | | 0.17 | | | | | 15.43 | | | | | 12.89 | | | | | 41,713 | | | | | 1.85 | | | | | 1.85 | | | | | 1.22 | | | | | 57 | |
| | | — | | | | | 0.76 | | | | | 15.26 | | | | | 5.95 | | | | | 40,937 | | | | | 1.85 | | | | | 1.85 | | | | | 0.64 | | | | | 121 | |
| (1) | Sales charges, where applicable, are not reflected in total return calculation. |
| (2) | Computed using average shares outstanding. |
| (3) | The Fund will also indirectly bear its prorated share of expenses of any underlying funds in which it invests. Such expenses are not included in the calculation of this ratio. |
| (4) | Amount is less than $0.005 per share. |
| (5) | Net expense ratios includes extraordinary proxy expenses. |
| (6) | Custody fees reimbursed were excluded from the Ratio of Net Expenses to Average Net Assets and Ratio of Net Investment Income (Loss) to Average Net Assets. If included the impact would have been to lower the Ratio of Net Expenses to Average Net Assets and increase the Ratio of Net Investment Income (Loss) to Average Net Assets by 0.09% (Class A) and 0.09% (Class C). Custody fees reimbursed were included in Total Return. If excluded the impact would have been to lower the Total Return by 0.09% (Class A) and 0.09% (Class C). See Note 11 in Notes to Financial Statements for a further explanation on the custody fees reimbursed. |
| (7) | The Fund changed its fiscal year end to September 30 during the period. |
See Notes to Financial Statements
33
VIRTUS STRATEGIC ALLOCATION FUND
NOTES TO FINANCIAL STATEMENTS
SEPTEMBER 30, 2017
Note 1. Organization
Virtus Equity Trust (the “Trust”) is organized as a Delaware statutory trust and is registered under the Investment Company Act of 1940, as amended (the “1940 Act”), as an open-end management investment company. Effective September 21, 2017 the Fund changed its fiscal year end from March 31 to September 30.
As of the date of this report, 11 diversified funds of the Trust are offered for sale of which the Strategic Allocation Fund (the “Fund”) is reported in this annual report. The Fund’s investment objectives are outlined in the Fund Summary Page. There is no guarantee that the Fund will achieve its objectives.
The Fund offers Class A shares and Class C shares. Effective March 6, 2017, all Class B shares were converted to Class A shares. Prior to March 6, 2017, Class B shares could be purchased by existing shareholders through qualifying transactions.
Class A shares are sold with a front-end sales charge of up to 5.75% with some exceptions. Generally, Class A shares are not subject to any charges by the Fund when redeemed; however, a 1% contingent deferred sales charge (“CDSC”) may be imposed on certain redemptions made within a certain period following purchases on which a finder’s fee has been paid. The period for which the CDSC applies for the Fund is 18 months. The CDSC period begins on the last day of the month preceding the month in which the purchase was made.
Class C shares are generally sold with a 1% CDSC, applicable if redeemed within one year of purchase.
Virtus Mutual Funds may impose an annual fee on accounts having balances of less than $2,500. The small account fee may be waived in certain circumstances, as disclosed in the prospectus and/or statement of additional information. The fees collected will be used to offset certain expenses of the Fund. These fees are reflected as “Low Balance Account Fees” in the Fund’s Statement of Operations for the period, as applicable.
Each Class of shares has identical voting, dividend, liquidation and other rights and the same terms and conditions, except that each Class bears different distribution and/or service fees under a Rule 12b-1 and/or shareholder service plan (“12b-1 Plan”) approved by the Board and has exclusive voting rights with respect to such plan. Income and other expenses as well as realized and unrealized gains and losses of the Fund are borne pro rata by the holders of each Class of shares.
Note 2. Significant Accounting Policies
The following is a summary of significant accounting policies consistently followed by the Fund in the preparation of its financial statements. The preparation of financial statements in conformity with U.S. generally accepted accounting principles (“U.S. GAAP”) requires management to make estimates and assumptions that affect the reported amounts of assets and liabilities, and disclosure of contingent assets and liabilities at the date of the financial statements and the reported amounts of increases and decreases in net assets from operations during the reporting period. Actual results could differ from those estimates, and those differences could be significant.
Security valuation procedures for the Fund, which include nightly price variance, as well as back-testing items such as bi-weekly unchanged price, monthly secondary source and transaction analysis, have been approved by the Board. All internally fair valued
34
VIRTUS STRATEGIC ALLOCATION FUND
NOTES TO FINANCIAL STATEMENTS (Continued)
SEPTEMBER 30, 2017
securities are approved by a valuation committee appointed by the Board (the “Valuation Committee”). The Valuation Committee is comprised of certain members of management as identified to the Board and convenes independently from portfolio management. All internally fair valued securities are updated daily and reviewed in detail by the Valuation Committee monthly unless changes occur within the period. The Valuation Committee reviews the validity of the model inputs and any changes to the model. Fair valuations are reviewed by the Board at least quarterly.
The Fund utilizes a fair value hierarchy which prioritizes the inputs to valuation techniques used to measure fair value into three broad levels. The Fund’s policy is to recognize transfers between levels at the end of the reporting period.
| | • Level 1 – | quoted prices in active markets for identical securities (security types generally include listed equities). |
| | • Level 2 – | prices determined using other significant observable inputs (including quoted prices for similar securities, interest rates, prepayment speeds, credit risk, etc.). |
| | • Level 3 – | prices determined using significant unobservable inputs (including the Valuation Committee’s own assumptions in determining the fair value of investments). |
A description of the valuation techniques applied to the Fund’s major categories of assets and liabilities measured at fair value on a recurring basis is as follows:
Equity securities are valued at the official closing price (typically last sale) on the exchange on which the securities are primarily traded or, if no closing price is available, at the last bid price and are categorized as Level 1 in the hierarchy. Restricted equity securities and private placements that are not widely traded, are illiquid, or are internally fair valued by the Valuation Committee, are generally categorized as Level 3 in the hierarchy.
Certain non-U.S. securities may be fair valued in cases where closing prices are not readily available or are deemed not reflective of readily available market prices. For example, significant events (such as movement in the U.S. securities market, or other regional and local developments) may occur between the time that non-U.S. markets close (where the security is principally traded) and the time that the Fund calculates its net asset value (“NAV”) (at the close of regular trading on the NYSE, generally 4 p.m. Eastern time) that may impact the value of securities traded in these non-U.S. markets. In such cases, the Fund fair values non-U.S. securities using an independent pricing service which considers the correlation of the trading patterns of the non-U.S. security to the intraday trading in the U.S. markets for investments such as ADRs, financial futures, ETFs, and certain indexes, as well as prices for similar securities. Such fair valuations are categorized as Level 2 in the hierarchy. Because the frequency of significant events is not predictable, fair valuation of certain non-U.S. common stocks may occur on a frequent basis.
Debt securities, including restricted securities, are valued based on evaluated quotations received from independent pricing services or from dealers who make markets in such securities. For most bond types, the pricing service utilizes matrix pricing that considers one or more of the following factors: yield or price of bonds of comparable quality, coupon, maturity, current cash flows, type, and current day trade information, as well as dealer supplied prices. These valuations are generally
35
VIRTUS STRATEGIC ALLOCATION FUND
NOTES TO FINANCIAL STATEMENTS (Continued)
SEPTEMBER 30, 2017
categorized as Level 2 in the hierarchy. Structured debt instruments, such as mortgage-backed and asset-backed securities, may also incorporate collateral analysis and utilize cash flow models for valuation and are generally categorized as Level 2 in the hierarchy. Pricing services do not provide pricing for all securities and therefore indicative bids from dealers are utilized which are based on pricing models used by market makers in the security and are generally categorized as Level 2 in the hierarchy. Debt securities that are not widely traded, or are internally fair valued by the Valuation Committee, are generally categorized as Level 3 in the hierarchy.
Listed derivatives, such as options, that are actively traded are valued based on quoted prices from the exchange and are categorized as Level 1 in the hierarchy. Over-the-counter derivative contracts, which include forward currency contracts and equity-linked instruments, do not require material subjectivity as pricing inputs are observed from actively quoted markets and are categorized as Level 2 in the hierarchy.
Investments in open-end mutual funds are valued at NAV. Investments in closed-end funds are valued as of the close of regular trading on the NYSE each business day. Both are categorized as Level 1 in the hierarchy.
A summary of the inputs used to value the Fund’s net assets by each major security type is disclosed at the end of the Schedule of Investments for the Fund. The inputs or methodologies used for valuing securities are not necessarily an indication of the risk associated with investing in those securities.
| | B. | Security Transactions and Investment Income |
Security transactions are recorded on the trade date. Realized gains and losses from the sale of securities are determined on the identified cost basis. Dividend income is recognized on the ex-dividend date or, in the case of certain foreign securities, as soon as the Fund is notified. Interest income is recorded on the accrual basis. The Fund amortizes premiums and accretes discounts using the effective interest method.
Any distributions from underlying funds are recorded in accordance with the character of the distributions as designated by the underlying funds.
Dividend income from REIT investments is recorded using management’s estimate of the income included in distributions received from the REIT investments. Distributions received in excess of this estimated amount are recorded as a reduction of the cost of investments or reclassified to capital gains. The actual amounts of income, return of capital, and capital gains are only determined by each REIT after its fiscal period-end, and may differ from the estimated amounts.
The Fund is treated as a separate taxable entity. It is the intention of the Fund to comply with the requirements of Subchapter M of the Internal Revenue Code and to distribute substantially all of its taxable income to its shareholders. Therefore, no provision for federal income taxes or excise taxes has been made.
The Fund may be subject to foreign taxes on income, gains on investments or currency repatriation, a portion of which may be recoverable. The Fund will accrue such taxes and recoveries as applicable based upon current interpretations of the tax rules and regulations that exist in the markets in which it invests.
36
VIRTUS STRATEGIC ALLOCATION FUND
NOTES TO FINANCIAL STATEMENTS (Continued)
SEPTEMBER 30, 2017
Management of the Fund has concluded that there are no significant uncertain tax positions that would require recognition in the financial statements. As of September 30, 2017, the tax years that remain subject to examination by the major tax jurisdictions under the statute of limitations are from the year 2014 forward (with limited exceptions).
| | D. | Distributions to Shareholders |
Distributions are recorded by the Fund on the ex-dividend date. Income and capital gain distributions are determined in accordance with income tax regulations that may differ from U.S. GAAP.
Expenses incurred together by the Fund and other affiliated mutual funds are allocated in proportion to the net assets of each such fund, except where allocation of direct expenses to each fund or an alternative allocation method can be more appropriately used.
In addition to the net annual operating expenses that the Fund bears directly, the shareholders of the Fund indirectly bear the Fund’s pro-rata expenses of any underlying mutual funds in which the Fund invests.
| | F. | Foreign Currency Translation |
Non-U.S. investment securities and other assets and liabilities denominated in foreign currencies are translated into U.S. dollar amounts at the foreign currency exchange rate effective at the end of the reporting period. Cost of investments is translated at the currency exchange rate effective at the trade date. The gain or loss resulting from a change in currency exchange rates between the trade and settlement date of a portfolio transaction is treated as a gain or loss on foreign currency. Likewise, the gain or loss resulting from a change in currency exchange rates between the date income is accrued and the date it is paid is treated as a gain or loss on foreign currency. The Fund does not isolate that portion of the results of operations arising from changes in foreign exchange rates on investments from the fluctuations arising from changes in the market prices of securities held. Such fluctuations are included with the net realized and unrealized gain or loss on investments.
The Fund may invest in direct debt instruments which are interests in amounts owed by a corporate, governmental, or other borrower to lenders or lending syndicates. Loan agreements are generally non-investment grade and often involve borrowers that are highly leveraged. The Fund may invest in obligations of borrowers who are in bankruptcy proceedings. Loan agreements are typically senior in the corporate capital structure of the borrower. A loan is often administered by a bank or other financial institution (the “lender”) that acts as agent for all holders. The agent administers the terms of the loan, as specified in the loan agreement. The Fund’s investments in loans may be in the form of participations in loans or assignments of all or a portion of loans from third parties. When investing in loan participations, the Fund has the right to receive payments of principal, interest and any fees to which it is entitled only from the lender selling the loan participation and only upon receipt by the lender of payments from the borrower. The Fund generally has no right to enforce compliance with the terms of the loan agreement with the borrower. As a result, the Fund may be subject to the credit risk of both the borrower and the lender that is selling the loan agreement.
37
VIRTUS STRATEGIC ALLOCATION FUND
NOTES TO FINANCIAL STATEMENTS (Continued)
SEPTEMBER 30, 2017
When the Fund purchases assignments from lenders it acquires direct rights against the borrower on the loan.
The Fund may invest in multiple series or tranches of a loan, which may have varying terms and carry different associated risks. Loan agreements may involve foreign borrowers and investments may be denominated in foreign currencies. Direct indebtedness of emerging countries involves a risk that the government entities responsible for the repayment of the debt may be unable, or unwilling, to pay the principal and interest when due.
The loan agreements have floating rate loan interests which generally pay interest at rates that are periodically determined by reference to a base lending rate plus a premium. The base lending rates are generally London Interbank Offered Rate (“LIBOR”), the prime rate offered by one or more U.S. banks or the certificate of deposit rate. When a loan agreement is purchased the Fund may pay an assignment fee. On an ongoing basis, the Fund may receive a commitment fee based on the undrawn portion of the underlying line of credit portion of a loan agreement. Prepayment penalty fees are received upon the prepayment of a loan agreement by a borrower. Prepayment penalty, facility, commitment, consent and amendment fees are recorded to income as earned or paid.
At September 30, 2017, all loan agreements held by the Fund are assignment loans.
| | H. | When-issued and Forward Commitments (Delayed Delivery) |
The Fund may engage in when-issued or forward commitment transactions. Securities purchased on a when-issued or forward commitment basis are known as delayed delivery transactions. Delayed delivery transactions involve a commitment by the Fund to purchase or sell a security at a future date (ordinarily up to 90 days later). When-issued or forward commitments enable the Fund to lock in what is believed to be an attractive price or yield on a particular security for a period of time, regardless of future changes in interest rates. The Fund records when-issued and delayed delivery securities on the trade date. The Fund maintains collateral for the securities purchased. Securities purchased on a when-issued or delayed delivery basis begin earning interest on the settlement date.
($ reported in thousands)
During the period, the Fund was permitted to loan securities to qualified brokers through an agreement with Brown Brothers Harriman (“BBH”), as a third party lending agent. Under the terms of the agreement, when doing so the Fund was required to maintain collateral with a market value not less than 100% of the market value of loaned securities. Collateral, consisting of cash and securities issued by the U.S. Government or its agencies, was adjusted daily in connection with changes in the market value of securities on loan. Cash collateral was invested in a short-term money market fund. Dividends earned on the collateral and premiums paid by the broker were recorded as income by the Fund net of fees and rebates charged by BBH for its services as securities lending agent and in connection with this securities lending program. Lending portfolio securities involves a risk of delay in the recovery of the loaned securities or in the declining value of the collateral. Effective July 31, 2017, securities lending was suspended on the Fund, and the agreement with BBH was terminated on August 14, 2017.
38
VIRTUS STRATEGIC ALLOCATION FUND
NOTES TO FINANCIAL STATEMENTS (Continued)
SEPTEMBER 30, 2017
| | J. | Earnings Credit and Interest |
Through an arrangement with the Fund’s previous custodian, which ended in September 2017, the Fund received either an earnings credit or interest on agreed upon target un-invested cash balances to reduce the Fund’s custody expenses. The credits are reflected as “Earnings credit from Custodian” and the interest is reflected under “Interest income” in the Fund’s Statements of Operations for the period, as applicable.
Note 3. Investment Advisory Fees and Related Party Transactions
($ reported in thousands except as noted)
Virtus Investment Advisers, Inc. (the “Adviser”), an indirect, wholly owned subsidiary of Virtus Investment Partners, Inc. (“Virtus”), is the investment adviser to the Fund. The Adviser manages the Fund’s investment program and general operations of the Fund, including oversight of the Fund’s subadvisers.
As compensation for its services to the Fund, the Adviser is entitled to a fee based upon the following annual rates as a percentage of the average daily net assets of the Fund:
| | | | |
First $1 Billion | | $1+ Billion -
$2 Billion | | $2+ Billion |
| 0.55% | | 0.50% | | 0.45% |
During the period covered by these financial statements, the Fund invested a portion of its assets in Virtus Newfleet Credit Opportunities Fund, an affiliated mutual fund. In order to avoid any duplication of advisory fees, the Adviser has voluntarily waived its advisory fees in an amount equal to that which would otherwise be paid by the Fund on the assets invested in the Virtus Newfleet Credit Opportunities Fund. For the period covered by these financial statements, the waiver amounted to $8. This waiver is included in “Less expenses reimbursed and/or waived by investment adviser” in the Statement of Operations.
The subadvisers manage the investments of the Fund for which they are paid a fee by the Adviser.
Newfleet Asset Management, LLC, an indirect, wholly-owned subsidiary of Virtus, is the subadviser to the Fund’s fixed income portfolio. Kayne Anderson Rudnick Investment Management, LLC, an indirect, wholly-owned subsidiary of Virtus, is the subadviser to the Fund’s domestic equity portfolio and Duff & Phelps Investment Management Co., an indirect, wholly-owned subsidiary of Virtus, is the subadviser to the Fund’s international equity portfolio.
VP Distributors, LLC (“VP Distributors”), an indirect, wholly owned subsidiary of Virtus, serves as the distributor of the Fund’s shares. VP Distributors has advised the Fund that for the fiscal period (the “period”) ended September 30, 2017, it retained net commissions of $60 for Class A shares and CDSC of $0 and $—(1) for Class A shares and Class C shares, respectively.
| | (1) | Amount is less than $500. |
39
VIRTUS STRATEGIC ALLOCATION FUND
NOTES TO FINANCIAL STATEMENTS (Continued)
SEPTEMBER 30, 2017
In addition, the Fund pays VP Distributors 12b-1 fees under a 12b-1 Plan as a percentage of the average daily net assets of each respective class at the annual rates as follows: Class A shares 0.25%; and Class C shares 1.00%.
Under certain circumstances, shares of certain Virtus Mutual Funds may be exchanged for shares of the same class of certain other Virtus Mutual Funds on the basis of the relative NAV per share at the time of the exchange. On exchanges with share classes that carry a CDSC, the CDSC schedule of the original shares purchased continues to apply.
| | D. | Administrator and Transfer Agent |
Virtus Fund Services, LLC, an indirect, wholly owned subsidiary of Virtus, serves as the administrator and transfer agent to the Trust.
For the period ended September 30, 2017, the Fund incurred administration fees totaling $231 which are included in the Statement of Operations within the line item “Administration fees”.
For the period ended September 30, 2017, the Fund incurred transfer agent fees totaling $189 which are included in the Statement of Operations within the line item “Transfer agent fees and expenses”. A portion of these fees was paid to outside entities that also provide services to the Trust.
| | E. | Investments in Affiliates |
A summary of total long-term and short-term purchases and sales of the affiliated underlying fund, Virtus Newfleet Credit Opportunities Fund, during the period ended September 30, 2017, is as follows:
| | | | | | | | | | | | | | |
Value,
beginning of
period | | Purchases | | Sales | | Realized
gain (loss) | | Net Change
in Unrealized
Appreciation
(Depreciation) | | Value, end
of period | | Dividend
Income | | Distributions
of Realized
Gains |
| $3,567 | | $— | | $(699) | | (1) | | (57) | | $2,810 | | $97 | | $— |
The Fund does not invest in the underlying fund for the purpose of exercising management or control; however, investments made by the Fund within each of its principal investment strategies may represent a significant portion of an underlying fund’s net assets.
The Trust provides a deferred compensation plan for its Trustees who receive compensation from the Trust. Under the deferred compensation plan, Trustees may elect to defer all or a portion of their compensation. Amounts deferred are retained by the Trust, and then, to the extent permitted by the 1940 Act, in turn, may be invested in the shares of affiliated or unaffiliated mutual funds selected by the participating Trustees. Investments in such instruments are included in “Other assets” in the Statement of Assets and Liabilities at September 30, 2017.
40
VIRTUS STRATEGIC ALLOCATION FUND
NOTES TO FINANCIAL STATEMENTS (Continued)
SEPTEMBER 30, 2017
Note 4. Purchases and Sales of Securities
($ reported in thousands)
Purchases and sales of securities (excluding U.S. Government and agency securities and short-term securities) during the period ended September 30, 2017, were as follows:
| | | | | | | | |
| | | Purchases | | | Sales | |
| | $ | 100,476 | | | $ | 123,235 | |
Purchases and sales of long-term U.S. Government and agency securities during the period ended September 30, 2017, were as follows:
| | | | | | | | |
| | | Purchases | | | Sales | |
| | $ | 12,927 | | | $ | 16,273 | |
Note 5. Indemnifications
Under the Trust’s organizational documents and in separate agreements between each Trustee and the Trust, its Trustees and officers are indemnified against certain liabilities arising out of the performance of their duties to the Trust and its funds. In addition, in the normal course of business, the Fund enters into contracts that provide a variety of indemnifications to other parties. The Fund’s maximum exposure under these arrangements is unknown as this would involve future claims that may be made against the Fund and that have not occurred. However, the Fund has not had prior claims or losses pursuant to these arrangements and expects the risk of loss to be remote.
Note 6. Credit Risk and Asset Concentration
In countries with limited or developing markets, investments may present greater risks than in more developed markets and the prices of such investments may be volatile. The consequences of political, social or economic changes in these markets may have disruptive effects on the market prices of these investments and the income they generate, as well as the Fund’s ability to repatriate such amounts.
High-yield/high-risk securities typically entail greater price volatility and/or principal and interest rate risk. There is a greater chance that an issuer will not be able to make principal and interest payments on time. Analysis of the creditworthiness of issuers of high-yield/high-risk securities may be complex, and as a result, it may be more difficult for the Adviser and/or Subadvisers to accurately predict risk.
The Fund may invest a high percentage of its assets in specific sectors of the market in the pursuit of its investment objectives. Fluctuations in these sectors of concentration may have a greater impact on the Fund, positive or negative, than if the Fund did not concentrate its investments in such sectors.
Note 7. Federal Income Tax Information
($ reported in thousands)
At September 30, 2017, federal tax cost and aggregate gross unrealized appreciation (depreciation) of securities held by the Fund were as follows:
| | | | | | |
Federal
Tax Cost | | Unrealized
Appreciation | | Unrealized
(Depreciation) | | Net Unrealized
Appreciation
(Depreciation) |
$416,284 | | $65,149 | | $(3,937) | | $61,212 |
41
VIRTUS STRATEGIC ALLOCATION FUND
NOTES TO FINANCIAL STATEMENTS (Continued)
SEPTEMBER 30, 2017
Capital losses realized after October 31 and certain late year losses may be deferred and treated as occurring on the first day of the following fiscal year. For the fiscal year ended September 30, 2017, the Fund deferred and recognized qualified late-year losses as follows:
| | | | | | |
Late Year
Ordinary
Loss
Deferred | | Late Year
Ordinary
Loss
Recognized | | Capital
Losses
Deferred | | Capital
Losses
Recognized |
| $— | | $— | | $— | | $2,256 |
The components of distributable earnings on a tax basis (excluding unrealized appreciation (depreciation) (which is disclosed above) consist of the following:
| | |
Undistributed
Ordinary
Income | | Undistributed
Long-term
Capital Gains |
| $667 | | $3,123 |
Short-term gain distributions reported in the Statements of Changes in Net Assets, if any, are reported as ordinary income for federal tax purposes. Distributions are determined on a tax basis and may differ from net investment income and realized capital gains for financial reporting purposes. The tax character of dividends and distributions paid during the periods ended was as follows:
| | | | | | | | | | | | |
| | | September 30,
2017 | | | March 31,
2017 | | | March 31,
2016 | |
| Ordinary Income | | $ | 3,187 | | | $ | 12,177 | | | $ | 9,325 | |
| Long-Term Capital Gains | | | 11 | | | | 31,756 | | | | 17,075 | |
| | | | | | | | | | | | |
| Total | | $ | 3,198 | | | $ | 43,933 | | | $ | 26,400 | |
| | | | | | | | | | | | |
For financial reporting purposes, book basis capital accounts are adjusted to reflect the tax character of permanent book/tax differences. Permanent reclassifications can arise from differing treatment of certain income and gain transactions, nondeductible current year net operating losses, expiring capital loss carryovers and investments in passive foreign investment companies. Permanent book and tax basis differences relating to shareholder distributions will result in reclassifications to capital paid in on shares of beneficial interest. The reclassifications have no impact on the net assets or NAV of the Fund. As of September 30, 2017, the Fund recorded reclassifications to increase (decrease) the accounts as listed below:
| | | | |
Capital Paid
in on Shares of
Beneficial
Interest | | Undistributed
Net Investment
Income (Loss) | | Accumulated
Net Realized
Gain (Loss) |
| $— | | $18 | | $(18) |
Note 8. Borrowings
($ reported in thousands)
On September 18, 2017, the Fund and other affiliated funds of the Trust entered into a $150,000 unsecured line of credit. This Credit Agreement is with a commercial bank that allows the Fund to borrow cash from the bank to manage large unexpected redemptions
42
VIRTUS STRATEGIC ALLOCATION FUND
NOTES TO FINANCIAL STATEMENTS (Continued)
SEPTEMBER 30, 2017
and trade fails, up to a limit of one-third the Fund’s total net assets in accordance with the terms of the agreement. This Credit Agreement has a term of 364 days. Interest is charged at the higher of the London Interbank Offered Rate (“LIBOR”) or the Federal Funds rate plus an additional percentage rate on the amount borrowed. Commitment fees are charged on the undrawn balance. The Fund and other affiliated funds that are parties are individually, and not jointly, liable for their particular advances, if any, under the line of credit. The lending bank has the ability to require repayment of outstanding borrowings under this Credit Agreement upon certain circumstances such as an event of default.
On June 29, 2016, the Fund and other affiliated funds of the Trust renewed a $50,000 secured line of credit. This Credit Agreement was with a commercial bank that allowed the Fund to borrow cash from the bank to manage large unexpected redemptions and trade fails, up to a limit of one-third of each Fund’s total net assets in accordance with the terms of the agreement. This Credit Agreement had a term of 364 days and was renewable by the Funds with the bank’s consent and approval of the Board. Interest was charged at the higher of the LIBOR or the Federal Funds rate plus an additional percentage rate on the amount borrowed. Commitment fees were charged on the undrawn balance. The Fund and other affiliated funds that were parties were individually, and not jointly, liable for their particular advances, if any, under the line of credit. The lending bank had the ability to require repayment of outstanding borrowings under this Credit Agreement upon certain circumstances such as an event of default. On June 14, 2017, the term of this Credit Agreement was extended for an additional 90 days. Effective September 18, 2017, the Credit Agreement was terminated and replaced by a new credit facility.
The Fund had no outstanding borrowings at any time during the period ended September 30, 2017.
Note 9. Illiquid and Restricted Securities
Investments are generally considered illiquid if they cannot be disposed of within seven days in the ordinary course of business at the approximate amount at which such securities have been valued by the Fund. Additionally, the following information is also considered in determining liquidity; the frequency of trades and quotes for the investment, whether the investment is listed for trading on a recognized domestic exchange and/or whether two or more brokers are willing to purchase or sell the security at a comparable price, the extent of market making activity in the investment and the nature of the market for investment.
Restricted securities are illiquid securities, as defined above, not registered under the Securities Act of 1933, as amended (the “1933 Act”). Generally, 144A securities are excluded from this category, except where defined as illiquid.
The Fund will bear any costs, including those involved in registration under the 1933 Act, in connection with the disposition of such securities.
The Fund held securities considered to be illiquid at September 30, 2017:
| | | | | | | | |
| | | Aggregate Value | | | % of Fund’s net
assets | |
| | $ | 64 | | | | 0.01 | % |
At September 30, 2017, the Fund did not hold any securities that were illiquid or restricted.
43
VIRTUS STRATEGIC ALLOCATION FUND
NOTES TO FINANCIAL STATEMENTS (Continued)
SEPTEMBER 30, 2017
Note 10. Regulatory Matters and Litigation
From time to time, the Trust, the Fund’s Adviser and/or subadvisers and/or their affiliates may be involved in litigation and arbitration as well as examinations and investigations by various regulatory bodies, including the SEC, involving compliance with, among other things, securities laws, client investment guidelines, laws governing the activities of broker-dealers and other laws and regulations affecting their products and other activities. At this time, the Fund’s Adviser believes that the outcomes of such matters are not likely, either individually or in the aggregate, to be material to these financial statements.
Note 11. Custody Fees Reimbursed
State Street Bank & Trust, custodian for the Fund through January 29, 2010, reimbursed the Fund for out-of-pocket custody expenses overbilled for the period 1998 through January 29, 2010. The amount reimbursed, including interest, is shown in the Statement of Operations under “Custody fees reimbursed.”
Note 12. Recent Accounting Pronouncement
In October 2016, the SEC released its Final Rule on Investment Company Reporting Modernization (the “Rule”). The Rule contains amendments to Regulation S-X which impact financial statement presentation, particularly the presentation of derivative investments. The financial statements presented are in compliance with the most recent Regulations S-X amendments.
Note 13. Subsequent Events
Management has evaluated the impact of all subsequent events on the Fund through the date the financial statements were issued and has determined that there are no subsequent events requiring recognition or disclosure in these financial statements.
44

Report of Independent Registered Public
Accounting Firm
To the Board of Trustees of
Virtus Equity Trust and Shareholders of
Virtus Strategic Allocation Fund
In our opinion, the accompanying statement of assets and liabilities, including the schedule of investments and the related statements of operations and of changes in net assets and the financial highlights present fairly, in all material respects, the financial position of Virtus Strategic Allocation Fund (one of the funds constituting Virtus Equity Trust, hereafter referred to as the “Fund”) as of September 30, 2017, and the results of its operations, the changes in its net assets and the financial highlights for the periods indicated, in conformity with accounting principles generally accepted in the United States of America. These financial statements and financial highlights (hereafter referred to as “financial statements”) are the responsibility of the Fund’s management. Our responsibility is to express an opinion on these financial statements based on our audits. We conducted our audits of these financial statements in accordance with the standards of the Public Company Accounting Oversight Board (United States). Those standards require that we plan and perform the audit to obtain reasonable assurance about whether the financial statements are free of material misstatement. An audit includes examining, on a test basis, evidence supporting the amounts and disclosures in the financial statements, assessing the accounting principles used and significant estimates made by management and evaluating the overall financial statement presentation. We believe that our audits, which included confirmation of securities as of September 30, 2017 by correspondence with the custodians, brokers, transfer agent of the investee fund and the application of alternative procedures where securities purchased had not been received, provide a reasonable basis for the opinion expressed above.
PricewaterhouseCoopers LLP
Philadelphia, Pennsylvania
November 22, 2017
45
VIRTUS STRATEGIC ALLOCATION FUND
TAX INFORMATION NOTICE (Unaudited)
SEPTEMBER 30, 2017
For the fiscal period ended September 30, 2017, the Fund makes the following disclosures for federal income tax purposes. Below is listed the percentages, or the maximum amount allowable, of its ordinary income dividends (“QDI”) to qualify for the lower tax rates applicable to individual shareholders, and the percentage of ordinary income dividends earned by the Fund which qualifies for the dividends received deduction (“DRD”) for corporate shareholders. The actual percentage of QDI and DRD for the calendar year will be designated in year-end tax statements. The Fund designates the amount below as long-term capital gains dividends (“LTCG”) taxable at a 20% rate, or lower depending on the shareholder’s income ($ reported in thousands). LTCG amount, if subsequently different, will be designated in the next annual report.
| | | | |
QDI | | DRD | | LTCG |
| 56% | | 25% | | $3,126 |
46
FUND MANAGEMENT TABLES (Unaudited)
Information pertaining to the Trustees and officers of the Trust as of September 30, 2017, is set forth below. The statement of additional information (SAI) includes additional information about the Trustees and is available without charge, upon request, by calling (800) 243-4361.
The address of each individual, unless otherwise noted, is c/o Virtus Equity Trust, 100 Pearl Street, Hartford, CT 06103. There is no stated term of office for Trustees or officers of the Trust.
Independent Trustees
| | |
Name, Year of Birth,
Length of Time Served
and Number of Portfolios
in Complex | | Principal Occupation(s)
During Past 5 Years and
Other Directorships Held by Trustee |
Brown, Thomas J. YOB: 1945 Served Since: 2016 87 Portfolios | | Retired. Trustee (since 2016), Virtus Mutual Fund Family (75 portfolios) and Virtus Alternative Solutions Trust (3 portfolios); Trustee (since 2011), Virtus Variable Insurance Trust (9 portfolios); Director (since 2010), D’Youville Senior Care Center; and Director (since 2005), VALIC Company Funds (49 portfolios). |
Burke, Donald C. YOB: 1960 Served Since: 2016 91 Portfolios | | Retired. Trustee (since 2016), Virtus Mutual Fund Family (75 portfolios), Virtus Variable Insurance Trust (9 portfolios) and Virtus Alternative Solutions Trust (3 portfolios); Director (since 2014) closed-end funds managed by Duff & Phelps Investment Management Co. (4 funds); Director, Avista Corp. (energy company) (since 2011); Trustee, Goldman Sachs Fund Complex (2010 to 2014); and Director, BlackRock Luxembourg and Cayman Funds (2006 to 2010). |
Gelfenbien, Roger A. YOB: 1943 Served Since: 2016 87 Portfolios | | Retired. Trustee (since 2016), Virtus Mutual Fund Family (75 portfolios) and Virtus Alternative Solutions Trust (3 portfolios); Trustee (since 2000), Virtus Variable Insurance Trust (9 portfolios); and Director (since 1999), USAllianz Variable Insurance Product Trust (42 portfolios). |
Harris, Sidney E. YOB: 1949 Served Since: 2017 87 Portfolios | | Professor and Dean Emeritus (since April 2015), Professor (1997 to 2014), Dean (1997 to 2004), J. Mack Robinson College of Business, Georgia State University; Trustee (since 2017), Virtus Mutual Fund Family (75 portfolios), Virtus Variable Insurance Trust (9 portfolios), and Virtus Alternative Solutions Trust (3 portfolios); Trustee (since 2013), KIPP Metro Atlanta; Trustee (since 1999) Total System Services, Inc.; Trustee (2004 to 2017), RidgeWorth Funds; Trustee (2012 to 2017), International University of the Grand Bassam; and Trustee (2011 to 2015), Genspring Family Offices, LLC. |
Mallin, John R. YOB: 1950 Served Since: 2016 87 Portfolios | | Partner/Attorney (since 2003), McCarter & English LLP (law firm), Real Property Practice Group; and Member (since 2014), Counselors of Real Estate. Trustee (since 2016), Virtus Mutual Fund Family (75 portfolios) and Virtus Alternative Solutions Trust (3 portfolios); Director (since 2013), Horizons, Inc. (non-profit); and Trustee (since 1999), Virtus Variable Insurance Trust (9 portfolios). |
McClellan, Hassell H. YOB: 1945 Served Since: 2015 87 Portfolios | | Retired (since 2013); and Professor (1984 to 2013), Wallace E. Carroll School of Management, Boston College. Chairperson of the Board (since 2017) and Trustee (since 2000), John Hancock Fund Complex (collectively, 227 portfolios); Trustee (since 2016), Virtus Alternative Solutions Trust (3 portfolios); Trustee (since 2015), Virtus Mutual Fund Family (75 portfolios); Director (since 2010), Barnes Group, Inc. (diversified global components manufacturer and logistical services company); Trustee, Virtus Variable Insurance Trust (9 portfolios) (since 2008). |
McDaniel, Connie D. YOB: 1958 Served Since: 2017 87 Portfolios | | Retired. Trustee (since 2017), Virtus Mutual Fund Family (75 portfolios), Virtus Variable Insurance Trust (9 portfolios), and Virtus Alternative Solutions Trust (3 portfolios); Trustee (since 2014), Total System Services, Inc.; and Trustee (2005 to 2017), RidgeWorth Funds. |
47
FUND MANAGEMENT TABLES (Unaudited) (Continued)
Independent Trustees (Continued)
| | |
Name, Year of Birth,
Length of Time Served
and Number of Portfolios
in Complex | | Principal Occupation(s)
During Past 5 Years and
Other Directorships Held by Trustee |
McLoughlin, Philip YOB: 1946 Served Since: 1996 95 Portfolios | | Retired. Director and Chairman (since 2016), Virtus Total Return Fund Inc. and Virtus Global Dividend & Income Fund Inc.; Director and Chairman (since 2014) Duff & Phelps Select Energy MLP Fund Inc.; Trustee and Chairman (since 2013), Virtus Alternative Solutions Trust (3 portfolios); Trustee and Chairman (since 2011), Virtus Global Multi-Sector Income Fund; Chairman and Trustee (since 2003), Virtus Variable Insurance Trust (9 portfolios); Director (since 1995), closed-end funds managed by Duff & Phelps Investment Management Co. (4 funds); Director (since 1991) and Chairman (since 2010), Lazard World Trust Fund (closed-end investment firm in Luxembourg); and Trustee (since 1989) and Chairman (since 2002), Virtus Mutual Fund Family (75 portfolios). |
McNamara, Geraldine M. YOB: 1951 Served Since: 2001 91 Portfolios | | Retired. Trustee (since 2016) Virtus Alternative Solutions Trust (3 portfolios); Trustee (since 2015), Virtus Variable Insurance Trust (9 portfolios); Director (since 2003), closed-end funds managed by Duff & Phelps Investment Management Co. (4 funds); and Trustee (since 2001), Virtus Mutual Fund Family (75 portfolios). |
Oates, James M. YOB: 1946 Served Since: 1996 91 Portfolios | | Managing Director (since 1994), Wydown Group (consulting firm). Director (since 2016), Virtus Total Return Fund Inc. and Virtus Global Dividend & Income Fund Inc.; Trustee (since 2016) Virtus Variable Insurance Trust (9 portfolios); Director (since 2014), Duff & Phelps Select Energy MLP Fund Inc.; Trustee (since 2013), Virtus Alternative Solutions Trust (3 portfolios); Trustee (since 2011), Virtus Global Multi-Sector Income Fund; Chairman (2005 to 2017) and Trustee (since 2005), John Hancock Fund Complex (227 portfolios); Director (2002 to 2014), New Hampshire Trust Company; Chairman (2000 to 2016), Emerson Investment Management, Inc.; Non-Executive Chairman (2000 to 2014), Hudson Castle Group, Inc. (formerly IBEX Capital Markets, Inc.) (financial services); Chairman and Director (1999 to 2014), Connecticut River Bank; Director (since 1996), Stifel Financial; and Trustee (since 1987), Virtus Mutual Fund Family (75 portfolios). |
Segerson, Richard E. YOB: 1948 Served Since: 1996 87 Portfolios | | Retired; and Managing Director (1998 to 2013), Northway Management Company. Trustee (since 2016) Virtus Alternative Solutions Trust (3 portfolios) and Virtus Variable Insurance Trust (9 portfolios); and Trustee (since 1983), Virtus Mutual Fund Family (75 portfolios). |
Verdonck, Ferdinand L.J. YOB: 1942 Served Since: 2006 87 Portfolios | | Director (1998 to 2015), The J.P. Morgan Continental European Investment Trust; Director (2005 to 2013), Galapagos N.V. (biotechnology); Director (1998 to 2015) Groupe SNEF; Vice Chairman (since 2014), Affirmed Therapeutics (biotechnology); and Mr. Verdonck is also a director of several non-U.S. companies. Trustee (since 2016) Virtus Variable Insurance Trust (9 portfolios) and Virtus Alternative Solutions Trust (3 portfolios); and Trustee (since 2002), Virtus Mutual Fund Family (75 portfolios). |
48
FUND MANAGEMENT TABLES (Unaudited) (Continued)
Interested Trustee
| | |
Name, Year of Birth,
Year Elected and
Number of Funds
Overseen | | Principal Occupation(s)
During Past 5 Years and
Other Directorships Held by Trustee |
Aylward, George R.* Trustee and President YOB: 1964 Elected: 2006 93 Portfolios | | Director, President and Chief Executive Officer (since 2008), Virtus Investment Partners, Inc. and/or certain of its subsidiaries; various senior officer positions with Virtus affiliates (since 2005). Chairman and Trustee (since 2015), Virtus ETF Trust II (2 funds); Trustee and President (since 2013), Virtus Alternative Solutions Trust (3 portfolios); Director (since 2013), Virtus Global Funds, PLC (2 portfolios); Trustee (since 2012) and President (since 2010), Virtus Variable Insurance Trust (9 portfolios); Director, President and Chief Executive Officer (since 2014), Duff & Phelps Select Energy MLP Fund Inc.; Trustee, President and Chief Executive Officer (since 2011), Virtus Global Multi-Sector Income Fund; Trustee and President (since 2006) and Executive Vice President (2004 to 2006), Virtus Mutual Fund Family (75 portfolios); and Director, President and Chief Executive Officer (since 2006), Virtus Global Dividend & Income Fund Inc. and Virtus Total Return Fund Inc. |
| * | Mr. Aylward is an “interested person,” as defined in the 1940 Act, by reason of his position as President and Chief Executive Officer of Virtus Investment Partners, Inc. (“Virtus”), the ultimate parent company of the Adviser, and various positions with its affiliates, including the Adviser. |
49
FUND MANAGEMENT TABLES (Unaudited) (Continued)
Officers of the Trust Who Are Not Trustees
| | | | |
Name, Address and
Year of Birth | | Position(s) Held with
Trust and Length of
Time Served | | Principal Occupation(s)
During Past 5 Years |
Bradley, W. Patrick YOB: 1972 | | Executive Vice President (since 2016); Senior Vice President (2013 to 2016); Vice President (2011 to 2013); Chief Financial Officer and Treasurer (since 2006). | | Executive Vice President, Fund Services (since 2016), Senior Vice President, Fund Services (2010 to 2016), Virtus Investment Partners, Inc. and/or certain of its subsidiaries; various officer positions (since 2006) with Virtus affiliates; Executive Vice President (since 2016), Senior Vice President (2013 to 2016), Vice President (2011 to 2013), Chief Financial Officer and Treasurer (since 2004), Virtus Variable Insurance Trust; Executive Vice President (since 2016), Senior Vice President (2013 to 2016), Vice President (2011 to 2013), Chief Financial Officer and Treasurer (since 2006), Virtus Mutual Fund Family; Executive Vice President (since 2016), Senior Vice President (2013 to 2016), Vice President (2012 to 2013) and Treasurer and Chief Financial Officer (since 2010), Virtus Total Return Fund Inc.. and Virtus Global Dividend & Income Fund Inc.; Executive Vice President (since 2016), Senior Vice President (2013 to 2016), Vice President (2011 to 2013), Chief Financial Officer and Treasurer (since 2011), Virtus Global Multi-Sector Income Fund; Vice President and Assistant Treasurer (since 2011), Duff & Phelps Global Utility Income Fund Inc.; Director (since 2013), Virtus Global Funds, PLC; and Executive Vice President (since 2016), Senior Vice President, Chief Financial Officer and Treasurer (2013 to 2016), Virtus Alternative Solutions Trust. |
Carr, Kevin J. YOB: 1954 | | Senior Vice President (since 2013); Vice President (2005 to 2013); Chief Legal Officer, Counsel and Secretary (since 2005). | | Senior Vice President (since 2009), Vice President, Counsel and Secretary (2008 to 2009), Virtus Investment Partners, Inc. and/or certain of its subsidiaries; various senior officer positions (since 2005) with Virtus affiliates; Senior Vice President (since 2013), Vice President (2005 to 2013), Chief Legal Officer, Counsel and Secretary (since 2005), Virtus Mutual Fund Family; Senior Vice President (2013 to 2014), Vice President (2012 to 2013) and Assistant Secretary (since 2012), Secretary and Chief Legal Officer (2005 to 2012), Virtus Total Return Fund Inc. and Virtus Global Dividend & Income Fund Inc.; Senior Vice President (since 2017), Assistant Secretary (since 2013), Vice President, Chief Legal Officer, Counsel and Secretary (2010 to 2013), Virtus Variable Insurance Trust; Vice President and Assistant Secretary (since 2011), Duff & Phelps Global Utility Income Fund Inc.; Senior Vice President and Assistant Secretary (2013 to 2014), Vice President and Assistant Secretary (2012 to 2013), Vice President, Chief Legal Officer, Counsel and Secretary (2011 to 2012), Virtus Closed-End Funds; Senior Vice President (since 2017) and Assistant Secretary (since 2013), Virtus Alternative Solutions Trust; Secretary (since 2015), ETFis Series Trust I; and Secretary (since 2015), Virtus ETF Trust II. |
50
FUND MANAGEMENT TABLES (Unaudited) (Continued)
Officers of the Trust Who Are Not Trustees (Continued)
| | | | |
Name, Address and
Year of Birth | | Position(s) Held with
Trust and Length of
Time Served | | Principal Occupation(s)
During Past 5 Years |
Engberg, Nancy J. YOB: 1956 | | Senior Vice President and Chief Compliance Officer (since 2017); Vice President and Chief Compliance Officer (2011 to 2017). | | Senior Vice President (since 2017), Vice President (2008 to 2017) and Chief Compliance Officer (2008 to 2011 and since 2016), Virtus Investment Partners, Inc. and/or certain of its subsidiaries; various officer positions (since 2003) with Virtus affiliates; Senior Vice President (since 2017), Vice President (2011 to 2017) and Chief Compliance Officer (since 2011), Virtus Mutual Fund Family; Senior Vice President (since 2017), Vice President (2010 to 2016) and Chief Compliance Officer (since 2011), Virtus Variable Insurance Trust; Senior Vice President (since 2017), Vice President (2011 to 2016) and Chief Compliance Officer (since 2011), Virtus Global Multi-Sector Income Fund; Senior Vice President (since 2017), Vice President (2012 to 2016) and Chief Compliance Officer (since 2012), Virtus Total Return Fund Inc. and Virtus Global Dividend & Income Fund Inc.; Senior Vice President (since 2017), Vice President (2013 to 2016) and Chief Compliance Officer (since 2013), Virtus Alternative Solutions Trust; Vice President & Chief Compliance Officer (since 2014), Duff & Phelps Select Energy MLP Fund Inc.; Chief Compliance Officer (since 2015), ETFis Series Trust I; and Chief Compliance Officer (since 2015), Virtus ETF Trust II. |
Short, Julia R. YOB: 1972 | | Senior Vice President (since 2017) | | Senior Vice President, Product Development (since 2017), Virtus Investment Partners, Inc. and/or certain of its subsidiaries; Senior Vice President (since 2017), Virtus Mutual Fund Family; President and Chief Executive Officer, RidgeWorth Funds (2007 to 2017); and Managing Director, Product Manager, RidgeWorth Investments (2004 to 2017). |
Waltman, Francis G. YOB: 1962 | | Executive Vice President (since 2013); Senior Vice President (2008 to 2013). | | Executive Vice President, Product Development (since 2009), Virtus Investment Partners, Inc. and/or certain of its subsidiaries; various senior officer positions (since 2006) with Virtus affiliates; Executive Vice President (since 2013), Senior Vice President (2008 to 2013), Virtus Mutual Fund Family; Executive Vice President (since 2013), Senior Vice President (2010 to 2013), Virtus Variable Insurance Trust; Executive Vice President (since 2013), Senior Vice President (2011 to 2013), Virtus Global Multi-Sector Income Fund; Executive Vice President (since 2014), Duff & Phelps Select Energy MLP Fund Inc.; Director (since 2013), Virtus Global Funds PLC; and Executive Vice President (since 2013), Virtus Alternative Solutions Trust. |
51
VIRTUS EQUITY TRUST
101 Munson Street
Greenfield, MA 01301-9668
Trustees
George R. Aylward
Thomas J. Brown
Donald C. Burke
Roger A. Gelfenbien
Sidney E. Harris
John R. Mallin
Hassell H. McClellan
Connie D. McDaniel
Philip R. McLoughlin, Chairman
Geraldine M. McNamara
James M. Oates
Richard E. Segerson
Ferdinand L.J. Verdonck
Officers
George R. Aylward, President
Francis G. Waltman, Executive Vice President
W. Patrick Bradley, Executive Vice President, Chief Financial Officer and Treasurer
Kevin J. Carr, Senior Vice President, Chief Legal Officer, Counsel and Secretary
Nancy J. Engberg, Senior Vice President and Chief Compliance Officer
Julia R. Short, Senior Vice President
Investment Adviser
Virtus Investment Advisers, Inc.
100 Pearl Street
Hartford, CT 06103-4506
Principal Underwriter
VP Distributors, LLC
100 Pearl Street
Hartford, CT 06103-4506
Administrator and Transfer Agent
Virtus Fund Services, LLC
100 Pearl Street
Hartford, CT 06103-4506
Custodian
The Bank of New York Mellon
225 Liberty Street
New York, NY 10286-1048
Independent Registered Public
Accounting Firm
PricewaterhouseCoopers LLP
2001 Market Street
Philadelphia, PA 19103-7042
How to Contact Us
Mutual Fund Services 1-800-243-1574
Adviser Consulting Group 1-800-243-4361
Website Virtus.com
Important Notice to Shareholders
The Securities and Exchange Commission has modified mailing regulations for semiannual and annual shareholder fund reports to allow mutual fund companies to send a single copy of these reports to shareholders who share the same mailing address. If you would like additional copies, please call Mutual Fund Services at 1-800-243-1574.
For more information about
Virtus Mutual Funds, please call
your financial representative, or
contact us at 1-800-243-1574
or Virtus.com.
Item 2. Code of Ethics.
| (a) | The registrant, as of the end of the period covered by this report, has adopted a code of ethics that applies to the registrant’s principal executive officer, principal financial officer, principal accounting officer or controller, or persons performing similar functions, regardless of whether these individuals are employed by the registrant or a third party. |
| (c) | There have been no amendments, during the period covered by this report, to a provision of the code of ethics that applies to the registrant’s principal executive officer, principal financial officer, principal accounting officer or controller, or persons performing similar functions, regardless of whether these individuals are employed by the registrant or a third party, and that relates to any element of the code of ethics described in Item 2(b) of the instructions for completion of Form N-CSR. |
| (d) | The registrant has not granted any waivers, during the period covered by this report, including an implicit waiver, from a provision of the code of ethics that applies to the registrant’s principal executive officer, principal financial officer, principal accounting officer or controller, or persons performing similar functions, regardless of whether these individuals are employed by the registrant or a third party, that relates to one or more of the items set forth in paragraph (b) of the instructions for completion of this Item. |
Item 3. Audit Committee Financial Expert.
(a)(1)The Registrant’s Board of Trustees has determined that the Registrant has an “audit committee financial expert” serving on its Audit Committee.
(a)(2)The Registrant’s Board of Trustees has determined that each of Thomas J. Brown, Donald C. Burke and Richard E. Segerson possesses the technical attributes identified in Instruction 2(b) of Item 3 to Form N-CSR to qualify as an “audit committee financial expert.” Each of Messrs. Brown, Burke and Segerson is an “independent” trustee pursuant to paragraph (a)(2) of Item 3 to Form N-CSR.
Item 4. Principal Accountant Fees and Services.
Audit Fees
| (a) | The aggregate fees billed for each of the last two fiscal years for professional services rendered by the principal accountant for the audit of the registrant’s annual financial statements or services that are normally provided by the accountant in connection with statutory and regulatory filings or engagements for those fiscal years are $261,865 for 2017 and $225,527 for the six months ended September 30, 2017. The Trust changed its fiscal period end from March 31 to September 30 during the period. |
Audit-Related Fees
| (b) | The aggregate fees billed in each of the last two fiscal years for assurance and related services by the principal accountant that are reasonably related to the performance of the audit of the registrant’s financial statements and are not reported under paragraph (a) of this Item are $11,813 for 2017 and $44,019 for the six months ended September 30, 2017. The Trust changed its fiscal period end from March 31 to September 30 during the period. |
Tax Fees
| (c) | The aggregate fees billed in each of the last two fiscal years for professional services rendered by the principal accountant for tax compliance, tax advice, and tax planning are $55,600 for 2017 and $1,500 for the six months ended September 30, 2017. The Trust changed its fiscal period end from March 31 to September 30 during the period. |
“Tax Fees” are those primarily associated with review of the Trust’s tax provision and qualification as a regulated investment company (RIC) in connection with audits of the Trust’s financial statement, review of year-end distributions by the Fund to avoid excise tax for the Trust, periodic discussion with management on tax issues affecting the Trust, and reviewing and signing the Fund’s federal income tax returns.
All Other Fees
| (d) | The aggregate fees billed in each of the last two fiscal years for products and services provided by the principal accountant, other than the services reported in paragraphs (a) through (c) of this Item are $0 for 2017 and $0 for the six months ended September 30, 2017. The Trust changed it’s fiscal period end from March 31 to September 30 during the period. |
| (e)(1) | Disclose the audit committee’s pre-approval policies and procedures described in paragraph (c)(7) of Rule 2-01 of Regulation S-X. |
The Virtus Equity Trust (the “Fund”) Board has adopted policies and procedures with regard to the pre-approval of services provided by PwC. Audit, audit-related and tax compliance services provided to the Fund on an annual basis require specific pre-approval by the Audit Committee. The Audit Committee must also approve other non-audit services provided to the Fund and those non-audit services provided to the Fund’s Affiliated Service Providers that relate directly to the operations and financial reporting of the Fund. Certain of these non-audit services that the Audit Committee believes are a) consistent with the SEC’s auditor independence rules and b) routine and recurring services that will not impair the
independence of the independent auditors may be approved by the Audit Committee without consideration on a specific case-by-case basis (“general pre-approval”).
The Audit Committee has determined that Mr. Thomas J. Brown, Chair of the Audit Committee, may provide pre-approval for such services that meet the above requirements in the event such approval is sought between regularly scheduled meetings. In any event, the Board is informed of each service approved subject to general pre-approval at the next regularly scheduled in-person Audit Committee meeting.
| (e)(2) | The percentage of services described in each of paragraphs (b) through (d) of this Item that were approved by the audit committee pursuant to paragraph (c)(7)(i)(C) of Rule 2-01 of Regulation S-X are as follows: |
(b) 0%
(c) 0%
(d) N/A
| (f) | The percentage of hours expended on the principal accountant’s engagement to audit the registrant’s financial statements for the most recent fiscal year that were attributed to work performed by persons other than the principal accountant’s full-time, permanent employees was less than fifty percent. |
| (g) | The aggregate non-audit fees billed by the registrant’s accountant for services rendered to the registrant, and rendered to the registrant’s investment adviser (not including any sub-adviser whose role is primarily portfolio management and is subcontracted with or overseen by another investment adviser), and any entity controlling, controlled by, or under common control with the adviser that provides ongoing services to the registrant for each of the last two fiscal years of the registrant was $482,558 for 2017 and $223,435 for the six months ended September 30, 2017. The Trust changed its fiscal period end from March 31 to September 30 during the period. |
| (h) | The registrant’s audit committee of the board of directors has considered whether the provision of non-audit services that were rendered to the registrant’s investment adviser (not including any sub-adviser whose role is primarily portfolio management and is subcontracted with or overseen by another investment adviser), and any entity controlling, controlled by, or under common control with the investment adviser that provides ongoing services to the registrant that were not pre-approved pursuant to paragraph (c)(7)(ii) of Rule 2-01 of Regulation S-X is compatible with maintaining the principal accountant’s independence. |
Item 5. Audit Committee of Listed Registrants.
Not applicable.
Item 6. Investments.
| (a) | Schedule of Investments in securities of unaffiliated issuers as of the close of the reporting period is included as part of the report to shareholders filed under Item 1 of this form. |
| Item 7. | Disclosure of Proxy Voting Policies and Procedures for Closed-End Management Investment Companies. |
Not applicable.
Item 8. Portfolio Managers of Closed-End Management Investment Companies.
Not applicable.
| Item 9. | Purchases of Equity Securities by Closed-End Management Investment Company and Affiliated Purchasers. |
Not applicable.
Item 10. Submission of Matters to a Vote of Security Holders.
There have been no material changes to the procedures by which the shareholders may recommend nominees to the registrant’s board of trustees, where those changes were implemented after the registrant last provided disclosure in response to the requirements of Item 407(c)(2)(iv) of Regulation S-K (17 CFR 229.407) (as required by Item 22(b)(15) of Schedule 14A (17 CFR 240.14a-101)), or this Item.
Item 11. Controls and Procedures.
| (a) | The registrant’s principal executive and principal financial officers, or persons performing similar functions, have concluded that the registrant’s disclosure controls and procedures (as defined in Rule 30a-3(c) under the Investment Company Act of 1940, as amended (the “1940 Act”) (17 CFR 270.30a-3(c))) are effective, as of a date within 90 days of the filing date of the report that includes the disclosure required by this paragraph, based on their evaluation of these controls and procedures required by Rule 30a-3(b) under the 1940 Act (17 CFR 270.30a-3(b)) and Rules 13a-15(b) or 15d-15(b) under the Securities Exchange Act of 1934, as amended (17 CFR 240.13a-15(b) or 240.15d-15(b)). |
| (b) | There were no changes in the registrant’s internal control over financial reporting (as defined in Rule 30a-3(d) under the 1940 Act (17 CFR 270.30a-3(d))) that occurred during the registrant’s |
| | last fiscal quarter that has materially affected, or is reasonably likely to materially affect, the registrant’s internal control over financial reporting. |
Item 12. Disclosure of Securities Lending Activities for Closed-End Management Investment Companies.
Not applicable.
Item 13. Exhibits.
| | (a)(1) | Code of ethics, or any amendment thereto, that is the subject of disclosure required by Item 2 is attached hereto. |
| | (a)(2) | Certifications pursuant to Rule 30a-2(a) under the 1940 Act and Section 302 of the Sarbanes-Oxley Act of 2002 are attached hereto. |
| | (b) | Certifications pursuant to Rule 30a-2(b) under the 1940 Act and Section 906 of the Sarbanes-Oxley Act of 2002 are attached hereto. |
SIGNATURES
Pursuant to the requirements of the Securities Exchange Act of 1934 and the Investment Company Act of 1940, the registrant has duly caused this report to be signed on its behalf by the undersigned, thereunto duly authorized.
| | |
| (Registrant) | | Virtus Equity Trust |
| | |
| |
| By (Signature and Title)* | | /s/ George R. Aylward |
| | George R. Aylward, President |
| | (principal executive officer) |
Pursuant to the requirements of the Securities Exchange Act of 1934 and the Investment Company Act of 1940, this report has been signed below by the following persons on behalf of the registrant and in the capacities and on the dates indicated.
| | |
| By (Signature and Title)* | | /s/ George R. Aylward |
| | George R. Aylward, President |
| | (principal executive officer) |
| | |
| By (Signature and Title)* | | /s/ W. Patrick Bradley |
| | W. Patrick Bradley, Executive Vice President, Chief Financial Officer, and Treasurer |
| | (principal financial officer) |
* Print the name and title of each signing officer under his or her signature.