UNITED STATES
SECURITIES AND EXCHANGE COMMISSION
Washington, D.C. 20549
FORMN-CSR
CERTIFIED SHAREHOLDER REPORT OF REGISTERED MANAGEMENT
INVESTMENT COMPANIES
Investment Company Act file number 811-00945
Virtus Equity Trust
(Exact name of registrant as specified in charter)
101 Munson Street
Greenfield, MA 01301-9668
(Address of principal executive offices) (Zip code)
Kevin J. Carr, Esq.
Senior Vice President, Chief Legal Officer, Counsel and Secretary for Registrant
One Financial Plaza
Hartford, CT 06103-2608
(Name and address of agent for service)
Registrant’s telephone number, including area code: (800)243-1574
Date of fiscal year end: September 30
Date of reporting period: September 30, 2019
FormN-CSR is to be used by management investment companies to file reports with the Commission not later than 10 days after the transmission to stockholders of any report that is required to be transmitted to stockholders under Rule30e-1 under the Investment Company Act of 1940 (17 CFR270.30e-1). The Commission may use the information provided on FormN-CSR in its regulatory, disclosure review, inspection, and policymaking roles.
A registrant is required to disclose the information specified by FormN-CSR, and the Commission will make this information public. A registrant is not required to respond to the collection of information contained in FormN-CSR unless the Form displays a currently valid Office of Management and Budget (“OMB”) control number. Please direct comments concerning the accuracy of the information collection burden estimate and any suggestions for reducing the burden to Secretary, Securities and Exchange Commission, 450 Fifth Street, NW, Washington, DC 20549-0609. The OMB has reviewed this collection of information under the clearance requirements of 44 U.S.C. § 3507.
Item 1. Reports to Stockholders.
The Report to Shareholders is attached herewith.
ANNUAL REPORT
VIRTUS EQUITY TRUST
| Virtus KAR Capital Growth Fund* |
| Virtus KAR Global Quality Dividend Fund |
| Virtus KAR Mid-Cap Core Fund |
| Virtus KAR Mid-Cap Growth Fund* |
| Virtus KAR Small-Cap Core Fund |
| Virtus KAR Small-Cap Growth Fund |
| Virtus KAR Small-Cap Value Fund |
| Virtus KAR Small-Mid Cap Core Fund |
| Virtus Rampart Enhanced Core Equity Fund |
| Virtus SGA Emerging Markets Growth Fund |
| Virtus SGA Global Growth Fund* |
*Prospectus supplement applicable to this fund appears at the back of this annual report.
Beginning on January 1, 2021, as permitted by regulations adopted by the Securities and Exchange Commission, paper copies of each Fund’s shareholder reports like this one will no longer be sent by mail, unless specifically requested from the Fund or from your financial intermediary, such as a broker-dealer or bank. Instead, the reports will be made available on a website, and you will be notified by mail each time a report is posted and provided with a website link to access the report.
You may elect at any time to receive not only shareholder reports but also certain other communications from the Fund electronically, or you may elect to receive paper copies of all future shareholder reports free of charge to you. If you own your shares directly with the Fund, you may make such elections by calling the Fund at 1-800-243-1574 or, with respect to requesting electronic delivery, by visiting www.virtus.com. An election made directly with the Fund will apply to all Virtus Mutual Funds in which you own shares directly. If you own your shares through a financial intermediary, please contact your financial intermediary to make your request and to determine whether your election will apply to all funds in which you own shares through that intermediary.
Not FDIC Insured • No Bank Guarantee • May Lose Value
Table of Contents
Message to Shareholders
| 1 |
Disclosure of Fund Expenses
| 2 |
Key Investment Terms
| 6 |
| Fund | Fund
Summary | Schedule
of
Investments |
Virtus KAR Capital Growth Fund (“KAR Capital Growth Fund”)
| 9 | 43 |
Virtus KAR Global Quality Dividend Fund (“KAR Global Quality Dividend Fund”)
| 12 | 45 |
Virtus KAR Mid-Cap Core Fund (“KAR Mid-Cap Core Fund”)
| 15 | 47 |
Virtus KAR Mid-Cap Growth Fund (“KAR Mid-Cap Growth Fund”)
| 18 | 48 |
Virtus KAR Small-Cap Core Fund (“KAR Small-Cap Core Fund”)
| 21 | 50 |
Virtus KAR Small-Cap Growth Fund (“KAR Small-Cap Growth Fund”)
| 24 | 51 |
Virtus KAR Small-Cap Value Fund (“KAR Small-Cap Value Fund”)
| 27 | 52 |
Virtus KAR Small-Mid Cap Core Fund (“KAR Small-Mid Cap Core Fund”)
| 30 | 53 |
Virtus Rampart Enhanced Core Equity Fund (“Rampart Enhanced Core Equity Fund”)
| 33 | 54 |
Virtus SGA Emerging Markets Growth Fund (“SGA Emerging Markets Growth Fund”)
| 36 | 59 |
Virtus SGA Global Growth Fund (“SGA Global Growth Fund”)
| 40 | 60 |
Statements of Assets and Liabilities
| | 61 |
Statements of Operations
| | 67 |
Statements of Changes in Net Assets
| | 71 |
Financial Highlights
| | 77 |
Notes to Financial Statements
| | 85 |
Report of Independent Registered Public Accounting Firm
| | 102 |
Tax Information Notice
| | 103 |
Results of Shareholder Meeting
| | 104 |
Consideration of Advisory and Subadvisory Agreements by the Board of Trustees
| | 105 |
Fund Management Tables
| | 111 |
Proxy Voting Procedures and Voting Record (Form N-PX)
The subadvisers vote proxies, if any, relating to portfolio securities in accordance with procedures that have been approved by the Board of Trustees of the Trust (“Trustees”, or the “Board”). You may obtain a description of these procedures, along with information regarding how the Funds voted proxies during the most recent 12-month period ended June 30, free of charge, by calling toll-free 1-800-243-1574. This information is also available through the Securities and Exchange Commission’s (the “SEC”) website athttps://www.sec.gov.
PORTFOLIO HOLDINGS INFORMATION
For periods prior to the quarter ending March 31, 2019, the Trust has filed a complete schedule of portfolio holdings for each Fund with the SEC for the first and third quarters of each fiscal year on Form N-Q. Each Fund’s Form N-Qs are available on the SEC’s website athttps://www.sec.gov.
For the period ended June 30, 2019, the Trust has filed a complete schedule of portfolio holdings for each Fund with the SEC for the third quarter of the fiscal year as an exhibit to its reports on Form N-PORT-EX. Form N-PORT-EX is available on the SEC’s website athttps://www.sec.gov.
Effective September 30, 2019, the Trust files a complete schedule of portfolio holdings for each Fund with the SEC for the first and third quarters of each fiscal year as an exhibit to its reports on Form N-PORT-P. Form N-PORT-P is available on the SEC’s website athttps://www.sec.gov.
This report is not authorized for distribution to prospective investors in the Funds presented in this book unless preceded or accompanied by an effective prospectus which includes information concerning the sales charge, each Fund’s record and other pertinent information.
To My Fellow Shareholders of Virtus Mutual Funds:
I am pleased to present this annual report that reviews the performance of your fund for the 12 months ended September 30, 2019.
After a sharp downturn in the fourth quarter of 2018, global financial markets rallied during the first nine months of 2019. While global growth continued to slow, interest rate cuts by the U.S. Federal Reserve and the European Central Bank helped restore confidence to the markets. The easing of monetary policy boosted the returns of both equities and fixed income in the first nine months of 2019. However, the uncertainty about trade, tariffs and other geopolitical issues led to frequent reversals in the direction of the markets.
Positive returns in the first nine months of 2019 offset the 2018 fourth quarter downturn. For the 12 months ended September 30, 2019, U.S. large-capitalization stocks, as measured by the S&P 500® Index, rose 4.25% as a result of a 20.55% increase for the year-to-date. Small-cap stocks, as measured by the Russell 2000® Index, rose 14.18% for the nine months of 2019, but were down 8.89% for the full year period. Within international equities, developed markets produced the strongest returns, with the MSCI EAFE® Index (net) up 12.80% for the nine-month period, but down 1.34% for the full year, compared to emerging markets, which were up 5.89% for the nine months of 2019, but declined 2.02% for the full year, as measured by the MSCI Emerging Markets Index (net).
In fixed income markets, the yield on the 10-year Treasury was 1.68% at September 30, 2019, down from 3.05% at September 30, 2018. The broader U.S. fixed income market, as represented by the Bloomberg Barclays U.S. Aggregate Bond Index, which tracks Treasuries and other investment-grade debt securities, was up 10.30% for the 12-month period. Non-investment grade bonds were up 6.36% for the period, as measured by the Bloomberg Barclays U.S. Corporate High Yield Bond Index.
It is impossible to know how the markets will perform from day to day or month to month. But a well-diversified portfolio can help investors weather the short-term ups and downs. While diversification cannot guarantee a profit or prevent a loss, owning a variety of traditional and alternative asset classes has been shown to dampen the inevitable market fluctuations. Your financial advisor can help you ensure that your portfolio is adequately diversified across asset classes and investment strategies, with a broad array of Virtus Funds available through your fund exchange privileges. These include distinctive equity, fixed income, alternative, and asset allocation funds managed by Virtus affiliates and select subadvisers. We invite you to learn more about the Virtus family of funds atVirtus.com.
On behalf of our investment affiliates, thank you for entrusting the Virtus Funds with your assets. Should you have questions about your account or require assistance, please visitVirtus.com, or call our customer service team at 800-243-1574. We appreciate your business and remain committed to your long-term financial success.
Sincerely,
George R. Aylward
President, Virtus Funds
November 2019
Performance data quoted represents past results. Past performance is no guarantee of future results, and current performance may be higher or lower than the performance shown above.
VIRTUS EQUITY TRUST
DISCLOSURE OF FUND EXPENSES (Unaudited)
FOR THE SIX-MONTH PERIOD OFApril 1, 2019 TOSeptember 30, 2019
We believe it is important for you to understand the impact of costs on your investment. All mutual funds have operating expenses. As a shareholder of a Virtus Equity Trust Fund discussed in this shareholder report (each, a “Fund”), you may incur two types of costs: (1) transaction costs, including sales charges on purchases of Class A shares and contingent deferred sales charges on Class C shares; and (2) ongoing costs, including investment advisory fees, distribution and service fees, and other expenses. Class I shares and Class R6 shares are sold without sales charges and do not incur distribution and service fees. Class R6 shares also do not incur shareholder servicing fees. For further information regarding applicable sales charges, see Note 1 in the Notes to Financial Statements. These examples are intended to help you understand your ongoing costs (in dollars) of investing in the Fund and to compare these costs with the ongoing costs of investing in other mutual funds. These examples are based on an investment of $1,000 invested at the beginning of the period and held for the entire six-month period. The Annualized Expense Ratios may be different from the expense ratios in the Financial Highlights which are for the fiscal year ended September 30, 2019.
Please note that the expenses shown in the accompanying tables are meant to highlight your ongoing costs only and do not reflect any transactional costs, such as sales charges or contingent deferred sales charges. Therefore, the accompanying tables are useful in comparing ongoing costs only, and will not help you determine the relative total costs of owning different funds. In addition, if these transactional costs were included, your costs would have been higher. The calculations assume no shares were bought or sold during the period. Your actual costs may have been higher or lower, depending on the amount of your investment and the timing of any purchases or redemptions.
Actual Expenses
The table below provides information about actual account values and actual expenses. You may use the information below, together with the amount you invested, to estimate the expenses that you paid over the period. Simply divide your account value by $1,000 (for example, an $8,600 account value divided by $1,000 = 8.6), then multiply the result by the number in the table under the heading entitled “Expenses Paid During Period” to estimate the expenses you paid on your account during this period.
| | | Beginning
Account Value
April 1, 2019 | | Ending
Account Value
September 30, 2019 | | Annualized
Expense
Ratio | | Expenses
Paid
During
Period* |
KAR Capital Growth Fund
| | | | | | | | |
| | Class A | $ 1,000.00 | | $ 1,006.64 | | 1.24 % | | $ 6.24 |
| | Class C | 1,000.00 | | 1,001.60 | | 2.02 | | 10.14 |
| | Class I | 1,000.00 | | 1,006.96 | | 1.03 | | 5.18 |
| | Class R6 | 1,000.00 | | 1,008.71 | | 0.75 | | 3.78 |
KAR Global Quality Dividend Fund
| | | | | | | | |
| | Class A | 1,000.00 | | 1,061.83 | | 1.35 | | 6.98 |
| | Class C | 1,000.00 | | 1,058.78 | | 2.11 | | 10.89 |
| | Class I | 1,000.00 | | 1,063.26 | | 1.10 | | 5.69 |
| | Class R6** | 1,000.00 | | 1,040.06 | | 0.78 | | 1.31 |
KAR Mid-Cap Core Fund
| | | | | | | | |
| | Class A | 1,000.00 | | 1,071.54 | | 1.20 | | 6.23 |
| | Class C | 1,000.00 | | 1,067.50 | | 1.95 | | 10.11 |
| | Class I | 1,000.00 | | 1,072.99 | | 0.95 | | 4.94 |
| | Class R6 | 1,000.00 | | 1,073.21 | | 0.87 | | 4.52 |
KAR Mid-Cap Growth Fund
| | | | | | | | |
| | Class A | 1,000.00 | | 1,036.60 | | 1.40 | | 7.15 |
| | Class C | 1,000.00 | | 1,032.69 | | 2.15 | | 10.96 |
| | Class I | 1,000.00 | | 1,038.09 | | 1.10 | | 5.62 |
| | Class R6 | 1,000.00 | | 1,039.33 | | 0.84 | | 4.29 |
KAR Small-Cap Core Fund
| | | | | | | | |
| | Class A | 1,000.00 | | 1,089.87 | | 1.28 | | 6.71 |
| | Class C | 1,000.00 | | 1,086.04 | | 2.03 | | 10.62 |
| | Class I | 1,000.00 | | 1,091.18 | | 1.02 | | 5.35 |
| | Class R6 | 1,000.00 | | 1,091.94 | | 0.94 | | 4.93 |
KAR Small-Cap Growth Fund
| | | | | | | | |
| | Class A | 1,000.00 | | 1,057.33 | | 1.37 | | 7.07 |
| | Class C | 1,000.00 | | 1,053.53 | | 2.10 | | 10.81 |
| | Class I | 1,000.00 | | 1,058.63 | | 1.11 | | 5.73 |
| | Class R6 | 1,000.00 | | 1,059.39 | | 1.00 | | 5.16 |
KAR Small-Cap Value Fund
| | | | | | | | |
| | Class A | 1,000.00 | | 1,063.23 | | 1.23 | | 6.36 |
| | Class C | 1,000.00 | | 1,058.61 | | 2.02 | | 10.42 |
| | Class I | 1,000.00 | | 1,064.42 | | 1.02 | | 5.28 |
| | Class R6 | 1,000.00 | | 1,064.97 | | 0.91 | | 4.71 |
VIRTUS EQUITY TRUST
DISCLOSURE OF FUND EXPENSES (Unaudited) (Continued)
FOR THE SIX-MONTH PERIOD OFApril 1, 2019 TOSeptember 30, 2019
| | | Beginning
Account Value
April 1, 2019 | | Ending
Account Value
September 30, 2019 | | Annualized
Expense
Ratio | | Expenses
Paid
During
Period* |
KAR Small-Mid Cap Core Fund
| | | | | | | | |
| | Class A | $1,000.00 | | $1,104.41 | | 1.30% | | $6.86 |
| | Class C | 1,000.00 | | 1,101.45 | | 2.05 | | 10.80 |
| | Class I | 1,000.00 | | 1,106.22 | | 1.05 | | 5.54 |
| | Class R6 | 1,000.00 | | 1,106.12 | | 0.97 | | 5.12 |
Rampart Enhanced Core Equity Fund
| | | | | | | | |
| | Class A | 1,000.00 | | 1,040.89 | | 1.20 | | 6.14 |
| | Class C | 1,000.00 | | 1,037.29 | | 1.95 | | 9.96 |
| | Class I | 1,000.00 | | 1,042.51 | | 0.95 | | 4.86 |
| | Class R6 | 1,000.00 | | 1,042.60 | | 0.91 | | 4.66 |
SGA Emerging Markets Growth Fund***
| | | | | | | | |
| | Class A | 1,000.00 | | 997.00 | | 1.48 | | 4.29 |
| | Class C | 1,000.00 | | 995.00 | | 2.23 | | 6.46 |
| | Class I | 1,000.00 | | 998.00 | | 1.23 | | 3.57 |
| | Class R6 | 1,000.00 | | 998.00 | | 1.05 | | 3.05 |
SGA Global Growth Fund
| | | | | | | | |
| | Class A | 1,000.00 | | 1,047.95 | | 1.37 | | 7.03 |
| | Class C | 1,000.00 | | 1,044.46 | | 2.09 | | 10.71 |
| | Class I**** | 1,000.00 | | 1,048.88 | | 1.16 | | 5.96 |
| | Class R6***** | 1,000.00 | | 1,050.17 | | 0.94 | | 4.83 |
| * | Expenses are equal to the relevant Fund’s annualized expense ratio, which is net of waived fees and reimbursed expenses, if applicable, multiplied by the average account value over the period, multiplied by the number of days (183) expenses were accrued in the most recent fiscal half-year, then divided by 365 to reflect the one-half year period. |
| ** | August 2, 2019, is the date the Class started accruing expenses. Expenses are equal to the Class’ annualized expense ratio, which is net of waived fees and reimbursed expenses, if applicable, multiplied by the average account value over the period, multiplied by the number of days (60) expenses were accrued in the most recent fiscal half-year, then divided by 365 to reflect the one-half year period. |
| *** | June 17, 2019, is the date the Fund started accruing expenses. Expenses are equal to the Fund’s annualized expense ratio, which is net of waived fees and reimbursed expenses, if applicable, multiplied by the average account value over the period, multiplied by the number of days (106) expenses were accrued in the most recent fiscal half-year, then divided by 365 to reflect the one-half year period. |
| **** | On May 3, 2019, Investor Class shares of the Predecessor Fund were reorganized into Class I shares of the Fund. See Note 1 in the Notes to Financial Statements. |
| ***** | On May 3, 2019, Y Class shares and Institutional Class shares of the Predecessor Fund were reorganized into Class R6 shares of the Fund. See Note 1 in the Notes to Financial Statements. |
For Funds which may invest in other funds, the annualized expense ratios noted above do not reflect fees and expenses associated with any underlying funds. If such fees and expenses had been included, the expenses would have been higher.
You can find more information about a Fund’s expenses in the Financial Statements section that follows. For additional information on operating expenses and other shareholder costs, refer to that Fund’s prospectus.
Hypothetical Example for Comparison Purposes
The table below provides information about hypothetical account values and hypothetical expenses based on a Fund’s actual expense ratio and an assumed rate of return of 5% per year before expenses, which is not your Fund’s actual return. The hypothetical account values and expenses may not be used to estimate the actual ending account balance or expenses you paid for the period. You may use this information to compare the ongoing costs of investing in your Fund and other funds. To do so, compare these 5% hypothetical examples with the 5% hypothetical examples that appear in the shareholder reports of other mutual funds.
| | | Beginning
Account Value
April 1, 2019 | | Ending
Account Value
September 30, 2019 | | Annualized
Expense
Ratio | | Expenses
Paid
During
Period* |
KAR Capital Growth Fund
| | | | | | | | |
| | Class A | $ 1,000.00 | | $ 1,018.85 | | 1.24 % | | $ 6.28 |
| | Class C | 1,000.00 | | 1,014.94 | | 2.02 | | 10.20 |
| | Class I | 1,000.00 | | 1,019.90 | | 1.03 | | 5.22 |
| | Class R6 | 1,000.00 | | 1,021.31 | | 0.75 | | 3.80 |
VIRTUS EQUITY TRUST
DISCLOSURE OF FUND EXPENSES (Unaudited) (Continued)
FOR THE SIX-MONTH PERIOD OFApril 1, 2019 TOSeptember 30, 2019
| | | Beginning
Account Value
April 1, 2019 | | Ending
Account Value
September 30, 2019 | | Annualized
Expense
Ratio | | Expenses
Paid
During
Period* |
KAR Global Quality Dividend Fund
| | | | | | | | |
| | Class A | $1,000.00 | | $1,018.30 | | 1.35% | | $6.83 |
| | Class C | 1,000.00 | | 1,014.49 | | 2.11 | | 10.66 |
| | Class I | 1,000.00 | | 1,019.55 | | 1.10 | | 5.57 |
| | Class R6 | 1,000.00 | | 1,021.16 | | 0.78 | | 3.95 |
KAR Mid-Cap Core Fund
| | | | | | | | |
| | Class A | 1,000.00 | | 1,019.05 | | 1.20 | | 6.07 |
| | Class C | 1,000.00 | | 1,015.29 | | 1.95 | | 9.85 |
| | Class I | 1,000.00 | | 1,020.31 | | 0.95 | | 4.81 |
| | Class R6 | 1,000.00 | | 1,020.71 | | 0.87 | | 4.41 |
KAR Mid-Cap Growth Fund
| | | | | | | | |
| | Class A | 1,000.00 | | 1,018.05 | | 1.40 | | 7.08 |
| | Class C | 1,000.00 | | 1,014.29 | | 2.15 | | 10.86 |
| | Class I | 1,000.00 | | 1,019.55 | | 1.10 | | 5.57 |
| | Class R6 | 1,000.00 | | 1,020.86 | | 0.84 | | 4.26 |
KAR Small-Cap Core Fund
| | | | | | | | |
| | Class A | 1,000.00 | | 1,018.65 | | 1.28 | | 6.48 |
| | Class C | 1,000.00 | | 1,014.89 | | 2.03 | | 10.25 |
| | Class I | 1,000.00 | | 1,019.95 | | 1.02 | | 5.16 |
| | Class R6 | 1,000.00 | | 1,020.36 | | 0.94 | | 4.76 |
KAR Small-Cap Growth Fund
| | | | | | | | |
| | Class A | 1,000.00 | | 1,018.20 | | 1.37 | | 6.93 |
| | Class C | 1,000.00 | | 1,014.54 | | 2.10 | | 10.61 |
| | Class I | 1,000.00 | | 1,019.50 | | 1.11 | | 5.62 |
| | Class R6 | 1,000.00 | | 1,020.05 | | 1.00 | | 5.06 |
KAR Small-Cap Value Fund
| | | | | | | | |
| | Class A | 1,000.00 | | 1,018.90 | | 1.23 | | 6.23 |
| | Class C | 1,000.00 | | 1,014.94 | | 2.02 | | 10.20 |
| | Class I | 1,000.00 | | 1,019.95 | | 1.02 | | 5.16 |
| | Class R6 | 1,000.00 | | 1,020.51 | | 0.91 | | 4.61 |
KAR Small-Mid Cap Core Fund
| | | | | | | | |
| | Class A | 1,000.00 | | 1,018.55 | | 1.30 | | 6.58 |
| | Class C | 1,000.00 | | 1,014.79 | | 2.05 | | 10.35 |
| | Class I | 1,000.00 | | 1,019.80 | | 1.05 | | 5.32 |
| | Class R6 | 1,000.00 | | 1,020.21 | | 0.97 | | 4.91 |
Rampart Enhanced Core Equity Fund
| | | | | | | | |
| | Class A | 1,000.00 | | 1,019.05 | | 1.20 | | 6.07 |
| | Class C | 1,000.00 | | 1,015.29 | | 1.95 | | 9.85 |
| | Class I | 1,000.00 | | 1,020.31 | | 0.95 | | 4.81 |
| | Class R6 | 1,000.00 | | 1,020.51 | | 0.91 | | 4.61 |
SGA Emerging Markets Growth Fund
| | | | | | | | |
| | Class A | 1,000.00 | | 1,017.65 | | 1.48 | | 7.49 |
| | Class C | 1,000.00 | | 1,013.89 | | 2.23 | | 11.26 |
| | Class I | 1,000.00 | | 1,018.90 | | 1.23 | | 6.23 |
| | Class R6 | 1,000.00 | | 1,019.80 | | 1.05 | | 5.32 |
SGA Global Growth Fund
| | | | | | | | |
| | Class A | 1,000.00 | | 1,018.20 | | 1.37 | | 6.93 |
| | Class C | 1,000.00 | | 1,014.59 | | 2.09 | | 10.56 |
| | Class I** | 1,000.00 | | 1,019.25 | | 1.16 | | 5.87 |
| | Class R6*** | 1,000.00 | | 1,020.36 | | 0.94 | | 4.76 |
| * | Expenses are equal to the relevant Fund’s annualized expense ratio, which is net of waived fees and reimbursed expenses, if applicable, multiplied by the average account value over the period, multiplied by the number of days (183) expenses were accrued in the most recent fiscal half-year, then divided by 365 to reflect the one-half year period. |
| ** | On May 3, 2019, Investor Class shares of the Predecessor Fund were reorganized into Class I shares of the Fund. See Note 1 in the Notes to Financial Statements. |
| *** | On May 3, 2019, Y Class shares and Institutional Class shares of the Predecessor Fund were reorganized into Class R6 shares of the Fund. See Note 1 in the Notes to Financial Statements. |
VIRTUS EQUITY TRUST
DISCLOSURE OF FUND EXPENSES (Unaudited) (Continued)
FOR THE SIX-MONTH PERIOD OFApril 1, 2019 TOSeptember 30, 2019
For Funds which may invest in other funds, the annualized expense ratios noted above do not reflect fees and expenses associated with any underlying funds. If such fees and expenses had been included, the expenses would have been higher.
You can find more information about a Fund’s expenses in the Financial Statements section that follows. For additional information on operating expenses and other shareholder costs, refer to that Fund’s prospectus.
VIRTUS EQUITY TRUST
KEY INVESTMENT TERMS (Unaudited)
September 30, 2019
American Depositary Receipt (“ADR”)
Represents shares of foreign companies traded in U.S. dollars on U.S. exchanges that are held by a U.S. bank or a trust. Foreign companies use ADRs in order to make it easier for Americans to buy their shares.
Bloomberg Barclays U.S. Aggregate Bond Index
The Bloomberg Barclays U.S. Aggregate Bond Index measures the U.S. investment-grade fixed-rate bond market. The index is calculated on a total return basis. The index is unmanaged, its returns do not reflect any fees, expenses, or sales charges, and it is not available for direct investment.
Bloomberg Barclays U.S. Corporate High Yield Bond Index
The Bloomberg Barclays U.S. Corporate High Yield Bond Index measures the U.S. dollar-denominated, high yield, fixed-rate corporate bond market. The index is calculated on a total return basis. The index is unmanaged, its returns do not reflect any fees, expenses, or sales charges, and it is not available for direct investment.
Dow Jones Industrial Average®
The Dow Jones Industrial Average® is a price-weighted measure of 30 U.S. blue-chip companies. The index covers all industries except transportation and utilities. The index is unmanaged, its returns do not reflect any fees, expenses, or sales charges, and it is not available for direct investment.
European Central Bank (“ECB”)
The ECB is responsible for conducting monetary policy for the euro area. The ECB was established as the core of the Eurosystem and the European System of Central Banks (“ESCB”). The ESCB comprises the ECB and the National Central Banks (“NCBs”) of all 17 European Union Member States whether they have adopted the Euro or not.
Exchange-Traded Funds (“ETF”)
An open-end fund that is traded on a stock exchange. Most ETFs have a portfolio of stocks or bonds that track a specific market index.
Federal Reserve (the “Fed”)
The Central Bank of the U.S., the Fed is responsible for controlling money supply, interest rates and credit with the goal of keeping the U.S. economy and currency stable. Governed by a seven-member board, the system includes 12 regional Federal Reserve Banks, 25 Branches and all national and state banks that are part of the system.
Global Quality Dividend Linked Benchmark
The Virtus Global Quality Dividend Linked Benchmark consists of the MSCI World High Dividend Yield Index (net). The MSCI World High Dividend Yield Index is based on the MSCI World Index, its parent index, and includes large and mid cap stocks across 23 Developed Markets (DM) countries. The index is designed to reflect the performance of equities in the parent index (excluding REITs) with higher dividend income and quality characteristics than average dividend yields that are both sustainable and persistent. The index also applies quality screens and reviews 12-month past performance to omit stocks with potentially deteriorating fundamentals that could force them to cut or reduce dividends. The index is calculated on a total return basis with net dividends reinvested; it is unmanaged; its returns do not reflect any fees, expenses or sales charges; and it is not available for direct investment. Performance of the Virtus Global Quality Dividend Linked Benchmark between 2/1/2017 and 12/31/2018 is that of the Russell Developed Large Cap Index. Prior to 2/1/2017 performance is that of the Russell 1000® Value Index.
Gross Domestic Product (“GDP”)
The gross domestic product represents the market value of all goods and services produced by the economy during the period measured, including personal consumption, government purchases, private inventories, paid-in construction costs and the foreign trade balance.
London Interbank Offered Rate (“LIBOR”)
A benchmark rate that some of the world’s leading banks charge each other for short-term loans and that serves as the first step to calculating interest rates on various loans throughout the world.
MSCI AC World Growth Index (net)
The MSCI AC World Growth Index (net) is a free float-adjusted market capitalization-weighted index that measures equity performance of large and mid cap securities exhibiting overall growth style characteristics across developed and emerging markets. The index is calculated on a total return basis with net dividends reinvested. The index is unmanaged, its returns do not reflect any fees, expenses, or sales charges, and is not available for direct investment.
MSCI AC World Index (net)
The MSCI AC World Index (net) is a free float-adjusted market capitalization-weighted index that measures equity performance of developed and emerging markets. The index is calculated on a total return basis with net dividends reinvested. The index is unmanaged, its returns do not reflect any fees, expenses, or sales charges, and is not available for direct investment.
VIRTUS EQUITY TRUST
KEY INVESTMENT TERMS (Unaudited) (Continued)
September 30, 2019
MSCI EAFE® Index (net)
The MSCI EAFE® (Europe, Australasia, Far East) Index (net) is a free float-adjusted market capitalization-weighted index that measures developed foreign market equity performance, excluding the U.S. and Canada. The index is calculated on a total return basis with net dividends reinvested. The index is unmanaged, its returns do not reflect any fees, expenses, or sales charges, and it is not available for direct investment.
MSCI Emerging Markets Index (net)
The MSCI Emerging Markets Index (net) is a free float-adjusted market capitalization-weighted index designed to measure equity market performance in the global emerging markets. The index is calculated on a total return basis with net dividends reinvested. The index is unmanaged, its returns do not reflect any fees, expenses, or sales charges, and it is not available for direct investment.
MSCI World High Dividend Yield Index (net)
The MSCI World High Dividend Yield Index (net) is based on the MSCI World Index, its parent index, and includes large- and mid-cap stocks across 23 developed markets countries. The index is designed to reflect the performance of equities in the parent index (excluding REITs) with higher dividend income and quality characteristics than average dividend yields that are both sustainable and persistent. The index also applies quality screens and reviews 12-month past performance to omit stocks with potentially deteriorating fundamentals that could force them to cut or reduce dividends. The index is calculated on a total return basis with net dividends reinvested. The index is unmanaged, its returns do not reflect any fees, expenses, or sales charges, and it is not available for direct investment.
Real Estate Investment Trust (“REIT”)
A publicly traded company that owns, develops and operates income-producing real estate such as apartments, office buildings, hotels, shopping centers and other commercial properties.
Russell 1000® Growth Index
The Russell 1000® Growth Index is a market capitalization-weighted index of growth-oriented stocks of the 1,000 largest companies in the Russell Universe, which comprises the 3,000 largest U.S. companies. The index is calculated on a total return basis with dividends reinvested. The index is unmanaged, its returns do not reflect any fees, expenses, or sales charges, and it is not available for direct investment.
Russell 2000® Growth Index
The Russell 2000® Growth Index is a market capitalization-weighted index of growth-oriented stocks of the smallest 2,000 companies in the Russell Universe, which comprises the 3,000 largest U.S. companies. The index is calculated on a total return basis with dividends reinvested. The index is unmanaged, its returns do not reflect any fees, expenses, or sales charges, and it is not available for direct investment.
Russell 2000® Index
The Russell 2000® Index is a market capitalization-weighted index of the 2,000 smallest companies in the Russell Universe, which comprises the 3,000 largest U.S. companies. The index is calculated on a total return basis with dividends reinvested. The index is unmanaged, its returns do not reflect any fees, expenses, or sales charges, and it is not available for direct investment.
Russell 2500TM Index
The Russell 2500TM Index is a market capitalization-weighted index of the 2,500 smallest companies in the Russell Universe, which comprises the 3,000 largest U.S. companies. The index is calculated on a total return basis with dividends reinvested. The index is unmanaged, its returns do not reflect any fees, expenses, or sales charges, and is not available for direct investment.
Russell 2000® Value Index
The Russell 2000® Value Index is a market capitalization-weighted index of value-oriented stocks of the smallest 2,000 companies in the Russell Universe, which comprises the 3,000 largest U.S. companies. The index is calculated on a total return basis with dividends reinvested. The index is unmanaged, its returns do not reflect any fees, expenses, or sales charges, and it is not available for direct investment.
Russell Midcap® Growth Index
The Russell Midcap® Growth Index is a market capitalization-weighted index of medium-capitalization, growth-oriented stocks of U.S. companies. The index is calculated on a total return basis with dividends reinvested. The index is unmanaged, its returns do not reflect any fees, expenses, or sales charges, and it is not available for direct investment.
Russell Midcap® Index
The Russell Midcap® Index is a market capitalization-weighted index of medium-capitalization stocks of U.S. companies. The index is calculated on a total return basis with dividends reinvested. The index is unmanaged, its returns do not reflect any fees, expenses, or sales charges, and it is not available for direct investment.
VIRTUS EQUITY TRUST
KEY INVESTMENT TERMS (Unaudited) (Continued)
September 30, 2019
S&P 500® Index
The S&P 500® Index is a free-float market capitalization-weighted index of 500 of the largest U.S. companies. The index is calculated on a total return basis with dividends reinvested. The index is unmanaged, its returns do not reflect any fees, expenses, or sales charges, and it is not available for direct investment.
| Ticker Symbols: |
| Class A: PSTAX |
| Class C: SSTFX |
| Class I: PLXGX |
| Class R6: VCGRX |
KAR Capital Growth Fund
Fund Summary (Unaudited)
Portfolio Manager Commentary by
Kayne Anderson Rudnick Investment Management, LLC
| ■ | The Fund is diversified and has an investment objective of long-term capital growth.There is no guarantee that the Fund will meet its objective. |
| ■ | For the fiscal year ended September 30, 2019, the Fund’s Class A shares at NAV returned 1.10%, Class C shares at NAV returned 0.26%, Class I shares at NAV returned 1.29%, and Class R6 shares at NAV returned 1.25%. For the same period, the Russell 1000® Growth Index, which serves as both the Fund’s broad-based and style-specific index appropriate the comparison, returned 3.71%. |
All performance figures assume reinvestment of distributions and exclude the effect of sales charges. Performance data quoted represents past results. Past performance is no guarantee of future results, and current performance may be higher or lower than the performance shown above. Investment return and principal value will fluctuate so your shares, when redeemed, may be worth more or less than their original cost. Please visit Virtus.com for performance data current to the most recent month-end.
How did the markets perform during the Fund’s fiscal year ended September 30, 2019?
Stock market returns were mixed during the fiscal year ended September 30, 2019, with the S&P 500® Index advancing 4.25%, while small-capitalization stocks, as represented by the Russell 2000® Index, fell 8.89% and international developed markets, as measured by the MSCI EAFE® Index (net), declined 1.34%. The MSCI Emerging Markets Index (net) also suffered for the period, declining 2.02%. The 12-month period saw increasing risk aversion by investors.
During the fiscal year, real estate and materials were the best performing sectors in the Russell 1000® Growth Index. The worst performing sectors were energy and health care.
Global industrial activity slowed over the past 12 to 18 months, primarily due to continued global trade friction with China and the European Union (EU). As these trade disputes dragged on, they clearly affected business confidence and investment plans,
particularly for the agricultural, industrial, and automotive industries.
Global consumer strength helped to defend the major economies from economic recession. The consumer, which represents the majority of gross domestic product (GDP) components, continued to benefit from plentiful jobs, modest wage growth, and rising net worth during the 12-month period.
What factors affected the Fund’s performance during its fiscal year?
The Fund underperformed the Russell 1000® Growth Index for the fiscal year ended September 30, 2019. Negative stock selection in communication services and consumer staples detracted the most from performance. This was partially offset by strong stock selection and an underweight in health care, as well as strong stock selection in industrials.
The biggest contributors to performance during the period were Avalara Inc. and Paycom Software.
| ■ | Avalara has created a proprietary database of tax rules for disparate industries and added geographical distinctions for those rules to create a robust tool that is valuable for online merchants. A Supreme Court ruling in 2018 that requires sales tax determinations based on the location of the buyer has greatly increased the market for Avalara’s software. Avalara’s second quarter 2019 revenue growth accelerated for the sixth straight quarter as 43 states have now adopted regulations to comply with the Supreme Court ruling. |
| ■ | Paycom Software’s cloud-based human capital management (HCM) and payroll software has carved out a niche as a nimble software as a service (SaaS) offering for small to medium-sized businesses. The company earned some of the best margins among its SaaS peers during the period due to the combination of its out-of-the-box solution, low cost research & development (R&D), and sales office strategy. Paycom’s revenue meaningfully exceeded expectations as its efforts to sell to larger employers proved highly successful. The company also saw improved retention and up-sell opportunities as a result of its differentiated mobile offering. |
| ■ | Other top contributors included MarketAxess Holdings, Zoetis, and Visa. |
The biggest detractors from Fund performance were NVIDIA and Amazon.
| ■ | NVIDIA’s gaming segment struggled from the cryptocurrency mining boom and lackluster demand for its most recent chip, which is waiting for applications to catch up with its capabilities. While revenue in the most recent quarter disappointed again, gross margins exceeded expectations both for the quarter, and the company guided higher for the next quarter. We continued to hold the stock at the end of the fiscal year. |
| ■ | Amazon continued on its powerful growth trajectory, powered by its wide-moat e-commerce business and dominant web services offering (AWS). However, two issues dented near-term sentiment. First, Amazon’s advertising offering grew nicely but did not exceed expectations as it did initially. Second, Amazon announced that it is rolling out one-day Prime shipping to all customers. This created some fulfillment inefficiencies in the second quarter, which caused margins to come in below consensus. Despite the concerns, we continued to hold the stock in the Fund at the end of the period. |
| ■ | Other detractors included Netflix, HealthEquity, and Activision Blizzard. |
The preceding information is the opinion of portfolio management only through the end of the period stated on the cover. Any such opinions are subject to change at any time based upon market or other conditions and should not be relied upon as investment advice. Past performance is no guarantee of future results, and there is no guarantee that market forecasts will be realized.
Equity Securities:The market price of equity securities may be adversely affected by financial market, industry, or issuer-specific events. Focus on a particular style or on small or medium-sized companies may enhance that risk.
Industry/Sector Concentration:A fund that focuses its investments in a particular industry or sector will be more sensitive to conditions that affect that industry or sector than a non-concentrated fund.
Prospectus:For additional information on risks, please see the Fund’s prospectus.
For information regarding the indexes and certain investment terms, see the Key Investment Terms starting on page 6.
Asset Allocation
The following table presents asset allocation within certain sectors as a percentage of total investments as of September 30, 2019.
| Consumer Discretionary | 27% |
| Information Technology | 24 |
| Communication Services | 13 |
| Industrials | 10 |
| Health Care | 8 |
| Financials | 7 |
| Consumer Staples | 6 |
| Other (includes securities lending collateral) | 5 |
| Total | 100% |
For information regarding the indexes and certain investment terms, see the Key Investment Terms starting on page 6.
KAR Capital Growth Fund (Continued)
Average Annual Total Returns1for periods ended 9/30/19
| | | 1 Year | 5 Years | 10 Years | Since
inception | Inception
date |
| Class A shares at NAV2 | | 1.10 % | 12.02 % | 12.36 % | — % | — |
| Class A shares at POP3,4 | | -4.72 | 10.70 | 11.70 | — | — |
| Class C shares at NAV2 and with CDSC4 | | 0.26 | 11.16 | 11.50 | — | — |
| Class I shares at NAV2 | | 1.29 | 12.29 | 12.64 | — | — |
| Class R6 shares at NAV2 | | 1.25 | — | — | 2.64 | 1/30/18 |
| Russell 1000® Growth Index | | 3.71 | 13.39 | 14.94 | 7.985 | — |
| Fund Expense Ratios6: Class A shares: 1.22%; Class C shares: 2.00%; Class I shares: 0.99%; Class R6 shares: Gross 0.91%, Net 0.73%. | | | | | | |
| All returns represent past performance which is no guarantee of future results. Current performance may be higher or lower than the performance shown. The investment return and principal value of an investment will fluctuate so that an investor’s shares, when redeemed, may be worth more or less than their original cost. The above table and graph below do not reflect the deduction of taxes that a shareholder would pay on fund distributions or the redemption of shares. Please visit Virtus.com for performance data current to the most recent month-end. |
Growth of $10,000for periods ended 9/30
This chart assumes an initial investment of $10,000 made on September 30, 2009, for Class A shares, Class C shares, and Class I shares including any applicable sales charges or fees. The performance of the other share class may be greater or less than that shown based on differences in inception date, fees, and sales charges. Performance assumes reinvestment of dividends and capital gain distributions.

| 1 | Total returns are historical and include changes in share price and the reinvestment of both dividends and capital gain distributions. |
| 2 | “NAV” (Net Asset Value) total returns do not include the effect of any sales charge. |
| 3 | “POP” (Public Offering Price) total returns include the effect of the maximum front-end 5.75% sales charge. |
| 4 | “CDSC” (contingent deferred sales charge) is applied to redemptions of certain classes of shares that do not have a sales charge applied at the time of purchase. CDSC for certain redemptions of Class A shares made within 18 months of a finder’s fee being paid and all Class C shares are 1% within the first year and 0% thereafter. |
| 5 | The since inception index return is from the inception date of Class R6 shares. |
| 6 | The expense ratios of the Fund are set forth according to the prospectus for the Fund effective January 28, 2019, as supplemented and revised, and may differ from the expense ratios disclosed in the Financial Highlight tables in this report. See the Financial Highlights for more current expense ratios. Net Expense: Expenses reduced by a contractual expense limitation in effect through January 31, 2020. Gross Expense: Does not reflect the effect of the expense limitation. Expense ratios include fees and expenses associated with any underlying funds. |
The index is unmanaged and not available for direct investment; therefore, its performance does not reflect the expenses associated with active management of an actual portfolio.
For information regarding the indexes and certain investment terms, see the Key Investment Terms starting on page 6.
| Ticker Symbols: |
| Class A: PPTAX |
| Class C: PPTCX |
| Class I: PIPTX |
| Class R6: VGQRX |
KAR Global Quality Dividend Fund
Fund Summary (Unaudited)
Portfolio Manager Commentary by
Kayne Anderson Rudnick Investment Management, LLC
| ■ | The Fund is diversified and has an investment objective of total return, consisting of both capital appreciation and current income.There is no guarantee that the Fund will meet its objective. |
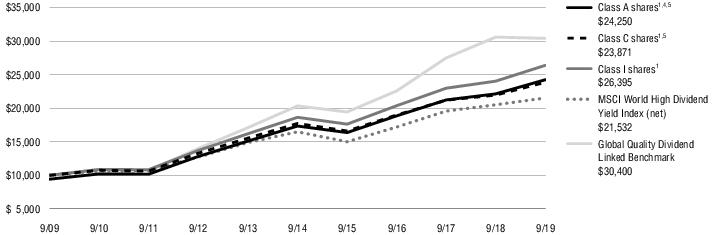
| ■ | For the fiscal year ended September 30, 2019, the Fund’s Class A shares at NAV returned 9.57%†, Class C shares at NAV returned 8.74%, Class I shares at NAV returned 9.85%, and Class R6 shares at NAV from August 1, 2019 (inception date) through September 30, 2019, returned 4.01%*. For the fiscal year ended September 30, 2019, the MSCI World High Dividend Yield Index (net), which serves as the Fund’s broad-based index returned 4.98% and the Global Quality Dividend Linked Benchmark, the Fund’s style-specific Index, returned -0.62%. |
† See footnote 3 on page 14.
* Returns less than 1 year are not annualized.
All performance figures assume reinvestment of distributions and exclude the effect of sales charges. Performance data quoted represents past results. Past performance is no guarantee of future results, and current performance may be higher or lower than the performance shown above. Investment return and principal value will fluctuate so your shares, when redeemed, may be worth more or less than their original cost. Please visit Virtus.com for performance data current to the most recent month-end.
How did the markets perform during the Fund’s fiscal year ended September 30, 2019?
Stock market returns were mixed during the fiscal year ended September 30, 2019, with the S&P 500® Index advancing 4.25%, while small-capitalization stocks, as represented by the Russell 2000® Index, fell 8.89% and international developed markets, as measured by the MSCI EAFE® Index (net), declined 1.34%. The MSCI Emerging Markets Index (net) also suffered for the period, declining 2.02%. The 12-month period saw increasing risk aversion by investors.
During the fiscal year, the best performing sectors within the MSCI World High Dividend Yield Index
(net) were utilities and consumer staples. The worst performing sectors were energy and materials.
Global industrial activity slowed over the past 12 to 18 months, primarily due to continued global trade friction with China and the European Union (EU). As these trade disputes dragged on, they clearly affected business confidence and investment plans, particularly for the agricultural, industrial, and automotive industries.
Global consumer strength helped to defend the major economies from economic recession. The consumer, which represents the majority of gross domestic product (GDP) components, continued to benefit from plentiful jobs, modest wage growth, and rising net worth during the 12-month period.
What factors affected the Fund’s performance during its fiscal year?
The Fund outperformed the MSCI World High Dividend Yield Index (net) during the fiscal year ended September 30, 2019. Strong stock selection in real estate, and positive stock selection and an overweight in utilities, contributed positively to performance. An underweight and poor stock selection in consumer staples, as well as poor stock selection and an overweight in energy, detracted from performance.
The biggest contributors to performance during the period were WEC Energy Group and BCE.
| ■ | WEC Energy Group achieved strong execution and operational efficiencies related to the retirement of older, less-efficient coal-fired plants. This offset weakness related to weather during the fiscal year. |
| ■ | BCE continued its evolution of becoming Canada’s broadband leader. The capital intensity of the business declined and the dividend continued to grow at a solid rate. |
| ■ | Other top contributors included Realty Income, Fortis, and Crown Castle International. |
The biggest detractors from Fund performance were Vermilion Energy and Royal Dutch Shell.
| ■ | Natural gas production in the U.S. has recently been so prolific that it has become cost-effective to transport liquefied natural gas into Europe. As a |
| | result, natural gas prices in Europe have weakened. That had negative implications on Vermilion Energy’s cash flow and its ability to maintain the dividend at its current level. As a result, we sold our shares. |
| ■ | Lower energy prices and concerns about lower economic growth contributed to weak stock performance for Royal Dutch Shell. However, the company committed to a relatively modest capital spending plan in order to live within its cash flow and maintain the dividend. We continued to hold the stock through the end of the fiscal year. |
| ■ | Other top detractors included HSBC Holdings, Total, and ABB. |
The preceding information is the opinion of portfolio management only through the end of the period stated on the cover. Any such opinions are subject to change at any time based upon market or other conditions and should not be relied upon as investment advice. Past performance is no guarantee of future results, and there is no guarantee that market forecasts will be realized.
Equity Securities:The market price of equity securities may be adversely affected by financial market, industry, or issuer-specific events. Focus on a particular style or on small or medium-sized companies may enhance that risk.
Foreign Investing:Investing internationally involves additional risks such as currency, political, accounting, economic, and market risk.
Prospectus:For additional information on risks, please see the Fund’s prospectus.
Asset Allocation
The following table presents asset allocation within certain sectors as a percentage of total investments as of September 30, 2019.
| Financials | 20% |
| Communication Services | 14 |
| Real Estate | 12 |
| Energy | 11 |
| Utilities | 9 |
| Consumer Staples | 7 |
| Health Care | 7 |
| Other (includes securities lending collateral) | 20 |
| Total | 100% |
For information regarding the indexes and certain investment terms, see the Key Investment Terms starting on page 6.
KAR Global Quality Dividend Fund (Continued)
Average Annual Total Returns1for periods ended 9/30/19
| | | 1 Year | 5 Years | 10 Years | Since
inception | Inception
date |
| Class A shares at NAV2 | | 9.57 %3 | 6.94 % | 9.91 % | — % | — |
| Class A shares at POP4,5 | | 3.27 | 5.68 | 9.26 | — | — |
| Class C shares at NAV2 and with CDSC5 | | 8.74 | 6.14 | 9.09 | — | — |
| Class I shares at NAV2 | | 9.85 | 7.21 | 10.19 | — | — |
| Class R6 shares at NAV2 | | — | — | — | 4.01 | 8/1/19 |
| MSCI World High Dividend Yield Index (net)6 | | 4.98 | 5.49 | 7.97 | 2.307 | — |
| Global Quality Dividend Linked Benchmark | | -0.62 | 8.37 | 11.76 | 2.307 | — |
| Fund Expense Ratios8: Class A shares: Gross 1.50%, Net 1.35%; Class C shares: Gross 2.25%, Net 2.10%; Class I shares: Gross 1.29%, Net 1.10%. | | | | | | |
| All returns represent past performance which is no guarantee of future results. Current performance may be higher or lower than the performance shown. The investment return and principal value of an investment will fluctuate so that an investor’s shares, when redeemed, may be worth more or less than their original cost. The above table and graph below do not reflect the deduction of taxes that a shareholder would pay on fund distributions or the redemption of shares. Please visit Virtus.com for performance data current to the most recent month-end. |
For information regarding the indexes and certain investment terms, see the Key Investment Terms starting on page 6.
KAR Global Quality Dividend Fund (Continued)
Growth of $10,000for periods ended 9/30
This chart assumes an initial investment of $10,000 made on September 30, 2009, for Class A shares, Class C shares, and Class I shares including any applicable sales charges or fees. The performance of the other share class may be greater or less than that shown based on differences in inception date, fees, and sales charges. Performance assumes reinvestment of dividends and capital gain distributions.
| 1 | Total returns are historical and include changes in share price and the reinvestment of both dividends and capital gain distributions. |
| 2 | “NAV” (Net Asset Value) total returns do not include the effect of any sales charge. |
| 3 | Total Return for the report period presented in the table differs from the return in the Financial Highlights. The total return presented in the above table is calculated based on the NAV at which shareholder transactions were processed. The total return presented in the Financial Highlights section of the report is calculated in the same manner, but also takes into account certain adjustments that are necessary under generally accepted accounting principles required in the annual report and semiannual report. |
| 4 | “POP” (Public Offering Price) total returns include the effect of the maximum front-end 5.75% sales charge. |
| 5 | “CDSC” (contingent deferred sales charge) is applied to redemptions of certain classes of shares that do not have a sales charge applied at the time of purchase. CDSC for certain redemptions of Class A shares made within 18 months of a finder’s fee being paid and all Class C shares are 1% within the first year and 0% thereafter. |
| 6 | As of December 31, 2018, FTSE Russell discontinued the calculation and publishing of the Russell Developed Large Cap Index, which was KAR Global Quality Dividend Fund’s primary benchmark at that time. The Fund’s primary benchmark therefore changed to the MSCI World High Dividend Yield Index effective January 1, 2019. We are unable to show the performance of the prior index since it has not been calculated or published since December 31, 2018. |
| 7 | The since inception index return is from the inception date of Class R6 shares. |
| 8 | The expense ratios of the Fund are set forth according to the prospectus for the Fund effective January 28, 2019, as supplemented and revised, and may differ from the expense ratios disclosed in the Financial Highlight tables in this report. See the Financial Highlights for more current expense ratios. Net Expense: Expenses reduced by a contractual expense limitation in effect through January 31, 2020. Gross Expense: Does not reflect the effect of the expense limitation. Expense ratios include fees and expenses associated with any underlying funds. |
The indexes are unmanaged and not available for direct investment; therefore, their performance does not reflect the expenses associated with active management of an actual portfolio.
For information regarding the indexes and certain investment terms, see the Key Investment Terms starting on page 6.
| Ticker Symbols: |
| Class A: VMACX |
| Class C: VMCCX |
| Class I: VIMCX |
| Class R6: VRMCX |
KAR Mid-Cap Core Fund
Fund Summary (Unaudited)
Portfolio Manager Commentary by
Kayne Anderson Rudnick Investment Management, LLC
| ■ | The Fund is diversified and has an investment objective of long-term capital appreciation.There is no guarantee that the Fund will meet its objective. |
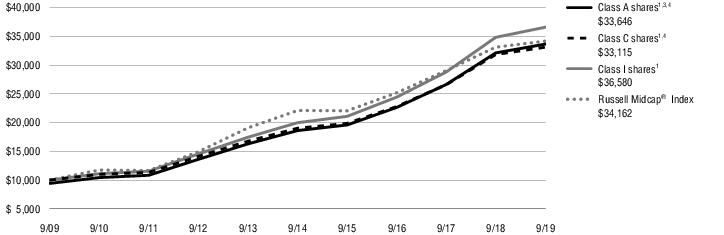
| ■ | For the fiscal year ended September 30, 2019, the Fund’s Class A shares at NAV returned 4.79%, Class C shares at NAV returned 4.03%, Class I shares at NAV returned 5.06%, and Class R6 shares at NAV returned 5.15%. For the same period, the Russell Midcap® Index, which serves as both the Fund’s broad-based and style-specific index appropriate the comparison, returned 3.19%. |
All performance figures assume reinvestment of distributions and exclude the effect of sales charges. Performance data quoted represents past results. Past performance is no guarantee of future results, and current performance may be higher or lower than the performance shown above. Investment return and principal value will fluctuate so your shares, when redeemed, may be worth more or less than their original cost. Please visit Virtus.com for performance data current to the most recent month-end.
How did the markets perform during the Fund’s fiscal year ended September 30, 2019?
Stock market returns were mixed during the fiscal year ended September 30, 2019, with the S&P 500® Index advancing 4.25%, while small-capitalization stocks, as represented by the Russell 2000® Index, fell 8.89% and international developed markets, as measured by the MSCI EAFE® Index (net), declined 1.34%. The MSCI Emerging Markets Index (net) also suffered for the period, declining 2.02%. The 12-month period saw increasing risk aversion by investors.
During the fiscal year, sectors within the Russell Midcap® Index that performed the best included utilities and financial services. Energy and health care were the weakest sectors of the Index.
Global industrial activity slowed over the past 12 to 18 months, primarily due to continued global trade friction with China and the European Union (EU). As these trade disputes dragged on, they clearly affected business confidence and investment plans,
particularly for the agricultural, industrial, and automotive industries.
Global consumer strength helped to defend the major economies from economic recession. The consumer, which represents the majority of gross domestic product (GDP) components, continued to benefit from plentiful jobs, modest wage growth, and rising net worth during the 12-month period.
What factors affected the Fund’s performance during its fiscal year?
The Fund outperformed the Russell Midcap® Index for the fiscal year ended September 30, 2019. Successful stock selection in the producer durables and consumer discretionary sectors contributed positively to performance. Negative stock selection and an underweight in financial services, as well as an underweight in the utilities sector detracted from performance.
The biggest contributors to performance during the period were Brooks Automation and SiteOne Landscape Supply.
| ■ | Brooks Automation was hard at work trying to grow its Life Sciences business while also focusing in on its Semiconductor segment. Semiconductor revenue was surprisingly strong despite the company’s peers struggling to sell equipment. We view this as evidence of Brooks’ differentiated technology. |
| ■ | SiteOne Landscape Supply reported encouraging results that saw improvements in margins and cash flow. While the company’s results can be impacted by poor weather, weather was less of an issue during the 12 months in the regions where SiteOne has a stronger presence. The company’s barcode initiative was successful in pilot branches, and is expected to be rolled out to the rest of the branches by the first half of 2020. Additionally, management noted that in the markets where the company has a full product line, these branches tend to be higher performers and also have higher margins, which has validated SiteOne’s business model of further consolidation. |
| ■ | Other top contributors included AMETEK, WABCO Holdings, and Exponent. |
The biggest detractors from Fund performance were Bank OZK and Elanco Animal Health.
| ■ | Bank OZK’s share price declined significantly in the most recent quarter after the company reported a surprise write-off on two loans in areas that are outside of its core construction lending franchise. Shares had already been under pressure for some time due to slowing loan growth, which we viewed as cyclical and not a structural headwind. However, the fact that the bank took loan losses in a non-core part of its book in a strong economic environment eroded management’s reputation as good underwriters. With strong credit quality, which was a key pillar of our investment thesis, called into question, we opted to exit our position in the fourth quarter of 2018. |
| ■ | Elanco Animal Health saw its shares fall in the past year, driven more recently by the company’s announced acquisition of Bayer’s animal health division in August 2019. It is a fairly sizeable deal for Elanco, and investors were concerned about the ability of Elanco to successfully integrate such a large acquisition without hampering future growth. This created recent weakness in the shares. We spoke with management, and we believe the company should be stronger at the end of this process with the addition of several solid brands in animal health. Therefore, the Fund continued to hold the stock as of the end of the fiscal year. |
| ■ | Other large detractors included Globus Medical, Wynn Resorts, and Skyworks Solutions. |
The preceding information is the opinion of portfolio management only through the end of the period stated on the cover. Any such opinions are subject to change at any time based upon market or other conditions and should not be relied upon as investment advice. Past performance is no guarantee of future results, and there is no guarantee that market forecasts will be realized.
Equity Securities:The market price of equity securities may be adversely affected by financial market, industry, or issuer-specific events. Focus on a particular style or on small or medium-sized companies may enhance that risk.
Limited Number of Investments:Because the Fund has a limited number of securities, it may be more susceptible to factors adversely affecting its securities than a less concentrated fund.
For information regarding the indexes and certain investment terms, see the Key Investment Terms starting on page 6.
Industry/Sector Concentration:A fund that focuses its investments in a particular industry or sector will be more sensitive to conditions that affect that industry or sector than a non-concentrated fund.
Prospectus:For additional information on risks, please see the Fund’s prospectus.
Asset Allocation
The following table presents asset allocation within certain sectors as a percentage of total investments as of September 30, 2019.
| Industrials | 29% |
| Information Technology | 21 |
| Health Care | 19 |
| Financials | 13 |
| Consumer Discretionary | 7 |
| Communication Services | 4 |
| Consumer Staples | 3 |
| Other (includes short-term investment) | 4 |
| Total | 100% |
For information regarding the indexes and certain investment terms, see the Key Investment Terms starting on page 6.
KAR Mid-Cap Core Fund (Continued)
Average Annual Total Returns1for periods ended 9/30/19
| | | 1 Year | 5 Years | 10 Years | Since
inception | Inception
date |
| Class A shares at NAV2 | | 4.79 % | 12.57 % | 13.57 % | — % | — |
| Class A shares at POP3,4 | | -1.24 | 11.25 | 12.90 | — | — |
| Class C shares at NAV2 and with CDSC4 | | 4.03 | 11.73 | 12.72 | — | — |
| Class I shares at NAV2 | | 5.06 | 12.86 | 13.85 | — | — |
| Class R6 shares at NAV2 | | 5.15 | — | — | 5.87 | 1/30/18 |
| Russell Midcap® Index | | 3.19 | 9.10 | 13.07 | 4.055 | — |
| Fund Expense Ratios6: Class A shares: Gross 1.39%, Net 1.20%; Class C shares: Gross 2.14%, Net 1.95%; Class I shares: Gross 1.14%, Net 0.95%; Class R6 shares: Gross 1.06%, Net 0.87%. | | | | | | |
| All returns represent past performance which is no guarantee of future results. Current performance may be higher or lower than the performance shown. The investment return and principal value of an investment will fluctuate so that an investor’s shares, when redeemed, may be worth more or less than their original cost. The above table and graph below do not reflect the deduction of taxes that a shareholder would pay on fund distributions or the redemption of shares. Please visit Virtus.com for performance data current to the most recent month-end. |
Growth of $10,000for periods ended 9/30
This chart assumes an initial investment of $10,000 made on September 30, 2009, for Class A shares, Class C shares, and Class I shares including any applicable sales charges or fees. The performance of the other share class may be greater or less than that shown based on differences in inception date, fees, and sales charges. Performance assumes reinvestment of dividends and capital gain distributions.
| 1 | Total returns are historical and include changes in share price and the reinvestment of both dividends and capital gain distributions. |
| 2 | “NAV” (Net Asset Value) total returns do not include the effect of any sales charge. |
| 3 | “POP” (Public Offering Price) total returns include the effect of the maximum front-end 5.75% sales charge. |
| 4 | “CDSC” (contingent deferred sales charge) is applied to redemptions of certain classes of shares that do not have a sales charge applied at the time of purchase. CDSC for certain redemptions of Class A shares made within 18 months of a finder’s fee being paid and all Class C shares are 1% within the first year and 0% thereafter. |
| 5 | The since inception index return is from the inception date of Class R6 shares. |
| 6 | The expense ratios of the Fund are set forth according to the prospectus for the Fund effective January 28, 2019, as supplemented and revised, and may differ from the expense ratios disclosed in the Financial Highlight tables in this report. See the Financial Highlights for more current expense ratios. Net Expense: Expenses reduced by a contractual expense limitation in effect through January 31, 2020. Gross Expense: Does not reflect the effect of the expense limitation. Expense ratios include fees and expenses associated with any underlying funds. |
The index is unmanaged and not available for direct investment; therefore, its performance does not reflect the expenses associated with active management of an actual portfolio.
For information regarding the indexes and certain investment terms, see the Key Investment Terms starting on page 6.
| Ticker Symbols: |
| Class A: PHSKX |
| Class C: PSKCX |
| Class I: PICMX |
| Class R6: VRMGX |
KAR Mid-Cap Growth Fund
Fund Summary (Unaudited)
Portfolio Manager Commentary by
Kayne Anderson Rudnick Investment Management, LLC
| ■ | The Fund is diversified and has an investment objective of capital appreciation.There is no guarantee that the Fund will meet its objective. |
| ■ | For the fiscal year ended September 30, 2019, the Fund’s Class A shares at NAV returned 7.46%, Class C shares at NAV returned 6.67%, Class I shares at NAV returned 7.79%, and Class R6 shares at NAV returned 8.05%. For the same period, the Russell Midcap® Growth Index, which serves as both the Fund’s broad-based and style-specific index appropriate the comparison, returned 5.20%. |
All performance figures assume reinvestment of distributions and exclude the effect of sales charges. Performance data quoted represents past results. Past performance is no guarantee of future results, and current performance may be higher or lower than the performance shown above. Investment return and principal value will fluctuate so your shares, when redeemed, may be worth more or less than their original cost. Please visit Virtus.com for performance data current to the most recent month-end.
How did the markets perform during the Fund’s fiscal year ended September 30, 2019?
Stock market returns were mixed during the fiscal year ended September 30, 2019, with the S&P 500® Index advancing 4.25%, while small-capitalization stocks, as represented by the Russell 2000® Index, fell 8.89% and international developed markets, as measured by the MSCI EAFE® Index (net), declined 1.34%. The MSCI Emerging Markets Index (net) also suffered for the period, declining 2.02%. The 12-month period saw increasing risk aversion by investors.
During the fiscal year, the best performing sectors within the Russell Midcap® Growth Index included real estate and consumer staples. The worst performing sectors were energy and health care.
Global industrial activity slowed over the past 12 to 18 months, primarily due to continued global trade friction with China and the European Union (EU). As these trade disputes dragged on, they clearly affected business confidence and investment plans,
particularly for the agricultural, industrial, and automotive industries.
Global consumer strength helped to defend the major economies from economic recession. The consumer, which represents the majority of gross domestic product (GDP) components, continued to benefit from plentiful jobs, modest wage growth, and rising net worth during the 12-month period.
What factors affected the Fund’s performance during its fiscal year?
The Fund outperformed the Russell Midcap® Growth Index for the fiscal year ended September 30, 2019. Successful stock selection in information technology and financials contributed positively to performance. Poor stock selection in health care and communication services detracted from performance.
The biggest contributors to performance during the period were Avalara and MercadoLibre.
| ■ | Avalara has created a proprietary database of tax rules for disparate industries and added geographical distinctions for those rules to create a robust tool that is valuable for online merchants. A Supreme Court ruling in 2018 that requires sales tax determinations based on the location of the buyer has greatly increased the market for Avalara’s software. Avalara’s second quarter 2019 revenue growth accelerated for the sixth straight quarter, as 43 states have now adopted regulations to comply with the court ruling. |
| ■ | MercadoLibre, the leading e-commerce business in South America, seems to have weathered the threat from Amazon for now, as Brazil’s infrastructure limits Amazon’s ability to expand rapidly and profitably. Over the last few quarters, MercadoLibre spotlighted a new, major growth driver that re-rated the stock. Mercado Pago, the company’s payments offering, gained rapid scale both on and off the platform. The markets that MercadoLibre serves have a high unbanked population, and the penetration of mobile payments remained very low. The company has made fintech innovations that include asset management, auto/home loans, insurance, and QR in-store payments. |
| ■ | Other top contributors included MarketAxess Holdings, The Trade Desk, and Paycom Software. |
The biggest detractors from Fund performance were Grubhub and Health Equity.
| ■ | While Grubhub continued to post robust numbers, it lost share to the more rapid growth of Uber Eats, Postmates, and DoorDash, all of whom have competed heavily to acquire customers and expand their network of restaurant partners. Grubhub also had a disadvantage in terms of ultimate operating leverage due to its dual delivery model, in which 30% of orders are fulfilled by Grubhub drivers, where it has to take a high commission to be profitable, and 70% by the restaurants themselves. After another quarter of decelerating Daily Active Grubs, the company’s measure for order frequency, and guidance for additional investment and promotions, we sold our position. |
| ■ | While HealthEquity meaningfully outpaced the slowing growth experienced by the rest of the industry, it acknowledged that, as it moves down market to smaller employers, incremental customers look for more than just a stand-alone Health Savings Account (HSA) provider. To that end, the company made a bold move to acquire WageWorks, a company that HealthEquity’s CEO had founded. WageWorks gives HealthEquity additional products to bundle for its smaller enterprise customers like Flexible Spending Accounts (FSAs), COBRA health insurance administration, and commuter reimbursement accounts. The acquisition diluted HealthEquity’s growth rate and margin profile, and saddled it with a chunk of new debt. Additionally, HealthEquity had been a prime beneficiary of rising interest rates from its high-margin custodial business. With the Federal Reserve (the Fed) moving into an easing cycle, though, the growth outlook for that segment moderated substantially. Despite these concerns, we continued to hold the stock at the end of the fiscal year. |
| ■ | Other top detractors included Netflix, ABIOMED, and STAAR Surgical. |
The preceding information is the opinion of portfolio management only through the end of the period stated on the cover. Any such opinions are subject to change at any time based upon market or other conditions and should not be relied upon as investment advice. Past performance is no guarantee
For information regarding the indexes and certain investment terms, see the Key Investment Terms starting on page 6.
of future results, and there is no guarantee that market forecasts will be realized.
Equity Securities:The market price of equity securities may be adversely affected by financial market, industry, or issuer-specific events. Focus on a particular style or on small or medium-sized companies may enhance that risk.
Industry/Sector Concentration:A fund that focuses its investments in a particular industry or sector will be more sensitive to conditions that affect that industry or sector than a non-concentrated fund.
Prospectus:For additional information on risks, please see the Fund’s prospectus.
Asset Allocation
The following table presents asset allocation within certain sectors as a percentage of total investments as of September 30, 2019.
| Information Technology | 33% |
| Consumer Discretionary | 19 |
| Industrials | 14 |
| Health Care | 12 |
| Financials | 8 |
| Consumer Staples | 7 |
| Communication Services | 2 |
| Other (includes short-term investment) | 5 |
| Total | 100% |
For information regarding the indexes and certain investment terms, see the Key Investment Terms starting on page 6.
KAR Mid-Cap Growth Fund (Continued)
Average Annual Total Returns1for periods ended 9/30/19
| | | 1 Year | 5 Years | 10 Years | Since
inception | Inception
date |
| Class A shares at NAV2 | | 7.46 % | 15.31 % | 13.14 % | — % | — |
| Class A shares at POP3,4 | | 1.28 | 13.95 | 12.47 | — | — |
| Class C shares at NAV2 and with CDSC4 | | 6.67 | 14.45 | 12.29 | — | — |
| Class I shares at NAV2 | | 7.79 | 15.61 | 13.43 | — | — |
| Class R6 shares at NAV2 | | 8.05 | — | — | 14.32 | 1/30/18 |
| Russell Midcap® Growth Index | | 5.20 | 11.12 | 14.08 | 7.465 | — |
| Fund Expense Ratios6: Class A shares: Gross 1.38%, Net 1.41%; Class C shares: Gross 2.18%, Net 2.16%; Class I shares: Gross 1.14%, Net 1.16; Class R6 shares: Gross 1.10%, Net 0.84%. | | | | | | |
| All returns represent past performance which is no guarantee of future results. Current performance may be higher or lower than the performance shown. The investment return and principal value of an investment will fluctuate so that an investor’s shares, when redeemed, may be worth more or less than their original cost. The above table and graph below do not reflect the deduction of taxes that a shareholder would pay on fund distributions or the redemption of shares. Please visit Virtus.com for performance data current to the most recent month-end. |
Growth of $10,000for periods ended 9/30
This chart assumes an initial investment of $10,000 made on September 30, 2009, for Class A shares, Class C shares, and Class I shares including any applicable sales charges or fees. The performance of the other share class may be greater or less than that shown based on differences in inception date, fees, and sales charges. Performance assumes reinvestment of dividends and capital gain distributions.

| 1 | Total returns are historical and include changes in share price and the reinvestment of both dividends and capital gain distributions. |
| 2 | “NAV” (Net Asset Value) total returns do not include the effect of any sales charge. |
| 3 | “POP” (Public Offering Price) total returns include the effect of the maximum front-end 5.75% sales charge. |
| 4 | “CDSC” (contingent deferred sales charge) is applied to redemptions of certain classes of shares that do not have a sales charge applied at the time of purchase. CDSC for certain redemptions of Class A shares made within 18 months of a finder’s fee being paid and all Class C shares are 1% within the first year and 0% thereafter. |
| 5 | The since inception index return is from the inception date of Class R6 shares. |
| 6 | The expense ratios of the Fund are set forth according to the prospectus for the Fund effective January 28, 2019, as supplemented and revised, and may differ from the expense ratios disclosed in the Financial Highlight tables in this report. See the Financial Highlights for more current expense ratios. Net Expense: Expenses reduced by a contractual expense limitation in effect through January 31, 2020. Gross Expense: Does not reflect the effect of the expense limitation. Expense ratios include fees and expenses associated with any underlying funds. |
The index is unmanaged and not available for direct investment; therefore, its performance does not reflect the expenses associated with active management of an actual portfolio.
For information regarding the indexes and certain investment terms, see the Key Investment Terms starting on page 6.
| Ticker Symbols: |
| Class A: PKSAX |
| Class C: PKSCX |
| Class I: PKSFX |
| Class R6: VSCRX |
KAR Small-Cap Core Fund
Fund Summary (Unaudited)
Portfolio Manager Commentary by
Kayne Anderson Rudnick Investment Management, LLC
| ■ | The Fund is diversified and has an investment objective of long-term capital appreciation, with dividend income a secondary consideration.There is no guarantee that the Fund will meet its objectives. |
| ■ | For the fiscal year ended September 30, 2019, the Fund’s Class A shares at NAV returned 12.54%†, Class C shares at NAV returned 11.69%, Class I shares at NAV returned 12.83%, and Class R6 shares at NAV returned 12.94%. For the same period, the Russell 2000® Index, which serves as both the Fund’s broad-based and style-specific index appropriate the comparison, returned -8.89%. |
† See footnote 3 on page 23.
All performance figures assume reinvestment of distributions and exclude the effect of sales charges. Performance data quoted represents past results. Past performance is no guarantee of future results, and current performance may be higher or lower than the performance shown above. Investment return and principal value will fluctuate so your shares, when redeemed, may be worth more or less than their original cost. Please visit Virtus.com for performance data current to the most recent month-end.
How did the markets perform during the Fund’s fiscal year ended September 30, 2019?
Stock market returns were mixed during the fiscal year ended September 30, 2019, with the S&P 500® Index advancing 4.25%, while small-capitalization stocks, as represented by the Russell 2000® Index, fell 8.89% and international developed markets, as measured by the MSCI EAFE® Index (net), declined 1.34%. The MSCI Emerging Markets Index (net) also suffered for the period, declining 2.02%. The 12-month period saw increasing risk aversion by investors.
During the fiscal year, nine of the 10 sectors within the Russell 2000® Index had negative performance. Utilities was the only sector that posted positive performance during the period.
Global industrial activity slowed over the past 12 to 18 months, primarily due to continued global trade
friction with China and the European Union (EU). As these trade disputes dragged on, they clearly affected business confidence and investment plans, particularly for the agricultural, industrial, and automotive industries.
Global consumer strength helped to defend the major economies from economic recession. The consumer, which represents the majority of gross domestic product (GDP) components, continued to benefit from plentiful jobs, modest wage growth, and rising net worth during the 12-month period.
What factors affected the Fund’s performance during its fiscal year?
The Fund handily outperformed the Russell 2000® Index during the fiscal year ended September 30, 2019. Strong stock selection and overweight positions in producer durables and technology contributed to performance. Underweights to utilities and consumer staples detracted from performance.
The biggest contributors to performance during the period were Copart and MarketAxess Holdings.
| ■ | For the 12 months ended September 30, 2019, Copart delivered strong growth in both salvage car volumes and sustained average selling price growth. The company accomplished this by increasing its business selling high value cars to international rebuilders. Copart benefited from its large and growing network of both domestic and international buyers. |
| ■ | Shares of MarketAxess appreciated after the company reported significant growth in the U.S. high yield bond, emerging market bond and Eurobond markets, driven by the success of its all-to-all trading protocol, called Open Trading. Its growing liquidity pool has enabled cost efficiencies for MarketAxess. |
| ■ | Other top contributors included CDW, Teledyne Technologies, and Autohome. |
The biggest detractors from Fund performance were Moelis & Co. and Core Laboratories.
| ■ | Moelis’s results over the past two quarters were down meaningfully year-over-year due to depressed global mergers & acquisitions (M&A) volumes. Europe was cited by the company and other investment banks as being especially bad for deal volumes. We believe the headwinds impacting |
| | Moelis are cyclical and not an indication of a structural problem with the business, so the Fund continued to hold the stock as of the end of the fiscal year. |
| ■ | Slowing U.S. onshore drilling activity put pressure on Core Labs’ Production Enhancement business while an expected acceleration in international projects failed to materialize during the period. These factors caused the company’s Reservoir Description segment to languish. Despite the headwinds, we continued to hold the stock at the end of the fiscal year. |
| ■ | Other top detractors included PriceSmart, Donaldson, and Jack Henry & Associates. |
The preceding information is the opinion of portfolio management only through the end of the period stated on the cover. Any such opinions are subject to change at any time based upon market or other conditions and should not be relied upon as investment advice. Past performance is no guarantee of future results, and there is no guarantee that market forecasts will be realized.
Equity Securities:The market price of equity securities may be adversely affected by financial market, industry, or issuer-specific events. Focus on a particular style or on small or medium-sized companies may enhance that risk.
Limited Number of Investments:Because the Fund has a limited number of securities, it may be more susceptible to factors adversely affecting its securities than a less concentrated fund.
Industry/Sector Concentration:A fund that focuses its investments in a particular industry or sector will be more sensitive to conditions that affect that industry or sector than a non-concentrated fund.
Prospectus:For additional information on risks, please see the Fund’s prospectus.
For information regarding the indexes and certain investment terms, see the Key Investment Terms starting on page 6.
Asset Allocation
The following table presents asset allocation within certain sectors as a percentage of total investments as of September 30, 2019.
| Industrials | 34% |
| Financials | 19 |
| Information Technology | 17 |
| Communication Services | 13 |
| Consumer Discretionary | 4 |
| Energy | 4 |
| Health Care | 2 |
| Other (includes short-term investment) | 7 |
| Total | 100% |
For information regarding the indexes and certain investment terms, see the Key Investment Terms starting on page 6.
KAR Small-Cap Core Fund (Continued)
Average Annual Total Returns1for periods ended 9/30/19
| | | 1 Year | 5 Years | 10 Years | Since
inception | Inception
date |
| Class A shares at NAV2 | | 12.54 %3 | 17.61 % | 15.84 % | — % | — |
| Class A shares at POP4,5 | | 6.07 | 16.22 | 15.15 | — | — |
| Class C shares at NAV2 and with CDSC5 | | 11.69 | 16.74 | 14.98 | — | — |
| Class I shares at NAV2 | | 12.83 | 17.90 | 16.13 | — | — |
| Class R6 shares at NAV2 | | 12.94 | — | — | 16.78 | 11/12/14 |
| Russell 2000® Index | | -8.89 | 8.19 | 11.19 | 6.736 | — |
| Fund Expense Ratios7: Class A shares: 1.31%; Class C shares: 2.04%, Class I shares: 1.03%; Class R6 shares: 0.96%. | | | | | | |
| All returns represent past performance which is no guarantee of future results. Current performance may be higher or lower than the performance shown. The investment return and principal value of an investment will fluctuate so that an investor’s shares, when redeemed, may be worth more or less than their original cost. The above table and graph below do not reflect the deduction of taxes that a shareholder would pay on fund distributions or the redemption of shares. Please visit Virtus.com for performance data current to the most recent month-end. |
Growth of $10,000for periods ended 9/30
This chart assumes an initial investment of $10,000 made on September 30, 2009, for Class A shares, Class C shares, and Class I shares including any applicable sales charges or fees. The performance of the other share class may be greater or less than that shown based on differences in inception date, fees, and sales charges. Performance assumes reinvestment of dividends and capital gain distributions.

| 1 | Total returns are historical and include changes in share price and the reinvestment of both dividends and capital gain distributions. |
| 2 | “NAV” (Net Asset Value) total returns do not include the effect of any sales charge. |
| 3 | Total Return for the report period presented in the table differs from the return in the Financial Highlights. The total return presented in the above table is calculated based on the NAV at which shareholder transactions were processed. The total return presented in the Financial Highlights section of the report is calculated in the same manner, but also takes into account certain adjustments that are necessary under generally accepted accounting principles required in the annual report and semiannual report. |
| 4 | “POP” (Public Offering Price) total returns include the effect of the maximum front-end 5.75% sales charge. |
| 5 | “CDSC” (contingent deferred sales charge) is applied to redemptions of certain classes of shares that do not have a sales charge applied at the time of purchase. CDSC for certain redemptions of Class A shares made within 18 months of a finder’s fee being paid and all Class C shares are 1% within the first year and 0% thereafter. |
| 6 | The since inception index return is from the inception date of Class R6 shares. |
| 7 | The expense ratios of the Fund are set forth according to the prospectus for the Fund effective January 28, 2019, as supplemented and revised, and may differ from the expense ratios disclosed in the Financial Highlight tables in this report. See the Financial Highlights for more current expense ratios. Expense ratios include fees and expenses associated with any underlying funds. |
The index is unmanaged and not available for direct investment; therefore, its performance does not reflect the expenses associated with active management of an actual portfolio.
For information regarding the indexes and certain investment terms, see the Key Investment Terms starting on page 6.
| Ticker Symbols: |
| Class A: PSGAX |
| Class C: PSGCX |
| Class I: PXSGX |
| Class R6: VRSGX |
KAR Small-Cap Growth Fund
Fund Summary (Unaudited)
Portfolio Manager Commentary by
Kayne Anderson Rudnick Investment Management, LLC
| ■ | The Fund is diversified and has an investment objective of long-term capital appreciation.There is no guarantee that the Fund will meet its objective. |
| ■ | For the fiscal year ended September 30, 2019, the Fund’s Class A shares at NAV returned 14.12%, Class C shares at NAV returned 13.28%, Class I shares at NAV returned 14.44%, and Class R6 shares at NAV returned 14.58%. For the same period, the Russell 2000® Growth Index, which serves as both the Fund’s broad-based and style-specific index appropriate the comparison, returned -9.63%. |
All performance figures assume reinvestment of distributions and exclude the effect of sales charges. Performance data quoted represents past results. Past performance is no guarantee of future results, and current performance may be higher or lower than the performance shown above. Investment return and principal value will fluctuate so your shares, when redeemed, may be worth more or less than their original cost. Please visit Virtus.com for performance data current to the most recent month-end.
How did the markets perform during the Fund’s fiscal year ended September 30, 2019?
Stock market returns were mixed during the fiscal year ended September 30, 2019, with the S&P 500® Index advancing 4.25%, while small-capitalization stocks, as represented by the Russell 2000® Index, fell 8.89% and international developed markets, as measured by the MSCI EAFE® Index (net), declined 1.34%. The MSCI Emerging Markets Index (net) also suffered for the period, declining 2.02%. The 12-month period saw increasing risk aversion by investors.
During the fiscal year, the majority of the sectors within the Russell 2000® Growth Index had negative performance. Utilities was the one exception which had slightly positive performance for the period.
Global industrial activity slowed over the past 12 to 18 months, primarily due to continued global trade friction with China and the European Union (EU). As these trade disputes dragged on, they clearly affected business confidence and investment plans,
particularly for the agricultural, industrial, and automotive industries.
Global consumer strength helped to defend the major economies from economic recession. The consumer, which represents the majority of gross domestic product (GDP) components, continued to benefit from plentiful jobs, modest wage growth, and rising net worth during the 12-month period.
What factors affected the Fund’s performance during its fiscal year?
The Fund handily outperformed the Russell 2000® Growth Index for the fiscal year ended September 30, 2019. Strong stock selection and an overweight in the technology sector, along with strong stock selection and an underweight to health care, contributed positively to performance. Poor stock selection in consumer discretionary and an underweight in utilities detracted from performance.
The biggest contributors to performance during the period were MarketAxess Holdings and Copart.
| ■ | Shares of MarketAxess appreciated after the company reported significant growth in the U.S. high yield bond, emerging market bond and Eurobond markets, driven by the success of its all-to-all trading protocol, called Open Trading. Its growing liquidity pool has enabled cost efficiencies for MarketAxess. |
| ■ | For the 12 months ended September 30, 2019, Copart delivered strong growth in both salvage car volumes and sustained average selling price growth. The company accomplished this by increasing its business selling high value cars to international rebuilders. Copart benefited from its large and growing network of both domestic and international buyers. |
| ■ | Other top contributors included Paycom Software, Autohome, and National Research. |
The biggest detractors from Fund performance were Ollie’s Bargain Outlet and Moelis & Co.
| ■ | In the most recent reported quarter, Ollie’s reported negative comparable store sales growth, which negatively impacted the performance of the stock. However, we believe the value proposition of Ollie’s remains intact, and we continued to hold the stock at the end of the period. |
| ■ | Moelis’s results over the past two quarters were down meaningfully year-over-year due to depressed global mergers & acquisitions (M&A) volumes. Europe was cited by the company and other investment banks as being especially bad for deal volumes. We believe the headwinds impacting Moelis are cyclical and not an indication of a structural problem with the business, so the Fund continued to hold the stock as of the end of the fiscal year. |
| ■ | Other top detractors included Fox Factory, PriceSmart, and NVE. |
The preceding information is the opinion of portfolio management only through the end of the period stated on the cover. Any such opinions are subject to change at any time based upon market or other conditions and should not be relied upon as investment advice. Past performance is no guarantee of future results, and there is no guarantee that market forecasts will be realized.
Equity Securities:The market price of equity securities may be adversely affected by financial market, industry, or issuer-specific events. Focus on a particular style or on small or medium-sized companies may enhance that risk.
Foreign & Emerging Markets:Investing internationally, especially in emerging markets, involves additional risks such as currency, political, accounting, economic, and market risk.
Limited Number of Investments:Because the Fund has a limited number of securities, it may be more susceptible to factors adversely affecting its securities than a less concentrated fund.
Industry/Sector Concentration:A fund that focuses its investments in a particular industry or sector will be more sensitive to conditions that affect that industry or sector than a non-concentrated fund.
Prospectus:For additional information on risks, please see the Fund’s prospectus.
For information regarding the indexes and certain investment terms, see the Key Investment Terms starting on page 6.
KAR Small-Cap Growth Fund
Asset Allocation
The following table presents asset allocation within certain sectors as a percentage of total investments as of September 30, 2019.
| Information Technology | 24% |
| Communication Services | 21 |
| Industrials | 20 |
| Financials | 16 |
| Consumer Discretionary | 9 |
| Health Care | 6 |
| Consumer Staples | 4 |
| Total | 100% |
For information regarding the indexes and certain investment terms, see the Key Investment Terms starting on page 6.
KAR Small-Cap Growth Fund (Continued)
Average Annual Total Returns1for periods ended 9/30/19
| | | 1 Year | 5 Years | 10 Years | Since
inception | Inception
date |
| Class A shares at NAV2 | | 14.12 % | 22.27 % | 18.26 % | — % | — |
| Class A shares at POP3,4 | | 7.55 | 20.83 | 17.56 | — | — |
| Class C shares at NAV2 and with CDSC4 | | 13.28 | 21.38 | 17.39 | — | — |
| Class I shares at NAV2 | | 14.44 | 22.59 | 18.57 | — | — |
| Class R6 shares at NAV2 | | 14.58 | — | — | 17.90 | 1/30/18 |
| Russell 2000® Growth Index | | -9.63 | 9.08 | 12.25 | 0.095 | — |
| Fund Expense Ratios6: Class A shares: 1.41%; Class C shares: 2.14%; Class I shares: 1.14%; Class R6 shares: 1.04%. | | | | | | |
| All returns represent past performance which is no guarantee of future results. Current performance may be higher or lower than the performance shown. The investment return and principal value of an investment will fluctuate so that an investor’s shares, when redeemed, may be worth more or less than their original cost. The above table and graph below do not reflect the deduction of taxes that a shareholder would pay on fund distributions or the redemption of shares. Please visit Virtus.com for performance data current to the most recent month-end. |
Growth of $10,000for periods ended 9/30
This chart assumes an initial investment of $10,000 made on September 30, 2009, for Class A shares, Class C shares, and Class I shares including any applicable sales charges or fees. The performance of the other share class may be greater or less than that shown based on differences in inception date, fees, and sales charges. Performance assumes reinvestment of dividends and capital gain distributions.

| 1 | Total returns are historical and include changes in share price and the reinvestment of both dividends and capital gain distributions. |
| 2 | “NAV” (Net Asset Value) total returns do not include the effect of any sales charge. |
| 3 | “POP” (Public Offering Price) total returns include the effect of the maximum front-end 5.75% sales charge. |
| 4 | “CDSC” (contingent deferred sales charge) is applied to redemptions of certain classes of shares that do not have a sales charge applied at the time of purchase. CDSC for certain redemptions of Class A shares made within 18 months of a finder’s fee being paid and all Class C shares are 1% within the first year and 0% thereafter. |
| 5 | The since inception index return is from the inception date of Class R6 shares. |
| 6 | The expense ratios of the Fund are set forth according to the prospectus for the Fund effective January 28, 2019, as supplemented and revised, and may differ from the expense ratios disclosed in the Financial Highlight tables in this report. See the Financial Highlights for more current expense ratios. Expense ratios include fees and expenses associated with any underlying funds. |
The index is unmanaged and not available for direct investment; therefore, its performance does not reflect the expenses associated with active management of an actual portfolio.
For information regarding the indexes and certain investment terms, see the Key Investment Terms starting on page 6.
| Ticker Symbols: |
| Class A: PQSAX |
| Class C: PQSCX |
| Class I: PXQSX |
| Class R6: VQSRX |
KAR Small-Cap Value Fund
Fund Summary (Unaudited)
Portfolio Manager Commentary by
Kayne Anderson Rudnick Investment Management, LLC
| ■ | The Fund is diversified and has an investment objective of long-term capital appreciation.There is no guarantee that the Fund will meet its objective. |
| ■ | For the fiscal year ended September 30, 2019, the Fund’s Class A shares at NAV returned -3.82%, Class C shares at NAV returned -4.56%, Class I shares at NAV returned -3.57%, and Class R6 shares at NAV returned -3.47%. For the same period, the Russell 2000® Value Index, which serves as both the Fund’s broad-based and style-specific index appropriate the comparison, returned -8.24%. |
All performance figures assume reinvestment of distributions and exclude the effect of sales charges. Performance data quoted represents past results. Past performance is no guarantee of future results, and current performance may be higher or lower than the performance shown above. Investment return and principal value will fluctuate so your shares, when redeemed, may be worth more or less than their original cost. Please visit Virtus.com for performance data current to the most recent month-end.
How did the markets perform during the Fund’s fiscal year ended September 30, 2019?
Stock market returns were mixed during the fiscal year ended September 30, 2019, with the S&P 500® Index advancing 4.25%, while small-capitalization stocks, as represented by the Russell 2000® Index, fell 8.89% and international developed markets, as measured by the MSCI EAFE® Index (net), declined 1.34%. The MSCI Emerging Markets Index (net) also suffered for the period, declining 2.02%. The 12-month period saw increasing risk aversion by investors.
During the fiscal year, seven of the nine sectors within the Russell 2000® Value Index had negative performance, with energy, health care, and materials & processing being the largest drags. Utilities and technology were the only two sectors with positive performance over the period.
Global industrial activity slowed over the past 12 to 18 months, primarily due to continued global trade friction with China and the European Union (EU). As
these trade disputes dragged on, they clearly affected business confidence and investment plans, particularly for the agricultural, industrial, and automotive industries.
Global consumer strength helped to defend the major economies from economic recession. The consumer, which represents the majority of gross domestic product (GDP) components, continued to benefit from plentiful jobs, modest wage growth, and rising net worth during the 12-month period.
What factors affected the Fund’s performance during its fiscal year?
The Fund outperformed the Russell 2000® Value Index for the fiscal year ended September 30, 2019. Strong stock selection in materials & processing, and strong stock selection and an underweight in health care contributed positively to performance. Poor stock selection in consumer staples and an underweight to utilities detracted from performance.
The biggest contributors to performance during the period were Scotts Miracle-Gro and Anika Therapeutics.
| ■ | Scotts Miracle-Gro’s hydroponic segment was adversely affected in 2018 by California’s cannabis licensing law, which caused many growers to exit the market. We took advantage of this stock weakness to add to our position. In 2019, hydroponic sales ceased their decline and then returned to double digit year-over-year organic growth in the second quarter, giving market participants confidence that the grower disruption had been resolved, and causing the stock to rebound strongly. |
| ■ | Anika saw its shares gain nicely over the 12-month period as solid sales growth from its MONOVISC and ORTHOVISC products enabled them to gain market share. Pricing for these products was stronger than anticipated during the period. The company also benefited from the establishment of a timeline for FDA approval for its CINGAL product. |
| ■ | Other top contributors included Brooks Automation, RLI, and RBC Bearings. |
The biggest detractors from the portfolio were National Beverage and Core Laboratories.
| ■ | In early October 2018, a class action lawsuit was |
| | filed against National Beverage alleging that the company’s LaCroix sparkling water, its largest and fastest-growing brand, contained harmful ingredients. Since that time, there has been a decline in LaCroix sales after years of double-digit growth. Investors grew concerned about the impact of the lawsuit on consumer perception of the brand, as well as a general increase in competitive offerings since late 2018. We continued to hold the stock through the end of the fiscal year, as we believe National Beverage is a leader in the growing sparkling water category. |
| ■ | Slowing U.S. onshore drilling activity put pressure on Core Labs’ Production Enhancement business while an expected acceleration in international projects failed to materialize during the period. These factors caused the company’s Reservoir Description segment to languish. Despite the headwinds, we continued to hold the stock at the end of the fiscal year. |
Other top detractors included Sally Beauty, Cheesecake Factory, and Thor Industries.
The preceding information is the opinion of portfolio management only through the end of the period stated on the cover. Any such opinions are subject to change at any time based upon market or other conditions and should not be relied upon as investment advice. Past performance is no guarantee of future results, and there is no guarantee that market forecasts will be realized.
Equity Securities:The market price of equity securities may be adversely affected by financial market, industry, or issuer-specific events. Focus on a particular style or on small or medium-sized companies may enhance that risk.
Limited Number of Investments:Because the Fund has a limited number of securities, it may be more susceptible to factors adversely affecting its securities than a less concentrated fund.
Industry/Sector Concentration:A fund that focuses its investments in a particular industry or sector will be more sensitive to conditions that affect that industry or sector than a non-concentrated fund.
Prospectus:For additional information on risks, please see the Fund’s prospectus.
For information regarding the indexes and certain investment terms, see the Key Investment Terms starting on page 6.
Asset Allocation
The following table presents asset allocation within certain sectors as a percentage of total investments as of September 30, 2019.
| Industrials | 27% |
| Financials | 20 |
| Information Technology | 18 |
| Consumer Discretionary | 7 |
| Real Estate | 7 |
| Materials | 7 |
| Consumer Staples | 5 |
| Other (includes short-term investment) | 9 |
| Total | 100% |
For information regarding the indexes and certain investment terms, see the Key Investment Terms starting on page 6.
KAR Small-Cap Value Fund (Continued)
Average Annual Total Returns1for periods ended 9/30/19
| | | 1 Year | 5 Years | 10 Years | Since
inception | Inception
date |
| Class A shares at NAV2 | | -3.82 % | 9.76 % | 11.68 % | — % | — |
| Class A shares at POP3,4 | | -9.35 | 8.47 | 11.02 | — | — |
| Class C shares at NAV2 and with CDSC4 | | -4.56 | 8.95 | 10.85 | — | — |
| Class I shares at NAV2 | | -3.57 | 10.04 | 11.96 | — | — |
| Class R6 shares at NAV2 | | -3.47 | — | — | 11.57 | 11/3/16 |
| Russell 2000® Value Index | | -8.24 | 7.17 | 10.06 | 8.945 | — |
| Fund Expense Ratios6: Class A shares: 1.27%; Class C shares: 1.97%; Class I shares: 0.99%; Class R6 shares: 0.90%. | | | | | | |
| All returns represent past performance which is no guarantee of future results. Current performance may be higher or lower than the performance shown. The investment return and principal value of an investment will fluctuate so that an investor’s shares, when redeemed, may be worth more or less than their original cost. The above table and graph below do not reflect the deduction of taxes that a shareholder would pay on fund distributions or the redemption of shares. Please visit Virtus.com for performance data current to the most recent month-end. |
Growth of $10,000for periods ended 9/30
This chart assumes an initial investment of $10,000 made on September 30, 2009, for Class A shares, Class C shares, and Class I shares including any applicable sales charges or fees. The performance of the other share class may be greater or less than that shown based on differences in inception date, fees, and sales charges. Performance assumes reinvestment of dividends and capital gain distributions.
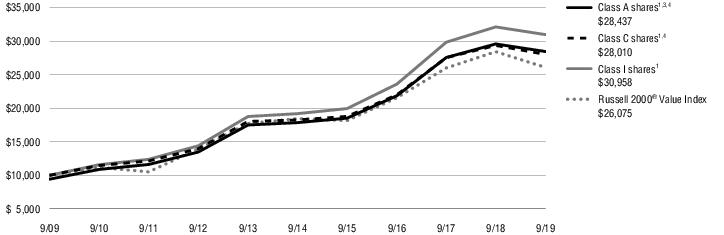
| 1 | Total returns are historical and include changes in share price and the reinvestment of both dividends and capital gain distributions. |
| 2 | “NAV” (Net Asset Value) total returns do not include the effect of any sales charge. |
| 3 | “POP” (Public Offering Price) total returns include the effect of the maximum front-end 5.75% sales charge. |
| 4 | “CDSC” (contingent deferred sales charge) is applied to redemptions of certain classes of shares that do not have a sales charge applied at the time of purchase. CDSC for certain redemptions of Class A shares made within 18 months of a finder’s fee being paid and all Class C shares are 1% within the first year and 0% thereafter. |
| 5 | The since inception index return is from the inception date of Class R6 shares. |
| 6 | The expense ratios of the Fund are set forth according to the prospectus for the Fund effective January 28, 2019, as supplemented and revised, and may differ from the expense ratios disclosed in the Financial Highlight tables in this report. See the Financial Highlights for more current expense ratios. Expense ratios include fees and expenses associated with any underlying funds. |
The index is unmanaged and not available for direct investment; therefore, its performance does not reflect the expenses associated with active management of an actual portfolio.
For information regarding the indexes and certain investment terms, see the Key Investment Terms starting on page 6.
| Ticker Symbols: |
| Class A: VKSAX |
| Class C: VKSCX |
| Class I: VKSIX |
| Class R6: VKSRX |
KAR Small-Mid Cap Core Fund
Fund Summary (Unaudited)
Portfolio Manager Commentary by
Kayne Anderson Rudnick Investment Management, LLC
| ■ | The Fund is diversified and has an investment objective of long-term capital appreciation with dividend income a secondary consideration.There is no guarantee that the Fund will meet its objectives. |
| ■ | For the fiscal year ended September 30, 2019, the Fund’s Class A shares at NAV returned 8.32%, Class C shares at NAV returned 7.50%, Class I shares at NAV returned 8.51%, and Class R6 shares at NAV returned 8.61%. For the same period, the Russell 2500™ Index, which serves as both the Fund’s broad-based and style-specific index appropriate the comparison, returned -4.04%. |
All performance figures assume reinvestment of distributions and exclude the effect of sales charges. Performance data quoted represents past results. Past performance is no guarantee of future results, and current performance may be higher or lower than the performance shown above. Investment return and principal value will fluctuate so your shares, when redeemed, may be worth more or less than their original cost. Please visit Virtus.com for performance data current to the most recent month-end.
How did the markets perform during the Fund’s fiscal year ended September 30, 2019?
Stock market returns were mixed during the fiscal year ended September 30, 2019, with the S&P 500® Index advancing 4.25%, while small-capitalization stocks, as represented by the Russell 2000® Index, fell 8.89% and international developed markets, as measured by the MSCI EAFE® Index (net), declined 1.34%. The MSCI Emerging Markets Index (net) also suffered for the period, declining 2.02%. The 12-month period saw increasing risk aversion by investors.
During the fiscal year, six of the nine sectors within the Russell 2500TM Index delivered negative performance. Utilities, financial services, and technology were the only sectors with positive performance during the period.
Global industrial activity slowed over the past 12 to 18 months, primarily due to continued global trade friction with China and the European Union (EU). As
these trade disputes dragged on, they clearly affected business confidence and investment plans, particularly for the agricultural, industrial, and automotive industries.
Global consumer strength helped to defend the major economies from economic recession. The consumer, which represents the majority of gross domestic product (GDP) components, continued to benefit from plentiful jobs, modest wage growth, and rising net worth during the 12-month period.
What factors affected the Fund’s performance during its fiscal year?
The Fund outperformed the Russell 2500TM Index during the fiscal year ended September 30, 2019. Strong stock selection and an overweight in technology, as well as strong stock selection in materials and processing, contributed to performance. Underweight positions in utilities and financial services detracted from performance.
The biggest contributors to performance during the period were Teradyne and DocuSign.
| ■ | While many investors focused on Teradyne’s position in robotics, the company surprised the market with its strong semiconductor and wireless test performance. Certain core markets, such as those serving new 5G technology, continued to grow during the period, and wireless was also strong. The Robots segment had less even performance, with a slowdown in customer spending likely aggravated by global tariff uncertainty. |
| ■ | Since going public last year, DocuSign has delivered strong top-line growth while also driving operating leverage. The company has made investments in research and development (R&D) to enhance its product offering and establish itself as more than an e-signature company. The period saw increased buying activity from larger enterprise customers, which pointed to the demand for contract management solutions. |
| ■ | Other top contributors included CDW, Scotts Miracle-Gro, and Copart. |
The biggest detractors from Fund performance were Bank OZK and Elanco Animal Health.
| ■ | Bank OZK’s share price declined significantly in the most recent quarter after the company reported a |
| | surprise write-off on two loans in areas that are outside of its core construction lending franchise. Shares had already been under pressure for some time due to slowing loan growth, which we viewed as cyclical and not a structural headwind. However, the fact that the bank took loan losses in a non-core part of its book in a strong economic environment eroded management’s reputation as good underwriters. With strong credit quality, which was a key pillar of our investment thesis, called into question, we opted to exit our position in the fourth quarter of 2018. |
| ■ | Elanco Animal Health saw its shares fall in the past year, driven more recently by the company’s announced acquisition of Bayer’s animal health division in August 2019. It is a fairly sizeable deal for Elanco, and investors were concerned about the ability of Elanco to successfully integrate such a large acquisition without hampering future growth. This created recent weakness in the shares. We spoke with management, and we believe the company should be stronger at the end of this process with the addition of several solid brands in animal health. Therefore, the Fund continued to hold the stock as of the end of the fiscal year. |
| ■ | Other top detractors included Thor Industries, Core Laboratories, and FLIR Systems. |
The preceding information is the opinion of portfolio management only through the end of the period stated on the cover. Any such opinions are subject to change at any time based upon market or other conditions and should not be relied upon as investment advice. Past performance is no guarantee of future results, and there is no guarantee that market forecasts will be realized.
Equity Securities:The market price of equity securities may be adversely affected by financial market, industry, or issuer-specific events. Focus on a particular style or on small or medium-sized companies may enhance that risk.
Limited Number of Investments:Because the Fund has a limited number of securities, it may be more susceptible to factors adversely affecting its securities than a less concentrated fund.
Industry/Sector Concentration:A fund that focuses its investments in a particular industry or sector will
For information regarding the indexes and certain investment terms, see the Key Investment Terms starting on page 6.
KAR Small-Mid Cap Core Fund
be more sensitive to conditions that affect that industry or sector than a non-concentrated fund.
Prospectus:For additional information on risks, please see the Fund’s prospectus.
Asset Allocation
The following table presents asset allocation within certain sectors as a percentage of total investments as of September 30, 2019.
| Information Technology | 31% |
| Industrials | 26 |
| Financials | 14 |
| Health Care | 12 |
| Consumer Discretionary | 8 |
| Materials | 5 |
| Short-Term Investment | 4 |
| Total | 100% |
For information regarding the indexes and certain investment terms, see the Key Investment Terms starting on page 6.
KAR Small-Mid Cap Core Fund (Continued)
Average Annual Total Returns1for periods ended 9/30/19
| | | 1 Year | Since
inception | Inception
date |
| Class A shares at NAV2 | | 8.32 % | 10.46 % | 3/7/18 |
| Class A shares at POP3,4 | | 2.09 | 6.37 | 3/7/18 |
| Class C shares at NAV2 and with CDSC4 | | 7.50 | 9.67 | 3/7/18 |
| Class I shares at NAV2 | | 8.51 | 10.72 | 3/7/18 |
| Class R6 shares at NAV2 | | 8.61 | 10.79 | 3/7/18 |
| Russell 2500™ Index | | -4.04 | 2.415 | — |
| Fund Expense Ratios6: Class A shares: Gross 5.84%, Net 1.30%; Class C shares: Gross 6.48%, Net 2.05%; Class I shares: Gross 5.74%, Net 1.05%; Class R6 shares: Gross 5.20%, Net 0.97%. | | | | |
| All returns represent past performance which is no guarantee of future results. Current performance may be higher or lower than the performance shown. The investment return and principal value of an investment will fluctuate so that an investor’s shares, when redeemed, may be worth more or less than their original cost. The above table and graph below do not reflect the deduction of taxes that a shareholder would pay on fund distributions or the redemption of shares. Please visit Virtus.com for performance data current to the most recent month-end. |
Growth of $10,000for periods ended 9/30
This chart assumes an initial investment of $10,000 made on March 7, 2018 (inception date of the Fund), for Class A shares, Class C shares, Class I shares, and Class R6 shares including any applicable sales charges or fees. Performance assumes reinvestment of dividends and capital gain distributions.

| 1 | Total returns are historical and include changes in share price and the reinvestment of both dividends and capital gain distributions. |
| 2 | “NAV” (Net Asset Value) total returns do not include the effect of any sales charge. |
| 3 | “POP” (Public Offering Price) total returns include the effect of the maximum front-end 5.75% sales charge. |
| 4 | “CDSC” (contingent deferred sales charge) is applied to redemptions of certain classes of shares that do not have a sales charge applied at the time of purchase. CDSC for certain redemptions of Class A shares made within 18 months of a finder’s fee being paid and all Class C shares are 1% within the first year and 0% thereafter. |
| 5 | The since inception index return is from the inception date of the Fund. |
| 6 | The expense ratios of the Fund are set forth according to the prospectus for the Fund effective January 28, 2019, as supplemented and revised, and may differ from the expense ratios disclosed in the Financial Highlight tables in this report. See the Financial Highlights for more current expense ratios. Net Expense: Expenses reduced by a contractual expense limitation in effect through January 31, 2020. Gross Expense: Does not reflect the effect of the expense limitation. Expense ratios include fees and expenses associated with any underlying funds. |
The index is unmanaged and not available for direct investment; therefore, its performance does not reflect the expenses associated with active management of an actual portfolio.
For information regarding the indexes and certain investment terms, see the Key Investment Terms starting on page 6.
| Ticker Symbols: |
| Class A: PDIAX |
| Class C: PGICX |
| Class I: PXIIX |
| Class R6: VECRX |
Rampart Enhanced Core Equity Fund
Fund Summary (Unaudited)
Portfolio Manager Commentary by
Rampart Investment Management Company, LLC
| ■ | The Fund is diversified and has investment objectives of capital appreciation and current income.There is no guarantee that the Fund will meet its objectives. |
| ■ | For the fiscal year ended September 30, 2019, the Fund’s Class A shares at NAV returned -0.85%, Class C shares at NAV returned -1.65%, Class I shares at NAV returned -0.58%, and Class R6 shares at NAV returned -0.56%. For the same period, the S&P 500® Index, which serves as both the Fund’s broad-based and style-specific index appropriate the comparison, returned 4.25%. |
All performance figures assume reinvestment of distributions and exclude the effect of sales charges. Performance data quoted represents past results. Past performance is no guarantee of future results, and current performance may be higher or lower than the performance shown above. Investment return and principal value will fluctuate so your shares, when redeemed, may be worth more or less than their original cost. Please visit Virtus.com for performance data current to the most recent month-end.
How did the markets perform during the Fund’s fiscal year ended September 30, 2019?
During the period from September 30, 2018 through September 30, 2019, the U.S. stock market was essentially flat – the S&P 500® Index rose just 4.25%, a well below average year in terms of outright performance. But, while the point-to-point performance barely made an impression, the year itself was highly volatile.
The period began with a traumatic fourth quarter for U.S. equity investors. The final three months of 2018 saw the S&P 500® Index plummet 14%, constituting the worst fourth quarter since 2008, and the ninth worst fourth quarter since 1928. We didn’t have to wait until the end of the quarter to start making historical comparisons though, as 16 of the 22 trading days in October were negative – the highest number since October of 2008. One of these down days was the -3.3% event on October 10th, the biggest one-day decline since the market meltdown of February 2018. November again presented the market with a handful of challenges, which only set the stage for a truly diabolical December.
The S&P 500® Index was off over 9% in December alone, which included an eight-day period in which the market was down more than 11%. There were five days when the market was down more than 2%, more than had occurred over the prior eight months. The 5% rally on December 26th was the largest one-day gain since March 2009. The range between the high and low levels on the S&P 500® Index during the month exceeded the range for all of 2017. There are plenty of other observations and statistical oddities, but everything points in the same direction – the U.S. stock market in December 2018 was crazy, insane, wild, irrational, absurd, and any other word that should never be used to describe a well-functioning large-cap stock market.
Most concerning about this volatile fourth quarter was that much of it had no obvious cause or explanation, at least nothing that would merit the kinds of responses we saw in the market. For example, the cause of the 3.3% drop on October 10th was unclear at the time, and it remained unclear through the end of the fiscal year. Things didn’t get any better the next day, as the market sold off another 2%. It was as if all sense of proportionality was gone, as if market participants had suddenly forgotten how to react to relatively normal stressors.
Fast forward to December 26th for another example of this dynamic. Traders came back from the Christmas holiday in the mood to buy, and by the end of a rather frantic session had pushed the S&P 500®Index up nearly 5%. The Dow Jones Industrial Average was up over 1,000 points, the largest one-day gain in the history of the index. And what prompted this euphoria? Unfortunately, we can find no event from that holiday-shortened week that could point to any substantial upward reaction, much less the largest percentage gain since 2009. (At least back then, the buyers were sensing the bottom of the 2008 stock market collapse.)
As 2018 ended and 2019 began, investor behavior appeared to normalize – if we accept that rational behavior and measured reactions are “normal.” The market pushed higher for the first several months of the year. While this was initially a continuation of the recovery from the December lows, it eventually evolved into a relatively stable bull market, built on solid earnings, optimistic economic indicators, low inflation, and low (and falling) interest rates. This growth period was followed by a range-bound, higher volatility phase, which closed out the fiscal
year. During both the bull phase and the sideways phase, market reactions to stressors largely appeared measured, timely, and appropriate.
One of the things the first three quarters of 2019 highlighted was that investors have given primacy to global trade in their decision-making process. The major market moves in 2019, both to the upside and the downside, can largely be explained by the shifting dynamics of the current trade war. Investors seem less concerned with Brexit, escalating tensions with Iran, military attacks on Saudi oil production, and the other, more prosaic macroeconomic noise that undergirds the global economy. None of that appears to matter nearly as much as trade and tariffs, specifically as they relate to China. And investors have made clear that they would prefer the trade war to end soon.
What factors affected the Fund’s performance during its fiscal year?
The Fund trailed the S& P 500® Index by 4.8% during the fiscal year ended September 30, 2019. This underperformance was largely driven by two key events. The Fund’s options overlay program was challenged in both the fourth quarter of 2018 and the early summer of 2019. Volatility spiked abruptly in October of 2018, resulting in losses to the options overlay strategy. By the time markets sold off again in December, higher risk assumptions were priced into the options, mitigating losses to the strategy in the final month of the year. The market rebounded in the first half of 2019, but again experienced heightened volatility in mid-August, with the Dow Jones Industrial Average experiencing its fourth worst point drop in history on August 14 due to geopolitical tensions and recession fears. This again proved a challenging period for the options overlay strategy, resulting in losses to that portion of the portfolio. The underlying equity portfolio performed in line with the market.
The preceding information is the opinion of portfolio management only through the end of the period stated on the cover. Any such opinions are subject to change at any time based upon market or other conditions and should not be relied upon as investment advice. Past performance is no guarantee of future results, and there is no guarantee that market forecasts will be realized.
Equity Securities:The market price of equity securities may be adversely affected by financial
For information regarding the indexes and certain investment terms, see the Key Investment Terms starting on page 6.
Rampart Enhanced Core Equity Fund
market, industry, or issuer-specific events. Focus on a particular style or on small or medium-sized companies may enhance that risk.
Portfolio Turnover:The Fund’s principal investments strategies will result in a consistently high portfolio turnover rate. A higher portfolio turnover rate may indicate higher transaction costs and may result in higher taxes when fund shares are held in a taxable account.
Options Overlay:The options overlay strategy may not be successful in achieving its objective of increasing distributable income while limiting the risk of loss and, in periods of significant moves in the
S&P 500® Index, has resulted and, in the future, may result in losses for investors.
Call/Put Spreads:Buying and selling call and put option spreads on the SPX Index risks the loss of the premium when buying, can limit upside participation and increase downside losses.
Fund of Funds:Because the Fund can invest in other funds, it indirectly bears its proportionate share of the operating expenses and management fees of the underlying fund(s).
Prospectus:For additional information on risks, please see the Fund’s prospectus.
Asset Allocation
The following table presents asset allocation within certain sectors as a percentage of total investments as of September 30, 2019.
| Information Technology | 22% |
| Health Care | 13 |
| Financials | 12 |
| Communication Services | 10 |
| Consumer Discretionary | 10 |
| Industrials | 9 |
| Consumer Staples | 8 |
| Other (includes short-term investments and written options) | 16 |
| Total | 100% |
For information regarding the indexes and certain investment terms, see the Key Investment Terms starting on page 6.
Rampart Enhanced Core Equity Fund (Continued)
Average Annual Total Returns1for periods ended 9/30/19
| | | 1 Year | 5 Years | 10 Years | Since
inception | Inception
date |
| Class A shares at NAV2 | | -0.85 % | 8.86 % | 10.98 % | — % | — |
| Class A shares at POP3,4 | | -6.55 | 7.58 | 10.32 | — | — |
| Class C shares at NAV2 and with CDSC4 | | -1.65 | 8.04 | 10.15 | — | — |
| Class I shares at NAV2 | | -0.58 | 9.13 | 11.25 | — | — |
| Class R6 shares at NAV2 | | -0.56 | — | — | 0.62 | 1/30/18 |
| S&P 500® Index | | 4.25 | 10.84 | 13.24 | 5.365 | — |
| Fund Expense Ratios6: Class A shares: Gross 1.31%, Net 1.20%; Class C shares: Gross 2.06%, Net 1.95%; Class I shares: Gross 1.08%, Net 0.95%; Class R6 shares: Gross 1.00%, Net 0.91%. | | | | | | |
| All returns represent past performance which is no guarantee of future results. Current performance may be higher or lower than the performance shown. The investment return and principal value of an investment will fluctuate so that an investor’s shares, when redeemed, may be worth more or less than their original cost. The above table and graph below do not reflect the deduction of taxes that a shareholder would pay on fund distributions or the redemption of shares. Please visit Virtus.com for performance data current to the most recent month-end. |
Growth of $10,000for periods ended 9/30
This chart assumes an initial investment of $10,000 made on September 30, 2009, for Class A shares, Class C shares, and Class I shares including any applicable sales charges or fees. The performance of the other share class may be greater or less than that shown based on differences in inception date, fees, and sales charges. Performance assumes reinvestment of dividends and capital gain distributions.
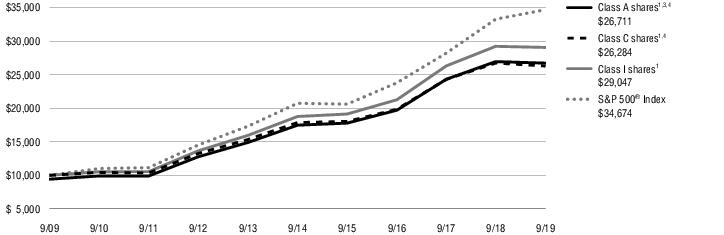
| 1 | Total returns are historical and include changes in share price and the reinvestment of both dividends and capital gain distributions. |
| 2 | “NAV” (Net Asset Value) total returns do not include the effect of any sales charge. |
| 3 | “POP” (Public Offering Price) total returns include the effect of the maximum front-end 5.75% sales charge. |
| 4 | “CDSC” (contingent deferred sales charge) is applied to redemptions of certain classes of shares that do not have a sales charge applied at the time of purchase. CDSC for certain redemptions of Class A shares made within 18 months of a finder’s fee being paid and all Class C shares are 1% within the first year and 0% thereafter. |
| 5 | The since inception index return is from the inception date of Class R6 shares. |
| 6 | The expense ratios of the Fund are set forth according to the prospectus for the Fund effective January 28, 2019, as supplemented and revised, and may differ from the expense ratios disclosed in the Financial Highlight tables in this report. See the Financial Highlights for more current expense ratios. Net Expense: Expenses reduced by a contractual expense limitation in effect through January 31, 2020. Gross Expense: Does not reflect the effect of the expense limitation. Expense ratios include fees and expenses associated with any underlying funds. |
The index is unmanaged and not available for direct investment; therefore, its performance does not reflect the expenses associated with active management of an actual portfolio.
For information regarding the indexes and certain investment terms, see the Key Investment Terms starting on page 6.
| Ticker Symbols: |
| Class A: VAEGX |
| Class C: VCEGX |
| Class I: VIEGX |
| Class R6: VESRX |
SGA Emerging Markets Growth Fund
Fund Summary (Unaudited)
Portfolio Manager Commentary by
Sustainable Growth Advisers, LP
| ■ | The Fund is diversified and has an investment objective of long-term capital appreciation.There is no guarantee that the Fund will meet its objective. |
| ■ | For the fiscal period June 13, 2019 (inception date) through September 30, 2019, the Fund’s Class A shares at NAV returned -0.30%*, Class C shares at NAV returned -0.50%*, Class I shares at NAV returned -0.20%*, and Class R6 shares at NAV returned -0.20%*. For the same period, the MSCI Emerging Markets Index (net), which serves as both the Fund’s broad-based and style-specific index appropriate the comparison, returned -0.87%*. |
* Returns less 1 year are not annualized.
All performance figures assume reinvestment of distributions and exclude the effect of sales charges. Performance data quoted represents past results. Past performance is no guarantee of future results, and current performance may be higher or lower than the performance shown above. Investment return and principal value will fluctuate so your shares, when redeemed, may be worth more or less than their original cost. Please visit Virtus.com for performance data current to the most recent month-end.
How did the markets perform during the fiscal period from June 13, 2019, through September 30, 2019?
Slowing growth and uncertainty plagued many of the emerging markets during the period. The two largest emerging market economies, China and India, continued to weaken. Economic growth in China slowed to 6.2% in the second quarter of 2019, the slowest rate in three decades, and the Indian economy grew 5.0%, its slowest rate in six years. In China, the country’s manufacturing base was particularly hard hit by the U.S.-China trade dispute and higher tariffs, combined with already slowing global demand. The Chinese government responded with significant stimulus measures over the past year in an effort to offset some of the recent weakness while also contributing positively to growth around the world. Likewise, in India, the government announced a proposed tax cut to spur economic activity and investment. The move was well received by investors, and Indian stocks rallied toward the end
of the period, with the materials, financials, and industrials sectors performing best.
Concerns over global economic growth and escalating trade tension between the U.S. and China, Japan, and South Korea weighed heavily on the markets in late July and August 2019, with emerging markets trailing developed markets and more resilient growth companies performing best. In contrast, speculation around renewed trade discussions between the U.S. and China lifted market sentiment in September. Increased optimism about a possible truce in the trade dispute, accompanied by more accommodative monetary policies from central banks around the world, led to a swift rotation out of more defensive growth stocks into more cyclically sensitive value stocks in September.
What factors affected the Fund’s performance from its inception on June 13, 2019, through September 30, 2019?
The Fund outperformed its benchmark for the period due to strong stock selection, particularly in Argentina and China.
Stock selection on a sector level detracted from relative returns over the period, although it added value during the market weakness in July and August. Selection in the information technology and consconsumer staples sectors detracted the most, while strong stock selection in the health care sector mitigated some of the weakness. Sector allocations, which are purely a byproduct of our bottom-up stock selection process, contributed positively to relative returns over the period, driven by overweights in the consumer discretionary and consumer staples sectors, an underweight to the financials sector, and a lack of exposure to the materials and industrials sectors.
Key Contributors
| ■ | Chinese private education firm New Oriental Education was the largest contributor during the fiscal period. The company posted strong results as it benefited from improved margins, classroom expansion, strong increases in student enrollment, and improved classroom utilization. In the latest quarter, both its K-12 and Overseas Testing segments posted strong growth, with the latter being above expectations due to reforms management made in order to cater more to |
| | younger students. We trimmed the position due to valuation, and maintained an average weight target. |
| ■ | Raia Drogasil, the largest drugstore chain in Brazil, was the second largest contributor over the period. The company benefited from a strong second quarter 2019 report, which highlighted an improving competitive backdrop, and reported mature same-store-sales (SSS) growth ahead of inflation, as the company gained market share. Raia Drogasil’s strategy of lowering prices for generic drugs resonated with customers and put pressure on smaller scale competitors. Overall revenues grew 17% compared to the same period last year, while SSS growth accelerated to 8%. We trimmed our position on strength during the period, but maintained an above-average weight in the company. |
| ■ | Chinese medical products company Shandong Weigao was the third largest contributor to Fund performance. The company posted solid results for the first half of 2019, with revenues growing 19% and earnings per share up by 23%, led by strength in its consumables and orthopedics units, as well as expanding margins. Sales in China, which constitute about 82% of Shandong Weigao’s total sales, grew 20%, while sales in the U.S., Europe, and other geographies were up almost 17%. With the circulation of H shares to management, we were pleased to see improvements in execution, as the listing of shares helped foster better alignment between the interests of shareholders and management. |
| ■ | Yum China and Infosys were the fourth and fifth largest contributors to performance, respectively. |
Key Detractors
| ■ | South African retailer Shoprite was the largest detractor from Fund performance during the period. Shoprite’s stock price was hurt by weakness in the South African equity market, a reduction in earnings guidance by the company, increasing competition, and temporary operational and currency issues. While the company’s most recent report highlighted improvement in South African (RSA) operations, it also showed weaker results in the non-RSA businesses which are critical to our growth thesis for the company. We were concerned that the non-RSA operations |
For information regarding the indexes and certain investment terms, see the Key Investment Terms starting on page 6.
SGA Emerging Markets Growth Fund
| | would continue to remain a contagion to the more favorable parts of the business. With the complexity of the non-RSA business rising, lower cash productivity, and higher debt, our expectation for growth in the future declined. Accordingly, we reallocated the capital to other higher confidence growth opportunities. |
| ■ | Latin American e-commerce leader MercadoLibre was the second largest detractor from Fund performance over the period, despite reporting strong second quarter 2019 results that showed accelerating revenue growth and improving margins. A steep decline in Argentine stocks and the Argentine Peso following the surprise outcome of a primary election in August, in which the populist Peronist party advanced, negatively impacted MercadoLibre’s stock price. The company also faced some deterioration in its Brazil operating results due to the ongoing impact of rising shipping costs associated with the Correios (Brazilian Postal Service) price hike, but was able to make progress reducing its reliance on Correios. We continue to have confidence in the MercadoLibre’s Latin American FinTech and e-commerce opportunities, and believe the company will be able to capitalize on the still low e-penetration in Latin American markets. We continued to hold the stock at the end of the period. |
| ■ | Ctrip.com, China’s leading online travel agency, was the third largest detractor from performance for the period. Continued concerns over the U.S.-China trade dispute, a slowing Chinese economy, currency depreciation, and unrest in Hong Kong all weighed on the near-term outlook for Ctrip.com and its stock price. Despite the recent weakness, Ctrip.com has seen an increasing proportion of repeat travelers each year, indicating high levels of customer loyalty. Given the greater near-term risks, yet attractive cash flow-based valuation, we maintained a below-average weight position in the company. |
| ■ | HDFC Bank and Universal Robina were the fourth and fifth largest detractors from performance, respectively. |
The preceding information is the opinion of portfolio management only through the end of the period stated on the cover. Any such opinions are subject to change at any time based upon market or other conditions and should not be relied upon as investment advice. Past performance is no guarantee of future results, and there is no guarantee that market forecasts will be realized.
Equity Securities:The market price of equity securities may be adversely affected by financial market, industry, or issuer-specific events. Focus on a particular style or on small or medium-sized companies may enhance that risk.
Geographic Concentration:A fund that focuses its investments in a particular geographic location will be highly sensitive to financial, economic, political, and other developments affecting the fiscal stability of that location.
Foreign & Emerging Markets:Investing internationally, especially in emerging markets, involves additional risks such as currency, political, accounting, economic, and market risk.
Industry/Sector Concentration:A fund that focuses its investments in a particular industry or sector will be more sensitive to conditions that affect that industry or sector than a non-concentrated fund.
Prospectus:For additional information on risks, please see the Fund’s prospectus.
Asset Allocation
The following table presents asset allocation within certain sectors as a percentage of total investments as of September 30, 2019.
| Consumer Staples | 34% |
| Consumer Discretionary | 31 |
| Financials | 16 |
| Information Technology | 8 |
| Health Care | 5 |
| Communication Services | 5 |
| Short-Term Investment | 1 |
| Total | 100% |
For information regarding the indexes and certain investment terms, see the Key Investment Terms starting on page 6.
SGA Emerging Markets Growth Fund (Continued)
Average Annual Total Returns1for periods ended 9/30/19
| | | Since
inception | Inception
date |
| Class A shares at NAV2 | -0.30% | 6/13/19 |
| Class A shares at POP3,4 | -6.03 | 6/13/19 |
| Class C shares at NAV2 | -0.50 | 6/13/19 |
| Class C shares with CDSC4 | -1.50 | 6/13/19 |
| Class I shares at NAV2 | -0.20 | 6/13/19 |
| Class R6 shares at NAV2 | -0.20 | 6/13/19 |
| MSCI Emerging Markets Index (net) | -0.875 | — |
| Fund Expense Ratios6: Class A shares: Gross 2.46%, Net 1.48%; Class C shares: Gross 3.21%, Net 2.23%; Class I shares: Gross 2.21%, Net 1.23%; Class R6 shares: Gross 2.11%, Net 1.05%. | | | |
| All returns represent past performance which is no guarantee of future results. Current performance may be higher or lower than the performance shown. The investment return and principal value of an investment will fluctuate so that an investor’s shares, when redeemed, may be worth more or less than their original cost. The above table and graph below do not reflect the deduction of taxes that a shareholder would pay on fund distributions or the redemption of shares. Please visit Virtus.com for performance data current to the most recent month-end. |
| 1 | Total returns are historical and include changes in share price and the reinvestment of both dividends and capital gain distributions. |
| 2 | “NAV” (Net Asset Value) total returns do not include the effect of any sales charge. |
| 3 | “POP” (Public Offering Price) total returns include the effect of the maximum front-end 5.75% sales charge. |
| 4 | “CDSC” (contingent deferred sales charge) is applied to redemptions of certain classes of shares that do not have a sales charge applied at the time of purchase. CDSC charges for certain redemptions of Class A shares made within 18 months of a finder’s fee being paid and all Class C shares are 1% within the first year and 0% thereafter. |
| 5 | The since inception index return is from the inception date of the Fund. |
| 6 | The expense ratios of the Fund are set forth according to the prospectus for the Fund effective June 12, 2019, as supplemented and revised, and may differ from the expense ratios disclosed in the Financial Highlight tables in this report. See the Financial Highlights for more current expense ratios. Net Expense: Expenses reduced by a contractual expense limitation in effect through January 31, 2021. Gross Expense: Does not reflect the effect of the expense limitation. Expense ratios include fees and expenses associated with any underlying funds. |
For information regarding the indexes and certain investment terms, see the Key Investment Terms starting on page 6.
SGA Emerging Markets Growth Fund (Continued)
Growth of $10,000for periods ended 9/30
This chart assumes an initial investment of $10,000 made on June 13, 2019 (inception date of the Fund), for Class A shares, Class C shares, Class I shares, and Class R6 shares including any applicable sales charges or fees. Performance assumes reinvestment of dividends and capital gain distributions.
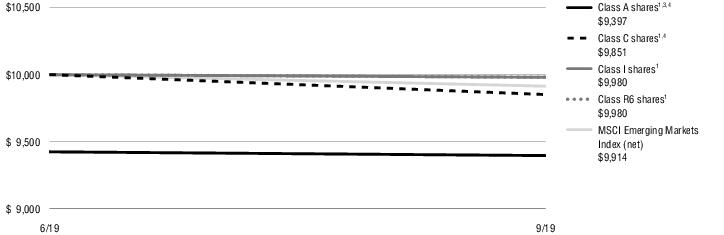
| 1 | Total returns are historical and include changes in share price and the reinvestment of both dividends and capital gain distributions. |
| 2 | “NAV” (Net Asset Value) total returns do not include the effect of any sales charge. |
| 3 | “POP” (Public Offering Price) total returns include the effect of the maximum front-end 5.75% sales charge. |
| 4 | “CDSC” (contingent deferred sales charge) is applied to redemptions of certain classes of shares that do not have a sales charge applied at the time of purchase. CDSC for certain redemptions of Class A shares made within 18 months of a finder’s fee being paid and all Class C shares are 1% within the first year and 0% thereafter. |
| 5 | The since inception index return is from the inception date of the Fund. |
| 6 | The expense ratios of the Fund are set forth according to the prospectus for the Fund effective June 12, 2019, as supplemented and revised, and may differ from the expense ratios disclosed in the Financial Highlight tables in this report. See the Financial Highlights for more current expense ratios. Net Expense: Expenses reduced by a contractual expense limitation in effect through January 31, 2021. Gross Expense: Does not reflect the effect of the expense limitation. Expense ratios include fees and expenses associated with any underlying funds. |
The index is unmanaged and not available for direct investment; therefore, its performance does not reflect the expenses associated with active management of an actual portfolio.
For information regarding the indexes and certain investment terms, see the Key Investment Terms starting on page 6.
| Ticker Symbols: |
| Class A: SGAAX |
| Class C: SGACX |
| Class I: SGAPX |
| Class R6: SGARX |
SGA Global Growth Fund
Fund Summary (Unaudited)
Portfolio Manager Commentary by
Sustainable Growth Advisers, LP
| ■ | The Fund is diversified and has an investment objective of long-term capital appreciation.There is no guarantee that the Fund will meet its objective. |
| ■ | Effective May 3, 2019, the Fund changed its fiscal year end from January 31 to September 30. As a result, the commentary addresses 8 months of performance from February 1, 2019 to September 30, 2019. |
| ■ | For the fiscal period February 1 through September 30, 2019, the Fund’s Class A shares at NAV returned 12.92%*, Class C shares at NAV returned 12.38%*, Class I shares at NAV returned 13.06%*, and Class R6 shares at NAV returned 13.24%*. For the same period, the MSCI AC World Index (net) returned 7.69%*, and the MSCI AC World Growth Index (net), returned 10.97%*. |
* Returns less 1 year are not annualized.
All performance figures assume reinvestment of distributions and exclude the effect of sales charges. Performance data quoted represents past results. Past performance is no guarantee of future results, and current performance may be higher or lower than the performance shown above. Investment return and principal value will fluctuate so your shares, when redeemed, may be worth more or less than their original cost. Please visit Virtus.com for performance data current to the most recent month-end.
How did the markets perform during the Fund’s fiscal period ended September 30, 2019?
Global markets experienced increasing volatility during the fiscal year driven by concerns over rising U.S. interest rates early in the period. This was followed by concerns regarding the slowing pace of global economic growth and the impact of trade tensions between the U.S. and China on economies around the world. While market leadership changed significantly many times during the year, more defensive areas of the MSCI All Country World Index (ACWI) outperformed, with utilities, real estate, and consumer staples providing the strongest returns. In contrast, more economically sensitive areas of the market such as energy and materials, which were expected to feel the most impact from slow or no growth, performed the worst. Health care, which
came under significant pressure due to increased political rhetoric and proposals to better contain rising drug and health care costs, was the third worst performer. Metrics typically associated with higher business quality such as positive earnings, low debt, high returns on equity, and lower market risk outperformed for the period.
What factors affected the Fund’s performance during its fiscal period?
The Fund outperformed its benchmark for the fiscal year ended September 30, 2019, due to strong stock selection, particularly within the non-U.S. developed markets.
For the period, stock selection in the consumer discretionary and information technology sectors was strongest, while selection in the energy and consumer staples sectors was weakest. Country and sector allocations are purely a byproduct of our stock selection process, but both contributed positively to relative performance. From a regional standpoint, the Fund’s overweight to emerging markets and underweight to the U.S. detracted from relative returns. From a sector standpoint, the Fund’s lack of exposure to energy and overweight to consumer staples contributed positively to results, while its lack of exposure to utilities, which typically don’t provide the growth or business quality we seek, detracted from relative returns.
Key Contributors
| ■ | Chinese private education firm New Oriental Education was the largest contributor during the fiscal year. The company posted strong results as it benefited from improved margins, classroom expansion, strong increases in student enrollment, and improved classroom utilization. In the latest quarter, both its K-12 and Overseas Testing segments posted strong growth, with the latter being above expectations due to reforms management made in order to cater more to younger students. We trimmed the position due to valuation, and maintained an average weight target. |
| ■ | Latin American e-commerce leader MercadoLibre was the Fund’s second largest contributor after it reported solid operating results over the period. The company’s burgeoning FinTech initiatives posted strong growth. While MercadoLibre faced some deterioration in its Brazil operating results |
| | due to the ongoing impact of rising shipping costs associated with the Correios (Brazilian Postal Service) price hike implemented last year, the company was able to make progress reducing its reliance on Correios. We trimmed the Fund’s position during the year on strength, and maintained a below-average weight position in the Fund. |
| ■ | Leading global data center provider Equinix was the third largest contributor to Fund performance. The company benefited from the rising need of businesses to interconnect, and the growth of existing U.S. clients as it expanded across geographic borders. During the latest quarter, the company again reported solid results, beating expectations and raising guidance for the full year due to strength in bookings and margins. Its strong operational performance as well as the market’s defensive focus and lower interest rates benefitted the stock’s performance. We trimmed the position on strength due to valuation, and reduced the position target to an average weight. |
| ■ | The fourth and fifth largest contributors to performance were Nestle and Red Hat. |
Key Detractors
| ■ | Oil service leader Schlumberger was the largest detractor from Fund performance for the period as the stock declined in tandem with oil prices. An oversupply situation reappeared following increases in production levels from Saudi Arabia and Russia. Based on our research, we determined that our thesis for the company had weakened due to a reduction in predictability of revenues and earnings fueled by the company’s expansion into more capital-intensive and commoditized areas of oil services. Given increased market volatility and the availability of other stocks which had become more attractively valued, we sold Schlumberger and redeployed the proceeds. |
| ■ | South African retailer Shoprite was the second largest detractor from Fund performance. Shoprite’s stock price was hurt by weakness in the South African equity market, a reduction in earnings guidance by the company, increasing competition, and temporary operational and currency issues. While the company’s most recent report highlighted improvement in South African (RSA) operations, it also showed weaker results in |
For information regarding the indexes and certain investment terms, see the Key Investment Terms starting on page 6.
| | the non-RSA businesses which are critical to our growth thesis for the company. We were concerned that the non-RSA operations would continue to remain a contagion to the more favorable parts of the business. With the complexity of the non-RSA business rising, lower cash productivity, and higher debt, our expectation for growth in the future declined. Accordingly, we reallocated the capital to other higher confidence growth opportunities. |
| ■ | Biopharmaceutical company Regeneron was the third largest detractor from performance. The company was negatively impacted by investor concerns over uncertainty related to government Medicare Part B reimbursement policies and their impact on the company’s largest drug, Eylea. At the same time, near-term earnings were negatively affected by the company’s success in receiving Food & Drug Administration (FDA) approval for key new drugs in the atopic dermatitis, rheumatoid arthritis, and immune-oncology areas. Investors were concerned about the expenses associated with effectively getting these drugs launched. Given the uncertainty about government reimbursement policies, and the likelihood of |
| | continued political rhetoric during the upcoming presidential campaign over drug cost containment, we trimmed the Fund’s position to a below-average weight. |
| ■ | The fourth and fifth largest detractors from performance were Amorepacific and Amazon. |
The preceding information is the opinion of portfolio management only through the end of the period stated on the cover. Any such opinions are subject to change at any time based upon market or other conditions and should not be relied upon as investment advice. Past performance is no guarantee of future results, and there is no guarantee that market forecasts will be realized.
Equity Securities:The market price of equity securities may be adversely affected by financial market, industry, or issuer-specific events. Focus on a particular style or on small or medium-sized companies may enhance that risk.
Foreign & Emerging Markets: Investing internationally, especially in emerging markets, involves additional risks such as currency, political, accounting, economic, and market risk.
Geographic Concentration:A fund that focuses its investments in a particular geographic location will be highly sensitive to financial, economic, political, and other developments affecting the fiscal stability of that location.
Industry/Sector Concentration:A fund that focuses its investments in a particular industry or sector will be more sensitive to conditions that affect that industry or sector than a non-concentrated fund.
Prospectus:For additional information on risks, please see the Fund’s prospectus.
Asset Allocation
The following table presents asset allocation within certain sectors as a percentage of total investments as of September 30, 2019.
| Consumer Discretionary | 26% |
| Information Technology | 21 |
| Consumer Staples | 13 |
| Health Care | 11 |
| Financials | 10 |
| Communication Services | 6 |
| Industrials | 3 |
| Other (includes short-term investment) | 10 |
| Total | 100% |
For information regarding the indexes and certain investment terms, see the Key Investment Terms starting on page 6.
SGA Global Growth Fund (Continued)
Average Annual Total Returns1for periods ended 9/30/19
| | | 1 Year | 5 Years | Since
inception | Inception
date |
| Class A shares at NAV2 | | 8.84 % | 12.61 % | 11.27 % | 10/4/13 |
| Class A shares at POP3,4 | | 2.58 | 11.29 | 10.17 | 10/4/13 |
| Class C shares at NAV2 and with CDSC4 | | 8.09 | 11.78 | 10.44 | 10/4/13 |
| Class I shares at NAV2 | | 8.99 | 12.65 | 11.31 | 10/4/13 |
| Class R6 shares at NAV2 | | 9.29 | 13.07 | 11.64 | 12/31/10 |
| MSCI AC World Index (net) | | 1.38 | 6.65 | —5 | — |
| MSCI AC World Growth Index (net) | | 2.76 | 8.94 | —6 | — |
| Fund Expense Ratios7: Class A shares: Gross 1.53%, Net 1.39%; Class C shares: Gross 2.28%, Net 2.14%; Class I shares: Gross 1.28%, Net 1.14%; Class R6 shares: Gross 1.16%, Net 0.91%. | | | | | |
| All returns represent past performance which is no guarantee of future results. Current performance may be higher or lower than the performance shown. The investment return and principal value of an investment will fluctuate so that an investor’s shares, when redeemed, may be worth more or less than their original cost. The above table and graph below do not reflect the deduction of taxes that a shareholder would pay on fund distributions or the redemption of shares. Please visit Virtus.com for performance data current to the most recent month-end. |
Growth of $10,000for periods ended 9/30
This chart assumes an initial investment of $10,000 made on December 31, 2010 (inception date of the Class R6 shares), for Class R6 shares including any applicable sales charges or fees. Performance assumes reinvestment of dividends and capital gain distributions.
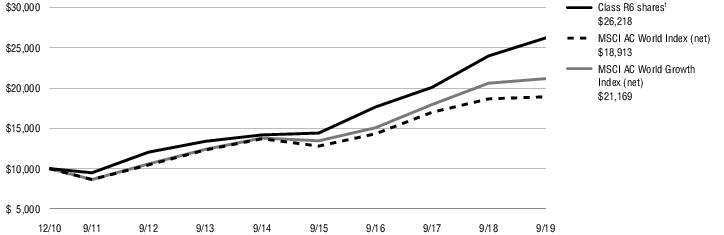
| 1 | Total returns are historical and include changes in share price and the reinvestment of both dividends and capital gain distributions. |
| 2 | “NAV” (Net Asset Value) total returns do not include the effect of any sales charge. |
| 3 | “POP” (Public Offering Price) total returns include the effect of the maximum front-end 5.75% sales charge. |
| 4 | “CDSC” (contingent deferred sales charge) is applied to redemptions of certain classes of shares that do not have a sales charge applied at the time of purchase. CDSC for certain redemptions of Class A shares made within 18 months of a finder’s fee being paid and all Class C shares are 1% within the first year and 0% thereafter. |
| 5 | The since inception index returned 7.34% for the inception date of Class I shares and 7.55% for the inception date of Class R6 shares. |
| 6 | The since inception index return is from the inception date of Class I shares. |
| 7 | The expense ratios of the Fund are set forth according to the prospectus for the Fund effective January 28, 2019, as supplemented and revised, and may differ from the expense ratios disclosed in the Financial Highlight tables in this report. See the Financial Highlights for more current expense ratios. Net Expense: Expenses reduced by a contractual expense limitation in effect through May 31, 2021. Gross Expense: Does not reflect the effect of the expense limitation. Expense ratios include fees and expenses associated with any underlying funds. |
The indexes are unmanaged and not available for direct investment; therefore, their performance does not reflect the expenses associated with active management of an actual portfolio.
For information regarding the indexes and certain investment terms, see the Key Investment Terms starting on page 6.
KAR Capital Growth Fund
SCHEDULE OF INVESTMENTS
September 30, 2019
($ reported in thousands)
| | Shares | | Value |
| Convertible Preferred Stock—1.4% |
| Information Technology—1.4% | | |
| BDC Payments Holdings, Inc.(1)(2)(3) | 663,721 | | $6,850 |
Total Convertible Preferred Stock
(Identified Cost $5,514) | | 6,850 |
| | | | |
| |
| | | | |
| |
| Common Stocks—97.6% |
| Communication Services—13.1% | | |
| Activision Blizzard, Inc. | 118,720 | | 6,283 |
| Facebook, Inc. Class A(2) | 162,000 | | 28,849 |
| Netflix, Inc.(2) | 61,270 | | 16,397 |
| Tencent Holdings Ltd. ADR | 346,130 | | 14,409 |
| | | | 65,938 |
| | | | |
| |
| Consumer Discretionary—26.6% | | |
| Alibaba Group Holding Ltd. Sponsored ADR(2) | 156,390 | | 26,153 |
| Amazon.com, Inc.(2) | 22,412 | | 38,905 |
| Ctrip.com International Ltd. ADR(2) | 157,330 | | 4,608 |
| Home Depot, Inc. (The) | 38,425 | | 8,916 |
| Las Vegas Sands Corp. | 194,673 | | 11,244 |
| McDonald’s Corp. | 39,120 | | 8,400 |
| MercadoLibre, Inc.(2) | 14,580 | | 8,037 |
| NIKE, Inc. Class B | 165,730 | | 15,565 |
| Ross Stores, Inc. | 107,426 | | 11,801 |
| | | | 133,629 |
| | | | |
| |
| Consumer Staples—6.4% | | |
| McCormick & Co., Inc. | 42,755 | | 6,683 |
| Monster Beverage Corp.(2) | 84,163 | | 4,886 |
| Philip Morris International, Inc. | 124,427 | | 9,448 |
| Procter & Gamble Co. (The) | 88,460 | | 11,003 |
| | | | 32,020 |
| | | | |
| |
| Financials—7.3% | | |
| Bank of America Corp. | 524,800 | | 15,309 |
| Charles Schwab Corp. (The) | 181,738 | | 7,602 |
| MarketAxess Holdings, Inc. | 29,180 | | 9,556 |
| | Shares | | Value |
| | | | |
| Financials—continued | | |
| Progressive Corp. (The) | 56,840 | | $4,391 |
| | | | 36,858 |
| | | | |
| |
| Health Care—8.0% | | |
| Bluebird Bio, Inc.(2) | 36,190 | | 3,323 |
| Danaher Corp. | 72,202 | | 10,428 |
| HealthEquity, Inc.(2) | 82,510 | | 4,715 |
| Illumina, Inc.(2) | 17,720 | | 5,391 |
| Zoetis, Inc. | 130,277 | | 16,231 |
| | | | 40,088 |
| | | | |
| |
| Industrials—9.5% | | |
| CoStar Group, Inc.(2) | 20,591 | | 12,215 |
| Equifax, Inc. | 38,290 | | 5,386 |
| Fair Isaac Corp.(2) | 14,750 | | 4,477 |
| Kansas City Southern | 62,660 | | 8,334 |
| Roper Technologies, Inc. | 33,639 | | 11,996 |
| Uber Technologies, Inc.(2)(4) | 174,111 | | 5,305 |
| | | | 47,713 |
| | | | |
| |
| Information Technology—24.0% | | |
| Accenture plc Class A | 48,318 | | 9,294 |
| Amphenol Corp. Class A | 151,408 | | 14,611 |
| Avalara, Inc.(2) | 173,760 | | 11,692 |
| NVIDIA Corp. | 78,640 | | 13,689 |
| Paycom Software, Inc.(2) | 94,742 | | 19,847 |
| Trade Desk, Inc. (The) Class A(2) | 55,190 | | 10,351 |
| Visa, Inc. Class A | 152,344 | | 26,205 |
| Workday, Inc. Class A(2) | 86,301 | | 14,668 |
| | | | 120,357 |
| | | | |
| |
| Materials—2.7% | | |
| Ecolab, Inc. | 67,766 | | 13,420 |
Total Common Stocks
(Identified Cost $242,594) | | 490,023 |
| | | | |
| |
| | | | |
| |
Total Long-Term Investments—99.0%
(Identified Cost $248,108) | | 496,873 |
| | | | |
| |
| | | | |
| |
| | Shares | | Value |
| | | | |
| | | | |
| Securities Lending Collateral—1.0% |
| Dreyfus Government Cash Management Fund - Institutional Shares (seven-day effective yield 1.854%)(5)(6) | 5,289,468 | | $5,289 |
Total Securities Lending Collateral
(Identified Cost $5,289) | | 5,289 |
| | | | |
| |
| | | | |
| |
TOTAL INVESTMENTS—100.0%
(Identified Cost $253,397) | | $502,162 |
| Other assets and liabilities, net—(0.0)% | | (50) |
| NET ASSETS—100.0% | | $502,112 |
| Abbreviation: |
| ADR | American Depositary Receipt |
| Footnote Legend: |
| (1) | The value of this security was determined using significant unobservable inputs and is reported as a Level 3 security in the Fair Value Hierarchy table located after the Schedule of Investments. |
| (2) | Non-income producing. |
| (3) | Restricted security. |
| (4) | All or a portion of security is on loan. |
| (5) | Shares of this fund are publicly offered, and its prospectus and annual report are publicly available. |
| (6) | Represents security purchased with cash collateral received for securities on loan. |
| Country Weightings (Unaudited)† |
| United States | 91% |
| China | 9 |
| Total | 100% |
| † % of total investments as of September 30, 2019. |
For information regarding the abbreviations, see the Key Investment Terms starting on page 6.
See Notes to Financial Statements.
KAR Capital Growth Fund
SCHEDULE OF INVESTMENTS (Continued)
September 30, 2019
($ reported in thousands)
The following table summarizes the market value of the Fund’s investments as of September 30, 2019, based on the inputs used to value them (See Security Valuation Note 2A in the Notes to Financial Statements):
| | Total
Value at
September 30, 2019 | | Level 1
Quoted Prices | | Level 3
Significant
Unobservable
Inputs |
| Assets: | | | | | |
| Equity Securities: | | | | | |
| Common Stocks | $490,023 | | $490,023 | | $— |
| Convertible Preferred Stock | 6,850 | | — | | 6,850 |
| Securities Lending Collateral | 5,289 | | 5,289 | | — |
| Total Investments | $502,162 | | $495,312 | | $6,850 |
There were no securities valued using significant observable inputs (Level 2) at September 30, 2019.
There were no transfers into or out of Level 3 related to securities held at September 30, 2019.
| | Total | | Convertible
Preferred
Stock |
| Investments in Securities | | | |
| Balance as of September 30, 2018: | $— | | $— |
| Change in unrealized appreciation (depreciation)(a) | 1,336 | | 1,336 |
| Purchases | 5,514 | | 5,514 |
| Balance as of September 30, 2019 | $6,850 | | $6,850 |
(a) The change in unrealized appreciation (depreciation) on investments still held at September 30, 2019, was $1,336.
BDC Payment Holdings, Inc.
The significant unobservable inputs used in the fair value measurement of the reporting entity’s convertible preferred stock is based on a market approach of comparable companies’ projected revenue multiples and ranges from 8.0x to 10.8x. Significant increases (decreases) in this input would result in a significantly lower (higher) fair value measurement.
See Notes to Financial Statements.
KAR Global Quality Dividend Fund
SCHEDULE OF INVESTMENTS
September 30, 2019
($ reported in thousands)
| | Shares | | Value |
| Common Stocks—97.0% |
| Communication Services—14.2% | | |
| AT&T, Inc. | 50,499 | | $1,911 |
| BCE, Inc. | 41,570 | | 2,012 |
| Spark New Zealand Ltd. | 629,220 | | 1,738 |
| | | | 5,661 |
| | | | |
| |
| Consumer Discretionary—2.8% | | |
| Compass Group plc Sponsored ADR | 7,318 | | 188 |
| Las Vegas Sands Corp. | 16,170 | | 934 |
| | | | 1,122 |
| | | | |
| |
| Consumer Staples—6.9% | | |
| Coca-Cola Co. (The) | 23,995 | | 1,306 |
| Kimberly-Clark Corp. | 3,910 | | 556 |
| Tate & Lyle plc | 96,941 | | 877 |
| | | | 2,739 |
| | | | |
| |
| Energy—10.8% | | |
| ONEOK, Inc. | 23,580 | | 1,738 |
| Royal Dutch Shell plc Sponsored Class B ADR | 23,820 | | 1,427 |
| TOTAL S.A. | 11,100 | | 579 |
| TOTAL S.A. Sponsored ADR | 11,110 | | 578 |
| | | | 4,322 |
| | | | |
| |
| Financials—19.6% | | |
| Bank of Hawaii Corp. | 5,599 | | 481 |
| Royal Bank of Canada | 19,610 | | 1,592 |
| Sabre Insurance Group plc | 270,000 | | 979 |
| SCOR SE | 20,748 | | 857 |
| SCOR SE Sponsored ADR | 72,940 | | 297 |
| Tokio Marine Holdings, Inc. | 12,020 | | 642 |
| Tryg A/S | 27,785 | | 796 |
| Zurich Insurance Group AG | 1,260 | | 482 |
| Zurich Insurance Group AG ADR | 44,237 | | 1,695 |
| | | | 7,821 |
| | | | |
| |
| Health Care—6.4% | | |
| AstraZeneca plc Sponsored ADR | 9,004 | | 402 |
| GlaxoSmithKline plc | 20,100 | | 431 |
| GlaxoSmithKline plc Sponsored ADR | 23,946 | | 1,022 |
| | Shares | | Value |
| | | | |
| Health Care—continued | | |
| Merck & Co., Inc. | 5,040 | | $424 |
| Sonic Healthcare Ltd. | 15,000 | | 284 |
| | | | 2,563 |
| | | | |
| |
| Industrials—6.2% | | |
| Port of Tauranga Ltd.(1) | 46,200 | | 187 |
| Waste Management, Inc. | 4,098 | | 471 |
| Watsco, Inc. | 10,676 | | 1,806 |
| | | | 2,464 |
| | | | |
| |
| Information Technology—6.1% | | |
| Analog Devices, Inc. | 4,790 | | 535 |
| Cisco Systems, Inc. | 7,370 | | 364 |
| Paychex, Inc. | 6,700 | | 554 |
| Tieto OYJ(1) | 38,478 | | 986 |
| | | | 2,439 |
| | | | |
| |
| Materials—2.8% | | |
| DS Smith plc | 87,000 | | 386 |
| Kemira OYJ | 26,400 | | 388 |
| Sonoco Products Co. | 5,980 | | 348 |
| | | | 1,122 |
| | | | |
| |
| Real Estate—11.9% | | |
| Crown Castle International Corp. | 11,000 | | 1,529 |
| Lamar Advertising Co. Class A | 23,937 | | 1,961 |
| Realty Income Corp. | 16,560 | | 1,270 |
| | | | 4,760 |
| | | | |
| |
| Utilities—9.3% | | |
| Fortis, Inc. | 35,220 | | 1,491 |
| NextEra Energy, Inc. | 3,850 | | 897 |
| WEC Energy Group, Inc. | 13,650 | | 1,298 |
| | | | 3,686 |
| | | | |
| |
Total Common Stocks
(Identified Cost $33,836) | | 38,699 |
| | | | |
| |
| | | | |
| |
Total Long-Term Investments—97.0%
(Identified Cost $33,836) | | 38,699 |
| | | | |
| |
| | | | |
| |
| | Shares | | Value |
| | | | |
| | | | |
| Securities Lending Collateral—1.5% |
| Dreyfus Government Cash Management Fund - Institutional Shares (seven-day effective yield 1.854%)(2)(3) | 605,876 | | $606 |
Total Securities Lending Collateral
(Identified Cost $606) | | 606 |
| | | | |
| |
| | | | |
| |
TOTAL INVESTMENTS—98.5%
(Identified Cost $34,442) | | $39,305 |
| Other assets and liabilities, net—1.5% | | 590 |
| NET ASSETS—100.0% | | $39,895 |
| Abbreviation: |
| ADR | American Depositary Receipt |
| Footnote Legend: |
| (1) | All or a portion of security is on loan. |
| (2) | Shares of this fund are publicly offered, and its prospectus and annual report are publicly available. |
| (3) | Represents security purchased with cash collateral received for securities on loan. |
| Country Weightings (Unaudited)† |
| United States | 48% |
| United Kingdom | 14 |
| Canada | 13 |
| France | 6 |
| Switzerland | 6 |
| New Zealand | 5 |
| Finland | 4 |
| Other | 4 |
| Total | 100% |
| † % of total investments as of September 30, 2019. |
For information regarding the abbreviations, see the Key Investment Terms starting on page 6.
See Notes to Financial Statements.
KAR Global Quality Dividend Fund
SCHEDULE OF INVESTMENTS (Continued)
September 30, 2019
($ reported in thousands)
The following table summarizes the market value of the Fund’s investments as of September 30, 2019, based on the inputs used to value them (See Security Valuation Note 2A in the Notes to Financial Statements):
| | Total
Value at
September 30, 2019 | | Level 1
Quoted Prices |
| Assets: | | | |
| Equity Securities: | | | |
| Common Stocks | $38,699 | | $38,699 |
| Securities Lending Collateral | 606 | | 606 |
| Total Investments | $39,305 | | $39,305 |
There were no securities valued using significant observable inputs (Level 2) or significant unobservable inputs (Level 3) at September 30, 2019.
There were no transfers into or out of Level 3 related to securities held at September 30, 2019.
See Notes to Financial Statements.
KAR Mid-Cap Core Fund
SCHEDULE OF INVESTMENTS
September 30, 2019
($ reported in thousands)
| | Shares | | Value |
| Common Stocks—97.4% |
| Communication Services—3.8% | | |
| Autohome, Inc. ADR(1) | 196,244 | | $16,314 |
| Consumer Discretionary—7.1% | | |
| Ross Stores, Inc. | 153,054 | | 16,813 |
| Tractor Supply Co. | 151,678 | | 13,718 |
| | | | 30,531 |
| | | | |
| |
| Consumer Staples—3.3% | | |
| Lamb Weston Holdings, Inc. | 193,585 | | 14,077 |
| Financials—12.9% | | |
| First Financial Bankshares, Inc. | 298,020 | | 9,933 |
| Houlihan Lokey, Inc. | 227,649 | | 10,267 |
| Moody’s Corp. | 54,097 | | 11,081 |
| Primerica, Inc. | 95,660 | | 12,171 |
| SEI Investments Co. | 207,773 | | 12,311 |
| | | | 55,763 |
| | | | |
| |
| Health Care—18.0% | | |
| AMN Healthcare Services, Inc.(1) | 240,607 | | 13,849 |
| Cooper Cos., Inc. (The) | 38,555 | | 11,451 |
| Elanco Animal Health, Inc.(1) | 522,415 | | 13,891 |
| Globus Medical, Inc. Class A(1) | 413,741 | | 21,151 |
| West Pharmaceutical Services, Inc. | 122,811 | | 17,417 |
| | | | 77,759 |
| | | | |
| |
| Industrials—28.5% | | |
| AMETEK, Inc. | 264,979 | | 24,330 |
| | Shares | | Value |
| | | | |
| Industrials—continued | | |
| Equifax, Inc. | 64,149 | | $9,024 |
| Exponent, Inc. | 184,357 | | 12,887 |
| Graco, Inc. | 169,050 | | 7,783 |
| Lennox International, Inc. | 53,843 | | 13,082 |
| Nordson Corp. | 94,887 | | 13,878 |
| Old Dominion Freight Line, Inc. | 83,479 | | 14,189 |
| SiteOne Landscape Supply, Inc.(1) | 222,600 | | 16,477 |
| Verisk Analytics, Inc. | 71,212 | | 11,261 |
| | | | 122,911 |
| | | | |
| |
| Information Technology—20.8% | | |
| Amphenol Corp. Class A | 179,626 | | 17,334 |
| Aspen Technology, Inc.(1) | 178,544 | | 21,975 |
| Broadridge Financial Solutions, Inc. | 144,285 | | 17,953 |
| Brooks Automation, Inc. | 504,518 | | 18,682 |
| Zebra Technologies Corp. Class A(1) | 66,520 | | 13,728 |
| | | | 89,672 |
| | | | |
| |
| Materials—3.0% | | |
| International Flavors & Fragrances, Inc. | 105,403 | | 12,932 |
Total Common Stocks
(Identified Cost $347,423) | | 419,959 |
| | | | |
| |
| | | | |
| |
Total Long-Term Investments—97.4%
(Identified Cost $347,423) | | 419,959 |
| | | | |
| |
| | | | |
| |
| | Shares | | Value |
| | | | |
| | | | |
| Short-Term Investment—1.0% |
| Money Market Mutual Fund—1.0% |
| Dreyfus Government Cash Management Fund - Institutional Shares (seven-day effective yield 1.854%)(2) | 4,404,569 | | $4,405 |
Total Short-Term Investment
(Identified Cost $4,405) | | 4,405 |
| | | | |
| |
| | | | |
| |
TOTAL INVESTMENTS—98.4%
(Identified Cost $351,828) | | $424,364 |
| Other assets and liabilities, net—1.6% | | 6,752 |
| NET ASSETS—100.0% | | $431,116 |
| Abbreviation: |
| ADR | American Depositary Receipt |
| Footnote Legend: |
| (1) | Non-income producing. |
| (2) | Shares of this fund are publicly offered, and its prospectus and annual report are publicly available. |
The following table summarizes the market value of the Fund’s investments as of September 30, 2019, based on the inputs used to value them (See Security Valuation Note 2A in the Notes to Financial Statements):
| | Total
Value at
September 30, 2019 | | Level 1
Quoted Prices |
| Assets: | | | |
| Equity Securities: | | | |
| Common Stocks | $419,959 | | $419,959 |
| Money Market Mutual Fund | 4,405 | | 4,405 |
| Total Investments | $424,364 | | $424,364 |
There were no securities valued using significant observable inputs (Level 2) or significant unobservable inputs (Level 3) at September 30, 2019.
There were no transfers into or out of Level 3 related to securities held at September 30, 2019.
For information regarding the abbreviations, see the Key Investment Terms starting on page 6.
See Notes to Financial Statements.
KAR Mid-Cap Growth Fund
SCHEDULE OF INVESTMENTS
September 30, 2019
($ reported in thousands)
| | Shares | | Value |
| Convertible Preferred Stock—0.8% |
| Information Technology—0.8% | | |
| BDC Payments Holdings, Inc.(1)(2)(3) | 421,295 | | $4,348 |
Total Convertible Preferred Stock
(Identified Cost $3,500) | | 4,348 |
| | | | |
| |
| | | | |
| |
| Common Stocks—94.0% |
| Communication Services—2.4% | | |
| Autohome, Inc. ADR(2) | 152,271 | | 12,658 |
| Consumer Discretionary—18.5% | | |
| Ctrip.com International Ltd. ADR(2) | 234,632 | | 6,872 |
| Domino’s Pizza, Inc. | 33,981 | | 8,311 |
| GSX Techedu, Inc. ADR(2) | 796,529 | | 12,195 |
| MercadoLibre, Inc.(2) | 37,303 | | 20,563 |
| New Oriental Education & Technology Group, Inc. Sponsored ADR(2) | 58,320 | | 6,460 |
| Pool Corp. | 64,828 | | 13,076 |
| Ross Stores, Inc. | 104,892 | | 11,522 |
| Under Armour, Inc. Class A(2) | 491,482 | | 9,800 |
| Wynn Resorts Ltd. | 89,644 | | 9,746 |
| | | | 98,545 |
| | | | |
| |
| Consumer Staples—7.4% | | |
| Brown-Forman Corp. Class B | 182,357 | | 11,448 |
| Freshpet, Inc.(2) | 132,576 | | 6,598 |
| Grocery Outlet Holding Corp.(2) | 114,842 | | 3,983 |
| McCormick & Co., Inc. | 72,660 | | 11,357 |
| Monster Beverage Corp.(2) | 104,373 | | 6,060 |
| | | | 39,446 |
| | | | |
| |
| Financials—8.3% | | |
| Goosehead Insurance, Inc. Class A | 210,521 | | 10,389 |
| MarketAxess Holdings, Inc. | 47,093 | | 15,423 |
| SEI Investments Co. | 158,022 | | 9,364 |
| T. Rowe Price Group, Inc. | 81,423 | | 9,302 |
| | | | 44,478 |
| | | | |
| |
| Health Care—11.6% | | |
| ABIOMED, Inc.(2) | 34,328 | | 6,107 |
| Bluebird Bio, Inc.(2) | 47,253 | | 4,339 |
| Elanco Animal Health, Inc.(2) | 216,974 | | 5,769 |
| | Shares | | Value |
| | | | |
| Health Care—continued | | |
| HealthEquity, Inc.(2) | 90,141 | | $5,151 |
| Illumina, Inc.(2) | 17,567 | | 5,344 |
| Mettler-Toledo International, Inc.(2) | 7,168 | | 5,049 |
| Silk Road Medical, Inc.(2) | 176,294 | | 5,735 |
| Teladoc Health, Inc.(2) | 165,949 | | 11,238 |
| Zoetis, Inc. | 103,407 | | 12,884 |
| | | | 61,616 |
| | | | |
| |
| Industrials—13.5% | | |
| CoStar Group, Inc.(2) | 19,525 | | 11,582 |
| Equifax, Inc. | 65,209 | | 9,173 |
| Fair Isaac Corp.(2) | 57,350 | | 17,407 |
| Kansas City Southern | 70,721 | | 9,407 |
| Roper Technologies, Inc. | 26,488 | | 9,446 |
| SiteOne Landscape Supply, Inc.(2) | 205,895 | | 15,240 |
| | | | 72,255 |
| | | | |
| |
| Information Technology—32.3% | | |
| Amphenol Corp. Class A | 126,595 | | 12,216 |
| Avalara, Inc.(2) | 249,726 | | 16,804 |
| Datadog, Inc. Class A(2) | 48,910 | | 1,659 |
| DocuSign, Inc.(2) | 169,950 | | 10,523 |
| Dynatrace, Inc.(2) | 295,101 | | 5,510 |
| Elastic N.V.(2) | 173,988 | | 14,326 |
| Fidelity National Information Services, Inc. | 74,005 | | 9,825 |
| FleetCor Technologies, Inc.(2) | 29,324 | | 8,410 |
| Gartner, Inc.(2) | 43,524 | | 6,223 |
| Okta, Inc.(2) | 113,174 | | 11,143 |
| Paycom Software, Inc.(2) | 81,307 | | 17,033 |
| Slack Technologies, Inc. Class A(2) | 196,148 | | 4,655 |
| Square, Inc. Class A(2) | 95,214 | | 5,898 |
| Teradyne, Inc. | 150,892 | | 8,738 |
| Trade Desk, Inc. (The) Class A(2) | 112,597 | | 21,118 |
| Workday, Inc. Class A(2) | 61,337 | | 10,425 |
| Zscaler, Inc.(2) | 162,908 | | 7,699 |
| | | | 172,205 |
| | | | |
| |
Total Common Stocks
(Identified Cost $422,388) | | 501,203 |
| | | | |
| |
| | | | |
| |
Total Long-Term Investments—94.8%
(Identified Cost $425,888) | | 505,551 |
| | | | |
| |
| | | | |
| |
| | Shares | | Value |
| | | | |
| | | | |
| Short-Term Investment—4.6% |
| Money Market Mutual Fund—4.6% |
| Dreyfus Government Cash Management Fund - Institutional Shares (seven-day effective yield 1.854%)(4) | 24,684,962 | | $24,685 |
Total Short-Term Investment
(Identified Cost $24,685) | | 24,685 |
| | | | |
| |
| | | | |
| |
TOTAL INVESTMENTS—99.4%
(Identified Cost $450,573) | | $530,236 |
| Other assets and liabilities, net—0.6% | | 3,265 |
| NET ASSETS—100.0% | | $533,501 |
| Abbreviation: |
| ADR | American Depositary Receipt |
| Footnote Legend: |
| (1) | The value of this security was determined using significant unobservable inputs and is reported as a Level 3 security in the Fair Value Hierarchy table located after the Schedule of Investments. |
| (2) | Non-income producing. |
| (3) | Restricted security. |
| (4) | Shares of this fund are publicly offered, and its prospectus and annual report are publicly available. |
| Country Weightings (Unaudited)† |
| United States | 93% |
| China | 7 |
| Total | 100% |
| † % of total investments as of September 30, 2019. |
For information regarding the abbreviations, see the Key Investment Terms starting on page 6.
See Notes to Financial Statements.
KAR Mid-Cap Growth Fund
SCHEDULE OF INVESTMENTS (Continued)
September 30, 2019
($ reported in thousands)
The following table summarizes the market value of the Fund’s investments as of September 30, 2019, based on the inputs used to value them (See Security Valuation Note 2A in the Notes to Financial Statements):
| | Total
Value at
September 30, 2019 | | Level 1
Quoted Prices | | Level 3
Significant
Unobservable
Inputs |
| Assets: | | | | | |
| Equity Securities: | | | | | |
| Common Stocks | $501,203 | | $501,203 | | $— |
| Convertible Preferred Stock | 4,348 | | — | | 4,348 |
| Money Market Mutual Fund | 24,685 | | 24,685 | | — |
| Total Investments | $530,236 | | $525,888 | | $4,348 |
There were no securities valued using significant observable inputs (Level 2) at September 30, 2019.
There were no transfers into or out of Level 3 related to securities held at September 30, 2019.
| | Total | | Convertible
Preferred
Stock |
| Investments in Securities | | | |
| Balance as of September 30, 2018: | $— | | $— |
| Change in unrealized appreciation (depreciation)(a) | 848 | | 848 |
| Purchases | 3,500 | | 3,500 |
| Balance as of September 30, 2019 | $4,348 | | $4,348 |
(a) The change in unrealized appreciation (depreciation) on investments still held at September 30, 2019, was $848.
BDC Payment Holdings, Inc.
The significant unobservable inputs used in the fair value measurement of the reporting entity’s convertible preferred stock is based on a market approach of comparable companies’ projected revenue multiples and ranges from 8.0x to 10.8x. Significant increases (decreases) in this input would result in a significantly lower (higher) fair value measurement.
See Notes to Financial Statements.
KAR Small-Cap Core Fund
SCHEDULE OF INVESTMENTS
September 30, 2019
($ reported in thousands)
| | Shares | | Value |
| Common Stocks—94.7% |
| Communication Services—12.9% | | |
| Autohome, Inc. ADR(1) | 1,391,500 | | $115,676 |
| Rightmove plc | 12,352,000 | | 83,621 |
| | | | 199,297 |
| | | | |
| |
| Consumer Discretionary—4.1% | | |
| Pool Corp. | 312,990 | | 63,130 |
| Consumer Staples—2.3% | | |
| PriceSmart, Inc. | 506,280 | | 35,996 |
| Energy—3.9% | | |
| Core Laboratories N.V. | 165,600 | | 7,720 |
| Dril-Quip, Inc.(1) | 1,042,040 | | 52,290 |
| | | | 60,010 |
| | | | |
| |
| Financials—18.5% | | |
| Artisan Partners Asset Management, Inc. Class A | 891,600 | | 25,179 |
| FactSet Research Systems, Inc. | 189,940 | | 46,150 |
| MarketAxess Holdings, Inc. | 192,332 | | 62,989 |
| Moelis & Co. Class A | 1,199,440 | | 39,401 |
| Primerica, Inc. | 706,912 | | 89,940 |
| RLI Corp. | 247,208 | | 22,968 |
| | | | 286,627 |
| | | | |
| |
| Health Care—2.4% | | |
| Atrion Corp. | 48,880 | | 38,086 |
| | Shares | | Value |
| | | | |
| Industrials—32.8% | | |
| Donaldson Co., Inc. | 527,200 | | $27,457 |
| Graco, Inc. | 1,302,210 | | 59,954 |
| Old Dominion Freight Line, Inc. | 477,530 | | 81,166 |
| RBC Bearings, Inc.(1) | 276,148 | | 45,816 |
| Simpson Manufacturing Co., Inc. | 716,779 | | 49,723 |
| Teledyne Technologies, Inc.(1) | 357,500 | | 115,111 |
| Toro Co. (The) | 862,701 | | 63,236 |
| WABCO Holdings, Inc.(1) | 490,950 | | 65,664 |
| | | | 508,127 |
| | | | |
| |
| Information Technology—16.2% | | |
| Aspen Technology, Inc.(1) | 719,100 | | 88,507 |
| CDW Corp. | 852,500 | | 105,062 |
| Jack Henry & Associates, Inc. | 238,800 | | 34,858 |
| Manhattan Associates, Inc.(1) | 281,720 | | 22,726 |
| | | | 251,153 |
| | | | |
| |
| Materials—1.6% | | |
| AptarGroup, Inc. | 213,412 | | 25,278 |
Total Common Stocks
(Identified Cost $1,002,403) | | 1,467,704 |
| | | | |
| |
| | | | |
| |
Total Long-Term Investments—94.7%
(Identified Cost $1,002,403) | | 1,467,704 |
| | | | |
| |
| | | | |
| |
| | Shares | | Value |
| | | | |
| | | | |
| Short-Term Investment—2.5% |
| Money Market Mutual Fund—2.5% |
| Dreyfus Government Cash Management Fund - Institutional Shares (seven-day effective yield 1.854%)(2) | 39,087,760 | | $39,088 |
Total Short-Term Investment
(Identified Cost $39,088) | | 39,088 |
| | | | |
| |
| | | | |
| |
TOTAL INVESTMENTS—97.2%
(Identified Cost $1,041,491) | | $1,506,792 |
| Other assets and liabilities, net—2.8% | | 42,716 |
| NET ASSETS—100.0% | | $1,549,508 |
| Abbreviation: |
| ADR | American Depositary Receipt |
| Footnote Legend: |
| (1) | Non-income producing. |
| (2) | Shares of this fund are publicly offered, and its prospectus and annual report are publicly available. |
| Country Weightings (Unaudited)† |
| United States | 87% |
| China | 8 |
| United Kingdom | 5 |
| Total | 100% |
| † % of total investments as of September 30, 2019. |
The following table summarizes the market value of the Fund’s investments as of September 30, 2019, based on the inputs used to value them (See Security Valuation Note 2A in the Notes to Financial Statements):
| | Total
Value at
September 30, 2019 | | Level 1
Quoted Prices |
| Assets: | | | |
| Equity Securities: | | | |
| Common Stocks | $1,467,704 | | $1,467,704 |
| Money Market Mutual Fund | 39,088 | | 39,088 |
| Total Investments | $1,506,792 | | $1,506,792 |
There were no securities valued using significant observable inputs (Level 2) or significant unobservable inputs (Level 3) at September 30, 2019.
There were no transfers into or out of Level 3 related to securities held at September 30, 2019.
For information regarding the abbreviations, see the Key Investment Terms starting on page 6.
See Notes to Financial Statements.
KAR Small-Cap Growth Fund
SCHEDULE OF INVESTMENTS
September 30, 2019
($ reported in thousands)
| | Shares | | Value |
| Common Stocks—96.7% |
| Communication Services—19.9% | | |
| Auto Trader Group plc | 58,074,329 | | $364,165 |
| Autohome, Inc. ADR(1) | 4,407,435 | | 366,390 |
| Rightmove plc | 40,235,150 | | 272,387 |
| | | | 1,002,942 |
| | | | |
| |
| Consumer Discretionary—8.4% | | |
| Fox Factory Holding Corp.(1) | 3,712,978 | | 231,096 |
| Ollie’s Bargain Outlet Holdings, Inc.(1) | 3,270,757 | | 191,797 |
| | | | 422,893 |
| | | | |
| |
| Consumer Staples—3.8% | | |
| Chefs’ Warehouse, Inc. (The)(1) | 2,808,023 | | 113,220 |
| PriceSmart, Inc. | 1,116,936 | | 79,414 |
| | | | 192,634 |
| | | | |
| |
| Financials—16.0% | | |
| FactSet Research Systems, Inc. | 579,650 | | 140,837 |
| Interactive Brokers Group, Inc. Class A | 3,753,516 | | 201,864 |
| MarketAxess Holdings, Inc. | 646,800 | | 211,827 |
| Morningstar, Inc. | 1,440,828 | | 210,563 |
| Oportun Financial Corp.(1) | 2,484,907 | | 40,305 |
| | | | 805,396 |
| | | | |
| |
| | Shares | | Value |
| | | | |
| Health Care—6.0% | | |
| Mesa Laboratories, Inc. | 85,353 | | $20,294 |
| National Research Corp. | 2,359,518 | | 136,262 |
| U.S. Physical Therapy, Inc. | 1,125,000 | | 146,869 |
| | | | 303,425 |
| | | | |
| |
| Industrials—19.1% | | |
| AAON, Inc. | 3,559,400 | | 163,519 |
| Copart, Inc.(1) | 3,400,700 | | 273,178 |
| HEICO Corp. Class A | 1,824,812 | | 177,573 |
| Old Dominion Freight Line, Inc. | 1,525,500 | | 259,289 |
| Omega Flex, Inc. | 908,755 | | 92,920 |
| | | | 966,479 |
| | | | |
| |
| Information Technology—23.5% | | |
| ANSYS, Inc.(1) | 615,300 | | 136,203 |
| Aspen Technology, Inc.(1) | 1,924,700 | | 236,892 |
| Avalara, Inc.(1) | 1,900,000 | | 127,851 |
| Blackline, Inc.(1) | 3,134,403 | | 149,856 |
| DocuSign, Inc.(1) | 3,487,563 | | 215,950 |
| NVE Corp. | 483,690 | | 32,093 |
| Paycom Software, Inc.(1) | 1,377,800 | | 288,635 |
| | | | 1,187,480 |
| | | | |
| |
Total Common Stocks
(Identified Cost $3,314,971) | | 4,881,249 |
| | | | |
| |
| | | | |
| |
Total Long-Term Investments—96.7%
(Identified Cost $3,314,971) | | 4,881,249 |
| | | | |
| |
| | | | |
| |
| | | Value |
| | | |
| | | |
TOTAL INVESTMENTS—96.7%
(Identified Cost $3,314,971) | $4,881,249 |
| Other assets and liabilities, net—3.3% | 164,820 |
| NET ASSETS—100.0% | $5,046,069 |
| Abbreviation: |
| ADR | American Depositary Receipt |
| Footnote Legend: |
| (1) | Non-income producing. |
| Country Weightings (Unaudited)† |
| United States | 79% |
| United Kingdom | 13 |
| China | 8 |
| Total | 100% |
| † % of total investments as of September 30, 2019. |
The following table summarizes the market value of the Fund’s investments as of September 30, 2019, based on the inputs used to value them (See Security Valuation Note 2A in the Notes to Financial Statements):
| | Total
Value at
September 30, 2019 | | Level 1
Quoted Prices |
| Assets: | | | |
| Equity Securities: | | | |
| Common Stocks | $4,881,249 | | $4,881,249 |
| Total Investments | $4,881,249 | | $4,881,249 |
There were no securities valued using significant observable inputs (Level 2) or significant unobservable inputs (Level 3) at September 30, 2019.
There were no transfers into or out of Level 3 related to securities held at September 30, 2019.
For information regarding the abbreviations, see the Key Investment Terms starting on page 6.
See Notes to Financial Statements.
KAR Small-Cap Value Fund
SCHEDULE OF INVESTMENTS
September 30, 2019
($ reported in thousands)
| | Shares | | Value |
| Common Stocks—96.7% |
| Communication Services—3.6% | | |
| Cinemark Holdings, Inc. | 558,100 | | $21,565 |
| Consumer Discretionary—7.3% | | |
| Cheesecake Factory, Inc. (The) | 582,100 | | 24,262 |
| Thor Industries, Inc. | 331,310 | | 18,765 |
| | | | 43,027 |
| | | | |
| |
| Consumer Staples—5.0% | | |
| National Beverage Corp. | 265,804 | | 11,791 |
| WD-40 Co. | 97,954 | | 17,978 |
| | | | 29,769 |
| | | | |
| |
| Energy—1.7% | | |
| Core Laboratories N.V. | 221,000 | | 10,303 |
| Financials—19.3% | | |
| Bank of Hawaii Corp. | 268,360 | | 23,060 |
| First Financial Bankshares, Inc. | 614,120 | | 20,469 |
| Houlihan Lokey, Inc. | 491,286 | | 22,157 |
| Primerica, Inc. | 206,663 | | 26,294 |
| RLI Corp. | 233,012 | | 21,649 |
| | | | 113,629 |
| | | | |
| |
| Health Care—2.9% | | |
| Anika Therapeutics, Inc.(1) | 307,640 | | 16,886 |
| Industrials—26.3% | | |
| Graco, Inc. | 429,981 | | 19,796 |
| Landstar System, Inc. | 181,428 | | 20,425 |
| Lincoln Electric Holdings, Inc. | 141,210 | | 12,251 |
| RBC Bearings, Inc.(1) | 197,800 | | 32,817 |
| | Shares | | Value |
| | | | |
| Industrials—continued | | |
| SiteOne Landscape Supply, Inc.(1) | 474,635 | | $35,133 |
| UniFirst Corp. | 45,950 | | 8,966 |
| Watsco, Inc. | 151,353 | | 25,606 |
| | | | 154,994 |
| | | | |
| |
| Information Technology—17.7% | | |
| American Software, Inc. Class A | 703,891 | | 10,573 |
| Badger Meter, Inc. | 250,304 | | 13,441 |
| Brooks Automation, Inc. | 677,130 | | 25,074 |
| Cass Information Systems, Inc. | 350,496 | | 18,923 |
| CoreLogic, Inc.(1) | 487,570 | | 22,560 |
| Jack Henry & Associates, Inc. | 95,240 | | 13,902 |
| | | | 104,473 |
| | | | |
| |
| Materials—6.4% | | |
| Scotts Miracle-Gro Co. (The) | 368,681 | | 37,539 |
| Real Estate—6.5% | | |
| Jones Lang LaSalle, Inc. | 50,838 | | 7,070 |
| MGM Growth Properties LLC Class A | 1,035,410 | | 31,114 |
| | | | 38,184 |
| | | | |
| |
Total Common Stocks
(Identified Cost $439,429) | | 570,369 |
| | | | |
| |
| | | | |
| |
Total Long-Term Investments—96.7%
(Identified Cost $439,429) | | 570,369 |
| | | | |
| |
| | | | |
| |
| | Shares | | Value |
| | | | |
| | | | |
| Short-Term Investment—0.6% |
| Money Market Mutual Fund—0.6% |
| Dreyfus Government Cash Management Fund - Institutional Shares (seven-day effective yield 1.854%)(2) | 3,359,526 | | $3,360 |
Total Short-Term Investment
(Identified Cost $3,360) | | 3,360 |
| | | | |
| |
| | | | |
| |
TOTAL INVESTMENTS—97.3%
(Identified Cost $442,789) | | $573,729 |
| Other assets and liabilities, net—2.7% | | 16,068 |
| NET ASSETS—100.0% | | $589,797 |
| Abbreviation: |
| LLC | Limited Liability Company |
| Footnote Legend: |
| (1) | Non-income producing. |
| (2) | Shares of this fund are publicly offered, and its prospectus and annual report are publicly available. |
The following table summarizes the market value of the Fund’s investments as of September 30, 2019, based on the inputs used to value them (See Security Valuation Note 2A in the Notes to Financial Statements):
| | Total
Value at
September 30, 2019 | | Level 1
Quoted Prices |
| Assets: | | | |
| Equity Securities: | | | |
| Common Stocks | $570,369 | | $570,369 |
| Money Market Mutual Fund | 3,360 | | 3,360 |
| Total Investments | $573,729 | | $573,729 |
There were no securities valued using significant observable inputs (Level 2) or significant unobservable inputs (Level 3) at September 30, 2019.
There were no transfers into or out of Level 3 related to securities held at September 30, 2019.
For information regarding the abbreviations, see the Key Investment Terms starting on page 6.
See Notes to Financial Statements.
KAR Small-Mid Cap Core Fund
SCHEDULE OF INVESTMENTS
September 30, 2019
($ reported in thousands)
| | Shares | | Value |
| Common Stocks—95.1% |
| Consumer Discretionary—7.7% | | |
| Pool Corp. | 5,240 | | $1,057 |
| Thor Industries, Inc. | 10,366 | | 587 |
| Winmark Corp. | 4,018 | | 709 |
| | | | 2,353 |
| | | | |
| |
| Financials—14.0% | | |
| Berkley (W.R.) Corp. | 16,373 | | 1,183 |
| Interactive Brokers Group, Inc. Class A | 13,874 | | 746 |
| MSCI, Inc. | 6,991 | | 1,522 |
| Primerica, Inc. | 6,434 | | 819 |
| | | | 4,270 |
| | | | |
| |
| Health Care—11.5% | | |
| AMN Healthcare Services, Inc.(1) | 13,498 | | 777 |
| Charles River Laboratories International, Inc.(1) | 7,672 | | 1,016 |
| Cooper Cos., Inc. (The) | 3,574 | | 1,061 |
| Elanco Animal Health, Inc.(1) | 25,580 | | 680 |
| | | | 3,534 |
| | | | |
| |
| Industrials—25.7% | | |
| Copart, Inc.(1) | 12,939 | | 1,039 |
| Expeditors International of Washington, Inc. | 14,100 | | 1,047 |
| Lennox International, Inc. | 4,865 | | 1,182 |
| Nordson Corp. | 7,953 | | 1,163 |
| | Shares | | Value |
| | | | |
| Industrials—continued | | |
| nVent Electric plc | 31,110 | | $686 |
| RBC Bearings, Inc.(1) | 6,807 | | 1,129 |
| Rollins, Inc. | 17,894 | | 610 |
| SiteOne Landscape Supply, Inc.(1) | 13,479 | | 998 |
| | | | 7,854 |
| | | | |
| |
| Information Technology—31.2% | | |
| ANSYS, Inc.(1) | 3,096 | | 685 |
| Aspen Technology, Inc.(1) | 11,898 | | 1,464 |
| CDW Corp. | 11,107 | | 1,369 |
| DocuSign, Inc.(1) | 19,643 | | 1,216 |
| FLIR Systems, Inc. | 22,012 | | 1,158 |
| Jack Henry & Associates, Inc. | 6,064 | | 885 |
| Teradyne, Inc. | 31,700 | | 1,836 |
| Zebra Technologies Corp. Class A(1) | 4,460 | | 921 |
| | | | 9,534 |
| | | | |
| |
| Materials—5.0% | | |
| Scotts Miracle-Gro Co. (The) | 15,146 | | 1,542 |
Total Common Stocks
(Identified Cost $27,412) | | 29,087 |
| | | | |
| |
| | | | |
| |
Total Long-Term Investments—95.1%
(Identified Cost $27,412) | | 29,087 |
| | | | |
| |
| | | | |
| |
| | Shares | | Value |
| | | | |
| | | | |
| Short-Term Investment—4.2% |
| Money Market Mutual Fund—4.2% |
| Dreyfus Government Cash Management Fund - Institutional Shares (seven-day effective yield 1.854%)(2) | 1,295,319 | | $1,295 |
Total Short-Term Investment
(Identified Cost $1,295) | | 1,295 |
| | | | |
| |
| | | | |
| |
TOTAL INVESTMENTS—99.3%
(Identified Cost $28,707) | | $30,382 |
| Other assets and liabilities, net—0.7% | | 220 |
| NET ASSETS—100.0% | | $30,602 |
| Footnote Legend: |
| (1) | Non-income producing. |
| (2) | Shares of this fund are publicly offered, and its prospectus and annual report are publicly available. |
The following table summarizes the market value of the Fund’s investments as of September 30, 2019, based on the inputs used to value them (See Security Valuation Note 2A in the Notes to Financial Statements):
| | Total
Value at
September 30, 2019 | | Level 1
Quoted Prices |
| Assets: | | | |
| Equity Securities: | | | |
| Common Stocks | $29,087 | | $29,087 |
| Money Market Mutual Fund | 1,295 | | 1,295 |
| Total Investments | $30,382 | | $30,382 |
There were no securities valued using significant observable inputs (Level 2) or significant unobservable inputs (Level 3) at September 30, 2019.
There were no transfers into or out of Level 3 related to securities held at September 30, 2019.
See Notes to Financial Statements.
Rampart Enhanced Core Equity Fund
SCHEDULE OF INVESTMENTS
September 30, 2019
($ reported in thousands)
| | Shares | | Value |
| Common Stocks—96.5% |
| Communication Services—10.4% | | |
| Activision Blizzard, Inc. | 5,102 | | $270 |
| Alphabet, Inc. Class A(1)(2) | 1,615 | | 1,972 |
| Alphabet, Inc. Class C(1)(2) | 1,652 | | 2,014 |
| AT&T, Inc.(2) | 37,788 | | 1,430 |
| CBS Corp. Class B | 2,418 | | 98 |
| CenturyLink, Inc. | 6,577 | | 82 |
| Charter Communications, Inc. Class A(1) | 993 | | 409 |
| Comcast Corp. Class A(2) | 23,922 | | 1,078 |
| Discovery, Inc. Class A(1) | 1,083 | | 29 |
| Discovery, Inc. Class C(1) | 2,477 | | 61 |
| DISH Network Corp. Class A(1) | 1,640 | | 56 |
| Electronic Arts, Inc.(1) | 2,032 | | 199 |
| Facebook, Inc. Class A(1)(2) | 13,146 | | 2,341 |
| Fox Corp. Class A(2) | 2,421 | | 76 |
| Fox Corp. Class B(2) | 1,111 | | 35 |
| Interpublic Group of Cos., Inc. (The) | 2,660 | | 57 |
| Netflix, Inc.(1) | 2,309 | | 618 |
| News Corp. Class A | 2,645 | | 37 |
| News Corp. Class B | 848 | | 12 |
| Omnicom Group, Inc. | 1,513 | | 118 |
| Take-Two Interactive Software, Inc.(1) | 772 | | 97 |
| T-Mobile US, Inc.(1) | 1,729 | | 136 |
| TripAdvisor, Inc.(1) | 716 | | 28 |
| Twitter, Inc.(1) | 4,992 | | 206 |
| Verizon Communications, Inc.(2) | 21,337 | | 1,288 |
| Viacom, Inc. Class B | 2,427 | | 58 |
| Walt Disney Co. (The)(2) | 9,107 | | 1,187 |
| | | | 13,992 |
| | | | |
| |
| Consumer Discretionary—10.2% | | |
| Advance Auto Parts, Inc. | 396 | | 65 |
| Amazon.com, Inc.(1)(2) | 2,211 | | 3,838 |
| Aptiv plc | 1,440 | | 126 |
| AutoZone, Inc.(1) | 136 | | 148 |
| Best Buy Co., Inc. | 1,289 | | 89 |
| Booking Holdings, Inc.(1)(2) | 240 | | 471 |
| BorgWarner, Inc. | 1,159 | | 43 |
| Capri Holdings Ltd.(1) | 839 | | 28 |
| CarMax, Inc.(1) | 931 | | 82 |
| Carnival Corp. | 2,279 | | 100 |
| Chipotle Mexican Grill, Inc.(1) | 135 | | 113 |
| Darden Restaurants, Inc. | 681 | | 81 |
| Dollar General Corp. | 1,436 | | 228 |
| Dollar Tree, Inc.(1) | 1,318 | | 150 |
| eBay, Inc. | 4,571 | | 178 |
| Expedia Group, Inc. | 770 | | 103 |
| Ford Motor Co.(2) | 21,762 | | 199 |
| Gap, Inc. (The) | 1,185 | | 21 |
| Garmin Ltd. | 667 | | 56 |
| General Motors Co.(2) | 7,487 | | 281 |
| Genuine Parts Co. | 810 | | 81 |
| H&R Block, Inc. | 1,131 | | 27 |
| Hanesbrands, Inc. | 2,008 | | 31 |
| | Shares | | Value |
| | | | |
| Consumer Discretionary—continued | | |
| Harley-Davidson, Inc. | 896 | | $32 |
| Hasbro, Inc. | 643 | | 76 |
| Hilton Worldwide Holdings, Inc. | 1,627 | | 151 |
| Home Depot, Inc. (The)(2) | 6,090 | | 1,413 |
| Horton (D.R.), Inc. | 1,875 | | 99 |
| Kohl’s Corp. | 903 | | 45 |
| L Brands, Inc. | 1,269 | | 25 |
| Leggett & Platt, Inc. | 731 | | 30 |
| Lennar Corp. Class A | 1,574 | | 88 |
| LKQ Corp.(1) | 1,750 | | 55 |
| Lowe’s Cos., Inc.(2) | 4,338 | | 477 |
| Macy’s, Inc. | 1,697 | | 26 |
| Marriott International, Inc. Class A | 1,550 | | 193 |
| McDonald’s Corp.(2) | 4,229 | | 908 |
| MGM Resorts International | 2,839 | | 79 |
| Mohawk Industries, Inc.(1) | 340 | | 42 |
| Newell Brands, Inc. | 2,178 | | 41 |
| NIKE, Inc. Class B(2) | 6,946 | | 652 |
| Nordstrom, Inc. | 583 | | 20 |
| Norwegian Cruise Line Holdings Ltd.(1) | 1,205 | | 62 |
| O’Reilly Automotive, Inc.(1) | 432 | | 172 |
| PulteGroup, Inc. | 1,409 | | 51 |
| PVH Corp. | 417 | | 37 |
| Ralph Lauren Corp. | 288 | | 27 |
| Ross Stores, Inc. | 2,044 | | 225 |
| Royal Caribbean Cruises Ltd. | 973 | | 105 |
| Starbucks Corp.(2) | 6,745 | | 596 |
| Tapestry, Inc. | 1,592 | | 41 |
| Target Corp.(2) | 2,842 | | 304 |
| Tiffany & Co. | 600 | | 56 |
| TJX Cos., Inc. (The) | 6,825 | | 380 |
| Tractor Supply Co. | 669 | | 61 |
| Ulta Beauty, Inc.(1) | 307 | | 77 |
| Under Armour, Inc. Class A(1) | 1,040 | | 21 |
| Under Armour, Inc. Class C(1) | 1,074 | | 19 |
| VF Corp. | 1,805 | | 161 |
| Whirlpool Corp. | 352 | | 56 |
| Wynn Resorts Ltd. | 544 | | 59 |
| Yum! Brands, Inc. | 1,699 | | 193 |
| | | | 13,694 |
| | | | |
| |
| Consumer Staples—7.6% | | |
| Altria Group, Inc.(2) | 10,104 | | 413 |
| Archer-Daniels-Midland Co. | 3,122 | | 128 |
| Brown-Forman Corp. Class B | 927 | | 58 |
| Campbell Soup Co. | 1,071 | | 50 |
| Church & Dwight Co., Inc. | 1,365 | | 103 |
| Clorox Co. (The) | 712 | | 108 |
| Coca-Cola Co. (The)(2) | 20,933 | | 1,140 |
| Colgate-Palmolive Co.(2) | 4,785 | | 352 |
| Conagra Brands, Inc. | 2,673 | | 82 |
| Constellation Brands, Inc. Class A | 924 | | 191 |
| Costco Wholesale Corp.(2) | 2,337 | | 673 |
| | Shares | | Value |
| | | | |
| Consumer Staples—continued | | |
| Coty, Inc. Class A | 1,670 | | $17 |
| Estee Lauder Cos., Inc. (The) Class A | 1,215 | | 242 |
| General Mills, Inc. | 3,320 | | 183 |
| Hershey Co. (The) | 774 | | 120 |
| Hormel Foods Corp. | 1,508 | | 66 |
| J.M. Smucker Co. (The) | 629 | | 69 |
| Kellogg Co. | 1,378 | | 89 |
| Kimberly-Clark Corp. | 1,913 | | 272 |
| Kraft Heinz Co.(The)(2) | 3,441 | | 96 |
| Kroger Co. (The) | 4,489 | | 116 |
| Lamb Weston Holdings, Inc. | 806 | | 59 |
| McCormick & Co., Inc. | 680 | | 106 |
| Molson Coors Brewing Co. Class B | 1,043 | | 60 |
| Mondelez International, Inc. Class A(2) | 7,879 | | 436 |
| Monster Beverage Corp.(1) | 2,172 | | 126 |
| PepsiCo, Inc.(2) | 7,652 | | 1,049 |
| Philip Morris International, Inc.(2) | 8,275 | | 628 |
| Procter & Gamble Co. (The)(2) | 13,729 | | 1,708 |
| Spectrum Brands Holdings, Inc. | 31 | | 2 |
| Sysco Corp. | 2,627 | | 209 |
| Tyson Foods, Inc. Class A | 1,630 | | 140 |
| Walgreens Boots Alliance, Inc.(2) | 4,352 | | 241 |
| Walmart, Inc.(2) | 7,655 | | 908 |
| | | | 10,240 |
| | | | |
| |
| Energy—3.9% | | |
| Apache Corp. | 1,703 | | 44 |
| Baker Hughes a GE Co. | 2,481 | | 57 |
| Cabot Oil & Gas Corp. | 2,054 | | 36 |
| Chevron Corp.(2) | 9,088 | | 1,078 |
| Cimarex Energy Co. | 457 | | 22 |
| Concho Resources, Inc. | 930 | | 63 |
| ConocoPhillips(2) | 5,183 | | 295 |
| Devon Energy Corp. | 1,861 | | 45 |
| Diamondback Energy, Inc. | 708 | | 64 |
| EOG Resources, Inc. | 2,608 | | 193 |
| Exxon Mobil Corp.(2) | 20,135 | | 1,422 |
| Halliburton Co.(2) | 4,064 | | 77 |
| Helmerich & Payne, Inc. | 509 | | 20 |
| Hess Corp. | 1,173 | | 71 |
| HollyFrontier Corp. | 764 | | 41 |
| Kinder Morgan, Inc.(2) | 9,374 | | 193 |
| Marathon Oil Corp. | 3,650 | | 45 |
| Marathon Petroleum Corp. | 3,335 | | 203 |
| National Oilwell Varco, Inc. | 1,772 | | 38 |
| Noble Energy, Inc. | 2,173 | | 49 |
| Occidental Petroleum Corp.(2) | 4,149 | | 184 |
| ONEOK, Inc. | 1,981 | | 146 |
| Phillips 66 | 2,042 | | 209 |
| Pioneer Natural Resources Co. | 786 | | 99 |
| Schlumberger Ltd.(2) | 6,362 | | 217 |
See Notes to Financial Statements.
Rampart Enhanced Core Equity Fund
SCHEDULE OF INVESTMENTS (Continued)
September 30, 2019
($ reported in thousands)
| | Shares | | Value |
| | | | |
| Energy—continued | | |
| TechnipFMC plc | 2,018 | | $49 |
| Valero Energy Corp. | 2,198 | | 187 |
| Williams Cos., Inc. (The) | 5,830 | | 140 |
| | | | 5,287 |
| | | | |
| |
| Financials—12.0% | | |
| Affiliated Managers Group, Inc. | 252 | | 21 |
| Aflac, Inc. | 3,683 | | 193 |
| Allstate Corp. (The)(2) | 1,645 | | 179 |
| American Express Co.(2) | 3,420 | | 404 |
| American International Group, Inc.(2) | 4,339 | | 242 |
| Ameriprise Financial, Inc. | 665 | | 98 |
| Aon plc | 1,189 | | 230 |
| Assurant, Inc. | 304 | | 38 |
| Bank of America Corp.(2) | 44,006 | | 1,284 |
| Bank of New York Mellon Corp. (The)(2) | 4,363 | | 197 |
| BB&T Corp. | 3,799 | | 203 |
| Berkshire Hathaway, Inc. Class B(1)(2) | 9,596 | | 1,996 |
| BlackRock, Inc.(2) | 590 | | 263 |
| Capital One Financial Corp.(2) | 2,316 | | 211 |
| Cboe Global Markets, Inc. | 543 | | 62 |
| Charles Schwab Corp. (The) | 5,883 | | 246 |
| Chubb Ltd. | 2,258 | | 365 |
| Cincinnati Financial Corp. | 747 | | 87 |
| Citigroup, Inc.(2) | 11,509 | | 795 |
| Citizens Financial Group, Inc. | 2,273 | | 80 |
| CME Group, Inc. | 1,748 | | 369 |
| Comerica, Inc. | 763 | | 50 |
| Discover Financial Services | 1,612 | | 131 |
| E*TRADE Financial Corp. | 1,210 | | 53 |
| Everest Re Group Ltd. | 202 | | 54 |
| Fifth Third Bancorp | 3,606 | | 99 |
| First Republic Bank | 826 | | 80 |
| Franklin Resources, Inc. | 1,458 | | 42 |
| Gallagher (Arthur J.) & Co. | 913 | | 82 |
| Globe Life, Inc. | 500 | | 48 |
| Goldman Sachs Group, Inc. (The)(2) | 1,679 | | 348 |
| Hartford Financial Services Group, Inc. (The) | 1,784 | | 108 |
| Huntington Bancshares, Inc. | 5,254 | | 75 |
| Intercontinental Exchange, Inc. | 2,688 | | 248 |
| Invesco Ltd. | 1,986 | | 34 |
| Jefferies Financial Group, Inc. | 1,243 | | 23 |
| JPMorgan Chase & Co.(2) | 16,090 | | 1,894 |
| KeyCorp | 5,021 | | 90 |
| Lincoln National Corp. | 1,004 | | 61 |
| Loews Corp. | 1,327 | | 68 |
| M&T Bank Corp. | 677 | | 107 |
| MarketAxess Holdings, Inc. | 186 | | 61 |
| Marsh & McLennan Cos., Inc. | 2,528 | | 253 |
| | Shares | | Value |
| | | | |
| Financials—continued | | |
| MetLife, Inc.(2) | 4,728 | | $223 |
| Moody’s Corp. | 816 | | 167 |
| Morgan Stanley(2) | 6,339 | | 270 |
| MSCI, Inc. | 416 | | 91 |
| Nasdaq, Inc. | 568 | | 56 |
| Northern Trust Corp. | 1,080 | | 101 |
| People’s United Financial, Inc. | 1,955 | | 31 |
| PNC Financial Services Group, Inc. (The) | 2,238 | | 314 |
| Principal Financial Group, Inc. | 1,285 | | 73 |
| Progressive Corp. (The) | 2,862 | | 221 |
| Prudential Financial, Inc. | 2,011 | | 181 |
| Raymond James Financial, Inc. | 628 | | 52 |
| Regions Financial Corp. | 5,020 | | 79 |
| S&P Global, Inc. | 1,218 | | 298 |
| State Street Corp. | 1,849 | | 109 |
| SunTrust Banks, Inc. | 2,204 | | 152 |
| SVB Financial Group(1) | 260 | | 54 |
| Synchrony Financial | 3,142 | | 107 |
| T. Rowe Price Group, Inc. | 1,172 | | 134 |
| Travelers Cos., Inc. (The) | 1,292 | | 192 |
| U.S. Bancorp(2) | 7,411 | | 410 |
| Unum Group | 1,052 | | 31 |
| Wells Fargo & Co.(2) | 19,983 | | 1,008 |
| Willis Towers Watson plc | 640 | | 123 |
| Zions Bancorp NA | 904 | | 40 |
| | | | 16,089 |
| | | | |
| |
| Health Care—12.4% | | |
| Abbott Laboratories(2) | 8,737 | | 731 |
| AbbVie, Inc.(2) | 7,317 | | 554 |
| ABIOMED, Inc.(1) | 226 | | 40 |
| Agilent Technologies, Inc. | 1,578 | | 121 |
| Alexion Pharmaceuticals, Inc.(1) | 1,102 | | 108 |
| Align Technology, Inc.(1) | 359 | | 65 |
| Allergan plc(2) | 1,518 | | 255 |
| AmerisourceBergen Corp. | 769 | | 63 |
| Amgen, Inc.(2) | 3,006 | | 582 |
| Anthem, Inc. | 1,261 | | 303 |
| Baxter International, Inc. | 2,336 | | 204 |
| Becton, Dickinson & Co. | 1,335 | | 338 |
| Biogen, Inc.(1)(2) | 955 | | 222 |
| Boston Scientific Corp.(1) | 6,880 | | 280 |
| Bristol-Myers Squibb Co.(2) | 8,039 | | 408 |
| Cardinal Health, Inc. | 1,483 | | 70 |
| Celgene Corp.(1)(2) | 3,465 | | 344 |
| Centene Corp.(1) | 2,031 | | 88 |
| Cerner Corp. | 1,607 | | 110 |
| Cigna Corp. | 1,863 | | 283 |
| Cooper Cos., Inc. (The) | 244 | | 72 |
| CVS Health Corp.(2) | 6,406 | | 404 |
| Danaher Corp.(2) | 3,122 | | 451 |
| DaVita, Inc.(1) | 519 | | 30 |
| DENTSPLY SIRONA, Inc. | 1,161 | | 62 |
| Edwards Lifesciences Corp.(1) | 1,039 | | 228 |
| Eli Lilly & Co.(2) | 4,270 | | 477 |
| Gilead Sciences, Inc.(2) | 6,288 | | 399 |
| | Shares | | Value |
| | | | |
| Health Care—continued | | |
| HCA Healthcare, Inc. | 1,317 | | $159 |
| Henry Schein, Inc.(1) | 735 | | 47 |
| Hologic, Inc.(1) | 1,329 | | 67 |
| Humana, Inc. | 670 | | 171 |
| IDEXX Laboratories, Inc.(1) | 428 | | 116 |
| Illumina, Inc.(1) | 729 | | 222 |
| Incyte Corp.(1) | 879 | | 65 |
| Intuitive Surgical, Inc.(1) | 574 | | 310 |
| IQVIA Holdings, Inc.(1) | 778 | | 116 |
| Johnson & Johnson(2) | 13,129 | | 1,699 |
| Laboratory Corporation of America Holdings(1) | 486 | | 82 |
| McKesson Corp. | 933 | | 127 |
| Medtronic plc(2) | 6,613 | | 718 |
| Merck & Co., Inc.(2) | 12,731 | | 1,072 |
| Mettler-Toledo International, Inc.(1) | 122 | | 86 |
| Mylan NV(1) | 2,518 | | 50 |
| Nektar Therapeutics(1) | 848 | | 15 |
| PerkinElmer, Inc. | 548 | | 47 |
| Perrigo Co. plc | 615 | | 34 |
| Pfizer, Inc.(2) | 27,613 | | 992 |
| Quest Diagnostics, Inc. | 661 | | 71 |
| Regeneron Pharmaceuticals, Inc.(1) | 386 | | 107 |
| ResMed, Inc. | 709 | | 96 |
| Stryker Corp. | 1,533 | | 332 |
| Teleflex, Inc. | 228 | | 77 |
| Thermo Fisher Scientific, Inc. | 1,987 | | 579 |
| UnitedHealth Group, Inc.(2) | 4,644 | | 1,009 |
| Universal Health Services, Inc. Class B | 409 | | 61 |
| Varian Medical Systems, Inc.(1) | 450 | | 54 |
| Vertex Pharmaceuticals, Inc.(1) | 1,270 | | 215 |
| Waters Corp.(1) | 341 | | 76 |
| WellCare Health Plans, Inc.(1) | 247 | | 64 |
| Zimmer Biomet Holdings, Inc. | 1,017 | | 140 |
| Zoetis, Inc. | 2,370 | | 295 |
| | | | 16,663 |
| | | | |
| |
| Industrials—8.5% | | |
| 3M Co.(2) | 2,851 | | 469 |
| A.O. Smith Corp. | 702 | | 33 |
| Alaska Air Group, Inc. | 618 | | 40 |
| Allegion plc | 464 | | 48 |
| American Airlines Group, Inc. | 2,061 | | 56 |
| AMETEK, Inc. | 1,124 | | 103 |
| Arconic, Inc. | 1,962 | | 51 |
| Boeing Co. (The)(2) | 2,578 | | 981 |
| Caterpillar, Inc.(2) | 2,834 | | 358 |
| Cintas Corp. | 418 | | 112 |
| Copart, Inc.(1) | 992 | | 80 |
| CSX Corp. | 3,810 | | 264 |
| Cummins, Inc. | 716 | | 116 |
| Deere & Co. | 1,563 | | 264 |
| Delta Air Lines, Inc. | 3,021 | | 174 |
See Notes to Financial Statements.
Rampart Enhanced Core Equity Fund
SCHEDULE OF INVESTMENTS (Continued)
September 30, 2019
($ reported in thousands)
| | Shares | | Value |
| | | | |
| Industrials—continued | | |
| Dover Corp. | 717 | | $71 |
| Eaton Corp. plc | 2,098 | | 174 |
| Emerson Electric Co.(2) | 3,012 | | 201 |
| Equifax, Inc. | 596 | | 84 |
| Expeditors International of Washington, Inc. | 849 | | 63 |
| Fastenal Co. | 2,822 | | 92 |
| FedEx Corp.(2) | 1,192 | | 173 |
| Flowserve Corp. | 635 | | 30 |
| Fortive Corp. | 1,455 | | 100 |
| Fortune Brands Home & Security, Inc. | 692 | | 38 |
| General Dynamics Corp.(2) | 1,330 | | 243 |
| General Electric Co.(2) | 42,789 | | 383 |
| Honeywell International, Inc.(2) | 3,601 | | 609 |
| Hunt (JB) Transport Services, Inc. | 432 | | 48 |
| Huntington Ingalls Industries, Inc. | 202 | | 43 |
| IDEX Corp. | 373 | | 61 |
| IHS Markit Ltd.(1) | 1,793 | | 120 |
| Illinois Tool Works, Inc. | 1,491 | | 233 |
| Ingersoll-Rand plc | 1,191 | | 147 |
| Jacobs Engineering Group, Inc. | 563 | | 51 |
| Johnson Controls International plc | 3,945 | | 173 |
| Kansas City Southern | 496 | | 66 |
| L3Harris Technologies, Inc. | 1,074 | | 224 |
| Lockheed Martin Corp.(2) | 1,194 | | 466 |
| Masco Corp. | 1,456 | | 61 |
| Nielsen Holdings plc | 1,747 | | 37 |
| Norfolk Southern Corp. | 1,320 | | 237 |
| Northrop Grumman Corp. | 829 | | 311 |
| PACCAR, Inc. | 1,717 | | 120 |
| Parker-Hannifin Corp. | 638 | | 115 |
| Pentair plc | 782 | | 30 |
| Quanta Services, Inc. | 698 | | 26 |
| Raytheon Co.(2) | 1,341 | | 263 |
| Republic Services, Inc. | 1,062 | | 92 |
| Robert Half International, Inc. | 587 | | 33 |
| Robinson (C.H.) Worldwide, Inc. | 681 | | 58 |
| Rockwell Automation, Inc. | 585 | | 96 |
| Rollins, Inc. | 729 | | 25 |
| Roper Technologies, Inc. | 511 | | 182 |
| Snap-on, Inc. | 273 | | 43 |
| Southwest Airlines Co. | 2,439 | | 132 |
| Stanley Black & Decker, Inc. | 753 | | 109 |
| Textron, Inc. | 1,142 | | 56 |
| TransDigm Group, Inc. | 242 | | 126 |
| Union Pacific Corp.(2) | 3,530 | | 572 |
| United Airlines Holdings, Inc.(1) | 1,122 | | 99 |
| United Parcel Service, Inc. Class B(2) | 3,442 | | 412 |
| United Rentals, Inc.(1) | 386 | | 48 |
| United Technologies Corp.(2) | 3,968 | | 542 |
| | Shares | | Value |
| | | | |
| Industrials—continued | | |
| Verisk Analytics, Inc. | 815 | | $129 |
| W.W. Grainger, Inc. | 222 | | 66 |
| Wabtec Corp.(2) | 893 | | 64 |
| Waste Management, Inc. | 1,928 | | 222 |
| Xylem, Inc. | 892 | | 71 |
| | | | 11,419 |
| | | | |
| |
| Information Technology—22.2% | | |
| Accenture plc Class A(2) | 3,496 | | 672 |
| Adobe, Inc.(1) | 2,685 | | 742 |
| Advanced Micro Devices, Inc.(1) | 4,873 | | 141 |
| Akamai Technologies, Inc.(1) | 901 | | 82 |
| Alliance Data Systems Corp. | 217 | | 28 |
| Amphenol Corp. Class A | 1,633 | | 158 |
| Analog Devices, Inc. | 2,045 | | 228 |
| ANSYS, Inc.(1) | 455 | | 101 |
| Apple, Inc.(2) | 23,835 | | 5,338 |
| Applied Materials, Inc. | 5,188 | | 259 |
| Arista Networks, Inc.(1) | 291 | | 70 |
| Autodesk, Inc.(1) | 1,202 | | 178 |
| Automatic Data Processing, Inc. | 2,380 | | 384 |
| Broadcom, Inc. | 2,187 | | 604 |
| Broadridge Financial Solutions, Inc. | 636 | | 79 |
| Cadence Design Systems, Inc.(1) | 1,558 | | 103 |
| Cisco Systems, Inc.(2) | 23,365 | | 1,154 |
| Citrix Systems, Inc. | 684 | | 66 |
| Cognizant Technology Solutions Corp. Class A | 3,110 | | 187 |
| Corning, Inc. | 4,298 | | 123 |
| DXC Technology Co. | 1,474 | | 43 |
| F5 Networks, Inc.(1) | 325 | | 46 |
| Fidelity National Information Services, Inc. | 3,337 | | 443 |
| Fiserv, Inc.(1) | 3,129 | | 324 |
| FleetCor Technologies, Inc.(1) | 471 | | 135 |
| FLIR Systems, Inc. | 738 | | 39 |
| Fortinet, Inc.(1) | 801 | | 61 |
| Gartner, Inc.(1) | 494 | | 71 |
| Global Payments, Inc. | 1,582 | | 252 |
| Hewlett Packard Enterprise Co. | 7,389 | | 112 |
| HP, Inc. | 8,448 | | 160 |
| Intel Corp.(2) | 24,666 | | 1,271 |
| International Business Machines Corp.(2) | 4,858 | | 706 |
| Intuit, Inc. | 1,429 | | 380 |
| IPG Photonics Corp.(1) | 198 | | 27 |
| Jack Henry & Associates, Inc. | 422 | | 62 |
| Juniper Networks, Inc. | 1,885 | | 47 |
| Keysight Technologies, Inc.(1) | 1,028 | | 100 |
| KLA Corp. | 890 | | 142 |
| Lam Research Corp. | 830 | | 192 |
| | Shares | | Value |
| | | | |
| Information Technology—continued | | |
| Leidos Holdings, Inc. | 788 | | $68 |
| Mastercard, Inc. Class A(2) | 4,945 | | 1,343 |
| Maxim Integrated Products, Inc. | 1,503 | | 87 |
| Microchip Technology, Inc. | 1,317 | | 122 |
| Micron Technology, Inc.(1) | 6,168 | | 264 |
| Microsoft Corp.(2) | 42,137 | | 5,858 |
| Motorola Solutions, Inc. | 899 | | 153 |
| NetApp, Inc. | 1,351 | | 71 |
| NVIDIA Corp. | 3,359 | | 585 |
| Oracle Corp.(2) | 13,307 | | 732 |
| Paychex, Inc. | 1,750 | | 145 |
| PayPal Holdings, Inc.(1)(2) | 6,443 | | 667 |
| Qorvo, Inc.(1) | 662 | | 49 |
| QUALCOMM, Inc.(2) | 6,717 | | 512 |
| salesforce.com, Inc.(1) | 4,690 | | 696 |
| Seagate Technology plc | 1,392 | | 75 |
| Skyworks Solutions, Inc. | 955 | | 76 |
| Symantec Corp. | 3,377 | | 80 |
| Synopsys, Inc.(1) | 827 | | 114 |
| TE Connectivity Ltd. | 1,847 | | 172 |
| Texas Instruments, Inc.(2) | 5,157 | | 667 |
| VeriSign, Inc.(1) | 575 | | 108 |
| Visa, Inc. Class A(2) | 9,552 | | 1,643 |
| Western Digital Corp. | 1,642 | | 98 |
| Western Union Co. (The) | 2,375 | | 55 |
| Xerox Holdings Corp. | 1,075 | | 32 |
| Xilinx, Inc. | 1,411 | | 135 |
| | | | 29,917 |
| | | | |
| |
| Materials—2.5% | | |
| Air Products & Chemicals, Inc. | 1,082 | | 240 |
| Albemarle Corp. | 522 | | 36 |
| Amcor plc | 8,238 | | 80 |
| Avery Dennison Corp. | 422 | | 48 |
| Ball Corp. | 1,643 | | 120 |
| Celanese Corp. | 626 | | 76 |
| CF Industries Holdings, Inc. | 1,073 | | 53 |
| Corteva, Inc.(2) | 3,713 | | 104 |
| Dow, Inc.(2) | 3,575 | | 170 |
| DuPont de Nemours, Inc.(2) | 3,710 | | 265 |
| Eastman Chemical Co. | 682 | | 50 |
| Ecolab, Inc. | 1,260 | | 249 |
| FMC Corp. | 649 | | 57 |
| Freeport-McMoRan, Inc. | 7,287 | | 70 |
| International Flavors & Fragrances, Inc. | 503 | | 62 |
| International Paper Co. | 1,979 | | 83 |
| Linde plc | 2,673 | | 518 |
| LyondellBasell Industries NV Class A | 1,297 | | 116 |
| Martin Marietta Materials, Inc. | 309 | | 85 |
| Mosaic Co. (The) | 1,748 | | 36 |
| Newmont Goldcorp Corp. | 3,997 | | 152 |
| Nucor Corp. | 1,515 | | 77 |
| Packaging Corporation of America | 473 | | 50 |
| PPG Industries, Inc. | 1,183 | | 140 |
| Sealed Air Corp. | 790 | | 33 |
| Sherwin-Williams Co. (The) | 404 | | 222 |
See Notes to Financial Statements.
Rampart Enhanced Core Equity Fund
SCHEDULE OF INVESTMENTS (Continued)
September 30, 2019
($ reported in thousands)
| | Shares | | Value |
| | | | |
| Materials—continued | | |
| Vulcan Materials Co. | 652 | | $99 |
| Westrock Co. | 1,277 | | 46 |
| | | | 3,337 |
| | | | |
| |
| Real Estate—3.2% | | |
| Alexandria Real Estate Equities, Inc. | 614 | | 95 |
| American Tower Corp. | 2,406 | | 532 |
| Apartment Investment & Management Co. Class A | 810 | | 42 |
| AvalonBay Communities, Inc. | 760 | | 164 |
| Boston Properties, Inc. | 845 | | 110 |
| CBRE Group, Inc. Class A(1) | 1,715 | | 91 |
| Crown Castle International Corp. | 2,264 | | 315 |
| Digital Realty Trust, Inc. | 1,136 | | 147 |
| Duke Realty Corp. | 1,957 | | 67 |
| Equinix, Inc. | 458 | | 264 |
| Equity Residential | 2,019 | | 174 |
| Essex Property Trust, Inc. | 358 | | 117 |
| Extra Space Storage, Inc. | 704 | | 82 |
| Federal Realty Investment Trust | 407 | | 55 |
| HCP, Inc. | 2,590 | | 92 |
| Host Hotels & Resorts, Inc. | 4,046 | | 70 |
| Iron Mountain, Inc. | 1,566 | | 51 |
| Kimco Realty Corp. | 2,302 | | 48 |
| Macerich Co. (The) | 580 | | 18 |
| Mid-America Apartment Communities, Inc. | 619 | | 81 |
| Prologis, Inc. | 3,435 | | 293 |
| Public Storage | 813 | | 199 |
| Realty Income Corp. | 1,707 | | 131 |
| Regency Centers Corp. | 906 | | 63 |
| SBA Communications, Corp. | 617 | | 149 |
| Simon Property Group, Inc.(2) | 1,690 | | 263 |
| SL Green Realty Corp. | 460 | | 38 |
| UDR, Inc. | 1,532 | | 74 |
| Ventas, Inc. | 2,003 | | 146 |
| Vornado Realty Trust | 949 | | 60 |
| Welltower, Inc. | 2,194 | | 199 |
| Weyerhaeuser Co. | 4,080 | | 113 |
| | | | 4,343 |
| | | | |
| |
| | Shares | | Value |
| | | | |
| Utilities—3.6% | | |
| AES Corp. | 3,610 | | $59 |
| Alliant Energy Corp. | 1,289 | | 70 |
| Ameren Corp. | 1,341 | | 107 |
| American Electric Power Co., Inc. | 2,690 | | 252 |
| American Water Works Co., Inc. | 985 | | 122 |
| Atmos Energy Corp. | 637 | | 73 |
| CenterPoint Energy, Inc. | 2,721 | | 82 |
| CMS Energy Corp. | 1,548 | | 99 |
| Consolidated Edison, Inc. | 1,784 | | 169 |
| Dominion Energy, Inc. | 4,372 | | 354 |
| DTE Energy Co. | 1,004 | | 133 |
| Duke Energy Corp.(2) | 3,974 | | 381 |
| Edison International | 1,926 | | 145 |
| Entergy Corp. | 1,039 | | 122 |
| Evergy, Inc. | 1,335 | | 89 |
| Eversource Energy | 1,747 | | 149 |
| Exelon Corp.(2) | 5,298 | | 256 |
| FirstEnergy Corp. | 2,743 | | 132 |
| NextEra Energy, Inc.(2) | 2,615 | | 609 |
| NiSource, Inc. | 2,030 | | 61 |
| NRG Energy, Inc. | 1,378 | | 55 |
| Pinnacle West Capital Corp. | 609 | | 59 |
| PPL Corp. | 3,931 | | 124 |
| Public Service Enterprise Group, Inc. | 2,759 | | 171 |
| Sempra Energy | 1,495 | | 221 |
| Southern Co. (The)(2) | 5,664 | | 350 |
| WEC Energy Group, Inc. | 1,721 | | 164 |
| Xcel Energy, Inc. | 2,803 | | 182 |
| | | | 4,790 |
| | | | |
| |
Total Common Stocks
(Identified Cost $99,862) | | 129,771 |
| | | | |
| |
| | | | |
| |
| Exchange-Traded Fund—2.6% |
| Invesco S&P 500 Low Volatility Index Fund(3) | 60,853 | | 3,524 |
Total Exchange-Traded Fund
(Identified Cost $3,379) | | 3,524 |
| | | | |
| |
| | | | |
| |
Total Long-Term Investments—99.1%
(Identified Cost $103,241) | | 133,295 |
| | | | |
| |
| | | | |
| |
| | | Value |
| | | |
| | | |
| Short-Term Investments—0.1% |
| Purchased Options—0.1% |
(See open purchased
options schedule) | | |
Total Purchased Options
(Premiums paid $155) | $127 |
| | | |
| |
| | | |
| |
Total Short-Term Investments
(Identified Cost $155) | 127 |
| | | |
| |
| | | |
| |
TOTAL INVESTMENTS, BEFORE WRITTEN OPTIONS—99.2%
(Identified Cost $103,396) | $133,422 |
| | | |
| |
| | | |
| |
| Written Options—(0.2)% |
(See open written options
schedule) | | |
Total Written Options
(Premiums received $281) | (245) |
| | | |
| |
| | | |
| |
TOTAL INVESTMENTS, NET OF WRITTEN OPTIONS—99.0%
(Identified Cost $103,115) | $133,177 |
| Other assets and liabilities, net—1.0% | 1,302 |
| NET ASSETS—100.0% | $134,479 |
| Footnote Legend: |
| (1) | Non-income producing. |
| (2) | All or a portion of the security is segregated as collateral for written options. |
| (3) | Shares of this fund are publicly offered, and its prospectus and annual report are publicly available. |
| Open Purchased Options Contracts as of September 30, 2019 were as follows: |
| Description of Options | Number of
Contracts | Contract
Notional
Amount | Strike
Price(1) | Expiration
Date | Value |
| Call Option | | | | | |
| S&P 500® Index | 178 | $57,405 | $3,225.00 | 11/08/19 | $9 |
| Put Option | | | | | |
| S&P 500® Index | 178 | 47,348 | 2,660.00 | 11/08/19 | 118 |
| Total Purchased Options | | $127 |
See Notes to Financial Statements.
Rampart Enhanced Core Equity Fund
SCHEDULE OF INVESTMENTS (Continued)
September 30, 2019
($ reported in thousands)
| Open Written Options Contracts as of September 30, 2019 were as follows: |
| Description of Options | Number of
Contracts | Contract
Notional
Amount | Strike
Price(1) | Expiration
Date | Value |
| Call Option | | | | | |
| S&P 500® Index | 178 | $56,070 | $3,150.00 | 11/08/19 | $(39) |
| Put Option | | | | | |
| S&P 500® Index | 178 | 48,683 | 2,735.00 | 11/08/19 | (206) |
| Total Written Options | | $(245) |
| Footnote Legend: |
| (1) | Strike price not reported in thousands. |
The following table summarizes the market value of the Fund’s investments as of September 30, 2019, based on the inputs used to value them (See Security Valuation Note 2A in the Notes to Financial Statements):
| | Total
Value at
September 30, 2019 | | Level 1
Quoted Prices | | Level 2
Significant
Observable
Inputs |
| Assets: | | | | | |
| Equity Securities: | | | | | |
| Common Stocks | $129,771 | | $129,771 | | $— |
| Exchange-Traded Fund | 3,524 | | 3,524 | | — |
| Other Financial Instruments: | | | | | |
| Purchased Options | 127 | | 9 | | 118 |
| Total Assets | 133,422 | | 133,304 | | 118 |
| Liabilities: | | | | | |
| Other Financial Instruments: | | | | | |
| Written Options | (245) | | (39) | | (206) |
| Total Investments | $133,177 | | $133,265 | | $(88) |
There were no securities valued using significant unobservable inputs (Level 3) at September 30, 2019.
There were no transfers into or out of Level 3 related to securities held at September 30, 2019.
See Notes to Financial Statements.
SGA Emerging Markets Growth Fund
SCHEDULE OF INVESTMENTS
September 30, 2019
($ reported in thousands)
| | Shares | | Value |
| Common Stocks—98.9% |
| Communication Services—4.9% | | |
| Tencent Holdings Ltd. | 5,031 | | $212 |
| Consumer Discretionary—31.0% | | |
| Alibaba Group Holding Ltd. Sponsored ADR(1) | 1,296 | | 217 |
| Ctrip.com International Ltd. ADR(1) | 4,139 | | 121 |
| Fast Retailing Co. Ltd. | 217 | | 129 |
| Huazhu Group Ltd. ADR | 5,411 | | 179 |
| JD.com, Inc. ADR(1) | 4,424 | | 125 |
| MercadoLibre, Inc.(1) | 323 | | 178 |
| New Oriental Education & Technology Group, Inc. Sponsored ADR(1) | 1,259 | | 139 |
| TAL Education Group ADR(1) | 3,515 | | 120 |
| Yum China Holdings, Inc. | 3,036 | | 138 |
| | | | 1,346 |
| | | | |
| |
| Consumer Staples—33.3% | | |
| Ambev S.A. ADR | 37,603 | | 174 |
| CP ALL PCL | 82,775 | | 220 |
| Fomento Economico Mexicano SAB de C.V. Sponsored ADR | 1,830 | | 168 |
| Nestle S.A. Registered Shares | 1,214 | | 132 |
| Raia Drogasil S.A. | 7,542 | | 174 |
| Shoprite Holdings Ltd. | 10,612 | | 86 |
| Unicharm Corp. | 4,463 | | 141 |
| Universal Robina Corp. | 39,950 | | 120 |
| Wal-Mart de Mexico SAB de C.V. | 78,418 | | 232 |
| | | | 1,447 |
| | | | |
| |
| Financials—16.0% | | |
| AIA Group Ltd. | 17,400 | | 164 |
| HDFC Bank Ltd. ADR | 3,986 | | 228 |
| | Shares | | Value |
| | | | |
| Financials—continued | | |
| Ping An Insurance Group Co. of China Ltd. Class H | 11,518 | | $132 |
| Sanlam Ltd. | 34,844 | | 172 |
| | | | 696 |
| | | | |
| |
| Health Care—5.4% | | |
| Abbott Laboratories | 1,059 | | 88 |
| Shandong Weigao Group Medical Polymer Co. Ltd. Class H | 139,752 | | 144 |
| | | | 232 |
| | | | |
| |
| Information Technology—8.3% | | |
| Infosys Ltd. Sponsored ADR | 19,717 | | 224 |
| Visa, Inc. Class A | 785 | | 135 |
| | | | 359 |
| | | | |
| |
Total Common Stocks
(Identified Cost $4,300) | | 4,292 |
| | | | |
| |
| | | | |
| |
Total Long-Term Investments—98.9%
(Identified Cost $4,300) | | 4,292 |
| | | | |
| |
| | | | |
| |
| Short-Term Investment—0.7% |
| Money Market Mutual Fund—0.7% |
| Dreyfus Government Cash Management Fund - Institutional Shares (seven-day effective yield 1.854%)(2) | 31,009 | | 31 |
Total Short-Term Investment
(Identified Cost $31) | | 31 |
| | | | |
| |
| | | | |
| |
| | | Value |
| | | |
| | | |
TOTAL INVESTMENTS—99.6%
(Identified Cost $4,331) | $4,323 |
| Other assets and liabilities, net—0.4% | 18 |
| NET ASSETS—100.0% | $4,341 |
| Abbreviation: |
| ADR | American Depositary Receipt |
| Footnote Legend: |
| (1) | Non-income producing. |
| (2) | Shares of this fund are publicly offered, and its prospectus and annual report are publicly available. |
| Country Weightings (Unaudited)† |
| China | 35% |
| India | 11 |
| Mexico | 9 |
| Brazil | 8 |
| Japan | 6 |
| South Africa | 6 |
| United States | 6 |
| Other | 19 |
| Total | 100% |
| † % of total investments as of September 30, 2019. |
The following table summarizes the market value of the Fund’s investments as of September 30, 2019, based on the inputs used to value them (See Security Valuation Note 2A in the Notes to Financial Statements):
| | Total
Value at
September 30, 2019 | | Level 1
Quoted Prices |
| Assets: | | | |
| Equity Securities: | | | |
| Common Stocks | $4,292 | | $4,292 |
| Money Market Mutual Fund | 31 | | 31 |
| Total Investments | $4,323 | | $4,323 |
There were no securities valued using significant observable inputs (Level 2) or significant unobservable inputs (Level 3) at September 30, 2019.
There were no transfers into or out of Level 3 related to securities held at September 30, 2019.
For information regarding the abbreviations, see the Key Investment Terms starting on page 6.
See Notes to Financial Statements.
SGA Global Growth Fund
SCHEDULE OF INVESTMENTS
September 30, 2019
($ reported in thousands)
| | Shares | | Value |
| Common Stocks—95.7% |
| Communication Services—6.2% | | |
| Alphabet, Inc. Class C(1) | 1,951 | | $2,378 |
| Tencent Holdings Ltd. | 33,144 | | 1,397 |
| | | | 3,775 |
| | | | |
| |
| Consumer Discretionary—25.7% | | |
| Alibaba Group Holding Ltd. Sponsored ADR(1) | 12,493 | | 2,089 |
| Amazon.com, Inc.(1) | 1,152 | | 2,000 |
| Booking Holdings, Inc.(1) | 644 | | 1,264 |
| Fast Retailing Co. Ltd. | 1,999 | | 1,187 |
| MercadoLibre, Inc.(1) | 2,024 | | 1,116 |
| New Oriental Education & Technology Group, Inc. Sponsored ADR(1) | 17,781 | | 1,969 |
| NIKE, Inc. Class B | 22,026 | | 2,069 |
| TJX Cos., Inc. (The) | 31,758 | | 1,770 |
| Yum! Brands, Inc. | 20,382 | | 2,312 |
| | | | 15,776 |
| | | | |
| |
| Consumer Staples—12.9% | | |
| Danone SA | 21,489 | | 1,893 |
| Heineken NV | 16,961 | | 1,833 |
| Mondelez International, Inc. Class A | 34,384 | | 1,902 |
| Nestle S.A. Registered Shares | 20,913 | | 2,269 |
| | | | 7,897 |
| | | | |
| |
| Financials—9.8% | | |
| AIA Group Ltd. | 232,942 | | 2,201 |
| HDFC Bank Ltd. ADR | 44,388 | | 2,532 |
| Sanlam Ltd. | 255,554 | | 1,259 |
| | | | 5,992 |
| | | | |
| |
| Health Care—10.5% | | |
| Abbott Laboratories | 25,267 | | 2,114 |
| Illumina, Inc.(1) | 4,001 | | 1,217 |
| Novo Nordisk A/S Class B | 38,471 | | 1,978 |
| | Shares | | Value |
| | | | |
| Health Care—continued | | |
| Regeneron Pharmaceuticals, Inc.(1) | 4,141 | | $1,149 |
| | | | 6,458 |
| | | | |
| |
| Industrials—3.4% | | |
| IHS Markit Ltd.(1) | 30,808 | | 2,060 |
| Information Technology—21.5% | | |
| Autodesk, Inc.(1) | 14,508 | | 2,143 |
| FleetCor Technologies, Inc.(1) | 6,495 | | 1,863 |
| Infosys Ltd. Sponsored ADR | 111,723 | | 1,270 |
| Microsoft Corp. | 13,728 | | 1,909 |
| salesforce.com, Inc.(1) | 12,317 | | 1,828 |
| SAP SE Sponsored ADR | 14,825 | | 1,747 |
| Visa, Inc. Class A | 14,003 | | 2,409 |
| | | | 13,169 |
| | | | |
| |
| Materials—2.5% | | |
| Linde plc | 8,017 | | 1,553 |
| Real Estate—3.2% | | |
| Equinix, Inc. | 3,431 | | 1,979 |
Total Common Stocks
(Identified Cost $44,490) | | 58,659 |
| | | | |
| |
| | | | |
| |
Total Long-Term Investments—95.7%
(Identified Cost $44,490) | | 58,659 |
| | | | |
| |
| | | | |
| |
| Short-Term Investment—4.2% |
| Money Market Mutual Fund—4.2% |
| Dreyfus Government Cash Management Fund - Institutional Shares (seven-day effective yield 1.854%)(2) | 2,554,458 | | 2,554 |
Total Short-Term Investment
(Identified Cost $2,554) | | 2,554 |
| | | | |
| |
| | | | |
| |
| | | Value |
| | | |
| | | |
TOTAL INVESTMENTS—99.9%
(Identified Cost $47,044) | $61,213 |
| Other assets and liabilities, net—0.1% | 57 |
| NET ASSETS—100.0% | $61,270 |
| Abbreviation: |
| ADR | American Depositary Receipt |
| Footnote Legend: |
| (1) | Non-income producing. |
| (2) | Shares of this fund are publicly offered, and its prospectus and annual report are publicly available. |
| Country Weightings (Unaudited)† |
| United States | 54% |
| China | 9 |
| India | 6 |
| United Kingdom | 6 |
| Switzerland | 4 |
| Hong Kong | 3 |
| Denmark | 3 |
| Other | 15 |
| Total | 100% |
| † % of total investments as of September 30, 2019. |
The following table summarizes the market value of the Fund’s investments as of September 30, 2019, based on the inputs used to value them (See Security Valuation Note 2A in the Notes to Financial Statements):
| | Total
Value at
September 30, 2019 | | Level 1
Quoted Prices |
| Assets: | | | |
| Equity Securities: | | | |
| Common Stocks | $58,659 | | $58,659 |
| Money Market Mutual Fund | 2,554 | | 2,554 |
| Total Investments | $61,213 | | $61,213 |
There were no securities valued using significant observable inputs (Level 2) or significant unobservable inputs (Level 3) at September 30, 2019.
There were no transfers into or out of Level 3 related to securities held at September 30, 2019.
For information regarding the abbreviations, see the Key Investment Terms starting on page 6.
See Notes to Financial Statements.
VIRTUS EQUITY TRUST
STATEMENTS OF ASSETS AND LIABILITIES
September 30, 2019
(Reported in thousands except shares and per share amounts)
| | KAR Capital
Growth Fund | | KAR Global Quality
Dividend Fund | | KAR Mid-Cap
Core Fund | | KAR Mid-Cap
Growth Fund |
| Assets | | | | | | | |
Investment in securities at value(1)(2)
| $502,162 | | $39,305 | | $424,364 | | $530,236 |
Foreign currency at value(3)
| — | | 871 | | — | | — |
Cash
| 5,574 | | 1,029 | | 5,532 | | 2,308 |
| Receivables | | | | | | | |
Fund shares sold
| 139 | | 38 | | 1,830 | | 2,247 |
Dividends
| 249 | | 131 | | 284 | | 131 |
Tax reclaims
| — | | 26 | | — | | — |
Securities lending income
| 10 | | 2 | | 1 | | — |
Prepaid Trustees’ retainer
| 10 | | 1 | | 8 | | 10 |
Prepaid expenses
| 42 | | 41 | | 47 | | 68 |
Other assets
| 42 | | 3 | | 35 | | 44 |
Total assets
| 508,228 | | 41,447 | | 432,101 | | 535,044 |
| Liabilities | | | | | | | |
| Payables | | | | | | | |
Fund shares repurchased
| 179 | | 17 | | 514 | | 877 |
Investment securities purchased
| — | | 865 | | — | | — |
Collateral on securities loaned
| 5,289 | | 606 | | — | | — |
Investment advisory fees
| 296 | | 14 | | 225 | | 369 |
Distribution and service fees
| 107 | | 9 | | 45 | | 72 |
Administration and accounting fees
| 45 | | 4 | | 38 | | 48 |
Transfer agent and sub-transfer agent fees and expenses
| 68 | | 7 | | 86 | | 78 |
Professional fees
| 22 | | 22 | | 22 | | 21 |
Trustee deferred compensation plan
| 42 | | 3 | | 35 | | 44 |
Other accrued expenses
| 68 | | 5 | | 20 | | 34 |
Total liabilities
| 6,116 | | 1,552 | | 985 | | 1,543 |
Net Assets
| $502,112 | | $39,895 | | $431,116 | | $533,501 |
| Net Assets Consist of: | | | | | | | |
Capital paid in on shares of beneficial interest
| $240,693 | | $36,405 | | $357,902 | | $452,209 |
Accumulated earnings (loss)
| 261,419 | | 3,490 | | 73,214 | | 81,292 |
Net Assets
| $502,112 | | $39,895 | | $431,116 | | $533,501 |
| Net Assets: | | | | | | | |
Class A
| $471,071 | | $29,367 | | $46,934 | | $181,184 |
Class C
| $8,632 | | $3,178 | | $43,268 | | $40,450 |
Class I
| $22,315 | | $7,246 | | $329,591 | | $309,892 |
Class R6
| $94 | | $104 | | $11,323 | | $1,975 |
| Shares Outstanding (unlimited number of shares authorized, no par value): | | | | | | | |
Class A
| 28,266,840 | | 1,987,565 | | 1,338,989 | | 4,845,273 |
Class C
| 690,837 | | 223,383 | | 1,328,185 | | 1,376,711 |
Class I
| 1,285,396 | | 489,847 | | 9,228,027 | | 8,007,325 |
Class R6
| 5,417 | | 7,027 | | 316,558 | | 50,835 |
| Net Asset Value and Redemption Price Per Share: | | | | | | | |
Class A
| $16.67 | | $14.78 | | $35.05 | | $37.39 |
Class C
| $12.49 | | $14.23 | | $32.58 | | $29.38 |
Class I
| $17.36 | | $14.79 | | $35.72 | | $38.70 |
Class R6
| $17.37 | | $14.80 | | $35.77 | | $38.85 |
See Notes to Financial Statements.
VIRTUS EQUITY TRUST
STATEMENTS OF ASSETS AND LIABILITIES (Continued)
September 30, 2019
(Reported in thousands except shares and per share amounts)
| | KAR Capital
Growth Fund | | KAR Global Quality
Dividend Fund | | KAR Mid-Cap
Core Fund | | KAR Mid-Cap
Growth Fund |
| Maximum Offering Price per Share (NAV/(1-Maximum Sales Charge)): | | | | | | | |
Class A
| $17.69 | | $15.68 | | $37.19 | | $39.67 |
Maximum Sales Charge - Class A
| 5.75% | | 5.75% | | 5.75% | | 5.75% |
(1)Investment in securities at cost
| $253,397 | | $34,442 | | $351,828 | | $450,573 |
(2) Market value of securities on loan
| $5,199 | | $575 | | $— | | $— |
(3) Foreign currency at cost
| $— | | $876 | | $— | | $— |
See Notes to Financial Statements.
VIRTUS EQUITY TRUST
STATEMENTS OF ASSETS AND LIABILITIES (Continued)
September 30, 2019
(Reported in thousands except shares and per share amounts)
| | KAR Small-Cap
Core Fund | | KAR Small-Cap
Growth Fund | | KAR Small-Cap
Value Fund | | KAR Small-Mid
Cap Core Fund |
| Assets | | | | | | | |
Investment in securities at value(1)
| $1,506,792 | | $4,881,249 | | $573,729 | | $30,382 |
Foreign currency at value(2)
| —(a) | | 3,289 | | — | | — |
Cash
| 43,968 | | 124,167 | | 15,731 | | 93 |
| Receivables | | | | | | | |
Investment securities sold
| — | | 40,299 | | — | | — |
Fund shares sold
| 775 | | 8,023 | | 888 | | 140 |
Dividends
| 261 | | 714 | | 628 | | 8 |
Securities lending income
| — | | 1 | | — | | — |
Prepaid Trustees’ retainer
| 28 | | 95 | | 11 | | 1 |
Prepaid expenses
| 67 | | 134 | | 52 | | 51 |
Other assets
| 127 | | 422 | | 48 | | 2 |
Total assets
| 1,552,018 | | 5,058,393 | | 591,087 | | 30,677 |
| Liabilities | | | | | | | |
| Payables | | | | | | | |
Fund shares repurchased
| 808 | | 5,040 | | 632 | | 1 |
Investment securities purchased
| — | | 985 | | — | | — |
Investment advisory fees
| 963 | | 3,482 | | 338 | | 43 |
Distribution and service fees
| 116 | | 406 | | 29 | | 1 |
Administration and accounting fees
| 135 | | 448 | | 51 | | 3 |
Transfer agent and sub-transfer agent fees and expenses
| 259 | | 1,242 | | 137 | | 2 |
Professional fees
| 24 | | 32 | | 22 | | 21 |
Trustee deferred compensation plan
| 127 | | 422 | | 48 | | 2 |
Other accrued expenses
| 78 | | 267 | | 33 | | 2 |
Total liabilities
| 2,510 | | 12,324 | | 1,290 | | 75 |
Net Assets
| $1,549,508 | | $5,046,069 | | $589,797 | | $30,602 |
| Net Assets Consist of: | | | | | | | |
Capital paid in on shares of beneficial interest
| $1,020,396 | | $3,559,562 | | $466,564 | | $29,092 |
Accumulated earnings (loss)
| 529,112 | | 1,486,507 | | 123,233 | | 1,510 |
Net Assets
| $1,549,508 | | $5,046,069 | | $589,797 | | $30,602 |
| Net Assets: | | | | | | | |
Class A
| $133,702 | | $735,210 | | $79,027 | | $1,473 |
Class C
| $106,191 | | $291,693 | | $15,361 | | $1,106 |
Class I
| $1,202,004 | | $3,973,860 | | $484,123 | | $24,898 |
Class R6
| $107,611 | | $45,306 | | $11,286 | | $3,125 |
| Shares Outstanding (unlimited number of shares authorized, no par value): | | | | | | | |
Class A
| 3,499,922 | | 19,635,552 | | 4,310,523 | | 127,713 |
Class C
| 3,338,724 | | 8,716,612 | | 859,001 | | 97,083 |
Class I
| 29,801,205 | | 103,809,525 | | 26,401,881 | | 2,153,185 |
Class R6
| 2,657,265 | | 1,181,506 | | 614,814 | | 270,000 |
| Net Asset Value and Redemption Price Per Share: | | | | | | | |
Class A
| $38.20 | | $37.44 | | $18.33 | | $11.53 |
Class C
| $31.81 | | $33.46 | | $17.88 | | $11.40 |
Class I
| $40.33 | | $38.28 | | $18.34 | | $11.56 |
Class R6
| $40.50 | | $38.35 | | $18.36 | | $11.57 |
See Notes to Financial Statements.
VIRTUS EQUITY TRUST
STATEMENTS OF ASSETS AND LIABILITIES (Continued)
September 30, 2019
(Reported in thousands except shares and per share amounts)
| | KAR Small-Cap
Core Fund | | KAR Small-Cap
Growth Fund | | KAR Small-Cap
Value Fund | | KAR Small-Mid
Cap Core Fund |
| Maximum Offering Price per Share (NAV/(1-Maximum Sales Charge)): | | | | | | | |
Class A
| $40.53 | | $39.72 | | $19.45 | | $12.23 |
Maximum Sales Charge - Class A
| 5.75% | | 5.75% | | 5.75% | | 5.75% |
(1)Investment in securities at cost
| $1,041,491 | | $3,314,971 | | $442,789 | | $28,707 |
(2) Foreign currency at cost
| $—(a) | | $3,296 | | $— | | $— |
| (a) | Amount is less than $500. |
See Notes to Financial Statements.
VIRTUS EQUITY TRUST
STATEMENTS OF ASSETS AND LIABILITIES (Continued)
September 30, 2019
(Reported in thousands except shares and per share amounts)
| | Rampart Enhanced
Core Equity Fund | | SGA Emerging Markets Growth Fund | | SGA Global Growth Fund |
| Assets | | | | | |
Investment in securities at value(1)
| $133,422 | | $4,323 | | $61,213 |
Cash
| 1,282 | | — | | — |
| Receivables | | | | | |
Investment securities sold
| — | | 66 | | — |
Fund shares sold
| 201 | | — | | 112 |
Receivable from adviser
| — | | 26 | | — |
Dividends
| 115 | | 2 | | 17 |
Tax reclaims
| — | | —(a) | | 36 |
Prepaid Trustees’ retainer
| 2 | | —(a) | | 1 |
Prepaid expenses
| 34 | | 1 | | 31 |
Other assets
| 11 | | —(a) | | 5 |
Total assets
| 135,067 | | 4,418 | | 61,415 |
| Liabilities | | | | | |
Cash overdraft
| — | | — | | —(a) |
Foreign currency overdraft(2)
| — | | 34 | | —(a) |
Written options at value(3)
| 245 | | — | | — |
| Payables | | | | | |
Fund shares repurchased
| 164 | | — | | 16 |
Investment securities purchased
| — | | 15 | | — |
Investment advisory fees
| 71 | | — | | 59 |
Distribution and service fees
| 30 | | —(a) | | 4 |
Administration and accounting fees
| 12 | | —(a) | | 5 |
Transfer agent and sub-transfer agent fees and expenses
| 22 | | —(a) | | 6 |
Professional fees
| 15 | | 25 | | 36 |
Trustee deferred compensation plan
| 11 | | —(a) | | 5 |
Other accrued expenses
| 18 | | 3 | | 14 |
Total liabilities
| 588 | | 77 | | 145 |
Net Assets
| $134,479 | | $4,341 | | $61,270 |
| Net Assets Consist of: | | | | | |
Capital paid in on shares of beneficial interest
| $113,175 | | $4,348 | | $47,855 |
Accumulated earnings (loss)
| 21,304 | | (7) | | 13,415 |
Net Assets
| $134,479 | | $4,341 | | $61,270 |
| Net Assets: | | | | | |
Class A
| $115,121 | | $100 | | $4,219 |
Class C
| $7,769 | | $100 | | $3,554 |
Class I
| $10,654 | | $109 | | $12,807* |
Class R6
| $935 | | $4,032 | | $40,690** |
| Shares Outstanding (unlimited number of shares authorized, no par value): | | | | | |
Class A
| 5,582,081 | | 10,000 | | 201,076 |
Class C
| 423,115 | | 10,000 | | 177,978 |
Class I
| 517,295 | | 10,958 | | 608,970* |
Class R6
| 45,479 | | 403,916 | | 1,887,425** |
| Net Asset Value and Redemption Price Per Share: | | | | | |
Class A
| $20.62 | | $9.97 | | $20.98 |
Class C
| $18.36 | | $9.95 | | $19.97 |
Class I
| $20.60 | | $9.98 | | $21.03* |
Class R6
| $20.56 | | $9.98 | | $21.56** |
See Notes to Financial Statements.
VIRTUS EQUITY TRUST
STATEMENTS OF ASSETS AND LIABILITIES (Continued)
September 30, 2019
(Reported in thousands except shares and per share amounts)
| | Rampart Enhanced
Core Equity Fund | | SGA Emerging Markets Growth Fund | | SGA Global Growth Fund |
| Maximum Offering Price per Share (NAV/(1-Maximum Sales Charge)): | | | | | |
Class A
| $21.88 | | $10.58 | | $22.26 |
Maximum Sales Charge - Class A
| 5.75% | | 5.75% | | 5.75% |
(1)Investment in securities at cost
| $103,396 | | $4,331 | | $47,044 |
(2) Foreign currency at cost
| $— | | $(34) | | $(—)(a) |
(3) Written options premiums received
| $281 | | $— | | $— |
| (a) | Amount is less than $500. |
| * | On May 3, 2019, Investor Class shares of the Predecessor Fund were reorganized into Class I shares of the Fund. See Note 1 in the Notes to Financial Statements. |
| ** | On May 3, 2019, Y Class shares and Institutional Class shares of the Predecessor Fund were reorganized into Class R6 shares of the Fund. See Note 1 in the Notes to Financial Statements. |
See Notes to Financial Statements.
VIRTUS EQUITY TRUST
STATEMENTS OF OPERATIONS
YEAR ENDEDSeptember 30, 2019
($ reported in thousands)
| | KAR Capital Growth Fund | | KAR Global Quality Dividend Fund | | KAR Mid-Cap Core Fund | | KAR Mid-Cap Growth Fund | | KAR Small-Cap Core Fund |
| Investment Income | | | | | | | | | |
Dividends
| $3,996 | | $1,564 | | $3,112 | | $1,638 | | $14,808 |
Interest
| — | | — | | — | | — | | 25 |
Security lending, net of fees
| 17 | | 15 | | 103 | | 34 | | 15 |
Foreign taxes withheld
| (4) | | (100) | | — | | (2) | | (55) |
Total investment income
| 4,009 | | 1,479 | | 3,215 | | 1,670 | | 14,793 |
| Expenses | | | | | | | | | |
Investment advisory fees
| 3,503 | | 274 | | 2,637 | | 2,529 | | 10,746 |
Distribution and service fees, Class A
| 1,180 | | 68 | | 96 | | 373 | | 319 |
Distribution and service fees, Class C
| 105 | | 39 | | 355 | | 227 | | 1,070 |
Administration and accounting fees
| 530 | | 47 | | 352 | | 339 | | 1,499 |
Transfer agent fees and expenses
| 296 | | 23 | | 143 | | 152 | | 617 |
Sub-transfer agent fees and expenses, Class A
| 165 | | 17 | | 38 | | 72 | | 121 |
Sub-transfer agent fees and expenses, Class C
| 7 | | 3 | | 36 | | 22 | | 97 |
Sub-transfer agent fees and expenses, Class I
| 16 | | 7 | | 248 | | 133 | | 874 |
Custodian fees
| 1 | | —(1) | | 1 | | 1 | | 2 |
Printing fees and expenses
| 55 | | 6 | | 38 | | 38 | | 147 |
Professional fees
| 36 | | 25 | | 26 | | 28 | | 45 |
Interest expense
| 1 | | —(1) | | —(1) | | —(1) | | 2 |
Registration fees
| 73 | | 47 | | 81 | | 80 | | 165 |
Trustees’ fees and expenses
| 41 | | 3 | | 23 | | 19 | | 117 |
Miscellaneous expenses
| 226 | | 28 | | 27 | | 62 | | 127 |
Total expenses
| 6,235 | | 587 | | 4,101 | | 4,075 | | 15,948 |
Less expenses reimbursed and/or waived by investment adviser(2)
| (1) | | (78) | | (524) | | — | | — |
Less low balance account fees
| (20) | | (1) | | —(1) | | (3) | | —(1) |
Plus expenses recaptured(2)
| — | | — | | — | | 116 | | — |
Net expenses
| 6,214 | | 508 | | 3,577 | | 4,188 | | 15,948 |
Net investment income (loss)
| (2,205) | | 971 | | (362) | | (2,518) | | (1,155) |
| Net Realized and Unrealized Gain (Loss) on Investments | | | | | | | | | |
| Net realized gain (loss) from: | | | | | | | | | |
Investments
| 20,250 | | (839) | | 1,545 | | 3,921 | | 65,046 |
Foreign currency transactions
| — | | (22) | | — | | — | | (21) |
| Net change in unrealized appreciation (depreciation) on: | | | | | | | | | |
Investments
| (16,012) | | 3,320 | | 26,947 | | 8,143 | | 92,814 |
Foreign currency transactions
| — | | 3 | | — | | — | | — |
Net realized and unrealized gain (loss) on investments
| 4,238 | | 2,462 | | 28,492 | | 12,064 | | 157,839 |
Net increase (decrease) in net assets resulting from operations
| $2,033 | | $3,433 | | $28,130 | | $9,546 | | $156,684 |
| (1) | Amount is less than $500. |
| (2) | See Note 4D in the Notes to Financial Statements. |
See Notes to Financial Statements.
VIRTUS EQUITY TRUST
STATEMENTS OF OPERATIONS (Continued)
YEAR ENDEDSeptember 30, 2019
($ reported in thousands)
| | KAR Small-Cap Growth Fund | | KAR Small-Cap Value Fund | | KAR Small-Mid Cap Core Fund | | Rampart Enhanced Core Equity Fund | | SGA Emerging Markets Growth Fund(1) |
| Investment Income | | | | | | | | | |
Dividends
| $33,937 | | $11,620 | | $110 | | $2,822 | | $13 |
Security lending, net of fees
| 29 | | — | | — | | — | | — |
Foreign taxes withheld
| — | | (70) | | —(2) | | —(2) | | (1) |
Total investment income
| 33,966 | | 11,550 | | 110 | | 2,822 | | 12 |
| Expenses | | | | | | | | | |
Investment advisory fees
| 39,291 | | 3,984 | | 82 | | 1,056 | | 13 |
Distribution and service fees, Class A
| 1,839 | | 196 | | 2 | | 284 | | —(2) |
Distribution and service fees, Class C
| 2,928 | | 194 | | 5 | | 141 | | —(2) |
Administration and accounting fees
| 5,023 | | 600 | | 20 | | 155 | | 3 |
Transfer agent fees and expenses
| 2,077 | | 252 | | 5 | | 76 | | 1 |
Sub-transfer agent fees and expenses, Class A
| 853 | | 59 | | 1 | | 69 | | — |
Sub-transfer agent fees and expenses, Class C
| 296 | | 16 | | — | | 8 | | — |
Sub-transfer agent fees and expenses, Class I
| 4,092 | | 480 | | 5 | | 8 | | — |
Custodian fees
| 8 | | 1 | | —(2) | | 4 | | 2 |
Printing fees and expenses
| 521 | | 68 | | 3 | | 16 | | 26 |
Professional fees
| 88 | | 29 | | 21 | | 19 | | 56 |
Interest expense
| 7 | | 1 | | —(2) | | — | | — |
Registration fees
| 394 | | 95 | | 73 | | 65 | | 18 |
Trustees’ fees and expenses
| 385 | | 47 | | — | | 12 | | —(2) |
Miscellaneous expenses
| 414 | | 65 | | 3 | | 53 | | 2 |
Total expenses
| 58,216 | | 6,087 | | 220 | | 1,966 | | 121 |
Less expenses reimbursed and/or waived by investment adviser(3)
| — | | — | | (102) | | (203) | | (107) |
Less low balance account fees
| (2) | | (1) | | — | | (2) | | — |
Net expenses
| 58,214 | | 6,086 | | 118 | | 1,761 | | 14 |
Net investment income (loss)
| (24,248) | | 5,464 | | (8) | | 1,061 | | (2) |
| Net Realized and Unrealized Gain (Loss) on Investments | | | | | | | | | |
| Net realized gain (loss) from: | | | | | | | | | |
Investments
| (41,169) | | (8,971) | | (155) | | (152) | | 2 |
Foreign currency transactions
| 21 | | — | | — | | — | | 1 |
Written options
| — | | — | | — | | (2,492) | | — |
| Net change in unrealized appreciation (depreciation) on: | | | | | | | | | |
Investments
| 641,060 | | (17,954) | | 1,483 | | (1,968) | | (8) |
Foreign currency transactions
| (34) | | — | | — | | — | | —(2) |
Written options
| — | | — | | — | | (304) | | — |
Net realized and unrealized gain (loss) on investments
| 599,878 | | (26,925) | | 1,328 | | (4,916) | | (5) |
Net increase (decrease) in net assets resulting from operations
| $575,630 | | $(21,461) | | $1,320 | | $(3,855) | | $(7) |
| (1) | Inception date June 13, 2019. |
| (2) | Amount is less than $500. |
| (3) | See Note 4D in the Notes to Financial Statements. |
See Notes to Financial Statements.
VIRTUS EQUITY TRUST
STATEMENTS OF OPERATIONS (Continued)
YEAR ENDEDSeptember 30, 2019
($ reported in thousands)
| | SGA Global Growth Fund |
| | Fiscal
Period Ended
September 30,
2019(1) | | Year Ended
January 31,
2019 |
| Investment Income | | | |
Dividends
| $511 | | $539 |
Dividends from affiliated funds
| 16 | | 48 |
Security lending, net of fees
| —(2) | | 6 |
Foreign taxes withheld
| (45) | | (30) |
Total Investment Income
| 482 | | 563 |
| Expenses | | | |
Investment advisory fees
| 298 | | 408 |
Distribution and service fees, Class A
| 7 | | 14 |
Distribution and service fees, Class C
| 23 | | 25 |
Distribution and service fees, Class I*
| 4 | | — |
Distribution and service fees, Investor Class*
| — | | 41 |
Administration Fees
| 46 | | — |
Transfer agent fees and expenses
| 13 | | — |
Transfer agent fees, Class A
| — | | —(2) |
Transfer agent fees, Class C
| — | | —(2) |
Transfer agent fees, Investor Class*
| — | | 2 |
Transfer agent fees, Institutional Class**
| — | | 6 |
Transfer agent fees, Y Class**
| — | | 12 |
Sub-transfer agent fees, Class A
| 1 | | — |
Sub-transfer agent fees, Class C
| 1 | | — |
Sub-transfer agent fees, Class I*
| 5 | | — |
Sub-transfer agent fees, Class R6**
| 4 | | — |
Custodian fees
| 1 | | — |
Printing fees and expenses
| 5 | | 15 |
Custody and fund accounting fees
| — | | 41 |
Professional fees
| 1 | | 79 |
Registration fees
| 44 | | 76 |
Trustees’ fees and expenses
| 1 | | 4 |
Miscellaneous expenses
| 29 | | 16 |
Total Expenses
| 483 | | 739 |
Less expenses reimbursed and/or waived by investment adviser(3)
| (71) | | (129) |
Net expenses
| 412 | | 610 |
Net Investment income (loss)
| 70 | | (47) |
| | | | |
See Notes to Financial Statements.
VIRTUS EQUITY TRUST
STATEMENTS OF OPERATIONS (Continued)
YEAR ENDEDSeptember 30, 2019
($ reported in thousands)
| | SGA Global Growth Fund |
| | Fiscal
Period Ended
September 30,
2019(1) | | Year Ended
January 31,
2019 |
| Net Realized and Unrealized Gain (Loss) on Investments | | | |
| Net realized gain (loss) from: | | | |
Unaffiliated investments
| $(167) | | $573 |
Foreign currency transactions
| (3) | | (19) |
Futures contracts
| 241 | | (316) |
| Net change in unrealized appreciation (depreciation) on: | | | |
Unaffiliated investments
| 6,390 | | (1,663) |
Foreign currency transactions
| (1) | | —(2) |
Futures contracts
| (128) | | 112 |
| Net Realized and Unrealized Gain (Loss) on Investments | 6,332 | | (1,313) |
Net increase (decrease) in net assets resulting from operations
| $6,402 | | $(1,360) |
| * | On May 3, 2019, Investor Class shares of the Predecessor Fund were reorganized into Class I shares of the Fund. See Note 1 in the Notes to Financial Statements. |
| ** | On May 3, 2019, Y Class shares and Institutional Class shares of the Predecessor Fund were reorganized into Class R6 shares of the Fund. See Note 1 in the Notes to Financial Statements. |
| (1) | Period from February 1, 2019 to September 30, 2019. The Fund had a fiscal period end change from January 31 to September 30. |
| (2) | Amount is less than $500. |
| (3) | See Note 4D in the Notes to Financial Statements. |
See Notes to Financial Statements.
VIRTUS EQUITY TRUST
STATEMENTS OF CHANGES IN NET ASSETS
($ reported in thousands)
| | KAR Capital Growth Fund | | KAR Global Quality Dividend Fund |
| | Year Ended
September 30,
2019 | | Year Ended
September 30,
2018 | | Year Ended
September 30,
2019 | | Year Ended
September 30,
2018 |
| Increase (Decrease) in Net Assets Resulting from Operations | | | | | | | |
Net investment income (loss)
| $(2,205) | | $(2,606) | | $971 | | $1,160 |
Net realized gain (loss)
| 20,250 | | 42,676 | | (861) | | 2,054 |
Net change in unrealized appreciation (depreciation)
| (16,012) | | 51,887 | | 3,323 | | (1,699) |
Increase (decrease) in net assets resulting from operations
| 2,033 | | 91,957 | | 3,433 | | 1,515 |
| Dividends and Distributions to Shareholders | | | | | | | |
| Net Investment Income and Net Realized Gains: | | | | | | | |
Class A
| (42,216) | | (23,456)(1) | | (2,449) | | (5,008)(1) |
Class C
| (1,557) | | (887)(1) | | (465) | | (706)(1) |
Class I
| (1,314) | | (664)(1) | | (495) | | (617)(1) |
Class R6
| (8) | | — | | — | | — |
Total Dividends and Distributions to Shareholders
| (45,095) | | (25,007) | | (3,409) | | (6,331) |
| Change in Net Assets from Capital Transactions (See Note 6): | | | | | | | |
Class A
| 2,187 | | (1,204) | | 2,837 | | (13,926) |
Class C
| (3,711) | | (1,201) | | (1,716) | | (466) |
Class I
| 6,417 | | 2,198 | | 2,329 | | (1,290) |
Class R6
| (5,834) | | 6,134 | | 100 | | — |
Increase (decrease) in net assets from capital transactions
| (941) | | 5,927 | | 3,550 | | (15,682) |
Net increase (decrease) in net assets
| (44,003) | | 72,877 | | 3,574 | | (20,498) |
| Net Assets | | | | | | | |
Beginning of period
| 546,115 | | 473,238 | | 36,321 | | 56,819 |
End of Period
| $502,112 | | $546,115 | | $39,895 | | $36,321 |
Accumulated undistributed net investment income (loss) at end of period
| N/A | | $(31) | | N/A | | $(11) |
| (1) | For the year ended September 30, 2018, the distributions to shareholders for the Funds were as follows:
|
| Dividends and Distributions to Shareholders | | | | |
| Net investment income: | | | | |
Class A
| | $— | | $(1,564) |
Class C
| | — | | (236) |
Class I
| | — | | (227) |
| Net realized gains: | | | | |
Class A
| | (23,456) | | (3,444) |
Class C
| | (887) | | (470) |
Class I
| | (664) | | (390) |
Total
| | $(25,007) | | $(6,331) |
See Notes to Financial Statements.
VIRTUS EQUITY TRUST
STATEMENTS OF CHANGES IN NET ASSETS (Continued)
($ reported in thousands)
| | KAR Mid-Cap Core Fund | | KAR Mid-Cap Growth Fund |
| | Year Ended
September 30,
2019 | | Year Ended
September 30,
2018 | | Year Ended
September 30,
2019 | | Year Ended
September 30,
2018 |
| Increase (Decrease) in Net Assets Resulting from Operations | | | | | | | |
Net investment income (loss)
| $(362) | | $(354) | | $(2,518) | | $(1,153) |
Net realized gain (loss)
| 1,545 | | 3,295 | | 3,921 | | 4,945 |
Net change in unrealized appreciation (depreciation)
| 26,947 | | 25,586 | | 8,143 | | 34,077 |
Increase (decrease) in net assets resulting from operations
| 28,130 | | 28,527 | | 9,546 | | 37,869 |
| Dividends and Distributions to Shareholders | | | | | | | |
| Net Investment Income and Net Realized Gains: | | | | | | | |
Class A
| (242) | | — | | (2,261) | | (4,734)(1) |
Class C
| (234) | | — | | (348) | | (334)(1) |
Class I
| (1,379) | | — | | (1,134) | | (242)(1) |
Class R6
| (17) | | — | | (3) | | — |
Total Dividends and Distributions to Shareholders
| (1,872) | | — | | (3,746) | | (5,310) |
| Change in Net Assets from Capital Transactions (See Note 6): | | | | | | | |
Class A
| 11,502 | | 1,611 | | 44,017 | | 20,953 |
Class C
| 10,731 | | 8,773 | | 27,696 | | 6,011 |
Class I
| 140,292 | | 78,595 | | 253,153 | | 46,976 |
Class R6
| 8,429 | | 2,335 | | 1,938 | | 96 |
Increase (decrease) in net assets from capital transactions
| 170,954 | | 91,314 | | 326,804 | | 74,036 |
Net increase (decrease) in net assets
| 197,212 | | 119,841 | | 332,604 | | 106,595 |
| Net Assets | | | | | | | |
Beginning of period
| 233,904 | | 114,063 | | 200,897 | | 94,302 |
End of Period
| $431,116 | | $233,904 | | $533,501 | | $200,897 |
Accumulated undistributed net investment income (loss) at end of period
| N/A | | $(163) | | N/A | | $(8) |
| (1) | For the year ended September 30, 2018, distributions to shareholders were from net realized gains. |
See Notes to Financial Statements.
VIRTUS EQUITY TRUST
STATEMENTS OF CHANGES IN NET ASSETS (Continued)
($ reported in thousands)
| | KAR Small-Cap Core Fund | | KAR Small-Cap Growth Fund |
| | Year Ended
September 30,
2019 | | Year Ended
September 30,
2018 | | Year Ended
September 30,
2019 | | Year Ended
September 30,
2018 |
| Increase (Decrease) in Net Assets Resulting from Operations | | | | | | | |
Net investment income (loss)
| $(1,155) | | $869 | | $(24,248) | | $(6,070) |
Net realized gain (loss)
| 65,025 | | 51,840 | | (41,148) | | 85,549 |
Net change in unrealized appreciation (depreciation)
| 92,814 | | 178,214 | | 641,026 | | 605,147 |
Increase (decrease) in net assets resulting from operations
| 156,684 | | 230,923 | | 575,630 | | 684,626 |
| Dividends and Distributions to Shareholders | | | | | | | |
| Net Investment Income and Net Realized Gains: | | | | | | | |
Class A
| (4,670) | | (148)(1) | | (14,708) | | — |
Class C
| (4,986) | | (110)(1) | | (6,272) | | — |
Class I
| (39,927) | | (781)(1) | | (69,698) | | — |
Class R6
| (3,179) | | (71)(1) | | (248) | | — |
| Tax Return on Capital: | | | | | | | |
Class A
| — | | — | | (765) | | — |
Class C
| — | | — | | (338) | | — |
Class I
| — | | — | | (3,824) | | — |
Class R6
| — | | — | | (28) | | — |
Total Dividends and Distributions to Shareholders
| (52,762) | | (1,110) | | (95,881) | | — |
| Change in Net Assets from Capital Transactions (See Note 6): | | | | | | | |
Class A
| (27,618) | | 46,792 | | (199,784) | | 490,851 |
Class C
| (21,478) | | 48,415 | | (39,105) | | 168,408 |
Class I
| (111,236) | | 585,811 | | (525,903) | | 2,503,278 |
Class R6
| 10,121 | | 29,571 | | 26,939 | | 12,739 |
Increase (decrease) in net assets from capital transactions
| (150,211) | | 710,589 | | (737,853) | | 3,175,276 |
Net increase (decrease) in net assets
| (46,289) | | 940,402 | | (258,104) | | 3,859,902 |
| Net Assets | | | | | | | |
Beginning of period
| 1,595,797 | | 655,395 | | 5,304,173 | | 1,444,271 |
End of Period
| $1,549,508 | | $1,595,797 | | $5,046,069 | | $5,304,173 |
Accumulated undistributed net investment income (loss) at end of period
| N/A | | $1,408 | | N/A | | $(152) |
| (1) | For the year ended September 30, 2018, distributions to shareholders were from net realized gains. |
See Notes to Financial Statements.
VIRTUS EQUITY TRUST
STATEMENTS OF CHANGES IN NET ASSETS (Continued)
($ reported in thousands)
| | KAR Small-Cap Value Fund | | KAR Small-Mid Cap Core Fund |
| | Year Ended
September 30,
2019 | | Year Ended
September 30,
2018 | | Year Ended
September 30,
2019 | | From inception
March 7, 2018 to
September 30,
2018 |
| Increase (Decrease) in Net Assets Resulting from Operations | | | | | | | |
Net investment income (loss)
| $5,464 | | $3,717 | | $(8) | | $(2) |
Net realized gain (loss)
| (8,971) | | 4,086 | | (155) | | 56 |
Net change in unrealized appreciation (depreciation)
| (17,954) | | 29,090 | | 1,483 | | 192 |
Increase (decrease) in net assets resulting from operations
| (21,461) | | 36,893 | | 1,320 | | 246 |
| Dividends and Distributions to Shareholders | | | | | | | |
| Net Investment Income and Net Realized Gains: | | | | | | | |
Class A
| (1,360) | | (1,402)(1) | | (4) | | — |
Class C
| (298) | | (475)(1) | | (2) | | — |
Class I
| (9,963) | | (5,442)(1) | | (16) | | — |
Class R6
| (328) | | (235)(1) | | (36) | | — |
Total Dividends and Distributions to Shareholders
| (11,949) | | (7,554) | | (58) | | — |
| Change in Net Assets from Capital Transactions (See Note 6): | | | | | | | |
Class A
| (253) | | (8,850) | | 1,211 | | 149 |
Class C
| (11,820) | | (1,250) | | 866 | | 128 |
Class I
| 34,116 | | 152,683 | | 23,837 | | 203 |
Class R6
| (8,883) | | 10,507 | | — | | 2,700 |
Increase (decrease) in net assets from capital transactions
| 13,160 | | 153,090 | | 25,914 | | 3,180 |
Net increase (decrease) in net assets
| (20,250) | | 182,429 | | 27,176 | | 3,426 |
| Net Assets | | | | | | | |
Beginning of period
| 610,047 | | 427,618 | | 3,426 | | — |
End of Period
| $589,797 | | $610,047 | | $30,602 | | $3,426 |
Accumulated undistributed net investment income (loss) at end of period
| N/A | | $3,683 | | N/A | | $— |
| (1) | For the year ended September 30, 2018, the distributions to shareholders for the Funds were as follows:
|
| Dividends and Distributions to Shareholders | | | | |
| Net investment income: | | | | |
Class A
| | $(43) | | $— |
Class C
| | (7) | | — |
Class I
| | (396) | | — |
Class R6
| | (19) | | — |
| Net realized gains: | | | | |
Class A
| | (1,359) | | — |
Class C
| | (468) | | — |
Class I
| | (5,046) | | — |
Class R6
| | (216) | | — |
Total
| | $(7,554) | | $— |
See Notes to Financial Statements.
VIRTUS EQUITY TRUST
STATEMENTS OF CHANGES IN NET ASSETS (Continued)
($ reported in thousands)
| | Rampart Enhanced Core Equity Fund | | SGA Emerging Markets Growth Fund |
| | Year Ended
September 30,
2019 | | Year Ended
September 30,
2018 | | From Inception
June 13, 2019 to
September 30,
2019 |
| Increase (Decrease) in Net Assets Resulting from Operations | | | | | |
Net investment income (loss)
| $1,061 | | $1,073 | | $(2) |
Net realized gain (loss)
| (2,644) | | (6,518) | | 3 |
Net change in unrealized appreciation (depreciation)
| (2,272) | | 22,265 | | (8) |
Increase (decrease) in net assets resulting from operations
| (3,855) | | 16,820 | | (7) |
| Dividends and Distributions to Shareholders | | | | | |
| Net Investment Income and Net Realized Gains: | | | | | |
Class A
| (1,129) | | (7,989)(1) | | — |
Class C
| (54) | | (2,242)(1) | | — |
Class I
| (161) | | (2,226)(1) | | — |
Class R6
| (23) | | — | | — |
Total Dividends and Distributions to Shareholders
| (1,367) | | (12,457) | | — |
| Change in Net Assets from Capital Transactions (See Note 6): | | | | | |
Class A
| (2,367) | | (5,360) | | 100 |
Class C
| (19,940) | | (2,831) | | 100 |
Class I
| (3,713) | | (17,626) | | 110 |
Class R6
| (3,786) | | 5,321 | | 4,038 |
Increase (decrease) in net assets from capital transactions
| (29,806) | | (20,496) | | 4,348 |
Net increase (decrease) in net assets
| (35,028) | | (16,133) | | 4,341 |
| Net Assets | | | | | |
Beginning of period
| 169,507 | | 185,640 | | — |
End of Period
| $134,479 | | $169,507 | | $4,341 |
Accumulated undistributed net investment income (loss) at end of period
| N/A | | $1,065 | | N/A |
| (1) | For the year ended September 30, 2018, the distributions to shareholders for the Funds were as follows:
|
| Dividends and Distributions to Shareholders | | | |
| Net investment income: | | | |
Class A
| | $(322) | |
Class I
| | (128) | |
| Net realized gains: | | | |
Class A
| | (7,667) | |
Class C
| | (2,242) | |
Class I
| | (2,098) | |
Total
| | $(12,457) | |
See Notes to Financial Statements.
VIRTUS EQUITY TRUST
STATEMENTS OF CHANGES IN NET ASSETS (Continued)
($ reported in thousands)
| | SGA Global Growth Fund |
| | Fiscal
Period Ended
September 30,
2019(1) | | Year Ended
January 31,
2019 | | Year Ended
January 31,
2018 |
| Increase (Decrease) in Net Assets Resulting from Operations | | | | | |
Net investment income (loss)
| $70 | | $(47) | | $(60) |
Net realized gain (loss)
| 71 | | 238 | | 2,578 |
Net change in unrealized appreciation (depreciation)
| 6,261 | | (1,551) | | 8,264 |
Increase (decrease) in net assets resulting from operations
| 6,402 | | (1,360) | | 10,782 |
| Dividends and Distributions to Shareholders | | | | | |
| Net Investment Income and Net Realized Gains: | | | | | |
Class A
| — | | (147) | | (116)(2) |
Class C
| — | | (113) | | (55)(2) |
Class I*
| — | | (286) | | (592)(2) |
Class R6**
| — | | (1,006) | | (466)(2) |
Y Class**
| — | | (672) | | (142)(2) |
Total Dividends and Distributions to Shareholders
| — | | (2,224) | | (1,371) |
| Change in Net Assets From Capital Transactions (See Note 6): | | | | | |
Class A
| 21 | | 167 | | 2,186 |
Class C
| 16 | | 1,253 | | 737 |
Class I*
| 6,224 | | (13,064) | | 3,830 |
Class R6**
| (765) | | 13,749 | | 4,912 |
Y Class**
| — | | 3,835 | | 3,104 |
Increase (decrease) in net assets from share transactions
| 5,496 | | 5,940 | | 14,769 |
Net increase (decrease) in net assets
| 11,898 | | 2,356 | | 24,180 |
| Net Assets | | | | | |
Beginning of period
| 49,372 | | 47,016 | | 22,836 |
End of Period
| $61,270 | | $49,372 | | $47,016 |
Accumulated undistributed net investment income (loss) at end of period
| N/A | | N/A | | $1 |
| * | On May 3, 2019, Investor Class shares of the Predecessor Fund were reorganized into Class I shares of the Fund. See Note 1 in the Notes to Financial Statements. |
| ** | On May 3, 2019, Y Class shares and Institutional Class shares of the Predecessor Fund were reorganized into Class R6 shares of the Fund. See Note 1 in the Notes to Financial Statements. |
| (1) | Period from February 1, 2019 to September 30, 2019. The Fund had a fiscal period end change from January 31 to September 30. |
| (2) | For the year ended January 31, 2018, distributions to shareholders were from net realized gains. |
See Notes to Financial Statements.
VIRTUS EQUITY TRUST
FINANCIAL HIGHLIGHTS
SELECTED PER SHARE DATA AND RATIOS FOR A SHARE OUTSTANDING
THROUGHOUT EACH PERIOD
| | | Net Asset Value,
Beginning of Period | Net Investment Income (Loss)(1) | Net Realized and
Unrealized Gain (Loss) | Total from Investment Operations | Dividends from
Net Investment Income | Tax Return of Capital | Distributions from
Net Realized Gains | Total Distributions | Change in Net Asset Value | Net Asset Value, End of Period | Total Return(2)(3) | Net Assets, End of Period
(in thousands) | Ratio of Net Expenses to
Average Net Assets(4)(5) | Ratio of Gross Expenses
to Average Net Assets(4)(5) | Ratio of Net Investment Income (Loss)
to Average Net Assets(4) | Portfolio Turnover Rate(3) |
| | | | | | | | | | | | | | | | | | |
| KAR Capital Growth Fund | | | | | | | | | | | | | | | | | |
| Class A | | | | | | | | | | | | | | | | | |
| 10/1/18 to 9/30/19 | | $18.37 | (0.07) | (0.08) | (0.15) | — | — | (1.55) | (1.55) | (1.70) | $16.67 | 1.10 % | $471,071 | 1.23 % (6) | 1.24 % | (0.43) % | 12 % |
| 10/1/17 to 9/30/18 | | 16.18 | (0.08) | 3.13 | 3.05 | — | — | (0.86) | (0.86) | 2.19 | 18.37 | 19.56 | 508,124 | 1.22 (6) | 1.22 | (0.49) | 17 |
| 10/1/16 to 9/30/17(7) | | 14.10 | (0.03) | 2.27 | 2.24 | — | — | (0.16) | (0.16) | 2.08 | 16.18 | 15.93 | 446,720 | 1.30 (6) | 1.30 | (0.40) | 13 |
| 4/1/16 to 3/31/17 | | 13.66 | (0.05) | 1.64 | 1.59 | — | — | (1.15) | (1.15) | 0.44 | 14.10 | 12.34 (8) | 402,118 | 1.33 (6)(8)(9) | 1.34 | (0.40) (8) | 21 |
| 4/1/15 to 3/31/16 | | 14.23 | (0.05) | 0.13 | 0.08 | — | — | (0.65) | (0.65) | (0.57) | 13.66 | 0.39 | 401,617 | 1.30 (6) | 1.30 | (0.32) | 20 |
| 4/1/14 to 3/31/15 | | 12.41 | (0.03) | 2.40 | 2.37 | — | — | (0.55) | (0.55) | 1.82 | 14.23 | 19.29 | 433,635 | 1.28 (6) | 1.28 | (0.22) | 28 |
| Class C | | | | | | | | | | | | | | | | | |
| 10/1/18 to 9/30/19 | | $14.34 | (0.15) | (0.15) | (0.30) | — | — | (1.55) | (1.55) | (1.85) | $12.49 | 0.26 % | $8,632 | 2.02 % (6) | 2.02 % | (1.22) % | 12 % |
| 10/1/17 to 9/30/18 | | 12.91 | (0.17) | 2.46 | 2.29 | — | — | (0.86) | (0.86) | 1.43 | 14.34 | 18.58 | 14,408 | 1.99 (6) | 2.00 | (1.26) | 17 |
| 10/1/16 to 9/30/17(7) | | 11.32 | (0.07) | 1.82 | 1.75 | — | — | (0.16) | (0.16) | 1.59 | 12.91 | 15.51 | 14,052 | 2.08 (6) | 2.08 | (1.18) | 13 |
| 4/1/16 to 3/31/17 | | 11.27 | (0.13) | 1.33 | 1.20 | — | — | (1.15) | (1.15) | 0.05 | 11.32 | 11.47 (8) | 13,345 | 2.08 (6)(8)(9) | 2.09 | (1.16) (8) | 21 |
| 4/1/15 to 3/31/16 | | 11.93 | (0.12) | 0.11 | (0.01) | — | — | (0.65) | (0.65) | (0.66) | 11.27 | (0.31) | 19,832 | 2.05 (6) | 2.06 | (1.07) | 20 |
| 4/1/14 to 3/31/15 | | 10.57 | (0.11) | 2.02 | 1.91 | — | — | (0.55) | (0.55) | 1.36 | 11.93 | 18.28 | 11,999 | 2.02 (6) | 2.02 | (0.97) | 28 |
| Class I | | | | | | | | | | | | | | | | | |
| 10/1/18 to 9/30/19 | | $19.02 | (0.04) | (0.07) | (0.11) | — | — | (1.55) | (1.55) | (1.66) | $17.36 | 1.29 % | $22,315 | 1.02 % (6) | 1.03 % | (0.21) % | 12 % |
| 10/1/17 to 9/30/18 | | 16.69 | (0.05) | 3.24 | 3.19 | — | — | (0.86) | (0.86) | 2.33 | 19.02 | 19.81 | 17,125 | 0.99 (6) | 0.99 | (0.26) | 17 |
| 10/1/16 to 9/30/17(7) | | 14.52 | (0.01) | 2.34 | 2.33 | — | — | (0.16) | (0.16) | 2.17 | 16.69 | 16.09 | 12,466 | 1.08 (6) | 1.08 | (0.18) | 13 |
| 4/1/16 to 3/31/17 | | 14.00 | (0.01) | 1.68 | 1.67 | — | — | (1.15) | (1.15) | 0.52 | 14.52 | 12.61 (8) | 10,180 | 1.08 (6)(8)(9) | 1.09 | (0.15) (8) | 21 |
| 4/1/15 to 3/31/16 | | 14.53 | (0.01) | 0.13 | 0.12 | — | — | (0.65) | (0.65) | (0.53) | 14.00 | 0.66 | 8,227 | 1.05 (6) | 1.05 | (0.07) | 20 |
| 4/1/14 to 3/31/15 | | 12.64 | — (10) | 2.44 | 2.44 | — | — | (0.55) | (0.55) | 1.89 | 14.53 | 19.50 | 8,595 | 1.02 (6) | 1.02 | 0.03 | 28 |
| Class R6 | | | | | | | | | | | | | | | | | |
| 10/1/18 to 9/30/19 | | $19.04 | (0.05) | (0.07) | (0.12) | — | — | (1.55) | (1.55) | (1.67) | $17.37 | 1.25 % | $94 | 0.78 % (11) | 0.94 % | (0.27) % | 12 % |
| 1/30/18(12) to 9/30/18 | | 18.46 | (—) (10) | 0.58 | 0.58 | — | — | — | — | 0.58 | 19.04 | 3.14 | 6,458 | 0.80 (11) | 0.91 | (0.03) | 17 (13) |
| | | | | | | | | | | | | | | | | | |
| KAR Global Quality Dividend Fund | | | | | | | | | | | | | | | | | |
| Class A | | | | | | | | | | | | | | | | | |
| 10/1/18 to 9/30/19 | | $14.98 | 0.38 | 0.85 | 1.23 | (0.39) | — | (1.04) | (1.43) | (0.20) | $14.78 | 9.64 % | $29,367 | 1.35 % | 1.56 % | 2.71 % | 35 % |
| 10/1/17 to 9/30/18 | | 16.20 | 0.40 | 0.25 | 0.65 | (0.65) | — | (1.22) | (1.87) | (1.22) | 14.98 | 4.24 | 26,351 | 1.35 | 1.50 | 2.63 | 33 |
| 10/1/16 to 9/30/17(7) | | 16.81 | 0.30 | 0.41 | 0.71 | (0.27) | — | (1.05) | (1.32) | (0.61) | 16.20 | 4.31 | 44,188 | 1.35 | 1.56 | 3.65 | 13 |
| 4/1/16 to 3/31/17 | | 15.09 | 0.20 | 1.66 | 1.86 | (0.14) | — | — | (0.14) | 1.72 | 16.81 | 12.42 | 46,670 | 1.36 (9) | 1.48 | 1.29 | 119 |
| 4/1/15 to 3/31/16 | | 15.40 | 0.14 | (0.37) | (0.23) | (0.08) | — | — | (0.08) | (0.31) | 15.09 | (1.53) | 50,081 | 1.35 | 1.44 | 0.94 | 25 |
| 4/1/14 to 3/31/15 | | 13.93 | 0.10 | 1.49 | 1.59 | (0.12) | — | — | (0.12) | 1.47 | 15.40 | 11.45 | 55,215 | 1.35 | 1.42 | 0.71 | 56 |
| Class C | | | | | | | | | | | | | | | | | |
| 10/1/18 to 9/30/19 | | $14.52 | 0.24 | 0.83 | 1.07 | (0.32) | — | (1.04) | (1.36) | (0.29) | $14.23 | 8.74 % | $3,178 | 2.10 % | 2.29 % | 1.79 % | 35 % |
| 10/1/17 to 9/30/18 | | 15.82 | 0.32 | 0.22 | 0.54 | (0.62) | — | (1.22) | (1.84) | (1.30) | 14.52 | 3.56 | 5,127 | 2.10 | 2.25 | 2.16 | 33 |
| 10/1/16 to 9/30/17(7) | | 16.38 | 0.23 | 0.39 | 0.62 | (0.13) | — | (1.05) | (1.18) | (0.56) | 15.82 | 3.86 | 6,107 | 2.10 | 2.33 | 2.87 | 13 |
| 4/1/16 to 3/31/17 | | 14.68 | 0.08 | 1.62 | 1.70 | — | — | — | — | 1.70 | 16.38 | 11.58 | 6,950 | 2.11 (9) | 2.23 | 0.54 | 119 |
| 4/1/15 to 3/31/16 | | 15.03 | 0.01 | (0.35) | (0.34) | (0.01) | — | — | (0.01) | (0.35) | 14.68 | (2.26) | 8,211 | 2.10 | 2.18 | 0.10 | 25 |
| 4/1/14 to 3/31/15 | | 13.67 | 0.01 | 1.43 | 1.44 | (0.08) | — | — | (0.08) | 1.36 | 15.03 | 10.64 | 20,383 | 2.10 | 2.16 | 0.07 | 56 |
The footnote legend is at the end of the financial highlights.
See Notes to Financial Statements.
VIRTUS EQUITY TRUST
FINANCIAL HIGHLIGHTS (Continued)
SELECTED PER SHARE DATA AND RATIOS FOR A SHARE OUTSTANDING
THROUGHOUT EACH PERIOD
| | | Net Asset Value,
Beginning of Period | Net Investment Income (Loss)(1) | Net Realized and
Unrealized Gain (Loss) | Total from Investment Operations | Dividends from
Net Investment Income | Tax Return of Capital | Distributions from
Net Realized Gains | Total Distributions | Change in Net Asset Value | Net Asset Value, End of Period | Total Return(2)(3) | Net Assets, End of Period
(in thousands) | Ratio of Net Expenses to
Average Net Assets(4)(5) | Ratio of Gross Expenses
to Average Net Assets(4)(5) | Ratio of Net Investment Income (Loss)
to Average Net Assets(4) | Portfolio Turnover Rate(3) |
| KAR Global Quality Dividend Fund (Continued) | | | | | | | | | | | | | | | | | |
| Class I | | | | | | | | | | | | | | | | | |
| 10/1/18 to 9/30/19 | | $15.02 | 0.42 | 0.83 | 1.25 | (0.44) | — | (1.04) | (1.48) | (0.23) | $14.79 | 9.85 % | $7,246 | 1.10 % | 1.36 % | 3.00 % | 35 % |
| 10/1/17 to 9/30/18 | | 16.20 | 0.47 | 0.23 | 0.70 | (0.66) | — | (1.22) | (1.88) | (1.18) | 15.02 | 4.56 | 4,843 | 1.10 | 1.29 | 3.14 | 33 |
| 10/1/16 to 9/30/17(7) | | 16.84 | 0.29 | 0.44 | 0.73 | (0.32) | — | (1.05) | (1.37) | (0.64) | 16.20 | 4.41 | 6,524 | 1.10 | 1.33 | 3.53 | 13 |
| 4/1/16 to 3/31/17 | | 15.12 | 0.25 | 1.65 | 1.90 | (0.18) | — | — | (0.18) | 1.72 | 16.84 | 12.66 | 7,096 | 1.11 (9) | 1.23 | 1.59 | 119 |
| 4/1/15 to 3/31/16 | | 15.40 | 0.17 | (0.35) | (0.18) | (0.10) | — | — | (0.10) | (0.28) | 15.12 | (1.21) | 6,496 | 1.10 | 1.18 | 1.15 | 25 |
| 4/1/14 to 3/31/15 | | 13.93 | 0.14 | 1.49 | 1.63 | (0.16) | — | — | (0.16) | 1.47 | 15.40 | 11.72 | 9,776 | 1.10 | 1.17 | 0.96 | 56 |
| Class R6 | | | | | | | | | | | | | | | | | |
| 8/1/19(12) to 9/30/19 | | $14.23 | 0.08 | 0.49 | 0.57 | — | — | — | — | 0.57 | $14.80 | 4.01 % | $104 | 0.78 % | 1.27 % | 3.39 % | 35 % |
| | | | | | | | | | | | | | | | | | |
| KAR Mid-Cap Core Fund | | | | | | | | | | | | | | | | | |
| Class A | | | | | | | | | | | | | | | | | |
| 10/1/18 to 9/30/19 | | $33.71 | (0.08) | 1.65 | 1.57 | — | — | (0.23) | (0.23) | 1.34 | $35.05 | 4.79 % | $46,934 | 1.20 % | 1.36 % | (0.23) % | 28 % |
| 10/1/17 to 9/30/18 | | 27.95 | (0.09) | 5.85 | 5.76 | — | — | — | — | 5.76 | 33.71 | 20.61 | 33,120 | 1.20 | 1.39 | (0.29) | 21 |
| 10/1/16 to 9/30/17(7) | | 25.80 | (0.05) | 2.29 | 2.24 | — | — | (0.09) | (0.09) | 2.15 | 27.95 | 8.70 | 26,238 | 1.20 | 1.49 | (0.35) | 11 |
| 4/1/16 to 3/31/17 | | 22.60 | (0.08) | 3.28 | 3.20 | — | — | — | — | 3.20 | 25.80 | 14.16 | 20,615 | 1.26 (9)(11) | 1.55 | (0.32) | 28 |
| 4/1/15 to 3/31/16 | | 23.00 | (0.06) | (0.20) | (0.26) | — | — | (0.14) | (0.14) | (0.40) | 22.60 | (1.14) | 20,639 | 1.35 | 1.64 | (0.27) | 21 |
| 4/1/14 to 3/31/15 | | 19.80 | (0.07) | 4.47 | 4.40 | — | — | (1.20) | (1.20) | 3.20 | 23.00 | 22.75 | 13,080 | 1.35 | 2.46 | (0.34) | 26 |
| Class C | | | | | | | | | | | | | | | | | |
| 10/1/18 to 9/30/19 | | $31.58 | (0.30) | 1.53 | 1.23 | — | — | (0.23) | (0.23) | 1.00 | $32.58 | 4.03 % | $43,268 | 1.95 % | 2.11 % | (0.98) % | 28 % |
| 10/1/17 to 9/30/18 | | 26.38 | (0.31) | 5.51 | 5.20 | — | — | — | — | 5.20 | 31.58 | 19.71 | 30,661 | 1.95 | 2.14 | (1.04) | 21 |
| 10/1/16 to 9/30/17(7) | | 24.45 | (0.14) | 2.16 | 2.02 | — | — | (0.09) | (0.09) | 1.93 | 26.38 | 8.28 | 17,870 | 1.95 | 2.25 | (1.10) | 11 |
| 4/1/16 to 3/31/17 | | 21.57 | (0.24) | 3.12 | 2.88 | — | — | — | — | 2.88 | 24.45 | 13.35 | 14,279 | 2.00 (9)(11) | 2.28 | (1.04) | 28 |
| 4/1/15 to 3/31/16 | | 22.12 | (0.22) | (0.19) | (0.41) | — | — | (0.14) | (0.14) | (0.55) | 21.57 | (1.91) | 6,670 | 2.10 | 2.38 | (1.03) | 21 |
| 4/1/14 to 3/31/15 | | 19.23 | (0.23) | 4.32 | 4.09 | — | — | (1.20) | (1.20) | 2.89 | 22.12 | 21.84 | 4,363 | 2.10 | 2.83 | (1.10) | 26 |
| Class I | | | | | | | | | | | | | | | | | |
| 10/1/18 to 9/30/19 | | $34.26 | 0.01 | 1.68 | 1.69 | — | — | (0.23) | (0.23) | 1.46 | $35.72 | 5.06 % | $329,591 | 0.95 % | 1.11 % | 0.03 % | 28 % |
| 10/1/17 to 9/30/18 | | 28.34 | (0.01) | 5.93 | 5.92 | — | — | — | — | 5.92 | 34.26 | 20.93 | 167,649 | 0.95 | 1.14 | (0.03) | 21 |
| 10/1/16 to 9/30/17(7) | | 26.12 | (0.01) | 2.32 | 2.31 | — | — | (0.09) | (0.09) | 2.22 | 28.34 | 8.82 | 69,955 | 0.95 | 1.25 | (0.10) | 11 |
| 4/1/16 to 3/31/17 | | 22.82 | (0.01) | 3.31 | 3.30 | — | — | — | — | 3.30 | 26.12 | 14.46 | 50,922 | 0.99 (9)(11) | 1.26 | (0.02) | 28 |
| 4/1/15 to 3/31/16 | | 23.17 | (0.01) | (0.20) | (0.21) | — | — | (0.14) | (0.14) | (0.35) | 22.82 | (0.92) | 7,570 | 1.10 | 1.38 | (0.03) | 21 |
| 4/1/14 to 3/31/15 | | 19.89 | (0.03) | 4.51 | 4.48 | — | — | (1.20) | (1.20) | 3.28 | 23.17 | 23.05 | 4,804 | 1.10 | 2.17 | (0.16) | 26 |
| Class R6 | | | | | | | | | | | | | | | | | |
| 10/1/18 to 9/30/19 | | $34.28 | 0.04 | 1.68 | 1.72 | — | — | (0.23) | (0.23) | 1.49 | $35.77 | 5.15 % | $11,323 | 0.87 % | 1.01 % | 0.11 % | 28 % |
| 1/30/18(12) to 9/30/18 | | 32.78 | 0.02 | 1.48 | 1.50 | — | — | — | — | 1.50 | 34.28 | 4.58 | 2,474 | 0.87 | 1.06 | 0.10 | 21 (13) |
The footnote legend is at the end of the financial highlights.
See Notes to Financial Statements.
VIRTUS EQUITY TRUST
FINANCIAL HIGHLIGHTS (Continued)
SELECTED PER SHARE DATA AND RATIOS FOR A SHARE OUTSTANDING
THROUGHOUT EACH PERIOD
| | | Net Asset Value,
Beginning of Period | Net Investment Income (Loss)(1) | Net Realized and
Unrealized Gain (Loss) | Total from Investment Operations | Dividends from
Net Investment Income | Tax Return of Capital | Distributions from
Net Realized Gains | Total Distributions | Change in Net Asset Value | Net Asset Value, End of Period | Total Return(2)(3) | Net Assets, End of Period
(in thousands) | Ratio of Net Expenses to
Average Net Assets(4)(5) | Ratio of Gross Expenses
to Average Net Assets(4)(5) | Ratio of Net Investment Income (Loss)
to Average Net Assets(4) | Portfolio Turnover Rate(3) |
| | | | | | | | | | | | | | | | | | |
| KAR Mid-Cap Growth Fund | | | | | | | | | | | | | | | | | |
| Class A | | | | | | | | | | | | | | | | | |
| 10/1/18 to 9/30/19 | | $35.55 | (0.31) | 2.79 | 2.48 | — | — | (0.64) | (0.64) | 1.84 | $37.39 | 7.46 % | $181,184 | 1.40 % (6)(14) | 1.33 % | (0.87) % | 28 % |
| 10/1/17 to 9/30/18 | | 27.74 | (0.28) | 9.65 | 9.37 | — | — | (1.56) | (1.56) | 7.81 | 35.55 | 35.38 | 131,422 | 1.40 (14) | 1.37 | (0.88) | 19 |
| 10/1/16 to 9/30/17(7) | | 24.56 | (0.12) | 3.43 | 3.31 | — | — | (0.13) | (0.13) | 3.18 | 27.74 | 13.48 | 84,912 | 1.40 | 1.49 | (0.88) | 12 |
| 4/1/16 to 3/31/17 | | 21.92 | (0.16) | 3.15 | 2.99 | — | — | (0.35) | (0.35) | 2.64 | 24.56 | 13.81 (8) | 80,648 | 1.41 (8)(9) | 1.52 | (0.75) (8) | 20 |
| 4/1/15 to 3/31/16 | | 22.80 | (0.18) | (0.36) | (0.54) | — | — | (0.34) | (0.34) | (0.88) | 21.92 | (2.51) | 76,660 | 1.39 | 1.49 | (0.84) | 26 |
| 4/1/14 to 3/31/15 | | 21.30 | (0.15) | 2.34 | 2.19 | — | — | (0.69) | (0.69) | 1.50 | 22.80 | 10.50 | 83,158 | 1.43 (11) | 1.46 | (0.71) | 27 |
| Class C | | | | | | | | | | | | | | | | | |
| 10/1/18 to 9/30/19 | | $28.30 | (0.47) | 2.19 | 1.72 | — | — | (0.64) | (0.64) | 1.08 | $29.38 | 6.67 % | $40,450 | 2.15 % (6)(14) | 2.12 % | (1.62) % | 28 % |
| 10/1/17 to 9/30/18 | | 22.54 | (0.42) | 7.74 | 7.32 | — | — | (1.56) | (1.56) | 5.76 | 28.30 | 34.40 | 12,571 | 2.15 | 2.17 | (1.63) | 19 |
| 10/1/16 to 9/30/17(7) | | 20.06 | (0.17) | 2.78 | 2.61 | — | — | (0.13) | (0.13) | 2.48 | 22.54 | 13.01 | 4,971 | 2.15 | 2.28 | (1.63) | 12 |
| 4/1/16 to 3/31/17 | | 18.09 | (0.27) | 2.59 | 2.32 | — | — | (0.35) | (0.35) | 1.97 | 20.06 | 13.03 (8) | 5,350 | 2.16 (8)(9) | 2.27 | (1.50) (8) | 20 |
| 4/1/15 to 3/31/16 | | 19.02 | (0.29) | (0.30) | (0.59) | — | — | (0.34) | (0.34) | (0.93) | 18.09 | (3.23) | 5,319 | 2.14 | 2.24 | (1.60) | 26 |
| 4/1/14 to 3/31/15 | | 18.01 | (0.26) | 1.96 | 1.70 | — | — | (0.69) | (0.69) | 1.01 | 19.02 | 9.68 | 5,976 | 2.18 (11) | 2.21 | (1.46) | 27 |
| Class I | | | | | | | | | | | | | | | | | |
| 10/1/18 to 9/30/19 | | $36.66 | (0.22) | 2.90 | 2.68 | — | — | (0.64) | (0.64) | 2.04 | $38.70 | 7.79 % | $309,892 | 1.11 % (6)(14) | 1.11 % | (0.58) % | 28 % |
| 10/1/17 to 9/30/18 | | 28.49 | (0.22) | 9.95 | 9.73 | — | — | (1.56) | (1.56) | 8.17 | 36.66 | 35.72 | 56,787 | 1.15 (14) | 1.13 | (0.65) | 19 |
| 10/1/16 to 9/30/17(7) | | 25.20 | (0.09) | 3.51 | 3.42 | — | — | (0.13) | (0.13) | 3.29 | 28.49 | 13.58 | 4,419 | 1.15 | 1.27 | (0.63) | 12 |
| 4/1/16 to 3/31/17 | | 22.42 | (0.11) | 3.24 | 3.13 | — | — | (0.35) | (0.35) | 2.78 | 25.20 | 14.13 (8) | 3,872 | 1.16 (8)(9) | 1.27 | (0.50) (8) | 20 |
| 4/1/15 to 3/31/16 | | 23.26 | (0.13) | (0.37) | (0.50) | — | — | (0.34) | (0.34) | (0.84) | 22.42 | (2.24) | 2,961 | 1.14 | 1.24 | (0.60) | 26 |
| 4/1/14 to 3/31/15 | | 21.66 | (0.10) | 2.39 | 2.29 | — | — | (0.69) | (0.69) | 1.60 | 23.26 | 10.79 | 3,288 | 1.18 (11) | 1.21 | (0.46) | 27 |
| Class R6 | | | | | | | | | | | | | | | | | |
| 10/1/18 to 9/30/19 | | $36.71 | (0.13) | 2.91 | 2.78 | — | — | (0.64) | (0.64) | 2.14 | $38.85 | 8.05 % | $1,975 | 0.85 % (11)(14) | 1.01 % | (0.34) % | 28 % |
| 1/30/18(12) to 9/30/18 | | 31.74 | (0.09) | 5.06 | 4.97 | — | — | — | — | 4.97 | 36.71 | 15.66 | 117 | 0.93 (11) | 1.09 | (0.40) | 19 (13) |
| | | | | | | | | | | | | | | | | | |
| KAR Small-Cap Core Fund | | | | | | | | | | | | | | | | | |
| Class A | | | | | | | | | | | | | | | | | |
| 10/1/18 to 9/30/19 | | $35.42 | (0.08) | 4.14 | 4.06 | — | — | (1.28) | (1.28) | 2.78 | $38.20 | 12.50 % | $133,702 | 1.29 % | 1.29 % | (0.24) % | 9 % |
| 10/1/17 to 9/30/18 | | 28.05 | (0.03) | 7.44 | 7.41 | — | — | (0.04) | (0.04) | 7.37 | 35.42 | 26.42 | 153,109 | 1.29 | 1.29 | (0.08) | 13 |
| 10/1/16 to 9/30/17(7) | | 24.21 | (0.06) | 3.91 | 3.85 | — | — | (0.01) | (0.01) | 3.84 | 28.05 | 15.92 | 79,752 | 1.33 | 1.33 | (0.49) | 2 |
| 4/1/16 to 3/31/17 | | 21.39 | (0.07) | 4.26 | 4.19 | — | — | (1.37) | (1.37) | 2.82 | 24.21 | 20.26 (8) | 62,122 | 1.37 (8)(9) | 1.37 | (0.31) (8) | 24 |
| 4/1/15 to 3/31/16 | | 25.65 | (0.05) | 0.01 | (0.04) | (0.05) | — | (4.17) | (4.22) | (4.26) | 21.39 | 0.02 | 53,722 | 1.37 | 1.37 | (0.21) | 33 |
| 4/1/14 to 3/31/15 | | 24.19 | 0.03 | 3.07 | 3.10 | — (10) | — | (1.64) | (1.64) | 1.46 | 25.65 | 13.28 | 67,696 | 1.34 | 1.34 | 0.12 | 28 �� |
| Class C | | | | | | | | | | | | | | | | | |
| 10/1/18 to 9/30/19 | | $29.95 | (0.28) | 3.42 | 3.14 | — | — | (1.28) | (1.28) | 1.86 | $31.81 | 11.69 % | $106,191 | 2.03 % | 2.03 % | (0.99) % | 9 % |
| 10/1/17 to 9/30/18 | | 23.90 | (0.23) | 6.32 | 6.09 | — | — | (0.04) | (0.04) | 6.05 | 29.95 | 25.52 | 122,439 | 2.02 | 2.02 | (0.82) | 13 |
| 10/1/16 to 9/30/17(7) | | 20.71 | (0.14) | 3.34 | 3.20 | — | — | (0.01) | (0.01) | 3.19 | 23.90 | 15.47 | 56,526 | 2.08 | 2.08 | (1.23) | 2 |
| 4/1/16 to 3/31/17 | | 18.61 | (0.21) | 3.68 | 3.47 | — | — | (1.37) | (1.37) | 2.10 | 20.71 | 19.39 (8) | 44,789 | 2.12 (8)(9) | 2.12 | (1.10) (8) | 24 |
| 4/1/15 to 3/31/16 | | 22.98 | (0.19) | (0.01) | (0.20) | — | — | (4.17) | (4.17) | (4.37) | 18.61 | (0.73) | 31,711 | 2.12 | 2.12 | (0.95) | 33 |
| 4/1/14 to 3/31/15 | | 21.99 | (0.11) | 2.74 | 2.63 | — (10) | — | (1.64) | (1.64) | 0.99 | 22.98 | 12.44 | 33,735 | 2.09 | 2.09 | (0.50) | 28 |
The footnote legend is at the end of the financial highlights.
See Notes to Financial Statements.
VIRTUS EQUITY TRUST
FINANCIAL HIGHLIGHTS (Continued)
SELECTED PER SHARE DATA AND RATIOS FOR A SHARE OUTSTANDING
THROUGHOUT EACH PERIOD
| | | Net Asset Value,
Beginning of Period | Net Investment Income (Loss)(1) | Net Realized and
Unrealized Gain (Loss) | Total from Investment Operations | Dividends from
Net Investment Income | Tax Return of Capital | Distributions from
Net Realized Gains | Total Distributions | Change in Net Asset Value | Net Asset Value, End of Period | Total Return(2)(3) | Net Assets, End of Period
(in thousands) | Ratio of Net Expenses to
Average Net Assets(4)(5) | Ratio of Gross Expenses
to Average Net Assets(4)(5) | Ratio of Net Investment Income (Loss)
to Average Net Assets(4) | Portfolio Turnover Rate(3) |
| KAR Small-Cap Core Fund (Continued) | | | | | | | | | | | | | | | | | |
| Class I | | | | | | | | | | | | | | | | | |
| 10/1/18 to 9/30/19 | | $37.26 | — (10) | 4.39 | 4.39 | (0.04) | — | (1.28) | (1.32) | 3.07 | $40.33 | 12.83 % | $1,202,004 | 1.02 % | 1.02 % | 0.01 % | 9 % |
| 10/1/17 to 9/30/18 | | 29.44 | 0.06 | 7.80 | 7.86 | — | — | (0.04) | (0.04) | 7.82 | 37.26 | 26.73 | 1,231,686 | 1.01 | 1.01 | 0.18 | 13 |
| 10/1/16 to 9/30/17(7) | | 25.37 | (0.03) | 4.11 | 4.08 | — | — | (0.01) | (0.01) | 4.07 | 29.44 | 16.10 | 474,552 | 1.08 | 1.08 | (0.23) | 2 |
| 4/1/16 to 3/31/17 | | 22.30 | (0.03) | 4.47 | 4.44 | — | — | (1.37) | (1.37) | 3.07 | 25.37 | 20.57 (8) | 338,491 | 1.12 (8)(9) | 1.12 | (0.11) (8) | 24 |
| 4/1/15 to 3/31/16 | | 26.58 | 0.01 | 0.01 | 0.02 | (0.13) | — | (4.17) | (4.30) | (4.28) | 22.30 | 0.28 | 189,167 | 1.12 | 1.12 | 0.04 | 33 |
| 4/1/14 to 3/31/15 | | 24.95 | 0.13 | 3.14 | 3.27 | — (10) | — | (1.64) | (1.64) | 1.63 | 26.58 | 13.57 | 248,933 | 1.08 | 1.08 | 0.53 | 28 |
| Class R6 | | | | | | | | | | | | | | | | | |
| 10/1/18 to 9/30/19 | | $37.40 | 0.04 | 4.40 | 4.44 | (0.06) | — | (1.28) | (1.34) | 3.10 | $40.50 | 12.94 % | $107,611 | 0.94 % | 0.94 % | 0.10 % | 9 % |
| 10/1/17 to 9/30/18 | | 29.52 | 0.09 | 7.83 | 7.92 | — | — | (0.04) | (0.04) | 7.88 | 37.40 | 26.86 | 88,563 | 0.94 | 0.94 | 0.25 | 13 |
| 10/1/16 to 9/30/17(7) | | 25.44 | (0.02) | 4.11 | 4.09 | — | — | (0.01) | (0.01) | 4.08 | 29.52 | 16.14 | 44,565 | 0.99 | 0.99 | (0.14) | 2 |
| 4/1/16 to 3/31/17 | | 22.33 | — (10) | 4.48 | 4.48 | — | — | (1.37) | (1.37) | 3.11 | 25.44 | 20.68 (8) | 31,338 | 1.01 (8)(9) | 1.01 | 0.01 (8) | 24 |
| 4/1/15 to 3/31/16 | | 26.59 | 0.07 | (0.01) | 0.06 | (0.15) | — | (4.17) | (4.32) | (4.26) | 22.33 | 0.41 | 20,811 | 1.01 | 1.02 | 0.33 | 33 |
| 11/12/14(12) to 3/31/15 | | 25.99 | 0.12 | 1.36 | 1.48 | — | — | (0.88) | (0.88) | 0.60 | 26.59 | 5.83 | 106 | 0.97 | 0.97 | 1.18 | 28 (13) |
| | | | | | | | | | | | | | | | | | |
| KAR Small-Cap Growth Fund | | | | | | | | | | | | | | | | | |
| Class A | | | | | | | | | | | | | | | | | |
| 10/1/18 to 9/30/19 | | $33.57 | (0.23) | 4.78 | 4.55 | — | (0.04) | (0.64) | (0.68) | 3.87 | $37.44 | 14.12 % | $735,210 | 1.37 % (6) | 1.37 % | (0.66) % | 16 % |
| 10/1/17 to 9/30/18 | | 25.43 | (0.11) | 8.25 | 8.14 | — | — | — | — | 8.14 | 33.57 | 32.01 | 866,966 | 1.37 (6) | 1.37 | (0.37) | 13 |
| 10/1/16 to 9/30/17(7) | | 21.12 | (0.09) | 4.40 | 4.31 | — (10) | — | — | — (10) | 4.31 | 25.43 | 20.41 | 263,281 | 1.50 (14) | 1.46 | (0.81) | 1 |
| 4/1/16 to 3/31/17 | | 17.67 | (0.14) | 4.14 | 4.00 | — | — | (0.55) | (0.55) | 3.45 | 21.12 | 23.25 (8) | 184,302 | 1.50 (8)(9) | 1.51 | (0.73) (8) | 21 |
| 4/1/15 to 3/31/16 | | 17.54 | (0.10) | 0.73 | 0.63 | — | — | (0.50) | (0.50) | 0.13 | 17.67 | 3.69 | 88,715 | 1.49 | 1.53 | (0.59) | 27 |
| 4/1/14 to 3/31/15 | | 16.97 | (0.13) | 2.46 | 2.33 | — | — | (1.76) | (1.76) | 0.57 | 17.54 | 14.56 | 83,611 | 1.50 | 1.57 | (0.76) | 27 |
| Class C | | | | | | | | | | | | | | | | | |
| 10/1/18 to 9/30/19 | | $30.30 | (0.44) | 4.28 | 3.84 | — | (0.04) | (0.64) | (0.68) | 3.16 | $33.46 | 13.28 % | $291,693 | 2.10 % (6) | 2.10 % | (1.40) % | 16 % |
| 10/1/17 to 9/30/18 | | 23.13 | (0.31) | 7.48 | 7.17 | — | — | — | — | 7.17 | 30.30 | 31.00 | 301,749 | 2.10 (6) | 2.10 | (1.10) | 13 |
| 10/1/16 to 9/30/17(7) | | 19.28 | (0.17) | 4.02 | 3.85 | — (10) | — | — | — (10) | 3.85 | 23.13 | 19.97 | 93,560 | 2.25 (14) | 2.21 | (1.56) | 1 |
| 4/1/16 to 3/31/17 | | 16.30 | (0.26) | 3.79 | 3.53 | — | — | (0.55) | (0.55) | 2.98 | 19.28 | 22.30 (8) | 58,327 | 2.26 (8)(9) | 2.26 | (1.49) (8) | 21 |
| 4/1/15 to 3/31/16 | | 16.33 | (0.21) | 0.68 | 0.47 | — | — | (0.50) | (0.50) | (0.03) | 16.30 | 2.97 | 19,525 | 2.25 | 2.28 | (1.34) | 27 |
| 4/1/14 to 3/31/15 | | 16.03 | (0.24) | 2.30 | 2.06 | — | — | (1.76) | (1.76) | 0.30 | 16.33 | 13.68 | 15,594 | 2.25 | 2.32 | (1.51) | 27 |
| Class I | | | | | | | | | | | | | | | | | |
| 10/1/18 to 9/30/19 | | $34.21 | (0.14) | 4.89 | 4.75 | — | (0.04) | (0.64) | (0.68) | 4.07 | $38.28 | 14.44 % | $3,973,860 | 1.11 % (6) | 1.11 % | (0.40) % | 16 % |
| 10/1/17 to 9/30/18 | | 25.86 | (0.03) | 8.38 | 8.35 | — | — | — | — | 8.35 | 34.21 | 32.29 | 4,121,658 | 1.10 (6) | 1.10 | (0.10) | 13 |
| 10/1/16 to 9/30/17(7) | | 21.45 | (0.07) | 4.48 | 4.41 | — (10) | — | — | — (10) | 4.41 | 25.86 | 20.56 | 1,087,430 | 1.25 (14) | 1.21 | (0.55) | 1 |
| 4/1/16 to 3/31/17 | | 17.89 | (0.10) | 4.21 | 4.11 | — | — | (0.55) | (0.55) | 3.56 | 21.45 | 23.59 (8) | 489,593 | 1.26 (8)(9) | 1.26 | (0.50) (8) | 21 |
| 4/1/15 to 3/31/16 | | 17.70 | (0.05) | 0.74 | 0.69 | — | — | (0.50) | (0.50) | 0.19 | 17.89 | 4.00 | 98,270 | 1.25 | 1.29 | (0.31) | 27 |
| 4/1/14 to 3/31/15 | | 17.08 | (0.08) | 2.46 | 2.38 | — | — | (1.76) | (1.76) | 0.62 | 17.70 | 14.83 | 35,058 | 1.25 | 1.32 | (0.47) | 27 |
| Class R6 | | | | | | | | | | | | | | | | | |
| 10/1/18 to 9/30/19 | | $34.23 | (0.12) | 4.92 | 4.80 | — | (0.04) | (0.64) | (0.68) | 4.12 | $38.35 | 14.58 % | $45,306 | 1.00 % (6) | 1.00 % | (0.31) % | 16 % |
| 1/30/18(12) to 9/30/18 | | 29.81 | 0.01 | 4.41 | 4.42 | — | — | — | — | 4.42 | 34.23 | 14.83 | 13,800 | 1.00 (6) | 1.00 | 0.05 | 13 |
The footnote legend is at the end of the financial highlights.
See Notes to Financial Statements.
VIRTUS EQUITY TRUST
FINANCIAL HIGHLIGHTS (Continued)
SELECTED PER SHARE DATA AND RATIOS FOR A SHARE OUTSTANDING
THROUGHOUT EACH PERIOD
| | | Net Asset Value,
Beginning of Period | Net Investment Income (Loss)(1) | Net Realized and
Unrealized Gain (Loss) | Total from Investment Operations | Dividends from
Net Investment Income | Tax Return of Capital | Distributions from
Net Realized Gains | Total Distributions | Change in Net Asset Value | Net Asset Value, End of Period | Total Return(2)(3) | Net Assets, End of Period
(in thousands) | Ratio of Net Expenses to
Average Net Assets(4)(5) | Ratio of Gross Expenses
to Average Net Assets(4)(5) | Ratio of Net Investment Income (Loss)
to Average Net Assets(4) | Portfolio Turnover Rate(3) |
| | | | | | | | | | | | | | | | | | |
| KAR Small-Cap Value Fund | | | | | | | | | | | | | | | | | |
| Class A | | | | | | | | | | | | | | | | | |
| 10/1/18 to 9/30/19 | | $19.44 | 0.14 | (0.93) | (0.79) | (0.13) | — | (0.19) | (0.32) | (1.11) | $18.33 | (3.82) % | $79,027 | 1.24 % (6) | 1.24 % | 0.80 % | 14 % |
| 10/1/17 to 9/30/18 | | 18.41 | 0.10 | 1.23 | 1.33 | (0.01) | — | (0.29) | (0.30) | 1.03 | 19.44 | 7.27 | 83,276 | 1.27 (6) | 1.27 | 0.55 | 6 |
| 10/1/16 to 9/30/17(7) | | 17.61 | 0.03 | 1.44 | 1.47 | (0.02) | — | (0.65) | (0.67) | 0.80 | 18.41 | 8.56 | 87,399 | 1.32 (6) | 1.32 | 0.29 | 10 |
| 4/1/16 to 3/31/17 | | 15.67 | 0.22 | 3.16 | 3.38 | (0.26) | — | (1.18) | (1.44) | 1.94 | 17.61 | 22.86 | 89,050 | 1.32 (6)(9) | 1.32 | 1.35 | 22 |
| 4/1/15 to 3/31/16 | | 16.61 | 0.07 | 0.07 | 0.14 | (0.10) | — | (0.98) | (1.08) | (0.94) | 15.67 | 0.94 | 71,280 | 1.30 (6) | 1.30 | 0.49 | 15 |
| 4/1/14 to 3/31/15 | | 16.74 | 0.09 | 1.38 | 1.47 | (0.03) | — | (1.57) | (1.60) | (0.13) | 16.61 | 9.33 | 74,738 | 1.28 (14) | 1.28 | 0.54 | 24 |
| Class C | | | | | | | | | | | | | | | | | |
| 10/1/18 to 9/30/19 | | $18.96 | 0.01 | (0.90) | (0.89) | — | — | (0.19) | (0.19) | (1.08) | $17.88 | (4.56) % | $15,361 | 1.99 % (6) | 1.99 % | 0.09 % | 14 % |
| 10/1/17 to 9/30/18 | | 18.08 | (0.03) | 1.20 | 1.17 | — | — | (0.29) | (0.29) | 0.88 | 18.96 | 6.54 | 29,922 | 1.97 (6) | 1.97 | (0.14) | 6 |
| 10/1/16 to 9/30/17(7) | | 17.35 | (0.04) | 1.42 | 1.38 | — | — | (0.65) | (0.65) | 0.73 | 18.08 | 8.17 | 29,795 | 2.06 (6) | 2.06 | (0.45) | 10 |
| 4/1/16 to 3/31/17 | | 15.45 | 0.10 | 3.11 | 3.21 | (0.13) | — | (1.18) | (1.31) | 1.90 | 17.35 | 21.95 | 29,416 | 2.07 (6)(9) | 2.07 | 0.65 | 22 |
| 4/1/15 to 3/31/16 | | 16.41 | (0.04) | 0.06 | 0.02 | — | — | (0.98) | (0.98) | (0.96) | 15.45 | 0.17 | 23,602 | 2.05 (6) | 2.05 | (0.26) | 15 |
| 4/1/14 to 3/31/15 | | 16.65 | (0.02) | 1.35 | 1.33 | — | — | (1.57) | (1.57) | (0.24) | 16.41 | 8.49 | 25,634 | 2.03 (14) | 2.03 | (0.12) | 24 |
| Class I | | | | | | | | | | | | | | | | | |
| 10/1/18 to 9/30/19 | | $19.49 | 0.18 | (0.94) | (0.76) | (0.20) | — | (0.19) | (0.39) | (1.15) | $18.34 | (3.57) % | $484,123 | 1.01 % (6) | 1.01 % | 1.02 % | 14 % |
| 10/1/17 to 9/30/18 | | 18.41 | 0.16 | 1.23 | 1.39 | (0.02) | — | (0.29) | (0.31) | 1.08 | 19.49 | 7.62 | 475,103 | 0.99 (6) | 0.99 | 0.84 | 6 |
| 10/1/16 to 9/30/17(7) | | 17.62 | 0.05 | 1.43 | 1.48 | (0.04) | — | (0.65) | (0.69) | 0.79 | 18.41 | 8.72 | 300,259 | 1.07 (6) | 1.07 | 0.55 | 10 |
| 4/1/16 to 3/31/17 | | 15.69 | 0.26 | 3.17 | 3.43 | (0.32) | — | (1.18) | (1.50) | 1.93 | 17.62 | 23.20 | 242,661 | 1.07 (6)(9) | 1.07 | 1.63 | 22 |
| 4/1/15 to 3/31/16 | | 16.64 | 0.11 | 0.07 | 0.18 | (0.15) | — | (0.98) | (1.13) | (0.95) | 15.69 | 1.17 | 144,487 | 1.05 (6) | 1.05 | 0.74 | 15 |
| 4/1/14 to 3/31/15 | | 16.77 | 0.16 | 1.35 | 1.51 | (0.07) | — | (1.57) | (1.64) | (0.13) | 16.64 | 9.59 | 163,082 | 1.03 (14) | 1.03 | 0.97 | 24 |
| Class R6 | | | | | | | | | | | | | | | | | |
| 10/1/18 to 9/30/19 | | $19.51 | 0.20 | (0.94) | (0.74) | (0.22) | — | (0.19) | (0.41) | (1.15) | $18.36 | (3.47) % | $11,286 | 0.90 % (6) | 0.90 % | 1.11 % | 14 % |
| 10/1/17 to 9/30/18 | | 18.42 | 0.18 | 1.22 | 1.40 | (0.02) | — | (0.29) | (0.31) | 1.09 | 19.51 | 7.69 | 21,746 | 0.90 (6) | 0.90 | 0.96 | 6 |
| 4/1/17 to 9/30/17(7) | | 17.63 | 0.05 | 1.44 | 1.49 | (0.05) | — | (0.65) | (0.70) | 0.79 | 18.42 | 8.78 | 10,165 | 0.99 (6) | 0.99 | 0.52 | 10 |
| 11/3/16(12) to 3/31/17 | | 14.90 | 0.05 | 3.15 | 3.20 | (0.22) | — | (0.25) | (0.47) | 2.73 | 17.63 | 21.58 | 122 | 0.98 (6) | 0.98 | 0.68 | 22 (13) |
| | | | | | | | | | | | | | | | | | |
| KAR Small-Mid Cap Core Fund | | | | | | | | | | | | | | | | | |
| Class A | | | | | | | | | | | | | | | | | |
| 10/1/18 to 9/30/19 | | $10.79 | (0.03) | 0.89 | 0.86 | — | — | (0.12) | (0.12) | 0.74 | $11.53 | 8.32 % | $1,473 | 1.30 % | 2.25 % | (0.28) % | 21 % |
| 3/7/18(12) to 9/30/18 | | 10.00 | (0.02) | 0.81 | 0.79 | — | — | — | — | 0.79 | 10.79 | 7.90 | 158 | 1.30 | 5.84 | (0.38) | 16 (13) |
| Class C | | | | | | | | | | | | | | | | | |
| 10/1/18 to 9/30/19 | | $10.75 | (0.11) | 0.88 | 0.77 | — | — | (0.12) | (0.12) | 0.65 | $11.40 | 7.50 % | $1,106 | 2.05 % | 2.92 % | (1.05) % | 21 % |
| 3/7/18(12) to 9/30/18 | | 10.00 | (0.07) | 0.82 | 0.75 | — | — | — | — | 0.75 | 10.75 | 7.50 | 135 | 2.05 | 6.48 | (1.14) | 16 (13) |
| Class I | | | | | | | | | | | | | | | | | |
| 10/1/18 to 9/30/19 | | $10.81 | (0.01) | 0.89 | 0.88 | (0.01) | — | (0.12) | (0.13) | 0.75 | $11.56 | 8.51 % | $24,898 | 1.05 % | 1.99 % | (0.05) % | 21 % |
| 3/7/18(12) to 9/30/18 | | 10.00 | (0.01) | 0.82 | 0.81 | — | — | — | — | 0.81 | 10.81 | 8.10 | 214 | 1.05 | 5.74 | (0.13) | 16 (13) |
| Class R6 | | | | | | | | | | | | | | | | | |
| 10/1/18 to 9/30/19 | | $10.81 | 0.01 | 0.88 | 0.89 | (0.01) | — | (0.12) | (0.13) | 0.76 | $11.57 | 8.61 % | $3,125 | 0.97 % | 1.91 % | 0.06 % | 21 % |
| 3/7/18(12) to 9/30/18 | | 10.00 | (—) (10) | 0.81 | 0.81 | — | — | — | — | 0.81 | 10.81 | 8.10 | 2,919 | 0.97 | 5.20 | (0.07) | 16 (13) |
The footnote legend is at the end of the financial highlights.
See Notes to Financial Statements.
VIRTUS EQUITY TRUST
FINANCIAL HIGHLIGHTS (Continued)
SELECTED PER SHARE DATA AND RATIOS FOR A SHARE OUTSTANDING
THROUGHOUT EACH PERIOD
| | | Net Asset Value,
Beginning of Period | Net Investment Income (Loss)(1) | Net Realized and
Unrealized Gain (Loss) | Total from Investment Operations | Dividends from
Net Investment Income | Tax Return of Capital | Distributions from
Net Realized Gains | Total Distributions | Change in Net Asset Value | Net Asset Value, End of Period | Total Return(2)(3) | Net Assets, End of Period
(in thousands) | Ratio of Net Expenses to
Average Net Assets(4)(5) | Ratio of Gross Expenses
to Average Net Assets(4)(5) | Ratio of Net Investment Income (Loss)
to Average Net Assets(4) | Portfolio Turnover Rate(3) |
| | | | | | | | | | | | | | | | | | |
| Rampart Enhanced Core Equity Fund | | | | | | | | | | | | | | | | | |
| Class A | | | | | | | | | | | | | | | | | |
| 10/1/18 to 9/30/19 | | $21.05 | 0.16 | (0.38) | (0.22) | (0.21) | — | — | (0.21) | (0.43) | $20.62 | (0.85) % | $115,121 | 1.20 % | 1.34 % | 0.80 % | 26 % |
| 10/1/17 to 9/30/18 | | 20.26 | 0.14 | 2.02 | 2.16 | (0.06) | — | (1.31) | (1.37) | 0.79 | 21.05 | 10.84 | 118,904 | 1.20 | 1.31 | 0.71 | 24 |
| 10/1/16 to 9/30/17(7) | | 20.27 | 0.06 | 1.72 | 1.78 | (0.06) | — | (1.73) | (1.79) | (0.01) | 20.26 | 9.26 | 120,445 | 1.23 (11) | 1.39 | 0.63 | 110 |
| 4/1/16 to 3/31/17 | | 18.14 | 0.15 | 2.68 | 2.83 | (0.22) | — | (0.48) | (0.70) | 2.13 | 20.27 | 15.85 (8) | 113,442 | 1.26 (8)(9) | 1.40 | 0.81 | 496 |
| 4/1/15 to 3/31/16 | | 20.97 | 0.14 | 0.56 | 0.70 | (0.15) | — | (3.38) | (3.53) | (2.83) | 18.14 | 4.02 | 101,113 | 1.25 | 1.38 | 0.74 | 312 |
| 4/1/14 to 3/31/15 | | 21.94 | 0.17 | 1.84 | 2.01 | (0.08) | — | (2.90) | (2.98) | (0.97) | 20.97 | 9.75 | 116,725 | 1.25 | 1.36 | 0.82 | 345 |
| Class C | | | | | | | | | | | | | | | | | |
| 10/1/18 to 9/30/19 | | $18.71 | 0.01 | (0.33) | (0.32) | (0.03) | — | — | (0.03) | (0.35) | $18.36 | (1.65) % | $7,769 | 1.95 % | 2.10 % | 0.07 % | 26 % |
| 10/1/17 to 9/30/18 | | 18.23 | (0.01) | 1.80 | 1.79 | — | — | (1.31) | (1.31) | 0.48 | 18.71 | 10.00 | 30,576 | 1.95 | 2.06 | (0.03) | 24 |
| 10/1/16 to 9/30/17(7) | | 18.44 | (0.02) | 1.56 | 1.54 | (0.02) | — | (1.73) | (1.75) | (0.21) | 18.23 | 8.85 | 32,710 | 1.98 (11) | 2.15 | (0.17) | 110 |
| 4/1/16 to 3/31/17 | | 16.48 | 0.01 | 2.44 | 2.45 | (0.01) | — | (0.48) | (0.49) | 1.96 | 18.44 | 15.01 (8) | 37,269 | 2.00 (8)(9) | 2.15 | 0.04 | 496 |
| 4/1/15 to 3/31/16 | | 19.42 | — (10) | 0.51 | 0.51 | (0.07) | — | (3.38) | (3.45) | (2.94) | 16.48 | 3.27 | 36,236 | 2.00 | 2.13 | 0.01 | 312 |
| 4/1/14 to 3/31/15 | | 20.60 | 0.01 | 1.72 | 1.73 | (0.01) | — | (2.90) | (2.91) | (1.18) | 19.42 | 8.91 | 37,312 | 2.00 | 2.12 | 0.06 | 345 |
| Class I | | | | | | | | | | | | | | | | | |
| 10/1/18 to 9/30/19 | | $21.03 | 0.21 | (0.38) | (0.17) | (0.26) | — | — | (0.26) | (0.43) | $20.60 | (0.58) % | $10,654 | 0.95 % | 1.09 % | 1.06 % | 26 % |
| 10/1/17 to 9/30/18 | | 20.22 | 0.19 | 2.01 | 2.20 | (0.08) | — | (1.31) | (1.39) | 0.81 | 21.03 | 11.10 | 15,028 | 0.95 | 1.08 | 0.92 | 24 |
| 10/1/16 to 9/30/17(7) | | 20.22 | 0.09 | 1.71 | 1.80 | (0.07) | — | (1.73) | (1.80) | (—) | 20.22 | 9.41 | 32,485 | 0.98 (11) | 1.15 | 0.91 | 110 |
| 4/1/16 to 3/31/17 | | 18.13 | 0.21 | 2.66 | 2.87 | (0.30) | — | (0.48) | (0.78) | 2.09 | 20.22 | 16.16 (8) | 21,011 | 1.01 (8)(9) | 1.15 | 1.13 | 496 |
| 4/1/15 to 3/31/16 | | 20.96 | 0.21 | 0.53 | 0.74 | (0.19) | — | (3.38) | (3.57) | (2.83) | 18.13 | 4.25 | 11,991 | 1.00 | 1.13 | 1.13 | 312 |
| 4/1/14 to 3/31/15 | | 21.90 | 0.22 | 1.85 | 2.07 | (0.11) | — | (2.90) | (3.01) | (0.94) | 20.96 | 10.06 | 8,969 | 1.00 | 1.11 | 1.05 | 345 |
| Class R6 | | | | | | | | | | | | | | | | | |
| 10/1/18 to 9/30/19 | | $21.03 | 0.20 | (0.37) | (0.17) | (0.30) | — | — | (0.30) | (0.47) | $20.56 | (0.56) % | $935 | 0.91 % | 1.03 % | 1.02 % | 26 % |
| 1/30/18(12) to 9/30/18 | | 20.70 | 0.15 | 0.18 | 0.33 | — | — | — | — | 0.33 | 21.03 | 1.59 | 4,999 | 0.91 | 1.00 | 1.16 | 24 |
| | | | | | | | | | | | | | | | | | |
| SGA Emerging Markets Growth Fund | | | | | | | | | | | | | | | | | |
| Class A | | | | | | | | | | | | | | | | | |
| 6/13/19(12) to 9/30/19 | | $10.00 | (0.02) | (0.01) | (0.03) | — | — | — | — | (0.03) | $9.97 | (0.30) % | $100 | 1.48 % | 9.63 % | (0.57) % | 6 % (13) |
| Class C | | | | | | | | | | | | | | | | | |
| 6/13/19(12) to 9/30/19 | | $10.00 | (0.04) | (0.01) | (0.05) | — | — | — | — | (0.05) | $9.95 | (0.50) % | $100 | 2.23 % | 10.38 % | (1.32) % | 6 % (13) |
| Class I | | | | | | | | | | | | | | | | | |
| 6/13/19(12) to 9/30/19 | | $10.00 | (0.01) | (0.01) | (0.02) | — | — | — | — | (0.02) | $9.98 | (0.20) % | $109 | 1.23 % | 9.38 % | (0.32) % | 6 % (13) |
| Class R6 | | | | | | | | | | | | | | | | | |
| 6/13/19(12) to 9/30/19 | | $10.00 | — (10) | (0.02) | (0.02) | — | — | — | — | (0.02) | $9.98 | (0.20) % | $4,032 | 1.05 % | 9.38 % | (0.14) % | 6 % (13) |
The footnote legend is at the end of the financial highlights.
See Notes to Financial Statements.
VIRTUS EQUITY TRUST
FINANCIAL HIGHLIGHTS (Continued)
SELECTED PER SHARE DATA AND RATIOS FOR A SHARE OUTSTANDING
THROUGHOUT EACH PERIOD
| | | Net Asset Value,
Beginning of Period | Net Investment Income (Loss)(1) | Net Realized and
Unrealized Gain (Loss) | Total from Investment Operations | Dividends from
Net Investment Income | Tax Return of Capital | Distributions from
Net Realized Gains | Total Distributions | Change in Net Asset Value | Net Asset Value, End of Period | Total Return(2)(3) | Net Assets, End of Period
(in thousands) | Ratio of Net Expenses to
Average Net Assets(4)(5) | Ratio of Gross Expenses
to Average Net Assets(4)(5) | Ratio of Net Investment Income (Loss)
to Average Net Assets(4) | Portfolio Turnover Rate(3) |
| | | | | | | | | | | | | | | | | | |
| SGA Global Growth Fund | | | | | | | | | | | | | | | | | |
| Class A | | | | | | | | | | | | | | | | | |
| 2/1/19 to 9/30/19(7) | | $18.58 | (0.01) | 2.41 | 2.40 | — | — | — | — | 2.40 | $20.98 | 12.92 % | $4,219 | 1.37 % | 1.48 % | (0.06) % | 13 % |
| 2/1/18 to 1/31/19 | | 19.72 | (0.05) | (0.32) | (0.37) | — | — | (0.77) | (0.77) | (1.14) | 18.58 | (1.46) | 3,786 | 1.38 | 1.60 | (0.28) | 54 |
| 2/1/17 to 1/31/18 | | 14.89 | (0.02) | 5.49 | 5.47 | — | — | (0.64) | (0.64) | 4.83 | 19.72 | 37.05 | 3,835 | 1.38 | 1.72 | (0.43) | 31 |
| 2/1/16 to 1/31/17 | | 13.65 | (0.03) | 1.76 | 1.79 | — | — | (0.55) | (0.55) | 1.24 | 14.89 | 13.21 | 1,028 | 1.38 | 2.33 | (0.27) | 32 |
| 2/1/15 to 1/31/16 | | 13.35 | (0.03) | 0.56 | 0.53 | (0.02) | — | (0.21) | (0.23) | 0.30 | 13.65 | 3.84 | 345 | 1.38 | 3.05 | (0.22) | 39 |
| 2/1/14 to 1/31/15 | | 13.03 | — (10) | 0.72 | 0.72 | (0.03) | — | (0.37) | (0.40) | 0.32 | 13.35 | 5.53 | 435 | 1.42 | 4.19 | (0.01) | 38 |
| Class C | | | | | | | | | | | | | | | | | |
| 2/1/19 to 9/30/19(7) | | $17.77 | (0.11) | 2.31 | 2.20 | — | — | — | — | 2.20 | $19.97 | 12.38 % | $3,554 | 2.10 % | 2.20 % | (0.83) % | 13 % |
| 2/1/18 to 1/31/19 | | 19.04 | (0.04) | (0.46) | (0.50) | — | — | (0.77) | (0.77) | (1.27) | 17.77 | (2.20) | 3,164 | 2.13 | 2.39 | (1.08) | 54 |
| 2/1/17 to 1/31/18 | | 14.50 | (0.04) | 5.22 | 5.18 | — | — | (0.64) | (0.64) | 4.54 | 19.04 | 36.04 | 2,062 | 2.13 | 2.47 | (1.08) | 31 |
| 2/1/16 to 1/31/17 | | 13.40 | 0.05 | 1.60 | 1.65 | — | — | (0.55) | (0.55) | 1.10 | 14.50 | 12.41 | 989 | 2.12 | 3.08 | (1.00) | 32 |
| 2/1/15 to 1/31/16 | | 13.21 | (0.12) | 0.54 | 0.42 | (0.02) | — | (0.21) | (0.23) | 0.19 | 13.40 | 3.04 | 410 | 2.13 | 3.76 | (0.89) | 39 |
| 2/1/14 to 1/31/15 | | 13.00 | (0.05) | 0.66 | 0.61 | (0.03) | — | (0.37) | (0.40) | 0.21 | 13.21 | 4.69 | 393 | 2.16 | 4.77 | (0.80) | 38 |
| Class I* | | | | | | | | | | | | | | | | | |
| 2/1/19 to 9/30/19(7) | | $18.61 | — (10) | 2.42 | 2.42 | — | — | — | — | 2.42 | $21.03 | 13.00 % | $12,807 | 1.19 % | 1.28 % | (0.02) % | 13 % |
| 2/1/18 to 1/31/19 | | 19.75 | (0.21) | (0.16) | (0.37) | — | — | (0.77) | (0.77) | (1.14) | 18.61 | (1.46) | 5,878 | 1.36 | 1.50 | (0.15) | 54 |
| 2/1/17 to 1/31/18 | | 14.90 | (0.04) | 5.53 | 5.49 | — | — | (0.64) | (0.64) | 4.85 | 19.75 | 37.16 | 19,474 | 1.36 | 1.57 | (0.29) | 31 |
| 2/1/16 to 1/31/17 | | 13.66 | 0.06 | 1.73 | 1.79 | — | — | (0.55) | (0.55) | 1.24 | 14.90 | 13.20 | 11,414 | 1.34 | 2.05 | (0.43) | 32 |
| 2/1/15 to 1/31/16 | | 13.36 | (0.04) | 0.57 | 0.53 | (0.02) | — | (0.21) | (0.23) | 0.30 | 13.66 | 3.84 | 422 | 1.36 | 3.08 | (0.32) | 39 |
| 2/1/14 to 1/31/15 | | 13.03 | 0.01 | 0.72 | 0.73 | (0.03) | — | (0.37) | (0.40) | 0.33 | 13.36 | 5.60 | 108 | 1.36 | 5.28 | 0.05 | 38 |
| Class R6** | | | | | | | | | | | | | | | | | |
| 2/1/19 to 9/30/19(7) | | $19.04 | 0.05 | 2.47 | 2.52 | — | — | — | — | 2.52 | $21.56 | 13.24 % | $40,690 | 0.95 % | 1.16 % | 0.34 % | 13 % |
| 2/1/18 to 1/31/19 | | 20.11 | 0.01 | (0.31) | (0.30) | — | — | (0.77) | (0.77) | (1.07) | 19.04 | (1.08) | 28,819 | 0.98 | 1.31 | 0.07 | 54 |
| 2/1/17 to 1/31/18 | | 15.11 | (0.01) | 5.65 | 5.64 | — | — | (0.64) | (0.64) | 5.00 | 20.11 | 37.64 | 15,913 | 0.98 | 1.34 | 0.08 | 31 |
| 2/1/16 to 1/31/17 | | 13.79 | 0.03 | 1.84 | 1.87 | — | — | (0.55) | (0.55) | 1.32 | 15.11 | 13.66 | 7,698 | 0.98 | 2.03 | 0.21 | 32 |
| 2/1/15 to 1/31/16 | | 13.43 | 0.03 | 0.56 | 0.59 | (0.02) | — | (0.21) | (0.23) | 0.36 | 13.79 | 4.26 | 6,219 | 0.98 | 2.62 | 0.27 | 39 |
| 2/1/14 to 1/31/15 | | 13.05 | 0.06 | 0.72 | 0.78 | (0.03) | — | (0.37) | (0.40) | 0.38 | 13.43 | 5.98 | 5,106 | 0.98 | 3.82 | 0.42 | 38 |
The footnote legend is at the end of the financial highlights.
See Notes to Financial Statements.
VIRTUS EQUITY TRUST
FINANCIAL HIGHLIGHTS (Continued)
SELECTED PER SHARE DATA AND RATIOS FOR A SHARE OUTSTANDING
THROUGHOUT EACH PERIOD
| Footnote Legend: |
| * | On May 3, 2019, Investor Class shares of the Predecessor Fund were reorganized into Class I shares of the Fund. See Note 1 in the Notes to Financial Statements. The Class I shares financial highlights for the periods prior to May 3, 2019 reflect the performance of the American Beacon SGA Global Growth Fund Investor Class shares. |
| ** | On May 3, 2019, Y Class shares and Institutional Class shares of the Predecessor Fund were reorganized into Class R6 shares of the Fund. See Note 1 in the Notes to Financial Statements. The Class R6 shares financial highlights for the periods prior to May 3, 2019 reflect the performance of the American Beacon SGA Global Growth Fund Institutional Class shares. |
| (1) | Calculated using average shares outstanding. |
| (2) | Sales charges, where applicable, are not reflected in the total return calculation. |
| (3) | Not annualized for periods less than one year. |
| (4) | Annualized for periods less than one year. |
| (5) | The Funds will also indirectly bear their prorated share of expenses of any underlying funds in which they invest. Such expenses are not included in the calculation of this ratio. |
| (6) | The share class is currently under its expense limitation. |
| (7) | The Fund changed its fiscal year end to September 30, during the period. |
| (8) | State Street Bank & Trust, custodian for some of the Funds through January 29, 2010, reimbursed the Funds for out-of-pocket custody expenses overbilled for the period 1998 through January 29, 2010. Custody fees reimbursed were excluded from the Ratio of Net Expenses to Average Net Assets and Ratio of Net Investment Income (Loss) to Average Net Assets. If included, the impact would have been to lower the Ratio of Net Expenses and increase the Ratio of Net Investment Income (Loss) as follows:
KAR Capital Growth Fund 0.06% (Class A), 0.05% (Class C), 0.06% (Class I)
KAR Mid-Cap Growth Fund 0.05% (Class A), 0.05% (Class C), 0.05% (Class I)
KAR Small-Cap Core Fund amounts are less than 0.005% for Classes A, C, I, and R6, respectively
KAR Small-Cap Growth Fund amounts are less than 0.005% for Classes A, C, and I, respectively
Rampart Enhanced Core Equity Fund amounts are less than 0.005% for Classes A, C, and I, respectively
Custody fees reimbursed were included in Total Return. If excluded, the impact would have been to lower the Total Return as follows:
KAR Capital Growth Fund 0.06% (Class A), 0.06% (Class C), 0.06% (Class I)
KAR Mid-Cap Growth Fund 0.05% (Class A), 0.05% (Class C), 0.05% (Class I)
KAR Small-Cap Core Fund amounts are less than 0.005% for Classes A, C, I, and R6, respectively
KAR Small-Cap Growth Fund amounts are less than 0.005% for Classes A, C, and I, respectively
Rampart Enhanced Core Equity Fund amounts are less than 0.005% for Classes A, C, and I, respectively
|
| (9) | Net expense ratio includes extraordinary proxy expenses. |
| (10) | Amount is less than $0.005 per share. |
| (11) | Represents a blended ratio. |
| (12) | Inception date. |
| (13) | Portfolio turnover is representative of the Fund for the entire period. |
| (14) | See note 4D in the Notes to Financial Statements for information on recapture of expenses previously reimbursed. |
See Notes to Financial Statements.
VIRTUS EQUITY TRUST
NOTES TO FINANCIAL STATEMENTS
September 30, 2019
Note 1. Organization
Virtus Equity Trust (the “Trust”) is organized as a Delaware statutory trust and is registered under the Investment Company Act of 1940, as amended (the “1940 Act”), as an open-end management investment company.
As of the date of this report, 12 diversified funds of the Trust are offered for sale, of which 11 (each a “Fund” or collectively, the “Funds”) are reported in this annual report. Each Fund’s investment objective is outlined in its respective Fund Summary page. There is no guarantee that a Fund will achieve its objective(s).
Before the SGA Global Growth Fund (the “Successor Fund”) commenced operations, on May 3, 2019, all of the property, assets and liabilities of the American Beacon SGA Global Growth FundSM (the “Predecessor Fund”) were transferred to the Successor Fund in a tax-free reorganization as set forth in an agreement and plan of reorganization (“Reorganization”) between the Trust, on behalf of the Successor Fund, and American Beacon, on behalf of the Predecessor Fund. As a result of the Reorganization, the Successor Fund assumed the performance and accounting history of the Predecessor Fund. Financial information included for the dates prior to the Reorganization is that of the Predecessor Fund, which previously had a fiscal period end of January 31.
All of the Funds offer Class A shares, Class C shares, Class I shares and Class R6 shares.
Class A shares are sold with a front-end sales charge of up to 5.75% with some exceptions. Generally, Class A shares are not subject to any charges by the Funds when redeemed; however, a 1% contingent deferred sales charge (“CDSC”) may be imposed on certain redemptions made within a certain period following purchases on which a finder’s fee has been paid. The period for which the CDSC applies for the Funds is 18 months. The CDSC period begins on the last day of the month preceding the month in which the purchase was made.
Class C shares are generally sold with a 1% CDSC, applicable if redeemed within one year of purchase. Effective January 1, 2019, with certain exceptions, Class C shares and any reinvested dividends and other distributions paid on such shares, will be automatically converted to Class A shares ten years after the purchase date. Class I shares and Class R6 shares are sold without a front-end sales charge or CDSC.
Class R6 shares are available only to the following investors without a minimum initial investment or minimum additional purchases: certain employer-sponsored retirement plans, including Section 401(k), 403(b) and 457 plans, profit-sharing plans, money purchase pension plans, and defined benefit plans and nonqualified deferred compensation plans, in each case provided that plan level or omnibus accounts are held on the books of the Funds. Other institutional investors may be permitted to purchase Class R6 shares subject to the applicable Fund’s determination of eligibility and may be subject to a minimum initial investment requirement. Class R6 shares do not carry sales commissions or pay Rule 12b-1 fees. No compensation, administrative payments, sub-transfer agency payments or service payments are paid to brokers or other entities from Fund assets or the Funds’ distributor’s or an affiliate’s resources on sales of or investments in Class R6 shares.
The Funds may impose an annual fee on accounts having balances of less than $2,500. The small account fee may be waived in certain circumstances, as disclosed in the prospectuses and/or statements of additional information. The fees collected will be used to offset certain expenses of the Funds. These fees are reflected as “Less low balance account fees” in each Fund’s Statement of Operations for the period, as applicable.
Each class of shares has identical voting, dividend, liquidation and other rights and the same terms and conditions, except that each class bears any expenses attributable specifically to that class (“class-specific expenses”) and has exclusive voting rights with respect to any Rule 12b-1 and/or shareholder service plan (“12b-1 Plan”) approved by the Board. Class I shares and Class R6 shares are not subject to a 12b-1 Plan. Class-specific expenses may include shareholder servicing fees, sub-transfer agency fees, and fees under a 12b-1 Plan, as well as certain other expenses as designated by the Funds’ Treasurer and approved by the Board. Investment income, common operating expenses and realized and unrealized gains and losses of each Fund are borne pro-rata by the holders of each class of shares.
Note 2. Significant Accounting Policies
($ reported in thousands)
The Trust is an investment company that follows the accounting and reporting guidance of Accounting Standards Codification Topic 946 applicable to Investment Companies. The following is a summary of significant accounting policies consistently followed by the Funds in the preparation of their financial statements and for derivatives, included in Note 3 below. The preparation of financial statements in conformity with U.S. generally accepted accounting principles (“U.S. GAAP”) requires management to make estimates and assumptions that affect the reported amounts of assets and liabilities, and disclosure of contingent assets and liabilities at the date of the financial statements and the reported amounts of increases and decreases in net assets from operations during the reporting period. Actual results could differ from those estimates and those differences could be significant.
| A. | Security Valuation |
| | Each Fund utilizes a fair value hierarchy which prioritizes the inputs to valuation techniques used to measure fair value into three broad levels. The Funds’ policy is to recognize transfers into or out of Level 3 at the end of the reporting period. |
| • | Level 1 – quoted prices in active markets for identical securities (security types generally include listed equities). |
| • | Level 2 – prices determined using other significant observable inputs (including quoted prices for similar securities, interest rates, prepayment speeds, credit risk, etc.). |
| • | Level 3 – prices determined using significant unobservable inputs (including the Valuation Committee’s own assumptions in determining the fair value of investments). |
VIRTUS EQUITY TRUST
NOTES TO FINANCIAL STATEMENTS (Continued)
September 30, 2019
A description of the valuation techniques applied to a Fund’s major categories of assets and liabilities measured at fair value on a recurring basis is as follows:
Equity securities are valued at the official closing price (typically last sale) on the exchange on which the securities are primarily traded or, if no closing price is available, at the last bid price and are categorized as Level 1 in the hierarchy. Restricted equity securities and private placements that are illiquid, or are internally fair valued by the Valuation Committee, are generally categorized as Level 3 in the hierarchy.
Certain non-U.S. securities may be fair valued in cases where closing prices are not readily available or are deemed not reflective of readily available market prices. For example, significant events (such as movement in the U.S. securities market, or other regional and local developments) may occur between the time that non-U.S. markets close (where the security is principally traded) and the time that a Fund calculates its net asset value (“NAV”) at the close of regular trading on the New York Stock Exchange (“NYSE”) (generally 4 p.m. Eastern time) that may impact the value of securities traded in these non-U.S. markets. In such cases, the Funds fair value non-U.S. securities using an independent pricing service which considers the correlation of the trading patterns of the non-U.S. security to the intraday trading in the U.S. markets for investments such as ADRs, financial futures, ETFs, and certain indexes, as well as prices for similar securities. Such fair valuations are categorized as Level 2 in the hierarchy. Because the frequency of significant events is not predictable, fair valuation of certain non-U.S. common stocks may occur on a frequent basis.
Listed derivatives, such as options and futures, that are actively traded are valued based on quoted prices from the exchange and are categorized as Level 1 in the hierarchy. Over-the-counter derivative contracts, which include forward currency contracts and equity-linked instruments, do not require material subjectivity as pricing inputs are observed from actively quoted markets and are categorized as Level 2 in the hierarchy.
Investments in open-end mutual funds are valued at NAV. Investments in closed-end funds and ETFs are valued as of the close of regular trading on the NYSE each business day. Each is categorized as Level 1 in the hierarchy.
A summary of the inputs used to value a Fund’s net assets by each major security type is disclosed at the end of the Schedule of Investments for each Fund. The inputs or methodologies used for valuing securities are not necessarily an indication of the risk associated with investing in those securities.
| B. | Security Transactions and Investment Income |
Security transactions are recorded on the trade date. Realized gains and losses from the sale of securities are determined on the identified cost basis. Dividend income is recognized on the ex-dividend date or, in the case of certain foreign securities, as soon as a Fund is notified. Interest income is recorded on the accrual basis. Each Fund amortizes premiums and accretes discounts using the effective interest method. Any distributions from underlying funds are recorded in accordance with the character of the distributions as designated by the underlying funds.
Dividend income from REITs is recorded using management’s estimate of the percentage of income included in distributions received from such investments based on historical information and other industry sources. The return of capital portion of the estimate is a reduction to investment income and a reduction in the cost basis of each investment which increases net realized gain (loss) and net change in unrealized appreciation (depreciation). If the return of capital distributions exceed its cost basis, the distributions are treated as realized gains. The actual amounts of income, return of capital, and capital gains are only determined by each REIT after its fiscal year-end, and may differ from the estimated amounts.
Each Fund is treated as a separate taxable entity. It is the intention of each Fund to comply with the requirements of Subchapter M of the Internal Revenue Code and to distribute substantially all of its taxable income to its shareholders. Therefore, no provision for federal income taxes or excise taxes has been made.
Certain Funds may be subject to foreign taxes on income, gains on investments or currency repatriation, a portion of which may be recoverable. Each Fund will accrue such taxes and recoveries as applicable based upon current interpretations of the tax rules and regulations that exist in the markets in which it invests.
Management of the Funds has concluded that there are no significant uncertain tax positions that would require recognition in the financial statements. As of September 30, 2019, the tax years that remain subject to examination by the major tax jurisdictions under the statute of limitations are from the year 2016 forward (with limited exceptions).
| D. | Distributions to Shareholders |
Distributions are recorded by each Fund on the ex-dividend date. Income and capital gain distributions are determined in accordance with income tax regulations that may differ from U.S. GAAP.
Expenses incurred together by a Fund and other affiliated mutual funds are allocated in proportion to the net assets of each such fund, except where allocation of direct expense to each Fund or an alternative allocation method can be more appropriately used.
In addition to the net annual operating expenses that a Fund bears directly, the shareholders of a Fund indirectly bear the pro-rata expenses of any underlying mutual funds in which the Fund invests.
VIRTUS EQUITY TRUST
NOTES TO FINANCIAL STATEMENTS (Continued)
September 30, 2019
| F. | Foreign Currency Transactions |
| | Non-U.S. investment securities and other assets and liabilities denominated in foreign currencies are translated into U.S. dollar amounts at the foreign currency exchange rate effective at the end of the reporting period. Cost of investments is translated at the currency exchange rate effective at the trade date. The gain or loss resulting from a change in currency exchange rates between the trade and settlement date of a portfolio transaction is treated as a gain or loss on foreign currency. Likewise, the gain or loss resulting from a change in currency exchange rates between the date income is accrued and the date it is paid is treated as a gain or loss on foreign currency. The Funds do not isolate that portion of the results of operations arising from changes in foreign exchange rates on investments from the fluctuations arising from changes in the market prices of securities held. Such fluctuations are included with the net realized and unrealized gain or loss on investments. |
| G. | Regulation S-X |
| | In August 2018, the SEC adopted amendments to Regulation S-X which are intended to facilitate the disclosure of information to investors and simplify compliance without significantly altering the information provided to investors. The amendments include eliminating the requirement to: separately state book basis components of net assets on the Statement of Assets & Liabilities; separately state the sources of distributions paid (except tax return of capital distributions must still be separately disclosed) on the Statements of Changes in Net Assets; and state the book basis amount of undistributed net investment income on the Statements of Changes in Net Assets. Certain prior year amounts have been reclassified for consistency with the current year presentation (see footnotes on Statements of Changes in Net Assets for separate disclosure). These reclassifications have no effect on total net assets, total distributions, the statement of operations, financial highlights, net asset value or total return. |
| H. | Securities Lending |
| | The Funds may loan securities to qualified brokers through a securities lending agency agreement with The Bank of New York Mellon (“BNYM”). Under the securities lending policy, when lending securities a Fund is required to maintain collateral with a market value not less than 100% of the market value of loaned securities. Collateral is adjusted daily in connection with changes in the market value of securities on loan. Collateral may consist of cash and securities issued by the U.S. Government or its agencies. Cash collateral is invested in a short-term money market fund. Dividends earned on the collateral and premiums paid by the broker are recorded as income by the Fund net of fees and rebates charged/paid by BNYM for its services as securities lending agent and in connection with this securities lending program. Lending portfolio securities involves a risk of delay in the recovery of the loaned securities or in the declining value of the collateral. |
| | Securities lending transactions are entered into by each Fund under Master Securities Lending Agreements (“MSLA”) which permit the Fund, under certain circumstances including an event of default (such as bankruptcy or insolvency), to offset amounts payable by the Fund to the same counterparty against amounts to be received and create one single net payment due to or from the Fund. |
| | At September 30, 2019, the securities loaned were subject to a MSLA on a net payment basis as follows: |
| | Value of
Securities
on Loan | | Cash
Collateral
Received(1) | | Net
Amount(2) |
KAR Capital Growth Fund
| $5,199 | | $ 5,199 | | $— |
KAR Global Quality Dividend Fund
| 575 | | 575 | | — |
| (1) | Collateral with a value of $5,289 and $606, respectively, has been received in connection with securities lending transactions. |
| (2) | Net amount represents the net amount receivable due from the counterparty in the event of default. |
Note 3. Derivative Financial Instruments
($ reported in thousands)
Disclosures about derivative instruments and hedging activities are intended to enable investors to understand how and why a Fund uses derivatives, how derivatives are accounted for, and how derivative instruments affect a Fund’s results of operations and financial position. Summarized below are such disclosures and accounting policies for each specific type of derivative instrument used by certain Funds.
| A. | Futures Contracts |
| | A futures contract is an agreement between two parties to purchase (long) or sell (short) a security at a set price for delivery on a future date. Upon entering into a futures contract, a Fund is required to pledge to the broker an amount of cash and/or securities equal to the “initial margin” requirements of the futures exchange on which the contract is traded. Pursuant to the contract, the Fund agrees to receive from or pay to the broker an amount of cash equal to the daily fluctuation in value of the contract. Such receipts or payments are known as variation margin and are recorded by a Fund for financial statement purposes on a daily basis as unrealized appreciation or depreciation. When the contract expires or is closed, gain or loss equal to the difference between the value of the contract at the time it was opened and the value at the time it was closed is realized. This is presented in the Statements of Operations as “Net realized gain (loss) from futures contracts.” |
VIRTUS EQUITY TRUST
NOTES TO FINANCIAL STATEMENTS (Continued)
September 30, 2019
| | During the fiscal period, the SGA Global Growth Fund utilized futures to optimize performance by gaining exposure to broad markets or to hedge the risk of securities within the portfolios. The potential risks of doing so are that 1) the use of futures may result in larger losses or smaller gains than the use of more traditional investments, 2) the prices of futures and the price movements of the securities that the future is intended to simulate may not correlate well, 3) the Fund’s success in using futures will be dependent upon the subadviser’s ability to correctly predict such price movements, 4) liquidity of futures can be adversely affected by market factors, and the prices of such securities may move in unexpected ways, and 5) if the Fund cannot close out a futures position, it may be compelled to continue to make daily cash payments to the broker to meet margin requirements, thus increasing transaction costs. Futures contracts outstanding at period end, if any, are listed after the Fund’s Schedule of Investments. |
| B. | Options Contracts |
| | An options contract provides the purchaser with the right, but not the obligation, to buy (call option) or sell (put option) a financial instrument at an agreed-upon price. Certain Funds may purchase or write both put and call options on portfolio securities for hedging purposes or to facilitate the rapid implementation of investment strategies if the Fund anticipates a significant market or sector advance. A Fund doing so is subject to equity price risk and/or foreign currency risk in the normal course of pursuing its investment objectives. |
| | When a Fund purchases an option, it pays a premium and an amount equal to that premium is recorded as an asset. When a Fund writes an option, it receives a premium and an amount equal to that premium is recorded as a liability. The asset or liability is adjusted daily to reflect the current market value of the option. Holdings of the Fund designated to cover outstanding written options are noted in the Schedules of Investments. Purchased options are reported as an asset within “Investment in unaffiliated securities at value” in the Statements of Assets and Liabilities. Written options written are reported as a liability within “Written options at value.” Changes in value of the purchased option are included in “Net change in unrealized appreciation (depreciation) on investments” in the Statements of Operations. Changes in value of written options are included in “Net change in unrealized appreciation (depreciation) on written options” in the Statements of Operations. |
| | If an option expires unexercised, the Fund realizes a gain or loss to the extent of the premium received or paid. If an option is exercised, the premium received or paid is recorded as an adjustment to the proceeds from the sale or the cost basis of the purchase. The difference between the premium and the amount received or paid on effecting a closing purchase or sale transaction is also treated as a realized gain or loss. Gain or loss on purchased options is included in “Net realized gain (loss) from investments” in the Statements of Operations. Gain or loss on written options is presented separately as “Net realized gain (loss) from written options” in the Statements of Operations. |
| | The risk in writing call options is that the Fund gives up the opportunity for profit if the market price of the referenced security increases and the option is exercised. The risk in writing put options is that the Fund may incur a loss if the market price of the referenced security decreases and the option is exercised. The risk in buying options is that the Fund pays a premium whether or not the option is exercised. The use of such instruments may involve certain additional risks as a result of unanticipated movements in the market. Writers (sellers) of options are subject to unlimited risk of loss, as the seller will be obligated to deliver or take delivery of the security at a predetermined price which may, upon exercise of the option, be significantly different from the then-market value. |
| | The Rampart Enhanced Core Equity Fund invested in written covered call options contracts in an attempt to manage equity price risk and with the purpose of generating realized gains. |
| | The following is a summary of the Rampart Enhanced Core Equity Fund’s derivative instrument holdings categorized by primary risk exposure (equity contracts) in the financial statements as of September 30, 2019: |
| Statements of Assets and Liabilities | |
| | Rampart Enhanced
Core Equity Fund |
Assets:
Purchased options at value
| $127(1) |
Liabilities:
Written Options at value
| (245) |
Net asset (liability) balance
| $(118) |
| Statement of Operations | |
| | Rampart Enhanced
Core Equity Fund |
Net realized gain (loss) from purchased options
| $(3,320) (2) |
Net realized gain (loss) from written options
| (2,492) |
Net change in unrealized appreciation (depreciation) on purchased options
| 137(3) |
Net change in unrealized appreciation (depreciation) on written options
| (304) |
Total net realized and unrealized gain (loss) on purchased and written options
| $(5,979) |
| | (1) Amount included in Investment in securities at value.
(2) Amount included in Net realized gain (loss) from investments.
(3) Amount included in Net change in unrealized appreciation (depreciation) on investments. |
| | For the period ended September 30, 2019, the average daily premiums paid by the Rampart Enhanced Core Equity Fund for purchased options were $516 and the average daily premiums received for written options by the Rampart Enhanced Core Equity Fund were $954. |
VIRTUS EQUITY TRUST
NOTES TO FINANCIAL STATEMENTS (Continued)
September 30, 2019
| | The following is a summary of the SGA Global Growth Fund’s derivative instruments categorized by primary risk exposure, presented in the financial statements as of September 30, 2019: |
The Effect of Derivative Financial Instruments in the Statements of Operations for the
Period Ended September 30, 2019 | |
| Net Realized Gain (Loss) From | |
| | SGA Global Growth Fund | |
| Equity contracts: | | |
| Futures(1) | $241 | |
| Total | $241 | |
| |
| (1) Included in net realized gain (loss) from futures contracts within the Statements of Operations. |
The Effect of Derivative Financial Instruments in the Statements of Operations for the
Period Ended September 30, 2019 | |
| Net Change in Unrealized Appreciation/(Depreciation) on | |
| | SGA Global Growth Fund | |
| Equity contracts: | | |
| Futures contracts(1) | $(128) | |
| Total | $(128) | |
| |
| (1) Included in net change in unrealized appreciation (depreciation) from futures contracts within the Statements of Operations. |
The quarterly average values for futures and daily average values for forwards held by the Fund in the table shown below indicate the volume of derivative activity for each applicable Fund for the period February 1, 2019 through September 30, 2019.
| | SGA Global Growth Fund |
Futures Contracts - Long Positions(1)
| $2,133 |
Note 4. Investment Advisory Fees and Related Party Transactions
($ reported in thousands)
| A. | Investment Adviser |
| | Virtus Investment Advisers, Inc. (the “Adviser”), an indirect, wholly-owned subsidiary of Virtus Investment Partners, Inc. (“Virtus”), is the investment adviser to the Funds. The Adviser manages the Funds’ investment programs and general operations of the Funds, including oversight of the Funds’ subadvisers. |
| | As compensation for its services to the Funds, the Adviser is entitled to a fee, which is calculated daily and paid monthly based upon the following annual rates as a percentage of the average daily net assets of each Fund: |
KAR Small-Cap Core Fund
| 0.75 % |
KAR Small-Cap Value Fund
| 0.70 |
SGA Global Growth Fund
| 0.80 |
| | First $400 Million | | $400+ Million through
$1 Billion | | $1+ Billion |
KAR Small-Cap Growth Fund
| 0.90 % | | 0.85 % | | 0.80 % |
| | First $500 Million | | Over $500 Million |
KAR Mid-Cap Growth Fund
| 0.80 % | | 0.70 % |
VIRTUS EQUITY TRUST
NOTES TO FINANCIAL STATEMENTS (Continued)
September 30, 2019
| | First $1 Billion | | $1+ Billion |
KAR Small-Mid Cap Core Fund
| 0.75 % | | 0.70 % |
SGA Emerging Markets Growth Fund
| 1.00 | | 0.95 |
| | First $1 Billion | | $1+ Billion through
$2 Billion | | $2+ Billion |
KAR Capital Growth Fund
| 0.70 % | | 0.65 % | | 0.60 % |
KAR Global Quality Dividend Fund
| 0.75 | | 0.70 | | 0.65 |
KAR Mid-Cap Core Fund
| 0.80 | | 0.75 | | 0.70 |
Rampart Enhanced Core Equity Fund
| 0.75 | | 0.70 | | 0.65 |
| B. | Subadvisers |
| | The subadvisers manage the investments of each Fund for which they are paid a fee by the Adviser. A list of the subadvisers and the Funds they serve as of the end of the period is as follows: |
| Fund | | Subadviser |
| KAR Capital Growth Fund | | KAR(1) |
| KAR Global Quality Dividend Fund | | KAR(1) |
| KAR Mid-Cap Core Fund | | KAR(1) |
| KAR Mid-Cap Growth Fund | | KAR(1) |
| KAR Small-Cap Core Fund | | KAR(1) |
| KAR Small-Cap Growth Fund | | KAR(1) |
| KAR Small-Cap Value Fund | | KAR(1) |
| KAR Small-Mid Cap Core Fund | | KAR(1) |
| Rampart Enhanced Core Equity Fund | | Rampart(2) |
| SGA Emerging Markets Growth Fund | | SGA(3) |
| SGA Global Growth Fund | | SGA(3) |
| (1) | Kayne Anderson Rudnick Investment Management, LLC (“KAR”), an indirect, wholly-owned subsidiary of Virtus. |
| (2) | Rampart Investment Management Company, LLC (“Rampart”), an indirect, wholly-owned subsidiary of Virtus. |
| (3) | Sustainable Growth Advisers, LP (“SGA”), an indirect, majority-owned subsidiary of Virtus. |
| C. | Expense Limits and Fee Waivers |
| | The Adviser has contractually agreed to limit certain Funds’ total operating expenses, subject to the exceptions listed below, so that such expenses do not exceed on an annualized basis, the following respective percentages of average annual daily net assets through January 31, 2020 (except as noted). Following the contractual period, the Adviser may discontinue these expense reimbursement arrangements at any time. The waivers and reimbursements are accrued daily and received monthly. |
| Fund | | Class A | | Class C | | Class I | | Class R6 |
KAR Capital Growth Fund
| | 1.47 %‡ | | 2.22 %‡ | | 1.22 %‡ | | 0.73 %(1) |
KAR Global Quality Dividend Fund
| | 1.35 | | 2.10 | | 1.10 | | 0.78 (2) |
KAR Mid-Cap Core Fund
| | 1.20 | | 1.95 | | 0.95 | | 0.87 |
KAR Mid-Cap Growth Fund
| | 1.40 ‡ | | 2.15 | | 1.15 ‡ | | 0.83 (1) |
KAR Small-Cap Growth Fund
| | 1.50 ‡ | | 2.25 ‡ | | 1.25 ‡ | | 1.18 ‡ |
KAR Small-Cap Value Fund
| | 1.42 ‡ | | 2.17 ‡ | | 1.17 ‡ | | 1.06 ‡ |
KAR Small-Mid Cap Core Fund
| | 1.30 | | 2.05 | | 1.05 | | 0.97 |
Rampart Enhanced Core Equity Fund
| | 1.20 | | 1.95 | | 0.95 | | 0.91 |
SGA Emerging Markets Growth Fund
| | 1.48 | | 2.23 | | 1.23 | | 1.05 |
SGA Global Growth Fund(3)
| | 1.38 | | 2.13 | | 1.13 * | | 0.90 (4)** |
| * | On May 3, 2019, Investor Class shares of the Predecessor Fund were reorganized into Class I shares of the Fund. See Note 1 in the Notes to Financial Statements. |
| ** | On May 3, 2019, Y Class shares and Institutional Class shares of the Predecessor Fund were reorganized into Class R6 shares of the Fund. See Note 1 in the Notes to Financial Statements. |
| ‡ | Each share class is currently below its expense cap. |
| (1) | Effective July 1, 2019. For the period October 1, 2018 through June 30, 2019, the Class R6 expense caps were as follows for KAR Capital Growth Fund and KAR Mid-Cap Growth Fund: 0.78% and 0.90%, respectively. |
| (2) | Effective July 31, 2019 through January 31, 2021. |
VIRTUS EQUITY TRUST
NOTES TO FINANCIAL STATEMENTS (Continued)
September 30, 2019
| (3) | Effective through May 31, 2021. |
| (4) | Effective July 1, 2019. For the period February 1, 2019 through June 30, 2019, the Class R6 expense cap was 0.98%. |
From July 1, 2019 through September 24, 2019, the exclusions included front-end or contingent deferred loads, taxes, leverage expenses, interest, brokerage commissions, expenses incurred in connection with any merger or reorganization, unusual or infrequently occurring expenses (such as litigation), acquired fund fees and expenses, and dividend expenses, if any). As of September 25, 2019, the exclusions include front-end or contingent deferred loads, taxes, leverage and borrowing expenses (such as commitment, amendment and renewal expenses on credit or redemption facilities), interest, brokerage commissions, expenses incurred in connection with any merger or reorganization, unusual or infrequently occurring expenses (such as litigation), acquired fund fees and expenses, and dividend expenses, if any.
| D. | Expense Recapture |
| | Under certain conditions, the Adviser may recapture operating expenses reimbursed or fees waived under these arrangements within three years after the date on which such amounts were incurred or waived. A Fund must pay its ordinary operating expenses before the Adviser is entitled to any reimbursement and must remain in compliance with any applicable expense limitations or, if none, the expense limitation in effect at the time of the waiver or reimbursement. All or a portion of the following Adviser reimbursed expenses may be recaptured by the fiscal year ending: |
| | | Expiration | |
| Fund | | 2020 | | 2021 | | 2022 | | Total |
| KAR Capital Growth Fund | | | | | | | | |
Class R6
| | $— | | $5 | | $1 | | $6 |
| KAR Global Quality Dividend Fund | | | | | | | | |
Class A
| | 70 | | 55 | | 56 | | 181 |
Class C
| | 11 | | 9 | | 8 | | 28 |
Class I
| | 11 | | 10 | | 14 | | 35 |
Class R6
| | — | | — | | —(1) | | —(1) |
| KAR Mid-Cap Core Fund | | | | | | | | |
Class A
| | 62 | | 55 | | 62 | | 179 |
Class C
| | 39 | | 45 | | 58 | | 142 |
Class I
| | 133 | | 200 | | 396 | | 729 |
Class R6
| | — | | 1 | | 8 | | 9 |
| KAR Mid-Cap Growth Fund | | | | | | | | |
Class A
| | 39 | | 5 | | — | | 44 |
Class C
| | 1 | | 2 | | —(1) | | 3 |
Class R6
| | — | | —(1) | | 1 | | 1 |
| KAR Small-Mid Cap Core Fund | | | | | | | | |
Class A
| | — | | 1 | | 9 | | 10 |
Class C
| | — | | 1 | | 7 | | 8 |
Class I
| | — | | — | | 67 | | 67 |
Class R6
| | — | | 50 | | 42 | | 92 |
| Rampart Enhanced Core Equity Fund | | | | | | | | |
Class A
| | 159 | | 133 | | 164 | | 456 |
Class C
| | 51 | | 34 | | 21 | | 106 |
Class I
| | 34 | | 30 | | 16 | | 80 |
Class R6
| | — | | 3 | | 2 | | 5 |
| SGA Emerging Markets Growth Fund | | | | | | | | |
Class A
| | — | | — | | 2 | | 2 |
Class C
| | — | | — | | 2 | | 2 |
Class I
| | — | | — | | 3 | | 3 |
Class R6
| | — | | — | | 100 | | 100 |
| SGA Global Growth Fund | | | | | | | | |
Class I*
| | — | | — | | 1 | | 1 |
Class R6**
| | — | | — | | 24 | | 24 |
| * | On May 3, 2019, Investor Class shares of the Predecessor Fund were reorganized into Class I shares of the Fund. See Note 1 in the Notes to Financial Statements. |
| ** | On May 3, 2019, Y Class shares and Institutional Class shares of the Predecessor Fund were reorganized into Class R6 shares of the Fund. See Note 1 in the Notes to Financial Statements. |
| (1) | Amount is less than $500. |
VIRTUS EQUITY TRUST
NOTES TO FINANCIAL STATEMENTS (Continued)
September 30, 2019
During the period ended September 30, 2019, the Adviser recaptured expenses previously reimbursed for the following Funds:
| Fund | | Class A | | Class C | | Class I | | Class R6 | | Total |
| KAR Capital Growth Fund | | $— | | $— | | $— | | $—(1) | | $—(1) |
| KAR Mid-Cap Growth Fund | | 105 | | 8 | | 4 | | — | | 117 |
| KAR Small-Mid Cap Core Fund | | 2 | | 2 | | 3 | | 16 | | 23 |
| Rampart Enhanced Core Equity Fund | | — | | — | | — | | —(1) | | —(1) |
| (1) | Amount is less than $500. |
| E. | Distributor |
| | VP Distributors, LLC (“VP Distributors”), an indirect, wholly-owned subsidiary of Virtus, serves as the distributor of each Fund’s shares. VP Distributors has advised the Funds that for the fiscal year (the “period”) ended September 30, 2019, it retained net commissions of $364 for Class A shares and CDSC of $67, $163, and $1 for Class A shares, Class C shares, and Class R6 shares, respectively. |
| | In addition, each Fund pays VP Distributors 12b-1 fees under a 12b-1 Plan as a percentage of the average daily net assets of each respective class at the annual rates of 0.25% for Class A shares and 1.00% for Class C shares. Class I shares and Class R6 shares are not subject to a 12b-1 Plan. |
| | Under certain circumstances, shares of certain Virtus Mutual Funds may be exchanged for shares of the same class of certain other Virtus Mutual Funds on the basis of the relative NAV per share at the time of the exchange. On exchanges with share classes that carry a CDSC, the CDSC schedule of the original shares purchased continues to apply. |
| F. | Administrator and Transfer Agent |
| | Virtus Fund Services, LLC, an indirect, wholly-owned subsidiary of Virtus, serves as the administrator and transfer agent to the Funds. |
| | For the period ended September 30, 2019, the Funds incurred administration fees totaling $7,803 which are included in the Statements of Operations within the line item “Administration and accounting fees.” The fees are calculated daily and paid monthly. |
| | For the period ended September 30, 2019, the Funds incurred transfer agent fees totaling $3,491 which are included in the Statements of Operations within the line item “Transfer agent fees and expenses.” The fees are calculated daily and paid monthly. |
| G. | Affiliated Shareholders |
| | At September 30, 2019, Virtus and its affiliates, held shares of certain Funds which may be redeemed at any time, that aggregated to the following: |
| | Shares | | Aggregate Net
Asset Value |
| KAR Small-Mid Cap Core Fund | | | |
Class A
| 10,000 | | $115 |
Class C
| 10,000 | | 114 |
Class I
| 1,104,828 | | 12,772 |
Class R6
| 270,000 | | 3,124 |
| H. | Investments in Affiliates |
| | A summary of the SGA Global Growth Fund’s total long-term and short-term purchases and sales of the affiliated underlying fund during the period ended September 30, 2019 is as follows: |
| | Value,
beginning
of period | | Purchases | | Sales
Proceeds | | Net
realized
gain (loss)
on
affiliated
fund | | Net change in
unrealized
appreciation
(depreciation)
on affiliated fund | | Value,
end of
period | | Shares | | Dividend
Income | | Distributions
of Realized
Gains |
| Affiliated Mutual Fund—0.0% | | | | | | | | | | | | |
American Beacon U.S. Government Money Market Select Fund, Select Class(1)
| $2,412 | | $10,412 | | $12,824 | | $— | | $— | | $— | | — | | $16 | | $— |
(1) Security was held by the Predecessor Fund prior to the Reorganization on May 3, 2019. It is not affiliated with the Successor Fund.
VIRTUS EQUITY TRUST
NOTES TO FINANCIAL STATEMENTS (Continued)
September 30, 2019
| I. | Trustee Compensation |
| | The Trust provides a deferred compensation plan for its Trustees who receive compensation from the Trust. Under the deferred compensation plan, Trustees may elect to defer all or a portion of their compensation. Amounts deferred are retained by the Trust, and then, to the extent permitted by the 1940 Act, in turn, may be invested in the shares of affiliated or unaffiliated mutual funds selected by the participating Trustees. Investments in such instruments are included in “Other assets” in the Statements of Assets and Liabilities at September 30, 2019. |
| J. | Cross Trades |
| | Cross trades for the period ended September 30, 2019, were executed by certain Funds pursuant to procedures adopted by the Board designed to ensure compliance with Rule 17a-7 under the 1940 Act. Cross trading is the buying or selling of portfolio securities between funds of investment companies, or between a fund of an investment company and another entity, that are or could be considered affiliates by virtue of having a common investment adviser (or affiliated investment advisers), common directors/ trustees and/or common officers. At its regularly scheduled meetings, the Funds’ CCO provides written representation that certain transactions effected pursuant to 17a-7 complied with procedures adopted by the Board. Pursuant to these procedures, for the period ended September 30, 2019, the KAR Small-Cap Core Fund and KAR Small-Cap Growth Fund engaged in Rule 17a-7 securities purchases of $8,419 and $1,256, respectively and Rule 17a-7 securities sales of $— and $8,213, respectively, which resulted in a net realized gain (loss) of $— and $(6,153), respectively. |
Note 5. Purchases and Sales of Securities
($ reported in thousands)
Purchases and sales of securities (excluding short-term securities and written options) during the period ended September 30, 2019, were as follows:
| | Purchases | | Sales |
KAR Capital Growth Fund
| $60,024 | | $112,266 |
KAR Global Quality Dividend Fund
| 12,924 | | 12,534 |
KAR Mid-Cap Core Fund
| 263,841 | | 89,430 |
KAR Mid-Cap Growth Fund
| 389,844 | | 83,412 |
KAR Small-Cap Core Fund
| 124,860 | | 254,086 |
KAR Small-Cap Growth Fund
| 716,366 | | 839,718 |
KAR Small-Cap Value Fund
| 101,912 | | 75,810 |
KAR Small-Mid Cap Core Fund
| 26,594 | | 2,186 |
Rampart Enhanced Core Equity Fund
| 36,579 | | 70,661 |
SGA Emerging Markets Growth Fund
| 4,500 | | 202 |
SGA Global Growth Fund
| 12,585 | | 7,280 |
There were no purchases or sales of long-term U.S. Government and agency securities during the period ended September 30, 2019.
Note 6. Capital Share Transactions
($ reported in thousands)
Transactions in shares of capital stock, during the periods ended as indicated below, were as follows:
| | KAR Capital Growth Fund | | KAR Global Quality Dividend Fund |
| | Year Ended
September 30, 2019 | | Year Ended
September 30, 2018 | | Year Ended
September 30, 2019 | | Year Ended
September 30, 2018 |
| | SHARES | | AMOUNT | | SHARES | | AMOUNT | | SHARES | | AMOUNT | | SHARES | | AMOUNT |
| Class A | | | | | | | | | | | | | | | |
Shares sold and cross class
conversions | 882 | | $13,899 | | 1,378 | | $23,273 | | 307 | | $4,130 | | 43 | | $642 |
| Reinvestment of distributions | 2,881 | | 39,215 | | 1,328 | | 21,555 | | 183 | | 2,343 | | 328 | | 4,834 |
Shares repurchased and cross
class conversions | (3,160) | | (50,927) | | (2,647) | | (46,032) | | (261) | | (3,636) | | (1,340) | | (19,402) |
| Net Increase / (Decrease) | 603 | | $2,187 | | 59 | | $(1,204) | | 229 | | $2,837 | | (969) | | $(13,926) |
| Class C | | | | | | | | | | | | | | | |
Shares sold and cross class
conversions | 132 | | $1,645 | | 102 | | $1,388 | | 49 | | $636 | | 32 | | $473 |
| Reinvestment of distributions | 140 | | 1,443 | | 64 | | 817 | | 33 | | 403 | | 43 | | 618 |
Shares repurchased and cross
class conversions | (588) | | (6,799) | | (250) | | (3,406) | | (212) | | (2,755) | | (108) | | (1,557) |
| Net Increase / (Decrease) | (316) | | $(3,711) | | (84) | | $(1,201) | | (130) | | $(1,716) | | (33) | | $(466) |
VIRTUS EQUITY TRUST
NOTES TO FINANCIAL STATEMENTS (Continued)
September 30, 2019
| | KAR Capital Growth Fund | | KAR Global Quality Dividend Fund |
| | Year Ended
September 30, 2019 | | Year Ended
September 30, 2018 | | Year Ended
September 30, 2019 | | Year Ended
September 30, 2018 |
| | SHARES | | AMOUNT | | SHARES | | AMOUNT | | SHARES | | AMOUNT | | SHARES | | AMOUNT |
| Class I | | | | | | | | | | | | | | | |
Shares sold and cross class
conversions | 601 | | $10,354 | | 661 | | $11,483 | | 219 | | $3,098 | | 192 | | $3,075 |
| Reinvestment of distributions | 92 | | 1,303 | | 35 | | 585 | | 38 | | 486 | | 40 | | 588 |
Shares repurchased and cross
class conversions | (308) | | (5,240) | | (542) | | (9,870) | | (90) | | (1,255) | | (312) | | (4,953) |
| Net Increase / (Decrease) | 385 | | $6,417 | | 154 | | $2,198 | | 167 | | $2,329 | | (80) | | $(1,290) |
| Class R6 | | | | | | | | | | | | | | | |
Shares sold and cross class
conversions | — | | $— | | 432 | | $7,839 | | 7 | | $100 | | — | | $— |
Shares repurchased and cross
class conversions | (334) | | (5,834) | | (93) | | (1,705) | | — | | — | | — | | — |
| Net Increase / (Decrease) | (334) | | $(5,834) | | 339 | | $6,134 | | 7 | | $100 | | — | | $— |
| | KAR Mid-Cap Core Fund | | KAR Mid-Cap Growth Fund |
| | Year Ended
September 30, 2019 | | Year Ended
September 30, 2018 | | Year Ended
September 30, 2019 | | Year Ended
September 30, 2018 |
| | SHARES | | AMOUNT | | SHARES | | AMOUNT | | SHARES | | AMOUNT | | SHARES | | AMOUNT |
| Class A | | | | | | | | | | | | | | | |
Shares sold and cross class
conversions | 694 | | $22,555 | | 327 | | $10,445 | | 2,798 | | $103,492 | | 849 | | $28,504 |
| Reinvestment of distributions | 8 | | 241 | | — | | — | | 70 | | 2,054 | | 157 | | 4,354 |
Shares repurchased and cross
class conversions | (346) | | (11,294) | | (283) | | (8,834) | | (1,720) | | (61,529) | | (370) | | (11,905) |
| Net Increase / (Decrease) | 356 | | $11,502 | | 44 | | $1,611 | | 1,148 | | $44,017 | | 636 | | $20,953 |
| Class C | | | | | | | | | | | | | | | |
Shares sold and cross class
conversions | 726 | | $21,901 | | 415 | | $12,383 | | 1,144 | | $33,483 | | 289 | | $7,739 |
| Reinvestment of distributions | 9 | | 234 | | — | | — | | 15 | | 347 | | 15 | | 333 |
Shares repurchased and cross
class conversions | (377) | | (11,404) | | (122) | | (3,610) | | (226) | | (6,134) | | (80) | | (2,061) |
| Net Increase / (Decrease) | 358 | | $10,731 | | 293 | | $8,773 | | 933 | | $27,696 | | 224 | | $6,011 |
| Class I | | | | | | | | | | | | | | | |
Shares sold and cross class
conversions | 7,301 | | $237,161 | | 3,336 | | $107,740 | | 8,845 | | $342,151 | | 1,722 | | $58,119 |
| Reinvestment of distributions | 47 | | 1,376 | | — | | — | | 37 | | 1,127 | | 8 | | 227 |
Shares repurchased and cross
class conversions | (3,014) | | (98,245) | | (911) | | (29,145) | | (2,424) | | (90,125) | | (336) | | (11,370) |
| Net Increase / (Decrease) | 4,334 | | $140,292 | | 2,425 | | $78,595 | | 6,458 | | $253,153 | | 1,394 | | $46,976 |
| Class R6 | | | | | | | | | | | | | | | |
Shares sold and cross class
conversions | 253 | | $8,720 | | 72 | | $2,337 | | 52 | | $2,107 | | 6 | | $194 |
| Reinvestment of distributions | 1 | | 17 | | — | | — | | —(1) | | 1 | | — | | — |
Shares repurchased and cross
class conversions | (9) | | (308) | | — (1) | | (2) | | (5) | | (170) | | (3) | | (98) |
| Net Increase / (Decrease) | 245 | | $8,429 | | 72 | | $2,335 | | 47 | | $1,938 | | 3 | | $96 |
| (1) | Amount is less than 500 shares. |
VIRTUS EQUITY TRUST
NOTES TO FINANCIAL STATEMENTS (Continued)
September 30, 2019
| | KAR Small-Cap Core Fund | | KAR Small-Cap Growth Fund |
| | Year Ended
September 30, 2019 | | Year Ended
September 30, 2018 | | Year Ended
September 30, 2019 | | Year Ended
September 30, 2018 |
| | SHARES | | AMOUNT | | SHARES | | AMOUNT | | SHARES | | AMOUNT | | SHARES | | AMOUNT |
| Class A | | | | | | | | | | | | | | | |
Shares sold and cross class
conversions | 654 | | $21,999 | | 3,611 | | $118,346 | | 5,131 | | $176,059 | | 22,652 | | $719,261 |
| Reinvestment of distributions | 141 | | 4,157 | | 4 | | 131 | | 477 | | 14,072 | | — | | — |
Shares repurchased and cross
class conversions | (1,619) | | (53,774) | | (2,134) | | (71,685) | | (11,800) | | (389,915) | | (7,176) | | (228,410) |
| Net Increase / (Decrease) | (824) | | $(27,618) | | 1,481 | | $46,792 | | (6,192) | | $(199,784) | | 15,476 | | $490,851 |
| Class C | | | | | | | | | | | | | | | |
Shares sold and cross class
conversions | 242 | | $6,886 | | 2,174 | | $61,092 | | 873 | | $27,067 | | 6,780 | | $192,680 |
| Reinvestment of distributions | 198 | | 4,888 | | 4 | | 108 | | 242 | | 6,416 | | — | | — |
Shares repurchased and cross
class conversions | (1,190) | | (33,252) | | (455) | | (12,785) | | (2,358) | | (72,588) | | (867) | | (24,272) |
| Net Increase / (Decrease) | (750) | | $(21,478) | | 1,723 | | $48,415 | | (1,243) | | $(39,105) | | 5,913 | | $168,408 |
| Class I | | | | | | | | | | | | | | | |
Shares sold and cross class
conversions | 7,010 | | $249,814 | | 24,195 | | $841,974 | | 27,768 | | $978,364 | | 97,746 | | $3,117,032 |
| Reinvestment of distributions | 1,102 | | 34,246 | | 21 | | 670 | | 2,195 | | 66,057 | | — | | — |
Shares repurchased and cross
class conversions | (11,363) | | (395,296) | | (7,283) | | (256,833) | | (46,623) | | (1,570,324) | | (19,336) | | (613,754) |
| Net Increase / (Decrease) | (3,251) | | $(111,236) | | 16,933 | | $585,811 | | (16,660) | | $(525,903) | | 78,410 | | $2,503,278 |
| Class R6 | | | | | | | | | | | | | | | |
Shares sold and cross class
conversions | 796 | | $29,265 | | 1,215 | | $42,276 | | 1,171 | | $40,434 | | 501 | | $16,067 |
| Reinvestment of distributions | 96 | | 2,985 | | 2 | | 71 | | 7 | | 224 | | — | | — |
Shares repurchased and cross
class conversions | (602) | | (22,129) | | (359) | | (12,776) | | (400) | | (13,719) | | (98) | | (3,328) |
| Net Increase / (Decrease) | 290 | | $10,121 | | 858 | | $29,571 | | 778 | | $26,939 | | 403 | | $12,739 |
| | KAR Small-Cap Value Fund | | KAR Small-Mid Cap Core Fund |
| | Year Ended
September 30, 2019 | | Year Ended
September 30, 2018 | | Year Ended
September 30, 2019 | | From inception
March 7, 2018 to
September 30, 2018 |
| | SHARES | | AMOUNT | | SHARES | | AMOUNT | | SHARES | | AMOUNT | | SHARES | | AMOUNT |
| Class A | | | | | | | | | | | | | | | |
Shares sold and cross class
conversions | 1,146 | | $19,247 | | 779 | | $14,625 | | 119 | | $1,266 | | 15 | | $155 |
| Reinvestment of distributions | 81 | | 1,293 | | 68 | | 1,277 | | —(1) | | 3 | | — | | — |
Shares repurchased and cross
class conversions | (1,199) | | (20,793) | | (1,312) | | (24,752) | | (6) | | (58) | | (1) | | (6) |
| Net Increase / (Decrease) | 28 | | $(253) | | (465) | | $(8,850) | | 113 | | $1,211 | | 14 | | $149 |
| Class C | | | | | | | | | | | | | | | |
Shares sold and cross class
conversions | 295 | | $4,835 | | 199 | | $3,681 | | 85 | | $873 | | 13 | | $128 |
| Reinvestment of distributions | 19 | | 293 | | 25 | | 464 | | —(1) | | 1 | | — | | — |
Shares repurchased and cross
class conversions | (1,033) | | (16,948) | | (294) | | (5,395) | | (1) | | (8) | | — | | — |
| Net Increase / (Decrease) | (719) | | $(11,820) | | (70) | | $(1,250) | | 84 | | $866 | | 13 | | $128 |
VIRTUS EQUITY TRUST
NOTES TO FINANCIAL STATEMENTS (Continued)
September 30, 2019
| | KAR Small-Cap Value Fund | | KAR Small-Mid Cap Core Fund |
| | Year Ended
September 30, 2019 | | Year Ended
September 30, 2018 | | Year Ended
September 30, 2019 | | From inception
March 7, 2018 to
September 30, 2018 |
| | SHARES | | AMOUNT | | SHARES | | AMOUNT | | SHARES | | AMOUNT | | SHARES | | AMOUNT |
| Class I | | | | | | | | | | | | | | | |
Shares sold and cross class
conversions | 12,613 | | $218,389 | | 13,481 | | $255,552 | | 2,222 | | $24,808 | | 24 | | $— |
| Reinvestment of distributions | 601 | | 9,562 | | 284 | | 5,358 | | 1 | | 15 | | — | | — |
Shares repurchased and cross
class conversions | (11,185) | | (193,835) | | (5,698) | | (108,227) | | (90) | | (986) | | (4) | | — |
| Net Increase / (Decrease) | 2,029 | | $34,116 | | 8,067 | | $152,683 | | 2,133 | | $23,837 | | 20 | | $— |
| Class R6 | | | | | | | | | | | | | | | |
Shares sold and cross class
conversions | 101 | | $1,754 | | 763 | | $14,317 | | — | | $— | | 270 | | $2,700 |
| Reinvestment of distributions | 20 | | 322 | | 13 | | 236 | | — | | — | | — | | — |
Shares repurchased and cross
class conversions | (620) | | (10,959) | | (213) | | (4,046) | | — | | — | | — | | — |
| Net Increase / (Decrease) | (499) | | $(8,883) | | 563 | | $10,507 | | — | | $— | | 270 | | $2,700 |
| (1) | Amount is less than 500 shares. |
| | Rampart Enhanced Core Equity Fund | | SGA Emerging Markets Growth Fund |
| | Year Ended
September 30, 2019 | | Year Ended
September 30, 2018 | | From Inception
June 13, 2019 to
September 30, 2019 |
| | SHARES | | AMOUNT | | SHARES | | AMOUNT | | SHARES | | AMOUNT |
| Class A | | | | | | | | | | | |
Shares sold and cross class
conversions | 1,001 | | $18,383 | | 236 | | $4,803 | | 10 | | $100 |
| Reinvestment of distributions | 60 | | 1,048 | | 362 | | 7,382 | | — | | — |
Shares repurchased and cross
class conversions | (1,128) | | (21,798) | | (894) | | (17,545) | | — | | — |
| Net Increase / (Decrease) | (67) | | $(2,367) | | (296) | | $(5,360) | | 10 | | $100 |
| Class C | | | | | | | | | | | |
Shares sold and cross class
conversions | 20 | | $344 | | 98 | | $1,752 | | 10 | | $100 |
| Reinvestment of distributions | 3 | | 52 | | 119 | | 2,172 | | — | | — |
Shares repurchased and cross
class conversions | (1,234) | | (20,336) | | (378) | | (6,755) | | — | | — |
| Net Increase / (Decrease) | (1,211) | | $(19,940) | | (161) | | $(2,831) | | 10 | | $100 |
| Class I | | | | | | | | | | | |
Shares sold and cross class
conversions | 72 | | $1,431 | | 241 | | $4,877 | | 11 | | $110 |
| Reinvestment of distributions | 9 | | 152 | | 104 | | 2,108 | | — | | — |
Shares repurchased and cross
class conversions | (278) | | (5,296) | | (1,237) | | (24,611) | | — | | — |
| Net Increase / (Decrease) | (197) | | $(3,713) | | (892) | | $(17,626) | | 11 | | $110 |
VIRTUS EQUITY TRUST
NOTES TO FINANCIAL STATEMENTS (Continued)
September 30, 2019
| | Rampart Enhanced Core Equity Fund | | SGA Emerging Markets Growth Fund |
| | Year Ended
September 30, 2019 | | Year Ended
September 30, 2018 | | From Inception
June 13, 2019 to
September 30, 2019 |
| | SHARES | | AMOUNT | | SHARES | | AMOUNT | | SHARES | | AMOUNT |
| Class R6 | | | | | | | | | | | |
Shares sold and cross class
conversions | 5 | | $104 | | 440 | | $9,076 | | 404 | | $4,038 |
| Reinvestment of distributions | 1 | | 22 | | — | | — | | ��� | | — |
Shares repurchased and cross
class conversions | (199) | | (3,912) | | (202) | | (3,755) | | — | | — |
| Net Increase / (Decrease) | (193) | | $(3,786) | | 238 | | $5,321 | | 404 | | $4,038 |
| | SGA Global Growth Fund |
| | Fiscal
Period Ended
September 30, 2019(1) | | Year Ended
January 31, 2019 | | Year Ended
January 31, 2018 |
| | SHARES | | AMOUNT | | SHARES | | AMOUNT | | SHARES | | AMOUNT |
| Class A | | | | | | | | | | | |
Shares sold and cross class
conversions | 110 | | $2,288 | | 91 | | $1,744 | | 165 | | $2,823 |
| Reinvestment of distributions | — | | — | | 8 | | 136 | | 6 | | 112 |
Shares repurchased and cross
class conversions | (112) | | (2,267) | | (90) | | (1,713) | | (46) | | (749) |
| Net Increase / (Decrease) | (2) | | $21 | | 9 | | $167 | | 125 | | $2,186 |
| Class C | | | | | | | | | | | |
Shares sold and cross class
conversions | 27 | | $538 | | 103 | | $1,882 | | 47 | | $850 |
| Reinvestment of distributions | — | | — | | 7 | | 112 | | 3 | | 55 |
Shares repurchased and cross
class conversions | (27) | | (522) | | (40) | | (741) | | (10) | | (168) |
| Net Increase / (Decrease) | — | | $16 | | 70 | | $1,253 | | 40 | | $737 |
| Class I* | | | | | | | | | | | |
Shares sold and cross class
conversions | 441 | | $9,232 | | 167 | | $3,136 | | 338 | | $5,872 |
| Reinvestment of distributions | — | | — | | 17 | | 286 | | 32 | | 592 |
Shares repurchased and cross
class conversions | (148) | | (3,008) | | (854) | | (16,486) | | (150) | | (2,634) |
| Net Increase / (Decrease) | 293 | | $6,224 | | (670) | | $(13,064) | | 220 | | $3,830 |
| Class R6** | | | | | | | | | | | |
Shares sold and cross class
conversions | 236 | | $4,825 | | 748 | | $14,323 | | 297 | | $5,174 |
| Reinvestment of distributions | — | | — | | 57 | | 978 | | 25 | | 465 |
Shares repurchased and cross
class conversions | (271) | | (5,590) | | (82) | | (1,552) | | (40) | | (727) |
| Net Increase / (Decrease) | (35) | | $(765) | | 723 | | $13,749 | | 282 | | $4,912 |
VIRTUS EQUITY TRUST
NOTES TO FINANCIAL STATEMENTS (Continued)
September 30, 2019
| | SGA Global Growth Fund |
| | Fiscal
Period Ended
September 30, 2019(1) | | Year Ended
January 31, 2019 | | Year Ended
January 31, 2018 |
| | SHARES | | AMOUNT | | SHARES | | AMOUNT | | SHARES | | AMOUNT |
| Class Y** | | | | | | | | | | | |
Shares sold and cross class
conversions | — | | $— | | 743 | | $14,798 | | 203 | | $3,632 |
| Reinvestment of distributions | — | | — | | 39 | | 667 | | 7 | | 133 |
Shares repurchased and cross
class conversions | — | | — | | (661) | | (11,630) | | (37) | | (661) |
| Net Increase / (Decrease) | — | | $— | | 121 | | $3,835 | | 173 | | $3,104 |
| * | On May 3, 2019, Investor Class shares of the Predecessor Fund were reorganized into Class I shares of the Fund. See Note 1 in the Notes to Financial Statements. |
| ** | On May 3, 2019, Y Class shares and Institutional Class shares of the Predecessor Fund were reorganized into Class R6 shares of the Fund. See Note 1 in the Notes to Financial Statements. |
| (1) | Period from February 1, 2019 to September 30, 2019. The Fund had a fiscal period end change from January 31 to September 30. |
Note 7. 10% Shareholders
As of September 30, 2019, certain Funds had individual shareholder account(s) and/or omnibus shareholder account(s) (comprised of a group of individual shareholders), which individually amounted to more than 10% of the total shares outstanding of each such Fund as detailed below:
| | % of Shares
Outstanding | | Number of
Accounts |
KAR Global Quality Dividend Fund
| 12% | | 1 |
KAR Mid-Cap Core Fund
| 34 | | 2 |
KAR Mid-Cap Growth Fund
| 25 | | 2 |
KAR Small-Cap Core Fund
| 25 | | 2 |
KAR Small-Cap Growth Fund
| 24 | | 2 |
KAR Small-Cap Value Fund
| 49 | | 2 |
KAR Small-Mid Cap Core Fund
| 81 | | 4* |
SGA Emerging Markets Growth Fund
| 75 | | 4* |
SGA Global Growth Fund
| 19 | | 1 |
| * | Includes affiliated shareholder account(s). |
Note 8. Credit Risk and Asset Concentration
In countries with limited or developing markets, investments may present greater risks than in more developed markets and the prices of such investments may be volatile. The consequences of political, social or economic changes in these markets may have disruptive effects on the market prices of these investments and the income they generate, as well as a Fund’s ability to repatriate such amounts.
Certain Funds may invest a high percentage of their assets in specific sectors of the market in the pursuit of their investment objectives. Fluctuations in these sectors of concentration may have a greater impact on a Fund, positive or negative, than if the Fund did not concentrate its investments in such sectors.
At September 30, 2019, the following Funds held securities issued by various companies in specific sectors as detailed below:
| Fund | | Sector | | Percentage of
Total Investments |
KAR Capital Growth Fund
| | Consumer Discretionary | | 27% |
KAR Mid-Cap Core Fund
| | Industrials | | 29 |
KAR Mid-Cap Growth Fund
| | Information Technology | | 33 |
KAR Small-Cap Core Fund
| | Industrials | | 34 |
KAR Small-Cap Value Fund
| | Industrials | | 27 |
KAR Small-Mid Cap Core Fund
| | Information Technology | | 31 |
KAR Small-Mid Cap Core Fund
| | Industrials | | 26 |
SGA Emerging Markets Growth Fund
| | Consumer Staples | | 34 |
SGA Emerging Markets Growth Fund
| | Consumer Discretionary | | 31 |
VIRTUS EQUITY TRUST
NOTES TO FINANCIAL STATEMENTS (Continued)
September 30, 2019
| Fund | | Sector | | Percentage of
Total Investments |
SGA Global Growth Fund
| | Consumer Discretionary | | 26 |
Note 9. Indemnifications
Under the Trust’s organizational documents and in separate agreements between each Trustee and the Trust, its Trustees and officers are indemnified against certain liabilities arising out of the performance of their duties to the Trust and its funds. In addition, in the normal course of business, the Trust and the Funds enter into contracts that provide a variety of indemnifications to other parties. The Trust’s and/or the Funds’ maximum exposure under these arrangements is unknown, as this would involve future claims that may be made against the Trust or the Funds and that have not occurred. However, neither the Trust nor the Funds have had prior claims or losses pursuant to these arrangements, and they expect the risk of loss to be remote.
Note 10. Restricted Securities
($ reported in thousands)
Restricted securities are not registered under the Securities Act of 1933, as amended (the “1933 Act”). Generally, 144A securities are excluded from this category.
Each Fund will bear any costs, including those involved in registration under the 1933 Act, in connection with the disposition of such securities.
The following Funds held securities considered to be restricted at September 30, 2019:
| Fund | | Investment | | Date of
Acquisition | | Cost | | Value | | Percentage of
Net Assets |
KAR Capital Growth Fund
| | BDC Payments Holdings, Inc. | | 12/21/18 | | $5,514 | | $6,850 | | 1.4% |
KAR Mid-Cap Growth Fund
| | BDC Payments Holdings, Inc. | | 12/21/18 | | 3,500 | | 4,348 | | 0.8 |
Note 11. Redemption Facility
($ reported in thousands)
On September 18, 2017, the Funds and certain other affiliated funds entered into an $150,000 unsecured line of credit (“Credit Agreement”). This Credit Agreement, as amended, is with a commercial bank that allows the Funds to borrow cash from the bank to manage large unexpected redemptions and trade fails, up to a limit of one-third of each Fund’s total net assets in accordance with the terms of the agreement. This Credit Agreement has a term of 364 days and has been renewed for a period up to March 12, 2020. Interest is charged at the higher of the LIBOR or the Federal Funds rate plus an additional percentage rate on the amount borrowed. Commitment fees are charged on the undrawn balance. The Funds and other affiliated funds that are parties are individually, and not jointly, liable for their particular advances, if any, under the line of credit. The lending bank has the ability to require repayment of outstanding borrowings under this Credit Agreement upon certain circumstances such as an event of default.
The Funds had no borrowings at any time during the period ended September 30, 2019.
Note 12. Federal Income Tax Information
($ reported in thousands)
At September 30, 2019, federal tax cost and aggregate gross unrealized appreciation (depreciation) of securities held by the Funds were as follows:
| Fund | | Federal
Tax Cost | | Unrealized
Appreciation | | Unrealized
(Depreciation) | | Net Unrealized
Appreciation
(Depreciation) |
KAR Capital Growth Fund
| | $ 253,944 | | $ 258,358 | | $ (10,140) | | $ 248,218 |
KAR Global Quality Dividend Fund
| | 34,567 | | 5,643 | | (905) | | 4,738 |
KAR Mid-Cap Core Fund
| | 353,230 | | 75,888 | | (4,754) | | 71,134 |
KAR Mid-Cap Growth Fund
| | 450,905 | | 96,459 | | (17,128) | | 79,331 |
KAR Small-Cap Core Fund
| | 1,041,490 | | 508,701 | | (43,399) | | 465,302 |
KAR Small-Cap Growth Fund
| | 3,317,145 | | 1,628,553 | | (64,449) | | 1,564,104 |
KAR Small-Cap Value Fund
| | 442,789 | | 154,004 | | (23,064) | | 130,940 |
KAR Small-Mid Cap Core Fund
| | 28,716 | | 1,989 | | (323) | | 1,666 |
Rampart Enhanced Core Equity Fund (securities)
| | 104,648 | | 32,564 | | (3,790) | | 28,774 |
| Rampart Enhanced Core Equity Fund (written options) | | (245) | | — | | — | | — |
SGA Emerging Markets Growth Fund
| | 4,331 | | 173 | | (181) | | (8) |
SGA Global Growth Fund
| | 47,256 | | 14,546 | | (589) | | 13,957 |
VIRTUS EQUITY TRUST
NOTES TO FINANCIAL STATEMENTS (Continued)
September 30, 2019
Certain Funds have capital loss carryovers available to offset future realized capital gains, through the indicated expiration dates shown below:
| | No Expiration | | Total |
| | Short-Term | | Long-Term | | Short-Term | | Long-Term |
KAR Small-Mid Cap Core Fund
| $76 | | $— | | $76 | | $— |
Rampart Enhanced Core Equity Fund
| 2,592 | | 5,160 | | 2,592 | | 5,160 |
SGA Global Growth Fund
| 422 | | 156 | | 422 | | 156 |
Capital losses realized after October 31 and certain late year ordinary losses may be deferred and treated as occurring on the first day of the following fiscal year. For the fiscal period ended September 30, 2019, the following Funds deferred and recognized qualified late year losses as follows:
| | Late Year
Ordinary
Losses
Deferred | | Late Year
Ordinary
Losses
Recognized | | Capital
Loss
Deferred | | Capital
Loss
Recognized | |
KAR Capital Growth Fund
| $ 1,695 | | $ — | | $ — | | $ — | |
KAR Global Quality Dividend Fund
| 20 | | (8) | | 1,227 | | (259) | |
KAR Mid-Cap Core Fund
| — | | (155) | | — | | — | |
KAR Mid-Cap Growth Fund
| 2,143 | | — | | — | | — | |
KAR Small-Cap Core Fund
| 21 | | (794) | | — | | — | |
KAR Small-Cap Growth Fund
| 14,770 | | (5,000) | | 62,570 | | — | |
KAR Small-Cap Value Fund
| — | | — | | 10,919 | | — | |
KAR Small-Mid Cap Core Fund
| 11 | | — | | 69 | | — | |
Rampart Enhanced Core Equity Fund
| — | | — | | 760 | | (6,203) | |
SGA Global Growth Fund
| — | | (31) | | — | | (569) | |
The components of distributable earnings on a tax basis (excluding unrealized appreciation (depreciation) which is disclosed in the beginning of this note) consist of the following:
| | Undistributed
Ordinary
Income | | Undistributed
Long-Term
Capital Gains |
KAR Capital Growth Fund
| $— | | $14,936 |
KAR Mid-Cap Core Fund
| 32 | | 2,064 |
KAR Mid-Cap Growth Fund
| — | | 4,123 |
KAR Small-Cap Core Fund
| — | | 63,920 |
KAR Small-Cap Value Fund
| 3,251 | | — |
Rampart Enhanced Core Equity Fund
| 1,056 | | — |
SGA Emerging Markets Growth Fund
| —(1) | | — |
SGA Global Growth Fund
| 37 | | — |
| (1) | Amount is less than $500. |
The differences between the book and tax basis components of distributable earnings relate principally to the timing of recognition of income and gains for federal income tax purposes. Short-term gain distributions if any, are reported as ordinary income for federal tax purposes. Distributions are determined on a tax basis and may differ from net investment income and realized capital gains for financial reporting purposes.
The tax character of dividends and distributions paid during the fiscal periods ended September 30, 2019, January 31, 2019, September 30, 2018 and January 31, 2018, were as follows:
| | Ordinary
Income | | Long-Term
Capital Gains | | Return of
Capital | | Total |
KAR Capital Growth Fund
| | | | | | | |
9/30/19
| $ 358 | | $ 44,737 | | $ — | | $45,095 |
9/30/18
| 6,245 | | 18,762 | | — | | 25,007 |
KAR Global Quality Dividend Fund
| | | | | | | |
9/30/19
| 3,346 | | 63 | | — | | 3,409 |
9/30/18
| 3,674 | | 2,657 | | — | | 6,331 |
KAR Mid-Cap Core Fund
| | | | | | | |
9/30/19
| — | | 1,872 | | — | | 1,872 |
VIRTUS EQUITY TRUST
NOTES TO FINANCIAL STATEMENTS (Continued)
September 30, 2019
| | Ordinary
Income | | Long-Term
Capital Gains | | Return of
Capital | | Total |
KAR Mid-Cap Growth Fund
| | | | | | | |
9/30/19
| $1,083 | | $2,663 | | $— | | $3,746 |
9/30/18
| — | | 5,310 | | — | | 5,310 |
KAR Small-Cap Core Fund
| | | | | | | |
9/30/19
| 11,398 | | 41,364 | | — | | 52,762 |
9/30/18
| — | | 1,110 | | — | | 1,110 |
KAR Small-Cap Growth Fund
| | | | | | | |
9/30/19
| 29,378 | | 61,548 | | 4,955 | | 95,881 |
KAR Small-Cap Value Fund
| | | | | | | |
9/30/19
| 6,373 | | 5,576 | | — | | 11,949 |
9/30/18
| 843 | | 6,711 | | — | | 7,554 |
KAR Small-Mid Cap Core Fund
| | | | | | | |
9/30/19
| 58 | | — | | — | | 58 |
Rampart Enhanced Core Equity Fund
| | | | | | | |
9/30/19
| 1,367 | | — | | — | | 1,367 |
9/30/18
| 4,150 | | 8,307 | | — | | 12,457 |
SGA Global Growth Fund
| | | | | | | |
1/31/19
| 233 | | 1,991 | | — | | 2,224 |
1/31/18
| 827 | | 544 | | — | | 1,371 |
For financial reporting purposes, book basis capital accounts are adjusted to reflect the tax character of permanent book/tax differences. Permanent reclassifications can arise from differing treatment of certain income and gain transactions, nondeductible current year net operating losses, expiring capital loss carryovers and investments in passive foreign investment companies. Permanent book and tax basis differences relating to shareholder distributions will result in reclassifications to capital paid in on shares of beneficial interest. The reclassifications have no impact on the net assets or NAV of the Funds. As of September 30, 2019, the Funds recorded reclassifications to increase (decrease) the accounts as listed below:
| | Capital Paid in on
Shares of
Beneficial Interest | | Accumulated
Earnings (Loss) |
KAR Capital Growth Fund
| $ (501) | | $ 501 |
KAR Global Quality Dividend Fund
| (2,383) | | 2,383 |
KAR Mid-Cap Growth Fund
| (364) | | 364 |
KAR Small-Cap Value Fund
| —(1) | | —(1) |
KAR Small-Mid Cap Core Fund
| (2) | | 2 |
Rampart Enhanced Core Equity Fund
| (114) | | 114 |
SGA Global Growth Fund
| —(1) | | —(1) |
| (1) | Amount is less than $500. |
Note 13. Regulatory Matters and Litigation
From time to time, the Trust, the Funds, the Adviser and/or Subadvisers and/or their affiliates may be involved in litigation and arbitration as well as examinations and investigations by various regulatory bodies, including the SEC, involving compliance with, among other things, securities laws, client investment guidelines, laws governing the activities of broker-dealers and other laws and regulations affecting their products and other activities. At this time, the Adviser believes that the outcomes of such matters are not likely, either individually or in aggregate, to be material to these financial statements.
Note 14. Recent Accounting Pronouncement
In August 2018, the Financial Accounting Standards Board issued an Accounting Standards Update (“ASU”), ASU No. 2018-13, which changes certain fair value measurement disclosure requirements. This ASU, in addition to other modifications and additions, removes the requirement to disclose the amount and reasons for transfers between Level 1 and Level 2 of the fair value hierarchy, the policy for the timing of transfers between levels and the valuation process for Level 3 fair value measurements. For public companies, the amendments are effective for financial statements issued for fiscal years beginning after December 15, 2019, and interim periods within those fiscal years. Management has evaluated the implications of certain provisions of ASU No. 2018-13 and has determined to early adopt all aspects related to the removal and modification of certain fair value measurement disclosures under the ASU effective immediately.
Note 15. Subsequent Events
Management has evaluated the impact of all subsequent events on the Funds through the date the financial statements were available for issuance, and has determined that there are no subsequent events requiring recognition or disclosure in these financial statements.
Report of Independent Registered Public Accounting Firm
To the Board of Trustees of Virtus Equity Trust and Shareholders of Virtus KAR Capital Growth Fund, Virtus KAR Global Quality
Dividend Fund, Virtus KAR Mid-Cap Core Fund, Virtus KAR Mid-Cap Growth Fund, Virtus KAR Small-Cap Core Fund, Virtus KAR Small-Cap Growth Fund, Virtus KAR Small-Cap Value Fund, Virtus KAR Small-Mid Cap Core Fund, Virtus Rampart Enhanced Core
Equity Fund, Virtus SGA Emerging Markets Growth Fund and Virtus SGA Global Growth Fund
Opinions on the Financial Statements
We have audited the accompanying statements of assets and liabilities, including the schedules of investments, of each of the funds listed in the table below (eleven of the funds constituting Virtus Equity Trust, hereafter collectively referred to as the “Funds”) as of
September 30, 2019, the related statements of operations and of changes in net assets for each of the periods indicated in the table below, including the related notes, and the financial highlights for each of the periods indicated therein (collectively referred to as the “financial statements”). In our opinion, the financial statements present fairly, in all material respects, the financial position of each of the Funds as of September 30, 2019, the results of each of their operations and the changes in each of their net assets for the periods
indicated in the table below, and each of the financial highlights for each of the periods indicated therein, in conformity with accounting principles generally accepted in the United States of America.
Virtus KAR Capital Growth Fund
Virtus KAR Global Quality Dividend Fund
Virtus KAR Mid-Cap Core Fund
Virtus KAR Mid-Cap Growth Fund
Virtus KAR Small-Cap Core Fund
Virtus KAR Small-Cap Growth Fund
Virtus KAR Small-Cap Value Fund
Virtus Rampart Enhanced Core Equity Fund | Statements of operations for the year ended September 30, 2019 and statements of changes in net assets for the years ended September 30, 2019 and 2018 |
| Virtus KAR Small-Mid Cap Core Fund | Statement of operations for the year ended September 30, 2019, and statements of changes in net assets for the year ended September 30, 2019 and the period March 7, 2018 (inception) through September 30, 2018 |
| Virtus SGA Emerging Markets Growth Fund | Statement of operations and statement of changes in net assets for the period June 13, 2019 (inception) through September 30, 2019 |
| Virtus SGA Global Growth Fund | Statements of operations for the period February 1, 2019 through September 30, 2019 and year ended January 31, 2019, and the statements of changes for the period February 1, 2019 through September 30, 2019 and years ended January 31, 2019 and 2018 |
Basis for Opinions
These financial statements are the responsibility of the Funds’ management. Our responsibility is to express an opinion on the Funds’ financial statements based on our audits. We are a public accounting firm registered with the Public Company Accounting Oversight Board (United States) (“PCAOB”) and are required to be independent with respect to the Funds in accordance with the U.S. federal securities laws and the applicable rules and regulations of the Securities and Exchange Commission and the PCAOB.
We conducted our audits of these financial statements in accordance with the standards of the PCAOB. Those standards require that we plan and perform the audit to obtain reasonable assurance about whether the financial statements are free of material misstatement, whether due to error or fraud.
Our audits included performing procedures to assess the risks of material misstatement of the financial statements, whether due to error or fraud, and performing procedures that respond to those risks. Such procedures included examining, on a test basis, evidence regarding the amounts and disclosures in the financial statements. Our audits also included evaluating the accounting principles used and significant estimates made by management, as well as evaluating the overall presentation of the financial statements. Our procedures included confirmation of securities owned as of September 30, 2019 by correspondence with the custodian, transfer agent and brokers; when replies were not received from brokers, we performed other auditing procedures. We believe that our audits provide a reasonable basis for our opinions.
/s/ PricewaterhouseCoopers LLP
Philadelphia, Pennsylvania
November 21, 2019
We have served as the Virtus Mutual Funds’ auditor since at least 1977. We have not been able to determine the specific year we began serving as auditor.
VIRTUS EQUITY TRUST
TAX INFORMATION NOTICE (Unaudited)
September 30, 2019
For the fiscal year ended September 30, 2019, the Funds make the following disclosures for federal income tax purposes. Below is listed the percentages, or the maximum amount allowable, of its ordinary income dividends (“QDI”) to qualify for the lower tax rates applicable to individual shareholders, and the percentage of ordinary income dividends earned by the Funds which qualifies for the dividends received deduction (“DRD”) for corporate shareholders. The actual percentage of QDI and DRD for the calendar year will be designated in year-end tax statements. The Funds designate the amounts below as long-term capital gains (“LTCG”) dividends taxable at a 20% rate, or lower depending on the shareholder’s income ($ reported in thousands). LTCG amounts, if subsequently different, will be designated in the next annual report.
| | QDI | | DRD | | LTCG |
| KAR Capital Growth Fund | — % | | — % | | $ 20,303 |
| KAR Global Quality Dividend Fund | 100 | | 39 | | 63 |
| KAR Mid-Cap Core Fund | 100 | | 100 | | 2,064 |
| KAR Mid-Cap Growth Fund | — | | — | | 4,124 |
| KAR Small-Cap Core Fund | 100 | | 100 | | 65,046 |
| KAR Small-Cap Growth Fund | 100 | | 100 | | — |
| KAR Small-Cap Value Fund | 100 | | 100 | | 1,510 |
| KAR Small-Mid Cap Core Fund | 100 | | 100 | | — |
| Rampart Enhanced Core Equity Fund | 100 | | 100 | | — |
| SGA Emerging Markets Growth Fund | 100 | | 59 | | — |
| SGA Global Growth Fund | 100 | | 100 | | — |
For the fiscal year ended September 30, 2019, certain Funds are disclosing the following information pursuant to notice requirements of Section 853(a) and 855(d) of the Internal Revenue Code, as amended, and the Treasury Regulations thereunder ($ reported in thousands).
| | Foreign Source
Income
Recognized | | Foreign Taxes
Paid on
Foreign
Source
Income |
| SGA Emerging Markets Growth Fund | $ 11 | | $ 1 |
RESULTS OF SHAREHOLDER MEETING (Unaudited)
April 23, 2019
At a special meeting of shareholders of American Beacon SGA Global Growth Fund (since merged with and into Virtus SGA Global Growth Fund), a series of American Beacon Funds, held on April 23, 2019, shareholders voted on the following proposal:
| Number of Eligible Votes: | | FOR | | AGAINST | | ABSTAIN |
| To approve an Agreement and Plan of Reorganization whereby Virtus SGA Global Growth Fund will acquire the assets of American Beacon Global Growth Fund. | | 1,456,041.643 | | 7,761.665 | | 17,134.000 |
Shareholders of the American Beacon SGA Global Growth Fund voted to approve the above proposal.
CONSIDERATION OF ADVISORY AND SUBADVISORY AGREEMENTS FOR
VIRTUS SGA EMERGING MARKETS GROWTH FUND (the “FUND”)
BY THE BOARD OF TRUSTEES (UNAUDITED)
The Board of Trustees (the “Board”) of Virtus Equity Trust (the “Trust”) is responsible for determining whether to approve the establishment and continuation of the investment advisory agreement (the “Advisory Agreement”) between the Trust and Virtus Investment Advisers, Inc. (“VIA”) and the subadvisory agreement (the “Subadvisory Agreement” and together with the Advisory Agreement, the “Agreements”) among the Trust, VIA and Sustainable Growth Advisers, LP (the “Subadviser”). At an in-person meeting held May 22, 2019, the Board, including a majority of the Trustees who are not interested persons of the Trust as defined in Section 2(a)(19) of the Investment Company Act of 1940, as amended (such Act, the “1940 Act” and such Trustees, the “Independent Trustees”), authorized the appointment of SGA as subadviser to the Fund and considered and approved the establishment of the Agreements, as further discussed below.
In connection with the approval of the Agreements, the Board requested and evaluated information provided by VIA and the Subadviser which, in the Board’s view, constituted information necessary for the Board to form a judgment as to whether approval of each of the Agreements would be in the best interests of the Fund and its shareholders. The Board noted the affiliation of the Subadviser with VIA and any potential conflicts of interest.
The Board was separately advised by independent legal counsel throughout the process. For each Agreement, the Board considered all the criteria separately with respect to the Fund and its shareholders. In its deliberations, the Board considered various factors, including those discussed below, none of which were controlling, and each Trustee may have attributed different weights to the various factors. The Independent Trustees also discussed the proposed approval of the Agreements in private sessions with their independent legal counsel at which no representatives of management were present.
In considering whether to approve the Agreements with respect to the Fund, the Board reviewed and analyzed the factors it deemed relevant, including: (1) the nature, extent and quality of the services to be provided to the Fund by VIA and the Subadviser; (2) information regarding performance of an account managed in a similar manner as the Fund was expected to be managed; (3) the level and method of computing the Fund’s advisory and subadvisory fees, and comparisons of the Fund’s proposed advisory fee rates with those of a group of other funds with similar investment objectives; (4) historical profitability of VIA and its affiliates under similar agreements; (5) any “fall-out” benefits to VIA, the Subadviser and their affiliates (i.e., ancillary benefits realized by VIA, the Subadviser or their affiliates from VIA’s or the Subadviser’s relationship with the Fund); (6) possible conflicts of interest; and (7) the terms of the Agreements.
Nature, Extent and Quality of Services
The Trustees received in advance of the meeting information provided by VIA and the Subadviser, including completed questionnaires, each concerning a number of topics, including such company’s investment philosophy, resources, operations and compliance structure. The Trustees also received a presentation by VIA’s senior management personnel, during which among other items, VIA’s history, investment process, investment strategies, personnel, compliance procedures and the firm’s overall performance were reviewed and discussed. The Trustees noted that the Fund would be managed using a “manager of managers” structure that generally involves the use of one or more subadvisers to manage some or all of the Fund’s portfolio. Under this structure, VIA is responsible for the oversight of the Fund’s investment program and for evaluating and selecting subadvisers on an ongoing basis and making any recommendations to the Board regarding hiring, retaining or replacing subadvisers. In considering the Advisory Agreement, the Board considered VIA’s process for supervising and managing the Fund’s subadviser, including (a) VIA’s ability to select and monitor the subadviser; (b) VIA’s ability to provide the services necessary to monitor the subadviser’s compliance with the Fund’s investment objective, policies and restrictions as well as provide other oversight activities; and (c) VIA’s ability and willingness to identify instances in which a subadviser should be replaced and to carry out the required changes. The Trustees also considered: (a) the experience and capability of VIA’s management and other personnel; (b) the financial condition of VIA, and whether it had the financial wherewithal to provide a high level and quality of services to the Fund; (c) the quality of VIA’s own regulatory and legal compliance policies, procedures and systems; (d) the nature, extent and quality of administrative, transfer agency and other services expected to be provided by VIA and its affiliates to the Fund; (e) VIA’s expected supervision of the Fund’s other service providers; and (f) VIA’s risk management processes. It was noted that affiliates of VIA were expected to serve as administrator, transfer agent and distributor of the Fund. The Board also took into account its knowledge of VIA’s management and the quality of the performance of its duties with respect to other Virtus Funds through Board meetings, discussions and reports, as well as information from the Trust’s Chief Compliance Officer regarding the Fund’s compliance policies and procedures proposed to be established pursuant to Rule 38a-1 under the 1940 Act.
With respect to the services to be provided by the Subadviser, the Board considered information provided to the Board by the Subadviser, including the Subadviser’s Form ADV, as well as a presentation provided by portfolio management personnel of the Subadviser. With respect to the Subadvisory Agreement, the Board noted that the Subadviser would provide portfolio management, compliance with the Fund’s investment policies and procedures, compliance with applicable securities laws and assurances thereof. The Board also noted that VIA’s and the Subadviser’s management of the Fund is subject to the oversight of the Board and must be carried out in accordance with the investment objective(s), policies and restrictions set forth in the Fund’s prospectuses and statement of additional information. In considering approval of the Subadvisory Agreement, the Board also considered the Subadviser’s investment management process, including (a) the experience and capability of the Subadviser’s management and other personnel committed by
CONSIDERATION OF ADVISORY AND SUBADVISORY AGREEMENTS FOR
VIRTUS SGA EMERGING MARKETS GROWTH FUND (the “FUND”)
BY THE BOARD OF TRUSTEES (UNAUDITED) (Continued)
the Subadviser to the Fund; (b) the financial condition of the Subadviser; (c) the quality of the Subadviser’s regulatory and legal compliance policies, procedures and systems; and (d) the Subadviser’s brokerage and trading practices, including with respect to best execution and soft dollars. The Board also took into account the Subadviser’s risk assessment and monitoring process. The Board noted the Subadviser’s regulatory history, including whether it was currently involved in any regulatory actions or investigations as well as material litigation, and any settlements and amelioratory actions undertaken, as appropriate.
After considering all of the information provided to them, the Trustees concluded that the nature, extent and quality of the services expected to be provided by VIA and the Subadviser were satisfactory and that there was a reasonable basis on which to conclude that each would provide a high quality of investment services to the Fund.
Investment Performance
Because the Fund had not commenced operations, the Board could not evaluate prior investment performance for the Fund. The Board reviewed and was satisfied with the comparative performance of representative accounts managed with similar investment strategies to those proposed for the Fund.
Management Fees and Total Expenses
The Board considered the fees proposed to be charged to the Fund for advisory services as well as the expected total expense levels of the Fund. Among other data provided, the Board noted that the proposed management fee and total expenses for the Fund were within the range of other funds deemed to be comparable to the Fund by management. The Board noted that the Fund was expected to have an expense cap in place to limit the total expenses incurred by the Fund and its shareholders. The Board also noted that the subadvisory fee for the Fund would be paid by VIA out of its management fees rather than paid separately by the Fund. In this regard, the Board took into account management’s discussion with respect to the advisory/subadvisory fee structure, including the amount of the advisory fee expected to be retained by VIA after payment of the subadvisory fee. The Board also took into account the expected size of the Fund and the impact on expenses.
The Board concluded that the proposed advisory and subadvisory fees for the Fund were fair and reasonable in light of the usual and customary charges made for services of the same nature and quality and the other factors considered.
Projected Profitability
The Board also considered certain information relating to profitability for its services to other Virtus Funds that had been provided by VIA, as a proxy for evaluating the projected profitability to VIA and its affiliates for their services to the Fund. In this regard, the Board considered information regarding the overall profitability, as well as on a fund-by-fund basis, of VIA for its management of certain Virtus Funds, as well as its profits and those of its affiliates for managing and providing other services to the Virtus Funds, such as distribution, transfer agency and administrative services provided to the Virtus Funds by VIA affiliates. In addition to the fees paid to VIA and its affiliates, the Board considered any other benefits derived by VIA or its affiliates from their relationships with the Virtus Funds. The Board reviewed the methodology used to allocate costs to each Virtus Fund, taking into account the fact that allocation methodologies are inherently subjective and various allocation methodologies may each be reasonable while producing different results. The Board concluded that the profitability to VIA and its affiliates from the Virtus Funds was reasonable in light of the quality of the services rendered to the Virtus Funds by VIA and its affiliates.
In considering the projected profitability to the Subadviser in connection with its relationship to the Fund, the Board noted that the fees under the Subadvisory Agreement would be paid by VIA out of the fees that VIA receives under the Advisory Agreement, so that Fund shareholders would not be directly impacted by those fees. In considering the reasonableness of the fees payable by VIA to the Subadviser, the Board noted that, because the Subadviser is an affiliate of VIA, such profitability might be directly or indirectly shared by VIA. For each of the above reasons, the Board concluded that the projected profitability to the Subadviser and its affiliates from their relationships with the Fund was not a material factor in approval of the Subadvisory Agreement.
Economies of Scale
The Board received and discussed information concerning whether VIA should be expected to realize economies of scale as the Fund’s assets grow. The Board noted that the proposed management fees for the Fund included a breakpoint based on assets under management, and that expense caps were expected to be implemented for the Fund. The Board also took into account management’s discussion of the Fund’s management fee and subadvisory fee structure. The Board also took into account the expected size of the Fund. The Board noted that VIA and the Fund may realize certain economies of scale if the assets of the Fund were to be materially higher than anticipated, particularly in relationship to certain fixed costs, and that shareholders of the Fund would have an opportunity to benefit from these economies of scale.
For similar reasons as stated above with respect to the Subadviser’s profitability, and based upon the expected size of the Fund to be managed by the Subadviser, the Board concluded that the potential for economies of scale in the Subadviser’s management of the Fund was not a material factor in the approval of the Subadvisory Agreement at this time.
CONSIDERATION OF ADVISORY AND SUBADVISORY AGREEMENTS FOR
VIRTUS SGA EMERGING MARKETS GROWTH FUND (the “FUND”)
BY THE BOARD OF TRUSTEES (UNAUDITED) (Continued)
Other Factors
The Board considered other benefits that may be realized by VIA and the Subadviser and their affiliates from their relationships with the Fund. Among them, the Board recognized that VP Distributors, LLC, an affiliate of VIA, serves as the distributor for the Trust, and, as such, was expected to receive payments pursuant to Rule 12b-1 from the Fund to compensate it for providing selling activities, which could lead to growth in the Fund’s assets and corresponding benefits from such growth, including economies of scale. The Board noted that an affiliate of VIA and the Subadviser also provides administrative and transfer agency services to the Trust. The Board noted management’s discussion of the fact that, while the Subadviser is an affiliate of VIA, there were no other direct benefits to the Subadviser or VIA in providing investment advisory services to the Fund, other than the fees to be earned under the Agreements, although there may be certain indirect benefits gained, including to the extent that serving the Fund could provide the opportunity to provide advisory services to additional portfolios of the Trust or certain reputational benefits.
Conclusion
Based on all of the foregoing considerations, the Board, including a majority of the Independent Trustees, determined that approval of each Agreement was in the best interests of the Fund and its shareholders. Accordingly, the Board, and the Independent Trustees voting separately, approved the Agreements with respect to the Fund.
CONSIDERATION OF ADVISORY AND SUBADVISORY AGREEMENTS FOR
VIRTUS SGA GLOBAL GROWTH FUND (the “FUND”)
BY THE BOARD OF TRUSTEES (UNAUDITED) (Continued)
The Board of Trustees (the “Board”) of Virtus Equity Trust (the “Trust”) is responsible for determining whether to approve the establishment and continuation of the investment advisory agreement (the “Advisory Agreement”) between the Trust and Virtus Investment Advisers, Inc. (“VIA”) and the subadvisory agreement (the “Subadvisory Agreement” and together with the Advisory Agreement, the “Agreements”) among the Trust, VIA and Sustainable Growth Advisers, LP (the “Subadviser” or “SGA”). At an in-person meeting held November 14, 2018, the Board, including a majority of the Trustees who are not interested persons of the Trust as defined in Section 2(a)(19) of the Investment Company Act of 1940, as amended (such Act, the “1940 Act” and such Trustees, the “Independent Trustees”), authorized the appointment of SGA as subadviser to the Fund and considered and approved the establishment of the Agreements, as further discussed below.
In connection with the approval of the Agreements, the Board requested and evaluated information provided by VIA and the Subadviser which, in the Board’s view, constituted information necessary for the Board to form a judgment as to whether approval of each of the Agreements would be in the best interests of the Fund and its shareholders. The Board noted the affiliation of the Subadviser with VIA and any potential conflicts of interest.
The Board was separately advised by independent legal counsel throughout the process. For each Agreement, the Board considered all the criteria separately with respect to the Fund and its shareholders. In its deliberations, the Board considered various factors, including those discussed below, none of which were controlling, and each Trustee may have attributed different weights to the various factors. The Independent Trustees also discussed the proposed approval of the Agreements in private sessions with their independent legal counsel at which no representatives of management were present.
In considering whether to approve the Agreements with respect to the Fund, the Board reviewed and analyzed the factors it deemed relevant, including: (1) the nature, extent and quality of the services to be provided to the Fund by VIA and the Subadviser; (2) information regarding performance of an account managed in a similar manner as the Fund was expected to be managed; (3) the level and method of computing the Fund’s advisory and subadvisory fees, and comparisons of the Fund’s proposed advisory fee rates with those of a group of other funds with similar investment objectives; (4) historical profitability of VIA and its affiliates under similar agreements; (5) any “fall-out” benefits to VIA, the Subadviser and their affiliates (i.e., ancillary benefits realized by VIA, the Subadviser or their affiliates from VIA’s or the Subadviser’s relationship with the Fund); (6) possible conflicts of interest; and (7) the terms of the Agreements.
Nature, Extent and Quality of Services
The Trustees received in advance of the meeting information provided by VIA and the Subadviser, including completed questionnaires, each concerning a number of topics, including such company’s investment philosophy, resources, operations and compliance structure. The Trustees also received a presentation by VIA’s senior management personnel, during which among other items, VIA’s history, investment process, investment strategies, personnel, compliance procedures and the firm’s overall performance were reviewed and discussed. The Trustees noted that the Fund would be managed using a “manager of managers” structure that generally involves the use of one or more subadvisers to manage some or all of the Fund’s portfolio. Under this structure, VIA is responsible for the oversight of the Fund’s investment program and for evaluating and selecting subadvisers on an ongoing basis and making any recommendations to the Board regarding hiring, retaining or replacing subadvisers. In considering the Advisory Agreement, the Board considered VIA’s process for supervising and managing the Fund’s subadviser, including (a) VIA’s ability to select and monitor the subadviser; (b) VIA’s ability to provide the services necessary to monitor the subadviser’s compliance with the Fund’s investment objective, policies and restrictions as well as provide other oversight activities; and (c) VIA’s ability and willingness to identify instances in which a subadviser should be replaced and to carry out the required changes. The Trustees also considered: (a) the experience and capability of VIA’s management and other personnel; (b) the financial condition of VIA, and whether it had the financial wherewithal to provide a high level and quality of services to the Fund; (c) the quality of VIA’s own regulatory and legal compliance policies, procedures and systems; (d) the nature, extent and quality of administrative, transfer agency and other services expected to be provided by VIA and its affiliates to the Fund; (e) VIA’s expected supervision of the Fund’s other service providers; and (f) VIA’s risk management processes. It was noted that affiliates of VIA were expected to serve as administrator, transfer agent and distributor of the Fund. The Board also took into account its knowledge of VIA’s management and the quality of the performance of its duties with respect to other Virtus Funds through Board meetings, discussions and reports, as well as information from the Trust’s Chief Compliance Officer regarding the Fund’s compliance policies and procedures proposed to be established pursuant to Rule 38a-1 under the 1940 Act.
With respect to the services to be provided by the Subadviser, the Board considered information provided to the Board by the Subadviser, including the Subadviser’s Form ADV, as well as a presentation provided by portfolio management personnel of the Subadviser. With respect to the Subadvisory Agreement, the Board noted that the Subadviser would provide portfolio management, compliance with the Fund’s investment policies and procedures, compliance with applicable securities laws and assurances thereof. The Board also noted that VIA’s and the Subadviser’s management of the Fund is subject to the oversight of the Board and must be carried out in accordance with the investment objective(s), policies and restrictions set forth in the Fund’s prospectuses and statement of additional information. In considering approval of the Subadvisory Agreement, the Board also considered the Subadviser’s investment management process, including (a) the experience and capability of the Subadviser’s management and other personnel committed by
CONSIDERATION OF ADVISORY AND SUBADVISORY AGREEMENTS FOR
VIRTUS SGA GLOBAL GROWTH FUND (the “FUND”)
BY THE BOARD OF TRUSTEES (UNAUDITED) (Continued)
the Subadviser to the Fund; (b) the financial condition of the Subadviser; (c) the quality of the Subadviser’s regulatory and legal compliance policies, procedures and systems; and (d) the Subadviser’s brokerage and trading practices, including with respect to best execution and soft dollars. The Board also took into account the Subadviser’s risk assessment and monitoring process. The Board noted the Subadviser’s regulatory history, including whether it was currently involved in any regulatory actions or investigations as well as material litigation, and any settlements and amelioratory actions undertaken, as appropriate.
After considering all of the information provided to them, the Trustees concluded that the nature, extent and quality of the services expected to be provided by VIA and the Subadviser were satisfactory and that there was a reasonable basis on which to conclude that each would provide a high quality of investment services to the Fund.
Investment Performance
Because the Fund had not commenced operations, the Board could not evaluate prior investment performance for the Fund. Investment performance was therefore not a material factor in the Board’s approval of the Agreements. However, the Board reviewed and was satisfied with the comparative performance of representative accounts managed by the Subadviser in a manner similar to the Fund’s proposed investment strategies.
Management Fees and Total Expenses
The Board considered the fees proposed to be charged to the Fund for advisory services as well as the expected total expense levels of the Fund. Among other data provided, the Board noted that the proposed management fee and total expenses for the Fund were within the range of other funds deemed to be comparable to the Fund by management. The Board noted that the Fund was expected to have an expense cap in place to limit the total expenses incurred by the Fund and its shareholders. The Board also noted that the subadvisory fee for the Fund would be paid by VIA out of its management fees rather than paid separately by the Fund. In this regard, the Board took into account management’s discussion with respect to the advisory/subadvisory fee structure, including the amount of the advisory fee expected to be retained by VIA after payment of the subadvisory fee. The Board also took into account the expected size of the Fund and the impact on expenses.
The Board concluded that the proposed advisory and subadvisory fees for the Fund were fair and reasonable in light of the usual and customary charges made for services of the same nature and quality and the other factors considered.
Projected Profitability
The Board also considered certain information relating to profitability for its services to other Virtus Funds that had been provided by VIA, as a proxy for evaluating the projected profitability to VIA and its affiliates for their services to the Fund. In this regard, the Board considered information regarding the overall profitability, as well as on a fund-by-fund basis, of VIA for its management of Virtus Funds, as well as its profits and those of its affiliates for managing and providing other services to the Virtus Funds, such as distribution, transfer agency and administrative services provided to the Virtus Funds by VIA affiliates. In addition to the fees paid to VIA and its affiliates, the Board considered any other benefits derived by VIA or its affiliates from their relationships with the Virtus Funds. The Board reviewed the methodology used to allocate costs to each Virtus Fund, taking into account the fact that allocation methodologies are inherently subjective and various allocation methodologies may each be reasonable while producing different results. The Board concluded that the profitability to VIA and its affiliates from the Virtus Funds was reasonable in light of the quality of the services rendered to the Virtus Funds by VIA and its affiliates.
In considering the projected profitability to the Subadviser in connection with its relationship to the Fund, the Board noted that the fees under the Subadvisory Agreement would be paid by VIA out of the fees that VIA receives under the Advisory Agreement, so that Fund shareholders would not be directly impacted by those fees. In considering the reasonableness of the fees payable by VIA to the Subadviser, the Board noted that, because the Subadviser is an affiliate of VIA, such profitability might be directly or indirectly shared by VIA. For each of the above reasons, the Board concluded that the projected profitability to the Subadviser and its affiliates from their relationships with the Fund was not a material factor in approval of the Subadvisory Agreement.
Economies of Scale
The Board received and discussed information concerning whether VIA should be expected to realize economies of scale as the Fund’s assets grow. The Board noted that expense caps were expected to be implemented for the Fund. The Board also took into account management’s discussion of the Fund’s management fee and subadvisory fee structure. The Board also took into account the expected size of the Fund. The Board noted that VIA and the Fund may realize certain economies of scale if the assets of the Fund were to be materially higher than anticipated, particularly in relationship to certain fixed costs, and that shareholders of the Fund would have an opportunity to benefit from these economies of scale.
For similar reasons as stated above with respect to the Subadviser’s profitability, and based upon the expected size of the Fund to be managed by the Subadviser, the Board concluded that the potential for economies of scale in the Subadviser’s management of the Fund was not a material factor in the approval of the Subadvisory Agreement at this time.
CONSIDERATION OF ADVISORY AND SUBADVISORY AGREEMENTS FOR
VIRTUS SGA GLOBAL GROWTH FUND (the “FUND”)
BY THE BOARD OF TRUSTEES (UNAUDITED) (Continued)
Other Factors
The Board considered other benefits that may be realized by VIA and the Subadviser and their affiliates from their relationships with the Fund. Among them, the Board recognized that VP Distributors, LLC, an affiliate of VIA, serves as the distributor for the Trust, and, as such, was expected to receive payments pursuant to Rule 12b-1 from the Fund to compensate it for providing selling activities, which could lead to growth in the Fund’s assets and corresponding benefits from such growth, including economies of scale. The Board noted that an affiliate of VIA and the Subadviser also provides administrative and transfer agency services to the Trust. The Board noted management’s discussion of the fact that, while the Subadviser is an affiliate of VIA, there were no other direct benefits to the Subadviser or VIA in providing investment advisory services to the Fund, other than the fees to be earned under the Agreements, although there may be certain indirect benefits gained, including to the extent that serving the Fund could provide the opportunity to provide advisory services to additional portfolios of the Trust or certain reputational benefits.
Conclusion
Based on all of the foregoing considerations, the Board, including a majority of the Independent Trustees, determined that approval of each Agreement was in the best interests of the Fund and its shareholders. Accordingly, the Board, and the Independent Trustees voting separately, approved the Agreements with respect to the Fund.
FUND MANAGEMENT TABLES (Unaudited)
Information pertaining to the Trustees and officers of the Trust as of the date of issuance of this report is set forth below. The statement of additional information (SAI) includes additional information about the Trustees and is available without charge, upon request, by calling
(800) 243-4361.
The address of each individual, unless otherwise noted, is c/o Virtus Equity Trust, One Financial Plaza, Hartford, CT 06103. There is no stated term of office for Trustees or officers of the Trust.
Independent Trustees
Name, Year of Birth,
Length of Time Served
and Number of
Portfolios in Complex | Principal Occupation(s) During Past 5 Years and
Other Directorships Held by Trustee |
Brown, Thomas J.
YOB: 1945
Served Since: 2016
67 Portfolios | Retired. Trustee (since 2016), Virtus Mutual Fund Family (56 portfolios) and Virtus Alternative Solutions Trust (3 portfolios); Trustee (since 2011), Virtus Variable Insurance Trust (8 portfolios); Director (since 2010), D’Youville Senior Care Center; and Director (since 2005), VALIC Company Funds (49 portfolios). |
Burke, Donald C.
YOB: 1960
Served Since: 2016
71 Portfolios | Retired. Trustee (since 2016), Virtus Mutual Fund Family (56 portfolios), Virtus Variable Insurance Trust (8 portfolios) and Virtus Alternative Solutions Trust (3 portfolios); Director (since 2014) closed-end funds managed by Duff & Phelps Investment Management Co. (4 funds); Director, Avista Corp. (energy company) (since 2011); Trustee, Goldman Sachs Fund Complex (2010 to 2014); and Director, BlackRock Luxembourg and Cayman Funds (2006 to 2010). |
Harris, Sidney E.
YOB: 1949
Served Since: 2017
67 Portfolios | Professor and Dean Emeritus (since April 2015), Professor (1997 to 2014), Dean (1997 to 2004), J. Mack Robinson College of Business, Georgia State University; Trustee (since 2019), Mutual Fund Directors Forum; Trustee (since 2017), Virtus Mutual Fund Family (56 portfolios), Virtus Variable Insurance Trust (8 portfolios), and Virtus Alternative Solutions Trust (3 portfolios); Trustee (since 2013), KIPP Metro Atlanta; Trustee (since 1999) Total System Services, Inc.; Trustee (2004 to 2017), RidgeWorth Funds; Trustee ( since 2012), International University of the Grand Bassam Foundation; and Trustee (2011 to 2015), Genspring Family Offices, LLC. |
Mallin, John R.
YOB: 1950
Served Since: 2016
67 Portfolios | Partner/Attorney (since 2003), McCarter & English LLP (law firm), Real Property Practice Group; and Member (since 2014), Counselors of Real Estate. Trustee (since 2016), Virtus Mutual Fund Family (56 portfolios) and Virtus Alternative Solutions Trust (3 portfolios); Director (since 2013), Horizons, Inc. (non-profit); and Trustee (since 1999), Virtus Variable Insurance Trust (8 portfolios). |
McClellan, Hassell H.
YOB: 1945
Served Since: 2015
67 Portfolios | Retired (since 2013); and Professor (1984 to 2013), Wallace E. Carroll School of Management, Boston College. Chairperson of the Board (since 2017) and Trustee (since 2000), John Hancock Fund Complex (collectively, 227 portfolios); Trustee (since 2016), Virtus Alternative Solutions Trust (3 portfolios); Trustee (since 2015), Virtus Mutual Fund Family (56 portfolios); Director (since 2010), Barnes Group, Inc. (diversified global components manufacturer and logistical services company); and Trustee (since 2008), Virtus Variable Insurance Trust (8 portfolios). |
McDaniel, Connie D.
YOB: 1958
Served Since: 2017
67 Portfolios | Retired (since 2013); and Vice President, Chief of Internal Audit, Corporate Audit Department (2009 to 2013); Vice President Global Finance Transformation (2007 to 2009); Vice President and Controller (1999 to 2007), The Coca-Cola Company; Trustee (since 2017), Virtus Mutual Fund Family (56 portfolios), Virtus Variable Insurance Trust (8 portfolios), and Virtus Alternative Solutions Trust (3 portfolios); Trustee (since 2014), Total System Services, Inc.; and Trustee (2005 to 2017), RidgeWorth Funds. |
McLoughlin, Philip
YOB: 1946
Served Since: 1993
75 Portfolios | Retired. Director and Chairman (since 2016), Virtus Total Return Fund Inc. and Virtus Global Dividend & Income Fund Inc.; Director and Chairman (since 2014) Duff & Phelps Select MLP and Midstream Energy Fund Inc.; Trustee and Chairman (since 2013), Virtus Alternative Solutions Trust (3 portfolios); Trustee and Chairman (since 2011), Virtus Global Multi-Sector Income Fund; Chairman and Trustee (since 2003), Virtus Variable Insurance Trust (8 portfolios); Director (since 1995), closed-end funds managed by Duff & Phelps Investment Management Co. (4 funds); Director (since 1991) and Chairman (since 2010), Lazard World Trust Fund (closed-end investment firm in Luxembourg); and Trustee (since 1989) and Chairman (since 2002), Virtus Mutual Fund Family (56 portfolios). |
McNamara, Geraldine M.
YOB: 1951
Served Since: 2001
71 Portfolios | Retired. Trustee (since 2016), Virtus Alternative Solutions Trust (3 portfolios); Trustee (since 2015), Virtus Variable Insurance Trust (8 portfolios); Director (since 2003), closed-end funds managed by Duff & Phelps Investment Management Co. (4 funds); and Trustee (since 2001), Virtus Mutual Fund Family (56 portfolios). |
Oates, James M.
YOB: 1946
Served Since: 1993
71 Portfolios | Managing Director (since 1994), Wydown Group (consulting firm). Director (since 2016), Virtus Total Return Fund Inc. and Virtus Global Dividend & Income Fund Inc.; Trustee (since 2016), Virtus Variable Insurance Trust (8 portfolios); Director (since 2014), Duff & Phelps Select MLP and Midstream Energy Fund Inc.; Trustee (since 2013), Virtus Alternative Solutions Trust (3 portfolios); Trustee (since 2011), Virtus Global Multi-Sector Income Fund; Trustee (since 2005) and Chairman (2005 to 2017), John Hancock Fund Complex (227 portfolios); Director (2002 to 2014), New Hampshire Trust Company; Chairman (2000 to 2016), Emerson Investment Management, Inc.; Non-Executive Chairman (2000 to 2014), Hudson Castle Group, Inc. (formerly IBEX Capital Markets, Inc.) (financial services); Chairman and Director (1999 to 2014), Connecticut River Bank; Director (since 1996), Stifel Financial; and Trustee (since 1987), Virtus Mutual Fund Family (56 portfolios). |
Segerson, Richard E.
YOB: 1946
Served Since: 1983
67 Portfolios | Retired; and Managing Director (1998 to 2013), Northway Management Company. Trustee (since 2016), Virtus Alternative Solutions Trust (3 portfolios) and Virtus Variable Insurance Trust (8 portfolios); and Trustee (since 1983), Virtus Mutual Fund Family (56 portfolios). |
FUND MANAGEMENT TABLES (Unaudited) (Continued)
Interested Trustee
Name, Year of Birth,
Year Elected and
Number of Funds
Overseen | Principal Occupation(s) During Past 5 Years and
Other Directorships Held by Trustee |
Aylward, George R.*
Trustee and President
YOB: 1964
Elected: 2006
77 Portfolios | Director, President and Chief Executive Officer (since 2008), Virtus Investment Partners, Inc. and/or certain of its subsidiaries; and various senior officer positions with Virtus affiliates (since 2005). Chairman and Trustee (since 2015), Virtus ETF Trust II (2 portfolios); Director, President and Chief Executive Officer (since 2014), Duff & Phelps Select MLP and Midstream Energy Fund Inc.; Trustee and President (since 2013),Virtus Alternative Solutions Trust (3 portfolios); Director (since 2013), Virtus Global Funds, PLC (4 portfolios); Trustee (since 2012) and President (since 2010), Virtus Variable Insurance Trust (8 portfolios); Trustee, President and Chief Executive Officer (since 2011), Virtus Global Multi-Sector Income Fund; Trustee and President (since 2006) and Executive Vice President (2004 to 2006), Virtus Mutual Fund Family (56 portfolios); and Director, President and Chief Executive Officer (since 2006), Virtus Global Dividend & Income Fund Inc. and Virtus Total Return Fund Inc. |
* Mr. Aylward is an “interested person,” as defined in the 1940 Act, by reason of his position as President and Chief Executive Officer of Virtus Investment Partners, Inc. (“Virtus”), the ultimate parent company of the Adviser, and various positions with its affiliates, including the Adviser.
Officers of the Trust Who Are Not Trustees
Name, Address and
Year of Birth | Position(s) Held with Trust and
Length of Time Served | Principal Occupation(s)
During Past 5 Years |
Batchelar, Peter
YOB: 1970 | Senior Vice President (since 2017), Vice President (2008 to 2017). | Senior Vice President, Product Development (since 2017), and Vice President, Product Development (2008 to 2017), Virtus Investment Partners, Inc. and/or certain of its subsidiaries; various officer positions (since 2008) with Virtus affiliates; Senior Vice President (since 2017), and Vice President (2008 to 2016), Virtus Mutual Fund Family; Senior Vice President (since 2017), and Vice President (2010 to 2016), Virtus Variable Insurance Trust; Senior Vice President (since 2017), and Vice President (2013 to 2016), Virtus Alternative Solutions Trust; and Senior Vice President (since 2017) and Vice President (2016 to 2017), Virtus Closed-End Funds. |
Bradley, W. Patrick
YOB: 1972 | Executive Vice President (since 2016); Senior Vice President (2013 to 2016); Vice President (2011 to 2013); Chief Financial Officer and Treasurer (since 2006). | Executive Vice President, Fund Services (since 2016), and Senior Vice President, Fund Services (2010 to 2016), Virtus Investment Partners, Inc. and/or certain of its subsidiaries; various officer positions (since 2006) with Virtus affiliates; Executive Vice President (since 2016), Senior Vice President (2013 to 2016), Vice President (2011 to 2013), Chief Financial Officer and Treasurer (since 2004), Virtus Variable Insurance Trust; Executive Vice President (since 2016), Senior Vice President (2013 to 2016), Vice President (2011 to 2013), Chief Financial Officer and Treasurer (since 2006), Virtus Mutual Fund Family; Executive Vice President (since 2016), Senior Vice President (2013 to 2016), Vice President (2012 to 2013), Treasurer and Chief Financial Officer (since 2010), Virtus Total Return Fund Inc. and Virtus Global Dividend & Income Fund Inc.; Executive Vice President (since 2016), Senior Vice President (2013 to 2016), Vice President (2011 to 2013), Chief Financial Officer and Treasurer (since 2011), Virtus Global Multi-Sector Income Fund; Executive Vice President (since 2016), Senior Vice President (2014 to 2016), Chief Financial Officer and Treasurer (since 2014), Duff & Phelps Select Energy MLP and Midstream Energy Fund Inc.; Vice President and Assistant Treasurer (since 2011), Duff & Phelps Global Utility Income Fund Inc.; Director (since 2013), Virtus Global Funds, PLC; and Executive Vice President (since 2016), Senior Vice President (2013 to 2016), and Chief Financial Officer and Treasurer (since 2013), Virtus Alternative Solutions Trust. |
FUND MANAGEMENT TABLES (Unaudited) (Continued)
Name, Address and
Year of Birth | Position(s) Held with Trust and
Length of Time Served | Principal Occupation(s)
During Past 5 Years |
Carr, Kevin J.
YOB: 1954 | Senior Vice President (since 2013), Vice President (2005 to 2013), Chief Legal Officer, Counsel and Secretary (since 2005). | Vice President and Senior Counsel (2017 to Present), Senior Vice President (2009 to 2017), Vice President, Counsel and Secretary (2008 to 2009), Virtus Investment Partners, Inc. and/or certain of its subsidiaries; various senior officer positions (since 2005) with Virtus affiliates; Senior Vice President (since 2013), Vice President (2005 to 2013), Chief Legal Officer, Counsel and Secretary (since 2005), Virtus Mutual Fund Family; Senior Vice President (2013 to 2014), Vice President (2012 to 2013), Secretary and Chief Legal Officer (2005 to 2013), and Assistant Secretary (2013 to 2014 and since 2017), Virtus Total Return Fund Inc. and Virtus Global Dividend & Income Fund Inc.; Senior Vice President (since 2017), Assistant Secretary (since 2013), Vice President, Chief Legal Officer, Counsel and Secretary (2010 to 2013), Virtus Variable Insurance Trust; Senior Vice President (2013 to 2014), Vice President (2011 to 2013), and Assistant Secretary (since 2011), Virtus Global Multi-Sector Income Fund; Assistant Secretary (since 2015), Duff & Phelps Select MLP and Midstream Energy Fund Inc.; Senior Vice President (since 2017) and Assistant Secretary (since 2013), Virtus Alternative Solutions Trust; Secretary (since 2015), ETFis Series Trust I; and Secretary (since 2015), Virtus ETF Trust II. |
Engberg, Nancy J.
YOB: 1956 | Senior Vice President (since 2017), Vice President and Chief Compliance Officer (2011 to 2017), and Chief Compliance Officer (since 2011). | Senior Vice President (since 2017), Vice President (2008 to 2017) and Chief Compliance Officer (2008 to 2011 and since 2016), Virtus Investment Partners, Inc. and/or certain of its subsidiaries; various officer positions (since 2003) with Virtus affiliates; Senior Vice President (since 2017), Vice President (2011 to 2017) and Chief Compliance Officer (since 2011), Virtus Mutual Fund Family; Senior Vice President (since 2017), Vice President (2010 to 2017) and Chief Compliance Officer (since 2011), Virtus Variable Insurance Trust; Senior Vice President (since 2017), Vice President (2011 to 2016) and Chief Compliance Officer (since 2011), Virtus Global Multi-Sector Income Fund; Senior Vice President (since 2017), Vice President (2012 to 2017) and Chief Compliance Officer (since 2012), Virtus Total Return Fund Inc. and Virtus Global Dividend & Income Fund Inc.; Senior Vice President (since 2017), Vice President (2013 to 2016) and Chief Compliance Officer (since 2013), Virtus Alternative Solutions Trust; Senior Vice President (since 2017), Vice President (2014 to 2017) and Chief Compliance Officer (since 2014), Duff & Phelps Select MLP and Midstream Energy Fund Inc.; Chief Compliance Officer (since 2015), ETFis Series Trust I; and Chief Compliance Officer (since 2015), Virtus ETF Trust II. |
Short, Julia R.
YOB: 1972 | Senior Vice President (since 2017). | Senior Vice President (since 2018), Virtus Closed-End Funds; Senior Vice President, Product Development (since 2017), Virtus Investment Partners, Inc. and/or certain of its subsidiaries; Senior Vice President (since 2017), Virtus Mutual Fund Family; Senior Vice President (since 2018), Virtus Closed-End Funds; President and Chief Executive Officer, RidgeWorth Funds (2007 to 2017); and Managing Director, Product Manager, RidgeWorth Investments (2004 to 2017). |
Waltman, Francis G.
YOB: 1962 | Executive Vice President (since 2013), Senior Vice President (2008 to 2013). | Executive Vice President, Product Development (since 2009), Virtus Investment Partners, Inc. and/or certain of its subsidiaries; various senior officer positions (since 2006) with Virtus affiliates; Executive Vice President (since 2013), Senior Vice President (2008 to 2013), Virtus Mutual Fund Family; Executive Vice President (since 2013), Senior Vice President (2010 to 2013), Virtus Variable Insurance Trust; Executive Vice President (since 2013), Senior Vice President (2011 to 2013), Virtus Global Multi-Sector Income Fund; Executive Vice President (since 2014), Duff & Phelps Select Energy MLP and Midstream Energy Fund Inc.; Director (since 2013), Virtus Global Funds PLC; Executive Vice President (since 2013), Virtus Alternative Solutions Trust; and Executive Vice President (since 2017), Virtus Global Dividend & Income Fund Inc. and Virtus Total Return Fund Inc. |
Virtus KAR Capital Growth Fund, Virtus KAR Mid-Cap Growth Fund
and Virtus SGA Global Growth Fund,
each a series of Virtus Equity Trust
Supplement dated July 1, 2019 to the Summary Prospectuses
and the Virtus Equity Trust Statutory Prospectus,
dated January 28, 2019, as supplemented
IMPORTANT NOTICE TO INVESTORS
Effective July 1, 2019, the funds’ investment adviser is implementing more favorable expense limitation arrangements for the funds’ Class R6 Shares. These changes are described in more detail below.
Virtus KAR Capital Growth Fund
Under “Fees and Expenses” in the fund’s summary prospectus and the summary section of the statutory prospectus, the information for Class R6 Shares in the “Annual Fund Operating Expenses” table and associated footnotes are hereby replaced with the following:
Annual Fund Operating Expenses (expenses that you pay
each year as a percentage of the value of your investment) | Class R6 |
| Management Fees | 0.70% |
| Distribution and Shareholder Servicing (12b-1) Fees | None |
| Other Expenses | 0.21% |
| Total Annual Fund Operating Expenses | 0.91% |
| Less: Fee Waiver and/or Expense Reimbursement | (0.18%) |
Total Annual Fund Operating Expenses After Expense
Reimbursement or Recapture(b) | 0.73% |
(b) The fund’s investment adviser has contractually agreed to limit the fund’s total operating expenses (excluding certain expenses, such as front-end or contingent deferred sales charges, taxes, leverage expenses, interest, brokerage commissions, expenses incurred in connection with any merger or reorganization, unusual or infrequently occurring expenses (such as litigation), acquired fund fees and expenses, and dividend expenses, if any) so that such expenses do not exceed 0.73% for Class R6 Shares through January 31, 2020. Following the contractual period, the adviser may discontinue these expense reimbursement arrangements at any time. Under certain conditions, the adviser may recapture operating expenses reimbursed and/or fees waived under these arrangements for a period of three years following the date such waiver or reimbursement occurred, provided that the recapture does not cause the fund to exceed its expense limit in effect at the time of the waiver or reimbursement, or at the time of recapture.
Under “Fees and Expenses” in the fund’s summary prospectus and the summary section of the statutory prospectus, the row showing Class R6 Shares in the “Example” table is hereby replaced with the following:
| | Share Status | 1 Year | 3 Years | 5 Years | 10 Years |
| Class R6 | Sold or Held | $75 | $272 | $486 | $1,103 |
In the first table in the section “More Information About Fund Expenses” on page 49 of the statutory prospectus, the information in the row relating to the fund is hereby replaced with the following:
| | Class A
Shares | Class C
Shares | Class I
Shares | Class R6
Shares | Through Date |
| Virtus KAR Capital Growth Fund | 1.47%(1) | 2.22%(1) | 1.22%(1) | 0.73% | January 31,
2020 |
(1) Fund expenses currently below the capped level.
Virtus KAR Mid-Cap Growth Fund
Under “Fees and Expenses” in the fund’s summary prospectus and the summary section of the statutory prospectus, the information for Class R6 Shares in the “Annual Fund Operating Expenses” table and associated footnotes are hereby replaced with the following:
Annual Fund Operating Expenses (expenses that you pay
each year as a percentage of the value of your investment) | Class R6 |
| Management Fees | 0.80% |
| Distribution and Shareholder Servicing (12b-1) Fees | None |
| Other Expenses | 0.29% |
| Acquired Fund Fees and Expenses | 0.01% |
| Total Annual Fund Operating Expenses(b) | 1.10% |
| Recapture of expenses previously reimbursed and/or waived | 0.00% |
| Less: Expense Reimbursement(c) | 0.26% |
Total Annual Fund Operating Expenses After Expense
Reimbursement or Recapture(b)(c) | 0.84% |
(b) The Total Annual Fund Operating Expenses do not correlate to the ratio of expenses to average net assets appearing in the Financial Highlights tables, which tables reflect only the operating expenses of the fund and do not include acquired fund fees and expenses.
(c) The fund’s investment adviser has contractually agreed to limit the fund’s total operating expenses (excluding certain expenses, such as front-end or contingent deferred sales charges, taxes, leverage expenses, interest, brokerage commissions, expenses incurred in connection with any merger or reorganization, unusual or infrequently occurring expenses (such as litigation), acquired fund fees and expenses, and dividend expenses, if any) so that such expenses do not exceed 2.15% for Class C Shares and 0.83% for Class R6 Shares through January 31, 2020. Following the contractual period, the adviser may discontinue these expense reimbursement arrangements at any time. Under certain conditions, the adviser may recapture operating expenses reimbursed and/or fees waived under these arrangements for a period of three years following the date such waiver or reimbursement occurred, provided that the recapture does not cause the fund to exceed its expense limit in effect at the time of the waiver or reimbursement, or at the time of recapture.
Under “Fees and Expenses” in the fund’s summary prospectus and the summary section of the statutory prospectus, the row showing Class R6 Shares in the “Example” table is hereby replaced with the following:
| | Share Status | 1 Year | 3 Years | 5 Years | 10 Years |
| Class R6 | Sold or Held | $86 | $324 | $581 | $1,317 |
In the first table in the section “More Information About Fund Expenses” on page 49 of the statutory prospectus, the information in the row relating to the fund is hereby replaced with the following:
| | Class A
Shares | Class C
Shares | Class I
Shares | Class R6
Shares | Through Date |
| Virtus KAR Mid-Cap Growth Fund | 1.40%(1) | 2.15% | 1.15%(1) | 0.83% | January 31,
2020 |
(1) Fund expenses currently below the capped level.
Virtus SGA Global Growth Fund
Under “Fees and Expenses” in the fund’s summary prospectus and the summary section of the statutory prospectus, the information for Class R6 Shares in the “Annual Fund Operating Expenses” table and associated footnotes are hereby replaced with the following:
Annual Fund Operating Expenses (expenses that you pay
each year as a percentage of the value of your investment) | Class R6 |
| Management Fees | 0.80% |
| Distribution and Shareholder Servicing (12b-1) Fees | None |
| Other Expenses(b) | 0.35% |
| Acquired Fund Fees and Expenses(b) | 0.01% |
| Total Annual Fund Operating Expenses(c) | 1.16% |
| Less: Fee Waiver and/or Expense Reimbursement(d) | (0.25%) |
| Total Annual Fund Operating Expenses After Expense Reimbursement(c)(d) | 0.91% |
(b) Restated to reflect current fees and expenses.
(c) The Total Annual Fund Operating Expenses do not correlate to the ratio of expenses to average net assets appearing in the Financial Highlights tables, which tables reflect only the operating expenses of the fund and do not include acquired fund fees and expenses.
(d) The fund’s investment adviser has contractually agreed to limit the fund’s total operating expenses (excluding certain expenses, such as front-end or contingent deferred sales charges, taxes, leverage expenses, interest, brokerage commissions, expenses incurred in connection with any merger or reorganization, unusual or infrequently occurring expenses (such as litigation), acquired fund fees and expenses, and dividend expenses, if any) so that such expenses do not exceed 1.38% for Class A Shares, 2.13% for Class C Shares, 1.13% for Class I Shares and 0.90% for Class R6 Shares through May 31, 2021. Following the contractual period, the adviser may discontinue these expense reimbursement arrangements at any time. Under certain conditions, the adviser may recapture operating expenses reimbursed and/or fees waived under these arrangements for a period of three years following the date such waiver or reimbursement occurred, provided that the recapture does not cause the fund to exceed its expense limit in effect at the time of the waiver or reimbursement, or at the time of recapture.
Under “Fees and Expenses” in the fund’s summary prospectus and the summary section of the statutory prospectus, the row showing Class R6 Shares in the “Example” table is hereby replaced with the following:
| | Share Status | 1 Year | 3 Years | 5 Years | 10 Years |
| Class R6 | Sold or Held | $93 | $318 | $589 | $1,363 |
In the first table in the section “More Information About Fund Expenses” on page 49 of the statutory prospectus, the information in the row relating to the fund is hereby replaced with the following:
| | Class A
Shares | Class C
Shares | Class I
Shares | Class R6
Shares | Through Date |
| Virtus SGA Global Growth Fund | 1.38% | 2.13% | 1.13% | 0.90% | May 31, 2021 |
Investors should retain this supplement with the Prospectuses for future reference.
VET 8019/KARCGF-KARMCGF-SGAGGF NewR6ExpCap (7/2019)
THIS PAGE INTENTIONALLY BLANK.
THIS PAGE INTENTIONALLY BLANK.
THIS PAGE INTENTIONALLY BLANK.
VIRTUS EQUITY TRUST
101 Munson Street
Greenfield, MA 01301-9668
Trustees
Philip R. McLoughlin, Chairman
George R. Aylward
Thomas J. Brown
Donald C. Burke
Sidney E. Harris
John R. Mallin
Hassell H. McClellan
Connie D. McDaniel
Geraldine M. McNamara
James M. Oates
Richard E. Segerson
Officers
George R. Aylward, President
Peter Batchelar, Senior Vice President
W. Patrick Bradley, Executive Vice President, Chief Financial Officer and Treasurer
Kevin J. Carr, Senior Vice President, Chief Legal Officer, Counsel and Secretary
Nancy J. Engberg, Senior Vice President and Chief Compliance Officer
Julia R. Short, Senior Vice President
Francis G. Waltman, Executive Vice President
Investment Adviser
Virtus Investment Advisers, Inc.
One Financial Plaza
Hartford, CT 06103-2608
Principal Underwriter
VP Distributors, LLC
One Financial Plaza
Hartford, CT 06103-2608
Administrator and Transfer Agent
Virtus Fund Services, LLC
One Financial Plaza
Hartford, CT 06103-2608
Custodian
The Bank of New York Mellon
240 Greenwich Street
New York, NY 10286-1048
Independent Registered Public
Accounting Firm
PricewaterhouseCoopers LLP
2001 Market Street
Philadelphia, PA 19103-7042
How to Contact Us
| Mutual Fund Services | 1-800-243-1574 |
| Adviser Consulting Group | 1-800-243-4361 |
Important Notice to Shareholders
The Securities and Exchange Commission has modified mailing regulations for semiannual and annual shareholder fund reports to allow mutual fund companies to send a single copy of these reports to shareholders who share the same mailing address. If you would like additional copies, please call Mutual Fund Services at 1-800-243-1574.
P.O. Box 9874
Providence, RI 02940-8074
For more information about Virtus Mutual Funds,
please contact us at1-800-243-1574, orVirtus.com.
ANNUAL REPORT
VIRTUS EQUITY TRUST
| Virtus Tactical Allocation Fund* |
*Prospectus supplement appears at the back of this annual report.
Beginning on January 1, 2021, as permitted by regulations adopted by the Securities and Exchange Commission, paper copies of the Fund’s shareholder reports like this one will no longer be sent by mail, unless specifically requested from the Fund or from your financial intermediary, such as a broker-dealer or bank. Instead, the reports will be made available on a website, and you will be notified by mail each time a report is posted and provided with a website link to access the report.
You may elect at any time to receive not only shareholder reports but also certain other communications from the Fund electronically, or you may elect to receive paper copies of all future shareholder reports free of charge to you. If you own your shares directly with the Fund, you may make such elections by calling the Fund at 1-800-243-1574 or, with respect to requesting electronic delivery, by visiting www.virtus.com. An election made directly with the Fund will apply to all Virtus Mutual Funds in which you own shares directly. If you own your shares through a financial intermediary, please contact your financial intermediary to make your request and to determine whether your election will apply to all funds in which you own shares through that intermediary.
Not FDIC Insured • No Bank Guarantee • May Lose Value
Table of Contents
Virtus Tactical Allocation Fund
(“Tactical Allocation Fund”)
Message to Shareholders
| 1 |
Disclosure of Fund Expenses
| 2 |
Key Investment Terms
| 4 |
Fund Summary
| 7 |
Schedule of Investments
| 13 |
Statement of Assets and Liabilities
| 38 |
Statement of Operations
| 40 |
Statements of Changes in Net Assets
| 41 |
Financial Highlights
| 44 |
Notes to Financial Statements
| 47 |
Report of Independent Registered Public Accounting Firm
| 61 |
Tax Information Notice
| 62 |
Consideration of Advisory and Subadvisory Agreements by the Board of Trustees
| 63 |
Fund Management Tables
| 66 |
Proxy Voting Procedures and Voting Record (Form N-PX)
The subadvisers vote proxies, if any, relating to portfolio securities in accordance with procedures that have been approved by the Board of Trustees of the Trust (“Trustees”, or the “Board”). You may obtain a description of these procedures, along with information regarding how the Fund voted proxies during the most recent 12-month period ended June 30, free of charge, by calling toll-free 1-800-243-1574. This information is also available through the Securities and Exchange Commission’s (the “SEC”) website athttps://www.sec.gov.
PORTFOLIO HOLDINGS INFORMATION
For periods prior to the quarter ending March 31, 2019, the Trust has filed a complete schedule of portfolio holdings for the Fund with the SEC for the first and third quarters of each fiscal year on Form N-Q. The Fund’s Form N-Qs are available on the SEC’s website athttps://www.sec.gov.
For the period ended June 30, 2019, the Trust has filed a complete schedule of portfolio holdings for the Funds with the SEC for the third quarter of the fiscal year as an exhibit to its reports on Form N-PORT-EX. Form N-PORT-EX is available on the SEC’s website athttps://www.sec.gov.
Effective September 30, 2019, the Trust files a complete schedule of portfolio holdings for the Funds with the SEC for the first and third quarters of each fiscal year as an exhibit to its reports on Form N-PORT-P. Form N-PORT-P is available on the SEC’s website athttps://www.sec.gov.
This report is not authorized for distribution to prospective investors in the Tactical Allocation Fund unless preceded or accompanied by an effective prospectus which includes information concerning the sales charge, the Fund’s record and other pertinent information.
To My Fellow Shareholders of Virtus Mutual Funds:
I am pleased to present this annual report that reviews the performance of your fund for the 12 months ended September 30, 2019.
After a sharp downturn in the fourth quarter of 2018, global financial markets rallied during the first nine months of 2019. While global growth continued to slow, interest rate cuts by the U.S. Federal Reserve and the European Central Bank helped restore confidence to the markets. The easing of monetary policy boosted the returns of both equities and fixed income in the first nine months of 2019. However, the uncertainty about trade, tariffs and other geopolitical issues led to frequent reversals in the direction of the markets.
Positive returns in the first nine months of 2019 offset the 2018 fourth quarter downturn. For the 12 months ended September 30, 2019, U.S. large-capitalization stocks, as measured by the S&P 500® Index, rose 4.25% as a result of a 20.55% increase for the year-to-date. Small-cap stocks, as measured by the Russell 2000® Index, rose 14.18% for the nine months of 2019, but were down 8.89% for the full year period. Within international equities, developed markets produced the strongest returns, with the MSCI EAFE® Index (net) up 12.80% for the nine-month period, but down 1.34% for the full year, compared to emerging markets, which were up 5.89% for the nine months of 2019, but declined 2.02% for the full year, as measured by the MSCI Emerging Markets Index (net).
In fixed income markets, the yield on the 10-year Treasury was 1.68% at September 30, 2019, down from 3.05% at September 30, 2018. The broader U.S. fixed income market, as represented by the Bloomberg Barclays U.S. Aggregate Bond Index, which tracks Treasuries and other investment-grade debt securities, was up 10.30% for the 12-month period. Non-investment grade bonds were up 6.36% for the period, as measured by the Bloomberg Barclays U.S. Corporate High Yield Bond Index.
It is impossible to know how the markets will perform from day to day or month to month. But a well-diversified portfolio can help investors weather the short-term ups and downs. While diversification cannot guarantee a profit or prevent a loss, owning a variety of traditional and alternative asset classes has been shown to dampen the inevitable market fluctuations. Your financial advisor can help you ensure that your portfolio is adequately diversified across asset classes and investment strategies, with a broad array of Virtus Funds available through your fund exchange privileges. These include distinctive equity, fixed income, alternative, and asset allocation funds managed by Virtus affiliates and select subadvisers. We invite you to learn more about the Virtus family of funds at Virtus.com.
On behalf of our investment affiliates, thank you for entrusting the Virtus Funds with your assets. Should you have questions about your account or require assistance, please visit Virtus.com, or call our customer service team at 800-243-1574. We appreciate your business and remain committed to your long-term financial success.
Sincerely,
George R. Aylward
President, Virtus Funds
November 2019
Performance data quoted represents past results. Past performance is no guarantee of future results, and current performance may be higher or lower than the performance shown above.
TACTICAL ALLOCATION FUND
DISCLOSURE OF FUND EXPENSES (Unaudited)
FOR THE SIX-MONTH PERIOD OFApril 1, 2019 TOSeptember 30, 2019
We believe it is important for you to understand the impact of costs on your investment. All mutual funds have operating expenses. As a shareholder of the Tactical Allocation Fund (the “Fund”), you may incur two types of costs: (1) transaction costs, including sales charges on purchases of Class A shares and contingent deferred sales charges on Class C shares; and (2) ongoing costs, including investment advisory fees, distribution and service fees, and other expenses. Class I shares and Class R6 shares are sold without sales charges and do not incur distribution and service fees. Class R6 shares also do not incur shareholder servicing fees. For further information regarding applicable sales charges, see Note 1 in the Notes to Financial Statements. These examples are intended to help you understand your ongoing costs (in dollars) of investing in the Fund and to compare these costs with the ongoing costs of investing in other mutual funds. These examples are based on an investment of $1,000 invested at the beginning of the period and held for the entire six-month period. The Annualized Expense Ratios may be different from the expense ratios in the Financial Highlights which are for the fiscal year ended September 30, 2019.
Please note that the expenses shown in the accompanying tables are meant to highlight your ongoing costs only and do not reflect any transactional costs, such as sales charges or contingent deferred sales charges. Therefore, the accompanying tables are useful in comparing ongoing costs only, and will not help you determine the relative total costs of owning different funds. In addition, if these transactional costs were included, your costs would have been higher. The calculations assume no shares were bought or sold during the period. Your actual costs may have been higher or lower, depending on the amount of your investment and the timing of any purchases or redemptions.
Actual Expenses
The table below provides information about actual account values and actual expenses. You may use the information below, together with the amount you invested, to estimate the expenses that you paid over the period. Simply divide your account value by $1,000 (for example, an $8,600 account value divided by $1,000 = 8.6), then multiply the result by the number in the table under the heading entitled “Expenses Paid During Period” to estimate the expenses you paid on your account during this period.
| | Beginning
Account Value
April 1, 2019 | | Ending
Account Value
September 30, 2019 | | Annualized
Expense
Ratio | | Expenses
Paid
During
Period* |
Class A
| $ 1,000.00 | | $ 1,026.69 | | 1.14 % | | $ 5.79 |
Class C
| 1,000.00 | | 1,021.67 | | 1.91 | | 9.68 |
Class I
| 1,000.00 | | 1,027.09 | | 0.88 | | 4.47 |
| * | Expenses are equal to the Fund’s annualized expense ratio, which is net of waived fees and reimbursed expenses, if applicable, multiplied by the average account value over the period, multiplied by the number of days (183) expenses were accrued in the most recent fiscal half-year, then divided by 365 to reflect the one-half year period. |
The Fund may invest in other funds, and the annualized expense ratios noted above do not reflect fees and expenses associated with any underlying funds. If such fees and expenses had been included, the expenses would have been higher.
TACTICAL ALLOCATION FUND
DISCLOSURE OF FUND EXPENSES (Unaudited) (Continued)
FOR THE SIX-MONTH PERIOD OFApril 1, 2019 TOSeptember 30, 2019
You can find more information about the Fund’s expenses in the Financial Statements section that follows. For additional information on operating expenses and other shareholder costs, refer to the Fund’s prospectus.
Hypothetical Example for Comparison Purposes
The table below provides information about hypothetical account values and hypothetical expenses based on the Fund’s actual expense ratio and an assumed rate of return of 5% per year before expenses, which is not your Fund’s actual return. The hypothetical account values and expenses may not be used to estimate the actual ending account balance or expenses you paid for the period. You may use this information to compare the ongoing costs of investing in your Fund and other funds. To do so, compare these 5% hypothetical examples with the 5% hypothetical examples that appear in the shareholder reports of other mutual funds.
| | Beginning
Account Value
April 1, 2019 | | Ending
Account Value
September 30, 2019 | | Annualized
Expense
Ratio | | Expenses
Paid
During
Period* |
Class A
| $ 1,000.00 | | $ 1,019.35 | | 1.14 % | | $ 5.77 |
Class C
| 1,000.00 | | 1,015.49 | | 1.91 | | 9.65 |
Class I
| 1,000.00 | | 1,020.66 | | 0.88 | | 4.46 |
| * | Expenses are equal to the Fund’s annualized expense ratio, which is net of waived fees and reimbursed expenses, if applicable, multiplied by the average account value over the period, multiplied by the number of days (183) expenses were accrued in the most recent fiscal half-year, then divided by 365 to reflect the one-half year period. |
The Fund may invest in other funds, and the annualized expense ratios noted above do not reflect fees and expenses associated with any underlying funds. If such fees and expenses had been included, the expenses would have been higher.
You can find more information about the Fund’s expenses in the Financial Statements section that follows. For additional information on operating expenses and other shareholder costs, refer to the Fund’s prospectus.
TACTICAL ALLOCATION FUND
KEY INVESTMENT TERMS (Unaudited)
September 30, 2019
American Depositary Receipt (“ADR”)
Represents shares of foreign companies traded in U.S. dollars on U.S. exchanges that are held by a U.S. bank or a trust. Foreign companies use ADRs in order to make it easier for Americans to buy their shares.
Bloomberg Barclays U.S. Aggregate Bond Index
The Bloomberg Barclays U.S. Aggregate Bond Index measures the U.S. investment grade fixed rate bond market. The index is calculated on a total return basis. The index is unmanaged, its returns do not reflect any fees, expenses, or sales charges, and it is not available for direct investment.
Bloomberg Barclays U.S. Corporate High Yield Bond Index
The Bloomberg Barclays U.S. Corporate High Yield Bond Index measures the U.S. dollar-denominated, high yield, fixed-rate corporate bond market. The index is calculated on a total return basis. The index is unmanaged, its returns do not reflect any fees, expenses, or sales charges, and it is not available for direct investment.
European Central Bank (“ECB”)
The ECB is responsible for conducting monetary policy for the euro area. The ECB was established as the core of the Euro-system and the European System of Central Banks (“ESCB”). The ESCB comprises the ECB and the National Central Banks (“NCBs”) of all 17 EU Member States whether they have adopted the Euro or not.
European Union (“EU”)
The EU is a unique economic and political union of 28 European countries. The EU was created in the aftermath of the Second World War and has developed an internal single market through a standardized system of laws that apply to all member states. A monetary union was established in 1999 and is composed of the 19 member states which use the Euro currency.
Exchange-Traded Funds (“ETFs”)
An open-end fund that is traded on a stock exchange. Most ETFs have a portfolio of stocks or bonds that track a specific market index.
Federal Reserve (the “Fed”)
The Central Bank of the U.S., the Fed is responsible for controlling money supply, interest rates and credit with the goal of keeping the U.S. economy and currency stable. Governed by a seven-member board, the system includes 12 regional Federal Reserve Banks, 25 Branches and all national and state banks that are part of the system.
Gross Domestic Product (GDP)
The gross domestic product represents the market value of all goods and services produced by the economy during the period measured, including personal consumption, government purchases, private inventories, paid-in construction costs and the foreign trade balance.
London Interbank Offered Rate (“LIBOR”)
A benchmark rate that some of the world’s leading banks charge each other for short-term loans and that serves as the first step to calculating interest rates on various loans throughout the world.
MSCI ACWI ex USA SMID Cap Index (net)
The MSCI ACWI ex USA SMID Cap Index (net) is a free float-adjusted market capitalization-weighted index that measures mid- and small-cap performance across 22 of 23
TACTICAL ALLOCATION FUND
KEY INVESTMENT TERMS (Unaudited) (Continued)
September 30, 2019
Developed Market countries (excluding the U.S.) and 24 Emerging Markets countries. The index is calculated on a total return basis with net dividends reinvested. The index is unmanaged, its returns do not reflect any fees, expenses, or sales charges, and is not available for direct investment.
MSCI EAFE® Index (net)
The MSCI EAFE® (Europe, Australasia, Far East) Index (net) is a free float-adjusted market capitalization-weighted index that measures developed foreign market equity performance, excluding the U.S. and Canada. The index is calculated on a total return basis with net dividends reinvested. The index is unmanaged, its returns do not reflect any fees, expenses, or sales charges, and it is not available for direct investment.
MSCI Emerging Markets Index (net)
The MSCI Emerging Markets Index (net) is a free float-adjusted market capitalization-weighted index designed to measure equity market performance in the global emerging markets. The index is calculated on a total return basis with net dividends reinvested. The index is unmanaged, its returns do not reflect any fees, expenses, or sales charges, and it is not available for direct investment.
Payment-in-Kind Security (“PIK”)
A bond which pays interest in the form of additional bonds, or preferred stock which pays dividends in the form of additional preferred stock.
Real Estate Investment Trust (“REIT”)
A publicly traded company that owns, develops, and operates income-producing real estate such as apartments, office buildings, hotels, shopping centers, and other commercial properties.
Russell 1000® Growth Index
The Russell 1000® Growth Index is a market capitalization-weighted index of growth-oriented stocks of the 1,000 largest companies in the Russell Universe, which comprises the 3,000 largest U.S. companies. The index is calculated on a total return basis with dividends reinvested. The index is unmanaged, its returns do not reflect any fees, expenses, or sales charges, and is not available for direct investment.
Russell 2000® Index
The Russell 2000® Index is a market capitalization-weighted index of the 2,000 smallest companies in the Russell Universe, which comprises the 3,000 largest U.S. companies. The index is calculated on a total return basis with dividends reinvested. The index is unmanaged, its returns do not reflect any fees, expenses, or sales charges, and it is not available for direct investment.
S&P 500® Index
The S&P 500® Index is a free-float market capitalization-weighted index of 500 of the largest U.S. companies. The index is calculated on a total return basis with dividends reinvested. The index is unmanaged, its returns do not reflect any fees, expenses, or sales charges, and it is not available for direct investment.
Sponsored ADR
An ADR which is issued with the cooperation of the company whose stock will underlie the ADR. Sponsored ADRs generally carry the same rights normally given to stockholders, such as voting rights. ADRs must be sponsored to be able to trade on a major U.S. exchange such as the New York Stock Exchange (“NYSE”).
TACTICAL ALLOCATION FUND
KEY INVESTMENT TERMS (Unaudited) (Continued)
September 30, 2019
Tactical Allocation Fund Linked Benchmark
The Tactical Allocation Fund Linked Benchmark consists of 45% Russell 1000® Growth Index (a market capitalization-weighted index of growth-oriented stocks of the 1,000 largest companies in the Russell Universe, which comprises the 3,000 largest U.S. companies, calculated on a total return basis with dividends reinvested), 15% MSCI ACWI ex USA SMID Cap Index (a free float-adjusted market capitalization-weighted index that measures mid- and small-cap foreign market equity performance, calculated on a total return basis with net dividends reinvested), and 40% Bloomberg Barclays U.S. Aggregate Bond Index (an index that measures the U.S. investment grade fixed rate bond market, calculated on a total return basis). The index is unmanaged, its returns do not reflect any fees, expenses, or sales charges, and is not available for direct investment. Performance of the Virtus Tactical Allocation Fund Linked Benchmark between 9/7/2016 and 6/3/2019 represents an allocation consisting of 45% Russell 1000® Growth Index, 15% MSCI EAFE® Index, and 40% Bloomberg Barclays U.S. Aggregate Bond Index. Prior to 9/7/2016, the allocation consisted of 50% S&P 500® Index and 50% Bloomberg Barclays U.S. Aggregate Bond Index.
| Ticker Symbols: |
| Class A: NAINX |
| Class C: POICX |
| Class I: VTAIX |
Tactical Allocation Fund
Fund Summary (Unaudited)
Portfolio Manager Commentary by
Kayne Anderson Rudnick
Investment Management, LLC
(Domestic and International Equity
Portfolio) and Newfleet Asset
Management, LLC
(Fixed Income Portfolio)
| ■ | The Fund is diversified and has investment objectives of capital appreciation and income.There is no guarantee that the Fund will meet its objectives. |
| ■ | For the fiscal year ended September 30, 2019, the Fund’s Class A shares at NAV returned 2.36%, Class C shares at NAV returned 1.48%, and Class I shares at NAV from January 29, 2019 (inception date) through September 30, 2019 returned 10.83%†*. For the fiscal year ended September 30, 2019, the Bloomberg Barclays U.S. Aggregate Bond Index; a broad-based fixed income index returned 10.30%; the MSCI ACWI ex USA SMID Cap Index (net) a broad-based International Index returned -4.54%; and the Russell 1000® Growth Index, a broad based US equity index, returned 3.71%. The Tactical Allocation Fund Linked Benchmark, the Fund’s style-specific benchmark, returned 5.89%. |
* Returns less than 1 year are not annualized.
† See footnote 5 on page 12.
All performance figures assume reinvestment of distributions and exclude the effect of sales charges. Performance data quoted represents past results. Past performance is no guarantee of future results, and current performance may be higher or lower than the performance shown above. Investment return and principal value will fluctuate so your shares, when redeemed, may be worth more or less than their original cost. Please visit Virtus.com for performance data current to the most recent month-end.
How did the markets perform during the Fund’s fiscal year ended September 30, 2019?
Domestic & International Equities
Stock market returns were mixed during the fiscal year ended September 30, 2019, with the S&P 500® Index advancing 4.25%, while small-capitalization stocks, as represented by the Russell 2000® Index, fell 8.89% and international developed markets, as measured by the MSCI EAFE® Index (net), declined 1.34%. The MSCI Emerging Markets Index (net) also suffered for the period, declining 2.02%. The 12-month period saw increasing risk aversion by investors
During the fiscal year, real estate and materials were the best performing sectors in the Russell 1000® Growth Index. The worst performing sectors were energy and health care. The best performing regions in the MSCI ACWI ex USA SMID Cap Index (net) were Latin America and Africa/Middle East, while Europe and Japan had the worst performance.
Global industrial activity slowed over the past 12 to 18 months, primarily due to continued global trade friction with China and the European Union (EU). As these trade disputes dragged on, they clearly affected business confidence and investment plans, particularly for the agricultural, industrial, and automotive industries.
Global consumer strength helped to defend the major economies from economic recession. The consumer, which represents the majority of gross domestic product (GDP) components, continued to benefit from plentiful jobs, modest wage growth, and rising net worth during the 12-month period.
Fixed Income
The 12-month period included multiple challenges, including bouts of elevated volatility. The final quarter of 2018 witnessed a meaningful mispricing of risk assets. This was especially
For information regarding the indexes and certain investment terms, see the Key Investment Terms starting on page 4.
Tactical Allocation Fund (Continued)
pronounced in December. Fixed income investors, like all market participants, continued to wrestle with volatility brought on by geopolitical developments, trade rhetoric, mixed global economic signals, and central banks’ attempts to normalize monetary policy via policy rate increases and balance sheet adjustments. U.S. economic data stayed on a positive trend, which contrasted with other global economies. During this time, U.S. Treasuries performed well while spread sector performance was mixed. Sectors within the securitized products universe, such as asset-backed securities and residential mortgage-backed securities, generally outperformed, whereas corporate and emerging markets-related sectors lagged. Within most spread sectors, assets with short and intermediate duration and those with higher credit ratings outperformed on a total return basis. The high yield sector was the largest underperformer during the fourth quarter of 2018.
The year 2019 began in stark contrast to how 2018 ended. While many of the same concerns loomed, major global central banks, including the Federal Reserve (the Fed) and the European Central Bank (ECB), reacted to slowing economic activity and tame inflation by pivoting their tone and policy toward easing. This significant development, combined with improved valuations, led to a return to favor of risk assets. Most spread sectors outperformed during the first three quarters of 2019, led by investment grade corporates, corporate high yield, and emerging markets. Within spread sectors, the asset classes that were hardest hit in late 2018 outperformed during the first nine months of 2019. Given the change in U.S. interest rates, longer duration within most asset classes outperformed on a total return basis. Securitized sectors, while still positive, lagged other sectors.
At its December 2018 meeting, the Fed raised its target range to 2.25% to 2.50%, up from 2.00% to 2.25%. The committee, indicating a pivot toward easing of monetary policy early in 2019,
signaled that rates are likely on hold for the balance of 2019. The Fed also announced changes to the management of its balance sheet. However, in early June the Chairman of the Fed indicated they are monitoring the impact of the tariff issues on the U.S. economic outlook, which was interpreted by the market that the Fed had opened the door to the rate cut discussion. The Fed subsequently lowered its target rate at both the July and September meetings to a range of 1.75-2.00%. The Committee continued through the end of the period to reinforce its view that current policy is appropriate and that it will continue to act to support the economic expansion.
The Treasury yield curve continued to twist and shift broadly flatter and lower during the 12 months ended September 30, 2019, and some segments of the U.S. yield curve remained inverted.
What factors affected the Fund’s performance during its fiscal year?
Domestic Equities
The Fund’s U.S. equity portfolio underperformed the Russell 1000® Growth Index for the fiscal year ended September 30, 2019. Negative stock selection in communication services and consumer staples detracted the most from performance. This was partially offset by strong stock selection and an underweight in health care, as well as strong stock selection in industrials.
The biggest contributors to performance during the period were Avalara and Paycom Software.
| • | Avalara has created a proprietary database of tax rules for disparate industries and added geographical distinctions for those rules to create a robust tool that is valuable for online merchants. A Supreme Court ruling in 2018 that requires sales tax determinations based on the location of the buyer has greatly increased the market for Avalara’s software. Avalara’s second quarter 2019 revenue growth accelerated for the sixth straight |
For information regarding the indexes and certain investment terms, see the Key Investment Terms starting on page 4.
Tactical Allocation Fund (Continued)
quarter, as 43 states have now adopted regulations to comply with the court ruling.
| • | Paycom Software’s cloud-based human capital management (HCM) and payroll software has carved out a niche as a nimble software as a service (SaaS) offering for small to medium-sized businesses. The company earned some of the best margins among its SaaS peers during the period due to the combination of its out-of-the-box solution, low cost research & development (R&D), and sales office strategy. Paycom’s revenue meaningfully exceeded expectations as its efforts to sell to larger employers proved highly successful. The company also saw improved retention and up-sell opportunities as a result of its differentiated mobile offering. |
| • | Other top contributors included MarketAxess Holdings, Zoetis, and Visa. |
The biggest detractors from portfolio performance were NVIDIA and Amazon.
| • | NVIDIA’s gaming segment struggled from the cryptocurrency mining boom and lackluster demand for its most recent chip, which is waiting for applications to catch up with its capabilities. While revenue in the most recent quarter disappointed again, gross margins exceeded expectations for the quarter, and the company guided higher for the next quarter. We continued to hold the stock at the end of the fiscal year. |
| • | Amazon continued on its powerful growth trajectory, powered by its wide-moat e-commerce business and dominant web services offering (AWS). However, two issues dented near-term sentiment. First, Amazon’s advertising offering grew nicely but did not exceed expectations as it had initially. Second, Amazon announced that it is rolling out one-day Prime shipping to all customers. This created some fulfillment inefficiencies in the second quarter, which caused margins to come in below consensus |
expectations. Despite the concerns, we continued to hold the stock in the Fund at the end of the period.
| • | Other bottom contributors included Netflix, HealthEquity, and Activision Blizzard. |
International Equities
Kayne Anderson Rudnick Investment Management, LLC (“KAR”) became the subadviser of the Fund’s international equity portfolio effective June 4, 2019. Performance of the Fund’s international equity portfolio prior thereto is that of a different manager.
The Fund’s international equity portfolio outperformed the MSCI ACWI ex USA SMID Cap Index (net) for the fiscal year ended September 30, 2019.
The biggest contributors to performance during the period were HeadHunter Group and ZOZO.
| • | Headhunter Group recently completed an initial public offering (IPO) in which we participated. The company has reported extremely strong revenue and profit growth since this time, and the shares reacted favorably during the 12-month period. |
| • | ZOZO operates a leading online fashion marketplace in Japan. The shares rallied after Yahoo! Japan made a tender offer to acquire ZOZO shares at a substantial premium. |
| • | Other top contributors included Banco Bradesco, Novartis, and Veolia Environnement, all of which were holdings from the previous investment manager of the portfolio. |
The biggest detractors from portfolio performance were Golden Ocean Group and Allergan.
| • | Golden Ocean Group and Allergan were holdings of the prior manager. These stocks are no longer held in the Fund. |
| • | Other top detractors included Ashtead Group, Sony, and TechnipFMC (holdings from the previous manager). These stocks were sold during the fiscal year. |
For information regarding the indexes and certain investment terms, see the Key Investment Terms starting on page 4.
Tactical Allocation Fund (Continued)
Fixed Income
The outperformance of most spread sectors relative to U.S. Treasuries was the key driver of the fixed income portfolio’s performance for the fiscal year ended September 30, 2019. Among fixed income sectors, the portfolio’s allocation to and issue selection within corporate high quality were positive contributors to performance. Issue selection within corporate high yield was also beneficial.
During the fiscal year, the portfolio’s allocations to asset-backed securities and bank loans were the largest detractors from performance.
The preceding information is the opinion of portfolio management only through the end of the period stated on the cover. Any such opinions are subject to change at any time based upon market or other conditions and should not be relied upon as investment advice. Past performance is no guarantee of future results, and there is no guarantee that market forecasts will be realized.
Equity Securities:The market price of equity securities may be adversely affected by financial market, industry, or issuer-specific events. Focus on a particular style or on small or medium-sized companies may enhance that risk.
Credit & Interest:Debt securities are subject to various risks, the most prominent of which are credit and interest rate risk. The issuer of a debt security may fail to make interest and/or principal payments. Values of debt securities may rise or fall in response to changes in interest rates, and this risk may be enhanced with longer-term maturities.
Foreign & Emerging Markets:Investing internationally, especially in emerging markets, involves additional risks such as currency, political, accounting, economic, and market risk.
Allocation:The Fund’s exposure to different asset classes may not be optimal for market conditions at a given time. Asset allocation does not guarantee a profit or protect against a loss in declining markets.
High Yield-High Risk Fixed Income Securities:There is a greater level of credit risk and price volatility involved with high yield securities than investment grade securities.
Prospectus:For additional information on risks, please see the Fund’s prospectus.
Asset Allocation
The following table presents asset allocation within certain sectors as a percentage of total investments as of September 30, 2019.
| Common Stocks | | 59% |
| Consumer Discretionary | 14% | |
| Information Technology | 14 | |
| Communication Services | 10 | |
| All other Common Stocks | 21 | |
| Corporate Bonds and Notes | | 18 |
| Financials | 6 | |
| Energy | 2 | |
| Real Estate | 2 | |
| All Other Corporate Bonds and Notes | 8 | |
| Mortgage-Backed Securities | | 10 |
| Asset-Backed Securities | | 4 |
| U.S. Government Securities | | 3 |
| Leveraged Loans | | 2 |
| Municipal Bonds | | 1 |
| Other (includes short-term investment and securities lending collateral) | | 3 |
| Total | | 100% |
For information regarding the indexes and certain investment terms, see the Key Investment Terms starting on page 4.
Tactical Allocation Fund (Continued)
Average Annual Total Returns1for periods ended 9/30/19
| | | 1 Year | 5 Years | 10 Years | Since
inception | Inception
date |
| Class A shares at NAV2 | | 2.36 % | 4.96 % | 7.36 % | — % | — |
| Class A shares at POP3,4 | | -3.53 | 3.73 | 6.72 | — | — |
| Class C shares at NAV2 and with CDSC4 | | 1.48 | 4.13 | 6.53 | — | — |
| Class I shares at NAV2 | | — | — | — | 10.83 5 | 1/29/19 |
| Bloomberg Barclays U.S. Aggregate Bond Index | | 10.30 | 3.38 | 3.75 | 7.94 6 | — |
| MSCI ACWI ex USA SMID Cap Index (net) | | -4.54 | 3.90 | 5.69 | 3.91 6 | — |
| MSCI EAFE® Index (net)* | | -1.34 | 3.27 | 4.90 | 7.07 6 | — |
| Russell 1000® Growth Index | | 3.71 | 13.39 | 14.94 | 16.95 6 | — |
| Tactical Allocation Fund Linked Benchmark | | 5.89 | 8.15 | 9.09 | 11.92 6 | — |
| Fund Expense Ratios7: Class A shares: 1.10%; Class C shares: 1.86%; Class I shares: 0.85%. | | | | | | |
All returns represent past performance which is no guarantee of future results. Current performance may be higher or lower than the performance shown. The investment return and principal value of an investment will fluctuate so that an investor’s shares, when redeemed, may be worth more or less than their original cost. The above table and graph below do not reflect the deduction of taxes that a shareholder would pay on fund distributions or the redemption of shares. Please visit Virtus.com for performance data current to the most recent month-end.
For information regarding the indexes and certain investment terms, see the Key Investment Terms starting on page 4.
Tactical Allocation Fund (Continued)
Growth of $10,000for periods ended 9/30
This chart assumes an initial investment of $10,000 made on September 30, 2009, for Class A shares and Class C shares including any applicable sales charges or fees. The performance of the other share class may be greater or less than that shown based on differences in inception dates, fees, and sales charges. Performance assumes reinvestment of dividends and capital gain distributions.

| 1 | Total returns are historical and include changes in share price and the reinvestment of both dividends and capital gain distributions. |
| 2 | “NAV” (Net Asset Value) total returns do not include the effect of any sales charge. |
| 3 | “POP” (Public Offering Price) total returns include the effect of the maximum front-end 5.75% sales charge. |
| 4 | “CDSC” (contingent deferred sales charge) is applied to redemptions of certain classes of shares that do not have a sales charge applied at the time of purchase. CDSC for certain redemptions of Class A shares made within 18 months of a finder’s fee being paid and all Class C shares are 1% within the first year and 0% thereafter. |
| 5 | Total Return for the report period presented in the table differs from the return in the Financial Highlights. The total return presented in the above table is calculated based on the NAV at which shareholder transactions were processed. The total return presented in the Financial Highlights section of the report is calculated in the same manner, but also takes into account certain adjustments that are necessary under generally accepted accounting principles required in the annual report and semiannual report. |
| 6 | The since inception index return is from the inception date of Class I shares. |
| 7 | The expense ratios of the Fund are set forth according to the prospectus for the Fund effective January 28, 2019, as supplemented and revised, and may differ from the expense ratios disclosed in the Financial Highlights tables in this report. See the Financial Highlights for more current expense ratios. Expense ratios include fees and expenses associated with any underlying funds. |
* The Fund changed its broad based International index during the year to the MSCI ACWI ex USA SMID Cap
Index (net), The Fund’s equity subadviser believes the MSCI ACWI ex USA SMID Cap Index better reflects the
markets and securities in which the Fund’s non-U.S. portfolio is invested than the Fund’s previous non-U.S.
benchmark, the MSCI EAFE® Index (net).
The indexes are unmanaged and not available for direct investment; therefore, their performance does not reflect the expenses associated with active management of an actual portfolio.
For information regarding the indexes and certain investment terms, see the Key Investment Terms starting on page 4.
Tactical Allocation Fund
SCHEDULE OF INVESTMENTS
September 30, 2019
($ reported in thousands)
| | Par Value | | Value |
| U.S. Government Securities—3.1% |
| U.S. Treasury Bond | | | |
| 2.500%, 2/15/46 | $4,850 | | $5,226 |
| 3.000%, 8/15/48 | 10,430 | | 12,413 |
U.S. Treasury Note
2.875%, 8/15/28 | 195 | | 214 |
Total U.S. Government Securities
(Identified Cost $14,685) | | 17,853 |
| | | | |
| |
| | | | |
| |
| Municipal Bonds—1.0% |
| California—0.5% | | |
State of California, Build America Bonds Taxable
7.600%, 11/1/40 | 1,275 | | 2,157 |
University of California, Series B-A, Taxable
4.428%, 5/15/48 | 380 | | 422 |
| | | | 2,579 |
| | | | |
| |
| Georgia—0.1% | | |
Rockdale County Water & Sewerage Authority Revenue Taxable
3.060%, 7/1/24 | 600 | | 618 |
| Idaho—0.1% | | |
Idaho Health Facilities Authority Saint Luke’s Health System Revenue Taxable
5.020%, 3/1/48 | 450 | | 575 |
| New York—0.2% | | |
New York City Transitional Finance Authority Future Tax Secured Revenue
4.000%, 5/1/42 | 1,155 | | 1,314 |
| | Par Value | | Value |
| | | | |
| Virginia—0.1% | | |
City of Bristol, General Obligation Taxable
4.210%, 1/1/42 | $640 | | $673 |
Total Municipal Bonds
(Identified Cost $5,408) | | 5,759 |
| | | | |
| |
| | | | |
| |
| Foreign Government Securities—0.5% |
| Bolivarian Republic of Venezuela | | | |
| 9.375%, 1/13/34(1) | 130 | | 14 |
RegS
8.250%, 10/13/24(1)(2) | 40 | | 4 |
RegS
7.650%, 4/21/25(1)(2) | 320 | | 34 |
| Dominican Republic | | | |
144A
6.875%, 1/29/26(3) | 100 | | 113 |
144A
5.950%, 1/25/27(3) | 160 | | 173 |
144A
6.000%, 7/19/28(3) | 150 | | 164 |
Kingdom of Jordan 144A
5.750%, 1/31/27(3) | 440 | | 451 |
Kingdom of Morocco 144A
5.500%, 12/11/42(3) | 200 | | 239 |
Kingdom of Saudi Arabia 144A
4.375%, 4/16/29(3) | 630 | | 707 |
| Republic of Turkey | | | |
| 7.375%, 2/5/25 | 170 | | 180 |
| 6.000%, 3/25/27 | 525 | | 515 |
| Sultanate of Oman | | | |
144A
5.375%, 3/8/27(3) | 470 | | 462 |
See Notes to Financial Statements.
Tactical Allocation Fund
SCHEDULE OF INVESTMENTS (Continued)
September 30, 2019
($ reported in thousands)
| | Par Value | | Value |
| | | | |
| Foreign Government Securities—continued |
144A
5.625%, 1/17/28(3) | $200 | | $197 |
Total Foreign Government Securities
(Identified Cost $3,431) | | 3,253 |
| | | | |
| |
| | | | |
| |
| Mortgage-Backed Securities—9.8% |
| Agency—0.3% | | |
| Federal Home Loan Mortgage Corporation | | | |
Pool #A46224
5.000%, 7/1/35 | 100 | | 111 |
Pool #A62213
6.000%, 6/1/37 | 152 | | 176 |
| Federal National Mortgage Association | | | |
Pool #254549
6.000%, 12/1/32 | 28 | | 32 |
Pool #735061
6.000%, 11/1/34 | 214 | | 247 |
Pool #880117
5.500%, 4/1/36 | 4 | | 4 |
Pool #938574
5.500%, 9/1/36 | 118 | | 133 |
Pool #310041
6.500%, 5/1/37 | 189 | | 224 |
Pool #909092
6.000%, 9/1/37 | 9 | | 10 |
Pool #972569
5.000%, 3/1/38 | 112 | | 121 |
Pool #909175
5.500%, 4/1/38 | 93 | | 105 |
Pool #929625
5.500%, 6/1/38 | 140 | | 157 |
Pool #909220
6.000%, 8/1/38 | 66 | | 76 |
| | | | 1,396 |
| | | | |
| |
| Non-Agency—9.5% | | |
Agate Bay Mortgage Trust 2016-3, A5 144A
3.500%, 8/25/46(3)(4) | 94 | | 96 |
| | Par Value | | Value |
| | | | |
| Non-Agency—continued | | |
Ajax Mortgage Loan Trust 2019-D, A1 144A
2.956%, 9/25/65(3)(4) | $879 | | $876 |
| American Homes 4 Rent Trust | | | |
2014-SFR2, C 144A
4.705%, 10/17/36(3) | 795 | | 858 |
2015-SFR1, A 144A
3.467%, 4/17/52(3) | 988 | | 1,028 |
2015-SFR2, C 144A
4.691%, 10/17/52(3) | 335 | | 365 |
| Angel Oak Mortgage Trust I LLC | | | |
2018-1, A1 144A
3.258%, 4/27/48(3)(4) | 190 | | 190 |
2018-2, A1 144A
3.674%, 7/27/48(3)(4) | 742 | | 749 |
2019-1, A1 144A
3.920%, 11/25/48(3)(4) | 681 | | 692 |
Angel Oak Mortgage Trust LLC 2019-3, A1 144A
2.930%, 5/25/59(3)(4) | 642 | | 646 |
| Arroyo Mortgage Trust | | | |
2018-1, A1 144A
3.763%, 4/25/48(3)(4) | 189 | | 193 |
2019-1, A1 144A
3.805%, 1/25/49(3)(4) | 237 | | 242 |
2019-2, A1 144A
3.347%, 4/25/49(3)(4) | 378 | | 384 |
Aventura Mall Trust 2013-AVM, C 144A
3.867%, 12/5/32(3)(4) | 580 | | 587 |
| Banc of America Funding Trust | | | |
2004-B, 2A1
4.943%, 11/20/34(4) | 64 | | 65 |
2005-1, 1A1
5.500%, 2/25/35 | 194 | | 199 |
Banc of America Mortgage Trust 2005-3, 1A15
5.500%, 4/25/35 | 88 | | 91 |
See Notes to Financial Statements.
Tactical Allocation Fund
SCHEDULE OF INVESTMENTS (Continued)
September 30, 2019
($ reported in thousands)
| | Par Value | | Value |
| | | | |
| Non-Agency—continued | | |
Bank of America (Merrill Lynch - Countrywide) Alternative Loan Trust 2004-22CB, 1A1
6.000%, 10/25/34 | $90 | | $92 |
Bank of America (Merrill Lynch - Countrywide) Home Loan Mortgage Pass-Through-Trust 2004-6, 1A2
4.614%, 5/25/34(4) | 284 | | 287 |
Bank of America (Merrill Lynch) Commercial Mortgage Securities Trust 2015-200P, A 144A
3.218%, 4/14/33(3) | 500 | | 525 |
| Bayview Opportunity Master Fund IVa Trust | | | |
2016-SPL1, B1 144A
4.250%, 4/28/55(3) | 510 | | 533 |
2017-SPL5, B1 144A
4.000%, 6/28/57(3)(4) | 100 | | 104 |
Bayview Opportunity Master Fund IVb Trust 2016-SPL2, B1 144A
4.250%, 6/28/53(3)(4) | 245 | | 256 |
Bunker Hill Loan Depositary Trust 2019-1, A1 144A
3.613%, 10/26/48(3)(4) | 1,150 | | 1,163 |
BX Trust 2018-MCSF, A (1 month LIBOR + 0.577%) 144A
2.604%, 4/15/35(3)(4) | 560 | | 558 |
Caesars Palace Las Vegas Trust 2017-VICI, C 144A
4.138%, 10/15/34(3) | 520 | | 544 |
| Citigroup Commercial Mortgage Trust | | | |
2013-375P, B 144A
3.635%, 5/10/35(3)(4) | 610 | | 631 |
2019-SST2, A (1 month LIBOR + 0.920%) 144A
2.948%, 12/15/36(3)(4) | 675 | | 674 |
| | Par Value | | Value |
| | | | |
| Non-Agency—continued | | |
| Citigroup Mortgage Loan Trust, Inc. | | | |
2015-A, A1 144A
3.500%, 6/25/58(3)(4) | $42 | | $42 |
2018-RP1, A1 144A
3.000%, 9/25/64(3)(4) | 1,003 | | 1,011 |
2019-RP1, A1 144A
3.500%, 1/25/66(3)(4) | 526 | | 539 |
| COLT Mortgage Loan Trust Funding LLC | | | |
2018-1, A1 144A
2.930%, 2/25/48(3)(4) | 127 | | 127 |
2019-1, A1 144A
3.705%, 3/25/49(3)(4) | 574 | | 582 |
2019-3, A1 144A
2.764%, 8/25/49(3)(4) | 932 | | 936 |
| CoreVest American Finance Trust | | | |
2018-1, A 144A
3.804%, 6/15/51(3) | 93 | | 96 |
2018-2, A 144A
4.026%, 11/15/52(3) | 162 | | 170 |
Credit Suisse Mortgage Capital Certificates 2019-ICE4, A (1 month LIBOR + 0.980%) 144A
3.008%, 5/15/36(3)(4) | 530 | | 530 |
Credit Suisse Mortgage Capital Trust 2014-IVR2, A2 144A
3.761%, 4/25/44(3)(4) | 37 | | 37 |
Deephaven Residential Mortgage Trust 2017-1A, A2 144A
2.928%, 12/26/46(3)(4) | 47 | | 47 |
| Ellington Financial Mortgage Trust | | | |
2017-1, A1 144A
2.687%, 10/25/47(3)(4) | 538 | | 536 |
2018-1, A1FX 144A
4.140%, 10/25/58(3)(4) | 267 | | 270 |
2019-1, A1 144A
2.934%, 6/25/59(3)(4) | 434 | | 435 |
See Notes to Financial Statements.
Tactical Allocation Fund
SCHEDULE OF INVESTMENTS (Continued)
September 30, 2019
($ reported in thousands)
| | Par Value | | Value |
| | | | |
| Non-Agency—continued | | |
| Galton Funding Mortgage Trust | | | |
2017-1, A21 144A
3.500%, 7/25/56(3)(4) | $164 | | $167 |
2018-1, A23 144A
3.500%, 11/25/57(3)(4) | 189 | | 190 |
2018-2, A41 144A
4.500%, 10/25/58(3)(4) | 588 | | 602 |
GCAT LLC 2019-NQM1, A1 144A
2.985%, 2/25/59(3)(4) | 338 | | 341 |
GSAA Home Equity Trust 2005-12, AF3W
4.999%, 9/25/35(4) | 129 | | 135 |
Hilton USA Trust 2016-SFP, B 144A
3.323%, 11/5/35(3) | 500 | | 499 |
| Homeward Opportunities Fund I Trust | | | |
2018-1, A1 144A
3.766%, 6/25/48(3)(4) | 114 | | 115 |
2018-2, A1 144A
3.985%, 11/25/58(3)(4) | 141 | | 143 |
2019-1, A1 144A
3.454%, 1/25/59(3)(4) | 573 | | 577 |
JPMorgan Chase (WaMu) Mortgage Pass-Through Certificates 2003-S11, 3A5
5.950%, 11/25/33 | 146 | | 149 |
| JPMorgan Chase Commercial Mortgage Securities Trust | | | |
2011-C4, A4 144A
4.388%, 7/15/46(3) | 117 | | 120 |
2014-C22, A4
3.801%, 9/15/47 | 300 | | 321 |
2015-C31, AS
4.106%, 8/15/48 | 565 | | 610 |
| JPMorgan Chase Mortgage Trust | | | |
2014-2, 2A2 144A
3.500%, 6/25/29(3)(4) | 67 | | 69 |
| | Par Value | | Value |
| | | | |
| Non-Agency—continued | | |
2014-1, 2A12 144A
3.500%, 1/25/44(3)(4) | $80 | | $81 |
2016-SH1, M2 144A
3.750%, 4/25/45(3)(4) | 368 | | 380 |
2016-SH2, M2 144A
3.750%, 12/25/45(3)(4) | 469 | | 489 |
2017-3, 2A2 144A
2.500%, 8/25/47(3)(4) | 191 | | 190 |
2017-5, A1 144A
3.178%, 10/26/48(3)(4) | 692 | | 701 |
2017-4, A3 144A
3.500%, 11/25/48(3)(4) | 270 | | 274 |
2018-8, A3 144A
4.000%, 1/25/49(3)(4) | 175 | | 178 |
KNDL Mortgage Trust 2019-KNSQ, A (1 month LIBOR + 0.800%) 144A
2.828%, 5/15/36(3)(4) | 565 | | 565 |
LHOME Mortgage Trust 2019-RTL1, A1 144A
4.580%, 10/25/23(3)(4)(5) | 670 | | 677 |
| MASTR Alternative Loan Trust | | | |
2005-5, 2A3
5.500%, 7/25/25 | 171 | | 173 |
2005-2, 2A1
6.000%, 1/25/35 | 68 | | 72 |
MASTR Specialized Loan Trust 2005-3, A2 144A
5.704%, 11/25/35(3)(4) | 140 | | 142 |
Mello Warehouse Securitization Trust 2019-1, C (1 month LIBOR + 1.200%) 144A
3.218%, 6/25/52(3)(4)(5) | 340 | | 340 |
| MetLife Securitization Trust | | | |
2017-1A, M1 144A
3.716%, 4/25/55(3)(4) | 100 | | 104 |
2019-1A, A1A 144A
3.750%, 4/25/58(3)(4) | 623 | | 644 |
See Notes to Financial Statements.
Tactical Allocation Fund
SCHEDULE OF INVESTMENTS (Continued)
September 30, 2019
($ reported in thousands)
| | Par Value | | Value |
| | | | |
| Non-Agency—continued | | |
| Mill City Mortgage Loan Trust | | | |
2017-1, A1 144A
2.750%, 11/25/58(3)(4) | $52 | | $52 |
2018-4, A1B 144A
3.500%, 4/25/66(3)(4) | 1,680 | | 1,720 |
| Morgan Stanley - Bank of America (Merrill Lynch) Trust | | | |
2013-C13, AS
4.266%, 11/15/46 | 275 | | 295 |
2015-C22, AS
3.561%, 4/15/48 | 835 | | 874 |
Motel 6 Trust 2017-MTL6, A (1 month LIBOR + 0.920%) 144A
2.948%, 8/15/34(3)(4) | 529 | | 529 |
| New Residential Mortgage Loan Trust | | | |
2018-4A, A1S (1 month LIBOR + 0.750%) 144A
2.768%, 1/25/48(3)(4) | 267 | | 266 |
2014-1A, A 144A
3.750%, 1/25/54(3)(4) | 375 | | 388 |
2015-2A, A1 144A
3.750%, 8/25/55(3)(4) | 257 | | 267 |
2016-1A, A1 144A
3.750%, 3/25/56(3)(4) | 121 | | 125 |
2016-4A, A1 144A
3.750%, 11/25/56(3)(4) | 84 | | 87 |
2016-4A, B1A 144A
4.500%, 11/25/56(3)(4) | 402 | | 433 |
2017-2A, A3 144A
4.000%, 3/25/57(3)(4) | 183 | | 190 |
2018-1A, A1A 144A
4.000%, 12/25/57(3)(4) | 682 | | 708 |
2019-NQM4, A1 144A
2.492%, 9/25/59(3)(4)(5) | 325 | | 325 |
NovaStar Mortgage Funding Trust 2004-4, M5 (1 month LIBOR + 1.725%)
3.743%, 3/25/35(4) | 288 | | 290 |
| | Par Value | | Value |
| | | | |
| Non-Agency—continued | | |
| OBX Trust | | | |
2018-EXP2, 1A1 144A
4.000%, 11/25/48(3)(4) | $835 | | $844 |
2019-INV1, A3 144A
4.500%, 11/25/48(3)(4) | 532 | | 549 |
One Market Plaza Trust 2017-1MKT, A 144A
3.614%, 2/10/32(3) | 470 | | 487 |
| Pretium Mortgage Credit Partners I LLC | | | |
2019-NPL3, A1 144A
3.105%, 7/27/59(3)(4) | 230 | | 230 |
2019-NPL1, A1 144A
4.213%, 7/25/60(3)(4) | 437 | | 441 |
| Progress Residential Trust | | | |
2018-SFR1, B 144A
3.484%, 3/17/35(3) | 980 | | 986 |
2018-SFR2, B 144A
3.841%, 8/17/35(3) | 475 | | 483 |
2019-SFR3, B 144A
2.571%, 9/17/36(3) | 460 | | 458 |
| PRPM LLC | | | |
2019-1A, A1 144A
4.500%, 1/25/24(3)(4) | 702 | | 707 |
2019-2A, A1 144A
3.967%, 4/25/24(3)(4) | 742 | | 750 |
RCO V Mortgage LLC 2019-1, A1 144A
3.721%, 5/24/24(3)(4) | 429 | | 431 |
Residential Asset Securitization Trust 2005-A1, A3
5.500%, 4/25/35 | 381 | | 394 |
Residential Mortgage Loan Trust 2019-2, A1 144A
2.913%, 5/25/59(3)(4) | 788 | | 790 |
Sequoia Mortgage Trust 2013-8, B1
3.529%, 6/25/43(4) | 249 | | 255 |
Starwood Mortgage Residential Trust 2019-IMC1, A1 144A
3.468%, 2/25/49(3)(4) | 394 | | 398 |
See Notes to Financial Statements.
Tactical Allocation Fund
SCHEDULE OF INVESTMENTS (Continued)
September 30, 2019
($ reported in thousands)
| | Par Value | | Value |
| | | | |
| Non-Agency—continued | | |
| Towd Point Mortgage Trust | | | |
2019-HE1, A1 (1 month LIBOR + 0.900%) 144A
2.918%, 4/25/48(3)(4) | $505 | | $505 |
2015-1, A2 144A
3.250%, 10/25/53(3)(4) | 500 | | 501 |
2015-3, A1B 144A
3.000%, 3/25/54(3)(4) | 53 | | 53 |
2016-1, A1B 144A
2.750%, 2/25/55(3)(4) | 58 | | 58 |
2016-1, M1 144A
3.500%, 2/25/55(3)(4) | 160 | | 163 |
2015-6, M1 144A
3.750%, 4/25/55(3)(4) | 100 | | 106 |
2015-5, A2 144A
3.500%, 5/25/55(3)(4) | 580 | | 590 |
2018-6, A1A 144A
3.750%, 3/25/58(3)(4) | 302 | | 310 |
2018-6, A2 144A
3.750%, 3/25/58(3)(4) | 800 | | 840 |
2019-1, A1 144A
3.750%, 3/25/58(3)(4) | 878 | | 921 |
2018-4, A1 144A
3.000%, 6/25/58(3)(4) | 1,097 | | 1,125 |
2018-SJ1, A1 144A
4.000%, 10/25/58(3)(4) | 250 | | 252 |
2015-2, 1M1 144A
3.250%, 11/25/60(3)(4) | 585 | | 595 |
Tricon American Homes Trust 2019-SFR1, C 144A
3.149%, 3/17/38(3) | 435 | | 436 |
Vericrest Opportunity Loan Trust 2019-NPL2, A1 144A
3.967%, 2/25/49(3)(4) | 443 | | 445 |
Vericrest Opportunity Loan Trust LXIV LLC 2017-NP11, A1 144A
3.375%, 10/25/47(3)(4) | 389 | | 390 |
| | Par Value | | Value |
| | | | |
| Non-Agency—continued | | |
Vericrest Opportunity Loan Trust LXIX LLC 2018-NPL5, A1A 144A
4.213%, 8/25/48(3)(4) | $541 | | $542 |
Vericrest Opportunity Loan Trust LXX LLC 2018-NPL6, A1A 144A
4.115%, 9/25/48(3)(4) | 211 | | 212 |
Vericrest Opportunity Loan Trust LXXI LLC 2018-NPL7, A1A 144A
3.967%, 9/25/48(3)(4) | 147 | | 148 |
Vericrest Opportunity Loan Trust LXXV LLC 2019-NPL1, A1A 144A
4.336%, 1/25/49(3)(4) | 598 | | 602 |
| Verus Securitization Trust | | | |
2017-2A, A1 144A
2.485%, 7/25/47(3)(4) | 175 | | 174 |
2018-1, A1 144A
2.929%, 2/25/48(3)(4) | 186 | | 186 |
2018-2, B1 144A
4.426%, 6/1/58(3)(4) | 580 | | 587 |
2018-3, A1 144A
4.108%, 10/25/58(3)(4) | 411 | | 416 |
2019-1, A1 144A
3.836%, 2/25/59(3)(4) | 677 | | 684 |
2019-INV1, A1 144A
3.402%, 12/25/59(3)(4) | 410 | | 413 |
| Wells Fargo Commercial Mortgage Trust | | | |
2014-C24, AS
3.931%, 11/15/47 | 565 | | 602 |
2015-LC20, A5
3.184%, 4/15/50 | 565 | | 591 |
See Notes to Financial Statements.
Tactical Allocation Fund
SCHEDULE OF INVESTMENTS (Continued)
September 30, 2019
($ reported in thousands)
| | Par Value | | Value |
| | | | |
| Non-Agency—continued | | |
2015-LC20, B
3.719%, 4/15/50 | $1,029 | | $1,081 |
| | | | 55,314 |
| | | | |
| |
Total Mortgage-Backed Securities
(Identified Cost $55,618) | | 56,710 |
| | | | |
| |
| | | | |
| |
| Asset-Backed Securities—4.3% |
| Auto Floor Plan—0.0% | | |
NextGear Floorplan Master Owner Trust 2018-1A, A2 144A
3.220%, 2/15/23(3) | 145 | | 147 |
| Automobiles—3.0% | | |
| ACC Trust | | | |
2018-1, A
144A 3.700%, 12/21/20(3) | 65 | | 65 |
2018-1, B
144A 4.820%, 5/20/21(3) | 550 | | 554 |
2019-1, A
144A 3.750%, 5/20/22(3) | 463 | | 467 |
| American Credit Acceptance Receivables Trust | | | |
2017-2, C
144A 2.860%, 6/12/23(3) | 163 | | 164 |
2018-1, C
144A 3.550%, 4/10/24(3) | 160 | | 161 |
2018-4, C
144A 3.970%, 1/13/25(3) | 680 | | 691 |
2019-2, C
144A 3.170%, 6/12/25(3) | 565 | | 571 |
Avis Budget Rental Car Funding LLC (AESOP) 2016-1A, A 144A
2.990%, 6/20/22(3) | 900 | | 910 |
| | Par Value | | Value |
| | | | |
| Automobiles—continued | | |
| Capital Auto Receivables Asset Trust | | | |
2017-1, C
144A 2.700%, 9/20/22(3) | $430 | | $434 |
2017-1, D
144A 3.150%, 2/20/25(3) | 135 | | 137 |
Centre Point Funding LLC 2012-2A, 1 144A
2.610%, 8/20/21(3) | 119 | | 119 |
CPS Auto Receivables Trust 2017-D, B 144A
2.430%, 1/18/22(3) | 473 | | 473 |
| Drive Auto Receivables Trust | | | |
2017-2, C
2.750%, 9/15/23 | 161 | | 161 |
2019-4, C
2.510%, 11/17/25 | 580 | | 581 |
| DT Auto Owner Trust | | | |
2018-1A, C
144A 3.470%, 12/15/23(3) | 145 | | 146 |
2018-3A, C
144A 3.790%, 7/15/24(3) | 380 | | 388 |
2019-2A, B
144A 2.990%, 4/17/23(3) | 565 | | 570 |
| Exeter Automobile Receivables Trust | | | |
2015-2A, C
144A 3.900%, 3/15/21(3) | 125 | | 126 |
2017-1A, B
144A 3.000%, 12/15/21(3) | 155 | | 155 |
2018-3A, C
144A 3.710%, 6/15/23(3) | 545 | | 554 |
2018-4A, D
144A 4.350%, 9/16/24(3) | 160 | | 166 |
See Notes to Financial Statements.
Tactical Allocation Fund
SCHEDULE OF INVESTMENTS (Continued)
September 30, 2019
($ reported in thousands)
| | Par Value | | Value |
| | | | |
| Automobiles—continued | | |
2019-1A, D
144A 4.130%, 12/16/24(3) | $155 | | $161 |
2019-2A, C
144A 3.300%, 3/15/24(3) | 570 | | 580 |
First Investors Auto Owner Trust 2016-2A, C 144A
2.530%, 7/15/22(3) | 505 | | 505 |
| Flagship Credit Auto Trust | | | |
2016-2, B
144A 3.840%, 9/15/22(3) | 366 | | 368 |
2017-3, C
144A 2.910%, 9/15/23(3) | 520 | | 523 |
2019-1, C
144A 3.600%, 2/18/25(3) | 835 | | 860 |
Foursight Capital Automobile Receivables Trust 2017-1, B 144A
3.050%, 12/15/22(3) | 420 | | 422 |
| GLS Auto Receivables Trust | | | |
2017-1A, B
144A 2.980%, 12/15/21(3) | 562 | | 563 |
2017-1A, C
144A 3.500%, 7/15/22(3) | 155 | | 156 |
2018-1A, B
144A 3.520%, 8/15/23(3) | 155 | | 156 |
2018-3A, C
144A 4.180%, 7/15/24(3) | 640 | | 661 |
| Hertz Vehicle Financing II LP | | | |
2016-4A, A
144A 2.650%, 7/25/22(3) | 685 | | 687 |
2019-1A, A
144A 3.710%, 3/25/23(3) | 560 | | 577 |
| | Par Value | | Value |
| | | | |
| Automobiles—continued | | |
Hyundai Auto Lease Securitization Trust 2018-A, A2A 144A
2.550%, 8/17/20(3) | $59 | | $59 |
| OneMain Direct Auto Receivables Trust | | | |
2017-2A, C
144A 2.820%, 7/15/24(3) | 420 | | 421 |
2018-1A, C
144A 3.850%, 10/14/25(3) | 355 | | 365 |
Prestige Auto Receivables Trust 2017-1A, C 144A
2.810%, 1/17/23(3) | 520 | | 522 |
| Skopos Auto Receivables Trust | | | |
2018-1A, B
144A 3.930%, 5/16/22(3) | 165 | | 166 |
2019-1A, C
144A 3.630%, 9/16/24(3) | 575 | | 575 |
Tesla Auto Lease Trust 2018-A, A 144A
2.320%, 12/20/19(3) | 12 | | 12 |
United Auto Credit Securitization Trust 2019-1, D 144A
3.470%, 8/12/24(3) | 565 | | 570 |
Veros Automobile Receivables Trust 2018-1, B 144A
4.050%, 2/15/24(3) | 135 | | 137 |
Westlake Automobile Receivables Trust 2017-2A, C 144A
2.590%, 12/15/22(3) | 525 | | 525 |
| | | | 17,164 |
| | | | |
| |
| Other—1.3% | | |
Aqua Finance Trust 2017-A, A 144A
3.720%, 11/15/35(3) | 86 | | 87 |
See Notes to Financial Statements.
Tactical Allocation Fund
SCHEDULE OF INVESTMENTS (Continued)
September 30, 2019
($ reported in thousands)
| | Par Value | | Value |
| | | | |
| Other—continued | | |
Arby’s Funding LLC 2015-1A, A2 144A
4.969%, 10/30/45(3) | $159 | | $163 |
CCG Receivables Trust 2018-1, A2 144A
2.500%, 6/16/25(3) | 612 | | 613 |
DB Master Finance LLC 2017-1A, A2I 144A
3.629%, 11/20/47(3) | 211 | | 216 |
Dell Equipment Finance Trust 2017-2, A3 144A
2.190%, 10/24/22(3) | 263 | | 263 |
Diamond Resorts Owner Trust 2017-1A, A 144A
3.270%, 10/22/29(3) | 156 | | 158 |
Drug Royalty II LP 2 2014-1, A2 144A
3.484%, 7/15/23(3) | 48 | | 48 |
Drug Royalty III LP 1 2016-1A, A 144A
3.979%, 4/15/27(3) | 46 | | 46 |
HOA Funding LLC 2014-1A, A2 144A
4.846%, 8/20/44(3) | 148 | | 149 |
Lendmark Funding Trust 2018-2A, A 144A
4.230%, 4/20/27(3) | 160 | | 166 |
| MVW Owner Trust | | | |
2016-1A, A
144A 2.250%, 12/20/33(3) | 192 | | 191 |
2017-1A, A
144A 2.420%, 12/20/34(3) | 259 | | 260 |
OneMain Financial Issuance Trust 2018-1A, A 144A
3.300%, 3/14/29(3) | 470 | | 478 |
Orange Lake Timeshare Trust 2019-A, B 144A
3.360%, 4/9/38(3) | 611 | | 621 |
| | Par Value | | Value |
| | | | |
| Other—continued | | |
Primose Funding LLC 2019-1A, A2 144A
4.475%, 7/30/49(3) | $575 | | $574 |
Prosper Marketplace Issuance Trust 2018-2A, B 144A
3.960%, 10/15/24(3) | 590 | | 596 |
Regional Management Issuance Trust 2018-2, A 144A
4.560%, 1/18/28(3) | 130 | | 133 |
Small Business Lending Trust 2019-A, A 144A
2.850%, 7/15/26(3) | 580 | | 580 |
SoFi Consumer Loan Program LLC 2016-3, A 144A
3.050%, 12/26/25(3) | 168 | | 169 |
SoFi Consumer Loan Program Trust 2019-3, A 144A
2.900%, 5/25/28(3) | 573 | | 577 |
Stack Infrastructure Issuer LLC 2019-1A, A2 144A
4.540%, 2/25/44(3) | 651 | | 683 |
TGIF Funding LLC 2017-1A, A2 144A
6.202%, 4/30/47(3) | 253 | | 248 |
Trinity Rail Leasing LLC 2019-1A, A 144A
3.820%, 4/17/49(3) | 558 | | 579 |
| | | | 7,598 |
| | | | |
| |
See Notes to Financial Statements.
Tactical Allocation Fund
SCHEDULE OF INVESTMENTS (Continued)
September 30, 2019
($ reported in thousands)
| | Par Value | | Value |
| | | | |
| Student Loan—0.0% | | |
SoFi Professional Loan Program LLC 2015-A, A2 144A
2.420%, 3/25/30(3) | $67 | | $67 |
Total Asset-Backed Securities
(Identified Cost $24,693) | | 24,976 |
| | | | |
| |
| | | | |
| |
| Corporate Bonds and Notes—17.6% |
| Communication Services—0.8% | | |
America Movil SAB de C.V.
6.450%, 12/5/22 | 20MXN | | 98 |
AT&T, Inc.
4.100%, 2/15/28 | 437 | | 473 |
Comcast Corp.
4.150%, 10/15/28 | 148 | | 166 |
| Diamond Sports Group LLC | | | |
| 144A 5.375%, 8/15/26(3) | 255 | | 265 |
| 144A 6.625%, 8/15/27(3) | 140 | | 145 |
Discovery Communications LLC
3.950%, 3/20/28 | 735 | | 766 |
| DISH DBS Corp. | | | |
| 5.875%, 7/15/22 | 280 | | 291 |
| 7.750%, 7/1/26 | 60 | | 61 |
| Frontier Communications Corp. | | | |
| 8.500%, 4/15/20(6) | 45 | | 23 |
| 144A 8.500%, 4/1/26(3) | 205 | | 205 |
| iHeartCommunications, Inc. | | | |
| 6.375%, 5/1/26(6) | 3 | | 4 |
| 8.375%, 5/1/27 | 6 | | 7 |
| 144A 5.250%, 8/15/27(3) | 50 | | 52 |
Escrow
0.000%, 5/1/23(5) | 55 | | — |
| | Par Value | | Value |
| | | | |
Communication
Services—continued | | |
Meredith Corp.
6.875%, 2/1/26 | $330 | | $335 |
Sirius XM Radio, Inc. 144A
5.500%, 7/1/29(3) | 170 | | 181 |
Sprint Spectrum Co. LLC 144A
4.738%, 3/20/25(3) | 750 | | 797 |
| Verizon Communications, Inc. | | | |
| 4.125%, 3/16/27 | 320 | | 353 |
(3 month LIBOR + 1.100%)
3.258%, 5/15/25(4) | 180 | | 183 |
| | | | 4,405 |
| | | | |
| |
| Consumer Discretionary—1.1% | | |
American Axle & Manufacturing, Inc.
6.500%, 4/1/27 | 350 | | 333 |
Brookfield Residential Properties, Inc. 144A
6.250%, 9/15/27(3) | 460 | | 462 |
Bunge Ltd. Finance Corp.
4.350%, 3/15/24 | 505 | | 532 |
Eldorado Resorts, Inc.
6.000%, 9/15/26 | 160 | | 175 |
Expedia Group, Inc. 144A
3.250%, 2/15/30(3) | 340 | | 339 |
Gateway Casinos & Entertainment Ltd. 144A
8.250%, 3/1/24(3) | 385 | | 399 |
General Motors Financial Co., Inc.
3.450%, 4/10/22 | 100 | | 102 |
| GLP Capital LP | | | |
| 5.250%, 6/1/25 | 100 | | 110 |
| 5.750%, 6/1/28 | 520 | | 592 |
IAA, Inc. 144A
5.500%, 6/15/27(3) | 55 | | 58 |
See Notes to Financial Statements.
Tactical Allocation Fund
SCHEDULE OF INVESTMENTS (Continued)
September 30, 2019
($ reported in thousands)
| | Par Value | | Value |
| | | | |
| Consumer Discretionary—continued | | |
Lear Corp.
3.800%, 9/15/27 | $775 | | $780 |
MGM Growth Properties Operating Partnership LP 144A
5.750%, 2/1/27(3) | 230 | | 258 |
Panther BF Aggregator 2 LP 144A
6.250%, 5/15/26(3) | 20 | | 21 |
PulteGroup, Inc.
6.375%, 5/15/33 | 280 | | 310 |
QVC, Inc.
4.375%, 3/15/23 | 700 | | 724 |
Scientific Games International, Inc. 144A
8.250%, 3/15/26(3) | 210 | | 224 |
TRI Pointe Group, Inc.
5.875%, 6/15/24 | 275 | | 293 |
Under Armour, Inc.
3.250%, 6/15/26 | 340 | | 328 |
William Lyon Homes, Inc.
6.000%, 9/1/23 | 485 | | 504 |
| | | | 6,544 |
| | | | |
| |
| Consumer Staples—0.5% | | |
Bacardi Ltd. 144A
4.700%, 5/15/28(3) | 920 | | 1,005 |
Conagra Brands, Inc.
4.300%, 5/1/24 | 670 | | 719 |
Flowers Foods, Inc.
4.375%, 4/1/22 | 700 | | 730 |
Kraft Heinz Foods Co. (The)
3.000%, 6/1/26 | 510 | | 505 |
Sigma Finance Netherlands BV 144A
4.875%, 3/27/28(3) | 200 | | 212 |
| | | | 3,171 |
| | | | |
| |
| Energy—1.8% | | |
Alliance Resource Operating Partners LP 144A
7.500%, 5/1/25(3) | 320 | | 316 |
| | Par Value | | Value |
| | | | |
| Energy—continued | | |
Boardwalk Pipelines LP
4.950%, 12/15/24 | $455 | | $487 |
Cheniere Energy Partners LP
5.625%, 10/1/26 | 245 | | 260 |
CrownRock LP 144A
5.625%, 10/15/25(3) | 345 | | 347 |
Energy Transfer Operating LP
4.200%, 4/15/27 | 680 | | 715 |
Helmerich & Payne, Inc.
4.650%, 3/15/25 | 395 | | 427 |
HollyFrontier Corp.
5.875%, 4/1/26 | 630 | | 706 |
KazMunayGas National Co. JSC 144A
4.750%, 4/19/27(3) | 200 | | 216 |
Kinder Morgan Energy Partners LP
7.500%, 11/15/40 | 595 | | 811 |
Kinder Morgan, Inc.
7.750%, 1/15/32 | 205 | | 282 |
| MPLX LP | | | |
| 4.000%, 3/15/28 | 571 | | 595 |
| 144A 4.250%, 12/1/27(3) | 330 | | 350 |
NuStar Logistics LP
5.625%, 4/28/27 | 350 | | 370 |
Odebrecht Offshore Drilling Finance Ltd. PIK Interest Capitalization, 144A
7.720%, 12/1/26(3)(7) | 177 | | 46 |
Odebrecht Oil & Gas Finance Ltd. 144A
0.000%(3)(8) | 25 | | —(9) |
Pertamina Persero PT 144A
6.450%, 5/30/44(3) | 780 | | 1,003 |
Petroleos de Venezuela S.A. 144A
6.000%, 5/16/24(1)(3) | 255 | | 20 |
Petroleos Mexicanos 144A
7.690%, 1/23/50(3) | 445 | | 464 |
See Notes to Financial Statements.
Tactical Allocation Fund
SCHEDULE OF INVESTMENTS (Continued)
September 30, 2019
($ reported in thousands)
| | Par Value | | Value |
| | | | |
| Energy—continued | | |
| Sabine Pass Liquefaction LLC | | | |
| 6.250%, 3/15/22 | $425 | | $458 |
| 4.200%, 3/15/28 | 500 | | 530 |
State Oil Co. of the Azerbaijan Republic RegS
6.950%, 3/18/30(2) | 655 | | 783 |
Transocean Guardian Ltd. 144A
5.875%, 1/15/24(3) | 120 | | 121 |
USA Compression Partners LP
6.875%, 4/1/26 | 475 | | 493 |
Valero Energy Partners LP
4.500%, 3/15/28 | 674 | | 737 |
| | | | 10,537 |
| | | | |
| |
| Financials—6.0% | | |
Acrisure LLC 144A
7.000%, 11/15/25(3) | 130 | | 121 |
AerCap Ireland Capital DAC
3.650%, 7/21/27 | 720 | | 734 |
Allstate Corp. (The) Series B
5.750%, 8/15/53(10) | 655 | | 699 |
Apollo Management Holdings LP 144A
4.000%, 5/30/24(3) | 690 | | 728 |
Ares Finance Co. LLC 144A
4.000%, 10/8/24(3) | 595 | | 586 |
Athene Holding Ltd.
4.125%, 1/12/28 | 600 | | 617 |
Aviation Capital Group LLC 144A
3.500%, 11/1/27(3) | 885 | | 882 |
Banco Bilbao Vizcaya Argentaria Bancomer S.A. 144A
5.125%, 1/18/33(3) | 540 | | 514 |
Banco de Credito e Inversiones 144A
3.500%, 10/12/27(3) | 645 | | 675 |
| | Par Value | | Value |
| | | | |
| Financials—continued | | |
Banco Santander Chile 144A
3.875%, 9/20/22(3) | $430 | | $446 |
| Bank of America Corp. | | | |
| 3.004%, 12/20/23 | 712 | | 727 |
| 4.200%, 8/26/24 | 662 | | 710 |
(3 month LIBOR + 0.770%)
3.057%, 2/5/26(4) | 110 | | 109 |
Bank of Montreal
3.803%, 12/15/32 | 1,126 | | 1,168 |
Brighthouse Financial, Inc.
3.700%, 6/22/27 | 715 | | 707 |
Brightsphere Investment Group, Inc.
4.800%, 7/27/26 | 735 | | 767 |
Brookfield Finance, Inc.
4.000%, 4/1/24 | 671 | | 714 |
| Capital One Financial Corp. | | | |
| 4.200%, 10/29/25 | 630 | | 671 |
| 3.750%, 7/28/26 | 765 | | 796 |
Citadel LP 144A
4.875%, 1/15/27(3) | 460 | | 469 |
| Citigroup, Inc. | | | |
| 4.050%, 7/30/22 | 700 | | 733 |
| 3.200%, 10/21/26 | 525 | | 542 |
(3 month LIBOR + 1.250%)
3.349%, 7/1/26(4) | 900 | | 913 |
Discover Bank
4.682%, 8/9/28 | 475 | | 497 |
Drawbridge Special Opportunities Fund LP 144A
5.000%, 8/1/21(3) | 250 | | 253 |
E*TRADE Financial Corp.
4.500%, 6/20/28 | 405 | | 441 |
Fairfax Financial Holdings Ltd.
4.850%, 4/17/28 | 705 | | 763 |
FS KKR Capital Corp.
4.250%, 1/15/20 | 615 | | 617 |
See Notes to Financial Statements.
Tactical Allocation Fund
SCHEDULE OF INVESTMENTS (Continued)
September 30, 2019
($ reported in thousands)
| | Par Value | | Value |
| | | | |
| Financials—continued | | |
| Goldman Sachs Group, Inc. (The) | | | |
| 5.750%, 1/24/22 | $600 | | $646 |
(3 month LIBOR + 1.170%)
3.328%, 5/15/26(4) | 685 | | 688 |
Guanay Finance Ltd. 144A
6.000%, 12/15/20(3) | 302 | | 305 |
ICAHN Enterprises LP 144A
6.250%, 5/15/26(3) | 575 | | 602 |
Jefferies Financial Group, Inc.
5.500%, 10/18/23 | 345 | | 375 |
| Jefferies Group LLC | | | |
| 6.875%, 4/15/21 | 78 | | 83 |
| 5.125%, 1/20/23 | 123 | | 132 |
| 4.850%, 1/15/27 | 340 | | 361 |
JPMorgan Chase & Co.
3.300%, 4/1/26 | 1,255 | | 1,315 |
Kazakhstan Temir Zholy Finance BV 144A
6.950%, 7/10/42(3) | 680 | | 910 |
| Liberty Mutual Group, Inc. | | | |
| 144A 4.250%, 6/15/23(3) | 153 | | 162 |
| 144A 4.569%, 2/1/29(3) | 537 | | 599 |
MetLife, Inc. Series D
5.875%(8) | 277 | | 300 |
| Morgan Stanley | | | |
| 3.125%, 7/27/26 | 740 | | 762 |
| 6.375%, 7/24/42 | 1,275 | | 1,856 |
Navient Corp.
6.750%, 6/25/25 | 415 | | 428 |
| Prudential Financial, Inc. | | | |
| 5.875%, 9/15/42 | 100 | | 108 |
| 5.625%, 6/15/43(10) | 755 | | 812 |
| Santander Holdings USA, Inc. | | | |
| 3.700%, 3/28/22 | 359 | | 368 |
| 3.500%, 6/7/24 | 455 | | 467 |
| 4.400%, 7/13/27 | 340 | | 364 |
SBA Tower Trust 144A
2.836%, 1/15/25(3) | 465 | | 466 |
| | Par Value | | Value |
| | | | |
| Financials—continued | | |
Societe Generale S.A. 144A
4.750%, 11/24/25(3) | $535 | | $575 |
| Springleaf Finance Corp. | | | |
| 6.875%, 3/15/25 | 235 | | 259 |
| 7.125%, 3/15/26 | 35 | | 39 |
Synchrony Financial
3.950%, 12/1/27 | 730 | | 748 |
Teachers Insurance & Annuity Association of America 144A
4.375%, 9/15/54(3) | 745 | | 780 |
Toronto-Dominion Bank (The)
3.625%, 9/15/31 | 820 | | 847 |
Trinity Acquisition plc
4.400%, 3/15/26 | 230 | | 250 |
UBS AG
7.625%, 8/17/22 | 500 | | 564 |
| Wells Fargo & Co. | | | |
| 3.550%, 9/29/25 | 510 | | 540 |
Series S
5.900%(8) | 570 | | 612 |
| | | | 34,922 |
| | | | |
| |
| Health Care—1.1% | | |
| AbbVie, Inc. | | | |
| 3.600%, 5/14/25 | 235 | | 244 |
| 3.200%, 5/14/26 | 585 | | 596 |
Advanz Pharma Corp.
8.000%, 9/6/24 | 22 | | 21 |
Anthem, Inc.
2.875%, 9/15/29 | 450 | | 445 |
Bausch Health Americas, Inc. 144A
9.250%, 4/1/26(3) | 75 | | 85 |
| Bausch Health Cos., Inc. | | | |
| 144A 7.000%, 3/15/24(3) | 15 | | 16 |
| 144A 5.500%, 11/1/25(3) | 310 | | 324 |
| Becton Dickinson & Co. | | | |
| 3.363%, 6/6/24 | 113 | | 118 |
| 3.700%, 6/6/27 | 356 | | 377 |
See Notes to Financial Statements.
Tactical Allocation Fund
SCHEDULE OF INVESTMENTS (Continued)
September 30, 2019
($ reported in thousands)
| | Par Value | | Value |
| | | | |
| Health Care—continued | | |
(3 month LIBOR + 0.875%)
2.979%, 12/29/20(4) | $94 | | $94 |
Catalent Pharma Solutions, Inc. 144A
5.000%, 7/15/27(3) | 70 | | 73 |
CVS Health Corp.
2.875%, 6/1/26 | 760 | | 761 |
| HCA, Inc. | | | |
| 5.375%, 2/1/25 | 180 | | 197 |
| 5.125%, 6/15/39 | 235 | | 257 |
| 5.250%, 6/15/49 | 350 | | 384 |
Mylan NV
3.950%, 6/15/26 | 595 | | 616 |
Par Pharmaceutical, Inc. 144A
7.500%, 4/1/27(3) | 215 | | 196 |
Perrigo Finance Unlimited Co.
4.375%, 3/15/26 | 570 | | 589 |
Surgery Center Holdings, Inc. 144A
6.750%, 7/1/25(3)(6) | 15 | | 13 |
Tenet Healthcare Corp. 144A
5.125%, 11/1/27(3) | 157 | | 162 |
Zimmer Biomet Holdings, Inc.
3.550%, 4/1/25 | 955 | | 1,003 |
| | | | 6,571 |
| | | | |
| |
| Industrials—1.3% | | |
American Airlines Pass-Through-Trust 2019-1, A
3.500%, 2/15/32 | 570 | | 591 |
Ashtead Capital, Inc. 144A
4.375%, 8/15/27(3) | 705 | | 725 |
Avolon Holdings Funding Ltd. 144A
4.375%, 5/1/26(3) | 565 | | 584 |
CNH Industrial N.V.
4.500%, 8/15/23 | 538 | | 570 |
| | Par Value | | Value |
| | | | |
| Industrials—continued | | |
Continental Airlines Pass-Through-Trust 1999-2, C2
6.236%, 3/15/20 | $37 | | $37 |
DP World plc 144A
6.850%, 7/2/37(3) | 370 | | 487 |
Hillenbrand, Inc.
4.500%, 9/15/26 | 590 | | 596 |
New Enterprise Stone & Lime Co., Inc. 144A
10.125%, 4/1/22(3) | 60 | | 62 |
Oshkosh Corp.
4.600%, 5/15/28 | 787 | | 848 |
Owens Corning
3.400%, 8/15/26 | 740 | | 744 |
Penske Truck Leasing Co., LP 144A
4.125%, 8/1/23(3) | 455 | | 482 |
Pentair Finance S.a.r.l
4.500%, 7/1/29 | 800 | | 830 |
TransDigm, Inc. 144A
6.250%, 3/15/26(3) | 225 | | 242 |
United Air Lines, Inc. Pass-Through-Trust 2007-1, A
6.636%, 7/2/22 | 543 | | 574 |
| | | | 7,372 |
| | | | |
| |
| Information Technology—1.0% | | |
Banff Merger Sub, Inc. 144A
9.750%, 9/1/26(3) | 15 | | 14 |
| Broadcom Corp. | | | |
| 3.000%, 1/15/22 | 195 | | 197 |
| 3.625%, 1/15/24 | 407 | | 416 |
Citrix Systems, Inc.
4.500%, 12/1/27 | 660 | | 714 |
| Dell International LLC | | | |
| 144A 6.020%, 6/15/26(3) | 100 | | 113 |
| 144A 4.900%, 10/1/26(3) | 360 | | 386 |
| 144A 8.100%, 7/15/36(3) | 270 | | 345 |
See Notes to Financial Statements.
Tactical Allocation Fund
SCHEDULE OF INVESTMENTS (Continued)
September 30, 2019
($ reported in thousands)
| | Par Value | | Value |
| | | | |
| Information Technology—continued | | |
Hewlett Packard Enterprise Co.
4.900%, 10/15/25 | $595 | | $660 |
Juniper Networks, Inc.
3.750%, 8/15/29 | 510 | | 512 |
Micron Technology, Inc.
4.185%, 2/15/27 | 565 | | 581 |
| Motorola Solutions, Inc. | | | |
| 4.600%, 2/23/28 | 440 | | 475 |
| 4.600%, 5/23/29 | 225 | | 245 |
Verisk Analytics, Inc.
4.000%, 6/15/25 | 685 | | 737 |
| VMware, Inc. | | | |
| 2.950%, 8/21/22 | 223 | | 226 |
| 3.900%, 8/21/27 | 333 | | 343 |
| | | | 5,964 |
| | | | |
| |
| Materials—1.3% | | |
Alpek SAB de C.V. 144A
5.375%, 8/8/23(3) | 260 | | 281 |
Anglo American Capital plc 144A
4.000%, 9/11/27(3) | 540 | | 558 |
ArcelorMittal
6.125%, 6/1/25 | 415 | | 467 |
BHP Billiton Finance USA Ltd. 144A
6.750%, 10/19/75(3)(10) | 455 | | 532 |
CRH America Finance, Inc. 144A
3.400%, 5/9/27(3) | 440 | | 455 |
CRH America, Inc. 144A
3.875%, 5/18/25(3) | 320 | | 340 |
DuPont de Nemours, Inc.
4.493%, 11/15/25 | 540 | | 596 |
Glencore Funding LLC 144A
4.000%, 3/27/27(3) | 685 | | 704 |
Greif, Inc. 144A
6.500%, 3/1/27(3) | 290 | | 308 |
Inversiones CMPC S.A. 144A
4.375%, 5/15/23(3) | 850 | | 886 |
Kraton Polymers LLC 144A
7.000%, 4/15/25(3) | 60 | | 63 |
| | Par Value | | Value |
| | | | |
| Materials—continued | | |
Olin Corp.
5.625%, 8/1/29 | $555 | | $577 |
SABIC Capital II BV 144A
4.500%, 10/10/28(3) | 660 | | 733 |
| Syngenta Finance N.V. | | | |
| 144A 4.441%, 4/24/23(3) | 200 | | 209 |
| 144A 4.892%, 4/24/25(3) | 200 | | 212 |
Vulcan Materials Co.
3.900%, 4/1/27 | 520 | | 546 |
| | | | 7,467 |
| | | | |
| |
| Real Estate—1.5% | | |
Alexandria Real Estate Equities, Inc.
3.950%, 1/15/27 | 345 | | 369 |
Corporate Office Properties LP
3.600%, 5/15/23 | 715 | | 728 |
| EPR Properties | | | |
| 4.750%, 12/15/26 | 865 | | 930 |
| 4.500%, 6/1/27 | 75 | | 80 |
ESH Hospitality, Inc. 144A
4.625%, 10/1/27(3) | 345 | | 346 |
Healthcare Realty Trust, Inc.
3.875%, 5/1/25 | 440 | | 460 |
Healthcare Trust of America Holdings LP
3.750%, 7/1/27 | 610 | | 639 |
Iron Mountain, Inc. 144A
4.875%, 9/15/29(3) | 475 | | 482 |
Kilroy Realty LP
4.375%, 10/1/25 | 640 | | 689 |
| Life Storage LP | | | |
| 3.500%, 7/1/26 | 540 | | 555 |
| 3.875%, 12/15/27 | 250 | | 264 |
| MPT Operating Partnership LP | | | |
| 5.000%, 10/15/27 | 240 | | 251 |
| 4.625%, 8/1/29 | 115 | | 118 |
Office Properties Income Trust
4.500%, 2/1/25 | 855 | | 882 |
See Notes to Financial Statements.
Tactical Allocation Fund
SCHEDULE OF INVESTMENTS (Continued)
September 30, 2019
($ reported in thousands)
| | Par Value | | Value |
| | | | |
| Real Estate—continued | | |
Physicians Realty LP
3.950%, 1/15/28 | $535 | | $560 |
Retail Opportunity Investments Partnership LP
4.000%, 12/15/24 | 485 | | 496 |
| Service Properties Trust | | | |
| 4.950%, 2/15/27 | 640 | | 649 |
| 4.375%, 2/15/30 | 40 | | 38 |
| | | | 8,536 |
| | | | |
| |
| Utilities—1.2% | | |
CenterPoint Energy, Inc.
4.250%, 11/1/28 | 680 | | 747 |
DPL, Inc. 144A
4.350%, 4/15/29(3) | 677 | | 669 |
Exelon Corp.
3.497%, 6/1/22 | 610 | | 626 |
FirstEnergy Transmission LLC 144A
4.350%, 1/15/25(3) | 735 | | 793 |
Pennsylvania Electric Co. 144A
3.600%, 6/1/29(3) | 635 | | 674 |
Perusahaan Listrik Negara PT 144A
4.125%, 5/15/27(3) | 210 | | 222 |
PSEG Power LLC
3.850%, 6/1/23 | 608 | | 643 |
Southern Power Co.
4.150%, 12/1/25 | 820 | | 888 |
Talen Energy Supply LLC 144A
6.625%, 1/15/28(3) | 260 | | 256 |
TerraForm Power Operating LLC 144A
5.000%, 1/31/28(3) | 350 | | 364 |
Transportadora de Gas Internacional SA ESP 144A
5.550%, 11/1/28(3) | 200 | | 231 |
| | Par Value | | Value |
| | | | |
| Utilities—continued | | |
Vistra Operations Co. LLC 144A
4.300%, 7/15/29(3) | $580 | | $595 |
| | | | 6,708 |
| | | | |
| |
Total Corporate Bonds and Notes
(Identified Cost $97,113) | | 102,197 |
| | | | |
| |
| | | | |
| |
| Leveraged Loans(4)—2.1% |
| Aerospace—0.1% | | |
Atlantic Aviation FBO, Inc. (1 month LIBOR + 3.750%)
5.800%, 12/6/25 | 84 | | 85 |
| Dynasty Acquisition Co., Inc. | | | |
Tranche B-1 (3 month LIBOR + 4.000%)
6.104%, 4/6/26 | 39 | | 39 |
Tranche B-2 (3 month LIBOR + 4.000%)
6.104%, 4/6/26 | 21 | | 21 |
TransDigm, Inc. 2018, Tranche E (1 month LIBOR + 2.500%)
4.544%, 5/30/25 | 207 | | 206 |
| | | | 351 |
| | | | |
| |
| Chemicals—0.0% | | |
Omnova Solutions, Inc. Tranche B-2 (1 month LIBOR + 3.250%)
5.294%, 8/25/23 | 102 | | 102 |
| Consumer Non-Durables—0.1% | | |
Kronos Acquisition Holdings, Inc. Tranche B-3 (3 month LIBOR + 4.000%)
6.256%, 5/15/23 | 444 | | 421 |
See Notes to Financial Statements.
Tactical Allocation Fund
SCHEDULE OF INVESTMENTS (Continued)
September 30, 2019
($ reported in thousands)
| | Par Value | | Value |
| | | | |
| Energy—0.1% | | |
California Resources Corp. 2016 (1 month LIBOR + 10.375%)
12.419%, 12/31/21 | $80 | | $70 |
CITGO Petroleum Corp. 2019, Tranche B (3 month LIBOR + 5.000%)
7.104%, 3/27/24 | 288 | | 289 |
Medallion Midland Acquisition LLC (1 month LIBOR + 3.250%)
5.294%, 10/30/24 | 79 | | 76 |
| | | | 435 |
| | | | |
| |
| Financial—0.1% | | |
Ditech Holding Corp. Tranche B (3 month PRIME + 0.000%)
0.000%, 6/30/22(1)(11) | 88 | | 35 |
Financial & Risk US Holdings, Inc. (1 month LIBOR + 3.750%)
5.794%, 10/1/25 | 451 | | 453 |
iStar, Inc. Tranche B (1 month LIBOR + 2.750%)
4.807%, 6/28/23 | 114 | | 114 |
| | | | 602 |
| | | | |
| |
| Food / Tobacco—0.1% | | |
CHG PPC Parent LLC First Lien (1 month LIBOR + 2.750%)
4.794%, 3/31/25 | 183 | | 183 |
Chobani LLC Tranche B (1 month LIBOR + 3.500%)
5.544%, 10/10/23 | 51 | | 50 |
| H-Food Holdings LLC | | | |
(1 month LIBOR + 3.688%)
5.731%, 5/23/25 | 69 | | 65 |
| | Par Value | | Value |
| | | | |
| Food / Tobacco—continued | | |
2018, Tranche B-2 (1 month LIBOR + 4.000%)
6.044%, 5/23/25 | $308 | | $291 |
| | | | 589 |
| | | | |
| |
| Forest Prod / Containers—0.0% | | |
Berry Global, Inc. Tranche U (1 month LIBOR + 2.500%)
4.549%, 7/1/26 | 230 | | 230 |
Spectrum Holdings III Corp. First Lien (1 month LIBOR + 3.250%)
5.294%, 1/31/25 | 40 | | 36 |
| | | | 266 |
| | | | |
| |
| Gaming / Leisure—0.1% | | |
Gateway Casinos & Entertainment Ltd. (3 month LIBOR + 3.000%)
5.104%, 12/1/23 | 49 | | 49 |
Seminole Tribe of Florida (1 month LIBOR + 1.750%)
3.794%, 7/8/24 | 333 | | 334 |
Stars Group Holdings B.V. (3 month LIBOR + 3.500%)
5.604%, 7/10/25 | 27 | | 27 |
Wyndham Hotels & Resorts, Inc. Tranche B (1 month LIBOR + 1.750%)
3.794%, 5/30/25 | 292 | | 293 |
| | | | 703 |
| | | | |
| |
| Healthcare—0.3% | | |
21st Century Oncology, Inc. Tranche B (3 month LIBOR + 6.125%)
8.455%, 1/16/23 | 30 | | 27 |
See Notes to Financial Statements.
Tactical Allocation Fund
SCHEDULE OF INVESTMENTS (Continued)
September 30, 2019
($ reported in thousands)
| | Par Value | | Value |
| | | | |
| Healthcare—continued | | |
Accelerated Health Systems LLC (1 month LIBOR + 3.500%)
5.542%, 10/31/25 | $74 | | $74 |
Agiliti Health, Inc. (1 month LIBOR + 3.000%)
5.125%, 1/4/26 | 15 | | 15 |
AHP Health Partners, Inc. (1 month LIBOR + 4.500%)
6.544%, 6/30/25 | 84 | | 84 |
| Bausch Health Cos., Inc. | | | |
(1 month LIBOR + 2.750%)
4.789%, 11/27/25 | 123 | | 123 |
(1 month LIBOR + 3.000%)
5.039%, 6/2/25 | 65 | | 65 |
CHG Healthcare Services, Inc. (1 month LIBOR + 3.000%)
5.044%, 6/7/23 | 316 | | 315 |
Explorer Holdings, Inc. (3 month LIBOR + 3.750%)
3.750%, 5/2/23 | 104 | | 103 |
IQVIA, Inc. Tranche B-3 (3 month LIBOR + 1.750%)
3.854%, 6/11/25 | 365 | | 366 |
LifePoint Health, Inc. Tranche B, First Lien (1 month LIBOR + 4.500%)
6.554%, 11/16/25 | 501 | | 501 |
NVA Holdings, Inc. Tranche B-4 (1 month LIBOR + 3.500%)
5.544%, 2/2/25 | 40 | | 40 |
| | | | 1,713 |
| | | | |
| |
| | Par Value | | Value |
| | | | |
| Housing—0.3% | | |
American Builders & Contractors Supply Co., Inc. Tranche B-2 (1 month LIBOR + 2.000%)
4.044%, 10/31/23 | $571 | | $571 |
Capital Automotive LP 2017, Tranche B-2 (1 month LIBOR + 2.500%)
4.550%, 3/25/24 | 273 | | 273 |
CPG International LLC (3 month LIBOR + 3.750%)
5.933%, 5/6/24 | 88 | | 87 |
Summit Materials LLC Tranche B (1 month LIBOR + 2.000%)
4.044%, 11/21/24 | 535 | | 535 |
| | | | 1,466 |
| | | | |
| |
| Information Technology—0.2% | | |
Applied Systems, Inc. Second Lien (3 month LIBOR + 7.000%)
9.104%, 9/19/25 | 57 | | 57 |
Boxer Parent Co., Inc. (1 month LIBOR + 4.250%)
6.294%, 10/2/25 | 506 | | 487 |
Kronos, Inc. 2018 (3 month LIBOR + 3.000%)
5.253%, 11/1/23 | 447 | | 448 |
| | | | 992 |
| | | | |
| |
| Media / Telecom - Broadcasting—0.1% | | |
iHeartCommunications, Inc. (1 month LIBOR + 4.000%)
6.100%, 5/1/26 | 11 | | 12 |
See Notes to Financial Statements.
Tactical Allocation Fund
SCHEDULE OF INVESTMENTS (Continued)
September 30, 2019
($ reported in thousands)
| | Par Value | | Value |
| | | | |
Media / Telecom -
Broadcasting—continued | | |
Nexstar Broadcasting, Inc. Tranche B-4 (3 month LIBOR + 2.750%)
0.000%, 9/18/26(11) | $360 | | $361 |
| | | | 373 |
| | | | |
| |
Media / Telecom - Cable/Wireless
Video—0.0% | | |
CSC Holdings LLC 2018 (1 month LIBOR + 2.250%)
4.278%, 1/15/26 | 274 | | 273 |
Media / Telecom -
Telecommunications—0.1% | | |
CenturyLink, Inc. Tranche B (1 month LIBOR + 2.750%)
4.794%, 1/31/25 | 455 | | 452 |
Media / Telecom - Wireless
Communications—0.0% | | |
CommScope, Inc. (1 month LIBOR + 3.250%)
5.294%, 4/4/26 | 90 | | 90 |
SBA Senior Finance II LLC (1 month LIBOR + 2.000%)
4.050%, 4/11/25 | 207 | | 207 |
| | | | 297 |
| | | | |
| |
| Service—0.2% | | |
Carlisle Food Service Products, Inc. First Lien (1 month LIBOR + 3.000%)
5.044%, 3/20/25 | 15 | | 14 |
| | Par Value | | Value |
| | | | |
| Service—continued | | |
Dun & Bradstreet Corp. (The) (1 month LIBOR + 5.000%)
7.054%, 2/6/26 | $415 | | $417 |
J2 Acquisition Ltd. Tranche B, First Lien (3 month LIBOR + 2.500%)
0.000%, 9/25/26(11) | 75 | | 75 |
Sedgwick Claims Management Services, Inc. (1 month LIBOR + 3.250%)
5.294%, 12/31/25 | 492 | | 484 |
TKC Holdings, Inc. First Lien (1 month LIBOR + 3.750%)
5.800%, 2/1/23 | 407 | | 399 |
| | | | 1,389 |
| | | | |
| |
| Transportation - Automotive—0.1% | | |
Navistar, Inc. Tranche B (1 month LIBOR + 3.500%)
5.530%, 11/6/24 | 330 | | 328 |
| Utility—0.2% | | |
APLP Holdings LP (1 month LIBOR + 2.750%)
4.794%, 4/13/23 | 86 | | 86 |
Brookfield WEC Holdings, Inc. First Lien (1 month LIBOR + 3.500%)
5.544%, 8/1/25 | 566 | | 568 |
Calpine Corp. 2019 (3 month LIBOR + 2.750%)
4.860%, 4/5/26 | 454 | | 455 |
See Notes to Financial Statements.
Tactical Allocation Fund
SCHEDULE OF INVESTMENTS (Continued)
September 30, 2019
($ reported in thousands)
| | Par Value | | Value |
| | | | |
| Utility—continued | | |
| Pacific Gas and Electric Co. | | | |
(1 month LIBOR + 2.250%)
4.320%, 12/31/20 | $195 | | $196 |
(4 month LIBOR + 1.125%)
1.125%, 12/31/20(12) | 70 | | 70 |
| | | | 1,375 |
| | | | |
| |
Total Leveraged Loans
(Identified Cost $12,226) | | 12,127 |
| | Shares | |
| Convertible Preferred Stock—0.7% |
| Information Technology—0.7% | |
| BDC Payments Holdings, Inc.(5)(13)(14) | 374,230 | 3,862 |
Total Convertible Preferred Stock
(Identified Cost $3,109) | 3,862 |
| | | |
| |
| | | |
| |
| Preferred Stocks—0.6% |
| Financials—0.5% | |
| Bank of New York Mellon Corp. (The) Series E, 4.950% | 525(15) | 527 |
| JPMorgan Chase & Co. Series Z, 5.300% | 800(15) | 808 |
| KeyCorp Series D, 5.000%(16) | 375(15) | 388 |
| M&T Bank Corp. Series F, 5.125%(16) | 476(15) | 500 |
| PNC Financial Services Group, Inc. (The) Series S, 5.000% | 715(15) | 742 |
| Zions Bancorp, 6.950% | 6,400 | 184 |
| | | 3,149 |
| | | |
| |
| | Shares | | Value |
| | | | |
| Industrials—0.1% | | |
| General Electric Co. Series D, 5.000% | 645(15) | | $612 |
Total Preferred Stocks
(Identified Cost $3,624) | | 3,761 |
| | | | |
| |
| | | | |
| |
| Common Stocks—58.9% |
| Communication Services—10.0% | | |
| 58.com, Inc. ADR(13) | 39,300 | | 1,938 |
| Activision Blizzard, Inc. | 67,710 | | 3,583 |
| Adevinta ASA Class A(13) | 96,970 | | 1,123 |
| Ascential plc | 481,822 | | 2,245 |
| Auto Trader Group plc | 416,388 | | 2,611 |
| Autohome, Inc. ADR(13) | 25,400 | | 2,112 |
| carsales.com Ltd. | 162,713 | | 1,679 |
| Clear Channel Outdoor Holdings, Inc.(13) | 1,381 | | 3 |
| CTS Eventim AG & Co. KGaA | 33,100 | | 1,865 |
| Facebook, Inc. Class A(13) | 90,120 | | 16,049 |
| Netflix, Inc.(13) | 34,480 | | 9,228 |
| REA Group Ltd. | 35,874 | | 2,620 |
| Rightmove plc | 530,871 | | 3,594 |
| Scout24 AG | 29,699 | | 1,693 |
| Tencent Holdings Ltd. ADR | 192,210 | | 8,002 |
| | | | 58,345 |
| | | | |
| |
| Consumer Discretionary—13.8% | | |
| Alibaba Group Holding Ltd. Sponsored ADR(13) | 87,350 | | 14,607 |
| Amazon.com, Inc.(13) | 12,520 | | 21,734 |
| Baozun, Inc. Sponsored ADR(13) | 36,400 | | 1,554 |
| Ctrip.com International Ltd. ADR(13) | 150,780 | | 4,416 |
| Home Depot, Inc. (The) | 21,360 | | 4,956 |
| Las Vegas Sands Corp. | 108,790 | | 6,284 |
| McDonald’s Corp. | 21,740 | | 4,668 |
| MercadoLibre, Inc.(13) | 8,140 | | 4,487 |
See Notes to Financial Statements.
Tactical Allocation Fund
SCHEDULE OF INVESTMENTS (Continued)
September 30, 2019
($ reported in thousands)
| | Shares | | Value |
| | | | |
| Consumer Discretionary—continued | | |
| NIKE, Inc. Class B | 92,160 | | $8,656 |
| Ross Stores, Inc. | 59,660 | | 6,554 |
| ZOZO, Inc. | 92,700 | | 2,136 |
| | | | 80,052 |
| | | | |
| |
| Consumer Staples—3.2% | | |
| Compania Cervecerias Unidas SA Sponsored ADR | 26,900 | | 597 |
| McCormick & Co., Inc. | 23,740 | | 3,710 |
| Monster Beverage Corp.(13) | 46,740 | | 2,714 |
| Philip Morris International, Inc. | 69,710 | | 5,293 |
| Procter & Gamble Co. (The) | 49,480 | | 6,154 |
| | | | 18,468 |
| | | | |
| |
| Energy—0.3% | | |
| Computer Modelling Group Ltd. | 264,419 | | 1,220 |
| Frontera Energy Corp. | 1,798 | | 17 |
| Pason Systems, Inc. | 51,500 | | 628 |
| | | | 1,865 |
| | | | |
| |
| Financials—5.2% | | |
| Bank of America Corp. | 293,600 | | 8,564 |
| Charles Schwab Corp. (The) | 101,060 | | 4,227 |
| Gruppo Mutuionline SpA | 108,581 | | 1,953 |
| MarketAxess Holdings, Inc. | 16,580 | | 5,430 |
| Mortgage Advice Bureau Holdings Ltd. | 393,241 | | 2,679 |
| Progressive Corp. (The) | 30,960 | | 2,392 |
| Sabre Insurance Group plc | 674,885 | | 2,448 |
| Vostok New Ventures Ltd. SDR(13) | 357,669 | | 2,416 |
| | | | 30,109 |
| | | | |
| |
| Health Care—4.0% | | |
| Bluebird Bio, Inc.(13) | 13,140 | | 1,206 |
| Danaher Corp. | 40,530 | | 5,854 |
| | Shares | | Value |
| | | | |
| Health Care—continued | | |
| Haw Par Corp., Ltd. | 149,800 | | $1,450 |
| HealthEquity, Inc.(13) | 45,780 | | 2,616 |
| Illumina, Inc.(13) | 9,930 | | 3,021 |
| Zoetis, Inc. | 73,060 | | 9,103 |
| | | | 23,250 |
| | | | |
| |
| Industrials—8.2% | | |
| 51job, Inc. ADR(13) | 21,100 | | 1,561 |
| Asiakastieto Group Oyj | 23,630 | | 688 |
| CoStar Group, Inc.(13) | 11,540 | | 6,846 |
| DSV A/S | 25,307 | | 2,408 |
| en-japan, Inc. | 65,400 | | 2,501 |
| Equifax, Inc. | 21,420 | | 3,013 |
| Fair Isaac Corp.(13) | 8,400 | | 2,550 |
| Haitian International Holdings Ltd. | 1,075,000 | | 2,203 |
| HeadHunter Group plc ADR | 209,800 | | 4,047 |
| JOST Werke AG | 64,706 | | 1,858 |
| Kansas City Southern | 34,790 | | 4,627 |
| Knorr-Bremse AG | 20,427 | | 1,920 |
| Roper Technologies, Inc. | 18,860 | | 6,725 |
| Rotork plc | 58,928 | | 226 |
| Uber Technologies, Inc.(6)(13) | 97,460 | | 2,970 |
| VAT Group AG | 13,982 | | 1,763 |
| Voltronic Power Technology Corp. | 80,850 | | 1,668 |
| | | | 47,574 |
| | | | |
| |
| Information Technology—12.7% | | |
| Accenture plc Class A | 27,250 | | 5,242 |
| Alten SA | 24,064 | | 2,749 |
| Amphenol Corp. Class A | 84,100 | | 8,116 |
| Avalara, Inc.(13) | 96,680 | | 6,506 |
| Bouvet ASA | 19,386 | | 643 |
| Douzone Bizon Co., Ltd. | 26,843 | | 1,468 |
| Fortnox AB | 23,147 | | 388 |
| NVIDIA Corp. | 43,950 | | 7,650 |
| Paycom Software, Inc.(13) | 52,940 | | 11,090 |
| SimCorp A/S | 4,526 | | 397 |
| Trade Desk, Inc. (The) Class A(13) | 30,680 | | 5,754 |
| Visa, Inc. Class A | 85,110 | | 14,640 |
See Notes to Financial Statements.
Tactical Allocation Fund
SCHEDULE OF INVESTMENTS (Continued)
September 30, 2019
($ reported in thousands)
| | Shares | | Value |
| | | | |
| Information Technology—continued | | |
| Webstep AS | 282,917 | | $734 |
| Workday, Inc. Class A(13) | 48,250 | | 8,201 |
| | | | 73,578 |
| | | | |
| |
| Materials—1.5% | | |
| Corp. Moctezuma SAB de C.V. | 482,093 | | 1,391 |
| Ecolab, Inc. | 37,740 | | 7,474 |
| | | | 8,865 |
| | | | |
| |
Total Common Stocks
(Identified Cost $243,133) | | 342,106 |
| | | | |
| |
| | | | |
| |
| Warrant—0.0% |
| Communication Services—0.0% | | |
| iHeartMedia, Inc.(5)(13) | 587 | | 8 |
Total Warrant
(Identified Cost $10) | | 8 |
| | | | |
| |
| | | | |
| |
Total Long-Term Investments—98.6%
(Identified Cost $463,050) | | 572,612 |
| | | | |
| |
| | | | |
| |
| Short-Term Investment—0.7% |
| Money Market Mutual Fund—0.7% |
| Dreyfus Government Cash Management Fund - Institutional Shares (seven-day effective yield 1.854%)(17) | 3,978,884 | | 3,979 |
Total Short-Term Investment
(Identified Cost $3,979) | | 3,979 |
| | | | |
| |
| | | | |
| |
| | Shares | | Value |
| | | | |
| | | | |
| Securities Lending Collateral—0.5% |
| Dreyfus Government Cash Management Fund - Institutional Shares (seven-day effective yield 1.854%)(17)(18) | 3,004,324 | | $3,004 |
Total Securities Lending Collateral
(Identified Cost $3,004) | | 3,004 |
| | | | |
| |
| | | | |
| |
TOTAL INVESTMENTS—99.8%
(Identified Cost $470,033) | | $579,595 |
| Other assets and liabilities, net—0.2% | | 1,321 |
| NET ASSETS—100.0% | | $580,916 |
| Abbreviations: |
| ADR | American Depositary Receipt |
| LIBOR | London Interbank Offered Rate |
| LLC | Limited Liability Company |
| LP | Limited Partnership |
| PIK | Payment-in-Kind Security |
| Foreign Currencies: |
| MXN | Mexican Peso |
| Footnote Legend: |
| (1) | Security in default; no interest payments are being received during the bankruptcy proceedings. |
| (2) | Regulation S security. Security is offered and sold outside of the United States, therefore, it is exempt from registration with the SEC under Rules 903 and 904 of the Securities Act of 1933. |
For information regarding the abbreviations, see the Key Investment Terms starting on page 4.
See Notes to Financial Statements.
Tactical Allocation Fund
SCHEDULE OF INVESTMENTS (Continued)
September 30, 2019
($ reported in thousands)
| (3) | Security exempt from registration under Rule 144A of the Securities Act of 1933. These securities may be resold in transactions exempt from registration, normally to qualified institutional buyers. At September 30, 2019, these securities amounted to a value of $106,279 or 18.3% of net assets. |
| (4) | Variable rate security. Rate disclosed is as of September 30, 2019. For leveraged loans, the rate shown may represent a weighted average interest rate. Information in parenthesis represents benchmark and reference rate for each security. Certain variable rate securities are not based on a published reference rate and spread but are determined by the issuer or agent and are based on current market conditions, or, for mortgage-backed securities, are impacted by the individual mortgages which are paying off over time. These securities do not indicate a reference rate and spread in their descriptions. |
| (5) | The value of this security was determined using significant unobservable inputs and is reported as a Level 3 security in the Fair Value Hierarchy table located after the Schedule of Investments. |
| (6) | All or a portion of security is on loan. |
| (7) | 87% of the income received was in cash and 13% was in PIK. |
| (8) | No contractual maturity date. |
| (9) | Amount is less than $500. |
| (10) | Interest payments may be deferred. |
| (11) | This loan will settle after September 30, 2019, at which time the interest rate, based on the LIBOR and the agreed upon spread on trade date, will be reflected. |
| (12) | Represents unfunded portion of security and commitment fee earned on this portion. |
| (13) | Non-income producing. |
| (14) | Restricted security. |
| (15) | Value shown as par value. |
| (16) | Interest may be forfeited. |
| (17) | Shares of this fund are publicly offered, and its prospectus and annual report are publicly available. |
| (18) | Represents security purchased with cash collateral received for securities on loan. |
| Country Weightings (Unaudited)† |
| United States | 79% |
| China | 6 |
| United Kingdom | 3 |
| Germany | 1 |
| Canada | 1 |
| Australia | 1 |
| Japan | 1 |
| Other | 8 |
| Total | 100% |
| † % of total investments as of September 30, 2019. |
See Notes to Financial Statements.
Tactical Allocation Fund
SCHEDULE OF INVESTMENTS (Continued)
September 30, 2019
($ reported in thousands)
The following table summarizes the market value of the Fund’s investments as of September 30, 2019, based on the inputs used to value them (See Security Valuation Note 2A in the Notes to Financial Statements):
| | Total
Value at
September 30, 2019 | | Level 1
Quoted Prices | | Level 2
Significant
Observable
Inputs | | Level 3
Significant
Unobservable
Inputs |
| Assets: | | | | | | | |
| Debt Securities: | | | | | | | |
| Asset-Backed Securities | $24,976 | | $— | | $24,976 | | $— |
| Corporate Bonds and Notes | 102,197 | | — | | 102,197 | | — |
| Foreign Government Securities | 3,253 | | — | | 3,253 | | — |
| Leveraged Loans | 12,127 | | — | | 12,127 | | — |
| Mortgage-Backed Securities | 56,710 | | — | | 55,368 | | 1,342 |
| Municipal Bonds | 5,759 | | — | | 5,759 | | — |
| U.S. Government Securities | 17,853 | | — | | 17,853 | | — |
| Equity Securities: | | | | | | | |
| Common Stocks | 342,106 | | 342,106 | | — | | — |
| Preferred Stocks | 3,761 | | 184 | | 3,577 | | — |
| Convertible Preferred Stock | 3,862 | | — | | — | | 3,862 |
| Warrant | 8 | | — | | — | | 8 |
| Securities Lending Collateral | 3,004 | | 3,004 | | — | | — |
| Money Market Mutual Fund | 3,979 | | 3,979 | | — | | — |
| Total Investments | $579,595 | | $349,273 | | $225,110 | | $5,212 |
There were no transfers into or out of Level 3 related to securities held at September 30, 2019.
Some of the Fund’s investments that were categorized as Level 3 were valued utilizing third party pricing information without adjustment. Such valuations are based on unobservable inputs. A significant change in third party information could result in a significantly lower or higher value of Level 3 investments.
See Notes to Financial Statements.
Tactical Allocation Fund
SCHEDULE OF INVESTMENTS (Continued)
September 30, 2019
($ reported in thousands)
The following is a reconciliation of assets of the Fund for Level 3 investments for which significant unobservable inputs were used to determine fair value.
| | Total | | Corporate
Bonds
and Notes | | Mortgage-Backed
Securities | | Convertible
Preferred
Stock | | Warrant |
| Investments in Securities | | | | | | | | | |
| Balance as of September 30, 2018: | $— | | $— | | $— | | $— | | $— |
| Accrued discount/(premium) | —(a) | | — | | —(a) | | — | | — |
Change in unrealized
appreciation (depreciation)(c) | 758 | | — | | 7 | | 753 | | (2) |
| Purchases | 4,478 | | 24 | | 1,335 | | 3,109 | | 10 |
| Sales | (24) | | (24) | | — | | — | | — |
| Balance as of September 30, 2019 | $5,212 | | $—(b) | | $1,342 | | $3,862 | | $8 |
| (a) Amount is less than $500. | | | | | | | | | |
(b) Includes internally fair valued security currently priced at $0.
(c) The change in unrealized appreciation (depreciation) on investments still held at September 30, 2019, was $758.
BDC Payment Holdings, Inc.
The significant unobservable inputs used in the fair value measurement of the reporting entity’s convertible preferred stock is based on a market approach of comparable companies’ projected revenue multiples and ranges from 8.0x to 10.8x. Significant increases (decreases) in this input would result in a significantly lower (higher) fair value measurement.
See Notes to Financial Statements.
TACTICAL ALLOCATION FUND
STATEMENT OF ASSETS AND LIABILITIES
September 30, 2019
(Reported in thousands except shares and per share amounts)
| Assets | |
Investment in securities at value(1)(2)
| $579,595 |
Foreign currency at value(3)
| 33 |
Cash
| 3,717 |
| Receivables | |
Investment securities sold
| 64 |
Fund shares sold
| 151 |
Dividends and interest
| 1,772 |
Tax reclaims
| 37 |
Securities lending income
| 6 |
Prepaid Trustees’ retainer
| 11 |
Prepaid expenses
| 37 |
Other assets
| 48 |
Total assets
| 585,471 |
| Liabilities | |
| Payables | |
Fund shares repurchased
| 258 |
Investment securities purchased
| 511 |
Collateral on securities loaned
| 3,004 |
Investment advisory fees
| 266 |
Distribution and service fees
| 126 |
Administration and accounting fees
| 51 |
Transfer agent and sub-transfer agent fees and expenses
| 158 |
Professional fees
| 57 |
Trustee deferred compensation plan
| 48 |
Other accrued expenses
| 76 |
Total liabilities
| 4,555 |
Net Assets
| $580,916 |
| Net Assets Consist of: | |
Capital paid in on shares of beneficial interest
| $465,091 |
Accumulated earnings (loss)
| 115,825 |
Net Assets
| $580,916 |
| Net Assets: | |
Class A
| $569,543 |
Class C
| $8,560 |
Class I
| $2,813 |
| Shares Outstanding (unlimited number of shares authorized, no par value): | |
Class A
| 59,907,567 |
Class C
| 874,943 |
Class I
| 295,983 |
See Notes to Financial Statements.
TACTICAL ALLOCATION FUND
STATEMENT OF ASSETS AND LIABILITIES (Continued)
September 30, 2019
(Reported in thousands except shares and per share amounts)
| Net Asset Value and Redemption Price Per Share: | |
Class A
| $9.51 |
Class C
| $9.78 |
Class I
| $9.51 |
| Maximum Offering Price per Share (NAV/(1-5.75%*)): | |
Class A
| $10.09 |
| * Maximum sales charge | |
(1)Investment in securities at cost
| $470,033 |
(2) Market value of securities on loan
| $2,950 |
(3) Foreign currency at cost
| $33 |
| | |
See Notes to Financial Statements.
TACTICAL ALLOCATION FUND
STATEMENT OF OPERATIONS
YEAR ENDED September 30, 2019
($ reported in thousands)
| Investment Income | |
Dividends
| $3,929 |
Dividends from affiliated fund
| 69 |
Interest
| 7,103 |
Security lending, net of fees
| 54 |
Foreign taxes withheld
| (176) |
Total investment income
| 10,979 |
| Expenses | |
Investment advisory fees
| 2,482 |
Distribution and service fees, Class A
| 1,092 |
Distribution and service fees, Class C
| 71 |
Administration and accounting fees
| 472 |
Transfer agent fees and expenses
| 280 |
Sub-transfer agent fees and expenses, Class A
| 201 |
Sub-transfer agent fees and expenses, Class C
| 10 |
Sub-transfer agent fees and expenses, Class I
| 1 |
Custodian fees
| 4 |
Printing fees and expenses
| 52 |
Professional fees
| 90 |
Interest expense
| 1 |
Registration fees
| 51 |
Trustees’ fees and expenses
| 31 |
Miscellaneous expenses
| 290 |
Total expenses
| 5,128 |
Less expenses reimbursed and/or waived by investment adviser(1)
| (12) |
Less low balance account fees
| (13) |
Net expenses
| 5,103 |
Net investment income (loss)
| 5,876 |
| Net Realized and Unrealized Gain (Loss) on Investments | |
| Net realized gain (loss) from: | |
Unaffiliated investments
| 10,141 |
Affiliated fund
| (212) |
Foreign currency transactions
| (129) |
Net increase from payment by affiliates(2)
| 12 |
| Net change in unrealized appreciation (depreciation) on: | |
Unaffiliated investments
| 27,049 |
Affiliated fund
| 47 |
Foreign currency transactions
| 1 |
Net realized and unrealized gain (loss) on investments
| 36,909 |
Net increase (decrease) in net assets resulting from operations
| $42,785 |
| | |
| (1) | See Note 3D in the Notes to Financial Statements. |
| (2) | See Note 3H in the Notes to Financial Statements. |
See Notes to Financial Statements.
TACTICAL ALLOCATION FUND
STATEMENTS OF CHANGES IN NET ASSETS
($ reported in thousands)
| | Year Ended
September 30,
2019 | | Year Ended
September 30,
2018 |
| Increase (Decrease) in Net Assets Resulting from Operations | | | |
Net investment income (loss)
| $5,876 | | $2,188 |
Net realized gain (loss)
| 9,800 | | 3,139 |
Net increase from payment by affiliates(1)
| 12 | | — |
Net change in unrealized appreciation (depreciation)
| 27,097 | | 8,501 |
Increase (decrease) in net assets resulting from operations
| 42,785 | | 13,828 |
| Dividends and Distributions to Shareholders | | | |
| Net Investment Income and Net Realized Gains: | | | |
Class A
| (8,659) | | (3,216)(2) |
Class C
| (106) | | (53)(2) |
Class I
| (23) | | — |
Total Dividends and Distributions to Shareholders
| (8,788) | | (3,269) |
| Change in Net Assets from Capital Transactions | | | |
| Shares sold and cross class conversions: | | | |
Class A (618 and 526 shares, respectively)
| 5,756 | | 4,961 |
Class C (178 and 32 shares, respectively)
| 1,738 | | 308 |
Class I (315 and — shares, respectively)
| 2,979 | | — |
| Net assets from merger(3): | | | |
Class A (48,375 and — shares, respectively)
| 423,501 | | — |
Class C (636 and — shares, respectively)
| 5,724 | | — |
| Reinvestment of distributions: | | | |
Class A (891 and 309 shares, respectively)
| 7,982 | | 2,896 |
Class C (12 and 5 shares, respectively)
| 101 | | 51 |
Class I (2 and — shares, respectively)
| 22 | | — |
| Shares repurchased and cross class conversions: | | | |
Class A ((5,183) and ((1,461)) shares, respectively)
| (48,127) | | (13,765) |
Class C ((327) and ((99)) shares, respectively)
| (3,141) | | (955) |
Class I ((21) and (—) shares, respectively)
| (206) | | — |
Increase (decrease) in net assets from capital transactions
| 396,329 | | (6,504) |
Net increase (decrease) in net assets
| 430,326 | | 4,055 |
| Net Assets | | | |
Beginning of period
| 150,590 | | 146,535 |
End of Period
| $580,916 | | $150,590 |
Accumulated undistributed net investment income (loss) at end of period
| N/A | | $(212) |
| (1) | See Note 3H in the Notes to Financial Statements. |
See Notes to Financial Statements.
TACTICAL ALLOCATION FUND
STATEMENTS OF CHANGES IN NET ASSETS (Continued)
($ reported in thousands)
| (2) | For the year ended September 30, 2018, the distributions to shareholders for the Fund were as follows:
|
| Dividends and Distributions to Shareholders | | |
| Net investment income: | | |
Class A
| | $(2,102) |
Class C
| | (23) |
| Net realized gains: | | |
Class A
| | (1,114) |
Class C
| | (30) |
Total
| | $(3,269) |
| (3) | See Note 11 in Notes to Financial Statements for more information. |
See Notes to Financial Statements.
THIS PAGE INTENTIONALLY BLANK.
THIS PAGE INTENTIONALLY BLANK.
TACTICAL ALLOCATION FUND
FINANCIAL HIGHLIGHTS
SELECTED PER SHARE DATA AND RATIOS FOR A SHARE OUTSTANDING
THROUGHOUT EACH PERIOD
| | Net Asset Value,
Beginning of Period | Net Investment Income (Loss)(1) | Net Realized and
Unrealized Gain (Loss) | Total from Investment Operations | Dividends from
Net Investment Income | Distributions from
Net Realized Gains | Total Distributions |
| | | | | | | | |
| Class A | | | | | | | |
| 10/1/18 to 9/30/19 | $9.66 | 0.13 | 0.06 | 0.19 | (0.12) | (0.22) | (0.34) |
| 10/1/17 to 9/30/18 | 9.00 | 0.14 | 0.73 | 0.87 | (0.14) | (0.07) | (0.21) |
| 4/1/16 to 9/30/17(9) | 8.33 | 0.08 | 0.69 | 0.77 | (0.08) | (0.02) | (0.10) |
| 4/1/16 to 3/31/17 | 8.44 | 0.17 | 0.56 | 0.73 | (0.15) | (0.69) | (0.84) |
| 4/1/15 to 3/31/16 | 9.75 | 0.20 | (0.88) | (0.68) | (0.17) | (0.46) | (0.63) |
| 4/1/14 to 3/31/15 | 10.06 | 0.21 | 0.15 | 0.36 | (0.20) | (0.47) | (0.67) |
| Class C | | | | | | | |
| 10/1/18 to 9/30/19 | $9.93 | 0.06 | 0.05 | 0.11 | (0.04) | (0.22) | (0.26) |
| 10/1/17 to 9/30/18 | 9.24 | 0.07 | 0.75 | 0.82 | (0.06) | (0.07) | (0.13) |
| 4/1/16 to 9/30/17(9) | 8.55 | 0.05 | 0.70 | 0.75 | (0.04) | (0.02) | (0.06) |
| 4/1/16 to 3/31/17 | 8.64 | 0.11 | 0.57 | 0.68 | (0.08) | (0.69) | (0.77) |
| 4/1/15 to 3/31/16 | 9.96 | 0.14 | (0.90) | (0.76) | (0.10) | (0.46) | (0.56) |
| 4/1/14 to 3/31/15 | 10.27 | 0.13 | 0.16 | 0.29 | (0.13) | (0.47) | (0.60) |
| Class I | | | | | | | |
| 1/29/19(13) to 9/30/19 | $8.66 | 0.10 | 0.85 | 0.95 | (0.10) | — | (0.10) |
The footnote legend is at the end of the financial highlights.
See Notes to Financial Statements.
TACTICAL ALLOCATION FUND
FINANCIAL HIGHLIGHTS (Continued)
SELECTED PER SHARE DATA AND RATIOS FOR A SHARE OUTSTANDING
THROUGHOUT EACH PERIOD
| Payment from Affiliates(1) | Change in Net Asset Value | Net Asset Value, End of Period | Total Return(2)(3) | Net Assets, End of Period
(in thousands) | Ratio of Net Expenses to
Average Net Assets(4)(5) | Ratio of Gross Expenses
to Average Net Assets(4)(5) | Ratio of Net Investment Income (Loss)
to Average Net Assets(4) | Portfolio Turnover Rate |
| | | | | | | | | |
| | | | | | | | | |
| — (6) | (0.15) | $9.51 | 2.36 % (7) | $569,543 | 1.14 % (8) | 1.14 % | 1.33 % | 51 % |
| — | 0.66 | 9.66 | 9.73 | 146,854 | 1.26 | 1.27 | 1.47 | 41 |
| — | 0.67 | 9.00 | 9.25 | 142,481 | 1.38 | 1.38 | 1.81 | 26 |
| — | (0.11) | 8.33 | 9.20 (10) | 137,388 | 1.37 (10)(11) | 1.38 | 1.86 (10) | 104 |
| — | (1.31) | 8.44 | (7.36) | 147,546 | 1.32 | 1.33 | 2.25 | 81 |
| — | (0.31) | 9.75 | 3.60 | 180,435 | 1.30 | 1.30 | 2.09 | 69 |
| | | | | | | | | |
| — (6) | (0.15) | $9.78 | 1.48 % (7) | $8,560 | 1.91 % (12) | 1.99 % | 0.59 % | 51 % |
| — | 0.69 | 9.93 | 8.94 | 3,736 | 2.04 | 2.05 | 0.68 | 41 |
| — | 0.69 | 9.24 | 8.80 | 4,054 | 2.14 | 2.15 | 1.05 | 26 |
| — | (0.09) | 8.55 | 8.37 (10) | 4,378 | 2.11 (10)(11) | 2.13 | 1.13 (10) | 104 |
| — | (1.32) | 8.64 | (8.02) | 5,460 | 2.07 | 2.08 | 1.51 | 81 |
| — | (0.31) | 9.96 | 2.81 | 6,328 | 2.04 | 2.04 | 1.29 | 69 |
| | | | | | | | | |
| — (6) | 0.85 | $9.51 | 10.94 % (7) | $2,813 | 0.88 % (8) | 0.89 % | 1.52 % | 51 % (14) |
The footnote legend is at the end of the financial highlights.
See Notes to Financial Statements.
TACTICAL ALLOCATION FUND
FINANCIAL HIGHLIGHTS (Continued)
SELECTED PER SHARE DATA AND RATIOS FOR A SHARE OUTSTANDING
THROUGHOUT EACH PERIOD
| Footnote Legend: |
| (1) | Calculated using average shares outstanding. |
| (2) | Sales charges, where applicable, are not reflected in the total return calculation. |
| (3) | Not annualized for periods less than one year. |
| (4) | Annualized for periods less than one year. |
| (5) | The Fund will also indirectly bear its prorated share of expenses of any underlying funds in which it invests. Such expenses are not included in the calculation of this ratio. |
| (6) | Amount is less than $0.005 per share. |
| (7) | Payment from affiliates had no impact on total return. |
| (8) | The share class is currently under its expense limitation. |
| (9) | The Fund changed its fiscal year end to September 30, during the period. |
| (10) | State Street Bank & Trust, custodian for the Fund through January 29, 2010, reimbursed the Fund out-of-pocket custody expenses overbilled for the period 1998 through January 29, 2010. Custody fees reimbursed were excluded from the Ratio of Net Expenses to Average Net Assets and Ratio of Net Investment Income (Loss) to Average Net Assets. If included, the impact would have been to lower the Ratio of Net Expenses to Average Net Assets and increase the Ratio of Net Investment Income (Loss) to Average Net Assets by 0.08%. Custody fees reimbursed were included in Total Return. If excluded, the impact would have been to lower the Total Return by 0.08%. |
| (11) | Net expense ratio includes extraordinary proxy expenses. |
| (12) | Due to a change in expense cap, the ratio shown is a blended expense ratio. |
| (13) | Inception date. |
| (14) | Portfolio turnover is representative of the Fund for the entire year ended September 30, 2019. |
See Notes to Financial Statements.
TACTICAL ALLOCATION FUND
NOTES TO FINANCIAL STATEMENTS
September 30, 2019
Note 1. Organization
Virtus Equity Trust (the “Trust”) is organized as a Delaware statutory trust and is registered under the Investment Company Act of 1940, as amended (the “1940 Act”), as an open-end management investment company.
As of the date of this report, 12 funds of the Trust are offered for sale, of which the Tactical Allocation Fund (the “Fund”) is reported in this annual report. The Fund’s investment objectives are outlined in the Fund Summary page.There is no guarantee that the Fund will achieve its objectives.
The Fund offers Class A shares, Class C shares and Class I shares.
Class A shares are sold with a front-end sales charge of up to 5.75% with some exceptions. Generally, Class A shares are not subject to any charges by the Fund when redeemed; however, a 1% contingent deferred sales charge (“CDSC”) may be imposed on certain redemptions made within a certain period following purchases on which a finder’s fee has been paid. The period for which the CDSC applies for the Fund is 18 months. The CDSC period begins on the last day of the month preceding the month in which the purchase was made.
Class C shares are generally sold with a 1% CDSC, applicable if redeemed within one year of purchase. Effective January 1, 2019, with certain exceptions, Class C shares and any reinvested dividends and other distributions paid on such shares, will be automatically converted to Class A shares ten years after the purchase date. Class I shares are sold without a front-end sales charge or CDSC.
The Fund may impose an annual fee on accounts having balances of less than $2,500. The small account fee may be waived in certain circumstances, as disclosed in the prospectuses and/or statements of additional information. The fees collected will be used to offset certain expenses of the Fund. These fees are reflected as “Less low balance account fees” in the Fund’s Statement of Operations for the period, as applicable.
Each class of shares has identical voting, dividend, liquidation and other rights and the same terms and conditions, except that each class bears any expenses attributable specifically to that class (“class-specific expenses”) and has exclusive voting rights with respect to any Rule 12b-1 and/or shareholder service plan (“12b-1 Plan”) approved by the Board. Class I shares are not subject to a 12b-1 Plan. Class-specific expenses may include shareholder servicing fees, sub-transfer agency fees, and fees under a 12b-1 Plan, as well as certain other expenses as designated by the Fund’s Treasurer and approved by the Board. Investment income, common operating expenses and realized and unrealized gains and losses of the Fund are borne pro-rata by the holders of each class of shares.
Note 2. Significant Accounting Policies
($ reported in thousands)
The Trust is an investment company that follows the accounting and reporting guidance of Accounting Standards Certification Topic 946 applicable to Investment Companies. The following is a summary of significant accounting policies consistently followed by the Fund in the preparation of its financial statements. The preparation of financial statements in conformity with U.S. generally accepted accounting principles (“U.S. GAAP”) requires management to make estimates and assumptions that affect the reported amounts of assets and liabilities, disclosure of contingent assets and liabilities at the date of the financial
TACTICAL ALLOCATION FUND
NOTES TO FINANCIAL STATEMENTS (Continued)
September 30, 2019
statements and the reported amounts of increases and decreases in net assets from operations during the reporting period. Actual results could differ from those estimates and those differences could be significant.
| A. | Security Valuation |
| | The Fund utilizes a fair value hierarchy which prioritizes the inputs to valuation techniques used to measure fair value into three broad levels. The Fund’s policy is to recognize transfers into or out of Level 3 at the end of the reporting period. |
• Level 1 – quoted prices in active markets for identical securities (security types generally include listed equities).
• Level 2 – prices determined using other significant observable inputs (including quoted prices for similar securities, interest rates, prepayment speeds, credit risk, etc.).
• Level 3 – prices determined using significant unobservable inputs (including the Valuation Committee’s own assumptions in determining the fair value of investments).
A description of the valuation techniques applied to the Fund’s major categories of assets and liabilities measured at fair value on a recurring basis is as follows:
Equity securities are valued at the official closing price (typically last sale) on the exchange on which the securities are primarily traded or, if no closing price is available, at the last bid price and are categorized as Level 1 in the hierarchy. Restricted equity securities and private placements that are illiquid, or are internally fair valued by the Valuation Committee, are generally categorized as Level 3 in the hierarchy.
Certain non-U.S. securities may be fair valued in cases where closing prices are not readily available or are deemed not reflective of readily available market prices. For example, significant events (such as movement in the U.S. securities market, or other regional and local developments) may occur between the time that non-U.S. markets close (where the security is principally traded) and the time that the Fund calculates its net asset value (“NAV”) at the close of regular trading on the New York Stock Exchange (“NYSE”) (generally 4 p.m. Eastern time) that may impact the value of securities traded in these non-U.S. markets. In such cases, the Fund fair values non-U.S. securities using an independent pricing service which considers the correlation of the trading patterns of the non-U.S. security to the intraday trading in the U.S. markets for investments such as ADRs, financial futures, ETFs, and certain indexes, as well as prices for similar securities. Such fair valuations are categorized as Level 2 in the hierarchy. Because the frequency of significant events is not predictable, fair valuation of certain non-U.S. common stocks may occur on a frequent basis.
Debt securities, including restricted securities, are valued based on evaluated quotations received from independent pricing services or from dealers who make markets in such securities. For most bond types, the pricing service utilizes matrix pricing that considers one or more of the following factors: yield or price of bonds of comparable quality, coupon, maturity, current cash flows, type, and current day trade information, as well as dealer supplied prices. These valuations are generally categorized as Level 2 in the hierarchy. Structured debt instruments, such as mortgage-backed and asset-backed securities may also incorporate collateral analysis and utilize cash flow models for
TACTICAL ALLOCATION FUND
NOTES TO FINANCIAL STATEMENTS (Continued)
September 30, 2019
valuation and are generally categorized as Level 2 in the hierarchy. Pricing services do not provide pricing for all securities and therefore indicative bids from dealers are utilized which are based on pricing models used by market makers in the security and are generally categorized as Level 2 in the hierarchy. Debt securities that are internally fair valued by the Valuation Committee are generally categorized as Level 3 in the hierarchy.
Listed derivatives, such as options, that are actively traded are valued based on quoted prices from the exchange and are categorized as Level 1 in the hierarchy. Over-the-counter derivative contracts, which include forward currency contracts and equity-linked instruments, do not require material subjectivity as pricing inputs are observed from actively quoted markets and are categorized as Level 2 in the hierarchy.
Investments in open-end mutual funds are valued at NAV. Investments in closed-end funds and ETFs are valued as of the close of regular trading on the NYSE each business day. Each is categorized as Level 1 in the hierarchy.
A summary of the inputs used to value the Fund’s net assets by each major security type is disclosed at the end of the Schedule of Investments for the Fund. The inputs or methodologies used for valuing securities are not necessarily an indication of the risk associated with investing in those securities.
| B. | Security Transactions and Investment Income |
| | Security transactions are recorded on the trade date. Realized gains and losses from the sale of securities are determined on the identified cost basis. Dividend income is recognized on the ex-dividend date or, in the case of certain foreign securities, as soon as the Fund is notified. Interest income is recorded on the accrual basis. The Fund amortizes premiums and accretes discounts using the effective interest method. Any distributions from underlying funds are recorded in accordance with the character of the distributions as designated by the underlying funds. |
| | Dividend income from REITs is recorded using management’s estimate of the percentage of income included in distributions received from such investments based on historical information and other industry sources. The return of capital portion of the estimate is a reduction to investment income and a reduction in the cost basis of each investment which increases net realized gain (loss) and net change in unrealized appreciation (depreciation). If the return of capital distributions exceed their cost basis, the distributions are treated as realized gains. The actual amounts of income, return of capital, and capital gains are only determined by each REIT after its fiscal year-end, and may differ from the estimated amounts. |
| C. | Income Taxes |
| | The Fund is treated as a separate taxable entity. It is the Fund’s intention to comply with the requirements of Subchapter M of the Internal Revenue Code and to distribute substantially all of its taxable income to its shareholders. Therefore, no provision for federal income taxes or excise taxes has been made. |
| | The Fund may be subject to foreign taxes on income, gains on investments or currency repatriation, a portion of which may be recoverable. The Fund will accrue such taxes and recoveries as applicable based upon current interpretations of the tax rules and regulations that exist in the markets in which it invests. |
TACTICAL ALLOCATION FUND
NOTES TO FINANCIAL STATEMENTS (Continued)
September 30, 2019
| | Management of the Fund has concluded that there are no significant uncertain tax positions that would require recognition in the financial statements. As of September 30, 2019, the tax years that remain subject to examination by the major tax jurisdictions under the statute of limitations are from the year 2016 forward (with limited exceptions). |
| D. | Distributions to Shareholders |
| | Distributions are recorded by the Fund on the ex-dividend date. Income and capital gain distributions are determined in accordance with income tax regulations that may differ from U.S. GAAP. |
| E. | Expenses |
| | Expenses incurred together by the Fund and other affiliated mutual funds are allocated in proportion to the net assets of each such fund, except where allocation of direct expense to each fund or an alternative allocation method can be more appropriately used. |
| | In addition to the net annual operating expenses that the Fund bears directly, the shareholders of the Fund indirectly bear the pro-rata expenses of any underlying mutual funds in which the Fund invests. |
| F. | Foreign Currency Transactions |
| | Non-U.S. investment securities and other assets and liabilities denominated in foreign currencies are translated into U.S. dollar amounts at the foreign currency exchange rate effective at the end of the reporting period. Cost of investments is translated at the currency exchange rate effective at the trade date. The gain or loss resulting from a change in currency exchange rates between the trade and settlement date of a portfolio transaction is treated as a gain or loss on foreign currency. Likewise, the gain or loss resulting from a change in currency exchange rates between the date income is accrued and the date it is paid is treated as a gain or loss on foreign currency. The Fund does not isolate that portion of the results of operations arising from changes in foreign exchange rates on investments from the fluctuations arising from changes in the market prices of securities held. Such fluctuations are included with the net realized and unrealized gain or loss on investments. |
| G. | When-Issued Purchases and Forward Commitments (Delayed Delivery) |
| | The Fund may engage in when-issued or forward commitment transactions. Securities purchased on a when-issued or forward commitment basis are also known as delayed delivery transactions. Delayed delivery transactions involve a commitment by the Fund to purchase or sell a security at a future date (ordinarily up to 90 days later). When-issued or forward commitments enable the Fund to lock in what is believed to be an attractive price or yield on a particular security for a period of time, regardless of future changes in interest rates. The Fund records when-issued and forward commitment securities on the trade date. The Fund maintains collateral for the securities purchased. Securities purchased on a when-issued or forward commitment basis begin earning interest on the settlement date. |
| H. | Leveraged Loans |
| | The Fund may invest in direct debt instruments which are interests in amounts owed by a corporate, governmental, or other borrower to lenders or lending syndicates. Leveraged loans are generally non-investment grade and often involve borrowers that are highly leveraged. The Fund may invest in obligations of borrowers who are in |
TACTICAL ALLOCATION FUND
NOTES TO FINANCIAL STATEMENTS (Continued)
September 30, 2019
| | bankruptcy proceedings. Leveraged loans are typically senior in the corporate capital structure of the borrower. A loan is often administered by a bank or other financial institution (the “lender”) that acts as agent for all holders. The agent administers the terms of the loan, as specified in the leveraged loan. The Fund’s investments in loans may be in the form of participations in loans or assignments of all or a portion of loans from third parties. When investing in loan participations, the Fund has the right to receive payments of principal, interest and any fees to which it is entitled only from the lender selling the loan participation and only upon receipt by the lender of payments from the borrower. The Fund generally has no right to enforce compliance with the terms of the leveraged loan with the borrower. As a result, the Fund may be subject to the credit risk of both the borrower and the lender that is selling the leveraged loan. When the Fund purchases assignments from lenders it acquires direct rights against the borrower on the loan. |
| | The Fund may invest in multiple series or tranches of a loan, which may have varying terms and carry different associated risks. Leveraged loans may involve foreign borrowers and investments may be denominated in foreign currencies. Direct indebtedness of emerging countries involves a risk that the government entities responsible for the repayment of the debt may be unable, or unwilling, to pay the principal and interest when due. |
| | The leveraged loans have floating rate loan interests which generally pay interest at rates that are periodically determined by reference to a base lending rate plus a premium. The base lending rates are generally LIBOR, the prime rate offered by one or more U.S. banks or the certificate of deposit rate. When a leveraged loan is purchased the Fund may pay an assignment fee. On an ongoing basis, the Fund may receive a commitment fee based on the undrawn portion of the underlying line of credit portion of a leveraged loan. Prepayment penalty fees are received upon the prepayment of a leveraged loan by a borrower. Prepayment penalty, facility, commitment, consent and amendment fees are recorded to income as earned or paid. |
| | At September 30, 2019, the Fund had the following unfunded loan commitment: |
| Borrower | | Unfunded Loan Commitment |
| Pacific Gas and Electric Co. | | $70 |
| I. | Regulation S-X |
| | In August 2018, the SEC adopted amendments to Regulation S-X which are intended to facilitate the disclosure of information to investors and simplify compliance without significantly altering the information provided to investors. The amendments include eliminating the requirement to: separately state book basis components of net assets on the Statement of Assets & Liabilities; separately state the sources of distributions paid (except tax return of capital distributions must still be separately disclosed) on the Statements of Changes in Net Assets; and state the book basis amount of undistributed net investment income on the Statements of Changes in Net Assets. Certain prior year amounts have been reclassified for consistency with the current year presentation (see footnotes on Statements of Changes in Net Assets for separate disclosure). These reclassifications have no effect on total net assets, total distributions, the statement of operations, financial highlights, net asset value or total return. |
TACTICAL ALLOCATION FUND
NOTES TO FINANCIAL STATEMENTS (Continued)
September 30, 2019
| J. | Securities Lending |
| | The Fund may loan securities to qualified brokers through a securities lending agency agreement with The Bank of New York Mellon (“BNYM”). Under the securities lending policy, when lending securities the Fund is required to maintain collateral with a market value not less than 100% of the market value of loaned securities. Collateral is adjusted daily in connection with changes in the market value of securities on loan. Collateral may consist of cash and securities issued by the U.S. Government or its agencies. Cash collateral is invested in a short-term money market fund. Dividends earned on the collateral and premiums paid by the broker are recorded as income by the Fund net of fees and rebates charged/paid by BNYM for its services as securities lending agent and in connection with this securities lending program. Lending portfolio securities involves a risk of delay in the recovery of the loaned securities or in the declining value of the collateral. |
| | Securities lending transactions are entered into by the Fund under Master Securities Lending Agreements (“MSLA”) which permit the Fund, under certain circumstances including an event of default (such as bankruptcy or insolvency), to offset amounts payable by the Fund to the same counterparty against amounts to be received and create one single net payment due to or from the Fund. |
| | At September 30, 2019, the securities loaned were subject to a MSLA on a net payment basis as follows: |
Value of
Securities
on loan | | Cash
Collateral
Received(1) | | Net
Amount(2) |
| $ 2,950 | | $ 2,950 | | $— |
| (1) | Collateral with a value of $3,004 has been received in connection with securities lending transactions. |
| (2) | Net amount represents the net amount receivable due from the counterparty in the event of default. |
Note 3. Investment Advisory Fees and Related Party Transactions
($ reported in thousands)
| A. | Investment Adviser |
| | Virtus Investment Advisers, Inc. (the “Adviser”), an indirect, wholly-owned subsidiary of Virtus Investment Partners, Inc. (“Virtus”), is the investment adviser to the Fund. The Adviser manages the Fund’s investment program and general operations of the Fund, including oversight of the Fund’s subadvisers. |
| | As compensation for its services to the Fund, the Adviser is entitled to a fee, which is calculated daily and paid monthly, based upon the following annual rates as a percentage of the average daily net assets of the Fund: |
| $1+ Billion | | $1+ Billion through
$2 Billion | | $2+ Billion |
| 0.55 %* | | 0.50 %* | | 0.45 %* |
TACTICAL ALLOCATION FUND
NOTES TO FINANCIAL STATEMENTS (Continued)
September 30, 2019
* Effective December 1, 2018. For the period of October 1, 2018 to November 30, 2018, the rates were 0.70% (first $ Billion), 0.65% ($1+ Billion through $2 Billion), and 0.60% ($2+ Billlion).
During the period covered by these financial statements, the Fund invested a portion of its assets in Virtus Newfleet Credit Opportunities Fund, an affiliated mutual fund. In order to avoid any duplication of advisory fees, the Adviser voluntarily waived its advisory fees in an amount equal to that which would otherwise be paid by the Fund on the assets invested in the Virtus Newfleet Credit Opportunities Fund. For the period covered by these financial statements, the waiver amounted to $7. This waiver was in addition to the expense limitation and/or fee waiver covered elsewhere in these financial statements and is included in the Statement of Operations in “Less expenses reimbursed and/or waived by investment adviser.”
| B. | Subadvisers |
| | The subadvisers manage the investments of the Fund for which they are paid a fee by the Adviser. |
| | Newfleet Asset Management, LLC, an indirect, wholly-owned subsidiary of Virtus, is the subadviser to the Fund’s fixed income portfolio. Kayne Anderson Rudnick Investment Management, LLC (“KAR”), an indirect, wholly-owned subsidiary of Virtus, is the subadviser to the Fund’s domestic equity portfolio, and effective June 4, 2019, KAR is the subaviser to the Fund’s international equity portfolio. Prior to June 4, 2019, Duff & Phelps Investment Management Co., an indirect, wholly-owned subsidiary of Virtus, was the subadviser to the Fund’s international equity portfolio. |
| C. | Expense Limits and Fee Waivers |
| | Effective January 25, 2019, the Adviser has contractually agreed to limit the Fund’s total operating expenses, subject to the exceptions listed below, so that such expenses do not exceed, on an annualized basis, the following respective percentages of the Fund’s average net asset values through January 31, 2021. Following the contractual period, the Adviser may discontinue these expense reimbursement arrangements at any time. The waivers and reimbursements are calculated daily and received monthly. |
| Class A | | Class C | | Class I |
| 1.15 % | | 1.90 % | | 0.90 %* |
* Effective at inception of Class I, January 29, 2019.
From July 1, 2019 through September 24, 2019, the exclusions included front-end or contingent deferred loads, taxes, leverage expenses, interest, brokerage commissions, expenses incurred in connection with any merger or reorganization, unusual or infrequently occurring expenses (such as litigation), acquired fund fees and expenses, and dividend expenses, if any). As of September 25, 2019, the exclusions include front-end or contingent deferred loads, taxes, leverage and borrowing expenses (such as commitment, amendment and renewal expenses on credit or redemption facilities), interest, brokerage commissions, expenses incurred in connection with any merger or reorganization, unusual or infrequently occurring expenses (such as litigation), acquired fund fees and expenses, and dividend expenses, if any.
TACTICAL ALLOCATION FUND
NOTES TO FINANCIAL STATEMENTS (Continued)
September 30, 2019
| D. | Expense Recapture |
| | Under certain conditions, the Adviser may recapture operating expenses reimbursed or fees waived under these arrangements within three years after the date on which such amounts were incurred or waived. The Fund must pay its ordinary operating expenses before the Adviser is entitled to any reimbursement and must remain in compliance with any applicable expense limitations or, if none, the expense limitation in effect at the time of the waiver or reimbursement. All or a portion of the following Adviser reimbursed expenses may be recaptured by the fiscal year ending: |
| E. | Distributor |
| | VP Distributors, LLC (“VP Distributors”), an indirect, wholly-owned subsidiary of Virtus, serves as the distributor of the Fund’s shares. VP Distributors has advised the Fund that for the fiscal year (the “period”) ended September 30, 2019, it retained net commissions of $15 for Class A shares. |
| | In addition, the Fund pays VP Distributors 12b-1 fees under a 12b-1 Plan as a percentage of the average daily net assets of each respective class at the following annual rates: 0.25% for Class A shares and 1.00% for Class C shares. Class I shares are not subject to a 12b-1 Plan. |
| | Under certain circumstances, shares of certain Virtus Mutual Funds may be exchanged for shares of the same class of certain other Virtus Mutual Funds on the basis of the relative NAV per share at the time of the exchange. On exchanges with share classes that carry a CDSC, the CDSC schedule of the original shares purchased continues to apply. |
| F. | Administrator and Transfer Agent |
| | Virtus Fund Services, LLC, an indirect, wholly-owned subsidiary of Virtus, serves as administrator and transfer agent to the Fund. |
| | For the period ended September 30, 2019, the Fund incurred administration fees totaling $425 which are included in the Statement of Operations within the line item “Administration and accounting fees”. The fees are calculated daily and paid monthly. |
| | For the period ended September 30, 2019, the Fund incurred transfer agent fees totaling $190 which are included in the Statement of Operations within the line items “Transfer agent fees and expenses.” The fees are calculated daily and paid monthly. |
TACTICAL ALLOCATION FUND
NOTES TO FINANCIAL STATEMENTS (Continued)
September 30, 2019
| G. | Investments in Affiliates |
| | A summary of total long-term and short-term purchases and sales of the affiliated fund, during the period ended September 30, 2019, is as follows: |
| | Value,
beginning
of period | | Purchases | | Sales
Proceeds | | Net
realized
gain (loss)
on
affiliated
fund | | Net change in
unrealized
appreciation
(depreciation)
on affiliated
fund | | Value,
end of
period | | Shares | | Dividend
Income | | Distributions
of Realized
Gains |
| Affiliated Mutual Fund—0.0% | | | | | | | | | | | | |
Virtus Newfleet Credit Opportunities Fund Class R6*
| $1,605 | | $1,751 | | $3,191 | | $(212) | | $47 | | $— | | — | | $69 | | $— |
| * | The Virtus Newfleet Credit Opportunities Fund liquidated on April 26, 2019. |
During the period ended September 30, 2019, the Fund received shares at a market value of $260 by means of a distribution in-kind.
| H. | Payment from Affiliate |
| | During the period ended September 30, 2019, the Adviser and/or Subadviser reimbursed the Fund for losses. These amounts are included in “Net increase from payment by affiliates” in the Statement of Operations. There was no impact on the total return. |
| I. | Trustee Compensation |
| | The Trust provides a deferred compensation plan for its Trustees who receive compensation from the Trust. Under the deferred compensation plan, Trustees may elect to defer all or a portion of their compensation. Amounts deferred are retained by the Trust, and then, to the extent permitted by the 1940 Act, in turn, may be invested in the shares of affiliated or unaffiliated mutual funds selected by the participating Trustees. Investments in such instruments are included in “Other assets” in the Statement of Assets and Liabilities at September 30, 2019. |
Note 4. Purchases and Sales of Securities
($ reported in thousands)
Purchases and sales of securities (excluding U.S. Government and agency securities and short term securities) during the period ended September 30, 2019, were as follows:
| Purchases | | Sales |
| $212,693 | | $241,708 |
Purchases and sales of long-term U.S. Government and agency securities during the period ended September 30, 2019, were as follows:
| Purchases | | Sales |
| $11,712 | | $17,635 |
TACTICAL ALLOCATION FUND
NOTES TO FINANCIAL STATEMENTS (Continued)
September 30, 2019
Note 5. Credit Risk and Asset Concentration
In countries with limited or developing markets, investments may present greater risks than in more developed markets and the prices of such investments may be volatile. The consequences of political, social or economic changes in these markets may have disruptive effects on the market prices of these investments and the income they generate, as well as the Fund’s ability to repatriate such amounts.
High-yield/high-risk securities typically entail greater price volatility and/or principal and interest rate risk. There is a greater chance that an issuer will not be able to make principal and interest payments on time. Analysis of the creditworthiness of issuers of high-yield/high-risk securities may be complex, and as a result, it may be more difficult for the Adviser and/or subadvisers to accurately predict risk.
The Fund may invest a high percentage of its assets in specific sectors of the market in the pursuit of its investment objectives. Fluctuations in these sectors of concentration may have a greater impact on the Fund, positive or negative, than if the Fund did not concentrate its investments in such sectors.
Note 6. Indemnifications
Under the Trust’s organizational documents and in separate agreements between each Trustee and the Trust, its Trustees and officers are indemnified against certain liabilities arising out of the performance of their duties to the Trust and its funds. In addition, in the normal course of business, the Trust and the Fund enter into contracts that provide a variety of indemnifications to other parties. The Trust’s and/or the Fund’s maximum exposure under these arrangements is unknown, as this would involve future claims that may be made against the Trust or the Fund and that have not occurred. However, neither the Trust nor the Fund has had prior claims or losses pursuant to these arrangements, and they expect the risk of loss to be remote.
Note 7. Restricted Securities
($ reported in thousands)
Restricted securities are not registered under the Securities Act of 1933, as amended (the “1933 Act”). Generally, 144A securities are excluded from this category.
The Fund will bear any costs, including those involved in registration under the 1933 Act, in connection with the disposition of such securities.
The Fund held securities considered to be restricted at September 30, 2019.
| Investment | | Date of
Acquisition | | Cost | | Value | | Percentage of
Net Assets |
| BDC Payments Holdings, Inc. | | 12/21/18 | | $3,109 | | $3,862 | | 0.7% |
Note 8. Redemption Facility
($ reported in thousands)
On September 18, 2017, the Fund and certain other affiliated funds entered into an $150,000 unsecured line of credit (“Credit Agreement”). This Credit Agreement, as amended, is with a commercial bank that allows the Fund to borrow cash from the bank to manage large
TACTICAL ALLOCATION FUND
NOTES TO FINANCIAL STATEMENTS (Continued)
September 30, 2019
unexpected redemptions and trade fails, up to a limit of one-third of the Fund’s total net assets in accordance with the terms of the agreement. This Credit Agreement has a term of 364 days and has been renewed for a period up to March 12, 2020. Interest is charged at the higher of the LIBOR or the Federal Funds rate plus an additional percentage rate on the amount borrowed. Commitment fees are charged on the undrawn balance. The Fund and other affiliated funds that are parties are individually, and not jointly, liable for their particular advances, if any, under the line of credit. The lending bank has the ability to require repayment of outstanding borrowings under this Credit Agreement upon certain circumstances such as an event of default.
The Fund had no outstanding borrowings at any time during the period ended September 30, 2019.
Note 9. Federal Income Tax Information
($ reported in thousands)
At September 30, 2019, federal tax cost and aggregate gross unrealized appreciation (depreciation) of securities held by the Fund were as follows:
Federal
Tax Cost | | Unrealized
Appreciation | | Unrealized
(Depreciation) | | Net Unrealized
Appreciation
(Depreciation) |
| $ 470,766 | | $ 120,183 | | $ (11,354) | | $ 108,829 |
Capital losses realized after October 31 and certain late year ordinary losses may be deferred and treated as occurring on the first day of the following fiscal year. For the fiscal period ended September 30, 2019, the Fund deferred and recognized post-October losses as follows:
Late Year
Ordinary
Losses
Deferred | | Late Year
Ordinary
Losses
Recognized | | Capital
Loss
Deferred | | Capital
Loss
Recognized |
| $ — | | $ — | | $ — | | $ (2,949) |
The components of distributable earnings on a tax basis (excluding unrealized appreciation (depreciation) which are disclosed in the beginning of this note) consist of the following:
Undistributed
Ordinary
Income | | Undistributed
Long-Term
Capital Gains |
| $354 | | $6,690 |
The differences between the book and tax basis components of distributable earnings relate principally to the timing of recognition of income and gains for federal income tax purposes. Short-term gain distributions, if any, are reported as ordinary income for federal tax
TACTICAL ALLOCATION FUND
NOTES TO FINANCIAL STATEMENTS (Continued)
September 30, 2019
purposes. Distributions are determined on a tax basis and may differ from net investment income and realized capital gains for financial reporting purposes.
| | Year Ended | | Year Ended |
| | 2019 | | 2018 |
Ordinary Income
| $5,422 | | $2,125 |
Long-Term Capital Gains
| 3,366 | | 1,144 |
Total
| $8,788 | | $3,269 |
For financial reporting purposes, book basis capital accounts are adjusted to reflect the tax character of permanent book/tax differences. Permanent reclassifications can arise from differing treatment of certain income and gain transactions, nondeductible current year net operating losses, expiring capital loss carryovers and investments in passive foreign investment companies. The reclassifications have no impact on the net assets or NAV of the Fund. As of September 30, 2019, the Fund recorded reclassifications to increase (decrease) the accounts as listed below:
Capital Paid in on
Shares of
Beneficial Interest | | Accumulated
Earnings (Loss) |
| $ 3,468 | | $ (3,468) |
Note 10. Reorganization
($ reported in thousands)
On November 14, 2018, the Board of Trustees of the Trust approved an Agreement and Plan of Reorganization (the “Plan”) with respect to Virtus Strategic Allocation Fund (the “Merged Fund”), a series of the Trust, and Tactical Allocation Fund (the “Acquiring Fund”), a series of the Trust, which provided for the transfer of all of the assets of the Merged Fund for shares of the Acquiring Fund and the assumption of the liabilities of the Merged Fund. The purpose of the transaction was to allow shareholders of both funds to own shares of a larger combined fund and to allow shareholders of the Merged Fund to own shares of a fund with a similar investment objective and style as, and potentially lower expenses than, the Merged Fund. The reorganization was accomplished by a tax-free exchange of shares on January 25, 2019. For financial reporting purposes, assets received and shares issued by the Acquiring Fund were recorded at fair value; however, the cost basis of the investments received from the Merged Fund was carried forward to align ongoing reporting of the Acquiring Fund’s realized and unrealized gains and losses with amounts distributable to shareholders for tax purposes.
TACTICAL ALLOCATION FUND
NOTES TO FINANCIAL STATEMENTS (Continued)
September 30, 2019
The share transactions associated with the merger are as follows:
| Merged Fund | | Shares
Outstanding | | Acquiring Fund | | Shares
Converted | | Merged Fund
Net Asset
Value of
Converted
Shares |
Virtus Strategic
Allocation Fund | | | | Tactical
Allocation Fund | | | | |
| Class A shares | | 30,726,803 | | Class A shares | | 48,374,727 | | $423,501 |
| Class C shares | | 419,945 | | Class C shares | | 635,849 | | 5,724 |
The net assets and net unrealized appreciation (depreciation) before the acquisition were as follows:
| Merged Fund | | Net
Assets | | Unrealized
Appreciation
(Depreciation) | | Acquiring
Fund | | Net
Assets |
Virtus
Strategic Allocation
Fund | | $429,225 | | $55,954 | | Tactical Allocation
Fund | | $133,917 |
The net assets of the Acquiring Fund immediately following the acquisition were $563,142.
Assuming the acquisition had been completed on October 1, 2018, the Tactical Allocation Fund’s pro-forma results of operations for the period ended September 30, 2019, would have been as follows:
Net investment income (loss)
| $7,628(a) |
Net realized and unrealized gain (loss) on investments
| 5,864(b) |
Net increase (decrease) in net assets resulting from operations
| $13,492 |
(a) $5,876, as reported in the Statement of Operations, plus $1,752 net investment income from Virtus Strategic Allocation Fund pre-merger.
(b) $36,909 as reported in the Statement of Operations, plus $(31,045) net realized and unrealized gain (loss) on investments from Virtus Strategic Allocation Fund pre-merger.
Because the Merged Fund and the Acquiring Fund have been managed as an integrated single Fund since the completion date it is not feasible to separate the income/(losses) and gains/(losses) of the merged Virtus Strategic Allocation Fund that have been included in the acquiring Tactical Allocation Fund Statement of Operations since January 25, 2019.
Note 11. Regulatory Matters and Litigation
From time to time, the Trust, the Adviser and/or Subadvisers and/or their affiliates may be involved in litigation and arbitration as well as examinations and investigations by various
TACTICAL ALLOCATION FUND
NOTES TO FINANCIAL STATEMENTS (Continued)
September 30, 2019
regulatory bodies, including the SEC, involving compliance with, among other things, securities laws, client investment guidelines, laws governing the activities of broker-dealers and other laws and regulations affecting their products and other activities. At this time, the Adviser believes that the outcomes of such matters are not likely, either individually or in aggregate, to be material to these financial statements.
Note 12. Recent Accounting Pronouncement
In March 2017, the Financial Accounting Standards Board (“FASB”) issued Accounting Standards Update (“ASU”), ASU 2017-08, Receivables – Nonrefundable Fees and Other Costs (Subtopic 310-20), Premium Amortization on Purchased Callable Debt Securities which amends the amortization period for certain purchased callable debt securities held at a premium, shortening such period to the earliest call date. This ASU does not require any accounting change for debt securities held at a discount; the discount continues to be amortized to maturity. This ASU is effective for fiscal years, and interim periods within those fiscal years, beginning after December 15, 2018. At this time, management is evaluating the implications of these changes on the financial statements.
In August 2018, the FASB issued ASU No. 2018-13, which changes certain fair value measurement disclosure requirements. This ASU, in addition to other modifications and additions, removes the requirement to disclose the amount and reasons for transfers between Level 1 and Level 2 of the fair value hierarchy, the policy for the timing of transfers between levels and the valuation process for Level 3 fair value measurements. For public companies, the amendments are effective for financial statements issued for fiscal years beginning after December 15, 2019, and interim periods within those fiscal years. Management has evaluated the implications of certain provisions of ASU No. 2018-13 and has determined to early adopt all aspects related to the removal and modification of certain fair value measurement disclosures under the ASU effective immediately.
Note 13. Subsequent Events
Management has evaluated the impact of all subsequent events on the Fund through the date the financial statements were available for issuance, and has determined that there are no subsequent events requiring recognition or disclosure in these financial statements.
Report of Independent Registered Public Accounting Firm
To the Board of Trustees of Virtus Equity Trust and Shareholders of Virtus Tactical Allocation Fund
Opinion on the Financial Statements
We have audited the accompanying statement of assets and liabilities, including the schedule of investments, of Virtus Tactical Allocation Fund (one of the funds constituting Virtus Equity Trust, referred to hereafter as the “Fund”) as of September 30, 2019, the related statement of operations for the year ended September 30, 2019, the statements of changes in net assets for each of the two years in the period ended September 30, 2019, including the related notes, and the financial highlights for each of the periods indicated therein (collectively referred to as the “financial statements”). In our opinion, the financial statements present fairly, in all material respects, the financial position of the Fund as of September 30, 2019, the results of its operations for the year then ended, the changes in its net assets for each of the two years in the period ended September 30, 2019 and the financial highlights for each of the periods indicated therein in conformity with accounting principles generally accepted in the United States of America.
Basis for Opinion
These financial statements are the responsibility of the Fund’s management. Our responsibility is to express an opinion on the Fund’s financial statements based on our audits. We are a public accounting firm registered with the Public Company Accounting Oversight Board (United States) (“PCAOB”) and are required to be independent with respect to the Fund in accordance with the U.S. federal securities laws and the applicable rules and regulations of the Securities and Exchange Commission and the PCAOB.
We conducted our audits of these financial statements in accordance with the standards of the PCAOB. Those standards require that we plan and perform the audit to obtain reasonable assurance about whether the financial statements are free of material misstatement, whether due to error or fraud.
Our audits included performing procedures to assess the risks of material misstatement of the financial statements, whether due to error or fraud, and performing procedures that respond to those risks. Such procedures included examining, on a test basis, evidence regarding the amounts and disclosures in the financial statements. Our audits also included evaluating the accounting principles used and significant estimates made by management, as well as evaluating the overall presentation of the financial statements. Our procedures included confirmation of securities owned as of September 30, 2019 by correspondence with the custodian, transfer agent and brokers; when replies were not received from brokers, we performed other auditing procedures. We believe that our audits provide a reasonable basis for our opinion.
/s/ PricewaterhouseCoopers LLP
Philadelphia, Pennsylvania
November 21, 2019
We have served as the Virtus Mutual Funds’ auditor since at least 1977. We have not been able to determine the specific year we began serving as auditor.
TACTICAL ALLOCATION FUND
TAX INFORMATION NOTICE (Unaudited)
September 30, 2019
For the fiscal year ended September 30, 2019, the Fund makes the following disclosures for federal income tax purposes. Below is listed the percentages, or the maximum amount allowable, of its ordinary income dividends (“QDI”) to qualify for the lower tax rates applicable to individual shareholders, and the percentage of ordinary income dividends earned by the Fund which qualifies for the dividends received deduction (“DRD”) for corporate shareholders. The actual percentage of QDI and DRD for the calendar year will be designated in year-end tax statements. The Fund designates the amounts below as long-term capital gains (“LTCG”) dividends taxable at a 20% rate, or lower depending on the shareholder’s income ($ reported in thousands). LTCG amounts, if subsequently different, will be designated in the next annual report.
| | QDI | | DRD | | LTCG |
| | 59% | | 29% | | $6,852 |
CONSIDERATION OF ADVISORY AND SUBADVISORY
AGREEMENTS BY THE BOARD OF TRUSTEES (Unaudited)
The Board of Trustees (the “Board”) of Virtus Equity Trust (the “Trust”) is responsible for the consideration and approval of advisory and subadvisory agreements for the Trust. At an in-person meeting held on May 21-22, 2019 (the “Meeting”), the Board, including a majority of the Trustees who are not interested persons of the Trust as defined in Section 2(a)(19) of the Investment Company Act of 1940, as amended (such Act, the “1940 Act” and such Trustees, the “Independent Trustees”), authorized the appointment of Kayne Anderson Rudnick Investment Management, LLC (the “Subadviser”) as subadviser to the international equity portfolio of Virtus Tactical Allocation Fund (the “Fund”), in addition to its management of the domestic equity portfolio, and approved an amendment to the subadvisory agreement with the Subadviser (the “Subadvisory Amendment”) for this purpose.
In considering the proposal to appoint the Subadviser, the Board requested and evaluated information provided by Virtus Investment Advisers, Inc. (“VIA”) and the Subadviser which, in the Board’s view, constituted information necessary for the Board to form a judgment as to whether appointment of the Subadviser would be in the best interests of the Fund and its shareholders. The Board also took into account discussions with management and information provided to the Board in its meetings throughout the year with respect to the services provided by the Subadviser to the Fund and other Virtus Funds, including quarterly performance reports prepared by management containing reviews of investment results. The Board noted the affiliation of the Subadviser with VIA and any potential conflicts of interest.
The Board was separately advised by independent legal counsel throughout the process. The Board considered all the criteria separately with respect to the Fund and its shareholders. In its deliberations, the Board considered various factors, including those discussed below, none of which were controlling, and each Trustee may have attributed different weights to the various factors. The Independent Trustees also discussed the proposed approval of the Subadvisory Amendment in private sessions with their independent legal counsel at which no representatives of management were present.
Basis for the Board’s Recommendation
In making its determination with respect to the Subadvisory Amendment, the Board considered various factors, including:
•Nature, extent, and quality of the services to be provided by the Subadviser. The Trustees received in advance of the Meeting information provided by the Subadviser, including the Subadviser’s Form ADV, as well as a presentation provided by portfolio management personnel of the Subadviser. The Board noted that the Subadviser would provide portfolio management, compliance with the Fund’s investment policies and procedures, compliance with applicable securities laws and assurances thereof. The Board also noted that VIA’s and the Subadviser’s management of the Fund is subject to the oversight of the Board and must be carried out in accordance with the investment objectives, policies and restrictions set forth in the Fund’s prospectuses and statement of additional information. The Trustees reviewed biographical information for the portfolio managers who would provide services under the Subadvisory Agreement, noting that they were already providing such services with respect to other Virtus Funds. In considering the approval of the Subadvisory Amendment, the Board also considered the Subadviser’s investment management process, including (a) the experience and capability of the Subadviser’s management and other personnel committed by the Subadviser to the Fund; (b) the financial condition of the Subadviser; (c) the quality of the Subadviser’s regulatory and legal compliance policies, procedures and systems; and (d) the
CONSIDERATION OF ADVISORY AND SUBADVISORY
AGREEMENTS BY THE BOARD OF TRUSTEES (Continued)
Subadviser’ s brokerage and trading practices, including with respect to best execution and soft dollars. The Board also took into account the Subadviser’s risk assessment and monitoring process. The Board noted the Subadviser’s regulatory history, including whether it was currently involved in any regulatory actions or investigations as well as material litigation, and any settlements and amelioratory actions undertaken, as appropriate. After considering all of the information provided to them, the Trustees concluded that the nature, extent and quality of the services expected to be provided by the Subadviser were satisfactory and that there was a reasonable basis on which to conclude that the Subadviser would provide a high quality of investment services with respect to the Fund’s international equity portfolio.
•Investment Performance. The Board took into account that the proposed portfolio managers managed other Virtus Funds on behalf of the Subadviser, and the Board considered the performance of each such fund relative to its benchmark. The Board concluded that the performance of each such fund was satisfactory.
•Subadvisory Fee. The Board took into account that the Fund’s subadvisory fees are paid by VIA out of its management fees rather than paid separately by the Fund, so that the Fund’s shareholders would not be directly impacted by those fees. The Board also noted that the proposed subadvisory fee schedule under the Subadvisory Amendment was the same as the subadvisory fee schedule for the Subadviser’s other portion of the Fund, for the Fund’s other subadviser, and for the subadvisers of the Trust’s other series. The Board concluded that the proposed subadvisory fees were fair and reasonable in light of services to be provided by the Subadviser and all factors considered.
•Profitability and Economies of Scale. In considering the projected profitability to the Subadviser in connection with its relationship to the Fund, the Board noted that the fees under the Subadvisory Agreement would be paid by VIA out of the fees that VIA receives under the Advisory Agreement, so that Fund shareholders would not be directly impacted by those fees. The Board also noted that the proposed subadvisory fees under the Subadvisory Agreement were the same as the subadvisory fees paid to the Fund’s previous international equity subadviser, paid to the Subadviser for the domestic equity portfolio, and paid to the Fund’s other subadviser. In considering the reasonableness of the fees payable by VIA to the Subadviser, the Board noted that, because the Subadviser is an affiliate of VIA, such profitability might be directly or indirectly shared by VIA. For each of the above reasons, the Board concluded that the projected profitability to the Subadviser and its affiliates from their relationships with the Fund was not a material factor in approval of the Subadvisory Amendment. For similar reasons, and based upon the expected size of the Fund’s portfolio to be managed by the Subadviser, the Board concluded that the potential for economies of scale in the Subadviser’s management of the Fund’s international equity portfolio was not a material factor in the approval of the Subadvisory Amendment at this time.
•Other Factors.The Board considered other benefits that may be realized by the Subadviser and its affiliates from their relationships with the Fund. Among them, the Board recognized that VP Distributors, LLC, an affiliate of VIA, serves as the distributor for the Trust, and, as such, receives payments pursuant to Rule 12b-1 from the Fund to compensate it for providing selling activities, which could lead to growth in the Fund’s assets and corresponding benefits from such growth, including economies of scale. The Board also noted that an affiliate of VIA and the Subadviser also provides administrative and transfer agency services to the Trust. The Board noted management’s discussion of the fact that, while the Subadviser is an affiliate of VIA, there are no other direct benefits to the Subadviser in providing subadvisory services to
CONSIDERATION OF ADVISORY AND SUBADVISORY
AGREEMENTS BY THE BOARD OF TRUSTEES (Continued)
the Fund, other than the fee to be earned under the Subadvisory Agreement, although there may be certain indirect benefits gained, including to the extent that serving the Fund could provide the opportunity to provide subadvisory services to additional series of the Trust or certain reputational benefits.
Conclusion
Based on all of the foregoing considerations, the Board, including a majority of the Independent Trustees, determined that approval of the Subadvisory Amendment was in the best interests of the Fund and its shareholders. Accordingly, the Board, and the Independent Trustees voting separately, approved the Subadvisory Amendment.
FUND MANAGEMENT TABLES (Unaudited)
Information pertaining to the Trustees and officers of the Trust as of the date of issuance of this report is set forth below. The statement of additional information (SAI) includes additional information about the Trustees and is available without charge, upon request, by calling
(800) 243-4361.
The address of each individual, unless otherwise noted, is c/o Virtus Equity Trust, One Financial Plaza, Hartford, CT 06103. There is no stated term of office for Trustees or officers of the Trust.
Independent Trustees
Name, Year of Birth,
Length of Time Served
and Number of
Portfolios in Complex | Principal Occupation(s) During Past 5 Years and
Other Directorships Held by Trustee |
Brown, Thomas J.
YOB: 1945
Served Since: 2016
67 Portfolios | Retired. Trustee (since 2016), Virtus Mutual Fund Family (56 portfolios) and Virtus Alternative Solutions Trust (3 portfolios); Trustee (since 2011), Virtus Variable Insurance Trust (8 portfolios); Director (since 2010), D’Youville Senior Care Center; and Director (since 2005), VALIC Company Funds (49 portfolios). |
Burke, Donald C.
YOB: 1960
Served Since: 2016
71 Portfolios | Retired. Trustee (since 2016), Virtus Mutual Fund Family (56 portfolios), Virtus Variable Insurance Trust (8 portfolios) and Virtus Alternative Solutions Trust (3 portfolios); Director (since 2014) closed-end funds managed by Duff & Phelps Investment Management Co. (4 funds); Director, Avista Corp. (energy company) (since 2011); Trustee, Goldman Sachs Fund Complex (2010 to 2014); and Director, BlackRock Luxembourg and Cayman Funds (2006 to 2010). |
Harris, Sidney E.
YOB: 1949
Served Since: 2017
67 Portfolios | Professor and Dean Emeritus (since April 2015), Professor (1997 to 2014), Dean (1997 to 2004), J. Mack Robinson College of Business, Georgia State University; Trustee (since 2019), Mutual Fund Directors Forum; Trustee (since 2017), Virtus Mutual Fund Family (56 portfolios), Virtus Variable Insurance Trust (8 portfolios), and Virtus Alternative Solutions Trust (3 portfolios); Trustee (since 2013), KIPP Metro Atlanta; Trustee (since 1999) Total System Services, Inc.; Trustee (2004 to 2017), RidgeWorth Funds; Trustee ( since 2012), International University of the Grand Bassam Foundation; and Trustee (2011 to 2015), Genspring Family Offices, LLC. |
Mallin, John R.
YOB: 1950
Served Since: 2016
67 Portfolios | Partner/Attorney (since 2003), McCarter & English LLP (law firm), Real Property Practice Group; and Member (since 2014), Counselors of Real Estate. Trustee (since 2016), Virtus Mutual Fund Family (56 portfolios) and Virtus Alternative Solutions Trust (3 portfolios); Director (since 2013), Horizons, Inc. (non-profit); and Trustee (since 1999), Virtus Variable Insurance Trust (8 portfolios). |
McClellan, Hassell H.
YOB: 1945
Served Since: 2015
67 Portfolios | Retired (since 2013); and Professor (1984 to 2013), Wallace E. Carroll School of Management, Boston College. Chairperson of the Board (since 2017) and Trustee (since 2000), John Hancock Fund Complex (collectively, 227 portfolios); Trustee (since 2016), Virtus Alternative Solutions Trust (3 portfolios); Trustee (since 2015), Virtus Mutual Fund Family (56 portfolios); Director (since 2010), Barnes Group, Inc. (diversified global components manufacturer and logistical services company); and Trustee (since 2008), Virtus Variable Insurance Trust (8 portfolios). |
McDaniel, Connie D.
YOB: 1958
Served Since: 2017
67 Portfolios | Retired (since 2013); and Vice President, Chief of Internal Audit, Corporate Audit Department (2009 to 2013); Vice President Global Finance Transformation (2007 to 2009); Vice President and Controller (1999 to 2007), The Coca-Cola Company; Trustee (since 2017), Virtus Mutual Fund Family (56 portfolios), Virtus Variable Insurance Trust (8 portfolios), and Virtus Alternative Solutions Trust (3 portfolios); Trustee (since 2014), Total System Services, Inc.; and Trustee (2005 to 2017), RidgeWorth Funds. |
FUND MANAGEMENT TABLES (Unaudited) (Continued)
Name, Year of Birth,
Length of Time Served
and Number of
Portfolios in Complex | Principal Occupation(s) During Past 5 Years and
Other Directorships Held by Trustee |
McLoughlin, Philip
YOB: 1946
Served Since: 1993
75 Portfolios | Retired. Director and Chairman (since 2016), Virtus Total Return Fund Inc. and Virtus Global Dividend & Income Fund Inc.; Director and Chairman (since 2014) Duff & Phelps Select MLP and Midstream Energy Fund Inc.; Trustee and Chairman (since 2013), Virtus Alternative Solutions Trust (3 portfolios); Trustee and Chairman (since 2011), Virtus Global Multi-Sector Income Fund; Chairman and Trustee (since 2003), Virtus Variable Insurance Trust (8 portfolios); Director (since 1995), closed-end funds managed by Duff & Phelps Investment Management Co. (4 funds); Director (since 1991) and Chairman (since 2010), Lazard World Trust Fund (closed-end investment firm in Luxembourg); and Trustee (since 1989) and Chairman (since 2002), Virtus Mutual Fund Family (56 portfolios). |
McNamara, Geraldine M.
YOB: 1951
Served Since: 2001
71 Portfolios | Retired. Trustee (since 2016), Virtus Alternative Solutions Trust (3 portfolios); Trustee (since 2015), Virtus Variable Insurance Trust (8 portfolios); Director (since 2003), closed-end funds managed by Duff & Phelps Investment Management Co. (4 funds); and Trustee (since 2001), Virtus Mutual Fund Family (56 portfolios). |
Oates, James M.
YOB: 1946
Served Since: 1993
71 Portfolios | Managing Director (since 1994), Wydown Group (consulting firm). Director (since 2016), Virtus Total Return Fund Inc. and Virtus Global Dividend & Income Fund Inc.; Trustee (since 2016), Virtus Variable Insurance Trust (8 portfolios); Director (since 2014), Duff & Phelps Select MLP and Midstream Energy Fund Inc.; Trustee (since 2013), Virtus Alternative Solutions Trust (3 portfolios); Trustee (since 2011), Virtus Global Multi-Sector Income Fund; Trustee (since 2005) and Chairman (2005 to 2017), John Hancock Fund Complex (227 portfolios); Director (2002 to 2014), New Hampshire Trust Company; Chairman (2000 to 2016), Emerson Investment Management, Inc.; Non-Executive Chairman (2000 to 2014), Hudson Castle Group, Inc. (formerly IBEX Capital Markets, Inc.) (financial services); Chairman and Director (1999 to 2014), Connecticut River Bank; Director (since 1996), Stifel Financial; and Trustee (since 1987), Virtus Mutual Fund Family (56 portfolios). |
Segerson, Richard E.
YOB: 1946
Served Since: 1983
67 Portfolios | Retired; and Managing Director (1998 to 2013), Northway Management Company. Trustee (since 2016), Virtus Alternative Solutions Trust (3 portfolios) and Virtus Variable Insurance Trust (8 portfolios); and Trustee (since 1983), Virtus Mutual Fund Family (56 portfolios). |
FUND MANAGEMENT TABLES (Unaudited) (Continued)
Interested Trustee
Name, Year of Birth,
Year Elected and
Number of Funds
Overseen | Principal Occupation(s) During Past 5 Years and
Other Directorships Held by Trustee |
Aylward, George R.*
Trustee and President
YOB: 1964
Elected: 2006
77 Portfolios | Director, President and Chief Executive Officer (since 2008), Virtus Investment Partners, Inc. and/or certain of its subsidiaries; and various senior officer positions with Virtus affiliates (since 2005). Chairman and Trustee (since 2015), Virtus ETF Trust II (2 portfolios); Director, President and Chief Executive Officer (since 2014), Duff & Phelps Select MLP and Midstream Energy Fund Inc.; Trustee and President (since 2013),Virtus Alternative Solutions Trust (3 portfolios); Director (since 2013), Virtus Global Funds, PLC (4 portfolios); Trustee (since 2012) and President (since 2010), Virtus Variable Insurance Trust (8 portfolios); Trustee, President and Chief Executive Officer (since 2011), Virtus Global Multi-Sector Income Fund; Trustee and President (since 2006) and Executive Vice President (2004 to 2006), Virtus Mutual Fund Family (56 portfolios); and Director, President and Chief Executive Officer (since 2006), Virtus Global Dividend & Income Fund Inc. and Virtus Total Return Fund Inc. |
* Mr. Aylward is an “interested person,” as defined in the 1940 Act, by reason of his position as President and Chief Executive Officer of Virtus Investment Partners, Inc. (“Virtus”), the ultimate parent company of the Adviser, and various positions with its affiliates, including the Adviser.
Officers of the Trust Who Are Not Trustees
Name, Address and
Year of Birth | Position(s) Held with Trust and
Length of Time Served | Principal Occupation(s)
During Past 5 Years |
Batchelar, Peter
YOB: 1970 | Senior Vice President (since 2017), Vice President (2008 to 2017). | Senior Vice President, Product Development (since 2017), and Vice President, Product Development (2008 to 2017), Virtus Investment Partners, Inc. and/or certain of its subsidiaries; various officer positions (since 2008) with Virtus affiliates; Senior Vice President (since 2017), and Vice President (2008 to 2016), Virtus Mutual Fund Family; Senior Vice President (since 2017), and Vice President (2010 to 2016), Virtus Variable Insurance Trust; Senior Vice President (since 2017), and Vice President (2013 to 2016), Virtus Alternative Solutions Trust; and Senior Vice President (since 2017) and Vice President (2016 to 2017), Virtus Closed-End Funds. |
FUND MANAGEMENT TABLES (Unaudited) (Continued)
Name, Address and
Year of Birth | Position(s) Held with Trust and
Length of Time Served | Principal Occupation(s)
During Past 5 Years |
Bradley, W. Patrick
YOB: 1972 | Executive Vice President (since 2016); Senior Vice President (2013 to 2016); Vice President (2011 to 2013); Chief Financial Officer and Treasurer (since 2006). | Executive Vice President, Fund Services (since 2016), and Senior Vice President, Fund Services (2010 to 2016), Virtus Investment Partners, Inc. and/or certain of its subsidiaries; various officer positions (since 2006) with Virtus affiliates; Executive Vice President (since 2016), Senior Vice President (2013 to 2016), Vice President (2011 to 2013), Chief Financial Officer and Treasurer (since 2004), Virtus Variable Insurance Trust; Executive Vice President (since 2016), Senior Vice President (2013 to 2016), Vice President (2011 to 2013), Chief Financial Officer and Treasurer (since 2006), Virtus Mutual Fund Family; Executive Vice President (since 2016), Senior Vice President (2013 to 2016), Vice President (2012 to 2013), Treasurer and Chief Financial Officer (since 2010), Virtus Total Return Fund Inc. and Virtus Global Dividend & Income Fund Inc.; Executive Vice President (since 2016), Senior Vice President (2013 to 2016), Vice President (2011 to 2013), Chief Financial Officer and Treasurer (since 2011), Virtus Global Multi-Sector Income Fund; Executive Vice President (since 2016), Senior Vice President (2014 to 2016), Chief Financial Officer and Treasurer (since 2014), Duff & Phelps Select Energy MLP and Midstream Energy Fund Inc.; Vice President and Assistant Treasurer (since 2011), Duff & Phelps Global Utility Income Fund Inc.; Director (since 2013), Virtus Global Funds, PLC; and Executive Vice President (since 2016), Senior Vice President (2013 to 2016), and Chief Financial Officer and Treasurer (since 2013), Virtus Alternative Solutions Trust. |
FUND MANAGEMENT TABLES (Unaudited) (Continued)
Name, Address and
Year of Birth | Position(s) Held with Trust and
Length of Time Served | Principal Occupation(s)
During Past 5 Years |
Carr, Kevin J.
YOB: 1954 | Senior Vice President (since 2013), Vice President (2005 to 2013), Chief Legal Officer, Counsel and Secretary (since 2005). | Vice President and Senior Counsel (2017 to Present), Senior Vice President (2009 to 2017), Vice President, Counsel and Secretary (2008 to 2009), Virtus Investment Partners, Inc. and/or certain of its subsidiaries; various senior officer positions (since 2005) with Virtus affiliates; Senior Vice President (since 2013), Vice President (2005 to 2013), Chief Legal Officer, Counsel and Secretary (since 2005), Virtus Mutual Fund Family; Senior Vice President (2013 to 2014), Vice President (2012 to 2013), Secretary and Chief Legal Officer (2005 to 2013), and Assistant Secretary (2013 to 2014 and since 2017), Virtus Total Return Fund Inc. and Virtus Global Dividend & Income Fund Inc.; Senior Vice President (since 2017), Assistant Secretary (since 2013), Vice President, Chief Legal Officer, Counsel and Secretary (2010 to 2013), Virtus Variable Insurance Trust; Senior Vice President (2013 to 2014), Vice President (2011 to 2013), and Assistant Secretary (since 2011), Virtus Global Multi-Sector Income Fund; Assistant Secretary (since 2015), Duff & Phelps Select MLP and Midstream Energy Fund Inc.; Senior Vice President (since 2017) and Assistant Secretary (since 2013), Virtus Alternative Solutions Trust; Secretary (since 2015), ETFis Series Trust I; and Secretary (since 2015), Virtus ETF Trust II. |
Engberg, Nancy J.
YOB: 1956 | Senior Vice President (since 2017), Vice President and Chief Compliance Officer (2011 to 2017), and Chief Compliance Officer (since 2011). | Senior Vice President (since 2017), Vice President (2008 to 2017) and Chief Compliance Officer (2008 to 2011 and since 2016), Virtus Investment Partners, Inc. and/or certain of its subsidiaries; various officer positions (since 2003) with Virtus affiliates; Senior Vice President (since 2017), Vice President (2011 to 2017) and Chief Compliance Officer (since 2011), Virtus Mutual Fund Family; Senior Vice President (since 2017), Vice President (2010 to 2017) and Chief Compliance Officer (since 2011), Virtus Variable Insurance Trust; Senior Vice President (since 2017), Vice President (2011 to 2016) and Chief Compliance Officer (since 2011), Virtus Global Multi-Sector Income Fund; Senior Vice President (since 2017), Vice President (2012 to 2017) and Chief Compliance Officer (since 2012), Virtus Total Return Fund Inc. and Virtus Global Dividend & Income Fund Inc.; Senior Vice President (since 2017), Vice President (2013 to 2016) and Chief Compliance Officer (since 2013), Virtus Alternative Solutions Trust; Senior Vice President (since 2017), Vice President (2014 to 2017) and Chief Compliance Officer (since 2014), Duff & Phelps Select MLP and Midstream Energy Fund Inc.; Chief Compliance Officer (since 2015), ETFis Series Trust I; and Chief Compliance Officer (since 2015), Virtus ETF Trust II. |
FUND MANAGEMENT TABLES (Unaudited) (Continued)
Name, Address and
Year of Birth | Position(s) Held with Trust and
Length of Time Served | Principal Occupation(s)
During Past 5 Years |
Short, Julia R.
YOB: 1972 | Senior Vice President (since 2017). | Senior Vice President (since 2018), Virtus Closed-End Funds; Senior Vice President, Product Development (since 2017), Virtus Investment Partners, Inc. and/or certain of its subsidiaries; Senior Vice President (since 2017), Virtus Mutual Fund Family; Senior Vice President (since 2018), Virtus Closed-End Funds; President and Chief Executive Officer, RidgeWorth Funds (2007 to 2017); and Managing Director, Product Manager, RidgeWorth Investments (2004 to 2017). |
Waltman, Francis G.
YOB: 1962 | Executive Vice President (since 2013), Senior Vice President (2008 to 2013). | Executive Vice President, Product Development (since 2009), Virtus Investment Partners, Inc. and/or certain of its subsidiaries; various senior officer positions (since 2006) with Virtus affiliates; Executive Vice President (since 2013), Senior Vice President (2008 to 2013), Virtus Mutual Fund Family; Executive Vice President (since 2013), Senior Vice President (2010 to 2013), Virtus Variable Insurance Trust; Executive Vice President (since 2013), Senior Vice President (2011 to 2013), Virtus Global Multi-Sector Income Fund; Executive Vice President (since 2014), Duff & Phelps Select Energy MLP and Midstream Energy Fund Inc.; Director (since 2013), Virtus Global Funds PLC; Executive Vice President (since 2013), Virtus Alternative Solutions Trust; and Executive Vice President (since 2017), Virtus Global Dividend & Income Fund Inc. and Virtus Total Return Fund Inc. |
Virtus Tactical Allocation Fund (the “fund”),
a series of Virtus Equity Trust
Supplement dated June 4, 2019 to the Summary and
Statutory Prospectuses dated January 28, 2019, as supplemented
IMPORTANT NOTICE TO INVESTORS
As approved by the Board of Trustees of Virtus Equity Trust, effective June 4, 2019, Kayne Anderson Rudnick Investment Management, LLC (“KAR”), currently a subadviser to the fund, is managing the domestic and international equity portfolios of the fund; previously KAR had managed the domestic equity portfolio only. Also effective June 4, 2019, Duff & Phelps Investment Management Co. (“Duff & Phelps”) is removed as subadviser for the international equity portfolio of the fund. Accordingly, all references to Duff & Phelps as a subadviser to the fund, and to Frederick Brimberg as a portfolio manager, are hereby removed from the fund’s prospectuses. Newfleet Asset Management, LLC, a subadviser to the fund, continues to manage the fund’s fixed income portfolio and Virtus Investment Advisers, Inc., the fund’s investment adviser, continues to serve as investment adviser of the fund.
Additional disclosure changes resulting from the removal of Duff & Phelps as subadviser are described below.
Under “Principal Investment Strategies” in the summary prospectus and the summary section of the statutory prospectus, the fourth sentence in the first paragraph is hereby replaced with the following: “For the fund’s non-U.S. equity exposure, the subadviser’s investment strategy emphasizes companies that the subadviser believes to have a sustainable competitive advantage, strong management and low financial risk and to be able to grow over market cycles.”
In the same section, the following is hereby added at the end of the third paragraph: “The fund’s non-U.S. equity investments are principally in small- and mid-capitalization companies. As of the date of this Prospectus, the fund’s equity subadviser considers small- and mid- capitalization companies to be those companies that, at the time of initial purchase, have market capitalizations generally within the range of companies included in the MSCI All Country World ex U.S. SMID Cap Index on a rolling three-year basis. On this basis, as of April 30, 2019, the total market capitalization range of companies included in the MSCI
All Country World ex U.S. SMID Cap Index over the past three years was $0 to $27.6 billion.”
The disclosure under “Principal Risks” in the summary prospectus and in the summary section of the statutory prospectus is hereby amended by adding the following disclosure:
> Small and Medium Market Capitalization Companies Risk. The risk that the fund’s investments in small and medium market capitalization companies will increase the volatility and risk of loss to the fund, as compared with investments in larger, more established companies.
Under “Management” in the summary prospectus and in the summary section of the statutory prospectus, the second paragraph is hereby replaced with the following: “The fund’s subadvisers are Kayne
Anderson Rudnick Investment Management, LLC (“KAR”) (equity portion) and Newfleet Asset Management, LLC (“Newfleet”) (fixed income portion), each an affiliate of VIA.
The disclosure under “Portfolio Managers” in the summary prospectus and in the summary section of the statutory prospectus is hereby revised by removing the information for Frederick Brimberg and inserting the following:
Hyung Kim, Portfolio Manager and Senior Research Analyst at KAR. Mr. Kim has served as a Portfolio Manager of the fund since June 2019.
Craig Thrasher, CFA, Portfolio Manager and Senior Research Analyst at KAR. Mr. Thrasher has served as a Portfolio Manager of the fund since June 2019.
Under “Principal Investment Strategies” on page 61 of the statutory prospectus, references to the fund’s “U.S. equity subadviser” are revised to reference the fund’s “equity subadviser.” Additionally, the fourth, fifth and sixth paragraphs are hereby replaced with the following:
For the fund’s non-U.S. equity allocation, the fund invests in a select group of small-cap and mid-cap companies believed by the fund’s equity subadviser to be undervalued relative to their future market growth potential. The investment strategy emphasizes companies that the subadviser believes to have a sustainable competitive advantage, strong management and low financial risk and to be able to grow over market cycles. The fund’s non-U.S. equity investments are principally in small and midcapitalization companies. As of the date of this Prospectus, the fund’s subadviser considers small and midcapitalization companies to be those companies that, at the time of initial purchase, have market capitalizations generally within the range of companies included in the MSCI All Country World ex U.S. SMID Cap Index on a rolling three-year basis. On this basis, as of April 30, 2019, the total market capitalization range of companies included in the MSCI All Country World ex U.S. SMID Cap Index over the past three years was $0 to $27.6 billion.
The equity subadviser’s sell discipline seeks to dispose of holdings that, among other things, achieve a target price, or are the subject of negative developments individually or as an industry, or as necessary to provide funding to upgrade and improve portfolio holdings or meet diversification requirements.
In the section “More Information About Risks Related to Principal Investment Strategies” the table on page 63 of the statutory prospectus is hereby amended by deleting the “X” in the row “Foreign Currency Transactions,” thereby indicating that this risk does not apply to the fund.
Under “The Adviser” on page 70 of the statutory prospectus, the following replaces the row in the table referencing the fund:
Virtus Tactical
Allocation Fund | KAR (equity portion)
Newfleet (fixed income portion) |
Under “The Subadvisers” on beginning page 71 of the statutory prospectus, the following replaces the row in the table referencing the fund:
Virtus Tactical
Allocation Fund | 50% of the Net Advisory Fee to KAR
(equity portion)
50% of the Net Advisory Fee to
Newfleet (fixed income portion) |
In the section “Portfolio Management” on page 72 of the statutory prospectus, the disclosure regarding Duff & Phelps and Frederick Brimberg is deleted. Also in this section, under “KAR,” the following replaces the row referencing the fund:
Virtus Tactical
Allocation Fund | Doug Foreman (since
September 2016)
Hyung Kim (since
June 2019)
Craig Thrasher, CFA
(since June 2019) |
Additionally, the following disclosure is added below the table showing portfolio managers at KAR:
Hyung Kim. Mr. Kim is a Portfolio Manager and Senior Research Analyst at KAR (since 2017). Prior to joining KAR, Mr. Kim was an international equity analyst for Advisory Research Inc. (2010 to 2017).
Craig Thrasher, CFA. Mr. Thrasher is a Portfolio Manager and Senior Research Analyst at KAR. Before joining KAR in 2008, Mr. Thrasher was employed at Kirr, Marbach & Company as an equity analyst, and at Wedbush Morgan Securities in correspondent credit. He has approximately 15 years of equity research experience.
All other disclosure concerning the fund, including fees and expenses, remains unchanged from the prospectuses dated January 28, 2019.
Investors should retain this supplement with the Prospectuses for future reference.
VET 8019/TactAlloc KARChanges (6/2019)
Supplement dated June 14, 2019 to the Summary Prospectus and the Virtus Equity Trust Statutory Prospectus, each dated January 28, 2019, as supplemented
IMPORTANT NOTICE TO INVESTORS
Effective June 4, 2019, the benchmark to which performance of the fund’s non-U.S. portfolio is compared has changed to MSCI ACWI ex USA SMID Cap Index (net). The fund’s equity subadviser believes the MSCI ACWI ex USA SMID Cap Index better reflects the markets and securities in which the fund’s non-U.S. portfolio is invested than the fund’s previous non-U.S. benchmark, the MSCI EAFE® Index (net). Accordingly, the Tactical Allocation Fund Linked Benchmark is changed to consist of 45% Russell 1000® Growth Index, 15% MSCI ACWI ex USA SMID Cap Index, and 40% Bloomberg Barclays U.S. Aggregate Bond Index. Performance of the Tactical Allocation Fund Linked Benchmark from September 7, 2016 to June 3, 2019 continues to represent an allocation consisting of 45% Russell 1000® Growth Index, 15% MSCI EAFE® Index, and 40% Bloomberg Barclays U.S. Aggregate Bond Index; and performance of the Tactical Allocation Fund Linked Benchmark prior to September 7, 2016 continues to represent an allocation consisting of 50% of the S&P 500® Index and 50% Bloomberg Barclays U.S. Aggregate Bond Index.
Additional Information about the MSCI ACWI ex USA SMID Cap Index
The MSCI ACWI ex USA SMID Cap Index (net) captures mid- and small-cap representation across 22 of 23 Developed Market (DM) countries (excluding the U.S.) and 24 Emerging Markets countries. The index covers approximately 28% of the free float-adjusted market capitalization in each country. The index is calculated on a total return basis with net dividends reinvested. The index is unmanaged and not available for direct investment.
Investors should retain this supplement with the Prospectuses for future reference.
VET 8019/TactAllocBenchmark (6/2019)
THIS PAGE INTENTIONALLY BLANK.
THIS PAGE INTENTIONALLY BLANK.
TACTICAL ALLOCATION FUND
101 Munson Street
Greenfield, MA 01301-9668
Trustees
Philip R. McLoughlin, Chairman
George R. Aylward
Thomas J. Brown
Donald C. Burke
Sidney E. Harris
John R. Mallin
Hassell H. McClellan
Connie D. McDaniel
Geraldine M. McNamara
James M. Oates
Richard E. Segerson
Officers
George R. Aylward, President
Peter Batchelar, Senior Vice President
W. Patrick Bradley, Executive Vice President, Chief Financial Officer and Treasurer
Kevin J. Carr, Senior Vice President, Chief Legal Officer, Counsel and Secretary
Nancy J. Engberg, Senior Vice President and Chief Compliance Officer
Julia R. Short, Senior Vice President
Francis G. Waltman, Executive Vice President
Investment Adviser
Virtus Investment Advisers, Inc.
One Financial Plaza
Hartford, CT 06103-2608
Principal Underwriter
VP Distributors, LLC
One Financial Plaza
Hartford, CT 06103-2608
Administrator and Transfer Agent
Virtus Fund Services, LLC
One Financial Plaza
Hartford, CT 06103-2608
Custodian
The Bank of New York Mellon
240 Greenwich Street
New York, NY 10286-1048
Independent Registered Public
Accounting Firm
PricewaterhouseCoopers LLP
2001 Market Street
Philadelphia, PA 19103-7042
How to Contact Us
| Mutual Fund Services | 1-800-243-1574 |
| Adviser Consulting Group | 1-800-243-4361 |
Important Notice to Shareholders
The Securities and Exchange Commission has modified mailing regulations for semiannual and annual shareholder fund reports to allow mutual fund companies to send a single copy of these reports to shareholders who share the same mailing address. If you would like additional copies, please call Mutual Fund Services at 1-800-243-1574.
P.O. Box 9874
Providence, RI 02940-8074
For more information about Virtus Mutual Funds,
please contact us at1-800-243-1574, orVirtus.com.
Item 2. Code of Ethics.
| | (a) | The registrant, as of the end of the period covered by this report, has adopted a code of ethics that applies to the registrant’s principal executive officer, principal financial officer, principal accounting officer or controller, or persons performing similar functions, regardless of whether these individuals are employed by the registrant or a third party. |
| | (c) | There have been no amendments, during the period covered by this report, to a provision of the code of ethics that applies to the registrant’s principal executive officer, principal financial officer, principal accounting officer or controller, or persons performing similar functions, regardless of whether these individuals are employed by the registrant or a third party, and that relates to any element of the code of ethics described in Item 2(b) of the instructions for completion of FormN-CSR. |
| | (d) | The registrant has not granted any waivers, during the period covered by this report, including an implicit waiver, from a provision of the code of ethics that applies to the registrant’s principal executive officer, principal financial officer, principal accounting officer or controller, or persons performing similar functions, regardless of whether these individuals are employed by the registrant or a third party, that relates to one or more of the items set forth in paragraph (b) of the instructions for completion of this Item. |
Item 3. Audit Committee Financial Expert.
| (a)(1) | The Registrant’s Board of Trustees has determined that the Registrant has an “audit committee financial expert” serving on its Audit Committee. |
| (a)(2) | The Registrant’s Board of Trustees has determined that Donald C. Burke, Thomas J. Brown and Richard E. Segerson each possess the technical attributes identified in Instruction 2(b) of Item 3 to FormN-CSR to qualify as an “audit committee financial expert.” Each of Mr. Burke, Mr. Brown and Mr. Segerson is an “independent” trustee pursuant to paragraph (a)(2) of Item 3 to FormN-CSR. |
Item 4. Principal Accountant Fees and Services.
| | • | | Registrant may incorporate the following information by reference, if this information has been disclosed in the registrant’s definitive proxy statement or definitive information statement. The proxy statement or information statementmust be filed no later than 120 days after the end of the fiscal year covered by the Annual Report. |
Audit Fees
| | (a) | The aggregate fees billed for each of the last two fiscal years for professional services rendered by the principal accountant for the audit of the registrant’s annual financial statements or services that are normally provided by the accountant in connection with statutory and regulatory filings or engagements for fiscal years ended September 30, 2018 and September 30, 2019 are $165,050 and $177,500, respectively. |
Audit-Related Fees
| | (b) | The aggregate fees billed in each of the last two fiscal years for assurance and related services by the principal accountant that are reasonably related to the performance of the audit of the registrant’s financial statements and are not reported under paragraph (a) of this Item for fiscal years ended September 30, 2018 and September 30, 2019 are $34,564 and $19,147, respectively. Such audit-related fees include out of pocket expenses. |
Tax Fees
| | (c) | The aggregate fees billed in each of the last two fiscal years for professional services rendered by the principal accountant for tax compliance, tax advice, and tax planning for fiscal years ended September 30, 2018 and September 30, 2019 are $60,225 and $33,052, respectively. |
“Tax Fees” are those primarily associated with review of the Trust’s tax provision and qualification as a regulated investment company (RIC) in connection with audits of the Trust’s financial statement, review ofyear-end distributions by the Fund to avoid excise tax for the Trust, periodic discussion with management on tax issues affecting the Trust, and reviewing and signing the Fund’s federal income tax returns.
All Other Fees
| | (d) | The aggregate fees billed in each of the last two fiscal years for products and services provided by the principal accountant, other than the services reported in paragraphs (a) through (c) of this Item are for fiscal years ended September 30, 2018 and September 30, 2019 are $0 and $0, respectively. |
| | (e)(1) | Disclose the audit committee’spre-approval policies and procedures described in paragraph (c)(7) of Rule2-01 of RegulationS-X. |
The Board of Trustees of Virtus Equity Trust (the “Fund”) has adopted policies and procedures with regard to thepre-approval of services provided by its independent auditors. Audit, audit-related and tax compliance services provided to the Fund on an annual basis require specificpre-approval by the Audit Committee. The Audit Committee must also approve othernon-audit services provided to the Fund and thosenon-audit services provided to the Fund’s Affiliated Service Providers that relate directly to the operations and financial reporting of the Fund. Certain of thesenon-audit services that the Audit Committee believes are a) consistent with the SEC’s auditor independence rules and b) routine and recurring services that will not impair the
independence of the independent auditors may be approved by the Audit Committee without consideration on a specificcase-by-case basis (“generalpre-approval”).
The Audit Committee has determined that Mr. Thomas J. Brown, Chair of the Audit Committee, may providepre-approval for such services that meet the above requirements in the event such approval is sought between regularly scheduled meetings. In any event, the Audit Committee is informed of each service approved subject to generalpre-approval at the next regularly scheduledin-person Audit Committee meeting.
| | (e)(2) | The percentage of services described in each of paragraphs (b) through (d) of this Item that were approved by the audit committee pursuant to paragraph (c)(7)(i)(C) of Rule2-01 of RegulationS-X are as follows: |
| | (f) | The percentage of hours expended on the principal accountant’s engagement to audit the registrant’s financial statements for the most recent fiscal year that were attributed to work performed by persons other than the principal accountant’s full-time, permanent employees was less than fifty percent. |
| | (g) | The aggregatenon-audit fees billed by the registrant’s accountant for services rendered to the registrant, and rendered to the registrant’s investment adviser (not including anysub-adviser whose role is primarily portfolio management and is subcontracted with or overseen by another investment adviser), and any entity controlling, controlled by, or under common control with the adviser that provides ongoing services to the registrant for fiscal years ended September 30, 2018 and September 30, 2019 are $94,789* and $52,199, respectively. |
*Prior year fees were restated to removenon-audit fees paid by affiliated registrants not requested by the item.
| | (h) | The registrant’s audit committee of the board of directorshas considered whether the provision ofnon-audit services that were rendered to the registrant’s investment adviser (not including anysub-adviser whose role is primarily portfolio management and is subcontracted with or overseen by another investment adviser), and any entity controlling, controlled by, or under common control with the investment adviser that provides ongoing services to the registrant that were notpre-approved pursuant to paragraph (c)(7)(ii) of Rule2-01 of RegulationS-X is compatible with maintaining the principal accountant’s independence. |
Item 5. Audit Committee of Listed Registrants.
Not applicable.
Item 6. Investments.
| (a) | Schedule of Investments in securities of unaffiliated issuers as of the close of the reporting period is included as part of the report to shareholders filed under Item 1 of this form. |
| Item 7. | Disclosure of Proxy Voting Policies and Procedures forClosed-End Management Investment Companies. |
Not applicable.
| Item 8. | Portfolio Managers ofClosed-End Management Investment Companies. |
Not applicable.
| Item 9. | Purchases of Equity Securities byClosed-End Management Investment Company and Affiliated Purchasers. |
Not applicable.
| Item 10. | Submission of Matters to a Vote of Security Holders. |
There have been no material changes to the procedures by which the shareholders may recommend nominees to the registrant’s board of trustees, where those changes were implemented after the registrant last provided disclosure in response to the requirements of Item 407(c)(2)(iv) of RegulationS-K (17 CFR 229.407) (as required by Item 22(b)(15) of Schedule 14A (17 CFR240.14a-101)), or this Item.
Item 11. Controls and Procedures.
| | (a) | The registrant’s principal executive and principal financial officers, or persons performing similar functions, have concluded that the registrant’s disclosure controls and procedures (as defined in Rule30a-3(c) under the Investment Company Act of 1940, as amended (the “1940 Act”) (17 CFR270.30a-3(c))) are effective, as of a date within 90 days of the filing date of the report that includes the disclosure required by this paragraph, based on their evaluation of these controls and procedures required by Rule30a-3(b) under the 1940 Act (17 CFR270.30a-3(b)) and Rules13a-15(b) or15d-15(b) under the Securities Exchange Act of 1934, as amended (17 CFR240.13a-15(b) or240.15d-15(b)). |
| | (b) | There were no changes in the registrant’s internal control over financial reporting (as defined in Rule30a-3(d) under the 1940 Act (17 CFR270.30a-3(d))) that occurred during the period covered by this report that has materially affected, or is reasonably likely to materially affect, the registrant’s internal control over financial reporting. |
| Item 12. | Disclosure of Securities Lending Activities forClosed-End Management Investment Companies. |
Not applicable.
| | (a)(1) | Code of ethics, or any amendment thereto, that is the subject of disclosure required by Item 2 is attached hereto. |
| | (a)(2) | Certifications pursuant to Rule30a-2(a) under the 1940 Act and Section 302 of the Sarbanes-Oxley Act of 2002 are attached hereto. |
| | (b) | Certifications pursuant to Rule30a-2(b) under the 1940 Act and Section 906 of the Sarbanes- Oxley Act of 2002 are attached hereto. |
SIGNATURES
Pursuant to the requirements of the Securities Exchange Act of 1934 and the Investment Company Act of 1940, the registrant has duly caused this report to be signed on its behalf by the undersigned, thereunto duly authorized.
| | |
(Registrant) | | Virtus Equity Trust |
| | |
| |
By (Signature and Title)* | | /s/ George R. Aylward |
| | George R. Aylward, President |
| | (principal executive officer) |
Pursuant to the requirements of the Securities Exchange Act of 1934 and the Investment Company Act of 1940, this report has been signed below by the following persons on behalf of the registrant and in the capacities and on the dates indicated.
| | |
By (Signature and Title)* | | /s/ George R. Aylward |
| | George R. Aylward, President |
| | (principal executive officer) |
| | |
By (Signature and Title)* | | /s/ W. Patrick Bradley |
| | W. Patrick Bradley, Executive Vice President, Chief Financial Officer,
and Treasurer |
| | (principal financial officer) |
* Print the name and title of each signing officer under his or her signature.