UNITED STATES
SECURITIES AND EXCHANGE COMMISSION
Washington, D.C. 20549
FORM N-CSR
CERTIFIED SHAREHOLDER REPORT OF REGISTERED
MANAGEMENT INVESTMENT COMPANIES
Investment Company Act file number 811-00945
Virtus Equity Trust
(Exact name of registrant as specified in charter)
101 Munson Street
Greenfield, MA 01301-9668
(Address of principal executive offices) (Zip code)
Kevin J. Carr, Esq.
Senior Vice President, Chief Legal Officer, Counsel and Secretary for Registrant
One Financial Plaza
Hartford, CT 06103-2608
(Name and address of agent for service)
Registrant’s telephone number, including area code: (800) 243-1574
Date of fiscal year end: September 30
Date of reporting period: September 30, 2022
Form N-CSR is to be used by management investment companies to file reports with the Commission not later than 10 days after the transmission to stockholders of any report that is required to be transmitted to stockholders under Rule 30e-1 under the Investment Company Act of 1940 (17 CFR 270.30e-1). The Commission may use the information provided on Form N-CSR in its regulatory, disclosure review, inspection, and policymaking roles.
A registrant is required to disclose the information specified by Form N-CSR, and the Commission will make this information public. A registrant is not required to respond to the collection of information contained in Form N-CSR unless the Form displays a currently valid Office of Management and Budget (“OMB”) control number. Please direct comments concerning the accuracy of the information collection burden estimate and any suggestions for reducing the burden to Secretary, Securities and Exchange Commission, 450 Fifth Street, NW, Washington, DC 20549-0609. The OMB has reviewed this collection of information under the clearance requirements of 44 U.S.C. § 3507.
Item 1. Reports to Stockholders.
| (a) | The Report to Shareholders is attached herewith. |
ANNUAL REPORT
VIRTUS EQUITY TRUST
| Virtus KAR Capital Growth Fund |
| Virtus KAR Equity Income Fund |
| Virtus KAR Global Quality Dividend Fund |
| Virtus KAR Mid-Cap Core Fund |
| Virtus KAR Mid-Cap Growth Fund |
| Virtus KAR Small-Cap Core Fund |
| Virtus KAR Small-Cap Growth Fund |
| Virtus KAR Small-Cap Value Fund |
| Virtus KAR Small-Mid Cap Core Fund |
| Virtus KAR Small-Mid Cap Growth Fund |
| Virtus KAR Small-Mid Cap Value Fund |
| Virtus SGA Emerging Markets Growth Fund |
| Virtus SGA Global Growth Fund* |
| Virtus SGA New Leaders Growth Fund |
| Virtus Tactical Allocation Fund* |
*Prospectus supplement applicable to this fund appears at the back of this annual report.
Not FDIC Insured • No Bank Guarantee • May Lose Value
Table of Contents
| 1 |
| 2 |
| 6 |
| Fund | Fund
Summary | Schedule
of
Investments |
| 10 | 62 |
| 13 | 63 |
| 16 | 64 |
| 19 | 66 |
| 23 | 67 |
| 26 | 69 |
| 30 | 70 |
| 34 | 72 |
| 38 | 73 |
| 42 | 74 |
| 45 | 75 |
| 48 | 76 |
| 52 | 77 |
| 55 | 78 |
| 58 | 79 |
| 90 |
| 98 |
| 101 |
| 109 |
| 119 |
| 139 |
| 141 |
| 142 |
| 143 |
| 144 |
Proxy Voting Procedures and Voting Record (Form N-PX)
The subadvisers vote proxies, if any, relating to portfolio securities in accordance with procedures that have been approved by the Board of Trustees of the Trust (“Trustees”, or the “Board”). You may obtain a description of these procedures, along with information regarding how the Funds voted proxies during the most recent 12-month period ended June 30, free of charge, by calling toll-free 1-800-243-1574. This information is also available through the Securities and Exchange Commission’s (the “SEC”) website at https://www.sec.gov.
PORTFOLIO HOLDINGS INFORMATION
The Trust files a complete schedule of portfolio holdings for each Fund with the SEC for the first and third quarters of each fiscal year as an exhibit to its reports on Form N-PORT-P. Form N-PORT-P is available on the SEC’s website at https://www.sec.gov.
This report is not authorized for distribution to prospective investors in the Funds presented in this book unless preceded or accompanied by an effective prospectus which includes information concerning the sales charge, each Fund’s record and other pertinent information.
To Virtus Equity Trust Shareholders:
I am pleased to present this annual report, which reviews the performance of your Fund for the 12 months ended September 30, 2022.
During the reporting period, market strength in 2021 was followed by volatility in the first nine months of 2022. The Federal Reserve (the “Fed”) and other central banks raised interest rates and tightened monetary policy in an effort to fight rising inflation. Russia’s invasion of Ukraine in February created geopolitical uncertainty and contributed to rising prices, particularly for energy and food.
Domestic equity indexes recorded declines for the 12 months ended September 30, 2022. U.S. large-capitalization stocks were down 15.47%, as measured by the S&P 500® Index, and small-cap stocks lost 23.50%, as measured by the Russell 2000® Index. Losses were also felt across international equities, with developed markets, as measured by the MSCI EAFE® Index (net), declining 25.13%, while emerging markets, as measured by the MSCI Emerging Markets Index (net), were down 28.11%.
In fixed income markets, the yield on the 10-year Treasury rose sharply to 3.83% on September 30, 2022, from 1.52% on September 30, 2021, as the Fed implemented several large interest rate hikes. The broader U.S. fixed income market, as represented by the Bloomberg U.S. Aggregate Bond Index, was down 14.60% for the 12-month period, while non-investment grade bonds, as measured by the Bloomberg U.S. Corporate High Yield Bond Index, lost 14.14%.
While market volatility can be challenging, staying focused on your long-term goals can help. Please call our customer service team at 800-243-1574 if you have questions about your account or require assistance. Thank you for your continued confidence in us.
Sincerely,
George R. Aylward
President,
November 2022
Refer to the Fund Summary section for your Fund’s performance. Performance data quoted represents past results. Past performance is no guarantee of future results, and current performance may be higher or lower than the performance shown above. Investing involves risk, including the risk of loss of principal invested.
VIRTUS EQUITY TRUST
DISCLOSURE OF FUND EXPENSES (Unaudited)
FOR THE SIX-MONTH PERIOD OF April 1, 2022 TO September 30, 2022
We believe it is important for you to understand the impact of costs on your investment. All mutual funds have operating expenses. As a shareholder of a Virtus Equity Trust Fund (each, a “Fund”), you may incur two types of costs: (1) transaction costs, including sales charges on purchases of Class A shares and contingent deferred sales charges on Class C shares; and (2) ongoing costs, including investment advisory fees, distribution and service fees, and other expenses. Class I shares and Class R6 shares are sold without sales charges and do not incur distribution and service fees. Class R6 shares also do not incur shareholder servicing fees. For further information regarding applicable sales charges, see Note 1 in the Notes to Financial Statements. These examples are intended to help you understand your ongoing costs (in dollars) of investing in a Fund and to compare these costs with the ongoing costs of investing in other mutual funds. These examples are based on an investment of $1,000 invested at the beginning of the period and held for the entire six-month period. The Annualized Expense Ratios may be different from the expense ratios in the Financial Highlights which are for the fiscal year ended September 30, 2022.
Please note that the expenses shown in the accompanying tables are meant to highlight your ongoing costs only and do not reflect any transactional costs, such as sales charges or contingent deferred sales charges. Therefore, the accompanying tables are useful in comparing ongoing costs only, and will not help you determine the relative total costs of owning different funds. In addition, if these transactional costs were included, your costs would have been higher. The calculations assume no shares were bought or sold during the period. Your actual costs may have been higher or lower, depending on the amount of your investment and the timing of any purchases or redemptions.
Actual Expenses
The table below provides information about actual account values and actual expenses. You may use the information below, together with the amount you invested, to estimate the expenses that you paid over the period. Simply divide your account value by $1,000 (for example, an $8,600 account value divided by $1,000 = 8.6), then multiply the result by the number in the table under the heading entitled “Expenses Paid During Period” to estimate the expenses you paid on your account during this period.
| | | Beginning
Account Value
April 1, 2022 | | Ending
Account Value
September 30, 2022 | | Annualized
Expense
Ratio | | Expenses
Paid
During
Period* |
KAR Capital Growth Fund
| | | | | | | | |
| | Class A | $ 1,000.00 | | $ 711.50 | | 1.23 % | | $ 5.28 |
| | Class C | 1,000.00 | | 708.30 | | 2.08 | | 8.91 |
| | Class I | 1,000.00 | | 711.60 | | 1.05 | | 4.51 |
| | Class R6 | 1,000.00 | | 712.90 | | 0.76 | | 3.26 |
KAR Equity Income Fund
| | | | | | | | |
| | Class A | 1,000.00 | | 867.40 | | 1.25 | | 5.85 |
| | Class C | 1,000.00 | | 863.90 | | 2.00 | | 9.35 |
| | Class I | 1,000.00 | | 868.40 | | 1.01 | | 4.73 |
| | Class R6 | 1,000.00 | | 868.30 | | 0.96 | | 4.50 |
KAR Global Quality Dividend Fund
| | | | | | | | |
| | Class A | 1,000.00 | | 841.00 | | 1.38 | | 6.37 |
| | Class C | 1,000.00 | | 837.10 | | 2.13 | | 9.81 |
| | Class I | 1,000.00 | | 841.90 | | 1.13 | | 5.22 |
| | Class R6 | 1,000.00 | | 842.90 | | 0.81 | | 3.74 |
KAR Mid-Cap Core Fund
| | | | | | | | |
| | Class A | 1,000.00 | | 824.40 | | 1.23 | | 5.63 |
| | Class C | 1,000.00 | | 821.30 | | 1.98 | | 9.04 |
| | Class I | 1,000.00 | | 825.40 | | 0.98 | | 4.48 |
| | Class R6 | 1,000.00 | | 825.70 | | 0.90 | | 4.12 |
KAR Mid-Cap Growth Fund
| | | | | | | | |
| | Class A | 1,000.00 | | 754.80 | | 1.27 | | 5.59 |
| | Class C | 1,000.00 | | 751.40 | | 2.16 | | 9.48 |
| | Class I | 1,000.00 | | 755.40 | | 1.07 | | 4.71 |
| | Class R6 | 1,000.00 | | 756.20 | | 0.86 | | 3.79 |
KAR Small-Cap Core Fund
| | | | | | | | |
| | Class A | 1,000.00 | | 906.10 | | 1.29 | | 6.16 |
| | Class C | 1,000.00 | | 902.80 | | 2.03 | | 9.68 |
| | Class I | 1,000.00 | | 907.30 | | 1.03 | | 4.92 |
| | Class R6 | 1,000.00 | | 907.70 | | 0.95 | | 4.54 |
KAR Small-Cap Growth Fund
| | | | | | | | |
| | Class A | 1,000.00 | | 811.80 | | 1.36 | | 6.18 |
| | Class C | 1,000.00 | | 808.90 | | 2.12 | | 9.61 |
| | Class I | 1,000.00 | | 812.70 | | 1.12 | | 5.09 |
| | Class R6 | 1,000.00 | | 813.10 | | 1.02 | | 4.64 |
VIRTUS EQUITY TRUST
DISCLOSURE OF FUND EXPENSES (Unaudited) (Continued)
FOR THE SIX-MONTH PERIOD OF April 1, 2022 TO September 30, 2022
| | | Beginning
Account Value
April 1, 2022 | | Ending
Account Value
September 30, 2022 | | Annualized
Expense
Ratio | | Expenses
Paid
During
Period* |
KAR Small-Cap Value Fund
| | | | | | | | |
| | Class A | $1,000.00 | | $825.30 | | 1.24% | | $ 5.67 |
| | Class C | 1,000.00 | | 822.10 | | 2.01 | | 9.18 |
| | Class I | 1,000.00 | | 826.30 | | 1.02 | | 4.67 |
| | Class R6 | 1,000.00 | | 826.50 | | 0.93 | | 4.26 |
KAR Small-Mid Cap Core Fund
| | | | | | | | |
| | Class A | 1,000.00 | | 785.70 | | 1.31 | | 5.86 |
| | Class C | 1,000.00 | | 782.60 | | 2.09 | | 9.34 |
| | Class I | 1,000.00 | | 787.10 | | 1.07 | | 4.79 |
| | Class R6 | 1,000.00 | | 787.00 | | 1.00 | | 4.48 |
KAR Small-Mid Cap Growth Fund
| | | | | | | | |
| | Class A | 1,000.00 | | 804.40 | | 1.33 | | 6.02 |
| | Class C | 1,000.00 | | 801.50 | | 2.08 | | 9.39 |
| | Class I | 1,000.00 | | 805.20 | | 1.08 | | 4.89 |
| | Class R6 | 1,000.00 | | 806.20 | | 1.02 | | 4.62 |
KAR Small-Mid Cap Value Fund
| | | | | | | | |
| | Class A | 1,000.00 | | 852.00 | | 1.21 | | 5.62 |
| | Class C | 1,000.00 | | 848.20 | | 1.95 | | 9.03 |
| | Class I | 1,000.00 | | 851.80 | | 0.95 | | 4.41 |
| | Class R6 | 1,000.00 | | 853.10 | | 0.85 | | 3.95 |
SGA Emerging Markets Growth Fund
| | | | | | | | |
| | Class A | 1,000.00 | | 810.90 | | 1.51 | | 6.85 |
| | Class C | 1,000.00 | | 807.50 | | 2.26 | | 10.24 |
| | Class I | 1,000.00 | | 812.30 | | 1.26 | | 5.72 |
| | Class R6 | 1,000.00 | | 813.20 | | 1.08 | | 4.91 |
SGA Global Growth Fund
| | | | | | | | |
| | Class A | 1,000.00 | | 752.80 | | 1.41 | | 6.20 |
| | Class C | 1,000.00 | | 750.10 | | 2.16 | | 9.48 |
| | Class I | 1,000.00 | | 753.80 | | 1.16 | | 5.10 |
| | Class R6 | 1,000.00 | | 754.80 | | 0.93 | | 4.09 |
SGA New Leaders Growth Fund
| | | | | | | | |
| | Class A | 1,000.00 | | 727.60 | | 1.38 | | 5.98 |
| | Class C | 1,000.00 | | 724.70 | | 2.14 | | 9.25 |
| | Class I | 1,000.00 | | 728.50 | | 1.14 | | 4.94 |
| | Class R6 | 1,000.00 | | 728.30 | | 0.94 | | 4.07 |
Tactical Allocation Fund
| | | | | | | | |
| | Class A | 1,000.00 | | 773.20 | | 1.02 | | 4.53 |
| | Class C | 1,000.00 | | 770.10 | | 1.78 | | 7.90 |
| | Class I | 1,000.00 | | 773.40 | | 0.79 | | 3.51 |
| | Class R6 | 1,000.00 | | 775.20 | | 0.63 | | 2.80 |
| * | Expenses are equal to the relevant Fund’s annualized expense ratio, which is net of waived fees and reimbursed expenses, if applicable, multiplied by the average account value over the period, multiplied by the number of days (183) expenses were accrued in the most recent fiscal half-year, then divided by 365 to reflect the one-half year period. |
For Funds which may invest in other funds, the annualized expense ratios noted above do not reflect fees and expenses associated with any underlying funds. If such fees and expenses had been included, the expenses would have been higher.
You can find more information about a Fund’s expenses in the Financial Statements section that follows. For additional information on operating expenses and other shareholder costs, refer to that Fund’s prospectus.
Hypothetical Example for Comparison Purposes
The table below provides information about hypothetical account values and hypothetical expenses based on a Fund’s actual expense ratio and an assumed rate of return of 5% per year before expenses, which is not your Fund’s actual return. The hypothetical account values and expenses may not be used to estimate the actual ending account balance or expenses you paid for the period. You may use this information to compare the ongoing costs of investing in your Fund and other funds. To do so, compare these 5% hypothetical examples with the 5% hypothetical examples that appear in the shareholder reports of other mutual funds.
VIRTUS EQUITY TRUST
DISCLOSURE OF FUND EXPENSES (Unaudited) (Continued)
FOR THE SIX-MONTH PERIOD OF April 1, 2022 TO September 30, 2022
| | | Beginning
Account Value
April 1, 2022 | | Ending
Account Value
September 30, 2022 | | Annualized
Expense
Ratio | | Expenses
Paid
During
Period* |
KAR Capital Growth Fund
| | | | | | | | |
| | Class A | $ 1,000.00 | | $ 1,018.90 | | 1.23 % | | $ 6.23 |
| | Class C | 1,000.00 | | 1,014.64 | | 2.08 | | 10.50 |
| | Class I | 1,000.00 | | 1,019.80 | | 1.05 | | 5.32 |
| | Class R6 | 1,000.00 | | 1,021.26 | | 0.76 | | 3.85 |
KAR Equity Income Fund
| | | | | | | | |
| | Class A | 1,000.00 | | 1,018.80 | | 1.25 | | 6.33 |
| | Class C | 1,000.00 | | 1,015.04 | | 2.00 | | 10.10 |
| | Class I | 1,000.00 | | 1,020.00 | | 1.01 | | 5.11 |
| | Class R6 | 1,000.00 | | 1,020.26 | | 0.96 | | 4.86 |
KAR Global Quality Dividend Fund
| | | | | | | | |
| | Class A | 1,000.00 | | 1,018.15 | | 1.38 | | 6.98 |
| | Class C | 1,000.00 | | 1,014.39 | | 2.13 | | 10.76 |
| | Class I | 1,000.00 | | 1,019.40 | | 1.13 | | 5.72 |
| | Class R6 | 1,000.00 | | 1,021.01 | | 0.81 | | 4.10 |
KAR Mid-Cap Core Fund
| | | | | | | | |
| | Class A | 1,000.00 | | 1,018.90 | | 1.23 | | 6.23 |
| | Class C | 1,000.00 | | 1,015.14 | | 1.98 | | 10.00 |
| | Class I | 1,000.00 | | 1,020.16 | | 0.98 | | 4.96 |
| | Class R6 | 1,000.00 | | 1,020.56 | | 0.90 | | 4.56 |
KAR Mid-Cap Growth Fund
| | | | | | | | |
| | Class A | 1,000.00 | | 1,018.70 | | 1.27 | | 6.43 |
| | Class C | 1,000.00 | | 1,014.24 | | 2.16 | | 10.91 |
| | Class I | 1,000.00 | | 1,019.70 | | 1.07 | | 5.42 |
| | Class R6 | 1,000.00 | | 1,020.76 | | 0.86 | | 4.36 |
KAR Small-Cap Core Fund
| | | | | | | | |
| | Class A | 1,000.00 | | 1,018.60 | | 1.29 | | 6.53 |
| | Class C | 1,000.00 | | 1,014.89 | | 2.03 | | 10.25 |
| | Class I | 1,000.00 | | 1,019.90 | | 1.03 | | 5.22 |
| | Class R6 | 1,000.00 | | 1,020.31 | | 0.95 | | 4.81 |
KAR Small-Cap Growth Fund
| | | | | | | | |
| | Class A | 1,000.00 | | 1,018.25 | | 1.36 | | 6.88 |
| | Class C | 1,000.00 | | 1,014.44 | | 2.12 | | 10.71 |
| | Class I | 1,000.00 | | 1,019.45 | | 1.12 | | 5.67 |
| | Class R6 | 1,000.00 | | 1,019.95 | | 1.02 | | 5.16 |
KAR Small-Cap Value Fund
| | | | | | | | |
| | Class A | 1,000.00 | | 1,018.85 | | 1.24 | | 6.28 |
| | Class C | 1,000.00 | | 1,014.99 | | 2.01 | | 10.15 |
| | Class I | 1,000.00 | | 1,019.95 | | 1.02 | | 5.16 |
| | Class R6 | 1,000.00 | | 1,020.41 | | 0.93 | | 4.71 |
KAR Small-Mid Cap Core Fund
| | | | | | | | |
| | Class A | 1,000.00 | | 1,018.50 | | 1.31 | | 6.63 |
| | Class C | 1,000.00 | | 1,014.59 | | 2.09 | | 10.56 |
| | Class I | 1,000.00 | | 1,019.70 | | 1.07 | | 5.42 |
| | Class R6 | 1,000.00 | | 1,020.05 | | 1.00 | | 5.06 |
KAR Small-Mid Cap Growth Fund
| | | | | | | | |
| | Class A | 1,000.00 | | 1,018.40 | | 1.33 | | 6.73 |
| | Class C | 1,000.00 | | 1,014.64 | | 2.08 | | 10.50 |
| | Class I | 1,000.00 | | 1,019.65 | | 1.08 | | 5.47 |
| | Class R6 | 1,000.00 | | 1,019.95 | | 1.02 | | 5.16 |
KAR Small-Mid Cap Value Fund
| | | | | | | | |
| | Class A | 1,000.00 | | 1,019.00 | | 1.21 | | 6.12 |
| | Class C | 1,000.00 | | 1,015.29 | | 1.95 | | 9.85 |
| | Class I | 1,000.00 | | 1,020.31 | | 0.95 | | 4.81 |
| | Class R6 | 1,000.00 | | 1,020.81 | | 0.85 | | 4.31 |
VIRTUS EQUITY TRUST
DISCLOSURE OF FUND EXPENSES (Unaudited) (Continued)
FOR THE SIX-MONTH PERIOD OF April 1, 2022 TO September 30, 2022
| | | Beginning
Account Value
April 1, 2022 | | Ending
Account Value
September 30, 2022 | | Annualized
Expense
Ratio | | Expenses
Paid
During
Period* |
SGA Emerging Markets Growth Fund
| | | | | | | | |
| | Class A | $1,000.00 | | $1,017.50 | | 1.51% | | $ 7.64 |
| | Class C | 1,000.00 | | 1,013.74 | | 2.26 | | 11.41 |
| | Class I | 1,000.00 | | 1,018.75 | | 1.26 | | 6.38 |
| | Class R6 | 1,000.00 | | 1,019.65 | | 1.08 | | 5.47 |
SGA Global Growth Fund
| | | | | | | | |
| | Class A | 1,000.00 | | 1,018.00 | | 1.41 | | 7.13 |
| | Class C | 1,000.00 | | 1,014.24 | | 2.16 | | 10.91 |
| | Class I | 1,000.00 | | 1,019.25 | | 1.16 | | 5.87 |
| | Class R6 | 1,000.00 | | 1,020.41 | | 0.93 | | 4.71 |
SGA New Leaders Growth Fund
| | | | | | | | |
| | Class A | 1,000.00 | | 1,018.15 | | 1.38 | | 6.98 |
| | Class C | 1,000.00 | | 1,014.34 | | 2.14 | | 10.81 |
| | Class I | 1,000.00 | | 1,019.35 | | 1.14 | | 5.77 |
| | Class R6 | 1,000.00 | | 1,020.36 | | 0.94 | | 4.76 |
Tactical Allocation Fund
| | | | | | | | |
| | Class A | 1,000.00 | | 1,019.95 | | 1.02 | | 5.16 |
| | Class C | 1,000.00 | | 1,016.14 | | 1.78 | | 9.00 |
| | Class I | 1,000.00 | | 1,021.11 | | 0.79 | | 4.00 |
| | Class R6 | 1,000.00 | | 1,021.91 | | 0.63 | | 3.19 |
| * | Expenses are equal to the relevant Fund’s annualized expense ratio, which is net of waived fees and reimbursed expenses, if applicable, multiplied by the average account value over the period, multiplied by the number of days (183) expenses were accrued in the most recent fiscal half-year, then divided by 365 to reflect the one-half year period. |
For Funds which may invest in other funds, the annualized expense ratios noted above do not reflect fees and expenses associated with any underlying funds. If such fees and expenses had been included, the expenses would have been higher.
You can find more information about a Fund’s expenses in the Financial Statements section that follows. For additional information on operating expenses and other shareholder costs, refer to that Fund’s prospectus.
VIRTUS EQUITY TRUST
KEY INVESTMENT TERMS (Unaudited)
September 30, 2022
American Depositary Receipt (“ADR”)
Represents shares of foreign companies traded in U.S. dollars on U.S. exchanges that are held by a U.S. bank or a trust. Foreign companies use ADRs in order to make it easier for Americans to buy their shares.
Bloomberg U.S. Aggregate Bond Index
The Bloomberg U.S. Aggregate Bond Index measures the U.S. investment-grade fixed-rate bond market. The index is calculated on a total return basis. The index is unmanaged, its returns do not reflect any fees, expenses, or sales charges, and it is not available for direct investment.
Bloomberg U.S. Corporate High Yield Bond Index
The Bloomberg U.S. Corporate High Yield Bond Index measures the U.S. dollar-denominated, high yield, fixed-rate corporate bond market. The index is calculated on a total return basis. The index is unmanaged, its returns do not reflect any fees, expenses, or sales charges, and it is not available for direct investment.
Build America Municipal Insured (“BAM”)
Build America Municipal Insured Bonds are municipal bonds insured against default by Build America Mutual, a Financial Guaranty insurance company.
European Central Bank (“ECB”)
The ECB is responsible for conducting monetary policy for the euro area. The ECB was established as the core of the Eurosystem and the European System of Central Banks (“ESCB”). The ESCB comprises the ECB and the National Central Banks (“NCBs”) of all 17 European Union Member States whether they have adopted the Euro or not.
Exchange-Traded Fund (“ETF”)
An open-end fund that is traded on a stock exchange. Most ETFs have a portfolio of stocks or bonds that track a specific market index.
Federal Reserve (the “Fed”)
The Central Bank of the U.S., the Fed is responsible for controlling money supply, interest rates and credit with the goal of keeping the U.S. economy and currency stable. Governed by a seven-member board, the system includes 12 regional Federal Reserve Banks, 25 branches and all national and state banks that are part of the system.
Global Quality Dividend Linked Benchmark
Performance of the Global Quality Dividend Linked benchmark is that of the MSCI World High Dividend Yield Index. Performance of the Global Quality Dividend Linked benchmark prior to February 1, 2017 is that of the Russell 1000® Value Index and from February 1, 2017 to December 31, 2018, it is that of the Russell Developed Large Cap Index (net). The indexes are unmanaged and not available for direct investment.
London Interbank Offered Rate (“LIBOR”)
A benchmark rate that some of the world’s leading banks charge each other for short-term loans and that serves as the first step to calculating interest rates on various loans throughout the world.
MSCI All Country World Growth Index (net)
The MSCI All Country World Growth Index (net) is a free float-adjusted market capitalization-weighted index that measures equity performance of large and mid-cap securities exhibiting overall growth style characteristics across developed and emerging markets. The index is calculated on a total return basis with net dividends reinvested. The index is unmanaged, its returns do not reflect any fees, expenses, or sales charges, and is not available for direct investment.
MSCI All Country World Index (ACWI) (net)
The MSCI All Country World Index (net) is a free float-adjusted market capitalization-weighted index that measures equity performance of developed and emerging markets. The index is calculated on a total return basis with net dividends reinvested. The index is unmanaged, its returns do not reflect any fees, expenses, or sales charges, and is not available for direct investment.
MSCI ACWI ex USA SMID Cap Index (net)
The MSCI ACWI ex USA SMID Cap Index (net) is a free float-adjusted market capitalization-weighted index that measures mid- and small-cap performance across 22 of 23 Developed Market countries (excluding the U.S.) and 24 Emerging Markets countries. The index is calculated on a total return basis with net dividends reinvested. The index is unmanaged, its returns do not reflect any fees, expenses, or sales charges, and is not available for direct investment.
MSCI All Country World Mid-Cap Index (net)
The MSCI All Country World Mid Cap Index (net) is a free float-adjusted market capitalization-weighted index that measures mid cap equity performance of developed and emerging markets. The index is calculated on a total return basis with net dividends reinvested.
VIRTUS EQUITY TRUST
KEY INVESTMENT TERMS (Unaudited) (Continued)
September 30, 2022
MSCI EAFE® Index (net)
The MSCI EAFE® (Europe, Australasia, Far East) Index (net) is a free float-adjusted market capitalization-weighted index that measures developed foreign market equity performance, excluding the U.S. and Canada. The index is calculated on a total return basis with net dividends reinvested. The index is unmanaged, its returns do not reflect any fees, expenses, or sales charges, and it is not available for direct investment.
MSCI Emerging Markets Index (net)
The MSCI Emerging Markets Index (net) is a free float-adjusted market capitalization-weighted index designed to measure equity market performance in the global emerging markets. The index is calculated on a total return basis with net dividends reinvested. The index is unmanaged, its returns do not reflect any fees, expenses, or sales charges, and it is not available for direct investment.
MSCI USA High Dividend Yield Index (net)
The MSCI USA High Dividend Yield Index is based on the MSCI USA Index, its parent index, and includes large and mid-cap stocks. The index is designed to reflect the performance of equities in the parent index (excluding REITs) with higher dividend income and quality characteristics than average dividend yields that are both sustainable and persistent. The index also applies quality screens and reviews 12-month past performance to omit stocks with potentially deteriorating fundamentals that could force them to cut or reduce dividends. The index is calculated on a total return basis with net dividends reinvested; it is unmanaged; its returns do not reflect any fees, expenses or sales charges; and it is not available for direct investment.
MSCI USA Index (net)
The MSCI USA Index is designed to measure the performance of the large and mid-cap segments of the US market. With 625 constituents, the index covers approximately 85% of the free float-adjusted market capitalization in the US.
MSCI World High Dividend Yield Index (net)
The MSCI World High Dividend Yield Index (net) is based on the MSCI World Index, its parent index, and includes large- and mid-cap stocks across 23 developed markets countries. The index is designed to reflect the performance of equities in the parent index (excluding REITs) with higher dividend income and quality characteristics than average dividend yields that are both sustainable and persistent. The index also applies quality screens and reviews 12-month past performance to omit stocks with potentially deteriorating fundamentals that could force them to cut or reduce dividends. The index is calculated on a total return basis with net dividends reinvested. The index is unmanaged, its returns do not reflect any fees, expenses, or sales charges, and it is not available for direct investment.
MSCI World Index (net)
The MSCI World Index (net) is a free float-adjusted market capitalization-weighted index that measures developed global market equity performance. The index is calculated on a total return basis with net dividends reinvested. The index is unmanaged, its returns do not reflect any fees, expenses, or sales charges, and it is not available for direct investment.
Real Estate Investment Trust (“REIT”)
A publicly traded company that owns, develops and operates income-producing real estate such as apartments, office buildings, hotels, shopping centers and other commercial properties.
Russell 1000® Growth Index
The Russell 1000® Growth Index is a market capitalization-weighted index of growth-oriented stocks of the 1,000 largest companies in the Russell Universe, which comprises the 3,000 largest U.S. companies. The index is calculated on a total return basis with dividends reinvested. The index is unmanaged, its returns do not reflect any fees, expenses, or sales charges, and it is not available for direct investment.
Russell 1000® Value Index
The Russell 1000® Value Index is a market capitalization-weighted index of value-oriented stocks of the 1,000 largest companies in the Russell Universe, which comprises the 3,000 largest U.S. companies. The index is calculated on a total return basis with dividends reinvested. The index is unmanaged, its returns do not reflect any fees, expenses, or sales charges, and it is not available for direct investment.
Russell 2000® Growth Index
The Russell 2000® Growth Index is a market capitalization-weighted index of growth-oriented stocks of the smallest 2,000 companies in the Russell Universe, which comprises the 3,000 largest U.S. companies. The index is calculated on a total return basis with dividends reinvested. The index is unmanaged, its returns do not reflect any fees, expenses, or sales charges, and it is not available for direct investment.
Russell 2000® Index
The Russell 2000® Index is a market capitalization-weighted index of the 2,000 smallest companies in the Russell Universe, which comprises the 3,000 largest U.S. companies. The index is calculated on a total return basis with dividends reinvested. The index is unmanaged, its returns do not reflect any fees, expenses, or sales charges, and it is not available for direct investment.
VIRTUS EQUITY TRUST
KEY INVESTMENT TERMS (Unaudited) (Continued)
September 30, 2022
Russell 2000® Value Index
The Russell 2000® Value Index is a market capitalization-weighted index of value-oriented stocks of the smallest 2,000 companies in the Russell Universe, which comprises the 3,000 largest U.S. companies. The index is calculated on a total return basis with dividends reinvested. The index is unmanaged, its returns do not reflect any fees, expenses, or sales charges, and it is not available for direct investment.
Russell 2500TM Index
The Russell 2500TM Index is a market capitalization-weighted index of the 2,500 smallest companies in the Russell Universe, which comprises the 3,000 largest U.S. companies. The index is calculated on a total return basis with dividends reinvested. The index is unmanaged, its returns do not reflect any fees, expenses, or sales charges, and is not available for direct investment.
Russell 2500TM Growth Index
The Russell 2500TM Growth Index is a market capitalization-weighted index of growth-oriented stocks of the 2,500 smallest companies in the Russell Universe, which comprises the 3,000 largest U.S. companies. The index is calculated on a total return basis with dividends reinvested. The index is unmanaged, its returns do not reflect any fees, expenses, or sales charges, and is not available for direct investment.
Russell 2500TM Value Index
The Russell 2500TM Value Index is a market capitalization-weighted index of value-oriented stocks of the 2,500 smallest companies in the Russell Universe, which comprises the 3,000 largest U.S. companies. The index is calculated on a total return basis with dividends reinvested. The index is unmanaged, its returns do not reflect any fees, expenses, or sales charges, and is not available for direct investment.
Russell Developed Large Cap Index (net)
The Russell Developed Large Cap Index (net) is a free-float market capitalization-weighted index constructed to provide a comprehensive and unbiased barometer for the large-cap segment in the developed world. The index is calculated on a total return basis with net dividends reinvested. The index is unmanaged, its returns do not reflect any fees, expenses, or sales charges, and it is not available for direct investment.
Russell Midcap® Growth Index
The Russell Midcap® Growth Index is a market capitalization-weighted index of medium-capitalization, growth-oriented stocks of U.S. companies. The index is calculated on a total return basis with dividends reinvested. The index is unmanaged, its returns do not reflect any fees, expenses, or sales charges, and it is not available for direct investment.
Russell Midcap® Index
The Russell Midcap® Index is a market capitalization-weighted index of medium-capitalization stocks of U.S. companies. The index is calculated on a total return basis with dividends reinvested. The index is unmanaged, its returns do not reflect any fees, expenses, or sales charges, and it is not available for direct investment.
S&P 500® Index
The S&P 500® Index is a free-float market capitalization-weighted index of 500 of the largest U.S. companies. The index is calculated on a total return basis with dividends reinvested. The index is unmanaged, its returns do not reflect any fees, expenses, or sales charges, and it is not available for direct investment.
Secured Overnight Financing Rate (“SOFR”)
SOFR is a broad measure of the cost of borrowing cash overnight collateralized by U.S. Treasury securities.
Sponsored ADR
An ADR which is issued with the cooperation of the company whose stock will underlie the ADR. Sponsored ADRs generally carry the same rights normally given to stockholders, such as voting rights. ADRs must be sponsored to be able to trade on a major U.S. exchange such as the New York Stock Exchange.
Tactical Allocation Fund Linked Benchmark
The Tactical Allocation Fund Linked Benchmark consists of 45% Russell 1000® Growth Index (a market capitalization-weighted index of growth-oriented stocks of the 1,000 largest companies in the Russell Universe, which comprises the 3,000 largest U.S. companies, calculated on a total return basis with dividends reinvested), 15% MSCI ACWI ex USA SMID Cap Index (a free float-adjusted market capitalization-weighted index that measures mid- and small-cap foreign market equity performance, calculated on a total return basis with net dividends reinvested), and 40% Bloomberg U.S. Aggregate Bond Index (an index that measures the U.S. investment grade fixed rate bond market, calculated on a total return basis). The index is unmanaged, its returns do not reflect any fees, expenses, or sales charges, and is not available for direct investment. Performance of the Tactical Allocation Fund Linked Benchmark between 9/7/2016 and 6/3/2019 represents an allocation consisting of 45% Russell 1000® Growth Index, 15% MSCI EAFE® Index, and 40% Bloomberg U.S. Aggregate Bond Index. Prior to 9/7/2016, the allocation consisted of 50% S&P 500® Index and 50% Bloomberg U.S. Aggregate Bond Index.
VIRTUS EQUITY TRUST
KEY INVESTMENT TERMS (Unaudited) (Continued)
September 30, 2022
Yield Curve
A yield curve is a line on a graph plotting the interest rates, at a set point in time, of bonds having equal credit quality but different maturity dates.
| | Ticker Symbols: |
| | Class A: PSTAX |
| | Class C: SSTFX |
| | Class I: PLXGX |
| | Class R6: VCGRX |
KAR Capital Growth Fund
Fund Summary (Unaudited)
Portfolio Manager Commentary by
Kayne Anderson Rudnick Investment Management, LLC
| ■ | The Fund is diversified and has an investment objective of long-term capital growth. There is no guarantee that the Fund will meet its objective. |
| ■ | For the fiscal year ended September 30, 2022, the Fund’s Class A shares at NAV returned -36.54%, Class C shares at NAV returned -37.07%, Class I shares at NAV returned -36.45%, and Class R6 shares at NAV returned -36.27%. For the same period, the Russell 1000® Growth Index, which serves as both the Fund’s broad-based and style-specific index appropriate the comparison, returned -22.59%. |
All performance figures assume reinvestment of distributions and exclude the effect of sales charges. Performance data quoted represents past results. Past performance is no guarantee of future results, and current performance may be higher or lower than the performance shown above. Investment return and principal value will fluctuate so your shares, when redeemed, may be worth more or less than their original cost. Please visit Virtus.com for performance data current to the most recent month-end.
How did the markets perform during the Fund’s fiscal year ended September 30, 2022?
After strong performance in 2021, markets became volatile in 2022, with both equities and fixed income entering bear markets. Signs of weakness and headwinds began in the fourth quarter of 2021 as market breadth narrowed. Returns for the S& P 500® Index in 2021 were heavily skewed by the performance of some large-cap stocks.
Meanwhile, the Federal Reserve (the Fed) began tapering its bond purchases in October 2021, after providing support to the fixed income markets during the pandemic. And, while the inflation that spiked after massive pandemic spending, supply chain bottlenecks, and COVID lockdowns at first appeared transitory, inflation quickly escalated in the second quarter of 2022 and became a major risk to the economy. The Russian invasion of Ukraine also
fueled inflation and once again pressured fragile supply chains.
The Fed raised interest rates five times during the fiscal year in an effort to tame record-high inflation. To make matters more challenging, robust employment became an obstacle in slowing spending, with the Fed saying it could make additional rate increases to attempt to bring down inflation. Investor pessimism and market sentiment soured to new lows for the duration of the fiscal year.
On the international front, China’s enforcement of its zero-COVID policy forced continued lockdowns, which rattled important supply chains. In addition, China’s significant regulatory crackdowns destroyed certain industries and gave investors pause to invest elsewhere in the country. Tensions with Taiwan also presented new risks due to U.S. semiconductor dependence and the role that plays in the digital transformation of the U.S.
For the fiscal year ended September 30, 2022, the S&P 500® Index declined 15.47%, while small-capitalization stocks, as represented by the Russell 2000® Index, were down 23.50%. International developed markets, as measured by the MSCI EAFE® Index (net), lost 25.13%, while the MSCI Emerging Markets Index (net) declined 28.11% for the period. Value stocks outperformed growth stocks for the fiscal year, with the Russell 1000® Value Index down 11.36% and the Russell 1000® Growth Index down 22.59%.
What factors affected the Fund’s performance during its fiscal year?
The Fund underperformed the Russell 1000® Growth Index for the fiscal year ended September 30, 2022. Poor stock selection in information technology and consumer discretionary detracted from performance. An overweight in financials and an underweight in utilities contributed to performance.
The biggest contributors to performance during the period were Progressive, AutoZone, Fair Isaac, HealthEquity, and Monster Beverage.
The biggest detractors from performance during the period were Bill.com, NVIDIA, Amazon.com, Meta Platforms, and Netflix.
The preceding information is the opinion of portfolio management only through the end of the period stated on the cover. Any such opinions are subject to change at any time based upon market or other conditions and should not be relied upon as investment advice. Past performance is no guarantee of future results, and there is no guarantee that market forecasts will be realized.
Equity Securities: The market price of equity securities may be adversely affected by financial market, industry, or issuer-specific events. Focus on a particular style or on small or medium-sized companies may enhance that risk.
Technology Concentration: Because the Fund is presently heavily weighted in the technology sector, it will be impacted by that sector’s performance more than a fund with broader sector diversification.
Market Volatility: The value of the securities in the Fund may go up or down in response to the prospects of individual companies and/or general economic conditions. Price changes may be short- or long-term. Local, regional or global events such as war (e.g., Russia’s invasion of Ukraine), acts of terrorism, the spread of infectious illness (e.g., COVID-19 pandemic) or other public health issues, recessions, or other events could have a significant impact on the Fund and its investments, including hampering the ability of the Fund’s manager(s) to invest the Fund’s assets as intended.
Prospectus: For additional information on risks, please see the Fund’s prospectus.
Asset Allocation
The following table presents asset allocation within certain sectors as a percentage of total investments as of September 30, 2022.
| Information Technology | 34% |
| Consumer Discretionary | 23 |
| Health Care | 9 |
| Industrials | 8 |
| Financials | 7 |
| Consumer Staples | 7 |
| Communication Services | 5 |
| Other (includes short-term investment) | 7 |
| Total | 100% |
For information regarding the indexes and certain investment terms, see the Key Investment Terms starting on page 6.
KAR Capital Growth Fund (Continued)
Average Annual Total Returns1 for periods ended 9/30/22
| | | 1 Year | 5 Years | 10 Years | Since
inception | Inception
date |
| Class A shares at NAV2 | | -36.54 % | 6.90 % | 10.64 % | — % | — |
| Class A shares at POP3,4 | | -40.03 | 5.70 | 10.01 | — | — |
| Class C shares at NAV2 and with CDSC4 | | -37.07 | 6.04 | 9.77 | — | — |
| Class I shares at NAV2 | | -36.45 | 6.99 | 10.82 | — | — |
| Class R6 shares at NAV2 | | -36.27 | — | — | 4.41 | 1/30/18 |
| Russell 1000® Growth Index | | -22.59 | 12.17 | 13.70 | 9.69 5 | — |
| Fund Expense Ratios6: Class A shares: Gross 1.20%, Net 1.20%; Class C shares: Gross 2.00%, Net 2.00%; Class I shares: Gross 1.00%, Net 1.00%; Class R6 shares: Gross 0.91%, Net 0.73%. |
| All returns represent past performance which is no guarantee of future results. Current performance may be higher or lower than the performance shown. The investment return and principal value of an investment will fluctuate so that an investor’s shares, when redeemed, may be worth more or less than their original cost. The above table and graph below do not reflect the deduction of taxes that a shareholder would pay on fund distributions or the redemption of shares. Please visit Virtus.com for performance data current to the most recent month-end. |
Growth of $10,000 for periods ended 9/30
This chart assumes an initial investment of $10,000 made on September 30, 2012, for Class A shares and Class C shares including any applicable sales charges or fees. The performance of the other share class may be greater or less than that shown based on differences in inception dates, fees, and sales charges. Performance assumes reinvestment of dividends and capital gain distributions.
For information regarding the indexes and certain investment terms, see the Key Investment Terms starting on page 6.
KAR Capital Growth Fund (Continued)
Growth of $100,000 for periods ended 9/30
This chart assumes an initial investment of $100,000 made on September 30, 2012, for Class I shares. The performance of the other share class may be greater or less than that shown based on differences in inception dates, fees, and sales charges. Performance assumes reinvestment of dividends and capital gain distributions.

| 1 | Total returns are historical and include changes in share price and the reinvestment of both dividends and capital gain distributions. |
| 2 | “NAV” (Net Asset Value) total returns do not include the effect of any sales charge. |
| 3 | “POP” (Public Offering Price) total returns include the effect of the maximum front-end 5.50% sales charge. |
| 4 | “CDSC” (contingent deferred sales charge) is applied to redemptions of certain classes of shares that do not have a sales charge applied at the time of purchase. CDSC for certain redemptions of Class A shares made within 18 months of a finder’s fee being paid and all Class C shares are 1% within the first year and 0% thereafter. |
| 5 | The since inception index return is from the inception date of Class R6 shares. |
| 6 | The expense ratios of the Fund are set forth according to the prospectus for the Fund effective January 28, 2022, as supplemented and revised, and may differ from the expense ratios disclosed in the Financial Highlights tables in this report. See the Financial Highlights for more current expense ratios. Net Expense: Expenses reduced by a contractual expense limitation in effect through January 31, 2023. Gross Expense: Does not reflect the effect of the expense limitation. Expense ratios include fees and expenses associated with any underlying funds. |
The index is unmanaged and not available for direct investment; therefore, its performance does not reflect the expenses associated with active management of an actual portfolio.
For information regarding the indexes and certain investment terms, see the Key Investment Terms starting on page 6.
| | Ticker Symbols: |
| | Class A: PDIAX |
| | Class C: PGICX |
| | Class I: PXIIX |
| | Class R6: VECRX |
KAR Equity Income Fund
Fund Summary (Unaudited)
Portfolio Manager Commentary by
Kayne Anderson Rudnick Investment Management, LLC
| ■ | The Fund is diversified and has investment objectives of capital appreciation and current income. There is no guarantee that the Fund will meet its objectives. |
| ■ | For the fiscal year ended September 30, 2022, the Fund’s Class A shares at NAV returned -7.01%, Class C shares at NAV returned -7.67%, Class I shares at NAV returned -6.74%, and Class R6 shares at NAV returned -6.74%. For the same period, the MSCI USA High Dividend Yield Index (net), which serves as both the Fund’s broad-based and style-specific index appropriate the comparison, returned -8.08%. |
All performance figures assume reinvestment of distributions and exclude the effect of sales charges. Performance data quoted represents past results. Past performance is no guarantee of future results, and current performance may be higher or lower than the performance shown above. Investment return and principal value will fluctuate so your shares, when redeemed, may be worth more or less than their original cost. Please visit Virtus.com for performance data current to the most recent month-end.
How did the markets perform during the Fund’s fiscal year ended September 30, 2022?
After strong performance in 2021, markets became volatile in 2022, with both equities and fixed income entering bear markets. Signs of weakness and headwinds began in the fourth quarter of 2021 as market breadth narrowed. Returns for the S& P 500® Index in 2021 were heavily skewed by the performance of some large-cap stocks.
Meanwhile, the Federal Reserve (the Fed) began tapering its bond purchases in October 2021, after providing support to the fixed income markets during the pandemic. And, while the inflation that spiked after massive pandemic spending, supply chain bottlenecks, and COVID lockdowns at first appeared transitory, inflation quickly escalated in the second quarter of 2022 and became a major risk to the economy. The Russian invasion of Ukraine also fueled inflation and once again pressured fragile supply chains.
The Fed raised interest rates five times during the fiscal year in an effort to tame record-high inflation. To make matters more challenging, robust employment became an obstacle in slowing spending, with the Fed saying it could make additional rate increases to attempt to bring down inflation. Investor pessimism and market sentiment soured to new lows for the duration of the fiscal year.
On the international front, China’s enforcement of its zero-COVID policy forced continued lockdowns, which rattled important supply chains. In addition, China’s significant regulatory crackdowns destroyed certain industries and gave investors pause to invest elsewhere in the country. Tensions with Taiwan also presented new risks due to U.S. semiconductor dependence and the role that plays in the digital transformation of the U.S.
For the fiscal year ended September 30, 2022, the S&P 500® Index declined 15.47%, while small-capitalization stocks, as represented by the Russell 2000® Index, were down 23.50%. International developed markets, as measured by the MSCI EAFE® Index (net), lost 25.13%, while the MSCI Emerging Markets Index (net) declined 28.11% for the period. Value stocks outperformed growth stocks for the fiscal year, with the Russell 1000® Value Index down 11.36% and the Russell 1000® Growth Index down 22.59%.
What factors affected the Fund’s performance during its fiscal year?
The Fund outperformed the MSCI USA High Dividend Yield Index (net) for the fiscal year ended September 30, 2022. Positive stock selection in industrials and positive stock selection and an underweight in information technology contributed to performance. Poor stock selection and an underweight in health care as well as poor stock selection in consumer discretionary detracted from performance.
The biggest contributors to performance during the period were BAE Systems, Kellogg, Pfizer, Merck & Co., and Paychex.
The biggest detractors from performance during the period were Verizon Communications, V.F., Eastman Chemical, U.S. Bancorp, and Leggett & Platt.
The preceding information is the opinion of portfolio management only through the end of the period
stated on the cover. Any such opinions are subject to change at any time based upon market or other conditions and should not be relied upon as investment advice. Past performance is no guarantee of future results, and there is no guarantee that market forecasts will be realized.
Equity Securities: The market price of equity securities may be adversely affected by financial market, industry, or issuer-specific events. Focus on a particular style or on small or medium-sized companies may enhance that risk.
Limited Number of Investments: Because the Fund has a limited number of securities, it may be more susceptible to factors adversely affecting its securities than a fund with a greater number of securities.
Market Volatility: The value of the securities in the Fund may go up or down in response to the prospects of individual companies and/or general economic conditions. Price changes may be short- or long-term. Local, regional or global events such as war (e.g., Russia’s invasion of Ukraine), acts of terrorism, the spread of infectious illness (e.g., COVID-19 pandemic) or other public health issues, recessions, or other events could have a significant impact on the Fund and its investments, including hampering the ability of the Fund’s manager(s) to invest the Fund’s assets as intended.
Prospectus: For additional information on risks, please see the Fund’s prospectus.
Asset Allocation
The following table presents asset allocation within certain sectors as a percentage of total investments as of September 30, 2022.
| Financials | 18% |
| Health Care | 13 |
| Consumer Staples | 13 |
| Utilities | 11 |
| Industrials | 11 |
| Communication Services | 9 |
| Materials | 8 |
| Other (includes short-term investment) | 17 |
| Total | 100% |
For information regarding the indexes and certain investment terms, see the Key Investment Terms starting on page 6.
KAR Equity Income Fund (Continued)
Average Annual Total Returns1 for periods ended 9/30/22
| | | 1 Year | 5 Years | 10 Years | Since
inception | Inception
date |
| Class A shares at NAV2 | | -7.01 % | 6.73 % | 10.19 % | — % | — |
| Class A shares at POP3,4 | | -12.13 | 5.53 | 9.57 | — | — |
| Class C shares at NAV2 and with CDSC4 | | -7.67 | 5.93 | 9.36 | — | — |
| Class I shares at NAV2 | | -6.74 | 7.00 | 10.45 | — | — |
| Class R6 shares at NAV2 | | -6.74 | — | — | 5.51 | 1/30/18 |
| MSCI USA High Dividend Yield Index (net) | | -8.08 | 4.89 | 8.75 | 2.97 5 | — |
| Fund Expense Ratios6: Class A shares: Gross 1.32%, Net 1.20%; Class C shares: Gross 2.10%, Net 1.95%; Class I shares: Gross 1.08%, Net 0.95%; Class R6 shares: Gross 1.00%, Net 0.91%. |
| All returns represent past performance which is no guarantee of future results. Current performance may be higher or lower than the performance shown. The investment return and principal value of an investment will fluctuate so that an investor’s shares, when redeemed, may be worth more or less than their original cost. The above table and graph below do not reflect the deduction of taxes that a shareholder would pay on fund distributions or the redemption of shares. Please visit Virtus.com for performance data current to the most recent month-end. |
Growth of $10,000 for periods ended 9/30
This chart assumes an initial investment of $10,000 made on September 30, 2012, for Class A shares and Class C shares including any applicable sales charges or fees. The performance of the other share class may be greater or less than that shown based on differences in inception dates, fees, and sales charges. Performance assumes reinvestment of dividends and capital gain distributions.
For information regarding the indexes and certain investment terms, see the Key Investment Terms starting on page 6.
KAR Equity Income Fund (Continued)
Growth of $100,000 for periods ended 9/30
This chart assumes an initial investment of $100,000 made on September 30, 2012, for Class I shares. The performance of the other share class may be greater or less than that shown based on differences in inception dates, fees, and sales charges. Performance assumes reinvestment of dividends and capital gain distributions.

| 1 | Total returns are historical and include changes in share price and the reinvestment of both dividends and capital gain distributions. |
| 2 | “NAV” (Net Asset Value) total returns do not include the effect of any sales charge. |
| 3 | “POP” (Public Offering Price) total returns include the effect of the maximum front-end 5.50% sales charge. |
| 4 | “CDSC” (contingent deferred sales charge) is applied to redemptions of certain classes of shares that do not have a sales charge applied at the time of purchase. CDSC for certain redemptions of Class A shares made within 18 months of a finder’s fee being paid and all Class C shares are 1% within the first year and 0% thereafter. |
| 5 | The since inception index return is from the inception date of Class R6 shares. |
| 6 | The expense ratios of the Fund are set forth according to the prospectus for the Fund effective January 28, 2022, as supplemented and revised, and may differ from the expense ratios disclosed in the Financial Highlights tables in this report. See the Financial Highlights for more current expense ratios. Net Expense: Expenses reduced by a contractual expense limitation in effect through January 31, 2023. Gross Expense: Does not reflect the effect of the expense limitation. Expense ratios include fees and expenses associated with any underlying funds. |
The index is unmanaged and not available for direct investment; therefore, its performance does not reflect the expenses associated with active management of an actual portfolio.
For information regarding the indexes and certain investment terms, see the Key Investment Terms starting on page 6.
| | Ticker Symbols: |
| | Class A: PPTAX |
| | Class C: PPTCX |
| | Class I: PIPTX |
| | Class R6: VGQRX |
KAR Global Quality Dividend Fund
Fund Summary (Unaudited)
Portfolio Manager Commentary by
Kayne Anderson Rudnick Investment Management, LLC
| ■ | The Fund is diversified and has an investment objective of total return, consisting of both capital appreciation and current income. There is no guarantee that the Fund will meet its objective. |
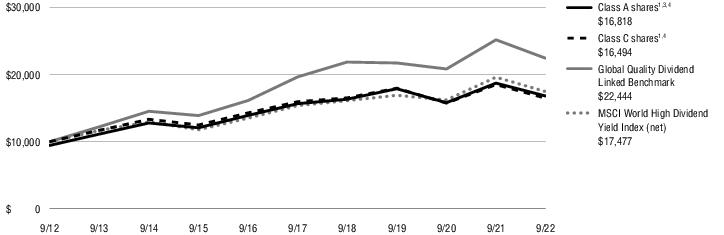
| ■ | For the fiscal year ended September 30, 2022, the Fund’s Class A shares at NAV returned -10.21%, Class C shares at NAV returned -10.93%, Class I shares at NAV returned -10.00%, and Class R6 shares at NAV returned -9.73%. For the same period, the MSCI World High Dividend Yield Index (net), which serves as the Fund’s broad-based index, returned -10.90% and the Global Quality Dividend Linked Benchmark, the Fund’s style-specific Index, returned -10.90%. |
All performance figures assume reinvestment of distributions and exclude the effect of sales charges. Performance data quoted represents past results. Past performance is no guarantee of future results, and current performance may be higher or lower than the performance shown above. Investment return and principal value will fluctuate so your shares, when redeemed, may be worth more or less than their original cost. Please visit Virtus.com for performance data current to the most recent month-end.
How did the markets perform during the Fund’s fiscal year ended September 30, 2022?
After strong performance in 2021, markets became volatile in 2022, with both equities and fixed income entering bear markets. Signs of weakness and headwinds began in the fourth quarter of 2021 as market breadth narrowed. Returns for the S& P 500® Index in 2021 were heavily skewed by the performance of some large-cap stocks.
Meanwhile, the Federal Reserve (the Fed) began tapering its bond purchases in October 2021, after providing support to the fixed income markets during the pandemic. And, while the inflation that spiked after massive pandemic spending, supply chain bottlenecks, and COVID lockdowns at first appeared transitory, inflation quickly escalated in the second quarter of 2022 and became a major risk to the economy. The Russian invasion of Ukraine also fueled inflation and once again pressured fragile supply chains.
The Fed raised interest rates five times during the fiscal year in an effort to tame record-high inflation. To make matters more challenging, robust employment became an obstacle in slowing spending, with the Fed saying it could make additional rate increases to attempt to bring down inflation. Investor pessimism and market sentiment soured to new lows for the duration of the fiscal year.
On the international front, China’s enforcement of its zero-COVID policy forced continued lockdowns, which rattled important supply chains. In addition, China’s significant regulatory crackdowns destroyed certain industries and gave investors pause to invest elsewhere in the country. Tensions with Taiwan also presented new risks due to U.S. semiconductor dependence and the role that plays in the digital transformation of the U.S.
For the fiscal year ended September 30, 2022, the S&P 500® Index declined 15.47%, while small-capitalization stocks, as represented by the Russell 2000® Index, were down 23.50%. International developed markets, as measured by the MSCI EAFE® Index (net), lost 25.13%, while the MSCI Emerging Markets Index (net) declined 28.11% for the period. Value stocks outperformed growth stocks for the fiscal year, with the Russell 1000® Value Index down 11.36% and the Russell 1000® Growth Index down 22.59%.
What factors affected the Fund’s performance during its fiscal year?
The Fund performed in line with the MSCI World High Dividend Yield Index (net) for the fiscal year ended September 30, 2022. Positive stock selection in industrials and positive stock selection and an underweight in information technology contributed to performance. An underweight in health care and poor stock selection in consumer discretionary detracted from performance.
The biggest contributors to performance during the period were BAE Systems, Pfizer, Southern Company, Merck & Co., and Coca-Cola Company.
The biggest detractors from performance during the period were Adecco, Telenor, V.F., Verizon Communications, and IGM Financial.
The preceding information is the opinion of portfolio management only through the end of the period stated on the cover. Any such opinions are subject to
change at any time based upon market or other conditions and should not be relied upon as investment advice. Past performance is no guarantee of future results, and there is no guarantee that market forecasts will be realized.
Equity Securities: The market price of equity securities may be adversely affected by financial market, industry, or issuer-specific events. Focus on a particular style or on small or medium-sized companies may enhance that risk.
Foreign Investing: Investing in foreign securities subjects the Fund to additional risks such as increased volatility; currency fluctuations; less liquidity; less publicly available information about the foreign investment; and political, regulatory, economic, and market risk.
Market Volatility: The value of the securities in the Fund may go up or down in response to the prospects of individual companies and/or general economic conditions. Price changes may be short- or long-term. Local, regional or global events such as war (e.g., Russia’s invasion of Ukraine), acts of terrorism, the spread of infectious illness (e.g., COVID-19 pandemic) or other public health issues, recessions, or other events could have a significant impact on the Fund and its investments, including hampering the ability of the Fund’s manager(s) to invest the Fund’s assets as intended.
Prospectus: For additional information on risks, please see the Fund’s prospectus.
Asset Allocation
The following table presents asset allocation within certain sectors as a percentage of total investments as of September 30, 2022.
| Financials | 22% |
| Communication Services | 16 |
| Utilities | 12 |
| Industrials | 10 |
| Consumer Staples | 10 |
| Health Care | 8 |
| Materials | 6 |
| Other (includes short-term investment and securities lending collateral) | 16 |
| Total | 100% |
For information regarding the indexes and certain investment terms, see the Key Investment Terms starting on page 6.
KAR Global Quality Dividend Fund (Continued)
Average Annual Total Returns1 for periods ended 9/30/22
| | | 1 Year | 5 Years | 10 Years | Since
inception | Inception
date |
| Class A shares at NAV2 | | -10.21 % | 1.42 % | 5.93 % | — % | — |
| Class A shares at POP3,4 | | -15.15 | 0.28 | 5.34 | — | — |
| Class C shares at NAV2 and with CDSC4 | | -10.93 | 0.66 | 5.13 | — | — |
| Class I shares at NAV2 | | -10.00 | 1.68 | 6.19 | — | — |
| Class R6 shares at NAV2 | | -9.73 | — | — | -0.20 | 8/1/19 |
| MSCI World High Dividend Yield Index (net) | | -10.90 | 2.58 | 5.74 | 1.75 5 | — |
| Global Quality Dividend Linked Benchmark | | -10.90 | 2.69 | 8.42 | 1.75 5 | — |
| Fund Expense Ratios6: Class A shares: Gross 1.51%, Net 1.35%; Class C shares: Gross 2.29%, Net 2.10%; Class I shares: Gross 1.26%, Net 1.10%; Class R6 shares: Gross 1.15%, Net 0.78%. |
| All returns represent past performance which is no guarantee of future results. Current performance may be higher or lower than the performance shown. The investment return and principal value of an investment will fluctuate so that an investor’s shares, when redeemed, may be worth more or less than their original cost. The above table and graph below do not reflect the deduction of taxes that a shareholder would pay on fund distributions or the redemption of shares. Please visit Virtus.com for performance data current to the most recent month-end. |
Growth of $10,000 for periods ended 9/30
This chart assumes an initial investment of $10,000 made on September 30, 2012, for Class A shares and Class C shares including any applicable sales charges or fees. The performance of the other share class may be greater or less than that shown based on differences in inception dates, fees, and sales charges. Performance assumes reinvestment of dividends and capital gain distributions.
For information regarding the indexes and certain investment terms, see the Key Investment Terms starting on page 6.
KAR Global Quality Dividend Fund (Continued)
Growth of $100,000 for periods ended 9/30
This chart assumes an initial investment of $100,000 made on September 30, 2012, for Class I shares. The performance of the other share class may be greater or less than that shown based on differences in inception dates, fees, and sales charges. Performance assumes reinvestment of dividends and capital gain distributions.

| 1 | Total returns are historical and include changes in share price and the reinvestment of both dividends and capital gain distributions. |
| 2 | “NAV” (Net Asset Value) total returns do not include the effect of any sales charge. |
| 3 | “POP” (Public Offering Price) total returns include the effect of the maximum front-end 5.50% sales charge. |
| 4 | “CDSC” (contingent deferred sales charge) is applied to redemptions of certain classes of shares that do not have a sales charge applied at the time of purchase. CDSC for certain redemptions of Class A shares made within 18 months of a finder’s fee being paid and all Class C shares are 1% within the first year and 0% thereafter. |
| 5 | The since inception index return is from the inception date of Class R6 shares. |
| 6 | The expense ratios of the Fund are set forth according to the prospectus for the Fund effective January 28, 2022, as supplemented and revised, and may differ from the expense ratios disclosed in the Financial Highlights tables in this report. See the Financial Highlights for more current expense ratios. Net Expense: Expenses reduced by a contractual expense limitation in effect through January 31, 2023. Gross Expense: Does not reflect the effect of the expense limitation. Expense ratios include fees and expenses associated with any underlying funds. |
The indexes are unmanaged and not available for direct investment; therefore, their performance does not reflect the expenses associated with active management of an actual portfolio.
For information regarding the indexes and certain investment terms, see the Key Investment Terms starting on page 6.
| | Ticker Symbols: |
| | Class A: VMACX |
| | Class C: VMCCX |
| | Class I: VIMCX |
| | Class R6: VRMCX |
KAR Mid-Cap Core Fund
Fund Summary (Unaudited)
Portfolio Manager Commentary by
Kayne Anderson Rudnick Investment Management, LLC
| ■ | The Fund is diversified and has an investment objective of long-term capital appreciation. There is no guarantee that the Fund will meet its objective. |
| ■ | For the fiscal year ended September 30, 2022, the Fund’s Class A shares at NAV returned -21.10%, Class C shares at NAV returned -21.70%, Class I shares at NAV returned -20.91%, and Class R6 shares at NAV returned -20.84%. For the same period, the Russell Midcap® Index, which serves as both the Fund’s broad-based and style-specific index appropriate the comparison, returned -19.39%. |
All performance figures assume reinvestment of distributions and exclude the effect of sales charges. Performance data quoted represents past results. Past performance is no guarantee of future results, and current performance may be higher or lower than the performance shown above. Investment return and principal value will fluctuate so your shares, when redeemed, may be worth more or less than their original cost. Please visit Virtus.com for performance data current to the most recent month-end.
How did the markets perform during the Fund’s fiscal year ended September 30, 2022?
After strong performance in 2021, markets became volatile in 2022, with both equities and fixed income entering bear markets. Signs of weakness and headwinds began in the fourth quarter of 2021 as market breadth narrowed. Returns for the S& P 500® Index in 2021 were heavily skewed by the performance of some large-cap stocks.
Meanwhile, the Federal Reserve (the Fed) began tapering its bond purchases in October 2021, after providing support to the fixed income markets during the pandemic. And, while the inflation that spiked after massive pandemic spending, supply chain bottlenecks, and COVID lockdowns at first appeared transitory, inflation quickly escalated in the second quarter of 2022 and became a major risk to the economy. The Russian invasion of Ukraine also fueled inflation and once again pressured fragile supply chains.
The Fed raised interest rates five times during the fiscal year in an effort to tame record-high inflation. To make matters more challenging, robust employment became an obstacle in slowing spending, with the Fed saying it could make additional rate increases to attempt to bring down inflation. Investor pessimism and market sentiment soured to new lows for the duration of the fiscal year.
On the international front, China’s enforcement of its zero-COVID policy forced continued lockdowns, which rattled important supply chains. In addition, China’s significant regulatory crackdowns destroyed certain industries and gave investors pause to invest elsewhere in the country. Tensions with Taiwan also presented new risks due to U.S. semiconductor dependence and the role that plays in the digital transformation of the U.S.
For the fiscal year ended September 30, 2022, the S&P 500® Index declined 15.47%, while small-capitalization stocks, as represented by the Russell 2000® Index, were down 23.50%. International developed markets, as measured by the MSCI EAFE® Index (net), lost 25.13%, while the MSCI Emerging Markets Index (net) declined 28.11% for the period. Value stocks outperformed growth stocks for the fiscal year, with the Russell 1000® Value Index down 11.36% and the Russell 1000® Growth Index down 22.59%.
What factors affected the Fund’s performance during its fiscal year?
The Fund underperformed the Russell Midcap® Index for the fiscal year ended September 30, 2022. Poor stock selection and an overweight in health care as well as an underweight in energy detracted from performance. Positive stock selection in financials and information technology contributed to performance.
The biggest contributors to performance during the period were Aspen Technology, Lamb Weston, LPL Financial, W. R. Berkley, and Tractor Supply.
The biggest detractors from performance during the period were Azenta, Zebra Technologies, West Pharmaceutical Services, Cooper Companies, and Latham Group.
The preceding information is the opinion of portfolio management only through the end of the period stated on the cover. Any such opinions are subject to
change at any time based upon market or other conditions and should not be relied upon as investment advice. Past performance is no guarantee of future results, and there is no guarantee that market forecasts will be realized.
Equity Securities: The market price of equity securities may be adversely affected by financial market, industry, or issuer-specific events. Focus on a particular style or on small or medium-sized companies may enhance that risk.
Industrial Concentration: Because the Fund is presently heavily weighted in the industrial sector, it will be impacted by that sector’s performance more than a fund with broader sector diversification.
Limited Number of Investments: Because the Fund has a limited number of securities, it may be more susceptible to factors adversely affecting its securities than a fund with a greater number of securities.
Market Volatility: The value of the securities in the Fund may go up or down in response to the prospects of individual companies and/or general economic conditions. Price changes may be short- or long-term. Local, regional or global events such as war (e.g., Russia’s invasion of Ukraine), acts of terrorism, the spread of infectious illness (e.g., COVID-19 pandemic) or other public health issues, recessions, or other events could have a significant impact on the Fund and its investments, including hampering the ability of the Fund’s manager(s) to invest the Fund’s assets as intended.
Prospectus: For additional information on risks, please see the Fund’s prospectus.
For information regarding the indexes and certain investment terms, see the Key Investment Terms starting on page 6.
KAR Mid-Cap Core Fund (Continued)
Asset Allocation
The following table presents asset allocation within certain sectors as a percentage of total investments as of September 30, 2022.
| Industrials | 32% |
| Financials | 17 |
| Information Technology | 16 |
| Health Care | 15 |
| Consumer Discretionary | 8 |
| Consumer Staples | 5 |
| Real Estate | 2 |
| Short-Term Investment | 5 |
| Total | 100% |
For information regarding the indexes and certain investment terms, see the Key Investment Terms starting on page 6.
KAR Mid-Cap Core Fund (Continued)
Average Annual Total Returns1 for periods ended 9/30/22
| | | 1 Year | 5 Years | 10 Years | Since
inception | Inception
date |
| Class A shares at NAV2 | | -21.10 % | 9.22 % | 11.77 % | — % | — |
| Class A shares at POP3,4 | | -25.44 | 7.99 | 11.14 | — | — |
| Class C shares at NAV2 and with CDSC4 | | -21.70 | 8.40 | 10.93 | — | — |
| Class I shares at NAV2 | | -20.91 | 9.49 | 12.04 | — | — |
| Class R6 shares at NAV2 | | -20.84 | — | — | 6.90 | 1/30/18 |
| Russell Midcap® Index | | -19.39 | 6.48 | 10.30 | 4.78 5 | — |
| Fund Expense Ratios6: Class A shares: Gross 1.31%, Net 1.20%; Class C shares: Gross 2.06%, Net 1.95%; Class I shares: Gross 1.05%, Net 0.95%; Class R6 shares: Gross 0.97%, Net 0.87%. |
| All returns represent past performance which is no guarantee of future results. Current performance may be higher or lower than the performance shown. The investment return and principal value of an investment will fluctuate so that an investor’s shares, when redeemed, may be worth more or less than their original cost. The above table and graph below do not reflect the deduction of taxes that a shareholder would pay on fund distributions or the redemption of shares. Please visit Virtus.com for performance data current to the most recent month-end. |
Growth of $10,000 for periods ended 9/30
This chart assumes an initial investment of $10,000 made on September 30, 2012, for Class A shares and Class C shares including any applicable sales charges or fees. The performance of the other share class may be greater or less than that shown based on differences in inception dates, fees, and sales charges. Performance assumes reinvestment of dividends and capital gain distributions.
For information regarding the indexes and certain investment terms, see the Key Investment Terms starting on page 6.
KAR Mid-Cap Core Fund (Continued)
Growth of $100,000 for periods ended 9/30
This chart assumes an initial investment of $100,000 made on September 30, 2012, for Class I shares. The performance of the other share class may be greater or less than that shown based on differences in inception dates, fees, and sales charges. Performance assumes reinvestment of dividends and capital gain distributions.

| 1 | Total returns are historical and include changes in share price and the reinvestment of both dividends and capital gain distributions. |
| 2 | “NAV” (Net Asset Value) total returns do not include the effect of any sales charge. |
| 3 | “POP” (Public Offering Price) total returns include the effect of the maximum front-end 5.50% sales charge. |
| 4 | “CDSC” (contingent deferred sales charge) is applied to redemptions of certain classes of shares that do not have a sales charge applied at the time of purchase. CDSC for certain redemptions of Class A shares made within 18 months of a finder’s fee being paid and all Class C shares are 1% within the first year and 0% thereafter. |
| 5 | The since inception index return is from the inception date of Class R6 shares. |
| 6 | The expense ratios of the Fund are set forth according to the prospectus for the Fund effective January 28, 2022, as supplemented and revised, and may differ from the expense ratios disclosed in the Financial Highlights tables in this report. See the Financial Highlights for more current expense ratios. Net Expense: Expenses reduced by a contractual expense limitation in effect through January 31, 2023. Gross Expense: Does not reflect the effect of the expense limitation. Expense ratios include fees and expenses associated with any underlying funds. |
The index is unmanaged and not available for direct investment; therefore, its performance does not reflect the expenses associated with active management of an actual portfolio.
For information regarding the indexes and certain investment terms, see the Key Investment Terms starting on page 6.
| | Ticker Symbols: |
| | Class A: PHSKX |
| | Class C: PSKCX |
| | Class I: PICMX |
| | Class R6: VRMGX |
KAR Mid-Cap Growth Fund
Fund Summary (Unaudited)
Portfolio Manager Commentary by
Kayne Anderson Rudnick Investment Management, LLC
| ■ | The Fund is diversified and has an investment objective of capital appreciation. There is no guarantee that the Fund will meet its objective. |
| ■ | For the fiscal year ended September 30, 2022, the Fund’s Class A shares at NAV returned -38.11%†, Class C shares at NAV returned -38.62%†, Class I shares at NAV returned -37.98%†, and Class R6 shares at NAV returned -37.86%†. For the same period, the Russell Midcap® Growth Index, which serves as both the Fund’s broad-based and style-specific index appropriate the comparison, returned -29.50%. |
† See footnote 3 on page 25.
All performance figures assume reinvestment of distributions and exclude the effect of sales charges. Performance data quoted represents past results. Past performance is no guarantee of future results, and current performance may be higher or lower than the performance shown above. Investment return and principal value will fluctuate so your shares, when redeemed, may be worth more or less than their original cost. Please visit Virtus.com for performance data current to the most recent month-end.
How did the markets perform during the Fund’s fiscal year ended September 30, 2022?
After strong performance in 2021, markets became volatile in 2022, with both equities and fixed income entering bear markets. Signs of weakness and headwinds began in the fourth quarter of 2021 as market breadth narrowed. Returns for the S& P 500® Index in 2021 were heavily skewed by the performance of some large-cap stocks.
Meanwhile, the Federal Reserve (the Fed) began tapering its bond purchases in October 2021, after providing support to the fixed income markets during the pandemic. And, while the inflation that spiked after massive pandemic spending, supply chain bottlenecks, and COVID lockdowns at first appeared transitory, inflation quickly escalated in the second quarter of 2022 and became a major risk to the economy. The Russian invasion of Ukraine also
fueled inflation and once again pressured fragile supply chains.
The Fed raised interest rates five times during the fiscal year in an effort to tame record-high inflation. To make matters more challenging, robust employment became an obstacle in slowing spending, with the Fed saying it could make additional rate increases to attempt to bring down inflation. Investor pessimism and market sentiment soured to new lows for the duration of the fiscal year.
On the international front, China’s enforcement of its zero-COVID policy forced continued lockdowns, which rattled important supply chains. In addition, China’s significant regulatory crackdowns destroyed certain industries and gave investors pause to invest elsewhere in the country. Tensions with Taiwan also presented new risks due to U.S. semiconductor dependence and the role that plays in the digital transformation of the U.S.
For the fiscal year ended September 30, 2022, the S&P 500® Index declined 15.47%, while small-capitalization stocks, as represented by the Russell 2000® Index, were down 23.50%. International developed markets, as measured by the MSCI EAFE® Index (net), lost 25.13%, while the MSCI Emerging Markets Index (net) declined 28.11% for the period. Value stocks outperformed growth stocks for the fiscal year, with the Russell 1000® Value Index down 11.36% and the Russell 1000® Growth Index down 22.59%.
What factors affected the Fund’s performance during its fiscal year?
The Fund underperformed the Russell Midcap® Growth Index for the fiscal year ended September 30, 2022. Poor stock selection in information technology and financials detracted from performance. Positive stock selection in communication services and an overweight in consumer staples contributed to performance.
The biggest contributors to performance during the period were Celsius, Fair Isaac, HealthEquity, Silk Road Medical, and Devon Energy.
The biggest detractors from performance during the period were Bill.com, DocuSign, SiteOne Landscape Supply, Goosehead Insurance, and MercadoLibre.
The preceding information is the opinion of portfolio management only through the end of the period stated on the cover. Any such opinions are subject to change at any time based upon market or other conditions and should not be relied upon as investment advice. Past performance is no guarantee of future results, and there is no guarantee that market forecasts will be realized.
Equity Securities: The market price of equity securities may be adversely affected by financial market, industry, or issuer-specific events. Focus on a particular style or on small or medium-sized companies may enhance that risk.
Technology Concentration: Because the Fund is presently heavily weighted in the technology sector, it will be impacted by that sector’s performance more than a fund with broader sector diversification.
Market Volatility: The value of the securities in the Fund may go up or down in response to the prospects of individual companies and/or general economic conditions. Price changes may be short- or long-term. Local, regional or global events such as war (e.g., Russia’s invasion of Ukraine), acts of terrorism, the spread of infectious illness (e.g., COVID-19 pandemic) or other public health issues, recessions, or other events could have a significant impact on the Fund and its investments, including hampering the ability of the Fund’s manager(s) to invest the Fund’s assets as intended.
Prospectus: For additional information on risks, please see the Fund’s prospectus.
Asset Allocation
The following table presents asset allocation within certain sectors as a percentage of total investments as of September 30, 2022.
| Information Technology | 29% |
| Consumer Discretionary | 18 |
| Health Care | 16 |
| Consumer Staples | 13 |
| Industrials | 9 |
| Financials | 6 |
| Communication Services | 5 |
| Other (includes short-term investment) | 4 |
| Total | 100% |
For information regarding the indexes and certain investment terms, see the Key Investment Terms starting on page 6.
KAR Mid-Cap Growth Fund (Continued)
Average Annual Total Returns1 for periods ended 9/30/22
| | | 1 Year | 5 Years | 10 Years | Since
inception | Inception
date |
| Class A shares at NAV2 | | -38.11 % 3 | 11.60 % | 11.59 % | — % | — |
| Class A shares at POP4,5 | | -41.51 | 10.35 | 10.96 | — | — |
| Class C shares at NAV2 and with CDSC5 | | -38.62 3 | 10.75 | 10.74 | — | — |
| Class I shares at NAV2 | | -37.98 3 | 11.85 | 11.85 | — | — |
| Class R6 shares at NAV2 | | -37.86 3 | — | — | 9.12 | 1/30/18 |
| Russell Midcap® Growth Index | | -29.50 | 7.62 | 10.85 | 5.39 6 | — |
| Fund Expense Ratios7: Class A shares: Gross 1.24%, Net 1.24%; Class C shares: Gross 1.99%, Net 1.99%; Class I shares: Gross 1.00%, Net 1.00%; Class R6 shares: Gross 0.89%, Net 0.83%. |
| All returns represent past performance which is no guarantee of future results. Current performance may be higher or lower than the performance shown. The investment return and principal value of an investment will fluctuate so that an investor’s shares, when redeemed, may be worth more or less than their original cost. The above table and graph below do not reflect the deduction of taxes that a shareholder would pay on fund distributions or the redemption of shares. Please visit Virtus.com for performance data current to the most recent month-end. |
Growth of $10,000 for periods ended 9/30
This chart assumes an initial investment of $10,000 made on September 30, 2012, for Class A shares and Class C shares including any applicable sales charges or fees. The performance of the other share class may be greater or less than that shown based on differences in inception dates, fees, and sales charges. Performance assumes reinvestment of dividends and capital gain distributions.
For information regarding the indexes and certain investment terms, see the Key Investment Terms starting on page 6.
KAR Mid-Cap Growth Fund (Continued)
Growth of $100,000 for periods ended 9/30
This chart assumes an initial investment of $100,000 made on September 30, 2012, for Class I shares. The performance of the other share class may be greater or less than that shown based on differences in inception dates, fees, and sales charges. Performance assumes reinvestment of dividends and capital gain distributions.

| 1 | Total returns are historical and include changes in share price and the reinvestment of both dividends and capital gain distributions. |
| 2 | “NAV” (Net Asset Value) total returns do not include the effect of any sales charge. |
| 3 | Total Return for the report period presented in the table differs from the return in the Financial Highlights. The total return presented in the above table is calculated based on the NAV at which shareholder transactions were processed. The total return presented in the Financial Highlights section of the report is calculated in the same manner, but also takes into account certain adjustments that are necessary under generally accepted accounting principles required in the annual report and semiannual report. |
| 4 | “POP” (Public Offering Price) total returns include the effect of the maximum front-end 5.50% sales charge. |
| 5 | “CDSC” (contingent deferred sales charge) is applied to redemptions of certain classes of shares that do not have a sales charge applied at the time of purchase. CDSC for certain redemptions of Class A shares made within 18 months of a finder’s fee being paid and all Class C shares are 1% within the first year and 0% thereafter. |
| 6 | The since inception index return is from the inception date of Class R6 shares. |
| 7 | The expense ratios of the Fund are set forth according to the prospectus for the Fund effective January 28, 2022, as supplemented and revised, and may differ from the expense ratios disclosed in the Financial Highlights tables in this report. See the Financial Highlights for more current expense ratios. Net Expense: Expenses reduced by a contractual expense limitation in effect through January 31, 2023. Gross Expense: Does not reflect the effect of the expense limitation. Expense ratios include fees and expenses associated with any underlying funds. |
The index is unmanaged and not available for direct investment; therefore, its performance does not reflect the expenses associated with active management of an actual portfolio.
For information regarding the indexes and certain investment terms, see the Key Investment Terms starting on page 6.
| | Ticker Symbols: |
| | Class A: PKSAX |
| | Class C: PKSCX |
| | Class I: PKSFX |
| | Class R6: VSCRX |
KAR Small-Cap Core Fund
Fund Summary (Unaudited)
Portfolio Manager Commentary by
Kayne Anderson Rudnick Investment Management, LLC
| ■ | The Fund is diversified and has an investment objective of long-term capital appreciation, with dividend income a secondary consideration. There is no guarantee that the Fund will meet its objectives. |
| ■ | For the fiscal year ended September 30, 2022, the Fund’s Class A shares at NAV returned -11.73%, Class C shares at NAV returned -12.37%, Class I shares at NAV returned -11.51%, and Class R6 shares at NAV returned -11.42%. For the same period, the Russell 2000® Index, which serves as both the Fund’s broad-based and style-specific index appropriate the comparison, returned -23.50%. |
All performance figures assume reinvestment of distributions and exclude the effect of sales charges. Performance data quoted represents past results. Past performance is no guarantee of future results, and current performance may be higher or lower than the performance shown above. Investment return and principal value will fluctuate so your shares, when redeemed, may be worth more or less than their original cost. Please visit Virtus.com for performance data current to the most recent month-end.
How did the markets perform during the Fund’s fiscal year ended September 30, 2022?
After strong performance in 2021, markets became volatile in 2022, with both equities and fixed income entering bear markets. Signs of weakness and headwinds began in the fourth quarter of 2021 as market breadth narrowed. Returns for the S& P 500® Index in 2021 were heavily skewed by the performance of some large-cap stocks.
Meanwhile, the Federal Reserve (the Fed) began tapering its bond purchases in October 2021, after providing support to the fixed income markets during the pandemic. And, while the inflation that spiked after massive pandemic spending, supply chain bottlenecks, and COVID lockdowns at first appeared transitory, inflation quickly escalated in the second quarter of 2022 and became a major risk to the economy. The Russian invasion of Ukraine also fueled inflation and once again pressured fragile supply chains.
The Fed raised interest rates five times during the fiscal year in an effort to tame record-high inflation. To make matters more challenging, robust employment became an obstacle in slowing spending, with the Fed saying it could make additional rate increases to attempt to bring down inflation. Investor pessimism and market sentiment soured to new lows for the duration of the fiscal year.
On the international front, China’s enforcement of its zero-COVID policy forced continued lockdowns, which rattled important supply chains. In addition, China’s significant regulatory crackdowns destroyed certain industries and gave investors pause to invest elsewhere in the country. Tensions with Taiwan also presented new risks due to U.S. semiconductor dependence and the role that plays in the digital transformation of the U.S.
For the fiscal year ended September 30, 2022, the S&P 500® Index declined 15.47%, while small-capitalization stocks, as represented by the Russell 2000® Index, were down 23.50%. International developed markets, as measured by the MSCI EAFE® Index (net), lost 25.13%, while the MSCI Emerging Markets Index (net) declined 28.11% for the period. Value stocks outperformed growth stocks for the fiscal year, with the Russell 1000® Value Index down 11.36% and the Russell 1000® Growth Index down 22.59%.
What factors affected the Fund’s performance during its fiscal year?
The Fund outperformed the Russell 2000® Index for the fiscal year ended September 30, 2022. Positive stock selection and an overweight in industrials as well as positive stock selection in information technology contributed to performance. Poor stock selection and an underweight in energy as well as an underweight in utilities detracted from performance.
The biggest contributors to performance during the period were FTI Consulting, BancFirst, Aspen Technology, Jack Henry & Associates, and RLI.
The biggest detractors from performance during the period were Rightmove, Moelis & Co., Simpson Manufacturing, CorVel, and Watts Water Technologies.
The preceding information is the opinion of portfolio management only through the end of the period stated on the cover. Any such opinions are subject to
change at any time based upon market or other conditions and should not be relied upon as investment advice. Past performance is no guarantee of future results, and there is no guarantee that market forecasts will be realized.
Equity Securities: The market price of equity securities may be adversely affected by financial market, industry, or issuer-specific events. Focus on a particular style or on small or medium-sized companies may enhance that risk.
Industrial Concentration: Because the Fund is presently heavily weighted in the industrial sector, it will be impacted by that sector’s performance more than a fund with broader sector diversification.
Limited Number of Investments: Because the Fund has a limited number of securities, it may be more susceptible to factors adversely affecting its securities than a fund with a greater number of securities.
Market Volatility: The value of the securities in the Fund may go up or down in response to the prospects of individual companies and/or general economic conditions. Price changes may be short- or long-term. Local, regional or global events such as war (e.g., Russia’s invasion of Ukraine), acts of terrorism, the spread of infectious illness (e.g., COVID-19 pandemic) or other public health issues, recessions, or other events could have a significant impact on the Fund and its investments, including hampering the ability of the Fund’s manager(s) to invest the Fund’s assets as intended.
Prospectus: For additional information on risks, please see the Fund’s prospectus.
For information regarding the indexes and certain investment terms, see the Key Investment Terms starting on page 6.
KAR Small-Cap Core Fund (Continued)
Asset Allocation
The following table presents asset allocation within certain sectors as a percentage of total investments as of September 30, 2022.
| Industrials | 38% |
| Financials | 24 |
| Information Technology | 14 |
| Consumer Discretionary | 8 |
| Health Care | 5 |
| Communication Services | 4 |
| Consumer Staples | 1 |
| Other (includes short-term investment) | 6 |
| Total | 100% |
For information regarding the indexes and certain investment terms, see the Key Investment Terms starting on page 6.
KAR Small-Cap Core Fund (Continued)
Average Annual Total Returns1 for periods ended 9/30/22
| | | 1 Year | 5 Years | 10 Years | Since
inception | Inception
date |
| Class A shares at NAV2 | | -11.73 % | 12.15 % | 13.39 % | — % | — |
| Class A shares at POP3,4 | | -16.58 | 10.89 | 12.75 | — | — |
| Class C shares at NAV2 and with CDSC4 | | -12.37 | 11.33 | 12.56 | — | — |
| Class I shares at NAV2 | | -11.51 | 12.45 | 13.68 | — | — |
| Class R6 shares at NAV2 | | -11.42 | 12.54 | — | 13.36 | 11/12/14 |
| Russell 2000® Index | | -23.50 | 3.55 | 8.55 | 5.79 5 | — |
| Fund Expense Ratios6: Class A shares: 1.26%; Class C shares: 1.99%; Class I shares: 1.00%; Class R6 shares: 0.92%. |
| All returns represent past performance which is no guarantee of future results. Current performance may be higher or lower than the performance shown. The investment return and principal value of an investment will fluctuate so that an investor’s shares, when redeemed, may be worth more or less than their original cost. The above table and graph below do not reflect the deduction of taxes that a shareholder would pay on fund distributions or the redemption of shares. Please visit Virtus.com for performance data current to the most recent month-end. |
Growth of $10,000 for periods ended 9/30
This chart assumes an initial investment of $10,000 made on September 30, 2012, for Class A shares and Class C shares including any applicable sales charges or fees. The performance of the other share class may be greater or less than that shown based on differences in inception dates, fees, and sales charges. Performance assumes reinvestment of dividends and capital gain distributions.
For information regarding the indexes and certain investment terms, see the Key Investment Terms starting on page 6.
KAR Small-Cap Core Fund (Continued)
Growth of $100,000 for periods ended 9/30
This chart assumes an initial investment of $100,000 made on September 30, 2012, for Class I shares. The performance of the other share class may be greater or less than that shown based on differences in inception dates, fees, and sales charges. Performance assumes reinvestment of dividends and capital gain distributions.

| 1 | Total returns are historical and include changes in share price and the reinvestment of both dividends and capital gain distributions. |
| 2 | “NAV” (Net Asset Value) total returns do not include the effect of any sales charge. |
| 3 | “POP” (Public Offering Price) total returns include the effect of the maximum front-end 5.50% sales charge. |
| 4 | “CDSC” (contingent deferred sales charge) is applied to redemptions of certain classes of shares that do not have a sales charge applied at the time of purchase. CDSC for certain redemptions of Class A shares made within 18 months of a finder’s fee being paid and all Class C shares are 1% within the first year and 0% thereafter. |
| 5 | The since inception index return is from the inception date of Class R6 shares. |
| 6 | The expense ratios of the Fund are set forth according to the prospectus for the Fund effective January 28, 2022, as supplemented and revised, and may differ from the expense ratios disclosed in the Financial Highlights tables in this report. See the Financial Highlights for more current expense ratios. Expense ratios include fees and expenses associated with any underlying funds. |
The index is unmanaged and not available for direct investment; therefore, its performance does not reflect the expenses associated with active management of an actual portfolio.
For information regarding the indexes and certain investment terms, see the Key Investment Terms starting on page 6.
| | Ticker Symbols: |
| | Class A: PSGAX |
| | Class C: PSGCX |
| | Class I: PXSGX |
| | Class R6: VRSGX |
KAR Small-Cap Growth Fund
Fund Summary (Unaudited)
Portfolio Manager Commentary by
Kayne Anderson Rudnick Investment Management, LLC
| ■ | The Fund is diversified and has an investment objective of long-term capital appreciation. There is no guarantee that the Fund will meet its objective. |
| ■ | For the fiscal year ended September 30, 2022, the Fund’s Class A shares at NAV returned -31.04%, Class C shares at NAV returned -31.52%, Class I shares at NAV returned -30.85%, and Class R6 shares at NAV returned -30.80%. For the same period, the Russell 2000® Growth Index, which serves as both the Fund’s broad-based and style-specific index appropriate the comparison, returned -29.27%. |
All performance figures assume reinvestment of distributions and exclude the effect of sales charges. Performance data quoted represents past results. Past performance is no guarantee of future results, and current performance may be higher or lower than the performance shown above. Investment return and principal value will fluctuate so your shares, when redeemed, may be worth more or less than their original cost. Please visit Virtus.com for performance data current to the most recent month-end.
How did the markets perform during the Fund’s fiscal year ended September 30, 2022?
After strong performance in 2021, markets became volatile in 2022, with both equities and fixed income entering bear markets. Signs of weakness and headwinds began in the fourth quarter of 2021 as market breadth narrowed. Returns for the S& P 500® Index in 2021 were heavily skewed by the performance of some large-cap stocks.
Meanwhile, the Federal Reserve (the Fed) began tapering its bond purchases in October 2021, after providing support to the fixed income markets during the pandemic. And, while the inflation that spiked after massive pandemic spending, supply chain bottlenecks, and COVID lockdowns at first appeared transitory, inflation quickly escalated in the second quarter of 2022 and became a major risk to the economy. The Russian invasion of Ukraine also fueled inflation and once again pressured fragile supply chains.
The Fed raised interest rates five times during the fiscal year in an effort to tame record-high inflation. To make matters more challenging, robust employment became an obstacle in slowing spending, with the Fed saying it could make additional rate increases to attempt to bring down inflation. Investor pessimism and market sentiment soured to new lows for the duration of the fiscal year.
On the international front, China’s enforcement of its zero-COVID policy forced continued lockdowns, which rattled important supply chains. In addition, China’s significant regulatory crackdowns destroyed certain industries and gave investors pause to invest elsewhere in the country. Tensions with Taiwan also presented new risks due to U.S. semiconductor dependence and the role that plays in the digital transformation of the U.S.
For the fiscal year ended September 30, 2022, the S&P 500® Index declined 15.47%, while small-capitalization stocks, as represented by the Russell 2000® Index, were down 23.50%. International developed markets, as measured by the MSCI EAFE® Index (net), lost 25.13%, while the MSCI Emerging Markets Index (net) declined 28.11% for the period. Value stocks outperformed growth stocks for the fiscal year, with the Russell 1000® Value Index down 11.36% and the Russell 1000® Growth Index down 22.59%.
What factors affected the Fund’s performance during its fiscal year?
The Fund underperformed the Russell 2000® Growth Index for the fiscal year ended September 30, 2022. Poor stock selection in information technology and consumer discretionary detracted from performance. Positive stock selection and an overweight in financials as well as positive stock selection and an underweight in health care contributed to performance.
The biggest contributors to performance during the period were Ryan Specialty, Aspen Technology, Grocery Outlet, The Chefs’ Warehouse, and Ollie’s Bargain Outlet.
The biggest detractors from performance during the period were Bill.com, Duck Creek Technologies, Fox Factory, Rightmove, and Auto Trader Group.
The preceding information is the opinion of portfolio management only through the end of the period
stated on the cover. Any such opinions are subject to change at any time based upon market or other conditions and should not be relied upon as investment advice. Past performance is no guarantee of future results, and there is no guarantee that market forecasts will be realized.
Equity Securities: The market price of equity securities may be adversely affected by financial market, industry, or issuer-specific events. Focus on a particular style or on small or medium-sized companies may enhance that risk.
Foreign Investing: Investing in foreign securities subjects the Fund to additional risks such as increased volatility, currency fluctuations, less liquidity, and political, regulatory, economic, and market risk.
Limited Number of Investments: Because the Fund has a limited number of securities, it may be more susceptible to factors adversely affecting its securities than a fund with a greater number of securities.
Sector Focused Investing: Events negatively affecting a particular industry or market sector in which the Fund focuses its investments may cause the value of the Fund to decrease.
Market Volatility: The value of the securities in the Fund may go up or down in response to the prospects of individual companies and/or general economic conditions. Price changes may be short- or long-term. Local, regional or global events such as war (e.g., Russia’s invasion of Ukraine), acts of terrorism, the spread of infectious illness (e.g., COVID-19 pandemic) or other public health issues, recessions, or other events could have a significant impact on the Fund and its investments, including hampering the ability of the Fund’s manager(s) to invest the Fund’s assets as intended.
Prospectus: For additional information on risks, please see the Fund’s prospectus.
For information regarding the indexes and certain investment terms, see the Key Investment Terms starting on page 6.
KAR Small-Cap Growth Fund (Continued)
Asset Allocation
The following table presents asset allocation within certain sectors as a percentage of total investments as of September 30, 2022.
| Financials | 30% |
| Information Technology | 24 |
| Consumer Discretionary | 15 |
| Communication Services | 11 |
| Industrials | 10 |
| Health Care | 6 |
| Consumer Staples | 3 |
| Other (includes short-term investment and securities lending collateral) | 1 |
| Total | 100% |
For information regarding the indexes and certain investment terms, see the Key Investment Terms starting on page 6.
KAR Small-Cap Growth Fund (Continued)
Average Annual Total Returns1 for periods ended 9/30/22
| | | 1 Year | 5 Years | 10 Years | Since
inception | Inception
date |
| Class A shares at NAV2 | | -31.04 % | 10.71 % | 14.78 % | — % | — |
| Class A shares at POP3,4 | | -34.83 | 9.47 | 14.13 | — | — |
| Class C shares at NAV2 and with CDSC4 | | -31.52 | 9.92 | 13.94 | — | — |
| Class I shares at NAV2 | | -30.85 | 11.00 | 15.07 | — | — |
| Class R6 shares at NAV2 | | -30.80 | — | — | 8.57 | 1/30/18 |
| Russell 2000® Growth Index | | -29.27 | 3.60 | 8.81 | 1.91 5 | — |
| Fund Expense Ratios6: Class A shares: 1.34%; Class C shares: 2.05%; Class I shares: 1.07%; Class R6 shares: 0.98%. |
| All returns represent past performance which is no guarantee of future results. Current performance may be higher or lower than the performance shown. The investment return and principal value of an investment will fluctuate so that an investor’s shares, when redeemed, may be worth more or less than their original cost. The above table and graph below do not reflect the deduction of taxes that a shareholder would pay on fund distributions or the redemption of shares. Please visit Virtus.com for performance data current to the most recent month-end. |
Growth of $10,000 for periods ended 9/30
This chart assumes an initial investment of $10,000 made on September 30, 2012, for Class A shares and Class C shares including any applicable sales charges or fees. The performance of the other share class may be greater or less than that shown based on differences in inception dates, fees, and sales charges. Performance assumes reinvestment of dividends and capital gain distributions.
For information regarding the indexes and certain investment terms, see the Key Investment Terms starting on page 6.
KAR Small-Cap Growth Fund (Continued)
Growth of $100,000 for periods ended 9/30
This chart assumes an initial investment of $100,000 made on September 30, 2012, for Class I shares. The performance of the other share class may be greater or less than that shown based on differences in inception dates, fees, and sales charges. Performance assumes reinvestment of dividends and capital gain distributions.

| 1 | Total returns are historical and include changes in share price and the reinvestment of both dividends and capital gain distributions. |
| 2 | “NAV” (Net Asset Value) total returns do not include the effect of any sales charge. |
| 3 | “POP” (Public Offering Price) total returns include the effect of the maximum front-end 5.50% sales charge. |
| 4 | “CDSC” (contingent deferred sales charge) is applied to redemptions of certain classes of shares that do not have a sales charge applied at the time of purchase. CDSC for certain redemptions of Class A shares made within 18 months of a finder’s fee being paid and all Class C shares are 1% within the first year and 0% thereafter. |
| 5 | The since inception index return is from the inception date of Class R6 shares. |
| 6 | The expense ratios of the Fund are set forth according to the prospectus for the Fund effective January 28, 2022, as supplemented and revised, and may differ from the expense ratios disclosed in the Financial Highlights tables in this report. See the Financial Highlights for more current expense ratios. Expense ratios include fees and expenses associated with any underlying funds. |
The index is unmanaged and not available for direct investment; therefore, its performance does not reflect the expenses associated with active management of an actual portfolio.
For information regarding the indexes and certain investment terms, see the Key Investment Terms starting on page 6.
| | Ticker Symbols: |
| | Class A: PQSAX |
| | Class C: PQSCX |
| | Class I: PXQSX |
| | Class R6: VQSRX |
KAR Small-Cap Value Fund
Fund Summary (Unaudited)
Portfolio Manager Commentary by
Kayne Anderson Rudnick Investment Management, LLC
| ■ | The Fund is diversified and has an investment objective of long-term capital appreciation. There is no guarantee that the Fund will meet its objective. |
| ■ | For the fiscal year ended September 30, 2022, the Fund’s Class A shares at NAV returned -24.26%, Class C shares at NAV returned -24.84%, Class I shares at NAV returned -24.08%, and Class R6 shares at NAV returned -24.03%. For the same period, the Russell 2000® Value Index, which serves as both the Fund’s broad-based and style-specific index appropriate the comparison, returned -17.69%. |
All performance figures assume reinvestment of distributions and exclude the effect of sales charges. Performance data quoted represents past results. Past performance is no guarantee of future results, and current performance may be higher or lower than the performance shown above. Investment return and principal value will fluctuate so your shares, when redeemed, may be worth more or less than their original cost. Please visit Virtus.com for performance data current to the most recent month-end.
How did the markets perform during the Fund’s fiscal year ended September 30, 2022?
After strong performance in 2021, markets became volatile in 2022, with both equities and fixed income entering bear markets. Signs of weakness and headwinds began in the fourth quarter of 2021 as market breadth narrowed. Returns for the S& P 500® Index in 2021 were heavily skewed by the performance of some large-cap stocks.
Meanwhile, the Federal Reserve (the Fed) began tapering its bond purchases in October 2021, after providing support to the fixed income markets during the pandemic. And, while the inflation that spiked after massive pandemic spending, supply chain bottlenecks, and COVID lockdowns at first appeared transitory, inflation quickly escalated in the second quarter of 2022 and became a major risk to the economy. The Russian invasion of Ukraine also fueled inflation and once again pressured fragile supply chains.
The Fed raised interest rates five times during the fiscal year in an effort to tame record-high inflation. To make matters more challenging, robust employment became an obstacle in slowing spending, with the Fed saying it could make additional rate increases to attempt to bring down inflation. Investor pessimism and market sentiment soured to new lows for the duration of the fiscal year.
On the international front, China’s enforcement of its zero-COVID policy forced continued lockdowns, which rattled important supply chains. In addition, China’s significant regulatory crackdowns destroyed certain industries and gave investors pause to invest elsewhere in the country. Tensions with Taiwan also presented new risks due to U.S. semiconductor dependence and the role that plays in the digital transformation of the U.S.
For the fiscal year ended September 30, 2022, the S&P 500® Index declined 15.47%, while small-capitalization stocks, as represented by the Russell 2000® Index, were down 23.50%. International developed markets, as measured by the MSCI EAFE® Index (net), lost 25.13%, while the MSCI Emerging Markets Index (net) declined 28.11% for the period. Value stocks outperformed growth stocks for the fiscal year, with the Russell 1000® Value Index down 11.36% and the Russell 1000® Growth Index down 22.59%.
What factors affected the Fund’s performance during its fiscal year?
The Fund underperformed the Russell 2000® Value Index for the fiscal year ended September 30, 2022. Poor stock selection and an overweight in consumer discretionary as well as an underweight in energy detracted from performance. Positive stock selection in industrials and financials contributed to performance.
The biggest contributors to performance during the period were Stock Yards Bancorp, Jack Henry & Associates, RBC Bearings, MGM Growth Properties, and RLI.
The biggest detractors from performance during the period were Scotts Miracle-Gro, Azenta, Latham Group, SiteOne Landscape Supply, and Thor Industries.
The preceding information is the opinion of portfolio management only through the end of the period
stated on the cover. Any such opinions are subject to change at any time based upon market or other conditions and should not be relied upon as investment advice. Past performance is no guarantee of future results, and there is no guarantee that market forecasts will be realized.
Equity Securities: The market price of equity securities may be adversely affected by financial market, industry, or issuer-specific events. Focus on a particular style or on small or medium-sized companies may enhance that risk.
Industrial Concentration: Because the Fund is presently heavily weighted in the industrial sector, it will be impacted by that sector’s performance more than a fund with broader sector diversification.
Limited Number of Investments: Because the Fund has a limited number of securities, it may be more susceptible to factors adversely affecting its securities than a fund with a greater number of securities.
Sector Focused Investing: Events negatively affecting a particular industry or market sector in which the Fund focuses its investments may cause the value of the Fund to decrease.
Market Volatility: The value of the securities in the Fund may go up or down in response to the prospects of individual companies and/or general economic conditions. Price changes may be short- or long-term. Local, regional or global events such as war (e.g., Russia’s invasion of Ukraine), acts of terrorism, the spread of infectious illness (e.g., COVID-19 pandemic) or other public health issue, recessions, or other events could have a significant impact on the Fund and its investments, including hampering the ability of the Fund’s manager(s) to invest the Fund’s assets as intended.
Prospectus: For additional information on risks, please see the Fund’s prospectus.
For information regarding the indexes and certain investment terms, see the Key Investment Terms starting on page 6.
KAR Small-Cap Value Fund (Continued)
Asset Allocation
The following table presents asset allocation within certain sectors as a percentage of total investments as of September 30, 2022.
| Industrials | 37% |
| Financials | 23 |
| Consumer Discretionary | 18 |
| Information Technology | 10 |
| Consumer Staples | 5 |
| Health Care | 3 |
| Materials | 2 |
| Short-Term Investment | 2 |
| Total | 100% |
For information regarding the indexes and certain investment terms, see the Key Investment Terms starting on page 6.
KAR Small-Cap Value Fund (Continued)
Average Annual Total Returns1 for periods ended 9/30/22
| | | 1 Year | 5 Years | 10 Years | Since
inception | Inception
date |
| Class A shares at NAV2 | | -24.26 % | 3.32 % | 9.19 % | — % | — |
| Class A shares at POP3,4 | | -28.43 | 2.16 | 8.58 | — | — |
| Class C shares at NAV2 and with CDSC4 | | -24.84 | 2.55 | 8.38 | — | — |
| Class I shares at NAV2 | | -24.08 | 3.57 | 9.47 | — | — |
| Class R6 shares at NAV2 | | -24.03 | 3.65 | — | 8.07 | 11/3/16 |
| Russell 2000® Value Index | | -17.69 | 2.87 | 7.94 | 6.78 5 | — |
| Fund Expense Ratios6: Class A shares: 1.20%; Class C shares: 1.96%; Class I shares: 0.96%; Class R6 shares: 0.89%. |
| All returns represent past performance which is no guarantee of future results. Current performance may be higher or lower than the performance shown. The investment return and principal value of an investment will fluctuate so that an investor’s shares, when redeemed, may be worth more or less than their original cost. The above table and graph below do not reflect the deduction of taxes that a shareholder would pay on fund distributions or the redemption of shares. Please visit Virtus.com for performance data current to the most recent month-end. |
Growth of $10,000 for periods ended 9/30
This chart assumes an initial investment of $10,000 made on September 30, 2012, for Class A shares and Class C shares including any applicable sales charges or fees. The performance of the other share class may be greater or less than that shown based on differences in inception dates, fees, and sales charges. Performance assumes reinvestment of dividends and capital gain distributions.
For information regarding the indexes and certain investment terms, see the Key Investment Terms starting on page 6.
KAR Small-Cap Value Fund (Continued)
Growth of $100,000 for periods ended 9/30
This chart assumes an initial investment of $100,000 made on September 30, 2012, for Class I shares. The performance of the other share class may be greater or less than that shown based on differences in inception dates, fees, and sales charges. Performance assumes reinvestment of dividends and capital gain distributions.

| 1 | Total returns are historical and include changes in share price and the reinvestment of both dividends and capital gain distributions. |
| 2 | “NAV” (Net Asset Value) total returns do not include the effect of any sales charge. |
| 3 | “POP” (Public Offering Price) total returns include the effect of the maximum front-end 5.50% sales charge. |
| 4 | “CDSC” (contingent deferred sales charge) is applied to redemptions of certain classes of shares that do not have a sales charge applied at the time of purchase. CDSC for certain redemptions of Class A shares made within 18 months of a finder’s fee being paid and all Class C shares are 1% within the first year and 0% thereafter. |
| 5 | The since inception index return is from the inception date of Class R6 shares. |
| 6 | The expense ratios of the Fund are set forth according to the prospectus for the Fund effective January 28, 2022, as supplemented and revised, and may differ from the expense ratios disclosed in the Financial Highlights tables in this report. See the Financial Highlights for more current expense ratios. Expense ratios include fees and expenses associated with any underlying funds. |
The index is unmanaged and not available for direct investment; therefore, its performance does not reflect the expenses associated with active management of an actual portfolio.
For information regarding the indexes and certain investment terms, see the Key Investment Terms starting on page 6.
| | Ticker Symbols: |
| | Class A: VKSAX |
| | Class C: VKSCX |
| | Class I: VKSIX |
| | Class R6: VKSRX |
KAR Small-Mid Cap Core Fund
Fund Summary (Unaudited)
Portfolio Manager Commentary by
Kayne Anderson Rudnick Investment Management, LLC
| ■ | The Fund is diversified and has an investment objective of long-term capital appreciation, with dividend income a secondary consideration. There is no guarantee that the Fund will meet its objectives. |
| ■ | For the fiscal year ended September 30, 2022, the Fund’s Class A shares at NAV returned -26.69%, Class C shares at NAV returned -27.25%, Class I shares at NAV returned -26.47%, and Class R6 shares at NAV returned -26.51%. For the same period, the Russell 2500™ Index, which serves as both the Fund’s broad-based and style-specific index appropriate the comparison, returned -21.11%. |
All performance figures assume reinvestment of distributions and exclude the effect of sales charges. Performance data quoted represents past results. Past performance is no guarantee of future results, and current performance may be higher or lower than the performance shown above. Investment return and principal value will fluctuate so your shares, when redeemed, may be worth more or less than their original cost. Please visit Virtus.com for performance data current to the most recent month-end.
How did the markets perform during the Fund’s fiscal year ended September 30, 2022?
After strong performance in 2021, markets became volatile in 2022, with both equities and fixed income entering bear markets. Signs of weakness and headwinds began in the fourth quarter of 2021 as market breadth narrowed. Returns for the S& P 500® Index in 2021 were heavily skewed by the performance of some large-cap stocks.
Meanwhile, the Federal Reserve (the Fed) began tapering its bond purchases in October 2021, after providing support to the fixed income markets during the pandemic. And, while the inflation that spiked after massive pandemic spending, supply chain bottlenecks, and COVID lockdowns at first appeared transitory, inflation quickly escalated in the second quarter of 2022 and became a major risk to the economy. The Russian invasion of Ukraine also fueled inflation and once again pressured fragile supply chains.
The Fed raised interest rates five times during the fiscal year in an effort to tame record-high inflation. To make matters more challenging, robust employment became an obstacle in slowing spending, with the Fed saying it could make additional rate increases to attempt to bring down inflation. Investor pessimism and market sentiment soured to new lows for the duration of the fiscal year.
On the international front, China’s enforcement of its zero-COVID policy forced continued lockdowns, which rattled important supply chains. In addition, China’s significant regulatory crackdowns destroyed certain industries and gave investors pause to invest elsewhere in the country. Tensions with Taiwan also presented new risks due to U.S. semiconductor dependence and the role that plays in the digital transformation of the U.S.
For the fiscal year ended September 30, 2022, the S&P 500® Index declined 15.47%, while small-capitalization stocks, as represented by the Russell 2000® Index, were down 23.50%. International developed markets, as measured by the MSCI EAFE® Index (net), lost 25.13%, while the MSCI Emerging Markets Index (net) declined 28.11% for the period. Value stocks outperformed growth stocks for the fiscal year, with the Russell 1000® Value Index down 11.36% and the Russell 1000® Growth Index down 22.59%.
What factors affected the Fund’s performance during its fiscal year?
The Fund underperformed the Russell 2500TM Index for the fiscal year ended September 30, 2022. Poor stock selection in materials and an underweight in energy detracted from performance. Positive stock selection in financials and an underweight in communication services contributed to performance.
The biggest contributors to performance during the period were LPL Financial, W. R. Berkley, Aspen Technology, Jack Henry & Associates, and Rollins.
The biggest detractors from performance during the period were Scotts Miracle-Gro, Zebra Technologies, Charles River Laboratories, SiteOne Landscape Supply, and Bentley Systems.
The preceding information is the opinion of portfolio management only through the end of the period stated on the cover. Any such opinions are subject to change at any time based upon market or other
conditions and should not be relied upon as investment advice. Past performance is no guarantee of future results, and there is no guarantee that market forecasts will be realized.
Equity Securities: The market price of equity securities may be adversely affected by financial market, industry, or issuer-specific events. Focus on a particular style or on small or medium-sized companies may enhance that risk.
Industrial Concentration: Because the Fund is presently heavily weighted in the industrial sector, it will be impacted by that sector’s performance more than a fund with broader sector diversification.
Technology Concentration: Because the Fund is presently heavily weighted in the technology sector, it will be impacted by that sector’s performance more than a fund with broader sector diversification.
Limited Number of Investments: Because the Fund has a limited number of securities, it may be more susceptible to factors adversely affecting its securities than a fund with a greater number of securities.
Market Volatility: The value of the securities in the Fund may go up or down in response to the prospects of individual companies and/or general economic conditions. Price changes may be short- or long-term. Local, regional or global events such as war (e.g., Russia’s invasion of Ukraine), acts of terrorism, the spread of infectious illness (e.g., COVID-19 pandemic) or other public health issues, recessions, or other events could have a significant impact on the Fund and its investments, including hampering the ability of the Fund’s manager(s) to invest the Fund’s assets as intended.
Prospectus: For additional information on risks, please see the Fund’s prospectus.
For information regarding the indexes and certain investment terms, see the Key Investment Terms starting on page 6.
KAR Small-Mid Cap Core Fund (Continued)
Asset Allocation
The following table presents asset allocation within certain sectors as a percentage of total investments as of September 30, 2022.
| Industrials | 27% |
| Information Technology | 25 |
| Financials | 16 |
| Consumer Discretionary | 15 |
| Health Care | 12 |
| Materials | 2 |
| Short-Term Investment | 3 |
| Total | 100% |
For information regarding the indexes and certain investment terms, see the Key Investment Terms starting on page 6.
KAR Small-Mid Cap Core Fund (Continued)
Average Annual Total Returns1 for periods ended 9/30/22
| | | 1 Year | Since
inception | Inception
date |
| Class A shares at NAV2 | | -26.69 % | 7.43 % | 3/7/18 |
| Class A shares at POP3,4 | | -30.72 | 6.11 | 3/7/18 |
| Class C shares at NAV2 and with CDSC4 | | -27.25 | 6.63 | 3/7/18 |
| Class I shares at NAV2 | | -26.47 | 7.71 | 3/7/18 |
| Class R6 shares at NAV2 | | -26.51 | 7.77 | 3/7/18 |
| Russell 2500™ Index | | -21.11 | 4.33 5 | — |
| Fund Expense Ratios6: Class A shares: Gross 1.30%, Net 1.30%; Class C shares: Gross 2.03%, Net 2.05%; Class I shares: Gross 1.01%, Net 1.02%; Class R6 shares: Gross 0.92%, Net 0.97%. |
| All returns represent past performance which is no guarantee of future results. Current performance may be higher or lower than the performance shown. The investment return and principal value of an investment will fluctuate so that an investor’s shares, when redeemed, may be worth more or less than their original cost. The above table and graph below do not reflect the deduction of taxes that a shareholder would pay on fund distributions or the redemption of shares. Please visit Virtus.com for performance data current to the most recent month-end. |
Growth of $10,000 for periods ended 9/30
This chart assumes an initial investment of $10,000 made on March 7, 2018 (inception date of the Fund), for Class A shares and Class C shares including any applicable sales charges or fees. The performance of the other share class may be greater or less than that shown based on differences in inception dates, fees, and sales charges. Performance assumes reinvestment of dividends and capital gain distributions.
For information regarding the indexes and certain investment terms, see the Key Investment Terms starting on page 6.
KAR Small-Mid Cap Core Fund (Continued)
Growth of $100,000 for periods ended 9/30
This chart assumes an initial investment of $100,000 made on March 7, 2018 (inception date of the Fund), for Class I shares. The performance of the other share class may be greater or less than that shown based on differences in inception dates, fees, and sales charges. Performance assumes reinvestment of dividends and capital gain distributions.
Growth of $2,500,000 for periods ended 9/30
This chart assumes an initial investment of $2,500,000 made on March 7, 2018 (inception date of the Fund), for Class R6 shares. The performance of the other share class may be greater or less than that shown based on differences in inception dates, fees, and sales charges. Performance assumes reinvestment of dividends and capital gain distributions.
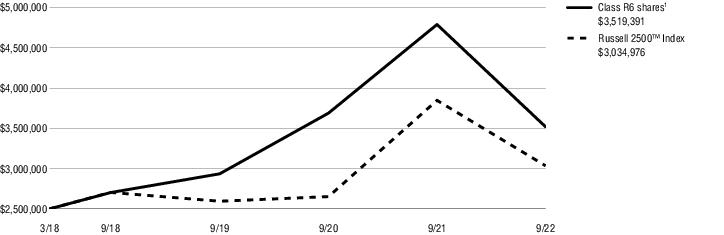
| 1 | Total returns are historical and include changes in share price and the reinvestment of both dividends and capital gain distributions. |
| 2 | “NAV” (Net Asset Value) total returns do not include the effect of any sales charge. |
| 3 | “POP” (Public Offering Price) total returns include the effect of the maximum front-end 5.50% sales charge. |
| 4 | “CDSC” (contingent deferred sales charge) is applied to redemptions of certain classes of shares that do not have a sales charge applied at the time of purchase. CDSC for certain redemptions of Class A shares made within 18 months of a finder’s fee being paid and all Class C shares are 1% within the first year and 0% thereafter. |
| 5 | The since inception index return is from the Fund’s inception date. |
| 6 | The expense ratios of the Fund are set forth according to the prospectus for the Fund effective January 28, 2022, as supplemented and revised, and may differ from the expense ratios disclosed in the Financial Highlights tables in this report. See the Financial Highlights for more current expense ratios. Net Expense: Expenses reduced by a contractual expense limitation in effect through January 31, 2023. Gross Expense: Does not reflect the effect of the expense limitation. Expense ratios include fees and expenses associated with any underlying funds. Expense ratios include fees and expenses associated with any underlying funds. |
The index is unmanaged and not available for direct investment; therefore, its performance does not reflect the expenses associated with active management of an actual portfolio.
For information regarding the indexes and certain investment terms, see the Key Investment Terms starting on page 6.
| | Ticker Symbols: |
| | Class A: VAKSX |
| | Class C: VCKSX |
| | Class I: VIKSX |
| | Class R6: VRKSX |
KAR Small-Mid Cap Growth Fund
Fund Summary (Unaudited)
Portfolio Manager Commentary by
Kayne Anderson Rudnick Investment Management, LLC
| ■ | The Fund is diversified and has an investment objective of long-term capital appreciation. There is no guarantee that the Fund will meet its objective. |
| ■ | For the fiscal year ended September 30, 2022, the Fund’s Class A shares at NAV returned -27.76%, Class C shares at NAV returned -28.22%, Class I shares at NAV returned -27.52%, and Class R6 shares at NAV returned -27.49%. For the same period, the Russell 2500™ Growth Index, which serves as both the Fund’s broad-based and style-specific index appropriate the comparison, returned -29.39%. |
All performance figures assume reinvestment of distributions and exclude the effect of sales charges. Performance data quoted represents past results. Past performance is no guarantee of future results, and current performance may be higher or lower than the performance shown above. Investment return and principal value will fluctuate so your shares, when redeemed, may be worth more or less than their original cost. Please visit Virtus.com for performance data current to the most recent month-end.
How did the markets perform during the Fund’s fiscal year ended September 30, 2022?
After strong performance in 2021, markets became volatile in 2022, with both equities and fixed income entering bear markets. Signs of weakness and headwinds began in the fourth quarter of 2021 as market breadth narrowed. Returns for the S& P 500® Index in 2021 were heavily skewed by the performance of some large-cap stocks.
Meanwhile, the Federal Reserve (the Fed) began tapering its bond purchases in October 2021, after providing support to the fixed income markets during the pandemic. And, while the inflation that spiked after massive pandemic spending, supply chain bottlenecks, and COVID lockdowns at first appeared transitory, inflation quickly escalated in the second quarter of 2022 and became a major risk to the economy. The Russian invasion of Ukraine also
fueled inflation and once again pressured fragile supply chains.
The Fed raised interest rates five times during the fiscal year in an effort to tame record-high inflation. To make matters more challenging, robust employment became an obstacle in slowing spending, with the Fed saying it could make additional rate increases to attempt to bring down inflation. Investor pessimism and market sentiment soured to new lows for the duration of the fiscal year.
On the international front, China’s enforcement of its zero-COVID policy forced continued lockdowns, which rattled important supply chains. In addition, China’s significant regulatory crackdowns destroyed certain industries and gave investors pause to invest elsewhere in the country. Tensions with Taiwan also presented new risks due to U.S. semiconductor dependence and the role that plays in the digital transformation of the U.S.
For the fiscal year ended September 30, 2022, the S&P 500® Index declined 15.47%, while small-capitalization stocks, as represented by the Russell 2000® Index, were down 23.50%. International developed markets, as measured by the MSCI EAFE® Index (net), lost 25.13%, while the MSCI Emerging Markets Index (net) declined 28.11% for the period. Value stocks outperformed growth stocks for the fiscal year, with the Russell 1000® Value Index down 11.36% and the Russell 1000® Growth Index down 22.59%.
The Fund outperformed the Russell 2500TM Growth Index for the fiscal year ended September 30, 2022. Positive stock selection and overweight positions in health care and financials contributed to performance. Poor stock selection in information technology and an underweight in energy detracted from performance.
The biggest contributors to performance during the period were Ryan Specialty, Lamb Weston, Jack Henry & Associates, HealthEquity, and Fair Isaac.
The biggest detractors from performance during the period were Copperleaf Technologies, West Pharmaceutical Services, SiteOne Landscape Supply, Bentley Systems, and TransUnion.
The preceding information is the opinion of portfolio management only through the end of the period stated on the cover. Any such opinions are subject to change at any time based upon market or other conditions and should not be relied upon as investment advice. Past performance is no guarantee of future results, and there is no guarantee that market forecasts will be realized.
Equity Securities: The market price of equity securities may be adversely affected by financial market, industry, or issuer-specific events. Focus on a particular style or on small or medium-sized companies may enhance that risk.
Limited Number of Investments: Because the Fund has a limited number of securities, it may be more susceptible to factors adversely affecting its securities than a fund with a greater number of securities.
Market Volatility: The value of the securities in the Fund may go up or down in response to the prospects of individual companies and/or general economic conditions. Price changes may be short- or long-term. Local, regional or global events such as war (e.g., Russia’s invasion of Ukraine), acts of terrorism, the spread of infectious illness (e.g., COVID-19 pandemic) or other public health issues, recessions, or other events could have a significant impact on the Fund and its investments, including hampering the ability of the Fund’s manager(s) to invest the Fund’s assets as intended.
Prospectus: For additional information on risks, please see the Fund’s prospectus.
Asset Allocation
The following table presents asset allocation within certain sectors as a percentage of total investments as of September 30, 2022.
| Information Technology | 25% |
| Health Care | 23 |
| Industrials | 18 |
| Financials | 13 |
| Consumer Discretionary | 5 |
| Consumer Staples | 3 |
| Communication Services | 3 |
| Short-Term Investment | 10 |
| Total | 100% |
For information regarding the indexes and certain investment terms, see the Key Investment Terms starting on page 6.
KAR Small-Mid Cap Growth Fund (Continued)
Average Annual Total Returns1 for periods ended 9/30/22
| | | 1 Year | Since
inception | Inception
date |
| Class A shares at NAV2 | | -27.76 % | -13.25 % | 12/8/20 |
| Class A shares at POP3,4 | | -31.73 | -15.92 | 12/8/20 |
| Class C shares at NAV2 and with CDSC4 | | -28.22 | -13.87 | 12/8/20 |
| Class I shares at NAV2 | | -27.52 | -13.01 | 12/8/20 |
| Class R6 shares at NAV2 | | -27.49 | -12.94 | 12/8/20 |
| Russell 2500™ Growth Index | | -29.39 | -13.26 5 | — |
| Fund Expense Ratios6: Class A shares: Gross 4.06%, Net 1.30%; Class C shares: Gross 4.88%, Net 2.05%; Class I shares: Gross 3.83%, Net 1.05%; Class R6 shares: Gross 3.79%, Net 0.99%. |
| All returns represent past performance which is no guarantee of future results. Current performance may be higher or lower than the performance shown. The investment return and principal value of an investment will fluctuate so that an investor’s shares, when redeemed, may be worth more or less than their original cost. The above table and graph below do not reflect the deduction of taxes that a shareholder would pay on fund distributions or the redemption of shares. Please visit Virtus.com for performance data current to the most recent month-end. |
Growth of $10,000 for periods ended 9/30
This chart assumes an initial investment of $10,000 made on December 8, 2020 (inception date of the Fund), for Class A shares and Class C shares including any applicable sales charges or fees. The performance of the other share class may be greater or less than that shown based on differences in inception dates, fees, and sales charges. Performance assumes reinvestment of dividends and capital gain distributions.
For information regarding the indexes and certain investment terms, see the Key Investment Terms starting on page 6.
KAR Small-Mid Cap Growth Fund (Continued)
Growth of $100,000 for periods ended 9/30
This chart assumes an initial investment of $100,000 made on December 8, 2020 (inception date of the Fund), for Class I shares. The performance of the other share class may be greater or less than that shown based on differences in inception dates, fees, and sales charges. Performance assumes reinvestment of dividends and capital gain distributions.
Growth of $2,500,000 for periods ended 9/30
This chart assumes an initial investment of $2,500,000 made on December 8, 2020 (inception date of the Fund), for Class R6 shares. The performance of the other share class may be greater or less than that shown based on differences in inception dates, fees, and sales charges. Performance assumes reinvestment of dividends and capital gain distributions.

| 1 | Total returns are historical and include changes in share price and the reinvestment of both dividends and capital gain distributions. |
| 2 | “NAV” (Net Asset Value) total returns do not include the effect of any sales charge. |
| 3 | “POP” (Public Offering Price) total returns include the effect of the maximum front-end 5.50% sales charge. |
| 4 | “CDSC” (contingent deferred sales charge) is applied to redemptions of certain classes of shares that do not have a sales charge applied at the time of purchase. CDSC for certain redemptions of Class A shares made within 18 months of a finder’s fee being paid and all Class C shares are 1% within the first year and 0% thereafter. |
| 5 | The since inception index return is from the Fund’s inception date. |
| 6 | The expense ratios of the Fund are set forth according to the prospectus for the Fund effective January 28, 2022, as supplemented and revised, and may differ from the expense ratios disclosed in the Financial Highlights tables in this report. See the Financial Highlights for more current expense ratios. Net Expense: Expenses reduced by a contractual expense limitation in effect through January 31, 2023. Gross Expense: Does not reflect the effect of the expense limitation. Expense ratios include fees and expenses associated with any underlying funds. |
The index is unmanaged and not available for direct investment; therefore, its performance does not reflect the expenses associated with active management of an actual portfolio.
For information regarding the indexes and certain investment terms, see the Key Investment Terms starting on page 6.
| | Ticker Symbols: |
| | Class A: VKSDX |
| | Class C: VKSEX |
| | Class I: VKSFX |
| | Class R6: VKSGX |
KAR Small-Mid Cap Value Fund
Fund Summary (Unaudited)
Portfolio Manager Commentary by
Kayne Anderson Rudnick Investment Management, LLC
| ■ | The Fund is diversified and has an investment objective of long-term capital appreciation. There is no guarantee that the Fund will meet its objective. |
| ■ | For the fiscal year ended September 30, 2022, the Fund’s Class A shares at NAV returned -19.25%, Class C shares at NAV returned -19.94%, Class I shares at NAV returned -19.10%, and Class R6 shares at NAV returned -19.09%. For the same period, the Russell 2500™ Value Index, which serves as both the Fund’s broad-based and style-specific index appropriate the comparison, returned -15.35%. |
All performance figures assume reinvestment of distributions and exclude the effect of sales charges. Performance data quoted represents past results. Past performance is no guarantee of future results, and current performance may be higher or lower than the performance shown above. Investment return and principal value will fluctuate so your shares, when redeemed, may be worth more or less than their original cost. Please visit Virtus.com for performance data current to the most recent month-end.
How did the markets perform during the Fund’s fiscal year ended September 30, 2022?
After strong performance in 2021, markets became volatile in 2022, with both equities and fixed income entering bear markets. Signs of weakness and headwinds began in the fourth quarter of 2021 as market breadth narrowed. Returns for the S& P 500® Index in 2021 were heavily skewed by the performance of some large-cap stocks.
Meanwhile, the Federal Reserve (the Fed) began tapering its bond purchases in October 2021, after providing support to the fixed income markets during the pandemic. And, while the inflation that spiked after massive pandemic spending, supply chain bottlenecks, and COVID lockdowns at first appeared transitory, inflation quickly escalated in the second quarter of 2022 and became a major risk to the economy. The Russian invasion of Ukraine also
fueled inflation and once again pressured fragile supply chains.
The Fed raised interest rates five times during the fiscal year in an effort to tame record-high inflation. To make matters more challenging, robust employment became an obstacle in slowing spending, with the Fed saying it could make additional rate increases to attempt to bring down inflation. Investor pessimism and market sentiment soured to new lows for the duration of the fiscal year.
On the international front, China’s enforcement of its zero-COVID policy forced continued lockdowns, which rattled important supply chains. In addition, China’s significant regulatory crackdowns destroyed certain industries and gave investors pause to invest elsewhere in the country. Tensions with Taiwan also presented new risks due to U.S. semiconductor dependence and the role that plays in the digital transformation of the U.S.
For the fiscal year ended September 30, 2022, the S&P 500® Index declined 15.47%, while small-capitalization stocks, as represented by the Russell 2000® Index, were down 23.50%. International developed markets, as measured by the MSCI EAFE® Index (net), lost 25.13%, while the MSCI Emerging Markets Index (net) declined 28.11% for the period. Value stocks outperformed growth stocks for the fiscal year, with the Russell 1000® Value Index down 11.36% and the Russell 1000® Growth Index down 22.59%.
The Fund underperformed the Russell 2500TM Value Index for the fiscal year ended September 30, 2022. Poor stock selection in materials and an underweight in energy detracted from performance. Positive stock selection in financials and positive stock selection and an underweight in real estate contributed to performance.
The biggest contributors to performance during the period were W. R. Berkley, LPL Financial, CDK Global, Jack Henry & Associates, and MGM Growth Properties.
The biggest detractors from performance during the period were Scotts Miracle-Gro, TransUnion, Zebra Technologies, Thor Industries, and The Cheesecake Factory.
The preceding information is the opinion of portfolio management only through the end of the period stated on the cover. Any such opinions are subject to change at any time based upon market or other conditions and should not be relied upon as investment advice. Past performance is no guarantee of future results, and there is no guarantee that market forecasts will be realized.
Equity Securities: The market price of equity securities may be adversely affected by financial market, industry, or issuer-specific events. Focus on a particular style or on small or medium-sized companies may enhance that risk.
Limited Number of Investments: Because the Fund has a limited number of securities, it may be more susceptible to factors adversely affecting its securities than a fund with a greater number of securities.
Market Volatility: The value of the securities in the Fund may go up or down in response to the prospects of individual companies and/or general economic conditions. Price changes may be short- or long-term. Local, regional or global events such as war (e.g., Russia’s invasion of Ukraine), acts of terrorism, the spread of infectious illness (e.g., COVID-19 pandemic) or other public health issues, recessions, or other events could have a significant impact on the Fund and its investments, including hampering the ability of the Fund’s manager(s) to invest the Fund’s assets as intended.
Prospectus: For additional information on risks, please see the Fund’s prospectus.
Asset Allocation
The following table presents asset allocation within certain sectors as a percentage of total investments as of September 30, 2022.
| Industrials | 26% |
| Information Technology | 19 |
| Financials | 17 |
| Consumer Discretionary | 16 |
| Real Estate | 6 |
| Consumer Staples | 4 |
| Materials | 4 |
| Other (includes short-term investment) | 8 |
| Total | 100% |
For information regarding the indexes and certain investment terms, see the Key Investment Terms starting on page 6.
KAR Small-Mid Cap Value Fund (Continued)
Average Annual Total Returns1 for periods ended 9/30/22
| | | 1 Year | Since
inception | Inception
date |
| Class A shares at NAV2 | | -19.25 % | -19.44 % | 8/3/21 |
| Class A shares at POP3,4 | | -23.69 | -23.27 | 8/3/21 |
| Class C shares at NAV2 and with CDSC4 | | -19.94 | -20.10 | 8/3/21 |
| Class I shares at NAV2 | | -19.10 | -19.31 | 8/3/21 |
| Class R6 shares at NAV2 | | -19.09 | -19.23 | 8/3/21 |
| Russell 2500™ Value Index | | -15.35 | -13.96 5 | — |
| Fund Expense Ratios6: Class A shares: Gross 12.81%, Net 1.17%; Class C shares: Gross 13.87%, Net 1.92%; Class I shares: Gross 12.88%, Net 0.92%; Class R6 shares: Gross 12.82%, Net 0.82%. |
| All returns represent past performance which is no guarantee of future results. Current performance may be higher or lower than the performance shown. The investment return and principal value of an investment will fluctuate so that an investor’s shares, when redeemed, may be worth more or less than their original cost. The above table and graph below do not reflect the deduction of taxes that a shareholder would pay on fund distributions or the redemption of shares. Please visit Virtus.com for performance data current to the most recent month-end. |
Growth of $10,000 for periods ended 9/30
This chart assumes an initial investment of $10,000 made on August 3, 2021 (inception date of the Fund), for Class A shares and Class C shares including any applicable sales charges or fees. The performance of the other share class may be greater or less than that shown based on differences in inception dates, fees, and sales charges. Performance assumes reinvestment of dividends and capital gain distributions.
For information regarding the indexes and certain investment terms, see the Key Investment Terms starting on page 6.
KAR Small-Mid Cap Value Fund (Continued)
Growth of $100,000 for periods ended 9/30
This chart assumes an initial investment of $100,000 made on August 3, 2021 (inception date of the Fund), for Class I shares. The performance of the other share class may be greater or less than that shown based on differences in inception dates, fees, and sales charges. Performance assumes reinvestment of dividends and capital gain distributions.
Growth of $2,500,000 for periods ended 9/30
This chart assumes an initial investment of $2,500,000 made on August 3, 2021 (inception date of the Fund), for Class R6 shares. The performance of the other share class may be greater or less than that shown based on differences in inception dates, fees, and sales charges. Performance assumes reinvestment of dividends and capital gain distributions.

| 1 | Total returns are historical and include changes in share price and the reinvestment of both dividends and capital gain distributions. |
| 2 | “NAV” (Net Asset Value) total returns do not include the effect of any sales charge. |
| 3 | “POP” (Public Offering Price) total returns include the effect of the maximum front-end 5.50% sales charge. |
| 4 | “CDSC” (contingent deferred sales charge) is applied to redemptions of certain classes of shares that do not have a sales charge applied at the time of purchase. CDSC for certain redemptions of Class A shares made within 18 months of a finder’s fee being paid and all Class C shares are 1% within the first year and 0% thereafter. |
| 5 | The since inception index return is from the Fund’s inception date. |
| 6 | The expense ratios of the Fund are set forth according to the prospectus for the Fund effective January 28, 2022, as supplemented and revised, and may differ from the expense ratios disclosed in the Financial Highlights tables in this report. See the Financial Highlights for more current expense ratios. Net Expense: Expenses reduced by a contractual expense limitation in effect through January 31, 2023. Gross Expense: Does not reflect the effect of the expense limitation. Expense ratios include fees and expenses associated with any underlying funds. |
The index is unmanaged and not available for direct investment; therefore, its performance does not reflect the expenses associated with active management of an actual portfolio.
For information regarding the indexes and certain investment terms, see the Key Investment Terms starting on page 6.
| | Ticker Symbols: |
| | Class A: VAEGX |
| | Class C: VCEGX |
| | Class I: VIEGX |
| | Class R6: VESRX |
SGA Emerging Markets Growth Fund
Fund Summary (Unaudited)
Portfolio Manager Commentary by
Sustainable Growth Advisers, LP
| ■ | The Fund is non-diversified and has an investment objective of long-term capital appreciation. There is no guarantee that the Fund will meet its objective. |
| ■ | For the fiscal year ended September 30, 2022, the Fund’s Class A shares at NAV returned -29.40%, Class C shares at NAV returned -29.94%, Class I shares at NAV returned -29.20%, and Class R6 shares at NAV returned -29.08%. For the same period, the MSCI Emerging Markets Index (net), which serves as both the Fund’s broad-based and style-specific index appropriate the comparison, returned -28.11%. |
All performance figures assume reinvestment of distributions and exclude the effect of sales charges. Performance data quoted represents past results. Past performance is no guarantee of future results, and current performance may be higher or lower than the performance shown above. Investment return and principal value will fluctuate so your shares, when redeemed, may be worth more or less than their original cost. Please visit Virtus.com for performance data current to the most recent month-end.
How did the markets perform during the Fund’s fiscal year ended September 30, 2022?
Emerging markets delivered their worst one-year returns since the 2008-09 financial crisis. Emerging markets were negatively impacted by a host of issues that included continuing inflationary pressures, synchronous global central bank monetary tightening, weakening currencies, disruptive zero-Covid policies, and property market weakness in China, as well as Russia’s unexpected invasion of Ukraine.
Emerging markets in Europe performed worst during the period as Russian stocks were removed from the broad market index. Markets in Hungary (-54.3%) and Poland (-51.9%) performed worst overall amid rising political uncertainty. Concerns about China’s economy fluctuated over the period, with optimism around easing Covid restrictions fading later in the period, which weighed heavily on Chinese stocks (-35.4%). Growing concerns around waning Chinese demand and overall global economic growth weighed on markets in South Korea (-40.7%) and Taiwan
(-30.5%), which underperformed given their greater dependence on technology hardware and semiconductor exports.
Indonesian markets (+14.3%) performed best, followed by Qatar (+12.7%), Kuwait (+6.4%), and UAE (+5.1%), all of which benefited from strength in energy markets. Latin American markets performed strongly, led by Brazil (+4.3%), as they benefited from strong commodity and energy markets. Growth stocks lagged over the 12-month period, given concerns about rising inflation and interest rates. The utilities (-8.0%), financials (-14.3%), and consumer staples (-17.8%) sectors suffered declines, but still performed best, while the health care (-42.8%), communication services (-36.2%), and information technology (-36.1%) sectors performed worst.
What factors affected the Fund’s performance during its fiscal year?
The Fund trailed the MSCI Emerging Markets Index (net) for the 12 months ended September 30, 2022. Stock selection detracted from relative returns, while sector allocation, which is a by-product of our bottom-up stock selection process, contributed positively.
Stock selection detracted the most in the financials and communication services sectors, offsetting positive selection in the consumer staples and health care sectors.
The Fund’s relative returns benefited from an overweight to the outperforming consumer staples sector and an underweight to the underperforming information technology sector. The Fund’s overweight to the consumer discretionary sector and lack of exposure to the utilities and energy sectors detracted from relative returns.
The largest contributors to Fund performance for the 12-month period were Bank of Central Asia, Wal-Mart de Mexico, and Budweiser APAC, while Raia Drogasil and Asian Paints detracted the least. The five largest detractors from Fund performance for the period were XP, Kakao, MercadoLibre, Naver, and Mengniu Dairy.
The preceding information is the opinion of portfolio management only through the end of the period stated on the cover. Any such opinions are subject to change at any time based upon market or other conditions and should not be relied upon as
investment advice. Past performance is no guarantee of future results, and there is no guarantee that market forecasts will be realized.
Equity Securities: The market price of equity securities may be adversely affected by financial market, industry, or issuer-specific events. Focus on a particular style or on small or medium-sized companies may enhance that risk.
Geographic Concentration: A fund that focuses its investments in a particular geographic location will be sensitive to financial, economic, political, and other events negatively affecting of that location.
Sector Focused Investing: Events negatively affecting a particular industry or market sector in which the Fund focuses its investments may cause the value of the Fund to decrease.
Foreign & Emerging Markets: Investing in foreign securities, especially in emerging markets, subjects the Fund to additional risks such as increased volatility, currency fluctuations, less liquidity, and political, regulatory, economic, and market risk.
Market Volatility: The value of the securities in the Fund may go up or down in response to the prospects of individual companies and/or general economic conditions. Price changes may be short- or long-term. Local, regional or global events such as war (e.g., Russia’s invasion of Ukraine), acts of terrorism, the spread of infectious illness (e.g., COVID-19 pandemic) or other public health issues, recessions, or other events could have a significant impact on the Fund and its investments, including hampering the ability of the Fund’s manager(s) to invest the Fund’s assets as intended.
Prospectus: For additional information on risks, please see the Fund’s prospectus.
For information regarding the indexes and certain investment terms, see the Key Investment Terms starting on page 6.
SGA Emerging Markets Growth Fund (Continued)
Asset Allocation
The following table presents asset allocation within certain sectors as a percentage of total investments as of September 30, 2022.
| Consumer Staples | 30% |
| Financials | 25 |
| Consumer Discretionary | 24 |
| Communication Services | 8 |
| Health Care | 5 |
| Information Technology | 5 |
| Materials | 3 |
| Total | 100% |
For information regarding the indexes and certain investment terms, see the Key Investment Terms starting on page 6.
SGA Emerging Markets Growth Fund (Continued)
Average Annual Total Returns1 for periods ended 9/30/22
| | | 1 Year | Since
inception | Inception
date |
| Class A shares at NAV2 | | -29.40 % | -2.38 % | 6/13/19 |
| Class A shares at POP3,4 | | -33.28 | -4.03 | 6/13/19 |
| Class C shares at NAV2 and with CDSC4 | | -29.94 | -3.11 | 6/13/19 |
| Class I shares at NAV2 | | -29.20 | -2.11 | 6/13/19 |
| Class R6 shares at NAV2 | | -29.08 | -1.95 | 6/13/19 |
| MSCI Emerging Markets Index (net) | | -28.11 | -2.14 5 | — |
| Fund Expense Ratios6: Class A shares: Gross 2.91%, Net 1.48%; Class C shares: Gross 3.66%, Net 2.23%; Class I shares: Gross 2.67%, Net 1.23%; Class R6 shares: Gross 2.63%, Net 1.05%. |
| All returns represent past performance which is no guarantee of future results. Current performance may be higher or lower than the performance shown. The investment return and principal value of an investment will fluctuate so that an investor’s shares, when redeemed, may be worth more or less than their original cost. The above table and graph below do not reflect the deduction of taxes that a shareholder would pay on fund distributions or the redemption of shares. Please visit Virtus.com for performance data current to the most recent month-end. |
Growth of $10,000 for periods ended 9/30
This chart assumes an initial investment of $10,000 made on June 13, 2019 (inception date of the Fund), for Class A shares and Class C shares including any applicable sales charges or fees. The performance of the other share class may be greater or less than that shown based on differences in inception dates, fees, and sales charges. Performance assumes reinvestment of dividends and capital gain distributions.
For information regarding the indexes and certain investment terms, see the Key Investment Terms starting on page 6.
SGA Emerging Markets Growth Fund (Continued)
Growth of $100,000 for periods ended 9/30
This chart assumes an initial investment of $100,000 made on June 13, 2019 (inception date of the Fund), for Class I shares. The performance of the other share class may be greater or less than that shown based on differences in inception dates, fees, and sales charges. Performance assumes reinvestment of dividends and capital gain distributions.
Growth of $2,500,000 for periods ended 9/30
This chart assumes an initial investment of $2,500,000 made on June 13, 2019 (inception date of the Fund), for Class R6 shares. The performance of the other share class may be greater or less than that shown based on differences in inception dates, fees, and sales charges. Performance assumes reinvestment of dividends and capital gain distributions.
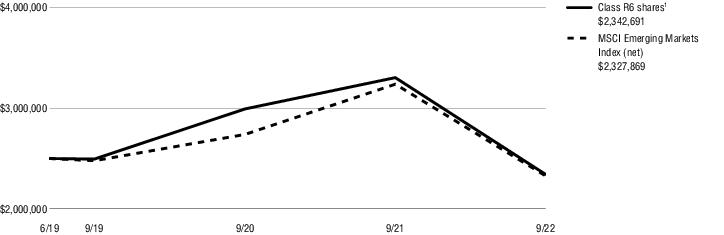
| 1 | Total returns are historical and include changes in share price and the reinvestment of both dividends and capital gain distributions. |
| 2 | “NAV” (Net Asset Value) total returns do not include the effect of any sales charge. |
| 3 | “POP” (Public Offering Price) total returns include the effect of the maximum front-end 5.50% sales charge. |
| 4 | “CDSC” (contingent deferred sales charge) is applied to redemptions of certain classes of shares that do not have a sales charge applied at the time of purchase. CDSC for certain redemptions of Class A shares made within 18 months of a finder’s fee being paid and all Class C shares are 1% within the first year and 0% thereafter. |
| 5 | The since inception index return is from the Fund’s inception date. |
| 6 | The expense ratios of the Fund are set forth according to the prospectus for the Fund effective January 28, 2022, as supplemented and revised, and may differ from the expense ratios disclosed in the Financial Highlights tables in this report. See the Financial Highlights for more current expense ratios. Net Expense: Expenses reduced by a contractual expense limitation in effect through January 31, 2023. Gross Expense: Does not reflect the effect of the expense limitation. Expense ratios include fees and expenses associated with any underlying funds. |
The index is unmanaged and not available for direct investment; therefore, its performance does not reflect the expenses associated with active management of an actual portfolio.
For information regarding the indexes and certain investment terms, see the Key Investment Terms starting on page 6.
| | Ticker Symbols: |
| | Class A: SGAAX |
| | Class C: SGACX |
| | Class I: SGAPX |
| | Class R6: SGARX |
SGA Global Growth Fund
Fund Summary (Unaudited)
Portfolio Manager Commentary by
Sustainable Growth Advisers, LP
| ■ | The Fund is diversified and has an investment objective of long-term capital appreciation. There is no guarantee that the Fund will meet its objective. |
| ■ | For the fiscal year ended September 30, 2022, the Fund’s Class A shares at NAV returned -31.91%, Class C shares at NAV returned -32.40%, Class I shares at NAV returned -31.74%, and Class R6 shares at NAV returned -31.58%. For the same period, the MSCI All Country World Index (net), returned -20.66%, and the MSCI All Country World Growth Index (net), returned -27.48%. |
All performance figures assume reinvestment of distributions and exclude the effect of sales charges. Performance data quoted represents past results. Past performance is no guarantee of future results, and current performance may be higher or lower than the performance shown above. Investment return and principal value will fluctuate so your shares, when redeemed, may be worth more or less than their original cost. Please visit Virtus.com for performance data current to the most recent month-end.
How did the markets perform during the Fund’s fiscal year ended September 30, 2022?
Global markets delivered their worst one-year returns since the 2008-09 financial crisis. Central banks around the world tightened monetary policy aggressively to reduce the worst inflationary pressures in decades, which spurred significant declines in equity markets. In the U.S., the Federal Reserve (the Fed) hiked its benchmark interest rate five times, lifting rates from 0% to 3.25%, with expectations for additional rate increases over the coming year.
In Europe, inflationary pressures were exacerbated by Russia’s unexpected invasion of Ukraine and a subsequent energy crisis that stemmed from Europe’s heavy dependence on Russian gas and oil. Weakness in China’s property market and ongoing disruptions from the Chinese government’s zero-Covid policies weighed on economic activity and investor sentiment toward Chinese stocks, which were among the worst performers over the period.
Growth stocks posted the worst performance, due to concerns around inflation and interest rates, while
continued optimism around future economic and corporate profit growth benefited value stocks and those more sensitive to the economic cycle. Energy was the only sector within the MSCI All Country World Index that delivered positive returns over the period (+16.2%), benefiting from buoyant energy prices. The utilities and consumer staples sectors declined least, returning -4.8% and -9.0% respectively. The worst-performing sectors were the communication services (-38.0%), consumer discretionary (-27.1%), and information technology ( 26.6%) sectors, driven by the selloff in faster-growing, higher-valuation stocks.
What factors affected the Fund’s performance during its fiscal year?
The Fund trailed its benchmark, the MSCI All Country World Index (net), for the fiscal year ended September 30, 2022. The underperformance of companies with higher growth prospects, as well as the outperformance of more economically sensitive stocks, weighed on the Fund’s relative returns.
Stock selection detracted broadly over the period, but most significantly in the information technology, health care, and industrials sectors. Sector allocations, which are a by-product of our bottom-up stock selection process, detracted from relative returns. In particular, the Fund’s returns were hampered by a lack of exposure to the strongly performing energy and utilities sectors, as well as an overweight to the underperforming information technology sector.
The five largest contributors to Fund performance were Abbott, Nike, Novo Nordisk, Regeneron, and IHS Markit. The five largest detractors from Fund performance were PayPal, Recruit, Salesforce, Workday, and Amazon.
The preceding information is the opinion of portfolio management only through the end of the period stated on the cover. Any such opinions are subject to change at any time based upon market or other conditions and should not be relied upon as investment advice. Past performance is no guarantee of future results, and there is no guarantee that market forecasts will be realized.
Equity Securities: The market price of equity securities may be adversely affected by financial market, industry, or issuer-specific events. Focus on
a particular style or on small or medium-sized companies may enhance that risk.
Foreign & Emerging Markets: Investing in foreign securities, especially in emerging markets, subjects the Fund to additional risks such as increased volatility, currency fluctuations, less liquidity, and political, regulatory, economic, and market risk.
Geographic Concentration: A fund that focuses its investments in a particular geographic location will be sensitive to financial, economic, political, and other events negatively affecting of that location.
Technology Concentration: Because the Fund is presently heavily weighted in the technology sector, it will be impacted by that sector’s performance more than a fund with broader sector diversification.
Market Volatility: The value of the securities in the Fund may go up or down in response to the prospects of individual companies and/or general economic conditions. Price changes may be short- or long-term. Local, regional or global events such as war (e.g., Russia’s invasion of Ukraine), acts of terrorism, the spread of infectious illness (e.g., COVID-19 pandemic) or other public health issues, recessions, or other events could have a significant impact on the Fund and its investments, including hampering the ability of the Fund’s manager(s) to invest the Fund’s assets as intended.
Prospectus: For additional information on risks, please see the Fund’s prospectus.
For information regarding the indexes and certain investment terms, see the Key Investment Terms starting on page 6.
SGA Global Growth Fund (Continued)
Asset Allocation
The following table presents asset allocation within certain sectors as a percentage of total investments as of September 30, 2022.
| Information Technology | 35% |
| Health Care | 20 |
| Financials | 15 |
| Consumer Discretionary | 10 |
| Consumer Staples | 9 |
| Communication Services | 3 |
| Industrials | 3 |
| Other (includes short-term investment) | 5 |
| Total | 100% |
For information regarding the indexes and certain investment terms, see the Key Investment Terms starting on page 6.
SGA Global Growth Fund (Continued)
Average Annual Total Returns1 for periods ended 9/30/22
| | | 1 Year | 5 Years | 10 Years | Since
inception | Inception
date |
| Class A shares at NAV2 | | -31.91 % | 5.91 % | — % | 7.71 % | 10/4/13 |
| Class A shares at POP3,4 | | -35.66 | 4.71 | — | 7.04 | 10/4/13 |
| Class C shares at NAV2 and with CDSC4 | | -32.40 | 5.13 | — | 6.91 | 10/4/13 |
| Class I shares at NAV2 | | -31.74 | 6.08 | — | 7.83 | 10/4/13 |
| Class R6 shares at NAV2 | | -31.58 | 6.38 | 8.56 | — | — |
| MSCI All Country World Index (net) | | -20.66 | 4.44 | 7.28 | 6.13 5 | — |
| MSCI All Country World Growth Index (net) | | -27.48 | 6.63 | 8.87 | 7.96 5 | — |
| Fund Expense Ratios6: Class A shares: Gross 1.47%, Net 1.38%; Class C shares: Gross 2.14%, Net 2.13%; Class I shares: Gross 1.15%, Net 1.13%; Class R6 shares: Gross 1.03%, Net 0.90%. |
| All returns represent past performance which is no guarantee of future results. Current performance may be higher or lower than the performance shown. The investment return and principal value of an investment will fluctuate so that an investor’s shares, when redeemed, may be worth more or less than their original cost. The above table and graph below do not reflect the deduction of taxes that a shareholder would pay on fund distributions or the redemption of shares. Please visit Virtus.com for performance data current to the most recent month-end. |
Growth of $2,500,000 for periods ended 9/30
This chart assumes an initial investment of $2,500,000 made on September 30, 2012, for Class R6 shares. The performance of the other share class may be greater or less than that shown based on differences in inception dates, fees, and sales charges. Performance assumes reinvestment of dividends and capital gain distributions.

| 1 | Total returns are historical and include changes in share price and the reinvestment of both dividends and capital gain distributions. |
| 2 | “NAV” (Net Asset Value) total returns do not include the effect of any sales charge. |
| 3 | “POP” (Public Offering Price) total returns include the effect of the maximum front-end 5.50% sales charge. |
| 4 | “CDSC” (contingent deferred sales charge) is applied to redemptions of certain classes of shares that do not have a sales charge applied at the time of purchase. CDSC for certain redemptions of Class A shares made within 18 months of a finder’s fee being paid and all Class C shares are 1% within the first year and 0% thereafter. |
| 5 | The since inception index return is from the inception date of Class A shares, Class C shares and Class I shares. |
| 6 | The expense ratios of the Fund are set forth according to the prospectus for the Fund effective January 28, 2022, as supplemented and revised, and may differ from the expense ratios disclosed in the Financial Highlights tables in this report. See the Financial Highlights for more current expense ratios. Net Expense: Expenses reduced by a contractual expense limitation in effect through February 1, 2022. Gross Expense: Does not reflect the effect of the expense limitation. Expense ratios include fees and expenses associated with any underlying funds. |
The indexes are unmanaged and not available for direct investment; therefore, their performance does not reflect the expenses associated with active management of an actual portfolio.
For information regarding the indexes and certain investment terms, see the Key Investment Terms starting on page 6.
| | Ticker Symbols: |
| | Class A: VNLAX |
| | Class C: VNLCX |
| | Class I: VNLIX |
| | Class R6: VNLRX |
SGA New Leaders Growth Fund
Fund Summary (Unaudited)
Portfolio Manager Commentary by
Sustainable Growth Advisers, LP
| ■ | The Fund is non-diversified and has an investment objective of long-term capital appreciation. There is no guarantee that the Fund will meet its objective. |
| ■ | For the fiscal year ended September 30, 2022, the Fund’s Class A shares at NAV returned -40.56%, Class C shares at NAV returned -41.02%, Class I shares at NAV returned -40.39%, and Class R6 shares at NAV returned -40.32%. For the same period, the MSCI All Country World Mid Cap Index (net), which serves as both the Fund’s broad-based and style-specific index appropriate the comparison, returned -24.12%. |
All performance figures assume reinvestment of distributions and exclude the effect of sales charges. Performance data quoted represents past results. Past performance is no guarantee of future results, and current performance may be higher or lower than the performance shown above. Investment return and principal value will fluctuate so your shares, when redeemed, may be worth more or less than their original cost. Please visit Virtus.com for performance data current to the most recent month-end.
How did the markets perform during the Fund’s fiscal year ended September 30, 2022?
Global markets delivered their worst one-year returns since the 2008-09 financial crisis. Central banks around the world tightened monetary policy aggressively to reduce the worst inflationary pressures in decades, which spurred significant declines in equity markets. In the U.S., the Federal Reserve (the Fed) hiked its benchmark interest rate five times, lifting rates from 0% to 3.25%, with expectations for additional rate increases over the coming year.
In Europe, inflationary pressures were exacerbated by Russia’s unexpected invasion of Ukraine and a subsequent energy crisis that stemmed from Europe’s heavy dependence on Russian gas and oil. Weakness in China’s property market and ongoing disruptions from the Chinese government’s
zero-Covid policies weighed on economic activity and investor sentiment toward Chinese stocks, which were among the worst performers over the period.
Growth stocks posted the worst performance, due to concerns around inflation and interest rates, while continued optimism around future economic and corporate profit growth benefited value stocks and those more sensitive to the economic cycle. Energy was the only sector in the MSCI All Country World Mid Cap Index that delivered positive returns over the period, benefiting from buoyant energy prices. The utilities and financials sectors declined least, while the worst-performing sectors were consumer discretionary, communication services, and health care, driven by the selloff in faster-growing, higher-valuation stocks.
The Fund trailed the MSCI All Country World Mid Cap Index (net) for the 12 months ended September 30, 2022. The Fund’s relative shortfall was driven primarily by stock selection, with selection in the information technology, communication services, and financials sectors detracting the most. Sector allocations, which are a by-product of our bottom-up stock selection process, also detracted, driven by a lack of exposure to the strongly performing energy and utilities sectors, as well as an overweight to the underperforming health care sector.
From a regional perspective, the Fund benefited from an underweight to non-U.S. developed markets and an overweight to the U.S., while stock selection detracted most significantly in the U.S.
The largest contributors to Fund performance for the 12-month period were Atlassian, ResMed, and Haleon, while Raia Drogasil and Shandong Weigao detracted the least. The five largest detractors from Fund performance over the period were Okta, Match Group, RingCentral, Spotify, and Kakao.
The preceding information is the opinion of portfolio management only through the end of the period stated on the cover. Any such opinions are subject to change at any time based upon market or other conditions and should not be relied upon as investment advice. Past performance is no guarantee
of future results, and there is no guarantee that market forecasts will be realized.
Equity Securities: The market price of equity securities may be adversely affected by financial market, industry, or issuer-specific events. Focus on a particular style or on small or medium-sized companies may enhance that risk.
Foreign & Emerging Markets: Investing in foreign securities, especially in emerging markets, subjects the Fund to additional risks such as increased volatility, currency fluctuations, less liquidity, and political, regulatory, economic, and market risk.
Geographic Concentration: A fund that focuses its investments in a particular geographic location will be sensitive to financial, economic, political, and other events negatively affecting of that location.
Market Volatility: The value of the securities in the Fund may go up or down in response to the prospects of individual companies and/or general economic conditions. Price changes may be short- or long-term. Local, regional or global events such as war (e.g., Russia’s invasion of Ukraine), acts of terrorism, the spread of infectious illness (e.g., COVID-19 pandemic) or other public health issues, recessions, or other events could have a significant impact on the Fund and its investments, including hampering the ability of the Fund’s manager(s) to invest the Fund’s assets as intended.
Prospectus: For additional information on risks, please see the Fund’s prospectus.
Asset Allocation
The following table presents asset allocation within certain sectors as a percentage of total investments as of September 30, 2022.
| Health Care | 23% |
| Information Technology | 20 |
| Consumer Staples | 15 |
| Financials | 11 |
| Communication Services | 10 |
| Consumer Discretionary | 8 |
| Materials | 6 |
| Other (includes short-term investment) | 7 |
| Total | 100% |
For information regarding the indexes and certain investment terms, see the Key Investment Terms starting on page 6.
SGA New Leaders Growth Fund (Continued)
Average Annual Total Returns1 for periods ended 9/30/22
| | | 1 Year | Since
inception | Inception
date |
| Class A shares at NAV2 | | -40.56 % | -21.71 % | 11/17/20 |
| Class A shares at POP3,4 | | -43.83 | -24.04 | 11/17/20 |
| Class C shares at NAV2 and with CDSC4 | | -41.02 | -22.31 | 11/17/20 |
| Class I shares at NAV2 | | -40.39 | -21.51 | 11/17/20 |
| Class R6 shares at NAV2 | | -40.32 | -21.38 | 11/17/20 |
| MSCI All Country World Mid Cap Index (net) | | -24.12 | -5.23 5 | — |
| Fund Expense Ratios6: Class A shares: Gross 3.60%, Net 1.34%; Class C shares: Gross 4.35%, Net 2.09%; Class I shares: Gross 3.32%, Net 1.09%; Class R6 shares: Gross 3.25%, Net 0.91%. |
| All returns represent past performance which is no guarantee of future results. Current performance may be higher or lower than the performance shown. The investment return and principal value of an investment will fluctuate so that an investor’s shares, when redeemed, may be worth more or less than their original cost. The above table and graph below do not reflect the deduction of taxes that a shareholder would pay on fund distributions or the redemption of shares. Please visit Virtus.com for performance data current to the most recent month-end. |
Growth of $10,000 for periods ended 9/30
This chart assumes an initial investment of $10,000 made on November 17, 2020 (inception date of the Fund), for Class A shares and Class C shares including any applicable sales charges or fees. The performance of the other share class may be greater or less than that shown based on differences in inception dates, fees, and sales charges. Performance assumes reinvestment of dividends and capital gain distributions.
For information regarding the indexes and certain investment terms, see the Key Investment Terms starting on page 6.
SGA New Leaders Growth Fund (Continued)
Growth of $100,000 for periods ended 9/30
This chart assumes an initial investment of $100,000 made on November 17, 2020 (inception date of the Fund), for Class I shares. The performance of the other share class may be greater or less than that shown based on differences in inception dates, fees, and sales charges. Performance assumes reinvestment of dividends and capital gain distributions.
Growth of $2,500,000 for periods ended 9/30
This chart assumes an initial investment of $2,500,000 made on November 17, 2020 (inception date of the Fund), for Class R6 shares. The performance of the other share class may be greater or less than that shown based on differences in inception dates, fees, and sales charges. Performance assumes reinvestment of dividends and capital gain distributions.

| 1 | Total returns are historical and include changes in share price and the reinvestment of both dividends and capital gain distributions. |
| 2 | “NAV” (Net Asset Value) total returns do not include the effect of any sales charge. |
| 3 | “POP” (Public Offering Price) total returns include the effect of the maximum front-end 5.50% sales charge. |
| 4 | “CDSC” (contingent deferred sales charge) is applied to redemptions of certain classes of shares that do not have a sales charge applied at the time of purchase. CDSC for certain redemptions of Class A shares made within 18 months of a finder’s fee being paid and all Class C shares are 1% within the first year and 0% thereafter. |
| 5 | The since inception index return is from the Fund’s inception date. |
| 6 | The expense ratios of the Fund are set forth according to the prospectus for the Fund effective January 28, 2022, as supplemented and revised, and may differ from the expense ratios disclosed in the Financial Highlights tables in this report. See the Financial Highlights for more current expense ratios. Net Expense: Expenses reduced by a contractual expense limitation in effect through January 31, 2023. Gross Expense: Does not reflect the effect of the expense limitation. Expense ratios include fees and expenses associated with any underlying funds. |
The index is unmanaged and not available for direct investment; therefore, its performance does not reflect the expenses associated with active management of an actual portfolio.
For information regarding the indexes and certain investment terms, see the Key Investment Terms starting on page 6.
| | Ticker Symbols: |
| | Class A: NAINX |
| | Class C: POICX |
| | Class I: VTAIX |
| | Class R6: VTARX |
Tactical Allocation Fund
Fund Summary (Unaudited)
Portfolio Manager Commentary by
Kayne Anderson Rudnick
Investment Management, LLC
(Domestic and International Equity
Portfolio) and Newfleet Asset
Management, LLC
(Fixed Income Portfolio)
| ■ | The Fund is diversified and has investment objectives of capital appreciation and income. There is no guarantee that the Fund will meet its objectives. |
| ■ | For the fiscal year ended September 30, 2022, the Fund’s Class A shares at NAV returned -31.03%, Class C shares at NAV returned -31.56%, and Class I shares at NAV returned -30.90%, and Class R6 shares at NAV returned -30.73%. For the same period, the Bloomberg U.S. Aggregate Bond Index; a broad-based fixed income index, returned -14.60%, the MSCI ACWI ex USA SMID Cap Index (net); a broad-based International Index, returned -28.85%; and the Russell 1000® Growth Index; a broad-based US equity index, returned -22.59%. The Tactical Allocation Fund Linked Benchmark, the Fund’s style-specific benchmark, returned -20.08%. |
All performance figures assume reinvestment of distributions and exclude the effect of sales charges. Performance data quoted represents past results. Past performance is no guarantee of future results, and current performance may be higher or lower than the performance shown above. Investment return and principal value will fluctuate so your shares, when redeemed, may be worth more or less than their original cost. Please visit Virtus.com for performance data current to the most recent month-end.
How did the markets perform during the Fund’s fiscal year ended September 30, 2022?
After strong performance in 2021, markets became volatile in 2022, with both equities and fixed income entering bear markets. Signs of weakness and headwinds began in the fourth quarter of 2021 as market breadth narrowed. Returns for the S& P 500® Index in 2021 were heavily skewed by the performance of some large-cap stocks.
Meanwhile, the Federal Reserve (the Fed) began tapering its bond purchases in October 2021, after providing support to the fixed income markets during the pandemic. And, while the inflation that spiked
after massive pandemic spending, supply chain bottlenecks, and COVID lockdowns at first appeared transitory, inflation quickly escalated in the second quarter of 2022 and became a major risk to the economy. The Russian invasion of Ukraine also fueled inflation and once again pressured fragile supply chains.
The Fed raised interest rates five times during the fiscal year in an effort to tame record-high inflation. To make matters more challenging, robust employment became an obstacle in slowing spending, with the Fed saying it could make additional rate increases to attempt to bring down inflation. Investor pessimism and market sentiment soured to new lows for the duration of the fiscal year.
On the international front, China’s enforcement of its zero-COVID policy forced continued lockdowns, which rattled important supply chains. In addition, China’s significant regulatory crackdowns destroyed certain industries and gave investors pause to invest elsewhere in the country. Tensions with Taiwan also presented new risks due to U.S. semiconductor dependence and the role that plays in the digital transformation of the U.S.
For the fiscal year ended September 30, 2022, the S&P 500® Index declined 15.47%, while small-capitalization stocks, as represented by the Russell 2000® Index, were down 23.50%. International developed markets, as measured by the MSCI EAFE® Index (net), lost 25.13%, while the MSCI Emerging Markets Index (net) declined 28.11% for the period. Value stocks outperformed growth stocks for the fiscal year, with the Russell 1000® Value Index down 11.36% and the Russell 1000® Growth Index down 22.59%.
Fixed Income
Central banks embarked on the first meaningful tightening of monetary policy in several years in response to elevated inflation during the fiscal year. Their messaging was consistent: they are focused on fighting high inflation. The monetary backdrop clouded the outlook for global and regional economies, and led to an increased probability of recession. This resulted in negative total returns for most assets. The pandemic remained a global issue, with China’s zero-COVID policy continuing to delay the normalization of supply chains, though there were signs that the rigid policy may be eased.
Meanwhile, the war between Russia and Ukraine presented an ongoing economic shock to food and energy prices. These unresolved issues made economic forecasting and modeling a challenge and contributed to a volatile investing environment during the fiscal year.
The Federal Reserve (the Fed) and other major central banks shifted their rhetoric sharply hawkish, indicating that keeping inflation under control is their primary goal, in response to elevated inflation measures. The Fed raised its main policy interest rate 3.00% during the fiscal year, including three jumbo moves of 0.75% each, and indicated its resolve to restore price stability. The Fed began to shrink its $8.9 trillion balance sheet, and increased its pace in September. The European Central Bank (ECB) also joined the inflation fight, raising its policy rate to 1.25% over two meetings, marking the first increases from zero interest rates since 2016. In addition to managing the start of its own balance sheet wind-down, the ECB is managing the complex task of preventing financial fragmentation among its member countries. The Bank of Japan was relatively less concerned about inflation given local economic conditions, but weakness in the yen was challenging that stance.
During the 12-month period, volatility in the fixed income markets increased due to both the more hawkish Fed policy and the Russian invasion of Ukraine. U.S. Treasuries outperformed spread sectors (non-governmental fixed income investments) on an excess return basis. Excess return refers to the difference in return – positive or negative – between an individual security and a comparable risk-free asset, in this case a U.S. Treasury with the same duration (interest rate sensitivity). With the spike in U.S. Treasury yields, less interest rate-sensitive sectors such as high yield bank loans, and other shorter-duration asset classes, including asset-backed securities, generally outperformed on a total return basis.
During the 12-month period, the U.S. Treasury yield curve shifted higher on the front end, resulting in an inverted yield curve. This occurs when the yields on longer-term investments drop below the yields on shorter-term investments with the same risk profile.
For information regarding the indexes and certain investment terms, see the Key Investment Terms starting on page 6.
Tactical Allocation Fund (Continued)
What factors affected the Fund’s performance during its fiscal year?
Domestic Equities
The Fund’s U.S. equity portfolio underperformed the Russell 1000® Growth Index for the fiscal year ended September 30, 2022. Poor stock selection in information technology and consumer discretionary detracted from performance. An overweight in financials and an underweight in utilities contributed to performance.
The biggest contributors to performance during the period were Progressive, AutoZone, Fair Isaac, HealthEquity, and Monster Beverage.
The biggest detractors from performance during the period were Bill.com, NVIDIA, Amazon.com, Meta Flatforms, and Netflix.
International Equities
The Fund’s international equity portfolio underperformed the MSCI ACWI Ex USA SMID Cap Index (net) for the fiscal year ended September 30, 2022. Poor stock selection in industrials and financials detracted from performance. Positive stock selection and an overweight in health care as well as positive stock selection in consumer staples contributed to performance.
From a country perspective, poor stock selection and an overweight in the U.K. as well as poor stock selection in Russia detracted from performance. Positive stock selection in China and Malaysia contributed to performance.
The biggest contributors to performance during the period were Pason Systems, FinecoBank, Anhui Gujing Distillery, BTS Group, and Wolters Kluwer.
The biggest detractors from performance during the period were HeadHunter Group, Mercari, Rightmove, Mortgage Advice Bureau, and Knorr-Bremse.
Fixed Income
The fixed income portfolio’s allocations to high yield bank loans, non-agency mortgage-backed securities over agency mortgage-backed securities, and asset-backed securities had a positive impact on performance for the 12-month period ended September 30, 2022.
The portfolio’s underweight to U.S. Treasury securities had a negative impact during the period.
The portfolio’s timing of the municipal bond crossover trade was a detractor during the period. A crossover trade refers to a scenario in which comparable U.S. Treasuries and tax-exempt municipal bonds show a disparity in valuations. Investors can seek to capture value by selling out of relatively overvalued U.S. Treasuries or taxable municipal bonds and buying tax-exempt bonds of comparable maturity. When market conditions change, the investor can reverse this trade.
The preceding information is the opinion of portfolio management only through the end of the period stated on the cover. Any such opinions are subject to change at any time based upon market or other conditions and should not be relied upon as investment advice. Past performance is no guarantee of future results, and there is no guarantee that market forecasts will be realized.
Equity Securities: The market price of equity securities may be adversely affected by financial market, industry, or issuer-specific events. Focus on a particular style or on small or medium-sized companies may enhance that risk.
Credit & Interest: Debt instruments are subject to various risks, including credit and interest rate risk. The issuer of a debt security may fail to make interest and/or principal payments. Values of debt instruments may rise or fall in response to changes in interest rates, and this risk may be enhanced with longer-term maturities.
Foreign & Emerging Markets: Investing in foreign securities, especially in emerging markets, subjects the Fund to additional risks such as increased volatility, currency fluctuations, less liquidity, and political, regulatory, economic, and market risk.
Allocation: The Fund’s exposure to different asset classes may not be optimal for market conditions at a given time. Asset allocation does not guarantee a profit or protect against a loss in declining markets.
High Yield Fixed Income Securities: There is a greater risk of issuer default, less liquidity, and increased price volatility related to high yield securities than investment grade securities.
Market Volatility: The value of the securities in the Fund may go up or down in response to the prospects of individual companies and/or general economic conditions. Price changes may be short- or long-term. Local, regional or global events such as war (e.g., Russia’s invasion of Ukraine), acts of terrorism, the spread of infectious illness (e.g., COVID-19 pandemic) or other public health issues, recessions, or other events could have a significant impact on the Fund and its investments, including hampering the ability of the Fund’s manager(s) to invest the Fund’s assets as intended.
Prospectus: For additional information on risks, please see the Fund’s prospectus.
Asset Allocation
The following table presents asset allocation within certain sectors as a percentage of total investments as of September 30, 2022.
| Common Stocks | | 61% |
| Information Technology | 18% | |
| Consumer Discretionary | 12 | |
| Industrials | 7 | |
| All Other Common Stocks | 24 | |
| Corporate Bonds and Notes | | 12 |
| Financials | 4 | |
| Energy | 2 | |
| Industrials | 1 | |
| All Other Corporate Bonds and Notes | 5 | |
| Mortgage-Backed Securities | | 10 |
| U.S. Government Securities | | 6 |
| Asset-Backed Securities | | 4 |
| Leveraged Loans | | 2 |
| Municipal Bonds | | 2 |
| Other (includes short-term investment and securities lending collateral) | | 3 |
| Total | | 100% |
For information regarding the indexes and certain investment terms, see the Key Investment Terms starting on page 6.
Tactical Allocation Fund (Continued)
Average Annual Total Returns1 for periods ended 9/30/22
| | | 1 Year | 5 Years | 10 Years | Since
inception | Inception
date |
| Class A shares at NAV2 | | -31.03 % | 3.24 % | 4.98 % | — % | — |
| Class A shares at POP3,4 | | -34.82 | 2.08 | 4.39 | — | — |
| Class C shares at NAV2 and with CDSC4 | | -31.56 | 2.45 | 4.18 | — | — |
| Class I shares at NAV2 | | -30.90 | — | — | 4.19 | 1/29/19 |
| Class R6 shares at NAV2 | | -30.73 | — | — | -11.74 | 10/20/20 |
| Bloomberg U.S. Aggregate Bond Index | | -14.60 | -0.27 | 0.89 | — 5 | — |
| MSCI ACWI ex USA SMID Cap Index (net) | | -28.85 | -1.25 | 3.74 | — 6 | — |
| Russell 1000® Growth Index | | -22.59 | 12.17 | 13.70 | — 7 | — |
| Tactical Allocation Fund Linked Benchmark | | -20.08 | 5.57 | 7.15 | — 8 | — |
| Fund Expense Ratios9: Class A shares: Gross 1.05%, Net 0.99%; Class C shares: Gross 1.86%, Net 1.75%; Class I shares: Gross 0.84%, Net 0.76%; Class R6 shares: Gross 0.84%, Net 0.60%. |
| All returns represent past performance which is no guarantee of future results. Current performance may be higher or lower than the performance shown. The investment return and principal value of an investment will fluctuate so that an investor’s shares, when redeemed, may be worth more or less than their original cost. The above table and graph below do not reflect the deduction of taxes that a shareholder would pay on fund distributions or the redemption of shares. Please visit Virtus.com for performance data current to the most recent month-end. |
Growth of $10,000 for periods ended 9/30
This chart assumes an initial investment of $10,000 made on September 30, 2012, for Class A shares and Class C shares including any applicable sales charges or fees. The performance of the other share class may be greater or less than that shown based on differences in inception dates, fees, and sales charges. Performance assumes reinvestment of dividends and capital gain distributions.

| 1 | Total returns are historical and include changes in share price and the reinvestment of both dividends and capital gain distributions. |
| 2 | “NAV” (Net Asset Value) total returns do not include the effect of any sales charge. |
| 3 | “POP” (Public Offering Price) total returns include the effect of the maximum front-end 5.50% sales charge. |
| 4 | “CDSC” (contingent deferred sales charge) is applied to redemptions of certain classes of shares that do not have a sales charge applied at the time of purchase. CDSC for certain redemptions of Class A shares made within 18 months of a finder’s fee being paid and all Class C shares are 1% within the first year and 0% thereafter. |
| 5 | The since inception index returned -0.62% from the inception date of Class I shares and -8.09% from the inception date of Class R6 shares. |
| 6 | The since inception index returned -0.01% from the inception date of Class I shares and -5.66% from the inception date of Class R6 shares. |
| 7 | The since inception index returned 13.37% from the inception date of Class I shares and -1.98% from the inception date of Class R6 shares. |
| 8 | The since inception index returned 6.18% from the inception date of Class I shares and -4.62% from the inception date of Class R6 shares. |
| 9 | The expense ratios of the Fund are set forth according to the prospectus for the Fund effective January 28, 2022, as supplemented and revised, and may differ from the expense ratios disclosed in the Financial Highlights tables in this report. See the Financial Highlights for more current expense ratios. Net Expense: Expenses reduced by a contractual expense limitation in effect through January 31, 2023. Gross Expense: Does not reflect the effect of the expense limitation. Expense ratios include fees and expenses associated with any underlying funds. |
For information regarding the indexes and certain investment terms, see the Key Investment Terms starting on page 6.
Tactical Allocation Fund (Continued)
The indexes are unmanaged and not available for direct investment; therefore, their performance does not reflect the expenses associated with active management of an actual portfolio.
For information regarding the indexes and certain investment terms, see the Key Investment Terms starting on page 6.
KAR Capital Growth Fund
SCHEDULE OF INVESTMENTS
September 30, 2022
($ reported in thousands)
| | Shares | | Value |
| Common Stocks—98.5% |
| Communication Services—5.4% | | |
| Meta Platforms, Inc. Class A(1) | 39,016 | | $ 5,294 |
| Trade Desk, Inc. (The) Class A(1) | 239,695 | | 14,322 |
| ZoomInfo Technologies, Inc. Class A(1) | 137,216 | | 5,716 |
| | | | 25,332 |
| | | | |
| |
| Consumer Discretionary—22.5% | | |
| Airbnb, Inc. Class A(1) | 88,337 | | 9,279 |
| Amazon.com, Inc.(1) | 386,763 | | 43,704 |
| AutoZone, Inc.(1) | 2,733 | | 5,854 |
| Home Depot, Inc. (The) | 33,130 | | 9,142 |
| Marriott International, Inc. Class A | 83,771 | | 11,740 |
| MercadoLibre, Inc.(1) | 7,823 | | 6,476 |
| NIKE, Inc. Class B | 142,969 | | 11,883 |
| Ross Stores, Inc. | 92,670 | | 7,809 |
| | | | 105,887 |
| | | | |
| |
| Consumer Staples—7.0% | | |
| Estee Lauder Cos., Inc. (The) Class A | 42,776 | | 9,236 |
| McCormick & Co., Inc. Non-voting Shares | 106,325 | | 7,578 |
| Monster Beverage Corp.(1) | 113,113 | | 9,836 |
| Procter & Gamble Co. (The) | 51,455 | | 6,496 |
| | | | 33,146 |
| | | | |
| |
| Energy—3.2% | | |
| Devon Energy Corp. | 68,697 | | 4,131 |
| Hess Corp. | 42,722 | | 4,656 |
| Pioneer Natural Resources Co. | 28,493 | | 6,170 |
| | | | 14,957 |
| | | | |
| |
| | Shares | | Value |
| | | | |
| Financials—7.2% | | |
| Bank of America Corp. | 376,396 | | $ 11,367 |
| CME Group, Inc. Class A | 46,329 | | 8,207 |
| MarketAxess Holdings, Inc. | 25,157 | | 5,597 |
| Progressive Corp. (The) | 76,292 | | 8,866 |
| | | | 34,037 |
| | | | |
| |
| Health Care—9.0% | | |
| Danaher Corp. | 62,277 | | 16,086 |
| HealthEquity, Inc.(1) | 71,184 | | 4,781 |
| Mettler-Toledo International, Inc.(1) | 4,233 | | 4,589 |
| Zoetis, Inc. Class A | 112,369 | | 16,663 |
| | | | 42,119 |
| | | | |
| |
| Industrials—7.6% | | |
| CoStar Group, Inc.(1) | 177,607 | | 12,370 |
| Equifax, Inc. | 45,805 | | 7,852 |
| Fair Isaac Corp.(1) | 18,667 | | 7,691 |
| Uber Technologies, Inc.(1) | 302,934 | | 8,028 |
| | | | 35,941 |
| | | | |
| |
| Information Technology—34.0% | | |
| Accenture plc Class A | 41,688 | | 10,726 |
| Amphenol Corp. Class A | 261,240 | | 17,493 |
| Bill.com Holdings, Inc.(1) | 108,708 | | 14,390 |
| Block, Inc. Class A(1) | 83,355 | | 4,584 |
| DocuSign, Inc.(1) | 56,773 | | 3,036 |
| Duck Creek Technologies, Inc.(1) | 361,613 | | 4,285 |
| MongoDB, Inc. Class A(1) | 25,228 | | 5,009 |
| NVIDIA Corp. | 145,211 | | 17,627 |
| Paycom Software, Inc.(1) | 72,308 | | 23,861 |
| Roper Technologies, Inc. | 29,002 | | 10,430 |
| Snowflake, Inc. Class A(1) | 63,560 | | 10,803 |
| Visa, Inc. Class A | 150,309 | | 26,702 |
| Workday, Inc. Class A(1) | 74,440 | | 11,331 |
| | | | 160,277 |
| | | | |
| |
| | Shares | | Value |
| | | | |
| Materials—1.3% | | |
| Ecolab, Inc. | 42,619 | | $ 6,155 |
| Real Estate—1.3% | | |
| Prologis, Inc. | 58,573 | | 5,951 |
Total Common Stocks
(Identified Cost $266,045) | | 463,802 |
Total Long-Term Investments—98.5%
(Identified Cost $266,045) | | 463,802 |
| | | | |
| Short-Term Investment—1.6% |
| Money Market Mutual Fund—1.6% |
| Dreyfus Government Cash Management Fund - Institutional Shares (seven-day effective yield 2.748%)(2) | 7,440,133 | | 7,440 |
Total Short-Term Investment
(Identified Cost $7,440) | | 7,440 |
TOTAL INVESTMENTS—100.1%
(Identified Cost $273,485) | | $471,242 |
| Other assets and liabilities, net—(0.1)% | | ���(421) |
| NET ASSETS—100.0% | | $470,821 |
| Footnote Legend: |
| (1) | Non-income producing. |
| (2) | Shares of this fund are publicly offered, and its prospectus and annual report are publicly available. |
The following table summarizes the value of the Fund’s investments as of September 30, 2022, based on the inputs used to value them (See Security Valuation Note 2A in the Notes to Financial Statements):
| | Total
Value at
September 30, 2022 | | Level 1
Quoted Prices |
| Assets: | | | |
| Equity Securities: | | | |
| Common Stocks | $463,802 | | $463,802 |
| Money Market Mutual Fund | 7,440 | | 7,440 |
| Total Investments | $471,242 | | $471,242 |
There were no securities valued using significant observable inputs (Level 2) or significant unobservable inputs (Level 3) at September 30, 2022.
There were no transfers into or out of Level 3 related to securities held at September 30, 2022.
See Notes to Financial Statements
KAR Equity Income Fund
SCHEDULE OF INVESTMENTS
September 30, 2022
($ reported in thousands)
| | Shares | | Value |
| Common Stocks—93.3% |
| Communication Services—8.5% | | |
| Omnicom Group, Inc. | 103,617 | | $ 6,537 |
| Verizon Communications, Inc. | 130,677 | | 4,962 |
| | | | 11,499 |
| | | | |
| |
| Consumer Discretionary—3.2% | | |
| Leggett & Platt, Inc. | 107,962 | | 3,587 |
| McDonald’s Corp. | 2,914 | | 672 |
| | | | 4,259 |
| | | | |
| |
| Consumer Staples—12.6% | | |
| Coca-Cola Co. (The) | 69,336 | | 3,884 |
| Flowers Foods, Inc. | 81,912 | | 2,022 |
| Kellogg Co. | 29,540 | | 2,058 |
| Kimberly-Clark Corp. | 33,188 | | 3,735 |
| PepsiCo, Inc. | 24,626 | | 4,021 |
| Procter & Gamble Co. (The) | 10,664 | | 1,346 |
| | | | 17,066 |
| | | | |
| |
| Energy—1.0% | | |
| Chevron Corp. | 9,292 | | 1,335 |
| Financials—17.9% | | |
| Bank of Hawaii Corp. | 69,080 | | 5,258 |
| PNC Financial Services Group, Inc. (The) | 27,082 | | 4,047 |
| Safety Insurance Group, Inc. | 43,392 | | 3,539 |
| T. Rowe Price Group, Inc. | 28,783 | | 3,023 |
| U.S. Bancorp | 63,421 | | 2,557 |
| Zurich Insurance Group AG ADR | 144,101 | | 5,732 |
| | | | 24,156 |
| | | | |
| |
| Health Care—12.8% | | |
| AbbVie, Inc. | 38,572 | | 5,177 |
| Johnson & Johnson | 8,526 | | 1,393 |
| Merck & Co., Inc. | 41,115 | | 3,541 |
| Patterson Cos., Inc. | 121,216 | | 2,911 |
| Pfizer, Inc. | 98,061 | | 4,291 |
| | | | 17,313 |
| | | | |
| |
| | Shares | | Value |
| | | | |
| Industrials—10.5% | | |
| BAE Systems plc Sponsored ADR | 132,116 | | $ 4,633 |
| MSC Industrial Direct Co., Inc. Class A | 70,954 | | 5,166 |
| Snap-on, Inc. | 6,533 | | 1,316 |
| Watsco, Inc. | 12,100 | | 3,115 |
| | | | 14,230 |
| | | | |
| |
| Information Technology—6.4% | | |
| Cisco Systems, Inc. | 79,994 | | 3,200 |
| International Business Machines Corp. | 45,195 | | 5,369 |
| | | | 8,569 |
| | | | |
| |
| Materials—7.7% | | |
| Amcor plc | 486,994 | | 5,226 |
| Eastman Chemical Co. | 39,333 | | 2,795 |
| Sonoco Products Co. | 42,948 | | 2,436 |
| | | | 10,457 |
| | | | |
| |
| Real Estate—2.0% | | |
| Crown Castle, Inc. | 18,426 | | 2,663 |
| Utilities—10.7% | | |
| Fortis, Inc. | 81,769 | | 3,107 |
| NextEra Energy, Inc. | 26,976 | | 2,115 |
| Pinnacle West Capital Corp. | 40,168 | | 2,591 |
| Southern Co. (The) | 69,384 | | 4,718 |
| WEC Energy Group, Inc. | 21,830 | | 1,952 |
| | | | 14,483 |
Total Common Stocks
(Identified Cost $126,627) | | 126,030 |
Total Long-Term Investments—93.3%
(Identified Cost $126,627) | | 126,030 |
| | | | |
| |
| | | | |
| |
| | Shares | | Value |
| | | | |
| | | | |
| Short-Term Investment—4.6% |
| Money Market Mutual Fund—4.6% |
| Dreyfus Government Cash Management Fund - Institutional Shares (seven-day effective yield 2.748%)(1) | 6,277,200 | | $ 6,277 |
Total Short-Term Investment
(Identified Cost $6,277) | | 6,277 |
TOTAL INVESTMENTS—97.9%
(Identified Cost $132,904) | | $132,307 |
| Other assets and liabilities, net—2.1% | | 2,805 |
| NET ASSETS—100.0% | | $135,112 |
| Abbreviation: |
| ADR | American Depositary Receipt |
| Footnote Legend: |
| (1) | Shares of this fund are publicly offered, and its prospectus and annual report are publicly available. |
| Country Weightings (Unaudited)† |
| United States | 86% |
| Switzerland | 8 |
| United Kingdom | 4 |
| Canada | 2 |
| Total | 100% |
| † % of total investments as of September 30, 2022. |
The following table summarizes the value of the Fund’s investments as of September 30, 2022, based on the inputs used to value them (See Security Valuation Note 2A in the Notes to Financial Statements):
| | Total
Value at
September 30, 2022 | | Level 1
Quoted Prices |
| Assets: | | | |
| Equity Securities: | | | |
| Common Stocks | $126,030 | | $126,030 |
| Money Market Mutual Fund | 6,277 | | 6,277 |
| Total Investments | $132,307 | | $132,307 |
There were no securities valued using significant observable inputs (Level 2) or significant unobservable inputs (Level 3) at September 30, 2022.
There were no transfers into or out of Level 3 related to securities held at September 30, 2022.
For information regarding the abbreviations, see the Key Investment Terms starting on page 6.
See Notes to Financial Statements
KAR Global Quality Dividend Fund
SCHEDULE OF INVESTMENTS
September 30, 2022
($ reported in thousands)
| | Shares | | Value |
| Common Stocks—98.6% |
| Communication Services—16.7% | | |
| BCE, Inc. | 38,549 | | $ 1,617 |
| Omnicom Group, Inc. | 20,454 | | 1,291 |
| Spark New Zealand Ltd. | 493,273 | | 1,380 |
| Telenor ASA(1) | 59,031 | | 540 |
| Verizon Communications, Inc. | 27,871 | | 1,058 |
| | | | 5,886 |
| | | | |
| |
| Consumer Discretionary—2.6% | | |
| Leggett & Platt, Inc. | 27,815 | | 924 |
| Consumer Staples—9.9% | | |
| Coca-Cola Co. (The) | 13,308 | | 746 |
| Coca-Cola Europacific Partners plc | 16,326 | | 696 |
| Flowers Foods, Inc. | 14,910 | | 368 |
| Orkla ASA | 70,035 | | 509 |
| PepsiCo, Inc. | 3,560 | | 581 |
| Unilever plc | 13,666 | | 600 |
| | | | 3,500 |
| | | | |
| |
| Energy—2.2% | | |
| TotalEnergies SE(1) | 16,285 | | 764 |
| Financials—22.7% | | |
| Bank of Hawaii Corp. | 9,571 | | 729 |
| IGM Financial, Inc.(1) | 38,659 | | 963 |
| PNC Financial Services Group, Inc. (The) | 2,197 | | 328 |
| Royal Bank of Canada | 13,978 | | 1,259 |
| Safety Insurance Group, Inc. | 9,677 | | 789 |
| Singapore Exchange Ltd. | 85,182 | | 559 |
| Tokio Marine Holdings, Inc. | 60,360 | | 1,073 |
| U.S. Bancorp | 18,226 | | 735 |
| Zurich Insurance Group AG | 2,065 | | 823 |
| Zurich Insurance Group AG ADR | 18,183 | | 723 |
| | | | 7,981 |
| | | | |
| |
| Health Care—8.8% | | |
| AbbVie, Inc. | 10,166 | | 1,364 |
| Merck & Co., Inc. | 7,050 | | 607 |
| Patterson Cos., Inc. | 13,596 | | 327 |
| Pfizer, Inc. | 11,979 | | 524 |
| Sonic Healthcare Ltd. | 13,979 | | 273 |
| | | | 3,095 |
| | | | |
| |
| Industrials—10.2% | | |
| Adecco Group AG Registered Shares | 22,338 | | 616 |
| | Shares | | Value |
| | | | |
| Industrials—continued | | |
| BAE Systems plc | 150,082 | | $ 1,319 |
| Deutsche Post AG Registered Shares | 19,312 | | 582 |
| MSC Industrial Direct Co., Inc. Class A | 14,963 | | 1,089 |
| | | | 3,606 |
| | | | |
| |
| Information Technology—4.6% | | |
| Cisco Systems, Inc. | 3,769 | | 150 |
| International Business Machines Corp. | 12,228 | | 1,453 |
| | | | 1,603 |
| | | | |
| |
| Materials—6.6% | | |
| Amcor plc | 139,181 | | 1,493 |
| Eastman Chemical Co. | 7,683 | | 546 |
| Kemira OYJ | 23,959 | | 266 |
| | | | 2,305 |
| | | | |
| |
| Real Estate—1.2% | | |
| Crown Castle, Inc. | 2,842 | | 411 |
| Utilities—13.1% | | |
| Fortis, Inc. | 30,816 | | 1,171 |
| Pinnacle West Capital Corp. | 11,267 | | 727 |
| Southern Co. (The) | 22,550 | | 1,533 |
| Terna - Rete Elettrica Nazionale | 132,647 | | 808 |
| WEC Energy Group, Inc. | 4,084 | | 365 |
| | | | 4,604 |
Total Common Stocks
(Identified Cost $36,354) | | 34,679 |
Total Long-Term Investments—98.6%
(Identified Cost $36,354) | | 34,679 |
| |
| Short-Term Investment—2.0% |
| Money Market Mutual Fund—2.0% |
| Dreyfus Government Cash Management Fund - Institutional Shares (seven-day effective yield 2.748%)(2) | 702,669 | | 703 |
Total Short-Term Investment
(Identified Cost $703) | | 703 |
| | | | |
| |
| | | | |
| |
| | Shares | | Value |
| | | | |
| | | | |
| Securities Lending Collateral—4.6% |
| Dreyfus Government Cash Management Fund - Institutional Shares (seven-day effective yield 2.748%)(2)(3) | 1,608,703 | | $ ��1,609 |
Total Securities Lending Collateral
(Identified Cost $1,609) | | 1,609 |
TOTAL INVESTMENTS—105.2%
(Identified Cost $38,666) | | $36,991 |
| Other assets and liabilities, net—(5.2)% | | (1,815) |
| NET ASSETS—100.0% | | $35,176 |
| Abbreviation: |
| ADR | American Depositary Receipt |
| Footnote Legend: |
| (1) | All or a portion of security is on loan. |
| (2) | Shares of this fund are publicly offered, and its prospectus and annual report are publicly available. |
| (3) | Represents security purchased with cash collateral received for securities on loan. |
| Country Weightings (Unaudited)† |
| United States | 51% |
| Canada | 13 |
| Switzerland | 10 |
| United Kingdom | 7 |
| New Zealand | 4 |
| Japan | 3 |
| Norway | 3 |
| Other | 9 |
| Total | 100% |
| † % of total investments as of September 30, 2022. |
For information regarding the abbreviations, see the Key Investment Terms starting on page 6.
See Notes to Financial Statements
KAR Global Quality Dividend Fund
SCHEDULE OF INVESTMENTS (Continued)
September 30, 2022
($ reported in thousands)
The following table summarizes the value of the Fund’s investments as of September 30, 2022, based on the inputs used to value them (See Security Valuation Note 2A in the Notes to Financial Statements):
| | Total
Value at
September 30, 2022 | | Level 1
Quoted Prices | | Level 2
Significant
Observable
Inputs |
| Assets: | | | | | |
| Equity Securities: | | | | | |
| Common Stocks | $34,679 | | $24,567 | | $10,112 |
| Money Market Mutual Fund | 703 | | 703 | | — |
| Securities Lending Collateral | 1,609 | | 1,609 | | — |
| Total Investments | $36,991 | | $26,879 | | $10,112 |
There were no securities valued using significant unobservable inputs (Level 3) at September 30, 2022.
There were no transfers into or out of Level 3 related to securities held at September 30, 2022.
See Notes to Financial Statements
KAR Mid-Cap Core Fund
SCHEDULE OF INVESTMENTS
September 30, 2022
($ reported in thousands)
| | Shares | | Value |
| Common Stocks—94.8% |
| Consumer Discretionary—7.9% | | |
| Domino’s Pizza, Inc. | 113,321 | | $ 35,152 |
| Ross Stores, Inc. | 481,805 | | 40,602 |
| SiteOne Landscape Supply, Inc.(1) | 199,613 | | 20,788 |
| | | | 96,542 |
| | | | |
| |
| Consumer Staples—4.9% | | |
| Lamb Weston Holdings, Inc. | 771,103 | | 59,668 |
| Financials—17.5% | | |
| Berkley (W.R.) Corp. | 816,719 | | 52,744 |
| Broadridge Financial Solutions, Inc. | 318,933 | | 46,028 |
| First Financial Bankshares, Inc. | 698,114 | | 29,202 |
| Houlihan Lokey, Inc. Class A | 522,416 | | 39,380 |
| LPL Financial Holdings, Inc. | 208,153 | | 45,477 |
| | | | 212,831 |
| | | | |
| |
| Health Care—14.9% | | |
| Azenta, Inc. | 1,049,876 | | 44,998 |
| Cooper Cos., Inc. (The) | 154,424 | | 40,752 |
| Globus Medical, Inc. Class A(1) | 926,806 | | 55,210 |
| West Pharmaceutical Services, Inc. | 163,819 | | 40,313 |
| | | | 181,273 |
| | | | |
| |
| Industrials—32.3% | | |
| Allegion plc | 341,690 | | 30,643 |
| AMETEK, Inc. | 589,173 | | 66,818 |
| | Shares | | Value |
| | | | |
| Industrials—continued | | |
| Equifax, Inc. | 182,342 | | $ 31,259 |
| Exponent, Inc. | 557,525 | | 48,878 |
| HEICO Corp. Class A | 393,412 | | 45,093 |
| Lennox International, Inc. | 84,072 | | 18,720 |
| Nordson Corp. | 226,586 | | 48,097 |
| Old Dominion Freight Line, Inc. | 144,625 | | 35,978 |
| Pentair plc | 614,222 | | 24,956 |
| Verisk Analytics, Inc. Class A | 253,096 | | 43,161 |
| | | | 393,603 |
| | | | |
| |
| Information Technology—15.7% | | |
| Aspen Technology, Inc.(1) | 274,486 | | 65,383 |
| Bentley Systems, Inc. Class B | 1,149,573 | | 35,165 |
| Dolby Laboratories, Inc. Class A | 736,439 | | 47,979 |
| Zebra Technologies Corp. Class A(1) | 165,598 | | 43,388 |
| | | | 191,915 |
| | | | |
| |
| Real Estate—1.6% | | |
| Equity LifeStyle Properties, Inc. | 313,070 | | 19,673 |
Total Common Stocks
(Identified Cost $1,033,821) | | 1,155,505 |
Total Long-Term Investments—94.8%
(Identified Cost $1,033,821) | | 1,155,505 |
| | | | |
| |
| | | | |
| |
| | Shares | | Value |
| | | | |
| | | | |
| Short-Term Investment—4.7% |
| Money Market Mutual Fund—4.7% |
| Dreyfus Government Cash Management Fund - Institutional Shares (seven-day effective yield 2.748%)(2) | 57,104,914 | | $ 57,105 |
Total Short-Term Investment
(Identified Cost $57,105) | | 57,105 |
TOTAL INVESTMENTS—99.5%
(Identified Cost $1,090,926) | | $1,212,610 |
| Other assets and liabilities, net—0.5% | | 6,412 |
| NET ASSETS—100.0% | | $1,219,022 |
| Footnote Legend: |
| (1) | Non-income producing. |
| (2) | Shares of this fund are publicly offered, and its prospectus and annual report are publicly available. |
The following table summarizes the value of the Fund’s investments as of September 30, 2022, based on the inputs used to value them (See Security Valuation Note 2A in the Notes to Financial Statements):
| | Total
Value at
September 30, 2022 | | Level 1
Quoted Prices |
| Assets: | | | |
| Equity Securities: | | | |
| Common Stocks | $1,155,505 | | $1,155,505 |
| Money Market Mutual Fund | 57,105 | | 57,105 |
| Total Investments | $1,212,610 | | $1,212,610 |
There were no securities valued using significant observable inputs (Level 2) or significant unobservable inputs (Level 3) at September 30, 2022.
There were no transfers into or out of Level 3 related to securities held at September 30, 2022.
See Notes to Financial Statements
KAR Mid-Cap Growth Fund
SCHEDULE OF INVESTMENTS
September 30, 2022
($ reported in thousands)
| | Shares | | Value |
| Preferred Stock—1.7% |
| Information Technology—1.7% | | |
| Security Scorecard, Inc. Series E, 0.000%(1)(2)(3) | 7,919,250 | | $ 27,955 |
Total Preferred Stock
(Identified Cost $40,000) | | 27,955 |
| |
| Common Stocks—97.1% |
| Communication Services—5.1% | | |
| ROBLOX Corp. Class A(2) | 502,402 | | 18,006 |
| Trade Desk, Inc. (The) Class A(2) | 541,285 | | 32,342 |
| ZoomInfo Technologies, Inc. Class A(2) | 736,208 | | 30,670 |
| | | | 81,018 |
| | | | |
| |
| Consumer Discretionary—17.9% | | |
| Domino’s Pizza, Inc. | 93,758 | | 29,084 |
| Global-e Online Ltd.(2) | 1,186,440 | | 31,749 |
| MercadoLibre, Inc.(2) | 47,734 | | 39,513 |
| Pool Corp. | 137,635 | | 43,797 |
| Rollins, Inc. | 972,204 | | 33,716 |
| Ross Stores, Inc. | 384,094 | | 32,368 |
| SiteOne Landscape Supply, Inc.(2) | 561,408 | | 58,465 |
| Sweetgreen, Inc. Class A (2) | 816,761 | | 15,110 |
| | | | 283,802 |
| | | | |
| |
| Consumer Staples—12.6% | | |
| Brown-Forman Corp. Class B | 680,765 | | 45,319 |
| Celsius Holdings, Inc.(2) | 797,561 | | 72,323 |
| Freshpet, Inc.(2) | 262,780 | | 13,163 |
| McCormick & Co., Inc. Non-voting Shares | 291,627 | | 20,784 |
| Monster Beverage Corp.(2) | 274,971 | | 23,911 |
| National Beverage Corp. | 609,711 | | 23,498 |
| | | | 198,998 |
| | | | |
| |
| Energy—3.2% | | |
| Devon Energy Corp. | 315,816 | | 18,990 |
| | Shares | | Value |
| | | | |
| Energy—continued | | |
| Diamondback Energy, Inc. | 267,038 | | $ 32,167 |
| | | | 51,157 |
| | | | |
| |
| Financials—6.2% | | |
| Goosehead Insurance, Inc. Class A(2) | 564,372 | | 20,114 |
| MarketAxess Holdings, Inc. | 78,542 | | 17,475 |
| Signature Bank | 248,483 | | 37,521 |
| T. Rowe Price Group, Inc. | 221,530 | | 23,263 |
| | | | 98,373 |
| | | | |
| |
| Health Care—15.6% | | |
| Definitive Healthcare Corp. Class A(2) | 882,454 | | 13,713 |
| HealthEquity, Inc.(2) | 796,867 | | 53,525 |
| IDEXX Laboratories, Inc.(2) | 77,158 | | 25,138 |
| Mettler-Toledo International, Inc.(2) | 39,892 | | 43,248 |
| Silk Road Medical, Inc.(2) | 685,657 | | 30,854 |
| STAAR Surgical Co.(2) | 487,351 | | 34,383 |
| Waters Corp.(2) | 47,522 | | 12,809 |
| Zoetis, Inc. Class A | 224,837 | | 33,341 |
| | | | 247,011 |
| | | | |
| |
| Industrials—9.6% | | |
| Acuity Brands, Inc. | 103,555 | | 16,307 |
| CoStar Group, Inc.(2) | 534,176 | | 37,205 |
| Equifax, Inc. | 242,059 | | 41,496 |
| Fair Isaac Corp.(2) | 136,190 | | 56,112 |
| | | | 151,120 |
| | | | |
| |
| Information Technology—26.9% | | |
| Amphenol Corp. Class A | 692,945 | | 46,400 |
| Bill.com Holdings, Inc.(2) | 325,237 | | 43,052 |
| Datadog, Inc. Class A(2) | 228,326 | | 20,271 |
| DocuSign, Inc.(2) | 401,968 | | 21,493 |
| DoubleVerify Holdings, Inc.(2) | 733,577 | | 20,063 |
| FleetCor Technologies, Inc.(2) | 174,806 | | 30,795 |
| Gartner, Inc.(2) | 291,806 | | 80,740 |
| | Shares | | Value |
| | | | |
| Information Technology—continued | | |
| MongoDB, Inc. Class A(2) | 86,085 | | $ 17,093 |
| nCino, Inc.(2) | 750,102 | | 25,586 |
| Paycom Software, Inc.(2) | 193,257 | | 63,773 |
| Roper Technologies, Inc. | 71,943 | | 25,874 |
| Teradyne, Inc. | 414,081 | | 31,118 |
| | | | 426,258 |
Total Common Stocks
(Identified Cost $1,388,468) | | 1,537,737 |
| | | | |
Total Long-Term Investments—98.8%
(Identified Cost $1,428,468) | | 1,565,692 |
| Short-Term Investment—1.2% |
| Money Market Mutual Fund—1.2% |
| Dreyfus Government Cash Management Fund - Institutional Shares (seven-day effective yield 2.748%)(4) | 18,357,068 | | 18,357 |
Total Short-Term Investment
(Identified Cost $18,357) | | 18,357 |
TOTAL INVESTMENTS—100.0%
(Identified Cost $1,446,825) | | $1,584,049 |
| Other assets and liabilities, net—0.0% | | 145 |
| NET ASSETS—100.0% | | $1,584,194 |
| Footnote Legend: |
| (1) | The value of this security was determined using significant unobservable inputs and is reported as a Level 3 security in the Fair Value Hierarchy table located after the Schedule of Investments. |
| (2) | Non-income producing. |
| (3) | All or a portion of the security is restricted. |
| (4) | Shares of this fund are publicly offered, and its prospectus and annual report are publicly available. |
The following table summarizes the value of the Fund’s investments as of September 30, 2022, based on the inputs used to value them (See Security Valuation Note 2A in the Notes to Financial Statements):
| | Total
Value at
September 30, 2022 | | Level 1
Quoted Prices | | Level 3
Significant
Unobservable
Inputs |
| Assets: | | | | | |
| Equity Securities: | | | | | |
| Common Stocks | $1,537,737 | | $1,537,737 | | $ — |
| Preferred Stock | 27,955 | | — | | 27,955 |
| Money Market Mutual Fund | 18,357 | | 18,357 | | — |
| Total Investments | $1,584,049 | | $1,556,094 | | $27,955 |
See Notes to Financial Statements
KAR Mid-Cap Growth Fund
SCHEDULE OF INVESTMENTS (Continued)
September 30, 2022
($ reported in thousands)
There were no securities valued using significant observable inputs (Level 2) at September 30, 2022.
There were no transfers into or out of Level 3 related to securities held at September 30, 2022.
Some of the Fund’s investments that were categorized as Level 3 may have been valued utilizing third party pricing information without adjustment. If applicable, such valuations are based on unobservable inputs. A significant change in third party information could result in a significantly lower or higher value of Level 3 investments.
The following is a reconciliation of assets of the Fund for Level 3 investments for which significant unobservable inputs were used to determine fair value.
| | Total | | Preferred
Stocks |
| Investments in Securities | | | |
| Balance as of September 30, 2021: | $ 42,579 | | $ 42,579 |
| Change in unrealized appreciation (depreciation)(a) | (14,624) | | (14,624) |
| Balance as of September 30, 2022 | $ 27,955 | | $ 27,955 |
(a) The net change in unrealized appreciation (depreciation) on investments still held at September 30, 2022, was $14,624.
The following table presents additional information about valuation techniques and inputs used for investments that are measured at fair value and categorized within Level 3 at September 30, 2022:
| Investments in Securities – Assets | Ending
Balance
at September 30, 2022 | | Valuation Technique Used | | Unobservable
Inputs | | Input
Values |
| Preferred Stock: | | | | | | | |
| Security Scorecard, Inc. Series E | $27,955 | | Market and Company Comparables | | EV Multiples | | 9.53x (2.35x - 24.57x) |
| | | | | | | | 6.83x (2.40x - 20.57x) |
See Notes to Financial Statements
KAR Small-Cap Core Fund
SCHEDULE OF INVESTMENTS
September 30, 2022
($ reported in thousands)
| | Shares | | Value |
| Common Stocks—96.4% |
| Communication Services—4.2% | | |
| Autohome, Inc. ADR | 418,682 | | $ 12,041 |
| Rightmove plc | 9,575,590 | | 51,085 |
| | | | 63,126 |
| | | | |
| |
| Consumer Discretionary—7.7% | | |
| Acushnet Holdings Corp. | 1,667,041 | | 72,499 |
| LCI Industries | 434,120 | | 44,046 |
| | | | 116,545 |
| | | | |
| |
| Consumer Staples—1.5% | | |
| PriceSmart, Inc. | 383,189 | | 22,068 |
| Energy—0.8% | | |
| Dril-Quip, Inc.(1) | 639,140 | | 12,476 |
| Financials—23.9% | | |
| Artisan Partners Asset Management, Inc. Class A | 1,433,877 | | 38,614 |
| BancFirst Corp. | 452,429 | | 40,479 |
| FactSet Research Systems, Inc. | 142,240 | | 56,912 |
| First Hawaiian, Inc. | 2,803,755 | | 69,056 |
| Moelis & Co. Class A | 1,374,917 | | 46,486 |
| Primerica, Inc. | 582,087 | | 71,859 |
| RLI Corp. | 348,403 | | 35,669 |
| | | | 359,075 |
| | | | |
| |
| Health Care—5.5% | | |
| Atrion Corp. | 48,880 | | 27,617 |
| CorVel Corp.(1) | 403,080 | | 55,799 |
| | | | 83,416 |
| | | | |
| |
| Industrials—37.9% | | |
| Donaldson Co., Inc. | 389,200 | | 19,075 |
| | Shares | | Value |
| | | | |
| Industrials—continued | | |
| EMCOR Group, Inc. | 735,170 | | $ 84,897 |
| FTI Consulting, Inc.(1) | 676,894 | | 112,168 |
| Graco, Inc. | 1,003,110 | | 60,136 |
| Landstar System, Inc. | 455,009 | | 65,690 |
| RBC Bearings, Inc.(1) | 277,987 | | 57,768 |
| Simpson Manufacturing Co., Inc. | 739,217 | | 57,955 |
| Toro Co. (The) | 667,701 | | 57,743 |
| Watts Water Technologies, Inc. Class A | 434,874 | | 54,677 |
| | | | 570,109 |
| | | | |
| |
| Information Technology—13.9% | | |
| Aspen Technology, Inc.(1) | 198,612 | | 47,310 |
Clearwater Analytics Holdings, Inc.
Class A (1) | 993,878 | | 16,687 |
| Jack Henry & Associates, Inc. | 181,100 | | 33,009 |
| Manhattan Associates, Inc.(1) | 532,220 | | 70,801 |
| Teledyne Technologies, Inc.(1) | 121,168 | | 40,891 |
| | | | 208,698 |
| | | | |
| |
| Materials—1.0% | | |
| AptarGroup, Inc. | 155,112 | | 14,740 |
Total Common Stocks
(Identified Cost $1,036,397) | | 1,450,253 |
Total Long-Term Investments—96.4%
(Identified Cost $1,036,397) | | 1,450,253 |
| | | | |
| |
| | | | |
| |
| | Shares | | Value |
| | | | |
| | | | |
| Short-Term Investment—3.5% |
| Money Market Mutual Fund—3.5% |
| Dreyfus Government Cash Management Fund - Institutional Shares (seven-day effective yield 2.748%)(2) | 53,128,646 | | $ 53,129 |
Total Short-Term Investment
(Identified Cost $53,129) | | 53,129 |
TOTAL INVESTMENTS—99.9%
(Identified Cost $1,089,526) | | $1,503,382 |
| Other assets and liabilities, net—0.1% | | 1,221 |
| NET ASSETS—100.0% | | $1,504,603 |
| Abbreviation: |
| ADR | American Depositary Receipt |
| Footnote Legend: |
| (1) | Non-income producing. |
| (2) | Shares of this fund are publicly offered, and its prospectus and annual report are publicly available. |
The following table summarizes the value of the Fund’s investments as of September 30, 2022, based on the inputs used to value them (See Security Valuation Note 2A in the Notes to Financial Statements):
| | Total
Value at
September 30, 2022 | | Level 1
Quoted Prices | | Level 2
Significant
Observable
Inputs |
| Assets: | | | | | |
| Equity Securities: | | | | | |
| Common Stocks | $1,450,253 | | $1,399,168 | | $51,085 |
| Money Market Mutual Fund | 53,129 | | 53,129 | | — |
| Total Investments | $1,503,382 | | $1,452,297 | | $51,085 |
There were no securities valued using significant unobservable inputs (Level 3) at September 30, 2022.
There were no transfers into or out of Level 3 related to securities held at September 30, 2022.
For information regarding the abbreviations, see the Key Investment Terms starting on page 6.
See Notes to Financial Statements
KAR Small-Cap Growth Fund
SCHEDULE OF INVESTMENTS
September 30, 2022
($ reported in thousands)
| | Shares | | Value |
| Common Stocks—98.9% |
| Communication Services—11.6% | | |
| Auto Trader Group plc | 30,042,329 | | $ 170,372 |
| Autohome, Inc. ADR | 1,764,519 | | 50,747 |
| MediaAlpha, Inc. Class A(1)(2) | 4,646,036 | | 40,653 |
| Rightmove plc | 27,280,150 | | 145,537 |
| | | | 407,309 |
| | | | |
| |
| Consumer Discretionary—15.2% | | |
| Dream Finders Homes, Inc. Class A(1)(2)(3) | 3,678,552 | | 38,993 |
| Fox Factory Holding Corp.(1)(2) | 2,752,978 | | 217,706 |
| Holley, Inc.(1)(2)(3) | 10,610,230 | | 42,971 |
| Ollie’s Bargain Outlet Holdings, Inc.(2) | 1,726,089 | | 89,066 |
| Olo, Inc. Class A(2) | 4,176,802 | | 32,997 |
| Revolve Group, Inc. Class A(1)(2)(3) | 5,278,701 | | 114,495 |
| | | | 536,228 |
| | | | |
| |
| Consumer Staples—2.7% | | |
| Grocery Outlet Holding Corp.(2) | 2,081,022 | | 69,277 |
| PriceSmart, Inc. | 428,298 | | 24,666 |
| | | | 93,943 |
| | | | |
| |
| Financials—29.9% | | |
| FactSet Research Systems, Inc. | 281,708 | | 112,714 |
| Goosehead Insurance, Inc. Class A(1)(2) | 1,790,476 | | 63,812 |
| Interactive Brokers Group, Inc. Class A | 2,344,856 | | 149,860 |
| MarketAxess Holdings, Inc. | 271,485 | | 60,403 |
| Morningstar, Inc. | 744,068 | | 157,980 |
| Oportun Financial Corp.(1)(2) | 1,782,554 | | 7,790 |
| Ryan Specialty Holdings, Inc. Class A(1)(2) | 7,775,150 | | 315,827 |
| ServisFirst Bancshares, Inc. | 2,271,389 | | 181,711 |
| | | | 1,050,097 |
| | | | |
| |
| | Shares | | Value |
| | | | |
| Health Care—5.6% | | |
| Mesa Laboratories, Inc. | 85,353 | | $ 12,020 |
| National Research Corp.(1) | 2,409,518 | | 95,899 |
| U.S. Physical Therapy, Inc.(1) | 1,185,000 | | 90,084 |
| | | | 198,003 |
| | | | |
| |
| Industrials—9.6% | | |
| AAON, Inc. | 2,607,400 | | 140,487 |
| HEICO Corp. Class A | 1,023,883 | | 117,358 |
| Omega Flex, Inc.(1) | 861,308 | | 79,774 |
| | | | 337,619 |
| | | | |
| |
| Information Technology—24.3% | | |
| Aspen Technology, Inc.(2) | 478,668 | | 114,019 |
| Avalara, Inc.(2) | 630,805 | | 57,908 |
| Bill.com Holdings, Inc.(2) | 1,647,005 | | 218,014 |
| Blackline, Inc.(2) | 1,811,403 | | 108,503 |
| Duck Creek Technologies, Inc.(1)(2) | 10,094,221 | | 119,616 |
| nCino, Inc.(2) | 3,174,809 | | 108,293 |
| NVE Corp.(1) | 412,690 | | 19,252 |
| SPS Commerce, Inc.(2) | 863,164 | | 107,231 |
| | | | 852,836 |
Total Common Stocks
(Identified Cost $2,797,874) | | 3,476,035 |
Total Long-Term Investments—98.9%
(Identified Cost $2,797,874) | | 3,476,035 |
| | | | |
| Short-Term Investment—0.7% |
| Money Market Mutual Fund—0.7% |
| Dreyfus Government Cash Management Fund - Institutional Shares (seven-day effective yield 2.748%)(4) | 25,562,392 | | 25,562 |
Total Short-Term Investment
(Identified Cost $25,562) | | 25,562 |
| | | | |
| |
| | | | |
| |
| | Shares | | Value |
| | | | |
| | | | |
| Securities Lending Collateral—0.6% |
| Dreyfus Government Cash Management Fund - Institutional Shares (seven-day effective yield 2.748%)(4)(5) | 21,458,767 | | $ 21,459 |
Total Securities Lending Collateral
(Identified Cost $21,459) | | 21,459 |
TOTAL INVESTMENTS—100.2%
(Identified Cost $2,844,895) | | $3,523,056 |
| Other assets and liabilities, net—(0.2)% | | (8,227) |
| NET ASSETS—100.0% | | $3,514,829 |
| Abbreviation: |
| ADR | American Depositary Receipt |
| Footnote Legend: |
| (1) | Affiliated company. See Note 3H in Notes to Financial Statements. |
| (2) | Non-income producing. |
| (3) | All or a portion of security is on loan. |
| (4) | Shares of this fund are publicly offered, and its prospectus and annual report are publicly available. |
| (5) | Represents security purchased with cash collateral received for securities on loan. |
| Country Weightings (Unaudited)† |
| United States | 90% |
| United Kingdom | 9 |
| China | 1 |
| Total | 100% |
| † % of total investments as of September 30, 2022. |
For information regarding the abbreviations, see the Key Investment Terms starting on page 6.
See Notes to Financial Statements
KAR Small-Cap Growth Fund
SCHEDULE OF INVESTMENTS (Continued)
September 30, 2022
($ reported in thousands)
The following table summarizes the value of the Fund’s investments as of September 30, 2022, based on the inputs used to value them (See Security Valuation Note 2A in the Notes to Financial Statements):
| | Total
Value at
September 30, 2022 | | Level 1
Quoted Prices | | Level 2
Significant
Observable
Inputs |
| Assets: | | | | | |
| Equity Securities: | | | | | |
| Common Stocks | $3,476,035 | | $3,160,126 | | $315,909 |
| Money Market Mutual Fund | 25,562 | | 25,562 | | — |
| Securities Lending Collateral | 21,459 | | 21,459 | | — |
| Total Investments | $3,523,056 | | $3,207,147 | | $315,909 |
There were no securities valued using significant unobservable inputs (Level 3) at September 30, 2022.
There were no transfers into or out of Level 3 related to securities held at September 30, 2022.
See Notes to Financial Statements
KAR Small-Cap Value Fund
SCHEDULE OF INVESTMENTS
September 30, 2022
($ reported in thousands)
| | Shares | | Value |
| Common Stocks—98.1% |
| Consumer Discretionary—17.8% | | |
| Cheesecake Factory, Inc. (The) | 1,002,215 | | $ 29,345 |
| Latham Group, Inc.(1) | 1,654,025 | | 5,938 |
| Leslie’s, Inc.(1) | 2,423,718 | | 35,653 |
| SiteOne Landscape Supply, Inc.(1) | 259,168 | | 26,990 |
| Terminix Global Holdings, Inc.(1) | 735,711 | | 28,170 |
| Thor Industries, Inc. | 478,406 | | 33,479 |
| | | | 159,575 |
| | | | |
| |
| Consumer Staples—5.6% | | |
| National Beverage Corp. | 738,970 | | 28,480 |
| WD-40 Co. | 124,451 | | 21,871 |
| | | | 50,351 |
| | | | |
| |
| Financials—22.9% | | |
| Bank of Hawaii Corp. | 488,715 | | 37,201 |
| First Financial Bankshares, Inc. | 399,223 | | 16,700 |
| Houlihan Lokey, Inc. Class A | 513,215 | | 38,686 |
| Lakeland Financial Corp. | 268,926 | | 19,581 |
| Primerica, Inc. | 204,035 | | 25,188 |
| RLI Corp. | 309,049 | | 31,640 |
| Stock Yards Bancorp, Inc. | 521,856 | | 35,491 |
| | | | 204,487 |
| | | | |
| |
| Health Care—3.4% | | |
| Azenta, Inc. | 704,107 | | 30,178 |
| Industrials—36.7% | | |
| Albany International Corp. Class A | 452,378 | | 35,661 |
| | Shares | | Value |
| | | | |
| Industrials—continued | | |
| Armstrong World Industries, Inc. | 408,020 | | $ 32,327 |
| Construction Partners, Inc. Class A(1) | 1,129,353 | | 29,623 |
| Graco, Inc. | 553,704 | | 33,195 |
| Hillman Solutions Corp.(1) | 2,182,229 | | 16,454 |
| John Bean Technologies Corp. | 221,348 | | 19,036 |
| Landstar System, Inc. | 236,288 | | 34,113 |
| RBC Bearings, Inc.(1) | 221,312 | | 45,991 |
| UniFirst Corp. | 200,302 | | 33,697 |
| Watsco, Inc. | 186,780 | | 48,088 |
| | | | 328,185 |
| | | | |
| |
| Information Technology—9.7% | | |
| American Software, Inc. Class A | 842,834 | | 12,912 |
| Badger Meter, Inc. | 174,469 | | 16,119 |
| EVERTEC, Inc. | 1,137,599 | | 35,664 |
| Jack Henry & Associates, Inc. | 119,445 | | 21,771 |
| | | | 86,466 |
| | | | |
| |
| Materials—2.0% | | |
| Scotts Miracle-Gro Co. (The) | 423,813 | | 18,118 |
Total Common Stocks
(Identified Cost $714,110) | | 877,360 |
Total Long-Term Investments—98.1%
(Identified Cost $714,110) | | 877,360 |
| | | | |
| |
| | | | |
| |
| | Shares | | Value |
| | | | |
| | | | |
| Short-Term Investment—1.9% |
| Money Market Mutual Fund—1.9% |
| Dreyfus Government Cash Management Fund - Institutional Shares (seven-day effective yield 2.748%)(2) | 16,490,429 | | $ 16,490 |
Total Short-Term Investment
(Identified Cost $16,490) | | 16,490 |
TOTAL INVESTMENTS—100.0%
(Identified Cost $730,600) | | $893,850 |
| Other assets and liabilities, net—0.0% | | 284 |
| NET ASSETS—100.0% | | $894,134 |
| Footnote Legend: |
| (1) | Non-income producing. |
| (2) | Shares of this fund are publicly offered, and its prospectus and annual report are publicly available. |
The following table summarizes the value of the Fund’s investments as of September 30, 2022, based on the inputs used to value them (See Security Valuation Note 2A in the Notes to Financial Statements):
| | Total
Value at
September 30, 2022 | | Level 1
Quoted Prices |
| Assets: | | | |
| Equity Securities: | | | |
| Common Stocks | $877,360 | | $877,360 |
| Money Market Mutual Fund | 16,490 | | 16,490 |
| Total Investments | $893,850 | | $893,850 |
There were no securities valued using significant observable inputs (Level 2) or significant unobservable inputs (Level 3) at September 30, 2022.
There were no transfers into or out of Level 3 related to securities held at September 30, 2022.
See Notes to Financial Statements
KAR Small-Mid Cap Core Fund
SCHEDULE OF INVESTMENTS
September 30, 2022
($ reported in thousands)
| | Shares | | Value |
| Common Stocks—97.5% |
| Consumer Discretionary—15.3% | | |
| Bright Horizons Family Solutions, Inc.(1) | 255,231 | | $ 14,714 |
| Pool Corp. | 136,963 | | 43,583 |
| Rollins, Inc. | 658,827 | | 22,848 |
| SiteOne Landscape Supply, Inc.(1) | 311,318 | | 32,421 |
| Thor Industries, Inc. | 453,244 | | 31,718 |
| | | | 145,284 |
| | | | |
| |
| Financials—15.6% | | |
| Berkley (W.R.) Corp. | 863,620 | | 55,772 |
| Interactive Brokers Group, Inc. Class A | 515,536 | | 32,948 |
| LPL Financial Holdings, Inc. | 273,590 | | 59,774 |
| | | | 148,494 |
| | | | |
| |
| Health Care—12.5% | | |
| Charles River Laboratories International, Inc.(1) | 196,957 | | 38,761 |
| Chemed Corp. | 60,673 | | 26,487 |
| Cooper Cos., Inc. (The) | 121,200 | | 31,985 |
| Globus Medical, Inc. Class A(1) | 374,762 | | 22,324 |
| | | | 119,557 |
| | | | |
| |
| Industrials—27.1% | | |
| Allegion plc | 298,762 | | 26,793 |
| Copart, Inc.(1) | 333,123 | | 35,444 |
| Equifax, Inc. | 193,407 | | 33,156 |
| Exponent, Inc. | 409,348 | | 35,888 |
| Fair Isaac Corp.(1) | 51,173 | | 21,084 |
| | Shares | | Value |
| | | | |
| Industrials—continued | | |
| Lennox International, Inc. | 134,600 | | $ 29,971 |
| Nordson Corp. | 207,798 | | 44,109 |
| Watsco, Inc. | 121,929 | | 31,392 |
| | | | 257,837 |
| | | | |
| |
| Information Technology—25.2% | | |
| ANSYS, Inc.(1) | 83,086 | | 18,420 |
| Aspen Technology, Inc.(1) | 130,999 | | 31,204 |
| Bentley Systems, Inc. Class B | 1,244,099 | | 38,057 |
| Dolby Laboratories, Inc. Class A | 354,785 | | 23,114 |
| Jack Henry & Associates, Inc. | 156,429 | | 28,512 |
| Teledyne Technologies, Inc.(1) | 84,850 | | 28,635 |
| Teradyne, Inc. | 432,470 | | 32,500 |
| Zebra Technologies Corp. Class A(1) | 150,608 | | 39,461 |
| | | | 239,903 |
| | | | |
| |
| Materials—1.8% | | |
| Scotts Miracle-Gro Co. (The) | 409,354 | | 17,500 |
Total Common Stocks
(Identified Cost $1,058,346) | | 928,575 |
Total Long-Term Investments—97.5%
(Identified Cost $1,058,346) | | 928,575 |
| | | | |
| |
| | | | |
| |
| | Shares | | Value |
| | | | |
| | | | |
| Short-Term Investment—2.5% |
| Money Market Mutual Fund—2.5% |
| Dreyfus Government Cash Management Fund - Institutional Shares (seven-day effective yield 2.748%)(2) | 23,875,519 | | $ 23,876 |
Total Short-Term Investment
(Identified Cost $23,876) | | 23,876 |
TOTAL INVESTMENTS—100.0%
(Identified Cost $1,082,222) | | $952,451 |
| Other assets and liabilities, net—(0.0)% | | (405) |
| NET ASSETS—100.0% | | $952,046 |
| Footnote Legend: |
| (1) | Non-income producing. |
| (2) | Shares of this fund are publicly offered, and its prospectus and annual report are publicly available. |
The following table summarizes the value of the Fund’s investments as of September 30, 2022, based on the inputs used to value them (See Security Valuation Note 2A in the Notes to Financial Statements):
| | Total
Value at
September 30, 2022 | | Level 1
Quoted Prices |
| Assets: | | | |
| Equity Securities: | | | |
| Common Stocks | $928,575 | | $928,575 |
| Money Market Mutual Fund | 23,876 | | 23,876 |
| Total Investments | $952,451 | | $952,451 |
There were no securities valued using significant observable inputs (Level 2) or significant unobservable inputs (Level 3) at September 30, 2022.
There were no transfers into or out of Level 3 related to securities held at September 30, 2022.
See Notes to Financial Statements
KAR Small-Mid Cap Growth Fund
SCHEDULE OF INVESTMENTS
September 30, 2022
($ reported in thousands)
| | Shares | | Value |
| Common Stocks—90.0% |
| Communication Services—2.4% | | |
| Rightmove plc Unsponsored ADR | 11,792 | | $ 125 |
| Consumer Discretionary—5.1% | | |
| Ollie’s Bargain Outlet Holdings, Inc.(1) | 2,576 | | 133 |
| SiteOne Landscape Supply, Inc.(1) | 1,258 | | 131 |
| | | | 264 |
| | | | |
| |
| Consumer Staples—3.4% | | |
| Lamb Weston Holdings, Inc. | 2,240 | | 173 |
| Financials—13.0% | | |
| FactSet Research Systems, Inc. | 537 | | 215 |
| MarketAxess Holdings, Inc. | 544 | | 121 |
| Ryan Specialty Holdings, Inc. Class A(1) | 8,178 | | 332 |
| | | | 668 |
| | | | |
| |
| Health Care—23.0% | | |
| Atrion Corp. | 96 | | 54 |
| Azenta, Inc. | 2,429 | | 104 |
| Cooper Cos., Inc. (The) | 414 | | 109 |
| Globus Medical, Inc. Class A(1) | 2,857 | | 170 |
| HealthEquity, Inc.(1) | 3,360 | | 226 |
| Silk Road Medical, Inc.(1) | 6,231 | | 281 |
| West Pharmaceutical Services, Inc. | 955 | | 235 |
| | | | 1,179 |
| | | | |
| |
| | Shares | | Value |
| | | | |
| Industrials—17.8% | | |
| Copart, Inc.(1) | 2,096 | | $ 223 |
| Fair Isaac Corp.(1) | 384 | | 158 |
| HEICO Corp. Class A | 2,145 | | 246 |
| TransUnion | 2,072 | | 124 |
| Verisk Analytics, Inc. Class A | 963 | | 164 |
| | | | 915 |
| | | | |
| |
| Information Technology—25.3% | | |
| Bentley Systems, Inc. Class B | 6,006 | | 184 |
| Clearwater Analytics Holdings, Inc. Class A (1) | 9,782 | | 164 |
| Copperleaf Technologies, Inc.(1) | 19,733 | | 89 |
| Duck Creek Technologies, Inc.(1) | 4,111 | | 49 |
| Jack Henry & Associates, Inc. | 1,288 | | 235 |
| nCino, Inc.(1) | 5,288 | | 180 |
| Teledyne Technologies, Inc.(1) | 569 | | 192 |
| Tyler Technologies, Inc.(1) | 601 | | 209 |
| | | | 1,302 |
Total Common Stocks
(Identified Cost $5,669) | | 4,626 |
Total Long-Term Investments—90.0%
(Identified Cost $5,669) | | 4,626 |
| |
| | | | |
| |
| | Shares | | Value |
| | | | |
| | | | |
| Short-Term Investment—9.6% |
| Money Market Mutual Fund—9.6% |
| Dreyfus Government Cash Management Fund - Institutional Shares (seven-day effective yield 2.748%)(2) | 492,797 | | $ 493 |
Total Short-Term Investment
(Identified Cost $493) | | 493 |
TOTAL INVESTMENTS—99.6%
(Identified Cost $6,162) | | $5,119 |
| Other assets and liabilities, net—0.4% | | 18 |
| NET ASSETS—100.0% | | $5,137 |
| Abbreviation: |
| ADR | American Depositary Receipt |
| Footnote Legend: |
| (1) | Non-income producing. |
| (2) | Shares of this fund are publicly offered, and its prospectus and annual report are publicly available. |
The following table summarizes the value of the Fund’s investments as of September 30, 2022, based on the inputs used to value them (See Security Valuation Note 2A in the Notes to Financial Statements):
| | Total
Value at
September 30, 2022 | | Level 1
Quoted Prices |
| Assets: | | | |
| Equity Securities: | | | |
| Common Stocks | $4,626 | | $4,626 |
| Money Market Mutual Fund | 493 | | 493 |
| Total Investments | $5,119 | | $5,119 |
There were no securities valued using significant observable inputs (Level 2) or significant unobservable inputs (Level 3) at September 30, 2022.
There were no transfers into or out of Level 3 related to securities held at September 30, 2022.
For information regarding the abbreviations, see the Key Investment Terms starting on page 6.
See Notes to Financial Statements
KAR Small-Mid Cap Value Fund
SCHEDULE OF INVESTMENTS
September 30, 2022
($ reported in thousands)
| | Shares | | Value |
| Common Stocks—94.7% |
| Consumer Discretionary—16.1% | | |
| Cheesecake Factory, Inc. (The) | 3,200 | | $ 94 |
| Gentex Corp. | 3,833 | | 91 |
| Leslie’s, Inc.(1) | 9,614 | | 141 |
| Terminix Global Holdings, Inc.(1) | 4,489 | | 172 |
| Thor Industries, Inc. | 1,854 | | 130 |
| | | | 628 |
| | | | |
| |
| Consumer Staples—4.5% | | |
| National Beverage Corp. | 2,907 | | 112 |
| WD-40 Co. | 370 | | 65 |
| | | | 177 |
| | | | |
| |
| Financials—17.0% | | |
| Bank of Hawaii Corp. | 1,864 | | 142 |
| Berkley (W.R.) Corp. | 3,191 | | 206 |
| Broadridge Financial Solutions, Inc. | 1,072 | | 155 |
| LPL Financial Holdings, Inc. | 740 | | 162 |
| | | | 665 |
| | | | |
| |
| Health Care—1.8% | | |
| CorVel Corp.(1) | 499 | | 69 |
| Industrials—26.0% | | |
| Armstrong World Industries, Inc. | 1,214 | | 96 |
| Graco, Inc. | 2,213 | | 133 |
| John Bean Technologies Corp. | 909 | | 78 |
| Landstar System, Inc. | 1,002 | | 145 |
| Lennox International, Inc. | 472 | | 105 |
| Oshkosh Corp. | 821 | | 58 |
| RBC Bearings, Inc.(1) | 766 | | 159 |
| | Shares | | Value |
| | | | |
| Industrials—continued | | |
| Toro Co. (The) | 1,562 | | $ 135 |
| TransUnion | 1,788 | | 106 |
| | | | 1,015 |
| | | | |
| |
| Information Technology—18.8% | | |
| American Software, Inc. Class A | 4,908 | | 75 |
| CDW Corp. | 516 | | 81 |
| Dolby Laboratories, Inc. Class A | 2,033 | | 132 |
| Jack Henry & Associates, Inc. | 1,075 | | 196 |
| Teradyne, Inc. | 1,336 | | 100 |
| Zebra Technologies Corp. Class A(1) | 583 | | 153 |
| | | | 737 |
| | | | |
| |
| Materials—4.4% | | |
| HB Fuller Co. | 1,698 | | 102 |
| Scotts Miracle-Gro Co. (The) | 1,602 | | 69 |
| | | | 171 |
| | | | |
| |
| Real Estate—6.1% | | |
| Lamar Advertising Co. Class A | 888 | | 73 |
| VICI Properties, Inc. | 5,597 | | 167 |
| | | | 240 |
Total Common Stocks
(Identified Cost $4,579) | | 3,702 |
Total Long-Term Investments—94.7%
(Identified Cost $4,579) | | 3,702 |
| | | | |
| |
| | | | |
| |
| | Shares | | Value |
| | | | |
| | | | |
| Short-Term Investment—6.2% |
| Money Market Mutual Fund—6.2% |
| Dreyfus Government Cash Management Fund - Institutional Shares (seven-day effective yield 2.748%)(2) | 243,059 | | $ 243 |
Total Short-Term Investment
(Identified Cost $243) | | 243 |
TOTAL INVESTMENTS—100.9%
(Identified Cost $4,822) | | $3,945 |
| Other assets and liabilities, net—(0.9)% | | (35) |
| NET ASSETS—100.0% | | $3,910 |
| Footnote Legend: |
| (1) | Non-income producing. |
| (2) | Shares of this fund are publicly offered, and its prospectus and annual report are publicly available. |
The following table summarizes the value of the Fund’s investments as of September 30, 2022, based on the inputs used to value them (See Security Valuation Note 2A in the Notes to Financial Statements):
| | Total
Value at
September 30, 2022 | | Level 1
Quoted Prices |
| Assets: | | | |
| Equity Securities: | | | |
| Common Stocks | $3,702 | | $3,702 |
| Money Market Mutual Fund | 243 | | 243 |
| Total Investments | $3,945 | | $3,945 |
There were no securities valued using significant observable inputs (Level 2) or significant unobservable inputs (Level 3) at September 30, 2022.
There were no transfers into or out of Level 3 related to securities held at September 30, 2022.
See Notes to Financial Statements
SGA Emerging Markets Growth Fund
SCHEDULE OF INVESTMENTS
September 30, 2022
($ reported in thousands)
| | Shares | | Value |
| Common Stocks—98.7% |
| Communication Services—7.9% | | |
| Kakao Corp. | 2,535 | | $ 100 |
| NAVER Corp. | 1,069 | | 142 |
| Tencent Holdings Ltd. | 2,856 | | 97 |
| | | | 339 |
| | | | |
| |
| Consumer Discretionary—23.4% | | |
| adidas AG | 830 | | 96 |
| Fast Retailing Co., Ltd. | 395 | | 209 |
| H World Group Ltd. | 59,410 | | 203 |
| JD.com, Inc. Class A | 4,172 | | 105 |
| MercadoLibre, Inc.(1) | 192 | | 159 |
| Yum China Holdings, Inc. | 4,916 | | 233 |
| | | | 1,005 |
| | | | |
| |
| Consumer Staples—29.3% | | |
| Budweiser Brewing Co. APAC Ltd. | 78,783 | | 205 |
| China Mengniu Dairy Co., Ltd.(1) | 46,285 | | 183 |
| CP ALL PCL Foreign Shares | 143,458 | | 213 |
| Fomento Economico Mexicano SAB de C.V. Sponsored ADR | 2,614 | | 164 |
| Raia Drogasil S.A. | 28,027 | | 118 |
| Unilever plc Sponsored ADR | 3,266 | | 143 |
| Wal-Mart de Mexico SAB de C.V. | 65,602 | | 231 |
| | | | 1,257 |
| | | | |
| |
| Financials—25.2% | | |
| AIA Group Ltd. | 21,721 | | 181 |
| Bank Central Asia Tbk PT | 442,738 | | 247 |
| HDFC Bank Ltd. ADR | 5,059 | | 295 |
| Sanlam Ltd. | 47,341 | | 134 |
| XP, Inc. Class A(1) | 11,933 | | 227 |
| | | | 1,084 |
| | | | |
| |
| | Shares | | Value |
| | | | |
| Health Care—5.2% | | |
| Shandong Weigao Group Medical Polymer Co., Ltd. Class H | 166,109 | | $ 222 |
| Information Technology—5.1% | | |
| Infosys Ltd. Sponsored ADR | 13,028 | | 221 |
| Materials—2.6% | | |
| Asian Paints Ltd. | 2,736 | | 112 |
Total Common Stocks
(Identified Cost $4,772) | | 4,240 |
Total Long-Term Investments—98.7%
(Identified Cost $4,772) | | 4,240 |
| | | | |
| Short-Term Investment—0.0% |
| Money Market Mutual Fund—0.0% |
| Dreyfus Government Cash Management Fund - Institutional Shares (seven-day effective yield 2.748%)(2) | 2,530 | | 3 |
Total Short-Term Investment
(Identified Cost $3) | | 3 |
TOTAL INVESTMENTS—98.7%
(Identified Cost $4,775) | | $4,243 |
| Other assets and liabilities, net—1.3% | | 54 |
| NET ASSETS—100.0% | | $4,297 |
| Abbreviation: |
| ADR | American Depositary Receipt |
| Footnote Legend: |
| (1) | Non-income producing. |
| (2) | Shares of this fund are publicly offered, and its prospectus and annual report are publicly available. |
| Country Weightings (Unaudited)† |
| China | 20% |
| India | 15 |
| Hong Kong | 14 |
| Brazil | 12 |
| Mexico | 9 |
| Indonesia | 6 |
| South Korea | 6 |
| Other | 18 |
| Total | 100% |
| † % of total investments as of September 30, 2022. |
The following table summarizes the value of the Fund’s investments as of September 30, 2022, based on the inputs used to value them (See Security Valuation Note 2A in the Notes to Financial Statements):
| | Total
Value at
September 30, 2022 | | Level 1
Quoted Prices | | Level 2
Significant
Observable
Inputs |
| Assets: | | | | | |
| Equity Securities: | | | | | |
| Common Stocks | $4,240 | | $1,558 | | $2,682 |
| Money Market Mutual Fund | 3 | | 3 | | — |
| Total Investments | $4,243 | | $1,561 | | $2,682 |
There were no securities valued using significant unobservable inputs (Level 3) at September 30, 2022.
There were no transfers into or out of Level 3 related to securities held at September 30, 2022.
For information regarding the abbreviations, see the Key Investment Terms starting on page 6.
See Notes to Financial Statements
SGA Global Growth Fund
SCHEDULE OF INVESTMENTS
September 30, 2022
($ reported in thousands)
| | Shares | | Value |
| Common Stocks—98.8% |
| Communication Services—2.9% | | |
| Alphabet, Inc. Class C(1) | 33,800 | | $ 3,250 |
| Consumer Discretionary—10.3% | | |
| Amazon.com, Inc.(1) | 46,803 | | 5,289 |
| MercadoLibre, Inc.(1) | 3,292 | | 2,725 |
| Yum! Brands, Inc. | 30,887 | | 3,284 |
| | | | 11,298 |
| | | | |
| |
| Consumer Staples—9.0% | | |
| China Mengniu Dairy Co., Ltd.(1) | 728,721 | | 2,880 |
| CP ALL PCL | 2,190,508 | | 3,253 |
| CP ALL PCL Foreign Shares | 202,599 | | 301 |
| Heineken N.V. | 39,365 | | 3,438 |
| | | | 9,872 |
| | | | |
| |
| Financials—15.5% | | |
| AIA Group Ltd. | 506,069 | | 4,213 |
| HDFC Bank Ltd. ADR | 78,099 | | 4,563 |
| MSCI, Inc. Class A | 8,164 | | 3,443 |
| S&P Global, Inc. | 7,580 | | 2,315 |
| XP, Inc. Class A(1) | 128,136 | | 2,436 |
| | | | 16,970 |
| | | | |
| |
| Health Care—19.6% | | |
| Alcon, Inc. | 54,692 | | 3,182 |
| Danaher Corp. | 12,534 | | 3,238 |
| ICON plc ADR(1) | 16,863 | | 3,099 |
| Intuitive Surgical, Inc.(1) | 14,317 | | 2,684 |
| Medtronic plc | 37,707 | | 3,045 |
| Novo Nordisk A/S Class B | 28,249 | | 2,814 |
| STERIS plc | 20,510 | | 3,410 |
| | | | 21,472 |
| | | | |
| |
| Industrials—2.5% | | |
| Recruit Holdings Co., Ltd. | 95,835 | | 2,761 |
| Information Technology—34.5% | | |
| Adobe, Inc. (1) | 7,874 | | 2,167 |
| Autodesk, Inc.(1) | 17,784 | | 3,322 |
| Dassault Systemes SE | 81,234 | | 2,805 |
| | Shares | | Value |
| | | | |
| Information Technology—continued | | |
| FleetCor Technologies, Inc.(1) | 15,459 | | $ 2,723 |
| Infosys Ltd. Sponsored ADR | 232,182 | | 3,940 |
| Intuit, Inc. | 8,456 | | 3,275 |
| Microsoft Corp. | 19,672 | | 4,582 |
| Salesforce, Inc.(1) | 26,350 | | 3,790 |
| SAP SE Sponsored ADR | 28,271 | | 2,297 |
| Visa, Inc. Class A | 27,856 | | 4,949 |
| Workday, Inc. Class A(1) | 26,739 | | 4,070 |
| | | | 37,920 |
| | | | |
| |
| Materials—2.0% | | |
| Linde plc | 8,167 | | 2,202 |
| Real Estate—2.5% | | |
| Equinix, Inc. | 4,770 | | 2,713 |
Total Common Stocks
(Identified Cost $112,629) | | 108,458 |
Total Long-Term Investments—98.8%
(Identified Cost $112,629) | | 108,458 |
| | | | |
| Short-Term Investment—1.1% |
| Money Market Mutual Fund—1.1% |
| Dreyfus Government Cash Management Fund - Institutional Shares (seven-day effective yield 2.748%)(2) | 1,176,394 | | 1,176 |
Total Short-Term Investment
(Identified Cost $1,176) | | 1,176 |
TOTAL INVESTMENTS—99.9%
(Identified Cost $113,805) | | $109,634 |
| Other assets and liabilities, net—0.1% | | 88 |
| NET ASSETS—100.0% | | $109,722 |
| Abbreviations: |
| ADR | American Depositary Receipt |
| MSCI | Morgan Stanley Capital International |
| S&P | Standard & Poor’s |
| Footnote Legend: |
| (1) | Non-income producing. |
| (2) | Shares of this fund are publicly offered, and its prospectus and annual report are publicly available. |
| Country Weightings (Unaudited)† |
| United States | 57% |
| India | 8 |
| Hong Kong | 6 |
| Thailand | 3 |
| Netherlands | 3 |
| Switzerland | 3 |
| Ireland | 3 |
| Other | 17 |
| Total | 100% |
| † % of total investments as of September 30, 2022. |
The following table summarizes the value of the Fund’s investments as of September 30, 2022, based on the inputs used to value them (See Security Valuation Note 2A in the Notes to Financial Statements):
| | Total
Value at
September 30, 2022 | | Level 1
Quoted Prices | | Level 2
Significant
Observable
Inputs |
| Assets: | | | | | |
| Equity Securities: | | | | | |
| Common Stocks | $108,458 | | $85,993 | | $22,465 |
| Money Market Mutual Fund | 1,176 | | 1,176 | | — |
| Total Investments | $109,634 | | $87,169 | | $22,465 |
There were no securities valued using significant unobservable inputs (Level 3) at September 30, 2022.
There were no transfers into or out of Level 3 related to securities held at September 30, 2022.
For information regarding the abbreviations, see the Key Investment Terms starting on page 6.
See Notes to Financial Statements
SGA New Leaders Growth Fund
SCHEDULE OF INVESTMENTS
September 30, 2022
($ reported in thousands)
| | Shares | | Value |
| Common Stocks—98.5% |
| Communication Services—10.3% | | |
| Kakao Corp. | 4,193 | | $ 165 |
| Match Group, Inc.(1) | 3,492 | | 167 |
| NAVER Corp. | 724 | | 97 |
| Spotify Technology S.A.(1) | 1,905 | | 164 |
| | | | 593 |
| | | | |
| |
| Consumer Discretionary—8.4% | | |
| H World Group Ltd. | 41,436 | | 141 |
| MercadoLibre, Inc.(1) | 198 | | 164 |
| Yum! Brands, Inc. | 1,686 | | 179 |
| | | | 484 |
| | | | |
| |
| Consumer Staples—14.9% | | |
| China Mengniu Dairy Co., Ltd.(1) | 47,254 | | 187 |
| CP ALL PCL Foreign Shares | 155,195 | | 230 |
| Fomento Economico Mexicano SAB de C.V. Sponsored ADR | 3,254 | | 204 |
| Haleon plc ADR(1) | 18,569 | | 113 |
| Raia Drogasil S.A. | 30,040 | | 127 |
| | | | 861 |
| | | | |
| |
| Financials—10.6% | | |
| First Republic Bank | 1,257 | | 164 |
| MSCI, Inc. Class A | 445 | | 188 |
| XP, Inc. Class A(1) | 13,661 | | 259 |
| | | | 611 |
| | | | |
| |
| Health Care—22.5% | | |
| Alcon, Inc. | 2,969 | | 173 |
| ICON plc ADR(1) | 942 | | 173 |
| IDEXX Laboratories, Inc.(1) | 329 | | 107 |
| IQVIA Holdings, Inc.(1) | 937 | | 170 |
| M3, Inc. | 4,408 | | 123 |
| Shandong Weigao Group Medical Polymer Co., Ltd. Class H | 151,290 | | 202 |
| STERIS plc | 1,064 | | 177 |
| Veeva Systems, Inc. Class A(1) | 1,048 | | 173 |
| | | | 1,298 |
| | | | |
| |
| | Shares | | Value |
| | | | |
| Industrials—3.3% | | |
| CoStar Group, Inc.(1) | 2,749 | | $ 191 |
| Information Technology—19.6% | | |
| Adyen N.V.(1) | 117 | | 146 |
| Atlassian Corp. plc Class A(1) | 755 | | 159 |
| Autodesk, Inc.(1) | 1,276 | | 239 |
| EPAM Systems, Inc.(1) | 467 | | 169 |
| FleetCor Technologies, Inc.(1) | 1,295 | | 228 |
| Workday, Inc. Class A(1) | 1,236 | | 188 |
| | | | 1,129 |
| | | | |
| |
| Materials—5.9% | | |
| Ball Corp. | 3,461 | | 167 |
| Ecolab, Inc. | 1,207 | | 175 |
| | | | 342 |
| | | | |
| |
| Real Estate—3.0% | | |
| Equinix, Inc. | 298 | | 170 |
Total Common Stocks
(Identified Cost $7,482) | | 5,679 |
Total Long-Term Investments—98.5%
(Identified Cost $7,482) | | 5,679 |
| |
| Short-Term Investment—0.8% |
| Money Market Mutual Fund—0.8% |
| Dreyfus Government Cash Management Fund - Institutional Shares (seven-day effective yield 2.748%)(2) | 41,899 | | 42 |
Total Short-Term Investment
(Identified Cost $42) | | 42 |
| |
TOTAL INVESTMENTS—99.3%
(Identified Cost $7,524) | | $5,721 |
| Other assets and liabilities, net—0.7% | | 43 |
| NET ASSETS—100.0% | | $5,764 |
| Abbreviations: |
| ADR | American Depositary Receipt |
| MSCI | Morgan Stanley Capital International |
| Footnote Legend: |
| (1) | Non-income producing. |
| (2) | Shares of this fund are publicly offered, and its prospectus and annual report are publicly available. |
| Country Weightings (Unaudited)† |
| United States | 47% |
| Brazil | 10 |
| Ireland | 6 |
| China | 6 |
| United Kingdom | 5 |
| South Korea | 5 |
| Thailand | 4 |
| Other | 17 |
| Total | 100% |
| † % of total investments as of September 30, 2022. |
The following table summarizes the value of the Fund’s investments as of September 30, 2022, based on the inputs used to value them (See Security Valuation Note 2A in the Notes to Financial Statements):
| | Total
Value at
September 30, 2022 | | Level 1
Quoted Prices | | Level 2
Significant
Observable
Inputs |
| Assets: | | | | | |
| Equity Securities: | | | | | |
| Common Stocks | $5,679 | | $4,388 | | $1,291 |
| Money Market Mutual Fund | 42 | | 42 | | — |
| Total Investments | $5,721 | | $4,430 | | $1,291 |
There were no securities valued using significant unobservable inputs (Level 3) at September 30, 2022.
There were no transfers into or out of Level 3 related to securities held at September 30, 2022.
For information regarding the abbreviations, see the Key Investment Terms starting on page 6.
See Notes to Financial Statements
Tactical Allocation Fund
SCHEDULE OF INVESTMENTS
September 30, 2022
($ reported in thousands)
| | Par Value | | Value |
| U.S. Government Securities—5.9% |
| U.S. Treasury Bonds | | | |
| 2.375%, 2/15/42 | $ 3,715 | | $ 2,847 |
| 3.250%, 5/15/42 | 1,195 | | 1,061 |
| 3.000%, 8/15/48 | 7,650 | | 6,470 |
| 2.000%, 2/15/50 | 2,045 | | 1,405 |
| 1.375%, 8/15/50 | 12,745 | | 7,380 |
| 1.875%, 2/15/51 | 5,255 | | 3,479 |
| 2.000%, 8/15/51 | 440 | | 300 |
| 2.250%, 2/15/52 | 605 | | 440 |
| 2.875%, 5/15/52 | 2,335 | | 1,958 |
| U.S. Treasury Notes | | | |
| 0.125%, 3/31/23 | 1,700 | | 1,669 |
| 2.500%, 4/30/24 | 1,200 | | 1,166 |
| 0.250%, 5/31/25 | 1,610 | | 1,448 |
| 1.125%, 2/15/31 | 2,565 | | 2,077 |
| 1.625%, 5/15/31 | 900 | | 755 |
| 1.250%, 8/15/31 | 1,170 | | 946 |
| 1.375%, 11/15/31 | 830 | | 674 |
Total U.S. Government Securities
(Identified Cost $44,017) | | 34,075 |
| Municipal Bonds—1.7% |
| California—0.1% | | |
Santa Clara Valley Water District Series B, Taxable
2.967%, 6/1/50 | 510 | | 341 |
University of California, Series B-A, Taxable
4.428%, 5/15/48 | 380 | | 327 |
| | | | 668 |
| | | | |
| |
| Florida—0.3% | | |
Broward County, Water & Sewer Utility Revenue Series A
4.000%, 10/1/47 | 2,115 | | 1,918 |
| Idaho—0.1% | | |
Idaho Health Facilities Authority St. Luke’s Health System Revenue Taxable
5.020%, 3/1/48 | 450 | | 413 |
| Illinois—0.0% | | |
Sales Tax Securitization Corp. Series B, Second Lien, Taxable (BAM Insured)
3.411%, 1/1/43 | 70 | | 54 |
| | Par Value | | Value |
| | | | |
| New York—0.9% | | |
Metropolitan Transportation Authority Revenue Taxable Series A
5.000%, 11/15/45 | $ 2,555 | | $ 2,678 |
New York State Environmental Facilities Corp. Revenue Taxable
5.000%, 6/15/51 | 2,130 | | 2,286 |
| | | | 4,964 |
| | | | |
| |
| Texas—0.2% | | |
City of San Antonio, General Obligation Taxable
1.963%, 2/1/33 | 530 | | 410 |
State of Texas, General Obligation Taxable
3.211%, 4/1/44 | 180 | | 141 |
Texas Public Finance Authority Revenue Taxable
2.140%, 2/1/35 | 585 | | 431 |
Texas Transportation Commission State Highway Fund Revenue Taxable
4.000%, 10/1/33 | 160 | | 147 |
| | | | 1,129 |
| | | | |
| |
| Virginia—0.1% | | |
City of Bristol, General Obligation Taxable (State AID Withholding Insured)
4.210%, 1/1/42 | 640 | | 559 |
Total Municipal Bonds
(Identified Cost $11,270) | | 9,705 |
| Foreign Government Securities—0.3% |
| Bolivarian Republic of Venezuela | | | |
| 9.375%, 1/13/34(1) | 130 | | 10 |
RegS
8.250%, 10/13/24(1)(2) | 40 | | 3 |
RegS
7.650%, 4/21/25(1)(2) | 320 | | 22 |
Dominican Republic 144A
4.875%, 9/23/32(3) | 820 | | 612 |
Emirate of Dubai Government International Bonds RegS
5.250%, 1/30/43(2) | 540 | | 461 |
| | Par Value | | Value |
| | | | |
| Foreign Government Securities—continued |
United Mexican States
2.659%, 5/24/31 | $ 645 | | $ 495 |
Total Foreign Government Securities
(Identified Cost $2,321) | | 1,603 |
| Mortgage-Backed Securities—9.7% |
| Agency—0.1% | | |
| Federal Home Loan Mortgage Corporation | | | |
Pool #A46224
5.000%, 7/1/35 | 52 | | 52 |
Pool #A62213
6.000%, 6/1/37 | 94 | | 99 |
| Federal National Mortgage Association | | | |
Pool #254549
6.000%, 12/1/32 | 14 | | 15 |
Pool #310041
6.500%, 5/1/37 | 84 | | 91 |
Pool #735061
6.000%, 11/1/34 | 104 | | 109 |
Pool #880117
5.500%, 4/1/36 | 3 | | 3 |
Pool #909092
6.000%, 9/1/37 | 6 | | 6 |
Pool #909175
5.500%, 4/1/38 | 55 | | 57 |
Pool #909220
6.000%, 8/1/38 | 59 | | 62 |
Pool #929625
5.500%, 6/1/38 | 72 | | 74 |
Pool #938574
5.500%, 9/1/36 | 62 | | 64 |
Pool #972569
5.000%, 3/1/38 | 68 | | 66 |
| | | | 698 |
| Non-Agency—9.6% | | |
| Ajax Mortgage Loan Trust | | | |
2019-D, A1 144A
2.956%, 9/25/65(3)(4) | 401 | | 372 |
2021-A, A1 144A
1.065%, 9/25/65(3)(4) | 466 | | 410 |
| American Homes 4 Rent Trust | | | |
2014-SFR2, C 144A
4.705%, 10/17/36(3) | 1,050 | | 1,024 |
2015-SFR2, C 144A
4.691%, 10/17/52(3) | 335 | | 325 |
| AMSR Trust | | | |
2020-SFR1, B 144A
2.120%, 4/17/37(3) | 530 | | 491 |
See Notes to Financial Statements
Tactical Allocation Fund
SCHEDULE OF INVESTMENTS (Continued)
September 30, 2022
($ reported in thousands)
| | Par Value | | Value |
| | | | |
| Non-Agency—continued | | |
2020-SFR2, C 144A
2.533%, 7/17/37(3) | $ 750 | | $ 688 |
2020-SFR2, D 144A
3.282%, 7/17/37(3) | 770 | | 714 |
Angel Oak Mortgage Trust 2020-4, A1 144A
1.469%, 6/25/65(3)(4) | 428 | | 395 |
Angel Oak SB Commercial Mortgage Trust 2020-SBC1, A1 144A
2.068%, 5/25/50(3)(4) | 581 | | 556 |
| Arroyo Mortgage Trust | | | |
2019-1, A1 144A
3.805%, 1/25/49(3)(4) | 156 | | 146 |
2019-2, A1 144A
3.347%, 4/25/49(3)(4) | 873 | | 817 |
2021-1R, A1 144A
1.175%, 10/25/48(3)(4) | 756 | | 646 |
2022-1, A1B 144A
3.269%, 12/25/56(3)(4) | 670 | | 563 |
BPR Trust 2021-KEN, A (1 month LIBOR + 1.250%, Cap N/A, Floor 1.250%) 144A
4.068%, 2/15/29(3)(4) | 920 | | 893 |
BX Commercial Mortgage Trust 2022-LP2, D (1 month Term SOFR + 1.961%, Cap N/A, Floor 1.961%) 144A
4.883%, 2/15/39(3)(4) | 247 | | 230 |
BX Trust 2019-OC11, D 144A
4.075%, 12/9/41(3)(4) | 1,379 | | 1,125 |
Cascade MH Asset Trust 2021-MH1, A1 144A
1.753%, 2/25/46(3) | 1,084 | | 935 |
CF Hippolyta Issuer LLC 2020-1, A1 144A
1.690%, 7/15/60(3) | 391 | | 347 |
| Chase Mortgage Finance Corp. | | | |
2016-SH1, M2 144A
3.750%, 4/25/45(3)(4) | 159 | | 134 |
2016-SH2, M2 144A
3.750%, 12/25/45(3)(4) | 342 | | 301 |
CHL Mortgage Pass-Through Trust 2004-6, 1A2
3.065%, 5/25/34(4) | 122 | | 114 |
| CIM Trust | | | |
2021-NR4, A1 144A
2.816%, 10/25/61(3)(4) | 433 | | 399 |
2022-R2, A1 144A
3.750%, 12/25/61(3)(4) | 229 | | 216 |
Citigroup Mortgage Loan Trust, Inc. 2018-RP1, A1 144A
3.000%, 9/25/64(3)(4) | 365 | | 354 |
| | Par Value | | Value |
| | | | |
| Non-Agency—continued | | |
COLT Mortgage Loan Trust 2022-5, A1 144A
4.550%, 4/25/67(3)(4) | $ 566 | | $ 539 |
COLT Trust 2020-RPL1, A1 144A
1.390%, 1/25/65(3)(4) | 149 | | 128 |
COMM Mortgage Trust 2020-CBM, B 144A
3.099%, 2/10/37(3) | 490 | | 442 |
CoreVest American Finance Issuer LLC 2021-RTL1, A1 144A
2.239%, 3/28/29(3)(4) | 290 | | 262 |
| CoreVest American Finance Trust | | | |
2019-3, C 144A
3.265%, 10/15/52(3) | 295 | | 247 |
2020-1, A1 144A
1.832%, 3/15/50(3) | 237 | | 222 |
2020-3, A 144A
1.358%, 8/15/53(3) | 480 | | 421 |
2020-4, A 144A
1.174%, 12/15/52(3) | 537 | | 473 |
| Credit Suisse Mortgage Capital Trust | | | |
2017-RPL1, A1 144A
2.750%, 7/25/57(3)(4) | 398 | | 382 |
2020-NQM1, A1 144A
1.208%, 5/25/65(3)(4) | 84 | | 77 |
2020-RPL4, A1 144A
2.000%, 1/25/60(3)(4) | 307 | | 273 |
2021-NQM1, A1 144A
0.809%, 5/25/65(3)(4) | 140 | | 130 |
2021-NQM2, A1 144A
1.179%, 2/25/66(3)(4) | 377 | | 327 |
Dominion Mortgage Trust 2021-RTL1, A1 144A
2.487%, 7/25/27(3)(4) | 875 | | 791 |
| Ellington Financial Mortgage Trust | | | |
2019-2, A3 144A
3.046%, 11/25/59(3)(4) | 41 | | 39 |
2021-2, A3 144A
1.291%, 6/25/66(3)(4) | 566 | | 469 |
2022-1, A1 144A
2.206%, 1/25/67(3)(4) | 397 | | 334 |
| FirstKey Homes Trust | | | |
2020-SFR2, B 144A
1.567%, 10/19/37(3) | 645 | | 577 |
2021-SFR1, D 144A
2.189%, 8/17/38(3) | 880 | | 745 |
Flagstar Mortgage Trust 2017-1, 1A3 144A
3.500%, 3/25/47(3)(4) | 88 | | 79 |
| Galton Funding Mortgage Trust | | | |
2017-1, A21 144A
3.500%, 7/25/56(3)(4) | 15 | | 14 |
2018-1, A23 144A
3.500%, 11/25/57(3)(4) | 24 | | 22 |
| | Par Value | | Value |
| | | | |
| Non-Agency—continued | | |
GCAT Trust 2020-NQM1, A1 144A
2.247%, 1/25/60(3)(4) | $ 26 | | $ 25 |
GCT Commercial Mortgage Trust 2021-GCT, A (1 month LIBOR + 0.800%, Cap N/A, Floor 0.800%) 144A
3.618%, 2/15/38(3)(4) | 1,080 | | 1,042 |
GS Mortgage Securities Trust 2020-GC45, AS
3.173%, 2/13/53(4) | 565 | | 472 |
GS Mortgage-Backed Securities Trust 2020-NQM1, A3 144A
2.352%, 9/27/60(3)(4) | 218 | | 201 |
Hilton USA Trust 2016-SFP, B 144A
3.323%, 11/5/35(3) | 500 | | 479 |
Home Partners of America Trust 2020-2, A 144A
1.532%, 1/17/41(3) | 486 | | 401 |
Imperial Fund Mortgage Trust 2021-NQM4, A1 144A
2.091%, 1/25/57(3)(4) | 1,182 | | 957 |
INTOWN Mortgage Trust 2022-STAY, A (1 month Term SOFR + 2.489%, Cap N/A, Floor 2.489%) 144A
5.334%, 8/15/37(3)(4) | 590 | | 583 |
| JPMorgan Chase Mortgage Trust | | | |
2014-1, 2A12 144A
3.500%, 1/25/44(3)(4) | 16 | | 15 |
2014-2, 2A2 144A
3.500%, 6/25/29(3)(4) | 21 | | 20 |
2017-1, A2 144A
3.450%, 1/25/47(3)(4) | 114 | | 100 |
2017-3, 2A2 144A
2.500%, 8/25/47(3)(4) | 52 | | 46 |
2017-4, A3 144A
3.500%, 11/25/48(3)(4) | 140 | | 130 |
2017-5, A1 144A
3.124%, 10/26/48(3)(4) | 100 | | 97 |
KKR Industrial Portfolio Trust 2021-KDIP, C (1 month LIBOR + 1.000%, Cap N/A, Floor 1.000%) 144A
3.818%, 12/15/37(3)(4) | 653 | | 618 |
KNDL Mortgage Trust 2019-KNSQ, A (1 month LIBOR + 0.800%, Cap N/A, Floor 0.800%) 144A
3.618%, 5/15/36(3)(4) | 565 | | 556 |
See Notes to Financial Statements
Tactical Allocation Fund
SCHEDULE OF INVESTMENTS (Continued)
September 30, 2022
($ reported in thousands)
| | Par Value | | Value |
| | | | |
| Non-Agency—continued | | |
| LHOME Mortgage Trust | | | |
2021-RTL1, A1 144A
2.090%, 9/25/26(3)(4) | $ 480 | | $ 461 |
2021-RTL2, A1 144A
2.090%, 6/25/26(3)(4) | 295 | | 279 |
MetLife Securitization Trust 2017-1A, M1 144A
3.421%, 4/25/55(3)(4) | 860 | | 769 |
| Mill City Mortgage Loan Trust | | | |
2017-1, M2 144A
3.250%, 11/25/58(3)(4) | 395 | | 373 |
2017-3, B1 144A
3.250%, 1/25/61(3)(4) | 365 | | 319 |
2019-1, M2 144A
3.500%, 10/25/69(3)(4) | 509 | | 433 |
| Morgan Stanley Bank of America Merrill Lynch Trust | | | |
2013-C13, AS
4.266%, 11/15/46 | 275 | | 269 |
2015-C22, AS
3.561%, 4/15/48 | 835 | | 783 |
2015-C25, A4
3.372%, 10/15/48 | 590 | | 559 |
| New Residential Mortgage Loan Trust | | | |
2014-1A, A 144A
3.750%, 1/25/54(3)(4) | 176 | | 164 |
2015-2A, A1 144A
3.750%, 8/25/55(3)(4) | 109 | | 101 |
2016-1A, A1 144A
3.750%, 3/25/56(3)(4) | 50 | | 47 |
2016-3A, B1 144A
4.000%, 9/25/56(3)(4) | 358 | | 328 |
2016-4A, A1 144A
3.750%, 11/25/56(3)(4) | 38 | | 35 |
2016-4A, B1A 144A
4.500%, 11/25/56(3)(4) | 490 | | 454 |
2017-2A, A3 144A
4.000%, 3/25/57(3)(4) | 80 | | 76 |
2019-NQM4, A1 144A
2.492%, 9/25/59(3)(4) | 135 | | 123 |
2019-RPL2, M2 144A
3.750%, 2/25/59(3)(4) | 660 | | 557 |
2020-1A, A1B 144A
3.500%, 10/25/59(3)(4) | 469 | | 437 |
2021-NQ2R, A1 144A
0.941%, 10/25/58(3)(4) | �� 177 | | 166 |
NLT Trust 2021-INV2, A1 144A
1.162%, 8/25/56(3)(4) | 455 | | 382 |
| OBX Trust | | | |
2019-INV1, A3 144A
4.500%, 11/25/48(3)(4) | 64 | | 61 |
2021-NQM3, A2 144A
1.260%, 7/25/61(3)(4) | 559 | | 448 |
| | Par Value | | Value |
| | | | |
| Non-Agency—continued | | |
Palisades Mortgage Loan Trust 2021-RTL1, A1 144A
2.857%, 6/25/26(3)(4) | $ 430 | | $ 403 |
| Preston Ridge Partners Mortgage LLC | | | |
2020-6, A1 144A
2.363%, 11/25/25(3)(4) | 711 | | 676 |
2021-2, A1 144A
2.115%, 3/25/26(3)(4) | 885 | | 826 |
2021-3, A1 144A
1.867%, 4/25/26(3)(4) | 452 | | 412 |
2021-9, A1 144A
2.363%, 10/25/26(3)(4) | 337 | | 311 |
2021-RPL1, A1 144A
1.319%, 7/25/51(3)(4) | 167 | | 149 |
Pretium Mortgage Credit Partners I LLC 2021-NPL1, A1 144A
2.240%, 9/27/60(3)(4) | 649 | | 614 |
| Progress Residential Trust | | | |
2019-SFR3, B 144A
2.571%, 9/17/36(3) | 460 | | 436 |
2021-SFR2, D 144A
2.197%, 4/19/38(3) | 940 | | 798 |
2021-SFR3, D 144A
2.288%, 5/17/26(3) | 450 | | 384 |
2021-SFR6, C 144A
1.855%, 7/17/38(3) | 145 | | 123 |
Provident Funding Mortgage Trust 2019-1, A2 144A
3.000%, 12/25/49(3)(4) | 239 | | 202 |
RCKT Mortgage Trust 2020-1, A1 144A
3.000%, 2/25/50(3)(4) | 268 | | 224 |
RCO VI Mortgage LLC 2022-1, A1 144A
3.000%, 1/25/27(3)(4) | 220 | | 206 |
RCO VII Mortgage LLC 2021-2, A1 144A
2.116%, 9/25/26(3)(4) | 305 | | 288 |
Residential Mortgage Loan Trust 2019-2, A1 144A
2.913%, 5/25/59(3)(4) | 61 | | 60 |
Roc Mortgage Trust 2021-RTL1, A1 144A
2.487%, 8/25/26(3)(4) | 865 | | 810 |
Sequoia Mortgage Trust 2013-8, B1
3.488%, 6/25/43(4) | 68 | | 64 |
SG Residential Mortgage Trust 2019-3, A1 144A
2.703%, 9/25/59(3)(4) | 89 | | 87 |
| Starwood Mortgage Residential Trust | | | |
2020-3, A1 144A
1.486%, 4/25/65(3)(4) | 113 | | 109 |
2021-3, A3 144A
1.518%, 6/25/56(3)(4) | 170 | | 139 |
| | Par Value | | Value |
| | | | |
| Non-Agency—continued | | |
| Towd Point Mortgage Trust | | | |
2016-1, M1 144A
3.500%, 2/25/55(3)(4) | $ 160 | | $ 158 |
2016-3, M1 144A
3.500%, 4/25/56(3)(4) | 1,080 | | 1,060 |
2016-4, B1 144A
3.823%, 7/25/56(3)(4) | 585 | | 535 |
2017-1, A2 144A
3.500%, 10/25/56(3)(4) | 485 | | 466 |
2017-1, M1 144A
3.750%, 10/25/56(3)(4) | 185 | | 172 |
2017-4, A2 144A
3.000%, 6/25/57(3)(4) | 936 | | 844 |
2018-6, A1B 144A
3.750%, 3/25/58(3)(4) | 420 | | 392 |
2018-6, A2 144A
3.750%, 3/25/58(3)(4) | 1,270 | | 1,139 |
2019-1, A1 144A
3.692%, 3/25/58(3)(4) | 404 | | 380 |
2019-2, A2 144A
3.750%, 12/25/58(3)(4) | 500 | | 439 |
2019-4, A2 144A
3.250%, 10/25/59(3)(4) | 650 | | 563 |
2020-MH1, A2 144A
2.500%, 2/25/60(3)(4)(5) | 1,115 | | 941 |
2021-1, A2 144A
2.750%, 11/25/61(3)(4) | 1,265 | | 992 |
| Tricon American Homes Trust | | | |
2019-SFR1, C 144A
3.149%, 3/17/38(3) | 435 | | 396 |
2020-SFR2, D 144A
2.281%, 11/17/39(3) | 880 | | 727 |
Tricon Residential Trust 2021-SFR1, B 144A
2.244%, 7/17/38(3) | 515 | | 450 |
TVC Mortgage Trust 2020-RTL1, M 144A
5.193%, 9/25/24(3)(4) | 510 | | 484 |
| VCAT LLC | | | |
2021-NPL2, A1 144A
2.115%, 3/27/51(3)(4) | 271 | | 256 |
2021-NPL3, A1 144A
1.743%, 5/25/51(3)(4) | 544 | | 499 |
2021-NPL4, A1 144A
1.868%, 8/25/51(3)(4) | 618 | | 567 |
Vericrest Opportunity Loan Trust C LLC 2021-NPL9, A1 144A
1.992%, 5/25/51(3)(4) | 230 | | 210 |
Vericrest Opportunity Loan Trust CVI LLC 2021-NP12, A1 144A
2.734%, 12/26/51(3)(4) | 229 | | 211 |
Vericrest Opportunity Loan Trust XCII LLC 2021-NPL1, A1 144A
1.893%, 2/27/51(3)(4) | 607 | | 551 |
See Notes to Financial Statements
Tactical Allocation Fund
SCHEDULE OF INVESTMENTS (Continued)
September 30, 2022
($ reported in thousands)
| | Par Value | | Value |
| | | | |
| Non-Agency—continued | | |
| Verus Securitization Trust | | | |
2019-4, M1 144A
3.207%, 11/25/59(3)(4) | $ 280 | | $ 256 |
2019-INV2, A1 144A
2.913%, 7/25/59(3)(4) | 88 | | 86 |
2022-4, A1 144A
4.474%, 4/25/67(3)(4) | 446 | | 425 |
2022-5, A1 144A
3.800%, 4/25/67(3)(4) | 825 | | 762 |
2022-7, A1 144A
5.152%, 7/25/67(3)(4) | 687 | | 668 |
| Visio Trust | | | |
2020-1R, A2 144A
1.567%, 11/25/55(3) | 150 | | 141 |
2021-1R, A1 144A
1.280%, 5/25/56(3) | 248 | | 226 |
Wells Fargo Commercial Mortgage Trust 2014-C24, AS
3.931%, 11/15/47 | 675 | | 644 |
| | | | 55,515 |
Total Mortgage-Backed Securities
(Identified Cost $62,250) | | 56,213 |
| | | | |
| |
| | | | |
| |
| Asset-Backed Securities—4.6% |
| Automobiles—2.9% | | |
American Credit Acceptance Receivables Trust 2021-2, C 144A
0.970%, 7/13/27(3) | 900 | | 878 |
AmeriCredit Automobile Receivables Trust 2020-3, C
1.060%, 8/18/26 | 1,245 | | 1,171 |
| Carvana Auto Receivables Trust | | | |
2019-2A, D 144A
3.280%, 1/15/25(3) | 537 | | 534 |
2019-3A, D 144A
3.040%, 4/15/25(3) | 575 | | 570 |
2020-P1, B
0.920%, 11/9/26 | 775 | | 704 |
2021-N3, D
1.580%, 6/12/28 | 585 | | 540 |
CIG Auto Receivables Trust 2020-1A, E 144A
4.430%, 2/12/27(3) | 545 | | 534 |
CPS Auto Receivables Trust 2020-C, C 144A
1.710%, 8/17/26(3) | 282 | | 280 |
| Credit Acceptance Auto Loan Trust | | | |
2020-3A, B 144A
1.770%, 12/17/29(3) | 540 | | 508 |
| | Par Value | | Value |
| | | | |
| Automobiles—continued | | |
2022-1A, A 144A
4.600%, 6/15/32(3) | $ 595 | | $ 580 |
Drive Auto Receivables Trust 2019-4, C
2.510%, 11/17/25 | 31 | | 31 |
| Exeter Automobile Receivables Trust | | | |
2018-4A, D 144A
4.350%, 9/16/24(3) | 61 | | 61 |
2019-1A, D 144A
4.130%, 12/16/24(3) | 67 | | 67 |
| First Investors Auto Owner Trust | | | |
2021-1A, C 144A
1.170%, 3/15/27(3) | 790 | | 743 |
2022-1A, C 144A
3.130%, 5/15/28(3) | 685 | | 632 |
| Flagship Credit Auto Trust | | | |
2020-3, C 144A
1.730%, 9/15/26(3) | 540 | | 516 |
2020-4, C 144A
1.280%, 2/16/27(3) | 965 | | 920 |
| Foursight Capital Automobile Receivables Trust | | | |
2019-1, E 144A
4.300%, 9/15/25(3) | 745 | | 742 |
2022-1, B 144A
2.150%, 5/17/27(3) | 545 | | 501 |
| GLS Auto Receivables Issuer Trust | | | |
2019-4A, C 144A
3.060%, 8/15/25(3) | 745 | | 734 |
2020-4A, C 144A
1.140%, 11/17/25(3) | 930 | | 911 |
GLS Auto Receivables Trust 2018-3A, C 144A
4.180%, 7/15/24(3) | 167 | | 167 |
LAD Auto Receivables Trust 2021-1A, D 144A
3.990%, 11/15/29(3) | 710 | | 639 |
Oscar US Funding XII LLC 2021-1A, A4 144A
1.000%, 4/10/28(3) | 550 | | 494 |
| Santander Drive Auto Receivables Trust | | | |
2020-4, C
1.010%, 1/15/26 | 1,290 | | 1,274 |
2021-3, C
0.950%, 9/15/27 | 880 | | 850 |
Skopos Auto Receivables Trust 2019-1A, C 144A
3.630%, 9/16/24(3) | 127 | | 127 |
United Auto Credit Securitization Trust 2021-1, C 144A
0.840%, 6/10/26(3) | 900 | | 889 |
| | Par Value | | Value |
| | | | |
| Automobiles—continued | | |
Veros Automobile Receivables Trust 2020-1, B 144A
2.190%, 6/16/25(3) | $ 114 | | $ 114 |
| | | | 16,711 |
| | | | |
| |
| Credit Card—0.2% | | |
Avant Credit Card Master Trust 2021-1A, A 144A
1.370%, 4/15/27(3) | 730 | | 662 |
Genesis Sales Finance Master Trust 2020-AA, A 144A
1.650%, 9/22/25(3) | 775 | | 758 |
| | | | 1,420 |
| | | | |
| |
| Other—1.5% | | |
| Aqua Finance Trust | | | |
2017-A, A 144A
3.720%, 11/15/35(3) | 19 | | 19 |
2019-A, C 144A
4.010%, 7/16/40(3) | 720 | | 659 |
2020-AA, B 144A
2.790%, 7/17/46(3) | 755 | | 687 |
Arby’s Funding LLC 2020-1A, A2 144A
3.237%, 7/30/50(3) | 813 | | 689 |
Bankers Healthcare Group Securitization Trust 2020-A, A 144A
2.560%, 9/17/31(3) | 174 | | 170 |
BHG Securitization Trust 2021-A, A 144A
1.420%, 11/17/33(3) | 537 | | 499 |
Cajun Global LLC 2021-1, A2 144A
3.931%, 11/20/51(3) | 425 | | 361 |
Diamond Resorts Owner Trust 2021-1A, A 144A
1.510%, 11/21/33(3) | 283 | | 258 |
Foundation Finance Trust 2021-1A, A 144A
1.270%, 5/15/41(3) | 415 | | 372 |
Jersey Mike’s Funding 2019-1A, A2 144A
4.433%, 2/15/50(3) | 516 | | 468 |
Mariner Finance Issuance Trust 2020-AA, A 144A
2.190%, 8/21/34(3) | 555 | | 536 |
MVW LLC 2020-1A, A 144A
1.740%, 10/20/37(3) | 538 | | 487 |
MVW Owner Trust 2016-1A, A 144A
2.250%, 12/20/33(3) | 53 | | 53 |
See Notes to Financial Statements
Tactical Allocation Fund
SCHEDULE OF INVESTMENTS (Continued)
September 30, 2022
($ reported in thousands)
| | Par Value | | Value |
| | | | |
| Other—continued | | |
Navient Private Education Refi Loan Trust 2021-EA, A 144A
0.970%, 12/16/69(3) | $ 680 | | $ 570 |
NBC Funding LLC 2021-1, A2 144A
2.989%, 7/30/51(3) | 586 | | 499 |
NMEF Funding LLC 2022-A, B 144A
3.350%, 10/16/28(3) | 525 | | 485 |
Octane Receivables Trust 2020-1A, A 144A
1.710%, 2/20/25(3) | 127 | | 126 |
Orange Lake Timeshare Trust 2019-A, B 144A
3.360%, 4/9/38(3) | 211 | | 198 |
Purchasing Power Funding LLC 2021-A, A 144A
1.570%, 10/15/25(3) | 900 | | 859 |
Trinity Rail Leasing LLC 2019-1A, A 144A
3.820%, 4/17/49(3) | 334 | | 307 |
Westgate Resorts LLC 2020-1A, A 144A
2.713%, 3/20/34(3) | 326 | | 317 |
| | | | 8,619 |
|
Total Asset-Backed Securities
(Identified Cost $28,485) | | 26,750 |
| | | | |
| |
| | | | |
| |
| Corporate Bonds and Notes—11.8% |
| Communication Services—0.4% | | |
Cable Onda S.A. 144A
4.500%, 1/30/30(3) | 460 | | 360 |
| CCO Holdings LLC | | | |
| 144A 6.375%, 9/1/29(3) | 54 | | 50 |
| 144A 4.750%, 3/1/30(3) | 250 | | 203 |
Level 3 Financing, Inc. 144A
4.250%, 7/1/28(3) | 555 | | 433 |
Sprint Spectrum Co. LLC 144A
4.738%, 3/20/25(3) | 250 | | 246 |
T-Mobile USA, Inc.
3.875%, 4/15/30 | 865 | | 767 |
TripAdvisor, Inc. 144A
7.000%, 7/15/25(3) | 395 | | 384 |
| | | | 2,443 |
| | | | |
| |
| Consumer Discretionary—0.6% | | |
Aramark Services, Inc. 144A
6.375%, 5/1/25(3) | 250 | | 245 |
| | Par Value | | Value |
| | | | |
| Consumer Discretionary—continued | | |
Ashtead Capital, Inc. 144A
5.500%, 8/11/32(3) | $ 255 | | $ 237 |
Brunswick Corp.
2.400%, 8/18/31 | 537 | | 373 |
Carriage Services, Inc. 144A
4.250%, 5/15/29(3) | 185 | | 146 |
Dick’s Sporting Goods, Inc.
3.150%, 1/15/32 | 486 | | 370 |
| Ford Motor Co. | | | |
| 3.250%, 2/12/32 | 406 | | 293 |
| 4.750%, 1/15/43 | 265 | | 176 |
M/I Homes, Inc.
4.950%, 2/1/28 | 370 | | 308 |
PulteGroup, Inc.
6.375%, 5/15/33 | 780 | | 736 |
Royal Caribbean Cruises Ltd. 144A
9.250%, 1/15/29(3) | 11 | | 11 |
Scientific Games International, Inc. 144A
7.000%, 5/15/28(3) | 290 | | 273 |
Tenneco, Inc. 144A
5.125%, 4/15/29(3) | 490 | | 484 |
| | | | 3,652 |
| | | | |
| |
| Consumer Staples—0.3% | | |
Albertsons Cos., Inc. 144A
3.500%, 3/15/29(3) | 45 | | 36 |
Bacardi Ltd. 144A
4.700%, 5/15/28(3) | 520 | | 486 |
BAT Capital Corp.
4.906%, 4/2/30 | 705 | | 622 |
Central American Bottling Corp. 144A
5.250%, 4/27/29(3) | 225 | | 194 |
Church & Dwight Co., Inc.
5.000%, 6/15/52 | 585 | | 539 |
| | | | 1,877 |
| | | | |
| |
| Energy—1.5% | | |
Aker BP ASA 144A
2.000%, 7/15/26(3) | 740 | | 638 |
Alliance Resource Operating Partners LP 144A
7.500%, 5/1/25(3) | 400 | | 389 |
| CrownRock LP | | | |
| 144A 5.625%, 10/15/25(3) | 300 | | 287 |
| 144A 5.000%, 5/1/29(3) | 270 | | 238 |
DCP Midstream Operating LP
3.250%, 2/15/32 | 210 | | 166 |
DT Midstream, Inc. 144A
4.125%, 6/15/29(3) | 360 | | 304 |
| | Par Value | | Value |
| | | | |
| Energy—continued | | |
Enbridge, Inc.
7.625%, 1/15/83 | $ 620 | | $ 598 |
Energy Transfer LP Series H
6.500% (6) | 515 | | 449 |
EQM Midstream Partners LP 144A
7.500%, 6/1/30(3) | 435 | | 411 |
Flex Intermediate Holdco LLC 144A
3.363%, 6/30/31(3) | 785 | | 611 |
HF Sinclair Corp. 144A
5.875%, 4/1/26(3) | 630 | | 618 |
Kinder Morgan Energy Partners LP
7.500%, 11/15/40 | 445 | | 459 |
Occidental Petroleum Corp.
6.125%, 1/1/31 | 355 | | 350 |
Odebrecht Oil & Gas Finance Ltd. 144A
0.000% (3)(6) | 25 | | — (7) |
Parsley Energy LLC 144A
4.125%, 2/15/28(3) | 330 | | 300 |
Pertamina Persero PT 144A
6.450%, 5/30/44(3)(8) | 980 | | 904 |
Petroleos de Venezuela S.A. 144A
6.000%, 5/16/24(3)(9) | 255 | | 5 |
Petroleos Mexicanos
7.690%, 1/23/50 | 560 | | 341 |
Reliance Industries Ltd. 144A
2.875%, 1/12/32(3) | 695 | | 544 |
Sabine Pass Liquefaction LLC
4.200%, 3/15/28 | 210 | | 192 |
Transcanada Trust
5.600%, 3/7/82 | 685 | | 594 |
Transocean Guardian Ltd. 144A
5.875%, 1/15/24(3) | 73 | | 69 |
Venture Global Calcasieu Pass LLC 144A
3.875%, 8/15/29(3) | 305 | | 262 |
| | | | 8,729 |
| | | | |
| |
| Financials—3.7% | | |
Allstate Corp. (The) Series B
5.750%, 8/15/53 | 565 | | 520 |
Ally Financial, Inc. Series B
4.700% (6) | 548 | | 427 |
Ascot Group Ltd. 144A
4.250%, 12/15/30(3) | 745 | | 621 |
See Notes to Financial Statements
Tactical Allocation Fund
SCHEDULE OF INVESTMENTS (Continued)
September 30, 2022
($ reported in thousands)
| | Par Value | | Value |
| | | | |
| Financials—continued | | |
Banco Mercantil del Norte S.A. 144A
6.625% (3)(6) | $ 620 | | $ 486 |
| Bank of America Corp. | | | |
| 2.687%, 4/22/32 | 1,725 | | 1,347 |
| 2.482%, 9/21/36 | 750 | | 542 |
Bank of New York Mellon Corp. (The) Series G
4.700% (6) | 710 | | 680 |
BBVA Bancomer S.A. 144A
5.125%, 1/18/33(3) | 540 | | 446 |
Blackstone Private Credit Fund
2.625%, 12/15/26 | 313 | | 257 |
Blue Owl Finance LLC 144A
3.125%, 6/10/31(3) | 415 | | 295 |
Brighthouse Financial, Inc.
5.625%, 5/15/30 | 648 | | 607 |
Brookfield Finance, Inc.
2.724%, 4/15/31 | 1,200 | | 953 |
Burford Capital Global Finance LLC 144A
6.250%, 4/15/28(3) | 200 | | 175 |
Capital One Financial Corp.
2.359%, 7/29/32 | 573 | | 406 |
Charles Schwab Corp. (The) Series H
4.000% (6) | 775 | | 569 |
Citadel LP 144A
4.875%, 1/15/27(3) | 565 | | 527 |
Citigroup, Inc. (SOFR + 1.280%)
4.039%, 2/24/28(4) | 339 | | 326 |
Corebridge Financial, Inc. 144A
6.875%, 12/15/52(3) | 565 | | 517 |
Doric Nimrod Air Alpha Pass-Through Trust 2013-1, A 144A
5.250%, 5/30/23(3) | 27 | | 27 |
Drawbridge Special Opportunities Fund LP 144A
3.875%, 2/15/26(3) | 770 | | 699 |
Goldman Sachs Group, Inc. (The)
1.992%, 1/27/32 | 365 | | 270 |
Jefferies Group LLC
2.625%, 10/15/31 | 920 | | 667 |
| JPMorgan Chase & Co. | | | |
| 5.717%, 9/14/33 | 495 | | 468 |
(SOFR + 1.180%)
3.922%, 2/24/28(4) | 530 | | 509 |
| 1.953%, 2/4/32 | 1,445 | | 1,069 |
| | Par Value | | Value |
| | | | |
| Financials—continued | | |
Ladder Capital Finance Holdings LLLP 144A
4.250%, 2/1/27(3) | $ 420 | | $ 338 |
Liberty Mutual Group, Inc. 144A
4.125%, 12/15/51(3) | 525 | | 406 |
Lincoln National Corp. (3 month LIBOR + 2.040%)
4.750%, 4/20/67(4) | 615 | | 464 |
MetLife, Inc. Series G
3.850% (6) | 695 | | 622 |
Morgan Stanley
6.375%, 7/24/42 | 580 | | 602 |
OneMain Finance Corp.
6.875%, 3/15/25 | 285 | | 268 |
OWL Rock Core Income Corp.
4.700%, 2/8/27 | 384 | | 336 |
| Prudential Financial, Inc. | | | |
| 5.625%, 6/15/43 | 720 | | 709 |
| 5.125%, 3/1/52 | 179 | | 155 |
| 6.000%, 9/1/52 | 104 | | 97 |
Santander Holdings USA, Inc.
4.400%, 7/13/27 | 640 | | 589 |
State Street Corp.
4.164%, 8/4/33 | 590 | | 532 |
Texas Capital Bancshares, Inc.
4.000%, 5/6/31 | 805 | | 693 |
| Wells Fargo & Co. | | | |
| 2.393%, 6/2/28 | 950 | | 815 |
Series BB
3.900%(6) | 1,155 | | 977 |
Zions Bancorp NA
3.250%, 10/29/29 | 405 | | 333 |
| | | | 21,346 |
| | | | |
| |
| Health Care—0.6% | | |
Bausch Health Cos., Inc. 144A
5.750%, 8/15/27(3) | 155 | | 106 |
| Bio-Rad Laboratories, Inc. | | | |
| 3.300%, 3/15/27 | 376 | | 341 |
| 3.700%, 3/15/32 | 119 | | 100 |
DENTSPLY SIRONA, Inc.
3.250%, 6/1/30 | 605 | | 467 |
HCA, Inc.
5.250%, 6/15/49 | 415 | | 338 |
Illumina, Inc.
2.550%, 3/23/31 | 370 | | 284 |
Par Pharmaceutical, Inc. 144A
7.500%, 4/1/27(3)(10) | 185 | | 146 |
| | Par Value | | Value |
| | | | |
| Health Care—continued | | |
Surgery Center Holdings, Inc. 144A
6.750%, 7/1/25(3) | $ 10 | | $ 9 |
Teva Pharmaceutical Finance Netherlands III B.V.
3.150%, 10/1/26 | 505 | | 412 |
Universal Health Services, Inc. 144A
2.650%, 1/15/32(3) | 685 | | 484 |
Utah Acquisition Sub, Inc.
3.950%, 6/15/26 | 535 | | 488 |
| Viatris, Inc. | | | |
| 2.300%, 6/22/27 | 481 | | 393 |
| 144A 2.300%, 6/22/27(3) | 1 | | — (7) |
| | | | 3,568 |
| | | | |
| |
| Industrials—1.3% | | |
Alaska Airlines Pass-Through Trust 2020-1, A 144A
4.800%, 8/15/27(3) | 797 | | 752 |
Aviation Capital Group LLC 144A
3.500%, 11/1/27(3) | 560 | | 465 |
Avolon Holdings Funding Ltd. 144A
4.375%, 5/1/26(3) | 565 | | 505 |
BlueLinx Holdings, Inc. 144A
6.000%, 11/15/29(3) | 505 | | 396 |
Boeing Co. (The)
5.930%, 5/1/60 | 370 | | 317 |
British Airways Pass-Through Trust 2021-1, A 144A
2.900%, 3/15/35(3) | 606 | | 492 |
Ferguson Finance plc 144A
4.650%, 4/20/32(3) | 730 | | 643 |
Fortress Transportation & Infrastructure Investors LLC 144A
6.500%, 10/1/25(3) | 24 | | 23 |
GFL Environmental, Inc. 144A
3.750%, 8/1/25(3) | 400 | | 366 |
Global Infrastructure Solutions, Inc. 144A
7.500%, 4/15/32(3) | 500 | | 380 |
Huntington Ingalls Industries, Inc.
2.043%, 8/16/28 | 778 | | 629 |
See Notes to Financial Statements
Tactical Allocation Fund
SCHEDULE OF INVESTMENTS (Continued)
September 30, 2022
($ reported in thousands)
| | Par Value | | Value |
| | | | |
| Industrials—continued | | |
Kazakhstan Temir Zholy Finance B.V. 144A
6.950%, 7/10/42(3) | $ 440 | | $ 434 |
| Masco Corp. | | | |
| 2.000%, 2/15/31 | 365 | | 273 |
| 3.125%, 2/15/51 | 365 | | 220 |
Pentair Finance S.a.r.l.
5.900%, 7/15/32 | 560 | | 529 |
Science Applications International Corp. 144A
4.875%, 4/1/28(3) | 335 | | 298 |
Sempra Global 144A
3.250%, 1/15/32(3) | 729 | | 580 |
Spirit AeroSystems, Inc. 144A
5.500%, 1/15/25(3) | 220 | | 208 |
TransDigm, Inc.
5.500%, 11/15/27 | 260 | | 226 |
| | | | 7,736 |
| | | | |
| |
| Information Technology—1.0% | | |
Broadcom, Inc.
4.150%, 11/15/30 | 712 | | 616 |
CDW LLC
3.569%, 12/1/31 | 1,044 | | 813 |
| Consensus Cloud Solutions, Inc. | | | |
| 144A 6.000%, 10/15/26(3) | 50 | | 44 |
| 144A 6.500%, 10/15/28(3) | 320 | | 272 |
Dell International LLC
8.100%, 7/15/36 | 594 | | 628 |
Entegris Escrow Corp. 144A
4.750%, 4/15/29(3) | 758 | | 668 |
HP, Inc.
5.500%, 1/15/33 | 710 | | 630 |
Kyndryl Holdings, Inc.
2.700%, 10/15/28 | 433 | | 317 |
Leidos, Inc.
2.300%, 2/15/31 | 800 | | 593 |
Motorola Solutions, Inc.
4.600%, 5/23/29 | 265 | | 244 |
Oracle Corp.
3.850%, 4/1/60 | 140 | | 85 |
TD SYNNEX Corp.
2.375%, 8/9/28 | 715 | | 576 |
| | | | 5,486 |
| | | | |
| |
| Materials—1.0% | | |
Albemarle Corp.
5.050%, 6/1/32 | 640 | | 593 |
Avient Corp. 144A
7.125%, 8/1/30(3) | 295 | | 272 |
Bayport Polymers LLC 144A
5.140%, 4/14/32(3) | 785 | | 714 |
| | Par Value | | Value |
| | | | |
| Materials—continued | | |
| Celanese U.S. Holdings LLC | | | |
| 5.900%, 7/5/24 | $ 185 | | $ 182 |
| 6.165%, 7/15/27 | 160 | | 151 |
Cleveland-Cliffs, Inc. 144A
6.750%, 3/15/26(3) | 560 | | 551 |
FMG Resources August 2006 Pty Ltd. 144A
5.875%, 4/15/30(3) | 495 | | 431 |
Freeport-McMoRan, Inc.
5.450%, 3/15/43 | 575 | | 480 |
Glencore Funding LLC 144A
2.850%, 4/27/31(3) | 750 | | 580 |
International Flavors & Fragrances, Inc. 144A
2.300%, 11/1/30(3) | 635 | | 488 |
Inversiones CMPC S.A. 144A
3.850%, 1/13/30(3) | 870 | | 702 |
Suzano Austria GmbH
2.500%, 9/15/28 | 295 | | 230 |
Teck Resources Ltd.
6.125%, 10/1/35 | 540 | | 506 |
| | | | 5,880 |
| | | | |
| |
| Real Estate—1.0% | | |
EPR Properties
4.750%, 12/15/26 | 865 | | 768 |
| GLP Capital LP | | | |
| 5.750%, 6/1/28 | 655 | | 613 |
| 3.250%, 1/15/32 | 72 | | 54 |
Kite Realty Group Trust
4.750%, 9/15/30 | 780 | | 678 |
| MPT Operating Partnership LP | | | |
| 4.625%, 8/1/29 | 115 | | 93 |
| 3.500%, 3/15/31 | 450 | | 313 |
Office Properties Income Trust
4.500%, 2/1/25 | 555 | | 494 |
Ontario Teachers’ Cadillac Fairview Properties Trust 144A
2.500%, 10/15/31(3) | 870 | | 680 |
Phillips Edison Grocery Center Operating Partnership I LP
2.625%, 11/15/31 | 760 | | 552 |
Retail Opportunity Investments Partnership LP
4.000%, 12/15/24 | 485 | | 464 |
Service Properties Trust
4.950%, 2/15/27 | 375 | | 278 |
| VICI Properties LP | | | |
| 4.950%, 2/15/30 | 350 | | 316 |
| | Par Value | | Value |
| | | | |
| Real Estate—continued | | |
| 5.125%, 5/15/32 | $ 350 | | $ 310 |
| | | | 5,613 |
| | | | |
| |
| Utilities—0.4% | | |
Brooklyn Union Gas Co. (The) 144A
4.866%, 8/5/32(3) | 805 | | 737 |
Perusahaan Perseroan Persero PT Perusahaan Listrik Negara 144A
4.125%, 5/15/27(3) | 210 | | 193 |
| Puget Energy, Inc. | | | |
| 2.379%, 6/15/28 | 453 | | 377 |
| 4.224%, 3/15/32 | 315 | | 272 |
Southern Co. (The) Series 21-A
3.750%, 9/15/51 | 794 | | 644 |
Vistra Corp. 144A
8.000% (3)(6) | 255 | | 234 |
| | | | 2,457 |
Total Corporate Bonds and Notes
(Identified Cost $81,624) | | 68,787 |
| Leveraged Loans—1.9% |
| Aerospace—0.3% | | |
Air Canada (3 month LIBOR + 3.500%)
6.421%, 8/11/28(4) | 78 | | 73 |
Brown Group Holding LLC (1 month LIBOR + 2.500%)
5.615%, 6/7/28(4) | 319 | | 303 |
Delta Air Lines, Inc. (3 month LIBOR + 3.750%)
6.460%, 10/20/27(4) | 235 | | 235 |
KKR Apple Bidco LLC (1 month LIBOR + 2.750%)
5.865%, 9/22/28(4) | 342 | | 326 |
Mileage Plus Holdings, LLC (3 month LIBOR + 5.250%)
8.777%, 6/21/27(4) | 228 | | 229 |
TransDigm, Inc. Tranche E (3 month LIBOR + 2.750%)
5.924%, 5/30/25(4) | 243 | | ��233 |
| | | | 1,399 |
| | | | |
| |
| Chemicals—0.1% | | |
Ineos U.S. Finance LLC 2024 (1 month LIBOR + 2.000%)
5.115%, 4/1/24(4) | 682 | | 658 |
See Notes to Financial Statements
Tactical Allocation Fund
SCHEDULE OF INVESTMENTS (Continued)
September 30, 2022
($ reported in thousands)
| | Par Value | | Value |
| | | | |
| Consumer Durables—0.0% | | |
Resideo Funding, Inc. Tranche B (2 month LIBOR + 2.250%)
5.010% - 5.570%, 2/11/28(4) | $ 245 | | $ 237 |
| Energy—0.1% | | |
Citgo Petroleum Corp. 2019, Tranche B (1 month LIBOR + 6.250%)
9.365%, 3/28/24(4) | 255 | | 255 |
Freeport LNG Investments LLP Tranche B (3 month LIBOR + 3.500%)
6.210%, 12/21/28(4) | 248 | | 229 |
Oryx Midstream Services Permian Basin LLC Tranche B (3 month LIBOR + 3.250%)
6.211%, 10/5/28(4) | 218 | | 211 |
| | | | 695 |
| | | | |
| |
| Financials—0.1% | | |
Blackhawk Network Holdings, Inc. First Lien (1 month Term SOFR + 3.000%)
6.034%, 6/15/25(4) | 370 | | 345 |
Citadel Securities LP Tranche B (1 month Term SOFR + 3.114%)
6.149%, 2/2/28(4) | 146 | | 144 |
| | | | 489 |
| | | | |
| |
| Food / Tobacco—0.1% | | |
CHG PPC Parent LLC 2021-1 (1 month LIBOR + 3.000%)
6.125%, 12/8/28(4) | 154 | | 147 |
Hostess Brands LLC 2019, Tranche B (1-3 month LIBOR + 2.250%)
5.056% - 5.365%, 8/3/25(4) | 296 | | 286 |
| | | | 433 |
| | | | |
| |
| Forest Prod / Containers—0.1% | | |
Berry Global, Inc. Tranche Z (3 month LIBOR + 1.750%)
4.178%, 7/1/26(4) | 248 | | 240 |
| | Par Value | | Value |
| | | | |
| Gaming / Leisure—0.3% | | |
Caesars Resort Collection LLC Tranche B (1 month LIBOR + 2.750%)
5.865%, 12/23/24(4) | $ 592 | | $ 578 |
Hilton Worldwide Finance LLC Tranche B-2 (1 month LIBOR + 1.750%)
4.834%, 6/22/26(4) | 245 | | 237 |
PUG LLC Tranche B (1 month LIBOR + 3.500%)
6.615%, 2/12/27(4) | 127 | | 109 |
Scientific Games Holdings LP (3 month Term SOFR + 3.500%)
5.617%, 4/4/29(4) | 95 | | 88 |
Scientific Games International, Inc. Tranche B (1 month Term SOFR + 3.100%)
5.906%, 4/13/29(4) | 135 | | 130 |
Station Casinos LLC Tranche B-1 (1 month LIBOR + 2.750%)
5.370%, 2/8/27(4) | 240 | | 229 |
UFC Holdings LLC Tranche B-3 (3 month LIBOR + 2.750%)
5.520%, 4/29/26(4) | 242 | | 232 |
| | | | 1,603 |
| | | | |
| |
| Health Care—0.1% | | |
Agiliti Health, Inc. (1 month LIBOR + 2.750%)
5.375%, 1/4/26(4) | 163 | | 158 |
LifePoint Health, Inc. Tranche B, First Lien (1 month LIBOR + 3.750%)
6.871%, 11/16/25(4) | 221 | | 204 |
Perrigo Investments LLC Tranche B (1 month Term SOFR + 2.600%)
5.634%, 4/20/29(4) | 344 | | 338 |
| | | | 700 |
| | | | |
| |
| Housing—0.0% | | |
Standard Industries, Inc. (3 month LIBOR + 2.500%)
6.675%, 9/22/28(4) | 245 | | 237 |
| Information Technology—0.2% | | |
Applied Systems, Inc. First Lien (3 month LIBOR + 3.000%)
6.674%, 9/19/24(4) | 389 | | 379 |
| | Par Value | | Value |
| | | | |
| Information Technology—continued | | |
CCC Intelligent Solutions, Inc. Tranche B (1 month LIBOR + 1.250%)
4.365%, 9/21/28(4) | $ 248 | | $ 239 |
Sophia LP Tranche B (3 month LIBOR + 3.500%)
7.174%, 10/7/27(4) | 242 | | 232 |
Tenable, Inc. (3 month LIBOR + 2.750%)
5.556%, 7/7/28(4) | 242 | | 230 |
UKG, Inc. 2021-2, First Lien (3 month LIBOR + 3.250%)
5.535%, 5/4/26(4) | 245 | | 233 |
| | | | 1,313 |
| | | | |
| |
| Manufacturing—0.1% | | |
Alliance Laundry Systems LLC Tranche B (1 month LIBOR + 3.500%)
5.955%, 10/8/27(4) | 248 | | 238 |
NCR Corp. (3 month LIBOR + 2.500%)
5.310%, 8/28/26(4) | 248 | | 237 |
| | | | 475 |
| | | | |
| |
| Media / Telecom - Broadcasting—0.0% | | |
Nexstar Broadcasting, Inc. Tranche B-4 (1 month LIBOR + 2.500%)
5.615%, 9/18/26(4) | 160 | | 157 |
Media / Telecom - Cable/Wireless
Video—0.0% | | |
DIRECTV Financing LLC (1 month LIBOR + 5.000%)
8.115%, 8/2/27(4) | 237 | | 221 |
Media / Telecom -
Telecommunications—0.0% | | |
CenturyLink, Inc. Tranche B (1 month LIBOR + 2.750%)
5.365%, 3/15/27(4) | 101 | | 92 |
Media / Telecom - Wireless
Communications—0.1% | | |
SBA Senior Finance II LLC Tranche B (1 month LIBOR + 1.750%)
4.870%, 4/11/25(4) | 359 | | 348 |
See Notes to Financial Statements
Tactical Allocation Fund
SCHEDULE OF INVESTMENTS (Continued)
September 30, 2022
($ reported in thousands)
| | Par Value | | Value |
| | | | |
| Service—0.2% | | |
| Dun & Bradstreet Corp. (The) | | | |
2022, Tranche B-2 (1 month Term SOFR + 3.250%)
6.282%, 1/18/29(4) | $ 30 | | $ 29 |
Tranche B (1 month LIBOR + 3.250%)
6.330%, 2/6/26(4) | 234 | | 226 |
NAB Holdings LLC First Lien (3 month Term SOFR + 3.150%)
6.703%, 11/23/28(4) | 248 | | 235 |
Peraton Corp. Tranche B, First Lien (1 month LIBOR + 3.750%)
6.865%, 2/1/28(4) | 318 | | 301 |
PODS LLC (1 month LIBOR + 3.000%)
6.115%, 3/31/28(4) | 250 | | 236 |
| | | | 1,027 |
| Transportation - Automotive—0.1% | | |
Cooper-Standard Automotive, Inc. Tranche B-1 (1 month LIBOR + 2.000%)
5.115%, 11/2/23(4) | 486 | | 448 |
| Utilities—0.0% | | |
Brookfield WEC Holdings, Inc. (1 month LIBOR + 2.750%)
5.865%, 8/1/25(4) | 241 | | 230 |
Total Leveraged Loans
(Identified Cost $11,428) | | 11,002 |
| | Shares | |
| Preferred Stocks—0.3% |
| Financials—0.2% | |
| JPMorgan Chase & Co. Series HH, 4.600% | 304 (11) | 265 |
| MetLife, Inc. Series D, 5.875% | 277 (11) | 252 |
| Truist Financial Corp. Series Q, 5.100% | 680 (11) | 603 |
| Zions Bancorp NA, 6.950% | 6,400 | 163 |
| | | 1,283 |
| | | |
| |
| Industrials—0.1% | |
| General Electric Co. Series D (3 month LIBOR + 3.330%), 6.623%(4) | 725 (11) | 678 |
Total Preferred Stocks
(Identified Cost $2,075) | 1,961 |
| | Shares | | Value |
| | | | |
| | | | |
| Common Stocks—60.7% |
| Communication Services—6.0% | | |
| Adevinta ASA Class B(12) | 199,477 | | $ 1,188 |
| Auto Trader Group plc | 677,940 | | 3,845 |
| Baltic Classifieds Group plc | 2,463,417 | | 3,735 |
| Dayamitra Telekomunikasi PT | 47,262,000 | | 2,245 |
| Infrastrutture Wireless Italiane SpA | 207,635 | | 1,811 |
| Meta Platforms, Inc. Class A(12) | 23,121 | | 3,137 |
| Moneysupermarket.com Group plc | 547,003 | | 1,129 |
| New Work SE | 15,527 | | 1,857 |
| Rightmove plc | 660,295 | | 3,523 |
| Trade Desk, Inc. (The) Class A(12) | 143,658 | | 8,584 |
| ZoomInfo Technologies, Inc. Class A(12) | 82,546 | | 3,439 |
| | | | 34,493 |
| Consumer Discretionary—11.8% | | |
| Airbnb, Inc. Class A(12) | 52,138 | | 5,477 |
| Allegro.eu S.A.(12) | 401,378 | | 1,727 |
| Amazon.com, Inc.(12) | 230,454 | | 26,041 |
| AutoZone, Inc.(12) | 1,627 | | 3,485 |
| Home Depot, Inc. (The) | 19,872 | | 5,483 |
| Marriott International, Inc. Class A | 49,419 | | 6,926 |
| Max Stock Ltd. | 572,792 | | 832 |
| MercadoLibre, Inc.(12) | 4,639 | | 3,840 |
| Mercari, Inc.(12) | 163,400 | | 2,179 |
| NIKE, Inc. Class B | 85,827 | | 7,134 |
| Ross Stores, Inc. | 55,627 | | 4,688 |
| Victorian Plumbing Group plc(12) | 1,405,019 | | 567 |
| | | | 68,379 |
| Consumer Staples—4.3% | | |
| Anhui Gujing Distillery Co., Ltd. Class B | 159,800 | | 2,361 |
| Estee Lauder Cos., Inc. (The) Class A | 25,337 | | 5,470 |
| Heineken Malaysia Bhd | 509,500 | | 2,616 |
| McCormick & Co., Inc. Non-voting Shares | 62,717 | | 4,470 |
| Monster Beverage Corp.(12) | 69,211 | | 6,019 |
| Procter & Gamble Co. (The) | 30,696 | | 3,875 |
| | | | 24,811 |
| Energy—1.8% | | |
| Devon Energy Corp. | 40,737 | | 2,449 |
| Frontera Energy Corp.(12) | 300 | | 2 |
| Hess Corp. | 25,385 | | 2,767 |
| Pason Systems, Inc. | 173,647 | | 1,662 |
| Pioneer Natural Resources Co. | 16,985 | | 3,678 |
| | | | 10,558 |
| | Shares | | Value |
| | | | |
| Financials—5.0% | | |
| Bank of America Corp. | 226,871 | | $ 6,851 |
| CME Group, Inc. Class A | 27,330 | | 4,841 |
| FinecoBank Banca Fineco SpA | 221,980 | | 2,742 |
| Gruppo MutuiOnline SpA | 75,613 | | 1,480 |
| Hargreaves Lansdown plc | 142,299 | | 1,363 |
| Hypoport SE(12) | 4,989 | | 440 |
| MarketAxess Holdings, Inc. | 15,469 | | 3,442 |
| Mortgage Advice Bureau Holdings Ltd. | 248,987 | | 1,770 |
| Nordnet AB publ | 66,366 | | 751 |
| Progressive Corp. (The) | 45,005 | | 5,230 |
| VNV Global AB(12) | 169,419 | | 342 |
| | | | 29,252 |
| | | | |
| |
| Health Care—5.3% | | |
| Danaher Corp. | 37,826 | | 9,770 |
| Haw Par Corp., Ltd. | 547,500 | | 3,901 |
| HealthEquity, Inc.(12) | 42,401 | | 2,848 |
| Mettler-Toledo International, Inc.(12) | 2,519 | | 2,731 |
| Nakanishi, Inc. | 80,900 | | 1,479 |
| Zoetis, Inc. Class A | 68,050 | | 10,091 |
| | | | 30,820 |
| Industrials—7.1% | | |
| Boa Vista Servicos S.A. | 1,472,564 | | 1,613 |
| CAE, Inc.(12) | 117,106 | | 1,797 |
| CoStar Group, Inc.(12) | 107,296 | | 7,473 |
| Enento Group Oyj(12) | 65,677 | | 1,353 |
| Equifax, Inc. | 27,025 | | 4,633 |
| Fair Isaac Corp.(12) | 11,402 | | 4,698 |
| Haitian International Holdings Ltd. | 1,294,337 | | 2,449 |
| HeadHunter Group plc ADR(5) | 115,928 | | — (7) |
| Howden Joinery Group plc | 251,522 | | 1,405 |
| Knorr-Bremse AG | 44,447 | | 1,909 |
| Marel HF | 329,459 | | 998 |
| Meitec Corp. | 143,400 | | 2,269 |
| MTU Aero Engines AG | 19,904 | | 2,975 |
| S-1 Corp. | 72,665 | | 2,927 |
| Uber Technologies, Inc.(12) | 180,152 | | 4,774 |
| | | | 41,273 |
| Information Technology—17.8% | | |
| Accenture plc Class A | 25,282 | | 6,505 |
| Alten S.A. | 27,211 | | 2,990 |
| Amphenol Corp. Class A | 156,415 | | 10,474 |
| Bill.com Holdings, Inc.(12) | 64,636 | | 8,556 |
| Block, Inc. Class A(12) | 49,728 | | 2,735 |
| Bouvet ASA | 424,107 | | 2,118 |
| Brockhaus Technologies AG(12) | 52,904 | | 799 |
| DocuSign, Inc.(12) | 33,610 | | 1,797 |
| Duck Creek Technologies, Inc.(12) | 215,166 | | 2,550 |
| FDM Group Holdings plc | 183,032 | | 1,272 |
| MongoDB, Inc. Class A(12) | 14,972 | | 2,973 |
See Notes to Financial Statements
Tactical Allocation Fund
SCHEDULE OF INVESTMENTS (Continued)
September 30, 2022
($ reported in thousands)
| | Shares | | Value |
| | | | |
| Information Technology—continued | | |
| NVIDIA Corp. | 86,342 | | $ 10,481 |
| Paycom Software, Inc.(12) | 43,536 | | 14,366 |
| Roper Technologies, Inc. | 17,485 | | 6,288 |
| Snowflake, Inc. Class A(12) | 38,075 | | 6,471 |
| Visa, Inc. Class A | 90,608 | | 16,096 |
| Workday, Inc. Class A(12) | 44,912 | | 6,836 |
| | | | 103,307 |
| Materials—1.0% | | |
| Corp. Moctezuma SAB de C.V. | 721,710 | | 2,200 |
| Ecolab, Inc. | 25,630 | | 3,701 |
| | | | 5,901 |
| Real Estate—0.6% | | |
| Prologis, Inc. | 34,810 | | 3,537 |
Total Common Stocks
(Identified Cost $293,938) | | 352,331 |
|
|
| Exchange-Traded Fund—0.2% |
| iShares JP Morgan USD Emerging Markets Bond ETF(13) | 13,077 | | 1,038 |
Total Exchange-Traded Fund
(Identified Cost $1,180) | | 1,038 |
| Warrant—0.0% |
| Financials—0.0% | | |
| VNV Global AB(12) | 88,478 | | 1 |
Total Warrant
(Identified Cost $—) | | 1 |
Total Long-Term Investments—97.1%
(Identified Cost $538,588) | | 563,466 |
| Short-Term Investment—2.6% |
| Money Market Mutual Fund—2.6% |
| Dreyfus Government Cash Management Fund - Institutional Shares (seven-day effective yield 2.748%)(13) | 14,741,910 | | 14,742 |
Total Short-Term Investment
(Identified Cost $14,742) | | 14,742 |
| | Shares | | Value |
| | | | |
| | | | |
| Securities Lending Collateral—0.0% |
| Dreyfus Government Cash Management Fund - Institutional Shares (seven-day effective yield 2.748%)(13)(14) | 145,700 | | $ 146 |
Total Securities Lending Collateral
(Identified Cost $146) | | 146 |
|
|
TOTAL INVESTMENTS—99.7%
(Identified Cost $553,476) | | $578,354 |
| Other assets and liabilities, net—0.3% | | 1,938 |
| NET ASSETS—100.0% | | $580,292 |
| Abbreviations: |
| ADR | American Depositary Receipt |
| BAM | Build America Municipal Insured |
| ETF | Exchange-Traded Fund |
| GS | Goldman Sachs & Co. |
| LIBOR | London Interbank Offered Rate |
| LLC | Limited Liability Company |
| LLLP | Limited Liability Limited Partnership |
| LLP | Limited Liability Partnership |
| LP | Limited Partnership |
| NA | National Association |
| SOFR | Secured Overnight Financing Rate |
| Footnote Legend: |
| (1) | Security in default; no interest payments are being received. |
| (2) | Regulation S security. Security is offered and sold outside of the United States; therefore, it is exempt from registration with the SEC under Rules 903 and 904 of the Securities Act of 1933. |
| (3) | Security exempt from registration under Rule 144A of the Securities Act of 1933. These securities may be resold in transactions exempt from registration, normally to qualified institutional buyers. At September 30, 2022, these securities amounted to a value of $102,160 or 17.6% of net assets. |
| (4) | Variable rate security. Rate disclosed is as of September 30, 2022. Information in parenthesis represents benchmark and reference rate for each security. Certain variable rate securities are not based on a published reference rate and spread but are determined by the issuer or agent and are based on current market conditions, or, for mortgage-backed securities, are impacted by the individual mortgages which are paying off over time. These securities do not indicate a reference rate and spread in their descriptions. |
| (5) | The value of this security was determined using significant unobservable inputs and is reported as a Level 3 security in the Fair Value Hierarchy table located after the Schedule of Investments. |
| (6) | No contractual maturity date. |
| (7) | Amount is less than $500. |
| (8) | All or a portion of security is on loan. |
| (9) | Security in default; no interest payments are being received during the bankruptcy proceedings. |
| (10) | Security in default, interest payments are being received during the bankruptcy proceedings. |
| (11) | Value shown as par value. |
| (12) | Non-income producing. |
| (13) | Shares of this fund are publicly offered, and its prospectus and annual report are publicly available. |
| (14) | Represents security purchased with cash collateral received for securities on loan. |
| Country Weightings (Unaudited)† |
| United States | 84% |
| United Kingdom | 3 |
| Germany | 1 |
| Canada | 1 |
| Japan | 1 |
| Italy | 1 |
| Brazil | 1 |
| Other | 8 |
| Total | 100% |
| † % of total investments as of September 30, 2022. |
For information regarding the abbreviations, see the Key Investment Terms starting on page 6.
See Notes to Financial Statements
Tactical Allocation Fund
SCHEDULE OF INVESTMENTS (Continued)
September 30, 2022
($ reported in thousands)
The following table summarizes the value of the Fund’s investments as of September 30, 2022, based on the inputs used to value them (See Security Valuation Note 2A in the Notes to Financial Statements):
| | Total
Value at
September 30, 2022 | | Level 1
Quoted Prices | | Level 2
Significant
Observable
Inputs | | Level 3
Significant
Unobservable
Inputs |
| Assets: | | | | | | | |
| Debt Securities: | | | | | | | |
| Asset-Backed Securities | $ 26,750 | | $ — | | $ 26,750 | | $ — |
| Corporate Bonds and Notes | 68,787 | | — | | 68,787 | | — |
| Foreign Government Securities | 1,603 | | — | | 1,603 | | — |
| Leveraged Loans | 11,002 | | — | | 11,002 | | — |
| Mortgage-Backed Securities | 56,213 | | — | | 55,272 | | 941 |
| Municipal Bonds | 9,705 | | — | | 9,705 | | — |
| U.S. Government Securities | 34,075 | | — | | 34,075 | | — |
| Equity Securities: | | | | | | | |
| Common Stocks | 352,331 | | 284,984 | | 67,347 | | — (1) |
| Preferred Stocks | 1,961 | | 163 | | 1,798 | | — |
| Warrant | 1 | | 1 | | — | | — |
| Exchange-Traded Fund | 1,038 | | 1,038 | | — | | — |
| Money Market Mutual Fund | 14,742 | | 14,742 | | — | | — |
| Securities Lending Collateral | 146 | | 146 | | — | | — |
| Total Investments | $578,354 | | $301,074 | | $276,339 | | $941 |
| (1) | Amount is less than $500. |
Securities held by the Fund with an end of period value of $—(1) were transferred from Level 3 to Level 2 due to a increase in trading activities at period end.
Securities held by the Fund with an end of period value of $941 were transferred from Level 2 to Level 3 due to a decrease in trading activities at period end.
Securities held by the Fund with an end of period value of —(1) were transferred from Level 1 to Level 3 due to a decrease in trading activities at period end. The value represents valuations of Russian Common Stocks for which Management has determined include significant unobservable inputs as of September 30, 2022.
Some of the Fund’s investments that were categorized as Level 3 may have been valued utilizing third party pricing information without adjustment. If applicable, such valuations are based on unobservable inputs. A significant change in third party information could result in a significantly lower or higher value of Level 3 investments.
Management has determined that the amount of Level 3 securities compared to total net assets is not material; therefore, the roll-forward of Level 3 securities and assumptions are not shown for the period ended September 30, 2022.
See Notes to Financial Statements
VIRTUS EQUITY TRUST
STATEMENTS OF ASSETS AND LIABILITIES
September 30, 2022
(Reported in thousands except shares and per share amounts)
| | KAR Capital
Growth Fund | | KAR Equity
Income Fund | | KAR Global Quality
Dividend Fund | | KAR Mid-Cap
Core Fund |
| Assets | | | | | | | |
Investment in securities at value(1)(2)
| $ 471,242 | | $ 132,307 | | $ 36,991 | | $ 1,212,610 |
Cash
| 100 | | 100 | | 50 | | 501 |
| Receivables | | | | | | | |
Investment securities sold
| — | | 2,311 | | 659 | | — |
Fund shares sold
| 48 | | 2,752 | | 36 | | 7,260 |
Dividends
| 141 | | 287 | | 150 | | 701 |
Tax reclaims
| — | | 87 | | 58 | | — |
Securities lending income
| — | | — | | — (a) | | — |
Prepaid Trustees’ retainer
| 7 | | 2 | | 1 | | 19 |
Prepaid expenses
| 25 | | 30 | | 22 | | 65 |
Other assets
| 55 | | 15 | | 4 | | 143 |
Total assets
| 471,618 | | 137,891 | | 37,971 | | 1,221,299 |
| Liabilities | | | | | | | |
Due to custodian
| — | | — | | — (a) | | — |
| Payables | | | | | | | |
Fund shares repurchased
| 95 | | 90 | | 33 | | 930 |
Investment securities purchased
| — | | 2,491 | | 1,082 | | — |
Collateral on securities loaned
| — | | — | | 1,609 | | — |
Investment advisory fees
| 295 | | 70 | | 15 | | 688 |
Distribution and service fees
| 100 | | 26 | | 5 | | 62 |
Administration and accounting fees
| 43 | | 12 | | 4 | | 112 |
Transfer agent and sub-transfer agent fees and expenses
| 80 | | 22 | | 7 | | 158 |
Professional fees
| 1 | | 9 | | 25 | | 135 |
Trustee deferred compensation plan
| 55 | | 15 | | 4 | | 143 |
Interest expense and/or commitment fees
| 3 | | 1 | | — (a) | | 5 |
Other accrued expenses
| 125 | | 43 | | 11 | | 44 |
Total liabilities
| 797 | | 2,779 | | 2,795 | | 2,277 |
Net Assets
| $ 470,821 | | $ 135,112 | | $ 35,176 | | $ 1,219,022 |
| Net Assets Consist of: | | | | | | | |
Capital paid in on shares of beneficial interest
| $ 188,907 | | $ 127,951 | | $ 37,082 | | $ 1,112,825 |
Accumulated earnings (loss)
| 281,914 | | 7,161 | | (1,906) | | 106,197 |
Net Assets
| $ 470,821 | | $ 135,112 | | $ 35,176 | | $ 1,219,022 |
| Net Assets: | | | | | | | |
Class A
| $ 435,925 | | $ 104,120 | | $ 21,388 | | $ 72,404 |
Class C
| $ 2,914 | | $ 3,395 | | $ 814 | | $ 53,041 |
Class I
| $ 30,739 | | $ 25,923 | | $ 10,797 | | $ 1,065,078 |
Class R6
| $ 1,243 | | $ 1,674 | | $ 2,177 | | $ 28,499 |
| Shares Outstanding (unlimited number of shares authorized, no par value): | | | | | | | |
Class A
| 25,844,987 | | 5,705,900 | | 1,650,594 | | 1,726,880 |
Class C
| 248,514 | | 218,394 | | 64,845 | | 1,395,671 |
Class I
| 1,739,239 | | 1,423,787 | | 834,506 | | 24,727,713 |
Class R6
| 69,225 | | 92,337 | | 166,944 | | 659,058 |
| Net Asset Value and Redemption Price Per Share:* | | | | | | | |
Class A
| $ 16.87 | | $ 18.25 | | $ 12.96 | | $ 41.93 |
Class C
| $ 11.73 | | $ 15.55 | | $ 12.54 | | $ 38.00 |
Class I
| $ 17.67 | | $ 18.21 | | $ 12.94 | | $ 43.07 |
Class R6
| $ 17.95 | | $ 18.13 | | $ 13.04 | | $ 43.24 |
See Notes to Financial Statements
VIRTUS EQUITY TRUST
STATEMENTS OF ASSETS AND LIABILITIES (Continued)
September 30, 2022
(Reported in thousands except shares and per share amounts)
| | KAR Capital
Growth Fund | | KAR Equity
Income Fund | | KAR Global Quality
Dividend Fund | | KAR Mid-Cap
Core Fund |
| Maximum Offering Price Per Share (NAV/(1-Maximum Sales Charge)): | | | | | | | |
Class A
| $ 17.85 | | $ 19.31 | | $ 13.71 | | $ 44.37 |
Maximum Sales Charge - Class A
| 5.50% | | 5.50% | | 5.50% | | 5.50% |
(1) Investment in securities at cost
| $ 273,485 | | $ 132,904 | | $ 38,666 | | $ 1,090,926 |
(2) Market value of securities on loan
| $ — | | $ — | | $ 1,527 | | $ — |
| (a) | Amount is less than $500. |
| * | Net Asset Value and Redemption Price Per Share are calculated using unrounded net assets. |
See Notes to Financial Statements
VIRTUS EQUITY TRUST
STATEMENTS OF ASSETS AND LIABILITIES (Continued)
September 30, 2022
(Reported in thousands except shares and per share amounts)
| | KAR Mid-Cap
Growth Fund | | KAR Small-Cap
Core Fund | | KAR Small-Cap
Growth Fund | | KAR Small-Cap
Value Fund |
| Assets | | | | | | | |
Investment in unaffiliated securities at value(1)(2)
| $ 1,584,049 | | $ 1,503,382 | | $ 2,276,184 | | $ 893,850 |
Investment in affiliated securities at value(3)
| — | | — | | 1,246,872 | | — |
Foreign currency at value(4)
| — | | — (a) | | — (a) | | — |
Cash
| 2,004 | | 2,004 | | 5,010 | | 1,002 |
| Receivables | | | | | | | |
Investment securities sold
| 8,166 | | — | | 15,041 | | — |
Fund shares sold
| 1,958 | | 815 | | 2,149 | | 699 |
Dividends
| 289 | | 633 | | 2,244 | | 352 |
Securities lending income
| — | | — | | 6 | | — |
Prepaid Trustees’ retainer
| 22 | | 22 | | 51 | | 13 |
Prepaid expenses
| 41 | | 32 | | 5 | | 42 |
Other assets
| 184 | | 170 | | 407 | | 102 |
Total assets
| 1,596,713 | | 1,507,058 | | 3,547,969 | | 896,060 |
| Liabilities | | | | | | | |
| Payables | | | | | | | |
Fund shares repurchased
| 3,138 | | 628 | | 5,095 | | 816 |
Investment securities purchased
| 7,253 | | — | | 1,645 | | — |
Collateral on securities loaned
| — | | — | | 21,459 | | — |
Investment advisory fees
| 1,029 | | 986 | | 2,570 | | 551 |
Distribution and service fees
| 120 | | 78 | | 243 | | 32 |
Administration and accounting fees
| 143 | | 133 | | 315 | | 79 |
Transfer agent and sub-transfer agent fees and expenses
| 332 | | 216 | | 775 | | 183 |
Professional fees
| 184 | | 156 | | 362 | | 110 |
Trustee deferred compensation plan
| 184 | | 170 | | 407 | | 102 |
Interest expense and/or commitment fees
| 10 | | 6 | | 20 | | 5 |
Other accrued expenses
| 126 | | 82 | | 249 | | 48 |
Total liabilities
| 12,519 | | 2,455 | | 33,140 | | 1,926 |
Net Assets
| $ 1,584,194 | | $ 1,504,603 | | $ 3,514,829 | | $ 894,134 |
| Net Assets Consist of: | | | | | | | |
Capital paid in on shares of beneficial interest
| $ 1,493,787 | | $ 989,549 | | $ 2,411,242 | | $ 714,337 |
Accumulated earnings (loss)
| 90,407 | | 515,054 | | 1,103,587 | | 179,797 |
Net Assets
| $ 1,584,194 | | $ 1,504,603 | | $ 3,514,829 | | $ 894,134 |
| Net Assets: | | | | | | | |
Class A
| $ 301,043 | | $ 117,382 | | $ 432,185 | | $ 90,204 |
Class C
| $ 59,318 | | $ 58,911 | | $ 163,204 | | $ 13,446 |
Class I
| $ 1,134,777 | | $ 1,008,114 | | $ 2,778,744 | | $ 756,418 |
Class R6
| $ 89,056 | | $ 320,196 | | $ 140,696 | | $ 34,066 |
| Shares Outstanding (unlimited number of shares authorized, no par value): | | | | | | | |
Class A
| 6,924,872 | | 3,136,663 | | 13,391,949 | | 4,442,029 |
Class C
| 1,789,746 | | 2,052,773 | | 6,005,591 | | 686,449 |
Class I
| 25,055,253 | | 24,994,806 | | 82,943,823 | | 37,159,913 |
Class R6
| 1,948,381 | | 7,900,606 | | 4,176,997 | | 1,670,334 |
| Net Asset Value and Redemption Price Per Share:* | | | | | | | |
Class A
| $ 43.47 | | $ 37.42 | | $ 32.27 | | $ 20.31 |
Class C
| $ 33.14 | | $ 28.70 | | $ 27.18 | | $ 19.59 |
Class I
| $ 45.29 | | $ 40.33 | | $ 33.50 | | $ 20.36 |
Class R6
| $ 45.71 | | $ 40.53 | | $ 33.68 | | $ 20.39 |
See Notes to Financial Statements
VIRTUS EQUITY TRUST
STATEMENTS OF ASSETS AND LIABILITIES (Continued)
September 30, 2022
(Reported in thousands except shares and per share amounts)
| | KAR Mid-Cap
Growth Fund | | KAR Small-Cap
Core Fund | | KAR Small-Cap
Growth Fund | | KAR Small-Cap
Value Fund |
| Maximum Offering Price Per Share (NAV/(1-Maximum Sales Charge)): | | | | | | | |
Class A
| $ 46.00 | | $ 39.60 | | $ 34.15 | | $ 21.49 |
Maximum Sales Charge - Class A
| 5.50% | | 5.50% | | 5.50% | | 5.50% |
(1) Investment in unaffiliated securities at cost
| $ 1,446,825 | | $ 1,089,526 | | $ 1,644,473 | | $ 730,600 |
(2) Market value of securities on loan
| $ — | | $ — | | $ 20,568 | | $ — |
(3) Investment in affiliated securities at cost
| $ — | | $ — | | $ 1,200,422 | | $ — |
(4) Foreign currency at cost
| $ — | | $ —(a) | | $ —(a) | | $ — |
| (a) | Amount is less than $500. |
| * | Net Asset Value and Redemption Price Per Share are calculated using unrounded net assets. |
See Notes to Financial Statements
VIRTUS EQUITY TRUST
STATEMENTS OF ASSETS AND LIABILITIES (Continued)
September 30, 2022
(Reported in thousands except shares and per share amounts)
| | KAR Small-Mid
Cap Core Fund | | KAR Small-Mid
Cap Growth Fund | | KAR Small-Mid Cap Value Fund | | SGA Emerging Markets Growth Fund |
| Assets | | | | | | | |
Investment in securities at value(1)
| $ 952,451 | | $ 5,119 | | $ 3,945 | | $ 4,243 |
Foreign currency at value(2)
| — | | — | | — | | 1 |
Cash
| 50 | | 50 | | 50 | | 50 |
| Receivables | | | | | | | |
Fund shares sold
| 2,145 | | 2 | | 12 | | — |
Receivable from adviser
| — | | 1 | | 10 | | 5 |
Dividends
| 141 | | 2 | | 4 | | 1 |
Tax reclaims
| — | | — | | — | | — (a) |
Prepaid Trustees’ retainer
| 14 | | — (a) | | — (a) | | — (a) |
Prepaid expenses
| 32 | | 20 | | 7 | | 12 |
Other assets
| 108 | | 1 | | — (a) | | — (a) |
Total assets
| 954,941 | | 5,195 | | 4,028 | | 4,312 |
| Liabilities | | | | | | | |
| Payables | | | | | | | |
Fund shares repurchased
| 1,739 | | 13 | | — | | — |
Investment securities purchased
| — | | 15 | | 87 | | — |
Foreign capital gains tax
| — | | — | | — | | 4 |
Investment advisory fees
| 627 | | — | | — | | — |
Distribution and service fees
| 31 | | — (a) | | — (a) | | — (a) |
Administration and accounting fees
| 84 | | 1 | | 1 | | 1 |
Transfer agent and sub-transfer agent fees and expenses
| 173 | | 1 | | — (a) | | — (a) |
Professional fees
| 116 | | 27 | | 30 | | 9 |
Trustee deferred compensation plan
| 108 | | 1 | | — (a) | | — (a) |
Interest expense and/or commitment fees
| 4 | | — (a) | | — (a) | | — (a) |
Other accrued expenses
| 13 | | — (a) | | — (a) | | 1 |
Total liabilities
| 2,895 | | 58 | | 118 | | 15 |
Net Assets
| $ 952,046 | | $ 5,137 | | $ 3,910 | | $ 4,297 |
| Net Assets Consist of: | | | | | | | |
Capital paid in on shares of beneficial interest
| $ 1,096,012 | | $ 6,705 | | $ 4,806 | | $ 5,156 |
Accumulated earnings (loss)
| (143,966) | | (1,568) | | (896) | | (859) |
Net Assets
| $ 952,046 | | $ 5,137 | | $ 3,910 | | $ 4,297 |
| Net Assets: | | | | | | | |
Class A
| $ 34,319 | | $ 435 | | $ 698 | | $ 136 |
Class C
| $ 26,271 | | $ 98 | | $ 80 | | $ 86 |
Class I
| $ 877,405 | | $ 1,940 | | $ 413 | | $ 230 |
Class R6
| $ 14,051 | | $ 2,664 | | $ 2,719 | | $ 3,845 |
| Shares Outstanding (unlimited number of shares authorized, no par value): | | | | | | | |
Class A
| 2,537,092 | | 56,312 | | 89,853 | | 16,238 |
Class C
| 2,009,909 | | 12,870 | | 10,361 | | 10,535 |
Class I
| 64,155,584 | | 249,710 | | 53,226 | | 27,209 |
Class R6
| 1,024,641 | | 342,543 | | 349,336 | | 452,800 |
| Net Asset Value and Redemption Price Per Share:* | | | | | | | |
Class A
| $ 13.53 | | $ 7.73 | | $ 7.77 | | $ 8.36 |
Class C
| $ 13.07 | | $ 7.63 | | $ 7.71 | | $ 8.14 |
Class I
| $ 13.68 | | $ 7.77 | | $ 7.76 | | $ 8.44 |
Class R6
| $ 13.71 | | $ 7.78 | | $ 7.78 | | $ 8.49 |
See Notes to Financial Statements
VIRTUS EQUITY TRUST
STATEMENTS OF ASSETS AND LIABILITIES (Continued)
September 30, 2022
(Reported in thousands except shares and per share amounts)
| | KAR Small-Mid
Cap Core Fund | | KAR Small-Mid
Cap Growth Fund | | KAR Small-Mid Cap Value Fund | | SGA Emerging Markets Growth Fund |
| Maximum Offering Price Per Share (NAV/(1-Maximum Sales Charge)): | | | | | | | |
Class A
| $ 14.32 | | $ 8.18 | | $ 8.22 | | $ 8.85 |
Maximum Sales Charge - Class A
| 5.50% | | 5.50% | | 5.50% | | 5.50% |
(1) Investment in securities at cost
| $ 1,082,222 | | $ 6,162 | | $ 4,822 | | $ 4,775 |
(2) Foreign currency at cost
| $ — | | $ — | | $ — | | $ 1 |
| (a) | Amount is less than $500. |
| * | Net Asset Value and Redemption Price Per Share are calculated using unrounded net assets. |
See Notes to Financial Statements
VIRTUS EQUITY TRUST
STATEMENTS OF ASSETS AND LIABILITIES (Continued)
September 30, 2022
(Reported in thousands except shares and per share amounts)
| | SGA Global Growth Fund | | SGA New Leaders Growth Fund | | Tactical
Allocation Fund |
| Assets | | | | | |
Investment in securities at value(1)(2)
| $ 109,634 | | $ 5,721 | | $ 578,354 |
Foreign currency at value(3)
| 24 | | — | | 131 |
Cash
| 50 | | 50 | | 1,174 |
| Receivables | | | | | |
Investment securities sold
| 603 | | — | | 192 |
Fund shares sold
| 20 | | — | | 20 |
Receivable from adviser
| — | | 5 | | — |
Dividends and interest
| 38 | | 1 | | 1,718 |
Tax reclaims
| 75 | | — | | 131 |
Securities lending income
| — | | — | | — (a) |
Prepaid Trustees’ retainer
| 2 | | — (a) | | 8 |
Prepaid expenses
| 23 | | 19 | | 26 |
Other assets
| 13 | | 1 | | 66 |
Total assets
| 110,482 | | 5,797 | | 581,820 |
| Liabilities | | | | | |
| Payables | | | | | |
Fund shares repurchased
| 86 | | — | | 271 |
Investment securities purchased
| 527 | | — | | 343 |
Collateral on securities loaned
| — | | — | | 146 |
Investment advisory fees
| 70 | | — | | 235 |
Distribution and service fees
| 8 | | — (a) | | 130 |
Administration and accounting fees
| 10 | | 1 | | 52 |
Transfer agent and sub-transfer agent fees and expenses
| 21 | | — (a) | | 110 |
Professional fees
| 15 | | 30 | | 47 |
Trustee deferred compensation plan
| 13 | | 1 | | 66 |
Interest expense and/or commitment fees
| 1 | | — (a) | | 3 |
Other accrued expenses
| 9 | | 1 | | 125 |
Total liabilities
| 760 | | 33 | | 1,528 |
Net Assets
| $ 109,722 | | $ 5,764 | | $ 580,292 |
| Net Assets Consist of: | | | | | |
Capital paid in on shares of beneficial interest
| $ 112,491 | | $ 8,565 | | $ 545,274 |
Accumulated earnings (loss)
| (2,769) | | (2,801) | | 35,018 |
Net Assets
| $ 109,722 | | $ 5,764 | | $ 580,292 |
| Net Assets: | | | | | |
Class A
| $ 18,375 | | $ 71 | | $ 542,371 |
Class C
| $ 3,767 | | $ 62 | | $ 12,326 |
Class I
| $ 33,241 | | $ 97 | | $ 25,520 |
Class R6
| $ 54,339 | | $ 5,534 | | $ 75 |
| Shares Outstanding (unlimited number of shares authorized, no par value): | | | | | |
Class A
| 942,610 | | 11,245 | | 61,015,844 |
Class C
| 209,189 | | 10,000 | | 1,357,592 |
Class I
| 1,687,977 | | 15,285 | | 2,878,784 |
Class R6
| 2,666,347 | | 866,711 | | 8,459 |
| Net Asset Value and Redemption Price Per Share:* | | | | | |
Class A
| $ 19.49 | | $ 6.33 | | $ 8.89 |
Class C
| $ 18.01 | | $ 6.24 | | $ 9.08 |
Class I
| $ 19.69 | | $ 6.36 | | $ 8.86 |
Class R6
| $ 20.38 | | $ 6.38 | | $ 8.87 |
See Notes to Financial Statements
VIRTUS EQUITY TRUST
STATEMENTS OF ASSETS AND LIABILITIES (Continued)
September 30, 2022
(Reported in thousands except shares and per share amounts)
| | SGA Global Growth Fund | | SGA New Leaders Growth Fund | | Tactical
Allocation Fund |
| Maximum Offering Price Per Share (NAV/(1-Maximum Sales Charge)): | | | | | |
Class A
| $ 20.62 | | $ 6.70 | | $ 9.41 |
Maximum Sales Charge - Class A
| 5.50% | | 5.50% | | 5.50% |
(1) Investment in securities at cost
| $ 113,805 | | $ 7,524 | | $ 553,476 |
(2) Market value of securities on loan
| $ — | | $ — | | $ 143 |
(3) Foreign currency at cost
| $ 24 | | $ — | | $ 132 |
| (a) | Amount is less than $500. |
| * | Net Asset Value and Redemption Price Per Share are calculated using unrounded net assets. |
See Notes to Financial Statements
VIRTUS EQUITY TRUST
STATEMENTS OF OPERATIONS YEAR ENDED
September 30, 2022
($ reported in thousands)
| | KAR Capital
Growth Fund | | KAR Equity
Income Fund | | KAR Global Quality
Dividend Fund | | KAR Mid-Cap
Core Fund | | KAR Mid-Cap
Growth Fund |
| Investment Income | | | | | | | | | |
Dividends
| $ 3,776 | | $ 5,020 | | $ 1,694 | | $ 11,029 | | $ 12,672 |
Securities lending, net of fees
| 2 | | 29 | | 6 | | — (1) | | — |
Foreign taxes withheld
| — | | (96) | | (121) | | — | | — |
Total investment income
| 3,778 | | 4,953 | | 1,579 | | 11,029 | | 12,672 |
| Expenses | | | | | | | | | |
Investment advisory fees
| 4,605 | | 1,068 | | 303 | | 11,071 | | 17,800 |
Distribution and service fees, Class A
| 1,509 | | 304 | | 61 | | 201 | | 1,076 |
Distribution and service fees, Class C
| 59 | | 37 | | 9 | | 638 | | 934 |
Administration and accounting fees
| 658 | | 149 | | 48 | | 1,403 | | 2,447 |
Transfer agent fees and expenses
| 310 | | 66 | | 20 | | 583 | | 1,020 |
Sub-transfer agent fees and expenses, Class A
| 207 | | 68 | | 14 | | 72 | | 382 |
Sub-transfer agent fees and expenses, Class C
| 6 | | 3 | | 1 | | 63 | | 136 |
Sub-transfer agent fees and expenses, Class I
| 47 | | 10 | | 11 | | 1,042 | | 1,904 |
Custodian fees
| 2 | | 1 | | 2 | | 4 | | 8 |
Printing fees and expenses
| 43 | | 12 | | 5 | | 101 | | 190 |
Professional fees
| 107 | | 61 | | 33 | | 223 | | 324 |
Interest expense and/or commitment fees
| 6 | | 1 | | 1 | | 11 | | 23 |
Registration fees
| 55 | | 47 | | 45 | | 115 | | 154 |
Trustees’ fees and expenses
| 35 | | 7 | | 2 | | 71 | | 135 |
Miscellaneous expenses
| 221 | | 56 | | 21 | | 82 | | 271 |
Total expenses
| 7,870 | | 1,890 | | 576 | | 15,680 | | 26,804 |
Less net expenses reimbursed and/or waived by investment adviser(2)
| (3) | | (161) | | (62) | | (1,299) | | (102) |
Less low balance account fees
| (9) | | (1) | | (1) | | — | | (1) |
Net expenses
| 7,858 | | 1,728 | | 513 | | 14,381 | | 26,701 |
Net investment income (loss)
| (4,080) | | 3,225 | | 1,066 | | (3,352) | | (14,029) |
| Net Realized and Unrealized Gain (Loss) on Investments | | | | | | | | | |
| Net realized gain (loss) from: | | | �� | | | | | | |
Investments
| 86,995 | | 4,995 | | 1,886 | | (11,459) | | (35,480) |
Foreign currency transactions
| — | | (1) | | (6) | | — | | — |
Net increase from payment by affiliate(3)
| — | | — | | — | | — | | 19 |
| Net change in unrealized appreciation (depreciation) on: | | | | | | | | | |
Investments
| (364,704) | | (18,112) | | (6,893) | | (315,507) | | (1,147,252) |
Foreign currency transactions
| — | | — | | (8) | | — | | — |
Net realized and unrealized gain (loss) on investments
| (277,709) | | (13,118) | | (5,021) | | (326,966) | | (1,182,713) |
Net increase (decrease) in net assets resulting from operations
| $(281,789) | | $ (9,893) | | $(3,955) | | $(330,318) | | $(1,196,742) |
| (1) | Amount is less than $500. |
| (2) | See Note 3D in Notes to Financial Statements. |
| (3) | See Note 3I in Notes to Financial Statements. |
See Notes to Financial Statements
VIRTUS EQUITY TRUST
STATEMENTS OF OPERATIONS (Continued)
YEAR ENDED September 30, 2022
($ reported in thousands)
| | KAR Small-Cap
Core Fund | | KAR Small-Cap
Growth Fund | | KAR Small-Cap
Value Fund | | KAR Small-Mid
Cap Core Fund | | KAR Small-Mid
Cap Growth Fund |
| Investment Income | | | | | | | | | |
Dividends
| $ 22,523 | | $ 15,933 | | $ 17,294 | | $ 8,718 | | $ 17 |
Dividends from affiliated
| — | | 7,432 | | — | | — | | — |
Securities lending, net of fees
| 1 | | 85 | | — | | — | | — (1) |
Total investment income
| 22,524 | | 23,450 | | 17,294 | | 8,718 | | 17 |
| Expenses | | | | | | | | | |
Investment advisory fees
| 13,296 | | 41,125 | | 8,638 | | 9,139 | | 44 |
Distribution and service fees, Class A
| 336 | | 1,520 | | 291 | | 111 | | 1 |
Distribution and service fees, Class C
| 744 | | 2,403 | | 182 | | 310 | | 1 |
Administration and accounting fees
| 1,762 | | 5,000 | | 1,227 | | 1,228 | | 14 |
Transfer agent fees and expenses
| 733 | | 2,077 | | 518 | | 506 | | 2 |
Sub-transfer agent fees and expenses, Class A
| 116 | | 615 | | 79 | | 43 | | — (1) |
Sub-transfer agent fees and expenses, Class C
| 56 | | 198 | | 15 | | 33 | | — (1) |
Sub-transfer agent fees and expenses, Class I
| 930 | | 3,760 | | 938 | | 1,033 | | 3 |
Custodian fees
| 5 | | 17 | | 4 | | 4 | | — (1) |
Printing fees and expenses
| 110 | | 347 | | 104 | | 89 | | 2 |
Professional fees
| 269 | | 641 | | 193 | | 198 | | 28 |
Interest expense and/or commitment fees
| 14 | | 45 | | 12 | | 10 | | — (1) |
Registration fees
| 69 | | 111 | | 104 | | 116 | | 50 |
Trustees’ fees and expenses
| 91 | | 273 | | 65 | | 63 | | — (1) |
Miscellaneous expenses
| 123 | | 442 | | 109 | | 72 | | 5 |
Total expenses
| 18,654 | | 58,574 | | 12,479 | | 12,955 | | 150 |
Less net expenses reimbursed and/or waived by investment adviser(2)
| — | | — | | — | | — | | (87) |
Less low balance account fees
| — | | (1) | | (1) | | — (1) | | — |
Plus net expenses recaptured
| — | | — | | — | | 31 | | — |
Net expenses
| 18,654 | | 58,573 | | 12,478 | | 12,986 | | 63 |
Net investment income (loss)
| 3,870 | | (35,123) | | 4,816 | | (4,268) | | (46) |
| Net Realized and Unrealized Gain (Loss) on Investments | | | | | | | | | |
| Net realized gain (loss) from: | | | | | | | | | |
Investments
| 118,123 | | 293,284 | | 14,056 | | (9,991) | | (453) |
Affiliated investments
| — | | 216,895 | | — | | — | | — |
Foreign currency transactions
| (8) | | (314) | | — | | — | | — (1) |
| Net change in unrealized appreciation (depreciation) on: | | | | | | | | | |
Investments
| (321,850) | | (1,082,947) | | (329,741) | | (356,103) | | (1,430) |
Affiliated investments
| — | | (1,188,337) | | — | | — | | — |
Foreign currency transactions
| 11 | | 32 | | — | | — | | — |
Net realized and unrealized gain (loss) on investments
| (203,724) | | (1,761,387) | | (315,685) | | (366,094) | | (1,883) |
Net increase (decrease) in net assets resulting from operations
| $(199,854) | | $(1,796,510) | | $(310,869) | | $(370,362) | | $(1,929) |
| (1) | Amount is less than $500. |
| (2) | See Note 3D in Notes to Financial Statements. |
See Notes to Financial Statements
VIRTUS EQUITY TRUST
STATEMENTS OF OPERATIONS (Continued)
YEAR ENDED September 30, 2022
($ reported in thousands)
| | KAR Small-Mid Cap Value Fund | | SGA Emerging Markets Growth Fund | | SGA Global Growth Fund | | SGA New Leaders Growth Fund | | Tactical
Allocation Fund |
| Investment Income | | | | | | | | | |
Dividends
| $ 51 | | $ 71 | | $ 1,067 | | $ 29 | | $ 4,928 |
Interest
| — | | — | | — | | — | | 7,847 |
Securities lending, net of fees
| — | | — (1) | | 3 | | — (1) | | 12 |
Foreign taxes withheld
| — | | (5) | | (56) | | (1) | | (278) |
Total investment income
| 51 | | 66 | | 1,014 | | 28 | | 12,509 |
| Expenses | | | | | | | | | |
Investment advisory fees
| 23 | | 52 | | 1,182 | | 51 | | 4,301 |
Distribution and service fees, Class A
| 1 | | — (1) | | 70 | | — (1) | | 1,798 |
Distribution and service fees, Class C
| 1 | | 1 | | 58 | | 1 | | 222 |
Administration and accounting fees
| 11 | | 13 | | 154 | | 14 | | 781 |
Transfer agent fees and expenses
| 2 | | 2 | | 61 | | 3 | | 368 |
Sub-transfer agent fees and expenses, Class A
| — (1) | | — (1) | | 45 | | — (1) | | 320 |
Sub-transfer agent fees and expenses, Class C
| — (1) | | — (1) | | 6 | | — | | 23 |
Sub-transfer agent fees and expenses, Class I
| — (1) | | — (1) | | 59 | | — | | 42 |
Custodian fees
| — (1) | | 3 | | 2 | | 3 | | 20 |
Printing fees and expenses
| 6 | | 2 | | 14 | | 3 | | 54 |
Professional fees
| 32 | | 36 | | 54 | | 30 | | 146 |
Interest expense and/or commitment fees
| — (1) | | — (1) | | 1 | | — (1) | | 7 |
Registration fees
| 54 | | 30 | | 48 | | 37 | | 57 |
Trustees’ fees and expenses
| — (1) | | — (1) | | 8 | | — (1) | | 42 |
Miscellaneous expenses
| 5 | | 5 | | 16 | | 3 | | 223 |
Total expenses
| 135 | | 144 | | 1,778 | | 145 | | 8,404 |
Less net expenses reimbursed and/or waived by investment adviser(2)
| (104) | | (86) | | (121) | | (84) | | (486) |
Less low balance account fees
| — | | — | | — (1) | | — | | (7) |
Net expenses
| 31 | | 58 | | 1,657 | | 61 | | 7,911 |
Net investment income (loss)
| 20 | | 8 | | (643) | | (33) | | 4,598 |
| Net Realized and Unrealized Gain (Loss) on Investments | | | | | | | | | |
| Net realized gain (loss) from: | | | | | | | | | |
Investments
| (30) | | (311) | | 3,990 | | (811) | | 38,488 |
Foreign currency transactions
| — | | — (1) | | (2) | | 2 | | (66) |
Foreign capital gains tax
| — | | (2) | | — | | — (1) | | — |
| Net change in unrealized appreciation (depreciation) on: | | | | | | | | | |
Investments
| (768) | | (1,485) | | (56,740) | | (2,361) | | (318,811) |
Foreign currency transactions
| — | | — (1) | | (8) | | — (1) | | (21) |
Foreign capital gains tax
| — | | 8 | | — | | — | | — |
Net realized and unrealized gain (loss) on investments
| (798) | | (1,790) | | (52,760) | | (3,170) | | (280,410) |
Net increase (decrease) in net assets resulting from operations
| $(778) | | $(1,782) | | $(53,403) | | $(3,203) | | $(275,812) |
| (1) | Amount is less than $500. |
| (2) | See Note 3D in Notes to Financial Statements. |
See Notes to Financial Statements
VIRTUS EQUITY TRUST
STATEMENTS OF CHANGES IN NET ASSETS
($ reported in thousands)
| | KAR Capital Growth Fund | | KAR Equity Income Fund |
| | Year Ended
September 30,
2022 | | Year Ended
September 30,
2021 | | Year Ended
September 30,
2022 | | Year Ended
September 30,
2021 |
| Increase (Decrease) in Net Assets Resulting from Operations | | | | | | | |
Net investment income (loss)
| $ (4,080) | | $ (6,452) | | $ 3,225 | | $ 3,111 |
Net realized gain (loss)
| 86,995 | | 64,719 | | 4,994 | | 3,083 |
Net change in unrealized appreciation (depreciation)
| (364,704) | | 92,901 | | (18,112) | | 19,166 |
Increase (decrease) in net assets resulting from operations
| (281,789) | | 151,168 | | (9,893) | | 25,360 |
| Dividends and Distributions to Shareholders | | | | | | | |
| Net Investment Income and Net Realized Gains: | | | | | | | |
Class A
| (53,757) | | (21,796) | | (5,143) | | (31,394) |
Class C
| (820) | | (600) | | (140) | | (1,891) |
Class I
| (4,151) | | (1,595) | | (497) | | (2,982) |
Class R6
| (122) | | (9) | | (70) | | (333) |
Total dividends and distributions to shareholders
| (58,850) | | (24,000) | | (5,850) | | (36,600) |
| Change in Net Assets from Capital Transactions (See Note 5): | | | | | | | |
Class A
| 11,694 | | (20,713) | | (6,082) | | 18,321 |
Class C
| (3,130) | | (5,645) | | (523) | | (1,372) |
Class I
| (4,688) | | 4,062 | | 16,933 | | 2,527 |
Class R6
| 1,244 | | 443 | | 725 | | 475 |
Increase (decrease) in net assets from capital transactions
| 5,120 | | (21,853) | | 11,053 | | 19,951 |
Net increase (decrease) in net assets
| (335,519) | | 105,315 | | (4,690) | | 8,711 |
| Net Assets | | | | | | | |
Beginning of period
| 806,340 | | 701,025 | | 139,802 | | 131,091 |
End of Period
| $ 470,821 | | $ 806,340 | | $ 135,112 | | $ 139,802 |
See Notes to Financial Statements
VIRTUS EQUITY TRUST
STATEMENTS OF CHANGES IN NET ASSETS (Continued)
($ reported in thousands)
| | KAR Global Quality Dividend Fund | | KAR Mid-Cap Core Fund |
| | Year Ended
September 30,
2022 | | Year Ended
September 30,
2021 | | Year Ended
September 30,
2022 | | Year Ended
September 30,
2021 |
| Increase (Decrease) in Net Assets Resulting from Operations | | | | | | | |
Net investment income (loss)
| $ 1,066 | | $ 999 | | $ (3,352) | | $ (4,505) |
Net realized gain (loss)
| 1,880 | | 1,836 | | (11,459) | | 33,114 |
Net change in unrealized appreciation (depreciation)
| (6,901) | | 3,333 | | (315,507) | | 279,183 |
Increase (decrease) in net assets resulting from operations
| (3,955) | | 6,168 | | (330,318) | | 307,792 |
| Dividends and Distributions to Shareholders | | | | | | | |
| Net Investment Income and Net Realized Gains: | | | | | | | |
Class A
| (510) | | (576) | | (1,497) | | (464) |
Class C
| (8) | | (27) | | (1,267) | | (429) |
Class I
| (404) | | (334) | | (21,030) | | (5,392) |
Class R6
| (53) | | (3) | | (951) | | (165) |
Total dividends and distributions to shareholders
| (975) | | (940) | | (24,745) | | (6,450) |
| Change in Net Assets from Capital Transactions (See Note 5): | | | | | | | |
Class A
| 534 | | (1,674) | | 5,309 | | 9,280 |
Class C
| (8) | | (729) | | 1,691 | | 1,742 |
Class I
| 697 | | (134) | | 185,127 | | 273,909 |
Class R6
| 517 | | 1,770 | | (15,752) | | 27,639 |
Increase (decrease) in net assets from capital transactions
| 1,740 | | (767) | | 176,375 | | 312,570 |
Net increase (decrease) in net assets
| (3,190) | | 4,461 | | (178,688) | | 613,912 |
| Net Assets | | | | | | | |
Beginning of period
| 38,366 | | 33,905 | | 1,397,710 | | 783,798 |
End of Period
| $ 35,176 | | $ 38,366 | | $ 1,219,022 | | $ 1,397,710 |
See Notes to Financial Statements
VIRTUS EQUITY TRUST
STATEMENTS OF CHANGES IN NET ASSETS (Continued)
($ reported in thousands)
| | KAR Mid-Cap Growth Fund | | KAR Small-Cap Core Fund |
| | Year Ended
September 30,
2022 | | Year Ended
September 30,
2021 | | Year Ended
September 30,
2022 | | Year Ended
September 30,
2021 |
| Increase (Decrease) in Net Assets Resulting from Operations | | | | | | | |
Net investment income (loss)
| $ (14,029) | | $ (24,505) | | $ 3,870 | | $ (108) |
Net realized gain (loss)
| (35,480) | | 52,141 | | 118,115 | | 212,206 |
Net increase from payment by affiliate(1)
| 19 | | — | | — | | — |
Net change in unrealized appreciation (depreciation)
| (1,147,252) | | 590,790 | | (321,839) | | 241,098 |
Increase (decrease) in net assets resulting from operations
| (1,196,742) | | 618,426 | | (199,854) | | 453,196 |
| Dividends and Distributions to Shareholders | | | | | | | |
| Net Investment Income and Net Realized Gains: | | | | | | | |
Class A
| (8,185) | | (606) | | (17,080) | | (9,053) |
Class C
| (2,544) | | (180) | | (12,382) | | (8,780) |
Class I
| (34,824) | | (2,375) | | (145,908) | | (85,597) |
Class R6
| (2,968) | | (139) | | (48,590) | | (26,170) |
Total dividends and distributions to shareholders
| (48,521) | | (3,300) | | (223,960) | | (129,600) |
| Change in Net Assets from Capital Transactions (See Note 5): | | | | | | | |
Class A
| (64,827) | | (13,276) | | 9,432 | | 6,511 |
Class C
| (34,319) | | 4,098 | | (4,941) | | (19,276) |
Class I
| (465,049) | | 211,073 | | 10,150 | | (24,692) |
Class R6
| (36,166) | | 80,643 | | (12,387) | | 61,400 |
Increase (decrease) in net assets from capital transactions
| (600,361) | | 282,538 | | 2,254 | | 23,943 |
Net increase (decrease) in net assets
| (1,845,624) | | 897,664 | | (421,560) | | 347,539 |
| Net Assets | | | | | | | |
Beginning of period
| 3,429,818 | | 2,532,154 | | 1,926,163 | | 1,578,624 |
End of Period
| $ 1,584,194 | | $ 3,429,818 | | $ 1,504,603 | | $ 1,926,163 |
| (1) | See Note 3I in Notes to Financial Statements. |
See Notes to Financial Statements
VIRTUS EQUITY TRUST
STATEMENTS OF CHANGES IN NET ASSETS (Continued)
($ reported in thousands)
| | KAR Small-Cap Growth Fund | | KAR Small-Cap Value Fund |
| | Year Ended
September 30,
2022 | | Year Ended
September 30,
2021 | | Year Ended
September 30,
2022 | | Year Ended
September 30,
2021 |
| Increase (Decrease) in Net Assets Resulting from Operations | | | | | | | |
Net investment income (loss)
| $ (35,123) | | $ (54,891) | | $ 4,816 | | $ 4,365 |
Net realized gain (loss)
| 509,865 | | 801,250 | | 14,056 | | 48,737 |
Net change in unrealized appreciation (depreciation)
| (2,271,252) | | 568,778 | | (329,741) | | 282,809 |
Increase (decrease) in net assets resulting from operations
| (1,796,510) | | 1,315,137 | | (310,869) | | 335,911 |
| Dividends and Distributions to Shareholders | | | | | | | |
| Net Investment Income and Net Realized Gains: | | | | | | | |
Class A
| (100,063) | | (79,097) | | (2,287) | | (662) |
Class C
| (45,933) | | (37,125) | | (355) | | (11) |
Class I
| (655,027) | | (537,686) | | (21,896) | | (8,138) |
Class R6
| (25,977) | | (14,092) | | (1,622) | | (189) |
Total dividends and distributions to shareholders
| (827,000) | | (668,000) | | (26,160) | | (9,000) |
| Change in Net Assets from Capital Transactions (See Note 5): | | | | | | | |
Class A
| (43,224) | | (53,154) | | (8,687) | | 16,147 |
Class C
| (22,917) | | (27,922) | | (3,114) | | (654) |
Class I
| (483,610) | | (441,585) | | (151,561) | | 194,304 |
Class R6
| 23,078 | | 98,665 | | (30,485) | | 64,780 |
Increase (decrease) in net assets from capital transactions
| (526,673) | | (423,996) | | (193,847) | | 274,577 |
Net increase (decrease) in net assets
| (3,150,183) | | 223,141 | | (530,876) | | 601,488 |
| Net Assets | | | | | | | |
Beginning of period
| 6,665,012 | | 6,441,871 | | 1,425,010 | | 823,522 |
End of Period
| $ 3,514,829 | | $ 6,665,012 | | $ 894,134 | | $ 1,425,010 |
See Notes to Financial Statements
VIRTUS EQUITY TRUST
STATEMENTS OF CHANGES IN NET ASSETS (Continued)
($ reported in thousands)
| | KAR Small-Mid Cap Core Fund | | KAR Small-Mid Cap Growth Fund |
| | Year Ended
September 30,
2022 | | Year Ended
September 30,
2021 | | Year Ended
September 30,
2022 | | From Inception December 8, 2020 to
September 30,
2021 |
| Increase (Decrease) in Net Assets Resulting from Operations | | | | | | | |
Net investment income (loss)
| $ (4,268) | | $ (4,982) | | $ (46) | | $ (32) |
Net realized gain (loss)
| (9,991) | | 21,174 | | (453) | | (40) |
Net change in unrealized appreciation (depreciation)
| (356,103) | | 168,800 | | (1,430) | | 387 |
Increase (decrease) in net assets resulting from operations
| (370,362) | | 184,992 | | (1,929) | | 315 |
| Dividends and Distributions to Shareholders | | | | | | | |
| Net Investment Income and Net Realized Gains: | | | | | | | |
Class A
| (599) | | — | | — | | — |
Class C
| (408) | | — | | — | | — |
Class I
| (14,991) | | (57) | | — | | — |
Class R6
| (222) | | (3) | | — | | — |
Total dividends and distributions to shareholders
| (16,220) | | (60) | | — | | — |
| Change in Net Assets from Capital Transactions (See Note 5): | | | | | | | |
Class A
| (222) | | 21,019 | | (107) | | 697 |
Class C
| 5,969 | | 16,317 | | 18 | | 112 |
Class I
| 65,718 | | 557,850 | | 692 | | 1,930 |
Class R6
| 3,622 | | 5,213 | | 380 | | 3,029 |
Increase (decrease) in net assets from capital transactions
| 75,087 | | 600,399 | | 983 | | 5,768 |
Net increase (decrease) in net assets
| (311,495) | | 785,331 | | (946) | | 6,083 |
| Net Assets | | | | | | | |
Beginning of period
| 1,263,541 | | 478,210 | | 6,083 | | — |
End of Period
| $ 952,046 | | $ 1,263,541 | | $ 5,137 | | $ 6,083 |
See Notes to Financial Statements
VIRTUS EQUITY TRUST
STATEMENTS OF CHANGES IN NET ASSETS (Continued)
($ reported in thousands)
| | KAR Small-Mid Cap Value Fund | | SGA Emerging Markets Growth Fund |
| | Year Ended
September 30,
2022 | | From Inception August 3, 2021 to
September 30,
2021 | | Year Ended
September 30,
2022 | | Year Ended
September 30,
2021 |
| Increase (Decrease) in Net Assets Resulting from Operations | | | | | | | |
Net investment income (loss)
| $ 20 | | $ 2 | | $ 8 | | $ (20) |
Net realized gain (loss)
| (30) | | — | | (313) | | 422 |
Net change in unrealized appreciation (depreciation)
| (768) | | (109) | | (1,477) | | 135 |
Increase (decrease) in net assets resulting from operations
| (778) | | (107) | | (1,782) | | 537 |
| Dividends and Distributions to Shareholders | | | | | | | |
| Net Investment Income and Net Realized Gains: | | | | | | | |
Class A
| (—) (1) | | — | | (14) | | (4) |
Class C
| — | | — | | (11) | | (3) |
Class I
| (1) | | — | | (27) | | (8) |
Class R6
| (10) | | — | | (368) | | (110) |
Total dividends and distributions to shareholders
| (11) | | — | | (420) | | (125) |
| Change in Net Assets from Capital Transactions (See Note 5): | | | | | | | |
Class A
| 643 | | 131 | | 1 | | 27 |
Class C
| 1 | | 103 | | (14) | | 8 |
Class I
| 399 | | 100 | | (47) | | 143 |
Class R6
| 729 | | 2,700 | | 364 | | 219 |
Increase (decrease) in net assets from capital transactions
| 1,772 | | 3,034 | | 304 | | 397 |
Net increase (decrease) in net assets
| 983 | | 2,927 | | (1,898) | | 809 |
| Net Assets | | | | | | | |
Beginning of period
| 2,927 | | — | | 6,195 | | 5,386 |
End of Period
| $ 3,910 | | $ 2,927 | | $ 4,297 | | $ 6,195 |
| (1) | Amount is less than $500. |
See Notes to Financial Statements
VIRTUS EQUITY TRUST
STATEMENTS OF CHANGES IN NET ASSETS (Continued)
($ reported in thousands)
| | SGA Global Growth Fund | | SGA New Leaders Growth Fund |
| | Year Ended
September 30,
2022 | | Year Ended
September 30,
2021 | | Year Ended
September 30,
2022 | | From Inception November 17, 2020 to
September 30,
2021 |
| Increase (Decrease) in Net Assets Resulting from Operations | | | | | | | |
Net investment income (loss)
| $ (643) | | $ (834) | | $ (33) | | $ (31) |
Net realized gain (loss)
| 3,988 | | 10,299 | | (809) | | (163) |
Net change in unrealized appreciation (depreciation)
| (56,748) | | 18,122 | | (2,361) | | 558 |
Increase (decrease) in net assets resulting from operations
| (53,403) | | 27,587 | | (3,203) | | 364 |
| Dividends and Distributions to Shareholders | | | | | | | |
| Net Investment Income and Net Realized Gains: | | | | | | | |
Class A
| (2,276) | | (963) | | — | | — |
Class C
| (518) | | (211) | | — | | — |
Class I
| (3,434) | | (1,091) | | — | | — |
Class R6
| (5,122) | | (2,435) | | — | | — |
Total dividends and distributions to shareholders
| (11,350) | | (4,700) | | — | | — |
| Change in Net Assets from Capital Transactions (See Note 5): | | | | | | | |
Class A
| (3,902) | | 3,849 | | 10 | | 103 |
Class C
| (934) | | 1,331 | | (2) | | 103 |
Class I
| (1,068) | | 20,190 | | — | | 155 |
Class R6
| 4,695 | | (4,192) | | 2,311 | | 5,923 |
Increase (decrease) in net assets from capital transactions
| (1,209) | | 21,178 | | 2,319 | | 6,284 |
Net increase (decrease) in net assets
| (65,962) | | 44,065 | | (884) | | 6,648 |
| Net Assets | | | | | | | |
Beginning of period
| 175,684 | | 131,619 | | 6,648 | | — |
End of Period
| $ 109,722 | | $ 175,684 | | $ 5,764 | | $ 6,648 |
See Notes to Financial Statements
VIRTUS EQUITY TRUST
STATEMENTS OF CHANGES IN NET ASSETS (Continued)
($ reported in thousands)
| | Tactical Allocation Fund |
| | Year Ended
September 30,
2022 | | Year Ended
September 30,
2021 |
| Increase (Decrease) in Net Assets Resulting from Operations | | | |
Net investment income (loss)
| $ 4,598 | | $ 2,626 |
Net realized gain (loss)
| 38,422 | | 68,512 |
Net change in unrealized appreciation (depreciation)
| (318,832) | | 73,048 |
Increase (decrease) in net assets resulting from operations
| (275,812) | | 144,186 |
| Dividends and Distributions to Shareholders | | | |
| Net Investment Income and Net Realized Gains: | | | |
Class A
| (60,102) | | (15,782) |
Class C
| (1,929) | | (873) |
Class I
| (3,906) | | (1,207) |
Class R6
| (8) | | (2) |
Total dividends and distributions to shareholders
| (65,945) | | (17,864) |
| Change in Net Assets from Capital Transactions (See Note 5): | | | |
Class A
| (12,680) | | 73,751 |
Class C
| (11,584) | | 14,669 |
Class I
| (8,300) | | 18,001 |
Class R6
| 4 | | 100 |
Increase (decrease) in net assets from capital transactions
| (32,560) | | 106,521 |
Net increase (decrease) in net assets
| (374,317) | | 232,843 |
| Net Assets | | | |
Beginning of period
| 954,609 | | 721,766 |
End of Period
| $ 580,292 | | $ 954,609 |
See Notes to Financial Statements
VIRTUS EQUITY TRUST
FINANCIAL HIGHLIGHTS
SELECTED PER SHARE DATA AND RATIOS FOR A SHARE OUTSTANDING
THROUGHOUT EACH PERIOD
| | | Net Asset Value,
Beginning of Period | Net Investment Income (Loss)(1) | Net Realized and
Unrealized Gain (Loss) | Total from Investment Operations | Dividends from
Net Investment Income | Return of Capital | Distributions from
Net Realized Gains | Total Distributions | Payment from Affiliates(1) | Change in Net Asset Value | Net Asset Value, End of Period | Total Return(2)(3) | Net Assets, End of Period
(in thousands) | Ratio of Net Expenses to
Average Net Assets(4)(5) | Ratio of Gross Expenses
to Average Net Assets(4)(5) | Ratio of Net Investment Income (Loss)
to Average Net Assets(4) | Portfolio Turnover Rate(3) |
| | | | | | | | | | | | | | | | | | | |
| KAR Capital Growth Fund | | | | | | | | | | | | | | | | | | |
| Class A | | | | | | | | | | | | | | | | | | |
| 10/1/21 to 9/30/22 | | $28.64 | (0.14) | (9.51) | (9.65) | — | — | (2.12) | (2.12) | — | (11.77) | $16.87 | (36.54) % | $ 435,925 | 1.20 % (6)(7) | 1.20 % | (0.63) % | 13 % |
| 10/1/20 to 9/30/21 | | 24.20 | (0.22) | 5.49 | 5.27 | — | — | (0.83) | (0.83) | — | 4.44 | 28.64 | 21.98 | 736,713 | 1.20 (6) | 1.20 | (0.83) | 8 |
| 10/1/19 to 9/30/20 | | 16.67 | (0.12) | 8.16 | 8.04 | — | — | (0.51) | (0.51) | — | 7.53 | 24.20 | 49.20 | 640,963 | 1.22 (6) | 1.23 | (0.63) | 4 |
| 10/1/18 to 9/30/19 | | 18.37 | (0.07) | (0.08) | (0.15) | — | — | (1.55) | (1.55) | — | (1.70) | 16.67 | 1.10 | 471,071 | 1.23 (6) | 1.24 | (0.43) | 12 |
| 10/1/17 to 9/30/18 | | 16.18 | (0.08) | 3.13 | 3.05 | — | — | (0.86) | (0.86) | — | 2.19 | 18.37 | 19.56 | 508,124 | 1.22 (6) | 1.22 | (0.49) | 17 |
| Class C | | | | | | | | | | | | | | | | | | |
| 10/1/21 to 9/30/22 | | $20.70 | (0.25) | (6.60) | (6.85) | — | — | (2.12) | (2.12) | — | (8.97) | $11.73 | (37.07) % | $ 2,914 | 2.01 % (6)(7) | 2.01 % | (1.48) % | 13 % |
| 10/1/20 to 9/30/21 | | 17.83 | (0.32) | 4.02 | 3.70 | — | — | (0.83) | (0.83) | — | 2.87 | 20.70 | 21.00 | 9,252 | 2.01 (6) | 2.01 | (1.63) | 8 |
| 10/1/19 to 9/30/20 | | 12.49 | (0.20) | 6.05 | 5.85 | — | — | (0.51) | (0.51) | — | 5.34 | 17.83 | 48.09 | 13,183 | 2.00 (6) | 2.00 | (1.41) | 4 |
| 10/1/18 to 9/30/19 | | 14.34 | (0.15) | (0.15) | (0.30) | — | — | (1.55) | (1.55) | — | (1.85) | 12.49 | 0.26 | 8,632 | 2.02 (6) | 2.02 | (1.22) | 12 |
| 10/1/17 to 9/30/18 | | 12.91 | (0.17) | 2.46 | 2.29 | — | — | (0.86) | (0.86) | — | 1.43 | 14.34 | 18.58 | 14,408 | 1.99 (6) | 2.00 | (1.26) | 17 |
| Class I | | | | | | | | | | | | | | | | | | |
| 10/1/21 to 9/30/22 | | $29.86 | (0.11) | (9.96) | (10.07) | — | — | (2.12) | (2.12) | — | (12.19) | $17.67 | (36.45) % | $ 30,739 | 1.01 % (6)(7) | 1.01 % | (0.44) % | 13 % |
| 10/1/20 to 9/30/21 | | 25.15 | (0.18) | 5.72 | 5.54 | — | — | (0.83) | (0.83) | — | 4.71 | 29.86 | 22.23 | 59,565 | 1.00 (6) | 1.00 | (0.63) | 8 |
| 10/1/19 to 9/30/20 | | 17.36 | (0.09) | 8.39 | 8.30 | — | — | (0.51) | (0.51) | — | 7.79 | 25.15 | 48.72 | 46,600 | 1.01 (6) | 1.02 | (0.44) | 4 |
| 10/1/18 to 9/30/19 | | 19.02 | (0.04) | (0.07) | (0.11) | — | — | (1.55) | (1.55) | — | (1.66) | 17.36 | 1.29 | 22,315 | 1.02 (6) | 1.03 | (0.21) | 12 |
| 10/1/17 to 9/30/18 | | 16.69 | (0.05) | 3.24 | 3.19 | — | — | (0.86) | (0.86) | — | 2.33 | 19.02 | 19.81 | 17,125 | 0.99 (6) | 0.99 | (0.26) | 17 |
| Class R6 | | | | | | | | | | | | | | | | | | |
| 10/1/21 to 9/30/22 | | $30.22 | (0.04) | (10.11) | (10.15) | — | — | (2.12) | (2.12) | — | (12.27) | $17.95 | (36.27) % | $ 1,243 | 0.74 % (7) | 0.92 % | (0.15) % | 13 % |
| 10/1/20 to 9/30/21 | | 25.38 | (0.11) | 5.78 | 5.67 | — | — | (0.83) | (0.83) | — | 4.84 | 30.22 | 22.55 | 810 | 0.73 | 0.91 | (0.38) | 8 |
| 10/1/19 to 9/30/20 | | 17.37 | (0.01) | 8.53 | 8.52 | — | — | (0.51) | (0.51) | — | 8.01 | 25.38 | 49.99 | 279 | 0.72 | 0.94 | (0.06) | 4 |
| 10/1/18 to 9/30/19 | | 19.04 | (0.05) | (0.07) | (0.12) | — | — | (1.55) | (1.55) | — | (1.67) | 17.37 | 1.25 | 94 | 0.78 (9) | 0.94 | (0.27) | 12 |
| 1/30/18 (10) to 9/30/18 | | 18.46 | (—) (11) | 0.58 | 0.58 | — | — | — | — | — | 0.58 | 19.04 | 3.14 | 6,458 | 0.80 (9) | 0.91 | (0.03) | 17 (12) |
| | | | | | | | | | | | | | | | | | | |
| KAR Equity Income Fund | | | | | | | | | | | | | | | | | | |
| Class A | | | | | | | | | | | | | | | | | | |
| 10/1/21 to 9/30/22 | | $20.46 | 0.47 | (1.80) | (1.33) | (0.44) | — | (0.44) | (0.88) | — | (2.21) | $18.25 | (7.01) % | $ 104,120 | 1.22 % (7) | 1.34 % | 2.26 % | 22 % |
| 10/1/20 to 9/30/21 | | 23.03 | 0.47 | 3.57 | 4.04 | (0.27) | — | (6.34) | (6.61) | — | (2.57) | 20.46 | 20.23 | 122,518 | 1.23 (7) | 1.36 | 2.21 | 25 |
| 10/1/19 to 9/30/20 | | 20.62 | 0.15 | 2.47 | 2.62 | (0.21) | — | — | (0.21) | — | 2.41 | 23.03 | 12.75 | 113,585 | 1.23 (7) | 1.38 | 0.72 | 118 |
| 10/1/18 to 9/30/19 | | 21.05 | 0.16 | (0.38) | (0.22) | (0.21) | — | — | (0.21) | — | (0.43) | 20.62 | (0.85) | 115,121 | 1.20 | 1.34 | 0.80 | 26 |
| 10/1/17 to 9/30/18 | | 20.26 | 0.14 | 2.02 | 2.16 | (0.06) | — | (1.31) | (1.37) | — | 0.79 | 21.05 | 10.84 | 118,904 | 1.20 | 1.31 | 0.71 | 24 |
| Class C | | | | | | | | | | | | | | | | | | |
| 10/1/21 to 9/30/22 | | $17.47 | 0.26 | (1.52) | (1.26) | (0.22) | — | (0.44) | (0.66) | — | (1.92) | $15.55 | (7.67) % | $ 3,395 | 1.97 % (7) | 2.12 % | 1.50 % | 22 % |
| 10/1/20 to 9/30/21 | | 20.51 | 0.28 | 3.12 | 3.40 | (0.10) | — | (6.34) | (6.44) | — | (3.04) | 17.47 | 19.31 | 4,303 | 1.97 (7) | 2.13 | 1.52 | 25 |
| 10/1/19 to 9/30/20 | | 18.36 | (0.01) | 2.19 | 2.18 | (0.03) | — | — | (0.03) | — | 2.15 | 20.51 | 11.91 | 6,394 | 1.97 (7) | 2.13 | (0.03) | 118 |
| 10/1/18 to 9/30/19 | | 18.71 | 0.01 | (0.33) | (0.32) | (0.03) | — | — | (0.03) | — | (0.35) | 18.36 | (1.65) | 7,769 | 1.95 | 2.10 | 0.07 | 26 |
| 10/1/17 to 9/30/18 | | 18.23 | (0.01) | 1.80 | 1.79 | — | — | (1.31) | (1.31) | — | 0.48 | 18.71 | 10.00 | 30,576 | 1.95 | 2.06 | (0.03) | 24 |
The footnote legend is at the end of the financial highlights.
See Notes to Financial Statements
VIRTUS EQUITY TRUST
FINANCIAL HIGHLIGHTS (Continued)
SELECTED PER SHARE DATA AND RATIOS FOR A SHARE OUTSTANDING
THROUGHOUT EACH PERIOD
| | | Net Asset Value,
Beginning of Period | Net Investment Income (Loss)(1) | Net Realized and
Unrealized Gain (Loss) | Total from Investment Operations | Dividends from
Net Investment Income | Return of Capital | Distributions from
Net Realized Gains | Total Distributions | Payment from Affiliates(1) | Change in Net Asset Value | Net Asset Value, End of Period | Total Return(2)(3) | Net Assets, End of Period
(in thousands) | Ratio of Net Expenses to
Average Net Assets(4)(5) | Ratio of Gross Expenses
to Average Net Assets(4)(5) | Ratio of Net Investment Income (Loss)
to Average Net Assets(4) | Portfolio Turnover Rate(3) |
| KAR Equity Income Fund (Continued) | | | | | | | | | | | | | | | | | | |
| Class I | | | | | | | | | | | | | | | | | | |
| 10/1/21 to 9/30/22 | | $20.41 | 0.51 | (1.78) | (1.27) | (0.49) | — | (0.44) | (0.93) | — | (2.20) | $18.21 | (6.74) % | $ 25,923 | 0.99 % (7) | 1.10 % | 2.48 % | 22 % |
| 10/1/20 to 9/30/21 | | 23.00 | 0.52 | 3.56 | 4.08 | (0.33) | — | (6.34) | (6.67) | — | (2.59) | 20.41 | 20.49 | 11,819 | 0.98 (7) | 1.11 | 2.43 | 25 |
| 10/1/19 to 9/30/20 | | 20.60 | 0.20 | 2.46 | 2.66 | (0.26) | — | — | (0.26) | — | 2.40 | 23.00 | 12.98 | 10,319 | 0.98 (7) | 1.13 | 0.97 | 118 |
| 10/1/18 to 9/30/19 | | 21.03 | 0.21 | (0.38) | (0.17) | (0.26) | — | — | (0.26) | — | (0.43) | 20.60 | (0.58) | 10,654 | 0.95 | 1.09 | 1.06 | 26 |
| 10/1/17 to 9/30/18 | | 20.22 | 0.19 | 2.01 | 2.20 | (0.08) | — | (1.31) | (1.39) | — | 0.81 | 21.03 | 11.10 | 15,028 | 0.95 | 1.08 | 0.92 | 24 |
| Class R6 | | | | | | | | | | | | | | | | | | |
| 10/1/21 to 9/30/22 | | $20.35 | 0.52 | (1.78) | (1.26) | (0.52) | — | (0.44) | (0.96) | — | (2.22) | $18.13 | (6.74) % | $ 1,674 | 0.94 % (7) | 1.03 % | 2.54 % | 22 % |
| 10/1/20 to 9/30/21 | | 22.96 | 0.51 | 3.57 | 4.08 | (0.35) | — | (6.34) | (6.69) | — | (2.61) | 20.35 | 20.55 | 1,162 | 0.94 (7) | 1.03 | 2.44 | 25 |
| 10/1/19 to 9/30/20 | | 20.56 | 0.21 | 2.47 | 2.68 | (0.28) | — | — | (0.28) | — | 2.40 | 22.96 | 13.08 | 793 | 0.93 (7) | 1.05 | 1.01 | 118 |
| 10/1/18 to 9/30/19 | | 21.03 | 0.20 | (0.37) | (0.17) | (0.30) | — | — | (0.30) | — | (0.47) | 20.56 | (0.56) | 935 | 0.91 | 1.03 | 1.02 | 26 |
| 1/30/18 (10) to 9/30/18 | | 20.70 | 0.15 | 0.18 | 0.33 | — | — | — | — | — | 0.33 | 21.03 | 1.59 | 4,999 | 0.91 | 1.00 | 1.16 | 24 |
| | | | | | | | | | | | | | | | | | | |
| KAR Global Quality Dividend Fund | | | | | | | | | | | | | | | | | | |
| Class A | | | | | | | | | | | | | | | | | | |
| 10/1/21 to 9/30/22 | | $14.74 | 0.38 | (1.84) | (1.46) | (0.32) | — | — | (0.32) | — | (1.78) | $12.96 | (10.21) % | $ 21,388 | 1.36 % (7) | 1.50 % | 2.54 % | 37 % |
| 10/1/20 to 9/30/21 | | 12.76 | 0.37 | 1.95 | 2.32 | (0.34) | — | — | (0.34) | — | 1.98 | 14.74 | 18.42 | 23,807 | 1.35 | 1.51 | 2.55 | 37 |
| 10/1/19 to 9/30/20 | | 14.78 | 0.31 | (1.99) | (1.68) | (0.34) | — | — | (0.34) | — | (2.02) | 12.76 | (11.69) | 22,089 | 1.35 | 1.61 | 2.32 | 53 |
| 10/1/18 to 9/30/19 | | 14.98 | 0.38 | 0.85 | 1.23 | (0.39) | — | (1.04) | (1.43) | — | (0.20) | 14.78 | 9.64 | 29,367 | 1.35 | 1.56 | 2.71 | 35 |
| 10/1/17 to 9/30/18 | | 16.20 | 0.40 | 0.25 | 0.65 | (0.65) | — | (1.22) | (1.87) | — | (1.22) | 14.98 | 4.24 | 26,351 | 1.35 | 1.50 | 2.63 | 33 |
| Class C | | | | | | | | | | | | | | | | | | |
| 10/1/21 to 9/30/22 | | $14.21 | 0.26 | (1.79) | (1.53) | (0.14) | — | — | (0.14) | — | (1.67) | $12.54 | (10.93) % | $ 814 | 2.11 % (7) | 2.31 % | 1.78 % | 37 % |
| 10/1/20 to 9/30/21 | | 12.29 | 0.24 | 1.90 | 2.14 | (0.22) | — | — | (0.22) | — | 1.92 | 14.21 | 17.52 | 931 | 2.10 | 2.29 | 1.74 | 37 |
| 10/1/19 to 9/30/20 | | 14.23 | 0.20 | (1.92) | (1.72) | (0.22) | — | — | (0.22) | — | (1.94) | 12.29 | (12.34) | 1,467 | 2.10 | 2.35 | 1.53 | 53 |
| 10/1/18 to 9/30/19 | | 14.52 | 0.24 | 0.83 | 1.07 | (0.32) | — | (1.04) | (1.36) | — | (0.29) | 14.23 | 8.74 | 3,178 | 2.10 | 2.29 | 1.79 | 35 |
| 10/1/17 to 9/30/18 | | 15.82 | 0.32 | 0.22 | 0.54 | (0.62) | — | (1.22) | (1.84) | — | (1.30) | 14.52 | 3.56 | 5,127 | 2.10 | 2.25 | 2.16 | 33 |
| Class I | | | | | | | | | | | | | | | | | | |
| 10/1/21 to 9/30/22 | | $14.76 | 0.42 | (1.85) | (1.43) | (0.39) | — | — | (0.39) | — | (1.82) | $12.94 | (10.00) % | $ 10,797 | 1.12 % (7) | 1.27 % | 2.79 % | 37 % |
| 10/1/20 to 9/30/21 | | 12.77 | 0.40 | 1.97 | 2.37 | (0.38) | — | — | (0.38) | — | 1.99 | 14.76 | 18.78 | 11,659 | 1.10 | 1.27 | 2.79 | 37 |
| 10/1/19 to 9/30/20 | | 14.79 | 0.35 | (1.99) | (1.64) | (0.38) | — | — | (0.38) | — | (2.02) | 12.77 | (11.47) | 10,259 | 1.10 | 1.40 | 2.66 | 53 |
| 10/1/18 to 9/30/19 | | 15.02 | 0.42 | 0.83 | 1.25 | (0.44) | — | (1.04) | (1.48) | — | (0.23) | 14.79 | 9.85 | 7,246 | 1.10 | 1.36 | 3.00 | 35 |
| 10/1/17 to 9/30/18 | | 16.20 | 0.47 | 0.23 | 0.70 | (0.66) | — | (1.22) | (1.88) | — | (1.18) | 15.02 | 4.56 | 4,843 | 1.10 | 1.29 | 3.14 | 33 |
| Class R6 | | | | | | | | | | | | | | | | | | |
| 10/1/21 to 9/30/22 | | $14.84 | 0.47 | (1.86) | (1.39) | (0.41) | — | — | (0.41) | — | (1.80) | $13.04 | (9.73) % | $ 2,177 | 0.80 % (7) | 1.18 % | 3.14 % | 37 % |
| 10/1/20 to 9/30/21 | | 12.81 | 0.45 | 1.97 | 2.42 | (0.39) | — | — | (0.39) | — | 2.03 | 14.84 | 19.15 | 1,969 | 0.78 | 1.15 | 3.04 | 37 |
| 10/1/19 to 9/30/20 | | 14.80 | 0.39 | (1.99) | (1.60) | (0.39) | — | — | (0.39) | — | (1.99) | 12.81 | (11.18) | 90 | 0.78 | 1.27 | 2.92 | 53 |
| 8/1/19 (10) to 9/30/19 | | 14.23 | 0.08 | 0.49 | 0.57 | — | — | — | — | — | 0.57 | 14.80 | 4.01 | 104 | 0.78 | 1.27 | 3.39 | 35 (12) |
The footnote legend is at the end of the financial highlights.
See Notes to Financial Statements
VIRTUS EQUITY TRUST
FINANCIAL HIGHLIGHTS (Continued)
SELECTED PER SHARE DATA AND RATIOS FOR A SHARE OUTSTANDING
THROUGHOUT EACH PERIOD
| | | Net Asset Value,
Beginning of Period | Net Investment Income (Loss)(1) | Net Realized and
Unrealized Gain (Loss) | Total from Investment Operations | Dividends from
Net Investment Income | Return of Capital | Distributions from
Net Realized Gains | Total Distributions | Payment from Affiliates(1) | Change in Net Asset Value | Net Asset Value, End of Period | Total Return(2)(3) | Net Assets, End of Period
(in thousands) | Ratio of Net Expenses to
Average Net Assets(4)(5) | Ratio of Gross Expenses
to Average Net Assets(4)(5) | Ratio of Net Investment Income (Loss)
to Average Net Assets(4) | Portfolio Turnover Rate(3) |
| | | | | | | | | | | | | | | | | | | |
| KAR Mid-Cap Core Fund | | | | | | | | | | | | | | | | | | |
| Class A | | | | | | | | | | | | | | | | | | |
| 10/1/21 to 9/30/22 | | $54.03 | (0.22) | (10.95) | (11.17) | — | — | (0.93) | (0.93) | — | (12.10) | $41.93 | (21.10) % | $ 72,404 | 1.21 % (7) | 1.31 % | (0.44) % | 20 % |
| 10/1/20 to 9/30/21 | | 39.93 | (0.29) | 14.71 | 14.42 | — | — | (0.32) | (0.32) | — | 14.10 | 54.03 | 36.25 | 86,713 | 1.20 | 1.31 | (0.58) | 15 |
| 10/1/19 to 9/30/20 | | 35.05 | (0.16) | 5.19 | 5.03 | — | — | (0.15) | (0.15) | — | 4.88 | 39.93 | 14.39 | 56,677 | 1.20 | 1.34 | (0.44) | 19 |
| 10/1/18 to 9/30/19 | | 33.71 | (0.08) | 1.65 | 1.57 | — | — | (0.23) | (0.23) | — | 1.34 | 35.05 | 4.79 | 46,934 | 1.20 | 1.36 | (0.23) | 28 |
| 10/1/17 to 9/30/18 | | 27.95 | (0.09) | 5.85 | 5.76 | — | — | — | — | — | 5.76 | 33.71 | 20.61 | 33,120 | 1.20 | 1.39 | (0.29) | 21 |
| Class C | | | | | | | | | | | | | | | | | | |
| 10/1/21 to 9/30/22 | | $49.42 | (0.54) | (9.95) | (10.49) | — | — | (0.93) | (0.93) | — | (11.42) | $38.00 | (21.70) % | $ 53,041 | 1.96 % (7) | 2.07 % | (1.19) % | 20 % |
| 10/1/20 to 9/30/21 | | 36.82 | (0.61) | 13.53 | 12.92 | — | — | (0.32) | (0.32) | — | 12.60 | 49.42 | 35.23 | 67,627 | 1.95 | 2.06 | (1.33) | 15 |
| 10/1/19 to 9/30/20 | | 32.58 | (0.40) | 4.79 | 4.39 | — | — | (0.15) | (0.15) | — | 4.24 | 36.82 | 13.51 | 49,164 | 1.95 | 2.10 | (1.19) | 19 |
| 10/1/18 to 9/30/19 | | 31.58 | (0.30) | 1.53 | 1.23 | — | — | (0.23) | (0.23) | — | 1.00 | 32.58 | 4.03 | 43,268 | 1.95 | 2.11 | (0.98) | 28 |
| 10/1/17 to 9/30/18 | | 26.38 | (0.31) | 5.51 | 5.20 | — | — | — | — | — | 5.20 | 31.58 | 19.71 | 30,661 | 1.95 | 2.14 | (1.04) | 21 |
| Class I | | | | | | | | | | | | | | | | | | |
| 10/1/21 to 9/30/22 | | $55.34 | (0.09) | (11.25) | (11.34) | — | — | (0.93) | (0.93) | — | (12.27) | $43.07 | (20.91) % | $1,065,078 | 0.96 % (7) | 1.06 % | (0.18) % | 20 % |
| 10/1/20 to 9/30/21 | | 40.79 | (0.17) | 15.04 | 14.87 | — | — | (0.32) | (0.32) | — | 14.55 | 55.34 | 36.59 | 1,188,000 | 0.95 | 1.05 | (0.33) | 15 |
| 10/1/19 to 9/30/20 | | 35.72 | (0.07) | 5.29 | 5.22 | — | — | (0.15) | (0.15) | — | 5.07 | 40.79 | 14.65 | 658,291 | 0.95 | 1.09 | (0.18) | 19 |
| 10/1/18 to 9/30/19 | | 34.26 | 0.01 | 1.68 | 1.69 | — | — | (0.23) | (0.23) | — | 1.46 | 35.72 | 5.06 | 329,591 | 0.95 | 1.11 | 0.03 | 28 |
| 10/1/17 to 9/30/18 | | 28.34 | (0.01) | 5.93 | 5.92 | — | — | — | — | — | 5.92 | 34.26 | 20.93 | 167,649 | 0.95 | 1.14 | (0.03) | 21 |
| Class R6 | | | | | | | | | | | | | | | | | | |
| 10/1/21 to 9/30/22 | | $55.51 | (0.06) | (11.28) | (11.34) | — | — | (0.93) | (0.93) | — | (12.27) | $43.24 | (20.84) % | $ 28,499 | 0.88 % (7) | 0.97 % | (0.12) % | 20 % |
| 10/1/20 to 9/30/21 | | 40.89 | (0.12) | 15.06 | 14.94 | — | — | (0.32) | (0.32) | — | 14.62 | 55.51 | 36.67 | 55,370 | 0.87 | 0.97 | (0.24) | 15 |
| 10/1/19 to 9/30/20 | | 35.77 | (0.04) | 5.31 | 5.27 | — | — | (0.15) | (0.15) | — | 5.12 | 40.89 | 14.77 | 19,666 | 0.87 | 1.00 | (0.10) | 19 |
| 10/1/18 to 9/30/19 | | 34.28 | 0.04 | 1.68 | 1.72 | — | — | (0.23) | (0.23) | — | 1.49 | 35.77 | 5.15 | 11,323 | 0.87 | 1.01 | 0.11 | 28 |
| 1/30/18 (10) to 9/30/18 | | 32.78 | 0.02 | 1.48 | 1.50 | — | — | — | — | — | 1.50 | 34.28 | 4.58 | 2,474 | 0.87 | 1.06 | 0.10 | 21 (12) |
| | | | | | | | | | | | | | | | | | | |
| KAR Mid-Cap Growth Fund | | | | | | | | | | | | | | | | | | |
| Class A | | | | | | | | | | | | | | | | | | |
| 10/1/21 to 9/30/22 | | $71.37 | (0.42) | (26.44) | (26.86) | — | — | (1.04) | (1.04) | — (11) | (27.90) | $43.47 | (38.15) % (13) | $ 301,043 | 1.25 % (6)(7) | 1.25 % | (0.73) % | 12 % |
| 10/1/20 to 9/30/21 | | 58.05 | (0.62) | 14.01 | 13.39 | — | — | (0.07) | (0.07) | — | 13.32 | 71.37 | 23.07 | 579,817 | 1.24 (6) | 1.24 | (0.91) | 17 |
| 10/1/19 to 9/30/20 | | 37.39 | (0.42) | 21.34 | 20.92 | — | — | (0.26) | (0.26) | — | 20.66 | 58.05 | 56.23 | 482,266 | 1.28 (6)(14) | 1.26 | (0.90) | 14 |
| 10/1/18 to 9/30/19 | | 35.55 | (0.31) | 2.79 | 2.48 | — | — | (0.64) | (0.64) | — | 1.84 | 37.39 | 7.46 | 181,184 | 1.40 (6)(14) | 1.33 | (0.87) | 28 |
| 10/1/17 to 9/30/18 | | 27.74 | (0.28) | 9.65 | 9.37 | — | — | (1.56) | (1.56) | — | 7.81 | 35.55 | 35.38 | 131,422 | 1.40 (14) | 1.37 | (0.88) | 19 |
| Class C | | | | | | | | | | | | | | | | | | |
| 10/1/21 to 9/30/22 | | $55.11 | (0.68) | (20.25) | (20.93) | — | — | (1.04) | (1.04) | — (11) | (21.97) | $33.14 | (38.65) % (13) | $ 59,318 | 2.05 % (6)(7) | 2.05 % | (1.53) % | 12 % |
| 10/1/20 to 9/30/21 | | 45.18 | (0.87) | 10.87 | 10.00 | — | — | (0.07) | (0.07) | — | 9.93 | 55.11 | 22.13 | 141,256 | 1.99 (6) | 1.99 | (1.66) | 17 |
| 10/1/19 to 9/30/20 | | 29.38 | (0.60) | 16.66 | 16.06 | — | — | (0.26) | (0.26) | — | 15.80 | 45.18 | 55.01 | 112,165 | 2.03 (6)(14) | 2.02 | (1.65) | 14 |
| 10/1/18 to 9/30/19 | | 28.30 | (0.47) | 2.19 | 1.72 | — | — | (0.64) | (0.64) | — | 1.08 | 29.38 | 6.67 | 40,450 | 2.15 (6)(14) | 2.12 | (1.62) | 28 |
| 10/1/17 to 9/30/18 | | 22.54 | (0.42) | 7.74 | 7.32 | — | — | (1.56) | (1.56) | — | 5.76 | 28.30 | 34.40 | 12,571 | 2.15 | 2.17 | (1.63) | 19 |
The footnote legend is at the end of the financial highlights.
See Notes to Financial Statements
VIRTUS EQUITY TRUST
FINANCIAL HIGHLIGHTS (Continued)
SELECTED PER SHARE DATA AND RATIOS FOR A SHARE OUTSTANDING
THROUGHOUT EACH PERIOD
| | | Net Asset Value,
Beginning of Period | Net Investment Income (Loss)(1) | Net Realized and
Unrealized Gain (Loss) | Total from Investment Operations | Dividends from
Net Investment Income | Return of Capital | Distributions from
Net Realized Gains | Total Distributions | Payment from Affiliates(1) | Change in Net Asset Value | Net Asset Value, End of Period | Total Return(2)(3) | Net Assets, End of Period
(in thousands) | Ratio of Net Expenses to
Average Net Assets(4)(5) | Ratio of Gross Expenses
to Average Net Assets(4)(5) | Ratio of Net Investment Income (Loss)
to Average Net Assets(4) | Portfolio Turnover Rate(3) |
| KAR Mid-Cap Growth Fund (Continued) | | | | | | | | | | | | | | | | | | |
| Class I | | | | | | | | | | | | | | | | | | |
| 10/1/21 to 9/30/22 | | $74.14 | (0.30) | (27.51) | (27.81) | — | — | (1.04) | (1.04) | — (11) | (28.85) | $45.29 | (38.00) % (13) | $1,134,777 | 1.01 % (6)(7) | 1.01 % | (0.50) % | 12 % |
| 10/1/20 to 9/30/21 | | 60.16 | (0.47) | 14.52 | 14.05 | — | — | (0.07) | (0.07) | — | 13.98 | 74.14 | 23.35 | 2,499,830 | 1.00 (6) | 1.00 | (0.66) | 17 |
| 10/1/19 to 9/30/20 | | 38.70 | (0.33) | 22.05 | 21.72 | — | — | (0.26) | (0.26) | — | 21.46 | 60.16 | 56.39 | 1,837,262 | 1.03 (6) | 1.03 | (0.66) | 14 |
| 10/1/18 to 9/30/19 | | 36.66 | (0.22) | 2.90 | 2.68 | — | — | (0.64) | (0.64) | — | 2.04 | 38.70 | 7.79 | 309,892 | 1.11 (6)(14) | 1.11 | (0.58) | 28 |
| 10/1/17 to 9/30/18 | | 28.49 | (0.22) | 9.95 | 9.73 | — | — | (1.56) | (1.56) | — | 8.17 | 36.66 | 35.72 | 56,787 | 1.15 (14) | 1.13 | (0.65) | 19 |
| Class R6 | | | | | | | | | | | | | | | | | | |
| 10/1/21 to 9/30/22 | | $74.68 | (0.20) | (27.73) | (27.93) | — | — | (1.04) | (1.04) | — (11) | (28.97) | $45.71 | (37.89) % (13) | $ 89,056 | 0.84 % (7) | 0.90 % | (0.34) % | 12 % |
| 10/1/20 to 9/30/21 | | 60.49 | (0.36) | 14.62 | 14.26 | — | — | (0.07) | (0.07) | — | 14.19 | 74.68 | 23.57 | 208,915 | 0.83 | 0.89 | (0.50) | 17 |
| 10/1/19 to 9/30/20 | | 38.85 | (0.28) | 22.18 | 21.90 | — | — | (0.26) | (0.26) | — | 21.64 | 60.49 | 56.64 | 100,461 | 0.83 | 0.93 | (0.51) | 14 |
| 10/1/18 to 9/30/19 | | 36.71 | (0.13) | 2.91 | 2.78 | — | — | (0.64) | (0.64) | — | 2.14 | 38.85 | 8.05 | 1,975 | 0.85 (9)(14) | 1.01 | (0.34) | 28 |
| 1/30/18 (10) to 9/30/18 | | 31.74 | (0.09) | 5.06 | 4.97 | — | — | — | — | — | 4.97 | 36.71 | 15.66 | 117 | 0.93 (9) | 1.09 | (0.40) | 19 (12) |
| | | | | | | | | | | | | | | | | | | |
| KAR Small-Cap Core Fund | | | | | | | | | | | | | | | | | | |
| Class A | | | | | | | | | | | | | | | | | | |
| 10/1/21 to 9/30/22 | | $47.98 | — (11) | (4.72) | (4.72) | — | — | (5.84) | (5.84) | — | (10.56) | $37.42 | (11.73) % | $ 117,382 | 1.27 % (7) | 1.27 % | — % (15) | 9 % |
| 10/1/20 to 9/30/21 | | 40.21 | (0.11) | 11.25 | 11.14 | — | — | (3.37) | (3.37) | — | 7.77 | 47.98 | 28.68 | 140,807 | 1.26 | 1.26 | (0.23) | 16 |
| 10/1/19 to 9/30/20 | | 38.20 | (0.17) | 3.84 | 3.67 | — | — | (1.66) | (1.66) | — | 2.01 | 40.21 | 9.78 | 112,178 | 1.28 | 1.28 | (0.46) | 19 |
| 10/1/18 to 9/30/19 | | 35.42 | (0.08) | 4.14 | 4.06 | — | — | (1.28) | (1.28) | — | 2.78 | 38.20 | 12.50 | 133,702 | 1.29 | 1.29 | (0.24) | 9 |
| 10/1/17 to 9/30/18 | | 28.05 | (0.03) | 7.44 | 7.41 | — | — | (0.04) | (0.04) | — | 7.37 | 35.42 | 26.42 | 153,109 | 1.29 | 1.29 | (0.08) | 13 |
| Class C | | | | | | | | | | | | | | | | | | |
| 10/1/21 to 9/30/22 | | $38.35 | (0.24) | (3.57) | (3.81) | — | — | (5.84) | (5.84) | — | (9.65) | $28.70 | (12.37) % | $ 58,911 | 2.00 % (7) | 2.00 % | (0.73) % | 9 % |
| 10/1/20 to 9/30/21 | | 32.95 | (0.35) | 9.12 | 8.77 | — | — | (3.37) | (3.37) | — | 5.40 | 38.35 | 27.74 | 84,992 | 1.99 | 1.99 | (0.93) | 16 |
| 10/1/19 to 9/30/20 | | 31.81 | (0.37) | 3.17 | 2.80 | — | — | (1.66) | (1.66) | — | 1.14 | 32.95 | 8.98 | 89,553 | 2.01 | 2.01 | (1.20) �� | 19 |
| 10/1/18 to 9/30/19 | | 29.95 | (0.28) | 3.42 | 3.14 | — | — | (1.28) | (1.28) | — | 1.86 | 31.81 | 11.69 | 106,191 | 2.03 | 2.03 | (0.99) | 9 |
| 10/1/17 to 9/30/18 | | 23.90 | (0.23) | 6.32 | 6.09 | — | — | (0.04) | (0.04) | — | 6.05 | 29.95 | 25.52 | 122,439 | 2.02 | 2.02 | (0.82) | 13 |
| Class I | | | | | | | | | | | | | | | | | | |
| 10/1/21 to 9/30/22 | | $51.22 | 0.12 | (5.11) | (4.99) | (0.06) | — | (5.84) | (5.90) | — | (10.89) | $40.33 | (11.51) % | $1,008,114 | 1.01 % (7) | 1.01 % | 0.26 % | 9 % |
| 10/1/20 to 9/30/21 | | 42.67 | 0.02 | 11.96 | 11.98 | (0.06) | — | (3.37) | (3.43) | — | 8.55 | 51.22 | 29.03 | 1,278,711 | 1.00 | 1.00 | 0.05 | 16 |
| 10/1/19 to 9/30/20 | | 40.33 | (0.07) | 4.08 | 4.01 | (0.01) | — | (1.66) | (1.67) | — | 2.34 | 42.67 | 10.11 | 1,082,010 | 1.00 | 1.00 | (0.18) | 19 |
| 10/1/18 to 9/30/19 | | 37.26 | — (11) | 4.39 | 4.39 | (0.04) | — | (1.28) | (1.32) | — | 3.07 | 40.33 | 12.83 | 1,202,004 | 1.02 | 1.02 | 0.01 | 9 |
| 10/1/17 to 9/30/18 | | 29.44 | 0.06 | 7.80 | 7.86 | — | — | (0.04) | (0.04) | — | 7.82 | 37.26 | 26.73 | 1,231,686 | 1.01 | 1.01 | 0.18 | 13 |
| Class R6 | | | | | | | | | | | | | | | | | | |
| 10/1/21 to 9/30/22 | | $51.45 | 0.16 | (5.12) | (4.96) | (0.12) | — | (5.84) | (5.96) | — | (10.92) | $40.53 | (11.42) % | $ 320,196 | 0.93 % (7) | 0.93 % | 0.35 % | 9 % |
| 10/1/20 to 9/30/21 | | 42.84 | 0.06 | 12.02 | 12.08 | (0.10) | — | (3.37) | (3.47) | — | 8.61 | 51.45 | 29.14 | 421,653 | 0.92 | 0.92 | 0.12 | 16 |
| 10/1/19 to 9/30/20 | | 40.50 | (0.06) | 4.10 | 4.04 | (0.04) | — | (1.66) | (1.70) | — | 2.34 | 42.84 | 10.15 | 294,883 | 0.93 | 0.93 | (0.14) | 19 |
| 10/1/18 to 9/30/19 | | 37.40 | 0.04 | 4.40 | 4.44 | (0.06) | — | (1.28) | (1.34) | — | 3.10 | 40.50 | 12.94 | 107,611 | 0.94 | 0.94 | 0.10 | 9 |
| 10/1/17 to 9/30/18 | | 29.52 | 0.09 | 7.83 | 7.92 | — | — | (0.04) | (0.04) | — | 7.88 | 37.40 | 26.86 | 88,563 | 0.94 | 0.94 | 0.25 | 13 |
The footnote legend is at the end of the financial highlights.
See Notes to Financial Statements
VIRTUS EQUITY TRUST
FINANCIAL HIGHLIGHTS (Continued)
SELECTED PER SHARE DATA AND RATIOS FOR A SHARE OUTSTANDING
THROUGHOUT EACH PERIOD
| | | Net Asset Value,
Beginning of Period | Net Investment Income (Loss)(1) | Net Realized and
Unrealized Gain (Loss) | Total from Investment Operations | Dividends from
Net Investment Income | Return of Capital | Distributions from
Net Realized Gains | Total Distributions | Payment from Affiliates(1) | Change in Net Asset Value | Net Asset Value, End of Period | Total Return(2)(3) | Net Assets, End of Period
(in thousands) | Ratio of Net Expenses to
Average Net Assets(4)(5) | Ratio of Gross Expenses
to Average Net Assets(4)(5) | Ratio of Net Investment Income (Loss)
to Average Net Assets(4) | Portfolio Turnover Rate(3) |
| | | | | | | | | | | | | | | | | | | |
| KAR Small-Cap Growth Fund | | | | | | | | | | | | | | | | | | |
| Class A | | | | | | | | | | | | | | | | | | |
| 10/1/21 to 9/30/22 | | $53.81 | (0.37) | (14.19) | (14.56) | — | — | (6.98) | (6.98) | — | (21.54) | $32.27 | (31.04) % | $ 432,185 | 1.34 % (6)(7) | 1.34 % | (0.87) % | 12 % |
| 10/1/20 to 9/30/21 | | 49.00 | (0.52) | 10.49 | 9.97 | — | — | (5.16) | (5.16) | — | 4.81 | 53.81 | 20.46 | 793,106 | 1.34 (6) | 1.34 | (0.97) | 11 |
| 10/1/19 to 9/30/20 | | 37.44 | (0.41) | 12.59 | 12.18 | — | — | (0.62) | (0.62) | — | 11.56 | 49.00 | 32.91 | 772,158 | 1.35 (6) | 1.35 | (0.99) | 17 |
| 10/1/18 to 9/30/19 | | 33.57 | (0.23) | 4.78 | 4.55 | — | (0.04) | (0.64) | (0.68) | — | 3.87 | 37.44 | 14.12 | 735,210 | 1.37 (6) | 1.37 | (0.66) | 16 |
| 10/1/17 to 9/30/18 | | 25.43 | (0.11) | 8.25 | 8.14 | — | — | — | — | — | 8.14 | 33.57 | 32.01 | 866,966 | 1.37 (6) | 1.37 | (0.37) | 13 |
| Class C | | | | | | | | | | | | | | | | | | |
| 10/1/21 to 9/30/22 | | $46.72 | (0.58) | (11.98) | (12.56) | — | — | (6.98) | (6.98) | — | (19.54) | $27.18 | (31.52) % | $ 163,204 | 2.07 % (6)(7) | 2.07 % | (1.61) % | 12 % |
| 10/1/20 to 9/30/21 | | 43.40 | (0.79) | 9.27 | 8.48 | — | — | (5.16) | (5.16) | — | 3.32 | 46.72 | 19.60 | 319,371 | 2.05 (6) | 2.05 | (1.68) | 11 |
| 10/1/19 to 9/30/20 | | 33.46 | (0.63) | 11.19 | 10.56 | — | — | (0.62) | (0.62) | — | 9.94 | 43.40 | 31.97 | 322,672 | 2.07 (6) | 2.07 | (1.72) | 17 |
| 10/1/18 to 9/30/19 | | 30.30 | (0.44) | 4.28 | 3.84 | — | (0.04) | (0.64) | (0.68) | — | 3.16 | 33.46 | 13.28 | 291,693 | 2.10 (6) | 2.10 | (1.40) | 16 |
| 10/1/17 to 9/30/18 | | 23.13 | (0.31) | 7.48 | 7.17 | — | — | — | — | — | 7.17 | 30.30 | 31.00 | 301,749 | 2.10 (6) | 2.10 | (1.10) | 13 |
| Class I | | | | | | | | | | | | | | | | | | |
| 10/1/21 to 9/30/22 | | $55.46 | (0.27) | (14.71) | (14.98) | — | — | (6.98) | (6.98) | — | (21.96) | $33.50 | (30.85) % | $2,778,744 | 1.08 % (6)(7) | 1.08 % | (0.62) % | 12 % |
| 10/1/20 to 9/30/21 | | 50.25 | (0.38) | 10.75 | 10.37 | — | — | (5.16) | (5.16) | — | 5.21 | 55.46 | 20.77 | 5,346,986 | 1.07 (6) | 1.07 | (0.70) | 11 |
| 10/1/19 to 9/30/20 | | 38.28 | (0.31) | 12.90 | 12.59 | — | — | (0.62) | (0.62) | — | 11.97 | 50.25 | 33.27 | 5,251,980 | 1.09 (6) | 1.09 | (0.74) | 17 |
| 10/1/18 to 9/30/19 | | 34.21 | (0.14) | 4.89 | 4.75 | — | (0.04) | (0.64) | (0.68) | — | 4.07 | 38.28 | 14.44 | 3,973,860 | 1.11 (6) | 1.11 | (0.40) | 16 |
| 10/1/17 to 9/30/18 | | 25.86 | (0.03) | 8.38 | 8.35 | — | — | — | — | — | 8.35 | 34.21 | 32.29 | 4,121,658 | 1.10 (6) | 1.10 | (0.10) | 13 |
| Class R6 | | | | | | | | | | | | | | | | | | |
| 10/1/21 to 9/30/22 | | $55.68 | (0.22) | (14.80) | (15.02) | — | — | (6.98) | (6.98) | — | (22.00) | $33.68 | (30.80) % | $ 140,696 | 0.99 % (6)(7) | 0.99 % | (0.51) % | 12 % |
| 10/1/20 to 9/30/21 | | 50.39 | (0.32) | 10.77 | 10.45 | — | — | (5.16) | (5.16) | — | 5.29 | 55.68 | 20.88 | 205,549 | 0.98 (6) | 0.98 | (0.58) | 11 |
| 10/1/19 to 9/30/20 | | 38.35 | (0.29) | 12.95 | 12.66 | — | — | (0.62) | (0.62) | — | 12.04 | 50.39 | 33.39 | 95,061 | 0.99 (6) | 0.99 | (0.68) | 17 |
| 10/1/18 to 9/30/19 | | 34.23 | (0.12) | 4.92 | 4.80 | — | (0.04) | (0.64) | (0.68) | — | 4.12 | 38.35 | 14.58 | 45,306 | 1.00 (6) | 1.00 | (0.31) | 16 |
| 1/30/18 (10) to 9/30/18 | | 29.81 | 0.01 | 4.41 | 4.42 | — | — | — | — | — | 4.42 | 34.23 | 14.83 | 13,800 | 1.00 (6) | 1.00 | 0.05 | 13 |
| | | | | | | | | | | | | | | | | | | |
| KAR Small-Cap Value Fund | | | | | | | | | | | | | | | | | | |
| Class A | | | | | | | | | | | | | | | | | | |
| 10/1/21 to 9/30/22 | | $27.28 | 0.05 | (6.53) | (6.48) | (0.02) | — | (0.47) | (0.49) | — | (6.97) | $20.31 | (24.26) % | $ 90,204 | 1.21 % (6)(7) | 1.21 % | 0.19 % | 9 % |
| 10/1/20 to 9/30/21 | | 19.97 | 0.04 | 7.42 | 7.46 | (0.15) | — | — | (0.15) | — | 7.31 | 27.28 | 37.45 | 130,975 | 1.20 (6) | 1.20 | 0.14 | 13 |
| 10/1/19 to 9/30/20 | | 18.33 | 0.12 | 1.63 | 1.75 | (0.11) | — | — | (0.11) | — | 1.64 | 19.97 | 9.57 | 83,622 | 1.23 (6) | 1.23 | 0.66 | 19 |
| 10/1/18 to 9/30/19 | | 19.44 | 0.14 | (0.93) | (0.79) | (0.13) | — | (0.19) | (0.32) | — | (1.11) | 18.33 | (3.82) | 79,027 | 1.24 (6) | 1.24 | 0.80 | 14 |
| 10/1/17 to 9/30/18 | | 18.41 | 0.10 | 1.23 | 1.33 | (0.01) | — | (0.29) | (0.30) | — | 1.03 | 19.44 | 7.27 | 83,276 | 1.27 (6) | 1.27 | 0.55 | 6 |
| Class C | | | | | | | | | | | | | | | | | | |
| 10/1/21 to 9/30/22 | | $26.51 | (0.14) | (6.31) | (6.45) | — | — | (0.47) | (0.47) | — | (6.92) | $19.59 | (24.84) % | $ 13,446 | 1.98 % (6)(7) | 1.98 % | (0.58) % | 9 % |
| 10/1/20 to 9/30/21 | | 19.44 | (0.16) | 7.24 | 7.08 | (0.01) | — | — | (0.01) | — | 7.07 | 26.51 | 36.44 | 21,623 | 1.96 (6) | 1.96 | (0.60) | 13 |
| 10/1/19 to 9/30/20 | | 17.88 | (0.01) | 1.57 | 1.56 | — | — | — | — | — | 1.56 | 19.44 | 8.72 | 16,233 | 1.98 (6) | 1.98 | (0.08) | 19 |
| 10/1/18 to 9/30/19 | | 18.96 | 0.01 | (0.90) | (0.89) | — | — | (0.19) | (0.19) | — | (1.08) | 17.88 | (4.56) | 15,361 | 1.99 (6) | 1.99 | 0.09 | 14 |
| 10/1/17 to 9/30/18 | | 18.08 | (0.03) | 1.20 | 1.17 | — | — | (0.29) | (0.29) | — | 0.88 | 18.96 | 6.54 | 29,922 | 1.97 (6) | 1.97 | (0.14) | 6 |
The footnote legend is at the end of the financial highlights.
See Notes to Financial Statements
VIRTUS EQUITY TRUST
FINANCIAL HIGHLIGHTS (Continued)
SELECTED PER SHARE DATA AND RATIOS FOR A SHARE OUTSTANDING
THROUGHOUT EACH PERIOD
| | | Net Asset Value,
Beginning of Period | Net Investment Income (Loss)(1) | Net Realized and
Unrealized Gain (Loss) | Total from Investment Operations | Dividends from
Net Investment Income | Return of Capital | Distributions from
Net Realized Gains | Total Distributions | Payment from Affiliates(1) | Change in Net Asset Value | Net Asset Value, End of Period | Total Return(2)(3) | Net Assets, End of Period
(in thousands) | Ratio of Net Expenses to
Average Net Assets(4)(5) | Ratio of Gross Expenses
to Average Net Assets(4)(5) | Ratio of Net Investment Income (Loss)
to Average Net Assets(4) | Portfolio Turnover Rate(3) |
| KAR Small-Cap Value Fund (Continued) | | | | | | | | | | | | | | | | | | |
| Class I | | | | | | | | | | | | | | | | | | |
| 10/1/21 to 9/30/22 | | $27.30 | 0.11 | (6.54) | (6.43) | (0.04) | — | (0.47) | (0.51) | — | (6.94) | $20.36 | (24.08) % | $ 756,418 | 0.98 % (6)(7) | 0.98 % | 0.42 % | 9 % |
| 10/1/20 to 9/30/21 | | 19.97 | 0.10 | 7.43 | 7.53 | (0.20) | — | — | (0.20) | — | 7.33 | 27.30 | 37.83 | 1,190,498 | 0.96 (6) | 0.96 | 0.38 | 13 |
| 10/1/19 to 9/30/20 | | 18.34 | 0.18 | 1.60 | 1.78 | (0.15) | — | — | (0.15) | — | 1.63 | 19.97 | 9.75 | 711,421 | 0.99 (6) | 0.99 | 0.94 | 19 |
| 10/1/18 to 9/30/19 | | 19.49 | 0.18 | (0.94) | (0.76) | (0.20) | — | (0.19) | (0.39) | — | (1.15) | 18.34 | (3.57) | 484,123 | 1.01 (6) | 1.01 | 1.02 | 14 |
| 10/1/17 to 9/30/18 | | 18.41 | 0.16 | 1.23 | 1.39 | (0.02) | — | (0.29) | (0.31) | — | 1.08 | 19.49 | 7.62 | 475,103 | 0.99 (6) | 0.99 | 0.84 | 6 |
| Class R6 | | | | | | | | | | | | | | | | | | |
| 10/1/21 to 9/30/22 | | $27.33 | 0.13 | (6.55) | (6.42) | (0.05) | — | (0.47) | (0.52) | — | (6.94) | $20.39 | (24.03) % | $ 34,066 | 0.89 % (6)(7) | 0.89 % | 0.52 % | 9 % |
| 10/1/20 to 9/30/21 | | 20.00 | 0.12 | 7.43 | 7.55 | (0.22) | — | — | (0.22) | — | 7.33 | 27.33 | 37.85 | 81,914 | 0.89 (6) | 0.89 | 0.46 | 13 |
| 10/1/19 to 9/30/20 | | 18.36 | 0.19 | 1.62 | 1.81 | (0.17) | — | — | (0.17) | — | 1.64 | 20.00 | 9.90 | 12,246 | 0.89 (6) | 0.89 | 1.01 | 19 |
| 10/1/18 to 9/30/19 | | 19.51 | 0.20 | (0.94) | (0.74) | (0.22) | — | (0.19) | (0.41) | — | (1.15) | 18.36 | (3.47) | 11,286 | 0.90 (6) | 0.90 | 1.11 | 14 |
| 10/1/17 to 9/30/18 | | 18.42 | 0.18 | 1.22 | 1.40 | (0.02) | — | (0.29) | (0.31) | — | 1.09 | 19.51 | 7.69 | 21,746 | 0.90 (6) | 0.90 | 0.96 | 6 |
| | | | | | | | | | | | | | | | | | | |
| KAR Small-Mid Cap Core Fund | | | | | | | | | | | | | | | | | | |
| Class A | | | | | | | | | | | | | | | | | | |
| 10/1/21 to 9/30/22 | | $18.67 | (0.10) | (4.82) | (4.92) | — | — | (0.22) | (0.22) | — | (5.14) | $13.53 | (26.69) % | $ 34,319 | 1.31 % (6)(7)(14) | 1.27 % | (0.60) % | 19 % |
| 10/1/20 to 9/30/21 | | 14.43 | (0.14) | 4.38 | 4.24 | — | — | — | — | — | 4.24 | 18.67 | 29.38 | 48,485 | 1.30 | 1.30 | (0.77) | 7 |
| 10/1/19 to 9/30/20 | | 11.53 | (0.03) | 2.93 | 2.90 | — | — | — | — | — | 2.90 | 14.43 | 25.15 | 19,735 | 1.30 | 1.39 | (0.23) | 31 |
| 10/1/18 to 9/30/19 | | 10.79 | (0.03) | 0.89 | 0.86 | — | — | (0.12) | (0.12) | — | 0.74 | 11.53 | 8.32 | 1,473 | 1.30 | 2.25 | (0.28) | 21 |
| 3/7/18 (10) to 9/30/18 | | 10.00 | (0.02) | 0.81 | 0.79 | — | — | — | — | — | 0.79 | 10.79 | 7.90 | 158 | 1.30 | 5.84 | (0.38) | 16 (12) |
| Class C | | | | | | | | | | | | | | | | | | |
| 10/1/21 to 9/30/22 | | $18.18 | (0.22) | (4.67) | (4.89) | — | — | (0.22) | (0.22) | — | (5.11) | $13.07 | (27.25) % | $ 26,271 | 2.04 % (6)(7)(14) | 2.03 % | (1.33) % | 19 % |
| 10/1/20 to 9/30/21 | | 14.16 | (0.27) | 4.29 | 4.02 | — | — | — | — | — | 4.02 | 18.18 | 28.39 | 30,401 | 2.05 (6)(14) | 2.03 | (1.52) | 7 |
| 10/1/19 to 9/30/20 | | 11.40 | (0.12) | 2.88 | 2.76 | — | — | — | — | — | 2.76 | 14.16 | 24.21 | 10,210 | 2.05 | 2.08 | (0.97) | 31 |
| 10/1/18 to 9/30/19 | | 10.75 | (0.11) | 0.88 | 0.77 | — | — | (0.12) | (0.12) | — | 0.65 | 11.40 | 7.50 | 1,106 | 2.05 | 2.92 | (1.05) | 21 |
| 3/7/18 (10) to 9/30/18 | | 10.00 | (0.07) | 0.82 | 0.75 | — | — | — | — | — | 0.75 | 10.75 | 7.50 | 135 | 2.05 | 6.48 | (1.14) | 16 (12) |
| Class I | | | | | | | | | | | | | | | | | | |
| 10/1/21 to 9/30/22 | | $18.82 | (0.05) | (4.87) | (4.92) | — | — | (0.22) | (0.22) | — | (5.14) | $13.68 | (26.47) % | $ 877,405 | 1.02 % (6)(7) | 1.02 % | (0.31) % | 19 % |
| 10/1/20 to 9/30/21 | | 14.51 | (0.09) | 4.40 | 4.31 | — (11) | — | — | — (11) | — | 4.31 | 18.82 | 29.72 | 1,168,320 | 1.02 (6)(14) | 1.01 | (0.49) | 7 |
| 10/1/19 to 9/30/20 | | 11.56 | 0.01 | 2.94 | 2.95 | — | — | — | — | — | 2.95 | 14.51 | 25.52 | 439,899 | 1.05 | 1.09 | 0.07 | 31 |
| 10/1/18 to 9/30/19 | | 10.81 | (0.01) | 0.89 | 0.88 | (0.01) | — | (0.12) | (0.13) | — | 0.75 | 11.56 | 8.51 | 24,898 | 1.05 | 1.99 | (0.05) | 21 |
| 3/7/18 (10) to 9/30/18 | | 10.00 | (0.01) | 0.82 | 0.81 | — | — | — | — | — | 0.81 | 10.81 | 8.10 | 214 | 1.05 | 5.74 | (0.13) | 16 (12) |
| Class R6 | | | | | | | | | | | | | | | | | | |
| 10/1/21 to 9/30/22 | | $18.87 | (0.05) | (4.89) | (4.94) | — | — | (0.22) | (0.22) | — | (5.16) | $13.71 | (26.51) % | $ 14,051 | 0.98 % (6)(7)(14) | 0.93 % | (0.28) % | 19 % |
| 10/1/20 to 9/30/21 | | 14.54 | (0.08) | 4.42 | 4.34 | (0.01) | — | — | (0.01) | — | 4.33 | 18.87 | 29.82 | 16,335 | 0.97 (6)(14) | 0.92 | (0.44) | 7 |
| 10/1/19 to 9/30/20 | | 11.57 | — (11) | 2.97 | 2.97 | — | — | — | — | — | 2.97 | 14.54 | 25.67 | 8,366 | 0.97 | 0.99 | 0.03 | 31 |
| 10/1/18 to 9/30/19 | | 10.81 | 0.01 | 0.88 | 0.89 | (0.01) | — | (0.12) | (0.13) | — | 0.76 | 11.57 | 8.61 | 3,125 | 0.97 | 1.91 | 0.06 | 21 |
| 3/7/18 (10) to 9/30/18 | | 10.00 | (—) (11) | 0.81 | 0.81 | — | — | — | — | — | 0.81 | 10.81 | 8.10 | 2,919 | 0.97 | 5.20 | (0.07) | 16 (12) |
The footnote legend is at the end of the financial highlights.
See Notes to Financial Statements
VIRTUS EQUITY TRUST
FINANCIAL HIGHLIGHTS (Continued)
SELECTED PER SHARE DATA AND RATIOS FOR A SHARE OUTSTANDING
THROUGHOUT EACH PERIOD
| | | Net Asset Value,
Beginning of Period | Net Investment Income (Loss)(1) | Net Realized and
Unrealized Gain (Loss) | Total from Investment Operations | Dividends from
Net Investment Income | Return of Capital | Distributions from
Net Realized Gains | Total Distributions | Payment from Affiliates(1) | Change in Net Asset Value | Net Asset Value, End of Period | Total Return(2)(3) | Net Assets, End of Period
(in thousands) | Ratio of Net Expenses to
Average Net Assets(4)(5) | Ratio of Gross Expenses
to Average Net Assets(4)(5) | Ratio of Net Investment Income (Loss)
to Average Net Assets(4) | Portfolio Turnover Rate(3) |
| | | | | | | | | | | | | | | | | | | |
| KAR Small-Mid Cap Growth Fund | | | | | | | | | | | | | | | | | | |
| Class A | | | | | | | | | | | | | | | | | | |
| 10/1/21 to 9/30/22 | | $10.70 | (0.10) | (2.87) | (2.97) | — | — | — | — | — | (2.97) | $ 7.73 | (27.76) % | $ 435 | 1.31 % (7) | 2.77 % | (1.04) % | 27 % |
| 12/8/20 (10) to 9/30/21 | | 10.00 | (0.09) | 0.79 | 0.70 | — | — | — | — | — | 0.70 | 10.70 | 7.00 | 725 | 1.30 | 4.06 | (1.05) | 14 (12) |
| Class C | | | | | | | | | | | | | | | | | | |
| 10/1/21 to 9/30/22 | | $10.63 | (0.16) | (2.84) | (3.00) | — | — | — | — | — | (3.00) | $ 7.63 | (28.22) % | $ 98 | 2.06 % (7) | 3.44 % | (1.77) % | 27 % |
| 12/8/20 (10) to 9/30/21 | | 10.00 | (0.15) | 0.78 | 0.63 | — | — | — | — | — | 0.63 | 10.63 | 6.30 | 119 | 2.05 | 4.88 | (1.82) | 14 (12) |
| Class I | | | | | | | | | | | | | | | | | | |
| 10/1/21 to 9/30/22 | | $10.72 | (0.07) | (2.88) | (2.95) | — | — | — | — | — | (2.95) | $ 7.77 | (27.52) % | $ 1,940 | 1.06 % (7) | 2.58 % | (0.76) % | 27 % |
| 12/8/20 (10) to 9/30/21 | | 10.00 | (0.07) | 0.79 | 0.72 | — | — | — | — | — | 0.72 | 10.72 | 7.20 | 1,998 | 1.05 | 3.83 | (0.79) | 14 (12) |
| Class R6 | | | | | | | | | | | | | | | | | | |
| 10/1/21 to 9/30/22 | | $10.73 | (0.07) | (2.88) | (2.95) | — | — | — | — | — | (2.95) | $ 7.78 | (27.49) % | $ 2,664 | 1.00 % (7) | 2.45 % | (0.71) % | 27 % |
| 12/8/20 (10) to 9/30/21 | | 10.00 | (0.07) | 0.80 | 0.73 | — | — | — | — | — | 0.73 | 10.73 | 7.30 | 3,241 | 0.99 | 3.79 | (0.76) | 14 (12) |
| | | | | | | | | | | | | | | | | | | |
| KAR Small-Mid Cap Value Fund | | | | | | | | | | | | | | | | | | |
| Class A | | | | | | | | | | | | | | | | | | |
| 10/1/21 to 9/30/22 | | $ 9.64 | 0.03 | (1.88) | (1.85) | (0.02) | — | — | (0.02) | — | (1.87) | $ 7.77 | (19.25) % | $ 698 | 1.20 % (7) | 4.12 % | 0.29 % | 19 % |
| 8/3/21 (10) to 9/30/21 | | 10.00 | — (11) | (0.36) | (0.36) | — | — | — | — | — | (0.36) | 9.64 | (3.60) | 127 | 1.17 | 12.81 | 0.09 | 0 |
| Class C | | | | | | | | | | | | | | | | | | |
| 10/1/21 to 9/30/22 | | $ 9.63 | (0.04) | (1.88) | (1.92) | — | — | — | — | — | (1.92) | $ 7.71 | (19.94) % | $ 80 | 1.93 % (7) | 4.86 % | (0.46) % | 19 % |
| 8/3/21 (10) to 9/30/21 | | 10.00 | (0.01) | (0.36) | (0.37) | — | — | — | — | — | (0.37) | 9.63 | (3.70) | 99 | 1.92 | 13.87 | (0.71) | 0 |
| Class I | | | | | | | | | | | | | | | | | | |
| 10/1/21 to 9/30/22 | | $ 9.64 | 0.04 | (1.87) | (1.83) | (0.05) | — | — | (0.05) | — | (1.88) | $ 7.76 | (19.10) % | $ 413 | 0.94 % (7) | 3.89 % | 0.47 % | 19 % |
| 8/3/21 (10) to 9/30/21 | | 10.00 | — (11) | (0.36) | (0.36) | — | — | — | — | — | (0.36) | 9.64 | (3.60) | 97 | 0.92 | 12.88 | 0.29 | 0 |
| Class R6 | | | | | | | | | | | | | | | | | | |
| 10/1/21 to 9/30/22 | | $ 9.65 | 0.06 | (1.89) | (1.83) | (0.04) | — | — | (0.04) | — | (1.87) | $ 7.78 | (19.09) % | $ 2,719 | 0.83 % (7) | 3.83 % | 0.63 % | 19 % |
| 8/3/21 (10) to 9/30/21 | | 10.00 | 0.01 | (0.36) | (0.35) | — | — | — | — | — | (0.35) | 9.65 | (3.50) | 2,604 | 0.82 | 12.82 | 0.47 | 0 |
| | | | | | | | | | | | | | | | | | | |
| SGA Emerging Markets Growth Fund | | | | | | | | | | | | | | | | | | |
| Class A | | | | | | | | | | | | | | | | | | |
| 10/1/21 to 9/30/22 | | $12.82 | (0.02) | (3.56) | (3.58) | — | — | (0.88) | (0.88) | — | (4.46) | $ 8.36 | (29.40) % | $ 136 | 1.49 % (7) | 3.02 % | (0.23) % | 30 % |
| 10/1/20 to 9/30/21 | | 11.90 | (0.09) | 1.28 | 1.19 | — | — | (0.27) | (0.27) | — | 0.92 | 12.82 | 9.93 | 206 | 1.48 | 2.91 | (0.66) | 46 |
| 10/1/19 to 9/30/20 | | 9.97 | (0.05) | 1.98 | 1.93 | — | — | — (11) | — (11) | — | 1.93 | 11.90 | 19.37 | 169 | 1.48 | 3.98 | (0.47) | 44 |
| 6/13/19 (10) to 9/30/19 | | 10.00 | (0.02) | (0.01) | (0.03) | — | — | — | — | — | (0.03) | 9.97 | (0.30) | 100 | 1.48 | 9.63 | (0.57) | 6 (12) |
| Class C | | | | | | | | | | | | | | | | | | |
| 10/1/21 to 9/30/22 | | $12.60 | (0.10) | (3.48) | (3.58) | — | — | (0.88) | (0.88) | — | (4.46) | $ 8.14 | (29.94) % | $ 86 | 2.24 % (7) | 3.76 % | (0.96) % | 30 % |
| 10/1/20 to 9/30/21 | | 11.79 | (0.19) | 1.27 | 1.08 | — | — | (0.27) | (0.27) | — | 0.81 | 12.60 | 9.08 | 159 | 2.23 | 3.66 | (1.42) | 46 |
| 10/1/19 to 9/30/20 | | 9.95 | (0.13) | 1.97 | 1.84 | — | — | — (11) | — (11) | — | 1.84 | 11.79 | 18.50 | 142 | 2.23 | 4.70 | (1.19) | 44 |
| 6/13/19 (10) to 9/30/19 | | 10.00 | (0.04) | (0.01) | (0.05) | — | — | — | — | — | (0.05) | 9.95 | (0.50) | 100 | 2.23 | 10.38 | (1.32) | 6 (12) |
The footnote legend is at the end of the financial highlights.
See Notes to Financial Statements
VIRTUS EQUITY TRUST
FINANCIAL HIGHLIGHTS (Continued)
SELECTED PER SHARE DATA AND RATIOS FOR A SHARE OUTSTANDING
THROUGHOUT EACH PERIOD
| | | Net Asset Value,
Beginning of Period | Net Investment Income (Loss)(1) | Net Realized and
Unrealized Gain (Loss) | Total from Investment Operations | Dividends from
Net Investment Income | Return of Capital | Distributions from
Net Realized Gains | Total Distributions | Payment from Affiliates(1) | Change in Net Asset Value | Net Asset Value, End of Period | Total Return(2)(3) | Net Assets, End of Period
(in thousands) | Ratio of Net Expenses to
Average Net Assets(4)(5) | Ratio of Gross Expenses
to Average Net Assets(4)(5) | Ratio of Net Investment Income (Loss)
to Average Net Assets(4) | Portfolio Turnover Rate(3) |
| SGA Emerging Markets Growth Fund (Continued) | | | | | | | | | | | | | | | | | | |
| Class I | | | | | | | | | | | | | | | | | | |
| 10/1/21 to 9/30/22 | | $12.90 | — (11) | (3.58) | (3.58) | — | — | (0.88) | (0.88) | — | (4.46) | $ 8.44 | (29.20) % | $ 230 | 1.24 % (7) | 2.76 % | 0.01 % | 30 % |
| 10/1/20 to 9/30/21 | | 11.94 | (0.06) | 1.29 | 1.23 | — | — | (0.27) | (0.27) | — | 0.96 | 12.90 | 10.24 | 405 | 1.23 | 2.67 | (0.42) | 46 |
| 10/1/19 to 9/30/20 | | 9.98 | (0.03) | 1.99 | 1.96 | — | — | — (11) | — (11) | — | 1.96 | 11.94 | 19.65 | 247 | 1.23 | 3.57 | (0.30) | 44 |
| 6/13/19 (10) to 9/30/19 | | 10.00 | (0.01) | (0.01) | (0.02) | — | — | — | — | — | (0.02) | 9.98 | (0.20) | 109 | 1.23 | 9.38 | (0.32) | 6 (12) |
| Class R6 | | | | | | | | | | | | | | | | | | |
| 10/1/21 to 9/30/22 | | $12.95 | 0.02 | (3.60) | (3.58) | — | — | (0.88) | (0.88) | — | (4.46) | $ 8.49 | (29.08) % | $ 3,845 | 1.06 % (7) | 2.74 % | 0.21 % | 30 % |
| 10/1/20 to 9/30/21 | | 11.97 | (0.03) | 1.28 | 1.25 | — | — | (0.27) | (0.27) | — | 0.98 | 12.95 | 10.38 | 5,425 | 1.05 | 2.63 | (0.24) | 46 |
| 10/1/19 to 9/30/20 | | 9.98 | — (11) | 1.99 | 1.99 | — | — | — (11) | — (11) | — | 1.99 | 11.97 | 19.95 | 4,828 | 1.05 | 3.72 | (0.02) | 44 |
| 6/13/19 (10) to 9/30/19 | | 10.00 | — (11) | (0.02) | (0.02) | — | — | — | — | — | (0.02) | 9.98 | (0.20) | 4,032 | 1.05 | 9.38 | (0.14) | 6 (12) |
| | | | | | | | | | | | | | | | | | | |
| SGA Global Growth Fund | | | | | | | | | | | | | | | | | | |
| Class A | | | | | | | | | | | | | | | | | | |
| 10/1/21 to 9/30/22 | | $30.69 | (0.18) | (8.97) | (9.15) | — | — | (2.05) | (2.05) | — | (11.20) | $19.49 | (31.91) % | $ 18,375 | 1.39 % (7) | 1.45 % | (0.71) % | 37 % |
| 10/1/20 to 9/30/21 | | 26.54 | (0.24) | 5.33 | 5.09 | — | — | (0.94) | (0.94) | — | 4.15 | 30.69 | 19.49 | 34,690 | 1.38 | 1.47 | (0.79) | 40 |
| 10/1/19 to 9/30/20 | | 20.98 | (0.12) | 5.68 | 5.56 | — | — | — | — | — | 5.56 | 26.54 | 26.50 | 26,504 | 1.36 (6) | 1.36 | (0.53) | 49 |
| 2/1/19 to 9/30/19(8) | | 18.58 | (0.01) | 2.41 | 2.40 | — | — | — | — | — | 2.40 | 20.98 | 12.92 | 4,219 | 1.37 | 1.48 | (0.06) | 13 |
| 2/1/18 to 1/31/19 | | 19.72 | (0.05) | (0.32) | (0.37) | — | — | (0.77) | (0.77) | — | (1.14) | 18.58 | (1.46) | 3,786 | 1.38 | 1.60 | (0.28) | 54 |
| 2/1/17 to 1/31/18 | | 14.89 | (0.02) | 5.49 | 5.47 | — | — | (0.64) | (0.64) | — | 4.83 | 19.72 | 37.05 | 3,835 | 1.38 | 1.72 | (0.43) | 31 |
| Class C | | | | | | | | | | | | | | | | | | |
| 10/1/21 to 9/30/22 | | $28.71 | (0.35) | (8.30) | (8.65) | — | — | (2.05) | (2.05) | — | (10.70) | $18.01 | (32.40) % | $ 3,767 | 2.14 % (6)(7)(14) | 2.14 % | (1.47) % | 37 % |
| 10/1/20 to 9/30/21 | | 25.06 | (0.43) | 5.02 | 4.59 | — | — | (0.94) | (0.94) | — | 3.65 | 28.71 | 18.62 | 7,326 | 2.13 | 2.14 | (1.54) | 40 |
| 10/1/19 to 9/30/20 | | 19.97 | (0.29) | 5.38 | 5.09 | — | — | — | — | — | 5.09 | 25.06 | 25.49 | 5,210 | 2.13 | 2.14 | (1.35) | 49 |
| 2/1/19 to 9/30/19(8) | | 17.77 | (0.11) | 2.31 | 2.20 | — | — | — | — | — | 2.20 | 19.97 | 12.38 | 3,554 | 2.10 | 2.20 | (0.83) | 13 |
| 2/1/18 to 1/31/19 | | 19.04 | (0.04) | (0.46) | (0.50) | — | — | (0.77) | (0.77) | — | (1.27) | 17.77 | (2.20) | 3,164 | 2.13 | 2.39 | (1.08) | 54 |
| 2/1/17 to 1/31/18 | | 14.50 | (0.04) | 5.22 | 5.18 | — | — | (0.64) | (0.64) | — | 4.54 | 19.04 | 36.04 | 2,062 | 2.13 | 2.47 | (1.08) | 31 |
| Class I* | | | | | | | | | | | | | | | | | | |
| 10/1/21 to 9/30/22 | | $30.91 | (0.12) | (9.05) | (9.17) | — | — | (2.05) | (2.05) | — | (11.22) | $19.69 | (31.74) % | $ 33,241 | 1.14 % (7) | 1.18 % | (0.47) % | 37 % |
| 10/1/20 to 9/30/21 | | 26.66 | (0.16) | 5.35 | 5.19 | — | — | (0.94) | (0.94) | — | 4.25 | 30.91 | 19.78 | 53,546 | 1.13 | 1.15 | (0.52) | 40 |
| 10/1/19 to 9/30/20 | | 21.03 | (0.08) | 5.71 | 5.63 | — (11) | — | — | — (11) | — | 5.63 | 26.66 | 26.79 | 27,529 | 1.13 | 1.20 | (0.34) | 49 |
| 2/1/19 to 9/30/19(8) | | 18.61 | — (11) | 2.42 | 2.42 | — | — | — | — | — | 2.42 | 21.03 | 13.00 | 12,807 | 1.19 | 1.28 | (0.02) | 13 |
| 2/1/18 to 1/31/19 | | 19.75 | (0.21) | (0.16) | (0.37) | — | — | (0.77) | (0.77) | — | (1.14) | 18.61 | (1.46) | 5,878 | 1.36 | 1.50 | (0.15) | 54 |
| 2/1/17 to 1/31/18 | | 14.90 | (0.04) | 5.53 | 5.49 | — | — | (0.64) | (0.64) | — | 4.85 | 19.75 | 37.16 | 19,474 | 1.36 | 1.57 | (0.29) | 31 |
| Class R6** | | | | | | | | | | | | | | | | | | |
| 10/1/21 to 9/30/22 | | $31.85 | (0.06) | (9.36) | (9.42) | — | — | (2.05) | (2.05) | — | (11.47) | $20.38 | (31.58) % | $ 54,339 | 0.91 % (7) | 1.04 % | (0.22) % | 37 % |
| 10/1/20 to 9/30/21 | | 27.38 | (0.10) | 5.51 | 5.41 | — | — | (0.94) | (0.94) | — | 4.47 | 31.85 | 20.07 | 80,122 | 0.90 | 1.03 | (0.31) | 40 |
| 10/1/19 to 9/30/20 | | 21.56 | (0.03) | 5.86 | 5.83 | (0.01) | — | — | (0.01) | — | 5.82 | 27.38 | 27.06 | 72,376 | 0.90 | 1.08 | (0.11) | 49 |
| 2/1/19 to 9/30/19(8) | | 19.04 | 0.05 | 2.47 | 2.52 | — | — | — | — | — | 2.52 | 21.56 | 13.24 | 40,690 | 0.95 | 1.16 | 0.34 | 13 |
| 2/1/18 to 1/31/19 | | 20.11 | 0.01 | (0.31) | (0.30) | — | — | (0.77) | (0.77) | — | (1.07) | 19.04 | (1.08) | 28,819 | 0.98 | 1.31 | 0.07 | 54 |
| 2/1/17 to 1/31/18 | | 15.11 | (0.01) | 5.65 | 5.64 | — | — | (0.64) | (0.64) | — | 5.00 | 20.11 | 37.64 | 15,913 | 0.98 | 1.34 | 0.08 | 31 |
The footnote legend is at the end of the financial highlights.
See Notes to Financial Statements
VIRTUS EQUITY TRUST
FINANCIAL HIGHLIGHTS (Continued)
SELECTED PER SHARE DATA AND RATIOS FOR A SHARE OUTSTANDING
THROUGHOUT EACH PERIOD
| | | Net Asset Value,
Beginning of Period | Net Investment Income (Loss)(1) | Net Realized and
Unrealized Gain (Loss) | Total from Investment Operations | Dividends from
Net Investment Income | Return of Capital | Distributions from
Net Realized Gains | Total Distributions | Payment from Affiliates(1) | Change in Net Asset Value | Net Asset Value, End of Period | Total Return(2)(3) | Net Assets, End of Period
(in thousands) | Ratio of Net Expenses to
Average Net Assets(4)(5) | Ratio of Gross Expenses
to Average Net Assets(4)(5) | Ratio of Net Investment Income (Loss)
to Average Net Assets(4) | Portfolio Turnover Rate(3) |
| | | | | | | | | | | | | | | | | | | |
| SGA New Leaders Growth Fund | | | | | | | | | | | | | | | | | | |
| Class A | | | | | | | | | | | | | | | | | | |
| 10/1/21 to 9/30/22 | | $10.65 | (0.08) | (4.24) | (4.32) | — | — | — | — | — | (4.32) | $ 6.33 | (40.56) % | $ 71 | 1.36 % (7)(9) | 2.44 % | (0.93) % | 30 % |
| 11/17/20 (10) to 9/30/21 | | 10.00 | (0.09) | 0.74 | 0.65 | — | — | — | — | — | 0.65 | 10.65 | 6.50 | 110 | 1.39 | 3.60 | (1.01) | 24 (12) |
| Class C | | | | | | | | | | | | | | | | | | |
| 10/1/21 to 9/30/22 | | $10.58 | (0.14) | (4.20) | (4.34) | — | — | — | — | — | (4.34) | $ 6.24 | (41.02) % | $ 62 | 2.11 % (7)(9) | 3.17 % | (1.68) % | 30 % |
| 11/17/20 (10) to 9/30/21 | | 10.00 | (0.16) | 0.74 | 0.58 | — | — | — | — | — | 0.58 | 10.58 | 5.80 | 108 | 2.14 | 4.35 | (1.76) | 24 (12) |
| Class I | | | | | | | | | | | | | | | | | | |
| 10/1/21 to 9/30/22 | | $10.67 | (0.06) | (4.25) | (4.31) | — | — | — | — | — | (4.31) | $ 6.36 | (40.39) % | $ 97 | 1.11 % (7)(9) | 2.20 % | (0.68) % | 30 % |
| 11/17/20 (10) to 9/30/21 | | 10.00 | (0.07) | 0.74 | 0.67 | — | — | — | — | — | 0.67 | 10.67 | 6.70 | 163 | 1.14 | 3.32 | (0.76) | 24 (12) |
| Class R6 | | | | | | | | | | | | | | | | | | |
| 10/1/21 to 9/30/22 | | $10.69 | (0.04) | (4.27) | (4.31) | — | — | — | — | — | (4.31) | $ 6.38 | (40.32) % | $ 5,534 | 0.92 % (7) | 2.24 % | (0.48) % | 30 % |
| 11/17/20 (10) to 9/30/21 | | 10.00 | (0.05) | 0.74 | 0.69 | — | — | — | — | — | 0.69 | 10.69 | 6.90 | 6,267 | 0.91 | 3.25 | (0.54) | 24 (12) |
| | | | | | | | | | | | | | | | | | | |
| Tactical Allocation Fund | | | | | | | | | | | | | | | | | | |
| Class A | | | | | | | | | | | | | | | | | | |
| 10/1/21 to 9/30/22 | | $13.86 | 0.07 | (4.06) | (3.99) | (0.07) | — | (0.91) | (0.98) | — | (4.97) | $ 8.89 | (31.03) % | $ 542,371 | 1.00 % (7) | 1.06 % | 0.60 % | 24 % |
| 10/1/20 to 9/30/21 | | 12.10 | 0.04 | 1.97 | 2.01 | (0.05) | — | (0.20) | (0.25) | — | 1.76 | 13.86 | 16.69 | 869,209 | 1.01 (7)(9) | 1.07 | 0.30 | 46 |
| 10/1/19 to 9/30/20 | | 9.51 | 0.07 | 2.71 | 2.78 | (0.07) | — | (0.12) | (0.19) | — | 2.59 | 12.10 | 29.72 | 683,100 | 1.06 (6) | 1.06 | 0.68 | 35 |
| 10/1/18 to 9/30/19 | | 9.66 | 0.13 | 0.06 | 0.19 | (0.12) | — | (0.22) | (0.34) | — (11) | (0.15) | 9.51 | 2.36 (13) | 569,543 | 1.14 (6) | 1.14 | 1.33 | 51 |
| 10/1/17 to 9/30/18 | | 9.00 | 0.14 | 0.73 | 0.87 | (0.14) | — | (0.07) | (0.21) | — | 0.66 | 9.66 | 9.73 | 146,854 | 1.26 | 1.27 | 1.47 | 41 |
| Class C | | | | | | | | | | | | | | | | | | |
| 10/1/21 to 9/30/22 | | $14.19 | (0.03) | (4.15) | (4.18) | (0.02) | — | (0.91) | (0.93) | — | (5.11) | $ 9.08 | (31.56) % | $ 12,326 | 1.76 % (7) | 1.87 % | (0.22) % | 24 % |
| 10/1/20 to 9/30/21 | | 12.44 | (0.06) | 2.02 | 1.96 | (0.01) | — | (0.20) | (0.21) | — | 1.75 | 14.19 | 15.82 | 33,401 | 1.77 (7)(9) | 1.88 | (0.46) | 46 |
| 10/1/19 to 9/30/20 | | 9.78 | (0.01) | 2.80 | 2.79 | (0.01) | — | (0.12) | (0.13) | — | 2.66 | 12.44 | 28.82 | 12,140 | 1.83 (6)(14) | 1.78 | (0.10) | 35 |
| 10/1/18 to 9/30/19 | | 9.93 | 0.06 | 0.05 | 0.11 | (0.04) | — | (0.22) | (0.26) | — (11) | (0.15) | 9.78 | 1.48 (13) | 8,560 | 1.91 (9) | 1.99 | 0.59 | 51 |
| 10/1/17 to 9/30/18 | | 9.24 | 0.07 | 0.75 | 0.82 | (0.06) | — | (0.07) | (0.13) | — | 0.69 | 9.93 | 8.94 | 3,736 | 2.04 | 2.05 | 0.68 | 41 |
| Class I | | | | | | | | | | | | | | | | | | |
| 10/1/21 to 9/30/22 | | $13.82 | 0.09 | (4.05) | (3.96) | (0.09) | — | (0.91) | (1.00) | — | (4.96) | $ 8.86 | (30.90) % | $ 25,520 | 0.77 % (7) | 0.86 % | 0.80 % | 24 % |
| 10/1/20 to 9/30/21 | | 12.07 | 0.07 | 1.96 | 2.03 | (0.08) | — | (0.20) | (0.28) | — | 1.75 | 13.82 | 16.88 | 51,887 | 0.78 (7)(9) | 0.86 | 0.55 | 46 |
| 10/1/19 to 9/30/20 | | 9.51 | 0.08 | 2.70 | 2.78 | (0.10) | — | (0.12) | (0.22) | — | 2.56 | 12.07 | 29.74 | 26,526 | 0.82 (6) | 0.82 | 0.73 | 35 |
| 1/29/19 (10) to 9/30/19 | | 8.66 | 0.10 | 0.85 | 0.95 | (0.10) | — | — | (0.10) | — (11) | 0.85 | 9.51 | 10.94 (13) | 2,813 | 0.88 (6) | 0.89 | 1.52 | 51 (12) |
| Class R6 | | | | | | | | | | | | | | | | | | |
| 10/1/21 to 9/30/22 | | $13.83 | 0.11 | (4.05) | (3.94) | (0.11) | — | (0.91) | (1.02) | — | (4.96) | $ 8.87 | (30.73) % | $ 75 | 0.61 % (7) | 0.70 % | 1.00 % | 24 % |
| 10/20/20 (10) to 9/30/21 | | 12.48 | 0.09 | 1.55 | 1.64 | (0.09) | — | (0.20) | (0.29) | — | 1.35 | 13.83 | 13.23 | 112 | 0.62 (7) | 0.86 | 0.70 | 46 (12) |
The footnote legend is at the end of the financial highlights.
See Notes to Financial Statements
VIRTUS EQUITY TRUST
FINANCIAL HIGHLIGHTS (Continued)
SELECTED PER SHARE DATA AND RATIOS FOR A SHARE OUTSTANDING
THROUGHOUT EACH PERIOD
| Footnote Legend: |
| * | On May 3, 2019, Investor Class shares of the Predecessor Fund were reorganized into Class I shares of the Fund. The Class I shares financial highlights for the periods prior to May 3, 2019 reflect the performance of the American Beacon SGA Global Growth Fund Investor Class shares. |
| ** | On May 3, 2019, Y Class shares and Institutional Class shares of the Predecessor Fund were reorganized into Class R6 shares of the Fund. The Class R6 shares financial highlights for the periods prior to May 3, 2019 reflect the performance of the American Beacon SGA Global Growth Fund Institutional Class shares. |
| (1) | Calculated using average shares outstanding. |
| (2) | Sales charges, where applicable, are not reflected in the total return calculation. |
| (3) | Not annualized for periods less than one year. |
| (4) | Annualized for periods less than one year. |
| (5) | The Funds will also indirectly bear their prorated share of expenses of any underlying funds in which they invest. Such expenses are not included in the calculation of this ratio. |
| (6) | The share class is currently under its expense limitation. |
| (7) | Net expense ratio includes extraordinary proxy expenses. |
| (8) | The Fund changed its fiscal year end to September 30, during the period. |
| (9) | Due to a change in expense cap, the ratio shown is a blended expense ratio. |
| (10) | Inception date. |
| (11) | Amount is less than $0.005 per share. |
| (12) | Portfolio turnover is representative of the Fund for the entire period. |
| (13) | Payment from affiliates had no impact on total return. |
| (14) | See Note 3D in Notes to Financial Statements for information on recapture of expenses previously reimbursed and/or waived. |
| (15) | Amount is less than 0.005%. |
See Notes to Financial Statements
VIRTUS EQUITY TRUST
NOTES TO FINANCIAL STATEMENTS
September 30, 2022
Note 1. Organization
Virtus Equity Trust (the “Trust”) is organized as a Delaware statutory trust and is registered under the Investment Company Act of 1940, as amended (the “1940 Act”), as an open-end management investment company.
As of the date of this report, the Trust is comprised of 15 funds (each a “Fund” or collectively, the “Funds”), each reported in this annual report. Each Fund’s investment objective is outlined in its respective Fund Summary page. There is no guarantee that a Fund will achieve its objective(s).
All of the Funds offer Class A shares, Class C shares, Class I shares and Class R6 shares.
Class A shares of the Funds are sold with a front-end sales charge of up to 5.50% with some exceptions. Generally, Class A shares are not subject to any charges by the Funds when redeemed; however, a 1% contingent deferred sales charge (“CDSC”) may be imposed on certain redemptions made within a certain period following purchases on which a finder’s fee has been paid. The period for which such CDSC applies for the Funds is 18 months. The CDSC period begins on the last day of the month preceding the month in which the purchase was made.
Class C shares are generally sold with a 1% CDSC, applicable if redeemed within one year of purchase. Class C shares and any reinvested dividends and other distributions paid on such shares, will be automatically converted to Class A shares of the same Fund following a required holding period, which as of March 1, 2021, was eight years. Effective January 1, 2019, to February 28, 2021, with certain exceptions, Class C shares and any reinvested dividends and other distributions paid on such shares, were automatically converted to Class A shares of the same Fund ten years after the purchase date. If an investor intends to purchase greater than $999,999 of Class C shares, and the purchase would qualify for Class A shares with no load, then the purchase will automatically be made into a purchase of Class A shares, thus reducing expenses. Class I shares and Class R6 shares are sold without a front-end sales charge or CDSC.
Class R6 shares are offered without a minimum initial investment to the following investors in plan level or omnibus accounts only (provided that they do not require or receive any compensation, administrative payments, sub-transfer agency payments or service payments with respect to Class R6 shares): (i) qualified retirement plans, including, but not limited to, 401(k) plans, 457 plans, employer-sponsored 403(b) plans, and defined benefit plans; (ii) banks and trust companies; (iii) insurance companies; (iv) financial intermediaries utilizing such shares in fee-based investment advisory programs; (v) registered investment companies; and (vi) non-qualified deferred compensation plans. Other institutional investors may be permitted to purchase Class R6 shares subject to the applicable Fund’s determination of eligibility and may be subject to a $2,500,000 minimum initial investment requirement. In addition, without a minimum initial investment requirement, Class R6 shares are available to any Trustee of the Virtus Funds and trustees/directors of affiliated open- and closed-end funds, directors, officers and employees of Virtus and its affiliates, and a spouse or domestic partner, child or minor grandchild of any such qualifying individual (in each case either individually or jointly with other investors), provided in each case that those shares are held directly with the Transfer Agent or in an eligible account. Class R6 shares do not carry sales commissions or pay Rule 12b-1 fees. No compensation, administrative payments, sub-transfer agency payments or service payments are paid to brokers or other entities from Fund assets or the Funds’ distributor’s or an affiliate’s resources on sales of or investments in Class R6 shares.
The Funds may impose an annual fee on accounts having balances of less than $2,500. The small account fee may be waived in certain circumstances, as disclosed in the prospectuses and/or statement of additional information. The fees collected will be used to offset certain expenses of the Funds. These fees are reflected as “Less low balance account fees” in each Fund’s Statement of Operations for the period, as applicable.
Each class of shares has identical voting, dividend, liquidation and other rights and the same terms and conditions, except that each class bears any expenses attributable specifically to that class (“class-specific expenses”) and has exclusive voting rights with respect to any Rule 12b-1 and/or shareholder service plan (“12b-1 Plan”) approved by the Board. Class I shares and Class R6 shares are not subject to a 12b-1 Plan. Class-specific expenses may include shareholder servicing fees, sub-transfer agency fees, and fees under a 12b-1 Plan, as well as certain other expenses as designated by the Funds’ Treasurer and approved by the Board. Investment income, common operating expenses and realized and unrealized gains and losses of each Fund are borne pro-rata by the holders of each class of shares.
Note 2. Significant Accounting Policies
($ reported in thousands)
The Trust is an investment company that follows the accounting and reporting guidance of the Financial Accounting Standards Board (“FASB”) Accounting Standards Codification Topic 946 Financial Services – Investment Companies. The following is a summary of significant accounting policies consistently followed by the Funds in the preparation of their financial statements. The preparation of financial statements in conformity with U.S. generally accepted accounting principles (“U.S. GAAP”) requires management to make estimates and assumptions that affect the reported amounts of assets and liabilities, disclosure of contingent assets and liabilities at the date of the financial statements, and the reported amounts of increases and decreases in net assets from operations during the reporting period. Actual results could differ from those estimates and those differences could be significant.
| A. | Security Valuation |
| | Each Fund utilizes a fair value hierarchy which prioritizes the inputs to valuation techniques used to measure fair value into three broad levels. The Funds’ policy is to recognize transfers into or out of Level 3 at the end of the reporting period. |
| | • Level 1 – quoted prices in active markets for identical securities (security types generally include listed equities). |
• Level 2 – prices determined using other significant observable inputs (including quoted prices for similar securities, interest rates, prepayment speeds, credit risk, etc.).
VIRTUS EQUITY TRUST
NOTES TO FINANCIAL STATEMENTS (Continued)
September 30, 2022
• Level 3 – prices determined using significant unobservable inputs (including the Valuation Committee’s own assumptions in determining the fair value of investments).
A description of the valuation techniques applied to a Fund’s major categories of assets and liabilities measured at fair value on a recurring basis is as follows:
Equity securities are valued at the official closing price (typically last sale) on the exchange on which the securities are primarily traded or, if no closing price is available, at the last bid price and are categorized as Level 1 in the hierarchy. Illiquid, restricted equity securities and illiquid private placements are internally fair valued by the Valuation Committee, and are generally categorized as Level 3 in the hierarchy.
Certain non-U.S. securities may be fair valued in cases where closing prices are not readily available or are deemed not reflective of readily available market prices. For example, significant events (such as movement in the U.S. securities market, or other regional and local developments) may occur between the time that non-U.S. markets close (where the security is principally traded) and the time that a Fund calculates its net asset value (“NAV”) at the close of regular trading on the New York Stock Exchange (“NYSE”) (generally 4 p.m. Eastern time) that may impact the value of securities traded in these non-U.S. markets. In such cases, the Funds fair value non-U.S. securities using an independent pricing service which considers the correlation of the trading patterns of the non-U.S. security to the intraday trading in the U.S. markets for investments such as ADRs, financial futures, ETFs, and certain indexes, as well as prices for similar securities. Such fair valuations are categorized as Level 2 in the hierarchy. Because the frequency of significant events is not predictable, fair valuation of certain non-U.S. common stocks may occur on a frequent basis.
Debt instruments, including convertible bonds, and restricted securities, are valued based on evaluated quotations received from independent pricing services or from dealers who make markets in such securities. For most bond types, the pricing service utilizes matrix pricing that considers one or more of the following factors: yield or price of bonds of comparable quality, coupon, maturity, current cash flows, type, activity of the underlying equities, and current day trade information, as well as dealer supplied prices. These valuations are generally categorized as Level 2 in the hierarchy. Structured debt instruments, such as mortgage-backed and asset-backed securities may also incorporate collateral analysis and utilize cash flow models for valuation and are generally categorized as Level 2 in the hierarchy. Pricing services do not provide pricing for all securities and therefore indicative bids from dealers are utilized which are based on pricing models used by market makers in the security and are generally categorized as Level 2 in the hierarchy. Debt instruments that are internally fair valued by the Valuation Committee are generally categorized as Level 3 in the hierarchy.
Listed derivatives, such as options, that are actively traded are valued at the last posted settlement price from the exchange where they are principally traded and are categorized as Level 1 in the hierarchy. Over-the-counter derivative contracts, which include forward currency contracts and equity-linked instruments, do not require material subjectivity as pricing inputs are observed from actively quoted markets and are categorized as Level 2 in the hierarchy.
Investments in open-end mutual funds are valued at NAV. Investments in closed-end funds and ETFs are valued as of the close of regular trading on the NYSE each business day. Each is categorized as Level 1 in the hierarchy.
A summary of the inputs used to value a Fund’s net assets by each major security type is disclosed at the end of the Schedule of Investments for each Fund. The inputs or methodologies used for valuing securities are not necessarily an indication of the risk associated with investing in those securities.
| B. | Security Transactions and Investment Income |
| | Security transactions are recorded on the trade date. Realized gains and losses from the sale of securities are determined on the identified cost basis. Dividend income and capital gain distributions are recognized on the ex-dividend date or, in the case of certain foreign securities, as soon as a Fund is notified. Interest income is recorded on the accrual basis. Each Fund amortizes premiums and accretes discounts using the effective interest method. Premiums on callable debt instruments are amortized to interest income to the earliest call date using the effective interest method. Any distributions from underlying funds are recorded in accordance with the character of the distributions as designated by the underlying funds. |
| | Dividend income from REITs is recorded using management’s estimate of the percentage of income included in distributions received from such investments based on historical information and other industry sources. The return of capital portion of the estimate is a reduction to investment income and a reduction in the cost basis of each investment which increases net realized gain (loss) and net change in unrealized appreciation (depreciation). If the return of capital distributions exceed their cost basis, the distributions are treated as realized gains. The actual amounts of income, return of capital, and capital gains are only determined by each REIT after its fiscal year-end, and may differ from the estimated amounts. |
| C. | Income Taxes |
| | Each Fund is treated as a separate taxable entity. It is the intention of each Fund to comply with the requirements of Subchapter M of the Internal Revenue Code of 1986, as amended (the “Code”) and to distribute substantially all of its taxable income to its shareholders. Therefore, no provision for federal income taxes or excise taxes has been made. |
| | Certain Funds may be subject to foreign taxes on income, gains on investments or currency repatriation, a portion of which may be recoverable. Each Fund will accrue such taxes and recoveries as applicable based upon current interpretations of the tax rules and regulations that exist in the markets in which it invests. |
| | Management of the Funds has concluded that there are no significant uncertain tax positions that would require recognition in the financial statements. Each Fund’s U.S. federal income tax return is generally subject to examination by the Internal Revenue Service for a period of three years after it is filed. State, local and/or non-U.S. tax returns and/or other filings may be subject to examination for different periods, depending upon the tax rules of each applicable jurisdiction. |
VIRTUS EQUITY TRUST
NOTES TO FINANCIAL STATEMENTS (Continued)
September 30, 2022
| D. | Distributions to Shareholders |
| | Distributions are recorded by each Fund on the ex-dividend date. Income and capital gain distributions are determined in accordance with income tax regulations which may differ from U.S. GAAP. |
| E. | Expenses |
| | Expenses incurred together by a Fund and other affiliated mutual funds are allocated in proportion to the net assets of each such fund, except where allocation of direct expenses to each Fund and other fund, or an alternative allocation method, can be more appropriately used. |
| | In addition to the net annual operating expenses that a Fund bears directly, the shareholders of a Fund indirectly bear the pro-rata expenses of any underlying mutual funds in which the Fund invests. |
| F. | Foreign Currency Transactions |
| | Non-U.S. investment securities and other assets and liabilities denominated in foreign currencies are translated into U.S. dollar amounts at the foreign currency exchange rate effective at the end of the reporting period. Cost of investments is translated at the currency exchange rate effective at the trade date. The gain or loss resulting from a change in currency exchange rates between the trade and settlement date of a portfolio transaction is treated as a gain or loss on foreign currency. Likewise, the gain or loss resulting from a change in currency exchange rates between the date income is accrued and the date it is paid is treated as a gain or loss on foreign currency. For fixed income securities, the Funds bifurcate that portion of the results of operations arising from changes in foreign exchange rates on investments from the fluctuations arising from changes in the market prices of securities held and such fluctuations are included with the net realized and unrealized gain or loss on foreign currency transactions. For equity securities, the Funds do not isolate that portion of the results of operations arising from changes in foreign exchange rates on investments from the fluctuations arising from changes in the market prices of securities held and such fluctuations are included with the net realized and unrealized gain or loss on investments. |
| G. | Payment-In-Kind Securities |
| | Certain Funds may invest in payment-in-kind securities, which are debt or preferred stock securities that require or permit payment of interest in the form of additional securities. Payment-in-kind securities allow the issuer to avoid or delay the need to generate cash to meet current interest payments and, as a result, may involve greater risk than securities that pay interest currently or in cash. |
| H. | When-issued Purchases and Forward Commitments (Delayed Delivery) |
| | Certain Funds may engage in when-issued or forward commitment transactions. Securities purchased on a when-issued or forward commitment basis are also known as delayed delivery transactions. Delayed delivery transactions involve a commitment by a Fund to purchase or sell a security at a future date (ordinarily up to 90 days later). When-issued or forward commitments enable the Funds to lock in what is believed to be an attractive price or yield on a particular security for a period of time, regardless of future changes in interest rates. Each Fund records when-issued and forward commitment securities on the trade date. Each Fund maintains collateral for the securities purchased. Securities purchased on a when-issued or forward commitment basis begin earning interest on the settlement date. |
| I. | Leveraged Loans |
| | Certain Funds may invest in direct debt instruments which are interests in amounts owed by a corporate, governmental, or other borrower to lenders or lending syndicates. Leveraged loans are generally non-investment grade and often involve borrowers that are highly leveraged. The Funds may invest in obligations of borrowers who are in bankruptcy proceedings. Leveraged loans are typically senior in the corporate capital structure of the borrower. A loan is often administered by a bank or other financial institution (the “lender”) that acts as agent for all holders. The agent administers the terms of the loan, as specified in the leveraged loan. A Fund’s investments in loans may be in the form of participations in loans or assignments of all or a portion of loans from third parties. When investing in loan participations, a Fund has the right to receive payments of principal, interest and any fees to which it is entitled only from the lender selling the loan participation and only upon receipt by the lender of payments from the borrower. A Fund generally has no right to enforce compliance with the terms of the leveraged loan with the borrower. As a result, a Fund may be subject to the credit risk of both the borrower and the lender that is selling the leveraged loan. When a Fund purchases assignments from lenders it acquires direct rights against the borrower on the loan. |
| | A Fund may invest in multiple series or tranches of a loan, which may have varying terms and carry different associated risks. Leveraged loans may involve foreign borrowers and investments may be denominated in foreign currencies. Direct indebtedness of emerging countries involves a risk that the government entities responsible for the repayment of the debt may be unable, or unwilling, to pay the principal and interest when due. |
| | The leveraged loans have floating rate loan interests which generally pay interest at rates that are periodically determined by reference to a base lending rate plus a premium. The base lending rates are generally LIBOR, SOFR, the prime rate offered by one or more U.S. banks or the certificate of deposit rate. When a leveraged loan is purchased a Fund may pay an assignment fee. On an ongoing basis, a Fund may receive a commitment fee based on the undrawn portion of the underlying line of credit portion of a leveraged loan. Prepayment penalty fees are received upon the prepayment of a leveraged loan by a borrower. Prepayment penalty, facility, commitment, consent and amendment fees are recorded to income as earned or paid. |
| | A Fund may invest in both secured loans and “covenant lite” loans which have few or no financial maintenance covenants that would require a borrower to maintain certain financial metrics. The lack of financial maintenance covenants in covenant lite loans increases the risk that the applicable Fund will experience difficulty or delays in enforcing its rights on its holdings of such loans, which may result in losses, especially during a downturn in the credit cycle. |
VIRTUS EQUITY TRUST
NOTES TO FINANCIAL STATEMENTS (Continued)
September 30, 2022
| J. | Securities Lending |
| | The Funds may loan securities to qualified brokers through a securities lending agency agreement with The Bank of New York Mellon (“BNYM”). Under the securities lending policy, when lending securities a Fund is required to maintain collateral with a market value not less than 100% of the market value of loaned securities. Collateral is adjusted daily in connection with changes in the market value of securities on loan bringing the collateral market value in line with the required percent. Due to timing of collateral adjustments, the market value of collateral held with respect to a loaned security, may be more or less than the value of the security on loan. |
| | Collateral may consist of cash and securities issued by the U.S. Government or its agencies. Cash collateral is invested in a short-term money market fund. Dividends earned on the collateral and premiums paid by the broker are recorded as income by the Fund net of fees and rebates charged/paid by BNYM for its services as securities lending agent and in connection with this securities lending program. Lending portfolio securities involves a risk of delay in the recovery of the loaned securities or in the declining value of the collateral. |
| | Securities lending transactions are entered into by each Fund under a Master Securities Lending Agreement (“MSLA”) which permits the Fund, under certain circumstances including an event of default (such as bankruptcy or insolvency), to offset amounts payable by the Fund to the same counterparty against amounts to be received and create one single net payment due to or from the Fund. |
| | At September 30, 2022, the securities loaned were subject to a MSLA on a net payment basis as follows: |
| Fund | | Value of
Securities
on Loan | | Cash
Collateral
Received(1) | | Net
Amount(2) |
KAR Global Quality Dividend Fund
| | $ 1,527 | | $ 1,527 | | $ — |
KAR Small-Cap Growth Fund
| | 20,568 | | 20,568 | | — |
Tactical Allocation Fund
| | 143 | | 143 | | — |
| (1) | Collateral received in excess of the market value of securities on loan is not presented in this table. The cash collateral received in connection with securities lending transactions has been used for the purchase of securities as disclosed in the Fund’s Schedule of Investments. |
| (2) | Net amount represents the net amount receivable due from the counterparty in the event of default. |
The following table reflects a breakdown of investments made from cash collateral received from lending activities and the remaining contractual maturity of those transactions as of September 30, 2022 for the Funds:
| Fund | | Investment of
Cash Collateral | | Overnight
and
Continuous |
KAR Global Quality Dividend Fund
| | Money Market Mutual Fund | | $ 1,609 |
KAR Small-Cap Growth Fund
| | Money Market Mutual Fund | | 21,459 |
Tactical Allocation Fund
| | Money Market Mutual Fund | | 146 |
Note 3. Investment Advisory Fees and Related Party Transactions
($ reported in thousands)
| A. | Investment Adviser |
| | Virtus Investment Advisers, Inc. (the “Adviser”), an indirect, wholly-owned subsidiary of Virtus Investment Partners, Inc. (“Virtus”), is the investment adviser to the Funds. The Adviser manages the Funds’ investment programs and general operations of the Funds, including oversight of the Funds’ subadvisers. |
| | As compensation for its services to the Funds, the Adviser is entitled to a fee, which is calculated daily and paid monthly based upon the following annual rates as a percentage of the average daily net assets of each Fund: |
KAR Small-Cap Core Fund
| 0.75% |
KAR Small-Cap Value Fund
| 0.70 |
| | First $400 Million | | $400+ Million through
$1 Billion | | $1+ Billion |
KAR Small-Cap Growth Fund
| 0.90% | | 0.85% | | 0.80% |
| | First $500 Million | | Over $500 Million |
KAR Mid-Cap Growth Fund
| 0.80% | | 0.70% |
VIRTUS EQUITY TRUST
NOTES TO FINANCIAL STATEMENTS (Continued)
September 30, 2022
| | First $1 Billion | | $1+ Billion |
KAR Small-Mid Cap Core Fund
| 0.75% | | 0.70% |
KAR Small-Mid Cap Growth Fund
| 0.75 | | 0.70 |
KAR Small-Mid Cap Value Fund
| 0.65 | | 0.60 |
SGA Emerging Markets Growth Fund
| 1.00 | | 0.95 |
SGA Global Growth Fund
| 0.80 | | 0.75 |
SGA New Leaders Growth Fund
| 0.80 | | 0.75 |
| | First $1 Billion | | $1+ Billion through
$2 Billion | | $2+ Billion |
KAR Capital Growth Fund
| 0.70% | | 0.65% | | 0.60% |
KAR Equity Income Fund
| 0.75 | | 0.70 | | 0.65 |
KAR Global Quality Dividend Fund
| 0.75 | | 0.70 | | 0.65 |
KAR Mid-Cap Core Fund
| 0.80 | | 0.75 | | 0.70 |
Tactical Allocation Fund
| 0.55 | | 0.50 | | 0.45 |
| B. | Subadvisers |
| | The subadvisers manage the investments of each Fund, for which they are paid a fee by the Adviser. A list of the subadvisers and the Funds they serve as of the end of the period is as follows: |
| Fund | | Subadviser |
KAR Capital Growth Fund
| | KAR(1) |
KAR Equity Income Fund
| | KAR(1) |
KAR Global Quality Dividend Fund
| | KAR(1) |
KAR Mid-Cap Core Fund
| | KAR(1) |
KAR Mid-Cap Growth Fund
| | KAR(1) |
KAR Small-Cap Core Fund
| | KAR(1) |
KAR Small-Cap Growth Fund
| | KAR(1) |
KAR Small-Cap Value Fund
| | KAR(1) |
KAR Small-Mid Cap Core Fund
| | KAR(1) |
KAR Small-Mid Cap Growth Fund
| | KAR(1) |
KAR Small-Mid Cap Value Fund
| | KAR(1) |
SGA Emerging Markets Growth Fund
| | SGA(2) |
SGA Global Growth Fund
| | SGA(2) |
SGA New Leaders Growth Fund
| | SGA(2) |
Tactical Allocation Fund (Equity Portfolio)
| | KAR(1) |
Tactical Allocation Fund (Fixed Income Portfolio)
| | Newfleet(3) |
| (1) | Kayne Anderson Rudnick Investment Management, LLC (“KAR”), an indirect, wholly-owned subsidiary of Virtus. |
| (2) | Sustainable Growth Advisers, LP (“SGA”), an indirect, majority-owned subsidiary of Virtus. |
| (3) | Newfleet Asset Management (“Newfleet”), a division of Virtus Fixed Income Advisers, LLC, an indirect, wholly-owned subsidiary of Virtus. |
VIRTUS EQUITY TRUST
NOTES TO FINANCIAL STATEMENTS (Continued)
September 30, 2022
| C. | Expense Limitations |
| | The Adviser has contractually agreed to limit each Fund’s annual total operating expenses, subject to the exceptions listed below, so that such expenses do not exceed, on an annualized basis, the following respective percentages of average daily net assets through January 31, 2023. Following the contractual period, the Adviser may discontinue these expense limitation arrangements at any time. The waivers and reimbursements are accrued daily and received monthly. |
| Fund | | Class A | | Class C | | Class I | | Class R6 |
KAR Capital Growth Fund
| | 1.47 % (1) | | 2.22 % (1) | | 1.22 % (1) | | 0.73 % |
KAR Equity Income Fund
| | 1.20 | | 1.95 | | 0.95 | | 0.91 |
KAR Global Quality Dividend Fund
| | 1.35 | | 2.10 | | 1.10 | | 0.78 |
KAR Mid-Cap Core Fund
| | 1.20 | | 1.95 | | 0.95 | | 0.87 |
KAR Mid-Cap Growth Fund
| | 1.40 (1) | | 2.15 (1) | | 1.15 (1) | | 0.83 |
KAR Small-Cap Core Fund
| | N/A | | N/A | | N/A | | N/A |
KAR Small-Cap Growth Fund
| | 1.50 (1) | | 2.25 (1) | | 1.25 (1) | | 1.18 (1) |
KAR Small-Cap Value Fund
| | 1.42 (1) | | 2.17 (1) | | 1.17 (1) | | 1.06 (1) |
KAR Small-Mid Cap Core Fund
| | 1.30 (1) | | 2.05 (1) | | 1.05 (1) | | 0.97 (1) |
KAR Small-Mid Cap Growth Fund
| | 1.30 | | 2.05 | | 1.05 | | 0.99 |
KAR Small-Mid Cap Value Fund
| | 1.17 | | 1.92 | | 0.92 | | 0.82 |
SGA Emerging Markets Growth Fund
| | 1.48 | | 2.23 | | 1.23 | | 1.05 |
SGA Global Growth Fund
| | 1.38 | | 2.13 (1) | | 1.13 | | 0.90 |
SGA New Leaders Growth Fund
| | 1.34 (2) | | 2.09 (2) | | 1.09 (2) | | 0.91 |
Tactical Allocation Fund
| | 0.99 | | 1.75 | | 0.76 | | 0.60 |
| (1) | The share class is currently under its expense limitation. |
| (2) | Effective December 1, 2021. For the period October 1, 2021 through November 30, 2021, the expense caps were as follows for Class A shares, Class C shares and Class I shares, respectively: 1.39%, 2.14% and 1.14%. |
The exclusions include front-end or contingent deferred loads, taxes, leverage and borrowing expenses (such as commitment, amendment and renewal expenses on credit or redemption facilities), interest, brokerage commissions, expenses incurred in connection with any merger or reorganization, unusual or infrequently occurring expenses (such as litigation), acquired fund fees and expenses, and dividend expenses, if any.
| D. | Expense Recapture |
| | Under certain conditions, the Adviser may recapture operating expenses reimbursed or fees waived under these arrangements within three years after the date on which such amounts were incurred or waived. A Fund must pay its ordinary operating expenses before the Adviser is entitled to any reimbursement and must remain in compliance with any applicable expense limitations or, if none, the expense limitation in effect at the time of the waiver or reimbursement. All or a portion of the following Adviser reimbursed expenses may be recaptured by the fiscal year ending September 30: |
| | | Expiration | | |
| Fund | | 2023 | | 2024 | | 2025 | | Total |
| KAR Capital Growth Fund | | | | | | | | |
Class R6
| | $ 1 | | $ 1 | | $ 3 | | $ 5 |
| KAR Equity Income Fund | | | | | | | | |
Class A
| | 170 | | 152 | | 136 | | 458 |
Class C
| | 11 | | 9 | | 5 | | 25 |
Class I
| | 15 | | 14 | | 18 | | 47 |
Class R6
| | 1 | | 1 | | 2 | | 4 |
| KAR Global Quality Dividend Fund | | | | | | | | |
Class A
| | 65 | | 38 | | 32 | | 135 |
Class C
| | 6 | | 2 | | 2 | | 10 |
Class I
| | 28 | | 19 | | 19 | | 66 |
Class R6
| | — (1) | | 5 | | 9 | | 14 |
| KAR Mid-Cap Core Fund | | | | | | | | |
Class A
| | 71 | | 84 | | 77 | | 232 |
Class C
| | 66 | | 68 | | 67 | | 201 |
Class I
| | 670 | | 982 | | 1,112 | | 2,764 |
Class R6
| | 21 | | 35 | | 43 | | 99 |
| KAR Mid-Cap Growth Fund | | | | | | | | |
Class C
| | — | | — | | — (1) | | — (1) |
Class R6
| | 21 | | 101 | | 102 | | 224 |
VIRTUS EQUITY TRUST
NOTES TO FINANCIAL STATEMENTS (Continued)
September 30, 2022
| | | Expiration | | |
| Fund | | 2023 | | 2024 | | 2025 | | Total |
| KAR Small-Mid Cap Core Fund | | | | | | | | |
Class A
| | $ — | | $ — | | $ — (1) | | $ — (1) |
Class C
| | — | | — | | 2 | | 2 |
Class I
| | — | | — | | 1 | | 1 |
Class R6
| | 3 | | — | | — | | 3 |
| KAR Small-Mid Cap Growth Fund | | | | | | | | |
Class A
| | — | | 11 | | 8 | | 19 |
Class C
| | — | | 3 | | 2 | | 5 |
Class I
| | — | | 25 | | 34 | | 59 |
Class R6
| | — | | 68 | | 43 | | 111 |
| KAR Small-Mid Cap Value Fund | | | | | | | | |
Class A
| | — | | 2 | | 7 | | 9 |
Class C
| | — | | 2 | | 3 | | 5 |
Class I
| | — | | 2 | | 9 | | 11 |
Class R6
| | — | | 51 | | 85 | | 136 |
| SGA Emerging Markets Growth Fund | | | | | | | | |
Class A
| | 4 | | 3 | | 2 | | 9 |
Class C
| | 3 | | 3 | | 2 | | 8 |
Class I
| | 4 | | 6 | | 5 | | 15 |
Class R6
| | 124 | | 89 | | 77 | | 290 |
| SGA Global Growth Fund | | | | | | | | |
Class A
| | — | | 30 | | 16 | | 46 |
Class C
| | — | | — | | 1 | | 1 |
Class I
| | 15 | | 9 | | 15 | | 39 |
Class R6
| | 107 | | 104 | | 90 | | 301 |
| SGA New Leaders Growth Fund | | | | | | | | |
Class A
| | — | | 2 | | 1 | | 3 |
Class C
| | — | | 2 | | 1 | | 3 |
Class I
| | — | | 3 | | 2 | | 5 |
Class R6
| | — | | 115 | | 80 | | 195 |
| Tactical Allocation Fund | | | | | | | | |
Class A
| | — | | 498 | | 424 | | 922 |
Class C
| | — | | 46 | | 24 | | 70 |
Class I
| | — | | 43 | | 38 | | 81 |
Class R6
| | — | | — (1) | | — (1) | | — (1) |
| (1) | Amount is less than $500. |
During the period ended September 30, 2022, the Adviser recaptured expenses previously waived for the following Funds:
| Fund | | Class A | | Class C | | Class I | | Class R6 | | Total |
KAR Mid-Cap Growth Fund
| | $ — | | $— (1) | | $— | | $ — | | $ — (1) |
KAR Small-Mid Cap Core Fund
| | 18 | | 6 | | 7 | | 10 | | 41 |
SGA Global Growth Fund
| | — | | 1 | | — (1) | | — | | 1 |
| (1) | Amount is less than $500. |
| E. | Distributor |
| | VP Distributors, LLC (“VP Distributors”), an indirect, wholly-owned subsidiary of Virtus, serves as the distributor of each Fund’s shares. VP Distributors has advised the Funds that for the fiscal year (the “period”) ended September 30, 2022, it retained net commissions of $173 for Class A shares and CDSC of $23 and $60 for Class A shares and Class C shares, respectively. |
| | In addition, each Fund pays VP Distributors 12b-1 fees under a 12b-1 Plan as a percentage of the average daily net assets of each respective class at the annual rates of 0.25% for Class A shares and 1.00% for Class C shares. Class I shares and Class R6 shares are not subject to a 12b-1 Plan. |
| | Under certain circumstances, shares of certain Virtus Mutual Funds may be exchanged for shares of the same class of certain other Virtus Mutual Funds on the basis of the relative NAV per share at the time of the exchange. On exchanges with share classes that carry a CDSC, the CDSC schedule of the original shares purchased continues to apply. |
VIRTUS EQUITY TRUST
NOTES TO FINANCIAL STATEMENTS (Continued)
September 30, 2022
| F. | Administrator and Transfer Agent |
| | Virtus Fund Services, LLC, an indirect, wholly-owned subsidiary of Virtus, serves as the administrator and transfer agent to the Funds. |
| | For the period ended September 30, 2022, the Funds incurred administration fees totaling $13,792 which are included in the Statements of Operations within the line item “Administration and accounting fees.” The fees are calculated daily and paid monthly. |
| | For the period ended September 30, 2022, the Funds incurred transfer agent fees totaling $ $6,154 which are included in the Statements of Operations within the line item “Transfer agent fees and expenses.” The fees are calculated daily and paid monthly. |
| G. | Affiliated Shareholders |
| | At September 30, 2022, Virtus and its affiliates held shares of the following Fund, which may be redeemed at any time, that aggregated to the following: |
| | Shares | | Aggregate Net
Asset Value |
| KAR Small-Mid Cap Growth Fund | | | |
Class A
| 10,000 | | $ 77 |
Class C
| 10,000 | | 76 |
Class I
| 10,000 | | 78 |
Class R6
| 313,143 | | 2,436 |
| KAR Small-Mid Cap Value Fund | | | |
Class A
| 10,000 | | 78 |
Class C
| 10,000 | | 77 |
Class I
| 10,000 | | 78 |
Class R6
| 349,336 | | 2,718 |
| H. | Investments with Affiliates |
| | The Funds are permitted to purchase assets from or sell assets to certain related affiliates under specified conditions outlined in procedures adopted by the Board. The procedures have been designed to ensure that any purchase or sale of assets by the Funds from or to another fund or portfolio that are, or could be, considered an affiliate by virtue of having a common investment adviser (or affiliated investment advisers), common Trustees and/or common officers comply with Rule 17a-7 under the 1940 Act. Further, as defined under the procedures, each transaction is effected at the current market price. During the period ended September 30, 2022, the Funds did not engage in any transactions pursuant to Rule 17a-7 under the 1940 Act. |
| | Outside of Rule 17a-7 transactions, other investments with affiliated issuers are separately reported in this footnote. An affiliated issuer includes any company in which the Fund held 5% or more of a company’s outstanding voting shares at any point during the period, as well as other circumstances where an investment adviser or subadviser to the Fund is deemed to exercise, directly or indirectly, a certain level of control over the company. |
| | A summary of the KAR Small-Cap Growth Fund’s total long-term and short-term purchases and sales of the respective shares of the affiliated investments during the period ended September 30, 2022, is as follows: |
| | Value,
beginning
of period | | Purchases | | Sales
proceeds | | Net
realized
gain
(loss)
on
affiliated
securities | | Net
change in
unrealized
appreciation
(depreciation)
on affiliated
securities | | Value,
end of
period | | Shares | | Dividend
income | | Distributions
of realized
gains |
| KAR Small-Cap Growth Fund |
| Common Stocks—35.5% |
| AAON, Inc.(1) | $ 219,503 | | $ — | | $ 46,299 | | $ 18,625 | | $ (110,349) | | $ — | | $ — | | $1,152 | | $— |
Chefs’ Warehouse, Inc. (The)(2)
| 79,944 | | — | | 89,974 | | 55,304 | | (45,274) | | — | | — | | — | | — |
Dream Finders Homes, Inc., Class A(3)
| — | | 63,568 | | $ — | | — | | (24,575) | | 38,993 | | 3,678,552 | | — | | — |
Duck Creek Technologies, Inc.(3)
| 384,632 | | 23,869 | | — | | — | | (288,885) | | 119,616 | | 10,094,221 | | — | | — |
Fox Factory Holding Corp.(3)
| 525,111 | | — | | 98,678 | | 64,081 | | (272,808) | | 217,706 | | 2,752,978 | | — | | — |
VIRTUS EQUITY TRUST
NOTES TO FINANCIAL STATEMENTS (Continued)
September 30, 2022
| | Value,
beginning
of period | | Purchases | | Sales
proceeds | | Net
realized
gain
(loss)
on
affiliated
securities | | Net
change in
unrealized
appreciation
(depreciation)
on affiliated
securities | | Value,
end of
period | | Shares | | Dividend
income | | Distributions
of realized
gains |
| KAR Small-Cap Growth Fund |
Goosehead Insurance, Inc., Class A(3)
| $ 170,672 | | $ 58,651 | | $ 53,918 | | $ 31,274 | | $ (142,867) | | $ 63,812 | | 1,790,476 | | $ — | | $— |
Holley, Inc.(3)
| — | | 96,077 | | — | | — | | (53,106) | | 42,971 | | 10,610,230 | | — | | — |
MediaAlpha, Inc., Class A(3)
| 86,788 | | — | | — | | — | | (46,135) | | 40,653 | | 4,646,036 | | — | | — |
National Research Corp.
| 101,610 | | — | | — | | — | | (5,711) | | 95,899 | | 2,409,518 | | 2,024 | | — |
NVE Corp.
| 26,400 | | — | | — | | — | | (7,148) | | 19,252 | | 412,690 | | 1,651 | | — |
Ollie’s Bargain Outlet Holdings, Inc.(1)(3)
| 284,140 | | — | | 174,730 | | 10,263 | | (69,135) | | — | | — | | — | | — |
Olo, Inc.(1)(3)
| 57,689 | | 22,530 | | 8,763 | | (9,479) | | (838) | | — | | — | | — | | — |
Omega Flex, Inc.
| 120,094 | | 14,967 | | 16,004 | | 7,940 | | (47,223) | | 79,774 | | 861,308 | | 697 | | — |
Oportun Financial Corp.(3)
| 65,977 | | 1,966 | | 16,098 | | 97 | | (44,152) | | 7,790 | | 1,782,554 | | — | | — |
Revolve Group, Inc., Class A(3)
| — | | 140,331 | | — | | — | | (25,836) | | 114,495 | | 5,278,701 | | — | | — |
Ryan Specialty Holdings, Inc., Class A(3)
| 344,632 | | — | | 104,277 | | 38,790 | | 36,682 | | 315,827 | | 7,775,150 | | — | | — |
U.S. Physical Therapy, Inc.
| 131,061 | | — | | — | | — | | (40,977) | | 90,084 | | 1,185,000 | | 1,908 | | — |
| Total | $2,598,253 | | $421,959 | | $608,741 | | $216,895 | | $(1,188,337) | | $1,246,872 | | | | $7,432 | | $— |
| (1) | Issuer is not an affiliated investment of the Fund at September 30, 2022. |
| (2) | Security was not an investment of the Fund at September 30, 2022. |
| (3) | Non-income producing. |
| I. | Payment from Affiliate |
| | During the period ended September 30, 2022, the adviser and/or Subadviser reimbursed the KAR Mid-Cap Growth Fund for losses. These amounts are included in “Net increase from payment by affiliates” in the Statements of Operations. There was no impact on the total return. |
| J. | Trustee Compensation |
| | The Trust provides a deferred compensation plan for its Trustees who receive compensation from the Trust. Under the deferred compensation plan, Trustees may elect to defer all or a portion of their compensation. Amounts deferred are retained by the Trust, and then, to the extent permitted by the 1940 Act, in turn, may be invested in the shares of affiliated or unaffiliated mutual funds selected by the participating Trustees. Investments in such instruments are included in “Other assets” in the Statements of Assets and Liabilities at September 30, 2022. |
Note 4. Purchases and Sales of Securities
($ reported in thousands)
Purchases and sales of securities (excluding U.S. Government and agency securities and short-term securities) during the period ended September 30, 2022, were as follows:
| | Purchases | | Sales |
KAR Capital Growth Fund
| $ 82,991 | | $ 137,151 |
KAR Equity Income Fund
| 32,484 | | 30,915 |
KAR Global Quality Dividend Fund
| 16,630 | | 14,573 |
KAR Mid-Cap Core Fund
| 394,390 | | 267,962 |
KAR Mid-Cap Growth Fund
| 295,532 | | 880,617 |
KAR Small-Cap Core Fund
| 159,516 | | 350,409 |
KAR Small-Cap Growth Fund
| 586,805 | | 1,734,480 |
KAR Small-Cap Value Fund
| 109,507 | | 285,617 |
KAR Small-Mid Cap Core Fund
| 324,078 | | 222,830 |
KAR Small-Mid Cap Growth Fund
| 2,038 | | 1,549 |
VIRTUS EQUITY TRUST
NOTES TO FINANCIAL STATEMENTS (Continued)
September 30, 2022
| | Purchases | | Sales |
KAR Small-Mid Cap Value Fund
| $ 2,262 | | $ 644 |
SGA Emerging Markets Growth Fund
| 1,536 | | 1,596 |
SGA Global Growth Fund
| 53,588 | | 65,232 |
SGA New Leaders Growth Fund
| 4,137 | | 1,872 |
Tactical Allocation Fund
| 172,091 | | 271,273 |
Purchases and sales of long-term U.S. Government and agency securities during the period ended September 30, 2022, were as follows:
| | Purchases | | Sales |
Tactical Allocation Fund
| $11,711 | | $7,623 |
Note 5. Capital Share Transactions
(reported in thousands)
Transactions in shares of capital stock, during the periods ended as indicated below, were as follows:
| | KAR Capital Growth Fund | | KAR Equity Income Fund |
| | Year Ended
September 30, 2022 | | Year Ended
September 30, 2021 | | Year Ended
September 30, 2022 | | Year Ended
September 30, 2021 |
| | SHARES | | AMOUNT | | SHARES | | AMOUNT | | SHARES | | AMOUNT | | SHARES | | AMOUNT |
| Class A | | | | | | | | | | | | | | | |
Shares sold and cross class
conversions | 770 | | $ 17,644 | | 479 | | $ 12,774 | | 405 | | $ 8,289 | | 262 | | $ 5,419 |
| Reinvestment of distributions | 1,819 | | 49,865 | | 744 | | 20,139 | | 235 | | 4,847 | | 1,573 | | 29,436 |
Shares repurchased and cross
class conversions | (2,469) | | (55,815) | | (1,983) | | (53,626) | | (923) | | (19,218) | | (778) | | (16,534) |
| Net Increase / (Decrease) | 120 | | $ 11,694 | | (760) | | $ (20,713) | | (283) | | $ (6,082) | | 1,057 | | $ 18,321 |
| Class C | | | | | | | | | | | | | | | |
Shares sold and cross class
conversions | 21 | | $ 336 | | 53 | | $ 1,025 | | 86 | | $ 1,489 | | 21 | | $ 401 |
| Reinvestment of distributions | 42 | | 810 | | 30 | | 586 | | 8 | | 139 | | 118 | | 1,891 |
Shares repurchased and cross
class conversions | (262) | | (4,276) | | (375) | | (7,256) | | (122) | | (2,151) | | (204) | | (3,664) |
| Net Increase / (Decrease) | (199) | | $ (3,130) | | (292) | | $ (5,645) | | (28) | | $ (523) | | (65) | | $ (1,372) |
| Class I | | | | | | | | | | | | | | | |
Shares sold and cross class
conversions | 334 | | $ 7,742 | | 400 | | $ 11,257 | | 1,122 | | $ 22,576 | | 213 | | $ 4,642 |
| Reinvestment of distributions | 144 | | 4,130 | | 56 | | 1,586 | | 23 | | 482 | | 153 | | 2,845 |
Shares repurchased and cross
class conversions | (734) | | (16,560) | | (314) | | (8,781) | | (300) | | (6,125) | | (235) | | (4,960) |
| Net Increase / (Decrease) | (256) | | $ (4,688) | | 142 | | $ 4,062 | | 845 | | $ 16,933 | | 131 | | $ 2,527 |
| Class R6 | | | | | | | | | | | | | | | |
Shares sold and cross class
conversions | 54 | | $ 1,497 | | 19 | | $ 541 | | 46 | | $ 948 | | 41 | | $ 884 |
| Reinvestment of distributions | 4 | | 111 | | — (1) | | 5 | | 3 | | 66 | | 16 | | 300 |
Shares repurchased and cross
class conversions | (15) | | (364) | | (3) | | (103) | | (14) | | (289) | | (34) | | (709) |
| Net Increase / (Decrease) | 43 | | $ 1,244 | | 16 | | $ 443 | | 35 | | $ 725 | | 23 | | $ 475 |
VIRTUS EQUITY TRUST
NOTES TO FINANCIAL STATEMENTS (Continued)
September 30, 2022
| | KAR Global Quality Dividend Fund | | KAR Mid-Cap Core Fund |
| | Year Ended
September 30, 2022 | | Year Ended
September 30, 2021 | | Year Ended
September 30, 2022 | | Year Ended
September 30, 2021 |
| | SHARES | | AMOUNT | | SHARES | | AMOUNT | | SHARES | | AMOUNT | | SHARES | | AMOUNT |
| Class A | | | | | | | | | | | | | | | |
Shares sold and cross class
conversions | 184 | | $ 2,751 | | 54 | | $ 781 | | 520 | | $ 25,809 | | 452 | | $ 22,422 |
| Reinvestment of distributions | 32 | | 479 | | 39 | | 536 | | 27 | | 1,495 | | 10 | | 462 |
Shares repurchased and cross
class conversions | (180) | | (2,696) | | (210) | | (2,991) | | (425) | | (21,995) | | (277) | | (13,604) |
| Net Increase / (Decrease) | 36 | | $ 534 | | (117) | | $ (1,674) | | 122 | | $ 5,309 | | 185 | | $ 9,280 |
| Class C | | | | | | | | | | | | | | | |
Shares sold and cross class
conversions | 32 | | $ 466 | | 69 | | $ 929 | | 278 | | $ 12,955 | | 276 | | $ 12,632 |
| Reinvestment of distributions | 1 | | 8 | | 2 | | 27 | | 25 | | 1,267 | | 10 | | 429 |
Shares repurchased and cross
class conversions | (34) | | (482) | | (125) | | (1,685) | | (276) | | (12,531) | | (252) | | (11,319) |
| Net Increase / (Decrease) | (1) | | $ (8) | | (54) | | $ (729) | | 27 | | $ 1,691 | | 34 | | $ 1,742 |
| Class I | | | | | | | | | | | | | | | |
Shares sold and cross class
conversions | 606 | | $ 9,126 | | 237 | | $ 3,420 | | 11,088 | | $ 567,760 | | 9,882 | | $ 505,077 |
| Reinvestment of distributions | 27 | | 401 | | 24 | | 331 | | 362 | | 20,844 | | 114 | | 5,388 |
Shares repurchased and cross
class conversions | (588) | | (8,830) | | (275) | | (3,885) | | (8,189) | | (403,477) | | (4,666) | | (236,556) |
| Net Increase / (Decrease) | 45 | | $ 697 | | (14) | | $ (134) | | 3,261 | | $ 185,127 | | 5,330 | | $ 273,909 |
| Class R6 | | | | | | | | | | | | | | | |
Shares sold and cross class
conversions | 43 | | $ 650 | | 143 | | $ 2,026 | | 194 | | $ 9,790 | | 616 | | $ 32,914 |
| Reinvestment of distributions | 3 | | 51 | | — | | — | | 16 | | 950 | | 3 | | 165 |
Shares repurchased and cross
class conversions | (12) | | (184) | | (17) | | (256) | | (548) | | (26,492) | | (103) | | (5,440) |
| Net Increase / (Decrease) | 34 | | $ 517 | | 126 | | $ 1,770 | | (338) | | $ (15,752) | | 516 | | $ 27,639 |
| | KAR Mid-Cap Growth Fund | | KAR Small-Cap Core Fund |
| | Year Ended
September 30, 2022 | | Year Ended
September 30, 2021 | | Year Ended
September 30, 2022 | | Year Ended
September 30, 2021 |
| | SHARES | | AMOUNT | | SHARES | | AMOUNT | | SHARES | | AMOUNT | | SHARES | | AMOUNT |
| Class A | | | | | | | | | | | | | | | |
Shares sold and cross class
conversions | 994 | | $ 57,568 | | 2,652 | | $ 177,626 | | 297 | | $ 12,884 | | 498 | | $ 23,084 |
| Reinvestment of distributions | 113 | | 7,619 | | 8 | | 567 | | 353 | | 15,608 | | 190 | | 8,187 |
Shares repurchased and cross
class conversions | (2,307) | | (130,014) | | (2,843) | | (191,469) | | (448) | | (19,060) | | (543) | | (24,760) |
| Net Increase / (Decrease) | (1,200) | | $ (64,827) | | (183) | | $ (13,276) | | 202 | | $ 9,432 | | 145 | | $ 6,511 |
| Class C | | | | | | | | | | | | | | | |
Shares sold and cross class
conversions | 209 | | $ 9,553 | | 745 | | $ 38,851 | | 29 | | $ 978 | | 46 | | $ 1,693 |
| Reinvestment of distributions | 49 | | 2,542 | | 3 | | 180 | | 354 | | 12,090 | | 248 | | 8,584 |
Shares repurchased and cross
class conversions | (1,031) | | (46,414) | | (668) | | (34,933) | | (546) | | (18,009) | | (796) | | (29,553) |
| Net Increase / (Decrease) | (773) | | $ (34,319) | | 80 | | $ 4,098 | | (163) | | $ (4,941) | | (502) | | $ (19,276) |
VIRTUS EQUITY TRUST
NOTES TO FINANCIAL STATEMENTS (Continued)
September 30, 2022
| | KAR Mid-Cap Growth Fund | | KAR Small-Cap Core Fund |
| | Year Ended
September 30, 2022 | | Year Ended
September 30, 2021 | | Year Ended
September 30, 2022 | | Year Ended
September 30, 2021 |
| | SHARES | | AMOUNT | | SHARES | | AMOUNT | | SHARES | | AMOUNT | | SHARES | | AMOUNT |
| Class I | | | | | | | | | | | | | | | |
Shares sold and cross class
conversions | 8,605 | | $ 512,895 | | 19,047 | | $ 1,324,506 | | 2,597 | | $ 118,523 | | 2,785 | | $ 135,357 |
| Reinvestment of distributions | 497 | | 34,760 | | 32 | | 2,372 | | 2,789 | | 132,938 | | 1,701 | | 77,950 |
Shares repurchased and cross
class conversions | (17,766) | | (1,012,704) | | (15,902) | | (1,115,805) | | (5,358) | | (241,311) | | (4,879) | | (237,999) |
| Net Increase / (Decrease) | (8,664) | | $ (465,049) | | 3,177 | | $ 211,073 | | 28 | | $ 10,150 | | (393) | | $ (24,692) |
| Class R6 | | | | | | | | | | | | | | | |
Shares sold and cross class
conversions | 965 | | $ 57,309 | | 1,707 | | $ 121,058 | | 1,513 | | $ 68,743 | | 2,794 | | $ 135,372 |
| Reinvestment of distributions | 42 | | 2,965 | | 2 | | 139 | | 301 | | 14,426 | | 187 | | 8,625 |
Shares repurchased and cross
class conversions | (1,856) | | (96,440) | | (572) | | (40,554) | | (2,109) | | (95,556) | | (1,669) | | (82,597) |
| Net Increase / (Decrease) | (849) | | $ (36,166) | | 1,137 | | $ 80,643 | | (295) | | $ (12,387) | | 1,312 | | $ 61,400 |
| | KAR Small-Cap Growth Fund | | KAR Small-Cap Value Fund |
| | Year Ended
September 30, 2022 | | Year Ended
September 30, 2021 | | Year Ended
September 30, 2022 | | Year Ended
September 30, 2021 |
| | SHARES | | AMOUNT | | SHARES | | AMOUNT | | SHARES | | AMOUNT | | SHARES | | AMOUNT |
| Class A | | | | | | | | | | | | | | | |
Shares sold and cross class
conversions | 1,190 | | $ 51,050 | | 2,008 | | $ 107,824 | | 573 | | $ 14,370 | | 1,471 | | $ 38,725 |
| Reinvestment of distributions | 1,914 | | 89,148 | | 1,348 | | 71,757 | | 79 | | 2,220 | | 26 | | 636 |
Shares repurchased and cross
class conversions | (4,451) | | (183,422) | | (4,374) | | (232,735) | | (1,012) | | (25,277) | | (883) | | (23,214) |
| Net Increase / (Decrease) | (1,347) | | $ (43,224) | | (1,018) | | $ (53,154) | | (360) | | $ (8,687) | | 614 | | $ 16,147 |
| Class C | | | | | | | | | | | | | | | |
Shares sold and cross class
conversions | 134 | | $ 4,975 | | 241 | | $ 11,287 | | 48 | | $ 1,196 | | 253 | | $ 6,360 |
| Reinvestment of distributions | 1,122 | | 44,255 | | 772 | | 35,847 | | 13 | | 354 | | — (1) | | 10 |
Shares repurchased and cross
class conversions | (2,086) | | (72,147) | | (1,611) | | (75,056) | | (190) | | (4,664) | | (273) | | (7,024) |
| Net Increase / (Decrease) | (830) | | $ (22,917) | | (598) | | $ (27,922) | | (129) | | $ (3,114) | | (20) | | $ (654) |
| Class I | | | | | | | | | | | | | | | |
Shares sold and cross class
conversions | 13,019 | | $ 547,197 | | 15,452 | | $ 849,066 | | 8,696 | | $ 221,327 | | 23,917 | | $ 624,881 |
| Reinvestment of distributions | 12,565 | | 606,256 | | 9,083 | | 497,200 | | 713 | | 20,021 | | 315 | | 7,728 |
Shares repurchased and cross
class conversions | (39,045) | | (1,637,063) | | (32,646) | | (1,787,851) | | (15,860) | | (392,909) | | (16,240) | | (438,305) |
| Net Increase / (Decrease) | (13,461) | | $ (483,610) | | (8,111) | | $ (441,585) | | (6,451) | | $ (151,561) | | 7,992 | | $ 194,304 |
| Class R6 | | | | | | | | | | | | | | | |
Shares sold and cross class
conversions | 1,270 | | $ 53,101 | | 2,700 | | $ 148,001 | | 763 | | $ 20,337 | | 2,599 | | $ 70,660 |
| Reinvestment of distributions | 533 | | 25,848 | | 253 | | 13,906 | | 39 | | 1,088 | | 8 | | 184 |
Shares repurchased and cross
class conversions | (1,318) | | (55,871) | | (1,148) | | (63,242) | | (2,129) | | (51,910) | | (222) | | (6,064) |
| Net Increase / (Decrease) | 485 | | $ 23,078 | | 1,805 | | $ 98,665 | | (1,327) | | $ (30,485) | | 2,385 | | $ 64,780 |
VIRTUS EQUITY TRUST
NOTES TO FINANCIAL STATEMENTS (Continued)
September 30, 2022
| | KAR Small-Mid Cap Core Fund | | KAR Small-Mid Cap Growth Fund |
| | Year Ended
September 30, 2022 | | Year Ended
September 30, 2021 | | Year Ended
September 30, 2022 | | From Inception December 8, 2020 to
September 30, 2021 |
| | SHARES | | AMOUNT | | SHARES | | AMOUNT | | SHARES | | AMOUNT | | SHARES | | AMOUNT |
| Class A | | | | | | | | | | | | | | | |
Shares sold and cross class
conversions | 961 | | $ 16,434 | | 1,648 | | $ 28,460 | | 14 | | $ 123 | | 80 | | $ 831 |
| Reinvestment of distributions | 31 | | 598 | | — | | — | | — | | — | | — | | — |
Shares repurchased and cross
class conversions | (1,051) | | (17,254) | | (419) | | (7,441) | | (25) | | (230) | | (12) | | (134) |
| Net Increase / (Decrease) | (59) | | $ (222) | | 1,229 | | $ 21,019 | | (11) | | $ (107) | | 68 | | $ 697 |
| Class C | | | | | | | | | | | | | | | |
Shares sold and cross class
conversions | 587 | | $ 9,842 | | 1,108 | | $ 19,101 | | 2 | | $ 24 | | 11 | | $ 112 |
| Reinvestment of distributions | 22 | | 408 | | — | | — | | — | | — | | — | | — |
Shares repurchased and cross
class conversions | (271) | | (4,281) | | (157) | | (2,784) | | (1) | | (6) | | — | | — |
| Net Increase / (Decrease) | 338 | | $ 5,969 | | 951 | | $ 16,317 | | 1 | | $ 18 | | 11 | | $ 112 |
| Class I | | | | | | | | | | | | | | | |
Shares sold and cross class
conversions | 31,319 | | $ 542,183 | | 42,226 | | $ 746,668 | | 180 | | $ 1,768 | | 202 | | $ 2,094 |
| Reinvestment of distributions | 772 | | 14,989 | | 3 | | 56 | | — | | — | | — | | — |
Shares repurchased and cross
class conversions | (30,000) | | (491,454) | | (10,477) | | (188,874) | | (117) | | (1,076) | | (16) | | (164) |
| Net Increase / (Decrease) | 2,091 | | $ 65,718 | | 31,752 | | $ 557,850 | | 63 | | $ 692 | | 186 | | $ 1,930 |
| Class R6 | | | | | | | | | | | | | | | |
Shares sold and cross class
conversions | 616 | | $ 10,746 | | 366 | | $ 6,531 | | 44 | | $ 416 | | 307 | | $ 3,080 |
| Reinvestment of distributions | 8 | | 153 | | — (1) | | 3 | | — | | — | | — | | — |
Shares repurchased and cross
class conversions | (465) | | (7,277) | | (76) | | (1,321) | | (4) | | (36) | | (5) | | (51) |
| Net Increase / (Decrease) | 159 | | $ 3,622 | | 290 | | $ 5,213 | | 40 | | $ 380 | | 302 | | $ 3,029 |
| | KAR Small-Mid Cap Value Fund | | SGA Emerging Markets Growth Fund |
| | Year Ended
September 30, 2022 | | From Inception August 3, 2021 to
September 30, 2021 | | Year Ended
September 30, 2022 | | Year Ended
September 30, 2021 |
| | SHARES | | AMOUNT | | SHARES | | AMOUNT | | SHARES | | AMOUNT | | SHARES | | AMOUNT |
| Class A | | | | | | | | | | | | | | | |
Shares sold and cross class
conversions | 81 | | $ 686 | | 13 | | $ 131 | | — (1) | | $ 2 | | 2 | | $ 32 |
| Reinvestment of distributions | — | | — (1) | | — | | — | | — (1) | | 5 | | — (1) | | 1 |
Shares repurchased and cross
class conversions | (4) | | (43) | | — | | — | | (—) (1) | | (6) | | (—) (1) | | (6) |
| Net Increase / (Decrease) | 77 | | $ 643 | | 13 | | $ 131 | | — (1) | | $ 1 | | 2 | | $ 27 |
| Class C | | | | | | | | | | | | | | | |
Shares sold and cross class
conversions | — (1) | | $ 1 | | 10 | | $ 103 | | 3 | | $ 32 | | 1 | | $ 7 |
| Reinvestment of distributions | — | | — | | — | | — | | — (1) | | 2 | | — (1) | | 1 |
Shares repurchased and cross
class conversions | — | | — | | — | | — | | (5) | | (48) | | — | | — |
| Net Increase / (Decrease) | — (1) | | $ 1 | | 10 | | $ 103 | | (2) | | $ (14) | | 1 | | $ 8 |
VIRTUS EQUITY TRUST
NOTES TO FINANCIAL STATEMENTS (Continued)
September 30, 2022
| | KAR Small-Mid Cap Value Fund | | SGA Emerging Markets Growth Fund |
| | Year Ended
September 30, 2022 | | From Inception August 3, 2021 to
September 30, 2021 | | Year Ended
September 30, 2022 | | Year Ended
September 30, 2021 |
| | SHARES | | AMOUNT | | SHARES | | AMOUNT | | SHARES | | AMOUNT | | SHARES | | AMOUNT |
| Class I | | | | | | | | | | | | | | | |
Shares sold and cross class
conversions | 52 | | $ 480 | | 10 | | $ 100 | | 2 | | $ 19 | | 10 | | $ 137 |
| Reinvestment of distributions | — (1) | | — (1) | | — | | — | | 2 | | 18 | | — (1) | | 6 |
Shares repurchased and cross
class conversions | (9) | | (81) | | — | | — | | (8) | | (84) | | — | | — |
| Net Increase / (Decrease) | 43 | | $ 399 | | 10 | | $ 100 | | (4) | | $ (47) | | 10 | | $ 143 |
| Class R6 | | | | | | | | | | | | | | | |
Shares sold and cross class
conversions | 79 | | $ 729 | | 270 | | $ 2,700 | | — (1) | | $ 5 | | 8 | | $ 115 |
| Reinvestment of distributions | — | | — | | — | | — | | 34 | | 359 | | 8 | | 107 |
Shares repurchased and cross
class conversions | — | | — | | — | | — | | (—) (1) | | (—) (2) | | (—) (1) | | (3) |
| Net Increase / (Decrease) | 79 | | $ 729 | | 270 | | $ 2,700 | | 34 | | $ 364 | | 16 | | $ 219 |
| | SGA Global Growth Fund | | SGA New Leaders Growth Fund |
| | Year Ended
September 30, 2022 | | Year Ended
September 30, 2021 | | Year Ended
September 30, 2022 | | From Inception November 17, 2020 to
September 30, 2021 |
| | SHARES | | AMOUNT | | SHARES | | AMOUNT | | SHARES | | AMOUNT | | SHARES | | AMOUNT |
| Class A | | | | | | | | | | | | | | | |
Shares sold and cross class
conversions | 105 | | $ 2,694 | | 220 | | $ 6,522 | | 1 | | $ 10 | | 10 | | $ 103 |
| Reinvestment of distributions | 79 | | 2,257 | | 34 | | 950 | | — | | — | | — | | — |
Shares repurchased and cross
class conversions | (372) | | (8,853) | | (122) | | (3,623) | | — | | — | | — | | — |
| Net Increase / (Decrease) | (188) | | $ (3,902) | | 132 | | $ 3,849 | | 1 | | $ 10 | | 10 | | $ 103 |
| Class C | | | | | | | | | | | | | | | |
Shares sold and cross class
conversions | 17 | | $ 411 | | 110 | | $ 3,082 | | — | | $ — | | 10 | | $ 103 |
| Reinvestment of distributions | 20 | | 518 | | 8 | | 211 | | — | | — | | — | | — |
Shares repurchased and cross
class conversions | (83) | | (1,863) | | (71) | | (1,962) | | (—) (1) | | (2) | | — | | — |
| Net Increase / (Decrease) | (46) | | $ (934) | | 47 | | $ 1,331 | | — (1) | | $ (2) | | 10 | | $ 103 |
| Class I | | | | | | | | | | | | | | | |
Shares sold and cross class
conversions | 347 | | $ 8,599 | | 1,109 | | $ 32,952 | | — | | $ — | | 15 | | $ 155 |
| Reinvestment of distributions | 120 | | 3,430 | | 38 | | 1,089 | | — | | — | | — | | — |
Shares repurchased and cross
class conversions | (511) | | (13,097) | | (448) | | (13,851) | | — | | — | | — | | — |
| Net Increase / (Decrease) | (44) | | $ (1,068) | | 699 | | $ 20,190 | | — | | $ — | | 15 | | $ 155 |
VIRTUS EQUITY TRUST
NOTES TO FINANCIAL STATEMENTS (Continued)
September 30, 2022
| | SGA Global Growth Fund | | SGA New Leaders Growth Fund |
| | Year Ended
September 30, 2022 | | Year Ended
September 30, 2021 | | Year Ended
September 30, 2022 | | From Inception November 17, 2020 to
September 30, 2021 |
| | SHARES | | AMOUNT | | SHARES | | AMOUNT | | SHARES | | AMOUNT | | SHARES | | AMOUNT |
| Class R6 | | | | | | | | | | | | | | | |
Shares sold and cross class
conversions | 106 | | $ 2,828 | | 97 | | $ 2,975 | | 281 | | $ 2,311 | | 586 | | $ 5,923 |
| Reinvestment of distributions | 173 | | 5,122 | | 82 | | 2,400 | | — | | — | | — | | — |
Shares repurchased and cross
class conversions | (129) | | (3,255) | | (307) | | (9,567) | | (—) (1) | | (—) (2) | | (—) (1) | | (—) (2) |
| Net Increase / (Decrease) | 150 | | $ 4,695 | | (128) | | $ (4,192) | | 281 | | $ 2,311 | | 586 | | $ 5,923 |
| | Tactical Allocation Fund |
| | Year Ended
September 30, 2022 | | Year Ended
September 30, 2021 |
| | SHARES | | AMOUNT | | SHARES | | AMOUNT |
| Class A | | | | | | | |
Shares sold and cross class
conversions | 1,763 | | $ 21,058 | | 4,727 | | $ 62,387 |
| Shares issued-merger (See Note 12) | — | | — | | 7,220 | | 86,813 |
| Reinvestment of distributions | 4,277 | | 55,565 | | 1,092 | | 14,523 |
Shares repurchased and cross
class conversions | (7,747) | | (89,303) | | (6,765) | | (89,972) |
| Net Increase / (Decrease) | (1,707) | | $ (12,680) | | 6,274 | | $ 73,751 |
| Class C | | | | | | | |
Shares sold and cross class
conversions | 130 | | $ 1,585 | | 410 | | $ 5,550 |
| Shares issued-merger (See Note 12) | — | | — | | 3,374 | | 41,685 |
| Reinvestment of distributions | 144 | | 1,924 | | 64 | | 871 |
Shares repurchased and cross
class conversions | (1,271) | | (15,093) | | (2,469) | | (33,437) |
| Net Increase / (Decrease) | (997) | | $ (11,584) | | 1,379 | | $ 14,669 |
| Class I | | | | | | | |
Shares sold and cross class
conversions | 777 | | $ 9,619 | | 1,580 | | $ 20,904 |
| Shares issued-merger (See Note 12) | — | | — | | 2,156 | | 25,853 |
| Reinvestment of distributions | 299 | | 3,867 | | 90 | | 1,191 |
Shares repurchased and cross
class conversions | (1,951) | | (21,786) | | (2,270) | | (29,947) |
| Net Increase / (Decrease) | (875) | | $ (8,300) | | 1,556 | | $ 18,001 |
| Class R6 | | | | | | | |
Shares sold and cross class
conversions | — (1) | | $ 4 | | 9 | | $ 110 |
| Reinvestment of distributions | — (1) | | — (2) | | — (1) | | — (2) |
Shares repurchased and cross
class conversions | (—) (1) | | (—) (2) | | (1) | | (10) |
| Net Increase / (Decrease) | — (1) | | $ 4 | | 8 | | $ 100 |
| (1) | Amount is less than 500 shares. |
| (2) | Amount is less than $500. |
VIRTUS EQUITY TRUST
NOTES TO FINANCIAL STATEMENTS (Continued)
September 30, 2022
Note 6. 10% Shareholders
As of September 30, 2022, certain Funds had individual shareholder account(s) and/or omnibus shareholder account(s) (comprised of a group of individual shareholders), which individually amounted to more than 10% of the total shares outstanding of such Fund as detailed below:
| | % of Shares
Outstanding | | Number of
Accounts |
KAR Global Quality Dividend Fund
| 24% | | 2 |
KAR Mid-Cap Core Fund
| 42 | | 3 |
KAR Mid-Cap Growth Fund
| 27 | | 2 |
KAR Small-Cap Core Fund
| 36 | | 3 |
KAR Small-Cap Growth Fund
| 11 | | 1 |
KAR Small-Cap Value Fund
| 39 | | 1 |
KAR Small-Mid Cap Core Fund
| 49 | | 3 |
KAR Small-Mid Cap Growth Fund
| 74 | | 3 * |
KAR Small-Mid Cap Value Fund
| 84 | | 3 * |
SGA Emerging Markets Growth Fund
| 71 | | 3 |
SGA Global Growth Fund
| 44 | | 3 |
SGA New Leaders Growth Fund
| 82 | | 2 * |
| * | Includes affiliated shareholder account(s). |
Note 7. Credit and Market Risk and Asset Concentration
Local, regional or global events such as war, acts of terrorism, the spread of infectious illness or other public health issue, recessions, or other events could have a significant impact on a Fund and its investments, including hampering the ability of each Fund’s portfolio manager(s) to invest each Fund’s assets as intended.
In July 2017, the head of the United Kingdom Financial Conduct Authority (“FCA”) announced the intention to phase out the use of LIBOR by the end of 2021. However, after subsequent announcements by the FCA, the LIBOR administrator and other regulators, certain of the most widely used LIBORs are expected to continue until June 30, 2023. The ICE Benchmark Administration Limited, which is regulated and authorized by FCA, and the administrator of LIBOR, ceased publishing certain LIBOR settings on December 31, 2021. The Funds may be exposed to financial instruments tied to LIBOR to determine payment obligations, financing terms, hedging strategies or investment value. The expected discontinuation of LIBOR could have a significant impact on the financial markets and may present a material risk for certain market participants, including the Funds. Abandonment of or modifications to LIBOR could lead to significant short- and long-term uncertainty and market instability. The risks associated with this discontinuation and transition may be exacerbated if the work necessary to effect an orderly transition to an alternative reference rate is not completed in a timely manner. It remains uncertain the effects such changes will have on the Funds, issuers of instruments in which the Funds invest, and the financial markets generally.
In countries with limited or developing markets, investments may present greater risks than in more developed markets and the prices of such investments may be volatile. The consequences of political, social or economic changes in these markets may have disruptive effects on the market prices of these investments and the income they generate, as well as a Fund’s ability to repatriate such amounts.
High-yield/high-risk securities typically entail greater price volatility and/or principal and interest rate risk. There is a greater chance that an issuer will not be able to make principal and interest payments on time. Analysis of the creditworthiness of issuers of high-yield/high-risk securities may be complex, and as a result, it may be more difficult for the Adviser and/or subadviser to accurately predict risk.
Certain Funds may invest a high percentage of their assets in specific sectors of the market in the pursuit of their investment objectives. Fluctuations in these sectors of concentration may have a greater impact on a Fund, positive or negative, than if the Fund did not concentrate its investments in such sectors.
At September 30, 2022, the following Funds held securities issued by various companies in specific sectors as detailed below:
| | Sector | | Percentage of
Total Investments |
KAR Capital Growth Fund
| Information Technology | | 34% |
KAR Mid-Cap Core Fund
| Industrials | | 32 |
KAR Mid-Cap Growth Fund
| Information Technology | | 29 |
KAR Small-Cap Core Fund
| Industrials | | 38 |
KAR Small-Cap Growth Fund
| Financials | | 30 |
KAR Small-Cap Value Fund
| Industrials | | 37 |
KAR Small-Mid Cap Core Fund
| Industrials | | 27 |
KAR Small-Mid Cap Core Fund
| Information Technology | | 25 |
KAR Small-Mid Cap Growth Fund
| Information Technology | | 25 |
VIRTUS EQUITY TRUST
NOTES TO FINANCIAL STATEMENTS (Continued)
September 30, 2022
| | Sector | | Percentage of
Total Investments |
KAR Small-Mid Cap Value Fund
| Industrials | | 26 |
SGA Emerging Markets Growth Fund
| Consumer Staples | | 30 |
SGA Emerging Markets Growth Fund
| Financials | | 25 |
SGA Global Growth Fund
| Information Technology | | 35 |
Note 8. Indemnifications
Under the Trust’s organizational documents and in separate agreements between each Trustee and the Trust, its Trustees and officers are indemnified against certain liabilities arising out of the performance of their duties to the Trust and its funds. In addition, in the normal course of business, the Trust and the Funds enter into contracts that provide a variety of indemnifications to other parties. The Trust’s and/or the Funds’ maximum exposure under these arrangements is unknown, as this would involve future claims that may be made against the Trust or the Funds and that have not occurred. However, neither the Trust nor the Funds have had prior claims or losses pursuant to these arrangements, and they expect the risk of loss to be remote.
Note 9. Restricted Securities
($ reported in thousands)
Restricted securities are not registered under the Securities Act of 1933, as amended (the “1933 Act”). Generally, 144A securities are excluded from this category. Each Fund will bear any costs, including those involved in registration under the 1933 Act, in connection with the disposition of such securities. The following Fund held securities that were considered to be restricted at September 30, 2022:
| Fund | | Investment | | Date of
Acquisition | | Cost | | Value | | Percentage of
Net Assets |
KAR Mid-Cap Growth Fund
| | Security Scorecard, Inc. Series E | | 3/5/2021 | | $40,000 | | $27,955 | | 1.7% |
Note 10. Redemption Facility
($ reported in thousands)
On September 18, 2017,the Funds and certain other affiliated funds entered into an $150,000 unsecured line of credit (“Credit Agreement”). On June 14, 2021, the Credit Agreement was increased to $250,000. This Credit Agreement, as amended, is with a commercial bank that allows the Funds to borrow cash from the bank to manage large unexpected redemptions and trade fails, up to a limit of one-third or one-fifth, as applicable, of each Fund’s total net assets in accordance with the terms of the agreement. This Credit Agreement has a term of 364 days and has been renewed for a period up to March 9, 2023. Interest is charged at the higher of the LIBOR or the Federal Funds rate plus an additional percentage rate on the amount borrowed. Commitment fees are charged on the undrawn balance. Total commitment fees paid for the period ended September 30, 2022, are included in the “Interest expense and/or commitment fees” line on the Statements of Operations. The Funds and other affiliated funds that are parties are individually, and not jointly, liable for their particular advances, if any, under the Credit Agreement. The lending bank has the ability to require repayment of outstanding borrowings under this Credit Agreement upon certain circumstances such as an event of default.
The following Funds had an outstanding loan during the period. The borrowings were valued at cost, which approximates fair value.
| Fund | | Interest Incurred
on Borrowing | | Average Dollar
Amount of Borrowing | | Weighted Average
Interest Rate on
Borrowing | | Days Loan
was Open |
KAR Global Quality Dividend Fund
| | $1 | | $ 2,000 | | 1.36% | | 8 |
KAR Mid-Cap Core Fund
| | 4 | | 16,400 | | 4.33 | | 2 |
KAR Small-Cap Growth Fund
| | 2 | | 13,075 | | 1.36 | | 4 |
KAR Small-Cap Value Fund
| | 1 | | 15,000 | | 1.79 | | 2 |
Note 11. Federal Income Tax Information
($ reported in thousands)
At September 30, 2022, the approximate aggregate cost basis and the unrealized appreciation (depreciation) of investments and other financial instruments for federal income tax purposes were as follows:
| Fund | | Federal
Tax Cost | | Unrealized
Appreciation | | Unrealized
(Depreciation) | | Net Unrealized
Appreciation
(Depreciation) |
KAR Capital Growth Fund
| | $ 273,801 | | $ 241,583 | | $ (44,142) | | $ 197,441 |
KAR Equity Income Fund
| | 132,977 | | 9,027 | | (9,697) | | (670) |
VIRTUS EQUITY TRUST
NOTES TO FINANCIAL STATEMENTS (Continued)
September 30, 2022
| Fund | | Federal
Tax Cost | | Unrealized
Appreciation | | Unrealized
(Depreciation) | | Net Unrealized
Appreciation
(Depreciation) |
KAR Global Quality Dividend Fund
| | $ 38,943 | | $ 3,282 | | $ (5,234) | | $ (1,952) |
KAR Mid-Cap Core Fund
| | 1,100,699 | | 180,913 | | (69,002) | | 111,911 |
KAR Mid-Cap Growth Fund
| | 1,454,225 | | 314,046 | | (184,222) | | 129,824 |
KAR Small-Cap Core Fund
| | 1,089,526 | | 479,533 | | (65,677) | | 413,856 |
KAR Small-Cap Growth Fund
| | 2,857,736 | | 1,142,395 | | (477,075) | | 665,320 |
KAR Small-Cap Value Fund
| | 731,143 | | 256,427 | | (93,720) | | 162,707 |
KAR Small-Mid Cap Core Fund
| | 1,083,040 | | 58,541 | | (189,130) | | (130,589) |
KAR Small-Mid Cap Growth Fund
| | 6,254 | | 182 | | (1,317) | | (1,135) |
KAR Small-Mid Cap Value Fund
| | 4,841 | | 93 | | (988) | | (895) |
SGA Emerging Markets Growth Fund
| | 4,789 | | 429 | | (975) | | (546) |
SGA Global Growth Fund
| | 114,714 | | 14,681 | | (19,761) | | (5,080) |
SGA New Leaders Growth Fund
| | 7,530 | | 64 | | (1,873) | | (1,809) |
Tactical Allocation Fund
| | 554,040 | | 120,129 | | (95,815) | | 24,314 |
Certain Funds have capital loss carryforwards available to offset future realized capital gains, if any, to the extent permitted by the Code. Net capital losses are carried forward without expiration and generally retain their short-term and/or long-term tax character, as applicable. For the period ended September 30, 2022, the Funds’ capital loss carryovers were as follows:
| Fund | | Short-Term | | Long-Term |
KAR Global Quality Dividend Fund
| | $ 95 | | $— |
KAR Small-Mid Cap Growth Fund
| | 44 | | — |
SGA Emerging Markets Growth Fund
| | 21 | | — |
SGA New Leaders Growth Fund
| | 163 | | — |
Tactical Allocation Fund
| | 26,995 | | — |
The components of distributable earnings on a tax basis and certain tax attributes for the Funds consist of the following:
| | Undistributed
Ordinary
Income | | Undistributed
Long-Term
Capital Gains | | Late Year
Ordinary Losses
Deferred | | Post-October
Capital Loss
Deferred | | Capital Loss
Deferred |
| KAR Capital Growth Fund | $ — | | $ 86,951 | | $ 2,422 | | $ — | | $ — |
| KAR Equity Income Fund | 2,895 | | 4,952 | | — | | — | | — |
| KAR Global Quality Dividend Fund | 153 | | — | | — | | — | | 95 |
| KAR Mid-Cap Core Fund | — | | — | | 2,168 | | 3,403 | | — |
| KAR Mid-Cap Growth Fund | — | | — | | 10,706 | | 28,527 | | — |
| KAR Small-Cap Core Fund | 5,339 | | 96,015 | | — | | — | | — |
| KAR Small-Cap Growth Fund | — | | 458,342 | | 19,705 | | — | | — |
| KAR Small-Cap Value Fund | 2,773 | | 14,419 | | — | | — | | — |
| KAR Small-Mid Cap Core Fund | — | | — | | 3,187 | | 10,082 | | — |
| KAR Small-Mid Cap Growth Fund | — | | — | | 32 | | 356 | | 44 |
| KAR Small-Mid Cap Value Fund | 11 | | — | | — | | 11 | | — |
| SGA Emerging Markets Growth Fund | — | | — | | — (1) | | 288 | | 21 |
| SGA Global Growth Fund | — | | 2,654 | | 323 | | — | | — |
| SGA New Leaders Growth Fund | — | | — | | 22 | | 806 | | 163 |
| Tactical Allocation Fund | 1,193 | | 36,594 | | — | | — | | 26,995 |
| (1) | Amount is less than $500. |
The differences between the book and tax basis of distributable earnings relate principally to the timing of recognition of income and gains for federal income tax purposes. Short-term gain distributions, if any, are reported as ordinary income for federal tax purposes. Distributions are determined on a tax basis and may differ from net investment income and realized capital gains for financial reporting purposes.
VIRTUS EQUITY TRUST
NOTES TO FINANCIAL STATEMENTS (Continued)
September 30, 2022
The tax character of dividends and distributions paid during the fiscal periods ended September 30, 2022 and 2021, was as follows:
| | Ordinary
Income | | Long-Term
Capital Gains | | Total |
KAR Capital Growth Fund
| | | | | |
9/30/22
| $ — | | $ 58,850 | | $ 58,850 |
9/30/21
| — | | 24,000 | | 24,000 |
KAR Equity Income Fund
| | | | | |
9/30/22
| 5,650 | | 200 | | 5,850 |
9/30/21
| 1,500 | | 35,100 | | 36,600 |
KAR Global Quality Dividend Fund
| | | | | |
9/30/22
| 975 | | — | | 975 |
9/30/21
| 940 | | — | | 940 |
KAR Mid-Cap Core Fund
| | | | | |
9/30/22
| 4,839 | | 19,906 | | 24,745 |
9/30/21
| 1,200 | | 5,250 | | 6,450 |
KAR Mid-Cap Growth Fund
| | | | | |
9/30/22
| — | | 48,521 | | 48,521 |
9/30/21
| — | | 3,300 | | 3,300 |
KAR Small-Cap Core Fund
| | | | | |
9/30/22
| 3,960 | | 220,000 | | 223,960 |
9/30/21
| 2,600 | | 127,000 | | 129,600 |
KAR Small-Cap Growth Fund
| | | | | |
9/30/22
| — | | 827,000 | | 827,000 |
9/30/21
| — | | 668,000 | | 668,000 |
KAR Small-Cap Value Fund
| | | | | |
9/30/22
| 21,865 | | 4,295 | | 26,160 |
9/30/21
| 9,000 | | — | | 9,000 |
KAR Small-Mid Cap Core Fund
| | | | | |
9/30/22
| 6,800 | | 9,420 | | 16,220 |
9/30/21
| 60 | | — | | 60 |
KAR Small-Mid Cap Value Fund
| | | | | |
9/30/22
| 11 | | — | | 11 |
SGA Emerging Markets Growth Fund
| | | | | |
9/30/22
| — | | 420 | | 420 |
9/30/21
| 48 | | 77 | | 125 |
SGA Global Growth Fund
| | | | | |
9/30/22
| 3,846 | | 7,504 | | 11,350 |
9/30/21
| 2,220 | | 2,480 | | 4,700 |
Tactical Allocation Fund
| | | | | |
9/30/22
| 33,235 | | 32,710 | | 65,945 |
9/30/21
| 7,664 | | 10,200 | | 17,864 |
Certain capital accounts in the financial statements are periodically adjusted for permanent differences in order to reflect their tax character. Permanent reclassifications can arise from differing treatment of certain income and gain transactions and nondeductible current year net operating losses. These adjustments have no impact on net assets or net asset value per share of the Funds. Temporary differences that arise from recognizing certain items of income, expense, gain or loss in different periods for financial statement and tax purposes will likely reverse at some time in the future.
Note 12. Reorganization
($ reported in thousands)
On June 17, 2020, the Board of Trustees of the Trust approved an Agreement and Plan of Reorganization (the “Plan”) with respect to Virtus Rampart Multi-Asset Trend Fund and Virtus Rampart Sector Trend Fund, (the “Merged Funds”), each series of Virtus Opportunities Trust, and Tactical Allocation Fund (the “Acquiring Fund”), which provided for the transfer of all of the assets of the Merged Funds for shares of the Acquiring Fund and the assumption of the liabilities of the Merged Funds. The purpose of the transaction was to allow shareholders of all such funds to own shares of a larger combined fund and to allow shareholders of the Merged Funds to own shares of a fund with a similar investment objective and style as, and potentially lower expenses than, the Merged Funds. The reorganization was accomplished by a tax-free exchange of shares on October 30, 2020. For financial reporting purposes, assets received and shares issued by the Acquiring Fund were recorded at fair value; however, the cost basis of each investment received from the Merged Funds was carried forward to align ongoing reporting of the Acquiring Fund’s realized and unrealized gains and losses with amounts distributable to shareholders for tax purposes.
VIRTUS EQUITY TRUST
NOTES TO FINANCIAL STATEMENTS (Continued)
September 30, 2022
The share transactions associated with the merger are as follows:
| Merged Fund | | Shares Outstanding | | Acquiring Fund | | Shares Converted | | Merged Fund Net
Asset Value of
Converted Shares | | | | | |
Virtus Rampart Multi-Asset
Trend Fund | | | | Tactical Allocation Fund | | | | | | | | | |
| Class A | | 1,008,720 | | Class A | | 943,504 | | $11,345 | | | | | |
| Class C | | 1,609,863 | | Class C | | 1,402,324 | | 17,327 | | | | | |
| Class I | | 584,346 | | Class I | | 552,308 | | 6,623 | | | | | |
Virtus Rampart Sector
Trend Fund | | | | Tactical Allocation Fund | | | | | | | | | |
| Class A | | 5,953,520 | | Class A | | 6,276,239 | | $75,468 | | | | | |
| Class C | | 1,937,610 | | Class C | | 1,971,499 | | 24,359 | | | | | |
| Class I | | 1,521,103 | | Class I | | 1,603,669 | | 19,230 | | | | | |
The net assets and net unrealized appreciation (depreciation) before the acquisition were as follows:
| Virtus Rampart Multi-Asset Trend Fund | | Virtus Rampart Sector Trend Fund | | Tactical Allocation Fund |
Net
Assets | Unrealized
Appreciation
(Depreciation) | | Net
Assets | Unrealized
Appreciation
(Depreciation) | | Net
Assets |
| $35,295 | $2,507 | | $119,057 | $10,140 | | $715,533 |
The net assets of the Fund immediately following the acquisition were $869,885.
Assuming the acquisition had been completed on October 1, 2020, the Acquiring Fund’s pro-forma results of operations for the period ended September 30, 2021 would have been as follows:
Net investment income (loss)
| $2,565 |
Net realized and unrealized gain (loss) on investments
| 137,788 |
Net increase (decrease) in net assets resulting from operations
| $140,353 |
Because the Merged Funds and the Acquiring Fund have been managed as an integrated single fund since the reorganization date, it is not feasible to separate the income/(losses) and gains/(losses) of the Virtus Rampart Multi-Asset Trend Fund and Virtus Rampart Sector Trend Fund that have been included in the Acquiring Fund’s Statements of Changes in Net Assets since October 30, 2020.
Note 13. Regulatory Matters and Litigation
From time to time, the Trust, the Funds, the Adviser and/or subadvisers and/or their affiliates may be involved in litigation and arbitration as well as examinations and investigations by various regulatory bodies, including the SEC, involving compliance with, among other things, securities laws, client investment guidelines, laws governing the activities of broker-dealers and other laws and regulations affecting their activities. At this time, the Adviser believes that the outcomes of such matters are not likely, either individually or in aggregate, to be material to these financial statements.
Note 14. Recent Accounting Pronouncement
In March 2020, the FASB issued Accounting Standards Update (“ASU”) No. 2020-04 (“ASU 2020-04”), Reference Rate Reform (Topic 848) – Facilitation of the Effects of Reference Rate Reform on Financial Reporting. The amendments in ASU 2020-04 provide optional temporary financial reporting relief from the effect of certain types of contract modifications due to the planned discontinuation of the LIBOR and other interbank-offered reference rates as of the end of 2021. In March 2021, the administrator for LIBOR announced the extension of the publication of a majority of the USD LIBOR settings to June 30, 2023. ASU 2020-04 is effective for certain reference rate-related contract modifications that occur during the period March 12, 2020 through December 31, 2022. Management is currently evaluating ASU 2020-04, but does not believe there will be a material impact.
Note 15. Subsequent Events
Management has evaluated the impact of all subsequent events on the Funds through the date the financial statements were available for issuance, and has determined that there are no subsequent events requiring recognition or disclosure in these financial statements.
Report of Independent Registered Public Accounting Firm
To the Board of Trustees of Virtus Equity Trust and Shareholders of Virtus KAR Capital Growth Fund, Virtus KAR Equity Income Fund, Virtus KAR Global Quality Dividend Fund, Virtus KAR Mid-Cap Core Fund, Virtus KAR Mid-Cap Growth Fund, Virtus KAR Small-Cap Core Fund, Virtus KAR Small-Cap Growth Fund, Virtus KAR Small-Cap Value Fund, Virtus KAR Small-Mid Cap Core Fund, Virtus KAR Small-Mid Cap Growth Fund, Virtus KAR Small-Mid Cap Value Fund, Virtus SGA Emerging Markets Growth Fund, Virtus SGA Global Growth Fund, Virtus SGA New Leaders Growth Fund and Virtus Tactical Allocation Fund
Opinions on the Financial Statements
We have audited the accompanying statements of assets and liabilities, including the schedules of investments, of each of the funds listed in the table below (constituting Virtus Equity Trust, hereafter collectively referred to as the “Funds”) as of September 30, 2022, the related statements of operations and of changes in net assets for each of the periods indicated in the table below, including the related notes, and the financial highlights for each of the periods indicated therein (collectively referred to as the “financial statements”). In our opinion, the financial statements present fairly, in all material respects, the financial position of each of the Funds as of September 30, 2022, the results of each of their operations and the changes in each of their net assets for each of the periods indicated in the table below, and each of the financial highlights for each of the periods indicated therein, in conformity with accounting principles generally accepted in the United States of America.
Virtus KAR Capital Growth Fund
Virtus KAR Equity Income Fund
Virtus KAR Global Quality Dividend Fund
Virtus KAR Mid-Cap Core Fund
Virtus KAR Mid-Cap Growth Fund
Virtus KAR Small-Cap Core Fund
Virtus KAR Small-Cap Growth Fund
Virtus KAR Small-Cap Value Fund
Virtus KAR Small-Mid Cap Core Fund
Virtus SGA Emerging Markets Growth Fund
Virtus SGA Global Growth Fund
Virtus Tactical Allocation Fund | Statements of operations for the year ended September 30, 2022 and statements of changes in net assets for the years ended September 30, 2022 and 2021 |
| Virtus KAR Small-Mid Cap Growth Fund | Statement of operations for the year ended September 30, 2022, and statement of changes in net assets for the year ended September 30, 2022 and the period December 8, 2020 (commencement of operations) through September 30, 2021 |
| Virtus KAR Small-Mid Cap Value Fund | Statement of operations for the year ended September 30, 2022, and statement of changes in net assets for the year ended September 30, 2022 and the period August 3, 2021 (commencement of operations) through September 30, 2021 |
| Virtus SGA New Leaders Growth Fund | Statement of operations for the year ended September 30, 2022, and statement of changes in net assets for the year ended September 30, 2022 and the period November 17, 2020 (commencement of operations) through September 30, 2021 |
Basis for Opinions
These financial statements are the responsibility of the Funds’ management. Our responsibility is to express an opinion on the Funds’ financial statements based on our audits. We are a public accounting firm registered with the Public Company Accounting Oversight Board (United States) (“PCAOB”) and are required to be independent with respect to the Funds in accordance with the U.S. federal securities laws and the applicable rules and regulations of the Securities and Exchange Commission and the PCAOB.
We conducted our audits of these financial statements in accordance with the standards of the PCAOB. Those standards require that we plan and perform the audit to obtain reasonable assurance about whether the financial statements are free of material misstatement, whether due to error or fraud.
Our audits included performing procedures to assess the risks of material misstatement of the financial statements, whether due to error or fraud, and performing procedures that respond to those risks. Such procedures included examining, on a test basis, evidence regarding the amounts and disclosures in the financial statements. Our audits also included evaluating the accounting principles used and significant estimates made by management, as well as evaluating the overall presentation of the financial statements. Our procedures included confirmation of securities owned as of September 30, 2022 by correspondence with the custodian, transfer agent and brokers; when replies were not received from brokers, we performed other auditing procedures. We believe that our audits provide a reasonable basis for our opinions.
/s/ PricewaterhouseCoopers LLP
Philadelphia, Pennsylvania
November 23, 2022
We have served as the Virtus Mutual Funds’ auditor since at least 1977. We have not been able to determine the specific year we began serving as auditor.
VIRTUS EQUITY TRUST
TAX INFORMATION NOTICE (Unaudited)
September 30, 2022
The following information ($ reported in thousands) is being provided in order to meet reporting requirements set forth by the Code and/or to meet state specific requirements. In early 2023, the Funds will notify applicable shareholders of amounts for use in preparing 2022 U.S. federal income tax forms. Shareholders should consult their tax advisors.
With respect to distributions paid during the fiscal year ended September 30, 2022, the Funds designate the following amounts (or, if subsequently determined to be different, the maximum amount allowable):
| | Qualified
Dividend
Income %
(non-corporate
shareholder) | | Dividend
Received
Deduction %
(corporate
shareholders) | | Long-Term
Capital Gain
Distributions ($) |
KAR Capital Growth Fund
| — % | | — % | | $ 86,982 |
KAR Equity Income Fund
| 100.00 | | 100.00 | | 5,004 |
KAR Global Quality Dividend Fund
| 100.00 | | 65.23 | | — |
KAR Small-Cap Core Fund
| 100.00 | | 100.00 | | 115,187 |
KAR Small-Cap Growth Fund
| — | | — | | 520,952 |
KAR Small-Cap Value Fund
| 100.00 | | 100.00 | | 14,427 |
KAR Small-Mid Cap Value Fund
| 100.00 | | 100.00 | | — |
SGA Global Growth Fund
| — | | — | | 4,670 |
Tactical Allocation Fund
| 100.00 | | 58.57 | | 36,603 |
RESULTS OF SHAREHOLDER MEETING
VIRTUS EQUITY TRUST
JUNE 28, 2022
(Unaudited)
At a special meeting of shareholders of Virtus Equity Trust (the “Trust”), held on June 28, 2022, shareholders voted on a proposal to elect seven Trustees to serve on the Board of Trustees until the next meeting of shareholders at which Trustees are elected. Following are the results of that vote:
| Nominee | Votes For | Votes Withheld |
| Sarah E. Cogan | 8,299,717,898.21 | 116,148,700.21 |
| Deborah A. DeCotis | 8,293,547,447.34 | 122,319,151.08 |
| F. Ford Drummond | 8,297,927,091.00 | 117,939,507.42 |
| Sidney E. Harris | 8,285,545,783.92 | 130,320,814.50 |
| Connie D. McDaniel | 8,302,141,403.20 | 113,725,195.22 |
| R. Keith Walton | 8,293,566,691.54 | 122,299,906.88 |
| Brian T. Zino | 7,977,487,634.39 | 438,378,964.03 |
Shareholders of the Trust voted to elect each of the individuals listed above as Trustees of the Trust.
In addition, at the same special meeting, shareholders of Virtus KAR Small-Cap Value Fund (the “Fund”) voted on a proposal to permit Virtus Investment Advisers, Inc., to hire, terminate and replace subadvisers for the Fund or to modify subadvisory agreements for the Fund without shareholder approval, and to permit the Fund to disclose advisory and subadvisory fee information in an aggregated manner. Following are the results of that vote:
| Votes For | Votes Against | Abstain |
| $651,348,843.97 or 60.310% of Fund | $3,491,349.13 or 0.323% of Fund | $1,852,522.54 or 0.171% of Fund |
Shareholders of the Fund voted to approve the above proposal.
STATEMENT REGARDING LIQUIDITY RISK MANAGEMENT PROGRAM (UNAUDITED)
Pursuant to Rule 22e-4 under the 1940 Act, the Funds have adopted a liquidity risk management program (the “Program”) to govern the Funds’ approach to managing liquidity risk, which is the risk that a Fund would not be able to meet redemption requests without significant dilution of remaining investors’ interests in the Fund. The Program is overseen by the Adviser as the Funds’ Liquidity Risk Management Program Administrator (the “Program Administrator”), and the Program’s principal objectives include assessing, managing and periodically reviewing each Fund’s liquidity risk, based on factors specific to the circumstances of the Funds. Assessment and management of a Fund’s liquidity risk under the Program take into consideration certain factors, such as the Fund’s investment strategy and the liquidity of its portfolio investments during normal and reasonably foreseeable stressed conditions, its short- and long-term cash-flow projections during both normal and reasonably foreseeable stressed conditions, and its cash and cash-equivalent holdings and access to other funding sources. As required by the rule, the Program includes policies and procedures for classification of Fund portfolio holdings in four liquidity categories, maintaining certain levels of highly liquid investments, and limiting holdings of illiquid investments.
At a meeting of the Board held on May 23-25, 2022, the Board received a report from the Program Administrator addressing the operation and management of the Program for calendar year 2021 (the “Review Period”). The Program Administrator’s report noted that for the Review Period, the Program Administrator believed that the Program was implemented and operated effectively in all material respects and that existing procedures, controls and safeguards were appropriately designed to enable the Program Administrator to administer the Program in compliance with Rule 22e-4. The Program Administrator’s report noted that during the Review Period, there were no events that created liquidity related concerns for the Funds. The Program Administrator’s report further noted that while changes to the Program had been made during the Review Period and reported to the Board, no material changes were made to the Program as a result of the Program Administrator’s annual review.
There can be no assurance that the Program will achieve its objectives in the future. Please refer to a Fund’s prospectus for more information regarding the Fund’s exposure to liquidity risk and other principal risks to which an investment in that Fund may be subject.
FUND MANAGEMENT TABLES (Unaudited)
Information pertaining to the Trustees and officers of the Trust as of the date of issuance of this report, is set forth below. The statement of additional information (SAI) includes additional information about the Trustees and is available without charge, upon request, by calling (800) 243-4361.
The address of each individual, unless otherwise noted, is c/o Virtus Equity Trust, One Financial Plaza, Hartford, CT 06103. There is no stated term of office for Trustees or officers of the Trust.
Independent Trustees
Name, Year of Birth,
Length of Time Served
and Number of
Portfolios in Fund
Complex Overseen by
Trustee | Principal Occupation(s) During Past 5 Years | Other Directorships Held by Trustee During Past 5 Years |
Burke, Donald C.
YOB: 1960
Served Since: 2016
103 Portfolios | Private investor (since 2009). Formerly, President and Chief Executive Officer, BlackRock U.S. Funds (2007 to 2009); Managing Director, BlackRock, Inc. (2006 to 2009); and Managing Director, Merrill Lynch Investment Managers (1990 to 2006). | Trustee (since 2022), Virtus Stone Harbor Emerging Markets Income Fund and Virtus Stone Harbor Emerging Markets Total Income Fund; Trustee (since 2021), The Merger Fund®, The Merger Fund® VL, Virtus Event Opportunities Trust (2 portfolios), Virtus Investment Trust (13 portfolios) and Virtus Strategy Trust (8 portfolios); Director (2020 to 2021), Duff & Phelps Select MLP and Midstream Energy Fund Inc.; Director (since 2020), Virtus Total Return Fund Inc.; Trustee (since 2020), Virtus Global Multi-Sector Income Fund; Trustee (since 2016), Virtus Mutual Fund Family (61 portfolios), Virtus Variable Insurance Trust (8 portfolios) and Virtus Alternative Solutions Trust (2 portfolios); Director (since 2014), closed-end funds managed by Duff & Phelps Investment Management Co. (3 funds); Director, Avista Corp. (energy company) (since 2011); Trustee, Goldman Sachs Fund Complex (2010 to 2014); and Director, BlackRock Luxembourg and Cayman Funds (2006 to 2010). |
Cogan, Sarah E.
YOB: 1956
Served Since: 2022
107 Portfolios | Retired Partner, Simpson Thacher & Bartlett LLP (“STB”) (law firm) (since 2019); Director, Girl Scouts of Greater New York (since 2016); Trustee, Natural Resources Defense Council, Inc. (since 2013); and formerly, Partner, STB (1989 to 2018). | Trustee (since 2022) and Advisory Board Member (2021 to 2022), Virtus Alternative Solutions Trust (2 portfolios), Virtus Mutual Fund Family (61 portfolios) and Virtus Variable Insurance Trust (8 portfolios); Trustee (since 2022), Virtus Stone Harbor Emerging Markets Income Fund and Virtus Stone Harbor Emerging Markets Total Income Fund; Trustee (since 2022), PIMCO Access Income Fund; Trustee (since 2021), PIMCO Flexible Emerging Markets Income Fund; Trustee (since 2021), The Merger Fund®, The Merger Fund® VL, and Virtus Event Opportunities Trust (2 portfolios); Advisory Board Member (February 2021 to June 2021), Duff & Phelps Select MLP and Midstream Energy Fund Inc.; Trustee (since 2021), Virtus Global Multi-Sector Income Fund and Virtus Total Return Fund Inc.; Trustee (since 2019), Virtus Investment Trust (13 portfolios) and Virtus Strategy Trust (8 portfolios); Trustee (since 2019), Virtus Artificial Intelligence & Technology Opportunities Fund, Virtus Convertible & Income 2024 Target Term Fund, Virtus Convertible & Income Fund, Virtus Convertible & Income Fund II, Virtus Diversified Income & Convertible Fund, Virtus Equity & Convertible Income Fund, and Virtus Dividend, Interest & Premium Strategy Fund; Trustee (since 2019), PIMCO California Municipal Income Fund, PIMCO California Municipal Income Fund II, PIMCO California Municipal Income Fund III, PIMCO Municipal Income Fund, PIMCO Municipal Income Fund II, PIMCO Municipal Income Fund III, PIMCO New York Municipal Income Fund, PIMCO New York Municipal Income Fund II, PIMCO New York Municipal Income Fund III, PIMCO Energy and Tactical Credit Opportunities Fund, PCM Fund, Inc, PIMCO Corporate & Income Strategy Fund, PIMCO Corporate & Income Opportunity Fund, PIMCO Dynamic Income Fund, PIMCO Global StocksPLUS® & Income Fund, PIMCO High Income Fund, PIMCO Income Strategy Fund, PIMCO Income Strategy Fund II, PIMCO Strategic Income Fund, Inc., PIMCO Flexible Credit Income Fund and PIMCO Flexible Municipal Income Fund; Trustee (since 2019), PIMCO Managed Accounts Trust (5 portfolios); and Trustee (2019 to 2021), PIMCO Dynamic Credit and Mortgage Income Fund and PIMCO Income Opportunity Fund. |
FUND MANAGEMENT TABLES (Unaudited) (Continued)
Name, Year of Birth,
Length of Time Served
and Number of
Portfolios in Fund
Complex Overseen by
Trustee | Principal Occupation(s) During Past 5 Years | Other Directorships Held by Trustee During Past 5 Years |
DeCotis, Deborah A.
YOB: 1952
Served Since: 2022
107 Portfolios | Director, Cadre Holdings Inc. (since 2022); Advisory Director, Morgan Stanley & Co., Inc. (since 1996); Member, Circle Financial Group (since 2009); Member, Council on Foreign Relations (since 2013); and Trustee, Smith College (since 2017). Formerly, Director, Watford Re (2017 to 2021); Co-Chair Special Projects Committee, Memorial Sloan Kettering (2005 to 2015); and Trustee, Stanford University (2010 to 2015). | Trustee (since 2022) and Advisory Board Member (2021 to 2022), Virtus Alternative Solutions Trust (2 portfolios), Virtus Mutual Fund Family (61 portfolios) and Virtus Variable Insurance Trust (8 portfolios); Trustee (since 2022), Virtus Stone Harbor Emerging Markets Income Fund and Virtus Stone Harbor Emerging Markets Total Income Fund; Trustee (since 2022), PIMCO Access Income Fund; Director, Cadre Holdings Inc. (since 2022); Trustee (since 2021), PIMCO Flexible Emerging Markets Income Fund; Trustee (since 2021), The Merger Fund®, The Merger Fund® VL, and Virtus Event Opportunities Trust (2 portfolios); Advisory Board Member (February 2021 to June 2021), Duff & Phelps Select MLP and Midstream Energy Fund Inc.; Trustee (since 2021), Virtus Global Multi-Sector Income Fund and Virtus Total Return Fund Inc.; Trustee (since 2020), PIMCO Dynamic Income Opportunities Fund; Trustee (since 2019), PIMCO Energy and Tactical Credit Opportunities Fund and Virtus Artificial Intelligence & Technology Opportunities Fund; Trustee (since 2018), PIMCO Flexible Municipal Income Fund; Trustee (since 2017), PIMCO Flexible Credit Income Fund and Virtus Convertible & Income 2024 Target Term Fund; Trustee (since 2015), Virtus Diversified Income & Convertible Fund; Trustee (since 2014), Virtus Investment Trust (13 portfolios); Trustee (2013 to 2021), PIMCO Dynamic Credit and Mortgage Income Fund; Trustee (since 2012), PIMCO Dynamic Income Fund; Trustee (since 2011), Virtus Strategy Trust (8 portfolios); Trustee (since 2011), PIMCO California Municipal Income Fund II, PIMCO California Municipal Income Fund III, PIMCO Municipal Income Fund, PIMCO Municipal Income Fund II, PIMCO Municipal Income Fund III, PIMCO New York Municipal Income Fund, PIMCO New York Municipal Income Fund II, PIMCO New York Municipal Income Fund III, PCM Fund, Inc., PIMCO Corporate & Income Strategy Fund, PIMCO Corporate & Income Opportunity Fund, PIMCO Global StocksPLUS® & Income Fund, PIMCO High Income Fund, PIMCO Income Strategy Fund, PIMCO Income Strategy Fund II, PIMCO Strategic Income Fund, Inc., and PIMCO Managed Accounts Trust (5 portfolios); Trustee (since 2011), Virtus Convertible & Income Fund, Virtus Convertible & Income Fund II, Virtus Equity & Convertible Income Fund, and Virtus Dividend, Interest & Premium Strategy Fund; and Trustee (2011 to 2021), PIMCO Income Opportunity Fund. |
Drummond, F. Ford
YOB: 1962
Served Since: 2022
107 Portfolios | Owner/Operator (since 1998), Drummond Ranch; and Director (since 2015), Texas and Southwestern Cattle Raisers Association. Formerly Chairman, Oklahoma Nature Conservancy (2019 to 2020); Board Member (2006 to 2020) and Chairman (2016 to 2018), Oklahoma Water Resources Board; Director (1998 to 2008), The Cleveland Bank; and General Counsel (1998 to 2008), BMIHealth Plans (benefits administration). | Trustee (since 2022) and Advisory Board Member (2021 to 2022), Virtus Alternative Solutions Trust (2 portfolios), Virtus Mutual Fund Family (61 portfolios), and Virtus Variable Insurance Trust (8 portfolios); Trustee (since 2022), Virtus Stone Harbor Emerging Markets Income Fund, Virtus Stone Harbor Emerging Markets Total Income Fund, The Merger Fund®, The Merger Fund® VL, and Virtus Event Opportunities Trust (2 portfolios); Advisory Board Member (February 2021 to June 2021), Duff & Phelps Select MLP and Midstream Energy Fund Inc.; Trustee (since 2021), Virtus Global Multi-Sector Income Fund and Virtus Total Return Fund Inc.; Trustee (since 2019), Virtus Artificial Intelligence & Technology Opportunities Fund; Trustee (since 2017), Virtus Convertible & Income 2024 Target Term Fund; Trustee (since 2015), Virtus Convertible & Income Fund, Virtus Convertible & Income Fund II, Virtus Diversified Income & Convertible Fund, Virtus Dividend, Interest & Premium Strategy Fund and Virtus Equity & Convertible Income Fund; Trustee (since 2014), Virtus Strategy Trust (8 portfolios); Director (since 2011), Bancfirst Corporation; and Trustee (since 2006), Virtus Investment Trust (13 portfolios). |
FUND MANAGEMENT TABLES (Unaudited) (Continued)
Name, Year of Birth,
Length of Time Served
and Number of
Portfolios in Fund
Complex Overseen by
Trustee | Principal Occupation(s) During Past 5 Years | Other Directorships Held by Trustee During Past 5 Years |
Harris, Sidney E.
YOB: 1949
Served Since: 2017
100 Portfolios | Private Investor (since 2021); Dean Emeritus (since 2015), Professor (2015 to 2021 and 1997 to 2014), and Dean (1997 to 2004), J. Mack Robinson College of Business, Georgia State University. | Trustee (since 2022), Virtus Stone Harbor Emerging Markets Income Fund and Virtus Stone Harbor Emerging Markets Total Income Fund; Trustee (since 2021), The Merger Fund®, The Merger Fund® VL, Virtus Event Opportunities Trust (2 portfolios), Virtus Investment Trust (13 portfolios) and Virtus Strategy Trust (8 portfolios); Director (2020 to 2021), Duff & Phelps Select MLP and Midstream Energy Fund Inc.; Director (since 2020), Virtus Total Return Fund Inc.; Trustee (since 2020), Virtus Global Multi-Sector Income Fund; Trustee (since 2019), Mutual Fund Directors Forum; Trustee (since 2017), Virtus Mutual Fund Family (61 portfolios), Virtus Variable Insurance Trust (8 portfolios), and Virtus Alternative Solutions Trust (2 portfolios); Trustee (2013 to 2020) and Honorary Trustee (since 2020), KIPP Metro Atlanta; Director (1999 to 2019), Total System Services, Inc.; Trustee (2004 to 2017), RidgeWorth Funds; Chairman (2012 to 2017), International University of the Grand Bassam Foundation; Trustee (since 2012), International University of the Grand Bassam Foundation; and Trustee (2011 to 2015), Genspring Family Offices, LLC. |
Mallin, John R.
YOB: 1950
Served Since: 2016
100 Portfolios | Partner/Attorney (since 2003), McCarter & English LLP (law firm) Real Property Practice Group; and Member (since 2014), Counselors of Real Estate. | Trustee (since 2022), Virtus Stone Harbor Emerging Markets Income Fund and Virtus Stone Harbor Emerging Markets Total Income Fund; Trustee (since 2021), The Merger Fund®, The Merger Fund® VL, Virtus Event Opportunities Trust (2 portfolios), Virtus Investment Trust (13 portfolios) and Virtus Strategy Trust (8 portfolios); Director (2020 to 2021), Duff & Phelps Select MLP and Midstream Energy Fund Inc.; Director (since 2020), Virtus Total Return Fund Inc.; Trustee (since 2020), Virtus Global Multi-Sector Income Fund; Trustee (since 2016), Virtus Mutual Fund Family (61 portfolios) and Virtus Alternative Solutions Trust (2 portfolios); Director (since 2019), 1892 Club, Inc. (non-profit); Director (2013 to 2020), Horizons, Inc. (non-profit); and Trustee (since 1999), Virtus Variable Insurance Trust (8 portfolios). |
McDaniel, Connie D.
YOB: 1958
Served Since: 2017
100 Portfolios | Retired (since 2013). Vice President, Chief of Internal Audit, Corporate Audit Department (2009 to 2013); Vice President, Global Finance Transformation (2007 to 2009); and Vice President and Controller (1999 to 2007), The Coca-Cola Company. | Trustee (since 2022), Virtus Stone Harbor Emerging Markets Income Fund and Virtus Stone Harbor Emerging Markets Total Income Fund; Trustee (since 2021), The Merger Fund®, The Merger Fund® VL, Virtus Event Opportunities Trust (2 portfolios), Virtus Investment Trust (13 portfolios) and Virtus Strategy Trust (8 portfolios); Director (2020 to 2021), Duff & Phelps Select MLP and Midstream Energy Fund Inc.; Director (since 2020), Virtus Total Return Fund Inc.; Trustee (since 2020), Virtus Global Multi-Sector Income Fund; Director (since 2019), Global Payments Inc.; Chairperson (since 2019), Governance & Nominating Committee, Global Payments Inc; Trustee (since 2017), Virtus Mutual Fund Family (61 portfolios), Virtus Variable Insurance Trust (8 portfolios), and Virtus Alternative Solutions Trust (2 portfolios); Director (since 2021), North Florida Land Trust; Director (2014 to 2019), Total System Services, Inc.; Member (since 2011) and Chair (2014 to 2016), Georgia State University, Robinson College of Business Board of Advisors; and Trustee (2005 to 2017), RidgeWorth Funds. |
McLoughlin, Philip
YOB: 1946
Served Since: 1993
110 Portfolios | Private investor since 2010. | Trustee (since 2022), Virtus Stone Harbor Emerging Markets Income Fund and Virtus Stone Harbor Emerging Markets Total Income Fund; Trustee (since 2021), The Merger Fund®, The Merger Fund® VL, Virtus Event Opportunities Trust (2 portfolios), Virtus Investment Trust (13 portfolios) and Virtus Strategy Trust (8 portfolios); Trustee (since 2021), Virtus Artificial Intelligence & Technology Opportunities Fund, Virtus Convertible & Income Fund II, Virtus Diversified Income & Convertible Fund, Virtus Equity & Convertible Income Fund and Virtus Dividend, Interest & Premium Strategy Fund; Trustee (since 2022) and Advisory Board Member (2021), Virtus Convertible & Income 2024 Target Term Fund and Virtus Convertible & Income Fund; Director and Chairman (since 2016), Virtus Total Return Fund Inc.; Director and Chairman (2016 to 2019), the former Virtus Total Return Fund Inc.; Director and Chairman (2014 to 2021), Duff & Phelps Select MLP and Midstream Energy Fund Inc.; Trustee and Chairman (since 2013), Virtus Alternative Solutions Trust (2 portfolios); Trustee and Chairman (since 2011), Virtus Global Multi-Sector Income Fund; Chairman and Trustee (since 2003), Virtus Variable Insurance Trust (8 portfolios); Director (since 1995), closed-end funds managed by Duff & Phelps Investment Management Co. (3 funds); Director (1991 to 2019) and Chairman (2010 to 2019), Lazard World Trust Fund (closed-end investment firm in Luxembourg); and Trustee (since 1989) and Chairman (since 2002), Virtus Mutual Fund Family (61 portfolios). |
FUND MANAGEMENT TABLES (Unaudited) (Continued)
Name, Year of Birth,
Length of Time Served
and Number of
Portfolios in Fund
Complex Overseen by
Trustee | Principal Occupation(s) During Past 5 Years | Other Directorships Held by Trustee During Past 5 Years |
McNamara, Geraldine M.
YOB: 1951
Served Since: 2001
103 Portfolios | Private investor (since 2006); and Managing Director, U.S. Trust Company of New York (1982 to 2006). | Trustee (since 2022), Virtus Stone Harbor Emerging Markets Income Fund and Virtus Stone Harbor Emerging Markets Total Income Fund; Trustee (since 2021), The Merger Fund®, The Merger Fund® VL, Virtus Event Opportunities Trust (2 portfolios), Virtus Investment Trust (13 portfolios) and Virtus Strategy Trust (8 portfolios); Director (2020 to 2021), Duff & Phelps Select MLP and Midstream Energy Fund Inc.; Director (since 2020), Virtus Total Return Fund Inc.; Trustee (since 2020), Virtus Global Multi-Sector Income Fund; Trustee (since 2016) Virtus Alternative Solutions Trust (2 portfolios); Trustee (since 2015), Virtus Variable Insurance Trust (8 portfolios); Director (since 2003), closed-end funds managed by Duff & Phelps Investment Management Co. (3 funds); and Trustee (since 2001), Virtus Mutual Fund Family (61 portfolios). |
Walton, R. Keith
YOB: 1964
Served Since: 2020
107 Portfolios | Venture and Operating Partner (since 2020), Plexo Capital, LLC; Venture Partner (since 2019) and Senior Adviser (2018 to 2019), Plexo, LLC; and Partner (since 2006), Global Infrastructure Partners. Formerly, Managing Director (2020 to 2021), Lafayette Square Holding Company LLC; Senior Adviser (2018 to 2019), Vatic Labs, LLC; Executive Vice President, Strategy (2017 to 2019), Zero Mass Water, LLC; and Vice President, Strategy (2013 to 2017), Arizona State University. | Trustee (since 2022) and Advisory Board Member (January 2022 to July 2022), Virtus Artificial Intelligence & Technology Opportunities Fund, Virtus Convertible & Income Fund and Virtus Equity & Convertible Income Fund; Trustee (since 2022), Virtus Stone Harbor Emerging Markets Income Fund and Virtus Stone Harbor Emerging Markets Total Income Fund; Trustee (since 2022), Virtus Diversified Income & Convertible Fund; Advisory Board Member (since 2022), Virtus Convertible & Income 2024 Target Term Fund, Virtus Convertible & Income Fund II and Virtus Dividend, Interest & Premium Strategy Fund; Trustee (since 2021), The Merger Fund®, The Merger Fund® VL, Virtus Event Opportunities Trust (2 portfolios), Virtus Investment Trust (13 portfolios) and Virtus Strategy Trust (8 portfolios); Trustee (since 2020) Virtus Alternative Solutions Trust (2 portfolios), Virtus Variable Insurance Trust (8 portfolios) and Virtus Mutual Fund Family (61 portfolios); Director (since 2017), certain funds advised by Bessemer Investment Management LLC; Director (2016 to 2021), Duff & Phelps Select MLP and Midstream Energy Fund Inc.; Trustee (since 2016), Virtus Global Multi-Sector Income Fund; Director (2006 to 2019), Systematica Investments Limited Funds; Director (2006 to 2017), BlueCrest Capital Management Funds; Trustee (2014 to 2017), AZ Service; Director (since 2004), Virtus Total Return Fund Inc.; and Director (2004 to 2019), the former Virtus Total Return Fund Inc. |
Zino, Brian T.
YOB: 1952
Served Since: 2020
107 Portfolios | Retired. Various roles (1982 to 2009), J. & W. Seligman & Co. Incorporated, including President (1994 to 2009). | Trustee (since 2022), Virtus Stone Harbor Emerging Markets Income Fund and Virtus Stone Harbor Emerging Markets Total Income Fund; Trustee (since 2021), The Merger Fund®, The Merger Fund® VL, Virtus Event Opportunities Trust (2 portfolios), Virtus Investment Trust (13 portfolios) and Virtus Strategy Trust (8 portfolios); Trustee (since 2022) and Advisory Board Member (2021), Virtus Artificial Intelligence & Technology Opportunities Fund, Virtus Convertible & Income 2024 Target Term Fund, Virtus Convertible & Income Fund, Virtus Convertible & Income Fund II, Virtus Diversified Income & Convertible Fund, Virtus Equity & Convertible Income Fund, and Virtus Dividend, Interest & Premium Strategy Fund; Trustee (since 2020) Virtus Alternative Solutions Trust (2 portfolios), Virtus Variable Insurance Trust (8 portfolios) and Virtus Mutual Fund Family (61 portfolios); Director (2016 to 2021), Duff & Phelps Select MLP and Midstream Energy Fund Inc.; Trustee (since 2016), Virtus Global Multi-Sector Income Fund; Director (since 2014), Virtus Total Return Fund Inc.; Director (2014 to 2019), the former Virtus Total Return Fund Inc.; Trustee (since 2011), Bentley University; Director (1986 to 2009) and President (1994 to 2009), J&W Seligman Co. Inc.; Director (1998 to 2009), Chairman (2002 to 2004) and Vice Chairman (2000 to 2002), ICI Mutual Insurance Company; Member, Board of Governors of ICI (1998 to 2008). |
FUND MANAGEMENT TABLES (Unaudited) (Continued)
Interested Trustee
Name, Year of Birth,
Length of Time Served
and Number of
Funds Overseen | Principal Occupation(s) During Past
5 Years | Principal Occupation(s) During Past 5 Years and
Other Directorships Held by Trustee |
Aylward, George R.*
Trustee and President
YOB: 1964
Served Since: 2006
112 Portfolios | Director, President and Chief Executive Officer (since 2008), Virtus Investment Partners, Inc. and/or certain of its subsidiaries, and various senior officer positions with Virtus affiliates (since 2005). | Trustee, President and Chief Executive Officer (since 2022), Virtus Stone Harbor Emerging Markets Income Fund and Virtus Stone Harbor Emerging Markets Total Income Fund; Member, Board of Governors of the Investment Company Institute (since 2021); Trustee and President (since 2021), The Merger Fund®, The Merger Fund® VL, Virtus Event Opportunities Trust (2 portfolios), Virtus Investment Trust (13 portfolios) and Virtus Strategy Trust (8 portfolios); Trustee, President and Chief Executive Officer (since 2021), Virtus Artificial Intelligence & Technology Opportunities Fund, Virtus Convertible & Income 2024 Target Term Fund, Virtus Convertible & Income Fund, Virtus Convertible & Income Fund II, Virtus Diversified Income & Convertible Fund, Virtus Equity & Convertible Income Fund, and Virtus Dividend, Interest & Premium Strategy Fund; Chairman and Trustee (since 2015), Virtus ETF Trust II (5 portfolios); Director, President and Chief Executive Officer (2014 to 2021), Duff & Phelps Select MLP and Midstream Energy Fund Inc.; Trustee and President (since 2013), Virtus Alternative Solutions Trust (2 portfolios); Director (since 2013), Virtus Global Funds, PLC (5 portfolios); Trustee (since 2012) and President (since 2010), Virtus Variable Insurance Trust (8 portfolios); Trustee, President and Chief Executive Officer (since 2011), Virtus Global Multi-Sector Income Fund; Trustee and President (since 2006) and Executive Vice President (2004 to 2006), Virtus Mutual Fund Family (61 portfolios); Director, President and Chief Executive Officer (since 2006), Virtus Total Return Fund Inc.; and Director, President and Chief Executive Officer (2006 to 2019), the former Virtus Total Return Fund Inc. |
*Mr. Aylward is an “interested person,” as defined in the 1940 Act, by reason of his position as President and Chief Executive Officer of Virtus Investment Partners, Inc. (“Virtus”), the ultimate parent company of the Adviser, and various positions with its affiliates, including the Adviser.
FUND MANAGEMENT TABLES (Unaudited) (Continued)
Officers of the Trust Who Are Not Trustees
Name, Address and
Year of Birth | Position(s) Held
with Trust and
Length of
Time Served | Principal Occupation(s) During Past 5 Years |
Batchelar, Peter J.
YOB: 1970 | Senior Vice President (since 2017), and Vice President (2008 to 2016). | Senior Vice President, Product Development (since 2017), Vice President, Product Development (2008 to 2017), and various officer positions (since 2008), Virtus Investment Partners, Inc. and/or certain of its subsidiaries; various officer positions (since 2008) of various registered funds advised by subsidiaries of Virtus Investment Partners, Inc. |
Bradley, W. Patrick
YOB: 1972 | Executive Vice President (since 2016); Senior Vice President (2013 to 2016); Vice President (2011 to 2013); Chief Financial Officer and Treasurer (since 2006). | Executive Vice President, Fund Services (since 2016), Senior Vice President, Fund Services (2010 to 2016) and various officer positions (since 2004), Virtus Investment Partners, Inc. and/or certain of its subsidiaries; various officer positions (since 2006) of various registered funds advised by subsidiaries of Virtus Investment Partners, Inc.; Member (since 2022), BNY Mellon Asset Servicing Client Advisory Board. |
Branigan, Timothy
YOB: 1976 | Vice President and Fund Chief Compliance Officer (since 2022); Assistant Vice President and Deputy Fund Chief Compliance Officer (March to May 2022); and Assistant Vice President and Assistant Chief Compliance Officer (2019 to 2022). | Various officer positions (since 2019) of various registered funds advised by subsidiaries of Virtus Investment Partners, Inc. |
Carr Kevin J.
YOB: 1954 | Senior Vice President (since 2013); Vice President (2005 to 2013); Chief Legal Officer, Counsel and Secretary (since 2005). | Vice President and Senior Counsel (since 2017), Senior Vice President (2009 to 2017), Vice President, Counsel and Secretary (2008 to 2009) and various officer positions (since 2005), Virtus Investment Partners, Inc. and/or certain of its subsidiaries; and various officer positions (since 2005) of various registered funds advised by subsidiaries of Virtus Investment Partners, Inc. |
Short, Julia R.
YOB: 1972 | Senior Vice President (since 2017). | Senior Vice President, Product Development (since 2017), Virtus Investment Partners, Inc. and/or certain of its subsidiaries; Senior Vice President (since 2017) of various registered funds advised by subsidiaries of Virtus Investment Partners, Inc.; and Managing Director, Product Manager, RidgeWorth Investments (2004 to 2017). |
Smirl, Richard W.
YOB: 1967 | Executive Vice President (since 2021). | Chief Operating Officer (since 2021), Virtus Investment Partners, Inc.; Executive Vice President (since 2021), Virtus Investment Partners, Inc. and/or certain of its subsidiaries; Executive Vice President (since 2021) of various registered funds advised by subsidiaries of Virtus Investment Partners, Inc.; Chief Operating Officer (2018 to 2021), Russell Investments; Executive Director (Jan. to July 2018), State of Wisconsin Investment Board; and Partner and Chief Operating Officer (2004 to 2018), William Blair Investment Management. |
Virtus SGA Global Growth Fund,
a series of Virtus Equity Trust
(Unaudited)
Supplement dated June 30, 2022, to the Summary Prospectus and the Virtus Equity Trust
Statutory Prospectus, each dated January 28, 2022, as supplemented
IMPORTANT NOTICE TO INVESTORS
As previously announced, effective June 30, 2022, Gordon M. Marchand is no longer a portfolio manager of the Virtus SGA Global Growth Fund (the “Fund”), and Kishore Rao is added as a portfolio manager of the Fund.
The disclosure under “Portfolio Management” in the Fund’s summary prospectus and in the summary section of the Fund’s statutory prospectus is hereby replaced in its entirety with the following:
•Hrishikesh Gupta, Analyst, Portfolio Manager, Principal and a member of the Investment Committee at SGA. Mr. Gupta has served as a Portfolio Manager of the fund since January 2021.
•Kishore Rao, Analyst, Portfolio Manager, Principal and a member of the Investment Committee at SGA. Mr. Rao has served as a Portfolio Manager of the fund since June 2022.
•Robert L. Rohn, Portfolio Manager and co-founder of SGA. Mr. Rohn has served as a Portfolio Manager of the fund and its predecessor funds since inception in December 2010.
The row for the Fund in the table under “SGA” on page 106 of the Fund’s statutory prospectus is hereby replaced with the following:
| Virtus SGA Global Growth Fund | Hrishikesh Gupta (since January 2021) |
| Kishore Rao (since June 2022) |
Robert L. Rohn (since the Predecessor Fund’s inception
in December 2010) |
In the narrative under the referenced table with respect to the SGA portfolio managers, the biography of Mr. Marchand is hereby removed.
Investors should retain this supplement with the Prospectuses for future reference.
VET 8019 SGA Global Growth PM Change (6/2022)
Virtus Tactical Allocation Fund (the “Fund”),
a series of Virtus Equity Trust
(Unaudited)
Supplement dated July 1, 2022, to the Summary and Statutory Prospectuses and the Statement of Additional Information (“SAI”) for the Fund listed above, each dated January 28, 2022, as supplemented
IMPORTANT NOTICE TO INVESTORS
Effective July 1, 2022, each of Newfleet Asset Management, LLC (“Newfleet”) and Stone Harbor Investment Partners, LLC (“Stone Harbor”) has merged with and into Seix Investment Advisors LLC(“Seix”), and the surviving entity has been renamed Virtus Fixed Income Advisers, LLC (“VFIA”). The portfolio management teams of Newfleet, Stone Harbor and Seix continue to operate independently of one another as separate divisions of VFIA. Prior to the merger, each of Newfleet, Stone Harbor and Seix was a wholly owned, indirect subsidiary of Virtus Investment Partners, Inc. (“Virtus”), and since the merger VFIA remains a wholly owned indirect subsidiary of Virtus.
The merger did not constitute a change in control of Newfleet, Stone Harbor or Seix that would result in the termination of the subadvisory agreements of any funds managed by those entities. Therefore, pursuant to approval by the Board of Trustees of Virtus Equity Trust, the subadvisory agreement pertaining to the fixed income portion of the Fund has been transferred to, and assumed by, VFIA effective July 1, 2022.
All references in the Fund’s Prospectuses and SAI to Newfleet as a subadviser to the Fund are hereby changed to, “Virtus Fixed Income Advisers, LLC, an affiliate of VIA, operating through its division Newfleet Asset Management.”
All references in the Fund’s Prospectuses to Newfleet as the employer of the Fund’s fixed income portfolio managers for the period beginning on July 1, 2022, are hereby changed to refer to “Newfleet Asset Management, a division of Virtus Fixed Income Advisers, LLC.” (References to Newfleet for periods of time prior to July 1, 2022, are unchanged.)
The following disclosure regarding VFIA replaces the disclosure regarding Newfleet in the section “The Subadvisers” beginning on page 103 of the Fund’s Statutory Prospectus and replaces the first paragraph of the disclosure regarding Newfleet in the section “Subadvisers and Subadvisory Agreements” beginning on page 89 of the SAI:
“Virtus Fixed Income Advisers, LLC, an affiliate of VIA, is located at One Financial Plaza, Hartford, CT 06103. VFIA operates through its division, Newfleet Asset Management (‘Newfleet’), in subadvising the fixed income portion of the Tactical Allocation Fund. As of May 31, 2022, the three advisers that merged into VFIA on July 1, 2022 had approximately $37.1 billion in aggregate assets under management.
The Newfleet division of VFIA acts as subadviser to mutual funds and as adviser to institutions and individuals. As of May 31, 2022, the Newfleet division of VFIA had approximately $8.9 billion in assets under management. Newfleet Asset Management, LLC, which merged with and into VFIA on July 1, 2022, and the former portfolio management team of which now operates as the Newfleet division of VFIA, had been an investment adviser since 1989.”
VET 8019/VFIA Announcement (7/2022)
THIS PAGE INTENTIONALLY BLANK.
VIRTUS EQUITY TRUST
101 Munson Street
Greenfield, MA 01301-9668
Trustees
Philip R. McLoughlin, Chairman
George R. Aylward
Donald C. Burke
Sarah E. Cogan
Deborah A. DeCotis
F. Ford Drummond
Sidney E. Harris
John R. Mallin
Connie D. McDaniel
Geraldine M. McNamara
R. Keith Walton
Brian T. Zino
Officers
George R. Aylward, President
Peter Batchelar, Senior Vice President
W. Patrick Bradley, Executive Vice President, Chief Financial Officer and Treasurer
Timothy Branigan, Vice President and Fund Chief Compliance Officer
Kevin J. Carr, Senior Vice President, Chief Legal Officer, Counsel and Secretary
Julia R. Short, Senior Vice President
Richard W. Smirl, Executive Vice President
Investment Adviser
Virtus Investment Advisers, Inc.
One Financial Plaza
Hartford, CT 06103-2608
Principal Underwriter
VP Distributors, LLC
One Financial Plaza
Hartford, CT 06103-2608
Administrator and Transfer Agent
Virtus Fund Services, LLC
One Financial Plaza
Hartford, CT 06103-2608
Custodian
The Bank of New York Mellon
240 Greenwich Street
New York, NY 10286-1048
Independent Registered Public
Accounting Firm
PricewaterhouseCoopers LLP
2001 Market Street
Philadelphia, PA 19103-7042
How to Contact Us
| Mutual Fund Services | 1-800-243-1574 |
| Adviser Consulting Group | 1-800-243-4361 |
Important Notice to Shareholders
The Securities and Exchange Commission has modified mailing regulations for semiannual and annual shareholder fund reports to allow mutual fund companies to send a single copy of these reports to shareholders who share the same mailing address. If you would like additional copies, please call Mutual Fund Services at 1-800-243-1574.
P.O. Box 9874
Providence, RI 02940-8074
For more information about Virtus Mutual Funds,
please contact us at 1-800-243-1574, or visit Virtus.com.
Item 2. Code of Ethics.
| | (a) | The registrant, as of the end of the period covered by this report, has adopted a code of ethics that applies to the registrant’s principal executive officer, principal financial officer, principal accounting officer or controller, or persons performing similar functions, regardless of whether these individuals are employed by the registrant or a third party. |
| | (b) | Other than certain non-substantive changes, there have been no amendments during the period covered by this report, to a provision of the code of ethics that applies to the registrant’s principal executive officer, principal financial officer, principal accounting officer or controller, or persons performing similar functions, regardless of whether these individuals are employed by the registrant or a third party, and that relates to any element of the code of ethics described in Item 2(b) of the instructions for completion of Form N-CSR. A copy of the currently applicable code is included as an exhibit. |
| | (d) | The registrant has not granted any waivers, during the period covered by this report, including an implicit waiver, from a provision of the code of ethics that applies to the registrant’s principal executive officer, principal financial officer, principal accounting officer or controller, or persons performing similar functions, regardless of whether these individuals are employed by the registrant or a third party, that relates to one or more of the items set forth in paragraph (b) of the instructions for completion of this Item. |
Item 3. Audit Committee Financial Expert.
| | |
(a)(1) | | The Registrant’s Board of Trustees has determined that the Registrant has an “audit committee financial expert” serving on its Audit Committee. |
(a)(2) | | The Registrant’s Board of Trustees has determined that each of Donald C. Burke, Connie D. McDaniel and Brian T. Zino possesses the technical attributes identified in Instruction 2(b) of Item 3 to Form N-CSR to qualify as an “audit committee financial expert.” Each such individual is an “independent” trustee pursuant to paragraph (a)(2) of Item 3 to Form N-CSR. |
Item 4. Principal Accountant Fees and Services.
| | • | | Registrant may incorporate the following information by reference, if this information has been disclosed in the registrant’s definitive proxy statement or definitive information statement. The proxy statement or information statement must be filed no later than 120 days after the end of the fiscal year covered by the Annual Report. |
Audit Fees
| | (a) | The aggregate fees billed for each of the last two fiscal years for professional services rendered by the principal accountant for the audit of the registrant’s annual financial statements or services that are normally provided by the accountant in connection with statutory and regulatory filings or engagements for fiscal years ended September 30, 2021 and September 30, 2022 are $274,360 and $301,796, respectively. |
Audit-Related Fees
| | (b) | The aggregate fees billed in each of the last two fiscal years for assurance and related services by the principal accountant that are reasonably related to the performance of the audit of the registrant’s financial statements and are not reported under paragraph (a) of this Item for fiscal years ended September 30, 2021 and September 30, 2022 are $20,402 and $17,841, respectively. Such audit-related fees include out of pocket expenses. |
Tax Fees
| | (c) | The aggregate fees billed in each of the last two fiscal years for professional services rendered by the principal accountant for tax compliance, tax advice, and tax planning for fiscal years ended September 30, 2021 and September 30, 2022 are $77,550 and $90,867, respectively. |
“Tax Fees” are those primarily associated with review of the Trust’s tax provision and qualification as a regulated investment company (RIC) in connection with audits of the Trust’s financial statement, review of year-end distributions by the Fund to avoid excise tax for the Trust, periodic discussion with management on tax issues affecting the Trust, and reviewing and signing the Fund’s federal income tax returns.
All Other Fees
| | (d) | The aggregate fees billed in each of the last two fiscal years for products and services provided by the principal accountant, other than the services reported in paragraphs (a) through (c) of this Item are for fiscal years ended September 30, 2021 and September 30, 2022 are $0 and $0, respectively. |
| | (e)(1) | Disclose the audit committee’s pre-approval policies and procedures described in paragraph (c)(7) of Rule 2-01 of Regulation S-X. |
The Board of Trustees of Virtus Equity Trust (the “Fund”) has adopted policies and procedures with regard to the pre-approval of services provided by its independent auditors. Audit, audit-related and tax compliance services provided to the Fund on an annual basis require specific pre-approval by the Audit Committee. The Audit Committee must also approve other non-audit services provided to the Fund and those non-audit services provided to the Fund’s Affiliated Service Providers that relate directly to the operations and financial reporting of the Fund. Certain of these non-audit services that the Audit Committee believes are a) consistent with the SEC’s auditor independence rules and b) routine and recurring services that will not impair the independence of the independent auditors may be approved by the Audit Committee without consideration on a specific case-by-case basis (“general pre-approval”).
The Audit Committee has determined that the Chair of the Audit Committee, may provide pre-approval for such services that meet the above requirements but are not included in the general pre-approval in the event such approval is sought between regularly scheduled meetings. In any event, the Audit Committee is informed of, and ratifies, each service approved subject to general pre-approval at the next regularly scheduled in-person Audit Committee meeting.
| | (e)(2) | The percentage of services described in each of paragraphs (b) through (d) of this Item that were approved by the audit committee pursuant to paragraph (c)(7)(i)(C) of Rule 2-01 of Regulation S-X are as follows: |
(b) 0%
(c) 0%
(d) N/A
| | (f) | The percentage of hours expended on the principal accountant’s engagement to audit the registrant’s financial statements for the most recent fiscal year that were attributed to work performed by persons other than the principal accountant’s full-time, permanent employees was less than fifty percent. |
| | (g) | The aggregate non-audit fees billed by the registrant’s accountant for services rendered to the registrant, and rendered to the registrant’s investment adviser (not including any sub-adviser whose role is primarily portfolio management and is subcontracted with or overseen by another investment adviser), and any entity controlling, controlled by, or under common control with the adviser that provides ongoing services to the registrant for fiscal years ended September 30, 2021 and September 30, 2022 are $97,952 and $108,708, respectively. |
| | (h) | The registrant’s audit committee of the board of directors has considered whether the provision of non-audit services that were rendered to the registrant’s investment adviser (not including any sub-adviser whose role is primarily portfolio management and is subcontracted with or overseen by another investment adviser), and any entity controlling, controlled by, or under common control with the investment adviser that provides ongoing services to the registrant that were not pre-approved pursuant to paragraph (c)(7)(ii) of Rule 2-01 of Regulation S-X is compatible with maintaining the principal accountant’s independence. |
Item 5. Audit Committee of Listed Registrants.
Not applicable.
Item 6. Investments.
| (a) | Schedule of Investments in securities of unaffiliated issuers as of the close of the reporting period is included as part of the report to shareholders filed under Item 1(a) of this form. |
Item 7. Disclosure of Proxy Voting Policies and Procedures for Closed-End Management Investment Companies.
Not applicable.
Item 8. Portfolio Managers of Closed-End Management Investment Companies.
Not applicable.
Item 9. Purchases of Equity Securities by Closed-End Management Investment Company and Affiliated Purchasers.
Not applicable.
Item 10. Submission of Matters to a Vote of Security Holders.
There have been no material changes to the procedures by which the shareholders may recommend nominees to the registrant’s board of trustees, where those changes were implemented after the registrant last provided disclosure in response to the requirements of Item 407(c)(2)(iv) of Regulation S-K (17 CFR 229.407) (as required by Item 22(b)(15) of Schedule 14A (17 CFR 240.14a-101)), or this Item.
Item 11. Controls and Procedures.
| | (a) | The registrant’s principal executive and principal financial officers, or persons performing similar functions, have concluded that the registrant’s disclosure controls and procedures (as defined in Rule 30a-3(c) under the Investment Company Act of 1940, as amended (the “1940 Act”) (17 CFR 270.30a-3(c))) are effective, as of a date within 90 days of the filing date of the report that includes the disclosure required by this paragraph, based on their evaluation of these controls and procedures required by Rule 30a-3(b) under the 1940 Act (17 CFR 270.30a-3(b)) and Rules 13a-15(b) or 15d-15(b) under the Securities Exchange Act of 1934, as amended (17 CFR 240.13a-15(b) or 240.15d-15(b)). |
| | (b) | There were no changes in the registrant’s internal control over financial reporting (as defined in Rule 30a-3(d) under the 1940 Act (17 CFR 270.30a-3(d))) that occurred during the period covered by this report that has materially affected, or is reasonably likely to materially affect, the registrant’s internal control over financial reporting. |
Item 12. Disclosure of Securities Lending Activities for Closed-End Management Investment Companies.
Not applicable.
Item 13. Exhibits.
SIGNATURES
Pursuant to the requirements of the Securities Exchange Act of 1934 and the Investment Company Act of 1940, the registrant has duly caused this report to be signed on its behalf by the undersigned, thereunto duly authorized.
| | |
| (Registrant) Virtus Equity Trust |
| |
| By (Signature and Title)* | | /s/ George R. Aylward |
| | George R. Aylward, President |
| | (principal executive officer) |
| Date 11/30/2022 |
Pursuant to the requirements of the Securities Exchange Act of 1934 and the Investment Company Act of 1940, this report has been signed below by the following persons on behalf of the registrant and in the capacities and on the dates indicated.
| | |
| By (Signature and Title)* | | /s/ George R. Aylward |
| | George R. Aylward, President |
| | (principal executive officer) |
| Date 11/30/2022 |
| | |
| By (Signature and Title)* | | /s/ W. Patrick Bradley |
| | W. Patrick Bradley, Executive Vice President, Chief Financial Officer, and Treasurer |
| | (principal financial officer) |
| Date 11/30/2022 |
| * | Print the name and title of each signing officer under his or her signature. |