UNITED STATES
SECURITIES AND EXCHANGE COMMISSION
Washington, D.C. 20549
FORM N-CSR
CERTIFIED SHAREHOLDER REPORT OF REGISTERED MANAGEMENT
INVESTMENT COMPANIES
Investment Company Act file number 811-00945
Virtus Equity Trust
(Exact name of registrant as specified in charter)
101 Munson Street
Greenfield, MA 01301-9668
(Address of principal executive offices) (Zip code)
Kevin J. Carr, Esq.
Senior Vice President, Chief Legal Officer, Counsel and Secretary for Registrant
One Financial Plaza
Hartford, CT 06103-2608
(Name and address of agent for service)
Registrant’s telephone number, including area code: (800) 243-1574
Date of fiscal year end: September 30
Date of reporting period: September 30, 2020
Form N-CSR is to be used by management investment companies to file reports with the Commission not later than 10 days after the transmission to stockholders of any report that is required to be transmitted to stockholders under Rule 30e-1 under the Investment Company Act of 1940 (17 CFR 270.30e-1). The Commission may use the information provided on Form N-CSR in its regulatory, disclosure review, inspection, and policymaking roles.
A registrant is required to disclose the information specified by Form N-CSR, and the Commission will make this information public. A registrant is not required to respond to the collection of information contained in Form N-CSR unless the Form displays a currently valid Office of Management and Budget (“OMB”) control number. Please direct comments concerning the accuracy of the information collection burden estimate and any suggestions for reducing the burden to Secretary, Securities and Exchange Commission, 450 Fifth Street, NW, Washington, DC 20549-0609. The OMB has reviewed this collection of information under the clearance requirements of 44 U.S.C. § 3507.
Item 1. Reports to Stockholders.
The Report to Shareholders is attached herewith.
ANNUAL REPORT
VIRTUS EQUITY TRUST
| Virtus KAR Capital Growth Fund |
Virtus KAR Equity Income Fund
(f/k/a: Virtus Rampart Enhanced Core Equity Fund)* |
| Virtus KAR Global Quality Dividend Fund |
| Virtus KAR Mid-Cap Core Fund |
| Virtus KAR Mid-Cap Growth Fund |
| Virtus KAR Small-Cap Core Fund |
| Virtus KAR Small-Cap Growth Fund |
| Virtus KAR Small-Cap Value Fund |
| Virtus KAR Small-Mid Cap Core Fund |
| Virtus SGA Emerging Markets Growth Fund |
| Virtus SGA Global Growth Fund* |
*Prospectus supplement applicable to this fund appears at the back of this annual report.
Beginning on January 1, 2021, as permitted by regulations adopted by the Securities and Exchange Commission, paper copies of each Fund’s shareholder reports like this one will no longer be sent by mail, unless specifically requested from the Fund or from your financial intermediary, such as a broker-dealer or bank. Instead, the reports will be made available on a website, and you will be notified by mail each time a report is posted and provided with a website link to access the report. If you already elected to receive shareholder reports electronically, you will not be affected by this change and you need not take any action.
You may elect at any time to receive not only shareholder reports but also certain other communications from the Fund electronically, or you may elect to receive paper copies of all future shareholder reports free of charge to you. If you own your shares directly with the Fund, you may make such elections by calling the Fund at 1-800-243-1574 or, with respect to requesting electronic delivery, by visiting www.virtus.com. An election made directly with the Fund will apply to all Virtus Mutual Funds in which you own shares directly. If you own your shares through a financial intermediary, please contact your financial intermediary to make your request and to determine whether your election will apply to all funds in which you own shares through that intermediary.
Not FDIC Insured • No Bank Guarantee • May Lose Value
Table of Contents
| 1 |
| 2 |
| 5 |
| Fund | Fund
Summary | Schedule
of
Investments |
| 8 | 38 |
| 11 | 40 |
| 13 | 41 |
| 16 | 42 |
| 19 | 43 |
| 22 | 45 |
| 25 | 46 |
| 28 | 47 |
| 31 | 48 |
| 34 | 49 |
| 36 | 50 |
| 52 |
| 57 |
| 60 |
| 66 |
| 74 |
| 90 |
| 91 |
| 92 |
| 93 |
| 94 |
| 99 |
Proxy Voting Procedures and Voting Record (Form N-PX)
The subadvisers vote proxies, if any, relating to portfolio securities in accordance with procedures that have been approved by the Board of Trustees of the Trust (“Trustees”, or the “Board”). You may obtain a description of these procedures, along with information regarding how the Funds voted proxies during the most recent 12-month period ended June 30, free of charge, by calling toll-free 1-800-243-1574. This information is also available through the Securities and Exchange Commission’s (the “SEC”) website at https://www.sec.gov.
PORTFOLIO HOLDINGS INFORMATION
The Trust files a complete schedule of portfolio holdings for each Fund with the SEC for the first and third quarters of each fiscal year as an exhibit to its reports on Form N-PORT-P. Form N-PORT-P is available on the SEC’s website at https://www.sec.gov.
This report is not authorized for distribution to prospective investors in the Funds presented in this book unless preceded or accompanied by an effective prospectus which includes information concerning the sales charge, each Fund’s record and other pertinent information.
To My Fellow Shareholders of Virtus Funds:
I am pleased to present this annual report, which reviews the performance of your Fund for the 12 months ended September 30, 2020.
We witnessed unprecedented events and stark changes during the past 12 months. The global economy, which experienced strong growth during the first five months of the fiscal year, was largely shut down in March of 2020 in response to the coronavirus pandemic. Markets reacted by declining sharply, leading policymakers to quickly introduce supportive monetary and fiscal measures. These proved effective, and many markets swiftly reversed course. In fact, the U.S. stock market erased its losses and reached a new high in August.
After this wild ride, most asset classes were able to post positive returns for the 12 months ended September 30, 2020. U.S. large-capitalization stocks returned 15.15%, as measured by the S&P 500® Index. Small-cap stocks lagged, but wound up in positive territory with a return of 0.39%, as measured by the Russell 2000® Index. Within international equities, developed markets, as measured by the MSCI EAFE® Index (net), were up 0.49% for the 12 months, trailing emerging markets, which gained 10.54%, as measured by the MSCI Emerging Markets Index (net).
In fixed income markets, monetary easing drove the yield on the 10-year Treasury to 0.69% at September 30, 2020, down sharply from 1.68% on September 30, 2019. The broader U.S. fixed income market, as represented by the Bloomberg Barclays U.S. Aggregate Bond Index, returned 6.98%. Non-investment grade bonds were up 3.25% for the period, as measured by the Bloomberg Barclays U.S. Corporate High Yield Bond Index.
Our investment teams maintained their disciplined approach in the midst of this turbulence, and remain focused on helping you achieve your long-term goals. While uncertainty may lie ahead, you can depend on us to continue investing your capital with skill and care. To learn more about the other investment strategies we offer, please visit Virtus.com.
On behalf of our investment managers, thank you for entrusting the Virtus Funds with your assets. Please call our customer service team at 800-243-1574 if you have questions about your account or require assistance. We appreciate your business and remain committed to your long-term financial success.
Sincerely,
George R. Aylward
President, Virtus Funds
November 2020
Performance data quoted represents past results. Past performance is no guarantee of future results, and current performance may be higher or lower than the performance shown above.
VIRTUS EQUITY TRUST
DISCLOSURE OF FUND EXPENSES (Unaudited)
FOR THE SIX-MONTH PERIOD OF April 1, 2020 TO September 30, 2020
We believe it is important for you to understand the impact of costs on your investment. All mutual funds have operating expenses. As a shareholder of a Virtus Equity Trust Fund discussed in this shareholder report (each, a “Fund”), you may incur two types of costs: (1) transaction costs, including sales charges on purchases of Class A shares and contingent deferred sales charges on Class C shares; and (2) ongoing costs, including investment advisory fees, distribution and service fees, and other expenses. Class I shares and Class R6 shares are sold without sales charges and do not incur distribution and service fees. Class R6 shares also do not incur shareholder servicing fees. For further information regarding applicable sales charges, see Note 1 in the Notes to Financial Statements. These examples are intended to help you understand your ongoing costs (in dollars) of investing in a Fund and to compare these costs with the ongoing costs of investing in other mutual funds. These examples are based on an investment of $1,000 invested at the beginning of the period and held for the entire six-month period. The Annualized Expense Ratios may be different from the expense ratios in the Financial Highlights which are for the fiscal year ended September 30, 2020.
Please note that the expenses shown in the accompanying tables are meant to highlight your ongoing costs only and do not reflect any transactional costs, such as sales charges or contingent deferred sales charges. Therefore, the accompanying tables are useful in comparing ongoing costs only, and will not help you determine the relative total costs of owning different funds. In addition, if these transactional costs were included, your costs would have been higher. The calculations assume no shares were bought or sold during the period. Your actual costs may have been higher or lower, depending on the amount of your investment and the timing of any purchases or redemptions.
Actual Expenses
The table below provides information about actual account values and actual expenses. You may use the information below, together with the amount you invested, to estimate the expenses that you paid over the period. Simply divide your account value by $1,000 (for example, an $8,600 account value divided by $1,000 = 8.6), then multiply the result by the number in the table under the heading entitled “Expenses Paid During Period” to estimate the expenses you paid on your account during this period.
| | | Beginning
Account Value
April 1, 2020 | | Ending
Account Value
September 30, 2020 | | Annualized
Expense
Ratio | | Expenses
Paid
During
Period* |
KAR Capital Growth Fund
| | | | | | | | |
| | Class A | $ 1,000.00 | | $ 1,526.80 | | 1.23 % | | $ 7.77 |
| | Class C | 1,000.00 | | 1,521.30 | | 2.00 | | 12.61 |
| | Class I | 1,000.00 | | 1,527.90 | | 1.02 | | 6.45 |
| | Class R6 | 1,000.00 | | 1,530.80 | | 0.73 | | 4.62 |
KAR Equity Income Fund
| | | | | | | | |
| | Class A | 1,000.00 | | 1,318.30 | | 1.26 | | 7.30 |
| | Class C | 1,000.00 | | 1,313.90 | | 2.00 | | 11.57 |
| | Class I | 1,000.00 | | 1,320.30 | | 1.01 | | 5.86 |
| | Class R6 | 1,000.00 | | 1,320.30 | | 0.96 | | 5.57 |
KAR Global Quality Dividend Fund
| | | | | | | | |
| | Class A | 1,000.00 | | 1,130.20 | | 1.35 | | 7.19 |
| | Class C | 1,000.00 | | 1,125.50 | | 2.10 | | 11.16 |
| | Class I | 1,000.00 | | 1,131.10 | | 1.10 | | 5.86 |
| | Class R6 | 1,000.00 | | 1,132.60 | | 0.78 | | 4.16 |
KAR Mid-Cap Core Fund
| | | | | | | | |
| | Class A | 1,000.00 | | 1,303.20 | | 1.20 | | 6.91 |
| | Class C | 1,000.00 | | 1,298.30 | | 1.95 | | 11.20 |
| | Class I | 1,000.00 | | 1,304.90 | | 0.95 | | 5.47 |
| | Class R6 | 1,000.00 | | 1,305.60 | | 0.87 | | 5.01 |
KAR Mid-Cap Growth Fund
| | | | | | | | |
| | Class A | 1,000.00 | | 1,535.30 | | 1.25 | | 7.92 |
| | Class C | 1,000.00 | | 1,529.50 | | 2.00 | | 12.65 |
| | Class I | 1,000.00 | | 1,537.00 | | 1.01 | | 6.41 |
| | Class R6 | 1,000.00 | | 1,538.40 | | 0.83 | | 5.27 |
KAR Small-Cap Core Fund
| | | | | | | | |
| | Class A | 1,000.00 | | 1,271.40 | | 1.29 | | 7.33 |
| | Class C | 1,000.00 | | 1,267.00 | | 2.01 | | 11.39 |
| | Class I | 1,000.00 | | 1,273.50 | | 1.01 | | 5.74 |
| | Class R6 | 1,000.00 | | 1,273.60 | | 0.93 | | 5.29 |
KAR Small-Cap Growth Fund
| | | | | | | | |
| | Class A | 1,000.00 | | 1,483.50 | | 1.36 | | 8.44 |
| | Class C | 1,000.00 | | 1,478.70 | | 2.07 | | 12.83 |
| | Class I | 1,000.00 | | 1,485.80 | | 1.09 | | 6.77 |
| | Class R6 | 1,000.00 | | 1,486.40 | | 1.00 | | 6.22 |
VIRTUS EQUITY TRUST
DISCLOSURE OF FUND EXPENSES (Unaudited) (Continued)
FOR THE SIX-MONTH PERIOD OF April 1, 2020 TO September 30, 2020
| | | Beginning
Account Value
April 1, 2020 | | Ending
Account Value
September 30, 2020 | | Annualized
Expense
Ratio | | Expenses
Paid
During
Period* |
KAR Small-Cap Value Fund
| | | | | | | | |
| | Class A | $1,000.00 | | $1,330.40 | | 1.23% | | $ 7.17 |
| | Class C | 1,000.00 | | 1,325.20 | | 1.98 | | 11.51 |
| | Class I | 1,000.00 | | 1,331.30 | | 0.99 | | 5.77 |
| | Class R6 | 1,000.00 | | 1,332.40 | | 0.89 | | 5.19 |
KAR Small-Mid Cap Core Fund
| | | | | | | | |
| | Class A | 1,000.00 | | 1,387.50 | | 1.30 | | 7.76 |
| | Class C | 1,000.00 | | 1,382.80 | | 2.05 | | 12.21 |
| | Class I | 1,000.00 | | 1,389.80 | | 1.05 | | 6.27 |
| | Class R6 | 1,000.00 | | 1,391.40 | | 0.97 | | 5.80 |
SGA Emerging Markets Growth Fund
| | | | | | | | |
| | Class A | 1,000.00 | | 1,351.90 | | 1.48 | | 8.70 |
| | Class C | 1,000.00 | | 1,345.90 | | 2.23 | | 13.08 |
| | Class I | 1,000.00 | | 1,352.20 | | 1.23 | | 7.23 |
| | Class R6 | 1,000.00 | | 1,354.10 | | 1.05 | | 6.18 |
SGA Global Growth Fund
| | | | | | | | |
| | Class A | 1,000.00 | | 1,373.00 | | 1.35 | | 8.01 |
| | Class C | 1,000.00 | | 1,367.20 | | 2.13 | | 12.61 |
| | Class I | 1,000.00 | | 1,374.90 | | 1.13 | | 6.71 |
| | Class R6 | 1,000.00 | | 1,376.60 | | 0.90 | | 5.35 |
| * | Expenses are equal to the relevant Fund’s annualized expense ratio, which is net of waived fees and reimbursed expenses, if applicable, multiplied by the average account value over the period, multiplied by the number of days (183) expenses were accrued in the most recent fiscal half-year, then divided by 366 to reflect the one-half year period. |
For Funds which may invest in other funds, the annualized expense ratios noted above do not reflect fees and expenses associated with any underlying funds. If such fees and expenses had been included, the expenses would have been higher.
You can find more information about a Fund’s expenses in the Financial Statements section that follows. For additional information on operating expenses and other shareholder costs, refer to that Fund’s prospectus.
Hypothetical Example for Comparison Purposes
The table below provides information about hypothetical account values and hypothetical expenses based on a Fund’s actual expense ratio and an assumed rate of return of 5% per year before expenses, which is not your Fund’s actual return. The hypothetical account values and expenses may not be used to estimate the actual ending account balance or expenses you paid for the period. You may use this information to compare the ongoing costs of investing in your Fund and other funds. To do so, compare these 5% hypothetical examples with the 5% hypothetical examples that appear in the shareholder reports of other mutual funds.
| | | Beginning
Account Value
April 1, 2020 | | Ending
Account Value
September 30, 2020 | | Annualized
Expense
Ratio | | Expenses
Paid
During
Period* |
KAR Capital Growth Fund
| | | | | | | | |
| | Class A | $ 1,000.00 | | $ 1,018.85 | | 1.23 % | | $ 6.21 |
| | Class C | 1,000.00 | | 1,015.00 | | 2.00 | | 10.08 |
| | Class I | 1,000.00 | | 1,019.90 | | 1.02 | | 5.15 |
| | Class R6 | 1,000.00 | | 1,021.35 | | 0.73 | | 3.69 |
KAR Equity Income Fund
| | | | | | | | |
| | Class A | 1,000.00 | | 1,018.70 | | 1.26 | | 6.36 |
| | Class C | 1,000.00 | | 1,015.00 | | 2.00 | | 10.08 |
| | Class I | 1,000.00 | | 1,019.95 | | 1.01 | | 5.10 |
| | Class R6 | 1,000.00 | | 1,020.20 | | 0.96 | | 4.85 |
KAR Global Quality Dividend Fund
| | | | | | | | |
| | Class A | 1,000.00 | | 1,018.25 | | 1.35 | | 6.81 |
| | Class C | 1,000.00 | | 1,014.50 | | 2.10 | | 10.58 |
| | Class I | 1,000.00 | | 1,019.50 | | 1.10 | | 5.55 |
| | Class R6 | 1,000.00 | | 1,021.10 | | 0.78 | | 3.94 |
VIRTUS EQUITY TRUST
DISCLOSURE OF FUND EXPENSES (Unaudited) (Continued)
FOR THE SIX-MONTH PERIOD OF April 1, 2020 TO September 30, 2020
| | | Beginning
Account Value
April 1, 2020 | | Ending
Account Value
September 30, 2020 | | Annualized
Expense
Ratio | | Expenses
Paid
During
Period* |
KAR Mid-Cap Core Fund
| | | | | | | | |
| | Class A | $1,000.00 | | $1,019.00 | | 1.20% | | $ 6.06 |
| | Class C | 1,000.00 | | 1,015.25 | | 1.95 | | 9.82 |
| | Class I | 1,000.00 | | 1,020.25 | | 0.95 | | 4.80 |
| | Class R6 | 1,000.00 | | 1,020.65 | | 0.87 | | 4.39 |
KAR Mid-Cap Growth Fund
| | | | | | | | |
| | Class A | 1,000.00 | | 1,018.75 | | 1.25 | | 6.31 |
| | Class C | 1,000.00 | | 1,015.00 | | 2.00 | | 10.08 |
| | Class I | 1,000.00 | | 1,019.95 | | 1.01 | | 5.10 |
| | Class R6 | 1,000.00 | | 1,020.85 | | 0.83 | | 4.19 |
KAR Small-Cap Core Fund
| | | | | | | | |
| | Class A | 1,000.00 | | 1,018.55 | | 1.29 | | 6.51 |
| | Class C | 1,000.00 | | 1,014.95 | | 2.01 | | 10.13 |
| | Class I | 1,000.00 | | 1,019.95 | | 1.01 | | 5.10 |
| | Class R6 | 1,000.00 | | 1,020.35 | | 0.93 | | 4.70 |
KAR Small-Cap Growth Fund
| | | | | | | | |
| | Class A | 1,000.00 | | 1,018.20 | | 1.36 | | 6.86 |
| | Class C | 1,000.00 | | 1,014.65 | | 2.07 | | 10.43 |
| | Class I | 1,000.00 | | 1,019.55 | | 1.09 | | 5.50 |
| | Class R6 | 1,000.00 | | 1,020.00 | | 1.00 | | 5.05 |
KAR Small-Cap Value Fund
| | | | | | | | |
| | Class A | 1,000.00 | | 1,018.85 | | 1.23 | | 6.21 |
| | Class C | 1,000.00 | | 1,015.10 | | 1.98 | | 9.97 |
| | Class I | 1,000.00 | | 1,020.05 | | 0.99 | | 5.00 |
| | Class R6 | 1,000.00 | | 1,020.55 | | 0.89 | | 4.50 |
KAR Small-Mid Cap Core Fund
| | | | | | | | |
| | Class A | 1,000.00 | | 1,018.50 | | 1.30 | | 6.56 |
| | Class C | 1,000.00 | | 1,014.75 | | 2.05 | | 10.33 |
| | Class I | 1,000.00 | | 1,019.75 | | 1.05 | | 5.30 |
| | Class R6 | 1,000.00 | | 1,020.15 | | 0.97 | | 4.90 |
SGA Emerging Markets Growth Fund
| | | | | | | | |
| | Class A | 1,000.00 | | 1,017.60 | | 1.48 | | 7.47 |
| | Class C | 1,000.00 | | 1,013.85 | | 2.23 | | 11.23 |
| | Class I | 1,000.00 | | 1,018.85 | | 1.23 | | 6.21 |
| | Class R6 | 1,000.00 | | 1,019.75 | | 1.05 | | 5.30 |
SGA Global Growth Fund
| | | | | | | | |
| | Class A | 1,000.00 | | 1,018.25 | | 1.35 | | 6.81 |
| | Class C | 1,000.00 | | 1,014.35 | | 2.13 | | 10.73 |
| | Class I | 1,000.00 | | 1,019.35 | | 1.13 | | 5.70 |
| | Class R6 | 1,000.00 | | 1,020.50 | | 0.90 | | 4.55 |
| * | Expenses are equal to the relevant Fund’s annualized expense ratio, which is net of waived fees and reimbursed expenses, if applicable, multiplied by the average account value over the period, multiplied by the number of days (183) expenses were accrued in the most recent fiscal half-year, then divided by 366 to reflect the one-half year period. |
For Funds which may invest in other funds, the annualized expense ratios noted above do not reflect fees and expenses associated with any underlying funds. If such fees and expenses had been included, the expenses would have been higher.
You can find more information about a Fund’s expenses in the Financial Statements section that follows. For additional information on operating expenses and other shareholder costs, refer to that Fund’s prospectus.
VIRTUS EQUITY TRUST
KEY INVESTMENT TERMS (Unaudited)
September 30, 2020
American Depositary Receipt (“ADR”)
Represents shares of foreign companies traded in U.S. dollars on U.S. exchanges that are held by a U.S. bank or a trust. Foreign companies use ADRs in order to make it easier for Americans to buy their shares.
Bloomberg Barclays U.S. Aggregate Bond Index
The Bloomberg Barclays U.S. Aggregate Bond Index measures the U.S. investment-grade fixed-rate bond market. The index is calculated on a total return basis. The index is unmanaged, its returns do not reflect any fees, expenses, or sales charges, and it is not available for direct investment.
Bloomberg Barclays U.S. Corporate High Yield Bond Index
The Bloomberg Barclays U.S. Corporate High Yield Bond Index measures the U.S. dollar-denominated, high yield, fixed-rate corporate bond market. The index is calculated on a total return basis. The index is unmanaged, its returns do not reflect any fees, expenses, or sales charges, and it is not available for direct investment.
Exchange-Traded Fund (“ETF”)
An open-end fund that is traded on a stock exchange. Most ETFs have a portfolio of stocks or bonds that track a specific market index.
Federal Reserve (the “Fed”)
The Central Bank of the U.S., the Fed is responsible for controlling money supply, interest rates and credit with the goal of keeping the U.S. economy and currency stable. Governed by a seven-member board, the system includes 12 regional Federal Reserve Banks, 25 branches and all national and state banks that are part of the system.
Global Quality Dividend Linked Benchmark
The Global Quality Dividend Linked Benchmark consists of the Russell Developed Large Cap Index (net), a free-float market capitalization-weighted index constructed to provide a comprehensive and unbiased barometer for the large-cap segment in the developed world, calculated on a total return basis with net dividends reinvested. The index is unmanaged, its returns do not reflect any fees, expenses, or sales charges, and is not available for direct investment. Performance of the Global Quality Dividend Linked Benchmark prior to 2/1/2017 is that of the Russell 1000® Value Index.
London Interbank Offered Rate (“LIBOR”)
A benchmark rate that some of the world’s leading banks charge each other for short-term loans and that serves as the first step to calculating interest rates on various loans throughout the world.
MSCI AC World Growth Index (net)
The MSCI AC World Growth Index (net) is a free float-adjusted market capitalization-weighted index that measures equity performance of large and mid cap securities exhibiting overall growth style characteristics across developed and emerging markets. The index is calculated on a total return basis with net dividends reinvested. The index is unmanaged, its returns do not reflect any fees, expenses, or sales charges, and is not available for direct investment.
MSCI All Country World Index (ACWI) (net)
The MSCI AC World Index (net) is a free float-adjusted market capitalization-weighted index that measures equity performance of developed and emerging markets. The index is calculated on a total return basis with net dividends reinvested. The index is unmanaged, its returns do not reflect any fees, expenses, or sales charges, and is not available for direct investment.
MSCI EAFE® Index (net)
The MSCI EAFE® (Europe, Australasia, Far East) Index (net) is a free float-adjusted market capitalization-weighted index that measures developed foreign market equity performance, excluding the U.S. and Canada. The index is calculated on a total return basis with net dividends reinvested. The index is unmanaged, its returns do not reflect any fees, expenses, or sales charges, and it is not available for direct investment.
MSCI Emerging Markets Index (net)
The MSCI Emerging Markets Index (net) is a free float-adjusted market capitalization-weighted index designed to measure equity market performance in the global emerging markets. The index is calculated on a total return basis with net dividends reinvested. The index is unmanaged, its returns do not reflect any fees, expenses, or sales charges, and it is not available for direct investment.
MSCI USA High Dividend Yield Index (net)
The MSCI USA High Dividend Yield Index is based on the MSCI USA Index, its parent index, and includes large and mid-cap stocks. The index is designed to reflect the performance of equities in the parent index (excluding REITs) with higher dividend income and quality characteristics than average dividend yields that are both sustainable and persistent. The index also applies quality screens and reviews 12-month past performance to omit stocks with potentially deteriorating fundamentals that could force them to cut or reduce dividends. The index is calculated on a total return basis with net dividends reinvested; it is unmanaged; its returns do not reflect any fees, expenses or sales charges; and it is not available for direct investment.
VIRTUS EQUITY TRUST
KEY INVESTMENT TERMS (Unaudited) (Continued) September 30, 2020
MSCI World High Dividend Yield Index (net)
The MSCI World High Dividend Yield Index (net) is based on the MSCI World Index, its parent index, and includes large- and mid-cap stocks across 23 developed markets countries. The index is designed to reflect the performance of equities in the parent index (excluding REITs) with higher dividend income and quality characteristics than average dividend yields that are both sustainable and persistent. The index also applies quality screens and reviews 12-month past performance to omit stocks with potentially deteriorating fundamentals that could force them to cut or reduce dividends. The index is calculated on a total return basis with net dividends reinvested. The index is unmanaged, its returns do not reflect any fees, expenses, or sales charges, and it is not available for direct investment.
Real Estate Investment Trust (“REIT”)
A publicly traded company that owns, develops and operates income-producing real estate such as apartments, office buildings, hotels, shopping centers and other commercial properties.
Russell 1000® Growth Index
The Russell 1000® Growth Index is a market capitalization-weighted index of growth-oriented stocks of the 1,000 largest companies in the Russell Universe, which comprises the 3,000 largest U.S. companies. The index is calculated on a total return basis with dividends reinvested. The index is unmanaged, its returns do not reflect any fees, expenses, or sales charges, and it is not available for direct investment.
Russell 1000® Value Index
The Russell 1000® Value Index is a market capitalization-weighted index of value-oriented stocks of the 1,000 largest companies in the Russell Universe, which comprises the 3,000 largest U.S. companies. The index is calculated on a total return basis with dividends reinvested. The index is unmanaged, its returns do not reflect any fees, expenses, or sales charges, and it is not available for direct investment.
Russell 2000® Growth Index
The Russell 2000® Growth Index is a market capitalization-weighted index of growth-oriented stocks of the smallest 2,000 companies in the Russell Universe, which comprises the 3,000 largest U.S. companies. The index is calculated on a total return basis with dividends reinvested. The index is unmanaged, its returns do not reflect any fees, expenses, or sales charges, and it is not available for direct investment.
Russell 2000® Index
The Russell 2000® Index is a market capitalization-weighted index of the 2,000 smallest companies in the Russell Universe, which comprises the 3,000 largest U.S. companies. The index is calculated on a total return basis with dividends reinvested. The index is unmanaged, its returns do not reflect any fees, expenses, or sales charges, and it is not available for direct investment.
Russell 2000® Value Index
The Russell 2000® Value Index is a market capitalization-weighted index of value-oriented stocks of the smallest 2,000 companies in the Russell Universe, which comprises the 3,000 largest U.S. companies. The index is calculated on a total return basis with dividends reinvested. The index is unmanaged, its returns do not reflect any fees, expenses, or sales charges, and it is not available for direct investment.
Russell 2500TM Index
The Russell 2500TM Index is a market capitalization-weighted index of the 2,500 smallest companies in the Russell Universe, which comprises the 3,000 largest U.S. companies. The index is calculated on a total return basis with dividends reinvested. The index is unmanaged, its returns do not reflect any fees, expenses, or sales charges, and is not available for direct investment.
Russell Midcap® Growth Index
The Russell Midcap® Growth Index is a market capitalization-weighted index of medium-capitalization, growth-oriented stocks of U.S. companies. The index is calculated on a total return basis with dividends reinvested. The index is unmanaged, its returns do not reflect any fees, expenses, or sales charges, and it is not available for direct investment.
Russell Midcap® Index
The Russell Midcap® Index is a market capitalization-weighted index of medium-capitalization stocks of U.S. companies. The index is calculated on a total return basis with dividends reinvested. The index is unmanaged, its returns do not reflect any fees, expenses, or sales charges, and it is not available for direct investment.
S&P 500® Index
The S&P 500® Index is a free-float market capitalization-weighted index of 500 of the largest U.S. companies. The index is calculated on a total return basis with dividends reinvested. The index is unmanaged, its returns do not reflect any fees, expenses, or sales charges, and it is not available for direct investment.
VIRTUS EQUITY TRUST
KEY INVESTMENT TERMS (Unaudited) (Continued) September 30, 2020
Sponsored ADR (“American Depositary Receipt”)
An ADR which is issued with the cooperation of the company whose stock will underlie the ADR. Sponsored ADRs generally carry the same rights normally given to stockholders, such as voting rights. ADRs must be sponsored to be able to trade on a major U.S. exchange such as the New York Stock Exchange.
| | Ticker Symbols: |
| | Class A: PSTAX |
| | Class C: SSTFX |
| | Class I: PLXGX |
| | Class R6: VCGRX |
KAR Capital Growth Fund
Fund Summary (Unaudited)
Portfolio Manager Commentary by
Kayne Anderson Rudnick Investment Management, LLC
| ■ | The Fund is diversified and has an investment objective of long-term capital growth. There is no guarantee that the Fund will meet its objective. |
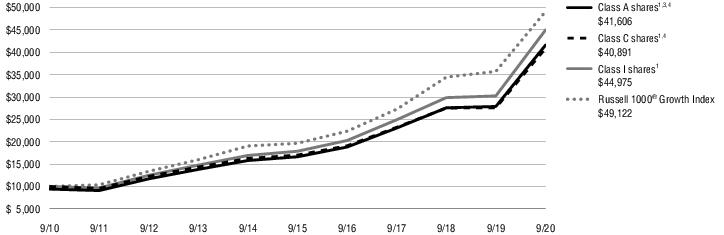
| ■ | For the fiscal year ended September 30, 2020, the Fund’s Class A shares at NAV returned 49.20%, Class C shares at NAV returned 48.09%, Class I shares at NAV returned 48.72%, and Class R6 shares at NAV returned 49.99%. For the same period, the Russell 1000® Growth Index, which serves as both the Fund’s broad-based and style-specific index appropriate the comparison, returned 37.53%. |
All performance figures assume reinvestment of distributions and exclude the effect of sales charges. Performance data quoted represents past results. Past performance is no guarantee of future results, and current performance may be higher or lower than the performance shown above. Investment return and principal value will fluctuate so your shares, when redeemed, may be worth more or less than their original cost. Please visit Virtus.com for performance data current to the most recent month-end.
How did the markets perform during the Fund’s fiscal year ended September 30, 2020?
Equity investors enjoyed solid returns in 2019 and then went for a roller coaster ride in the first quarter of 2020, as markets around the world declined due to the COVID-19 pandemic, which necessitated an almost complete shutdown of economic activity. After a nosedive first quarter of 2020, the S&P 500® Index recovered in the following three months to have its best quarter in over 20 years, erasing most of the first-quarter loss. With aggressive stimulus from governments around the world flowing into the markets as a backstop to the global health crisis, the S&P 500® Index made a new high in the third quarter of 2020, just 103 days after sliding 35%. That is the fastest-ever recovery from a decline greater than 30%. Markets continued to forge ahead, and experienced a garden-variety correction during the first few weeks of September, as some rotation started to occur. Stocks continued to advance, however, and closed the fiscal year on a positive trend.
For the fiscal year ended September 30, 2020, the S&P 500® Index returned 15.15%, while small-capitalization stocks, as represented by the Russell 2000® Index, turned slightly positive, delivering a gain of 0.39%. International developed markets, as measured by the MSCI EAFE Index (net), pushed into positive territory with a 0.49% return, while the MSCI Emerging Markets Index (net) surged to gain 10.54% for the 12-month period. Value stocks significantly underperformed growth stocks over the fiscal year, with the Russell 1000® Value Index returning -5.03% and the Russell 1000® Growth Index up 37.53%. Value indexes contain many more businesses that were adversely affected by COVID-19. Conversely, many growth companies benefited from the work-from-home environment brought about by the pandemic.
What factors affected the Fund’s performance during its fiscal year?
The Fund outperformed its benchmark, the Russell 1000® Growth Index, during the fiscal year ended September 30, 2020. Strong stock selection in information technology and communication services contributed to performance. Poor stock selection and overweight positions in financials and materials detracted from performance.
The biggest contributors to performance during the period were Amazon.com and Bill.com.
• Amazon continued on its powerful growth trajectory, powered by its wide-moat e-commerce business and dominant web services offering, Amazon Web Services. Amazon delivered blockbuster quarterly revenue that many investors expected, as stay-at-home restrictions helped the company capture an even greater share of consumer spending.
• Bill.com is a natural beneficiary of businesses digitizing, automating one of the most labor-intensive back office operations with its invoice and payment processing solution. Providing further validation of the value of its software, Bill.com has also been selected by each of the three largest banks in the country to offer a white-label version of its software to their commercial clients.
• Other top contributors included Nvidia, Alibaba Group, and The Trade Desk.
The biggest detractors from performance were Ross Stores and Bank of America.
• Ross Stores underperformed due to the fact that its locations were closed for a period of time and, even after reopening, traffic did not return to previous levels. Soft earnings reports, withdrawn earnings guidance, a $2 billion debt offering, and suspension of both the dividend and the share repurchase program all conspired to dent investor confidence. However, none of these developments were surprising. The company still reports optimism about inventory availability, which we believe ultimately drives the shopping experience and store traffic. We continued to hold the stock as of the end of the fiscal year.
• Bank of America generates over 50% of its income from interest, which came under pressure from the Federal Reserve’s (the Fed’s) decision to cut interest rates in March of 2020. Despite the fact that the bank has exemplary credit ratios, it voluntarily agreed to suspend share repurchases to ensure liquidity during the COVID-19 crisis. This removed a critical source of support from the company’s share price. We continued to hold the stock through the end of the reporting period.
• Other top detractors included Las Vegas Sands, Charles Schwab, and EcoLab.
The preceding information is the opinion of portfolio management only through the end of the period stated on the cover. Any such opinions are subject to change at any time based upon market or other conditions and should not be relied upon as investment advice. Past performance is no guarantee of future results, and there is no guarantee that market forecasts will be realized.
Equity Securities: The market price of equity securities may be adversely affected by financial market, industry, or issuer-specific events. Focus on a particular style or on small or medium-sized companies may enhance that risk.
Market Volatility: Local, regional, or global events such as war, acts of terrorism, the spread of infectious illness or other public health issues, recessions, or other events could have a significant impact on the portfolio and its investments, including hampering the ability of the portfolio manager(s) to invest the portfolio’s assets as intended.
Prospectus: For additional information on risks, please see the Fund’s prospectus.
For information regarding the indexes and certain investment terms, see the Key Investment Terms starting on page 5.
KAR Capital Growth Fund (Continued)
Asset Allocation
The following table presents asset allocation within certain sectors as a percentage of total investments as of September 30, 2020.
| Information Technology | 33% |
| Consumer Discretionary | 26 |
| Communication Services | 14 |
| Industrials | 9 |
| Health Care | 6 |
| Financials | 5 |
| Consumer Staples | 5 |
| Other | 2 |
| Total | 100% |
For information regarding the indexes and certain investment terms, see the Key Investment Terms starting on page 5.
KAR Capital Growth Fund (Continued)
Average Annual Total Returns1 for periods ended 9/30/20
| | | 1 Year | 5 Years | 10 Years | Since
inception | Inception
date |
| Class A shares at NAV2 | | 49.20 % | 20.11 % | 16.01 % | — % | — |
| Class A shares at POP3,4 | | 40.62 | 18.70 | 15.32 | — | — |
| Class C shares at NAV2 and with CDSC4 | | 48.09 | 19.17 | 15.12 | — | — |
| Class I shares at NAV2 | | 48.72 | 20.26 | 16.22 | — | — |
| Class R6 shares at NAV2 | | 49.99 | — | — | 18.31 | 1/30/18 |
| Russell 1000® Growth Index | | 37.53 | 20.10 | 17.25 | 18.21 5 | — |
| Fund Expense Ratios6: Class A shares: 1.24%; Class C shares: 2.02%; Class I shares: 1.03%; Class R6 shares: Gross 0.94%, Net 0.73%. | | | | | | |
| All returns represent past performance which is no guarantee of future results. Current performance may be higher or lower than the performance shown. The investment return and principal value of an investment will fluctuate so that an investor’s shares, when redeemed, may be worth more or less than their original cost. The above table and graph below do not reflect the deduction of taxes that a shareholder would pay on fund distributions or the redemption of shares. Please visit Virtus.com for performance data current to the most recent month-end. |
Growth of $10,000 for periods ended 9/30
This chart assumes an initial investment of $10,000 made on September 30, 2010, for Class A shares, Class C shares, and Class I shares including any applicable sales charges or fees. The performance of the other share class may be greater or less than that shown based on differences in inception dates, fees, and sales charges. Performance assumes reinvestment of dividends and capital gain distributions.
| 1 | Total returns are historical and include changes in share price and the reinvestment of both dividends and capital gain distributions. |
| 2 | “NAV” (Net Asset Value) total returns do not include the effect of any sales charge. |
| 3 | “POP” (Public Offering Price) total returns include the effect of the maximum front-end 5.75% sales charge. |
| 4 | “CDSC” (contingent deferred sales charge) is applied to redemptions of certain classes of shares that do not have a sales charge applied at the time of purchase. CDSC for certain redemptions of Class A shares made within 18 months of a finder’s fee being paid and all Class C shares are 1% within the first year and 0% thereafter. |
| 5 | The since inception index return is from the inception date of Class R6 shares. |
| 6 | The expense ratios of the Fund are set forth according to the prospectus for the Fund effective January 28, 2020, as supplemented and revised, and may differ from the expense ratios disclosed in the Financial Highlights tables in this report. See the Financial Highlights for more current expense ratios. Net Expense: Expenses reduced by a contractual expense limitation in effect through January 31, 2021. Gross Expense: Does not reflect the effect of the expense limitation. Expense ratios include fees and expenses associated with any underlying funds. |
The index is unmanaged and not available for direct investment; therefore, its performance does not reflect the expenses associated with active management of an actual portfolio.
For information regarding the indexes and certain investment terms, see the Key Investment Terms starting on page 5.
| | Ticker Symbols: |
| | Class A: PDIAX |
| | Class C: PGICX |
| | Class I: PXIIX |
| | Class R6: VECRX |
KAR Equity Income Fund
Fund Summary (Unaudited)
Portfolio Manager Commentary by
Kayne Anderson Rudnick Investment Management, LLC
| ■ | The Fund is diversified and has investment objectives of capital appreciation and current income. There is no guarantee that the Fund will meet its objectives. |
| ■ | For the fiscal year ended September 30, 2020, the Fund’s Class A shares at NAV returned 12.75%, Class C shares at NAV returned 11.91%, Class I shares at NAV returned 12.98%, and Class R6 shares at NAV returned 13.08%. For the same period, the MSCI USA High Dividend Yield Index (net), which serves as both the Fund’s broad-based and style-specific index appropriate the comparison, returned -3.30%. |
All performance figures assume reinvestment of distributions and exclude the effect of sales charges. Performance data quoted represents past results. Past performance is no guarantee of future results, and current performance may be higher or lower than the performance shown above. Investment return and principal value will fluctuate so your shares, when redeemed, may be worth more or less than their original cost. Please visit Virtus.com for performance data current to the most recent month-end.
How did the markets perform during the Fund’s fiscal year ended September 30, 2020?
Equity investors enjoyed solid returns in 2019 and then went for a roller coaster ride in the first quarter of 2020, as markets around the world declined due to the COVID-19 pandemic, which necessitated an almost complete shutdown of economic activity. After a nosedive first quarter of 2020, the S&P 500® Index recovered in the following three months to have its best quarter in over 20 years, erasing most of the first-quarter loss. With aggressive stimulus from governments around the world flowing into the markets as a backstop to the global health crisis, the S&P 500® Index made a new high in the third quarter of 2020, just 103 days after sliding 35%. That is the fastest-ever recovery from a decline greater than 30%. Markets continued to forge ahead, and experienced a garden-variety correction during the first few weeks of September, as some rotation
started to occur. Stocks continued to advance, however, and closed the fiscal year on a positive trend.
For the fiscal year ended September 30, 2020, the S&P 500® Index returned 15.15%, while small-capitalization stocks, as represented by the Russell 2000® Index, turned slightly positive, delivering a gain of 0.39%. International developed markets, as measured by the MSCI EAFE Index (net), pushed into positive territory with a 0.49% return, while the MSCI Emerging Markets Index (net) surged to gain 10.54% for the 12-month period. Value stocks significantly underperformed growth stocks over the fiscal year, with the Russell 1000® Value Index returning -5.03% and the Russell 1000® Growth Index up 37.53%. Value indexes contain many more businesses that were adversely affected by COVID-19. Conversely, many growth companies benefited from the work-from-home environment brought about by the pandemic.
What factors affected the Fund’s performance during its fiscal year?
Kayne Anderson Rudnick Investment Management, LLC (“KAR”) became the subadviser of the Fund effective September 1, 2020. Performance of the Fund prior thereto is that of a different manager.
The Fund outperformed its benchmark, the MSCI USA High Dividend Yield Index (net), during the fiscal year ended September 30, 2020. Strong stock selection in information technology and communication services contributed to performance. Underweight positions in health care and consumer staples detracted from performance.
The biggest contributors to performance during the period were Apple and Microsoft.
• Apple and Microsoft were holdings of the prior investment manager of the Fund.
• Other top contributors included Amazon.com, Facebook, and NVIDIA (also holdings of the prior manager).
The biggest detractors from performance during the period were Wells Fargo and Boeing.
• Wells Fargo and Boeing were holdings of the prior investment manager of the Fund.
• Other top detractors included Cisco Systems, Exxon Mobil (holding of the prior manager), and Patterson Companies.
The preceding information is the opinion of portfolio management only through the end of the period stated on the cover. Any such opinions are subject to change at any time based upon market or other conditions and should not be relied upon as investment advice. Past performance is no guarantee of future results, and there is no guarantee that market forecasts will be realized.
Equity Securities: The market price of equity securities may be adversely affected by financial market, industry, or issuer-specific events. Focus on a particular style or on small or medium-sized companies may enhance that risk.
Limited Number of Investments: Because the Fund has a limited number of securities, it may be more susceptible to factors adversely affecting its securities than a fund with a greater number of securities.
Market Volatility: Local, regional, or global events such as war, acts of terrorism, the spread of infectious illness or other public health issues, recessions, or other events could have a significant impact on the portfolio and its investments, including hampering the ability of the portfolio manager(s) to invest the portfolio’s assets as intended.
Prospectus: For additional information on risks, please see the Fund’s prospectus.
Asset Allocation
The following table presents asset allocation within certain sectors as a percentage of total investments as of September 30, 2020.
| Industrials | 17% |
| Health Care | 14 |
| Information Technology | 13 |
| Consumer Staples | 12 |
| Utilities | 10 |
| Communication Services | 9 |
| Consumer Discretionary | 8 |
| Other (includes short-term investment) | 17 |
| Total | 100% |
For information regarding the indexes and certain investment terms, see the Key Investment Terms starting on page 5.
KAR Equity Income Fund (Continued)
Average Annual Total Returns1 for periods ended 9/30/20
| | | 1 Year | 5 Years | 10 Years | Since
inception | Inception
date |
| Class A shares at NAV2 | | 12.75 % | 11.12 % | 11.76 % | — % | — |
| Class A shares at POP3,4 | | 6.27 | 9.81 | 11.10 | — | — |
| Class C shares at NAV2 and with CDSC4 | | 11.91 | 10.29 | 10.92 | — | — |
| Class I shares at NAV2 | | 12.98 | 11.40 | 12.03 | — | — |
| Class R6 shares at NAV2 | | 13.08 | — | — | 5.12 | 1/30/18 |
| S&P 500® Index5 | | 15.15 | 14.15 | 13.74 | 8.92 6 | — |
| MSCI USA High Dividend Yield Index (net) | | -3.30 | 9.68 | 10.95 | 1.36 6 | — |
| Fund Expense Ratios7: Class A shares: Gross 1.34%, Net 1.20%; Class C shares: Gross 2.10%, Net 1.95%; Class I shares: Gross 1.09%, Net 0.95%; Class R6 shares: Gross 1.03%, Net 0.91%. | | | | | | |
| All returns represent past performance which is no guarantee of future results. Current performance may be higher or lower than the performance shown. The investment return and principal value of an investment will fluctuate so that an investor’s shares, when redeemed, may be worth more or less than their original cost. The above table and graph below do not reflect the deduction of taxes that a shareholder would pay on fund distributions or the redemption of shares. Please visit Virtus.com for performance data current to the most recent month-end. |
Growth of $10,000 for periods ended 9/30
This chart assumes an initial investment of $10,000 made on September 30, 2010, for Class A shares, Class C shares, and Class I shares including any applicable sales charges or fees. The performance of the other share class may be greater or less than that shown based on differences in inception dates, fees, and sales charges. Performance assumes reinvestment of dividends and capital gain distributions.

| 1 | Total returns are historical and include changes in share price and the reinvestment of both dividends and capital gain distributions. |
| 2 | “NAV” (Net Asset Value) total returns do not include the effect of any sales charge. |
| 3 | “POP” (Public Offering Price) total returns include the effect of the maximum front-end 5.75% sales charge. |
| 4 | “CDSC” (contingent deferred sales charge) is applied to redemptions of certain classes of shares that do not have a sales charge applied at the time of purchase. CDSC for certain redemptions of Class A shares made within 18 months of a finder’s fee being paid and all Class C shares are 1% within the first year and 0% thereafter. |
| 5 | The Fund changed its primary benchmark during the year to the MSCI USA High Dividend Yield Index (net).The Fund’s new subadviser believes the MSCI USA High Dividend Yield Index (net) better reflects the markets and securities in which the Fund is invested than the Fund’s previous benchmark, the S&P 500® Index. |
| 6 | The since inception index return is from the inception date of Class R6 shares. |
| 7 | The expense ratios of the Fund are set forth according to the prospectus for the Fund effective January 28, 2020, as supplemented and revised, and may differ from the expense ratios disclosed in the Financial Highlights tables in this report. See the Financial Highlights for more current expense ratios. Net Expense: Expenses reduced by a contractual expense limitation in effect through January 31, 2022. Gross Expense: Does not reflect the effect of the expense limitation. Expense ratios include fees and expenses associated with any underlying funds. |
The indexes are unmanaged and not available for direct investment; therefore, their performance does not reflect the expenses associated with active management of an actual portfolio.
For information regarding the indexes and certain investment terms, see the Key Investment Terms starting on page 5.
| | Ticker Symbols: |
| | Class A: PPTAX |
| | Class C: PPTCX |
| | Class I: PIPTX |
| | Class R6: VGQRX |
KAR Global Quality Dividend Fund
Fund Summary (Unaudited)
Portfolio Manager Commentary by
Kayne Anderson Rudnick Investment Management, LLC
| ■ | The Fund is diversified and has an investment objective of total return, consisting of both capital appreciation and current income. There is no guarantee that the Fund will meet its objective. |
| ■ | For the fiscal year ended September 30, 2020, the Fund’s Class A shares at NAV returned -11.63%†, Class C shares at NAV returned -12.34%, Class I shares at NAV returned -11.47%, and Class R6 shares at NAV returned -11.18%. The MSCI World High Dividend Yield Index (net), which serves as the Fund’s broad-based index, returned -4.09% and the Global Quality Dividend Linked Benchmark, the Fund’s style-specific Index, returned -4.09%. |
† See footnote 3 on page 15.
All performance figures assume reinvestment of distributions and exclude the effect of sales charges. Performance data quoted represents past results. Past performance is no guarantee of future results, and current performance may be higher or lower than the performance shown above. Investment return and principal value will fluctuate so your shares, when redeemed, may be worth more or less than their original cost. Please visit Virtus.com for performance data current to the most recent month-end.
How did the markets perform during the Fund’s fiscal year ended September 30, 2020?
Equity investors enjoyed solid returns in 2019 and then went for a roller coaster ride in the first quarter of 2020, as markets around the world declined due to the COVID-19 pandemic, which necessitated an almost complete shutdown of economic activity. After a nosedive first quarter of 2020, the S&P 500® Index recovered in the following three months to have its best quarter in over 20 years, erasing most of the first-quarter loss. With aggressive stimulus from governments around the world flowing into the markets as a backstop to the global health crisis, the S&P 500® Index made a new high in the third quarter of 2020, just 103 days after sliding 35%. That is the fastest-ever recovery from a decline greater than 30%. Markets continued to forge ahead, and experienced a garden-variety correction during the first few weeks of September, as some rotation
started to occur. Stocks continued to advance, however, and closed the fiscal year on a positive trend.
For the fiscal year ended September 30, 2020, the S&P 500® Index returned 15.15%, while small-capitalization stocks, as represented by the Russell 2000® Index, turned slightly positive, delivering a gain of 0.39%. International developed markets, as measured by the MSCI EAFE Index (net), pushed into positive territory with a 0.49% return, while the MSCI Emerging Markets Index (net) surged to gain 10.54% for the 12-month period. Value stocks significantly underperformed growth stocks over the fiscal year, with the Russell 1000® Value Index returning -5.03% and the Russell 1000® Growth Index up 37.53%. Value indexes contain many more businesses that were adversely affected by COVID-19. Conversely, many growth companies benefited from the work-from-home environment brought about by the pandemic.
What factors affected the Fund’s performance during its fiscal year?
The Fund underperformed its benchmark, the MSCI World High Dividend Yield Index, during the fiscal year ended September 30, 2020. Poor stock selection and an underweight in health care, as well as poor stock selection in real estate, detracted from performance. Strong stock selection and an overweight in industrials, and strong stock selection in consumer discretionary, helped to offset some of the underperformance.
The biggest contributors to performance during the fiscal year were Watsco and Spark New Zealand.
• Watsco’s core HVAC products were seen to provide protection during COVID-19. The company also benefited from the rollout of new mobile apps and an e-commerce platform that proved to be a strong competitive advantage. In addition, as the business slowed somewhat, working capital cash flow improved, providing protection for the dividend.
• Strong business results from Spark New Zealand’s mobile and cloud businesses and containment of COVID-19 in New Zealand contributed to the strong performance of the shares during the fiscal year.
• Other top contributors included Crown Castle International, Fastenal, and Eastman Chemical.
The biggest detractors from performance during the period were Lamar Advertising and WPP.
• Lamar Advertising’s customers tend to be smaller, local businesses, and this segment was hit particularly hard by COVID-19. The severity and length of the downturn could result in an extended period of lower-than-anticipated revenue for the company, which would have a significant impact on the company’s cash flow and ability to pay its dividend. As a result, we sold our shares during the reporting period. The company subsequently reduced its dividend by half.
• Since the onset of COVID-19, the advertising industry has seen significantly stronger disruption than it normally experiences during recessionary periods. As a result, WPP suspended the dividend that it had announced in February 2020. Because the current environment may weigh on the industry for an extended period of time and may negatively impact future dividends, we sold our shares during the period.
• Other top detractors included ONEOK, Realty Income, and AT&T.
The preceding information is the opinion of portfolio management only through the end of the period stated on the cover. Any such opinions are subject to change at any time based upon market or other conditions and should not be relied upon as investment advice. Past performance is no guarantee of future results, and there is no guarantee that market forecasts will be realized.
Equity Securities: The market price of equity securities may be adversely affected by financial market, industry, or issuer-specific events. Focus on a particular style or on small or medium-sized companies may enhance that risk.
Foreign Investing: Investing in foreign securities subjects the Fund to additional risks such as increased volatility, currency fluctuations, less liquidity, and political, regulatory, economic, and market risk.
Market Volatility: Local, regional, or global events such as war, acts of terrorism, the spread of infectious illness or other public health issues, recessions, or other events could have a significant impact on the portfolio and its investments, including hampering the ability of the portfolio manager(s) to invest the portfolio’s assets as intended.
Prospectus: For additional information on risks, please see the Fund’s prospectus.
For information regarding the indexes and certain investment terms, see the Key Investment Terms starting on page 5.
KAR Global Quality Dividend Fund (Continued)
Asset Allocation
The following table presents asset allocation within certain sectors as a percentage of total investments as of September 30, 2020.
| Communication Services | 18% |
| Health Care | 15 |
| Financials | 14 |
| Industrials | 14 |
| Information Technology | 11 |
| Utilities | 10 |
| Consumer Staples | 9 |
| Other | 9 |
| Total | 100% |
For information regarding the indexes and certain investment terms, see the Key Investment Terms starting on page 5.
KAR Global Quality Dividend Fund (Continued)
Average Annual Total Returns1 for periods ended 9/30/20
| | | 1 Year | 5 Years | 10 Years | Since
inception | Inception
date |
| Class A shares at NAV2 | | -11.63 % 3 | 5.54 % | 7.70 % | — % | — |
| Class A shares at POP4,5 | | -16.71 | 4.29 | 7.06 | — | — |
| Class C shares at NAV2 and with CDSC5 | | -12.34 | 4.74 | 6.89 | — | — |
| Class I shares at NAV2 | | -11.47 | 5.80 | 7.96 | — | — |
| Class R6 shares at NAV2 | | -11.18 | — | — | -6.57 | 8/1/19 |
| MSCI World High Dividend Yield Index (net) | | -4.09 | 6.61 | 6.85 | -1.62 6 | — |
| Global Quality Dividend Linked Benchmark | | -4.09 | 8.45 | 10.35 | -1.62 6 | — |
| Fund Expense Ratios7: Class A shares: Gross 1.56%, Net 1.35%; Class C shares: Gross 2.29%, Net 2.10%; Class I shares: Gross 1.36%, Net 1.10%; Class R6 shares: Gross 1.27%, Net 0.78%. | | | | | | |
| All returns represent past performance which is no guarantee of future results. Current performance may be higher or lower than the performance shown. The investment return and principal value of an investment will fluctuate so that an investor’s shares, when redeemed, may be worth more or less than their original cost. The above table and graph below do not reflect the deduction of taxes that a shareholder would pay on fund distributions or the redemption of shares. Please visit Virtus.com for performance data current to the most recent month-end. |
Growth of $10,000 for periods ended 9/30
This chart assumes an initial investment of $10,000 made on September 30, 2010, for Class A shares, Class C shares, and Class I shares including any applicable sales charges or fees. The performance of the other share class may be greater or less than that shown based on differences in inception dates, fees, and sales charges. Performance assumes reinvestment of dividends and capital gain distributions.

| 1 | Total returns are historical and include changes in share price and the reinvestment of both dividends and capital gain distributions. |
| 2 | “NAV” (Net Asset Value) total returns do not include the effect of any sales charge. |
| 3 | Total Return for the report period presented in the table differs from the return in the Financial Highlights. The total return presented in the above table is calculated based on the NAV at which shareholder transactions were processed. The total return presented in the Financial Highlights section of the report is calculated in the same manner, but also takes into account certain adjustments that are necessary under generally accepted accounting principles required in the annual report and semiannual report. |
| 4 | “POP” (Public Offering Price) total returns include the effect of the maximum front-end 5.75% sales charge. |
| 5 | “CDSC” (contingent deferred sales charge) is applied to redemptions of certain classes of shares that do not have a sales charge applied at the time of purchase. CDSC for certain redemptions of Class A shares made within 18 months of a finder’s fee being paid and all Class C shares are 1% within the first year and 0% thereafter. |
| 6 | The since inception index return is from the inception date of Class R6 shares. |
| 7 | The expense ratios of the Fund are set forth according to the prospectus for the Fund effective January 28, 2020, as supplemented and revised, and may differ from the expense ratios disclosed in the Financial Highlights tables in this report. See the Financial Highlights for more current expense ratios. Net Expense: Expenses reduced by a contractual expense limitation in effect through January 31, 2021. Gross Expense: Does not reflect the effect of the expense limitation. Expense ratios include fees and expenses associated with any underlying funds. |
The indexes are unmanaged and not available for direct investment; therefore, their performance does not reflect the expenses associated with active management of an actual portfolio.
For information regarding the indexes and certain investment terms, see the Key Investment Terms starting on page 5.
| | Ticker Symbols: |
| | Class A: VMACX |
| | Class C: VMCCX |
| | Class I: VIMCX |
| | Class R6: VRMCX |
KAR Mid-Cap Core Fund
Fund Summary (Unaudited)
Portfolio Manager Commentary by
Kayne Anderson Rudnick Investment Management, LLC
| ■ | The Fund is diversified and has an investment objective of long-term capital appreciation. There is no guarantee that the Fund will meet its objective. |
| ■ | For the fiscal year ended September 30, 2020, the Fund’s Class A shares at NAV returned 14.39%, Class C shares at NAV returned 13.51%, Class I shares at NAV returned 14.65%, and Class R6 shares at NAV returned 14.77%. For the same period, the Russell Midcap® Index, which serves as both the Fund’s broad-based and style-specific index appropriate the comparison, returned 4.55%. |
All performance figures assume reinvestment of distributions and exclude the effect of sales charges. Performance data quoted represents past results. Past performance is no guarantee of future results, and current performance may be higher or lower than the performance shown above. Investment return and principal value will fluctuate so your shares, when redeemed, may be worth more or less than their original cost. Please visit Virtus.com for performance data current to the most recent month-end.
How did the markets perform during the Fund’s fiscal year ended September 30, 2020?
Equity investors enjoyed solid returns in 2019 and then went for a roller coaster ride in the first quarter of 2020, as markets around the world declined due to the COVID-19 pandemic, which necessitated an almost complete shutdown of economic activity. After a nosedive first quarter of 2020, the S&P 500® Index recovered in the following three months to have its best quarter in over 20 years, erasing most of the first-quarter loss. With aggressive stimulus from governments around the world flowing into the markets as a backstop to the global health crisis, the S&P 500® Index made a new high in the third quarter of 2020, just 103 days after sliding 35%. That is the fastest-ever recovery from a decline greater than 30%. Markets continued to forge ahead, and experienced a garden-variety correction during the first few weeks of September, as some rotation started to occur. Stocks continued to advance, however, and closed the fiscal year on a positive trend.
For the fiscal year ended September 30, 2020, the S&P 500® Index returned 15.15%, while small-capitalization stocks, as represented by the Russell 2000® Index, turned slightly positive, delivering a gain of 0.39%. International developed markets, as measured by the MSCI EAFE Index (net), pushed into positive territory with a 0.49% return, while the MSCI Emerging Markets Index (net) surged to gain 10.54% for the 12-month period. Value stocks significantly underperformed growth stocks over the fiscal year, with the Russell 1000® Value Index returning -5.03% and the Russell 1000® Growth Index up 37.53%. Value indexes contain many more businesses that were adversely affected by COVID-19. Conversely, many growth companies benefited from the work-from-home environment brought about by the pandemic.
What factors affected the Fund’s performance during its fiscal year?
The Fund outperformed its benchmark, the Russell Midcap Index, during the fiscal year ended September 30, 2020. Strong stock selection in financials, and strong stock selection and an overweight in industrials, contributed to performance. Poor stock selection and an underweight in information technology, and poor stock selection in consumer staples, detracted from performance.
The biggest contributors to performance during the period were West Pharmaceutical Services and Old Dominion Freight Line.
• West Pharmaceutical Services saw its shares rise during the fiscal year despite COVID-19 issues, as far fewer clinical trials were cancelled and there was a need for the company’s delivery products during the crisis. The company also benefits from low debt and solid free cash flow.
• Old Dominion Freight Line’s management team was able to illustrate that competitors who were focused on cost have experienced service failures. As a result, Old Dominion continued to take market share by providing high-quality services to customers.
• Other top contributors included SiteOne Landscape Supply, Brooks Automation, and Tractor Supply Company.
The biggest detractors from performance for the period were AMN Healthcare Services and Allegion.
• AMN Healthcare Services has struggled with a technology transition in its temporary physician
staffing service that has hurt results for several quarters. With the onset of COVID-19, demand for all practice lines halted, apart from travel nurses, and results suffered.
• Allegion experienced a slowdown due to the impact of the pandemic, as many offices did not see the majority of employees return to work. Digital upgrades that are necessary over the long term have been pushed out as companies are taking their time given the continuation of remote working conditions. Longer-term, electronic lock solutions are even more critical, not only for security reasons, but now for employee health safety reasons as well.
• Other top detractors included Ross Stores, SEI Investments, and Lamb Weston.
The preceding information is the opinion of portfolio management only through the end of the period stated on the cover. Any such opinions are subject to change at any time based upon market or other conditions and should not be relied upon as investment advice. Past performance is no guarantee of future results, and there is no guarantee that market forecasts will be realized.
Equity Securities: The market price of equity securities may be adversely affected by financial market, industry, or issuer-specific events. Focus on a particular style or on small or medium-sized companies may enhance that risk.
Limited Number of Investments: Because the Fund has a limited number of securities, it may be more susceptible to factors adversely affecting its securities than a fund with a greater number of securities.
Market Volatility: Local, regional, or global events such as war, acts of terrorism, the spread of infectious illness or other public health issues, recessions, or other events could have a significant impact on the portfolio and its investments, including hampering the ability of the portfolio manager(s) to invest the portfolio’s assets as intended.
Prospectus: For additional information on risks, please see the Fund’s prospectus.
For information regarding the indexes and certain investment terms, see the Key Investment Terms starting on page 5.
KAR Mid-Cap Core Fund (Continued)
Asset Allocation
The following table presents asset allocation within certain sectors as a percentage of total investments as of September 30, 2020.
| Industrials | 33% |
| Information Technology | 22 |
| Health Care | 18 |
| Financials | 10 |
| Consumer Discretionary | 6 |
| Consumer Staples | 4 |
| Communication Services | 3 |
| Other (includes short-term investment) | 4 |
| Total | 100% |
For information regarding the indexes and certain investment terms, see the Key Investment Terms starting on page 5.
KAR Mid-Cap Core Fund (Continued)
Average Annual Total Returns1 for periods ended 9/30/20
| | | 1 Year | 5 Years | 10 Years | Since
inception | Inception
date |
| Class A shares at NAV2 | | 14.39 % | 14.47 % | 13.94 % | — % | — |
| Class A shares at POP3,4 | | 7.81 | 13.12 | 13.27 | — | — |
| Class C shares at NAV2 and with CDSC4 | | 13.51 | 13.61 | 13.08 | — | — |
| Class I shares at NAV2 | | 14.65 | 14.75 | 14.21 | — | — |
| Class R6 shares at NAV2 | | 14.77 | — | — | 9.11 | 1/30/18 |
| Russell Midcap® Index | | 4.55 | 10.13 | 11.76 | 4.24 5 | — |
| Fund Expense Ratios6: Class A shares: Gross 1.36%, Net 1.20%; Class C shares: Gross 2.11%, Net 1.95%; Class I shares: Gross 1.11%, Net 0.95%; Class R6 shares: Gross 1.01%, Net 0.87%. | | | | | | |
| All returns represent past performance which is no guarantee of future results. Current performance may be higher or lower than the performance shown. The investment return and principal value of an investment will fluctuate so that an investor’s shares, when redeemed, may be worth more or less than their original cost. The above table and graph below do not reflect the deduction of taxes that a shareholder would pay on fund distributions or the redemption of shares. Please visit Virtus.com for performance data current to the most recent month-end. |
Growth of $10,000 for periods ended 9/30
This chart assumes an initial investment of $10,000 made on September 30, 2010, for Class A shares, Class C shares, and Class I shares including any applicable sales charges or fees. The performance of the other share class may be greater or less than that shown based on differences in inception dates, fees, and sales charges. Performance assumes reinvestment of dividends and capital gain distributions.

| 1 | Total returns are historical and include changes in share price and the reinvestment of both dividends and capital gain distributions. |
| 2 | “NAV” (Net Asset Value) total returns do not include the effect of any sales charge. |
| 3 | “POP” (Public Offering Price) total returns include the effect of the maximum front-end 5.75% sales charge. |
| 4 | “CDSC” (contingent deferred sales charge) is applied to redemptions of certain classes of shares that do not have a sales charge applied at the time of purchase. CDSC for certain redemptions of Class A shares made within 18 months of a finder’s fee being paid and all Class C shares are 1% within the first year and 0% thereafter. |
| 5 | The since inception index return is from the inception date of Class R6 shares. |
| 6 | The expense ratios of the Fund are set forth according to the prospectus for the Fund effective January 28, 2020, as supplemented and revised, and may differ from the expense ratios disclosed in the Financial Highlights tables in this report. See the Financial Highlights for more current expense ratios. Net Expense: Expenses reduced by a contractual expense limitation in effect through January 31, 2021. Gross Expense: Does not reflect the effect of the expense limitation. Expense ratios include fees and expenses associated with any underlying funds. |
The index is unmanaged and not available for direct investment; therefore, its performance does not reflect the expenses associated with active management of an actual portfolio.
For information regarding the indexes and certain investment terms, see the Key Investment Terms starting on page 5.
| | Ticker Symbols: |
| | Class A: PHSKX |
| | Class C: PSKCX |
| | Class I: PICMX |
| | Class R6: VRMGX |
KAR Mid-Cap Growth Fund
Fund Summary (Unaudited)
Portfolio Manager Commentary by
Kayne Anderson Rudnick Investment Management, LLC
| ■ | The Fund is diversified and has an investment objective of capital appreciation. There is no guarantee that the Fund will meet its objective. |
| ■ | For the fiscal year ended September 30, 2020, the Fund’s Class A shares at NAV returned 56.23%, Class C shares at NAV returned 55.01%, Class I shares at NAV returned 56.39%, and Class R6 shares at NAV returned 56.64%. For the same period, the Russell Midcap® Growth Index, which serves as both the Fund’s broad-based and style-specific index appropriate the comparison, returned 23.23%. |
All performance figures assume reinvestment of distributions and exclude the effect of sales charges. Performance data quoted represents past results. Past performance is no guarantee of future results, and current performance may be higher or lower than the performance shown above. Investment return and principal value will fluctuate so your shares, when redeemed, may be worth more or less than their original cost. Please visit Virtus.com for performance data current to the most recent month-end.
How did the markets perform during the Fund’s fiscal year ended September 30, 2020?
Equity investors enjoyed solid returns in 2019 and then went for a roller coaster ride in the first quarter of 2020, as markets around the world declined due to the COVID-19 pandemic, which necessitated an almost complete shutdown of economic activity. After a nosedive first quarter of 2020, the S&P 500® Index recovered in the following three months to have its best quarter in over 20 years, erasing most of the first-quarter loss. With aggressive stimulus from governments around the world flowing into the markets as a backstop to the global health crisis, the S&P 500® Index made a new high in the third quarter of 2020, just 103 days after sliding 35%. That is the fastest-ever recovery from a decline greater than 30%. Markets continued to forge ahead, and experienced a garden-variety correction during the first few weeks of September, as some rotation started to occur. Stocks continued to advance, however, and closed the fiscal year on a positive trend.
For the fiscal year ended September 30, 2020, the S&P 500® Index returned 15.15%, while small-capitalization stocks, as represented by the Russell 2000® Index, turned slightly positive, delivering a gain of 0.39%. International developed markets, as measured by the MSCI EAFE Index (net), pushed into positive territory with a 0.49% return, while the MSCI Emerging Markets Index (net) surged to gain 10.54% for the 12-month period. Value stocks significantly underperformed growth stocks over the fiscal year, with the Russell 1000® Value Index returning -5.03% and the Russell 1000® Growth Index up 37.53%. Value indexes contain many more businesses that were adversely affected by COVID-19. Conversely, many growth companies benefited from the work-from-home environment brought about by the pandemic.
What factors affected the Fund’s performance during its fiscal year?
The Fund outperformed its benchmark, the Russell Midcap® Growth Index, during the fiscal year ended September 30, 2020. Strong stock selection in information technology and consumer discretionary contributed to performance. Poor stock selection in communication services and an underweight in utilities contributed the least to performance.
The biggest contributors to performance during the period were The Trade Desk and Teladoc Health.
• The Trade Desk outperformed as growth returned to programmatic advertising in the third quarter of 2020, after the ad spending slowdown that followed the first COVID-19 wave. At about 25% of revenue, connected TV (CTV) is The Trade Desk’s most important strategic focus at the moment, and one that could thrive under stay-at-home restrictions. The global TV ad market is at least $250 billion and CTV is estimated to be just 3% penetrated, with The Trade Desk named as the preferred provider by Disney and getting premium inventory from Amazon, Comcast, and Roku.
• While initially focusing on addressing low-acuity and low-priced diseases, Teladoc Health expanded its portfolio to include behavioral, second opinions, and international services. During the COVID-19 pandemic, telemedicine became the go-to way of reaching doctors while staying confined to one’s home. Insurance providers and government agencies promoted a telemedicine-first framework, with many assuming all costs.
• Other top contributors included DocuSign, Bill.com, and GSX Techedu.
The biggest detractors from performance during the period were Ross Stores and ABIOMED.
• Due to the COVID-19 pandemic, Ross Stores closed its entire retail footprint on March 20, 2020, and began to reopen stores on May 14, 2020. As Ross reignited its company-wide distribution system and store base, the company experienced operational missteps that resulted in inadequate inventory at stores. While closing and reopening the Ross system proved operationally difficult, we view it as a solvable problem. COVID-19 has impacted the near-term performance of the company, but we believe the fundamental competitive positioning of the business remains intact. We continued to hold the stock at the end of the fiscal year.
• ABIOMED struggled with near-term execution. A “Dear Doctor” letter from the Food & Drug Administration (FDA) caused a pause in adoption that the company compounded by shifting its focus too dramatically toward other procedure types. While the FDA rescinded that letter, growth did not recover due to new concerns about vascular access and closures. After COVID-19 hit, all elective procedures (including most of ABIOMED’s non-shock indications) were postponed or canceled. As a result, we sold our shares during the first quarter of 2020.
• Other top detractors included Under Armour, Wynn Resorts, and SEI Investments.
The preceding information is the opinion of portfolio management only through the end of the period stated on the cover. Any such opinions are subject to change at any time based upon market or other conditions and should not be relied upon as investment advice. Past performance is no guarantee of future results, and there is no guarantee that market forecasts will be realized.
Equity Securities: The market price of equity securities may be adversely affected by financial market, industry, or issuer-specific events. Focus on a particular style or on small or medium-sized companies may enhance that risk.
Market Volatility: Local, regional, or global events such as war, acts of terrorism, the spread of infectious illness or other public health issues, recessions, or other events could have a significant impact on the portfolio and its investments, including hampering the ability of the portfolio manager(s) to invest the portfolio’s assets as intended.
Prospectus: For additional information on risks, please see the Fund’s prospectus.
For information regarding the indexes and certain investment terms, see the Key Investment Terms starting on page 5.
KAR Mid-Cap Growth Fund (Continued)
Asset Allocation
The following table presents asset allocation within certain sectors as a percentage of total investments as of September 30, 2020.
| Information Technology | 34% |
| Consumer Discretionary | 15 |
| Industrials | 13 |
| Health Care | 12 |
| Consumer Staples | 10 |
| Financials | 6 |
| Communication Services | 3 |
| Short-Term Investment | 7 |
| Total | 100% |
For information regarding the indexes and certain investment terms, see the Key Investment Terms starting on page 5.
KAR Mid-Cap Growth Fund (Continued)
Average Annual Total Returns1 for periods ended 9/30/20
| | | 1 Year | 5 Years | 10 Years | Since
inception | Inception
date |
| Class A shares at NAV2 | | 56.23 % | 26.15 % | 17.07 % | — % | — |
| Class A shares at POP3,4 | | 47.24 | 24.67 | 16.38 | — | — |
| Class C shares at NAV2 and with CDSC4 | | 55.01 | 25.20 | 16.19 | — | — |
| Class I shares at NAV2 | | 56.39 | 26.43 | 17.35 | — | — |
| Class R6 shares at NAV2 | | 56.64 | — | — | 28.62 | 1/30/18 |
| Russell Midcap® Growth Index | | 23.23 | 15.53 | 14.55 | 13.11 5 | — |
| Fund Expense Ratios6: Class A shares: Gross 1.34%, Net 1.41%; Class C shares: Gross 2.13%, Net 2.16%; Class I shares: Gross 1.12%, Net 1.12%; Class R6 shares: Gross 1.02%, Net 0.84%. | | | | | | |
| All returns represent past performance which is no guarantee of future results. Current performance may be higher or lower than the performance shown. The investment return and principal value of an investment will fluctuate so that an investor’s shares, when redeemed, may be worth more or less than their original cost. The above table and graph below do not reflect the deduction of taxes that a shareholder would pay on fund distributions or the redemption of shares. Please visit Virtus.com for performance data current to the most recent month-end. |
Growth of $10,000 for periods ended 9/30
This chart assumes an initial investment of $10,000 made on September 30, 2010, for Class A shares, Class C shares, and Class I shares including any applicable sales charges or fees. The performance of the other share class may be greater or less than that shown based on differences in inception dates, fees, and sales charges. Performance assumes reinvestment of dividends and capital gain distributions.
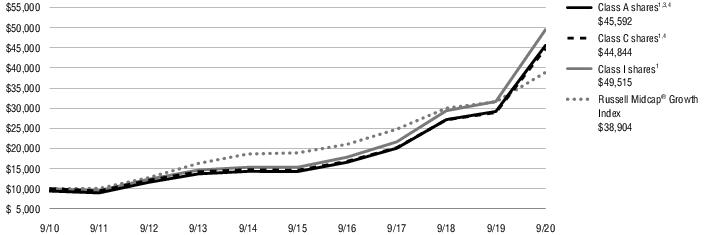
| 1 | Total returns are historical and include changes in share price and the reinvestment of both dividends and capital gain distributions. |
| 2 | “NAV” (Net Asset Value) total returns do not include the effect of any sales charge. |
| 3 | “POP” (Public Offering Price) total returns include the effect of the maximum front-end 5.75% sales charge. |
| 4 | “CDSC” (contingent deferred sales charge) is applied to redemptions of certain classes of shares that do not have a sales charge applied at the time of purchase. CDSC for certain redemptions of Class A shares made within 18 months of a finder’s fee being paid and all Class C shares are 1% within the first year and 0% thereafter. |
| 5 | The since inception index return is from the inception date of Class R6 shares. |
| 6 | The expense ratios of the Fund are set forth according to the prospectus for the Fund effective January 28, 2020, as supplemented and revised, and may differ from the expense ratios disclosed in the Financial Highlights tables in this report. See the Financial Highlights for more current expense ratios. Net Expense: Expenses reduced by a contractual expense limitation in effect through January 31, 2021. Gross Expense: Does not reflect the effect of the expense limitation. Expense ratios include fees and expenses associated with any underlying funds. |
The index is unmanaged and not available for direct investment; therefore, its performance does not reflect the expenses associated with active management of an actual portfolio.
For information regarding the indexes and certain investment terms, see the Key Investment Terms starting on page 5.
| | Ticker Symbols: |
| | Class A: PKSAX |
| | Class C: PKSCX |
| | Class I: PKSFX |
| | Class R6: VSCRX |
KAR Small-Cap Core Fund
Fund Summary (Unaudited)
Portfolio Manager Commentary by
Kayne Anderson Rudnick Investment Management, LLC
| ■ | The Fund is diversified and has an investment objective of long-term capital appreciation, with dividend income a secondary consideration. There is no guarantee that the Fund will meet its objectives. |
| ■ | For the fiscal year ended September 30, 2020, the Fund’s Class A shares at NAV returned 9.78%, Class C shares at NAV returned 8.98%, Class I shares at NAV returned 10.11%, and Class R6 shares at NAV returned 10.15%. For the same period, the Russell 2000® Index, which serves as both the Fund’s broad-based and style-specific index appropriate the comparison, returned 0.39%. |
All performance figures assume reinvestment of distributions and exclude the effect of sales charges. Performance data quoted represents past results. Past performance is no guarantee of future results, and current performance may be higher or lower than the performance shown above. Investment return and principal value will fluctuate so your shares, when redeemed, may be worth more or less than their original cost. Please visit Virtus.com for performance data current to the most recent month-end.
How did the markets perform during the Fund’s fiscal year ended September 30, 2020?
Equity investors enjoyed solid returns in 2019 and then went for a roller coaster ride in the first quarter of 2020, as markets around the world declined due to the COVID-19 pandemic, which necessitated an almost complete shutdown of economic activity. After a nosedive first quarter of 2020, the S&P 500® Index recovered in the following three months to have its best quarter in over 20 years, erasing most of the first-quarter loss. With aggressive stimulus from governments around the world flowing into the markets as a backstop to the global health crisis, the S&P 500® Index made a new high in the third quarter of 2020, just 103 days after sliding 35%. That is the fastest-ever recovery from a decline greater than 30%. Markets continued to forge ahead, and experienced a garden-variety correction during the first few weeks of September, as some rotation
started to occur. Stocks continued to advance, however, and closed the fiscal year on a positive trend.
For the fiscal year ended September 30, 2020, the S&P 500® Index returned 15.15%, while small-capitalization stocks, as represented by the Russell 2000® Index, turned slightly positive, delivering a gain of 0.39%. International developed markets, as measured by the MSCI EAFE Index (net), pushed into positive territory with a 0.49% return, while the MSCI Emerging Markets Index (net) surged to gain 10.54% for the 12-month period. Value stocks significantly underperformed growth stocks over the fiscal year, with the Russell 1000® Value Index returning -5.03% and the Russell 1000® Growth Index up 37.53%. Value indexes contain many more businesses that were adversely affected by COVID-19. Conversely, many growth companies benefited from the work-from-home environment brought about by the pandemic.
What factors affected the Fund’s performance during its fiscal year?
The Fund outperformed its benchmark, the Russell 2000® Index, for the fiscal year ended September 30, 2020. Strong stock selection in financials and industrials contributed to performance. Poor stock selection and an underweight in health care, as well as poor stock selection in information technology, detracted from performance.
The biggest contributors to performance during the period were Old Dominion Freight Line and POOLCORP.
• Old Dominion Freight Line’s management team was able to illustrate that competitors who were focused on cost have experienced service failures. As a result, Old Dominion continued to take market share by providing high-quality services to customers.
• Despite the easing of restrictions across many states from the pandemic during the third quarter of 2020, there was still a large population working from home at the end of the fiscal year. As a result, POOLCORP continued to see business acceleration as homeowners spent more time at home and spent more money on home improvements.
• Other top contributors included MarketAxess, Manhattan Associates, and FactSet Research Systems.
The biggest detractors from performance during the period were First Hawaiian Bank and Dril-Quip.
• First Hawaiian Bank’s shares did not recover from the sharp selloff at the end of the first quarter of 2020 related to COVID-19. The ongoing pandemic and strict quarantine restrictions in Hawaii brought tourism to a standstill and caused a significant uptick in unemployment. While we expect the impact of COVID-19 to remain a meaningful near-term headwind for the Hawaiian economy, we think the bank’s conservative balance sheet can allow it to navigate this tough environment. We continued to hold the stock at the end of the reporting period.
• Dril-Quip’s business suffered during the severe cyclical downturn in the energy industry. Although customer orders improved through 2019, the substantial decline in oil prices in March 2020 stalled deep-water drilling activity and customer purchases of Dril-Quip’s subsea equipment.
• Other top detractors included RBC Bearings, Primerica, and Atrion.
The preceding information is the opinion of portfolio management only through the end of the period stated on the cover. Any such opinions are subject to change at any time based upon market or other conditions and should not be relied upon as investment advice. Past performance is no guarantee of future results, and there is no guarantee that market forecasts will be realized.
Equity Securities: The market price of equity securities may be adversely affected by financial market, industry, or issuer-specific events. Focus on a particular style or on small or medium-sized companies may enhance that risk.
Limited Number of Investments: Because the Fund has a limited number of securities, it may be more susceptible to factors adversely affecting its securities than a fund with a greater number of securities.
Market Volatility: Local, regional, or global events such as war, acts of terrorism, the spread of infectious illness or other public health issues, recessions, or other events could have a significant impact on the portfolio and its investments, including hampering the ability of the portfolio manager(s) to invest the portfolio’s assets as intended.
Prospectus: For additional information on risks, please see the Fund’s prospectus.
For information regarding the indexes and certain investment terms, see the Key Investment Terms starting on page 5.
KAR Small-Cap Core Fund (Continued)
Asset Allocation
The following table presents asset allocation within certain sectors as a percentage of total investments as of September 30, 2020.
| Industrials | 30% |
| Financials | 19 |
| Information Technology | 17 |
| Communication Services | 14 |
| Consumer Discretionary | 10 |
| Health Care | 4 |
| Consumer Staples | 2 |
| Other (includes short-term investment) | 4 |
| Total | 100% |
For information regarding the indexes and certain investment terms, see the Key Investment Terms starting on page 5.
KAR Small-Cap Core Fund (Continued)
Average Annual Total Returns1 for periods ended 9/30/20
| | | 1 Year | 5 Years | 10 Years | Since
inception | Inception
date |
| Class A shares at NAV2 | | 9.78 % | 19.20 % | 15.60 % | — % | — |
| Class A shares at POP3,4 | | 3.47 | 17.80 | 14.92 | — | — |
| Class C shares at NAV2 and with CDSC4 | | 8.98 | 18.33 | 14.75 | — | — |
| Class I shares at NAV2 | | 10.11 | 19.53 | 15.90 | — | — |
| Class R6 shares at NAV2 | | 10.15 | 19.62 | — | 15.62 | 11/12/14 |
| Russell 2000® Index | | 0.39 | 8.00 | 9.85 | 5.62 5 | — |
| Fund Expense Ratios6: Class A shares: 1.29%; Class C shares: 2.03%; Class I shares: 1.02%; Class R6 shares: 0.94%. | | | | | | |
| All returns represent past performance which is no guarantee of future results. Current performance may be higher or lower than the performance shown. The investment return and principal value of an investment will fluctuate so that an investor’s shares, when redeemed, may be worth more or less than their original cost. The above table and graph below do not reflect the deduction of taxes that a shareholder would pay on fund distributions or the redemption of shares. Please visit Virtus.com for performance data current to the most recent month-end. |
Growth of $10,000 for periods ended 9/30
This chart assumes an initial investment of $10,000 made on September 30, 2010, for Class A shares, Class C shares, and Class I shares including any applicable sales charges or fees. The performance of the other share class may be greater or less than that shown based on differences in inception dates, fees, and sales charges. Performance assumes reinvestment of dividends and capital gain distributions.

| 1 | Total returns are historical and include changes in share price and the reinvestment of both dividends and capital gain distributions. |
| 2 | “NAV” (Net Asset Value) total returns do not include the effect of any sales charge. |
| 3 | “POP” (Public Offering Price) total returns include the effect of the maximum front-end 5.75% sales charge. |
| 4 | “CDSC” (contingent deferred sales charge) is applied to redemptions of certain classes of shares that do not have a sales charge applied at the time of purchase. CDSC for certain redemptions of Class A shares made within 18 months of a finder’s fee being paid and all Class C shares are 1% within the first year and 0% thereafter. |
| 5 | The since inception index return is from the inception date of Class R6 shares. |
| 6 | The expense ratios of the Fund are set forth according to the prospectus for the Fund effective January 28, 2020, as supplemented and revised, and may differ from the expense ratios disclosed in the Financial Highlights tables in this report. See the Financial Highlights for more current expense ratios. Expense ratios include fees and expenses associated with any underlying funds. |
The index is unmanaged and not available for direct investment; therefore, its performance does not reflect the expenses associated with active management of an actual portfolio.
For information regarding the indexes and certain investment terms, see the Key Investment Terms starting on page 5.
| | Ticker Symbols: |
| | Class A: PSGAX |
| | Class C: PSGCX |
| | Class I: PXSGX |
| | Class R6: VRSGX |
KAR Small-Cap Growth Fund
Fund Summary (Unaudited)
Portfolio Manager Commentary by
Kayne Anderson Rudnick Investment Management, LLC
| ■ | The Fund is diversified and has an investment objective of long-term capital appreciation. There is no guarantee that the Fund will meet its objective. |
| ■ | For the fiscal year ended September 30, 2020, the Fund’s Class A shares at NAV returned 32.91%, Class C shares at NAV returned 31.97%, Class I shares at NAV returned 33.27%, and Class R6 shares at NAV returned 33.39%. For the same period, the Russell 2000® Growth Index, which serves as both the Fund’s broad-based and style-specific index appropriate the comparison, returned 15.71%. |
All performance figures assume reinvestment of distributions and exclude the effect of sales charges. Performance data quoted represents past results. Past performance is no guarantee of future results, and current performance may be higher or lower than the performance shown above. Investment return and principal value will fluctuate so your shares, when redeemed, may be worth more or less than their original cost. Please visit Virtus.com for performance data current to the most recent month-end.
How did the markets perform during the Fund’s fiscal year ended September 30, 2020?
Equity investors enjoyed solid returns in 2019 and then went for a roller coaster ride in the first quarter of 2020, as markets around the world declined due to the COVID-19 pandemic, which necessitated an almost complete shutdown of economic activity. After a nosedive first quarter of 2020, the S&P 500® Index recovered in the following three months to have its best quarter in over 20 years, erasing most of the first-quarter loss. With aggressive stimulus from governments around the world flowing into the markets as a backstop to the global health crisis, the S&P 500® Index made a new high in the third quarter of 2020, just 103 days after sliding 35%. That is the fastest-ever recovery from a decline greater than 30%. Markets continued to forge ahead, and experienced a garden-variety correction during the first few weeks of September, as some rotation started to occur. Stocks continued to advance, however, and closed the fiscal year on a positive trend.
For the fiscal year ended September 30, 2020, the S&P 500® Index returned 15.15%, while small-capitalization stocks, as represented by the Russell 2000® Index, turned slightly positive, delivering a gain of 0.39%. International developed markets, as measured by the MSCI EAFE Index (net), pushed into positive territory with a 0.49% return, while the MSCI Emerging Markets Index (net) surged to gain 10.54% for the 12-month period. Value stocks significantly underperformed growth stocks over the fiscal year, with the Russell 1000® Value Index returning -5.03% and the Russell 1000® Growth Index up 37.53%. Value indexes contain many more businesses that were adversely affected by COVID-19. Conversely, many growth companies benefited from the work-from-home environment brought about by the pandemic.
What factors affected the Fund’s performance during its fiscal year?
The Fund outperformed its benchmark, the Russell 2000® Growth Index, during the fiscal year ended September 30, 2020. Strong stock selection in information technology, as well as strong selection and an underweight in industrials, contributed to performance. Poor stock selection and an underweight in health care, and poor stock selection in consumer staples, detracted from performance.
The biggest contributors to performance during the period were Ollie’s Bargain Outlet and Old Dominion Freight Line.
• Ollie’s Bargain Outlet performed well based on its capacity to remain open throughout the COVID-19 pandemic. The stock traded higher, fueled by investor expectations that increased and opportunistic deal flow could yield strong bargains for the company’s customers, and that Ollie’s is likely to be in a fundamentally stronger business position after the pandemic ends.
• Old Dominion Freight Line’s management team was able to illustrate that competitors who were focused on cost have experienced service failures. As a result, Old Dominion continued to take market share by providing high-quality services to customers.
• Other top contributors included DocuSign, MarketAxess, and Avalara.
The biggest detractors from performance during the period were The Chefs’ Warehouse and U.S. Physical Therapy.
• The Chefs’ Warehouse, along with all other food distributors, was severely negatively impacted in the near term by the closures of in-person dining locations. Our analysis shows that the company has sufficient liquidity and no debt maturities until 2022. We continue to view the business as possessing unique scale and distribution in the specialty markets it serves, and continued to hold the stock as of the end of the fiscal year.
• U.S. Physical Therapy’s shares traded lower after reporting financial results that contained some issues which gave investors pause. The industrial business was impacted by the integration of some mergers & acquisitions (M&A) deals that affected profit margins. Also, there is concern about a potential rate cut in 2021 by the Centers for Medicare & Medicaid Services (CMS) for physical therapy services. We are monitoring these issues, but continue to believe the business is structurally sound. We continued to hold the stock as of the end of the fiscal year.
• Other top detractors included Interactive Brokers Group, HEICO, and Oportun Financial.
The preceding information is the opinion of portfolio management only through the end of the period stated on the cover. Any such opinions are subject to change at any time based upon market or other conditions and should not be relied upon as investment advice. Past performance is no guarantee of future results, and there is no guarantee that market forecasts will be realized.
Equity Securities: The market price of equity securities may be adversely affected by financial market, industry, or issuer-specific events. Focus on a particular style or on small or medium-sized companies may enhance that risk.
Foreign Investing: Investing in foreign securities subjects the Fund to additional risks such as increased volatility, currency fluctuations, less liquidity, and political, regulatory, economic, and market risk.
Limited Number of Investments: Because the Fund has a limited number of securities, it may be more susceptible to factors adversely affecting its securities than a fund with a greater number of securities.
Market Volatility: Local, regional, or global events such as war, acts of terrorism, the spread of infectious illness or other public health issues, recessions, or other events could have a significant impact on the portfolio and its investments, including
For information regarding the indexes and certain investment terms, see the Key Investment Terms starting on page 5.
KAR Small-Cap Growth Fund (Continued)
hampering the ability of the portfolio manager(s) to invest the portfolio’s assets as intended.
Prospectus: For additional information on risks, please see the Fund’s prospectus.
Asset Allocation
The following table presents asset allocation within certain sectors as a percentage of total investments as of September 30, 2020.
| Information Technology | 30% |
| Communication Services | 18 |
| Financials | 17 |
| Consumer Discretionary | 11 |
| Industrials | 9 |
| Consumer Staples | 4 |
| Health Care | 4 |
| Short-Term Investment | 7 |
| Total | 100% |
For information regarding the indexes and certain investment terms, see the Key Investment Terms starting on page 5.
KAR Small-Cap Growth Fund (Continued)
Average Annual Total Returns1 for periods ended 9/30/20
| | | 1 Year | 5 Years | 10 Years | Since
inception | Inception
date |
| Class A shares at NAV2 | | 32.91 % | 28.44 % | 21.18 % | — % | — |
| Class A shares at POP3,4 | | 25.27 | 26.93 | 20.47 | — | — |
| Class C shares at NAV2 and with CDSC4 | | 31.97 | 27.50 | 20.28 | — | — |
| Class I shares at NAV2 | | 33.27 | 28.76 | 21.50 | — | — |
| Class R6 shares at NAV2 | | 33.39 | — | — | 23.46 | 1/30/18 |
| Russell 2000® Growth Index | | 15.71 | 11.42 | 12.34 | 5.68 5 | — |
| Fund Expense Ratios6: Class A shares: 1.37%; Class C shares: 2.10%; Class I shares: 1.11%; Class R6 shares: 1.00%. | | | | | | |
| All returns represent past performance which is no guarantee of future results. Current performance may be higher or lower than the performance shown. The investment return and principal value of an investment will fluctuate so that an investor’s shares, when redeemed, may be worth more or less than their original cost. The above table and graph below do not reflect the deduction of taxes that a shareholder would pay on fund distributions or the redemption of shares. Please visit Virtus.com for performance data current to the most recent month-end. |
Growth of $10,000 for periods ended 9/30
This chart assumes an initial investment of $10,000 made on September 30, 2010, for Class A shares, Class C shares, and Class I shares including any applicable sales charges or fees. The performance of the other share class may be greater or less than that shown based on differences in inception dates, fees, and sales charges. Performance assumes reinvestment of dividends and capital gain distributions.
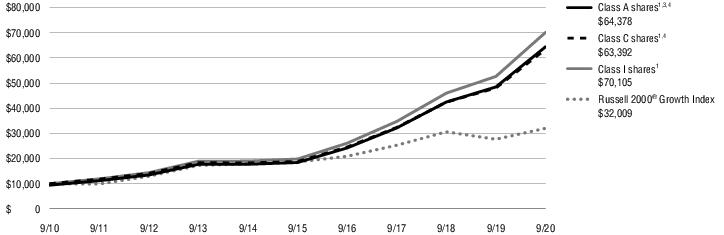
| 1 | Total returns are historical and include changes in share price and the reinvestment of both dividends and capital gain distributions. |
| 2 | “NAV” (Net Asset Value) total returns do not include the effect of any sales charge. |
| 3 | “POP” (Public Offering Price) total returns include the effect of the maximum front-end 5.75% sales charge. |
| 4 | “CDSC” (contingent deferred sales charge) is applied to redemptions of certain classes of shares that do not have a sales charge applied at the time of purchase. CDSC for certain redemptions of Class A shares made within 18 months of a finder’s fee being paid and all Class C shares are 1% within the first year and 0% thereafter. |
| 5 | The since inception index return is from the inception date of Class R6 shares. |
| 6 | The expense ratios of the Fund are set forth according to the prospectus for the Fund effective January 28, 2020, as supplemented and revised, and may differ from the expense ratios disclosed in the Financial Highlights tables in this report. See the Financial Highlights for more current expense ratios. Expense ratios include fees and expenses associated with any underlying funds. |
The index is unmanaged and not available for direct investment; therefore, its performance does not reflect the expenses associated with active management of an actual portfolio.
For information regarding the indexes and certain investment terms, see the Key Investment Terms starting on page 5.
| | Ticker Symbols: |
| | Class A: PQSAX |
| | Class C: PQSCX |
| | Class I: PXQSX |
| | Class R6: VQSRX |
KAR Small-Cap Value Fund
Fund Summary (Unaudited)
Portfolio Manager Commentary by
Kayne Anderson Rudnick Investment Management, LLC
| ■ | The Fund is diversified and has an investment objective of long-term capital appreciation. There is no guarantee that the Fund will meet its objective. |
| ■ | For the fiscal year ended September 30, 2020, the Fund’s Class A shares at NAV returned 9.57%, Class C shares at NAV returned 8.72%, Class I shares at NAV returned 9.75%, and Class R6 shares at NAV returned 9.90%. For the same period, the Russell 2000® Value Index, which serves as both the Fund’s broad-based and style-specific index appropriate the comparison, returned -14.88%. |
All performance figures assume reinvestment of distributions and exclude the effect of sales charges. Performance data quoted represents past results. Past performance is no guarantee of future results, and current performance may be higher or lower than the performance shown above. Investment return and principal value will fluctuate so your shares, when redeemed, may be worth more or less than their original cost. Please visit Virtus.com for performance data current to the most recent month-end.
How did the markets perform during the Fund’s fiscal year ended September 30, 2020?
Equity investors enjoyed solid returns in 2019 and then went for a roller coaster ride in the first quarter of 2020, as markets around the world declined due to the COVID-19 pandemic, which necessitated an almost complete shutdown of economic activity. After a nosedive first quarter of 2020, the S&P 500® Index recovered in the following three months to have its best quarter in over 20 years, erasing most of the first-quarter loss. With aggressive stimulus from governments around the world flowing into the markets as a backstop to the global health crisis, the S&P 500® Index made a new high in the third quarter of 2020, just 103 days after sliding 35%. That is the fastest-ever recovery from a decline greater than 30%. Markets continued to forge ahead, and experienced a garden-variety correction during the first few weeks of September, as some rotation started to occur. Stocks continued to advance, however, and closed the fiscal year on a positive trend.
For the fiscal year ended September 30, 2020, the S&P 500® Index returned 15.15%, while small-capitalization stocks, as represented by the Russell 2000® Index, turned slightly positive, delivering a gain of 0.39%. International developed markets, as measured by the MSCI EAFE Index (net), pushed into positive territory with a 0.49% return, while the MSCI Emerging Markets Index (net) surged to gain 10.54% for the 12-month period. Value stocks significantly underperformed growth stocks over the fiscal year, with the Russell 1000® Value Index returning -5.03% and the Russell 1000® Growth Index up 37.53%. Value indexes contain many more businesses that were adversely affected by COVID-19. Conversely, many growth companies benefited from the work-from-home environment brought about by the pandemic.
What factors affected the Fund’s performance during its fiscal year?
The Fund outperformed its benchmark, the Russell 2000® Value Index, during the fiscal year ended September 30, 2020. Strong stock selection and an underweight in financials, as well as strong stock selection and an overweight in industrials, contributed to performance. Poor stock selection and an underweight in health care, and poor stock selection in communication services, detracted from performance.
The biggest contributors to performance during the period were Scotts Miracle-Gro and Thor Industries.
• Scotts Miracle-Gro’s hydroponic cannabis grower customers were adversely affected in 2018 by California’s cannabis licensing law, and many growers exited the market during that year. We took advantage of this stock weakness to add to our position. In 2019, hydroponic sales returned to double-digit year-over-year organic growth, giving market participants increased confidence that the grower disruption had been resolved. This caused the stock to rebound strongly. Throughout 2020, the company benefited from increased demand for both edible gardening and hydroponics as a result of the COVID-19 pandemic.
• As COVID-19 severely impacted the airline and hotel industries, the recreational vehicle (RV) industry, including Thor, experienced healthy demand for its products.
• Other top contributors included SiteOne Landscape Supply, National Beverage, and Brooks Automation.
The biggest detractors from performance were Cinemark and The Cheesecake Factory.
• Cinemark’s shares experienced pressure due to the shelter-in-place orders across geographies. The impact of social distancing requirements, the shifting of blockbuster movie releases to future dates, and the accompanying new release distribution experiments, such as direct-to-streaming, resulted in increased uncertainty for the movie theater chain’s business.
• The Cheesecake Factory came under pressure from the physical distancing orders across the U.S. As a result of these restrictions, the company’s restaurants operated at a limited capacity as permitted by state and local governments. However, The Cheesecake Factory demonstrated its continued value proposition to customers and recaptured a meaningful share of its pre-COVID business through a combination of on-premises and off-premises dining.
• Other top detractors included Bank of Hawaii, RBC Bearings, and Cass Information Systems.
The preceding information is the opinion of portfolio management only through the end of the period stated on the cover. Any such opinions are subject to change at any time based upon market or other conditions and should not be relied upon as investment advice. Past performance is no guarantee of future results, and there is no guarantee that market forecasts will be realized.
Equity Securities: The market price of equity securities may be adversely affected by financial market, industry, or issuer-specific events. Focus on a particular style or on small or medium-sized companies may enhance that risk.
Limited Number of Investments: Because the Fund has a limited number of securities, it may be more susceptible to factors adversely affecting its securities than a fund with a greater number of securities.
Market Volatility: Local, regional, or global events such as war, acts of terrorism, the spread of infectious illness or other public health issues, recessions, or other events could have a significant impact on the portfolio and its investments, including hampering the ability of the portfolio manager(s) to invest the portfolio’s assets as intended.
Prospectus: For additional information on risks, please see the Fund’s prospectus.
For information regarding the indexes and certain investment terms, see the Key Investment Terms starting on page 5.
KAR Small-Cap Value Fund (Continued)
Asset Allocation
The following table presents asset allocation within certain sectors as a percentage of total investments as of September 30, 2020.
| Industrials | 37% |
| Financials | 15 |
| Information Technology | 14 |
| Consumer Discretionary | 12 |
| Consumer Staples | 7 |
| Materials | 7 |
| Real Estate | 4 |
| Other (includes short-term investment) | 4 |
| Total | 100% |
For information regarding the indexes and certain investment terms, see the Key Investment Terms starting on page 5.
KAR Small-Cap Value Fund (Continued)
Average Annual Total Returns1 for periods ended 9/30/20
| | | 1 Year | 5 Years | 10 Years | Since
inception | Inception
date |
| Class A shares at NAV2 | | 9.57 % | 10.97 % | 11.10 % | — % | — |
| Class A shares at POP3,4 | | 3.27 | 9.66 | 10.44 | — | — |
| Class C shares at NAV2 and with CDSC4 | | 8.72 | 10.15 | 10.27 | — | — |
| Class I shares at NAV2 | | 9.75 | 11.24 | 11.36 | — | — |
| Class R6 shares at NAV2 | | 9.90 | — | — | 11.13 | 11/3/16 |
| Russell 2000® Value Index | | -14.88 | 4.11 | 7.09 | 2.27 5 | — |
| Fund Expense Ratios6: Class A shares: 1.24%; Class C shares: 1.99%; Class I shares: 1.01%; Class R6 shares: 0.90%. | | | | | | |
| All returns represent past performance which is no guarantee of future results. Current performance may be higher or lower than the performance shown. The investment return and principal value of an investment will fluctuate so that an investor’s shares, when redeemed, may be worth more or less than their original cost. The above table and graph below do not reflect the deduction of taxes that a shareholder would pay on fund distributions or the redemption of shares. Please visit Virtus.com for performance data current to the most recent month-end. |
Growth of $10,000 for periods ended 9/30
This chart assumes an initial investment of $10,000 made on September 30, 2010, for Class A shares, Class C shares, and Class I shares including any applicable sales charges or fees. The performance of the other share class may be greater or less than that shown based on differences in inception dates, fees, and sales charges. Performance assumes reinvestment of dividends and capital gain distributions.
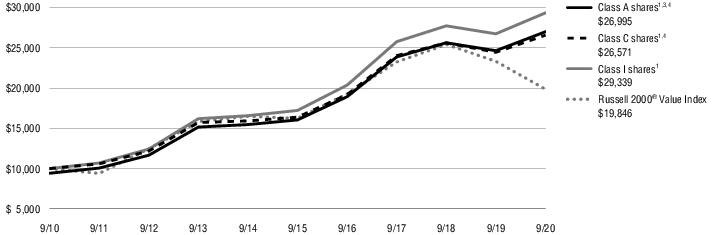
| 1 | Total returns are historical and include changes in share price and the reinvestment of both dividends and capital gain distributions. |
| 2 | “NAV” (Net Asset Value) total returns do not include the effect of any sales charge. |
| 3 | “POP” (Public Offering Price) total returns include the effect of the maximum front-end 5.75% sales charge. |
| 4 | “CDSC” (contingent deferred sales charge) is applied to redemptions of certain classes of shares that do not have a sales charge applied at the time of purchase. CDSC for certain redemptions of Class A shares made within 18 months of a finder’s fee being paid and all Class C shares are 1% within the first year and 0% thereafter. |
| 5 | The since inception index return is from the inception date of Class R6 shares. |
| 6 | The expense ratios of the Fund are set forth according to the prospectus for the Fund effective January 28, 2020, as supplemented and revised, and may differ from the expense ratios disclosed in the Financial Highlights tables in this report. See the Financial Highlights for more current expense ratios. Expense ratios include fees and expenses associated with any underlying funds. |
The index is unmanaged and not available for direct investment; therefore, its performance does not reflect the expenses associated with active management of an actual portfolio.
For information regarding the indexes and certain investment terms, see the Key Investment Terms starting on page 5.
| | Ticker Symbols: |
| | Class A: VKSAX |
| | Class C: VKSCX |
| | Class I: VKSIX |
| | Class R6: VKSRX |
KAR Small-Mid Cap Core Fund
Fund Summary (Unaudited)
Portfolio Manager Commentary by
Kayne Anderson Rudnick Investment Management, LLC
| ■ | The Fund is diversified and has an investment objective of long-term capital appreciation, with dividend income a secondary consideration. There is no guarantee that the Fund will meet its objectives. |
| ■ | For the fiscal year ended September 30, 2020, the Fund’s Class A shares at NAV returned 25.15%, Class C shares at NAV returned 24.21%, Class I shares at NAV returned 25.52%, and Class R6 shares at NAV returned 25.67%. For the same period, the Russell 2500™ Index, which serves as both the Fund’s broad-based and style-specific index appropriate the comparison, returned 2.22%. |
All performance figures assume reinvestment of distributions and exclude the effect of sales charges. Performance data quoted represents past results. Past performance is no guarantee of future results, and current performance may be higher or lower than the performance shown above. Investment return and principal value will fluctuate so your shares, when redeemed, may be worth more or less than their original cost. Please visit Virtus.com for performance data current to the most recent month-end.
How did the markets perform during the Fund’s fiscal year ended September 30, 2020?
Equity investors enjoyed solid returns in 2019 and then went for a roller coaster ride in the first quarter of 2020, as markets around the world declined due to the COVID-19 pandemic, which necessitated an almost complete shutdown of economic activity. After a nosedive first quarter of 2020, the S&P 500® Index recovered in the following three months to have its best quarter in over 20 years, erasing most of the first-quarter loss. With aggressive stimulus from governments around the world flowing into the markets as a backstop to the global health crisis, the S&P 500® Index made a new high in the third quarter of 2020, just 103 days after sliding 35%. That is the fastest-ever recovery from a decline greater than 30%. Markets continued to forge ahead, and experienced a garden-variety correction during the first few weeks of September, as some rotation
started to occur. Stocks continued to advance, however, and closed the fiscal year on a positive trend.
For the fiscal year ended September 30, 2020, the S&P 500® Index returned 15.15%, while small-capitalization stocks, as represented by the Russell 2000® Index, turned slightly positive, delivering a gain of 0.39%. International developed markets, as measured by the MSCI EAFE Index (net), pushed into positive territory with a 0.49% return, while the MSCI Emerging Markets Index (net) surged to gain 10.54% for the 12-month period. Value stocks significantly underperformed growth stocks over the fiscal year, with the Russell 1000® Value Index returning -5.03% and the Russell 1000® Growth Index up 37.53%. Value indexes contain many more businesses that were adversely affected by COVID-19. Conversely, many growth companies benefited from the work-from-home environment brought about by the pandemic.
What factors affected the Fund’s performance during its fiscal year?
The Fund outperformed its benchmark, the Russell 2500TM Index, during the fiscal year ended September 30, 2020. Overweight positions and strong stock selection in information technology and consumer discretionary contributed positively to performance. An underweight and poor stock selection in health care, as well as an underweight in communication services, detracted from performance.
The biggest contributors to performance during the period were DocuSign and MSCI.
• DocuSign had strong momentum in signing new users for its contract management solutions. With COVID-19, the need to move to digital document management accelerated further. DocuSign also experienced accelerating growth for its e-signature solutions.
• MSCI posted strong operational results for the 12-month period, with double-digit growth in both revenue and profits. While the emergence of COVID-19 caused an initial selloff in the stock during the first quarter of 2020, the shares recovered as the company continued to report revenue and profit growth. MSCI also benefited from maintaining its earnings guidance for the full year, whereas most companies pulled their guidance due to the uncertainty from COVID-19.
• Other top contributors included Scotts Miracle-Gro, Thor Industries, and Teradyne.
The biggest detractors from performance during the period were AMN Healthcare and Winmark.
• AMN Healthcare Services has struggled with a technology transition in its temporary physician staffing service that has hurt results for several quarters. With the onset of COVID-19, demand for all practice lines halted, apart from travel nurses, and results suffered. We sold the stock in the third quarter of 2020.
• Due to the impacts and restrictions from COVID-19 and shelter-in-place orders across the U.S. and Canada, Winmark franchisees had to temporarily close their stores. As a result, store closures directly impacted and reduced the company’s fees and earnings.
• Other top detractors included FLIR Systems, W.R. Berkley, and RBC Bearings.
The preceding information is the opinion of portfolio management only through the end of the period stated on the cover. Any such opinions are subject to change at any time based upon market or other conditions and should not be relied upon as investment advice. Past performance is no guarantee of future results, and there is no guarantee that market forecasts will be realized.
Equity Securities: The market price of equity securities may be adversely affected by financial market, industry, or issuer-specific events. Focus on a particular style or on small or medium-sized companies may enhance that risk.
Limited Number of Investments: Because the Fund has a limited number of securities, it may be more susceptible to factors adversely affecting its securities than a fund with a greater number of securities.
Market Volatility: Local, regional, or global events such as war, acts of terrorism, the spread of infectious illness or other public health issues, recessions, or other events could have a significant impact on the portfolio and its investments, including hampering the ability of the portfolio manager(s) to invest the portfolio’s assets as intended.
Prospectus: For additional information on risks, please see the Fund’s prospectus.
For information regarding the indexes and certain investment terms, see the Key Investment Terms starting on page 5.
KAR Small-Mid Cap Core Fund (Continued)
Asset Allocation
The following table presents asset allocation within certain sectors as a percentage of total investments as of September 30, 2020.
| Information Technology | 28% |
| Industrials | 27 |
| Health Care | 13 |
| Consumer Discretionary | 11 |
| Financials | 10 |
| Materials | 6 |
| Short-Term Investment | 5 |
| Total | 100% |
For information regarding the indexes and certain investment terms, see the Key Investment Terms starting on page 5.
KAR Small-Mid Cap Core Fund (Continued)
Average Annual Total Returns1 for periods ended 9/30/20
| | | 1 Year | Since
inception | Inception
date |
| Class A shares at NAV2 | | 25.15 % | 15.95 % | 3/7/18 |
| Class A shares at POP3,4 | | 17.96 | 13.31 | 3/7/18 |
| Class C shares at NAV2 and with CDSC4 | | 24.21 | 15.10 | 3/7/18 |
| Class I shares at NAV2 | | 25.52 | 16.25 | 3/7/18 |
| Class R6 shares at NAV2 | | 25.67 | 16.34 | 3/7/18 |
| Russell 2500™ Index | | 2.22 | 2.33 5 | — |
| Fund Expense Ratios6: Class A shares: Gross 2.26%, Net 1.31%; Class C shares: Gross 2.93%, Net 2.06%; Class I shares: Gross 2.00%, Net 1.06%; Class R6 shares: Gross 1.92%, Net 0.98%. | | | | |
| All returns represent past performance which is no guarantee of future results. Current performance may be higher or lower than the performance shown. The investment return and principal value of an investment will fluctuate so that an investor’s shares, when redeemed, may be worth more or less than their original cost. The above table and graph below do not reflect the deduction of taxes that a shareholder would pay on fund distributions or the redemption of shares. Please visit Virtus.com for performance data current to the most recent month-end. |
Growth of $10,000 for periods ended 9/30
This chart assumes an initial investment of $10,000 made on March 7, 2018 (inception date of the Fund), for Class A shares, Class C shares, Class I shares, and Class R6 shares including any applicable sales charges or fees. Performance assumes reinvestment of dividends and capital gain distributions.
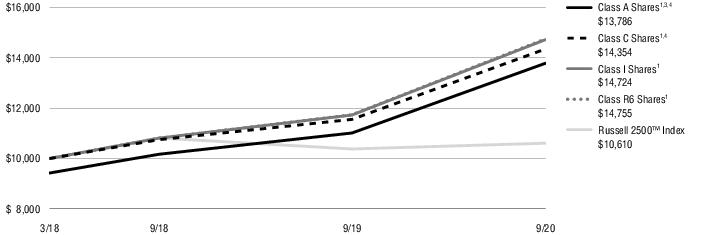
| 1 | Total returns are historical and include changes in share price and the reinvestment of both dividends and capital gain distributions. |
| 2 | “NAV” (Net Asset Value) total returns do not include the effect of any sales charge. |
| 3 | “POP” (Public Offering Price) total returns include the effect of the maximum front-end 5.75% sales charge. |
| 4 | “CDSC” (contingent deferred sales charge) is applied to redemptions of certain classes of shares that do not have a sales charge applied at the time of purchase. CDSC for certain redemptions of Class A shares made within 18 months of a finder’s fee being paid and all Class C shares are 1% within the first year and 0% thereafter. |
| 5 | The since inception index return is from the Fund’s inception date. |
| 6 | The expense ratios of the Fund are set forth according to the prospectus for the Fund effective January 28, 2020, as supplemented and revised, and may differ from the expense ratios disclosed in the Financial Highlights tables in this report. See the Financial Highlights for more current expense ratios. Net Expense: Expenses reduced by a contractual expense limitation in effect through January 31, 2021. Gross Expense: Does not reflect the effect of the expense limitation. Expense ratios include fees and expenses associated with any underlying funds. |
The index is unmanaged and not available for direct investment; therefore, its performance does not reflect the expenses associated with active management of an actual portfolio.
For information regarding the indexes and certain investment terms, see the Key Investment Terms starting on page 5.
| | Ticker Symbols: |
| | Class A: VAEGX |
| | Class C: VCEGX |
| | Class I: VIEGX |
| | Class R6: VESRX |
SGA Emerging Markets Growth Fund
Fund Summary (Unaudited)
Portfolio Manager Commentary by
Sustainable Growth Advisers, LP
| ■ | The Fund is non-diversified and has an investment objective of long-term capital appreciation. There is no guarantee that the Fund will meet its objective. |
| ■ | For the fiscal year ended September 30, 2020, the Fund’s Class A shares at NAV returned 19.47%†, Class C shares at NAV returned 18.50%, Class I shares at NAV returned 19.65%, and Class R6 shares at NAV returned 19.95%. For the same period, the MSCI Emerging Markets Index (net), which serves as both the Fund’s broad-based and style-specific index appropriate the comparison, returned 10.54%. |
† See footnote 3 on page 35.
All performance figures assume reinvestment of distributions and exclude the effect of sales charges. Performance data quoted represents past results. Past performance is no guarantee of future results, and current performance may be higher or lower than the performance shown above. Investment return and principal value will fluctuate so your shares, when redeemed, may be worth more or less than their original cost. Please visit Virtus.com for performance data current to the most recent month-end.
How did the markets perform during the Fund’s fiscal year ended September 30, 2020?
Emerging market equities experienced significantly increased volatility due to the COVID-19 pandemic and its economic and social impacts. Returns varied significantly within emerging markets over the period, given differences in the handling of the pandemic and varying degrees of economic interruptions. Markets in Asia performed best over the period, driven by strength in Taiwan, China, and Korea.
Chinese markets were lifted by easing U.S.-China trade tensions in the fourth quarter of 2019, while also benefiting from draconian lockdowns and strict social restrictions early in 2020, which stemmed the spread of the coronavirus and supported a quicker economic recovery. In contrast, Latin American markets performed worst over the period as economies in the region were severely impacted by the pandemic-induced economic interruptions,
plunging currencies, and commodity market weakness.
Wide dispersion in sector performance was also evident within the MSCI Emerging Markets Index (net) over the period, with the consumer discretionary, health care, information technology, and communication services sectors returning 49.0%, 47.1%, 42.5%, and 25.7%, respectively, while the energy, financials, and utilities sectors returned -18.7%, -18.6%, and -18.1%, respectively.
What factors affected the Fund’s performance during its fiscal year?
The Fund outperformed the MSCI Emerging Markets Index (net), driven by both positive stock selection effects and sector allocations.
Stock selection contributed broadly but was strongest in the consumer discretionary, communication services, and health care sectors. In contrast, selection in the consumer staples sector detracted most, with several stocks negatively impacted by lockdowns and social distancing restrictions in their respective markets. Stock selection in the information technology sector detracted given the significant broad-based rally in technology shares during the period.
The Fund benefited from overweights in the strongly performing consumer discretionary and health care sectors, an underweight in the financial sector, and a lack of exposure to the energy sector. From a country perspective, the biggest contribution came from the Fund’s Chinese positions, as stock selection was strong while also benefiting from an overweight to businesses based in China. The Fund’s overweight to businesses based in Mexico detracted most from relative returns.
The top five contributors to Fund performance for the period were Latin American e-commerce leader MercadoLibre, Chinese online retailer JD.com, leading Chinese education company TAL Education, Chinese medical device company Shandong Weigao, and Chinese technology and gaming leader Tencent. The five largest detractors from Fund performance for the period were Mexican brewer Ambev, South African financial services company Sanlam, Thai convenience store leader CP All, Mexican consumer company FEMSA, and Wal-Mart de Mexico.
The preceding information is the opinion of portfolio management only through the end of the period stated on the cover. Any such opinions are subject to change at any time based upon market or other conditions and should not be relied upon as investment advice. Past performance is no guarantee of future results, and there is no guarantee that market forecasts will be realized.
Equity Securities: The market price of equity securities may be adversely affected by financial market, industry, or issuer-specific events. Focus on a particular style or on small or medium-sized companies may enhance that risk.
Geographic Concentration: A fund that focuses its investments in a particular geographic location will be sensitive to financial, economic, political, and other events negatively affecting of that location.
Foreign & Emerging Markets: Investing in foreign securities, especially in emerging markets, subjects the Fund to additional risks such as increased volatility, currency fluctuations, less liquidity, and political, regulatory, economic, and market risk.
Market Volatility: Local, regional, or global events such as war, acts of terrorism, the spread of infectious illness or other public health issues, recessions, or other events could have a significant impact on the portfolio and its investments, including hampering the ability of the portfolio manager(s) to invest the portfolio’s assets as intended.
Prospectus: For additional information on risks, please see the Fund’s prospectus.
Asset Allocation
The following table presents asset allocation within certain sectors as a percentage of total investments as of September 30, 2020.
| Consumer Discretionary | 35% |
| Consumer Staples | 22 |
| Financials | 17 |
| Information Technology | 7 |
| Communication Services | 6 |
| Health Care | 5 |
| Materials | 3 |
| Other (includes short-term investment) | 5 |
| Total | 100% |
For information regarding the indexes and certain investment terms, see the Key Investment Terms starting on page 5.
SGA Emerging Markets Growth Fund (Continued)
Average Annual Total Returns1 for periods ended 9/30/20
| | | 1 Year | Since
inception | Inception
date |
| Class A shares at NAV2 | | 19.47 % 3 | 14.38 % | 6/13/19 |
| Class A shares at POP4,5 | | 12.60 | 9.30 | 6/13/19 |
| Class C shares at NAV2 and with CDSC5 | | 18.50 | 13.50 | 6/13/19 |
| Class I shares at NAV2 | | 19.65 | 14.61 | 6/13/19 |
| Class R6 shares at NAV2 | | 19.95 | 14.83 | 6/13/19 |
| MSCI Emerging Markets Index (net) | | 10.54 | 7.28 6 | — |
| Fund Expense Ratios7: Class A shares: Gross 3.20%, Net 1.49%; Class C shares: Gross 3.92%, Net 2.24%; Class I shares: Gross 2.93%, Net 1.24%; Class R6 shares: Gross 2.93%, Net 1.06%. | | | | |
| All returns represent past performance which is no guarantee of future results. Current performance may be higher or lower than the performance shown. The investment return and principal value of an investment will fluctuate so that an investor’s shares, when redeemed, may be worth more or less than their original cost. The above table and graph below do not reflect the deduction of taxes that a shareholder would pay on fund distributions or the redemption of shares. Please visit Virtus.com for performance data current to the most recent month-end. |
Growth of $10,000 for periods ended 9/30
This chart assumes an initial investment of $10,000 made on June 13, 2019 (inception date of the Fund), for Class A shares, Class C shares, Class I shares, and Class R6 shares including any applicable sales charges or fees. Performance assumes reinvestment of dividends and capital gain distributions.

| 1 | Total returns are historical and include changes in share price and the reinvestment of both dividends and capital gain distributions. |
| 2 | “NAV” (Net Asset Value) total returns do not include the effect of any sales charge. |
| 3 | Total Return for the report period presented in the table differs from the return in the Financial Highlights. The total return presented in the above table is calculated based on the NAV at which shareholder transactions were processed. The total return presented in the Financial Highlights section of the report is calculated in the same manner, but also takes into account certain adjustments that are necessary under generally accepted accounting principles required in the annual report and semiannual report. |
| 4 | “POP” (Public Offering Price) total returns include the effect of the maximum front-end 5.75% sales charge. |
| 5 | “CDSC” (contingent deferred sales charge) is applied to redemptions of certain classes of shares that do not have a sales charge applied at the time of purchase. CDSC for certain redemptions of Class A shares made within 18 months of a finder’s fee being paid and all Class C shares are 1% within the first year and 0% thereafter. |
| 6 | The since inception index return is from the Fund’s inception date. |
| 7 | The expense ratios of the Fund are set forth according to the prospectus for the Fund effective January 28, 2020, as supplemented and revised, and may differ from the expense ratios disclosed in the Financial Highlights tables in this report. See the Financial Highlights for more current expense ratios. Net Expense: Expenses reduced by a contractual expense limitation in effect through January 31, 2021. Gross Expense: Does not reflect the effect of the expense limitation. Expense ratios include fees and expenses associated with any underlying funds. |
The index is unmanaged and not available for direct investment; therefore, its performance does not reflect the expenses associated with active management of an actual portfolio.
For information regarding the indexes and certain investment terms, see the Key Investment Terms starting on page 5.
| | Ticker Symbols: |
| | Class A: SGAAX |
| | Class C: SGACX |
| | Class I: SGAPX |
| | Class R6: SGARX |
SGA Global Growth Fund
Fund Summary (Unaudited)
Portfolio Manager Commentary by
Sustainable Growth Advisers, LP
| ■ | The Fund is diversified and has an investment objective of long-term capital appreciation. There is no guarantee that the Fund will meet its objective. |
| ■ | For the fiscal year ended September 30, 2020, the Fund’s Class A shares at NAV returned 26.50%, Class C shares at NAV returned 25.49%, Class I shares at NAV returned 26.79%, and Class R6 shares at NAV returned 27.06%. For the same period, the MSCI AC World Index (net), returned 10.44%, and the MSCI AC World Growth Index (net), returned 30.22%. |
All performance figures assume reinvestment of distributions and exclude the effect of sales charges. Performance data quoted represents past results. Past performance is no guarantee of future results, and current performance may be higher or lower than the performance shown above. Investment return and principal value will fluctuate so your shares, when redeemed, may be worth more or less than their original cost. Please visit Virtus.com for performance data current to the most recent month-end.
How did the markets perform during the Fund’s fiscal year ended September 30, 2020?
Global equity markets experienced significantly increased volatility due to the COVID-19 pandemic and its economic and social impacts, but generated strong returns for the 12-month period, due to massive monetary accommodation and fiscal stimulus being applied across the globe.
For the period, the MSCI All Country World Index (ACWI) returned 10.4%. U.S. markets outperformed non-U.S. developed markets by a wide margin, and outperformed emerging markets to a much smaller degree. Market leadership for the period was narrow, with information technology (45.3%) performing best, followed by consumer discretionary (29.5%) and health care (22.2%) stocks, which also performed well ahead of the rest of the market. Energy (-38.4%), financials (-14.9%), and real estate (-10.7%) performed the worst. Large-cap growth companies with low return on equity, less debt, and no earnings performed best during the period.
What factors affected the Fund’s performance during its fiscal year?
The Fund outperformed its benchmark MSCI All Country World Index (ACWI) due to positive sector allocations and stock selection. Overweights to the strongly performing information technology and consumer discretionary sectors, and no exposure to the weakly performing energy sector, benefited returns.
Stock selection contributed the most in the health care and consumer discretionary sectors. Stock selection detracted most in the more defensive consumer staples sector, which was out of favor given the market’s high degree of optimism, and the information technology sector, which performed strongly but where we had trimmed strongly performing positions whose valuations had become less attractive. In the consumer staples sector, the primary detractors were Heineken, Danone, and CP All. Stock selection weakness in the information technology sector was largely the result of not holding Apple and NVIDIA during the period, which cost the Fund 2.2% and 0.5%, respectively, in relative returns.
The Fund had an overweight position in emerging markets – a by-product of taking advantage of what we deemed to be attractive stock opportunities within the context of the pandemic and concerns over the impact of slowing global economic growth and the U.S.-China trade war. The Fund was underweight in U.S. stocks as a result of gradually reducing exposure to high-quality stocks that had become more expensive. It was also underweight in non-U.S. developed stocks, particularly in Europe, where growth remained slow for much of the period due in part to restrained growth in China and fewer exports by European manufacturers. Stock selection was positive across all three regions, but strongest in the U.S.
The top five contributors to Fund performance for the period were U.S. e-commerce and public cloud company Amazon, Chinese e-commerce leader Alibaba, U.S. software-as-a-service leader Salesforce.com, U.S. digital payment leader PayPal, and U.S. enterprise software and public cloud leader Microsoft. The Fund’s largest detractors from performance were U.S. global restaurant company Yum! Brands, African insurer Sanlam, Indian bank
HDFC, Dutch premium brewer Heineken, and U.S. payment solution provider FleetCor.
The preceding information is the opinion of portfolio management only through the end of the period stated on the cover. Any such opinions are subject to change at any time based upon market or other conditions and should not be relied upon as investment advice. Past performance is no guarantee of future results, and there is no guarantee that market forecasts will be realized.
Equity Securities: The market price of equity securities may be adversely affected by financial market, industry, or issuer-specific events. Focus on a particular style or on small or medium-sized companies may enhance that risk.
Foreign & Emerging Markets: Investing in foreign securities, especially in emerging markets, subjects the Fund to additional risks such as increased volatility, currency fluctuations, less liquidity, and political, regulatory, economic, and market risk.
Geographic Concentration: A fund that focuses its investments in a particular geographic location will be sensitive to financial, economic, political, and other events negatively affecting of that location.
Market Volatility: Local, regional, or global events such as war, acts of terrorism, the spread of infectious illness or other public health issues, recessions, or other events could have a significant impact on the portfolio and its investments, including hampering the ability of the portfolio manager(s) to invest the portfolio’s assets as intended.
Prospectus: For additional information on risks, please see the Fund’s prospectus.
Asset Allocation
The following table presents asset allocation within certain sectors as a percentage of total investments as of September 30, 2020.
| Information Technology | 27% |
| Consumer Discretionary | 20 |
| Health Care | 16 |
| Communication Services | 10 |
| Financials | 9 |
| Industrials | 6 |
| Consumer Staples | 5 |
| Other (includes short-term investment) | 7 |
| Total | 100% |
For information regarding the indexes and certain investment terms, see the Key Investment Terms starting on page 5.
SGA Global Growth Fund (Continued)
Average Annual Total Returns1 for periods ended 9/30/20
| | | 1 Year | 5 Years | Since
inception | Inception
date |
| Class A shares at NAV2 | | 26.50 % | 17.76 % | 13.32 % | 10/4/13 |
| Class A shares at POP3,4 | | 19.23 | 16.37 | 12.37 | 10/4/13 |
| Class C shares at NAV2 and with CDSC4 | | 25.49 | 16.87 | 12.47 | 10/4/13 |
| Class I shares at NAV2 | | 26.79 | 17.83 | 13.39 | 10/4/13 |
| Class R6 shares at NAV2 | | 27.06 | 18.24 | 13.13 | 12/31/10 |
| MSCI AC World Index (net) | | 10.44 | 10.30 | — 5 | — |
| MSCI AC World Growth Index (net) | | 30.22 | 15.43 | — 6 | — |
| Fund Expense Ratios7: Class A shares: Gross 1.46%, Net 1.39%; Class C shares: Gross 2.17%, Net 2.14%; Class I shares: Gross 1.25%, Net 1.14%; Class R6 shares: Gross 1.14%, Net 0.91%. | | | | | |
| All returns represent past performance which is no guarantee of future results. Current performance may be higher or lower than the performance shown. The investment return and principal value of an investment will fluctuate so that an investor’s shares, when redeemed, may be worth more or less than their original cost. The above table and graph below do not reflect the deduction of taxes that a shareholder would pay on fund distributions or the redemption of shares. Please visit Virtus.com for performance data current to the most recent month-end. |
Growth of $10,000 for periods ended 9/30
This chart assumes an initial investment of $10,000 made on December 31, 2010 (inception date of the Class R6 shares), for Class R6 shares including any applicable sales charges or fees. Performance assumes reinvestment of dividends and capital gain distributions.

| 1 | Total returns are historical and include changes in share price and the reinvestment of both dividends and capital gain distributions. |
| 2 | “NAV” (Net Asset Value) total returns do not include the effect of any sales charge. |
| 3 | “POP” (Public Offering Price) total returns include the effect of the maximum front-end 5.75% sales charge. |
| 4 | “CDSC” (contingent deferred sales charge) is applied to redemptions of certain classes of shares that do not have a sales charge applied at the time of purchase. CDSC for certain redemptions of Class A shares made within 18 months of a finder’s fee being paid and all Class C shares are 1% within the first year and 0% thereafter. |
| 5 | The since inception index returned 7.78% for the inception date of Class A shares, Class C shares, and Class I shares and 7.84% for the inception date of Class R6 shares. |
| 6 | The since inception index returned 12.06% for the inception date of Class I shares and 10.95% for the inception date of Class R6 shares. |
| 7 | The expense ratios of the Fund are set forth according to the prospectus for the Fund effective January 28, 2020, as supplemented and revised, and may differ from the expense ratios disclosed in the Financial Highlights tables in this report. See the Financial Highlights for more current expense ratios. Net Expense: Expenses reduced by a contractual expense limitation in effect through May 31, 2021. Gross Expense: Does not reflect the effect of the expense limitation. Expense ratios include fees and expenses associated with any underlying funds. |
The indexes are unmanaged and not available for direct investment; therefore, their performance does not reflect the expenses associated with active management of an actual portfolio.
For information regarding the indexes and certain investment terms, see the Key Investment Terms starting on page 5.
KAR Capital Growth Fund
SCHEDULE OF INVESTMENTS September 30, 2020
($ reported in thousands)
| | Shares | | Value |
| Common Stocks—99.4% |
| Communication Services—14.0% | | |
| Activision Blizzard, Inc. | 109,820 | | $ 8,890 |
| Facebook, Inc. Class A(1) | 149,860 | | 39,248 |
| Netflix, Inc.(1) | 56,680 | | 28,342 |
| Tencent Holdings Ltd. ADR | 320,190 | | 21,661 |
| | | | 98,141 |
| | | | |
| |
| Consumer Discretionary—25.9% | | |
| Alibaba Group Holding Ltd. Sponsored ADR(1) | 144,660 | | 42,527 |
| Amazon.com, Inc.(1) | 20,722 | | 65,248 |
| Home Depot, Inc. (The) | 35,535 | | 9,868 |
| Las Vegas Sands Corp. | 180,043 | | 8,401 |
| McDonald’s Corp. | 36,170 | | 7,939 |
| MercadoLibre, Inc.(1) | 13,470 | | 14,581 |
| NIKE, Inc. Class B | 153,280 | | 19,243 |
| Ross Stores, Inc. | 99,366 | | 9,273 |
| Trip.com Group Ltd. ADR(1) | 145,530 | | 4,532 |
| | | | 181,612 |
| | | | |
| |
| Consumer Staples—4.6% | | |
| Estee Lauder Cos., Inc. (The) Class A | 16,200 | | 3,535 |
| McCormick & Co., Inc. | 39,535 | | 7,674 |
| Monster Beverage Corp.(1) | 121,283 | | 9,727 |
| Procter & Gamble Co. (The) | 81,820 | | 11,372 |
| | | | 32,308 |
| | | | |
| |
| Financials—5.1% | | |
| Bank of America Corp. | 485,380 | | 11,693 |
| | Shares | | Value |
| | | | |
| Financials—continued | | |
| CME Group, Inc. | 35,230 | | $ 5,894 |
| MarketAxess Holdings, Inc. | 26,990 | | 12,998 |
| Progressive Corp. (The) | 52,570 | | 4,977 |
| | | | 35,562 |
| | | | |
| |
| Health Care—6.2% | | |
| Danaher Corp. | 66,782 | | 14,380 |
| HealthEquity, Inc.(1) | 76,320 | | 3,920 |
| Illumina, Inc.(1) | 16,370 | | 5,060 |
| Zoetis, Inc. | 120,487 | | 19,925 |
| | | | 43,285 |
| | | | |
| |
| Industrials—8.8% | | |
| CoStar Group, Inc.(1) | 19,041 | | 16,157 |
| Equifax, Inc. | 35,420 | | 5,557 |
| Fair Isaac Corp.(1) | 20,020 | | 8,516 |
| Kansas City Southern | 57,950 | | 10,479 |
| Roper Technologies, Inc. | 31,099 | | 12,288 |
| Uber Technologies, Inc.(1) | 244,081 | | 8,904 |
| | | | 61,901 |
| | | | |
| |
| Information Technology—33.0% | | |
| Accenture plc Class A | 44,698 | | 10,101 |
| Amphenol Corp. Class A | 140,058 | | 15,164 |
| Avalara, Inc.(1) | 160,730 | | 20,467 |
| Bill.com Holdings, Inc.(1) | 326,540 | | 32,755 |
| Duck Creek Technologies, Inc.(1)(2) | 367,685 | | 16,704 |
| NVIDIA Corp. | 72,740 | | 39,368 |
| Paycom Software, Inc.(1) | 77,532 | | 24,136 |
| Snowflake, Inc. Class A(1) | 3,696 | | 928 |
| Trade Desk, Inc. (The) Class A(1) | 51,040 | | 26,479 |
| | Shares | | Value |
| | | | |
| Information Technology—continued | | |
| Visa, Inc. Class A | 140,904 | | $ 28,177 |
| Workday, Inc. Class A(1) | 79,831 | | 17,174 |
| | | | 231,453 |
| | | | |
| |
| Materials—1.8% | | |
| Ecolab, Inc. | 62,676 | | 12,525 |
Total Common Stocks
(Identified Cost $227,227) | | 696,787 |
| | | | |
| |
| | | | |
| |
Total Long-Term Investments—99.4%
(Identified Cost $227,227) | | 696,787 |
| | | | |
| |
| | | | |
| |
TOTAL INVESTMENTS—99.4%
(Identified Cost $227,227) | | $696,787 |
| Other assets and liabilities, net—0.6% | | 4,238 |
| NET ASSETS—100.0% | | $701,025 |
| Abbreviation: |
| ADR | American Depositary Receipt |
| Footnote Legend: |
| (1) | Non-income producing. |
| (2) | All or a portion of the security is restricted. |
| Country Weightings (Unaudited)† |
| United States | 88% |
| China | 10 |
| Brazil | 2 |
| Total | 100% |
| † % of total investments as of September 30, 2020. |
The following table summarizes the market value of the Fund’s investments as of September 30, 2020, based on the inputs used to value them (See Security Valuation Note 2A in the Notes to Financial Statements):
| | Total
Value at
September 30, 2020 | | Level 1
Quoted Prices |
| Assets: | | | |
| Equity Securities: | | | |
| Common Stocks | $696,787 | | $696,787 |
| Total Investments | $696,787 | | $696,787 |
There were no securities valued using significant observable inputs (Level 2) or significant unobservable inputs (Level 3) at September 30, 2020.
Securities held by the Fund with an end of period value of $32,755 were transferred from Level 3 to Level 1 due to a market listing.
For information regarding the abbreviations, see the Key Investment Terms starting on page 5.
See Notes to Financial Statements
KAR Capital Growth Fund
SCHEDULE OF INVESTMENTS (Continued)
September 30, 2020
($ reported in thousands)
The following is a reconciliation of assets of the Fund for Level 3 investments for which significant unobservable inputs were used to determine fair value.
| | Total | | Convertible
Preferred
Stock |
| Investments in Securities | | | |
| Balance as of September 30, 2019: | $ 6,850 | | $ 6,850 |
| Realized gain (loss) | 400 | | 400 |
| Change in unrealized appreciation (depreciation)(a) | 25,994 | | 25,994 |
| Sales | (489) | | (489) |
| Transfers from Level 3(b) | (32,755) | | (32,755) |
| Balance as of September 30, 2020 | $ — | | $ — |
(a) The change in unrealized appreciation (depreciation) on investments still held at September 30, 2020, was $25,994.
(b) “Transfers into and/or from” represent the ending value as of September 30, 2020, for any investment security where a change in the pricing level occurred from the beginning to the end of the period.
See Notes to Financial Statements
KAR Equity Income Fund
SCHEDULE OF INVESTMENTS September 30, 2020
($ reported in thousands)
| | Shares | | Value |
| Common Stocks—99.5% |
| Communication Services—9.1% | | |
| AT&T, Inc. | 148,600 | | $ 4,236 |
| Omnicom Group, Inc. | 42,600 | | 2,109 |
| Verizon Communications, Inc. | 94,500 | | 5,622 |
| | | | 11,967 |
| | | | |
| |
| Consumer Discretionary—8.3% | | |
| Home Depot, Inc. (The) | 12,200 | | 3,388 |
| Leggett & Platt, Inc. | 92,300 | | 3,800 |
| McDonald’s Corp. | 16,900 | | 3,710 |
| | | | 10,898 |
| | | | |
| |
| Consumer Staples—12.0% | | |
| Clorox Co. (The) | 6,300 | | 1,324 |
| Coca-Cola Co. (The) | 77,600 | | 3,831 |
| Kimberly-Clark Corp. | 26,600 | | 3,928 |
| PepsiCo, Inc. | 27,600 | | 3,825 |
| Procter & Gamble Co. (The) | 20,100 | | 2,794 |
| | | | 15,702 |
| | | | |
| |
| Financials—7.8% | | |
| Bank of Hawaii Corp. | 62,400 | | 3,153 |
| PNC Financial Services Group, Inc. (The) | 33,200 | | 3,649 |
| Zurich Insurance Group AG ADR | 98,000 | | 3,414 |
| | | | 10,216 |
| | | | |
| |
| Health Care—14.3% | | |
| GlaxoSmithKline plc Sponsored ADR | 121,600 | | 4,577 |
| Johnson & Johnson | 18,000 | | 2,680 |
| Merck & Co., Inc. | 46,300 | | 3,840 |
| Patterson Cos., Inc. | 208,200 | | 5,019 |
| Pfizer, Inc. | 71,800 | | 2,635 |
| | | | 18,751 |
| | | | |
| |
| | Shares | | Value |
| | | | |
| Industrials—16.6% | | |
| 3M Co. | 33,300 | | $ 5,334 |
| Fastenal Co. | 88,700 | | 4,000 |
| MSC Industrial Direct Co., Inc. Class A | 42,160 | | 2,668 |
| Snap-on, Inc. | 19,000 | | 2,795 |
| Watsco, Inc. | 29,850 | | 6,952 |
| | | | 21,749 |
| | | | |
| |
| Information Technology—12.9% | | |
| Analog Devices, Inc. | 21,300 | | 2,487 |
| Cisco Systems, Inc. | 114,100 | | 4,494 |
| International Business Machines Corp. | 51,300 | | 6,242 |
| Paychex, Inc. | 46,100 | | 3,677 |
| | | | 16,900 |
| | | | |
| |
| Materials—6.5% | | |
| Eastman Chemical Co. | 58,300 | | 4,554 |
| Sonoco Products Co. | 78,220 | | 3,995 |
| | | | 8,549 |
| | | | |
| |
| Real Estate—1.9% | | |
| Crown Castle International Corp. | 14,800 | | 2,464 |
| Utilities—10.1% | | |
| Fortis, Inc. | 93,600 | | 3,824 |
| NextEra Energy, Inc. | 9,600 | | 2,665 |
| Southern Co. (The) | 79,100 | | 4,289 |
| WEC Energy Group, Inc. | 24,800 | | 2,403 |
| | | | 13,181 |
| | | | |
| |
Total Common Stocks
(Identified Cost $132,028) | | 130,377 |
| | | | |
| |
| | | | |
| |
Total Long-Term Investments—99.5%
(Identified Cost $132,028) | | 130,377 |
| | | | |
| |
| | | | |
| |
| | Shares | | Value |
| | | | |
| | | | |
| Short-Term Investment—0.7% |
| Money Market Mutual Fund—0.7% |
| Dreyfus Government Cash Management Fund - Institutional Shares (seven-day effective yield 0.025%)(1) | 952,145 | | $ 952 |
Total Short-Term Investment
(Identified Cost $952) | | 952 |
| | | | |
| |
| | | | |
| |
TOTAL INVESTMENTS—100.2%
(Identified Cost $132,980) | | $131,329 |
| Other assets and liabilities, net—(0.2)% | | (238) |
| NET ASSETS—100.0% | | $131,091 |
| Abbreviation: |
| ADR | American Depositary Receipt |
| Footnote Legend: |
| (1) | Shares of this fund are publicly offered, and its prospectus and annual report are publicly available. |
| Country Weightings (Unaudited)† |
| United States | 91% |
| United Kingdom | 3 |
| Canada | 3 |
| Switzerland | 3 |
| Total | 100% |
| † % of total investments as of September 30, 2020. |
The following table summarizes the market value of the Fund’s investments as of September 30, 2020, based on the inputs used to value them (See Security Valuation Note 2A in the Notes to Financial Statements):
| | Total
Value at
September 30, 2020 | | Level 1
Quoted Prices |
| Assets: | | | |
| Equity Securities: | | | |
| Common Stocks | $130,377 | | $130,377 |
| Money Market Mutual Fund | 952 | | 952 |
| Total Investments | $131,329 | | $131,329 |
There were no securities valued using significant observable inputs (Level 2) or significant unobservable inputs (Level 3) at September 30, 2020.
There were no transfers into or out of Level 3 related to securities held at September 30, 2020.
For information regarding the abbreviations, see the Key Investment Terms starting on page 5.
See Notes to Financial Statements
KAR Global Quality Dividend Fund
SCHEDULE OF INVESTMENTS September 30, 2020
($ reported in thousands)
| | Shares | | Value |
| Common Stocks—97.6% |
| Communication Services—17.6% | | |
| AT&T, Inc. | 49,760 | | $ 1,419 |
| BCE, Inc. | 41,064 | | 1,703 |
| Spark New Zealand Ltd. | 607,349 | | 1,895 |
| Verizon Communications, Inc. | 16,095 | | 957 |
| | | | 5,974 |
| | | | |
| |
| Consumer Discretionary—2.9% | | |
| Leggett & Platt, Inc. | 23,731 | | 977 |
| Consumer Staples—8.9% | | |
| Coca-Cola Co. (The) | 19,391 | | 957 |
| Kimberly-Clark Corp. | 3,548 | | 524 |
| PepsiCo, Inc. | 4,766 | | 661 |
| Tate & Lyle plc | 100,404 | | 862 |
| | | | 3,004 |
| | | | |
| |
| Financials—13.8% | | |
| Bank of Hawaii Corp. | 5,400 | | 273 |
| PNC Financial Services Group, Inc. (The) | 5,918 | | 650 |
| Royal Bank of Canada | 19,997 | | 1,402 |
| Tokio Marine Holdings, Inc. | 22,320 | | 977 |
| Zurich Insurance Group AG | 1,260 | | 439 |
| Zurich Insurance Group AG ADR | 27,320 | | 952 |
| | | | 4,693 |
| | | | |
| |
| Health Care—14.8% | | |
| GlaxoSmithKline plc | 34,600 | | 648 |
| GlaxoSmithKline plc Sponsored ADR | 22,590 | | 850 |
| Johnson & Johnson | 3,248 | | 484 |
| | Shares | | Value |
| | | | |
| Health Care—continued | | |
| Merck & Co., Inc. | 9,551 | | $ 792 |
| Patterson Cos., Inc. | 49,924 | | 1,204 |
| Pfizer, Inc. | 18,633 | | 684 |
| Sonic Healthcare Ltd. | 14,479 | | 344 |
| | | | 5,006 |
| | | | |
| |
| Industrials—13.8% | | |
| 3M Co. | 4,366 | | 699 |
| Adecco Group AG | 16,292 | | 861 |
| MSC Industrial Direct Co., Inc. Class A | 10,852 | | 687 |
| Snap-on, Inc. | 4,986 | | 734 |
| Watsco, Inc. | 7,227 | | 1,683 |
| | | | 4,664 |
| | | | |
| |
| Information Technology—10.8% | | |
| Analog Devices, Inc. | 3,441 | | 402 |
| Cisco Systems, Inc. | 22,022 | | 867 |
| International Business Machines Corp. | 12,649 | | 1,539 |
| Paychex, Inc. | 10,867 | | 867 |
| | | | 3,675 |
| | | | |
| |
| Materials—4.1% | | |
| Eastman Chemical Co. | 10,067 | | 786 |
| Kemira OYJ | 25,486 | | 325 |
| Sonoco Products Co. | 5,772 | | 295 |
| | | | 1,406 |
| | | | |
| |
| Real Estate—1.4% | | |
| Crown Castle International Corp. | 2,794 | | 465 |
| Utilities—9.5% | | |
| Fortis, Inc. | 33,998 | | 1,389 |
| | Shares | | Value |
| | | | |
| Utilities—continued | | |
| NextEra Energy, Inc. | 640 | | $ 178 |
| Southern Co. (The) | 23,003 | | 1,247 |
| WEC Energy Group, Inc. | 4,204 | | 407 |
| | | | 3,221 |
| | | | |
| |
Total Common Stocks
(Identified Cost $31,202) | | 33,085 |
| | | | |
| |
| | | | |
| |
Total Long-Term Investments—97.6%
(Identified Cost $31,202) | | 33,085 |
| | | | |
| |
| | | | |
| |
TOTAL INVESTMENTS—97.6%
(Identified Cost $31,202) | | $33,085 |
| Other assets and liabilities, net—2.4% | | 820 |
| NET ASSETS—100.0% | | $33,905 |
| Abbreviation: |
| ADR | American Depositary Receipt |
| Country Weightings (Unaudited)† |
| United States | 61% |
| Canada | 13 |
| United Kingdom | 8 |
| Switzerland | 7 |
| New Zealand | 6 |
| Japan | 3 |
| Australia | 1 |
| Other | 1 |
| Total | 100% |
| † % of total investments as of September 30, 2020. |
The following table summarizes the market value of the Fund’s investments as of September 30, 2020, based on the inputs used to value them (See Security Valuation Note 2A in the Notes to Financial Statements):
| | Total
Value at
September 30, 2020 | | Level 1
Quoted Prices | | Level 2
Significant
Observable
Inputs |
| Assets: | | | | | |
| Equity Securities: | | | | | |
| Common Stocks | $33,085 | | $29,869 | | $3,216 |
| Total Investments | $33,085 | | $29,869 | | $3,216 |
There were no securities valued using significant unobservable inputs (Level 3) at September 30, 2020.
There were no transfers into or out of Level 3 related to securities held at September 30, 2020.
For information regarding the abbreviations, see the Key Investment Terms starting on page 5.
See Notes to Financial Statements
KAR Mid-Cap Core Fund
SCHEDULE OF INVESTMENTS September 30, 2020
($ reported in thousands)
| | Shares | | Value |
| Common Stocks—97.9% |
| Communication Services—3.6% | | |
| Autohome, Inc. ADR | 291,844 | | $ 28,017 |
| Consumer Discretionary—5.9% | | |
| Ross Stores, Inc. | 342,131 | | 31,928 |
| Tractor Supply Co. | 102,851 | | 14,742 |
| | | | 46,670 |
| | | | |
| |
| Consumer Staples—3.6% | | |
| Lamb Weston Holdings, Inc. | 425,179 | | 28,177 |
| Financials—9.8% | | |
| First Financial Bankshares, Inc. | 501,420 | | 13,995 |
| Houlihan Lokey, Inc. | 360,549 | | 21,291 |
| Moody’s Corp. | 85,797 | | 24,868 |
| SEI Investments Co. | 332,873 | | 16,883 |
| | | | 77,037 |
| | | | |
| |
| Health Care—17.8% | | |
| Cooper Cos., Inc. (The) | 85,520 | | 28,831 |
| Elanco Animal Health, Inc.(1) | 1,074,623 | | 30,014 |
| Globus Medical, Inc. Class A(1) | 659,541 | | 32,661 |
| West Pharmaceutical Services, Inc. | 173,701 | | 47,750 |
| | | | 139,256 |
| | | | |
| |
| Industrials—33.2% | | |
| Allegion plc | 246,163 | | 24,348 |
| AMETEK, Inc. | 423,079 | | 42,054 |
| Equifax, Inc. | 160,302 | | 25,151 |
| Exponent, Inc. | 282,357 | | 20,338 |
| | Shares | | Value |
| | | | |
| Industrials—continued | | |
| HEICO Corp. Class A | 283,418 | | $ 25,128 |
| Lennox International, Inc. | 88,593 | | 24,151 |
| Nordson Corp. | 115,413 | | 22,139 |
| Old Dominion Freight Line, Inc. | 126,064 | | 22,808 |
| SiteOne Landscape Supply, Inc.(1) | 269,260 | | 32,836 |
| Verisk Analytics, Inc. | 116,512 | | 21,591 |
| | | | 260,544 |
| | | | |
| |
| Information Technology—22.2% | | |
| Amphenol Corp. Class A | 147,053 | | 15,921 |
| Aspen Technology, Inc.(1) | 257,496 | | 32,596 |
| Bentley Systems, Inc. Class B(1) | 516,456 | | 16,217 |
| Broadridge Financial Solutions, Inc. | 225,585 | | 29,777 |
| Brooks Automation, Inc. | 748,218 | | 34,613 |
| Dolby Laboratories, Inc. Class A | 283,285 | | 18,776 |
| Zebra Technologies Corp. Class A(1) | 102,020 | | 25,756 |
| | | | 173,656 |
| | | | |
| |
| Real Estate—1.8% | | |
| Equity LifeStyle Properties, Inc. | 225,408 | | 13,817 |
Total Common Stocks
(Identified Cost $609,166) | | 767,174 |
| | | | |
| |
| | | | |
| |
Total Long-Term Investments—97.9%
(Identified Cost $609,166) | | 767,174 |
| | | | |
| |
| | | | |
| |
| | Shares | | Value |
| | | | |
| | | | |
| Short-Term Investment—1.9% |
| Money Market Mutual Fund—1.9% |
| Dreyfus Government Cash Management Fund - Institutional Shares (seven-day effective yield 0.025%)(2) | 15,044,036 | | $ 15,044 |
Total Short-Term Investment
(Identified Cost $15,044) | | 15,044 |
| | | | |
| |
| | | | |
| |
TOTAL INVESTMENTS—99.8%
(Identified Cost $624,210) | | $782,218 |
| Other assets and liabilities, net—0.2% | | 1,580 |
| NET ASSETS—100.0% | | $783,798 |
| Abbreviation: |
| ADR | American Depositary Receipt |
| Footnote Legend: |
| (1) | Non-income producing. |
| (2) | Shares of this fund are publicly offered, and its prospectus and annual report are publicly available. |
The following table summarizes the market value of the Fund’s investments as of September 30, 2020, based on the inputs used to value them (See Security Valuation Note 2A in the Notes to Financial Statements):
| | Total
Value at
September 30, 2020 | | Level 1
Quoted Prices |
| Assets: | | | |
| Equity Securities: | | | |
| Common Stocks | $767,174 | | $767,174 |
| Money Market Mutual Fund | 15,044 | | 15,044 |
| Total Investments | $782,218 | | $782,218 |
There were no securities valued using significant observable inputs (Level 2) or significant unobservable inputs (Level 3) at September 30, 2020.
There were no transfers into or out of Level 3 related to securities held at September 30, 2020.
For information regarding the abbreviations, see the Key Investment Terms starting on page 5.
See Notes to Financial Statements
KAR Mid-Cap Growth Fund
SCHEDULE OF INVESTMENTS September 30, 2020
($ reported in thousands)
| | Shares | | Value |
| Common Stocks—92.2% |
| Communication Services—2.5% | | |
| Autohome, Inc. ADR | 429,445 | | $ 41,227 |
| ZoomInfo Technologies, Inc. Class A(1) | 489,984 | | 21,064 |
| | | | 62,291 |
| | | | |
| |
| Consumer Discretionary—15.4% | | |
| Domino’s Pizza, Inc. | 97,260 | | 41,363 |
| GSX Techedu, Inc. ADR(1) | 544,038 | | 49,023 |
| MercadoLibre, Inc.(1) | 106,697 | | 115,497 |
| New Oriental Education & Technology Group, Inc. Sponsored ADR(1) | 163,140 | | 24,389 |
| Pool Corp. | 184,383 | | 61,684 |
| Ross Stores, Inc. | 399,212 | | 37,255 |
| Trip.com Group Ltd. ADR(1) | 1,024,741 | | 31,910 |
| Wynn Resorts Ltd. | 379,613 | | 27,260 |
| | | | 388,381 |
| | | | |
| |
| Consumer Staples—9.6% | | |
| Brown-Forman Corp. Class B | 529,453 | | 39,879 |
| Freshpet, Inc.(1) | 534,787 | | 59,709 |
| Grocery Outlet Holding Corp.(1) | 588,879 | | 23,155 |
| McCormick & Co., Inc. | 151,461 | | 29,399 |
| Monster Beverage Corp.(1) | 442,011 | | 35,449 |
| National Beverage Corp.(1) | 351,554 | | 23,909 |
| Vital Farms, Inc.(1) | 791,667 | | 32,086 |
| | | | 243,586 |
| | | | |
| |
| Financials—5.7% | | |
| Goosehead Insurance, Inc. Class A | 596,558 | | 51,656 |
| MarketAxess Holdings, Inc. | 132,377 | | 63,751 |
| T. Rowe Price Group, Inc. | 232,888 | | 29,861 |
| | | | 145,268 |
| | | | |
| |
| | Shares | | Value |
| | | | |
| Health Care—11.7% | | |
| Elanco Animal Health, Inc.(1) | 984,892 | | $ 27,508 |
| HealthEquity, Inc.(1) | 595,798 | | 30,606 |
| IDEXX Laboratories, Inc.(1) | 80,940 | | 31,818 |
| Mettler-Toledo International, Inc.(1) | 34,713 | | 33,524 |
| Silk Road Medical, Inc.(1) | 720,453 | | 48,422 |
| Teladoc Health, Inc.(1) | 349,724 | | 76,674 |
| Zoetis, Inc. | 293,040 | | 48,460 |
| | | | 297,012 |
| | | | |
| |
| Industrials—13.2% | | |
| CoStar Group, Inc.(1) | 55,772 | | 47,323 |
| Equifax, Inc. | 252,577 | | 39,629 |
| Fair Isaac Corp.(1) | 167,363 | | 71,193 |
| Kansas City Southern | 203,313 | | 36,765 |
| Rollins, Inc. | 683,351 | | 37,031 |
| Roper Technologies, Inc. | 75,583 | | 29,864 |
| SiteOne Landscape Supply, Inc.(1) | 589,407 | | 71,878 |
| | | | 333,683 |
| | | | |
| |
| Information Technology—34.1% | | |
| Amphenol Corp. Class A | 362,092 | | 39,204 |
| Avalara, Inc.(1) | 626,326 | | 79,756 |
| Bill.com Holdings, Inc.(1) | 736,925 | | 73,921 |
| Coupa Software, Inc.(1) | 93,484 | | 25,637 |
| Datadog, Inc. Class A(1) | 495,702 | | 50,641 |
| DocuSign, Inc.(1) | 425,597 | | 91,605 |
| Dynatrace, Inc.(1) | 710,572 | | 29,148 |
| Fidelity National Information Services, Inc. | 207,802 | | 30,591 |
| FleetCor Technologies, Inc.(1) | 129,094 | | 30,737 |
| Gartner, Inc.(1) | 121,417 | | 15,171 |
| nCino, Inc.(1) | 378,101 | | 30,127 |
| Okta, Inc.(1) | 321,803 | | 68,818 |
| Paycom Software, Inc.(1) | 204,668 | | 63,713 |
| Square, Inc. Class A(1) | 262,354 | | 42,646 |
| Teradyne, Inc. | 432,217 | | 34,344 |
| Trade Desk, Inc. (The) Class A(1) | 239,451 | | 124,222 |
| | Shares | | Value |
| | | | |
| Information Technology—continued | | |
| Workday, Inc. Class A(1) | 155,590 | | $ 33,472 |
| | | | 863,753 |
| | | | |
| |
Total Common Stocks
(Identified Cost $1,640,288) | | 2,333,974 |
| | | | |
| |
| | | | |
| |
Total Long-Term Investments—92.2%
(Identified Cost $1,640,288) | | 2,333,974 |
| | | | |
| |
| | | | |
| |
| Short-Term Investment—7.2% |
| Money Market Mutual Fund—7.2% |
| Dreyfus Government Cash Management Fund - Institutional Shares (seven-day effective yield 0.025%)(2) | 183,612,006 | | 183,612 |
Total Short-Term Investment
(Identified Cost $183,612) | | 183,612 |
| | | | |
| |
| | | | |
| |
TOTAL INVESTMENTS—99.4%
(Identified Cost $1,823,900) | | $2,517,586 |
| Other assets and liabilities, net—0.6% | | 14,568 |
| NET ASSETS—100.0% | | $2,532,154 |
| Abbreviation: |
| ADR | American Depositary Receipt |
| Footnote Legend: |
| (1) | Non-income producing. |
| (2) | Shares of this fund are publicly offered, and its prospectus and annual report are publicly available. |
| Country Weightings (Unaudited)† |
| United States | 89% |
| China | 6 |
| Brazil | 5 |
| Total | 100% |
| † % of total investments as of September 30, 2020. |
For information regarding the abbreviations, see the Key Investment Terms starting on page 5.
See Notes to Financial Statements
KAR Mid-Cap Growth Fund
SCHEDULE OF INVESTMENTS (Continued)
September 30, 2020
($ reported in thousands)
The following table summarizes the market value of the Fund’s investments as of September 30, 2020, based on the inputs used to value them (See Security Valuation Note 2A in the Notes to Financial Statements):
| | Total
Value at
September 30, 2020 | | Level 1
Quoted Prices |
| Assets: | | | |
| Equity Securities: | | | |
| Common Stocks | $2,333,974 | | $2,333,974 |
| Money Market Mutual Fund | 183,612 | | 183,612 |
| Total Investments | $2,517,586 | | $2,517,586 |
There were no securities valued using significant observable inputs (Level 2) or significant unobservable inputs (Level 3) at September 30, 2020.
Securities held by the Fund with an end of period value of $73,921 were transferred from Level 3 to Level 1 due to a market listing.
The following is a reconciliation of assets of the Fund for Level 3 investments for which significant unobservable inputs were used to determine fair value.
| | Total | | Convertible
Preferred
Stock |
| Investments in Securities | | | |
| Balance as of September 30, 2019: | $ 4,348 | | $ 4,348 |
| Realized gain (loss) | — (a) | | — (a) |
| Change in unrealized appreciation (depreciation)(b) | 39,108 | | 39,108 |
| Purchases | 30,465 | | 30,465 |
| Transfers from Level 3(c) | (73,921) | | (73,921) |
| Balance as of September 30, 2020 | $ — | | $ — |
(a) Amount less than $500.
(b) The change in unrealized appreciation (depreciation) on investments still held at September 30, 2020, was $39,108.
(c) “Transfers into and/or from” represent the ending value as of September 30, 2020, for any investment security where a change in the pricing level occurred from the beginning to the end of the period.
See Notes to Financial Statements
KAR Small-Cap Core Fund
SCHEDULE OF INVESTMENTS September 30, 2020
($ reported in thousands)
| | Shares | | Value |
| Common Stocks—95.2% |
| Communication Services—13.0% | | |
| Autohome, Inc. ADR | 1,172,700 | | $ 112,579 |
| Rightmove plc | 11,399,000 | | 92,195 |
| | | | 204,774 |
| | | | |
| |
| Consumer Discretionary—9.4% | | |
| Acushnet Holdings Corp. | 1,523,361 | | 51,200 |
| Pool Corp. | 291,990 | | 97,682 |
| | | | 148,882 |
| | | | |
| |
| Consumer Staples—2.1% | | |
| PriceSmart, Inc. | 487,680 | | 32,406 |
| Energy—1.3% | | |
| Dril-Quip, Inc.(1) | 799,140 | | 19,787 |
| Financials—18.8% | | |
| Artisan Partners Asset Management, Inc. Class A | 891,600 | | 34,764 |
| FactSet Research Systems, Inc. | 176,940 | | 59,254 |
| First Hawaiian, Inc. | 3,561,808 | | 51,539 |
| Moelis & Co. Class A | 1,199,440 | | 42,148 |
| Primerica, Inc. | 629,912 | | 71,268 |
| RLI Corp. | 449,203 | | 37,612 |
| | | | 296,585 |
| | | | |
| |
| Health Care—3.6% | | |
| Atrion Corp. | 48,880 | | 30,599 |
| CorVel Corp.(1) | 312,612 | | 26,706 |
| | | | 57,305 |
| | | | |
| |
| | Shares | | Value |
| | | | |
| Industrials—28.9% | | |
| Donaldson Co., Inc. | 482,200 | | $ 22,384 |
| EMCOR Group, Inc. | 625,648 | | 42,362 |
| Graco, Inc. | 1,185,110 | | 72,706 |
| RBC Bearings, Inc.(1) | 247,448 | | 29,993 |
| Simpson Manufacturing Co., Inc. | 670,779 | | 65,173 |
| Teledyne Technologies, Inc.(1) | 332,500 | | 103,145 |
| Toro Co. (The) | 803,701 | | 67,471 |
| Watts Water Technologies, Inc. Class A | 523,774 | | 52,456 |
| | | | 455,690 |
| | | | |
| |
| Information Technology—16.8% | | |
| Aspen Technology, Inc.(1) | 603,600 | | 76,410 |
| CDW Corp. | 766,600 | | 91,632 |
| Jack Henry & Associates, Inc. | 221,300 | | 35,981 |
| Manhattan Associates, Inc.(1) | 646,720 | | 61,755 |
| | | | 265,778 |
| | | | |
| |
| Materials—1.3% | | |
| AptarGroup, Inc. | 182,012 | | 20,604 |
Total Common Stocks
(Identified Cost $1,007,201) | | 1,501,811 |
| | | | |
| |
| | | | |
| |
Total Long-Term Investments—95.2%
(Identified Cost $1,007,201) | | 1,501,811 |
| | | | |
| |
| | | | |
| |
| | Shares | | Value |
| | | | |
| | | | |
| Short-Term Investment—2.0% |
| Money Market Mutual Fund—2.0% |
| Dreyfus Government Cash Management Fund - Institutional Shares (seven-day effective yield 0.025%)(2) | 32,067,690 | | $ 32,068 |
Total Short-Term Investment
(Identified Cost $32,068) | | 32,068 |
| | | | |
| |
| | | | |
| |
TOTAL INVESTMENTS—97.2%
(Identified Cost $1,039,269) | | $1,533,879 |
| Other assets and liabilities, net—2.8% | | 44,745 |
| NET ASSETS—100.0% | | $1,578,624 |
| Abbreviation: |
| ADR | American Depositary Receipt |
| Footnote Legend: |
| (1) | Non-income producing. |
| (2) | Shares of this fund are publicly offered, and its prospectus and annual report are publicly available. |
| Country Weightings (Unaudited)† |
| United States | 86% |
| China | 8 |
| United Kingdom | 6 |
| Total | 100% |
| † % of total investments as of September 30, 2020. |
The following table summarizes the market value of the Fund’s investments as of September 30, 2020, based on the inputs used to value them (See Security Valuation Note 2A in the Notes to Financial Statements):
| | Total
Value at
September 30, 2020 | | Level 1
Quoted Prices |
| Assets: | | | |
| Equity Securities: | | | |
| Common Stocks | $1,501,811 | | $1,501,811 |
| Money Market Mutual Fund | 32,068 | | 32,068 |
| Total Investments | $1,533,879 | | $1,533,879 |
There were no securities valued using significant observable inputs (Level 2) or significant unobservable inputs (Level 3) at September 30, 2020.
There were no transfers into or out of Level 3 related to securities held at September 30, 2020.
For information regarding the abbreviations, see the Key Investment Terms starting on page 5.
See Notes to Financial Statements
KAR Small-Cap Growth Fund
SCHEDULE OF INVESTMENTS September 30, 2020
($ reported in thousands)
| | Shares | | Value |
| Common Stocks—91.2% |
| Communication Services—18.2% | | |
| Auto Trader Group plc | 58,074,329 | | $ 421,893 |
| Autohome, Inc. ADR | 4,407,435 | | 423,113 |
| Rightmove plc | 40,235,150 | | 325,420 |
| | | | 1,170,426 |
| | | | |
| |
| Consumer Discretionary—10.9% | | |
| Fox Factory Holding Corp.(1) | 3,832,978 | | 284,905 |
| Ollie’s Bargain Outlet Holdings, Inc.(1) | 4,783,672 | | 417,854 |
| | | | 702,759 |
| | | | |
| |
| Consumer Staples—4.0% | | |
| Chefs’ Warehouse, Inc. (The)(1) | 2,808,023 | | 40,829 |
| Grocery Outlet Holding Corp.(1) | 4,110,075 | | 161,608 |
| PriceSmart, Inc. | 863,298 | | 57,366 |
| | | | 259,803 |
| | | | |
| |
| Financials—16.8% | | |
| FactSet Research Systems, Inc. | 713,708 | | 239,007 |
| Goosehead Insurance, Inc. Class A | 1,205,700 | | 104,402 |
| Interactive Brokers Group, Inc. Class A | 3,753,516 | | 181,407 |
| MarketAxess Holdings, Inc. | 607,985 | | 292,799 |
| Morningstar, Inc. | 1,459,942 | | 234,481 |
| Oportun Financial Corp.(1) | 2,635,930 | | 31,078 |
| | | | 1,083,174 |
| | | | |
| |
| | Shares | | Value |
| | | | |
| Health Care—3.8% | | |
| Mesa Laboratories, Inc. | 85,353 | | $ 21,745 |
| National Research Corp. | 2,409,518 | | 118,572 |
| U.S. Physical Therapy, Inc. | 1,185,000 | | 102,953 |
| | | | 243,270 |
| | | | |
| |
| Industrials—8.5% | | |
| AAON, Inc. | 4,009,400 | | 241,566 |
| HEICO Corp. Class A | 1,847,383 | | 163,789 |
| Omega Flex, Inc. | 908,755 | | 142,420 |
| | | | 547,775 |
| | | | |
| |
| Information Technology—29.0% | | |
| Aspen Technology, Inc.(1) | 1,873,926 | | 237,220 |
| Avalara, Inc.(1) | 1,900,000 | | 241,946 |
| Bill.com Holdings, Inc.(1) | 3,368,005 | | 337,845 |
| Blackline, Inc.(1) | 3,134,403 | | 280,937 |
| Duck Creek Technologies, Inc.(1)(2) | 8,694,221 | | 394,979 |
| nCino, Inc.(1) | 1,519,202 | | 121,050 |
| NVE Corp. | 482,690 | | 23,690 |
| Paycom Software, Inc.(1) | 460,353 | | 143,308 |
| SPS Commerce, Inc.(1) | 1,095,164 | | 85,280 |
| | | | 1,866,255 |
| | | | |
| |
Total Common Stocks
(Identified Cost $3,492,790) | | 5,873,462 |
| | | | |
| |
| | | | |
| |
Total Long-Term Investments—91.2%
(Identified Cost $3,492,790) | | 5,873,462 |
| | | | |
| |
| | | | |
| |
| | Shares | | Value |
| | | | |
| | | | |
| Short-Term Investment—6.9% |
| Money Market Mutual Fund—6.9% |
| Dreyfus Government Cash Management Fund - Institutional Shares (seven-day effective yield 0.025%)(3) | 446,916,192 | | $ 446,916 |
Total Short-Term Investment
(Identified Cost $446,916) | | 446,916 |
| | | | |
| |
| | | | |
| |
TOTAL INVESTMENTS—98.1%
(Identified Cost $3,939,706) | | $6,320,378 |
| Other assets and liabilities, net—1.9% | | 121,493 |
| NET ASSETS—100.0% | | $6,441,871 |
| Abbreviation: |
| ADR | American Depositary Receipt |
| Footnote Legend: |
| (1) | Non-income producing. |
| (2) | All or a portion of the security is restricted. |
| (3) | Shares of this fund are publicly offered, and its prospectus and annual report are publicly available. |
| Country Weightings (Unaudited)† |
| United States | 82% |
| United Kingdom | 11 |
| China | 7 |
| Total | 100% |
| † % of total investments as of September 30, 2020. |
The following table summarizes the market value of the Fund’s investments as of September 30, 2020, based on the inputs used to value them (See Security Valuation Note 2A in the Notes to Financial Statements):
| | Total
Value at
September 30, 2020 | | Level 1
Quoted Prices |
| Assets: | | | |
| Equity Securities: | | | |
| Common Stocks | $5,873,462 | | $5,873,462 |
| Money Market Mutual Fund | 446,916 | | 446,916 |
| Total Investments | $6,320,378 | | $6,320,378 |
There were no securities valued using significant observable inputs (Level 2) or significant unobservable inputs (Level 3) at September 30, 2020.
There were no transfers into or out of Level 3 related to securities held at September 30, 2020.
For information regarding the abbreviations, see the Key Investment Terms starting on page 5.
See Notes to Financial Statements
KAR Small-Cap Value Fund
SCHEDULE OF INVESTMENTS September 30, 2020
($ reported in thousands)
| | Shares | | Value |
| Common Stocks—95.5% |
| Consumer Discretionary—11.4% | | |
| Cheesecake Factory, Inc. (The) | 932,980 | | $ 25,881 |
| ServiceMaster Global Holdings, Inc.(1) | 873,006 | | 34,815 |
| Thor Industries, Inc. | 345,844 | | 32,945 |
| | | | 93,641 |
| | | | |
| |
| Consumer Staples—7.2% | | |
| National Beverage Corp.(1) | 530,734 | | 36,095 |
| WD-40 Co. | 119,744 | | 22,669 |
| | | | 58,764 |
| | | | |
| |
| Financials—14.7% | | |
| Bank of Hawaii Corp. | 357,160 | | 18,044 |
| First Financial Bankshares, Inc. | 371,393 | | 10,365 |
| Houlihan Lokey, Inc. | 630,164 | | 37,211 |
| Primerica, Inc. | 193,131 | | 21,851 |
| RLI Corp. | 278,512 | | 23,320 |
| Stock Yards Bancorp, Inc. | 302,020 | | 10,281 |
| | | | 121,072 |
| | | | |
| |
| Health Care—1.6% | | |
| Anika Therapeutics, Inc.(1) | 374,977 | | 13,270 |
| Industrials—36.6% | | |
| Albany International Corp. Class A | 440,859 | | 21,827 |
| Armstrong World Industries, Inc. | 254,491 | | 17,512 |
| Construction Partners, Inc. Class A(1) | 694,000 | | 12,631 |
| CoreLogic, Inc. | 606,242 | | 41,024 |
| Graco, Inc. | 521,576 | | 31,999 |
| | Shares | | Value |
| | | | |
| Industrials—continued | | |
| John Bean Technologies Corp. | 195,554 | | $ 17,970 |
| Landstar System, Inc. | 220,033 | | 27,612 |
| RBC Bearings, Inc.(1) | 206,100 | | 24,981 |
| SiteOne Landscape Supply, Inc.(1) | 379,665 | | 46,300 |
| UniFirst Corp. | 104,071 | | 19,708 |
| Watsco, Inc. | 171,653 | | 39,976 |
| | | | 301,540 |
| | | | |
| |
| Information Technology—13.2% | | |
| American Software, Inc. Class A | 900,095 | | 12,637 |
| Badger Meter, Inc. | 294,118 | | 19,227 |
| Brooks Automation, Inc. | 893,200 | | 41,319 |
| EVERTEC, Inc. | 494,745 | | 17,173 |
| Jack Henry & Associates, Inc. | 113,960 | | 18,529 |
| | | | 108,885 |
| | | | |
| |
| Materials—6.5% | | |
| Scotts Miracle-Gro Co. (The) | 348,806 | | 53,336 |
| Real Estate—4.3% | | |
| MGM Growth Properties LLC Class A | 1,269,910 | | 35,532 |
Total Common Stocks
(Identified Cost $575,858) | | 786,040 |
| | | | |
| |
| | | | |
| |
Total Long-Term Investments—95.5%
(Identified Cost $575,858) | | 786,040 |
| | | | |
| |
| | | | |
| |
| | Shares | | Value |
| | | | |
| | | | |
| Short-Term Investment—2.4% |
| Money Market Mutual Fund—2.4% |
| Dreyfus Government Cash Management Fund - Institutional Shares (seven-day effective yield 0.025%)(2) | 19,908,910 | | $ 19,909 |
Total Short-Term Investment
(Identified Cost $19,909) | | 19,909 |
| | | | |
| |
| | | | |
| |
TOTAL INVESTMENTS—97.9%
(Identified Cost $595,767) | | $805,949 |
| Other assets and liabilities, net—2.1% | | 17,573 |
| NET ASSETS—100.0% | | $823,522 |
| Abbreviation: |
| LLC | Limited Liability Company |
| Footnote Legend: |
| (1) | Non-income producing. |
| (2) | Shares of this fund are publicly offered, and its prospectus and annual report are publicly available. |
The following table summarizes the market value of the Fund’s investments as of September 30, 2020, based on the inputs used to value them (See Security Valuation Note 2A in the Notes to Financial Statements):
| | Total
Value at
September 30, 2020 | | Level 1
Quoted Prices |
| Assets: | | | |
| Equity Securities: | | | |
| Common Stocks | $786,040 | | $786,040 |
| Money Market Mutual Fund | 19,909 | | 19,909 |
| Total Investments | $805,949 | | $805,949 |
There were no securities valued using significant observable inputs (Level 2) or significant unobservable inputs (Level 3) at September 30, 2020.
There were no transfers into or out of Level 3 related to securities held at September 30, 2020.
For information regarding the abbreviations, see the Key Investment Terms starting on page 5.
See Notes to Financial Statements
KAR Small-Mid Cap Core Fund
SCHEDULE OF INVESTMENTS September 30, 2020
($ reported in thousands)
| | Shares | | Value |
| Common Stocks—93.2% |
| Consumer Discretionary—10.5% | | |
| Bright Horizons Family Solutions, Inc.(1) | 74,476 | | $ 11,324 |
| Pool Corp. | 61,135 | | 20,452 |
| Thor Industries, Inc. | 194,796 | | 18,556 |
| | | | 50,332 |
| | | | |
| |
| Financials—9.6% | | |
| Berkley (W.R.) Corp. | 264,570 | | 16,178 |
| Interactive Brokers Group, Inc. Class A | 162,770 | | 7,867 |
| MSCI, Inc. | 60,803 | | 21,693 |
| | | | 45,738 |
| | | | |
| |
| Health Care—13.0% | | |
| Charles River Laboratories International, Inc.(1) | 91,766 | | 20,780 |
| Chemed Corp. | 28,594 | | 13,735 |
| Cooper Cos., Inc. (The) | 57,406 | | 19,353 |
| Elanco Animal Health, Inc.(1) | 298,088 | | 8,326 |
| | | | 62,194 |
| | | | |
| |
| Industrials—26.4% | | |
| Allegion plc | 140,774 | | 13,924 |
| Copart, Inc.(1) | 154,515 | | 16,249 |
| Equifax, Inc. | 87,657 | | 13,753 |
| Exponent, Inc. | 112,296 | | 8,089 |
| Fair Isaac Corp.(1) | 23,270 | | 9,898 |
| Lennox International, Inc. | 57,700 | | 15,730 |
| Nordson Corp. | 94,380 | | 18,104 |
| | Shares | | Value |
| | | | |
| Industrials—continued | | |
| Rollins, Inc. | 207,825 | | $ 11,262 |
| SiteOne Landscape Supply, Inc.(1) | 156,361 | | 19,068 |
| | | | 126,077 |
| | | | |
| |
| Information Technology—28.0% | | |
| ANSYS, Inc.(1) | 36,100 | | 11,813 |
| Aspen Technology, Inc.(1) | 107,684 | | 13,632 |
| Bentley Systems, Inc. Class B(1) | 379,490 | | 11,916 |
| CDW Corp. | 132,727 | | 15,865 |
| DocuSign, Inc.(1) | 103,355 | | 22,246 |
| FLIR Systems, Inc. | 262,829 | | 9,422 |
| Jack Henry & Associates, Inc. | 71,511 | | 11,627 |
| Teradyne, Inc. | 262,263 | | 20,839 |
| Zebra Technologies Corp. Class A(1) | 66,365 | | 16,755 |
| | | | 134,115 |
| | | | |
| |
| Materials—5.7% | | |
| Scotts Miracle-Gro Co. (The) | 178,553 | | 27,303 |
Total Common Stocks
(Identified Cost $388,227) | | 445,759 |
| | | | |
| |
| | | | |
| |
Total Long-Term Investments—93.2%
(Identified Cost $388,227) | | 445,759 |
| | | | |
| |
| | | | |
| |
| | Shares | | Value |
| | | | |
| | | | |
| Short-Term Investment—5.2% |
| Money Market Mutual Fund—5.2% |
| Dreyfus Government Cash Management Fund - Institutional Shares (seven-day effective yield 0.025%)(2) | 24,692,792 | | $ 24,693 |
Total Short-Term Investment
(Identified Cost $24,693) | | 24,693 |
| | | | |
| |
| | | | |
| |
TOTAL INVESTMENTS—98.4%
(Identified Cost $412,920) | | $470,452 |
| Other assets and liabilities, net—1.6% | | 7,758 |
| NET ASSETS—100.0% | | $478,210 |
| Footnote Legend: |
| (1) | Non-income producing. |
| (2) | Shares of this fund are publicly offered, and its prospectus and annual report are publicly available. |
The following table summarizes the market value of the Fund’s investments as of September 30, 2020, based on the inputs used to value them (See Security Valuation Note 2A in the Notes to Financial Statements):
| | Total
Value at
September 30, 2020 | | Level 1
Quoted Prices |
| Assets: | | | |
| Equity Securities: | | | |
| Common Stocks | $445,759 | | $445,759 |
| Money Market Mutual Fund | 24,693 | | 24,693 |
| Total Investments | $470,452 | | $470,452 |
There were no securities valued using significant observable inputs (Level 2) or significant unobservable inputs (Level 3) at September 30, 2020.
There were no transfers into or out of Level 3 related to securities held at September 30, 2020.
See Notes to Financial Statements
SGA Emerging Markets Growth Fund
SCHEDULE OF INVESTMENTS September 30, 2020
($ reported in thousands)
| | Shares | | Value |
| Common Stocks—97.4% |
| Communication Services—6.3% | | |
| Kakao Corp. | 398 | | $ 124 |
| Tencent Holdings Ltd. | 3,236 | | 218 |
| | | | 342 |
| | | | |
| |
| Consumer Discretionary—34.9% | | |
| Alibaba Group Holding Ltd.(1) | 9,468 | | 347 |
| Fast Retailing Co. Ltd. | 284 | | 178 |
| Huazhu Group Ltd. ADR | 4,880 | | 211 |
| JD.com, Inc. ADR(1) | 2,553 | | 198 |
| MercadoLibre, Inc.(1) | 205 | | 222 |
| New Oriental Education & Technology Group, Inc. Sponsored ADR(1) | 1,155 | | 173 |
| TAL Education Group ADR(1) | 2,033 | | 155 |
| Trip.com Group Ltd. ADR(1) | 6,432 | | 200 |
| Yum China Holdings, Inc. | 3,663 | | 194 |
| | | | 1,878 |
| | | | |
| |
| Consumer Staples—21.8% | | |
| Budweiser Brewing Co. APAC Ltd. | 47,346 | | 138 |
| CP ALL PCL | 135,696 | | 259 |
| Fomento Economico Mexicano SAB de C.V. Sponsored ADR | 3,036 | | 171 |
| Raia Drogasil S.A. | 30,025 | | 126 |
| Unicharm Corp. | 3,523 | | 158 |
| Universal Robina Corp. | 37,619 | | 104 |
| Wal-Mart de Mexico SAB de C.V. | 91,303 | | 218 |
| | | | 1,174 |
| | | | |
| |
| Financials—16.4% | | |
| AIA Group Ltd. | 21,143 | | 210 |
| HDFC Bank Ltd. ADR(1) | 5,836 | | 292 |
| Ping An Insurance Group Co. of China Ltd. Class H | 14,055 | | 146 |
| Sanlam Ltd. | 41,508 | | 129 |
| XP, Inc. Class A(1) | 2,500 | | 104 |
| | | | 881 |
| | | | |
| |
| | Shares | | Value |
| | | | |
| Health Care—5.4% | | |
| Shandong Weigao Group Medical Polymer Co. Ltd. Class H | 63,970 | | $ 128 |
| Wuxi Biologics Cayman, Inc.(1) | 6,649 | | 163 |
| | | | 291 |
| | | | |
| |
| Industrials—2.5% | | |
| Kansas City Southern | 734 | | 133 |
| Information Technology—7.1% | | |
| Infosys Ltd. Sponsored ADR | 16,675 | | 230 |
| Visa, Inc. Class A | 772 | | 155 |
| | | | 385 |
| | | | |
| |
| Materials—3.0% | | |
| Asian Paints Ltd. | 6,027 | | 162 |
Total Common Stocks
(Identified Cost $4,437) | | 5,246 |
| | | | |
| |
| | | | |
| |
Total Long-Term Investments—97.4%
(Identified Cost $4,437) | | 5,246 |
| | | | |
| |
| | | | |
| |
| Short-Term Investment—1.5% |
| Money Market Mutual Fund—1.5% |
| Dreyfus Government Cash Management Fund - Institutional Shares (seven-day effective yield 0.025%)(2) | 79,814 | | 80 |
Total Short-Term Investment
(Identified Cost $80) | | 80 |
| |
TOTAL INVESTMENTS—98.9%
(Identified Cost $4,517) | | $5,326 |
| Other assets and liabilities, net—1.1% | | 60 |
| NET ASSETS—100.0% | | $5,386 |
| Abbreviation: |
| ADR | American Depositary Receipt |
| Footnote Legend: |
| (1) | Non-income producing. |
| (2) | Shares of this fund are publicly offered, and its prospectus and annual report are publicly available. |
| Country Weightings (Unaudited)† |
| China | 40% |
| India | 13 |
| United States | 8 |
| Mexico | 7 |
| Hong Kong | 7 |
| Japan | 6 |
| Thailand | 5 |
| Other | 14 |
| Total | 100% |
| † % of total investments as of September 30, 2020. |
The following table summarizes the market value of the Fund’s investments as of September 30, 2020, based on the inputs used to value them (See Security Valuation Note 2A in the Notes to Financial Statements):
| | Total
Value at
September 30, 2020 | | Level 1
Quoted Prices | | Level 2
Significant
Observable
Inputs |
| Assets: | | | | | |
| Equity Securities: | | | | | |
| Common Stocks | $5,246 | | $2,911 | | $2,335 |
| Money Market Mutual Fund | 80 | | 80 | | — |
| Total Investments | $5,326 | | $2,991 | | $2,335 |
There were no securities valued using significant unobservable inputs (Level 3) at September 30, 2020.
There were no transfers into or out of Level 3 related to securities held at September 30, 2020.
For information regarding the abbreviations, see the Key Investment Terms starting on page 5.
See Notes to Financial Statements
SGA Global Growth Fund
SCHEDULE OF INVESTMENTS September 30, 2020
($ reported in thousands)
| | Shares | | Value |
| Common Stocks—98.0% |
| Communication Services—9.8% | | |
| Alphabet, Inc. Class C(1) | 3,338 | | $ 4,905 |
| Facebook, Inc. Class A(1) | 17,969 | | 4,706 |
| Tencent Holdings Ltd. | 48,259 | | 3,260 |
| | | | 12,871 |
| | | | |
| |
| Consumer Discretionary—20.2% | | |
| Alibaba Group Holding Ltd. Sponsored ADR(1) | 21,131 | | 6,212 |
| Amazon.com, Inc.(1) | 1,657 | | 5,217 |
| Fast Retailing Co. Ltd. | 5,754 | | 3,616 |
| New Oriental Education & Technology Group, Inc. Sponsored ADR(1) | 25,187 | | 3,766 |
| NIKE, Inc. Class B | 31,410 | | 3,943 |
| Yum! Brands, Inc. | 41,606 | | 3,799 |
| | | | 26,553 |
| | | | |
| |
| Consumer Staples—5.1% | | |
| CP ALL PCL | 2,000,054 | | 3,813 |
| Heineken NV | 33,454 | | 2,976 |
| | | | 6,789 |
| | | | |
| |
| Financials—9.0% | | |
| AIA Group Ltd. | 485,261 | | 4,824 |
| HDFC Bank Ltd. ADR(1) | 110,078 | | 5,499 |
| Sanlam Ltd. | 483,683 | | 1,501 |
| | | | 11,824 |
| | | | |
| |
| Health Care—16.3% | | |
| Abbott Laboratories | 43,702 | | 4,756 |
| Alcon, Inc.(1) | 68,103 | | 3,879 |
| Illumina, Inc.(1) | 11,852 | | 3,663 |
| Intuitive Surgical, Inc.(1) | 4,815 | | 3,416 |
| Novo Nordisk A/S Class B | 49,298 | | 3,411 |
| Regeneron Pharmaceuticals, Inc.(1) | 4,134 | | 2,314 |
| | | | 21,439 |
| |
| Industrials—6.0% | | |
| IHS Markit Ltd. | 57,046 | | 4,479 |
| Kansas City Southern | 18,772 | | 3,394 |
| | | | 7,873 |
| | | | |
| |
| | Shares | | Value |
| | | | |
| Information Technology—26.7% | | |
| Autodesk, Inc.(1) | 14,192 | | $ 3,279 |
| Dassault Systemes SE | 13,804 | | 2,585 |
| FleetCor Technologies, Inc.(1) | 19,393 | | 4,617 |
| Infosys Ltd. Sponsored ADR | 286,160 | | 3,952 |
| Microsoft Corp. | 24,655 | | 5,186 |
| PayPal Holdings, Inc.(1) | 20,106 | | 3,961 |
| salesforce.com, Inc.(1) | 15,040 | | 3,780 |
| SAP SE Sponsored ADR | 16,610 | | 2,588 |
| Visa, Inc. Class A | 26,088 | | 5,217 |
| | | | 35,165 |
| | | | |
| |
| Materials—3.0% | | |
| Linde plc | 16,434 | | 3,914 |
| Real Estate—1.9% | | |
| Equinix, Inc. | 3,416 | | 2,597 |
Total Common Stocks
(Identified Cost $94,579) | | 129,025 |
| | | | |
| |
| | | | |
| |
Total Long-Term Investments—98.0%
(Identified Cost $94,579) | | 129,025 |
| | | | |
| |
| | | | |
| |
| Short-Term Investment—2.0% |
| Money Market Mutual Fund—2.0% |
| Dreyfus Government Cash Management Fund - Institutional Shares (seven-day effective yield 0.025%)(2) | 2,595,404 | | 2,595 |
Total Short-Term Investment
(Identified Cost $2,595) | | 2,595 |
| | | | |
| |
| | | | |
| |
TOTAL INVESTMENTS—100.0%
(Identified Cost $97,174) | | $131,620 |
| Other assets and liabilities, net—(0.0)% | | (1) |
| NET ASSETS—100.0% | | $131,619 |
| Abbreviation: |
| ADR | American Depositary Receipt |
| Footnote Legend: |
| (1) | Non-income producing. |
| (2) | Shares of this fund are publicly offered, and its prospectus and annual report are publicly available. |
| Country Weightings (Unaudited)† |
| United States | 56% |
| China | 9 |
| India | 7 |
| United Kingdom | 6 |
| Hong Kong | 4 |
| Switzerland | 3 |
| Thailand | 3 |
| Other | 12 |
| Total | 100% |
| † % of total investments as of September 30, 2020. |
For information regarding the abbreviations, see the Key Investment Terms starting on page 5.
See Notes to Financial Statements
SGA Global Growth Fund
SCHEDULE OF INVESTMENTS (Continued)
September 30, 2020
($ reported in thousands)
The following table summarizes the market value of the Fund’s investments as of September 30, 2020, based on the inputs used to value them (See Security Valuation Note 2A in the Notes to Financial Statements):
| | Total
Value at
September 30, 2020 | | Level 1
Quoted Prices | | Level 2
Significant
Observable
Inputs |
| Assets: | | | | | |
| Equity Securities: | | | | | |
| Common Stocks | $129,025 | | $113,512 | | $15,513 |
| Money Market Mutual Fund | 2,595 | | 2,595 | | — |
| Total Investments | $131,620 | | $116,107 | | $15,513 |
There were no securities valued using significant unobservable inputs (Level 3) at September 30, 2020.
There were no transfers into or out of Level 3 related to securities held at September 30, 2020.
See Notes to Financial Statements
VIRTUS EQUITY TRUST
STATEMENTS OF ASSETS AND LIABILITIES September 30, 2020
(Reported in thousands except shares and per share amounts)
| | KAR Capital
Growth Fund | | KAR Equity
Income Fund | | KAR Global Quality
Dividend Fund | | KAR Mid-Cap
Core Fund |
| Assets | | | | | | | |
Investment in securities at value(1)
| $ 696,787 | | $ 131,329 | | $ 33,085 | | $ 782,218 |
Foreign currency at value(2)
| — | | — | | — (a) | | — |
Cash
| 4,917 | | — (a) | | 745 | | 5,597 |
| Receivables | | | | | | | |
Fund shares sold
| 106 | | 19 | | 1 | | 2,011 |
Dividends
| 138 | | 195 | | 144 | | 371 |
Tax reclaims
| — | | — | | 37 | | — |
Prepaid Trustees’ retainer
| 14 | | 2 | | 1 | | 15 |
Prepaid expenses
| 30 | | 27 | | 19 | | 50 |
Other assets
| 74 | | 14 | | 4 | | 84 |
Total assets
| 702,066 | | 131,586 | | 34,036 | | 790,346 |
| Liabilities | | | | | | | |
| Payables | | | | | | | |
Fund shares repurchased
| 205 | | 148 | | 27 | | 5,751 |
Investment securities purchased
| — | | 154 | | 40 | | — |
Investment advisory fees
| 393 | | 58 | | 13 | | 412 |
Distribution and service fees
| 139 | | 29 | | 6 | | 52 |
Administration and accounting fees
| 59 | | 12 | | 3 | | 67 |
Transfer agent and sub-transfer agent fees and expenses
| 74 | | 20 | | 7 | | 133 |
Professional fees
| 24 | | 22 | | 25 | | 24 |
Trustee deferred compensation plan
| 74 | | 14 | | 4 | | 84 |
Interest expense and/or commitment fees
| 1 | | — (a) | | — (a) | | 1 |
Other accrued expenses
| 72 | | 38 | | 6 | | 24 |
Total liabilities
| 1,041 | | 495 | | 131 | | 6,548 |
Net Assets
| $ 701,025 | | $ 131,091 | | $ 33,905 | | $ 783,798 |
| Net Assets Consist of: | | | | | | | |
Capital paid in on shares of beneficial interest
| $ 216,456 | | $ 96,947 | | $ 36,135 | | $ 625,075 |
Accumulated earnings (loss)
| 484,569 | | 34,144 | | (2,230) | | 158,723 |
Net Assets
| $ 701,025 | | $ 131,091 | | $ 33,905 | | $ 783,798 |
| Net Assets: | | | | | | | |
Class A
| $ 640,963 | | $ 113,585 | | $ 22,089 | | $ 56,677 |
Class C
| $ 13,183 | | $ 6,394 | | $ 1,467 | | $ 49,164 |
Class I
| $ 46,600 | | $ 10,319 | | $ 10,259 | | $ 658,291 |
Class R6
| $ 279 | | $ 793 | | $ 90 | | $ 19,666 |
| Shares Outstanding (unlimited number of shares authorized, no par value): | | | | | | | |
Class A
| 26,485,364 | | 4,931,827 | | 1,731,743 | | 1,419,337 |
Class C
| 739,267 | | 311,743 | | 119,400 | | 1,335,128 |
Class I
| 1,852,824 | | 448,633 | | 803,116 | | 16,136,626 |
Class R6
| 10,990 | | 34,535 | | 7,027 | | 481,008 |
| Net Asset Value and Redemption Price Per Share: | | | | | | | |
Class A
| $ 24.20 | | $ 23.03 | | $ 12.76 | | $ 39.93 |
Class C
| $ 17.83 | | $ 20.51 | | $ 12.29 | | $ 36.82 |
Class I
| $ 25.15 | | $ 23.00 | | $ 12.77 | | $ 40.79 |
Class R6
| $ 25.38 | | $ 22.96 | | $ 12.81 | | $ 40.89 |
See Notes to Financial Statements
VIRTUS EQUITY TRUST
STATEMENTS OF ASSETS AND LIABILITIES (Continued)
September 30, 2020
(Reported in thousands except shares and per share amounts)
| | KAR Capital
Growth Fund | | KAR Equity
Income Fund | | KAR Global Quality
Dividend Fund | | KAR Mid-Cap
Core Fund |
| Maximum Offering Price per Share (NAV/(1-Maximum Sales Charge)): | | | | | | | |
Class A
| $ 25.68 | | $ 24.44 | | $ 13.54 | | $ 42.37 |
Maximum Sales Charge - Class A
| 5.75% | | 5.75% | | 5.75% | | 5.75% |
(1) Investment in securities at cost
| $ 227,227 | | $ 132,980 | | $ 31,202 | | $ 624,210 |
(2) Foreign currency at cost
| $ — | | $ — | | $ —(a) | | $ — |
| (a) | Amount is less than $500. |
See Notes to Financial Statements
VIRTUS EQUITY TRUST
STATEMENTS OF ASSETS AND LIABILITIES (Continued)
September 30, 2020
(Reported in thousands except shares and per share amounts)
| | KAR Mid-Cap
Growth Fund | | KAR Small-Cap
Core Fund | | KAR Small-Cap
Growth Fund | | KAR Small-Cap
Value Fund |
| Assets | | | | | | | |
Investment in securities at value(1)
| $ 2,517,586 | | $ 1,533,879 | | $ 6,320,378 | | $ 805,949 |
Foreign currency at value(2)
| — | | — (a) | | — | | — |
Cash
| 2,304 | | 43,897 | | 127,426 | | 15,709 |
| Receivables | | | | | | | |
Fund shares sold
| 17,428 | | 2,800 | | 8,516 | | 2,338 |
Dividends
| 265 | | 357 | | 12 | | 827 |
Prepaid Trustees’ retainer
| 47 | | 32 | | 129 | | 16 |
Prepaid expenses
| 144 | | 45 | | 78 | | 52 |
Other assets
| 262 | | 169 | | 680 | | 89 |
Total assets
| 2,538,036 | | 1,581,179 | | 6,457,219 | | 824,980 |
| Liabilities | | | | | | | |
| Payables | | | | | | | |
Fund shares repurchased
| 3,362 | | 854 | | 8,060 | | 577 |
Investment advisory fees
| 1,426 | | 968 | | 4,201 | | 477 |
Distribution and service fees
| 184 | | 97 | | 419 | | 31 |
Administration and accounting fees
| 210 | | 135 | | 541 | | 72 |
Transfer agent and sub-transfer agent fees and expenses
| 338 | | 244 | | 1,167 | | 156 |
Professional fees
| 26 | | 28 | | 40 | | 25 |
Trustee deferred compensation plan
| 262 | | 169 | | 680 | | 89 |
Interest expense and/or commitment fees
| 2 | | 2 | | 8 | | 1 |
Other accrued expenses
| 72 | | 58 | | 232 | | 30 |
Total liabilities
| 5,882 | | 2,555 | | 15,348 | | 1,458 |
Net Assets
| $ 2,532,154 | | $ 1,578,624 | | $ 6,441,871 | | $ 823,522 |
| Net Assets Consist of: | | | | | | | |
Capital paid in on shares of beneficial interest
| $ 1,847,745 | | $ 965,883 | | $ 3,428,414 | | $ 633,607 |
Accumulated earnings (loss)
| 684,409 | | 612,741 | | 3,013,457 | | 189,915 |
Net Assets
| $ 2,532,154 | | $ 1,578,624 | | $ 6,441,871 | | $ 823,522 |
| Net Assets: | | | | | | | |
Class A
| $ 482,266 | | $ 112,178 | | $ 772,158 | | $ 83,622 |
Class C
| $ 112,165 | | $ 89,553 | | $ 322,672 | | $ 16,233 |
Class I
| $ 1,837,262 | | $ 1,082,010 | | $ 5,251,980 | | $ 711,421 |
Class R6
| $ 100,461 | | $ 294,883 | | $ 95,061 | | $ 12,246 |
| Shares Outstanding (unlimited number of shares authorized, no par value): | | | | | | | |
Class A
| 8,307,417 | | 2,789,507 | | 15,757,023 | | 4,188,382 |
Class C
| 2,482,372 | | 2,718,137 | | 7,434,716 | | 835,073 |
Class I
| 30,541,452 | | 25,360,022 | | 104,516,069 | | 35,619,476 |
Class R6
| 1,660,683 | | 6,882,647 | | 1,886,681 | | 612,427 |
| Net Asset Value and Redemption Price Per Share: | | | | | | | |
Class A
| $ 58.05 | | $ 40.21 | | $ 49.00 | | $ 19.97 |
Class C
| $ 45.18 | | $ 32.95 | | $ 43.40 | | $ 19.44 |
Class I
| $ 60.16 | | $ 42.67 | | $ 50.25 | | $ 19.97 |
Class R6
| $ 60.49 | | $ 42.84 | | $ 50.39 | | $ 20.00 |
| Maximum Offering Price per Share (NAV/(1-Maximum Sales Charge)): | | | | | | | |
Class A
| $ 61.59 | | $ 42.66 | | $ 51.99 | | $ 21.19 |
Maximum Sales Charge - Class A
| 5.75% | | 5.75% | | 5.75% | | 5.75% |
(1) Investment in securities at cost
| $ 1,823,900 | | $ 1,039,269 | | $ 3,939,706 | | $ 595,767 |
(2) Foreign currency at cost
| $ — | | $ —(a) | | $ — | | $ — |
| (a) | Amount is less than $500. |
See Notes to Financial Statements
VIRTUS EQUITY TRUST
STATEMENTS OF ASSETS AND LIABILITIES (Continued)
September 30, 2020
(Reported in thousands except shares and per share amounts)
| | KAR Small-Mid
Cap Core Fund | | SGA Emerging Markets Growth Fund | | SGA Global Growth Fund |
| Assets | | | | | |
Investment in securities at value(1)
| $ 470,452 | | $ 5,326 | | $ 131,620 |
Foreign currency at value(2)
| — | | 71 | | — (a) |
Cash
| 133 | | — (a) | | — |
| Receivables | | | | | |
Investment securities sold
| — | | 71 | | — |
Fund shares sold
| 8,392 | | — | | 31 |
Dividends
| 45 | | 3 | | 28 |
Tax reclaims
| — | | — (a) | | 47 |
Prepaid Trustees’ retainer
| 7 | | — (a) | | 3 |
Prepaid expenses
| 35 | | 23 | | 38 |
Other assets
| 47 | | 1 | | 14 |
Total assets
| 479,111 | | 5,495 | | 131,781 |
| Liabilities | | | | | |
| Payables | | | | | |
Fund shares repurchased
| 443 | | — | | 6 |
Investment securities purchased
| — | | 71 | | — |
Foreign capital gains tax
| — | | 2 | | — |
Investment advisory fees
| 264 | | 9 | | 70 |
Distribution and service fees
| 12 | | — (a) | | 10 |
Administration and accounting fees
| 39 | | — (a) | | 11 |
Transfer agent and sub-transfer agent fees and expenses
| 62 | | — (a) | | 8 |
Professional fees
| 23 | | 25 | | 33 |
Trustee deferred compensation plan
| 47 | | 1 | | 14 |
Interest expense and/or commitment fees
| — (a) | | — (a) | | — (a) |
Other accrued expenses
| 11 | | 1 | | 10 |
Total liabilities
| 901 | | 109 | | 162 |
Net Assets
| $ 478,210 | | $ 5,386 | | $ 131,619 |
| Net Assets Consist of: | | | | | |
Capital paid in on shares of beneficial interest
| $ 421,639 | | $ 4,476 | | $ 92,849 |
Accumulated earnings (loss)
| 56,571 | | 910 | | 38,770 |
Net Assets
| $ 478,210 | | $ 5,386 | | $ 131,619 |
| Net Assets: | | | | | |
Class A
| $ 19,735 | | $ 169 | | $ 26,504 |
Class C
| $ 10,210 | | $ 142 | | $ 5,210 |
Class I
| $ 439,899 | | $ 247 | | $ 27,529 |
Class R6
| $ 8,366 | | $ 4,828 | | $ 72,376 |
| Shares Outstanding (unlimited number of shares authorized, no par value): | | | | | |
Class A
| 1,367,158 | | 14,151 | | 998,663 |
Class C
| 721,006 | | 12,048 | | 207,843 |
Class I
| 30,311,778 | | 20,675 | | 1,032,685 |
Class R6
| 575,361 | | 403,317 | | 2,643,577 |
| Net Asset Value and Redemption Price Per Share: | | | | | |
Class A
| $ 14.43 | | $ 11.90 | | $ 26.54 |
Class C
| $ 14.16 | | $ 11.79 | | $ 25.06 |
Class I
| $ 14.51 | | $ 11.94 | | $ 26.66 |
Class R6
| $ 14.54 | | $ 11.97 | | $ 27.38 |
See Notes to Financial Statements
VIRTUS EQUITY TRUST
STATEMENTS OF ASSETS AND LIABILITIES (Continued)
September 30, 2020
(Reported in thousands except shares and per share amounts)
| | KAR Small-Mid
Cap Core Fund | | SGA Emerging Markets Growth Fund | | SGA Global Growth Fund |
| Maximum Offering Price per Share (NAV/(1-Maximum Sales Charge)): | | | | | |
Class A
| $ 15.31 | | $ 12.63 | | $ 28.16 |
Maximum Sales Charge - Class A
| 5.75% | | 5.75% | | 5.75% |
(1) Investment in securities at cost
| $ 412,920 | | $ 4,517 | | $ 97,174 |
(2) Foreign currency at cost
| $ — | | $ 71 | | $ —(a) |
| (a) | Amount is less than $500. |
See Notes to Financial Statements
VIRTUS EQUITY TRUST
STATEMENTS OF OPERATIONS YEAR ENDED September 30, 2020
($ reported in thousands)
| | KAR Capital
Growth Fund | | KAR Equity
Income Fund | | KAR Global Quality
Dividend Fund | | KAR Mid-Cap
Core Fund | | KAR Mid-Cap
Growth Fund |
| Investment Income | | | | | | | | | |
Dividends
| $ 3,355 | | $ 2,543 | | $ 1,444 | | $ 4,485 | | $ 4,562 |
Security lending, net of fees
| 43 | | — | | 8 | | 1 | | — |
Foreign taxes withheld
| — | | (5) | | (94) | | — | | — |
Total investment income
| 3,398 | | 2,538 | | 1,358 | | 4,486 | | 4,562 |
| Expenses | | | | | | | | | |
Investment advisory fees
| 4,026 | | 980 | | 276 | | 4,684 | | 9,214 |
Distribution and service fees, Class A
| 1,330 | | 281 | | 63 | | 131 | | 720 |
Distribution and service fees, Class C
| 101 | | 71 | | 24 | | 453 | | 682 |
Administration and accounting fees
| 609 | | 144 | | 46 | | 619 | | 1,308 |
Transfer agent fees and expenses
| 342 | | 75 | | 25 | | 256 | | 566 |
Sub-transfer agent fees and expenses, Class A
| 173 | | 66 | | 15 | | 44 | | 208 |
Sub-transfer agent fees and expenses, Class C
| 6 | | 3 | | 2 | | 44 | | 63 |
Sub-transfer agent fees and expenses, Class I
| 29 | | 7 | | 12 | | 454 | | 837 |
Custodian fees
| 1 | | 3 | | 1 | | 1 | | 3 |
Printing fees and expenses
| 47 | | 19 | | 15 | | 48 | | 108 |
Professional fees
| 40 | | 24 | | 26 | | 31 | | 38 |
Interest expense and/or commitment fees
| 3 | | 1 | | — (1) | | 3 | | 7 |
Registration fees
| 64 | | 56 | | 59 | | 106 | | 169 |
Trustees’ fees and expenses
| 47 | | 11 | | 3 | | 45 | | 75 |
Miscellaneous expenses
| 244 | | 84 | | 24 | | 46 | | 114 |
Total expenses
| 7,062 | | 1,825 | | 591 | | 6,965 | | 14,112 |
Less net expenses reimbursed and/or waived by investment adviser(2)
| (1) | | (197) | | (99) | | (828) | | — |
Less low balance account fees
| (17) | | (2) | | (1) | | — (1) | | (2) |
Plus net expenses recaptured(2)
| — | | — | | — | | — | | 26 |
Net expenses
| 7,044 | | 1,626 | | 491 | | 6,137 | | 14,136 |
Net investment income (loss)
| (3,646) | | 912 | | 867 | | (1,651) | | (9,574) |
| Net Realized and Unrealized Gain (Loss) on Investments | | | | | | | | | |
| Net realized gain (loss) from: | | | | | | | | | |
Investments
| 18,655 | | 52,646 | | (2,752) | | 3,785 | | 1,409 |
Foreign currency transactions
| — | | — | | (1) | | — | | — |
Written options
| — | | (7,962) | | — | | — | | — |
| Net change in unrealized appreciation (depreciation) on: | | | | | | | | | |
Investments
| 220,795 | | (31,677) | | (2,980) | | 85,472 | | 614,023 |
Foreign currency transactions
| — | | — | | (2) | | — | | — |
Written options
| — | | (36) | | — | | — | | — |
Net realized and unrealized gain (loss) on investments
| 239,450 | | 12,971 | | (5,735) | | 89,257 | | 615,432 |
Net increase (decrease) in net assets resulting from operations
| $235,804 | | $ 13,883 | | $(4,868) | | $87,606 | | $605,858 |
| (1) | Amount is less than $500. |
| (2) | See Note 4D in Notes to Financial Statements. |
See Notes to Financial Statements
VIRTUS EQUITY TRUST
STATEMENTS OF OPERATIONS (Continued)
YEAR ENDED September 30, 2020
($ reported in thousands)
| | KAR Small-Cap
Core Fund | | KAR Small-Cap
Growth Fund | | KAR Small-Cap
Value Fund | | KAR Small-Mid
Cap Core Fund | | SGA Emerging Markets Growth Fund |
| Investment Income | | | | | | | | | |
Dividends
| $ 12,484 | | $ 19,007 | | $ 12,729 | | $ 1,993 | | $ 56 |
Security lending, net of fees
| 4 | | 6 | | — | | — | | — |
Foreign taxes withheld
| (20) | | — | | (27) | | — | | (5) |
Total investment income
| 12,468 | | 19,013 | | 12,702 | | 1,993 | | 51 |
| Expenses | | | | | | | | | |
Investment advisory fees
| 11,431 | | 44,545 | | 4,629 | | 1,343 | | 49 |
Distribution and service fees, Class A
| 302 | | 1,799 | | 197 | | 23 | | — |
Distribution and service fees, Class C
| 962 | | 2,976 | | 157 | | 45 | | 2 |
Administration and accounting fees
| 1,598 | | 5,728 | | 698 | | 195 | | 13 |
Transfer agent fees and expenses
| 670 | | 2,407 | | 295 | | 82 | | 2 |
Sub-transfer agent fees and expenses, Class A
| 108 | | 741 | | 58 | | 10 | | — (1) |
Sub-transfer agent fees and expenses, Class C
| 74 | | 242 | | 13 | | 3 | | — (1) |
Sub-transfer agent fees and expenses, Class I
| 827 | | 4,147 | | 539 | | 147 | | — (1) |
Custodian fees
| 2 | | 8 | | 1 | | 1 | | — |
Printing fees and expenses
| 104 | | 408 | | 58 | | 17 | | 2 |
Professional fees
| 49 | | 171 | | 33 | | 24 | | 24 |
Interest expense and/or commitment fees
| 9 | | 33 | | 4 | | 1 | | — (1) |
Registration fees
| 84 | | 159 | | 90 | | 97 | | 86 |
Trustees’ fees and expenses
| 130 | | 454 | | 53 | | 9 | | — (1) |
Miscellaneous expenses
| 152 | | 524 | | 60 | | 16 | | 6 |
Total expenses
| 16,502 | | 64,342 | | 6,885 | | 2,013 | | 184 |
Less net expenses reimbursed and/or waived by investment adviser(2)
| — | | — | | — | | (67) | | (130) |
Less low balance account fees
| — (1) | | (2) | | (1) | | — (1) | | — |
Net expenses
| 16,502 | | 64,340 | | 6,884 | | 1,946 | | 54 |
Net investment income (loss)
| (4,034) | | (45,327) | | 5,818 | | 47 | | (3) |
| Net Realized and Unrealized Gain (Loss) on Investments | | | | | | | | | |
| Net realized gain (loss) from: | | | | | | | | | |
Investments
| 120,335 | | 811,784 | | (13,648) | | (843) | | 107 |
Foreign currency transactions
| 8 | | 50 | | — | | — | | (1) |
| Net change in unrealized appreciation (depreciation) on: | | | | | | | | | |
Investments
| 29,309 | | 814,394 | | 79,242 | | 55,857 | | 817 |
Foreign currency transactions
| — | | 7 | | — | | — | | — (1) |
Foreign capital gains tax
| — | | — | | — | | — | | (2) |
Net realized and unrealized gain (loss) on investments
| 149,652 | | 1,626,235 | | 65,594 | | 55,014 | | 921 |
Net increase (decrease) in net assets resulting from operations
| $145,618 | | $1,580,908 | | $ 71,412 | | $55,061 | | $ 918 |
| (1) | Amount is less than $500. |
| (2) | See Note 4D in Notes to Financial Statements. |
See Notes to Financial Statements
VIRTUS EQUITY TRUST
STATEMENTS OF OPERATIONS (Continued)
YEAR ENDED September 30, 2020
($ reported in thousands)
| | SGA Global Growth Fund |
| Investment Income | |
Dividends
| $ 862 |
Security lending, net of fees
| — (1) |
Foreign taxes withheld
| (48) |
Total investment income
| 814 |
| Expenses | |
Investment advisory fees
| 821 |
Distribution and service fees, Class A
| 37 |
Distribution and service fees, Class C
| 44 |
Administration and accounting fees
| 115 |
Transfer agent fees and expenses
| 46 |
Sub-transfer agent fees and expenses, Class A
| 4 |
Sub-transfer agent fees and expenses, Class C
| 2 |
Sub-transfer agent fees and expenses, Class I
| 27 |
Custodian fees
| — (1) |
Printing fees and expenses
| 11 |
Professional fees
| 29 |
Interest expense and/or commitment fees
| — (1) |
Registration fees
| 57 |
Trustees’ fees and expenses
| 8 |
Miscellaneous expenses
| 19 |
Total expenses
| 1,220 |
Less net expenses reimbursed and/or waived by investment adviser(2)
| (123) |
Net expenses
| 1,097 |
Net investment income (loss)
| (283) |
| Net Realized and Unrealized Gain (Loss) on Investments | |
| Net realized gain (loss) from: | |
Investments
| 5,406 |
Foreign currency transactions
| (11) |
| Net change in unrealized appreciation (depreciation) on: | |
Investments
| 20,277 |
Foreign currency transactions
| 3 |
Net realized and unrealized gain (loss) on investments
| 25,675 |
Net increase (decrease) in net assets resulting from operations
| $25,392 |
| (1) | Amount is less than $500. |
| (2) | See Note 4D in Notes to Financial Statements. |
See Notes to Financial Statements
VIRTUS EQUITY TRUST
STATEMENTS OF CHANGES IN NET ASSETS
($ reported in thousands)
| | KAR Capital Growth Fund | | KAR Equity Income Fund |
| | Year Ended
September 30,
2020 | | Year Ended
September 30,
2019 | | Year Ended
September 30,
2020 | | Year Ended
September 30,
2019 |
| Increase (Decrease) in Net Assets Resulting from Operations | | | | | | | |
Net investment income (loss)
| $ (3,646) | | $ (2,205) | | $ 912 | | $ 1,061 |
Net realized gain (loss)
| 18,655 | | 20,250 | | 44,684 | | (2,644) |
Net change in unrealized appreciation (depreciation)
| 220,795 | | (16,012) | | (31,713) | | (2,272) |
Increase (decrease) in net assets resulting from operations
| 235,804 | | 2,033 | | 13,883 | | (3,855) |
| Dividends and Distributions to Shareholders | | | | | | | |
| Net Investment Income and Net Realized Gains: | | | | | | | |
Class A
| (13,917) | | (42,216) | | (1,182) | | (1,129) |
Class C
| (341) | | (1,557) | | (14) | | (54) |
Class I
| (673) | | (1,314) | | (133) | | (161) |
Class R6
| (6) | | (8) | | (13) | | (23) |
Total Dividends and Distributions to Shareholders
| (14,937) | | (45,095) | | (1,342) | | (1,367) |
| Change in Net Assets from Capital Transactions (See Note 6): | | | | | | | |
Class A
| (34,651) | | 2,187 | | (12,326) | | (2,367) |
Class C
| 792 | | (3,711) | | (2,051) | | (19,940) |
Class I
| 11,756 | | 6,417 | | (1,330) | | (3,713) |
Class R6
| 149 | | (5,834) | | (222) | | (3,786) |
Increase (decrease) in net assets from capital transactions
| (21,954) | | (941) | | (15,929) | | (29,806) |
Net increase (decrease) in net assets
| 198,913 | | (44,003) | | (3,388) | | (35,028) |
| Net Assets | | | | | | | |
Beginning of period
| 502,112 | | 546,115 | | 134,479 | | 169,507 |
End of Period
| $ 701,025 | | $ 502,112 | | $ 131,091 | | $ 134,479 |
See Notes to Financial Statements
VIRTUS EQUITY TRUST
STATEMENTS OF CHANGES IN NET ASSETS (Continued)
($ reported in thousands)
| | KAR Global Quality Dividend Fund | | KAR Mid-Cap Core Fund |
| | Year Ended
September 30,
2020 | | Year Ended
September 30,
2019 | | Year Ended
September 30,
2020 | | Year Ended
September 30,
2019 |
| Increase (Decrease) in Net Assets Resulting from Operations | | | | | | | |
Net investment income (loss)
| $ 867 | | $ 971 | | $ (1,651) | | $ (362) |
Net realized gain (loss)
| (2,753) | | (861) | | 3,785 | | 1,545 |
Net change in unrealized appreciation (depreciation)
| (2,982) | | 3,323 | | 85,472 | | 26,947 |
Increase (decrease) in net assets resulting from operations
| (4,868) | | 3,433 | | 87,606 | | 28,130 |
| Dividends and Distributions to Shareholders | | | | | | | |
| Net Investment Income and Net Realized Gains: | | | | | | | |
Class A
| (669) | | (2,449) | | (222) | | (242) |
Class C
| (45) | | (465) | | (207) | | (234) |
Class I
| (228) | | (495) | | (1,612) | | (1,379) |
Class R6
| (3) | | — | | (56) | | (17) |
Total Dividends and Distributions to Shareholders
| (945) | | (3,409) | | (2,097) | | (1,872) |
| Change in Net Assets from Capital Transactions (See Note 6): | | | | | | | |
Class A
| (3,290) | | 2,837 | | 3,463 | | 11,502 |
Class C
| (1,314) | | (1,716) | | 523 | | 10,731 |
Class I
| 4,427 | | 2,329 | | 256,818 | | 140,292 |
Class R6
| — | | 100 | | 6,369 | | 8,429 |
Increase (decrease) in net assets from capital transactions
| (177) | | 3,550 | | 267,173 | | 170,954 |
Net increase (decrease) in net assets
| (5,990) | | 3,574 | | 352,682 | | 197,212 |
| Net Assets | | | | | | | |
Beginning of period
| 39,895 | | 36,321 | | 431,116 | | 233,904 |
End of Period
| $ 33,905 | | $ 39,895 | | $ 783,798 | | $ 431,116 |
See Notes to Financial Statements
VIRTUS EQUITY TRUST
STATEMENTS OF CHANGES IN NET ASSETS (Continued)
($ reported in thousands)
| | KAR Mid-Cap Growth Fund | | KAR Small-Cap Core Fund |
| | Year Ended
September 30,
2020 | | Year Ended
September 30,
2019 | | Year Ended
September 30,
2020 | | Year Ended
September 30,
2019 |
| Increase (Decrease) in Net Assets Resulting from Operations | | | | | | | |
Net investment income (loss)
| $ (9,574) | | $ (2,518) | | $ (4,034) | | $ (1,155) |
Net realized gain (loss)
| 1,409 | | 3,921 | | 120,343 | | 65,025 |
Net change in unrealized appreciation (depreciation)
| 614,023 | | 8,143 | | 29,309 | | 92,814 |
Increase (decrease) in net assets resulting from operations
| 605,858 | | 9,546 | | 145,618 | | 156,684 |
| Dividends and Distributions to Shareholders | | | | | | | |
| Net Investment Income and Net Realized Gains: | | | | | | | |
Class A
| (1,240) | | (2,261) | | (5,631) | | (4,670) |
Class C
| (384) | | (348) | | (5,334) | | (4,986) |
Class I
| (2,476) | | (1,134) | | (48,638) | | (39,927) |
Class R6
| (25) | | (3) | | (5,252) | | (3,179) |
Total Dividends and Distributions to Shareholders
| (4,125) | | (3,746) | | (64,855) | | (52,762) |
| Change in Net Assets from Capital Transactions (See Note 6): | | | | | | | |
Class A
| 167,734 | | 44,017 | | (24,683) | | (27,618) |
Class C
| 40,327 | | 27,696 | | (18,869) | | (21,478) |
Class I
| 1,098,875 | | 253,153 | | (187,888) | | (111,236) |
Class R6
| 89,984 | | 1,938 | | 179,793 | | 10,121 |
Increase (decrease) in net assets from capital transactions
| 1,396,920 | | 326,804 | | (51,647) | | (150,211) |
Net increase (decrease) in net assets
| 1,998,653 | | 332,604 | | 29,116 | | (46,289) |
| Net Assets | | | | | | | |
Beginning of period
| 533,501 | | 200,897 | | 1,549,508 | | 1,595,797 |
End of Period
| $ 2,532,154 | | $ 533,501 | | $ 1,578,624 | | $ 1,549,508 |
See Notes to Financial Statements
VIRTUS EQUITY TRUST
STATEMENTS OF CHANGES IN NET ASSETS (Continued)
($ reported in thousands)
| | KAR Small-Cap Growth Fund | | KAR Small-Cap Value Fund |
| | Year Ended
September 30,
2020 | | Year Ended
September 30,
2019 | | Year Ended
September 30,
2020 | | Year Ended
September 30,
2019 |
| Increase (Decrease) in Net Assets Resulting from Operations | | | | | | | |
Net investment income (loss)
| $ (45,327) | | $ (24,248) | | $ 5,818 | | $ 5,464 |
Net realized gain (loss)
| 811,834 | | (41,148) | | (13,648) | | (8,971) |
Net change in unrealized appreciation (depreciation)
| 814,401 | | 641,026 | | 79,242 | | (17,954) |
Increase (decrease) in net assets resulting from operations
| 1,580,908 | | 575,630 | | 71,412 | | (21,461) |
| Dividends and Distributions to Shareholders | | | | | | | |
| Net Investment Income and Net Realized Gains: | | | | | | | |
Class A
| (11,736) | | (14,708) | | (469) | | (1,360) |
Class C
| (5,279) | | (6,272) | | — | | (298) |
Class I
| (65,197) | | (69,698) | | (4,156) | | (9,963) |
Class R6
| (823) | | (248) | | (105) | | (328) |
| Return of Capital: | | | | | | | |
Class A
| — | | (765) | | — | | — |
Class C
| — | | (338) | | — | | — |
Class I
| — | | (3,824) | | — | | — |
Class R6
| — | | (28) | | — | | — |
Total Dividends and Distributions to Shareholders
| (83,035) | | (95,881) | | (4,730) | | (11,949) |
| Change in Net Assets from Capital Transactions (See Note 6): | | | | | | | |
Class A
| (146,328) | | (199,784) | | (2,705) | | (253) |
Class C
| (45,805) | | (39,105) | | (112) | | (11,820) |
Class I
| 60,051 | | (525,903) | | 169,955 | | 34,116 |
Class R6
| 30,011 | | 26,939 | | (95) | | (8,883) |
Increase (decrease) in net assets from capital transactions
| (102,071) | | (737,853) | | 167,043 | | 13,160 |
Net increase (decrease) in net assets
| 1,395,802 | | (258,104) | | 233,725 | | (20,250) |
| Net Assets | | | | | | | |
Beginning of period
| 5,046,069 | | 5,304,173 | | 589,797 | | 610,047 |
End of Period
| $ 6,441,871 | | $ 5,046,069 | | $ 823,522 | | $ 589,797 |
See Notes to Financial Statements
VIRTUS EQUITY TRUST
STATEMENTS OF CHANGES IN NET ASSETS (Continued)
($ reported in thousands)
| | KAR Small-Mid Cap Core Fund | | SGA Emerging Markets Growth Fund |
| | Year Ended
September 30,
2020 | | Year Ended
September 30,
2019 | | Year Ended
September 30,
2020 | | From Inception
June 13, 2019 to
September 30,
2019 |
| Increase (Decrease) in Net Assets Resulting from Operations | | | | | | | |
Net investment income (loss)
| $ 47 | | $ (8) | | $ (3) | | $ (2) |
Net realized gain (loss)
| (843) | | (155) | | 106 | | 3 |
Net change in unrealized appreciation (depreciation)
| 55,857 | | 1,483 | | 815 | | (8) |
Increase (decrease) in net assets resulting from operations
| 55,061 | | 1,320 | | 918 | | (7) |
| Dividends and Distributions to Shareholders | | | | | | | |
| Net Investment Income and Net Realized Gains: | | | | | | | |
Class A
| — | | (4) | | (—) (1) | | — |
Class C
| — | | (2) | | (—) (1) | | — |
Class I
| — | | (16) | | (—) (1) | | — |
Class R6
| — | | (36) | | (1) | | — |
Total Dividends and Distributions to Shareholders
| — | | (58) | | (1) | | — |
| Change in Net Assets from Capital Transactions (See Note 6): | | | | | | | |
Class A
| 16,375 | | 1,211 | | 43 | | 100 |
Class C
| 8,117 | | 866 | | 16 | | 100 |
Class I
| 363,831 | | 23,837 | | 100 | | 110 |
Class R6
| 4,224 | | — | | (31) | | 4,038 |
Increase (decrease) in net assets from capital transactions
| 392,547 | | 25,914 | | 128 | | 4,348 |
Net increase (decrease) in net assets
| 447,608 | | 27,176 | | 1,045 | | 4,341 |
| Net Assets | | | | | | | |
Beginning of period
| 30,602 | | 3,426 | | 4,341 | | — |
End of Period
| $ 478,210 | | $ 30,602 | | $ 5,386 | | $ 4,341 |
| (1) | Amount is less than $500. |
See Notes to Financial Statements
VIRTUS EQUITY TRUST
STATEMENTS OF CHANGES IN NET ASSETS (Continued)
($ reported in thousands)
| | SGA Global Growth Fund |
| | Year Ended
September 30,
2020 | | Fiscal
Period Ended
September 30,
2019(1) | | Year Ended
January 31,
2019 |
| Increase (Decrease) in Net Assets Resulting from Operations | | | | | |
Net investment income (loss)
| $ (283) | | $ 70 | | $ (47) |
Net realized gain (loss)
| 5,395 | | 71 | | 238 |
Net change in unrealized appreciation (depreciation)
| 20,280 | | 6,261 | | (1,551) |
Increase (decrease) in net assets resulting from operations
| 25,392 | | 6,402 | | (1,360) |
| Dividends and Distributions to Shareholders | | | | | |
| Net Investment Income and Net Realized Gains: | | | | | |
Class A
| — | | — | | (147) |
Class C
| — | | — | | (113) |
Class I*
| (3) | | — | | (286) |
Class R6**
| (34) | | — | | (1,006) |
Y Class**
| — | | — | | (672) |
Total Dividends and Distributions to Shareholders
| (37) | | — | | (2,224) |
| Change in Net Assets From Capital Transactions (See Note 6): | | | | | |
Class A
| 19,110 | | 21 | | 167 |
Class C
| 699 | | 16 | | 1,253 |
Class I*
| 9,377 | | 6,224 | | (13,064) |
Class R6**
| 15,808 | | (765) | | 13,749 |
Y Class**
| — | | — | | 3,835 |
Increase (decrease) in net assets from share transactions
| 44,994 | | 5,496 | | 5,940 |
Net increase (decrease) in net assets
| 70,349 | | 11,898 | | 2,356 |
| Net Assets | | | | | |
Beginning of period
| 61,270 | | 49,372 | | 47,016 |
End of Period
| $131,619 | | $61,270 | | $ 49,372 |
| * | On May 3, 2019, Investor Class shares of the Predecessor Fund were reorganized into Class I shares of the Fund. See Note 1 in Notes to Financial Statements. |
| ** | On May 3, 2019, Y Class shares and Institutional Class shares of the Predecessor Fund were reorganized into Class R6 shares of the Fund. See Note 1 in Notes to Financial Statements. |
| (1) | Period from February 1, 2019 to September 30, 2019. The Fund had a fiscal period end change from January 31 to September 30. |
See Notes to Financial Statements
VIRTUS EQUITY TRUST
FINANCIAL HIGHLIGHTS
SELECTED PER SHARE DATA AND RATIOS FOR A SHARE OUTSTANDING
THROUGHOUT EACH PERIOD
| | | Net Asset Value,
Beginning of Period | Net Investment Income (Loss)(1) | Net Realized and
Unrealized Gain (Loss) | Total from Investment Operations | Dividends from
Net Investment Income | Return of Capital | Distributions from
Net Realized Gains | Total Distributions | Change in Net Asset Value | Net Asset Value, End of Period | Total Return(2)(3) | Net Assets, End of Period
(in thousands) | Ratio of Net Expenses to
Average Net Assets(4)(5) | Ratio of Gross Expenses
to Average Net Assets(4)(5) | Ratio of Net Investment Income (Loss)
to Average Net Assets(4) | Portfolio Turnover Rate(3) |
| | | | | | | | | | | | | | | | | | |
| KAR Capital Growth Fund | | | | | | | | | | | | | | | | | |
| Class A | | | | | | | | | | | | | | | | | |
| 10/1/19 to 9/30/20 | | $16.67 | (0.12) | 8.16 | 8.04 | — | — | (0.51) | (0.51) | 7.53 | $24.20 | 49.20 % | $ 640,963 | 1.22 % (6) | 1.23 % | (0.63) % | 4 % |
| 10/1/18 to 9/30/19 | | 18.37 | (0.07) | (0.08) | (0.15) | — | — | (1.55) | (1.55) | (1.70) | 16.67 | 1.10 | 471,071 | 1.23 (6) | 1.24 | (0.43) | 12 |
| 10/1/17 to 9/30/18 | | 16.18 | (0.08) | 3.13 | 3.05 | — | — | (0.86) | (0.86) | 2.19 | 18.37 | 19.56 | 508,124 | 1.22 (6) | 1.22 | (0.49) | 17 |
| 4/1/17 to 9/30/17(7) | | 14.10 | (0.03) | 2.27 | 2.24 | — | — | (0.16) | (0.16) | 2.08 | 16.18 | 15.93 | 446,720 | 1.30 (6) | 1.30 | (0.40) | 13 |
| 4/1/16 to 3/31/17 | | 13.66 | (0.05) | 1.64 | 1.59 | — | — | (1.15) | (1.15) | 0.44 | 14.10 | 12.34 (8) | 402,118 | 1.33 (6)(8)(9) | 1.34 | (0.40) (8) | 21 |
| 4/1/15 to 3/31/16 | | 14.23 | (0.05) | 0.13 | 0.08 | — | — | (0.65) | (0.65) | (0.57) | 13.66 | 0.39 | 401,617 | 1.30 (6) | 1.30 | (0.32) | 20 |
| Class C | | | | | | | | | | | | | | | | | |
| 10/1/19 to 9/30/20 | | $12.49 | (0.20) | 6.05 | 5.85 | — | — | (0.51) | (0.51) | 5.34 | $17.83 | 48.09 % | $ 13,183 | 2.00 % (6) | 2.00 % | (1.41) % | 4 % |
| 10/1/18 to 9/30/19 | | 14.34 | (0.15) | (0.15) | (0.30) | — | — | (1.55) | (1.55) | (1.85) | 12.49 | 0.26 | 8,632 | 2.02 (6) | 2.02 | (1.22) | 12 |
| 10/1/17 to 9/30/18 | | 12.91 | (0.17) | 2.46 | 2.29 | — | — | (0.86) | (0.86) | 1.43 | 14.34 | 18.58 | 14,408 | 1.99 (6) | 2.00 | (1.26) | 17 |
| 4/1/17 to 9/30/17(7) | | 11.32 | (0.07) | 1.82 | 1.75 | — | — | (0.16) | (0.16) | 1.59 | 12.91 | 15.51 | 14,052 | 2.08 (6) | 2.08 | (1.18) | 13 |
| 4/1/16 to 3/31/17 | | 11.27 | (0.13) | 1.33 | 1.20 | — | — | (1.15) | (1.15) | 0.05 | 11.32 | 11.47 (8) | 13,345 | 2.08 (6)(8)(9) | 2.09 | (1.16) (8) | 21 |
| 4/1/15 to 3/31/16 | | 11.93 | (0.12) | 0.11 | (0.01) | — | — | (0.65) | (0.65) | (0.66) | 11.27 | (0.31) | 19,832 | 2.05 (6) | 2.06 | (1.07) | 20 |
| Class I | | | | | | | | | | | | | | | | | |
| 10/1/19 to 9/30/20 | | $17.36 | (0.09) | 8.39 | 8.30 | — | — | (0.51) | (0.51) | 7.79 | $25.15 | 48.72 % | $ 46,600 | 1.01 % (6) | 1.02 % | (0.44) % | 4 % |
| 10/1/18 to 9/30/19 | | 19.02 | (0.04) | (0.07) | (0.11) | — | — | (1.55) | (1.55) | (1.66) | 17.36 | 1.29 | 22,315 | 1.02 (6) | 1.03 | (0.21) | 12 |
| 10/1/17 to 9/30/18 | | 16.69 | (0.05) | 3.24 | 3.19 | — | — | (0.86) | (0.86) | 2.33 | 19.02 | 19.81 | 17,125 | 0.99 (6) | 0.99 | (0.26) | 17 |
| 4/1/17 to 9/30/17(7) | | 14.52 | (0.01) | 2.34 | 2.33 | — | — | (0.16) | (0.16) | 2.17 | 16.69 | 16.09 | 12,466 | 1.08 (6) | 1.08 | (0.18) | 13 |
| 4/1/16 to 3/31/17 | | 14.00 | (0.01) | 1.68 | 1.67 | — | — | (1.15) | (1.15) | 0.52 | 14.52 | 12.61 (8) | 10,180 | 1.08 (6)(8)(9) | 1.09 | (0.15) (8) | 21 |
| 4/1/15 to 3/31/16 | | 14.53 | (0.01) | 0.13 | 0.12 | — | — | (0.65) | (0.65) | (0.53) | 14.00 | 0.66 | 8,227 | 1.05 (6) | 1.05 | (0.07) | 20 |
| Class R6 | | | | | | | | | | | | | | | | | |
| 10/1/19 to 9/30/20 | | $17.37 | (0.01) | 8.53 | 8.52 | — | — | (0.51) | (0.51) | 8.01 | $25.38 | 49.99 % | $ 279 | 0.72 % | 0.94 % | (0.06) % | 4 % |
| 10/1/18 to 9/30/19 | | 19.04 | (0.05) | (0.07) | (0.12) | — | — | (1.55) | (1.55) | (1.67) | 17.37 | 1.25 | 94 | 0.78 (10) | 0.94 | (0.27) | 12 |
| 1/30/18 (11) to 9/30/18 | | 18.46 | (—) (12) | 0.58 | 0.58 | — | — | — | — | 0.58 | 19.04 | 3.14 | 6,458 | 0.80 (10) | 0.91 | (0.03) | 17 (13) |
| | | | | | | | | | | | | | | | | | |
| KAR Equity Income Fund | | | | | | | | | | | | | | | | | |
| Class A | | | | | | | | | | | | | | | | | |
| 10/1/19 to 9/30/20 | | $20.62 | 0.15 | 2.47 | 2.62 | (0.21) | — | — | (0.21) | 2.41 | $23.03 | 12.75 % | $ 113,585 | 1.23 % (9) | 1.38 % | 0.72 % | 118 % |
| 10/1/18 to 9/30/19 | | 21.05 | 0.16 | (0.38) | (0.22) | (0.21) | — | — | (0.21) | (0.43) | 20.62 | (0.85) | 115,121 | 1.20 | 1.34 | 0.80 | 26 |
| 10/1/17 to 9/30/18 | | 20.26 | 0.14 | 2.02 | 2.16 | (0.06) | — | (1.31) | (1.37) | 0.79 | 21.05 | 10.84 | 118,904 | 1.20 | 1.31 | 0.71 | 24 |
| 4/1/17 to 9/30/17(7) | | 20.27 | 0.06 | 1.72 | 1.78 | (0.06) | — | (1.73) | (1.79) | (0.01) | 20.26 | 9.26 | 120,445 | 1.23 (10) | 1.39 | 0.63 | 110 |
| 4/1/16 to 3/31/17 | | 18.14 | 0.15 | 2.68 | 2.83 | (0.22) | — | (0.48) | (0.70) | 2.13 | 20.27 | 15.85 (8) | 113,442 | 1.26 (8)(9) | 1.40 | 0.81 | 496 |
| 4/1/15 to 3/31/16 | | 20.97 | 0.14 | 0.56 | 0.70 | (0.15) | — | (3.38) | (3.53) | (2.83) | 18.14 | 4.02 | 101,113 | 1.25 | 1.38 | 0.74 | 312 |
| Class C | | | | | | | | | | | | | | | | | |
| 10/1/19 to 9/30/20 | | $18.36 | (0.01) | 2.19 | 2.18 | (0.03) | — | — | (0.03) | 2.15 | $20.51 | 11.91 % | $ 6,394 | 1.97 % (9) | 2.13 % | (0.03) % | 118 % |
| 10/1/18 to 9/30/19 | | 18.71 | 0.01 | (0.33) | (0.32) | (0.03) | — | — | (0.03) | (0.35) | 18.36 | (1.65) | 7,769 | 1.95 | 2.10 | 0.07 | 26 |
| 10/1/17 to 9/30/18 | | 18.23 | (0.01) | 1.80 | 1.79 | — | — | (1.31) | (1.31) | 0.48 | 18.71 | 10.00 | 30,576 | 1.95 | 2.06 | (0.03) | 24 |
| 4/1/17 to 9/30/17(7) | | 18.44 | (0.02) | 1.56 | 1.54 | (0.02) | — | (1.73) | (1.75) | (0.21) | 18.23 | 8.85 | 32,710 | 1.98 (10) | 2.15 | (0.17) | 110 |
| 4/1/16 to 3/31/17 | | 16.48 | 0.01 | 2.44 | 2.45 | (0.01) | — | (0.48) | (0.49) | 1.96 | 18.44 | 15.01 (8) | 37,269 | 2.00 (8)(9) | 2.15 | 0.04 | 496 |
| 4/1/15 to 3/31/16 | | 19.42 | — (12) | 0.51 | 0.51 | (0.07) | — | (3.38) | (3.45) | (2.94) | 16.48 | 3.27 | 36,236 | 2.00 | 2.13 | 0.01 | 312 |
The footnote legend is at the end of the financial highlights.
See Notes to Financial Statements
VIRTUS EQUITY TRUST
FINANCIAL HIGHLIGHTS (Continued)
SELECTED PER SHARE DATA AND RATIOS FOR A SHARE OUTSTANDING
THROUGHOUT EACH PERIOD
| | | Net Asset Value,
Beginning of Period | Net Investment Income (Loss)(1) | Net Realized and
Unrealized Gain (Loss) | Total from Investment Operations | Dividends from
Net Investment Income | Return of Capital | Distributions from
Net Realized Gains | Total Distributions | Change in Net Asset Value | Net Asset Value, End of Period | Total Return(2)(3) | Net Assets, End of Period
(in thousands) | Ratio of Net Expenses to
Average Net Assets(4)(5) | Ratio of Gross Expenses
to Average Net Assets(4)(5) | Ratio of Net Investment Income (Loss)
to Average Net Assets(4) | Portfolio Turnover Rate(3) |
| KAR Equity Income Fund (Continued) | | | | | | | | | | | | | | | | | |
| Class I | | | | | | | | | | | | | | | | | |
| 10/1/19 to 9/30/20 | | $20.60 | 0.20 | 2.46 | 2.66 | (0.26) | — | — | (0.26) | 2.40 | $23.00 | 12.98 % | $ 10,319 | 0.98 % (9) | 1.13 % | 0.97 % | 118 % |
| 10/1/18 to 9/30/19 | | 21.03 | 0.21 | (0.38) | (0.17) | (0.26) | — | — | (0.26) | (0.43) | 20.60 | (0.58) | 10,654 | 0.95 | 1.09 | 1.06 | 26 |
| 10/1/17 to 9/30/18 | | 20.22 | 0.19 | 2.01 | 2.20 | (0.08) | — | (1.31) | (1.39) | 0.81 | 21.03 | 11.10 | 15,028 | 0.95 | 1.08 | 0.92 | 24 |
| 4/1/17 to 9/30/17(7) | | 20.22 | 0.09 | 1.71 | 1.80 | (0.07) | — | (1.73) | (1.80) | — | 20.22 | 9.41 | 32,485 | 0.98 (10) | 1.15 | 0.91 | 110 |
| 4/1/16 to 3/31/17 | | 18.13 | 0.21 | 2.66 | 2.87 | (0.30) | — | (0.48) | (0.78) | 2.09 | 20.22 | 16.16 (8) | 21,011 | 1.01 (8)(9) | 1.15 | 1.13 | 496 |
| 4/1/15 to 3/31/16 | | 20.96 | 0.21 | 0.53 | 0.74 | (0.19) | — | (3.38) | (3.57) | (2.83) | 18.13 | 4.25 | 11,991 | 1.00 | 1.13 | 1.13 | 312 |
| Class R6 | | | | | | | | | | | | | | | | | |
| 10/1/19 to 9/30/20 | | $20.56 | 0.21 | 2.47 | 2.68 | (0.28) | — | — | (0.28) | 2.40 | $22.96 | 13.08 % | $ 793 | 0.93 % (9) | 1.05 % | 1.01 % | 118 % |
| 10/1/18 to 9/30/19 | | 21.03 | 0.20 | (0.37) | (0.17) | (0.30) | — | — | (0.30) | (0.47) | 20.56 | (0.56) | 935 | 0.91 | 1.03 | 1.02 | 26 |
| 1/30/18 (11) to 9/30/18 | | 20.70 | 0.15 | 0.18 | 0.33 | — | — | — | — | 0.33 | 21.03 | 1.59 | 4,999 | 0.91 | 1.00 | 1.16 | 24 |
| | | | | | | | | | | | | | | | | | |
| KAR Global Quality Dividend Fund | | | | | | | | | | | | | | | | | |
| Class A | | | | | | | | | | | | | | | | | |
| 10/1/19 to 9/30/20 | | $14.78 | 0.31 | (1.99) | (1.68) | (0.34) | — | — | (0.34) | (2.02) | $12.76 | (11.69) % | $ 22,089 | 1.35 % | 1.61 % | 2.32 % | 53 % |
| 10/1/18 to 9/30/19 | | 14.98 | 0.38 | 0.85 | 1.23 | (0.39) | — | (1.04)��� | (1.43) | (0.20) | 14.78 | 9.64 | 29,367 | 1.35 | 1.56 | 2.71 | 35 |
| 10/1/17 to 9/30/18 | | 16.20 | 0.40 | 0.25 | 0.65 | (0.65) | — | (1.22) | (1.87) | (1.22) | 14.98 | 4.24 | 26,351 | 1.35 | 1.50 | 2.63 | 33 |
| 4/1/17 to 9/30/17(7) | | 16.81 | 0.30 | 0.41 | 0.71 | (0.27) | — | (1.05) | (1.32) | (0.61) | 16.20 | 4.31 | 44,188 | 1.35 | 1.56 | 3.65 | 13 |
| 4/1/16 to 3/31/17 | | 15.09 | 0.20 | 1.66 | 1.86 | (0.14) | — | — | (0.14) | 1.72 | 16.81 | 12.42 | 46,670 | 1.36 (9) | 1.48 | 1.29 | 119 |
| 4/1/15 to 3/31/16 | | 15.40 | 0.14 | (0.37) | (0.23) | (0.08) | — | — | (0.08) | (0.31) | 15.09 | (1.53) | 50,081 | 1.35 | 1.44 | 0.94 | 25 |
| Class C | | | | | | | | | | | | | | | | | |
| 10/1/19 to 9/30/20 | | $14.23 | 0.20 | (1.92) | (1.72) | (0.22) | — | — | (0.22) | (1.94) | $12.29 | (12.34) % | $ 1,467 | 2.10 % | 2.35 % | 1.53 % | 53 % |
| 10/1/18 to 9/30/19 | | 14.52 | 0.24 | 0.83 | 1.07 | (0.32) | — | (1.04) | (1.36) | (0.29) | 14.23 | 8.74 | 3,178 | 2.10 | 2.29 | 1.79 | 35 |
| 10/1/17 to 9/30/18 | | 15.82 | 0.32 | 0.22 | 0.54 | (0.62) | — | (1.22) | (1.84) | (1.30) | 14.52 | 3.56 | 5,127 | 2.10 | 2.25 | 2.16 | 33 |
| 4/1/17 to 9/30/17(7) | | 16.38 | 0.23 | 0.39 | 0.62 | (0.13) | — | (1.05) | (1.18) | (0.56) | 15.82 | 3.86 | 6,107 | 2.10 | 2.33 | 2.87 | 13 |
| 4/1/16 to 3/31/17 | | 14.68 | 0.08 | 1.62 | 1.70 | — | — | — | — | 1.70 | 16.38 | 11.58 | 6,950 | 2.11 (9) | 2.23 | 0.54 | 119 |
| 4/1/15 to 3/31/16 | | 15.03 | 0.01 | (0.35) | (0.34) | (0.01) | — | — | (0.01) | (0.35) | 14.68 | (2.26) | 8,211 | 2.10 | 2.18 | 0.10 | 25 |
| Class I | | | | | | | | | | | | | | | | | |
| 10/1/19 to 9/30/20 | | $14.79 | 0.35 | (1.99) | (1.64) | (0.38) | — | — | (0.38) | (2.02) | $12.77 | (11.47) % | $ 10,259 | 1.10 % | 1.40 % | 2.66 % | 53 % |
| 10/1/18 to 9/30/19 | | 15.02 | 0.42 | 0.83 | 1.25 | (0.44) | — | (1.04) | (1.48) | (0.23) | 14.79 | 9.85 | 7,246 | 1.10 | 1.36 | 3.00 | 35 |
| 10/1/17 to 9/30/18 | | 16.20 | 0.47 | 0.23 | 0.70 | (0.66) | — | (1.22) | (1.88) | (1.18) | 15.02 | 4.56 | 4,843 | 1.10 | 1.29 | 3.14 | 33 |
| 4/1/17 to 9/30/17(7) | | 16.84 | 0.29 | 0.44 | 0.73 | (0.32) | — | (1.05) | (1.37) | (0.64) | 16.20 | 4.41 | 6,524 | 1.10 | 1.33 | 3.53 | 13 |
| 4/1/16 to 3/31/17 | | 15.12 | 0.25 | 1.65 | 1.90 | (0.18) | — | — | (0.18) | 1.72 | 16.84 | 12.66 | 7,096 | 1.11 (9) | 1.23 | 1.59 | 119 |
| 4/1/15 to 3/31/16 | | 15.40 | 0.17 | (0.35) | (0.18) | (0.10) | — | — | (0.10) | (0.28) | 15.12 | (1.21) | 6,496 | 1.10 | 1.18 | 1.15 | 25 |
| Class R6 | | | | | | | | | | | | | | | | | |
| 10/1/19 to 9/30/20 | | $14.80 | 0.39 | (1.99) | (1.60) | (0.39) | — | — | (0.39) | (1.99) | $12.81 | (11.18) % | $ 90 | 0.78 % | 1.27 % | 2.92 % | 53 % |
| 8/1/19 (11) to 9/30/19 | | 14.23 | 0.08 | 0.49 | 0.57 | — | — | — | — | 0.57 | 14.80 | 4.01 | 104 | 0.78 | 1.27 | 3.39 | 35 (13) |
The footnote legend is at the end of the financial highlights.
See Notes to Financial Statements
VIRTUS EQUITY TRUST
FINANCIAL HIGHLIGHTS (Continued)
SELECTED PER SHARE DATA AND RATIOS FOR A SHARE OUTSTANDING
THROUGHOUT EACH PERIOD
| | | Net Asset Value,
Beginning of Period | Net Investment Income (Loss)(1) | Net Realized and
Unrealized Gain (Loss) | Total from Investment Operations | Dividends from
Net Investment Income | Return of Capital | Distributions from
Net Realized Gains | Total Distributions | Change in Net Asset Value | Net Asset Value, End of Period | Total Return(2)(3) | Net Assets, End of Period
(in thousands) | Ratio of Net Expenses to
Average Net Assets(4)(5) | Ratio of Gross Expenses
to Average Net Assets(4)(5) | Ratio of Net Investment Income (Loss)
to Average Net Assets(4) | Portfolio Turnover Rate(3) |
| | | | | | | | | | | | | | | | | | |
| KAR Mid-Cap Core Fund | | | | | | | | | | | | | | | | | |
| Class A | | | | | | | | | | | | | | | | | |
| 10/1/19 to 9/30/20 | | $35.05 | (0.16) | 5.19 | 5.03 | — | — | (0.15) | (0.15) | 4.88 | $39.93 | 14.39 % | $ 56,677 | 1.20 % | 1.34 % | (0.44) % | 19 % |
| 10/1/18 to 9/30/19 | | 33.71 | (0.08) | 1.65 | 1.57 | — | — | (0.23) | (0.23) | 1.34 | 35.05 | 4.79 | 46,934 | 1.20 | 1.36 | (0.23) | 28 |
| 10/1/17 to 9/30/18 | | 27.95 | (0.09) | 5.85 | 5.76 | — | — | — | — | 5.76 | 33.71 | 20.61 | 33,120 | 1.20 | 1.39 | (0.29) | 21 |
| 4/1/17 to 9/30/17(7) | | 25.80 | (0.05) | 2.29 | 2.24 | — | — | (0.09) | (0.09) | 2.15 | 27.95 | 8.70 | 26,238 | 1.20 | 1.49 | (0.35) | 11 |
| 4/1/16 to 3/31/17 | | 22.60 | (0.08) | 3.28 | 3.20 | — | — | — | — | 3.20 | 25.80 | 14.16 | 20,615 | 1.26 (9)(10) | 1.55 | (0.32) | 28 |
| 4/1/15 to 3/31/16 | | 23.00 | (0.06) | (0.20) | (0.26) | — | — | (0.14) | (0.14) | (0.40) | 22.60 | (1.14) | 20,639 | 1.35 | 1.64 | (0.27) | 21 |
| Class C | | | | | | | | | | | | | | | | | |
| 10/1/19 to 9/30/20 | | $32.58 | (0.40) | 4.79 | 4.39 | — | — | (0.15) | (0.15) | 4.24 | $36.82 | 13.51 % | $ 49,164 | 1.95 % | 2.10 % | (1.19) % | 19 % |
| 10/1/18 to 9/30/19 | | 31.58 | (0.30) | 1.53 | 1.23 | — | — | (0.23) | (0.23) | 1.00 | 32.58 | 4.03 | 43,268 | 1.95 | 2.11 | (0.98) | 28 |
| 10/1/17 to 9/30/18 | | 26.38 | (0.31) | 5.51 | 5.20 | — | — | — | — | 5.20 | 31.58 | 19.71 | 30,661 | 1.95 | 2.14 | (1.04) | 21 |
| 4/1/17 to 9/30/17(7) | | 24.45 | (0.14) | 2.16 | 2.02 | — | — | (0.09) | (0.09) | 1.93 | 26.38 | 8.28 | 17,870 | 1.95 | 2.25 | (1.10) | 11 |
| 4/1/16 to 3/31/17 | | 21.57 | (0.24) | 3.12 | 2.88 | — | — | — | — | 2.88 | 24.45 | 13.35 | 14,279 | 2.00 (9)(10) | 2.28 | (1.04) | 28 |
| 4/1/15 to 3/31/16 | | 22.12 | (0.22) | (0.19) | (0.41) | — | — | (0.14) | (0.14) | (0.55) | 21.57 | (1.91) | 6,670 | 2.10 | 2.38 | (1.03) | 21 |
| Class I | | | | | | | | | | | | | | | | | |
| 10/1/19 to 9/30/20 | | $35.72 | (0.07) | 5.29 | 5.22 | — | — | (0.15) | (0.15) | 5.07 | $40.79 | 14.65 % | $ 658,291 | 0.95 % | 1.09 % | (0.18) % | 19 % |
| 10/1/18 to 9/30/19 | | 34.26 | 0.01 | 1.68 | 1.69 | — | — | (0.23) | (0.23) | 1.46 | 35.72 | 5.06 | 329,591 | 0.95 | 1.11 | 0.03 | 28 |
| 10/1/17 to 9/30/18 | | 28.34 | (0.01) | 5.93 | 5.92 | — | — | — | — | 5.92 | 34.26 | 20.93 | 167,649 | 0.95 | 1.14 | (0.03) | 21 |
| 4/1/17 to 9/30/17(7) | | 26.12 | (0.01) | 2.32 | 2.31 | — | — | (0.09) | (0.09) | 2.22 | 28.34 | 8.82 | 69,955 | 0.95 | 1.25 | (0.10) | 11 |
| 4/1/16 to 3/31/17 | | 22.82 | (0.01) | 3.31 | 3.30 | — | — | — | — | 3.30 | 26.12 | 14.46 | 50,922 | 0.99 (9)(10) | 1.26 | (0.02) | 28 |
| 4/1/15 to 3/31/16 | | 23.17 | (0.01) | (0.20) | (0.21) | — | — | (0.14) | (0.14) | (0.35) | 22.82 | (0.92) | 7,570 | 1.10 | 1.38 | (0.03) | 21 |
| Class R6 | | | | | | | | | | | | | | | | | |
| 10/1/19 to 9/30/20 | | $35.77 | (0.04) | 5.31 | 5.27 | — | — | (0.15) | (0.15) | 5.12 | $40.89 | 14.77 % | $ 19,666 | 0.87 % | 1.00 % | (0.10) % | 19 % |
| 10/1/18 to 9/30/19 | | 34.28 | 0.04 | 1.68 | 1.72 | — | — | (0.23) | (0.23) | 1.49 | 35.77 | 5.15 | 11,323 | 0.87 | 1.01 | 0.11 | 28 |
| 1/30/18 (11) to 9/30/18 | | 32.78 | 0.02 | 1.48 | 1.50 | — | — | — | — | 1.50 | 34.28 | 4.58 | 2,474 | 0.87 | 1.06 | 0.10 | 21 (13) |
| | | | | | | | | | | | | | | | | | |
| KAR Mid-Cap Growth Fund | | | | | | | | | | | | | | | | | |
| Class A | | | | | | | | | | | | | | | | | |
| 10/1/19 to 9/30/20 | | $37.39 | (0.42) | 21.34 | 20.92 | — | — | (0.26) | (0.26) | 20.66 | $58.05 | 56.23 % | $ 482,266 | 1.28 % (6)(14) | 1.26 % | (0.90) % | 14 % |
| 10/1/18 to 9/30/19 | | 35.55 | (0.31) | 2.79 | 2.48 | — | — | (0.64) | (0.64) | 1.84 | 37.39 | 7.46 | 181,184 | 1.40 (6)(14) | 1.33 | (0.87) | 28 |
| 10/1/17 to 9/30/18 | | 27.74 | (0.28) | 9.65 | 9.37 | — | — | (1.56) | (1.56) | 7.81 | 35.55 | 35.38 | 131,422 | 1.40 (14) | 1.37 | (0.88) | 19 |
| 4/1/17 to 9/30/17(7) | | 24.56 | (0.12) | 3.43 | 3.31 | — | — | (0.13) | (0.13) | 3.18 | 27.74 | 13.48 | 84,912 | 1.40 | 1.49 | (0.88) | 12 |
| 4/1/16 to 3/31/17 | | 21.92 | (0.16) | 3.15 | 2.99 | — | — | (0.35) | (0.35) | 2.64 | 24.56 | 13.81 (8) | 80,648 | 1.41 (8)(9) | 1.52 | (0.75) (8) | 20 |
| 4/1/15 to 3/31/16 | | 22.80 | (0.18) | (0.36) | (0.54) | — | — | (0.34) | (0.34) | (0.88) | 21.92 | (2.51) | 76,660 | 1.39 | 1.49 | (0.84) | 26 |
| Class C | | | | | | | | | | | | | | | | | |
| 10/1/19 to 9/30/20 | | $29.38 | (0.60) | 16.66 | 16.06 | — | — | (0.26) | (0.26) | 15.80 | $45.18 | 55.01 % | $ 112,165 | 2.03 % (6)(14) | 2.02 % | (1.65) % | 14 % |
| 10/1/18 to 9/30/19 | | 28.30 | (0.47) | 2.19 | 1.72 | — | — | (0.64) | (0.64) | 1.08 | 29.38 | 6.67 | 40,450 | 2.15 (6)(14) | 2.12 | (1.62) | 28 |
| 10/1/17 to 9/30/18 | | 22.54 | (0.42) | 7.74 | 7.32 | — | — | (1.56) | (1.56) | 5.76 | 28.30 | 34.40 | 12,571 | 2.15 | 2.17 | (1.63) | 19 |
| 4/1/17 to 9/30/17(7) | | 20.06 | (0.17) | 2.78 | 2.61 | — | — | (0.13) | (0.13) | 2.48 | 22.54 | 13.01 | 4,971 | 2.15 | 2.28 | (1.63) | 12 |
| 4/1/16 to 3/31/17 | | 18.09 | (0.27) | 2.59 | 2.32 | — | — | (0.35) | (0.35) | 1.97 | 20.06 | 13.03 (8) | 5,350 | 2.16 (8)(9) | 2.27 | (1.50) (8) | 20 |
| 4/1/15 to 3/31/16 | | 19.02 | (0.29) | (0.30) | (0.59) | — | — | (0.34) | (0.34) | (0.93) | 18.09 | (3.23) | 5,319 | 2.14 | 2.24 | (1.60) | 26 |
The footnote legend is at the end of the financial highlights.
See Notes to Financial Statements
VIRTUS EQUITY TRUST
FINANCIAL HIGHLIGHTS (Continued)
SELECTED PER SHARE DATA AND RATIOS FOR A SHARE OUTSTANDING
THROUGHOUT EACH PERIOD
| | | Net Asset Value,
Beginning of Period | Net Investment Income (Loss)(1) | Net Realized and
Unrealized Gain (Loss) | Total from Investment Operations | Dividends from
Net Investment Income | Return of Capital | Distributions from
Net Realized Gains | Total Distributions | Change in Net Asset Value | Net Asset Value, End of Period | Total Return(2)(3) | Net Assets, End of Period
(in thousands) | Ratio of Net Expenses to
Average Net Assets(4)(5) | Ratio of Gross Expenses
to Average Net Assets(4)(5) | Ratio of Net Investment Income (Loss)
to Average Net Assets(4) | Portfolio Turnover Rate(3) |
| KAR Mid-Cap Growth Fund (Continued) | | | | | | | | | | | | | | | | | |
| Class I | | | | | | | | | | | | | | | | | |
| 10/1/19 to 9/30/20 | | $38.70 | (0.33) | 22.05 | 21.72 | — | — | (0.26) | (0.26) | 21.46 | $60.16 | 56.39 % | $1,837,262 | 1.03 % (6) | 1.03 % | (0.66) % | 14 % |
| 10/1/18 to 9/30/19 | | 36.66 | (0.22) | 2.90 | 2.68 | — | — | (0.64) | (0.64) | 2.04 | 38.70 | 7.79 | 309,892 | 1.11 (6)(14) | 1.11 | (0.58) | 28 |
| 10/1/17 to 9/30/18 | | 28.49 | (0.22) | 9.95 | 9.73 | — | — | (1.56) | (1.56) | 8.17 | 36.66 | 35.72 | 56,787 | 1.15 (14) | 1.13 | (0.65) | 19 |
| 4/1/17 to 9/30/17(7) | | 25.20 | (0.09) | 3.51 | 3.42 | — | — | (0.13) | (0.13) | 3.29 | 28.49 | 13.58 | 4,419 | 1.15 | 1.27 | (0.63) | 12 |
| 4/1/16 to 3/31/17 | | 22.42 | (0.11) | 3.24 | 3.13 | — | — | (0.35) | (0.35) | 2.78 | 25.20 | 14.13 (8) | 3,872 | 1.16 (8)(9) | 1.27 | (0.50) (8) | 20 |
| 4/1/15 to 3/31/16 | | 23.26 | (0.13) | (0.37) | (0.50) | — | — | (0.34) | (0.34) | (0.84) | 22.42 | (2.24) | 2,961 | 1.14 | 1.24 | (0.60) | 26 |
| Class R6 | | | | | | | | | | | | | | | | | |
| 10/1/19 to 9/30/20 | | $38.85 | (0.28) | 22.18 | 21.90 | — | — | (0.26) | (0.26) | 21.64 | $60.49 | 56.64 % | $ 100,461 | 0.83 % | 0.93 % | (0.51) % | 14 % |
| 10/1/18 to 9/30/19 | | 36.71 | (0.13) | 2.91 | 2.78 | — | — | (0.64) | (0.64) | 2.14 | 38.85 | 8.05 | 1,975 | 0.85 (10)(14) | 1.01 | (0.34) | 28 |
| 1/30/18 (11) to 9/30/18 | | 31.74 | (0.09) | 5.06 | 4.97 | — | — | — | — | 4.97 | 36.71 | 15.66 | 117 | 0.93 (10) | 1.09 | (0.40) | 19 (13) |
| | | | | | | | | | | | | | | | | | |
| KAR Small-Cap Core Fund | | | | | | | | | | | | | | | | | |
| Class A | | | | | | | | | | | | | | | | | |
| 10/1/19 to 9/30/20 | | $38.20 | (0.17) | 3.84 | 3.67 | — | — | (1.66) | (1.66) | 2.01 | $40.21 | 9.78 % | $ 112,178 | 1.28 % | 1.28 % | (0.46) % | 19 % |
| 10/1/18 to 9/30/19 | | 35.42 | (0.08) | 4.14 | 4.06 | — | — | (1.28) | (1.28) | 2.78 | 38.20 | 12.50 | 133,702 | 1.29 | 1.29 | (0.24) | 9 |
| 10/1/17 to 9/30/18 | | 28.05 | (0.03) | 7.44 | 7.41 | — | — | (0.04) | (0.04) | 7.37 | 35.42 | 26.42 | 153,109 | 1.29 | 1.29 | (0.08) | 13 |
| 4/1/17 to 9/30/17(7) | | 24.21 | (0.06) | 3.91 | 3.85 | — | — | (0.01) | (0.01) | 3.84 | 28.05 | 15.92 | 79,752 | 1.33 | 1.33 | (0.49) | 2 |
| 4/1/16 to 3/31/17 | | 21.39 | (0.07) | 4.26 | 4.19 | — | — | (1.37) | (1.37) | 2.82 | 24.21 | 20.26 (8) | 62,122 | 1.37 (8)(9) | 1.37 | (0.31) (8) | 24 |
| 4/1/15 to 3/31/16 | | 25.65 | (0.05) | 0.01 | (0.04) | (0.05) | — | (4.17) | (4.22) | (4.26) | 21.39 | 0.02 | 53,722 | 1.37 | 1.37 | (0.21) | 33 |
| Class C | | | | | | | | | | | | | | | | | |
| 10/1/19 to 9/30/20 | | $31.81 | (0.37) | 3.17 | 2.80 | — | — | (1.66) | (1.66) | 1.14 | $32.95 | 8.98 % | $ 89,553 | 2.01 % | 2.01 % | (1.20) % | 19 % |
| 10/1/18 to 9/30/19 | | 29.95 | (0.28) | 3.42 | 3.14 | — | — | (1.28) | (1.28) | 1.86 | 31.81 | 11.69 | 106,191 | 2.03 | 2.03 | (0.99) | 9 |
| 10/1/17 to 9/30/18 | | 23.90 | (0.23) | 6.32 | 6.09 | — | — | (0.04) | (0.04) | 6.05 | 29.95 | 25.52 | 122,439 | 2.02 | 2.02 | (0.82) | 13 |
| 4/1/17 to 9/30/17(7) | | 20.71 | (0.14) | 3.34 | 3.20 | — | — | (0.01) | (0.01) | 3.19 | 23.90 | 15.47 | 56,526 | 2.08 | 2.08 | (1.23) | 2 |
| 4/1/16 to 3/31/17 | | 18.61 | (0.21) | 3.68 | 3.47 | — | — | (1.37) | (1.37) | 2.10 | 20.71 | 19.39 (8) | 44,789 | 2.12 (8)(9) | 2.12 | (1.10) (8) | 24 |
| 4/1/15 to 3/31/16 | | 22.98 | (0.19) | (0.01) | (0.20) | — | — | (4.17) | (4.17) | (4.37) | 18.61 | (0.73) | 31,711 | 2.12 | 2.12 | (0.95) | 33 |
| Class I | | | | | | | | | | | | | | | | | |
| 10/1/19 to 9/30/20 | | $40.33 | (0.07) | 4.08 | 4.01 | (0.01) | — | (1.66) | (1.67) | 2.34 | $42.67 | 10.11 % | $1,082,010 | 1.00 % | 1.00 % | (0.18) % | 19 % |
| 10/1/18 to 9/30/19 | | 37.26 | — (12) | 4.39 | 4.39 | (0.04) | — | (1.28) | (1.32) | 3.07 | 40.33 | 12.83 | 1,202,004 | 1.02 | 1.02 | 0.01 | 9 |
| 10/1/17 to 9/30/18 | | 29.44 | 0.06 | 7.80 | 7.86 | — | — | (0.04) | (0.04) | 7.82 | 37.26 | 26.73 | 1,231,686 | 1.01 | 1.01 | 0.18 | 13 |
| 4/1/17 to 9/30/17(7) | | 25.37 | (0.03) | 4.11 | 4.08 | — | — | (0.01) | (0.01) | 4.07 | 29.44 | 16.10 | 474,552 | 1.08 | 1.08 | (0.23) | 2 |
| 4/1/16 to 3/31/17 | | 22.30 | (0.03) | 4.47 | 4.44 | — | — | (1.37) | (1.37) | 3.07 | 25.37 | 20.57 (8) | 338,491 | 1.12 (8)(9) | 1.12 | (0.11) (8) | 24 |
| 4/1/15 to 3/31/16 | | 26.58 | 0.01 | 0.01 | 0.02 | (0.13) | — | (4.17) | (4.30) | (4.28) | 22.30 | 0.28 | 189,167 | 1.12 | 1.12 | 0.04 | 33 |
| Class R6 | | | | | | | | | | | | | | | | | |
| 10/1/19 to 9/30/20 | | $40.50 | (0.06) | 4.10 | 4.04 | (0.04) | — | (1.66) | (1.70) | 2.34 | $42.84 | 10.15 % | $ 294,883 | 0.93 % | 0.93 % | (0.14) % | 19 % |
| 10/1/18 to 9/30/19 | | 37.40 | 0.04 | 4.40 | 4.44 | (0.06) | — | (1.28) | (1.34) | 3.10 | 40.50 | 12.94 | 107,611 | 0.94 | 0.94 | 0.10 | 9 |
| 10/1/17 to 9/30/18 | | 29.52 | 0.09 | 7.83 | 7.92 | — | — | (0.04) | (0.04) | 7.88 | 37.40 | 26.86 | 88,563 | 0.94 | 0.94 | 0.25 | 13 |
| 4/1/17 to 9/30/17(7) | | 25.44 | (0.02) | 4.11 | 4.09 | — | — | (0.01) | (0.01) | 4.08 | 29.52 | 16.14 | 44,565 | 0.99 | 0.99 | (0.14) | 2 |
| 4/1/16 to 3/31/17 | | 22.33 | — (12) | 4.48 | 4.48 | — | — | (1.37) | (1.37) | 3.11 | 25.44 | 20.68 (8) | 31,338 | 1.01 (8)(9) | 1.01 | 0.01 (8) | 24 |
| 4/1/15 to 3/31/16 | | 26.59 | 0.07 | (0.01) | 0.06 | (0.15) | — | (4.17) | (4.32) | (4.26) | 22.33 | 0.41 | 20,811 | 1.01 | 1.02 | 0.33 | 33 |
The footnote legend is at the end of the financial highlights.
See Notes to Financial Statements
VIRTUS EQUITY TRUST
FINANCIAL HIGHLIGHTS (Continued)
SELECTED PER SHARE DATA AND RATIOS FOR A SHARE OUTSTANDING
THROUGHOUT EACH PERIOD
| | | Net Asset Value,
Beginning of Period | Net Investment Income (Loss)(1) | Net Realized and
Unrealized Gain (Loss) | Total from Investment Operations | Dividends from
Net Investment Income | Return of Capital | Distributions from
Net Realized Gains | Total Distributions | Change in Net Asset Value | Net Asset Value, End of Period | Total Return(2)(3) | Net Assets, End of Period
(in thousands) | Ratio of Net Expenses to
Average Net Assets(4)(5) | Ratio of Gross Expenses
to Average Net Assets(4)(5) | Ratio of Net Investment Income (Loss)
to Average Net Assets(4) | Portfolio Turnover Rate(3) |
| | | | | | | | | | | | | | | | | | |
| KAR Small-Cap Growth Fund | | | | | | | | | | | | | | | | | |
| Class A | | | | | | | | | | | | | | | | | |
| 10/1/19 to 9/30/20 | | $37.44 | (0.41) | 12.59 | 12.18 | — | — | (0.62) | (0.62) | 11.56 | $49.00 | 32.91 % | $ 772,158 | 1.35 % (6) | 1.35 % | (0.99) % | 17 % |
| 10/1/18 to 9/30/19 | | 33.57 | (0.23) | 4.78 | 4.55 | — | (0.04) | (0.64) | (0.68) | 3.87 | 37.44 | 14.12 | 735,210 | 1.37 (6) | 1.37 | (0.66) | 16 |
| 10/1/17 to 9/30/18 | | 25.43 | (0.11) | 8.25 | 8.14 | — | — | — | — | 8.14 | 33.57 | 32.01 | 866,966 | 1.37 (6) | 1.37 | (0.37) | 13 |
| 4/1/17 to 9/30/17(7) | | 21.12 | (0.09) | 4.40 | 4.31 | — (12) | — | — | — (12) | 4.31 | 25.43 | 20.41 | 263,281 | 1.50 (14) | 1.46 | (0.81) | 1 |
| 4/1/16 to 3/31/17 | | 17.67 | (0.14) | 4.14 | 4.00 | — | — | (0.55) | (0.55) | 3.45 | 21.12 | 23.25 (8) | 184,302 | 1.50 (8)(9) | 1.51 | (0.73) (8) | 21 |
| 4/1/15 to 3/31/16 | | 17.54 | (0.10) | 0.73 | 0.63 | — | — | (0.50) | (0.50) | 0.13 | 17.67 | 3.69 | 88,715 | 1.49 | 1.53 | (0.59) | 27 |
| Class C | | | | | | | | | | | | | | | | | |
| 10/1/19 to 9/30/20 | | $33.46 | (0.63) | 11.19 | 10.56 | — | — | (0.62) | (0.62) | 9.94 | $43.40 | 31.97 % | $ 322,672 | 2.07 % (6) | 2.07 % | (1.72) % | 17 % |
| 10/1/18 to 9/30/19 | | 30.30 | (0.44) | 4.28 | 3.84 | — | (0.04) | (0.64) | (0.68) | 3.16 | 33.46 | 13.28 | 291,693 | 2.10 (6) | 2.10 | (1.40) | 16 |
| 10/1/17 to 9/30/18 | | 23.13 | (0.31) | 7.48 | 7.17 | — | — | — | — | 7.17 | 30.30 | 31.00 | 301,749 | 2.10 (6) | 2.10 | (1.10) | 13 |
| 4/1/17 to 9/30/17(7) | | 19.28 | (0.17) | 4.02 | 3.85 | — (12) | — | — | — (12) | 3.85 | 23.13 | 19.97 | 93,560 | 2.25 (14) | 2.21 | (1.56) | 1 |
| 4/1/16 to 3/31/17 | | 16.30 | (0.26) | 3.79 | 3.53 | — | — | (0.55) | (0.55) | 2.98 | 19.28 | 22.30 (8) | 58,327 | 2.26 (8)(9) | 2.26 | (1.49) (8) | 21 |
| 4/1/15 to 3/31/16 | | 16.33 | (0.21) | 0.68 | 0.47 | — | — | (0.50) | (0.50) | (0.03) | 16.30 | 2.97 | 19,525 | 2.25 | 2.28 | (1.34) | 27 |
| Class I | | | | | | | | | | | | | | | | | |
| 10/1/19 to 9/30/20 | | $38.28 | (0.31) | 12.90 | 12.59 | — | — | (0.62) | (0.62) | 11.97 | $50.25 | 33.27 % | $5,251,980 | 1.09 % (6) | 1.09 % | (0.74) % | 17 % |
| 10/1/18 to 9/30/19 | | 34.21 | (0.14) | 4.89 | 4.75 | — | (0.04) | (0.64) | (0.68) | 4.07 | 38.28 | 14.44 | 3,973,860 | 1.11 (6) | 1.11 | (0.40) | 16 |
| 10/1/17 to 9/30/18 | | 25.86 | (0.03) | 8.38 | 8.35 | — | — | — | — | 8.35 | 34.21 | 32.29 | 4,121,658 | 1.10 (6) | 1.10 | (0.10) | 13 |
| 4/1/17 to 9/30/17(7) | | 21.45 | (0.07) | 4.48 | 4.41 | — (12) | — | — | — (12) | 4.41 | 25.86 | 20.56 | 1,087,430 | 1.25 (14) | 1.21 | (0.55) | 1 |
| 4/1/16 to 3/31/17 | | 17.89 | (0.10) | 4.21 | 4.11 | — | — | (0.55) | (0.55) | 3.56 | 21.45 | 23.59 (8) | 489,593 | 1.26 (8)(9) | 1.26 | (0.50) (8) | 21 |
| 4/1/15 to 3/31/16 | | 17.70 | (0.05) | 0.74 | 0.69 | — | — | (0.50) | (0.50) | 0.19 | 17.89 | 4.00 | 98,270 | 1.25 | 1.29 | (0.31) | 27 |
| Class R6 | | | | | | | | | | | | | | | | | |
| 10/1/19 to 9/30/20 | | $38.35 | (0.29) | 12.95 | 12.66 | — | — | (0.62) | (0.62) | 12.04 | $50.39 | 33.39 % | $ 95,061 | 0.99 % (6) | 0.99 % | (0.68) % | 17 % |
| 10/1/18 to 9/30/19 | | 34.23 | (0.12) | 4.92 | 4.80 | — | (0.04) | (0.64) | (0.68) | 4.12 | 38.35 | 14.58 | 45,306 | 1.00 (6) | 1.00 | (0.31) | 16 |
| 1/30/18 (11) to 9/30/18 | | 29.81 | 0.01 | 4.41 | 4.42 | — | — | — | — | 4.42 | 34.23 | 14.83 | 13,800 | 1.00 (6) | 1.00 | 0.05 | 13 |
| | | | | | | | | | | | | | | | | | |
| KAR Small-Cap Value Fund | | | | | | | | | | | | | | | | | |
| Class A | | | | | | | | | | | | | | | | | |
| 10/1/19 to 9/30/20 | | $18.33 | 0.12 | 1.63 | 1.75 | (0.11) | — | — | (0.11) | 1.64 | $19.97 | 9.57 % | $ 83,622 | 1.23 % (6) | 1.23 % | 0.66 % | 19 % |
| 10/1/18 to 9/30/19 | | 19.44 | 0.14 | (0.93) | (0.79) | (0.13) | — | (0.19) | (0.32) | (1.11) | 18.33 | (3.82) | 79,027 | 1.24 (6) | 1.24 | 0.80 | 14 |
| 10/1/17 to 9/30/18 | | 18.41 | 0.10 | 1.23 | 1.33 | (0.01) | — | (0.29) | (0.30) | 1.03 | 19.44 | 7.27 | 83,276 | 1.27 (6) | 1.27 | 0.55 | 6 |
| 4/1/17 to 9/30/17(7) | | 17.61 | 0.03 | 1.44 | 1.47 | (0.02) | — | (0.65) | (0.67) | 0.80 | 18.41 | 8.56 | 87,399 | 1.32 (6) | 1.32 | 0.29 | 10 |
| 4/1/16 to 3/31/17 | | 15.67 | 0.22 | 3.16 | 3.38 | (0.26) | — | (1.18) | (1.44) | 1.94 | 17.61 | 22.86 | 89,050 | 1.32 (6)(9) | 1.32 | 1.35 | 22 |
| 4/1/15 to 3/31/16 | | 16.61 | 0.07 | 0.07 | 0.14 | (0.10) | — | (0.98) | (1.08) | (0.94) | 15.67 | 0.94 | 71,280 | 1.30 (6) | 1.30 | 0.49 | 15 |
| Class C | | | | | | | | | | | | | | | | | |
| 10/1/19 to 9/30/20 | | $17.88 | (0.01) | 1.57 | 1.56 | — | — | — | — | 1.56 | $19.44 | 8.72 % | $ 16,233 | 1.98 % (6) | 1.98 % | (0.08) % | 19 % |
| 10/1/18 to 9/30/19 | | 18.96 | 0.01 | (0.90) | (0.89) | — | — | (0.19) | (0.19) | (1.08) | 17.88 | (4.56) | 15,361 | 1.99 (6) | 1.99 | 0.09 | 14 |
| 10/1/17 to 9/30/18 | | 18.08 | (0.03) | 1.20 | 1.17 | — | — | (0.29) | (0.29) | 0.88 | 18.96 | 6.54 | 29,922 | 1.97 (6) | 1.97 | (0.14) | 6 |
| 4/1/17 to 9/30/17(7) | | 17.35 | (0.04) | 1.42 | 1.38 | — | — | (0.65) | (0.65) | 0.73 | 18.08 | 8.17 | 29,795 | 2.06 (6) | 2.06 | (0.45) | 10 |
| 4/1/16 to 3/31/17 | | 15.45 | 0.10 | 3.11 | 3.21 | (0.13) | — | (1.18) | (1.31) | 1.90 | 17.35 | 21.95 | 29,416 | 2.07 (6)(9) | 2.07 | 0.65 | 22 |
| 4/1/15 to 3/31/16 | | 16.41 | (0.04) | 0.06 | 0.02 | — | — | (0.98) | (0.98) | (0.96) | 15.45 | 0.17 | 23,602 | 2.05 (6) | 2.05 | (0.26) | 15 |
The footnote legend is at the end of the financial highlights.
See Notes to Financial Statements
VIRTUS EQUITY TRUST
FINANCIAL HIGHLIGHTS (Continued)
SELECTED PER SHARE DATA AND RATIOS FOR A SHARE OUTSTANDING
THROUGHOUT EACH PERIOD
| | | Net Asset Value,
Beginning of Period | Net Investment Income (Loss)(1) | Net Realized and
Unrealized Gain (Loss) | Total from Investment Operations | Dividends from
Net Investment Income | Return of Capital | Distributions from
Net Realized Gains | Total Distributions | Change in Net Asset Value | Net Asset Value, End of Period | Total Return(2)(3) | Net Assets, End of Period
(in thousands) | Ratio of Net Expenses to
Average Net Assets(4)(5) | Ratio of Gross Expenses
to Average Net Assets(4)(5) | Ratio of Net Investment Income (Loss)
to Average Net Assets(4) | Portfolio Turnover Rate(3) |
| KAR Small-Cap Value Fund (Continued) | | | | | | | | | | | | | | | | | |
| Class I | | | | | | | | | | | | | | | | | |
| 10/1/19 to 9/30/20 | | $18.34 | 0.18 | 1.60 | 1.78 | (0.15) | — | — | (0.15) | 1.63 | $19.97 | 9.75 % | $ 711,421 | 0.99 % (6) | 0.99 % | 0.94 % | 19 % |
| 10/1/18 to 9/30/19 | | 19.49 | 0.18 | (0.94) | (0.76) | (0.20) | — | (0.19) | (0.39) | (1.15) | 18.34 | (3.57) | 484,123 | 1.01 (6) | 1.01 | 1.02 | 14 |
| 10/1/17 to 9/30/18 | | 18.41 | 0.16 | 1.23 | 1.39 | (0.02) | — | (0.29) | (0.31) | 1.08 | 19.49 | 7.62 | 475,103 | 0.99 (6) | 0.99 | 0.84 | 6 |
| 4/1/17 to 9/30/17(7) | | 17.62 | 0.05 | 1.43 | 1.48 | (0.04) | — | (0.65) | (0.69) | 0.79 | 18.41 | 8.72 | 300,259 | 1.07 (6) | 1.07 | 0.55 | 10 |
| 4/1/16 to 3/31/17 | | 15.69 | 0.26 | 3.17 | 3.43 | (0.32) | — | (1.18) | (1.50) | 1.93 | 17.62 | 23.20 | 242,661 | 1.07 (6)(9) | 1.07 | 1.63 | 22 |
| 4/1/15 to 3/31/16 | | 16.64 | 0.11 | 0.07 | 0.18 | (0.15) | — | (0.98) | (1.13) | (0.95) | 15.69 | 1.17 | 144,487 | 1.05 (6) | 1.05 | 0.74 | 15 |
| Class R6 | | | | | | | | | | | | | | | | | |
| 10/1/19 to 9/30/20 | | $18.36 | 0.19 | 1.62 | 1.81 | (0.17) | — | — | (0.17) | 1.64 | $20.00 | 9.90 % | $ 12,246 | 0.89 % (6) | 0.89 % | 1.01 % | 19 % |
| 10/1/18 to 9/30/19 | | 19.51 | 0.20 | (0.94) | (0.74) | (0.22) | — | (0.19) | (0.41) | (1.15) | 18.36 | (3.47) | 11,286 | 0.90 (6) | 0.90 | 1.11 | 14 |
| 10/1/17 to 9/30/18 | | 18.42 | 0.18 | 1.22 | 1.40 | (0.02) | — | (0.29) | (0.31) | 1.09 | 19.51 | 7.69 | 21,746 | 0.90 (6) | 0.90 | 0.96 | 6 |
| 4/1/17 to 9/30/17(7) | | 17.63 | 0.05 | 1.44 | 1.49 | (0.05) | — | (0.65) | (0.70) | 0.79 | 18.42 | 8.78 | 10,165 | 0.99 (6) | 0.99 | 0.52 | 10 |
| 11/3/16 (11) to 3/31/17 | | 14.90 | 0.05 | 3.15 | 3.20 | (0.22) | — | (0.25) | (0.47) | 2.73 | 17.63 | 21.58 | 122 | 0.98 (6) | 0.98 | 0.68 | 22 (13) |
| | | | | | | | | | | | | | | | | | |
| KAR Small-Mid Cap Core Fund | | | | | | | | | | | | | | | | | |
| Class A | | | | | | | | | | | | | | | | | |
| 10/1/19 to 9/30/20 | | $11.53 | (0.03) | 2.93 | 2.90 | — | — | — | — | 2.90 | $14.43 | 25.15 % | $ 19,735 | 1.30 % | 1.39 % | (0.23) % | 31 % |
| 10/1/18 to 9/30/19 | | 10.79 | (0.03) | 0.89 | 0.86 | — | — | (0.12) | (0.12) | 0.74 | 11.53 | 8.32 | 1,473 | 1.30 | 2.25 | (0.28) | 21 |
| 3/7/18 (11) to 9/30/18 | | 10.00 | (0.02) | 0.81 | 0.79 | — | — | — | — | 0.79 | 10.79 | 7.90 | 158 | 1.30 | 5.84 | (0.38) | 16 (13) |
| Class C | | | | | | | | | | | | | | | | | |
| 10/1/19 to 9/30/20 | | $11.40 | (0.12) | 2.88 | 2.76 | — | — | — | — | 2.76 | $14.16 | 24.21 % | $ 10,210 | 2.05 % | 2.08 % | (0.97) % | 31 % |
| 10/1/18 to 9/30/19 | | 10.75 | (0.11) | 0.88 | 0.77 | — | — | (0.12) | (0.12) | 0.65 | 11.40 | 7.50 | 1,106 | 2.05 | 2.92 | (1.05) | 21 |
| 3/7/18 (11) to 9/30/18 | | 10.00 | (0.07) | 0.82 | 0.75 | — | — | — | — | 0.75 | 10.75 | 7.50 | 135 | 2.05 | 6.48 | (1.14) | 16 (13) |
| Class I | | | | | | | | | | | | | | | | | |
| 10/1/19 to 9/30/20 | | $11.56 | 0.01 | 2.94 | 2.95 | — | — | — | — | 2.95 | $14.51 | 25.52 % | $ 439,899 | 1.05 % | 1.09 % | 0.07 % | 31 % |
| 10/1/18 to 9/30/19 | | 10.81 | (0.01) | 0.89 | 0.88 | (0.01) | — | (0.12) | (0.13) | 0.75 | 11.56 | 8.51 | 24,898 | 1.05 | 1.99 | (0.05) | 21 |
| 3/7/18 (11) to 9/30/18 | | 10.00 | (0.01) | 0.82 | 0.81 | — | — | — | — | 0.81 | 10.81 | 8.10 | 214 | 1.05 | 5.74 | (0.13) | 16 (13) |
| Class R6 | | | | | | | | | | | | | | | | | |
| 10/1/19 to 9/30/20 | | $11.57 | — (12) | 2.97 | 2.97 | — | — | — | — | 2.97 | $14.54 | 25.67 % | $ 8,366 | 0.97 % | 0.99 % | 0.03 % | 31 % |
| 10/1/18 to 9/30/19 | | 10.81 | 0.01 | 0.88 | 0.89 | (0.01) | — | (0.12) | (0.13) | 0.76 | 11.57 | 8.61 | 3,125 | 0.97 | 1.91 | 0.06 | 21 |
| 3/7/18 (11) to 9/30/18 | | 10.00 | (—) (12) | 0.81 | 0.81 | — | — | — | — | 0.81 | 10.81 | 8.10 | 2,919 | 0.97 | 5.20 | (0.07) | 16 (13) |
| | | | | | | | | | | | | | | | | | |
| SGA Emerging Markets Growth Fund | | | | | | | | | | | | | | | | | |
| Class A | | | | | | | | | | | | | | | | | |
| 10/1/19 to 9/30/20 | | $ 9.97 | (0.05) | 1.98 | 1.93 | — | — | — (12) | — (12) | 1.93 | $11.90 | 19.37 % | $ 169 | 1.48 % | 3.98 % | (0.47) % | 44 % |
| 6/13/19 (11) to 9/30/19 | | 10.00 | (0.02) | (0.01) | (0.03) | — | — | — | — | (0.03) | 9.97 | (0.30) | 100 | 1.48 | 9.63 | (0.57) | 6 (13) |
| Class C | | | | | | | | | | | | | | | | | |
| 10/1/19 to 9/30/20 | | $ 9.95 | (0.13) | 1.97 | 1.84 | — | — | — (12) | — (12) | 1.84 | $11.79 | 18.50 % | $ 142 | 2.23 % | 4.70 % | (1.19) % | 44 % |
| 6/13/19 (11) to 9/30/19 | | 10.00 | (0.04) | (0.01) | (0.05) | — | — | — | — | (0.05) | 9.95 | (0.50) | 100 | 2.23 | 10.38 | (1.32) | 6 (13) |
The footnote legend is at the end of the financial highlights.
See Notes to Financial Statements
VIRTUS EQUITY TRUST
FINANCIAL HIGHLIGHTS (Continued)
SELECTED PER SHARE DATA AND RATIOS FOR A SHARE OUTSTANDING
THROUGHOUT EACH PERIOD
| | | Net Asset Value,
Beginning of Period | Net Investment Income (Loss)(1) | Net Realized and
Unrealized Gain (Loss) | Total from Investment Operations | Dividends from
Net Investment Income | Return of Capital | Distributions from
Net Realized Gains | Total Distributions | Change in Net Asset Value | Net Asset Value, End of Period | Total Return(2)(3) | Net Assets, End of Period
(in thousands) | Ratio of Net Expenses to
Average Net Assets(4)(5) | Ratio of Gross Expenses
to Average Net Assets(4)(5) | Ratio of Net Investment Income (Loss)
to Average Net Assets(4) | Portfolio Turnover Rate(3) |
| SGA Emerging Markets Growth Fund (Continued) | | | | | | | | | | | | | | | | | |
| Class I | | | | | | | | | | | | | | | | | |
| 10/1/19 to 9/30/20 | | $ 9.98 | (0.03) | 1.99 | 1.96 | — | — | — (12) | — (12) | 1.96 | $11.94 | 19.65 % | $ 247 | 1.23 % | 3.57 % | (0.30) % | 44 % |
| 6/13/19 (11) to 9/30/19 | | 10.00 | (0.01) | (0.01) | (0.02) | — | — | — | — | (0.02) | 9.98 | (0.20) | 109 | 1.23 | 9.38 | (0.32) | 6 (13) |
| Class R6 | | | | | | | | | | | | | | | | | |
| 10/1/19 to 9/30/20 | | $ 9.98 | — (12) | 1.99 | 1.99 | — | — | — (12) | — (12) | 1.99 | $11.97 | 19.95 % | $ 4,828 | 1.05 % | 3.72 % | (0.02) % | 44 % |
| 6/13/19 (11) to 9/30/19 | | 10.00 | — (12) | (0.02) | (0.02) | — | — | — | — | (0.02) | 9.98 | (0.20) | 4,032 | 1.05 | 9.38 | (0.14) | 6 (13) |
| | | | | | | | | | | | | | | | | | |
| SGA Global Growth Fund | | | | | | | | | | | | | | | | | |
| Class A | | | | | | | | | | | | | | | | | |
| 10/1/19 to 9/30/20 | | $20.98 | (0.12) | 5.68 | 5.56 | — | — | — | — | 5.56 | $26.54 | 26.50 % | $ 26,504 | 1.36 % (6) | 1.36 % | (0.53) % | 49 % |
| 2/1/19 to 9/30/19(7) | | 18.58 | (0.01) | 2.41 | 2.40 | — | — | — | — | 2.40 | 20.98 | 12.92 | 4,219 | 1.37 | 1.48 | (0.06) | 13 |
| 2/1/18 to 1/31/19 | | 19.72 | (0.05) | (0.32) | (0.37) | — | — | (0.77) | (0.77) | (1.14) | 18.58 | (1.46) | 3,786 | 1.38 | 1.60 | (0.28) | 54 |
| 2/1/17 to 1/31/18 | | 14.89 | (0.02) | 5.49 | 5.47 | — | — | (0.64) | (0.64) | 4.83 | 19.72 | 37.05 | 3,835 | 1.38 | 1.72 | (0.43) | 31 |
| 2/1/16 to 1/31/17 | | 13.65 | (0.03) | 1.76 | 1.79 | — | — | (0.55) | (0.55) | 1.24 | 14.89 | 13.21 | 1,028 | 1.38 | 2.33 | (0.27) | 32 |
| 2/1/15 to 1/31/16 | | 13.35 | (0.03) | 0.56 | 0.53 | (0.02) | — | (0.21) | (0.23) | 0.30 | 13.65 | 3.84 | 345 | 1.38 | 3.05 | (0.22) | 39 |
| Class C | | | | | | | | | | | | | | | | | |
| 10/1/19 to 9/30/20 | | $19.97 | (0.29) | 5.38 | 5.09 | — | — | — | — | 5.09 | $25.06 | 25.49 % | $ 5,210 | 2.13 % | 2.14 % | (1.35) % | 49 % |
| 2/1/19 to 9/30/19(7) | | 17.77 | (0.11) | 2.31 | 2.20 | — | — | — | — | 2.20 | 19.97 | 12.38 | 3,554 | 2.10 | 2.20 | (0.83) | 13 |
| 2/1/18 to 1/31/19 | | 19.04 | (0.04) | (0.46) | (0.50) | — | — | (0.77) | (0.77) | (1.27) | 17.77 | (2.20) | 3,164 | 2.13 | 2.39 | (1.08) | 54 |
| 2/1/17 to 1/31/18 | | 14.50 | (0.04) | 5.22 | 5.18 | — | — | (0.64) | (0.64) | 4.54 | 19.04 | 36.04 | 2,062 | 2.13 | 2.47 | (1.08) | 31 |
| 2/1/16 to 1/31/17 | | 13.40 | 0.05 | 1.60 | 1.65 | — | — | (0.55) | (0.55) | 1.10 | 14.50 | 12.41 | 989 | 2.12 | 3.08 | (1.00) | 32 |
| 2/1/15 to 1/31/16 | | 13.21 | (0.12) | 0.54 | 0.42 | (0.02) | — | (0.21) | (0.23) | 0.19 | 13.40 | 3.04 | 410 | 2.13 | 3.76 | (0.89) | 39 |
| Class I* | | | | | | | | | | | | | | | | | |
| 10/1/19 to 9/30/20 | | $21.03 | (0.08) | 5.71 | 5.63 | — (12) | — | — | — (12) | 5.63 | $26.66 | 26.79 % | $ 27,529 | 1.13 % | 1.20 % | (0.34) % | 49 % |
| 2/1/19 to 9/30/19(7) | | 18.61 | — (12) | 2.42 | 2.42 | — | — | — | — | 2.42 | 21.03 | 13.00 | 12,807 | 1.19 | 1.28 | (0.02) | 13 |
| 2/1/18 to 1/31/19 | | 19.75 | (0.21) | (0.16) | (0.37) | — | — | (0.77) | (0.77) | (1.14) | 18.61 | (1.46) | 5,878 | 1.36 | 1.50 | (0.15) | 54 |
| 2/1/17 to 1/31/18 | | 14.90 | (0.04) | 5.53 | 5.49 | — | — | (0.64) | (0.64) | 4.85 | 19.75 | 37.16 | 19,474 | 1.36 | 1.57 | (0.29) | 31 |
| 2/1/16 to 1/31/17 | | 13.66 | 0.06 | 1.73 | 1.79 | — | — | (0.55) | (0.55) | 1.24 | 14.90 | 13.20 | 11,414 | 1.34 | 2.05 | (0.43) | 32 |
| 2/1/15 to 1/31/16 | | 13.36 | (0.04) | 0.57 | 0.53 | (0.02) | — | (0.21) | (0.23) | 0.30 | 13.66 | 3.84 | 422 | 1.36 | 3.08 | (0.32) | 39 |
| Class R6** | | | | | | | | | | | | | | | | | |
| 10/1/19 to 9/30/20 | | $21.56 | (0.03) | 5.86 | 5.83 | (0.01) | — | — | (0.01) | 5.82 | $27.38 | 27.06 % | $ 72,376 | 0.90 % | 1.08 % | (0.11) % | 49 % |
| 2/1/19 to 9/30/19(7) | | 19.04 | 0.05 | 2.47 | 2.52 | — | — | — | — | 2.52 | 21.56 | 13.24 | 40,690 | 0.95 | 1.16 | 0.34 | 13 |
| 2/1/18 to 1/31/19 | | 20.11 | 0.01 | (0.31) | (0.30) | — | — | (0.77) | (0.77) | (1.07) | 19.04 | (1.08) | 28,819 | 0.98 | 1.31 | 0.07 | 54 |
| 2/1/17 to 1/31/18 | | 15.11 | (0.01) | 5.65 | 5.64 | — | — | (0.64) | (0.64) | 5.00 | 20.11 | 37.64 | 15,913 | 0.98 | 1.34 | 0.08 | 31 |
| 2/1/16 to 1/31/17 | | 13.79 | 0.03 | 1.84 | 1.87 | — | — | (0.55) | (0.55) | 1.32 | 15.11 | 13.66 | 7,698 | 0.98 | 2.03 | 0.21 | 32 |
| 2/1/15 to 1/31/16 | | 13.43 | 0.03 | 0.56 | 0.59 | (0.02) | — | (0.21) | (0.23) | 0.36 | 13.79 | 4.26 | 6,219 | 0.98 | 2.62 | 0.27 | 39 |
The footnote legend is at the end of the financial highlights.
See Notes to Financial Statements
VIRTUS EQUITY TRUST
FINANCIAL HIGHLIGHTS (Continued)
SELECTED PER SHARE DATA AND RATIOS FOR A SHARE OUTSTANDING
THROUGHOUT EACH PERIOD
| Footnote Legend: |
| * | On May 3, 2019, Investor Class shares of the Predecessor Fund were reorganized into Class I shares of the Fund. See Note 1 in Notes to Financial Statements. The Class I shares financial highlights for the periods prior to May 3, 2019 reflect the performance of the American Beacon SGA Global Growth Fund Investor Class shares. |
| ** | On May 3, 2019, Y Class shares and Institutional Class shares of the Predecessor Fund were reorganized into Class R6 shares of the Fund. See Note 1 in Notes to Financial Statements. The Class R6 shares financial highlights for the periods prior to May 3, 2019 reflect the performance of the American Beacon SGA Global Growth Fund Institutional Class shares. |
| (1) | Calculated using average shares outstanding. |
| (2) | Sales charges, where applicable, are not reflected in the total return calculation. |
| (3) | Not annualized for periods less than one year. |
| (4) | Annualized for periods less than one year. |
| (5) | The Funds will also indirectly bear their prorated share of expenses of any underlying funds in which they invest. Such expenses are not included in the calculation of this ratio. |
| (6) | The share class is currently under its expense limitation. |
| (7) | The Fund changed its fiscal year end to September 30, during the period. |
| (8) | State Street Bank & Trust, custodian for some of the Funds through January 29, 2010, reimbursed the Funds for out-of-pocket custody expenses overbilled for the period 1998 through January 29, 2010. Custody fees reimbursed were excluded from the Ratio of Net Expenses to Average Net Assets and Ratio of Net Investment Income (Loss) to Average Net Assets. If included, the impact would have been to lower the Ratio of Net Expenses and increase the Ratio of Net Investment Income (Loss) as follows:
KAR Capital Growth Fund 0.06% (Class A), 0.05% (Class C), 0.06% (Class I)
KAR Equity Income Fund amounts are less than 0.005% for Classes A, C, and I, respectively
KAR Mid-Cap Growth Fund 0.05% (Class A), 0.05% (Class C), 0.05% (Class I)
KAR Small-Cap Core Fund amounts are less than 0.005% for Classes A, C, I, and R6, respectively
KAR Small-Cap Growth Fund amounts are less than 0.005% for Classes A, C, and I, respectivelyCustody fees reimbursed were included in Total Return. If excluded, the impact would have been to lower the Total Return as follows:
KAR Capital Growth Fund 0.06% (Class A), 0.06% (Class C), 0.06% (Class I)
KAR Equity Income Fund amounts are less than 0.005% for Classes A, C, and I, respectively
KAR Mid-Cap Growth Fund 0.05% (Class A), 0.05% (Class C), 0.05% (Class I)
KAR Small-Cap Core Fund amounts are less than 0.005% for Classes A, C, I, and R6, respectively
KAR Small-Cap Growth Fund amounts are less than 0.005% for Classes A, C, and I, respectively |
| (9) | Net expense ratio includes extraordinary proxy expenses. |
| (10) | Represents a blended ratio. |
| (11) | Inception date. |
| (12) | Amount is less than $0.005 per share. |
| (13) | Portfolio turnover is representative of the Fund for the entire period. |
| (14) | See Note 4D in Notes to Financial Statements for information on recapture of expenses previously reimbursed and/or waived. |
See Notes to Financial Statements
VIRTUS EQUITY TRUST
NOTES TO FINANCIAL STATEMENTS September 30, 2020
Note 1. Organization
Virtus Equity Trust (the “Trust”) is organized as a Delaware statutory trust and is registered under the Investment Company Act of 1940, as amended (the “1940 Act”), as an open-end management investment company.
As of the date of this report, 12 diversified funds of the Trust are offered for sale, of which 11 (each a “Fund” or collectively, the “Funds”) are reported in this annual report. Each Fund’s investment objective is outlined in its respective Fund Summary page. There is no guarantee that a Fund will achieve its objective(s).
Before the SGA Global Growth Fund (the “Successor Fund”) commenced operations, on May 3, 2019, all of the property, assets and liabilities of the American Beacon SGA Global Growth FundSM (the “Predecessor Fund”) were transferred to the Successor Fund in a tax-free reorganization as set forth in an agreement and plan of reorganization (“Reorganization”) between the Trust, on behalf of the Successor Fund, and American Beacon, on behalf of the Predecessor Fund. As a result of the Reorganization, the Successor Fund assumed the performance and accounting history of the Predecessor Fund. Financial information included for the dates prior to the Reorganization is that of the Predecessor Fund, which previously had a fiscal period end of January 31.
All of the Funds offer Class A shares, Class C shares, Class I shares and Class R6 shares.
Class A shares are sold with a front-end sales charge of up to 5.75% with some exceptions. Generally, Class A shares are not subject to any charges by the Funds when redeemed; however, a 1% contingent deferred sales charge (“CDSC”) may be imposed on certain redemptions made within a certain period following purchases on which a finder’s fee has been paid. The period for which the CDSC applies for the Funds is 18 months. The CDSC period begins on the last day of the month preceding the month in which the purchase was made.
Class C shares are generally sold with a 1% CDSC, applicable if redeemed within one year of purchase. Effective January 1, 2019, with certain exceptions, Class C shares and any reinvested dividends and other distributions paid on such shares, will be automatically converted to Class A shares ten years after the purchase date. Class I shares and Class R6 shares are sold without a front-end sales charge or CDSC.
Class R6 shares are offered without a minimum initial investment to the following investors in plan level or omnibus accounts only (provided that they do not require or receive any compensation, administrative payments, sub-transfer agency payments or service payments with respect to Class R6 shares): (i) qualified retirement plans, including, but not limited to, 401(k) plans, 457 plans, employer sponsored 403(b) plans, and defined benefit plans; (ii) banks and trust companies; (iii) insurance companies; (iv) financial intermediaries utilizing such shares in fee-based investment advisory programs; (v) registered investment companies; and (vi) non-qualified deferred compensation plans. Other institutional investors may be permitted to purchase Class R6 shares subject to the applicable Fund’s determination of eligibility and may be subject to a $2,500,000 minimum initial investment requirement. In addition, without a minimum initial investment requirement, Class R6 shares are available to any Trustee of the Virtus Funds and trustees/directors of affiliated open- and closed-end funds, directors, officers and employees of Virtus and its affiliates, and a spouse or domestic partner, child or minor grandchild of any such qualifying individual (in each case either individually or jointly with other investors), provided in each case that those shares are held directly with the Transfer Agent or in an eligible account. Class R6 shares do not carry sales commissions or pay Rule 12b-1 fees. No compensation, administrative payments, sub-transfer agency payments or service payments are paid to brokers or other entities from Fund assets or the Funds’ distributor’s or an affiliate’s resources on sales of or investments in Class R6 shares.
The Funds may impose an annual fee on accounts having balances of less than $2,500. The small account fee may be waived in certain circumstances, as disclosed in the prospectuses and/or statement of additional information. The fees collected will be used to offset certain expenses of the Funds. These fees are reflected as “Less low balance account fees” in each Fund’s Statement of Operations for the period, as applicable.
Each class of shares has identical voting, dividend, liquidation and other rights and the same terms and conditions, except that each class bears any expenses attributable specifically to that class (“class-specific expenses”) and has exclusive voting rights with respect to any Rule 12b-1 and/or shareholder service plan (“12b-1 Plan”) approved by the Board. Class I shares and Class R6 shares are not subject to a 12b-1 Plan. Class-specific expenses may include shareholder servicing fees, sub-transfer agency fees, and fees under a 12b-1 Plan, as well as certain other expenses as designated by the Funds’ Treasurer and approved by the Board. Investment income, common operating expenses and realized and unrealized gains and losses of each Fund are borne pro-rata by the holders of each class of shares.
Note 2. Significant Accounting Policies
The Trust is an investment company that follows the accounting and reporting guidance of Accounting Standards Codification Topic 946 applicable to Investment Companies. The following is a summary of significant accounting policies consistently followed by the Funds in the preparation of their financial statements and for derivatives, included in Note 3 below. The preparation of financial statements in conformity with U.S. generally accepted accounting principles (“U.S. GAAP”) requires management to make estimates and assumptions that affect the reported amounts of assets and liabilities, disclosure of contingent assets and liabilities at the date of the financial statements and the reported amounts of increases and decreases in net assets from operations during the reporting period. Actual results could differ from those estimates and those differences could be significant.
| A. | Security Valuation |
| | Each Fund utilizes a fair value hierarchy which prioritizes the inputs to valuation techniques used to measure fair value into three broad levels. The Funds’ policy is to recognize transfers into or out of Level 3 at the end of the reporting period. |
| | • Level 1 – quoted prices in active markets for identical securities (security types generally include listed equities). |
• Level 2 – prices determined using other significant observable inputs (including quoted prices for similar securities, interest rates, prepayment speeds, credit risk, etc.).
VIRTUS EQUITY TRUST
NOTES TO FINANCIAL STATEMENTS (Continued)
September 30, 2020
• Level 3 – prices determined using significant unobservable inputs (including the Valuation Committee’s own assumptions in determining the fair value of investments).
A description of the valuation techniques applied to a Fund’s major categories of assets and liabilities measured at fair value on a recurring basis is as follows:
Equity securities are valued at the official closing price (typically last sale) on the exchange on which the securities are primarily traded or, if no closing price is available, at the last bid price and are categorized as Level 1 in the hierarchy. Restricted equity securities and private placements that are illiquid, or are internally fair valued by the Valuation Committee, are generally categorized as Level 3 in the hierarchy.
Certain non-U.S. securities may be fair valued in cases where closing prices are not readily available or are deemed not reflective of readily available market prices. For example, significant events (such as movement in the U.S. securities market, or other regional and local developments) may occur between the time that non-U.S. markets close (where the security is principally traded) and the time that a Fund calculates its net asset value (“NAV”) at the close of regular trading on the New York Stock Exchange (“NYSE”) (generally 4 p.m. Eastern time) that may impact the value of securities traded in these non-U.S. markets. In such cases, the Funds fair value non-U.S. securities using an independent pricing service which considers the correlation of the trading patterns of the non-U.S. security to the intraday trading in the U.S. markets for investments such as ADRs, financial futures, ETFs, and certain indexes, as well as prices for similar securities. Such fair valuations are categorized as Level 2 in the hierarchy. Because the frequency of significant events is not predictable, fair valuation of certain non-U.S. common stocks may occur on a frequent basis.
Listed derivatives, such as options, that are actively traded are valued based on quoted prices from the exchange and are categorized as Level 1 in the hierarchy. Over-the-counter derivative contracts, which include forward currency contracts and equity-linked instruments, do not require material subjectivity as pricing inputs are observed from actively quoted markets and are categorized as Level 2 in the hierarchy.
Investments in open-end mutual funds are valued at NAV. Investments in closed-end funds and ETFs are valued as of the close of regular trading on the NYSE each business day. Each is categorized as Level 1 in the hierarchy.
A summary of the inputs used to value a Fund’s net assets by each major security type is disclosed at the end of the Schedule of Investments for each Fund. The inputs or methodologies used for valuing securities are not necessarily an indication of the risk associated with investing in those securities.
| B. | Security Transactions and Investment Income |
| | Security transactions are recorded on the trade date. Realized gains and losses from the sale of securities are determined on the identified cost basis. Dividend income is recognized on the ex-dividend date or, in the case of certain foreign securities, as soon as a Fund is notified. Interest income is recorded on the accrual basis. Each Fund amortizes premiums and accretes discounts using the effective interest method. Any distributions from underlying funds are recorded in accordance with the character of the distributions as designated by the underlying funds. |
| | Dividend income from REITs is recorded using management’s estimate of the percentage of income included in distributions received from such investments based on historical information and other industry sources. The return of capital portion of the estimate is a reduction to investment income and a reduction in the cost basis of each investment which increases net realized gain (loss) and net change in unrealized appreciation (depreciation). If the return of capital distributions exceed their cost basis, the distributions are treated as realized gains. The actual amounts of income, return of capital, and capital gains are only determined by each REIT after its fiscal year-end, and may differ from the estimated amounts. |
| C. | Income Taxes |
| | Each Fund is treated as a separate taxable entity. It is the intention of each Fund to comply with the requirements of Subchapter M of the Internal Revenue Code and to distribute substantially all of its taxable income to its shareholders. Therefore, no provision for federal income taxes or excise taxes has been made. |
| | Certain Funds may be subject to foreign taxes on income, gains on investments or currency repatriation, a portion of which may be recoverable. Each Fund will accrue such taxes and recoveries as applicable based upon current interpretations of the tax rules and regulations that exist in the markets in which it invests. |
| | Management of the Funds has concluded that there are no significant uncertain tax positions that would require recognition in the financial statements. As of September 30, 2020, the tax years that remain subject to examination by the major tax jurisdictions under the statute of limitations are from the year 2017 forward (with limited exceptions). |
| D. | Distributions to Shareholders |
| | Distributions are recorded by each Fund on the ex-dividend date. Income and capital gain distributions are determined in accordance with income tax regulations that may differ from U.S. GAAP. |
| E. | Expenses |
| | Expenses incurred together by a Fund and other affiliated mutual funds are allocated in proportion to the net assets of each such fund, except where allocation of direct expense to each Fund or an alternative allocation method can be more appropriately used. |
| | In addition to the net annual operating expenses that a Fund bears directly, the shareholders of a Fund indirectly bear the pro-rata expenses of any underlying mutual funds in which the Fund invests. |
VIRTUS EQUITY TRUST
NOTES TO FINANCIAL STATEMENTS (Continued)
September 30, 2020
| F. | Foreign Currency Transactions |
| | Non-U.S. investment securities and other assets and liabilities denominated in foreign currencies are translated into U.S. dollar amounts at the foreign currency exchange rate effective at the end of the reporting period. Cost of investments is translated at the currency exchange rate effective at the trade date. The gain or loss resulting from a change in currency exchange rates between the trade and settlement date of a portfolio transaction is treated as a gain or loss on foreign currency. Likewise, the gain or loss resulting from a change in currency exchange rates between the date income is accrued and the date it is paid is treated as a gain or loss on foreign currency. The Funds do not isolate that portion of the results of operations arising from changes in foreign exchange rates on investments from the fluctuations arising from changes in the market prices of securities held. Such fluctuations are included with the net realized and unrealized gain or loss on investments. |
| G. | Securities Lending |
| | The Funds may loan securities to qualified brokers through a securities lending agency agreement with The Bank of New York Mellon (“BNYM”). Under the securities lending policy, when lending securities a Fund is required to maintain collateral with a market value not less than 100% of the market value of loaned securities. Collateral is adjusted daily in connection with changes in the market value of securities on loan. Collateral may consist of cash and securities issued by the U.S. Government or its agencies. Cash collateral is invested in a short-term money market fund. Dividends earned on the collateral and premiums paid by the broker are recorded as income by the Fund net of fees and rebates charged/paid by BNYM for its services as securities lending agent and in connection with this securities lending program. Lending portfolio securities involves a risk of delay in the recovery of the loaned securities or in the declining value of the collateral. |
| | Securities lending transactions are entered into by each Fund under Master Securities Lending Agreements (“MSLA”) which permit the Fund, under certain circumstances including an event of default (such as bankruptcy or insolvency), to offset amounts payable by the Fund to the same counterparty against amounts to be received and create one single net payment due to or from the Fund. |
| | Effective March 13, 2020, the securities lending program was put on hold and all securities on loan were recalled. |
Note 3. Derivative Financial Instruments and Transactions
($ reported in thousands)
Disclosures about derivative instruments and hedging activities are intended to enable investors to understand how and why a Fund uses derivatives, how derivatives are accounted for, and how derivative instruments affect a Fund’s results of operations and financial position. Summarized below are such disclosures and accounting policies for each specific type of derivative instrument used by certain Funds.
| A. | Options Contracts |
| | An options contract provides the purchaser with the right, but not the obligation, to buy (call option) or sell (put option) a financial instrument at an agreed-upon price. Certain Funds may purchase or write both put and call options on portfolio securities for hedging purposes or to facilitate the rapid implementation of investment strategies if the Fund anticipates a significant market or sector advance. A Fund doing so is subject to equity price risk in the normal course of pursuing its investment objectives. |
| | When a Fund purchases an option, it pays a premium and an amount equal to that premium is recorded as an asset. When a Fund writes an option, it receives a premium and an amount equal to that premium is recorded as a liability. The asset or liability is adjusted daily to reflect the current market value of the option. Holdings of the Fund designated to cover outstanding written options are noted in the Schedules of Investments. Purchased options are reported as an asset within “Investment in securities at value” in the Statements of Assets and Liabilities. Written options written are reported as a liability within “Written options at value.” Changes in value of the purchased option are included in “Net change in unrealized appreciation (depreciation) on investments” in the Statements of Operations. Changes in value of written options are included in “Net change in unrealized appreciation (depreciation) on written options” in the Statements of Operations. |
| | If an option expires unexercised, the Fund realizes a gain or loss to the extent of the premium received or paid. If an option is exercised, the premium received or paid is recorded as an adjustment to the proceeds from the sale or the cost basis of the purchase. The difference between the premium and the amount received or paid on effecting a closing purchase or sale transaction is also treated as a realized gain or loss. Gain or loss on purchased options is included in “Net realized gain (loss) from investments” in the Statements of Operations. Gain or loss on written options is presented separately as “Net realized gain (loss) from written options” in the Statements of Operations. |
| | The risk in writing call options is that the Fund gives up the opportunity for profit if the market price of the referenced security increases and the option is exercised. The risk in writing put options is that the Fund may incur a loss if the market price of the referenced security decreases and the option is exercised. The risk in buying options is that the Fund pays a premium whether or not the option is exercised. The use of such instruments may involve certain additional risks as a result of unanticipated movements in the market. Writers (sellers) of options are subject to unlimited risk of loss, as the seller will be obligated to deliver or take delivery of the security at a predetermined price which may, upon exercise of the option, be significantly different from the then-market value. |
| | The KAR Equity Income Fund invested in written covered call options contracts during the year in an attempt to manage equity price risk and with the purpose of generating realized gains. |
VIRTUS EQUITY TRUST
NOTES TO FINANCIAL STATEMENTS (Continued)
September 30, 2020
The following is a summary of the KAR Equity Income Fund’s derivative instrument holdings categorized by primary risk exposure (equity contracts) in the financial statements as of September 30, 2020:
| Statement of Operations | |
| | KAR Equity
Income Fund |
Net realized gain (loss) from purchased options
| $ 5,165 (1) |
Net realized gain (loss) from written options
| (7,962) |
Net change in unrealized appreciation (depreciation) on purchased options
| 28 (2) |
Net change in unrealized appreciation (depreciation) on written options
| (36) |
Total net realized and unrealized gain (loss) on purchased and written options
| $ (2,805) |
| (1) | Amount included in Net realized gain (loss) from investments. |
| (2) | Amount included in Net change in unrealized appreciation (depreciation) on investments. |
For the period October 1, 2019 through March 11, 2020, the average daily premiums paid by the KAR Equity Income Fund for purchased options were $119 and the average daily premiums received for written options by the KAR Equity Income Fund were $212. Effective March 12, 2020, the options overlay strategy was suspended, and effective June 18, 2020, it was removed from the investment strategy of the Fund.
Note 4. Investment Advisory Fees and Related Party Transactions
($ reported in thousands)
| A. | Investment Adviser |
| | Virtus Investment Advisers, Inc. (the “Adviser”), an indirect, wholly-owned subsidiary of Virtus Investment Partners, Inc. (“Virtus”), is the investment adviser to the Funds. The Adviser manages the Funds’ investment programs and general operations of the Funds, including oversight of the Funds’ subadvisers. |
| | As compensation for its services to the Funds, the Adviser is entitled to a fee, which is calculated daily and paid monthly based upon the following annual rates as a percentage of the average daily net assets of each Fund: |
KAR Small-Cap Core Fund
| 0.75 % |
KAR Small-Cap Value Fund
| 0.70 |
| | First $400 Million | | $400+ Million through
$1 Billion | | $1+ Billion |
KAR Small-Cap Growth Fund
| 0.90 % | | 0.85 % | | 0.80 % |
| | First $500 Million | | Over $500 Million |
KAR Mid-Cap Growth Fund
| 0.80 % | | 0.70 % |
| | First $1 Billion | | $1+ Billion |
KAR Small-Mid Cap Core Fund
| 0.75 % | | 0.70 % |
SGA Emerging Markets Growth Fund
| 1.00 | | 0.95 |
SGA Global Growth Fund
| 0.80 | | 0.75 |
| | First $1 Billion | | $1+ Billion through
$2 Billion | | $2+ Billion |
KAR Capital Growth Fund
| 0.70 % | | 0.65 % | | 0.60 % |
KAR Equity Income Fund
| 0.75 | | 0.70 | | 0.65 |
KAR Global Quality Dividend Fund
| 0.75 | | 0.70 | | 0.65 |
KAR Mid-Cap Core Fund
| 0.80 | | 0.75 | | 0.70 |
VIRTUS EQUITY TRUST
NOTES TO FINANCIAL STATEMENTS (Continued)
September 30, 2020
| B. | Subadvisers |
| | The subadvisers manage the investments of each Fund for which they are paid a fee by the Adviser. A list of the subadvisers and the Funds they serve as of the end of the period is as follows: |
| Fund | | Subadviser |
KAR Capital Growth Fund
| | KAR (1) |
KAR Equity Income Fund
| | KAR (2) |
KAR Global Quality Dividend Fund
| | KAR (1) |
KAR Mid-Cap Core Fund
| | KAR (1) |
KAR Mid-Cap Growth Fund
| | KAR (1) |
KAR Small-Cap Core Fund
| | KAR (1) |
KAR Small-Cap Growth Fund
| | KAR (1) |
KAR Small-Cap Value Fund
| | KAR (1) |
KAR Small-Mid Cap Core Fund
| | KAR (1) |
SGA Emerging Markets Growth Fund
| | SGA (3) |
SGA Global Growth Fund
| | SGA (3) |
| (1) | Kayne Anderson Rudnick Investment Management, LLC (“KAR”), an indirect, wholly-owned subsidiary of Virtus. |
| (2) | Effective September 1, 2020, KAR is the subadviser to the Fund. Prior to September 1, 2020, Rampart Investment Management Company, LLC, an indirect, wholly-owned subsidiary of Virtus, was the subadviser to the Fund. |
| (3) | Sustainable Growth Advisers, LP, an indirect, majority-owned subsidiary of Virtus. |
| C. | Expense Limitations |
| | The Adviser has contractually agreed to limit certain Funds’ annual total operating expenses, subject to the exceptions listed below, so that such expenses do not exceed on an annualized basis, the following respective percentages of average daily net assets through January 31, 2021 (except as noted). Following the contractual period, the Adviser may discontinue these expense reimbursement arrangements at any time. The waivers and reimbursements are accrued daily and received monthly. |
| Fund | | Class A | | Class C | | Class I | | Class R6 |
KAR Capital Growth Fund
| | 1.47 % * | | 2.22 % * | | 1.22 % * | | 0.73 % |
KAR Equity Income Fund**
| | 1.20 | | 1.95 | | 0.95 | | 0.91 |
KAR Global Quality Dividend Fund
| | 1.35 | | 2.10 | | 1.10 | | 0.78 |
KAR Mid-Cap Core Fund
| | 1.20 | | 1.95 | | 0.95 | | 0.87 |
KAR Mid-Cap Growth Fund
| | 1.40 * | | 2.15 * | | 1.15 * | | 0.83 |
KAR Small-Cap Growth Fund
| | 1.50 * | | 2.25 * | | 1.25 * | | 1.18 * |
KAR Small-Cap Value Fund
| | 1.42 * | | 2.17 * | | 1.17 * | | 1.06 * |
KAR Small-Mid Cap Core Fund
| | 1.30 | | 2.05 | | 1.05 | | 0.97 |
SGA Emerging Markets Growth Fund
| | 1.48 | | 2.23 | | 1.23 | | 1.05 |
SGA Global Growth Fund***
| | 1.38 * | | 2.13 | | 1.13 | | 0.90 |
| * | Each share class is currently below its expense cap. |
| ** | Effective through January 31, 2022. |
| *** | Effective through May 31, 2021. |
The exclusions include front-end or contingent deferred loads, taxes, leverage and borrowing expenses (such as commitment, amendment and renewal expenses on credit or redemption facilities), interest, brokerage commissions, expenses incurred in connection with any merger or reorganization, unusual or infrequently occurring expenses (such as litigation), acquired fund fees and expenses, and dividend expenses, if any.
| D. | Expense Recapture |
| | Under certain conditions, the Adviser may recapture operating expenses reimbursed or fees waived under these arrangements within three years after the date on which such amounts were incurred or waived. A Fund must pay its ordinary operating expenses before the Adviser is entitled to any reimbursement and must remain in compliance with any applicable expense limitations or, if none, the expense limitation in effect at the time of the waiver or reimbursement. All or a portion of the following Adviser reimbursed expenses may be recaptured by the fiscal year ending: |
VIRTUS EQUITY TRUST
NOTES TO FINANCIAL STATEMENTS (Continued)
September 30, 2020
| | | Expiration | | |
| Fund | | 2021 | | 2022 | | 2023 | | Total |
| KAR Capital Growth Fund | | | | | | | | |
Class R6
| | $ 5 | | $ 1 | | $ 1 | | $ 7 |
| KAR Equity Income Fund | | | | | | | | |
Class A
| | 133 | | 164 | | 170 | | 467 |
Class C
| | 34 | | 21 | | 11 | | 66 |
Class I
| | 30 | | 16 | | 15 | | 61 |
Class R6
| | 3 | | 2 | | 1 | | 6 |
| KAR Global Quality Dividend Fund | | | | | | | | |
Class A
| | 55 | | 56 | | 65 | | 176 |
Class C
| | 9 | | 8 | | 6 | | 23 |
Class I
| | 10 | | 14 | | 28 | | 52 |
Class R6
| | — | | — (1) | | — (1) | | — (1) |
| KAR Mid-Cap Core Fund | | | | | | | | |
Class A
| | 55 | | 62 | | 71 | | 188 |
Class C
| | 45 | | 58 | | 66 | | 169 |
Class I
| | 200 | | 396 | | 670 | | 1,266 |
Class R6
| | 1 | | 8 | | 21 | | 30 |
| KAR Mid-Cap Growth Fund | | | | | | | | |
Class R6
| | — (1) | | 1 | | 21 | | 22 |
| KAR Small-Mid Cap Core Fund | | | | | | | | |
Class A
| | 1 | | 9 | | 9 | | 19 |
Class C
| | 1 | | 7 | | 1 | | 9 |
Class I
| | — | | 67 | | 56 | | 123 |
Class R6
| | 48 | | 42 | | 3 | | 93 |
| SGA Emerging Markets Growth Fund | | | | | | | | |
Class A
| | — | | 2 | | 4 | | 6 |
Class C
| | — | | 2 | | 3 | | 5 |
Class I
| | — | | 3 | | 4 | | 7 |
Class R6
| | — | | 96 | | 124 | | 220 |
| SGA Global Growth Fund | | | | | | | | |
Class C
| | — | | — | | 1 | | 1 |
Class I
| | — | | 1 | | 15 | | 16 |
Class R6
| | — | | 24 | | 107 | | 131 |
| (1) | Amount is less than $500. |
During the period ended September 30, 2020, the Adviser recaptured expenses previously waived for the following Funds:
| Fund | | Class A | | Class C | | Class I | | Class R6 | | Total |
KAR Mid-Cap Growth Fund
| | $ 52 | | $ 5 | | — | | $ — | | $ 57 |
KAR Small-Mid Cap Core Fund
| | — | | — (1) | | — | | 2 | | 2 |
SGA Emerging Markets Growth Fund
| | — (1) | | — (1) | | 1 | | 4 | | 5 |
SGA Global Growth Fund
| | 1 | | — (1) | | — | | — | | 1 |
| (1) | Amount is less than $500. |
| E. | Distributor |
| | VP Distributors, LLC (“VP Distributors”), an indirect, wholly-owned subsidiary of Virtus, serves as the distributor of each Fund’s shares. VP Distributors has advised the Funds that for the fiscal year (the “period”) ended September 30, 2020, it retained net commissions of $431 for Class A shares and CDSC of $16, $79, and $(1) for Class A shares, Class C shares, and Class R6 shares, respectively. |
| | In addition, each Fund pays VP Distributors 12b-1 fees under a 12b-1 Plan as a percentage of the average daily net assets of each respective class at the annual rates of 0.25% for Class A shares and 1.00% for Class C shares. Class I shares and Class R6 shares are not subject to a 12b-1 Plan. |
| | Under certain circumstances, shares of certain Virtus Mutual Funds may be exchanged for shares of the same class of certain other Virtus Mutual Funds on the basis of the relative NAV per share at the time of the exchange. On exchanges with share classes that carry a CDSC, the CDSC schedule of the original shares purchased continues to apply. |
VIRTUS EQUITY TRUST
NOTES TO FINANCIAL STATEMENTS (Continued)
September 30, 2020
| F. | Administrator and Transfer Agent |
| | Virtus Fund Services, LLC, an indirect, wholly-owned subsidiary of Virtus, serves as the administrator and transfer agent to the Funds. |
| | For the period ended September 30, 2020, the Funds incurred administration fees totaling $10,056, which are included in the Statements of Operations within the line item “Administration and accounting fees.” The fees are calculated daily and paid monthly. |
| | For the period ended September 30, 2020, the Funds incurred transfer agent fees totaling $4,508, which are included in the Statements of Operations within the line item “Transfer agent fees and expenses.” The fees are calculated daily and paid monthly. |
| G. | Payment from Affiliate |
| | The KAR Capital Growth Fund and KAR Mid-Cap Growth Fund were reimbursed by KAR for costs incurred due to an error in the processing of a corporate action of an investment during the period ended September 30, 2020. |
| H. | Trustee Compensation |
| | The Trust provides a deferred compensation plan for its Trustees who receive compensation from the Trust. Under the deferred compensation plan, Trustees may elect to defer all or a portion of their compensation. Amounts deferred are retained by the Trust, and then, to the extent permitted by the 1940 Act, in turn, may be invested in the shares of affiliated or unaffiliated mutual funds selected by the participating Trustees. Investments in such instruments are included in “Other assets” in the Statements of Assets and Liabilities at September 30, 2020. |
Note 5. Purchases and Sales of Securities
($ reported in thousands)
Purchases and sales of securities (excluding short-term securities and written options) during the period ended September 30, 2020, were as follows:
| | Purchases | | Sales |
KAR Capital Growth Fund
| $ 23,356 | | $ 62,856 |
KAR Equity Income Fund
| 151,939 | | 170,517 |
KAR Global Quality Dividend Fund
| 19,199 | | 19,019 |
KAR Mid-Cap Core Fund
| 367,431 | | 109,473 |
KAR Mid-Cap Growth Fund
| 1,383,573 | | 170,582 |
KAR Small-Cap Core Fund
| 271,079 | | 378,883 |
KAR Small-Cap Growth Fund
| 884,082 | | 1,509,632 |
KAR Small-Cap Value Fund
| 269,113 | | 118,241 |
KAR Small-Mid Cap Core Fund
| 415,606 | | 53,948 |
SGA Emerging Markets Growth Fund
| 2,115 | | 2,085 |
SGA Global Growth Fund
| 93,342 | | 48,658 |
There were no purchases or sales of long-term U.S. Government and agency securities during the period ended September 30, 2020.
Note 6. Capital Share Transactions
(reported in thousands)
Transactions in shares of capital stock, during the periods ended as indicated below, were as follows:
| | KAR Capital Growth Fund | | KAR Equity Income Fund |
| | Year Ended
September 30, 2020 | | Year Ended
September 30, 2019 | | Year Ended
September 30, 2020 | | Year Ended
September 30, 2019 |
| | SHARES | | AMOUNT | | SHARES | | AMOUNT | | SHARES | | AMOUNT | | SHARES | | AMOUNT |
| Class A | | | | | | | | | | | | | | | |
Shares sold and cross class
conversions | 889 | | $ 17,200 | | 882 | | $ 13,899 | | 472 | | $ 9,444 | | 1,001 | | $ 18,383 |
| Reinvestment of distributions | 705 | | 12,891 | | 2,881 | | 39,215 | | 50 | | 1,108 | | 60 | | 1,048 |
Shares repurchased and cross
class conversions | (3,375) | | (64,742) | | (3,160) | | (50,927) | | (1,172) | | (22,878) | | (1,128) | | (21,798) |
| Net Increase / (Decrease) | (1,781) | | $ (34,651) | | 603 | | $ 2,187 | | (650) | | $ (12,326) | | (67) | | $ (2,367) |
VIRTUS EQUITY TRUST
NOTES TO FINANCIAL STATEMENTS (Continued)
September 30, 2020
| | KAR Capital Growth Fund | | KAR Equity Income Fund |
| | Year Ended
September 30, 2020 | | Year Ended
September 30, 2019 | | Year Ended
September 30, 2020 | | Year Ended
September 30, 2019 |
| | SHARES | | AMOUNT | | SHARES | | AMOUNT | | SHARES | | AMOUNT | | SHARES | | AMOUNT |
| Class C | | | | | | | | | | | | | | | |
Shares sold and cross class
conversions | 223 | | $ 3,361 | | 132 | | $ 1,645 | | 33 | | $ 593 | | 20 | | $ 344 |
| Reinvestment of distributions | 22 | | 302 | | 140 | | 1,443 | | 1 | | 13 | | 3 | | 52 |
Shares repurchased and cross
class conversions | (197) | | (2,871) | | (588) | | (6,799) | | (145) | | (2,657) | | (1,234) | | (20,336) |
| Net Increase / (Decrease) | 48 | | $ 792 | | (316) | | $ (3,711) | | (111) | | $ (2,051) | | (1,211) | | $ (19,940) |
| Class I | | | | | | | | | | | | | | | |
Shares sold and cross class
conversions | 1,610 | | $ 31,747 | | 601 | | $ 10,354 | | 56 | | $ 1,201 | | 72 | | $ 1,431 |
| Reinvestment of distributions | 35 | | 670 | | 92 | | 1,303 | | 6 | | 126 | | 9 | | 152 |
Shares repurchased and cross
class conversions | (1,078) | | (20,661) | | (308) | | (5,240) | | (131) | | (2,657) | | (278) | | (5,296) |
| Net Increase / (Decrease) | 567 | | $ 11,756 | | 385 | | $ 6,417 | | (69) | | $ (1,330) | | (197) | | $ (3,713) |
| Class R6 | | | | | | | | | | | | | | | |
Shares sold and cross class
conversions | 55 | | $ 1,111 | | — | | $ — | | 7 | | $ 153 | | 5 | | $ 104 |
| Reinvestment of distributions | — (1) | | 3 | | — | | — | | 1 | | 11 | | 1 | | 22 |
Shares repurchased and cross
class conversions | (49) | | (965) | | (334) | | (5,834) | | (19) | | (386) | | (199) | | (3,912) |
| Net Increase / (Decrease) | 6 | | $ 149 | | (334) | | $ (5,834) | | (11) | | $ (222) | | (193) | | $ (3,786) |
| (1) | Amount is less than 500 shares. |
| | KAR Global Quality Dividend Fund | | KAR Mid-Cap Core Fund |
| | Year Ended
September 30, 2020 | | Year Ended
September 30, 2019 | | Year Ended
September 30, 2020 | | Year Ended
September 30, 2019 |
| | SHARES | | AMOUNT | | SHARES | | AMOUNT | | SHARES | | AMOUNT | | SHARES | | AMOUNT |
| Class A | | | | | | | | | | | | | | | |
Shares sold and cross class
conversions | 144 | | $ 1,888 | | 307 | | $ 4,130 | | 539 | | $ 19,654 | | 694 | | $ 22,555 |
| Reinvestment of distributions | 42 | | 639 | | 183 | | 2,343 | | 6 | | 220 | | 8 | | 241 |
Shares repurchased and cross
class conversions | (442) | | (5,817) | | (261) | | (3,636) | | (465) | | (16,411) | | (346) | | (11,294) |
| Net Increase / (Decrease) | (256) | | $ (3,290) | | 229 | | $ 2,837 | | 80 | | $ 3,463 | | 356 | | $ 11,502 |
| Class C | | | | | | | | | | | | | | | |
Shares sold and cross class
conversions | 25 | | $ 294 | | 49 | | $ 636 | | 360 | | $ 11,989 | | 726 | | $ 21,901 |
| Reinvestment of distributions | 3 | | 40 | | 33 | | 403 | | 6 | | 207 | | 9 | | 234 |
Shares repurchased and cross
class conversions | (132) | | (1,648) | | (212) | | (2,755) | | (359) | | (11,673) | | (377) | | (11,404) |
| Net Increase / (Decrease) | (104) | | $ (1,314) | | (130) | | $ (1,716) | | 7 | | $ 523 | | 358 | | $ 10,731 |
| Class I | | | | | | | | | | | | | | | |
Shares sold and cross class
conversions | 494 | | $ 6,644 | | 219 | | $ 3,098 | | 11,000 | | $ 403,004 | | 7,301 | | $ 237,161 |
| Reinvestment of distributions | 15 | | 226 | | 38 | | 486 | | 42 | | 1,611 | | 47 | | 1,376 |
Shares repurchased and cross
class conversions | (196) | | (2,443) | | (90) | | (1,255) | | (4,134) | | (147,797) | | (3,014) | | (98,245) |
| Net Increase / (Decrease) | 313 | | $ 4,427 | | 167 | | $ 2,329 | | 6,908 | | $ 256,818 | | 4,334 | | $ 140,292 |
VIRTUS EQUITY TRUST
NOTES TO FINANCIAL STATEMENTS (Continued)
September 30, 2020
| | KAR Global Quality Dividend Fund | | KAR Mid-Cap Core Fund |
| | Year Ended
September 30, 2020 | | Year Ended
September 30, 2019 | | Year Ended
September 30, 2020 | | Year Ended
September 30, 2019 |
| | SHARES | | AMOUNT | | SHARES | | AMOUNT | | SHARES | | AMOUNT | | SHARES | | AMOUNT |
| Class R6 | | | | | | | | | | | | | | | |
Shares sold and cross class
conversions | — | | $ — | | 7 | | $ 100 | | 302 | | $ 11,813 | | 253 | | $ 8,720 |
| Reinvestment of distributions | — | | — | | — | | — | | 1 | | 57 | | 1 | | 17 |
Shares repurchased and cross
class conversions | — | | — | | — | | — | | (139) | | (5,501) | | (9) | | (308) |
| Net Increase / (Decrease) | — | | $ — | | 7 | | $ 100 | | 164 | | $ 6,369 | | 245 | | $ 8,429 |
| | KAR Mid-Cap Growth Fund | | KAR Small-Cap Core Fund |
| | Year Ended
September 30, 2020 | | Year Ended
September 30, 2019 | | Year Ended
September 30, 2020 | | Year Ended
September 30, 2019 |
| | SHARES | | AMOUNT | | SHARES | | AMOUNT | | SHARES | | AMOUNT | | SHARES | | AMOUNT |
| Class A | | | | | | | | | | | | | | | |
Shares sold and cross class
conversions | 5,968 | | $ 285,158 | | 2,798 | | $ 103,492 | | 401 | | $ 15,166 | | 654 | | $ 21,999 |
| Reinvestment of distributions | 27 | | 1,126 | | 70 | | 2,054 | | 132 | | 5,104 | | 141 | | 4,157 |
Shares repurchased and cross
class conversions | (2,533) | | (118,550) | | (1,720) | | (61,529) | | (1,243) | | (44,953) | | (1,619) | | (53,774) |
| Net Increase / (Decrease) | 3,462 | | $ 167,734 | | 1,148 | | $ 44,017 | | (710) | | $ (24,683) | | (824) | | $ (27,618) |
| Class C | | | | | | | | | | | | | | | |
Shares sold and cross class
conversions | 1,502 | | $ 54,358 | | 1,144 | | $ 33,483 | | 110 | | $ 3,391 | | 242 | | $ 6,886 |
| Reinvestment of distributions | 12 | | 384 | | 15 | | 347 | | 162 | | 5,183 | | 198 | | 4,888 |
Shares repurchased and cross
class conversions | (408) | | (14,415) | | (226) | | (6,134) | | (893) | | (27,443) | | (1,190) | | (33,252) |
| Net Increase / (Decrease) | 1,106 | | $ 40,327 | | 933 | | $ 27,696 | | (621) | | $ (18,869) | | (750) | | $ (21,478) |
| Class I | | | | | | | | | | | | | | | |
Shares sold and cross class
conversions | 30,351 | | $ 1,478,624 | | 8,845 | | $ 342,151 | | 5,755 | | $ 218,747 | | 7,010 | | $ 249,814 |
| Reinvestment of distributions | 58 | | 2,469 | | 37 | | 1,127 | | 988 | | 40,516 | | 1,102 | | 34,246 |
Shares repurchased and cross
class conversions | (7,875) | | (382,218) | | (2,424) | | (90,125) | | (11,184) | | (447,151) | | (11,363) | | (395,296) |
| Net Increase / (Decrease) | 22,534 | | $ 1,098,875 | | 6,458 | | $ 253,153 | | (4,441) | | $ (187,888) | | (3,251) | | $ (111,236) |
| Class R6 | | | | | | | | | | | | | | | |
Shares sold and cross class
conversions | 1,702 | | $ 94,521 | | 52 | | $ 2,107 | | 5,516 | | $ 232,147 | | 796 | | $ 29,265 |
| Reinvestment of distributions | 1 | | 25 | | — (1) | | 1 | | 118 | | 4,844 | | 96 | | 2,985 |
Shares repurchased and cross
class conversions | (93) | | (4,562) | | (5) | | (170) | | (1,409) | | (57,198) | | (602) | | (22,129) |
| Net Increase / (Decrease) | 1,610 | | $ 89,984 | | 47 | | $ 1,938 | | 4,225 | | $ 179,793 | | 290 | | $ 10,121 |
| (1) | Amount is less than 500 shares. |
VIRTUS EQUITY TRUST
NOTES TO FINANCIAL STATEMENTS (Continued)
September 30, 2020
| | KAR Small-Cap Growth Fund | | KAR Small-Cap Value Fund |
| | Year Ended
September 30, 2020 | | Year Ended
September 30, 2019 | | Year Ended
September 30, 2020 | | Year Ended
September 30, 2019 |
| | SHARES | | AMOUNT | | SHARES | | AMOUNT | | SHARES | | AMOUNT | | SHARES | | AMOUNT |
| Class A | | | | | | | | | | | | | | | |
Shares sold and cross class
conversions | 2,602 | | $ 104,387 | | 5,131 | | $ 176,059 | | 627 | | $ 10,835 | | 1,146 | | $ 19,247 |
| Reinvestment of distributions | 263 | | 10,502 | | 477 | | 14,072 | | 23 | | 448 | | 81 | | 1,293 |
Shares repurchased and cross
class conversions | (6,743) | | (261,217) | | (11,800) | | (389,915) | | (772) | | (13,988) | | (1,199) | | (20,793) |
| Net Increase / (Decrease) | (3,878) | | $ (146,328) | | (6,192) | | $ (199,784) | | (122) | | $ (2,705) | | 28 | | $ (253) |
| Class C | | | | | | | | | | | | | | | |
Shares sold and cross class
conversions | 450 | | $ 16,101 | | 873 | | $ 27,067 | | 278 | | $ 5,040 | | 295 | | $ 4,835 |
| Reinvestment of distributions | 143 | | 5,103 | | 242 | | 6,416 | | — | | — | | 19 | | 293 |
Shares repurchased and cross
class conversions | (1,875) | | (67,009) | | (2,358) | | (72,588) | | (302) | | (5,152) | | (1,033) | | (16,948) |
| Net Increase / (Decrease) | (1,282) | | $ (45,805) | | (1,243) | | $ (39,105) | | (24) | | $ (112) | | (719) | | $ (11,820) |
| Class I | | | | | | | | | | | | | | | |
Shares sold and cross class
conversions | 30,624 | | $ 1,260,988 | | 27,768 | | $ 978,364 | | 19,799 | | $ 360,401 | | 12,613 | | $ 218,389 |
| Reinvestment of distributions | 1,460 | | 59,776 | | 2,195 | | 66,057 | | 198 | | 3,832 | | 601 | | 9,562 |
Shares repurchased and cross
class conversions | (31,378) | | (1,260,713) | | (46,623) | | (1,570,324) | | (10,779) | | (194,278) | | (11,185) | | (193,835) |
| Net Increase / (Decrease) | 706 | | $ 60,051 | | (16,660) | | $ (525,903) | | 9,218 | | $ 169,955 | | 2,029 | | $ 34,116 |
| Class R6 | | | | | | | | | | | | | | | |
Shares sold and cross class
conversions | 1,149 | | $ 48,543 | | 1,171 | | $ 40,434 | | 133 | | $ 2,466 | | 101 | | $ 1,754 |
| Reinvestment of distributions | 19 | | 796 | | 7 | | 224 | | 5 | | 103 | | 20 | | 322 |
Shares repurchased and cross
class conversions | (463) | | (19,328) | | (400) | | (13,719) | | (141) | | (2,664) | | (620) | | (10,959) |
| Net Increase / (Decrease) | 705 | | $ 30,011 | | 778 | | $ 26,939 | | (3) | | $ (95) | | (499) | | $ (8,883) |
| | KAR Small-Mid Cap Core Fund | | SGA Emerging Markets Growth Fund |
| | Year Ended
September 30, 2020 | | Year Ended
September 30, 2019 | | Year Ended
September 30, 2020 | | From Inception
June 13, 2019 to
September 30, 2019 |
| | SHARES | | AMOUNT | | SHARES | | AMOUNT | | SHARES | | AMOUNT | | SHARES | | AMOUNT |
| Class A | | | | | | | | | | | | | | | |
Shares sold and cross class
conversions | 1,701 | | $ 21,815 | | 119 | | $ 1,266 | | 4 | | $ 43 | | 10 | | $ 100 |
| Reinvestment of distributions | — | | — | | — (1) | | 3 | | — (1) | | — (2) | | — | | — |
Shares repurchased and cross
class conversions | (461) | | (5,440) | | (6) | | (58) | | — | | — | | — | | — |
| Net Increase / (Decrease) | 1,240 | | $ 16,375 | | 113 | | $ 1,211 | | 4 | | $ 43 | | 10 | | $ 100 |
| Class C | | | | | | | | | | | | | | | |
Shares sold and cross class
conversions | 702 | | $ 9,015 | | 85 | | $ 873 | | 3 | | $ 27 | | 10 | | $ 100 |
| Reinvestment of distributions | — | | — | | — (1) | | 1 | | — (1) | | — (2) | | — | | — |
Shares repurchased and cross
class conversions | (78) | | (898) | | (1) | | (8) | | (1) | | (11) | | — | | — |
| Net Increase / (Decrease) | 624 | | $ 8,117 | | 84 | | $ 866 | | 2 | | $ 16 | | 10 | | $ 100 |
VIRTUS EQUITY TRUST
NOTES TO FINANCIAL STATEMENTS (Continued)
September 30, 2020
| | KAR Small-Mid Cap Core Fund | | SGA Emerging Markets Growth Fund |
| | Year Ended
September 30, 2020 | | Year Ended
September 30, 2019 | | Year Ended
September 30, 2020 | | From Inception
June 13, 2019 to
September 30, 2019 |
| | SHARES | | AMOUNT | | SHARES | | AMOUNT | | SHARES | | AMOUNT | | SHARES | | AMOUNT |
| Class I | | | | | | | | | | | | | | | |
Shares sold and cross class
conversions | 33,974 | | $ 437,472 | | 2,222 | | $ 24,808 | | 10 | | $ 100 | | 11 | | $ 110 |
| Reinvestment of distributions | — | | — | | 1 | | 15 | | — (1) | | — (2) | | — | | — |
Shares repurchased and cross
class conversions | (5,815) | | (73,641) | | (90) | | (986) | | — | | — | | — | | — |
| Net Increase / (Decrease) | 28,159 | | $ 363,831 | | 2,133 | | $ 23,837 | | 10 | | $ 100 | | 11 | | $ 110 |
| Class R6 | | | | | | | | | | | | | | | |
Shares sold and cross class
conversions | 593 | | $ 8,210 | | — | | $ — | | 61 | | $ 656 | | 404 | | $ 4,038 |
| Reinvestment of distributions | — | | — | | — | | — | | — (1) | | — (2) | | — | | — |
Shares repurchased and cross
class conversions | (288) | | (3,986) | | — | | — | | (62) | | (687) | | — | | — |
| Net Increase / (Decrease) | 305 | | $ 4,224 | | — | | $ — | | (1) | | $ (31) | | 404 | | $ 4,038 |
| (1) | Amount is less than 500 shares. |
| (2) | Amount is less than $500. |
| | SGA Global Growth Fund |
| | Year Ended
September 30, 2020 | | Fiscal
Period Ended
September 30, 2019(1) | | Year Ended
January 31, 2019 |
| | SHARES | | AMOUNT | | SHARES | | AMOUNT | | SHARES | | AMOUNT |
| Class A | | | | | | | | | | | |
Shares sold and cross class
conversions | 1,212 | | $ 28,564 | | 110 | | $ 2,288 | | 91 | | $ 1,744 |
| Reinvestment of distributions | — | | — | | — | | — | | 8 | | 136 |
Shares repurchased and cross
class conversions | (414) | | (9,454) | | (112) | | (2,267) | | (90) | | (1,713) |
| Net Increase / (Decrease) | 798 | | $ 19,110 | | (2) | | $ 21 | | 9 | | $ 167 |
| Class C | | | | | | | | | | | |
Shares sold and cross class
conversions | 69 | | $ 1,510 | | 27 | | $ 538 | | 103 | | $ 1,882 |
| Reinvestment of distributions | — | | — | | — | | — | | 7 | | 112 |
Shares repurchased and cross
class conversions | (39) | | (811) | | (27) | | (522) | | (40) | | (741) |
| Net Increase / (Decrease) | 30 | | $ 699 | | — | | $ 16 | | 70 | | $ 1,253 |
| Class I* | | | | | | | | | | | |
Shares sold and cross class
conversions | 881 | | $ 20,118 | | 441 | | $ 9,232 | | 167 | | $ 3,136 |
| Reinvestment of distributions | — (2) | | 3 | | — | | — | | 17 | | 286 |
Shares repurchased and cross
class conversions | (457) | | (10,744) | | (148) | | (3,008) | | (854) | | (16,486) |
| Net Increase / (Decrease) | 424 | | $ 9,377 | | 293 | | $ 6,224 | | (670) | | $ (13,064) |
VIRTUS EQUITY TRUST
NOTES TO FINANCIAL STATEMENTS (Continued)
September 30, 2020
| | SGA Global Growth Fund |
| | Year Ended
September 30, 2020 | | Fiscal
Period Ended
September 30, 2019(1) | | Year Ended
January 31, 2019 |
| | SHARES | | AMOUNT | | SHARES | | AMOUNT | | SHARES | | AMOUNT |
| Class R6** | | | | | | | | | | | |
Shares sold and cross class
conversions | 1,167 | | $ 25,797 | | 236 | | $ 4,825 | | 748 | | $ 14,323 |
| Reinvestment of distributions | 1 | | 33 | | — | | — | | 57 | | 978 |
Shares repurchased and cross
class conversions | (412) | | (10,022) | | (271) | | (5,590) | | (82) | | (1,552) |
| Net Increase / (Decrease) | 756 | | $ 15,808 | | (35) | | $ (765) | | 723 | | $ 13,749 |
| Class Y** | | | | | | | | | | | |
Shares sold and cross class
conversions | — | | $ — | | — | | $ — | | 743 | | $ 14,798 |
| Reinvestment of distributions | — | | — | | — | | — | | 39 | | 667 |
Shares repurchased and cross
class conversions | — | | — | | — | | — | | (661) | | (11,630) |
| Net Increase / (Decrease) | — | | $ — | | — | | $ — | | 121 | | $ 3,835 |
| * | On May 3, 2019, Investor Class shares of the Predecessor Fund were reorganized into Class I shares of the Fund. See Note 1. |
| ** | On May 3, 2019, Y Class shares and Institutional Class shares of the Predecessor Fund were reorganized into Class R6 shares of the Fund. See Note 1. |
| (1) | Period from February 1, 2019 to September 30, 2019. The Fund had a fiscal period end change from January 31 to September 30. |
| (2) | Amount is less than 500 shares. |
Note 7. 10% Shareholders
As of September 30, 2020, certain Funds had individual shareholder account(s) and/or omnibus shareholder account(s) (comprised of a group of individual shareholders), which individually amounted to more than 10% of the total shares outstanding of each such Fund as detailed below:
| | % of Shares
Outstanding | | Number of
Accounts* |
KAR Global Quality Dividend Fund
| 20% | | 1 |
KAR Mid-Cap Core Fund
| 40 | | 3 |
KAR Mid-Cap Growth Fund
| 37 | | 3 |
KAR Small-Cap Core Fund
| 37 | | 3 |
KAR Small-Cap Growth Fund
| 23 | | 2 |
KAR Small-Cap Value Fund
| 58 | | 2 |
KAR Small-Mid Cap Core Fund
| 49 | | 3 |
SGA Emerging Markets Growth Fund
| 72 | | 3 |
SGA Global Growth Fund
| 43 | | 3 |
| * | None of the accounts are affiliated. |
Note 8. Market Risk and Asset Concentration
Local, regional or global events such as war, acts of terrorism, the spread of infectious illness or other public health issue, recessions, or other events could have a significant impact on a Fund and its investments, including hampering the ability of the Fund’s portfolio manager(s) to invest the Fund’s assets as intended.
In countries with limited or developing markets, investments may present greater risks than in more developed markets and the prices of such investments may be volatile. The consequences of political, social or economic changes in these markets may have disruptive effects on the market prices of these investments and the income they generate, as well as a Fund’s ability to repatriate such amounts.
Certain Funds may invest a high percentage of their assets in specific sectors of the market in the pursuit of their investment objectives. Fluctuations in these sectors of concentration may have a greater impact on a Fund, positive or negative, than if the Fund did not concentrate its investments in such sectors.
VIRTUS EQUITY TRUST
NOTES TO FINANCIAL STATEMENTS (Continued)
September 30, 2020
At September 30, 2020, the following Funds held securities issued by various companies in specific sectors as detailed below:
| Fund | | Sector | | Percentage of
Total Investments |
KAR Capital Growth Fund
| | Information Technology | | 33% |
KAR Capital Growth Fund
| | Consumer Discretionary | | 26 |
KAR Mid-Cap Core Fund
| | Industrials | | 33 |
KAR Mid-Cap Growth Fund
| | Information Technology | | 34 |
KAR Small-Cap Core Fund
| | Industrials | | 30 |
KAR Small-Cap Growth Fund
| | Information Technology | | 30 |
KAR Small-Cap Value Fund
| | Industrials | | 37 |
KAR Small-Mid Cap Core Fund
| | Information Technology | | 28 |
KAR Small-Mid Cap Core Fund
| | Industrials | | 27 |
SGA Emerging Markets Growth Fund
| | Consumer Discretionary | | 35 |
SGA Global Growth Fund
| | Information Technology | | 27 |
Note 9. Indemnifications
Under the Trust’s organizational documents and in separate agreements between each Trustee and the Trust, its Trustees and officers are indemnified against certain liabilities arising out of the performance of their duties to the Trust and its funds. In addition, in the normal course of business, the Trust and the Funds enter into contracts that provide a variety of indemnifications to other parties. The Trust’s and/or the Funds’ maximum exposure under these arrangements is unknown, as this would involve future claims that may be made against the Trust or the Funds and that have not occurred. However, neither the Trust nor the Funds have had prior claims or losses pursuant to these arrangements, and they expect the risk of loss to be remote.
Note 10. Restricted Securities
($ reported in thousands)
Restricted securities are not registered under the Securities Act of 1933, as amended (the “1933 Act”). Generally, 144A securities are excluded from this category. Each Fund will bear any costs, including those involved in registration under the 1933 Act, in connection with the disposition of such securities. Certain Funds held securities considered to be restricted at September 30, 2020, as follows:
| Fund | | Investment | | Date of
Acquisition | | Cost | | Value | | Percentage of
Net Assets |
KAR Capital Growth Fund
| | Duck Creek Technologies, Inc. | | 06/05/2020 | | $ 5,813 | | $ 16,704 | | 2.4% |
KAR Small-Cap Growth Fund
| | Duck Creek Technologies, Inc. | | 06/05/2020 | | 138,881 | | 394,979 | | 6.1 |
Note 11. Redemption Facility
($ reported in thousands)
On September 18, 2017, the Funds and certain other affiliated funds entered into an $150,000 unsecured line of credit (“Credit Agreement”). This Credit Agreement, as amended, is with a commercial bank that allows the Funds to borrow cash from the bank to manage large unexpected redemptions and trade fails, up to a limit of one-third of each Fund’s total net assets in accordance with the terms of the agreement. This Credit Agreement has a term of 364 days and has been renewed for a period up to March 11, 2021. Interest is charged at the higher of the LIBOR or the Federal Funds rate plus an additional percentage rate on the amount borrowed. Commitment fees are charged on the undrawn balance. The Funds and other affiliated funds that are parties are individually, and not jointly, liable for their particular advances, if any, under the Credit Agreement. The lending bank has the ability to require repayment of outstanding borrowings under this Credit Agreement upon certain circumstances such as an event of default.
The following Fund had an outstanding loan during the period. The borrowings were valued at cost, which approximates fair value.
| Fund | | Interest Incurred
on Borrowing | | Average Dollar
Amount of Borrowing | | Weighted Average
Interest Rate on
Borrowing | | Days Loan
was Open |
KAR Small-Cap Growth Fund
| | $1 | | $20,000 | | 2.11% | | 1 |
VIRTUS EQUITY TRUST
NOTES TO FINANCIAL STATEMENTS (Continued)
September 30, 2020
Note 12. Federal Income Tax Information
($ reported in thousands)
At September 30, 2020, federal tax cost and aggregate gross unrealized appreciation (depreciation) of securities held by the Funds were as follows:
| Fund | | Federal
Tax Cost | | Unrealized
Appreciation | | Unrealized
(Depreciation) | | Net Unrealized
Appreciation
(Depreciation) |
KAR Capital Growth Fund
| | $ 227,835 | | $ 473,097 | | $ (4,145) | | $ 468,952 |
KAR Equity Income Fund
| | 133,122 | | 3,068 | | (4,861) | | (1,793) |
KAR Global Quality Dividend Fund
| | 31,296 | | 3,427 | | (1,638) | | 1,789 |
KAR Mid-Cap Core Fund
| | 625,981 | | 164,027 | | (7,790) | | 156,237 |
KAR Mid-Cap Growth Fund
| | 1,824,840 | | 703,224 | | (10,478) | | 692,746 |
KAR Small-Cap Core Fund
| | 1,039,269 | | 569,076 | | (74,466) | | 494,610 |
KAR Small-Cap Growth Fund
| | 3,941,880 | | 2,466,367 | | (87,869) | | 2,378,498 |
KAR Small-Cap Value Fund
| | 595,767 | | 234,936 | | (24,754) | | 210,182 |
KAR Small-Mid Cap Core Fund
| | 413,575 | | 60,223 | | (3,346) | | 56,877 |
SGA Emerging Markets Growth Fund
| | 4,529 | | 1,216 | | (419) | | 797 |
SGA Global Growth Fund
| | 97,481 | | 36,598 | | (2,459) | | 34,139 |
Certain Funds have capital loss carryovers available to offset future realized capital gains, if any, to the extent permitted by the Internal Revenue Code. Net capital losses are carried forward without expiration and generally retain their short-term and/or long-term tax character, as applicable. The Funds’ capital loss carryovers are as follows:
| | Short-Term | | Long-Term |
KAR Global Quality Dividend Fund
| $ 286 | | $ 941 |
KAR Small-Cap Value Fund
| 1,206 | | 9,109 |
KAR Small-Mid Cap Core Fund
| 72 | | 35 |
For the year ended September 30, 2020, the following Funds utilized capital loss carryovers as follows:
| Fund | |
KAR Equity Income Fund
| $ 7,753 |
KAR Small-Mid Cap Core Fund
| 4 |
SGA Global Growth Fund
| 577 |
Capital losses realized after October 31 and certain late year ordinary losses may be deferred and treated as occurring on the first day of the following fiscal year. For the period ended September 30, 2020, the following Funds deferred and recognized qualified late year losses as follows:
| | Late Year
Ordinary
Losses
Deferred | | Late Year
Ordinary
Losses
Recognized | | Capital
Loss
Deferred | | Capital
Loss
Recognized |
KAR Capital Growth Fund
| $ 3,025 | | $ (1,695) | | $ — | | $ — |
| KAR Equity Income Fund | — | | — | | — | | (760) |
KAR Global Quality Dividend Fund
| 4 | | (20) | | 2,783 | | (1,227) |
KAR Mid-Cap Core Fund
| 456 | | — | | — | | — |
KAR Mid-Cap Growth Fund
| 8,402 | | (2,143) | | — | | — |
| KAR Small-Cap Core Fund | — | | (3,225) | | — | | — |
KAR Small-Cap Growth Fund
| 30,785 | | (23,016) | | — | | (54,753) |
KAR Small-Cap Value Fund
| — | | — | | 14,251 | | (10,315) |
KAR Small-Mid Cap Core Fund
| — | | (11) | | 235 | | (69) |
| | | | | | | | |
VIRTUS EQUITY TRUST
NOTES TO FINANCIAL STATEMENTS (Continued)
September 30, 2020
The components of distributable earnings on a tax basis (excluding unrealized appreciation (depreciation) which is disclosed in the beginning of this note) consist of the following:
| | Undistributed
Ordinary
Income | | Undistributed
Long-Term
Capital Gains |
KAR Capital Growth Fund
| $ — | | $ 18,703 |
KAR Equity Income Fund
| 977 | | 34,978 |
KAR Mid-Cap Core Fund
| — | | 2,981 |
KAR Mid-Cap Growth Fund
| — | | 155 |
KAR Small-Cap Core Fund
| — | | 118,265 |
KAR Small-Cap Growth Fund
| — | | 666,180 |
KAR Small-Cap Value Fund
| 4,364 | | — |
KAR Small-Mid Cap Core Fund
| 50 | | — |
SGA Emerging Markets Growth Fund
| 48 | | 66 |
SGA Global Growth Fund
| 2,191 | | 2,442 |
The differences between the book and tax basis distributable earnings relate principally to the timing of recognition of income and gains for federal income tax purposes. Short-term gain distributions if any, are reported as ordinary income for federal tax purposes. Distributions are determined on a tax basis and may differ from net investment income and realized capital gains for financial reporting purposes.
The tax character of dividends and distributions paid during the fiscal periods ended September 30, 2020, September 30, 2019 and January 31, 2019, were as follows:
| | Ordinary
Income | | Long-Term
Capital Gains | | Return of
Capital | | Total |
KAR Capital Growth Fund
| | | | | | | |
9/30/20
| $ — | | $ 14,937 | | $ — | | $14,937 |
9/30/19
| 358 | | 44,737 | | — | | 45,095 |
KAR Equity Income Fund
| | | | | | | |
9/30/20
| 1,342 | | — | | — | | 1,342 |
9/30/19
| 1,367 | | — | | — | | 1,367 |
KAR Global Quality Dividend Fund
| | | | | | | |
9/30/20
| 945 | | — | | — | | 945 |
9/30/19
| 3,346 | | 63 | | — | | 3,409 |
KAR Mid-Cap Core Fund
| | | | | | | |
9/30/20
| 32 | | 2,065 | | — | | 2,097 |
9/30/19
| — | | 1,872 | | — | | 1,872 |
KAR Mid-Cap Growth Fund
| | | | | | | |
9/30/20
| — | | 4,125 | | — | | 4,125 |
9/30/19
| 1,083 | | 2,663 | | — | | 3,746 |
KAR Small-Cap Core Fund
| | | | | | | |
9/30/20
| — | | 64,855 | | — | | 64,855 |
9/30/19
| 11,398 | | 41,364 | | — | | 52,762 |
KAR Small-Cap Growth Fund
| | | | | | | |
9/30/20
| — | | 83,035 | | — | | 83,035 |
9/30/19
| 29,378 | | 61,548 | | 4,955 | | 95,881 |
KAR Small-Cap Value Fund
| | | | | | | |
9/30/20
| 4,730 | | — | | — | | 4,730 |
9/30/19
| 6,373 | | 5,576 | | — | | 11,949 |
KAR Small-Mid Cap Core Fund
| | | | | | | |
9/30/19
| 58 | | — | | — | | 58 |
SGA Emerging Markets Growth Fund
| | | | | | | |
9/30/20
| 1 | | — | | — | | 1 |
SGA Global Growth Fund
| | | | | | | |
9/30/20
| 37 | | — | | — | | 37 |
1/31/19
| 233 | | 1,991 | | — | | 2,224 |
VIRTUS EQUITY TRUST
NOTES TO FINANCIAL STATEMENTS (Continued)
September 30, 2020
For financial reporting purposes, book basis capital accounts are adjusted to reflect the tax character of permanent book/tax differences. Permanent reclassifications can arise from differing treatment of certain income and gain transactions, nondeductible current year net operating losses, expiring capital loss carryovers and investments in passive foreign investment companies. The reclassifications have no impact on the net assets or NAV of the Funds. As of September 30, 2020, the Funds recorded reclassifications to increase (decrease) the accounts as listed below:
| | Capital Paid in on
Shares of
Beneficial Interest | | Total Distributable
Earnings
(Accumulated Losses) |
KAR Capital Growth Fund
| $ (2,283) | | $ 2,283 |
KAR Equity Income Fund
| (299) | | 299 |
KAR Global Quality Dividend Fund
| (93) | | 93 |
KAR Mid-Cap Core Fund
| — (1) | | — (1) |
KAR Mid-Cap Growth Fund
| (1,384) | | 1,384 |
KAR Small-Cap Core Fund
| (2,866) | | 2,866 |
KAR Small-Cap Growth Fund
| (29,077) | | 29,077 |
KAR Small-Cap Value Fund
| — (1) | | — (1) |
KAR Small-Mid Cap Core Fund
| — (1) | | — (1) |
SGA Global Growth Fund
| — (1) | | — (1) |
| (1) | Amount is less than $500. |
Note 13. Regulatory Matters and Litigation
From time to time, the Trust, the Funds, the Adviser and/or subadvisers and/or their affiliates may be involved in litigation and arbitration as well as examinations and investigations by various regulatory bodies, including the SEC, involving compliance with, among other things, securities laws, client investment guidelines, laws and regulations affecting their activities. At this time, the Adviser believes that the outcomes of such matters are not likely, either individually or in aggregate, to be material to these financial statements.
Note 14. Recent Accounting Pronouncements
In August 2018, the Financial Accounting Standards Board (“FASB”) issued Accounting Standards Update (“ASU”) No. 2018-13, which changes certain fair value measurement disclosure requirements. This ASU, in addition to other modifications and additions, removes the requirement to disclose the amount and reasons for transfers between Level 1 and Level 2 of the fair value hierarchy, the policy for the timing of transfers between levels and the valuation process for Level 3 fair value measurements. For public companies, the amendments are effective for financial statements issued for fiscal years beginning after December 15, 2019, and interim periods within those fiscal years. Management has evaluated the implications of certain provisions of ASU No. 2018-13 and has determined to early adopt all aspects related to the removal and modification of certain fair value measurement disclosures under the ASU effective immediately.
In March 2020, the FASB issued ASU No. 2020-04, Reference Rate Reform (Topic 848) - Facilitation of the Effects of Reference Rate Reform on Financial Reporting. The amendments in ASU 2020-04 provides optional temporary financial reporting relief from the effect of certain types of contract modifications due to the planned discontinuation of the LIBOR and other interbank-offered based reference rates as of the end of 2021. ASU 2020-04 is effective for certain reference rate-related contract modifications that occur during the period March 12, 2020 through December 31, 2022. Management is currently evaluating the impact, if any, of applying ASU 2020-04.
Note 15. Subsequent Events
Management has evaluated the impact of all subsequent events on the Funds through the date the financial statements were available for issuance, and has determined that the following is the only subsequent event requiring recognition or disclosure in these financial statements.
Effective October 1, 2020, the Funds may loan portfolio securities under the securities lending program.
Report of Independent Registered Public Accounting Firm
To the Board of Trustees of Virtus Equity Trust and Shareholders of Virtus KAR Capital Growth Fund, Virtus KAR Equity Income Fund, Virtus KAR Global Quality Dividend Fund, Virtus KAR Mid-Cap Core Fund, Virtus KAR Mid-Cap Growth Fund, Virtus KAR Small-Cap Core Fund, Virtus KAR Small-Cap Growth Fund, Virtus KAR Small-Cap Value Fund, Virtus KAR Small-Mid Cap Core Fund, Virtus SGA Emerging Markets Growth Fund and Virtus SGA Global Growth Fund
Opinions on the Financial Statements
We have audited the accompanying statements of assets and liabilities, including the schedules of investments, of each of the funds listed in the table below (eleven of the funds constituting Virtus Equity Trust, hereafter collectively referred to as the “Funds”) as of September 30, 2020, the related statements of operations and of changes in net assets for each of the periods indicated in the table below, including the related notes, and the financial highlights for each of the periods indicated therein (collectively referred to as the “financial statements”). In our opinion, the financial statements present fairly, in all material respects, the financial position of each of the Funds as of September 30, 2020, the results of each of their operations and the changes in each of their net assets for the periods indicated in the table below, and each of the financial highlights for each of the periods indicated therein, in conformity with accounting principles generally accepted in the United States of America.
Virtus KAR Capital Growth Fund
Virtus KAR Equity Income Fund
Virtus KAR Global Quality Dividend Fund
Virtus KAR Mid-Cap Core Fund
Virtus KAR Mid-Cap Growth Fund
Virtus KAR Small-Cap Core Fund
Virtus KAR Small-Cap Growth Fund
Virtus KAR Small-Cap Value Fund
KAR Small-Mid Cap Core Fund | Statements of operations for the year ended September 30, 2020 and statements of changes in net assets for the years ended September 30, 2020 and 2019 |
| Virtus SGA Global Growth Fund | Statement of operations for the year ended September 30, 2020, and statements of changes in net assets for the year ended September 30, 2020, period February 1, 2019 through September 30, 2019 and year ended January 31, 2019 |
| Virtus SGA Emerging Markets Growth Fund | Statement of operations for the year ended September 30, 2020, and statements of changes in net assets for the year ended September 30, 2020 and the period June 13, 2019 (inception) through September 30, 2019 |
Basis for Opinions
These financial statements are the responsibility of the Funds’ management. Our responsibility is to express an opinion on the Funds’ financial statements based on our audits. We are a public accounting firm registered with the Public Company Accounting Oversight Board (United States) (“PCAOB”) and are required to be independent with respect to the Funds in accordance with the U.S. federal securities laws and the applicable rules and regulations of the Securities and Exchange Commission and the PCAOB.
We conducted our audits of these financial statements in accordance with the standards of the PCAOB. Those standards require that we plan and perform the audit to obtain reasonable assurance about whether the financial statements are free of material misstatement, whether due to error or fraud.
Our audits included performing procedures to assess the risks of material misstatement of the financial statements, whether due to error or fraud, and performing procedures that respond to those risks. Such procedures included examining, on a test basis, evidence regarding the amounts and disclosures in the financial statements. Our audits also included evaluating the accounting principles used and significant estimates made by management, as well as evaluating the overall presentation of the financial statements. Our procedures included confirmation of securities owned as of September 30, 2020 by correspondence with the custodian, transfer agent and brokers; when replies were not received from brokers, we performed other auditing procedures. We believe that our audits provide a reasonable basis for our opinions.
/s/ PricewaterhouseCoopers LLP
Philadelphia, Pennsylvania
November 20, 2020
We have served as the Virtus Mutual Funds’ auditor since at least 1977. We have not been able to determine the specific year we began serving as auditor.
VIRTUS EQUITY TRUST
TAX INFORMATION NOTICE (Unaudited)
September 30, 2020
For the fiscal year ended September 30, 2020, the Funds make the following disclosures for federal income tax purposes. Below is listed the percentages, or the maximum amount allowable, of its ordinary income dividends (“QDI”) to qualify for the lower tax rates applicable to individual shareholders, and the percentage of ordinary income dividends earned by the Funds which qualifies for the dividends received deduction (“DRD”) for corporate shareholders. The actual percentage of QDI and DRD for the calendar year will be designated in year-end tax statements. The Funds designate the amounts below as long-term capital gains (“LTCG”) dividends taxable at a 20% rate, or lower depending on the shareholder’s income ($ reported in thousands). LTCG amounts, if subsequently different, will be designated in the next annual report.
| | QDI | | DRD | | LTCG |
KAR Capital Growth Fund
| —% | | — % | | $ 18,704 |
KAR Equity Income Fund
| 100 | | 100 | | 34,978 |
KAR Global Quality Dividend Fund
| 100 | | 74 | | — |
KAR Mid-Cap Core Fund
| — | | — | | 2,982 |
KAR Mid-Cap Growth Fund
| — | | — | | 157 |
KAR Small-Cap Core Fund
| — | | — | | 120,335 |
KAR Small-Cap Growth Fund
| — | | — | | 749,215 |
KAR Small-Cap Value Fund
| 100 | | 100 | | — |
KAR Small-Mid Cap Core Fund
| 100 | | 100 | | — |
SGA Emerging Markets Growth Fund
| 95 | | 6 | | 66 |
SGA Global Growth Fund
| 32 | | 12 | | 2,442 |
For the fiscal year ended September 30, 2020, certain Funds are disclosing the following information pursuant to notice requirements of Section 853(a) and 855(d) of the Internal Revenue Code, as amended, and the Treasury Regulations thereunder ($ reported in thousands).
| | Foreign Source
Income
Recognized | | Foreign Taxes
Paid on
Foreign
Source
Income |
SGA Emerging Markets Growth Fund
| $ 52 | | $ 5 |
STATEMENT REGARDING LIQUIDITY RISK MANAGEMENT PROGRAM (UNAUDITED)
Pursuant to Rule 22e-4 under the 1940 Act, the Funds have adopted a liquidity risk management program (the “Program”) to govern the Funds’ approach to managing liquidity risk, which is the risk that a Fund would not be able to meet redemption requests without significant dilution of remaining investors’ interests in the Fund. The Program is overseen by the Adviser as the Funds’ Liquidity Risk Management Program Administrator (the “Program Administrator”), and the Program’s principal objectives include assessing, managing and periodically reviewing each Fund’s liquidity risk, based on factors specific to the circumstances of the Funds.
Assessment and management of a Fund’s liquidity risk under the Program take into consideration certain factors, such as the Fund’s investment strategy and the liquidity of its portfolio investments during normal and reasonably foreseeable stressed conditions, its short- and long-term cash-flow projections during both normal and reasonably foreseeable stressed conditions, and its cash and cash-equivalent holdings and access to other funding sources. As required by the rule, the Program includes policies and procedures for classification of Fund portfolio holdings in four liquidity categories, maintaining certain levels of highly liquid investments, and limiting holdings of illiquid investments.
At a meeting of the Board held on May 19-21, 2020, the Board received a report from the Program Administrator addressing the operation and management of the Program for the period from December 1, 2018 through December 31, 2019 (the “Review Period”). The Board acknowledged that because the Review Period ended before 2020, it did not cover the more recent period of market volatility relating to the COVID-19 pandemic. The Program Administrator’s report noted that for the Review Period, the Program Administrator believed that the Program was implemented and operated effectively in all material respects and that existing procedures, controls and safeguards were appropriately designed to enable the Program Administrator to administer the Program in compliance with Rule 22e-4. The Program Administrator’s report noted that during the Review Period, there were no events that created liquidity related concerns for the Funds. The Program Administrator’s report further noted that while changes to the Program had been made during the Review Period and reported to the Board, no material changes were made to the Program as a result of the Program Administrator’s annual review.
There can be no assurance that the Program will achieve its objectives in the future. Please refer to a Fund’s prospectus for more information regarding the Fund’s exposure to liquidity risk and other principal risks to which an investment in that Fund may be subject.
RESULTS OF SHAREHOLDER MEETING
VIRTUS EQUITY TRUST
AUGUST 28, 2020 (Unaudited)
At a special meeting of shareholders of Virtus Rampart Enhanced Core Equity Fund (the “Fund”), a series of Virtus Equity Trust, held on August 28, 2020, shareholders voted on the following proposals:
| Number of Eligible Votes: | | FOR | | AGAINST | | ABSTAIN |
| To approve a Subadvisory Agreement by and among Virtus Equity Trust, Virtus Investment Advisers, Inc., and Kayne Anderson Rudnick Investment Management, LLC | | 50,609,647.36 | | 1,937,804.90 | | 9,834,360.54 |
| Number of Eligible Votes: | | FOR | | AGAINST | | ABSTAIN |
| To approve a proposal to permit Virtus Investment Advisers, Inc., as the investment adviser to Virtus Rampart Enhanced Core Equity Fund (the “Fund”), to hire, terminate and replace affiliated (both wholly-owned and partially-owned) and unaffiliated subadvisers for the Fund or to modify subadvisory agreements for the Fund without shareholder approval, and to permit the Fund to disclose advisory and subadvisory fee information in an aggregated manner | | 46,755,094.19 | | 5,797,285.46 | | 9,829,433.15 |
Shareholders of the Fund voted to approve the above proposals.
CONSIDERATION OF ADVISORY AND SUBADVISORY AGREEMENTS FOR
VIRTUS KAR EQUITY INCOME FUND
(formerly RAMPART ENHANCED CORE EQUITY FUND)
BY THE BOARD OF TRUSTEES (Unaudited)
The Board of Trustees (the “Board”) of Virtus Equity Trust (the “Trust”) is responsible for determining whether to approve the establishment and continuation of advisory and subadvisory agreements for the Trust. At a meeting held on June 17, 2020, in a virtual meeting format in light of public health concerns regarding the spread of COVID-19 (the “Meeting”), the Board, including a majority of the Trustees who are not interested persons of the Trust as defined in Section 2(a)(19) of the Investment Company Act of 1940, as amended (such Act, the “1940 Act” and such Trustees, the “Independent Trustees”), authorized the appointment of Kayne Anderson Rudnick Investment Management, LLC (the “Subadviser”) as subadviser to Virtus Rampart Enhanced Core Equity Fund (the “Fund”) and approved a new investment subadvisory agreement with the Subadviser (the “Subadvisory Agreement”). In connection with the appointment of the Subadviser, the Board also considered and approved the name change from Virtus Rampart Enhanced Core Equity Fund to Virtus KAR Equity Income Fund and related investment strategy changes.
In considering the proposal to appoint the Subadviser, the Board requested and evaluated information provided by Virtus Investment Advisers, Inc. (“VIA”) and the Subadviser which, in the Board’s view, constituted information necessary for the Board to form a judgment as to whether appointment of the Subadviser would be in the best interests of the Fund and its shareholders. The Board also took into account discussions with management and information provided to the Board in its meetings throughout the year with respect to the services to be provided by the Subadviser and its representatives to other Virtus Funds, including quarterly performance reports prepared by management containing reviews of investment results. The Board noted the affiliation of the Subadviser with VIA and any potential conflicts of interest.
The Board was separately advised by independent legal counsel throughout the process. The Board considered all the criteria separately with respect to the Fund and its shareholders. In its deliberations, the Board considered various factors, including those discussed below, none of which were controlling, and each Trustee may have attributed different weights to the various factors. The Independent Trustees also discussed the proposed approval of the Subadvisory Agreement in private sessions with their independent legal counsel at which no representatives of management were present.
Basis for the Board’s Recommendation
In making its determination with respect to the Subadvisory Agreement, the Board considered various factors, including:
Nature, extent, and quality of the services to be provided by the Subadviser.
The Trustees received in advance of the Meeting information provided by the Subadviser, including the Subadviser’s Form ADV, as well as a presentation provided by portfolio management personnel of the Subadviser. The Board noted that the Subadviser would provide portfolio management, compliance with the Fund’s investment policies and procedures, compliance with applicable securities laws and assurances thereof. The Board also noted that VIA’s and the Subadviser’s management of the Fund is subject to the oversight of the Board and must be carried out in accordance with the investment objective, policies and restrictions set forth in the Fund’s prospectuses and statement of additional information. In considering the approval of the Subadvisory Agreement, the Board also considered the Subadviser’s investment management process, including (a) the experience and capability of the Subadviser’s management and other personnel committed by the Subadviser to the Fund; (b) the financial condition of the Subadviser; (c) the quality of the Subadviser’s regulatory and legal compliance policies, procedures and systems; and (d) the Subadviser’s brokerage and trading practices, including with respect to best execution and soft dollars. The Board also took into account the Subadviser’s risk assessment and monitoring process. The Board noted the Subadviser’s regulatory history, including whether it was currently involved in any regulatory actions or investigations as well as material litigation, and any settlements and amelioratory actions undertaken, as appropriate. After considering all of the information provided to them, the Trustees concluded that the nature, extent and quality of the services expected to be provided by the Subadviser were satisfactory and that there was a reasonable basis on which to conclude that the Subadviser would provide a high quality of investment services to the Fund.
Investment Performance.
The Board considered certain information regarding performance of a segment of the portfolio of another Virtus Fund managed by the proposed Subadviser versus a peer group, an appropriate index and the Fund’s historical performance as well as discussions with management and information provided to the Board in its meetings throughout the year with respect to the services provided by the Subadviser and its representatives to other Virtus Funds, including quarterly performance reports prepared by management containing reviews of investment results.
Subadvisory Fee.
The Board took into account that the Fund’s subadvisory fees are paid by VIA out of its management fees rather than paid separately by the Fund, so that the Fund’s shareholders would not be directly impacted by those fees. The Board also noted that the proposed subadvisory fee schedule under the Subadvisory Agreement was the same as the subadvisory fee schedule for subadvisers of the Trust’s other series. The Board concluded that the proposed subadvisory fees were fair and reasonable in light of services to be provided by the Subadviser and all factors considered.
CONSIDERATION OF ADVISORY AND SUBADVISORY AGREEMENTS FOR
VIRTUS KAR EQUITY INCOME FUND
(formerly RAMPART ENHANCED CORE EQUITY FUND)
BY THE BOARD OF TRUSTEES (Unaudited) (Continued)
Profitability and Economies of Scale.
In considering the projected profitability to the Subadviser in connection with its relationship to the Fund, the Board noted that the fees under the Subadvisory Agreement would be paid by VIA out of the fees that VIA receives under the Advisory Agreement, so that Fund shareholders would not be directly impacted by those fees. The Board also noted that the proposed subadvisory fees under the Subadvisory Agreement was the same as the subadvisory fees paid to the Fund’s’ previous subadviser. In considering the reasonableness of the fees payable by VIA to the Subadviser, the Board noted that, because the Subadviser is an affiliate of VIA, such profitability might be directly or indirectly shared by VIA. For each of the above reasons, the Board concluded that the projected profitability to the Subadviser and its affiliates from their relationships with the Fund was not a material factor in approval of the Subadvisory Agreement. For similar reasons, and based upon the expected size of the Fund to be managed by the Subadviser, the Board concluded that the potential for economies of scale in the Subadviser’s management of the Fund was not a material factor in the approval of the Subadvisory Agreement at this time.
Other Factors.
The Board considered other benefits that may be realized by the Subadviser and its affiliates from their relationships with the Fund. Among them, the Board recognized that VP Distributors, LLC, an affiliate of the VIA, serves as the distributor for the Trust, and, as such, receives payments pursuant to Rule 12b-1 from the Fund to compensate it for providing selling activities, which could lead to growth in the Fund’s assets and corresponding benefits from such growth, including economies of scale. The Board also noted that an affiliate of VIA and the Subadviser also provides administrative and transfer agency services to the Trust. The Board noted management’s discussion of the fact that, while the Subadviser is an affiliate of VIA, there are no other direct benefits to the Subadviser in providing subadvisory services to the Fund, other than the fee to be earned under the Subadvisory Agreement, although there may be certain indirect benefits gained, including to the extent that serving the Fund could provide the opportunity to provide subadvisory services to additional series of the Trust or certain reputational benefits.
Conclusion
Based on all of the foregoing considerations, the Board, including a majority of the Independent Trustees, determined that approval of each Subadvisory Agreement was in the best interests of the Fund and its shareholders. Accordingly, the Board, and the Independent Trustees voting separately, approved the Subadvisory Agreement.
CONSIDERATION OF ADVISORY AND SUBADVISORY AGREEMENTS FOR
VIRTUS SGA NEW LEADERS GROWTH FUND (the “FUND”)
BY THE BOARD OF TRUSTEES (Unaudited)
The Board of Trustees (the “Board”) of Virtus Equity Trust (the “Trust”) is responsible for determining whether to approve the establishment and continuation of the investment advisory agreement (the “Advisory Agreement”) between the Trust and Virtus Investment Advisers, Inc. (“VIA”) and the subadvisory agreement (the “Subadvisory Agreement” and together with the Advisory Agreement, the “Agreements”) among the Trust, VIA and Sustainable Growth Advisers, LP (the “Subadviser” or “SGA”). At a meeting held on August 26, 2020, in a virtual meeting format in light of public health concerns regarding the spread of COVID-19 (the “Meeting”), the Board, including a majority of the Trustees who are not interested persons of the Trust as defined in Section 2(a)(19) of the Investment Company Act of 1940, as amended (such Act, the “1940 Act” and such Trustees, the “Independent Trustees”), authorized the appointment of VIA as adviser to the Fund and SGA as subadviser to the Fund, and considered and approved the establishment of the Agreements, as further discussed below.
In connection with the approval of the Agreements, the Board requested and evaluated information provided by VIA and the Subadviser which, in the Board’s view, constituted information necessary for the Board to form a judgment as to whether approval of each of the Agreements would be in the best interests of the Fund and its shareholders. The Board noted the affiliation of the Subadviser with VIA and any potential conflicts of interest.
The Board was separately advised by independent legal counsel throughout the process. For each Agreement, the Board considered all the criteria separately with respect to the Fund and its shareholders. In its deliberations, the Board considered various factors, including those discussed below, none of which were controlling, and each Trustee may have attributed different weights to the various factors. The Independent Trustees also discussed the proposed approval of the Agreements in private sessions with their independent legal counsel at which no representatives of management were present.
In considering whether to approve the Agreements with respect to the Fund, the Board reviewed and analyzed the factors it deemed relevant, including: (1) the nature, extent and quality of the services to be provided to the Fund by VIA and the Subadviser; (2) information regarding performance of an account managed in a similar manner as the Fund was expected to be managed; (3) the level and method of computing the Fund’s advisory and subadvisory fees, and comparisons of the Fund’s proposed advisory fee rates with those of a group of other funds with similar investment objectives; (4) historical profitability of VIA and its affiliates under similar agreements; (5) any “fall-out” benefits to VIA, the Subadviser and their affiliates (i.e., ancillary benefits realized by VIA, the Subadviser or their affiliates from VIA’s or the Subadviser’s relationship with the Fund); (6) possible conflicts of interest; and (7) the terms of the Agreements.
Nature, Extent and Quality of Services
The Trustees received in advance of the meeting information provided by VIA and the Subadviser, including completed questionnaires, each concerning a number of topics, including such company’s investment philosophy, resources, operations and compliance structure. The Trustees also received a presentation by VIA’s senior management personnel, during which among other items, VIA’s history, investment process, investment strategies, personnel, compliance procedures and the firm’s overall performance were reviewed and discussed. The Trustees noted that the Fund would be managed using a “manager of managers” structure that generally involves the use of one or more subadvisers to manage some or all of the Fund’s portfolio. Under this structure, VIA is responsible for the oversight of the Fund’s investment program and for evaluating and selecting subadvisers on an ongoing basis and making any recommendations to the Board regarding hiring, retaining or replacing subadvisers. In considering the Advisory Agreement, the Board considered VIA’s process for supervising and managing the Fund’s subadviser, including (a) VIA’s ability to select and monitor the subadviser; (b) VIA’s ability to provide the services necessary to monitor the subadviser’s compliance with the Fund’s investment objective, policies and restrictions as well as provide other oversight activities; and (c) VIA’s ability and willingness to identify instances in which a subadviser should be replaced and to carry out the required changes. The Trustees also considered: (a) the experience and capability of VIA’s management and other personnel; (b) the financial condition of VIA, and whether it had the financial wherewithal to provide a high level and quality of services to the Fund; (c) the quality of VIA’s own regulatory and legal compliance policies, procedures and systems; (d) the nature, extent and quality of administrative, transfer agency and other services expected to be provided by VIA and its affiliates to the Fund; (e) VIA’s expected supervision of the Fund’s other service providers; and (f) VIA’s risk management processes. It was noted that affiliates of VIA were expected to serve as administrator, transfer agent and distributor of the Fund. The Board also took into account its knowledge of VIA’s management and the quality of the performance of its duties with respect to other Virtus Funds through Board meetings, discussions and reports, as well as information from the Trust’s Chief Compliance Officer regarding the Fund’s compliance policies and procedures proposed to be established pursuant to Rule 38a-1 under the 1940 Act.
With respect to the services to be provided by the Subadviser, the Trustees received in advance of the Meeting information provided by the Subadviser, including the Subadviser’s Form ADV, as well as a presentation provided by portfolio management personnel of the Subadviser. With respect to the Subadvisory Agreement, the Board noted that the Subadviser would provide portfolio management, compliance with the Fund’s investment policies and procedures, compliance with applicable securities laws and assurances thereof. The Board also noted that VIA’s and the Subadviser’s management of the Fund is subject to the oversight of the Board and must be carried out in accordance with the investment objective(s), policies and restrictions set forth in the Fund’s prospectuses and statement of additional information. In considering approval of the Subadvisory Agreement, the Board also considered the Subadviser’s investment
CONSIDERATION OF ADVISORY AND SUBADVISORY AGREEMENTS FOR
VIRTUS SGA NEW LEADERS GROWTH FUND (the “FUND”)
BY THE BOARD OF TRUSTEES (Unaudited) (Continued)
management process, including (a) the experience and capability of the Subadviser’s management and other personnel committed by the Subadviser to the Fund; (b) the financial condition of the Subadviser; (c) the quality of the Subadviser’s regulatory and legal compliance policies, procedures and systems; and (d) the Subadviser’s brokerage and trading practices, including with respect to best execution and soft dollars. The Board also took into account the Subadviser’s risk assessment and monitoring process. The Board noted the Subadviser’s regulatory history, including whether it was currently involved in any regulatory actions or investigations as well as material litigation, and any settlements and amelioratory actions undertaken, as appropriate.
After considering all of the information provided to them, the Trustees concluded that the nature, extent and quality of the services expected to be provided by VIA and the Subadviser were satisfactory and that there was a reasonable basis on which to conclude that each would provide a high quality of investment services to the Fund.
Investment Performance
Because the Fund had not commenced operations, the Board could not evaluate prior investment performance for the Fund. Investment performance was therefore not a material factor in the Board’s approval of the Agreements. However, the Board reviewed and was satisfied with the comparative performance of representative accounts managed by the Subadviser in a manner similar to the Fund’s proposed investment strategies.
Management Fees and Total Expenses
The Board considered the fees proposed to be charged to the Fund for advisory services as well as the expected total expense levels of the Fund. Among other data provided, the Board noted that the proposed management fee and total expenses for the Fund were within the range of other funds deemed to be comparable to the Fund by management. The Board noted that the Fund was expected to have an expense cap in place to limit the total expenses incurred by the Fund and its shareholders. The Board also noted that the subadvisory fee for the Fund would be paid by VIA out of its management fees rather than paid separately by the Fund. In this regard, the Board took into account management’s discussion with respect to the advisory/subadvisory fee structure, including the amount of the advisory fee expected to be retained by VIA after payment of the subadvisory fee. The Board also took into account the expected size of the Fund and the impact on expenses.
The Board concluded that the proposed advisory and subadvisory fees for the Fund were fair and reasonable in light of the usual and customary charges made for services of the same nature and quality and the other factors considered.
Projected Profitability
The Board also considered certain information relating to profitability for its services to other Virtus Funds that had been provided by VIA, as a proxy for evaluating the projected profitability to VIA and its affiliates for their services to the Fund. In this regard, the Board considered information regarding the overall profitability, as well as on a fund-by-fund basis, of VIA for its management of Virtus Funds, as well as its profits and those of its affiliates for managing and providing other services to the Virtus Funds, such as distribution, transfer agency and administrative services provided to the Virtus Funds by VIA affiliates. In addition to the fees paid to VIA and its affiliates, the Board considered any other benefits derived by VIA or its affiliates from their relationships with the Virtus Funds. The Board reviewed the methodology used to allocate costs to each Virtus Fund, taking into account the fact that allocation methodologies are inherently subjective and various allocation methodologies may each be reasonable while producing different results. The Board concluded that the profitability to VIA and its affiliates from the Virtus Funds was reasonable in light of the quality of the services rendered to the Virtus Funds by VIA and its affiliates.
In considering the projected profitability to the Subadviser in connection with its relationship to the Fund, the Board noted that the fees under the Subadvisory Agreement would be paid by VIA out of the fees that VIA receives under the Advisory Agreement, so that Fund shareholders would not be directly impacted by those fees. In considering the reasonableness of the fees payable by VIA to the Subadviser, the Board noted that, because the Subadviser is an affiliate of VIA, such profitability might be directly or indirectly shared by VIA. For each of the above reasons, the Board concluded that the projected profitability to the Subadviser and its affiliates from their relationships with the Fund was not a material factor in approval of the Subadvisory Agreement.
Economies of Scale
The Board received and discussed information concerning whether VIA should be expected to realize economies of scale as the Fund’s assets grow. The Board noted that expense caps were expected to be implemented for the Fund. The Board also took into account management’s discussion of the Fund’s management fee and subadvisory fee structure. The Board also took into account the expected size of the Fund. The Board noted that VIA and the Fund may realize certain economies of scale if the assets of the Fund were to be materially higher than anticipated, particularly in relationship to certain fixed costs, and that shareholders of the Fund would have an opportunity to benefit from these economies of scale.
For similar reasons as stated above with respect to the Subadviser’s profitability, and based upon the expected size of the Fund to be managed by the Subadviser, the Board concluded that the potential for economies of scale in the Subadviser’s management of the Fund was not a material factor in the approval of the Subadvisory Agreement at this time.
CONSIDERATION OF ADVISORY AND SUBADVISORY AGREEMENTS FOR
VIRTUS SGA NEW LEADERS GROWTH FUND (the “FUND”)
BY THE BOARD OF TRUSTEES (Unaudited) (Continued)
Other Factors
The Board considered other benefits that may be realized by VIA and the Subadviser and their affiliates from their relationships with the Fund. Among them, the Board recognized that VP Distributors, LLC, an affiliate of the Adviser, serves as the distributor for the Trust, and, as such, was expected to receive payments pursuant to Rule 12b-1 from the Fund to compensate it for providing selling activities, which could lead to growth in the Fund’s assets and corresponding benefits from such growth, including economies of scale. The Board also noted that an affiliate of VIA and the Subadviser also provides administrative and transfer agency services to the Trust. The Board noted management’s discussion of the fact that, while the Subadviser is an affiliate of VIA, there were no other direct benefits to the Subadviser or VIA in providing investment advisory services to the Fund, other than the fees to be earned under the Agreements, although there may be certain indirect benefits gained, including to the extent that serving the Fund could provide the opportunity to provide advisory services to additional portfolios of the Trust or certain reputational benefits.
Conclusion
Based on all of the foregoing considerations, the Board, including a majority of the Independent Trustees, determined that approval of each Agreement was in the best interests of the Fund and its shareholders. Accordingly, the Board, and the Independent Trustees voting separately, approved the Agreements with respect to the Fund.
FUND MANAGEMENT TABLES (Unaudited)
Information pertaining to the Trustees and officers of the Trust as of the date of issuance of this report, is set forth below. The statement of additional information (SAI) includes additional information about the Trustees and is available without charge, upon request, by calling (800) 243-4361.
The address of each individual, unless otherwise noted, is c/o Virtus Equity Trust, One Financial Plaza, Hartford, CT 06103. There is no stated term of office for Trustees or officers of the Trust.
Independent Trustees
Name, Year of Birth,
Length of Time Served
and Number of
Portfolios in Fund
Complex Overseen by
Trustee | Principal Occupation(s) During Past 5 Years | Other Directorships Held by Trustee During Past 5 Years |
Brown, Thomas J.
YOB: 1945
Served Since: 2016
68 Portfolios | Retired. | Honorary Board Member (since 2020), Duff & Phelps Select MLP and Midstream Energy Fund Inc., Virtus Total Return Fund Inc. and Virtus Global Multi-Sector Income Fund; Trustee (since 2016), Virtus Mutual Fund Family (54 portfolios) and Virtus Alternative Solutions Trust (3 portfolios); Trustee (since 2011), Virtus Variable Insurance Trust (8 portfolios); Director (since 2010), D’Youville Senior Care Center; and Director (since 2005), VALIC Company Funds (49 portfolios). |
Burke, Donald C.
YOB: 1960
Served Since: 2016
72 Portfolios | Retired. | Director (since 2020), Duff & Phelps Select MLP and Midstream Energy Fund Inc. and Virtus Total Return Fund Inc.; and Trustee (since 2020), Virtus Global Multi-Sector Income Fund; Trustee (since 2016), Virtus Mutual Fund Family (54 portfolios), Virtus Variable Insurance Trust (8 portfolios) and Virtus Alternative Solutions Trust (3 portfolios); Director (since 2014), closed-end funds managed by Duff & Phelps Investment Management Co. (4 funds); Director, Avista Corp. (energy company) (since 2011); Trustee, Goldman Sachs Fund Complex (2010 to 2014); and Director, BlackRock Luxembourg and Cayman Funds (2006 to 2010). |
Harris, Sidney E.
YOB: 1949
Served Since: 2017
68 Portfolios | Professor and Dean Emeritus (since April 2015), Professor (1997 to 2014), Dean (1997 to 2004), J. Mack Robinson College of Business, Georgia State University. | Director (since 2020), Duff & Phelps Select MLP and Midstream Energy Fund Inc. and Virtus Total Return Fund Inc.; Trustee (since 2020), Virtus Global Multi-Sector Income Fund; Trustee (since 2019), Mutual Fund Directors Forum; Trustee (since 2017), Virtus Mutual Fund Family (54 portfolios), Virtus Variable Insurance Trust (8 portfolios) and Virtus Alternative Solutions Trust (3 portfolios); Trustee (since 2013), KIPP Metro Atlanta; Director (1999 to 2019) Total System Services, Inc.; Trustee (2004 to 2017), RidgeWorth Funds; Trustee (since 2012), International University of the Grand Bassam Foundation; and Trustee (2011 to 2015), Genspring Family Offices, LLC. |
Mallin, John R.
YOB: 1950
Served Since: 2016
68 Portfolios | Partner/Attorney (since 2003), McCarter & English LLP (law firm), Real Property Practice Group; Member (since 2014), Counselors of Real Estate. | Director (since 2020), Duff & Phelps Select MLP and Midstream Energy Fund Inc. and Virtus Total Return Fund Inc.; Trustee (since 2020), Virtus Global Multi-Sector Income Fund; Trustee (since 2016), Virtus Mutual Fund Family (54 portfolios) and Virtus Alternative Solutions Trust (3 portfolios); Director (since 2013), Horizons, Inc. (non-profit); and Trustee (since 1999), Virtus Variable Insurance Trust (8 portfolios). |
McClellan, Hassell H.
YOB: 1945
Served Since: 2015
68 Portfolios | Retired. Professor (1984 to 2013), Wallace E. Carroll School of Management, Boston College. | Honorary Board Member (since 2020), Duff & Phelps Select MLP and Midstream Energy Fund Inc., Virtus Total Return Fund Inc. and Virtus Global Multi-Sector Income Fund; Chairperson of the Board (since 2017) and Trustee (since 2000), John Hancock Fund Complex (collectively, 227 portfolios); Trustee (since 2016), Virtus Alternative Solutions Trust (3 portfolios); Trustee since 2015), Virtus Mutual Fund Family (54 portfolios); Director (since 2010), Barnes Group, Inc. (diversified global components manufacturer and logistical services company); and Trustee (since 2008), Virtus Variable Insurance Trust (8 portfolios). |
McDaniel, Connie D.
YOB: 1958
Served Since: 2017
68 Portfolios | Retired (since 2013). Vice President, Chief of Internal Audit, Corporate Audit Department (2009 to 2013), Vice President Global Finance Transformation (2007 to 2009), Vice President and Controller (1999 to 2007), The Coca-Cola Company. | Director (since 2020), Duff & Phelps Select MLP and Midstream Energy Fund Inc. and Virtus Total Return Fund Inc.; Trustee (since 2020), Virtus Global Multi-Sector Income Fund; Director (since 2019), Global Payments Inc.; Trustee (since 2017), Virtus Mutual Fund Family (54 portfolios), Virtus Variable Insurance Trust (8 portfolios) and Virtus Alternative Solutions Trust (3 portfolios); Director (2014 to 2019), Total System Services, Inc.; Member (since 2011) and Chair (2014 to 2016), Georgia State University, Robinson College of Business Board of Advisors; and Trustee (2005 to 2017), RidgeWorth Funds. |
FUND MANAGEMENT TABLES (Unaudited) (Continued)
Name, Year of Birth,
Length of Time Served
and Number of
Portfolios in Fund
Complex Overseen by
Trustee | Principal Occupation(s) During Past 5 Years | Other Directorships Held by Trustee During Past 5 Years |
McLoughlin, Philip
YOB: 1946
Served Since: 1993
72 Portfolios | Retired. | Director and Chairman (since 2016), Virtus Total Return Fund Inc.; Director and Chairman (2016 to 2019), the former Virtus Total Return Fund Inc.; Director and Chairman (since 2014), Duff & Phelps Select MLP and Midstream Energy Fund Inc.; Trustee and Chairman (since 2013), Virtus Alternative Solutions Trust (3 portfolios); Trustee and Chairman (since 2011), Virtus Global Multi-Sector Income Fund; Chairman and Trustee (since 2003), Virtus Variable Insurance Trust (8 portfolios); Director (since 1995), closed-end funds managed by Duff & Phelps Investment Management Co. (4 funds); Director (1991 to 2019) and Chairman (2010 to 2019), Lazard World Trust Fund (closed-end investment firm in Luxembourg); and Trustee (since 1989) and Chairman (since 2002), Virtus Mutual Fund Family (54 portfolios). |
McNamara, Geraldine M.
YOB: 1951
Served Since: 2001
72 Portfolios | Retired. | Director (since 2020), Duff & Phelps Select MLP and Midstream Energy Fund Inc. and Virtus Total Return Fund Inc.; Trustee (since 2020), Virtus Global Multi-Sector Income Fund; Trustee (since 2016), Virtus Alternative Solutions Trust (3 portfolios); Trustee (since 2015), Virtus Variable Insurance Trust (8 portfolios); Director (since 2003), closed-end funds managed by Duff & Phelps Investment Management Co. (4 funds); and Trustee (since 2001), Virtus Mutual Fund Family (54 portfolios). |
Oates, James M.
YOB: 1946
Served Since: 1993
68 Portfolios | Managing Director (since 1994), Wydown Group (consulting firm). | Director (since 2016), Virtus Total Return Fund Inc.; Director (2016 to 2019), the former Virtus Total Return Fund Inc.; Trustee (since 2016), Virtus Variable Insurance Trust (8 portfolios); Director (since 2014), Duff & Phelps Select MLP and Midstream Energy Fund Inc.; Trustee (since 2013), Virtus Alternative Solutions Trust (3 portfolios); Trustee (since 2013), Virtus Global Multi-Sector Income Fund; Trustee (since 2005) and Chairman (2005 to 2017), John Hancock Fund Complex (227 portfolios); Director (2002 to 2014), New Hampshire Trust Company; Chairman (2000 to 2016), Emerson Investment Management, Inc.; Non-Executive Chairman (2000 to 2014), Hudson Castle Group, Inc. (formerly IBEX Capital Markets, Inc.) (financial services); Chairman and Director (1999 to 2014), Connecticut River Bank; Director (since 1996), Stifel Financial; and Trustee (since 1987), Virtus Mutual Fund Family (54 portfolios). |
Segerson, Richard E.
YOB: 1946
Served Since: 1983
68 Portfolios | Retired. Managing Director (1998 to 2013), Northway Management Company. | Honorary Board Member (since 2020), Duff & Phelps Select MLP and Midstream Energy Fund Inc., Virtus Total Return Fund Inc. and Virtus Global Multi-Sector Income Fund; Trustee (since 2016), Virtus Alternative Solutions Trust (3 portfolios) and Virtus Variable Insurance Trust (8 portfolios); and Trustee (since 1983), Virtus Mutual Fund Family (54 portfolios). |
Walton, R. Keith
YOB: 1964
Served Since: 2020
68 Portfolios | Venture and Operating Partner (since 2020), Plexo Capital, LLC; Venture Partner (since 2019) and Senior Adviser (2018 to 2019), Plexo, LLC; Senior Adviser (2018 to 2019), Vatic Labs, LLC; Executive Vice President, Strategy (2017 to 2019), Zero Mass Water, LLC; Vice President, Strategy (2013 to 2017), Arizona State University; Partner (since 2006), Global Infrastructure Partners. | Trustee (since 2020) Virtus Alternative Solutions Trust (3 portfolios), Virtus Variable Insurance Trust (8 portfolios) and Virtus Mutual Fund Family (54 portfolios); Director (since 2017), certain funds advised by Bessemer Investment Management LLC; Director (since 2016), Duff & Phelps Select MLP and Midstream Energy Fund Inc.; Trustee (since 2016), Virtus Global Multi-Sector Income Fund; Director (2006 to 2019), Systematica Investments Limited Funds; Director (2006 to 2017), BlueCrest Capital Management Funds; Trustee (2014 to 2017), AZ Service; Director (since 2004), Virtus Total Return Fund Inc.; and Director (2004 to 2019), the former Virtus Total Return Fund Inc. |
Zino, Brian T.
YOB: 1952
Served Since: 2020
68 Portfolios | Retired. Various roles (1982 to 2008), J. & W. Seligman & Co. Incorporated, including President (1994 to 2008). | Trustee (since 2020) Virtus Alternative Solutions Trust (3 portfolios), Virtus Variable Insurance Trust (8 portfolios) and Virtus Mutual Fund Family (54 portfolios); Director (since 2016), Duff & Phelps Select MLP and Midstream Energy Fund Inc.; Trustee (since 2016), Virtus Global Multi-Sector Income Fund; Director (since 2014), Virtus Total Return Fund Inc.; Director (2014 to 2019), the former Virtus Total Return Fund Inc.; Trustee (since 2011), Bentley University; Director (1986 to 2008) and President (1994 to 2008), J&W Seligman Co. Inc.; Director (1998 to 2009), Chairman (2002 to 2004) and Vice Chairman (2000 to 2002), ICI Mutual Insurance Company; Member, Board of Governors of ICI (1998 to 2008). |
FUND MANAGEMENT TABLES (Unaudited) (Continued)
Interested Trustee
Name, Year of Birth,
Length of Time Served
and Number of
Funds Overseen | Principal Occupation(s) During Past 5 Years | Principal Occupation(s) During Past 5 Years and
Other Directorships Held by Trustee |
Aylward, George R.*
Trustee and President
YOB: 1964
Served Since: 2006
70 Portfolios | Director, President and Chief Executive Officer (since 2008), Virtus Investment Partners, Inc. and/or certain of its subsidiaries, and various senior officer positions with Virtus affiliates (since 2005). | Chairman and Trustee (since 2015), Virtus ETF Trust II (2 portfolios); Director, President and Chief Executive Officer (since 2014), Duff & Phelps Select MLP and Midstream Energy Fund Inc.; Trustee and President (since 2013), Virtus Alternative Solutions Trust (3 portfolios); Director (since 2013), Virtus Global Funds, PLC (5 portfolios); Trustee (since 2012) and President (since 2010), Virtus Variable Insurance Trust (8 portfolios); Trustee, President and Chief Executive Officer (since 2011), Virtus Global Multi-Sector Income Fund; Trustee and President (since 2006) and Executive Vice President (2004 to 2006), Virtus Mutual Fund Family (54 portfolios); Director, President and Chief Executive Officer (since 2006), Virtus Total Return Fund Inc.; and Director, President and Chief Executive Officer (2006 to 2019), the former Virtus Total Return Fund Inc. |
*Mr. Aylward is an “interested person,” as defined in the 1940 Act, by reason of his position as President and Chief Executive Officer of Virtus Investment Partners, Inc. (“Virtus”), the ultimate parent company of the Adviser, and various positions with its affiliates, including the Adviser.
Advisory Board Member
Name, Year of Birth,
Length of Time
Served, and Number
of Portfolios in Fund
Complex Overseen | Principal Occupation(s) During Past 5 Years | Other Directorships Held by
Trustee During Past 5 Years |
Moyer, William R.
YOB: 1944
Served Since: 2020
68 Portfolios | Private investor (since 2004); Financial and Operations Principal (2006 to 2017), Newcastle Distributors LLC (broker dealer). | Advisory Board Member (since 2020), Virtus Variable Insurance Trust (8 portfolios) and Virtus Mutual Fund Family (54 portfolios); Advisory Board Member (since 2020) and Director (2016 to 2019), Virtus Total Return Fund Inc.; Director (2016 to 2019), the former Virtus Total Return Fund Inc.; Advisory Board Member (since 2020) and Director (2014 to 2019), Duff & Phelps Select MLP and Midstream Energy Fund Inc.; Advisory Board Member (since 2020) and Trustee (2011 to 2019), Virtus Global Multi-Sector Income Fund; Advisory Board Member (since 2020) and Trustee (2013 to 2016), Virtus Alternative Solutions Trust (3 portfolios). |
Officers of the Trust Who Are Not Trustees
Name, Address and
Year of Birth | Position(s) Held
with Trust and
Length of
Time Served | Principal Occupation(s) During Past 5 Years |
Batchelar, Peter J.
YOB: 1970 | Senior Vice President (since 2017), and Vice President (2008 to 2016). | Senior Vice President, Product Development (since 2017), Vice President, Product Development (2008 to 2016), and various officer positions (since 2008), Virtus Investment Partners, Inc. and/or certain of its subsidiaries; Senior Vice President (since 2017), Vice President (2008 to 2016), Virtus Mutual Fund Family; Senior Vice President (since 2017), Vice President (2010 to 2016), Virtus Variable Insurance Trust; Senior Vice President (since 2017), Vice President (2013 to 2016), Virtus Alternative Solutions Trust; Senior Vice President (since 2017) and Vice President (2016 to 2017), Duff & Phelps Select MLP and Midstream Energy Fund Inc., Virtus Total Return Fund Inc. and Virtus Global Multi-Sector Income Fund; and Senior Vice President (2017 to 2019) and Vice President (2016 to 2017), the former Virtus Total Return Fund Inc. |
FUND MANAGEMENT TABLES (Unaudited) (Continued)
Name, Address and
Year of Birth | Position(s) Held
with Trust and
Length of
Time Served | Principal Occupation(s) During Past 5 Years |
Bradley, W. Patrick
YOB: 1972 | Executive Vice President (since 2016); Senior Vice President (2013 to 2016); Vice President (2011 to 2013); Chief Financial Officer and Treasurer (since 2006). | Executive Vice President, Fund Services (since 2016), Senior Vice President, Fund Services (2010 to 2016), and various officer positons (since 2006), Virtus Investment Partners, Inc. and/or certain of its subsidiaries; Director (since 2019), Virtus Global Funds ICAV; Executive Vice President (since 2016), Senior Vice President (2013 to 2016), Vice President (2011 to 2013), Chief Financial Officer and Treasurer (since 2004), Virtus Variable Insurance Trust; Executive Vice President (since 2016), Senior Vice President (2013 to 2016), Vice President (2011 to 2013), Chief Financial Officer and Treasurer (since 2006), Virtus Mutual Fund Family; Executive Vice President (since 2016), Senior Vice President (2013 to 2016), Vice President (2012 to 2013) and Treasurer and Chief Financial Officer (since 2010), Virtus Total Return Fund Inc.; Executive Vice President (2016 to 2019), Senior Vice President (2013 to 2016), Vice President (2012 to 2013), Treasurer and Chief Financial Officer (since 2010), the former Virtus Total Return Fund Inc.; Executive Vice President (since 2016), Senior Vice President (2013 to 2016), Vice President (2011 to 2013), Chief Financial Officer and Treasurer (since 2011), Virtus Global Multi-Sector Income Fund; Executive Vice President (since 2016), Senior Vice President (2014 to 2016), Chief Financial Officer and Treasurer (since 2014), Duff & Phelps Select MLP and Midstream Energy Fund Inc.; Vice President and Assistant Treasurer (since 2011), Duff & Phelps Utility and Infrastructure Fund Inc.; Director (since 2013), Virtus Global Funds, PLC; and Executive Vice President (since 2016), Senior Vice President (2013 to 2016), and Chief Financial Officer and Treasurer (since 2013), Virtus Alternative Solutions Trust. |
Carr, Kevin J.
YOB: 1954 | Senior Vice President (since 2013); Vice President (2005 to 2013); Chief Legal Officer, Counsel and Secretary (since 2005). | Vice President and Senior Counsel (2017 to Present), Senior Vice President (2009 to 2017), Vice President, Counsel and Secretary (2008 to 2009), and various officer positions (since 2005), Virtus Investment Partners, Inc. and/or certain of its subsidiaries; Senior Vice President (since 2013), Vice President (2005 to 2013),Chief Legal Officer, Counsel and Secretary (since 2005), Virtus Mutual Fund Family; Senior Vice President (2013 to 2014), Vice President (2012 to 2013), Secretary and Chief Legal Officer (2005 to 2013), and Assistant Secretary (2013 to 2014 and since 2017), Virtus Total Return Fund Inc.; Senior Vice President (2013 to 2014), Vice President (2012 to 2013),Secretary and Chief Legal Officer (2005 to 2013) and Assistant Secretary (2013 to 2014 and 2017 to 2019), the former Virtus Total Return Fund Inc.; Senior Vice President (since 2017), Assistant Secretary (since 2013), Vice President, Chief Legal Officer, Counsel and Secretary (2010 to 2013), Virtus Variable Insurance Trust; Senior Vice President (2013 to 2014),Vice President (2011 to 2013), and Assistant Secretary (since 2011), Virtus Global Multi-Sector Income Fund; Assistant Secretary (since 2015), Duff & Phelps Select MLP and Midstream Energy Fund Inc.; Senior Vice President (since 2017) and Assistant Secretary (since 2013), Virtus Alternative Solutions Trust; Secretary (since 2015), ETFis Series Trust I; and Secretary (since 2015), Virtus ETF Trust II. |
Engberg, Nancy J.
YOB: 1956 | Senior Vice President (since 2017); Vice President (2011 to 2017); and Chief Compliance Officer (since 2011). | Senior Vice President (since 2017), Vice President (2008 to 2017) and Chief Compliance Officer (2008 to 2011 and since 2016), and various officer positions (since 2003), Virtus Investment Partners, Inc. and/or certain of its subsidiaries; Senior Vice President (since 2017), Vice President (2011 to 2017) and Chief Compliance Officer (since 2011), Virtus Mutual Fund Family; Senior Vice President (since 2017), Vice President (2010 to 2017) and Chief Compliance Officer (since 2011), Virtus Variable Insurance Trust; Senior Vice President (since 2017), Vice President (2011 to 2016) and Chief Compliance Officer (since 2011), Virtus Global Multi-Sector Income Fund; Senior Vice President (since 2017), Vice President (2012 to 2017) and Chief Compliance Officer (since 2012), Virtus Total Return Fund Inc.; Senior Vice President (2017 to 2019), Vice President (2012 to 2017) and Chief Compliance Officer (since 2012), the former Virtus Total Return Fund Inc.; Senior Vice President (since 2017), Vice President (2013 to 2016) and Chief Compliance Officer (since 2013), Virtus Alternative Solutions Trust; Senior Vice President (since 2017), Vice President (2014 to 2017) and Chief Compliance Officer (since 2014), Duff & Phelps Select MLP and Midstream Energy Fund Inc.; Chief Compliance Officer (since 2015), ETFis Series Trust I; and Chief Compliance Officer (since 2015), Virtus ETF Trust II. |
FUND MANAGEMENT TABLES (Unaudited) (Continued)
Name, Address and
Year of Birth | Position(s) Held
with Trust and
Length of
Time Served | Principal Occupation(s) During Past 5 Years |
Short, Julia R.
YOB: 1972 | Senior Vice President (since 2017). | Senior Vice President (since 2018), Duff & Phelps Select MLP and Midstream Energy Fund Inc., Virtus Total Return Fund Inc. and Virtus Global Multi-Sector Income Fund; Senior Vice President (2018 to 2019), the former Virtus Total Return Fund Inc.; Senior Vice President, Product Development (since 2017), Virtus Investment Partners, Inc. and/or certain of its subsidiaries; Senior Vice President (since 2017), Virtus Mutual Fund Family; President and Chief Executive Officer, RidgeWorth Funds (2007 to 2017); and Managing Director, Product Manager, RidgeWorth Investments (2004 to 2017). |
Waltman, Francis G.
YOB: 1962 | Executive Vice President (since 2013); Senior Vice President (2008 to 2013). | Executive Vice President, Product Development (since 2009), and various senior officer positions (since 2006), Virtus Investment Partners, Inc. and/or certain of its subsidiaries; Director (since 2019), Virtus Global Funds ICAV; Executive Vice President (since 2013), Senior Vice President (2008 to 2013), Virtus Mutual Fund Family; Executive Vice President (since 2013), Senior Vice President (2010 to 2013), Virtus Variable Insurance Trust; Executive Vice President (since 2013), Senior Vice President (2011 to 2013), Virtus Global Multi-Sector Income Fund; Executive Vice President (since 2014), Duff & Phelps Select MLP and Midstream Energy Fund Inc.; Director (since 2013), Virtus Global Funds PLC; Executive Vice President (since 2013), Virtus Alternative Solutions Trust; Executive Vice President (since 2017), Virtus Total Return Fund Inc.; and Executive Vice President (2017 to 2019), the former Virtus Total Return Fund Inc. |
Virtus Rampart Enhanced Core Equity Fund,
a series of Virtus Equity Trust
(Unaudited)
Supplement dated August 31, 2020 to the
Statutory Prospectus dated January 28, 2020, as supplemented
IMPORTANT NOTICE TO INVESTORS
The statutory prospectus for Virtus Equity Trust has been updated to reflect changes to Virtus Rampart Enhanced Core Equity Fund, including a name change.
Effective August 31, 2020, the Virtus Rampart Enhanced Core Equity Fund’s name has been changed to Virtus KAR Equity Income Fund (the “Fund”). The disclosure for Virtus Rampart Enhanced Core Equity Fund in the Virtus Equity Trust statutory prospectus is no longer valid. Please see the Fund’s separate statutory prospectus and summary prospectus for additional disclosure regarding these changes.
Investors should retain this amendment with the
Prospectuses for future reference.
VET 8019 RampartEnhancedCoreEquityFundKARChanges (8/2020)
Virtus SGA Global Growth Fund
a series of Virtus Equity Trust
(Unaudited)
Supplement dated July 13, 2020 to the Summary Prospectus, the Virtus Equity Trust
Statutory Prospectus and the Statement of Additional Information (“SAI”),
each dated January 28, 2020, as supplemented
IMPORTANT NOTICE TO INVESTORS
SGA has announced that at the end of this year George P. Fraise will be stepping down as a portfolio manager for the Virtus SGA Global Growth Fund, and Hrishikesh Gupta is expected to be appointed in his place as of January 1, 2021. The Prospectuses and SAI will be updated as appropriate at the time of the changes.
Investors should retain this supplement with the
Prospectuses and SAI for future reference.
VET 8019/SGAGlobalGrowth PM Announcement (7/2020)
THIS PAGE INTENTIONALLY BLANK.
THIS PAGE INTENTIONALLY BLANK.
THIS PAGE INTENTIONALLY BLANK.
VIRTUS EQUITY TRUST
101 Munson Street
Greenfield, MA 01301-9668
Trustees
Philip R. McLoughlin, Chairman
George R. Aylward
Thomas J. Brown
Donald C. Burke
Sidney E. Harris
John R. Mallin
Hassell H. McClellan
Connie D. McDaniel
Geraldine M. McNamara
James M. Oates
Richard E. Segerson
R. Keith Walton
Brian T. Zino
Advisory Board Member
William R. Moyer
Officers
George R. Aylward, President
Peter Batchelar, Senior Vice President
W. Patrick Bradley, Executive Vice President, Chief Financial Officer and Treasurer
Kevin J. Carr, Senior Vice President, Chief Legal Officer, Counsel and Secretary
Nancy J. Engberg, Senior Vice President and Chief Compliance Officer
Julia R. Short, Senior Vice President
Francis G. Waltman, Executive Vice President
Investment Adviser
Virtus Investment Advisers, Inc.
One Financial Plaza
Hartford, CT 06103-2608
Principal Underwriter
VP Distributors, LLC
One Financial Plaza
Hartford, CT 06103-2608
Administrator and Transfer Agent
Virtus Fund Services, LLC
One Financial Plaza
Hartford, CT 06103-2608
Custodian
The Bank of New York Mellon
240 Greenwich Street
New York, NY 10286-1048
Independent Registered Public
Accounting Firm
PricewaterhouseCoopers LLP
2001 Market Street
Philadelphia, PA 19103-7042
How to Contact Us
| Mutual Fund Services | 1-800-243-1574 |
| Adviser Consulting Group | 1-800-243-4361 |
Important Notice to Shareholders
The Securities and Exchange Commission has modified mailing regulations for semiannual and annual shareholder fund reports to allow mutual fund companies to send a single copy of these reports to shareholders who share the same mailing address. If you would like additional copies, please call Mutual Fund Services at 1-800-243-1574.
P.O. Box 9874
Providence, RI 02940-8074
For more information about Virtus Mutual Funds,
please contact us at 1-800-243-1574, or Virtus.com.
ANNUAL REPORT
VIRTUS EQUITY TRUST
Virtus Tactical Allocation Fund*
*Prospectus supplement appears at the back of this annual report.
Beginning on January 1, 2021, as permitted by regulations adopted by the Securities and Exchange Commission, paper copies of the Fund’s shareholder reports like this one will no longer be sent by mail, unless specifically requested from the Fund or from your financial intermediary, such as a broker-dealer or bank. Instead, the reports will be made available on a website, and you will be notified by mail each time a report is posted and provided with a website link to access the report. If you already elected to receive shareholder reports electronically, you will not be affected by this change and you need not take any action.
You may elect at any time to receive not only shareholder reports but also certain other communications from the Fund electronically, or you may elect to receive paper copies of all future shareholder reports free of charge to you. If you own your shares directly with the Fund, you may make such elections by calling the Fund at 1-800-243-1574 or, with respect to requesting electronic delivery, by visiting www.virtus.com. An election made directly with the Fund will apply to all Virtus Mutual Funds in which you own shares directly. If you own your shares through a financial intermediary, please contact your financial intermediary to make your request and to determine whether your election will apply to all funds in which you own shares through that intermediary.
Not FDIC Insured • No Bank Guarantee • May Lose Value
Table of Contents
Virtus Tactical Allocation Fund
(“Tactical Allocation Fund”)
Proxy Voting Procedures and Voting Record (Form N-PX)
The subadvisers vote proxies, if any, relating to portfolio securities in accordance with procedures that have been approved by the Board of Trustees of the Trust (“Trustees”, or the “Board”). You may obtain a description of these procedures, along with information regarding how the Fund voted proxies during the most recent 12-month period ended June 30, free of charge, by calling toll-free 1-800-243-1574. This information is also available through the Securities and Exchange Commission’s (the “SEC”) website at https://www.sec.gov.
PORTFOLIO HOLDINGS INFORMATION
The Trust files a complete schedule of portfolio holdings for the Fund with the SEC for the first and third quarters of each fiscal year as an exhibit to its reports on Form N-PORT-P. Form N-PORT-P is available on the SEC’s website at https://www.sec.gov.
This report is not authorized for distribution to prospective investors in the Tactical Allocation Fund unless preceded or accompanied by an effective prospectus which includes information concerning the sales charge, the Fund’s record and other pertinent information.
To My Fellow Shareholders of Virtus Funds:
I am pleased to present this annual report, which reviews the performance of your Fund for the 12 months ended September 30, 2020.
We witnessed unprecedented events and stark changes during the past 12 months. The global economy, which experienced strong growth during the first five months of the fiscal year, was largely shut down in March of 2020 in response to the coronavirus pandemic. Markets reacted by declining sharply, leading policymakers to quickly introduce supportive monetary and fiscal measures. These proved effective, and many markets swiftly reversed course. In fact, the U.S. stock market erased its losses and reached a new high in August.
After this wild ride, most asset classes were able to post positive returns for the 12 months ended September 30, 2020. U.S. large-capitalization stocks returned 15.15%, as measured by the S&P 500® Index. Small-cap stocks lagged, but wound up in positive territory with a return of 0.39%, as measured by the Russell 2000® Index. Within international equities, developed markets, as measured by the MSCI EAFE® Index (net), were up 0.49% for the 12 months, trailing emerging markets, which gained 10.54%, as measured by the MSCI Emerging Markets Index (net).
In fixed income markets, monetary easing drove the yield on the 10-year Treasury to 0.69% at September 30, 2020, down sharply from 1.68% on September 30, 2019. The broader U.S. fixed income market, as represented by the Bloomberg Barclays U.S. Aggregate Bond Index, returned 6.98%. Non-investment grade bonds were up 3.25% for the period, as measured by the Bloomberg Barclays U.S. Corporate High Yield Bond Index.
Our investment teams maintained their disciplined approach in the midst of this turbulence, and remain focused on helping you achieve your long-term goals. While uncertainty may lie ahead, you can depend on us to continue investing your capital with skill and care. To learn more about the other investment strategies we offer, please visit Virtus.com.
On behalf of our investment managers, thank you for entrusting the Virtus Funds with your assets. Please call our customer service team at 800-243-1574 if you have questions about your account or require assistance. We appreciate your business and remain committed to your long-term financial success.
Sincerely,
George R. Aylward
President, Virtus Funds
November 2020
Performance data quoted represents past results. Past performance is no guarantee of future results, and current performance may be higher or lower than the performance shown above.
TACTICAL ALLOCATION FUND
DISCLOSURE OF FUND EXPENSES (Unaudited)
FOR THE SIX-MONTH PERIOD OF April 1, 2020 TO September 30, 2020
We believe it is important for you to understand the impact of costs on your investment. All mutual funds have operating expenses. As a shareholder of the Tactical Allocation Fund (the “Fund”), you may incur two types of costs: (1) transaction costs, including sales charges on purchases of Class A shares and contingent deferred sales charges on Class C shares; and (2) ongoing costs, including investment advisory fees, distribution and service fees, and other expenses. Class I shares are sold without sales charges and do not incur distribution and service fees. For further information regarding applicable sales charges, see Note 1 in the Notes to Financial Statements. These examples are intended to help you understand your ongoing costs (in dollars) of investing in the Fund and to compare these costs with the ongoing costs of investing in other mutual funds. These examples are based on an investment of $1,000 invested at the beginning of the period and held for the entire six-month period. The Annualized Expense Ratios may be different from the expense ratios in the Financial Highlights which are for the fiscal year ended September 30, 2020.
Please note that the expenses shown in the accompanying tables are meant to highlight your ongoing costs only and do not reflect any transactional costs, such as sales charges or contingent deferred sales charges. Therefore, the accompanying tables are useful in comparing ongoing costs only, and will not help you determine the relative total costs of owning different funds. In addition, if these transactional costs were included, your costs would have been higher. The calculations assume no shares were bought or sold during the period. Your actual costs may have been higher or lower, depending on the amount of your investment and the timing of any purchases or redemptions.
Actual Expenses
The table below provides information about actual account values and actual expenses. You may use the information below, together with the amount you invested, to estimate the expenses that you paid over the period. Simply divide your account value by $1,000 (for example, an $8,600 account value divided by $1,000 = 8.6), then multiply the result by the number in the table under the heading entitled “Expenses Paid During Period” to estimate the expenses you paid on your account during this period.
| | Beginning
Account Value
April 1, 2020 | | Ending
Account Value
September 30, 2020 | | Annualized
Expense
Ratio | | Expenses
Paid
During
Period* |
Class A
| $ 1,000.00 | | $ 1,353.40 | | 1.07 % | | $ 6.30 |
Class C
| 1,000.00 | | 1,347.80 | | 1.77 | | 10.39 |
Class I
| 1,000.00 | | 1,356.10 | | 0.83 | | 4.89 |
| * | Expenses are equal to the Fund’s annualized expense ratio, which is net of waived fees and reimbursed expenses, if applicable, multiplied by the average account value over the period, multiplied by the number of days (183) expenses were accrued in the most recent fiscal half-year, then divided by 366 to reflect the one-half year period. |
The Fund may invest in other funds, and the annualized expense ratios noted above do not reflect fees and expenses associated with any underlying funds. If such fees and expenses had been included, the expenses would have been higher.
TACTICAL ALLOCATION FUND
DISCLOSURE OF FUND EXPENSES (Unaudited) (Continued)
FOR THE SIX-MONTH PERIOD OF April 1, 2020 TO September 30, 2020
You can find more information about the Fund’s expenses in the Financial Statements section that follows. For additional information on operating expenses and other shareholder costs, refer to the Fund’s prospectus.
Hypothetical Example for Comparison Purposes
The table below provides information about hypothetical account values and hypothetical expenses based on the Fund’s actual expense ratio and an assumed rate of return of 5% per year before expenses, which is not your Fund’s actual return. The hypothetical account values and expenses may not be used to estimate the actual ending account balance or expenses you paid for the period. You may use this information to compare the ongoing costs of investing in your Fund and other funds. To do so, compare these 5% hypothetical examples with the 5% hypothetical examples that appear in the shareholder reports of other mutual funds.
| | Beginning
Account Value
April 1, 2020 | | Ending
Account Value
September 30, 2020 | | Annualized
Expense
Ratio | | Expenses
Paid
During
Period* |
Class A
| $ 1,000.00 | | $ 1,019.65 | | 1.07 % | | $ 5.40 |
Class C
| 1,000.00 | | 1,016.15 | | 1.77 | | 8.92 |
Class I
| 1,000.00 | | 1,020.85 | | 0.83 | | 4.19 |
| * | Expenses are equal to the Fund’s annualized expense ratio, which is net of waived fees and reimbursed expenses, if applicable, multiplied by the average account value over the period, multiplied by the number of days (183) expenses were accrued in the most recent fiscal half-year, then divided by 366 to reflect the one-half year period. |
The Fund may invest in other funds, and the annualized expense ratios noted above do not reflect fees and expenses associated with any underlying funds. If such fees and expenses had been included, the expenses would have been higher.
You can find more information about the Fund’s expenses in the Financial Statements section that follows. For additional information on operating expenses and other shareholder costs, refer to the Fund’s prospectus.
TACTICAL ALLOCATION FUND
KEY INVESTMENT TERMS (Unaudited)
September 30, 2020
American Depositary Receipt (“ADR”)
Represents shares of foreign companies traded in U.S. dollars on U.S. exchanges that are held by a U.S. bank or a trust. Foreign companies use ADRs in order to make it easier for Americans to buy their shares.
Bloomberg Barclays U.S. Aggregate Bond Index
The Bloomberg Barclays U.S. Aggregate Bond Index measures the U.S. investment grade fixed rate bond market. The index is calculated on a total return basis. The index is unmanaged, its returns do not reflect any fees, expenses, or sales charges, and it is not available for direct investment.
Bloomberg Barclays U.S. Corporate High Yield Bond Index
The Bloomberg Barclays U.S. Corporate High Yield Bond Index measures the U.S. dollar-denominated, high yield, fixed-rate corporate bond market. The index is calculated on a total return basis. The index is unmanaged, its returns do not reflect any fees, expenses, or sales charges, and it is not available for direct investment.
Exchange-Traded Funds (“ETFs”)
An open-end fund that is traded on a stock exchange. Most ETFs have a portfolio of stocks or bonds that track a specific market index.
Federal Reserve (the “Fed”)
The Central Bank of the U.S., the Fed is responsible for controlling money supply, interest rates and credit with the goal of keeping the U.S. economy and currency stable. Governed by a seven-member board, the system includes 12 regional Federal Reserve Banks, 25 branches and all national and state banks that are part of the system.
London Interbank Offered Rate (“LIBOR”)
A benchmark rate that some of the world’s leading banks charge each other for short-term loans and that serves as the first step to calculating interest rates on various loans throughout the world.
MSCI ACWI ex USA SMID Cap Index (net)
The MSCI ACWI ex USA SMID Cap Index (net) is a free float-adjusted market capitalization-weighted index that measures mid- and small-cap performance across 22 of 23 Developed Market countries (excluding the U.S.) and 24 Emerging Markets countries. The index is calculated on a total return basis with net dividends reinvested. The index is unmanaged, its returns do not reflect any fees, expenses, or sales charges, and is not available for direct investment.
MSCI EAFE® Index (net)
The MSCI EAFE® (Europe, Australasia, Far East) Index (net) is a free float-adjusted market capitalization-weighted index that measures developed foreign market equity performance, excluding the U.S. and Canada. The index is calculated on a total return basis with net dividends reinvested. The index is unmanaged, its returns do not reflect any fees, expenses, or sales charges, and it is not available for direct investment.
MSCI Emerging Markets Index (net)
The MSCI Emerging Markets Index (net) is a free float-adjusted market capitalization-weighted index designed to measure equity market performance in the global emerging markets. The
TACTICAL ALLOCATION FUND
KEY INVESTMENT TERMS (Unaudited) (Continued) September 30, 2020
index is calculated on a total return basis with net dividends reinvested. The index is unmanaged, its returns do not reflect any fees, expenses, or sales charges, and it is not available for direct investment.
Real Estate Investment Trust (“REIT”)
A publicly traded company that owns, develops, and operates income-producing real estate such as apartments, office buildings, hotels, shopping centers, and other commercial properties.
Risk Assets
Risk assets are those that tend to demonstrate price volatility, such as equities, high yield bonds, currencies, and commodities.
Russell 1000® Growth Index
The Russell 1000® Growth Index is a market capitalization-weighted index of growth-oriented stocks of the 1,000 largest companies in the Russell Universe, which comprises the 3,000 largest U.S. companies. The index is calculated on a total return basis with dividends reinvested. The index is unmanaged, its returns do not reflect any fees, expenses, or sales charges, and is not available for direct investment.
Russell 1000® Value Index
The Russell 1000® Value Index is a market capitalization-weighted index of value-oriented stocks of the 1,000 largest companies in the Russell Universe, which comprises the 3,000 largest U.S. companies. The index is calculated on a total return basis with dividends reinvested. The index is unmanaged, its returns do not reflect any fees, expenses, or sales charges, and it is not available for direct investment.
Russell 2000® Index
The Russell 2000® Index is a market capitalization-weighted index of the 2,000 smallest companies in the Russell Universe, which comprises the 3,000 largest U.S. companies. The index is calculated on a total return basis with dividends reinvested. The index is unmanaged, its returns do not reflect any fees, expenses, or sales charges, and it is not available for direct investment.
S&P 500® Index
The S&P 500® Index is a free-float market capitalization-weighted index of 500 of the largest U.S. companies. The index is calculated on a total return basis with dividends reinvested. The index is unmanaged, its returns do not reflect any fees, expenses, or sales charges, and it is not available for direct investment.
Sponsored ADR
An ADR which is issued with the cooperation of the company whose stock will underlie the ADR. Sponsored ADRs generally carry the same rights normally given to stockholders, such as voting rights. ADRs must be sponsored to be able to trade on a major U.S. exchange such as the New York Stock Exchange.
Tactical Allocation Fund Linked Benchmark
The Tactical Allocation Fund Linked Benchmark consists of 45% Russell 1000® Growth Index (a market capitalization-weighted index of growth-oriented stocks of the 1,000 largest companies in the Russell Universe, which comprises the 3,000 largest U.S. companies, calculated on a total return basis with dividends reinvested), 15% MSCI ACWI ex USA SMID Cap Index (a free float-adjusted market capitalization-weighted index that measures mid- and small-cap foreign market equity performance, calculated on a total return basis with net dividends reinvested), and 40% Bloomberg Barclays U.S. Aggregate Bond Index (an index that measures the U.S.
TACTICAL ALLOCATION FUND
KEY INVESTMENT TERMS (Unaudited) (Continued) September 30, 2020
investment grade fixed rate bond market, calculated on a total return basis). The index is unmanaged, its returns do not reflect any fees, expenses, or sales charges, and is not available for direct investment. Performance of the Virtus Tactical Allocation Fund Linked Benchmark between 9/7/2016 and 6/3/2019 represents an allocation consisting of 45% Russell 1000® Growth Index, 15% MSCI EAFE® Index, and 40% Bloomberg Barclays U.S. Aggregate Bond Index. Prior to 9/7/2016, the allocation consisted of 50% S&P 500® Index and 50% Bloomberg Barclays U.S. Aggregate Bond Index.
Yield Curve
A yield curve is a line on a graph plotting the interest rates, at a set point in time, of bonds having equal credit quality but different maturity dates.
| | Ticker Symbols: |
| | Class A: NAINX |
| | Class C: POICX |
| | Class I: VTAIX |
Tactical Allocation Fund
Fund Summary (Unaudited)
Portfolio Manager Commentary by
Kayne Anderson Rudnick
Investment Management, LLC
(Domestic and International Equity
Portfolio) and Newfleet Asset
Management, LLC
(Fixed Income Portfolio)
| ■ | The Fund is diversified and has investment objectives of capital appreciation and income. There is no guarantee that the Fund will meet its objectives. |
| ■ | For the fiscal year ended September 30, 2020, the Fund’s Class A shares at NAV returned 29.72%, Class C shares at NAV returned 28.82%, and Class I shares at NAV returned 29.87%†. For the same period, the Bloomberg Barclays U.S. Aggregate Bond Index; a broad-based fixed income index, returned 6.98%; the MSCI ACWI ex USA SMID Cap Index (net), a broad-based International Index, returned 4.88%; and the Russell 1000® Growth Index, a broad-based US equity index, returned 37.53%. The Tactical Allocation Fund Linked Benchmark, the Fund’s style-specific benchmark, returned 20.39%. |
† See footnote 5 on page 12.
All performance figures assume reinvestment of distributions and exclude the effect of sales charges. Performance data quoted represents past results. Past performance is no guarantee of future results, and current performance may be higher or lower than the performance shown above. Investment return and principal value will fluctuate so your shares, when redeemed, may be worth more or less than their original cost. Please visit Virtus.com for performance data current to the most recent month-end.
How did the markets perform during the Fund’s fiscal year ended September 30, 2020?
Domestic & International Equities
Equity investors enjoyed solid returns in 2019 and then went for a roller coaster ride in the first quarter of 2020, as markets around the world
declined due to the COVID-19 pandemic, which necessitated an almost complete shutdown of economic activity. After a nosedive first quarter of 2020, the S&P 500® Index recovered in the following three months to have its best quarter in over 20 years, erasing most of the first-quarter loss. With aggressive stimulus from governments around the world flowing into the markets as a backstop to the global health crisis, the S&P 500® Index made a new high in the third quarter of 2020, just 103 days after sliding 35%. That is the fastest-ever recovery from a decline greater than 30%. Markets continued to forge ahead, and experienced a garden-variety correction during the first few weeks of September, as some rotation started to occur. Stocks continued to advance, however, and closed the fiscal year on a positive trend.
For the fiscal year ended September 30, 2020, the S&P 500® Index returned 15.15%, while small-capitalization stocks, as represented by the Russell 2000® Index, turned slightly positive, delivering a gain of 0.39%. International developed markets, as measured by the MSCI EAFE Index (net), pushed into positive territory with a 0.49% return, while the MSCI Emerging Markets Index (net) surged to gain 10.54% for the 12-month period. Value stocks significantly underperformed growth stocks over the fiscal year, with the Russell 1000® Value Index returning -5.03% and the Russell 1000® Growth Index up 37.53%. Value indexes contain many more businesses that were adversely affected by COVID-19. Conversely, many growth companies benefited from the work-from-home environment brought about by the pandemic.
Fixed Income
The 12-month period included a variety of market conditions, but the most influential were the emergence of a global pandemic, the associated economic and earnings fallout, and both the fiscal and monetary policy response.
For information regarding the indexes and certain investment terms, see the Key Investment Terms starting on page 4.
Tactical Allocation Fund (Continued)
In the final quarter of 2019, investors maintained their appetite for risk assets. Fixed income markets responded favorably to monetary easing by global central banks, positive developments on the trade front, and signs of stability in economic data. Geopolitical developments including trade, Middle East tensions, and European politics, as well as central bank headlines, all continued to be significant market movers. During this period, spread sectors outperformed U.S. Treasuries, led by higher-volatility sectors such as corporate high yield, bank loans, and emerging market debt. In a change from the first three quarters of 2019, lower quality within these sectors outperformed higher quality. Within spread sectors, corporate credit outperformed securitized sectors such as commercial mortgage-backed securities and asset-backed securities.
In stark contrast, the first quarter of 2020 saw volatility spike to levels not reached since the financial crisis of 2008-2009. The quarter will be remembered for the emergence of COVID-19 as the first global pandemic since the H1N1 swine flu of 2009-10. The ultimate human and economic toll are still unknown, as the event continues to unfold, however, governments and central banks responded in unprecedented fashion to help blunt the effects of the virus. The containment measures implemented through the end of the fiscal year were unambiguously negative for local, regional, and global economic growth. However, markets rebounded from the lows they reached during the second quarter of 2020.
The spread of the coronavirus, its negative effect on global economic growth, and the fear it created in the market caused fixed income spreads to widen significantly during March. Valuations cheapened meaningfully, reaching levels not seen since 2008-09. Cheaper valuations and an active approach by both monetary and fiscal authorities proved a powerful combination, setting the stage for improved financial market performance off the March 2020 lows. We sought to take advantage of the market volatility by following the same
investment approach we have implemented for close to three decades.
During the first quarter of 2020, U.S. Treasuries outperformed spread sectors. The underperformers were led by higher-volatility sectors such as corporate high yield, bank loans, and emerging market debt. In the six months since, the fixed income markets experienced a significant rebound, with spread sectors outperforming U.S. Treasuries led by those sectors that experienced the greatest degree of underperformance during the first quarter.
The Federal Reserve (the Fed) lowered its target interest rate three times during the 12-month period. On two separate occasions in March, in response to the pandemic, the Fed cut by a total of 1.25% to a range of 0–0.25%.
During the 12-month period, the Treasury yield curve steepened, shifting broadly lower, more so on the front end.
What factors affected the Fund’s performance during its fiscal year?
Domestic Equities
The Fund’s U.S. equity portfolio outperformed its benchmark, the Russell 1000® Growth Index, during the fiscal year ended September 30, 2020. Strong stock selection in information technology and communication services contributed to performance. Poor stock selection and overweight positions in financials and materials detracted from performance.
The biggest contributors to performance during the period were Amazon.com and Bill.com.
• Amazon continued on its powerful growth trajectory, powered by its wide-moat e-commerce business and dominant web services offering, Amazon Web Services. Amazon delivered blockbuster quarterly revenue that many investors expected, as stay-at-home restrictions helped the company capture an even greater share of consumer spending.
For information regarding the indexes and certain investment terms, see the Key Investment Terms starting on page 4.
Tactical Allocation Fund (Continued)
• Bill.com is a natural beneficiary of businesses digitizing, automating one of the most labor-intensive back office operations with its invoice and payment processing solution. Providing further validation of the value of its software, Bill.com has also been selected by each of the three largest banks in the country to offer a white-label version of its software to their commercial clients.
• Other top contributors included NVIDIA, Alibaba Group, and The Trade Desk.
The biggest detractors from performance during the period were Ross Stores and Bank of America.
• Ross Stores underperformed due to the fact that its locations were closed for a period of time and, even after reopening, traffic did not return to previous levels. Soft earnings reports, withdrawn earnings guidance, a $2 billion debt offering, and suspension of both the dividend and the share repurchase program all conspired to dent investor confidence. However, none of these developments were surprising. The company still reports optimism about inventory availability, which we believe ultimately drives the shopping experience and store traffic. We continued to hold the stock as of the end of the fiscal year.
• Bank of America generates over 50% of its income from interest, which came under pressure from the Fed’s decision to cut interest rates in March of 2020. Despite the fact that the bank has exemplary credit ratios, it voluntarily agreed to suspend share repurchases to ensure liquidity during the COVID-19 crisis. This removed a critical source of support from the company’s share price. We continued to hold the stock through the end of the reporting period.
• Other top detractors included Las Vegas Sands, Ecolab, and Charles Schwab.
International Equities
The Fund’s international equity portfolio outperformed its benchmark, the MSCI ACWI ex
USA SMID Cap Index (net), during the fiscal year ended September 30, 2020. Strong stock selection and an overweight in information technology, as well as strong stock selection in communication services, contributed to performance. Poor stock selection and underweight positions in health care and consumer staples detracted from performance.
The biggest contributors to performance during the period were Mercari and Adevinta.
• Mercari’s e-commerce activity increased substantially following the onset of the global pandemic.
• Adevinta owns a number of leading online classified ad platforms around the world. During the period, Adevinta announced an agreement to buy eBay Classifieds Group, which led to a sharp increase in the company’s share price.
• Other top contributors included Voltronic Power Technology, Freee K.K., and Scout24.
The biggest detractors from performance during the period were Pason Systems and En-Japan.
• The stock price of Pason Systems suffered, along with those of other energy-related stocks, as an unfavorable balance between supply and demand weighed on oil prices. The company’s competitive position and balance sheet remain strong, and we believe the current valuation is attractive. Therefore, we continued to hold it as of the end of the Fund’s fiscal year.
• We concluded that En-Japan’s competitive position was not as strong as we originally believed, and exited our position in the first half of the fiscal year.
• Other top detractors included Ascential, Haw Par, and CAE.
Fixed Income
The outperformance of U.S. Treasuries relative to spread sectors was the key driver of the fixed income portfolio’s underperformance for the fiscal year ended September 30, 2020. Among
For information regarding the indexes and certain investment terms, see the Key Investment Terms starting on page 4.
Tactical Allocation Fund (Continued)
fixed income sectors, the portfolio’s allocations to bank loans and asset-backed securities detracted from performance.
The portfolio’s allocations to and issue selection within corporate high-quality bonds and non-agency residential mortgage-backed securities positively contributed to performance for the fiscal year. During the 12-month period, we also identified an opportunity to add municipal bonds to the portfolio at attractive valuations, which positively contributed to overall performance.
The preceding information is the opinion of portfolio management only through the end of the period stated on the cover. Any such opinions are subject to change at any time based upon market or other conditions and should not be relied upon as investment advice. Past performance is no guarantee of future results, and there is no guarantee that market forecasts will be realized.
Equity Securities: The market price of equity securities may be adversely affected by financial market, industry, or issuer-specific events. Focus on a particular style or on small or medium-sized companies may enhance that risk.
Credit & Interest: Debt instruments are subject to various risks, including credit and interest rate risk. The issuer of a debt security may fail to make interest and/or principal payments. Values of debt instruments may rise or fall in response to changes in interest rates, and this risk may be enhanced with longer-term maturities.
Foreign & Emerging Markets: Investing in foreign securities, especially in emerging markets, subjects the Fund to additional risks such as increased volatility, currency fluctuations, less liquidity, and political, regulatory, economic, and market risk.
Allocation: The Fund’s exposure to different asset classes may not be optimal for market conditions at a given time. Asset allocation does not
guarantee a profit or protect against a loss in declining markets.
High Yield Fixed Income Securities: There is a greater risk of issuer default, less liquidity, and increased price volatility related to high yield securities than investment grade securities.
Market Volatility: Local, regional, or global events such as war, acts of terrorism, the spread of infectious illness or other public health issues, recessions, or other events could have a significant impact on the portfolio and its investments, including hampering the ability of the portfolio manager(s) to invest the portfolio’s assets as intended.
Prospectus: For additional information on risks, please see the Fund’s prospectus.
Asset Allocation
The following table presents asset allocation within certain sectors as a percentage of total investments as of September 30, 2020.
| Common Stocks | | 69% |
| Information Technology | 21% | |
| Consumer Discretionary | 16 | |
| Communication Services | 11 | |
| All Other Common Stocks | 21 | |
| Corporate Bonds and Notes | | 12 |
| Financials | 4 | |
| Industrials | 1 | |
| Consumer Discretionary | 1 | |
| All Other Corporate Bonds and Notes | 6 | |
| Mortgage-Backed Securities | | 8 |
| U.S. Government Securities | | 3 |
| Asset-Backed Securities | | 3 |
| Leveraged Loans | | 2 |
| Municipal Bonds | | 1 |
| Other (includes short-term investment) | | 2 |
| Total | | 100% |
For information regarding the indexes and certain investment terms, see the Key Investment Terms starting on page 4.
Tactical Allocation Fund (Continued)
Average Annual Total Returns1 for periods ended 9/30/20
| | | 1 Year | 5 Years | 10 Years | Since
inception | Inception
date |
| Class A shares at NAV2 | | 29.72 % | 11.94 % | 9.43 % | — % | — |
| Class A shares at POP3,4 | | 22.26 | 10.62 | 8.78 | — | — |
| Class C shares at NAV2 and with CDSC4 | | 28.82 | 11.07 | 8.59 | — | — |
| Class I shares at NAV2 | | 29.87 5 | — | — | 24.35 | 1/29/19 |
| Bloomberg Barclays U.S. Aggregate Bond Index | | 6.98 | 4.18 | 3.64 | 9.00 6 | — |
| MSCI ACWI ex USA SMID Cap Index (net) | | 4.88 | 6.40 | 4.85 | 5.28 6 | — |
| Russell 1000® Growth Index | | 37.53 | 20.10 | 17.25 | 32.90 6 | — |
| Tactical Allocation Fund Linked Benchmark | | 20.39 | 11.94 | 10.11 | 19.53 6 | — |
| Fund Expense Ratios7: Class A shares: 1.14%; Class C shares: Gross 1.99%, Net 1.90%; Class I shares: 0.89%. | | | | | | |
| All returns represent past performance which is no guarantee of future results. Current performance may be higher or lower than the performance shown. The investment return and principal value of an investment will fluctuate so that an investor’s shares, when redeemed, may be worth more or less than their original cost. The above table and graph below do not reflect the deduction of taxes that a shareholder would pay on fund distributions or the redemption of shares. Please visit Virtus.com for performance data current to the most recent month-end. |
| |
| |
| |
| |
| |
| |
| |
For information regarding the indexes and certain investment terms, see the Key Investment Terms starting on page 4.
Tactical Allocation Fund (Continued)
Growth of $10,000 for periods ended 9/30
This chart assumes an initial investment of $10,000 made on September 30, 2010, for Class A shares and Class C shares including any applicable sales charges or fees. The performance of the other share class may be greater or less than that shown based on differences in inception dates, fees, and sales charges. Performance assumes reinvestment of dividends and capital gain distributions.

| 1 | Total returns are historical and include changes in share price and the reinvestment of both dividends and capital gain distributions. |
| 2 | “NAV” (Net Asset Value) total returns do not include the effect of any sales charge. |
| 3 | “POP” (Public Offering Price) total returns include the effect of the maximum front-end 5.75% sales charge. |
| 4 | “CDSC” (contingent deferred sales charge) is applied to redemptions of certain classes of shares that do not have a sales charge applied at the time of purchase. CDSC for certain redemptions of Class A shares made within 18 months of a finder’s fee being paid and all Class C shares are 1% within the first year and 0% thereafter. |
| 5 | Total Return for the report period presented in the table differs from the return in the Financial Highlights. The total return presented in the above table is calculated based on the NAV at which shareholder transactions were processed. The total return presented in the Financial Highlights section of the report is calculated in the same manner, but also takes into account certain adjustments that are necessary under generally accepted accounting principles required in the annual report and semiannual report. |
| 6 | The since inception index return is from the inception date of Class I shares. |
| 7 | The expense ratios of the Fund are set forth according to the prospectus for the Fund effective January 28, 2020, as supplemented and revised, and may differ from the expense ratios disclosed in the Financial Highlight tables in this report. See the Financial Highlights for more current expense ratios. Net Expense: Expenses reduced by a contractual expense limitation in effect through January 31, 2021. Expense ratios include fees and expenses associated with any underlying funds. |
The indexes are unmanaged and not available for direct investment; therefore, their performance does not reflect the expenses associated with active management of an actual portfolio.
For information regarding the indexes and certain investment terms, see the Key Investment Terms starting on page 4.
Tactical Allocation Fund
SCHEDULE OF INVESTMENTS September 30, 2020
($ reported in thousands)
| | Par Value | | Value |
| U.S. Government Securities—3.5% |
| U.S. Treasury Bonds | | | |
| 3.000%, 8/15/48 | $10,430 | | $ 14,215 |
| 2.000%, 2/15/50 | 2,045 | | 2,313 |
| U.S. Treasury Notes | | | |
| 2.250%, 3/31/21 | 4,965 | | 5,017 |
| 0.125%, 5/31/22 | 495 | | 495 |
| 2.875%, 8/15/28 | 1,225 | | 1,446 |
| 1.500%, 2/15/30 | 1,360 | | 1,467 |
Total U.S. Government Securities
(Identified Cost $20,742) | | 24,953 |
| | | | |
| |
| Municipal Bonds—1.1% |
| California—0.4% | | |
State of California, Build America Bonds Taxable
7.600%, 11/1/40 | 1,275 | | 2,297 |
University of California, Series B-A, Taxable
4.428%, 5/15/48 | 380 | | 432 |
| | | | 2,729 |
| | | | |
| |
| Georgia—0.1% | | |
Rockdale County Water & Sewerage Authority Revenue Taxable (CNTY GTD Insured)
3.060%, 7/1/24 | 600 | | 637 |
| Idaho—0.1% | | |
Idaho Health Facilities Authority Saint Luke’s Health System Revenue Taxable
5.020%, 3/1/48 | 450 | | 588 |
| Illinois—0.0% | | |
Sales Tax Securitization Corp. Series B, Second Lien, Taxable (BAM Insured)
3.411%, 1/1/43 | 70 | | 74 |
| | Par Value | | Value |
| | | | |
| Massachusetts—0.1% | | |
Massachusetts Bay Transportation Authority Revenue, Series A-1, Taxable
5.250%, 7/1/32 | $ 535 | | $ 770 |
| Oregon—0.1% | | |
Clackamas & Washington Counties School District No. 3 Series B (SCH BD GTY Insured)
5.000%, 6/15/32 | 535 | | 722 |
| Texas—0.2% | | |
City of San Antonio, General Obligation Taxable
1.963%, 2/1/33 | 530 | | 544 |
Klein Independent School District (PSF-GTD Insured)
5.000%, 8/1/32 | 405 | | 549 |
State of Texas, General Obligation Taxable
3.211%, 4/1/44 | 180 | | 194 |
Texas Transportation Commission State Highway Fund Revenue Taxable
4.000%, 10/1/33 | 160 | | 201 |
| | | | 1,488 |
| | | | |
| |
| Virginia—0.1% | | |
City of Bristol, General Obligation Taxable
4.210%, 1/1/42 | 640 | | 692 |
Total Municipal Bonds
(Identified Cost $6,964) | | 7,700 |
| | | | |
| |
See Notes to Financial Statements
Tactical Allocation Fund
SCHEDULE OF INVESTMENTS (Continued)
September 30, 2020
($ reported in thousands)
| | Par Value | | Value |
| | | | |
| Foreign Government Securities—0.3% |
Kingdom of Saudi Arabia 144A
3.250%, 10/22/30(1) | $ 485 | | $ 527 |
Republic of South Africa
4.850%, 9/27/27 | 420 | | 414 |
Republic of Turkey
7.375%, 2/5/25 | 570 | | 588 |
State of Qatar 144A
4.400%, 4/16/50(1) | 415 | | 534 |
| Venezuela Government International Bond | | | |
| 9.375%, 1/13/34(2) | 130 | | 10 |
RegS
8.250%, 10/13/24(2)(3) | 40 | | 3 |
RegS
7.650%, 4/21/25(2)(3) | 320 | | 24 |
Total Foreign Government Securities
(Identified Cost $2,477) | | 2,100 |
| | | | |
| |
| Mortgage-Backed Securities—7.5% |
| Agency—0.9% | | |
| Federal Home Loan Mortgage Corporation | | | |
Pool #A46224
5.000%, 7/1/35 | 87 | | 100 |
Pool #A62213
6.000%, 6/1/37 | 129 | | 152 |
| Federal National Mortgage Association | | | |
Pool #254549
6.000%, 12/1/32 | 23 | | 27 |
Pool #735061
6.000%, 11/1/34 | 177 | | 210 |
Pool #880117
5.500%, 4/1/36 | 4 | | 4 |
Pool #938574
5.500%, 9/1/36 | 100 | | 117 |
Pool #310041
6.500%, 5/1/37 | 161 | | 194 |
Pool #909092
6.000%, 9/1/37 | 8 | | 10 |
Pool #972569
5.000%, 3/1/38 | 102 | | 114 |
| | Par Value | | Value |
| | | | |
| Agency—continued | | |
Pool #909175
5.500%, 4/1/38 | $ 90 | | $ 104 |
Pool #929625
5.500%, 6/1/38 | 98 | | 114 |
Pool #909220
6.000%, 8/1/38 | 64 | | 75 |
Pool #CA4128
3.000%, 9/1/49 | 726 | | 760 |
Pool #CA4978
3.000%, 1/1/50 | 707 | | 741 |
Pool#MA3905
3.000%, 1/1/50 | 3,617 | | 3,787 |
| | | | 6,509 |
| | | | |
| |
| Non-Agency—6.6% | | |
Ajax Mortgage Loan Trust 2019-D, A1 144A
2.956%, 9/25/65(1)(4) | 748 | | 758 |
| American Homes 4 Rent Trust | | | |
2014-SFR2, C 144A
4.705%, 10/17/36(1) | 795 | | 861 |
2015-SFR1, A 144A
3.467%, 4/17/52(1) | 969 | | 1,034 |
2015-SFR2, C 144A
4.691%, 10/17/52(1) | 335 | | 369 |
| AMSR Trust | | | |
2020-SFR1, B 144A
2.120%, 4/17/37(1) | 530 | | 538 |
2020-SFR2, C 144A
2.533%, 7/17/37(1) | 400 | | 410 |
2020-SFR2, D 144A
3.282%, 7/17/37(1) | 100 | | 104 |
Angel Oak Mortgage Trust LLC 2019-3, A1 144A
2.930%, 5/25/59(1)(4) | 379 | | 384 |
| Arroyo Mortgage Trust | | | |
2018-1, A1 144A
3.763%, 4/25/48(1)(4) | 134 | | 137 |
2019-1, A1 144A
3.805%, 1/25/49(1)(4) | 176 | | 181 |
2019-2, A1 144A
3.347%, 4/25/49(1)(4) | 285 | | 293 |
See Notes to Financial Statements
Tactical Allocation Fund
SCHEDULE OF INVESTMENTS (Continued)
September 30, 2020
($ reported in thousands)
| | Par Value | | Value |
| | | | |
| Non-Agency—continued | | |
| Banc of America Funding Trust | | | |
2004-B, 2A1
4.308%, 11/20/34(4) | $ 61 | | $ 64 |
2005-1, 1A1
5.500%, 2/25/35 | 161 | | 166 |
Banc of America Mortgage Trust 2005-3, 1A15
5.500%, 4/25/35 | 67 | | 70 |
| Bayview Opportunity Master Fund IVa Trust | | | |
2016-SPL1, B1 144A
4.250%, 4/28/55(1) | 510 | | 533 |
2017-SPL5, B1 144A
4.000%, 6/28/57(1)(4) | 100 | | 106 |
Bayview Opportunity Master Fund IVb Trust 2016-SPL2, B1 144A
4.250%, 6/28/53(1)(4) | 245 | | 257 |
BX Commercial Mortgage Trust 2020-BXLP, D (1 month LIBOR + 1.250%) 144A
1.402%, 12/15/36(1)(4) | 455 | | 450 |
BX Trust 2019-OC11, D 144A
4.075%, 12/9/41(1)(4) | 570 | | 553 |
CF Hippolyta LLC 2020-1, A1 144A
1.690%, 7/15/60(1) | 425 | | 430 |
CHL Mortgage Pass-Through Trust 2004-6, 1A2
3.459%, 5/25/34(4) | 169 | | 165 |
Citigroup Commercial Mortgage Trust 2019-SST2, A (1 month LIBOR + 0.920%) 144A
1.072%, 12/15/36(1)(4) | 675 | | 663 |
| | Par Value | | Value |
| | | | |
| Non-Agency—continued | | |
| Citigroup Mortgage Loan Trust, Inc. | | | |
2015-A, A1 144A
3.500%, 6/25/58(1)(4) | $ 22 | | $ 22 |
2018-RP1, A1 144A
3.000%, 9/25/64(1)(4) | 843 | | 890 |
COLT Mortgage Loan Trust Funding LLC 2020-1, A1 144A
2.488%, 2/25/50(1)(4) | 459 | | 464 |
COMM Mortgage Trust 2020-CBM, B 144A
3.099%, 2/10/37(1) | 490 | | 481 |
| CoreVest American Finance Trust | | | |
2018-2, A 144A
4.026%, 11/15/52(1) | 155 | | 167 |
2019-3, C 144A
3.265%, 10/15/52(1) | 295 | | 298 |
2020-1, A1 144A
1.832%, 3/15/50(1) | 579 | | 585 |
2020-3, A 144A
1.358%, 8/15/53(1) | 435 | | 434 |
Credit Suisse Mortgage Capital Certificates 2019-ICE4, A (1 month LIBOR + 0.980%) 144A
1.132%, 5/15/36(1)(4) | 530 | | 529 |
| Credit Suisse Mortgage Capital Trust | | | |
2014-IVR2, A2 144A
3.695%, 4/25/44(1)(4) | 25 | | 26 |
2020-RPL4, A1 144A
2.000%, 1/25/60(1) | 540 | | 557 |
2020-NQM1, A1 144A
1.208%, 5/25/65(1)(4) | 320 | | 320 |
Deephaven Residential Mortgage Trust 2017-1A, A2 144A
2.928%, 12/26/46(1)(4) | 22 | | 23 |
See Notes to Financial Statements
Tactical Allocation Fund
SCHEDULE OF INVESTMENTS (Continued)
September 30, 2020
($ reported in thousands)
| | Par Value | | Value |
| | | | |
| Non-Agency—continued | | |
| Ellington Financial Mortgage Trust | | | |
2018-1, A1FX 144A
4.140%, 10/25/58(1)(4) | $ 171 | | $ 176 |
2019-2, A3 144A
3.046%, 11/25/59(1)(4) | 147 | | 150 |
Exantas Capital Corp. 2020-RSO8, A (1 month LIBOR + 1.150%) 144A
1.301%, 3/15/35(1)(4) | 585 | | 577 |
Flagstar Mortgage Trust 2017-1, 1A3 144A
3.500%, 3/25/47(1)(4) | 435 | | 448 |
| Galton Funding Mortgage Trust | | | |
2017-1, A21 144A
3.500%, 7/25/56(1)(4) | 99 | | 102 |
2018-1, A23 144A
3.500%, 11/25/57(1)(4) | 115 | | 118 |
2018-2, A41 144A
4.500%, 10/25/58(1)(4) | 293 | | 299 |
2019-H1, A1 144A
2.657%, 10/25/59(1)(4) | 201 | | 205 |
2020-H1, A1 144A
2.310%, 1/25/60(1)(4) | 698 | | 711 |
GCAT LLC 2019-NQM1, A1 144A
2.985%, 2/25/59(1)(4) | 239 | | 243 |
GS Mortgage Securities Trust 2020-GC45, AS
3.173%, 2/13/53(4) | 565 | | 630 |
Hilton USA Trust 2016-SFP, B 144A
3.323%, 11/5/35(1) | 500 | | 499 |
| Homeward Opportunities Fund I Trust | | | |
2018-1, A1 144A
3.766%, 6/25/48(1)(4) | 69 | | 69 |
2018-2, A1 144A
3.985%, 11/25/58(1)(4) | 98 | | 101 |
2019-1, A1 144A
3.454%, 1/25/59(1)(4) | 364 | | 371 |
| | Par Value | | Value |
| | | | |
| Non-Agency—continued | | |
JPMorgan Chase (WaMu) Mortgage Pass-Through Certificates 2003-S11, 3A5
5.950%, 11/25/33 | $ 111 | | $ 115 |
| JPMorgan Chase Commercial Mortgage Securities Trust | | | |
2011-C4, A4 144A
4.388%, 7/15/46(1) | 34 | | 35 |
2015-C31, AS
4.106%, 8/15/48 | 565 | | 628 |
| JPMorgan Chase Mortgage Trust | | | |
2014-2, 2A2 144A
3.500%, 6/25/29(1)(4) | 48 | | 49 |
2014-1, 2A12 144A
3.500%, 1/25/44(1)(4) | 55 | | 57 |
2016-SH1, M2 144A
3.750%, 4/25/45(1)(4) | 239 | | 242 |
2016-SH2, M2 144A
3.750%, 12/25/45(1)(4) | 484 | | 499 |
2017-3, 2A2 144A
2.500%, 8/25/47(1)(4) | 132 | | 135 |
2017-5, A1 144A
3.128%, 10/26/48(1)(4) | 457 | | 466 |
JPMorgan Mortgage Trust 2017-1, A2 144A
3.500%, 1/25/47(1)(4) | 400 | | 412 |
KNDL Mortgage Trust 2019-KNSQ, A (1 month LIBOR + 0.800%) 144A
0.952%, 5/15/36(1)(4) | 565 | | 565 |
LHOME Mortgage Trust 2019-RTL1, A1 144A
4.580%, 10/25/23(1)(4) | 670 | | 680 |
| MASTR Alternative Loan Trust | | | |
2005-5, 2A3
5.500%, 7/25/25 | 142 | | 142 |
See Notes to Financial Statements
Tactical Allocation Fund
SCHEDULE OF INVESTMENTS (Continued)
September 30, 2020
($ reported in thousands)
| | Par Value | | Value |
| | | | |
| Non-Agency—continued | | |
2005-2, 2A1
6.000%, 1/25/35 | $ 57 | | $ 61 |
MASTR Specialized Loan Trust 2005-3, A2 144A
5.704%, 11/25/35(1)(4) | 63 | | 63 |
Mello Warehouse Securitization Trust 2019-1, C (1 month LIBOR + 1.200%) 144A
1.348%, 6/25/52(1)(4) | 340 | | 339 |
| MetLife Securitization Trust | | | |
2017-1A, M1 144A
3.645%, 4/25/55(1)(4) | 100 | | 106 |
2019-1A, A1A 144A
3.750%, 4/25/58(1)(4) | 498 | | 534 |
Mill City Mortgage Loan Trust 2019-1, M2 144A
3.500%, 10/25/69(1)(4) | 509 | | 554 |
| Morgan Stanley - Bank of America (Merrill Lynch) Trust | | | |
2013-C13, AS
4.266%, 11/15/46 | 275 | | 298 |
2015-C22, AS
3.561%, 4/15/48 | 835 | | 902 |
| New Residential Mortgage Loan Trust | | | |
2014-1A, A 144A
3.750%, 1/25/54(1)(4) | 295 | | 318 |
2015-2A, A1 144A
3.750%, 8/25/55(1)(4) | 198 | | 214 |
2016-1A, A1 144A
3.750%, 3/25/56(1)(4) | 95 | | 102 |
2016-4A, A1 144A
3.750%, 11/25/56(1)(4) | 68 | | 73 |
2016-4A, B1A 144A
4.500%, 11/25/56(1)(4) | 385 | | 428 |
2017-2A, A3 144A
4.000%, 3/25/57(1)(4) | 146 | | 158 |
2019-NQM4, A1 144A
2.492%, 9/25/59(1)(4) | 255 | | 260 |
2020-1A, A1B 144A
3.500%, 10/25/59(1)(4) | 484 | | 518 |
| | Par Value | | Value |
| | | | |
| Non-Agency—continued | | |
NovaStar Mortgage Funding Trust 2004-4, M5 (1 month LIBOR + 1.725%)
1.873%, 3/25/35(4) | $ 160 | | $ 162 |
| OBX Trust | | | |
2019-INV1, A3 144A
4.500%, 11/25/48(1)(4) | 321 | | 334 |
2018-EXP2, 1A1 144A
4.000%, 7/25/58(1)(4) | 482 | | 490 |
| Preston Ridge Partners Mortgage LLC | | | |
2019-1A, A1 144A
4.500%, 1/25/24(1)(4) | 534 | | 538 |
2020-2, A1 144A
3.671%, 8/25/25(1)(4) | 207 | | 207 |
2020-3, A1 144A
2.857%, 9/25/25(1) | 410 | | 410 |
Pretium Mortgage Credit Partners I LLC 2019-NPL3, A1 144A
3.105%, 7/27/59(1)(4) | 133 | | 133 |
| Progress Residential Trust | | | |
2018-SFR1, B 144A
3.484%, 3/17/35(1) | 980 | | 989 |
2018-SFR2, B 144A
3.841%, 8/17/35(1) | 475 | | 485 |
2019-SFR2, A 144A
3.147%, 5/17/36(1) | 388 | | 400 |
2019-SFR3, B 144A
2.571%, 9/17/36(1) | 460 | | 469 |
Provident Funding Mortgage Trust 2019-1, A2 144A
3.000%, 12/25/49(1)(4) | 963 | | 995 |
RCKT Mortgage Trust 2020-1, A1 144A
3.000%, 2/25/50(1)(4) | 1,034 | | 1,065 |
RCO V Mortgage LLC 2019-2, A1 144A
3.475%, 11/25/24(1)(4) | 594 | | 592 |
Residential Mortgage Loan Trust 2019-2, A1 144A
2.913%, 5/25/59(1)(4) | 519 | | 528 |
See Notes to Financial Statements
Tactical Allocation Fund
SCHEDULE OF INVESTMENTS (Continued)
September 30, 2020
($ reported in thousands)
| | Par Value | | Value |
| | | | |
| Non-Agency—continued | | |
SBA Tower Trust 144A
1.884%, 1/15/26(1) | $ 530 | | $ 542 |
Sequoia Mortgage Trust 2013-8, B1
3.514%, 6/25/43(4) | 198 | | 202 |
Starwood Mortgage Residential Trust 2019-IMC1, A1 144A
3.468%, 2/25/49(1)(4) | 502 | | 515 |
| Towd Point Mortgage Trust | | | |
2015-3, A1B 144A
3.000%, 3/25/54(1)(4) | 20 | | 20 |
2016-1, M1 144A
3.500%, 2/25/55(1)(4) | 160 | | 171 |
2015-5, A2 144A
3.500%, 5/25/55(1)(4) | 580 | | 602 |
2016-3, M1 144A
3.500%, 4/25/56(1)(4) | 1,080 | | 1,137 |
2017-4, A2 144A
3.000%, 6/25/57(1)(4) | 670 | | 722 |
2017-6, A2 144A
3.000%, 10/25/57(1)(4) | 585 | | 622 |
2018-6, A2 144A
3.750%, 3/25/58(1)(4) | 1,270 | | 1,414 |
2018-SJ1, A1 144A
4.000%, 10/25/58(1)(4) | 100 | | 101 |
2019-1, A1 144A
3.750%, 3/25/58(1)(4) | 731 | | 792 |
2019-2, A2 144A
3.750%, 12/25/58(1)(4) | 355 | | 388 |
2015-2, 1M1 144A
3.250%, 11/25/60(1)(4) | 585 | | 616 |
Towd Point Trust 2019-HE1, A1 (1 month LIBOR + 0.900%) 144A
1.048%, 4/25/48(1)(4) | 697 | | 694 |
Tricon American Homes Trust 2019-SFR1, C 144A
3.149%, 3/17/38(1) | 435 | | 454 |
TVC Mortgage Trust 2020-RTL1, M 144A
5.193%, 9/25/24(1)(4) | 510 | | 449 |
| | Par Value | | Value |
| | | | |
| Non-Agency—continued | | |
| VCAT LLC | | | |
2019-NPL2, A1 144A
3.573%, 11/25/49(1)(4) | $ 502 | | $ 501 |
2020-NPL1, A1 144A
3.671%, 8/25/50(1)(4) | 211 | | 211 |
| Vericrest Opportunity Loan Trust | | | |
2019-NPL2, A1 144A
3.967%, 2/25/49(1)(4) | 274 | | 274 |
2020-NPL2, A1A 144A
2.981%, 2/25/50(1)(4) | 357 | | 357 |
Vericrest Opportunity Loan Trust LXXXV LLC 2020-NPL1, A1A 144A
3.228%, 1/25/50(1)(4) | 552 | | 553 |
| Verus Securitization Trust | | | |
2018-2, B1 144A
4.426%, 6/1/58(1)(4) | 580 | | 602 |
2018-3, A1 144A
4.108%, 10/25/58(1)(4) | 236 | | 242 |
2019-INV1, A1 144A
3.402%, 12/25/59(1)(4) | 282 | | 289 |
Wells Fargo Commercial Mortgage Trust 2014-C24, AS
3.931%, 11/15/47 | 265 | | 272 |
Wells Fargo Mortgage Backed Securities Trust 2020-4, A1 144A
3.000%, 7/25/50(1)(4) | 315 | | 325 |
| | | | 47,838 |
| | | | |
| |
Total Mortgage-Backed Securities
(Identified Cost $53,069) | | 54,347 |
| | | | |
| |
See Notes to Financial Statements
Tactical Allocation Fund
SCHEDULE OF INVESTMENTS (Continued)
September 30, 2020
($ reported in thousands)
| | Par Value | | Value |
| | | | |
| Asset-Backed Securities—2.9% |
| Auto Floor Plan—0.0% | | |
NextGear Floorplan Master Owner Trust 2018-1A, A2 144A
3.220%, 2/15/23(1) | $ 145 | | $ 146 |
| Automobiles—1.8% | | |
ACC Trust 2019-1, A 144A
3.750%, 5/20/22(1) | 166 | | 167 |
| American Credit Acceptance Receivables Trust | | | |
2018-1, C 144A
3.550%, 4/10/24(1) | 17 | | 17 |
2018-4, C 144A
3.970%, 1/13/25(1) | 641 | | 650 |
2019-2, C 144A
3.170%, 6/12/25(1) | 565 | | 575 |
Avis Budget Rental Car Funding LLC (AESOP) 2016-1A, A 144A
2.990%, 6/20/22(1) | 900 | | 907 |
| Capital Auto Receivables Asset Trust | | | |
2017-1, C 144A
2.700%, 9/20/22(1) | 430 | | 437 |
2017-1, D 144A
3.150%, 2/20/25(1) | 135 | | 138 |
| Carvana Auto Receivables Trust | | | |
2019-1A, E 144A
5.640%, 1/15/26(1) | 510 | | 531 |
2019-3A, D 144A
3.040%, 4/15/25(1) | 575 | | 588 |
CIG Auto Receivables Trust 2020-1A, E 144A
4.430%, 2/12/27(1) | 545 | | 545 |
| CPS Auto Receivables Trust | | | |
2020-B, C 144A
3.300%, 4/15/26(1) | 600 | | 622 |
| | Par Value | | Value |
| | | | |
| Automobiles—continued | | |
2020-C, C 144A
1.710%, 8/17/26(1) | $ 540 | | $ 541 |
Drive Auto Receivables Trust 2019-4, C
2.510%, 11/17/25 | 580 | | 593 |
| DT Auto Owner Trust | | | |
2018-1A, C 144A
3.470%, 12/15/23(1) | 22 | | 22 |
2019-2A, B 144A
2.990%, 4/17/23(1) | 565 | | 572 |
| Exeter Automobile Receivables Trust | | | |
2018-4A, D 144A
4.350%, 9/16/24(1) | 160 | | 168 |
2019-1A, D 144A
4.130%, 12/16/24(1) | 155 | | 162 |
2019-2A, C 144A
3.300%, 3/15/24(1) | 570 | | 586 |
2019-4A, C 144A
2.440%, 9/16/24(1) | 690 | | 705 |
First Investors Auto Owner Trust 2016-2A, C 144A
2.530%, 7/15/22(1) | 242 | | 243 |
Flagship Credit Auto Trust 2020-3, C 144A
1.730%, 9/15/26(1) | 540 | | 551 |
| GLS Auto Receivables Trust | | | |
2017-1A, C 144A
3.500%, 7/15/22(1) | 113 | | 114 |
2018-1A, B 144A
3.520%, 8/15/23(1) | 155 | | 157 |
2018-3A, C 144A
4.180%, 7/15/24(1) | 640 | | 667 |
| Hertz Vehicle Financing II LP | | | |
2016-4A, A 144A
2.650%, 7/25/22(1) | 258 | | 258 |
2019-1A, A 144A
3.710%, 3/25/23(1) | 219 | | 219 |
See Notes to Financial Statements
Tactical Allocation Fund
SCHEDULE OF INVESTMENTS (Continued)
September 30, 2020
($ reported in thousands)
| | Par Value | | Value |
| | | | |
| Automobiles—continued | | |
OneMain Direct Auto Receivables Trust 2018-1A, C 144A
3.850%, 10/14/25(1) | $ 355 | | $ 364 |
Skopos Auto Receivables Trust 2019-1A, C 144A
3.630%, 9/16/24(1) | 575 | | 584 |
United Auto Credit Securitization Trust 2019-1, D 144A
3.470%, 8/12/24(1) | 565 | | 577 |
| Veros Automobile Receivables Trust | | | |
2018-1, B 144A
4.050%, 2/15/24(1) | 65 | | 65 |
2020-1, B 144A
2.190%, 6/16/25(1) | 585 | | 587 |
| | | | 12,912 |
| | | | |
| |
| Credit Card—0.2% | | |
Fair Square Issuance Trust 2020-AA, A 144A
2.900%, 9/20/24(1) | 645 | | 645 |
Genesis Private Label Amortizing Trust 2020-1, B 144A
2.830%, 7/20/30(1) | 625 | | 628 |
| | | | 1,273 |
| | | | |
| |
| Other—0.9% | | |
Aqua Finance Trust 2017-A, A 144A
3.720%, 11/15/35(1) | 59 | | 59 |
Arby’s Funding LLC 2020-1A, A2 144A
3.237%, 7/30/50(1) | 540 | | 555 |
Bankers Healthcare Group Securitization Trust 2020-A, A 144A
2.470%, 9/17/31(1) | 498 | | 498 |
Diamond Resorts Owner Trust 2017-1A, A 144A
3.270%, 10/22/29(1) | 112 | | 114 |
| | Par Value | | Value |
| | | | |
| Other—continued | | |
FREED ABS Trust 2020-3FP, A 144A
2.400%, 9/20/27(1) | $ 458 | | $ 459 |
Jersey Mike’s Funding 2019-1A, A2 144A
4.433%, 2/15/50(1) | 570 | | 606 |
Lendmark Funding Trust 2018-2A, A 144A
4.230%, 4/20/27(1) | 160 | | 164 |
| MVW LLC | | | |
2019-2A, A 144A
2.220%, 10/20/38(1) | 549 | | 560 |
2020-1A, A 144A
1.740%, 10/20/37(1) | 416 | | 421 |
MVW Owner Trust 2016-1A, A 144A
2.250%, 12/20/33(1) | 132 | | 132 |
Oasis LLC 2020-1A, A 144A
3.820%, 1/15/32(1) | 362 | | 363 |
| Octane Receivables Trust | | | |
2019-1A, A 144A
3.160%, 9/20/23(1) | 322 | | 322 |
2020-1A, A 144A
1.710%, 2/20/25(1) | 650 | | 650 |
OneMain Financial Issuance Trust 2018-1A, A 144A
3.300%, 3/14/29(1) | 470 | | 482 |
Orange Lake Timeshare Trust 2019-A, B 144A
3.360%, 4/9/38(1) | 434 | | 439 |
Prosper Marketplace Issuance Trust 2018-2A, B 144A
3.960%, 10/15/24(1) | 107 | | 107 |
Regional Management Issuance Trust 2018-2, A 144A
4.560%, 1/18/28(1) | 130 | | 132 |
Small Business Lending Trust 2019-A, A 144A
2.850%, 7/15/26(1) | 229 | | 225 |
See Notes to Financial Statements
Tactical Allocation Fund
SCHEDULE OF INVESTMENTS (Continued)
September 30, 2020
($ reported in thousands)
| | Par Value | | Value |
| | | | |
| Other—continued | | |
Trinity Rail Leasing LLC 2019-1A, A 144A
3.820%, 4/17/49(1) | $ 366 | | $ 382 |
Westgate Resorts LLC 2020-1A, A 144A
2.713%, 3/20/34(1) | 308 | | 313 |
| | | | 6,983 |
| | | | |
| |
Total Asset-Backed Securities
(Identified Cost $20,947) | | 21,314 |
| | | | |
| |
| Corporate Bonds and Notes—12.0% |
| Communication Services—0.6% | | |
ANGI Group LLC 144A
3.875%, 8/15/28(1) | 215 | | 213 |
Cable Onda S.A. 144A
4.500%, 1/30/30(1) | 460 | | 479 |
Consolidated Communications, Inc. 144A
6.500%, 10/1/28(1) | 325 | | 331 |
| Diamond Sports Group LLC | | | |
| 144A 5.375%, 8/15/26(1) | 255 | | 180 |
| 144A 6.625%, 8/15/27(1) | 140 | | 73 |
| DISH DBS Corp. | | | |
| 5.000%, 3/15/23 | 110 | | 112 |
| 7.750%, 7/1/26 | 60 | | 66 |
Frontier Communications Corp. 144A
8.500%, 4/1/26(1) | 205 | | 207 |
Level 3 Financing, Inc. 144A
4.250%, 7/1/28(1) | 485 | | 492 |
Live Nation Entertainment, Inc. 144A
4.750%, 10/15/27(1) | 80 | | 75 |
Meredith Corp.
6.875%, 2/1/26 | 330 | | 276 |
| | Par Value | | Value |
| | | | |
Communication
Services—continued | | |
Radiate Holdco LLC 144A
4.500%, 9/15/26(1) | $ 75 | | $ 75 |
Sprint Spectrum Co. LLC 144A
4.738%, 3/20/25(1) | 400 | | 432 |
Telesat Canada 144A
6.500%, 10/15/27(1) | 170 | | 171 |
Tencent Holdings Ltd. 144A
3.975%, 4/11/29(1) | 585 | | 665 |
T-Mobile USA, Inc. 144A
3.875%, 4/15/30(1) | 630 | | 716 |
TripAdvisor, Inc. 144A
7.000%, 7/15/25(1) | 110 | | 115 |
| | | | 4,678 |
| | | | |
| |
| Consumer Discretionary—1.1% | | |
American Axle & Manufacturing, Inc.
6.500%, 4/1/27 | 350 | | 339 |
American Builders & Contractors Supply Co., Inc. 144A
4.000%, 1/15/28(1) | 420 | | 427 |
Aramark Services, Inc. 144A
6.375%, 5/1/25(1) | 205 | | 214 |
Block Financial LLC
3.875%, 8/15/30 | 500 | | 502 |
Caesars Entertainment, Inc. 144A
6.250%, 7/1/25(1) | 100 | | 104 |
Dana, Inc.
5.375%, 11/15/27 | 445 | | 456 |
Ford Motor Co.
9.000%, 4/22/25 | 412 | | 472 |
Gateway Casinos & Entertainment Ltd. 144A
8.250%, 3/1/24(1) | 385 | | 325 |
General Motors Co.
6.800%, 10/1/27 | 275 | | 334 |
See Notes to Financial Statements
Tactical Allocation Fund
SCHEDULE OF INVESTMENTS (Continued)
September 30, 2020
($ reported in thousands)
| | Par Value | | Value |
| | | | |
Consumer
Discretionary—continued | | |
General Motors Financial Co., Inc.
3.450%, 4/10/22 | $ 100 | | $ 103 |
Hanesbrands, Inc. 144A
5.375%, 5/15/25(1) | 410 | | 435 |
Lear Corp.
3.800%, 9/15/27 | 775 | | 818 |
M/I Homes, Inc.
4.950%, 2/1/28 | 435 | | 448 |
Marriott Ownership Resorts, Inc.
4.750%, 1/15/28 | 335 | | 317 |
Nissan Motor Co. Ltd. 144A
4.810%, 9/17/30(1) | 400 | | 401 |
PulteGroup, Inc.
6.375%, 5/15/33 | 280 | | 352 |
| QVC, Inc. | | | |
| 4.375%, 3/15/23 | 345 | | 359 |
| 4.750%, 2/15/27 | 175 | | 180 |
| Scientific Games International, Inc. | | | |
| 144A 8.250%, 3/15/26(1) | 210 | | 220 |
| 144A 7.000%, 5/15/28(1) | 80 | | 80 |
TRI Pointe Group, Inc.
5.875%, 6/15/24 | 340 | | 367 |
Under Armour, Inc.
3.250%, 6/15/26 | 340 | | 320 |
VF Corp.
2.400%, 4/23/25 | 305 | | 324 |
Weekley Homes LLC 144A
4.875%, 9/15/28(1) | 345 | | 348 |
| | | | 8,245 |
| | | | |
| |
| Consumer Staples—0.2% | | |
Albertsons Cos., Inc. 144A
4.625%, 1/15/27(1) | 455 | | 466 |
| | Par Value | | Value |
| | | | |
| Consumer Staples—continued | | |
Bacardi Ltd. 144A
4.700%, 5/15/28(1) | $ 340 | | $ 395 |
BAT Capital Corp.
4.906%, 4/2/30 | 500 | | 589 |
| | | | 1,450 |
| | | | |
| |
| Energy—1.1% | | |
Aker BP ASA 144A
2.875%, 1/15/26(1) | 540 | | 535 |
Alliance Resource Operating Partners LP 144A
7.500%, 5/1/25(1) | 320 | | 227 |
Boardwalk Pipelines LP
4.950%, 12/15/24 | 455 | | 499 |
Cheniere Energy, Inc. 144A
4.625%, 10/15/28(1) | 165 | | 169 |
CrownRock LP 144A
5.625%, 10/15/25(1) | 345 | | 325 |
| EQM Midstream Partners LP | | | |
| 144A 6.000%, 7/1/25(1) | 55 | | 57 |
| 144A 6.500%, 7/1/27(1) | 65 | | 69 |
HollyFrontier Corp.
5.875%, 4/1/26 | 630 | | 690 |
Kinder Morgan Energy Partners LP
7.500%, 11/15/40 | 595 | | 801 |
MPLX LP
4.250%, 12/1/27 | 330 | | 371 |
Odebrecht Oil & Gas Finance Ltd. 144A
0.000% (1)(5)(6) | 25 | | — (7) |
Parsley Energy LLC 144A
4.125%, 2/15/28(1) | 440 | | 414 |
Patterson-UTI Energy, Inc.
5.150%, 11/15/29 | 350 | | 272 |
See Notes to Financial Statements
Tactical Allocation Fund
SCHEDULE OF INVESTMENTS (Continued)
September 30, 2020
($ reported in thousands)
| | Par Value | | Value |
| | | | |
| Energy—continued | | |
Pertamina Persero PT 144A
6.450%, 5/30/44(1) | $ 780 | | $ 1,010 |
Petroleos de Venezuela S.A. 144A
6.000%, 5/16/24(1)(2) | 255 | | 6 |
Petroleos Mexicanos 144A
7.690%, 1/23/50(1) | 445 | | 367 |
Petronas Capital Ltd. 144A
3.500%, 4/21/30(1) | 530 | | 592 |
| Sabine Pass Liquefaction LLC | | | |
| 6.250%, 3/15/22 | 425 | | 451 |
| 4.200%, 3/15/28 | 210 | | 228 |
Targa Resources Partners LP
5.875%, 4/15/26 | 430 | | 442 |
Transocean Guardian Ltd. 144A
5.875%, 1/15/24(1) | 106 | | 68 |
| | | | 7,593 |
| | | | |
| |
| Financials—3.7% | | |
AerCap Ireland Capital DAC
3.650%, 7/21/27 | 720 | | 659 |
Allstate Corp. (The) Series B
5.750%, 8/15/53(8) | 440 | | 457 |
Apollo Management Holdings LP 144A
4.000%, 5/30/24(1) | 455 | | 503 |
Ares Finance Co. LLC 144A
4.000%, 10/8/24(1) | 595 | | 638 |
Athene Global Funding 144A
2.450%, 8/20/27(1) | 540 | | 554 |
| Bank of America Corp. | | | |
| 4.200%, 8/26/24 | 662 | | 737 |
(3 month LIBOR + 0.770%)
1.019%, 2/5/26(4) | 110 | | 109 |
| | Par Value | | Value |
| | | | |
| Financials—continued | | |
Bank of Montreal
3.803%, 12/15/32 | $ 661 | | $ 736 |
Bank of New York Mellon Corp. (The) Series G
4.700% (6) | 485 | | 515 |
BBVA Bancomer S.A. 144A
5.125%, 1/18/33(1) | 540 | | 520 |
| Brighthouse Financial, Inc. | | | |
| 3.700%, 6/22/27 | 173 | | 180 |
| 5.625%, 5/15/30 | 333 | | 388 |
Brightsphere Investment Group, Inc.
4.800%, 7/27/26 | 385 | | 408 |
Brookfield Finance, Inc.
4.250%, 6/2/26 | 755 | | 865 |
| Capital One Financial Corp. | | | |
| 4.200%, 10/29/25 | 165 | | 183 |
| 3.750%, 7/28/26 | 765 | | 832 |
Charles Schwab Corp. (The) Series G
5.375% (6) | 462 | | 501 |
Citadel LP 144A
4.875%, 1/15/27(1) | 460 | | 494 |
| Citigroup, Inc. | | | |
| 4.050%, 7/30/22 | 500 | | 531 |
| 3.200%, 10/21/26 | 525 | | 579 |
(3 month LIBOR + 1.250%)
1.475%, 7/1/26(4) | 575 | | 584 |
Discover Bank
4.682%, 8/9/28 | 475 | | 498 |
Drawbridge Special Opportunities Fund LP 144A
5.000%, 8/1/21(1) | 250 | | 253 |
Fairfax Financial Holdings Ltd.
4.850%, 4/17/28 | 705 | | 772 |
FirstCash, Inc. 144A
4.625%, 9/1/28(1) | 180 | | 184 |
See Notes to Financial Statements
Tactical Allocation Fund
SCHEDULE OF INVESTMENTS (Continued)
September 30, 2020
($ reported in thousands)
| | Par Value | | Value |
| | | | |
| Financials—continued | | |
Goldman Sachs Group, Inc. (The) (3 month LIBOR + 1.170%)
1.450%, 5/15/26(4) | $ 685 | | $ 692 |
ICAHN Enterprises LP
6.250%, 5/15/26 | 575 | | 599 |
Jefferies Financial Group, Inc.
5.500%, 10/18/23 | 345 | | 381 |
| Jefferies Group LLC | | | |
| 5.125%, 1/20/23 | 123 | | 134 |
| 4.850%, 1/15/27 | 340 | | 386 |
JPMorgan Chase & Co.
2.956%, 5/13/31 | 1,045 | | 1,117 |
Ladder Capital Finance Holdings LLLP 144A
4.250%, 2/1/27(1) | 345 | | 298 |
| Liberty Mutual Group, Inc. | | | |
| 144A 4.250%, 6/15/23(1) | 153 | | 167 |
| 144A 4.569%, 2/1/29(1) | 537 | | 649 |
MetLife, Inc. Series G
3.850% (6)(8)(9) | 570 | | 568 |
| Morgan Stanley | | | |
| 3.125%, 7/27/26 | 740 | | 817 |
| 6.375%, 7/24/42 | 560 | | 871 |
| OneMain Finance Corp. | | | |
| 6.875%, 3/15/25 | 235 | | 261 |
| 7.125%, 3/15/26 | 135 | | 151 |
| 5.375%, 11/15/29 | 35 | | 36 |
| Prudential Financial, Inc. | | | |
| 5.875%, 9/15/42 | 100 | | 105 |
| 5.625%, 6/15/43(8) | 755 | | 802 |
| Santander Holdings USA, Inc. | | | |
| 3.700%, 3/28/22 | 359 | | 372 |
| 3.500%, 6/7/24 | 455 | | 488 |
| 4.400%, 7/13/27 | 340 | | 374 |
Societe Generale S.A. 144A
4.750%, 11/24/25(1) | 535 | | 587 |
| | Par Value | | Value |
| | | | |
| Financials—continued | | |
Synchrony Financial
3.950%, 12/1/27 | $ 730 | | $ 785 |
Toronto-Dominion Bank (The)
3.625%, 9/15/31 | 585 | | 657 |
UBS AG
7.625%, 8/17/22 | 500 | | 557 |
Voya Financial, Inc.
5.650%, 5/15/53 | 455 | | 468 |
| Wells Fargo & Co. | | | |
| 2.393%, 6/2/28 | 695 | | 725 |
Series S
5.900%(6)(8) | 570 | | 583 |
Zions Bancorp NA
3.250%, 10/29/29 | 405 | | 405 |
| | | | 26,715 |
| | | | |
| |
| Health Care—0.7% | | |
Advanz Pharma Corp., Ltd.
8.000%, 9/6/24 | 22 | | 22 |
Anthem, Inc.
2.875%, 9/15/29 | 450 | | 486 |
Centene Corp.
4.625%, 12/15/29 | 190 | | 205 |
| HCA, Inc. | | | |
| 5.125%, 6/15/39 | 235 | | 285 |
| 5.250%, 6/15/49 | 350 | | 425 |
Jaguar Holding Co. II 144A
5.000%, 6/15/28(1) | 160 | | 167 |
LifePoint Health, Inc. 144A
4.375%, 2/15/27(1) | 170 | | 170 |
Mylan NV
3.950%, 6/15/26 | 470 | | 528 |
Par Pharmaceutical, Inc. 144A
7.500%, 4/1/27(1) | 215 | | 225 |
Perrigo Finance Unlimited Co.
4.375%, 3/15/26 | 570 | | 637 |
See Notes to Financial Statements
Tactical Allocation Fund
SCHEDULE OF INVESTMENTS (Continued)
September 30, 2020
($ reported in thousands)
| | Par Value | | Value |
| | | | |
| Health Care—continued | | |
| Royalty Pharma plc | | | |
| 144A 2.200%, 9/2/30(1) | $ 407 | | $ 405 |
| 144A 3.550%, 9/2/50(1) | 245 | | 236 |
Surgery Center Holdings, Inc. 144A
6.750%, 7/1/25(1) | 15 | | 15 |
| Tenet Healthcare Corp. | | | |
| 144A 7.500%, 4/1/25(1) | 50 | | 54 |
| 144A 5.125%, 11/1/27(1) | 352 | | 362 |
Teva Pharmaceutical Finance Netherlands III B.V.
3.150%, 10/1/26 | 340 | | 300 |
Universal Health Services, Inc. 144A
2.650%, 10/15/30(1) | 555 | | 552 |
| | | | 5,074 |
| | | | |
| |
| Industrials—1.3% | | |
Ashtead Capital, Inc. 144A
4.375%, 8/15/27(1) | 705 | | 733 |
Aviation Capital Group LLC 144A
3.500%, 11/1/27(1) | 560 | | 501 |
Avolon Holdings Funding Ltd. 144A
4.375%, 5/1/26(1) | 565 | | 536 |
| Boeing Co. (The) | | | |
| 5.150%, 5/1/30 | 275 | | 308 |
| 3.750%, 2/1/50 | 165 | | 151 |
| 5.930%, 5/1/60 | 136 | | 168 |
DP World plc 144A
6.850%, 7/2/37(1) | 370 | | 461 |
Flowserve Corp.
3.500%, 10/1/30 | 685 | | 679 |
GFL Environmental, Inc. 144A
3.750%, 8/1/25(1) | 340 | | 339 |
Hillenbrand, Inc.
5.000%, 9/15/26 | 375 | | 407 |
| | Par Value | | Value |
| | | | |
| Industrials—continued | | |
Howmet Aerospace, Inc.
6.875%, 5/1/25 | $ 190 | | $ 210 |
Kazakhstan Temir Zholy Finance BV 144A
6.950%, 7/10/42(1) | 440 | | 590 |
| Oshkosh Corp. | | | |
| 4.600%, 5/15/28 | 507 | | 579 |
| 3.100%, 3/1/30 | 147 | | 156 |
Quanta Services, Inc.
2.900%, 10/1/30 | 700 | | 715 |
Signature Aviation US Holdings, Inc. 144A
4.000%, 3/1/28(1) | 455 | | 423 |
Spirit AeroSystems, Inc. 144A
5.500%, 1/15/25(1) | 430 | | 432 |
Standard Industries, Inc. 144A
4.375%, 7/15/30(1) | 545 | | 559 |
Stanley Black & Decker, Inc.
4.000%, 3/15/60(8) | 399 | | 415 |
TransDigm, Inc.
5.500%, 11/15/27 | 370 | | 356 |
Transurban Finance Co. Pty Ltd. 144A
2.450%, 3/16/31(1) | 560 | | 571 |
WESCO Distribution, Inc. 144A
7.250%, 6/15/28(1) | 205 | | 225 |
| | | | 9,514 |
| | | | |
| |
| Information Technology—0.9% | | |
Banff Merger Sub, Inc. 144A
9.750%, 9/1/26(1) | 15 | | 16 |
Broadcom, Inc.
4.150%, 11/15/30 | 535 | | 601 |
Citrix Systems, Inc.
3.300%, 3/1/30 | 815 | | 870 |
Dell International LLC 144A
8.100%, 7/15/36(1) | 270 | | 354 |
Flex Ltd.
3.750%, 2/1/26 | 405 | | 442 |
See Notes to Financial Statements
Tactical Allocation Fund
SCHEDULE OF INVESTMENTS (Continued)
September 30, 2020
($ reported in thousands)
| | Par Value | | Value |
| | | | |
Information
Technology—continued | | |
Hewlett Packard Enterprise Co.
4.900%, 10/15/25 | $ 595 | | $ 682 |
HP, Inc.
3.400%, 6/17/30 | 655 | | 702 |
Microchip Technology, Inc. 144A
4.250%, 9/1/25(1) | 425 | | 441 |
Motorola Solutions, Inc.
4.600%, 2/23/28 | 440 | | 513 |
NCR Corp. 144A
5.250%, 10/1/30(1) | 45 | | 45 |
Science Applications International Corp. 144A
4.875%, 4/1/28(1) | 420 | | 426 |
| VMware, Inc. | | | |
| 3.900%, 8/21/27 | 333 | | 372 |
| 4.700%, 5/15/30 | 345 | | 408 |
Xerox Holdings Corp. 144A
5.500%, 8/15/28(1) | 320 | | 315 |
| | | | 6,187 |
| | | | |
| |
| Materials—0.7% | | |
Ardagh Packaging Finance plc 144A
4.125%, 8/15/26(1) | 410 | | 416 |
Avient Corp. 144A
5.750%, 5/15/25(1) | 410 | | 435 |
Celanese US Holdings LLC
3.500%, 5/8/24 | 570 | | 613 |
Cleveland-Cliffs, Inc. 144A
6.750%, 3/15/26(1) | 310 | | 315 |
Glencore Funding LLC 144A
1.625%, 9/1/25(1) | 565 | | 559 |
Inversiones CMPC S.A. 144A
3.850%, 1/13/30(1) | 670 | | 733 |
| | Par Value | | Value |
| | | | |
| Materials—continued | | |
Novelis Corp. 144A
4.750%, 1/30/30(1) | $ 225 | | $ 219 |
| Nutrition & Biosciences, Inc. | | | |
| 144A 2.300%, 11/1/30(1) | 435 | | 438 |
| 144A 3.468%, 12/1/50(1) | 62 | | 62 |
Olin Corp.
5.625%, 8/1/29 | 555 | | 547 |
Syngenta Finance N.V. 144A
4.441%, 4/24/23(1) | 200 | | 211 |
Teck Resources Ltd.
6.125%, 10/1/35 | 500 | | 597 |
| | | | 5,145 |
| | | | |
| |
| Real Estate—1.1% | | |
American Campus Communities Operating Partnership LP
3.875%, 1/30/31 | 580 | | 633 |
Corporate Office Properties LP
3.600%, 5/15/23 | 715 | | 750 |
EPR Properties
4.750%, 12/15/26 | 865 | | 828 |
ESH Hospitality, Inc. 144A
4.625%, 10/1/27(1) | 460 | | 451 |
GLP Capital LP
5.750%, 6/1/28 | 560 | | 639 |
| Healthcare Trust of America Holdings LP | | | |
| 3.750%, 7/1/27 | 610 | | 678 |
| 3.100%, 2/15/30 | 105 | | 113 |
Iron Mountain, Inc. 144A
4.875%, 9/15/29(1) | 475 | | 483 |
iStar, Inc.
4.250%, 8/1/25 | 445 | | 415 |
See Notes to Financial Statements
Tactical Allocation Fund
SCHEDULE OF INVESTMENTS (Continued)
September 30, 2020
($ reported in thousands)
| | Par Value | | Value |
| | | | |
| Real Estate—continued | | |
| MPT Operating Partnership LP | | | |
| 5.000%, 10/15/27 | $ 240 | | $ 250 |
| 4.625%, 8/1/29 | 115 | | 120 |
Office Properties Income Trust
4.500%, 2/1/25 | 855 | | 865 |
Retail Opportunity Investments Partnership LP
4.000%, 12/15/24 | 485 | | 486 |
Service Properties Trust
4.950%, 2/15/27 | 640 | | 570 |
Spirit Realty LP
3.200%, 2/15/31 | 565 | | 551 |
| | | | 7,832 |
| | | | |
| |
| Utilities—0.6% | | |
American Electric Power Co., Inc.
2.300%, 3/1/30 | 500 | | 515 |
DPL, Inc.
4.350%, 4/15/29 | 402 | | 429 |
Edison International
4.125%, 3/15/28 | 540 | | 554 |
Exelon Corp.
3.497%, 6/1/22 | 300 | | 314 |
Pennsylvania Electric Co. 144A
3.600%, 6/1/29(1) | 435 | | 488 |
Perusahaan Listrik Negara PT 144A
4.125%, 5/15/27(1) | 210 | | 226 |
Southern Power Co.
4.150%, 12/1/25 | 585 | | 671 |
Talen Energy Supply LLC 144A
6.625%, 1/15/28(1) | 260 | | 252 |
| | Par Value | | Value |
| | | | |
| Utilities—continued | | |
TerraForm Power Operating LLC 144A
5.000%, 1/31/28(1) | $ 210 | | $ 230 |
Vistra Operations Co. LLC 144A
4.300%, 7/15/29(1) | 580 | | 632 |
| | | | 4,311 |
| | | | |
| |
Total Corporate Bonds and Notes
(Identified Cost $82,684) | | 86,744 |
| | | | |
| |
| Leveraged Loans(4)—1.8% |
| Aerospace—0.1% | | |
AI Convoy (Luxembourg) S.a.r.l. Tranche B (6 month LIBOR + 3.500%)
4.650%, 1/18/27 | 348 | | 346 |
Mileage Plus Holdings, LLC (3 month LIBOR + 5.250%)
6.250%, 6/20/27 | 430 | | 437 |
TransDigm, Inc. Tranche E (1 month LIBOR + 2.250%)
2.397%, 5/30/25 | 205 | | 193 |
| | | | 976 |
| | | | |
| |
| Chemicals—0.1% | | |
H.B. Fuller Co. Tranche B (1 month LIBOR + 2.000%)
2.156%, 10/21/24 | 201 | | 198 |
See Notes to Financial Statements
Tactical Allocation Fund
SCHEDULE OF INVESTMENTS (Continued)
September 30, 2020
($ reported in thousands)
| | Par Value | | Value |
| | | | |
| Chemicals—continued | | |
Ineos U.S. Finance LLC 2024 (1 month LIBOR + 2.000%)
2.147%, 4/1/24 | $ 259 | | $ 251 |
| | | | 449 |
| | | | |
| |
| Consumer Non-Durables—0.0% | | |
Kronos Acquisition Holdings, Inc. Tranche B-3 (1 month LIBOR + 4.000%)
5.000%, 5/15/23 | 296 | | 293 |
| Energy—0.1% | | |
Buckeye Partners LP (1 month LIBOR + 2.750%)
2.897%, 11/1/26 | 105 | | 102 |
California Resources Corp. 2016 (1 month LIBOR + 10.375%)
11.375%, 12/31/21(2) | 80 | | 2 |
CITGO Petroleum Corp. 2019, Tranche B (3 month LIBOR + 5.000%)
6.000%, 3/27/24 | 260 | | 246 |
| | | | 350 |
| | | | |
| |
| Financial—0.0% | | |
Ryan Specialty Group LLC (1 month LIBOR + 3.250%)
4.000%, 9/1/27 | 50 | | 50 |
| Food / Tobacco—0.0% | | |
Aramark Services, Inc. Tranche B-4 (1 month LIBOR + 1.750%)
1.897%, 1/15/27 | 99 | | 95 |
CHG PPC Parent LLC First Lien (1 month LIBOR + 2.750%)
2.897%, 3/31/25 | 181 | | 174 |
| | | | 269 |
| | | | |
| |
| | Par Value | | Value |
| | | | |
| Forest Prod / Containers—0.1% | | |
Berry Global, Inc. Tranche Y (1 month LIBOR + 2.000%)
2.156%, 7/1/26 | $ 491 | | $ 476 |
Graham Packaging Co., Inc. (1 month LIBOR + 3.750%)
4.500%, 8/4/27 | 430 | | 427 |
Reynolds Consumer Products LLC (1 month LIBOR + 1.750%)
1.897%, 2/4/27 | 67 | | 66 |
Spectrum Holdings III Corp. First Lien (3 month LIBOR + 3.250%)
4.273%, 1/31/25 | 40 | | 36 |
| | | | 1,005 |
| | | | |
| |
| Gaming / Leisure—0.1% | | |
Aristocrat Technologies, Inc. (3 month LIBOR + 3.750%)
4.750%, 10/19/24 | 55 | | 55 |
Pug LLC Tranche B (1 month LIBOR + 3.500%)
3.647%, 2/12/27 | 278 | | 244 |
Seminole Tribe of Florida (1 month LIBOR + 1.750%)
1.897%, 7/8/24 | 299 | | 292 |
Station Casinos LLC Tranche B-1 (1 month LIBOR + 2.250%)
2.500%, 2/8/27 | 164 | | 156 |
| | | | 747 |
| | | | |
| |
| Healthcare—0.2% | | |
AHP Health Partners, Inc. (1 month LIBOR + 4.500%)
5.500%, 6/30/25 | 82 | | 82 |
See Notes to Financial Statements
Tactical Allocation Fund
SCHEDULE OF INVESTMENTS (Continued)
September 30, 2020
($ reported in thousands)
| | Par Value | | Value |
| | | | |
| Healthcare—continued | | |
| Bausch Health Cos., Inc. | | | |
(1 month LIBOR + 2.750%)
2.901%, 11/27/25 | $ 112 | | $ 109 |
(1 month LIBOR + 3.000%)
3.151%, 6/2/25 | 58 | | 56 |
Catalent Pharma Solutions, Inc. Tranche B-2 (1 month LIBOR + 2.250%)
3.250%, 5/18/26 | 213 | | 212 |
CHG Healthcare Services, Inc. (3 month LIBOR + 3.000%)
4.000%, 6/7/23 | 313 | | 308 |
Greatbatch Ltd. Tranche B (1 month LIBOR + 2.500%)
0.000%, 10/27/22(10) | 435 | | 434 |
LifePoint Health, Inc. Tranche B, First Lien (1 month LIBOR + 3.750%)
3.897%, 11/17/25 | 353 | | 342 |
| | | | 1,543 |
| | | | |
| |
| Housing—0.1% | | |
CPG International LLC (3 month LIBOR + 3.750%)
4.750%, 5/6/24 | 51 | | 50 |
Summit Materials LLC Tranche B (1 month LIBOR + 2.000%)
2.145%, 11/21/24 | 529 | | 523 |
| | | | 573 |
| | | | |
| |
| | Par Value | | Value |
| | | | |
| Information Technology—0.1% | | |
| Applied Systems, Inc. | | | |
First Lien (3 month LIBOR + 3.250%)
0.000%, 9/19/24(10) | $ 215 | | $ 213 |
Second Lien (3 month LIBOR + 7.000%)
8.000%, 9/19/25 | 57 | | 58 |
Boxer Parent Co., Inc. (1 month LIBOR + 4.250%)
4.397%, 10/2/25 | 453 | | 439 |
Sophia LP (3 month LIBOR + 3.750%)
0.000%, 10/7/27(10) | 55 | | 55 |
Ultimate Software Group, Inc. (The) 2020 (3 month LIBOR + 4.000%)
4.750%, 5/4/26 | 175 | | 174 |
| | | | 939 |
| | | | |
| |
| Manufacturing—0.0% | | |
Gardner Denver, Inc. Tranche A (1 month LIBOR + 2.750%)
2.897%, 3/1/27 | 40 | | 39 |
Ingersoll-Rand Services Co. 2020, Tranche B-1 (1 month LIBOR + 1.750%)
1.897%, 2/28/27 | 45 | | 43 |
Star US Bidco LLC (1 month LIBOR + 4.250%)
5.250%, 3/17/27 | 259 | | 246 |
| | | | 328 |
| | | | |
| |
See Notes to Financial Statements
Tactical Allocation Fund
SCHEDULE OF INVESTMENTS (Continued)
September 30, 2020
($ reported in thousands)
| | Par Value | | Value |
| | | | |
Media / Telecom -
Broadcasting—0.1% | | |
Nexstar Broadcasting, Inc. Tranche B-4 (1 month LIBOR + 2.750%)
2.905%, 9/18/26 | $ 346 | | $ 338 |
Media / Telecom - Cable/Wireless
Video—0.1% | | |
CSC Holdings LLC 2018 (1 month LIBOR + 2.250%)
2.402%, 1/15/26 | 271 | | 261 |
Radiate Holdco LLC Tranche B (3 month LIBOR + 3.500%)
0.000%, 9/25/26(10) | 53 | | 53 |
Virgin Media Bristol LLC Tranche B (3 month LIBOR + 3.250%)
0.000%, 1/31/29(10) | 70 | | 69 |
| | | | 383 |
| | | | |
| |
Media / Telecom - Diversified
Media—0.0% | | |
| UPC Broadband Holding B.V. | | | |
Tranche B-1 (3 month LIBOR + 3.500%)
0.000%, 1/31/29(10) | 170 | | 164 |
Tranche B-2 (3 month LIBOR + 3.500%)
0.000%, 1/31/29(10) | 170 | | 165 |
| | | | 329 |
| | | | |
| |
Media / Telecom -
Telecommunications—0.1% | | |
CenturyLink, Inc. Tranche B (1 month LIBOR + 2.250%)
2.397%, 3/15/27 | 154 | | 147 |
| Consolidated Communications, Inc. | | | |
(3 month LIBOR + 4.750%)
0.000%, 10/2/27(10) | 145 | | 143 |
| | Par Value | | Value |
| | | | |
Media / Telecom -
Telecommunications—continued | | |
2016 (1 month LIBOR + 3.000%)
4.000%, 10/5/23 | $ 198 | | $ 196 |
Zayo Group Holdings, Inc. (1 month LIBOR + 3.000%)
3.147%, 3/9/27 | 348 | | 338 |
| | | | 824 |
| | | | |
| |
Media / Telecom - Wireless
Communications—0.1% | | |
CommScope, Inc. (1 month LIBOR + 3.250%)
3.397%, 4/4/26 | 40 | | 38 |
SBA Senior Finance II LLC Tranche B (1 month LIBOR + 1.750%)
1.900%, 4/11/25 | 205 | | 200 |
T-Mobile USA, Inc. (1 month LIBOR + 3.000%)
3.147%, 4/1/27 | 294 | | 294 |
| | | | 532 |
| | | | |
| |
| Service—0.2% | | |
Asplundh Tree Expert LLC (3 month LIBOR + 2.500%)
2.655%, 9/4/27 | 95 | | 95 |
Dun & Bradstreet Corp. (The) Tranche B (1 month LIBOR + 3.750%)
3.895%, 2/6/26 | 413 | | 408 |
Sedgwick Claims Management Services, Inc. (1 month LIBOR + 3.250%)
3.397%, 12/31/25 | 418 | | 402 |
See Notes to Financial Statements
Tactical Allocation Fund
SCHEDULE OF INVESTMENTS (Continued)
September 30, 2020
($ reported in thousands)
| | Par Value | | Value |
| | | | |
| Service—continued | | |
TKC Holdings, Inc. First Lien (3 month LIBOR + 3.750%)
4.750%, 2/1/23 | $ 288 | | $ 270 |
| | | | 1,175 |
| | | | |
| |
| Transportation - Automotive—0.1% | | |
Cooper-Standard Automotive, Inc. Tranche B-1 (1 month LIBOR + 2.000%)
2.750%, 11/2/23 | 301 | | 256 |
Navistar, Inc. Tranche B (1 month LIBOR + 3.500%)
3.660%, 11/6/24 | 227 | | 225 |
| | | | 481 |
| | | | |
| |
| Utility—0.2% | | |
APLP Holdings LP 2020, Tranche B (3 month LIBOR + 2.500%)
3.500%, 4/14/25 | 223 | | 223 |
Brookfield WEC Holdings, Inc. (1 month LIBOR + 3.000%)
3.750%, 8/1/25 | 427 | | 415 |
Calpine Corp. 2019 (1 month LIBOR + 2.250%)
2.400%, 4/5/26 | 449 | | 437 |
| | | | 1,075 |
| | | | |
| |
Total Leveraged Loans
(Identified Cost $12,949) | | 12,659 |
| | Shares | |
| Preferred Stocks—0.5% |
| Financials—0.4% | |
| Discover Financial Services Series D, 6.125%(8) | 175 (11) | 185 |
| | Shares | | Value |
| Financials—continued | | |
| Fifth Third Bancorp Series L, 4.500%(8) | 452 (11) | | $ 455 |
| JPMorgan Chase & Co. Series HH, 4.600% | 199 (11) | | 195 |
| KeyCorp Series D, 5.000%(9) | 375 (11) | | 378 |
| MetLife, Inc. Series D, 5.875% | 277 (11) | | 301 |
| PNC Financial Services Group, Inc. (The) Series S, 5.000% | 715 (11) | | 755 |
| Truist Financial Corp. Series Q, 5.100%(8) | 515 (11) | | 557 |
| Zions Bancorp NA, 6.950% | 6,400 | | 176 |
| | | | 3,002 |
| | | | |
| |
| Industrials—0.1% | | |
| General Electric Co. Series D, 5.000% | 645 (11) | | 514 |
Total Preferred Stocks
(Identified Cost $3,443) | | 3,516 |
| | | | |
| |
| Common Stocks—69.0% |
| Communication Services—11.3% | | |
| Activision Blizzard, Inc. | 64,190 | | 5,196 |
| Adevinta ASA(12) | 153,825 | | 2,644 |
| Ascential plc(12) | 667,874 | | 2,537 |
| Auto Trader Group plc | 477,287 | | 3,467 |
| Clear Channel Outdoor Holdings, Inc.(12) | 1,381 | | 2 |
| CTS Eventim AG & Co. KGaA(12) | 62,130 | | 3,007 |
| Facebook, Inc. Class A(12) | 85,450 | | 22,379 |
| Karnov Group AB | 369,404 | | 2,227 |
| MarkLines Co., Ltd. | 78,700 | | 1,781 |
| Netflix, Inc.(12) | 32,700 | | 16,351 |
| New Work SE | 5,452 | | 1,665 |
| Rightmove plc | 521,548 | | 4,218 |
| Tencent Holdings Ltd. ADR | 182,240 | | 12,329 |
See Notes to Financial Statements
Tactical Allocation Fund
SCHEDULE OF INVESTMENTS (Continued)
September 30, 2020
($ reported in thousands)
| | Shares | | Value |
| | | | |
Communication
Services—continued | | |
| Tongdao Liepin Group(12) | 655,000 | | $ 1,639 |
| Yandex N.V. Class A(12) | 36,147 | | 2,359 |
| | | | 81,801 |
| | | | |
| |
| Consumer Discretionary—15.4% | | |
| Alibaba Group Holding Ltd. Sponsored ADR(12) | 82,820 | | 24,347 |
| Amazon.com, Inc.(12) | 11,860 | | 37,344 |
| Home Depot, Inc. (The) | 20,250 | | 5,624 |
| Las Vegas Sands Corp. | 103,140 | | 4,812 |
| McDonald’s Corp. | 20,610 | | 4,524 |
| MercadoLibre, Inc.(12) | 7,710 | | 8,346 |
| Mercari, Inc.(12) | 55,700 | | 2,574 |
| NIKE, Inc. Class B | 87,390 | | 10,971 |
| Ross Stores, Inc. | 56,570 | | 5,279 |
| Trip.com Group Ltd. ADR(12) | 82,850 | | 2,580 |
| Union Auction PCL | 6,446,000 | | 2,846 |
| Vasta Platform Ltd.(12) | 102,828 | | 1,587 |
| | | | 110,834 |
| | | | |
| |
| Consumer Staples—2.6% | | |
| Estee Lauder Cos., Inc. (The) Class A | 9,270 | | 2,023 |
| Heineken Malaysia Bhd(12) | 39,800 | | 198 |
| McCormick & Co., Inc. | 22,500 | | 4,367 |
| Monster Beverage Corp.(12) | 70,350 | | 5,642 |
| Procter & Gamble Co. (The) | 46,920 | | 6,522 |
| | | | 18,752 |
| | | | |
| |
| Energy—0.2% | | |
| Frontera Energy Corp. | 1,798 | | 3 |
| Pason Systems, Inc. | 434,381 | | 1,726 |
| | | | 1,729 |
| | | | |
| |
| Financials—4.2% | | |
| Bank of America Corp. | 278,360 | | 6,706 |
| CME Group, Inc. | 20,140 | | 3,370 |
| | Shares | | Value |
| | | | |
| Financials—continued | | |
| Gruppo Mutuionline SpA | 139,280 | | $ 3,870 |
| MarketAxess Holdings, Inc. | 15,720 | | 7,571 |
| Mortgage Advice Bureau Holdings Ltd.(12) | 236,217 | | 2,149 |
| Progressive Corp. (The) | 29,350 | | 2,778 |
| Sabre Insurance Group plc | 486,752 | | 1,598 |
| VNV Global AB(12) | 324,205 | | 2,599 |
| | | | 30,641 |
| | | | |
| |
| Health Care—3.9% | | |
| Danaher Corp. | 38,430 | | 8,275 |
| Haw Par Corp., Ltd. | 315,200 | | 2,154 |
| HealthEquity, Inc.(12) | 43,410 | | 2,230 |
| Illumina, Inc.(12) | 9,400 | | 2,905 |
| Nakanishi, Inc. | 63,000 | | 1,126 |
| Zoetis, Inc. | 69,270 | | 11,455 |
| | | | 28,145 |
| | | | |
| |
| Industrials—9.3% | | |
| BTS Group AB Class B(12) | 87,329 | | 1,960 |
| CAE, Inc. | 139,551 | | 2,041 |
| CoStar Group, Inc.(12) | 10,940 | | 9,283 |
| CTT Systems AB(12) | 76,230 | | 1,049 |
| DSV PANALPINA A/S | 8,034 | | 1,313 |
| Enento Group Oyj | 78,378 | | 3,124 |
| Equifax, Inc. | 20,300 | | 3,185 |
| Fair Isaac Corp.(12) | 11,610 | | 4,939 |
| Haitian International Holdings Ltd. | 585,000 | | 1,362 |
| HeadHunter Group plc ADR | 262,629 | | 6,429 |
| Kansas City Southern | 32,980 | | 5,964 |
| Knorr-Bremse AG | 8,582 | | 1,013 |
| Marel HF | 421,474 | | 2,051 |
| Max Stock Ltd.(12) | 404,186 | | 1,410 |
| MTU Aero Engines AG | 6,617 | | 1,102 |
| Roper Technologies, Inc. | 17,880 | | 7,064 |
| Rotork plc | 335,895 | | 1,223 |
| S-1 Corp. | 15,002 | | 1,125 |
| Simplybiz Group plc (The) | 1,357,260 | | 2,745 |
See Notes to Financial Statements
Tactical Allocation Fund
SCHEDULE OF INVESTMENTS (Continued)
September 30, 2020
($ reported in thousands)
| | Shares | | Value |
| | | | |
| Industrials—continued | | |
| Uber Technologies, Inc.(12) | 138,230 | | $ 5,042 |
| Voltronic Power Technology Corp. | 98,894 | | 3,359 |
| | | | 66,783 |
| | | | |
| |
| Information Technology—20.9% | | |
| Accenture plc Class A | 25,840 | | 5,840 |
| Admicom Oyj | 11,871 | | 1,077 |
| Alten SA(12) | 39,915 | | 3,791 |
| Amphenol Corp. Class A | 79,740 | | 8,633 |
| Avalara, Inc.(12) | 91,670 | | 11,673 |
| Bill.com Holdings, Inc.(12) | 185,794 | | 18,637 |
| Bouvet ASA | 40,402 | | 2,608 |
| Brockhaus Capital Management AG(12) | 40,915 | | 1,439 |
| Duck Creek Technologies, Inc.(12)(13) | 208,727 | | 9,482 |
| FDM Group Holdings plc | 135,161 | | 1,775 |
| Fortnox AB | 32,097 | | 968 |
| Freee KK(12) | 18,200 | | 1,380 |
| NVIDIA Corp. | 41,670 | | 22,553 |
| Paycom Software, Inc.(12) | 44,340 | | 13,803 |
| SimCorp A/S | 16,172 | | 2,128 |
| Snowflake, Inc. Class A(12) | 2,124 | | 533 |
| Trade Desk, Inc. (The) Class A(12) | 29,090 | | 15,091 |
| Visa, Inc. Class A | 80,690 | | 16,136 |
| Webcash Corp. | 53,113 | | 3,157 |
| Webstep AS(12) | 282,917 | | 649 |
| Workday, Inc. Class A(12) | 45,740 | | 9,840 |
| | | | 151,193 |
| | | | |
| |
| Materials—1.2% | | |
| Corp. Moctezuma SAB de C.V. | 482,093 | | 1,156 |
| | Shares | | Value |
| | | | |
| Materials—continued | | |
| Ecolab, Inc. | 35,770 | | $ 7,148 |
| | | | 8,304 |
| | | | |
| |
Total Common Stocks
(Identified Cost $250,312) | | 498,182 |
| | | | |
| |
| Warrant—0.0% |
| Financials—0.0% | | |
| VNV Global AB(12) | 88,478 | | 77 |
Total Warrant
(Identified Cost $—) | | 77 |
| | | | |
| |
Total Long-Term Investments—98.6%
(Identified Cost $453,587) | | 711,592 |
| | | | |
| |
| Short-Term Investment—1.1% |
| Money Market Mutual Fund—1.1% |
| Dreyfus Government Cash Management Fund - Institutional Shares (seven-day effective yield 0.025%)(14) | 8,346,808 | | 8,347 |
Total Short-Term Investment
(Identified Cost $8,347) | | 8,347 |
| | | | |
| |
TOTAL INVESTMENTS—99.7%
(Identified Cost $461,934) | | $719,939 |
| Other assets and liabilities, net—0.3% | | 1,827 |
| NET ASSETS—100.0% | | $721,766 |
See Notes to Financial Statements
Tactical Allocation Fund
SCHEDULE OF INVESTMENTS (Continued)
September 30, 2020
($ reported in thousands)
| Abbreviations: |
| ABS | Asset-Backed Securities |
| ADR | American Depositary Receipt |
| BAM | Build America Municipal Insured |
| CNTY GTD | County Guarantee Program |
| GS | Goldman Sachs & Co. |
| LIBOR | London Interbank Offered Rate |
| LLC | Limited Liability Company |
| LLLP | Limited Liability Limited Partnership |
| LP | Limited Partnership |
| MASTR | Morgan Stanley Structured Asset Security |
| PSF-GTD | Permanent School Fund Guarantee Program |
| SCH BD GTY | School Bond Guaranty |
| WaMu | Washington Mutual |
| Footnote Legend: |
| (1) | Security exempt from registration under Rule 144A of the Securities Act of 1933. These securities may be resold in transactions exempt from registration, normally to qualified institutional buyers. At September 30, 2020, these securities amounted to a value of $97,371 or 13.5% of net assets. |
| (2) | Security in default; no interest payments are being received during the bankruptcy proceedings. |
| (3) | Regulation S security. Security is offered and sold outside of the United States, therefore, it is exempt from registration with the SEC under Rules 903 and 904 of the Securities Act of 1933. |
| (4) | Variable rate security. Rate disclosed is as of September 30, 2020. For leveraged loans, the rate shown may represent a weighted average interest rate. Information in parenthesis represents benchmark and reference rate for each security. Certain variable rate securities are not based on a published reference rate and spread but are determined by the issuer or agent and are based on current market conditions, or, for mortgage-backed securities, are impacted by the individual mortgages which are paying off over time. These securities do not indicate a reference rate and spread in their descriptions. |
| (5) | The value of this security was determined using significant unobservable inputs and is reported as a Level 3 security in the Fair Value Hierarchy table located after the Schedule of Investments. |
| (6) | No contractual maturity date. |
| (7) | Amount is less than $500. |
| (8) | Interest payments may be deferred. |
| (9) | Interest may be forfeited. |
| (10) | This loan will settle after September 30, 2020, at which time the interest rate, based on the LIBOR and the agreed upon spread on trade date, will be reflected. |
| (11) | Value shown as par value. |
| (12) | Non-income producing. |
| (13) | All or a portion of the security is restricted. |
| (14) | Shares of this fund are publicly offered, and its prospectus and annual report are publicly available. |
| Country Weightings (Unaudited)† |
| United States | 77% |
| China | 6 |
| United Kingdom | 3 |
| Brazil | 1 |
| Sweden | 1 |
| Russia | 1 |
| Canada | 1 |
| Other | 10 |
| Total | 100% |
| † % of total investments as of September 30, 2020. |
For information regarding the abbreviations, see the Key Investment Terms starting on page 4.
See Notes to Financial Statements
Tactical Allocation Fund
SCHEDULE OF INVESTMENTS (Continued)
September 30, 2020
($ reported in thousands)
The following table summarizes the market value of the Fund’s investments as of September 30, 2020, based on the inputs used to value them (See Security Valuation Note 2A in the Notes to Financial Statements):
| | Total
Value at
September 30, 2020 | | Level 1
Quoted Prices | | Level 2
Significant
Observable
Inputs | | Level 3
Significant
Unobservable
Inputs |
| Assets: | | | | | | | |
| Debt Securities: | | | | | | | |
| Asset-Backed Securities | $ 21,314 | | $ — | | $ 21,314 | | $— |
| Corporate Bonds and Notes | 86,744 | | — | | 86,744 | | — (1) |
| Foreign Government Securities | 2,100 | | — | | 2,100 | | — |
| Leveraged Loans | 12,659 | | — | | 12,659 | | — |
| Mortgage-Backed Securities | 54,347 | | — | | 54,347 | | — |
| Municipal Bonds | 7,700 | | — | | 7,700 | | — |
| U.S. Government Securities | 24,953 | | — | | 24,953 | | — |
| Equity Securities: | | | | | | | |
| Common Stocks | 498,182 | | 478,327 | | 19,855 | | — |
| Preferred Stocks | 3,516 | | 176 | | 3,340 | | — |
| Warrant | 77 | | 77 | | — | | — |
| Money Market Mutual Fund | 8,347 | | 8,347 | | — | | — |
| Total Investments | $719,939 | | $486,927 | | $233,012 | | $— (1) |
| (1) | Amount is less than $500. |
Securities held by the Fund with an end of period value of $18,637 were transferred from Level 3 to Level 1 due to a market listing. Securities held by the Fund with an end of period value of $1,279 were transferred from Level 3 to Level 2 due to an increase in trading activities at period end.
Securities held by the Fund with an end of period value of $—(1) were transferred from Level 2 to Level 3 due to a decrease in trading activities at period end.
Some of the Fund’s investments that were categorized as Level 3 were valued utilizing third party pricing information without adjustment. Such valuations are based on unobservable inputs. A significant change in third party information could result in a significantly lower or higher value of Level 3 investments.
See Notes to Financial Statements
Tactical Allocation Fund
SCHEDULE OF INVESTMENTS (Continued)
September 30, 2020
($ reported in thousands)
The following is a reconciliation of assets of the Fund for Level 3 investments for which significant unobservable inputs were used to determine fair value.
| | Total | | Corporate
Bonds
and Notes | | Mortgage-Backed
Securities | | Convertible
Preferred
Stock | | Warrant |
| Investments in Securities | | | | | | | | | |
| Balance as of September 30, 2019: | $ 5,212 | | $— (a) | | $ 1,342 | | $ 3,862 | | $ 8 |
| Accrued discount/(premium) | — (a) | | — | | — (a) | | — | | — |
| Realized gain (loss) | 99 | | — (a) | | — | | 99 | | (—) (a) |
| Change in unrealized appreciation (depreciation)(b) | 14,806 | | — | | 7 | | 14,797 | | 2 |
| Sales (c) | (201) | | — (a) | | (70) | | (121) | | (10) |
| Transfers into Level 3(d) | — (a) | | — (a) | | — | | — | | — |
| Transfers from Level 3(d) | (19,916) | | — | | (1,279) | | (18,637) | | — |
| Balance as of September 30, 2020 | $ —(a) | | $— (a) | | $ — | | $ — | | $ — |
(a) Amount is less than $500.
(b) The change in unrealized appreciation (depreciation) on investments still held at September 30, 2020, was $14,804.
(c) Includes paydowns on securities.
(d) “Transfers into and/or from” represent the ending value as of September 30, 2020, for any investment security where a change in the pricing level occurred from the beginning to the end of the period.
See Notes to Financial Statements
TACTICAL ALLOCATION FUND
STATEMENT OF ASSETS AND LIABILITIES September 30, 2020
(Reported in thousands except shares and per share amounts)
| Assets | |
Investment in securities at value(1)
| $ 719,939 |
Foreign currency at value(2)
| 13 |
Cash
| 3,896 |
| Receivables | |
Investment securities sold
| 1,037 |
Fund shares sold
| 616 |
Dividends and interest
| 1,458 |
Tax reclaims
| 35 |
Prepaid Trustees’ retainer
| 14 |
Prepaid expenses
| 22 |
Other assets
| 77 |
Total assets
| 727,107 |
| Liabilities | |
| Payables | |
Fund shares repurchased
| 191 |
Investment securities purchased
| 4,365 |
Investment advisory fees
| 320 |
Distribution and service fees
| 148 |
Administration and accounting fees
| 61 |
Transfer agent and sub-transfer agent fees and expenses
| 78 |
Professional fees
| 34 |
Trustee deferred compensation plan
| 77 |
Interest expense and/or commitment fees
| 1 |
Other accrued expenses
| 66 |
Total liabilities
| 5,341 |
Net Assets
| $ 721,766 |
| Net Assets Consist of: | |
Capital paid in on shares of beneficial interest
| $ 451,481 |
Accumulated earnings (loss)
| 270,285 |
Net Assets
| $ 721,766 |
| Net Assets: | |
Class A
| $ 683,100 |
Class C
| $ 12,140 |
Class I
| $ 26,526 |
| Shares Outstanding (unlimited number of shares authorized, no par value): | |
Class A
| 56,448,545 |
Class C
| 975,630 |
Class I
| 2,198,433 |
See Notes to Financial Statements
TACTICAL ALLOCATION FUND
STATEMENT OF ASSETS AND LIABILITIES (Continued)
September 30, 2020
(Reported in thousands except shares and per share amounts)
| Net Asset Value and Redemption Price Per Share: | |
Class A
| $ 12.10 |
Class C
| $ 12.44 |
Class I
| $ 12.07 |
| Maximum Offering Price per Share (NAV/(1-5.75%*)): | |
Class A
| $ 12.84 |
| * Maximum sales charge | |
(1) Investment in securities at cost
| $ 461,934 |
(2) Foreign currency at cost
| $ 14 |
| | |
See Notes to Financial Statements
TACTICAL ALLOCATION FUND
STATEMENT OF OPERATIONS YEAR ENDED September 30, 2020
($ reported in thousands)
| Investment Income | |
Dividends
| $ 3,101 |
Interest
| 7,938 |
Security lending, net of fees
| 27 |
Foreign taxes withheld
| (125) |
Total investment income
| 10,941 |
| Expenses | |
Investment advisory fees
| 3,454 |
Distribution and service fees, Class A
| 1,524 |
Distribution and service fees, Class C
| 96 |
Administration and accounting fees
| 663 |
Transfer agent fees and expenses
| 334 |
Sub-transfer agent fees and expenses, Class A
| 174 |
Sub-transfer agent fees and expenses, Class I
| 2 |
Custodian fees
| 5 |
Printing fees and expenses
| 34 |
Professional fees
| 57 |
Interest expense and/or commitment fees
| 4 |
Registration fees
| 57 |
Trustees’ fees and expenses
| 52 |
Miscellaneous expenses
| 269 |
Total expenses
| 6,725 |
Plus net expenses recaptured(1)
| 5 |
Less low balance account fees
| (11) |
Net expenses
| 6,719 |
Net investment income (loss)
| 4,222 |
| Net Realized and Unrealized Gain (Loss) on Investments | |
| Net realized gain (loss) from: | |
Investments
| 13,465 |
Foreign currency transactions
| (64) |
| Net change in unrealized appreciation (depreciation) on: | |
Investments
| 148,434 |
Foreign currency transactions
| — (2) |
Net realized and unrealized gain (loss) on investments
| 161,835 |
Net increase (decrease) in net assets resulting from operations
| $166,057 |
| | |
| (1) | See Note 3D in Notes to Financial Statements. |
| (2) | Amount is less than $500. |
See Notes to Financial Statements
TACTICAL ALLOCATION FUND
STATEMENTS OF CHANGES IN NET ASSETS
| | Year Ended
September 30,
2020 | | Year Ended
September 30,
2019 |
| Increase (Decrease) in Net Assets Resulting from Operations | | | |
Net investment income (loss)
| $ 4,222 | | $ 5,876 |
Net realized gain (loss)
| 13,401 | | 9,800 |
Net increase from payment by affiliate
| — | | 12 |
Net change in unrealized appreciation (depreciation)
| 148,434 | | 27,097 |
Increase (decrease) in net assets resulting from operations
| 166,057 | | 42,785 |
| Dividends and Distributions to Shareholders | | | |
| Net Investment Income and Net Realized Gains: | | | |
Class A
| (11,431) | | (8,659) |
Class C
| (118) | | (106) |
Class I
| (110) | | (23) |
Total Dividends and Distributions to Shareholders
| (11,659) | | (8,788) |
| Change in Net Assets from Capital Transactions | | | |
| Shares sold and cross class conversions: | | | |
Class A (2,820 and 618 shares, respectively)
| 30,276 | | 5,756 |
Class C (293 and 178 shares, respectively)
| 3,215 | | 1,738 |
Class I (2,470 and 315 shares, respectively)
| 27,408 | | 2,979 |
| Net assets from merger(1): | | | |
Class A (— and 48,375 shares, respectively)
| — | | 423,501 |
Class C (— and 636 shares, respectively)
| — | | 5,724 |
| Reinvestment of distributions: | | | |
Class A (1,062 and 891 shares, respectively)
| 10,675 | | 7,982 |
Class C (11 and 12 shares, respectively)
| 114 | | 101 |
Class I (10 and 2 shares, respectively)
| 110 | | 22 |
| Shares repurchased and cross class conversions: | | | |
Class A ((7,341) and (5,183) shares, respectively)
| (76,872) | | (48,127) |
Class C ((203) and (327) shares, respectively)
| (2,171) | | (3,141) |
Class I ((578) and (21) shares, respectively)
| (6,303) | | (206) |
Increase (decrease) in net assets from capital transactions
| (13,548) | | 396,329 |
Net increase (decrease) in net assets
| 140,850 | | 430,326 |
| Net Assets | | | |
Beginning of period
| 580,916 | | 150,590 |
End of Period
| $ 721,766 | | $ 580,916 |
| (1) | See Note 10 in Notes to Financial Statements. |
See Notes to Financial Statements
THIS PAGE INTENTIONALLY BLANK.
TACTICAL ALLOCATION FUND
FINANCIAL HIGHLIGHTS
SELECTED PER SHARE DATA AND RATIOS FOR A SHARE OUTSTANDING
THROUGHOUT EACH PERIOD
| | Net Asset Value,
Beginning of Period | Net Investment Income (Loss)(1) | Net Realized and
Unrealized Gain (Loss) | Total from Investment Operations | Dividends from
Net Investment Income | Distributions from
Net Realized Gains | Total Distributions |
| | | | | | | | |
| Class A | | | | | | | |
| 10/1/19 to 9/30/20 | $9.51 | 0.07 | 2.71 | 2.78 | (0.07) | (0.12) | (0.19) |
| 10/1/18 to 9/30/19 | 9.66 | 0.13 | 0.06 | 0.19 | (0.12) | (0.22) | (0.34) |
| 10/1/17 to 9/30/18 | 9.00 | 0.14 | 0.73 | 0.87 | (0.14) | (0.07) | (0.21) |
| 4/1/17 to 9/30/17(9) | 8.33 | 0.08 | 0.69 | 0.77 | (0.08) | (0.02) | (0.10) |
| 4/1/16 to 3/31/17 | 8.44 | 0.17 | 0.56 | 0.73 | (0.15) | (0.69) | (0.84) |
| 4/1/15 to 3/31/16 | 9.75 | 0.20 | (0.88) | (0.68) | (0.17) | (0.46) | (0.63) |
| Class C | | | | | | | |
| 10/1/19 to 9/30/20 | $9.78 | (0.01) | 2.80 | 2.79 | (0.01) | (0.12) | (0.13) |
| 10/1/18 to 9/30/19 | 9.93 | 0.06 | 0.05 | 0.11 | (0.04) | (0.22) | (0.26) |
| 10/1/17 to 9/30/18 | 9.24 | 0.07 | 0.75 | 0.82 | (0.06) | (0.07) | (0.13) |
| 4/1/17 to 9/30/17(9) | 8.55 | 0.05 | 0.70 | 0.75 | (0.04) | (0.02) | (0.06) |
| 4/1/16 to 3/31/17 | 8.64 | 0.11 | 0.57 | 0.68 | (0.08) | (0.69) | (0.77) |
| 4/1/15 to 3/31/16 | 9.96 | 0.14 | (0.90) | (0.76) | (0.10) | (0.46) | (0.56) |
| Class I | | | | | | | |
| 10/1/19 to 9/30/20 | $9.51 | 0.08 | 2.70 | 2.78 | (0.10) | (0.12) | (0.22) |
| 1/29/19 (14) to 9/30/19 | 8.66 | 0.10 | 0.85 | 0.95 | (0.10) | — | (0.10) |
The footnote legend is at the end of the financial highlights.
See Notes to Financial Statements
TACTICAL ALLOCATION FUND
FINANCIAL HIGHLIGHTS (Continued)
SELECTED PER SHARE DATA AND RATIOS FOR A SHARE OUTSTANDING
THROUGHOUT EACH PERIOD
| Payment from Affiliates(1) | Change in Net Asset Value | Net Asset Value, End of Period | Total Return(2)(3) | Net Assets, End of Period
(in thousands) | Ratio of Net Expenses to
Average Net Assets(4)(5) | Ratio of Gross Expenses
to Average Net Assets(4)(5) | Ratio of Net Investment Income (Loss)
to Average Net Assets(4) | Portfolio Turnover Rate |
| | | | | | | | | |
| | | | | | | | | |
| — | 2.59 | $12.10 | 29.72 % | $683,100 | 1.06 % (6) | 1.06 % | 0.68 % | 35 % |
| — (7) | (0.15) | 9.51 | 2.36 (8) | 569,543 | 1.14 (6) | 1.14 | 1.33 | 51 |
| — | 0.66 | 9.66 | 9.73 | 146,854 | 1.26 | 1.27 | 1.47 | 41 |
| — | 0.67 | 9.00 | 9.25 | 142,481 | 1.38 | 1.38 | 1.81 | 26 |
| — | (0.11) | 8.33 | 9.20 (10) | 137,388 | 1.37 (10)(11) | 1.38 | 1.86 (10) | 104 |
| — | (1.31) | 8.44 | (7.36) | 147,546 | 1.32 | 1.33 | 2.25 | 81 |
| | | | | | | | | |
| — | 2.66 | $12.44 | 28.82 % | $ 12,140 | 1.83 % (6)(12) | 1.78 % | (0.10) % | 35 % |
| — (7) | (0.15) | 9.78 | 1.48 (8) | 8,560 | 1.91 (13) | 1.99 | 0.59 | 51 |
| — | 0.69 | 9.93 | 8.94 | 3,736 | 2.04 | 2.05 | 0.68 | 41 |
| — | 0.69 | 9.24 | 8.80 | 4,054 | 2.14 | 2.15 | 1.05 | 26 |
| — | (0.09) | 8.55 | 8.37 (10) | 4,378 | 2.11 (10)(11) | 2.13 | 1.13 (10) | 104 |
| — | (1.32) | 8.64 | (8.02) | 5,460 | 2.07 | 2.08 | 1.51 | 81 |
| | | | | | | | | |
| — | 2.56 | $12.07 | 29.74 % | $ 26,526 | 0.82 % (6) | 0.82 % | 0.73 % | 35 % |
| — (7) | 0.85 | 9.51 | 10.94 (8) | 2,813 | 0.88 (6) | 0.89 | 1.52 | 51 (15) |
The footnote legend is at the end of the financial highlights.
See Notes to Financial Statements
TACTICAL ALLOCATION FUND
FINANCIAL HIGHLIGHTS (Continued)
SELECTED PER SHARE DATA AND RATIOS FOR A SHARE OUTSTANDING
THROUGHOUT EACH PERIOD
| Footnote Legend: |
| (1) | Calculated using average shares outstanding. |
| (2) | Sales charges, where applicable, are not reflected in the total return calculation. |
| (3) | Not annualized for periods less than one year. |
| (4) | Annualized for periods less than one year. |
| (5) | The Fund will also indirectly bear its prorated share of expenses of any underlying funds in which it invests. Such expenses are not included in the calculation of this ratio. |
| (6) | The share class is currently under its expense limitation. |
| (7) | Amount is less than $0.005 per share. |
| (8) | Payment from affiliates had no impact on total return. |
| (9) | The Fund changed its fiscal year end to September 30, during the period. |
| (10) | State Street Bank & Trust, custodian for the Fund through January 29, 2010, reimbursed the Fund for out-of-pocket custody expenses overbilled for the period 1998 through January 29, 2010. Custody fees reimbursed were excluded from the Ratio of Net Expenses to Average Net Assets and Ratio of Net Investment Income (Loss) to Average Net Assets. If included, the impact would have been to lower the Ratio of Net Expenses to Average Net Assets and increase the Ratio of Net Investment Income (Loss) to Average Net Assets by 0.08%. Custody fees reimbursed were included in Total Return. If excluded, the impact would have been to lower the Total Return by 0.08%. |
| (11) | Net expense ratio includes extraordinary proxy expenses. |
| (12) | See Note 3D in Notes to Financial Statements for information on recapture of expenses previously waived. |
| (13) | Due to a change in expense cap, the ratio shown is a blended expense ratio. |
| (14) | Inception date. |
| (15) | Portfolio turnover is representative of the Fund for the entire year ended September 30, 2019. |
See Notes to Financial Statements
TACTICAL ALLOCATION FUND
NOTES TO FINANCIAL STATEMENTS September 30, 2020
Note 1. Organization
Virtus Equity Trust (the “Trust”) is organized as a Delaware statutory trust and is registered under the Investment Company Act of 1940, as amended (the “1940 Act”), as an open-end management investment company.
As of the date of this report, 12 funds of the Trust are offered for sale, of which the Tactical Allocation Fund (the “Fund”) is reported in this annual report. The Fund’s investment objectives are outlined in the Fund Summary page. There is no guarantee that the Fund will achieve its objectives.
The Fund offers Class A shares, Class C shares and Class I shares.
Class A shares are sold with a front-end sales charge of up to 5.75% with some exceptions. Generally, Class A shares are not subject to any charges by the Fund when redeemed; however, a 1% contingent deferred sales charge (“CDSC”) may be imposed on certain redemptions made within a certain period following purchases on which a finder’s fee has been paid. The period for which the CDSC applies for the Fund is 18 months. The CDSC period begins on the last day of the month preceding the month in which the purchase was made.
Class C shares are generally sold with a 1% CDSC, applicable if redeemed within one year of purchase. Effective January 1, 2019, with certain exceptions, Class C shares and any reinvested dividends and other distributions paid on such shares, will be automatically converted to Class A shares ten years after the purchase date. Class I shares are sold without a front-end sales charge or CDSC.
The Fund may impose an annual fee on accounts having balances of less than $2,500. The small account fee may be waived in certain circumstances, as disclosed in the prospectus and/or statement of additional information. The fees collected will be used to offset certain expenses of the Fund. These fees are reflected as “Less low balance account fees” in the Fund’s Statement of Operations for the period, as applicable.
Each class of shares has identical voting, dividend, liquidation and other rights and the same terms and conditions, except that each class bears any expenses attributable specifically to that class (“class-specific expenses”) and has exclusive voting rights with respect to any Rule 12b-1 and/or shareholder service plan (“12b-1 Plan”) approved by the Board. Class I shares are not subject to a 12b-1 Plan. Class-specific expenses may include shareholder servicing fees, sub-transfer agency fees, and fees under a 12b-1 Plan, as well as certain other expenses as designated by the Fund’s Treasurer and approved by the Board. Investment income, common operating expenses and realized and unrealized gains and losses of the Fund are borne pro-rata by the holders of each class of shares.
Note 2. Significant Accounting Policies
The Trust is an investment company that follows the accounting and reporting guidance of Accounting Standards Codification Topic 946 applicable to Investment Companies. The following is a summary of significant accounting policies consistently followed by the Fund in the preparation of its financial statements. The preparation of financial statements in conformity with U.S. generally accepted accounting principles (“U.S. GAAP”) requires management to make estimates and assumptions that affect the reported amounts of assets and liabilities, disclosure of contingent assets and liabilities at the date of the financial statements and the reported amounts of increases and decreases in net assets from
TACTICAL ALLOCATION FUND
NOTES TO FINANCIAL STATEMENTS (Continued)
September 30, 2020
operations during the reporting period. Actual results could differ from those estimates and those differences could be significant.
| A. | Security Valuation |
| | The Fund utilizes a fair value hierarchy which prioritizes the inputs to valuation techniques used to measure fair value into three broad levels. The Fund’s policy is to recognize transfers into or out of Level 3 at the end of the reporting period. |
• Level 1 – quoted prices in active markets for identical securities (security types generally include listed equities).
• Level 2 – prices determined using other significant observable inputs (including quoted prices for similar securities, interest rates, prepayment speeds, credit risk, etc.).
• Level 3 – prices determined using significant unobservable inputs (including the Valuation Committee’s own assumptions in determining the fair value of investments).
A description of the valuation techniques applied to the Fund’s major categories of assets and liabilities measured at fair value on a recurring basis is as follows:
Equity securities are valued at the official closing price (typically last sale) on the exchange on which the securities are primarily traded or, if no closing price is available, at the last bid price and are categorized as Level 1 in the hierarchy. Restricted equity securities and private placements that are illiquid, or are internally fair valued by the Valuation Committee, are generally categorized as Level 3 in the hierarchy.
Certain non-U.S. securities may be fair valued in cases where closing prices are not readily available or are deemed not reflective of readily available market prices. For example, significant events (such as movement in the U.S. securities market, or other regional and local developments) may occur between the time that non-U.S. markets close (where the security is principally traded) and the time that the Fund calculates its net asset value (“NAV”) at the close of regular trading on the New York Stock Exchange (“NYSE”) (generally 4 p.m. Eastern time) that may impact the value of securities traded in these non-U.S. markets. In such cases, the Fund fair values non-U.S. securities using an independent pricing service which considers the correlation of the trading patterns of the non-U.S. security to the intraday trading in the U.S. markets for investments such as ADRs, financial futures, ETFs, and certain indexes, as well as prices for similar securities. Such fair valuations are categorized as Level 2 in the hierarchy. Because the frequency of significant events is not predictable, fair valuation of certain non-U.S. common stocks may occur on a frequent basis.
Debt securities, including restricted securities, are valued based on evaluated quotations received from independent pricing services or from dealers who make markets in such securities. For most bond types, the pricing service utilizes matrix pricing that considers one or more of the following factors: yield or price of bonds of comparable quality, coupon, maturity, current cash flows, type, and current day trade information, as well as dealer supplied prices. These valuations are generally categorized as Level 2 in the hierarchy. Structured debt instruments, such as mortgage-backed and asset-backed securities may also incorporate collateral analysis and utilize cash flow models for valuation and are generally categorized as Level 2 in the hierarchy. Pricing services do
TACTICAL ALLOCATION FUND
NOTES TO FINANCIAL STATEMENTS (Continued)
September 30, 2020
not provide pricing for all securities and therefore indicative bids from dealers are utilized which are based on pricing models used by market makers in the security and are generally categorized as Level 2 in the hierarchy. Debt securities that are internally fair valued by the Valuation Committee are generally categorized as Level 3 in the hierarchy.
Listed derivatives, such as options, that are actively traded are valued based on quoted prices from the exchange and are categorized as Level 1 in the hierarchy. Over-the-counter derivative contracts, which include forward currency contracts and equity-linked instruments, do not require material subjectivity as pricing inputs are observed from actively quoted markets and are categorized as Level 2 in the hierarchy.
Investments in open-end mutual funds are valued at NAV. Investments in closed-end funds and ETFs are valued as of the close of regular trading on the NYSE each business day. Each is categorized as Level 1 in the hierarchy.
A summary of the inputs used to value the Fund’s net assets by each major security type is disclosed at the end of the Schedule of Investments for the Fund. The inputs or methodologies used for valuing securities are not necessarily an indication of the risk associated with investing in those securities.
| B. | Security Transactions and Investment Income |
| | Security transactions are recorded on the trade date. Realized gains and losses from the sale of securities are determined on the identified cost basis. Dividend income is recognized on the ex-dividend date or, in the case of certain foreign securities, as soon as the Fund is notified. Interest income is recorded on the accrual basis. The Fund amortizes premiums and accretes discounts using the effective interest method. Premiums on callable debt securities are amortized to interest income to the earliest call date using the effective interest method. Any distributions from underlying funds are recorded in accordance with the character of the distributions as designated by the underlying funds. |
| | Dividend income from REITs is recorded using management’s estimate of the percentage of income included in distributions received from such investments based on historical information and other industry sources. The return of capital portion of the estimate is a reduction to investment income and a reduction in the cost basis of each investment which increases net realized gain (loss) and net change in unrealized appreciation (depreciation). If the return of capital distributions exceed their cost basis, the distributions are treated as realized gains. The actual amounts of income, return of capital, and capital gains are only determined by each REIT after its fiscal year-end, and may differ from the estimated amounts. |
| C. | Income Taxes |
| | The Fund is treated as a separate taxable entity. It is the Fund’s intention to comply with the requirements of Subchapter M of the Internal Revenue Code and to distribute substantially all of its taxable income to its shareholders. Therefore, no provision for federal income taxes or excise taxes has been made. |
| | The Fund may be subject to foreign taxes on income, gains on investments or currency repatriation, a portion of which may be recoverable. The Fund will accrue such taxes and recoveries as applicable based upon current interpretations of the tax rules and regulations that exist in the markets in which it invests. |
TACTICAL ALLOCATION FUND
NOTES TO FINANCIAL STATEMENTS (Continued)
September 30, 2020
| | Management of the Fund has concluded that there are no significant uncertain tax positions that would require recognition in the financial statements. As of September 30, 2020, the tax years that remain subject to examination by the major tax jurisdictions under the statute of limitations are from the year 2017 forward (with limited exceptions). |
| D. | Distributions to Shareholders |
| | Distributions are recorded by the Fund on the ex-dividend date. Income and capital gain distributions are determined in accordance with income tax regulations that may differ from U.S. GAAP. |
| E. | Expenses |
| | Expenses incurred together by the Fund and other affiliated mutual funds are allocated in proportion to the net assets of each such fund, except where allocation of direct expense to each fund or an alternative allocation method can be more appropriately used. |
| | In addition to the net annual operating expenses that the Fund bears directly, the shareholders of the Fund indirectly bear the pro-rata expenses of any underlying mutual funds in which the Fund invests. |
| F. | Foreign Currency Transactions |
| | Non-U.S. investment securities and other assets and liabilities denominated in foreign currencies are translated into U.S. dollar amounts at the foreign currency exchange rate effective at the end of the reporting period. Cost of investments is translated at the currency exchange rate effective at the trade date. The gain or loss resulting from a change in currency exchange rates between the trade and settlement date of a portfolio transaction is treated as a gain or loss on foreign currency. Likewise, the gain or loss resulting from a change in currency exchange rates between the date income is accrued and the date it is paid is treated as a gain or loss on foreign currency. The Fund does not isolate that portion of the results of operations arising from changes in foreign exchange rates on investments from the fluctuations arising from changes in the market prices of securities held. Such fluctuations are included with the net realized and unrealized gain or loss on investments. |
| G. | When-Issued Purchases and Forward Commitments (Delayed Delivery) |
| | The Fund may engage in when-issued or forward commitment transactions. Securities purchased on a when-issued or forward commitment basis are also known as delayed delivery transactions. Delayed delivery transactions involve a commitment by the Fund to purchase or sell a security at a future date (ordinarily up to 90 days later). When-issued or forward commitments enable the Fund to lock in what is believed to be an attractive price or yield on a particular security for a period of time, regardless of future changes in interest rates. The Fund records when-issued and forward commitment securities on the trade date. The Fund maintains collateral for the securities purchased. Securities purchased on a when-issued or forward commitment basis begin earning interest on the settlement date. |
| H. | Leveraged Loans |
| | The Fund may invest in direct debt instruments which are interests in amounts owed by a corporate, governmental, or other borrower to lenders or lending syndicates. Leveraged loans are generally non-investment grade and often involve borrowers that are highly leveraged. The Fund may invest in obligations of borrowers who are in |
TACTICAL ALLOCATION FUND
NOTES TO FINANCIAL STATEMENTS (Continued)
September 30, 2020
| | bankruptcy proceedings. Leveraged loans are typically senior in the corporate capital structure of the borrower. A loan is often administered by a bank or other financial institution (the “lender”) that acts as agent for all holders. The agent administers the terms of the loan, as specified in the leveraged loan. The Fund’s investments in loans may be in the form of participations in loans or assignments of all or a portion of loans from third parties. When investing in loan participations, the Fund has the right to receive payments of principal, interest and any fees to which it is entitled only from the lender selling the loan participation and only upon receipt by the lender of payments from the borrower. The Fund generally has no right to enforce compliance with the terms of the leveraged loan with the borrower. As a result, the Fund may be subject to the credit risk of both the borrower and the lender that is selling the leveraged loan. When the Fund purchases assignments from lenders it acquires direct rights against the borrower on the loan. |
| | The Fund may invest in multiple series or tranches of a loan, which may have varying terms and carry different associated risks. Leveraged loans may involve foreign borrowers and investments may be denominated in foreign currencies. Direct indebtedness of emerging countries involves a risk that the government entities responsible for the repayment of the debt may be unable, or unwilling, to pay the principal and interest when due. |
| | The leveraged loans have floating rate loan interests which generally pay interest at rates that are periodically determined by reference to a base lending rate plus a premium. The base lending rates are generally LIBOR, the prime rate offered by one or more U.S. banks or the certificate of deposit rate. When a leveraged loan is purchased the Fund may pay an assignment fee. On an ongoing basis, the Fund may receive a commitment fee based on the undrawn portion of the underlying line of credit portion of a leveraged loan. Prepayment penalty fees are received upon the prepayment of a leveraged loan by a borrower. Prepayment penalty, facility, commitment, consent and amendment fees are recorded to income as earned or paid. |
| I. | Securities Lending |
| | The Fund may loan securities to qualified brokers through a securities lending agency agreement with The Bank of New York Mellon (“BNYM”). Under the securities lending policy, when lending securities the Fund is required to maintain collateral with a market value not less than 100% of the market value of loaned securities. Collateral is adjusted daily in connection with changes in the market value of securities on loan. Collateral may consist of cash and securities issued by the U.S. Government or its agencies. Cash collateral is invested in a short-term money market fund. Dividends earned on the collateral and premiums paid by the broker are recorded as income by the Fund net of fees and rebates charged/paid by BNYM for its services as securities lending agent and in connection with this securities lending program. Lending portfolio securities involves a risk of delay in the recovery of the loaned securities or in the declining value of the collateral. |
| | Securities lending transactions are entered into by the Fund under a Master Securities Lending Agreement (“MSLA”) that permits the Fund, under certain circumstances including an event of default (such as bankruptcy or insolvency), to offset amounts payable by the Fund to the same counterparty against amounts to be received and create one single net payment due to or from the Fund. |
TACTICAL ALLOCATION FUND
NOTES TO FINANCIAL STATEMENTS (Continued)
September 30, 2020
| | Effective March 13, 2020, the securities lending program was put on hold and all securities on loan were recalled. |
Note 3. Investment Advisory Fees and Related Party Transactions
($ reported in thousands)
| A. | Investment Adviser |
| | Virtus Investment Advisers, Inc. (the “Adviser”), an indirect, wholly-owned subsidiary of Virtus Investment Partners, Inc. (“Virtus”), is the investment adviser to the Fund. The Adviser manages the Fund’s investment program and general operations of the Fund, including oversight of the Fund’s subadvisers. |
| | As compensation for its services to the Fund, the Adviser is entitled to a fee, which is calculated daily and paid monthly based upon the following annual rates as a percentage of the average daily net assets of the Fund: |
| First $1 Billion | | $1+ Billion through
$2 Billion | | $2+ Billion |
| 0.55 % | | 0.50 % | | 0.45 % |
| B. | Subadvisers |
| | The subadvisers manage the investments of the Fund for which they are paid a fee by the Adviser. |
| | Newfleet Asset Management, LLC, an indirect, wholly-owned subsidiary of Virtus, is the subadviser to the Fund’s fixed income portfolio. Kayne Anderson Rudnick Investment Management, LLC (“KAR”), an indirect, wholly-owned subsidiary of Virtus, is the subadviser to the Fund’s domestic equity portfolio and international equity portfolio. |
| C. | Expense Limitations |
| | The Adviser has contractually agreed to limit the Fund’s annual total operating expenses, subject to the exceptions listed below, so that such expenses do not exceed, on an annualized basis, the following percentages of the Fund’s average net asset values through January 31, 2021. Following the contractual period, the Adviser may discontinue these expense reimbursement arrangements at any time. The waivers and reimbursements are calculated daily and received monthly. |
| Class A | | Class C | | Class I |
| 1.15 % ‡ | | 1.90 % ‡ | | 0.90 % ‡ |
| ‡ | Each share class is currently below its expense cap. |
The exclusions include front-end or contingent deferred loads, taxes, leverage and borrowing expenses (such as commitment, amendment and renewal expenses on credit or redemption facilities), interest, brokerage commissions, expenses incurred in connection with any merger or reorganization, unusual or infrequently occurring expenses (such as litigation), acquired fund fees and expenses, and dividend expenses, if any.
| D. | Expense Recapture |
| | Under certain conditions, the Adviser may recapture operating expenses reimbursed or fees waived under these arrangements within three years after the date on which such |
TACTICAL ALLOCATION FUND
NOTES TO FINANCIAL STATEMENTS (Continued)
September 30, 2020
| | amounts were incurred or waived. The Fund must pay its ordinary operating expenses before the Adviser is entitled to any reimbursement and must remain in compliance with any applicable expense limitations or, if none, the expense limitation in effect at the time of the waiver or reimbursement. |
| | During the period ended September 30, 2020, the Adviser recaptured expenses previously waived for the Fund: |
| | Class A | | Class C | | Class I | | Total |
| | $2 | | $6 | | $— (1) | | $8 |
(1) Amount is less than $500.
| E. | Distributor |
| | VP Distributors, LLC (“VP Distributors”), an indirect, wholly-owned subsidiary of Virtus, serves as the distributor of the Fund’s shares. VP Distributors has advised the Fund that for the fiscal year (the “period”) ended September 30, 2020, it retained net commissions of $30 for Class A shares and CDSC of $(6) for Class C shares. |
| | In addition, the Fund pays VP Distributors 12b-1 fees under a 12b-1 Plan as a percentage of the average daily net assets of each respective class at the following annual rates: 0.25% for Class A shares and 1.00% for Class C shares. Class I shares are not subject to a 12b-1 Plan. |
| | Under certain circumstances, shares of certain Virtus Mutual Funds may be exchanged for shares of the same class of certain other Virtus Mutual Funds on the basis of the relative NAV per share at the time of the exchange. On exchanges with share classes that carry a CDSC, the CDSC schedule of the original shares purchased continues to apply. |
| F. | Administrator and Transfer Agent |
| | Virtus Fund Services, LLC, an indirect, wholly-owned subsidiary of Virtus, serves as administrator and transfer agent to the Fund. |
| | For the period ended September 30, 2020, the Fund incurred administration fees totaling $600 which are included in the Statement of Operations within the line item “Administration and accounting fees.” The fees are calculated daily and paid monthly. |
| | For the period ended September 30, 2020, the Fund incurred transfer agent fees totaling $269 which are included in the Statement of Operations within the line item “Transfer agent fees and expenses.” The fees are calculated daily and paid monthly. |
| G. | Payment from Affiliate |
| | The Fund was reimbursed by KAR for costs incurred due to an error in the processing of a corporate action of an investment during the period ended September 30, 2020. |
| H. | Trustee Compensation |
| | The Trust provides a deferred compensation plan for its Trustees who receive compensation from the Trust. Under the deferred compensation plan, Trustees may elect to defer all or a portion of their compensation. Amounts deferred are retained by the Trust, and then, to the extent permitted by the 1940 Act, in turn, may be invested in the shares of affiliated or unaffiliated mutual funds selected by the participating Trustees. |
TACTICAL ALLOCATION FUND
NOTES TO FINANCIAL STATEMENTS (Continued)
September 30, 2020
| | Investments in such instruments are included in “Other assets” in the Statement of Assets and Liabilities at September 30, 2020. |
Note 4. Purchases and Sales of Securities
($ reported in thousands)
Purchases and sales of securities (excluding U.S. Government and agency securities and short-term securities) during the period ended September 30, 2020, were as follows:
| Purchases | | Sales |
| $191,911 | | $224,024 |
Purchases and sales of long-term U.S. Government and agency securities during the period ended September 30, 2020, were as follows:
| Purchases | | Sales |
| $26,195 | | $17,695 |
Note 5. Credit and Market Risk and Asset Concentration
Local, regional or global events such as war, acts of terrorism, the spread of infectious illness or other public health issue, recessions, or other events could have a significant impact on the Fund and its investments, including hampering the ability of the Fund’s portfolio manager(s) to invest the Fund’s assets as intended.
In countries with limited or developing markets, investments may present greater risks than in more developed markets and the prices of such investments may be volatile. The consequences of political, social or economic changes in these markets may have disruptive effects on the market prices of these investments and the income they generate, as well as the Fund’s ability to repatriate such amounts.
High-yield/high-risk securities typically entail greater price volatility and/or principal and interest rate risk. There is a greater chance that an issuer will not be able to make principal and interest payments on time. Analysis of the creditworthiness of issuers of high-yield/high-risk securities may be complex, and as a result, it may be more difficult for the Adviser and/or subadvisers to accurately predict risk.
The Fund may invest a high percentage of its assets in specific sectors of the market in the pursuit of its investment objectives. Fluctuations in these sectors of concentration may have a greater impact on the Fund, positive or negative, than if the Fund did not concentrate its investments in such sectors.
The United Kingdom’s Financial Conduct Authority announced a phase out of LIBOR by the end of 2021, and it is expected that LIBOR will cease to be published after that time. The Fund may be exposed to financial instruments tied to LIBOR to determine payment obligations, financing terms, hedging strategies or investment value. The expected discontinuation of LIBOR could have a significant impact on the financial markets and may present a material risk for certain market participants, including the Fund. Abandonment of or modifications to LIBOR could lead to significant short- and long-term uncertainty and market instability. The risks associated with this discontinuation and transition may be exacerbated if the work necessary to effect an orderly transition to an alternative reference rate is not
TACTICAL ALLOCATION FUND
NOTES TO FINANCIAL STATEMENTS (Continued)
September 30, 2020
completed in a timely manner. It remains uncertain how such changes would be implemented and the effects such changes would have on the Fund, issuers of instruments in which the Fund invests, and the financial markets generally.
Note 6. Indemnifications
Under the Trust’s organizational documents and in separate agreements between each Trustee and the Trust, its Trustees and officers are indemnified against certain liabilities arising out of the performance of their duties to the Trust and its funds. In addition, in the normal course of business, the Trust and the Fund enter into contracts that provide a variety of indemnifications to other parties. The Trust’s and/or the Fund’s maximum exposure under these arrangements is unknown, as this would involve future claims that may be made against the Trust or the Fund and that have not occurred. However, neither the Trust nor the Fund has had prior claims or losses pursuant to these arrangements, and they expect the risk of loss to be remote.
Note 7. Restricted Securities
($ reported in thousands)
Restricted securities are not registered under the Securities Act of 1933, as amended (the “1933 Act”). Generally, 144A securities are excluded from this category. The Fund will bear any costs, including those involved in registration under the 1933 Act, in connection with the disposition of such securities. The Fund held the following security considered to be restricted at September 30, 2020:
| | Investment | | Date of
Acquisition | | Cost | | Value | | Percentage of
Net Assets |
| | Duck Creek Technologies, Inc. | | 06/05/2020 | | $3,300 | | $9,482 | | 1.3% |
Note 8. Redemption Facility
($ reported in thousands)
On September 18, 2017, the Fund and certain other affiliated funds entered into a $150,000 unsecured line of credit (“Credit Agreement”). This Credit Agreement, as amended, is with a commercial bank that allows the Fund to borrow cash from the bank to manage large unexpected redemptions and trade fails, up to a limit of one-third of the Fund’s total net assets in accordance with the terms of the agreement. This Credit Agreement has a term of 364 days and has been renewed for a period up to March 11, 2021. Interest is charged at the higher of the LIBOR or the Federal Funds rate plus an additional percentage rate on the amount borrowed. Commitment fees are charged on the undrawn balance. The Fund and other affiliated funds that are parties are individually, and not jointly, liable for their particular advances, if any, under the Credit Agreement. The lending bank has the ability to require repayment of outstanding borrowings under this Credit Agreement upon certain circumstances such as an event of default.
The Fund had no borrowings at any time during the period ended September 30, 2020.
TACTICAL ALLOCATION FUND
NOTES TO FINANCIAL STATEMENTS (Continued)
September 30, 2020
Note 9. Federal Income Tax Information
($ reported in thousands)
At September 30, 2020, federal tax cost and aggregate gross unrealized appreciation (depreciation) of securities held by the Fund were as follows:
Federal
Tax Cost | | Unrealized
Appreciation | | Unrealized
(Depreciation) | | Net Unrealized
Appreciation
(Depreciation) |
| $ 462,500 | | $ 267,572 | | $ (10,133) | | $ 257,439 |
The components of distributable earnings on a tax basis (excluding unrealized appreciation (depreciation) which are disclosed in the beginning of this note) consist of the following:
Undistributed
Ordinary
Income | | Undistributed
Long-Term
Capital Gains |
| $4,763 | | $8,149 |
The differences between the book and tax basis distributable earnings relate principally to the timing of recognition of income and gains for federal income tax purposes. Short-term gain distributions, if any, are reported as ordinary income for federal tax purposes. Distributions are determined on a tax basis and may differ from net investment income and realized capital gains for financial reporting purposes.
The tax character of dividends and distributions paid during the fiscal periods ended September 30, 2020 and 2019 was as follows:
| | Year Ended | | Year Ended |
| | 2020 | | 2019 |
Ordinary Income
| $ 4,750 | | $5,422 |
Long-Term Capital Gains
| 6,909 | | 3,366 |
Total
| $11,659 | | $8,788 |
For financial reporting purposes, book basis capital accounts are adjusted to reflect the tax character of permanent book/tax differences. Permanent reclassifications can arise from differing treatment of certain income and gain transactions, nondeductible current year net operating losses, expiring capital loss carryovers and investments in passive foreign investment companies. The reclassifications have no impact on the net assets or NAV of the Fund. As of September 30, 2020, the Fund recorded reclassifications to increase (decrease) the accounts as listed below:
Capital Paid in on
Shares of
Beneficial Interest | | Total Distributable
Earnings
(Accumulated Losses) |
| $ (62) | | $ 62 |
TACTICAL ALLOCATION FUND
NOTES TO FINANCIAL STATEMENTS (Continued)
September 30, 2020
Note 10. Reorganization
($ reported in thousands)
On November 14, 2018, the Board of Trustees of the Trust approved an Agreement and Plan of Reorganization (the “Plan”) with respect to Virtus Strategic Allocation Fund (the “Merged Fund”), a series of the Trust, and Tactical Allocation Fund (the “Acquiring Fund”), a series of the Trust, which provided for the transfer of all of the assets of the Merged Fund for shares of the Acquiring Fund and the assumption of the liabilities of the Merged Fund. The purpose of the transaction was to allow shareholders of both funds to own shares of a larger combined fund and to allow shareholders of the Merged Fund to own shares of a fund with a similar investment objective and style as, and potentially lower expenses than, the Merged Fund. The reorganization was accomplished by a tax-free exchange of shares on January 25, 2019. For financial reporting purposes, assets received and shares issued by the Acquiring Fund were recorded at fair value; however, the cost basis of the investments received from the Merged Fund was carried forward to align ongoing reporting of the Acquiring Fund’s realized and unrealized gains and losses with amounts distributable to shareholders for tax purposes.
The share transactions associated with the merger are as follows:
| Merged Fund | | Shares
Outstanding | | Acquiring
Fund | | Shares
Converted | | Merged Fund
Net Asset
Value of
Converted
Shares | | | | |
Virtus Strategic
Allocation Fund | | | | Tactical
Allocation Fund | | | | | | | | |
| Class A Shares | | 30,726,803 | | Class A Shares | | 48,374,727 | | $423,501 | | | | |
| Class C Shares | | 419,945 | | Class C Shares | | 635,849 | | 5,724 | | | | |
The net assets and net unrealized appreciation (depreciation) before the acquisition were as follows:
| Merged Fund | | Net
Assets | | Unrealized
Appreciation
(Depreciation) | | Acquiring
Fund | | Net
Assets |
Virtus
Strategic Allocation
Fund | | $429,225 | | $55,954 | | Tactical
Allocation
Fund | | $133,917 |
The net assets of the Acquiring Fund immediately following the acquisition were $563,142.
TACTICAL ALLOCATION FUND
NOTES TO FINANCIAL STATEMENTS (Continued)
September 30, 2020
Assuming the acquisition had been completed on October 1, 2018, the Tactical Allocation Fund’s pro-forma results of operations for the period ended September 30, 2019 would have been as follows:
Net investment income (loss)
| $7,628(a) |
Net realized and unrealized gain (loss) on investments
| 5,864 (b) |
Net increase (decrease) in net assets resulting from operations
| $13,492 |
(a) $5,876, as reported in the Statement of Operations, plus $1,752 net investment income from Virtus Strategic Allocation Fund pre-merger.
(b) $36,909, as reported in the Statement of Operations, plus $(31,045) net realized and unrealized gain (loss) on investments from Virtus Strategic Allocation Fund pre-merger.
Because the Merged Fund and the Acquiring Fund have been managed as an integrated single Fund since the completion date it is not feasible to separate the income/(losses) and gains/(losses) of the merged Virtus Strategic Allocation Fund that have been included in the acquiring Tactical Allocation Fund’s Statement of Operations since January 25, 2019.
Note 11. Regulatory Matters and Litigation
From time to time, the Trust, the Fund, the Adviser and/or subadvisers and/or their affiliates may be involved in litigation and arbitration as well as examinations and investigations by various regulatory bodies, including the SEC, involving compliance with, among other things, securities laws, client investment guidelines, laws and regulations affecting their activities. At this time, the Adviser believes that the outcomes of such matters are not likely, either individually or in aggregate, to be material to these financial statements.
Note 12. Recent Accounting Pronouncements
In August 2018, the Financial Accounting Standards Board (“FASB”) issued Accounting Standards Update (“ASU”) No. 2018-13, which changes certain fair value measurement disclosure requirements. This ASU, in addition to other modifications and additions, removes the requirement to disclose the amount and reasons for transfers between Level 1 and Level 2 of the fair value hierarchy, the policy for the timing of transfers between levels and the valuation process for Level 3 fair value measurements. For public companies, the amendments are effective for financial statements issued for fiscal years beginning after December 15, 2019, and interim periods within those fiscal years. Management has evaluated the implications of certain provisions of ASU No. 2018-13 and has determined to early adopt all aspects related to the removal and modification of certain fair value measurement disclosures under the ASU effective immediately.
In March 2020, the FASB issued ASU No. 2020-04, Reference Rate Reform (Topic 848) - Facilitation of the Effects of Reference Rate Reform on Financial Reporting. The amendments in ASU 2020-04 provides optional temporary financial reporting relief from the effect of certain types of contract modifications due to the planned discontinuation of the LIBOR and other interbank-offered based reference rates as of the end of 2021. ASU
TACTICAL ALLOCATION FUND
NOTES TO FINANCIAL STATEMENTS (Continued)
September 30, 2020
2020-04 is effective for certain reference rate-related contract modifications that occur during the period March 12, 2020 through December 31, 2022. Management is currently evaluating the impact, if any, of applying ASU 2020-04.
Note 13. Subsequent Events
Management has evaluated the impact of all subsequent events on the Fund through the date the financial statements were available for issuance, and has determined that the following are the subsequent events requiring recognition or disclosure in these financial statements.
Effective October 1, 2020, the Fund may loan portfolio securities under the securities lending program.
Effective October 30, 2020, Virtus Rampart Multi-Asset Trend Fund and Virtus Rampart Sector Trend Fund, each formerly a series of Virtus Opportunities Trust, were merged with and into Virtus Tactical Allocation Fund, a series of Virtus Equity Trust.
Report of Independent Registered Public Accounting Firm
To the Board of Trustees of Virtus Equity Trust and Shareholders of Virtus Tactical Allocation Fund
Opinion on the Financial Statements
We have audited the accompanying statement of assets and liabilities, including the schedule of investments, of Virtus Tactical Allocation Fund (one of the funds constituting Virtus Equity Trust, referred to hereafter as the “Fund”) as of September 30, 2020, the related statement of operations for the year ended September 30, 2020, the statements of changes in net assets for each of the two years in the period ended September 30, 2020, including the related notes, and the financial highlights for each of the periods indicated therein (collectively referred to as the “financial statements”). In our opinion, the financial statements present fairly, in all material respects, the financial position of the Fund as of September 30, 2020, the results of its operations for the year then ended, the changes in its net assets for each of the two years in the period ended September 30, 2020 and the financial highlights for each of the periods indicated therein in conformity with accounting principles generally accepted in the United States of America.
Basis for Opinion
These financial statements are the responsibility of the Fund’s management. Our responsibility is to express an opinion on the Fund’s financial statements based on our audits. We are a public accounting firm registered with the Public Company Accounting Oversight Board (United States) (“PCAOB”) and are required to be independent with respect to the Fund in accordance with the U.S. federal securities laws and the applicable rules and regulations of the Securities and Exchange Commission and the PCAOB.
We conducted our audits of these financial statements in accordance with the standards of the PCAOB. Those standards require that we plan and perform the audit to obtain reasonable assurance about whether the financial statements are free of material misstatement, whether due to error or fraud.
Our audits included performing procedures to assess the risks of material misstatement of the financial statements, whether due to error or fraud, and performing procedures that respond to those risks. Such procedures included examining, on a test basis, evidence regarding the amounts and disclosures in the financial statements. Our audits also included evaluating the accounting principles used and significant estimates made by management, as well as evaluating the overall presentation of the financial statements. Our procedures included confirmation of securities owned as of September 30, 2020 by correspondence with the custodian, transfer agent and brokers; when replies were not received from brokers, we performed other auditing procedures. We believe that our audits provide a reasonable basis for our opinion.
/s/ PricewaterhouseCoopers LLP
Philadelphia, Pennsylvania
November 20, 2020
We have served as the Virtus Mutual Funds’ auditor since at least 1977. We have not been able to determine the specific year we began serving as auditor.
TACTICAL ALLOCATION FUND
TAX INFORMATION NOTICE (Unaudited)
September 30, 2020
For the fiscal year ended September 30, 2020, the Fund makes the following disclosures for federal income tax purposes. Below is listed the percentages, or the maximum amount allowable, of its ordinary income dividends (“QDI”) to qualify for the lower tax rates applicable to individual shareholders, and the percentage of ordinary income dividends earned by the Fund which qualifies for the dividends received deduction (“DRD”) for corporate shareholders. The actual percentage of QDI and DRD for the calendar year will be designated in year-end tax statements. The Fund designates the amounts below as long-term capital gains (“LTCG”) dividends taxable at a 20% rate, or lower depending on the shareholder’s income ($ reported in thousands). LTCG amounts, if subsequently different, will be designated in the next annual report.
| | QDI | | DRD | | LTCG |
| | 30% | | 18% | | $8,369 |
STATEMENT REGARDING LIQUIDITY RISK MANAGEMENT PROGRAM (UNAUDITED)
Pursuant to Rule 22e-4 under the 1940 Act, the Fund has adopted a liquidity risk management program (the “Program”) to govern the Fund’s approach to managing liquidity risk, which is the risk that the Fund would not be able to meet redemption requests without significant dilution of remaining investors’ interests in the Fund. The Program is overseen by the Adviser as the Fund’s Liquidity Risk Management Program Administrator (the “Program Administrator”), and the Program’s principal objectives include assessing, managing and periodically reviewing the Fund’s liquidity risk, based on factors specific to the circumstances of the Fund.
Assessment and management of the Fund’s liquidity risk under the Program takes into consideration certain factors, such as the Fund’s investment strategy and the liquidity of its portfolio investments during normal and reasonably foreseeable stressed conditions, its short- and long-term cash-flow projections during both normal and reasonably foreseeable stressed conditions, and its cash and cash-equivalent holdings and access to other funding sources. As required by the rule, the Program includes policies and procedures for classification of Fund portfolio holdings in four liquidity categories, maintaining certain levels of highly liquid investments, and limiting holdings of illiquid investments.
At a meeting of the Board held on May 19-21, 2020, the Board received a report from the Program Administrator addressing the operation and management of the Program for the period from December 1, 2018 through December 31, 2019 (the “Review Period”). The Board acknowledged that because the Review Period ended before 2020, it did not cover the more recent period of market volatility relating to the COVID-19 pandemic. The Program Administrator’s report noted that for the Review Period, the Program Administrator believed that the Program was implemented and operated effectively in all material respects and that existing procedures, controls and safeguards were appropriately designed to enable the Program Administrator to administer the Program in compliance with Rule 22e-4. The Program Administrator’s report noted that during the Review Period, there were no events that created liquidity related concerns for the Fund. The Program Administrator’s report further noted that while changes to the Program had been made during the Review Period and reported to the Board, no material changes were made to the Program as a result of the Program Administrator’s annual review.
There can be no assurance that the Program will achieve its objectives in the future. Please refer to the Fund’s prospectus for more information regarding the Fund’s exposure to liquidity risk and other principal risks to which an investment in the Fund may be subject.
FUND MANAGEMENT TABLES (Unaudited)
Information pertaining to the Trustees and officers of the Trust as of the date of issuance of this report, is set forth below. The statement of additional information (SAI) includes additional information about the Trustees and is available without charge, upon request, by calling (800) 243-4361.
The address of each individual, unless otherwise noted, is c/o Virtus Equity Trust, One Financial Plaza, Hartford, CT 06103. There is no stated term of office for Trustees or officers of the Trust.
Independent Trustees
Name, Year of Birth,
Length of Time Served
and Number of
Portfolios in Fund
Complex Overseen by
Trustee | Principal Occupation(s) During Past 5 Years | Other Directorships Held by Trustee During Past 5 Years |
Brown, Thomas J.
YOB: 1945
Served Since: 2016
68 Portfolios | Retired. | Honorary Board Member (since 2020), Duff & Phelps Select MLP and Midstream Energy Fund Inc., Virtus Total Return Fund Inc. and Virtus Global Multi-Sector Income Fund; Trustee (since 2016), Virtus Mutual Fund Family (54 portfolios) and Virtus Alternative Solutions Trust (3 portfolios); Trustee (since 2011), Virtus Variable Insurance Trust (8 portfolios); Director (since 2010), D’Youville Senior Care Center; and Director (since 2005), VALIC Company Funds (49 portfolios). |
Burke, Donald C.
YOB: 1960
Served Since: 2016
72 Portfolios | Retired. | Director (since 2020), Duff & Phelps Select MLP and Midstream Energy Fund Inc. and Virtus Total Return Fund Inc.; and Trustee (since 2020), Virtus Global Multi-Sector Income Fund; Trustee (since 2016), Virtus Mutual Fund Family (54 portfolios), Virtus Variable Insurance Trust (8 portfolios) and Virtus Alternative Solutions Trust (3 portfolios); Director (since 2014), closed-end funds managed by Duff & Phelps Investment Management Co. (4 funds); Director, Avista Corp. (energy company) (since 2011); Trustee, Goldman Sachs Fund Complex (2010 to 2014); and Director, BlackRock Luxembourg and Cayman Funds (2006 to 2010). |
Harris, Sidney E.
YOB: 1949
Served Since: 2017
68 Portfolios | Professor and Dean Emeritus (since April 2015), Professor (1997 to 2014), Dean (1997 to 2004), J. Mack Robinson College of Business, Georgia State University. | Director (since 2020), Duff & Phelps Select MLP and Midstream Energy Fund Inc. and Virtus Total Return Fund Inc.; Trustee (since 2020), Virtus Global Multi-Sector Income Fund; Trustee (since 2019), Mutual Fund Directors Forum; Trustee (since 2017), Virtus Mutual Fund Family (54 portfolios), Virtus Variable Insurance Trust (8 portfolios) and Virtus Alternative Solutions Trust (3 portfolios); Trustee (since 2013), KIPP Metro Atlanta; Director (1999 to 2019) Total System Services, Inc.; Trustee (2004 to 2017), RidgeWorth Funds; Trustee (since 2012), International University of the Grand Bassam Foundation; and Trustee (2011 to 2015), Genspring Family Offices, LLC. |
FUND MANAGEMENT TABLES (Unaudited) (Continued)
Name, Year of Birth,
Length of Time Served
and Number of
Portfolios in Fund
Complex Overseen by
Trustee | Principal Occupation(s) During Past 5 Years | Other Directorships Held by Trustee During Past 5 Years |
Mallin, John R.
YOB: 1950
Served Since: 2016
68 Portfolios | Partner/Attorney (since 2003), McCarter & English LLP (law firm), Real Property Practice Group; Member (since 2014), Counselors of Real Estate. | Director (since 2020), Duff & Phelps Select MLP and Midstream Energy Fund Inc. and Virtus Total Return Fund Inc.; Trustee (since 2020), Virtus Global Multi-Sector Income Fund; Trustee (since 2016), Virtus Mutual Fund Family (54 portfolios) and Virtus Alternative Solutions Trust (3 portfolios); Director (since 2013), Horizons, Inc. (non-profit); and Trustee (since 1999), Virtus Variable Insurance Trust (8 portfolios). |
McClellan, Hassell H.
YOB: 1945
Served Since: 2015
68 Portfolios | Retired. Professor (1984 to 2013), Wallace E. Carroll School of Management, Boston College. | Honorary Board Member (since 2020), Duff & Phelps Select MLP and Midstream Energy Fund Inc., Virtus Total Return Fund Inc. and Virtus Global Multi-Sector Income Fund; Chairperson of the Board (since 2017) and Trustee (since 2000), John Hancock Fund Complex (collectively, 227 portfolios); Trustee (since 2016), Virtus Alternative Solutions Trust (3 portfolios); Trustee since 2015), Virtus Mutual Fund Family (54 portfolios); Director (since 2010), Barnes Group, Inc. (diversified global components manufacturer and logistical services company); and Trustee (since 2008), Virtus Variable Insurance Trust (8 portfolios). |
McDaniel, Connie D.
YOB: 1958
Served Since: 2017
68 Portfolios | Retired (since 2013). Vice President, Chief of Internal Audit, Corporate Audit Department (2009 to 2013), Vice President Global Finance Transformation (2007 to 2009), Vice President and Controller (1999 to 2007), The Coca-Cola Company. | Director (since 2020), Duff & Phelps Select MLP and Midstream Energy Fund Inc. and Virtus Total Return Fund Inc.; Trustee (since 2020), Virtus Global Multi-Sector Income Fund; Director (since 2019), Global Payments Inc.; Trustee (since 2017), Virtus Mutual Fund Family (54 portfolios), Virtus Variable Insurance Trust (8 portfolios) and Virtus Alternative Solutions Trust (3 portfolios); Director (2014 to 2019), Total System Services, Inc.; Member (since 2011) and Chair (2014 to 2016), Georgia State University, Robinson College of Business Board of Advisors; and Trustee (2005 to 2017), RidgeWorth Funds. |
McLoughlin, Philip
YOB: 1946
Served Since: 1993
72 Portfolios | Retired. | Director and Chairman (since 2016), Virtus Total Return Fund Inc.; Director and Chairman (2016 to 2019), the former Virtus Total Return Fund Inc.; Director and Chairman (since 2014), Duff & Phelps Select MLP and Midstream Energy Fund Inc.; Trustee and Chairman (since 2013), Virtus Alternative Solutions Trust (3 portfolios); Trustee and Chairman (since 2011), Virtus Global Multi-Sector Income Fund; Chairman and Trustee (since 2003), Virtus Variable Insurance Trust (8 portfolios); Director (since 1995), closed-end funds managed by Duff & Phelps Investment Management Co. (4 funds); Director (1991 to 2019) and Chairman (2010 to 2019), Lazard World Trust Fund (closed-end investment firm in Luxembourg); and Trustee (since 1989) and Chairman (since 2002), Virtus Mutual Fund Family (54 portfolios). |
FUND MANAGEMENT TABLES (Unaudited) (Continued)
Name, Year of Birth,
Length of Time Served
and Number of
Portfolios in Fund
Complex Overseen by
Trustee | Principal Occupation(s) During Past 5 Years | Other Directorships Held by Trustee During Past 5 Years |
McNamara, Geraldine M.
YOB: 1951
Served Since: 2001
72 Portfolios | Retired. | Director (since 2020), Duff & Phelps Select MLP and Midstream Energy Fund Inc. and Virtus Total Return Fund Inc.; Trustee (since 2020), Virtus Global Multi-Sector Income Fund; Trustee (since 2016), Virtus Alternative Solutions Trust (3 portfolios); Trustee (since 2015), Virtus Variable Insurance Trust (8 portfolios); Director (since 2003), closed-end funds managed by Duff & Phelps Investment Management Co. (4 funds); and Trustee (since 2001), Virtus Mutual Fund Family (54 portfolios). |
Oates, James M.
YOB: 1946
Served Since: 1993
68 Portfolios | Managing Director (since 1994), Wydown Group (consulting firm). | Director (since 2016), Virtus Total Return Fund Inc.; Director (2016 to 2019), the former Virtus Total Return Fund Inc.; Trustee (since 2016), Virtus Variable Insurance Trust (8 portfolios); Director (since 2014), Duff & Phelps Select MLP and Midstream Energy Fund Inc.; Trustee (since 2013), Virtus Alternative Solutions Trust (3 portfolios); Trustee (since 2013), Virtus Global Multi-Sector Income Fund; Trustee (since 2005) and Chairman (2005 to 2017), John Hancock Fund Complex (227 portfolios); Director (2002 to 2014), New Hampshire Trust Company; Chairman (2000 to 2016), Emerson Investment Management, Inc.; Non-Executive Chairman (2000 to 2014), Hudson Castle Group, Inc. (formerly IBEX Capital Markets, Inc.) (financial services); Chairman and Director (1999 to 2014), Connecticut River Bank; Director (since 1996), Stifel Financial; and Trustee (since 1987), Virtus Mutual Fund Family (54 portfolios). |
Segerson, Richard E.
YOB: 1946
Served Since: 1983
68 Portfolios | Retired. Managing Director (1998 to 2013), Northway Management Company. | Honorary Board Member (since 2020), Duff & Phelps Select MLP and Midstream Energy Fund Inc., Virtus Total Return Fund Inc. and Virtus Global Multi-Sector Income Fund; Trustee (since 2016), Virtus Alternative Solutions Trust (3 portfolios) and Virtus Variable Insurance Trust (8 portfolios); and Trustee (since 1983), Virtus Mutual Fund Family (54 portfolios). |
Walton, R. Keith
YOB: 1964
Served Since: 2020
68 Portfolios | Venture and Operating Partner (since 2020), Plexo Capital, LLC; Venture Partner (since 2019) and Senior Adviser (2018 to 2019), Plexo, LLC; Senior Adviser (2018 to 2019), Vatic Labs, LLC; Executive Vice President, Strategy (2017 to 2019), Zero Mass Water, LLC; Vice President, Strategy (2013 to 2017), Arizona State University; Partner (since 2006), Global Infrastructure Partners. | Trustee (since 2020) Virtus Alternative Solutions Trust (3 portfolios), Virtus Variable Insurance Trust (8 portfolios) and Virtus Mutual Fund Family (54 portfolios); Director (since 2017), certain funds advised by Bessemer Investment Management LLC; Director (since 2016), Duff & Phelps Select MLP and Midstream Energy Fund Inc.; Trustee (since 2016), Virtus Global Multi-Sector Income Fund; Director (2006 to 2019), Systematica Investments Limited Funds; Director (2006 to 2017), BlueCrest Capital Management Funds; Trustee (2014 to 2017), AZ Service; Director (since 2004), Virtus Total Return Fund Inc.; and Director (2004 to 2019), the former Virtus Total Return Fund Inc. |
FUND MANAGEMENT TABLES (Unaudited) (Continued)
Name, Year of Birth,
Length of Time Served
and Number of
Portfolios in Fund
Complex Overseen by
Trustee | Principal Occupation(s) During Past 5 Years | Other Directorships Held by Trustee During Past 5 Years |
Zino, Brian T.
YOB: 1952
Served Since: 2020
68 Portfolios | Retired. Various roles (1982 to 2008), J. & W. Seligman & Co. Incorporated, including President (1994 to 2008). | Trustee (since 2020) Virtus Alternative Solutions Trust (3 portfolios), Virtus Variable Insurance Trust (8 portfolios) and Virtus Mutual Fund Family (54 portfolios); Director (since 2016), Duff & Phelps Select MLP and Midstream Energy Fund Inc.; Trustee (since 2016), Virtus Global Multi-Sector Income Fund; Director (since 2014), Virtus Total Return Fund Inc.; Director (2014 to 2019), the former Virtus Total Return Fund Inc.; Trustee (since 2011), Bentley University; Director (1986 to 2008) and President (1994 to 2008), J&W Seligman Co. Inc.; Director (1998 to 2009), Chairman (2002 to 2004) and Vice Chairman (2000 to 2002), ICI Mutual Insurance Company; Member, Board of Governors of ICI (1998 to 2008). |
Interested Trustee
Name, Year of Birth,
Length of Time Served
and Number of
Funds Overseen | Principal Occupation(s) During Past 5 Years | Principal Occupation(s) During Past 5 Years and
Other Directorships Held by Trustee |
Aylward, George R.*
Trustee and President
YOB: 1964
Served Since: 2006
70 Portfolios | Director, President and Chief Executive Officer (since 2008), Virtus Investment Partners, Inc. and/or certain of its subsidiaries, and various senior officer positions with Virtus affiliates (since 2005). | Chairman and Trustee (since 2015), Virtus ETF Trust II (2 portfolios); Director, President and Chief Executive Officer (since 2014), Duff & Phelps Select MLP and Midstream Energy Fund Inc.; Trustee and President (since 2013), Virtus Alternative Solutions Trust (3 portfolios); Director (since 2013), Virtus Global Funds, PLC (5 portfolios); Trustee (since 2012) and President (since 2010), Virtus Variable Insurance Trust (8 portfolios); Trustee, President and Chief Executive Officer (since 2011), Virtus Global Multi-Sector Income Fund; Trustee and President (since 2006) and Executive Vice President (2004 to 2006), Virtus Mutual Fund Family (54 portfolios); Director, President and Chief Executive Officer (since 2006), Virtus Total Return Fund Inc.; and Director, President and Chief Executive Officer (2006 to 2019), the former Virtus Total Return Fund Inc. |
*Mr. Aylward is an “interested person,” as defined in the 1940 Act, by reason of his position as President and Chief Executive Officer of Virtus Investment Partners, Inc. (“Virtus”), the ultimate parent company of the Adviser, and various positions with its affiliates, including the Adviser.
FUND MANAGEMENT TABLES (Unaudited) (Continued)
Advisory Board Member
Name, Year of Birth,
Length of Time
Served, and Number
of Portfolios in Fund
Complex Overseen | Principal Occupation(s) During Past 5 Years | Other Directorships Held by
Trustee During Past 5 Years |
Moyer, William R.
YOB: 1944
Served Since: 2020
68 Portfolios | Private investor (since 2004); Financial and Operations Principal (2006 to 2017), Newcastle Distributors LLC (broker dealer). | Advisory Board Member (since 2020), Virtus Variable Insurance Trust (8 portfolios) and Virtus Mutual Fund Family (54 portfolios); Advisory Board Member (since 2020) and Director (2016 to 2019), Virtus Total Return Fund Inc.; Director (2016 to 2019), the former Virtus Total Return Fund Inc.; Advisory Board Member (since 2020) and Director (2014 to 2019), Duff & Phelps Select MLP and Midstream Energy Fund Inc.; Advisory Board Member (since 2020) and Trustee (2011 to 2019), Virtus Global Multi-Sector Income Fund; Advisory Board Member (since 2020) and Trustee (2013 to 2016), Virtus Alternative Solutions Trust (3 portfolios). |
Officers of the Trust Who Are Not Trustees
Name, Address and
Year of Birth | Position(s) Held
with Trust and
Length of
Time Served | Principal Occupation(s) During Past 5 Years |
Batchelar, Peter J.
YOB: 1970 | Senior Vice President (since 2017), and Vice President (2008 to 2016). | Senior Vice President, Product Development (since 2017), Vice President, Product Development (2008 to 2016), and various officer positions (since 2008), Virtus Investment Partners, Inc. and/or certain of its subsidiaries; Senior Vice President (since 2017), Vice President (2008 to 2016), Virtus Mutual Fund Family; Senior Vice President (since 2017), Vice President (2010 to 2016), Virtus Variable Insurance Trust; Senior Vice President (since 2017), Vice President (2013 to 2016), Virtus Alternative Solutions Trust; Senior Vice President (since 2017) and Vice President (2016 to 2017), Duff & Phelps Select MLP and Midstream Energy Fund Inc., Virtus Total Return Fund Inc. and Virtus Global Multi-Sector Income Fund; and Senior Vice President (2017 to 2019) and Vice President (2016 to 2017), the former Virtus Total Return Fund Inc. |
FUND MANAGEMENT TABLES (Unaudited) (Continued)
Name, Address and
Year of Birth | Position(s) Held
with Trust and
Length of
Time Served | Principal Occupation(s) During Past 5 Years |
Bradley, W. Patrick
YOB: 1972 | Executive Vice President (since 2016); Senior Vice President (2013 to 2016); Vice President (2011 to 2013); Chief Financial Officer and Treasurer (since 2006). | Executive Vice President, Fund Services (since 2016), Senior Vice President, Fund Services (2010 to 2016), and various officer positons (since 2006), Virtus Investment Partners, Inc. and/or certain of its subsidiaries; Director (since 2019), Virtus Global Funds ICAV; Executive Vice President (since 2016), Senior Vice President (2013 to 2016), Vice President (2011 to 2013), Chief Financial Officer and Treasurer (since 2004), Virtus Variable Insurance Trust; Executive Vice President (since 2016), Senior Vice President (2013 to 2016), Vice President (2011 to 2013), Chief Financial Officer and Treasurer (since 2006), Virtus Mutual Fund Family; Executive Vice President (since 2016), Senior Vice President (2013 to 2016), Vice President (2012 to 2013) and Treasurer and Chief Financial Officer (since 2010), Virtus Total Return Fund Inc.; Executive Vice President (2016 to 2019), Senior Vice President (2013 to 2016), Vice President (2012 to 2013), Treasurer and Chief Financial Officer (since 2010), the former Virtus Total Return Fund Inc.; Executive Vice President (since 2016), Senior Vice President (2013 to 2016), Vice President (2011 to 2013), Chief Financial Officer and Treasurer (since 2011), Virtus Global Multi-Sector Income Fund; Executive Vice President (since 2016), Senior Vice President (2014 to 2016), Chief Financial Officer and Treasurer (since 2014), Duff & Phelps Select MLP and Midstream Energy Fund Inc.; Vice President and Assistant Treasurer (since 2011), Duff & Phelps Utility and Infrastructure Fund Inc.; Director (since 2013), Virtus Global Funds, PLC; and Executive Vice President (since 2016), Senior Vice President (2013 to 2016), and Chief Financial Officer and Treasurer (since 2013), Virtus Alternative Solutions Trust. |
FUND MANAGEMENT TABLES (Unaudited) (Continued)
Name, Address and
Year of Birth | Position(s) Held
with Trust and
Length of
Time Served | Principal Occupation(s) During Past 5 Years |
Carr, Kevin J.
YOB: 1954 | Senior Vice President (since 2013); Vice President (2005 to 2013); Chief Legal Officer, Counsel and Secretary (since 2005). | Vice President and Senior Counsel (2017 to Present), Senior Vice President (2009 to 2017), Vice President, Counsel and Secretary (2008 to 2009), and various officer positions (since 2005), Virtus Investment Partners, Inc. and/or certain of its subsidiaries; Senior Vice President (since 2013), Vice President (2005 to 2013),Chief Legal Officer, Counsel and Secretary (since 2005), Virtus Mutual Fund Family; Senior Vice President (2013 to 2014), Vice President (2012 to 2013), Secretary and Chief Legal Officer (2005 to 2013), and Assistant Secretary (2013 to 2014 and since 2017), Virtus Total Return Fund Inc.; Senior Vice President (2013 to 2014), Vice President (2012 to 2013),Secretary and Chief Legal Officer (2005 to 2013) and Assistant Secretary (2013 to 2014 and 2017 to 2019), the former Virtus Total Return Fund Inc.; Senior Vice President (since 2017), Assistant Secretary (since 2013), Vice President, Chief Legal Officer, Counsel and Secretary (2010 to 2013), Virtus Variable Insurance Trust; Senior Vice President (2013 to 2014),Vice President (2011 to 2013), and Assistant Secretary (since 2011), Virtus Global Multi-Sector Income Fund; Assistant Secretary (since 2015), Duff & Phelps Select MLP and Midstream Energy Fund Inc.; Senior Vice President (since 2017) and Assistant Secretary (since 2013), Virtus Alternative Solutions Trust; Secretary (since 2015), ETFis Series Trust I; and Secretary (since 2015), Virtus ETF Trust II. |
FUND MANAGEMENT TABLES (Unaudited) (Continued)
Name, Address and
Year of Birth | Position(s) Held
with Trust and
Length of
Time Served | Principal Occupation(s) During Past 5 Years |
Engberg, Nancy J.
YOB: 1956 | Senior Vice President (since 2017); Vice President (2011 to 2017); and Chief Compliance Officer (since 2011). | Senior Vice President (since 2017), Vice President (2008 to 2017) and Chief Compliance Officer (2008 to 2011 and since 2016), and various officer positions (since 2003), Virtus Investment Partners, Inc. and/or certain of its subsidiaries; Senior Vice President (since 2017), Vice President (2011 to 2017) and Chief Compliance Officer (since 2011), Virtus Mutual Fund Family; Senior Vice President (since 2017), Vice President (2010 to 2017) and Chief Compliance Officer (since 2011), Virtus Variable Insurance Trust; Senior Vice President (since 2017), Vice President (2011 to 2016) and Chief Compliance Officer (since 2011), Virtus Global Multi-Sector Income Fund; Senior Vice President (since 2017), Vice President (2012 to 2017) and Chief Compliance Officer (since 2012), Virtus Total Return Fund Inc.; Senior Vice President (2017 to 2019), Vice President (2012 to 2017) and Chief Compliance Officer (since 2012), the former Virtus Total Return Fund Inc.; Senior Vice President (since 2017), Vice President (2013 to 2016) and Chief Compliance Officer (since 2013), Virtus Alternative Solutions Trust; Senior Vice President (since 2017), Vice President (2014 to 2017) and Chief Compliance Officer (since 2014), Duff & Phelps Select MLP and Midstream Energy Fund Inc.; Chief Compliance Officer (since 2015), ETFis Series Trust I; and Chief Compliance Officer (since 2015), Virtus ETF Trust II. |
Short, Julia R.
YOB: 1972 | Senior Vice President (since 2017). | Senior Vice President (since 2018), Duff & Phelps Select MLP and Midstream Energy Fund Inc., Virtus Total Return Fund Inc. and Virtus Global Multi-Sector Income Fund; Senior Vice President (2018 to 2019), the former Virtus Total Return Fund Inc.; Senior Vice President, Product Development (since 2017), Virtus Investment Partners, Inc. and/or certain of its subsidiaries; Senior Vice President (since 2017), Virtus Mutual Fund Family; President and Chief Executive Officer, RidgeWorth Funds (2007 to 2017); and Managing Director, Product Manager, RidgeWorth Investments (2004 to 2017). |
FUND MANAGEMENT TABLES (Unaudited) (Continued)
Name, Address and
Year of Birth | Position(s) Held
with Trust and
Length of
Time Served | Principal Occupation(s) During Past 5 Years |
Waltman, Francis G.
YOB: 1962 | Executive Vice President (since 2013); Senior Vice President (2008 to 2013). | Executive Vice President, Product Development (since 2009), and various senior officer positions (since 2006), Virtus Investment Partners, Inc. and/or certain of its subsidiaries; Director (since 2019), Virtus Global Funds ICAV; Executive Vice President (since 2013), Senior Vice President (2008 to 2013), Virtus Mutual Fund Family; Executive Vice President (since 2013), Senior Vice President (2010 to 2013), Virtus Variable Insurance Trust; Executive Vice President (since 2013), Senior Vice President (2011 to 2013), Virtus Global Multi-Sector Income Fund; Executive Vice President (since 2014), Duff & Phelps Select MLP and Midstream Energy Fund Inc.; Director (since 2013), Virtus Global Funds PLC; Executive Vice President (since 2013), Virtus Alternative Solutions Trust; Executive Vice President (since 2017), Virtus Total Return Fund Inc.; and Executive Vice President (2017 to 2019), the former Virtus Total Return Fund Inc. |
Virtus Tactical Allocation Fund,
a series of Virtus Equity Trust (Unaudited)
Supplement dated October 30, 2020 to the Summary Prospectus and Statutory Prospectus, each, dated October 19, 2020, as supplemented
IMPORTANT NOTICE TO INVESTORS
At a virtual Special Meeting of Shareholders held on October 14, 2020, shareholders approved an Agreement and Plan of Reorganization under which Virtus Rampart Multi-Asset Trend Fund, a series of the Virtus Opportunities Trust (the “Trust”), will be combined into Virtus Tactical Allocation Fund (the “Fund”).
In addition, at a virtual Special Meeting of Shareholders held on October 23, 2020, shareholders approved an Agreement and Plan of Reorganization under which Virtus Rampart Sector Trend Fund, a series of the Trust, will also be combined into the Fund.
As a result, the adviser to the Fund, Virtus Investment Advisers, Inc. (the “Adviser”), has contractually agreed to limit total operating expenses for the Fund, effective October 31, 2020. These changes are described in more detail below.
Under “Fees and Expenses” in the Fund’s summary prospectus and the summary section of the statutory prospectus, the “Annual Fund Operating Expenses” table and associated footnotes will be replaced with the following:
| Annual Fund Operating Expenses (expenses that you pay each year as a percentage of the value of your investment) | Class A | Class C | Class I | Class R6 |
| Management Fees | 0.55% | 0.55% | 0.55% | 0.55% |
| Distribution and Shareholder Servicing (12b-1) Fees | 0.25% | 1.00% | None | None |
| Other Expenses(b) | 0.26% | 0.24% | 0.25% | 0.21% |
| Total Annual Fund Operating Expenses | 1.06% | 1.79% | 0.80% | 0.76% |
| Less: Fee Waiver and/or Expense Reimbursement(c) | (0.07)% | (0.04)% | (0.04)% | (0.16)% |
| Total Annual Fund Operating Expenses After Expense Reimbursement (c) | 0.99% | 1.75% | 0.76% | 0.60% |
(b) Estimated for current fiscal years as annualized.
(c) The fund’s investment adviser has contractually agreed to limit the fund’s total operating expenses (excluding certain expenses, such as front-end or contingent deferred sales charges, taxes, leverage and borrowing expenses (such as commitment, amendment and renewal expenses on credit or redemption facilities), interest, brokerage commissions, expenses incurred in connection with any merger or reorganization, unusual or infrequently occurring expenses (such as litigation), acquired fund fees and expenses, and dividend expenses, if any) so that such expenses do not exceed 0.99% for Class A Shares, 1.75% for Class C Shares, 0.76% for Class I Shares, and 0.60% for Class R6 Shares through January 31, 2022. Following the contractual period, the adviser may discontinue these expense reimbursement arrangements at any time. Under certain conditions, the adviser may recapture operating expenses reimbursed and/or fees waived under these arrangements for a period of three years following the date such waiver or reimbursement occurred, provided that the recapture does not cause the fund to exceed its expense limit in effect at the time of the waiver or reimbursement, or at the time of recapture.
Under “Fees and Expenses,” the “Example” table is hereby replaced with the following:
| | Share Status | 1 Year | 3 Years | 5 Years | 10 Years |
| Class A | Sold or Held | $672 | $885 | $1,123 | $1,804 |
| Class C | Sold | $280 | $569 | $995 | $2,183 |
| Held | $180 | $569 | $995 | $2,183 |
| Class I | Sold or Held | $80 | $260 | $468 | $1,065 |
| Class R6 | Sold or Held | $61 | $210 | $390 | $911 |
In the first table in the section “More Information About Fund Expenses” on page 7 of the statutory prospectus, the row corresponding to the Fund will be replaced with the following:
| | Class A Shares | Class C Shares | Class I Shares | Class R6 Shares |
| Virtus Tactical Allocation Fund | 0.99% | 1.75% | 0.76% | 0.60% |
Investors should retain this supplement with the Prospectuses for future reference.
VOT 8020/Tactical AllocationNewExpCaps (10/2020)
THIS PAGE INTENTIONALLY BLANK.
THIS PAGE INTENTIONALLY BLANK.
THIS PAGE INTENTIONALLY BLANK.
THIS PAGE INTENTIONALLY BLANK.
THIS PAGE INTENTIONALLY BLANK.
TACTICAL ALLOCATION FUND
101 Munson Street
Greenfield, MA 01301-9668
Trustees
Philip R. McLoughlin, Chairman
George R. Aylward
Thomas J. Brown
Donald C. Burke
Sidney E. Harris
John R. Mallin
Hassell H. McClellan
Connie D. McDaniel
Geraldine M. McNamara
James M. Oates
Richard E. Segerson
R. Keith Walton
Brian T. Zino
Advisory Board Member
William R. Moyer
Officers
George R. Aylward, President
Peter Batchelar, Senior Vice President
W. Patrick Bradley, Executive Vice President, Chief Financial Officer and Treasurer
Kevin J. Carr, Senior Vice President, Chief Legal Officer, Counsel and Secretary
Nancy J. Engberg, Senior Vice President and Chief Compliance Officer
Julia R. Short, Senior Vice President
Francis G. Waltman, Executive Vice President
Investment Adviser
Virtus Investment Advisers, Inc.
One Financial Plaza
Hartford, CT 06103-2608
Principal Underwriter
VP Distributors, LLC
One Financial Plaza
Hartford, CT 06103-2608
Administrator and Transfer Agent
Virtus Fund Services, LLC
One Financial Plaza
Hartford, CT 06103-2608
Custodian
The Bank of New York Mellon
240 Greenwich Street
New York, NY 10286-1048
Independent Registered Public
Accounting Firm
PricewaterhouseCoopers LLP
2001 Market Street
Philadelphia, PA 19103-7042
How to Contact Us
| Mutual Fund Services | 1-800-243-1574 |
| Adviser Consulting Group | 1-800-243-4361 |
Important Notice to Shareholders
The Securities and Exchange Commission has modified mailing regulations for semiannual and annual shareholder fund reports to allow mutual fund companies to send a single copy of these reports to shareholders who share the same mailing address. If you would like additional copies, please call Mutual Fund Services at 1-800-243-1574.
P.O. Box 9874
Providence, RI 02940-8074
For more information about Virtus Mutual Funds,
please contact us at 1-800-243-1574, or Virtus.com.
Item 2. Code of Ethics.
| | (a) | The registrant, as of the end of the period covered by this report, has adopted a code of ethics that applies to the registrant’s principal executive officer, principal financial officer, principal accounting officer or controller, or persons performing similar functions, regardless of whether these individuals are employed by the registrant or a third party. |
| | (b) | There have been no amendments, during the period covered by this report, to a provision of the code of ethics that applies to the registrant’s principal executive officer, principal financial officer, principal accounting officer or controller, or persons performing similar functions, regardless of whether these individuals are employed by the registrant or a third party, and that relates to any element of the code of ethics described in Item 2(b) of the instructions for completion of Form N-CSR. |
| | (d) | The registrant has not granted any waivers, during the period covered by this report, including an implicit waiver, from a provision of the code of ethics that applies to the registrant’s principal executive officer, principal financial officer, principal accounting officer or controller, or persons performing similar functions, regardless of whether these individuals are employed by the registrant or a third party, that relates to one or more of the items set forth in paragraph (b) of the instructions for completion of this Item. |
Item 3. Audit Committee Financial Expert.
| (a)(1) | The Registrant’s Board of Trustees has determined that the Registrant has an “audit committee financial expert” serving on its Audit Committee. |
| (a)(2) | The Registrant’s Board of Trustees has determined that each of Thomas J. Brown, Donald C. Burke, Connie D. McDaniel and Brian T. Zino possesses the technical attributes identified in Instruction 2(b) of Item 3 to Form N-CSR to qualify as an “audit committee financial expert.” Each such individual is an “independent” trustee pursuant to paragraph (a)(2) of Item 3 to Form N-CSR. |
Item 4. Principal Accountant Fees and Services.
| | • | | Registrant may incorporate the following information by reference, if this information has been disclosed in the registrant’s definitive proxy statement or definitive information statement. The proxy statement or information statement must be filed no later than 120 days after the end of the fiscal year covered by the Annual Report. |
Audit Fees
| | (a) | The aggregate fees billed for each of the last two fiscal years for professional services rendered by the principal accountant for the audit of the registrant’s annual financial statements or services that are normally provided by the accountant in connection with statutory and regulatory filings or engagements for fiscal years ended September 30, 2019 and September 30, 2020 are $177,500 and $210,889, respectively. |
Audit-Related Fees
| | (b) | The aggregate fees billed in each of the last two fiscal years for assurance and related services by the principal accountant that are reasonably related to the performance of the audit of the registrant’s financial statements and are not reported under paragraph (a) of this Item for fiscal years ended September 30, 2019 and September 30, 2020 are $19,147 and $17,185, respectively. Such audit-related fees include out of pocket expenses. |
Tax Fees
| | (c) | The aggregate fees billed in each of the last two fiscal years for professional services rendered by the principal accountant for tax compliance, tax advice, and tax planning for fiscal years ended September 30, 2019 and September 30, 2020 are $33,052 and $45,725, respectively. |
“Tax Fees” are those primarily associated with review of the Trust’s tax provision and qualification as a regulated investment company (RIC) in connection with audits of the Trust’s financial statement, review of year-end distributions by the Fund to avoid excise tax for the Trust, periodic discussion with management on tax issues affecting the Trust, and reviewing and signing the Fund’s federal income tax returns.
All Other Fees
| | (d) | The aggregate fees billed in each of the last two fiscal years for products and services provided by the principal accountant, other than the services reported in paragraphs (a) through (c) of this Item are for fiscal years ended September 30, 2020 and September 30, 2019 are $0 and $0, respectively. |
| | (e)(1) | Disclose the audit committee’s pre-approval policies and procedures described in paragraph (c)(7) of Rule 2-01 of Regulation S-X. |
The Board of Trustees of Virtus Equity Trust (the “Fund”) has adopted policies and procedures with regard to the pre-approval of services provided by its independent auditors. Audit, audit-related and tax compliance services provided to the Fund on an annual basis require specific pre-approval by the Audit Committee. The Audit Committee must also approve other non-audit
services provided to the Fund and those non-audit services provided to the Fund’s Affiliated Service Providers that relate directly to the operations and financial reporting of the Fund. Certain of these non-audit services that the Audit Committee believes are a) consistent with the SEC’s auditor independence rules and b) routine and recurring services that will not impair the independence of the independent auditors may be approved by the Audit Committee without consideration on a specific case-by-case basis (“general pre-approval”).
The Audit Committee has determined that Mr. Thomas J. Brown, Chair of the Audit Committee, may provide pre-approval for such services that meet the above requirements in the event such approval is sought between regularly scheduled meetings. In any event, the Audit Committee is informed of each service approved subject to general pre-approval at the next regularly scheduled in-person Audit Committee meeting.
| | (e)(2) | The percentage of services described in each of paragraphs (b) through (d) of this Item that were approved by the audit committee pursuant to paragraph (c)(7)(i)(C) of Rule 2-01 of Regulation S-X are as follows: |
| | (f) | The percentage of hours expended on the principal accountant’s engagement to audit the registrant’s financial statements for the most recent fiscal year that were attributed to work performed by persons other than the principal accountant’s full-time, permanent employees was less than fifty percent. |
| | (g) | The aggregate non-audit fees billed by the registrant’s accountant for services rendered to the registrant, and rendered to the registrant’s investment adviser (not including any sub-adviser whose role is primarily portfolio management and is subcontracted with or overseen by another investment adviser), and any entity controlling, controlled by, or under common control with the adviser that provides ongoing services to the registrant for fiscal years ended September 30, 2019 and September 30, 2020 are $52,199 and $62,910, respectively. |
| | (h) | The registrant’s audit committee of the board of directors has considered whether the provision of non-audit services that were rendered to the registrant’s investment adviser (not including any sub-adviser whose role is primarily portfolio management and is subcontracted with or overseen by another investment adviser), and any entity controlling, controlled by, or under common control with the investment adviser that provides ongoing services to the registrant that were not pre-approved pursuant to paragraph (c)(7)(ii) of Rule 2-01 of Regulation S-X is compatible with maintaining the principal accountant’s independence. |
Item 5. Audit Committee of Listed Registrants.
Not applicable.
Item 6. Investments.
| (a) | Schedule of Investments in securities of unaffiliated issuers as of the close of the reporting period is included as part of the report to shareholders filed under Item 1 of this form. |
| Item 7. | Disclosure of Proxy Voting Policies and Procedures for Closed-End Management Investment Companies. |
Not applicable.
| Item 8. | Portfolio Managers of Closed-End Management Investment Companies. |
Not applicable.
| Item 9. | Purchases of Equity Securities by Closed-End Management Investment Company and Affiliated Purchasers. |
Not applicable.
| Item 10. | Submission of Matters to a Vote of Security Holders. |
There have been no material changes to the procedures by which the shareholders may recommend nominees to the registrant’s board of trustees, where those changes were implemented after the registrant last provided disclosure in response to the requirements of Item 407(c)(2)(iv) of Regulation S-K (17 CFR 229.407) (as required by Item 22(b)(15) of Schedule 14A (17 CFR 240.14a-101)), or this Item.
Item 11. Controls and Procedures.
| | (a) | The registrant’s principal executive and principal financial officers, or persons performing similar functions, have concluded that the registrant’s disclosure controls and procedures (as defined in Rule 30a-3(c) under the Investment Company Act of 1940, as amended (the “1940 Act”) (17 CFR 270.30a-3(c))) are effective, as of a date within 90 days of the filing date of the report that includes the disclosure required by this paragraph, based on their evaluation of these controls and procedures required by Rule 30a-3(b) under the 1940 Act (17 CFR 270.30a-3(b)) and Rules 13a-15(b) or 15d-15(b) under the Securities Exchange Act of 1934, as amended (17 CFR 240.13a-15(b) or 240.15d-15(b)). |
| | (b) | There were no changes in the registrant’s internal control over financial reporting (as defined in Rule 30a-3(d) under the 1940 Act (17 CFR 270.30a-3(d))) that occurred during the period covered by this report that has materially affected, or is reasonably likely to materially affect, the registrant’s internal control over financial reporting. |
| Item 12. | Disclosure of Securities Lending Activities for Closed-End Management Investment Companies. |
Not applicable.
SIGNATURES
Pursuant to the requirements of the Securities Exchange Act of 1934 and the Investment Company Act of 1940, the registrant has duly caused this report to be signed on its behalf by the undersigned, thereunto duly authorized.
| | |
(Registrant) | | Virtus Equity Trust |
| | |
| |
By (Signature and Title)* | | /s/ George R. Aylward |
| | George R. Aylward, President |
| | (principal executive officer) |
Pursuant to the requirements of the Securities Exchange Act of 1934 and the Investment Company Act of 1940, this report has been signed below by the following persons on behalf of the registrant and in the capacities and on the dates indicated.
| | |
By (Signature and Title)* | | /s/ George R. Aylward |
| | George R. Aylward, President |
| | (principal executive officer) |
| | |
By (Signature and Title)* | | /s/ W. Patrick Bradley |
| | W. Patrick Bradley, Executive Vice President, Chief Financial Officer,
and Treasurer |
| | (principal financial officer) |
* Print the name and title of each signing officer under his or her signature.