UNITED STATES
SECURITIES AND EXCHANGE COMMISSION
Washington, D.C. 20549
FORM N-CSR
CERTIFIED SHAREHOLDER REPORT OF REGISTERED MANAGEMENT
INVESTMENT COMPANIES
Investment Company Act file number 811-00945
Virtus Equity Trust
(Exact name of registrant as specified in charter)
101 Munson Street
Greenfield, MA 01301-9668
(Address of principal executive offices) (Zip code)
Kevin J. Carr, Esq.
Senior Vice President, Chief Legal Officer, Counsel and Secretary for Registrant
100 Pearl Street
Hartford, CT 06103-4506
(Name and address of agent for service)
Registrant’s telephone number, including area code: (800) 243-1574
Date of fiscal year end: September 30
Date of reporting period: September 30, 2018
Form N-CSR is to be used by management investment companies to file reports with the Commission not later than 10 days after the transmission to stockholders of any report that is required to be transmitted to stockholders under Rule 30e-1 under the Investment Company Act of 1940 (17 CFR 270.30e-1). The Commission may use the information provided on Form N-CSR in its regulatory, disclosure review, inspection, and policymaking roles.
A registrant is required to disclose the information specified by Form N-CSR, and the Commission will make this information public. A registrant is not required to respond to the collection of information contained in Form N-CSR unless the Form displays a currently valid Office of Management and Budget (“OMB”) control number. Please direct comments concerning the accuracy of the information collection burden estimate and any suggestions for reducing the burden to Secretary, Securities and Exchange Commission, 450 Fifth Street, NW, Washington, DC 20549-0609. The OMB has reviewed this collection of information under the clearance requirements of 44 U.S.C. § 3507.
Item 1. Reports to Stockholders.
The Report to Shareholders is attached herewith.
| | |
ANNUAL REPORT VIRTUS EQUITY TRUST | |  |
September 30, 2018
|
Virtus KAR Capital Growth Fund |
|
Virtus KAR Global Quality Dividend Fund |
|
Virtus KAR Mid-Cap Core Fund |
|
Virtus KAR Mid-Cap Growth Fund |
|
Virtus KAR Small-Cap Core Fund |
|
Virtus KAR Small-Cap Growth Fund |
|
Virtus KAR Small-Cap Value Fund |
|
Virtus KAR Small-Mid Cap Core Fund |
|
Virtus Rampart Enhanced Core Equity Fund |
|
Virtus Tactical Allocation Fund |
Not FDIC Insured
No Bank Guarantee
May Lose Value

Table of Contents
Proxy Voting Procedures and Voting Record (Form N-PX)
The subadvisers vote proxies relating to portfolio securities in accordance with procedures that have been approved by the Board of Trustees of the Trust (“Trustees,” or the “Board”). You may obtain a description of these procedures, along with information regarding how the Funds voted proxies during the most recent 12-month period ended June 30, free of charge, by calling toll-free 1-800-243-1574. This information is also available through the Securities and Exchange Commission’s (the “SEC”) website at http://www.sec.gov.
Form N-Q Information
The Trust files a complete schedule of portfolio holdings for each Fund with the SEC for the first and third quarters of each fiscal year on Form N-Q. Form N-Q is available on the SEC’s website at http://www.sec.gov. Form N-Q may be reviewed and copied at the SEC’s Public Reference Room. Information on the operation of the SEC’s Public Reference Room can be obtained by calling toll-free 1-800-SEC-0330.
This report is not authorized for distribution to prospective investors in the Funds presented in this book unless preceded or accompanied by an effective prospectus which includes information concerning the sales charge, each Fund’s record and other pertinent information.
MESSAGE TO SHAREHOLDERS
To My Fellow Shareholders of Virtus Mutual Funds:
| | |
 | | I am pleased to present this annual report that reviews the performance of your fund for the 12 months ended September 30, 2018. U.S. economic growth and strong corporate earnings were consistent themes during the period, which began on an optimistic note with the sweeping tax overhaul that was signed into law at the end of 2017. As growth heated up, inflation fears caused stock markets to plunge in early February, ushering in the return of volatility after being conspicuously absent throughout 2017. Global trade war concerns sparked by the Trump administration’s tariff talk caused markets to remain unsettled into March before resuming |
an upward course through the spring and late summer. Meanwhile, persistent economic strength moved the Federal Reserve to hike its key interest rate four times in the period, most recently in late September, to end at 2.25%, its highest level in nearly a decade. For the 12 months ended September 30, 2018, U.S. large-cap stocks, as measured by the S&P 500® Index, returned 17.91%, outpacing small-cap stocks, which returned 15.24%, as measured by the Russell 2000® Index. Within international equities, performance was mixed with developed markets up 2.74%, as measured by the MSCI EAFE® Index (net), and emerging markets down 0.81%, as measured by the MSCI Emerging Markets Index (net). In the fixed income markets, the yield on the 10-year Treasury steadily climbed, to reach 3.05% at September 30, 2018, up from 2.33% at September 30, 2017. The broader U.S. fixed income market, as represented by the Bloomberg Barclays U.S. Aggregate Bond Index, which tracks Treasuries and other investment-grade debt securities, declined 1.22% for the 12 months. Non-investment grade bonds eked out a positive return of 3.05%, as measured by the Bloomberg Barclays U.S. Corporate High Yield Bond Index. Market uncertainty is an ever-present reminder of the importance of portfolio diversification, including exposure to traditional and alternative asset classes. While diversification cannot guarantee a profit or prevent a loss, owning a variety of asset classes may cushion your portfolio against inevitable market fluctuations. Your financial advisor can help you ensure that your portfolio is adequately diversified across asset classes and investment strategies, with a broad array of Virtus Funds available through your fund exchange privileges. These include distinctive equity, fixed income, international, and asset allocation funds managed by Virtus affiliates and select subadvisers. We invite you to learn more about the Virtus family of funds at Virtus.com. On behalf of our investment affiliates, thank you for entrusting the Virtus Funds with your assets. Should you have questions about your account or require assistance, please visit Virtus.com, or call our customer service team at 1-800-243-1574. We appreciate your business and remain committed to your long-term financial success. Sincerely, 
George R. Aylward President, Virtus Mutual Funds October 2018 |
Performance data quoted represents past results. Past performance is no guarantee of future results, and current performance may be higher or lower than the performance shown above.
1
VIRTUS EQUITY TRUST
DISCLOSURE OF FUND EXPENSES (Unaudited)
FOR THE SIX-MONTH PERIOD OF APRIL 1, 2018 TO SEPTEMBER 30, 2018
We believe it is important for you to understand the impact of costs on your investment. All mutual funds have operating expenses. As a shareholder of a Virtus Equity Trust Fund (each, a “Fund”) you may incur two types of costs; (1) transaction costs, including sales charges on purchases of Class A shares and contingent deferred sales charges on Class C shares; and (2) ongoing costs, including investment advisory fees, distribution, and other expenses. Class I shares and Class R6 shares are sold without a sales charge and do not incur distribution fees. Class R6 shares also do not incur shareholder servicing fees. For further information regarding applicable sales charges, see Note 1 in the Notes to Financial Statements. These examples are intended to help you understand your ongoing costs (in dollars) of investing in a Fund and to compare these costs with the ongoing costs of investing in other mutual funds. These examples are based on an investment of $1,000 invested at the beginning of the period and held for the entire six-month period. The Annualized Expense Ratios may be different from the expense ratios in the Financial Highlights which is for the fiscal year ended September 30, 2018.
Please note that the expenses shown in the accompanying tables are meant to highlight your ongoing costs only and do not reflect any transactional costs, such as sales charges or contingent deferred sales charges. Therefore, the accompanying tables are useful in comparing ongoing costs only, and will not help you determine the relative total costs of owning different funds. In addition, if these transactional costs were included, your costs would have been higher. The calculations assume no shares were bought or sold during the period. Your actual costs may have been higher or lower, depending on the amount of your investment and the timing of any purchases or redemptions.
Actual Expenses
The table below provides information about actual account values and actual expenses. You may use the information below, together with the amount you invested, to estimate the expenses that you paid over the period. Simply divide your account value by $1,000 (for example, an $8,600 account value divided by $1,000 = 8.6), then multiply the result by the number in the table under the heading “Expenses Paid During Period” to estimate the expenses you paid on your account during this period.
| | | | | | | | | | | | | | | | | | |
| | | | | Beginning
Account Value
April 1,
2018 | | | Ending
Account Value
September 30,
2018 | | | Annualized
Expense
Ratio | | | Expenses
Paid
During
Period* | |
KAR Capital Growth Fund | | Class A | | $ | 1,000.00 | | | $ | 1,081.90 | | | | 1.20 | % | | $ | 6.26 | |
| | Class C | | | 1,000.00 | | | | 1,077.40 | | | | 1.97 | | | | 10.26 | |
| | Class I | | | 1,000.00 | | | | 1,082.50 | | | | 0.98 | | | | 5.12 | |
| | Class R6 | | | 1,000.00 | | | | 1,083.70 | | | | 0.78 | | | | 4.07 | |
KAR Global Quality Dividend Fund | | Class A | | | 1,000.00 | | | | 1,044.60 | | | | 1.35 | | | | 6.92 | |
| | Class C | | | 1,000.00 | | | | 1,041.60 | | | | 2.09 | | | | 10.70 | |
| | Class I | | | 1,000.00 | | | | 1,046.00 | | | | 1.10 | | | | 5.64 | |
KAR Mid-Cap Core Fund | | Class A | | | 1,000.00 | | | | 1,088.80 | | | | 1.20 | | | | 6.28 | |
| | Class C | | | 1,000.00 | | | | 1,084.50 | | | | 1.95 | | | | 10.19 | |
| | Class I | | | 1,000.00 | | | | 1,090.00 | | | | 0.95 | | | | 4.98 | |
| | Class R6 | | | 1,000.00 | | | | 1,090.70 | | | | 0.87 | | | | 4.56 | |
KAR Mid-Cap Growth Fund | | Class A | | | 1,000.00 | | | | 1,146.00 | | | | 1.40 | | | | 7.53 | |
| | Class C | | | 1,000.00 | | | | 1,141.60 | | | | 2.15 | | | | 11.54 | |
| | Class I | | | 1,000.00 | | | | 1,147.10 | | | | 1.15 | | | | 6.19 | |
| | Class R6 | | | 1,000.00 | | | | 1,148.60 | | | | 0.90 | | | | 4.85 | |
KAR Small-Cap Core Fund | | Class A | | | 1,000.00 | | | | 1,085.20 | | | | 1.30 | | | | 6.80 | |
| | Class C | | | 1,000.00 | | | | 1,081.60 | | | | 2.02 | | | | 10.54 | |
| | Class I | | | 1,000.00 | | | | 1,086.60 | | | | 1.02 | | | | 5.34 | |
| | Class R6 | | | 1,000.00 | | | | 1,087.20 | | | | 0.94 | | | | 4.92 | |
KAR Small-Cap Growth Fund | | Class A | | | 1,000.00 | | | | 1,137.20 | | | | 1.36 | | | | 7.29 | |
| | Class C | | | 1,000.00 | | | | 1,133.10 | | | | 2.09 | | | | 11.18 | |
| | Class I | | | 1,000.00 | | | | 1,138.40 | | | | 1.10 | | | | 5.90 | |
| | Class R6 | | | 1,000.00 | | | | 1,139.10 | | | | 1.00 | | | | 5.36 | |
KAR Small-Cap Value Fund | | Class A | | | 1,000.00 | | | | 1,055.90 | | | | 1.26 | | | | 6.49 | |
| | Class C | | | 1,000.00 | | | | 1,052.20 | | | | 1.96 | | | | 10.08 | |
| | Class I | | | 1,000.00 | | | | 1,057.50 | | | | 0.99 | | | | 5.11 | |
| | Class R6 | | | 1,000.00 | | | | 1,057.50 | | | | 0.90 | | | | 4.64 | |
KAR Small-Mid Cap Core Fund | | Class A | | | 1,000.00 | | | | 1,101.00 | | | | 1.30 | | | | 6.85 | |
| | Class C | | | 1,000.00 | | | | 1,098.10 | | | | 2.05 | | | | 10.78 | |
| | Class I | | | 1,000.00 | | | | 1,103.10 | | | | 1.05 | | | | 5.54 | |
| | Class R6 | | | 1,000.00 | | | | 1,103.10 | | | | 0.97 | | | | 5.11 | |
2
VIRTUS EQUITY TRUST
DISCLOSURE OF FUND EXPENSES (Unaudited) (Continued)
FOR THE SIX-MONTH PERIOD OF APRIL 1, 2018 TO SEPTEMBER 30, 2018
| | | | | | | | | | | | | | | | | | |
| | | | | Beginning
Account Value
April 1,
2018 | | | Ending
Account Value
September 30,
2018 | | | Annualized
Expense
Ratio | | | Expenses
Paid
During
Period* | |
Rampart Enhanced Core Equity Fund | | Class A | | $ | 1,000.00 | | | $ | 1,127.50 | | | | 1.20 | % | | $ | 6.40 | |
| | Class C | | | 1,000.00 | | | | 1,123.00 | | | | 1.95 | | | | 10.38 | |
| | Class I | | | 1,000.00 | | | | 1,128.80 | | | | 0.95 | | | | 5.07 | |
| | Class R6 | | | 1,000.00 | | | | 1,128.80 | | | | 0.91 | | | | 4.86 | |
Tactical Allocation Fund | | Class A | | | 1,000.00 | | | | 1,037.30 | | | | 1.26 | | | | 6.44 | |
| | Class C | | | 1,000.00 | | | | 1,033.30 | | | | 2.04 | | | | 10.40 | |
| * | Expenses are equal to the relevant Fund’s, annualized expense ratio, which is net of waived fees and reimbursed expenses, if applicable, multiplied by the average account value over the period, multiplied by the number of days (183) expenses were accrued in the most recent fiscal half-year, then divided by 365 to reflect the one-half year period. |
Each Fund may invest in other funds and the annualized expense ratios noted above do not reflect fees and expenses associated with the underlying funds. If such fees and expenses had been included, the expense ratios would have been higher.
You can find more information about a Fund’s expenses in the Financial Statements section that follows. For additional information on operating expenses and other shareholder costs, refer to that Fund’s prospectus.
3
VIRTUS EQUITY TRUST
DISCLOSURE OF FUND EXPENSES (Unaudited) (Continued)
FOR THE SIX-MONTH PERIOD OF APRIL 1, 2018 TO SEPTEMBER 30, 2018
Hypothetical Example for Comparison Purposes
The table below provides information about hypothetical account values and hypothetical expenses based on each Fund’s actual expense ratio and an assumed rate of return of 5% per year before expenses, which is not your Fund’s actual return. The hypothetical account values and expenses may not be used to estimate the actual ending account balance or expenses you paid for the period. You may use this information to compare this 5% hypothetical example with the 5% hypothetical examples that appear in the shareholder reports of other mutual funds.
| | | | | | | | | | | | | | | | | | |
| | | | | Beginning
Account Value
April 1,
2018 | | | Ending
Account Value
September 30,
2018 | | | Annualized
Expense
Ratio | | | Expenses
Paid
During
Period* | |
KAR Capital Growth Fund | | Class A | | $ | 1,000.00 | | | $ | 1,019.05 | | | | 1.20 | % | | $ | 6.07 | |
| | Class C | | | 1,000.00 | | | | 1,015.19 | | | | 1.97 | | | | 9.95 | |
| | Class I | | | 1,000.00 | | | | 1,020.16 | | | | 0.98 | | | | 4.96 | |
| | Class R6 | | | 1,000.00 | | | | 1,021.16 | | | | 0.78 | | | | 3.95 | |
KAR Global Quality Dividend Fund | | Class A | | | 1,000.00 | | | | 1,018.30 | | | | 1.35 | | | | 6.83 | |
| | Class C | | | 1,000.00 | | | | 1,014.59 | | | | 2.09 | | | | 10.56 | |
| | Class I | | | 1,000.00 | | | | 1,019.55 | | | | 1.10 | | | | 5.57 | |
KAR Mid-Cap Core Fund | | Class A | | | 1,000.00 | | | | 1,019.05 | | | | 1.20 | | | | 6.07 | |
| | Class C | | | 1,000.00 | | | | 1,015.29 | | | | 1.95 | | | | 9.85 | |
| | Class I | | | 1,000.00 | | | | 1,020.31 | | | | 0.95 | | | | 4.81 | |
| | Class R6 | | | 1,000.00 | | | | 1,020.71 | | | | 0.87 | | | | 4.41 | |
KAR Mid-Cap Growth Fund | | Class A | | | 1,000.00 | | | | 1,018.05 | | | | 1.40 | | | | 7.08 | |
| | Class C | | | 1,000.00 | | | | 1,014.29 | | | | 2.15 | | | | 10.86 | |
| | Class I | | | 1,000.00 | | | | 1,019.30 | | | | 1.15 | | | | 5.82 | |
| | Class R6 | | | 1,000.00 | | | | 1,020.56 | | | | 0.90 | | | | 4.56 | |
KAR Small-Cap Core Fund | | Class A | | | 1,000.00 | | | | 1,018.55 | | | | 1.30 | | | | 6.58 | |
| | Class C | | | 1,000.00 | | | | 1,014.94 | | | | 2.02 | | | | 10.20 | |
| | Class I | | | 1,000.00 | | | | 1,019.95 | | | | 1.02 | | | | 5.16 | |
| | Class R6 | | | 1,000.00 | | | | 1,020.36 | | | | 0.94 | | | | 4.76 | |
KAR Small-Cap Growth Fund | | Class A | | | 1,000.00 | | | | 1,018.25 | | | | 1.36 | | | | 6.88 | |
| | Class C | | | 1,000.00 | | | | 1,014.59 | | | | 2.09 | | | | 10.56 | |
| | Class I | | | 1,000.00 | | | | 1,019.55 | | | | 1.10 | | | | 5.57 | |
| | Class R6 | | | 1,000.00 | | | | 1,020.05 | | | | 1.00 | | | | 5.06 | |
KAR Small-Cap Value Fund | | Class A | | | 1,000.00 | | | | 1,018.75 | | | | 1.26 | | | | 6.38 | |
| | Class C | | | 1,000.00 | | | | 1,015.24 | | | | 1.96 | | | | 9.90 | |
| | Class I | | | 1,000.00 | | | | 1,020.10 | | | | 0.99 | | | | 5.01 | |
| | Class R6 | | | 1,000.00 | | | | 1,020.56 | | | | 0.90 | | | | 4.56 | |
KAR Small-Mid Cap Core Fund | | Class A | | | 1,000.00 | | | | 1,018.55 | | | | 1.30 | | | | 6.58 | |
| | Class C | | | 1,000.00 | | | | 1,014.79 | | | | 2.05 | | | | 10.35 | |
| | Class I | | | 1,000.00 | | | | 1,019.80 | | | | 1.05 | | | | 5.32 | |
| | Class R6 | | | 1,000.00 | | | | 1,020.21 | | | | 0.97 | | | | 4.91 | |
Rampart Enhanced Core Equity Fund | | Class A | | | 1,000.00 | | | | 1,019.05 | | | | 1.20 | | | | 6.07 | |
| | Class C | | | 1,000.00 | | | | 1,015.29 | | | | 1.95 | | | | 9.85 | |
| | Class I | | | 1,000.00 | | | | 1,020.31 | | | | 0.95 | | | | 4.81 | |
| | Class R6 | | | 1,000.00 | | | | 1,020.51 | | | | 0.91 | | | | 4.61 | |
Tactical Allocation Fund | | Class A | | | 1,000.00 | | | | 1,018.75 | | | | 1.26 | | | | 6.38 | |
| | Class C | | | 1,000.00 | | | | 1,014.84 | | | | 2.04 | | | | 10.30 | |
| * | Expenses are equal to the relevant Fund’s annualized expense ratio, which is net of waived fees and reimbursed expenses, if applicable, multiplied by the average account value over the period, multiplied by the number of days (183) expenses were accrued in the most recent fiscal half-year, then divided by 365 to reflect the one-half year period. |
Each Fund may invest in other funds, and the annualized expense ratios noted above do not reflect fees and expenses associated with the underlying funds. If such fees and expenses had been included, the expense ratios would have been higher.
You can find more information about a Fund’s expenses in the Financial Statements section that follows. For additional information on operating expenses and other shareholder costs, refer to that Fund’s prospectus.
4
VIRTUS EQUITY TRUST
KEY INVESTMENT TERMS (Unaudited)
SEPTEMBER 30, 2018
American Depositary Receipt (“ADR”)
Represents shares of foreign companies traded in U.S. dollars on U.S. exchanges that are held by a U.S. bank or a trust. Foreign companies use ADRs in order to make it easier for Americans to buy their shares.
Bloomberg Barclays U.S. Aggregate Bond Index
The Bloomberg Barclays U.S. Aggregate Bond Index measures the U.S. investment-grade fixed-rate bond market. The index is calculated on a total return basis. The index is unmanaged, its returns do not reflect any fees, expenses, or sales charges, and it is not available for direct investment.
Bloomberg Barclays U.S. Corporate High Yield Bond Index
The Bloomberg Barclays U.S. Corporate High Yield Bond Index measures the U.S. dollar-denominated, high yield, fixed-rate corporate bond market. The index is calculated on a total return basis. The index is unmanaged, its returns do not reflect any fees, expenses, or sales charges, and it is not available for direct investment.
Chicago Board Options Exchange Volatility Index® (“CBOE VIX®”)
The CBOE VIX® shows the market’s expectation of 30-day volatility. It is constructed using the implied volatilities of a wide range of S&P 500® Index options. This volatility is meant to be forward looking and is calculated from both calls and puts. The CBOE VIX® is a widely used measure of market risk and is often referred to as the “investor fear gauge.” The index is unmanaged, its returns do not reflect any fees, expenses, or sales charges, and it is not available for direct investment
Exchange-Traded Funds (“ETF”)
An open-end fund that is traded on a stock exchange. Most ETFs have a portfolio of stocks or bonds that track a specific market index.
Federal Reserve (the “Fed”)
The Central Bank of the U.S., the Fed is responsible for controlling money supply, interest rates and credit with the goal of keeping the U.S. economy and currency stable. Governed by a seven-member board, the system includes 12 regional Federal Reserve Banks, 25 Branches and all national and state banks that are part of the system.
Global Quality Dividend Linked Benchmark
The Global Quality Dividend Linked Benchmark consists of the Russell Developed Large Cap Index (net), a free-float market capitalization-weighted index constructed to provide a comprehensive and unbiased barometer for the large-cap segment in the developed world, calculated on a total return basis with net dividends reinvested. The index is unmanaged, its returns do not reflect any fees, expenses, or sales charges, and is not available for direct investment. Performance of the Global Quality Dividend Linked Benchmark prior to 2/1/2017 is that of the Russell 1000® Value Index.
Gross Domestic Product (“GDP”)
The gross domestic product represents the market value of all goods and services produced by the economy during the period measured, including personal consumption, government purchases, private inventories, paid-in construction costs and the foreign trade balance.
London Interbank Offered Rate (LIBOR)
A benchmark rate that some of the world’s leading banks charge each other for short-term loans and that serves as the first step to calculating interest rates on various loans throughout the world.
MSCI EAFE® Index (net)
The MSCI EAFE® (“Europe, Australasia, Far East”) Index (net) is a free float-adjusted market capitalization-weighted index that measures developed foreign market equity performance, excluding the U.S. and Canada. The index is calculated on a total return basis with net dividends reinvested. The index is unmanaged, its returns do not reflect any fees, expenses, or sales charges, and it is not available for direct investment.
MSCI Emerging Markets Index (net)
The MSCI Emerging Markets Index (net) is a free float-adjusted market capitalization-weighted index designed to measure equity market performance in the global emerging markets. The index is calculated on a total return basis with net dividends reinvested. The index is unmanaged, its returns do not reflect any fees, expenses, or sales charges, and it is not available for direct investment.
5
VIRTUS EQUITY TRUST
KEY INVESTMENT TERMS (Unaudited) (Continued)
SEPTEMBER 30, 2018
Payment-in-Kind Security (“PIK”)
A bond which pays interest in the form of additional bonds, or preferred stock which pays dividends in the form of additional preferred stock.
Real Estate Investment Trust (“REIT”)
A publicly traded company that owns, develops and operates income-producing real estate such as apartments, office buildings, hotels, shopping centers and other commercial properties.
Russell 1000® Growth Index
The Russell 1000® Growth Index is a market capitalization-weighted index of growth-oriented stocks of the 1,000 largest companies in the Russell Universe, which comprises the 3,000 largest U.S. companies. The index is calculated on a total return basis with dividends reinvested. The index is unmanaged, its returns do not reflect any fees, expenses, or sales charges, and it is not available for direct investment.
Russell 1000® Value Index
The Russell 1000® Value Index is a market capitalization-weighted index of value-oriented stocks of the 1,000 largest companies in the Russell Universe, which comprises the 3,000 largest U.S. companies. The index is calculated on a total return basis with dividends reinvested. The index is unmanaged, its returns do not reflect any fees, expenses, or sales charges, and it is not available for direct investment.
Russell 2000® Growth Index
The Russell 2000® Growth Index is a market capitalization-weighted index of growth-oriented stocks of the smallest 2,000 companies in the Russell Universe, which comprises the 3,000 largest U.S. companies. The index is calculated on a total return basis with dividends reinvested. The index is unmanaged, its returns do not reflect any fees, expenses, or sales charges, and it is not available for direct investment.
Russell 2000® Index
The Russell 2000® Index is a market capitalization-weighted index of the 2,000 smallest companies in the Russell Universe, which comprises the 3,000 largest U.S. companies. The index is calculated on a total return basis with dividends reinvested. The index is unmanaged, its returns do not reflect any fees, expenses, or sales charges, and it is not available for direct investment.
Russell 2500TM Index
The Russell 2500TM Index is a market capitalization-weighted index of the 2,500 smallest companies in the Russell Universe, which comprises the 3,000 largest U.S. companies. The index is calculated on a total return basis with dividends reinvested. The index is unmanaged, its returns do not reflect any fees, expenses, or sales charges, and is not available for direct investment.
Russell 2000® Value Index
The Russell 2000® Value Index is a market capitalization-weighted index of value-oriented stocks of the smallest 2,000 companies in the Russell Universe, which comprises the 3,000 largest U.S. companies. The index is calculated on a total return basis with dividends reinvested. The index is unmanaged, its returns do not reflect any fees, expenses, or sales charges, and it is not available for direct investment.
Russell Developed Large Cap Index (net)
The Russell Developed Large Cap Index (net) is a free-float market capitalization-weighted index constructed to provide a comprehensive and unbiased barometer for the large-cap segment in the developed world. The index is calculated on a total return basis with net dividends reinvested. The index is unmanaged, its returns do not reflect any fees, expenses, or sales charges, and it is not available for direct investment.
Russell Midcap® Growth Index
The Russell Midcap® Growth Index is a market capitalization-weighted index of medium-capitalization, growth-oriented stocks of U.S. companies. The index is calculated on a total return basis with dividends reinvested. The index is unmanaged, its returns do not reflect any fees, expenses, or sales charges, and it is not available for direct investment.
6
VIRTUS EQUITY TRUST
KEY INVESTMENT TERMS (Unaudited) (Continued)
SEPTEMBER 30, 2018
Russell Midcap® Index
The Russell Midcap® Index is a market capitalization-weighted index of medium-capitalization stocks of U.S. companies. The index is calculated on a total return basis with dividends reinvested. The index is unmanaged, its returns do not reflect any fees, expenses, or sales charges, and it is not available for direct investment.
S&P 500® Index
The S&P 500® Index is a free-float market capitalization-weighted index of 500 of the largest U.S. companies. The index is calculated on a total return basis with dividends reinvested. The index is unmanaged, its returns do not reflect any fees, expenses, or sales charges, and it is not available for direct investment.
Sponsored ADR (“American Depositary Receipt”)
An ADR which is issued with the cooperation of the company whose stock will underlie the ADR. Sponsored ADRs generally carry the same rights normally given to stockholders, such as voting rights. ADRs must be sponsored to be able to trade on a major U.S. exchange such as the New York Stock Exchange (“NYSE”).
Tactical Allocation Fund Linked Benchmark
The Tactical Allocation Fund Linked Benchmark consists of 45% Russell 1000® Growth Index (a market capitalization-weighted index of growth-oriented stocks of the 1,000 largest companies in the Russell Universe, which comprises the 3,000 largest U.S. companies, calculated on a total return basis with dividends reinvested), 15% MSCI EAFE® Index (a free float-adjusted market capitalization-weighted index that measures developed foreign market equity performance, excluding the U.S. and Canada, calculated on a total return basis with net dividends reinvested), and 40% Bloomberg Barclays U.S. Aggregate Bond Index (an index that measures the U.S. investment grade fixed rate bond market, calculated on a total return basis). The index is unmanaged, its returns do not reflect any fees, expenses, or sales charges, and is not available for direct investment. Performance of the Tactical Allocation Fund Linked Benchmark prior to 9/7/2016 represents an allocation consisting of 50% S&P 500® Index and 50% Bloomberg Barclays U.S. Aggregate Bond Index.
7
| | |
KAR Capital Growth Fund Fund Summary (Unaudited) | | Ticker Symbols: A Share: PSTAX C Share: SSTFX I Share: PLXGX R6 Share: VCGRX |
Portfolio Manager Commentary by Kayne Anderson Rudnick Investment Management, LLC
| ⬛ | | The Fund is diversified and has an investment objective of long-term capital growth. There is no guarantee that the Fund will meet its objective. |
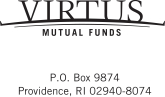
| ⬛ | | For the fiscal year ended September 30, 2018, the Fund’s Class A shares at NAV returned 19.56%, Class C shares at NAV returned 18.58%, Class I shares at NAV returned 19.81%, and Class R6 shares at NAV from January 30, 2018 (inception date) through September 30, 2018, returned 3.14%*. For the fiscal year ended September 30, 2018, the Russell 1000® Growth Index, which serves as both the Fund’s broad-based and style-specific benchmark appropriate the comparison, returned 26.30%. |
* Returns less than 1 year are not annualized.
All performance figures assume reinvestment of distributions and exclude the effect of sales changes. Performance data quoted represents past results. Past performance is no guarantee of future results, and current performance may be higher or lower than the performance shown above. Investment return and principal value will fluctuate so your shares, when redeemed, may be worth more or less than their original cost. Please visit Virtus.com for performance data current to the most recent month-end.
How did the markets perform during the Fund’s fiscal year ended September 30, 2018?
Despite increased volatility, U.S. equities continued to march ahead during the fiscal year, with the S&P 500® Index returning 17.91% for the 12-month period. Smaller stocks, as represented by the Russell 2000® Index, performed strongly as well, rising 15.24%. Growth stocks outperformed their value counterparts for the period, though both categories rose by double digits. Foreign markets struggled in comparison, with the MSCI EAFE® Index gaining 2.74% and the MSCI Emerging Markets Index down 0.81% for the period.
The Russell 1000® Growth Index rose 26.30% for the 12 months through September 30, 2018. All sectors within the index were positive, led by the consumer discretionary and information technology sectors
with gains of 43.06% and 41.14%, respectively. The weakest performing sector was materials, up 2.48%.
Key events that drove markets in the past year included a correction that rattled U.S. equity markets in early 2018 after a calm 2017. While the bout of volatility set major indices back a step, stocks soon recovered. They continued to advance during the fiscal year thanks to strong earnings and robust business and economic activity at home, including expansion in service sectors and solid gross domestic product (GDP) growth.
Market strength continued – though not without volatility – despite the introduction of new trade tariffs earlier in 2018 and the continued escalation of tariff-related tensions, particularly with China. Prolonged negotiations and uncertainty put pressure on emerging market stocks during the 12 months. This, paired with a general slowing in Europe and viewed against continued strength in the U.S., seemed to indicate that “global synchronized recovery” was not an apt description for the environment.
What factors affected the Fund’s performance during its fiscal year?
The Fund underperformed the Russell 1000® Growth Index for the 12 months ended September 30, 2018. Factors negatively affecting the Fund included weak stock selection in the consumer discretionary sector and an underweight in information technology. Strong stock selection in industrials and materials helped offset losses.
The stocks that contributed the most to the year’s gains were Amazon and Netflix.
| ⬛ | | Amazon continued on its powerful growth trajectory, driven by its wide-moat e-commerce business and dominant web services offering. Amazon’s advertising capabilities helped propel the company to outpace second-quarter revenue and earnings expectations by a gigantic margin. In addition, Amazon showed operating leverage on a wide variety of expense items, including fulfillment, technology, content and marketing, hinting at the potential for meaningful margin expansion down the road. |
| ⬛ | | Netflix is a global leader in on-demand entertainment, with over 125 million subscribers, more |
| | | than 55% of whom are outside the U.S. Net subscriber additions continued to greatly outpace expectations due to successful content creation, notable early success in cable and telecommunications distribution channels, and highly effective local advertising. Margins surprised to the upside, driven by rapid improvements in international profitability even as subscriber growth was a little uneven. |
The positions that detracted the most from performance were Celgene and Ctrip.com.
| ⬛ | | Celgene was aggressive in deploying capital to bolster future growth, but the results of its pipeline programs severely disappointed. Most recently, its REVLIMID failed in a phase-3 follicular lymphoma trial, but that paled in comparison to the failure of GED-0301 for Crohn’s disease, which subsequently forced Celgene to lower its 2020 guidance. We lost faith that the company would be able to weather its $15 billion revenue cliff, and we exited the position. |
| ⬛ | | Ctrip.com has consolidated and monopolized the high-end online travel market in China. It came under fire as regulators forced the company to unbundle products such as trip insurance that it automatically added to ticket purchases. The company was also affected by coordinated reductions in domestic commissions. We believe both of those issues are well understood. On the flip side, the company’s outbound travel business experienced a boom, with advantaged inventory and pricing focused on its core high-end consumer. As only a very small percent of Chinese citizens have ever been outside the country, we believe demand could drive future growth. Therefore, we continued to hold the position in the Fund at the end of the period. |
The preceding information is the opinion of portfolio management only through the end of the period stated on the cover. Any such opinions are subject to change at any time based upon market or other conditions and should not be relied upon as investment advice. Past performance is no guarantee of future results, and there is no guarantee that market forecasts will be realized.
Equity Securities: The market price of equity securities may be adversely affected by financial
For information regarding the indexes and certain investment terms, see the Key Investment Terms starting on page 5.
8
| | |
| KAR Capital Growth Fund (Continued) | | |
market, industry, or issuer-specific events. Focus on a particular style or on small or medium-sized companies may enhance that risk.
Limited Number of Investments: Because the Fund has a limited number of securities, it may be more susceptible to factors adversely affecting its securities than a less concentrated fund.
Industry/Sector Concentration: A fund that focuses its investments in a particular industry or sector will be more sensitive to conditions that affect that industry or sector than a non-concentrated fund.
Prospectus: For additional information on risks, please see the Fund’s prospectus.
| | | | |
| |
| Asset Allocations | |
| |
The following table presents asset allocations within certain sectors as a percentage of total investments as of September 30, 2018. | |
Information Technology | | | 39 | % |
Consumer Discretionary | | | 26 | |
Health Care | | | 10 | |
Industrials | | | 8 | |
Financials | | | 6 | |
Consumer Staples | | | 4 | |
Energy | | | 4 | |
Other (includes Securities Lending Collateral) | | | 3 | |
| | | | | |
Total | | | 100 | % |
| | | | | |
For information regarding the indexes and certain investment terms, see the Key Investment Terms starting on page 5.
9
KAR Capital Growth Fund (Continued)
| | | | | | | | | | | | | | | | | | | | |
| Average Annual Total Returns1 for periods ended 9/30/18 | | | | | | | |
| | | 1 year | | | 5 years | | | 10 years | | | Since
Inception | | | Inception
Date | |
| Class A shares at NAV2 | | | 19.56 | % | | | 14.81 | % | | | 11.81 | % | | | — | | | | — | |
| Class A shares at POP3,4 | | | 12.68 | | | | 13.46 | | | | 11.15 | | | | — | | | | — | |
| Class C shares at NAV2 and with CDSC4 | | | 18.58 | | | | 13.94 | | | | 10.96 | | | | — | | | | — | |
| Class I shares at NAV | | | 19.81 | | | | 15.10 | | | | 12.10 | | | | — | | | | — | |
| Class R6 shares at NAV | | | — | | | | — | | | | — | | | | 3.14 | % | | | 1/30/18 | |
| Russell 1000® Growth Index | | | 26.30 | | | | 16.58 | | | | 14.31 | | | | 9.57 | 5 | | | | |
Fund Expense Ratios6: Class A shares: 1.29%; Class C shares: 2.04% Class I shares: 1.04%; Class R6 shares: Gross 1.01%, Net 0.78%.
All returns represent past performance which is no guarantee of future results. Current performance may be higher or lower than the performance shown. The investment return and principal value of an investment will fluctuate so that an investor’s shares, when redeemed, may be worth more or less than their original cost. The above table and graph below do not reflect the deduction of taxes that a shareholder would pay on fund distributions or the redemption of fund shares. Please visit Virtus.com for performance data current to the most recent month-end.
| 1 | Total returns are historical and include changes in share price and the reinvestment of both dividends and capital gain distributions. |
| 2 | “NAV” (Net Asset Value) total returns do not include the effect of any sales charge. |
| 3 | “POP” (Public Offering Price) total returns include the effect of the maximum front-end 5.75% sales charge. |
| 4 | “CDSC” (contingent deferred sales charge) is applied to redemptions of certain classes of shares that do not have a sales charge applied at the time of purchase. CDSC charges for certain redemptions of Class A shares made within 18 months of a finder’s fee being paid and all Class C shares are 1% within the first year and 0% thereafter. |
| 5 | The since inception index return is from the inception date of Class R6 shares. |
| 6 | The expense ratios of the Fund are set forth according to the prospectus for the Fund effective March 6, 2018, as supplemented and revised, and may differ from the expense ratios disclosed in the Financial Highlights tables in this report. See the Financial Highlights for more current expense ratios. Net Expense: Expenses reduced by a contractual fee waiver, in effect through March 31, 2019. Gross Expense: Does not reflect the effect of the fee waiver. Expense ratios include fees and expenses associated with the underlying funds. |
Growth of $10,000 for periods ended 9/30
This chart assumes an initial investment of $10,000 made on September 30, 2008, for Class A shares, Class C shares, and Class I shares including any applicable sales charges or fees. The performance of the other share class may be greater or less than that shown based on differences in inception date, fees and sales charges. Performance assumes reinvestment of dividends and capital gain distributions.
The index is unmanaged and not available for direct investment; therefore, its performance does not reflect the expenses associated with active management of an actual portfolio.
For information regarding the indexes and certain investment terms, see the Key Investment Terms starting on page 5.
10
| | |
KAR Global Quality Dividend Fund Fund Summary (Unaudited) | | Ticker Symbols: A Share: PPTAX C Share: PPTCX I Share: PIPTX |
Portfolio Manager Commentary by Kayne Anderson Rudnick Investment Management, LLC
| ⬛ | | The Fund is diversified and has an investment objective of total return, consisting of both capital appreciation and current income. There is no guarantee that the Fund will meet its objective. |
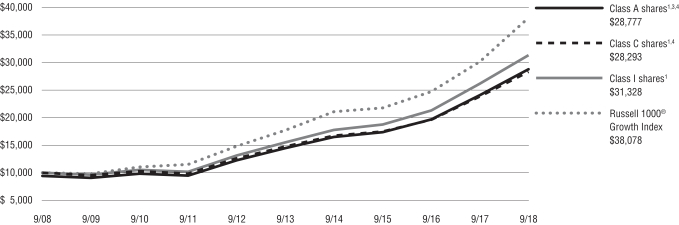
| ⬛ | | For the fiscal year ended September 30, 2018, the Fund’s Class A shares at NAV returned 4.24% Class C shares at NAV returned 3.56% and Class I shares at NAV returned 4.56%. For the same period, the Russell Developed Large Cap Index (net), which serves as the Fund’s broad-based index returned 11.27% and the Global Quality Dividend Linked Benchmark, the Fund’s style-specific Index, returned 11.27%. |
All performance figures assume reinvestment of distributions and exclude the effect of sales changes. Performance data quoted represents past results. Past performance is no guarantee of future results, and current performance may be higher or lower than the performance shown above. Investment return and principal value will fluctuate so your shares, when redeemed, may be worth more or less than their original cost. Please visit Virtus.com for performance data current to the most recent month-end.
How did the markets perform during the Fund’s fiscal year ended September 30, 2018?
Despite increased volatility, U.S. equities continued to march ahead during the fiscal year, with the S&P 500® Index returning 17.91% for the 12-month period. Smaller stocks, as represented by the Russell 2000® Index, performed strongly as well, rising 15.24%. Growth stocks outperformed their value counterparts for the period, though both categories rose by double digits. Foreign markets struggled in comparison, with the MSCI EAFE® Index gaining 2.74% and the MSCI Emerging Markets Index down 0.81% for the period.
The Russell Developed Large Cap Index was up 11.27% for the 12 months through September 30, 2018. All sectors within the index were positive, led by the telecommunication services and information technology sectors, which gained 34.20% and 31.69%, respectively. The utilities sector was the weakest performer, returning 1.67%.
Key events that drove markets in the past year included a correction that rattled U.S. equity markets in early 2018 after a calm 2017. While the bout of volatility set major indices back a step, stocks soon recovered. They continued to advance during the fiscal year thanks to strong earnings and robust business and economic activity at home, including expansion in service sectors and solid gross domestic product (GDP) growth.
Market strength continued – though not without volatility – despite the introduction of new trade tariffs earlier in 2018 and the continued escalation of tariff-related tensions, particularly with China. Prolonged negotiations and uncertainty put pressure on emerging market stocks during the 12 months. This, paired with a general slowing in Europe and viewed against continued strength in the U.S., seemed to indicate that “global synchronized recovery” was not an apt description for the environment.
What factors affected the Fund’s performance during its fiscal year?
The Fund underperformed the Russell Developed Large Cap Index for the 12 months ended September 30, 2018. An underweight position in information technology and weak stock selection in communication services weighed on performance. Losses were offset somewhat by strong stock selection in the real estate and financials sectors.
The stocks that contributed the most to the year’s gains were Royal Dutch Shell and Total SA.
| ⬛ | | Royal Dutch Shell saw higher energy prices contribute to strong cash flow and outperformance. The company strengthened its balance sheet over the past several years, which positioned it to return capital to shareholders. |
| ⬛ | | Total benefited from higher energy prices and the ramp-up of new projects, which contributed to strong cash flow and to outperformance. |
Positions that detracted the most from performance were HSBC Holdings and BCE.
| ⬛ | | HSBC’s shares were hurt by the negative implications of a U.S.-China trade war and the impact on the company’s Asian operations. |
| ⬛ | | Concerns about a potentially more difficult operating environment weighed on BCE shares despite the company’s strong operational results and a 5% increase in its dividend. |
The preceding information is the opinion of portfolio management only through the end of the period stated on the cover. Any such opinions are subject to change at any time based upon market or other conditions and should not be relied upon as investment advice. Past performance is no guarantee of future results, and there is no guarantee that market forecasts will be realized.
Equity Securities: The market price of equity securities may be adversely affected by financial market, industry, or issuer-specific events. Focus on a particular style or on small or medium-sized companies may enhance that risk.
Limited Number of Investments: Because the Fund has a limited number of securities, it may be more susceptible to factors adversely affecting its securities than a less concentrated fund.
Industry/Sector Concentration: A fund that focuses its investments in a particular industry or sector will be more sensitive to conditions that affect that industry or sector than a non-concentrated fund.
Prospectus: For additional information on risks, please see the Fund’s prospectus.
| | | | |
| |
| Asset Allocations | |
| |
The following table presents asset allocations within certain sectors as a percentage of total investments as of September 30, 2018. | |
Financials | | | 19 | % |
Telecommunication Services | | | 12 | |
Consumer Staples | | | 11 | |
Energy | | | 11 | |
Health Care | | | 10 | |
Real Estate | | | 9 | |
Utilities | | | 8 | |
Other (includes Securities Lending Collateral) | | | 20 | |
| | | | | |
Total | | | 100 | % |
| | | | | |
For information regarding the indexes and certain investment terms, see the Key Investment Terms starting on page 5.
11
KAR Global Quality Dividend Fund (Continued)
| | | | | | | | | | | | |
| Average Annual Total Returns1 for periods ended 9/30/18 | | | | |
| | | 1 year | | | 5 years | | | 10 years | |
| Class A shares at NAV2 | | | 4.24 | % | | | 7.94 | % | | | 8.21 | % |
| Class A shares at POP3,4 | | | -1.76 | | | | 6.67 | | | | 7.57 | |
| Class C shares at NAV2 and with CDSC4 | | | 3.56 | | | | 7.15 | | | | 7.40 | |
| Class I shares at NAV | | | 4.56 | | | | 8.21 | | | | 8.49 | |
| Russell Developed Large Cap Index (net) | | | 11.27 | | | | 9.40 | | | | 8.81 | |
| Global Quality Dividend Linked Benchmark | | | 11.27 | | | | 12.33 | | | | 10.58 | |
Fund Expense Ratios5: Class A shares: Gross 1.55%, Net 1.35%; Class C shares: Gross 2.30%, Net 2.10%; Class I shares: Gross 1.33%, Net 1.10%.
All returns represent past performance which is no guarantee of future results. Current performance may be higher or lower than the performance shown. The investment return and principal value of an investment will fluctuate so that an investor’s shares, when redeemed, may be worth more or less than their original cost. The above table and graph below do not reflect the deduction of taxes that a shareholder would pay on fund distributions or the redemption of fund shares. Please visit Virtus.com for performance data current to the most recent month-end.
| 1 | Total returns are historical and include changes in share price and the reinvestment of both dividends and capital gain distributions. |
| 2 | “NAV” (Net Asset Value) total returns do not include the effect of any sales charge. |
| 3 | “POP” (Public Offering Price) total returns include the effect of the maximum front-end 5.75% sales charge. |
| 4 | “CDSC” (contingent deferred sales charge) is applied to redemptions of certain classes of shares that do not have a sales charge applied at the time of purchase. CDSC charges for certain redemptions of Class A shares made within 18 months of a finder’s fee being paid and all Class C shares are 1% within the first year and 0% thereafter. |
| 5 | The expense ratios of the Fund are set forth according to the prospectus for the Fund effective March 6, 2018, as supplemented and revised, and may differ from the expense ratios disclosed in the Financial Highlights tables in this report. See the Financial Highlights for more current expense ratios. Net Expense: Expenses reduced by a contractual fee waiver, in effect through March 31, 2019. Gross Expense: Does not reflect the effect of the fee waiver. Expense ratios include fees and expenses associated with the underlying funds. |
Growth of $10,000 for periods ended 9/30
This chart assumes an initial investment of $10,000 made on September 30, 2008, for Class A shares, Class C shares, and Class I shares including any applicable sales charges or fees. Performance assumes reinvestment of dividends and capital gain distributions.
The indexes are unmanaged and not available for direct investment; therefore, their performance does not reflect the expenses associated with active management of an actual portfolio.
For information regarding the indexes and certain investment terms, see the Key Investment Terms starting on page 5.
12
| | |
KAR Mid-Cap Core Fund Fund Summary (Unaudited) | | Ticker Symbols: A Share: VMACX C Share: VMCCX I Share: VIMCX R6 Share: VRMCX |
Portfolio Manager Commentary by Kayne Anderson Rudnick Investment Management, LLC
| ⬛ | | The Fund is diversified and has an investment objective of long-term capital appreciation. There is no guarantee that the Fund will meet its objective. |
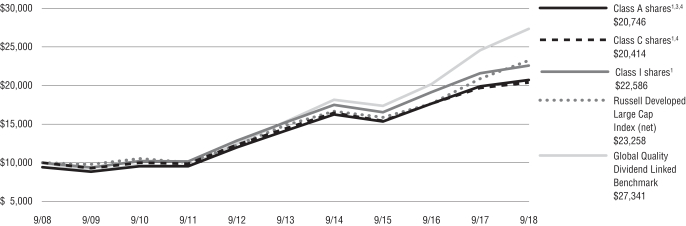
| ⬛ | | For the fiscal year ended September 30, 2018, the Fund’s Class A shares at NAV returned 20.61%, Class C shares at NAV returned 19.71%, Class I shares at NAV returned 20.93%, and Class R6 shares at NAV from January 30, 2018 (inception date) through September 30, 2018, returned 4.58%*. For the fiscal year ended September 30, 2018, the Russell Midcap® Index, which serves as both the Fund’s broad-based and style-specific benchmark appropriate the comparison, returned 13.98%. |
* Returns less than 1 year are not annualized.
All performance figures assume reinvestment of distributions and exclude the effect of sales changes. Performance data quoted represents past results. Past performance is no guarantee of future results, and current performance may be higher or lower than the performance shown above. Investment return and principal value will fluctuate so your shares, when redeemed, may be worth more or less than their original cost. Please visit Virtus.com for performance data current to the most recent month-end.
How did the markets perform during the Fund’s fiscal year ended September 30, 2018?
Despite increased volatility, U.S. equities continued to march ahead during the fiscal year, with the S&P 500® Index returning 17.91% for the 12-month period. Smaller stocks, as represented by the Russell 2000® Index, performed strongly as well, rising 15.24%. Growth stocks outperformed their value counterparts for the period, though both categories rose by double digits. Foreign markets struggled in comparison, with the MSCI EAFE® Index gaining 2.74% and the MSCI Emerging Markets Index down 0.81% for the period.
The Russell Midcap® Index was up 13.98% for the 12 months through September 30, 2018. Technology was the best performing sector within the index, rising 26.49%. Other sectors with strong returns
included health care (23.48%), energy (18.53%), and producer durables (16.02%). The materials and processing sector had the lowest gain, up 2.43%.
Key events that drove markets in the past year included a correction that rattled U.S. equity markets in early 2018 after a calm 2017. While the bout of volatility set major indices back a step, stocks soon recovered. They continued to advance during the fiscal year thanks to strong earnings and robust business and economic activity at home, including expansion in service sectors and solid gross domestic product (GDP) growth.
Market strength continued – though not without volatility – despite the introduction of new trade tariffs earlier in 2018 and the continued escalation of tariff-related tensions, particularly with China. Prolonged negotiations and uncertainty put pressure on emerging market stocks during the 12 months. This, paired with a general slowing in Europe and viewed against continued strength in the U.S., seemed to indicate that “global synchronized recovery” was not an apt description for the environment.
What factors affected the Fund’s performance during its fiscal year?
The Fund outperformed the Russell Midcap® Index for the 12 months ended September 30, 2018. Stock selection and allocation effects combined to work in the Fund’s favor across all sectors, but particular standouts included strong stock selection in health care and producer durables. Weak stock selection in technology and an underweight in energy slightly detracted from performance.
The stocks that contributed the most to the year’s gains were Globus Medical and Aspen Technology.
| ⬛ | | Globus Medical saw its shares rise during the Fund’s fiscal year as the company’s sales force strengthened in terms of numbers and effectiveness. The company continued to develop its robotic and trauma products and maintain a solid balance sheet with no debt. The Fund continued to hold the stock at the end of the period. |
| ⬛ | | Over a year ago, Aspen released its latest solution, the Asset Performance Monitoring suite. Demand for this software was robust, which helped to accelerate annual contract value growth. Additionally, with greater stability in the oil markets, the |
| | | company stated its belief that it had seen a bottom in revenue associated with engineering and construction clients. |
The positions that detracted the most from performance were WABCO Holdings and Bank OZK.
| ⬛ | | WABCO’s shares declined due to inflation in raw material costs and the impact on margins, as well as the uncertainty surrounding the implications of tariffs and their influence on heavy-duty truck demand. We have no special insight regarding inflation and tariffs, so we focused on assessing the strength of the company’s competitive position, which remained intact. |
| ⬛ | | Shares of Bank OZK (formerly known as Bank of the Ozarks) underperformed due to investor concern regarding the continued slowdown in the growth of the bank’s loan portfolio. However, our investment thesis is anchored to the fact that, over long periods of time, Bank OZK has been one of the most efficient banks in the country, with credit and profitability metrics well above those of its peers. We therefore continued to own the business at the end of the period. |
The preceding information is the opinion of portfolio management only through the end of the period stated on the cover. Any such opinions are subject to change at any time based upon market or other conditions and should not be relied upon as investment advice. Past performance is no guarantee of future results, and there is no guarantee that market forecasts will be realized.
Equity Securities: The market price of equity securities may be adversely affected by financial market, industry, or issuer-specific events. Focus on a particular style or on small or medium-sized companies may enhance that risk.
Limited Number of Investments: Because the Fund has a limited number of securities, it may be more susceptible to factors adversely affecting its securities than a less concentrated fund.
Industry/Sector Concentration: A fund that focuses its investments in a particular industry or sector will be more sensitive to conditions that affect that industry or sector than a non-concentrated fund.
For information regarding the indexes and certain investment terms, see the Key Investment Terms starting on page 5.
13
| | |
| KAR Mid-Cap Core Fund (Continued) | | |
Prospectus: For additional information on risks, please see the Fund’s prospectus.
| | | | |
| |
| Asset Allocations | |
| |
The following table presents asset allocations within certain sectors as a percentage of total investments as of September 30, 2018. | |
Health Care | | | 23 | % |
Industrials | | | 22 | |
Information Technology | | | 15 | |
Financials | | | 14 | |
Consumer Discretionary | | | 10 | |
Consumer Staples | | | 8 | |
Materials | | | 3 | |
Other (includes Short-Term Investment) | | | 5 | |
| | | | | |
Total | | | 100 | % |
| | | | | |
For information regarding the indexes and certain investment terms, see the Key Investment Terms starting on page 5.
14
KAR Mid-Cap Core Fund (Continued)
| | | | | | | | | | | | | | | | |
| Average Annual Total Returns1 for periods ended 9/30/18 | | | | | | | | | | | | |
| | | 1 year | | | 5 year | | | Since
Inception | | | Inception
Date | |
| Class A shares at NAV2 | | | 20.61 | % | | | 14.52 | % | | | 15.64 | % | | | 6/22/09 | |
| Class A shares at POP3,4 | | | 13.67 | | | | 13.18 | | | | 14.91 | | | | 6/22/09 | |
| Class C shares at NAV2 and with CDSC4 | | | 19.71 | | | | 13.68 | | | | 14.77 | | | | 6/22/09 | |
| Class I shares at NAV | | | 20.93 | | | | 14.81 | | | | 15.92 | | | | 6/22/09 | |
| Class R6 shares at NAV | | | — | | | | — | | | | 4.58 | | | | 1/30/18 | |
| Russell Midcap® Index | | | 13.98 | | | | 11.65 | | | | — | 5 | | | — | |
Fund Expense Ratios6: Class A shares: Gross 1.49%, Net 1.21%; Class C shares: Gross 2.22%, Net 1.96%; Class I shares: Gross 1.23%, Net 0.96%; Class R6 shares: Gross 1.15%, Net 0.88%.
All returns represent past performance which is no guarantee of future results. Current performance may be higher or lower than the performance shown. The investment return and principal value of an investment will fluctuate so that an investor’s shares, when redeemed, may be worth more or less than their original cost. The above table and graph below do not reflect the deduction of taxes that a shareholder would pay on fund distributions or the redemption of fund shares. Please visit Virtus.com for performance data current to the most recent month-end.
| 1 | Total returns are historical and include changes in share price and the reinvestment of both dividends and capital gain distributions. |
| 2 | “NAV” (Net Asset Value) total returns do not include the effect of any sales charge. |
| 3 | “POP” (Public Offering Price) total returns include the effect of the maximum front-end 5.75% sales charge. |
| 4 | “CDSC” (contingent deferred sales charge) is applied to redemptions of certain classes of shares that do not have a sales charge applied at the time of purchase. CDSC charges for certain redemptions of Class A shares made within 18 months of a finder’s fee being paid and all Class C shares are 1% within the first year and 0% thereafter. |
| 5 | The since inception index returns for Class A shares, Class C shares and Class I shares are 16.61% and for Class R6 returns are 3.54%. Index returns are from each respective class inception date. |
| 6 | The expense ratios of the Fund are set forth according to the prospectus for the Fund effective March 6, 2018, as supplemented and revised, and may differ from the expense ratios disclosed in the Financial Highlights tables in this report. See the Financial Highlights for more current expense ratios. Net Expense: Expenses reduced by a contractual fee waiver, in effect through March 31, 2019. Gross Expense: Does not reflect the effect of the fee waiver. Expense ratios include fees and expenses associated with the underlying funds. |
Growth of $10,000 for periods ended 9/30
This chart assumes an initial investment of $10,000 made on June 22, 2009 (inception date of the Fund), for Class A shares, Class C shares, and Class I shares including any applicable sales charges or fees. The performance of the other share class may be greater or less than that shown based on differences in inception dates, fees, and sales charges. Performance assumes reinvestment of dividends and capital gain distributions.
The index is unmanaged and not available for direct investment; therefore, its performance does not reflect the expenses associated with active management of an actual portfolio.
For information regarding the indexes and certain investment terms, see the Key Investment Terms starting on page 5.
15
| | |
KAR Mid-Cap Growth Fund Fund Summary (Unaudited) | | Ticker Symbols: A Share: PHSKX C Share: PSKCX I Share: PICMX R6 Share: VRMGX |
Portfolio Manager Commentary by Kayne Anderson Rudnick Investment Management, LLC
| ⬛ | | The Fund is diversified and has an investment objective of capital appreciation. There is no guarantee that the Fund will meet its objective. |
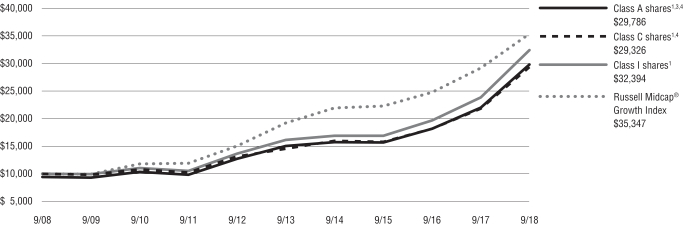
| ⬛ | | For the fiscal year ended September 30, 2018, the Fund’s Class A shares at NAV returned 35.38%, Class C shares at NAV returned 34.40%, Class I shares at NAV returned 35.72%, and Class R6 shares at NAV from January 30, 2018 (inception date) through September 30, 2018, returned 15.66%*. For the fiscal year ended September 30, 2018, the Russell Midcap® Growth Index, which serves as both the Fund’s broad-based and style-specific benchmark appropriate the comparison, returned 21.10%. |
* Returns less than 1 year are not annualized.
All performance figures assume reinvestment of distributions and exclude the effect of sales changes. Performance data quoted represents past results. Past performance is no guarantee of future results, and current performance may be higher or lower than the performance shown above. Investment return and principal value will fluctuate so your shares, when redeemed, may be worth more or less than their original cost. Please visit Virtus.com for performance data current to the most recent month-end.
How did the markets perform during the Fund’s fiscal year ended September 30, 2018?
Despite increased volatility, U.S. equities continued to march ahead during the fiscal year, with the S&P 500® Index returning 17.91% for the 12-month period. Smaller stocks, as represented by the Russell 2000® Index, performed strongly as well, rising 15.24%. Growth stocks outperformed their value counterparts for the period, though both categories rose by double digits. Foreign markets struggled in comparison, with the MSCI EAFE® Index gaining 2.74% and the MSCI Emerging Markets Index down 0.81% for the period.
The Russell Midcap® Growth Index was up 21.10% for the 12 months through September 30, 2018. The best performing sector within the index was information technology, which returned 30.75%.
Other sectors with positive performance included health care (29.38%), utilities (21.63%), and consumer staples (21.40%). Materials was the only negative sector for the period, falling 6.99%.
Key events that drove markets in the past year included a correction that rattled U.S. equity markets in early 2018 after a calm 2017. While the bout of volatility set major indices back a step, stocks soon recovered. They continued to advance during the fiscal year thanks to strong earnings and robust business and economic activity at home, including expansion in service sectors and solid gross domestic product (GDP) growth.
Market strength continued – though not without volatility – despite the introduction of new trade tariffs earlier in 2018 and the continued escalation of tariff-related tensions, particularly with China. Prolonged negotiations and uncertainty put pressure on emerging market stocks during the 12 months. This, paired with a general slowing in Europe and viewed against continued strength in the U.S., seemed to indicate that “global synchronized recovery” was not an apt description for the environment.
What factors affected the Fund’s performance during its fiscal year?
The Fund outperformed the Russell Midcap® Growth Index for the 12 months ended September 30, 2018. Strong stock selection in the communication services and health care sectors helped fuel performance. Gains were hampered somewhat by weak stock selection in financials and energy.
The stocks that contributed the most to the year’s gains were Netflix and Paycom.
| ⬛ | | Netflix is a global leader in on-demand entertainment, with over 125 million subscribers, more than 55% of whom are outside the U.S. Net subscriber additions continued to greatly outpace expectations due to successful content creation, notable early success in cable and telecommunications distribution channels, and highly effective local advertising. Margins surprised to the upside, driven by rapid improvements in international profitability even as subscriber growth was a little uneven. |
| ⬛ | | Paycom’s out-of-the-box solution, low cost research and development (R&D), and sales office strategy combined to give the company some of the best margins among its software as a service (SaaS) peers. After a lull in new sales office openings in 2017, the company ramped them up in 2018, which contributed to a reacceleration of growth. Paycom has developed a differentiated mobile offering that increases user engagement, which is intended to drive customer value and, ultimately, retention and product upsell. |
The positions that detracted the most from performance were Ctrip.com and Avalara.
| ⬛ | | Ctrip.com has consolidated and monopolized the high-end online travel market in China. It came under fire as regulators forced the company to unbundle products such as trip insurance that it automatically added to ticket purchases. The company was also affected by coordinated reductions in domestic commissions. We believe both of those issues are well understood. On the flip side, the company’s outbound travel business experienced a boom, with advantaged inventory and pricing focused on its core high-end consumer. As only a very small percent of Chinese citizens have ever been outside the country, we believe demand could drive future growth. Therefore, we continued to hold the position in the Fund at the end of the period. |
| ⬛ | | Avalara’s performance was primarily a matter of valuation correction after the company’s initial public offering (IPO) in June of 2018. During the third quarter of 2018, the company saw revenue growth of 25% and guided to future revenue growth in the 20% to 25% range. However, the stock’s valuation corrected downward after investors adjusted their growth expectations from higher levels at the time of the IPO. |
The preceding information is the opinion of portfolio management only through the end of the period stated on the cover. Any such opinions are subject to change at any time based upon market or other conditions and should not be relied upon as investment advice. Past performance is no guarantee of future results, and there is no guarantee that market forecasts will be realized.
For information regarding the indexes and certain investment terms, see the Key Investment Terms starting on page 5.
16
| | |
| KAR Mid-Cap Growth Fund (Continued) | | |
Equity Securities: The market price of equity securities may be adversely affected by financial market, industry, or issuer-specific events. Focus on a particular style or on small or medium-sized companies may enhance that risk.
Limited Number of Investments: Because the Fund has a limited number of securities, it may be more susceptible to factors adversely affecting its securities than a less concentrated fund.
Industry/Sector Concentration: A fund that focuses its investments in a particular industry or sector will be more sensitive to conditions that affect that industry or sector than a non-concentrated fund.
Prospectus: For additional information on risks, please see the Fund’s prospectus.
| | | | |
| |
| Asset Allocations | |
| |
The following table presents asset allocations within certain sectors as a percentage of total investments as of September 30, 2018. | |
Information Technology | | | 37 | % |
Consumer Discretionary | | | 20 | |
Health Care | | | 16 | |
Industrials | | | 7 | |
Financials | | | 7 | |
Consumer Staples | | | 6 | |
Energy | | | 2 | |
Other (includes Short-Term Investment) | | | 5 | |
| | | | | |
Total | | | 100 | % |
| | | | | |
For information regarding the indexes and certain investment terms, see the Key Investment Terms starting on page 5.
17
KAR Mid-Cap Growth Fund (Continued)
| | | | | | | | | | | | | | | | | | | | |
| Average Annual Total Returns1 for periods ended 9/30/18 | | | | | | | | | | |
| | | 1 year | | | 5 years | | | 10 years | | | Since
Inception | | | Inception Dated | |
| Class A shares at NAV2 | | | 35.38 | % | | | 14.67 | % | | | 12.20 | % | | | — | | | | — | |
| Class A shares at POP3,4 | | | 27.59 | | | | 13.32 | | | | 11.53 | | | | — | | | | — | |
| Class C shares at NAV2 and with CDSC4 | | | 34.40 | | | | 13.82 | | | | 11.36 | | | | — | | | | — | |
| Class I shares at NAV | | | 35.72 | | | | 14.95 | | | | 12.47 | | | | — | | | | — | |
Class R6 shares at NAV | | | — | | | | — | | | | — | | | | 15.66 | % | | | 1/30/18 | |
| Russell Midcap® Growth Index | | | 21.10 | | | | 13.00 | | | | 13.46 | | | | 7.16 | 5 | | | — | |
Fund Expense Ratios6: Class A shares: Gross 1.48%, Net 1.40%; Class C shares: Gross 2.27%, Net 2.15%; Class I shares: Gross 1.24%, Net 1.15%; Class R6 shares Gross 1.20%, Net 1.11%.
All returns represent past performance which is no guarantee of future results. Current performance may be higher or lower than the performance shown. The investment return and principal value of an investment will fluctuate so that an investor’s shares, when redeemed, may be worth more or less than their original cost. The above table and graph below do not reflect the deduction of taxes that a shareholder would pay on fund distributions or the redemption of fund shares. Please visit Virtus.com for performance data current to the most recent month-end.
| 1 | Total returns are historical and include changes in share price and the reinvestment of both dividends and capital gain distributions. |
| 2 | “NAV” (Net Asset Value) total returns do not include the effect of any sales charge. |
| 3 | “POP” (Public Offering Price) total returns include the effect of the maximum front-end 5.75% sales charge. |
| 4 | “CDSC” (contingent deferred sales charge) is applied to redemptions of certain classes of shares that do not have a sales charge applied at the time of purchase. CDSC charges for certain redemptions of Class A shares made within 18 months of a finder’s fee being paid and all Class C shares are 1% within the first year and 0% thereafter. |
| 5 | The since inception index return is from the inception date of Class R6 shares. |
| 6 | The expense ratios of the Fund are set forth according to the prospectus for the Fund effective March 6, 2018, as supplemented and revised, and may differ from the expense ratios disclosed in the Financial Highlights tables in this report. See the Financial Highlights for more current expense ratios. Net Expense: Expenses reduced by a contractual fee waiver, in effect through March 31, 2019. Gross Expense: Does not reflect the effect of the fee waiver. Expense ratios include fees and expenses associated with the underlying funds. |
Growth of $10,000 for periods ended 9/30
This chart assumes an initial investment of $10,000 made on September 30, 2008, for Class A shares, Class C shares, and Class I shares including any applicable sales charges or fees. The performance of the other share class may be greater or less than that shown based on differences in inception date, fees and sales charges. Performance assumes reinvestment of dividends and capital gain distributions.
The index is unmanaged and not available for direct investment; therefore, its performance does not reflect the expenses associated with active management of an actual portfolio.
For information regarding the indexes and certain investment terms, see the Key Investment Terms starting on page 5.
18
| | |
KAR Small-Cap Core Fund Fund Summary (Unaudited) | | Ticker Symbols: A Share: PKSAX C Share: PKSCX I Share: PKSFX R6 Share: VSCRX |
Portfolio Manager Commentary by Kayne Anderson Rudnick Investment Management, LLC
| ⬛ | | The Fund is diversified and has an investment objective of long-term capital appreciation, with dividend income a secondary consideration. There is no guarantee that the Fund will meet its objectives. |
| ⬛ | | For the fiscal year ended September 30, 2018, the Fund’s Class A shares at NAV returned 26.42%, Class C shares at NAV returned 25.52%, Class I shares at NAV returned 26.73%, and Class R6 shares at NAV returned 26.86%. For the same period, the Russell 2000® Index, which serves as the Fund’s broad-based and style-specific benchmark appropriate the comparison, returned 15.24%. |
All performance figures assume reinvestment of distributions and exclude the effect of sales changes. Performance data quoted represents past results. Past performance is no guarantee of future results, and current performance may be higher or lower than the performance shown above. Investment return and principal value will fluctuate so your shares, when redeemed, may be worth more or less than their original cost. Please visit Virtus.com for performance data current to the most recent month-end.
How did the markets perform during the Fund’s fiscal year ended September 30, 2018?
Despite increased volatility, U.S. equities continued to march ahead during the fiscal year, with the S&P 500® Index returning 17.91% for the 12-month period. Smaller stocks, as represented by the Russell 2000® Index, performed strongly as well, rising 15.24%. Growth stocks outperformed their value counterparts for the period, though both categories rose by double digits. Foreign markets struggled in comparison, with the MSCI EAFE® Index gaining 2.74% and the MSCI Emerging Markets Index down 0.81% for the period.
The Russell 2000® Index was up 15.24% for the 12 months through September 30, 2018. All the sectors within the index had positive returns, led by health care, which was up 29.72%. Other sectors with strong returns included technology (21.80%), consumer discretionary (21.49%), and energy (14.52%). The materials and processing sector was the weakest performing sector, with a gain of 4.14%.
Key events that drove markets in the past year included a correction that rattled U.S. equity markets
in early 2018 after a calm 2017. While the bout of volatility set major indices back a step, stocks soon recovered. They continued to advance during the fiscal year thanks to strong earnings and robust business and economic activity at home, including expansion in service sectors and solid gross domestic product (GDP) growth.
Market strength continued – though not without volatility – despite the introduction of new trade tariffs earlier in 2018 and the continued escalation of tariff-related tensions, particularly with China. Prolonged negotiations and uncertainty put pressure on emerging market stocks during the 12 months. This, paired with a general slowing in Europe and viewed against continued strength in the U.S., seemed to indicate that “global synchronized recovery” was not an apt description for the environment.
What factors affected the Fund’s performance during its fiscal year?
The Fund outperformed the Russell 2000® Index for the 12 months ended September 30, 2018. Strong stock selection in producer durables and financial services helped performance. Consumer discretionary was the only category that had a detracting effect at the sector level, due to weak stock selection.
The stocks that contributed the most to the year’s gains were Autohome and Aspen Technology.
| ⬛ | | Autohome’s shares rose after management exited the unprofitable direct sales segment. The company’s core subscription and advertising businesses continued to prosper. |
| ⬛ | | Over a year ago, Aspen released its latest solution, the Asset Performance Monitoring suite. Demand for this software was robust, which helped to accelerate annual contract value growth. Additionally, with greater stability in the oil markets, the company stated its belief that it had seen a bottom in revenue associated with engineering and construction clients. |
The positions that detracted the most from performance were WABCO Holdings and Fox Factory.
| ⬛ | | WABCO’s shares declined due to inflation in raw material costs and the impact on margins, as well as the uncertainty surrounding the implications of tariffs and their influence on heavy-duty truck |
| | | demand. We have no special insight regarding inflation and tariffs, so we focused on assessing the strength of the company’s competitive position, which remained intact. |
| ⬛ | | Shares of Fox experienced weakness through the end of 2017 and into 2018 as the company indicated growth was likely to decelerate in 2018 to a level more consistent with the company’s annual long-term target ranges. Additionally, Fox illustrated that the pace of margin improvement would be lower in 2018 than in 2017. We exited the position in the first half of 2018. |
The preceding information is the opinion of portfolio management only through the end of the period stated on the cover. Any such opinions are subject to change at any time based upon market or other conditions and should not be relied upon as investment advice. Past performance is no guarantee of future results, and there is no guarantee that market forecasts will be realized.
Equity Securities: The market price of equity securities may be adversely affected by financial market, industry, or issuer-specific events. Focus on a particular style or on small or medium-sized companies may enhance that risk.
Limited Number of Investments: Because the Fund has a limited number of securities, it may be more susceptible to factors adversely affecting its securities than a less concentrated fund.
Industry/Sector Concentration: A fund that focuses its investments in a particular industry or sector will be more sensitive to conditions that affect that industry or sector than a non-concentrated fund.
Prospectus: For additional information on risks, please see the Fund’s prospectus.
| | | | |
| |
| Asset Allocations | |
| |
| The following table presents asset allocations within certain sectors as a percentage of total investments as of September 30, 2018. | |
Industrials | | | 31 | % |
Information Technology | | | 27 | |
Financials | | | 18 | |
Energy | | | 5 | |
Consumer Discretionary | | | 4 | |
Real Estate | | | 3 | |
Consumer Staples | | | 2 | |
Other (includes Short-Term Investment) | | | 10 | |
| | | | | |
Total | | | 100 | % |
| | | | | |
For information regarding the indexes and certain investment terms, see the Key Investment Terms starting on page 5.
19
KAR Small-Cap Core Fund (Continued)
| | | | | | | | | | | | | | | | | | | | |
| Average Annual Total Returns1 for periods ended 9/30/18 | | | | |
| | | 1 year | | | 5 years | | | 10 years | | | Since
Inception | | | Inception Date | |
| Class A shares at NAV2 | | | 26.42 | % | | | 15.65 | % | | | 14.61 | % | | | — | | | | — | |
| Class A shares at POP3,4 | | | 19.15 | | | | 14.29 | | | | 13.93 | | | | — | | | | — | |
| Class C shares at NAV2 and with CDSC4 | | | 25.52 | | | | 14.80 | | | | 13.76 | | | | — | | | | — | |
| Class I shares at NAV | | | 26.73 | | | | 15.95 | | | | 14.90 | | | | — | | | | — | |
| Class R6 shares at NAV | | | 26.86 | | | | — | | | | — | | | | 17.82 | % | | | 11/12/14 | |
| Russell 2000® Index | | | 15.24 | | | | 11.07 | | | | 11.11 | | | | 11.18 | 5 | | | — | |
Fund Expense Ratios6: Class A shares: 1.32%; Class C shares: 2.07%; Class I shares: 1.07%; Class R6 shares: 1.00%.
All returns represent past performance which is no guarantee of future results. Current performance may be higher or lower than the performance shown. The investment return and principal value of an investment will fluctuate so that an investor’s shares, when redeemed, may be worth more or less than their original cost. The above table and graph below do not reflect the deduction of taxes that a shareholder would pay on fund distributions or the redemption of fund shares. Please visit Virtus.com for performance data current to the most recent month-end.
| 1 | Total returns are historical and include changes in share price and the reinvestment of both dividends and capital gain distributions. |
| 2 | “NAV” (Net Asset Value) total returns do not include the effect of any sales charge. |
| 3 | “POP” (Public Offering Price) total returns include the effect of the maximum front-end 5.75% sales charge. |
| 4 | “CDSC” (contingent deferred sales charge) is applied to redemptions of certain classes of shares that do not have a sales charge applied at the time of purchase. CDSC charges for certain redemptions of Class A shares made within 18 months of a finder’s fee being paid and all Class C shares are 1% within the first year and 0% thereafter. |
| 5 | The since inception index return is from the inception date of Class R6 shares. |
| 6 | The expense ratios of the Fund are set forth according to the prospectus for the Fund effective March 6, 2018, as supplemented and revised, and may differ from the expense ratios disclosed in the Financial Highlights tables in this report. See the Financial Highlights for more current expense ratios. Expense ratios include fees and expenses associated with the underlying funds. |
Growth of $10,000 for periods ended 9/30
This chart assumes an initial investment of $10,000 made on September 30, 2008, for Class A shares, Class C shares, and Class I shares including any applicable sales charges or fees. The performance of the other share class may be greater or less than that shown based on differences in inception dates, fees, and sales charges. Performance assumes reinvestment of dividends and capital gain distributions.
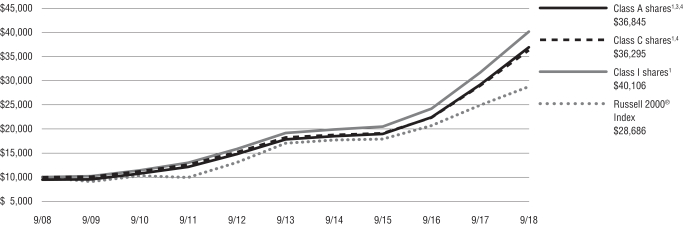
The index is unmanaged and not available for direct investment; therefore, its performance does not reflect the expenses associated with active management of an actual portfolio.
For information regarding the indexes and certain investment terms, see the Key Investment Terms starting on page 5.
20
| | |
KAR Small-Cap Growth Fund Fund Summary (Unaudited) | | Ticker Symbols: A Share: PSGAX C Share: PSGCX I Share: PXSGX R6 Share: VRSGX |
Portfolio Manager Commentary by Kayne Anderson Rudnick Investment Management, LLC
| ⬛ | | The Fund is diversified and has an investment objective of long-term capital appreciation. There is no guarantee that the Fund will meet its objective. |
| ⬛ | | For the fiscal year ended September 30, 2018, the Fund’s Class A shares at NAV returned 32.01%, Class C shares at NAV returned 31.06%†, Class I shares at NAV returned 32.34%, and Class R6 shares at NAV from January 30, 2018 (inception date) through September 30, 2018, returned 14.83%*. For the fiscal year ended September 30, 2018, the Russell 2000® Growth Index, which serves as both the Fund’s broad-based and style-specific benchmark appropriate the comparison, returned 21.06%. |
* Returns less 1 year are not annualized.
† See footnote 7 on page 22.
All performance figures assume reinvestment of distributions and exclude the effect of sales changes. Performance data quoted represents past results. Past performance is no guarantee of future results, and current performance may be higher or lower than the performance shown above. Investment return and principal value will fluctuate so your shares, when redeemed, may be worth more or less than their original cost. Please visit Virtus.com for performance data current to the most recent month-end.
How did the markets perform during the Fund’s fiscal year ended September 30, 2018?
Despite increased volatility, U.S. equities continued to march ahead during the fiscal year, with the S&P 500® Index returning 17.91% for the 12-month period. Smaller stocks, as represented by the Russell 2000® Index, performed strongly as well, rising 15.24%. Growth stocks outperformed their value counterparts for the period, though both categories rose by double digits. Foreign markets struggled in comparison, with the MSCI EAFE® Index gaining 2.74% and the MSCI Emerging Markets Index down 0.81% for the period.
The Russell 2000® Growth Index was up 21.06% for the 12 months ended September 30, 2018. All the sectors within the index had positive returns, led by health care, which gained 30.66%. Other sectors with strong returns included technology (29.72%),
consumer discretionary (25.92%), and consumer staples (25.03%). Energy was the weakest performing sector, up 0.91%.
Key events that drove markets in the past year included a correction that rattled U.S. equity markets in early 2018 after a calm 2017. While the bout of volatility set major indices back a step, stocks soon recovered. They continued to advance during the fiscal year thanks to strong earnings and robust business and economic activity at home, including expansion in service sectors and solid gross domestic product (GDP) growth.
Market strength continued – though not without volatility – despite the introduction of new trade tariffs earlier in 2018 and the continued escalation of tariff-related tensions, particularly with China. Prolonged negotiations and uncertainty put pressure on emerging market stocks during the 12 months. This, paired with a general slowing in Europe and viewed against continued strength in the U.S., seemed to indicate that “global synchronized recovery” was not an apt description for the environment.
What factors affected the Fund’s performance during its fiscal year?
The Fund outperformed the Russell 2000® Growth Index for the 12 months ended September 30, 2018. Strong stock selection in producer durables and technology helped performance. Health care was the only sector that had a detracting effect, driven by an underweight position in the sector.
The stocks that contributed the most to the year’s gains were Autohome and Ollie’s Bargain Outlet Holdings.
| ⬛ | | Autohome’s shares rose after management exited the unprofitable direct sales segment. The company’s core subscription and advertising businesses continued to prosper. |
| ⬛ | | The value proposition of Ollie’s, which is focused around a treasure-hunt shopping experience, provided substantial growth to the business. As a result, the company was able to expand its store count and increase both its consolidated and comparable-store sales. These developments were positively correlated with the performance of the stock. |
The positions that detracted the most from performance were Emerald Expositions Events and PriceSmart.
| ⬛ | | Emerald Expositions was in the process of managing the ongoing change in online transactions and the impact on wholesale purchasing behavior. |
| ⬛ | | PriceSmart owns and operates 41 retail membership warehouse clubs in Latin America, the Caribbean, and the U.S. During the period, PriceSmart’s results were negatively impacted by the political turmoil in Nicaragua. |
The preceding information is the opinion of portfolio management only through the end of the period stated on the cover. Any such opinions are subject to change at any time based upon market or other conditions and should not be relied upon as investment advice. Past performance is no guarantee of future results, and there is no guarantee that market forecasts will be realized.
Equity Securities: The market price of equity securities may be adversely affected by financial market, industry, or issuer-specific events. Focus on a particular style or on small or medium-sized companies may enhance that risk.
Limited Number of Investments: Because the Fund has a limited number of securities, it may be more susceptible to factors adversely affecting its securities than a less concentrated fund.
Industry/Sector Concentration: A fund that focuses its investments in a particular industry or sector will be more sensitive to conditions that affect that industry or sector than a non-concentrated fund.
Prospectus: For additional information on risks, please see the Fund’s prospectus.
| | | | |
| |
| Asset Allocations | |
| |
The following table presents asset allocations within certain sectors as a percentage of total investments as of September 30, 2018. | |
Information Technology | | | 37 | % |
Industrials | | | 16 | |
Financials | | | 16 | |
Consumer Discretionary | | | 9 | |
Consumer Staples | | | 4 | |
Health Care | | | 3 | |
Short-Term Investment | | | 15 | |
| | | | | |
Total | | | 100 | % |
| | | | | |
For information regarding the indexes and certain investment terms, see the Key Investment Terms starting on page 5.
21
KAR Small-Cap Growth Fund (Continued)
| | | | | | | | | | | | | | | | | | | | |
| Average Annual Total Returns1 for periods ended 9/30/18 | | | | |
| | | 1 year | | | 5 years | | | 10 Years | | | Since
Inception | | | Inception
Date | |
| Class A shares at NAV2 | | | 32.01 | % | | | 19.11 | % | | | 16.12 | % | | | — | | | | — | |
| Class A shares at POP3,4 | | | 24.42 | | | | 17.71 | | | | 15.44 | | | | — | | | | — | |
| Class C shares at NAV2,7 and with CDSC4 | | | 31.06 | | | | 18.22 | | | | 15.24 | | | | — | | | | — | |
| Class I shares at NAV7 | | | 32.34 | | | | 19.41 | | | | 16.31 | | | | — | | | | — | |
| Class R6 shares at NAV | | | — | | | | — | | | | — | | | | 14.83 | % | | | 1/30/18 | |
| Russell 2000® Growth Index | | | 21.06 | | | | 12.14 | | | | 12.65 | | | | 10.83 | 5 | | | — | |
Fund Expense Ratios6: Class A shares: 1.48%; Class C shares: 2.21%; Class I shares: 1.21%; Class R6 1.14%.
All returns represent past performance which is no guarantee of future results. Current performance may be higher or lower than the performance shown. The investment return and principal value of an investment will fluctuate so that an investor’s shares, when redeemed, may be worth more or less than their original cost. The above table and graph below do not reflect the deduction of taxes that a shareholder would pay on fund distributions or the redemption of fund shares. Please visit Virtus.com for performance data current to the most recent month-end.
| 1 | Total returns are historical and include changes in share price and the reinvestment of both dividends and capital gain distributions. |
| 2 | “NAV” (Net Asset Value) total returns do not include the effect of any sales charge. |
| 3 | “POP” (Public Offering Price) total returns include the effect of the maximum front-end 5.75% sales charge. |
| 4 | “CDSC” (contingent deferred sales charge) is applied to redemptions of certain classes of shares that do not have a sales charge applied at the time of purchase. CDSC charges for certain redemptions of Class A shares made within 18 months of a finder’s fee being paid and all Class C shares are 1% within the first year and 0% thereafter. |
| 5 | The since inception index return is from the inception date of Class R6 shares. |
| 6 | The expense ratios of the Fund are set forth according to the prospectus for the Fund effective March 6, 2018, as supplemented and revised, and may differ from the expense ratios disclosed in the Financial Highlights tables in this report. See the Financial Highlights for more current expense ratios. Expense ratios include fees and expenses associated with the underlying funds. |
| 7 | Total return for the report period presented in the table differs from the total return in the Financial Highlights. The total return presented in the above table is calculated based on the NAV at which shareholder transactions were processed. The total return presented in the Financial Highlights section of the report is calculated in the same manner, but also takes into account certain adjustments that are necessary under generally accepted accounting principles required in the annual report and semiannual report. |
Growth of $10,000 for periods ended 9/30
This chart assumes an initial investment of $10,000 made on September 30, 2008, for Class A shares, Class C shares, and Class I shares including any applicable sales charges or fees. The performance of the other share class may be greater or less than that shown based on differences in inception dates, fees, and sales charges. Performance assumes reinvestment of dividends and capital gain distributions.
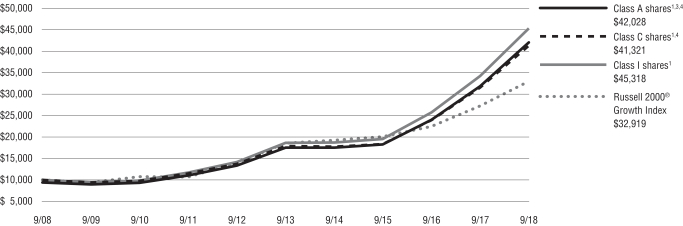
The index is unmanaged and not available for direct investment; therefore, its performance does not reflect the expenses associated with active management of an actual portfolio.
For information regarding the indexes and certain investment terms, see the Key Investment Terms starting on page 5.
22
| | |
KAR Small-Cap Value Fund Fund Summary (Unaudited) | | Ticker Symbols: A Share: PQSAX C Share: PQSCX I Share: PXQSX R6 Share: VQSRX |
Portfolio Manager Commentary by Kayne Anderson Rudnick Investment Management, LLC
| ⬛ | | The Fund is diversified and has an investment objective of long-term capital appreciation. There is no guarantee that the Fund will meet its objective. |
| ⬛ | | For the fiscal year ended September 30, 2018, the Fund’s Class A shares at NAV returned 7.33%†, Class C shares at NAV returned 6.59%, Class I shares at NAV returned 7.62%, and Class R6 shares at NAV, returned 7.69%. For the same period, the Russell 2000® Value Index, which serves as the Fund’s broad-based and style-specific benchmark appropriate the comparison, returned 9.33%. |
† See footnote 7 on page 25.
All performance figures assume reinvestment of distributions and exclude the effect of sales changes. Performance data quoted represents past results. Past performance is no guarantee of future results, and current performance may be higher or lower than the performance shown above. Investment return and principal value will fluctuate so your shares, when redeemed, may be worth more or less than their original cost. Please visit Virtus.com for performance data current to the most recent month-end.
How did the markets perform during the Fund’s fiscal year ended September 30, 2018?
Despite increased volatility, U.S. equities continued to march ahead during the fiscal year, with the S&P 500® Index returning 17.91% for the 12-month period. Smaller stocks, as represented by the Russell 2000® Index, performed strongly as well, rising 15.24%. Growth stocks outperformed their value counterparts for the period, though both categories rose by double digits. Foreign markets struggled in comparison, with the MSCI EAFE® Index gaining 2.74% and the MSCI Emerging Markets Index down 0.81% for the period.
The Russell 2000® Value Index was up 9.33% for the 12 months ended September 30, 2018. Health care was the best performing sector with a return of 25.86%. Other sectors that saw double-digit gains were energy (17.76%), consumer discretionary (15.11%), and producer durables (13.82%). The
consumer staples sector was the only category with negative performance, down by 2.44%.
Key events that drove markets in the past year included a correction that rattled U.S. equity markets in early 2018 after a calm 2017. While the bout of volatility set major indices back a step, stocks soon recovered. They continued to advance during the fiscal year thanks to strong earnings and robust business and economic activity at home, including expansion in service sectors and solid gross domestic product (GDP) growth.
Market strength continued – though not without volatility – despite the introduction of new trade tariffs earlier in 2018 and the continued escalation of tariff-related tensions, particularly with China. Prolonged negotiations and uncertainty put pressure on emerging market stocks during the 12 months. This, paired with a general slowing in Europe and viewed against continued strength in the U.S., seemed to indicate that “global synchronized recovery” was not an apt description for the environment.
What factors affected the Fund’s performance during its fiscal year?
The Fund underperformed the Russell 2000® Value Index for the 12 months ended September 30, 2018. Weak stock selection in health care and consumer discretionary pulled performance back, while losses were partially offset by strong stock selection in financial services and technology.
The stocks that contributed the most to the year’s gains were SiteOne and Jack Henry & Associates.
| ⬛ | | SiteOne continued to consolidate the highly fragmented wholesale landscape supply distribution industry, and saw accelerating growth in organic daily sales. With the increased scale for the company and initiatives such as improving supply chain, SiteOne was able to expand gross margins. |
| ⬛ | | Over the 12-month fiscal period, Jack Henry reported strong revenue growth from new core processing implementations and further adoption of the company’s payment solutions. Guidance for the next fiscal year calls for high single-digit revenue growth and double-digit earnings per share (EPS) growth. Other factors in Jack Henry’s favor include the high switching costs inherent in its |
| | | services, as well as the opportunity to continue to grow its business. We remained shareholders of the company at the end of the period. |
The positions that detracted the most from performance were Thor Industries and RE/MAX Holdings.
| ⬛ | | Shares of Thor came under pressure due to industry fears of a top in the current recreational vehicle (RV) cycle. Industry participants pointed to increased inventories at dealers and reduced volume of unit sales as cause for concern. Thor’s revenues were up over the trailing 12-month period, but quarterly financials were weaker. The company added manufacturing capacity in order to more aptly respond to demand. We continued to hold the stock at the end of the period. |
| ⬛ | | Shares of RE/MAX declined as a result of weak existing-home sales trends and higher costs the company is incurring to build out technology infrastructure. |
The preceding information is the opinion of portfolio management only through the end of the period stated on the cover. Any such opinions are subject to change at any time based upon market or other conditions and should not be relied upon as investment advice. Past performance is no guarantee of future results, and there is no guarantee that market forecasts will be realized.
Equity Securities: The market price of equity securities may be adversely affected by financial market, industry, or issuer-specific events. Focus on a particular style or on small or medium-sized companies may enhance that risk.
Limited Number of Investments: Because the Fund has a limited number of securities, it may be more susceptible to factors adversely affecting its securities than a less concentrated fund.
Industry/Sector Concentration: A fund that focuses its investments in a particular industry or sector will be more sensitive to conditions that affect that industry or sector than a non-concentrated fund.
For information regarding the indexes and certain investment terms, see the Key Investment Terms starting on page 5.
23
| | |
| KAR Small-Cap Value Fund (Continued) | | |
Prospectus: For additional information on risks, please see the Fund’s prospectus.
| | | | |
| |
| Asset Allocations | |
| |
The following table presents asset allocations within certain sectors as a percentage of total investments as of September 30, 2018. | |
Industrials | | | 21 | % |
Financials | | | 18 | |
Information Technology | | | 15 | |
Consumer Discretionary | | | 15 | |
Real Estate | | | 10 | |
Consumer Staples | | | 7 | |
Energy | | | 4 | |
Other (includes Short-Term Investment) | | | 10 | |
| | | | | |
Total | | | 100 | % |
| | | | | |
For information regarding the indexes and certain investment terms, see the Key Investment Terms starting on page 5.
24
KAR Small-Cap Value Fund (Continued)
| | | | | | | | | | | | | | | | | | | | |
| Average Annual Total Returns1 for periods ended 9/30/18 | |
| | | 1 year | | | 5 years | | | 10 years | | | Since
Inception | | | Inception
Date | |
| Class A shares at NAV2,7 | | | 7.33 | % | | | 11.06 | % | | | 11.46 | % | | | — | | | | — | |
| Class A shares at POP3,4 | | | 1.16 | | | | 9.75 | | | | 10.80 | | | | — | | | | — | |
| Class C shares at NAV2,7 and with CDSC4 | | | 6.59 | | | | 10.25 | | | | 10.63 | | | | — | | | | — | |
| Class I shares at NAV | | | 7.62 | | | | 11.35 | | | | 11.75 | | | | — | | | | — | |
| Class R6 shares at NAV | | | 7.69 | | | | — | | | | — | | | | 20.44 | % | | | 11/3/16 | |
| Russell 2000® Value Index | | | 9.33 | | | | 9.91 | | | | 9.52 | | | | 19.27 | 5 | | | — | |
Fund Expense Ratios6: Class A shares: 1.34%; Class C shares: 2.04%; Class I shares: 1.05%; Class R6 shares: 1.00%.
All returns represent past performance which is no guarantee of future results. Current performance may be higher or lower than the performance shown. The investment return and principal value of an investment will fluctuate so that an investor’s shares, when redeemed, may be worth more or less than their original cost. The above table and graph below do not reflect the deduction of taxes that a shareholder would pay on fund distributions or the redemption of fund shares. Please visit Virtus.com for performance data current to the most recent month-end.
| 1 | Total returns are historical and include changes in share price and the reinvestment of both dividends and capital gain distributions. |
| 2 | “NAV” (Net Asset Value) total returns do not include the effect of any sales charge. |
| 3 | “POP” (Public Offering Price) total returns include the effect of the maximum front-end 5.75% sales charge. |
| 4 | “CDSC” (contingent deferred sales charge) is applied to redemptions of certain classes of shares that do not have a sales charge applied at the time of purchase. CDSC charges for certain redemptions of Class A shares made within 18 months of a finder’s fee being paid and all Class C shares are 1% within the first year and 0% thereafter. |
| 5 | The since inception index returns is from the inception date of Class R6 shares. |
| 6 | The expense ratios of the Fund are set forth according to the prospectus for the Fund effective March 6, 2018, as supplemented and revised, and may differ from the expense ratios disclosed in the Financial Highlights tables in this report. See the Financial Highlights for more current expense ratios. Expense ratios include fees and expenses associated with the underlying funds. |
| 7 | Total return for the report period presented in the table differs from the total return in the Financial Highlights. The total return presented in the above table is calculated based on the NAV at which shareholder transactions were processed. The total return presented in the Financial Highlights section of the report is calculated in the same manner, but also takes into account certain adjustments that are necessary under generally accepted accounting principles required in the annual report and semiannual report. |
Growth of $10,000 for periods ended 9/30
This chart assumes an initial investment of $10,000 made on September 30, 2008, for Class A shares, Class C shares, and Class I shares including any applicable sales charges or fees. The performance of the other share class may be greater or less than that shown based on differences in inception dates, fees, and sales charges. Performance assumes reinvestment of dividends and capital gain distributions.
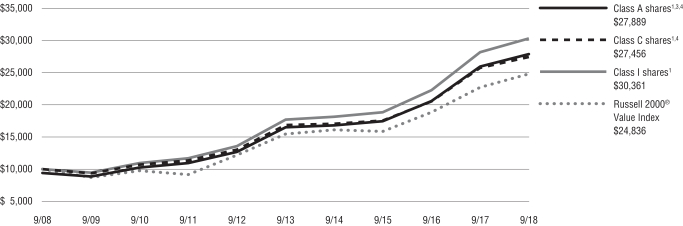
The index is unmanaged and not available for direct investment; therefore, its performance does not reflect the expenses associated with active management of an actual portfolio.
For information regarding the indexes and certain investment terms, see the Key Investment Terms starting on page 5.
25
| | |
KAR Small-Mid Cap Core Fund Fund Summary (Unaudited) | | Ticker Symbols: A Share: VKSAX C Share: VKSCX I Share: VKSIX R6 Share: VKSRX |
Portfolio Manager Commentary by Kayne Anderson Rudnick Investment Management, LLC
| ⬛ | | The Fund is diversified and has an investment objective of long-term capital appreciation with dividend income a secondary consideration. There is no guarantee that the Fund will achieve its objectives. |
| ⬛ | | For the fiscal period March 7, 2018 (inception date) through September 30, 2018, the Fund’s Class A shares at NAV returned 7.90%*, Class C shares at NAV returned 7.50%*, Class I shares at NAV returned 8.10%* and Class R6 shares at NAV returned 8.10%*. For the same period, the Russell 2500TM Index, which serves as the Fund’s broad-based and style-specific benchmark appropriate for comparison, returned 8.17%*. |
* Returns less than 1 year are not annualized.
All performance figures assume reinvestment of distributions and exclude the effect of sales changes. Performance data quoted represents past results. Past performance is no guarantee of future results, and current performance may be higher or lower than the performance shown above. Investment return and principal value will fluctuate so your shares, when redeemed, may be worth more or less than their original cost. Please visit Virtus.com for performance data current to the most recent month-end.
How did the markets perform during the fiscal seven-month period from March 7 through September 30, 2018?
U.S. equities started the year with a wobble, but recovered and continued to advance over much of the seven months from March 7 through September 30, 2018. The S&P 500® Index returned 8.58% for the period, while smaller stocks, as represented by the Russell 2000® Index, gained 13.05%. Growth stocks outperformed value stocks for the period. Foreign markets struggled in comparison, with the MSCI EAFE® Index falling 1.70% and the MSCI Emerging Markets Index down 10.66%, reflecting the outsized hit emerging market countries took as the U.S. dollar continued to strengthen and U.S.-China trade tensions escalated over the past several months.
The Russell 2500® Index was up 8.17% for the period from March 7 through September 30, 2018.
Energy was the best performing sector, with a return of 18.95%. Utilities and health care also were strong performers, up 16.49% and 15.46%, respectively. The materials and processing sector was the only one with a loss, down 1.46%.
Key events that drove markets in the past seven months included the Trump administration’s ushering in new tariffs against China and other major trade partners. Global markets, which had appeared to stage somewhat synchronized growth, began to diverge. While U.S. market strength continued – despite an ongoing escalation of tariff-related tensions – international markets struggled to advance, weighed down by prolonged trade negotiations and the resulting uncertainty, as well as country-specific challenges.
What factors affected the Fund’s performance during the fiscal period?
The Fund slightly underperformed the Russell 2500® Index from its inception on March 7 through September 30, 2018. Weak stock selection in consumer discretionary and energy negatively affected returns, while strong stock selection in producer durables and materials and processing helped offset losses.
The stocks that contributed the most to performance during the period were Aspen Technology and Cotiviti Holdings.
| ⬛ | | Over a year ago, Aspen released its latest solution, the Asset Performance Monitoring suite. Demand for this software was robust, which helped to accelerate annual contract value growth. Additionally, with greater stability in the oil markets, the company stated its belief that it had seen a bottom in revenue associated with engineering and construction clients. |
| ⬛ | | Cotiviti saw its shares outperform during the period due to solid financial results as well as the company’s acquisition by Veritas Capital. The deal was finalized in August 2018, and the stock was liquidated. |
The positions that detracted the most from performance were Signature Bank and Bank OZK.
| ⬛ | | Signature shares underperformed due to rising short-term interest rates, which pressured the |
| | | margin the bank made on its loans. It also struggled with multiple write-downs in its taxi medallion portfolio due to competition from ride-sharing companies. Despite these near-term headwinds, Signature continued to find success in recruiting high performing bankers from other institutions onto its platform. We remained owners of the business at the end of the period. |
| ⬛ | | Shares of Bank OZK (formerly known as Bank of the Ozarks) underperformed due to investor concern regarding the continued slowdown in the growth of the bank’s loan portfolio. However, our investment thesis is anchored to the fact that, over long periods of time, Bank OZK has been one of the most efficient banks in the country, with credit and profitability metrics well above those of its peers. We therefore continued to own the business at the end of the period. |
The preceding information is the opinion of portfolio management only through the end of the period stated on the cover. Any such opinions are subject to change at any time based upon market or other conditions and should not be relied upon as investment advice. Past performance is no guarantee of future results, and there is no guarantee that market forecasts will be realized.
Equity Securities: The market price of equity securities may be adversely affected by financial market, industry, or issuer-specific events. Focus on a particular style or on small or medium-sized companies may enhance that risk.
Limited Number of Investments: Because the Fund has a limited number of securities, it may be more susceptible to factors adversely affecting its securities than a less concentrated fund.
Industry/Sector Concentration: A fund that focuses its investments in a particular industry or sector will be more sensitive to conditions that affect that industry or sector than a non-concentrated fund.
For information regarding the indexes and certain investment terms, see the Key Investment Terms starting on page 5.
26
| | |
| KAR Small-Mid Cap Core Fund (Continued) | | |
Prospectus: For additional information on risks, please see the Fund’s prospectus.
| | | | |
| |
| Asset Allocations | |
| |
The following table presents asset allocations within certain sectors as a percentage of total investments as of September 30, 2018. | |
Industrials | | | 30 | % |
Information Technology | | | 22 | |
Financials | | | 17 | |
Health Care | | | 13 | |
Consumer Discretionary | | | 10 | |
Materials | | | 4 | |
Energy | | | 3 | |
Other (includes Short-Term Investment) | | | 1 | |
| | | | | |
Total | | | 100 | % |
| | | | | |
For information regarding the indexes and certain investment terms, see the Key Investment Terms starting on page 5.
27
KAR Small-Mid Cap Core Fund (Continued)
| | | | | | | | | | | | |
| Average Annual Total Returns1 for periods ended 9/30/18 | |
| | | Since
Inception | | | | | | Inception
Date | |
| Class A shares at NAV2 | | | 7.90 | % | | | | | | | 3/7/18 | |
| Class A shares at POP3,4 | | | 1.70 | | | | | | | | 3/7/18 | |
| Class C shares at NAV2 | | | 7.50 | | | | | | | | 3/7/18 | |
| Class C shares with CDSC4 | | | 6.50 | | | | | | | | 3/7/18 | |
| Class I shares at NAV | | | 8.10 | | | | | | | | 3/7/18 | |
| Class R6 shares at NAV | | | 8.10 | | | | | | | | 3/7/18 | |
| Russell 2500TM Index | | | 8.17 | 5 | | | | | | | — | |
Fund Expense Ratios6: Class A shares: Gross 1.75%, Net 1.30%; Class C shares: Gross 2.49%, Net 2.05%; Class I shares: Gross 1.48%, Net 1.05%; Class R6 shares: Gross 1.41%, Net 0.97%.
All returns represent past performance which is no guarantee of future results. Current performance may be higher or lower than the performance shown. The investment return and principal value of an investment will fluctuate so that an investor’s shares, when redeemed, may be worth more or less than their original cost. The above table and graph below do not reflect the deduction of taxes that a shareholder would pay on fund distributions or the redemption of shares. Please visit Virtus.com for performance data current to the most recent month-end.
| 1 | Total returns are historical and include changes in share price and the reinvestment of both dividends and capital gain distributions. |
| 2 | “NAV” (Net Asset Value) total returns do not include the effect of any sales charge. |
| 3 | “POP” (Public Offering Price) total returns include the effect of the maximum front-end 5.75% sales charge. |
| 4 | “CDSC” (contingent deferred sales charge) is applied to redemptions of certain classes of shares that do not have a sales charge applied at the time of purchase. CDSC charges for certain redemptions of Class A shares made within 18 months of a finder’s fee being paid and all Class C shares are 1% within the first year and 0% thereafter. |
| 5 | The since inception index return is from the inception date of the Fund. |
| 6 | The expense ratios of the Fund are set forth according to the prospectus for the Fund effective March 6, 2018, as supplemented and revised, and may differ from the expense ratios disclosed in the Financial Highlights tables in this report. See the Financial Highlights for more current expense ratios. Net Expense: Expenses reduced by a contractual fee waiver, in effect through March 31, 2019. Gross Expense: Does not reflect the effect of the fee waiver. Expense ratios include fees and expenses associated with the underlying funds. |
Growth of $10,000 for periods ended 9/30
This chart assumes an initial investment of $10,000 made on March 7, 2018 (inception date of the Fund), for Class A shares, Class C shares, Class I shares and Class R6 shares including any applicable sales charges or fees. Performance assumes reinvestment of dividends and capital gain distributions.
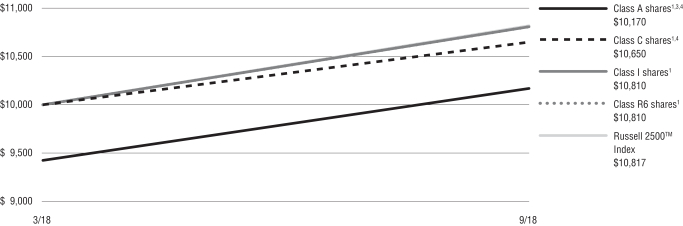
The index is unmanaged and not available for direct investment; therefore, its performance does not reflect the expenses associated with active management of an actual portfolio.
For information regarding the indexes and certain investment terms, see the Key Investment Terms starting on page 5.
28
| | |
Rampart Enhanced Core Equity Fund Fund Summary (Unaudited) | | Ticker Symbols: A Share: PDIAX C Share: PGICX I Share: PXIIX R6 Share: VECRX |
Portfolio Manager Commentary by Rampart Investment Management Company, LLC
| ⬛ | | The Fund is diversified and has investment objectives of capital appreciation and current income. There is no guarantee that the Fund will meet its objectives. |
| ⬛ | | For the fiscal year ended September 30, 2018, the Fund’s Class A shares at NAV returned 10.84%, Class C shares at NAV returned 10.00%, Class I shares at NAV returned 11.10%, and Class R6 shares at NAV from January 30, 2018 (inception date) through September 30, 2018, returned 1.59%* . For the fiscal year ended September 30, 2018, the S&P 500® Index, which serves as the Fund’s broad-based and style-specific benchmark appropriate the comparison, returned 17.91%. |
* Returns less than 1 year are not annualized.
All performance figures assume reinvestment of distributions and exclude the effect of sales changes. Performance data quoted represents past results. Past performance is no guarantee of future results, and current performance may be higher or lower than the performance shown above. Investment return and principal value will fluctuate so your shares, when redeemed, may be worth more or less than their original cost. Please visit Virtus.com for performance data current to the most recent month-end.
How did the markets perform during the Fund’s fiscal year ended September 30, 2018?
Twelve months ago, this report referenced the importance of central bank support in the current bull market, which is nearly 10 years old. During the 12-month period, the U.S. Fed funds rate rose 1%, as did the 1-month London Interbank Offered Rate (LIBOR). The rate on the 10-year U.S. Treasury nearly matched this increase. The reaction of U.S. stocks was somewhat mixed. While the bull market continued on as ferociously as ever, with the S&P 500® Index rising nearly 18% from September 30, 2017 through September 30, 2018, it was accompanied by an increase in volatility not seen for some time.
But the period didn’t start that way. The fourth quarter of 2017 will go down in history as an unprecedented nadir for U.S. stock volatility. Realized volatility was nearly one-third of historical averages,
and the Chicago Board Options Exchange Volatility Index® (CBOE VIX®) reached the lowest level in its nearly 30-year history. This was reflected in a steady upward grind in stock prices.
As the new year began, the relatively orderly bull market of late 2017 was replaced with a frenzied rush to ever higher prices, and a rapid succession of new all-time S&P 500® Index highs, representing the strongest January for U.S. stocks since 1997. This intense buying pressure finally broke in the last week of January, at which point the market witnessed a drawdown event with few rivals in recent memory. Over nine trading sessions, the S&P 500® Index dropped more than 10%, and the volatility market experienced a re-pricing of historic magnitude and violence. Much of the loss was quickly recaptured, only to be given back in late March. This “double dip” event was similar in some ways to the risk flares seen in late 2015 and early 2016, except that the recovery in this most recent experience was longer and more shallow. By August 2018, the January highs had been reached once again, but by all accounts the trading environment proved more risky and the highs more tenuous than in the early days of the year.
There were a number of potential explanations for this dynamic activity. A global trade war of increasing acrimony was certainly one. Pockets of geopolitical agitation may have been another. But the simplest explanation may be the most insightful and actionable – it is rare that a bull market can withstand the pressure of steadily increasing interest rates. We need only look back about a decade to see a recent example.
What factors affected the Fund’s performance during its fiscal year?
The Fund seeks to outperform the S&P 500® Index by augmenting a core equity portfolio with an options trading strategy. This options strategy can be broadly categorized as “short volatility,” in that the Fund seeks to make profits by selling options. This strategy, though, like most short volatility strategies, can experience asymmetrically large losses when markets behave irrationally, with wild swings to the upside and downside. In other words, this short volatility strategy can be challenged when volatility rises suddenly and steeply.
The experience of the January 2018 bull market tumbling into the February correction is illustrative. In
periods when markets unwind in an orderly fashion, the options strategy can be well-positioned to generate profits. But when markets unwind rapidly, as we saw in early February, the losses incurred can wipe out a long period of gains.
The return to expected market behavior in the second and third quarters of 2018 helped the Fund recoup some of the losses, but the damage from such a historically unprecedented series of events will take time to undo. The second and third quarters, while still firmly established as a bull market period, nonetheless proved more volatile than the remarkably sanguine fourth quarter of 2017. This was a good environment for the options overlay strategy, as higher volatility typically leads to higher options prices, allowing the Fund to take less risk with the options strategy while still generating consistent levels of income.
The preceding information is the opinion of portfolio management only through the end of the period stated on the cover. Any such opinions are subject to change at any time based upon market or other conditions and should not be relied upon as investment advice. Past performance is no guarantee of future results, and there is no guarantee that market forecasts will be realized.
Equity Securities: The market price of equity securities may be adversely affected by financial market, industry, or issuer-specific events. Focus on a particular style or on small or medium-sized companies may enhance that risk.
Call/Put Spreads: Buying and selling call and put option spreads on the S&P 500® Index risks the loss of the premium when buying, can limit upside participation and increase downside losses.
Fund of Funds: Because the Fund can invest in other funds, it indirectly bears its proportionate share of the operating expenses and management fees of the underlying fund(s).
Industry/Sector Concentration: A fund that focuses its investments in a particular industry or sector will be more sensitive to conditions that affect that industry or sector than a non-concentrated fund.
Portfolio Turnover: The Fund’s principal investments strategies will result in a consistently high portfolio turnover rate. A higher portfolio turnover rate may indicate higher transaction costs and may result in higher taxes when fund shares are held in a taxable account.
For information regarding the indexes and certain investment terms, see the Key Investment Terms starting on page 5.
29
| | |
| Rampart Enhanced Core Equity Fund (Continued) | | |
Prospectus: For additional information on risks, please see the Fund’s prospectus.
| | | | |
| |
| Asset Allocations | |
| |
The following table presents asset allocations within certain sectors as a percentage of total investments as of September 30, 2018. | |
Information Technology | | | 27 | % |
Health Care | | | 15 | |
Consumer Discretionary | | | 13 | |
Financials | | | 12 | |
Industrials | | | 9 | |
Consumer Staples | | | 7 | |
Energy | | | 5 | |
Other (includes Short-Term Investments and Written Options) | | | 12 | |
| | | | | |
Total | | | 100 | % |
| | | | | |
For information regarding the indexes and certain investment terms, see the Key Investment Terms starting on page 5.
30
Rampart Enhanced Core Equity Fund (Continued)
| | | | | | | | | | | | | | | | | | | | |
| Average Annual Total Returns1 for periods ended 9/30/18 | | | | |
| | | 1 year | | | 5 years | | | 10 years | | | Since
Inception | | | Inception
Date | |
| Class A shares at NAV2 | | | 10.84 | % | | | 12.58 | % | | | 10.30 | % | | | — | | | | — | |
| Class A shares at POP3,4 | | | 4.47 | | | | 11.26 | | | | 9.65 | | | | — | | | | — | |
| Class C shares at NAV2 and with CDSC4 | | | 10.00 | | | | 11.74 | | | | 9.47 | | | | — | | | | — | |
| Class I shares at NAV | | | 11.10 | | | | 12.86 | | | | 10.57 | | | | — | | | | — | |
| Class R6 shares at NAV | | | — | | | | — | | | | — | | | | 1.59 | % | | | 1/30/18 | |
| S&P 500® Index | | | 17.91 | | | | 13.95 | | | | 11.97 | | | | 4.63 | 5 | | | — | |
Fund Expense Ratios6: Class A shares: Gross 1.39%, Net 1.21%; Class C shares: Gross 2.12%, Net 1.96%; Class I shares: Gross 1.13%, Net 0.96%; Class R6 shares: Gross 1.09%, Net 0.92%.
All returns represent past performance which is no guarantee of future results. Current performance may be higher or lower than the performance shown. The investment return and principal value of an investment will fluctuate so that an investor’s shares, when redeemed, may be worth more or less than their original cost. The above table and graph below do not reflect the deduction of taxes that a shareholder would pay on fund distributions or the redemption of fund shares. Please visit Virtus.com for performance data current to the most recent month-end.
| 1 | Total returns are historical and include changes in share price and the reinvestment of both dividends and capital gain distributions. |
| 2 | “NAV” (Net Asset Value) total returns do not include the effect of any sales charge. |
| 3 | “POP” (Public Offering Price) total returns include the effect of the maximum front-end 5.75% sales charge. |
| 4 | “CDSC” (contingent deferred sales charge) is applied to redemptions of certain classes of shares that do not have a sales charge applied at the time of purchase. CDSC charges for certain redemptions of Class A shares made within 18 months of a finder’s fee being paid and all Class C shares are 1% within the first year and 0% thereafter. |
| 5 | The since inception index return is from the inception date of Class R6 shares. |
| 6 | The expense ratios of the Fund are set forth according to the prospectus for the Fund effective March 6, 2018, as supplemented and revised, and may differ from the expense ratios disclosed in the Financial Highlights tables in this report. See the Financial Highlights for more current expense ratios. Net Expense: Expenses reduced by a contractual fee waiver, in effect through March 31, 2019. Gross Expense: Does not reflect the effect of the fee waiver. Expense ratios include fees and expenses associated with the underlying funds. |
Growth of $10,000 for periods ended 9/30
This chart assumes an initial investment of $10,000 made on September 30, 2008, for Class A shares, Class C shares and Class I shares including any applicable sales charges or fees. The performance of the other share class may be greater or less than that shown based on differences in inception date, fees and sales charges. Performance assumes reinvestment of dividends and capital gain distributions.
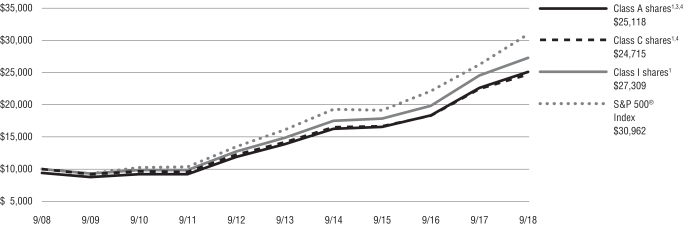
The index is unmanaged and not available for direct investment; therefore, its performance does not reflect the expenses associated with active management of an actual portfolio.
For information regarding the indexes and certain investment terms, see the Key Investment Terms starting on page 5.
31
| | |
Tactical Allocation Fund Fund Summary (Unaudited) | | Ticker Symbols: A Share: NAINX C Share: POICX |
Portfolio Managers Commentaries by
Duff & Phelps Investment Management Co.
(International Equity Portfolio),
Kayne Anderson Rudnick Investment Management, LLC
(Domestic Equity Portfolio) and
Newfleet Asset Management, LLC (Fixed Income Portfolio)
| ⬛ | | The Fund is diversified and has investment objectives of capital appreciation and income. There is no guarantee that the Fund will meet its objectives. |
| ⬛ | | For the fiscal year ended September 30, 2018, the Fund’s Class A shares at NAV returned 9.73%, and Class C shares at NAV returned 8.94%. For the same period, the Bloomberg Barclays U.S. Aggregate Bond Index; a broad-based fixed income index returned -1.22%, MSCI EAFE® Index (net) a broad-based International Index return 2.74%; the Russell 1,000® Growth Index a broad-based U.S. equity index return 26.30%; and the Tactical Allocation Fund Linked Benchmark, the Fund’s style-specific benchmark, returned 11.21%. |
All performance figures assume reinvestment of distributions and exclude the effect of sales changes. Performance data quoted represents past results. Past performance is no guarantee of future results, and current performance may be higher or lower than the performance shown above. Investment return and principal value will fluctuate so your shares, when redeemed, may be worth more or less than their original cost. Please visit Virtus.com for performance data current to the most recent month-end.
How did the markets perform during the Fund’s fiscal year ended September 30, 2018?
Domestic Equities
Despite increased volatility, U.S. equities continued to march ahead during the fiscal year, with the S&P 500® Index returning 17.91% for the 12-month period. Smaller stocks, as represented by the Russell 2000® Index, performed strongly as well, rising 15.24%. Growth stocks outperformed their value counterparts for the period, though both categories rose by double digits. Foreign markets struggled in comparison, with the MSCI EAFE® Index gaining
2.74% and the MSCI Emerging Markets Index down 0.81% for the period.
The Russell 1000® Growth Index rose 26.30% for the 12 months through September 30, 2018. All sectors within the index were positive, led by the consumer discretionary and information technology sectors with gains of 43.06% and 41.14%, respectively. The weakest performing sector was materials, up 2.48%.
Key events that drove markets in the past year included a correction that rattled U.S. equity markets in early 2018 after a calm 2017. While the bout of volatility set major indices back a step, stocks soon recovered. They continued to advance during the fiscal year thanks to strong earnings and robust business and economic activity at home, including expansion in service sectors and solid gross domestic product (GDP) growth.
Market strength continued – though not without volatility – despite the introduction of new trade tariffs earlier in 2018 and the continued escalation of tariff-related tensions, particularly with China. Prolonged negotiations and uncertainty put pressure on emerging market stocks during the 12 months. This, paired with a general slowing in Europe and viewed against continued strength in the U.S., seemed to indicate that “global synchronized recovery” was not an apt description for the environment.
International Equities
The international equity markets posted positive returns during the fiscal year ended September 30, 2018, with the MSCI EAFE® Index gaining 2.74%. International equity markets shrugged off the U.S.-China “Trade and Tariff War” and higher interest rates, although both concerns caused episodes of skittishness at times. The dominant tailwind driving equity markets was a building consensus that global economic growth is alive and well, powered by a strong U.S. economy. Underlying economic fundamentals remained largely positive in support of the global growth story, which served to mute the overall impact of adverse news events.
Nine of the 11 sectors in the MSCI EAFE® Index posted positive returns. The top performing sectors were energy, healthcare, and information technology. The weakest performing sectors were financials, communication services, and utilities.
Fixed Income
Most spread sectors outperformed during the fiscal year ended September 30, 2018, led by corporate high yield and high yield bank loans. Within spread sectors, assets with longer duration underperformed on a total return basis, as yields rose and bond prices fell. Non-U.S. dollar-denominated securities and emerging markets high yield were the largest underperformers during the period.
The 12-month period presented multiple challenges, including several bouts of elevated volatility. Market participants continued to wrestle with periods of instability caused by geopolitical developments, trade rhetoric, mixed global economic signals, and the evolution of the various quantitative easing (QE) programs that began after the now decade-old financial crisis. During the period, oil prices continued their ascent, driven higher by the outlook for supply/demand dynamics. U.S. economic data stayed on a positive trend, which contrasted with other global economies.
As anticipated, the Federal Reserve (the Fed) raised its target rate 0.25% on four separate occasions during the 12 months to a range of 2.00% to 2.25%.
Over the last 12 months, yields increased overall, but more so for shorter maturity bonds than for longer term securities.
What factors affected the Fund’s performance during its fiscal year?
Domestic Equities
The Fund’s domestic equity portfolio underperformed the Russell 1000® Growth Index for the 12 months ended September 30, 2018. Factors negatively affecting the portfolio included weak stock selection in the consumer discretionary sector and an underweight in information technology. Strong stock selection in industrials and materials helped offset losses.
The stocks that contributed the most to the year’s gains were Amazon and Netflix.
| ⬛ | | Amazon continued on its powerful growth trajectory, driven by its wide-moat e-commerce business and dominant web services offering. Amazon’s advertising capabilities helped propel the company to outpace second-quarter revenue and |
For information regarding the indexes and certain investment terms, see the Key Investment Terms starting on page 5.
32
| | |
| Tactical Allocation Fund (Continued) | | |
| | | earnings expectations by a gigantic margin. In addition, Amazon showed operating leverage on a wide variety of expense items, including fulfillment, technology, content and marketing, hinting at the potential for meaningful margin expansion down the road. |
| ⬛ | | Netflix is a global leader in on-demand entertainment, with over 125 million subscribers, more than 55% of whom are outside the U.S. Net subscriber additions continued to greatly outpace expectations due to successful content creation, notable early success in cable and telecommunications distribution channels, and highly effective local advertising. Margins surprised to the upside, driven by rapid improvements in international profitability even as subscriber growth was a little uneven. |
The positions that detracted the most from performance were Celgene and Ctrip.com.
| ⬛ | | Celgene was aggressive in deploying capital to bolster future growth, but the results of its pipeline programs severely disappointed. Most recently, its REVLIMID failed in a phase-3 follicular lymphoma trial, but that paled in comparison to the failure of GED-0301 for Crohn’s disease, which subsequently forced Celgene to lower its 2020 guidance. We lost faith that the company would be able to weather its $15 billion revenue cliff, and we exited the position. |
| ⬛ | | Ctrip.com has consolidated and monopolized the high-end online travel market in China. It came under fire as regulators forced the company to unbundle products such as trip insurance that it automatically added to ticket purchases. The company was also affected by coordinated reductions in domestic commissions. We believe both of those issues are well understood. On the flip side, the company’s outbound travel business experienced a boom, with advantaged inventory and pricing focused on its core high-end consumer. As only a very small percent of Chinese citizens have ever been outside the country, we believe demand could drive future growth. Therefore, we continued to hold the position in the Fund at the end of the period. |
International Equities
The Fund’s international equity portfolio posted positive performance during the fiscal year, and also outperformed the international equity market, as measured by the MSCI EAFE® Index. Stock selection was the primary contributor to relative returns, while sector allocations also made a positive impact on results.
Stock selection within industrials, consumer staples, and financials contributed most significantly to the international portfolio’s relative performance. The largest single-stock contribution to relative returns came from Japanese consumer electronics company Sony, which rose more than 62% during the period.
Stock selection within the communication services, information technology, and healthcare sectors detracted from results. Shares of travel website company Ctrip.com fell more than 29% during the period due to concerns over a possible slowdown in Chinese travel trends and a general malaise in the Chinese stock market. We continued to hold the stock in the Fund at the end of the period.
The sector allocations that contributed the most to the portfolio’s relative performance were overweight exposures to energy, materials, and information technology, and an underweight exposure to communication services. However, the portfolio’s overweight exposures to financials and industrials, as well as underweight exposures to consumer discretionary and utilities, detracted from results.
During the period, we found select opportunities across all major sectors of the global economy, but continued to lean into cyclical sectors such as energy, financials, industrials, and technology. We also maintained underweight positions in defensive sectors such as consumer staples and communication services, for both top-down and bottom-up reasons.
Fixed Income
The underperformance of U.S. Treasuries relative to most fixed income spread sectors was the key driver of the Fund’s outperformance for the fiscal year ended September 30, 2018.
Among fixed income sectors, the Fund’s allocations to corporate high yield, bank loans, and asset-backed
securities were the largest positive contributors to performance for the fiscal year.
During the fiscal year, the Fund’s allocations to emerging markets high yield and non-U.S. dollar-denominated securities were the largest detractors from performance.
The preceding information is the opinion of portfolio management only through the end of the period stated on the cover. Any such opinions are subject to change at any time based upon market or other conditions and should not be relied upon as investment advice. Past performance is no guarantee of future results, and there is no guarantee that market forecasts will be realized.
Equity Securities: The market price of equity securities may be adversely affected by financial market, industry, or issuer-specific events. Focus on a particular style or on small or medium-sized companies may enhance that risk.
Credit & Interest: Debt securities are subject to various risks, the most prominent of which are credit and interest rate risk. The issuer of a debt security may fail to make interest and/or principal payments. Values of debt securities may rise or fall in response to changes in interest rates, and this risk may be enhanced with longer-term maturities.
Foreign & Emerging Markets: Investing internationally, especially in emerging markets, involves additional risks such as currency, political, accounting, economic, and market risk.
Allocation: The Fund’s exposure to different asset classes may not be optimal for market conditions at a given time. Asset allocation does not guarantee a profit or protect against a loss in declining markets.
High Yield-High Risk Fixed Income Securities: There is a greater level of credit risk and price volatility involved with high yield securities than investment grade securities.
For information regarding the indexes and certain investment terms, see the Key Investment Terms starting on page 5.
33
| | |
| Tactical Allocation Fund (Continued) | | |
Prospectus: For additional information on risks, please see the Fund’s prospectus.
| | | | | | | | |
| |
| Asset Allocations | |
| |
The following table presents asset allocations within certain sectors as a percentage of total investments as of September 30, 2018. | |
Common Stocks | | | | | | | 63 | % |
Information Technology | | | 21 | % | | | | |
Consumer Discretionary | | | 14 | | | | | |
Financials | | | 6 | | | | | |
All Other Sectors in Common Stocks | | | 22 | | | | | |
Corporate Bonds and Notes | | | | | | | 18 | |
Financials | | | 4 | | | | | |
Energy | | | 3 | | | | | |
Consumer Discretionary | | | 3 | | | | | |
All Other Sectors in Corporate Bonds and Notes | | | 8 | | | | | |
Leveraged Loans | | | | | | | 5 | |
Mortgage-Backed Securities | | | | | | | 5 | |
Foreign Government Securities | | | | | | | 2 | |
Asset-Backed Securities | | | | | | | 2 | |
Other (includes Securities Lending Collateral) | | | | | | | 5 | |
| | | | | | | | | |
Total | | | | | | | 100 | % |
| | | | | | | | | |
For information regarding the indexes and certain investment terms, see the Key Investment Terms starting on page 5.
34
Tactical Allocation Fund (Continued)
| | | | | | | | | | | | |
| Average Annual Total Returns1 for periods ended 9/30/18 | | | | | | | | | |
| | | 1 year | | | 5 years | | | 10 years | |
| Class A shares at NAV2 | | | 9.73 | % | | | 6.70 | % | | | 7.38 | % |
| Class A shares at POP3,4 | | | 3.42 | | | | 5.44 | | | | 6.74 | |
| Class C shares at NAV2 and with CDSC4 | | | 8.94 | | | | 5.88 | | | | 6.58 | |
| Bloomberg Barclays U.S. Aggregate Bond Index | | | -1.22 | | | | 2.16 | | | | 3.77 | |
| MSCI EAFE® Index (net) | | | 2.74 | | | | 4.42 | | | | 5.38 | |
| Russell 1000® Growth Index | | | 26.30 | | | | 16.58 | | | | 14.31 | |
| Tactical Allocation Fund Linked Benchmark | | | 11.21 | | | | 9.31 | | | | 8.72 | |
Fund Expense Ratios5: Class A shares: 1.38%; Class C shares: 2.16%.
All returns represent past performance which is no guarantee of future results. Current performance may be higher or lower than the performance shown. The investment return and principal value of an investment will fluctuate so that an investor’s shares, when redeemed, may be worth more or less than their original cost. The above table and graph below do not reflect the deduction of taxes that a shareholder would pay on fund distributions or the redemption of fund shares. Please visit Virtus.com for performance data current to the most recent month-end.
| 1 | Total returns are historical and include changes in share price and the reinvestment of both dividends and capital gain distributions. |
| 2 | “NAV” (Net Asset Value) total returns do not include the effect of any sales charge. |
| 3 | “POP” (Public Offering Price) total returns include the effect of the maximum front-end 5.75% sales charge. |
| 4 | “CDSC” (contingent deferred sales charge) is applied to redemptions of certain classes of shares that do not have a sales charge applied at the time of purchase. CDSC charges for certain redemptions of Class A shares made within 18 months of a finder’s fee being paid and all Class C shares are 1% within the first year and 0% thereafter. |
| 5 | The expense ratios of the Fund are set forth in the prospectus for the Fund effective March 6, 2018, as supplemented and revised, and may differ from the expense ratios disclosed in the Financial Highlights tables in this report. See the Financial Highlights for more current expense ratios. Expense ratios include fees and expenses associated with the underlying funds. |
Growth of $10,000 for periods ended 9/30
This chart assumes an initial investment of $10,000 made on September 30, 2008, for Class A shares and Class C shares including any applicable sales charges or fees. Performance assumes reinvestment of dividends and capital gain distributions.
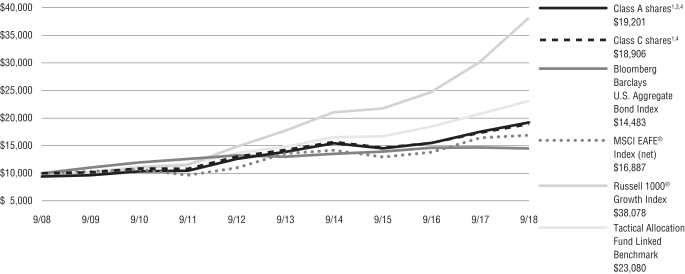
The indexes are unmanaged and not available for direct investment; therefore, their performance does not reflect the expenses associated with active management of an actual portfolio.
For information regarding the indexes and certain investment terms, see the Key Investment Terms starting on page 5.
35
KAR CAPITAL GROWTH FUND
SCHEDULE OF INVESTMENTS
SEPTEMBER 30, 2018
($ reported in thousands)
| | | | | | | | |
| | | SHARES | | | VALUE | |
| COMMON STOCKS—99.9% | |
|
| Consumer Discretionary—25.9% | |
Amazon.com, Inc.(1) | | | 24,482 | | | $ | 49,037 | |
Ctrip.com International Ltd. ADR(1) | | | 170,910 | | | | 6,353 | |
Home Depot, Inc. (The) | | | 56,855 | | | | 11,777 | |
Las Vegas Sands Corp. | | | 213,073 | | | | 12,642 | |
McDonald’s Corp. | | | 42,160 | | | | 7,053 | |
MercadoLibre, Inc. | | | 15,720 | | | | 5,352 | |
Netflix, Inc.(1) | | | 66,920 | | | | 25,037 | |
NIKE, Inc. Class B | | | 145,190 | | | | 12,300 | |
Ross Stores, Inc. | | | 116,716 | | | | 11,567 | |
| | | | | | | | |
| | | | 141,118 | |
| | | | | |
|
| Consumer Staples—4.6% | |
Monster Beverage Corp.(1) | | | 285,593 | | | | 16,644 | |
Philip Morris International, Inc. | | | 103,417 | | | | 8,433 | |
| | | | | | | | |
| | | | 25,077 | |
| | | | | |
|
| Energy—3.7% | |
Cabot Oil & Gas Corp. | | | 312,611 | | | | 7,040 | |
Core Laboratories N.V. | | | 48,749 | | | | 5,647 | |
Pioneer Natural Resources Co. | | | 43,730 | | | | 7,617 | |
| | | | | | | | |
| | | | 20,304 | |
| | | | | |
|
| Financials—6.2% | |
Bank of America Corp. | | | 571,810 | | | | 16,846 | |
Charles Schwab Corp. (The) | | | 145,678 | | | | 7,160 | |
MarketAxess Holdings, Inc. | | | 31,860 | | | | 5,687 | |
SEI Investments Co. | | | 67,710 | | | | 4,137 | |
| | | | | | | | |
| | | | 33,830 | |
| | | | | |
|
| Health Care—9.9% | |
Bluebird Bio, Inc.(1) | | | 39,000 | | | | 5,694 | |
Danaher Corp. | | | 78,592 | | | | 8,540 | |
HealthEquity, Inc.(1) | | | 140,880 | | | | 13,300 | |
Illumina, Inc.(1) | | | 36,500 | | | | 13,398 | |
| | | | | | | | |
| | | SHARES | | | VALUE | |
|
| Health Care—continued | |
Zoetis, Inc. | | | 141,517 | | | $ | 12,957 | |
| | | | | | | | |
| | | | 53,889 | |
| | | | | |
|
| Industrials—7.8% | |
Caterpillar, Inc. | | | 64,790 | | | | 9,880 | |
CoStar Group, Inc.(1) | | | 22,391 | | | | 9,423 | |
Kansas City Southern | | | 67,520 | | | | 7,649 | |
Rockwell Automation, Inc. | | | 25,240 | | | | 4,733 | |
Roper Technologies, Inc. | | | 36,799 | | | | 10,900 | |
| | | | | | | | |
| | | | 42,585 | |
| | | | | |
|
| Information Technology—39.7% | |
Accenture plc Class A | | | 53,238 | | | | 9,061 | |
Activision Blizzard, Inc. | | | 131,110 | | | | 10,907 | |
Alibaba Group Holding Ltd. Sponsored ADR(1) | | | 170,830 | | | | 28,146 | |
Amphenol Corp. Class A | | | 165,208 | | | | 15,533 | |
Arista Networks, Inc.(1) | | | 27,390 | | | | 7,282 | |
Avalara, Inc.(1)(2) | | | 187,230 | | | | 6,540 | |
Facebook, Inc. Class A(1) | | | 160,740 | | | | 26,435 | |
Gartner, Inc.(1) | | | 41,350 | | | | 6,554 | |
NVIDIA Corp. | | | 85,350 | | | | 23,985 | |
Paycom Software, Inc.(1) | | | 103,162 | | | | 16,032 | |
Tencent Holdings Ltd. ADR | | | 255,440 | | | | 10,432 | |
Trade Desk, Inc. (The) Class A(1) | | | 39,260 | | | | 5,925 | |
Visa, Inc. Class A | | | 166,174 | | | | 24,941 | |
Workday, Inc. Class A(1) | | | 94,281 | | | | 13,763 | |
Yandex N.V. Class A(1) | | | 349,184 | | | | 11,485 | |
| | | | | | | | |
| | | | 217,021 | |
| | | | | |
| Materials—2.1% | |
Ecolab, Inc. | | | 73,306 | | | | 11,493 | |
TOTAL COMMON STOCKS
(Identified Cost $280,540) | | | | | | | 545,317 | |
| TOTAL LONG-TERM INVESTMENTS—99.9% | |
| (Identified Cost $280,540) | | | | 545,317 | |
| | | | | | | | |
| | | SHARES | | | VALUE | |
| SECURITIES LENDING COLLATERAL—0.9% | |
Dreyfus Government Cash Management Fund – Institutional Shares (seven-day effective yield 1.950%)(3)(4) | | | 5,056,065 | | | $ | 5,056 | |
TOTAL SECURITIES LENDING COLLATERAL
(Identified Cost $5,056) | | | | 5,056 | |
TOTAL INVESTMENTS—100.8%
(Identified Cost $285,596) | | | | 550,373 | |
Other assets and liabilities, net—(0.8)% | | | | (4,258 | ) |
| | | | | | | | |
| NET ASSETS—100.0% | | | | | | $ | 546,115 | |
| | | | | | | | |
Abbreviation:
| ADR | American Depositary Receipt |
Footnote Legend:
| (2) | All or a portion of security is on loan. |
| (3) | Shares of this fund are publicly offered, and its prospectus and annual report are publicly available. |
| (4) | Represents security purchased with cash collateral received for securities on loan. |
| | | | |
| Country Weightings (Unaudited)† | |
United States (includes securities lending collateral) | | | 90 | % |
China | | | 8 | |
Russia | | | 2 | |
Total | | | 100 | % |
† % of total investments as of September 30, 2018. | |
The following table provides a summary of inputs used to value the Fund’s investments as of September 30, 2018 (See Security Valuation Note 2A in the Notes to Financial Statements):
| | | | | | | | |
| | | Total
Value at
September 30, 2018 | | | Level 1
Quoted
Prices | |
Equity Securities: | | | | | | | | |
Common Stocks | | $ | 545,317 | | | $ | 545,317 | |
Securities Lending Collateral | | | 5,056 | | | | 5,056 | |
| | | | | | | | |
Total Investments | | $ | 550,373 | | | $ | 550,373 | |
| | | | | | | | |
There were no securities valued using significant observable inputs (Level 2) or significant unobservable inputs (Level 3) at September 30, 2018.
There were no transfers into or out of Level 3 related to securities held at September 30, 2018.
For information regarding the abbreviation, see the Key Investment Terms starting on page 5.
See Notes to Financial Statements
36
KAR GLOBAL QUALITY DIVIDEND FUND
SCHEDULE OF INVESTMENTS
SEPTEMBER 30, 2018
($ reported in thousands)
| | | | | | | | |
| | | SHARES | | | VALUE | |
| COMMON STOCKS—99.0% | |
|
| Consumer Discretionary—3.8% | |
Compass Group plc Sponsored ADR | | | 17,538 | | | $ | 397 | |
Las Vegas Sands Corp. | | | 16,720 | | | | 992 | |
| | | | | | | | |
| | | | 1,389 | |
| | | | | |
|
| Consumer Staples—11.1% | |
Altria Group, Inc. | | | 11,006 | | | | 664 | |
British American Tobacco plc Sponsored ADR | | | 7,380 | | | | 344 | |
Clorox Co. (The) | | | 6,135 | | | | 923 | |
Coca-Cola Co. (The) | | | 24,595 | | | | 1,136 | |
Imperial Brands plc | | | 12,400 | | | | 432 | |
Imperial Brands plc Sponsored ADR | | | 14,990 | | | | 520 | |
| | | | | | | | |
| | | | 4,019 | |
| | | | | |
|
| Energy—10.6% | |
Royal Dutch Shell plc Class B Sponsored ADR | | | 23,820 | | | | 1,689 | |
TOTAL S.A. Sponsored ADR | | | 16,830 | | | | 1,084 | |
Vermilion Energy, Inc. | | | 33,020 | | | | 1,088 | |
| | | | | | | | |
| | | | 3,861 | |
| | | | | |
|
| Financials—19.0% | |
Bank of Hawaii Corp. | | | 5,599 | | | | 442 | |
HSBC Holdings plc Sponsored ADR(1) | | | 31,640 | | | | 1,392 | |
Royal Bank of Canada | | | 15,430 | | | | 1,237 | |
Sabre Insurance Group plc | | | 252,000 | | | | 870 | |
SCOR SE Sponsored ADR | | | 189,775 | | | | 866 | |
Tokio Marine Holdings, Inc. | | | 13,520 | | | | 671 | |
Zurich Insurance Group AG ADR | | | 44,837 | | | | 1,412 | |
| | | | | | | | |
| | | | 6,890 | |
| | | | | |
| Health Care—10.2% | |
AstraZeneca plc Sponsored ADR | | | 18,660 | | | | 738 | |
GlaxoSmithKline plc | | | 20,100 | | | | 403 | |
GlaxoSmithKline plc Sponsored ADR | | | 23,946 | | | | 962 | |
Merck & Co., Inc. | | | 15,060 | | | | 1,068 | |
Sonic Healthcare Ltd. Sponsored ADR | | | 29,510 | | | | 530 | |
| | | | | | | | |
| | | | 3,701 | |
| | | | | |
| | | | | | | | |
| | | SHARES | | | VALUE | |
| Industrials—7.7% | |
ABB Ltd. Registered Shares | | | 31,900 | | | $ | 754 | |
Air New Zealand Ltd. | | | 318,970 | | | | 653 | |
Port of Tauranga Ltd. | | | 88,200 | | | | 306 | |
Waste Management, Inc. | | | 4,098 | | | | 370 | |
Watsco, Inc. | | | 4,055 | | | | 722 | |
| | | | | | | | |
| | | | 2,805 | |
| | | | | |
|
| Information Technology—5.4% | |
Analog Devices, Inc. | | | 4,790 | | | | 443 | |
Cisco Systems, Inc. | | | 7,550 | | | | 367 | |
Paychex, Inc. | | | 6,900 | | | | 508 | |
Tieto OYJ | | | 20,560 | | | | 636 | |
| | | | | | | | |
| | | | 1,954 | |
| | | | | |
|
| Materials—2.6% | |
Sonoco Products Co. | | | 17,050 | | | | 946 | |
| | | | | | | | |
|
| Real Estate—8.5% | |
Crown Castle International Corp. | | | 8,030 | | | | 894 | |
Lamar Advertising Co. Class A | | | 15,950 | | | | 1,241 | |
Realty Income Corp. | | | 16,910 | | | | 962 | |
| | | | | | | | |
| | | | 3,097 | |
| | | | | |
| Telecommunication Services—11.7% | |
AT&T, Inc. | | | 31,249 | | | | 1,049 | |
BCE, Inc. | | | 36,910 | | | | 1,496 | |
Spark New Zealand Ltd. | | | 629,220 | | | | 1,689 | |
| | | | | | | | |
| | | | 4,234 | |
| | | | | |
|
| Utilities—8.4% | |
Duke Energy Corp. | | | 14,420 | | | | 1,154 | |
Fortis, Inc. | | | 29,720 | | | | 963 | |
WEC Energy Group, Inc. | | | 14,050 | | | | 938 | |
| | | | | | | | |
| | | | | 3,055 | |
TOTAL COMMON STOCKS
(Identified Cost $34,408) | | | | 35,951 | |
| TOTAL LONG-TERM INVESTMENTS—99.0% | |
| (Identified Cost $34,408) | | | | 35,951 | |
| | | | | | | | |
| | | SHARES | | | VALUE | |
| SECURITIES LENDING COLLATERAL—0.0% | |
Dreyfus Government Cash Management Fund – Institutional Shares (seven-day effective yield 1.950%)(2)(3) | | | 4,600 | | | $ | 5 | |
TOTAL SECURITIES LENDING COLLATERAL
(Identified Cost $5) | | | | 5 | |
TOTAL INVESTMENTS—99.0%
(Identified Cost $34,413) | | | | 35,956 | |
Other assets and liabilities, net—1.0% | | | | 365 | |
| | | | | | | | |
| NET ASSETS—100.0% | | | | | | $ | 36,321 | |
| | | | | | | | |
Abbreviation:
| ADR | American Depositary Receipt |
Footnote Legend:
| (1) | All or a portion of security is on loan. |
| (2) | Represents security purchased with cash collateral received for securities on loan. |
| (3) | Shares of this fund are publicly offered, and its prospectus and annual report are publicly available. |
| | | | |
| Country Weightings (Unaudited)† | |
United States (includes securities lending collateral) | | | 41 | % |
United Kingdom | | | 22 | |
Canada | | | 13 | |
New Zealand | | | 7 | |
Switzerland | | | 6 | |
France | | | 5 | |
Japan | | | 2 | |
Other | | | 4 | |
Total | | | 100 | % |
† % of total investments as of September 30, 2018. | |
The following table provides a summary of inputs used to value the Fund’s investments as of September 30, 2018 (See Security Valuation Note 2A in the Notes to Financial Statements):
| | | | | | | | |
| | | Total
Value at
September 30, 2018 | | | Level 1
Quoted
Prices | |
Equity Securities: | | | | | | | | |
Common Stocks | | $ | 35,951 | | | $ | 35,951 | |
Securities Lending Collateral | | | 5 | | | | 5 | |
| | | | | | | | |
Total Investments | | $ | 35,956 | | | $ | 35,956 | |
| | | | | | | | |
There were no securities valued using significant observable inputs (Level 2) or significant unobservable inputs (Level 3) at September 30, 2018.
There were no transfers into or out of Level 3 related to securities held at September 30, 2018.
For information regarding the abbreviation, see the Key Investment Terms starting on page 5.
See Notes to Financial Statements
37
KAR MID-CAP CORE FUND
SCHEDULE OF INVESTMENTS
SEPTEMBER 30, 2018
($ reported in thousands)
| | | | | | | | |
| | | SHARES | | | VALUE | |
| COMMON STOCKS—92.8% | |
|
| Consumer Discretionary—9.9% | |
Ross Stores, Inc. | | | 87,694 | | | $ | 8,691 | |
Tractor Supply Co. | | | 114,446 | | | | 10,401 | |
Wynn Resorts Ltd. | | | 32,504 | | | | 4,130 | |
| | | | | | | | |
| | | | 23,222 | |
| | | | | |
|
| Consumer Staples—7.4% | |
Lamb Weston Holdings, Inc. | | | 104,100 | | | | 6,933 | |
Monster Beverage Corp.(1) | | | 178,549 | | | | 10,406 | |
| | | | | | | | |
| | | | 17,339 | |
| | | | | |
|
| Financials—13.8% | |
Bank OZK | | | 150,050 | | | | 5,696 | |
First Financial Bankshares, Inc. | | | 82,965 | | | | 4,903 | |
Houlihan Lokey, Inc. | | | 131,640 | | | | 5,915 | |
Moody’s Corp. | | | 29,885 | | | | 4,997 | |
SEI Investments Co. | | | 68,580 | | | | 4,190 | |
Signature Bank | | | 57,754 | | | | 6,632 | |
| | | | | | | | |
| | | | 32,333 | |
| | | | | |
|
| Health Care—22.5% | |
AMN Healthcare Services, Inc.(1) | | | 129,300 | | | | 7,073 | |
Cooper Cos., Inc. (The) | | | 36,458 | | | | 10,104 | |
Elanco Animal Health, Inc.(1) | | | 208,568 | | | | 7,277 | |
Globus Medical, Inc. Class A(1) | | | 225,200 | | | | 12,782 | |
West Pharmaceutical Services, Inc. | | | 67,232 | | | | 8,301 | |
Zoetis, Inc. | | | 76,340 | | | | 6,990 | |
| | | | | | | | |
| | | | 52,527 | |
| | | | | |
| | | | | | | | |
| | | SHARES | | | VALUE | |
| Industrials—21.6% | |
AMETEK, Inc. | | | 143,700 | | | $ | 11,370 | |
Exponent, Inc. | | | 104,380 | | | | 5,595 | |
Graco, Inc. | | | 167,465 | | | | 7,760 | |
Lennox International, Inc. | | | 30,100 | | | | 6,574 | |
Nordson Corp. | | | 52,917 | | | | 7,350 | |
Verisk Analytics, Inc.(1) | | | 40,300 | | | | 4,858 | |
WABCO Holdings, Inc.(1) | | | 60,305 | | | | 7,112 | |
| | | | | | | | |
| | | | 50,619 | |
| | | | | |
|
| Information Technology—15.0% | |
Amphenol Corp. Class A | | | 97,083 | | | | 9,128 | |
Aspen Technology, Inc.(1) | | | 99,981 | | | | 11,389 | |
Broadridge Financial Solutions, Inc. | | | 76,260 | | | | 10,062 | |
Skyworks Solutions, Inc. | | | 49,010 | | | | 4,446 | |
| | | | | | | | |
| | | | 35,025 | |
| | | | | |
|
| Materials—2.6% | |
International Flavors & Fragrances, Inc. | | | 43,069 | | | | 5,992 | |
TOTAL COMMON STOCKS
(Identified Cost $171,468) | | | | | | | 217,057 | |
| TOTAL LONG-TERM INVESTMENTS—92.8% | |
| (Identified Cost $171,468) | | | | | | | 217,057 | |
| | | | | | | | |
| | | SHARES | | | VALUE | |
| SHORT-TERM INVESTMENT—4.1% | |
|
| Money Market Mutual Fund—4.1% | |
Dreyfus Government Cash Management Fund – Institutional Shares (seven-day effective yield 1.950%)(2) | | | 9,660,451 | | | $ | 9,660 | |
TOTAL SHORT-TERM INVESTMENT
(Identified Cost $9,660) | | | | 9,660 | |
TOTAL INVESTMENTS—96.9%
(Identified Cost $181,128) | | | | 226,717 | |
Other assets and liabilities, net—3.1% | | | | 7,187 | |
| | | | | | | | |
| NET ASSETS—100.0% | | | | | | $ | 233,904 | |
| | | | | | | | |
Footnote Legend:
| (2) | Shares of this fund are publicly offered, and its prospectus and annual report are publicly available. |
The following table provides a summary of inputs used to value the Fund’s investments as of September 30, 2018 (See Security Valuation Note 2A in the Notes to Financial Statements):
| | | | | | | | |
| | | Total
Value at
September 30, 2018 | | | Level 1
Quoted
Prices | |
Equity Securities: | | | | | | | | |
Common Stocks | | $ | 217,057 | | | $ | 217,057 | |
Short-Term Investment | | | 9,660 | | | | 9,660 | |
| | | | | | | | |
Total Investments | | $ | 226,717 | | | $ | 226,717 | |
| | | | | | | | |
There were no securities valued using significant observable inputs (Level 2) or significant unobservable inputs (Level 3) at September 30, 2018.
There were no transfers into or out of Level 3 related to securities held at September 30, 2018.
See Notes to Financial Statements
38
KAR MID-CAP GROWTH FUND
SCHEDULE OF INVESTMENTS
SEPTEMBER 30, 2018
($ reported in thousands)
| | | | | | | | |
| | | SHARES | | | VALUE | |
| COMMON STOCKS—93.1% | |
|
| Consumer Discretionary—19.4% | |
Ctrip.com International Ltd. ADR(1) | | | 71,715 | | | $ | 2,666 | |
Domino’s Pizza, Inc. | | | 15,935 | | | | 4,698 | |
Expedia Group, Inc. | | | 19,171 | | | | 2,501 | |
MercadoLibre, Inc. | | | 15,820 | | | | 5,386 | |
Netflix, Inc.(1) | | | 26,500 | | | | 9,914 | |
Pool Corp. | | | 28,015 | | | | 4,675 | |
Ross Stores, Inc. | | | 32,705 | | | | 3,241 | |
Under Armour, Inc. Class A(1) | | | 112,710 | | | | 2,392 | |
Wynn Resorts Ltd. | | | 27,780 | | | | 3,530 | |
| | | | | | | | |
| | | | 39,003 | |
| | | | | |
|
| Consumer Staples—6.4% | |
Brown-Forman Corp. Class B | | | 78,405 | | | | 3,964 | |
McCormick & Co., Inc. | | | 24,200 | | | | 3,188 | |
Monster Beverage Corp.(1) | | | 96,710 | | | | 5,636 | |
| | | | | | | | |
| | | | 12,788 | |
| | | | | |
|
| Energy—2.4% | |
Cabot Oil & Gas Corp. | | | 100,685 | | | | 2,268 | |
Core Laboratories N.V. | | | 21,630 | | | | 2,505 | |
| | | | | | | | |
| | | | 4,773 | |
| | | | | |
|
| Financials—6.6% | |
MarketAxess Holdings, Inc. | | | 20,400 | | | | 3,641 | |
Northern Trust Corp. | | | 28,920 | | | | 2,954 | |
SEI Investments Co. | | | 50,930 | | | | 3,112 | |
Worldpay, Inc. Class A(1) | | | 34,680 | | | | 3,512 | |
| | | | | | | | |
| | | | 13,219 | |
| | | | | |
|
| Health Care—15.2% | |
Bluebird Bio, Inc.(1) | | | 10,650 | | | | 1,555 | |
Diplomat Pharmacy, Inc.(1) | | | 138,870 | | | | 2,695 | |
Elanco Animal Health, Inc.(1) | | | 22,190 | | | | 774 | |
HealthEquity, Inc.(1) | | | 65,470 | | | | 6,181 | |
Illumina, Inc.(1) | | | 14,785 | | | | 5,427 | |
Mettler-Toledo International, Inc.(1) | | | 3,095 | | | | 1,885 | |
| | | | | | | | |
| | | SHARES | | | VALUE | |
|
| Health Care—continued | |
STAAR Surgical Co.(1) | | | 40,700 | | | $ | 1,954 | |
Teladoc Health, Inc.(1) | | | 69,680 | | | | 6,017 | |
Zoetis, Inc. | | | 44,660 | | | | 4,089 | |
| | | | | | | | |
| | | | 30,577 | |
| | | | | |
|
| Industrials—6.9% | |
CoStar Group, Inc.(1) | | | 6,200 | | | | 2,609 | |
Kansas City Southern | | | 30,300 | | | | 3,432 | |
Rockwell Automation, Inc. | | | 9,100 | | | | 1,706 | |
Roper Technologies, Inc. | | | 11,640 | | | | 3,448 | |
SiteOne Landscape Supply, Inc.(1) | | | 37,000 | | | | 2,788 | |
| | | | | | | | |
| | | | 13,983 | |
| | | | | |
|
| Information Technology—36.2% | |
Amphenol Corp. Class A | | | 44,095 | | | | 4,146 | |
Appian Corp.(1) | | | 66,460 | | | | 2,200 | |
Arista Networks, Inc.(1) | | | 7,370 | | | | 1,960 | |
Autohome, Inc. ADR | | | 66,570 | | | | 5,153 | |
Avalara, Inc.(1) | | | 108,450 | | | | 3,788 | |
Cargurus, Inc.(1) | | | 57,944 | | | | 3,227 | |
DocuSign, Inc.(1) | | | 71,320 | | | | 3,749 | |
Ellie Mae, Inc.(1) | | | 29,860 | | | | 2,830 | |
Fair Isaac Corp.(1) | | | 19,940 | | | | 4,557 | |
FleetCor Technologies, Inc.(1) | | | 12,460 | | | | 2,839 | |
Gartner, Inc.(1) | | | 32,065 | | | | 5,082 | |
GrubHub, Inc.(1) | | | 28,390 | | | | 3,936 | |
Okta, Inc.(1) | | | 49,345 | | | | 3,472 | |
Paycom Software, Inc.(1) | | | 34,910 | | | | 5,425 | |
Teradyne, Inc. | | | 65,340 | | | | 2,416 | |
Trade Desk, Inc. (The) Class A(1) | | | 48,050 | | | | 7,251 | |
Workday, Inc. Class A(1) | | | 26,910 | | | | 3,928 | |
Yandex N.V. Class A(1) | | | 116,235 | | | | 3,823 | |
Zscaler, Inc.(1) | | | 72,100 | | | | 2,940 | |
| | | | | | | | |
| | | | | 72,722 | |
TOTAL COMMON STOCKS
(Identified Cost $115,545) | | | | | | | 187,065 | |
| TOTAL LONG-TERM INVESTMENTS—93.1% | |
| (Identified Cost $115,545) | | | | | | | 187,065 | |
| | | | | | | | |
| | | SHARES | | | VALUE | |
| SHORT-TERM INVESTMENT—5.3% | |
|
| Money Market Mutual Fund—5.3% | |
Dreyfus Government Cash Management Fund – Institutional Shares (seven-day effective yield 1.950%)(2) | | | 10,604,879 | | | $ | 10,605 | |
TOTAL SHORT-TERM INVESTMENT
(Identified Cost $10,605) | | | | 10,605 | |
TOTAL INVESTMENTS—98.4%
(Identified Cost $126,150) | | | | 197,670 | |
Other assets and liabilities, net—1.6% | | | | 3,227 | |
| | | | | | | | |
| NET ASSETS—100.0% | | | | | | $ | 200,897 | |
| | | | | | | | |
Abbreviation:
| ADR | American Depositary Receipt |
Footnote Legend:
| (2) | Shares of this fund are publicly offered, and its prospectus and annual report are publicly available. |
| | | | |
| Country Weightings (Unaudited)† | |
United States (includes short-term investment) | | | 94 | % |
China | | | 4 | |
Russia | | | 2 | |
Total | | | 100 | % |
† % of total investments as of September 30, 2018. | |
The following table provides a summary of inputs used to value the Fund’s investments as of September 30, 2018 (See Security Valuation Note 2A in the Notes to Financial Statements):
| | | | | | | | |
| | | Total
Value at
September 30, 2018 | | | Level 1
Quoted
Prices | |
Equity Securities: | | | | | | | | |
Common Stocks | | $ | 187,065 | | | $ | 187,065 | |
Short-Term Investment | | | 10,605 | | | | 10,605 | |
| | | | | | | | |
Total Investments | | $ | 197,670 | | | $ | 197,670 | |
| | | | | | | | |
There were no securities valued using significant observable inputs (Level 2) or significant unobservable inputs (Level 3) at September 30, 2018.
There were no transfers into or out of Level 3 related to securities held at September 30, 2018.
For information regarding the abbreviation, see the Key Investment Terms starting on page 5.
See Notes to Financial Statements
39
KAR SMALL-CAP CORE FUND
SCHEDULE OF INVESTMENTS
SEPTEMBER 30, 2018
($ reported in thousands)
| | | | | | | | |
| | | SHARES | | | VALUE | |
| COMMON STOCKS—90.4% | |
|
| Consumer Discretionary—3.8% | |
Pool Corp. | | | 364,990 | | | $ | 60,909 | |
| | | | | | | | |
|
| Consumer Staples—1.7% | |
PriceSmart, Inc. | | | 334,900 | | | | 27,110 | |
| | | | | | | | |
|
| Energy—4.6% | |
Core Laboratories N.V. | | | 165,600 | | | | 19,181 | |
Dril-Quip, Inc.(1) | | | 1,042,040 | | | | 54,447 | |
| | | | | | | | |
| | | | 73,628 | |
| | | | | |
|
| Financials—17.5% | |
Artisan Partners Asset Management, Inc. Class A | | | 1,019,600 | | | | 33,035 | |
FactSet Research Systems, Inc. | | | 217,540 | | | | 48,666 | |
MarketAxess Holdings, Inc. | | | 207,332 | | | | 37,007 | |
Moelis & Co. Class A | | | 944,560 | | | | 51,762 | |
Primerica, Inc. | | | 706,912 | | | | 85,218 | |
RLI Corp. | | | 306,708 | | | | 24,101 | |
| | | | | | | | |
| | | | 279,789 | |
| | | | | |
|
| Health Care—0.8% | |
Atrion Corp. | | | 18,942 | | | | 13,161 | |
| | | | | | | | |
|
| Industrials—30.7% | |
Copart, Inc.(1) | | | 1,325,500 | | | | 68,303 | |
Donaldson Co., Inc. | | | 644,200 | | | | 37,531 | |
Graco, Inc. | | | 1,146,100 | | | | 53,110 | |
| | | | | | | | |
| | | SHARES | | | VALUE | |
|
| Industrials—continued | |
Old Dominion Freight Line, Inc. | | | 525,530 | | | $ | 84,747 | |
RBC Bearings, Inc.(1) | | | 335,648 | | | | 50,468 | |
Teledyne Technologies, Inc.(1) | | | 357,500 | | | | 88,188 | |
Toro Co. (The) | | | 639,780 | | | | 38,368 | |
WABCO Holdings, Inc.(1) | | | 589,950 | | | | 69,579 | |
| | | | | | | | |
| | | | 490,294 | |
| | | | | |
|
| Information Technology—26.2% | |
Aspen Technology, Inc.(1) | | | 744,100 | | | | 84,760 | |
Autohome, Inc. ADR | | | 1,433,500 | | | | 110,967 | |
CDW Corp. | | | 889,000 | | | | 79,050 | |
Jack Henry & Associates, Inc. | | | 274,800 | | | | 43,990 | |
Manhattan Associates, Inc.(1) | | | 413,220 | | | | 22,562 | |
Rightmove plc | | | 12,352,000 | | | | 75,830 | |
| | | | | | | | |
| | | | 417,159 | |
| | | | | |
|
| Materials—1.7% | |
AptarGroup, Inc. | | | 242,412 | | | | 26,117 | |
| | | | | | | | |
|
| Real Estate—3.4% | |
HFF, Inc. Class A | | | 1,285,800 | | | | 54,621 | |
TOTAL COMMON STOCKS
(Identified Cost $1,070,301) | | | | 1,442,788 | |
| TOTAL LONG-TERM INVESTMENTS—90.4% | |
| (Identified Cost $1,070,301) | | | | 1,442,788 | |
| | | | | | | | |
| | | SHARES | | | VALUE | |
| SHORT-TERM INVESTMENT—7.0% | |
|
| Money Market Mutual Fund—7.0% | |
Dreyfus Government Cash Management Fund – Institutional Shares (seven-day effective yield 1.950%)(2) | | | 111,513,859 | | | $ | 111,514 | |
TOTAL SHORT-TERM INVESTMENT
(Identified Cost $111,514) | | | | 111,514 | |
TOTAL INVESTMENTS—97.4%
(Identified Cost $1,181,815) | | | | 1,554,302 | |
Other assets and liabilities, net—2.6% | | | | 41,495 | |
| | | | | | | | |
| NET ASSETS—100.0% | | | | | | $ | 1,595,797 | |
| | | | | | | | |
Abbreviation:
| ADR | American Depositary Receipt |
Footnote Legend:
| (2) | Shares of this fund are publicly offered, and its prospectus and annual report are publicly available. |
| | | | |
| Country Weightings† | |
United States (includes short-term investment) | | | 88 | % |
China | | | 7 | |
United Kingdom | | | 5 | |
Total | | | 100 | % |
† % of total investments as of September 30, 2018. | |
The following table provides a summary of inputs used to value the Fund’s investments as of September 30, 2018 (See Security Valuation Note 2A in the Notes to Financial Statements):
| | | | | | | | |
| | | Total
Value at
September 30, 2018 | | | Level 1
Quoted
Prices | |
Equity Securities: | | | | | | | | |
Common Stocks | | $ | 1,442,788 | | | $ | 1,442,788 | |
Short-Term Investment | | | 111,514 | | | | 111,514 | |
| | | | | | | | |
Total Investments | | $ | 1,554,302 | | | $ | 1,554,302 | |
| | | | | | | | |
There were no securities valued using significant observable inputs (Level 2) or significant unobservable inputs (Level 3) at September 30, 2018.
There were no transfers into or out of Level 3 related to securities held at September 30, 2018.
For information regarding the abbreviation, see the Key Investment Terms starting on page 5.
See Notes to Financial Statements
40
KAR SMALL-CAP GROWTH FUND
SCHEDULE OF INVESTMENTS
SEPTEMBER 30, 2018
($ reported in thousands)
| | | | | | | | |
| | | SHARES | | | VALUE | |
| COMMON STOCKS—83.1% | |
|
| Consumer Discretionary—9.1% | |
Emerald Expositions Events, Inc. | | | 1,956,200 | | | $ | 32,238 | |
Fox Factory Holding Corp.(1) | | | 3,712,978 | | | | 260,094 | |
Ollie’s Bargain Outlet Holdings, Inc.(1) | | | 1,996,457 | | | | 191,860 | |
| | | | | | | | |
| | | | 484,192 | |
| | | | | |
|
| Consumer Staples—4.0% | |
Chefs’ Warehouse, Inc. (The)(1) | | | 2,615,700 | | | | 95,081 | |
PriceSmart, Inc. | | | 1,445,200 | | | | 116,989 | |
| | | | | | | | |
| | | | 212,070 | |
| | | | | |
|
| Financials—15.8% | |
FactSet Research Systems, Inc. | | | 579,650 | | | | 129,674 | |
Interactive Brokers Group, Inc. Class A | | | 3,753,516 | | | | 207,607 | |
MarketAxess Holdings, Inc. | | | 811,800 | | | | 144,898 | |
Moelis & Co. Class A | | | 3,165,300 | | | | 173,458 | |
Morningstar, Inc. | | | 1,440,828 | | | | 181,400 | |
| | | | | | | | |
| | | | 837,037 | |
| | | | | |
|
| Health Care—2.6% | |
National Research Corp. | | | 2,194,691 | | | | 84,715 | |
U.S. Physical Therapy, Inc. | | | 460,000 | | | | 54,556 | |
| | | | | | | | |
| | | | 139,271 | |
| | | | | |
| | | | | | | | |
| | | SHARES | | | VALUE | |
| Industrials—16.0% | |
AAON, Inc. | | | 3,559,400 | | | $ | 134,545 | |
Copart, Inc.(1) | | | 3,675,700 | | | | 189,409 | |
HEICO Corp. Class A | | | 2,939,412 | | | | 221,926 | |
Old Dominion Freight Line, Inc. | | | 1,525,500 | | | | 246,002 | |
Omega Flex, Inc. | | | 780,514 | | | | 55,541 | |
| | | | | | | | |
| | | | 847,423 | |
| | | | | |
|
| Information Technology—35.6% | |
ANSYS, Inc.(1) | | | 702,300 | | | | 131,105 | |
Aspen Technology, Inc.(1) | | | 2,027,000 | | | | 230,896 | |
Auto Trader Group plc | | | 53,465,475 | | | | 311,223 | |
Autohome, Inc. ADR | | | 6,551,189 | | | | 507,128 | |
DocuSign, Inc.(1) | | | 2,568,963 | | | | 135,050 | |
Ellie Mae, Inc.(1) | | | 1,772,850 | | | | 168,013 | |
Mesa Laboratories, Inc. | | | 85,353 | | | | 15,843 | |
NVE Corp. | | | 483,690 | | | | 51,213 | |
Paycom Software, Inc.(1) | | | 679,100 | | | | 105,539 | |
Rightmove plc | | | 38,235,150 | | | | 234,728 | |
| | | | | | | | |
| | | | | 1,890,738 | |
TOTAL COMMON STOCKS
(Identified Cost $3,485,513) | | | | 4,410,731 | |
| TOTAL LONG-TERM INVESTMENTS—83.1% | |
| (Identified Cost $3,485,513) | | | | 4,410,731 | |
| | | | | | | | |
| | | SHARES | | | VALUE | |
| SHORT-TERM INVESTMENT—14.2% | |
|
| Money Market Mutual Fund—14.2% | |
Dreyfus Government Cash Management Fund – Institutional Shares (seven-day effective yield 1.950%)(2) | | | 751,969,132 | | | $ | 751,969 | |
TOTAL SHORT-TERM INVESTMENT
(Identified Cost $751,969) | | | | 751,969 | |
TOTAL INVESTMENTS—97.3%
(Identified Cost $4,237,482) | | | | 5,162,700 | |
Other assets and liabilities, net—2.7% | | | | 141,473 | |
| | | | | | | | |
| NET ASSETS—100.0% | | | | | | $ | 5,304,173 | |
| | | | | | | | |
Abbreviation:
| ADR | American Depositary Receipt |
Footnote Legend:
| (2) | Shares of this fund are publicly offered, and its prospectus and annual report are publicly available. |
| | | | |
| Country Weightings (Unaudited)† | |
United States (includes short-term investment) | | | 80 | % |
United Kingdom | | | 10 | |
China | | | 10 | |
Total | | | 100 | % |
† % of total investments as of September 30, 2018. | |
The following table provides a summary of inputs used to value the Fund’s investments as of September 30, 2018 (See Security Valuation Note 2A in the Notes to Financial Statements):
| | | | | | | | |
| | | Total
Value at
September 30, 2018 | | | Level 1
Quoted
Prices | |
Equity Securities: | | | | | | | | |
Common Stocks | | $ | 4,410,731 | | | $ | 4,410,731 | |
Short-Term Investment | | | 751,969 | | | | 751,969 | |
| | | | | | | | |
Total Investments | | $ | 5,162,700 | | | $ | 5,162,700 | |
| | | | | | | | |
There were no securities valued using significant observable inputs (Level 2) or significant unobservable inputs (Level 3) at September 30, 2018.
There were no transfers into or out of Level 3 related to securities held at September 30, 2018.
For information regarding the abbreviation, see the Key Investment Terms starting on page 5.
See Notes to Financial Statements
41
KAR SMALL-CAP VALUE FUND
SCHEDULE OF INVESTMENTS
SEPTEMBER 30, 2018
($ reported in thousands)
| | | | | | | | |
| | | SHARES | | | VALUE | |
| COMMON STOCKS—93.8% | |
|
| Consumer Discretionary—14.4% | |
Cheesecake Factory, Inc. (The) | | | 558,100 | | | $ | 29,881 | |
Cinemark Holdings, Inc. | | | 558,100 | | | | 22,435 | |
Sally Beauty Holdings, Inc.(1) | | | 936,151 | | | | 17,216 | |
Thor Industries, Inc. | | | 220,900 | | | | 18,489 | |
| | | | | | | | |
| | | | 88,021 | |
| | | | | |
|
| Consumer Staples—6.7% | |
National Beverage Corp.(1) | | | 229,304 | | | | 26,741 | |
WD-40 Co. | | | 83,454 | | | | 14,363 | |
| | | | | | | | |
| | | | 41,104 | |
| | | | | |
|
| Energy—3.9% | |
Core Laboratories N.V. | | | 205,000 | | | | 23,745 | |
| | | | | | | | |
|
| Financials—17.7% | |
Artisan Partners Asset Management, Inc. Class A | | | 444,100 | | | | 14,389 | |
Bank of Hawaii Corp. | | | 256,360 | | | | 20,229 | |
First Financial Bankshares, Inc. | | | 279,060 | | | | 16,492 | |
Houlihan Lokey, Inc. | | | 377,846 | | | | 16,977 | |
Primerica, Inc. | | | 187,163 | | | | 22,563 | |
RLI Corp. | | | 219,012 | | | | 17,210 | |
| | | | | | | | |
| | | | 107,860 | |
| | | | | |
|
| Health Care—2.4% | |
Anika Therapeutics, Inc.(1) | | | 347,290 | | | | 14,649 | |
| | | | | | | | |
| | | | | | | | |
| | | SHARES | | | VALUE | |
| Industrials—20.2% | |
Graco, Inc. | | | 379,481 | | | $ | 17,585 | |
Landstar System, Inc. | | | 168,928 | | | | 20,609 | |
Lincoln Electric Holdings, Inc. | | | 128,210 | | | | 11,980 | |
RBC Bearings, Inc.(1) | | | 186,200 | | | | 27,997 | |
SiteOne Landscape Supply, Inc.(1) | | | 331,635 | | | | 24,986 | |
Watsco, Inc. | | | 111,033 | | | | 19,775 | |
| | | | | | | | |
| | | | 122,932 | |
| | | | | |
|
| Information Technology—14.6% | |
American Software, Inc. Class A | | | 613,891 | | | | 7,447 | |
Badger Meter, Inc. | | | 431,034 | | | | 22,823 | |
Brooks Automation, Inc. | | | 580,440 | | | | 20,333 | |
Cass Information Systems, Inc. | | | 273,080 | | | | 17,783 | |
Jack Henry & Associates, Inc. | | | 129,150 | | | | 20,674 | |
| | | | | | | | |
| | | | 89,060 | |
| | | | | |
|
| Materials—3.8% | |
Scotts Miracle-Gro Co. (The) | | | 294,701 | | | | 23,202 | |
| | | | | | | | |
|
| Real Estate—10.1% | |
HFF, Inc. Class A | | | 411,300 | | | | 17,472 | |
MGM Growth Properties LLC Class A | | | 942,910 | | | | 27,806 | |
| | | | | | | | |
| | | SHARES | | | VALUE | |
|
| Real Estate—continued | |
RE/MAX Holdings, Inc. Class A | | | 373,420 | | | $ | 16,561 | |
| | | | | | | | |
| | | | | 61,839 | |
TOTAL COMMON STOCKS
(Identified Cost $423,518) | | | | | | | 572,412 | |
| TOTAL LONG-TERM INVESTMENTS—93.8% | |
| (Identified Cost $423,518) | | | | | | | 572,412 | |
| | | | | | | | |
|
| SHORT-TERM INVESTMENT—3.2% | |
|
| Money Market Mutual Fund—3.2% | |
Dreyfus Government Cash Management Fund – Institutional Shares (seven-day effective yield 1.950%)(2) | | | 19,262,898 | | | | 19,263 | |
TOTAL SHORT-TERM INVESTMENT
(Identified Cost $19,263) | | | | 19,263 | |
TOTAL INVESTMENTS—97.0%
(Identified Cost $442,781) | | | | 591,675 | |
Other assets and liabilities, net—3.0% | | | | 18,372 | |
| | | | | | | | |
| NET ASSETS—100.0% | | | | | | $ | 610,047 | |
| | | | | | | | |
Footnote Legend:
| (2) | Shares of this fund are publicly offered, and its prospectus and annual report are publicly available. |
The following table provides a summary of inputs used to value the Fund’s investments as of September 30, 2018 (See Security Valuation Note 2A in the Notes to Financial Statements):
| | | | | | | | |
| | | Total
Value at
September 30, 2018 | | | Level 1
Quoted
Prices | |
Equity Securities: | | | | | | | | |
Common Stocks | | $ | 572,412 | | | $ | 572,412 | |
Short-Term Investment | | | 19,263 | | | | 19,263 | |
| | | | | | | | |
Total Investments | | $ | 591,675 | | | $ | 591,675 | |
| | | | | | | | |
There were no securities valued using significant observable inputs (Level 2) or significant unobservable inputs (Level 3) at September 30, 2018.
There were no transfers into or out of Level 3 related to securities held at September 30, 2018.
See Notes to Financial Statements
42
KAR SMALL-MID CAP CORE FUND
SCHEDULE OF INVESTMENTS
SEPTEMBER 30, 2018
($ reported in thousands)
| | | | | | | | |
| | | SHARES | | | VALUE | |
| COMMON STOCKS—97.8% | |
|
| Consumer Discretionary—9.6% | |
Pool Corp. | | | 657 | | | $ | 109 | |
Thor Industries, Inc. | | | 689 | | | | 58 | |
Winmark Corp. | | | 499 | | | | 83 | |
Wynn Resorts Ltd. | | | 628 | | | | 80 | |
| | | | | | | | |
| | | | 330 | |
| | | | | |
|
| Energy—2.6% | |
Core Laboratories N.V. | | | 767 | | | | 89 | |
| | | | | | | | |
|
| Financials—17.2% | |
Bank OZK | | | 2,176 | | | | 83 | |
Berkley (W.R.) Corp. | | | 1,327 | | | | 106 | |
MSCI, Inc. | | | 875 | | | | 155 | |
Primerica, Inc. | | | 1,188 | | | | 143 | |
Signature Bank | | | 907 | | | | 104 | |
| | | | | | | | |
| | | | 591 | |
| | | | | |
|
| Health Care—13.3% | |
AMN Healthcare Services, Inc.(1) | | | 1,879 | | | | 103 | |
Charles River Laboratories International, Inc.(1) | | | 712 | | | | 96 | |
Cooper Cos., Inc. (The) | | | 539 | | | | 149 | |
Elanco Animal Health, Inc.(1) | | | 3,081 | | | | 107 | |
| | | | | | | | |
| | | | 455 | |
| | | | | |
| | | | | | | | |
| | | SHARES | | | VALUE | |
| Industrials—29.3% | |
Copart, Inc.(1) | | | 1,678 | | | $ | 86 | |
Expeditors International of Washington, Inc. | | | 1,758 | | | | 129 | |
Landstar System, Inc. | | | 773 | | | | 94 | |
Lennox International, Inc. | | | 605 | | | | 132 | |
Nordson Corp. | | | 977 | | | | 136 | |
RBC Bearings, Inc.(1) | | | 1,114 | | | | 168 | |
Snap-on, Inc. | | | 761 | | | | 140 | |
WABCO Holdings, Inc.(1) | | | 998 | | | | 118 | |
| | | | | | | | |
| | | | 1,003 | |
| | | | | |
|
| Information Technology—21.5% | |
ANSYS, Inc.(1) | | | 395 | | | | 74 | |
Aspen Technology, Inc.(1) | | | 1,502 | | | | 171 | |
CDW Corp. | | | 1,374 | | | | 122 | |
FLIR Systems, Inc. | | | 2,215 | | | | 136 | |
Jack Henry & Associates, Inc. | | | 766 | | | | 123 | |
Teradyne, Inc. | | | 2,952 | | | | 109 | |
| | | | | | | | |
| | | | 735 | |
| | | | | |
|
| Materials—4.3% | |
Scotts Miracle-Gro Co. (The) | | | 1,867 | | | | 147 | |
TOTAL COMMON STOCKS
(Identified Cost $3,158) | | | | | | | 3,350 | |
| TOTAL LONG-TERM INVESTMENTS—97.8% | |
| (Identified Cost $3,158) | | | | | | | 3,350 | |
| | | | | | | | |
| | | SHARES | | | VALUE | |
| SHORT-TERM INVESTMENT—0.5% | |
|
| Money Market Mutual Fund—0.5% | |
Dreyfus Government Cash Management Fund – Institutional Shares (seven-day effective yield 1.950%)(2) | | | 18,221 | | | $ | 18 | |
TOTAL SHORT-TERM INVESTMENT
(Identified Cost $18) | | | | 18 | |
TOTAL INVESTMENTS—98.3%
(Identified Cost $3,176) | | | | 3,368 | |
Other assets and liabilities, net—1.7% | | | | 58 | |
| | | | | | | | |
| NET ASSETS—100.0% | | | | | | $ | 3,426 | |
| | | | | | | | |
Footnote Legend:
| (2) | Shares of this fund are publicly offered, and its prospectus and annual report are publicly available. |
The following table provides a summary of inputs used to value the Fund’s investments as of September 30, 2018 (See Security Valuation Note 2A in the Notes to Financial Statements):
| | | | | | | | |
| | | Total
Value at
September 30, 2018 | | | Level 1
Quoted
Prices | |
Equity Securities: | | | | | | | | |
Common Stocks | | $ | 3,350 | | | $ | 3,350 | |
Short-Term Investment | | | 18 | | | | 18 | |
| | | | | | | | |
Total Investments | | $ | 3,368 | | | $ | 3,368 | |
| | | | | | | | |
There were no securities valued using significant observable inputs (Level 2) or significant unobservable inputs (Level 3) at September 30, 2018.
There were no transfers into or out of Level 3 related to securities held at September 30, 2018.
See Notes to Financial Statements
43
RAMPART ENHANCED CORE EQUITY FUND
SCHEDULE OF INVESTMENTS
SEPTEMBER 30, 2018
($ reported in thousands)
| | | | | | | | |
| | | SHARES | | | VALUE | |
| COMMON STOCKS—96.3% | |
|
| Consumer Discretionary—12.9% | |
Advance Auto Parts, Inc. | | | 506 | | | $ | 85 | |
Amazon.com, Inc.(1)(2) | | | 2,753 | | | | 5,514 | |
Aptiv plc | | | 1,810 | | | | 152 | |
AutoZone, Inc.(1) | | | 182 | | | | 141 | |
Best Buy Co., Inc. | | | 1,686 | | | | 134 | |
Booking Holdings, Inc.(1)(2) | | | 329 | | | | 653 | |
BorgWarner, Inc. | | | 1,350 | | | | 58 | |
CarMax, Inc.(1) | | | 1,217 | | | | 91 | |
Carnival Corp. | | | 2,775 | | | | 177 | |
CBS Corp. Class B | | | 2,334 | | | | 134 | |
Charter Communications, Inc. Class A(1) | | | 1,266 | | | | 413 | |
Chipotle Mexican Grill, Inc.(1) | | | 166 | | | | 75 | |
Comcast Corp. Class A(2) | | | 31,390 | | | | 1,112 | |
Darden Restaurants, Inc. | | | 846 | | | | 94 | |
Discovery, Inc. Class A(1) | | | 1,067 | | | | 34 | |
Discovery, Inc. Class C(1) | | | 2,335 | | | | 69 | |
DISH Network Corp. Class A(1) | | | 1,565 | | | | 56 | |
Dollar General Corp. | | | 1,737 | | | | 190 | |
Dollar Tree, Inc.(1) | | | 1,625 | | | | 133 | |
Expedia Group, Inc. | | | 826 | | | | 108 | |
Foot Locker, Inc. | | | 807 | | | | 41 | |
Ford Motor Co.(2) | | | 26,755 | | | | 248 | |
Gap, Inc. (The) | | | 1,483 | | | | 43 | |
Garmin Ltd. | | | 760 | | | | 53 | |
General Motors Co.(2) | | | 8,671 | | | | 292 | |
Genuine Parts Co. | | | 1,003 | | | | 100 | |
Goodyear Tire & Rubber Co. (The) | | | 1,639 | | | | 38 | |
H&R Block, Inc. | | | 1,430 | | | | 37 | |
Hanesbrands, Inc. | | | 2,463 | | | | 45 | |
Harley-Davidson, Inc. | | | 1,147 | | | | 52 | |
Hasbro, Inc. | | | 777 | | | | 82 | |
Hilton Worldwide Holdings, Inc. | | | 1,910 | | | | 154 | |
Home Depot, Inc. (The)(2) | | | 7,885 | | | | 1,633 | |
Horton (D.R.), Inc. | | | 2,348 | | | | 99 | |
Interpublic Group of Cos., Inc. (The) | | | 2,635 | | | | 60 | |
Kohl’s Corp. | | | 1,150 | | | | 86 | |
L Brands, Inc. | | | 1,658 | | | | 50 | |
Leggett & Platt, Inc. | | | 897 | | | | 39 | |
Lennar Corp. Class A | | | 1,870 | | | | 87 | |
LKQ Corp.(1) | | | 2,117 | | | | 67 | |
Lowe’s Cos., Inc.(2) | | | 5,619 | | | | 645 | |
Macy’s, Inc. | | | 2,094 | | | | 73 | |
Marriott International, Inc. Class A | | | 2,029 | | | | 268 | |
Mattel, Inc.(1) | | | 2,352 | | | | 37 | |
McDonald’s Corp.(2) | | | 5,367 | | | | 898 | |
MGM Resorts International | | | 3,425 | | | | 96 | |
Michael Kors Holdings Ltd.(1) | | | 1,025 | | | | 70 | |
Mohawk Industries, Inc.(1) | | | 433 | | | | 76 | |
Netflix, Inc.(1) | | | 2,971 | | | | 1,112 | |
Newell Brands, Inc. | | | 3,320 | | | | 67 | |
News Corp. Class A | | | 2,620 | | | | 35 | |
News Corp. Class B | | | 832 | | | | 11 | |
NIKE, Inc. Class B(2) | | | 8,768 | | | | 743 | |
Nordstrom, Inc. | | | 803 | | | | 48 | |
Norwegian Cruise Line Holdings Ltd.(1) | | | 1,413 | | | | 81 | |
O’Reilly Automotive, Inc.(1) | | | 560 | | | | 195 | |
Omnicom Group, Inc. | | | 1,554 | | | | 106 | |
PulteGroup, Inc. | | | 1,802 | | | | 45 | |
| | | | | | | | |
| | | SHARES | | | VALUE | |
|
| Consumer Discretionary—continued | |
PVH Corp. | | | 527 | | | $ | 76 | |
Ralph Lauren Corp. | | | 381 | | | | 52 | |
Ross Stores, Inc. | | | 2,588 | | | | 256 | |
Royal Caribbean Cruises Ltd. | | | 1,158 | | | | 150 | |
Starbucks Corp.(2) | | | 9,433 | | | | 536 | |
Tapestry, Inc. | | | 1,967 | | | | 99 | |
Target Corp.(2) | | | 3,644 | | | | 321 | |
Tiffany & Co. | | | 696 | | | | 90 | |
TJX Cos., Inc. (The) | | | 4,286 | | | | 480 | |
Tractor Supply Co. | | | 834 | | | | 76 | |
TripAdvisor, Inc.(1) | | | 732 | | | | 37 | |
Twenty-First Century Fox, Inc. Class A(2) | | | 7,205 | | | | 334 | |
Twenty-First Century Fox, Inc. Class B(2) | | | 3,002 | | | | 138 | |
Ulta Beauty, Inc.(1) | | | 391 | | | | 110 | |
Under Armour, Inc. Class A(1) | | | 1,271 | | | | 27 | |
Under Armour, Inc. Class C(1) | | | 1,287 | | | | 25 | |
VF Corp. | | | 2,238 | | | | 209 | |
Viacom, Inc. Class B | | | 2,413 | | | | 81 | |
Walt Disney Co. (The)(2) | | | 10,163 | | | | 1,188 | |
Whirlpool Corp. | | | 441 | | | | 52 | |
Wynn Resorts Ltd. | | | 579 | | | | 74 | |
Yum! Brands, Inc. | | | 2,209 | | | | 201 | |
| | | | | | | | |
| | | | 21,947 | |
| | | | | |
|
| Consumer Staples—6.7% | |
Altria Group, Inc.(2) | | | 12,491 | | | | 753 | |
Archer-Daniels-Midland Co. | | | 3,857 | | | | 194 | |
Brown-Forman Corp. Class B | | | 1,807 | | | | 91 | |
Campbell Soup Co. | | | 1,327 | | | | 49 | |
Church & Dwight Co., Inc. | | | 1,688 | | | | 100 | |
Clorox Co. (The) | | | 893 | | | | 134 | |
Coca-Cola Co. (The)(2) | | | 26,183 | | | | 1,209 | |
Colgate-Palmolive Co.(2) | | | 6,017 | | | | 403 | |
Conagra Brands, Inc. | | | 2,715 | | | | 92 | |
Constellation Brands, Inc. Class A | | | 1,159 | | | | 250 | |
Costco Wholesale Corp.(2) | | | 2,937 | | | | 690 | |
Coty, Inc. Class A | | | 3,262 | | | | 41 | |
Estee Lauder Cos., Inc. (The) Class A | | | 1,545 | | | | 225 | |
General Mills, Inc. | | | 4,090 | | | | 176 | |
Hershey Co. (The) | | | 964 | | | | 98 | |
Hormel Foods Corp. | | | 1,863 | | | | 73 | |
J.M. Smucker Co. (The) | | | 784 | | | | 80 | |
Kellogg Co. | | | 1,723 | | | | 121 | |
Kimberly-Clark Corp. | | | 2,410 | | | | 274 | |
Kraft Heinz Co.(The)(2) | | | 4,121 | | | | 227 | |
Kroger Co. (The) | | | 5,607 | | | | 163 | |
McCormick & Co., Inc. | | | 837 | | | | 110 | |
Molson Coors Brewing Co. Class B | | | 1,276 | | | | 79 | |
Mondelez International, Inc. Class A(2) | | | 10,175 | | | | 437 | |
Monster Beverage Corp.(1) | | | 2,833 | | | | 165 | |
PepsiCo, Inc.(2) | | | 9,693 | | | | 1,084 | |
Philip Morris International, Inc.(2) | | | 10,627 | | | | 867 | |
Procter & Gamble Co. (The)(2) | | | 17,192 | | | | 1,431 | |
Sysco Corp. | | | 3,306 | | | | 242 | |
Tyson Foods, Inc. Class A | | | 2,053 | | | | 122 | |
Walgreens Boots Alliance, Inc.(2) | | | 5,883 | | | | 429 | |
Walmart, Inc.(2) | | | 9,891 | | | | 929 | |
| | | | | | | | |
| | | | 11,338 | |
| | | | | |
| | | | | | | | |
| | | SHARES | | | VALUE | |
| Energy—5.4% | |
Anadarko Petroleum Corp. | | | 3,174 | | | $ | 214 | |
Andeavor | | | 857 | | | | 131 | |
Apache Corp. | | | 2,355 | | | | 112 | |
Baker Hughes a GE Co. | | | 2,566 | | | | 87 | |
Cabot Oil & Gas Corp. | | | 2,782 | | | | 63 | |
Chevron Corp.(2) | | | 11,774 | | | | 1,440 | |
Cimarex Energy Co. | | | 588 | | | | 55 | |
Concho Resources, Inc.(1) | | | 1,171 | | | | 179 | |
ConocoPhillips(2) | | | 7,209 | | | | 558 | |
Devon Energy Corp. | | | 3,225 | | | | 129 | |
EOG Resources, Inc. | | | 3,567 | | | | 455 | |
EQT Corp. | | | 1,554 | | | | 69 | |
Exxon Mobil Corp.(2) | | | 26,086 | | | | 2,218 | |
Halliburton Co.(2) | | | 5,397 | | | | 219 | |
Helmerich & Payne, Inc. | | | 671 | | | | 46 | |
Hess Corp. | | | 1,613 | | | | 115 | |
HollyFrontier Corp. | | | 1,088 | | | | 76 | |
Kinder Morgan, Inc.(2) | | | 11,689 | | | | 207 | |
Marathon Oil Corp. | | | 5,257 | | | | 122 | |
Marathon Petroleum Corp. | | | 2,846 | | | | 228 | |
National Oilwell Varco, Inc. | | | 2,354 | | | | 101 | |
Newfield Exploration Co.(1) | | | 1,231 | | | | 35 | |
Noble Energy, Inc. | | | 2,985 | | | | 93 | |
Occidental Petroleum Corp.(2) | | | 4,718 | | | | 388 | |
ONEOK, Inc. | | | 2,533 | | | | 172 | |
Phillips 66 | | | 2,586 | | | | 291 | |
Pioneer Natural Resources Co. | | | 1,050 | | | | 183 | |
Schlumberger Ltd.(2) | | | 8,534 | | | | 520 | |
TechnipFMC plc | | | 2,674 | | | | 83 | |
Valero Energy Corp. | | | 2,655 | | | | 302 | |
Williams Cos., Inc. (The) | | | 7,305 | | | | 199 | |
| | | | | | | | |
| | | | 9,090 | |
| | | | | |
|
| Financials—12.0% | |
Affiliated Managers Group, Inc. | | | 335 | | | | 46 | |
Aflac, Inc. | | | 4,770 | | | | 225 | |
Allstate Corp. (The)(2) | | | 2,166 | | | | 214 | |
American Express Co.(2) | | | 4,400 | | | | 469 | |
American International Group, Inc.(2) | | | 5,531 | | | | 294 | |
Ameriprise Financial, Inc. | | | 891 | | | | 132 | |
AON plc | | | 1,507 | | | | 232 | |
Assurant, Inc. | | | 327 | | | | 35 | |
Bank of America Corp.(2) | | | 58,098 | | | | 1,712 | |
Bank of New York Mellon Corp. (The)(2) | | | 6,227 | | | | 317 | |
BB&T Corp. | | | 4,804 | | | | 233 | |
Berkshire Hathaway, Inc. Class B(1)(2) | | | 11,859 | | | | 2,539 | |
BlackRock, Inc.(2) | | | 760 | | | | 358 | |
Brighthouse Financial, Inc.(1)(2) | | | 738 | | | | 33 | |
Capital One Financial Corp.(2) | | | 2,997 | | | | 284 | |
CBOE Global Markets, Inc. | | | 693 | | | | 66 | |
Charles Schwab Corp. (The) | | | 7,398 | | | | 364 | |
Chubb Ltd. | | | 2,870 | | | | 384 | |
Cincinnati Financial Corp. | | | 920 | | | | 71 | |
Citigroup, Inc.(2) | | | 15,711 | | | | 1,127 | |
Citizens Financial Group, Inc. | | | 2,987 | | | | 115 | |
CME Group, Inc. | | | 2,098 | | | | 357 | |
Comerica, Inc. | | | 1,059 | | | | 96 | |
Discover Financial Services | | | 2,150 | | | | 164 | |
E*TRADE Financial Corp.(1) | | | 1,626 | | | | 85 | |
Everest Re Group Ltd. | | | 252 | | | | 58 | |
Fifth Third Bancorp | | | 4,224 | | | | 118 | |
See Notes to Financial Statements
44
RAMPART ENHANCED CORE EQUITY FUND
SCHEDULE OF INVESTMENTS (Continued)
SEPTEMBER 30, 2018
($ reported in thousands)
| | | | | | | | |
| | | SHARES | | | VALUE | |
|
| Financials—continued | |
Franklin Resources, Inc. | | | 1,964 | | | $ | 60 | |
Gallagher (Arthur J.) & Co. | | | 1,123 | | | | 84 | |
Goldman Sachs Group, Inc. (The)(2) | | | 2,164 | | | | 485 | |
Hartford Financial Services Group, Inc. (The) | | | 2,207 | | | | 110 | |
Huntington Bancshares, Inc. | | | 6,808 | | | | 102 | |
Intercontinental Exchange, Inc. | | | 3,569 | | | | 267 | |
Invesco Ltd. | | | 2,531 | | | | 58 | |
Jefferies Financial Group, Inc. | | | 1,868 | | | | 41 | |
JPMorgan Chase & Co.(2) | | | 20,978 | | | | 2,367 | |
KeyCorp | | | 6,541 | | | | 130 | |
Lincoln National Corp. | | | 1,348 | | | | 91 | |
Loews Corp. | | | 1,613 | | | | 81 | |
M&T Bank Corp. | | | 895 | | | | 147 | |
Marsh & McLennan Cos., Inc. | | | 3,126 | | | | 259 | |
MetLife, Inc.(2) | | | 6,263 | | | | 293 | |
Moody’s Corp. | | | 1,029 | | | | 172 | |
Morgan Stanley(2) | | | 8,398 | | | | 391 | |
MSCI, Inc. | | | 548 | | | | 97 | |
Nasdaq, Inc. | | | 720 | | | | 62 | |
Northern Trust Corp. | | | 1,303 | | | | 133 | |
People’s United Financial, Inc. | | | 2,143 | | | | 37 | |
PNC Financial Services Group, Inc. (The) | | | 2,893 | | | | 394 | |
Principal Financial Group, Inc. | | | 1,641 | | | | 96 | |
Progressive Corp. (The) | | | 3,588 | | | | 255 | |
Prudential Financial, Inc. | | | 2,588 | | | | 262 | |
Raymond James Financial, Inc. | | | 800 | | | | 74 | |
Regions Financial Corp. | | | 6,920 | | | | 127 | |
S&P Global, Inc. | | | 1,548 | | | | 302 | |
State Street Corp. | | | 2,251 | | | | 189 | |
SunTrust Banks, Inc. | | | 2,864 | | | | 191 | |
SVB Financial Group(1) | | | 326 | | | | 101 | |
Synchrony Financial | | | 4,371 | | | | 136 | |
T. Rowe Price Group, Inc. | | | 1,492 | | | | 163 | |
Torchmark Corp. | | | 651 | | | | 56 | |
Travelers Cos., Inc. (The) | | | 1,665 | | | | 216 | |
U.S. Bancorp(2) | | | 9,614 | | | | 508 | |
Unum Group | | | 1,363 | | | | 53 | |
Wells Fargo & Co.(2) | | | 27,021 | | | | 1,420 | |
Willis Towers Watson plc | | | 812 | | | | 114 | |
Zions Bancorp NA | | | 1,214 | | | | 61 | |
| | | | | | | | |
| | | | 20,313 | |
| | | | | |
|
| Health Care—14.9% | |
Abbott Laboratories(2) | | | 11,991 | | | | 880 | |
AbbVie, Inc.(2) | | | 10,365 | | | | 980 | |
ABIOMED, Inc.(1) | | | 289 | | | | 130 | |
Aetna, Inc. | | | 2,237 | | | | 454 | |
Agilent Technologies, Inc. | | | 2,188 | | | | 154 | |
Alexion Pharmaceuticals, Inc.(1) | | | 1,522 | | | | 212 | |
Align Technology, Inc.(1) | | | 493 | | | | 193 | |
Allergan plc(2) | | | 2,319 | | | | 442 | |
AmerisourceBergen Corp. | | | 1,112 | | | | 103 | |
Amgen, Inc.(2) | | | 4,555 | | | | 944 | |
Anthem, Inc. | | | 1,745 | | | | 478 | |
Baxter International, Inc. | | | 3,370 | | | | 260 | |
Becton, Dickinson & Co. | | | 1,828 | | | | 477 | |
Biogen, Inc.(1)(2) | | | 1,443 | | | | 510 | |
Boston Scientific Corp.(1) | | | 9,437 | | | | 363 | |
Bristol-Myers Squibb Co.(2) | | | 11,180 | | | | 694 | |
Cardinal Health, Inc. | | | 2,125 | | | | 115 | |
Celgene Corp.(1)(2) | | | 4,835 | | | | 433 | |
| | | | | | | | |
| | | SHARES | | | VALUE | |
|
| Health Care—continued | |
Centene Corp.(1) | | | 1,403 | | | $ | 203 | |
Cerner Corp.(1) | | | 2,156 | | | | 139 | |
Cigna Corp. | | | 1,664 | | | | 346 | |
Cooper Cos., Inc. (The) | | | 335 | | | | 93 | |
CVS Health Corp.(2) | | | 6,953 | | | | 547 | |
Danaher Corp.(2) | | | 4,205 | | | | 457 | |
DaVita, Inc.(1) | | | 955 | | | | 68 | |
DENTSPLY SIRONA, Inc. | | | 1,556 | | | | 59 | |
Edwards Lifesciences Corp.(1) | | | 1,442 | | | | 251 | |
Eli Lilly & Co.(2) | | | 6,533 | | | | 701 | |
Envision Healthcare Corp.(1) | | | 828 | | | | 38 | |
Express Scripts Holding Co.(1) | | | 3,842 | | | | 365 | |
Gilead Sciences, Inc.(2) | | | 8,893 | | | | 687 | |
HCA Healthcare, Inc. | | | 1,911 | | | | 266 | |
Henry Schein, Inc.(1) | | | 1,053 | | | | 89 | |
Hologic, Inc.(1) | | | 1,867 | | | | 76 | |
Humana, Inc. | | | 942 | | | | 319 | |
IDEXX Laboratories, Inc.(1) | | | 594 | | | | 148 | |
Illumina, Inc.(1) | | | 1,005 | | | | 369 | |
Incyte Corp.(1) | | | 1,203 | | | | 83 | |
Intuitive Surgical, Inc.(1) | | | 775 | | | | 445 | |
IQVIA Holdings, Inc.(1) | | | 1,107 | | | | 144 | |
Johnson & Johnson(2) | | | 18,345 | | | | 2,535 | |
Laboratory Corporation of America Holdings(1) | | | 700 | | | | 122 | |
McKesson Corp. | | | 1,382 | | | | 183 | |
Medtronic plc(2) | | | 9,262 | | | | 911 | |
Merck & Co., Inc.(2) | | | 18,401 | | | | 1,305 | |
Mettler-Toledo International, Inc.(1) | | | 174 | | | | 106 | |
Mylan NV(1) | | | 3,526 | | | | 129 | |
Nektar Therapeutics(1) | | | 1,102 | | | | 67 | |
PerkinElmer, Inc. | | | 757 | | | | 74 | |
Perrigo Co., plc | | | 881 | | | | 62 | |
Pfizer, Inc.(2) | | | 40,009 | | | | 1,763 | |
Quest Diagnostics, Inc. | | | 929 | | | | 100 | |
Regeneron Pharmaceuticals, Inc.(1) | | | 529 | | | | 214 | |
ResMed, Inc. | | | 976 | | | | 113 | |
Stryker Corp. | | | 2,198 | | | | 390 | |
Thermo Fisher Scientific, Inc. | | | 2,752 | | | | 672 | |
UnitedHealth Group, Inc.(2) | | | 6,573 | | | | 1,749 | |
Universal Health Services, Inc. Class B | | | 596 | | | | 76 | |
Varian Medical Systems, Inc.(1) | | | 626 | | | | 70 | |
Vertex Pharmaceuticals, Inc.(1) | | | 1,743 | | | | 336 | |
Waters Corp.(1) | | | 536 | | | | 104 | |
Zimmer Biomet Holdings, Inc. | | | 1,390 | | | | 183 | |
Zoetis, Inc. | | | 3,309 | | | | 303 | |
| | | | | | | | |
| | | | 25,282 | |
| | | | | |
|
| Industrials—8.8% | |
3M Co.(2) | | | 3,658 | | | | 771 | |
A.O. Smith Corp. | | | 894 | | | | 48 | |
Alaska Air Group, Inc. | | | 759 | | | | 52 | |
Allegion plc | | | 585 | | | | 53 | |
American Airlines Group, Inc. | | | 2,567 | | | | 106 | |
AMETEK, Inc. | | | 1,427 | | | | 113 | |
Arconic, Inc. | | | 2,618 | | | | 58 | |
Boeing Co. (The)(2) | | | 3,374 | | | | 1,255 | |
Caterpillar, Inc.(2) | | | 3,684 | | | | 562 | |
Cintas Corp. | | | 533 | | | | 105 | |
Copart, Inc.(1) | | | 1,245 | | | | 64 | |
CSX Corp. | | | 5,393 | | | | 399 | |
| | | | | | | | |
| | | SHARES | | | VALUE | |
|
| Industrials—continued | |
Cummins, Inc. | | | 954 | | | $ | 139 | |
Deere & Co. | | | 1,998 | | | | 300 | |
Delta Air Lines, Inc. | | | 3,976 | | | | 230 | |
Dover Corp. | | | 953 | | | | 84 | |
Eaton Corp. plc | | | 2,694 | | | | 234 | |
Emerson Electric Co.(2) | | | 3,882 | | | | 297 | |
Equifax, Inc. | | | 741 | | | | 97 | |
Expeditors International of Washington, Inc. | | | 1,076 | | | | 79 | |
Fastenal Co. | | | 1,772 | | | | 103 | |
FedEx Corp.(2) | | | 1,515 | | | | 365 | |
Flowserve Corp. | | | 806 | | | | 44 | |
Fluor Corp. | | | 866 | | | | 50 | |
Fortive Corp. | | | 1,890 | | | | 159 | |
Fortune Brands Home & Security, Inc. | | | 899 | | | | 47 | |
General Dynamics Corp.(2) | | | 1,702 | | | | 349 | |
General Electric Co.(2) | | | 53,512 | | | | 604 | |
Harris Corp. | | | 732 | | | | 124 | |
Honeywell International, Inc.(2) | | | 4,602 | | | | 766 | |
Hunt (JB) Transport Services, Inc. | | | 527 | | | | 63 | |
Huntington Ingalls Industries, Inc. | | | 274 | | | | 70 | |
IHS Markit Ltd.(1) | | | 2,194 | | | | 118 | |
Illinois Tool Works, Inc. | | | 1,878 | | | | 265 | |
Ingersoll-Rand plc | | | 1,528 | | | | 156 | |
Jacobs Engineering Group, Inc. | | | 743 | | | | 57 | |
Johnson Controls International plc | | | 5,707 | | | | 200 | |
Kansas City Southern | | | 632 | | | | 72 | |
L3 Technologies, Inc. | | | 484 | | | | 103 | |
Lockheed Martin Corp.(2) | | | 1,531 | | | | 530 | |
Masco Corp. | | | 1,913 | | | | 70 | |
Nielsen Holdings plc | | | 2,063 | | | | 57 | |
Norfolk Southern Corp. | | | 1,741 | | | | 314 | |
Northrop Grumman Corp. | | | 1,074 | | | | 341 | |
PACCAR, Inc. | | | 2,168 | | | | 148 | |
Parker-Hannifin Corp. | | | 819 | | | | 151 | |
Pentair plc | | | 1,000 | | | | 43 | |
Quanta Services, Inc.(1) | | | 922 | | | | 31 | |
Raytheon Co.(2) | | | 1,770 | | | | 366 | |
Republic Services, Inc. | | | 1,374 | | | | 100 | |
Robert Half International, Inc. | | | 761 | | | | 54 | |
Robinson (C.H.) Worldwide, Inc. | | | 858 | | | | 84 | |
Rockwell Automation, Inc. | | | 774 | | | | 145 | |
Rockwell Collins, Inc. | | | 1,012 | | | | 142 | |
Roper Technologies, Inc. | | | 636 | | | | 188 | |
Snap-on, Inc. | | | 349 | | | | 64 | |
Southwest Airlines Co. | | | 3,287 | | | | 205 | |
Stanley Black & Decker, Inc. | | | 951 | | | | 139 | |
Stericycle, Inc.(1) | | | 527 | | | | 31 | |
Textron, Inc. | | | 1,578 | | | | 113 | |
TransDigm Group, Inc.(1) | | | 300 | | | | 112 | |
Union Pacific Corp.(2) | | | 4,779 | | | | 778 | |
United Continental Holdings, Inc.(1) | | | 1,452 | | | | 129 | |
United Parcel Service, Inc. Class B(2) | | | 4,249 | | | | 496 | |
United Rentals, Inc.(1) | | | 515 | | | | 84 | |
United Technologies Corp.(2) | | | 4,584 | | | | 641 | |
Verisk Analytics, Inc.(1) | | | 957 | | | | 115 | |
W.W. Grainger, Inc. | | | 314 | | | | 112 | |
Waste Management, Inc. | | | 2,451 | | | | 222 | |
See Notes to Financial Statements
45
RAMPART ENHANCED CORE EQUITY FUND
SCHEDULE OF INVESTMENTS (Continued)
SEPTEMBER 30, 2018
($ reported in thousands)
| | | | | | | | |
| | | SHARES | | | VALUE | |
|
| Industrials—continued | |
Xylem, Inc. | | | 1,109 | | | $ | 89 | |
| | | | | | | | |
| | | | 14,855 | |
| | | | | |
|
| Information Technology—26.1% | |
Accenture plc Class A(2) | | | 4,365 | | | | 743 | |
Activision Blizzard, Inc. | | | 5,167 | | | | 430 | |
Adobe Systems, Inc.(1) | | | 3,343 | | | | 902 | |
Advanced Micro Devices, Inc.(1) | | | 5,593 | | | | 173 | |
Akamai Technologies, Inc.(1) | | | 1,158 | | | | 85 | |
Alliance Data Systems Corp. | | | 327 | | | | 77 | |
Alphabet, Inc. Class A(1)(2) | | | 2,027 | | | | 2,447 | |
Alphabet, Inc. Class C(1)(2) | | | 2,061 | | | | 2,460 | |
Amphenol Corp. Class A | | | 2,046 | | | | 192 | |
Analog Devices, Inc. | | | 2,518 | | | | 233 | |
ANSYS, Inc.(1) | | | 570 | | | | 106 | |
Apple, Inc.(2) | | | 33,366 | | | | 7,532 | |
Applied Materials, Inc. | | | 6,843 | | | | 264 | |
Arista Networks, Inc.(1) | | | 323 | | | | 86 | |
Autodesk, Inc.(1) | | | 1,487 | | | | 232 | |
Automatic Data Processing, Inc. | | | 2,990 | | | | 450 | |
Broadcom, Inc. | | | 2,725 | | | | 672 | |
Broadridge Financial Solutions, Inc. | | | 803 | | | | 106 | |
CA, Inc. | | | 2,121 | | | | 94 | |
Cadence Design Systems, Inc.(1) | | | 1,914 | | | | 87 | |
Cisco Systems, Inc.(2) | | | 31,925 | | | | 1,553 | |
Citrix Systems, Inc.(1) | | | 874 | | | | 97 | |
Cognizant Technology Solutions Corp. Class A | | | 3,977 | | | | 307 | |
Corning, Inc. | | | 5,637 | | | | 199 | |
DXC Technology Co. | | | 1,933 | | | | 181 | |
eBay, Inc.(1) | | | 6,275 | | | | 207 | |
Electronic Arts, Inc.(1) | | | 2,083 | | | | 251 | |
F5 Networks, Inc.(1) | | | 415 | | | | 83 | |
Facebook, Inc. Class A(1)(2) | | | 16,283 | | | | 2,678 | |
Fidelity National Information Services, Inc. | | | 2,247 | | | | 245 | |
Fiserv, Inc.(1) | | | 2,779 | | | | 229 | |
FleetCor Technologies, Inc.(1) | | | 608 | | | | 139 | |
FLIR Systems, Inc. | | | 931 | | | | 57 | |
Gartner, Inc.(1) | | | 619 | | | | 98 | |
Global Payments, Inc. | | | 1,083 | | | | 138 | |
Hewlett Packard Enterprise Co. | | | 10,366 | | | | 169 | |
HP, Inc. | | | 11,142 | | | | 287 | |
Intel Corp.(2) | | | 31,634 | | | | 1,496 | |
International Business Machines Corp.(2) | | | 5,795 | | | | 876 | |
Intuit, Inc. | | | 1,655 | | | | 376 | |
IPG Photonics Corp.(1) | | | 255 | | | | 40 | |
Juniper Networks, Inc. | | | 2,370 | | | | 71 | |
KLA-Tencor Corp. | | | 1,058 | | | | 108 | |
Lam Research Corp. | | | 1,114 | | | | 169 | |
Mastercard, Inc. Class A(2) | | | 6,224 | | | | 1,386 | |
Microchip Technology, Inc. | | | 1,596 | | | | 126 | |
Micron Technology, Inc.(1) | | | 7,873 | | | | 356 | |
Microsoft Corp.(2) | | | 52,156 | | | | 5,965 | |
Motorola Solutions, Inc. | | | 1,101 | | | | 143 | |
NetApp, Inc. | | | 1,819 | | | | 156 | |
NVIDIA Corp. | | | 4,121 | | | | 1,158 | |
Oracle Corp.(2) | | | 20,230 | | | | 1,043 | |
Paychex, Inc. | | | 2,171 | | | | 160 | |
PayPal Holdings, Inc.(1)(2) | | | 7,577 | | | | 666 | |
Qorvo, Inc.(1) | | | 859 | | | | 66 | |
QUALCOMM, Inc.(2) | | | 9,547 | | | | 688 | |
| | | | | | | | |
| | | SHARES | | | VALUE | |
|
| Information Technology—continued | |
Red Hat, Inc.(1) | | | 1,206 | | | $ | 164 | |
salesforce.com, Inc.(1) | | | 4,788 | | | | 761 | |
Seagate Technology plc | | | 1,949 | | | | 92 | |
Skyworks Solutions, Inc. | | | 1,236 | | | | 112 | |
Symantec Corp. | | | 4,219 | | | | 90 | |
Synopsys, Inc.(1) | | | 1,012 | | | | 100 | |
Take-Two Interactive Software, Inc.(1) | | | 776 | | | | 107 | |
TE Connectivity Ltd. | | | 2,377 | | | | 209 | |
Texas Instruments, Inc.(2) | | | 6,645 | | | | 713 | |
Total System Services, Inc. | | | 1,126 | | | | 111 | |
Twitter, Inc.(1) | | | 4,445 | | | | 127 | |
VeriSign, Inc.(1) | | | 652 | | | | 104 | |
Visa, Inc. Class A(2) | | | 12,125 | | | | 1,820 | |
Western Digital Corp. | | | 2,031 | | | | 119 | |
Western Union Co. (The) | | | 3,128 | | | | 60 | |
Xerox Corp. | | | 1,452 | | | | 39 | |
Xilinx, Inc. | | | 1,720 | | | | 138 | |
| | | | | | | | |
| | | | 44,204 | |
| | | | | |
|
| Materials—2.2% | |
Air Products & Chemicals, Inc. | | | 1,351 | | | | 226 | |
Albemarle Corp. | | | 682 | | | | 68 | |
Avery Dennison Corp. | | | 542 | | | | 59 | |
Ball Corp. | | | 2,152 | | | | 95 | |
CF Industries Holdings, Inc. | | | 1,438 | | | | 78 | |
DowDuPont, Inc.(2) | | | 14,299 | | | | 920 | |
Eastman Chemical Co. | | | 880 | | | | 84 | |
Ecolab, Inc. | | | 1,604 | | | | 251 | |
FMC Corp. | | | 829 | | | | 72 | |
Freeport-McMoRan, Inc. | | | 8,302 | | | | 116 | |
International Flavors & Fragrances, Inc. | | | 486 | | | | 68 | |
International Paper Co. | | | 2,551 | | | | 125 | |
LyondellBasell Industries N.V. Class A | | | 1,981 | | | | 203 | |
Martin Marietta Materials, Inc. | | | 388 | | | | 71 | |
Mosaic Co. (The) | | | 2,161 | | | | 70 | |
Newmont Mining Corp. | | | 3,287 | | | | 99 | |
Nucor Corp. | | | 1,960 | | | | 124 | |
Packaging Corporation of America | | | 581 | | | | 64 | |
PPG Industries, Inc. | | | 1,536 | | | | 168 | |
Praxair, Inc. | | | 1,771 | | | | 285 | |
Sealed Air Corp. | | | 993 | | | | 40 | |
Sherwin-Williams Co. (The) | | | 507 | | | | 231 | |
Vulcan Materials Co. | | | 814 | | | | 90 | |
WestRock Co. | | | 1,580 | | | | 84 | |
| | | | | | | | |
| | | | 3,691 | |
| | | | | |
|
| Real Estate—2.6% | |
Alexandria Real Estate Equities, Inc. | | | 704 | | | | 89 | |
American Tower Corp. | | | 3,019 | | | | 439 | |
Apartment Investment & Management Co. Class A | | | 1,076 | | | | 47 | |
AvalonBay Communities, Inc. | | | 945 | | | | 171 | |
Boston Properties, Inc. | | | 1,055 | | | | 130 | |
CBRE Group, Inc. Class A(1) | | | 2,067 | | | | 91 | |
Crown Castle International Corp. | | | 2,836 | | | | 316 | |
Digital Realty Trust, Inc. | | | 1,408 | | | | 158 | |
Duke Realty Corp. | | | 2,441 | | | | 69 | |
Equinix, Inc. | | | 543 | | | | 235 | |
| | | | | | | | |
| | | SHARES | | | VALUE | |
|
| Real Estate—continued | |
Equity Residential | | | 2,517 | | | $ | 167 | |
Essex Property Trust, Inc. | | | 452 | | | | 112 | |
Extra Space Storage, Inc. | | | 862 | | | | 75 | |
Federal Realty Investment Trust | | | 501 | | | | 63 | |
HCP, Inc. | | | 3,212 | | | | 85 | |
Host Hotels & Resorts, Inc. | | | 5,068 | | | | 107 | |
Iron Mountain, Inc. | | | 1,924 | | | | 66 | |
Kimco Realty Corp. | | | 2,905 | | | | 49 | |
Macerich Co. (The) | | | 742 | | | | 41 | |
Mid-America Apartment Communities, Inc. | | | 778 | | | | 78 | |
Prologis, Inc. | | | 4,302 | | | | 292 | |
Public Storage | | | 1,024 | | | | 206 | |
Realty Income Corp. | | | 1,944 | | | | 111 | |
Regency Centers Corp. | | | 1,008 | | | | 65 | |
SBA Communications, Corp.(1) | | | 787 | | | | 126 | |
Simon Property Group, Inc.(2) | | | 2,117 | | | | 374 | |
SL Green Realty Corp. | | | 604 | | | | 59 | |
UDR, Inc. | | | 1,829 | | | | 74 | |
Ventas, Inc. | | | 2,436 | | | | 132 | |
Vornado Realty Trust | | | 1,183 | | | | 86 | |
Welltower, Inc. | | | 2,543 | | | | 164 | |
Weyerhaeuser Co. | | | 5,175 | | | | 167 | |
| | | | | | | | |
| | | | 4,444 | |
| | | | | |
|
| Telecommunication Services—1.9% | |
AT&T, Inc.(2) | | | 49,294 | | | | 1,655 | |
CenturyLink, Inc. | | | 6,664 | | | | 141 | |
Verizon Communications, Inc.(2) | | | 28,049 | | | | 1,498 | |
| | | | | | | | |
| | | | 3,294 | |
| | | | | |
|
| Utilities—2.8% | |
AES Corp. | | | 4,527 | | | | 63 | |
Alliant Energy Corp. | | | 1,584 | | | | 67 | |
Ameren Corp. | | | 1,668 | | | | 105 | |
American Electric Power Co., Inc. | | | 3,371 | | | | 239 | |
American Water Works Co., Inc. | | | 1,219 | | | | 107 | |
CenterPoint Energy, Inc. | | | 2,953 | | | | 82 | |
CMS Energy Corp. | | | 1,934 | | | | 95 | |
Consolidated Edison, Inc. | | | 2,127 | | | | 162 | |
Dominion Energy, Inc. | | | 4,466 | | | | 314 | |
DTE Energy Co. | | | 1,242 | | | | 135 | |
Duke Energy Corp.(2) | | | 4,798 | | | | 384 | |
Edison International | | | 2,230 | | | | 151 | |
Entergy Corp. | | | 1,238 | | | | 100 | |
Evergy, Inc. | | | 1,856 | | | | 102 | |
Eversource Energy | | | 2,169 | | | | 133 | |
Exelon Corp.(2) | | | 6,607 | | | | 288 | |
FirstEnergy Corp. | | | 3,068 | | | | 114 | |
NextEra Energy, Inc.(2) | | | 3,227 | | | | 541 | |
NiSource, Inc. | | | 2,309 | | | | 58 | |
NRG Energy, Inc. | | | 2,047 | | | | 77 | |
PG&E Corp. | | | 3,534 | | | | 163 | |
Pinnacle West Capital Corp. | | | 766 | | | | 61 | |
PPL Corp. | | | 4,784 | | | | 140 | |
Public Service Enterprise Group, Inc. | | | 3,458 | | | | 183 | |
SCANA Corp. | | | 976 | | | | 38 | |
Sempra Energy | | | 1,808 | | | | 206 | |
Southern Co. (The)(2) | | | 6,924 | | | | 302 | |
WEC Energy Group, Inc. | | | 2,160 | | | | 144 | |
See Notes to Financial Statements
46
RAMPART ENHANCED CORE EQUITY FUND
SCHEDULE OF INVESTMENTS (Continued)
SEPTEMBER 30, 2018
($ reported in thousands)
| | | | | | | | |
| | | SHARES | | | VALUE | |
|
| Utilities—continued | |
Xcel Energy, Inc. | | | 3,483 | | | $ | 164 | |
| | | | | | | | |
| | | | | | | | 4,718 | |
TOTAL COMMON STOCKS
(Identified Cost $130,971) | | | | | | | 163,176 | |
|
| EXCHANGE-TRADED FUND—2.0% | |
Invesco S&P 500 Low Volatility ETF(3) | | | 67,329 | | | | 3,334 | |
TOTAL EXCHANGE-TRADED FUND
(Identified Cost $3,380) | | | | 3,334 | |
| TOTAL LONG-TERM INVESTMENTS—98.3% | |
| (Identified Cost $134,351) | | | | 166,510 | |
| | | | | | |
| | | SHARES | | VALUE | |
| SHORT-TERM INVESTMENTS—0.1% | |
| | |
| Purchased Options—0.1% | | | | | |
(See the open purchased options table below for the detailed information.) | |
TOTAL PURCHASED OPTIONS—0.1%
(Premiums Paid $416) | | $ | 251 | |
TOTAL SHORT-TERM INVESTMENTS (Identified Cost $134,767) | | | 166,761 | |
| TOTAL INVESTMENTS, BEFORE WRITTEN OPTIONS—98.4% | |
| (Identified Cost $134,767) | | | 166,761 | |
| | | | | | |
| | | SHARES | | VALUE | |
| WRITTEN OPTIONS—(0.3)% | | | | | |
(See the open written options table below for the detailed information.) | |
TOTAL WRITTEN OPTIONS—(0.3)%
(Premiums Received $771) | | $ | (431 | ) |
| TOTAL INVESTMENTS, NET OF WRITTEN OPTIONS—98.1% | |
| (Identified Cost $133,996) | | 166,330 | |
Other assets and liabilities, net—1.9% | | | 3,177 | |
| | | | | | |
| NET ASSETS—100.0% | | $ | 169,507 | |
| | | | | | |
Abbreviation:
Footnote Legend:
| (2) | All or a portion of the security is segregated as collateral for written options. |
| (3) | Shares of this fund is publicly offered and the prospectus and annual reports is publicly available. |
| | | | | | | | | | | | | | | | | | | | |
Open Purchased Options contracts as of September 30, 2018, were as follows: | |
| Description of Options | | Number of
Contracts | | | Contract
Notional
Amount | | | Strike
Price(1) | | | Expiration
Date | | | Value | |
Call Options | | | | | | | | | | | | | | | | | | | | |
S&P 500® Index | | | 280 | | | $ | 84,700 | | | $ | 3,025 | | | | 10/1/18 | | | $ | — | |
S&P 500® Index | | | 279 | | | | 84,816 | | | | 3,040 | | | | 10/3/18 | | | | 1 | |
S&P 500® Index | | | 282 | | | | 86,433 | | | | 3,065 | | | | 10/5/18 | | | | 3 | |
S&P 500® Index | | | 282 | | | | 86,292 | | | | 3,060 | | | | 10/8/18 | | | | — | |
S&P 500® Index | | | 282 | | | | 86,292 | | | | 3,060 | | | | 10/10/18 | | | | — | |
S&P 500® Index | | | 282 | | | | 86,151 | | | | 3,055 | | | | 10/12/18 | | | | 9 | |
| | | | | | | | | | | | | | | | | | | | |
| | | | | | | | | | | | | | | | | | | 13 | |
| | | | | | | | | | | | | | | | | | | | |
Put Options | | | | | | | | | | | | | | | | | | | | |
S&P 500® Index | | | 280 | | | | 76,580 | | | | 2,735 | | | | 10/1/18 | | | | 7 | |
S&P 500® Index | | | 279 | | | | 76,586 | | | | 2,745 | | | | 10/3/18 | | | | 22 | |
S&P 500® Index | | | 282 | | | | 78,396 | | | | 2,780 | | | | 10/5/18 | | | | 32 | |
S&P 500® Index | | | 282 | | | | 77,550 | | | | 2,750 | | | | 10/8/18 | | | | 41 | |
S&P 500® Index | | | 282 | | | | 77,691 | | | | 2,755 | | | | 10/10/18 | | | | 60 | |
S&P 500® Index | | | 282 | | | | 77,409 | | | | 2,745 | | | | 10/12/18 | | | | 76 | |
| | | | | | | | | | | | | | | | | | | | |
| | | | | | | | | | | | | | | | | | | 238 | |
| |
Total Purchased Options | | | | | | | | | | | | | | | | | | $ | 251 | |
| | | | | | | | | | | | | | | | | | | | |
See Notes to Financial Statements
47
For information regarding the abbreviation, see the Key Investment Terms starting on page 5.
RAMPART ENHANCED CORE EQUITY FUND
SCHEDULE OF INVESTMENTS (Continued)
SEPTEMBER 30, 2018
($ reported in thousands)
| | | | | | | | | | | | | | | | | | | | |
Open Written Options contracts as of September 30, 2018, were as follows: | |
| Description of Options | | Number of
Contracts | | | Contract
Notional
Amount | | | Strike
Price(1) | | | Expiration
Date | | | Value | |
Call Options | | | | | | | | | | | | | | | | | | | | |
S&P 500® Index | | | 280 | | | $ | 83,020 | | | $ | 2,965 | | | | 10/1/18 | | | $ | (1 | ) |
S&P 500® Index | | | 279 | | | | 83,142 | | | | 2,980 | | | | 10/3/18 | | | | (3 | ) |
S&P 500® Index | | | 282 | | | | 84,741 | | | | 3,005 | | | | 10/5/18 | | | | (4 | ) |
S&P 500® Index | | | 282 | | | | 84,600 | | | | 3,000 | | | | 10/8/18 | | | | (8 | ) |
S&P 500® Index | | | 282 | | | | 84,600 | | | | 3,000 | | | | 10/10/18 | | | | (13 | ) |
S&P 500® Index | | | 282 | | | | 84,459 | | | | 2,995 | | | | 10/12/18 | | | | (23 | ) |
| | | | | | | | | | | | | | | | | | | | |
| | | | | | | | | | | | | | | | | | | (52 | ) |
| | | | | | | | | | | | | | | | | | | | |
Put Options | | | | | | | | | | | | | | | | | | | | |
S&P 500® Index | | | 280 | | | | 78,260 | | | | 2,795 | | | | 10/1/18 | | | | (8 | ) |
S&P 500® Index | | | 279 | | | | 78,260 | | | | 2,805 | | | | 10/3/18 | | | | (22 | ) |
S&P 500® Index | | | 282 | | | | 80,088 | | | | 2,840 | | | | 10/5/18 | | | | (62 | ) |
S&P 500® Index | | | 282 | | | | 79,242 | | | | 2,810 | | | | 10/8/18 | | | | (76 | ) |
S&P 500® Index | | | 282 | | | | 79,383 | | | | 2,815 | | | | 10/10/18 | | | | (95 | ) |
S&P 500® Index | | | 282 | | | | 79,101 | | | | 2,805 | | | | 10/12/18 | | | | (116 | ) |
| | | | | | | | | | | | | | | | | | | | |
| | | | | | | | | | | | | | | | | | | (379 | ) |
| |
Total Written Options | | | | | | | | | | | | | | | | | | $ | (431 | ) |
| | | | | | | | | | | | | | | | | | | | |
Footnote Legend:
| (1) | Strike price not reported in thousands. |
The following table provides a summary of inputs used to value the Fund’s investments as of September 30, 2018 (See Security Valuation Note 2A in the Notes to Financial Statements):
| | | | | | | | | | | | |
| | | Total
Value at
September 30, 2018 | | | Level 1
Quoted
Prices | | | Level 2
Quoted
Prices | |
Equity Securities: | | | | | | | | | | | | |
Common Stocks | | $ | 163,176 | | | $ | 163,176 | | | $ | — | |
Exchange-Traded Fund | | | 3,334 | | | | 3,334 | | | | — | |
Purchased Options | | | 251 | | | | 182 | | | | 69 | |
| | | | | | | | | | | | |
Total Investments before Written Options | | $ | 166,761 | | | $ | 166,692 | | | $ | 69 | |
| | | | | | | | | | | | |
Liabilities: | | | | | | | | | | | | |
Written Options | | $ | (431 | ) | | $ | (313 | ) | | $ | (118 | ) |
| | | | | | | | | | | | |
Total Investments net of Written Options | | $ | 166,330 | | | $ | 166,379 | | | $ | (49 | ) |
| | | | | | | | | | | | |
The purchased options and written options contracts that have been valued at zero on the open purchased options contracts and the open written options contracts tables are considered to be Level 2 investments in this table.
There were no securities valued using significant unobservable inputs (Level 3) at September 30, 2018.
There were no transfers into or out of Level 3 related to securities held at September 30, 2018.
See Notes to Financial Statements
48
TACTICAL ALLOCATION FUND
SCHEDULE OF INVESTMENTS
SEPTEMBER 30, 2018
($ reported in thousands)
| | | | | | | | |
| | | PAR
VALUE | | | VALUE | |
| U.S. GOVERNMENT SECURITIES—1.4% | |
U.S. Treasury Note | | | | | | | | |
1.375%, 4/30/20 | | $ | 190 | | | $ | 186 | |
1.875%, 2/28/22 | | | 1,015 | | | | 981 | |
2.375%, 1/31/23 | | | 825 | | | | 806 | |
2.000%, 2/15/25 | | | 135 | | | | 127 | |
TOTAL U.S. GOVERNMENT SECURITIES
(Identified Cost $2,123) | | | | 2,100 | |
| | |
| FOREIGN GOVERNMENT SECURITIES—2.4% | | | | | | |
Argentine Republic | | | | | | | | |
6.875%, 1/26/27 | | | 155 | | | | 132 | |
Series NY, 8.280%, 12/31/33 | | | 58 | | | | 52 | |
Bolivarian Republic of Venezuela | | | | | | | | |
RegS, 8.250%, 10/13/24(4)(10) | | | 40 | | | | 11 | |
RegS, 7.650%, 4/21/25(4)(10) | | | 320 | | | | 87 | |
9.375%, 1/13/34(10) | | | 130 | | | | 38 | |
Dominican Republic | | | | | | | | |
144A, 6.875%, 1/29/26(3) | | | 100 | | | | 107 | |
144A, 6.000%, 7/19/28(3) | | | 150 | | | | 152 | |
Federative Republic of Brazil | | | | | | | | |
Notas do Tesouro Nacional Series F,
10.000%, 1/1/23 | | | 570 | BRL | | | 141 | |
Notas do Tesouro Nacional Series F,
10.000%, 1/1/25 | | | 175 | BRL | | | 42 | |
Kingdom of Bahrain 144A
7.000%, 10/12/28(3) | | | 200 | | | | 198 | |
Kingdom of Morocco 144A
5.500%, 12/11/42(3) | | | 200 | | | | 210 | |
Provincia de Buenos Aires 144A
7.875%, 6/15/27(3) | | | 235 | | | | 196 | |
Republic of Chile
5.500%, 8/5/20 | | | 95,000 | CLP | | | 149 | |
Republic of Colombia
4.375%, 3/21/23 | | | 527,000 | COP | | | 169 | |
Republic of Costa Rica 144A
7.000%, 4/4/44(3) | | | 200 | | | | 176 | |
Republic of Ecuador 144A
8.875%, 10/23/27(3) | | | 200 | | | | 190 | |
Republic of Indonesia | | | | | | | | |
FR70, 8.375%, 3/15/24 | | | 2,177,000 | IDR | | | 147 | |
144A, 8.500%, 10/12/35(3) | | | 240 | | | | 329 | |
Republic of Philippines
9.500%, 2/2/30 | | | 190 | | | | 281 | |
Republic of South Africa Series 2023
7.750%, 2/28/23 | | | 1,400 | ZAR | | | 97 | |
Russian Federation | | | | | | | | |
Series 6216, 6.700%, 5/15/19 | | | 11,210 | RUB | | | 171 | |
Series 6215, 7.000%, 8/16/23 | | | 3,250 | RUB | | | 47 | |
Sultanate of Oman 144A
5.375%, 3/8/27(3) | | | 230 | | | | 223 | |
Ukraine | | | | | | | | |
144A, 7.750%, 9/1/23(3) | | | 120 | | | | 118 | |
144A, 7.750%, 9/1/26(3) | | | 160 | | | | 150 | |
United Mexican States Series M
6.500%, 6/9/22 | | | 1,091 | MXN | | | 56 | |
TOTAL FOREIGN GOVERNMENT SECURITIES
(Identified Cost $4,186) | | | | 3,669 | |
| | |
| MORTGAGE-BACKED SECURITIES—4.5% | | | | | | |
| | |
| Agency—0.6% | | | | | | |
Federal Home Loan Mortgage Corporation Pool #G08702
3.500%, 4/1/46 | | | 186 | | | | 184 | |
| | | | | | | | |
| | | PAR
VALUE | | | VALUE | |
| Agency—continued | | | | | | |
Federal National Mortgage Association | | | | | | | | |
Pool #AX2491, 4.000%, 10/1/44 | | $ | 167 | | | $ | 169 | |
Pool #MA2471, 3.500%, 12/1/45 | | | 123 | | | | 121 | |
Pool #MA2542, 3.000%, 2/1/46 | | | 57 | | | | 55 | |
Pool #MA3058, 4.000%, 7/1/47 | | | 224 | | | | 227 | |
Pool #MA3088, 4.000%, 8/1/47 | | | 173 | | | | 174 | |
| | | | | | | | |
| | | | | | | 930 | |
| | | | | | | | |
| | |
| Non-Agency—3.9% | | | | | | |
Agate Bay Mortgage Trust 2016-3, A5 144A
3.500%, 8/25/46(2)(3) | | | 111 | | | | 110 | |
American Homes 4 Rent Trust | | | | | | | | |
2014-SFR2, C 144A, 4.705%, 10/17/36(3) | | | 180 | | | | 185 | |
2015-SFR2, C 144A, 4.691%, 10/17/45(3) | | | 205 | | | | 211 | |
2015-SFR1, A 144A, 3.467%, 4/17/52(3) | | | 136 | | | | 134 | |
Ameriquest Mortgage Securities, Inc. Pass-Through Certificates, 2003-AR3, M4 , (1 month LIBOR – 5.850%) 3.796%, 6/25/33(2) | | | 98 | | | | 98 | |
AMSR Trust 2016-SFR1, D 144A , (1 month LIBOR + 2.400%) 4.558%, 11/17/33(2)(3) | | | 145 | | | | 146 | |
Angel Oak Mortgage Trust I LLC 2018-2, A1 144A
3.674%, 7/27/48(2)(3) | | | 82 | | | | 82 | |
Banc of America Funding Trust 2005-1, 1A1
5.500%, 2/25/35 | | | 23 | | | | 23 | |
Bank of America (Countrywide) Asset-Backed Certificates 2005-1, AF5A 4.989%, 7/25/35 | | | 109 | | | | 112 | |
Bank of America (Merrill Lynch – Countrywide) Alternative Loan Trust 2004-22CB, 1A1
6.000%, 10/25/34 | | | 105 | | | | 108 | |
Bayview Opportunity Master Fund IVa Trust 2016- SPL1, B1 144A 4.250%, 4/28/55(3) | | | 120 | | | | 121 | |
Bayview Opportunity Master Fund IVb Trust 2016-SPL2, B1 144A 4.250%, 6/28/53(2)(3) | | | 100 | | | | 101 | |
Citigroup Mortgage Loan Trust, Inc. | | | | | | | | |
2015-A, A1 144A, 3.500%, 6/25/58(2)(3) | | | 67 | | | | 66 | |
2018-RP1, A1 144A, 3.000%, 9/25/64(2)(3) | | | 233 | | | | 228 | |
Colony Starwood Homes Trust 2016-2A, C 144A , (1 month LIBOR + 2.150%)
4.308%, 12/17/33(2)(3) | | | 145 | | | | 145 | |
COLT Mortgage Loan Trust Funding LLC 2018-1, A1 144A 2.930%, 2/25/48(2)(3) | | | 67 | | | | 67 | |
Credit Suisse Commercial Mortgage-Backed Trust 2006-8, 3A1 6.000%, 10/25/21 | | | 30 | | | | 27 | |
Credit Suisse Mortgage Capital Trust 2014-IVR2, A2 144A 3.760%, 4/25/44(2)(3) | | | 44 | | | | 44 | |
Deephaven Residential Mortgage Trust
2017-1A, A2 144A, 2.928%, 12/26/46(2)(3) | | | 106 | | | | 105 | |
2018-1A, A1 144A, 2.976%, 12/25/57(2)(3) | | | 98 | | | | 97 | |
GAHR Commercial Mortgage Trust 2015-NRF, CFX 144A
3.495%, 12/15/34(2)(3) | | | 130 | | | | 130 | |
Galton Funding Mortgage Trust 2018-1, A23 144A
3.500%, 11/25/57(2)(3) | | | 127 | | | | 124 | |
GSAA Home Equity Trust 2005-12, AF3W
4.999%, 9/25/35(2) | | | 39 | | | | 40 | |
Homeward Opportunities Fund I Trust 2018-1, A1 144A
3.766%, 6/25/48(2)(3) | | | 157 | | | | 157 | |
JPMorgan Chase Commercial Mortgage Securities Trust 2011-C4, A4 144A 4.388%, 7/15/46(3) | | | 117 | | | | 119 | |
JPMorgan Chase Mortgage Trust | | | | | | | | |
2014-1, 2A12 144A, 3.500%, 1/25/44(2)(3) | | | 98 | | | | 96 | |
2016-1, M2 144A, 3.750%, 4/25/45(2)(3) | | | 90 | | | | 88 | |
2016-2, M2 144A, 3.750%, 12/25/45(2)(3) | | | 178 | | | | 174 | |
2017-5, A1 144A, 3.172%, 10/26/48(2)(3) | | | 190 | | | | 188 | |
2017-4, A3 144A, 3.500%, 11/25/48(2)(3) | | | 88 | | | | 85 | |
See Notes to Financial Statements
49
TACTICAL ALLOCATION FUND
SCHEDULE OF INVESTMENTS (Continued)
SEPTEMBER 30, 2018
($ reported in thousands)
| | | | | | | | |
| | | PAR
VALUE | | | VALUE | |
| | |
| Non-Agency—continued | | | | | | |
MASTR Alternative Loan Trust | | | | | | | | |
2005-5, 2A3, 5.500%, 7/25/25 | | $ | 70 | | | $ | 70 | |
2005-2, 2A1, 6.000%, 1/25/35 | | | 75 | | | | 77 | |
MASTR Specialized Loan Trust 2005-3, A2 144A
5.704%, 11/25/35(3) | | | 30 | | | | 31 | |
New Residential Mortgage Loan Trust | | | | | | | | |
2014-1A, A 144A, 3.750%, 1/25/54(2)(3) | | | 39 | | | | 39 | |
2017-2A, A3 144A, 4.000%, 3/25/57(2)(3) | | | 68 | | | | 69 | |
Oak Hill Advisors Residential Loan Trust 2017-NPL2, A1 144A 3.000%, 7/25/57(3) | | | 133 | | | | 131 | |
One Market Plaza Trust 2017-1MKT, A 144A
3.614%, 2/10/32(3) | | | 110 | | | | 109 | |
Progress Residential Trust | | | | | | | | |
2018-SFR1, B 144A, 3.484%, 3/17/35(3) | | | 220 | | | | 216 | |
2018-SFR2, B 144A, 3.841%, 8/17/35(3) | | | 100 | | | | 99 | |
Resecuritization Pass-Through Trust 2005-8R, A5
6.000%, 10/25/34 | | | 43 | | | | 43 | |
Residential Asset Mortgage Products Trust 2005-SL2, A4
7.500%, 2/25/32 | | | 59 | | | | 55 | |
Residential Asset Securitization Trust 2005-A1, A3
5.500%, 4/25/35 | | | 97 | | | | 99 | |
RETL 2018-RVP, C 144A , (1 month LIBOR +
2.050%) 4.208%, 3/15/33(2)(3) | | | 47 | | | | 47 | |
Sequoia Mortgage Trust 2013-8, B1
3.529%, 6/25/43(2) | | | 95 | | | | 92 | |
Towd Point Mortgage Trust | | | | | | | | |
2015-1, A2 144A, 3.250%, 10/25/53(2)(3) | | | 115 | | | | 113 | |
2015-3, A1B 144A, 3.000%, 3/25/54(2)(3) | | | 80 | | | | 80 | |
2015-6, M1 144A, 3.750%, 4/25/55(2)(3) | | | 100 | | | | 99 | |
2015-5, A2 144A, 3.500%, 5/25/55(2)(3) | | | 100 | | | | 99 | |
2018-4, A1 144A, 3.000%, 6/25/58(2)(3) | | | 104 | | | | 100 | |
2015-2, 1M1 144A, 3.250%, 11/25/60(2)(3) | | | 345 | | | | 331 | |
Vericrest Opportunity Loan Trust LVI LLC 2017-NPL3, A1 144A 3.500%, 3/25/47(3) | | | 61 | | | | 61 | |
Vericrest Opportunity Loan Trust LXIV LLC 2017-NP11, A1 144A 3.375%, 10/25/47(3) | | | 179 | | | | 178 | |
Verus Securitization Trust 2018-1, A1 144A
2.929%, 2/25/48(2)(3) | | | 75 | | | | 73 | |
Wells Fargo Commercial Mortgage Trust 2015-LC20, B
3.719%, 4/15/50 | | | 165 | | | | 161 | |
| | | | | | | | |
| | | | | | | | 5,883 | |
TOTAL MORTGAGE-BACKED SECURITIES
(Identified Cost $6,901) | | | | 6,813 | |
| | |
| ASSET-BACKED SECURITIES—2.3% | | | | | | |
| | |
| Auto Floor Plan—0.1% | | | | | | |
NextGear Floorplan Master Owner Trust 2018-1A, A2 144A 3.220%, 2/15/23(3) | | | 145 | | | | 144 | |
| | | | | | | | |
| | |
| Automobiles—1.4% | | | | | | |
ACC Trust 2018-1, B 144A 4.820%, 5/20/21(3) | | | 115 | | | | 115 | |
American Credit Acceptance Receivables Trust 2018-1, C 144A 3.550%, 4/10/24(3) | | | 160 | | | | 160 | |
Capital Auto Receivables Asset Trust 2017-1, D 144A
3.150%, 2/20/25(3) | | | 135 | | | | 133 | |
CarNow Auto Receivables Trust 2016-1A, D 144A
7.340%, 11/15/21(3) | | | 140 | | | | 141 | |
Chrysler Capital Auto Receivables Trust 2016-BA, D 144A
3.510%, 9/15/23(3) | | | 135 | | | | 134 | |
DT Auto Owner Trust 2018-1A, C 144A
3.470%, 12/15/23(3) | | | 145 | | | | 145 | |
| | | | | | | | |
| | | PAR
VALUE | | | VALUE | |
| | |
| Automobiles—continued | | | | | | |
Exeter Automobile Receivables Trust | | | | | | | | |
2015-2A, C 144A, 3.900%, 3/15/21(3) | | $ | 175 | | | $ | 176 | |
2014-3A, D 144A, 5.690%, 4/15/21(3) | | | 165 | | | | 167 | |
Flagship Credit Auto Trust | | | | | | | | |
2015-1, D 144A, 5.260%, 7/15/21(3) | | | 200 | | | | 203 | |
2014-1, E 144A, 5.710%, 8/16/21(3) | | | 130 | | | | 130 | |
GLS Auto Receivables Trust | | | | | | | | |
2017-1A, B 144A, 2.980%, 12/15/21(3) | | | 105 | | | | 104 | |
2017-1A, C 144A, 3.500%, 7/15/22(3) | | | 155 | | | | 154 | |
2018-1A, B 144A, 3.520%, 8/15/23(3) | | | 155 | | | | 154 | |
Skopos Auto Receivables Trust 2018-1A, B 144A
3.930%, 5/16/22(3) | | | 165 | | | | 164 | |
| | | | | | | | |
| | | | | | | 2,080 | |
| | | | | | | | |
| Other—0.8% | | | | | | |
Aqua Finance Trust 2017-A, A 144A
3.720%, 11/15/35(3) | | | 121 | | | | 118 | |
Arbys Funding LLC 2015-1A, A2 144A
4.969%, 10/30/45(3) | | | 160 | | | | 162 | |
CLUB Credit Trust 2017-P1, B 144A
3.560%, 9/15/23(3) | | | 110 | | | | 109 | |
CoreVest American Finance Trust 2018-1, A 144A
3.804%, 6/15/51(3) | | | 99 | | | | 99 | |
DB Master Finance LLC 2017-1A, A2I 144A
3.629%, 11/20/47(3) | | | 134 | | | | 131 | |
Drug Royalty III LP 1 2016-1A, A 144A
3.979%, 4/15/27(3) | | | 116 | | | | 116 | |
HOA Funding LLC 2014-1A, A2 144A
4.846%, 8/20/44(3) | | | 152 | | | | 150 | |
Prosper Marketplace Issuance Trust
2017-1A, B 144A, 3.650%, 6/15/23(3) | | | 137 | | | | 137 | |
2017-2A, B 144A, 3.480%, 9/15/23(3) | | | 110 | | | | 110 | |
TGIF Funding LLC 2017-1A, A2 144A
6.202%, 4/30/47(3) | | | 137 | | | | 137 | |
| | | | | | | | |
| | | | | | | | 1,269 | |
TOTAL ASSET-BACKED SECURITIES
(Identified Cost $3,501) | | | | 3,493 | |
| | |
| CORPORATE BONDS AND NOTES—17.8% | | | | | | |
| | |
| Consumer Discretionary—2.7% | | | | | | |
American Axle & Manufacturing, Inc.
6.250%, 3/15/26 | | | 5 | | | | 5 | |
Beazer Homes USA, Inc. | | | | | | | | |
6.750%, 3/15/25 | | | 45 | | | | 42 | |
5.875%, 10/15/27 | | | 115 | | | | 98 | |
Boyd Gaming Corp.
6.000%, 8/15/26 | | | 35 | | | | 35 | |
Bunge Ltd. Finance Corp.
4.350%, 3/15/24 | | | 140 | | | | 139 | |
Caesars Resort Collection LLC 144A
5.250%, 10/15/25(3) | | | 110 | | | | 105 | |
Cequel Communications Holdings I LLC 144A
7.500%, 4/1/28(3) | | | 200 | | | | 209 | |
Charter Communications Operating LLC | | | | | | | | |
4.500%, 2/1/24 | | | 85 | | | | 85 | |
4.908%, 7/23/25 | | | 135 | | | | 137 | |
Clear Channel Worldwide Holdings, Inc. Series B
7.625%, 3/15/20 | | | 200 | | | | 201 | |
Delta Merger Sub, Inc. 144A
6.000%, 9/15/26(3) | | | 40 | | | | 41 | |
Discovery Communications LLC
3.950%, 3/20/28 | | | 130 | | | | 123 | |
See Notes to Financial Statements
50
TACTICAL ALLOCATION FUND
SCHEDULE OF INVESTMENTS (Continued)
SEPTEMBER 30, 2018
($ reported in thousands)
| | | | | | | | |
| | | PAR
VALUE | | | VALUE | |
| | |
| Consumer Discretionary—continued | | | | | | |
DISH DBS Corp. | | | | | | | | |
5.875%, 7/15/22 | | $ | 115 | | | $ | 112 | |
7.750%, 7/1/26 | | | 60 | | | | 57 | |
Dollar Tree, Inc.
4.000%, 5/15/25 | | | 83 | | | | 81 | |
Downstream Development Authority of The Quapaw Tribe of Oklahoma 144A
10.500%, 2/15/23(3) | | | 45 | | | | 46 | |
Ford Motor Credit Co., LLC
4.389%, 1/8/26 | | | 200 | | | | 190 | |
Frontdoor, Inc. 144A
6.750%, 8/15/26(3) | | | 100 | | | | 103 | |
Gateway Casinos & Entertainment Ltd. 144A
8.250%, 3/1/24(3) | | | 100 | | | | 105 | |
GLP Capital LP
5.250%, 6/1/25 | | | 100 | | | | 102 | |
Graham Holdings Co. 144A
5.750%, 6/1/26(3) | | | 150 | | | | 154 | |
Hilton Domestic Operating Co., Inc. 144A
5.125%, 5/1/26(3) | | | 120 | | | | 119 | |
Horton (D.R.), Inc.
4.750%, 2/15/23 | | | 85 | | | | 87 | |
iHeartCommunications, Inc.
9.000%, 12/15/19(10) | | | 55 | | | | 41 | |
Lear Corp.
3.800%, 9/15/27 | | | 160 | | | | 148 | |
Lennar Corp. | | | | | | | | |
5.250%, 6/1/26 | | | 80 | | | | 79 | |
4.750%, 11/29/27 | | | 55 | | | | 53 | |
M/I Homes, Inc.
5.625%, 8/1/25 | | | 90 | | | | 85 | |
Marriott Ownership Resorts, Inc. 144A
6.500%, 9/15/26(3) | | | 90 | | | | 92 | |
McGraw-Hill Global Education Holdings LLC 144A
7.875%, 5/15/24(3) | | | 95 | | | | 85 | |
MDC Holdings, Inc.
5.500%, 1/15/24 | | | 85 | | | | 85 | |
Meredith Corp. 144A
6.875%, 2/1/26(3)(18) | | | 70 | | | | 72 | |
MGM Resorts International
5.750%, 6/15/25 | | | 135 | | | | 135 | |
Neiman Marcus Group Ltd. 144A
8.000%, 10/15/21(3) | | | 115 | | | | 76 | |
Scientific Games International, Inc.
6.625%, 5/15/21 | | | 95 | | | | 95 | |
Tenneco, Inc.
5.000%, 7/15/26 | | | 150 | | | | 133 | |
Viking Cruises Ltd. 144A
5.875%, 9/15/27(3) | | | 105 | | | | 102 | |
Vista Outdoor, Inc.
5.875%, 10/1/23 | | | 115 | | | | 113 | |
Weekley Homes LLC
6.625%, 8/15/25 | | | 110 | | | | 105 | |
William Lyon Homes, Inc.
6.000%, 9/1/23 | | | 140 | | | | 135 | |
| | | | | | | | |
| | | | | | | 4,010 | |
| | | | | | | | |
| | |
| Consumer Staples—0.5% | | | | | | |
Bacardi Ltd. 144A
4.700%, 5/15/28(3) | | | 140 | | | | 139 | |
BAT Capital Corp. 144A
3.557%, 8/15/27(3) | | | 110 | | | | 103 | |
| | | | | | | | |
| | | PAR
VALUE | | | VALUE | |
| | |
| Consumer Staples—continued | | | | | | |
CVS Health Corp.
4.300%, 3/25/28 | | $ | 165 | | | $ | 163 | |
Kronos Acquisition Holdings, Inc. 144A
9.000%, 8/15/23(3) | | | 135 | | | | 127 | |
Safeway, Inc.
7.250%, 2/1/31(18) | | | 80 | | | | 76 | |
Sigma Finance Netherlands BV 144A
4.875%, 3/27/28(3) | | | 200 | | | | 196 | |
| | | | | | | | |
| | | | | | | 804 | |
| | | | | | | | |
| | |
| Energy—3.4% | | | | | | |
Alta Mesa Holdings LP
7.875%, 12/15/24 | | | 70 | | | | 66 | |
American Midstream Partners LP 144A
9.500%, 12/15/21(3) | | | 60 | | | | 60 | |
Anadarko Finance Co. Series B
7.500%, 5/1/31 | | | 45 | | | | 55 | |
Anadarko Petroleum Corp.
6.600%, 3/15/46 | | | 85 | | | | 100 | |
Blue Racer Midstream LLC 144A
6.625%, 7/15/26(3) | | | 140 | | | | 143 | |
Bristow Group, Inc. 144A
8.750%, 3/1/23(3)(18) | | | 50 | | | | 49 | |
Callon Petroleum Co.
6.125%, 10/1/24 | | | 113 | | | | 115 | |
Carrizo Oil & Gas, Inc.
6.250%, 4/15/23 | | | 120 | | | | 123 | |
Cheniere Corpus Christi Holdings LLC
7.000%, 6/30/24 | | | 145 | | | | 159 | |
Cheniere Energy Partners LP 144A
5.625%, 10/1/26(3) | | | 65 | | | | 65 | |
Chesapeake Energy Corp.
8.000%, 6/15/27(18) | | | 110 | | | | 112 | |
Citgo Holding, Inc. 144A
10.750%, 2/15/20(3) | | | 100 | | | | 106 | |
Continental Resources, Inc.
4.500%, 4/15/23 | | | 60 | | | | 61 | |
Denbury Resources, Inc. | | | | | | | | |
144A, 9.250%, 3/31/22(3) | | | 98 | | | | 106 | |
144A, 7.500%, 2/15/24(3) | | | 55 | | | | 57 | |
Ecopetrol S.A.
5.375%, 6/26/26 | | | 190 | | | | 196 | |
Encana Corp.
8.125%, 9/15/30 | | | 65 | | | | 83 | |
Energy Transfer Equity LP | | | | | | | | |
4.250%, 3/15/23 | | | 35 | | | | 35 | |
5.875%, 1/15/24 | | | 65 | | | | 68 | |
EP Energy LLC | | | | | | | | |
6.375%, 6/15/23 | | | 90 | | | | 60 | |
144A, 8.000%, 11/29/24(3) | | | 80 | | | | 81 | |
144A, 7.750%, 5/15/26(3) | | | 50 | | | | 51 | |
HollyFrontier Corp.
5.875%, 4/1/26 | | | 155 | | | | 165 | |
Jagged Peak Energy LLC 144A
5.875%, 5/1/26(3) | | | 140 | | | | 139 | |
KazMunayGas National Co. JSC 144A
4.750%, 4/19/27(3) | | | 200 | | | | 200 | |
Kinder Morgan, Inc.
7.750%, 1/15/32 | | | 205 | | | | 259 | |
MPLX LP
4.000%, 3/15/28 | | | 86 | | | | 83 | |
Nabors Industries, Inc. | | | | | | | | |
5.500%, 1/15/23 | | | 95 | | | | 93 | |
144A, 5.750%, 2/1/25(3) | | | 50 | | | | 48 | |
See Notes to Financial Statements
51
TACTICAL ALLOCATION FUND
SCHEDULE OF INVESTMENTS (Continued)
SEPTEMBER 30, 2018
($ reported in thousands)
| | | | | | | | |
| | | PAR
VALUE | | | VALUE | |
| | |
| Energy—continued | | | | | | |
Odebrecht Offshore Drilling Finance Ltd. PIK Interest Capitalization , 144A
7.720%, 12/1/26(3)(14) | | $ | 165 | | | $ | 47 | |
Odebrecht Oil & Gas Finance Ltd. 144A
0.000%, 12/31/49(3) | | | 25 | | | | — | (17) |
Petrobras Global Finance BV | | | | | | | | |
7.375%, 1/17/27 | | | 380 | | | | 385 | |
5.999%, 1/27/28 | | | 70 | | | | 65 | |
Petroleos de Venezuela S.A. 144A
6.000%, 5/16/24(3)(10) | | | 255 | | | | 56 | |
Petroleos Mexicanos | | | | | | | | |
6.500%, 3/13/27 | | | 230 | | | | 235 | |
6.500%, 6/2/41 | | | 195 | | | | 183 | |
Range Resources Corp.
4.875%, 5/15/25 | | | 140 | | | | 132 | |
Sanchez Energy Corp. 144A
7.250%, 2/15/23(3)(18) | | | 65 | | | | 64 | |
Seven Generations Energy Ltd. 144A
5.375%, 9/30/25(3) | | | 110 | | | | 107 | |
State Oil Co. of the Azerbaijan Republic RegS
6.950%, 3/18/30(4) | | | 200 | | | | 216 | |
Sunoco LP | | | | | | | | |
144A, 5.500%, 2/15/26(3) | | | 40 | | | | 39 | |
144A, 5.875%, 3/15/28(3) | | | 20 | | | | 19 | |
Targa Resources Partners LP 144A
5.875%, 4/15/26(3) | | | 125 | | | | 129 | |
Transocean, Inc. | | | | | | | | |
144A, 9.000%, 7/15/23(3) | | | 65 | | | | 71 | |
6.800%, 3/15/38 | | | 35 | | | | 30 | |
USA Compression Partners LP 144A
6.875%, 4/1/26(3) | | | 125 | | | | 129 | |
Valero Energy Partners LP
4.500%, 3/15/28 | | | 140 | | | | 137 | |
Vine Oil & Gas LP 144A
8.750%, 4/15/23(3) | | | 85 | | | | 83 | |
Weatherford International Ltd.
9.875%, 2/15/24 | | | 40 | | | | 39 | |
| | | | | | | | |
| | | | | | | 5,104 | |
| | | | | | | | |
| | |
| Financials—3.9% | | | | | | |
Acrisure LLC 144A
7.000%, 11/15/25(3) | | | 130 | | | | 121 | |
AerCap Ireland Capital DAC
3.650%, 7/21/27 | | | 150 | | | | 137 | |
Allstate Corp. (The) Series B
5.750%, 8/15/53(7) | | | 125 | | | | 129 | |
Athene Holding Ltd.
4.125%, 1/12/28 | | | 130 | | | | 121 | |
Australia & New Zealand Banking Group Ltd. 144A
4.400%, 5/19/26(3) | | | 200 | | | | 196 | |
Aviation Capital Group LLC 144A
3.500%, 11/1/27(3) | | | 145 | | | | 132 | |
Banco Bilbao Vizcaya Argentaria Bancomer S.A. 144A
5.125%, 1/18/33(3) | | | 200 | | | | 182 | |
Banco de Bogota S.A. 144A
6.250%, 5/12/26(3) | | | 200 | | | | 208 | |
Banco Internacional del Peru SAA Interbank 144A
6.625%, 3/19/29(3) | | | 55 | | | | 60 | |
Bank of America Corp. | | | | | | | | |
4.200%, 8/26/24 | | | 167 | | | | 168 | |
(3 month LIBOR + 0.770%) 3.111%, 2/5/26(2) | | | 110 | | | | 108 | |
Bank of Montreal
3.803%, 12/15/32 | | | 88 | | | | 82 | |
| | | | | | | | |
| | | PAR
VALUE | | | VALUE | |
| | |
| Financials—continued | | | | | | |
Brighthouse Financial, Inc.
3.700%, 6/22/27 | | $ | 170 | | | $ | 151 | |
BrightSphere Investment Group plc
4.800%, 7/27/26 | | | 150 | | | | 146 | |
Capital One Financial Corp.
3.750%, 7/28/26 | | | 135 | | | | 126 | |
Drawbridge Special Opportunities Fund LP 144A
5.000%, 8/1/21(3) | | | 250 | | | | 251 | |
E*TRADE Financial Corp.
4.500%, 6/20/28 | | | 175 | | | | 175 | |
Fairfax Financial Holdings Ltd. 144A
4.850%, 4/17/28(3) | | | 155 | | | | 153 | |
FS Investment Corp.
4.750%, 5/15/22 | | | 130 | | | | 129 | |
Goldman Sachs Group, Inc. (The), (3 month LIBOR + 1.170%) 3.484%, 5/15/26(2) | | | 225 | | | | 225 | |
Grupo de Inversiones Suramericana S.A. 144A
5.500%, 4/29/26(3) | | | 200 | | | | 204 | |
ICAHN Enterprises LP
6.375%, 12/15/25 | | | 130 | | | | 131 | |
ING Groep N.V. 6.000%(6)(7) | | | 200 | | | | 199 | |
Jefferies Financial Group, Inc.
5.500%, 10/18/23 | | | 70 | | | | 72 | |
Jefferies Group LLC
4.850%, 1/15/27 | | | 40 | | | | 39 | |
Kazakhstan Temir Zholy Finance BV 144A
6.950%, 7/10/42(3) | | | 200 | | | | 221 | |
Navient Corp. | | | | | | | | |
7.250%, 9/25/23 | | | 35 | | | | 37 | |
6.750%, 6/25/25 | | | 105 | | | | 106 | |
Prudential Financial, Inc. | | | | | | | | |
5.875%, 9/15/42 | | | 100 | | | | 106 | |
5.625%, 6/15/43(7) | | | 75 | | | | 78 | |
Santander Holdings USA, Inc.
4.400%, 7/13/27 | | | 135 | | | | 129 | |
Sberbank of Russia 144A
5.500%, 2/26/24(3)(5) | | | 200 | | | | 199 | |
Springleaf Finance Corp. | | | | | | | | |
6.875%, 3/15/25 | | | 70 | | | | 70 | |
7.125%, 3/15/26 | | | 35 | | | | 35 | |
Synchrony Financial
3.950%, 12/1/27 | | | 280 | | | | 254 | |
Teachers Insurance & Annuity Association of America 144A 4.375%, 9/15/54(3) | | | 150 | | | | 149 | |
Tempo Acquisition LLC 144A
6.750%, 6/1/25(3) | | | 145 | | | | 141 | |
Toronto-Dominion Bank (The)
3.625%, 9/15/31 | | | 170 | | | | 160 | |
Voya Financial, Inc.
5.650%, 5/15/53 | | | 135 | | | | 136 | |
Wells Fargo & Co. | | | | | | | | |
3.550%, 9/29/25 | | | 135 | | | | 132 | |
Series S, 5.900%(6) | | | 310 | | | | 315 | |
| | | | | | | | |
| | | | | | | 5,913 | |
| | | | | | | | |
| | |
| Health Care—1.4% | | | | | | |
Anthem, Inc.
3.650%, 12/1/27 | | | 35 | | | | 33 | |
Avantor, Inc. | | | | | | | | |
144A, 6.000%, 10/1/24(3) | | | 50 | | | | 51 | |
144A, 9.000%, 10/1/25(3) | | | 105 | | | | 108 | |
See Notes to Financial Statements
52
TACTICAL ALLOCATION FUND
SCHEDULE OF INVESTMENTS (Continued)
SEPTEMBER 30, 2018
($ reported in thousands)
| | | | | | | | |
| | | PAR
VALUE | | | VALUE | |
| | |
| Health Care—continued | | | | | | |
Bausch Health Cos., Inc. | | | | | | | | |
144A, 6.500%, 3/15/22(3) | | $ | 10 | | | $ | 10 | |
144A, 7.000%, 3/15/24(3) | | | 15 | | | | 16 | |
144A, 6.125%, 4/15/25(3) | | | 55 | | | | 52 | |
144A, 5.500%, 11/1/25(3) | | | 135 | | | | 135 | |
144A, 9.250%, 4/1/26(3) | | | 75 | | | | 81 | |
Bayer US Finance II LLC 144A , (3 month LIBOR +
1.010%) 3.344%, 12/15/23(2)(3) | | | 200 | | | | 200 | |
Becton Dickinson & Co.
3.700%, 6/6/27 | | | 170 | | | | 163 | |
Centene Corp. 144A
5.375%, 6/1/26(3) | | | 40 | | | | 41 | |
Concordia International Corp.
8.000%, 9/6/24 | | | 22 | | | | 21 | |
DJO Finco, Inc. 144A
8.125%, 6/15/21(3) | | | 55 | | | | 56 | |
Eagle Holding Co. II, LLC PIK Interest Capitalization, 144A
7.625%, 5/15/22(3)(8) | | | 70 | | | | 71 | |
Endo Dac 144A
6.000%, 7/15/23(3) | | | 140 | | | | 124 | |
Envision Healthcare Corp. 144A
6.250%, 12/1/24(3) | | | 25 | | | | 27 | |
Halfmoon Parent, Inc. | | | | | | | | |
144A, 4.125%, 11/15/25(3) | | | 117 | | | | 117 | |
144A, 4.375%, 10/15/28(3) | | | 12 | | | | 12 | |
HCA, Inc.
5.250%, 6/15/26 | | | 55 | | | | 57 | |
HLF Financing S.a.r.l. LLC 144A
7.250%, 8/15/26(3) | | | 145 | | | | 147 | |
MPH Acquisition Holdings LLC 144A
7.125%, 6/1/24(3) | | | 70 | | | | 73 | |
Mylan NV
3.950%, 6/15/26 | | | 140 | | | | 132 | |
Surgery Center Holdings, Inc. | | | | | | | | |
144A, 8.875%, 4/15/21(3) | | | 100 | | | | 104 | |
144A, 6.750%, 7/1/25(3) | | | 15 | | | | 14 | |
Tenet Healthcare Corp. | | | | | | | | |
8.125%, 4/1/22 | | | 30 | | | | 32 | |
7.000%, 8/1/25(18) | | | 115 | | | | 114 | |
Teva Pharmaceutical Finance Netherlands III BV
3.150%, 10/1/26 | | | 85 | | | | 71 | |
West Street Merger Sub, Inc. 144A
6.375%, 9/1/25(3) | | | 70 | | | | 66 | |
| | | | | | | | |
| | | | | | | 2,128 | |
| | | | | | | | |
| | |
| Industrials—1.2% | | | | | | |
Ashtead Capital, Inc. 144A
4.375%, 8/15/27(3) | | | 200 | | | | 190 | |
Bombardier, Inc. 144A
6.125%, 1/15/23(3) | | | 115 | | | | 116 | |
CNH Industrial N.V. | | | | | | | | |
4.500%, 8/15/23 | | | 112 | | | | 114 | |
3.850%, 11/15/27 | | | 58 | | | | 55 | |
Continental Airlines Pass-Through-Trust 1999-2, C2
6.236%, 3/15/20 | | | 40 | | | | 41 | |
DP World Ltd. 144A
6.850%, 7/2/37(3) | | | 100 | | | | 114 | |
Garda World Security Corp. 144A
8.750%, 5/15/25(3) | | | 55 | | | | 54 | |
Hillman Group, Inc. (The) 144A
6.375%, 7/15/22(3) | | | 55 | | | | 49 | |
Hulk Finance Corp. 144A
7.000%, 6/1/26(3) | | | 120 | | | | 116 | |
| | | | | | | | |
| | | PAR
VALUE | | | VALUE | |
| | |
| Industrials—continued | | | | | | |
Masco Corp.
5.950%, 3/15/22 | | $ | 99 | | | $ | 106 | |
New Enterprise Stone & Lime Co., Inc. 144A
10.125%, 4/1/22(3) | | | 10 | | | | 11 | |
Oshkosh Corp.
4.600%, 5/15/28 | | | 183 | | | | 181 | |
Owens Corning
3.400%, 8/15/26 | | | 150 | | | | 137 | |
Pitney Bowes, Inc.
4.375%, 5/15/22 | | | 157 | | | | 145 | |
Titan Acquisition Ltd. 144A
7.750%, 4/15/26(3) | | | 75 | | | | 65 | |
TransDigm, Inc. | | | | | | | | |
6.500%, 7/15/24 | | | 60 | | | | 61 | |
6.500%, 5/15/25 | | | 45 | | | | 46 | |
US Airways 2012-1 Class B Pass-Through Trust
8.000%, 10/1/19 | | | 133 | | | | 139 | |
Wrangler Buyer Corp. 144A
6.000%, 10/1/25(3) | | | 114 | | | | 111 | |
| | | | | | | | |
| | | | | | | 1,851 | |
| | | | | | | | |
| | |
| Information Technology—0.9% | | | | | | |
Arrow Electronics, Inc.
3.875%, 1/12/28 | | | 135 | | | | 126 | |
Banff Merger Sub, Inc. 144A
9.750%, 9/1/26(3) | | | 15 | | | | 15 | |
Broadcom Corp. | | | | | | | | |
3.000%, 1/15/22 | | | 45 | | | | 44 | |
3.625%, 1/15/24 | | | 100 | | | | 97 | |
3.125%, 1/15/25 | | | 90 | | | | 84 | |
CDK Global, Inc.
5.875%, 6/15/26 | | | 135 | | | | 139 | |
Citrix Systems, Inc.
4.500%, 12/1/27 | | | 125 | | | | 120 | |
Dell International LLC | | | | | | | | |
144A, 5.450%, 6/15/23(3) | | | 30 | | | | 32 | |
144A, 8.100%, 7/15/36(3) | | | 60 | | | | 72 | |
Everi Payments, Inc. 144A
7.500%, 12/15/25(3) | | | 30 | | | | 30 | |
Exela Intermediate LLC 144A
10.000%, 7/15/23(3) | | | 100 | | | | 107 | |
Radiate Holdco LLC | | | | | | | | |
144A, 6.875%, 2/15/23(3) | | | 15 | | | | 14 | |
144A, 6.625%, 2/15/25(3) | | | 165 | | | | 154 | |
VeriSign, Inc.
4.750%, 7/15/27 | | | 120 | | | | 117 | |
ViaSat, Inc. 144A
5.625%, 9/15/25(3) | | | 115 | | | | 109 | |
VMware, Inc.
3.900%, 8/21/27 | | | 93 | | | | 88 | |
| | | | | | | | |
| | | | | | | 1,348 | |
| | | | | | | | |
| | |
| Materials—1.6% | | | | | | |
Alpek SAB de C.V. 144A
5.375%, 8/8/23(3) | | | 260 | | | | 266 | |
Anglo American Capital plc 144A
4.000%, 9/11/27(3) | | | 200 | | | | 184 | |
ArcelorMittal
6.125%, 6/1/25 | | | 145 | | | | 157 | |
BHP Billiton Finance USA Ltd. 144A
6.750%, 10/19/75(3)(7) | | | 205 | | | | 225 | |
Fibria Overseas Finance Ltd.
4.000%, 1/14/25 | | | 54 | | | | 50 | |
See Notes to Financial Statements
53
TACTICAL ALLOCATION FUND
SCHEDULE OF INVESTMENTS (Continued)
SEPTEMBER 30, 2018
($ reported in thousands)
| | | | | | | | |
| | | PAR
VALUE | | | VALUE | |
| | |
| Materials—continued | | | | | | |
FMG Resources August 2006 Pty Ltd. 144A
5.125%, 3/15/23(3) | | $ | 90 | | | $ | 89 | |
Glencore Funding LLC 144A
4.000%, 3/27/27(3) | | | 165 | | | | 155 | |
GTL Trade Finance, Inc. 144A
5.893%, 4/29/24(3) | | | 150 | | | | 152 | |
Hexion, Inc.
6.625%, 4/15/20 | | | 90 | | | | 85 | |
James Hardie International Finance DAC 144A
5.000%, 1/15/28(3) | | | 200 | | | | 189 | |
Kraton Polymers LLC 144A
7.000%, 4/15/25(3) | | | 105 | | | | 108 | |
NOVA Chemicals Corp. | | | | | | | | |
144A, 4.875%, 6/1/24(3) | | | 40 | | | | 38 | |
144A, 5.000%, 5/1/25(3) | | | 105 | | | | 100 | |
Platform Specialty Products Corp. 144A
5.875%, 12/1/25(3) | | | 90 | | | | 89 | |
PQ Corp. 144A
5.750%, 12/15/25(3) | | | 40 | | | | 40 | |
Rusal Capital Designated Activity Co. 144A
5.125%, 2/2/22(3) | | | 200 | | | | 130 | |
Schweitzer-Mauduit International, Inc. 144A
6.875%, 10/1/26(3) | | | 60 | | | | 61 | |
Teck Resources Ltd. 144A
8.500%, 6/1/24(3) | | | 35 | | | | 38 | |
Trident Merger Sub, Inc. 144A
6.625%, 11/1/25(3) | | | 85 | | | | 80 | |
United States Steel Corp.
6.250%, 3/15/26 | | | 120 | | | | 119 | |
| | | | | | | | |
| | | | | | | 2,355 | |
| | | | | | | | |
| | |
| Real Estate—0.6% | | | | | | |
EPR Properties | | | | | | | | |
4.750%, 12/15/26 | | | 145 | | | | 142 | |
4.500%, 6/1/27 | | | 75 | | | | 72 | |
Healthcare Trust of America Holdings LP
3.750%, 7/1/27 | | | 70 | | | | 66 | |
Hospitality Properties Trust | | | | | | | | |
4.950%, 2/15/27 | | | 140 | | | | 137 | |
4.375%, 2/15/30 | | | 40 | | | | 37 | |
LifeStorage LP
3.875%, 12/15/27 | | | 50 | | | | 47 | |
MPT Operating Partnership LP | | | | | | | | |
5.500%, 5/1/24 | | | 75 | | | | 76 | |
5.000%, 10/15/27 | | | 55 | | | | 53 | |
Physicians Realty LP
4.300%, 3/15/27 | | | 140 | | | | 135 | |
Select Income REIT
4.500%, 2/1/25 | | | 165 | | | | 158 | |
Welltower, Inc.
4.250%, 4/15/28 | | | 40 | | | | 39 | |
| | | | | | | | |
| | | | | | | 962 | |
| | | | | | | | |
| | |
| Telecommunication Services—1.0% | | | | | | |
America Movil SAB de C.V.
6.450%, 12/5/22 | | | 2,000 | MXN | | | 98 | |
AT&T, Inc. | | | | | | | | |
(3 month LIBOR + 1.180%)
3.514%, 6/12/24(2) | | | 110 | | | | 111 | |
5.250%, 3/1/37 | | | 30 | | | | 30 | |
4.800%, 6/15/44 | | | 110 | | | | 101 | |
5.650%, 2/15/47 | | | 55 | | | | 56 | |
| | | | | | | | |
| | | PAR
VALUE | | | VALUE | |
| | |
| Telecommunication Services—continued | | | | | | |
Cincinnati Bell, Inc. 144A
7.000%, 7/15/24(3) | | $ | 155 | | | $ | 142 | |
Digicel Group Ltd. 144A
8.250%, 9/30/20(3) | | | 200 | | | | 153 | |
Frontier Communications Corp. | | | | | | | | |
8.500%, 4/15/20 | | | 45 | | | | 45 | |
7.625%, 4/15/24 | | | 140 | | | | 90 | |
144A, 8.500%, 4/1/26(3) | | | 45 | | | | 43 | |
Sprint Corp. | | | | | | | | |
7.875%, 9/15/23 | | | 45 | | | | 49 | |
7.625%, 3/1/26 | | | 45 | | | | 48 | |
T-Mobile USA, Inc.
4.500%, 2/1/26 | | | 145 | | | | 138 | |
Telenet Finance Luxembourg Notes S.a.r.l. 144A
5.500%, 3/1/28(3) | | | 200 | | | | 188 | |
West Corp. 144A
8.500%, 10/15/25(3) | | | 35 | | | | 32 | |
Windstream Services LLC | | | | | | | | |
144A, 10.500%, 6/30/24(3) | | | 60 | | | | 51 | |
144A, 8.625%, 10/31/25(3) | | | 90 | | | | 86 | |
| | | | | | | | |
| | | | | | | 1,461 | |
| | | | | | | | |
| | |
| Utilities—0.6% | | | | | | |
Enel Finance International NV 144A
4.625%, 9/14/25(3) | | | 200 | | | | 196 | |
Eskom Holdings SOC Ltd. 144A
7.125%, 2/11/25(3) | | | 200 | | | | 192 | |
Ferrellgas Partners LP
8.625%, 6/15/20 | | | 25 | | | | 24 | |
Perusahaan Listrik Negara PT 144A
4.125%, 5/15/27(3) | | | 210 | | | | 196 | |
TerraForm Power Operating LLC 144A
5.000%, 1/31/28(3) | | | 90 | | | | 84 | |
Vistra Energy Corp.
7.375%, 11/1/22 | | | 125 | | | | 130 | |
| | | | | | | | |
| | | | | | | | 822 | |
TOTAL CORPORATE BONDS AND NOTES
(Identified Cost $27,460) | | | | | | | 26,758 | |
| | |
| LEVERAGED LOANS(2)—5.2% | | | | | | |
| | |
| Aerospace—0.1% | | | | | | |
TransDigm, Inc. | | | | | | | | |
Tranche F, (1 month LIBOR + 2.500%)
4.742%, 6/9/23 | | | 108 | | | | 109 | |
Tranche E, (1 month LIBOR + 2.500%)
4.742%, 5/30/25 | | | 50 | | | | 50 | |
| | | | | | | | |
| | | | | | | 159 | |
| | | | | | | | |
| | |
| Chemicals—0.1% | | | | | | |
New Arclin U.S. Holding Corp. First Lien, (3 month LIBOR + 3.500%) 5.886%, 2/14/24 | | | 63 | | | | 64 | |
Omnova Solutions, Inc. Tranche B-2, (1 month LIBOR + 3.250%) 5.492%, 8/25/23 | | | 103 | | | | 103 | |
| | | | | | | | |
| | | | | | | 167 | |
| | | | | | | | |
| | |
| Consumer Durables—0.1% | | | | | | |
Global Appliance, Inc. Tranche B, (1 month LIBOR + 4.000%) 6.250%, 9/29/24 | | | 89 | | | | 86 | |
| | | | | | | | |
See Notes to Financial Statements
54
TACTICAL ALLOCATION FUND
SCHEDULE OF INVESTMENTS (Continued)
SEPTEMBER 30, 2018
($ reported in thousands)
| | | | | | | | |
| | | PAR
VALUE | | | VALUE | |
| | |
| Consumer Non-Durables—0.3% | | | | | | |
American Greetings Corp., (1 month LIBOR + 4.500%)
6.742%, 4/6/24 | | $ | 140 | | | $ | 140 | |
Energizer Holdings, Inc. Tranche B, (3 month LIBOR + 2.250%) 0.000%, 6/20/25(9) | | | 30 | | | | 30 | |
Herbalife Nutrition Ltd. Tranche B, (1 month LIBOR + 3.250%) 5.492%, 8/18/25 | | | 25 | | | | 25 | |
Kronos Acquisition Intermediate, Inc., (1 month LIBOR + 4.000%) 6.242%, 5/15/23 | | | 52 | | | | 52 | |
Parfums Holdings Co., Inc. First Lien, (3 month LIBOR + 4.250%) 6.529%, 6/30/24 | | | 59 | | | | 60 | |
Rodan & Fields LLC, (1 month LIBOR + 4.000%)
6.158%, 6/16/25 | | | 130 | | | | 131 | |
| | | | | | | | |
| | | | | | | 438 | |
| | | | | | | | |
| | |
| Energy—0.2% | | | | | | |
California Resources Corp., (1 month LIBOR + 10.375%)
12.617%, 12/31/21 | | | 80 | | | | 89 | |
Lotus Midstream LLC Tranche B, (3 month LIBOR + 3.250%) 0.000%, 9/26/25(9) | | | 25 | | | | 25 | |
Medallion Midland Acquisition LLC, (1 month LIBOR + 3.250%) 5.492%, 10/30/24 | | | 79 | | | | 79 | |
Moda Ingleside Energy Center LLC, (3 month LIBOR + 3.250%) 0.000%, 9/29/25(9) | | | 10 | | | | 10 | |
Seadrill Operating LP, (3 month LIBOR + 6.000%)
8.386%, 2/21/21 | | | 62 | | | | 58 | |
Traverse Midstream Partners LLC, (3 month LIBOR + 4.000%) 6.600%, 9/27/24 | | | 90 | | | | 91 | |
| | | | | | | | |
| | | | | | | 352 | |
| | | | | | | | |
| | |
| Financial—0.4% | | | | | | |
Asurion LLC Tranche B-2, (1 month LIBOR + 6.500%)
8.742%, 8/4/25 | | | 147 | | | | 151 | |
Blackhawk Network Holdings, Inc. First Lien, (3 month LIBOR + 3.000%) 5.386%, 6/15/25 | | | 170 | | | | 171 | |
Ditech Holding Corp. Tranche B, (1 month LIBOR + 6.000%) 8.242%, 6/30/22 | | | 95 | | | | 90 | |
Financial & Risk US Holdings, Inc., (3 month LIBOR + 3.750%) 0.000%, 10/1/25(9) | | | 110 | | | | 110 | |
Franklin Square Holdings LP, (1 month LIBOR + 2.500%) 4.625%, 8/1/25 | | | 20 | | | | 20 | |
Genworth Holdings, Inc., (1 month LIBOR + 4.500%)
6.648%, 3/7/23 | | | 10 | | | | 10 | |
iStar, Inc., (1 month LIBOR + 2.750%)
4.893%, 6/28/23 | | | 115 | | | | 115 | |
| | | | | | | | |
| | | | | | | 667 | |
| | | | | | | | |
| | |
| Food and Drug—0.1% | | | | | | |
Albertson’s LLC Tranche B-4, (1 month LIBOR + 2.750%) 4.992%, 8/25/21 | | | 117 | | | | 117 | |
| | | | | | | | |
| | |
| Food/Tobacco—0.0% | | | | | | |
Chobani LLC First Lien, (1 month LIBOR + 3.500%)
5.742%, 10/10/23 | | | 52 | | | | 50 | |
H-Food Holdings, LLC, (1 month LIBOR + 3.000%)
5.242%, 5/23/25 | | | 20 | | | | 20 | |
| | | | | | | | |
| | | | | | | 70 | |
| | | | | | | | |
| | |
| Forest Prod/Containers—0.0% | | | | | | |
Spectrum Holdings III Corp. First Lien, (1 month LIBOR + 3.250%) 5.492%, 1/31/25 | | | 41 | | | | 40 | |
| | | | | | | | |
| | | | | | | | |
| | | PAR
VALUE | | | VALUE | |
| Gaming/Leisure—0.3% | | | | | | |
Gateway Casinos & Entertainment Ltd., (3 month LIBOR + 3.000%) 5.386%, 12/1/23 | | $ | 50 | | | $ | 50 | |
Playa Resorts Holding B.V., (1 month LIBOR + 2.750%)
4.990%, 4/29/24 | | | 84 | | | | 83 | |
Scientific Games International, Inc. Tranche B-5, (2 month LIBOR + 2.750%) 5.034%, 8/14/24 | | | 85 | | | | 85 | |
Seminole Tribe of Florida 2018 Replacement, Tranche B, (1 month LIBOR + 1.750%) 3.992%, 7/8/24 | | | 54 | | | | 55 | |
Stars Group Holdings B.V., (3 month LIBOR + 3.500%)
5.886%, 7/10/25 | | | 30 | | | | 30 | |
UFC Holdings LLC First Lien, (1 month LIBOR + 3.250%)
5.500%, 8/18/23 | | | 77 | | | | 77 | |
Wyndham Hotels & Resorts, Inc. Tranche B, (1 month LIBOR + 1.750%) 3.992%, 5/30/25 | | | 25 | | | | 25 | |
| | | | | | | | |
| | | | | | | 405 | |
| | | | | | | | |
| | |
| Healthcare—0.4% | | | | | | |
21st Century Oncology, Inc. Tranche B, (3 month LIBOR + 6.125%) 8.465%, 1/16/23 | | | 30 | | | | 29 | |
AHP Health Partners, Inc., (1 month LIBOR + 4.500%)
6.742%, 6/30/25 | | | 85 | | | | 86 | |
Auris LuxCo Tranche B, (3 month LIBOR + 3.750%)
0.000%, 7/24/25(9) | | | 15 | | | | 15 | |
Bausch Health Cos., Inc., (1 month LIBOR + 3.000%)
5.104%, 6/2/25 | | | 20 | | | | 20 | |
CCS-CMGC Holdings, Inc., (3 month LIBOR + 5.500%)
0.000%, 9/25/25(9) | | | 80 | | | | 80 | |
CHG Healthcare Services, Inc. First Lien, (3 month LIBOR + 3.000%) 5.306%, 6/7/23 | | | 30 | | | | 30 | |
Envision Healthcare Corp., (3 month LIBOR + 3.750%)
0.000%, 10/10/25(9) | | | 114 | | | | 113 | |
Ortho-Clinical Diagnostics, Inc., (1 month LIBOR + 3.250%) 5.492%, 6/30/25 | | | 109 | | | | 109 | |
Prospect Medical Holdings, Inc. Tranche B-1, (1 month LIBOR + 5.500%) 7.625%, 2/22/24 | | | 55 | | | | 55 | |
U.S. Renal Care, Inc. First Lien, (3 month LIBOR + 4.250%) 0.000%, 12/30/22(9) | | | 65 | | | | 63 | |
| | | | | | | | |
| | | | | | | 600 | |
| | | | | | | | |
| | |
| Housing—0.2% | | | | | | |
84 Lumber Co. Tranche B-1, (1 month LIBOR + 5.250%)
7.466%, 10/25/23 | | | 75 | | | | 75 | |
American Builders & Contractors Supply Co., Inc.
Tranche B-2, (1 month LIBOR + 2.000%)
4.242%, 10/31/23 | | | 114 | | | | 114 | |
Capital Automotive LP Tranche B, (1 month LIBOR + 6.000%) 8.250%, 3/24/25 | | | 37 | | | | 38 | |
CPG International LLC, (3 month LIBOR + 3.750%)
6.251%, 5/5/24 | | | 89 | | | | 90 | |
| | | | | | | | |
| | | | | | | 317 | |
| | | | | | | | |
| Information Technology—0.7% | | | | | | |
Applied Systems, Inc. Second Lien, (3 month LIBOR + 7.000%) 9.386%, 9/19/25 | | | 15 | | | | 15 | |
BMC Software Finance, Inc., (3 month LIBOR + 4.250%)
0.000%, 10/2/25(9) | | | 140 | | | | 141 | |
Intralinks, Inc. First Lien, (1 month LIBOR + 4.000%)
6.250%, 11/14/24 | | | 39 | | | | 39 | |
Kronos, Inc. | | | | | | | | |
First Lien, (3 month LIBOR + 3.000%)
5.343%, 11/1/23 | | | 164 | | | | 165 | |
Second Lien, (3 month LIBOR + 8.250%)
10.593%, 11/1/24 | | | 38 | | | | 39 | |
See Notes to Financial Statements
55
TACTICAL ALLOCATION FUND
SCHEDULE OF INVESTMENTS (Continued)
SEPTEMBER 30, 2018
($ reported in thousands)
| | | | | | | | |
| | | PAR
VALUE | | | VALUE | |
| Information Technology—continued | | | | | | |
Renaissance Holding Corp. First Lien, (1 month LIBOR + 3.250%) 5.492%, 5/30/25 | | $ | 170 | | | $ | 169 | |
SS&C Technologies Holdings, Inc. | | | | | | | | |
Tranche B-3, (1 month LIBOR + 2.250%)
4.492%, 4/16/25 | | | 187 | | | | 188 | |
Tranche B-4, (1 month LIBOR + 2.250%)
4.492%, 4/16/25 | | | 73 | | | | 73 | |
Vertafore, Inc. First Lien, (1 month LIBOR + 3.250%)
5.492%, 7/2/25 | | | 150 | | | | 150 | |
| | | | | | | | |
| | | | | | | 979 | |
| | | | | | | | |
| | |
| Manufacturing—0.3% | | | | | | |
Accudyne Industries Borrower S.C.A., (1 month LIBOR + 3.000%) 5.242%, 8/18/24 | | | 100 | | | | 100 | |
Altra Industrial Motion Corp., (3 month LIBOR + 2.000%) 0.000%, 10/1/25(9) | | | 15 | | | | 15 | |
CPI Acquisition, Inc. First Lien, (3 month LIBOR + 4.500%) 6.839%, 8/17/22 | | | 152 | | | | 101 | |
Deliver Buyer, Inc., (3 month LIBOR + 5.000%)
7.313%, 5/1/24 | | | 70 | | | | 70 | |
Filtration Group Corp., (1 month LIBOR + 3.000%)
5.242%, 3/29/25 | | | 124 | | | | 125 | |
Hillman Group, Inc. (The), (1 month LIBOR + 3.500%)
5.742%, 5/30/25 | | | 65 | | | | 64 | |
| | | | | | | | |
| | | | | | | 475 | |
| | | | | | | | |
| | |
| Media/Telecom—Cable/Wireless Video—0.1% | | | | | | |
Altice US Finance I Corp. 2017 Refinancing, (1 month LIBOR + 2.250%) 4.492%, 7/28/25 | | | 85 | | | | 84 | |
Telenet Financing USD LLC, (3 month LIBOR + 2.250%)
4.408%, 8/15/26 | | | 85 | | | | 85 | |
| | | | | | | | |
| | | | | | | 169 | |
| | | | | | | | |
| | |
| Media/Telecom—Diversified Media—0.1% | | | | | | |
Crown Finance US, Inc., (1 month LIBOR + 2.500%)
4.742%, 2/28/25 | | | 149 | | | | 149 | |
Meredith Corp., (1 month LIBOR + 3.000%)
5.242%, 1/31/25 | | | 71 | | | | 71 | |
| | | | | | | | |
| | | | | | | 220 | |
| | | | | | | | |
| | |
| Media/Telecom—Telecommunications—0.2% | | | | | | |
CenturyLink, Inc. Tranche B, (1 month LIBOR + 2.750%)
4.992%, 1/31/25 | | | 99 | | | | 98 | |
Securus Technologies Holdings, Inc. | | | | | | | | |
(3 month LIBOR + 4.500%)
0.000%, 11/1/24(9) (15) | | | 24 | | | | 24 | |
First Lien, (1 month LIBOR + 4.500%)
6.742%, 11/1/24 | | | 60 | | | | 60 | |
Second Lien, (1 month LIBOR + 8.250%)
10.492%, 11/1/25 | | | 60 | | | | 60 | |
TDC A/S Tranche B-2, (3 month LIBOR + 3.500%)
5.839%, 6/4/25 | | | 45 | | | | 45 | |
West Corp. Tranche B-1, (1 month LIBOR + 3.500%)
5.742%, 10/10/24 | | | 50 | | | | 50 | |
| | | | | | | | |
| | | | | | | 337 | |
| | | | | | | | |
| | |
| Metals/Minerals—0.2% | | | | | | |
Contura Energy, Inc., (2 month LIBOR + 5.000%)
7.300%, 3/18/24 | | | 81 | | | | 81 | |
Covia Holdings Corp., (1 month LIBOR + 3.750%)
6.136%, 6/1/25 | | | 155 | | | | 146 | |
| | | | | | | | |
| | | PAR
VALUE | | | VALUE | |
| | |
| Metals/Minerals—continued | | | | | | |
Graftech International Ltd., (1 month LIBOR + 3.500%)
5.742%, 2/12/25 | | $ | 138 | | | $ | 139 | |
| | | | | | | | |
| | | | | | | 366 | |
| | | | | | | | |
| | |
| Retail—0.1% | | | | | | |
Neiman Marcus Group Ltd. LLC, (1 month LIBOR + 3.250%) 5.370%, 10/25/20 | | | 94 | | | | 87 | |
| | | | | | | | |
| | |
| Service—0.9% | | | | | | |
Advantage Sales & Marketing, Inc. Tranche B-2, (1 month LIBOR + 3.250%) 5.492%, 7/23/21 | | | 74 | | | | 68 | |
Carlisle Food Service Products, Inc. | | | | | | | | |
First Lien, (3 month LIBOR + 1.000%)
1.000%, 3/20/25(15) | | | 3 | | | | 3 | |
First Lien, (1 month LIBOR + 3.000%)
5.212%, 3/20/25 | | | 12 | | | | 12 | |
Hoya Midco LLC First Lien, (1 month LIBOR + 3.500%)
5.742%, 6/30/24 | | | 109 | | | | 109 | |
Laureate Education, Inc., (1 month LIBOR + 3.500%)
5.742%, 4/26/24 | | | 75 | | | | 75 | |
NAB Holdings LLC 2018 Refinancing, (3 month LIBOR + 3.000%) 5.386%, 7/1/24 | | | 169 | | | | 167 | |
One Call Corp. First Lien, (1 month LIBOR + 5.250%)
7.384%, 11/27/22 | | | 110 | | | | 104 | |
Pearl Intermediate Parent LLC | | | | | | | | |
First Lien (3 month LIBOR + 2.165%)
4.915% 2/14/25 | | | 14 | | | | 14 | |
First Lien (3 month LIBOR + 1.000%)
1.000% 2/14/25(15) | | | 5 | | | | 5 | |
First Lien, (1 month LIBOR + 2.750%)
4.915%, 2/14/25 | | | 65 | | | | 65 | |
PI UK Holdco II Ltd. Tranche B-1, (1 month LIBOR + 3.500%) 5.742%, 1/3/25 | | | 169 | | | | 168 | |
Red Ventures LLC First Lien, (1 month LIBOR + 4.000%)
6.242%, 11/8/24 | | | 135 | | | | 137 | |
Sedgwick Claims Management Services, Inc.
Second Lien, (1 month LIBOR + 5.750%)
7.992%, 2/28/22 | | | 160 | | | | 160 | |
SSH Group Holdings, Inc. First Lien, (3 month LIBOR + 4.250%) 6.590%, 7/30/25 | | | 75 | | | | 76 | |
St. George’s University Scholastic Services LLC | | | | | | | | |
(3 month LIBOR + 3.500%)
3.500%, 7/17/25(15) | | | 14 | | | | 14 | |
(1 month LIBOR + 3.500%)
5.750%, 7/17/25 | | | 46 | | | | 46 | |
TKC Holdings, Inc. First Lien, (1 month LIBOR + 3.750%)
6.000%, 2/1/23 | | | 89 | | | | 89 | |
| | | | | | | | |
| | | | | | | 1,312 | |
| | | | | | | | |
| | |
| Transportation—Automotive—0.1% | | | | | | |
Navistar, Inc. Tranche B, (1 month LIBOR + 3.500%)
5.640%, 11/6/24 | | | 109 | | | | 110 | |
| | | | | | | | |
| | |
| Utility—0.3% | | | | | | |
APLP Holdings LP, (1 month LIBOR + 3.000%)
5.242%, 4/13/23 | | | 101 | | | | 101 | |
Brookfield WEC Holdings, Inc. (Westinghouse Electric Co., LLC) | | | | | | | | |
First Lien, (1 month LIBOR + 3.750%)
5.992%, 8/1/25 | | | 100 | | | | 101 | |
See Notes to Financial Statements
56
TACTICAL ALLOCATION FUND
SCHEDULE OF INVESTMENTS (Continued)
SEPTEMBER 30, 2018
($ reported in thousands)
| | | | | | | | |
| | | PAR
VALUE | | | VALUE | |
| | |
| Utility—continued | | | | | | |
Second Lien, (1 month LIBOR + 6.750%)
8.992%, 8/3/26 | | $ | 55 | | | $ | 56 | |
Talen Energy Supply LLC, (1 month LIBOR + 4.000%)
6.242%, 4/15/24 | | | 69 | | | | 69 | |
Vistra Operations Co., LLC, (1 month LIBOR + 2.000%)
4.242%, 8/4/23 | | | 63 | | | | 63 | |
| | | | | | | | |
| | | | | | | | 390 | |
TOTAL LEVERAGED LOANS
(Identified Cost $7,901) | | | | 7,863 | |
| | |
| | | SHARES | | | | |
| PREFERRED STOCKS—1.0% | | | | | | |
| | |
| Financials—0.9% | | | | | | |
Huntington Bancshares, Inc. Series E, 5.700% | | | 145 | (11) | | | 144 | |
JPMorgan Chase & Co.
Series V 5.000% | | | 80 | (11) | | | 81 | |
Series Z 5.300% | | | 160 | (11) | | | 163 | |
KeyCorp Series D, 5.000%(16) | | | 230 | (11) | | | 225 | |
M&T Bank Corp. Series F, 5.125%(16) | | | 170 | (11) | | | 171 | |
MetLife, Inc. Series D, 5.875% | | | 75 | (11) | | | 77 | |
PNC Financial Services Group, Inc. (The) Series R 4.850% | | | 155 | (11) | | | 155 | |
Series S 5.000% | | | 145 | (11) | | | 144 | |
Zions Bancorp 6.950% | | | 6,400 | | | | 180 | |
| | | | | | | | |
| | | | | | | 1,340 | |
| | | | | | | | |
| | |
| Industrials—0.1% | | | | | | |
General Electric Co. Series D, 5.000% | | | 227 | (11) | | | 222 | |
TOTAL PREFERRED STOCKS
(Identified Cost $1,541) | | | | 1,562 | |
| | |
| COMMON STOCK—63.3% | | | | | | |
| | |
| Consumer Discretionary—13.9% | | | | | | |
Amazon.com, Inc.(1) | | | 3,270 | | | | 6,550 | |
Carnival Corp. | | | 9,268 | | | | 591 | |
Ctrip.com International Ltd. ADR(1) | | | 37,169 | | | | 1,382 | |
Home Depot, Inc. (The) | | | 7,580 | | | | 1,570 | |
Las Vegas Sands Corp. | | | 28,490 | | | | 1,690 | |
McDonald’s Corp. | | | 5,620 | | | | 940 | |
MercadoLibre, Inc. | | | 2,090 | | | | 712 | |
Netflix, Inc.(1) | | | 8,930 | | | | 3,341 | |
NIKE, Inc. Class B | | | 19,350 | | | | 1,639 | |
Ross Stores, Inc. | | | 15,720 | | | | 1,558 | |
Sony Corp. Sponsored ADR | | | 15,783 | | | | 957 | |
| | | | | | | | |
| | | | | | | 20,930 | |
| | | | | | | | |
| | |
| Consumer Staples—3.1% | | | | | | |
Fomento Economico Mexicano SAB de C.V. Sponsored ADR | | | 6,748 | | | | 668 | |
Marine Harvest ASA Sponsored ADR | | | 26,849 | | | | 621 | |
Monster Beverage Corp.(1) | | | 38,090 | | | | 2,220 | |
Philip Morris International, Inc. | | | 13,940 | | | | 1,137 | |
| | | | | | | | |
| | | | | | | 4,646 | |
| | | | | | | | |
| | |
| Energy—3.2% | | | | | | |
Cabot Oil & Gas Corp. | | | 41,700 | | | | 939 | |
Core Laboratories N.V. | | | 6,560 | | | | 760 | |
Eni SpA. Sponsored ADR | | | 18,145 | | | | 683 | |
| | | | | | | | |
| | |
| | | SHARES | | | VALUE | |
| | |
| Energy—continued | | | | | | |
Equinor ASA. Sponsored ADR | | | 27,735 | | | $ | 782 | |
Frontera Energy Corp.(1) | | | 1,798 | | | | 25 | |
Pioneer Natural Resources Co. | | | 5,830 | | | | 1,016 | |
TechnipFMC plc | | | 21,452 | | | | 670 | |
| | | | | | | | |
| | | | | | | 4,875 | |
| | | | | | | | |
| | |
| Financials—6.4% | | | | | | |
Bank of America Corp. | | | 76,450 | | | | 2,252 | |
BOC Hong Kong Holdings Ltd. Sponsored ADR | | | 6,531 | | | | 619 | |
CaixaBank S.A. ADR | | | 425,923 | | | | 641 | |
Charles Schwab Corp. (The) | | | 19,500 | | | | 958 | |
China Construction Bank Corp. ADR | | | 37,705 | | | | 658 | |
Credit Agricole S.A. ADR | | | 81,435 | | | | 579 | |
DBS Group Holdings Ltd. Sponsored ADR | | | 10,325 | | | | 787 | |
MarketAxess Holdings, Inc. | | | 4,260 | | | | 760 | |
ORIX Corp. Sponsored ADR | | | 8,805 | | | | 714 | |
Ping An Insurance Group Co. of China Ltd. ADR | | | 26,610 | | | | 539 | |
SEI Investments Co. | | | 9,020 | | | | 551 | |
UBS Group AG Registered Shares | | | 40,383 | | | | 635 | |
| | | | | | | | |
| | | | | | | 9,693 | |
| | | | | | | | |
| | |
| Health Care—5.9% | | | | | | |
Allergan plc | | | 4,636 | | | | 883 | |
Bayer AG Sponsored ADR | | | 19,628 | | | | 435 | |
Bluebird Bio, Inc.(1) | | | 3,385 | | | | 494 | |
Danaher Corp. | | | 10,590 | | | | 1,151 | |
HealthEquity, Inc.(1) | | | 18,790 | | | | 1,774 | |
ICON plc(1) | | | 3,975 | | | | 611 | |
Illumina, Inc.(1) | | | 4,880 | | | | 1,791 | |
Zoetis, Inc. | | | 18,900 | | | | 1,730 | |
| | | | | | | | |
| | | | | | | 8,869 | |
| | | | | | | | |
| | |
| Industrials—6.4% | | | | | | |
Airbus SE ADR | | | 24,028 | | | | 752 | |
Ashtead Group plc ADR | | | 7,441 | | | | 953 | |
Caterpillar, Inc. | | | 8,720 | | | | 1,330 | |
CoStar Group, Inc.(1) | | | 2,990 | | | | 1,258 | |
easyJet plc Sponsored ADR | | | 34,620 | | | | 589 | |
Golden Ocean Group Ltd. | | | 84,121 | | | | 829 | |
Kansas City Southern | | | 9,100 | | | | 1,031 | |
Nidec Corp. Sponsored ADR | | | 21,442 | | | | 769 | |
Rockwell Automation, Inc. | | | 3,430 | | | | 643 | |
Roper Technologies, Inc. | | | 4,920 | | | | 1,457 | |
| | | | | | | | |
| | | | | | | 9,611 | |
| | | | | | | | |
| | |
| Information Technology—21.2% | | | | | | |
Accenture plc Class A | | | 7,120 | | | | 1,212 | |
Activision Blizzard, Inc. | | | 17,520 | | | | 1,458 | |
Alibaba Group Holding Ltd. Sponsored ADR(1) | | | 22,790 | | | | 3,755 | |
Amphenol Corp. Class A | | | 22,090 | | | | 2,077 | |
Arista Networks, Inc.(1) | | | 3,650 | | | | 971 | |
ASML Holding NV Registered Shares | | | 4,251 | | | | 799 | |
Avalara, Inc.(1) | | | 25,020 | | | | 874 | |
Broadcom, Inc. | | | 3,129 | | | | 772 | |
Facebook, Inc. Class A(1) | | | 21,490 | | | | 3,534 | |
Gartner, Inc.(1) | | | 5,520 | | | | 875 | |
Hitachi Ltd. ADR | | | 10,935 | | | | 741 | |
NVIDIA Corp. | | | 11,430 | | | | 3,212 | |
Paycom Software, Inc.(1) | | | 13,860 | | | | 2,154 | |
SAP SE Sponsored ADR | | | 5,087 | | | | 626 | |
Tencent Holdings Ltd. ADR | | | 33,130 | | | | 1,353 | |
See Notes to Financial Statements
57
TACTICAL ALLOCATION FUND
SCHEDULE OF INVESTMENTS (Continued)
SEPTEMBER 30, 2018
($ reported in thousands)
| | | | | | | | |
| | |
| | | SHARES | | | VALUE | |
| | |
| Information Technology—continued | | | | | | |
Trade Desk, Inc. (The) Class A(1) | | | 5,270 | | | $ | 795 | |
Visa, Inc. Class A | | | 22,220 | | | | 3,335 | |
Workday, Inc. Class A(1) | | | 12,570 | | | | 1,835 | |
Yandex N.V. Class A(1) | | | 46,680 | | | | 1,535 | |
| | | | | | | | |
| | | | | | | 31,913 | |
| | | | | | | | |
| | |
| Materials—2.1% | | | | | | |
Anhui Conch Cement Co., Ltd. ADR | | | 34,472 | | | | 1,041 | |
Ecolab, Inc. | | | 9,800 | | | | 1,537 | |
Glencore plc ADR(1)(18) | | | 74,055 | | | | 635 | |
| | | | | | | | |
| | | | | | | 3,213 | |
| | | | | | | | |
| | |
| Real Estate—0.4% | | | | | | |
LendLease Group Sponsored ADR | | | 44,004 | | | | 625 | |
| | | | | | | | |
| | |
| Telecommunication Services—0.4% | | | | | | |
BT Group plc Sponsored ADR | | | 34,546 | | | | 510 | |
| | | | | | | | |
| | |
| Utilities—0.3% | | | | | | |
Veolia Environnement S.A. ADR | | | 22,613 | | | | 450 | |
TOTAL COMMON STOCK
(Identified Cost $67,422) | | | | 95,335 | |
| | |
| EXCHANGE-TRADED FUND—0.2% | | | | | | |
iShares iBoxx High Yield Corporate Bond Index Fund(12)(18) | | | 3,192 | | | | 276 | |
TOTAL EXCHANGE-TRADED FUND
(Identified Cost $275) | | | | 276 | |
| | |
| AFFILIATED MUTUAL FUND—1.1% | | | | | | |
Virtus Newfleet Credit Opportunities Fund Class R6(12) | | | 165,934 | | | | 1,605 | |
TOTAL AFFILIATED MUTUAL FUND
(Identified Cost $1,652) | | | | 1,605 | |
TOTAL LONG-TERM INVESTMENTS—99.2%
| | | | | | | | |
| (Identified Cost $122,962) | | | | 149,474 | (13) |
| | | |
| SECURITIES LENDING COLLATERAL—1.0% | | | | | | |
Dreyfus Government Cash Management Fund –
Institutional Shares (seven-day effective yield 1.950%)(12)(19) | | | 1,437,656 | | | | 1,438 | |
TOTAL SECURITIES LENDING COLLATERAL
(Identified Cost $1,438) | | | | | | | 1,438 | |
TOTAL INVESTMENTS—100.2%
(Identified Cost $124,400) | | | | | | | 150,912 | |
Other assets and liabilities, net—(0.2)% | | | | | | | (322 | ) |
| | | | | | | | |
| NET ASSETS—100.0% | | | | | | $ | 150,590 | |
| | | | | | | | |
Abbreviations:
| ADR | American Depositary Receipt |
| LIBOR | London Interbank Offered Rate |
| PIK | Payment-in-Kind Security |
| REIT | Real Estate Investment Trust |
Foreign Currencies
Footnote Legend:
| (1) | Non-income producing. |
| (2) | Variable rate security. Rate disclosed is as of September 30, 2018. For leveraged loans, the rate shown may represent a weighted average interest rate. Information in parenthesis represents benchmark and reference rate for each security. Certain variable rate securities are not based on a published reference rate and spread but are determined by the issuer or agent and are based on current market conditions, or, for mortgage-backed securities, are impacted by the individual mortgages which are paying off over time. These securities do not indicate a reference rate and spread in their descriptions. |
| (3) | Security exempt from registration under Rule 144A of the Securities Act of 1933. These securities may be resold in transactions exempt from registration, normally to qualified institutional buyers. At September 30, 2018, these securities amounted to a value of $22,532 or 15.0% of net assets. |
| (4) | Regulation S security. Security is offered and sold outside of the United States, therefore, it is exempt from registration with the SEC under Rules 903 and 904 of the Securities Act of 1933. |
| (5) | This Note was issued for the sole purpose of funding a leveraged loan between the issuer and the borrower. As the credit risk for this security lies solely with the borrower, the name represented here is that of the borrower. |
| (6) | No contractual maturity date. |
| (7) | Interest payments may be deferred. |
| (8) | 13% of the income received was in cash and 87% in PIK. |
| (9) | This loan will settle after September 30, 2018, at which time the interest rate, based on the LIBOR and the agreed upon spread on trade date, will be reflected. |
| (10) | Security in default, no interest payments are being received during the bankruptcy proceedings. |
| (11) | Value shown as par value. |
| (12) | Shares of this fund are publicly offered and its prospectus and annual report are publicly available. |
| (13) | All or a portion of the Fund’s assets have been segregated for delayed delivery security. |
| (14) | 100% of the income received was PIK. |
| (15) | Represents the unfunded portion of security and commitment fee earned on this portion. |
| (16) | Interest may be forfeited. |
| (17) | Amount is less than $500. |
| (18) | All or a portion of security is on loan. |
| (19) | Represents security purchased with cash collateral received for securities on loan. |
| | | | |
| Country Weightings (Unaudited)† | | | |
United States (includes securities lending collateral) | | | 71 | % |
China | | | 6 | |
Japan | | | 2 | |
United Kingdom | | | 2 | |
France | | | 2 | |
Switzerland | | | 2 | |
Netherlands | | | 2 | |
Other | | | 13 | |
Total | | | 100 | % |
† % of total investments as of September 30, 2018. | | | | |
For information regarding the abbreviations, see the Key Investment Terms starting on page 5.
See Notes to Financial Statements
58
TACTICAL ALLOCATION FUND
SCHEDULE OF INVESTMENTS (Continued)
SEPTEMBER 30, 2018
($ reported in thousands)
The following table provides a summary of inputs used to value the Fund’s investments as of September 30, 2018 (See Security Valuation Note 2A in the Notes to Financial Statements):
| | | | | | | | | | | | |
| | | Total
Value at
September 30, 2018 | | | Level 1
Quoted
Prices | | | Level 2
Significant
Observable
Inputs | |
Debt Securities: | | | | | | | | | | | | |
Asset-Backed Securities | | $ | 3,493 | | | $ | — | | | $ | 3,493 | |
Corporate Bonds and Notes | | | 26,758 | | | | — | | | | 26,758 | |
Foreign Government Securities | | | 3,669 | | | | — | | | | 3,669 | |
Leveraged Loans | | | 7,863 | | | | — | | | | 7,863 | |
Mortgage-Backed Securities | | | 6,813 | | | | — | | | | 6,813 | |
U.S. Government Securities | | | 2,100 | | | | — | | | | 2,100 | |
Equity Securities: | | | | | | | | | | | | |
Common Stocks | | | 95,335 | | | | 95,335 | | | | — | |
Exchange-Traded Fund | | | 276 | | | | 276 | | | | — | |
Preferred Stocks | | | 1,562 | | | | 180 | | | | 1,382 | |
Affiliated Mutual Fund | | | 1,605 | | | | 1,605 | | | | — | |
Securities Lending Collateral | | | 1,438 | | | | 1,438 | | | | — | |
| | | | | | | | | | | | |
Total Investments | | $ | 150,912 | | | $ | 98,834 | | | $ | 52,078 | |
| | | | | | | | | | | | |
There were no securities valued using significant unobservable inputs (Level 3) at September 30, 2018.
There were no transfers into or out of Level 3 related to securities held at September 30, 2018.
See Notes to Financial Statements
59
VIRTUS EQUITY TRUST
STATEMENTS OF ASSETS AND LIABILITIES
SEPTEMBER 30, 2018
(Reported in thousands except shares and per share amounts)
| | | | | | | | | | | | | | | | | | | | |
| | | KAR Capital
Growth Fund | | | KAR Global Quality
Dividend Fund | | | KAR Mid-Cap
Core Fund | | | KAR Mid-Cap
Growth Fund | | | KAR Small-Cap
Core Fund | |
| Assets | | | | | | | | | | | | | | | | | | | | |
Investment in unaffiliated securities at value(1)(2) | | $ | 550,373 | | | $ | 35,956 | | | $ | 226,717 | | | $ | 197,670 | | | $ | 1,554,302 | |
Foreign currency at value(3) | | | — | | | | 5 | | | | — | | | | — | | | | — | |
Cash | | | 1,387 | | | | 234 | | | | 5,531 | | | | 2,307 | | | | 43,959 | |
Receivables | | | | | | | | | | | | | | | | | | | | |
Fund shares sold | | | 57 | | | | — | | | | 1,800 | | | | 1,149 | | | | 2,468 | |
Dividends and interest | | | 261 | | | | 163 | | | | 134 | | | | 59 | | | | 262 | |
Tax reclaims | | | — | | | | 22 | | | | — | | | | — | | | | — | |
Securities lending receivable | | | — | (4) | | | — | (4) | | | — | | | | — | | | | — | |
Prepaid expenses | | | 48 | | | | 27 | | | | 37 | | | | 41 | | | | 115 | |
Prepaid trustee retainer | | | 10 | | | | 1 | | | | 4 | | | | 3 | | | | 30 | |
Other assets | | | 32 | | | | 2 | | | | 13 | | | | 11 | | | | 94 | |
| | | | | | | | | | | | | | | | | | | | |
Total assets | | | 552,168 | | | | 36,410 | | | | 234,236 | | | | 201,240 | | | | 1,601,230 | |
| | | | | | | | | | | | | | | | | | | | |
| Liabilities | | | | | | | | | | | | | | | | | | | | |
Payables | | | | | | | | | | | | | | | | | | | | |
Fund shares repurchased | | | 303 | | | | 6 | | | | 83 | | | | 66 | | | | 3,698 | |
Collateral on securities loaned | | | 5,056 | | | | 5 | | | | — | | | | — | | | | — | |
Investment advisory fees | | | 314 | | | | 28 | | | | 110 | | | | 143 | | | | 1,001 | |
Distribution and service fees | | | 116 | | | | 10 | | | | 31 | | | | 37 | | | | 136 | |
Administration and accounting fees | | | 47 | | | | 3 | | | | 20 | | | | 17 | | | | 143 | |
Transfer agent and sub-transfer agent fees and expenses | | | 140 | | | | 14 | | | | 47 | | | | 41 | | | | 279 | |
Professional fees | | | 22 | | | | 19 | | | | 20 | | | | 21 | | | | 24 | |
Trustee deferred compensation plan | | | 32 | | | | 2 | | | | 13 | | | | 11 | | | | 94 | |
Other accrued expenses | | | 23 | | | | 2 | | | | 8 | | | | 7 | | | | 58 | |
| | | | | | | | | | | | | | | | | | | | |
Total liabilities | | | 6,053 | | | | 89 | | | | 332 | | | | 343 | | | | 5,433 | |
| | | | | | | | | | | | | | | | | | | | |
| Net Assets | | $ | 546,115 | | | $ | 36,321 | | | $ | 233,904 | | | $ | 200,897 | | | $ | 1,595,797 | |
| | | | | | | | | | | | | | | | | | | | |
| Net Assets Consist of: | | | | | | | | | | | | | | | | | | | | |
Capital paid in on shares of beneficial interest | | $ | 242,135 | | | $ | 35,238 | | | $ | 186,948 | | | $ | 125,769 | | | $ | 1,170,607 | |
Accumulated undistributed net investment income (loss) | | | (31 | ) | | | (11 | ) | | | (163 | ) | | | (8 | ) | | | 1,408 | |
Accumulated undistributed net realized gain (loss) | | | 39,234 | | | | (449 | ) | | | 1,530 | | | | 3,616 | | | | 51,295 | |
Net unrealized appreciation (depreciation) on investments | | | 264,777 | | | | 1,543 | | | | 45,589 | | | | 71,520 | | | | 372,487 | |
| | | | | | | | | | | | | | | | | | | | |
| Net Assets | | $ | 546,115 | | | $ | 36,321 | | | $ | 233,904 | | | $ | 200,897 | | | $ | 1,595,797 | |
| | | | | | | | | | | | | | | | | | | | |
| Net Assets: | | | | | | | | | | | | | | | | | | | | |
Class A | | $ | 508,124 | | | $ | 26,351 | | | $ | 33,120 | | | $ | 131,422 | | | $ | 153,109 | |
Class C | | $ | 14,408 | | | $ | 5,127 | | | $ | 30,661 | | | $ | 12,571 | | | $ | 122,439 | |
Class I | | $ | 17,125 | | | $ | 4,843 | | | $ | 167,649 | | | $ | 56,787 | | | $ | 1,231,686 | |
Class R6 | | $ | 6,458 | | | $ | — | | | $ | 2,474 | | | $ | 117 | | | $ | 88,563 | |
| Shares Outstanding (unlimited number of shares authorized, no par value): | | | | | | | | | | | | | | | | | | | | |
Class A | | | 27,663,485 | | | | 1,758,894 | | | | 982,503 | | | | 3,697,062 | | | | 4,323,262 | |
Class C | | | 1,004,509 | | | | 353,253 | | | | 970,806 | | | | 444,284 | | | | 4,088,730 | |
Class I | | | 900,424 | | | | 322,433 | | | | 4,893,402 | | | | 1,548,916 | | | | 33,053,169 | |
Class R6 | | | 339,109 | | | | — | | | | 72,182 | | | | 3,190 | | | | 2,367,792 | |
| Net Asset Value and Redemption Price Per Share: | | | | | | | | | | | | | | | | | | | | |
Class A | | $ | 18.37 | | | $ | 14.98 | | | $ | 33.71 | | | $ | 35.55 | | | $ | 35.42 | |
Class C | | $ | 14.34 | | | $ | 14.52 | | | $ | 31.58 | | | $ | 28.30 | | | $ | 29.95 | |
Class I | | $ | 19.02 | | | $ | 15.02 | | | $ | 34.26 | | | $ | 36.66 | | | $ | 37.26 | |
Class R6 | | $ | 19.04 | | | $ | — | | | $ | 34.28 | | | $ | 36.71 | | | $ | 37.40 | |
| Maximum offering price per share (NAV/(1-5.75%)) | | | | | | | | | | | | | | | | | | | | |
Class A | | $ | 19.49 | | | $ | 15.89 | | | $ | 35.77 | | | $ | 37.72 | | | $ | 37.58 | |
| | | | | |
(1) Investment in unaffiliated securities at cost | | $ | 285,596 | | | $ | 34,413 | | | $ | 181,128 | | | $ | 126,150 | | | $ | 1,181,815 | |
(2) Market value of securities on loan | | $ | 4,806 | | | $ | 4 | | | $ | — | | | $ | — | | | $ | — | |
(3) Foreign currency at cost | | $ | — | | | $ | 5 | | | $ | — | | | $ | — | | | $ | — | |
(4) Amount less than $500. | | | | | | | | | | | | | | | | | | | | |
See Notes to Financial Statements
60
VIRTUS EQUITY TRUST
STATEMENTS OF ASSETS AND LIABILITIES (Continued)
SEPTEMBER 30, 2018
(Reported in thousands except shares and per share amounts)
| | | | | | | | | | | | | | | | | | | | |
| | | KAR Small-Cap
Growth Fund | | | KAR Small-Cap
Value Fund | | | KAR Small-Mid
Cap Core Fund | | | Rampart Enhanced
Core Equity Fund | | | Tactical
Allocation Fund | |
| Assets | | | | | | | | | | | | | | | | | | | | |
Investment in unaffiliated securities at value(1)(2) | | $ | 5,162,700 | | | $ | 591,675 | | | $ | 3,368 | | | $ | 166,761 | | | $ | 149,307 | |
Investments in affiliated securities at value(3) | | | — | | | | — | | | | — | | | | — | | | | 1,605 | |
Foreign currency at value(4) | | | 2,523 | | | | — | | | | — | | | | — | | | | — | (6) |
Cash | | | 127,605 | | | | 15,731 | | | | 93 | | | | 3,253 | | | | 1,102 | |
Receivables | | | | | | | | | | | | | | | | | | | | |
Investment securities sold | | | — | | | | — | | | | — | | | | 143 | | | | 586 | |
Fund shares sold | | | 43,183 | | | | 2,996 | | | | 15 | | | | 3 | | | | 1 | |
Receivable from adviser | | | — | | | | — | | | | 29 | | | | — | | | | — | |
Dividends and interest | | | 1,579 | | | | 587 | | | | 2 | | | | 142 | | | | 638 | |
Tax reclaims | | | — | | | | — | | | | — | | | | — | | | | 6 | |
Securities lending receivable | | | 82 | | | | — | | | | — | | | | — | | | | 3 | |
Prepaid expenses | | | 318 | | | | 53 | | | | — | | | | 41 | | | | 26 | |
Prepaid trustee retainer | | | 91 | | | | 11 | | | | — | (6) | | | 3 | | | | 3 | |
Other assets | | | 306 | | | | 35 | | | | — | (6) | | | 10 | | | | 9 | |
| | | | | | | | | | | | | | | | | | | | |
Total assets | | | 5,338,387 | | | | 611,088 | | | | 3,507 | | | | 170,356 | | | | 153,286 | |
| | | | | | | | | | | | | | | | | | | | |
| Liabilities | | | | | | | | | | | | | | | | | | | | |
Written options at value(5) | | | — | | | | — | | | | — | | | | 431 | | | | — | |
Payables | | | | | | | | | | | | | | | | | | | | |
Fund shares repurchased | | | 21,779 | | | | 393 | | | | — | | | | 88 | | | | 118 | |
Investment securities purchased | | | 6,489 | | | | — | | | | 59 | | | | 85 | | | | 929 | |
Collateral on securities loaned | | | — | | | | — | | | | — | | | | — | | | | 1,438 | |
Investment advisory fees | | | 3,533 | | | | 352 | | | | — | | | | 101 | | | | 85 | |
Distribution and service fees | | | 421 | | | | 42 | | | | — | (6) | | | 49 | | | | 33 | |
Administration and accounting fees | | | 469 | | | | 54 | | | | — | (6) | | | 14 | | | | 13 | |
Transfer agent and sub-transfer agent fees and expenses | | | 1,019 | | | | 119 | | | | — | (6) | | | 43 | | | | 36 | |
Professional fees | | | 29 | | | | 23 | | | | 20 | | | | 15 | | | | 26 | |
Trustee deferred compensation plan | | | 306 | | | | 35 | | | | — | (6) | | | 10 | | | | 9 | |
Other accrued expenses | | | 169 | | | | 23 | | | | 2 | | | | 13 | | | | 9 | |
| | | | | | | | | | | | | | | | | | | | |
Total liabilities | | | 34,214 | | | | 1,041 | | | | 81 | | | | 849 | | | | 2,696 | |
| | | | | | | | | | | | | | | | | | | | |
| Net Assets | | $ | 5,304,173 | | | $ | 610,047 | | | $ | 3,426 | | | $ | 169,507 | | | $ | 150,590 | |
| | | | | | | | | | | | | | | | | | | | |
| Net Assets Consist of: | | | | | | | | | | | | | | | | | | | | |
Capital paid in on shares of beneficial interest | | $ | 4,302,370 | | | $ | 453,404 | | | $ | 3,180 | | | $ | 143,095 | | | $ | 121,248 | |
Accumulated undistributed net investment income (loss) | | | (152 | ) | | | 3,683 | | | | — | | | | 1,065 | | | | (212 | ) |
Accumulated undistributed net realized gain (loss) | | | 76,710 | | | | 4,066 | | | | 54 | | | | (6,987 | ) | | | 3,042 | |
Net unrealized appreciation (depreciation) on investments | | | 925,245 | | | | 148,894 | | | | 192 | | | | 31,994 | | | | 26,512 | |
Net unrealized appreciation (depreciation) on written options | | | — | | | | — | | | | — | | | | 340 | | | | — | |
| | | | | | | | | | | | | | | | | | | | |
| Net Assets | | $ | 5,304,173 | | | $ | 610,047 | | | $ | 3,426 | | | $ | 169,507 | | | $ | 150,590 | |
| | | | | | | | | | | | | | | | | | | | |
| Net Assets: | | | | | | | | | | | | | | | | | | | | |
Class A | | $ | 866,966 | | | $ | 83,276 | | | $ | 158 | | | $ | 118,904 | | | $ | 146,854 | |
Class C | | $ | 301,749 | | | $ | 29,922 | | | $ | 135 | | | $ | 30,576 | | | $ | 3,736 | |
Class I | | $ | 4,121,658 | | | $ | 475,103 | | | $ | 214 | | | $ | 15,028 | | | $ | — | |
Class R6 | | $ | 13,800 | | | $ | 21,746 | | | $ | 2,919 | | | $ | 4,999 | | | $ | — | |
| Shares Outstanding (unlimited number of shares authorized, no par value): | | | | | | | | | | | | | | | | | | | | |
Class A | | | 25,827,852 | | | | 4,283,125 | | | | 14,589 | | | | 5,648,835 | | | | 15,206,806 | |
Class C | | | 9,959,366 | | | | 1,578,237 | | | | 12,588 | | | | 1,634,352 | | | | 376,361 | |
Class I | | | 120,469,047 | | | | 24,373,659 | | | | 19,803 | | | | 714,676 | | | | — | |
Class R6 | | | 403,195 | | | | 1,114,338 | | | | 270,000 | | | | 237,648 | | | | — | |
| Net Asset Value and Redemption Price Per Share: | | | | | | | | | | | | | | | | | | | | |
Class A | | $ | 33.57 | | | $ | 19.44 | | | $ | 10.79 | | | $ | 21.05 | | | $ | 9.66 | |
Class C | | $ | 30.30 | | | $ | 18.96 | | | $ | 10.75 | | | $ | 18.71 | | | $ | 9.93 | |
Class I | | $ | 34.21 | | | $ | 19.49 | | | $ | 10.81 | | | $ | 21.03 | | | $ | — | |
Class R6 | | $ | 34.23 | | | $ | 19.51 | | | $ | 10.81 | | | $ | 21.03 | | | $ | — | |
| Maximum offering price per share (NAV/(1-5.75%)) | | | | | | | | | | | | | | | | | | | | |
Class A | | $ | 35.62 | | | $ | 20.63 | | | $ | 11.45 | | | $ | 22.33 | | | $ | 10.25 | |
| | | | | |
(1) Investment in unaffiliated securities at cost | | $ | 4,237,482 | | | $ | 442,781 | | | $ | 3,176 | | | $ | 134,767 | | | $ | 122,748 | |
(2) Market value of securities on loan | | $ | — | | | $ | — | | | $ | — | | | $ | — | | | $ | 1,384 | |
(3) Investments in affiliated securities at cost | | $ | — | | | $ | — | | | $ | — | | | $ | — | | | $ | 1,652 | |
(4) Foreign currency at cost | | $ | 2,523 | | | $ | — | | | $ | — | | | $ | — | | | $ | — | (6) |
(5) Written options premiums received | | $ | — | | | $ | — | | | $ | — | | | $ | 771 | | | $ | — | |
(6) Amount is less than $500. | | | | | | | | | | | | | | | | | | | | |
See Notes to Financial Statements
61
VIRTUS EQUITY TRUST
STATEMENTS OF OPERATIONS
YEAR ENDED SEPTEMBER 30, 2018
($ reported in thousands)
| | | | | | | | | | | | | | | | | | | | |
| | | KAR Capital
Growth Fund | | | KAR Global Quality
Dividend Fund | | | KAR Mid-Cap
Core Fund | | | KAR Mid-Cap
Growth Fund | | | KAR Small-Cap
Core Fund | |
| Investment Income | | | | | | | | | | | | | | | | | | | | |
Dividends | | $ | 3,854 | | | $ | 1,901 | | | $ | 1,480 | | | $ | 685 | | | $ | 13,844 | |
Interest | | | — | (1) | | | — | (1) | | | — | | | | — | (1) | | | — | |
Security lending, net of fees | | | — | (1) | | | — | (1) | | | — | | | | — | | | | — | |
Foreign taxes withheld | | | (16 | ) | | | (116 | ) | | | (13 | ) | | | (5 | ) | | | (44 | ) |
| | | | | | | | | | | | | | | | | | | | |
Total investment income | | | 3,838 | | | | 1,785 | | | | 1,467 | | | | 680 | | | | 13,800 | |
| | | | | | | | | | | | | | | | | | | | |
| Expenses | | | | | | | | | | | | | | | | | | | | |
Investment advisory fees | | | 3,667 | | | | 331 | | | | 1,274 | | | | 1,050 | | | | 8,690 | |
Distribution and service fees, Class A | | | 1,224 | | | | 83 | | | | 71 | | | | 257 | | | | 325 | |
Distribution and service fees, Class C | | | 143 | | | | 57 | | | | 237 | | | | 70 | | | | 896 | |
Administration and accounting fees | | | 553 | | | | 47 | | | | 169 | | | | 139 | | | | 1,220 | |
Transfer agent fees and expenses | | | 468 | | | | 42 | | | | 77 | | | | 106 | | | | 526 | |
Sub-transfer agent fees and expenses, Class A | | | 162 | | | | 16 | | | | 27 | | | | 35 | | | | 127 | |
Sub-transfer agent fees and expenses, Class C | | | 9 | | | | 3 | | | | 23 | | | | 7 | | | | 73 | |
Sub-transfer agent fees and expenses, Class I | | | 12 | | | | 6 | | | | 103 | | | | 16 | | | | 647 | |
Interest expense | | | — | | | | 1 | | | | — | | | | — | | | | — | |
Registration fees | | | 71 | | | | 51 | | | | 74 | | | | 63 | | | | 144 | |
Printing fees and expenses | | | 56 | | | | 8 | | | | 22 | | | | 16 | | | | 122 | |
Custodian fees | | | 5 | | | | 16 | | | | 2 | | | | 2 | | | | 1 | |
Professional fees | | | 36 | | | | 25 | | | | 25 | | | | 24 | | | | 45 | |
Trustees’ fees and expenses | | | 38 | | | | 4 | | | | 10 | | | | 8 | | | | 70 | |
Miscellaneous expenses | | | 26 | | | | 4 | | | | 8 | | | | 6 | | | | 45 | |
| | | | | | | | | | | | | | | | | | | | |
Total expenses | | | 6,470 | | | | 694 | | | | 2,122 | | | | 1,799 | | | | 12,931 | |
Less expenses reimbursed and/or waived by investment adviser | | | (5 | ) | | | (68 | ) | | | (301 | ) | | | — | | | | — | |
Less low balance account fees | | | (21 | ) | | | (1 | ) | | | — | (1) | | | (3 | ) | | | — | (1) |
Plus expenses recaptured | | | — | | | | — | | | | — | | | | 37 | | | | — | |
| | | | | | | | | | | | | | | | | | | | |
Net expenses | | | 6,444 | | | | 625 | | | | 1,821 | | | | 1,833 | | | | 12,931 | |
| | | | | | | | | | | | | | | | | | | | |
Net investment income (loss) | | | (2,606 | ) | | | 1,160 | | | | (354 | ) | | | (1,153 | ) | | | 869 | |
| | | | | | | | | | | | | | | | | | | | |
| Net Realized and Unrealized Gain (Loss) on Investments: | | | | | | | | | | | | | | | | | | | | |
Net realized gain (loss) from: | | | | | | | | | | | | | | | | | | | | |
Unaffiliated investments | | | 42,676 | | | | 2,065 | | | | 3,295 | | | | 4,945 | | | | 51,859 | |
Foreign Currency Transactions | | | — | | | | (11 | ) | | | — | | | | — | | | | (19 | ) |
Net change in unrealized appreciation (depreciation) on: | | | | | | | | | | | | | | | | | | | | |
Unaffiliated investments | | | 51,887 | | | | (1,699 | ) | | | 25,586 | | | | 34,077 | | | | 178,214 | |
Foreign Currency Transactions | | | — | | | | — | (1) | | | — | | | | — | | | | — | |
| | | | | | | | | | | | | | | | | | | | |
| Net realized and unrealized gain (loss) on investments | | | 94,563 | | | | 355 | | | | 28,881 | | | | 39,022 | | | | 230,054 | |
| | | | | | | | | | | | | | | | | | | | |
| Net increase (decrease) in net assets resulting from operations | | $ | 91,957 | | | $ | 1,515 | | | $ | 28,527 | | | $ | 37,869 | | | $ | 230,923 | |
| | | | | | | | | | | | | | | | | | | | |
(1) Amount is less than $500.
See Notes to Financial Statements
62
VIRTUS EQUITY TRUST
STATEMENTS OF OPERATIONS (Continued)
YEAR ENDED SEPTEMBER 30, 2018
($ reported in thousands)
| | | | | | | | | | | | | | | | | | | | |
| | | KAR Small-Cap
Growth Fund | | | KAR Small-Cap
Value Fund | | | KAR Small-Mid
Cap Core Fund(1) | | | Rampart Enhanced
Core Equity Fund | | | Tactical
Allocation Fund | |
| | | | | | | | | | | | | | | | |
| Investment Income | | | | | | | | | | | | | | | | | | | | |
Dividends | | $ | 30,076 | | | $ | 9,274 | | | $ | 16 | | | $ | 3,345 | | | $ | 1,268 | |
Dividends from affiliated Fund | | | — | | | | — | | | | — | | | | — | | | | 83 | |
Interest | | | — | (2) | | | — | (2) | | | — | | | | — | (2) | | | 2,820 | |
Security lending, net of fees | | | 82 | | | | — | | | | — | | | | — | | | | 3 | |
Foreign taxes withheld | | | — | | | | (58 | ) | | | — | (2) | | | — | | | | (55 | ) |
| | | | | | | | | | | | | | | | | | | | |
Total investment income | | | 30,158 | | | | 9,216 | | | | 16 | | | | 3,345 | | | | 4,119 | |
| | | | | | | | | | | | | | | | | | | | |
| Expenses | | | | | | | | | | | | | | | | | | | | |
Investment advisory fees | | | 24,766 | | | | 3,528 | | | | 13 | | | | 1,317 | | | | 1,055 | |
Distribution and service fees, Class A | | | 1,248 | | | | 218 | | | | — | (2) | | | 294 | | | | 367 | |
Distribution and service fees, Class C | | | 1,765 | | | | 296 | | | | 1 | | | | 314 | | | | 39 | |
Administration and accounting fees | | | 3,168 | | | | 533 | | | | 3 | | | | 186 | | | | 161 | |
Transfer agent fees and expenses | | | 1,375 | | | | 252 | | | | 1 | | | | 126 | | | | 119 | |
Sub-transfer agent fees and expenses, Class A | | | 523 | | | | 89 | | | | — | (2) | | | 62 | | | | 56 | |
Sub-transfer agent fees and expenses, Class C | | | 165 | | | | 19 | | | | — | | | | 16 | | | | 3 | |
Sub-transfer agent fees and expenses, Class I | | | 2,265 | | | | 312 | | | | — | (2) | | | 20 | | | | — | |
Registration fees | | | 285 | | | | 97 | | | | 15 | | | | 65 | | | | 40 | |
Printing fees and expenses | | | 317 | | | | 63 | | | | 26 | | | | 20 | | | | 18 | |
Custodian fees | | | 4 | | | | — | (2) | | | — | (2) | | | 10 | | | | 35 | |
Professional fees | | | 75 | | | | 36 | | | | 31 | | | | 21 | | | | 31 | |
Trustees’ fees and expenses | | | 164 | | | | 34 | | | | — | (2) | | | 13 | | | | 11 | |
Miscellaneous expenses | | | 111 | | | | 23 | | | | 3 | | | | 10 | | | | 9 | |
| | | | | | | | | | | | | | | | | | | | |
Total expenses | | | 36,231 | | | | 5,500 | | | | 93 | | | | 2,474 | | | | 1,944 | |
Less expenses reimbursed and/or waived by investment adviser | | | — | | | | — | | | | (75 | ) | | | (200 | ) | | | (9 | ) |
Low balance account fees | | | (3 | ) | | | (1 | ) | | | — | | | | (2 | ) | | | (4 | ) |
| | | | | | | | | | | | | | | | | | | | |
Net expenses | | | 36,228 | | | | 5,499 | | | | 18 | | | | 2,272 | | | | 1,931 | |
| | | | | | | | | | | | | | | | | | | | |
Net investment income (loss) | | | (6,070 | ) | | | 3,717 | | | | (2 | ) | | | 1,073 | | | | 2,188 | |
| | | | | | | | | | | | | | | | | | | | |
| Net Realized and Unrealized Gain (Loss) on Investments: | | | | | | | | | | | | | | | | | | | | |
Net realized gain (loss) from: | | | | | | | | | | | | | | | | | | | | |
Unaffiliated investments | | | 85,740 | | | | 4,086 | | | | 56 | | | | 3,419 | | | | 3,139 | |
Foreign Currency Transactions | | | (191 | ) | | | — | | | | — | | | | — | | | | — | (2) |
Written Options | | | — | | | | — | | | | — | | | | (9,937 | ) | | | — | |
Net change in unrealized appreciation (depreciation) on: | | | | | | | | | | | | | | | | | | | | |
Affiliated Investments | | | — | | | | — | | | | — | | | | — | | | | (20 | ) |
Unaffiliated investments | | | 605,120 | | | | 29,090 | | | | 192 | | | | 22,165 | | | | 8,521 | |
Foreign Currency Transactions | | | 27 | | | | — | | | | — | | | | — | | | | — | (2) |
Written Options | | | — | | | | — | | | | — | | | | 100 | | | | — | |
| | | | | | | | | | | | | | | | | | | | |
| Net realized and unrealized gain (loss) on investments | | | 690,696 | | | | 33,176 | | | | 248 | | | | 15,747 | | | | 11,640 | |
| | | | | | | | | | | | | | | | | | | | |
| Net increase (decrease) in net assets resulting from operations | | $ | 684,626 | | | $ | 36,893 | | | $ | 246 | | | $ | 16,820 | | | $ | 13,828 | |
| | | | | | | | | | | | | | | | | | | | |
(1) Inception date March 7, 2018.
(2) Amount is less than $500.
See Notes to Financial Statements
63
VIRTUS EQUITY TRUST
STATEMENTS OF CHANGES IN NET ASSETS
($ reported in thousands)
| | | | | | | | | | | | | | | | | | | | | | | | |
| | | KAR Capital Growth Fund | | | KAR Global Quality Dividend Fund | |
| | | Year Ended
September 30,
2018 | | | Fiscal
Period Ended
September 30,
2017(1) | | | Year Ended
March 31,
2017 | | | Year Ended
September 30,
2018 | | | Fiscal
Period Ended
September 30,
2017(1) | | | Year Ended
March 31,
2017 | |
| Increase (Decrease) in Net Assets Resulting From Operations | | | | | | | | | | | | | | | | | | | | | | | | |
Net investment income (loss) | | $ | (2,606 | ) | | $ | (961 | ) | | $ | (1,557 | ) | | $ | 1,160 | | | $ | 1,042 | | | $ | 786 | |
Net realized gain (loss) | | | 42,676 | | | | 26,076 | | | | 37,319 | | | | 2,054 | | | | 966 | | | | 18,741 | |
Net change in unrealized appreciation (depreciation) | | | 51,887 | | | | 41,631 | | | | 12,779 | | | | (1,699 | ) | | | 479 | | | | (12,232 | ) |
| | | | | | | | | | | | | | | | | | | | | | | | |
| Increase (decrease) in net assets resulting from operations | | | 91,957 | | | | 66,746 | | | | 48,541 | | | | 1,515 | | | | 2,487 | | | | 7,295 | |
| | | | | | | | | | | | | | | | | | | | | | | | |
| Dividends and Distributions to Shareholders: | | | | | | | | | | | | | | | | | | | | | | | | |
| Net Investment Income: | | | | | | | | | | | | | | | | | | | | | | | | |
Class A | | | — | | | | — | | | | — | | | | (1,564 | ) | | | (702 | ) | | | (462 | ) |
Class C | | | — | | | | — | | | | — | | | | (236 | ) | | | (52 | ) | | | — | |
Class I | | | — | | | | — | | | | — | | | | (227 | ) | | | (126 | ) | | | (73 | ) |
| Net Realized Gains: | | | | | | | | | | | | | | | | | | | | | | | | |
Class A | | | (23,456 | ) | | | (4,395 | ) | | | (31,380 | ) | | | (3,444 | ) | | | (2,728 | ) | | | — | |
Class B | | | — | | | | — | | | | (68 | ) | | | — | | | | — | | | | — | |
Class C | | | (887 | ) | | | (170 | ) | | | (1,402 | ) | | | (470 | ) | | | (413 | ) | | | — | |
Class I | | | (664 | ) | | | (114 | ) | | | (670 | ) | | | (390 | ) | | | (417 | ) | | | — | |
| | | | | | | | | | | | | | | | | | | | | | | | |
Dividends and distributions to shareholders | | | (25,007 | ) | | | (4,679 | ) | | | (33,520 | ) | | | (6,331 | ) | | | (4,438 | ) | | | (535 | ) |
| | | | | | | | | | | | | | | | | | | | | | | | |
| Change in Net Assets From Capital Transactions (See Note 6) | | | | | | | | | | | | | | | | | | | | | | | | |
Class A | | | (1,204 | ) | | | (14,052 | ) | | | (13,975 | ) | | | (13,926 | ) | | | (999 | ) | | | (8,659 | ) |
Class B | | | — | | | | — | | | | (1,437 | ) | | | — | | | | — | | | | — | |
Class C | | | (1,201 | ) | | | (1,139 | ) | | | (6,689 | ) | | | (466 | ) | | | (626 | ) | | | (2,075 | ) |
Class I | | | 2,198 | | | | 719 | | | | 1,623 | | | | (1,290 | ) | | | (321 | ) | | | (98 | ) |
Class R6 | | | 6,134 | | | | — | | | | — | | | | — | | | | — | | | | — | |
| | | | | | | | | | | | | | | | | | | | | | | | |
| Increase (decrease) in net assets from capital transactions | | | 5,927 | | | | (14,472 | ) | | | (20,478 | ) | | | (15,682 | ) | | | (1,946 | ) | | | (10,832 | ) |
| | | | | | | | | | | | | | | | | | | | | | | | |
| | | | | | |
| Net increase (decrease) in net assets | | | 72,877 | | | | 47,595 | | | | (5,457 | ) | | | (20,498 | ) | | | (3,897 | ) | | | (4,072 | ) |
| | | | | | |
| Net Assets | | | | | | | | | | | | | | | | | | | | | | | | |
Beginning of period | | | 473,238 | | | | 425,643 | | | | 431,100 | | | | 56,819 | | | | 60,716 | | | | 64,788 | |
| | | | | | | | | | | | | | | | | | | | | | | | |
| End of period | | $ | 546,115 | | | $ | 473,238 | | | $ | 425,643 | | | $ | 36,321 | | | $ | 56,819 | | | $ | 60,716 | |
| | | | | | | | | | | | | | | | | | | | | | | | |
Accumulated undistributed net investment income (loss) at end of period | | $ | (31 | ) | | $ | (20 | ) | | $ | (118 | ) | | $ | (11 | ) | | $ | 870 | | | $ | 711 | |
(1) The Fund changed its fiscal year end to September 30 during the period.
See Notes to Financial Statements
64
VIRTUS EQUITY TRUST
STATEMENTS OF CHANGES IN NET ASSETS (Continued)
($ reported in thousands)
| | | | | | | | | | | | | | | | | | | | | | | | |
| | | KAR Mid-Cap Core Fund | | | KAR Mid-Cap Growth Fund | |
| | | Year Ended
September 30,
2018 | | | Fiscal
Period Ended
September 30,
2017(1) | | | Year Ended
March 31,
2017 | | | Year Ended
September 30,
2018 | | | Fiscal
Period Ended
September 30,
2017(1) | | | Year Ended
March 31,
2017 | |
| Increase (Decrease) in Net Assets Resulting From Operations | | | | | | | | | | | | | | | | | | | | | | | | |
Net investment income (loss) | | $ | (354 | ) | | $ | (161 | ) | | $ | (181 | ) | | $ | (1,153 | ) | | $ | (421 | ) | | $ | (636 | ) |
Net realized gain (loss) | | | 3,295 | | | | (1,087 | ) | | | 369 | | | | 4,945 | | | | 5,473 | | | | 2,053 | |
Net change in unrealized appreciation (depreciation) | | | 25,586 | | | | 9,658 | | | | 7,696 | | | | 34,077 | | | | 6,593 | | | | 9,805 | |
| | | | | | | | | | | | | | | | | | | | | | | | |
| Increase (decrease) in net assets resulting from operations | | | 28,527 | | | | 8,410 | | | | 7,884 | | | | 37,869 | | | | 11,645 | | | | 11,222 | |
| | | | | | | | | | | | | | | | | | | | | | | | |
| Dividends and Distributions to Shareholders: | | | | | | | | | | | | | | | | | | | | | | | | |
| Net Realized Gains: | | | | | | | | | | | | | | | | | | | | | | | | |
Class A | | | — | | | | (81 | ) | | | — | | | | (4,734 | ) | | | (402 | ) | | | (1,177 | ) |
Class B | | | — | | | | — | | | | — | | | | — | | | | — | | | | (3 | ) |
Class C | | | — | | | | (56 | ) | | | — | | | | (334 | ) | | | (29 | ) | | | (100 | ) |
Class I | | | — | | | | (196 | ) | | | — | | | | (242 | ) | | | (20 | ) | | | (50 | ) |
| | | | | | | | | | | | | | | | | | | | | | | | |
| Dividends and distributions to shareholders | | | — | | | | (333 | ) | | | — | | | | (5,310 | ) | | | (451 | ) | | | (1,330 | ) |
| | | | | | | | | | | | | | | | | | | | | | | | |
| Change in Net Assets From Capital Transactions (See Note 6) | | | | | | | | | | | | | | | | | | | | | | | | |
Class A | | | 1,611 | | | | 3,725 | | | | (3,230 | ) | | | 20,953 | | | | (5,804 | ) | | | (4,977 | ) |
Class B | | | — | | | | — | | | | — | | | | — | | | | — | | | | (349 | ) |
Class C | | | 8,773 | | | | 2,347 | | | | 6,343 | | | | 6,011 | | | | (990 | ) | | | (466 | ) |
Class I | | | 78,595 | | | | 14,098 | | | | 39,940 | | | | 46,976 | | | | 32 | | | | 501 | |
Class R6 | | | 2,335 | | | | — | | | | — | | | | 96 | | | | — | | | | — | |
| | | | | | | | | | | | | | | | | | | | | | | | |
| Increase (decrease) in net assets from capital transactions | | | 91,314 | | | | 20,170 | | | | 43,053 | | | | 74,036 | | | | (6,762 | ) | | | (5,291 | ) |
| | | | | | | | | | | | | | | | | | | | | | | | |
| | | | | | |
| Net increase (decrease) in net assets | | | 119,841 | | | | 28,247 | | | | 50,937 | | | | 106,595 | | | | 4,432 | | | | 4,601 | |
| | | | | | |
| Net Assets | | | | | | | | | | | | | | | | | | | | | | | | |
Beginning of period | | | 114,063 | | | | 85,816 | | | | 34,879 | | | | 94,302 | | | | 89,870 | | | | 85,269 | |
| | | | | | | | | | | | | | | | | | | | | | | | |
| End of period | | $ | 233,904 | | | $ | 114,063 | | | $ | 85,816 | | | $ | 200,897 | | | $ | 94,302 | | | $ | 89,870 | |
| | | | | | | | | | | | | | | | | | | | | | | | |
Accumulated undistributed net investment income (loss) at end of period | | $ | (163 | ) | | $ | (4 | ) | | $ | (64 | ) | | $ | (8 | ) | | $ | (4 | ) | | $ | (128 | ) |
(1) The Fund changed its fiscal year end to September 30 during the period.
See Notes to Financial Statements
65
VIRTUS EQUITY TRUST
STATEMENTS OF CHANGES IN NET ASSETS (Continued)
($ reported in thousands)
| | | | | | | | | | | | | | | | | | | | | | | | |
| | | KAR Small-Cap Core Fund | | | KAR Small-Cap Growth Fund | |
| | | Year Ended
September 30,
2018 | | | Fiscal
Period Ended
September 30,
2017(1) | | | Year Ended
March 31,
2017 | | | Year Ended
September 30,
2018 | | | Fiscal
Period Ended
September 30,
2017(1) | | | Year Ended
March 31,
2017 | |
| Increase (Decrease) in Net Assets Resulting From Operations | | | | | | | | | | | | | | | | | | | | | | | | |
Net investment income (loss) | | $ | 869 | | | $ | (949 | ) | | $ | (882 | ) | | $ | (6,070 | ) | | $ | (3,445 | ) | | $ | (2,732 | ) |
Net realized gain (loss) | | | 51,840 | | | | 977 | | | | 13,272 | | | | 85,549 | | | | (179 | ) | | | (530 | ) |
Net change in unrealized appreciation (depreciation) | | | 178,214 | | | | 82,548 | | | | 58,696 | | | | 605,147 | | | | 192,974 | | | | 89,239 | |
| | | | | | | | | | | | | | | | | | | | | | | | |
| Increase (decrease) in net assets resulting from operations | | | 230,923 | | | | 82,576 | | | | 71,086 | | | | 684,626 | | | | 189,350 | | | | 85,977 | |
| | | | | | | | | | | | | | | | | | | | | | | | |
| Dividends and Distributions to Shareholders: | | | | | | | | | | | | | | | | | | | | | | | | |
| Net Realized Gains: | | | | | | | | | | | | | | | | | | | | | | | | |
Class A | | | (148 | ) | | | (33 | ) | | | (3,619 | ) | | | — | | | | (4 | ) | | | (3,423 | ) |
Class C | | | (110 | ) | | | (29 | ) | | | (2,464 | ) | | | — | | | | (1 | ) | | | (815 | ) |
Class I | | | (781 | ) | | | (183 | ) | | | (14,391 | ) | | | — | | | | (11 | ) | | | (3,649 | ) |
Class R6 | | | (71 | ) | | | (16 | ) | | | (1,436 | ) | | | — | | | | — | | | | — | |
| | | | | | | | | | | | | | | | | | | | | | | | |
| Dividends and distributions to shareholders | | | (1,110 | ) | | | (261 | ) | | | (21,910 | ) | | | — | | | | (16 | ) | | | (7,887 | ) |
| | | | | | | | | | | | | | | | | | | | | | | | |
| Change in Net Assets From Capital Transactions (See Note 6) | | | | | | | | | | | | | | | | | | | | | | | | |
Class A | | | 46,792 | | | | 7,469 | | | | 669 | | | | 490,851 | | | | 39,060 | | | | 66,312 | |
Class C | | | 48,415 | | | | 4,421 | | | | 9,088 | | | | 168,408 | | | | 21,772 | | | | 32,713 | |
Class I | | | 585,811 | | | | 76,745 | | | | 115,257 | | | | 2,503,278 | | | | 461,883 | | | | 348,597 | |
Class R6 | | | 29,571 | | | | 7,704 | | | | 7,139 | | | | 12,739 | | | | — | | | | — | |
| | | | | | | | | | | | | | | | | | | | | | | | |
| Increase (decrease) in net assets from capital transactions | | | 710,589 | | | | 96,339 | | | | 132,153 | | | | 3,175,276 | | | | 522,715 | | | | 447,622 | |
| | | | | | | | | | | | | | | | | | | | | | | | |
| | | | | | |
| Net increase (decrease) in net assets | | | 940,402 | | | | 178,655 | | | | 181,329 | | | | 3,859,902 | | | | 712,049 | | | | 525,712 | |
| | | | | | |
| Net Assets | | | | | | | | | | | | | | | | | | | | | | | | |
Beginning of period | | | 655,395 | | | | 476,740 | | | | 295,411 | | | | 1,444,271 | | | | 732,222 | | | | 206,510 | |
| | | | | | | | | | | | | | | | | | | | | | | | |
| End of period | | $ | 1,595,797 | | | $ | 655,395 | | | $ | 476,740 | | | $ | 5,304,173 | | | $ | 1,444,271 | | | $ | 732,222 | |
| | | | | | | | | | | | | | | | | | | | | | | | |
Accumulated undistributed net investment income (loss) at end of period | | $ | 1,408 | | | $ | (23 | ) | | $ | (17 | ) | | $ | (152 | ) | | $ | (42 | ) | | $ | (1,112 | ) |
(1) The Fund changed its fiscal year end to September 30 during the period.
See Notes to Financial Statements
66
VIRTUS EQUITY TRUST
STATEMENTS OF CHANGES IN NET ASSETS (Continued)
($ reported in thousands)
| | | | | | | | | | | | | | | | |
| | | KAR Small-Cap Value Fund | | | KAR Small-Mid
Cap Core Fund | |
| | | Year Ended
September 30,
2018 | | | Fiscal
Period Ended
September 30,
2017(1) | | | Year Ended
March 31,
2017 | | | From inception
March 7, 2018
to September 30,
2018 | |
Increase (Decrease) in Net Assets Resulting From Operations | | | | | | | | | | | | | | | | |
Net investment income (loss) | | $ | 3,717 | | | $ | 776 | | | $ | 4,329 | | | $ | (2 | ) |
Net realized gain (loss) | | | 4,086 | | | | 7,206 | | | | 22,843 | | | | 56 | |
Net change in unrealized appreciation (depreciation) | | | 29,090 | | | | 25,088 | | | | 35,164 | | | | 192 | |
| | | | | | | | | | | | | | | | |
| Increase (decrease) in net assets resulting from operations | | | 36,893 | | | | 33,070 | | | | 62,336 | | | | 246 | |
| | | | | | | | | | | | | | | | |
| Dividends and Distributions to Shareholders: | | | | | | | | | | | | | | | | |
| Net Investment Income: | | | | | | | | | | | | | | | | |
Class A | | | (43 | ) | | | (85 | ) | | | (1,269 | ) | | | — | |
Class C | | | (7 | ) | | | — | | | | (219 | ) | | | — | |
Class I | | | (396 | ) | | | (607 | ) | | | (3,715 | ) | | | — | |
Class R6 | | | (19 | ) | | | (12 | ) | | | (1 | ) | | | — | |
| Net Realized Gains: | | | | | | | | | | | | | | | | |
Class A | | | (1,359 | ) | | | (3,083 | ) | | | (5,493 | ) | | | — | |
Class C | | | (468 | ) | | | (1,062 | ) | | | (1,848 | ) | | | — | |
Class I | | | (5,046 | ) | | | (9,201 | ) | | | (12,527 | ) | | | — | |
Class R6 | | | (216 | ) | | | (143 | ) | | | (2 | ) | | | — | |
| | | | | | | | | | | | | | | | |
| Dividends and distributions to shareholders | | | (7,554 | ) | | | (14,193 | ) | | | (25,074 | ) | | | — | |
| | | | | | | | | | | | | | | | |
| Change in Net Assets From Capital Transactions (See Note 6) | | | | | | | | | | | | | | | | |
Class A | | | (8,850 | ) | | | (5,537 | ) | | | 8,100 | | | | 149 | |
Class C | | | (1,250 | ) | | | (823 | ) | | | 2,713 | | | | 128 | |
Class I | | | 152,683 | | | | 44,299 | | | | 73,702 | | | | 203 | |
Class R6 | | | 10,507 | | | | 9,553 | | | | 103 | | | | 2,700 | |
| | | | | | | | | | | | | | | | |
| Increase (decrease) in net assets from capital transactions | | | 153,090 | | | | 47,492 | | | | 84,618 | | | | 3,180 | |
| | | | | | | | | | | | | | | | |
| | | | |
| Net increase (decrease) in net assets | | | 182,429 | | | | 66,369 | | | | 121,880 | | | | 3,426 | |
| | | | |
| Net Assets | | | | | | | | | | | | | | | | |
Beginning of period | | | 427,618 | | | | 361,249 | | | | 239,369 | | | | — | |
| | | | | | | | | | | | | | | | |
| End of period | | $ | 610,047 | | | $ | 427,618 | | | $ | 361,249 | | | $ | 3,426 | |
| | | | | | | | | | | | | | | | |
Accumulated undistributed net investment income (loss) at end of period | | $ | 3,683 | | | $ | 325 | | | $ | 253 | | | $ | — | |
(1) The Fund changed its fiscal year end to September 30 during the period.
See Notes to Financial Statements
67
VIRTUS EQUITY TRUST
STATEMENTS OF CHANGES IN NET ASSETS (Continued)
($ reported in thousands)
| | | | | | | | | | | | | | | | | | | | | | | | |
| | | Rampart Enhanced Core Equity Fund | | | Tactical Allocation Fund | |
| | | Year Ended
September 30,
2018 | | | Fiscal
Period Ended
September 30,
2017(1) | | | Year Ended
March 31,
2017 | | | Year Ended
September 30,
2018 | | | Fiscal
Period Ended
September 30,
2017(1) | | | Year Ended
March 31,
2017
| |
| Increase (Decrease) in Net Assets Resulting From Operations | | | | | | | | | | | | | | | | | | | | | | | | |
Net investment income (loss) | | $ | 1,073 | | | $ | 452 | | | $ | 1,073 | | | $ | 2,188 | | | $ | 1,295 | | | $ | 2,835 | |
Net realized gain (loss) | | | (6,518 | ) | | | 13,531 | | | | 23,880 | | | | 3,139 | | | | 1,582 | | | | 11,061 | |
Net change in unrealized appreciation (depreciation) | | | 22,265 | | | | 1,571 | | | | (1,318 | ) | | | 8,501 | | | | 9,870 | | | | (1,016 | ) |
| | | | | | | | | | | | | | | | | | | | | | | | |
| Increase (decrease) in net assets resulting from operations | | | 16,820 | | | | 15,554 | | | | 23,635 | | | | 13,828 | | | | 12,747 | | | | 12,880 | |
| | | | | | | | | | | | | | | | | | | | | | | | |
| Dividends and Distributions to Shareholders: | | | | | | | | | | | | | | | | | | | | | | | | |
| Net Investment Income: | | | | | | | | | | | | | | | | | | | | | | | | |
Class A | | | (322 | ) | | | (334 | ) | | | (1,189 | ) | | | (2,102 | ) | | | (1,295 | ) | | | (2,473 | ) |
Class B | | | — | | | | — | | | | — | | | | — | | | | — | | | | (1 | ) |
Class C | | | — | | | | (33 | ) | | | (23 | ) | | | (23 | ) | | | (20 | ) | | | (43 | ) |
Class I | | | (128 | ) | | | (75 | ) | | | (299 | ) | | | — | | | | — | | | | — | |
| Net Realized Gains: | | | | | | | | | | | | | | | | | | | | | | | | |
Class A | | | (7,667 | ) | | | (9,614 | ) | | | (2,709 | ) | | | (1,114 | ) | | | (274 | ) | | | (11,015 | ) |
Class B | | | | | | | — | | | | — | | | | | | | | — | | | | (10 | ) |
Class C | | | (2,242 | ) | | | (3,015 | ) | | | (981 | ) | | | (30 | ) | | | (8 | ) | | | (349 | ) |
Class I | | | (2,098 | ) | | | (1,784 | ) | | | (465 | ) | | | — | | | | — | | | | — | |
| | | | | | | | | | | | | | | | | | | | | | | | |
| Dividends and distributions to shareholders | | | (12,457 | ) | | | (14,855 | ) | | | (5,666 | ) | | | (3,269 | ) | | | (1,597 | ) | | | (13,891 | ) |
| | | | | | | | | | | | | | | | | | | | | | | | |
| Change in Net Assets From Capital Transactions (See Note 6) | | | | | | | | | | | | | | | | | | | | | | | | |
Class A | | | (5,360 | ) | | | 6,623 | | | | 524 | | | | (5,908 | ) | | | (5,732 | ) | | | (9,161 | ) |
Class B | | | — | | | | — | | | | — | | | | — | | | | — | | | | (208 | ) |
Class C | | | (2,831 | ) | | | (4,434 | ) | | | (3,110 | ) | | | (596 | ) | | | (649 | ) | | | (1,069 | ) |
Class I | | | (17,626 | ) | | | 11,030 | | | | 6,999 | | | | — | | | | — | | | | — | |
Class R6 | | | 5,321 | | | | — | | | | — | | | | — | | | | — | | | | — | |
| | | | | | | | | | | | | | | | | | | | | | | | |
| Increase (decrease) in net assets from capital transactions | | | (20,496 | ) | | | 13,219 | | | | 4,413 | | | | (6,504 | ) | | | (6,381 | ) | | | (10,438 | ) |
| | | | | | | | | | | | | | | | | | | | | | | | |
| | | | | | |
| Net increase (decrease) in net assets | | | (16,133 | ) | | | 13,918 | | | | 22,382 | | | | 4,055 | | | | 4,769 | | | | (11,449 | ) |
| | | | | | |
| Net Assets | | | | | | | | | | | | | | | | | | | | | | | | |
Beginning of period | | | 185,640 | | | | 171,722 | | | | 149,340 | | | | 146,535 | | | | 141,766 | | | | 153,215 | |
| | | | | | | | | | | | | | | | | | | | | | | | |
| End of period | | $ | 169,507 | | | $ | 185,640 | | | $ | 171,722 | | | $ | 150,590 | | | $ | 146,535 | | | $ | 141,766 | |
| | | | | | | | | | | | | | | | | | | | | | | | |
Accumulated undistributed net investment income (loss) at end of period | | $ | 1,065 | | | $ | 436 | | | $ | 426 | | | $ | (212 | ) | | $ | (150 | ) | | $ | (9 | ) |
(1) The Fund changed its fiscal year end to September 30 during the period.
See Notes to Financial Statements
68
VIRTUS EQUITY TRUST
FINANCIAL HIGHLIGHTS
SELECTED PER SHARE DATA AND RATIOS FOR A SHARE OUTSTANDING
THROUGHOUT EACH PERIOD
| | | | | | | | | | | | | | | | | | | | | | | | | | | | | | | | | | | | | | | | | | | | | | | | | | | | | | | | | | | | | | | | | | | | | | | | | | | | | |
| | | | Net Asset Value,
Beginning of Period | | Net Investment Income (Loss)(1) | | Net Realized and
Unrealized Gain (Loss) | | Total from Investment Operations | | Dividends from
Net Investment Income | | Distributions from
Net Realized Gains | | Total Distributions | | Change in Net Asset Value | | Net Asset Value, End of Period | | Total
Return(2)(4) | | Net Assets, End of Period
(in thousands) | | Ratio of Net Expenses to
Average Net Assets(3)(10) | | Ratio of Gross Expenses to Average
Net Assets(3)(10) | | Ratio of Net Investment Income
(Loss) to Average Net Assets(3) | | Portfolio Turnover Rate(4) |
KAR Capital Growth Fund | | | | | | | | | | | | | | | | | | | | | | | | | | | | | | | | | | | | | | | | | | | | | | | | | | | | | | | | | | | | | | | | | | | | | | | | | | | | | |
Class A | | | | | | | | | | | | | | | | | | | | | | | | | | | | | | | | | | | | | | | | | | | | | | | | | | | | | | | | | | | | | | | | | | | | | | | | | | | | | |
10/1/17 to 9/30/18 | | | | | $ | 16.18 | | | | | (0.08 | ) | | | | 3.13 | | | | | 3.05 | | | | | — | | | | | (0.86 | ) | | | | (0.86 | ) | | | | 2.19 | | | | $ | 18.37 | | | | | 19.56 | % | | | $ | 508,124 | | | | | 1.22 | % | | | | 1.22 | % | | | | (0.49 | )% | | | | 17 | % |
4/1/17 to 9/30/17(14) | | | | | | 14.10 | | | | | (0.03 | ) | | | | 2.27 | | | | | 2.24 | | | | | — | | | | | (0.16 | ) | | | | (0.16 | ) | | | | 2.08 | | | | | 16.18 | | | | | 15.93 | | | | | 446,720 | | | | | 1.30 | (12) | | | | 1.30 | | | | | (0.40 | ) | | | | 13 | |
4/1/16 to 3/31/17 | | | | | | 13.66 | | | | | (0.05 | ) | | | | 1.64 | | | | | 1.59 | | | | | — | | | | | (1.15 | ) | | | | (1.15 | ) | | | | 0.44 | | | | | 14.10 | | | | | 12.34 | (13) | | | | 402,118 | | | | | 1.33 | (9)(12)(13) | | | | 1.34 | | | | | (0.40 | )(13) | | | | 21 | |
4/1/15 to 3/31/16 | | | | | | 14.23 | | | | | (0.05 | ) | | | | 0.13 | | | | | 0.08 | | | | | — | | | | | (0.65 | ) | | | | (0.65 | ) | | | | (0.57 | ) | | | | 13.66 | | | | | 0.39 | | | | | 401,617 | | | | | 1.30 | (12) | | | | 1.30 | | | | | (0.32 | ) | | | | 20 | |
4/1/14 to 3/31/15 | | | | | | 12.41 | | | | | (0.03 | ) | | | | 2.40 | | | | | 2.37 | | | | | — | | | | | (0.55 | ) | | | | (0.55 | ) | | | | 1.82 | | | | | 14.23 | | | | | 19.29 | | | | | 433,635 | | | | | 1.28 | (12) | | | | 1.28 | | | | | (0.22 | ) | | | | 28 | |
4/1/13 to 3/31/14 | | | | | | 10.45 | | | | | (0.01 | ) | | | | 2.00 | | | | | 1.99 | | | | | (0.03 | ) | | | | — | | | | | (0.03 | ) | | | | 1.96 | | | | | 12.41 | | | | | 19.11 | | | | | 399,131 | | | | | 1.28 | (12) | | | | 1.28 | | | | | (0.11 | ) | | | | 26 | |
| | | | | | | | | | | | | | | | |
Class C | | | | | | | | | | | | | | | | | | | | | | | | | | | | | | | | | | | | | | | | | | | | | | | | | | | | | | | | | | | | | | | | | | | | | | | | | | | | | |
10/1/17 to 9/30/18 | | | | | $ | 12.91 | | | | | (0.17 | ) | | | | 2.46 | | | | | 2.29 | | | | | — | | | | | (0.86 | ) | | | | (0.86 | ) | | | | 1.43 | | | | $ | 14.34 | | | | | 18.58 | % | | | $ | 14,408 | | | | | 1.99 | % | | | | 2.00 | % | | | | (1.26 | )% | | | | 17 | % |
4/1/17 to 9/30/17(14) | | | | | | 11.32 | | | | | (0.07 | ) | | | | 1.82 | | | | | 1.75 | | | | | — | | | | | (0.16 | ) | | | | (0.16 | ) | | | | 1.59 | | | | | 12.91 | | | | | 15.51 | | | | | 14,052 | | | | | 2.08 | (12) | | | | 2.08 | | | | | (1.18 | ) | | | | 13 | |
4/1/16 to 3/31/17 | | | | | | 11.27 | | | | | (0.13 | ) | | | | 1.33 | | | | | 1.20 | | | | | — | | | | | (1.15 | ) | | | | (1.15 | ) | | | | 0.05 | | | | | 11.32 | | | | | 11.47 | (13) | | | | 13,345 | | | | | 2.08 | (9)(12)(13) | | | | 2.09 | | | | | (1.16 | )(13) | | | | 21 | |
4/1/15 to 3/31/16 | | | | | | 11.93 | | | | | (0.12 | ) | | | | 0.11 | | | | | (0.01 | ) | | | | — | | | | | (0.65 | ) | | | | (0.65 | ) | | | | (0.66 | ) | | | | 11.27 | | | | | (0.31 | ) | | | | 19,832 | | | | | 2.05 | (12) | | | | 2.06 | | | | | (1.07 | ) | | | | 20 | |
4/1/14 to 3/31/15 | | | | | | 10.57 | | | | | (0.11 | ) | | | | 2.02 | | | | | 1.91 | | | | | — | | | | | (0.55 | ) | | | | (0.55 | ) | | | | 1.36 | | | | | 11.93 | | | | | 18.28 | | | | | 11,999 | | | | | 2.02 | (12) | | | | 2.02 | | | | | (0.97 | ) | | | | 28 | |
4/1/13 to 3/31/14 | | | | | | 8.94 | | | | | (0.08 | ) | | | | 1.71 | | | | | 1.63 | | | | | — | | | | | — | | | | | — | | | | | 1.63 | | | | | 10.57 | | | | | 18.23 | | | | | 6,329 | | | | | 2.03 | (12) | | | | 2.03 | | | | | (0.86 | ) | | | | 26 | |
| | | | | | | | | | | | | | | | |
Class I | | | | | | | | | | | | | | | | | | | | | | | | | | | | | | | | | | | | | | | | | | | | | | | | | | | | | | | | | | | | | | | | | | | | | | | | | | | | | |
10/1/17 to 9/30/18 | | | | | $ | 16.69 | | | | | (0.05 | ) | | | | 3.24 | | | | | 3.19 | | | | | — | | | | | (0.86 | ) | | | | (0.86 | ) | | | | 2.33 | | | | $ | 19.02 | | | | | 19.81 | % | | | $ | 17,125 | | | | | 0.99 | % | | | | 0.99 | % | | | | (0.26 | )% | | | | 17 | % |
4/1/17 to 9/30/17(14) | | | | | | 14.52 | | | | | (0.01 | ) | | | | 2.34 | | | | | 2.33 | | | | | — | | | | | (0.16 | ) | | | | (0.16 | ) | | | | 2.17 | | | | | 16.69 | | | | | 16.09 | | | | | 12,466 | | | | | 1.08 | (12) | | | | 1.08 | | | | | (0.18 | ) | | | | 13 | |
4/1/16 to 3/31/17 | | | | | | 14.00 | | | | | (0.01 | ) | | | | 1.68 | | | | | 1.67 | | | | | — | | | | | (1.15 | ) | | | | (1.15 | ) | | | | 0.52 | | | | | 14.52 | | | | | 12.61 | (13) | | | | 10,180 | | | | | 1.08 | (9)(12)(13) | | | | 1.09 | | | | | (0.15 | )(13) | | | | 21 | |
4/1/15 to 3/31/16 | | | | | | 14.53 | | | | | (0.01 | ) | | | | 0.13 | | | | | 0.12 | | | | | — | | | | | (0.65 | ) | | | | (0.65 | ) | | | | (0.53 | ) | | | | 14.00 | | | | | 0.66 | | | | | 8,227 | | | | | 1.05 | (12) | | | | 1.05 | | | | | (0.07 | ) | | | | 20 | |
4/1/14 to 3/31/15 | | | | | | 12.64 | | | | | — | (5) | | | | 2.44 | | | | | 2.44 | | | | | — | | | | | (0.55 | ) | | | | (0.55 | ) | | | | 1.89 | | | | | 14.53 | | | | | 19.50 | | | | | 8,595 | | | | | 1.02 | (12) | | | | 1.02 | | | | | 0.03 | | | | | 28 | |
4/1/13 to 3/31/14 | | | | | | 10.64 | | | | | 0.02 | | | | | 2.04 | | | | | 2.06 | | | | | (0.06 | ) | | | | — | | | | | (0.06 | ) | | | | 2.00 | | | | | 12.64 | | | | | 19.45 | | | | | 5,532 | | | | | 1.03 | (12) | | | | 1.03 | | | | | 0.14 | | | | | 26 | |
| | | | | | | | | | | | | | | | |
Class R6 | | | | | | | | | | | | | | | | | | | | | | | | | | | | | | | | | | | | | | | | | | | | | | | | | | | | | | | | | | | | | | | | | | | | | | | | | | | | | |
1/30/18(7) to 9/30/18 | | | | | $ | 18.46 | | | | | (— | )(5) | | | | 0.58 | | | | | 0.58 | | | | | — | | | | | — | | | | | — | | | | | 0.58 | | | | $ | 19.04 | | | | | 3.14 | % | | | $ | 6,458 | | | | | 0.80 | %(8) | | | | 0.91 | % | | | | (0.03 | )% | | | | 17 | %(11) |
| KAR Global Quality | | | | | | | | | | | | | | | | | | | | | | | | | | | | | | | | | | | | | | | | | | | | | | | | | | | | | | | | | | | | | | | | | | | | | | | | | | | | | |
Dividend Fund | | | | | | | | | | | | | | | | | | | | | | | | | | | | | | | | | | | | | | | | | | | | | | | | | | | | | | | | | | | | | | | | | | | | | | | | | | | | | |
Class A | | | | | | | | | | | | | | | | | | | | | | | | | | | | | | | | | | | | | | | | | | | | | | | | | | | | | | | | | | | | | | | | | | | | | | | | | | | | | |
10/1/17 to 9/30/18 | | | | | $ | 16.20 | | | | | 0.40 | | | | | 0.25 | | | | | 0.65 | | | | | (0.65 | ) | | | | (1.22 | ) | | | | (1.87 | ) | | | | (1.22 | ) | | | $ | 14.98 | | | | | 4.24 | % | | | $ | 26,351 | | | | | 1.35 | % | | | | 1.50 | % | | | | 2.63 | % | | | | 33 | % |
4/1/17 to 9/30/17(14) | | | | | | 16.81 | | | | | 0.30 | | | | | 0.41 | | | | | 0.71 | | | | | (0.27 | ) | | | | (1.05 | ) | | | | (1.32 | ) | | | | (0.61 | ) | | | | 16.20 | | | | | 4.31 | | | | | 44,188 | | | | | 1.35 | | | | | 1.56 | | | | | 3.65 | | | | | 13 | |
4/1/16 to 3/31/17 | | | | | | 15.09 | | | | | 0.20 | | | | | 1.66 | | | | | 1.86 | | | | | (0.14 | ) | | | | — | | | | | (0.14 | ) | | | | 1.72 | | | | | 16.81 | | | | | 12.42 | | | | | 46,670 | | | | | 1.36 | (9) | | | | 1.48 | | | | | 1.29 | | | | | 119 | |
4/1/15 to 3/31/16 | | | | | | 15.40 | | | | | 0.14 | | | | | (0.37 | ) | | | | (0.23 | ) | | | | (0.08 | ) | | | | — | | | | | (0.08 | ) | | | | (0.31 | ) | | | | 15.09 | | | | | (1.53 | ) | | | | 50,081 | | | | | 1.35 | | | | | 1.44 | | | | | 0.94 | | | | | 25 | |
4/1/14 to 3/31/15 | | | | | | 13.93 | | | | | 0.10 | | | | | 1.49 | | | | | 1.59 | | | | | (0.12 | ) | | | | — | | | | | (0.12 | ) | | | | 1.47 | | | | | 15.40 | | | | | 11.45 | | | | | 55,215 | | | | | 1.35 | | | | | 1.42 | | | | | 0.71 | | | | | 56 | |
4/1/13 to 3/31/14 | | | | | | 11.96 | | | | | 0.10 | | | | | 1.98 | | | | | 2.08 | | | | | (0.11 | ) | | | | — | | | | | (0.11 | ) | | | | 1.97 | | | | | 13.93 | | | | | 17.50 | | | | | 49,275 | | | | | 1.35 | | | | | 1.43 | | | | | 0.81 | | | | | 23 | |
| | | | | | | | | | | | | | | | |
Class C | | | | | | | | | | | | | | | | | | | | | | | | | | | | | | | | | | | | | | | | | | | | | | | | | | | | | | | | | | | | | | | | | | | | | | | | | | | | | |
10/1/17 to 9/30/18 | | | | | $ | 15.82 | | | | | 0.32 | | | | | 0.22 | | | | | 0.54 | | | | | (0.62 | ) | | | | (1.22 | ) | | | | (1.84 | ) | | | | (1.30 | ) | | | $ | 14.52 | | | | | 3.56 | % | | | $ | 5,127 | | | | | 2.10 | % | | | | 2.25 | % | | | | 2.16 | % | | | | 33 | % |
4/1/17 to 9/30/17(14) | | | | | | 16.38 | | | | | 0.23 | | | | | 0.39 | | | | | 0.62 | | | | | (0.13 | ) | | | | (1.05 | ) | | | | (1.18 | ) | | | | (0.56 | ) | | | | 15.82 | | | | | 3.86 | | | | | 6,107 | | | | | 2.10 | | | | | 2.33 | | | | | 2.87 | | | | | 13 | |
4/1/16 to 3/31/17 | | | | | | 14.68 | | | | | 0.08 | | | | | 1.62 | | | | | 1.70 | | | | | — | | | | | — | | | | | — | | | | | 1.70 | | | | | 16.38 | | | | | 11.58 | | | | | 6,950 | | | | | 2.11 | (9) | | | | 2.23 | | | | | 0.54 | | | | | 119 | |
4/1/15 to 3/31/16 | | | | | | 15.03 | | | | | 0.01 | | | | | (0.35 | ) | | | | (0.34 | ) | | | | (0.01 | ) | | | | — | | | | | (0.01 | ) | | | | (0.35 | ) | | | | 14.68 | | | | | (2.26 | ) | | | | 8,211 | | | | | 2.10 | | | | | 2.18 | | | | | 0.10 | | | | | 25 | |
4/1/14 to 3/31/15 | | | | | | 13.67 | | | | | 0.01 | | | | | 1.43 | | | | | 1.44 | | | | | (0.08 | ) | | | | — | | | | | (0.08 | ) | | | | 1.36 | | | | | 15.03 | | | | | 10.64 | | | | | 20,383 | | | | | 2.10 | | | | | 2.16 | | | | | 0.07 | | | | | 56 | |
4/1/13 to 3/31/14 | | | | | | 11.77 | | | | | 0.01 | | | | | 1.94 | | | | | 1.95 | | | | | (0.05 | ) | | | | — | | | | | (0.05 | ) | | | | 1.90 | | | | | 13.67 | | | | | 16.56 | | | | | 3,803 | | | | | 2.10 | | | | | 2.18 | | | | | 0.05 | | | | | 23 | |
The footnote legend is at the end of the Financial Highlights.
See Notes to Financial Statements
69
VIRTUS EQUITY TRUST
FINANCIAL HIGHLIGHTS (Continued)
SELECTED PER SHARE DATA AND RATIOS FOR A SHARE OUTSTANDING
THROUGHOUT EACH PERIOD
| | | | | | | | | | | | | | | | | | | | | | | | | | | | | | | | | | | | | | | | | | | | | | | | | | | | | | | | | | | | | | | | | | | | | | | | | | | | | |
| | | | Net Asset Value,
Beginning of Period | | Net Investment Income (Loss)(1) | | Net Realized and
Unrealized Gain (Loss) | | Total from Investment Operations | | Dividends from
Net Investment Income | | Distributions from
Net Realized Gains | | Total Distributions | | Change in Net Asset Value | | Net Asset Value, End of Period | | Total
Return(2)(4) | | Net Assets, End of Period
(in thousands) | | Ratio of Net Expenses to
Average Net Assets(3)(10) | | Ratio of Gross Expenses to Average
Net Assets(3)(10) | | Ratio of Net Investment Income
(Loss) to Average Net Assets(3) | | Portfolio Turnover Rate(4) |
| KAR Global Quality | | | | | | | | | | | | | | | | | | | | | | | | | | | | | | | | | | | | | | | | | | | | | | | | | | | | | | | | | | | | | | | | | | | | | | | | | | | | | |
Dividend Fund (Continued) | | | | | | | | | | | | | | | | | | | | | | | | | | | | | | | | | | | | | | | | | | | | | | | | | | | | | | | | | | | | | | | | | | | | | | | | | | | | | |
Class I | | | | | | | | | | | | | | | | | | | | | | | | | | | | | | | | | | | | | | | | | | | | | | | | | | | | | | | | | | | | | | | | | | | | | | | | | | | | | |
10/1/17 to 9/30/18 | | | | | $ | 16.20 | | | | | 0.47 | | | | | 0.23 | | | | | 0.70 | | | | | (0.66 | ) | | | | (1.22 | ) | | | | (1.88 | ) | | | | (1.18 | ) | | | $ | 15.02 | | | | | 4.56 | % | | | $ | 4,843 | | | | | 1.10 | % | | | | 1.29 | % | | | | 3.14 | % | | | | 33 | % |
4/1/17 to 9/30/17(14) | | | | | | 16.84 | | | | | 0.29 | | | | | 0.44 | | | | | 0.73 | | | | | (0.32 | ) | | | | (1.05 | ) | | | | (1.37 | ) | | | | (0.64 | ) | | | | 16.20 | | | | | 4.41 | | | | | 6,524 | | | | | 1.10 | | | | | 1.33 | | | | | 3.53 | | | | | 13 | |
4/1/16 to 3/31/17 | | | | | | 15.12 | | | | | 0.25 | | | | | 1.65 | | | | | 1.90 | | | | | (0.18 | ) | | | | — | | | | | (0.18 | ) | | | | 1.72 | | | | | 16.84 | | | | | 12.66 | | | | | 7,096 | | | | | 1.11 | (9) | | | | 1.23 | | | | | 1.59 | | | | | 119 | |
4/1/15 to 3/31/16 | | | | | | 15.40 | | | | | 0.17 | | | | | (0.35 | ) | | | | (0.18 | ) | | | | (0.10 | ) | | | | — | | | | | (0.10 | ) | | | | (0.28 | ) | | | | 15.12 | | | | | (1.21 | ) | | | | 6,496 | | | | | 1.10 | | | | | 1.18 | | | | | 1.15 | | | | | 25 | |
4/1/14 to 3/31/15 | | | | | | 13.93 | | | | | 0.14 | | | | | 1.49 | | | | | 1.63 | | | | | (0.16 | ) | | | | — | | | | | (0.16 | ) | | | | 1.47 | | | | | 15.40 | | | | | 11.72 | | | | | 9,776 | | | | | 1.10 | | | | | 1.17 | | | | | 0.96 | | | | | 56 | |
4/1/13 to 3/31/14 | | | | | | 11.97 | | | | | 0.13 | | | | | 1.97 | | | | | 2.10 | | | | | (0.14 | ) | | | | — | | | | | (0.14 | ) | | | | 1.96 | | | | | 13.93 | | | | | 17.70 | | | | | 9,546 | | | | | 1.10 | | | | | 1.18 | | | | | 0.99 | | | | | 23 | |
KAR Mid-Cap Core Fund | | | | | | | | | | | | | | | | | | | | | | | | | | | | | | | | | | | | | | | | | | | | | | | | | | | | | | | | | | | | | | | | | | | | | | | | | | | | | |
Class A | | | | | | | | | | | | | | | | | | | | | | | | | | | | | | | | | | | | | | | | | | | | | | | | | | | | | | | | | | | | | | | | | | | | | | | | | | | | | |
10/1/17 to 9/30/18 | | | | | $ | 27.95 | | | | | (0.09 | ) | | | | 5.85 | | | | | 5.76 | | | | | — | | | | | — | | | | | — | | | | | 5.76 | | | | $ | 33.71 | | | | | 20.61 | % | | | $ | 33,120 | | | | | 1.20 | % | | | | 1.39 | % | | | | (0.29 | )% | | | | 21 | % |
4/1/17 to 9/30/17(14) | | | | | | 25.80 | | | | | (0.05 | ) | | | | 2.29 | | | | | 2.24 | | | | | — | | | | | (0.09 | ) | | | | (0.09 | ) | | | | 2.15 | | | | | 27.95 | | | | | 8.70 | | | | | 26,238 | | | | | 1.20 | | | | | 1.49 | | | | | (0.35 | ) | | | | 11 | |
4/1/16 to 3/31/17 | | | | | | 22.60 | | | | | (0.08 | ) | | | | 3.28 | | | | | 3.20 | | | | | — | | | | | — | | | | | — | | | | | 3.20 | | | | | 25.80 | | | | | 14.16 | | | | | 20,615 | | | | | 1.26 | (8)(9) | | | | 1.55 | | | | | (0.32 | ) | | | | 28 | |
4/1/15 to 3/31/16 | | | | | | 23.00 | | | | | (0.06 | ) | | | | (0.20 | ) | | | | (0.26 | ) | | | | — | | | | | (0.14 | ) | | | | (0.14 | ) | | | | (0.40 | ) | | | | 22.60 | | | | | (1.14 | ) | | | | 20,639 | | | | | 1.35 | | | | | 1.64 | | | | | (0.27 | ) | | | | 21 | |
4/1/14 to 3/31/15 | | | | | | 19.80 | | | | | (0.07 | ) | | | | 4.47 | | | | | 4.40 | | | | | — | | | | | (1.20 | ) | | | | (1.20 | ) | | | | 3.20 | | | | | 23.00 | | | | | 22.75 | | | | | 13,080 | | | | | 1.35 | | | | | 2.46 | | | | | (0.34 | ) | | | | 26 | |
4/1/13 to 3/31/14 | | | | | | 17.49 | | | | | (0.06 | ) | | | | 2.68 | | | | | 2.62 | | | | | — | | | | | (0.31 | ) | | | | (0.31 | ) | | | | 2.31 | | | | | 19.80 | | | | | 15.17 | | | | | 3,027 | | | | | 1.35 | | | | | 3.08 | | | | | (0.31 | ) | | | | 30 | |
| | | | | | | | | | | | | | | | |
Class C | | | | | | | | | | | | | | | | | | | | | | | | | | | | | | | | | | | | | | | | | | | | | | | | | | | | | | | | | | | | | | | | | | | | | | | | | | | | | |
10/1/17 to 9/30/18 | | | | | $ | 26.38 | | | | | (0.31 | ) | | | | 5.51 | | | | | 5.20 | | | | | — | | | | | — | | | | | — | | | | | 5.20 | | | | $ | 31.58 | | | | | 19.71 | % | | | $ | 30,661 | | | | | 1.95 | % | | | | 2.14 | % | | | | (1.04 | )% | | | | 21 | % |
4/1/17 to 9/30/17(14) | | | | | | 24.45 | | | | | (0.14 | ) | | | | 2.16 | | | | | 2.02 | | | | | — | | | | | (0.09 | ) | | | | (0.09 | ) | | | | 1.93 | | | | | 26.38 | | | | | 8.28 | | | | | 17,870 | | | | | 1.95 | | | | | 2.25 | | | | | (1.10 | ) | | | | 11 | |
4/1/16 to 3/31/17 | | | | | | 21.57 | | | | | (0.24 | ) | | | | 3.12 | | | | | 2.88 | | | | | — | | | | | — | | | | | — | | | | | 2.88 | | | | | 24.45 | | | | | 13.35 | | | | | 14,279 | | | | | 2.00 | (8)(9) | | | | 2.28 | | | | | (1.04 | ) | | | | 28 | |
4/1/15 to 3/31/16 | | | | | | 22.12 | | | | | (0.22 | ) | | | | (0.19 | ) | | | | (0.41 | ) | | | | — | | | | | (0.14 | ) | | | | (0.14 | ) | | | | (0.55 | ) | | | | 21.57 | | | | | (1.91 | ) | | | | 6,670 | | | | | 2.10 | | | | | 2.38 | | | | | (1.03 | ) | | | | 21 | |
4/1/14 to 3/31/15 | | | | | | 19.23 | | | | | (0.23 | ) | | | | 4.32 | | | | | 4.09 | | | | | — | | | | | (1.20 | ) | | | | (1.20 | ) | | | | 2.89 | | | | | 22.12 | | | | | 21.84 | | | | | 4,363 | | | | | 2.10 | | | | | 2.83 | | | | | (1.10 | ) | | | | 26 | |
4/1/13 to 3/31/14 | | | | | | 17.12 | | | | | (0.18 | ) | | | | 2.60 | | | | | 2.42 | | | | | — | | | | | (0.31 | ) | | | | (0.31 | ) | | | | 2.11 | | | | | 19.23 | | | | | 14.32 | | | | | 209 | | | | | 2.10 | | | | | 3.84 | | | | | (1.01 | ) | | | | 30 | |
| | | | | | | | | | | | | | | | |
Class I | | | | | | | | | | | | | | | | | | | | | | | | | | | | | | | | | | | | | | | | | | | | | | | | | | | | | | | | | | | | | | | | | | | | | | | | | | | | | |
10/1/17 to 9/30/18 | | | | | $ | 28.34 | | | | | (0.01 | ) | | | | 5.93 | | | | | 5.92 | | | | | — | | | | | — | | | | | — | | | | | 5.92 | | | | $ | 34.26 | | | | | 20.93 | % | | | $ | 167,649 | | | | | 0.95 | % | | | | 1.14 | % | | | | (0.03 | )% | | | | 21 | % |
4/1/17 to 9/30/17(14) | | | | | | 26.12 | | | | | (0.01 | ) | | | | 2.32 | | | | | 2.31 | | | | | — | | | | | (0.09 | ) | | | | (0.09 | ) | | | | 2.22 | | | | | 28.34 | | | | | 8.82 | | | | | 69,955 | | | | | 0.95 | | | | | 1.25 | | | | | (0.10 | ) | | | | 11 | |
4/1/16 to 3/31/17 | | | | | | 22.82 | | | | | (0.01 | ) | | | | 3.31 | | | | | 3.30 | | | | | — | | | | | — | | | | | — | | | | | 3.30 | | | | | 26.12 | | | | | 14.46 | | | | | 50,922 | | | | | 0.99 | (8)(9) | | | | 1.26 | | | | | (0.02 | ) | | | | 28 | |
4/1/15 to 3/31/16 | | | | | | 23.17 | | | | | (0.01 | ) | | | | (0.20 | ) | | | | (0.21 | ) | | | | — | | | | | (0.14 | ) | | | | (0.14 | ) | | | | (0.35 | ) | | | | 22.82 | | | | | (0.92 | ) | | | | 7,570 | | | | | 1.10 | | | | | 1.38 | | | | | (0.03 | ) | | | | 21 | |
4/1/14 to 3/31/15 | | | | | | 19.89 | | | | | (0.03 | ) | | | | 4.51 | | | | | 4.48 | | | | | — | | | | | (1.20 | ) | | | | (1.20 | ) | | | | 3.28 | | | | | 23.17 | | | | | 23.05 | | | | | 4,804 | | | | | 1.10 | | | | | 2.17 | | | | | (0.16 | ) | | | | 26 | |
4/1/13 to 3/31/14 | | | | | | 17.52 | | | | | (0.01 | ) | | | | 2.69 | | | | | 2.68 | | | | | — | | | | | (0.31 | ) | | | | (0.31 | ) | | | | 2.37 | | | | | 19.89 | | | | | 15.48 | | | | | 1,178 | | | | | 1.10 | | | | | 2.85 | | | | | (0.08 | ) | | | | 30 | |
4/1/12 to 3/31/13 | | | | | | 15.84 | | | | | 0.25 | | | | | 1.84 | | | | | 2.09 | | | | | (0.30 | ) | | | | (0.11 | ) | | | | (0.41 | ) | | | | 1.68 | | | | | 17.52 | | | | | 13.50 | | | | | 1,316 | | | | | 1.10 | | | | | 3.65 | | | | | 1.56 | | | | | 62 | |
| | | | | | | | | | | | | | | | |
Class R6 | | | | | | | | | | | | | | | | | | | | | | | | | | | | | | | | | | | | | | | | | | | | | | | | | | | | | | | | | | | | | | | | | | | | | | | | | | | | | |
1/30/18(7) to 9/30/18 | | | | | $ | 32.78 | | | | | 0.02 | | | | | 1.48 | | | | | 1.50 | | | | | — | | | | | — | | | | | — | | | | | 1.50 | | | | $ | 34.28 | | | | | 4.58 | % | | | $ | 2,474 | | | | | 0.87 | % | | | | 1.06 | % | | | | 0.10 | % | | | | 21 | %(11) |
The footnote legend is at the end of the Financial Highlights.
See Notes to Financial Statements
70
VIRTUS EQUITY TRUST
FINANCIAL HIGHLIGHTS (Continued)
SELECTED PER SHARE DATA AND RATIOS FOR A SHARE OUTSTANDING
THROUGHOUT EACH PERIOD
| | | | | | | | | | | | | | | | | | | | | | | | | | | | | | | | | | | | | | | | | | | | | | | | | | | | | | | | | | | | | | | | | | | | | | | | | | | | | |
| | | | Net Asset Value,
Beginning of Period | | Net Investment Income (Loss)(1) | | Net Realized and
Unrealized Gain (Loss) | | Total from Investment Operations | | Dividends from
Net Investment Income | | Distributions from
Net Realized Gains | | Total Distributions | | Change in Net Asset Value | | Net Asset Value, End of Period | | Total
Return(2)(4) | | Net Assets, End of Period
(in thousands) | | Ratio of Net Expenses to
Average Net Assets(3)(10) | | Ratio of Gross Expenses to Average
Net Assets(3)(10) | | Ratio of Net Investment Income
(Loss) to Average Net Assets(3) | | Portfolio Turnover Rate(4) |
KAR Mid-Cap Growth Fund | | | | | | | | | | | | | | | | | | | | | | | | | | | | | | | | | | | | | | | | | | | | | | | | | | | | | | | | | | | | | | | | | | | | | | | | | | | | | |
Class A | | | | | | | | | | | | | | | | | | | | | | | | | | | | | | | | | | | | | | | | | | | | | | | | | | | | | | | | | | | | | | | | | | | | | | | | | | | | | |
10/1/17 to 9/30/18 | | | | | $ | 27.74 | | | | | (0.28 | ) | | | | 9.65 | | | | | 9.37 | | | | | — | | | | | (1.56 | ) | | | | (1.56 | ) | | | | 7.81 | | | | $ | 35.55 | | | | | 35.38 | % | | | $ | 131,422 | | | | | 1.40 | %(6) | | | | 1.37 | % | | | | (0.88 | )% | | | | 19 | % |
4/1/17 to 9/30/17(14) | | | | | | 24.56 | | | | | (0.12 | ) | | | | 3.43 | | | | | 3.31 | | | | | — | | | | | (0.13 | ) | | | | (0.13 | ) | | | | 3.18 | | | | | 27.74 | | | | | 13.48 | | | | | 84,912 | | | | | 1.40 | | | | | 1.49 | | | | | (0.88 | ) | | | | 12 | |
4/1/16 to 3/31/17 | | | | | | 21.92 | | | | | (0.16 | ) | | | | 3.15 | | | | | 2.99 | | | | | — | | | | | (0.35 | ) | | | | (0.35 | ) | | | | 2.64 | | | | | 24.56 | | | | | 13.81 | (13) | | | | 80,648 | | | | | 1.41 | (9)(13) | | | | 1.52 | | | | | (0.75 | )(13) | | | | 20 | |
4/1/15 to 3/31/16 | | | | | | 22.80 | | | | | (0.18 | ) | | | | (0.36 | ) | | | | (0.54 | ) | | | | — | | | | | (0.34 | ) | | | | (0.34 | ) | | | | (0.88 | ) | | | | 21.92 | | | | | (2.51 | ) | | | | 76,660 | | | | | 1.39 | | | | | 1.49 | | | | | (0.84 | ) | | | | 26 | |
4/1/14 to 3/31/15 | | | | | | 21.30 | | | | | (0.15 | ) | | | | 2.34 | | | | | 2.19 | | | | | — | | | | | (0.69 | ) | | | | (0.69 | ) | | | | 1.50 | | | | | 22.80 | | | | | 10.50 | | | | | 83,158 | | | | | 1.43 | (8) | | | | 1.46 | | | | | (0.71 | ) | | | | 27 | |
4/1/13 to 3/31/14 | | | | | | 19.02 | | | | | (0.15 | ) | | | | 2.43 | | | | | 2.28 | | | | | — | | | | | — | | | | | — | | | | | 2.28 | | | | | 21.30 | | | | | 11.99 | | | | | 81,016 | | | | | 1.45 | | | | | 1.44 | | | | | (0.74 | ) | | | | 32 | |
| | | | | | | | | | | | | | | | |
Class C | | | | | | | | | | | | | | | | | | | | | | | | | | | | | | | | | | | | | | | | | | | | | | | | | | | | | | | | | | | | | | | | | | | | | | | | | | | | | |
10/1/17 to 9/30/18 | | | | | $ | 22.54 | | | | | (0.42 | ) | | | | 7.74 | | | | | 7.32 | | | | | — | | | | | (1.56 | ) | | | | (1.56 | ) | | | | 5.76 | | | | $ | 28.30 | | | | | 34.40 | % | | | $ | 12,571 | | | | | 2.15 | %(6) | | | | 2.17 | % | | | | (1.63 | )% | | | | 19 | % |
4/1/17 to 9/30/17(14) | | | | | | 20.06 | | | | | (0.17 | ) | | | | 2.78 | | | | | 2.61 | | | | | — | | | | | (0.13 | ) | | | | (0.13 | ) | | | | 2.48 | | | | | 22.54 | | | | | 13.01 | | | | | 4,971 | | | | | 2.15 | | | | | 2.28 | | | | | (1.63 | ) | | | | 12 | |
4/1/16 to 3/31/17 | | | | | | 18.09 | | | | | (0.27 | ) | | | | 2.59 | | | | | 2.32 | | | | | — | | | | | (0.35 | ) | | | | (0.35 | ) | | | | 1.97 | | | | | 20.06 | | | | | 13.03 | (13) | | | | 5,350 | | | | | 2.16 | (9)(13) | | | | 2.27 | | | | | (1.50 | )(13) | | | | 20 | |
4/1/15 to 3/31/16 | | | | | | 19.02 | | | | | (0.29 | ) | | | | (0.30 | ) | | | | (0.59 | ) | | | | — | | | | | (0.34 | ) | | | | (0.34 | ) | | | | (0.93 | ) | | | | 18.09 | | | | | (3.23 | ) | | | | 5,319 | | | | | 2.14 | | | | | 2.24 | | | | | (1.60 | ) | | | | 26 | |
4/1/14 to 3/31/15 | | | | | | 18.01 | | | | | (0.26 | ) | | | | 1.96 | | | | | 1.70 | | | | | — | | | | | (0.69 | ) | | | | (0.69 | ) | | | | 1.01 | | | | | 19.02 | | | | | 9.68 | | | | | 5,976 | | | | | 2.18 | (8) | | | | 2.21 | | | | | (1.46 | ) | | | | 27 | |
4/1/13 to 3/31/14 | | | | | | 16.21 | | | | | (0.26 | ) | | | | 2.06 | | | | | 1.80 | | | | | — | | | | | — | | | | | — | | | | | 1.80 | | | | | 18.01 | | | | | 11.10 | | | | | 5,233 | | | | | 2.20 | | | | | 2.19 | | | | | (1.49 | ) | | | | 32 | |
| | | | | | | | | | | | | | | | |
Class I | | | | | | | | | | | | | | | | | | | | | | | | | | | | | | | | | | | | | | | | | | | | | | | | | | | | | | | | | | | | | | | | | | | | | | | | | | | | | |
10/1/17 to 9/30/18 | | | | | $ | 28.49 | | | | | (0.22 | ) | | | | 9.95 | | | | | 9.73 | | | | | — | | | | | (1.56 | ) | | | | (1.56 | ) | | | | 8.17 | | | | $ | 36.66 | | | | | 35.72 | % | | | $ | 56,787 | | | | | 1.15 | %(6) | | | | 1.13 | % | | | | (0.65 | )% | | | | 19 | % |
4/1/17 to 9/30/17(14) | | | | | | 25.20 | | | | | (0.09 | ) | | | | 3.51 | | | | | 3.42 | | | | | — | | | | | (0.13 | ) | | | | (0.13 | ) | | | | 3.29 | | | | | 28.49 | | | | | 13.58 | | | | | 4,419 | | | | | 1.15 | | | | | 1.27 | | | | | (0.63 | ) | | | | 12 | |
4/1/16 to 3/31/17 | | | | | | 22.42 | | | | | (0.11 | ) | | | | 3.24 | | | | | 3.13 | | | | | — | | | | | (0.35 | ) | | | | (0.35 | ) | | | | 2.78 | | | | | 25.20 | | | | | 14.13 | (13) | | | | 3,872 | | | | | 1.16 | (9)(13) | | | | 1.27 | | | | | (0.50 | )(13) | | | | 20 | |
4/1/15 to 3/31/16 | | | | | | 23.26 | | | | | (0.13 | ) | | | | (0.37 | ) | | | | (0.50 | ) | | | | — | | | | | (0.34 | ) | | | | (0.34 | ) | | | | (0.84 | ) | | | | 22.42 | | | | | (2.24 | ) | | | | 2,961 | | | | | 1.14 | | | | | 1.24 | | | | | (0.60 | ) | | | | 26 | |
4/1/14 to 3/31/15 | | | | | | 21.66 | | | | | (0.10 | ) | | | | 2.39 | | | | | 2.29 | | | | | — | | | | | (0.69 | ) | | | | (0.69 | ) | | | | 1.60 | | | | | 23.26 | | | | | 10.79 | | | | | 3,288 | | | | | 1.18 | (8) | | | | 1.21 | | | | | (0.46 | ) | | | | 27 | |
4/1/13 to 3/31/14 | | | | | | 19.30 | | | | | (0.10 | ) | | | | 2.46 | | | | | 2.36 | | | | | — | | | | | — | | | | | — | | | | | 2.36 | | | | | 21.66 | | | | | 12.23 | | | | | 2,324 | | | | | 1.20 | | | | | 1.19 | | | | | (0.49 | ) | | | | 32 | |
| | | | | | | | | | | | | | | | |
Class R6 | | | | | | | | | | | | | | | | | | | | | | | | | | | | | | | | | | | | | | | | | | | | | | | | | | | | | | | | | | | | | | | | | | | | | | | | | | | | | |
1/30/18(7) to 9/30/18 | | | | | $ | 31.74 | | | | | (0.09 | ) | | | | 5.06 | | | | | 4.97 | | | | | — | | | | | — | | | | | — | | | | | 4.97 | | | | $ | 36.71 | | | | | 15.66 | % | | | $ | 117 | | | | | 0.93 | %(6)(8) | | | | 1.09 | % | | | | (0.40 | )% | | | | 19 | %(11) |
KAR Small-Cap Core Fund | | | | | | | | | | | | | | | | | | | | | | | | | | | | | | | | | | | | | | | | | | | | | | | | | | | | | | | | | | | | | | | | | | | | | | | | | | | | | |
Class A | | | | | | | | | | | | | | | | | | | | | | | | | | | | | | | | | | | | | | | | | | | | | | | | | | | | | | | | | | | | | | | | | | | | | | | | | | | | | |
10/1/17 to 9/30/18 | | | | | $ | 28.05 | | | | | (0.03 | ) | | | | 7.44 | | | | | 7.41 | | | | | — | | | | | (0.04 | ) | | | | (0.04 | ) | | | | 7.37 | | | | $ | 35.42 | | | | | 26.42 | % | | | $ | 153,109 | | | | | 1.29 | % | | | | 1.29 | % | | | | (0.08 | )% | | | | 13 | % |
4/1/17 to 9/30/17(14) | | | | | | 24.21 | | | | | (0.06 | ) | | | | 3.91 | | | | | 3.85 | | | | | — | | | | | (0.01 | ) | | | | (0.01 | ) | | | | 3.84 | | | | | 28.05 | | | | | 15.92 | | | | | 79,752 | | | | | 1.33 | | | | | 1.33 | | | | | (0.49 | ) | | | | 2 | |
4/1/16 to 3/31/17 | | | | | | 21.39 | | | | | (0.07 | ) | | | | 4.26 | | | | | 4.19 | | | | | — | | | | | (1.37 | ) | | | | (1.37 | ) | | | | 2.82 | | | | | 24.21 | | | | | 20.26 | (13) | | | | 62,122 | | | | | 1.37 | (9)(13) | | | | 1.37 | | | | | (0.31 | )(13) | | | | 24 | |
4/1/15 to 3/31/16 | | | | | | 25.65 | | | | | (0.05 | ) | | | | 0.01 | | | | | (0.04 | ) | | | | (0.05 | ) | | | | (4.17 | ) | | | | (4.22 | ) | | | | (4.26 | ) | | | | 21.39 | | | | | 0.02 | | | | | 53,722 | | | | | 1.37 | | | | | 1.37 | | | | | (0.21 | ) | | | | 33 | |
4/1/14 to 3/31/15 | | | | | | 24.19 | | | | | 0.03 | | | | | 3.07 | | | | | 3.10 | | | | | — | | | | | (1.64 | ) | | | | (1.64 | ) | | | | 1.46 | | | | | 25.65 | | | | | 13.28 | | | | | 67,696 | | | | | 1.34 | | | | | 1.34 | | | | | 0.12 | | | | | 28 | |
4/1/13 to 3/31/14 | | | | | | 21.41 | | | | | (0.02 | ) | | | | 2.84 | | | | | 2.82 | | | | | (0.03 | ) | | | | (0.01 | ) | | | | (0.04 | ) | | | | 2.78 | | | | | 24.19 | | | | | 13.17 | | | | | 162,302 | | | | | 1.39 | | | | | 1.39 | | | | | (0.09 | ) | | | | 31 | |
| | | | | | | | | | | | | | | | |
Class C | | | | | | | | | | | | | | | | | | | | | | | | | | | | | | | | | | | | | | | | | | | | | | | | | | | | | | | | | | | | | | | | | | | | | | | | | | | | | |
10/1/17 to 9/30/18 | | | | | $ | 23.90 | | | | | (0.23 | ) | | | | 6.32 | | | | | 6.09 | | | | | — | | | | | (0.04 | ) | | | | (0.04 | ) | | | | 6.05 | | | | $ | 29.95 | | | | | 25.52 | % | | | $ | 122,439 | | | | | 2.02 | % | | | | 2.02 | % | | | | (0.82 | )% | | | | 13 | % |
4/1/17 to 9/30/17(14) | | | | | | 20.71 | | | | | (0.14 | ) | | | | 3.34 | | | | | 3.20 | | | | | — | | | | | (0.01 | ) | | | | (0.01 | ) | | | | 3.19 | | | | | 23.90 | | | | | 15.47 | | | | | 56,526 | | | | | 2.08 | | | | | 2.08 | | | | | (1.23 | ) | | | | 2 | |
4/1/16 to 3/31/17 | | | | | | 18.61 | | | | | (0.21 | ) | | | | 3.68 | | | | | 3.47 | | | | | — | | | | | (1.37 | ) | | | | (1.37 | ) | | | | 2.10 | | | | | 20.71 | | | | | 19.39 | (13) | | | | 44,789 | | | | | 2.12 | (9)(13) | | | | 2.12 | | | | | (1.10 | )(13) | | | | 24 | |
4/1/15 to 3/31/16 | | | | | | 22.98 | | | | | (0.19 | ) | | | | (0.01 | ) | | | | (0.20 | ) | | | | — | | | | | (4.17 | ) | | | | (4.17 | ) | | | | (4.37 | ) | | | | 18.61 | | | | | (0.73 | ) | | | | 31,711 | | | | | 2.12 | | | | | 2.12 | | | | | (0.95 | ) | | | | 33 | |
4/1/14 to 3/31/15 | | | | | | 21.99 | | | | | (0.11 | ) | | | | 2.74 | | | | | 2.63 | | | | | — | | | | | (1.64 | ) | | | | (1.64 | ) | | | | 0.99 | | | | | 22.98 | | | | | 12.44 | | | | | 33,735 | | | | | 2.09 | | | | | 2.09 | | | | | (0.50 | ) | | | | 28 | |
4/1/13 to 3/31/14 | | | | | | 19.58 | | | | | (0.18 | ) | | | | 2.60 | | | | | 2.42 | | | | | — | (5) | | | | (0.01 | ) | | | | (0.01 | ) | | | | 2.41 | | | | | 21.99 | | | | | 12.35 | | | | | 33,437 | | | | | 2.14 | | | | | 2.14 | | | | | (0.84 | ) | | | | 31 | |
The footnote legend is at the end of the Financial Highlights.
See Notes to Financial Statements
71
VIRTUS EQUITY TRUST
FINANCIAL HIGHLIGHTS (Continued)
SELECTED PER SHARE DATA AND RATIOS FOR A SHARE OUTSTANDING
THROUGHOUT EACH PERIOD
| | | | | | | | | | | | | | | | | | | | | | | | | | | | | | | | | | | | | | | | | | | | | | | | | | | | | | | | | | | | | | | | | | | | | | | | | | | | | |
| | | | Net Asset Value,
Beginning of Period | | Net Investment Income (Loss)(1) | | Net Realized and
Unrealized Gain (Loss) | | Total from Investment Operations | | Dividends from
Net Investment Income | | Distributions from
Net Realized Gains | | Total Distributions | | Change in Net Asset Value | | Net Asset Value, End of Period | | Total
Return(2)(4) | | Net Assets, End of Period
(in thousands) | | Ratio of Net Expenses to
Average Net Assets(3)(10) | | Ratio of Gross Expenses to Average
Net Assets(3)(10) | | Ratio of Net Investment Income
(Loss) to Average Net Assets(3) | | Portfolio Turnover Rate(4) |
| KAR Small-Cap Core Fund | | | | | | | | | | | | | | | | | | | | | | | | | | | | | | | | | | | | | | | | | | | | | | | | | | | | | | | | | | | | | | | | | | | | | | | | | | | | | |
(Continued) | | | | | | | | | | | | | | | | | | | | | | | | | | | | | | | | | | | | | | | | | | | | | | | | | | | | | | | | | | | | | | | | | | | | | | | | | | | | | |
Class I | | | | | | | | | | | | | | | | | | | | | | | | | | | | | | | | | | | | | | | | | | | | | | | | | | | | | | | | | | | | | | | | | | | | | | | | | | | | | |
10/1/17 to 9/30/18 | | | | | $ | 29.44 | | | | | 0.06 | | | | | 7.80 | | | | | 7.86 | | | | | — | | | | | (0.04 | ) | | | | (0.04 | ) | | | | 7.82 | | | | $ | 37.26 | | | | | 26.73 | % | | | $ | 1,231,686 | | | | | 1.01 | % | | | | 1.01 | % | | | | 0.18 | % | | | | 13 | % |
4/1/17 to 9/30/17(14) | | | | | | 25.37 | | | | | (0.03 | ) | | | | 4.11 | | | | | 4.08 | | | | | — | | | | | (0.01 | ) | | | | (0.01 | ) | | | | 4.07 | | | | | 29.44 | | | | | 16.10 | | | | | 474,552 | | | | | 1.08 | | | | | 1.08 | | | | | (0.23 | ) | | | | 2 | |
4/1/16 to 3/31/17 | | | | | | 22.30 | | | | | (0.03 | ) | | | | 4.47 | | | | | 4.44 | | | | | — | | | | | (1.37 | ) | | | | (1.37 | ) | | | | 3.07 | | | | | 25.37 | | | | | 20.57 | (13) | | | | 338,491 | | | | | 1.12 | (9)(13) | | | | 1.12 | | | | | (0.11 | )(13) | | | | 24 | |
4/1/15 to 3/31/16 | | | | | | 26.58 | | | | | 0.01 | | | | | 0.01 | | | | | 0.02 | | | | | (0.13 | ) | | | | (4.17 | ) | | | | (4.30 | ) | | | | (4.28 | ) | | | | 22.30 | | | | | 0.28 | | | | | 189,167 | | | | | 1.12 | | | | | 1.12 | | | | | 0.04 | | | | | 33 | |
4/1/14 to 3/31/15 | | | | | | 24.95 | | | | | 0.13 | | | | | 3.14 | | | | | 3.27 | | | | | — | | | | | (1.64 | ) | | | | (1.64 | ) | | | | 1.63 | | | | | 26.58 | | | | | 13.57 | | | | | 248,933 | | | | | 1.08 | | | | | 1.08 | | | | | 0.53 | | | | | 28 | |
4/1/13 to 3/31/14 | | | | | | 22.04 | | | | | 0.04 | | | | | 2.92 | | | | | 2.96 | | | | | (0.04 | ) | | | | (0.01 | ) | | | | (0.05 | ) | | | | 2.91 | | | | | 24.95 | | | | | 13.44 | | | | | 242,400 | | | | | 1.14 | | | | | 1.14 | | | | | 0.19 | | | | | 31 | |
| | | | | | | | | | | | | | | | |
Class R6 | | | | | | | | | | | | | | | | | | | | | | | | | | | | | | | | | | | | | | | | | | | | | | | | | | | | | | | | | | | | | | | | | | | | | | | | | | | | | |
10/1/17 to 9/30/18 | | | | | $ | 29.52 | | | | | 0.09 | | | | | 7.83 | | | | | 7.92 | | | | | — | | | | | (0.04 | ) | | | | (0.04 | ) | | | | 7.88 | | | | $ | 37.40 | | | | | 26.86 | % | | | $ | 88,563 | | | | | 0.94 | % | | | | 0.94 | % | | | | 0.25 | % | | | | 13 | % |
4/1/17 to 9/30/17(14) | | | | | | 25.44 | | | | | (0.02 | ) | | | | 4.11 | | | | | 4.09 | | | | | — | | | | | (0.01 | ) | | | | (0.01 | ) | | | | 4.08 | | | | | 29.52 | | | | | 16.14 | | | | | 44,565 | | | | | 0.99 | | | | | 0.99 | | | | | (0.14 | ) | | | | 2 | |
4/1/16 to 3/31/17 | | | | | | 22.33 | | | | | — | (5) | | | | 4.48 | | | | | 4.48 | | | | | — | | | | | (1.37 | ) | | | | (1.37 | ) | | | | 3.11 | | | | | 25.44 | | | | | 20.68 | (13) | | | | 31,338 | | | | | 1.01 | (9)(13) | | | | 1.01 | | | | | 0.01 | (13) | | | | 24 | |
4/1/15 to 3/31/16 | | | | | | 26.59 | | | | | 0.07 | | | | | (0.01 | ) | | | | 0.06 | | | | | (0.15 | ) | | | | (4.17 | ) | | | | (4.32 | ) | | | | (4.26 | ) | | | | 22.33 | | | | | 0.41 | | | | | 20,811 | | | | | 1.01 | | | | | 1.02 | | | | | 0.33 | | | | | 33 | |
11/12/14(7) to 3/31/15 | | | | | | 25.99 | | | | | 0.12 | | | | | 1.36 | | | | | 1.48 | | | | | — | | | | | (0.88 | ) | | | | (0.88 | ) | | | | 0.60 | | | | | 26.59 | | | | | 5.83 | | | | | 106 | | | | | 0.97 | | | | | 0.97 | | | | | 1.18 | | | | | 28 | (11) |
| KAR Small-Cap Growth | | | | | | | | | | | | | | | | | | | | | | | | | | | | | | | | | | | | | | | | | | | | | | | | | | | | | | | | | | | | | | | | | | | | | | | | | | | | | |
Fund | | | | | | | | | | | | | | | | | | | | | | | | | | | | | | | | | | | | | | | | | | | | | | | | | | | | | | | | | | | | | | | | | | | | | | | | | | | | | |
Class A | | | | | | | | | | | | | | | | | | | | | | | | | | | | | | | | | | | | | | | | | | | | | | | | | | | | | | | | | | | | | | | | | | | | | | | | | | | | | |
10/1/17 to 9/30/18 | | | | | $ | 25.43 | | | | | (0.11 | ) | | | | 8.25 | | | | | 8.14 | | | | | — | | | | | — | | | | | — | | | | | 8.14 | | | | $ | 33.57 | | | | | 32.01 | % | | | $ | 866,966 | | | | | 1.37 | % | | | | 1.37 | % | | | | (0.37 | )% | | | | 13 | % |
4/1/17 to 9/30/17(14) | | | | | | 21.12 | | | | | (0.09 | ) | | | | 4.40 | | | | | 4.31 | | | | | — | (5) | | | | — | | | | | — | (5) | | | | 4.31 | | | | | 25.43 | | | | | 20.41 | | | | | 263,281 | | | | | 1.50 | (6) | | | | 1.46 | | | | | (0.81 | ) | | | | 1 | |
4/1/16 to 3/31/17 | | | | | | 17.67 | | | | | (0.14 | ) | | | | 4.14 | | | | | 4.00 | | | | | — | | | | | (0.55 | ) | | | | (0.55 | ) | | | | 3.45 | | | | | 21.12 | | | | | 23.25 | (13) | | | | 184,302 | | | | | 1.50 | (9)(13) | | | | 1.51 | | | | | (0.73 | )(13) | | | | 21 | |
4/1/15 to 3/31/16 | | | | | | 17.54 | | | | | (0.10 | ) | | | | 0.73 | | | | | 0.63 | | | | | — | | | | | (0.50 | ) | | | | (0.50 | ) | | | | 0.13 | | | | | 17.67 | | | | | 3.69 | | | | | 88,715 | | | | | 1.49 | | | | | 1.53 | | | | | (0.59 | ) | | | | 27 | |
4/1/14 to 3/31/15 | | | | | | 16.97 | | | | | (0.13 | ) | | | | 2.46 | | | | | 2.33 | | | | | — | | | | | (1.76 | ) | | | | (1.76 | ) | | | | 0.57 | | | | | 17.54 | | | | | 14.56 | | | | | 83,611 | | | | | 1.50 | | | | | 1.57 | | | | | (0.76 | ) | | | | 27 | |
4/1/13 to 3/31/14 | | | | | | 14.92 | | | | | (0.15 | ) | | | | 2.68 | | | | | 2.53 | | | | | — | | | | | (0.48 | ) | | | | (0.48 | ) | | | | 2.05 | | | | | 16.97 | | | | | 17.15 | | | | | 94,902 | | | | | 1.50 | | | | | 1.56 | | | | | (0.93 | ) | | | | 23 | |
| | | | | | | | | | | | | | | | |
Class C | | | | | | | | | | | | | | | | | | | | | | | | | | | | | | | | | | | | | | | | | | | | | | | | | | | | | | | | | | | | | | | | | | | | | | | | | | | | | |
10/1/17 to 9/30/18 | | | | | $ | 23.13 | | | | | (0.31 | ) | | | | 7.48 | | | | | 7.17 | | | | | — | | | | | — | | | | | — | | | | | 7.17 | | | | $ | 30.30 | | | | | 31.00 | % | | | $ | 301,749 | | | | | 2.10 | % | | | | 2.10 | % | | | | (1.10 | )% | | | | 13 | % |
4/1/17 to 9/30/17(14) | | | | | | 19.28 | | | | | (0.17 | ) | | | | 4.02 | | | | | 3.85 | | | | | — | (5) | | | | — | | | | | — | (5) | | | | 3.85 | | | | | 23.13 | | | | | 19.97 | | | | | 93,560 | | | | | 2.25 | (6) | | | | 2.21 | | | | | (1.56 | ) | | | | 1 | |
4/1/16 to 3/31/17 | | | | | | 16.30 | | | | | (0.26 | ) | | | | 3.79 | | | | | 3.53 | | | | | — | | | | | (0.55 | ) | | | | (0.55 | ) | | | | 2.98 | | | | | 19.28 | | | | | 22.30 | (13) | | | | 58,327 | | | | | 2.26 | (9)(13) | | | | 2.26 | | | | | (1.49 | )(13) | | | | 21 | |
4/1/15 to 3/31/16 | | | | | | 16.33 | | | | | (0.21 | ) | | | | 0.68 | | | | | 0.47 | | | | | — | | | | | (0.50 | ) | | | | (0.50 | ) | | | | (0.03 | ) | | | | 16.30 | | | | | 2.97 | | | | | 19,525 | | | | | 2.25 | | | | | 2.28 | | | | | (1.34 | ) | | | | 27 | |
4/1/14 to 3/31/15 | | | | | | 16.03 | | | | | (0.24 | ) | | | | 2.30 | | | | | 2.06 | | | | | — | | | | | (1.76 | ) | | | | (1.76 | ) | | | | 0.30 | | | | | 16.33 | | | | | 13.68 | | | | | 15,594 | | | | | 2.25 | | | | | 2.32 | | | | | (1.51 | ) | | | | 27 | |
4/1/13 to 3/31/14 | | | | | | 14.22 | | | | | (0.26 | ) | | | | 2.55 | | | | | 2.29 | | | | | — | | | | | (0.48 | ) | | | | (0.48 | ) | | | | 1.81 | | | | | 16.03 | | | | | 16.29 | | | | | 13,298 | | | | | 2.25 | | | | | 2.31 | | | | | (1.68 | ) | | | | 23 | |
| | | | | | | | | | | | | | | | |
Class I | | | | | | | | | | | | | | | | | | | | | | | | | | | | | | | | | | | | | | | | | | | | | | | | | | | | | | | | | | | | | | | | | | | | | | | | | | | | | |
10/1/17 to 9/30/18 | | | | | $ | 25.86 | | | | | (0.03 | ) | | | | 8.38 | | | | | 8.35 | | | | | — | | | | | — | | | | | — | | | | | 8.35 | | | | $ | 34.21 | | | | | 32.29 | % | | | $ | 4,121,658 | | | | | 1.10 | % | | | | 1.10 | % | | | | (0.10 | )% | | | | 13 | % |
4/1/17 to 9/30/17(14) | | | | | | 21.45 | | | | | (0.07 | ) | | | | 4.48 | | | | | 4.41 | | | | | — | (5) | | | | — | | | | | — | (5) | | | | 4.41 | | | | | 25.86 | | | | | 20.56 | | | | | 1,087,430 | | | | | 1.25 | (6) | | | | 1.21 | | | | | (0.55 | ) | | | | 1 | |
4/1/16 to 3/31/17 | | | | | | 17.89 | | | | | (0.10 | ) | | | | 4.21 | | | | | 4.11 | | | | | — | | | | | (0.55 | ) | | | | (0.55 | ) | | | | 3.56 | | | | | 21.45 | | | | | 23.59 | (13) | | | | 489,593 | | | | | 1.26 | (9)(13) | | | | 1.26 | | | | | (0.50 | )(13) | | | | 21 | |
4/1/15 to 3/31/16 | | | | | | 17.70 | | | | | (0.05 | ) | | | | 0.74 | | | | | 0.69 | | | | | — | | | | | (0.50 | ) | | | | (0.50 | ) | | | | 0.19 | | | | | 17.89 | | | | | 4.00 | | | | | 98,270 | | | | | 1.25 | | | | | 1.29 | | | | | (0.31 | ) | | | | 27 | |
4/1/14 to 3/31/15 | | | | | | 17.08 | | | | | (0.08 | ) | | | | 2.46 | | | | | 2.38 | | | | | — | | | | | (1.76 | ) | | | | (1.76 | ) | | | | 0.62 | | | | | 17.70 | | | | | 14.83 | | | | | 35,058 | | | | | 1.25 | | | | | 1.32 | | | | | (0.47 | ) | | | | 27 | |
4/1/13 to 3/31/14 | | | | | | 14.98 | | | | | (0.11 | ) | | | | 2.69 | | | | | 2.58 | | | | | — | | | | | (0.48 | ) | | | | (0.48 | ) | | | | 2.10 | | | | | 17.08 | | | | | 17.42 | | | | | 20,685 | | | | | 1.25 | | | | | 1.30 | | | | | (0.68 | ) | | | | 23 | |
| | | | | | | | | | | | | | | | |
Class R6 | | | | | | | | | | | | | | | | | | | | | | | | | | | | | | | | | | | | | | | | | | | | | | | | | | | | | | | | | | | | | | | | | | | | | | | | | | | | | |
1/30/18(7) to 9/30/18 | | | | | $ | 29.81 | | | | | 0.01 | | | | | 4.41 | | | | | 4.42 | | | | | — | | | | | — | | | | | — | | | | | 4.42 | | | | $ | 34.23 | | | | | 14.83 | % | | | $ | 13,800 | | | | | 1.00 | % | | | | 1.00 | % | | | | 0.05 | % | | | | 13 | %(11) |
The footnote legend is at the end of the Financial Highlights.
See Notes to Financial Statements
72
VIRTUS EQUITY TRUST
FINANCIAL HIGHLIGHTS (Continued)
SELECTED PER SHARE DATA AND RATIOS FOR A SHARE OUTSTANDING
THROUGHOUT EACH PERIOD
| | | | | | | | | | | | | | | | | | | | | | | | | | | | | | | | | | | | | | | | | | | | | | | | | | | | | | | | | | | | | | | | | | | | | | | | | | | | | |
| | | | Net Asset Value,
Beginning of Period | | Net Investment Income (Loss)(1) | | Net Realized and
Unrealized Gain (Loss) | | Total from Investment Operations | | Dividends from
Net Investment Income | | Distributions from
Net Realized Gains | | Total Distributions | | Change in Net Asset Value | | Net Asset Value, End of Period | | Total
Return(2)(4) | | Net Assets, End of Period
(in thousands) | | Ratio of Net Expenses to
Average Net Assets(3)(10) | | Ratio of Gross Expenses to Average
Net Assets(3)(10) | | Ratio of Net Investment Income
(Loss) to Average Net Assets(3) | | Portfolio Turnover Rate(4) |
| KAR Small-Cap Value | | | | | | | | | | | | | | | | | | | | | | | | | | | | | | | | | | | | | | | | | | | | | | | | | | | | | | | | | | | | | | | | | | | | | | | | | | | | | |
Fund | | | | | | | | | | | | | | | | | | | | | | | | | | | | | | | | | | | | | | | | | | | | | | | | | | | | | | | | | | | | | | | | | | | | | | | | | | | | | |
Class A | | | | | | | | | | | | | | | | | | | | | | | | | | | | | | | | | | | | | | | | | | | | | | | | | | | | | | | | | | | | | | | | | | | | | | | | | | | | | |
10/1/17 to 9/30/18 | | | | | $ | 18.41 | | | | | 0.10 | | | | | 1.23 | | | | | 1.33 | | | | | (0.01 | ) | | | | (0.29 | ) | | | | (0.30 | ) | | | | 1.03 | | | | $ | 19.44 | | | | | 7.27 | % | | | $ | 83,276 | | | | | 1.27 | % | | | | 1.27 | % | | | | 0.55 | % | | | | 6 | % |
4/1/17 to 9/30/17(14) | | | | | | 17.61 | | | | | 0.03 | | | | | 1.44 | | | | | 1.47 | | | | | (0.02 | ) | | | | (0.65 | ) | | | | (0.67 | ) | | | | 0.80 | | | | | 18.41 | | | | | 8.56 | | | | | 87,399 | | | | | 1.32 | (12) | | | | 1.32 | | | | | 0.29 | | | | | 10 | |
4/1/16 to 3/31/17 | | | | | | 15.67 | | | | | 0.22 | | | | | 3.16 | | | | | 3.38 | | | | | (0.26 | ) | | | | (1.18 | ) | | | | (1.44 | ) | | | | 1.94 | | | | | 17.61 | | | | | 22.86 | | | | | 89,050 | | | | | 1.32 | (9)(12) | | | | 1.32 | | | | | 1.35 | | | | | 22 | |
4/1/15 to 3/31/16 | | | | | | 16.61 | | | | | 0.07 | | | | | 0.07 | | | | | 0.14 | | | | | (0.10 | ) | | | | (0.98 | ) | | | | (1.08 | ) | | | | (0.94 | ) | | | | 15.67 | | | | | 0.94 | | | | | 71,280 | | | | | 1.30 | (12) | | | | 1.30 | | | | | 0.49 | | | | | 15 | |
4/1/14 to 3/31/15 | | | | | | 16.74 | | | | | 0.09 | | | | | 1.38 | | | | | 1.47 | | | | | (0.03 | ) | | | | (1.57 | ) | | | | (1.60 | ) | | | | (0.13 | ) | | | | 16.61 | | | | | 9.33 | | | | | 74,738 | | | | | 1.28 | (6) | | | | 1.28 | | | | | 0.54 | | | | | 24 | |
4/1/13 to 3/31/14 | | | | | | 13.91 | | | | | 0.04 | | | | | 2.84 | | | | | 2.88 | | | | | (0.05 | ) | | | | — | | | | | (0.05 | ) | | | | 2.83 | | | | | 16.74 | | | | | 20.78 | | | | | 137,496 | | | | | 1.32 | (6) | | | | 1.32 | | | | | 0.24 | | | | | 24 | |
| | | | | | | | | | | | | | | | |
Class C | | | | | | | | | | | | | | | | | | | | | | | | | | | | | | | | | | | | | | | | | | | | | | | | | | | | | | | | | | | | | | | | | | | | | | | | | | | | | |
10/1/17 to 9/30/18 | | | | | $ | 18.08 | | | | | (0.03 | ) | | | | 1.20 | | | | | 1.17 | | | | | — | | | | | (0.29 | ) | | | | (0.29 | ) | | | | 0.88 | | | | $ | 18.96 | | | | | 6.54 | % | | | $ | 29,922 | | | | | 1.97 | % | | | | 1.97 | % | | | | (0.14 | )% | | | | 6 | % |
4/1/17 to 9/30/17(14) | | | | | | 17.35 | | | | | (0.04 | ) | | | | 1.42 | | | | | 1.38 | | | | | — | | | | | (0.65 | ) | | | | (0.65 | ) | | | | 0.73 | | | | | 18.08 | | | | | 8.17 | | | | | 29,795 | | | | | 2.06 | (12) | | | | 2.06 | | | | | (0.45 | ) | | | | 10 | |
4/1/16 to 3/31/17 | | | | | | 15.45 | | | | | 0.10 | | | | | 3.11 | | | | | 3.21 | | | | | (0.13 | ) | | | | (1.18 | ) | | | | (1.31 | ) | | | | 1.90 | | | | | 17.35 | | | | | 21.95 | | | | | 29,416 | | | | | 2.07 | (9)(12) | | | | 2.07 | | | | | 0.65 | | | | | 22 | |
4/1/15 to 3/31/16 | | | | | | 16.41 | | | | | (0.04 | ) | | | | 0.06 | | | | | 0.02 | | | | | — | | | | | (0.98 | ) | | | | (0.98 | ) | | | | (0.96 | ) | | | | 15.45 | | | | | 0.17 | | | | | 23,602 | | | | | 2.05 | (12) | | | | 2.05 | | | | | (0.26 | ) | | | | 15 | |
4/1/14 to 3/31/15 | | | | | | 16.65 | | | | | (0.02 | ) | | | | 1.35 | | | | | 1.33 | | | | | — | | | | | (1.57 | ) | | | | (1.57 | ) | | | | (0.24 | ) | | | | 16.41 | | | | | 8.49 | | | | | 25,634 | | | | | 2.03 | (6) | | | | 2.03 | | | | | (0.12 | ) | | | | 24 | |
4/1/13 to 3/31/14 | | | | | | 13.89 | | | | | (0.08 | ) | | | | 2.84 | | | | | 2.76 | | | | | — | | | | | — | | | | | — | | | | | 2.76 | | | | | 16.65 | | | | | 19.87 | | | | | 27,132 | | | | | 2.07 | (6) | | | | 2.07 | | | | | (0.52 | ) | | | | 24 | |
| | | | | | | | | | | | | | | | |
Class I | | | | | | | | | | | | | | | | | | | | | | | | | | | | | | | | | | | | | | | | | | | | | | | | | | | | | | | | | | | | | | | | | | | | | | | | | | | | | |
10/1/17 to 9/30/18 | | | | | $ | 18.41 | | | | | 0.16 | | | | | 1.23 | | | | | 1.39 | | | | | (0.02 | ) | | | | (0.29 | ) | | | | (0.31 | ) | | | | 1.08 | | | | $ | 19.49 | | | | | 7.62 | % | | | $ | 475,103 | | | | | 0.99 | % | | | | 0.99 | % | | | | 0.84 | % | | | | 6 | % |
4/1/17 to 9/30/17(14) | | | | | | 17.62 | | | | | 0.05 | | | | | 1.43 | | | | | 1.48 | | | | | (0.04 | ) | | | | (0.65 | ) | | | | (0.69 | ) | | | | 0.79 | | | | | 18.41 | | | | | 8.72 | | | | | 300,259 | | | | | 1.07 | (12) | | | | 1.07 | | | | | 0.55 | | | | | 10 | |
4/1/16 to 3/31/17 | | | | | | 15.69 | | | | | 0.26 | | | | | 3.17 | | | | | 3.43 | | | | | (0.32 | ) | | | | (1.18 | ) | | | | (1.50 | ) | | | | 1.93 | | | | | 17.62 | | | | | 23.20 | | | | | 242,661 | | | | | 1.07 | (9)(12) | | | | 1.07 | | | | | 1.63 | | | | | 22 | |
4/1/15 to 3/31/16 | | | | | | 16.64 | | | | | 0.11 | | | | | 0.07 | | | | | 0.18 | | | | | (0.15 | ) | | | | (0.98 | ) | | | | (1.13 | ) | | | | (0.95 | ) | | | | 15.69 | | | | | 1.17 | | | | | 144,487 | | | | | 1.05 | (12) | | | | 1.05 | | | | | 0.74 | | | | | 15 | |
4/1/14 to 3/31/15 | | | | | | 16.77 | | | | | 0.16 | | | | | 1.35 | | | | | 1.51 | | | | | (0.07 | ) | | | | (1.57 | ) | | | | (1.64 | ) | | | | (0.13 | ) | | | | 16.64 | | | | | 9.59 | | | | | 163,082 | | | | | 1.03 | (6) | | | | 1.03 | | | | | 0.97 | | | | | 24 | |
4/1/13 to 3/31/14 | | | | | | 13.92 | | | | | 0.08 | | | | | 2.84 | | | | | 2.92 | | | | | (0.07 | ) | | | | — | | | | | (0.07 | ) | | | | 2.85 | | | | | 16.77 | | | | | 21.06 | | | | | 104,149 | | | | | 1.07 | (6) | | | | 1.07 | | | | | 0.49 | | | | | 24 | |
| | | | | | | | | | | | | | | | |
Class R6 | | | | | | | | | | | | | | | | | | | | | | | | | | | | | | | | | | | | | | | | | | | | | | | | | | | | | | | | | | | | | | | | | | | | | | | | | | | | | |
10/1/17 to 9/30/18 | | | | | $ | 18.42 | | | | | 0.18 | | | | | 1.22 | | | | | 1.40 | | | | | (0.02 | ) | | | | (0.29 | ) | | | | (0.31 | ) | | | | 1.09 | | | | $ | 19.51 | | | | | 7.69 | % | | | $ | 21,746 | | | | | 0.90 | % | | | | 0.90 | % | | | | 0.96 | % | | | | 6 | % |
4/1/17 to 9/30/17(14) | | | | | | 17.63 | | | | | 0.05 | | | | | 1.44 | | | | | 1.49 | | | | | (0.05 | ) | | | | (0.65 | ) | | | | (0.70 | ) | | | | 0.79 | | | | | 18.42 | | | | | 8.78 | | | | | 10,165 | | | | | 0.99 | (12) | | | | 0.99 | | | | | 0.52 | | | | | 10 | |
11/3/16(7) to 3/31/17 | | | | | | 14.90 | | | | | 0.05 | | | | | 3.15 | | | | | 3.20 | | | | | (0.22 | ) | | | | (0.25 | ) | | | | (0.47 | ) | | | | 2.73 | | | | | 17.63 | | | | | 21.58 | | | | | 122 | | | | | 0.98 | (12) | | | | 0.98 | | | | | 0.68 | | | | | 22 | (11) |
| KAR Small-Mid Cap | | | | | | | | | | | | | | | | | | | | | | | | | | | | | | | | | | | | | | | | | | | | | | | | | | | | | | | | | | | | | | | | | | | | | | | | | | | | | |
Core Fund | | | | | | | | | | | | | | | | | | | | | | | | | | | | | | | | | | | | | | | | | | | | | | | | | | | | | | | | | | | | | | | | | | | | | | | | | | | | | |
Class A | | | | | | | | | | | | | | | | | | | | | | | | | | | | | | | | | | | | | | | | | | | | | | | | | | | | | | | | | | | | | | | | | | | | | | | | | | | | | |
3/7/18(7) to 9/30/18 | | | | | $ | 10.00 | | | | | (0.02 | ) | | | | 0.81 | | | | | 0.79 | | | | | — | | | | | — | | | | | — | | | | | 0.79 | | | | $ | 10.79 | | | | | 7.90 | % | | | $ | 158 | | | | | 1.30 | % | | | | 5.84 | % | | | | (0.38 | )% | | | | 16 | % |
| | | | | | | | | | | | | | | | |
Class C | | | | | | | | | | | | | | | | | | | | | | | | | | | | | | | | | | | | | | | | | | | | | | | | | | | | | | | | | | | | | | | | | | | | | | | | | | | | | |
3/7/18(7) to 9/30/18 | | | | | $ | 10.00 | | | | | (0.07 | ) | | | | 0.82 | | | | | 0.75 | | | | | — | | | | | — | | | | | — | | | | | 0.75 | | | | $ | 10.75 | | | | | 7.50 | % | | | $ | 135 | | | | | 2.05 | % | | | | 6.48 | % | | | | (1.14 | )% | | | | 16 | % |
| | | | | | | | | | | | | | | | |
Class I | | | | | | | | | | | | | | | | | | | | | | | | | | | | | | | | | | | | | | | | | | | | | | | | | | | | | | | | | | | | | | | | | | | | | | | | | | | | | |
3/7/18(7) to 9/30/18 | | | | | $ | 10.00 | | | | | (0.01 | ) | | | | 0.82 | | | | | 0.81 | | | | | — | | | | | — | | | | | — | | | | | 0.81 | | | | $ | 10.81 | | | | | 8.10 | % | | | $ | 214 | | | | | 1.05 | % | | | | 5.74 | % | | | | (0.13 | )% | | | | 16 | % |
| | | | | | | | | | | | | | | | |
Class R6 | | | | | | | | | | | | | | | | | | | | | | | | | | | | | | | | | | | | | | | | | | | | | | | | | | | | | | | | | | | | | | | | | | | | | | | | | | | | | |
3/7/18(7) to 9/30/18(17) | | | | | $ | 10.00 | | | | | (— | )(5) | | | | 0.81 | | | | | 0.81 | | | | | — | | | | | — | | | | | — | | | | | 0.81 | | | | $ | 10.81 | | | | | 8.10 | % | | | $ | 2,919 | | | | | 0.97 | % | | | | 5.20 | % | | | | (0.07 | )% | | | | 16 | % |
The footnote legend is at the end of the Financial Highlights.
See Notes to Financial Statements
73
VIRTUS EQUITY TRUST
FINANCIAL HIGHLIGHTS (Continued)
SELECTED PER SHARE DATA AND RATIOS FOR A SHARE OUTSTANDING
THROUGHOUT EACH PERIOD
| | | | | | | | | | | | | | | | | | | | | | | | | | | | | | | | | | | | | | | | | | | | | | | | | | | | | | | | | | | | | | | | | | | | | | | | | | | | | |
| | | | Net Asset Value,
Beginning of Period | | Net Investment Income (Loss)(1) | | Net Realized and
Unrealized Gain (Loss) | | Total from Investment Operations | | Dividends from
Net Investment Income | | Distributions from
Net Realized Gains | | Total Distributions | | Change in Net Asset Value | | Net Asset Value, End of Period | | Total
Return(2)(4) | | Net Assets, End of Period
(in thousands) | | Ratio of Net Expenses to
Average Net Assets(3)(10) | | Ratio of Gross Expenses to Average
Net Assets(3)(10) | | Ratio of Net Investment Income
(Loss) to Average Net Assets(3) | | Portfolio Turnover Rate(4) |
| Rampart Enhanced | | | | | | | | | | | | | | | | | | | | | | | | | | | | | | | | | | | | | | | | | | | | | | | | | | | | | | | | | | | | | | | | | | | | | | | | | | | | | |
Core Equity Fund | | | | | | | | | | | | | | | | | | | | | | | | | | | | | | | | | | | | | | | | | | | | | | | | | | | | | | | | | | | | | | | | | | | | | | | | | | | | | |
Class A | | | | | | | | | | | | | | | | | | | | | | | | | | | | | | | | | | | | | | | | | | | | | | | | | | | | | | | | | | | | | | | | | | | | | | | | | | | | | |
10/1/17 to 9/30/18 | | | | | $ | 20.26 | | | | | 0.14 | | | | | 2.02 | | | | | 2.16 | | | | | (0.06 | ) | | | | (1.31 | ) | | | | (1.37 | ) | | | | 0.79 | | | | $ | 21.05 | | | | | 10.84 | % | | | $ | 118,904 | | | | | 1.20 | % | | | | 1.31 | % | | | | 0.71 | % | | | | 24 | % |
4/1/17 to 9/30/17(14) | | | | | | 20.27 | | | | | 0.06 | | | | | 1.72 | | | | | 1.78 | | | | | (0.06 | ) | | | | (1.73 | ) | | | | (1.79 | ) | | | | (0.01 | ) | | | | 20.26 | | | | | 9.26 | | | | | 120,445 | | | | | 1.23 | (8) | | | | 1.39 | | | | | 0.63 | | | | | 110 | |
4/1/16 to 3/31/17 | | | | | | 18.14 | | | | | 0.15 | | | | | 2.68 | | | | | 2.83 | | | | | (0.22 | ) | | | | (0.48 | ) | | | | (0.70 | ) | | | | 2.13 | | | | | 20.27 | | | | | 15.85 | (13) | | | | 113,442 | | | | | 1.26 | (9)(13) | | | | 1.40 | | | | | 0.81 | (13) | | | | 496 | |
4/1/15 to 3/31/16 | | | | | | 20.97 | | | | | 0.14 | | | | | 0.56 | | | | | 0.70 | | | | | (0.15 | ) | | | | (3.38 | ) | | | | (3.53 | ) | | | | (2.83 | ) | | | | 18.14 | | | | | 4.02 | | | | | 101,113 | | | | | 1.25 | | | | | 1.38 | | | | | 0.74 | | | | | 312 | |
4/1/14 to 3/31/15 | | | | | | 21.94 | | | | | 0.17 | | | | | 1.84 | | | | | 2.01 | | | | | (0.08 | ) | | | | (2.90 | ) | | | | (2.98 | ) | | | | (0.97 | ) | | | | 20.97 | | | | | 9.75 | | | | | 116,725 | | | | | 1.25 | | | | | 1.36 | | | | | 0.82 | | | | | 345 | |
4/1/13 to 3/31/14 | | | | | | 19.51 | | | | | 0.14 | | | | | 4.02 | | | | | 4.16 | | | | | (0.10 | ) | | | | (1.63 | ) | | | | (1.73 | ) | | | | 2.43 | | | | | 21.94 | | | | | 21.84 | | | | | 111,074 | | | | | 1.25 | | | | | 1.39 | | | | | 0.66 | | | | | 283 | |
| | | | | | | | | | | | | | | | |
Class C | | | | | | | | | | | | | | | | | | | | | | | | | | | | | | | | | | | | | | | | | | | | | | | | | | | | | | | | | | | | | | | | | | | | | | | | | | | | | |
10/1/17 to 9/30/18 | | | | | $ | 18.23 | | | | | (0.01 | ) | | | | 1.80 | | | | | 1.79 | | | | | — | | | | | (1.31 | ) | | | | (1.31 | ) | | | | 0.48 | | | | $ | 18.71 | | | | | 10.00 | % | | | $ | 30,576 | | | | | 1.95 | % | | | | 2.06 | % | | | | (0.03 | )% | | | | 24 | % |
4/1/17 to 9/30/17(14) | | | | | | 18.44 | | | | | (0.02 | ) | | | | 1.56 | | | | | 1.54 | | | | | (0.02 | ) | | | | (1.73 | ) | | | | (1.75 | ) | | | | (0.21 | ) | | | | 18.23 | | | | | 8.85 | | | | | 32,710 | | | | | 1.98 | (8) | | | | 2.15 | | | | | (0.17 | ) | | | | 110 | |
4/1/16 to 3/31/17 | | | | | | 16.48 | | | | | 0.01 | | | | | 2.44 | | | | | 2.45 | | | | | (0.01 | ) | | | | (0.48 | ) | | | | (0.49 | ) | | | | 1.96 | | | | | 18.44 | | | | | 15.01 | (13) | | | | 37,269 | | | | | 2.00 | (9)(13) | | | | 2.15 | | | | | 0.04 | (13) | | | | 496 | |
4/1/15 to 3/31/16 | | | | | | 19.42 | | | | | — | (5) | | | | 0.51 | | | | | 0.51 | | | | | (0.07 | ) | | | | (3.38 | ) | | | | (3.45 | ) | | | | (2.94 | ) | | | | 16.48 | | | | | 3.27 | | | | | 36,236 | | | | | 2.00 | | | | | 2.13 | | | | | 0.01 | | | | | 312 | |
4/1/14 to 3/31/15 | | | | | | 20.60 | | | | | 0.01 | | | | | 1.72 | | | | | 1.73 | | | | | (0.01 | ) | | | | (2.90 | ) | | | | (2.91 | ) | | | | (1.18 | ) | | | | 19.42 | | | | | 8.91 | | | | | 37,312 | | | | | 2.00 | | | | | 2.12 | | | | | 0.06 | | | | | 345 | |
4/1/13 to 3/31/14 | | | | | | 18.46 | | | | | (0.02 | ) | | | | 3.81 | | | | | 3.79 | | | | | (0.02 | ) | | | | (1.63 | ) | | | | (1.65 | ) | | | | 2.14 | | | | | 20.60 | | | | | 20.93 | | | | | 27,930 | | | | | 2.00 | | | | | 2.14 | | | | | (0.09 | ) | | | | 283 | |
| | | | | | | | | | | | | | | | |
Class I | | | | | | | | | | | | | | | | | | | | | | | | | | | | | | | | | | | | | | | | | | | | | | | | | | | | | | | | | | | | | | | | | | | | | | | | | | | | | |
10/1/17 to 9/30/18 | | | | | $ | 20.22 | | | | | 0.19 | | | | | 2.01 | | | | | 2.20 | | | | | (0.08 | ) | | | | (1.31 | ) | | | | (1.39 | ) | | | | 0.81 | | | | $ | 21.03 | | | | | 11.10 | % | | | $ | 15,028 | | | | | 0.95 | % | | | | 1.08 | % | | | | 0.92 | % | | | | 24 | % |
4/1/17 to 9/30/17(14) | | | | | | 20.22 | | | | | 0.09 | | | | | 1.71 | | | | | 1.80 | | | | | (0.07 | ) | | | | (1.73 | ) | | | | (1.80 | ) | | | | — | | | | | 20.22 | | | | | 9.41 | | | | | 32,485 | | | |
| 0.98
| (8)
| | | | 1.15 | | | | | 0.91 | | | | | 110 | |
4/1/16 to 3/31/17 | | | | | | 18.13 | | | | | 0.21 | | | | | 2.66 | | | | | 2.87 | | | | | (0.30 | ) | | | | (0.48 | ) | | | | (0.78 | ) | | | | 2.09 | | | | | 20.22 | | | | | 16.16 | (13) | | | | 21,011 | | | | | 1.01 | (9)(13) | | | | 1.15 | | | | | 1.13 | (13) | | | | 496 | |
4/1/15 to 3/31/16 | | | | | | 20.96 | | | | | 0.21 | | | | | 0.53 | | | | | 0.74 | | | | | (0.19 | ) | | | | (3.38 | ) | | | | (3.57 | ) | | | | (2.83 | ) | | | | 18.13 | | | | | 4.25 | | | | | 11,991 | | | | | 1.00 | | | | | 1.13 | | | | | 1.13 | | | | | 312 | |
4/1/14 to 3/31/15 | | | | | | 21.90 | | | | | 0.22 | | | | | 1.85 | | | | | 2.07 | | | | | (0.11 | ) | | | | (2.90 | ) | | | | (3.01 | ) | | | | (0.94 | ) | | | | 20.96 | | | | | 10.06 | | | | | 8,969 | | | | | 1.00 | | | | | 1.11 | | | | | 1.05 | | | | | 345 | |
4/1/13 to 3/31/14 | | | | | | 19.48 | | | | | 0.19 | | | | | 4.01 | | | | | 4.20 | | | | | (0.15 | ) | | | | (1.63 | ) | | | | (1.78 | ) | | | | 2.42 | | | | | 21.90 | | | | | 22.12 | | | | | 11,291 | | | | | 1.00 | | | | | 1.14 | | | | | 0.90 | | | | | 283 | |
| | | | | | | | | | | | | | | | |
Class R6 | | | | | | | | | | | | | | | | | | | | | | | | | | | | | | | | | | | | | | | | | | | | | | | | | | | | | | | | | | | | | | | | | | | | | | | | | | | | | |
1/30/18(7) to 9/30/18 | | | | | $ | 20.70 | | | | | 0.15 | | | | | 0.18 | | | | | 0.33 | | | | | — | | | | | — | | | | | — | | | | | 0.33 | | | | $ | 21.03 | | | | | 1.59 | % | | | $ | 4,999 | | | | | 0.91 | % | | | | 1.00 | % | | | | 1.16 | % | | | | 24 | %(11) |
| Tactical Allocation | | | | | | | | | | | | | | | | | | | | | | | | | | | | | | | | | | | | | | | | | | | | | | | | | | | | | | | | | | | | | | | | | | | | | | | | | | | | | |
Fund | | | | | | | | | | | | | | | | | | | | | | | | | | | | | | | | | | | | | | | | | | | | | | | | | | | | | | | | | | | | | | | | | | | | | | | | | | | | | |
Class A | | | | | | | | | | | | | | | | | | | | | | | | | | | | | | | | | | | | | | | | | | | | | | | | | | | | | | | | | | | | | | | | | | | | | | | | | | | | | |
10/1/17 to 9/30/18 | | | | | $ | 9.00 | | | | | 0.14 | | | | | 0.73 | | | | | 0.87 | | | | | (0.14 | ) | | | | (0.07 | ) | | | | (0.21 | ) | | | | 0.66 | | | | $ | 9.66 | | | | | 9.73 | % | | | $ | 146,854 | | | | | 1.26 | % | | | | 1.27 | % | | | | 1.47 | % | | | | 41 | % |
4/1/17 to 9/30/17(14) | | | | | | 8.33 | | | | | 0.08 | | | | | 0.69 | | | | | 0.77 | | | | | (0.08 | ) | | | | (0.02 | ) | | | | (0.10 | ) | | | | 0.67 | | | | | 9.00 | | | | | 9.25 | | | | | 142,481 | | | | | 1.38 | | | | | 1.38 | | | | | 1.81 | | | | | 26 | |
4/1/16 to 3/31/17 | | | | | | 8.44 | | | | | 0.17 | | | | | 0.56 | | | | | 0.73 | | | | | (0.15 | ) | | | | (0.69 | ) | | | | (0.84 | ) | | | | (0.11 | ) | | | | 8.33 | | | | | 9.20 | (13) | | | | 137,388 | | | | | 1.37 | (9)(13) | | | | 1.38 | | | | | 1.86 | (13) | | | | 104 | |
4/1/15 to 3/31/16 | | | | | | 9.75 | | | | | 0.20 | | | | | (0.88 | ) | | | | (0.68 | ) | | | | (0.17 | ) | | | | (0.46 | ) | | | | (0.63 | ) | | | | (1.31 | ) | | | | 8.44 | | | | | (7.36 | ) | | | | 147,546 | | | | | 1.32 | | | | | 1.33 | | | | | 2.25 | | | | | 81 | |
4/1/14 to 3/31/15 | | | | | | 10.06 | | | | | 0.21 | | | | | 0.15 | | | | | 0.36 | | | | | (0.20 | ) | | | | (0.47 | ) | | | | (0.67 | ) | | | | (0.31 | ) | | | | 9.75 | | | | | 3.60 | | | | | 180,435 | | | | | 1.30 | | | | | 1.30 | | | | | 2.09 | | | | | 69 | |
4/1/13 to 3/31/14 | | | | | | 9.88 | | | | | 0.22 | | | | | 1.13 | | | | | 1.35 | | | | | (0.21 | ) | | | | (0.96 | ) | | | | (1.17 | ) | | | | 0.18 | | | | | 10.06 | | | | | 14.84 | | | | | 195,509 | | | | | 1.29 | | | | | 1.29 | | | | | 2.22 | | | | | 61 | |
The footnote legend is at the end of the Financial Highlights.
See Notes to Financial Statements
74
VIRTUS EQUITY TRUST
FINANCIAL HIGHLIGHTS (Continued)
SELECTED PER SHARE DATA AND RATIOS FOR A SHARE OUTSTANDING
THROUGHOUT EACH PERIOD
| | | | | | | | | | | | | | | | | | | | | | | | | | | | | | | | | | | | | | | | | | | | | | | | | | | | | | | | | | | | | | | | | | | | | | | | | | | | | |
| | | | Net Asset Value,
Beginning of Period | | Net Investment Income (Loss)(1) | | Net Realized and
Unrealized Gain (Loss) | | Total from Investment Operations | | Dividends from
Net Investment Income | | Distributions from
Net Realized Gains | | Total Distributions | | Change in Net Asset Value | | Net Asset Value, End of Period | | Total
Return(2)(4) | | Net Assets, End of Period
(in thousands) | | Ratio of Net Expenses to
Average Net Assets(3)(10) | | Ratio of Gross Expenses to Average
Net Assets(3)(10) | | Ratio of Net Investment Income
(Loss) to Average Net Assets(3) | | Portfolio Turnover Rate(4) |
| Tactical Allocation Fund | | | | | | | | | | | | | | | | | | | | | | | | | | | | | | | | | | | | | | | | | | | | | | | | | | | | | | | | | | | | | | | | | | | | | | | | | | | | | |
(Continued) | | | | | | | | | | | | | | | | | | | | | | | | | | | | | | | | | | | | | | | | | | | | | | | | | | | | | | | | | | | | | | | | | | | | | | | | | | | | | |
Class C | | | | | | | | | | | | | | | | | | | | | | | | | | | | | | | | | | | | | | | | | | | | | | | | | | | | | | | | | | | | | | | | | | | | | | | | | | | | | |
10/1/17 to 9/30/18 | | | | | $ | 9.24 | | | | | 0.07 | | | | | 0.75 | | | | | 0.82 | | | | | (0.06 | ) | | | | (0.07 | ) | | | | (0.13 | ) | | | | 0.69 | | | | $ | 9.93 | | | | | 8.94 | % | | | $ | 3,736 | | | | | 2.04 | % | | | | 2.05 | % | | | | 0.68 | % | | | | 41 | % |
4/1/17 to 9/30/17(14) | | | | | | 8.55 | | | | | 0.05 | | | | | 0.70 | | | | | 0.75 | | | | | (0.04 | ) | | | | (0.02 | ) | | | | (0.06 | ) | | | | 0.69 | | | | | 9.24 | | | | | 8.80 | | | | | 4,054 | | | | | 2.14 | | | | | 2.15 | | | | | 1.05 | | | | | 26 | |
4/1/16 to 3/31/17 | | | | | | 8.64 | | | | | 0.11 | | | | | 0.57 | | | | | 0.68 | | | | | (0.08 | ) | | | | (0.69 | ) | | | | (0.77 | ) | | | | (0.09 | ) | | | | 8.55 | | | | | 8.37 | (13) | | | | 4,378 | | | | | 2.11 | (9)(13) | | | | 2.13 | | | | | 1.13 | (13) | | | | 104 | |
4/1/15 to 3/31/16 | | | | | | 9.96 | | | | | 0.14 | | | | | (0.90 | ) | | | | (0.76 | ) | | | | (0.10 | ) | | | | (0.46 | ) | | | | (0.56 | ) | | | | (1.32 | ) | | | | 8.64 | | | | | (8.02 | ) | | | | 5,460 | | | | | 2.07 | | | | | 2.08 | | | | | 1.51 | | | | | 81 | |
4/1/14 to 3/31/15 | | | | | | 10.27 | | | | | 0.13 | | | | | 0.16 | | | | | 0.29 | | | | | (0.13 | ) | | | | (0.47 | ) | | | | (0.60 | ) | | | | (0.31 | ) | | | | 9.96 | | | | | 2.81 | | | | | 6,328 | | | | | 2.04 | | | | | 2.04 | | | | | 1.29 | | | | | 69 | |
4/1/13 to 3/31/14 | | | | | | 10.07 | | | | | 0.15 | | | | | 1.15 | | | | | 1.30 | | | | | (0.14 | ) | | | | (0.96 | ) | | | | (1.10 | ) | | | | 0.20 | | | | | 10.27 | | | | | 13.90 | | | | | 3,785 | | | | | 2.04 | | | | | 2.04 | | | | | 1.46 | | | | | 61 | |
Footnote Legend:
| (1) | Calculated using average shares outstanding. |
| (2) | Sales charges, where applicable, are not reflected in the total return calculation. |
| (3) | Annualized for periods less than one year. |
| (4) | Not annualized for periods less than one year. |
| (5) | Amount is less than $0.005 per share. |
| (6) | See Note 4D in the Notes to Financial Statements for information on recapture of expenses previously waived. |
| (8) | Represents a blended ratio. |
| (9) | Net expense ratio includes extraordinary proxy expenses. |
| (10) | Each Fund will also indirectly bear its prorated share of expenses of the underlying funds in which they invest. Such expenses are not included in the calculation of this ratio. |
| (11) | Portfolio turnover is representative of the Fund for the entire period. |
| (12) | The Fund is currently under its expense limitation. |
| (13) | State Street Bank & Trust, custodian for some of the Funds through January 29, 2010, reimbursed the Funds for out-of-pocket custody expenses overbilled for the period 1998 through January 29, 2010. Custody fees reimbursed were excluded from the Ratio of Net Expenses to Average Net Assets and the Ratio of Net Investment Income (Loss) to Average Net Assets. If it was included, the impact would have been to lower the Ratio of Net Expenses and increase the Ratio of Net Investment Income (Loss) as follows: |
| | | | | | | | | | | | | | | | |
| | | Class A | | | Class C | | | Class I | | | Class R6 | |
KAR Capital Growth Fund | | | 0.06 | % | | | 0.05 | % | | | 0.06 | % | | | N/A | |
KAR Mid-Cap Growth Fund | | | 0.05 | % | | | 0.05 | % | | | 0.05 | % | | | N/A | |
KAR Small-Cap Core Fund* | | | — | | | | — | | | | — | | | | — | |
KAR Small-Cap Growth Fund* | | | — | | | | — | | | | — | | | | N/A | |
Rampart Enhanced Core Equity Fund* | | | — | | | | — | | | | — | | | | N/A | |
Tactical Allocation Fund | | | 0.08 | % | | | 0.08 | % | | | N/A | | | | N/A | |
| | * | Amount is less than 0.005% |
The footnote legend is at the end of the Financial Highlights.
See Notes to Financial Statements
75
VIRTUS EQUITY TRUST
FINANCIAL HIGHLIGHTS (Continued)
SELECTED PER SHARE DATA AND RATIOS FOR A SHARE OUTSTANDING
THROUGHOUT EACH PERIOD
Custody fees reimbursed were included in Total Return. If excluded, the impact would have been to lower the Total Return as follows:
| | | | | | | | | | | | | | | | |
| | | Class A | | | Class C | | | Class I | | | Class R6 | |
KAR Capital Growth Fund | | | 0.06 | % | | | 0.06 | % | | | 0.06 | % | | | N/A | |
KAR Mid-Cap Growth Fund | | | 0.05 | % | | | 0.05 | % | | | 0.05 | % | | | N/A | |
KAR Small-Cap Core Fund* | | | — | | | | — | | | | — | | | | — | |
KAR Small-Cap Growth Fund* | | | — | | | | — | | | | — | | | | N/A | |
Rampart Enhanced Core Equity Fund* | | | — | | | | — | | | | — | | | | N/A | |
Tactical Allocation Fund | | | 0.08 | % | | | 0.08 | % | | | N/A | | | | N/A | |
| | * | Amount is less than 0.005%. |
| (14) | The Fund changed its fiscal year end to September 30 during the period. |
See Notes to Financial Statements
76
VIRTUS EQUITY TRUST
NOTES TO FINANCIAL STATEMENTS
SEPTEMBER 30, 2018
Note 1. Organization
Virtus Equity Trust (the “Trust”) is organized as a Delaware statutory trust and is registered under the Investment Company Act of 1940, as amended (the “1940 Act”), as an open-end management investment company. Effective September 21, 2017, the Funds changed their fiscal year end from March 31 to September 30.
As of the date of this report, 11 diversified funds of the Trust are offered for sale, of which 10 (each a “Fund” or collectively, the “Funds”) are reported in this annual report. The Funds’ investment objectives are outlined in each Fund’s summary page. There is no guarantee that the Funds will achieve their objectives.
All of the Funds offer Class A shares and Class C shares. All Funds with the exception of the Tactical Allocation Fund offer Class I shares. All Funds with the exception of KAR Global Quality Dividend Fund and Tactical Allocation Fund offer class R6 shares. Effective March 6, 2017, all Class B shares were converted to Class A shares. Prior to March 6, 2017, Class B shares could be purchased by existing shareholders through qualifying transactions.
Class A shares are sold with a front-end sales charge of up to 5.75% with some exceptions. Generally, Class A shares are not subject to any charges by the Funds when redeemed; however, a 1% contingent deferred sales charge (“CDSC”) may be imposed on certain redemptions made within a certain period following purchases on which a finder’s fee has been paid. The period for which the CDSC applies for the Funds is 18 months. The CDSC period begins on the last day of the month preceding the month in which the purchase was made.
Class C shares are generally sold with a 1% CDSC, applicable if redeemed within one year of purchase. Class I shares and Class R6 shares are sold without a front-end sales charge or CDSC.
Class R6 shares are available only to the following investors without a minimum initial investment or minimum additional purchases: certain employer-sponsored retirement plans, including Section 401(k), 403(b) and 457 plans, profit-sharing plans, money purchase pension and defined benefit plans and nonqualified deferred compensation plans, in each case provided that plan level or omnibus accounts are held on the books of the fund. Other institutional investors may be permitted to purchase Class R6 shares subject to the applicable Fund’s determination of eligibility and may be subject to a minimum initial investment requirement. Class R6 shares do not carry sales commissions or pay Rule 12b-1 fees. No compensation, administrative payments, sub-transfer agency payments or service payments are paid to brokers or other entities from Fund assets or the Funds’ distributor’s or an affiliate’s resources on sales of or investments in Class R6 shares.
The Funds may impose an annual fee on accounts having balances of less than $2,500. The small account fee may be waived in certain circumstances, as disclosed in the prospectuses and/or statements of additional information. The fees collected will be used to offset certain expenses of the Funds. These fees are reflected as “Low balance account fees” in each Fund’s Statements of Operations for the period, as applicable.
Each class of shares has identical voting, dividend, liquidation and other rights and the same terms and conditions, except that each class bears any expenses attributable specifically to that class (“class-specific expenses”) and has exclusive voting rights with respect to any Rule 12b-1 and/or shareholder service plan (“12b-1 Plan”) approved by the Board. Class I shares and Class R6 shares are not subject to a 12b-1 Plan. Class-specific expenses may include shareholder servicing fees, sub-transfer agency fees, and fees under a 12b-1 Plan, as well as certain other expenses as designated by the Fund’s Treasurer and approved by the Board. Investment income, common operating expenses and realized and unrealized gains and losses of each Fund are borne pro-rata by the holders of each class of shares.
Note 2. Significant Accounting Policies
The Trust is an investment company that follows the accounting and reporting guidance of Accounting Standards Codification Topic 946 applicable to Investment Companies. The following is a summary of significant accounting policies consistently followed by the Funds in the preparation of their financial statements and for derivatives, included in Note 3 below. The preparation of financial statements in conformity with U.S. generally accepted accounting principles (“U.S. GAAP”) requires management to make estimates and assumptions that affect the reported amounts of assets and liabilities, disclosure of contingent assets and liabilities at the date of the financial statements and the reported amounts of increases and decreases in net assets from operations during the reporting period. Actual results could differ from those estimates and those differences could be significant.
Each Fund utilizes a fair value hierarchy which prioritizes the inputs to valuation techniques used to measure fair value into three broad levels. The Funds’ policy is to recognize transfers into or out Level 3 at the end of the reporting period.
| | • Level 1 – | quoted prices in active markets for identical securities (security types generally include listed equities). |
| | • Level 2 – | prices determined using other significant observable inputs (including quoted prices for similar securities, interest rates, prepayment speeds, credit risk, etc.). |
| | • Level 3 – | prices determined using significant unobservable inputs (including the Valuation Committee’s own assumptions in determining the fair value of investments). |
A description of the valuation techniques applied to a Fund’s major categories of assets and liabilities measured at fair value on a recurring basis is as follows:
Equity securities are valued at the official closing price (typically last sale) on the exchange on which the securities are primarily traded or, if no closing price is available, at the last bid price and are categorized as Level 1 in the hierarchy. Restricted equity securities and private placements that are illiquid, or are internally fair valued by the Valuation Committee, are generally categorized as Level 3 in the hierarchy.
Certain non-U.S. securities may be fair valued in cases where closing prices are not readily available or are deemed not reflective of readily available market prices. For example, significant events (such as movement in the U.S. securities market, or other regional and local developments) may occur between the time that non-U.S. markets close (where the security is principally traded) and the time that a Fund calculates its net asset value (“NAV”) at the close of regular trading on the NYSE, (generally 4 p.m. Eastern time) that may impact the value of
77
VIRTUS EQUITY TRUST
NOTES TO FINANCIAL STATEMENTS (Continued)
SEPTEMBER 30, 2018
securities traded in these non-U.S. markets. In such cases, the Funds fair value non-U.S. securities using an independent pricing service which considers the correlation of the trading patterns of the non-U.S. security to the intraday trading in the U.S. markets for investments such as ADRs, financial futures, ETFs, and certain indexes, as well as prices for similar securities. Such fair valuations are categorized as Level 2 in the hierarchy. Because the frequency of significant events is not predictable, fair valuation of certain non-U.S. common stocks may occur on a frequent basis.
Debt securities, including restricted securities, are valued based on evaluated quotations received from independent pricing services or from dealers who make markets in such securities. For most bond types, the pricing service utilizes matrix pricing that considers one or more of the following factors: yield or price of bonds of comparable quality, coupon, maturity, current cash flows, type, and current day trade information, as well as dealer- supplied prices. These valuations are generally categorized as Level 2 in the hierarchy. Structured debt instruments, such as mortgage-backed and asset-backed securities, may also incorporate collateral analysis and utilize cash flow models for valuation and are generally categorized as Level 2 in the hierarchy. Pricing services do not provide pricing for all securities and therefore indicative bids from dealers are utilized which are based on pricing models used by market makers in the security and are generally categorized as Level 2 in the hierarchy. Debt securities that are internally fair valued by the Valuation Committee, are generally categorized as Level 3 in the hierarchy.
Listed derivatives such as options, that are actively traded are valued based on quoted prices from the exchange and are categorized as Level 1 in the hierarchy. Over-the-counter derivative contracts, which include forward currency contracts and equity-linked instruments, do not require material subjectivity as pricing inputs are observed from actively quoted markets and are categorized as Level 2 in the hierarchy.
Investments in open-end mutual funds are valued at NAV. Investments in closed-end funds and ETFs are valued as of the close of regular trading on the NYSE each business day. Each is categorized as Level 1 in the hierarchy.
A summary of the inputs used to value a Fund’s net assets by each major security type is disclosed at the end of the Schedule of Investments for each Fund. The inputs or methodologies used for valuing securities are not necessarily an indication of the risk associated with investing in those securities.
| | B. | Security Transactions and Investment Income |
Security transactions are recorded on the trade date. Realized gains and losses from the sale of securities are determined on the identified cost basis. Dividend income is recognized on the ex-dividend date or, in the case of certain foreign securities, as soon as a Fund is notified. Interest income is recorded on the accrual basis. Each Fund amortizes premiums and accretes discounts using the effective interest method. Any distributions from underlying funds are recorded in accordance with the character of the distributions as designated by the underlying funds.
Dividend income from REIT investments is recorded using management’s estimate of the percentage of income included in distributions received from the REIT investments from such investment based on historical information and other industry sources. The return of capital portion of the estimate is a reduction to investment income and a reduction in the cost basis of each investment which increases net realized gain (loss) and net change in unrealized appreciation (depreciation). If the return of capital distributions exceed its cost basis, the distributions are treated as realized gains. The actual amounts of income, return of capital, and capital gains are only determined by each REIT after its fiscal year end, and may differ from the estimated amounts.
Each Fund is treated as a separate taxable entity. It is the intention of each Fund the requirements of Subchapter M of the Internal Revenue Code and to distribute substantially all of its taxable income to its shareholders. Therefore, no provision for federal income taxes or excise taxes has been made.
Certain Funds may be subject to foreign taxes on income, gains on investments or currency repatriation, a portion of which may be recoverable. Each Fund will accrue such taxes and recoveries as applicable based upon current interpretations of the tax rules and regulations that exist in the markets in which it invests.
Management of the Funds has concluded that there are no significant uncertain tax positions that would require recognition in the financial statements. As of September 30, 2018, the tax years that remain subject to examination by the major tax jurisdictions under the statute of limitations are from the year 2015 forward (with limited exceptions).
| | D. | Distributions to Shareholders |
Distributions are recorded by each Fund on the ex-dividend date. Income and capital gain distributions are determined in accordance with income tax regulations that which may differ from U.S. GAAP.
Expenses incurred together by a Fund and other affiliated mutual funds are allocated in proportion to the net assets of each such fund, except where allocation of direct expenses to each Fund or an alternative allocation method can be more appropriately used.
In addition to the net annual operating expenses that a Fund bears directly, the shareholders of a Fund indirectly bear each Fund’s pro-rata expenses of any underlying mutual funds in which the Fund invests.
| | F. | Foreign Currency Transactions |
Non-U.S. investment securities and other assets and liabilities denominated in foreign currencies are translated into U.S. dollar amounts at the foreign currency exchange rate effective at the end of the reporting period. Cost of investments is translated at the currency exchange rate effective at the trade date. The gain or loss resulting from a change in currency exchange rates between the trade and settlement date of a portfolio transaction is treated as a gain or loss on foreign currency. Likewise, the gain or loss resulting from a change in currency exchange rates between the date income is accrued and the date it is paid is treated as a gain or loss on foreign currency. The Funds do not isolate that portion of the results of operations arising from changes in foreign exchange rates on investments from the fluctuations arising from changes in the market prices of securities held. Such fluctuations are included with the net realized and unrealized gain or loss on investments.
78
VIRTUS EQUITY TRUST
NOTES TO FINANCIAL STATEMENTS (Continued)
SEPTEMBER 30, 2018
| | G. | When-Issued Purchases and Forward Commitments (Delayed Delivery) |
Certain Funds may engage in when-issued or forward commitment transactions. Securities purchased on a when-issued or forward commitment basis are also known as delayed delivery transactions. Delayed delivery transactions involve a commitment by a Fund to purchase or sell a security at a future date (ordinarily up to 90 days later). When-issued or forward commitments enables the Fund to lock in what is believed to be an attractive price or yield on a particular security for a period of time, regardless of future changes in interest rates. Each Fund records delayed delivery securities on the trade date. Each Fund maintains collateral for the securities purchased. Securities purchased on a when-issued or forward commitment basis begin earning interest on the settlement date.
Certain Funds may invest in direct debt instruments which are interests in amounts owed by a corporate, governmental, or other borrower to lenders or lending syndicates. Leveraged loans are generally non-investment grade and often involve borrowers that are highly leveraged. The Funds may invest in obligations of borrowers who are in bankruptcy proceedings. Leveraged loans are typically senior in the corporate capital structure of the borrower. A loan is often administered by a bank or other financial institution (the “lender”) that acts as agent for all holders. The agent administers the terms of the loan, as specified in the loan agreement. A Fund’s investments in loans may be in the form of participations in loans or assignments of all or a portion of loans from third parties. When investing in loan participations, a Fund has the right to receive payments of principal, interest and any fees to which it is entitled only from the lender selling the loan participation and only upon receipt by the lender of payments from the borrower. A Fund generally has no right to enforce compliance with the terms of the loan agreement with the borrower. As a result, a Fund may be subject to the credit risk of both the borrower and the lender that is selling the leveraged loan. When a Fund purchases assignments from lenders it acquires direct rights against the borrower on the loan.
A Fund may invest in multiple series or tranches of a loan, which may have varying terms and carry different associated risks. Leveraged loans may involve foreign borrowers and investments may be denominated in foreign currencies. Direct indebtedness of emerging countries involves a risk that the government entities responsible for the repayment of the debt may be unable, or unwilling, to pay the principal and interest when due.
The leveraged loans have floating rate loan interests which generally pay interest at rates that are periodically determined by reference to a base lending rate plus a premium. The base lending rates are generally the LIBOR, the prime rate offered by one or more U.S. banks or the certificate of deposit rate. When a leveraged loan is purchased a Fund may pay an assignment fee. On an ongoing basis, a Fund may receive a commitment fee based on the undrawn portion of the underlying line of credit portion of a leveraged loan. Prepayment penalty fees are received upon the prepayment of a leveraged loan by a borrower. Prepayment penalty, facility, commitment, consent and amendment fees are recorded to income as earned or paid.
As of September 30, 2018, the Tactical Allocation Fund had the following unfunded loan commitments:
| | | | |
Borrower | | Unfunded Loan Commitment | |
Carlisle Food Service Products, Inc. | | $ | 3 | |
Pearl Intermediate Parent LLC | | | 5 | |
Securus Technologies Holdings, Inc. | | | 24 | |
St. George’s University Scholastic Services LLC | | | 14 | |
($ reported in thousands)
Certain Funds may loan securities to qualified brokers through a securities lending agency agreement with The Bank of New York Mellon (“BNYM”). Under the securities lending policy, when a Fund lends securities it is required to maintain collateral with a market value not less than 100% of the market value of loaned securities. Collateral is adjusted daily in connection with changes in the market value of securities on loan. Collateral may consist of cash and securities issued by the U.S. Government or its agencies. Cash collateral is invested in a short-term money market fund. Dividends earned on the collateral and premiums paid by the broker are recorded as income by the Fund net of fees and rebates charged/paid by BNYM for its services as securities lending agent and in connection with this securities lending program. Lending portfolio securities involves a risk of delay in the recovery of the loaned securities or in the declining value of the collateral.
At September 30, 2018, the following Funds had securities on loan:
| | | | | | | | |
| | | Market Value | | | Cash Collateral | |
KAR Capital Growth Fund | | $ | 4,806 | | | $ | 5,056 | |
KAR Global Quality Dividend Fund | | | 4 | | | | 5 | |
Tactical Allocation Fund | | | 1,384 | | | | 1,438 | |
Note 3. Derivative Financial Instruments and Transactions
($ reported in thousands)
Disclosures about derivative instruments and hedging activities are intended to enable investors to understand how and why a Fund uses derivatives, how derivatives are accounted for, and how derivative instruments affect a Fund’s results of operations and financial position. Summarized below are such disclosures and accounting policies for each specific type of derivative instrument used by certain Funds.
Options Contracts: An options contract provides the purchaser with the right, but not the obligation, to buy (call option) or sell (put option) a financial instrument at an agreed-upon price. Certain Funds may purchase or write both put and call options on portfolio securities for hedging purposes or to facilitate the rapid implementation of investment strategies if the Fund anticipates a significant market or sector advance. The Funds are subject to equity price risk in the normal course of pursuing their investment objectives. The Funds may use options contracts to hedge against changes in the values of equities.
When a Fund purchases an option, it pays a premium and an amount equal to that premium is recorded as an asset. When a Fund writes an option, it receives a premium and an amount equal to that premium is recorded as a liability. The asset or liability is adjusted daily to reflect the current market value of the option. Holdings of the Fund designated to cover outstanding written options are noted in the Schedules of Investments.
79
VIRTUS EQUITY TRUST
NOTES TO FINANCIAL STATEMENTS (Continued)
SEPTEMBER 30, 2018
Purchased options are reported as an asset within “Investment in unaffiliated securities at value” in the Statements of Assets and Liabilities. Options written are reported as a liability within “Written options at value.” Changes in value of the purchased option are included in “Net change in unrealized appreciation (depreciation) on unaffiliated investments” in the Statements of Operations. Changes in value of written options are included in “Net change in unrealized appreciation (depreciation) on written options” in the Statements of Operations.
If an option expires unexercised, the Fund realizes a gain or loss to the extent of the premium received or paid. If an option is exercised, the premium received or paid is recorded as an adjustment to the proceeds from the sale or the cost basis of the purchase. The difference between the premium and the amount received or paid on effecting a closing purchase or sale transaction is also treated as a realized gain or loss. Gain or loss on purchased options is included in “Net realized gain (loss) on unaffiliated investments” in the Statements of Operations. Gain or loss on written options is presented separately as “Net realized gain (loss) on written options” in the Statements of Operations.
The risk in writing call options is that the Fund gives up the opportunity for profit if the market price of the referenced security/currency increases and the option is exercised. The risk in writing put options is that the Fund may incur a loss if the market price of the referenced security/currency decreases and the option is exercised. The risk in buying options is that the Fund pays a premium whether or not the option is exercised. The use of such instruments may involve certain additional risks as a result of unanticipated movements in the market. Writers (sellers) of options are subject to unlimited risk of loss, as the seller will be obligated to deliver or take delivery of the security at a predetermined price which may, upon exercise of the option, be significantly different from the then-market value.
The Rampart Enhanced Core Equity Fund invested in written covered call options contracts in an attempt to manage equity price risk and with the purpose of generating realized gains.
The following is a summary of the Rampart Enhanced Core Equity Fund’s options contracts as categorized equity risk, presented in the financial statements as of September 30, 2018:
| | | | |
Statements of Assets and Liabilities | |
| | | Rampart
Enhanced
Core Equity
Fund | |
Assets: Purchased options at value | | $ | 251 | (1) |
Liabilities: Written options at value | | | (431 | ) |
| | | | |
Net asset (liability) balance | | $ | (180 | ) |
| | | | |
| | | | |
Statements of Operations | |
| | | Rampart
Enhanced
Core Equity
Fund | |
Net realized gain (loss) on purchased options | | $ | 285 | (2) |
Net realized gain (loss) on written options | | | (9,937 | ) |
Net change in unrealized appreciation (depreciation) from purchased options | | | 11 | (3) |
Net change in unrealized appreciation (depreciation) from written options | | | 100 | |
| | | | |
Total net realized and unrealized gain (loss) on purchased and written options | | $ | (9,541 | ) |
| | | | |
| | (1) | Amount included in Investment in unaffiliated securities at value. |
| | (2) | Amount included in Net realized gain (loss) from unaffiliated investments. |
| | (3) | Amount included in Net change in unrealized appreciation (depreciation) from unaffiliated investments. |
For the period ended September 30, 2018, the average daily premiums paid by the Rampart Enhanced Core Equity Fund for purchased options were $272 and the average daily premiums received for written options by the Rampart Enhanced Core Equity Fund were $537.
Note 4. Investment Advisory Fees and Related Party Transactions
($ reported in thousands)
Virtus Investment Advisers, Inc. (the “Adviser”), an indirect, wholly-owned subsidiary of Virtus Investment Partners, Inc. (“Virtus”), is the investment adviser to the Trust. The Adviser manages the Funds’ investment programs and general operations of the Funds, including oversight of the Funds’ subadvisers.
As compensation for its services to the Funds, the Adviser is entitled to a fee, which is calculated daily and paid monthly based upon the following annual rates as a percentage of the average daily net assets of each Fund:
| | | | |
KAR Small-Cap Core Fund | | | 0.75 | % |
KAR Small-Cap Value Fund | | | 0.70 | |
| | | | | | |
| | | First $400 Million | | $400+ Million through $1 Billion | | $1+ Billion |
KAR Small-Cap Growth Fund | | 0.90% | | 0.85% | | 0.80% |
| | | |
| | | First $500 Million | | Over $500 Million | | |
KAR Mid-Cap Growth Fund | | 0.80% | | 0.70% | | |
| | | |
| | | First $1 Billion | | Over $1 Billion | | |
KAR Small-Mid Cap Core Fund | | 0.75% | | 0.70% | | |
80
VIRTUS EQUITY TRUST
NOTES TO FINANCIAL STATEMENTS (Continued)
SEPTEMBER 30, 2018
| | | | | | | | | | | | |
| | | First $1 Billion | | | $1+ Billion through $2 Billion | | | $2+ Billion | |
KAR Capital Growth Fund | | | 0.70 | % | | | 0.65 | % | | | 0.60 | % |
KAR Global Quality Dividend Fund | | | 0.75 | | | | 0.70 | | | | 0.65 | |
KAR Mid-Cap Core Fund | | | 0.80 | | | | 0.75 | | | | 0.70 | |
Rampart Enhanced Core Equity Fund | | | 0.75 | | | | 0.70 | | | | 0.65 | |
Tactical Allocation Fund | | | 0.70 | | | | 0.65 | | | | 0.60 | |
During the period covered by these financial statements, the Tactical Allocation Fund invested a portion of its assets in Virtus Newfleet Credit Opportunities Fund, an affiliated mutual fund. In order to avoid any duplication of advisory fees, the Adviser has voluntarily waived its advisory fees in an amount equal to that which would otherwise be paid by the Fund on the assets invested in the Virtus Newfleet Credit Opportunities Fund. For the period covered by these financial statements, the waiver amounted to $9. This waiver is in addition to the expense limitation and/or fee waiver covered elsewhere in these financial statements and is included in “Less expenses reimbursed and/or waived by investment adviser” in the Statements of Operations.
The subadvisers manage the investments of each Fund, for which they are paid a fee by the Adviser. A list of the subadvisers and the Funds they serve as of the end of the period is as follows:
| | | | | | |
Fund | | Subadviser | | Fund | | Subadviser |
| KAR Capital Growth Fund | | KAR(1)(3) | | KAR Small-Cap Value Fund | | KAR(1)(3) |
| KAR Global Quality Dividend Fund | | KAR(1)(3) | | KAR Small-Mid Cap Core Fund | | KAR(1)(3) |
KAR Mid-Cap Core Fund | | KAR(1)(3) | | Rampart Enhanced Core Equity Fund | | Rampart Investment Management Company, LLC(3) |
KAR Mid-Cap Growth Fund | | KAR(1)(3) | | Tactical Allocation Fund (Domestic Equity Portfolio) | | KAR(1)(3) |
| KAR Small-Cap Core Fund | | KAR(1)(3) | | Tactical Allocation Fund (International Equity Portfolio) | | DPIM(2)(3) |
KAR Small-Cap Growth Fund | | KAR(1)(3) | | Tactical Allocation Fund (Fixed Income Portfolio) | | Newfleet Asset Management, LLC(3) |
| | (1) | Kayne Anderson Rudnick Investment Management, LLC (“KAR”) |
| | (2) | Duff & Phelps Investment Management Co. (“DPIM”) |
| | (3) | An indirect, wholly-owned subsidiary of Virtus. |
| | C. | Expense Limits and Fee Waivers |
The Adviser has contractually agreed to limit certain Funds’ annual total operating expenses (excluding front-end or contingent deferred loads, taxes, leverage expenses, interest, brokerage commissions, expenses incurred in connection with any merger or reorganization, unusual or infrequently occurring expenses (such as litigation), acquired fund fees and expenses, and dividend expenses, if any), so that such expenses do not exceed, on an annualized basis, the following respective percentages of average daily net assets through March 31, 2019. The waivers and reimbursements are calculated daily and received monthly.
| | | | | | | | | | | | | | | | |
| | | Class A | | | Class C | | | Class I | | | Class R6 | |
KAR Capital Growth Fund* | | | 1.47 | %‡ | | | 2.22 | %‡ | | | 1.22 | %‡ | | | 0.78 | % |
KAR Global Quality Dividend Fund | | | 1.35 | | | | 2.10 | | | | 1.10 | | | | — | |
KAR Mid-Cap Core Fund** | | | 1.20 | | | | 1.95 | | | | 0.95 | | | | 0.87 | |
KAR Mid-Cap Growth Fund# | | | 1.40 | | | | 2.15 | | | | 1.15 | | | | 0.90 | |
KAR Small-Cap Growth Fund‡** | | | 1.50 | | | | 2.25 | | | | 1.25 | | | | 1.18 | |
KAR Small-Cap Value Fund‡ | | | 1.42 | | | | 2.17 | | | | 1.17 | | | | 1.06 | |
KAR Small-Mid Cap Core Fund | | | 1.30 | | | | 2.05 | | | | 1.05 | | | | 0.97 | |
Rampart Enhanced Core Equity Fund** | | | 1.20 | | | | 1.95 | | | | 0.95 | | | | 0.91 | |
| | ‡ | Each share class is currently below its expense cap. |
| | * | Effective March 29, 2018 for Class R6. For the period of January 30, 2018 (inception of the class) to March 28, 2018, the expense cap for Class R6 was 1.19%. |
| | # | Effective March 29, 2018 for Class R6. For the period of January 30, 2018 (inception of the class) to March 28, 2018, the expense cap for Class R6 was 1.11%. |
| | ** | Effective January 30, 2018 (inception date of Class) for Class R6. |
($ reported in thousands)
Under certain conditions, the Adviser may recapture operating expenses reimbursed or fees waived under these arrangements, within three years after the date on which such amounts were incurred or waived. A Fund must pay its ordinary operating expenses before the Adviser is entitled to any reimbursement and must remain in compliance with any applicable expense limitations or, if none, the expense limitation in effect at the time of the waiver or reimbursement. All or a portion of the following Adviser-reimbursed expenses may be recaptured by the fiscal year ending:
| | | | | | | | | | | | | | | | |
Fund | | 2019 | | | 2020 | | | 2021 | | | Total | |
| KAR Capital Growth Fund | | | | | | | | | | | | | | | | |
Class R6 | | $ | — | | | $ | — | | | $ | 5 | (1) | | $ | 5 | (1) |
| KAR Global Quality Dividend Fund | | | | | | | | | | | | | | | | |
Class A | | | 63 | | | | 70 | | | | 55 | | | | 188 | |
Class C | | | 11 | | | | 11 | | | | 9 | | | | 31 | |
Class I | | | 8 | | | | 11 | | | | 10 | | | | 29 | |
81
VIRTUS EQUITY TRUST
NOTES TO FINANCIAL STATEMENTS (Continued)
SEPTEMBER 30, 2018
| | | | | | | | | | | | | | | | |
Fund | | 2019 | | | 2020 | | | 2021 | | | Total | |
| KAR Mid-Cap Core Fund | | | | | | | | | | | | | | | | |
Class A | | $ | 69 | | | $ | 62 | | | $ | 55 | | | $ | 186 | |
Class C | | | 22 | | | | 39 | | | | 45 | | | | 106 | |
Class I | | | 29 | | | | 133 | | | | 200 | | | | 362 | |
Class R6 | | | — | | | | — | | | | 1 | | | | 1 | |
| KAR Mid-Cap Growth Fund | | | | | | | | | | | | | | | | |
Class A | | | 79 | | | | 70 | | | | 5 | | | | 154 | |
Class C | | | 7 | | | | 5 | | | | 2 | | | | 14 | |
Class I | | | — | | | | 1 | | | | 3 | | | | 4 | |
Class R6 | | | — | | | | — | | | | — | (1) | | | — | (1) |
| KAR Small-Mid Cap Core Fund | | | | | | | | | | | | | | | | |
Class A | | | — | | | | — | | | | 3 | | | | 3 | |
Class C | | | — | | | | — | | | | 3 | | | | 3 | |
Class I | | | — | | | | — | | | | 3 | | | | 3 | |
Class R6 | | | — | | | | — | | | | 66 | | | | 66 | |
| Rampart Enhanced Core Equity Fund | | | | | | | | | | | | | | | | |
Class A | | | 145 | | | | 159 | | | | 133 | | | | 437 | |
Class C | | | 53 | | | | 51 | | | | 34 | | | | 138 | |
Class I | | | 19 | | | | 34 | | | | 30 | | | | 83 | |
Class R6 | | | — | | | | — | | | | 3 | | | | 3 | |
| | (1) | Amount is less than $500. |
($ reported in thousands)
VP Distributors, LLC (“VP Distributors”), an indirect, wholly-owned subsidiary of Virtus, serves as the distributor of each Fund’s shares. VP Distributors has advised the Funds that for the fiscal year (the “period”) ended September 30, 2018, it retained net commissions of $834 for Class A shares and CDSC of $(2), and $82 for Class A shares, and Class C shares, respectively.
In addition, each Fund pays VP Distributors 12b-1 fees under a 12b-1 Plan as a percentage of the average daily net assets of each respective class at the annual rates of 0.25% Class A shares; 1.00% Class C shares; Class I shares and Class R6 shares are not subject to a 12b-1 Plan.
Under certain circumstances, shares of certain Virtus Mutual Funds may be exchanged for shares of the same class of certain other Virtus Mutual Funds on the basis of the relative NAV per share at the time of the exchange. On exchanges with share classes that carry a CDSC, the CDSC schedule of the original shares purchased continues to apply.
| | F. | Administrator and Transfer Agent |
($ reported in thousands)
Virtus Fund Services, LLC, an indirect, wholly-owned subsidiary of Virtus, serves as the administrator and transfer agent to the Trust.
For the period ended September 30, 2018, the Funds incurred administration fees totaling $5,549 which are included in the Statements of Operations within the line item “Administration and accounting fees”. The fees are calculated daily and paid monthly.
For the period ended September 30, 2018, the Funds incurred transfer agent fees totaling $7,290 which are included in the Statements of Operations within the line items “Transfer agent fees and expenses” and “Sub-transfer agent fees and expenses”. A portion of these fees was paid to outside entities that also provide services to the Trust. The fees are calculated daily and paid monthly.
| | G. | Affiliated Shareholders |
($ reported in thousands)
At September 30, 2018, Virtus and its affiliates and the retirement plans of Virtus and its affiliates held shares of certain Funds which may be redeemed at any time that aggregated to the following:
| | | | | | | | |
| | | Shares | | | Aggregate Net
Asset Value | |
| KAR Capital Growth Fund | | | | | | | | |
Class A | | | 14 | | | $ | — | (1) |
Class R6 | | | 339,110 | | | | 6,457 | |
| KAR Mid-Cap Core Fund | | | | | | | | |
Class R6 | | | 3,051 | | | | 105 | |
| KAR Mid-Cap Growth | | | | | | | | |
Class R6 | | | 3,151 | | | | 116 | |
| KAR Small-Cap Growth Fund | | | | | | | | |
Class R6 | | | 111,936 | | | | 3,832 | |
| KAR Small-Cap Value Fund | | | | | | | | |
Class R6 | | | 249,164 | | | | 4,861 | |
82
VIRTUS EQUITY TRUST
NOTES TO FINANCIAL STATEMENTS (Continued)
SEPTEMBER 30, 2018
| | | | | | | | |
| | | Shares | | | Aggregate Net
Asset Value | |
| KAR Small-Mid Cap Core Fund | | | | | | | | |
Class A | | | 10,000 | | | $ | 108 | |
Class C | | | 10,000 | | | | 108 | |
Class I | | | 10,000 | | | | 108 | |
Class R6 | | | 270,000 | | | | 2,919 | |
| Rampart Enhanced Core Equity Fund | | | | | | | | |
Class R6 | | | 163,320 | | | | 3,435 | |
| | (1) | Amount is less than $500. |
| | H. | Investments in Affiliates |
($ reported in thousands)
A summary of the Tactical Allocation Fund’s total long-term and short-term purchases and sales of the affiliated underlying fund during the period ended September 30, 2018 is as follows:
| | | | | | | | | | | | | | | | | | | | | | | | | | | | | | | | | | | | |
| | | Value,
beginning
of period | | | Purchases | | | Sales | | | Net
Realized
gain
(loss) | | | Net change
in unrealized
appreciation
(depreciation) | | | Value, end
of period | | | Shares | | | Dividend
Income | | | Distributions
of Realized
Gains | |
Affiliated Mutual Fund - 1.1% | | | | | | | | | | | | | | | | | | | | | | | | | | | | | | | | | |
Virtus Newfleet Credit Opportunities Fund Class R6(1) | | $ | 1,295 | | | $ | 330 | | | $ | — | | | $ | — | | | $ | (20 | ) | | $ | 1,605 | | | | 165,934 | | | $ | 83 | | | $ | — | |
| | (1) | Shares of this fund are publicly offered, and its prospectus and annual report are publicly available. |
The Trust provides a deferred compensation plan for its Trustees who receive compensation from the Trust. Under the deferred compensation plan, Trustees may elect to defer all or a portion of their compensation. Amounts deferred are retained by the Trust, and then, to the extent permitted by the 1940 Act, in turn, may be invested in the shares of affiliated or unaffiliated mutual funds selected by the participating Trustees. Investments in such instruments are included in “Other assets” in the Statements of Assets and Liabilities at September 30, 2018.
Note 5. Purchases and Sales of Securities
($ reported in thousands)
Purchases and sales of securities (excluding U.S. Government and agency securities, short-term securities, and written options) during the period ended September 30, 2018, were as follows:
| | | | | | | | |
| | | Purchases | | | Sales | |
KAR Capital Growth Fund | | $ | 86,786 | | | $ | 107,083 | |
KAR Global Quality Dividend Fund | | | 14,488 | | | | 35,202 | |
KAR Mid-Cap Core Fund | | | 115,299 | | | | 32,432 | |
KAR Mid-Cap Growth Fund | | | 78,698 | | | | 24,074 | |
KAR Small-Cap Core Fund | | | 746,970 | | | | 137,787 | |
KAR Small-Cap Growth Fund | | | 2,799,313 | | | | 333,494 | |
KAR Small-Cap Value Fund | | | 166,075 | | | | 26,915 | |
KAR Small-Mid Cap Core Fund | | | 3,592 | | | | 489 | |
Rampart Enhanced Core Equity Fund | | | 41,014 | | | | 83,003 | |
Tactical Allocation Fund | | | 57,869 | | | | 65,640 | |
Purchases and sales of long-term U.S. Government and agency securities for the Tactical Allocation Fund during the period ended September 30, 2018, were as follows:
| | | | |
Purchases | | Sales | |
$2,682 | | $ | 1,760 | |
83
VIRTUS EQUITY TRUST
NOTES TO FINANCIAL STATEMENTS (Continued)
SEPTEMBER 30, 2018
Note 6. Capital Share Transactions
(reported in thousands)
Transactions in shares of capital stock, during the periods ended as indicated below, were as follows:
| | | | | | | | | | | | | | | | | | | | | | | | |
| | | KAR Capital Growth Fund | |
| | | Year Ended
September 30, 2018 | | | Fiscal Period Ended
September 30, 2017(1) | | | Year Ended
March 31, 2017 | |
| | | SHARES | | | AMOUNT | | | SHARES | | | AMOUNT | | | SHARES | | | AMOUNT | |
| | | | | | | | | | | | | | | | | | | | | | | | |
| Class A | | | | | | | | | | | | | | | | | | | | | | | | |
| Sale of shares | | | 1,378 | | | $ | 23,273 | | | | 209 | | | $ | 3,179 | | | | 403 | | | $ | 5,482 | |
| Conversion from Class B shares(2) | | | | | | | | | | | — | | | | — | | | | 43 | | | | 602 | |
| Reinvestment of distributions | | | 1,328 | | | | 21,555 | | | | 263 | | | | 4,031 | | | | 2,208 | | | | 28,727 | |
| Shares repurchased | | | (2,647 | ) | | | (46,032 | ) | | | (1,396 | ) | | | (21,262 | ) | | | (3,521 | ) | | | (48,786 | ) |
| | | | | | | | | | | | | | | | | | | | | | | | |
| Net Increase / (Decrease) | | | 59 | | | $ | (1,204 | ) | | | (924 | ) | | $ | (14,052 | ) | | | (867 | ) | | $ | (13,975 | ) |
| | | | | | | | | | | | | | | | | | | | | | | | |
| Class B | | | | | | | | | | | | | | | | | | | | | | | | |
| Sale of shares | | | — | | | $ | — | | | | — | | | $ | — | | | | — | (3) | | $ | — | (4) |
| Reinvestment of distributions | | | — | | | | — | | | | — | | | | — | | | | 6 | | | | 67 | |
| Shares repurchased | | | — | | | | — | | | | — | | | | — | | | | (78 | ) | | | (902 | ) |
| Conversion to Class A shares(2) | | | — | | | | — | | | | — | | | | — | | | | (54 | ) | | | (602 | ) |
| | | | | | | | | | | | | | | | | | | | | | | | |
| Net Increase / (Decrease) | | | — | | | $ | — | | | | — | | | $ | — | | | | (126 | ) | | $ | (1,437 | ) |
| | | | | | | | | | | | | | | | | | | | | | | | |
| Class C | | | | | | | | | | | | | | | | | | | | | | | | |
| Sale of shares | | | 102 | | | $ | 1,388 | | | | 77 | | | $ | 918 | | | | 88 | | | $ | 972 | |
| Reinvestment of distributions | | | 64 | | | | 817 | | | | 12 | | | | 152 | | | | 109 | | | | 1,140 | |
| Shares repurchased | | | (250 | ) | | | (3,406 | ) | | | (180 | ) | | | (2,209 | ) | | | (777 | ) | | | (8,801 | ) |
| | | | | | | | | | | | | | | | | | | | | | | | |
| Net Increase / (Decrease) | | | (84 | ) | | $ | (1,201 | ) | | | (91 | ) | | $ | (1,139 | ) | | | (580 | ) | | $ | (6,689 | ) |
| | | | | | | | | | | | | | | | | | | | | | | | |
| Class I | | | | | | | | | | | | | | | | | | | | | | | | |
| Sale of shares | | | 661 | | | $ | 11,483 | | | | 120 | | | $ | 1,893 | | | | 272 | | | $ | 3,894 | |
| Reinvestment of distributions | | | 35 | | | | 585 | | | | 6 | | | | 102 | | | | 47 | | | | 637 | |
| Shares repurchased | | | (542 | ) | | | (9,870 | ) | | | (81 | ) | | | (1,276 | ) | | | (206 | ) | | | (2,908 | ) |
| | | | | | | | | | | | | | | | | | | | | | | | |
| Net Increase / (Decrease) | | | 154 | | | $ | 2,198 | | | | 45 | | | $ | 719 | | | | 113 | | | $ | 1,623 | |
| | | | | | | | | | | | | | | | | | | | | | | | |
| Class R6 | | | | | | | | | | | | | | | | | | | | | | | | |
| Sale of shares | | | 432 | | | $ | 7,839 | | | | — | | | $ | — | | | | — | | | $ | — | |
| Shares repurchased | | | (93 | ) | | | (1,705 | ) | | | — | | | | — | | | | — | | | | — | |
| | | | | | | | | | | | | | | | | | | | | | | | |
| Net Increase / (Decrease) | | | 339 | | | $ | 6,134 | | | | — | | | $ | — | | | | — | | | $ | — | |
| | | | | | | | | | | | | | | | | | | | | | | | |
| |
| | | KAR Global Quality Dividend Fund | |
| | | Year Ended
September 30, 2018 | | | Fiscal Period Ended
September 30, 2017(1) | | | Year Ended
March 31, 2017 | |
| | | SHARES | | | AMOUNT | | | SHARES | | | AMOUNT | | | SHARES | | | AMOUNT | |
| | | | | | | | | | | | | | | | | | | | | | | | |
| Class A | | | | | | | | | | | | | | | | | | | | | | | | |
| Sale of shares | | | 43 | | | $ | 642 | | | | 44 | | | $ | 724 | | | | 128 | | | $ | 1,985 | |
| Reinvestment of distributions | | | 328 | | | | 4,834 | | | | 207 | | | | 3,317 | | | | 29 | | | | 451 | |
| Shares repurchased | | | (1,340 | ) | | | (19,402 | ) | | | (298 | ) | | | (5,040 | ) | | | (700 | ) | | | (11,095 | ) |
| | | | | | | | | | | | | | | | | | | | | | | | |
| Net Increase / (Decrease) | | | (969 | ) | | $ | (13,926 | ) | | | (47 | ) | | $ | (999 | ) | | | (543 | ) | | $ | (8,659 | ) |
| | | | | | | | | | | | | | | | | | | | | | | | |
| Class C | | | | | | | | | | | | | | | | | | | | | | | | |
| Sale of shares | | | 32 | | | $ | 473 | | | | 7 | | | $ | 116 | | | | 59 | | | $ | 906 | |
| Reinvestment of distributions | | | 43 | | | | 618 | | | | 26 | | | | 403 | | | | — | | | | — | |
| Shares repurchased | | | (108 | ) | | | (1,557 | ) | | | (71 | ) | | | (1,145 | ) | | | (194 | ) | | | (2,981 | ) |
| | | | | | | | | | | | | | | | | | | | | | | | |
| Net Increase / (Decrease) | | | (33 | ) | | $ | (466 | ) | | | (38 | ) | | $ | (626 | ) | | | (135 | ) | | $ | (2,075 | ) |
| | | | | | | | | | | | | | | | | | | | | | | | |
| Class I | | | | | | | | | | | | | | | | | | | | | | | | |
| Sale of shares | | | 192 | | | $ | 3,075 | | | | 38 | | | $ | 626 | | | | 94 | | | $ | 1,535 | |
| Reinvestment of distributions | | | 40 | | | | 588 | | | | 33 | | | | 522 | | | | 4 | | | | 68 | |
| Shares repurchased | | | (312 | ) | | | (4,953 | ) | | | (89 | ) | | | (1,469 | ) | | | (107 | ) | | | (1,701 | ) |
| | | | | | | | | | | | | | | | | | | | | | | | |
| Net Increase / (Decrease) | | | (80 | ) | | $ | (1,290 | ) | | | (18 | ) | | $ | (321 | ) | | | (9 | ) | | $ | (98 | ) |
| | | | | | | | | | | | | | | | | | | | | | | | |
| (1) | The Fund changed its fiscal year end to September 30 during the period. |
| (2) | See Note 1 in Notes to Financial Statements for more information. |
| (3) | Amount is less than 500 shares. |
| (4) | Amount is less than $500. |
84
VIRTUS EQUITY TRUST
NOTES TO FINANCIAL STATEMENTS (Continued)
SEPTEMBER 30, 2018
| | | | | | | | | | | | | | | | | | | | | | | | |
| | | KAR Mid-Cap Core Fund | |
| | | Year Ended
September 30, 2018 | | | Fiscal Period Ended
September 30, 2017(1) | | | Year Ended
March 31, 2017 | |
| | | SHARES | | | AMOUNT | | | SHARES | | | AMOUNT | | | SHARES | | | AMOUNT | |
| | | | | | | | | | | | | | | | | | | | | | | | |
| Class A | | | | | | | | | | | | | | | | | | | | | | | | |
| Sale of shares | | | 327 | | | $ | 10,445 | | | | 209 | | | $ | 5,573 | | | | 860 | | | $ | 20,379 | |
| Reinvestment of distributions | | | — | | | | — | | | | 3 | | | | 80 | | | | — | | | | — | |
| Shares repurchased | | | (283 | ) | | | (8,834 | ) | | | (72 | ) | | | (1,928 | ) | | | (974 | ) | | | (23,609 | ) |
| | | | | | | | | | | | | | | | | | | | | | | | |
| Net Increase / (Decrease) | | | 44 | | | $ | 1,611 | | | | 140 | | | $ | 3,725 | | | | (114 | ) | | $ | (3,230 | ) |
| | | | | | | | | | | | | | | | | | | | | | | | |
| Class C | | | | | | | | | | | | | | | | | | | | | | | | |
| Sale of shares | | | 415 | | | $ | 12,383 | | | | 138 | | | $ | 3,470 | | | | 409 | | | $ | 9,372 | |
| Reinvestment of distributions | | | — | | | | — | | | | 2 | | | | 56 | | | | — | | | | — | |
| Shares repurchased | | | (122 | ) | | | (3,610 | ) | | | (47 | ) | | | (1,179 | ) | | | (134 | ) | | | (3,029 | ) |
| | | | | | | | | | | | | | | | | | | | | | | | |
| Net Increase / (Decrease) | | | 293 | | | $ | 8,773 | | | | 93 | | | $ | 2,347 | | | | 275 | | | $ | 6,343 | |
| | | | | | | | | | | | | | | | | | | | | | | | |
| Class I | | | | | | | | | | | | | | | | | | | | | | | | |
| Sale of shares | | | 3,336 | | | $ | 107,740 | | | | 968 | | | $ | 26,148 | | | | 1,943 | | | $ | 47,890 | |
| Reinvestment of distributions | | | — | | | | — | | | | 7 | | | | 194 | | | | — | | | | — | |
| Shares repurchased | | | (911 | ) | | | (29,145 | ) | | | (456 | ) | | | (12,244 | ) | | | (325 | ) | | | (7,950 | ) |
| | | | | | | | | | | | | | | | | | | | | | | | |
| Net Increase / (Decrease) | | | 2,425 | | | $ | 78,595 | | | | 519 | | | $ | 14,098 | | | | 1,618 | | | $ | 39,940 | |
| | | | | | | | | | | | | | | | | | | | | | | | |
| Class R6 | | | | | | | | | | | | | | | | | | | | | | | | |
| Sale of shares | | | 72 | | | $ | 2,337 | | | | — | | | $ | — | | | | — | | | $ | — | |
| Shares repurchased | | | — | (3) | | | (2 | ) | | | — | | | | — | | | | — | | | | — | |
| | | | | | | | | | | | | | | | | | | | | | | | |
| Net Increase / (Decrease) | | | 72 | | | $ | 2,335 | | | | — | | | $ | — | | | | — | | | $ | — | |
| | | | | | | | | | | | | | | | | | | | | | | | |
| |
| | | KAR Mid-Cap Growth Fund | |
| | | Year Ended
September 30, 2018 | | | Fiscal Period Ended
September 30, 2017(1) | | | Year Ended
March 31, 2017 | |
| | | SHARES | | | | AMOUNT | | | | SHARES | | | | AMOUNT | | | | SHARES | | | | AMOUNT | |
| | | | | | | | | | | | | | | | | | | | | | | | |
| Class A | | | | | | | | | | | | | | | | | | | | | | | | |
| Sale of shares | | | 849 | | | $ | 28,504 | | | | 55 | | | $ | 1,451 | | | | 127 | | | $ | 2,897 | |
| Conversion from Class B shares(2) | | | — | | | | — | | | | — | | | | — | | | | 6 | | | | 156 | |
| Reinvestment of distributions | | | 157 | | | | 4,354 | | | | 14 | | | | 370 | | | | 48 | | | | 1,082 | |
| Shares repurchased | | | (370 | ) | | | (11,905 | ) | | | (291 | ) | | | (7,625 | ) | | | (396 | ) | | | (9,112 | ) |
| | | | | | | | | | | | | | | | | | | | | | | | |
| Net Increase / (Decrease) | | | 636 | | | $ | 20,953 | | | | (222 | ) | | $ | (5,804 | ) | | | (215 | ) | | $ | (4,977 | ) |
| | | | | | | | | | | | | | | | | | | | | | | | |
| Class B | | | | | | | | | | | | | | | | | | | | | | | | |
| Sale of shares | | | — | | | $ | — | | | | — | | | $ | — | | | | — | | | $ | — | (4) |
| Reinvestment of distributions | | | — | | | | — | | | | — | | | | — | | | | — | (3) | | | 3 | |
| Shares repurchased | | | — | | | | — | | | | — | | | | — | | | | (10 | ) | | | (196 | ) |
| Conversion to Class A shares(2) | | | — | | | | — | | | | — | | | | — | | | | (8 | ) | | | (156 | ) |
| | | | | | | | | | | | | | | | | | | | | | | | |
| Net Increase / (Decrease) | | | — | | | $ | — | | | | — | | | $ | — | | | | (18 | ) | | $ | (349 | ) |
| | | | | | | | | | | | | | | | | | | | | | | | |
| Class C | | | | | | | | | | | | | | | | | | | | | | | | |
| Sale of shares | | | 289 | | | $ | 7,739 | | | | 15 | | | $ | 330 | | | | 89 | | | $ | 1,704 | |
| Reinvestment of distributions | | | 15 | | | | 333 | | | | 1 | | | | 29 | | | | 5 | | | | 89 | |
| Shares repurchased | | | (80 | ) | | | (2,061 | ) | | | (63 | ) | | | (1,349 | ) | | | (121 | ) | | | (2,259 | ) |
| | | | | | | | | | | | | | | | | | | | | | | | |
| Net Increase / (Decrease) | | | 224 | | | $ | 6,011 | | | | (47 | ) | | $ | (990 | ) | | | (27 | ) | | $ | (466 | ) |
| | | | | | | | | | | | | | | | | | | | | | | | |
| Class I | | | | | | | | | | | | | | | | | | | | | | | | |
| Sale of shares | | | 1,722 | | | $ | 58,119 | | | | 14 | | | $ | 389 | | | | 47 | | | $ | 1,092 | |
| Reinvestment of distributions | | | 8 | | | | 227 | | | | 1 | | | | 19 | | | | 2 | | | | 47 | |
| Shares repurchased | | | (336 | ) | | | (11,370 | ) | | | (14 | ) | | | (376 | ) | | | (27 | ) | | | (638 | ) |
| | | | | | | | | | | | | | | | | | | | | | | | |
| Net Increase / (Decrease) | | | 1,394 | | | $ | 46,976 | | | | 1 | | | $ | 32 | | | | 22 | | | $ | 501 | |
| | | | | | | | | | | | | | | | | | | | | | | | |
| Class R6 | | | | | | | | | | | | | | | | | | | | | | | | |
| Sale of shares | | | 6 | | | $ | 194 | | | | — | | | $ | — | | | | — | | | $ | — | |
| Shares repurchased | | | (3 | ) | | | (98 | ) | | | — | | | | — | | | | — | | | | — | |
| | | | | | | | | | | | | | | | | | | | | | | | |
| Net Increase / (Decrease) | | | 3 | | | $ | 96 | | | | — | | | $ | — | | | | — | | | $ | — | |
| | | | | | | | | | | | | | | | | | | | | | | | |
| (1) | The Fund changed its fiscal year end to September 30 during the period. |
| (2) | See Note 1 in Notes to Financial Statement for more information. |
| (3) | Amount is less than 500 shares. |
| (4) | Amount is less than $500. |
85
VIRTUS EQUITY TRUST
NOTES TO FINANCIAL STATEMENTS (Continued)
SEPTEMBER 30, 2018
| | | | | | | | | | | | | | | | | | | | | | | | |
| | | KAR Small-Cap Core Fund | |
| | | Year Ended
September 30, 2018 | | | Fiscal Period Ended
September 30, 2017(1) | | | Year Ended
March 31, 2017 | |
| | | SHARES | | | AMOUNT | | | SHARES | | | AMOUNT | | | SHARES | | | AMOUNT | |
| | | | | | | | | | | | | | | | | | | | | | | | |
| Class A | | | | | | | | | | | | | | | | | | | | | | | | |
| Sale of shares | | | 3,611 | | | $ | 118,346 | | | | 608 | | | $ | 16,037 | | | | 1,507 | | | $ | 34,529 | |
| Reinvestment of distributions | | | 4 | | | | 131 | | | | 1 | | | | 30 | | | | 153 | | | | 3,396 | |
| Shares repurchased | | | (2,134 | ) | | | (71,685 | ) | | | (332 | ) | | | (8,598 | ) | | | (1,606 | ) | | | (37,256 | ) |
| | | | | | | | | | | | | | | | | | | | | | | | |
| Net Increase / (Decrease) | | | 1,481 | | | $ | 46,792 | | | | 277 | | | $ | 7,469 | | | | 54 | | | $ | 669 | |
| | | | | | | | | | | | | | | | | | | | | | | | |
| Class C | | | | | | | | | | | | | | | | | | | | | | | | |
| Sale of shares | | | 2,174 | | | $ | 61,092 | | | | 420 | | | $ | 9,214 | | | | 778 | | | $ | 15,284 | |
| Reinvestment of distributions | | | 4 | | | | 108 | | | | 1 | | | | 29 | | | | 123 | | | | 2,351 | |
| Shares repurchased | | | (455 | ) | | | (12,785 | ) | | | (220 | ) | | | (4,822 | ) | | | (442 | ) | | | (8,547 | ) |
| | | | | | | | | | | | | | | | | | | | | | | | |
| Net Increase / (Decrease) | | | 1,723 | | | $ | 48,415 | | | | 201 | | | $ | 4,421 | | | | 459 | | | $ | 9,088 | |
| | | | | | | | | | | | | | | | | | | | | | | | |
| Class I | | | | | | | | | | | | | | | | | | | | | | | | |
| Sale of shares | | | 24,195 | | | $ | 841,974 | | | | 4,161 | | | $ | 114,129 | | | | 7,980 | | | $ | 188,854 | |
| Reinvestment of distributions | | | 21 | | | | 670 | | | | 6 | | | | 167 | | | | 571 | | | | 13,259 | |
| Shares repurchased | | | (7,283 | ) | | | (256,833 | ) | | | (1,387 | ) | | | (37,551 | ) | | | (3,695 | ) | | | (86,856 | ) |
| | | | | | | | | | | | | | | | | | | | | | | | |
| Net Increase / (Decrease) | | | 16,933 | | | $ | 585,811 | | | | 2,780 | | | $ | 76,745 | | | | 4,856 | | | $ | 115,257 | |
| | | | | | | | | | | | | | | | | | | | | | | | |
| Class R6 | | | | | | | | | | | | | | | | | | | | | | | | |
| Sale of shares | | | 1,215 | | | $ | 42,276 | | | | 373 | | | $ | 10,312 | | | | 446 | | | $ | 10,598 | |
| Reinvestment of distributions | | | 2 | | | | 71 | | | | 1 | | | | 16 | | | | 62 | | | | 1,435 | |
| Shares repurchased | | | (359 | ) | | | (12,776 | ) | | | (97 | ) | | | (2,624 | ) | | | (208 | ) | | | (4,894 | ) |
| | | | | | | | | | | | | | | | | | | | | | | | |
| Net Increase / (Decrease) | | | 858 | | | $ | 29,571 | | | | 277 | | | $ | 7,704 | | | | 300 | | | $ | 7,139 | |
| | | | | | | | | | | | | | | | | | | | | | | | |
| |
| | | KAR Small-Cap Growth Fund | |
| | | Year Ended
September 30, 2018 | | | Fiscal Period Ended
September 30, 2017(1) | | | Year Ended
March 31, 2017 | |
| | | SHARES | | | AMOUNT | | | SHARES | | | AMOUNT | | | SHARES | | | AMOUNT | |
| | | | | | | | | | | | | | | | | | | | | | | | |
| | | | | | | | | | | | | | | | | | | | | | | | |
| Class A | | | | | | | | | | | | | | | | | | | | | | | | |
| Sale of shares | | | 22,652 | | | $ | 719,261 | | | | 3,221 | | | $ | 75,203 | | | | 9,213 | | | $ | 178,982 | |
| Reinvestment of distributions | | | — | | | | — | | | | — | (2) | | | 3 | | | | 186 | | | | 3,272 | |
| Shares repurchased | | | (7,176 | ) | | | (228,410 | ) | | | (1,594 | ) | | | (36,146 | ) | | | (5,694 | ) | | | (115,942 | ) |
| | | | | | | | | | | | | | | | | | | | | | | | |
| Net Increase / (Decrease) | | | 15,476 | | | $ | 490,851 | | | | 1,627 | | | $ | 39,060 | | | | 3,705 | | | $ | 66,312 | |
| | | | | | | | | | | | | | | | | | | | | | | | |
| Class C | | | | | | | | | | | | | | | | | | | | | | | | |
| Sale of shares | | | 6,780 | | | $ | 192,680 | | | | 1,339 | | | $ | 28,543 | | | | 2,108 | | | $ | 37,801 | |
| Reinvestment of distributions | | | — | | | | — | | | | — | (2) | | | 1 | | | | 44 | | | | 711 | |
| Shares repurchased | | | (867 | ) | | | (24,272 | ) | | | (319 | ) | | | (6,772 | ) | | | (325 | ) | | | (5,799 | ) |
| | | | | | | | | | | | | | | | | | | | | | | | |
| Net Increase / (Decrease) | | | 5,913 | | | $ | 168,408 | | | | 1,020 | | | $ | 21,772 | | | | 1,827 | | | $ | 32,713 | |
| | | | | | | | | | | | | | | | | | | | | | | | |
| Class I | | | | | | | | | | | | | | | | | | | | | | | | |
| Sale of shares | | | 97,746 | | | $ | 3,117,032 | | | | 22,541 | | | $ | 539,222 | | | | 22,582 | | | $ | 452,219 | |
| Reinvestment of distributions | | | — | | | | — | | | | — | (2) | | | 10 | | | | 170 | | | | 3,037 | |
| Shares repurchased | | | (19,336 | ) | | | (613,754 | ) | | | (3,312 | ) | | | (77,349 | ) | | | (5,416 | ) | | | (106,659 | ) |
| | | | | | | | | | | | | | | | | | | | | | | | |
| Net Increase / (Decrease) | | | 78,410 | | | $ | 2,503,278 | | | | 19,229 | | | $ | 461,883 | | | | 17,336 | | | $ | 348,597 | |
| | | | | | | | | | | | | | | | | | | | | | | | |
| Class R6 | | | | | | | | | | | | | | | | | | | | | | | | |
| Sale of shares | | | 501 | | | $ | 16,067 | | | | — | | | $ | — | | | | — | | | $ | — | |
| Shares repurchased | | | (98 | ) | | | (3,328 | ) | | | — | | | | — | | | | — | | | | — | |
| | | | | | | | | | | | | | | | | | | | | | | | |
| Net Increase / (Decrease) | | | 403 | | | $ | 12,739 | | | | | | | $ | | | | | | | | $ | | |
| | | | | | | | | | | | | | | | | | | | | | | | |
| (1) | The Fund changed its fiscal year end to September 30 during the period. |
| (2) | Amount is less than 500 shares. |
86
VIRTUS EQUITY TRUST
NOTES TO FINANCIAL STATEMENTS (Continued)
SEPTEMBER 30, 2018
| | | | | | | | | | | | | | | | | | | | | | | | |
| | | KAR Small-Cap Value Fund | |
| | | Year Ended
September 30, 2018 | | | Fiscal Period Ended
September 30, 2017(1) | | | Year Ended
March 31, 2017 | |
| | | SHARES | | | AMOUNT | | | SHARES | | | AMOUNT | | | SHARES | | | AMOUNT | |
| | | | | | | | | | | | | | | | | | | | | | | | |
| Class A | | | | | | | | | | | | | | | | | | | | | | | | |
| Sale of shares | | | 779 | | | $ | 14,625 | | | | 318 | | | $ | 5,561 | | | | 1,626 | | | $ | 26,711 | |
| Reinvestment of distributions | | | 68 | | | | 1,277 | | | | 168 | | | | 2,887 | | | | 396 | | | | 6,244 | |
| Shares repurchased | | | (1,312 | ) | | | (24,752 | ) | | | (794 | ) | | | (13,985 | ) | | | (1,515 | ) | | | (24,855 | ) |
| | | | | | | | | | | | | | | | | | | | | | | | |
| Net Increase / (Decrease) | | | (465 | ) | | $ | (8,850 | ) | | | (308 | ) | | $ | (5,537 | ) | | | 507 | | | $ | 8,100 | |
| | | | | | | | | | | | | | | | | | | | | | | | |
| Class C | | | | | | | | | | | | | | | | | | | | | | | | |
| Sale of shares | | | 199 | | | $ | 3,681 | | | | 107 | | | $ | 1,853 | | | | 417 | | | $ | 6,683 | |
| Reinvestment of distributions | | | 25 | | | | 464 | | | | 61 | | | | 1,032 | | | | 123 | | | | 1,918 | |
| Shares repurchased | | | (294 | ) | | | (5,395 | ) | | | (215 | ) | | | (3,708 | ) | | | (373 | ) | | | (5,888 | ) |
| | | | | | | | | | | | | | | | | | | | | | | | |
| Net Increase / (Decrease) | | | (70 | ) | | $ | (1,250 | ) | | | (47 | ) | | $ | (823 | ) | | | 167 | | | $ | 2,713 | |
| | | | | | | | | | | | | | | | | | | | | | | | |
| Class I | | | | | | | | | | | | | | | | | | | | | | | | |
| Sale of shares | | | 13,481 | | | $ | 255,552 | | | | 4,212 | | | $ | 73,980 | | | | 8,261 | | | $ | 134,255 | |
| Reinvestment of distributions | | | 284 | | | | 5,358 | | | | 560 | | | | 9,602 | | | | 1,006 | | | | 15,898 | |
| Shares repurchased | | | (5,698 | ) | | | (108,227 | ) | | | (2,237 | ) | | | (39,283 | ) | | | (4,704 | ) | | | (76,451 | ) |
| | | | | | | | | | | | | | | | | | | | | | | | |
| Net Increase / (Decrease) | | | 8,067 | | | $ | 152,683 | | | | 2,535 | | | $ | 44,299 | | | | 4,563 | | | $ | 73,702 | |
| | | | | | | | | | | | | | | | | | | | | | | | |
| Class R6 | | | | | | | | | | | | | | | | | | | | | | | | |
| Sale of Shares | | | 763 | | | $ | 14,317 | | | | 559 | | | $ | 9,803 | | | | 7 | | | $ | 100 | |
| Reinvestment of distributions | | | 13 | | | | 236 | | | | 9 | | | | 155 | | | | — | (2) | | | 3 | |
| Shares repurchased | | | (213 | ) | | | (4,046 | ) | | | (23 | ) | | | (405 | ) | | | — | | | | — | |
| | | | | | | | | | | | | | | | | | | | | | | | |
| Net Increase / (Decrease) | | | 563 | | | $ | 10,507 | | | | 545 | | | $ | 9,553 | | | | 7 | | | $ | 103 | |
| | | | | | | | | | | | | | | | | | | | | | | | |
| | | | | |
| | | KAR Small-Mid Cap
Core Fund | | | | | | | | | | | | | |
| | | | | | | | | | | | | | | | | | | | | | | | |
| | | From inception
March 7, 2018 to
September 30, 2018 | | | | | | | | | | | | | |
| | | SHARES | | | AMOUNT | | | | | | | |
| Class A | | | | | | | | | | | | | | | | | | | | | | | | |
| Sale of shares | | | 15 | | | $ | 155 | | | | | | | | | | | | | | | | | |
| Shares repurchased | | | (1 | ) | | | (6 | ) | | | | | | | | | | | | | | | | |
| | | | | | | | | | | | | | | | | | | | | | | | |
| Net Increase / (Decrease) | | | 14 | | | $ | 149 | | | | | | | | | | | | | | | | | |
| | | | | | | | | | | | | | | | | | | | | | | | |
| Class C | | | | | | | | | | | | | | | | | | | | | | | | |
| Sale of shares | | | 13 | | | $ | 128 | | | | | | | | | | | | | | | | | |
| | | | | | | | | | | | | | | | | | | | | | | | |
| Net Increase / (Decrease) | | | 13 | | | $ | 128 | | | | | | | | | | | | | | | | | |
| | | | | | | | | | | | | | | | | | | | | | | | |
| Class I | | | | | | | | | | | | | | | | | | | | | | | | |
| Sale of shares | | | 24 | | | $ | 250 | | | | | | | | | | | | | | | | | |
| Shares repurchased | | | (4 | ) | | | (47 | ) | | | | | | | | | | | | | | | | |
| | | | | | | | | | | | | | | | | | | | | | | | |
| Net Increase / (Decrease) | | | 20 | | | $ | 203 | | | | | | | | | | | | | | | | | |
| | | | | | | | | | | | | | | | | | | | | | | | |
| Class R6 | | | | | | | | | | | | | | | | | | | | | | | | |
| Sale of shares | | | 270 | | | $ | 2,700 | | | | | | | | | | | | | | | | | |
| | | | | | | | | | | | | | | | | | | | | | | | |
| Net Increase / (Decrease) | | | 270 | | | $ | 2,700 | | | | | | | | | | | | | | | | | |
| | | | | | | | | | | | | | | | | | | | | | | | |
| (1) | The Fund changed its fiscal year end to September 30 during the period. |
| (2) | Amount is less than 500 shares. |
87
VIRTUS EQUITY TRUST
NOTES TO FINANCIAL STATEMENTS (Continued)
SEPTEMBER 30, 2018
| | | | | | | | | | | | | | | | | | | | | | | | |
| | | Rampart Enhanced Core Equity Fund | |
| | | Year Ended
September 30, 2018 | | | Fiscal Period Ended
September 30, 2017(1) | | | Year Ended
March 31, 2017 | |
| | | SHARES | | | AMOUNT | | | SHARES | | | AMOUNT | | | SHARES | | | AMOUNT | |
| | | | | | | | | | | | | | | | | | | | | | | | |
| Class A | | | | | | | | | | | | | | | | | | | | | | | | |
| Sale of shares | | | 236 | | | $ | 4,803 | | | | 296 | | | $ | 6,015 | | | | 750 | | | $ | 14,419 | |
| Reinvestment of distributions | | | 362 | | | | 7,382 | | | | 477 | | | | 9,158 | | | | 191 | | | | 3,644 | |
| Shares repurchased | | | (894 | ) | | | (17,545 | ) | | | (424 | ) | | | (8,550 | ) | | | (920 | ) | | | (17,539 | ) |
| | | | | | | | | | | | | | | | | | | | | | | | |
| Net Increase / (Decrease) | | | (296 | ) | | $ | (5,360 | ) | | | 349 | | | $ | 6,623 | | | | 21 | | | $ | 524 | |
| | | | | | | | | | | | | | | | | | | | | | | | |
| Class C | | | | | | | | | | | | | | | | | | | | | | | | |
| Sale of shares | | | 98 | | | $ | 1,752 | | | | 43 | | | $ | 773 | | | | 402 | | | $ | 6,824 | |
| Reinvestment of distributions | | | 119 | | | | 2,172 | | | | 169 | | | | 2,918 | | | | 51 | | | | 887 | |
| Shares repurchased | | | (378 | ) | | | (6,755 | ) | | | (438 | ) | | | (8,125 | ) | | | (630 | ) | | | (10,821 | ) |
| | | | | | | | | | | | | | | | | | | | | | | | |
| Net Increase / (Decrease) | | | (161 | ) | | $ | (2,831 | ) | | | (226 | ) | | $ | (4,434 | ) | | | (177 | ) | | $ | (3,110 | ) |
| | | | | | | | | | | | | | | | | | | | | | | | |
| Class I | | | | | | | | | | | | | | | | | | | | | | | | |
| Sale of shares | | | 241 | | | $ | 4,877 | | | | 664 | | | $ | 13,051 | | | | 671 | | | $ | 12,576 | |
| Reinvestment of distributions | | | 104 | | | | 2,108 | | | | 90 | | | | 1,722 | | | | 38 | | | | 713 | |
| Shares repurchased | | | (1,237 | ) | | | (24,611 | ) | | | (186 | ) | | | (3,743 | ) | | | (331 | ) | | | (6,290 | ) |
| | | | | | | | | | | | | | | | | | | | | | | | |
| Net Increase / (Decrease) | | | (892 | ) | | $ | (17,626 | ) | | | 568 | | | $ | 11,030 | | | | 378 | | | $ | 6,999 | |
| | | | | | | | | | | | | | | | | | | | | | | | |
| Class R6 | | | | | | | | | | | | | | | | | | | | | | | | |
| Sale of shares | | | 440 | | | $ | 9,076 | | | | — | | | $ | — | | | | — | | | $ | — | |
| Shares repurchased | | | (202 | ) | | | (3,755 | ) | | | — | | | | — | | | | — | | | | — | |
| | | | | | | | | | | | | | | | | | | | | | | | |
| Net Increase / (Decrease) | | | 238 | | | $ | 5,321 | | | | — | | | $ | — | | | | — | | | $ | — | |
| | | | | | | | | | | | | | | | | | | | | | | | |
| |
| | | Tactical Allocation Fund | |
| | | Year Ended
September 30, 2018 | | | Fiscal Period Ended
September 30, 2017(1) | | | Year Ended
March 31, 2017 | |
| | | SHARES | | | AMOUNT | | | SHARES | | | AMOUNT | | | SHARES | | | AMOUNT | |
| | | | | | | | | | | | | | | | | | | | | | | | |
| Class A | | | | | | | | | | | | | | | | | | | | | | | | |
| Sale of shares | | | 526 | | | $ | 4,961 | | | | 55 | | | $ | 472 | | | | 131 | | | $ | 1,089 | |
| Conversion from Class B shares(2) | | | — | | | | — | | | | — | | | | — | | | | 12 | | | | 97 | |
| Reinvestment of distributions | | | 309 | | | | 2,896 | | | | 161 | | | | 1,411 | | | | 1,531 | | | | 12,254 | |
| Shares repurchased | | | (1,461 | ) | | | (13,765 | ) | | | (873 | ) | | | (7,615 | ) | | | (2,669 | ) | | | (22,601 | ) |
| | | | | | | | | | | | | | | | | | | | | | | | |
| Net Increase / (Decrease) | | | (626 | ) | | $ | (5,908 | ) | | | (657 | ) | | $ | (5,732 | ) | | | (995 | ) | | $ | (9,161 | ) |
| | | | | | | | | | | | | | | | | | | | | | | | |
| Class B | | | | | | | | | | | | | | | | | | | | | | | | |
| Sale of shares | | | — | | | $ | — | | | | — | | | $ | — | | | | — | (3) | | $ | — | (4) |
| Reinvestment of distributions | | | — | | | | — | | | | — | | | | — | | | | 1 | | | | 11 | |
| Shares repurchased | | | — | | | | — | | | | — | | | | — | | | | (13 | ) | | | (122 | ) |
| Conversion to Class A shares(2) | | | — | | | | — | | | | — | | | | — | | | | (12 | ) | | | (97 | ) |
| | | | | | | | | | | | | | | | | | | | | | | | |
| Net Increase / (Decrease) | | | — | | | $ | — | | | | — | | | $ | — | | | | (24 | ) | | $ | (208 | ) |
| | | | | | | | | | | | | | | | | | | | | | | | |
| Class C | | | | | | | | | | | | | | | | | | | | | | | | |
| Sale of shares | | | 32 | | | $ | 308 | | | | 14 | | | $ | 127 | | | | 63 | | | $ | 536 | |
| Reinvestment of distributions | | | 5 | | | | 51 | | | | 3 | | | | 26 | | | | 45 | | | | 367 | |
| Shares repurchased | | | (99 | ) | | | (955 | ) | | | (90 | ) | | | (802 | ) | | | (228 | ) | | | (1,972 | ) |
| | | | | | | | | | | | | | | | | | | | | | | | |
| Net Increase / (Decrease) | | | (62 | ) | | $ | (596 | ) | | | (73 | ) | | $ | (649 | ) | | | (120 | ) | | $ | (1,069 | ) |
| | | | | | | | | | | | | | | | | | | | | | | | |
| (1) | The Fund changed its fiscal year end to September 30 during the period. |
| (2) | See Note 1 in Notes to Financial Statements for more information. |
| (3) | Amount is less than 500 shares. |
| (4) | Amount is less than $500. |
Under the Trust’s organizational documents and in separate agreements between each Trustee and the Trust, its Trustees and officers are indemnified against certain liabilities arising out of the performance of their duties to the Trust and its funds. In addition, in the normal course of business, the Trust and the Funds enter into contracts that provide a variety of indemnifications to other parties. The Trust’s and/or the Funds’ maximum exposure under these arrangements is unknown, as this would involve future claims that may be made against the Trust or the Funds and that have not occurred. However, neither the Trust nor the Funds have had prior claims or losses pursuant to these arrangements, and they expect the risk of loss to be remote
88
VIRTUS EQUITY TRUST
NOTES TO FINANCIAL STATEMENTS (Continued)
SEPTEMBER 30, 2018
| Note | 8. Credit Risk and Asset Concentration |
In countries with limited or developing markets, investments may present greater risks than in more developed markets and the prices of such investments may be volatile. The consequences of political, social or economic changes in these markets may have disruptive effects on the market prices of these investments and the income they generate, as well as a Fund’s ability to repatriate such amounts.
High-yield/high-risk securities typically entail greater price volatility and/or principal and interest rate risk. There is a greater chance that an issuer will not be able to make principal and interest payments on time. Analysis of the creditworthiness of issuers of high-yield/high-risk securities may be complex, and as a result, it may be more difficult for the Adviser and/or subadvisers to accurately predict risk.
Certain Funds may invest a high percentage of their assets in specific sectors of the market in the pursuit of their investment objectives. Fluctuations in these sectors of concentration may have a greater impact on a Fund, positive or negative, than if a Fund did not concentrate its investments in such sectors.
At September 30, 2018, the following Funds held securities issued by various companies in specific sectors as detailed below:
| | | | | | |
Fund | | Sector | | Percentage of Total
Investments | |
| KAR Capital Growth Fund | | Information Technology | | | 39 | % |
| KAR Capital Growth Fund | | Consumer Discretionary | | | 26 | |
| KAR Mid-Cap Growth Fund | | Information Technology | | | 37 | |
| KAR Small-Cap Core Fund | | Industrials | | | 31 | |
| KAR Small-Cap Core Fund | | Information Technology | | | 27 | |
| KAR Small-Cap Growth Fund | | Information Technology | | | 37 | |
| KAR Small-Mid Cap Core Fund | | Industrials | | | 30 | |
| Rampart Enhanced Core Equity Fund | | Information Technology | | | 27 | |
As of September 30, 2018, certain Funds had individual shareholder account(s), and/or omnibus shareholder account(s) (comprised of a group of individual shareholders), which individually amounted to more than 10% of the total shares outstanding of each such Fund as detailed below:
| | | | | | | | |
| | | % of Shares
Outstanding | | | Number of
Accounts | |
KAR Mid-Cap Core Fund | | | 35 | % | | | 2 | |
KAR Small-Cap Core Fund | | | 13 | | | | 1 | |
KAR Small-Cap Growth Fund | | | 25 | | | | 2 | |
KAR Small-Cap Value Fund | | | 48 | | | | 2 | |
KAR Small-Mid Cap Core Fund | | | 85 | | | | 1 | * |
Note 10. Federal Income Tax Information
($ reported in thousands)
At September 30, 2018, federal tax cost and aggregate gross unrealized appreciation (depreciation) of securities held by the Funds were as follows:
| | | | | | | | | | | | | | | | |
| | | Federal
Tax Cost | | | Unrealized
Appreciation | | | Unrealized
(Depreciation) | | | Net Unrealized
Appreciation
(Depreciation) | |
KAR Capital Growth Fund | | $ | 286,090 | | | $ | 273,149 | | | $ | (8,866 | ) | | $ | 264,283 | |
KAR Global Quality Dividend Fund | | | 34,603 | | | | 3,153 | | | | (1,800 | ) | | | 1,353 | |
KAR Mid-Cap Core Fund | | | 181,470 | | | | 48,347 | | | | (3,100 | ) | | | 45,247 | |
KAR Mid-Cap Growth Fund | | | 126,280 | | | | 72,757 | | | | (1,367 | ) | | | 71,390 | |
KAR Small-Cap Core Fund | | | 1,181,815 | | | | 380,953 | | | | (8,466 | ) | | | 372,487 | |
KAR Small-Cap Growth Fund | | | 4,239,656 | | | | 948,294 | | | | (25,250 | ) | | | 923,044 | |
KAR Small-Cap Value Fund | | | 442,781 | | | | 158,591 | | | | (9,697 | ) | | | 148,894 | |
KAR Small- Mid Cap Core Fund | | | 3,176 | | | | 348 | | | | (156 | ) | | | 192 | |
Rampart Enhanced Core Equity Fund (Securities) | | | 135,213 | | | | 35,406 | | | | (3,858 | ) | | | 31,548 | |
Rampart Enhanced Core Equity Fund Written Options | | | (431 | ) | | | — | | | | — | | | | — | |
Tactical Allocation Fund | | | 124,794 | | | | 30,521 | | | | (4,403 | ) | | | 26,118 | |
For the period ended September 30, 2018, the following Funds utilized losses deferred in prior years against current year capital gains:
| | | | |
KAR Mid-Cap Core Fund | | $ | 1,120 | |
KAR Small-Cap Growth Fund | | | 2,841 | |
89
VIRTUS EQUITY TRUST
NOTES TO FINANCIAL STATEMENTS (Continued)
SEPTEMBER 30, 2018
Capital losses realized after October 31 and certain late year ordinary losses may be deferred and treated as occurring on the first day of the following fiscal period. For the period ended September 30, 2018, the following Funds deferred and recognized qualified late year ordinary and capital losses:
| | | | | | | | | | | | | | | | |
| | | Late Year
Ordinary
Losses
Deferred | | | Late Year
Ordinary
Losses
Recognized | | | Capital
Loss
Deferred | | | Capital
Loss
Recognized | |
KAR Global Quality Dividend Fund | | $ | 7 | | | $ | — | | | $ | 258 | | | $ | — | |
KAR Mid-Cap Core Fund | | | 155 | | | | — | | | | — | | | | — | |
Rampart Enhanced Core Equity Fund | | | — | | | | — | | | | 6,201 | | | | — | |
The components of distributable earnings on a tax basis (excluding unrealized appreciation (depreciation) which is disclosed in the beginning of this note) consist of the following:
| | | | | | | | |
| | | Undistributed
Ordinary
Income | | | Undistributed
Long-Term
Capital Gains | |
KAR Capital Growth Fund | | $ | 358 | | | $ | 39,369 | |
KAR Global Quality Dividend Fund | | | — | | | | — | |
KAR Mid-Cap Core Fund | | | — | | | | 1,872 | |
KAR Mid-Cap Growth Fund | | | 1,083 | | | | 2,662 | |
KAR Small-Cap Core Fund | | | 12,523 | | | | 40,238 | |
KAR Small-Cap Growth Fund | | | 17,336 | | | | 61,548 | |
KAR Small-Cap Value Fund | | | 3,713 | | | | 4,066 | |
KAR Small- Mid Cap Core Fund | | | 54 | | | | — | |
Rampart Enhanced Core Equity Fund | | | 1,076 | | | | — | |
Tactical Allocation Fund | | | 29 | | | | 3,203 | |
The differences between the book and tax basis components of distributable earnings relate principally to the timing of recognition of income and gains for federal income tax purposes. These differences may include the treatment of non-taxable dividends, foreign currency gain or loss, derivatives, passive foreign investment companies, partnerships, losses deferred due to wash sales and other differences.
Short-term gain distributions reported in the Statements of Changes in Net Assets, if any, are reported as ordinary income for federal tax purposes. Distributions are determined on a tax basis and may differ from net investment income and realized capital gains for financial reporting purposes. The tax character of dividends and distributions paid during the periods ended September 30, 2018 and March 31, 2017 respectively, was as follows:
| | | | | | | | | | | | | | | | |
| | | | | | Ordinary
Income | | | Long-Term
Capital Gains | | | Total | |
KAR Capital Growth Fund | | | 9/30/18 | | | $ | 6,245 | | | $ | 18,762 | | | $ | 25,007 | |
| | | 9/30/17 | | | | — | | | | 4,679 | | | | 4,679 | |
| | | 3/31/17 | | | | — | | | | 33,520 | | | | 33,520 | |
KAR Global Quality Dividend Fund | | | 9/30/18 | | | | 3,674 | | | | 2,657 | | | | 6,331 | |
| | | 9/30/17 | | | | 880 | | | | 3,558 | | | | 4,438 | |
| | | 3/31/17 | | | | 535 | | | | — | | | | 535 | |
KAR Mid-Cap Core Fund | | | 9/30/18 | | | | — | | | | — | | | | — | |
| | | 9/30/17 | | | | — | | | | 333 | | | | 333 | |
| | | 3/31/17 | | | | — | | | | — | | | | — | |
KAR Mid-Cap Growth Fund | | | 9/30/18 | | | | — | | | | 5,310 | | | | 5,310 | |
| | | 9/30/17 | | | | — | | | | 451 | | | | 451 | |
| | | 3/31/17 | | | | — | | | | 1,330 | | | | 1,330 | |
KAR Small-Cap Core Fund | | | 9/30/18 | | | | — | | | | 1,110 | | | | 1,110 | |
| | | 9/30/17 | | | | — | | | | 261 | | | | 261 | |
| | | 3/31/17 | | | | — | | | | 21,910 | | | | 21,910 | |
KAR Small-Cap Growth Fund | | | 9/30/18 | | | | — | | | | — | | | | — | |
| | | 9/30/17 | | | | — | | | | 16 | | | | 16 | |
| | | 3/31/17 | | | | — | | | | 7,887 | | | | 7,887 | |
KAR Small-Cap Value Fund | | | 9/30/18 | | | | 843 | | | | 6,711 | | | | 7,554 | |
| | | 9/30/17 | | | | 704 | | | | 13,489 | | | | 14,193 | |
| | | 3/31/17 | | | | 5,204 | | | | 19,870 | | | | 25,074 | |
KAR Small-Mid Cap Core Fund | | | 9/30/18 | | | | — | | | | — | | | | — | |
Rampart Enhanced Core Equity Fund | | | 9/30/18 | | | | 4,150 | | | | 8,307 | | | | 12,457 | |
| | | 9/30/17 | | | | 13,655 | | | | 1,200 | | | | 14,855 | |
| | | 3/31/17 | | | | 3,502 | | | | 2,164 | | | | 5,666 | |
Tactical Allocation Fund | | | 9/30/18 | | | | 2,125 | | | | 1,144 | | | | 3,269 | |
| | | 9/30/17 | | | | 1,315 | | | | 282 | | | | 1,597 | |
| | | 3/31/17 | | | | 4,164 | | | | 9,727 | | | | 13,891 | |
90
VIRTUS EQUITY TRUST
NOTES TO FINANCIAL STATEMENTS (Continued)
SEPTEMBER 30, 2018
For financial reporting purposes, book basis capital accounts are adjusted to reflect the tax character of permanent book/tax differences. Permanent reclassifications can arise from differing treatment of certain income and gain transactions, nondeductible current year net operating losses, expiring capital loss carryovers and investments in passive foreign investment companies. Permanent book and tax basis differences relating to shareholder distributions will result in reclassifications to capital paid in on shares of beneficial interest. The reclassifications have no impact on the net assets or NAV of the Funds. As of September 30, 2018, the Funds recorded reclassifications to increase (decrease) the accounts as listed below:
| | | | | | | | | | | | |
| | | Capital Paid in on
Shares of
Beneficial Interest | | | Undistributed
Net Investment
Income (Loss) | | | Accumulated
Net Realized
Gain (Loss) | |
KAR Capital Growth Fund | | $ | — | | | $ | 2,595 | | | $ | (2,595 | ) |
KAR Global Quality Dividend Fund | | | (847 | ) | | | (14 | ) | | | 861 | |
KAR Mid-Cap Core Fund | | | — | | | | 195 | | | | (195 | ) |
KAR Mid-Cap Growth Fund | | | — | | | | 1,149 | | | | (1,149 | ) |
KAR Small-Cap Core Fund | | | (581 | ) | | | 562 | | | | 19 | |
KAR Small-Cap Growth Fund | | | — | | | | 5,960 | | | | (5,960 | ) |
KAR Small-Cap Value Fund | | | — | | | | 106 | | | | (106 | ) |
KAR Small- Mid Cap Core Fund | | | — | | | | 2 | | | | (2 | ) |
Rampart Enhanced Core Equity Fund | | | — | | | | 6 | | | | (6 | ) |
Tactical Allocation Fund | | | — | | | | (125 | ) | | | 125 | |
Note 11. Redemption Facility
($ reported in thousands)
On September 18, 2017, the Funds, except for the Virtus KAR Small-Mid Cap Core Fund, and certain other affiliated funds entered into an $150,000 unsecured line of (“Credit Agreement”). This Credit Agreement, as amended, is with a commercial bank that allows the Funds to borrow cash from the bank to manage large unexpected redemptions and trade fails, up to a limit of one-third or one-fifth of each Fund’s total net assets in accordance with the terms of the agreement. This Credit Agreement has a term of 364 days and has been renewed for a period up to March 14, 2019. Interest is charged at the higher of the LIBOR or the Federal Funds rate plus an additional percentage rate on the amount borrowed. Commitment fees are charged on the undrawn balance. The Funds and other affiliated funds that are parties are individually, and not jointly, liable for their particular advances, if any, under the line of credit. The lending bank has the ability to require repayment of outstanding borrowings under this Credit Agreement upon certain circumstances such as an event of default.
From February 14, 2018 to February 19, 2018, the KAR Global Quality Dividend Fund made borrowings under this Credit Agreement. The average daily borrowings under the Credit agreement and the daily average interest rate was $2,967 and 2.84% respectively. No other Funds had borrowings under this Credit Agreement during the period and no Fund had outstanding borrowings under this Credit Agreement at September 30, 2018.
Note 12. Illiquid and Restricted Securities
Investments are generally considered illiquid if they cannot be disposed of within seven days in the ordinary course of business at the approximate amount at which such securities have been valued by a Fund. Additionally, the following information is also considered in determining liquidity: the frequency of trades and quotes for the investment, whether the investment is listed for trading on a recognized domestic exchange and/or whether two or more brokers are willing to purchase or sell the security at a comparable price, the extent of market making activity in the investment and the nature of the market for investment.
Restricted securities are not registered under the Securities Act of 1933, as amended (the “1933 Act”). Generally, 144A securities are excluded from this category, except where defined as illiquid.
Each Fund will bear any costs, including those involved in registration under the 1933 Act, in connection with the disposition of such securities.
At September 30, 2018, the Funds did not hold any securities that were illiquid or restricted.
Note 13. Regulatory Matters and Litigation
From time to time, the Trust, the Funds’ Adviser and/or subadvisers and/or their affiliates may be involved in litigation and arbitration as well as examinations and investigations by various regulatory bodies, including the SEC, involving compliance with, among other things, securities laws, client investment guidelines, laws governing the activities of broker-dealers and other laws and regulations affecting their products and other activities. At this time, the Funds’ Adviser believes that the outcomes of such matters are not likely, either individually or in the aggregate, to be material to these financial statements.
91
VIRTUS EQUITY TRUST
NOTES TO FINANCIAL STATEMENTS (Continued)
SEPTEMBER 30, 2018
Note 14. Recent Accounting Pronouncements
In August 2018, the Financial Accounting Standards Board issued Accounting Standards Update (“ASU”), ASU No. 2018-13, which changes certain fair value measurement disclosure requirements. The new ASU, in addition to other modifications and additions, removes the requirement to disclose the amount and reasons for transfers between Level 1 and Level 2 of the fair value hierarchy, the policy for the timing of transfers between levels and the valuation process for Level 3 fair value measurements. For public companies, the amendments are effective for financial statements issued for fiscal years beginning after December 15, 2019, and interim periods within those fiscal years. Management has evaluated the implications of certain provisions of ASU No. 2018-13 and has determined to early adopt all aspects related to the removal and modification of certain fair value measurement disclosures under the ASU effective immediately.
In August 2018, the SEC adopted amendments to Regulation S-X which are intended to facilitate the disclosure of information to investors and simplify compliance without significantly altering the information provided to investors. The amendments include eliminating the requirement to: separately state book basis components of net assets on the Statement of Assets & Liabilities; separately state the sources of distributions paid (except tax return of capital distributions must still be separately disclosed) on the Statement of Changes in Net Assets; and state the book basis amount of undistributed net investment income on the Statement of Changes in Net Assets. The compliance date for the amendments to Regulation S-X is for filings made with the SEC after November 5, 2018. The adoption will have no effect on the Fund’s net assets or results of operations.
In March 2017, the Financial Accounting Standards Board issued an Accounting Standards Update, ASU 2017-08, Receivables – Nonrefundable Fees and Other Costs (Subtopic 310-20), Premium Amortization on Purchased Callable Debt Securities which amends the amortization period for certain purchased callable debt securities held at a premium, shortening such period to the earliest call date. This ASU does not require any accounting change for debt securities held at a discount; the discount continues to be amortized to maturity. This ASU is effective for fiscal years, and interim periods within those fiscal years, beginning after December 15, 2018. At this time, management is evaluating the implications of these changes on the financial statements.
Note 15. Subsequent Events
Management has evaluated the impact of all subsequent events on the Funds through the date the financial statements were available for issuance and has determined that the following subsequent event requires recognition or disclosure in these financial statements.
On November 14, 2018, the Board of Trustees of Virtus Equity Trust (the “Board”), on behalf of Virtus Strategic Allocation Fund and Virtus Tactical Allocation Fund, approved an Agreement and Plan of Reorganization relating to the combination of Virtus Strategic Allocation Fund, a series of Virtus Equity Trust, with and into Virtus Tactical Allocation Fund, also a series of Virtus Equity Trust. The merger does not require the approval of shareholders of either Fund and will be effective on or about January 25, 2019.
92

REPORT OF INDEPENDENT REGISTERED PUBLIC ACCOUNTING FIRM
To the Board of Trustees of Virtus Equity Trust and Shareholders of Virtus KAR Capital Growth Fund, Virtus KAR Global Quality Dividend Fund, Virtus KAR Mid-Cap Core Fund, Virtus KAR Mid-Cap Growth Fund, Virtus KAR Small-Cap Core Fund, Virtus KAR Small-Cap Growth Fund, Virtus KAR Small-Cap Value Fund, Virtus KAR Small-Mid Cap Core Fund, Virtus Rampart Enhanced Core Equity Fund and Virtus Tactical Allocation Fund
Opinions on the Financial Statements
We have audited the accompanying statements of assets and liabilities, including the schedules of investments, of each of the funds listed in the table below (ten of the funds constituting Virtus Equity Trust, hereafter collectively referred to as the “Funds”) as of September 30, 2018, the related statements of operations and of changes in net assets for each of the periods indicated in the table below, including the related notes, and the financial highlights for each of the periods indicated therein (collectively referred to as the “financial statements”). In our opinion, the financial statements present fairly, in all material respects, the financial position of each of the Funds as of September 30, 2018, the results of each of their operations and the changes in each of their net assets for the periods indicated in the table below, and each of the financial highlights for each of the periods indicated therein, in conformity with accounting principles generally accepted in the United States of America.
| | |
Virtus KAR Capital Growth Fund Virtus KAR Global Quality Dividend Fund Virtus KAR Mid-Cap Core Fund Virtus KAR Mid-Cap Growth Fund Virtus KAR Small-Cap Core Fund Virtus KAR Small-Cap Growth Fund Virtus KAR Small-Cap Value Fund Virtus Rampart Enhanced Core Equity Fund Virtus Tactical Allocation Fund | | Statements of operations for the year ended September 30, 2018, and statements of changes in net assets for the year ended September 30, 2018, the period April 1, 2017 through September 30, 2017 and the year ended March 31, 2017 |
| Virtus KAR Small-Mid Cap Core Fund | | Statements of operations and of changes in net assets for the period March 7, 2018 (inception) through September 30, 2018 |
Basis for Opinions
These financial statements are the responsibility of the Funds’ management. Our responsibility is to express an opinion on the Funds’ financial statements based on our audits. We are a public accounting firm registered with the Public Company Accounting Oversight Board (United States) (“PCAOB”) and are required to be independent with respect to the Funds in accordance with the U.S. federal securities laws and the applicable rules and regulations of the Securities and Exchange Commission and the PCAOB.
We conducted our audits of these financial statements in accordance with the standards of the PCAOB. Those standards require that we plan and perform the audit to obtain reasonable assurance about whether the financial statements are free of material misstatement, whether due to error or fraud.
Our audits included performing procedures to assess the risks of material misstatement of the financial statements, whether due to error or fraud, and performing procedures that respond to those risks. Such procedures included examining, on a test basis, evidence regarding the amounts and disclosures in the financial statements. Our audits also included evaluating the accounting principles used and significant estimates made by management, as well as evaluating the overall presentation of the financial statements. Our procedures included confirmation of securities owned as of September 30, 2018 by correspondence with the custodian, transfer agents and brokers; when replies were not received from brokers, we performed other auditing procedures. We believe that our audits provide a reasonable basis for our opinions.
/s/ PricewaterhouseCoopers LLP
Philadelphia, Pennsylvania
November 20, 2018
We have served as the Virtus Mutual Funds’ auditor since at least 1977. We have not been able to determine the specific year we began serving as auditor.
93
VIRTUS EQUITY TRUST
TAX INFORMATION NOTICE (Unaudited)
SEPTEMBER 30, 2018
For the fiscal period ended September 30, 2018, the Funds make the following disclosures for federal income tax purposes. Below is listed the percentages, or the maximum amount allowable, of its ordinary income dividends (“QDI”) to qualify for the lower tax rates applicable to individual shareholders, and the percentage of ordinary income dividends earned by the Funds which qualifies for the dividends received deduction (“DRD”) for corporate shareholders. The actual percentage of QDI and DRD for the calendar year will be designated in year-end tax statements. The Funds designate the amounts below as long-term capital gains dividends (“LTCG”) taxable at a 20% rate, or lower depending on the shareholder’s income ($ reported in thousands). LTCG amounts, if subsequently different, will be designated in the next annual report.
| | | | | | | | | | | | |
| | | QDI | | | DRD | | | LTCG | |
KAR Capital Growth Fund | | | 100 | % | | | 100 | % | | $ | 39,397 | |
KAR Global Quality Dividend Fund | | | 100 | | | | 33 | | | | 2,337 | |
KAR Mid-Cap Core Fund | | | — | | | | — | | | | 1,872 | |
KAR Mid-Cap Growth Fund | | | 57 | | | | 50 | | | | 2,673 | |
KAR Small-Cap Core Fund | | | 98 | | | | 86 | | | | 40,802 | |
KAR Small-Cap Growth Fund | | | 100 | | | | 100 | | | | 61,548 | |
KAR Small-Cap Value Fund | | | 100 | | | | 100 | | | | 4,087 | |
KAR Small- Mid Cap Core Fund | | | 29 | | | | 27 | | | | — | |
Rampart Enhanced Core Equity Fund | | | 100 | | | | 100 | | | | 5 | |
Tactical Allocation Fund | | | 60 | | | | 26 | | | | 3,277 | |
For the fiscal period ended September 30, 2018, the KAR Global Quality Dividend Fund recognized $1,284 ($ reported in thousands), of foreign source income on which the KAR Global Quality Dividend Fund paid foreign taxes of $116 ($ reported in thousands). This information is being furnished to you pursuant to notice requirements of Section 853(a) and 855(d) of the Internal Revenue Code, as amended, and the Treasury Regulations thereunder.
94
FUND MANAGEMENT TABLES (Unaudited)
Information pertaining to the Trustees and officers of the Trust as of the date of issuance of this report is set forth below. The statement of additional information (SAI) includes additional information about the Trustees and is available without charge, upon request, by calling (800) 243-4361.
The address of each individual, unless otherwise noted, is c/o Virtus Equity Trust, 100 Pearl Street, Hartford, CT 06103. There is no stated term of office for Trustees or officers of the Trust.
Independent Trustees
| | |
| | |
Name,
Year of Birth,
Length of Time Served and
Number of Portfolios in Complex | | Principal Occupation(s) During Past 5 Years and Other Directorships Held by Trustee |
Brown, Thomas J. YOB: 1945 Served Since: 2016 71 Portfolios | | Retired. Trustee (since 2016), Virtus Mutual Fund Family (60 portfolios) and Virtus Alternative Solutions Trust (3 portfolios); Trustee (since 2011), Virtus Variable Insurance Trust (8 portfolios); Director (since 2010), D’Youville Senior Care Center; and Director (since 2005), VALIC Company Funds (49 portfolios). |
Burke, Donald C. YOB: 1960 Served Since: 2016 75 Portfolios | | Retired. Trustee (since 2016), Virtus Mutual Fund Family (60 portfolios), Virtus Variable Insurance Trust (8 portfolios) and Virtus Alternative Solutions Trust (3 portfolios); Director (since 2014) closed-end funds managed by Duff & Phelps Investment Management Co. (4 funds); Director, Avista Corp. (energy company) (since 2011); Trustee, Goldman Sachs Fund Complex (2010 to 2014); and Director, BlackRock Luxembourg and Cayman Funds (2006 to 2010). |
Gelfenbien, Roger A. YOB: 1943 Served Since: 2016 71 Portfolios | | Retired. Trustee (since 2016), Virtus Mutual Fund Family (60 portfolios) and Virtus Alternative Solutions Trust (3 portfolios); Trustee (since 2000), Virtus Variable Insurance Trust (8 portfolios); and Director (1999 to 2017), USAllianz Variable Insurance Product Trust (42 portfolios). |
Harris, Sidney E. YOB: 1949 Served Since: 2017 71 Portfolios | | Professor and Dean Emeritus (since April 2015), Professor (1997 to 2014), Dean (1997 to 2004), J. Mack Robinson College of Business, Georgia State University; Trustee (since 2017), Virtus Mutual Fund Family (60 portfolios), Virtus Variable Insurance Trust (8 portfolios), and Virtus Alternative Solutions Trust (3 portfolios); Trustee (since 2013), KIPP Metro Atlanta; Trustee (since 1999) Total System Services, Inc.; Trustee (2004 to 2017), RidgeWorth Funds; Trustee (2012 to 2017), International University of the Grand Bassam; and Trustee (2011 to 2015), Genspring Family Offices, LLC. |
Mallin, John R. YOB: 1950 Served Since: 2016 71 Portfolios | | Partner/Attorney (since 2003), McCarter & English LLP (law firm), Real Property Practice Group; and Member (since 2014), Counselors of Real Estate. Trustee (since 2016), Virtus Mutual Fund Family (60 portfolios) and Virtus Alternative Solutions Trust (3 portfolios); Director (since 2013), Horizons, Inc. (non-profit); and Trustee (since 1999), Virtus Variable Insurance Trust (8 portfolios). |
McClellan, Hassell H. YOB: 1945 Served Since: 2015 71 Portfolios | | Retired (since 2013); and Professor (1984 to 2013), Wallace E. Carroll School of Management, Boston College. Chairperson of the Board (since 2017) and Trustee (since 2000), John Hancock Fund Complex (collectively, 227 portfolios); Trustee (since 2016), Virtus Alternative Solutions Trust (3 portfolios); Trustee (since 2015), Virtus Mutual Fund Family (60 portfolios); Director (since 2010), Barnes Group, Inc. (diversified global components manufacturer and logistical services company); and Trustee (since 2008), Virtus Variable Insurance Trust (8 portfolios). |
McDaniel, Connie D. YOB: 1958 Served Since: 2017 71 Portfolios | | Retired (since 2013); and Vice President, Chief of Internal Audit, Corporate Audit Department (2009 to 2013); Vice President Global Finance Transformation (2007 to 2009); Vice President and Controller (1999 to 2007), The Coca-Cola Company. Trustee (since 2017), Virtus Mutual Fund Family (60 portfolios), Virtus Variable Insurance Trust (8 portfolios), and Virtus Alternative Solutions Trust (3 portfolios); Trustee (since 2014), Total System Services, Inc.; and Trustee (2005 to 2017), RidgeWorth Funds. |
McLoughlin, Philip YOB: 1946 Served Since: 1996 79 Portfolios | | Retired. Director and Chairman (since 2016), Virtus Total Return Fund Inc. and Virtus Global Dividend & Income Fund Inc.; Director and Chairman (since 2014) Duff & Phelps Select Energy MLP Fund Inc.; Trustee and Chairman (since 2013), Virtus Alternative Solutions Trust (3 portfolios); Trustee and Chairman (since 2011), Virtus Global Multi-Sector Income Fund; Chairman and Trustee (since 2003), Virtus Variable Insurance Trust (8 portfolios); Director (since 1995), closed-end funds managed by Duff & Phelps Investment Management Co. (4 funds); Director (since 1991) and Chairman (since 2010), Lazard World Trust Fund (closed-end investment firm in Luxembourg); and Trustee (since 1989) and Chairman (since 2002), Virtus Mutual Fund Family (60 portfolios). |
McNamara, Geraldine M. YOB: 1951 Served Since: 2001 75 Portfolios | | Retired. Trustee (since 2016), Virtus Alternative Solutions Trust (3 portfolios); Trustee (since 2015), Virtus Variable Insurance Trust (8 portfolios); Director (since 2003), closed-end funds managed by Duff & Phelps Investment Management Co. (4 funds); and Trustee (since 2001), Virtus Mutual Fund Family (60 portfolios). |
95
FUND MANAGEMENT TABLES (Unaudited) (Continued)
Independent Trustees (Continued)
| | |
| | |
Name,
Year of Birth,
Length of Time Served and
Number of Portfolios in Complex | | Principal Occupation(s) During Past 5 Years and Other Directorships Held by Trustee |
Oates, James M. YOB: 1946 Served Since: 1996 75 Portfolios | | Managing Director (since 1994), Wydown Group (consulting firm). Director (since 2016), Virtus Total Return Fund Inc. and Virtus Global Dividend & Income Fund Inc.; Trustee (since 2016), Virtus Variable Insurance Trust (8 portfolios); Director (since 2014), Duff & Phelps Select Energy MLP Fund Inc.; Trustee (since 2013), Virtus Alternative Solutions Trust (3 portfolios); Trustee (since 2011), Virtus Global Multi-Sector Income Fund; Trustee (since 2005) and Chairman (2005 to 2017), John Hancock Fund Complex (227 portfolios); Director (2002 to 2014), New Hampshire Trust Company; Chairman (2000 to 2016), Emerson Investment Management, Inc.; Non-Executive Chairman (2000 to 2014), Hudson Castle Group, Inc. (formerly IBEX Capital Markets, Inc.) (financial services); Chairman and Director (1999 to 2014), Connecticut River Bank; Director (since 1996), Stifel Financial; and Trustee (since 1987), Virtus Mutual Fund Family (60 portfolios). |
Segerson, Richard E. YOB: 1946 Served Since: 1996 71 Portfolios | | Retired; and Managing Director (1998 to 2013), Northway Management Company. Trustee (since 2016), Virtus Alternative Solutions Trust (3 portfolios) and Virtus Variable Insurance Trust (8 portfolios); and Trustee (since 1983), Virtus Mutual Fund Family (60 portfolios). |
Interested Trustee
| | |
| | |
Name,
Year of Birth,
Year Elected and
Number of Funds Overseen | | Principal Occupation(s) During Past 5 Years and
Other Directorships Held by Trustee |
Aylward, George R.* Trustee and President YOB: 1964 Elected: 2006 77 Portfolios | | Director, President and Chief Executive Officer (since 2008), Virtus Investment Partners, Inc. and/or certain of its subsidiaries; various senior officer positions with Virtus affiliates (since 2005). Chairman and Trustee (since 2015), Virtus ETF Trust II (2 portfolios); Director, President and Chief Executive Officer (since 2014), Duff & Phelps Select Energy MLP Fund Inc.; Trustee and President (since 2013), Virtus Alternative Solutions Trust (3 portfolios); Director (since 2013), Virtus Global Funds, PLC (3 portfolios); Trustee (since 2012) and President (since 2010), Virtus Variable Insurance Trust (8 portfolios); Trustee, President and Chief Executive Officer (since 2011), Virtus Global Multi-Sector Income Fund; Trustee and President (since 2006) and Executive Vice President (2004 to 2006), Virtus Mutual Fund Family (60 portfolios); and Director, President and Chief Executive Officer (since 2006), Virtus Global Dividend & Income Fund Inc. and Virtus Total Return Fund Inc. |
* Mr. Aylward is an “interested person,” as defined in the 1940 Act, by reason of his position as President and Chief Executive Officer of Virtus Investment Partners, Inc. (“Virtus”), the ultimate parent company of the Adviser, and various positions with its affiliates, including the Adviser.
96
FUND MANAGEMENT TABLES (Unaudited) (Continued)
Officers of the Trust Who Are Not Trustees
| | | | |
| | | |
Name, Address and Year of Birth | | Position(s) Held with Trust and
Length of Time Served | | Principal Occupation(s)
During Past 5 Years |
Bradley, W. Patrick YOB: 1972 | | Executive Vice President (since 2016); Senior Vice President (2013 to 2016); Vice President (2011 to 2013); Chief Financial Officer and Treasurer (since 2006). | | Executive Vice President, Fund Services (since 2016), Senior Vice President, Fund Services (2010 to 2016), Virtus Investment Partners, Inc. and/or certain of its subsidiaries; various officer positions (since 2006) with Virtus affiliates; Executive Vice President (since 2016), Senior Vice President (2013 to 2016), Vice President (2011 to 2013), Chief Financial Officer and Treasurer (since 2004), Virtus Variable Insurance Trust; Executive Vice President (since 2016), Senior Vice President (2013 to 2016), Vice President (2011 to 2013), Chief Financial Officer and Treasurer (since 2006), Virtus Mutual Fund Family; Executive Vice President (since 2016), Senior Vice President (2013 to 2016), Vice President (2012 to 2013) and Treasurer and Chief Financial Officer (since 2010), Virtus Total Return Fund Inc. and Virtus Global Dividend & Income Fund Inc.; Executive Vice President (since 2016), Senior Vice President (2013 to 2016), Vice President (2011 to 2013), Chief Financial Officer and Treasurer (since 2011), Virtus Global Multi-Sector Income Fund; Executive Vice President (since 2016), Senior Vice President (2014 to 2016), Chief Financial Officer and Treasurer (since 2014), Duff & Phelps Select Energy MLP Fund Inc.; Vice President and Assistant Treasurer (since 2011), Duff & Phelps Global Utility Income Fund Inc.; Director (since 2013), Virtus Global Funds, PLC; and Executive Vice President (since 2016), Senior Vice President (2013 to 2016), and Chief Financial Officer and Treasurer (since 2013), Virtus Alternative Solutions Trust. |
Carr, Kevin J. YOB: 1954 | | Senior Vice President (since 2013); Vice President (2005 to 2013); Chief Legal Officer, Counsel and Secretary (since 2005). | | Vice President and Senior Counsel (2017 to Present), Senior Vice President (2009 to 2017), Vice President, Counsel and Secretary (2008 to 2009), Virtus Investment Partners, Inc. and/or certain of its subsidiaries; various senior officer positions (since 2005) with Virtus affiliates; Senior Vice President (since 2013), Vice President (2005 to 2013), Chief Legal Officer, Counsel and Secretary (since 2005), Virtus Mutual Fund Family; Senior Vice President (2013 to 2014), Vice President (2012 to 2013), Secretary and Chief Legal Officer (2005 to 2013), Virtus Total Return Fund Inc. and Virtus Global Dividend & Income Fund Inc.; Senior Vice President (since 2017), Assistant Secretary (since 2013), Vice President, Chief Legal Officer, Counsel and Secretary (2010 to 2013), Virtus Variable Insurance Trust; Senior Vice President (2013 to 2014), Vice President (2011 to 2013), Virtus Global Multi-Sector Income Fund; Assistant Secretary (since 2015), Duff & Phelps Select Energy MLP Fund Inc.; Senior Vice President (since 2017) and Assistant Secretary (since 2013), Virtus Alternative Solutions Trust; Secretary (since 2015), ETFis Series Trust I; and Secretary (since 2015), Virtus ETF Trust II. |
Engberg, Nancy J. YOB: 1956 | | Senior Vice President (since 2017); Vice President (2011 to 2017); and Chief Compliance Officer (since 2011). | | Senior Vice President (since 2017), Vice President (2008 to 2017) and Chief Compliance Officer (2008 to 2011 and since 2016), Virtus Investment Partners, Inc. and/or certain of its subsidiaries; various officer positions (since 2003) with Virtus affiliates; Senior Vice President (since 2017), Vice President (2011 to 2017) and Chief Compliance Officer (since 2011), Virtus Mutual Fund Family; Senior Vice President (since 2017), Vice President (2010 to 2017) and Chief Compliance Officer (since 2011), Virtus Variable Insurance Trust; Senior Vice President (since 2017), Vice President (2011 to 2016) and Chief Compliance Officer (since 2011), Virtus Global Multi-Sector Income Fund; Senior Vice President (since 2017), Vice President (2012 to 2017) and Chief Compliance Officer (since 2012), Virtus Total Return Fund Inc. and Virtus Global Dividend & Income Fund Inc.; Senior Vice President (since 2017), Vice President (2013 to 2016) and Chief Compliance Officer (since 2013), Virtus Alternative Solutions Trust; Senior Vice President (since 2017), Vice President (2014 to 2017) and Chief Compliance Officer (since 2014), Duff & Phelps Select Energy MLP Fund Inc.; Chief Compliance Officer (since 2015), ETFis Series Trust I; and Chief Compliance Officer (since 2015), Virtus ETF Trust II. |
Short, Julia R. YOB: 1972 | | Senior Vice President (since 2017). | | Senior Vice President, Product Development (since 2017), Virtus Investment Partners, Inc. and/or certain of its subsidiaries; Senior Vice President (since 2017), Virtus Mutual Fund Family; Senior Vice President (since 2018), Virtus Closed-End Funds; President and Chief Executive Officer, RidgeWorth Funds (2007 to 2017); and Managing Director, Product Manager, RidgeWorth Investments (2004 to 2017). |
Waltman, Francis G. YOB: 1962 | | Executive Vice President (since 2013); Senior Vice President (2008 to 2013). | | Executive Vice President, Product Development (since 2009), Virtus Investment Partners, Inc. and/or certain of its subsidiaries; various senior officer positions (since 2006) with Virtus affiliates; Executive Vice President (since 2013), Senior Vice President (2008 to 2013), Virtus Mutual Fund Family; Executive Vice President (since 2013), Senior Vice President (2010 to 2013), Virtus Variable Insurance Trust; Executive Vice President (since 2013), Senior Vice President (2011 to 2013), Virtus Global Multi-Sector Income Fund; Executive Vice President (since 2014), Duff & Phelps Select Energy MLP Fund Inc.; Director (since 2013), Virtus Global Funds PLC; and Executive Vice President (since 2013), Virtus Alternative Solutions Trust. |
97
VIRTUS EQUITY TRUST
101 Munson Street
Greenfield, MA 01301-9668
Trustees
Philip R. McLoughlin, Chairman
George R. Aylward
Thomas J. Brown
Donald C. Burke
Roger A. Gelfenbien
Sidney E. Harris
John R. Mallin
Hassell H. McClellan
Connie D. McDaniel
Geraldine M. McNamara
James M. Oates
Richard E. Segerson
Officers
George R. Aylward, President
Peter Batchelar, Senior Vice President
W. Patrick Bradley, Executive Vice President, Chief Financial Officer and Treasurer
Kevin J. Carr, Senior Vice President, Chief Legal Officer, Counsel and Secretary
Nancy J. Engberg, Senior Vice President and Chief Compliance Officer
Julia R. Short, Senior Vice President
Francis G. Waltman, Executive Vice President
Investment Adviser
Virtus Investment Advisers, Inc.
100 Pearl Street
Hartford, CT 06103-4506
Principal Underwriter
VP Distributors, LLC
100 Pearl Street
Hartford, CT 06103-4506
Administrator and Transfer Agent
Virtus Fund Services, LLC
100 Pearl Street
Hartford, CT 06103-4506
Custodian
The Bank of New York Mellon
240 Greenwich Street
New York, NY 10286-1048
Independent Registered Public Accounting Firm
PricewaterhouseCoopers LLP
2001 Market Street
Philadelphia, PA 19103-7042
How to Contact Us
| | |
Mutual Fund Services | | 1-800-243-1574 |
Adviser Consulting Group | | 1-800-243-4361 |
Website | | Virtus.com |
Important Notice to Shareholders
The Securities and Exchange Commission has modified mailing regulations for semiannual and annual shareholder fund reports to allow mutual fund companies to send a single copy of these reports to shareholders who share the same mailing address. If you would like additional copies, please call Mutual Fund Services at 1-800-243-1574.
| | |

| | |
P.O. Box 9874 Providence, RI 02940-8074 | | |
For more information about Virtus Mutual Funds,
please call your financial representative, contact us
at 1-800-243-1574 or Virtus.com.
| | |
ANNUAL REPORT VIRTUS EQUITY TRUST | |  |
September 30, 2018
|
Virtus Strategic Allocation Fund |
Not FDIC Insured
No Bank Guarantee
May Lose Value

Table of Contents
Virtus Strategic Allocation Fund
(“Strategic Allocation Fund”)
PROXY VOTING PROCEDURES AND VOTING RECORD (FORM N-PX)
The subadvisers vote proxies relating to portfolio securities in accordance with procedures that have been approved by the Board of Trustees of the Trust (“Trustees,” or the “Board”). You may obtain a description of these procedures, along with information regarding how the Fund voted proxies during the most recent 12-month period ended June 30, free of charge, by calling toll-free 1-800-243-1574. This information is also available through the Securities and Exchange Commission’s (the “SEC”) website at http://www.sec.gov.
FORM N-Q INFORMATION
The Trust files a complete schedule of portfolio holdings for the Fund with the SEC for the first and third quarters of each fiscal period on Form N-Q. Form N-Q is available on the SEC’s website at http://www.sec.gov. Form N-Q may be reviewed and copied at the SEC’s Public Reference Room. Information on the operation of the SEC’s Public Reference Room can be obtained by calling toll-free 1-800-SEC-0330.
This report is not authorized for distribution to prospective investors in the Strategic Allocation Fund unless preceded or accompanied by an effective prospectus which includes information concerning the sales charge, the Fund’s record and other pertinent information.
MESSAGE TO SHAREHOLDERS
To My Fellow Shareholders of Virtus Mutual Funds:
| | |
 | | I am pleased to present this annual report that reviews the performance of your fund for the 12 months ended September 30, 2018. U.S. economic growth and strong corporate earnings were consistent themes during the period, which began on an optimistic note with the sweeping tax overhaul that was signed into law at the end of 2017. As growth heated up, inflation fears caused stock markets to plunge in early February, ushering in the return of volatility after being conspicuously absent throughout 2017. Global trade war concerns sparked by the Trump administration’s tariff talk caused markets to remain unsettled into March before resuming an upward course through the spring and late summer. Meanwhile, persistent economic strength moved the Federal |
Reserve to hike its key interest rate four times in the period, most recently in late September, to end at 2.25%, its highest level in nearly a decade. For the 12 months ended September 30, 2018, U.S. large-cap stocks, as measured by the S&P 500® Index, returned 17.91%, outpacing small-cap stocks, which returned 15.24%, as measured by the Russell 2000® Index. Within international equities, performance was mixed with developed markets up 2.74%, as measured by the MSCI EAFE® Index (net), and emerging markets down 0.81%, as measured by the MSCI Emerging Markets Index (net). In the fixed income markets, the yield on the 10-year Treasury steadily climbed, to reach 3.05% at September 30, 2018, up from 2.33% at September 30, 2017. The broader U.S. fixed income market, as represented by the Bloomberg Barclays U.S. Aggregate Bond Index, which tracks Treasuries and other investment-grade debt securities, declined 1.22% for the 12 months. Non-investment grade bonds eked out a positive return of 3.05%, as measured by the Bloomberg Barclays U.S. Corporate High Yield Bond Index. Market uncertainty is an ever-present reminder of the importance of portfolio diversification, including exposure to traditional and alternative asset classes. While diversification cannot guarantee a profit or prevent a loss, owning a variety of asset classes may cushion your portfolio against inevitable market fluctuations. Your financial advisor can help you ensure that your portfolio is adequately diversified across asset classes and investment strategies, with a broad array of Virtus Funds available through your fund exchange privileges. These include distinctive equity, fixed income, international, and asset allocation funds managed by Virtus affiliates and select subadvisers. We invite you to learn more about the Virtus family of funds at Virtus.com. On behalf of our investment affiliates, thank you for entrusting the Virtus Funds with your assets. Should you have questions about your account or require assistance, please visit Virtus.com, or call our customer service team at 1-800-243-1574. We appreciate your business and remain committed to your long-term financial success. |
Sincerely,

George R. Aylward
President, Virtus Mutual Funds
October 2018
Performance data quoted represents past results. Past performance is no guarantee of future results, and current performance may be higher or lower than the performance shown above.
1
STRATEGIC ALLOCATION FUND
DISCLOSURE OF FUND EXPENSES (Unaudited)
FOR THE SIX-MONTH PERIOD OF APRIL 1, 2018 TO SEPTEMBER 30, 2018
We believe it is important for you to understand the impact of costs on your investment. All mutual funds have operating expenses. As a shareholder of the Strategic Allocation Fund (the “Fund”) you may incur two types of costs; (1) transaction costs, including sales charges on purchases of Class A shares and contingent deferred sales charges on Class C shares; and (2) ongoing costs, including investment advisory fees, distribution and service fees, and other expenses. For further information regarding applicable sales charges, see Note 1 in the Notes to Financial Statements. These examples are intended to help you understand your ongoing costs (in dollars) of investing in the Fund and to compare these costs with the ongoing costs of investing in other mutual funds. These examples are based on an investment of $1,000 invested at the beginning of the period and held for the entire six-month period. The Annualized Expense Ratios may be different from the expense ratios in the Financial Highlights which is for the fiscal year ended September 30, 2018.
Please note that the expenses shown in the accompanying tables are meant to highlight your ongoing costs only and do not reflect any transactional costs, such as sales charges or contingent deferred sales charges. Therefore, the accompanying tables are useful in comparing ongoing costs only, and will not help you determine the relative total costs of owning different funds. In addition, if these transactional costs were included, your costs would have been higher. The calculations assume no shares were bought or sold during the period. Your actual costs may have been higher or lower, depending on the amount of your investment and the timing of any purchases or redemptions.
Actual Expenses
The table below provides information about the Fund’s actual account values and actual expenses. You may use the information below, together with the amount you invested, to estimate the expenses that you paid over the period. Simply divide your account value by $1,000 (for example, an $8,600 account value divided by $1,000 = 8.6), then multiply the result by the number in the first table under the heading “Expenses Paid During Period” to estimate the expenses you paid on your account during this period.
| | | | | | | | | | | | | | | | |
| | | Beginning
Account Value
April 1,
2018 | | | Ending
Account Value
September 30,
2018 | | | Annualized
Expense
Ratio | | | Expenses
Paid
During
Period* | |
Class A | | $ | 1,000.00 | | | $ | 1,039.90 | | | | 1.07 | % | | $ | 5.47 | |
Class C | | | 1,000.00 | | | | 1,034.90 | | | | 1.83 | | | | 9.34 | |
| * | Expenses are equal to the Fund’s annualized expense ratio, which is net of waived fees and reimbursed expenses, if applicable, multiplied by the average account value over the period, multiplied by the number of days (183) expenses were accrued in the most recent fiscal half-year, then divided by 365 to reflect the one-half year period. |
The Fund may invest in other funds, and the annualized expense ratios noted above do not reflect fees and expenses associated with the underlying funds. If such fees and expenses had been included, the expense ratios would have been higher.
You can find more information about the Fund’s expenses in the Financial Statements section that follows. For additional information on operating expenses and other shareholder costs, refer to the Fund’s prospectus.
2
STRATEGIC ALLOCATION FUND
DISCLOSURE OF FUND EXPENSES (Unaudited) (Continued)
FOR THE SIX-MONTH PERIOD OF APRIL 1, 2018 TO SEPTEMBER 30, 2018
Hypothetical Example for Comparison Purposes
The accompanying table below provides information about hypothetical account values and hypothetical expenses based on the Fund’s actual expense ratio and an assumed rate of return of 5% per year before expenses, which is not your Fund’s actual return. The hypothetical account values and expenses may not be used to estimate the actual ending account balance or expenses you paid for the period. You may use this information to compare this 5% hypothetical example with the 5% hypothetical examples that appear in the shareholder reports of the other mutual funds.
| | | | | | | | | | | | | | | | |
| | | Beginning
Account Value
April 1,
2018 | | | Ending
Account Value
September 30,
2018 | | | Annualized
Expense
Ratio | | | Expenses
Paid
During
Period* | |
Class A | | $ | 1,000.00 | | | $ | 1,019.70 | | | | 1.07 | % | | $ | 5.42 | |
Class C | | | 1,000.00 | | | | 1,015.89 | | | | 1.83 | | | | 9.25 | |
| * | Expenses are equal to the Fund’s annualized expense ratio, which is net of waived fees and reimbursed expenses, if applicable, multiplied by the average account value over the period, multiplied by the number of days (183) expenses were accrued in the most recent fiscal half-year, then divided by 365 to reflect the one-half year period. |
The Fund may invest in other funds, and the annualized expense ratios noted above do not reflect fees and expenses associated with the underlying funds. If such fees and expenses had been included, the expense ratios would have been higher.
You can find more information about the Fund’s expenses in the Financial Statements section that follows. For additional information on operating expenses and other shareholder costs, refer to the Fund’s prospectus.
3
STRATEGIC ALLOCATION FUND
KEY INVESTMENT TERMS (Unaudited)
SEPTEMBER 30, 2018
American Depositary Receipt (“ADR”)
Represents shares of foreign companies traded in U.S. dollars on U.S. exchanges that are held by a U.S. bank or a trust. Foreign companies use ADRs in order to make it easier for Americans to buy their shares.
Bloomberg Barclays U.S. Aggregate Bond Index
The Bloomberg Barclays U.S. Aggregate Bond Index measures the U.S. investment-grade fixed-rate bond market. The index is calculated on a total return basis. The index is unmanaged, its returns do not reflect any fees, expenses, or sales charges, and it is not available for direct investment.
Bloomberg Barclays U.S. Corporate High Yield Bond Index
The Bloomberg Barclays U.S. Corporate High Yield Bond Index measures the U.S. dollar-denominated, high yield, fixed-rate corporate bond market. The index is calculated on a total return basis. The index is unmanaged, its returns do not reflect any fees, expenses, or sales charges, and it is not available for direct investment.
Exchange-Traded Funds (“ETF”)
An open-end fund that is traded on a stock exchange. Most ETFs have a portfolio of stocks or bonds that track a specific market index.
Federal Reserve (the “Fed”)
The Central Bank of the U.S., responsible for controlling money supply, interest rates, and credit with the goal of keeping the U.S. economy and currency stable. Governed by a seven-member board, the system includes 12 regional Federal Reserve Banks, 25 Branches, and all national and state banks that are part of the system.
Gross Domestic Product (“GDP”)
The gross domestic product represents the market value of all goods and services produced by the economy during the period measured, including personal consumption, government purchases, private inventories, paid-in construction costs and the foreign trade balance.
London Interbank Offered Rate (“LIBOR”)
A benchmark rate that some of the world’s leading banks charge each other for short-term loans and that serves as the first step to calculating interest rates on various loans throughout the world.
MSCI EAFE® Index (net)
The MSCI EAFE® (Europe, Australasia, Far East) Index (net) is a free float-adjusted market capitalization-weighted index that measures developed foreign market equity performance, excluding the U.S. and Canada. The index is calculated on a total return basis with net dividends reinvested. The index is unmanaged, its returns do not reflect any fees, expenses, or sales charges, and it is not available for direct investment.
MSCI Emerging Markets Index (net)
The MSCI Emerging Markets Index (net) is a free float-adjusted market capitalization-weighted index designed to measure equity market performance in the global emerging markets. The index is calculated on a total return basis with net dividends reinvested. The index is unmanaged, its returns do not reflect any fees, expenses, or sales charges, and it is not available for direct investment.
4
STRATEGIC ALLOCATION FUND
KEY INVESTMENT TERMS (Unaudited) (Continued)
SEPTEMBER 30, 2018
Quantitative Easing (“QE”)
An unconventional monetary policy in which a central bank purchases government securities or other securities from the market in order to lower interest rates and increase the money supply. Quantitative easing increases the money supply by flooding financial institutions with capital in an effort to promote increased lending and liquidity. Quantitative easing is considered when short-term interest rates are at or approaching zero, and does not involve the printing of new banknotes.
Real Estate Investment Trust (“REIT”)
A publicly traded company that owns, develops and operates income-producing real estate such as apartments, office buildings, hotels, shopping centers and other commercial properties.
Russell 1000® Growth Index
The Russell 1000® Growth Index is a market capitalization-weighted index of growth-oriented stocks of the 1,000 largest companies in the Russell Universe, which comprises the 3,000 largest U.S. companies. The index is calculated on a total return basis with dividends reinvested. The index is unmanaged, its returns do not reflect any fees, expenses, or sales charges, and it is not available for direct investment.
Russell 2000® Index
The Russell 2000® Index is a market capitalization-weighted index of the 2,000 smallest companies in the Russell Universe, which comprises the 3,000 largest U.S. companies. The index is calculated on a total return basis with dividends reinvested. The index is unmanaged, its returns do not reflect any fees, expenses, or sales charges, and it is not available for direct investment.
S&P 500® Index
The S&P 500® Index is a free-float market capitalization-weighted index of 500 of the largest U.S. companies. The index is calculated on a total return basis with dividends reinvested. The index is unmanaged, its returns do not reflect any fees, expenses, or sales charges, and it is not available for direct investment.
Sponsored ADR
An ADR which is issued with the cooperation of the company whose stock will underlie the ADR. Sponsored ADRs generally carry the same rights normally given to stockholders, such as voting rights. ADRs must be sponsored to be able to trade on a major U.S. exchange such as the New York Stock Exchange (“NYSE”).
Strategic Allocation Fund Linked Benchmark
The Strategic Allocation Fund Linked Benchmark consists of 45% Russell 1000® Growth Index (a market capitalization-weighted index of growth-oriented stocks of the 1,000 largest companies in the Russell Universe, which comprises the 3,000 largest U.S. companies, calculated on a total return basis with dividends reinvested), 15% MSCI EAFE® Index (a free float-adjusted market capitalization-weighted index that measures developed foreign market equity performance, excluding the U.S. and Canada, calculated on a total return basis with net dividends reinvested) and 40% Bloomberg Barclays U.S. Aggregate Bond Index (an index that measures the U.S. investment grade fixed rate bond market, calculated on a total return basis). The index is unmanaged, its returns do not reflect any fees, expenses, or sales charges, and is not available for direct investment. Performance of the Strategic Allocation Fund Linked Benchmark prior to 9/7/2016 represents an allocation consisting of 60% S&P 500® Index and 40% Bloomberg Barclays U.S. Aggregate Bond Index.
5
| | |
STRATEGIC ALLOCATION FUND Fund Summary (Unaudited) Portfolio Management Commentaries by Duff & Phelps Investment Management Co. (International Equity Portfolio), Kayne Anderson Rudnick Investment Management, LLC (Domestic Equity Portfolio), and Newfleet Asset Management, LLC (Fixed Income Portfolio) | | Ticker Symbols: A Share: PHBLX C Share: PSBCX |
| ⬛ | | Strategic Allocation Fund (the “Fund”) is diversified and has investment objectives of reasonable income, long-term capital growth and conservation of capital. There is no guarantee the Fund will achieve its objectives. |
| ⬛ | | For the fiscal year ended September 30, 2018, the Fund’s Class A shares at NAV returned 10.01%, and Class C shares at NAV returned 9.05%. For the fiscal year, the Bloomberg Barclays U.S. Aggregate Bond Index, a broad-based fixed income index, returned -1.22%; the MSCI EAFE® Index (net) a broad-based International Index returned 2.74%; the Russell 1000® Growth Index, a broad-based U.S. equity index, returned 26.30%; and the Strategic Allocation Fund Linked Benchmark, the Fund’s style-specific benchmark, returned 11.21%. |
All performance figures assume reinvestment of distributions and exclude the effect of sales changes. Performance data quoted represents past results. Past performance is no guarantee of future results, and current performance may be higher or lower than the performance shown above. Investment return and principal value will fluctuate so your shares, when redeemed, may be worth more or less than their original cost. Please visit Virtus.com for performance data current to the most recent month-end.
How did the markets perform during the Fund’s fiscal year ended September 30, 2018?
Domestic Equities
Despite increased volatility, U.S. equities continued to march ahead during the fiscal year, with the S&P 500® Index returning 17.91% for
the 12-month period. Smaller stocks, as represented by the Russell 2000® Index, performed strongly as well, rising 15.24%. Growth stocks outperformed their value counterparts for the period, though both categories rose by double digits. Foreign markets struggled in comparison, with the MSCI EAFE® Index (net) gaining 2.74% and the MSCI Emerging Markets Index (net) down 0.81% for the period.
The Russell 1000® Growth Index rose 26.30% for the 12 months through September 30, 2018. All sectors within the index were positive, led by the consumer discretionary and information technology sectors with gains of 43.06% and 41.14%, respectively. The weakest performing sector was materials, up 2.48%.
Key events that drove markets in the past year included a correction that rattled U.S. equity markets in early 2018 after a calm 2017. While the bout of volatility set major indices back a step, stocks soon recovered. They continued to advance during the fiscal year thanks to strong earnings and robust business and economic activity at home, including expansion in service sectors and solid gross domestic product (GDP) growth.
Market strength continued – though not without volatility – despite the introduction of new trade tariffs earlier in 2018 and the continued escalation of tariff-related tensions, particularly with China. Prolonged negotiations and uncertainty put pressure on emerging market stocks during the 12 months. This, paired with a general slowing in Europe and viewed against continued strength in the U.S., seemed to indicate that “global synchronized recovery” was not an apt description for the environment.
For information regarding the indexes and certain investment terms, see the Key Investment Terms on page 4.
6
| | |
| STRATEGIC ALLOCATION FUND (Unaudited) (Continued) |
International Equities
The international equity markets posted positive returns during the fiscal year ended September 30, 2018, with the MSCI EAFE® Index (net) gaining 2.74%. International equity markets shrugged off the U.S.-China “Trade and Tariff War” and higher interest rates, although both concerns caused episodes of skittishness at times. The dominant tailwind driving equity markets was a building consensus that global economic growth is alive and well, powered by a strong U.S. economy. Underlying economic fundamentals remained largely positive in support of the global growth story, which served to mute the overall impact of adverse news events.
Nine of the 11 sectors in the MSCI EAFE® Index (net) posted positive returns. The top performing sectors were energy, healthcare, and information technology. The weakest performing sectors were financials, communication services, and utilities.
Fixed Income
Most spread sectors outperformed during the fiscal year ended September 30, 2018, led by corporate high yield and high yield bank loans. Within spread sectors, assets with longer duration underperformed on a total return basis, as yields rose and bond prices fell. Non-U.S. dollar-denominated securities and emerging markets high yield were the largest underperformers during the period.
The 12-month period presented multiple challenges, including several bouts of elevated volatility. Market participants continued to wrestle with periods of instability caused by geopolitical developments, trade rhetoric, mixed global economic signals, and the evolution of the various quantitative easing (QE) programs that began after the now decade-old financial crisis. During the period, oil prices continued their ascent, driven higher by the outlook for supply/demand dynamics. U.S. economic data stayed on
a positive trend, which contrasted with other global economies.
As anticipated, the Federal Reserve (the Fed) raised its target rate 0.25% on four separate occasions during the 12 months to a range of 2.00% to 2.25%.
Over the last 12 months, yields increased overall, but more so for shorter maturity bonds than for longer term securities.
What factors affected the Fund’s performance during its fiscal year?
Domestic Equities
The Fund’s domestic equity portfolio underperformed the Russell 1000® Growth Index for the 12 months ended September 30, 2018. Factors negatively affecting the portfolio included weak stock selection in the consumer discretionary sector and an underweight in information technology. Strong stock selection in industrials and materials helped offset losses.
The stocks that contributed the most to the year’s gains were Amazon and Netflix.
| ⬛ | | Amazon continued on its powerful growth trajectory, driven by its wide-moat e-commerce business and dominant web services offering. Amazon’s advertising capabilities helped propel the company to outpace second-quarter revenue and earnings expectations by a gigantic margin. In addition, Amazon showed operating leverage on a wide variety of expense items, including fulfillment, technology, content and marketing, hinting at the potential for meaningful margin expansion down the road. |
| ⬛ | | Netflix is a global leader in on-demand entertainment, with over 125 million subscribers, more than 55% of whom are outside the U.S. Net subscriber additions continued to greatly outpace expectations due to successful content creation, notable early success in cable and telecommunications distribution channels, |
For information regarding the indexes and certain investment terms, see the Key Investment Terms on page 4.
7
| | |
| STRATEGIC ALLOCATION FUND (Unaudited) (Continued) |
| | | and highly effective local advertising. Margins surprised to the upside, driven by rapid improvements in international profitability even as subscriber growth was a little uneven. |
The positions that detracted the most from performance were Celgene and Ctrip.com.
| ⬛ | | Celgene was aggressive in deploying capital to bolster future growth, but the results of its pipeline programs severely disappointed. Most recently, its REVLIMID failed in a phase-3 follicular lymphoma trial, but that paled in comparison to the failure of GED-0301 for Crohn’s disease, which subsequently forced Celgene to lower its 2020 guidance. We lost faith that the company would be able to weather its $15 billion revenue cliff, and we exited the position. |
| ⬛ | | Ctrip.com has consolidated and monopolized the high-end online travel market in China. It came under fire as regulators forced the company to unbundle products such as trip insurance that it automatically added to ticket purchases. The company was also affected by coordinated reductions in domestic commissions. We believe both of those issues are well understood. On the flip side, the company’s outbound travel business experienced a boom, with advantaged inventory and pricing focused on its core high-end consumer. As only a very small percent of Chinese citizens have ever been outside the country, we believe demand could drive future growth. Therefore, we continued to hold the position in the Fund at the end of the period. |
International Equities
The Fund’s international equity portfolio posted positive performance during the fiscal year, and also outperformed the international equity market, as measured by the MSCI EAFE® Index. Stock selection was the primary contributor to relative returns, while sector allocations also made a positive impact on results.
Stock selection within industrials, consumer staples, and financials contributed most significantly to the international portfolio’s relative performance. The largest single-stock contribution to relative returns came from Japanese consumer electronics company Sony, which rose more than 62% during the period.
Stock selection within the communication services, information technology, and healthcare sectors detracted from results. Shares of travel website company Ctrip.com fell more than 29% during the period due to concerns over a possible slowdown in Chinese travel trends and a general malaise in the Chinese stock market. We continued to hold the stock in the Fund at the end of the period.
The sector allocations that contributed the most to the portfolio’s relative performance were overweight exposures to energy, materials, and information technology, and an underweight exposure to communication services. However, the portfolio’s overweight exposures to financials and industrials, as well as underweight exposures to consumer discretionary and utilities, detracted from results.
During the period, we found select opportunities across all major sectors of the global economy, but continued to lean into cyclical sectors such as energy, financials, industrials, and technology. We also maintained underweight positions in defensive sectors such as consumer staples and communication services, for both top-down and bottom-up reasons.
Fixed Income
The underperformance of U.S. Treasuries relative to most fixed income spread sectors was the key driver of the Fund’s outperformance for the fiscal year ended September 30, 2018.
Among fixed income sectors, the Fund’s allocations to bank loans, residential mortgages, and asset-backed securities were the largest
For information regarding the indexes and certain investment terms, see the Key Investment Terms on page 4.
8
| | |
| STRATEGIC ALLOCATION FUND (Unaudited) (Continued) |
positive contributors to performance for the fiscal year. Issue selection within corporate high quality was also beneficial.
During the fiscal year, the Fund’s allocation to emerging markets high yield was the largest detractor from performance.
The preceding information is the opinion of portfolio management only through the end of the period stated on the cover. Any such opinions are subject to change at any time based upon market or other conditions and should not be relied upon as investment advice. Past performance is no guarantee of future results, and there is no guarantee that market forecasts will be realized.
Equity Securities: The market price of equity securities may be adversely affected by financial market, industry, or issuerspecific events. Focus on a particular style or on small or medium-sized companies may enhance that risk.
Credit & Interest: Debt securities are subject to various risks, the most prominent of which are credit and interest rate risk. The issuer of a debt security may fail to make interest and/or principal payments. Values of debt securities may rise or fall in response to changes in interest rates, and this risk may be enhanced with longer-term maturities.
Foreign & Emerging Markets: Investing internationally, especially in emerging markets, involves additional risks such as currency, political, accounting, economic, and market risk.
Allocation: The Fund’s exposure to different asset classes may not be optimal for market conditions at a given time. Asset allocation does not guarantee a profit or protect against a loss in declining markets.
High Yield-High Risk Fixed Income Securities: There is a greater level of credit risk and price volatility involved with high-yield securities than investment grade securities.
Prospectus: For additional information on risks, please see the Fund’s prospectus.
| | | | | | | | |
| |
| Asset Allocations | |
| |
The following table presents the asset allocations within certain sectors as a percentage of total investments as of September 30, 2018. | |
Common Stocks | | | | | | | 62 | % |
Information Technology | | | 21 | % | | | | |
Consumer Discretionary | | | 14 | | | | | |
Financials | | | 6 | | | | | |
All Other Common Stocks | | | 21 | | | | | |
Corporate Bonds and Notes | | | | | | | 18 | |
Financials | | | 6 | | | | | |
Consumer Discretionary | | | 2 | | | | | |
Real Estate | | | 2 | | | | | |
All Other Corporate Bonds and Notes | | | 8 | | | | | |
Mortgage-Backed Securities | | | | | | | 6 | |
Asset-Backed Securities | | | | | | | 3 | |
U.S. Government Securities | | | | | | | 3 | |
Leveraged Loans | | | | | | | 2 | |
Other (includes Collateral for Securities Lending) | | | | | | | 6 | |
| | | | | | | | | |
Total | | | | | | | 100 | % |
| | | | | | | | | |
For information regarding the indexes and certain investment terms, see the Key Investment Terms on page 4.
9
| | |
| STRATEGIC ALLOCATION FUND (Unaudited) (Continued) |
| | | | | | | | | | | | |
| Average Annual Total Returns1 for periods ended 9/30/18 | |
| | | 1
Year | | | 5
Years | | | 10
Years | |
| Class A shares at NAV 2 | | | 10.01 | % | | | 6.54 | % | | | 7.15 | % |
| Class A shares at POP 3,4 | | | 3.68 | | | | 5.29 | | | | 6.52 | |
| Class C shares at NAV 2 and with CDSC 4 | | | 9.05 | | | | 5.73 | | | | 6.34 | |
| Bloomberg Barclays U.S. Aggregate Bond Index | | | -1.22 | | | | 2.16 | | | | 3.77 | |
| MSCI EAFE® Index (net) | | | 2.74 | | | | 4.42 | | | | 5.38 | |
| Russell 1000® Growth Index | | | 26.30 | | | | 16.58 | | | | 14.31 | |
| Strategic Allocation Fund Linked Benchmark | | | 11.21 | | | | 9.75 | | | | 9.17 | |
Fund Expense Ratios5: Class A shares: 1.16%; Class C shares: 1.91%.
All returns represent past performance which is no guarantee of future results. Current performance may be higher or lower than the performance shown. The investment return and principal value of an investment will fluctuate so that an investor’s shares, when redeemed, may be worth more or less than their original cost. The above table and graph below do not reflect the deduction of taxes that a shareholder would pay on fund distributions or the redemption of fund shares. Please visit Virtus.com for performance data current to the most recent month-end.
| 1 | Total returns are historical and include changes in share price and the reinvestment of both dividends and capital gain distributions. |
| 2 | “NAV” (Net Asset Value) total returns do not include the effect of any sales charge. |
| 3 | “POP” (Public Offering Price) total returns include the effect of the maximum front-end 5.75% sales charge. |
| 4 | “CDSC” (contingent deferred sales charge) is applied to redemptions of certain classes of shares that do not have a sales charge applied at the time of purchase. CDSC charges for certain redemptions of Class A shares made within 18 months of a finder’s fee being paid and all Class C shares are 1% within the first year and 0% thereafter. |
| 5 | The expense ratios of the Fund are set forth according to the prospectus for the Fund effective March 6, 2018, as supplemented and revised, and may differ from the expense ratios disclosed in the Financial Highlights tables in this report. See the Financial Highlights for more current expense ratios. Expense ratios include fees and expenses associated with the underlying funds. |
The indexes are unmanaged and not available for direct investment; therefore their performance does not reflect the expenses associated with active management of an actual portfolio.
10
| | |
| STRATEGIC ALLOCATION FUND (Unaudited) (Continued) |
Growth of $10,000 for periods ended 9/30
This chart assumes an initial investment of $10,000 made on September 30, 2008, for Class A shares and Class C shares including any applicable sales charges or fees. Performance assumes reinvestment of dividends and capital gain distributions.
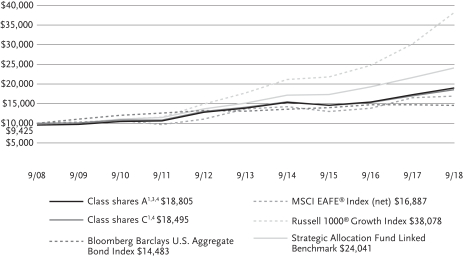
The indexes are unmanaged and not available for direct investment; therefore their performance does not reflect the expenses associated with active management of an actual portfolio.
For information regarding the indexes and certain investment terms, see Key Investment Terms on page 4.
11
STRATEGIC ALLOCATION FUND
SCHEDULE OF INVESTMENTS
SEPTEMBER 30, 2018
($ reported in thousands)
| | | | | | | | |
| | | PAR VALUE | | | VALUE | |
| U.S. GOVERNMENT SECURITIES—2.8% | |
U.S. Treasury Bond | | | | | | | | |
2.500%, 2/15/46 | | $ | 7,250 | | | $ | 6,324 | |
3.000%, 8/15/48 | | | 2,170 | | | | 2,087 | |
U.S. Treasury Note | | | | | | | | |
1.750%, 10/31/18 | | | 1,420 | | | | 1,420 | |
1.375%, 4/30/20 | | | 2,720 | | | | 2,661 | |
1.625%, 2/15/26 | | | 730 | | | | 663 | |
TOTAL U.S. GOVERNMENT SECURITIES
(Identified Cost $13,389) | | | | 13,155 | |
| MUNICIPAL BONDS—1.6% | |
| California—0.5% | |
State of California, Build America Bonds Taxable
7.600%, 11/1/40 | | | 1,275 | | | | 1,895 | |
University of California, Series B-A, Taxable
4.428%, 5/15/48 | | | 380 | | | | 384 | |
| | | | | | | | |
| | | | 2,279 | |
| | | | | | | | |
| Georgia—0.1% | |
Rockdale County Water & Sewerage Authority Revenue Taxable
3.060%, 7/1/24 | | | 600 | | | | 580 | |
| | | | | | | | |
| Idaho—0.1% | |
Idaho Health Facilities Authority Saint Lukes Health System Revenue Taxable
5.020%, 3/1/48 | | | 450 | | | | 455 | |
| | | | | | | | |
| New York—0.8% | |
New York City Transitional Finance Authority Future Tax Secured Revenue
Series A-3
5.000%, 8/1/40 | | | 1,630 | | | | 1,830 | |
Port Authority of New York & New Jersey, Consolidated Bonds Revenue
5.000%, 4/15/57 | | | 1,560 | | | | 1,729 | |
| | | | | | | | |
| | | | 3,559 | |
| | | | | | | | |
| | | | | | | | |
| | | PAR VALUE | | | VALUE | |
| Virginia—0.1% | |
City of Bristol, General Obligation Taxable
4.210%, 1/1/42 | | $ | 640 | | | $ | 640 | |
TOTAL MUNICIPAL BONDS
(Identified Cost $7,716) | | | | 7,513 | |
| FOREIGN GOVERNMENT SECURITIES—0.6% | |
Argentine Republic | | | | | | | | |
7.625%, 4/22/46 | | | 195 | | | | 158 | |
6.875%, 1/11/48 | | | 165 | | | | 127 | |
Dominican Republic 144A 5.950%, 1/25/27(3) | | | 565 | | | | 575 | |
Kingdom of Abu Dhabi 144A
2.500%, 10/11/22(3) | | | 505 | | | | 486 | |
Kingdom of Bahrain 144A 7.000%, 10/12/28(3) | | | 485 | | | | 480 | |
Republic of Indonesia 144A 8.500%, 10/12/35(3) | | | 575 | | | | 788 | |
Sultanate of Oman | | | | | | | | |
144A, 5.375%, 3/8/27(3) | | | 240 | | | | 233 | |
144A, 5.625%, 1/17/28(3) | | | 200 | | | | 197 | |
TOTAL FOREIGN GOVERNMENT SECURITIES
(Identified Cost $3,169) | | | | 3,044 | |
| MORTGAGE-BACKED SECURITIES—6.5% | |
| Agency—1.8% | |
Federal Home Loan Mortgage Corporation | | | | | | | | |
Pool #A46224, 5.000%, 7/1/35 | | | 123 | | | | 130 | |
Pool #G01980, 5.000%, 12/1/35 | | | 441 | | | | 471 | |
Pool #A62213, 6.000%, 6/1/37 | | | 194 | | | | 215 | |
Pool #G08628, 4.000%, 2/1/45 | | | 384 | | | | 389 | |
Pool #G08702, 3.500%, 4/1/46 | | | 602 | | | | 594 | |
Federal National Mortgage Association | | | | | | | | |
Pool #776432, 4.000%, 7/1/19 | | | 1 | | | | 1 | |
Pool #254549, 6.000%, 12/1/32 | | | 34 | | | | 37 | |
See Notes to Financial Statements
12
STRATEGIC ALLOCATION FUND
SCHEDULE OF INVESTMENTS (Continued)
SEPTEMBER 30, 2018
($ reported in thousands)
| | | | | | | | |
| | | PAR VALUE | | | VALUE | |
| Agency (continued) | |
Pool #735061, 6.000%, 11/1/34 | | $ | 260 | | | $ | 286 | |
Pool #880117, 5.500%, 4/1/36 | | | 4 | | | | 4 | |
Pool #938574, 5.500%, 9/1/36 | | | 143 | | | | 154 | |
Pool #310041, 6.500%, 5/1/37 | | | 212 | | | | 240 | |
Pool #909092, 6.000%, 9/1/37 | | | 10 | | | | 11 | |
Pool #972569, 5.000%, 3/1/38 | | | 147 | | | | 156 | |
Pool #909175, 5.500%, 4/1/38 | | | 96 | | | | 102 | |
Pool #929625, 5.500%, 6/1/38 | | | 157 | | | | 171 | |
Pool #909220, 6.000%, 8/1/38 | | | 76 | | | | 83 | |
Pool #931995, 5.000%, 9/1/39 | | | 174 | | | | 186 | |
Pool #931983, 5.500%, 9/1/39 | | | 1,059 | | | | 1,138 | |
Pool #AE2496, 4.500%, 9/1/40 | | | 355 | | | | 370 | |
Pool #AO8769, 3.500%, 8/1/42 | | | 563 | | | | 558 | |
Pool #AL3000, 3.500%, 12/1/42 | | | 608 | | | | 603 | |
Pool #MA2471, 3.500%, 12/1/45 | | | 129 | | | | 128 | |
Pool #MA2495, 3.500%, 1/1/46 | | | 657 | | | | 650 | |
Pool #AS6515, 4.000%, 1/1/46 | | | 333 | | | | 336 | |
Pool #AS8483, 3.000%, 12/1/46 | | | 807 | | | | 773 | |
Pool #AS9393, 4.000%, 4/1/47 | | | 586 | | | | 592 | |
| | | | | | | | |
| | | | 8,378 | |
| | | | | | | | |
| Non-Agency—4.7% | |
American Homes 4 Rent Trust | | | | | | | | |
2014-SFR2, C 144A, 4.705%, 10/17/36(3) | | | 615 | | | | 632 | |
2015-SFR2, C 144A, 4.691%, 10/17/45(3) | | | 130 | | | | 134 | |
| | | | | | | | |
| | | PAR VALUE | | | VALUE | |
| Non-Agency (continued) | |
2015-SFR1, A 144A, 3.467%, 4/17/52(3) | | $ | 872 | | | $ | 857 | |
Ameriquest Mortgage Securities, Inc. Pass-Through Certificates, 2003-AR3, M4, (1 month LIBOR - 5.850%)
3.796%, 6/25/33(2) | | | 350 | | | | 348 | |
AMSR Trust 2016-SFR1, C 144A, (1 month LIBOR + 2.250%)
4.408%, 11/17/33(2)(3) | | | 243 | | | | 243 | |
Angel Oak Mortgage Trust I LLC | | | | | | | | |
2018-1, A1 144A, 3.258%, 4/27/48(2)(3) | | | 323 | | | | 323 | |
2018-2, A1 144A, 3.674%, 7/27/48(2)(3) | | | 264 | | | | 264 | |
Aventura Mall Trust 2013-AVM, C 144A 3.867%, 12/5/32(2)(3) | | | 580 | | | | 588 | |
Banc of America Funding Trust | | | | | | | | |
2004-B, 2A1,
3.835%, 11/20/34(2) | | | 80 | | | | 80 | |
2005-1, 1A1,
5.500%, 2/25/35 | | | 194 | | | | 194 | |
Banc of America Mortgage Trust 2005-3, 1A15
5.500%, 4/25/35 | | | 103 | | | | 104 | |
Bank of America (Merrill Lynch - Countrywide) Home Loan Mortgage Pass-Through-Trust 2004-6, 1A2
4.155%, 5/25/34(2) | | | 354 | | | | 353 | |
Bank of America (Merrill Lynch) Commercial Mortgage Securities Trust 2015-200P, A 144A 3.218%, 4/14/33(3) | | | 500 | | | | 487 | |
Bayview Opportunity Master Fund IVa Trust | | | | | | | | |
2016-SPL1, B1 144A, 4.250%, 4/28/55(3) | | | 390 | | | | 394 | |
2017-SPL5, B1 144A, 4.000%, 6/28/57(2)(3) | | | 100 | | | | 100 | |
See Notes to Financial Statements
13
STRATEGIC ALLOCATION FUND
SCHEDULE OF INVESTMENTS (Continued)
SEPTEMBER 30, 2018
($ reported in thousands)
| | | | | | | | |
| | | PAR VALUE | | | VALUE | |
| Non-Agency (continued) | |
Bayview Opportunity Master Fund IVb Trust 2016-SPL2, B1 144A 4.250%, 6/28/53(2)(3) | | $ | 145 | | | $ | 147 | |
Caesars Palace Las Vegas Trust 2017-VICI, C 144A 4.138%, 10/15/34(3) | | | 270 | | | | 271 | |
Citigroup Mortgage Loan Trust, Inc. 2018-RP1, A1 144A 3.000%, 9/25/64(2)(3) | | | 868 | | | | 850 | |
Colony Starwood Homes Trust 2016-2A, C 144A, (1 month LIBOR + 2.150%)
4.308%, 12/17/33(2)(3) | | | 485 | | | | 487 | |
COLT Mortgage Loan Trust Funding LLC | | | | | | | | |
2017-1, A3 144A, 3.074%, 5/27/47(2)(3) | | | 72 | | | | 72 | |
2018-1, A1 144A, 2.930%, 2/25/48(2)(3) | | | 217 | | | | 216 | |
Credit Suisse Commercial Mortgage-Backed Trust 2006-8, 3A1
6.000%, 10/25/21 | | | 105 | | | | 95 | |
Galton Funding Mortgage Trust | | | | | | | | |
2017-1, A21 144A,
3.500%, 7/25/56(2)(3) | | | 217 | | | | 214 | |
2018-1, A23 144A,
3.500%, 11/25/57(2)(3) | | | 123 | | | | 120 | |
GSAA Home Equity Trust 2005-12, AF3W
4.999%, 9/25/35(2) | | | 105 | | | | 106 | |
Hilton USA Trust 2016-SFP, B 144A 3.323%, 11/5/35(3) | | | 500 | | | | 488 | |
JPMorgan Chase (WaMu) Mortgage Pass-Through Certificates 2003-S11, 3A5
5.950%, 11/25/33 | | | 250 | | | | 254 | |
| | | | | | | | |
| | | PAR VALUE | | | VALUE | |
| Non-Agency (continued) | |
JPMorgan Chase Commercial Mortgage Securities Trust 2014-C22, A4
3.801%, 9/15/47 | | $ | 300 | | | $ | 303 | |
JPMorgan Chase Mortgage Trust | | | | | | | | |
2004-A4, 2A1,
4.326%, 9/25/34(2) | | | 283 | | | | 287 | |
2016-1, M2 144A, 3.750%, 4/25/45(2)(3) | | | 328 | | | | 321 | |
2016-2, M2 144A, 3.750%, 12/25/45(2)(3) | | | 351 | | | | 344 | |
2017-3, 2A2 144A, 2.500%, 8/25/47(2)(3) | | | 216 | | | | 206 | |
2017-5, A1 144A, 3.172%, 10/26/48(2)(3) | | | 632 | | | | 626 | |
2017-4, A3 144A, 3.500%, 11/25/48(2)(3) | | | 228 | | | | 221 | |
MASTR Alternative Loan Trust 2005-5, 2A3
5.500%, 7/25/25 | | | 147 | | | | 148 | |
MASTR Specialized Loan Trust 2005-3, A2 144A 5.704%, 11/25/35(3) | | | 176 | | | | 179 | |
MetLife Securitization Trust 2017-1A, M1 144A 3.659%, 4/25/55(2)(3) | | | 100 | | | | 98 | |
Morgan Stanley - Bank of America (Merrill Lynch) Trust | | | | | | | | |
2013-C13, AS,
4.266%, 11/15/46 | | | 275 | | | | 280 | |
2015-C22, AS,
3.561%, 4/15/48 | | | 835 | | | | 816 | |
Motel 6 Trust 2017-MTL6, A 144A, (1 month LIBOR + 0.920%)
3.078%, 8/15/34(2)(3) | | | 610 | | | | 610 | |
New Residential Mortgage Loan Trust | | | | | | | | |
2014-1A, A 144A, 3.750%, 1/25/54(2)(3) | | | 426 | | | | 425 | |
2015-2A, A1 144A, 3.750%, 8/25/55(2)(3) | | | 312 | | | | 311 | |
See Notes to Financial Statements
14
STRATEGIC ALLOCATION FUND
SCHEDULE OF INVESTMENTS (Continued)
SEPTEMBER 30, 2018
($ reported in thousands)
| | | | | | | | |
| | | PAR VALUE | | | VALUE | |
| Non-Agency (continued) | |
2016-1A, A1 144A, 3.750%, 3/25/56(2)(3) | | $ | 152 | | | $ | 152 | |
2016-4A, B1A 144A, 4.500%, 11/25/56(2)(3) | | | 419 | | | | 424 | |
2018-1A, A1A 144A, 4.000%, 12/25/57(2)(3) | | | 228 | | | | 229 | |
NovaStar Mortgage Funding Trust 2004-4, M5, (1 month LIBOR + 1.725%)
3.941%, 3/25/35(2) | | | 400 | | | | 405 | |
Oak Hill Advisors Residential Loan Trust 2017-NPL2, A1 144A 3.000%, 7/25/57(3) | | | 529 | | | | 520 | |
One Market Plaza Trust 2017-1MKT, A 144A 3.614%, 2/10/32(3) | | | 360 | | | | 358 | |
Pretium Mortgage Credit Partners I LLC 2017-NPL5, A1 144A 3.327%, 12/30/32(2)(3) | | | 121 | | | | 121 | |
Progress Residential Trust | | | | | | | | |
2018-SFR1, B 144A, 3.484%, 3/17/35(3) | | | 760 | | | | 746 | |
2018-SFR2, B 144A,
3.841%, 8/17/35(3) | | | 235 | | | | 233 | |
Residential Asset Securitization Trust 2005-A1, A3
5.500%, 4/25/35 | | | 334 | | | | 343 | |
RETL 2018-RVP, C 144A, (1 month LIBOR + 2.050%)
4.208%, 3/15/33(2)(3) | | | 402 | | | | 404 | |
Sequoia Mortgage Trust 2013-8, B1
3.529%, 6/25/43(2) | | | 168 | | | | 163 | |
Towd Point Mortgage Trust | | | | | | | | |
2015-1, A2 144A, 3.250%, 10/25/53(2)(3) | | | 385 | | | | 379 | |
2016-1, A1B 144A, 2.750%, 2/25/55(2)(3) | | | 84 | | | | 83 | |
2016-1, M1 144A, 3.500%, 2/25/55(2)(3) | | | 160 | | | | 157 | |
| | | | | | | | |
| | | PAR VALUE | | | VALUE | |
| Non-Agency (continued) | |
2015-5, A2 144A, 3.500%, 5/25/55(2)(3) | | $ | 480 | | | $ | 474 | |
2015-2, 1M1 144A, 3.250%, 11/25/60(2)(3) | | | 1,245 | | | | 1,195 | |
Vericrest Opportunity Loan Trust LVI LLC 2017-NPL3, A1 144A 3.500%, 3/25/47(3) | | | 208 | | | | 207 | |
Vericrest Opportunity Loan Trust LXIV LLC 2017-NP11, A1 144A 3.375%, 10/25/47(3) | | | 592 | | | | 588 | |
Vericrest Opportunity Loan Trust LXX LLC 2018-NPL6, A1A, 144A 4.115%, 9/25/48(2)(3) | | | 270 | | | | 270 | |
Verus Securitization Trust | | | | | | | | |
2017-2A, A1 144A, 2.485%, 7/25/47(2)(3) | | | 343 | | | | 334 | |
2018-1, A1 144A, 2.929%, 2/25/48(2)(3) | | | 246 | | | | 243 | |
2018-2, A1 144A, 3.677%, 6/1/58(2)(3) | | | 438 | | | | 438 | |
Wells Fargo Commercial Mortgage Trust 2015-LC20, B
3.719%, 4/15/50 | | | 600 | | | | 585 | |
| | | | | | | | |
| | | | | 22,647 | |
TOTAL MORTGAGE-BACKED SECURITIES
(Identified Cost $31,195) | | | | 31,025 | |
| ASSET-BACKED SECURITIES—3.2% | |
| Automobiles—1.9% | |
ACC Trust 2018-1, A 144A 3.700%, 12/21/20(3) | | | 341 | | | | 341 | |
American Credit Acceptance Receivables Trust 2017-2, C 144A 2.860%, 6/12/23(3) | | | 445 | | | | 443 | |
AmeriCredit Automobile Receivables Trust 2014-1, D
2.540%, 6/8/20 | | | 643 | | | | 643 | |
See Notes to Financial Statements
15
STRATEGIC ALLOCATION FUND
SCHEDULE OF INVESTMENTS (Continued)
SEPTEMBER 30, 2018
($ reported in thousands)
| | | | | | | | |
| | | PAR VALUE | | | VALUE | |
| Automobiles (continued) | |
Avis Budget Rental Car Funding LLC (AESOP) 2016-1A, A 144A 2.990%, 6/20/22(3) | | $ | 500 | | | $ | 494 | |
Capital Auto Receivables Asset Trust 2017-1, C 144A 2.700%, 9/20/22(3) | | | 430 | | | | 422 | |
Centre Point Funding LLC 2012-2A, 1 144A 2.610%, 8/20/21(3) | | | 293 | | | | 289 | |
Drive Auto Receivables Trust | | | | | | | | |
2015-DA, C 144A, 3.380%, 11/15/21(3) | | | 206 | | | | 206 | |
2017-2, C,
2.750%, 9/15/23 | | | 525 | | | | 524 | |
DT Auto Owner Trust 2016-4A, C 144A 2.740%, 10/17/22(3) | | | 472 | | | | 472 | |
Exeter Automobile Receivables Trust | | | | | | | | |
2015-2A, C 144A, 3.900%, 3/15/21(3) | | | 615 | | | | 618 | |
2017-1A, B 144A, 3.000%, 12/15/21(3) | | | 470 | | | | 469 | |
2018-3A, C 144A, 3.710%, 6/15/23(3) | | | 545 | | | | 544 | |
Flagship Credit Auto Trust 2017-3, C 144A 2.910%, 9/15/23(3) | | | 520 | | | | 511 | |
Foursight Capital Automobile Receivables Trust 2017-1, B 144A 3.050%, 12/15/22(3) | | | 420 | | | | 414 | |
GLS Auto Receivables Trust 2017-1A, B 144A 2.980%, 12/15/21(3) | | | 530 | | | | 526 | |
Hyundai Auto Lease Securitization Trust 2018-A, A2A 144A 2.550%, 8/17/20(3) | | | 470 | | | | 469 | |
OneMain Direct Auto Receivables Trust 2017-2A, C 144A 2.820%, 7/15/24(3) | | | 420 | | | | 413 | |
Prestige Auto Receivables Trust 2017-1A, C 144A 2.810%, 1/17/23(3) | | | 520 | | | | 509 | |
| | | | | | | | |
| | | PAR VALUE | | | VALUE | |
| Automobiles (continued) | |
Tesla Auto Lease Trust 2018-A, A 144A 2.320%, 12/20/19(3) | | $ | 285 | | | $ | 285 | |
Westlake Automobile Receivables Trust 2017-2A, C 144A 2.590%, 12/15/22(3) | | | 525 | | | | 520 | |
| | | | | | | | |
| | | | 9,112 | |
| | | | | | | | |
| Other—1.2% | |
AXIS Equipment Finance Receivables IV LLC 2018-1A, A2 144A 3.240%, 12/20/23(3) | | | 470 | | | | 468 | |
CCG Receivables Trust 2018-1, A2 144A 2.500%, 6/16/25(3) | | | 570 | | | | 567 | |
DB Master Finance LLC 2017-1A, A2I 144A 3.629%, 11/20/47(3) | | | 427 | | | | 416 | |
Dell Equipment Finance Trust 2017-2, A3 144A 2.190%, 10/24/22(3) | | | 395 | | | | 391 | |
Diamond Resorts Owner Trust 2017-1A, A 144A 3.270%, 10/22/29(3) | | | 249 | | | | 246 | |
Drug Royalty II LP 2 2014-1, A2 144A 3.484%, 7/15/23(3) | | | 170 | | | | 169 | |
Mariner Finance Issuance Trust 2017-AA, A 144A 3.620%, 2/20/29(3) | | | 450 | | | | 450 | |
MVW Owner Trust | | | | | | | | |
2016-1A, A 144A, 2.250%, 12/20/33(3) | | | 283 | | | | 273 | |
2017-1A, A 144A, 2.420%, 12/20/34(3) | | | 414 | | | | 400 | |
OneMain Financial Issuance Trust 2018-1A, A 144A 3.300%, 3/14/29(3) | | | 470 | | | | 467 | |
Prosper Marketplace Issuance Trust 2017-2A, B 144A 3.480%, 9/15/23(3) | | | 440 | | | | 439 | |
See Notes to Financial Statements
16
STRATEGIC ALLOCATION FUND
SCHEDULE OF INVESTMENTS (Continued)
SEPTEMBER 30, 2018
($ reported in thousands)
| | | | | | | | |
| | | PAR VALUE | | | VALUE | |
| Other (continued) | |
SoFi Consumer Loan Program LLC 2016-3, A
144A 3.050%, 12/26/25(3) | | $ | 385 | | | $ | 383 | |
Taco Bell Funding LLC 2016-1A, A21 144A 3.832%, 5/25/46(3) | | | 463 | | | | 463 | |
TGIF Funding LLC 2017-1A, A2 144A 6.202%, 4/30/47(3) | | | 439 | | | | 439 | |
| | | | | | | | |
| | | | 5,571 | |
| | | | | | | | |
| Student Loans—0.1% | |
Laurel Road Prime Student Loan Trust 2017-B, A2FX 144A 2.770%, 8/25/42(3) | | | 523 | | | | 509 | |
SoFi Professional Loan Program LLC 2015-A, A2 144A 2.420%, 3/25/30(3) | | | 114 | | | | 112 | |
| | | | | | | | |
| | | | | 621 | |
TOTAL ASSET-BACKED SECURITIES
(Identified Cost $15,438) | | | | 15,304 | |
| CORPORATE BONDS AND NOTES—18.0% | |
| Consumer Discretionary—2.1% | |
Altice France S.A.
144A 7.375%, 5/1/26(3) | | | 200 | | | | 200 | |
Beazer Homes USA, Inc.
6.750%, 3/15/25 | | | 305 | | | | 282 | |
Bunge Ltd. Finance Corp.
4.350%, 3/15/24 | | | 365 | | | | 361 | |
Charter Communications Operating LLC
4.908%, 7/23/25 | | | 515 | | | | 523 | |
CSC Holdings LLC
144A 5.375%, 2/1/28(3) | | | 300 | | | | 286 | |
Delta Merger Sub, Inc. 144A 6.000%, 9/15/26(3) | | | 120 | | | | 122 | |
Discovery Communications LLC
3.950%, 3/20/28 | | | 490 | | | | 465 | |
DISH DBS Corp.
5.875%, 7/15/22 | | | 370 | | | | 361 | |
| | | | | | | | |
| | | PAR VALUE | | | VALUE | |
| Consumer Discretionary (continued) | |
Dollar General Corp.
4.125%, 5/1/28 | | $ | 548 | | | $ | 540 | |
Dollar Tree, Inc.
4.000%, 5/15/25 | | | 275 | | | | 270 | |
frontdoor, Inc. 144A 6.750%, 8/15/26(3) | | | 225 | | | | 232 | |
Gateway Casinos & Entertainment Ltd.
144A 8.250%, 3/1/24(3) | | | 145 | | | | 153 | |
General Motors Financial Co., Inc.
3.450%, 4/10/22 | | | 100 | | | | 98 | |
GLP Capital LP
5.750%, 6/1/28 | | | 520 | | | | 535 | |
Graham Holdings Co.
144A 5.750%, 6/1/26(3) | | | 415 | | | | 425 | |
Horton (D.R.), Inc.
4.750%, 2/15/23 | | | 550 | | | | 563 | |
Lear Corp.
3.800%, 9/15/27 | | | 615 | | | | 571 | |
Lennar Corp. | | | | | | | | |
5.250%, 6/1/26 | | | 330 | | | | 328 | |
4.750%, 11/29/27 | | | 300 | | | | 289 | |
Live Nation Entertainment, Inc. 144A 5.625%, 3/15/26(3) | | | 275 | | | | 278 | |
Marriott Ownership Resorts, Inc. 144A 6.500%, 9/15/26(3) | | | 195 | | | | 200 | |
MDC Holdings, Inc.
5.500%, 1/15/24 | | | 340 | | | | 339 | |
Meredith Corp. 144A 6.875%, 2/1/26(3)(12) | | | 370 | | | | 379 | |
PulteGroup, Inc.
6.375%, 5/15/33 | | | 280 | | | | 269 | |
QVC, Inc.
4.375%, 3/15/23 | | | 700 | | | | 691 | |
Tenneco, Inc.
5.000%, 7/15/26 | | | 410 | | | | 364 | |
TRI Pointe Group, Inc.
5.875%, 6/15/24 | | | 275 | | | | 273 | |
William Lyon Homes, Inc.
6.000%, 9/1/23 | | | 345 | | | | 333 | |
Wyndham Worldwide Corp.
4.500%, 4/1/27 | | | 140 | | | | 132 | |
| | | | | | | | |
| | | | 9,862 | |
| | | | | | | | |
See Notes to Financial Statements
17
STRATEGIC ALLOCATION FUND
SCHEDULE OF INVESTMENTS (Continued)
SEPTEMBER 30, 2018
($ reported in thousands)
| | | | | | | | |
| | | PAR VALUE | | | VALUE | |
| Consumer Staples—0.8% | |
Anheuser-Busch InBev Finance, Inc.
3.650%, 2/1/26 | | $ | 435 | | | $ | 422 | |
Anheuser-Busch InBev Worldwide, Inc.
4.000%, 4/13/28 | | | 270 | | | | 266 | |
Bacardi Ltd.
144A 4.700%, 5/15/28(3) | | | 455 | | | | 452 | |
CVS Health Corp. | | | | | | | | |
2.875%, 6/1/26 | | | 760 | | | | 697 | |
4.300%, 3/25/28 | | | 409 | | | | 405 | |
Flowers Foods, Inc.
4.375%, 4/1/22 | | | 700 | | | | 712 | |
Kraft Heinz Foods Co. (The)
3.000%, 6/1/26 | | | 510 | | | | 465 | |
Safeway, Inc.
7.250%, 2/1/31(12) | | | 295 | | | | 281 | |
| | | | | | | | |
| | | | 3,700 | |
| | | | | | | | |
| Energy—1.7% | |
Andeavor Logistics LP
4.250%, 12/1/27 | | | 510 | | | | 498 | |
Bristow Group, Inc. 144A 8.750%, 3/1/23(3)(12) | | | 155 | | | | 152 | |
Cheniere Energy Partners LP
144A 5.625%, 10/1/26(3) | | | 180 | | | | 181 | |
Crestwood Midstream Partners LP
5.750%, 4/1/25 | | | 275 | | | | 281 | |
Enbridge Energy Partners LP | | | | | | | | |
4.375%, 10/15/20 | | | 105 | | | | 107 | |
5.875%, 10/15/25 | | | 415 | | | | 457 | |
Energy Transfer Partners LP
4.200%, 4/15/27 | | | 220 | | | | 212 | |
EP Energy LLC 144A 8.000%, 11/29/24(3) | | | 160 | | | | 161 | |
Helmerich & Payne International Drilling Co.
4.650%, 3/15/25 | | | 395 | | | | 404 | |
HollyFrontier Corp.
5.875%, 4/1/26 | | | 475 | | | | 506 | |
Jagged Peak Energy LLC
144A 5.875%, 5/1/26(3) | | | 310 | | | | 309 | |
| | | | | | | | |
| | | PAR VALUE | | | VALUE | |
| Energy (continued) | |
Kinder Morgan Energy Partners LP
7.500%, 11/15/40 | | $ | 595 | | | $ | 737 | |
MPLX LP
4.875%, 12/1/24 | | | 915 | | | | 950 | |
NuStar Logistics LP
5.625%, 4/28/27 | | | 350 | | | | 346 | |
Range Resources Corp.
4.875%, 5/15/25 | | | 300 | | | | 284 | |
Sabine Pass Liquefaction LLC
6.250%, 3/15/22 | | | 425 | | | | 457 | |
State Oil Co. of the Azerbaijan Republic RegS
6.950%, 3/18/30(4) | | | 455 | | | | 492 | |
Sunoco LP
144A 5.500%, 2/15/26(3) | | | 495 | | | | 478 | |
Transocean Guardian Ltd.
144A 5.875%, 1/15/24(3) | | | 135 | | | | 136 | |
USA Compression Partners LP
144A 6.875%, 4/1/26(3) | | | 350 | | | | 361 | |
Valero Energy Partners LP
4.500%, 3/15/28 | | | 450 | | | | 442 | |
| | | | | | | | |
| | | | 7,951 | |
| | | | | | | | |
| Financials—5.7% | |
AerCap Ireland Capital DAC
3.650%, 7/21/27 | | | 570 | | | | 522 | |
Allstate Corp. (The)
Series B
5.750%, 8/15/53(5) | | | 530 | | | | 546 | |
Apollo Management Holdings LP
144A 4.000%, 5/30/24(3) | | | 690 | | | | 685 | |
Ares Capital Corp. | | | | | | | | |
3.500%, 2/10/23 | | | 215 | | | | 205 | |
4.250%, 3/1/25 | | | 395 | | | | 379 | |
Ares Finance Co., LLC
144A 4.000%, 10/8/24(3) | | | 595 | | | | 562 | |
Athene Holding Ltd.
4.125%, 1/12/28 | | | 470 | | | | 439 | |
Aviation Capital Group LLC 144A 3.500%, 11/1/27(3) | | | 515 | | | | 470 | |
See Notes to Financial Statements
18
STRATEGIC ALLOCATION FUND
SCHEDULE OF INVESTMENTS (Continued)
SEPTEMBER 30, 2018
($ reported in thousands)
| | | | | | | | |
| | | PAR VALUE | | | VALUE | |
| Financials (continued) | |
Banco Bilbao Vizcaya Argentaria Bancomer S.A. 144A 5.125%, 1/18/33(3) | | $ | 340 | | | $ | 309 | |
Banco de Credito e Inversiones 144A 3.500%, 10/12/27(3) | | | 645 | | | | 589 | |
Banco Santander Chile
144A 3.875%, 9/20/22(3) | | | 430 | | | | 429 | |
Bank of America Corp. | | | | | | | | |
3.004%, 12/20/23 | | | 712 | | | | 691 | |
4.200%, 8/26/24 | | | 1,065 | | | | 1,070 | |
Bank of Montreal
3.803%, 12/15/32 | | | 803 | | | | 750 | |
BrightSphere Investment Group plc
4.800%, 7/27/26 | | | 585 | | | | 568 | |
Brookfield Finance LLC
4.000%, 4/1/24 | | | 671 | | | | 668 | |
Capital One Financial Corp. | | | | | | | | |
4.200%, 10/29/25 | | | 630 | | | | 615 | |
3.750%, 7/28/26 | | | 580 | | | | 541 | |
Citigroup, Inc.
4.050%, 7/30/22 | | | 700 | | | | 706 | |
Compass Bank
3.875%, 4/10/25 | | | 705 | | | | 676 | |
FS Investment Corp. | | | | | | | | |
4.250%, 1/15/20 | | | 615 | | | | 615 | |
4.750%, 5/15/22 | | | 115 | | | | 114 | |
Goldman Sachs Group, Inc. (The)
5.750%, 1/24/22 | | | 1,020 | | | | 1,085 | |
Guanay Finance Ltd. 144A 6.000%, 12/15/20(3) | | | 526 | | | | 527 | |
ICAHN Enterprises LP
6.375%, 12/15/25 | | | 390 | | | | 391 | |
Jefferies Financial Group, Inc.
5.500%, 10/18/23 | | | 535 | | | | 554 | |
Jefferies Group LLC | | | | | | | | |
6.875%, 4/15/21 | | | 78 | | | | 84 | |
5.125%, 1/20/23 | | | 123 | | | | 127 | |
4.850%, 1/15/27 | | | 300 | | | | 295 | |
JPMorgan Chase & Co.
3.300%, 4/1/26 | | | 1,025 | | | | 982 | |
| | | | | | | | |
| | | PAR VALUE | | | VALUE | |
| Financials (continued) | |
Kazakhstan Temir Zholy Finance BV
144A 6.950%, 7/10/42(3) | | $ | 480 | | | $ | 529 | |
Liberty Mutual Group, Inc.
144A 4.250%, 6/15/23(3) | | | 690 | | | | 698 | |
Macquarie Group Ltd.
144A 6.250%, 1/14/21(3) | | | 570 | | | | 601 | |
Manulife Financial Corp.
4.150%, 3/4/26 | | | 570 | | | | 575 | |
Morgan Stanley | | | | | | | | |
3.125%, 7/27/26 | | | 730 | | | | 680 | |
6.375%, 7/24/42 | | | 710 | | | | 884 | |
Navient Corp. | | | | | | | | |
7.250%, 9/25/23 | | | 100 | | | | 106 | |
6.750%, 6/25/25 | | | 360 | | | | 362 | |
Prudential Financial, Inc.
5.625%, 6/15/43(5) | | | 680 | | | | 709 | |
S&P Global, Inc.
4.000%, 6/15/25 | | | 480 | | | | 481 | |
Santander Holdings USA, Inc. | | | | | | | | |
3.700%, 3/28/22 | | | 445 | | | | 439 | |
4.400%, 7/13/27 | | | 205 | | | | 196 | |
Societe Generale S.A. 144A 4.750%, 11/24/25(3) | | | 535 | | | | 530 | |
Springleaf Finance Corp.
6.875%, 3/15/25 | | | 240 | | | | 240 | |
Synchrony Financial
3.950%, 12/1/27 | | | 450 | | | | 408 | |
Teachers Insurance & Annuity Association of America 144A 4.375%, 9/15/54(3) | | | 595 | | | | 592 | |
Toronto-Dominion Bank (The)
3.625%, 9/15/31 | | | 650 | | | | 610 | |
Trinity Acquisition plc | | | | | | | | |
3.500%, 9/15/21 | | | 50 | | | | 50 | |
4.400%, 3/15/26 | | | 230 | | | | 229 | |
Turkiye Vakiflar Bankasi TAO 144A 5.625%, 5/30/22(3) | | | 245 | | | | 213 | |
UBS AG
7.625%, 8/17/22 | | | 500 | | | | 557 | |
See Notes to Financial Statements
19
STRATEGIC ALLOCATION FUND
SCHEDULE OF INVESTMENTS (Continued)
SEPTEMBER 30, 2018
($ reported in thousands)
| | | | | | | | |
| | | PAR VALUE | | | VALUE | |
| Financials (continued) | |
Wells Fargo & Co. | | | | | | | | |
3.550%, 9/29/25 | | $ | 375 | | | $ | 365 | |
Series S,
5.900% | | | 715 | | | | 726 | |
| | | | | | | | |
| | | | 26,974 | |
| | | | | | | | |
| Health Care—1.5% | |
Abbott Laboratories
3.750%, 11/30/26 | | | 730 | | | | 728 | |
AbbVie, Inc. | | | | | | | | |
3.600%, 5/14/25 | | | 235 | | | | 227 | |
3.200%, 5/14/26 | | | 355 | | | | 331 | |
Allergan Sales LLC 144A 4.875%, 2/15/21(3) | | | 226 | | | | 233 | |
AmerisourceBergen Corp.
3.450%, 12/15/27 | | | 340 | | | | 317 | |
Anthem, Inc. | | | | | | | | |
3.650%, 12/1/27 | | | 134 | | | | 127 | |
4.101%, 3/1/28 | | | 480 | | | | 473 | |
Bausch Health Cos., Inc. | | | | | | | | |
144A, 7.500%, 7/15/21(3) | | | 60 | | | | 61 | |
144A, 6.500%, 3/15/22(3) | | | 25 | | | | 26 | |
144A, 5.500%, 11/1/25(3) | | | 175 | | | | 175 | |
Becton Dickinson & Co. | | | | | | | | |
(3 month LIBOR +
0.875%) 3.261%, 12/29/20(2) | | | 125 | | | | 125 | |
3.363%, 6/6/24 | | | 113 | | | | 109 | |
3.700%, 6/6/27 | | | 375 | | | | 359 | |
Cardinal Health, Inc. | | | | | | | | |
3.200%, 3/15/23 | | | 300 | | | | 291 | |
3.410%, 6/15/27 | | | 195 | | | | 180 | |
Centene Corp.
144A 5.375%, 6/1/26(3) | | | 90 | | | | 92 | |
Elanco Animal Health, Inc.
144A 4.900%, 8/28/28(3) | | | 101 | | | | 103 | |
Envision Healthcare Corp.
144A 6.250%, 12/1/24(3) | | | 85 | | | | 91 | |
Fresenius U.S. Finance II, Inc.
144A 4.500%, 1/15/23(3) | | | 120 | | | | 122 | |
Halfmoon Parent, Inc. | | | | | | | | |
144A, 4.125%, 11/15/25(3) | | | 19 | | | | 19 | |
144A, 4.375%, 10/15/28(3) | | | 407 | | | | 406 | |
| | | | | | | | |
| | | PAR VALUE | | | VALUE | |
| Health Care (continued) | |
HCA, Inc.
5.375%, 2/1/25 | | $ | 405 | | | $ | 413 | |
HLF Financing S.a.r.l. LLC
144A 7.250%, 8/15/26(3) | | | 250 | | | | 254 | |
Mylan NV
3.950%, 6/15/26 | | | 400 | | | | 378 | |
Shire Acquisitions Investments Ireland DAC
2.400%, 9/23/21 | | | 230 | | | | 222 | |
Surgery Center Holdings, Inc.
144A 8.875%, 4/15/21(3) | | | 260 | | | | 271 | |
Tenet Healthcare Corp.
4.625%, 7/15/24 | | | 165 | | | | 160 | |
Teva Pharmaceutical Finance Netherlands III BV
3.150%, 10/1/26 | | | 195 | | | | 162 | |
Zimmer Biomet Holdings, Inc.
3.550%, 4/1/25 | | | 725 | | | | 695 | |
| | | | | | | | |
| | | | 7,150 | |
| | | | | | | | |
| Industrials—0.8% | |
Ashtead Capital, Inc.
144A 4.375%, 8/15/27(3) | | | 350 | | | | 333 | |
CNH Industrial N.V. | | | | | | | | |
4.500%, 8/15/23 | | | 426 | | | | 433 | |
3.850%, 11/15/27 | | | 225 | | | | 213 | |
Continental Airlines Pass-Through-Trust 1999-2, C2
6.236%, 3/15/20 | | | 139 | | | | 141 | |
CRH America, Inc.
144A 3.875%, 5/18/25(3) | | | 90 | | | | 88 | |
Masco Corp. | | | | | | | | |
5.950%, 3/15/22 | | | 291 | | | | 311 | |
4.450%, 4/1/25 | | | 220 | | | | 222 | |
Oshkosh Corp.
4.600%, 5/15/28 | | | 604 | | | | 597 | |
Owens Corning
3.400%, 8/15/26 | | | 590 | | | | 541 | |
Penske Truck Leasing Co., LP
144A 4.125%, 8/1/23(3) | | | 455 | | | | 454 | |
See Notes to Financial Statements
20
STRATEGIC ALLOCATION FUND
SCHEDULE OF INVESTMENTS (Continued)
SEPTEMBER 30, 2018
($ reported in thousands)
| | | | | | | | |
| | | PAR VALUE | | | VALUE | |
| Industrials (continued) | |
Pitney Bowes, Inc.
4.375%, 5/15/22 | | $ | 499 | | | $ | 462 | |
| | | | | | | | |
| | | | 3,795 | |
| | | | | | | | |
| Information Technology—0.8% | |
Arrow Electronics, Inc.
3.875%, 1/12/28 | | | 525 | | | | 489 | |
Broadcom Corp. | | | | | | | | |
3.000%, 1/15/22 | | | 195 | | | | 190 | |
3.625%, 1/15/24 | | | 370 | | | | 359 | |
CDK Global, Inc.
5.875%, 6/15/26 | | | 365 | | | | 377 | |
Citrix Systems, Inc.
4.500%, 12/1/27 | | | 455 | | | | 438 | |
Dell International LLC | | | | | | | | |
144A, 6.020%, 6/15/26(3) | | | 100 | | | | 106 | |
144A, 8.100%, 7/15/36(3) | | | 210 | | | | 252 | |
Hewlett Packard Enterprise Co.
4.900%, 10/15/25 | | | 390 | | | | 401 | |
Verisk Analytics, Inc.
4.000%, 6/15/25 | | | 685 | | | | 676 | |
VMware, Inc. | | | | | | | | |
2.950%, 8/21/22 | | | 223 | | | | 215 | |
3.900%, 8/21/27 | | | 240 | | | | 227 | |
| | | | | | | | |
| | | | 3,730 | |
| | | | | | | | |
| Materials—1.3% | |
Anglo American Capital plc 144A 4.000%, 9/11/27(3) | | | 540 | | | | 497 | |
ArcelorMittal 6.125%, 6/1/25 | | | 405 | | | | 440 | |
BHP Billiton Finance USA Ltd. 144A 6.750%, 10/19/75(3)(5) | | | 450 | | | | 493 | |
CRH America Finance, Inc.
144A 3.400%, 5/9/27(3) | | | 440 | | | | 410 | |
Glencore Funding LLC
144A 4.000%, 3/27/27(3) | | | 520 | | | | 488 | |
GTL Trade Finance, Inc.
144A 5.893%, 4/29/24(3) | | | 305 | | | | 308 | |
Inversiones CMPC S.A.
144A 4.375%, 5/15/23(3) | | | 850 | | | | 850 | |
NewMarket Corp.
4.100%, 12/15/22 | | | 759 | | | | 758 | |
| | | | | | | | |
| | | PAR VALUE | | | VALUE | |
| Materials (continued) | |
NOVA Chemicals Corp. | | | | | | | | |
144A, 4.875%, 6/1/24(3) | | $ | 145 | | | $ | 139 | |
144A, 5.000%, 5/1/25(3) | | | 225 | | | | 214 | |
Rusal Capital Designated Activity Co.
144A 5.125%, 2/2/22(3) | | | 455 | | | | 296 | |
Schweitzer-Mauduit International, Inc.
144A 6.875%, 10/1/26(3) | | | 150 | | | | 153 | |
Syngenta Finance N.V. | | | | | | | | |
144A, 4.441%, 4/24/23(3) | | | 200 | | | | 199 | |
144A, 4.892%, 4/24/25(3) | | | 200 | | | | 196 | |
United States Steel Corp.
6.250%, 3/15/26 | | | 325 | | | | 322 | |
Vulcan Materials Co.
3.900%, 4/1/27 | | | 520 | | | | 496 | |
| | | | | | | | |
| | | | 6,259 | |
| | | | | | | | |
| Real Estate—1.7% | |
Alexandria Real Estate Equities, Inc.
3.950%, 1/15/27 | | | 345 | | | | 333 | |
Brixmor Operating Partnership LP
3.875%, 8/15/22 | | | 160 | | | | 159 | |
Corporate Office Properties LP
3.600%, 5/15/23 | | | 715 | | | | 691 | |
EPR Properties
4.750%, 12/15/26 | | | 720 | | | | 706 | |
Greystar Student Housing Growth & Income OP LP
4.600%, 12/1/24 | | | 595 | | | | 635 | |
Healthcare Realty Trust, Inc.
3.875%, 5/1/25 | | | 440 | | | | 427 | |
Healthcare Trust of America Holdings LP
3.750%, 7/1/27 | | | 540 | | | | 508 | |
Hospitality Properties Trust
4.950%, 2/15/27 | | | 640 | | | | 627 | |
Kilroy Realty LP
4.375%, 10/1/25 | | | 640 | | | | 638 | |
LifeStorage LP | | | | | | | | |
3.500%, 7/1/26 | | | 540 | | | | 501 | |
3.875%, 12/15/27 | | | 200 | | | | 188 | |
See Notes to Financial Statements
21
STRATEGIC ALLOCATION FUND
SCHEDULE OF INVESTMENTS (Continued)
SEPTEMBER 30, 2018
($ reported in thousands)
| | | | | | | | |
| | | PAR VALUE | | | VALUE | |
| Real Estate (continued) | |
MPT Operating Partnership LP | | | | | | | | |
6.375%, 3/1/24 | | $ | 55 | | | $ | 58 | |
5.500%, 5/1/24 | | | 245 | | | | 247 | |
5.000%, 10/15/27 | | | 185 | | | | 179 | |
Physicians Realty LP
3.950%, 1/15/28 | | | 535 | | | | 499 | |
Retail Opportunity Investments Partnership LP
4.000%, 12/15/24 | | | 485 | | | | 455 | |
Select Income REIT
4.500%, 2/1/25 | | | 690 | | | | 661 | |
Welltower, Inc.
4.000%, 6/1/25 | | | 730 | | | | 720 | |
| | | | | | | | |
| | | | 8,232 | |
| | | | | | | | |
| Telecommunication Services—0.6% | |
AT&T, Inc. 144A
4.100%, 2/15/28(3) | | | 1,462 | | | | 1,417 | |
Frontier Communications Corp. | | | | | | | | |
7.625%, 4/15/24 | | | 490 | | | | 316 | |
144A, 8.500%, 4/1/26(3) | | | 160 | | | | 151 | |
Telenet Finance Luxembourg Notes S.a.r.l.
144A 5.500%, 3/1/28(3) | | | 400 | | | | 376 | |
Verizon Communications, Inc. | | | | | | | | |
(3 month LIBOR +
1.100%) 3.414%, 5/15/25(2) | | | 180 | | | | 182 | |
4.125%, 3/16/27 | | | 525 | | | | 525 | |
| | | | | | | | |
| | | | 2,967 | |
| | | | | | | | |
| Utilities—1.0% | |
American Electric Power Co., Inc.
3.200%, 11/13/27 | | | 465 | | | | 435 | |
Duke Energy Corp.
2.650%, 9/1/26 | | | 605 | | | | 547 | |
Eskom Holdings SOC Ltd.
144A 7.125%, 2/11/25(3) | | | 440 | | | | 423 | |
Exelon Corp.
3.497%, 6/1/22 | | | 725 | | | | 712 | |
| | | | | | | | |
| | | PAR VALUE | | | VALUE | |
| Utilities (continued) | |
FirstEnergy Transmission LLC 144A 4.350%, 1/15/25(3) | | $ | 735 | | | $ | 743 | |
PSEG Power LLC
3.850%, 6/1/23 | | | 153 | | | | 152 | |
Southern Power Co.
4.150%, 12/1/25 | | | 590 | | | | 581 | |
State Grid Overseas Investment 2014 Ltd.
144A 4.125%, 5/7/24(3) | | | 610 | | | | 617 | |
TerraForm Power Operating LLC
144A 5.000%, 1/31/28(3) | | | 260 | | | | 242 | |
Vistra Operations Co., LLC
144A 5.500%, 9/1/26(3) | | | 60 | | | | 61 | |
| | | | | | | | |
| | | | | 4,513 | |
TOTAL CORPORATE BONDS AND NOTES
(Identified Cost $86,893) | | | | 85,133 | |
| LEVERAGED LOANS(2)—2.5% | |
| Aerospace—0.0% | |
TransDigm, Inc. Tranche E, (1 month LIBOR +
2.500%) 4.742%, 5/30/25 | | | 159 | | | | 160 | |
| | | | | | | | |
| Consumer Durables—0.1% | |
Fluidra, S.A., (1 month LIBOR + 2.250%) 4.492%, 7/2/25 | | | 95 | | | | 95 | |
Global Appliance, Inc. Tranche B, (1 month LIBOR + 4.000%) 6.250%, 9/29/24 | | | 144 | | | | 138 | |
| | | | | | | | |
| | | | 233 | |
| | | | | | | | |
| Consumer Non-Durables—0.1% | |
Herbalife Nutrition Ltd. Tranche B, (1 month LIBOR + 3.250%) 5.492%, 8/18/25 | | | 50 | | | | 51 | |
See Notes to Financial Statements
22
STRATEGIC ALLOCATION FUND
SCHEDULE OF INVESTMENTS (Continued)
SEPTEMBER 30, 2018
($ reported in thousands)
| | | | | | | | |
| | | PAR VALUE | | | VALUE | |
| Consumer Non-Durables (continued) | |
Kronos Acquisition Intermediate, Inc., (1 month LIBOR + 4.000%) 6.242%, 5/15/23 | | $ | 362 | | | $ | 360 | |
| | | | | | | | |
| | | | 411 | |
| | | | | | | | |
| Energy—0.0% | |
Lotus Midstream LLC Tranche B, (3 month LIBOR + 3.250%) 0.000%, 9/26/25(6) | | | 60 | | | | 60 | |
Paragon Offshore Finance Co., (3 month LIBOR + 3.250%) 0.000%, 9/29/25(6) | | | 25 | | | | 25 | |
| | | | | | | | |
| | | | 85 | |
| | | | | | | | |
| Financial—0.1% | |
Financial & Risk US Holdings, Inc., (3 month LIBOR + 3.750%) 0.000%, 10/1/25(6) | | | 285 | | | | 284 | |
Franklin Square Holdings LP, (1 month LIBOR +
2.500%) 4.625%, 8/1/25 | | | 65 | | | | 65 | |
Genworth Holdings, Inc., (1 month LIBOR + 4.500%) 6.648%, 3/7/23 | | | 15 | | | | 16 | |
| | | | | | | | |
| | | | 365 | |
| | | | | | | | |
| Food and Drug—0.1% | |
Albertson’s LLC Tranche B-4, (1 month LIBOR +
2.750%) 4.992%, 8/25/21 | | | 321 | | | | 321 | |
| | | | | | | | |
| Food/Tobacco—0.1% | |
Aramark Intermediate HoldCo Corp. Tranche B-3, (3 month LIBOR +
1.750%) 4.084%, 3/11/25 | | | 159 | | | | 159 | |
| | | | | | | | |
| | | PAR VALUE | | | VALUE | |
| Food/Tobacco (continued) | |
CHG PPC Parent LLC First Lien, (1 month LIBOR + 2.750%) 4.992%, 3/31/25 | | $ | 184 | | | $ | 184 | |
H-Food Holdings, LLC, (1 month LIBOR +
3.000%) 5.242%, 5/23/25 | | | 50 | | | | 50 | |
| | | | | | | | |
| | | | 393 | |
| | | | | | | | |
| Gaming/Leisure—0.4% | |
Aristocrat Leisure Ltd. Tranche B-3, (3 month LIBOR + 1.750%) 4.098%, 10/19/24 | | | 362 | | | | 362 | |
Gateway Casinos & Entertainment Ltd., (3 month LIBOR +
3.000%) 5.386%, 12/1/23 | | | 55 | | | | 55 | |
GVC Holdings plc Tranche B-2, (1 month LIBOR + 2.500%) 4.742%, 3/29/24 | | | 244 | | | | 245 | |
Playa Resorts Holding B.V., (1 month LIBOR +
2.750%) 4.990%, 4/29/24 | | | 218 | | | | 216 | |
Scientific Games International, Inc. Tranche B-5, (2 month LIBOR + 2.750%) 5.034%, 8/14/24 | | | 279 | | | | 278 | |
Seminole Tribe of Florida 2018 Replacement, Tranche B, (1 month LIBOR + 1.750%) 3.992%, 7/8/24 | | | 282 | | | | 283 | |
Wyndham Hotels & Resorts, Inc. Tranche B, (1 month LIBOR + 1.750%) 3.992%, 5/30/25 | | | 465 | | | | 466 | |
| | | | | | | | |
| | | | 1,905 | |
| | | | | | | | |
See Notes to Financial Statements
23
STRATEGIC ALLOCATION FUND
SCHEDULE OF INVESTMENTS (Continued)
SEPTEMBER 30, 2018
($ reported in thousands)
| | | | | | | | |
| | | PAR VALUE | | | VALUE | |
| Healthcare—0.3% | |
Bausch Health Cos., Inc., (1 month LIBOR +
3.000%) 5.104%, 6/2/25 | | $ | 54 | | | $ | 54 | |
CCS-CMGC Holdings, Inc., (3 month LIBOR +
5.500%) 0.000%, 9/25/25(6) | | | 255 | | | | 255 | |
CHG Healthcare Services, Inc. First Lien, (3 month LIBOR + 3.000%) 5.306%, 6/7/23 | | | 290 | | | | 292 | |
Endo Luxembourg Finance Co. S.a.r.l., (1 month LIBOR +
4.250%) 6.500%, 4/29/24 | | | 128 | | | | 129 | |
Envision Healthcare Corp., (3 month LIBOR + 3.750%) 0.000%, 10/10/25(6) | | | 375 | | | | 373 | |
Iqvia, Inc. Tranche B-3, (3 month LIBOR +
1.750%) 4.136%, 6/11/25 | | | 369 | | | | 369 | |
Quorum Health Corp., (1 month LIBOR + 6.750%) 8.992%, 4/29/22 | | | 130 | | | | 132 | |
| | | | | | | | |
| | | | 1,604 | |
| | | | | | | | |
| Housing—0.2% | |
American Builders & Contractors Supply Co., Inc. Tranche B-2, (1 month LIBOR +
2.000%) 4.242%, 10/31/23 | | | 463 | | | | 461 | |
Capital Automotive LP Tranche B-2, (1 month LIBOR + 2.500%) 4.750%, 3/25/24 | | | 384 | | | | 385 | |
| | | | | | | | |
| | | | 846 | |
| | | | | | | | |
| | | | | | | | |
| | | PAR VALUE | | | VALUE | |
| Information Technology—0.3% | |
BMC Software Finance, Inc., (3 month LIBOR +
4.250%) 0.000%, 10/2/25(6) | | $ | 370 | | | $ | 373 | |
Kronos, Inc. First Lien, (3 month LIBOR +
3.000%) 5.343%, 11/1/23 | | | 289 | | | | 290 | |
Rackspace Hosting, Inc. Tranche B, (3 month LIBOR + 3.000%) 5.348%, 11/3/23 | | | 391 | | | | 385 | |
Renaissance Holding Corp. First Lien, (1 month LIBOR + 3.250%) 5.492%, 5/30/25 | | | 80 | | | | 80 | |
SS&C Technologies Holdings, Inc. | | | | | | | | |
Tranche B-3, (1 month LIBOR + 2.250%) 4.492%, 4/16/25 | | | 319 | | | | 319 | |
Tranche B-4, (1 month LIBOR + 2.250%) 4.492%, 4/16/25 | | | 124 | | | | 124 | |
| | | | | | | | |
| | | | 1,571 | |
| | | | | | | | |
| Manufacturing—0.0% | |
Accudyne Industries Borrower S.C.A., (1 month LIBOR + 3.000%) 5.242%, 8/18/24 | | | 181 | | | | 182 | |
Altra Industrial Motion Corp., (3 month LIBOR + 2.000%) 0.000%, 10/1/25(6) | | | 40 | | | | 40 | |
| | | | | | | | |
| | | | 222 | |
| | | | | | | | |
| Media/Telecom - Cable/Wireless Video—0.1% | |
Altice US Finance I Corp. 2017 Refinancing, (1 month LIBOR + 2.250%) 4.492%, 7/28/25 | | | 373 | | | | 372 | |
See Notes to Financial Statements
24
STRATEGIC ALLOCATION FUND
SCHEDULE OF INVESTMENTS (Continued)
SEPTEMBER 30, 2018
($ reported in thousands)
| | | | | | | | |
| | | PAR VALUE | | | VALUE | |
Media/Telecom - Cable/Wireless Video
(continued) | |
Telenet Financing USD LLC, (1 month LIBOR +
2.250%) 4.408%, 8/15/26 | | $ | 280 | | | $ | 279 | |
| | | | | | | | |
| | | | 651 | |
| | | | | | | | |
| Media/Telecom - Diversified Media—0.1% | |
Crown Finance US, Inc., (1 month LIBOR +
2.500%) 4.742%, 2/28/25 | | | 373 | | | | 373 | |
| | | | | | | | |
| Media Telecom - Telecommunications—0.1% | |
CenturyLink, Inc. Tranche B, (1 month LIBOR +
2.750%) 4.992%, 1/31/25 | | | 562 | | | | 557 | |
| | | | | | | | |
Media/Telecom - Wireless
Communications—0.1% | |
Digicel International Finance Ltd. Tranche B, (3 month LIBOR +
3.250%) 5.570%, 5/27/24 | | | 25 | | | | 23 | |
SBA Senior Finance II LLC, (1 month LIBOR +
2.000%) 4.250%, 4/11/25 | | | 209 | | | | 210 | |
| | | | | | | | |
| | | | 233 | |
| | | | | | | | |
| Metals/Minerals—0.1% | |
Covia Holdings Corp., (1 month LIBOR + 3.750%) 6.136%, 6/1/25 | | | 279 | | | | 263 | |
| | | | | | | | |
| Service—0.1% | |
Red Ventures LLC First Lien, (1 month LIBOR +
4.000%) 6.242%, 11/8/24 | | | 303 | | | | 307 | |
| | | | | | | | |
| | | PAR VALUE | | | VALUE | |
| Service (continued) | |
TKC Holdings, Inc. First Lien, (1 month LIBOR +
3.750%) 6.000%, 2/1/23 | | $ | 202 | | | $ | 202 | |
| | | | | | | | |
| | | | 509 | |
| | | | | | | | |
| Transportation - Automotive—0.0% | |
Navistar, Inc. Tranche B, (1 month LIBOR + 3.500%) 5.640%, 11/6/24 | | | 224 | | | | 225 | |
| | | | | | | | |
| Utility—0.2% | |
Brookfield WEC Holdings, Inc. (Westinghouse Electric Co., LLC) First Lien, (1 month LIBOR +
3.750%) 5.992%, 8/1/25 | | | 275 | | | | 278 | |
NRG Energy, Inc., (3 month LIBOR +
1.750%) 4.136%, 6/30/23 | | | 262 | | | | 262 | |
Vistra Operations Co., LLC | | | | | | | | |
(1 month LIBOR +
2.000%) 4.242%, 8/4/23 | | | 167 | | | | 167 | |
(1 month LIBOR +
2.000%) 4.181%, 12/31/25 | | | 209 | | | | 210 | |
| | | | | | | | |
| | | | | 917 | |
| TOTAL LEVERAGED LOANS (Identified Cost $11,854) | | | | 11,844 | |
| | |
| | | SHARES | | | | |
| PREFERRED STOCKS—1.1% | |
| Financials—0.8% | |
Bank of New York Mellon Corp. (The)
Series E, 4.950% | | | 525 | (7) | | | 535 | |
Huntington Bancshares, Inc.
Series E, 5.700% | | | 365 | (7) | | | 362 | |
JPMorgan Chase & Co. Series Z, 5.300% | | | 640 | (7) | | | 654 | |
See Notes to Financial Statements
25
STRATEGIC ALLOCATION FUND
SCHEDULE OF INVESTMENTS (Continued)
SEPTEMBER 30, 2018
($ reported in thousands)
| | | | | | | | |
| | | SHARES | | | VALUE | |
| Financials (continued) | |
KeyCorp
Series D, 5.000%(9) | | | 375 | (7) | | $ | 368 | |
M&T Bank Corp.
Series F, 5.125%(9) | | | 570 | (7) | | | 574 | |
MetLife, Inc.
Series D, 5.875% | | | 202 | (7) | | | 207 | |
PNC Financial Services Group, Inc. (The) | | | | | | | | |
Series R, 4.850% | | | 570 | (5) | | | 569 | |
Series S, 5.000% | | | 570 | (5) | | | 568 | |
| | | | | | | | |
| | | | 3,837 | |
| | | | | | | | |
| Industrials—0.3% | |
General Electric Co. Series D, 5.000% | | | 1,488 | (7) | | | 1,450 | |
| TOTAL PREFERRED STOCKS (Identified Cost $5,186) | | | | 5,287 | |
| COMMON STOCKS—62.4% | |
| Consumer Discretionary—13.8% | |
Amazon.com, Inc.(1) | | | 10,330 | | | | 20,691 | |
Carnival Corp. | | | 28,190 | | | | 1,798 | |
Ctrip.com International Ltd. ADR(1) | | | 115,068 | | | | 4,277 | |
Home Depot, Inc. (The) | | | 23,980 | | | | 4,967 | |
Las Vegas Sands Corp. | | | 90,190 | | | | 5,351 | |
McDonald’s Corp. | | | 17,790 | | | | 2,976 | |
MercadoLibre, Inc. | | | 6,680 | | | | 2,274 | |
Netflix, Inc.(1) | | | 28,230 | | | | 10,562 | |
NIKE, Inc. Class B | | | 61,250 | | | | 5,189 | |
Ross Stores, Inc. | | | 49,740 | | | | 4,929 | |
Sony Corp. Sponsored ADR | | | 46,851 | | | | 2,842 | |
| | | | | | | | |
| | | | 65,856 | |
| | | | | | | | |
| Consumer Staples—3.0% | |
Fomento Economico Mexicano SAB de C.V. Sponsored ADR | | | 20,066 | | | | 1,986 | |
Marine Harvest ASA Sponsored ADR | | | 78,764 | | | | 1,823 | |
Monster Beverage Corp.(1) | | | 120,480 | | | | 7,022 | |
Philip Morris International, Inc. | | | 44,200 | | | | 3,604 | |
| | | | | | | | |
| | | | 14,435 | |
| | | | | | | | |
| | | | | | | | |
| | | SHARES | | | VALUE | |
| Energy—3.1% | |
Cabot Oil & Gas Corp. | | | 133,560 | | | $ | 3,008 | |
Core Laboratories N.V. | | | 20,630 | | | | 2,390 | |
Eni SpA. Sponsored ADR | | | 53,546 | | | | 2,016 | |
Equinor ASA. Sponsored ADR | | | 81,859 | | | | 2,308 | |
Pioneer Natural Resources Co. | | | 18,570 | | | | 3,235 | |
TechnipFMC plc | | | 63,314 | | | | 1,979 | |
| | | | | | | | |
| | | | 14,936 | |
| | | | | | | | |
| Financials—6.3% | |
Bank of America Corp. | | | 241,980 | | | | 7,129 | |
BOC Hong Kong Holdings Ltd. Sponsored ADR | | | 19,486 | | | | 1,848 | |
CaixaBank S.A. ADR | | | 1,265,865 | | | | 1,905 | |
Charles Schwab Corp. (The) | | | 61,700 | | | | 3,032 | |
China Construction Bank Corp. ADR | | | 112,533 | | | | 1,963 | |
Credit Agricole S.A. ADR | | | 243,829 | | | | 1,734 | |
DBS Group Holdings Ltd. Sponsored ADR | | | 30,599 | | | | 2,332 | |
MarketAxess Holdings, Inc. | | | 13,590 | | | | 2,426 | |
ORIX Corp. Sponsored ADR | | | 26,112 | | | | 2,116 | |
Ping An Insurance Group Co. of China Ltd. ADR(12) | | | 78,799 | | | | 1,595 | |
SEI Investments Co. | | | 28,990 | | | | 1,771 | |
UBS Group AG Registered Shares | | | 119,986 | | | | 1,887 | |
| | | | | | | | |
| | | | 29,738 | |
| | | | | | | | |
| Health Care—5.8% | |
Allergan plc | | | 13,539 | | | | 2,579 | |
Bayer AG Sponsored ADR | | | 58,125 | | | | 1,287 | |
Bluebird Bio, Inc.(1) | | | 10,775 | | | | 1,573 | |
Danaher Corp. | | | 33,250 | | | | 3,613 | |
HealthEquity, Inc.(1) | | | 59,430 | | | | 5,611 | |
ICON plc(1) | | | 11,879 | | | | 1,826 | |
Illumina, Inc.(1) | | | 15,460 | | | | 5,675 | |
Zoetis, Inc. | | | 59,810 | | | | 5,476 | |
| | | | | | | | |
| | | | 27,640 | |
| | | | | | | | |
| Industrials—6.2% | |
Airbus SE ADR | | | 71,210 | | | | 2,227 | |
Ashtead Group plc ADR | | | 22,078 | | | | 2,828 | |
See Notes to Financial Statements
26
STRATEGIC ALLOCATION FUND
SCHEDULE OF INVESTMENTS (Continued)
SEPTEMBER 30, 2018
($ reported in thousands)
| | | | | | | | |
| | | SHARES | | | VALUE | |
| Industrials (continued) | |
Caterpillar, Inc. | | | 27,460 | | | $ | 4,187 | |
CoStar Group, Inc.(1) | | | 9,450 | | | | 3,977 | |
easyJet plc Sponsored ADR | | | 102,954 | | | | 1,750 | |
Golden Ocean Group Ltd. | | | 246,776 | | | | 2,433 | |
Kansas City Southern | | | 29,070 | | | | 3,293 | |
Nidec Corp. Sponsored ADR(12) | | | 63,864 | | | | 2,292 | |
Rockwell Automation, Inc. | | | 10,790 | | | | 2,023 | |
Roper Technologies, Inc. | | | 15,650 | | | | 4,636 | |
| | | | | | | | |
| | | | 29,646 | |
| | | | | | | | |
| Information Technology—21.1% | |
Accenture plc Class A | | | 22,680 | | | | 3,860 | |
Activision Blizzard, Inc. | | | 55,450 | | | | 4,613 | |
Alibaba Group Holding Ltd. Sponsored ADR(1) | | | 72,070 | | | | 11,874 | |
Amphenol Corp. Class A | | | 69,920 | | | | 6,574 | |
Arista Networks, Inc.(1) | | | 11,550 | | | | 3,071 | |
ASML Holding NV Registered Shares | | | 12,598 | | | | 2,369 | |
Avalara, Inc.(1)(12) | | | 79,130 | | | | 2,764 | |
Broadcom, Inc. | | | 9,308 | | | | 2,296 | |
Facebook, Inc. Class A(1) | | | 68,020 | | | | 11,187 | |
Gartner, Inc.(1) | | | 17,440 | | | | 2,764 | |
Hitachi Ltd. ADR | | | 32,464 | | | | 2,201 | |
NVIDIA Corp. | | | 36,180 | | | | 10,167 | |
Paycom Software, Inc.(1) | | | 43,650 | | | | 6,784 | |
SAP SE Sponsored ADR | | | 15,116 | | | | 1,859 | |
Tencent Holdings Ltd. ADR | | | 108,090 | | | | 4,414 | |
Trade Desk, Inc. (The) Class A(1) | | | 16,640 | | | | 2,511 | |
Visa, Inc. Class A | | | 70,320 | | | | 10,554 | |
Workday, Inc. Class A(1) | | | 39,770 | | | | 5,806 | |
Yandex N.V. Class A(1) | | | 147,760 | | | | 4,860 | |
| | | | | | | | |
| | | | 100,528 | |
| | | | | | | | |
| Materials—2.1% | |
Anhui Conch Cement Co., Ltd. ADR | | | 102,442 | | | | 3,094 | |
Ecolab, Inc. | | | 31,010 | | | | 4,861 | |
Glencore plc ADR(1)(12) | | | 221,434 | | | | 1,899 | |
| | | | | | | | |
| | | | 9,854 | |
| | | | | | | | |
| Real Estate—0.4% | |
LendLease Group Sponsored ADR | | | 130,807 | | | | 1,858 | |
| | | | | | | | |
| | | | | | | | |
| | | SHARES | | | VALUE | |
| Telecommunication Services—0.3% | |
BT Group plc Sponsored ADR(12) | | | 102,774 | | | $ | 1,518 | |
| | | | | | | | |
| Utilities—0.3% | |
Veolia Environnement S.A. ADR | | | 67,223 | | | | 1,337 | |
TOTAL COMMON STOCKS
(Identified Cost $209,384) | | | | 297,346 | |
| EXCHANGE-TRADED FUND—0.2% | |
iShares iBoxx $ Investment Grade Corporate Bond ETF(10) | | | 7,583 | | | | 871 | |
TOTAL EXCHANGE-TRADED FUND
(Identified Cost $871) | | | | 871 | |
| AFFILIATED MUTUAL FUND—0.6% | |
Virtus Newfleet Credit Opportunities Fund Class R6(10) | | | 287,054 | | | | 2,776 | |
TOTAL AFFILIATED MUTUAL FUND
(Identified Cost $2,869) | | | | 2,776 | |
| TOTAL LONG-TERM INVESTMENTS—99.4% | |
| (Identified Cost $387,964) | | | | 473,298 | (11) |
| SECURITIES LENDING COLLATERAL—1.3% | |
Dreyfus Government Cash Management Fund – Institutional Shares (seven-day effective yield
1.950%)(10)(13) | | | 6,367,858 | | | | 6,368 | |
TOTAL SECURITIES LENDING COLLATERAL
(Identified Cost $6,368) | | | | 6,368 | |
TOTAL INVESTMENTS—100.7% (Identified Cost $394,332) | | | 479,666(1) | |
Other assets and liabilities, net—(0.7)% | | | | (3,243 | ) |
| | | | | | | | |
| NET ASSETS—100.0% | | | $476,423 | |
| | | | | | | | |
See Notes to Financial Statements
27
STRATEGIC ALLOCATION FUND
SCHEDULE OF INVESTMENTS (Continued)
SEPTEMBER 30, 2018
($ reported in thousands)
Abbreviations:
| ADR | American Depositary Receipt |
| LIBOR | London Interbank Offered Rate |
| REIT | Real Estate Investment Trust |
Footnote Legend:
| (1) | Non-income producing. |
| (2) | Variable rate security. Rate disclosed is as of September 30, 2018. For leveraged loans, the rate shown may represent a weighted average interest rate. Information in parenthesis represents benchmark and reference rate for each security. Certain variable rate securities are not based on a published reference rate and spread but are determined by the issuer or agent and are based on current market conditions, or, for mortgage-backed securities, are impacted by the individual mortgages which are paying off over time. These securities do not indicate a reference rate and spread in their descriptions. |
| (3) | Security exempt from registration under Rule 144A of the Securities Act of 1933. These securities may be resold in transactions exempt from registration, normally to qualified institutional buyers. At September 30, 2018, these securities amounted to a value of $57,277 or 12.0% of net assets. |
| (4) | Regulation S security. Security is offered and sold outside of the United States, therefore, it is exempt from registration with the SEC under Rules 903 and 904 of the Securities Act of 1933. |
| (5) | Interest payments may be deferred. |
| (6) | This loan will settle after September 30, 2018, at which time the interest rate, based on the LIBOR and the agreed upon spread on trade date, will be reflected. |
| (7) | Value shown as par value. |
| (8) | No contractual maturity date. |
| (9) | Interest may be forfeited. |
| (10) | Shares of this fund are publicly offered, and its prospectus and annual report are publicly available. |
| (11) | All or a portion of the Fund’s assets have been segregated for delayed delivery security. |
| (12) | All or a portion of security is on loan. |
| (13) | Represents security purchased with cash collateral received for securities on loan. |
| | | | |
| Country Weightings (Unaudited)† | | | |
United States | | | 77 | % |
China | | | 6 | |
France | | | 2 | |
Japan | | | 2 | |
United Kingdom | | | 2 | |
Ireland | | | 1 | |
Norway | | | 1 | |
Other | | | 9 | |
Total | | | 100 | % |
| † | % of total investments as of September 30, 2018. |
For information regarding the abbreviations, see Key Investment Terms starting on page 4
See Notes to Financial Statements
28
STRATEGIC ALLOCATION FUND
SCHEDULE OF INVESTMENTS (Continued)
SEPTEMBER 30, 2018
($ reported in thousands)
The following table provides a summary of inputs used to value the Fund’s investments as of September 30, 2018 (See Security Valuation Note 2A in the Notes to Financial Statements):
| | | | | | | | | | | | |
| | | Total Value at
September 30,
2018 | | | Level 1
Quoted Prices | | | Level 2
Significant
Observable
Inputs | |
Debt Securities: | | | | | | | | | | | | |
Asset-Backed Securities | | $ | 15,304 | | | $ | — | | | $ | 15,304 | |
Corporate Bonds And Notes | | | 85,133 | | | | — | | | | 85,133 | |
Foreign Government Securities | | | 3,044 | | | | — | | | | 3,044 | |
Leveraged Loans | | | 11,844 | | | | — | | | | 11,844 | |
Mortgage-backed Securities | | | 31,025 | | | | — | | | | 31,025 | |
Municipal Bonds | | | 7,513 | | | | — | | | | 7,513 | |
U.S. Government Securities | | | 13,155 | | | | — | | | | 13,155 | |
Equity Securities: | | | | | | | | | | | | |
Common Stocks | | | 297,346 | | | | 297,346 | | | | — | |
Preferred Stocks | | | 5,287 | | | | — | | | | 5,287 | |
Affiliated Mutual Fund | | | 2,776 | | | | 2,776 | | | | — | |
Exchange-traded Fund | | | 871 | | | | 871 | | | | — | |
Securities Lending Collateral | | | 6,368 | | | | 6,368 | | | | — | |
| | | | | | | | | | | | |
Total Investments | | $ | 479,666 | | | $ | 307,361 | | | $ | 172,305 | |
| | | | | | | | | | | | |
There are no securities valued using significant unobservable inputs (Level 3) at September 30, 2018.
There were no transfers into or out of Level 3 related to securities held at September 30, 2018.
See Notes to Financial Statements
29
STRATEGIC ALLOCATION FUND
STATEMENT OF ASSETS AND LIABILITIES
SEPTEMBER 30, 2018
(Reported in thousands except shares and per share amounts)
| | | | |
| Assets | | | | |
Investment in securities at value(1)(3) | | $ | 476,890 | |
Investments in affiliated funds at value(2) | | | 2,776 | |
Cash | | | 3,667 | |
| Receivables | | | | |
Investment securities sold | | | 401 | |
Fund shares sold | | | 44 | |
Dividends and interest | | | 1,786 | |
Tax reclaims | | | 29 | |
Prepaid expenses | | | 24 | |
Prepaid trustee retainer | | | 9 | |
Other assets | | | 28 | |
| | | | |
Total assets | | | 485,654 | |
| | | | |
| Liabilities | | | | |
| Payables | | | | |
Fund shares repurchased | | | 236 | |
Investment securities purchased | | | 2,054 | |
Collateral on securities loaned | | | 6,368 | |
Investment advisory fees | | | 214 | |
Distribution and service fees | | | 115 | |
Administration and accounting fees | | | 41 | |
Transfer agent and sub-transfer agent fees and expenses | | | 112 | |
Professional fees | | | 31 | |
Trustee deferred compensation plan | | | 28 | |
Other accrued expenses | | | 32 | |
| �� | | | |
Total liabilities | | | 9,231 | |
| | | | |
| Net Assets | | $ | 476,423 | |
| | | | |
| |
| Net Assets Consist of: | | | | |
Capital paid in on shares of beneficial interest | | $ | 374,866 | |
Accumulated undistributed net investment income (loss) | | | (558 | ) |
Accumulated undistributed net realized gain (loss) | | | 16,782 | |
Net unrealized appreciation (depreciation) on investments | | | 85,333 | |
| | | | |
| Net Assets | | $ | 476,423 | |
| | | | |
| Net Assets: | | | | |
Class A | | $ | 447,974 | |
Class C | | $ | 28,449 | |
| Shares Outstanding (unlimited number of shares authorized, no par value): | | | | |
Class A | | | 29,078,937 | |
Class C | | | 1,865,040 | |
| Net Asset Value and Redemption Price Per Share: | | | | |
Class A | | $ | 15.41 | |
Class C | | $ | 15.25 | |
Class A Maximum offering price per share NAV/(1-5.75%) | | $ | 16.35 | |
| |
(1) Investment in securities at cost | | $ | 391,463 | |
| |
(2) Investments in affiliated funds at cost | | | 2,869 | |
| |
(3) Market value of securities on loan | | | 6,099 | |
See Notes to Financial Statements
30
STRATEGIC ALLOCATION FUND
STATEMENT OF OPERATIONS
YEAR ENDED SEPTEMBER 30, 2018
($ reported in thousands)
| | | | |
| Investment Income | | | | |
Dividends | | $ | 3,925 | |
Dividend income from affiliated funds | | | 170 | |
Interest | | | 7,055 | |
Security lending, net of fees | | | 6 | |
Foreign taxes withheld | | | (165 | ) |
| | | | |
Total investment income | | | 10,991 | |
| | | | |
| Expenses | | | | |
Investment advisory fees | | | 2,668 | |
Distribution and service fees, Class A | | | 1,140 | |
Distribution and service fees, Class C | | | 292 | |
Administration and accounting fees | | | 514 | |
Transfer agent fees and expenses | | | 381 | |
Sub-transfer agent fees and expenses, Class A | | | 151 | |
Sub-transfer agent fees and expenses, Class C | | | 17 | |
Registration fees | | | 47 | |
Printing fees and expenses | | | 55 | |
Custodian fees | | | 97 | |
Professional fees | | | 44 | |
Trustees’ fees and expenses | | | 37 | |
Miscellaneous expenses | | | 26 | |
| | | | |
Total expenses | | | 5,469 | |
Less expenses reimbursed and/or waived by investment adviser | | | (15 | ) |
Low balance account fees | | | (11 | ) |
| | | | |
Net expenses | | | 5,443 | |
| | | | |
| Net investment income (loss) | | | 5,548 | |
| | | | |
| Net Realized and Unrealized Gain (Loss) on Investments: | | | | |
Net realized gain (loss) from: | | | | |
Unaffiliated investments | | | 17,973 | |
Net change in unrealized appreciation (depreciation) on: | | | | |
Affiliated Investments | | | (34 | ) |
Unaffiliated investments | | | 22,470 | |
Foreign Currency Transactions | | | (1 | ) |
| | | | |
| Net realized and unrealized gain (loss) on investments | | | 40,408 | |
| | | | |
| Net increase (decrease) in net assets resulting from operations | | $ | 45,956 | |
| | | | |
See Notes to Financial Statements
31
STRATEGIC ALLOCATION FUND
STATEMENTS OF CHANGES IN NET ASSETS
($ reported in thousands)
| | | | | | | | | | | | |
| | | Year Ended
September 30, 2018 | | | Fiscal
Period Ended
September 30, 2017(1) | | | Year Ended
March 31, 2017 | |
Increase (Decrease) in Net Assets Resulting From Operations | | | | | | | | | | | | |
Net investment income (loss) | | $ | 5,548 | | | $ | 3,056 | | | $ | 7,222 | |
Net realized gain (loss) | | | 17,973 | | | | 5,108 | | | | 34,480 | |
Net change in unrealized appreciation (depreciation) | | | 22,435 | | | | 33,961 | | | | (9,141 | ) |
| | | | | | | | | | | | |
| Increase (decrease) in net assets resulting from operations | | | 45,956 | | | | 42,125 | | | | 32,561 | |
| | | | | | | | | | | | |
| Dividends and Distributions to Shareholders: | | | | | | | | | | | | |
| Net Investment Income: | | | | | | | | | | | | |
Class A | | | (5,914 | ) | | | (3,099 | ) | | | (6,925 | ) |
Class B | | | — | | | | — | | | | (3 | ) |
Class C | | | (160 | ) | | | (88 | ) | | | (322 | ) |
| Net Realized Gains: | | | | | | | | | | | | |
Class A | | | (3,104 | ) | | | (10 | ) | | | (33,970 | ) |
Class B | | | — | | | | — | | | | (27 | ) |
Class C | | | (203 | ) | | | (1 | ) | | | (2,686 | ) |
| | | | | | | | | | | | |
| Dividends and distributions to shareholders | | | (9,381 | ) | | | (3,198 | ) | | | (43,933 | ) |
| | | | | | | | | | | | |
| Change in Net Assets from Capital Transactions | | | | | | | | | | | | |
| Sale of shares | | | | | | | | | | | | |
Class A (996, 382 and 485 shares, respectively) | | | 14,953 | | | | 5,244 | | | | 6,467 | |
Class B (0, 0 and —(2) shares, respectively) | | | — | | | | — | | | | — | (3) |
Class C (58, 17 and 66 shares, respectively) | | | 860 | | | | 232 | | | | 874 | |
| | | |
| Reinvestment of distributions | | | | | | | | | | | | |
Class A (560, 204 and 3,012 shares, respectively) | | | 8,350 | | | | 2,852 | | | | 38,224 | |
Class B (0, 0 and 2 shares, respectively) | | | — | | | | — | | | | 30 | |
Class C (24, 6 and 212 shares, respectively) | | | 353 | | | | 86 | | | | 2,658 | |
| | | |
| Conversion of shares(4) | | | | | | | | | | | | |
To Class A (0, 0 and 21 shares, respectively) | | | — | | | | — | | | | 279 | |
From Class B (0, 0 and 21 shares, respectively) | | | — | | | | — | | | | (279 | ) |
| | | |
| Shares repurchased | | | | | | | | | | | | |
Class A (3,998, 2,079 and 4,545 shares, respectively) | | | (60,225 | ) | | | (28,665 | ) | | | (61,067 | ) |
Class B (0, 0 and 21 shares, respectively) | | | — | | | | — | | | | (284 | ) |
Class C (317, 401 and 694 shares, respectively) | | | (4,692 | ) | | | (5,452 | ) | | | (9,236 | ) |
| | | | | | | | | | | | |
| Increase (decrease) in net assets from capital transactions | | | (40,401 | ) | | | (25,703 | ) | | | (22,334 | ) |
| | | | | | | | | | | | |
| Net increase (decrease) in net assets | | | (3,826 | ) | | | 13,224 | | | | (33,706 | ) |
| | | |
| Net Assets | | | | | | | | | | | | |
Beginning of period | | | 480,249 | | | | 467,025 | | | | 500,731 | |
| | | | | | | | | | | | |
| End of period | | $ | 476,423 | | | $ | 480,249 | | | $ | 467,025 | |
| | | | | | | | | | | | |
Accumulated undistributed net investment income (loss) at end of period | | $ | (558 | ) | | $ | (242 | ) | | $ | (129 | ) |
| (1) | Fund changed its fiscal year end to September 30 during the period. |
| (2) | Amount is less than 500 shares. |
| (3) | Amount is less than $500. |
| (4) | See Note 1 in Notes to Financial Statements for more information. |
See Notes to Financial Statements
32
THIS PAGE INTENTIONALLY BLANK.
STRATEGIC ALLOCATION FUND
FINANCIAL HIGHLIGHTS
SELECTED PER SHARE DATA AND RATIOS FOR A SHARE OUTSTANDING
THROUGHOUT EACH PERIOD
| | | | | | | | | | | | | | | | | | | | | | | | | | | | | | | | | | | |
| | | Net Asset Value,
Beginning of Period | | Net Investment Income (Loss)(1) | | Net Realized and Unrealized Gain (Loss) | | Total from Investment Operations | | Dividends from Net Investment Income | | Distributions from Net Realized Gains | | Total Distributions |
Class A | | | | | | | | | | | | | | | | | | | | | | | | | | | | | | | | | | | |
10/1/17 to 09/30/18 | | | $ | 14.29 | | | | | 0.18 | | | | | 1.24 | | | | | 1.42 | | | | | (0.20 | ) | | | | (0.10 | ) | | | | (0.30 | ) |
4/1/17 to 9/30/17(7) | | | | 13.17 | | | | | 0.09 | | | | | 1.13 | | | | | 1.22 | | | | | (0.10 | ) | | | | — | (4) | | | | (0.10 | ) |
4/1/16 to 3/31/17 | | | | 13.55 | | | | | 0.21 | | | | | 0.69 | | | | | 0.90 | | | | | (0.21 | ) | | | | (1.07 | ) | | | | (1.28 | ) |
4/1/15 to 3/31/16 | | | | 15.18 | | | | | 0.29 | | | | | (1.22 | ) | | | | (0.93 | ) | | | | (0.25 | ) | | | | (0.45 | ) | | | | (0.70 | ) |
4/1/14 to 3/31/15 | | | | 15.54 | | | | | 0.29 | | | | | 0.33 | | | | | 0.62 | | | | | (0.30 | ) | | | | (0.68 | ) | | | | (0.98 | ) |
4/1/13 to 3/31/14 | | | | 15.35 | | | | | 0.30 | | | | | 1.65 | | | | | 1.95 | | | | | (0.29 | ) | | | | (1.47 | ) | | | | (1.76 | ) |
| | | | | | | |
Class C | | | | | | | | | | | | | | | | | | | | | | | | | | | | | | | | | | | |
10/1/17 to 09/30/18 | | | $ | 14.16 | | | | | 0.06 | | | | | 1.21 | | | | | 1.27 | | | | | (0.08 | ) | | | | (0.10 | ) | | | | (0.18 | ) |
4/1/17 to 9/30/17(7) | | | | 13.04 | | | | | 0.04 | | | | | 1.12 | | | | | 1.16 | | | | | (0.04 | ) | | | | — | (4) | | | | (0.04 | ) |
4/1/16 to 3/31/17 | | | | 13.44 | | | | | 0.11 | | | | | 0.68 | | | | | 0.79 | | | | | (0.12 | ) | | | | (1.07 | ) | | | | (1.19 | ) |
4/1/15 to 3/31/16 | | | | 15.06 | | | | | 0.18 | | | | | (1.21 | ) | | | | (1.03 | ) | | | | (0.14 | ) | | | | (0.45 | ) | | | | (0.59 | ) |
4/1/14 to 3/31/15 | | | | 15.43 | | | | | 0.17 | | | | | 0.33 | | | | | 0.50 | | | | | (0.19 | ) | | | | (0.68 | ) | | | | (0.87 | ) |
4/1/13 to 3/31/14 | | | | 15.26 | | | | | 0.18 | | | | | 1.63 | | | | | 1.81 | | | | | (0.17 | ) | | | | (1.47 | ) | | | | (1.64 | ) |
See Notes to Financial Statements
34
STRATEGIC ALLOCATION FUND
FINANCIAL HIGHLIGHTS (Continued)
SELECTED PER SHARE DATA AND RATIOS FOR A SHARE OUTSTANDING
THROUGHOUT EACH PERIOD
| | | | | | | | | | | | | | | | | | | | | | | | | | | | | | | | | | | | | | | | | | | |
| Payments from Affiliates | | Change in Net Asset Value | | Net Asset Value, End of Period | | Total Return(2)(9) | | Net Assets, End of Period (in thousands) | | Ratio of Net Expenses to Average Net Assets(3)(8) | | Ratio of Gross Expenses to Average Net Assets(3)(8) | | Ratio of Net Investment Income (Loss) to Average Net Assets(8) | | Portfolio Turnover Rate(9) |
| | | | | | | | | | | | | | | | | | | | | | | | | | | | | | | | | | | | | | | | | | | | |
| | | — | | | | | 1.12 | | | | $ | 15.41 | | | | | 10.01 | % | | | $ | 447,974 | | | | | 1.08 | % | | | | 1.08 | % | | | | 1.19 | % | | | | 34 | % |
| | | — | | | | | 1.12 | | | | | 14.29 | | | | | 9.26 | | | | | 450,516 | | | | | 1.15 | | | | | 1.16 | | | | | 1.33 | | | | | 24 | |
| | | — | | | | | (0.38 | ) | | | | 13.17 | | | | | 7.13 | (6) | | | | 434,712 | | | | | 1.16 | (5)(6) | | | | 1.16 | | | | | 1.46 | (6) | | | | 100 | |
| | | — | (4) | | | | (1.63 | ) | | | | 13.55 | | | | | (6.37 | ) | | | | 461,276 | | | | | 1.12 | | | | | 1.13 | | | | | 2.05 | | | | | 75 | |
| | | — | | | | | (0.36 | ) | | | | 15.18 | | | | | 4.08 | | | | | 541,818 | | | | | 1.10 | | | | | 1.10 | | | | | 1.89 | | | | | 62 | |
| | | — | | | | | 0.19 | | | | | 15.54 | | | | | 13.79 | | | | | 570,784 | | | | | 1.10 | | | | | 1.10 | | | | | 1.97 | | | | | 57 | |
| | | | | | | | |
| | | | | | | | | | | | | | | | | | | | | | | | | | | | | | | | | | | | | | | | | | | | |
| | | — | | | | | 1.09 | | | | $ | 15.25 | | | | | 9.05 | % | | | $ | 28,449 | | | | | 1.84 | % | | | | 1.85 | % | | | | 0.42 | % | | | | 34 | % |
| | | — | | | | | 1.12 | | | | | 14.16 | | | | | 8.91 | | | | | 29,733 | | | | | 1.92 | | | | | 1.92 | | | | | 0.58 | | | | | 24 | |
| | | — | | | | | (0.40 | ) | | | | 13.04 | | | | | 6.33 | (6) | | | | 32,313 | | | | | 1.91 | (5)(6) | | | | 1.91 | | | | | 0.71 | (6) | | | | 100 | |
| | | — | (4) | | | | (1.62 | ) | | | | 13.44 | | | | | (7.06 | ) | | | | 38,913 | | | | | 1.87 | | | | | 1.88 | | | | | 1.31 | | | | | 75 | |
| | | — | | | | | (0.37 | ) | | | | 15.06 | | | | | 3.29 | | | | | 47,131 | | | | | 1.85 | | | | | 1.85 | | | | | 1.12 | | | | | 62 | |
| | | — | | | | | 0.17 | | | | | 15.43 | | | | | 12.89 | | | | | 41,713 | | | | | 1.85 | | | | | 1.85 | | | | | 1.22 | | | | | 57 | |
| (1) | Calculated using average shares outstanding. |
| (2) | Sales charges, where applicable, are not reflected in total return calculation. |
| (3) | The Fund will also indirectly bear its prorated share of expenses of any underlying funds in which it invests. Such expenses are not included in the calculation of this ratio. |
| (4) | Amount is less than $0.005 per share. |
| (5) | Net expense ratios include extraordinary proxy expenses. |
| (6) | State Street Bank & Trust, custodian for the Fund through January 29, 2010, reimbursed the Fund for out-of-pocket custody expenses over billed for the period 1998 through January 29, 2010. Custody fees reimbursed were excluded from the Ratio of Net Expenses to Average Net Assets and the Ratio of Net Investment Income (Loss) to Average Net Assets. If it was included the impact would have been to lower the Ratio of Net Expenses and increase the Ratio of Net Investment Income (Loss) as follows: |
| | | | | | | | |
| | | Class A | | | Class C | |
| | | 0.09 | % | | | 0.09 | % |
| | Custody fees reimbursed were included in Total Return. If excluded the impact would have been to lower the Total Return as follows: |
| | | | | | | | |
| | | Class A | | | Class C | |
| | | 0.09 | % | | | 0.09 | % |
| (7) | The Fund changed its fiscal year end to September 30 during the period. |
| (8) | Annualized for periods less than one year. |
| (9) | Not annualized for periods less than one year. |
See Notes to Financial Statements
35
STRATEGIC ALLOCATION FUND
NOTES TO FINANCIAL STATEMENTS
SEPTEMBER 30, 2018
Note 1. Organization
Virtus Equity Trust (the “Trust”) is organized as a Delaware statutory trust and is registered under the Investment Company Act of 1940, as amended (the “1940 Act”), as an open-end management investment company. Effective September 21, 2017 the Fund changed its fiscal year end from March 31 to September 30.
As of the date of this report, 11 diversified funds of the Trust are offered for sale, of which the Strategic Allocation Fund (the “Fund”) is reported in this annual report. The Fund’s investment objectives are outlined in the Fund Summary Page. There is no guarantee that the Fund will achieve its objectives.
The Fund offers Class A shares and Class C shares. Effective March 6, 2017, all Class B shares were converted to Class A shares. Prior to March 6, 2017, Class B shares could be purchased by existing shareholders through qualifying transactions.
Class A shares are sold with a front-end sales charge of up to 5.75% with some exceptions. Generally, Class A shares are not subject to any charges by the Fund when redeemed; however, a 1% contingent deferred sales charge (“CDSC”) may be imposed on certain redemptions made within a certain period following purchases on which a finder’s fee has been paid. The period for which the CDSC applies for the Fund is 18 months. The CDSC period begins on the last day of the month preceding the month in which the purchase was made.
Class C shares are generally sold with a 1% CDSC, applicable if redeemed within one year of purchase.
The Fund may impose an annual fee on accounts having balances of less than $2,500. The small account fee may be waived in certain circumstances, as disclosed in the prospectus and/or statement of additional information. The fees collected will be used to offset certain expenses of the Fund. These fees are reflected as “Low balance account fees” in the Fund’s Statement of Operations for the period, as applicable.
Each class of shares has identical voting, dividend, liquidation and other rights and the same terms and conditions, except that each class bears any expenses attributable specifically to that class (“class-specific expenses”) and has exclusive voting rights with respect to any Rule 12b-1 and/or shareholder service plan (“12b-1 Plan”) approved by the Board. Class-specific expenses may include shareholder servicing fees, sub-transfer agency fees, and fees under a 12b-1 Plan, as well as certain other expenses as designated by the Fund’s Treasurer and approved by the Board. Investment income, common operating expenses and realized and unrealized gains and losses of the Fund are borne pro-rata by the holders of each class of shares.
Note 2. Significant Accounting Policies
The Trust is an investment company that follows the accounting and reporting guidance of Accounting Standards Certification Topic 946 applicable to Investment Companies. The following is a summary of significant accounting policies consistently followed by the Fund in the preparation of its financial statements. The preparation of financial statements in conformity with U.S. generally accepted accounting principles (“U.S. GAAP”) requires management to make estimates and assumptions that affect the reported amounts of assets and liabilities, and disclosure of contingent assets and liabilities at the date of the financial statements and the reported amounts of increases and decreases in net assets from
36
STRATEGIC ALLOCATION FUND
NOTES TO FINANCIAL STATEMENTS (Continued)
SEPTEMBER 30, 2018
operations during the reporting period. Actual results could differ from those estimates, and those differences could be significant.
The Fund utilizes a fair value hierarchy which prioritizes the inputs to valuation techniques used to measure fair value into three broad levels. The Fund’s policy is to recognize transfers into or out of Level 3 at the end of the reporting period.
| | • Level 1 – | quoted prices in active markets for identical securities (security types generally include listed equities). |
| | • Level 2 – | prices determined using other significant observable inputs (including quoted prices for similar securities, interest rates, prepayment speeds, credit risk, etc.). |
| | • Level 3 – | prices determined using significant unobservable inputs (including the Valuation Committee’s own assumptions in determining the fair value of investments). |
A description of the valuation techniques applied to the Fund’s major categories of assets and liabilities measured at fair value on a recurring basis is as follows:
Equity securities are valued at the official closing price (typically last sale) on the exchange on which the securities are primarily traded or, if no closing price is available, at the last bid price and are categorized as Level 1 in the hierarchy. Restricted equity securities and private placements that are illiquid, or are internally fair valued by the Valuation Committee, are generally categorized as Level 3 in the hierarchy.
Certain non-U.S. securities may be fair valued in cases where closing prices are not readily available or are deemed not reflective of readily available market prices. For example, significant events (such as movement in the U.S. securities market, or other regional and local developments) may occur between the time that non-U.S. markets close (where the security is principally traded) and the time that the Fund calculates its net asset value (“NAV”) at the close of regular trading on the NYSE, (generally 4 p.m. Eastern time) that may impact the value of securities traded in these non-U.S. markets. In such cases, the Fund fair values non-U.S. securities using an independent pricing service which considers the correlation of the trading patterns of the non-U.S. security to the intraday trading in the U.S. markets for investments such as ADRs, financial futures, ETFs, and certain indexes, as well as prices for similar securities. Such fair valuations are categorized as Level 2 in the hierarchy. Because the frequency of significant events is not predictable, fair valuation of certain non-U.S. common stocks may occur on a frequent basis.
Debt securities, including restricted securities, are valued based on evaluated quotations received from independent pricing services or from dealers who make markets in such securities. For most bond types, the pricing service utilizes matrix pricing that considers one or more of the following factors: yield or price of bonds of comparable quality, coupon, maturity, current cash flows, type, and current day trade information, as well as dealer supplied prices. These valuations are generally categorized as Level 2 in the hierarchy. Structured debt instruments, such as mortgage-backed and asset-backed securities, may also incorporate collateral analysis and utilize cash flow models for valuation and are generally categorized as Level 2 in the hierarchy. Pricing services do not provide pricing for all securities and therefore
37
STRATEGIC ALLOCATION FUND
NOTES TO FINANCIAL STATEMENTS (Continued)
SEPTEMBER 30, 2018
indicative bids from dealers are utilized which are based on pricing models used by market makers in the security and are generally categorized as Level 2 in the hierarchy. Debt securities that are internally fair valued by the Valuation Committee, are generally categorized as Level 3 in the hierarchy.
Listed derivatives that are actively traded are valued based on quoted prices from the exchange and are categorized as Level 1 in the hierarchy. Over-the-counter derivative contracts, which include forward currency contracts and equity-linked instruments, do not require material subjectivity as pricing inputs are observed from actively quoted markets and are categorized as Level 2 in the hierarchy.
Investments in open-end mutual funds are valued at NAV. Investments in closed-end funds and ETFs are valued as of the close of regular trading on the NYSE each business day. Each is categorized as Level 1 in the hierarchy.
A summary of the inputs used to value the Fund’s net assets by each major security type is disclosed at the end of the Schedule of Investments for the Fund. The inputs or methodologies used for valuing securities are not necessarily an indication of the risk associated with investing in those securities.
| | B. | Security Transactions and Investment Income |
Security transactions are recorded on the trade date. Realized gains and losses from the sale of securities are determined on the identified cost basis. Dividend income is recognized on the ex-dividend date or, in the case of certain foreign securities, as soon as the Fund is notified. Interest income is recorded on the accrual basis. The Fund amortizes premiums and accretes discounts using the effective interest method.
Any distributions from underlying funds are recorded in accordance with the character of the distributions as designated by the underlying funds.
Dividend income from REIT investments is recorded using management’s estimate of the percentage of income included in distributions received from such investments based on historical information and other industry sources. The return of capital portion of the estimate is a reduction to investment income and a reduction in the cost basis of each investment which increases net realized gain (loss) and net change in unrealized appreciation (depreciation). If the return of capital distributions exceed its cost basis, the distributions are treated as realized gains. The actual amounts of income, return of capital, and capital gains are only determined by each REIT after its fiscal year-end, and may differ from the estimated amounts.
The Fund is treated as a separate taxable entity. It is the intention of the Fund to comply with the requirements of Subchapter M of the Internal Revenue Code and to distribute substantially all of its taxable income to its shareholders. Therefore, no provision for federal income taxes or excise taxes has been made.
The Fund may be subject to foreign taxes on income, gains on investments or currency repatriation, a portion of which may be recoverable. The Fund will accrue such taxes and recoveries as applicable based upon current interpretations of the tax rules and regulations that exist in the markets in which it invests.
38
STRATEGIC ALLOCATION FUND
NOTES TO FINANCIAL STATEMENTS (Continued)
SEPTEMBER 30, 2018
Management of the Fund has concluded that there are no significant uncertain tax positions that would require recognition in the financial statements. As of September 30, 2018, the tax years that remain subject to examination by the major tax jurisdictions under the statute of limitations are from the year 2015 forward (with limited exceptions).
| | D. | Distributions to Shareholders |
Distributions are recorded by the Fund on the ex-dividend date. Income and capital gain distributions are determined in accordance with income tax regulations which may differ from U.S. GAAP.
Expenses incurred together by the Fund and other affiliated mutual funds are allocated in proportion to the net assets of each such fund, except where allocation of direct expenses to each fund or an alternative allocation method can be more appropriately used.
In addition to the net annual operating expenses that the Fund bears directly, the shareholders of the Fund indirectly bear the Fund’s pro-rata expenses of any underlying mutual funds in which the Fund invests.
| | F. | Foreign Currency Transactions |
Non-U.S. investment securities and other assets and liabilities denominated in foreign currencies are translated into U.S. dollar amounts at the foreign currency exchange rate effective at the end of the reporting period. Cost of investments is translated at the currency exchange rate effective at the trade date. The gain or loss resulting from a change in currency exchange rates between the trade and settlement date of a portfolio transaction is treated as a gain or loss on foreign currency. Likewise, the gain or loss resulting from a change in currency exchange rates between the date income is accrued and the date it is paid is treated as a gain or loss on foreign currency. The Fund does not isolate that portion of the results of operations arising from changes in foreign exchange rates on investments from the fluctuations arising from changes in the market prices of securities held. Such fluctuations are included with the net realized and unrealized gain or loss on investments.
| | G. | When-issued Purchases and Forward Commitments (Delayed Delivery) |
The Fund may engage in when-issued or forward commitment transactions. Securities purchased on a when-issued or forward commitment basis are known as delayed delivery transactions. Delayed delivery transactions involve a commitment by the Fund to purchase or sell a security at a future date (ordinarily up to 90 days later). When-issued or forward commitments enable the Fund to lock in what is believed to be an attractive price or yield on a particular security for a period of time, regardless of future changes in interest rates. The Fund records when-issued and delayed delivery securities on the trade date. The Fund maintains collateral for the securities purchased. Securities purchased on a when-issued basis begin earning interest on the settlement date.
The Fund may invest in direct debt instruments which are interests in amounts owed by a corporate, governmental, or other borrower to lenders or lending syndicates.
39
STRATEGIC ALLOCATION FUND
NOTES TO FINANCIAL STATEMENTS (Continued)
SEPTEMBER 30, 2018
Leveraged loans are generally non-investment grade and often involve borrowers that are highly leveraged. The Fund may invest in obligations of borrowers who are in bankruptcy proceedings. Leveraged loans are typically senior in the corporate capital structure of the borrower. A loan is often administered by a bank or other financial institution (the “lender”) that acts as agent for all holders. The agent administers the terms of the loan, as specified in the loan agreement. The Fund’s investments in loans may be in the form of participations in loans or assignments of all or a portion of loans from third parties. When investing in loan participations, the Fund has the right to receive payments of principal, interest and any fees to which it is entitled only from the lender selling the loan participation and only upon receipt by the lender of payments from the borrower. The Fund generally has no right to enforce compliance with the terms of the loan agreement with the borrower. As a result, the Fund may be subject to the credit risk of both the borrower and the lender that is selling the leveraged loan. When the Fund purchases assignments from lenders it acquires direct rights against the borrower on the loan.
The Fund may invest in multiple series or tranches of a loan, which may have varying terms and carry different associated risks. Leveraged loans may involve foreign borrowers and investments may be denominated in foreign currencies. Direct indebtedness of emerging countries involves a risk that the government entities responsible for the repayment of the debt may be unable, or unwilling, to pay the principal and interest when due.
The leveraged loans have floating rate loan interests which generally pay interest at rates that are periodically determined by reference to a base lending rate plus a premium. The base lending rates are generally the LIBOR, the prime rate offered by one or more U.S. banks or the certificate of deposit rate. When a leveraged loan is purchased the Fund may pay an assignment fee. On an ongoing basis, the Fund may receive a commitment fee based on the undrawn portion of the underlying line of credit portion of a leveraged loan. Prepayment penalty fees are received upon the prepayment of a leveraged loan by a borrower. Prepayment penalty, facility, commitment, consent and amendment fees are recorded to income as earned or paid.
At September 30, 2018, all leveraged loans held by the Fund are assignment loans.
($ reported in thousands)
The Fund may loan securities to qualified brokers through a securities lending agency agreement with The Bank of New York Mellon (“BNYM”). Under the securities lending policy, when lending securities the Fund is required to maintain collateral with a market value not less than 100% of the market value of loaned securities. Collateral is adjusted daily in connection with changes in the market value of securities on loan. Collateral may consist of cash and securities issued by the U.S. Government or its agencies. Cash collateral is invested in a short-term money market fund. Dividends earned on the collateral and premiums paid by the broker are recorded as income by the Fund net of fees and rebates charged/paid by BNYM for its services as securities lending agent and in connection with this securities lending program. Lending portfolio securities involves
40
STRATEGIC ALLOCATION FUND
NOTES TO FINANCIAL STATEMENTS (Continued)
SEPTEMBER 30, 2018
a risk of delay in the recovery of the loaned securities or in the declining value of the collateral. During the period ended September 30, 2018, the Fund had securities on loan as follows:
| | | | | | | | |
| | | Market Value | | | Cash Collateral | |
| | $ | 6,099 | | | $ | 6,368 | |
Note 3. Investment Advisory Fees and Related Party Transactions
($ reported in thousands)
Virtus Investment Advisers, Inc. (the “Adviser”), an indirect, wholly-owned subsidiary of Virtus Investment Partners, Inc. (“Virtus”), is the investment adviser to the Fund. The Adviser manages the Fund’s investment program and general operations of the Fund, including oversight of the Fund’s subadvisers.
As compensation for its services to the Fund, the Adviser is entitled to a fee, which is calculated daily and paid monthly, based upon the following annual rates as a percentage of the average daily net assets of the Fund:
| | | | |
First $1 Billion | | $1+ Billion –
$2 Billion | | $2+ Billion |
| 0.55% | | 0.50% | | 0.45% |
During the period covered by these financial statements, the Fund invested a portion of its assets in Virtus Newfleet Credit Opportunities Fund, an affiliated mutual fund. In order to avoid any duplication of advisory fees, the Adviser has voluntarily waived its advisory fees in an amount equal to that which would otherwise be paid by the fund on the assets invested in the Virtus Newfleet Credit Opportunities Fund. For the period covered by these financial statements, the waiver amounted to $15. This waiver is included in “Less expenses reimbursed and/or waived by investment adviser” in the Statement of Operations.
The subadvisers manage the investments of the Fund for which they are paid a fee by the Adviser.
Newfleet Asset Management, LLC, an indirect, wholly-owned subsidiary of Virtus, is the subadviser to the Fund’s fixed income portfolio. Kayne Anderson Rudnick Investment Management, LLC, an indirect, wholly-owned subsidiary of Virtus, is the subadviser to the Fund’s domestic equity portfolio and Duff & Phelps Investment Management Co., an indirect, wholly-owned subsidiary of Virtus, is the subadviser to the Fund’s international equity portfolio.
($ Reported in thousands)
VP Distributors, LLC (“VP Distributors”), an indirect, wholly-owned subsidiary of Virtus, serves as the distributor of the Fund’s shares. VP Distributors has advised the Fund that for the fiscal year (the “period”) ended September 30, 2018, it retained net commissions of $29 for Class A shares and CDSC of $—(1) and $9 for Class A shares and Class C shares, respectively.
41
STRATEGIC ALLOCATION FUND
NOTES TO FINANCIAL STATEMENTS (Continued)
SEPTEMBER 30, 2018
In addition, the Fund pays VP Distributors 12b-1 fees under a 12b-1 Plan as a percentage of the average daily net assets of each respective class at the annual rates of 0.25% for Class A shares and 1.00% for Class C shares.
Under certain circumstances, shares of certain Virtus Mutual Funds may be exchanged for shares of the same class of certain other Virtus Mutual Funds on the basis of the relative NAV per share at the time of the exchange. On exchanges with share classes that carry a CDSC, the CDSC schedule of the original shares purchased continues to apply.
| | (1) | Amount is less than $500. |
| | D. | Administrator and Transfer Agent |
($ Reported in thousands)
Virtus Fund Services, LLC, an indirect, wholly-owned subsidiary of Virtus, serves as the administrator and transfer agent to the Trust.
For the period ended September 30, 2018, the Fund incurred administration fees in aggregate totaling $459 which are included in the Statement of Operations within the line item “Administration and accounting fees”. The fees are calculated daily and paid monthly.
For the period ended September 30, 2018, the Fund incurred transfer agent fees in aggregate totaling $374 which are included in the Statement of Operations within the line items “Transfer agent fees and expenses” and “Sub-transfer agent fees Class A and Class C”. A portion of these fees were paid to outside entities that also provide services to the Trust. The fees are calculated daily and paid monthly.
| | E. | Investments in Affiliates |
($ reported in thousands)
A summary of total long-term and short-term purchases and sales of the affiliated underlying fund during the period ended September 30, 2018, is as follows:
| | | | | | | | | | | | | | | | | | | | | | | | | | | | | | | | | | | | |
| | | Value,
beginning
of period | | | Purchases | | | Sales | | | Realized
gain (loss) | | | Net change in
unrealized
appreciation
(depreciation) | | | Value,
end of
period | | | Shares | | | Dividend
Income | | | Distributions
of Realized
Gains | |
| Affiliated Mutual Fund 0.6% | | | | | | | | | | | | | | | | | | | | | | | | | | | | | |
Virtus Newfleet Credit Opportunities Fund Class R6(1) | | $ | 2,810 | | | $ | — | | | $ | — | | | $ | — | | | $ | (34 | ) | | $ | 2,776 | | | | 287,054 | | | $ | 170 | | | $ | — | |
| | (1) | Shares of this fund are publicly offered, and its prospectus and annual report are publicly available. |
The Fund does not invest in the underlying fund for the purpose of exercising management or control; however, investments made by the Fund within each of its principal investment strategies may represent a significant portion of an underlying fund’s net assets.
The Trust provides a deferred compensation plan for its Trustees who receive compensation from the Trust. Under the deferred compensation plan, Trustees may elect to defer all or a portion of their compensation. Amounts deferred are retained by the Trust, and then, to the extent permitted by the 1940 Act, in turn, may be invested in
42
STRATEGIC ALLOCATION FUND
NOTES TO FINANCIAL STATEMENTS (Continued)
SEPTEMBER 30, 2018
the shares of affiliated or unaffiliated mutual funds selected by the participating Trustees. Investments in such instruments are included in “Other assets” in the Statement of Assets and Liabilities at September 30, 2018.
Note 4. Purchases and Sales of Securities
($ reported in thousands)
Purchases and sales of securities (excluding U.S. Government and agency securities and short-term securities) during the period ended September 30, 2018, were as follows:
| | | | | | | | |
| | | Purchases | | | Sales | |
| | $ | 148,858 | | | $ | 190,434 | |
Purchases and sales of long-term U.S. Government and agency securities during the period ended September 30, 2018, were as follows:
| | | | | | | | |
| | | Purchases | | | Sales | |
| | $ | 14,689 | | | $ | 15,187 | |
Note 5. Indemnifications
Under the Trust’s organizational documents and in separate agreements between each Trustee and the Trust, its Trustees and officers are indemnified against certain liabilities arising out of the performance of their duties to the Trust and its funds. In addition, in the normal course of business, the Trust and the Fund enter into contracts that provide a variety of indemnifications to other parties. The Trust’s and/or the Fund’s maximum exposure under these arrangements is unknown as this would involve future claims that may be made against the Trust or the Fund and that have not occurred. However, neither the Trust nor the Fund has had prior claims or losses pursuant to these arrangements, and they expect the risk of loss to be remote.
Note 6. Credit Risk and Asset Concentration
In countries with limited or developing markets, investments may present greater risks than in more developed markets and the prices of such investments may be volatile. The consequences of political, social or economic changes in these markets may have disruptive effects on the market prices of these investments and the income they generate, as well as the Fund’s ability to repatriate such amounts.
High-yield/high-risk securities typically entail greater price volatility and/or principal and interest rate risk. There is a greater chance that an issuer will not be able to make principal and interest payments on time. Analysis of the creditworthiness of issuers of high-yield/high-risk securities may be complex, and as a result, it may be more difficult for the Adviser and/or Subadvisers to accurately predict risk.
The Fund may invest a high percentage of its assets in specific sectors of the market in the pursuit of its investment objectives. Fluctuations in these sectors of concentration may have a greater impact on the Fund, positive or negative, than if the Fund did not concentrate its investments in such sectors.
43
STRATEGIC ALLOCATION FUND
NOTES TO FINANCIAL STATEMENTS (Continued)
SEPTEMBER 30, 2018
Note 7. Federal Income Tax Information
($ reported in thousands)
At September 30, 2018, federal tax cost and aggregate gross unrealized appreciation (depreciation) of securities held by the Fund were as follows:
| | | | | | |
Federal Tax Cost | | Unrealized Appreciation | | Unrealized (Depreciation) | | Net Unrealized Appreciation (Depreciation) |
$395,687 | | $95,780 | | $(11,801) | | $83,979 |
The components of distributable earnings on a tax basis (excluding unrealized appreciation (depreciation) which is disclosed above) consist of the following:
| | |
Undistributed
Ordinary
Income | | Undistributed
Long-term
Capital Gains |
| $1,266 | | $16,341 |
Short-term gain distributions reported in the Statements of Changes in Net Assets, if any, are reported as ordinary income for federal tax purposes. Distributions are determined on a tax basis and may differ from net investment income and realized capital gains for financial reporting purposes. The tax character of dividends and distributions paid during the periods ended was as follows:
| | | | | | | | | | | | |
| | | September 30,
2018 | | | September 30,
2017 | | | March 31,
2017 | |
| Ordinary Income | | $ | 6,074 | | | $ | 3,187 | | | $ | 12,177 | |
| Long-Term Capital Gains | | | 3,307 | | | | 11 | | | | 31,756 | |
| | | | | | | | | | | | |
| Total | | $ | 9,381 | | | $ | 3,198 | | | $ | 43,933 | |
| | | | | | | | | | | | |
For financial reporting purposes, book basis capital accounts are adjusted to reflect the tax character of permanent book/tax differences. Permanent reclassifications can arise from differing treatment of certain income and gain transactions, nondeductible current year net operating losses, expiring capital loss carryovers and investments in passive foreign investment companies. Permanent book and tax basis differences relating to shareholder distributions will result in reclassifications to capital paid in on shares of beneficial interest. The reclassifications have no impact on the net assets or NAV of the Fund. As of September 30, 2018, the Fund recorded reclassifications to increase (decrease) the accounts as listed below:
| | | | |
Capital Paid
in on Shares of
Beneficial
Interest | | Undistributed
Net Investment
Income (Loss) | | Accumulated
Net Realized
Gain (Loss) |
| $— | | $210 | | $(210) |
Note 8. Redemption Facility
($ reported in thousands)
On September 18, 2017, the Fund and certain other affiliated funds entered into an $150,000 unsecured line of credit (“Credit Agreement”). This Credit Agreement as
44
STRATEGIC ALLOCATION FUND
NOTES TO FINANCIAL STATEMENTS (Continued)
SEPTEMBER 30, 2018
amended, is with a commercial bank that allows the Fund to borrow cash from the bank to manage large unexpected redemptions and trade fails, up to a limit of one-third of the Fund’s total net assets in accordance with the terms of the agreement. This Credit Agreement has a term of 364 days and has been renewed for a period up to March 14, 2019. Interest is charged at the higher of the LIBOR or the Federal Funds rate plus an additional percentage rate on the amount borrowed. Commitment fees are charged on the undrawn balance. The Fund and other affiliated funds that are parties are individually, and not jointly, liable for their particular advances, if any, under the line of credit. The lending bank has the ability to require repayment of outstanding borrowings under this Credit Agreement upon certain circumstances such as an event of default.
The Fund made no borrowings under this Credit Agreement at any time during the period and did not have any outstanding borrowings under this Credit Agreement at September 30, 2018.
Note 9. Illiquid and Restricted Securities
Investments are generally considered illiquid if they cannot be disposed of within seven days in the ordinary course of business at the approximate amount at which such securities have been valued by the Fund. Additionally, the following information is also considered in determining liquidity: the frequency of trades and quotes for the investment, whether the investment is listed for trading on a recognized domestic exchange and/or whether two or more brokers are willing to purchase or sell the security at a comparable price, the extent of market making activity in the investment and the nature of the market for investment.
Restricted securities are illiquid securities not registered under the Securities Act of 1933, as amended (the “1933 Act”). Generally, 144A securities are excluded from this category, except where defined as illiquid.
The Fund will bear any costs, including those involved in registration under the 1933 Act, in connection with the disposition of such securities.
At September 30, 2018, the Fund did not hold any securities that were illiquid or restricted.
Note 10. Regulatory Matters and Litigation
From time to time, the Trust, the Fund’s Adviser and/or subadvisers and/or their affiliates may be involved in litigation and arbitration as well as examinations and investigations by various regulatory bodies, including the SEC, involving compliance with, among other things, securities laws, client investment guidelines, laws governing the activities of broker-dealers and other laws and regulations affecting their products and other activities. At this time, the Fund’s Adviser believes that the outcomes of such matters are not likely, either individually or in the aggregate, to be material to these financial statements.
Note 11. Recent Accounting Pronouncements
In August 2018, the Financial Accounting Standards Board issued Accounting Standards Update (“ASU”), ASU No. 2018-13, which changes certain fair value measurement disclosure requirements. The new ASU, in addition to other modifications and additions, removes the requirement to disclose the amount and reasons for transfers between Level 1 and Level 2 of the fair value hierarchy, the policy for the timing of transfers between levels and the valuation process for Level 3 fair value measurements. For public companies, the amendments are effective for financial statements issued for fiscal years beginning after December 15, 2019, and interim periods within those fiscal years. Management has
45
STRATEGIC ALLOCATION FUND
NOTES TO FINANCIAL STATEMENTS (Continued)
SEPTEMBER 30, 2018
evaluated the implications of certain provisions of ASU No. 2018-13 and has determined to early adopt all aspects related to the removal and modification of certain fair value measurement disclosures under the ASU effective immediately.
In August 2018, the SEC adopted amendments to Regulation S-X which are intended to facilitate the disclosure of information to investors and simplify compliance without significantly altering the information provided to investors. The amendments include eliminating the requirement to: separately state book basis components of net assets on the Statement of Assets & Liabilities; separately state the sources of distributions paid (except tax return of capital distributions must still be separately disclosed) on the Statement of Changes in Net Assets; and state the book basis amount of undistributed net investment income on the Statement of Changes in Net Assets. The compliance date for the amendments to Regulation S-X is for filings made with the SEC after November 5, 2018. The adoption will have no effect on the Fund’s net assets or results of operations.
In March 2017, the Financial Accounting Standards Board issued an Accounting Standards Update, ASU 2017-08, Receivables – Nonrefundable Fees and Other Costs (Subtopic 310-20), Premium Amortization on Purchased Callable Debt Securities which amends the amortization period for certain purchased callable debt securities held at a premium, shortening such period to the earliest call date. This ASU does not require any accounting change for debt securities held at a discount; the discount continues to be amortized to maturity. This ASU is effective for fiscal years, and interim periods within those fiscal years, beginning after December 15, 2018. At this time, management is evaluating the implications of these changes on the financial statements.
Note 12. Subsequent Events
Management has evaluated the impact of all subsequent events on the Fund through the date the financial statements were available for issuance and has determined that the following subsequent event requires recognition or disclosure in these financial statements.
On November 14, 2018, the Board of Trustees of Virtus Equity Trust (the “Board”), on behalf of Virtus Strategic Allocation Fund and Virtus Tactical Allocation Fund, approved an Agreement and Plan of Reorganization relating to the combination of Virtus Strategic Allocation Fund, a series of Virtus Equity Trust, with and into Virtus Tactical Allocation Fund, also a series of Virtus Equity Trust. The merger does not require the approval of shareholders of either Fund and will be effective on or about January 25, 2019.
46

Report of Independent Registered Public
Accounting Firm
To the Board of Trustees of
Virtus Equity Trust and Shareholders of
Virtus Strategic Allocation Fund
Opinion on the Financial Statements
We have audited the accompanying statement of assets and liabilities, including the schedule of investments, of Virtus Strategic Allocation Fund (one of the funds constituting Virtus Equity Trust, hereafter referred to as the “Fund”) as of September 30, 2018, the related statement of operations for the year ended September 30, 2018, the statement of changes in net assets for the year ended September 30, 2018, the period April 1, 2017 through September 30, 2017 and the year ended March 31, 2017, including the related notes, and the financial highlights for each of the periods indicated therein (collectively referred to as the “financial statements”). In our opinion, the financial statements present fairly, in all material respects, the financial position of the Fund as of September 30, 2018, the results of its operations for the year then ended, the changes in its net assets for the year ended September 30, 2018, the period April 1, 2017 through September 30, 2017 and the year ended March 31, 2017 and the financial highlights for each of the periods indicated therein in conformity with accounting principles generally accepted in the United States of America.
Basis for Opinion
These financial statements are the responsibility of the Fund’s management. Our responsibility is to express an opinion on the Fund’s financial statements based on our audits. We are a public accounting firm registered with the Public Company Accounting Oversight Board (United States) (“PCAOB”) and are required to be independent with respect to the Fund in accordance with the U.S. federal securities laws and the applicable rules and regulations of the Securities and Exchange Commission and the PCAOB.
We conducted our audits of these financial statements in accordance with the standards of the PCAOB. Those standards require that we plan and perform the audit to obtain reasonable assurance about whether the financial statements are free of material misstatement, whether due to error or fraud.
Our audits included performing procedures to assess the risks of material misstatement of the financial statements, whether due to error or fraud, and performing procedures that respond to those risks. Such procedures included examining, on a test basis, evidence regarding the amounts and disclosures in the financial statements. Our audits also included evaluating the accounting principles used and significant estimates made by management, as well as evaluating the overall presentation of the financial statements. Our procedures included confirmation of securities owned as of September 30, 2018 by correspondence with the custodian, transfer agents and brokers; when replies were not received from brokers, we performed other auditing procedures. We believe that our audits provide a reasonable basis for our opinion.
/s/ PricewaterhouseCoopers LLP
Philadelphia, Pennsylvania
November 20, 2018
We have served as the Virtus Mutual Funds’ auditor since at least 1977. We have not been able to determine the specific year we began serving as auditor.
47
STRATEGIC ALLOCATION FUND
TAX INFORMATION NOTICE (Unaudited)
SEPTEMBER 30, 2018
For the fiscal year ended September 30, 2018, the Fund makes the following disclosures for federal income tax purposes. Below is listed the percentages, or the maximum amount allowable, of its ordinary income dividends (“QDI”) to qualify for the lower tax rates applicable to individual shareholders, and the percentage of ordinary income dividends earned by the Fund which qualifies for the dividends received deduction (“DRD”) for corporate shareholders. The actual percentage of QDI and DRD for the calendar year will be designated in year-end tax statements. The Fund designates the amount below as long-term capital gains dividends (“LTCG”) taxable at a 20% rate, or lower depending on the shareholder’s income ($ reported in thousands). LTCG amount, if subsequently different, will be designated in the next annual report.
| | | | |
QDI | | DRD | | LTCG |
| 55% | | 25% | | $16,525 |
48
FUND MANAGEMENT TABLES (Unaudited)
Information pertaining to the Trustees and officers of the Trust as of the date of issuance of this report is set forth below. The statement of additional information (SAI) includes additional information about the Trustees and is available without charge, upon request, by calling (800) 243-4361.
The address of each individual, unless otherwise noted, is c/o Virtus Equity Trust, 100 Pearl Street, Hartford, CT 06103. There is no stated term of office for Trustees or officers of the Trust.
Independent Trustees
| | |
Name, Year of Birth,
Length of Time Served
and Number of Portfolios
in Complex | | Principal Occupation(s)
During Past 5 Years and
Other Directorships Held by Trustee |
Brown, Thomas J. YOB: 1945 Served Since: 2016 71 Portfolios | | Retired. Trustee (since 2016), Virtus Mutual Fund Family (60 portfolios) and Virtus Alternative Solutions Trust (3 portfolios); Trustee (since 2011), Virtus Variable Insurance Trust (8 portfolios); Director (since 2010), D’Youville Senior Care Center; and Director (since 2005), VALIC Company Funds (49 portfolios). |
Burke, Donald C. YOB: 1960 Served Since: 2016 75 Portfolios | | Retired. Trustee (since 2016), Virtus Mutual Fund Family (60 portfolios), Virtus Variable Insurance Trust (8 portfolios) and Virtus Alternative Solutions Trust (3 portfolios); Director (since 2014) closed-end funds managed by Duff & Phelps Investment Management Co. (4 funds); Director, Avista Corp. (energy company) (since 2011); Trustee, Goldman Sachs Fund Complex (2010 to 2014); and Director, BlackRock Luxembourg and Cayman Funds (2006 to 2010). |
Gelfenbien, Roger A. YOB: 1943 Served Since: 2016 71 Portfolios | | Retired. Trustee (since 2016), Virtus Mutual Fund Family (60 portfolios) and Virtus Alternative Solutions Trust (3 portfolios); Trustee (since 2000), Virtus Variable Insurance Trust (8 portfolios); and Director (1999 to 2017), USAllianz Variable Insurance Product Trust (42 portfolios). |
Harris, Sidney E. YOB: 1949 Served Since: 2017 71 Portfolios | | Professor and Dean Emeritus (since April 2015), Professor (1997 to 2014), Dean (1997 to 2004), J. Mack Robinson College of Business, Georgia State University; Trustee (since 2017), Virtus Mutual Fund Family (60 portfolios), Virtus Variable Insurance Trust (8 portfolios), and Virtus Alternative Solutions Trust (3 portfolios); Trustee (since 2013), KIPP Metro Atlanta; Trustee (since 1999) Total System Services, Inc.; Trustee (2004 to 2017), RidgeWorth Funds; Trustee (2012 to 2017), International University of the Grand Bassam; and Trustee (2011 to 2015), Genspring Family Offices, LLC. |
Mallin, John R. YOB: 1950 Served Since: 2016 71 Portfolios | | Partner/Attorney (since 2003), McCarter & English LLP (law firm), Real Property Practice Group; and Member (since 2014), Counselors of Real Estate. Trustee (since 2016), Virtus Mutual Fund Family (60 portfolios) and Virtus Alternative Solutions Trust (3 portfolios); Director (since 2013), Horizons, Inc. (non-profit); and Trustee (since 1999), Virtus Variable Insurance Trust (8 portfolios). |
McClellan, Hassell H. YOB: 1945 Served Since: 2015 71 Portfolios | | Retired (since 2013); and Professor (1984 to 2013), Wallace E. Carroll School of Management, Boston College. Chairperson of the Board (since 2017) and Trustee (since 2000), John Hancock Fund Complex (collectively, 227 portfolios); Trustee (since 2016), Virtus Alternative Solutions Trust (3 portfolios); Trustee (since 2015), Virtus Mutual Fund Family (60 portfolios); Director (since 2010), Barnes Group, Inc. (diversified global components manufacturer and logistical services company); and Trustee (since 2008), Virtus Variable Insurance Trust (8 portfolios). |
McDaniel, Connie D. YOB: 1958 Served Since: 2017 71 Portfolios | | Retired (since 2013); and Vice President, Chief of Internal Audit, Corporate Audit Department (2009 to 2013); Vice President Global Finance Transformation (2007 to 2009); Vice President and Controller (1999 to 2007), The Coca-Cola Company. Trustee (since 2017), Virtus Mutual Fund Family (60 portfolios), Virtus Variable Insurance Trust (8 portfolios), and Virtus Alternative Solutions Trust (3 portfolios); Trustee (since 2014), Total System Services, Inc.; and Trustee (2005 to 2017), RidgeWorth Funds. |
49
FUND MANAGEMENT TABLES (Unaudited) (Continued)
Independent Trustees (Continued)
| | |
Name, Year of Birth,
Length of Time Served
and Number of Portfolios
in Complex | | Principal Occupation(s)
During Past 5 Years and
Other Directorships Held by Trustee |
McLoughlin, Philip YOB: 1946 Served Since: 1996 79 Portfolios | | Retired. Director and Chairman (since 2016), Virtus Total Return Fund Inc. and Virtus Global Dividend & Income Fund Inc.; Director and Chairman (since 2014) Duff & Phelps Select Energy MLP Fund Inc.; Trustee and Chairman (since 2013), Virtus Alternative Solutions Trust (3 portfolios); Trustee and Chairman (since 2011), Virtus Global Multi-Sector Income Fund; Chairman and Trustee (since 2003), Virtus Variable Insurance Trust (8 portfolios); Director (since 1995), closed-end funds managed by Duff & Phelps Investment Management Co. (4 funds); Director (since 1991) and Chairman (since 2010), Lazard World Trust Fund (closed-end investment firm in Luxembourg); and Trustee (since 1989) and Chairman (since 2002), Virtus Mutual Fund Family (60 portfolios). |
McNamara, Geraldine M. YOB: 1951 Served Since: 2001 75 Portfolios | | Retired. Trustee (since 2016), Virtus Alternative Solutions Trust (3 portfolios); Trustee (since 2015), Virtus Variable Insurance Trust (8 portfolios); Director (since 2003), closed-end funds managed by Duff & Phelps Investment Management Co. (4 funds); and Trustee (since 2001), Virtus Mutual Fund Family (60 portfolios). |
Oates, James M. YOB: 1946 Served Since: 1996 75 Portfolios | | Managing Director (since 1994), Wydown Group (consulting firm). Director (since 2016), Virtus Total Return Fund Inc. and Virtus Global Dividend & Income Fund Inc.; Trustee (since 2016), Virtus Variable Insurance Trust (8 portfolios); Director (since 2014), Duff & Phelps Select Energy MLP Fund Inc.; Trustee (since 2013), Virtus Alternative Solutions Trust (3 portfolios); Trustee (since 2011), Virtus Global Multi-Sector Income Fund; Trustee (since 2005) and Chairman (2005 to 2017), John Hancock Fund Complex (227 portfolios); Director (2002 to 2014), New Hampshire Trust Company; Chairman (2000 to 2016), Emerson Investment Management, Inc.; Non-Executive Chairman (2000 to 2014), Hudson Castle Group, Inc. (formerly IBEX Capital Markets, Inc.) (financial services); Chairman and Director (1999 to 2014), Connecticut River Bank; Director (since 1996), Stifel Financial; and Trustee (since 1987), Virtus Mutual Fund Family (60 portfolios). |
Segerson, Richard E. YOB: 1946 Served Since: 1996 71 Portfolios | | Retired; and Managing Director (1998 to 2013), Northway Management Company. Trustee (since 2016), Virtus Alternative Solutions Trust (3 portfolios) and Virtus Variable Insurance Trust (8 portfolios); and Trustee (since 1983), Virtus Mutual Fund Family (60 portfolios). |
Interested Trustee
| | |
Name, Year of Birth,
Year Elected and
Number of Funds
Overseen | | Principal Occupation(s)
During Past 5 Years and
Other Directorships Held by Trustee |
Aylward, George R.* Trustee and President YOB: 1964 Elected: 2006 77 Portfolios | | Director, President and Chief Executive Officer (since 2008), Virtus Investment Partners, Inc. and/or certain of its subsidiaries; various senior officer positions with Virtus affiliates (since 2005). Chairman and Trustee (since 2015), Virtus ETF Trust II (2 portfolios); Director, President and Chief Executive Officer (since 2014), Duff & Phelps Select Energy MLP Fund Inc.; Trustee and President (since 2013), Virtus Alternative Solutions Trust (3 portfolios); Director (since 2013), Virtus Global Funds, PLC (3 portfolios); Trustee (since 2012) and President (since 2010), Virtus Variable Insurance Trust (8 portfolios); Trustee, President and Chief Executive Officer (since 2011), Virtus Global Multi-Sector Income Fund; Trustee and President (since 2006) and Executive Vice President (2004 to 2006), Virtus Mutual Fund Family (60 portfolios); and Director, President and Chief Executive Officer (since 2006), Virtus Global Dividend & Income Fund Inc. and Virtus Total Return Fund Inc. |
| * | Mr. Aylward is an “interested person,” as defined in the 1940 Act, by reason of his position as President and Chief Executive Officer of Virtus Investment Partners, Inc. (“Virtus”), the ultimate parent company of the Adviser, and various positions with its affiliates, including the Adviser. |
50
FUND MANAGEMENT TABLES (Unaudited) (Continued)
Officers of the Trust Who Are Not Trustees
| | | | |
Name, Address and
Year of Birth | | Position(s) Held with
Trust and Length of
Time Served | | Principal Occupation(s)
During Past 5 Years |
Bradley, W. Patrick YOB: 1972 | | Executive Vice President (since 2016); Senior Vice President (2013 to 2016); Vice President (2011 to 2013); Chief Financial Officer and Treasurer (since 2006). | | Executive Vice President, Fund Services (since 2016), Senior Vice President, Fund Services (2010 to 2016), Virtus Investment Partners, Inc. and/or certain of its subsidiaries; various officer positions (since 2006) with Virtus affiliates; Executive Vice President (since 2016), Senior Vice President (2013 to 2016), Vice President (2011 to 2013), Chief Financial Officer and Treasurer (since 2004), Virtus Variable Insurance Trust; Executive Vice President (since 2016), Senior Vice President (2013 to 2016), Vice President (2011 to 2013), Chief Financial Officer and Treasurer (since 2006), Virtus Mutual Fund Family; Executive Vice President (since 2016), Senior Vice President (2013 to 2016), Vice President (2012 to 2013) and Treasurer and Chief Financial Officer (since 2010), Virtus Total Return Fund Inc. and Virtus Global Dividend & Income Fund Inc.; Executive Vice President (since 2016), Senior Vice President (2013 to 2016), Vice President (2011 to 2013), Chief Financial Officer and Treasurer (since 2011), Virtus Global Multi-Sector Income Fund; Executive Vice President (since 2016), Senior Vice President (2014 to 2016), Chief Financial Officer and Treasurer (since 2014), Duff & Phelps Select Energy MLP Fund Inc.; Vice President and Assistant Treasurer (since 2011), Duff & Phelps Global Utility Income Fund Inc.; Director (since 2013), Virtus Global Funds, PLC; and Executive Vice President (since 2016), Senior Vice President (2013 to 2016), and Chief Financial Officer and Treasurer (since 2013), Virtus Alternative Solutions Trust. |
Carr, Kevin J. YOB: 1954 | | Senior Vice President (since 2013); Vice President (2005 to 2013); Chief Legal Officer, Counsel and Secretary (since 2005). | | Vice President and Senior Counsel (2017 to Present), Senior Vice President (2009 to 2017), Vice President, Counsel and Secretary (2008 to 2009), Virtus Investment Partners, Inc. and/or certain of its subsidiaries; various senior officer positions (since 2005) with Virtus affiliates; Senior Vice President (since 2013), Vice President (2005 to 2013), Chief Legal Officer, Counsel and Secretary (since 2005), Virtus Mutual Fund Family; Senior Vice President (2013 to 2014), Vice President (2012 to 2013), Secretary and Chief Legal Officer (2005 to 2013), Virtus Total Return Fund Inc. and Virtus Global Dividend & Income Fund Inc.; Senior Vice President (since 2017), Assistant Secretary (since 2013), Vice President, Chief Legal Officer, Counsel and Secretary (2010 to 2013), Virtus Variable Insurance Trust; Senior Vice President(2013 to 2014), Vice President(2011 to 2013), Virtus Global Multi-Sector Income Fund; Assistant Secretary (since 2015), Duff & Phelps Select Energy MLP Fund Inc.; Senior Vice President (since 2017) and Assistant Secretary (since 2013), Virtus Alternative Solutions Trust; Secretary (since 2015), ETFis Series Trust I; and Secretary (since 2015), Virtus ETF Trust II. |
51
FUND MANAGEMENT TABLES (Unaudited) (Continued)
Officers of the Trust Who Are Not Trustees (Continued)
| | | | |
Name, Address and
Year of Birth | | Position(s) Held with
Trust and Length of
Time Served | | Principal Occupation(s)
During Past 5 Years |
Engberg, Nancy J. YOB: 1956 | | Senior Vice President (since 2017); Vice President (2011 to 2017); and Chief Compliance Officer (since 2011). | | Senior Vice President (since 2017), Vice President (2008 to 2017) and Chief Compliance Officer (2008 to 2011 and since 2016), Virtus Investment Partners, Inc. and/or certain of its subsidiaries; various officer positions (since 2003) with Virtus affiliates; Senior Vice President (since 2017), Vice President (2011 to 2017) and Chief Compliance Officer (since 2011), Virtus Mutual Fund Family; Senior Vice President (since 2017), Vice President (2010 to 2017) and Chief Compliance Officer (since 2011), Virtus Variable Insurance Trust; Senior Vice President (since 2017), Vice President (2011 to 2016) and Chief Compliance Officer (since 2011), Virtus Global Multi-Sector Income Fund; Senior Vice President (since 2017), Vice President (2012 to 2017) and Chief Compliance Officer (since 2012), Virtus Total Return Fund Inc. and Virtus Global Dividend & Income Fund Inc.; Senior Vice President (since 2017), Vice President (2013 to 2016) and Chief Compliance Officer (since 2013), Virtus Alternative Solutions Trust; Senior Vice President (since 2017), Vice President (2014 to 2017) and Chief Compliance Officer (since 2014), Duff & Phelps Select Energy MLP Fund Inc.; Chief Compliance Officer (since 2015), ETFis Series Trust I; and Chief Compliance Officer (since 2015), Virtus ETF Trust II. |
Short, Julia R. YOB: 1972 | | Senior Vice President (since 2017). | | Senior Vice President, Product Development (since 2017), Virtus Investment Partners, Inc. and/or certain of its subsidiaries; Senior Vice President (since 2017), Virtus Mutual Fund Family; Senior Vice President (since 2018), Virtus Closed-End Funds; President and Chief Executive Officer, RidgeWorth Funds (2007 to 2017); and Managing Director, Product Manager, RidgeWorth Investments (2004 to 2017). |
Waltman, Francis G. YOB: 1962 | | Executive Vice President (since 2013); Senior Vice President (2008 to 2013). | | Executive Vice President, Product Development (since 2009), Virtus Investment Partners, Inc. and/or certain of its subsidiaries; various senior officer positions (since 2006) with Virtus affiliates; Executive Vice President (since 2013), Senior Vice President (2008 to 2013), Virtus Mutual Fund Family; Executive Vice President (since 2013), Senior Vice President (2010 to 2013), Virtus Variable Insurance Trust; Executive Vice President (since 2013), Senior Vice President (2011 to 2013), Virtus Global Multi-Sector Income Fund; Executive Vice President (since 2014), Duff & Phelps Select Energy MLP Fund Inc.; Director (since 2013), Virtus Global Funds PLC; and Executive Vice President (since 2013), Virtus Alternative Solutions Trust. |
52
VIRTUS EQUITY TRUST
101 Munson Street
Greenfield, MA 01301-9668
Trustees
Philip R. McLoughlin, Chairman
George R. Aylward
Thomas J. Brown
Donald C. Burke
Roger A. Gelfenbien
Sidney E. Harris
John R. Mallin
Hassell H. McClellan
Connie D. McDaniel
Geraldine M. McNamara
James M. Oates
Richard E. Segerson
Officers
George R. Aylward, President
Peter Batchelar, Senior Vice President
W. Patrick Bradley, Executive Vice President, Chief Financial Officer and Treasurer
Kevin J. Carr, Senior Vice President, Chief Legal Officer, Counsel and Secretary
Nancy J. Engberg, Senior Vice President and Chief Compliance Officer
Julia R. Short, Senior Vice President
Francis G. Waltman, Executive Vice President
Investment Adviser
Virtus Investment Advisers, Inc.
100 Pearl Street
Hartford, CT 06103-4506
Principal Underwriter
VP Distributors, LLC
100 Pearl Street
Hartford, CT 06103-4506
Administrator and Transfer Agent
Virtus Fund Services, LLC
100 Pearl Street
Hartford, CT 06103-4506
Custodian
The Bank of New York Mellon
240 Greenwich Street
New York, NY 10286-1048
Independent Registered Public Accounting Firm
PricewaterhouseCoopers LLP
2001 Market Street
Philadelphia, PA 19103-7042
How to Contact Us
Mutual Fund Services 1-800-243-1574
Adviser Consulting Group 1-800-243-4361
Website Virtus.com
Important Notice to Shareholders
The Securities and Exchange Commission has modified mailing regulations for semiannual and annual shareholder fund reports to allow mutual fund companies to send a single copy of these reports to shareholders who share the same mailing address. If you would like additional copies, please call Mutual Fund Services at 1-800-243-1574.
For more information about
Virtus Mutual Funds, please call
your financial representative, or
contact us at 1-800-243-1574
or Virtus.com.
Item 2. Code of Ethics.
| | (a) | The registrant, as of the end of the period covered by this report, has adopted a code of ethics that applies to the registrant’s principal executive officer, principal financial officer, principal accounting officer or controller, or persons performing similar functions, regardless of whether these individuals are employed by the registrant or a third party. |
| | (b) | There have been no amendments, during the period covered by this report, to a provision of the code of ethics that applies to the registrant’s principal executive officer, principal financial officer, principal accounting officer or controller, or persons performing similar functions, regardless of whether these individuals are employed by the registrant or a third party, and that relates to any element of the code of ethics described in Item 2(b) of the instructions for completion of Form N-CSR. |
| | (c) | The registrant has not granted any waivers, during the period covered by this report, including an implicit waiver, from a provision of the code of ethics that applies to the registrant’s principal executive officer, principal financial officer, principal accounting officer or controller, or persons performing similar functions, regardless of whether these individuals are employed by the registrant or a third party, that relates to one or more of the items set forth in paragraph (b) of the instructions for completion of this Item. |
Item 3. Audit Committee Financial Expert.
| (a)(1) | The Registrant’s Board of Trustees has determined that the Registrant has an “audit committee financial expert” serving on its Audit Committee. |
| (a)(2) | The Registrant’s Board of Trustees has determined that Donald C. Burke, Thomas J. Brown and Richard E. Segerson each possess the technical attributes identified in Instruction 2(b) of Item 3 to Form N-CSR to qualify as an “audit committee financial expert.” Each of Mr. Burke, Mr. Brown and Mr. Segerson is an “independent” trustee pursuant to paragraph (a)(2) of Item 3 to Form N-CSR. |
Item 4. Principal Accountant Fees and Services.
| | ● | | Registrant may incorporate the following information by reference, if this information has been disclosed in the registrant’s definitive proxy statement or definitive information statement. The proxy statement or information statement must be filed no later than 120 days after the end of the fiscal year covered by the Annual Report. |
Audit Fees
| | (a) | The aggregate fees billed for each of the last two fiscal years for professional services rendered by the principal accountant for the audit of the registrant’s annual financial statements or services that are normally provided by the accountant in connection with statutory and regulatory filings or engagements for those fiscal years are $261,865 for the 12 months ended March 31, 2017, $225,527 for the six months ended September 30, 2017 and $165,050 for 2018. [The Trust changed its fiscal period end from March 31 to September 30 in 2017.] |
Audit-Related Fees
| | (b) | The aggregate fees billed in each of the last two fiscal years for assurance and related services by the principal accountant that are reasonably related to the performance of the audit of the registrant’s financial statements and are not reported under paragraph (a) of this Item are $11,813 for the 12 months ended March 31, 2017, $44,019 for the six months ended September 30, 2017 and $34,564 for 2018. Such audit-related fees include the out of pocket expenses. [The Trust changed its fiscal period end from March 31 to September 30 in 2017.] |
Tax Fees
| | (c) | The aggregate fees billed in each of the last two fiscal years for professional services rendered by the principal accountant for tax compliance, tax advice, and tax planning are $55,600 for the 12 months ended March 31, 2017, $1,500 for the six months ended September 30, 2017 and $60,225 for 2018. [The Trust changed its fiscal period end from March 31 to September 30 in 2017.] |
“Tax Fees” are those primarily associated with review of the Trust’s tax provision and qualification as a regulated investment company (RIC) in connection with audits of the Trust’s financial statement, review of year-end distributions by the Fund to avoid excise tax for the Trust, periodic discussion with management on tax issues affecting the Trust, and reviewing and signing the Fund’s federal income returns.
All Other Fees
| | (d) | The aggregate fees billed in each of the last two fiscal years for products and services provided by the principal accountant, other than the services reported in paragraphs (a) through (c) of this Item are $0 for the 12 months ended March 31, 2017 and the six months ended September 30, 2017 and $0 for 2018. [The Trust changed its fiscal period end from March 31 to September 30 in 2017.] |
| (e)(1) | Disclose the audit committee’s pre-approval policies and procedures described in paragraph (c)(7) of Rule 2-01 of Regulation S-X. |
The Virtus Equity Trust (the “Fund”) Board has adopted policies and procedures with regard to the pre-approval of services provided by PwC. Audit, audit-related and tax compliance services
provided to the Fund on an annual basis require specific pre-approval by the Audit Committee. The Audit Committee must approve other non-audit services provided to the Fund and those non-audit services provided to the Fund’s Affiliated Service Providers that relate directly to the operations and financial reporting of the Fund. Certain of these non-audit services that the Audit Committee believes are a) consistent with the SEC’s auditor independence rules and b) routine and recurring services that will not impair the independence of the independent auditors may be approved by the Audit Committee without consideration on a specific case-by-case basis (“general pre-approval”).
The Audit Committee has determined that Thomas J. Brown, Chair of the Audit Committee, may provide pre-approval for such services that meet the above requirements in the event such approval is sought between regularly scheduled meetings. In any event, the Audit Committee is informed of each service approved subject to general pre-approval at the next regularly scheduled in-person Audit Committee meeting.
| (e)(2) | The percentage of services described in each of paragraphs (b) through (d) of this Item that were approved by the audit committee pursuant to paragraph (c)(7)(i)(C) of Rule 2-01 of Regulation S-X are as follows: |
| | (f) | The percentage of hours expended on the principal accountant’s engagement to audit the registrant’s financial statements for the most recent fiscal year that were attributed to work performed by persons other than the principal accountant’s full-time, permanent employees was less than fifty percent. |
| | (d) | (g) The aggregate non-audit fees billed by the registrant’s accountant for services rendered to the registrant, and rendered to the registrant’s investment adviser (not including any sub-adviser whose role is primarily portfolio management and is subcontracted with or overseen by another investment adviser), and any entity controlling, controlled by, or under common control with the adviser that provides ongoing services to the registrant for each of the last two fiscal years of the registrant was $482,558 for the 12 months ended March 31, 2017, $223,435 for the six months ended September 30, 2017 and $820,610 for 2018. [The Trust changed its fiscal period end from March 31 to September 30 in 2017.] |
Item 5. Audit Committee of Listed Registrants.
Not applicable.
Item 6. Investments.
| (a) | Schedule of Investments in securities of unaffiliated issuers as of the close of the reporting period is included as part of the report to shareholders filed under Item 1 of this form. |
| Item 7. | Disclosure of Proxy Voting Policies and Procedures for Closed-End Management Investment Companies. |
Not applicable.
Item 8. Portfolio Managers of Closed-End Management Investment Companies.
Not applicable.
| Item 9. | Purchases of Equity Securities by Closed-End Management Investment Company and Affiliated Purchasers. |
Not applicable.
Item 10. Submission of Matters to a Vote of Security Holders.
There have been no material changes to the procedures by which the shareholders may recommend nominees to the registrant’s board of trustees, where those changes were implemented after the registrant last provided disclosure in response to the requirements of Item 407(c)(2)(iv) of Regulation S-K (17 CFR 229.407) (as required by Item 22(b)(15) of Schedule 14A (17 CFR 240.14a-101)), or this Item.
Item 11. Controls and Procedures.
| | (a) | The registrant’s principal executive and principal financial officers, or persons performing similar functions, have concluded that the registrant’s disclosure controls and procedures (as defined in Rule 30a-3(c) under the Investment Company Act of 1940, as amended (the “1940 Act”) (17 CFR 270.30a-3(c))) are effective, as of a date within 90 days of the filing date of the report that includes the disclosure required by this paragraph, based on their evaluation of these controls and procedures required by Rule 30a-3(b) under the 1940 Act (17 CFR 270.30a-3(b)) and Rules 13a-15(b) or 15d-15(b) under the Securities Exchange Act of 1934, as amended (17 CFR 240.13a-15(b) or 240.15d-15(b)). |
| | (b) | There were no changes in the registrant’s internal control over financial reporting (as defined in Rule 30a-3(d) under the 1940 Act (17 CFR 270.30a-3(d))) that occurred during the registrant’s last fiscal quarter that has materially affected, or is reasonably likely to materially affect, the registrant’s internal control over financial reporting. |
| Item 12. | Disclosure of Securities Lending Activities for Closed-End Management Investment Companies. |
Not applicable.
Item 13. Exhibits.
| | (a)(1) | Code of ethics, or any amendment thereto, that is the subject of disclosure required by Item 2 is attached hereto. |
| | (a)(2) | Certifications pursuant to Rule 30a-2(a) under the 1940 Act and Section 302 of the Sarbanes-Oxley Act of 2002 are attached hereto. |
| | (b) | Certifications pursuant to Rule 30a-2(b) under the 1940 Act and Section 906 of the Sarbanes-Oxley Act of 2002 are attached hereto. |
SIGNATURES
Pursuant to the requirements of the Securities Exchange Act of 1934 and the Investment Company Act of 1940, the registrant has duly caused this report to be signed on its behalf by the undersigned, thereunto duly authorized.
| | | | |
(Registrant) Virtus Equity Trust |
|
By (Signature and Title)* /s/ George R. Aylward |
George R. Aylward, President | | |
(principal executive officer) | | |
|
Date 12/7/2018 |
Pursuant to the requirements of the Securities Exchange Act of 1934 and the Investment Company Act of 1940, this report has been signed below by the following persons on behalf of the registrant and in the capacities and on the dates indicated.
| | | | |
By (Signature and Title)* /s/ George R. Aylward |
George R. Aylward, President | | |
(principal executive officer) | | |
|
Date 12/7/2018 |
|
By (Signature and Title)* /s/ W. Patrick Bradley |
W. Patrick Bradley, Executive Vice President, Chief Financial Officer,
and Treasurer |
(principal financial officer) |
|
Date 12/7/2018 |
* Print the name and title of each signing officer under his or her signature.