UNITED STATES
SECURITIES AND EXCHANGE COMMISSION
Washington, D.C. 20549
FORM N-CSR
CERTIFIED SHAREHOLDER REPORT OF REGISTERED
MANAGEMENT INVESTMENT COMPANIES
Investment Company Act file number 811-00945
Virtus Equity Trust
(Exact name of registrant as specified in charter)
101 Munson Street
Greenfield, MA 01301-9668
(Address of principal executive offices) (Zip code)
Kevin J. Carr, Esq.
Senior Vice President, Chief Legal Officer, Counsel and Secretary for Registrant
One Financial Plaza
Hartford, CT 06103-2608
(Name and address of agent for service)
Registrant’s telephone number, including area code: (800) 243-1574
Date of fiscal year end: September 30
Date of reporting period: September 30, 2021
Form N-CSR is to be used by management investment companies to file reports with the Commission not later than 10 days after the transmission to stockholders of any report that is required to be transmitted to stockholders under Rule 30e-1 under the Investment Company Act of 1940 (17 CFR 270.30e-1). The Commission may use the information provided on Form N-CSR in its regulatory, disclosure review, inspection, and policymaking roles.
A registrant is required to disclose the information specified by Form N-CSR, and the Commission will make this information public. A registrant is not required to respond to the collection of information contained in Form N-CSR unless the Form displays a currently valid Office of Management and Budget (“OMB”) control number. Please direct comments concerning the accuracy of the information collection burden estimate and any suggestions for reducing the burden to Secretary, Securities and Exchange Commission, 450 Fifth Street, NW, Washington, DC 20549-0609. The OMB has reviewed this collection of information under the clearance requirements of 44 U.S.C. § 3507.
Item 1. Reports to Stockholders.
| (a) | The Report to Shareholders is attached herewith. |
| (b) | Not applicable. |

| Virtus KAR Capital Growth Fund |
| Virtus KAR Equity Income Fund |
| Virtus KAR Global Quality Dividend Fund |
| Virtus KAR Mid-Cap Core Fund |
| Virtus KAR Mid-Cap Growth Fund |
| Virtus KAR Small-Cap Core Fund |
| Virtus KAR Small-Cap Growth Fund |
| Virtus KAR Small-Cap Value Fund |
| Virtus KAR Small-Mid Cap Core Fund |
| Virtus KAR Small-Mid Cap Growth Fund |
| Virtus KAR Small-Mid Cap Value Fund |
| Virtus SGA Emerging Markets Growth Fund |
| Virtus SGA Global Growth Fund |
| Virtus SGA New Leaders Growth Fund |
| Virtus Tactical Allocation Fund |
| 1 | ||
| 2 | ||
| 6 | ||
| Fund | Fund Summary | Schedule of Investments |
| 9 | 43 | |
| 11 | 44 | |
| 13 | 46 | |
| 15 | 47 | |
| 17 | 48 | |
| 19 | 50 | |
| 21 | 51 | |
| 23 | 52 | |
| 25 | 53 | |
| 27 | 54 | |
| 29 | 55 | |
| 31 | 56 | |
| 34 | 57 | |
| 37 | 58 | |
| 39 | 59 | |
| 72 | ||
| 80 | ||
| 83 | ||
| 91 | ||
| 102 | ||
| 122 | ||
| 124 | ||
| 125 | ||
| 126 | ||
| 129 | ||


President, Virtus Funds
| Beginning Account Value April 1, 2021 | Ending Account Value September 30, 2021 | Annualized Expense Ratio | Expenses Paid During Period* | |||||
KAR Capital Growth Fund | ||||||||
| Class A | $ 1,000.00 | $ 1,102.80 | 1.20 % | $ 6.33 | ||||
| Class C | 1,000.00 | 1,098.10 | 2.06 | 10.83 | ||||
| Class I | 1,000.00 | 1,103.90 | 1.00 | 5.27 | ||||
| Class R6 | 1,000.00 | 1,105.30 | 0.73 | 3.85 | ||||
KAR Equity Income Fund | ||||||||
| Class A | 1,000.00 | 1,016.90 | 1.26 | 6.37 | ||||
| Class C | 1,000.00 | 1,012.80 | 2.00 | 10.09 | ||||
| Class I | 1,000.00 | 1,018.00 | 1.01 | 5.11 | ||||
| Class R6 | 1,000.00 | 1,018.50 | 0.96 | 4.86 | ||||
KAR Global Quality Dividend Fund | ||||||||
| Class A | 1,000.00 | 1,020.80 | 1.35 | 6.84 | ||||
| Class C | 1,000.00 | 1,016.50 | 2.10 | 10.62 | ||||
| Class I | 1,000.00 | 1,022.20 | 1.10 | 5.58 | ||||
| Class R6 | 1,000.00 | 1,023.40 | 0.78 | 3.96 | ||||
KAR Mid-Cap Core Fund | ||||||||
| Class A | 1,000.00 | 1,095.90 | 1.20 | 6.30 | ||||
| Class C | 1,000.00 | 1,091.90 | 1.95 | 10.23 | ||||
| Class I | 1,000.00 | 1,097.10 | 0.95 | 4.99 | ||||
| Class R6 | 1,000.00 | 1,097.70 | 0.87 | 4.57 | ||||
KAR Mid-Cap Growth Fund | ||||||||
| Class A | 1,000.00 | 1,099.50 | 1.27 | 6.68 | ||||
| Class C | 1,000.00 | 1,095.20 | 2.00 | 10.50 | ||||
| Class I | 1,000.00 | 1,100.80 | 1.01 | 5.32 | ||||
| Class R6 | 1,000.00 | 1,101.80 | 0.83 | 4.37 | ||||
KAR Small-Cap Core Fund | ||||||||
| Class A | 1,000.00 | 1,035.60 | 1.26 | 6.43 | ||||
| Class C | 1,000.00 | 1,032.00 | 1.98 | 10.09 | ||||
| Class I | 1,000.00 | 1,037.10 | 0.99 | 5.06 | ||||
| Class R6 | 1,000.00 | 1,037.50 | 0.91 | 4.65 | ||||
KAR Small-Cap Growth Fund | ||||||||
| Class A | 1,000.00 | 1,055.70 | 1.34 | 6.91 | ||||
| Class C | 1,000.00 | 1,052.00 | 2.05 | 10.55 | ||||
| Class I | 1,000.00 | 1,057.00 | 1.07 | 5.52 | ||||
| Class R6 | 1,000.00 | 1,057.50 | 0.97 | 5.00 |
| Beginning Account Value April 1, 2021 | Ending Account Value September 30, 2021 | Annualized Expense Ratio | Expenses Paid During Period* | |||||
KAR Small-Cap Value Fund | ||||||||
| Class A | $1,000.00 | $ 985.20 | 1.21% | $ 6.02 | ||||
| Class C | 1,000.00 | 981.50 | 1.97 | 9.79 | ||||
| Class I | 1,000.00 | 986.30 | 0.96 | 4.78 | ||||
| Class R6 | 1,000.00 | 986.60 | 0.91 | 4.53 | ||||
KAR Small-Mid Cap Core Fund | ||||||||
| Class A | 1,000.00 | 1,043.00 | 1.30 | 6.66 | ||||
| Class C | 1,000.00 | 1,039.50 | 2.05 | 10.48 | ||||
| Class I | 1,000.00 | 1,045.00 | 1.00 | 5.13 | ||||
| Class R6 | 1,000.00 | 1,045.40 | 0.97 | 4.97 | ||||
KAR Small-Mid Cap Growth Fund | ||||||||
| Class A | 1,000.00 | 1,093.00 | 1.30 | 6.82 | ||||
| Class C | 1,000.00 | 1,088.00 | 2.05 | 10.73 | ||||
| Class I | 1,000.00 | 1,093.90 | 1.05 | 5.51 | ||||
| Class R6 | 1,000.00 | 1,094.90 | 0.99 | 5.20 | ||||
KAR Small-Mid Cap Value Fund** | ||||||||
| Class A | 1,000.00 | 964.00 | 1.17 | 1.83 | ||||
| Class C | 1,000.00 | 963.00 | 1.92 | 2.99 | ||||
| Class I | 1,000.00 | 964.00 | 0.92 | 1.44 | ||||
| Class R6 | 1,000.00 | 965.00 | 0.82 | 1.28 | ||||
SGA Emerging Markets Growth Fund | ||||||||
| Class A | 1,000.00 | 928.30 | 1.48 | 7.15 | ||||
| Class C | 1,000.00 | 925.10 | 2.23 | 10.76 | ||||
| Class I | 1,000.00 | 930.10 | 1.23 | 5.95 | ||||
| Class R6 | 1,000.00 | 930.30 | 1.05 | 5.08 | ||||
SGA Global Growth Fund | ||||||||
| Class A | 1,000.00 | 1,057.20 | 1.38 | 7.12 | ||||
| Class C | 1,000.00 | 1,053.20 | 2.15 | 11.07 | ||||
| Class I | 1,000.00 | 1,058.60 | 1.13 | 5.83 | ||||
| Class R6 | 1,000.00 | 1,059.90 | 0.90 | 4.65 | ||||
SGA New Leaders Growth Fund | ||||||||
| Class A | 1,000.00 | 1,025.00 | 1.39 | 7.06 | ||||
| Class C | 1,000.00 | 1,021.20 | 2.14 | 10.84 | ||||
| Class I | 1,000.00 | 1,026.00 | 1.14 | 5.79 | ||||
| Class R6 | 1,000.00 | 1,026.90 | 0.91 | 4.62 | ||||
Tactical Allocation Fund | ||||||||
| Class A | 1,000.00 | 1,072.50 | 1.02 | 5.30 | ||||
| Class C | 1,000.00 | 1,068.50 | 1.78 | 9.23 | ||||
| Class I | 1,000.00 | 1,072.90 | 0.79 | 4.11 | ||||
| Class R6 | 1,000.00 | 1,074.20 | 0.63 | 3.28 |
| * | Expenses are equal to the relevant Fund’s annualized expense ratio, which is net of waived fees and reimbursed expenses, if applicable, multiplied by the average account value over the period, multiplied by the number of days (183) expenses were accrued in the most recent fiscal half-year, then divided by 365 to reflect the one-half year period. |
| ** | August 4, 2021, is the date the Fund started accruing expenses. Expenses are equal to the Fund’s annualized expense ratio, which is net of waived fees and reimbursed expenses, if applicable, multiplied by the average account value over the period, multiplied by the number of days (58) expenses were accrued in the most recent fiscal half-year, then divided by 365 to reflect the one-half year period. |
| Beginning Account Value April 1, 2021 | Ending Account Value September 30, 2021 | Annualized Expense Ratio | Expenses Paid During Period* | |||||
KAR Capital Growth Fund | ||||||||
| Class A | $ 1,000.00 | $ 1,019.05 | 1.20 % | $ 6.07 | ||||
| Class C | 1,000.00 | 1,014.74 | 2.06 | 10.40 | ||||
| Class I | 1,000.00 | 1,020.05 | 1.00 | 5.06 | ||||
| Class R6 | 1,000.00 | 1,021.41 | 0.73 | 3.70 | ||||
KAR Equity Income Fund | ||||||||
| Class A | 1,000.00 | 1,018.75 | 1.26 | 6.38 | ||||
| Class C | 1,000.00 | 1,015.04 | 2.00 | 10.10 | ||||
| Class I | 1,000.00 | 1,020.00 | 1.01 | 5.11 | ||||
| Class R6 | 1,000.00 | 1,020.26 | 0.96 | 4.86 | ||||
KAR Global Quality Dividend Fund | ||||||||
| Class A | 1,000.00 | 1,018.30 | 1.35 | 6.83 | ||||
| Class C | 1,000.00 | 1,014.54 | 2.10 | 10.61 | ||||
| Class I | 1,000.00 | 1,019.55 | 1.10 | 5.57 | ||||
| Class R6 | 1,000.00 | 1,021.16 | 0.78 | 3.95 | ||||
KAR Mid-Cap Core Fund | ||||||||
| Class A | 1,000.00 | 1,019.05 | 1.20 | 6.07 | ||||
| Class C | 1,000.00 | 1,015.29 | 1.95 | 9.85 | ||||
| Class I | 1,000.00 | 1,020.31 | 0.95 | 4.81 | ||||
| Class R6 | 1,000.00 | 1,020.71 | 0.87 | 4.41 | ||||
KAR Mid-Cap Growth Fund | ||||||||
| Class A | 1,000.00 | 1,018.70 | 1.27 | 6.43 | ||||
| Class C | 1,000.00 | 1,015.04 | 2.00 | 10.10 | ||||
| Class I | 1,000.00 | 1,020.00 | 1.01 | 5.11 | ||||
| Class R6 | 1,000.00 | 1,020.91 | 0.83 | 4.20 | ||||
KAR Small-Cap Core Fund | ||||||||
| Class A | 1,000.00 | 1,018.75 | 1.26 | 6.38 | ||||
| Class C | 1,000.00 | 1,015.14 | 1.98 | 10.00 | ||||
| Class I | 1,000.00 | 1,020.10 | 0.99 | 5.01 | ||||
| Class R6 | 1,000.00 | 1,020.51 | 0.91 | 4.61 | ||||
KAR Small-Cap Growth Fund | ||||||||
| Class A | 1,000.00 | 1,018.35 | 1.34 | 6.78 | ||||
| Class C | 1,000.00 | 1,014.79 | 2.05 | 10.35 | ||||
| Class I | 1,000.00 | 1,019.70 | 1.07 | 5.42 | ||||
| Class R6 | 1,000.00 | 1,020.21 | 0.97 | 4.91 | ||||
KAR Small-Cap Value Fund | ||||||||
| Class A | 1,000.00 | 1,019.00 | 1.21 | 6.12 | ||||
| Class C | 1,000.00 | 1,015.19 | 1.97 | 9.95 | ||||
| Class I | 1,000.00 | 1,020.26 | 0.96 | 4.86 | ||||
| Class R6 | 1,000.00 | 1,020.51 | 0.91 | 4.61 | ||||
KAR Small-Mid Cap Core Fund | ||||||||
| Class A | 1,000.00 | 1,018.55 | 1.30 | 6.58 | ||||
| Class C | 1,000.00 | 1,014.79 | 2.05 | 10.35 | ||||
| Class I | 1,000.00 | 1,020.05 | 1.00 | 5.06 | ||||
| Class R6 | 1,000.00 | 1,020.21 | 0.97 | 4.91 | ||||
KAR Small-Mid Cap Growth Fund | ||||||||
| Class A | 1,000.00 | 1,018.55 | 1.30 | 6.58 | ||||
| Class C | 1,000.00 | 1,014.79 | 2.05 | 10.35 | ||||
| Class I | 1,000.00 | 1,019.80 | 1.05 | 5.32 | ||||
| Class R6 | 1,000.00 | 1,020.10 | 0.99 | 5.01 |
| Beginning Account Value April 1, 2021 | Ending Account Value September 30, 2021 | Annualized Expense Ratio | Expenses Paid During Period* | |||||
KAR Small-Mid Cap Value Fund** | ||||||||
| Class A | $1,000.00 | $1,006.09 | 1.17% | $ 1.86 | ||||
| Class C | 1,000.00 | 1,004.89 | 1.92 | 3.06 | ||||
| Class I | 1,000.00 | 1,006.48 | 0.92 | 1.47 | ||||
| Class R6 | 1,000.00 | 1,006.64 | 0.82 | 1.31 | ||||
SGA Emerging Markets Growth Fund | ||||||||
| Class A | 1,000.00 | 1,017.65 | 1.48 | 7.49 | ||||
| Class C | 1,000.00 | 1,013.89 | 2.23 | 11.26 | ||||
| Class I | 1,000.00 | 1,018.90 | 1.23 | 6.23 | ||||
| Class R6 | 1,000.00 | 1,019.80 | 1.05 | 5.32 | ||||
SGA Global Growth Fund | ||||||||
| Class A | 1,000.00 | 1,018.15 | 1.38 | 6.98 | ||||
| Class C | 1,000.00 | 1,014.29 | 2.15 | 10.86 | ||||
| Class I | 1,000.00 | 1,019.40 | 1.13 | 5.72 | ||||
| Class R6 | 1,000.00 | 1,020.56 | 0.90 | 4.56 | ||||
SGA New Leaders Growth Fund | ||||||||
| Class A | 1,000.00 | 1,018.10 | 1.39 | 7.03 | ||||
| Class C | 1,000.00 | 1,014.34 | 2.14 | 10.81 | ||||
| Class I | 1,000.00 | 1,019.35 | 1.14 | 5.77 | ||||
| Class R6 | 1,000.00 | 1,020.51 | 0.91 | 4.61 | ||||
Tactical Allocation Fund | ||||||||
| Class A | 1,000.00 | 1,019.95 | 1.02 | 5.16 | ||||
| Class C | 1,000.00 | 1,016.14 | 1.78 | 9.00 | ||||
| Class I | 1,000.00 | 1,021.11 | 0.79 | 4.00 | ||||
| Class R6 | 1,000.00 | 1,021.91 | 0.63 | 3.19 |
| * | Expenses are equal to the relevant Fund’s annualized expense ratio, which is net of waived fees and reimbursed expenses, if applicable, multiplied by the average account value over the period, multiplied by the number of days (183) expenses were accrued in the most recent fiscal half-year, then divided by 365 to reflect the one-half year period. |
| ** | August 4, 2021, is the date the Fund started accruing expenses. Expenses are equal to the Fund’s annualized expense ratio, which is net of waived fees and reimbursed expenses, if applicable, multiplied by the average account value over the period, multiplied by the number of days (58) expenses were accrued in the most recent fiscal half-year, then divided by 365 to reflect the one-half year period. |
| Ticker Symbols: | |
| Class A: PSTAX | |
| Class C: SSTFX | |
| Class I: PLXGX | |
| Class R6: VCGRX |
Kayne Anderson Rudnick Investment Management, LLC
| ■ | The Fund is diversified and has an investment objective of long-term capital growth. There is no guarantee that the Fund will meet its objective. |
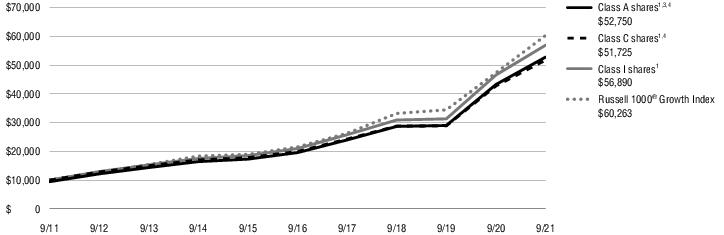
| ■ | For the fiscal year ended September 30, 2021, the Fund’s Class A shares at NAV returned 21.98%, Class C shares at NAV returned 21.00%, Class I shares at NAV returned 22.23%, and Class R6 shares at NAV returned 22.55%. For the same period, the Russell 1000® Growth Index, which serves as both the Fund’s broad-based and style-specific index appropriate the comparison, returned 27.32%. |
| Information Technology | 42% |
| Consumer Discretionary | 21 |
| Communication Services | 13 |
| Industrials | 7 |
| Health Care | 6 |
| Financials | 5 |
| Consumer Staples | 4 |
| Other (includes short-term investment) | 2 |
| Total | 100% |
| 1 Year | 5 Years | 10 Years | Since inception | Inception date | ||||||||
| Class A shares at NAV2 | 21.98 % | 21.93 % | 18.76 % | — % | — | |||||||
| Class A shares at POP3,4 | 15.28 | 20.56 | 18.09 | — | — | |||||||
| Class C shares at NAV2 and with CDSC4 | 21.00 | 20.98 | 17.86 | — | — | |||||||
| Class I shares at NAV2 | 22.23 | 22.07 | 18.99 | — | — | |||||||
| Class R6 shares at NAV2 | 22.55 | — | — | 19.45 | 1/30/18 | |||||||
| Russell 1000® Growth Index | 27.32 | 22.84 | 19.68 | 20.63 5 | — | |||||||
| Fund Expense Ratios6: Class A shares: 1.23%; Class C shares: 2.00%; Class I shares: 1.01%; Class R6 shares: Gross 0.94%, Net 0.73%. | ||||||||||||
| All returns represent past performance which is no guarantee of future results. Current performance may be higher or lower than the performance shown. The investment return and principal value of an investment will fluctuate so that an investor’s shares, when redeemed, may be worth more or less than their original cost. The above table and graph below do not reflect the deduction of taxes that a shareholder would pay on fund distributions or the redemption of shares. Please visit Virtus.com for performance data current to the most recent month-end. |
| 1 | Total returns are historical and include changes in share price and the reinvestment of both dividends and capital gain distributions. |
| 2 | “NAV” (Net Asset Value) total returns do not include the effect of any sales charge. |
| 3 | “POP” (Public Offering Price) total returns include the effect of the maximum front-end 5.50% sales charge. |
| 4 | “CDSC” (contingent deferred sales charge) is applied to redemptions of certain classes of shares that do not have a sales charge applied at the time of purchase. CDSC for certain redemptions of Class A shares made within 18 months of a finder’s fee being paid and all Class C shares are 1% within the first year and 0% thereafter. |
| 5 | The since inception index return is from the inception date of Class R6 shares. |
| 6 | The expense ratios of the Fund are set forth according to the prospectus for the Fund effective February 1, 2021, as supplemented and revised, and may differ from the expense ratios disclosed in the Financial Highlights tables in this report. See the Financial Highlights for more current expense ratios. Net Expense: Expenses reduced by a contractual expense limitation in effect through February 1, 2022. Gross Expense: Does not reflect the effect of the expense limitation. Expense ratios include fees and expenses associated with any underlying funds. |
| Ticker Symbols: | |
| Class A: PDIAX | |
| Class C: PGICX | |
| Class I: PXIIX | |
| Class R6: VECRX |
Kayne Anderson Rudnick Investment Management, LLC
| ■ | The Fund is diversified and has investment objectives of capital appreciation and current income. There is no guarantee that the Fund will meet its objectives. |
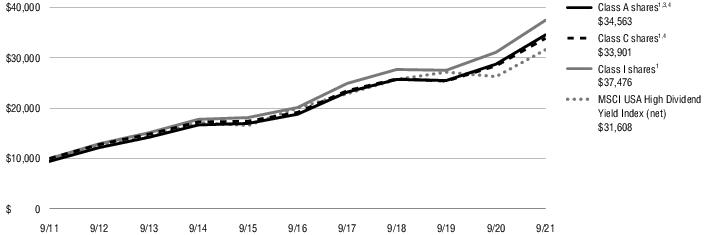
| ■ | For the fiscal year ended September 30, 2021, the Fund’s Class A shares at NAV returned 20.23%, Class C shares at NAV returned 19.31%, Class I shares at NAV returned 20.49%, and Class R6 shares at NAV returned 20.55%. For the same period, the MSCI USA High Dividend Yield Index (net), which serves as both the Fund’s broad-based and style-specific index appropriate the comparison, returned 20.32%. |
| Financials | 16% |
| Consumer Staples | 13 |
| Industrials | 13 |
| Information Technology | 11 |
| Health Care | 11 |
| Utilities | 9 |
| Materials | 8 |
| Other (includes short-term investment and securities lending collateral) | 19 |
| Total | 100% |
| 1 Year | 5 Years | 10 Years | Since inception | Inception date | ||||||||
| Class A shares at NAV2 | 20.23 % | 12.95 % | 13.85 % | — % | — | |||||||
| Class A shares at POP3,4 | 13.62 | 11.68 | 13.20 | — | — | |||||||
| Class C shares at NAV2 and with CDSC4 | 19.31 | 12.09 | 12.98 | — | — | |||||||
| Class I shares at NAV2 | 20.49 | 13.22 | 14.12 | — | — | |||||||
| Class R6 shares at NAV2 | 20.55 | — | — | 9.11 | 1/30/18 | |||||||
| MSCI USA High Dividend Yield Index (net) | 20.32 | 9.54 | 12.20 | 6.21 5 | — | |||||||
| Fund Expense Ratios6: Class A shares: Gross 1.35%, Net 1.20%; Class C shares: Gross 2.11%, Net 1.95%; Class I shares: Gross 1.10%, Net 0.95%; Class R6 shares: Gross 1.03%; Net 0.91%. | ||||||||||||
| All returns represent past performance which is no guarantee of future results. Current performance may be higher or lower than the performance shown. The investment return and principal value of an investment will fluctuate so that an investor’s shares, when redeemed, may be worth more or less than their original cost. The above table and graph below do not reflect the deduction of taxes that a shareholder would pay on fund distributions or the redemption of shares. Please visit Virtus.com for performance data current to the most recent month-end. |
| 1 | Total returns are historical and include changes in share price and the reinvestment of both dividends and capital gain distributions. |
| 2 | “NAV” (Net Asset Value) total returns do not include the effect of any sales charge. |
| 3 | “POP” (Public Offering Price) total returns include the effect of the maximum front-end 5.50% sales charge. |
| 4 | “CDSC” (contingent deferred sales charge) is applied to redemptions of certain classes of shares that do not have a sales charge applied at the time of purchase. CDSC for certain redemptions of Class A shares made within 18 months of a finder’s fee being paid and all Class C shares are 1% within the first year and 0% thereafter. |
| 5 | The since inception index return is from the inception date of Class R6 shares. |
| 6 | The expense ratios of the Fund are set forth according to the prospectus for the Fund effective February 1, 2021, as supplemented and revised, and may differ from the expense ratios disclosed in the Financial Highlights tables in this report. See the Financial Highlights for more current expense ratios. Net Expense: Expenses reduced by a contractual expense limitation in effect through February 1, 2022. Gross Expense: Does not reflect the effect of the expense limitation. Expense ratios include fees and expenses associated with any underlying funds. |
| Ticker Symbols: | |
| Class A: PPTAX | |
| Class C: PPTCX | |
| Class I: PIPTX | |
| Class R6: VGQRX |
Kayne Anderson Rudnick Investment Management, LLC
| ■ | The Fund is diversified and has an investment objective of total return, consisting of both capital appreciation and current income. There is no guarantee that the Fund will meet its objective. |
| ■ | For the fiscal year ended September 30, 2021, the Fund’s Class A shares at NAV returned 18.42%, Class C shares at NAV returned 17.52%, Class I shares at NAV returned 18.78%, and Class R6 shares at NAV returned 19.15%. The MSCI World High Dividend Yield Index (net), which serves as the Fund’s broad-based index, returned 20.84% and the Global Quality Dividend Linked Benchmark, the Fund’s style-specific Index, returned 20.84%. |
| Financials | 21% |
| Communication Services | 19 |
| Industrials | 12 |
| Utilities | 10 |
| Consumer Staples | 10 |
| Health Care | 9 |
| Information Technology | 7 |
| Other (includes short-term investment) | 12 |
| Total | 100% |
| 1 Year | 5 Years | 10 Years | Since inception | Inception date | ||||||||
| Class A shares at NAV2 | 18.42 % | 6.11 % | 9.57 % | — % | — | |||||||
| Class A shares at POP3,4 | 11.91 | 4.91 | 8.95 | — | — | |||||||
| Class C shares at NAV2 and with CDSC4 | 17.52 | 5.31 | 8.75 | — | — | |||||||
| Class I shares at NAV2 | 18.78 | 6.37 | 9.85 | — | — | |||||||
| Class R6 shares at NAV2 | 19.15 | — | — | 4.53 | 8/1/19 | |||||||
| MSCI World High Dividend Yield Index (net) | 20.84 | 7.73 | 8.83 | 8.17 5 | — | |||||||
| Global Quality Dividend Linked Benchmark | 20.84 | 9.30 | 12.67 | 8.17 5 | — | |||||||
| Fund Expense Ratios6: Class A shares: Gross 1.61%, Net 1.35%; Class C shares: Gross 2.35%, Net 2.10%; Class I shares: Gross 1.40%, Net 1.10%; Class R6 shares: Gross 1.27%, Net 0.78%. | ||||||||||||
| All returns represent past performance which is no guarantee of future results. Current performance may be higher or lower than the performance shown. The investment return and principal value of an investment will fluctuate so that an investor’s shares, when redeemed, may be worth more or less than their original cost. The above table and graph below do not reflect the deduction of taxes that a shareholder would pay on fund distributions or the redemption of shares. Please visit Virtus.com for performance data current to the most recent month-end. |

| 1 | Total returns are historical and include changes in share price and the reinvestment of both dividends and capital gain distributions. |
| 2 | “NAV” (Net Asset Value) total returns do not include the effect of any sales charge. |
| 3 | “POP” (Public Offering Price) total returns include the effect of the maximum front-end 5.50% sales charge. |
| 4 | “CDSC” (contingent deferred sales charge) is applied to redemptions of certain classes of shares that do not have a sales charge applied at the time of purchase. CDSC for certain redemptions of Class A shares made within 18 months of a finder’s fee being paid and all Class C shares are 1% within the first year and 0% thereafter. |
| 5 | The since inception index return is from the inception date of Class R6 shares. |
| 6 | The expense ratios of the Fund are set forth according to the prospectus for the Fund effective February 1, 2021, as supplemented and revised, and may differ from the expense ratios disclosed in the Financial Highlights tables in this report. See the Financial Highlights for more current expense ratios. Net Expense: Expenses reduced by a contractual expense limitation in effect through February 1, 2022. Gross Expense: Does not reflect the effect of the expense limitation. Expense ratios include fees and expenses associated with any underlying funds. |
| Ticker Symbols: | |
| Class A: VMACX | |
| Class C: VMCCX | |
| Class I: VIMCX | |
| Class R6: VRMCX |
Kayne Anderson Rudnick Investment Management, LLC
| ■ | The Fund is diversified and has an investment objective of long-term capital appreciation. There is no guarantee that the Fund will meet its objective. |
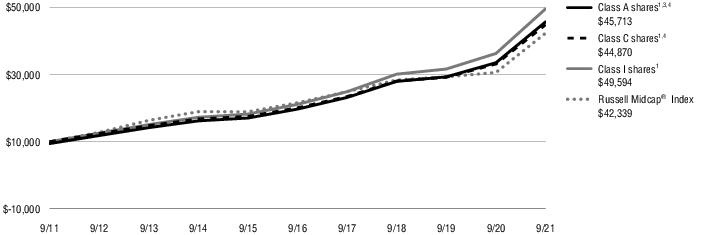
| ■ | For the fiscal year ended September 30, 2021, the Fund’s Class A shares at NAV returned 36.25%, Class C shares at NAV returned 35.23%, Class I shares at NAV returned 36.59%, and Class R6 shares at NAV returned 36.67%. For the same period, the Russell Midcap® Index, which serves as both the Fund’s broad-based and style-specific index appropriate the comparison, returned 38.11%. |
| Industrials | 33% |
| Health Care | 18 |
| Information Technology | 18 |
| Financials | 13 |
| Consumer Discretionary | 10 |
| Consumer Staples | 3 |
| Real Estate | 2 |
| Short-Term Investment | 3 |
| Total | 100% |
| 1 Year | 5 Years | 10 Years | Since inception | Inception date | ||||||||
| Class A shares at NAV2 | 36.25 % | 18.29 % | 17.07 % | — % | — | |||||||
| Class A shares at POP3,4 | 28.76 | 16.96 | 16.41 | — | — | |||||||
| Class C shares at NAV2 and with CDSC4 | 35.23 | 17.40 | 16.20 | — | — | |||||||
| Class I shares at NAV2 | 36.59 | 18.58 | 17.37 | — | — | |||||||
| Class R6 shares at NAV2 | 36.67 | — | — | 16.02 | 1/30/18 | |||||||
| Russell Midcap® Index | 38.11 | 14.39 | 15.52 | 12.55 5 | — | |||||||
| Fund Expense Ratios6: Class A shares: Gross 1.35%, Net 1.21%; Class C shares: Gross 2.10%, Net 1.96%; Class I shares: Gross 1.10%, Net 0.96%; Class R6 shares: Gross 1.01%, Net 0.88%. | ||||||||||||
| All returns represent past performance which is no guarantee of future results. Current performance may be higher or lower than the performance shown. The investment return and principal value of an investment will fluctuate so that an investor’s shares, when redeemed, may be worth more or less than their original cost. The above table and graph below do not reflect the deduction of taxes that a shareholder would pay on fund distributions or the redemption of shares. Please visit Virtus.com for performance data current to the most recent month-end. |
| 1 | Total returns are historical and include changes in share price and the reinvestment of both dividends and capital gain distributions. |
| 2 | “NAV” (Net Asset Value) total returns do not include the effect of any sales charge. |
| 3 | “POP” (Public Offering Price) total returns include the effect of the maximum front-end 5.50% sales charge. |
| 4 | “CDSC” (contingent deferred sales charge) is applied to redemptions of certain classes of shares that do not have a sales charge applied at the time of purchase. CDSC for certain redemptions of Class A shares made within 18 months of a finder’s fee being paid and all Class C shares are 1% within the first year and 0% thereafter. |
| 5 | The since inception index return is from the inception date of Class R6 shares. |
| 6 | The expense ratios of the Fund are set forth according to the prospectus for the Fund effective February 1, 2021, as supplemented and revised, and may differ from the expense ratios disclosed in the Financial Highlights tables in this report. See the Financial Highlights for more current expense ratios. Net Expense: Expenses reduced by a contractual expense limitation in effect through February 1, 2022. Gross Expense: Does not reflect the effect of the expense limitation. Expense ratios include fees and expenses associated with any underlying funds. |
| Ticker Symbols: | |
| Class A: PHSKX | |
| Class C: PSKCX | |
| Class I: PICMX | |
| Class R6: VRMGX |
Kayne Anderson Rudnick Investment Management, LLC
| ■ | The Fund is diversified and has an investment objective of capital appreciation. There is no guarantee that the Fund will meet its objective. |
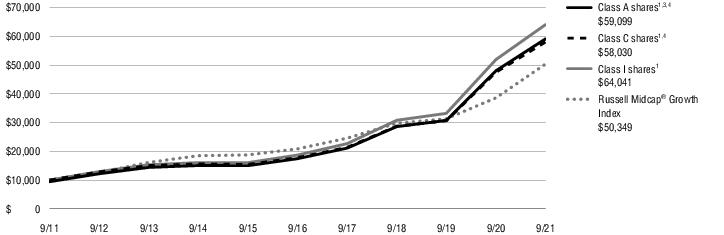
| ■ | For the fiscal year ended September 30, 2021, the Fund’s Class A shares at NAV returned 23.07%, Class C shares at NAV returned 22.13%, Class I shares at NAV returned 23.35%, and Class R6 shares at NAV returned 23.57%. For the same period, the Russell Midcap® Growth Index, which serves as both the Fund’s broad-based and style-specific index appropriate the comparison, returned 30.45%. |
| Information Technology | 39% |
| Consumer Discretionary | 19 |
| Health Care | 11 |
| Industrials | 9 |
| Consumer Staples | 9 |
| Financials | 8 |
| Communication Services | 2 |
| Short-Term Investment | 3 |
| Total | 100% |
| 1 Year | 5 Years | 10 Years | Since inception | Inception date | ||||||||
| Class A shares at NAV2 | 23.07 % | 27.61 % | 20.12 % | — % | — | |||||||
| Class A shares at POP3,4 | 16.30 | 26.17 | 19.44 | — | — | |||||||
| Class C shares at NAV2 and with CDSC4 | 22.13 | 26.65 | 19.22 | — | — | |||||||
| Class I shares at NAV2 | 23.35 | 27.90 | 20.41 | — | — | |||||||
| Class R6 shares at NAV2 | 23.57 | — | — | 27.23 | 1/30/18 | |||||||
| Russell Midcap® Growth Index | 30.45 | 19.27 | 17.54 | 17.60 5 | — | |||||||
| Fund Expense Ratios6: Class A shares: 1.28%; Class C shares: 2.04%; Class I shares: 1.05%; Class R6 shares: Gross 0.95%, Net 0.85%. | ||||||||||||
| All returns represent past performance which is no guarantee of future results. Current performance may be higher or lower than the performance shown. The investment return and principal value of an investment will fluctuate so that an investor’s shares, when redeemed, may be worth more or less than their original cost. The above table and graph below do not reflect the deduction of taxes that a shareholder would pay on fund distributions or the redemption of shares. Please visit Virtus.com for performance data current to the most recent month-end. |
| 1 | Total returns are historical and include changes in share price and the reinvestment of both dividends and capital gain distributions. |
| 2 | “NAV” (Net Asset Value) total returns do not include the effect of any sales charge. |
| 3 | “POP” (Public Offering Price) total returns include the effect of the maximum front-end 5.50% sales charge. |
| 4 | “CDSC” (contingent deferred sales charge) is applied to redemptions of certain classes of shares that do not have a sales charge applied at the time of purchase. CDSC for certain redemptions of Class A shares made within 18 months of a finder’s fee being paid and all Class C shares are 1% within the first year and 0% thereafter. |
| 5 | The since inception index return is from the inception date of Class R6 shares. |
| 6 | The expense ratios of the Fund are set forth according to the prospectus for the Fund effective February 1, 2021, as supplemented and revised, and may differ from the expense ratios disclosed in the Financial Highlights tables in this report. See the Financial Highlights for more current expense ratios. Net Expense: Expenses reduced by a contractual expense limitation in effect through February 1, 2022. Gross Expense: Does not reflect the effect of the expense limitation. Expense ratios include fees and expenses associated with any underlying funds. |
| Ticker Symbols: | |
| Class A: PKSAX | |
| Class C: PKSCX | |
| Class I: PKSFX | |
| Class R6: VSCRX |
Kayne Anderson Rudnick Investment Management, LLC
| ■ | The Fund is diversified and has an investment objective of long-term capital appreciation, with dividend income a secondary consideration. There is no guarantee that the Fund will meet its objectives. |
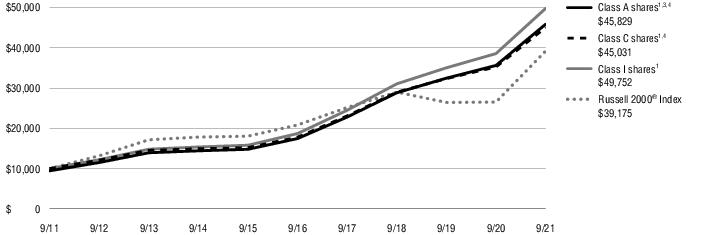
| ■ | For the fiscal year ended September 30, 2021, the Fund’s Class A shares at NAV returned 28.68%, Class C shares at NAV returned 27.74%, Class I shares at NAV returned 29.03%, and Class R6 shares at NAV returned 29.14%. For the same period, the Russell 2000® Index, which serves as both the Fund’s broad-based and style-specific index appropriate the comparison, returned 47.68%. |
| Industrials | 37% |
| Financials | 20 |
| Information Technology | 16 |
| Communication Services | 8 |
| Health Care | 6 |
| Consumer Discretionary | 5 |
| Consumer Staples | 2 |
| Other (includes short-term investment) | 6 |
| Total | 100% |
| 1 Year | 5 Years | 10 Years | Since inception | Inception date | ||||||||
| Class A shares at NAV2 | 28.68 % | 21.27 % | 17.10 % | — % | — | |||||||
| Class A shares at POP3,4 | 21.60 | 19.91 | 16.44 | — | — | |||||||
| Class C shares at NAV2 and with CDSC4 | 27.74 | 20.38 | 16.24 | — | — | |||||||
| Class I shares at NAV2 | 29.03 | 21.60 | 17.40 | — | — | |||||||
| Class R6 shares at NAV2 | 29.14 | 21.70 | — | 17.49 | 11/12/14 | |||||||
| Russell 2000® Index | 47.68 | 13.45 | 14.63 | 10.89 5 | — | |||||||
| Fund Expense Ratios6: Class A shares: 1.28%; Class C shares: 2.01%; Class I shares: 1.00%; Class R6 shares: 0.93%. | ||||||||||||
| All returns represent past performance which is no guarantee of future results. Current performance may be higher or lower than the performance shown. The investment return and principal value of an investment will fluctuate so that an investor’s shares, when redeemed, may be worth more or less than their original cost. The above table and graph below do not reflect the deduction of taxes that a shareholder would pay on fund distributions or the redemption of shares. Please visit Virtus.com for performance data current to the most recent month-end. |
| 1 | Total returns are historical and include changes in share price and the reinvestment of both dividends and capital gain distributions. |
| 2 | “NAV” (Net Asset Value) total returns do not include the effect of any sales charge. |
| 3 | “POP” (Public Offering Price) total returns include the effect of the maximum front-end 5.50% sales charge. |
| 4 | “CDSC” (contingent deferred sales charge) is applied to redemptions of certain classes of shares that do not have a sales charge applied at the time of purchase. CDSC for certain redemptions of Class A shares made within 18 months of a finder’s fee being paid and all Class C shares are 1% within the first year and 0% thereafter. |
| 5 | The since inception index return is from the inception date of Class R6 shares. |
| 6 | The expense ratios of the Fund are set forth according to the prospectus for the Fund effective February 1, 2021, as supplemented and revised, and may differ from the expense ratios disclosed in the Financial Highlights tables in this report. See the Financial Highlights for more current expense ratios. Expense ratios include fees and expenses associated with any underlying funds. |
| Ticker Symbols: | |
| Class A: PSGAX | |
| Class C: PSGCX | |
| Class I: PXSGX | |
| Class R6: VRSGX |
Kayne Anderson Rudnick Investment Management, LLC
| ■ | The Fund is diversified and has an investment objective of long-term capital appreciation. There is no guarantee that the Fund will meet its objective. |
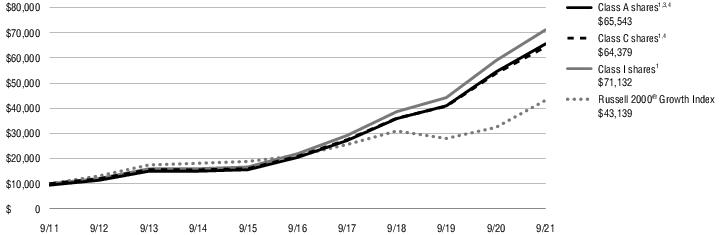
| ■ | For the fiscal year ended September 30, 2021, the Fund’s Class A shares at NAV returned 20.46%, Class C shares at NAV returned 19.60%, Class I shares at NAV returned 20.77%, and Class R6 shares at NAV returned 20.88%. For the same period, the Russell 2000® Growth Index, which serves as both the Fund’s broad-based and style-specific index appropriate the comparison, returned 33.27%. |
| Information Technology | 32% |
| Financials | 22 |
| Communication Services | 15 |
| Consumer Discretionary | 13 |
| Industrials | 7 |
| Health Care | 4 |
| Consumer Staples | 3 |
| Short-Term Investment | 4 |
| Total | 100% |
| 1 Year | 5 Years | 10 Years | Since inception | Inception date | ||||||||
| Class A shares at NAV2 | 20.46 % | 26.21 % | 21.37 % | — % | — | |||||||
| Class A shares at POP3,4 | 13.83 | 24.79 | 20.68 | — | — | |||||||
| Class C shares at NAV2 and with CDSC4 | 19.60 | 25.28 | 20.47 | — | — | |||||||
| Class I shares at NAV2 | 20.77 | 26.54 | 21.68 | — | — | |||||||
| Class R6 shares at NAV2 | 20.88 | — | — | 22.75 | 1/30/18 | |||||||
| Russell 2000® Growth Index | 33.27 | 15.34 | 15.74 | 12.58 5 | — | |||||||
| Fund Expense Ratios6: Class A shares: 1.36%; Class C shares: 2.08%; Class I shares:1.10%; Class R6 shares: 1.00%. | ||||||||||||
| All returns represent past performance which is no guarantee of future results. Current performance may be higher or lower than the performance shown. The investment return and principal value of an investment will fluctuate so that an investor’s shares, when redeemed, may be worth more or less than their original cost. The above table and graph below do not reflect the deduction of taxes that a shareholder would pay on fund distributions or the redemption of shares. Please visit Virtus.com for performance data current to the most recent month-end. |
| 1 | Total returns are historical and include changes in share price and the reinvestment of both dividends and capital gain distributions. |
| 2 | “NAV” (Net Asset Value) total returns do not include the effect of any sales charge. |
| 3 | “POP” (Public Offering Price) total returns include the effect of the maximum front-end 5.50% sales charge. |
| 4 | “CDSC” (contingent deferred sales charge) is applied to redemptions of certain classes of shares that do not have a sales charge applied at the time of purchase. CDSC for certain redemptions of Class A shares made within 18 months of a finder’s fee being paid and all Class C shares are 1% within the first year and 0% thereafter. |
| 5 | The since inception index return is from the inception date of Class R6 shares. |
| 6 | The expense ratios of the Fund are set forth according to the prospectus for the Fund effective February 1, 2021, as supplemented and revised, and may differ from the expense ratios disclosed in the Financial Highlights tables in this report. See the Financial Highlights for more current expense ratios. Expense ratios include fees and expenses associated with any underlying funds. |
| Ticker Symbols: | |
| Class A: PQSAX | |
| Class C: PQSCX | |
| Class I: PXQSX | |
| Class R6: VQSRX |
Kayne Anderson Rudnick Investment Management, LLC
| ■ | The Fund is diversified and has an investment objective of long-term capital appreciation. There is no guarantee that the Fund will meet its objective. |
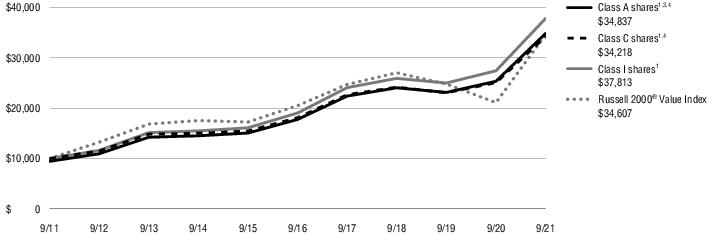
| ■ | For the fiscal year ended September 30, 2021, the Fund’s Class A shares at NAV returned 37.45%, Class C shares at NAV returned 36.44%, Class I shares at NAV returned 37.83%, and Class R6 shares at NAV returned 37.85%. For the same period, the Russell 2000® Value Index, which serves as both the Fund’s broad-based and style-specific index appropriate the comparison, returned 63.92%. |
| Industrials | 27% |
| Consumer Discretionary | 22 |
| Financials | 17 |
| Information Technology | 14 |
| Consumer Staples | 6 |
| Materials | 5 |
| Real Estate | 4 |
| Other (includes short-term investment) | 5 |
| Total | 100% |
| 1 Year | 5 Years | 10 Years | Since inception | Inception date | ||||||||
| Class A shares at NAV2 | 37.45 % | 14.41 % | 13.94 % | — % | — | |||||||
| Class A shares at POP3,4 | 29.89 | 13.12 | 13.29 | — | — | |||||||
| Class C shares at NAV2 and with CDSC4 | 36.44 | 13.58 | 13.09 | — | — | |||||||
| Class I shares at NAV2 | 37.83 | 14.70 | 14.23 | — | — | |||||||
| Class R6 shares at NAV2 | 37.85 | — | — | 16.12 | 11/3/16 | |||||||
| Russell 2000® Value Index | 63.92 | 11.03 | 13.22 | 12.59 5 | — | |||||||
| Fund Expense Ratios6: Class A shares: 1.23%; Class C shares: 1.98%; Class I shares: 0.99%; Class R6 shares: 0.89%. | ||||||||||||
| All returns represent past performance which is no guarantee of future results. Current performance may be higher or lower than the performance shown. The investment return and principal value of an investment will fluctuate so that an investor’s shares, when redeemed, may be worth more or less than their original cost. The above table and graph below do not reflect the deduction of taxes that a shareholder would pay on fund distributions or the redemption of shares. Please visit Virtus.com for performance data current to the most recent month-end. |
| 1 | Total returns are historical and include changes in share price and the reinvestment of both dividends and capital gain distributions. |
| 2 | “NAV” (Net Asset Value) total returns do not include the effect of any sales charge. |
| 3 | “POP” (Public Offering Price) total returns include the effect of the maximum front-end 5.50% sales charge. |
| 4 | “CDSC” (contingent deferred sales charge) is applied to redemptions of certain classes of shares that do not have a sales charge applied at the time of purchase. CDSC for certain redemptions of Class A shares made within 18 months of a finder’s fee being paid and all Class C shares are 1% within the first year and 0% thereafter. |
| 5 | The since inception index return is from the inception date of Class R6 shares. |
| 6 | The expense ratios of the Fund are set forth according to the prospectus for the Fund effective February 1, 2021, as supplemented and revised, and may differ from the expense ratios disclosed in the Financial Highlights tables in this report. See the Financial Highlights for more current expense ratios. Expense ratios include fees and expenses associated with any underlying funds. |
| Ticker Symbols: | |
| Class A: VKSAX | |
| Class C: VKSCX | |
| Class I: VKSIX | |
| Class R6: VKSRX |
Kayne Anderson Rudnick Investment Management, LLC
| ■ | The Fund is diversified and has an investment objective of long-term capital appreciation, with dividend income a secondary consideration. There is no guarantee that the Fund will meet its objectives. |
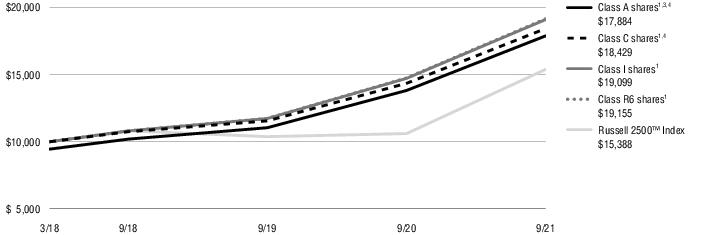
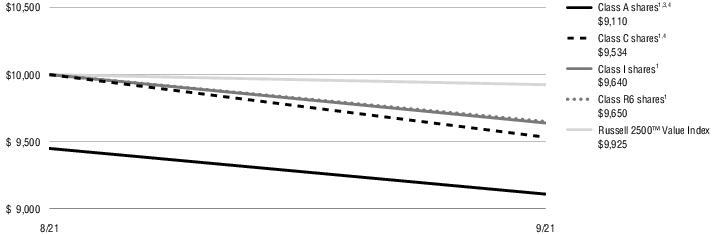
| ■ | For the fiscal year ended September 30, 2021, the Fund’s Class A shares at NAV returned 29.38%, Class C shares at NAV returned 28.39%, Class I shares at NAV returned 29.72%, and Class R6 shares at NAV returned 29.82%. For the same period, the Russell 2500™ Index, which serves as both the Fund’s broad-based and style-specific index appropriate the comparison, returned 45.03%. |
| Information Technology | 26% |
| Industrials | 20 |
| Consumer Discretionary | 17 |
| Health Care | 14 |
| Financials | 14 |
| Materials | 4 |
| Short-Term Investment | 5 |
| Total | 100% |
| 1 Year | Since inception | Inception date | ||||||
| Class A shares at NAV2 | 29.38 % | 19.56 % | 3/7/18 | |||||
| Class A shares at POP3,4 | 22.27 | 17.68 | 3/7/18 | |||||
| Class C shares at NAV2 and with CDSC4 | 28.39 | 18.68 | 3/7/18 | |||||
| Class I shares at NAV2 | 29.72 | 19.87 | 3/7/18 | |||||
| Class R6 shares at NAV2 | 29.82 | 19.97 | 3/7/18 | |||||
| Russell 2500™ Index | 45.03 | 12.83 5 | — | |||||
| Fund Expense Ratios6: Class A shares: Gross 1.40%, Net 1.31%; Class C shares: Gross 2.08%, Net 2.06%; Class I shares: Gross 1.10%, Net 1.06%; Class R6 shares: Gross 1.00%, Net 0.98%. | ||||||||
| All returns represent past performance which is no guarantee of future results. Current performance may be higher or lower than the performance shown. The investment return and principal value of an investment will fluctuate so that an investor’s shares, when redeemed, may be worth more or less than their original cost. The above table and graph below do not reflect the deduction of taxes that a shareholder would pay on fund distributions or the redemption of shares. Please visit Virtus.com for performance data current to the most recent month-end. |
| 1 | Total returns are historical and include changes in share price and the reinvestment of both dividends and capital gain distributions. |
| 2 | “NAV” (Net Asset Value) total returns do not include the effect of any sales charge. |
| 3 | “POP” (Public Offering Price) total returns include the effect of the maximum front-end 5.50% sales charge. |
| 4 | “CDSC” (contingent deferred sales charge) is applied to redemptions of certain classes of shares that do not have a sales charge applied at the time of purchase. CDSC for certain redemptions of Class A shares made within 18 months of a finder’s fee being paid and all Class C shares are 1% within the first year and 0% thereafter. |
| 5 | The since inception index return is from the Fund’s inception date. |
| 6 | The expense ratios of the Fund are set forth according to the prospectus for the Fund effective February 1, 2021, as supplemented and revised, and may differ from the expense ratios disclosed in the Financial Highlights tables in this report. See the Financial Highlights for more current expense ratios. Net Expense: Expenses reduced by a contractual expense limitation in effect through February 1, 2022. Gross Expense: Does not reflect the effect of the expense limitation. Expense ratios include fees and expenses associated with any underlying funds. |
| Ticker Symbols: | |
| Class A: VAKSX | |
| Class C: VCKSX | |
| Class I: VIKSX | |
| Class R6: VRKSX |
Kayne Anderson Rudnick Investment Management, LLC
| ■ | The Fund is diversified and has an investment objective of long-term capital appreciation. There is no guarantee that the Fund will meet its objective. |
| ■ | For the fiscal period December 8, 2020 (inception date) through September 30, 2021, the Fund’s Class A shares at NAV returned 7.00%*, Class C shares at NAV returned 6.30%*, Class I shares at NAV returned 7.20%*, and Class R6 shares at NAV returned 7.30%*. For the same period, the Russell 2500™ Growth Index, which serves as both the Fund’s broad-based and style-specific index appropriate the comparison, returned 9.46%*. |
| Information Technology | 31% |
| Industrials | 22 |
| Health Care | 22 |
| Financials | 10 |
| Consumer Discretionary | 9 |
| Communication Services | 4 |
| Consumer Staples | 2 |
| Total | 100% |
| Since inception | Inception date | |||||
| Class A shares at NAV2 | 7.00 % | 12/8/20 | ||||
| Class A shares at POP3,4 | 1.12 | 12/8/20 | ||||
| Class C shares at NAV2 | 6.30 | 12/8/20 | ||||
| Class C shares with CDSC4 | 5.30 | 12/8/20 | ||||
| Class I shares at NAV2 | 7.20 | 12/8/20 | ||||
| Class R6 shares at NAV2 | 7.30 | 12/8/20 | ||||
| Russell 2500™ Growth Index | 9.46 5 | — | ||||
| Fund Expense Ratios6: Class A shares: Gross 1.40%, Net 1.30%; Class C shares: Gross 2.09%, Net 2.05%; Class I shares: Gross 1.14%, Net 1.05%; Class R6 shares: Gross 1.05%, Net 0.99%. | ||||||
| All returns represent past performance which is no guarantee of future results. Current performance may be higher or lower than the performance shown. The investment return and principal value of an investment will fluctuate so that an investor’s shares, when redeemed, may be worth more or less than their original cost. The above table and graph below do not reflect the deduction of taxes that a shareholder would pay on fund distributions or the redemption of shares. Please visit Virtus.com for performance data current to the most recent month-end. |

| 1 | Total returns are historical and include changes in share price and the reinvestment of both dividends and capital gain distributions. |
| 2 | “NAV” (Net Asset Value) total returns do not include the effect of any sales charge. |
| 3 | “POP” (Public Offering Price) total returns include the effect of the maximum front-end 5.50% sales charge. |
| 4 | “CDSC” (contingent deferred sales charge) is applied to redemptions of certain classes of shares that do not have a sales charge applied at the time of purchase. CDSC for certain redemptions of Class A shares made within 18 months of a finder’s fee being paid and all Class C shares are 1% within the first year and 0% thereafter. |
| 5 | The since inception index return is from the Fund’s inception date. |
| 6 | The expense ratios of the Fund are set forth according to the prospectus for the Fund effective February 1, 2021, as supplemented and revised, and may differ from the expense ratios disclosed in the Financial Highlights tables in this report. See the Financial Highlights for more current expense ratios. Net Expense: Expenses reduced by a contractual expense limitation in effect through February 1, 2022. Gross Expense: Does not reflect the effect of the expense limitation. Expense ratios include fees and expenses associated with any underlying funds. |
| Ticker Symbols: | |
| Class A: VKSDX | |
| Class C: VKSEX | |
| Class I: VKSFX | |
| Class R6: VKSGX |
Kayne Anderson Rudnick Investment Management, LLC
| ■ | The Fund is diversified and has an investment objective of long-term capital appreciation. There is no guarantee that the Fund will meet its objective. |
| ■ | For the fiscal period August 3, 2021 (inception date) through September 30, 2021, the Fund’s Class A shares at NAV returned -3.60%*, Class C shares at NAV returned -3.70%*, Class I shares at NAV returned -3.60%*, and Class R6 shares at NAV returned -3.50%*. For the same period, the Russell 2500™ Value Index, which serves as both the Fund’s broad-based and style-specific index appropriate the comparison, returned -0.75%*. |
| Industrials | 25% |
| Information Technology | 23 |
| Consumer Discretionary | 15 |
| Financials | 14 |
| Real Estate | 7 |
| Materials | 6 |
| Consumer Staples | 5 |
| Other (includes short-term investment) | 5 |
| Total | 100% |
| Since inception | Inception date | |||||
| Class A shares at NAV2 | -3.60 % | 8/3/21 | ||||
| Class A shares at POP3,4 | -8.90 | 8/3/21 | ||||
| Class C shares at NAV2 | -3.70 | 8/3/21 | ||||
| Class C shares with CDSC4 | -4.66 | 8/3/21 | ||||
| Class I shares at NAV2 | -3.60 | 8/3/21 | ||||
| Class R6 shares at NAV2 | -3.50 | 8/3/21 | ||||
| Russell 2500™ Value Index | -0.75 5 | — | ||||
| Fund Expense Ratios6: Class A shares: Gross 1.28%, Net 1.17%; Class C shares: Gross 2.03%, Net 1.92%; Class I shares: Gross 1.05%, Net 0.92%; Class R6 shares: Gross 0.95%; Net 0.82%. | ||||||
| All returns represent past performance which is no guarantee of future results. Current performance may be higher or lower than the performance shown. The investment return and principal value of an investment will fluctuate so that an investor’s shares, when redeemed, may be worth more or less than their original cost. The above table and graph below do not reflect the deduction of taxes that a shareholder would pay on fund distributions or the redemption of shares. Please visit Virtus.com for performance data current to the most recent month-end. |
| 1 | Total returns are historical and include changes in share price and the reinvestment of both dividends and capital gain distributions. |
| 2 | “NAV” (Net Asset Value) total returns do not include the effect of any sales charge. |
| 3 | “POP” (Public Offering Price) total returns include the effect of the maximum front-end 5.50% sales charge. |
| 4 | “CDSC” (contingent deferred sales charge) is applied to redemptions of certain classes of shares that do not have a sales charge applied at the time of purchase. CDSC for certain redemptions of Class A shares made within 18 months of a finder’s fee being paid and all Class C shares are 1% within the first year and 0% thereafter. |
| 5 | The since inception index return is from the inception date of the Fund. |
| 6 | The expense ratios of the Fund are set forth according to the prospectus for the Fund effective August 2, 2021, as supplemented and revised, and may differ from the expense ratios disclosed in the Financial Highlights tables in this report. See the Financial Highlights for more current expense ratios. Net Expense: Expenses reduced by a contractual expense limitation in effect through January 31, 2023. Gross Expense: Does not reflect the effect of the expense limitation. Expense ratios include fees and expenses associated with any underlying funds. |
| Ticker Symbols: | |
| Class A: VAEGX | |
| Class C: VCEGX | |
| Class I: VIEGX | |
| Class R6: VESRX |
Sustainable Growth Advisers, LP
| ■ | The Fund is non-diversified and has an investment objective of long-term capital appreciation. There is no guarantee that the Fund will meet its objective. |
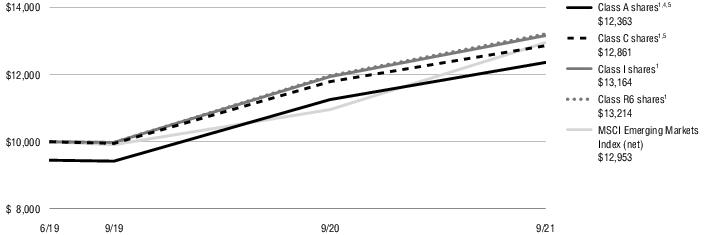
| ■ | For the fiscal year ended September 30, 2021, the Fund’s Class A shares at NAV returned 9.84%†, Class C shares at NAV returned 9.08%, Class I shares at NAV returned 10.24%, and Class R6 shares at NAV returned 10.38%. For the same period, the MSCI Emerging Markets Index (net), which serves as both the Fund’s broad-based and style-specific index appropriate the comparison, returned 18.20%. |
| Consumer Staples | 29% |
| Financials | 24 |
| Consumer Discretionary | 23 |
| Health Care | 6 |
| Information Technology | 6 |
| Communication Services | 5 |
| Real Estate | 3 |
| Other (includes short-term investment) | 4 |
| Total | 100% |
| 1 Year | Since inception | Inception date | ||||||
| Class A shares at NAV2 | 9.84 % 3 | 12.39 % | 6/13/19 | |||||
| Class A shares at POP4,5 | 3.80 | 9.66 | 6/13/19 | |||||
| Class C shares at NAV2 and with CDSC5 | 9.08 | 11.56 | 6/13/19 | |||||
| Class I shares at NAV2 | 10.24 | 12.69 | 6/13/19 | |||||
| Class R6 shares at NAV2 | 10.38 | 12.87 | 6/13/19 | |||||
| MSCI Emerging Markets Index (net) | 18.20 | 11.90 6 | — | |||||
| Fund Expense Ratios7: Class A shares: Gross 3.99%, Net 1.49%; Class C shares: Gross 4.71%, Net 2.24%; Class I shares: Gross 3.58%, Net 1.24%; Class R6 shares: Gross 3.73%, Net 1.06%. | ||||||||
| All returns represent past performance which is no guarantee of future results. Current performance may be higher or lower than the performance shown. The investment return and principal value of an investment will fluctuate so that an investor’s shares, when redeemed, may be worth more or less than their original cost. The above table and graph below do not reflect the deduction of taxes that a shareholder would pay on fund distributions or the redemption of shares. Please visit Virtus.com for performance data current to the most recent month-end. |
| 1 | Total returns are historical and include changes in share price and the reinvestment of both dividends and capital gain distributions. |
| 2 | “NAV” (Net Asset Value) total returns do not include the effect of any sales charge. |
| 3 | Total Return for the report period presented in the table differs from the return in the Financial Highlights. The total return presented in the above table is calculated based on the NAV at which shareholder transactions were processed. The total return presented in the Financial Highlights section of the report is calculated in the same manner, but also takes into account certain adjustments that are necessary under generally accepted accounting principles required in the annual report and semiannual report. |
| 4 | “POP” (Public Offering Price) total returns include the effect of the maximum front-end 5.50% sales charge. |
| 5 | “CDSC” (contingent deferred sales charge) is applied to redemptions of certain classes of shares that do not have a sales charge applied at the time of purchase. CDSC for certain redemptions of Class A shares made within 18 months of a finder’s fee being paid and all Class C shares are 1% within the first year and 0% thereafter. |
| 6 | The since inception index return is from the Fund’s inception date. |
| 7 | The expense ratios of the Fund are set forth according to the prospectus for the Fund effective February 1, 2021, as supplemented and revised, and may differ from the expense ratios disclosed in the Financial Highlights tables in this report. See the Financial Highlights for more current expense ratios. Net Expense: Expenses reduced by a contractual expense limitation in effect through February 1, 2022. Gross Expense: Does not reflect the effect of the expense limitation. Expense ratios include fees and expenses associated with any underlying funds. |
| Ticker Symbols: | |
| Class A: SGAAX | |
| Class C: SGACX | |
| Class I: SGAPX | |
| Class R6: SGARX |
Sustainable Growth Advisers, LP
| ■ | The Fund is diversified and has an investment objective of long-term capital appreciation. There is no guarantee that the Fund will meet its objective. |
| ■ | For the fiscal year ended September 30, 2021, the Fund’s Class A shares at NAV returned 19.49%, Class C shares at NAV returned 18.62%, Class I shares at NAV returned 19.78%, and Class R6 shares at NAV returned 20.07%. For the same period, the MSCI AC World Index (net), returned 27.44%, and the MSCI AC World Growth Index (net), returned 23.83%. |
| Information Technology | 32% |
| Health Care | 18 |
| Consumer Discretionary | 13 |
| Communication Services | 9 |
| Financials | 8 |
| Consumer Staples | 8 |
| Industrials | 5 |
| Other (includes short-term investment) | 7 |
| Total | 100% |
| 1 Year | 5 Years | 10 Years | Since inception | Inception date | ||||||||
| Class A shares at NAV2 | 19.49 % | 17.27 % | — % | 14.08 % | 10/4/13 | |||||||
| Class A shares at POP3,4 | 12.92 | 15.95 | — | 13.27 | 10/4/13 | |||||||
| Class C shares at NAV2 and with CDSC4 | 18.62 | 16.39 | — | 13.22 | 10/4/13 | |||||||
| Class I shares at NAV2 | 19.78 | 17.41 | — | 14.18 | 10/4/13 | |||||||
| Class R6 shares at NAV2 | 20.07 | 17.77 | 15.49 | — | — | |||||||
| MSCI AC World Index (net) | 27.44 | 13.20 | 11.90 | 10.06 5 | — | |||||||
| MSCI AC World Growth Index (net) | 23.83 | 17.76 | 14.73 | 13.46 5 | — | |||||||
| Fund Expense Ratios6: Class A shares: 1.37%; Class C shares: Gross 2.15%, Net 2.14%; Class I shares: Gross 1.21%, Net 1.14%; Class R6 shares: Gross 1.09%, Net 0.91%. | ||||||||||||
| All returns represent past performance which is no guarantee of future results. Current performance may be higher or lower than the performance shown. The investment return and principal value of an investment will fluctuate so that an investor’s shares, when redeemed, may be worth more or less than their original cost. The above table and graph below do not reflect the deduction of taxes that a shareholder would pay on fund distributions or the redemption of shares. Please visit Virtus.com for performance data current to the most recent month-end. |

| 1 | Total returns are historical and include changes in share price and the reinvestment of both dividends and capital gain distributions. |
| 2 | “NAV” (Net Asset Value) total returns do not include the effect of any sales charge. |
| 3 | “POP” (Public Offering Price) total returns include the effect of the maximum front-end 5.50% sales charge. |
| 4 | “CDSC” (contingent deferred sales charge) is applied to redemptions of certain classes of shares that do not have a sales charge applied at the time of purchase. CDSC for certain redemptions of Class A shares made within 18 months of a finder’s fee being paid and all Class C shares are 1% within the first year and 0% thereafter. |
| 5 | The since inception index return is from the inception date of Class A shares, Class C shares and Class I shares. |
| 6 | The expense ratios of the Fund are set forth according to the prospectus for the Fund effective February 1, 2021, as supplemented and revised, and may differ from the expense ratios disclosed in the Financial Highlights tables in this report. See the Financial Highlights for more current expense ratios. Net Expense: Expenses reduced by a contractual expense limitation in effect through February 1, 2022. Gross Expense: Does not reflect the effect of the expense limitation. Expense ratios include fees and expenses associated with any underlying funds. |
| Ticker Symbols: | |
| Class A: VNLAX | |
| Class C: VNLCX | |
| Class I: VNLIX | |
| Class R6: VNLRX |
Sustainable Growth Advisers, LP
| ■ | The Fund is non-diversified and has an investment objective of long-term capital appreciation. There is no guarantee that the Fund will meet its objective. |
| ■ | For the fiscal period November 17, 2020 (inception date) through September 30, 2021, the Fund’s Class A shares at NAV returned 6.50%*, Class C shares at NAV returned 5.80%*, Class I shares at NAV returned 6.70%*, and Class R6 shares at NAV returned 6.90%*. For the same period, the MSCI AC World Mid Cap Index (net), which serves as both the Fund’s broad-based and style-specific index appropriate the comparison, returned 19.21%*. |
| Information Technology | 26% |
| Health Care | 25 |
| Consumer Staples | 13 |
| Consumer Discretionary | 11 |
| Communication Services | 10 |
| Financials | 9 |
| Real Estate | 3 |
| Other (includes short-term investment) | 3 |
| Total | 100% |
| Since inception | Inception date | |||||
| Class A shares at NAV2 | 6.50 % | 11/17/20 | ||||
| Class A shares at POP3,4 | 0.64 | 11/17/20 | ||||
| Class C shares at NAV2 | 5.80 | 11/17/20 | ||||
| Class C shares with CDSC4 | 4.80 | 11/17/20 | ||||
| Class I shares at NAV2 | 6.70 | 11/17/20 | ||||
| Class R6 shares at NAV2 | 6.90 | 11/17/20 | ||||
| MSCI AC World Mid Cap Index (net) | 19.21 5 | — | ||||
| Fund Expense Ratios6: Class A shares: Gross 1.45%, Net 1.39%; Class C shares: Gross 2.16%, Net 2.14%; Class I shares: Gross 1.24%, Net 1.14%; Class R6 shares: Gross 1.13%, Net 0.91%. | ||||||
| All returns represent past performance which is no guarantee of future results. Current performance may be higher or lower than the performance shown. The investment return and principal value of an investment will fluctuate so that an investor’s shares, when redeemed, may be worth more or less than their original cost. The above table and graph below do not reflect the deduction of taxes that a shareholder would pay on fund distributions or the redemption of shares. Please visit Virtus.com for performance data current to the most recent month-end. |

| 1 | Total returns are historical and include changes in share price and the reinvestment of both dividends and capital gain distributions. |
| 2 | “NAV” (Net Asset Value) total returns do not include the effect of any sales charge. |
| 3 | “POP” (Public Offering Price) total returns include the effect of the maximum front-end 5.50% sales charge. |
| 4 | “CDSC” (contingent deferred sales charge) is applied to redemptions of certain classes of shares that do not have a sales charge applied at the time of purchase. CDSC for certain redemptions of Class A shares made within 18 months of a finder’s fee being paid and all Class C shares are 1% within the first year and 0% thereafter. |
| 5 | The since inception index return is from the Fund’s inception date. |
| 6 | The expense ratios of the Fund are set forth according to the prospectus for the Fund effective February 1, 2021, as supplemented and revised, and may differ from the expense ratios disclosed in the Financial Highlights tables in this report. See the Financial Highlights for more current expense ratios. Net Expense: Expenses reduced by a contractual expense limitation in effect through February 1, 2022. Gross Expense: Does not reflect the effect of the expense limitation. Expense ratios include fees and expenses associated with any underlying funds. |
| Ticker Symbols: | |
| Class A: NAINX | |
| Class C: POICX | |
| Class I: VTAIX | |
| Class R6: VTARX |
Kayne Anderson Rudnick
Investment Management, LLC
(Domestic and International Equity
Portfolio) and Newfleet Asset
Management, LLC
(Fixed Income Portfolio)
| ■ | The Fund is diversified and has investment objectives of capital appreciation and income. There is no guarantee that the Fund will meet its objectives. |
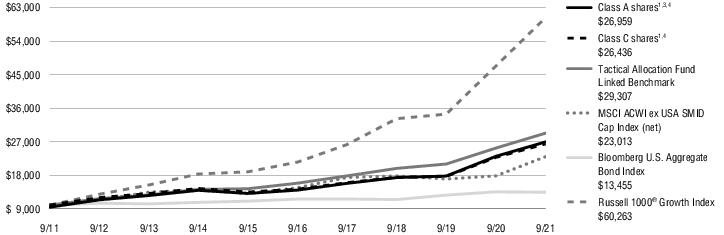
| ■ | For the fiscal year ended September 30, 2021, the Fund’s Class A shares at NAV returned 16.69%, Class C shares at NAV returned 15.82%, and Class I shares at NAV returned 16.88%, and Class R6 shares at NAV from October 20, 2020 (inception date) through September 30, 2021, returned 13.23%*. For the fiscal year ended September 30, 2021, the Bloomberg U.S. Aggregate Bond Index; a broad-based fixed income index, returned -0.90%, the MSCI ACWI ex USA SMID Cap Index (net); a broad-based International Index, returned 28.94%; and the Russell 1000® Growth Index; a broad-based US equity index, returned 27.32%. The Tactical Allocation Fund Linked Benchmark, the Fund’s style-specific benchmark, returned 15.76%. |
| Common Stocks | 68% | |
| Information Technology | 23% | |
| Consumer Discretionary | 13 | |
| Communication Services | 10 | |
| All Other Common Stocks | 22 | |
| Corporate Bonds and Notes | 11 | |
| Financials | 4 | |
| Energy | 1 | |
| Information Technology | 1 | |
| All Other Corporate Bonds and Notes | 5 | |
| Mortgage-Backed Securities | 8 | |
| U.S. Government Securities | 4 | |
| Asset-Backed Securities | 3 | |
| Leveraged Loans | 3 | |
| Foreign Government Securities | 1 | |
| Other (includes short-term investment and securities lending collateral) | 2 | |
| Total | 100% |
| 1 Year | 5 Years | 10 Years | Since inception | Inception date | ||||||||
| Class A shares at NAV2 | 16.69 % | 13.95 % | 11.05 % | — % | — | |||||||
| Class A shares at POP3,4 | 10.27 | 12.67 | 10.43 | — | — | |||||||
| Class C shares at NAV2 and with CDSC4 | 15.82 | 13.09 | 10.21 | — | — | |||||||
| Class I shares at NAV2 | 16.88 | — | — | 21.50 | 1/29/19 | |||||||
| Class R6 shares at NAV2 | — | — | — | 13.23 | 10/20/20 | |||||||
| Bloomberg U.S. Aggregate Bond Index | -0.90 | 2.94 | 3.01 | — 5 | — | |||||||
| MSCI ACWI ex USA SMID Cap Index (net) | 28.94 | 9.40 | 8.69 | — 6 | — | |||||||
| Russell 1000® Growth Index | 27.32 | 22.84 | 19.68 | — 7 | ||||||||
| Tactical Allocation Fund Linked Benchmark | 15.76 | 13.02 | 11.35 | — 8 | — | |||||||
| Fund Expense Ratios9: Class A shares: Gross 1.06%, Net 0.99%; Class C shares: Gross 1.84%, Net 1.75%; Class I shares: Gross 0.85%, Net 0.76%; Class R6 shares: Gross 0.76%, Net 0.60%. | ||||||||||||
| All returns represent past performance which is no guarantee of future results. Current performance may be higher or lower than the performance shown. The investment return and principal value of an investment will fluctuate so that an investor’s shares, when redeemed, may be worth more or less than their original cost. The above table and graph below do not reflect the deduction of taxes that a shareholder would pay on fund distributions or the redemption of shares. Please visit Virtus.com for performance data current to the most recent month-end. |
| 1 | Total returns are historical and include changes in share price and the reinvestment of both dividends and capital gain distributions. |
| 2 | “NAV” (Net Asset Value) total returns do not include the effect of any sales charge. |
| 3 | “POP” (Public Offering Price) total returns include the effect of the maximum front-end 5.50% sales charge. |
| 4 | “CDSC” (contingent deferred sales charge) is applied to redemptions of certain classes of shares that do not have a sales charge applied at the time of purchase. CDSC for certain redemptions of Class A shares made within 18 months of a finder’s fee being paid and all Class C shares are 1% within the first year and 0% thereafter. |
| 5 | The since inception index returned 5.18% for the inception date of Class I shares and -0.63% for the inception date of Class R6 shares. |
| 6 | The since inception index returned 13.58% for the inception date of Class I shares and 25.50% for the inception date of Class R6 shares. |
| 7 | The since inception index returned 30.78% for the inception date of Class I shares and 24.26% for the inception date of Class R6 shares. |
| 8 | The since inception index returned 18.10% for the inception date of Class I shares and 14.14% for the inception date of Class R6 shares. |
| 9 | The expense ratios of the Fund are set forth according to the prospectus for the Fund effective February 1, 2021, as supplemented and revised, and may differ from the expense ratios disclosed in the Financial Highlights tables in this report. See the Financial Highlights for more current expense ratios. Net Expense: Expenses reduced by a contractual expense limitation in effect through February 1, 2022. Gross Expense: Does not reflect the effect of the expense limitation. Expense ratios include fees and expenses associated with any underlying funds. |
| Shares | Value | ||
| Common Stocks—98.7% | |||
| Communication Services—12.8% | |||
| Facebook, Inc. Class A(1) | 142,100 | $ 48,227 | |
| Netflix, Inc.(1) | 46,780 | 28,552 | |
| Tencent Holdings Ltd. Unsponsored ADR | 303,650 | 18,149 | |
| ZoomInfo Technologies, Inc. Class A(1) | 139,520 | 8,537 | |
| 103,465 | |||
| Consumer Discretionary—21.0% | |||
| Airbnb, Inc. Class A(1) | 66,165 | 11,099 | |
| Alibaba Group Holding Ltd. Sponsored ADR(1) | 137,180 | 20,310 | |
| Amazon.com, Inc.(1) | 19,662 | 64,590 | |
| Home Depot, Inc. (The) | 33,685 | 11,057 | |
| Marriott International, Inc. Class A(1) | 63,920 | 9,466 | |
| MercadoLibre, Inc.(1) | 12,780 | 21,463 | |
| NIKE, Inc. Class B | 145,370 | 21,112 | |
| Ross Stores, Inc. | 94,226 | 10,257 | |
| 169,354 | |||
| Consumer Staples—4.5% | |||
| Estee Lauder Cos., Inc. (The) Class A | 29,944 | 8,981 | |
| McCormick & Co., Inc. | 75,570 | 6,123 | |
| Monster Beverage Corp.(1) | 115,013 | 10,217 | |
| Procter & Gamble Co. (The) | 77,580 | 10,846 | |
| 36,167 | |||
| Financials—4.7% | |||
| Bank of America Corp. | 382,715 | 16,246 | |
| CME Group, Inc. Class A | 33,410 | 6,461 | |
| MarketAxess Holdings, Inc. | 25,580 | 10,761 | |
| Progressive Corp. (The) | 49,850 | 4,506 | |
| 37,974 | |||
| Shares | Value | ||
| Health Care—5.7% | |||
| Danaher Corp. | 63,322 | $ 19,278 | |
| HealthEquity, Inc.(1) | 72,380 | 4,687 | |
| Zoetis, Inc. Class A | 114,257 | 22,182 | |
| 46,147 | |||
| Industrials—7.3% | |||
| CoStar Group, Inc.(1) | 180,590 | 15,541 | |
| Equifax, Inc. | 33,600 | 8,515 | |
| Fair Isaac Corp.(1) | 18,980 | 7,553 | |
| Roper Technologies, Inc. | 29,489 | 13,156 | |
| Uber Technologies, Inc.(1) | 308,021 | 13,799 | |
| 58,564 | |||
| Information Technology—41.6% | |||
| Accenture plc Class A | 42,388 | 13,561 | |
| Amphenol Corp. Class A | 265,626 | 19,452 | |
| Avalara, Inc.(1) | 152,410 | 26,637 | |
| Bill.com Holdings, Inc.(1) | 274,976 | 73,405 | |
| DocuSign, Inc.(1) | 30,160 | 7,764 | |
| Duck Creek Technologies, Inc.(1) | 367,685 | 16,266 | |
| MongoDB, Inc. Class A(1) | 16,880 | 7,959 | |
| NVIDIA Corp. | 250,852 | 51,966 | |
| Paycom Software, Inc.(1) | 73,522 | 36,449 | |
| Snowflake, Inc. Class A(1) | 38,166 | 11,543 | |
| Trade Desk, Inc. (The) Class A(1) | 243,720 | 17,133 | |
| Visa, Inc. Class A | 152,834 | 34,044 | |
| Workday, Inc. Class A(1) | 75,691 | 18,914 | |
| 335,093 | |||
| Materials—1.1% | |||
| Ecolab, Inc. | 43,336 | 9,041 | |
| Total Common Stocks (Identified Cost $233,344) | 795,805 | ||
| Total Long-Term Investments—98.7% (Identified Cost $233,344) | 795,805 | ||
| Shares | Value | ||
| Short-Term Investment—1.4% | |||
| Money Market Mutual Fund—1.4% | |||
| Dreyfus Government Cash Management Fund - Institutional Shares (seven-day effective yield 0.030%)(2) | 11,388,998 | $ 11,389 | |
| Total Short-Term Investment (Identified Cost $11,389) | 11,389 | ||
| TOTAL INVESTMENTS—100.1% (Identified Cost $244,733) | $807,194 | ||
| Other assets and liabilities, net—(0.1)% | (854) | ||
| NET ASSETS—100.0% | $806,340 | ||
| Abbreviation: | |
| ADR | American Depositary Receipt |
| Footnote Legend: | |
| (1) | Non-income producing. |
| (2) | Shares of this fund are publicly offered, and its prospectus and annual report are publicly available. |
| Country Weightings (Unaudited)† | |
| United States | 92% |
| China | 5 |
| Brazil | 3 |
| Total | 100% |
| ��� % of total investments as of September 30, 2021. | |
| Total Value at September 30, 2021 | Level 1 Quoted Prices | ||
| Assets: | |||
| Equity Securities: | |||
| Common Stocks | $795,805 | $795,805 | |
| Money Market Mutual Fund | 11,389 | 11,389 | |
| Total Investments | $807,194 | $807,194 |
| Shares | Value | ||
| Common Stocks—98.4% | |||
| Communication Services—8.3% | |||
| Omnicom Group, Inc. | 74,250 | $ 5,380 | |
| Verizon Communications, Inc. | 114,753 | 6,198 | |
| 11,578 | |||
| Consumer Discretionary—5.7% | |||
| Home Depot, Inc. (The) | 4,618 | 1,516 | |
| Leggett & Platt, Inc. | 108,350 | 4,858 | |
| McDonald’s Corp. | 6,420 | 1,548 | |
| 7,922 | |||
| Consumer Staples—13.2% | |||
| Clorox Co. (The) | 5,560 | 921 | |
| Coca-Cola Co. (The) | 69,740 | 3,659 | |
| Kellogg Co. | 66,950 | 4,279 | |
| Kimberly-Clark Corp. | 33,313 | 4,412 | |
| PepsiCo, Inc. | 24,680 | 3,712 | |
| Procter & Gamble Co. (The) | 10,690 | 1,495 | |
| 18,478 | |||
| Financials—16.6% | |||
| Bank of Hawaii Corp. | 69,419 | 5,704 | |
| PNC Financial Services Group, Inc. (The) | 41,142 | 8,049 | |
| U.S. Bancorp | 63,625 | 3,782 | |
| Zurich Insurance Group AG ADR(1) | 140,065 | 5,751 | |
| 23,286 | |||
| Health Care—11.2% | |||
| Johnson & Johnson | 8,503 | 1,373 | |
| Merck & Co., Inc. | 41,630 | 3,127 | |
| Patterson Cos., Inc. | 185,350 | 5,586 | |
| Pfizer, Inc. | 130,780 | 5,625 | |
| 15,711 | |||
| Industrials—12.9% | |||
| BAE Systems plc Sponsored ADR(1) | 168,578 | 5,154 | |
| MSC Industrial Direct Co., Inc. Class A | 71,008 | 5,694 | |
| Snap-on, Inc. | 6,453 | 1,348 | |
| Watsco, Inc. | 22,133 | 5,857 | |
| 18,053 | |||
| Shares | Value | ||
| Information Technology—11.6% | |||
| Analog Devices, Inc. | 9,196 | $ 1,540 | |
| Cisco Systems, Inc. | 101,770 | 5,540 | |
| International Business Machines Corp. | 45,100 | 6,266 | |
| Paychex, Inc. | 25,506 | 2,868 | |
| 16,214 | |||
| Materials—8.3% | |||
| Amcor plc | 438,674 | 5,084 | |
| Eastman Chemical Co. | 39,719 | 4,001 | |
| Sonoco Products Co. | 42,606 | 2,539 | |
| 11,624 | |||
| Real Estate—1.6% | |||
| Crown Castle International Corp. | 12,820 | 2,222 | |
| Utilities—9.0% | |||
| Fortis, Inc. | 81,700 | 3,622 | |
| NextEra Energy, Inc. | 34,310 | 2,694 | |
| Southern Co. (The) | 69,040 | 4,278 | |
| WEC Energy Group, Inc. | 22,030 | 1,943 | |
| 12,537 | |||
| Total Common Stocks (Identified Cost $120,110) | 137,625 | ||
| Total Long-Term Investments—98.4% (Identified Cost $120,110) | 137,625 | ||
| Short-Term Investment—1.4% | |||
| Money Market Mutual Fund—1.4% | |||
| Dreyfus Government Cash Management Fund - Institutional Shares (seven-day effective yield 0.030%)(2) | 2,005,646 | 2,006 | |
| Total Short-Term Investment (Identified Cost $2,006) | 2,006 | ||
| Shares | Value | ||
| Securities Lending Collateral—1.4% | |||
| Dreyfus Government Cash Management Fund - Institutional Shares (seven-day effective yield 0.030%)(2)(3) | 1,905,030 | $ 1,905 | |
| Total Securities Lending Collateral (Identified Cost $1,905) | 1,905 | ||
| TOTAL INVESTMENTS—101.2% (Identified Cost $124,021) | $141,536 | ||
| Other assets and liabilities, net—(1.2)% | (1,734) | ||
| NET ASSETS—100.0% | $139,802 | ||
| Abbreviation: | |
| ADR | American Depositary Receipt |
| Footnote Legend: | |
| (1) | All or a portion of security is on loan. |
| (2) | Shares of this fund are publicly offered, and its prospectus and annual report are publicly available. |
| (3) | Represents security purchased with cash collateral received for securities on loan. |
| Country Weightings (Unaudited)† | |
| United States | 86% |
| Switzerland | 4 |
| United Kingdom | 4 |
| Jersey | 4 |
| Canada | 2 |
| Total | 100% |
| † % of total investments as of September 30, 2021. | |
| Total Value at September 30, 2021 | Level 1 Quoted Prices | ||
| Assets: | |||
| Equity Securities: | |||
| Common Stocks | $137,625 | $137,625 | |
| Securities Lending Collateral | 1,905 | 1,905 | |
| Money Market Mutual Fund | 2,006 | 2,006 | |
| Total Investments | $141,536 | $141,536 |
| Shares | Value | ||
| Common Stocks—98.1% | |||
| Communication Services—18.6% | |||
| BCE, Inc. | 38,938 | $ 1,949 | |
| Omnicom Group, Inc. | 16,214 | 1,175 | |
| Spark New Zealand Ltd. | 483,335 | 1,590 | |
| Telenor ASA | 57,580 | 969 | |
| Verizon Communications, Inc. | 27,116 | 1,465 | |
| 7,148 | |||
| Consumer Discretionary—2.6% | |||
| Leggett & Platt, Inc. | 22,502 | 1,009 | |
| Consumer Staples—9.7% | |||
| Coca-Cola Co. (The) | 18,391 | 965 | |
| PepsiCo, Inc. | 4,522 | 680 | |
| Tate & Lyle plc | 146,172 | 1,360 | |
| Unilever plc | 13,115 | 710 | |
| 3,715 | |||
| Financials—20.7% | |||
| Bank of Hawaii Corp. | 8,847 | 727 | |
| IGM Financial, Inc. | 20,938 | 748 | |
| PNC Financial Services Group, Inc. (The) | 5,611 | 1,098 | |
| Royal Bank of Canada | 13,392 | 1,332 | |
| Singapore Exchange Ltd. | 46,617 | 341 | |
| Tokio Marine Holdings, Inc. | 21,020 | 1,127 | |
| U.S. Bancorp | 16,899 | 1,005 | |
| Zurich Insurance Group AG | 1,380 | 564 | |
| Zurich Insurance Group AG ADR | 23,997 | 985 | |
| 7,927 | |||
| Health Care—8.9% | |||
| Johnson & Johnson | 1,149 | 185 | |
| Merck & Co., Inc. | 9,057 | 680 | |
| Patterson Cos., Inc. | 34,832 | 1,050 | |
| Pfizer, Inc. | 25,320 | 1,089 | |
| Sonic Healthcare Ltd. | 13,730 | 397 | |
| 3,401 | |||
| Shares | Value | ||
| Industrials—11.7% | |||
| Adecco Group AG | 21,848 | $ 1,095 | |
| BAE Systems plc | 235,195 | 1,781 | |
| MSC Industrial Direct Co., Inc. Class A | 10,302 | 826 | |
| Watsco, Inc. | 2,961 | 784 | |
| 4,486 | |||
| Information Technology—7.4% | |||
| Cisco Systems, Inc. | 13,403 | 730 | |
| International Business Machines Corp. | 11,993 | 1,666 | |
| Paychex, Inc. | 3,823 | 430 | |
| 2,826 | |||
| Materials—6.8% | |||
| Amcor plc | 111,274 | 1,289 | |
| Eastman Chemical Co. | 9,547 | 962 | |
| Kemira OYJ | 24,170 | 371 | |
| 2,622 | |||
| Real Estate—1.2% | |||
| Crown Castle International Corp. | 2,649 | 459 | |
| Utilities—10.5% | |||
| Fortis, Inc. | 32,239 | 1,429 | |
| Southern Co. (The) | 21,811 | 1,352 | |
| Terna - Rete Elettrica Nazionale | 128,720 | 913 | |
| WEC Energy Group, Inc. | 3,987 | 352 | |
| 4,046 | |||
| Total Common Stocks (Identified Cost $32,421) | 37,639 | ||
| Total Long-Term Investments—98.1% (Identified Cost $32,421) | 37,639 | ||
| Shares | Value | ||
| Short-Term Investment—1.4% | |||
| Money Market Mutual Fund—1.4% | |||
| Dreyfus Government Cash Management Fund - Institutional Shares (seven-day effective yield 0.030%)(1) | 525,385 | $ 525 | |
| Total Short-Term Investment (Identified Cost $525) | 525 | ||
| TOTAL INVESTMENTS—99.5% (Identified Cost $32,946) | $38,164 | ||
| Other assets and liabilities, net—0.5% | 202 | ||
| NET ASSETS—100.0% | $38,366 | ||
| Abbreviation: | |
| ADR | American Depositary Receipt |
| Footnote Legend: | |
| (1) | Shares of this fund are publicly offered, and its prospectus and annual report are publicly available. |
| Country Weightings (Unaudited)† | |
| United States | 50% |
| Canada | 14 |
| Switzerland | 10 |
| United Kingdom | 10 |
| New Zealand | 4 |
| Japan | 3 |
| Norway | 3 |
| Other | 6 |
| Total | 100% |
| † % of total investments as of September 30, 2021. | |
| Total Value at September 30, 2021 | Level 1 Quoted Prices | Level 2 Significant Observable Inputs | |||
| Assets: | |||||
| Equity Securities: | |||||
| Common Stocks | $37,639 | $26,421 | $11,218 | ||
| Money Market Mutual Fund | 525 | 525 | — | ||
| Total Investments | $38,164 | $26,946 | $11,218 |
| Shares | Value | ||
| Common Stocks—97.0% | |||
| Consumer Discretionary—10.2% | |||
| Latham Group, Inc.(1) | 1,754,462 | $ 28,773 | |
| Ross Stores, Inc. | 438,371 | 47,717 | |
| SiteOne Landscape Supply, Inc.(1) | 178,779 | 35,661 | |
| Tractor Supply Co. | 147,358 | 29,856 | |
| 142,007 | |||
| Consumer Staples—3.1% | |||
| Lamb Weston Holdings, Inc. | 703,198 | 43,155 | |
| Financials—13.4% | |||
| Berkley (W.R.) Corp. | 499,772 | 36,573 | |
| Broadridge Financial Solutions, Inc. | 290,706 | 48,443 | |
| First Financial Bankshares, Inc. | 632,120 | 29,046 | |
| Houlihan Lokey, Inc. Class A | 478,951 | 44,112 | |
| LPL Financial Holdings, Inc. | 186,017 | 29,160 | |
| 187,334 | |||
| Health Care—17.8% | |||
| Cooper Cos., Inc. (The) | 107,454 | 44,412 | |
| Elanco Animal Health, Inc.(1) | 1,420,682 | 45,305 | |
| Globus Medical, Inc. Class A(1) | 850,522 | 65,167 | |
| West Pharmaceutical Services, Inc. | 221,910 | 94,210 | |
| 249,094 | |||
| Industrials—33.2% | |||
| Allegion plc | 309,063 | 40,852 | |
| AMETEK, Inc. | 534,384 | 66,269 | |
| Shares | Value | ||
| Industrials—continued | |||
| Equifax, Inc. | 210,054 | $ 53,232 | |
| Exponent, Inc. | 511,586 | 57,886 | |
| HEICO Corp. Class A | 351,018 | 41,571 | |
| Lennox International, Inc. | 76,087 | 22,382 | |
| Nordson Corp. | 207,354 | 49,381 | |
| Old Dominion Freight Line, Inc. | 163,964 | 46,890 | |
| Pentair plc | 553,883 | 40,229 | |
| Verisk Analytics, Inc. Class A | 226,888 | 45,439 | |
| 464,131 | |||
| Information Technology—17.7% | |||
| Amphenol Corp. Class A | 386,656 | 28,315 | |
| Aspen Technology, Inc.(1) | 319,471 | 39,231 | |
| Bentley Systems, Inc. Class B | 589,056 | 35,720 | |
| Brooks Automation, Inc. | 728,195 | 74,531 | |
| Dolby Laboratories, Inc. Class A | 365,556 | 32,169 | |
| Zebra Technologies Corp. Class A(1) | 73,726 | 38,000 | |
| 247,966 | |||
| Real Estate—1.6% | |||
| Equity LifeStyle Properties, Inc. | 286,065 | 22,342 | |
| Total Common Stocks (Identified Cost $918,838) | 1,356,029 | ||
| Total Long-Term Investments—97.0% (Identified Cost $918,838) | 1,356,029 | ||
| Shares | Value | ||
| Short-Term Investment—2.8% | |||
| Money Market Mutual Fund—2.8% | |||
| Dreyfus Government Cash Management Fund - Institutional Shares (seven-day effective yield 0.030%)(2) | 38,401,527 | $ 38,402 | |
| Total Short-Term Investment (Identified Cost $38,402) | 38,402 | ||
| TOTAL INVESTMENTS—99.8% (Identified Cost $957,240) | $1,394,431 | ||
| Other assets and liabilities, net—0.2% | 3,279 | ||
| NET ASSETS—100.0% | $1,397,710 | ||
| Footnote Legend: | |
| (1) | Non-income producing. |
| (2) | Shares of this fund are publicly offered, and its prospectus and annual report are publicly available. |
| Total Value at September 30, 2021 | Level 1 Quoted Prices | ||
| Assets: | |||
| Equity Securities: | |||
| Common Stocks | $1,356,029 | $1,356,029 | |
| Money Market Mutual Fund | 38,402 | 38,402 | |
| Total Investments | $1,394,431 | $1,394,431 |
| Shares | Value | ||
| Preferred Stock—1.2% | |||
| Information Technology—1.2% | |||
| Security Scorecard, Inc. Series E, 0.000%(1)(2)(3) | 2,639,750 | $ 42,579 | |
| Total Preferred Stock (Identified Cost $40,000) | 42,579 | ||
| Common Stocks—96.0% | |||
| Communication Services—1.5% | |||
| ZoomInfo Technologies, Inc. Class A(2) | 838,144 | 51,286 | |
| Consumer Discretionary—18.8% | |||
| Domino’s Pizza, Inc. | 108,304 | 51,657 | |
| DraftKings, Inc. Class A(2) | 697,725 | 33,602 | |
| Global-e Online Ltd.(2) | 579,370 | 41,599 | |
| MercadoLibre, Inc.(2) | 117,619 | 197,529 | |
| Olo, Inc. Class A(2) | 1,064,387 | 31,963 | |
| Pool Corp. | 159,159 | 69,140 | |
| Rollins, Inc. | 1,127,475 | 39,834 | |
| Ross Stores, Inc. | 444,301 | 48,362 | |
| SiteOne Landscape Supply, Inc.(2) | 649,900 | 129,636 | |
| 643,322 | |||
| Consumer Staples—8.6% | |||
| Brown-Forman Corp. Class B | 788,717 | 52,852 | |
| Celsius Holdings, Inc.(2) | 505,536 | 45,544 | |
| Freshpet, Inc.(2) | 474,380 | 67,689 | |
| McCormick & Co., Inc. | 338,322 | 27,414 | |
| Monster Beverage Corp.(2) | 483,651 | 42,963 | |
| National Beverage Corp. | 1,028,890 | 54,007 | |
| Olaplex Holdings, Inc.(2) | 188,013 | 4,606 | |
| 295,075 | |||
| Financials—8.4% | |||
| Goosehead Insurance, Inc. Class A | 652,468 | 99,364 | |
| MarketAxess Holdings, Inc. | 145,736 | 61,310 | |
| Signature Bank | 287,250 | 78,212 | |
| T. Rowe Price Group, Inc. | 256,124 | 50,380 | |
| 289,266 | |||
| Health Care—11.0% | |||
| Definitive Healthcare Corp. Class A(2) | 188,093 | 8,056 | |
| Shares | Value | ||
| Health Care—continued | |||
| Elanco Animal Health, Inc.(2) | 1,531,339 | $ 48,834 | |
| HealthEquity, Inc.(2) | 921,842 | 59,698 | |
| IDEXX Laboratories, Inc.(2) | 89,260 | 55,511 | |
| Mettler-Toledo International, Inc.(2) | 38,431 | 52,933 | |
| Silk Road Medical, Inc.(2) | 792,890 | 43,633 | |
| STAAR Surgical Co.(2) | 188,956 | 24,287 | |
| Treace Medical Concepts, Inc.(2) | 718,025 | 19,315 | |
| Zoetis, Inc. Class A | 326,017 | 63,293 | |
| 375,560 | |||
| Industrials—9.2% | |||
| Acuity Brands, Inc. | 181,369 | 31,444 | |
| CoStar Group, Inc.(2) | 616,930 | 53,093 | |
| Equifax, Inc. | 280,040 | 70,968 | |
| Fair Isaac Corp.(2) | 184,987 | 73,612 | |
| Lyft, Inc. Class A(2) | 939,226 | 50,333 | |
| Roper Technologies, Inc. | 83,187 | 37,112 | |
| 316,562 | |||
| Information Technology—38.5% | |||
| Amphenol Corp. Class A | 803,900 | 58,870 | |
| Avalara, Inc.(2) | 685,464 | 119,799 | |
| Bill.com Holdings, Inc.(2) | 809,049 | 215,976 | |
| Coupa Software, Inc.(2) | 102,339 | 22,431 | |
| Datadog, Inc. Class A(2) | 543,609 | 76,839 | |
| DocuSign, Inc.(2) | 464,458 | 119,565 | |
| Dynatrace, Inc.(2) | 781,857 | 55,488 | |
| FleetCor Technologies, Inc.(2) | 202,572 | 52,926 | |
| Gartner, Inc.(2) | 337,417 | 102,534 | |
| nCino, Inc.(2) | 867,259 | 61,601 | |
| Okta, Inc. Class A(2) | 355,610 | 84,401 | |
| Paycom Software, Inc.(2) | 224,256 | 111,175 | |
| Square, Inc. Class A(2) | 213,905 | 51,303 | |
| Teradyne, Inc. | 473,018 | 51,639 | |
| Trade Desk, Inc. (The) Class A(2) | 1,308,630 | 91,997 | |
| Workday, Inc. Class A(2) | 173,430 | 43,338 | |
| 1,319,882 | |||
| Total Common Stocks (Identified Cost $2,009,056) | 3,290,953 | ||
| Total Long-Term Investments—97.2% (Identified Cost $2,049,056) | 3,333,532 | ||
| Shares | Value | ||
| Short-Term Investment—2.9% | |||
| Money Market Mutual Fund—2.9% | |||
| Dreyfus Government Cash Management Fund - Institutional Shares (seven-day effective yield 0.030%)(4) | 99,286,906 | $ 99,287 | |
| Total Short-Term Investment (Identified Cost $99,287) | 99,287 | ||
| TOTAL INVESTMENTS—100.1% (Identified Cost $2,148,343) | $3,432,819 | ||
| Other assets and liabilities, net—(0.1)% | (3,001) | ||
| NET ASSETS—100.0% | $3,429,818 | ||
| Footnote Legend: | |
| (1) | The value of this security was determined using significant unobservable inputs and is reported as a Level 3 security in the Fair Value Hierarchy table located after the Schedule of Investments. |
| (2) | Non-income producing. |
| (3) | All or a portion of the security is restricted. |
| (4) | Shares of this fund are publicly offered, and its prospectus and annual report are publicly available. |
| Country Weightings (Unaudited)† | |
| United States | 93% |
| Brazil | 6 |
| Israel | 1 |
| Total | 100% |
| † % of total investments as of September 30, 2021. | |
| Total Value at September 30, 2021 | Level 1 Quoted Prices | Level 3 Significant Unobservable Inputs | |||
| Assets: | |||||
| Equity Securities: | |||||
| Common Stocks | $3,290,953 | $3,290,953 | $ — | ||
| Preferred Stock | 42,579 | — | 42,579 | ||
| Money Market Mutual Fund | 99,287 | 99,287 | — | ||
| Total Investments | $3,432,819 | $3,390,240 | $42,579 |
| Total | Preferred Stock | ||
| Balance as of September 30, 2020: | $ — | $ — | |
| Change in unrealized appreciation (depreciation)(a) | 2,579 | 2,579 | |
| Purchases | 40,000 | 40,000 | |
| Balance as of September 30, 2021 | $42,579 | $42,579 |
| Investments in Securities – Assets | Ending Balance at September 30, 2021 | Valuation Technique Used | Unobservable Inputs | Input Values | |||
| Preferred Stock: | |||||||
| Security Scorecard, Inc. Series E | $42,579 | Market and Company Comparables | EV Multiples | 20.97x(8.88x - 65.23x) | |||
| 15.10x (6.23x - 54.76x) | |||||||
| Shares | Value | ||
| Common Stocks—96.0% | |||
| Communication Services—7.6% | |||
| Autohome, Inc. ADR | 1,040,195 | $ 48,816 | |
| Rightmove plc | 10,659,000 | 97,927 | |
| 146,743 | |||
| Consumer Discretionary—4.7% | |||
| Acushnet Holdings Corp. | 1,863,041 | 87,004 | |
| LCI Industries | 27,878 | 3,753 | |
| 90,757 | |||
| Consumer Staples—1.7% | |||
| PriceSmart, Inc. | 417,189 | 32,353 | |
| Energy—1.1% | |||
| Dril-Quip, Inc.(1) | 799,140 | 20,122 | |
| Financials—20.4% | |||
| Artisan Partners Asset Management, Inc. Class A | 795,600 | 38,921 | |
| FactSet Research Systems, Inc. | 167,440 | 66,102 | |
| First Hawaiian, Inc. | 3,053,755 | 89,628 | |
| Moelis & Co. Class A | 1,107,440 | 68,517 | |
| Primerica, Inc. | 576,512 | 88,570 | |
| RLI Corp. | 407,903 | 40,900 | |
| 392,638 | |||
| Health Care—6.4% | |||
| Atrion Corp. | 48,880 | 34,094 | |
| CorVel Corp.(1) | 481,080 | 89,587 | |
| 123,681 | |||
| Industrials—36.7% | |||
| Donaldson Co., Inc. | 450,200 | 25,846 | |
| EMCOR Group, Inc. | 813,970 | 93,916 | |
| Shares | Value | ||
| Industrials—continued | |||
| FTI Consulting, Inc.(1) | 821,194 | $ 110,615 | |
| Graco, Inc. | 1,141,110 | 79,843 | |
| Landstar System, Inc. | 522,209 | 82,415 | |
| RBC Bearings, Inc.(1) | 318,987 | 67,689 | |
| Simpson Manufacturing Co., Inc. | 802,717 | 85,867 | |
| Toro Co. (The) | 751,701 | 73,223 | |
| Watts Water Technologies, Inc. Class A | 523,774 | 88,041 | |
| 707,455 | |||
| Information Technology—16.3% | |||
| Aspen Technology, Inc.(1) | 559,600 | 68,719 | |
| Clearwater Analytics Holdings, Inc. Class A (1) | 1,093,878 | 28,014 | |
| Jack Henry & Associates, Inc. | 207,800 | 34,092 | |
| Manhattan Associates, Inc.(1) | 611,720 | 93,611 | |
| Teledyne Technologies, Inc.(1) | 208,552 | 89,590 | |
| 314,026 | |||
| Materials—1.1% | |||
| AptarGroup, Inc. | 182,012 | 21,723 | |
| Total Common Stocks (Identified Cost $1,113,792) | 1,849,498 | ||
| Total Long-Term Investments—96.0% (Identified Cost $1,113,792) | 1,849,498 | ||
| Shares | Value | ||
| Short-Term Investment—4.4% | |||
| Money Market Mutual Fund—4.4% | |||
| Dreyfus Government Cash Management Fund - Institutional Shares (seven-day effective yield 0.030%)(2) | 84,215,614 | $ 84,216 | |
| Total Short-Term Investment (Identified Cost $84,216) | 84,216 | ||
| TOTAL INVESTMENTS—100.4% (Identified Cost $1,198,008) | $1,933,714 | ||
| Other assets and liabilities, net—(0.4)% | (7,551) | ||
| NET ASSETS—100.0% | $1,926,163 | ||
| Abbreviation: | |
| ADR | American Depositary Receipt |
| Footnote Legend: | |
| (1) | Non-income producing. |
| (2) | Shares of this fund are publicly offered, and its prospectus and annual report are publicly available. |
| Country Weightings (Unaudited)† | |
| United States | 92% |
| United Kingdom | 5 |
| China | 3 |
| Total | 100% |
| † % of total investments as of September 30, 2021. | |
| Total Value at September 30, 2021 | Level 1 Quoted Prices | Level 2 Significant Observable Inputs | |||
| Assets: | |||||
| Equity Securities: | |||||
| Common Stocks | $1,849,498 | $1,751,571 | $97,927 | ||
| Money Market Mutual Fund | 84,216 | 84,216 | — | ||
| Total Investments | $1,933,714 | $1,835,787 | $97,927 |
| Shares | Value | ||
| Common Stocks—95.8% | |||
| Communication Services—14.9% | |||
| Auto Trader Group plc | 42,947,329 | $ 338,691 | |
| Autohome, Inc. ADR | 4,885,180 | 229,262 | |
| MediaAlpha, Inc. Class A(1)(2) | 4,646,036 | 86,788 | |
| Rightmove plc | 36,615,150 | 336,392 | |
| 991,133 | |||
| Consumer Discretionary—13.0% | |||
| Fox Factory Holding Corp.(1)(2) | 3,632,978 | 525,111 | |
| Ollie’s Bargain Outlet Holdings, Inc.(1)(2) | 4,713,672 | 284,140 | |
| Olo, Inc. Class A(1)(2) | 1,921,045 | 57,689 | |
| 866,940 | |||
| Consumer Staples—3.2% | |||
| Chefs’ Warehouse, Inc. (The)(1)(2) | 2,454,523 | 79,944 | |
| Grocery Outlet Holding Corp.(2) | 3,961,022 | 85,439 | |
| PriceSmart, Inc. | 640,298 | 49,655 | |
| 215,038 | |||
| Financials—21.6% | |||
| FactSet Research Systems, Inc. | 380,708 | 150,296 | |
| Goosehead Insurance, Inc. Class A(1) | 1,120,700 | 170,672 | |
| Interactive Brokers Group, Inc. Class A | 3,187,856 | 198,731 | |
| MarketAxess Holdings, Inc. | 330,985 | 139,242 | |
| Morningstar, Inc. | 943,942 | 244,509 | |
| Oportun Financial Corp.(1)(2) | 2,635,930 | 65,977 | |
| Ryan Specialty Group Holdings, Inc. Class A(1)(2) | 10,175,150 | 344,632 | |
| Shares | Value | ||
| Financials—continued | |||
| ServisFirst Bancshares, Inc. | 1,648,516 | $ 128,255 | |
| 1,442,314 | |||
| Health Care—3.9% | |||
| Mesa Laboratories, Inc. | 85,353 | 25,807 | |
| National Research Corp.(1) | 2,409,518 | 101,610 | |
| U.S. Physical Therapy, Inc.(1) | 1,185,000 | 131,061 | |
| 258,478 | |||
| Industrials—7.4% | |||
| AAON, Inc.(1) | 3,359,400 | 219,503 | |
| HEICO Corp. Class A | 1,307,383 | 154,833 | |
| Omega Flex, Inc.(1) | 841,642 | 120,094 | |
| 494,430 | |||
| Information Technology—31.8% | |||
| Aspen Technology, Inc.(2) | 1,578,926 | 193,892 | |
| Avalara, Inc.(2) | 1,420,000 | 248,173 | |
| Bill.com Holdings, Inc.(2) | 2,257,005 | 602,508 | |
| Blackline, Inc.(2) | 2,472,403 | 291,892 | |
| Duck Creek Technologies, Inc.(1)(2) | 8,694,221 | 384,632 | |
| nCino, Inc.(2) | 2,821,202 | 200,390 | |
| NVE Corp.(1) | 412,690 | 26,400 | |
| SPS Commerce, Inc.(2) | 1,045,164 | 168,595 | |
| 2,116,482 | |||
| Total Common Stocks (Identified Cost $3,435,370) | 6,384,815 | ||
| Total Long-Term Investments—95.8% (Identified Cost $3,435,370) | 6,384,815 | ||
| Shares | Value | ||
| Short-Term Investment—4.3% | |||
| Money Market Mutual Fund—4.3% | |||
| Dreyfus Government Cash Management Fund - Institutional Shares (seven-day effective yield 0.030%)(3) | 284,304,587 | $ 284,305 | |
| Total Short-Term Investment (Identified Cost $284,305) | 284,305 | ||
| TOTAL INVESTMENTS—100.1% (Identified Cost $3,719,675) | $6,669,120 | ||
| Other assets and liabilities, net—(0.1)% | (4,108) | ||
| NET ASSETS—100.0% | $6,665,012 | ||
| Abbreviation: | |
| ADR | American Depositary Receipt |
| Footnote Legend: | |
| (1) | Affiliated investment. See Note 3H in Notes to Financial Statements. |
| (2) | Non-income producing. |
| (3) | Shares of this fund are publicly offered, and its prospectus and annual report are publicly available. |
| Country Weightings (Unaudited)† | |
| United States | 87% |
| United Kingdom | 10 |
| China | 3 |
| Total | 100% |
| † % of total investments as of September 30, 2021. | |
| Total Value at September 30, 2021 | Level 1 Quoted Prices | Level 2 Significant Observable Inputs | |||
| Assets: | |||||
| Equity Securities: | |||||
| Common Stocks | $6,384,815 | $5,709,732 | $675,083 | ||
| Money Market Mutual Fund | 284,305 | 284,305 | — | ||
| Total Investments | $6,669,120 | $5,994,037 | $675,083 |
| Shares | Value | ||
| Common Stocks—96.1% | |||
| Consumer Discretionary—21.9% | |||
| Cheesecake Factory, Inc. (The)(1) | 1,200,215 | $ 56,410 | |
| Latham Group, Inc.(1) | 1,813,745 | 29,745 | |
| Leslie’s, Inc.(1) | 1,872,923 | 38,470 | |
| SiteOne Landscape Supply, Inc.(1) | 382,893 | 76,376 | |
| Terminix Global Holdings, Inc.(1) | 1,075,711 | 44,825 | |
| Thor Industries, Inc. | 538,406 | 66,095 | |
| 311,921 | |||
| Consumer Staples—5.6% | |||
| National Beverage Corp. | 867,770 | 45,549 | |
| WD-40 Co. | 148,451 | 34,364 | |
| 79,913 | |||
| Financials—17.5% | |||
| Bank of Hawaii Corp. | 569,215 | 46,772 | |
| First Financial Bankshares, Inc. | 478,223 | 21,974 | |
| Houlihan Lokey, Inc. Class A | 753,490 | 69,397 | |
| Primerica, Inc. | 243,735 | 37,445 | |
| RLI Corp. | 365,989 | 36,698 | |
| Stock Yards Bancorp, Inc. | 627,556 | 36,806 | |
| 249,092 | |||
| Health Care—1.4% | |||
| Anika Therapeutics, Inc.(1) | 465,689 | 19,820 | |
| Industrials—26.8% | |||
| Albany International Corp. Class A | 536,678 | 41,254 | |
| Armstrong World Industries, Inc. | 477,520 | 45,589 | |
| Shares | Value | ||
| Industrials—continued | |||
| Construction Partners, Inc. Class A(1) | 800,935 | $ 26,727 | |
| Graco, Inc. | 657,704 | 46,020 | |
| John Bean Technologies Corp. | 254,148 | 35,721 | |
| Landstar System, Inc. | 273,288 | 43,130 | |
| RBC Bearings, Inc.(1) | 265,552 | 56,350 | |
| UniFirst Corp. | 132,387 | 28,148 | |
| Watsco, Inc. | 223,780 | 59,217 | |
| 382,156 | |||
| Information Technology—14.1% | |||
| American Software, Inc. Class A | 1,006,834 | 23,912 | |
| Badger Meter, Inc. | 204,069 | 20,640 | |
| Brooks Automation, Inc. | 845,607 | 86,548 | |
| EVERTEC, Inc. | 999,895 | 45,715 | |
| Jack Henry & Associates, Inc. | 144,745 | 23,747 | |
| 200,562 | |||
| Materials—4.7% | |||
| Scotts Miracle-Gro Co. (The) | 457,813 | 67,005 | |
| Real Estate—4.1% | |||
| MGM Growth Properties LLC Class A | 1,534,190 | 58,759 | |
| Total Common Stocks (Identified Cost $876,237) | 1,369,228 | ||
| Total Long-Term Investments—96.1% (Identified Cost $876,237) | 1,369,228 | ||
| Shares | Value | ||
| Short-Term Investment—3.7% | |||
| Money Market Mutual Fund—3.7% | |||
| Dreyfus Government Cash Management Fund - Institutional Shares (seven-day effective yield 0.030%)(2) | 53,515,358 | $ 53,515 | |
| Total Short-Term Investment (Identified Cost $53,515) | 53,515 | ||
| TOTAL INVESTMENTS—99.8% (Identified Cost $929,752) | $1,422,743 | ||
| Other assets and liabilities, net—0.2% | 2,267 | ||
| NET ASSETS—100.0% | $1,425,010 | ||
| Abbreviation: | |
| LLC | Limited Liability Company |
| Footnote Legend: | |
| (1) | Non-income producing. |
| (2) | Shares of this fund are publicly offered, and its prospectus and annual report are publicly available. |
| Total Value at September 30, 2021 | Level 1 Quoted Prices | ||
| Assets: | |||
| Equity Securities: | |||
| Common Stocks | $1,369,228 | $1,369,228 | |
| Money Market Mutual Fund | 53,515 | 53,515 | |
| Total Investments | $1,422,743 | $1,422,743 |
| Shares | Value | ||
| Common Stocks—94.5% | |||
| Consumer Discretionary—17.0% | |||
| Bright Horizons Family Solutions, Inc.(1) | 223,547 | $ 31,167 | |
| Pool Corp. | 126,366 | 54,895 | |
| Rollins, Inc. | 630,608 | 22,279 | |
| SiteOne Landscape Supply, Inc.(1) | 286,664 | 57,181 | |
| Thor Industries, Inc. | 399,046 | 48,987 | |
| 214,509 | |||
| Financials—13.3% | |||
| Berkley (W.R.) Corp. | 535,490 | 39,187 | |
| Interactive Brokers Group, Inc. Class A | 492,037 | 30,674 | |
| LPL Financial Holdings, Inc. | 254,499 | 39,895 | |
| MSCI, Inc. Class A | 95,662 | 58,195 | |
| 167,951 | |||
| Health Care—14.1% | |||
| Charles River Laboratories International, Inc.(1) | 183,196 | 75,599 | |
| Chemed Corp. | 56,566 | 26,310 | |
| Cooper Cos., Inc. (The) | 114,239 | 47,216 | |
| Elanco Animal Health, Inc.(1) | 919,270 | 29,316 | |
| 178,441 | |||
| Industrials—19.7% | |||
| Allegion plc | 279,148 | 36,898 | |
| Copart, Inc.(1) | 304,551 | 42,247 | |
| Equifax, Inc. | 177,360 | 44,946 | |
| Exponent, Inc. | 233,353 | 26,404 | |
| Shares | Value | ||
| Industrials—continued | |||
| Fair Isaac Corp.(1) | 44,955 | $ 17,889 | |
| Lennox International, Inc. | 118,969 | 34,997 | |
| Nordson Corp. | 192,058 | 45,739 | |
| 249,120 | |||
| Information Technology—26.1% | |||
| ANSYS, Inc.(1) | 74,860 | 25,486 | |
| Aspen Technology, Inc.(1) | 216,280 | 26,559 | |
| Bentley Systems, Inc. Class B | 826,354 | 50,110 | |
| CDW Corp. | 268,004 | 48,782 | |
| Duck Creek Technologies, Inc.(1) | 529,879 | 23,442 | |
| Jack Henry & Associates, Inc. | 147,060 | 24,127 | |
| Teledyne Technologies, Inc.(1) | 43,221 | 18,567 | |
| Teradyne, Inc. | 393,348 | 42,942 | |
| Zebra Technologies Corp. Class A(1) | 135,314 | 69,743 | |
| 329,758 | |||
| Materials—4.3% | |||
| Scotts Miracle-Gro Co. (The) | 366,503 | 53,642 | |
| Total Common Stocks (Identified Cost $967,089) | 1,193,421 | ||
| Total Long-Term Investments—94.5% (Identified Cost $967,089) | 1,193,421 | ||
| Shares | Value | ||
| Short-Term Investment—5.1% | |||
| Money Market Mutual Fund—5.1% | |||
| Dreyfus Government Cash Management Fund - Institutional Shares (seven-day effective yield 0.030%)(2) | 65,012,105 | $ 65,012 | |
| Total Short-Term Investment (Identified Cost $65,012) | 65,012 | ||
| TOTAL INVESTMENTS—99.6% (Identified Cost $1,032,101) | $1,258,433 | ||
| Other assets and liabilities, net—0.4% | 5,108 | ||
| NET ASSETS—100.0% | $1,263,541 | ||
| Abbreviation: | |
| MSCI | Morgan Stanley Capital International |
| Footnote Legend: | |
| (1) | Non-income producing. |
| (2) | Shares of this fund are publicly offered, and its prospectus and annual report are publicly available. |
| Total Value at September 30, 2021 | Level 1 Quoted Prices | ||
| Assets: | |||
| Equity Securities: | |||
| Common Stocks | $1,193,421 | $1,193,421 | |
| Money Market Mutual Fund | 65,012 | 65,012 | |
| Total Investments | $1,258,433 | $1,258,433 |
| Shares | Value | ||
| Common Stocks—99.0% | |||
| Communication Services—4.3% | |||
| MediaAlpha, Inc. Class A(1) | 4,307 | $ 81 | |
| Rightmove plc ADR | 9,998 | 182 | |
| 263 | |||
| Consumer Discretionary—9.2% | |||
| Ollie’s Bargain Outlet Holdings, Inc.(1) | 2,249 | 136 | |
| Olo, Inc. Class A(1) | 4,742 | 142 | |
| SiteOne Landscape Supply, Inc.(1) | 1,414 | 282 | |
| 560 | |||
| Consumer Staples—2.0% | |||
| Lamb Weston Holdings, Inc. | 1,934 | 119 | |
| Financials—10.0% | |||
| FactSet Research Systems, Inc. | 455 | 179 | |
| MarketAxess Holdings, Inc. | 468 | 197 | |
| Ryan Specialty Group Holdings, Inc. Class A(1) | 6,880 | 233 | |
| 609 | |||
| Health Care—21.4% | |||
| Cooper Cos., Inc. (The) | 350 | 145 | |
| Elanco Animal Health, Inc.(1) | 4,512 | 144 | |
| Globus Medical, Inc. Class A(1) | 2,410 | 184 | |
| HealthEquity, Inc.(1) | 2,960 | 192 | |
| Silk Road Medical, Inc.(1) | 5,346 | 294 | |
| Shares | Value | ||
| Health Care—continued | |||
| West Pharmaceutical Services, Inc. | 801 | $ 340 | |
| 1,299 | |||
| Industrials—21.8% | |||
| Copart, Inc.(1) | 1,809 | 251 | |
| Fair Isaac Corp.(1) | 328 | 130 | |
| HEICO Corp. Class A | 1,847 | 219 | |
| Old Dominion Freight Line, Inc. | 1,261 | 361 | |
| TransUnion | 1,789 | 201 | |
| Verisk Analytics, Inc. Class A | 825 | 165 | |
| 1,327 | |||
| Information Technology—30.3% | |||
| Avalara, Inc.(1) | 1,388 | 243 | |
| Bentley Systems, Inc. Class B | 5,087 | 309 | |
| Clearwater Analytics Holdings, Inc. Class A (1) | 8,174 | 209 | |
| Duck Creek Technologies, Inc.(1) | 3,418 | 151 | |
| Five9, Inc.(1) | 1,117 | 178 | |
| Jack Henry & Associates, Inc. | 1,093 | 179 | |
| nCino, Inc.(1) | 1,869 | 133 | |
| Teledyne Technologies, Inc.(1) | 483 | 208 | |
| Tyler Technologies, Inc.(1) | 509 | 233 | |
| 1,843 | |||
| Total Common Stocks (Identified Cost $5,633) | 6,020 | ||
| Total Long-Term Investments—99.0% (Identified Cost $5,633) | 6,020 | ||
| Shares | Value | ||
| Short-Term Investment—0.2% | |||
| Money Market Mutual Fund—0.2% | |||
| Dreyfus Government Cash Management Fund - Institutional Shares (seven-day effective yield 0.030%)(2) | 13,591 | $ 14 | |
| Total Short-Term Investment (Identified Cost $14) | 14 | ||
| TOTAL INVESTMENTS—99.2% (Identified Cost $5,647) | $6,034 | ||
| Other assets and liabilities, net—0.8% | 49 | ||
| NET ASSETS—100.0% | $6,083 | ||
| Abbreviation: | |
| ADR | American Depositary Receipt |
| Footnote Legend: | |
| (1) | Non-income producing. |
| (2) | Shares of this fund are publicly offered, and its prospectus and annual report are publicly available. |
| Total Value at September 30, 2021 | Level 1 Quoted Prices | ||
| Assets: | |||
| Equity Securities: | |||
| Common Stocks | $6,020 | $6,020 | |
| Money Market Mutual Fund | 14 | 14 | |
| Total Investments | $6,034 | $6,034 |
| Shares | Value | ||
| Common Stocks—98.5% | |||
| Consumer Discretionary—14.6% | |||
| Cheesecake Factory, Inc. (The)(1) | 1,966 | $ 92 | |
| Gentex Corp. | 2,238 | 74 | |
| Leslie’s, Inc.(1) | 2,639 | 54 | |
| Terminix Global Holdings, Inc.(1) | 1,666 | 70 | |
| Thor Industries, Inc. | 1,127 | 138 | |
| 428 | |||
| Consumer Staples—5.0% | |||
| National Beverage Corp. | 1,801 | 95 | |
| WD-40 Co. | 222 | 51 | |
| 146 | |||
| Financials—13.8% | |||
| Bank of Hawaii Corp. | 1,164 | 96 | |
| Berkley (W.R.) Corp. | 1,509 | 110 | |
| Broadridge Financial Solutions, Inc. | 637 | 106 | |
| MSCI, Inc. Class A | 151 | 92 | |
| 404 | |||
| Health Care—5.0% | |||
| Anika Therapeutics, Inc.(1) | 1,074 | 46 | |
| CorVel Corp.(1) | 539 | 100 | |
| 146 | |||
| Industrials—24.6% | |||
| Armstrong World Industries, Inc. | 752 | 72 | |
| Graco, Inc. | 1,339 | 94 | |
| John Bean Technologies Corp. | 551 | 77 | |
| Landstar System, Inc. | 594 | 94 | |
| Lennox International, Inc. | 172 | 51 | |
| RBC Bearings, Inc.(1) | 556 | 118 | |
| Shares | Value | ||
| Industrials—continued | |||
| Toro Co. (The) | 949 | $ 92 | |
| TransUnion | 1,103 | 124 | |
| 722 | |||
| Information Technology—22.2% | |||
| American Software, Inc. Class A | 2,946 | 70 | |
| CDK Global, Inc. | 1,140 | 48 | |
| CDW Corp. | 529 | 96 | |
| Dolby Laboratories, Inc. Class A | 761 | 67 | |
| Jack Henry & Associates, Inc. | 674 | 111 | |
| Teradyne, Inc. | 988 | 108 | |
| Zebra Technologies Corp. Class A(1) | 289 | 149 | |
| 649 | |||
| Materials—6.3% | |||
| Axalta Coating Systems Ltd. (1) | 2,404 | 70 | |
| Scotts Miracle-Gro Co. (The) | 780 | 114 | |
| 184 | |||
| Real Estate—7.0% | |||
| Lamar Advertising Co. Class A | 965 | 109 | |
| MGM Growth Properties LLC Class A | 2,494 | 96 | |
| 205 | |||
| Total Common Stocks (Identified Cost $2,993) | 2,884 | ||
| Total Long-Term Investments—98.5% (Identified Cost $2,993) | 2,884 | ||
| Shares | Value | ||
| Short-Term Investment—0.5% | |||
| Money Market Mutual Fund—0.5% | |||
| Dreyfus Government Cash Management Fund - Institutional Shares (seven-day effective yield 0.030%)(2) | 14,054 | $ 14 | |
| Total Short-Term Investment (Identified Cost $14) | 14 | ||
| TOTAL INVESTMENTS—99.0% (Identified Cost $3,007) | $2,898 | ||
| Other assets and liabilities, net—1.0% | 29 | ||
| NET ASSETS—100.0% | $2,927 | ||
| Abbreviations: | |
| LLC | Limited Liability Company |
| MSCI | Morgan Stanley Capital International |
| Footnote Legend: | |
| (1) | Non-income producing. |
| (2) | Shares of this fund are publicly offered, and its prospectus and annual report are publicly available. |
| Total Value at September 30, 2021 | Level 1 Quoted Prices | ||
| Assets: | |||
| Equity Securities: | |||
| Common Stocks | $2,884 | $2,884 | |
| Money Market Mutual Fund | 14 | 14 | |
| Total Investments | $2,898 | $2,898 |
| Shares | Value | ||
| Common Stocks—98.4% | |||
| Communication Services—5.0% | |||
| Kakao Corp. | 1,855 | $ 182 | |
| Tencent Holdings Ltd. | 2,152 | 129 | |
| 311 | |||
| Consumer Discretionary—22.5% | |||
| Alibaba Group Holding Ltd.(1) | 5,228 | 97 | |
| Fast Retailing Co. Ltd. | 275 | 203 | |
| Huazhu Group Ltd. ADR(1) | 4,742 | 218 | |
| JD.com, Inc. ADR(1) | 1,803 | 130 | |
| MercadoLibre, Inc.(1) | 166 | 279 | |
| Trip.com Group Ltd. ADR(1) | 4,397 | 135 | |
| Yum China Holdings, Inc. | 5,704 | 331 | |
| 1,393 | |||
| Consumer Staples—29.2% | |||
| Budweiser Brewing Co. APAC Ltd. | 100,952 | 257 | |
| China Mengniu Dairy Co., Ltd.(1) | 45,030 | 290 | |
| CP ALL PCL | 183,032 | 342 | |
| Fomento Economico Mexicano SAB de C.V. Sponsored ADR | 3,036 | 263 | |
| Raia Drogasil S.A. | 36,870 | 157 | |
| Unilever plc Sponsored ADR | 3,266 | 177 | |
| Wal-Mart de Mexico SAB de C.V. | 95,484 | 324 | |
| 1,810 | |||
| Financials—23.8% | |||
| AIA Group Ltd. | 21,721 | 250 | |
| Bank Central Asia Tbk PT | 119,234 | 290 | |
| HDFC Bank Ltd. ADR | 4,865 | 356 | |
| Sanlam Ltd. | 60,214 | 255 | |
| XP, Inc. Class A(1) | 8,016 | 322 | |
| 1,473 | |||
| Shares | Value | ||
| Health Care—6.0% | |||
| Shandong Weigao Group Medical Polymer Co., Ltd. Class H | 140,426 | $ 249 | |
| Wuxi Biologics Cayman, Inc.(1) | 7,632 | 124 | |
| 373 | |||
| Information Technology—5.8% | |||
| Infosys Ltd. Sponsored ADR | 16,159 | 359 | |
| Materials—2.9% | |||
| Asian Paints Ltd. | 4,156 | 181 | |
| Real Estate—3.2% | |||
| Country Garden Services Holdings Co., Ltd. | 24,827 | 196 | |
| Total Common Stocks (Identified Cost $5,143) | 6,096 | ||
| Total Long-Term Investments—98.4% (Identified Cost $5,143) | 6,096 | ||
| Short-Term Investment—1.1% | |||
| Money Market Mutual Fund—1.1% | |||
| Dreyfus Government Cash Management Fund - Institutional Shares (seven-day effective yield 0.030%)(2) | 67,774 | 68 | |
| Total Short-Term Investment (Identified Cost $68) | 68 | ||
| TOTAL INVESTMENTS—99.5% (Identified Cost $5,211) | $6,164 | ||
| Other assets and liabilities, net—0.5% | 31 | ||
| NET ASSETS—100.0% | $6,195 | ||
| Abbreviation: | |
| ADR | American Depositary Receipt |
| Footnote Legend: | |
| (1) | Non-income producing. |
| (2) | Shares of this fund are publicly offered, and its prospectus and annual report are publicly available. |
| Country Weightings (Unaudited)† | |
| China | 26% |
| India | 15 |
| Hong Kong | 13 |
| Brazil | 12 |
| Mexico | 9 |
| Thailand | 6 |
| Indonesia | 5 |
| Other | 14 |
| Total | 100% |
| † % of total investments as of September 30, 2021. | |
| Total Value at September 30, 2021 | Level 1 Quoted Prices | Level 2 Significant Observable Inputs | |||
| Assets: | |||||
| Equity Securities: | |||||
| Common Stocks | $6,096 | $3,051 | $3,045 | ||
| Money Market Mutual Fund | 68 | 68 | — | ||
| Total Investments | $6,164 | $3,119 | $3,045 |
| Shares | Value | ||
| Common Stocks—98.4% | |||
| Communication Services—9.5% | |||
| Alphabet, Inc. Class C(1) | 2,016 | $ 5,373 | |
| Facebook, Inc. Class A(1) | 17,500 | 5,940 | |
| Walt Disney Co. (The)(1) | 31,213 | 5,280 | |
| 16,593 | |||
| Consumer Discretionary—12.5% | |||
| Amazon.com, Inc.(1) | 2,524 | 8,291 | |
| MercadoLibre, Inc.(1) | 2,549 | 4,281 | |
| NIKE, Inc. Class B | 23,463 | 3,407 | |
| Yum! Brands, Inc. | 48,204 | 5,896 | |
| 21,875 | |||
| Consumer Staples—8.1% | |||
| China Mengniu Dairy Co., Ltd.(1) | 603,810 | 3,889 | |
| CP ALL PCL | 2,900,227 | 5,421 | |
| Heineken NV | 47,357 | 4,943 | |
| 14,253 | |||
| Financials—8.4% | |||
| AIA Group Ltd. | 528,562 | 6,081 | |
| HDFC Bank Ltd. ADR | 97,862 | 7,153 | |
| XP, Inc. Class A(1) | 39,783 | 1,598 | |
| 14,832 | |||
| Health Care—17.7% | |||
| Abbott Laboratories | 44,800 | 5,292 | |
| Alcon, Inc. | 44,537 | 3,584 | |
| Illumina, Inc.(1) | 8,004 | 3,246 | |
| Intuitive Surgical, Inc.(1) | 3,519 | 3,498 | |
| Medtronic plc | 42,222 | 5,293 | |
| Novo Nordisk A/S Class B | 54,483 | 5,252 | |
| Shares | Value | ||
| Health Care—continued | |||
| Regeneron Pharmaceuticals, Inc.(1) | 8,230 | $ 4,981 | |
| 31,146 | |||
| Industrials—5.0% | |||
| IHS Markit Ltd. | 29,933 | 3,491 | |
| Recruit Holdings Co., Ltd. | 86,806 | 5,306 | |
| 8,797 | |||
| Information Technology—32.3% | |||
| Autodesk, Inc.(1) | 19,353 | 5,519 | |
| Dassault Systemes SE | 92,985 | 4,893 | |
| FleetCor Technologies, Inc.(1) | 21,526 | 5,624 | |
| Infosys Ltd. Sponsored ADR | 230,113 | 5,120 | |
| Microsoft Corp. | 25,082 | 7,071 | |
| PayPal Holdings, Inc.(1) | 23,549 | 6,128 | |
| salesforce.com, Inc.(1) | 26,071 | 7,071 | |
| SAP SE Sponsored ADR | 24,932 | 3,367 | |
| Visa, Inc. Class A | 31,068 | 6,920 | |
| Workday, Inc. Class A(1) | 20,337 | 5,082 | |
| 56,795 | |||
| Materials—1.9% | |||
| Linde plc | 11,538 | 3,385 | |
| Real Estate—3.0% | |||
| Equinix, Inc. | 6,552 | 5,177 | |
| Total Common Stocks (Identified Cost $120,284) | 172,853 | ||
| Total Long-Term Investments—98.4% (Identified Cost $120,284) | 172,853 | ||
| Shares | Value | ||
| Short-Term Investment—1.6% | |||
| Money Market Mutual Fund—1.6% | |||
| Dreyfus Government Cash Management Fund - Institutional Shares (seven-day effective yield 0.030%)(2) | 2,776,871 | $ 2,777 | |
| Total Short-Term Investment (Identified Cost $2,777) | 2,777 | ||
| TOTAL INVESTMENTS—100.0% (Identified Cost $123,061) | $175,630 | ||
| Other assets and liabilities, net—0.0% | 54 | ||
| NET ASSETS—100.0% | $175,684 | ||
| Abbreviation: | |
| ADR | American Depositary Receipt |
| Footnote Legend: | |
| (1) | Non-income producing. |
| (2) | Shares of this fund are publicly offered, and its prospectus and annual report are publicly available. |
| Country Weightings (Unaudited)† | |
| United States | 61% |
| India | 7 |
| Hong Kong | 6 |
| United Kingdom | 4 |
| Thailand | 3 |
| Japan | 3 |
| Denmark | 3 |
| Other | 13 |
| Total | 100% |
| † % of total investments as of September 30, 2021. | |
| Total Value at September 30, 2021 | Level 1 Quoted Prices | Level 2 Significant Observable Inputs | |||
| Assets: | |||||
| Equity Securities: | |||||
| Common Stocks | $172,853 | $137,068 | $35,785 | ||
| Money Market Mutual Fund | 2,777 | 2,777 | — | ||
| Total Investments | $175,630 | $139,845 | $35,785 |
| Shares | Value | ||
| Common Stocks—99.1% | |||
| Communication Services—9.4% | |||
| Kakao Corp. | 1,114 | $ 109 | |
| Match Group, Inc.(1) | 1,940 | 305 | |
| Spotify Technology S.A.(1) | 941 | 212 | |
| 626 | |||
| Consumer Discretionary—10.3% | |||
| Huazhu Group Ltd. ADR(1) | 3,361 | 154 | |
| MercadoLibre, Inc.(1) | 99 | 167 | |
| Trip.com Group Ltd. ADR(1) | 5,037 | 155 | |
| Yum! Brands, Inc. | 1,676 | 205 | |
| 681 | |||
| Consumer Staples—13.1% | |||
| China Mengniu Dairy Co., Ltd.(1) | 23,141 | 149 | |
| CP ALL PCL | 138,924 | 260 | |
| Fomento Economico Mexicano SAB de C.V. Sponsored ADR | 2,401 | 208 | |
| Raia Drogasil S.A. | 24,435 | 104 | |
| Unicharm Corp. | 3,403 | 151 | |
| 872 | |||
| Financials—9.0% | |||
| First Republic Bank | 1,042 | 201 | |
| MSCI, Inc. Class A | 325 | 198 | |
| XP, Inc. Class A(1) | 4,932 | 198 | |
| 597 | |||
| Health Care—24.9% | |||
| Alcon, Inc. | 2,491 | 200 | |
| ICON plc ADR(1) | 780 | 204 | |
| IDEXX Laboratories, Inc.(1) | 242 | 151 | |
| IQVIA Holdings, Inc.(1) | 1,120 | 268 | |
| M3, Inc. | 2,040 | 145 | |
| ResMed, Inc. | 654 | 172 | |
| Shandong Weigao Group Medical Polymer Co., Ltd. Class H | 92,776 | 165 | |
| STERIS plc | 1,056 | 216 | |
| Shares | Value | ||
| Health Care—continued | |||
| Wuxi Biologics Cayman, Inc.(1) | 8,417 | $ 137 | |
| 1,658 | |||
| Industrials—3.1% | |||
| CoStar Group, Inc.(1) | 2,360 | 203 | |
| Information Technology—26.1% | |||
| Adyen N.V.(1) | 53 | 148 | |
| Autodesk, Inc.(1) | 949 | 271 | |
| EPAM Systems, Inc.(1) | 556 | 317 | |
| FleetCor Technologies, Inc.(1) | 1,082 | 283 | |
| Okta, Inc. Class A(1) | 1,093 | 259 | |
| RingCentral, Inc. Class A(1) | 1,208 | 263 | |
| Workday, Inc. Class A(1) | 784 | 196 | |
| 1,737 | |||
| Real Estate—3.2% | |||
| Equinix, Inc. | 268 | 212 | |
| Total Common Stocks (Identified Cost $6,028) | 6,586 | ||
| Total Long-Term Investments—99.1% (Identified Cost $6,028) | 6,586 | ||
| Short-Term Investment—0.4% | |||
| Money Market Mutual Fund—0.4% | |||
| Dreyfus Government Cash Management Fund - Institutional Shares (seven-day effective yield 0.030%)(2) | 27,426 | 27 | |
| Total Short-Term Investment (Identified Cost $27) | 27 | ||
| TOTAL INVESTMENTS—99.5% (Identified Cost $6,055) | $6,613 | ||
| Other assets and liabilities, net—0.5% | 35 | ||
| NET ASSETS—100.0% | $6,648 | ||
| Abbreviations: | |
| ADR | American Depositary Receipt |
| MSCI | Morgan Stanley Capital International |
| Footnote Legend: | |
| (1) | Non-income producing. |
| (2) | Shares of this fund are publicly offered, and its prospectus and annual report are publicly available. |
| Country Weightings (Unaudited)† | |
| United States | 57% |
| China | 9 |
| Brazil | 5 |
| Japan | 4 |
| Thailand | 4 |
| Sweden | 3 |
| Mexico | 3 |
| Other | 15 |
| Total | 100% |
| † % of total investments as of September 30, 2021. | |
| Total Value at September 30, 2021 | Level 1 Quoted Prices | Level 2 Significant Observable Inputs | |||
| Assets: | |||||
| Equity Securities: | |||||
| Common Stocks | $6,586 | $5,322 | $1,264 | ||
| Money Market Mutual Fund | 27 | 27 | — | ||
| Total Investments | $6,613 | $5,349 | $1,264 |
| Par Value | Value | ||
| U.S. Government Securities—3.9% | |||
| U.S. Treasury Bonds | |||
| 3.000%, 8/15/48 | $ 8,965 | $ 10,682 | |
| 2.000%, 2/15/50 | 2,045 | 2,009 | |
| 1.375%, 8/15/50 | 12,745 | 10,755 | |
| 1.875%, 2/15/51 | 5,890 | 5,617 | |
| 2.000%, 8/15/51 | 440 | 432 | |
| U.S. Treasury Notes | |||
| 0.250%, 11/15/23 | 1,260 | 1,258 | |
| 0.250%, 5/31/25 | 1,610 | 1,583 | |
| 1.125%, 2/15/31 | 2,565 | 2,484 | |
| 1.625%, 5/15/31 | 900 | 910 | |
| 1.250%, 8/15/31 | 1,170 | 1,142 | |
| Total U.S. Government Securities (Identified Cost $36,279) | 36,872 | ||
| Municipal Bonds—0.4% | |||
| California—0.1% | |||
| Santa Clara Valley Water District Series B, Taxable 2.967%, 6/1/50 | 510 | 501 | |
| University of California, Series B-A, Taxable 4.428%, 5/15/48 | 380 | 418 | |
| 919 | |||
| Idaho—0.1% | |||
| Idaho Health Facilities Authority St. Luke’s Health System Revenue Taxable 5.020%, 3/1/48 | 450 | 572 | |
| Illinois—0.0% | |||
| Sales Tax Securitization Corp. Series B, Second Lien, Taxable (BAM Insured) 3.411%, 1/1/43 | 70 | 76 | |
| Texas—0.1% | |||
| City of San Antonio, General Obligation Taxable 1.963%, 2/1/33 | 530 | 523 | |
| State of Texas, General Obligation Taxable 3.211%, 4/1/44 | 180 | 189 | |
| Texas Public Finance Authority Revenue Taxable 2.140%, 2/1/35 | 585 | 565 | |
| Texas Transportation Commission State Highway Fund Revenue Taxable 4.000%, 10/1/33 | 160 | 191 | |
| 1,468 | |||
| Par Value | Value | ||
| Virginia—0.1% | |||
| City of Bristol, General Obligation Taxable (State AID Withholding Insured) 4.210%, 1/1/42 | $ 640 | $ 703 | |
| Total Municipal Bonds (Identified Cost $3,540) | 3,738 | ||
| Foreign Government Securities—0.4% | |||
| Bolivarian Republic of Venezuela | |||
| 9.375%, 1/13/34(1) | 130 | 14 | |
| RegS 7.650%, 4/21/25(1)(2) | 320 | 34 | |
| Emirate of Dubai Government International Bonds RegS 5.250%, 1/30/43(2) | 540 | 614 | |
| Oman Government International Bond 144A 7.375%, 10/28/32(3) | 580 | 660 | |
| Republic of Turkey 5.875%, 6/26/31 | 1,125 | 1,056 | |
| Republic of Venezuela RegS 8.250%, 10/13/24(1)(2) | 40 | 4 | |
| Saudi Arabia Government International Bond 144A 3.250%, 10/22/30(3) | 485 | 519 | |
| State of Qatar 144A 4.400%, 4/16/50(3) | 615 | 750 | |
| United Mexican States 2.659%, 5/24/31 | 645 | 622 | |
| Total Foreign Government Securities (Identified Cost $4,746) | 4,273 | ||
| Mortgage-Backed Securities—7.7% | |||
| Agency—0.3% | |||
| Federal Home Loan Mortgage Corporation | |||
| Pool #A46224 5.000%, 7/1/35 | 62 | 71 | |
| Pool #A62213 6.000%, 6/1/37 | 111 | 131 | |
| Federal National Mortgage Association | |||
| Pool #254549 6.000%, 12/1/32 | 18 | 21 | |
| Pool #735061 6.000%, 11/1/34 | 136 | 160 | |
| Pool #880117 5.500%, 4/1/36 | 3 | 4 | |
| Pool #938574 5.500%, 9/1/36 | 80 | 92 | |
| Par Value | Value | ||
| Agency—continued | |||
| Pool #310041 6.500%, 5/1/37 | $ 108 | $ 129 | |
| Pool #909092 6.000%, 9/1/37 | 7 | 8 | |
| Pool #972569 5.000%, 3/1/38 | 86 | 96 | |
| Pool #909175 5.500%, 4/1/38 | 58 | 66 | |
| Pool #929625 5.500%, 6/1/38 | 82 | 96 | |
| Pool #909220 6.000%, 8/1/38 | 62 | 72 | |
| Pool #MA3905 3.000%, 1/1/50 | 1,635 | 1,713 | |
| 2,659 | |||
| Non-Agency—7.4% | |||
| ACRES Commercial Realty Corp. 2020-RSO8, A (SOFR30A + 1.264%, Cap N/A, Floor 1.150%) 144A 1.314%, 3/15/35(3)(4)(5) | 66 | 66 | |
| Ajax Mortgage Loan Trust | |||
| 2021-A, A1 144A 1.065%, 9/25/65(3)(5) | 636 | 634 | |
| 2019-D, A1 144A 2.956%, 9/25/65(3)(5) | 561 | 565 | |
| American Homes 4 Rent Trust | |||
| 2014-SFR2, C 144A 4.705%, 10/17/36(3) | 1,050 | 1,119 | |
| 2015-SFR1, A 144A 3.467%, 4/17/52(3) | 947 | 1,000 | |
| 2015-SFR2, C 144A 4.691%, 10/17/52(3) | 335 | 363 | |
| AMSR Trust | |||
| 2020-SFR1, B 144A 2.120%, 4/17/37(3) | 530 | 535 | |
| 2020-SFR2, C 144A 2.533%, 7/17/37(3) | 750 | 763 | |
| 2020-SFR2, D 144A 3.282%, 7/17/37(3) | 770 | 790 | |
| Angel Oak Mortgage Trust LLC 2020-4, A1 144A 1.469%, 6/25/65(3)(5) | 940 | 947 | |
| Angel Oak SB Commercial Mortgage Trust 2020-SBC1, A1 144A 2.068%, 5/25/50(3)(5) | 853 | 854 | |
| Arroyo Mortgage Trust | |||
| 2021-1R, A1 144A 1.175%, 10/25/48(3)(5) | 1,142 | 1,143 | |
| 2019-1, A1 144A 3.805%, 1/25/49(3)(5) | 107 | 109 | |
| 2019-2, A1 144A 3.347%, 4/25/49(3)(5) | 1,635 | 1,656 | |
| Par Value | Value | ||
| Non-Agency—continued | |||
| Banc of America Funding Trust | |||
| 2004-B, 2A1 2.648%, 11/20/34(5) | $ 33 | $ 36 | |
| 2005-1, 1A1 5.500%, 2/25/35 | 98 | 103 | |
| Bayview Opportunity Master Fund IVa Trust | |||
| 2016-SPL1, B1 144A 4.250%, 4/28/55(3) | 510 | 526 | |
| 2017-SPL5, B1 144A 4.000%, 6/28/57(3)(5) | 100 | 103 | |
| Bayview Opportunity Master Fund IVb Trust 2016-SPL2, B1 144A 4.250%, 6/28/53(3)(5) | 245 | 254 | |
| BBCMS Mortgage Trust 2018-TALL, A (1 month LIBOR + 0.722%, Cap N/A, Floor 0.722%) 144A 0.806%, 3/15/37(3)(5) | 800 | 798 | |
| BPR Trust 2021-KEN, A (1 month LIBOR + 1.250%, Cap N/A, Floor 1.250%) 144A 1.334%, 2/15/29(3)(5) | 920 | 920 | |
| BRAVO Residential Funding Trust 2021-A, A1 144A 1.991%, 1/25/24(3)(5) | 421 | 421 | |
| BX Commercial Mortgage Trust 2020-BXLP, D (1 month LIBOR + 1.250%, Cap N/A, Floor 1.250%) 144A 1.334%, 12/15/36(3)(5) | 419 | 419 | |
| BX Trust 2019-OC11, D 144A 4.075%, 12/9/41(3)(5) | 1,379 | 1,457 | |
| Cascade MH Asset Trust 2021-MH1, A1 144A 1.753%, 2/25/46(3) | 1,257 | 1,256 | |
| CF Hippolyta LLC 2020-1, A1 144A 1.690%, 7/15/60(3) | 403 | 409 | |
| CHL Mortgage Pass-Through Trust 2004-6, 1A2 2.076%, 5/25/34(5) | 128 | 129 | |
| Citigroup Mortgage Loan Trust, Inc. | |||
| 2015-A, A1 144A 3.500%, 6/25/58(3)(5) | 4 | 4 | |
| 2018-RP1, A1 144A 3.000%, 9/25/64(3)(5) | 589 | 604 | |
| Par Value | Value | ||
| Non-Agency—continued | |||
| COLT Mortgage Loan Trust Funding LLC 2020-1, A1 144A 2.488%, 2/25/50(3)(5) | $ 156 | $ 156 | |
| COLT Trust 2020-RPL1, A1 144A 1.390%, 1/25/65(3)(5) | 180 | 180 | |
| COMM Mortgage Trust 2020-CBM, B 144A 3.099%, 2/10/37(3) | 490 | 503 | |
| CoreVest American Finance Issuer LLC 2021-RTL1, A1 144A 2.239%, 3/26/29(3)(5) | 290 | 291 | |
| Corevest American Finance Trust 2020-1, A1 144A 1.832%, 3/15/50(3) | 490 | 497 | |
| CoreVest American Finance Trust | |||
| 2019-3, C 144A 3.265%, 10/15/52(3) | 295 | 306 | |
| 2018-2, A 144A 4.026%, 11/15/52(3) | 413 | 432 | |
| 2020-4, A 144A 1.174%, 12/15/52(3) | 590 | 584 | |
| 2020-3, A 144A 1.358%, 8/15/53(3) | 695 | 689 | |
| Credit Suisse Mortgage Capital Certificates 2019-ICE4, A (1 month LIBOR + 0.980%, Cap N/A, Floor 0.980%) 144A 1.064%, 5/15/36(3)(5) | 530 | 532 | |
| Credit Suisse Mortgage Capital Trust | |||
| 2014-IVR2, A2 144A 3.819%, 4/25/44(3)(5) | 13 | 13 | |
| 2017-RPL1, A1 144A 2.750%, 7/25/57(3)(5) | 580 | 599 | |
| 2020-RPL4, A1 144A 2.000%, 1/25/60(3)(5) | 395 | 403 | |
| 2021-NQM1, A1 144A 0.809%, 5/25/65(3)(5) | 245 | 245 | |
| 2020-NQM1, A1 144A 1.208%, 5/25/65(3)(5) | 162 | 163 | |
| 2021-NQM2, A1 144A 1.179%, 2/25/66(3)(5) | 614 | 615 | |
| Dominion Mortgage Trust 2021-RTL1, A1 144A 2.487%, 7/25/27(3)(5) | 875 | 878 | |
| Ellington Financial Mortgage Trust | |||
| 2019-2, A3 144A 3.046%, 11/25/59(3)(5) | 78 | 79 | |
| 2021-2, A3 144A 1.291%, 6/25/66(3)(5) | 779 | 780 | |
| Par Value | Value | ||
| Non-Agency—continued | |||
| FirstKey Homes Trust | |||
| 2020-SFR2, B 144A 1.567%, 10/19/37(3) | $ 645 | $ 645 | |
| 2021-SFR1, D 144A 2.189%, 8/17/38(3) | 880 | 876 | |
| Flagstar Mortgage Trust 2017-1, 1A3 144A 3.500%, 3/25/47(3)(5) | 154 | 156 | |
| Galton Funding Mortgage Trust | |||
| 2017-1, A21 144A 3.500%, 7/25/56(3)(5) | 44 | 44 | |
| 2018-1, A23 144A 3.500%, 11/25/57(3)(5) | 49 | 50 | |
| 2019-H1, A1 144A 2.657%, 10/25/59(3)(5) | 35 | 36 | |
| 2020-H1, A1 144A 2.310%, 1/25/60(3)(5) | 172 | 174 | |
| GCAT LLC 2019-NQM1, A1 144A 2.985%, 2/25/59(3)(5) | 125 | 125 | |
| GCAT Trust 2020-NQM1, A1 144A 2.247%, 1/25/60(3)(5) | 84 | 85 | |
| GCT Commercial Mortgage Trust 2021-GCT, A (1 month LIBOR + 0.800%, Cap N/A, Floor 0.800%) 144A 0.884%, 2/15/38(3)(5) | 1,080 | 1,081 | |
| GS Mortgage Securities Trust | |||
| 2012-ALOH, A 144A 3.551%, 4/10/34(3) | 187 | 188 | |
| 2020-GC45, AS 3.173%, 2/13/53(5) | 565 | 599 | |
| GS Mortgage-Backed Securities Trust 2020-NQM1, A3 144A 2.352%, 9/27/60(3)(5) | 411 | 416 | |
| Hilton USA Trust 2016-SFP, B 144A 3.323%, 11/5/35(3) | 500 | 501 | |
| Home Partners of America Trust 2020-2, A 144A 1.532%, 1/17/41(3) | 558 | 550 | |
| Homeward Opportunities Fund I Trust 2018-2, A1 144A 3.985%, 11/25/58(3)(5) | 1,443 | 1,462 | |
| JPMorgan Chase (WaMu) Mortgage Pass-Through Certificates 2003-S11, 3A5 5.950%, 11/25/33 | 99 | 102 | |
| Par Value | Value | ||
| Non-Agency—continued | |||
| JPMorgan Chase Mortgage Trust | |||
| 2014-2, 2A2 144A 3.500%, 6/25/29(3)(5) | $ 32 | $ 33 | |
| 2014-1, 2A12 144A 3.500%, 1/25/44(3)(5) | 27 | 27 | |
| 2016-SH1, M2 144A 3.750%, 4/25/45(3)(5) | 223 | 226 | |
| 2016-SH2, M2 144A 3.750%, 12/25/45(3)(5) | 411 | 419 | |
| 2017-1, A2 144A 3.480%, 1/25/47(3)(5) | 165 | 167 | |
| 2017-3, 2A2 144A 2.500%, 8/25/47(3)(5) | 75 | 76 | |
| 2017-5, A1 144A 3.090%, 10/26/48(3)(5) | 247 | 253 | |
| 2017-4, A3 144A 3.500%, 11/25/48(3)(5) | 370 | 374 | |
| KKR Industrial Portfolio Trust 2021-KDIP, C (1 month LIBOR + 1.000%, Cap N/A, Floor 1.000%) 144A 1.084%, 12/15/37(3)(5) | 870 | 870 | |
| KNDL Mortgage Trust 2019-KNSQ, A (1 month LIBOR + 0.800%, Cap N/A, Floor 0.800%) 144A 0.884%, 5/15/36(3)(5) | 565 | 566 | |
| LHOME Mortgage Trust | |||
| 2021-RTL2, A1 144A 2.090%, 6/25/26(3)(5) | 295 | 295 | |
| 2021-RTL1, A1 144A 2.090%, 9/25/26(3)(5) | 480 | 479 | |
| Mello Warehouse Securitization Trust | |||
| 2021-1, C (1 month LIBOR + 1.100%, Cap N/A, Floor 1.100%) 144A 1.184%, 2/25/55(3)(5) | 400 | 399 | |
| 2021-2, C (1 month LIBOR + 1.100%, Cap N/A, Floor 1.100%) 144A 1.186%, 4/25/55(3)(5) | 180 | 180 | |
| MetLife Securitization Trust | |||
| 2017-1A, M1 144A 3.480%, 4/25/55(3)(5) | 860 | 897 | |
| 2019-1A, A1A 144A 3.750%, 4/25/58(3)(5) | 313 | 322 | |
| Mill City Mortgage Loan Trust | |||
| 2017-1, M2 144A 3.250%, 11/25/58(3)(5) | 395 | 410 | |
| 2019-1, M2 144A 3.500%, 10/25/69(3)(5) | 509 | 542 | |
| Morgan Stanley - Bank of America (Merrill Lynch) Trust 2013-C13, AS 4.266%, 11/15/46 | 275 | 291 | |
| Par Value | Value | ||
| Non-Agency—continued | |||
| Morgan Stanley Bank of America Merrill Lynch Trust 2015-C22, AS 3.561%, 4/15/48 | $ 835 | $ 878 | |
| New Residential Mortgage Loan Trust | |||
| 2014-1A, A 144A 3.750%, 1/25/54(3)(5) | 224 | 235 | |
| 2015-2A, A1 144A 3.750%, 8/25/55(3)(5) | 143 | 151 | |
| 2016-1A, A1 144A 3.750%, 3/25/56(3)(5) | 70 | 75 | |
| 2016-3A, B1 144A 4.000%, 9/25/56(3)(5) | 408 | 433 | |
| 2016-4A, A1 144A 3.750%, 11/25/56(3)(5) | 52 | 55 | |
| 2016-4A, B1A 144A 4.500%, 11/25/56(3)(5) | 526 | 571 | |
| 2017-2A, A3 144A 4.000%, 3/25/57(3)(5) | 110 | 117 | |
| 2021-NQ2R, A1 144A 0.941%, 10/25/58(3)(5) | 325 | 325 | |
| 2019-NQM4, A1 144A 2.492%, 9/25/59(3)(5) | 108 | 109 | |
| 2020-1A, A1B 144A 3.500%, 10/25/59(3)(5) | 629 | 657 | |
| NewRez Warehouse Securitization Trust 2021-1, C (1 month LIBOR + 1.050%, Cap N/A, Floor 1.050%) 144A 1.136%, 5/25/55(3)(5) | 120 | 120 | |
| NLT Trust 2021-INV2, A1 144A 1.162%, 8/25/56(3)(5) | 525 | 526 | |
| NovaStar Mortgage Funding Trust 2004-4, M5 (1 month LIBOR + 1.725%, Cap 11.00%, Floor 1.725%) 1.811%, 3/25/35(5) | 17 | 17 | |
| OBX Trust | |||
| 2019-INV1, A3 144A 4.500%, 11/25/48(3)(5) | 141 | 144 | |
| 2018-EXP2, 1A1 144A 4.000%, 7/25/58(3)(5) | 29 | 29 | |
| 2021-NQM3, A2 144A 1.260%, 7/25/61(3)(5) | 718 | 717 | |
| Preston Ridge Partners Mortgage LLC | |||
| 2020-2, A1 144A 3.671%, 8/25/25(3)(5) | 171 | 172 | |
| 2020-3, A1 144A 2.857%, 9/25/25(3)(5) | 932 | 934 | |
| 2020-6, A1 144A 2.363%, 11/25/25(3)(5) | 962 | 968 | |
| 2021-2, A1 144A 2.115%, 3/25/26(3)(5) | 1,196 | 1,198 | |
| 2021-3, A1 144A 1.867%, 4/25/26(3)(5) | 554 | 557 | |
| Par Value | Value | ||
| Non-Agency—continued | |||
| 2021-RPL1, A1 144A 1.319%, 7/25/51(3)(5) | $ 225 | $ 225 | |
| Pretium Mortgage Credit Partners I LLC | |||
| 2020-NPL3, A1 144A 3.105%, 6/27/60(3)(5) | 853 | 853 | |
| 2021-NPL1, A1 144A 2.240%, 9/27/60(3)(5) | 453 | 453 | |
| Progress Residential Trust | |||
| 2021-SFR3, D 144A 2.288%, 5/17/26(3) | 450 | 450 | |
| 2019-SFR2, A 144A 3.147%, 5/17/36(3) | 387 | 390 | |
| 2019-SFR3, B 144A 2.571%, 9/17/36(3) | 460 | 466 | |
| 2021-SFR2, D 144A 2.197%, 4/19/38(3) | 750 | 748 | |
| 2021-SFR6, C 144A 1.855%, 7/17/38(3) | 145 | 144 | |
| Provident Funding Mortgage Trust 2019-1, A2 144A 3.000%, 12/25/49(3)(5) | 333 | 336 | |
| RCKT Mortgage Trust 2020-1, A1 144A 3.000%, 2/25/50(3)(5) | 471 | 480 | |
| RCO VII Mortgage LLC 2021-2, A1 144A 2.116%, 9/25/26(3)(5) | 530 | 530 | |
| Residential Mortgage Loan Trust 2019-2, A1 144A 2.913%, 5/25/59(3)(5) | 222 | 225 | |
| Sequoia Mortgage Trust 2013-8, B1 3.498%, 6/25/43(5) | 100 | 101 | |
| SG Residential Mortgage Trust 2019-3, A1 144A 2.703%, 9/25/59(3)(5) | 335 | 336 | |
| Starwood Mortgage Residential Trust | |||
| 2021-3, A3 144A 1.518%, 6/25/56(3)(5) | 276 | 275 | |
| 2020-2, A1 144A 2.718%, 4/25/60(3)(5) | 227 | 229 | |
| 2020-3, A1 144A 1.486%, 4/25/65(3)(5) | 256 | 257 | |
| Towd Point Mortgage Trust | |||
| 2016-1, M1 144A 3.500%, 2/25/55(3)(5) | 160 | 164 | |
| 2016-3, M1 144A 3.500%, 4/25/56(3)(5) | 1,080 | 1,118 | |
| 2016-4, B1 144A 3.826%, 7/25/56(3)(5) | 585 | �� 632 | |
| 2017-4, A2 144A 3.000%, 6/25/57(3)(5) | 670 | 699 | |
| 2019-1, A1 144A 3.705%, 3/25/58(3)(5) | 548 | 577 | |
| 2018-6, A1B 144A 3.750%, 3/25/58(3)(5) | 420 | 443 | |
| 2018-6, A2 144A 3.750%, 3/25/58(3)(5) | 1,270 | 1,339 | |
| Par Value | Value | ||
| Non-Agency—continued | |||
| 2019-2, A2 144A 3.750%, 12/25/58(3)(5) | $ 500 | $ 533 | |
| 2019-4, A2 144A 3.250%, 10/25/59(3)(5) | 650 | 690 | |
| 2020-MH1, A2 144A 2.500%, 2/25/60(3)(5) | 1,115 | 1,115 | |
| 2015-2, 1M1 144A 3.250%, 11/25/60(3)(5) | 585 | 597 | |
| Towd Point Trust 2019-HE1, A1 (1 month LIBOR + 0.900%) 144A 0.986%, 4/25/48(3)(5) | 313 | 313 | |
| Tricon American Homes Trust | |||
| 2019-SFR1, C 144A 3.149%, 3/17/38(3) | 435 | 448 | |
| 2020-SFR2, D 144A 2.281%, 11/17/39(3) | 880 | 865 | |
| TVC Mortgage Trust 2020-RTL1, M 144A 5.193%, 9/25/24(3)(5) | 510 | 508 | |
| VCAT LLC | |||
| 2021-NPL1, A2 144A 4.826%, 12/26/50(3)(5) | 620 | 620 | |
| 2021-NPL2, A1 144A 2.115%, 3/27/51(3)(5) | 384 | 385 | |
| 2021-NPL3, A1 144A 1.743%, 5/25/51(3)(5) | 432 | 432 | |
| 2021-NPL4, A1 144A 1.868%, 8/25/51(3)(5) | 857 | 856 | |
| 2021-NPL5, A1 144A 1.868%, 8/25/61(3)(5) | 290 | 290 | |
| Vericrest Opportunity Loan Trust C LLC 2021-NPL9, A1 144A 1.992%, 5/25/51(3)(5) | 327 | 327 | |
| Vericrest Opportunity Loan Trust XCII LLC 2021-NPL1, A1 144A 1.893%, 2/27/51(3)(5) | 640 | 640 | |
| Verus Securitization Trust | |||
| 2019-INV2, A1 144A 2.913%, 7/25/59(3)(5) | 198 | 200 | |
| 2019-4, M1 144A 3.207%, 11/25/59(3)(5) | 280 | 284 | |
| Visio Trust | |||
| 2020-1R, A2 144A 1.567%, 11/25/55(3) | 309 | 311 | |
| 2021-1R, A1 144A 1.280%, 5/25/56(3) | 386 | 388 | |
| Wells Fargo Commercial Mortgage Trust 2014-C24, AS 3.931%, 11/15/47 | 265 | 281 | |
| Par Value | Value | ||
| Non-Agency—continued | |||
| Wells Fargo Mortgage Backed Securities Trust 2020-4, A1 144A 3.000%, 7/25/50(3)(5) | $ 151 | $ 153 | |
| ZH Trust 2021-1, A 144A 2.253%, 2/18/27(3) | 265 | 265 | |
| 70,803 | |||
| Total Mortgage-Backed Securities (Identified Cost $72,772) | 73,462 | ||
| Asset-Backed Securities—3.4% | |||
| Automobiles—2.0% | |||
| American Credit Acceptance Receivables Trust | |||
| 2019-2, C 144A 3.170%, 6/12/25(3) | 280 | 282 | |
| 2021-2, C 144A 0.970%, 7/13/27(3) | 900 | 902 | |
| AmeriCredit Automobile Receivables Trust 2020-3, C 1.060%, 8/18/26 | 1,245 | 1,253 | |
| Carvana Auto Receivables Trust | |||
| 2019-3A, D 144A 3.040%, 4/15/25(3) | 575 | 592 | |
| 2020-P1, B 0.920%, 11/9/26 | 775 | 768 | |
| 2021-N3, D 1.580%, 6/12/28 | 585 | 584 | |
| CIG Auto Receivables Trust 2020-1A, E 144A 4.430%, 2/12/27(3) | 545 | 558 | |
| CPS Auto Receivables Trust 2020-C, C 144A 1.710%, 8/17/26(3) | 540 | 547 | |
| Credit Acceptance Auto Loan Trust 2020-3A, B 144A 1.770%, 12/17/29(3) | 540 | 547 | |
| Drive Auto Receivables Trust 2019-4, C 2.510%, 11/17/25 | 580 | 585 | |
| Exeter Automobile Receivables Trust | |||
| 2019-2A, C 144A 3.300%, 3/15/24(3) | 325 | 328 | |
| 2019-4A, C 144A 2.440%, 9/16/24(3) | 690 | 696 | |
| 2018-4A, D 144A 4.350%, 9/16/24(3) | 160 | 165 | |
| Par Value | Value | ||
| Automobiles—continued | |||
| 2019-1A, D 144A 4.130%, 12/16/24(3) | $ 155 | $ 159 | |
| First Investors Auto Owner Trust 2021-1A, C 144A 1.170%, 3/15/27(3) | 790 | 788 | |
| Flagship Credit Auto Trust | |||
| 2020-3, C 144A 1.730%, 9/15/26(3) | 540 | 549 | |
| 2020-4, C 144A 1.280%, 2/16/27(3) | 965 | 972 | |
| Foursight Capital Automobile Receivables Trust 2019-1, E 144A 4.300%, 9/15/25(3) | 745 | 774 | |
| GLS Auto Receivables Issuer Trust | |||
| 2019-4A, C 144A 3.060%, 8/15/25(3) | 745 | 765 | |
| 2020-4A, C 144A 1.140%, 11/17/25(3) | 930 | 935 | |
| GLS Auto Receivables Trust | |||
| 2018-1A, B 144A 3.520%, 8/15/23(3) | 47 | 47 | |
| 2018-3A, C 144A 4.180%, 7/15/24(3) | 640 | 654 | |
| OneMain Direct Auto Receivables Trust 2018-1A, C 144A 3.850%, 10/14/25(3) | 355 | 357 | |
| Oscar US Funding XII LLC 2021-1A, A4 144A 1.000%, 4/10/28(3) | 550 | 546 | |
| Santander Drive Auto Receivables Trust | |||
| 2020-4, C 1.010%, 1/15/26 | 1,390 | 1,399 | |
| 2021-3, C 0.950%, 9/15/27 | 880 | 882 | |
| Skopos Auto Receivables Trust 2019-1A, C 144A 3.630%, 9/16/24(3) | 575 | 584 | |
| United Auto Credit Securitization Trust | |||
| 2019-1, D 144A 3.470%, 8/12/24(3) | 296 | 297 | |
| 2021-1, C 144A 0.840%, 6/10/26(3) | 900 | 900 | |
| Veros Automobile Receivables Trust 2020-1, B 144A 2.190%, 6/16/25(3) | 585 | 589 | |
| 19,004 | |||
| Par Value | Value | ||
| Credit Card—0.3% | |||
| Avant Credit Card Master Trust 2021-1A, A 144A 1.370%, 4/15/27(3) | $ 730 | $ 729 | |
| Fair Square Issuance Trust 2020-AA, A 144A 2.900%, 9/20/24(3) | 645 | 649 | |
| Genesis Private Label Amortizing Trust 2020-1, B 144A 2.830%, 7/20/30(3) | 535 | 535 | |
| Genesis Sales Finance Master Trust 2020-AA, A 144A 1.650%, 9/22/25(3) | 775 | 780 | |
| 2,693 | |||
| Other—1.1% | |||
| Aqua Finance Trust | |||
| 2017-A, A 144A 3.720%, 11/15/35(3) | 36 | 38 | |
| 2019-A, C 144A 4.010%, 7/16/40(3) | 720 | 748 | |
| 2020-AA, B 144A 2.790%, 7/17/46(3) | 755 | 769 | |
| Arby’s Funding LLC 2020-1A, A2 144A 3.237%, 7/30/50(3) | 535 | 554 | |
| Bankers Healthcare Group Securitization Trust 2020-A, A 144A 2.560%, 9/17/31(3) | 325 | 330 | |
| Consumer Loan Underlying Bond Credit Trust 2019-P1, B 144A 3.280%, 7/15/26(3) | 409 | 412 | |
| Diamond Resorts Owner Trust | |||
| 2017-1A, A 144A 3.270%, 10/22/29(3) | 77 | 78 | |
| 2021-1A, A 144A 1.510%, 11/21/33(3) | 490 | 491 | |
| Foundation Finance Trust | |||
| 2017-1A, A 144A 3.300%, 7/15/33(3) | 410 | 414 | |
| 2021-1A, A 144A 1.270%, 5/15/41(3) | 633 | 630 | |
| Jersey Mike’s Funding 2019-1A, A2 144A 4.433%, 2/15/50(3) | 520 | 552 | |
| Lendmark Funding Trust 2018-2A, A 144A 4.230%, 4/20/27(3) | 160 | 160 | |
| Mariner Finance Issuance Trust 2020-AA, A 144A 2.190%, 8/21/34(3) | 555 | 567 | |
| Par Value | Value | ||
| Other—continued | |||
| MVW LLC 2020-1A, A 144A 1.740%, 10/20/37(3) | $ 291 | $ 294 | |
| MVW Owner Trust 2016-1A, A 144A 2.250%, 12/20/33(3) | 86 | 87 | |
| Navient Private Education Refi Loan Trust 2021-EA, A 144A 0.970%, 12/16/69(3) | 864 | 861 | |
| NBC Funding LLC 2021-1, A2 144A 2.989%, 7/30/51(3) | 590 | 594 | |
| Oasis LLC 2020-1A, A 144A 3.820%, 1/15/32(3) | 155 | 156 | |
| Octane Receivables Trust | |||
| 2019-1A, A 144A 3.160%, 9/20/23(3) | 99 | 99 | |
| 2020-1A, A 144A 1.710%, 2/20/25(3) | 338 | 341 | |
| OneMain Financial Issuance Trust 2018-1A, A 144A 3.300%, 3/14/29(3) | 225 | 226 | |
| Orange Lake Timeshare Trust 2019-A, B 144A 3.360%, 4/9/38(3) | 315 | 324 | |
| Purchasing Power Funding LLC 2021-A, A 144A 1.570%, 10/15/25(3) | 900 | 902 | |
| Trinity Rail Leasing LLC 2019-1A, A 144A 3.820%, 4/17/49(3) | 350 | 363 | |
| Westgate Resorts LLC 2020-1A, A 144A 2.713%, 3/20/34(3) | 553 | 563 | |
| 10,553 | |||
| Total Asset-Backed Securities (Identified Cost $32,010) | 32,250 | ||
| Corporate Bonds and Notes—10.4% | |||
| Communication Services—0.5% | |||
| Cable Onda S.A. 144A 4.500%, 1/30/30(3) | 460 | 483 | |
| CCO Holdings LLC 144A 4.750%, 3/1/30(3) | 290 | 303 | |
| CommScope, Inc. 144A 4.750%, 9/1/29(3) | 60 | 60 | |
| Diamond Sports Group LLC 144A 5.375%, 8/15/26(3)(6) | 255 | 168 | |
| Par Value | Value | ||
| Communication Services—continued | |||
| DIRECTV Holdings LLC 144A 5.875%, 8/15/27(3) | $ 145 | $ 151 | |
| DISH DBS Corp. | |||
| 5.000%, 3/15/23 | 300 | 311 | |
| 7.750%, 7/1/26 | 180 | 203 | |
| Level 3 Financing, Inc. 144A 4.250%, 7/1/28(3) | 650 | 655 | |
| Live Nation Entertainment, Inc. 144A 4.750%, 10/15/27(3)(6) | 80 | 81 | |
| Radiate Holdco LLC 144A 4.500%, 9/15/26(3) | 150 | 155 | |
| Sprint Spectrum Co. LLC 144A 4.738%, 3/20/25(3) | 525 | 561 | |
| T-Mobile USA, Inc. 3.875%, 4/15/30 | 865 | 955 | |
| TripAdvisor, Inc. 144A 7.000%, 7/15/25(3) | 445 | 472 | |
| Verizon Communications, Inc. 2.550%, 3/21/31 | 419 | 424 | |
| 4,982 | |||
| Consumer Discretionary—0.8% | |||
| American Builders & Contractors Supply Co., Inc. 144A 4.000%, 1/15/28(3) | 590 | 602 | |
| Aramark Services, Inc. 144A 6.375%, 5/1/25(3) | 290 | 305 | |
| Brunswick Corp. 2.400%, 8/18/31 | 537 | 519 | |
| Carriage Services, Inc. 144A 4.250%, 5/15/29(3) | 215 | 215 | |
| Ford Motor Co. 9.000%, 4/22/25 | 652 | 784 | |
| Gap, Inc. (The) 144A 3.875%, 10/1/31(3) | 335 | 335 | |
| Gateway Casinos & Entertainment Ltd. 144A 8.250%, 3/1/24(3) | 385 | 391 | |
| Hanesbrands, Inc. 144A 5.375%, 5/15/25(3) | 560 | 586 | |
| Hilton Grand Vacations Borrower Escrow LLC 144A 5.000%, 6/1/29(3) | 145 | 148 | |
| M/I Homes, Inc. 4.950%, 2/1/28 | 435 | 455 | |
| Par Value | Value | ||
| Consumer Discretionary—continued | |||
| Marriott International, Inc. Series HH 2.850%, 4/15/31 | $ 82 | $ 83 | |
| Marriott Ownership Resorts, Inc. 4.750%, 1/15/28 | 335 | 342 | |
| PulteGroup, Inc. 6.375%, 5/15/33 | 780 | 1,025 | |
| QVC, Inc. 4.375%, 3/15/23 | 440 | 459 | |
| Scientific Games International, Inc. | |||
| 144A 5.000%, 10/15/25(3) | 370 | 381 | |
| 144A 8.250%, 3/15/26(3) | 210 | 223 | |
| 144A 7.000%, 5/15/28(3) | 80 | 86 | |
| Tenneco, Inc. 144A 5.125%, 4/15/29(3) | 540 | 552 | |
| 7,491 | |||
| Consumer Staples—0.3% | |||
| Albertsons Cos., Inc. | |||
| 144A 4.625%, 1/15/27(3) | 455 | 477 | |
| 144A 3.500%, 3/15/29(3) | 60 | 60 | |
| Anheuser-Busch InBev Worldwide, Inc. | |||
| 4.000%, 4/13/28 | 520 | 587 | |
| 4.750%, 1/23/29 | 130 | 153 | |
| Bacardi Ltd. 144A 4.700%, 5/15/28(3) | 520 | 601 | |
| BAT Capital Corp. 4.906%, 4/2/30 | 705 | 807 | |
| Vector Group Ltd. 144A 5.750%, 2/1/29(3) | 585 | 585 | |
| 3,270 | |||
| Energy—1.2% | |||
| Alliance Resource Operating Partners LP 144A 7.500%, 5/1/25(3) | 460 | 467 | |
| Boardwalk Pipelines LP 4.950%, 12/15/24 | 550 | 609 | |
| Cheniere Energy Partners LP 144A 3.250%, 1/31/32(3) | 420 | 421 | |
| Cheniere Energy, Inc. 4.625%, 10/15/28 | 235 | 248 | |
| CNX Midstream Partners LP 144A 4.750%, 4/15/30(3) | 25 | 25 | |
| CrownRock LP | |||
| 144A 5.625%, 10/15/25(3) | 345 | 353 | |
| 144A 5.000%, 5/1/29(3) | 300 | 313 | |
| Par Value | Value | ||
| Energy—continued | |||
| Energy Transfer LP Series H 6.500% (7) | $ 590 | $ 614 | |
| EQM Midstream Partners LP | |||
| 144A 6.000%, 7/1/25(3) | 55 | 60 | |
| 144A 6.500%, 7/1/27(3) | 65 | 73 | |
| 144A 4.750%, 1/15/31(3) | 140 | 146 | |
| Flex Intermediate Holdco LLC 144A 3.363%, 6/30/31(3) | 785 | 796 | |
| HollyFrontier Corp. 5.875%, 4/1/26 | 630 | 723 | |
| Kinder Morgan Energy Partners LP 7.500%, 11/15/40 | 445 | 657 | |
| Lundin Energy Finance B.V. 144A 2.000%, 7/15/26(3) | 740 | 744 | |
| Occidental Petroleum Corp. 5.500%, 12/1/25 | 15 | 17 | |
| Odebrecht Oil & Gas Finance Ltd. 144A 0.000% (3)(4)(7) | 25 | — (8) | |
| Parsley Energy LLC 144A 4.125%, 2/15/28(3) | 330 | 345 | |
| Patterson-UTI Energy, Inc. 5.150%, 11/15/29 | 350 | 359 | |
| Pertamina Persero PT 144A 6.450%, 5/30/44(3) | 980 | 1,277 | |
| Petroleos de Venezuela S.A. 144A 6.000%, 5/16/24(1)(3) | 255 | 15 | |
| Petroleos Mexicanos | |||
| 6.500%, 3/13/27 | 350 | 370 | |
| 7.690%, 1/23/50 | 560 | 530 | |
| Petronas Capital Ltd. 144A 3.500%, 4/21/30(3) | 530 | 574 | |
| Sabine Pass Liquefaction LLC 4.200%, 3/15/28 | 210 | 235 | |
| Southwestern Energy Co. 144A 5.375%, 2/1/29(3) | 230 | 246 | |
| Targa Resources Partners LP 5.875%, 4/15/26 | 430 | 449 | |
| Transocean Guardian Ltd. 144A 5.875%, 1/15/24(3) | 91 | 90 | |
| Venture Global Calcasieu Pass LLC 144A 3.875%, 8/15/29(3) | 315 | 325 | |
| 11,081 | |||
| Financials—3.9% | |||
| AerCap Ireland Capital DAC 3.650%, 7/21/27 | 390 | 414 | |
| Par Value | Value | ||
| Financials—continued | |||
| Allstate Corp. (The) Series B 5.750%, 8/15/53 | $ 565 | $ 611 | |
| Ally Financial, Inc. Series B 4.700% (7) | 628 | 654 | |
| Ares Finance Co. LLC 144A 4.000%, 10/8/24(3) | 705 | 751 | |
| Ascot Group Ltd. 144A 4.250%, 12/15/30(3) | 745 | 790 | |
| Athene Global Funding 144A 2.450%, 8/20/27(3) | 775 | 800 | |
| Bank of America Corp. | |||
| 2.687%, 4/22/32 | 1,725 | 1,757 | |
| 2.482%, 9/21/36 | 750 | 735 | |
| (3 month LIBOR + 0.770%) 0.891%, 2/5/26(5) | 640 | 649 | |
| Bank of New York Mellon Corp. (The) Series G 4.700% (7) | 710 | 779 | |
| BBVA Bancomer S.A. 144A 5.125%, 1/18/33(3) | 540 | 563 | |
| Blackstone Private Credit Fund 144A 2.625%, 12/15/26(3) | 305 | 304 | |
| Blue Owl Finance LLC 144A 3.125%, 6/10/31(3) | 740 | 732 | |
| Brighthouse Financial, Inc. 5.625%, 5/15/30 | 648 | 782 | |
| Brookfield Finance, Inc. 2.724%, 4/15/31 | 1,200 | 1,227 | |
| Burford Capital Global Finance LLC 144A 6.250%, 4/15/28(3) | 200 | 212 | |
| Capital One Financial Corp. 2.359%, 7/29/32 | 573 | 561 | |
| Charles Schwab Corp. (The) Series H 4.000% (7) | 775 | 799 | |
| Citadel LP 144A 4.875%, 1/15/27(3) | 565 | 610 | |
| Citigroup, Inc. | |||
| 3.200%, 10/21/26 | 525 | 566 | |
| (3 month LIBOR + 1.250%) 1.381%, 7/1/26(5) | 1,200 | 1,238 | |
| Coinbase Global, Inc. 144A 3.625%, 10/1/31(3) | 600 | 570 | |
| Discover Bank 4.682%, 8/9/28 | 1,435 | 1,527 | |
| Drawbridge Special Opportunities Fund LP 144A 3.875%, 2/15/26(3) | 770 | 791 | |
| Fairfax Financial Holdings Ltd. 4.850%, 4/17/28 | 585 | 668 | |
| Par Value | Value | ||
| Financials—continued | |||
| Goldman Sachs Group, Inc. (The) (3 month LIBOR + 1.170%) 1.295%, 5/15/26(5) | $ 685 | $ 702 | |
| Icahn Enterprises LP 6.250%, 5/15/26 | 710 | 742 | |
| Jefferies Group LLC 4.850%, 1/15/27 | 340 | 394 | |
| JPMorgan Chase & Co. 1.953%, 2/4/32 | 1,445 | 1,394 | |
| Ladder Capital Finance Holdings LLLP 144A 4.250%, 2/1/27(3) | 490 | 485 | |
| Liberty Mutual Group, Inc. | |||
| 144A 4.569%, 2/1/29(3) | 627 | 729 | |
| 144A 4.125%, 12/15/51(3) | 600 | 617 | |
| Lincoln National Corp. (3 month LIBOR + 2.040%) 2.174%, 4/20/67(5) | 615 | 548 | |
| MetLife, Inc. Series G 3.850% (7) | 695 | 726 | |
| Morgan Stanley | |||
| 3.125%, 7/27/26 | 1,080 | 1,162 | |
| 6.375%, 7/24/42 | 580 | 878 | |
| Nippon Life Insurance Co. 144A 2.900%, 9/16/51(3) | 390 | 385 | |
| OneMain Finance Corp. | |||
| 6.875%, 3/15/25 | 330 | 371 | |
| 7.125%, 3/15/26 | 135 | 156 | |
| Prudential Financial, Inc. | |||
| 5.875%, 9/15/42 | 285 | 296 | |
| 5.625%, 6/15/43 | 720 | 766 | |
| Santander Holdings USA, Inc. 4.400%, 7/13/27 | 640 | 719 | |
| Societe Generale S.A. 144A 4.750%, 11/24/25(3) | 535 | 594 | |
| Synovus Financial Corp. 5.900%, 2/7/29 | 300 | 323 | |
| Texas Capital Bancshares, Inc. 4.000%, 5/6/31 | 890 | 926 | |
| Toronto-Dominion Bank (The) 3.625%, 9/15/31 | 725 | 797 | |
| UBS AG 7.625%, 8/17/22 | 1,430 | 1,515 | |
| Wells Fargo & Co. | |||
| 2.393%, 6/2/28 | 1,310 | 1,351 | |
| Series BB 3.900%(7) | 1,155 | 1,191 | |
| Zions Bancorp NA 3.250%, 10/29/29 | 405 | 421 | |
| 37,278 | |||
| Par Value | Value | ||
| Health Care—0.6% | |||
| Anthem, Inc. 2.875%, 9/15/29 | $ 565 | $ 595 | |
| Bausch Health Cos., Inc. 144A 5.750%, 8/15/27(3) | 200 | 210 | |
| Centene Corp. 4.625%, 12/15/29 | 220 | 240 | |
| DaVita, Inc. 144A 4.625%, 6/1/30(3) | 565 | 581 | |
| HCA, Inc. 5.250%, 6/15/49 | 415 | 530 | |
| Illumina, Inc. 2.550%, 3/23/31 | 370 | 373 | |
| Jaguar Holding Co. II 144A 5.000%, 6/15/28(3) | 285 | 307 | |
| Legacy LifePoint Health LLC 144A 4.375%, 2/15/27(3) | 305 | 304 | |
| Mozart Debt Merger Sub, Inc. 144A 3.875%, 4/1/29(3) | 155 | 155 | |
| Par Pharmaceutical, Inc. 144A 7.500%, 4/1/27(3) | 215 | 219 | |
| Prime Healthcare Services, Inc. 144A 7.250%, 11/1/25(3) | 35 | 38 | |
| Surgery Center Holdings, Inc. 144A 6.750%, 7/1/25(3) | 15 | 15 | |
| Tenet Healthcare Corp. 144A 7.500%, 4/1/25(3) | 50 | 53 | |
| Teva Pharmaceutical Finance Netherlands III B.V. 3.150%, 10/1/26 | 515 | 493 | |
| Universal Health Services, Inc. 144A 2.650%, 1/15/32(3) | 490 | 485 | |
| Utah Acquisition Sub, Inc. 3.950%, 6/15/26 | 535 | 589 | |
| Viatris, Inc. 144A 2.300%, 6/22/27(3) | 481 | 492 | |
| 5,679 | |||
| Industrials—0.8% | |||
| American Airlines, Inc. 144A 5.750%, 4/20/29(3) | 185 | 199 | |
| Ashtead Capital, Inc. 144A 4.375%, 8/15/27(3) | 905 | 949 | |
| Aviation Capital Group LLC 144A 3.500%, 11/1/27(3) | 560 | 590 | |
| Avolon Holdings Funding Ltd. 144A 4.375%, 5/1/26(3) | 565 | 610 | |
| Par Value | Value | ||
| Industrials—continued | |||
| Boeing Co. (The) 5.150%, 5/1/30 | $ 415 | $ 487 | |
| British Airways Pass-Through Trust 2021-1, A 144A 2.900%, 3/15/35(3) | 610 | 613 | |
| Dycom Industries, Inc. 144A 4.500%, 4/15/29(3) | 230 | 231 | |
| Fortress Transportation and Infrastructure Investors LLC 144A 6.500%, 10/1/25(3) | 35 | 36 | |
| GFL Environmental, Inc. | |||
| 144A 3.750%, 8/1/25(3) | 460 | 473 | |
| 144A 4.000%, 8/1/28(3) | 440 | 437 | |
| Huntington Ingalls Industries, Inc. 144A 2.043%, 8/16/28(3) | 778 | 768 | |
| Kazakhstan Temir Zholy Finance BV 144A 6.950%, 7/10/42(3) | 440 | 603 | |
| Spirit AeroSystems, Inc. 144A 5.500%, 1/15/25(3) | 595 | 629 | |
| TransDigm, Inc. 5.500%, 11/15/27 | 305 | 313 | |
| United Airlines, Inc. 144A 4.625%, 4/15/29(3) | 425 | 439 | |
| 7,377 | |||
| Information Technology—0.9% | |||
| Broadcom, Inc. | |||
| 4.150%, 11/15/30 | 712 | 789 | |
| 144A 2.450%, 2/15/31(3) | 388 | 376 | |
| 144A 3.187%, 11/15/36(3) | 38 | 38 | |
| Citrix Systems, Inc. 3.300%, 3/1/30 | 975 | 996 | |
| Consensus Cloud Solutions, Inc. | |||
| 144A 6.000%, 10/15/26(3) | 60 | 62 | |
| 144A 6.500%, 10/15/28(3) | 85 | 88 | |
| Dell International LLC 8.100%, 7/15/36 | 210 | 318 | |
| Flex Ltd. 3.750%, 2/1/26 | 555 | 604 | |
| HP, Inc. 3.400%, 6/17/30 | 835 | 888 | |
| Leidos, Inc. 2.300%, 2/15/31 | 800 | 782 | |
| Motorola Solutions, Inc. | |||
| 4.600%, 2/23/28 | 517 | 596 | |
| 4.600%, 5/23/29 | 265 | 308 | |
| Par Value | Value | ||
| Information Technology—continued | |||
| NCR Corp. 144A 5.125%, 4/15/29(3) | $ 350 | $ 361 | |
| Science Applications International Corp. 144A 4.875%, 4/1/28(3) | 580 | 599 | |
| SK Hynix, Inc. 144A 1.500%, 1/19/26(3) | 465 | 459 | |
| Square, Inc. 144A 3.500%, 6/1/31(3) | 405 | 415 | |
| SYNNEX Corp. 144A 2.375%, 8/9/28(3) | 905 | 896 | |
| Xerox Holdings Corp. 144A 5.500%, 8/15/28(3) | 455 | 471 | |
| 9,046 | |||
| Materials—0.7% | |||
| Ardagh Metal Packaging Finance USA LLC 144A 4.000%, 9/1/29(3) | 200 | 202 | |
| Ardagh Packaging Finance plc 144A 4.125%, 8/15/26(3) | 610 | 633 | |
| Chemours Co. (The) 144A 5.750%, 11/15/28(3) | 430 | 450 | |
| Cleveland-Cliffs, Inc. 144A 6.750%, 3/15/26(3) | 570 | 608 | |
| Freeport-McMoRan, Inc. 5.450%, 3/15/43 | 475 | 585 | |
| Glencore Funding LLC 144A 2.850%, 4/27/31(3) | 750 | 754 | |
| International Flavors & Fragrances, Inc. 144A 2.300%, 11/1/30(3) | 635 | 630 | |
| Inversiones CMPC S.A. 144A 3.850%, 1/13/30(3) | 870 | 920 | |
| Louisiana-Pacific Corp. 144A 3.625%, 3/15/29(3) | 490 | 493 | |
| New Enterprise Stone & Lime Co., Inc. 144A 5.250%, 7/15/28(3) | 10 | 10 | |
| Suzano Austria GmbH 2.500%, 9/15/28 | 295 | 287 | |
| Teck Resources Ltd. 6.125%, 10/1/35 | 540 | 700 | |
| 6,272 | |||
| Real Estate—0.6% | |||
| American Assets Trust LP 3.375%, 2/1/31 | 261 | 270 | |
| EPR Properties 4.750%, 12/15/26 | 865 | 947 | |
| Par Value | Value | ||
| Real Estate—continued | |||
| GLP Capital LP 5.750%, 6/1/28 | $ 655 | $ 769 | |
| MPT Operating Partnership LP | |||
| 5.000%, 10/15/27 | 240 | 253 | |
| 4.625%, 8/1/29 | 140 | 150 | |
| 3.500%, 3/15/31 | 525 | 536 | |
| Office Properties Income Trust 4.500%, 2/1/25 | 555 | 595 | |
| Phillips Edison Grocery Center Operating Partnership I LP 2.625%, 11/15/31 | 380 | 376 | |
| Retail Opportunity Investments Partnership LP 4.000%, 12/15/24 | 485 | 518 | |
| Retail Properties of America, Inc. 4.750%, 9/15/30 | 780 | 858 | |
| Service Properties Trust 4.950%, 2/15/27 | 640 | 638 | |
| 5,910 | |||
| Utilities—0.1% | |||
| Perusahaan Listrik Negara PT 144A 4.125%, 5/15/27(3) | 210 | 228 | |
| Puget Energy, Inc. 144A 2.379%, 6/15/28(3) | 453 | 453 | |
| Southern Co. (The) Series A 3.750%, 9/15/51 | 794 | 809 | |
| 1,490 | |||
| Total Corporate Bonds and Notes (Identified Cost $96,000) | 99,876 | ||
| Leveraged Loans—3.0% | |||
| Aerospace—0.4% | |||
| Air Canada (3 month LIBOR + 3.500%) 4.250%, 8/11/28(5) | 78 | 78 | |
| American Airlines, Inc. (3 month LIBOR + 4.750%) 5.500%, 4/20/28(5) | 455 | 470 | |
| Brown Group Holding LLC (3 month LIBOR + 2.750%) 3.250%, 6/7/28(5) | 584 | 583 | |
| Par Value | Value | ||
| Aerospace—continued | |||
| Delta Air Lines, Inc. (3 month LIBOR + 3.750%) 0.000%, 10/20/27(5)(9) | $ 550 | $ 585 | |
| KKR Apple Bidco LLC (1 month LIBOR + 3.000%) 3.500%, 9/22/28(5) | 585 | 584 | |
| Mileage Plus Holdings, LLC (3 month LIBOR + 5.250%) 6.250%, 6/21/27(5) | 600 | 637 | |
| TransDigm, Inc. Tranche E (1 month LIBOR + 2.250%) 2.334%, 5/30/25(5) | 673 | 665 | |
| 3,602 | |||
| Chemicals—0.2% | |||
| Ineos U.S. Finance LLC 2024 (3 month LIBOR + 2.000%) 2.084%, 4/1/24(5) | 689 | 684 | |
| Ineos U.S. Petrochem LLC 2026, Tranche B (1 month LIBOR + 2.750%) 3.250%, 1/29/26(5) | 459 | 459 | |
| Starfruit Finco B.V. (1 month LIBOR + 2.750%) 2.832%, 10/1/25(5) | 526 | 523 | |
| Trinseo Materials Operating SCA 2021 (1 month LIBOR + 2.500%) 2.584%, 5/3/28(5) | 484 | 482 | |
| 2,148 | |||
| Consumer Durables—0.0% | |||
| Resideo Funding, Inc. Tranche B (1 month LIBOR + 2.250%) 2.750%, 2/11/28(5) | 298 | 298 | |
| Consumer Non-Durables—0.1% | |||
| Diamond BC B.V. Tranche B (3 month LIBOR + 3.000%) 0.000%, 9/29/28(5)(9) | 570 | 570 | |
| Energy—0.1% | |||
| Buckeye Partners LP Tranche B, First Lien (1 month LIBOR + 2.250%) 2.334%, 11/1/26(5) | 103 | 103 | |
| Par Value | Value | ||
| Energy—continued | |||
| Citgo Petroleum Corp. 2019, Tranche B (3 month LIBOR + 6.250%) 7.250%, 3/28/24(5) | $ 258 | $ 258 | |
| DT Midstream, Inc. (3 month LIBOR + 2.000%) 2.500%, 6/26/28(5) | 160 | 159 | |
| Oryx Midstream Services Permian Basin LLC Tranche B (3 month LIBOR + 3.250%) 0.000%, 10/5/28(5)(9) | 110 | 110 | |
| 630 | |||
| Financial—0.1% | |||
| Asurion LLC Tranche B-9 (1 month LIBOR + 3.250%) 3.334%, 7/31/27(5) | 284 | 280 | |
| Avolon TLB Borrower 1 U.S. LLC Tranche B-5 (1 month LIBOR + 2.250%) 2.750%, 12/1/27(5) | 308 | 308 | |
| Citadel Securities LP 2021 (1 month LIBOR + 2.500%) 2.584%, 2/2/28(5) | 657 | 650 | |
| Zebra Buyer LLC (3 month LIBOR + 3.500%) 0.000%, 4/21/28(5)(9) | 45 | 45 | |
| 1,283 | |||
| Food / Tobacco—0.1% | |||
| Aramark Services, Inc. Tranche B-4 (1 month LIBOR + 1.750%) 1.834%, 1/15/27(5) | 93 | 91 | |
| CHG PPC Parent LLC First Lien (1 month LIBOR + 2.750%) 2.834%, 3/31/25(5) | 179 | 178 | |
| Hostess Brands LLC 2019, Tranche B (1 month LIBOR + 2.250%) 3.000%, 8/3/25(5) | 596 | 593 | |
| JBS USA Lux S.A. (1 month LIBOR + 2.000%) 2.084%, 5/1/26(5) | 600 | 598 | |
| 1,460 | |||
| Forest Prod / Containers—0.1% | |||
| Berry Global, Inc. Tranche Z (2 month LIBOR + 1.750%) 1.856%, 7/1/26(5) | 558 | 555 | |
| Par Value | Value | ||
| Gaming / Leisure—0.2% | |||
| Aristocrat Technologies, Inc. (3 month LIBOR + 3.750%) 4.750%, 10/19/24(5) | $ 287 | $ 288 | |
| Caesars Resort Collection LLC Tranche B (1 month LIBOR + 2.750%) 2.834%, 12/23/24(5) | 612 | 608 | |
| Hilton Grand Vacations Borrower LLC (1 month LIBOR + 3.000%) 3.500%, 8/2/28(5) | 80 | 80 | |
| Hilton Worldwide Finance LLC Tranche B-2 (1 month LIBOR + 1.750%) 1.833%, 6/22/26(5) | 605 | 600 | |
| Pug LLC Tranche B (1 month LIBOR + 3.500%) 3.584%, 2/12/27(5) | 275 | 269 | |
| Scientific Games International, Inc. Tranche B-5 (1 month LIBOR + 2.750%) 2.834%, 8/14/24(5) | 294 | 293 | |
| Station Casinos LLC Tranche B-1 (1 month LIBOR + 2.250%) 2.500%, 2/8/27(5) | 163 | 161 | |
| 2,299 | |||
| Health Care—0.2% | |||
| Agiliti Health, Inc. (3 month LIBOR + 2.750%) 0.000%, 1/4/26(5)(9) | 165 | 164 | |
| Bausch Health Cos., Inc. | |||
| (1 month LIBOR + 2.750%) 2.834%, 11/27/25(5) | 93 | 92 | |
| (1 month LIBOR + 3.000%) 3.084%, 6/2/25(5) | 46 | 46 | |
| IQVIA, Inc. Tranche B-3 (3 month LIBOR + 1.750%) 1.882%, 6/11/25(5) | 347 | 347 | |
| LifePoint Health, Inc. Tranche B, First Lien (1 month LIBOR + 3.750%) 3.834%, 11/17/25(5) | 435 | 434 | |
| Medline Borrower LP (3 month LIBOR + 3.250%) 0.000%, 10/23/28(5)(9) | 170 | 169 | |
| Parexel International Corp. (3 month LIBOR + 3.500%) 0.000%, 8/11/28(5)(9) | 100 | 100 | |
| Par Value | Value | ||
| Health Care—continued | |||
| PPD, Inc. (1 month LIBOR + 2.000%) 2.500%, 1/13/28(5) | $ 418 | $ 417 | |
| 1,769 | |||
| Housing—0.2% | |||
| CPG International LLC (3 month LIBOR + 2.500%) 3.250%, 5/6/24(5) | 501 | 501 | |
| Quikrete Holdings, Inc. Tranche B-1 (3 month LIBOR + 3.000%) 0.000%, 1/31/27(5)(9) | 435 | 433 | |
| Standard Industries, Inc. Tranche B (3 month LIBOR + 2.500%) 0.000%, 9/22/28(5)(9) | 700 | 700 | |
| Summit Materials LLC Tranche B (1 month LIBOR + 2.000%) 2.084%, 11/21/24(5) | 598 | 597 | |
| 2,231 | |||
| Information Technology—0.3% | |||
| Applied Systems, Inc. | |||
| First Lien (3 month LIBOR + 3.250%) 3.750%, 9/19/24(5) | 394 | 394 | |
| Second Lien (3 month LIBOR + 5.500%) 6.250%, 9/19/25(5) | 54 | 55 | |
| Boxer Software 2nd 2021 (3 month LIBOR + 3.750%) 3.882%, 10/2/25(5) | 550 | 547 | |
| CCC Intelligent Solutions, Inc. (3 month LIBOR + 2.500%) 3.000%, 9/21/28(5) | 25 | 25 | |
| Sophia LP (3 month LIBOR + 3.750%) 3.882%, 10/7/27(5) | 541 | 543 | |
| Tenable, Inc. (3 month LIBOR + 2.750%) 3.250%, 7/7/28(5) | 620 | 618 | |
| UKG, Inc. 2021 (3 month LIBOR + 3.250%) 4.000%, 5/4/26(5) | 268 | 268 | |
| 2,450 | |||
| Manufacturing—0.2% | |||
| Alliance Laundry Systems LLC Tranche B (3 month LIBOR + 3.500%) 4.250%, 10/8/27(5) | 501 | 502 | |
| Par Value | Value | ||
| Manufacturing—continued | |||
| Gates Global LLC Tranche B-3 (1 month LIBOR + 2.500%) 3.250%, 3/31/27(5) | $ 596 | $ 594 | |
| Star U.S. Bidco LLC (1 month LIBOR + 4.250%) 5.250%, 3/17/27(5) | 460 | 461 | |
| 1,557 | |||
| Media / Telecom - Broadcasting—0.0% | |||
| Nexstar Broadcasting, Inc. Tranche B-4 (1 month LIBOR + 2.500%) 2.586%, 9/18/26(5) | 451 | 450 | |
| Media / Telecom - Cable/Wireless Video—0.1% | |||
| CSC Holdings LLC 2018 (1 month LIBOR + 2.250%) 2.334%, 1/15/26(5) | 417 | 411 | |
| Radiate Holdco LLC Tranche B (1 month LIBOR + 3.500%) 4.250%, 9/25/26(5) | 61 | 60 | |
| Virgin Media Bristol LLC Tranche Q (1 month LIBOR + 3.250%) 3.334%, 1/31/29(5) | 70 | 70 | |
| 541 | |||
| Media / Telecom - Diversified Media—0.0% | |||
| UPC Financing Partnership Tranche AX (1 month LIBOR + 3.000%) 3.084%, 1/31/29(5) | 130 | 130 | |
| Media / Telecom - Telecommunications—0.1% | |||
| CenturyLink, Inc. Tranche B (1 month LIBOR + 2.250%) 2.334%, 3/15/27(5) | 152 | 150 | |
| Consolidated Communications, Inc. Tranche B-1 (1 month LIBOR + 3.500%) 4.250%, 10/2/27(5) | 104 | 104 | |
| Zayo Group Holdings, Inc. (1 month LIBOR + 3.000%) 3.084%, 3/9/27(5) | 377 | 373 | |
| 627 | |||
| Par Value | Value | ||
| Media / Telecom - Wireless Communications—0.1% | |||
| SBA Senior Finance II LLC Tranche B (1 month LIBOR + 1.750%) 1.840%, 4/11/25(5) | $ 619 | $ 613 | |
| Retail—0.1% | |||
| Harbor Freight Tools USA, Inc. 2021 (1 month LIBOR + 2.750%) 3.250%, 10/19/27(5) | 610 | 610 | |
| PetsMart LLC (3 month LIBOR + 3.750%) 4.500%, 2/11/28(5) | 300 | 300 | |
| 910 | |||
| Service—0.3% | |||
| AlixPartners LLP (1 month LIBOR + 2.750%) 3.250%, 2/4/28(5) | 687 | 685 | |
| Dun & Bradstreet Corp. (The) Tranche B (1 month LIBOR + 3.250%) 3.336%, 2/6/26(5) | 736 | 735 | |
| Peraton Corp. Tranche B, First Lien (1 month LIBOR + 3.750%) 4.500%, 2/1/28(5) | 327 | 327 | |
| PODS LLC (1 month LIBOR + 3.000%) 3.750%, 3/31/28(5) | 328 | 329 | |
| Sedgwick Claims Management Services, Inc. (1 month LIBOR + 3.250%) 3.334%, 12/31/25(5) | 627 | 621 | |
| WEX, Inc. Tranche B (1 month LIBOR + 2.250%) 2.334%, 3/31/28(5) | 582 | 579 | |
| 3,276 | |||
| Transportation - Automotive—0.0% | |||
| Cooper-Standard Automotive, Inc. Tranche B-1 (1 month LIBOR + 2.000%) 2.750%, 11/2/23(5) | 491 | 468 | |
| Utility—0.1% | |||
| Astoria Energy LLC Tranche B (3 month LIBOR + 3.500%) 4.500%, 12/10/27(5) | 424 | 425 | |
| Par Value | Value | ||
| Utility—continued | |||
| Brookfield WEC Holdings, Inc. (1 month LIBOR + 2.750%) 3.250%, 8/1/25(5) | $ 620 | $ 616 | |
| 1,041 | |||
| Total Leveraged Loans (Identified Cost $28,858) | 28,908 | ||
| Shares | ||
| Preferred Stocks—0.3% | ||
| Financials—0.2% | ||
| Discover Financial Services Series D, 6.125% | 175 (10) | 196 |
| JPMorgan Chase & Co. Series HH, 4.600% | 304 (10) | 311 |
| MetLife, Inc. Series D, 5.875%(6) | 277 (10) | 326 |
| Truist Financial Corp. Series Q, 5.100% | 680 (10) | 782 |
| Zions Bancorp NA, 6.950% | 6,400 | 184 |
| 1,799 | ||
| Industrials—0.1% | ||
| General Electric Co. Series D, 3.446% | 725 (10) | 709 |
| Total Preferred Stocks (Identified Cost $2,253) | 2,508 | |
| Common Stocks—68.6% | ||
| Communication Services—10.6% | ||
| Adevinta ASA Class B(11) | 162,082 | 2,777 |
| Ascential plc(11) | 740,523 | 4,085 |
| Auto Trader Group plc | 688,962 | 5,433 |
| Autohome, Inc. ADR | 28,430 | 1,334 |
| CTS Eventim AG & Co. KGaA(11) | 24,308 | 1,829 |
| Facebook, Inc. Class A(11) | 87,948 | 29,849 |
| Infrastrutture Wireless Italiane SpA | 445,557 | 4,963 |
| Karnov Group AB Class B | 237,170 | 1,441 |
| MarkLines Co., Ltd. | 56,600 | 1,572 |
| Netflix, Inc.(11) | 29,800 | 18,188 |
| New Work SE | 13,557 | 3,320 |
| Rightmove plc | 701,548 | 6,445 |
| Tencent Holdings Ltd. Unsponsored ADR | 188,665 | 11,276 |
| Yandex N.V. Class A(11) | 37,249 | 2,968 |
| Shares | Value | ||
| Communication Services—continued | |||
| ZoomInfo Technologies, Inc. Class A(11) | 86,970 | $ 5,322 | |
| 100,802 | |||
| Consumer Discretionary—12.9% | |||
| Airbnb, Inc. Class A(11) | 41,240 | 6,918 | |
| Alibaba Group Holding Ltd. Sponsored ADR(11) | 85,245 | 12,621 | |
| Allegro.eu S.A.(11) | 336,513 | 4,886 | |
| Amazon.com, Inc.(11) | 12,144 | 39,895 | |
| Home Depot, Inc. (The) | 20,942 | 6,874 | |
| Marriott International, Inc. Class A(11) | 36,908 | 5,466 | |
| Max Stock Ltd. | 572,792 | 2,043 | |
| MercadoLibre, Inc.(11) | 7,967 | 13,380 | |
| Mercari, Inc.(11) | 65,700 | 3,630 | |
| NIKE, Inc. Class B | 90,471 | 13,139 | |
| Redbubble Ltd.(11) | 1,176,280 | 3,671 | |
| Ross Stores, Inc. | 58,645 | 6,384 | |
| Sonans Holding AS(11) | 641,602 | 3,728 | |
| Vasta Platform Ltd. Class A(11) | 215,022 | 980 | |
| 123,615 | |||
| Consumer Staples—2.8% | |||
| BIM Birlesik Magazalar AS | 438,033 | 3,150 | |
| Estee Lauder Cos., Inc. (The) Class A | 18,092 | 5,426 | |
| Heineken Malaysia Bhd | 237,500 | 1,310 | |
| McCormick & Co., Inc. | 46,639 | 3,779 | |
| Monster Beverage Corp.(11) | 72,955 | 6,481 | |
| Procter & Gamble Co. (The) | 48,682 | 6,806 | |
| 26,952 | |||
| Energy—0.4% | |||
| Frontera Energy Corp.(11) | 1,798 | 11 | |
| Pason Systems, Inc. | 498,219 | 3,390 | |
| 3,401 | |||
| Financials—4.7% | |||
| Bank of America Corp. | 238,976 | 10,144 | |
| Cerved Group SpA(11) | 124,491 | 1,469 | |
| CME Group, Inc. Class A | 20,906 | 4,043 | |
| Gruppo Mutuionline SpA | 73,090 | 3,608 | |
| Kaspi.KZ JSC GDR, 144A(3) | 42,939 | 4,578 | |
| MarketAxess Holdings, Inc. | 16,301 | 6,858 | |
| Mortgage Advice Bureau Holdings Ltd. | 186,773 | 2,875 | |
| Nordnet AB publ | 191,530 | 3,431 | |
| Progressive Corp. (The) | 30,547 | 2,761 | |
| Sabre Insurance Group plc | 624,849 | 1,837 | |
| VNV Global AB(11) | 268,730 | 3,211 | |
| 44,815 | |||
| Health Care—3.6% | |||
| Danaher Corp. | 39,808 | 12,119 | |
| Shares | Value | ||
| Health Care—continued | |||
| Haw Par Corp., Ltd. | 385,700 | $ 3,270 | |
| HealthEquity, Inc.(11) | 44,670 | 2,893 | |
| Nakanishi, Inc. | 80,900 | 1,842 | |
| Zoetis, Inc. Class A | 71,705 | 13,921 | |
| 34,045 | |||
| Industrials—9.5% | |||
| Boa Vista Servicos S.A. | 948,109 | 2,216 | |
| BTS Group AB Class B | 63,310 | 2,617 | |
| CAE, Inc.(11) | 155,026 | 4,632 | |
| CoStar Group, Inc.(11) | 113,100 | 9,733 | |
| Enento Group Oyj(11) | 62,798 | 2,566 | |
| Equifax, Inc. | 20,951 | 5,309 | |
| Fair Isaac Corp.(11) | 12,010 | 4,779 | |
| Haitian International Holdings Ltd. | 925,000 | 2,870 | |
| HeadHunter Group plc ADR | 176,101 | 8,594 | |
| Knorr-Bremse AG | 44,447 | 4,756 | |
| Marel HF | 696,971 | 4,760 | |
| Meitec Corp. | 46,500 | 2,561 | |
| MTU Aero Engines AG | 17,779 | 3,997 | |
| Roper Technologies, Inc. | 18,438 | 8,226 | |
| Rotork plc | 312,027 | 1,458 | |
| S-1 Corp. | 71,730 | 5,066 | |
| Uber Technologies, Inc.(11) | 189,893 | 8,507 | |
| Voltronic Power Technology Corp. | 72,894 | 4,445 | |
| Wolters Kluwer N.V. | 34,299 | 3,636 | |
| 90,728 | |||
| Information Technology—23.3% | |||
| Accenture plc Class A | 26,640 | 8,523 | |
| Admicom Oyj | 11,333 | 1,210 | |
| Alten S.A. | 27,211 | 3,982 | |
| Amphenol Corp. Class A | 164,776 | 12,066 | |
| Avalara, Inc.(11) | 94,889 | 16,584 | |
| Bill.com Holdings, Inc.(11) | 171,305 | 45,730 | |
| Bouvet ASA | 404,095 | 2,729 | |
| Brockhaus Capital Management AG(11) | 52,904 | 1,354 | |
| DocuSign, Inc.(11) | 18,700 | 4,814 | |
| Duck Creek Technologies, Inc.(11) | 224,852 | 9,947 | |
| FDM Group Holdings plc | 139,017 | 2,374 | |
| Fineos Corp., Ltd. CDI(11) | 225,034 | 700 | |
| Mintra Holding AS(11) | 310,566 | 209 | |
| MongoDB, Inc. Class A(11) | 10,510 | 4,956 | |
| NVIDIA Corp. | 152,470 | 31,586 | |
| Paycom Software, Inc.(11) | 45,840 | 22,725 | |
| SimCorp A/S | 12,046 | 1,423 | |
| Snowflake, Inc. Class A(11) | 23,763 | 7,187 | |
| Trade Desk, Inc. (The) Class A(11) | 151,300 | 10,636 | |
| Visa, Inc. Class A | 95,438 | 21,259 | |
| Webcash Corp. | 37,463 | 963 | |
| Shares | Value | ||
| Information Technology—continued | |||
| Workday, Inc. Class A(11) | 47,302 | $ 11,820 | |
| 222,777 | |||
| Materials—0.8% | |||
| Corp. Moctezuma SAB de C.V. | 620,531 | 2,100 | |
| Ecolab, Inc. | 27,000 | 5,633 | |
| 7,733 | |||
| Total Common Stocks (Identified Cost $316,714) | 654,868 | ||
| Exchange-Traded Fund—0.1% | |||
| VanEck High Yield Muni ETF(6) | 12,557 | 785 | |
| Total Exchange-Traded Fund (Identified Cost $787) | 785 | ||
| Warrant—0.0% | |||
| Financials—0.0% | |||
| VNV Global AB(11) | 88,478 | 121 | |
| Total Warrant (Identified Cost $—) | 121 | ||
| Total Long-Term Investments—98.2% (Identified Cost $593,959) | 937,661 | ||
| Short-Term Investment—2.1% | |||
| Money Market Mutual Fund—2.1% | |||
| Dreyfus Government Cash Management Fund - Institutional Shares (seven-day effective yield 0.030%)(12) | 20,287,280 | 20,287 | |
| Total Short-Term Investment (Identified Cost $20,287) | 20,287 | ||
| Shares | Value | ||
| Securities Lending Collateral—0.2% | |||
| Dreyfus Government Cash Management Fund - Institutional Shares (seven-day effective yield 0.030%)(12)(13) | 1,266,803 | $ 1,267 | |
| Total Securities Lending Collateral (Identified Cost $1,267) | 1,267 | ||
| TOTAL INVESTMENTS—100.5% (Identified Cost $615,513) | $959,215 | ||
| Other assets and liabilities, net—(0.5)% | (4,606) | ||
| NET ASSETS—100.0% | $954,609 | ||
| Abbreviations: | |
| ADR | American Depositary Receipt |
| BAM | Build America Municipal Insured |
| CDI | CREST Depositary Interest |
| ETF | Exchange-Traded Fund |
| GDR | Global Depositary Receipt |
| GS | Goldman Sachs & Co. |
| JSC | Joint Stock Company |
| LIBOR | London Interbank Offered Rate |
| LLC | Limited Liability Company |
| LLLP | Limited Liability Limited Partnership |
| LP | Limited Partnership |
| NA | National Association |
| SOFR30A | Secured Overnight Financing Rate 30 Day Average |
| WaMu | Washington Mutual |
| Footnote Legend: | |
| (1) | Security in default; no interest payments are being received during the bankruptcy proceedings. |
| (2) | Regulation S security. Security is offered and sold outside of the United States; therefore, it is exempt from registration with the SEC under Rules 903 and 904 of the Securities Act of 1933. |
| (3) | Security exempt from registration under Rule 144A of the Securities Act of 1933. These securities may be resold in transactions exempt from registration, normally to qualified institutional buyers. At September 30, 2021, these securities amounted to a value of $143,973 or 15.1% of net assets. |
| (4) | The value of this security was determined using significant unobservable inputs and is reported as a Level 3 security in the Fair Value Hierarchy table located after the Schedule of Investments. |
| (5) | Variable rate security. Rate disclosed is as of September 30, 2021. Information in parenthesis represents benchmark and reference rate for each security. Certain variable rate securities are not based on a published reference rate and spread but are determined by the issuer or agent and are based on current market conditions, or, for mortgage-backed securities, are impacted by the individual mortgages which are paying off over time. These securities do not indicate a reference rate and spread in their descriptions. |
| (6) | All or a portion of security is on loan. |
| (7) | No contractual maturity date. |
| (8) | Amount is less than $500. |
| (9) | This loan will settle after September 30, 2021, at which time the interest rate, based on the LIBOR and the agreed upon spread on trade date, will be reflected. |
| (10) | Value shown as par value. |
| (11) | Non-income producing. |
| (12) | Shares of this fund are publicly offered, and its prospectus and annual report are publicly available. |
| (13) | Represents security purchased with cash collateral received for securities on loan. |
| Country Weightings (Unaudited)† | |
| United States | 77% |
| China | 3 |
| United Kingdom | 3 |
| Brazil | 2 |
| Germany | 2 |
| Canada | 1 |
| Russia | 1 |
| Other | 11 |
| Total | 100% |
| † % of total investments as of September 30, 2021. | |
| Total Value at September 30, 2021 | Level 1 Quoted Prices | Level 2 Significant Observable Inputs | Level 3 Significant Unobservable Inputs | ||||
| Assets: | |||||||
| Debt Securities: | |||||||
| Asset-Backed Securities | $ 32,250 | $ — | $ 32,250 | $— | |||
| Corporate Bonds and Notes | 99,876 | — | 99,876 | — (1) | |||
| Foreign Government Securities | 4,273 | — | 4,273 | — | |||
| Leveraged Loans | 28,908 | — | 28,908 | — | |||
| Mortgage-Backed Securities | 73,462 | — | 73,396 | 66 | |||
| Municipal Bonds | 3,738 | — | 3,738 | — | |||
| U.S. Government Securities | 36,872 | — | 36,872 | — | |||
| Equity Securities: | |||||||
| Common Stocks | 654,868 | 525,366 | 129,502 | — | |||
| Preferred Stocks | 2,508 | 184 | 2,324 | — | |||
| Warrant | 121 | 121 | — | — | |||
| Securities Lending Collateral | 1,267 | 1,267 | — | — | |||
| Exchange-Traded Fund | 785 | 785 | — | — | |||
| Money Market Mutual Fund | 20,287 | 20,287 | — | — | |||
| Total Investments | $959,215 | $548,010 | $411,139 | $66 |
| (1) | Amount is less than $500. |
| KAR Capital Growth Fund | KAR Equity Income Fund | KAR Global Quality Dividend Fund | KAR Mid-Cap Core Fund | ||||
| Assets | |||||||
Investment in securities at value(1)(2) | $ 807,194 | $ 141,536 | $ 38,164 | $ 1,394,431 | |||
Foreign currency at value(3) | — | — | — (a) | — | |||
Cash | 100 | 100 | 50 | 500 | |||
| Receivables | |||||||
Fund shares sold | 47 | 6 | 1 | 4,472 | |||
Dividends | 113 | 248 | 163 | 509 | |||
Tax reclaims | — | 58 | 39 | — | |||
Securities lending income | — (a) | — | 1 | — (a) | |||
Prepaid Trustees’ retainer | 9 | 2 | 1 | 16 | |||
Prepaid expenses | 30 | 26 | 24 | 54 | |||
Other assets | 81 | 14 | 4 | 139 | |||
Total assets | 807,574 | 141,990 | 38,447 | 1,400,121 | |||
| Liabilities | |||||||
| Payables | |||||||
Fund shares repurchased | 82 | 64 | 1 | 859 | |||
Collateral on securities loaned | — | 1,905 | — | — | |||
Investment advisory fees | 487 | 72 | 18 | 825 | |||
Distribution and service fees | 167 | 30 | 6 | 76 | |||
Administration and accounting fees | 69 | 12 | 4 | 117 | |||
Transfer agent and sub-transfer agent fees and expenses | 186 | 43 | 15 | 319 | |||
Professional fees | 25 | 2 | 22 | 26 | |||
Trustee deferred compensation plan | 81 | 14 | 4 | 139 | |||
Interest expense and/or commitment fees | 1 | — (a) | — | 1 | |||
Other accrued expenses | 136 | 46 | 11 | 49 | |||
Total liabilities | 1,234 | 2,188 | 81 | 2,411 | |||
Net Assets | $ 806,340 | $ 139,802 | $ 38,366 | $ 1,397,710 | |||
| Net Assets Consist of: | |||||||
Capital paid in on shares of beneficial interest | $ 190,279 | $ 116,898 | $ 35,342 | $ 937,645 | |||
Accumulated earnings (loss) | 616,061 | 22,904 | 3,024 | 460,065 | |||
Net Assets | $ 806,340 | $ 139,802 | $ 38,366 | $ 1,397,710 | |||
| Net Assets: | |||||||
Class A | $ 736,713 | $ 122,518 | $ 23,807 | $ 86,713 | |||
Class C | $ 9,252 | $ 4,303 | $ 931 | $ 67,627 | |||
Class I | $ 59,565 | $ 11,819 | $ 11,659 | $ 1,188,000 | |||
Class R6 | $ 810 | $ 1,162 | $ 1,969 | $ 55,370 | |||
| Shares Outstanding (unlimited number of shares authorized, no par value): | |||||||
Class A | 25,724,857 | 5,989,187 | 1,614,689 | 1,604,957 | |||
Class C | 447,035 | 246,301 | 65,494 | 1,368,404 | |||
Class I | 1,995,090 | 578,934 | 789,694 | 21,466,530 | |||
Class R6 | 26,794 | 57,107 | 132,667 | 997,430 | |||
| Net Asset Value and Redemption Price Per Share:* | |||||||
Class A | $ 28.64 | $ 20.46 | $ 14.74 | $ 54.03 | |||
Class C | $ 20.70 | $ 17.47 | $ 14.21 | $ 49.42 | |||
Class I | $ 29.86 | $ 20.41 | $ 14.76 | $ 55.34 | |||
Class R6 | $ 30.22 | $ 20.35 | $ 14.84 | $ 55.51 |
| KAR Capital Growth Fund | KAR Equity Income Fund | KAR Global Quality Dividend Fund | KAR Mid-Cap Core Fund | ||||
| Maximum Offering Price Per Share (NAV/(1-Maximum Sales Charge)): | |||||||
Class A | $ 30.31 | $ 21.65 | $ 15.60 | $ 57.17 | |||
Maximum Sales Charge - Class A | 5.50% | 5.50% | 5.50% | 5.50% | |||
(1) Investment in securities at cost | $ 244,733 | $ 124,021 | $ 32,946 | $ 957,240 | |||
(2) Market value of securities on loan | $ — | $ 1,858 | $ — | $ — | |||
(3) Foreign currency at cost | $ — | $ — | $ —(a) | $ — |
| (a) | Amount is less than $500. |
| * | Net Asset Value and Redemption Price Per Share are calculated using unrounded net assets. |
| KAR Mid-Cap Growth Fund | KAR Small-Cap Core Fund | KAR Small-Cap Growth Fund | KAR Small-Cap Value Fund | ||||
| Assets | |||||||
Investment in unaffiliated securities at value(1) | $ 3,432,819 | $ 1,933,714 | $ 4,070,867 | $ 1,422,743 | |||
Investment in affiliated securities at value(2) | — | — | 2,598,253 | — | |||
Cash | 2,000 | 2,001 | 5,001 | 1,000 | |||
| Receivables | |||||||
Fund shares sold | 6,643 | 601 | 3,062 | 3,902 | |||
Dividends | 324 | 433 | 2,361 | 1,142 | |||
Securities lending income | — | — | 4 | — | |||
Prepaid Trustees’ retainer | 39 | 22 | 77 | 16 | |||
Prepaid expenses | 73 | 35 | 17 | 49 | |||
Other assets | 347 | 190 | 669 | 136 | |||
Total assets | 3,442,245 | 1,936,996 | 6,680,311 | 1,428,988 | |||
| Liabilities | |||||||
| Payables | |||||||
Fund shares repurchased | 4,322 | 4,901 | 6,687 | 1,930 | |||
Investment securities purchased | 3,948 | 3,767 | — | 509 | |||
Investment advisory fees | 2,107 | 1,217 | 4,632 | 816 | |||
Distribution and service fees | 247 | 101 | 444 | 46 | |||
Administration and accounting fees | 293 | 160 | 562 | 115 | |||
Transfer agent and sub-transfer agent fees and expenses | 987 | 392 | 1,974 | 343 | |||
Professional fees | 36 | 30 | 52 | 27 | |||
Trustee deferred compensation plan | 347 | 190 | 669 | 136 | |||
Interest expense and/or commitment fees | 4 | 2 | 9 | 1 | |||
Other accrued expenses | 136 | 73 | 270 | 55 | |||
Total liabilities | 12,427 | 10,833 | 15,299 | 3,978 | |||
Net Assets | $ 3,429,818 | $ 1,926,163 | $ 6,665,012 | $ 1,425,010 | |||
| Net Assets Consist of: | |||||||
Capital paid in on shares of beneficial interest | $ 2,117,279 | $ 987,295 | $ 2,959,120 | $ 908,184 | |||
Accumulated earnings (loss) | 1,312,539 | 938,868 | 3,705,892 | 516,826 | |||
Net Assets | $ 3,429,818 | $ 1,926,163 | $ 6,665,012 | $ 1,425,010 | |||
| Net Assets: | |||||||
Class A | $ 579,817 | $ 140,807 | $ 793,106 | $ 130,975 | |||
Class C | $ 141,256 | $ 84,992 | $ 319,371 | $ 21,623 | |||
Class I | $ 2,499,830 | $ 1,278,711 | $ 5,346,986 | $ 1,190,498 | |||
Class R6 | $ 208,915 | $ 421,653 | $ 205,549 | $ 81,914 | |||
| Shares Outstanding (unlimited number of shares authorized, no par value): | |||||||
Class A | 8,124,477 | 2,934,690 | 14,739,022 | 4,801,831 | |||
Class C | 2,562,967 | 2,216,216 | 6,835,983 | 815,805 | |||
Class I | 33,718,570 | 24,966,639 | 96,404,733 | 43,611,211 | |||
Class R6 | 2,797,563 | 8,195,298 | 3,691,554 | 2,997,306 | |||
| Net Asset Value and Redemption Price Per Share:* | |||||||
Class A | $ 71.37 | $ 47.98 | $ 53.81 | $ 27.28 | |||
Class C | $ 55.11 | $ 38.35 | $ 46.72 | $ 26.51 | |||
Class I | $ 74.14 | $ 51.22 | $ 55.46 | $ 27.30 | |||
Class R6 | $ 74.68 | $ 51.45 | $ 55.68 | $ 27.33 |
| KAR Mid-Cap Growth Fund | KAR Small-Cap Core Fund | KAR Small-Cap Growth Fund | KAR Small-Cap Value Fund | ||||
| Maximum Offering Price Per Share (NAV/(1-Maximum Sales Charge)): | |||||||
Class A | $ 75.52 | $ 50.77 | $ 56.94 | $ 28.87 | |||
Maximum Sales Charge - Class A | 5.50% | 5.50% | 5.50% | 5.50% | |||
(1) Investment in securities at cost | $ 2,148,343 | $ 1,198,008 | $ 2,356,209 | $ 929,752 | |||
(2) Investment in affiliated securities at cost | $ — | $ — | $ 1,363,466 | $ — |
| * | Net Asset Value and Redemption Price Per Share are calculated using unrounded net assets. |
| KAR Small-Mid Cap Core Fund | KAR Small-Mid Cap Growth Fund | KAR Small-Mid Cap Value Fund | SGA Emerging Markets Growth Fund | ||||
| Assets | |||||||
Investment in securities at value(1) | $ 1,258,433 | $ 6,034 | $ 2,898 | $ 6,164 | |||
Cash | 50 | 85 | 50 | 50 | |||
| Receivables | |||||||
Fund shares sold | 6,897 | 1 | — | — | |||
Receivable from adviser | — | 7 | 25 | 3 | |||
Dividends | 111 | 1 | 2 | 2 | |||
Prepaid Trustees’ retainer | 14 | — (a) | — (a) | — (a) | |||
Prepaid expenses | 56 | 15 | — | 14 | |||
Other assets | 126 | 1 | — (a) | 1 | |||
Total assets | 1,265,687 | 6,144 | 2,975 | 6,234 | |||
| Liabilities | |||||||
| Payables | |||||||
Fund shares repurchased | 737 | — | — | — | |||
Investment securities purchased | — | 35 | — | — | |||
Foreign capital gains tax | — | — | — | 11 | |||
Investment advisory fees | 786 | — | — | — | |||
Distribution and service fees | 37 | — (a) | — (a) | — (a) | |||
Administration and accounting fees | 106 | 1 | 1 | 1 | |||
Transfer agent and sub-transfer agent fees and expenses | 288 | 1 | — (a) | — (a) | |||
Professional fees | 25 | 22 | 26 | 25 | |||
Trustee deferred compensation plan | 126 | 1 | — (a) | 1 | |||
Interest expense and/or commitment fees | 1 | — (a) | — | — (a) | |||
Other accrued expenses | 40 | 1 | 21 | 1 | |||
Total liabilities | 2,146 | 61 | 48 | 39 | |||
Net Assets | $ 1,263,541 | $ 6,083 | $ 2,927 | $ 6,195 | |||
| Net Assets Consist of: | |||||||
Capital paid in on shares of beneficial interest | $ 1,022,038 | $ 5,766 | $ 3,034 | $ 4,869 | |||
Accumulated earnings (loss) | 241,503 | 317 | (107) | 1,326 | |||
Net Assets | $ 1,263,541 | $ 6,083 | $ 2,927 | $ 6,195 | |||
| Net Assets: | |||||||
Class A | $ 48,485 | $ 725 | $ 127 | $ 206 | |||
Class C | $ 30,401 | $ 119 | $ 99 | $ 159 | |||
Class I | $ 1,168,320 | $ 1,998 | $ 97 | $ 405 | |||
Class R6 | $ 16,335 | $ 3,241 | $ 2,604 | $ 5,425 | |||
| Shares Outstanding (unlimited number of shares authorized, no par value): | |||||||
Class A | 2,596,359 | 67,743 | 13,159 | 16,108 | |||
Class C | 1,671,853 | 11,220 | 10,299 | 12,584 | |||
Class I | 62,063,962 | 186,337 | 10,000 | 31,395 | |||
Class R6 | 865,806 | 302,122 | 270,000 | 418,942 | |||
| Net Asset Value and Redemption Price Per Share:* | |||||||
Class A | $ 18.67 | $ 10.70 | $ 9.64 | $ 12.82 | |||
Class C | $ 18.18 | $ 10.63 | $ 9.63 | $ 12.60 | |||
Class I | $ 18.82 | $ 10.72 | $ 9.64 | $ 12.90 | |||
Class R6 | $ 18.87 | $ 10.73 | $ 9.65 | $ 12.95 |
| KAR Small-Mid Cap Core Fund | KAR Small-Mid Cap Growth Fund | KAR Small-Mid Cap Value Fund | �� | SGA Emerging Markets Growth Fund | |||
| Maximum Offering Price Per Share (NAV/(1-Maximum Sales Charge)): | |||||||
Class A | $ 19.76 | $ 11.32 | $ 10.20 | $ 13.57 | |||
Maximum Sales Charge - Class A | 5.50% | 5.50% | 5.50% | 5.50% | |||
(1) Investment in securities at cost | $ 1,032,101 | $ 5,647 | $ 3,007 | $ 5,211 |
| (a) | Amount is less than $500. |
| * | Net Asset Value and Redemption Price Per Share are calculated using unrounded net assets. |
| SGA Global Growth Fund | SGA New Leaders Growth Fund | Tactical Allocation Fund | |||
| Assets | |||||
Investment in securities at value(1)(2) | $ 175,630 | $ 6,613 | $ 959,215 | ||
Foreign currency at value(3) | — | — | 251 | ||
Cash | 50 | 50 | 1,166 | ||
| Receivables | |||||
Investment securities sold | — | — | 842 | ||
Fund shares sold | 149 | — | 101 | ||
Receivable from adviser | — | 7 | — | ||
Dividends and interest | 41 | 1 | 1,634 | ||
Tax reclaims | 65 | — | 84 | ||
Securities lending income | — | — | 1 | ||
Prepaid Trustees’ retainer | 2 | — (a) | 11 | ||
Prepaid expenses | 28 | 4 | 25 | ||
Other assets | 18 | 1 | 95 | ||
Total assets | 175,983 | 6,676 | 963,425 | ||
| Liabilities | |||||
| Payables | |||||
Fund shares repurchased | 69 | — | 478 | ||
Investment securities purchased | — | — | 5,893 | ||
Collateral on securities loaned | — | — | 1,267 | ||
Investment advisory fees | 105 | — | 360 | ||
Distribution and service fees | 14 | — (a) | 214 | ||
Administration and accounting fees | 16 | 1 | 80 | ||
Transfer agent and sub-transfer agent fees and expenses | 41 | 1 | 240 | ||
Professional fees | 20 | 24 | 49 | ||
Trustee deferred compensation plan | 18 | 1 | 95 | ||
Interest expense and/or commitment fees | — (a) | — (a) | 1 | ||
Other accrued expenses | 16 | 1 | 139 | ||
Total liabilities | 299 | 28 | 8,816 | ||
Net Assets | $ 175,684 | $ 6,648 | $ 954,609 | ||
| Net Assets Consist of: | |||||
Capital paid in on shares of beneficial interest | $ 114,027 | $ 6,280 | $ 577,834 | ||
Accumulated earnings (loss) | 61,657 | 368 | 376,775 | ||
Net Assets | $ 175,684 | $ 6,648 | $ 954,609 | ||
| Net Assets: | |||||
Class A | $ 34,690 | $ 110 | $ 869,209 | ||
Class C | $ 7,326 | $ 108 | $ 33,401 | ||
Class I | $ 53,546 | $ 163 | $ 51,887 | ||
Class R6 | $ 80,122 | $ 6,267 | $ 112 | ||
| Shares Outstanding (unlimited number of shares authorized, no par value): | |||||
Class A | 1,130,303 | 10,284 | 62,722,399 | ||
Class C | 255,181 | 10,224 | 2,354,389 | ||
Class I | 1,732,304 | 15,285 | 3,754,020 | ||
Class R6 | 2,515,945 | 586,057 | 8,070 | ||
| Net Asset Value and Redemption Price Per Share:* | |||||
Class A | $ 30.69 | $ 10.65 | $ 13.86 | ||
Class C | $ 28.71 | $ 10.58 | $ 14.19 | ||
Class I | $ 30.91 | $ 10.67 | $ 13.82 | ||
Class R6 | $ 31.85 | $ 10.69 | $ 13.83 |
| SGA Global Growth Fund | SGA New Leaders Growth Fund | Tactical Allocation Fund | |||
| Maximum Offering Price Per Share (NAV/(1-Maximum Sales Charge)): | |||||
Class A | $ 32.48 | $ 11.27 | $ 14.67 | ||
Maximum Sales Charge - Class A | 5.50% | 5.50% | 5.50% | ||
(1) Investment in securities at cost | $ 123,061 | $ 6,055 | $ 615,513 | ||
(2) Market value of securities on loan | $ — | $ — | $ 1,236 | ||
(3) Foreign currency at cost | $ — | $ — | $ 251 |
| (a) | Amount is less than $500. |
| * | Net Asset Value and Redemption Price Per Share are calculated using unrounded net assets. |
| KAR Capital Growth Fund | KAR Equity Income Fund | KAR Global Quality Dividend Fund | KAR Mid-Cap Core Fund | KAR Mid-Cap Growth Fund | |||||
| Investment Income | |||||||||
Dividends | $ 2,858 | $ 4,922 | $1,574 | $ 7,166 | $ 10,989 | ||||
Securities lending, net of fees | 4 | 7 | 6 | 10 | — | ||||
Foreign taxes withheld | — | (64) | (93) | — | — | ||||
Total investment income | 2,862 | 4,865 | 1,487 | 7,176 | 10,989 | ||||
| Expenses | |||||||||
Investment advisory fees | 5,458 | 1,061 | 287 | 9,088 | 23,655 | ||||
Distribution and service fees, Class A | 1,781 | 308 | 60 | 190 | 1,453 | ||||
Distribution and service fees, Class C | 117 | 58 | 13 | 616 | 1,384 | ||||
Administration and accounting fees | 786 | 149 | 46 | 1,150 | 3,306 | ||||
Transfer agent fees and expenses | 423 | 78 | 25 | 478 | 1,415 | ||||
Sub-transfer agent fees and expenses, Class A | 239 | 72 | 15 | 70 | 558 | ||||
Sub-transfer agent fees and expenses, Class C | 10 | 4 | 1 | 57 | 134 | ||||
Sub-transfer agent fees and expenses, Class I | 54 | 8 | 12 | 837 | 2,566 | ||||
Custodian fees | 2 | 1 | 1 | 2 | 6 | ||||
Printing fees and expenses | 45 | 3 | 4 | 73 | 226 | ||||
Professional fees | 32 | 70 | 22 | 35 | 108 | ||||
Interest expense and/or commitment fees | 4 | 1 | — (1) | 5 | 17 | ||||
Registration fees | 58 | 48 | 42 | 121 | 333 | ||||
Trustees’ fees and expenses | 46 | 8 | 2 | 60 | 188 | ||||
Miscellaneous expenses | 271 | 62 | 23 | 68 | 247 | ||||
Total expenses | 9,326 | 1,931 | 553 | 12,850 | 35,596 | ||||
Less net expenses reimbursed and/or waived by investment adviser(2) | (1) | (176) | (64) | (1,169) | (101) | ||||
Less low balance account fees | (11) | (1) | (1) | — | (1) | ||||
Net expenses | 9,314 | 1,754 | 488 | 11,681 | 35,494 | ||||
Net investment income (loss) | (6,452) | 3,111 | 999 | (4,505) | (24,505) | ||||
| Net Realized and Unrealized Gain (Loss) on Investments | |||||||||
| Net realized gain (loss) from: | |||||||||
Investments | 64,719 | 3,083 | 1,846 | 33,114 | 52,141 | ||||
Foreign currency transactions | — (1) | — (1) | (10) | — | — | ||||
| Net change in unrealized appreciation (depreciation) on: | |||||||||
Investments | 92,901 | 19,166 | 3,335 | 279,183 | 590,790 | ||||
Foreign currency transactions | — | — | (2) | — | — | ||||
Net realized and unrealized gain (loss) on investments | 157,620 | 22,249 | 5,169 | 312,297 | 642,931 | ||||
Net increase (decrease) in net assets resulting from operations | $151,168 | $25,360 | $6,168 | $307,792 | $618,426 |
| (1) | Amount is less than $500. |
| (2) | See Note 3D in Notes to Financial Statements. |
| KAR Small-Cap Core Fund | KAR Small-Cap Growth Fund | KAR Small-Cap Value Fund | KAR Small-Mid Cap Core Fund | KAR Small-Mid Cap Growth Fund(1) | |||||
| Investment Income | |||||||||
Dividends | $ 19,641 | $ 17,497 | $ 17,149 | $ 5,034 | $ 9 | ||||
Dividends from affiliated | — | 8,579 | — | — | — | ||||
Securities lending, net of fees | — | 34 | — | — | — (2) | ||||
Total investment income | 19,641 | 26,110 | 17,149 | 5,034 | 9 | ||||
| Expenses | |||||||||
Investment advisory fees | 14,141 | 57,250 | 8,952 | 7,072 | 29 | ||||
Distribution and service fees, Class A | 334 | 2,104 | 303 | 97 | 1 | ||||
Distribution and service fees, Class C | 930 | 3,420 | 219 | 221 | 1 | ||||
Administration and accounting fees | 1,889 | 7,070 | 1,281 | 950 | 10 | ||||
Transfer agent fees and expenses | 787 | 2,975 | 546 | 400 | 2 | ||||
Sub-transfer agent fees and expenses, Class A | 123 | 913 | 86 | 44 | — (2) | ||||
Sub-transfer agent fees and expenses, Class C | 70 | 254 | 19 | 22 | — (2) | ||||
Sub-transfer agent fees and expenses, Class I | 995 | 5,302 | 970 | 761 | 1 | ||||
Custodian fees | 3 | 11 | 2 | 1 | 1 | ||||
Printing fees and expenses | 104 | 415 | 94 | 62 | 25 | ||||
Professional fees | 45 | 123 | 37 | 33 | 34 | ||||
Interest expense and/or commitment fees | 9 | 35 | 6 | 5 | — (2) | ||||
Registration fees | 79 | 170 | 119 | 125 | 40 | ||||
Trustees’ fees and expenses | 111 | 437 | 70 | 44 | — (2) | ||||
Miscellaneous expenses | 129 | 523 | 80 | 44 | 4 | ||||
Total expenses | 19,749 | 81,002 | 12,784 | 9,881 | 148 | ||||
Less net expenses reimbursed and/or waived by investment adviser(3) | — | — | — | — | (107) | ||||
Less low balance account fees | — | (1) | — (2) | — (2) | — | ||||
Plus net expenses recaptured | — | — | — | 135 | — | ||||
Net expenses | 19,749 | 81,001 | 12,784 | 10,016 | 41 | ||||
Net investment income (loss) | (108) | (54,891) | 4,365 | (4,982) | (32) | ||||
| Net Realized and Unrealized Gain (Loss) on Investments | |||||||||
| Net realized gain (loss) from: | |||||||||
Investments | 212,193 | 755,435 | 48,737 | 21,174 | (40) | ||||
Affiliated investments | — | 45,839 | — | — | — | ||||
Foreign currency transactions | 13 | (24) | — | — | — | ||||
| Net change in unrealized appreciation (depreciation) on: | |||||||||
Investments | 241,096 | 240,194 | 282,809 | 168,800 | 387 | ||||
Affiliated investments | — | 328,579 | — | — | — | ||||
Foreign currency transactions | 2 | 5 | — | — | — | ||||
Net realized and unrealized gain (loss) on investments | 453,304 | 1,370,028 | 331,546 | 189,974 | 347 | ||||
Net increase (decrease) in net assets resulting from operations | $453,196 | $1,315,137 | $335,911 | $184,992 | $ 315 |
| (1) | Inception date December 8, 2020. |
| (2) | Amount is less than $500. |
| (3) | See Note 3D in Notes to Financial Statements. |
| KAR Small-Mid Cap Value Fund(1) | SGA Emerging Markets Growth Fund | SGA Global Growth Fund | SGA New Leaders Growth Fund(2) | Tactical Allocation Fund | |||||
| Investment Income | |||||||||
Dividends | $ 6 | $ 57 | $ 1,022 | $ 20 | $ 4,456 | ||||
Interest | — | — | — | — | 8,116 | ||||
Securities lending, net of fees | — | — | 2 | — (3) | 16 | ||||
Foreign taxes withheld | — | (5) | (52) | (1) | (280) | ||||
Total investment income | 6 | 52 | 972 | 19 | 12,308 | ||||
| Expenses | |||||||||
Investment advisory fees | 3 | 65 | 1,307 | 42 | 5,163 | ||||
Distribution and service fees, Class A | — (3) | 1 | 81 | — (3) | 2,104 | ||||
Distribution and service fees, Class C | — (3) | 1 | 65 | 1 | 416 | ||||
Administration and accounting fees | 2 | 15 | 171 | 12 | 944 | ||||
Transfer agent fees and expenses | — (3) | 3 | 71 | 3 | 499 | ||||
Sub-transfer agent fees and expenses, Class A | — (3) | — (3) | 62 | — | 342 | ||||
Sub-transfer agent fees and expenses, Class C | — (3) | — (3) | 6 | — | 44 | ||||
Sub-transfer agent fees and expenses, Class I | — (3) | — (3) | 54 | — | 52 | ||||
Custodian fees | — (3) | — (3) | 1 | — (3) | 14 | ||||
Printing fees and expenses | 19 | 3 | 16 | 28 | 73 | ||||
Professional fees | 32 | 32 | 16 | 36 | 249 | ||||
Interest expense and/or commitment fees | — | — (3) | 1 | — (3) | 5 | ||||
Registration fees | 4 | 49 | 65 | 43 | 53 | ||||
Trustees’ fees and expenses | — (3) | — (3) | 9 | — | 54 | ||||
Miscellaneous expenses | 1 | 4 | 23 | 7 | 265 | ||||
Total expenses | 61 | 173 | 1,948 | 172 | 10,277 | ||||
Less net expenses reimbursed and/or waived by investment adviser(4) | (57) | (101) | (142) | (122) | (587) | ||||
Less low balance account fees | — | — | — (3) | — | (8) | ||||
Net expenses | 4 | 72 | 1,806 | 50 | 9,682 | ||||
Net investment income (loss) | 2 | (20) | (834) | (31) | 2,626 | ||||
| Net Realized and Unrealized Gain (Loss) on Investments | |||||||||
| Net realized gain (loss) from: | |||||||||
Investments | — | 425 | 10,313 | (164) | 68,559 | ||||
Foreign currency transactions | — | — (3) | (14) | 1 | (47) | ||||
Foreign capital gains tax | — | (3) | — | — | — | ||||
| Net change in unrealized appreciation (depreciation) on: | |||||||||
Investments | (109) | 144 | 18,123 | 558 | 73,049 | ||||
Foreign currency transactions | — | — (3) | (1) | — (3) | (1) | ||||
Foreign capital gains tax | — | (9) | — | — | — | ||||
Net realized and unrealized gain (loss) on investments | (109) | 557 | 28,421 | 395 | 141,560 | ||||
Net increase (decrease) in net assets resulting from operations | $(107) | $ 537 | $27,587 | $ 364 | $144,186 |
| (1) | Inception date August 3, 2021. |
| (2) | Inception date November 17, 2020. |
| (3) | Amount is less than $500. |
| (4) | See Note 3D in Notes to Financial Statements. |
| KAR Capital Growth Fund | KAR Equity Income Fund | ||||||
| Year Ended September 30, 2021 | Year Ended September 30, 2020 | Year Ended September 30, 2021 | Year Ended September 30, 2020 | ||||
| Increase (Decrease) in Net Assets Resulting from Operations | |||||||
Net investment income (loss) | $ (6,452) | $ (3,646) | $ 3,111 | $ 912 | |||
Net realized gain (loss) | 64,719 | 18,655 | 3,083 | 44,684 | |||
Net change in unrealized appreciation (depreciation) | 92,901 | 220,795 | 19,166 | (31,713) | |||
Increase (decrease) in net assets resulting from operations | 151,168 | 235,804 | 25,360 | 13,883 | |||
| Dividends and Distributions to Shareholders | |||||||
| Net Investment Income and Net Realized Gains: | |||||||
Class A | (21,796) | (13,917) | (31,394) | (1,182) | |||
Class C | (600) | (341) | (1,891) | (14) | |||
Class I | (1,595) | (673) | (2,982) | (133) | |||
Class R6 | (9) | (6) | (333) | (13) | |||
Total dividends and distributions to shareholders | (24,000) | (14,937) | (36,600) | (1,342) | |||
| Change in Net Assets from Capital Transactions (See Note 6): | |||||||
Class A | (20,713) | (34,651) | 18,321 | (12,326) | |||
Class C | (5,645) | 792 | (1,372) | (2,051) | |||
Class I | 4,062 | 11,756 | 2,527 | (1,330) | |||
Class R6 | 443 | 149 | 475 | (222) | |||
Increase (decrease) in net assets from capital transactions | (21,853) | (21,954) | 19,951 | (15,929) | |||
Net increase (decrease) in net assets | 105,315 | 198,913 | 8,711 | (3,388) | |||
| Net Assets | |||||||
Beginning of period | 701,025 | 502,112 | 131,091 | 134,479 | |||
End of Period | $ 806,340 | $ 701,025 | $ 139,802 | $ 131,091 | |||
| KAR Global Quality Dividend Fund | KAR Mid-Cap Core Fund | ||||||
| Year Ended September 30, 2021 | Year Ended September 30, 2020 | Year Ended September 30, 2021 | Year Ended September 30, 2020 | ||||
| Increase (Decrease) in Net Assets Resulting from Operations | |||||||
Net investment income (loss) | $ 999 | $ 867 | $ (4,505) | $ (1,651) | |||
Net realized gain (loss) | 1,836 | (2,753) | 33,114 | 3,785 | |||
Net change in unrealized appreciation (depreciation) | 3,333 | (2,982) | 279,183 | 85,472 | |||
Increase (decrease) in net assets resulting from operations | 6,168 | (4,868) | 307,792 | 87,606 | |||
| Dividends and Distributions to Shareholders | |||||||
| Net Investment Income and Net Realized Gains: | |||||||
Class A | (576) | (669) | (464) | (222) | |||
Class C | (27) | (45) | (429) | (207) | |||
Class I | (334) | (228) | (5,392) | (1,612) | |||
Class R6 | (3) | (3) | (165) | (56) | |||
Total dividends and distributions to shareholders | (940) | (945) | (6,450) | (2,097) | |||
| Change in Net Assets from Capital Transactions (See Note 6): | |||||||
Class A | (1,674) | (3,290) | 9,280 | 3,463 | |||
Class C | (729) | (1,314) | 1,742 | 523 | |||
Class I | (134) | 4,427 | 273,909 | 256,818 | |||
Class R6 | 1,770 | — | 27,639 | 6,369 | |||
Increase (decrease) in net assets from capital transactions | (767) | (177) | 312,570 | 267,173 | |||
Net increase (decrease) in net assets | 4,461 | (5,990) | 613,912 | 352,682 | |||
| Net Assets | |||||||
Beginning of period | 33,905 | 39,895 | 783,798 | 431,116 | |||
End of Period | $ 38,366 | $ 33,905 | $ 1,397,710 | $ 783,798 | |||
| KAR Mid-Cap Growth Fund | KAR Small-Cap Core Fund | ||||||
| Year Ended September 30, 2021 | Year Ended September 30, 2020 | Year Ended September 30, 2021 | Year Ended September 30, 2020 | ||||
| Increase (Decrease) in Net Assets Resulting from Operations | |||||||
Net investment income (loss) | $ (24,505) | $ (9,574) | $ (108) | $ (4,034) | |||
Net realized gain (loss) | 52,141 | 1,409 | 212,206 | 120,343 | |||
Net change in unrealized appreciation (depreciation) | 590,790 | 614,023 | 241,098 | 29,309 | |||
Increase (decrease) in net assets resulting from operations | 618,426 | 605,858 | 453,196 | 145,618 | |||
| Dividends and Distributions to Shareholders | |||||||
| Net Investment Income and Net Realized Gains: | |||||||
Class A | (606) | (1,240) | (9,053) | (5,631) | |||
Class C | (180) | (384) | (8,780) | (5,334) | |||
Class I | (2,375) | (2,476) | (85,597) | (48,638) | |||
Class R6 | (139) | (25) | (26,170) | (5,252) | |||
Total dividends and distributions to shareholders | (3,300) | (4,125) | (129,600) | (64,855) | |||
| Change in Net Assets from Capital Transactions (See Note 6): | |||||||
Class A | (13,276) | 167,734 | 6,511 | (24,683) | |||
Class C | 4,098 | 40,327 | (19,276) | (18,869) | |||
Class I | 211,073 | 1,098,875 | (24,692) | (187,888) | |||
Class R6 | 80,643 | 89,984 | 61,400 | 179,793 | |||
Increase (decrease) in net assets from capital transactions | 282,538 | 1,396,920 | 23,943 | (51,647) | |||
Net increase (decrease) in net assets | 897,664 | 1,998,653 | 347,539 | 29,116 | |||
| Net Assets | |||||||
Beginning of period | 2,532,154 | 533,501 | 1,578,624 | 1,549,508 | |||
End of Period | $ 3,429,818 | $ 2,532,154 | $ 1,926,163 | $ 1,578,624 | |||
| KAR Small-Cap Growth Fund | KAR Small-Cap Value Fund | ||||||
| Year Ended September 30, 2021 | Year Ended September 30, 2020 | Year Ended September 30, 2021 | Year Ended September 30, 2020 | ||||
| Increase (Decrease) in Net Assets Resulting from Operations | |||||||
Net investment income (loss) | $ (54,891) | $ (45,327) | $ 4,365 | $ 5,818 | |||
Net realized gain (loss) | 801,250 | 811,834 | 48,737 | (13,648) | |||
Net change in unrealized appreciation (depreciation) | 568,778 | 814,401 | 282,809 | 79,242 | |||
Increase (decrease) in net assets resulting from operations | 1,315,137 | 1,580,908 | 335,911 | 71,412 | |||
| Dividends and Distributions to Shareholders | |||||||
| Net Investment Income and Net Realized Gains: | |||||||
Class A | (79,097) | (11,736) | (662) | (469) | |||
Class C | (37,125) | (5,279) | (11) | — | |||
Class I | (537,686) | (65,197) | (8,138) | (4,156) | |||
Class R6 | (14,092) | (823) | (189) | (105) | |||
Total dividends and distributions to shareholders | (668,000) | (83,035) | (9,000) | (4,730) | |||
| Change in Net Assets from Capital Transactions (See Note 6): | |||||||
Class A | (53,154) | (146,328) | 16,147 | (2,705) | |||
Class C | (27,922) | (45,805) | (654) | (112) | |||
Class I | (441,585) | 60,051 | 194,304 | 169,955 | |||
Class R6 | 98,665 | 30,011 | 64,780 | (95) | |||
Increase (decrease) in net assets from capital transactions | (423,996) | (102,071) | 274,577 | 167,043 | |||
Net increase (decrease) in net assets | 223,141 | 1,395,802 | 601,488 | 233,725 | |||
| Net Assets | |||||||
Beginning of period | 6,441,871 | 5,046,069 | 823,522 | 589,797 | |||
End of Period | $ 6,665,012 | $ 6,441,871 | $ 1,425,010 | $ 823,522 | |||
| KAR Small-Mid Cap Core Fund | KAR Small-Mid Cap Growth Fund | ||||
| Year Ended September 30, 2021 | Year Ended September 30, 2020 | From Inception December 8, 2020 to September 30, 2021 | |||
| Increase (Decrease) in Net Assets Resulting from Operations | |||||
Net investment income (loss) | $ (4,982) | $ 47 | $ (32) | ||
Net realized gain (loss) | 21,174 | (843) | (40) | ||
Net change in unrealized appreciation (depreciation) | 168,800 | 55,857 | 387 | ||
Increase (decrease) in net assets resulting from operations | 184,992 | 55,061 | 315 | ||
| Dividends and Distributions to Shareholders | |||||
| Net Investment Income and Net Realized Gains: | |||||
Class I | (57) | — | — | ||
Class R6 | (3) | — | — | ||
Total dividends and distributions to shareholders | (60) | — | — | ||
| Change in Net Assets from Capital Transactions (See Note 6): | |||||
Class A | 21,019 | 16,375 | 697 | ||
Class C | 16,317 | 8,117 | 112 | ||
Class I | 557,850 | 363,831 | 1,930 | ||
Class R6 | 5,213 | 4,224 | 3,029 | ||
Increase (decrease) in net assets from capital transactions | 600,399 | 392,547 | 5,768 | ||
Net increase (decrease) in net assets | 785,331 | 447,608 | 6,083 | ||
| Net Assets | |||||
Beginning of period | 478,210 | 30,602 | — | ||
End of Period | $ 1,263,541 | $ 478,210 | $ 6,083 | ||
| KAR Small-Mid Cap Value Fund | SGA Emerging Markets Growth Fund | ||||
| From Inception August 3, 2021 to September 30, 2021 | Year Ended September 30, 2021 | Year Ended September 30, 2020 | |||
| Increase (Decrease) in Net Assets Resulting from Operations | |||||
Net investment income (loss) | $ 2 | $ (20) | $ (3) | ||
Net realized gain (loss) | — | 422 | 106 | ||
Net change in unrealized appreciation (depreciation) | (109) | 135 | 815 | ||
Increase (decrease) in net assets resulting from operations | (107) | 537 | 918 | ||
| Dividends and Distributions to Shareholders | |||||
| Net Investment Income and Net Realized Gains: | |||||
Class A | — | (4) | (—) (1) | ||
Class C | — | (3) | (—) (1) | ||
Class I | — | (8) | (—) (1) | ||
Class R6 | — | (110) | (1) | ||
Total Dividends and Distributions to Shareholders | — | (125) | (1) | ||
| Change in Net Assets From Capital Transactions (See Note 6): | |||||
Class A | 131 | 27 | 43 | ||
Class C | 103 | 8 | 16 | ||
Class I | 100 | 143 | 100 | ||
Class R6 | 2,700 | 219 | (31) | ||
Increase (decrease) in net assets from share transactions | 3,034 | 397 | 128 | ||
Net increase (decrease) in net assets | 2,927 | 809 | 1,045 | ||
| Net Assets | |||||
Beginning of period | — | 5,386 | 4,341 | ||
End of Period | $2,927 | $6,195 | $5,386 | ||
| (1) | Amount is less than $500. |
| SGA Global Growth Fund | SGA New Leaders Growth Fund | ||||
| Year Ended September 30, 2021 | Year Ended September 30, 2020 | From Inception November 17, 2020 to September 30, 2021 | |||
| Increase (Decrease) in Net Assets Resulting from Operations | |||||
Net investment income (loss) | $ (834) | $ (283) | $ (31) | ||
Net realized gain (loss) | 10,299 | 5,395 | (163) | ||
Net change in unrealized appreciation (depreciation) | 18,122 | 20,280 | 558 | ||
Increase (decrease) in net assets resulting from operations | 27,587 | 25,392 | 364 | ||
| Dividends and Distributions to Shareholders | |||||
| Net Investment Income and Net Realized Gains: | |||||
Class A | (963) | — | — | ||
Class C | (211) | — | — | ||
Class I | (1,091) | (3) | — | ||
Class R6 | (2,435) | (34) | — | ||
Total Dividends and Distributions to Shareholders | (4,700) | (37) | — | ||
| Change in Net Assets From Capital Transactions (See Note 6): | |||||
Class A | 3,849 | 19,110 | 103 | ||
Class C | 1,331 | 699 | 103 | ||
Class I | 20,190 | 9,377 | 155 | ||
Class R6 | (4,192) | 15,808 | 5,923 | ||
Increase (decrease) in net assets from share transactions | 21,178 | 44,994 | 6,284 | ||
Net increase (decrease) in net assets | 44,065 | 70,349 | 6,648 | ||
| Net Assets | |||||
Beginning of period | 131,619 | 61,270 | — | ||
End of Period | $175,684 | $131,619 | $6,648 | ||
| Tactical Allocation Fund | |||
| Year Ended September 30, 2021 | Year Ended September 30, 2020 | ||
| Increase (Decrease) in Net Assets Resulting from Operations | |||
Net investment income (loss) | $ 2,626 | $ 4,222 | |
Net realized gain (loss) | 68,512 | 13,401 | |
Net change in unrealized appreciation (depreciation) | 73,048 | 148,434 | |
Increase (decrease) in net assets resulting from operations | 144,186 | 166,057 | |
| Dividends and Distributions to Shareholders | |||
| Net Investment Income and Net Realized Gains: | |||
Class A | (15,782) | (11,431) | |
Class C | (873) | (118) | |
Class I | (1,207) | (110) | |
Class R6 | (2) | — | |
Total dividends and distributions to shareholders | (17,864) | (11,659) | |
| Change in Net Assets from Capital Transactions (See Note 6): | |||
Class A | 73,751 | (35,921) | |
Class C | 14,669 | 1,158 | |
Class I | 18,001 | 21,215 | |
Class R6 | 100 | — | |
Increase (decrease) in net assets from capital transactions | 106,521 | (13,548) | |
Net increase (decrease) in net assets | 232,843 | 140,850 | |
| Net Assets | |||
Beginning of period | 721,766 | 580,916 | |
End of Period | $ 954,609 | $ 721,766 | |
THROUGHOUT EACH PERIOD
| Net Asset Value, Beginning of Period | Net Investment Income (Loss)(1) | Net Realized and Unrealized Gain (Loss) | Total from Investment Operations | Dividends from Net Investment Income | Return of Capital | Distributions from Net Realized Gains | Total Distributions | Payment from Affiliates(1) | Change in Net Asset Value | Net Asset Value, End of Period | Total Return(2)(3) | Net Assets, End of Period (in thousands) | Ratio of Net Expenses to Average Net Assets(4)(5) | Ratio of Gross Expenses to Average Net Assets(4)(5) | Ratio of Net Investment Income (Loss) to Average Net Assets(4) | Portfolio Turnover Rate(3) | ||
| KAR Capital Growth Fund | ||||||||||||||||||
| Class A | ||||||||||||||||||
| 10/1/20 to 9/30/21 | $24.20 | (0.22) | 5.49 | 5.27 | — | — | (0.83) | (0.83) | — | 4.44 | $28.64 | 21.98 % | $ 736,713 | 1.20 % (6) | 1.20 % | (0.83) % | 8 % | |
| 10/1/19 to 9/30/20 | 16.67 | (0.12) | 8.16 | 8.04 | — | — | (0.51) | (0.51) | — | 7.53 | 24.20 | 49.20 | 640,963 | 1.22 (6) | 1.23 | (0.63) | 4 | |
| 10/1/18 to 9/30/19 | 18.37 | (0.07) | (0.08) | (0.15) | — | — | (1.55) | (1.55) | — | (1.70) | 16.67 | 1.10 | 471,071 | 1.23 (6) | 1.24 | (0.43) | 12 | |
| 10/1/17 to 9/30/18 | 16.18 | (0.08) | 3.13 | 3.05 | — | — | (0.86) | (0.86) | — | 2.19 | 18.37 | 19.56 | 508,124 | 1.22 (6) | 1.22 | (0.49) | 17 | |
| 4/1/17 to 9/30/17(7) | 14.10 | (0.03) | 2.27 | 2.24 | — | — | (0.16) | (0.16) | — | 2.08 | 16.18 | 15.93 | 446,720 | 1.30 (6) | 1.30 | (0.40) | 13 | |
| 4/1/16 to 3/31/17 | 13.66 | (0.05) | 1.64 | 1.59 | — | — | (1.15) | (1.15) | — | 0.44 | 14.10 | 12.34 (8) | 402,118 | 1.33 (6)(8)(9) | 1.34 | (0.40) (8) | 21 | |
| Class C | ||||||||||||||||||
| 10/1/20 to 9/30/21 | $17.83 | (0.32) | 4.02 | 3.70 | — | — | (0.83) | (0.83) | — | 2.87 | $20.70 | 21.00 % | $ 9,252 | 2.01 % (6) | 2.01 % | (1.63) % | 8 % | |
| 10/1/19 to 9/30/20 | 12.49 | (0.20) | 6.05 | 5.85 | — | — | (0.51) | (0.51) | — | 5.34 | 17.83 | 48.09 | 13,183 | 2.00 (6) | 2.00 | (1.41) | 4 | |
| 10/1/18 to 9/30/19 | 14.34 | (0.15) | (0.15) | (0.30) | — | — | (1.55) | (1.55) | — | (1.85) | 12.49 | 0.26 | 8,632 | 2.02 (6) | 2.02 | (1.22) | 12 | |
| 10/1/17 to 9/30/18 | 12.91 | (0.17) | 2.46 | 2.29 | — | — | (0.86) | (0.86) | — | 1.43 | 14.34 | 18.58 | 14,408 | 1.99 (6) | 2.00 | (1.26) | 17 | |
| 4/1/17 to 9/30/17(7) | 11.32 | (0.07) | 1.82 | 1.75 | — | — | (0.16) | (0.16) | — | 1.59 | 12.91 | 15.51 | 14,052 | 2.08 (6) | 2.08 | (1.18) | 13 | |
| 4/1/16 to 3/31/17 | 11.27 | (0.13) | 1.33 | 1.20 | — | — | (1.15) | (1.15) | — | 0.05 | 11.32 | 11.47 (8) | 13,345 | 2.08 (6)(8)(9) | 2.09 | (1.16) (8) | 21 | |
| Class I | ||||||||||||||||||
| 10/1/20 to 9/30/21 | $25.15 | (0.18) | 5.72 | 5.54 | — | — | (0.83) | (0.83) | — | 4.71 | $29.86 | 22.23 % | $ 59,565 | 1.00 % (6) | 1.00 % | (0.63) % | 8 % | |
| 10/1/19 to 9/30/20 | 17.36 | (0.09) | 8.39 | 8.30 | — | — | (0.51) | (0.51) | — | 7.79 | 25.15 | 48.72 | 46,600 | 1.01 (6) | 1.02 | (0.44) | 4 | |
| 10/1/18 to 9/30/19 | 19.02 | (0.04) | (0.07) | (0.11) | — | — | (1.55) | (1.55) | — | (1.66) | 17.36 | 1.29 | 22,315 | 1.02 (6) | 1.03 | (0.21) | 12 | |
| 10/1/17 to 9/30/18 | 16.69 | (0.05) | 3.24 | 3.19 | — | — | (0.86) | (0.86) | — | 2.33 | 19.02 | 19.81 | 17,125 | 0.99 (6) | 0.99 | (0.26) | 17 | |
| 4/1/17 to 9/30/17(7) | 14.52 | (0.01) | 2.34 | 2.33 | — | — | (0.16) | (0.16) | — | 2.17 | 16.69 | 16.09 | 12,466 | 1.08 (6) | 1.08 | (0.18) | 13 | |
| 4/1/16 to 3/31/17 | 14.00 | (0.01) | 1.68 | 1.67 | — | — | (1.15) | (1.15) | — | 0.52 | 14.52 | 12.61 (8) | 10,180 | 1.08 (6)(8)(9) | 1.09 | (0.15) (8) | 21 | |
| Class R6 | ||||||||||||||||||
| 10/1/20 to 9/30/21 | $25.38 | (0.11) | 5.78 | 5.67 | — | — | (0.83) | (0.83) | — | 4.84 | $30.22 | 22.55 % | $ 810 | 0.73 % | 0.91 % | (0.38) % | 8 % | |
| 10/1/19 to 9/30/20 | 17.37 | (0.01) | 8.53 | 8.52 | — | — | (0.51) | (0.51) | — | 8.01 | 25.38 | 49.99 | 279 | 0.72 | 0.94 | (0.06) | 4 | |
| 10/1/18 to 9/30/19 | 19.04 | (0.05) | (0.07) | (0.12) | — | — | (1.55) | (1.55) | — | (1.67) | 17.37 | 1.25 | 94 | 0.78 (10) | 0.94 | (0.27) | 12 | |
| 1/30/18 (11) to 9/30/18 | 18.46 | (—) (12) | 0.58 | 0.58 | — | — | — | — | — | 0.58 | 19.04 | 3.14 | 6,458 | 0.80 (10) | 0.91 | (0.03) | 17 (13) | |
| KAR Equity Income Fund | ||||||||||||||||||
| Class A | ||||||||||||||||||
| 10/1/20 to 9/30/21 | $23.03 | 0.47 | 3.57 | 4.04 | (0.27) | — | (6.34) | (6.61) | — | (2.57) | $20.46 | 20.23 % | $ 122,518 | 1.23 % (9) | 1.36 % | 2.21 % | 25 % | |
| 10/1/19 to 9/30/20 | 20.62 | 0.15 | 2.47 | 2.62 | (0.21) | — | — | (0.21) | — | 2.41 | 23.03 | 12.75 | 113,585 | 1.23 (9) | 1.38 | 0.72 | 118 | |
| 10/1/18 to 9/30/19 | 21.05 | 0.16 | (0.38) | (0.22) | (0.21) | — | — | (0.21) | — | (0.43) | 20.62 | (0.85) | 115,121 | 1.20 | 1.34 | 0.80 | 26 | |
| 10/1/17 to 9/30/18 | 20.26 | 0.14 | 2.02 | 2.16 | (0.06) | — | (1.31) | (1.37) | — | 0.79 | 21.05 | 10.84 | 118,904 | 1.20 | 1.31 | 0.71 | 24 | |
| 4/1/17 to 9/30/17(7) | 20.27 | 0.06 | 1.72 | 1.78 | (0.06) | — | (1.73) | (1.79) | — | (0.01) | 20.26 | 9.26 | 120,445 | 1.23 (10) | 1.39 | 0.63 | 110 | |
| 4/1/16 to 3/31/17 | 18.14 | 0.15 | 2.68 | 2.83 | (0.22) | — | (0.48) | (0.70) | — | 2.13 | 20.27 | 15.85 (8) | 113,442 | 1.26 (8)(9) | 1.40 | 0.81 | 496 |
| Net Asset Value, Beginning of Period | Net Investment Income (Loss)(1) | Net Realized and Unrealized Gain (Loss) | Total from Investment Operations | Dividends from Net Investment Income | Return of Capital | Distributions from Net Realized Gains | Total Distributions | Payment from Affiliates(1) | Change in Net Asset Value | Net Asset Value, End of Period | Total Return(2)(3) | Net Assets, End of Period (in thousands) | Ratio of Net Expenses to Average Net Assets(4)(5) | Ratio of Gross Expenses to Average Net Assets(4)(5) | Ratio of Net Investment Income (Loss) to Average Net Assets(4) | Portfolio Turnover Rate(3) | ||
| KAR Equity Income Fund (Continued) | ||||||||||||||||||
| Class C | ||||||||||||||||||
| 10/1/20 to 9/30/21 | $20.51 | 0.28 | 3.12 | 3.40 | (0.10) | — | (6.34) | (6.44) | — | (3.04) | $17.47 | 19.31 % | $ 4,303 | 1.97 % (9) | 2.13 % | 1.52 % | 25 % | |
| 10/1/19 to 9/30/20 | 18.36 | (0.01) | 2.19 | 2.18 | (0.03) | — | — | (0.03) | — | 2.15 | 20.51 | 11.91 | 6,394 | 1.97 (9) | 2.13 | (0.03) | 118 | |
| 10/1/18 to 9/30/19 | 18.71 | 0.01 | (0.33) | (0.32) | (0.03) | — | — | (0.03) | — | (0.35) | 18.36 | (1.65) | 7,769 | 1.95 | 2.10 | 0.07 | 26 | |
| 10/1/17 to 9/30/18 | 18.23 | (0.01) | 1.80 | 1.79 | — | — | (1.31) | (1.31) | — | 0.48 | 18.71 | 10.00 | 30,576 | 1.95 | 2.06 | (0.03) | 24 | |
| 4/1/17 to 9/30/17(7) | 18.44 | (0.02) | 1.56 | 1.54 | (0.02) | — | (1.73) | (1.75) | — | (0.21) | 18.23 | 8.85 | 32,710 | 1.98 (10) | 2.15 | (0.17) | 110 | |
| 4/1/16 to 3/31/17 | 16.48 | 0.01 | 2.44 | 2.45 | (0.01) | — | (0.48) | (0.49) | — | 1.96 | 18.44 | 15.01 (8) | 37,269 | 2.00 (8)(9) | 2.15 | 0.04 | 496 | |
| Class I | ||||||||||||||||||
| 10/1/20 to 9/30/21 | $23.00 | 0.52 | 3.56 | 4.08 | (0.33) | — | (6.34) | (6.67) | — | (2.59) | $20.41 | 20.49 % | $ 11,819 | 0.98 % (9) | 1.11 % | 2.43 % | 25 % | |
| 10/1/19 to 9/30/20 | 20.60 | 0.20 | 2.46 | 2.66 | (0.26) | — | — | (0.26) | — | 2.40 | 23.00 | 12.98 | 10,319 | 0.98 (9) | 1.13 | 0.97 | 118 | |
| 10/1/18 to 9/30/19 | 21.03 | 0.21 | (0.38) | (0.17) | (0.26) | — | — | (0.26) | — | (0.43) | 20.60 | (0.58) | 10,654 | 0.95 | 1.09 | 1.06 | 26 | |
| 10/1/17 to 9/30/18 | 20.22 | 0.19 | 2.01 | 2.20 | (0.08) | — | (1.31) | (1.39) | — | 0.81 | 21.03 | 11.10 | 15,028 | 0.95 | 1.08 | 0.92 | 24 | |
| 4/1/17 to 9/30/17(7) | 20.22 | 0.09 | 1.71 | 1.80 | (0.07) | — | (1.73) | (1.80) | — | — | 20.22 | 9.41 | 32,485 | 0.98 (10) | 1.15 | 0.91 | 110 | |
| 4/1/16 to 3/31/17 | 18.13 | 0.21 | 2.66 | 2.87 | (0.30) | — | (0.48) | (0.78) | — | 2.09 | 20.22 | 16.16 (8) | 21,011 | 1.01 (8)(9) | 1.15 | 1.13 | 496 | |
| Class R6 | ||||||||||||||||||
| 10/1/20 to 9/30/21 | $22.96 | 0.51 | 3.57 | 4.08 | (0.35) | — | (6.34) | (6.69) | — | (2.61) | $20.35 | 20.55 % | $ 1,162 | 0.94 % (9) | 1.03 % | 2.44 % | 25 % | |
| 10/1/19 to 9/30/20 | 20.56 | 0.21 | 2.47 | 2.68 | (0.28) | — | — | (0.28) | — | 2.40 | 22.96 | 13.08 | 793 | 0.93 (9) | 1.05 | 1.01 | 118 | |
| 10/1/18 to 9/30/19 | 21.03 | 0.20 | (0.37) | (0.17) | (0.30) | — | — | (0.30) | — | (0.47) | 20.56 | (0.56) | 935 | 0.91 | 1.03 | 1.02 | 26 | |
| 1/30/18 (11) to 9/30/18 | 20.70 | 0.15 | 0.18 | 0.33 | — | — | — | — | — | 0.33 | 21.03 | 1.59 | 4,999 | 0.91 | 1.00 | 1.16 | 24 | |
| KAR Global Quality Dividend Fund | ||||||||||||||||||
| Class A | ||||||||||||||||||
| 10/1/20 to 9/30/21 | $12.76 | 0.37 | 1.95 | 2.32 | (0.34) | — | — | (0.34) | — | 1.98 | $14.74 | 18.42 % | $ 23,807 | 1.35 % | 1.51 % | 2.55 % | 37 % | |
| 10/1/19 to 9/30/20 | 14.78 | 0.31 | (1.99) | (1.68) | (0.34) | — | — | (0.34) | — | (2.02) | 12.76 | (11.69) | 22,089 | 1.35 | 1.61 | 2.32 | 53 | |
| 10/1/18 to 9/30/19 | 14.98 | 0.38 | 0.85 | 1.23 | (0.39) | — | (1.04) | (1.43) | — | (0.20) | 14.78 | 9.64 | 29,367 | 1.35 | 1.56 | 2.71 | 35 | |
| 10/1/17 to 9/30/18 | 16.20 | 0.40 | 0.25 | 0.65 | (0.65) | — | (1.22) | (1.87) | — | (1.22) | 14.98 | 4.24 | 26,351 | 1.35 | 1.50 | 2.63 | 33 | |
| 4/1/17 to 9/30/17(7) | 16.81 | 0.30 | 0.41 | 0.71 | (0.27) | — | (1.05) | (1.32) | — | (0.61) | 16.20 | 4.31 | 44,188 | 1.35 | 1.56 | 3.65 | 13 | |
| 4/1/16 to 3/31/17 | 15.09 | 0.20 | 1.66 | 1.86 | (0.14) | — | — | (0.14) | — | 1.72 | 16.81 | 12.42 | 46,670 | 1.36 (9) | 1.48 | 1.29 | 119 | |
| Class C | ||||||||||||||||||
| 10/1/20 to 9/30/21 | $12.29 | 0.24 | 1.90 | 2.14 | (0.22) | — | — | (0.22) | — | 1.92 | $14.21 | 17.52 % | $ 931 | 2.10 % | 2.29 % | 1.74 % | 37 % | |
| 10/1/19 to 9/30/20 | 14.23 | 0.20 | (1.92) | (1.72) | (0.22) | — | — | (0.22) | — | (1.94) | 12.29 | (12.34) | 1,467 | 2.10 | 2.35 | 1.53 | 53 | |
| 10/1/18 to 9/30/19 | 14.52 | 0.24 | 0.83 | 1.07 | (0.32) | — | (1.04) | (1.36) | — | (0.29) | 14.23 | 8.74 | 3,178 | 2.10 | 2.29 | 1.79 | 35 | |
| 10/1/17 to 9/30/18 | 15.82 | 0.32 | 0.22 | 0.54 | (0.62) | — | (1.22) | (1.84) | — | (1.30) | 14.52 | 3.56 | 5,127 | 2.10 | 2.25 | 2.16 | 33 | |
| 4/1/17 to 9/30/17(7) | 16.38 | 0.23 | 0.39 | 0.62 | (0.13) | — | (1.05) | (1.18) | — | (0.56) | 15.82 | 3.86 | 6,107 | 2.10 | 2.33 | 2.87 | 13 | |
| 4/1/16 to 3/31/17 | 14.68 | 0.08 | 1.62 | 1.70 | — | — | — | — | — | 1.70 | 16.38 | 11.58 | 6,950 | 2.11 (9) | 2.23 | 0.54 | 119 |
| Net Asset Value, Beginning of Period | Net Investment Income (Loss)(1) | Net Realized and Unrealized Gain (Loss) | Total from Investment Operations | Dividends from Net Investment Income | Return of Capital | Distributions from Net Realized Gains | Total Distributions | Payment from Affiliates(1) | Change in Net Asset Value | Net Asset Value, End of Period | Total Return(2)(3) | Net Assets, End of Period (in thousands) | Ratio of Net Expenses to Average Net Assets(4)(5) | Ratio of Gross Expenses to Average Net Assets(4)(5) | Ratio of Net Investment Income (Loss) to Average Net Assets(4) | Portfolio Turnover Rate(3) | ||
| KAR Global Quality Dividend Fund (Continued) | ||||||||||||||||||
| Class I | ||||||||||||||||||
| 10/1/20 to 9/30/21 | $12.77 | 0.40 | 1.97 | 2.37 | (0.38) | — | — | (0.38) | — | 1.99 | $14.76 | 18.78 % | $ 11,659 | 1.10 % | 1.27 % | 2.79 % | 37 % | |
| 10/1/19 to 9/30/20 | 14.79 | 0.35 | (1.99) | (1.64) | (0.38) | — | — | (0.38) | — | (2.02) | 12.77 | (11.47) | 10,259 | 1.10 | 1.40 | 2.66 | 53 | |
| 10/1/18 to 9/30/19 | 15.02 | 0.42 | 0.83 | 1.25 | (0.44) | — | (1.04) | (1.48) | — | (0.23) | 14.79 | 9.85 | 7,246 | 1.10 | 1.36 | 3.00 | 35 | |
| 10/1/17 to 9/30/18 | 16.20 | 0.47 | 0.23 | 0.70 | (0.66) | — | (1.22) | (1.88) | — | (1.18) | 15.02 | 4.56 | 4,843 | 1.10 | 1.29 | 3.14 | 33 | |
| 4/1/17 to 9/30/17(7) | 16.84 | 0.29 | 0.44 | 0.73 | (0.32) | — | (1.05) | (1.37) | — | (0.64) | 16.20 | 4.41 | 6,524 | 1.10 | 1.33 | 3.53 | 13 | |
| 4/1/16 to 3/31/17 | 15.12 | 0.25 | 1.65 | 1.90 | (0.18) | — | — | (0.18) | — | 1.72 | 16.84 | 12.66 | 7,096 | 1.11 (9) | 1.23 | 1.59 | 119 | |
| Class R6 | ||||||||||||||||||
| 10/1/20 to 9/30/21 | $12.81 | 0.45 | 1.97 | 2.42 | (0.39) | — | — | (0.39) | — | 2.03 | $14.84 | 19.15 % | $ 1,969 | 0.78 % | 1.15 % | 3.04 % | 37 % | |
| 10/1/19 to 9/30/20 | 14.80 | 0.39 | (1.99) | (1.60) | (0.39) | — | — | (0.39) | — | (1.99) | 12.81 | (11.18) | 90 | 0.78 | 1.27 | 2.92 | 53 | |
| 8/1/19 (11) to 9/30/19 | 14.23 | 0.08 | 0.49 | 0.57 | — | — | — | — | — | 0.57 | 14.80 | 4.01 | 104 | 0.78 | 1.27 | 3.39 | 35 (13) | |
| KAR Mid-Cap Core Fund | ||||||||||||||||||
| Class A | ||||||||||||||||||
| 10/1/20 to 9/30/21 | $39.93 | (0.29) | 14.71 | 14.42 | — | — | (0.32) | (0.32) | — | 14.10 | $54.03 | 36.25 % | $ 86,713 | 1.20 % | 1.31 % | (0.58) % | 15 % | |
| 10/1/19 to 9/30/20 | 35.05 | (0.16) | 5.19 | 5.03 | — | — | (0.15) | (0.15) | — | 4.88 | 39.93 | 14.39 | 56,677 | 1.20 | 1.34 | (0.44) | 19 | |
| 10/1/18 to 9/30/19 | 33.71 | (0.08) | 1.65 | 1.57 | — | — | (0.23) | (0.23) | — | 1.34 | 35.05 | 4.79 | 46,934 | 1.20 | 1.36 | (0.23) | 28 | |
| 10/1/17 to 9/30/18 | 27.95 | (0.09) | 5.85 | 5.76 | — | — | — | — | — | 5.76 | 33.71 | 20.61 | 33,120 | 1.20 | 1.39 | (0.29) | 21 | |
| 4/1/17 to 9/30/17(7) | 25.80 | (0.05) | 2.29 | 2.24 | — | — | (0.09) | (0.09) | — | 2.15 | 27.95 | 8.70 | 26,238 | 1.20 | 1.49 | (0.35) | 11 | |
| 4/1/16 to 3/31/17 | 22.60 | (0.08) | 3.28 | 3.20 | — | — | — | — | — | 3.20 | 25.80 | 14.16 | 20,615 | 1.26 (9)(10) | 1.55 | (0.32) | 28 | |
| Class C | ||||||||||||||||||
| 10/1/20 to 9/30/21 | $36.82 | (0.61) | 13.53 | 12.92 | — | — | (0.32) | (0.32) | — | 12.60 | $49.42 | 35.23 % | $ 67,627 | 1.95 % | 2.06 % | (1.33) % | 15 % | |
| 10/1/19 to 9/30/20 | 32.58 | (0.40) | 4.79 | 4.39 | — | — | (0.15) | (0.15) | — | 4.24 | 36.82 | 13.51 | 49,164 | 1.95 | 2.10 | (1.19) | 19 | |
| 10/1/18 to 9/30/19 | 31.58 | (0.30) | 1.53 | 1.23 | — | — | (0.23) | (0.23) | — | 1.00 | 32.58 | 4.03 | 43,268 | 1.95 | 2.11 | (0.98) | 28 | |
| 10/1/17 to 9/30/18 | 26.38 | (0.31) | 5.51 | 5.20 | — | — | — | — | — | 5.20 | 31.58 | 19.71 | 30,661 | 1.95 | 2.14 | (1.04) | 21 | |
| 4/1/17 to 9/30/17(7) | 24.45 | (0.14) | 2.16 | 2.02 | — | — | (0.09) | (0.09) | — | 1.93 | 26.38 | 8.28 | 17,870 | 1.95 | 2.25 | (1.10) | 11 | |
| 4/1/16 to 3/31/17 | 21.57 | (0.24) | 3.12 | 2.88 | — | — | — | — | — | 2.88 | 24.45 | 13.35 | 14,279 | 2.00 (9)(10) | 2.28 | (1.04) | 28 | |
| Class I | ||||||||||||||||||
| 10/1/20 to 9/30/21 | $40.79 | (0.17) | 15.04 | 14.87 | — | — | (0.32) | (0.32) | — | 14.55 | $55.34 | 36.59 % | $1,188,000 | 0.95 % | 1.05 % | (0.33) % | 15 % | |
| 10/1/19 to 9/30/20 | 35.72 | (0.07) | 5.29 | 5.22 | — | — | (0.15) | (0.15) | — | 5.07 | 40.79 | 14.65 | 658,291 | 0.95 | 1.09 | (0.18) | 19 | |
| 10/1/18 to 9/30/19 | 34.26 | 0.01 | 1.68 | 1.69 | — | — | (0.23) | (0.23) | — | 1.46 | 35.72 | 5.06 | 329,591 | 0.95 | 1.11 | 0.03 | 28 | |
| 10/1/17 to 9/30/18 | 28.34 | (0.01) | 5.93 | 5.92 | — | — | — | — | — | 5.92 | 34.26 | 20.93 | 167,649 | 0.95 | 1.14 | (0.03) | 21 | |
| 4/1/17 to 9/30/17(7) | 26.12 | (0.01) | 2.32 | 2.31 | — | — | (0.09) | (0.09) | — | 2.22 | 28.34 | 8.82 | 69,955 | 0.95 | 1.25 | (0.10) | 11 | |
| 4/1/16 to 3/31/17 | 22.82 | (0.01) | 3.31 | 3.30 | — | — | — | — | — | 3.30 | 26.12 | 14.46 | 50,922 | 0.99 (9)(10) | 1.26 | (0.02) | 28 | |
| Class R6 | ||||||||||||||||||
| 10/1/20 to 9/30/21 | $40.89 | (0.12) | 15.06 | 14.94 | — | — | (0.32) | (0.32) | — | 14.62 | $55.51 | 36.67 % | $ 55,370 | 0.87 % | 0.97 % | (0.24) % | 15 % | |
| 10/1/19 to 9/30/20 | 35.77 | (0.04) | 5.31 | 5.27 | — | — | (0.15) | (0.15) | — | 5.12 | 40.89 | 14.77 | 19,666 | 0.87 | 1.00 | (0.10) | 19 | |
| 10/1/18 to 9/30/19 | 34.28 | 0.04 | 1.68 | 1.72 | — | — | (0.23) | (0.23) | — | 1.49 | 35.77 | 5.15 | 11,323 | 0.87 | 1.01 | 0.11 | 28 | |
| 1/30/18 (11) to 9/30/18 | 32.78 | 0.02 | 1.48 | 1.50 | — | — | — | — | — | 1.50 | 34.28 | 4.58 | 2,474 | 0.87 | 1.06 | 0.10 | 21 (13) |
| Net Asset Value, Beginning of Period | Net Investment Income (Loss)(1) | Net Realized and Unrealized Gain (Loss) | Total from Investment Operations | Dividends from Net Investment Income | Return of Capital | Distributions from Net Realized Gains | Total Distributions | Payment from Affiliates(1) | Change in Net Asset Value | Net Asset Value, End of Period | Total Return(2)(3) | Net Assets, End of Period (in thousands) | Ratio of Net Expenses to Average Net Assets(4)(5) | Ratio of Gross Expenses to Average Net Assets(4)(5) | Ratio of Net Investment Income (Loss) to Average Net Assets(4) | Portfolio Turnover Rate(3) | ||
| KAR Mid-Cap Growth Fund | ||||||||||||||||||
| Class A | ||||||||||||||||||
| 10/1/20 to 9/30/21 | $58.05 | (0.62) | 14.01 | 13.39 | — | — | (0.07) | (0.07) | — | 13.32 | $71.37 | 23.07 % | $ 579,817 | 1.24 % (6) | 1.24 % | (0.91) % | 17 % | |
| 10/1/19 to 9/30/20 | 37.39 | (0.42) | 21.34 | 20.92 | — | — | (0.26) | (0.26) | — | 20.66 | 58.05 | 56.23 | 482,266 | 1.28 (6)(14) | 1.26 | (0.90) | 14 | |
| 10/1/18 to 9/30/19 | 35.55 | (0.31) | 2.79 | 2.48 | — | — | (0.64) | (0.64) | — | 1.84 | 37.39 | 7.46 | 181,184 | 1.40 (6)(14) | 1.33 | (0.87) | 28 | |
| 10/1/17 to 9/30/18 | 27.74 | (0.28) | 9.65 | 9.37 | — | — | (1.56) | (1.56) | — | 7.81 | 35.55 | 35.38 | 131,422 | 1.40 (14) | 1.37 | (0.88) | 19 | |
| 4/1/17 to 9/30/17(7) | 24.56 | (0.12) | 3.43 | 3.31 | — | — | (0.13) | (0.13) | — | 3.18 | 27.74 | 13.48 | 84,912 | 1.40 | 1.49 | (0.88) | 12 | |
| 4/1/16 to 3/31/17 | 21.92 | (0.16) | 3.15 | 2.99 | — | — | (0.35) | (0.35) | — | 2.64 | 24.56 | 13.81 (8) | 80,648 | 1.41 (8)(9) | 1.52 | (0.75) (8) | 20 | |
| Class C | ||||||||||||||||||
| 10/1/20 to 9/30/21 | $45.18 | (0.87) | 10.87 | 10.00 | — | — | (0.07) | (0.07) | — | 9.93 | $55.11 | 22.13 % | $ 141,256 | 1.99 % (6) | 1.99 % | (1.66) % | 17 % | |
| 10/1/19 to 9/30/20 | 29.38 | (0.60) | 16.66 | 16.06 | — | — | (0.26) | (0.26) | — | 15.80 | 45.18 | 55.01 | 112,165 | 2.03 (6)(14) | 2.02 | (1.65) | 14 | |
| 10/1/18 to 9/30/19 | 28.30 | (0.47) | 2.19 | 1.72 | — | — | (0.64) | (0.64) | — | 1.08 | 29.38 | 6.67 | 40,450 | 2.15 (6)(14) | 2.12 | (1.62) | 28 | |
| 10/1/17 to 9/30/18 | 22.54 | (0.42) | 7.74 | 7.32 | — | — | (1.56) | (1.56) | — | 5.76 | 28.30 | 34.40 | 12,571 | 2.15 | 2.17 | (1.63) | 19 | |
| 4/1/17 to 9/30/17(7) | 20.06 | (0.17) | 2.78 | 2.61 | — | — | (0.13) | (0.13) | — | 2.48 | 22.54 | 13.01 | 4,971 | 2.15 | 2.28 | (1.63) | 12 | |
| 4/1/16 to 3/31/17 | 18.09 | (0.27) | 2.59 | 2.32 | — | — | (0.35) | (0.35) | — | 1.97 | 20.06 | 13.03 (8) | 5,350 | 2.16 (8)(9) | 2.27 | (1.50) (8) | 20 | |
| Class I | ||||||||||||||||||
| 10/1/20 to 9/30/21 | $60.16 | (0.47) | 14.52 | 14.05 | — | — | (0.07) | (0.07) | — | 13.98 | $74.14 | 23.35 % | $2,499,830 | 1.00 % (6) | 1.00 % | (0.66) % | 17 % | |
| 10/1/19 to 9/30/20 | 38.70 | (0.33) | 22.05 | 21.72 | — | — | (0.26) | (0.26) | — | 21.46 | 60.16 | 56.39 | 1,837,262 | 1.03 (6) | 1.03 | (0.66) | 14 | |
| 10/1/18 to 9/30/19 | 36.66 | (0.22) | 2.90 | 2.68 | — | — | (0.64) | (0.64) | — | 2.04 | 38.70 | 7.79 | 309,892 | 1.11 (6)(14) | 1.11 | (0.58) | 28 | |
| 10/1/17 to 9/30/18 | 28.49 | (0.22) | 9.95 | 9.73 | — | — | (1.56) | (1.56) | — | 8.17 | 36.66 | 35.72 | 56,787 | 1.15 (14) | 1.13 | (0.65) | 19 | |
| 4/1/17 to 9/30/17(7) | 25.20 | (0.09) | 3.51 | 3.42 | — | — | (0.13) | (0.13) | — | 3.29 | 28.49 | 13.58 | 4,419 | 1.15 | 1.27 | (0.63) | 12 | |
| 4/1/16 to 3/31/17 | 22.42 | (0.11) | 3.24 | 3.13 | — | — | (0.35) | (0.35) | — | 2.78 | 25.20 | 14.13 (8) | 3,872 | 1.16 (8)(9) | 1.27 | (0.50) (8) | 20 | |
| Class R6 | ||||||||||||||||||
| 10/1/20 to 9/30/21 | $60.49 | (0.36) | 14.62 | 14.26 | — | — | (0.07) | (0.07) | — | 14.19 | $74.68 | 23.57 % | $ 208,915 | 0.83 % | 0.89 % | (0.50) % | 17 % | |
| 10/1/19 to 9/30/20 | 38.85 | (0.28) | 22.18 | 21.90 | — | — | (0.26) | (0.26) | — | 21.64 | 60.49 | 56.64 | 100,461 | 0.83 | 0.93 | (0.51) | 14 | |
| 10/1/18 to 9/30/19 | 36.71 | (0.13) | 2.91 | 2.78 | — | — | (0.64) | (0.64) | — | 2.14 | 38.85 | 8.05 | 1,975 | 0.85 (10)(14) | 1.01 | (0.34) | 28 | |
| 1/30/18 (11) to 9/30/18 | 31.74 | (0.09) | 5.06 | 4.97 | — | — | — | — | — | 4.97 | 36.71 | 15.66 | 117 | 0.93 (10) | 1.09 | (0.40) | 19 (13) | |
| KAR Small-Cap Core Fund | ||||||||||||||||||
| Class A | ||||||||||||||||||
| 10/1/20 to 9/30/21 | $40.21 | (0.11) | 11.25 | 11.14 | — | — | (3.37) | (3.37) | — | 7.77 | $47.98 | 28.68 % | $ 140,807 | 1.26 % | 1.26 % | (0.23) % | 16 % | |
| 10/1/19 to 9/30/20 | 38.20 | (0.17) | 3.84 | 3.67 | — | — | (1.66) | (1.66) | — | 2.01 | 40.21 | 9.78 | 112,178 | 1.28 | 1.28 | (0.46) | 19 | |
| 10/1/18 to 9/30/19 | 35.42 | (0.08) | 4.14 | 4.06 | — | — | (1.28) | (1.28) | — | 2.78 | 38.20 | 12.50 | 133,702 | 1.29 | 1.29 | (0.24) | 9 | |
| 10/1/17 to 9/30/18 | 28.05 | (0.03) | 7.44 | 7.41 | — | — | (0.04) | (0.04) | — | 7.37 | 35.42 | 26.42 | 153,109 | 1.29 | 1.29 | (0.08) | 13 | |
| 4/1/17 to 9/30/17(7) | 24.21 | (0.06) | 3.91 | 3.85 | — | — | (0.01) | (0.01) | — | 3.84 | 28.05 | 15.92 | 79,752 | 1.33 | 1.33 | (0.49) | 2 | |
| 4/1/16 to 3/31/17 | 21.39 | (0.07) | 4.26 | 4.19 | — | — | (1.37) | (1.37) | — | 2.82 | 24.21 | 20.26 (8) | 62,122 | 1.37 (8)(9) | 1.37 | (0.31) (8) | 24 |
| Net Asset Value, Beginning of Period | Net Investment Income (Loss)(1) | Net Realized and Unrealized Gain (Loss) | Total from Investment Operations | Dividends from Net Investment Income | Return of Capital | Distributions from Net Realized Gains | Total Distributions | Payment from Affiliates(1) | Change in Net Asset Value | Net Asset Value, End of Period | Total Return(2)(3) | Net Assets, End of Period (in thousands) | Ratio of Net Expenses to Average Net Assets(4)(5) | Ratio of Gross Expenses to Average Net Assets(4)(5) | Ratio of Net Investment Income (Loss) to Average Net Assets(4) | Portfolio Turnover Rate(3) | ||
| KAR Small-Cap Core Fund (Continued) | ||||||||||||||||||
| Class C | ||||||||||||||||||
| 10/1/20 to 9/30/21 | $32.95 | (0.35) | 9.12 | 8.77 | — | — | (3.37) | (3.37) | — | 5.40 | $38.35 | 27.74 % | $ 84,992 | 1.99 % | 1.99 % | (0.93) % | 16 % | |
| 10/1/19 to 9/30/20 | 31.81 | (0.37) | 3.17 | 2.80 | — | — | (1.66) | (1.66) | — | 1.14 | 32.95 | 8.98 | 89,553 | 2.01 | 2.01 | (1.20) | 19 | |
| 10/1/18 to 9/30/19 | 29.95 | (0.28) | 3.42 | 3.14 | — | — | (1.28) | (1.28) | — | 1.86 | 31.81 | 11.69 | 106,191 | 2.03 | 2.03 | (0.99) | 9 | |
| 10/1/17 to 9/30/18 | 23.90 | (0.23) | 6.32 | 6.09 | — | — | (0.04) | (0.04) | — | 6.05 | 29.95 | 25.52 | 122,439 | 2.02 | 2.02 | (0.82) | 13 | |
| 4/1/17 to 9/30/17(7) | 20.71 | (0.14) | 3.34 | 3.20 | — | — | (0.01) | (0.01) | — | 3.19 | 23.90 | 15.47 | 56,526 | 2.08 | 2.08 | (1.23) | 2 | |
| 4/1/16 to 3/31/17 | 18.61 | (0.21) | 3.68 | 3.47 | — | — | (1.37) | (1.37) | — | 2.10 | 20.71 | 19.39 (8) | 44,789 | 2.12 (8)(9) | 2.12 | (1.10) (8) | 24 | |
| Class I | ||||||||||||||||||
| 10/1/20 to 9/30/21 | $42.67 | 0.02 | 11.96 | 11.98 | (0.06) | — | (3.37) | (3.43) | — | 8.55 | $51.22 | 29.03 % | $1,278,711 | 1.00 % | 1.00 % | 0.05 % | 16 % | |
| 10/1/19 to 9/30/20 | 40.33 | (0.07) | 4.08 | 4.01 | (0.01) | — | (1.66) | (1.67) | — | 2.34 | 42.67 | 10.11 | 1,082,010 | 1.00 | 1.00 | (0.18) | 19 | |
| 10/1/18 to 9/30/19 | 37.26 | — (12) | 4.39 | 4.39 | (0.04) | — | (1.28) | (1.32) | — | 3.07 | 40.33 | 12.83 | 1,202,004 | 1.02 | 1.02 | 0.01 | 9 | |
| 10/1/17 to 9/30/18 | 29.44 | 0.06 | 7.80 | 7.86 | — | — | (0.04) | (0.04) | — | 7.82 | 37.26 | 26.73 | 1,231,686 | 1.01 | 1.01 | 0.18 | 13 | |
| 4/1/17 to 9/30/17(7) | 25.37 | (0.03) | 4.11 | 4.08 | — | — | (0.01) | (0.01) | — | 4.07 | 29.44 | 16.10 | 474,552 | 1.08 | 1.08 | (0.23) | 2 | |
| 4/1/16 to 3/31/17 | 22.30 | (0.03) | 4.47 | 4.44 | — | — | (1.37) | (1.37) | — | 3.07 | 25.37 | 20.57 (8) | 338,491 | 1.12 (8)(9) | 1.12 | (0.11) (8) | 24 | |
| Class R6 | ||||||||||||||||||
| 10/1/20 to 9/30/21 | $42.84 | 0.06 | 12.02 | 12.08 | (0.10) | — | (3.37) | (3.47) | — | 8.61 | $51.45 | 29.14 % | $ 421,653 | 0.92 % | 0.92 % | 0.12 % | 16 % | |
| 10/1/19 to 9/30/20 | 40.50 | (0.06) | 4.10 | 4.04 | (0.04) | — | (1.66) | (1.70) | — | 2.34 | 42.84 | 10.15 | 294,883 | 0.93 | 0.93 | (0.14) | 19 | |
| 10/1/18 to 9/30/19 | 37.40 | 0.04 | 4.40 | 4.44 | (0.06) | — | (1.28) | (1.34) | — | 3.10 | 40.50 | 12.94 | 107,611 | 0.94 | 0.94 | 0.10 | 9 | |
| 10/1/17 to 9/30/18 | 29.52 | 0.09 | 7.83 | 7.92 | — | — | (0.04) | (0.04) | — | 7.88 | 37.40 | 26.86 | 88,563 | 0.94 | 0.94 | 0.25 | 13 | |
| 4/1/17 to 9/30/17(7) | 25.44 | (0.02) | 4.11 | 4.09 | — | — | (0.01) | (0.01) | — | 4.08 | 29.52 | 16.14 | 44,565 | 0.99 | 0.99 | (0.14) | 2 | |
| 4/1/16 to 3/31/17 | 22.33 | — (12) | 4.48 | 4.48 | — | — | (1.37) | (1.37) | — | 3.11 | 25.44 | 20.68 (8) | 31,338 | 1.01 (8)(9) | 1.01 | 0.01 (8) | 24 | |
| KAR Small-Cap Growth Fund | ||||||||||||||||||
| Class A | ||||||||||||||||||
| 10/1/20 to 9/30/21 | $49.00 | (0.52) | 10.49 | 9.97 | — | — | (5.16) | (5.16) | — | 4.81 | $53.81 | 20.46 % | $ 793,106 | 1.34 % (6) | 1.34 % | (0.97) % | 11 % | |
| 10/1/19 to 9/30/20 | 37.44 | (0.41) | 12.59 | 12.18 | — | — | (0.62) | (0.62) | — | 11.56 | 49.00 | 32.91 | 772,158 | 1.35 (6) | 1.35 | (0.99) | 17 | |
| 10/1/18 to 9/30/19 | 33.57 | (0.23) | 4.78 | 4.55 | — | (0.04) | (0.64) | (0.68) | — | 3.87 | 37.44 | 14.12 | 735,210 | 1.37 (6) | 1.37 | (0.66) | 16 | |
| 10/1/17 to 9/30/18 | 25.43 | (0.11) | 8.25 | 8.14 | — | — | — | — | — | 8.14 | 33.57 | 32.01 | 866,966 | 1.37 (6) | 1.37 | (0.37) | 13 | |
| 4/1/17 to 9/30/17(7) | 21.12 | (0.09) | 4.40 | 4.31 | — (12) | — | — | — (12) | — | 4.31 | 25.43 | 20.41 | 263,281 | 1.50 (14) | 1.46 | (0.81) | 1 | |
| 4/1/16 to 3/31/17 | 17.67 | (0.14) | 4.14 | 4.00 | — | — | (0.55) | (0.55) | — | 3.45 | 21.12 | 23.25 (8) | 184,302 | 1.50 (8)(9) | 1.51 | (0.73) (8) | 21 | |
| Class C | ||||||||||||||||||
| 10/1/20 to 9/30/21 | $43.40 | (0.79) | 9.27 | 8.48 | — | — | (5.16) | (5.16) | — | 3.32 | $46.72 | 19.60 % | $ 319,371 | 2.05 % (6) | 2.05 % | (1.68) % | 11 % | |
| 10/1/19 to 9/30/20 | 33.46 | (0.63) | 11.19 | 10.56 | — | — | (0.62) | (0.62) | — | 9.94 | 43.40 | 31.97 | 322,672 | 2.07 (6) | 2.07 | (1.72) | 17 | |
| 10/1/18 to 9/30/19 | 30.30 | (0.44) | 4.28 | 3.84 | — | (0.04) | (0.64) | (0.68) | — | 3.16 | 33.46 | 13.28 | 291,693 | 2.10 (6) | 2.10 | (1.40) | 16 | |
| 10/1/17 to 9/30/18 | 23.13 | (0.31) | 7.48 | 7.17 | — | — | — | — | — | 7.17 | 30.30 | 31.00 | 301,749 | 2.10 (6) | 2.10 | (1.10) | 13 | |
| 4/1/17 to 9/30/17(7) | 19.28 | (0.17) | 4.02 | 3.85 | — (12) | — | — | — (12) | — | 3.85 | 23.13 | 19.97 | 93,560 | 2.25 (14) | 2.21 | (1.56) | 1 | |
| 4/1/16 to 3/31/17 | 16.30 | (0.26) | 3.79 | 3.53 | — | — | (0.55) | (0.55) | — | 2.98 | 19.28 | 22.30 (8) | 58,327 | 2.26 (8)(9) | 2.26 | (1.49) (8) | 21 |
| Net Asset Value, Beginning of Period | Net Investment Income (Loss)(1) | Net Realized and Unrealized Gain (Loss) | Total from Investment Operations | Dividends from Net Investment Income | Return of Capital | Distributions from Net Realized Gains | Total Distributions | Payment from Affiliates(1) | Change in Net Asset Value | Net Asset Value, End of Period | Total Return(2)(3) | Net Assets, End of Period (in thousands) | Ratio of Net Expenses to Average Net Assets(4)(5) | Ratio of Gross Expenses to Average Net Assets(4)(5) | Ratio of Net Investment Income (Loss) to Average Net Assets(4) | Portfolio Turnover Rate(3) | ||
| KAR Small-Cap Growth Fund (Continued) | ||||||||||||||||||
| Class I | ||||||||||||||||||
| 10/1/20 to 9/30/21 | $50.25 | (0.38) | 10.75 | 10.37 | — | — | (5.16) | (5.16) | — | 5.21 | $55.46 | 20.77 % | $5,346,986 | 1.07 % (6) | 1.07 % | (0.70) % | 11 % | |
| 10/1/19 to 9/30/20 | 38.28 | (0.31) | 12.90 | 12.59 | — | — | (0.62) | (0.62) | — | 11.97 | 50.25 | 33.27 | 5,251,980 | 1.09 (6) | 1.09 | (0.74) | 17 | |
| 10/1/18 to 9/30/19 | 34.21 | (0.14) | 4.89 | 4.75 | — | (0.04) | (0.64) | (0.68) | — | 4.07 | 38.28 | 14.44 | 3,973,860 | 1.11 (6) | 1.11 | (0.40) | 16 | |
| 10/1/17 to 9/30/18 | 25.86 | (0.03) | 8.38 | 8.35 | — | — | — | — | — | 8.35 | 34.21 | 32.29 | 4,121,658 | 1.10 (6) | 1.10 | (0.10) | 13 | |
| 4/1/17 to 9/30/17(7) | 21.45 | (0.07) | 4.48 | 4.41 | — (12) | — | — | — (12) | — | 4.41 | 25.86 | 20.56 | 1,087,430 | 1.25 (14) | 1.21 | (0.55) | 1 | |
| 4/1/16 to 3/31/17 | 17.89 | (0.10) | 4.21 | 4.11 | — | — | (0.55) | (0.55) | — | 3.56 | 21.45 | 23.59 (8) | 489,593 | 1.26 (8)(9) | 1.26 | (0.50) (8) | 21 | |
| Class R6 | ||||||||||||||||||
| 10/1/20 to 9/30/21 | $50.39 | (0.32) | 10.77 | 10.45 | — | — | (5.16) | (5.16) | — | 5.29 | $55.68 | 20.88 % | $ 205,549 | 0.98 % (6) | 0.98 % | (0.58) % | 11 % | |
| 10/1/19 to 9/30/20 | 38.35 | (0.29) | 12.95 | 12.66 | — | — | (0.62) | (0.62) | — | 12.04 | 50.39 | 33.39 | 95,061 | 0.99 (6) | 0.99 | (0.68) | 17 | |
| 10/1/18 to 9/30/19 | 34.23 | (0.12) | 4.92�� | 4.80 | — | (0.04) | (0.64) | (0.68) | — | 4.12 | 38.35 | 14.58 | 45,306 | 1.00 (6) | 1.00 | (0.31) | 16 | |
| 1/30/18 (11) to 9/30/18 | 29.81 | 0.01 | 4.41 | 4.42 | — | — | — | — | — | 4.42 | 34.23 | 14.83 | 13,800 | 1.00 (6) | 1.00 | 0.05 | 13 | |
| KAR Small-Cap Value Fund | ||||||||||||||||||
| Class A | ||||||||||||||||||
| 10/1/20 to 9/30/21 | $19.97 | 0.04 | 7.42 | 7.46 | (0.15) | — | — | (0.15) | — | 7.31 | $27.28 | 37.45 % | $ 130,975 | 1.20 % (6) | 1.20 % | 0.14 % | 13 % | |
| 10/1/19 to 9/30/20 | 18.33 | 0.12 | 1.63 | 1.75 | (0.11) | — | — | (0.11) | — | 1.64 | 19.97 | 9.57 | 83,622 | 1.23 (6) | 1.23 | 0.66 | 19 | |
| 10/1/18 to 9/30/19 | 19.44 | 0.14 | (0.93) | (0.79) | (0.13) | — | (0.19) | (0.32) | — | (1.11) | 18.33 | (3.82) | 79,027 | 1.24 (6) | 1.24 | 0.80 | 14 | |
| 10/1/17 to 9/30/18 | 18.41 | 0.10 | 1.23 | 1.33 | (0.01) | — | (0.29) | (0.30) | — | 1.03 | 19.44 | 7.27 | 83,276 | 1.27 (6) | 1.27 | 0.55 | 6 | |
| 4/1/17 to 9/30/17(7) | 17.61 | 0.03 | 1.44 | 1.47 | (0.02) | — | (0.65) | (0.67) | — | 0.80 | 18.41 | 8.56 | 87,399 | 1.32 (6) | 1.32 | 0.29 | 10 | |
| 4/1/16 to 3/31/17 | 15.67 | 0.22 | 3.16 | 3.38 | (0.26) | — | (1.18) | (1.44) | — | 1.94 | 17.61 | 22.86 | 89,050 | 1.32 (6)(9) | 1.32 | 1.35 | 22 | |
| Class C | ||||||||||||||||||
| 10/1/20 to 9/30/21 | $19.44 | (0.16) | 7.24 | 7.08 | (0.01) | — | — | (0.01) | — | 7.07 | $26.51 | 36.44 % | $ 21,623 | 1.96 % (6) | 1.96 % | (0.60) % | 13 % | |
| 10/1/19 to 9/30/20 | 17.88 | (0.01) | 1.57 | 1.56 | — | — | — | — | — | 1.56 | 19.44 | 8.72 | 16,233 | 1.98 (6) | 1.98 | (0.08) | 19 | |
| 10/1/18 to 9/30/19 | 18.96 | 0.01 | (0.90) | (0.89) | — | — | (0.19) | (0.19) | — | (1.08) | 17.88 | (4.56) | 15,361 | 1.99 (6) | 1.99 | 0.09 | 14 | |
| 10/1/17 to 9/30/18 | 18.08 | (0.03) | 1.20 | 1.17 | — | — | (0.29) | (0.29) | — | 0.88 | 18.96 | 6.54 | 29,922 | 1.97 (6) | 1.97 | (0.14) | 6 | |
| 4/1/17 to 9/30/17(7) | 17.35 | (0.04) | 1.42 | 1.38 | — | — | (0.65) | (0.65) | — | 0.73 | 18.08 | 8.17 | 29,795 | 2.06 (6) | 2.06 | (0.45) | 10 | |
| 4/1/16 to 3/31/17 | 15.45 | 0.10 | 3.11 | 3.21 | (0.13) | — | (1.18) | (1.31) | — | 1.90 | 17.35 | 21.95 | 29,416 | 2.07 (6)(9) | 2.07 | 0.65 | 22 | |
| Class I | ||||||||||||||||||
| 10/1/20 to 9/30/21 | $19.97 | 0.10 | 7.43 | 7.53 | (0.20) | — | — | (0.20) | — | 7.33 | $27.30 | 37.83 % | $1,190,498 | 0.96 % (6) | 0.96 % | 0.38 % | 13 % | |
| 10/1/19 to 9/30/20 | 18.34 | 0.18 | 1.60 | 1.78 | (0.15) | — | — | (0.15) | — | 1.63 | 19.97 | 9.75 | 711,421 | 0.99 (6) | 0.99 | 0.94 | 19 | |
| 10/1/18 to 9/30/19 | 19.49 | 0.18 | (0.94) | (0.76) | (0.20) | — | (0.19) | (0.39) | — | (1.15) | 18.34 | (3.57) | 484,123 | 1.01 (6) | 1.01 | 1.02 | 14 | |
| 10/1/17 to 9/30/18 | 18.41 | 0.16 | 1.23 | 1.39 | (0.02) | — | (0.29) | (0.31) | — | 1.08 | 19.49 | 7.62 | 475,103 | 0.99 (6) | 0.99 | 0.84 | 6 | |
| 4/1/17 to 9/30/17(7) | 17.62 | 0.05 | 1.43 | 1.48 | (0.04) | — | (0.65) | (0.69) | — | 0.79 | 18.41 | 8.72 | 300,259 | 1.07 (6) | 1.07 | 0.55 | 10 | |
| 4/1/16 to 3/31/17 | 15.69 | 0.26 | 3.17 | 3.43 | (0.32) | — | (1.18) | (1.50) | — | 1.93 | 17.62 | 23.20 | 242,661 | 1.07 (6)(9) | 1.07 | 1.63 | 22 |
| Net Asset Value, Beginning of Period | Net Investment Income (Loss)(1) | Net Realized and Unrealized Gain (Loss) | Total from Investment Operations | Dividends from Net Investment Income | Return of Capital | Distributions from Net Realized Gains | Total Distributions | Payment from Affiliates(1) | Change in Net Asset Value | Net Asset Value, End of Period | Total Return(2)(3) | Net Assets, End of Period (in thousands) | Ratio of Net Expenses to Average Net Assets(4)(5) | Ratio of Gross Expenses to Average Net Assets(4)(5) | Ratio of Net Investment Income (Loss) to Average Net Assets(4) | Portfolio Turnover Rate(3) | ||
| KAR Small-Cap Value Fund (Continued) | ||||||||||||||||||
| Class R6 | ||||||||||||||||||
| 10/1/20 to 9/30/21 | $20.00 | 0.12 | 7.43 | 7.55 | (0.22) | — | — | (0.22) | — | 7.33 | $27.33 | 37.85 % | $ 81,914 | 0.89 % (6) | 0.89 % | 0.46 % | 13 % | |
| 10/1/19 to 9/30/20 | 18.36 | 0.19 | 1.62 | 1.81 | (0.17) | — | — | (0.17) | — | 1.64 | 20.00 | 9.90 | 12,246 | 0.89 (6) | 0.89 | 1.01 | 19 | |
| 10/1/18 to 9/30/19 | 19.51 | 0.20 | (0.94) | (0.74) | (0.22) | — | (0.19) | (0.41) | — | (1.15) | 18.36 | (3.47) | 11,286 | 0.90 (6) | 0.90 | 1.11 | 14 | |
| 10/1/17 to 9/30/18 | 18.42 | 0.18 | 1.22 | 1.40 | (0.02) | — | (0.29) | (0.31) | — | 1.09 | 19.51 | 7.69 | 21,746 | 0.90 (6) | 0.90 | 0.96 | 6 | |
| 4/1/17 to 9/30/17(7) | 17.63 | 0.05 | 1.44 | 1.49 | (0.05) | — | (0.65) | (0.70) | — | 0.79 | 18.42 | 8.78 | 10,165 | 0.99 (6) | 0.99 | 0.52 | 10 | |
| 11/3/16 (11) to 3/31/17 | 14.90 | 0.05 | 3.15 | 3.20 | (0.22) | — | (0.25) | (0.47) | — | 2.73 | 17.63 | 21.58 | 122 | 0.98 (6) | 0.98 | 0.68 | 22 (13) | |
| KAR Small-Mid Cap Core Fund | ||||||||||||||||||
| Class A | ||||||||||||||||||
| 10/1/20 to 9/30/21 | $14.43 | (0.14) | 4.38 | 4.24 | — | — | — | — | — | 4.24 | $18.67 | 29.38 % | $ 48,485 | 1.30 % | 1.30 % | (0.77) % | 7 % | |
| 10/1/19 to 9/30/20 | 11.53 | (0.03) | 2.93 | 2.90 | — | — | — | — | — | 2.90 | 14.43 | 25.15 | 19,735 | 1.30 | 1.39 | (0.23) | 31 | |
| 10/1/18 to 9/30/19 | 10.79 | (0.03) | 0.89 | 0.86 | — | — | (0.12) | (0.12) | — | 0.74 | 11.53 | 8.32 | 1,473 | 1.30 | 2.25 | (0.28) | 21 | |
| 3/7/18 (11) to 9/30/18 | 10.00 | (0.02) | 0.81 | 0.79 | — | — | — | — | — | 0.79 | 10.79 | 7.90 | 158 | 1.30 | 5.84 | (0.38) | 16 (13) | |
| Class C | ||||||||||||||||||
| 10/1/20 to 9/30/21 | $14.16 | (0.27) | 4.29 | 4.02 | — | — | — | — | — | 4.02 | $18.18 | 28.39 % | $ 30,401 | 2.05 % (6)(14) | 2.03 % | (1.52) % | 7 % | |
| 10/1/19 to 9/30/20 | 11.40 | (0.12) | 2.88 | 2.76 | — | — | — | — | — | 2.76 | 14.16 | 24.21 | 10,210 | 2.05 | 2.08 | (0.97) | 31 | |
| 10/1/18 to 9/30/19 | 10.75 | (0.11) | 0.88 | 0.77 | — | — | (0.12) | (0.12) | — | 0.65 | 11.40 | 7.50 | 1,106 | 2.05 | 2.92 | (1.05) | 21 | |
| 3/7/18 (11) to 9/30/18 | 10.00 | (0.07) | 0.82 | 0.75 | — | — | — | — | — | 0.75 | 10.75 | 7.50 | 135 | 2.05 | 6.48 | (1.14) | 16 (13) | |
| Class I | ||||||||||||||||||
| 10/1/20 to 9/30/21 | $14.51 | (0.09) | 4.40 | 4.31 | — (12) | — | — | — (12) | — | 4.31 | $18.82 | 29.72 % | $1,168,320 | 1.02 % (6)(14) | 1.01 % | (0.49) % | 7 % | |
| 10/1/19 to 9/30/20 | 11.56 | 0.01 | 2.94 | 2.95 | — | — | — | — | — | 2.95 | 14.51 | 25.52 | 439,899 | 1.05 | 1.09 | 0.07 | 31 | |
| 10/1/18 to 9/30/19 | 10.81 | (0.01) | 0.89 | 0.88 | (0.01) | — | (0.12) | (0.13) | — | 0.75 | 11.56 | 8.51 | 24,898 | 1.05 | 1.99 | (0.05) | 21 | |
| 3/7/18 (11) to 9/30/18 | 10.00 | (0.01) | 0.82 | 0.81 | — | — | — | — | — | 0.81 | 10.81 | 8.10 | 214 | 1.05 | 5.74 | (0.13) | 16 (13) | |
| Class R6 | ||||||||||||||||||
| 10/1/20 to 9/30/21 | $14.54 | (0.08) | 4.42 | 4.34 | (0.01) | — | — | (0.01) | — | 4.33 | $18.87 | 29.82 % | $ 16,335 | 0.97 % (6)(14) | 0.92 % | (0.44) % | 7 % | |
| 10/1/19 to 9/30/20 | 11.57 | — (12) | 2.97 | 2.97 | — | — | — | — | — | 2.97 | 14.54 | 25.67 | 8,366 | 0.97 | 0.99 | 0.03 | 31 | |
| 10/1/18 to 9/30/19 | 10.81 | 0.01 | 0.88 | 0.89 | (0.01) | — | (0.12) | (0.13) | — | 0.76 | 11.57 | 8.61 | 3,125 | 0.97 | 1.91 | 0.06 | 21 | |
| 3/7/18 (11) to 9/30/18 | 10.00 | (—) (12) | 0.81 | 0.81 | — | — | — | — | — | 0.81 | 10.81 | 8.10 | 2,919 | 0.97 | 5.20 | (0.07) | 16 (13) | |
| KAR Small-Mid Cap Growth Fund | ||||||||||||||||||
| Class A | ||||||||||||||||||
| 12/8/20 (11) to 9/30/21 | $10.00 | (0.09) | 0.79 | 0.70 | — | — | — | — | — | 0.70 | $10.70 | 7.00 % | $ 725 | 1.30 % | 4.06 % | (1.05) % | 14 % (13) | |
| Class C | ||||||||||||||||||
| 12/8/20 (11) to 9/30/21 | $10.00 | (0.15) | 0.78 | 0.63 | — | — | — | — | — | 0.63 | $10.63 | 6.30 % | $ 119 | 2.05 % | 4.88 % | (1.82) % | 14 % (13) | |
| Class I | ||||||||||||||||||
| 12/8/20 (11) to 9/30/21 | $10.00 | (0.07) | 0.79 | 0.72 | — | — | — | — | — | 0.72 | $10.72 | 7.20 % | $ 1,998 | 1.05 % | 3.83 % | (0.79) % | 14 % (13) | |
| Class R6 | ||||||||||||||||||
| 12/8/20 (11) to 9/30/21 | $10.00 | (0.07) | 0.80 | 0.73 | — | — | — | — | — | 0.73 | $10.73 | 7.30 % | $ 3,241 | 0.99 % | 3.79 % | (0.76) % | 14 % (13) |
| Net Asset Value, Beginning of Period | Net Investment Income (Loss)(1) | Net Realized and Unrealized Gain (Loss) | Total from Investment Operations | Dividends from Net Investment Income | Return of Capital | Distributions from Net Realized Gains | Total Distributions | Payment from Affiliates(1) | Change in Net Asset Value | Net Asset Value, End of Period | Total Return(2)(3) | Net Assets, End of Period (in thousands) | Ratio of Net Expenses to Average Net Assets(4)(5) | Ratio of Gross Expenses to Average Net Assets(4)(5) | Ratio of Net Investment Income (Loss) to Average Net Assets(4) | Portfolio Turnover Rate(3) | ||
| KAR Small-Mid Cap Value Fund | ||||||||||||||||||
| Class A | ||||||||||||||||||
| 8/3/21 (11) to 9/30/21 | $10.00 | — (12) | (0.36) | (0.36) | — | — | — | — | — | (0.36) | $ 9.64 | (3.60) % | $ 127 | 1.17 % | 12.81 % | 0.09 % | 0 % | |
| Class C | ||||||||||||||||||
| 8/3/21 (11) to 9/30/21 | $10.00 | (0.01) | (0.36) | (0.37) | — | — | — | — | — | (0.37) | $ 9.63 | (3.70) % | $ 99 | 1.92 % | 13.87 % | (0.71) % | 0 % | |
| Class I | ||||||||||||||||||
| 8/3/21 (11) to 9/30/21 | $10.00 | — (12) | (0.36) | (0.36) | — | — | — | — | — | (0.36) | $ 9.64 | (3.60) % | $ 97 | 0.92 % | 12.88 % | 0.29 % | 0 % | |
| Class R6 | ||||||||||||||||||
| 8/3/21 (11) to 9/30/21 | $10.00 | 0.01 | (0.36) | (0.35) | — | — | — | — | — | (0.35) | $ 9.65 | (3.50) % | $ 2,604 | 0.82 % | 12.82 % | 0.47 % | 0 % | |
| SGA Emerging Markets Growth Fund | ||||||||||||||||||
| Class A | ||||||||||||||||||
| 10/1/20 to 9/30/21 | $11.90 | (0.09) | 1.28 | 1.19 | — | — | (0.27) | (0.27) | — | 0.92 | $12.82 | 9.93 % | $ 206 | 1.48 % | 2.91 % | (0.66) % | 46 % | |
| 10/1/19 to 9/30/20 | 9.97 | (0.05) | 1.98 | 1.93 | — | — | — (12) | — (12) | — | 1.93 | 11.90 | 19.37 | 169 | 1.48 | 3.98 | (0.47) | 44 | |
| 6/13/19 (11) to 9/30/19 | 10.00 | (0.02) | (0.01) | (0.03) | — | — | — | — | — | (0.03) | 9.97 | (0.30) | 100 | 1.48 | 9.63 | (0.57) | 6 (13) | |
| Class C | ||||||||||||||||||
| 10/1/20 to 9/30/21 | $11.79 | (0.19) | 1.27 | 1.08 | — | — | (0.27) | (0.27) | — | 0.81 | $12.60 | 9.08 % | $ 159 | 2.23 % | 3.66 % | (1.42) % | 46 % | |
| 10/1/19 to 9/30/20 | 9.95 | (0.13) | 1.97 | 1.84 | — | — | — (12) | — (12) | — | 1.84 | 11.79 | 18.50 | 142 | 2.23 | 4.70 | (1.19) | 44 | |
| 6/13/19 (11) to 9/30/19 | 10.00 | (0.04) | (0.01) | (0.05) | — | — | — | — | — | (0.05) | 9.95 | (0.50) | 100 | 2.23 | 10.38 | (1.32) | 6 (13) | |
| Class I | ||||||||||||||||||
| 10/1/20 to 9/30/21 | $11.94 | (0.06) | 1.29 | 1.23 | — | — | (0.27) | (0.27) | — | 0.96 | $12.90 | 10.24 % | $ 405 | 1.23 % | 2.67 % | (0.42) % | 46 % | |
| 10/1/19 to 9/30/20 | 9.98 | (0.03) | 1.99 | 1.96 | — | — | — (12) | — (12) | — | 1.96 | 11.94 | 19.65 | 247 | 1.23 | 3.57 | (0.30) | 44 | |
| 6/13/19 (11) to 9/30/19 | 10.00 | (0.01) | (0.01) | (0.02) | — | — | — | — | — | (0.02) | 9.98 | (0.20) | 109 | 1.23 | 9.38 | (0.32) | 6 (13) | |
| Class R6 | ||||||||||||||||||
| 10/1/20 to 9/30/21 | $11.97 | (0.03) | 1.28 | 1.25 | — | — | (0.27) | (0.27) | — | 0.98 | $12.95 | 10.38 % | $ 5,425 | 1.05 % | 2.63 % | (0.24) % | 46 % | |
| 10/1/19 to 9/30/20 | 9.98 | — (12) | 1.99 | 1.99 | — | — | — (12) | — (12) | — | 1.99 | 11.97 | 19.95 | 4,828 | 1.05 | 3.72 | (0.02) | 44 | |
| 6/13/19 (11) to 9/30/19 | 10.00 | — (12) | (0.02) | (0.02) | — | — | — | — | — | (0.02) | 9.98 | (0.20) | 4,032 | 1.05 | 9.38 | (0.14) | 6 (13) | |
| SGA Global Growth Fund | ||||||||||||||||||
| Class A | ||||||||||||||||||
| 10/1/20 to 9/30/21 | $26.54 | (0.24) | 5.33 | 5.09 | — | — | (0.94) | (0.94) | — | 4.15 | $30.69 | 19.49 % | $ 34,690 | 1.38 % | 1.47 % | (0.79) % | 40 % | |
| 10/1/19 to 9/30/20 | 20.98 | (0.12) | 5.68 | 5.56 | — | — | — | — | — | 5.56 | 26.54 | 26.50 | 26,504 | 1.36 (6) | 1.36 | (0.53) | 49 | |
| 2/1/19 to 9/30/19(7) | 18.58 | (0.01) | 2.41 | 2.40 | — | — | — | — | — | 2.40 | 20.98 | 12.92 | 4,219 | 1.37 | 1.48 | (0.06) | 13 | |
| 2/1/18 to 1/31/19 | 19.72 | (0.05) | (0.32) | (0.37) | — | — | (0.77) | (0.77) | — | (1.14) | 18.58 | (1.46) | 3,786 | 1.38 | 1.60 | (0.28) | 54 | |
| 2/1/17 to 1/31/18 | 14.89 | (0.02) | 5.49 | 5.47 | — | — | (0.64) | (0.64) | — | 4.83 | 19.72 | 37.05 | 3,835 | 1.38 | 1.72 | (0.43) | 31 | |
| 2/1/16 to 1/31/17 | 13.65 | 0.03 | 1.76 | 1.79 | — | — | (0.55) | (0.55) | — | 1.24 | 14.89 | 13.21 | 1,028 | 1.38 | 2.33 | (0.27) | 32 |
| Net Asset Value, Beginning of Period | Net Investment Income (Loss)(1) | Net Realized and Unrealized Gain (Loss) | Total from Investment Operations | Dividends from Net Investment Income | Return of Capital | Distributions from Net Realized Gains | Total Distributions | Payment from Affiliates(1) | Change in Net Asset Value | Net Asset Value, End of Period | Total Return(2)(3) | Net Assets, End of Period (in thousands) | Ratio of Net Expenses to Average Net Assets(4)(5) | Ratio of Gross Expenses to Average Net Assets(4)(5) | Ratio of Net Investment Income (Loss) to Average Net Assets(4) | Portfolio Turnover Rate(3) | ||
| SGA Global Growth Fund (Continued) | ||||||||||||||||||
| Class C | ||||||||||||||||||
| 10/1/20 to 9/30/21 | $25.06 | (0.43) | 5.02 | 4.59 | — | — | (0.94) | (0.94) | — | 3.65 | $28.71 | 18.62 % | $ 7,326 | 2.13 % | 2.14 % | (1.54) % | 40 % | |
| 10/1/19 to 9/30/20 | 19.97 | (0.29) | 5.38 | 5.09 | — | — | — | — | — | 5.09 | 25.06 | 25.49 | 5,210 | 2.13 | 2.14 | (1.35) | 49 | |
| 2/1/19 to 9/30/19(7) | 17.77 | (0.11) | 2.31 | 2.20 | — | — | — | — | — | 2.20 | 19.97 | 12.38 | 3,554 | 2.10 | 2.20 | (0.83) | 13 | |
| 2/1/18 to 1/31/19 | 19.04 | (0.04) | (0.46) | (0.50) | — | — | (0.77) | (0.77) | — | (1.27) | 17.77 | (2.20) | 3,164 | 2.13 | 2.39 | (1.08) | 54 | |
| 2/1/17 to 1/31/18 | 14.50 | (0.04) | 5.22 | 5.18 | — | — | (0.64) | (0.64) | — | 4.54 | 19.04 | 36.04 | 2,062 | 2.13 | 2.47 | (1.08) | 31 | |
| 2/1/16 to 1/31/17 | 13.40 | 0.05 | 1.60 | 1.65 | — | — | (0.55) | (0.55) | — | 1.10 | 14.50 | 12.41 | 989 | 2.12 | 3.08 | (1.00) | 32 | |
| Class I* | ||||||||||||||||||
| 10/1/20 to 9/30/21 | $26.66 | (0.16) | 5.35 | 5.19 | — | — | (0.94) | (0.94) | — | 4.25 | $30.91 | 19.78 % | $ 53,546 | 1.13 % | 1.15 % | (0.52) % | 40 % | |
| 10/1/19 to 9/30/20 | 21.03 | (0.08) | 5.71 | 5.63 | — (12) | — | — | — (12) | — | 5.63 | 26.66 | 26.79 | 27,529 | 1.13 | 1.20 | (0.34) | 49 | |
| 2/1/19 to 9/30/19(7) | 18.61 | — (12) | 2.42 | 2.42 | — | — | — | — | — | 2.42 | 21.03 | 13.00 | 12,807 | 1.19 | 1.28 | (0.02) | 13 | |
| 2/1/18 to 1/31/19 | 19.75 | (0.21) | (0.16) | (0.37) | — | — | (0.77) | (0.77) | — | (1.14) | 18.61 | (1.46) | 5,878 | 1.36 | 1.50 | (0.15) | 54 | |
| 2/1/17 to 1/31/18 | 14.90 | (0.04) | 5.53 | 5.49 | — | — | (0.64) | (0.64) | — | 4.85 | 19.75 | 37.16 | 19,474 | 1.36 | 1.57 | (0.29) | 31 | |
| 2/1/16 to 1/31/17 | 13.66 | 0.06 | 1.73 | 1.79 | — | — | (0.55) | (0.55) | — | 1.24 | 14.90 | 13.20 | 11,414 | 1.34 | 2.05 | (0.43) | 32 | |
| Class R6** | ||||||||||||||||||
| 10/1/20 to 9/30/21 | $27.38 | (0.10) | 5.51 | 5.41 | — | — | (0.94) | (0.94) | — | 4.47 | $31.85 | 20.07 % | $ 80,122 | 0.90 % | 1.03 % | (0.31) % | 40 % | |
| 10/1/19 to 9/30/20 | 21.56 | (0.03) | 5.86 | 5.83 | (0.01) | — | — | (0.01) | — | 5.82 | 27.38 | 27.06 | 72,376 | 0.90 | 1.08 | (0.11) | 49 | |
| 2/1/19 to 9/30/19(7) | 19.04 | 0.05 | 2.47 | 2.52 | — | — | — | — | — | 2.52 | 21.56 | 13.24 | 40,690 | 0.95 | 1.16 | 0.34 | 13 | |
| 2/1/18 to 1/31/19 | 20.11 | 0.01 | (0.31) | (0.30) | — | — | (0.77) | (0.77) | — | (1.07) | 19.04 | (1.08) | 28,819 | 0.98 | 1.31 | 0.07 | 54 | |
| 2/1/17 to 1/31/18 | 15.11 | (0.01) | 5.65 | 5.64 | — | — | (0.64) | (0.64) | — | 5.00 | 20.11 | 37.64 | 15,913 | 0.98 | 1.34 | 0.08 | 31 | |
| 2/1/16 to 1/31/17 | 13.79 | 0.03 | 1.84 | 1.87 | — | — | (0.55) | (0.55) | — | 1.32 | 15.11 | 13.66 | 7,698 | 0.98 | 2.03 | 0.21 | 32 | |
| SGA New Leaders Growth Fund | ||||||||||||||||||
| Class A | ||||||||||||||||||
| 11/17/20 (11) to 9/30/21 | $10.00 | (0.09) | 0.74 | 0.65 | — | — | — | — | — | 0.65 | $10.65 | 6.50 % | $ 110 | 1.39 % | 3.60 % | (1.01) % | 24 % (13) | |
| Class C | ||||||||||||||||||
| 11/17/20 (11) to 9/30/21 | $10.00 | (0.16) | 0.74 | 0.58 | — | — | — | — | — | 0.58 | $10.58 | 5.80 % | $ 108 | 2.14 % | 4.35 % | (1.76) % | 24 % (13) | |
| Class I | ||||||||||||||||||
| 11/17/20 (11) to 9/30/21 | $10.00 | (0.07) | 0.74 | 0.67 | — | — | — | — | — | 0.67 | $10.67 | 6.70 % | $ 163 | 1.14 % | 3.32 % | (0.76) % | 24 % (13) | |
| Class R6 | ||||||||||||||||||
| 11/17/20 (11) to 9/30/21 | $10.00 | (0.05) | 0.74 | 0.69 | — | — | — | — | — | 0.69 | $10.69 | 6.90 % | $ 6,267 | 0.91 % | 3.25 % | (0.54) % | 24 % (13) |
| Net Asset Value, Beginning of Period | Net Investment Income (Loss)(1) | Net Realized and Unrealized Gain (Loss) | Total from Investment Operations | Dividends from Net Investment Income | Return of Capital | Distributions from Net Realized Gains | Total Distributions | Payment from Affiliates(1) | Change in Net Asset Value | Net Asset Value, End of Period | Total Return(2)(3) | Net Assets, End of Period (in thousands) | Ratio of Net Expenses to Average Net Assets(4)(5) | Ratio of Gross Expenses to Average Net Assets(4)(5) | Ratio of Net Investment Income (Loss) to Average Net Assets(4) | Portfolio Turnover Rate(3) | ||
| Tactical Allocation Fund | ||||||||||||||||||
| Class A | ||||||||||||||||||
| 10/1/20 to 9/30/21 | $12.10 | 0.04 | 1.97 | 2.01 | (0.05) | — | (0.20) | (0.25) | — | 1.76 | $13.86 | 16.69 % | $ 869,209 | 1.01 % (9)(10) | 1.07 % | 0.30 % | 46 % | |
| 10/1/19 to 9/30/20 | 9.51 | 0.07 | 2.71 | 2.78 | (0.07) | — | (0.12) | (0.19) | — | 2.59 | 12.10 | 29.72 | 683,100 | 1.06 (6) | 1.06 | 0.68 | 35 | |
| 10/1/18 to 9/30/19 | 9.66 | 0.13 | 0.06 | 0.19 | (0.12) | — | (0.22) | (0.34) | — (12) | (0.15) | 9.51 | 2.36 (15) | 569,543 | 1.14 (6) | 1.14 | 1.33 | 51 | |
| 10/1/17 to 9/30/18 | 9.00 | 0.14 | 0.73 | 0.87 | (0.14) | — | (0.07) | (0.21) | — | 0.66 | 9.66 | 9.73 | 146,854 | 1.26 | 1.27 | 1.47 | 41 | |
| 4/1/17 to 9/30/17(7) | 8.33 | 0.08 | 0.69 | 0.77 | (0.08) | — | (0.02) | (0.10) | — | 0.67 | 9.00 | 9.25 | 142,481 | 1.38 | 1.38 | 1.81 | 26 | |
| 4/1/16 to 3/31/17 | 8.44 | 0.17 | 0.56 | 0.73 | (0.15) | — | (0.69) | (0.84) | — | (0.11) | 8.33 | 9.20 (8) | 137,388 | 1.37 (8)(9) | 1.38 | 1.86 (8) | 104 | |
| Class C | ||||||||||||||||||
| 10/1/20 to 9/30/21 | $12.44 | (0.06) | 2.02 | 1.96 | (0.01) | — | (0.20) | (0.21) | — | 1.75 | $14.19 | 15.82 % | $ 33,401 | 1.77 % (9)(10) | 1.88 % | (0.46) % | 46 % | |
| 10/1/19 to 9/30/20 | 9.78 | (0.01) | 2.80 | 2.79 | (0.01) | — | (0.12) | (0.13) | — | 2.66 | 12.44 | 28.82 | 12,140 | 1.83 (6)(14) | 1.78 | (0.10) | 35 | |
| 10/1/18 to 9/30/19 | 9.93 | 0.06 | 0.05 | 0.11 | (0.04) | — | (0.22) | (0.26) | — (12) | (0.15) | 9.78 | 1.48 (15) | 8,560 | 1.91 (10) | 1.99 | 0.59 | 51 | |
| 10/1/17 to 9/30/18 | 9.24 | 0.07 | 0.75 | 0.82 | (0.06) | — | (0.07) | (0.13) | — | 0.69 | 9.93 | 8.94 | 3,736 | 2.04 | 2.05 | 0.68 | 41 | |
| 4/1/17 to 9/30/17(7) | 8.55 | 0.05 | 0.70 | 0.75 | (0.04) | — | (0.02) | (0.06) | — | 0.69 | 9.24 | 8.80 | 4,054 | 2.14 | 2.15 | 1.05 | 26 | |
| 4/1/16 to 3/31/17 | 8.64 | 0.11 | 0.57 | 0.68 | (0.08) | — | (0.69) | (0.77) | — | (0.09) | 8.55 | 8.37 (8) | 4,378 | 2.11 (8)(9) | 2.13 | 1.13 (8) | 104 | |
| Class I | ||||||||||||||||||
| 10/1/20 to 9/30/21 | $12.07 | 0.07 | 1.96 | 2.03 | (0.08) | — | (0.20) | (0.28) | — | 1.75 | $13.82 | 16.88 % | $ 51,887 | 0.78 % (9)(10) | 0.86 % | 0.55 % | 46 % | |
| 10/1/19 to 9/30/20 | 9.51 | 0.08 | 2.70 | 2.78 | (0.10) | — | (0.12) | (0.22) | — | 2.56 | 12.07 | 29.74 | 26,526 | 0.82 (6) | 0.82 | 0.73 | 35 | |
| 1/29/19 (11) to 9/30/19 | 8.66 | 0.10 | 0.85 | 0.95 | (0.10) | — | — | (0.10) | — (12) | 0.85 | 9.51 | 10.94 (15) | 2,813 | 0.88 (6) | 0.89 | 1.52 | 51 (13) | |
| Class R6 | ||||||||||||||||||
| 10/20/20 (11) to 9/30/21 | $12.48 | 0.09 | 1.55 | 1.64 | (0.09) | — | (0.20) | (0.29) | — | 1.35 | $13.83 | 13.23 % | $ 112 | 0.62 % (9) | 0.86 % | 0.70 % | 46 % (13) |
| Footnote Legend: | |
| * | On May 3, 2019, Investor Class shares of the Predecessor Fund were reorganized into Class I shares of the Fund. The Class I shares financial highlights for the periods prior to May 3, 2019 reflect the performance of the American Beacon SGA Global Growth Fund Investor Class shares. |
| ** | On May 3, 2019, Y Class shares and Institutional Class shares of the Predecessor Fund were reorganized into Class R6 shares of the Fund. The Class R6 shares financial highlights for the periods prior to May 3, 2019 reflect the performance of the American Beacon SGA Global Growth Fund Institutional Class shares. |
| (1) | Calculated using average shares outstanding. |
| (2) | Sales charges, where applicable, are not reflected in the total return calculation. |
| (3) | Not annualized for periods less than one year. |
| (4) | Annualized for periods less than one year. |
| (5) | The Funds will also indirectly bear their prorated share of expenses of any underlying funds in which they invest. Such expenses are not included in the calculation of this ratio. |
| (6) | The share class is currently under its expense limitation. |
| (7) | The Fund changed its fiscal year end to September 30, during the period. |
| (8) | State Street Bank & Trust, custodian for some of the Funds through January 29, 2010, reimbursed the Funds for out-of-pocket custody expenses overbilled for the period 1998 through January 29, 2010. Custody fees reimbursed were excluded from the Ratio of Net Expenses to Average Net Assets and Ratio of Net Investment Income (Loss) to Average Net Assets. If included, the impact would have been to lower the Ratio of Net Expenses and increase the Ratio of Net Investment Income (Loss) as follows: KAR Capital Growth Fund 0.06% (Class A), 0.05% (Class C), 0.06% (Class I) KAR Equity Income Fund amounts are less than 0.005% for Classes A, C, and I, respectively KAR Mid-Cap Growth Fund 0.05% (Class A), 0.05% (Class C), 0.05% (Class I) KAR Small-Cap Core Fund amounts are less than 0.005% for Classes A, C, I, and R6, respectively KAR Small-Cap Growth Fund amounts are less than 0.005% for Classes A, C, and I, respectively Tactical Allocation Fund 0.08% (Class A), 0.08% (Class C) Custody fees reimbursed were included in Total Return. If excluded, the impact would have been to lower the Total Return as follows: KAR Capital Growth Fund 0.06% (Class A), 0.06% (Class C), 0.06% (Class I) KAR Equity Income Fund amounts are less than 0.005% for Classes A, C, and I, respectively KAR Mid-Cap Growth Fund 0.05% (Class A), 0.05% (Class C), 0.05% (Class I) KAR Small-Cap Core Fund amounts are less than 0.005% for Classes A, C, I, and R6, respectively KAR Small-Cap Growth Fund amounts are less than 0.005% for Classes A, C, and I, respectively Tactical Allocation Fund 0.08% (Class A), 0.08% (Class C) |
| (9) | Net expense ratio includes extraordinary proxy expenses. |
| (10) | Due to a change in expense cap, the ratio shown is a blended expense ratio. |
| (11) | Inception date. |
| (12) | Amount is less than $0.005 per share. |
| (13) | Portfolio turnover is representative of the Fund for the entire period. |
| (14) | See Note 3D in Notes to Financial Statements for information on recapture of expenses previously reimbursed and/or waived. |
| (15) | Payment from affiliates had no impact on total return. |
| A. | Security Valuation |
| Each Fund utilizes a fair value hierarchy which prioritizes the inputs to valuation techniques used to measure fair value into three broad levels. The Funds’ policy is to recognize transfers into or out of Level 3 at the end of the reporting period. | |
| • Level 1 – quoted prices in active markets for identical securities (security types generally include listed equities). |
| B. | Security Transactions and Investment Income |
| Security transactions are recorded on the trade date. Realized gains and losses from the sale of securities are determined on the identified cost basis. Dividend income is recognized on the ex-dividend date or, in the case of certain foreign securities, as soon as a Fund is notified. Interest income is recorded on the accrual basis. Each Fund amortizes premiums and accretes discounts using the effective interest method. Premiums on callable debt securities are amortized to interest income to the earliest call date using the effective interest method. Any distributions from underlying funds are recorded in accordance with the character of the distributions as designated by the underlying funds. | |
| Dividend income from REITs is recorded using management’s estimate of the percentage of income included in distributions received from such investments based on historical information and other industry sources. The return of capital portion of the estimate is a reduction to investment income and a reduction in the cost basis of each investment which increases net realized gain (loss) and net change in unrealized appreciation (depreciation). If the return of capital distributions exceed their cost basis, the distributions are treated as realized gains. The actual amounts of income, return of capital, and capital gains are only determined by each REIT after its fiscal year-end, and may differ from the estimated amounts. | |
| C. | Income Taxes |
| Each Fund is treated as a separate taxable entity. It is the intention of each Fund to comply with the requirements of Subchapter M of the Internal Revenue Code of 1986, as amended (the “Code”) and to distribute substantially all of its taxable income to its shareholders. Therefore, no provision for federal income taxes or excise taxes has been made. | |
| Certain Funds may be subject to foreign taxes on income, gains on investments or currency repatriation, a portion of which may be recoverable. Each Fund will accrue such taxes and recoveries as applicable based upon current interpretations of the tax rules and regulations that exist in the markets in which it invests. | |
| Management of the Funds has concluded that there are no significant uncertain tax positions that would require recognition in the financial statements. Each Fund’s U.S. federal income tax return is generally subject to examination by the Internal Revenue Service for a period of three years after it is filed. State, local and/or non-U.S. tax returns and/or other filings may be subject to examination for different periods, depending upon the tax rules of each applicable jurisdiction. |
| D. | Distributions to Shareholders |
| Distributions are recorded by each Fund on the ex-dividend date. Income and capital gain distributions are determined in accordance with income tax regulations which may differ from U.S. GAAP. | |
| E. | Expenses |
| Expenses incurred together by a Fund and other affiliated mutual funds are allocated in proportion to the net assets of each such fund, except where allocation of direct expenses to each Fund or an alternative allocation method can be more appropriately used. | |
| In addition to the net annual operating expenses that a Fund bears directly, the shareholders of a Fund indirectly bear the pro-rata expenses of any underlying mutual funds in which the Fund invests. | |
| F. | Foreign Currency Transactions |
| Non-U.S. investment securities and other assets and liabilities denominated in foreign currencies are translated into U.S. dollar amounts at the foreign currency exchange rate effective at the end of the reporting period. Cost of investments is translated at the currency exchange rate effective at the trade date. The gain or loss resulting from a change in currency exchange rates between the trade and settlement date of a portfolio transaction is treated as a gain or loss on foreign currency. Likewise, the gain or loss resulting from a change in currency exchange rates between the date income is accrued and the date it is paid is treated as a gain or loss on foreign currency. The Funds do not isolate that portion of the results of operations arising from changes in foreign exchange rates on investments from the fluctuations arising from changes in the market prices of securities held. Such fluctuations are included with the net realized and unrealized gain or loss on investments. | |
| G. | Payment In-Kind Securities |
| Certain Funds may invest in payment in-kind securities, which are debt or preferred stock securities that require or permit payment of interest in the form of additional securities. Payment in-kind securities allow the issuer to avoid or delay the need to generate cash to meet current interest payments and, as a result, may involve greater risk than securities that pay interest currently or in cash. | |
| H. | When-issued Purchases and Forward Commitments (Delayed Delivery) |
| Certain Funds may engage in when-issued or forward commitment transactions. Securities purchased on a when-issued or forward commitment basis are also known as delayed delivery transactions. Delayed delivery transactions involve a commitment by a Fund to purchase or sell a security at a future date (ordinarily up to 90 days later). When-issued or forward commitments enable the Funds to lock in what is believed to be an attractive price or yield on a particular security for a period of time, regardless of future changes in interest rates. Each Fund records when-issued and forward commitment securities on the trade date. Each Fund maintains collateral for the securities purchased. Securities purchased on a when-issued or forward commitment basis begin earning interest on the settlement date. | |
| I. | Leveraged Loans |
| Certain Funds may invest in direct debt instruments which are interests in amounts owed by a corporate, governmental, or other borrower to lenders or lending syndicates. Leveraged loans are generally non-investment grade and often involve borrowers that are highly leveraged. The Funds may invest in obligations of borrowers who are in bankruptcy proceedings. Leveraged loans are typically senior in the corporate capital structure of the borrower. A loan is often administered by a bank or other financial institution (the “lender”) that acts as agent for all holders. The agent administers the terms of the loan, as specified in the leveraged loan. A Fund’s investments in loans may be in the form of participations in loans or assignments of all or a portion of loans from third parties. When investing in loan participations, a Fund has the right to receive payments of principal, interest and any fees to which it is entitled only from the lender selling the loan participation and only upon receipt by the lender of payments from the borrower. A Fund generally has no right to enforce compliance with the terms of the leveraged loan with the borrower. As a result, a Fund may be subject to the credit risk of both the borrower and the lender that is selling the leveraged loan. When a Fund purchases assignments from lenders it acquires direct rights against the borrower on the loan. | |
| A Fund may invest in multiple series or tranches of a loan, which may have varying terms and carry different associated risks. Leveraged loans may involve foreign borrowers and investments may be denominated in foreign currencies. Direct indebtedness of emerging countries involves a risk that the government entities responsible for the repayment of the debt may be unable, or unwilling, to pay the principal and interest when due. | |
| The leveraged loans have floating rate loan interests which generally pay interest at rates that are periodically determined by reference to a base lending rate plus a premium. The base lending rates are generally LIBOR, the prime rate offered by one or more U.S. banks or the certificate of deposit rate. When a leveraged loan is purchased a Fund may pay an assignment fee. On an ongoing basis, a Fund may receive a commitment fee based on the undrawn portion of the underlying line of credit portion of a leveraged loan. Prepayment penalty fees are received upon the prepayment of a leveraged loan by a borrower. Prepayment penalty, facility, commitment, consent and amendment fees are recorded to income as earned or paid. | |
| J. | Securities Lending |
| Effective October 1, 2020, the Funds may resume loaning securities to qualified brokers through a securities lending agency agreement with The Bank of New York Mellon (“BNYM”). Under the securities lending policy, when lending securities a Fund is required to maintain collateral with a market value not less than 100% of the market value of loaned securities. Collateral is adjusted daily in connection with changes in the market value of securities on loan. Collateral may consist of cash and securities issued by the U.S. Government or its agencies. Cash collateral is invested in a short-term money market fund. Dividends earned on the collateral and premiums paid by the broker are recorded as income by the Fund net of fees and rebates charged/paid by BNYM for its services as securities lending agent and in connection with this securities lending program. Lending portfolio securities involves a risk of delay in the recovery of the loaned securities or in the declining value of the collateral. |
| Securities lending transactions are entered into by each Fund under a Master Securities Lending Agreement (“MSLA”) which permits the Fund, under certain circumstances including an event of default (such as bankruptcy or insolvency), to offset amounts payable by the Fund to the same counterparty against amounts to be received and create one single net payment due to or from the Fund. | |
| At September 30, 2021, the securities loaned were subject to a MSLA on a net payment basis as follows: |
| Fund | Value of Securities on Loan | Cash Collateral Received(1) | Net Amount(2) | |||
KAR Equity Income Fund | $ 1,858 | $ 1,858 | $ — | |||
Tactical Allocation Fund | 1,236 | 1,236 | — |
| (1) | Collateral received in excess of the market value of securities on loan is not presented in this table. The cash collateral received in connection with securities lending transactions has been used for the purchase of securities as disclosed in the Fund’s Schedule of Investments. |
| (2) | Net amount represents the net amount receivable due from the counterparty in the event of default. |
| Fund | Securities Lending Transactions | Overnight and continuous | ||
KAR Equity Income Fund | Money Market Mutual Fund | $1,905 | ||
Tactical Allocation Fund | Money Market Mutual Fund | 1,267 |
| A. | Investment Adviser |
| Virtus Investment Advisers, Inc. (the “Adviser”), an indirect, wholly-owned subsidiary of Virtus Investment Partners, Inc. (“Virtus”), is the investment adviser to the Funds. The Adviser manages the Funds’ investment programs and general operations of the Funds, including oversight of the Funds’ subadvisers. | |
| As compensation for its services to the Funds, the Adviser is entitled to a fee, which is calculated daily and paid monthly based upon the following annual rates as a percentage of the average daily net assets of each Fund: |
KAR Small-Cap Core Fund | 0.75 % |
KAR Small-Cap Value Fund | 0.70 |
| First $400 Million | $400+ Million through $1 Billion | $1+ Billion | |||
KAR Small-Cap Growth Fund | 0.90 % | 0.85 % | 0.80 % |
| First $500 Million | Over $500 Million | ||
KAR Mid-Cap Growth Fund | 0.80 % | 0.70 % |
| First $1 Billion | $1+ Billion | ||
KAR Small-Mid Cap Core Fund | 0.75 % | 0.70 % | |
KAR Small-Mid Cap Growth Fund | 0.75 | 0.70 | |
KAR Small-Mid Cap Value Fund | 0.65 | 0.60 | |
SGA Emerging Markets Growth Fund | 1.00 | 0.95 | |
SGA Global Growth Fund | 0.80 | 0.75 | |
SGA New Leaders Growth Fund | 0.80 | 0.75 |
| First $1 Billion | $1+ Billion through $2 Billion | $2+ Billion | |||
KAR Capital Growth Fund | 0.70 % | 0.65 % | 0.60 % |
| First $1 Billion | $1+ Billion through $2 Billion | $2+ Billion | |||
KAR Equity Income Fund | 0.75% | 0.70 % | 0.65% | ||
KAR Global Quality Dividend Fund | 0.75 | 0.70 | 0.65 | ||
KAR Mid-Cap Core Fund | 0.80 | 0.75 | 0.70 | ||
Tactical Allocation Fund | 0.55 | 0.50 | 0.45 |
| B. | Subadvisers |
| The subadvisers manage the investments of each Fund for which they are paid a fee by the Adviser. A list of the subadvisers and the Funds they serve as of the end of the period is as follows: |
| Fund | Subadviser | |
KAR Capital Growth Fund | KAR(1) | |
KAR Equity Income Fund | KAR(1) | |
KAR Global Quality Dividend Fund | KAR(1) | |
KAR Mid-Cap Core Fund | KAR(1) | |
KAR Mid-Cap Growth Fund | KAR(1) | |
KAR Small-Cap Core Fund | KAR(1) | |
KAR Small-Cap Growth Fund | KAR(1) | |
KAR Small-Cap Value Fund | KAR(1) | |
KAR Small-Mid Cap Core Fund | KAR(1) | |
KAR Small-Mid Cap Growth Fund | KAR(1) | |
KAR Small-Mid Cap Value Fund | KAR(1) | |
SGA Emerging Markets Growth Fund | SGA(2) | |
SGA Global Growth Fund | SGA(2) | |
SGA New Leaders Growth Fund | SGA(2) | |
Tactical Allocation Fund (Equity Portfolio) | KAR(1) | |
Tactical Allocation Fund (Fixed Income Portfolio) | Newfleet(3) |
| (1) | Kayne Anderson Rudnick Investment Management, LLC (“KAR”), an indirect, wholly-owned subsidiary of Virtus. |
| (2) | Sustainable Growth Advisers, LP (“SGA”), an indirect, majority-owned subsidiary of Virtus. |
| (3) | Newfleet Asset Management, LLC (“Newfleet”), an indirect, wholly-owned subsidiary of Virtus. |
| C. | Expense Limitations |
| The Adviser has contractually agreed to limit each Fund’s annual total operating expenses, subject to the exceptions listed below, so that such expenses do not exceed, on an annualized basis, the following respective percentages of average daily net assets through February 1, 2022 (except as noted). Following the contractual period, the Adviser may discontinue these expense limitation arrangements at any time. The waivers and reimbursements are accrued daily and received monthly. |
| Fund | Class A | Class C | Class I | Class R6 | ||||
KAR Capital Growth Fund | 1.47 % (1) | 2.22 % (1) | 1.22 % (1) | 0.73 % | ||||
KAR Equity Income Fund | 1.20 | 1.95 | 0.95 | 0.91 | ||||
KAR Global Quality Dividend Fund | 1.35 | 2.10 | 1.10 | 0.78 | ||||
KAR Mid-Cap Core Fund | 1.20 | 1.95 | 0.95 | 0.87 | ||||
KAR Mid-Cap Growth Fund | 1.40 (1) | 2.15 (1) | 1.15 (1) | 0.83 | ||||
KAR Small-Cap Core Fund | N/A | N/A | N/A | N/A | ||||
KAR Small-Cap Growth Fund | 1.50 (1) | 2.25 (1) | 1.25 (1) | 1.18 (1) | ||||
KAR Small-Cap Value Fund | 1.42 (1) | 2.17 (1) | 1.17 (1) | 1.06 (1) | ||||
KAR Small-Mid Cap Core Fund | 1.30 | 2.05 (1) | 1.05 (1) | 0.97 (1) | ||||
KAR Small-Mid Cap Growth Fund(2) | 1.30 | 2.05 | 1.05 | 0.99 | ||||
KAR Small-Mid Cap Value Fund(3) | 1.17 | 1.92 | 0.92 | 0.82 | ||||
SGA Emerging Markets Growth Fund | 1.48 | 2.23 | 1.23 | 1.05 | ||||
SGA Global Growth Fund | 1.38 | 2.13 | 1.13 | 0.90 | ||||
SGA New Leaders Growth Fund(4) | 1.39 | 2.14 | 1.14 | 0.91 | ||||
Tactical Allocation Fund | 0.99 (5) | 1.75 (5) | 0.76 (5) | 0.60 (6) |
| (1) | The share class is currently under its expense limitation. |
| (2) | Effective December 8, 2020. |
| (3) | Effective August 3, 2021. |
| (4) | Effective November 17, 2020. |
| (5) | Effective October 31, 2020. For the period October 1, 2020 through October 30, 2020, the expense caps were as follows for Class A shares, Class C shares and Class I shares, respectively: 1.15%, 1.90% and 0.90%. |
| (6) | Effective October 20, 2020. |
| D. | Expense Recapture |
| Under certain conditions, the Adviser may recapture operating expenses reimbursed or fees waived under these arrangements within three years after the date on which such amounts were incurred or waived. A Fund must pay its ordinary operating expenses before the Adviser is entitled to any reimbursement and must remain in compliance with any applicable expense limitations or, if none, the expense limitation in effect at the time of the waiver or reimbursement. All or a portion of the following Adviser reimbursed expenses may be recaptured by the fiscal year ending September 30: |
| Expiration | ||||||||
| Fund | 2022 | 2023 | 2024 | Total | ||||
| KAR Capital Growth Fund | ||||||||
Class R6 | $ 1 | $ 1 | $ 1 | $ 3 | ||||
| KAR Equity Income Fund | ||||||||
Class A | 164 | 170 | 152 | 486 | ||||
Class C | 21 | 11 | 9 | 41 | ||||
Class I | 16 | 15 | 14 | 45 | ||||
Class R6 | 2 | 1 | 1 | 4 | ||||
| KAR Global Quality Dividend Fund | ||||||||
Class A | 56 | 65 | 38 | 159 | ||||
Class C | 8 | 6 | 2 | 16 | ||||
Class I | 14 | 28 | 19 | 61 | ||||
Class R6 | — (1) | — (1) | 5 | 5 | ||||
| KAR Mid-Cap Core Fund | ||||||||
Class A | 62 | 71 | 84 | 217 | ||||
Class C | 58 | 66 | 68 | 192 | ||||
Class I | 396 | 670 | 982 | 2,048 | ||||
Class R6 | 8 | 21 | 35 | 64 | ||||
| KAR Mid-Cap Growth Fund | ||||||||
Class R6 | 1 | 21 | 101 | 123 | ||||
| KAR Small-Mid Cap Core Fund | ||||||||
Class A | 4 | 9 | 5 | 18 | ||||
Class C | — (1) | — (1) | 3 | 3 | ||||
Class R6 | 40 | 3 | — | 43 | ||||
| KAR Small-Mid Cap Growth Fund | ||||||||
Class A | — | — | 11 | 11 | ||||
Class C | — | — | 3 | 3 | ||||
Class I | — | — | 25 | 25 | ||||
Class R6 | — | — | 68 | 68 | ||||
| KAR Small-Mid Cap Value Fund | ||||||||
Class A | — | — | 2 | 2 | ||||
Class C | — | — | 2 | 2 | ||||
Class I | — | — | 2 | 2 | ||||
Class R6 | — | — | 51 | 51 | ||||
| SGA Emerging Markets Growth Fund | ||||||||
Class A | 2 | 4 | 3 | 9 | ||||
Class C | 2 | 3 | 3 | 8 | ||||
Class I | 3 | 4 | 6 | 13 | ||||
Class R6 | 96 | 124 | 89 | 309 | ||||
| SGA Global Growth Fund | ||||||||
Class A | — | — | 30 | 30 | ||||
Class C | — | — | 1 | 1 | ||||
Class I | 1 | 15 | 9 | 25 | ||||
Class R6 | 24 | 107 | 104 | 235 | ||||
| Expiration | ||||||||
| Fund | 2022 | 2023 | 2024 | Total | ||||
| SGA New Leaders Growth Fund | ||||||||
Class A | $ — | $ — | $ 2 | $ 2 | ||||
Class C | — | — | 2 | 2 | ||||
Class I | — | — | 3 | 3 | ||||
Class R6 | — | — | 115 | 115 | ||||
| Tactical Allocation Fund | ||||||||
Class A | — | — | 498 | 498 | ||||
Class C | — | — | 46 | 46 | ||||
Class I | — | — | 43 | 43 | ||||
Class R6 | — | — | — (1) | — | ||||
| (1) | Amount is less than $500. |
| Fund | Class A | Class C | Class I | Class R6 | Total | |||||
KAR Small-Mid Cap Core Fund | $ 6 | $ 8 | $123 | $ 6 | $ 143 | |||||
SGA Global Growth Fund | — (1) | — (1) | 1 | — | 1 |
| (1) | Amount is less than $500. |
| E. | Distributor |
| VP Distributors, LLC (“VP Distributors”), an indirect, wholly-owned subsidiary of Virtus, serves as the distributor of each Fund’s shares. VP Distributors has advised the Funds that for the fiscal year (the “period”) ended September 30, 2021, it retained net commissions of $387 for Class A shares and CDSC of $300 and $68 for Class A shares and Class C shares, respectively. | |
| In addition, each Fund pays VP Distributors 12b-1 fees under a 12b-1 Plan as a percentage of the average daily net assets of each respective class at the annual rates of 0.25% for Class A shares and 1.00% for Class C shares. Class I shares and Class R6 shares are not subject to a 12b-1 Plan. | |
| Under certain circumstances, shares of certain Virtus Mutual Funds may be exchanged for shares of the same class of certain other Virtus Mutual Funds on the basis of the relative NAV per share at the time of the exchange. On exchanges with share classes that carry a CDSC, the CDSC schedule of the original shares purchased continues to apply. | |
| F. | Administrator and Transfer Agent |
| Virtus Fund Services, LLC, an indirect, wholly-owned subsidiary of Virtus, serves as the administrator and transfer agent to the Funds. | |
| For the period ended September 30, 2021, the Funds incurred administration fees totaling $16,378 which are included in the Statements of Operations within the line item “Administration and accounting fees.” The fees are calculated daily and paid monthly. | |
| For the period ended September 30, 2021, the Funds incurred transfer agent fees totaling $7,315 which are included in the Statements of Operations within the line item “Transfer agent fees and expenses.” The fees are calculated daily and paid monthly. | |
| G. | Affiliated Shareholders |
| At September 30, 2021, Virtus and its affiliates held shares of certain Funds, which may be redeemed at any time, that aggregated to the following: |
| Shares | Aggregate Net Asset Value | ||
| KAR Small-Mid Cap Growth Fund | |||
Class A | 10,000 | $ 107 | |
Class C | 10,000 | 106 | |
Class I | 10,000 | 107 | |
Class R6 | 279,105 | 2,995 | |
| KAR Small-Mid Cap Value Fund | |||
Class A | 10,000 | 96 | |
Class C | 10,000 | 96 | |
Class I | 10,000 | 96 | |
Class R6 | 270,000 | 2,606 |
| H. | Investments with Affiliates |
| The Funds are permitted to purchase assets from or sell assets to certain related affiliated funds under specified conditions outlined in procedures adopted by the Board. The procedures have been designed to ensure that any purchase or sale of assets by the Funds from or to another fund or portfolio that are, or could be, considered an affiliate by virtue of having a common investment adviser (or affiliated investment advisers), common Trustees and/or common officers comply with Rule 17a-7 under the 1940 Act. Further, as defined under the procedures, each transaction is effected at the current market price. During the period ended September 30, 2021, the Funds did not engage in any transactions pursuant to Rule 17a-7 under the 1940 Act. | |
| Outside of Rule 17a-7 transactions, other investments with affiliated issuers are separately reported in this footnote. An affiliated issuer includes any company in which the Fund held 5% or more of a company’s outstanding voting shares at any point during the period, as well as other circumstances where an investment adviser or subadviser to the Fund is deemed to exercise, directly or indirectly, a certain level of control over the company. A summary of the Fund’s total long-term and short-term purchases and sales of the securities of affiliated issuers during the period ended September 30, 2021, is as follows: |
| Value, beginning of period | Purchases | Sales proceeds | Net realized gain (loss) on affiliated securities | Net change in unrealized appreciation (depreciation) on affiliated securities | Value, end of period | Shares | Dividend income | Distributions of realized gains | |||||||||
| KAR Small-Cap Growth Fund | |||||||||||||||||
| Common Stocks—39.0% | |||||||||||||||||
AAON, Inc. | $ 241,566 | $ — | 41,910 | $12,504 | $ 7,343 | $ 219,503 | 3,359,400 | $1,523 | $— | ||||||||
Chefs’ Warehouse, Inc. (The)(1) | 40,829 | — | 10,474 | 559 | 49,030 | 79,944 | 2,454,523 | — | — | ||||||||
Duck Creek Technologies, Inc.(1) | 394,978 | — | — | — | (10,346) | 384,632 | 8,694,221 | — | — | ||||||||
Fox Factory Holding Corp.(1) | 284,905 | — | 30,826 | 20,271 | 250,761 | 525,111 | 3,632,978 | — | — | ||||||||
Goosehead Insurance, Inc. | 104,402 | — | 10,363 | 6,226 | 70,407 | 170,672 | 1,120,700 | 1,826 | — | ||||||||
MediaAlpha, Inc.(1) | — | 129,926 | — | — | (43,138) | 86,788 | 4,646,036 | — | — | ||||||||
National Research Corp. | 118,572 | — | — | — | (16,962) | 101,610 | 2,409,518 | 867 | — | ||||||||
NVE Corp. | 23,690 | — | 4,902 | (727) | 8,339 | 26,400 | 412,690 | 1,791 | — | ||||||||
Ollie’s Bargain Outlet Holdings, Inc.(1) | 417,854 | — | 6,478 | 1,972 | (129,208) | 284,140 | 4,713,672 | — | — | ||||||||
Olo, Inc.(1) | — | 56,851 | — | — | 838 | 57,689 | 1,921,045 | — | — | ||||||||
Omega Flex, Inc. | 142,420 | — | 10,154 | 5,034 | (17,206) | 120,094 | 841,642 | 1,292 | — | ||||||||
Oportun Financial Corp.(1) | 31,078 | — | — | — | 34,899 | 65,977 | 2,635,930 | — | — | ||||||||
Ryan Specialty Group Holdings, Inc.(1) | — | 248,918 | — | — | 95,714 | 344,632 | 10,175,150 | — | — | ||||||||
U.S. Physical Therapy, Inc. | 102,953 | — | — | — | 28,108 | 131,061 | 1,185,000 | 1,280 | — | ||||||||
| Total | $1,903,247 | $435,695 | $115,107 | $45,839 | $ 328,579 | $2,598,253 | $8,579 | $— | |||||||||
| (1) | Non-income producing. |
| I. | Trustee Compensation |
| The Trust provides a deferred compensation plan for its Trustees who receive compensation from the Trust. Under the deferred compensation plan, Trustees may elect to defer all or a portion of their compensation. Amounts deferred are retained by the Trust, and then, to the extent permitted by the 1940 Act, in turn, may be invested in the shares of affiliated or unaffiliated mutual funds selected by the participating Trustees. Investments in such instruments are included in “Other assets” in the Statements of Assets and Liabilities at September 30, 2021. |
| Purchases | Sales | ||
KAR Capital Growth Fund | $ 64,285 | $ 122,866 | |
KAR Equity Income Fund | 34,538 | 49,479 | |
KAR Global Quality Dividend Fund | 13,556 | 14,152 | |
KAR Mid-Cap Core Fund | 440,299 | 163,718 | |
KAR Mid-Cap Growth Fund | 871,153 | 514,518 | |
KAR Small-Cap Core Fund | 286,435 | 386,701 | |
KAR Small-Cap Growth Fund | 721,520 | 1,580,213 | |
KAR Small-Cap Value Fund | 411,995 | 159,281 | |
KAR Small-Mid Cap Core Fund | 622,868 | 65,179 | |
KAR Small-Mid Cap Growth Fund | 6,303 | 629 | |
KAR Small-Mid Cap Value Fund | 2,994 | — | |
SGA Emerging Markets Growth Fund | 3,088 | 2,807 | |
SGA Global Growth Fund | 77,493 | 62,101 | |
SGA New Leaders Growth Fund | 7,545 | 1,354 | |
Tactical Allocation Fund | 375,981 | 452,545 |
| Purchases | Sales | ||
Tactical Allocation Fund | $36,062 | $24,068 |
| KAR Capital Growth Fund | KAR Equity Income Fund | ||||||||||||||
| Year Ended September 30, 2021 | Year Ended September 30, 2020 | Year Ended September 30, 2021 | Year Ended September 30, 2020 | ||||||||||||
| SHARES | AMOUNT | SHARES | AMOUNT | SHARES | AMOUNT | SHARES | AMOUNT | ||||||||
| Class A | |||||||||||||||
| Shares sold and cross class conversions | 479 | $ 12,774 | 889 | $ 17,200 | 262 | $ 5,419 | 472 | $ 9,444 | |||||||
| Reinvestment of distributions | 744 | 20,139 | 705 | 12,891 | 1,573 | 29,436 | 50 | 1,108 | |||||||
| Shares repurchased and cross class conversions | (1,983) | (53,626) | (3,375) | (64,742) | (778) | (16,534) | (1,172) | (22,878) | |||||||
| Net Increase / (Decrease) | (760) | $ (20,713) | (1,781) | $ (34,651) | 1,057 | $ 18,321 | (650) | $ (12,326) | |||||||
| Class C | |||||||||||||||
| Shares sold and cross class conversions | 53 | $ 1,025 | 223 | $ 3,361 | 21 | $ 401 | 33 | $ 593 | |||||||
| Reinvestment of distributions | 30 | 586 | 22 | 302 | 118 | 1,891 | 1 | 13 | |||||||
| Shares repurchased and cross class conversions | (375) | (7,256) | (197) | (2,871) | (204) | (3,664) | (145) | (2,657) | |||||||
| Net Increase / (Decrease) | (292) | $ (5,645) | 48 | $ 792 | (65) | $ (1,372) | (111) | $ (2,051) | |||||||
| KAR Capital Growth Fund | KAR Equity Income Fund | ||||||||||||||
| Year Ended September 30, 2021 | Year Ended September 30, 2020 | Year Ended September 30, 2021 | Year Ended September 30, 2020 | ||||||||||||
| SHARES | AMOUNT | SHARES | AMOUNT | SHARES | AMOUNT | SHARES | AMOUNT | ||||||||
| Class I | |||||||||||||||
| Shares sold and cross class conversions | 400 | $ 11,257 | 1,610 | $ 31,747 | 213 | $ 4,642 | 56 | $ 1,201 | |||||||
| Reinvestment of distributions | 56 | 1,586 | 35 | 670 | 153 | 2,845 | 6 | 126 | |||||||
| Shares repurchased and cross class conversions | (314) | (8,781) | (1,078) | (20,661) | (235) | (4,960) | (131) | (2,657) | |||||||
| Net Increase / (Decrease) | 142 | $ 4,062 | 567 | $ 11,756 | 131 | $ 2,527 | (69) | $ (1,330) | |||||||
| Class R6 | |||||||||||||||
| Shares sold and cross class conversions | 19 | $ 541 | 55 | $ 1,111 | 41 | $ 884 | 7 | $ 153 | |||||||
| Reinvestment of distributions | — (1) | 5 | — (1) | 3 | 16 | 300 | 1 | 11 | |||||||
| Shares repurchased and cross class conversions | (3) | (103) | (49) | (965) | (34) | (709) | (19) | (386) | |||||||
| Net Increase / (Decrease) | 16 | $ 443 | 6 | $ 149 | 23 | $ 475 | (11) | $ (222) | |||||||
| KAR Global Quality Dividend Fund | KAR Mid-Cap Core Fund | ||||||||||||||
| Year Ended September 30, 2021 | Year Ended September 30, 2020 | Year Ended September 30, 2021 | Year Ended September 30, 2020 | ||||||||||||
| SHARES | AMOUNT | SHARES | AMOUNT | SHARES | AMOUNT | SHARES | AMOUNT | ||||||||
| Class A | |||||||||||||||
| Shares sold and cross class conversions | 54 | $ 781 | 144 | $ 1,888 | 452 | $ 22,422 | 539 | $ 19,654 | |||||||
| Reinvestment of distributions | 39 | 536 | 42 | 639 | 10 | 462 | 6 | 220 | |||||||
| Shares repurchased and cross class conversions | (210) | (2,991) | (442) | (5,817) | (277) | (13,604) | (465) | (16,411) | |||||||
| Net Increase / (Decrease) | (117) | $ (1,674) | (256) | $ (3,290) | 185 | $ 9,280 | 80 | $ 3,463 | |||||||
| Class C | |||||||||||||||
| Shares sold and cross class conversions | 69 | $ 929 | 25 | $ 294 | 276 | $ 12,632 | 360 | $ 11,989 | |||||||
| Reinvestment of distributions | 2 | 27 | 3 | 40 | 10 | 429 | 6 | 207 | |||||||
| Shares repurchased and cross class conversions | (125) | (1,685) | (132) | (1,648) | (252) | (11,319) | (359) | (11,673) | |||||||
| Net Increase / (Decrease) | (54) | $ (729) | (104) | $ (1,314) | 34 | $ 1,742 | 7 | $ 523 | |||||||
| Class I | |||||||||||||||
| Shares sold and cross class conversions | 237 | $ 3,420 | 494 | $ 6,644 | 9,882 | $ 505,077 | 11,000 | $ 403,004 | |||||||
| Reinvestment of distributions | 24 | 331 | 15 | 226 | 114 | 5,388 | 42 | 1,611 | |||||||
| Shares repurchased and cross class conversions | (275) | (3,885) | (196) | (2,443) | (4,666) | (236,556) | (4,134) | (147,797) | |||||||
| Net Increase / (Decrease) | (14) | $ (134) | 313 | $ 4,427 | 5,330 | $ 273,909 | 6,908 | $ 256,818 | |||||||
| Class R6 | |||||||||||||||
| Shares sold and cross class conversions | 143 | $ 2,026 | — | $ — | 616 | $ 32,914 | 302 | $ 11,813 | |||||||
| Reinvestment of distributions | — | — | — | — | 3 | 165 | 1 | 57 | |||||||
| Shares repurchased and cross class conversions | (17) | (256) | — | — | (103) | (5,440) | (139) | (5,501) | |||||||
| Net Increase / (Decrease) | 126 | $ 1,770 | — | $ — | 516 | $ 27,639 | 164 | $ 6,369 | |||||||
| KAR Mid-Cap Growth Fund | KAR Small-Cap Core Fund | ||||||||||||||
| Year Ended September 30, 2021 | Year Ended September 30, 2020 | Year Ended September 30, 2021 | Year Ended September 30, 2020 | ||||||||||||
| SHARES | AMOUNT | SHARES | AMOUNT | SHARES | AMOUNT | SHARES | AMOUNT | ||||||||
| Class A | |||||||||||||||
| Shares sold and cross class conversions | 2,652 | $ 177,626 | 5,968 | $ 285,158 | 498 | $ 23,084 | 401 | $ 15,166 | |||||||
| Reinvestment of distributions | 8 | 567 | 27 | 1,126 | 190 | 8,187 | 132 | 5,104 | |||||||
| Shares repurchased and cross class conversions | (2,843) | (191,469) | (2,533) | (118,550) | (543) | (24,760) | (1,243) | (44,953) | |||||||
| Net Increase / (Decrease) | (183) | $ (13,276) | 3,462 | $ 167,734 | 145 | $ 6,511 | (710) | $ (24,683) | |||||||
| Class C | |||||||||||||||
| Shares sold and cross class conversions | 745 | $ 38,851 | 1,502 | $ 54,358 | 46 | $ 1,693 | 110 | $ 3,391 | |||||||
| Reinvestment of distributions | 3 | 180 | 12 | 384 | 248 | 8,584 | 162 | 5,183 | |||||||
| Shares repurchased and cross class conversions | (668) | (34,933) | (408) | (14,415) | (796) | (29,553) | (893) | (27,443) | |||||||
| Net Increase / (Decrease) | 80 | $ 4,098 | 1,106 | $ 40,327 | (502) | $ (19,276) | (621) | $ (18,869) | |||||||
| Class I | |||||||||||||||
| Shares sold and cross class conversions | 19,047 | $ 1,324,506 | 30,351 | $ 1,478,624 | 2,785 | $ 135,357 | 5,755 | $ 218,747 | |||||||
| Reinvestment of distributions | 32 | 2,372 | 58 | 2,469 | 1,701 | 77,950 | 988 | 40,516 | |||||||
| Shares repurchased and cross class conversions | (15,902) | (1,115,805) | (7,875) | (382,218) | (4,879) | (237,999) | (11,184) | (447,151) | |||||||
| Net Increase / (Decrease) | 3,177 | $ 211,073 | 22,534 | $ 1,098,875 | (393) | $ (24,692) | (4,441) | $ (187,888) | |||||||
| Class R6 | |||||||||||||||
| Shares sold and cross class conversions | 1,707 | $ 121,058 | 1,702 | $ 94,521 | 2,794 | $ 135,372 | 5,516 | $ 232,147 | |||||||
| Reinvestment of distributions | 2 | 139 | 1 | 25 | 187 | 8,625 | 118 | 4,844 | |||||||
| Shares repurchased and cross class conversions | (572) | (40,554) | (93) | (4,562) | (1,669) | (82,597) | (1,409) | (57,198) | |||||||
| Net Increase / (Decrease) | 1,137 | $ 80,643 | 1,610 | $ 89,984 | 1,312 | $ 61,400 | 4,225 | $ 179,793 | |||||||
| KAR Small-Cap Growth Fund | KAR Small-Cap Value Fund | ||||||||||||||
| Year Ended September 30, 2021 | Year Ended September 30, 2020 | Year Ended September 30, 2021 | Year Ended September 30, 2020 | ||||||||||||
| SHARES | AMOUNT | SHARES | AMOUNT | SHARES | AMOUNT | SHARES | AMOUNT | ||||||||
| Class A | |||||||||||||||
| Shares sold and cross class conversions | 2,008 | $ 107,824 | 2,602 | $ 104,387 | 1,471 | $ 38,725 | 627 | $ 10,835 | |||||||
| Reinvestment of distributions | 1,348 | 71,757 | 263 | 10,502 | 26 | 636 | 23 | 448 | |||||||
| Shares repurchased and cross class conversions | (4,374) | (232,735) | (6,743) | (261,217) | (883) | (23,214) | (772) | (13,988) | |||||||
| Net Increase / (Decrease) | (1,018) | $ (53,154) | (3,878) | $ (146,328) | 614 | $ 16,147 | (122) | $ (2,705) | |||||||
| Class C | |||||||||||||||
| Shares sold and cross class conversions | 241 | $ 11,287 | 450 | $ 16,101 | 253 | $ 6,360 | 278 | $ 5,040 | |||||||
| Reinvestment of distributions | 772 | 35,847 | 143 | 5,103 | — (1) | 10 | — | — | |||||||
| Shares repurchased and cross class conversions | (1,611) | (75,056) | (1,875) | (67,009) | (273) | (7,024) | (302) | (5,152) | |||||||
| Net Increase / (Decrease) | (598) | $ (27,922) | (1,282) | $ (45,805) | (20) | $ (654) | (24) | $ (112) | |||||||
| KAR Small-Cap Growth Fund | KAR Small-Cap Value Fund | ||||||||||||||
| Year Ended September 30, 2021 | Year Ended September 30, 2020 | Year Ended September 30, 2021 | Year Ended September 30, 2020 | ||||||||||||
| SHARES | AMOUNT | SHARES | AMOUNT | SHARES | AMOUNT | SHARES | AMOUNT | ||||||||
| Class I | |||||||||||||||
| Shares sold and cross class conversions | 15,452 | $ 849,066 | 30,624 | $ 1,260,988 | 23,917 | $ 624,881 | 19,799 | $ 360,401 | |||||||
| Reinvestment of distributions | 9,083 | 497,200 | 1,460 | 59,776 | 315 | 7,728 | 198 | 3,832 | |||||||
| Shares repurchased and cross class conversions | (32,646) | (1,787,851) | (31,378) | (1,260,713) | (16,240) | (438,305) | (10,779) | (194,278) | |||||||
| Net Increase / (Decrease) | (8,111) | $ (441,585) | 706 | $ 60,051 | 7,992 | $ 194,304 | 9,218 | $ 169,955 | |||||||
| Class R6 | |||||||||||||||
| Shares sold and cross class conversions | 2,700 | $ 148,001 | 1,149 | $ 48,543 | 2,599 | $ 70,660 | 133 | $ 2,466 | |||||||
| Reinvestment of distributions | 253 | 13,906 | 19 | 796 | 8 | 184 | 5 | 103 | |||||||
| Shares repurchased and cross class conversions | (1,148) | (63,242) | (463) | (19,328) | (222) | (6,064) | (141) | (2,664) | |||||||
| Net Increase / (Decrease) | 1,805 | $ 98,665 | 705 | $ 30,011 | 2,385 | $ 64,780 | (3) | $ (95) | |||||||
| KAR Small-Mid Cap Core Fund | KAR Small-Mid Cap Growth Fund | ||||||||||
| Year Ended September 30, 2021 | Year Ended September 30, 2020 | From Inception December 8, 2020 to September 30, 2021 | |||||||||
| SHARES | AMOUNT | SHARES | AMOUNT | SHARES | AMOUNT | ||||||
| Class A | |||||||||||
| Shares sold and cross class conversions | 1,648 | $ 28,460 | 1,701 | $ 21,815 | 80 | $ 831 | |||||
| Shares repurchased and cross class conversions | (419) | (7,441) | (461) | (5,440) | (12) | (134) | |||||
| Net Increase / (Decrease) | 1,229 | $ 21,019 | 1,240 | $ 16,375 | 68 | $ 697 | |||||
| Class C | |||||||||||
| Shares sold and cross class conversions | 1,108 | $ 19,101 | 702 | $ 9,015 | 11 | $ 112 | |||||
| Shares repurchased and cross class conversions | (157) | (2,784) | (78) | (898) | — | — | |||||
| Net Increase / (Decrease) | 951 | $ 16,317 | 624 | $ 8,117 | 11 | $ 112 | |||||
| Class I | |||||||||||
| Shares sold and cross class conversions | 42,226 | $ 746,668 | 33,974 | $ 437,472 | 202 | $ 2,094 | |||||
| Reinvestment of distributions | 3 | 56 | — | — | — | — | |||||
| Shares repurchased and cross class conversions | (10,477) | (188,874) | (5,815) | (73,641) | (16) | (164) | |||||
| Net Increase / (Decrease) | 31,752 | $ 557,850 | 28,159 | $ 363,831 | 186 | $ 1,930 | |||||
| Class R6 | |||||||||||
| Shares sold and cross class conversions | 366 | $ 6,531 | 593 | $ 8,210 | 307 | $ 3,080 | |||||
| Reinvestment of distributions | — (1) | 3 | — | — | — | — | |||||
| Shares repurchased and cross class conversions | (76) | (1,321) | (288) | (3,986) | (5) | (51) | |||||
| Net Increase / (Decrease) | 290 | $ 5,213 | 305 | $ 4,224 | 302 | $ 3,029 | |||||
| KAR Small-Mid Cap Value Fund | SGA Emerging Markets Growth Fund | ||||||||||
| From Inception August 3, 2021 to September 30, 2021 | Year Ended September 30, 2021 | Year Ended September 30, 2020 | |||||||||
| SHARES | AMOUNT | SHARES | AMOUNT | SHARES | AMOUNT | ||||||
| Class A | |||||||||||
| Shares sold and cross class conversions | 13 | $ 131 | 2 | $ 32 | 4 | $ 43 | |||||
| Reinvestment of distributions | — | — | — (1) | 1 | — (1) | — (2) | |||||
| Shares repurchased and cross class conversions | — | — | (—) (1) | (6) | — | — | |||||
| Net Increase / (Decrease) | 13 | $ 131 | 2 | $ 27 | 4 | $ 43 | |||||
| Class C | |||||||||||
| Shares sold and cross class conversions | 10 | $ 103 | 1 | $ 7 | 3 | $ 27 | |||||
| Reinvestment of distributions | — | — | — (1) | 1 | — (1) | — (2) | |||||
| Shares repurchased and cross class conversions | — | — | — | — | (1) | (11) | |||||
| Net Increase / (Decrease) | 10 | $ 103 | 1 | $ 8 | 2 | $ 16 | |||||
| Class I | |||||||||||
| Shares sold and cross class conversions | 10 | $ 100 | 10 | $ 137 | 10 | $ 100 | |||||
| Reinvestment of distributions | — | — | — (1) | 6 | — (1) | — (2) | |||||
| Net Increase / (Decrease) | 10 | $ 100 | 10 | $ 143 | 10 | $ 100 | |||||
| Class R6 | |||||||||||
| Shares sold and cross class conversions | 270 | $ 2,700 | 8 | $ 115 | 61 | $ 656 | |||||
| Reinvestment of distributions | — | — | 8 | 107 | — (1) | — (2) | |||||
| Shares repurchased and cross class conversions | — | — | (—) (1) | (3) | (62) | (687) | |||||
| Net Increase / (Decrease) | 270 | $ 2,700 | 16 | $ 219 | (1) | $ (31) | |||||
| SGA Global Growth Fund | SGA New Leaders Growth Fund | ||||||||||
| Year Ended September 30, 2021 | Year Ended September 30, 2020 | From Inception November 17, 2020 to September 30, 2021 | |||||||||
| SHARES | AMOUNT | SHARES | AMOUNT | SHARES | AMOUNT | ||||||
| Class A | |||||||||||
| Shares sold and cross class conversions | 220 | $ 6,522 | 1,212 | $ 28,564 | 10 | $ 103 | |||||
| Reinvestment of distributions | 34 | 950 | — | — | — | — | |||||
| Shares repurchased and cross class conversions | (122) | (3,623) | (414) | (9,454) | — | — | |||||
| Net Increase / (Decrease) | 132 | $ 3,849 | 798 | $ 19,110 | 10 | $ 103 | |||||
| Class C | |||||||||||
| Shares sold and cross class conversions | 110 | $ 3,082 | 69 | $ 1,510 | 10 | $ 103 | |||||
| Reinvestment of distributions | 8 | 211 | — | — | — | — | |||||
| Shares repurchased and cross class conversions | (71) | (1,962) | (39) | (811) | — | — | |||||
| Net Increase / (Decrease) | 47 | $ 1,331 | 30 | $ 699 | 10 | $ 103 | |||||
| SGA Global Growth Fund | SGA New Leaders Growth Fund | ||||||||||
| Year Ended September 30, 2021 | Year Ended September 30, 2020 | From Inception November 17, 2020 to September 30, 2021 | |||||||||
| SHARES | AMOUNT | SHARES | AMOUNT | SHARES | AMOUNT | ||||||
| Class I | |||||||||||
| Shares sold and cross class conversions | 1,109 | $ 32,952 | 881 | $ 20,118 | 15 | $ 155 | |||||
| Reinvestment of distributions | 38 | 1,089 | — (1) | 3 | — | — | |||||
| Shares repurchased and cross class conversions | (448) | (13,851) | (457) | (10,744) | — | — | |||||
| Net Increase / (Decrease) | 699 | $ 20,190 | 424 | $ 9,377 | 15 | $ 155 | |||||
| Class R6 | |||||||||||
| Shares sold and cross class conversions | 97 | $ 2,975 | 1,167 | $ 25,797 | 586 | $ 5,923 | |||||
| Reinvestment of distributions | 82 | 2,400 | 1 | 33 | — | — | |||||
| Shares repurchased and cross class conversions | (307) | (9,567) | (412) | (10,022) | (—) (1) | (—) (2) | |||||
| Net Increase / (Decrease) | (128) | $ (4,192) | 756 | $ 15,808 | 586 | $ 5,923 | |||||
| Tactical Allocation Fund | |||||||
| Year Ended September 30, 2021 | Year Ended September 30, 2020 | ||||||
| SHARES | AMOUNT | SHARES | AMOUNT | ||||
| Class A | |||||||
| Shares sold and cross class conversions | 4,727 | $ 62,387 | 2,820 | $ 30,276 | |||
| Shares issued-merger (See Note 12) | 7,220 | 86,813 | — | — | |||
| Reinvestment of distributions | 1,092 | 14,523 | 1,062 | 10,675 | |||
| Shares repurchased and cross class conversions | (6,765) | (89,972) | (7,341) | (76,872) | |||
| Net Increase / (Decrease) | 6,274 | $ 73,751 | (3,459) | $ (35,921) | |||
| Class C | |||||||
| Shares sold and cross class conversions | 410 | $ 5,550 | 293 | $ 3,215 | |||
| Shares issued-merger (See Note 12) | 3,374 | 41,685 | — | — | |||
| Reinvestment of distributions | 64 | 871 | 11 | 114 | |||
| Shares repurchased and cross class conversions | (2,469) | (33,437) | (203) | (2,171) | |||
| Net Increase / (Decrease) | 1,379 | $ 14,669 | 101 | $ 1,158 | |||
| Class I | |||||||
| Shares sold and cross class conversions | 1,580 | $ 20,904 | 2,470 | $ 27,408 | |||
| Shares issued-merger (See Note 12) | 2,156 | 25,853 | — | — | |||
| Reinvestment of distributions | 90 | 1,191 | 10 | 110 | |||
| Shares repurchased and cross class conversions | (2,270) | (29,947) | (578) | (6,303) | |||
| Net Increase / (Decrease) | 1,556 | $ 18,001 | 1,902 | $ 21,215 | |||
| Tactical Allocation Fund | |||||||
| Year Ended September 30, 2021 | Year Ended September 30, 2020 | ||||||
| SHARES | AMOUNT | SHARES | AMOUNT | ||||
| Class R6 | |||||||
| Shares sold and cross class conversions | 9 | $ 110 | — | $ — | |||
| Reinvestment of distributions | — (1) | — (2) | — | — | |||
| Shares repurchased and cross class conversions | (1) | (10) | — | — | |||
| Net Increase / (Decrease) | 8 | $ 100 | — | $ — | |||
| (1) | Amount is less than 500 shares. |
| (2) | Amount is less than $500. |
| % of Shares Outstanding | Number of Accounts | ||
KAR Global Quality Dividend Fund | 15% | 1 | |
KAR Mid-Cap Core Fund | 41 | 3 | |
KAR Mid-Cap Growth Fund | 27 | 2 | |
KAR Small-Cap Core Fund | 41 | 3 | |
KAR Small-Cap Growth Fund | 22 | 2 | |
KAR Small-Cap Value Fund | 48 | 2 | |
KAR Small-Mid Cap Core Fund | 52 | 3 | |
KAR Small-Mid Cap Growth Fund | 68 | 2 * | |
KAR Small-Mid Cap Value Fund | 89 | 1 * | |
SGA Emerging Markets Growth Fund | 69 | 3 | |
SGA Global Growth Fund | 43 | 3 | |
SGA New Leaders Growth Fund | 75 | 2 * |
| * | Includes affiliated shareholder account(s). |
| Fund | Sector | Percentage of Total Investments | ||
KAR Capital Growth Fund | Information Technology | 42% | ||
KAR Mid-Cap Core Fund | Industrials | 33 | ||
KAR Mid-Cap Growth Fund | Information Technology | 39 | ||
KAR Small-Cap Core Fund | Industrials | 37 | ||
KAR Small-Cap Growth Fund | Information Technology | 32 | ||
KAR Small-Cap Value Fund | Industrials | 27 | ||
KAR Small-Mid Cap Core Fund | Information Technology | 26 | ||
KAR Small-Mid Cap Growth Fund | Information Technology | 31 | ||
KAR Small-Mid Cap Value Fund | Industrials | 25 | ||
SGA Emerging Markets Growth Fund | Consumer Staples | 29 | ||
| SGA Global Growth Fund | Information Technology | 32 | ||
| SGA New Leaders Growth Fund | Information Technology | 26 | ||
SGA New Leaders Growth Fund | Healthcare | 25 |
| Fund | Investment | Date of Acquisition | Cost | Value | Percentage of Net Assets | |||||
KAR Mid-Cap Growth Fund | Security Scorecard, Inc. Series E | 3/5/2021 | $40,000 | $42,579 | 1.2% |
| Fund | Federal Tax Cost | Unrealized Appreciation | Unrealized (Depreciation) | Net Unrealized Appreciation (Depreciation) | ||||
KAR Capital Growth Fund | $ 245,062 | $ 563,017 | $ (885) | $ 562,132 | ||||
KAR Equity Income Fund | 124,086 | 19,067 | (1,617) | 17,450 | ||||
KAR Global Quality Dividend Fund | 33,045 | 5,914 | (795) | 5,119 | ||||
KAR Mid-Cap Core Fund | 958,959 | 448,476 | (13,004) | 435,472 | ||||
KAR Mid-Cap Growth Fund | 2,148,798 | 1,299,565 | (15,544) | 1,284,021 | ||||
KAR Small-Cap Core Fund | 1,198,008 | 753,267 | (17,561) | 735,706 | ||||
KAR Small-Cap Growth Fund | 3,721,744 | 3,071,484 | (124,108) | 2,947,376 | ||||
KAR Small-Cap Value Fund | 929,924 | 504,521 | (11,702) | 492,819 | ||||
KAR Small-Mid Cap Core Fund | 1,033,010 | 239,699 | (14,276) | 225,423 | ||||
KAR Small-Mid Cap Growth Fund | 5,647 | 680 | (293) | 387 | ||||
KAR Small-Mid Cap Value Fund | 3,007 | 65 | (174) | (109) | ||||
SGA Emerging Markets Growth Fund | 5,223 | 1,227 | (286) | 941 | ||||
SGA Global Growth Fund | 123,289 | 54,162 | (1,821) | 52,341 | ||||
SGA New Leaders Growth Fund | 6,055 | 792 | (234) | 558 | ||||
Tactical Allocation Fund | 617,742 | 354,197 | (12,725) | 341,472 |
| Fund | Short-Term | Long-Term | ||
KAR Global Quality Dividend Fund | $ 2,024 | $135 | ||
KAR Small-Mid Cap Growth Fund | 40 | — | ||
SGA New Leaders Growth Fund | 163 | — | ||
Tactical Allocation Fund | 28,307 | — |
| Undistributed Ordinary Income | Undistributed Long-Term Capital Gains | Late Year Ordinary Losses Deferred | Capital Loss Deferred | ||||
KAR Capital Growth Fund | $ — | $ 58,819 | $ 4,808 | $ — | |||
KAR Equity Income Fund | 5,319 | 148 | — | — | |||
KAR Global Quality Dividend Fund | 69 | — | — | 2,159 | |||
KAR Mid-Cap Core Fund | 4,824 | 19,907 | — | — | |||
KAR Mid-Cap Growth Fund | — | 48,511 | 19,644 | — | |||
KAR Small-Cap Core Fund | 1,745 | 201,605 | — | — | |||
KAR Small-Cap Growth Fund | — | 796,894 | 37,715 | — | |||
KAR Small-Cap Value Fund | 19,856 | 4,287 | — | — | |||
KAR Small-Mid Cap Core Fund | 6,793 | 9,413 | — | — | |||
KAR Small-Mid Cap Growth Fund | — | — | 29 | 40 | |||
KAR Small-Mid Cap Value Fund | 2 | — | — | — | |||
SGA Emerging Markets Growth Fund | — | 414 | 17 | — | |||
SGA Global Growth Fund | 3,846 | 5,488 | — | — | |||
SGA New Leaders Growth Fund | — | — | 25 | 163 | |||
Tactical Allocation Fund | 31,005 | 32,701 | — | 28,307 |
| Ordinary Income | Long-Term Capital Gains | Total | |||
KAR Capital Growth Fund | |||||
9/30/21 | $ — | $ 24,000 | $ 24,000 | ||
9/30/20 | — | 14,937 | 14,937 | ||
KAR Equity Income Fund | |||||
9/30/21 | 1,500 | 35,100 | 36,600 | ||
9/30/20 | 1,342 | — | 1,342 | ||
KAR Global Quality Dividend Fund | |||||
9/30/21 | 940 | — | 940 | ||
9/30/20 | 945 | — | 945 | ||
KAR Mid-Cap Core Fund | |||||
9/30/21 | 1,200 | 5,250 | 6,450 | ||
9/30/20 | 32 | 2,065 | 2,097 | ||
KAR Mid-Cap Growth Fund | |||||
9/30/21 | — | 3,300 | 3,300 | ||
9/30/20 | — | 4,125 | 4,125 | ||
KAR Small-Cap Core Fund | |||||
9/30/21 | 2,600 | 127,000 | 129,600 | ||
9/30/20 | — | 64,855 | 64,855 | ||
KAR Small-Cap Growth Fund | |||||
9/30/21 | — | 668,000 | 668,000 | ||
9/30/20 | — | 83,035 | 83,035 | ||
KAR Small-Cap Value Fund | |||||
9/30/21 | 9,000 | — | 9,000 | ||
9/30/20 | 4,730 | — | 4,730 | ||
KAR Small-Mid Cap Core Fund | |||||
9/30/21 | 60 | — | 60 | ||
SGA Emerging Markets Growth Fund | |||||
9/30/21 | 48 | 77 | 125 | ||
9/30/20 | 1 | — | 1 | ||
SGA Global Growth Fund | |||||
9/30/21 | 2,220 | 2,480 | 4,700 | ||
9/30/20 | 37 | — | 37 | ||
Tactical Allocation Fund | |||||
9/30/21 | 7,664 | 10,200 | 17,864 | ||
9/30/20 | 4,750 | 6,909 | 11,659 |
| Merged Fund | Shares Outstanding | Acquiring Fund | Shares Converted | Merged Fund Net Asset Value of Converted Shares | ||||||||
| Virtus Rampart Multi-Asset Trend Fund | Tactical Allocation Fund | |||||||||||
| Class A | 1,008,720 | Class A | 943,504 | $11,345 | ||||||||
| Class C | 1,609,863 | Class C | 1,402,324 | 17,327 | ||||||||
| Class I | 584,346 | Class I | 552,308 | 6,623 | ||||||||
| Virtus Rampart Sector Trend Fund | Tactical Allocation Fund | |||||||||||
| Class A | 5,953,520 | Class A | 6,276,239 | $75,468 | ||||||||
| Class C | 1,937,610 | Class C | 1,971,499 | 24,359 | ||||||||
| Class I | 1,521,103 | Class I | 1,603,669 | 19,230 | ||||||||
| Virtus Rampart Multi-Asset Trend Fund | Virtus Rampart Sector Trend Fund | Tactical Allocation Fund | ||||
| Net Assets | Unrealized Appreciation (Depreciation) | Net Assets | Unrealized Appreciation (Depreciation) | Net Assets | ||
| $35,295 | $2,507 | $119,057 | $10,140 | $715,533 | ||
Net investment income (loss) | $2,565(a) |
Net realized and unrealized gain (loss) on investments | 137,788 (b) |
Net increase (decrease) in net assets resulting from operations | $140,353 |

September 30, 2021, the related statements of operations and of changes in net assets for each of the periods indicated in the table below, including the related notes, and the financial highlights for each of the periods indicated therein (collectively referred to as the “financial statements”). In our opinion, the financial statements present fairly, in all material respects, the financial position of each of the Funds as of September 30, 2021, the results of each of their operations and the changes in each of their net assets for the
periods indicated in the table below, and each of the financial highlights for each of the periods indicated therein, in conformity with accounting principles generally accepted in the United States of America.
| Virtus KAR Capital Growth Fund Virtus KAR Equity Income Fund Virtus KAR Global Quality Dividend Fund Virtus KAR Mid-Cap Core Fund Virtus KAR Mid-Cap Growth Fund Virtus KAR Small-Cap Core Fund Virtus KAR Small-Cap Growth Fund Virtus KAR Small-Cap Value Fund Virtus KAR Small-Mid Cap Core Fund Virtus SGA Emerging Markets Growth Fund Virtus SGA Global Growth Fund Virtus Tactical Allocation Fund | Statements of operations for the year ended September 30, 2021 and statements of changes in net assets for each of the years ended September 30, 2021 and 2020 |
| Virtus KAR Small-Mid Cap Growth Fund | Statement of operations and statement of changes in net assets for the period December 8, 2020 (inception) through September 30, 2021 |
| Virtus KAR Small-Mid Cap Value Fund | Statement of operations and statement of changes in net assets for the period August 3, 2021 (inception) through September 30, 2021 |
| Virtus SGA New Leaders Growth Fund | Statement of operations and statement of changes in net assets for the period November 17, 2020 (inception) through September 30, 2021 |
Philadelphia, Pennsylvania
November 26, 2021
| Qualified Dividend Income % (non-corporate shareholder) | Dividend Received Deduction % (corporate shareholders) | Long-Term Capital Gain Distributions ($) | |||
KAR Capital Growth Fund | — % | — % | $ 64,116 | ||
KAR Equity Income Fund | 79.97 | 73.41 | 270 | ||
KAR Global Quality Dividend Fund | 100.00 | 78.12 | — | ||
KAR Mid-Cap Core Fund | 100.00 | 96.53 | 22,176 | ||
KAR Mid-Cap Growth Fund | — | — | 51,656 | ||
KAR Small-Cap Core Fund | 100.00 | 100.00 | 210,340 | ||
KAR Small-Cap Growth Fund | — | — | 798,715 | ||
KAR Small-Cap Value Fund | 58.65 | 60.57 | 4,287 | ||
KAR Small-Mid Cap Core Fund | 73.66 | 68.97 | 9,413 | ||
KAR Small-Mid Cap Value Fund | 100.00 | 100.00 | — | ||
SGA Emerging Markets Growth Fund | — | — | 425 | ||
SGA Global Growth Fund | 20.80 | 8.33 | 5,526 | ||
Tactical Allocation Fund | 11.88 | 4.92 | 34,751 |
(b) information regarding performance of a composite of accounts managed in a similar manner as the Fund was expected to be managed; (c) the level and method of computing the Fund’s advisory and subadvisory fees, and comparisons of the Fund’s proposed advisory fee rates with those of a group of other funds with similar investment objectives; (d) historical profitability of VIA and its affiliates under similar agreements; (e) any “fall-out” benefits to VIA, the Subadviser and their affiliates (i.e., ancillary benefits realized by VIA, the Subadviser or their affiliates from VIA’s or the Subadviser’s relationship with the Fund); (f) possible conflicts of interest; and (g) the terms of the Agreements.
| Name, Year of Birth, Length of Time Served and Number of Portfolios in Fund Complex Overseen by Trustee | Principal Occupation(s) During Past 5 Years | Other Directorships Held by Trustee During Past 5 Years |
| Burke, Donald C. YOB: 1960 Served Since: 2016 99 Portfolios | Retired. | Trustee (since 2021), The Merger Fund®, The Merger Fund® VL, and Virtus Event Opportunities Trust (2 portfolios); Trustee (since 2021), Virtus Investment Trust (13 portfolios) and Virtus Strategy Trust (12 portfolios); Director (2020 to 2021), Duff & Phelps Select MLP and Midstream Energy Fund Inc.; Director (since 2020), Virtus Total Return Fund Inc.; Trustee (since 2020), Virtus Global Multi-Sector Income Fund; Trustee (since 2016), Virtus Mutual Fund Family (55 portfolios), Virtus Variable Insurance Trust (8 portfolios) and Virtus Alternative Solutions Trust (2 portfolios); Director (since 2014), closed-end funds managed by Duff & Phelps Investment Management Co. (3 funds); Director, Avista Corp. (energy company) (since 2011); Trustee, Goldman Sachs Fund Complex (2010 to 2014); and Director, BlackRock Luxembourg and Cayman Funds (2006 to 2010). |
| Harris, Sidney E. YOB: 1949 Served Since: 2017 96 Portfolios | Private Investor (since 2021); Professor and Dean Emeritus (2015 to 2021), Professor (1997 to 2014), Dean (1997 to 2004), J. Mack Robinson College of Business, Georgia State University. | Trustee (since 2021), The Merger Fund®, The Merger Fund® VL, and Virtus Event Opportunities Trust (2 portfolios); Trustee (since 2021), Virtus Investment Trust (13 portfolios) and Virtus Strategy Trust (12 portfolios); Director (2020 to 2021), Duff & Phelps Select MLP and Midstream Energy Fund Inc.; and Director (since 2020), Virtus Total Return Fund Inc.; Trustee (since 2020), Virtus Global Multi-Sector Income Fund; Trustee (since 2019), Mutual Fund Directors Forum; Trustee (since 2017), Virtus Mutual Fund Family (55 portfolios), Virtus Variable Insurance Trust (8 portfolios) and Virtus Alternative Solutions Trust (2 portfolios); Trustee (2013 to 2020) and Honorary Trustee (since 2020), KIPP Metro Atlanta; Director (1999 to 2019), Total System Services, Inc.; Trustee (2004 to 2017), RidgeWorth Funds; Chairman (2012 to 2017), International University of the Grand Bassam Foundation; Trustee (since 2012), International University of the Grand Bassam Foundation; and Trustee (2011 to 2015), Genspring Family Offices, LLC. |
| Mallin, John R. YOB: 1950 Served Since: 2016 96 Portfolios | Partner/Attorney (since 2003), McCarter & English LLP (law firm) Real Property Practice Group; and Member (since 2014), Counselors of Real Estate. | Trustee (since 2021), The Merger Fund®, The Merger Fund® VL, and Virtus Event Opportunities Trust (2 portfolios); Trustee (since 2021), Virtus Investment Trust (13 portfolios) and Virtus Strategy Trust (12 portfolios); Director (2020 to 2021), Duff & Phelps Select MLP and Midstream Energy Fund Inc.; and Director (since 2020), Virtus Total Return Fund Inc.; Trustee (since 2020), Virtus Global Multi-Sector Income Fund; Trustee (since 2016), Virtus Mutual Fund Family (55 portfolios) and Virtus Alternative Solutions Trust (2 portfolios); Director (since 2019), 1892 Club, Inc. (non-profit); Director (2013 to 2020), Horizons, Inc. (non-profit); and Trustee (since 1999), Virtus Variable Insurance Trust (8 portfolios). |
| McDaniel, Connie D. YOB: 1958 Served Since: 2017 96 Portfolios | Retired (since 2013). Vice President, Chief of Internal Audit, Corporate Audit Department (2009 to 2013); Vice President Global Finance Transformation (2007 to 2009); Vice President and Controller (1999 to 2007), The Coca-Cola Company. | Trustee (since 2021), The Merger Fund®, The Merger Fund® VL, and Virtus Event Opportunities Trust (2 portfolios); Trustee (since 2021), Virtus Investment Trust (13 portfolios) and Virtus Strategy Trust (12 portfolios); Director (2020 to 2021), Duff & Phelps Select MLP and Midstream Energy Fund Inc.; and Director (since 2020), Virtus Total Return Fund Inc.; Trustee (since 2020), Virtus Global Multi-Sector Income Fund; Director (since 2019), Global Payments Inc.; Trustee (since 2017), Virtus Mutual Fund Family (55 portfolios), Virtus Variable Insurance Trust (8 portfolios), and Virtus Alternative Solutions Trust (2 portfolios); Director (since 2021), North Florida Land Trust; Director (2014 to 2019), Total System Services, Inc.; Member (since 2011) and Chair (2014 to 2016), Georgia State University, Robinson College of Business Board of Advisors; and Trustee (2005 to 2017), RidgeWorth Funds. |
| Name, Year of Birth, Length of Time Served and Number of Portfolios in Fund Complex Overseen by Trustee | Principal Occupation(s) During Past 5 Years | Other Directorships Held by Trustee During Past 5 Years |
| McLoughlin, Philip YOB: 1946 Served Since: 1993 106 Portfolios | Retired. | Trustee (since 2021), The Merger Fund®, The Merger Fund® VL, and Virtus Event Opportunities Trust (2 portfolios); Trustee (since 2021), Virtus Investment Trust (13 portfolios) and Virtus Strategy Trust (12 portfolios); Trustee (since 2021), Virtus AllianzGI Artificial Intelligence & Technology Opportunities Fund, Virtus AllianzGI Convertible & Income Fund II, Virtus AllianzGI Diversified Income & Convertible, Virtus AllianzGI Equity & Convertible Income Fund and Virtus Dividend, Interest & Premium Strategy Fund; Advisory Board Member (since 2021), Virtus AllianzGI Convertible & Income 2024 Target Term Fund and Virtus AllianzGI Convertible & Income Fund; Director and Chairman (since 2016), Virtus Total Return Fund Inc.; Director and Chairman (2016 to 2019), the former Virtus Total Return Fund Inc.; Director and Chairman (2014 to 2021), Duff & Phelps Select MLP and Midstream Energy Fund Inc.; Trustee and Chairman (since 2013), Virtus Alternative Solutions Trust (2 portfolios); Trustee and Chairman (since 2011), Virtus Global Multi-Sector Income Fund; Chairman and Trustee (since 2003), Virtus Variable Insurance Trust (8 portfolios); Director (since 1995), closed-end funds managed by Duff & Phelps Investment Management Co. (3 funds); Director (1991 to 2019) and Chairman (2010 to 2019), Lazard World Trust Fund (closed-end investment firm in Luxembourg); and Trustee (since 1989) and Chairman (since 2002), Virtus Mutual Fund Family (55 portfolios). |
| McNamara, Geraldine M. YOB: 1951 Served Since: 2001 99 Portfolios | Retired. | Trustee (since 2021), The Merger Fund®, The Merger Fund® VL, and Virtus Event Opportunities Trust (2 portfolios); Trustee (since 2021), Virtus Investment Trust (13 portfolios) and Virtus Strategy Trust (12 portfolios); Director (2020 to 2021), Duff & Phelps Select MLP and Midstream Energy Fund Inc. and Virtus Total Return Fund Inc.; Trustee (since 2020), Virtus Global Multi-Sector Income Fund; Trustee (since 2016), Virtus Alternative Solutions Trust (2 portfolios); Trustee (since 2015), Virtus Variable Insurance Trust (8 portfolios); Director (since 2003), closed-end funds managed by Duff & Phelps Investment Management Co. (3 funds); and Trustee (since 2001), Virtus Mutual Fund Family (55 portfolios). |
| Walton, R. Keith. YOB: 1964 Served Since: 2020 96 Portfolios | Managing Director (2020 to 2021), Lafayette Square Holding Company LLC; Venture and Operating Partner (since 2020), Plexo Capital, LLC; Venture Partner (since 2019) and Senior Adviser (2018 to 2019), Plexo, LLC; Senior Adviser (2018 to 2019), Vatic Labs, LLC; Executive Vice President, Strategy (2017 to 2019), Zero Mass Water, LLC; Vice President, Strategy (2013 to 2017), Arizona State University; Partner (since 2006), Global Infrastructure Partners. | Trustee (since 2021), The Merger Fund®, The Merger Fund® VL, and Virtus Event Opportunities Trust (2 portfolios); Trustee (since 2021), Virtus Investment Trust (13 portfolios) and Virtus Strategy Trust (12 portfolios); Trustee (since 2020) Virtus Alternative Solutions Trust (2 portfolios), Virtus Variable Insurance Trust (8 portfolios) and Virtus Mutual Fund Family (55 portfolios); Director (since 2017), certain funds advised by Bessemer Investment Management LLC; Director (2016 to 2021), Duff & Phelps Select MLP and Midstream Energy Fund Inc.; Trustee (since 2016), Virtus Global Multi-Sector Income Fund; Director (2006 to 2019), Systematica Investments Limited Funds; Director (2006 to 2017), BlueCrest Capital Management Funds; Trustee (2014 to 2017), AZ Service; Director (since 2004), Virtus Total Return Fund Inc.; and Director (2004 to 2019), the former Virtus Total Return Fund Inc. |
| Zino, Brian T. YOB: 1952 Served Since: 2020 103 Portfolios | Retired. Various roles (1982 to 2009), J. & W. Seligman & Co. Incorporated, including President (1994 to 2009). | Trustee (since 2021), The Merger Fund®, The Merger Fund® VL, and Virtus Event Opportunities Trust (2 portfolios); Advisory Board Member (since 2021), Virtus AllianzGI Closed-End Funds (7 portfolios); Trustee (since 2021), Virtus Investment Trust (13 portfolios) and Virtus Strategy Trust (12 portfolios); Trustee (since 2020), Virtus Alternative Solutions Trust (2 portfolios), Virtus Variable Insurance Trust (8 portfolios) and Virtus Mutual Fund Family (55 portfolios); Director (2016 to 2021), Duff & Phelps Select MLP and Midstream Energy Fund Inc.; Trustee (since 2016), Virtus Global Multi-Sector Income Fund; Director (since 2014), Virtus Total Return Fund Inc.; Director (2014 to 2019), the former Virtus Total Return Fund Inc.; Trustee (since 2011), Bentley University; Director (1986 to 2009) and President (1994 to 2009), J&W Seligman Co. Inc.; Director (1998 to 2009), Chairman (2002 to 2004) and Vice Chairman (2000 to 2002), ICI Mutual Insurance Company; Member, Board of Governors of ICI (1998 to 2008). |
| Name, Year of Birth, Length of Time Served and Number of Funds Overseen | Principal Occupation(s) During Past 5 Years | Principal Occupation(s) During Past 5 Years and Other Directorships Held by Trustee |
| Aylward, George R.* Trustee and President YOB: 1964 Served Since: 2006 108 Portfolios | Director, President and Chief Executive Officer (since 2008), Virtus Investment Partners, Inc. and/or certain of its subsidiaries, and various senior officer positions with Virtus affiliates (since 2005). | Trustee and President (since 2021), The Merger Fund®, The Merger Fund® VL, and Virtus Event Opportunities Trust (2 portfolios); Trustee and President (since 2021), Virtus Investment Trust (13 portfolios) and Virtus Strategy Trust (12 portfolios); Trustee, President and Chief Executive Officer (since 2021), Virtus AllianzGI Closed-End Funds (7 portfolios); and Chairman and Trustee (since 2015), Virtus ETF Trust II (5 portfolios); Director, President and Chief Executive Officer (2014 to 2021), Duff & Phelps Select MLP and Midstream Energy Fund Inc.; Trustee and President (since 2013), Virtus Alternative Solutions Trust (2 portfolios); Director (since 2013), Virtus Global Funds, PLC (5 portfolios); Trustee (since 2012) and President (since 2010), Virtus Variable Insurance Trust (8 portfolios); Trustee, President and Chief Executive Officer (since 2011), Virtus Global Multi-Sector Income Fund; Trustee and President (since 2006) and Executive Vice President (2004 to 2006), Virtus Mutual Fund Family (55 portfolios); Director, President and Chief Executive Officer (since 2006), Virtus Total Return Fund Inc.; and Director, President and Chief Executive Officer (2006 to 2019), the former Virtus Total Return Fund Inc. |
| Name, Year of Birth, Length of Time Served, and Number of Portfolios in Fund Complex Overseen | Principal Occupation(s) During Past 5 Years | Other Directorships Held by Trustee During Past 5 Years |
| Cogan, Sarah E. YOB: 1956 Served Since: 2021 103 Portfolios | Retired Partner, Simpson Thacher & Bartlett LLP (“STB”) (law firm) (since 2018); Director, Girl Scouts of Greater New York (since 2016); Trustee, Natural Resources Defense Council, Inc. (since 2013); and formerly, Partner, STB (1989 to 2018). | Trustee (since 2021), The Merger Fund®, The Merger Fund® VL, and Virtus Event Opportunities Trust (2 portfolios); Advisory Board Member (since 2021), Virtus Alternative Solutions Trust (2 portfolios), Virtus Mutual Fund Family (55 portfolios), and Virtus Variable Insurance Trust (8 portfolios); Advisory Board Member (February 2021 to June 2021), Duff & Phelps Select MLP and Midstream Energy Fund Inc.; Trustee (since 2021), Virtus Global Multi-Sector Income Fund and Virtus Total Return Fund Inc.; Trustee (since 2019), Virtus Investment Trust (13 portfolios) and Virtus Strategy Trust (12 portfolios); Trustee (since 2019), Virtus AllianzGI Closed-End Funds (7 portfolios); Trustee (since 2019), PIMCO California Municipal Income Fund, PIMCO California Municipal Income Fund II, PIMCO California Municipal Income Fund III, PIMCO Municipal Income Fund, PIMCO Municipal Income Fund II, PIMCO Municipal Income Fund III, PIMCO New York Municipal Income Fund, PIMCO New York Municipal Income Fund II, PIMCO New York Municipal Income Fund III, PIMCO Energy and Tactical Credit Opportunities Fund, PCM Fund, Inc, PIMCO Corporate & Income Strategy Fund, PIMCO Corporate & Income Opportunity Fund, PIMCO Dynamic Credit and Mortgage Income Fund, PIMCO Dynamic Income Fund, PIMCO Global StocksPLUS® & Income Fund, PIMCO High Income Fund, PIMCO Income Opportunity Fund, PIMCO Income Strategy Fund, PIMCO Income Strategy Fund II, PIMCO Strategic Income Fund, Inc., PIMCO Flexible Credit Income Fund and PIMCO Flexible Municipal Income Fund; and Trustee (since 2019), PIMCO Managed Accounts Trust (5 portfolios). |
| Name, Year of Birth, Length of Time Served, and Number of Portfolios in Fund Complex Overseen | Principal Occupation(s) During Past 5 Years | Other Directorships Held by Trustee During Past 5 Years |
| DeCotis, Deborah A. YOB: 1952 Served Since: 2021 103 Portfolios | Advisory Director, Morgan Stanley & Co., Inc. (since 1996); Member, Circle Financial Group (since 2009); Member, Council on Foreign Relations (since 2013); Trustee, Smith College (since 2017); and Director, Watford Re (since 2017). Formerly, Co-Chair Special Projects Committee, Memorial Sloan Kettering (2005 to 2015); Trustee, Stanford University (2010 to 2015); and Principal, LaLoop LLC, a retail accessories company (1999 to 2014). | Trustee (since 2021), The Merger Fund®, The Merger Fund® VL, and Virtus Event Opportunities Trust (2 portfolios); Advisory Board Member (since 2021), Virtus Alternative Solutions Trust (2 portfolios), Virtus Mutual Fund Family (55 portfolios), and Virtus Variable Insurance Trust (8 portfolios); Advisory Board Member (February 2021 to June 2021), Duff & Phelps Select MLP and Midstream Energy Fund Inc.; Trustee (since 2021), Virtus Global Multi-Sector Income Fund and Virtus Total Return Fund Inc.; Trustee (since 2020), PIMCO Dynamic Income Opportunities Fund; Trustee (since 2019), PIMCO Energy and Tactical Credit Opportunities Fund and Virtus AllianzGI Artificial Intelligence & Technology Opportunities Fund; Trustee (since 2018), PIMCO Flexible Municipal Income Fund Trustee (since 2017), PIMCO Flexible Credit Income Fund and Virtus AllianzGI Convertible & Income 2024 Target Term Fund; Trustee (since 2015), Virtus AllianzGI Diversified Income & Convertible Fund; Trustee (since 2014), Virtus Investment Trust (13 portfolios); Trustee (since 2013), PIMCO Dynamic Credit and Mortgage Income Fund; Trustee (since 2012), PIMCO Dynamic Income Fund; Trustee (since 2011), Virtus Strategy Trust (12 portfolios); Trustee (since 2011), PIMCO California Municipal Income Fund II, PIMCO California Municipal Income Fund III, PIMCO Municipal Income Fund, PIMCO Municipal Income Fund II, PIMCO Municipal Income Fund III, PIMCO New York Municipal Income Fund, PIMCO New York Municipal Income Fund II, PIMCO New York Municipal Income Fund III, PCM Fund, Inc., PIMCO Corporate & Income Strategy Fund, PIMCO Corporate & Income Opportunity Fund, PIMCO Global StocksPLUS® & Income Fund, PIMCO High Income Fund, PIMCO Income Opportunity Fund, PIMCO Income Strategy Fund, PIMCO Income Strategy Fund II, PIMCO Strategic Income Fund, Inc., PIMCO Managed Accounts Trust (5 portfolios); and Trustee (since 2011), Virtus AllianzGI Convertible & Income Fund, Virtus AllianzGI Convertible & Income Fund II, Virtus AllianzGI Equity & Convertible Income Fund, and Virtus Dividend, Interest & Premium Strategy Fund. |
| Drummond, F. Ford YOB: 1962 Served Since: 2021 103 Portfolios | Owner/Operator (since 1998), Drummond Ranch; formerly Board Member (2006 to 2020) and Chairman (2016 to 2018), Oklahoma Water Resources Board;, Director (1998 to 2008), The Cleveland Bank; and General Counsel (1998 to 2008), BMIHealth Plans (benefits administration). | Trustee (since 2021), The Merger Fund®, The Merger Fund® VL, and Virtus Event Opportunities Trust (2 portfolios); Advisory Board Member (since 2021), Virtus Alternative Solutions Trust (2 portfolios), Virtus Mutual Fund Family (55 portfolios), and Virtus Variable Insurance Trust (8 portfolios); Advisory Board Member (February 2021 to June 2021), Duff & Phelps Select MLP and Midstream Energy Fund Inc.; Trustee (since 2021), Virtus Global Multi-Sector Income Fund and Virtus Total Return Fund Inc.; Trustee (since 2019), Virtus AllianzGI Artificial Intelligence & Technology Opportunities Fund; Trustee (since 2017), Virtus AllianzGI Convertible & Income 2024 Target Term Fund; Trustee (since 2015), Virtus AllianzGI Convertible & Income Fund, Virtus AllianzGI Convertible & Income Fund II, Virtus AllianzGI Diversified Income & Convertible Fund, Virtus Dividend, Interest & Premium Strategy Fund and Virtus AllianzGI Equity & Convertible Income Fund; Trustee (since 2014), Virtus Strategy Trust (12 portfolios); Director (since 2011), Bancfirst Corporation; and Trustee (since 2006), Virtus Investment Trust (13 portfolios). |
| Moyer, William R. YOB: 1944 Served Since: 2020 96 Portfolios | Private investor (since 2004); and Financial and Operations Principal (2006 to 2017), Newcastle Distributors LLC (broker dealer). | Advisory Board Member (since 2021), The Merger Fund®, The Merger Fund® VL, and Virtus Event Opportunities Trust (2 portfolios); Advisory Board Member (since 2021), Virtus Investment Trust (13 portfolios) and Virtus Strategy Trust (12 portfolios); Advisory Board Member (since 2020), Virtus Variable Insurance Trust (8 portfolios) and Virtus Mutual Fund Family (55 portfolios); Advisory Board Member (since 2020) and Director (2016 to 2019), Virtus Total Return Fund Inc.; Director (2016 to 2019), the former Virtus Total Return Fund Inc.; Advisory Board Member (2020 to 2021) and Director (2014 to 2019), Duff & Phelps Select MLP and Midstream Energy Fund Inc.; Advisory Board Member (since 2020) and Trustee (2011 to 2019), Virtus Global Multi-Sector Income Fund; Advisory Board Member (since 2020) and Trustee (2013 to 2016), Virtus Alternative Solutions Trust (2 portfolios). |
| Name, Address and Year of Birth | Position(s) Held with Trust and Length of Time Served | Principal Occupation(s) During Past 5 Years |
| Batchelar, Peter J. YOB: 1970 | Senior Vice President (since 2017), and Vice President (2008 to 2016). | Senior Vice President, Product Development (since 2017), Vice President, Product Development (2008 to 2016), and various officer positions (since 2008), Virtus Investment Partners, Inc. and/or certain of its subsidiaries; Senior Vice President (since 2021), The Merger Fund®, The Merger Fund® VL and Virtus Event Opportunities Trust; Senior Vice President (since 2021), Virtus Investment Trust and Virtus Strategy Trust; Senior Vice President (since 2021), AllianzGI Closed-End Funds; Senior Vice President (since 2017) and Vice President (2008 to 2016), Virtus Mutual Fund Family; Senior Vice President (since 2017) and Vice President (2010 to 2016), Virtus Variable Insurance Trust; Senior Vice President (since 2017) and Vice President (2013 to 2016), Virtus Alternative Solutions Trust; Senior Vice President (2017 to 2021) and Vice President (2016 to 2017), Duff & Phelps Select MLP and Midstream Energy Fund Inc.; Senior Vice President (since 2017) and Vice President (2016 to 2017), Virtus Total Return Fund Inc. and Virtus Global Multi-Sector Income Fund; and Senior Vice President (2017 to 2019) and Vice President (2016 to 2017), the former Virtus Total Return Fund Inc. |
| Bradley, W. Patrick YOB: 1972 | Executive Vice President (since 2016); Senior Vice President (2013 to 2016); Vice President (2011 to 2013); Chief Financial Officer and Treasurer (since 2006). | Executive Vice President, Fund Services (since 2016), Senior Vice President, Fund Services (2010 to 2016), and various officer positions (since 2006), Virtus Investment Partners, Inc. and/or certain of its subsidiaries; Executive Vice President, Chief Financial Officer and Treasurer (since 2021), The Merger Fund®, The Merger Fund® VL and Virtus Event Opportunities Trust; Executive Vice President, Chief Financial Officer and Treasurer (since 2021), Virtus Investment Trust and Virtus Strategy Trust; Executive Vice President, Chief Financial Officer and Treasurer (since 2021), Virtus AllianzGI Closed-End Funds; Director (since 2019), Virtus Global Funds ICAV; Executive Vice President (since 2016), Senior Vice President (2013 to 2016), Vice President (2011 to 2013), Chief Financial Officer and Treasurer (since 2004), Virtus Variable Insurance Trust; Executive Vice President (since 2016), Senior Vice President (2013 to 2016), Vice President (2011 to 2013), Chief Financial Officer and Treasurer (since 2006), Virtus Mutual Fund Family; Executive Vice President (since 2016), Senior Vice President (2013 to 2016), Vice President (2012 to 2013) and Chief Financial Officer and Treasurer (since 2010), Virtus Total Return Fund Inc.; Executive Vice President (2016 to 2019), Senior Vice President (2013 to 2016), Vice President (2012 to 2013), Chief Financial Officer and Treasurer (since 2010), the former Virtus Total Return Fund Inc.; Executive Vice President (since 2016), Senior Vice President (2013 to 2016), Vice President (2011 to 2013), Chief Financial Officer and Treasurer (since 2011), Virtus Global Multi-Sector Income Fund; Executive Vice President ( 2016 to 2021), Senior Vice President (2014 to 2016), Chief Financial Officer and Treasurer (2014 to 2021), Duff & Phelps Select MLP and Midstream Energy Fund Inc.; Executive Vice President (since 2016), Senior Vice President (2013 to 2016), and Chief Financial Officer and Treasurer (since 2013), Virtus Alternative Solutions Trust; Director (since 2013), Virtus Global Funds, PLC; and Vice President and Assistant Treasurer (since 2011), Duff & Phelps Utility and Infrastructure Fund Inc. |
| Name, Address and Year of Birth | Position(s) Held with Trust and Length of Time Served | Principal Occupation(s) During Past 5 Years |
| Carr, Kevin J. YOB: 1954 | Senior Vice President (since 2013); Vice President (2005 to 2013); Chief Legal Officer, Counsel and Secretary (since 2005). | Vice President and Senior Counsel (2017 to Present), Senior Vice President (2009 to 2017), Vice President, Counsel and Secretary (2008 to 2009), and various officer positions (since 2005), Virtus Investment Partners, Inc. and/or certain of its subsidiaries; Interim Chief Legal Officer, Senior Vice President and Assistant Secretary (since 2021), The Merger Fund®, The Merger Fund® VL and Virtus Event Opportunities Trust; Interim Chief Legal Officer, Senior Vice President and Assistant Secretary (since 2021), Virtus Investment Trust and Virtus Strategy Trust; Assistant Secretary, (since 2021), Virtus AllianzGI Closed-End Funds; Senior Vice President (since 2013), Vice President (2005 to 2013), Chief Legal Officer, Counsel and Secretary (since 2005), Virtus Mutual Fund Family; Interim Chief Legal Officer (since 2021), Senior Vice President (2013 to 2014), Vice President (2012 to 2013), Secretary and Chief Legal Officer (2005 to 2013), Assistant Secretary (2013 to 2014 and since 2017), Virtus Total Return Fund Inc.; Senior Vice President (2013 to 2014), Vice President (2012 to 2013), Secretary and Chief Legal Officer (2005 to 2013) and Assistant Secretary (2013 to 2014 and 2017 to 2019), the former Virtus Total Return Fund Inc.; Interim Chief Legal Officer (since 2021), Senior Vice President (since 2017), Assistant Secretary (since 2013), Vice President, Chief Legal Officer, Counsel and Secretary (2010 to 2013), Virtus Variable Insurance Trust; Interim Chief Legal Officer (since 2021), Senior Vice President (2013 to 2014), Vice President (2011 to 2013), Assistant Secretary (since 2011), Virtus Global Multi-Sector Income Fund; Assistant Secretary (2015 to 2021), Duff & Phelps Select MLP and Midstream Energy Fund Inc.; Interim Chief Legal Officer (since 2021), Senior Vice President (since 2017) and Assistant Secretary (since 2013), Virtus Alternative Solutions Trust; Secretary (since 2015), ETFis Series Trust I; and Secretary (since 2015), Virtus ETF Trust II. |
| Engberg, Nancy J. YOB: 1956 | Senior Vice President (since 2017); Vice President (2011 to 2017); and Chief Compliance Officer (since 2011). | Senior Vice President (since 2017), Vice President (2008 to 2017) and Chief Compliance Officer (2008 to 2011 and since 2016), and various officer positions (since 2003), Virtus Investment Partners, Inc. and/or certain of its subsidiaries; Senior Vice President and Chief Compliance Officer (since 2021), The Merger Fund®, The Merger Fund® VL and Virtus Event Opportunities Trust; Senior Vice President and Chief Compliance Officer (since 2021), Virtus Investment Trust, Virtus Strategy Trust and Virtus AllianzGI Closed-End Funds; Senior Vice President (since 2017), Vice President (2011 to 2017) and Chief Compliance Officer (since 2011), Virtus Mutual Fund Family; Senior Vice President (since 2017), Vice President (2010 to 2017) and Chief Compliance Officer (since 2011), Virtus Variable Insurance Trust; Senior Vice President (since 2017), Vice President (2011 to 2017) and Chief Compliance Officer (since 2011), Virtus Global Multi-Sector Income Fund; Senior Vice President (since 2017), Vice President (2012 to 2017) and Chief Compliance Officer (since 2012), Virtus Total Return Fund Inc.; Senior Vice President (2017 to 2019), Vice President (2012 to 2017) and Chief Compliance Officer (2012 to 2019), the former Virtus Total Return Fund Inc.; Senior Vice President (since 2017), Vice President (2013 to 2016) and Chief Compliance Officer (since 2013), Virtus Alternative Solutions Trust; Senior Vice President (2017 to 2021), Vice President (2014 to 2017) and Chief Compliance Officer (2014 to 2021), Duff & Phelps Select MLP and Midstream Energy Fund Inc.; Chief Compliance Officer (since 2015), ETFis Series Trust I; and Chief Compliance Officer (since 2015), Virtus ETF Trust II. |
| Short, Julia R. YOB: 1972 | Senior Vice President (since 2017). | Senior Vice President, Product Development (since 2017), Virtus Investment Partners, Inc. and/or certain of its subsidiaries; Senior Vice President (since 2021), The Merger Fund®, The Merger Fund® VL and Virtus Event Opportunities Trust; Senior Vice President (since 2021), Virtus Investment Trust, Virtus Strategy Trust and Virtus Closed-End Funds; Senior Vice President (2018 to 2021), Duff & Phelps Select MLP and Midstream Energy Fund Inc.; and Senior Vice President (since 2018), Virtus Global Multi-Sector Income Fund and Virtus Total Return Fund Inc.; Senior Vice President (2018 to 2019), the former Virtus Total Return Fund Inc.; Senior Vice President (since 2017), Virtus Mutual Fund Family; President and Chief Executive Officer, RidgeWorth Funds (2007 to 2017); and Managing Director, Product Manager, RidgeWorth Investments (2004 to 2017). |
| Name, Address and Year of Birth | Position(s) Held with Trust and Length of Time Served | Principal Occupation(s) During Past 5 Years |
| Smirl, Richard W. YOB: 1967 | Executive Vice President (since 2021). | Executive Vice President, Product Management (since 2021), and Executive Vice President and Chief Operating Officer (since 2021), Virtus Investment Partners, Inc. and/or certain of its subsidiaries; Executive Vice President (since 2021), The Merger Fund®, The Merger Fund® VL and Virtus Event Opportunities Trust; Executive Vice President (since 2021), Virtus Mutual Fund Family, Virtus Investment Trust, Virtus Strategy Trust, Virtus Global Multi-Sector Income Fund, and Virtus Total Return Fund Inc.; Executive Vice President (May to June 2021), Duff & Phelps Select MLP and Midstream Energy Fund Inc.; Chief Operating Officer (2018 to 2021), Russell Investments; Executive Director (Jan. to July 2018), State of Wisconsin Investment Board; and Partner and Chief Operating Officer (2004 to 2018), William Blair Investment Management. |
Accounting Firm
| Mutual Fund Services | 1-800-243-1574 |
| Adviser Consulting Group | 1-800-243-4361 |
The Securities and Exchange Commission has modified mailing regulations for semiannual and annual shareholder fund reports to allow mutual fund companies to send a single copy of these reports to shareholders who share the same mailing address. If you would like additional copies, please call Mutual Fund Services at 1-800-243-1574.

please contact us at 1-800-243-1574, or visit Virtus.com.
| 8015 | 11-21 |
Item 2. Code of Ethics.
| (a) | The registrant, as of the end of the period covered by this report, has adopted a code of ethics that applies to the registrant’s principal executive officer, principal financial officer, principal accounting officer or controller, or persons performing similar functions, regardless of whether these individuals are employed by the registrant or a third party. |
| (b) | Effective October 1, 2021, the code of ethics that applies to the registrant’s principal executive officer, principal financial officer, principal accounting officer or controller, or persons performing similar functions was amended. A copy of the currently applicable code is included as an exhibit. |
| (d) | The registrant has not granted any waivers, during the period covered by this report, including an implicit waiver, from a provision of the code of ethics that applies to the registrant’s principal executive officer, principal financial officer, principal accounting officer or controller, or persons performing similar functions, regardless of whether these individuals are employed by the registrant or a third party, that relates to one or more of the items set forth in paragraph (b) of the instructions for completion of this Item. |
Item 3. Audit Committee Financial Expert.
| (a)(1) | The Registrant’s Board of Trustees has determined that the Registrant has an “audit committee financial expert” serving on its Audit Committee. |
| (a)(2) | The Registrant’s Board of Trustees has determined that each of Donald C. Burke, Connie D. McDaniel and Brian T. Zino possesses the technical attributes identified in Instruction 2(b) of Item 3 to Form N-CSR to qualify as an “audit committee financial expert.” Each such individual is an “independent” trustee pursuant to paragraph (a)(2) of Item 3 to Form N-CSR. |
| (a)(3) | Not applicable. |
Item 4. Principal Accountant Fees and Services.
| • | Registrant may incorporate the following information by reference, if this information has been disclosed in the registrant’s definitive proxy statement or definitive information statement. The proxy statement or information statement must be filed no later than 120 days after the end of the fiscal year covered by the Annual Report. |
Audit Fees
| (a) | The aggregate fees billed for each of the last two fiscal years for professional services rendered by the principal accountant for the audit of the registrant’s annual financial statements or services that are normally provided by the accountant in connection with statutory and regulatory filings or engagements for fiscal years ended September 30, 2020 and September 30, 2021 are $210,889 and $274,360, respectively. |
Audit-Related Fees
| (b) | The aggregate fees billed in each of the last two fiscal years for assurance and related services by the principal accountant that are reasonably related to the performance of the audit of the registrant’s financial statements and are not reported under paragraph (a) of this Item for fiscal years ended September 30, 2020 and September 30, 2021 are $17,185 and $20,402, respectively. Such audit-related fees include out of pocket expenses. |
Tax Fees
| (c) | The aggregate fees billed in each of the last two fiscal years for professional services rendered by the principal accountant for tax compliance, tax advice, and tax planning for fiscal years ended September 30, 2020 and September 30, 2021 are $45,725 and $77,550, respectively. |
“Tax Fees” are those primarily associated with review of the Trust’s tax provision and qualification as a regulated investment company (RIC) in connection with audits of the Trust’s financial statement, review of year-end distributions by the Fund to avoid excise tax for the Trust, periodic discussion with management on tax issues affecting the Trust, and reviewing and signing the Fund’s federal income tax returns.
All Other Fees
| (d) | The aggregate fees billed in each of the last two fiscal years for products and services provided by the principal accountant, other than the services reported in paragraphs (a) through (c) of this Item are for fiscal years ended September 30, 2020 and September 30, 2021 are $0 and $0, respectively. |
| (e)(1) | Disclose the audit committee’s pre-approval policies and procedures described in paragraph (c)(7) of Rule 2-01 of Regulation S-X. |
The Board of Trustees of Virtus Equity Trust (the “Fund”) has adopted policies and procedures with regard to the pre-approval of services provided by its independent auditors. Audit, audit-related and tax compliance services provided to the Fund on an annual basis require specific pre-approval by the Audit Committee. The Audit Committee must also approve other non-audit services provided to the Fund and those non-audit services provided to the Fund’s Affiliated Service Providers that relate directly to the operations and financial reporting of the Fund. Certain of these non-audit services that the Audit Committee believes are a) consistent with the SEC’s auditor independence rules and b) routine and recurring services that will not impair the independence of the independent auditors may be approved by the Audit Committee without consideration on a specific case-by-case basis (“general pre-approval”).
The Audit Committee has determined that Ms. Connie D. McDaniel, Chair of the Audit Committee, may provide pre-approval for such services that meet the above requirements in the event such approval is sought between regularly scheduled meetings. In any event, the Audit Committee is informed of, and ratifies, each service approved subject to general pre-approval at the next regularly scheduled in-person Audit Committee meeting.
| (e)(2) | The percentage of services described in each of paragraphs (b) through (d) of this Item that were approved by the audit committee pursuant to paragraph (c)(7)(i)(C) of Rule 2-01 of Regulation S-X are as follows: |
(b) 0%
(c) 0%
(d) N/A
| (f) | The percentage of hours expended on the principal accountant’s engagement to audit the registrant’s financial statements for the most recent fiscal year that were attributed to work performed by persons other than the principal accountant’s full-time, permanent employees was less than fifty percent. |
| (g) | The aggregate non-audit fees billed by the registrant’s accountant for services rendered to the registrant, and rendered to the registrant’s investment adviser (not including any sub-adviser whose role is primarily portfolio management and is subcontracted with or overseen by another investment adviser), and any entity controlling, controlled by, or under common control with the adviser that provides ongoing services to the registrant for fiscal years ended September 30, 2020 and September 30, 2021 are $62,910 and $97,952, respectively. |
| (h) | The registrant’s audit committee of the board of directors has considered whether the provision of non-audit services that were rendered to the registrant’s investment adviser (not including any sub-adviser whose role is primarily portfolio management and is subcontracted with or overseen by another investment adviser), and any entity controlling, controlled by, or under common control with the investment adviser that provides ongoing services to the registrant that were not pre-approved pursuant to paragraph (c)(7)(ii) of Rule 2-01 of Regulation S-X is compatible with maintaining the principal accountant’s independence. |
Item 5. Audit Committee of Listed Registrants.
Not applicable.
Item 6. Investments.
| (a) | Schedule of Investments in securities of unaffiliated issuers as of the close of the reporting period is included as part of the report to shareholders filed under Item 1(a) of this form. |
| (b) | Not applicable. |
Item 7. Disclosure of Proxy Voting Policies and Procedures for Closed-End Management Investment Companies.
Not applicable.
Item 8. Portfolio Managers of Closed-End Management Investment Companies.
Not applicable.
Item 9. Purchases of Equity Securities by Closed-End Management Investment Company and Affiliated Purchasers.
Not applicable.
Item 10. Submission of Matters to a Vote of Security Holders.
There have been no material changes to the procedures by which the shareholders may recommend nominees to the registrant’s board of trustees, where those changes were implemented after the registrant last provided disclosure in response to the requirements of Item 407(c)(2)(iv) of Regulation S-K (17 CFR 229.407) (as required by Item 22(b)(15) of Schedule 14A (17 CFR 240.14a-101)), or this Item.
Item 11. Controls and Procedures.
| (a) | The registrant’s principal executive and principal financial officers, or persons performing similar functions, have concluded that the registrant’s disclosure controls and procedures (as defined in Rule 30a-3(c) under the Investment Company Act of 1940, as amended (the “1940 Act”) (17 CFR 270.30a-3(c))) are effective, as of a date within 90 days of the filing date of the report that includes the disclosure required by this paragraph, based on their evaluation of these controls and procedures required by Rule 30a-3(b) under the 1940 Act (17 CFR 270.30a-3(b)) and Rules 13a-15(b) or 15d-15(b) under the Securities Exchange Act of 1934, as amended (17 CFR 240.13a-15(b) or 240.15d-15(b)). |
| (b) | There were no changes in the registrant’s internal control over financial reporting (as defined in Rule 30a-3(d) under the 1940 Act (17 CFR 270.30a-3(d))) that occurred during the period covered by this report that has materially affected, or is reasonably likely to materially affect, the registrant’s internal control over financial reporting. |
Item 12. Disclosure of Securities Lending Activities for Closed-End Management Investment Companies.
Not applicable.
Item 13. Exhibits.
(a)(2)(1) Not applicable.
(a)(2)(2) Not applicable.
SIGNATURES
Pursuant to the requirements of the Securities Exchange Act of 1934 and the Investment Company Act of 1940, the registrant has duly caused this report to be signed on its behalf by the undersigned, thereunto duly authorized.
| (Registrant) | Virtus Equity Trust |
| By (Signature and Title)* | /s/ George R. Aylward | |
| George R. Aylward, President | ||
| (principal executive officer) | ||
| Date | 12/7/21 |
Pursuant to the requirements of the Securities Exchange Act of 1934 and the Investment Company Act of 1940, this report has been signed below by the following persons on behalf of the registrant and in the capacities and on the dates indicated.
| By (Signature and Title)* | /s/ George R. Aylward | |
| George R. Aylward, President | ||
| (principal executive officer) |
Date 12/7/21
| By (Signature and Title)* | /s/ W. Patrick Bradley | |
| W. Patrick Bradley, Executive Vice President, Chief Financial Officer, and Treasurer | ||
| (principal financial officer) |
Date 12/7/21
| * | Print the name and title of each signing officer under his or her signature. |