countries. The index is calculated on a total return basis with net dividends reinvested. The index is unmanaged, its returns do not reflect any fees, expenses, or sales charges, and is not available for direct investment.
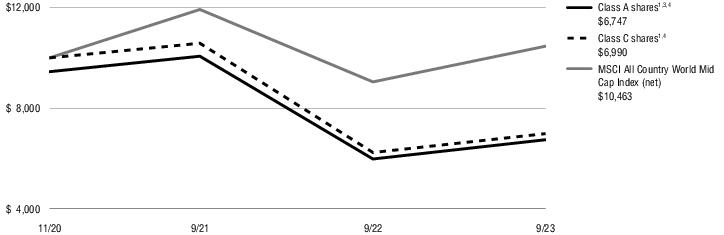
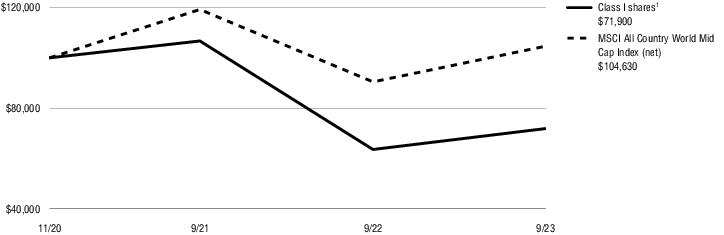
MSCI All Country World Mid-Cap Index (net)
The MSCI All Country World Mid Cap Index (net) is a free float-adjusted market capitalization-weighted index that measures mid cap equity performance of developed and emerging markets. The index is calculated on a total return basis with net dividends reinvested.
MSCI EAFE® Index (net)
The MSCI EAFE® (Europe, Australasia, Far East) Index (net) is a free float-adjusted market capitalization-weighted index that measures developed foreign market equity performance, excluding the U.S. and Canada. The index is calculated on a total return basis with net dividends reinvested. The index is unmanaged, its returns do not reflect any fees, expenses, or sales charges, and it is not available for direct investment.
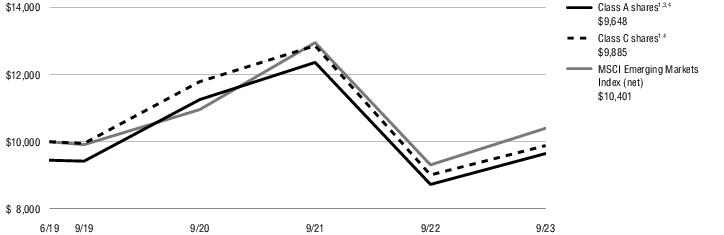
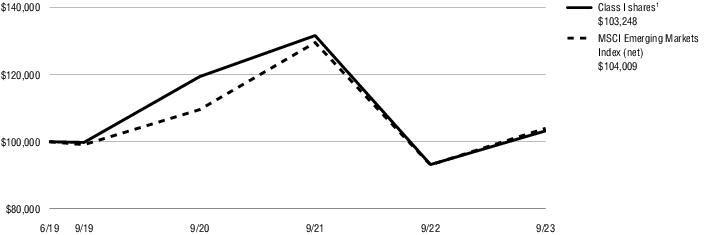
MSCI Emerging Markets Index (net)
The MSCI Emerging Markets Index (net) is a free float-adjusted market capitalization-weighted index designed to measure equity market performance in the global emerging markets. The index is calculated on a total return basis with net dividends reinvested. The index is unmanaged, its returns do not reflect any fees, expenses, or sales charges, and it is not available for direct investment.
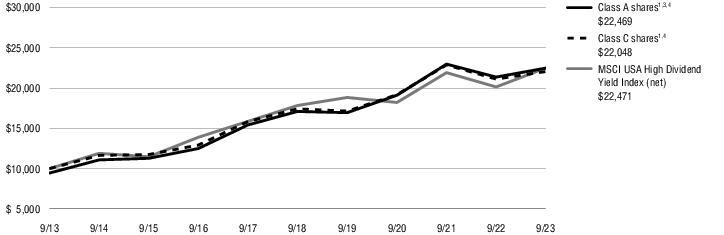
MSCI USA High Dividend Yield Index (net)
The MSCI USA High Dividend Yield Index is based on the MSCI USA Index, its parent index, and includes large and mid-cap stocks. The index is designed to reflect the performance of equities in the parent index (excluding REITs) with higher dividend income and quality
characteristics than average dividend yields that are both sustainable and persistent. The index also applies quality screens and reviews 12-month past performance to omit stocks with potentially deteriorating fundamentals that could force them to cut or reduce dividends. The
index is calculated on a total return basis with net dividends reinvested; it is unmanaged; its returns do not reflect any fees, expenses or sales charges; and it is not available for direct investment.
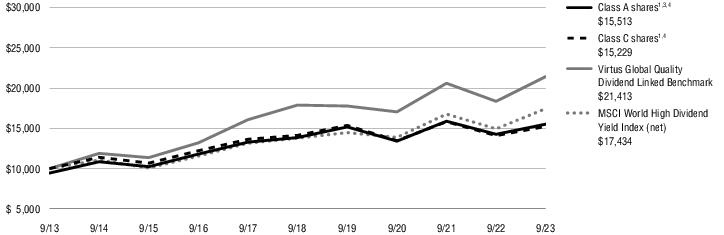
MSCI World High Dividend Yield Index (net)
The MSCI World High Dividend Yield Index (net) is based on the MSCI World Index, its parent index, and includes large- and mid-cap stocks across 23 developed markets countries. The index is designed to reflect the performance of equities in the parent index (excluding
REITs) with higher dividend income and quality characteristics than average dividend yields that are both sustainable and persistent. The index also applies quality screens and reviews 12-month past performance to omit stocks with potentially deteriorating fundamentals that
could force them to cut or reduce dividends. The index is calculated on a total return basis with net dividends reinvested. The index is unmanaged, its returns do not reflect any fees, expenses, or sales charges, and it is not available for direct investment.
Real Estate Investment Trust (“REIT”)
A publicly traded company that owns, develops and operates income-producing real estate such as apartments, office buildings, hotels, shopping centers and other commercial properties.
Risk Asset
A risk asset is generally any asset that has a significant degree of price volatility, such as equities, commodities, high-yield bonds, real estate, and currencies.
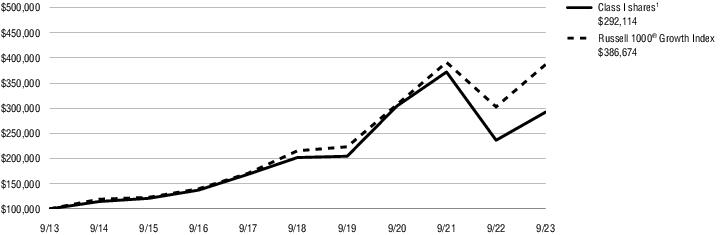
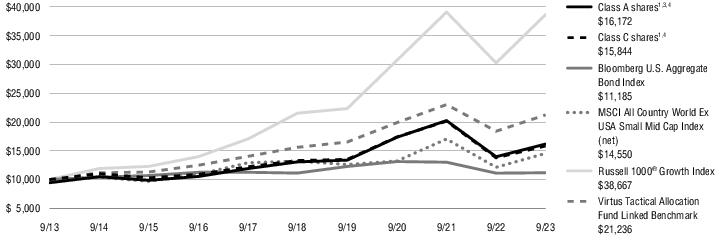
Russell 1000® Growth Index
The Russell 1000® Growth Index is a market capitalization-weighted index of growth-oriented stocks of the 1,000 largest companies in the Russell Universe, which comprises the 3,000 largest U.S. companies. The index is calculated on a total return basis with dividends
reinvested. The index is unmanaged, its returns do not reflect any fees, expenses, or sales charges, and it is not available for direct investment.
Russell 1000® Value Index
The Russell 1000® Value Index is a market capitalization-weighted index of value-oriented stocks of the smallest 1,000 companies in the Russell Universe, which comprises the 3,000 largest U.S. companies. The index is calculated on a total return basis with dividends
reinvested. The index is unmanaged, its returns do not reflect any fees, expenses, or sales charges, and it is not available for direct investment.
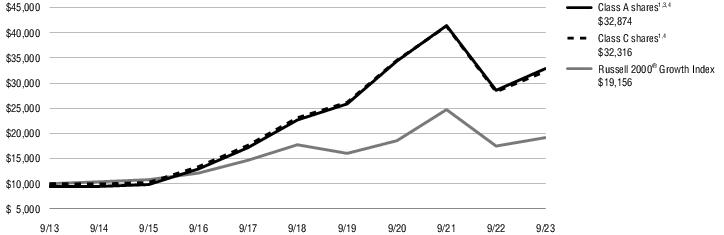
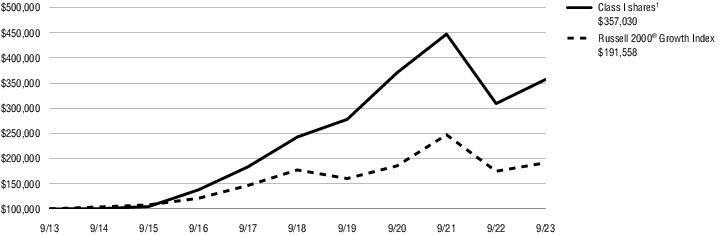
Russell 2000® Growth Index
The Russell 2000® Growth Index is a market capitalization-weighted index of growth-oriented stocks of the smallest 2,000 companies in the Russell Universe, which comprises the 3,000 largest U.S. companies. The index is calculated on a total return basis with dividends
reinvested. The index is unmanaged, its returns do not reflect any fees, expenses, or sales charges, and it is not available for direct investment.
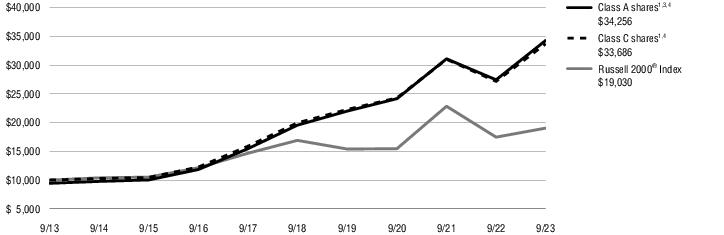
Russell 2000® Index
The Russell 2000® Index is a market capitalization-weighted index of the 2,000 smallest companies in the Russell Universe, which comprises the 3,000 largest U.S. companies. The index is calculated on a total return basis with dividends reinvested. The index is unmanaged, its returns do not reflect any fees, expenses, or sales charges, and it is not available for direct investment.