UNITED STATES
SECURITIES AND EXCHANGE COMMISSION
Washington, D.C. 20549
FORM N-CSR
CERTIFIED SHAREHOLDER REPORT OF REGISTERED MANAGEMENT INVESTMENT COMPANIES
Investment Company Act file number
811-03235
FMI Common Stock Fund, Inc.
(Exact name of registrant as specified in charter)
100 East Wisconsin Avenue, Suite 2200
Milwaukee, WI 53202
(Address of principal executive offices) (Zip code)
Ted D. Kellner
Fiduciary Management, Inc.
100 East Wisconsin Avenue, Suite 2200
Milwaukee, WI 53202
(Name and address of agent for service)
(414) 226-4555
Registrant's telephone number, including area code:
Date of fiscal year end: September 30
Date of reporting period: September 30, 2006
Item 1. Reports to Stockholders.
ANNUAL REPORT
September 30, 2006
FMI
Common Stock
Fund, Inc.
A NO-LOAD
MUTUAL FUND
FMI
Common Stock
Fund, Inc.
September 30, 2006
Dear Fellow Shareholders:
The quarter ending September 30 was quite good for the FMI Common Stock Fund, which advanced 4.58% compared to a 0.44% gain for the Russell 2000 Index. For the calendar year to date, the Fund is up 8.74% versus 8.69% for the Russell 2000. Contributions came from a variety of stocks, including ADVO, which was the target of a takeover by Valassis Communications. Fortunately, we sold ADVO immediately after the deal was announced because subsequently, Valassis got cold feet and is now trying to scuttle the agreement. The two are now engaged in litigation. While the big premium paid by Valassis made for a happy day in July, shareholders with good memories may recall that the deal value was only slightly higher than what we paid roughly 15 months prior. We took the proceeds and reinvested them in what we consider to be a superior franchise, Harte-Hanks, Inc., an investment we discuss in more detail below.
Another takeover aided results in the quarter. A group led by Texas Pacific announced they would take PETCO Animal Supplies, Inc., the pet supplies retailer, private, at a nice premium. Family Dollar Stores, Inc. also advanced significantly in response to good sales and earnings results. From a group perspective, commercial services, retail and process industries were all strong in the quarter.
On the downside, The BISYS Group, Inc.’s modestly disappointing sales and earnings update hurt the stock. This has been a frustrating and heretofore lousy investment for us. Some shareholders may wonder why we don’t sell this stock. The answer is that each day we come to work, we begin with a clean slate. Every new idea and every existing investment is evaluated on its merits and investment potential looking out three to four years. The simple truth is that BISYS was sicker than we thought when we initially bought the stock. With perfect hindsight, it was a mistake to have bought it when we did. Over the past 12-18 months, however, the company has been on the mend. The balance sheet is now debt-free with over $100 million in cash. The two core businesses are very profitable and generate free cash flow in excess of net income. We believe a private buyer could generate an attractive return paying a 30% premium to the current price.
Arrow Electronics, Inc. (semiconductor and systems distribution) and Werner Enterprises, Inc. (trucking) were also weak in the September quarter. Fears of an economic slowdown appear to be the culprit. From a group perspective, the poor performers were technology services, distribution services and transportation.
From a big picture standpoint, a couple of themes we have hammered on for awhile seem to be playing out. First, housing has rolled over; new and existing home sales have declined sharply, and prices have dropped substantially, not only in the more speculative regions, but also in the Midwest, Mid-Atlantic and South. So far, we haven’t seen the reverse wealth effect on consumer spending that was expected. Perhaps the windfall from the sudden drop in gasoline prices has masked the impact in the short run. However, we continue to expect a tougher environment for consumer discretionary spending in coming quarters.
Second, energy prices have retreated. Oil peaked around $78 per barrel and now trades for approximately $60. Natural gas prices are down over 50% from late last year. As we indicated in our letter of June 30, the fundamentals seem to support a much lower price. Our relatively light position in energy stocks should help performance over the coming year or so.
We were also not surprised to see the meltdown of Amaranth, the hedge fund that declined 60% speculating on levered energy derivatives. This debacle was precipitated by a sudden move in the energy markets. This world of energy trading is tiny compared to that of credit derivatives and credit default swaps, where we anticipate more meaningful “events” in coming years. The credit default swap market is estimated to exceed $26 trillion, or more than twice the size of the U.S. Gross Domestic Product (GDP). Perhaps we will address this situation in more detail in a future letter, but suffice it to say that the hedge funds and the banks are up to their eyeballs in these products. Everyone operates with the assumption that the counterparties on all of the interlocking trades are going to meet their obligations at the appointed time. History suggests that this may not happen. We think the mad rush to hedge funds over the past several years is going to end badly. While it may be self-serving, we advocate a prudent, even “plain vanilla” approach to investing, particularly with overall valuations elevated and financial risk perhaps greater, due to the untested nature of the credit derivatives market.
As a reminder to newer investors with the FMI Common Stock Fund, our first and third calendar quarter commentaries have a brief overview of performance and pertinent macro developments, followed by a description of a few of the Fund investments. The second and fourth quarter letters usually deal with a particular theme, or a more detailed economic and stock market overview. Our letters are archived on our website, www.fmifunds.com.
HARTE-HANKS, INC.
Description
Harte-Hanks provides advertising and marketing services via two distinct operating units: Direct Marketing (60% of revenues and 55% of income) and the Shoppers business. In Direct Marketing, Harte-Hanks provides vertically integrated customer relationship management (CRM) services, including database construction, data analysis and lead generation. Additional capabilities include customer acquisition campaigns, telemarketing and fulfillment. In the Shoppers business, Harte-Hanks is the leading publisher and distributor of coupon booklets delivered via third-class mail to 13 million residents in California and Florida.
Good Business
| • | Harte-Hanks has leading market share and technology within its two respective businesses. |
| • | The Direct Marketing business benefits from the trends toward target marketing. |
| • | The Shoppers business capitalizes on the decrease in newspaper subscribers and the desire for businesses and individuals to advertise locally. |
| • | The Shoppers business is generally a recurring revenue business. |
| • | Direct Marketing has longstanding Fortune 500 relationships. |
| • | The company generates a return on invested capital (ROIC) greater than 15%, which is higher than its weighted average cost of capital (WACC). |
| • | Harte-Hanks has a modest amount of debt and generates substantial free cash flow. |
Valuation
| • | At current prices, the shares trade at approximately 18.3x and 8.5x earnings per share (EPS) and earnings before interest, taxes, depreciation and amortization (EBITDA), respectively. This is a discount to the broader indices, especially smaller market capitalization benchmarks. |
| • | Over the past ten years, the shares have traded between 18.0-30.0x EPS and approximately 10.0x EBITDA. |
Management
| • | Richard Hochhauser, who has been with the company since 1975, is President and Chief Executive Officer. Mr. Hochhauser replaced Larry Franklin, current Chairman, in these positions in 2002. |
| • | Dean Blythe, who has been with Harte-Hanks since 2001, is Chief Financial Officer. |
| • | Collectively, Harte-Hanks’ executives and officers own one-third of the company’s shares. |
Investment Thesis
The shares of Harte-Hanks have not kept pace with the market in 2006, resulting in an attractive entry point for this strong franchise. Share performance has been flat, due primarily to the media sector’s underperformance and slower internal growth when compared to 2005. The shares trade at or near the low end of historical parameters. Growth opportunities should be better-than-average over the next three to five years, combined with very strong cash flow generation for expansion, share repurchases and dividends.
ADESA, INC.
Description
Adesa provides wholesale vehicle auction and related redistribution services, which account for 87% of revenue and 70% of profit. The company also provides short-term inventory-secured financing for used vehicle dealers, which accounts for 13% of revenue and 30% of profit. Adesa’s operations span North America with 54 used vehicle auction sites, 38 salvage vehicle auction sites, and 85 loan production offices.
Good Business
| • | The auction business has significant barriers to entry in the form of facilities, technology, and expertise. |
| • | The company earns fees from sellers and buyers for facilitating the exchange of vehicles through an auction marketplace, and for providing floor plan financing for used vehicle dealers. While not strictly recurring, these fees are largely predictable in nature. |
| • | The ROIC is just under 10%, and Adesa sees this moving into the double-digits. The return is more impressive when one considers the company owns the vast majority of its real estate. |
| • | The debt-to-capital ratio is 26.3%, and Adesa generates solid cash flow. |
Valuation
| • | The stock has underperformed the Russell 2000 by nearly 30% since its initial public offering (IPO) in June 2004. |
| • | Adesa trades at a discount to the Russell 2000 weighted average on the basis of price-to-earnings (P/E), price-to-sales, enterprise value-to-EBITDA (EV/EBITDA), and price-to-book. |
| • | A private equity firm acquired Adesa’s competitor, Insurance Auto Auction, for 10.1x trailing EBITDA. Adesa is more than 20% below this value. |
Management
| • | Dave Gartzke is Chairman and Chief Executive Officer. Although a former utility company executive for ALLETE, he is supported by individuals with auto industry experience. |
| • | Brad Todd is President of Auction Services. He has been with the company since 1994. |
| • | Cam Hitchcock is President of Dealer Services. He joined Adesa as Chief Financial Officer in 2004, and previously served as Treasurer of Dean Foods and Lear. |
Investment Thesis
Adesa is one of the largest competitors in the used and salvage vehicle auction markets, which should exhibit stable growth over the long-term. The business model is attractive, as the company generates a high degree of recurring revenue and does not take inventory risk. Adesa operates in a defendable niche, and is fiscally sound. The stock appears to be significantly undervalued.
OPTION CARE, INC.
Description
Option Care is a national provider of specialty pharmacy services (60% of revenues) and home infusion services (40% of revenues) to patients with acute and/or chronic conditions. The company services its patients through a network of 113 pharmacy locations and two high-volume distribution facilities. Option Care complements its drug distribution services by managing patient compliance and providing reimbursement support.
Good Business
| • | Option Care has the only national network of home infusion therapy centers. The company has established relationships with over 300 payer organizations and over 25 drug manufacturers. |
| • | The business is durable, serving the aligned needs of biotech drug manufacturers, payers and patients by ensuring that compliance dosage requirements are met. |
| • | Revenues are highly recurring due to the chronic disease states of those who are served by the company. |
| • | The business has low capital requirements. Over the last six years ROIC has averaged 13%. |
| • | The balance sheet is strong with $19 million in cash and only $86 million in debt. |
| • | As a payer, government represents only 18% of revenues. |
Valuation
| • | The specialty pharma group has traded for an average multiple of 17.0x, ranging from a low of 13.0x to a high of 27.0x over the past five years. Option Care trades at an industry average P/E despite a stronger growth profile and balance sheet. |
| • | On a price-to-sales basis the industry has traded for 1.2x on average over the past five years. Option Care trades near the lower end of the group’s historical range (0.5x to 3.0x). |
| • | Option Care has an attractive free cash flow yield of approximately 5%. |
| • | Buyout transactions have taken place at significantly higher valuations. |
Management
| • | Rajat Rai has served as the company’s Chief Executive Officer since early 2001. Rajat began his tenure at the company in August 1992 and has held various positions, including that of Chief Operating Officer. |
| • | Paul Mastrapa was appointed Chief Financial Officer in 2002. Previously, Paul founded and subsequently served as the CEO of AdvoLife, a venture capital-backed provider of private pay chronic care management services. |
Investment Thesis
Option Care operates a defendable business as one of the few remaining independent specialty pharmacies, and the only national home infusion network of scale. Demand for the company’s products is both recurring and relatively inelastic. The company has a strong financial profile and possesses an attractive internal pipeline of growth through its franchisees. Over the next three to five years the company will benefit from the inherent growth in the biotechnology drug pipeline. The valuation is attractive.
Our Board of Directors has declared distributions on October 26, 2006 of $0.074059 per share from net investment income, $0.54522 per share from short-term capital gains, which will be treated as ordinary income, and $2.23623 per share from net long-term capital gains, payable October 27, 2006, to shareholders of record on October 25, 2006.
Thank you for your confidence in FMI Common Stock Fund.
Sincerely,
 |  |  |
| Ted D. Kellner, CFA | Donald S. Wilson, CFA | Patrick J. English, CFA |
| President and | Vice President | Vice President and |
| Portfolio Manager | | Portfolio Manager |
100 E. Wisconsin Ave., Suite 2200 • Milwaukee, WI 53202 • 414-226-4555
www.fmifunds.com
FMI Common Stock Fund, Inc.
COST DISCUSSION
As a shareholder of the Fund you incur ongoing costs, including management fees and other Fund expenses. You do not incur transaction costs such as sales charges (loads) on purchase payments, reinvested dividends, or other distributions; redemption fees; and exchange fees because the Fund does not charge these fees. This example is intended to help you understand your ongoing costs (in dollars) of investing in FMI Common Stock Fund and to compare these costs with the ongoing costs of investing in other mutual funds.
The example is based on an investment of $1,000 invested at the beginning of the period and held for the entire period from April 1, 2006 through September 30, 2006.
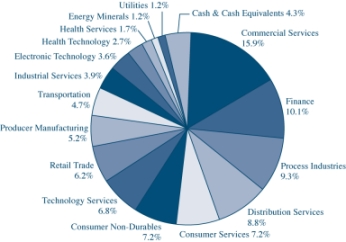
Industry Sectors as of September 30, 2006
Actual Expenses
The first line of the table below provides information about actual account values and actual expenses. You may use the information in this line, together with the amount you invested, to estimate the expenses that you paid over the period. Simply divide your account value by $1,000 (for example, an $8,600 account value divided by $1,000 = 8.6), then multiply the result by the number in the first line under the heading entitled “Expenses Paid During Period” to estimate the expenses you paid on your account during this period.
In addition to the costs highlighted and described below, the only Fund transaction costs you might currently incur would be wire fees ($15 per wire), if you choose to have proceeds from a redemption wired to your bank account instead of receiving a check. Additionally, U.S. Bank charges an annual processing fee ($15) if you maintain an IRA account with the Fund. To determine your total costs of investing in the Fund, you would need to add any applicable wire or IRA processing fees you’ve incurred during the period to the costs provided in the example at the end of this article.
Hypothetical Example for Comparison Purposes
The second line of the table below provides information about hypothetical account values and hypothetical expenses based on the Fund’s actual expense ratio and an assumed rate of return of 5% per year before expenses, which is not the Fund’s actual return. The hypothetical account values and expenses may not be used to estimate the actual ending account balance or expenses you paid for the period. You may use this information to compare the ongoing costs of investing in the Fund and other funds. To do so, compare this 5% hypothetical example with the 5% hypothetical examples that appear in the shareholder reports of the other funds.
Please note that the expenses shown in the table are meant to highlight your ongoing costs only and do not reflect any transactional costs, such as sales charges (loads), redemption or exchange fees. Therefore, the second line of the table is useful in comparing ongoing costs only, and will not help you determine the relative total costs of owning different funds. In addition, if these transactional costs were included, your costs would have been higher.
| | Beginning | Ending | Expenses Paid |
| | Account | Account | During Period* |
| | Value 4/01/06 | Value 9/30/06 | 4/01/06-9/30/06 |
| FMI Common Stock Fund Actual | $1,000.00 | $1,000.80 | $6.02 |
| Hypothetical (5% return before expenses) | $1,000.00 | $1,019.10 | $6.07 |
| * | Expenses are equal to the Fund’s annualized expense ratio of 1.20%, multiplied by the average account value over the period, multiplied by 183/365 (to reflect the one-half year period between April 1, 2006 and September 30, 2006). |
FMI Common Stock Fund, Inc.
MANAGEMENT’S DISCUSSION OF FUND PERFORMANCE
During the fiscal year ended September 30, 2006, the FMI Common Stock Fund had a total return of 12.62%. Process Industries, Commercial Services and Health Technology were all strong performers in the period. Similar to last year, takeovers had a significant impact on results. Engelhard Corp., Duratek Inc., Sybron Dental Specialties, Inc., ADVO Inc. and Albemarle Corp. were all either purchased or subjected to a letter of intent. Distribution Services, Finance and Consumer Services detracted from the return in the period. Individual stocks contributing negatively to performance included The BISYS Group, Inc., School Specialty, Inc., and Arrow Electronics, Inc. The benchmark Russell 2000 returned 9.92% during the fiscal year and was driven by Producer Manufacturing and Retail Trade. The Financial sector remains an exceptionally high percentage (22%) of the benchmark and is not favorably viewed by the manager. Small cap stocks have generally outperformed large cap stocks over the last several years and today have less attractive valuation characteristics compared to large cap stocks. It is possible, and perhaps even likely, that small cap equities will underperform their large cap brethren in a more difficult economic and stock market environment. The FMI Common Stock Fund trades at a discount valuation compared to the benchmark Russell 2000. Over long periods of time, lower valuation stocks have outperformed higher valuation stocks. Future results, however, may differ from historical results.
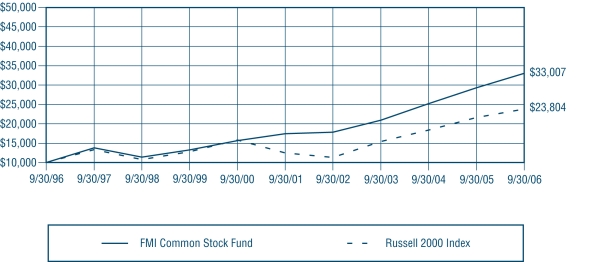
COMPARISON OF CHANGE IN VALUE OF $10,000 INVESTMENT IN
FMI COMMON STOCK FUND AND THE RUSSELL 2000 INDEX(1)
| | Past performance is not predictive of future performance. The graph and the table do not reflect the deduction of taxes that a shareholder would pay on Fund distributions
or the redemption of Fund shares. |
| AVERAGE ANNUAL TOTAL RETURN |
| 1-Year | 5-Year | 10-Year |
| 12.62% | 13.62% | 12.69% |
| (1) | Russell 2000 Index is an index comprised of 2,000 publicly traded small capitalization common stocks that are ranked in terms of capitalization below the large and mid-range capitalization sectors of the United States equity market. The Russell 2000 Index is a trademark/service market of the Frank Russell Company. |
FMI Common Stock Fund
REPORT OF INDEPENDENT REGISTERED PUBLIC ACCOUNTING FIRM
To the Board of Directors and Shareholders
of FMI Common Stock Fund, Inc.
In our opinion, the accompanying statement of net assets and the related statements of operations and of changes in net assets and the financial highlights present fairly, in all material respects, the financial position of FMI Common Stock Fund, Inc. (the “Fund”) at September 30, 2006, the results of its operations for the year then ended, the changes in its net assets for each of the two years in the period then ended and the financial highlights for each of the five years in the period then ended, in conformity with accounting principles generally accepted in the United States of America. These financial statements and financial highlights (hereafter referred to as “financial statements”) are the responsibility of the Fund’s management; our responsibility is to express an opinion on these financial statements based on our audits. We conducted our audits of these financial statements in accordance with the standards of the Public Company Accounting Oversight Board (United States). Those standards require that we plan and perform the audit to obtain reasonable assurance about whether the financial statements are free of material misstatement. An audit includes examining, on a test basis, evidence supporting the amounts and disclosures in the financial statements, assessing the accounting principles used and significant estimates made by management, and evaluating the overall financial statement presentation. We believe that our audits, which included confirmation of securities at September 30, 2006 by correspondence with the custodian and brokers, provide a reasonable basis for our opinion.

Milwaukee, Wisconsin
October 27, 2006
FMI Common Stock Fund, Inc.
STATEMENT OF NET ASSETS
September 30, 2006
Shares | | | | Cost | | | Value |
COMMON STOCKS — 95.7% (a) | | | | | | | |
COMMERCIAL SERVICES SECTOR — 15.9% | | | | | | | |
| | | Advertising/Marketing Services — 2.5% | | | | | |
| 434,700 | | Harte-Hanks, Inc. | $ | 11,124,247 | | $ | 11,454,345 |
| | | Miscellaneous Commercial Services — 7.1% | | | | | |
| 414,100 | | ABM Industries Inc. | | 6,695,817 | | | 7,768,516 |
| 185,500 | | Adesa, Inc. | | 4,807,006 | | | 4,286,905 |
| 249,300 | | G & K Services, Inc. | | 7,490,993 | | | 9,081,999 |
| 526,000 | | Global Imaging | | | | | |
| | | Systems, Inc.* | | 6,652,708 | | | 11,608,820 |
| | | | | 25,646,524 | | | 32,746,240 |
| | | Personnel Services — 6.3% | | | | | |
| 394,200 | | Korn/Ferry International* | | 6,547,904 | | | 8,254,548 |
| 846,300 | | MPS Group, Inc.* | | 7,593,621 | | | 12,787,593 |
| 200,100 | | Watson Wyatt | | | | | |
| | | Worldwide Inc. | | 4,455,449 | | | 8,188,092 |
| | | | | 18,596,974 | | | 29,230,233 |
CONSUMER NON-DURABLES SECTOR — 7.2% | | | | | | | |
| | | Apparel/Footwear — 3.8% | | | | | |
| 445,500 | | Liz Claiborne, Inc. | | 14,180,718 | | | 17,601,705 |
| | | Food: Meat/Fish/Dairy — 2.0% | | | | | |
| 332,600 | | Pilgrim’s Pride Corp. | | 7,134,417 | | | 9,096,610 |
| | | Food: Specialty/Candy — 1.4% | | | | | |
| 146,400 | | Lancaster Colony Corp. | | 5,573,063 | | | 6,552,864 |
CONSUMER SERVICES SECTOR — 7.2% | | | | | | | |
| | | Other Consumer Services — 3.5% | | | | | |
| 1,470,600 | | ServiceMaster Co. | | 18,488,785 | | | 16,485,426 |
| | | Publishing: Books/Magazines — 0.2% | | | | | |
| 18,200 | | Meredith Corp. | | 896,847 | | | 897,806 |
| | | Publishing: Newspapers — 1.1% | | | | | |
| 442,600 | | Journal | | | | | |
| | | Communications, Inc. | | 6,989,749 | | | 4,988,102 |
| | | Restaurants — 2.4% | | | | | |
| 513,900 | | Applebee’s | | | | | |
| | | International, Inc. | | 11,478,413 | | | 11,053,989 |
DISTRIBUTION SERVICES SECTOR — 8.8% | | | | | | | |
| | | Electronics Distributors — 4.9% | | | | | |
| 515,400 | | Arrow Electronics, Inc.* | | 8,937,698 | | | 14,137,422 |
| 278,200 | | ScanSource, Inc.* | | 6,639,398 | | | 8,437,806 |
| | | | | 15,577,096 | | | 22,575,228 |
| | | Wholesale Distributors — 3.9% | | | | | |
| 185,300 | | School Specialty, Inc.* | | 6,567,303 | | | 6,539,237 |
| 246,800 | | United Stationers Inc.* | | 10,338,715 | | | 11,478,668 |
| | | | | 16,906,018 | | | 18,017,905 |
ELECTRONIC TECHNOLOGY SECTOR — 3.6% | | | | | | | |
| | | Computer Peripherals — 1.2% | | | | | |
| 138,200 | | Imation Corp. | | 4,619,779 | | | 5,548,730 |
| | | Electronic Equipment/Instruments — 2.4% | | | | | |
| 556,500 | | Paxar Corp.* | | 7,398,017 | | | 11,118,870 |
ENERGY MINERALS SECTOR — 1.2% | | | | | | | |
| | | Oil & Gas Production — 1.2% | | | | | |
| 150,600 | | St. Mary Land & | | | | | |
| | | Exploration Co. | | 2,476,603 | | | 5,528,526 |
FINANCE SECTOR — 10.1% | | | | | | | |
| | | Insurance Brokers/Services — 3.0% | | | | | |
| 530,000 | | Arthur J. Gallagher & Co. | | 15,257,864 | | | 14,135,100 |
| | | Investment Managers — 1.1% | | | | | |
| 115,600 | | Investors Financial | | | | | |
| | | Services Corp. | | 4,456,696 | | | 4,980,048 |
| | | Life/Health Insurance — 3.2% | | | | | |
| 325,000 | | Protective Life Corp. | | 10,221,438 | | | 14,868,750 |
| | | Property/Casualty Insurance — 2.8% | | | | | |
| 581,250 | | Old Republic | | | | | |
| | | International Corp. | | 8,942,810 | | | 12,874,687 |
HEALTH SERVICES SECTOR — 1.7% | | | | | | | |
| | | Medical/Nursing Services — 1.7% | | | | | |
| 595,600 | | Option Care, Inc. | | 7,823,416 | | | 7,975,084 |
HEALTH TECHNOLOGY SECTOR — 2.7% | | | | | | | |
| | | Medical Specialties — 2.7% | | | | | |
| 213,200 | | Beckman Coulter, Inc. | | 12,351,695 | | | 12,271,792 |
INDUSTRIAL SERVICES SECTOR — 3.9% | | | | | | | |
| | | Engineering & Construction — 0.9% | | | | | |
| 279,000 | | Pike Electric Corp.* | | 4,124,594 | | | 4,157,100 |
| | | Environmental Services — 2.0% | | | | | |
| 244,300 | | Waste Connections, Inc.* | | 9,403,767 | | | 9,261,413 |
| | | Oilfield Services/Equipment — 1.0% | | | | | |
| 221,000 | | Dresser-Rand | | | | | |
| | | Group, Inc.* | | 4,637,472 | | | 4,508,400 |
FMI Common Stock Fund, Inc.
STATEMENT OF NET ASSETS (Continued)
September 30, 2006
Shares | | | | | | | Value |
COMMON STOCKS — 95.7% (a) (Continued) | | | | | | | |
PROCESS INDUSTRIES SECTOR — 9.3% | | | | | | | |
| | | Containers/Packaging — 7.2% | | | | | |
| 306,000 | | AptarGroup, Inc. | $ | 10,236,012 | | $ | 15,569,280 |
| 534,700 | | Bemis Company, Inc. | | 14,306,525 | | | 17,570,242 |
| | | | | 24,542,537 | | | 33,139,522 |
| | | Industrial Specialties — 2.1% | | | | | |
| 369,800 | | Valspar Corp. | | 8,613,414 | | | 9,836,680 |
PRODUCER MANUFACTURING SECTOR — 5.2% | | | | | | | |
| | | Electrical Products — 4.1% | | | | | |
| 294,400 | | Acuity Brands, Inc. | | 8,197,421 | | | 13,365,760 |
| 162,600 | | Littelfuse, Inc.* | | 4,304,026 | | | 5,642,220 |
| | | | | 12,501,447 | | | 19,007,980 |
| | | Industrial Machinery — 1.1% | | | | | |
| 119,900 | | IDEX Corp. | | 2,231,602 | | | 5,161,695 |
RETAIL TRADE SECTOR — 6.2% | | | | | | | |
| | | Discount Stores — 3.2% | | | | | |
| 503,900 | | Family Dollar Stores, Inc. | | 11,030,830 | | | 14,734,036 |
| | | Food Retail — 2.3% | | | | | |
| 408,000 | | Ruddick Corp. | | 8,452,562 | | | 10,620,240 |
| | | Specialty Stores — 0.7 % | | | | | |
| 126,500 | | PetSmart, Inc. | | 3,039,694 | | | 3,510,375 |
TECHNOLOGY SERVICES SECTOR — 6.8% | | | | | | | |
| | | Data Processing Services — 6.8% | | | | | |
| 1,152,400 | | The BISYS Group, Inc.* | | 16,254,811 | | | 12,515,064 |
| 482,800 | | eFunds Corp.* | | 8,954,519 | | | 11,674,104 |
| 305,000 | | Hewitt Associates, Inc.* | | 6,678,839 | | | 7,399,300 |
| | | | | 31,888,169 | | | 31,588,468 |
TRANSPORTATION SECTOR — 4.7% | | | | | | | |
| | | Air Freight/Couriers — 2.0% | | | | | |
| 345,000 | | Pacer International, Inc. | | 7,542,952 | | | 9,577,200 |
| | | Trucking — 2.7% | | | | | |
| 662,000 | | Werner Enterprises, Inc. | | 12,737,307 | | | 12,386,020 |
UTILITIES SECTOR — 1.2% | | | | | | | |
| | | Gas Distributors — 1.2 % | | | | | |
| 137,800 | | Northwest | | | | | |
| | | Natural Gas Co. | | 4,758,266 | | | 5,412,784 |
| | | Total common stocks | | 371,645,782 | | | 442,903,953 |
Principal Amount | | | | Cost | | | Value |
SHORT-TERM INVESTMENTS — 4.5% (a) | | | | | | | |
| | | Commercial Paper — 2.3% | | | | | |
| $5,500,000 | | General Electric | | | | | |
| | | Capital Corp., | | | | | |
| | | 5.15%, due 10/06/06 | $ | 5,496,066 | | $ | 5,496,066 |
| 5,500,000 | | Prudential Funding LLC, | | | | | |
| | | 5.15%, due 10/06/06 | | 5,496,066 | | | 5,496,066 |
| | | Total commercial paper | | 10,992,132 | | | 10,992,132 |
| | | Variable Rate Demand Note — 2.2% | | | | | |
| 10,086,506 | | U.S. Bank, N.A., 5.07% | | 10,086,506 | | | 10,086,506 |
| | | Total short-term | | | | | |
| | | investments | | 21,078,638 | | | 21,078,638 |
| | | Total investments | | $392,724,420 | | | 463,982,591 |
| | | Liabilities, less cash and | | | | | |
| | | receivables —(0.2%) (a) | | | | | (1,004,826) |
| | | Net Assets | | | | | $462,977,765 |
| | | Net Asset Value Per Share | | | | | |
| | | ($0.01 par value, indefinite | | | | | |
| | | shares authorized), offering | | | | | |
| | | and redemption price | | | | | |
| | | ($462,977,765 ÷ 17,479,591 | | | | | |
| | | shares outstanding) | | | | | $26.49 |
| * | Non-income producing security. |
| (a) | Percentages for the various classifications relate to net assets. |
The accompanying notes to financial statements are an integral part of this statement.
FMI Common Stock Fund, Inc.
STATEMENT OF OPERATIONS
For the Year Ended September 30, 2006
INCOME: | | | |
| Dividends | | $ | 5,805,019 | |
| Interest | | | 1,292,910 | |
| Total income | | | 7,097,929 | |
EXPENSES: | | | | |
| Management fees | | | 4,559,671 | |
| Transfer agent fees | | | 405,725 | |
| Administrative and accounting services | | | 242,983 | |
| Custodian fees | | | 96,100 | |
| Printing and postage expense | | | 64,892 | |
| Professional fees | | | 49,579 | |
| Registration fees | | | 33,745 | |
| Insurance expense | | | 22,154 | |
| Board of Directors fees | | | 18,000 | |
| Other expenses | | | 25,580 | |
| Total expenses | | | 5,518,429 | |
NET INVESTMENT INCOME | | | 1,579,500 | |
NET REALIZED GAIN ON INVESTMENTS | | | 60,560,485 | |
NET DECREASE IN UNREALIZED APPRECIATION ON INVESTMENTS | | | (8,979,508 | ) |
NET GAIN ON INVESTMENTS | | | 51,580,977 | |
NET INCREASE IN NET ASSETS RESULTING FROM OPERATIONS | | $ | 53,160,477 | |
The accompanying notes to financial statements are an integral part of this statement.
FMI Common Stock Fund, Inc.
STATEMENTS OF CHANGES IN NET ASSETS
For the Years Ended September 30, 2006 and 2005
| | | 2006 | | 2005 | |
OPERATIONS: | | | | | |
| Net investment income (loss) | | $ | 1,579,500 | | $ | (267,831 | ) |
| Net realized gain on investments | | | 60,560,485 | | | 37,746,046 | |
| Net (decrease) increase in unrealized appreciation on investments | | | (8,979,508 | ) | | 25,863,930 | |
| Net increase in net assets resulting from operations | | | 53,160,477 | | | 63,342,145 | |
DISTRIBUTIONS TO SHAREHOLDERS: | | | | | | | |
| Dividend from net investment income ($0.0160 per share) | | | (285,959 | ) | | — | |
| Distributions from net realized gains ($2.9507 and $1.2121 per share, respectively) | | | (49,389,802 | ) | | (20,047,301 | ) |
| Total distributions | | | (49,675,761 | )* | | (20,047,301 | )* |
FUND SHARE ACTIVITIES: | | | | | | | |
| Proceeds from shares issued (2,006,733 and 2,346,370 shares, respectively) | | | 51,182,074 | | | 58,819,177 | |
| Net asset value of shares issued in distributions reinvested | | | | | | | |
| (2,061,437 and 832,834 shares, respectively) | | | 48,115,686 | | | 19,454,999 | |
| Cost of shares redeemed (3,165,073 and 3,248,869 shares, respectively) | | | (80,474,016 | ) | | (81,763,402 | ) |
| Net increase (decrease) in net assets derived from Fund share activities | | | 18,823,744 | | | (3,489,226 | ) |
| TOTAL INCREASE | | | 22,308,460 | | | 39,805,618 | |
| NET ASSETS AT THE BEGINNING OF THE YEAR | | | 440,669,305 | | | 400,863,687 | |
| NET ASSETS AT THE END OF THE YEAR | | | | | | | |
| (Includes undistributed net investment income of $1,293,541 and $0, respectively) | | $ | 462,977,765 | | $ | 440,669,305 | |
The accompanying notes to financial statements are an integral part of these statements.
FMI Common Stock Fund, Inc.
FINANCIAL HIGHLIGHTS
(Selected data for each share of the Fund outstanding throughout each year)
| | | Years Ended September 30, | |
| | | 2006 | | 2005 | | 2004 | | 2003 | | 2002 | |
PER SHARE OPERATING | | | | | | | | | | | |
PERFORMANCE: | | | | | | | | | | | |
| Net asset value, beginning of year | | $ | 26.58 | | $ | 24.08 | | $ | 20.47 | | $ | 17.38 | | $ | 19.60 | |
| Income from investment operations: | | | | | | | | | | | | | | | | |
| Net investment income (loss)* | | | 0.09 | | | (0.02 | ) | | (0.08 | ) | | (0.09 | ) | | (0.01 | ) |
| Net realized and unrealized | | | | | | | | | | | | | | | | |
| gains on investments | | | 2.79 | | | 3.73 | | | 4.17 | | | 3.18 | | | 0.47 | ** |
| Total from investment operations | | | 2.88 | | | 3.71 | | | 4.09 | | | 3.09 | | | 0.46 | |
| Less distributions: | | | | | | | | | | | | | | | | |
| Dividend from net investment income | | | (0.02 | ) | | — | | | — | | | — | | | — | |
| Distributions from net realized gains | | | (2.95 | ) | | (1.21 | ) | | (0.48 | ) | | — | | | (2.68 | ) |
| Total from distributions | | | (2.97 | ) | | (1.21 | ) | | (0.48 | ) | | — | | | (2.68 | ) |
| Net asset value, end of year | | $ | 26.49 | | $ | 26.58 | | $ | 24.08 | | $ | 20.47 | | $ | 17.38 | |
TOTAL RETURN | | | 12.62 | % | | 16.11 | % | | 20.33 | % | | 17.78 | % | | 2.18 | % |
RATIOS/SUPPLEMENTAL DATA: | | | | | | | | | | | | | | | | |
| Net assets, end of year (in 000’s $) | | | 462,978 | | | 440,669 | | | 400,864 | | | 221,919 | | | 93,336 | |
| Ratio of expenses to average net assets | | | 1.21 | % | | 1.21 | % | | 1.23 | % | | 1.25 | % | | 1.14 | % |
| Ratio of net investment income (loss) | | | | | | | | | | | | | | | | |
| to average net assets | | | 0.35 | % | | (0.06 | %) | | (0.33 | %) | | (0.46 | %) | | (0.03 | %) |
| Portfolio turnover rate | | | 38.4 | % | | 34.2 | % | | 39.4 | % | | 34.0 | % | | 28.8 | % |
| * | Net investment income (loss) per share is calculated using average shares outstanding. |
| ** | The amount shown may not correlate with the aggregate gains and losses of portfolio securities due to the timing of subscriptions and redemptions of Fund shares. |
The accompanying notes to financial statements are an integral part of this statement.
FMI Common Stock Fund, Inc.
NOTES TO FINANCIAL STATEMENTS
September 30, 2006
| (1) | Summary of Significant Accounting Policies — |
The following is a summary of significant accounting policies of the FMICommon Stock Fund, Inc. (the “Fund”), which is registered as a diversified, open-end management investment company under the Investment Company Act of 1940, as amended. The Fund was incorporated under the laws of Wisconsin on July 29, 1981. Effective April 15, 2004, the Fund closed to new investors. The investment objective of the Fund is to produce long-term capital appreciation principally through investing in common stocks.
| (a) | Each security, excluding short-term investments, is valued at the last sale price reported by the principal security exchange on which the issue is traded. Securities that are traded on the Nasdaq Markets (Nasdaq Global Select Market, Nasdaq Global Market and Nasdaq Capital Market formerly known as the Nasdaq National Market or the Nasdaq SmallCap Market) are valued at the Nasdaq Official Closing Price or if no sale is reported, the latest bid price. Securities which are traded over-the-counter are valued at the latest bid price. Securities for which quotations are not readily available are valued at fair value as determined by the investment adviser under the supervision of the Board of Directors. The fair value of a security is the amount which the Fund might reasonably expect to receive upon a current sale. The fair value of a security may differ from the last quoted price and the Fund may not be able to sell a security at the fair value. Market quotations may not be available, for example, if trading in particular securities was halted during the day and not resumed prior to the close of trading on the New York Stock Exchange. Short-term investments with maturities of 60 days or less are valued at amortized cost, which approximates value. For financial reporting purposes, investment transactions are recorded on the trade date. |
On September 15, 2006, the Financial Accounting Standards Board issued Standard No. 157, “Fair Value Measurements” (“FAS 157”). FAS 157 addresses how companies should measure fair value when specified assets and liabilities are measured at fair value for either recognition or disclosure purposes under generally accepted accounting principles (GAAP). FAS 157 is intended to make the measurement of fair value more consistent and comparable and improve disclosures about those measures. FAS 157 is effective for financial statements issued for fiscal years beginning after November 15, 2007. At this time, management believes the adoption of FAS 157 will have no material impact on the financial statements of the Fund.
| (b) | Net realized gains and losses on sales of securities are computed on the identified cost basis. |
| (c) | Dividend income is recorded on the ex-dividend date. Interest income is recorded on an accrual basis. |
| (d) | The Fund has investments in short-term variable rate demand notes, which are unsecured instruments. The Fund may be susceptible to credit risk with respect to these notes to the extent the issuer defaults on its payment obligation. The Fund’s policy is to monitor the creditworthiness of the issuer and nonperformance by these issuers is not anticipated. |
| (e) | Accounting principles generally accepted in the United States of America (“GAAP”) require that permanent differences between income for financial reporting and tax purposes be reclassified in the capital accounts. |
| (f) | The preparation of financial statements in conformity with GAAP requires management to make estimates and assumptions that affect the reported amounts of assets and liabilities and disclosure of contingent assets and liabilities at the date of the financial statements and the reported amounts of revenues and expenses during the reporting period. Actual results could differ from these estimates. |
| (g) | No provision has been made for Federal income taxes since the Fund has elected to be taxed as a “regulated investment company” and intends to distribute substantially all net investment company taxable income and net capital gains to its shareholders and otherwise comply with the provisions of the Internal Revenue Code applicable to regulated investment companies. |
FMI Common Stock Fund, Inc.
NOTES TO FINANCIAL STATEMENTS (Continued)
September 30, 2006
| (1) | Summary of Significant Accounting Policies — (Continued) |
On July 13, 2006, the Financial Accounting Standards Board (“FASB”) released FASB Interpretation No. 48 “Accounting for Uncertainty in Income Taxes” (“FIN 48”). FIN48 provides guidance for how uncertain tax positions should be recognized, measured, presented and disclosed in the financial statements. FIN 48 requires the evaluation of tax positions taken or expected to be taken in the course of preparing the Fund’s tax returns to determine whether the tax positions are “more-likely-than-not” of being sustained by the applicable tax authority. Tax positions not meeting the more-likely-than-not threshold would be recorded as a tax benefit or expense in the current year. Adoption of FIN 48 is required for fiscal years beginning after December 15, 2006 and is to be applied to all open tax years as of the effective date. At this time, management is evaluating the implications of FIN 48 and its impact on the financial statements but does not anticipate that FIN 48 will have a material impact on the Fund’s financial statements.
| (2) | Investment Adviser and Management Agreement and Transactions With Related Parties — |
The Fund has a management agreement with Fiduciary Management, Inc. (“FMI”), with whom certain officers and directors of the Fund are affiliated, to serve as investment adviser and manager. Under the terms of the agreement, the Fund will pay FMIa monthly management fee at the annual rate of 1% of the daily net assets of the Fund. The Fund has an administrative agreement with FMI to supervise all aspects of the Fund’s operations except those performed by FMI pursuant to the management agreement. Under the terms of the agreement, the Fund will pay FMI a monthly administrative fee at the annual rate of 0.1% of the daily net assets up to and including $30,000,000 and 0.05% of the daily net assets of the Fund in excess of $30,000,000.
Under the management agreement, FMI will reimburse the Fund for expenses over 1.3% of the daily net assets of the Fund. No such reimbursements were required for the year ended September 30, 2006.
In the normal course of business the Fund enters into contracts with service providers that contain general indemnification clauses. The Fund’s maximum exposure under these arrangements is unknown as this would involve future claims that may be made against the Fund that have not yet occurred. However, based on experience, the Fund expects the risk of loss to be remote.
| (3) | Distributions to Shareholders — |
Net investment income and net realized gains, if any, are distributed to shareholders at least annually. On October 26, 2006, the Fund distributed $1,293,541 from net investment income ($0.074059 per share), $9,523,011 from net short-term realized gains ($0.54522 per share) and $39,058,818 from long-term realized gains ($2.23623 per share). The distributions were paid on October 27, 2006 to shareholders of record on October 25, 2006.
| (4) | Investment Transactions — |
For the year ended September 30, 2006, purchases and proceeds of sales of investment securities (excluding short-term investments) were $165,792,921 and $206,549,825, respectively.
| (5) | Accounts Payable and Accrued Liabilities — |
As of September 30, 2006, liabilities of the Fund included the following:
| Payable to brokers for investments purchased | $896,847 |
| Payable to shareholders for redemptions | 566,601 |
| Payable to FMI for management and administrative fees | 355,695 |
| Other liabilities | 79,216 |
FMI Common Stock Fund, Inc.
NOTES TO FINANCIAL STATEMENTS (Continued)
September 30, 2006
| (6) | Sources of Net Assets — |
As of September 30, 2006, the sources of net assets were as follows:
| Fund shares issued and outstanding | | $ | 341,859,323 | |
| Net unrealized appreciation on investments | | | 71,258,171 | |
| Undistributed net realized gains on investments | | | 48,566,730 | |
| Undistributed net investment income | | | 1,293,541 | |
| | | $ | 462,977,765 | |
| (7) | Income Tax Information — |
The following information for the Fund is presented on an income tax basis as of September 30, 2006:
| Gross | Gross | Net Unrealized | Distributable | Distributable |
Cost of | Unrealized | Unrealized | Appreciation | Ordinary | Long-Term |
Investments | Appreciation | Depreciation | on Investments | Income | Capital Gains |
| $392,739,522 | $83,264,018 | $12,020,949 | $71,243,069 | $10,816,552 | $39,058,818 |
The difference between the cost amount for financial statement and federal income tax purposes is due primarily to timing differences in recognizing certain gains and losses on security transactions.
The tax components of dividends paid during the years ended September 30, 2006 and 2005, capital loss carryovers, which may be used to offset future capital gains, subject to Internal Revenue Code limitations, as of September 30, 2006, and tax basis post-October losses as of September 30, 2006, which are not recognized for tax purposes until the first day of the following fiscal year are:
| | September 30, 2006 | | September 30, 2005 |
| | Ordinary | Long-Term | Net Capital | | | Ordinary | Long-Term |
| Income | Capital Gains | Loss | Post-October | | Income | Capital Gains |
| Distributions | Distributions | Carryovers | Losses | | Distributions | Distributions |
| $9,612,105 | $40,063,656 | $— | $— | | $11,746,220 | $8,301,081 |
For corporate shareholders of the Fund, the percentage of dividend income distributed for the year ended September 30, 2006 which is designated as qualifying for the dividends received deduction is 40% (unaudited).
For all shareholders of the Fund, the percentage of dividend income distributed for the year ended September 30, 2006 which is designated as qualified dividend income under the Jobs and Growth Tax Relief Act of 2003, is 40% (unaudited).
FMI Common Stock Fund, Inc.
DIRECTORS AND OFFICERS
| | | | | | Other |
| | | Term of | Principal | # of Funds | Directorships |
| | Position | Office and | Occupation(s) | in Complex | Held by |
Name, Age | Held with | Length of | During Past | Overseen | Director |
and Address | the Fund | Time Served | Five Years | by Director | or Officer |
Non-Interested Directors | | | | | |
| Barry K. Allen, 58 | Director | Indefinite Term | Mr. Allen is Executive Vice President | 4 | Harley-Davidson, |
| 1801 California Street | | Since October | of Qwest Communications International, | | Inc., FMIFunds, |
| Denver, CO 80202 | | 1996 | Inc. (Denver, CO) a global | | Inc. and |
| | | | communications company, since | | FMIMutual Funds, |
| | | | September 2002. From July 2000 to | | Inc. |
| | | | September 2002, Mr. Allen was President | | |
| | | | of Allen Enterprises, LLC, (Brookfield, | | |
| | | | WI) a private equity investments | | |
| | | | management company he founded after | | |
| | | | retiring from Ameritech (Chicago, IL) | | |
| | | | in July 2000. | | |
| George D. Dalton, 78 | Director | Indefinite Term | Mr. Dalton is Chairman and Chief | 4 | Clark Consulting, |
| 20825 Swenson Drive | | Since January | Executive Officer of NOVO1 | | Inc., FMIFunds, Inc., |
| Waukesha, WI 53186 | | 1998 | (f/k/a Call_Solutions.com, Inc.,) | | and FMIMutual |
| | | | (Waukesha, WI) a privately held company | | Funds, Inc. |
| | | | specializing in teleservices call centers | | |
| | | | since January 2000. | | |
| Gordon H. | Director | Indefinite Term | Mr. Gunnlaugsson retired from M&I | 4 | Renaissance Learning |
| Gunnlaugsson, 62 | | Since March | Corporation (Milwaukee, WI). He was | | Systems, Inc., FMI |
| c/o Fiduciary | | 2001 | employed by M&I Corporation from | | Funds, Inc. and FMI |
| Management, Inc. | | | June 1, 1970 to December 31, 2000 where | | Mutual Funds, Inc. |
| 100 E. Wisconsin Ave. | | | he most recently held the positions of | | |
| Suite 2200 | | | Executive Vice President and Chief | | |
| Milwaukee, WI 53202 | | | Financial Officer. | | |
| Paul S. Shain, 43 | Director | Indefinite Term | Mr. Shain is Chief Executive Officer of | 4 | FMIFunds, Inc. and |
| 5520 Research | | Since March | Berbee Information Networks Corporation, | | FMIMutual Funds, |
| Park Drive | | 2001 | a strategic business unit of CDW | | Inc. |
| Madison, WI 53711 | | | Corporation (Vernon Hills, IL). Berbee is | | |
| | | | a leading provider of Information | | |
| | | | Technology Services including application | | |
| | | | development, infrastructure integration and | | |
| | | | hosting and managed services. Mr. Shain | | |
| | | | has been employed by such firm in various | | |
| | | | capacities since January 2000. | | |
FMI Common Stock Fund, Inc.
DIRECTORS AND OFFICERS (Continued)
| | | | | | Other |
| | | Term of | Principal | # of Funds | Directorships |
| | Position | Office and | Occupation(s) | in Complex | Held by |
Name, Age | Held with | Length of | During Past | Overseen | Director |
and Address | the Fund | Time Served | Five Years | by Director | or Officer |
Interested Directors | | | | | |
| Patrick J. English,* 45 | Director | Indefinite Term | Mr. English is President of Fiduciary | 3 | FMIFunds, Inc. |
| c/o Fiduciary | | Since January | Management, Inc. and has been employed | | |
| Management, Inc. | | 1998 | by the Adviser in various capacities | | |
| 100 E. Wisconsin Ave. | Vice | One Year Term | since December, 1986. | | |
| Suite 2200 | President | Since 1996 | | | |
Milwaukee, WI 53202 | | | | | |
| Ted D. Kellner,* 60 | Director | Indefinite Term | Mr. Kellner is Chairman of the Board | 3 | Marshall & Ilsley |
| c/o Fiduciary | | Since July 1981 | and Chief Executive Officer of Fiduciary | | Corporation and |
| Management, Inc. | President | One Year Term | Management, Inc. which he co-founded | | FMIFunds, Inc. |
| 100 E. Wisconsin Ave. | and | Since 1981 | in 1980. | | |
| Suite 2200 | Treasurer | | | | |
Milwaukee, WI 53202 | | | | | |
| Donald S. Wilson,* 63 | Director | Indefinite Term | Mr. Wilson is Vice Chairman, Treasurer | 2 | FMIMutual Funds, |
| c/o Fiduciary | | Since July 1981 | and Chief Compliance Officer of | | Inc. |
| Management, Inc. | Vice | One Year Term | Fiduciary Management, Inc. | | |
| 100 E. Wisconsin Ave. | President | Since 1981 | which he co-founded in 1980. | | |
| Suite 2200 | and | | | | |
| Milwaukee, WI 53202 | Secretary | | | | |
Other Officers | | | | | |
| Kathleen M. Lauters, 54 | Chief | At Discretion | Ms. Lauters has been the Fund’s Chief | N/A | None |
| c/o Fiduciary | Compliance | of Board | Compliance Officer since September 2004. | | |
| Management, Inc. | Officer | Since September | From June 1995 to September 2004 Ms. | | |
| 100 E. Wisconsin Ave. | | 2004 | Lauters was employed by Strong Capital | | |
| Suite 2200 | | | Management, most recently as Senior | | |
Milwaukee, WI 53202 | | | Compliance Analyst. | | |
| Camille F. Wildes, 54 | Vice | One Year Term | Ms. Wildes is a Vice-President of | N/A | None |
| c/o Fiduciary | President | Since December | Fiduciary Management, Inc. and has | | |
| Management, Inc. | and | 1999 | been employed by the Adviser in various | | |
| 100 E. Wisconsin Ave. | Assistant | | capacities since December, 1982. | | |
| Suite 2200 | Treasurer | | | | |
| Milwaukee, WI 53202 | | | | | |
| __________ | | | | | |
| * | Messrs. English, Kellner and Wilson are interested directors of the Fund because they are officers of the Fund and the Adviser. |
For additional information about the Directors and Officers or for a description of the policies and procedures that the Fund uses to determine how to vote proxies relating to portfolio securities, please call (800) 811-5311 and request a Statement of Additional Information. One will be mailed to you free of charge. The Statement of Additional Information is also available on the website of the Securities and Exchange Commission (the “Commission”) at http://www.sec.gov. Information on how the Fund voted proxies relating to portfolio securities is available on the Fund’s website at http://www.fmifunds.com or the website of the Commission no later than August 31 for the prior 12 months ending June 30. The Fund files its complete schedule of portfolio holdings with the Commission for the first and third quarters of each fiscal year on Form N-Q. The Fund’s Form N-Q is available on the Commission’s website. The Fund’s Form N-Q may be reviewed and copied at the Commission’s Public Reference Room in Washington, D.C., and that information on the operation of the Public Reference Room may be obtained by calling 1-800-SEC-0330.
(This Page Intentionally Left Blank.)
FMI Common Stock Fund, Inc.
100 East Wisconsin Avenue, Suite 2200
Milwaukee, Wisconsin 53202
www.fmifunds.com
414-226-4555
BOARD OF DIRECTORS
BARRY K. ALLEN
GEORGE D. DALTON
PATRICK J. ENGLISH
GORDON H. GUNNLAUGSSON
TED D. KELLNER
PAUL S. SHAIN
DONALD S. WILSON
INVESTMENT ADVISER
AND ADMINISTRATOR
FIDUCIARY MANAGEMENT, INC.
100 East Wisconsin Avenue, Suite 2200
Milwaukee, Wisconsin 53202
TRANSFER AGENT AND
DIVIDEND DISBURSING AGENT
U.S. BANCORP FUND SERVICES, LLC
615 East Michigan Street
Milwaukee, Wisconsin 53202
800-811-5311
or
414-765-4124
CUSTODIAN
U.S. BANK, N.A.
1555 North RiverCenter Drive, Suite 302
Milwaukee, Wisconsin 53212
INDEPENDENT REGISTERED PUBLIC ACCOUNTING FIRM
PRICEWATERHOUSECOOPERS LLP
100 East Wisconsin Avenue, Suite 1800
Milwaukee, Wisconsin 53202
LEGAL COUNSEL
FOLEY & LARDNER LLP
777 East Wisconsin Avenue
Milwaukee, Wisconsin 53202
This report is not authorized for use as an offer of sale or a solicitation of an offer to buy shares of FMICommon Stock Fund unless accompanied or preceded by the Fund’s current prospectus. Performance data quoted represents past performance; past performance does not guarantee future results. The investment return and principal value of an investment will fluctuate so that an investor’s shares, when redeemed, may be worth more or less than their original cost. Current performance of the Fund may be lower or higher than the performance quoted. Performance data current to the most recent month end may be obtained by visiting www.fmifunds.com.
Item 2. Code of Ethics.
Registrant has adopted a code of ethics. See attached Exhibit 12 (a).
Item 3. Audit Committee Financial Expert.
Registrant’s Board of Directors has determined that Mr. Gordon Gunnlaugsson, a member of its audit committee, is an audit committee financial expert. Mr. Gunnlaugsson is “independent” as such term is defined in Form N-CSR.
Item 4. Principal Accountant Fees and Services.
(a) Audit Fees
$16,000 (FY 2006) and $16,255 (FY 2005) are the aggregate fees billed for each of the last two fiscal years for professional services rendered by the principal accountant to the registrant for the audit of the registrant’s annual financial statements or services that are normally provided by the accountant in connection with statutory and regulatory filings or engagements for those fiscal years.
(b) Audit-Related Fees
There were no fees billed in each of the last two fiscal years for Audit-Related Fees.
$5,991.25 (FY 2006) and $5,400 (FY 2005) are the aggregate fees billed in each of the last two fiscal years for professional services rendered by the principal accountant to the registrant for tax compliance, tax advice, tax planning and tax return preparation.
There were no fees billed in each of the last two fiscal years for professional services rendered by the principal accountant to registrant’s investment adviser for tax compliance, tax advice and tax planning that were required to be approved by the audit committee pursuant to paragraph (c)(7)(ii) of Rule 2-01 of Regulation S-X.
(d) All Other Fees
There were no fees billed in each of the last two fiscal years for products and services provided by the principal accountant to the registrant, other than the services reported in paragraphs (a) - (c) of this Item 4.
There were no fees billed in each of the last two fiscal years for products and services provided by the principal accountant to registrant’s investment adviser, which were required to be approved by the audit committee pursuant to paragraph (c)(7)(ii) or Rule 2-01 or Regulation S-X.
(e) (1) The Audit Committee pre-approves any services for the Fund to be performed by the independent public accountants.
(e) (2) None
(f) Not applicable.
(g) See the tax fees disclosed in paragraph (c) of this Item 4.
(h) Not applicable, as no non-audit services were provided to registrant’s investment adviser.
Item 5. Audit Committee of Listed Registrants.
Not applicable.
Item 6. Schedule of Investments.
Not applicable.
Item 7. Disclosure of Proxy Voting Policies and Procedures for Closed-End Management Investment Companies
Not applicable.
Item 8. Portfolio Managers of Closed-End Management Investment Companies.
Not applicable.
Item 9. Purchases of Equity Securities By Closed-End Management Investment Company and Affiliated Purchasers.
Not applicable.
Item 10. Submission of Matters to a Vote of Security Holders.
None.
Item 11. Controls and Procedures.
| (a) | The disclosure controls and procedures of the FMI Common Stock Fund, Inc. are periodically evaluated. As of September 29, 2006, the date of the last evaluation, we concluded that our disclosure controls and procedures are adequate. |
| (b) | The internal controls of the FMI Common Stock Fund, Inc. are periodically evaluated. There were no changes to FMI Common Stock Fund’s internal control over financial reporting that occurred during the second fiscal quarter of the period covered by this report that have materially affected, or are reasonably likely to materially affect, such controls. |
Item 12. Exhibits.
| (a) | Any code of ethics or amendment thereto. Filed herewith. |
| (b) | Certifications pursuant to Section 302 of the Sarbanes-Oxley Act of 2002. Filed herewith. |
| (c) | Certification pursuant to Section 906 of the Sarbanes-Oxley Act of 2002. Filed herewith. |
SIGNATURES
Pursuant to the requirements of the Securities Exchange Act of 1934 and the Investment Company Act of 1940, the registrant has duly caused this report to be signed on its behalf by the undersigned, thereunto duly authorized.
FMI Common Stock Fund, Inc.
Registrant
By /s/ Ted D. Kellner
Ted D. Kellner, Principal Executive Officer
Date November 2, 2006
Pursuant to the requirements of the Securities Exchange Act of 1934 and the Investment Company Act of 1940, this report has been signed below by the following persons on behalf of the registrant and in the capacities and on the dates indicated.
FMI Common Stock Fund, Inc.
Registrant
By /s/ Ted D. Kellner
Ted D. Kellner, Principal Financial Officer
Date November 2, 2006