UNITED STATES
SECURITIES AND EXCHANGE COMMISSION
Washington, D.C. 20549
FORM N-CSR
CERTIFIED SHAREHOLDER REPORT OF REGISTERED
MANAGEMENT INVESTMENT COMPANIES
Investment Company Act file number 811-03235
FMI Common Stock Fund, Inc.
(Exact name of registrant as specified in charter)
100 East Wisconsin Avenue, Suite 2200
Milwaukee, WI 53202
(Address of principal executive offices) (Zip code)
Ted D. Kellner
Fiduciary Management, Inc.
100 East Wisconsin Avenue, Suite 2200
Milwaukee, WI 53202
(Name and address of agent for service)
(414) 226-4555
Registrant's telephone number, including area code:
Date of fiscal year end: September 30
Date of reporting period: September 30, 2009
Item 1. Reports to Stockholders.
ANNUAL REPORT
September 30, 2009
FMI
Common Stock
Fund, Inc.
A NO-LOAD
MUTUAL FUND
FMI
Common Stock
Fund, Inc.
September 30, 2009
Dear Fellow Shareholders:
The FMI Common Stock Fund gained 19.99% in the quarter compared to 19.28% for the benchmark Russell 2000 Index. Strong absolute returns were driven largely by a rebound in financial stocks and those perceived to be beneficiaries of an expanding economy, including Carlisle, Arrow Electronics and Harte-Hanks. Old Republic International and Protective Life led a very strong absolute and relative showing in the financial sector. Despite this, we remain somewhat wary of financials and continue to be significantly underweight compared to the Russell 2000. Our retail and process industries sectors lagged the benchmark. The Fund has significantly outpaced the Russell 2000 on a calendar year-to-date basis (32.35% vs. 22.43%), a result that is pleasing given the fact that our portfolio typically lags in strong rallies. The Fund’s focus on both low valuation and franchises that are perhaps less cyclical than those owned by the typical fund or the benchmark usually provides good protection in difficult markets and recessions, but often trails coming out of tough times, as speculation increases and investors’ attentions move to cyclicals and so-called “high beta” stocks.
The spectacular rise (over 70%) in the Russell 2000 from early March seems disconnected from the underlying fundamentals, which remain very poor. On the other hand, one could argue that the Russell’s move from 847 in October of 2007 to below 343 in March of this year was an overreaction to the financial crisis and recession. On balance, today’s 605 Russell 2000 price appears to incorporate fairly optimistic expectations of future economic growth. Based on bottom-up estimates for the constituents of the Russell 2000, the price/earnings (P/E) ratio for 2009 and 2010 is 28.1 and 23.8, respectively. The Russell 2000 will need exceptional growth the rest of this year and next, just to reach the earnings embedded in these multiples.
| For new investors, the September and March quarterly letters contain an abbreviated general commentary and an outline of a number of portfolio investments. The June and December letters have a lengthier commentary with no individual company discussion. Past letters are available on the FMI Funds website at www.fmifunds.com. |
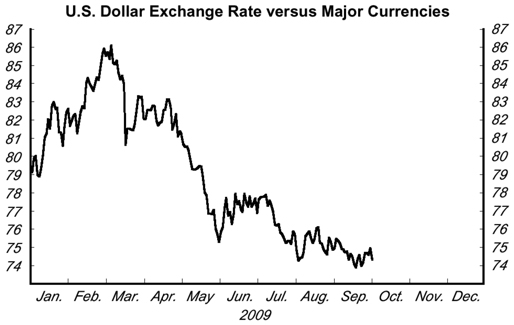
Source: Federal Reserve Board
While it is not unusual to have strong earnings growth as the economy emerges from recession, the market seems to believe this outcome is a foregone conclusion. We have little doubt that eventually better times will come, but there is currently meager fundamental improvement. Demand remains incredibly weak across a wide spectrum of industries. We are acutely attuned to signs of revenue growth, as this will be the indicator that a bona fide recovery is indeed underway, but so far the evidence is unconvincing. Unemployment continues to rise, with the official rate of 9.7% near the high of the 1982 recession. If “discouraged” workers (unemployed but not actively looking for work over the previous four weeks) and nondiscretionary part-time workers (those who would rather have full-time employment) are added, the figure is 16.8%, a post-depression high. Consumer confidence has bounced off the bottom, but remains over 30% below where it stood a few years ago. Business leaders are still hunkered down as they try to digest the implications of massive government intervention (health care, environment, financial regulation, tariffs and taxes). Many Americans are very concerned about the huge and rapidly increasing budget deficits, and this sentiment appears to be shared by our trading partners as the dollar nears an all time low.
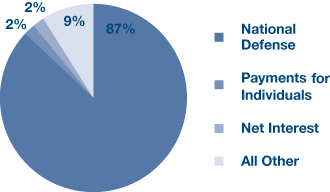
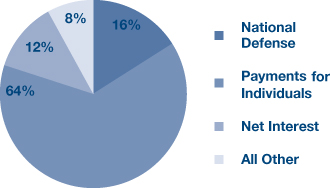
Faith in the system, inflation expectations, interest rates and tax policy all impact business confidence and the direction of the economy. As government debt relative to GDP moves toward World War II levels, there are those that say not to worry; after all, the U.S. managed through that period and went on to a generally prosperous second half of the century. We are struck by the shallowness of this argument. A recent piece from JP Morgan cited Office of Management and Budget (OMB) data that showed, in 1945, nearly 90% of the budget was defense. Only 2% of the budget went to “payments for individuals” which includes social security, Medicare and welfare, among other programs. Based on the OMB’s 2014 projection (today’s pie chart isn’t significantly different), 64% of the budget will go to “payments for individuals.” It was relatively easy to slash defense spending once WWII ended (and we did). The growth in government programs and bureaucracies in recent decades has been nearly impossible to control, much less reduce. Today we are layering on explosive government spending due to financial bailouts and new fiscal programs. Ultimately we may have to deal with inflation, but not today.
1945: Breakdown of budget outlays: | | 2014E: Breakdown of budget outlays: |
| Actual Allocation of Government | | Projected Allocation of Government |
| expenditure | | expenditure |
| | |
Source: OMB – U.S. Office of Management and Budget
Though the current environment poses very significant challenges to business creation/expansion and employment growth, history shows that negative conditions don’t persist forever. Forces often move in counter directions, checking excesses and setting the stage for better times. When confidence improves, businesses will take advantage of abundant and attractively priced labor, low capital costs and excess capacity. Consumers are saving more and while this depresses near term GDP growth, it sets the stage for more sustainable investment and consumption down the road. Additionally, there are signs of recovery in a few countries in Asia and Europe and that will help stimulate demand in the United States.
As alluded to earlier, stocks that are particularly economically sensitive have had explosive moves off the bottom. Many now seem to reflect a best case scenario. At the same time, a number of companies with steady demand characteristics have underperformed in this market. We have made, and continue to make, some moves to take advantage of this situation, including the sale of ATMI, Watsco and Perot (Dell takeover). We’ve also reduced our exposure to Rockwell, HNI Corp. and Group 1 Automotive. On the flip side, we initiated new purchases in Gartner and a regional supermarket chain (purchase not completed yet). We have also added to PetSmart, AJ Gallagher and Sigma-Aldrich. The portfolio remains well diversified, but somewhat more defensive than a quarter ago. Below we have highlighted two recent additions.
GARTNER, INC. (NYSE: IT)
Description
Gartner, Inc. provides independent and objective research analysis on information technology (IT), computer hardware, software communications, and related technology industries. The company operates in three segments: Research (61% of sales), Consulting (27%), and Events (12%). The Research segment offers research content and advice for technology professionals and the investment community in the form of reports and briefings, as well as peer networking services and membership programs designed for chief information officers (CIOs) and other senior executives. The Consulting segment consists of core consulting, measurement engagements, and strategic advisory services, which provide assessments of cost, performance, efficiency, and quality focused on the IT industry. The Events segment consists of various symposia, conferences, and exhibitions.
Good Business
| | • | Gartner’s research services are highly valued by IT professionals and serve a necessary function. |
| | • | With $1.3 billion in sales, Gartner has only penetrated 5-10% of its addressable market. |
| | • | The company’s research products are offered through annual and multi-year subscription agreements, which have 70%+ retention rates. Therefore, greater than 50% of revenues are recurring in nature. |
| | • | The business model is easy to understand. |
| | • | Gartner generates high returns on invested capital (ROIC). The company’s ROIC for the trailing 5-year and 10-year periods is approximately 25%, and comfortably exceeds its cost of capital. |
| | • | The business has limited capital requirements and generates excess free cash flow (FCF). Management has consistently returned FCF to shareholders via share buybacks. |
| | • | The balance sheet is solid with $270 million of net debt. Gartner’s interest coverage ratio is greater than 9.0 and its net leverage ratio is less than 1.4. |
Valuation
| | • | Over the past 12 months, Gartner’s share price has declined nearly 30%. Over the past two years, Gartner’s share price has declined 42% and underperformed the Russell 2000 by roughly 500 basis points. |
| | • | In 2008, Gartner generated diluted earnings per share (EPS) of $1.05 and FCF per share of $1.62. Over the past three years, Gartner’s FCF has averaged $1.09 per share. The company’s common stock trades for 14.7 times this number. |
| | • | On a price-to-cash flow basis, Gartner’s trailing 10-year average is 14.6. This compares to the current multiple of 8.1. |
| | • | Since 2001, Gartner’s shares have traded at average enterprise value/sales (EV/sales) and enterprise value/earnings before interest, taxes depreciation and amortization (EV/EBITDA) multiple of 1.6 and 11.9, respectively. This compares to current multiples of 1.4 and 9.0, respectively. |
| | • | From 2001-2008, Gartner’s operating margin averaged 10.2%. We believe the company has the potential to improve its operating margin to the 13-15% range, which could drive valuations higher. |
Management
| | • | Gene Hall has been Gartner’s CEO since August 2004. Prior to joining the company, Mr. Hall was a senior executive at ADP. Mr. Hall beneficially owns 1.9 million shares or roughly 2.0% of total shares outstanding. |
| | • | Peter Sondergaard has led the Research business since August 2004. Mr. Sondergaard has been employed with Gartner for 18 years. Prior to joining the company, he was Research Director for IDC in Europe. |
| | • | Dale Kutnick has led Gartner’s Executive Programs since February 2007. Prior to joining the company, Mr. Kutnick was the co-founder and Chairman of META Group. He has over 20 years of industry experience. |
Investment Thesis
Since becoming CEO in December 2004, Gene Hall has done a commendable job of refocusing Gartner, improving its competitive position, and returning price discipline to the company’s research products. Investor concerns over cuts in IT spending, technology employee layoffs, and falling client retention ratios, have put downward pressure on Gartner’s stock price. We believe these concerns are temporary and provide us with the opportunity to invest in a high quality franchise, generating above average ROIC and excess free cash flow, at an attractive valuation.
KIRBY CORP. (NYSE: KEX)
Description
Kirby is the country’s largest transporter of bulk liquid cargoes by tank barge throughout the Mississippi River System and Gulf Intracoastal Waterway. The firm transports petrochemicals (67%), black oil products (18%), refined petroleum products (10%), and agricultural chemicals (5%). The equipment owned or operated by the company consists of 897 active inland tank barges and 232 active inland towboats.
Good Business
| | • | Kirby is the low cost operator due to economies of scale. The Jones Act shields the company from foreign competition. |
| | • | The inland waterway system plays a vital role in the U.S. economy; there is always a market to move product by barge. About 80% of the company’s marine transportation revenues are derived from term contracts, and time charters account for 55% to 60% of term contracts. Approximately 70% of the petrochemicals business is driven by demand for consumer non-durables. |
| | • | The ROIC was 14.5% in 2008 and averaged roughly 10.5% from peak (2001) to peak (2008). Kirby earns its cost of capital. |
| | • | This is an easy business to understand. |
| | • | Kirby is focused on things that it can control, such as costs, customer relationships, and safety. |
| | • | The long-term debt/cap ratio is 19.7%, the leverage ratio is 0.64, and the interest coverage ratio is 26.4. The company generates a significant amount of cash. |
Valuation
| | • | The stock trades near the low-end of its 10-year average valuation range on a P/E, price/book, price/sales, and price/cash flow basis. |
| | • | There is downside of approximately 30%, based on an analysis of trough EPS and historical price/book multiples. |
| | • | If the company is able to grow its book value/share at a 10% compound annual rate over the next five years, and the stock is accorded its 10-year average price/book multiple of 2.34, Kirby would gain over 75%. Book value/share has increased at a 17.1% and 15.5% annual rate over the last 5- and 10-year periods, respectively. |
Management
| | • | We like the management. This is a conservative senior executive team that has, on average, 25 to 30 years of experience. |
| | • | Compensation is based in part on the achievement of a return on total capital target. Stock ownership guidelines were implemented this year. Insiders own 5% of the shares. |
| | • | Joseph Pyne, 61, has served as President and CEO of Kirby since April 1995. Norman Nolen, 66, has served as CFO and Treasurer of the company since February 1999. Berdon Lawrence, 66, has served as Chairman since October 1999. |
Investment Thesis
This is a good business run by a strong management team and whose shares are attractively valued. Kirby’s stock has declined over 40% from its high in May 2008, on concerns of overcapacity and economic weakness. Kirby has the financial wherewithal to ride out a tough economy. Some significant competitors are going to struggle or disappear, creating a more attractive operating environment on the other side.
******
Our Board of Directors has declared distributions effective October 29, 2009 of $0.036561 per share from net investment income and $0.00737 per share from net long-term capital gains, payable October 30, 2009, to shareholders of record on October 28, 2009.
Given the relatively strong investment performance and fund flows into the FMI Common Stock Fund, the Board of Directors has agreed with management’s recommendation to close the Fund to new investors, effective December 31, 2009. Existing shareholders and participants in employee retirement plans where the Fund is an eligible investment are exempt from this action. Other exceptions and conditions are articulated in the prospectus supplement filed with the SEC on September 29, 2009.
Thank you for your support of the FMI Common Stock Fund.
Sincerely,
 |  |  |
| Ted D. Kellner, CFA | Donald S. Wilson, CFA | Patrick J. English, CFA |
| President and | Vice President | Vice President and |
| Portfolio Manager | | Portfolio Manager |
100 E. Wisconsin Ave., Suite 2200 • Milwaukee, WI 53202 • 414-226-4555
www.fmifunds.com
FMI Common Stock Fund, Inc.
Industry Sectors as of September 30, 2009
As a shareholder of the Fund you incur ongoing costs, including management fees and other Fund expenses. You do not incur transaction costs such as sales charges (loads) on purchase payments, reinvested dividends, or other distributions; redemption fees; and exchange fees because the Fund does not charge these fees. This example is intended to help you understand your ongoing costs (in dollars) of investing in FMI Common Stock Fund and to compare these costs with the ongoing costs of investing in other mutual funds.
The example is based on an investment of $1,000 invested at the beginning of the period and held for the entire period from April 1, 2009 through September 30, 2009.
Actual Expenses
The first line of the table below provides information about actual account values and actual expenses. You may use the information in this line, together with the amount you invested, to estimate the expenses that you paid over the period. Simply divide your account value by $1,000 (for example, an $8,600 account value divided by $1,000 = 8.6), then multiply the result by the number in the first line under the heading entitled “Expenses Paid During Period” to estimate the expenses you paid on your account during this period.
In addition to the costs highlighted and described below, the only Fund transaction costs you might currently incur would be wire fees ($15 per wire), if you choose to have proceeds from a redemption wired to your bank account instead of receiving a check. Additionally, U.S. Bank charges an annual processing fee ($15) if you maintain an IRA account with the Fund. To determine your total costs of investing in the Fund, you would need to add any applicable wire or IRA processing fees you’ve incurred during the period to the costs provided in the example at the end of this article.
Hypothetical Example for Comparison Purposes
The second line of the table below provides information about hypothetical account values and hypothetical expenses based on the Fund’s actual expense ratio and an assumed rate of return of 5% per year before expenses, which is not the Fund’s actual return. The hypothetical account values and expenses may not be used to estimate the actual ending account balance or expenses you paid for the period. You may use this information to compare the ongoing costs of investing in the Fund and other funds. To do so, compare this 5% hypothetical example with the 5% hypothetical examples that appear in the shareholder reports of the other funds.
Please note that the expenses shown in the table are meant to highlight your ongoing costs only and do not reflect any transactional costs, such as sales charges (loads), redemption fees or exchange fees. Therefore, the second line of the table is useful in comparing ongoing costs only, and will not help you determine the relative total costs of owning different funds. In addition, if these transactional costs were included, your costs would have been higher.
| | Beginning | Ending | Expenses Paid |
| | Account | Account | During Period* |
| | Value 4/01/09 | Value 9/30/09 | 4/01/09-9/30/09 |
| FMI Common Stock Fund Actual | $1,000.00 | $1,458.10 | $7.64 |
| Hypothetical (5% return before expenses) | $1,000.00 | $1,018.90 | $6.28 |
| * | Expenses are equal to the Fund’s annualized expense ratio of 1.24%, multiplied by the average account value over the period, multiplied by 183/365 (to reflect the one-half year period between April 1, 2009 and September 30, 2009). |
FMI Common Stock Fund, Inc.
MANAGEMENT’S DISCUSSION OF FUND PERFORMANCE
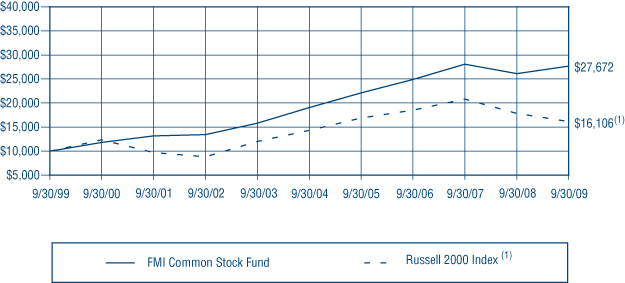
During the fiscal year ended September 30, 2009, the FMI Common Stock Fund (the “Fund”) had a total return of 6.04%. This compared favorably to a -9.55% return of the benchmark Russell 2000. Finance, Producer Manufacturing and Distribution Services led relative results in the period. An underweight position in Finance, combined with better stock selection made this group a leader compared to the Russell 2000. Strong stock selection was the primary positive factor in Producer Manufacturing and Distribution Services. Electronic Technology, Commercial Services and Technology Services all negatively affected the relative results. Both stock selection and relative weightings hurt the Fund with respect to these three sectors. Rockwell Automation, Valspar and Group 1 Automotive were a few of the strongest individual contributors. AMN Healthcare, Protective Life and HNI Corp. were significant detractors in the period. G&K Services, Littelfuse, AMN Healthcare, and Associated Banc-Corp were all sold during the fiscal year due to fundamental considerations. Acuity, IDEX, Chipotle, and Watsco were sold due to valuation. Perot was sold following the announced takeover by Dell. The Fund is underweight Finance, Health Technology and Electronic Technology and overweight Producer Manufacturing, Retail Trade and Commercial Services. Extreme worries about mortgages, derivatives and banking in the first fiscal quarter softened as the year progressed, giving way to optimism about an economic rebound as the quarter ended. The Fund’s adviser believes difficult economic conditions may continue for some time. The Fund continues to sell at a discount to the Russell 2000, based on most valuation measures. Over long time periods, lower valuation stocks have outperformed higher valuation stocks. Future results, however, may differ from the past.
| | COMPARISON OF CHANGE IN VALUE OF $10,000 INVESTMENT IN FMI COMMON STOCK FUND AND THE RUSSELL 2000 INDEX(1) | |
| | | Past performance does not predict future performance. The graph and the table do not reflect the deduction of taxes that a shareholder would pay on Fund distributions or the redemption of Fund shares. | |
| (1) | | The Russell 2000 Index measures the performance of the 2,000 smallest companies in the Russell 3000 Index, which comprises the 3,000 largest U.S. companies based on total market capitalization. | |
| | | | |
| AVERAGE ANNUAL TOTAL RETURN |
| 1-Year | 5-Year | 10-Year |
| 6.04% | 7.78% | 10.71% |
FMI Common Stock Fund, Inc.
STATEMENT OF ASSETS AND LIABILITIES
| ASSETS: | | | |
| Investments in securities, at value (cost $751,816,443) | | $ | 870,564,548 | |
| Receivable from shareholders for purchases | | | 3,570,773 | |
| Receivable from investments sold | | | 1,309,941 | |
| Dividends receivable | | | 706,966 | |
| Cash | | | 87,121 | |
| Total assets | | $ | 876,239,349 | |
| LIABILITIES: | | | | |
| Payable to brokers for investments purchased | | $ | 2,480,710 | |
| Payable to adviser for management and administrative fees | | | 627,588 | |
| Payable to shareholders for redemptions | | | 435,506 | |
| Other liabilities | | | 138,695 | |
| Total liabilities | | | 3,682,499 | |
| NET ASSETS: | | | | |
| Capital Stock, $0.01 par value; indefinite shares authorized; 41,409,728 shares outstanding | | | 778,657,091 | |
| Net unrealized appreciation on investments | | | 118,748,105 | |
| Accumulated net realized loss on investments | | | (26,380,900 | ) |
| Undistributed net investment income | | | 1,532,554 | |
| Net assets | | | 872,556,850 | |
| Total liabilities and net assets | | $ | 876,239,349 | |
| CALCULATION OF NET ASSET VALUE PER SHARE: | | | | |
| Net asset value, offering and redemption price per share ($872,556,850 ÷ 41,409,728 shares outstanding) | | $ | 21.07 | |
The accompanying notes to financial statements are an integral part of this statement.
SCHEDULE OF INVESTMENTS
| Shares | | | | Cost | | | Value | |
| COMMON STOCKS — 90.0% (a) | | | | | | |
COMMERCIAL SERVICES SECTOR — 10.0% | | | | | | |
| | | Advertising/Marketing Services — 2.4% | | | | | | |
| | 1,526,000 | | Harte-Hanks, Inc. | | $ | 21,995,833 | | | $ | 21,104,580 | |
| | | | Miscellaneous Commercial Services — 3.7% | | | | | | | | |
| | 731,000 | | Cintas Corp. | | | 17,837,545 | | | | 22,156,610 | |
| | 556,300 | | Gartner, Inc.* | | | 8,841,032 | | | | 10,163,601 | |
| | | | | | | 26,678,577 | | | | 32,320,211 | |
| | | | Personnel Services — 3.9% | | | | | | | | |
| | 1,134,000 | | Korn/Ferry International* | | | 16,762,028 | | | | 16,545,060 | |
| | 1,645,000 | | MPS Group, Inc.* | | | 13,930,031 | | | | 17,305,400 | |
| | | | | | | 30,692,059 | | | | 33,850,460 | |
| CONSUMER SERVICES SECTOR — 2.4% | | | | | | | | |
| | | | Publishing: Books/Magazines — 2.4% | | | | | | | | |
| | 704,000 | | Meredith Corp. | | | 18,040,033 | | | | 21,077,760 | |
| | | | | | | | | | | | |
| DISTRIBUTION SERVICES SECTOR — 11.6% | | | | | | | | |
| | | | Electronics Distributors — 5.8% | | | | | | | | |
| | 1,161,000 | | Arrow Electronics, Inc.* | | | 20,554,756 | | | | 32,682,150 | |
| | 653,000 | | ScanSource, Inc.* | | | 16,156,276 | | | | 18,492,960 | |
| | | | | | | 36,711,032 | | | | 51,175,110 | |
| | | | Medical Distributors — 3.1% | | | | | | | | |
| | 984,000 | | Patterson Companies Inc.* | | | 21,183,855 | | | | 26,814,000 | |
| | | | Wholesale Distributors — 2.7% | | | | | | | | |
| | 663,000 | | Beacon Roofing | | | | | | | | |
| | | | Supply, Inc.* | | | 7,870,445 | | | | 10,594,740 | |
| | 267,000 | | United Stationers Inc.* | | | 10,668,229 | | | | 12,711,870 | |
| | | | | | | 18,538,674 | | | | 23,306,610 | |
| ELECTRONIC TECHNOLOGY SECTOR — 0.7% | | | | | | | | |
| | | | Computer Peripherals — 0.7% | | | | | | | | |
| | 220,400 | | Zebra Technologies Corp.* | | | 3,854,612 | | | | 5,714,972 | |
ENERGY MINERALS SECTOR — 3.6% | | | | | | | | |
| | | | Oil & Gas Production — 3.6% | | | | | | | | |
| | 978,000 | | St. Mary Land | | | | | | | | |
| | | | & Exploration Co. | | | 23,461,913 | | | | 31,745,880 | |
FINANCE SECTOR — 11.0% | | | | | | | | |
| | | | Insurance Brokers/Services — 2.9% | | | | | | | | |
| | 1,024,000 | | Arthur J. Gallagher & Co. | | | 23,728,422 | | | | 24,954,880 | |
| | | | Investment Managers — 2.9% | | | | | | | | |
| | 393,000 | | Affiliated Managers | | | | | | | | |
| | | | Group, Inc.* | | | 18,209,187 | | | | 25,548,930 | |
FMI Common Stock Fund, Inc.
SCHEDULE OF INVESTMENTS (Continued)
| Shares | | | | Cost | | | Value | |
| COMMON STOCKS — 90.0% (a) (Continued) | | | | | | |
| | | | | | | |
| FINANCE SECTOR — 11.0% (Continued) | | | | | | |
| | | Life/Health Insurance — 2.4% | | | | | | |
| | 994,000 | | Protective Life Corp. | | $ | 21,308,946 | | | $ | 21,291,480 | |
| | | | Property/Casualty Insurance — 2.4% | | | | | | | | |
| | 1,742,000 | | Old Republic | | | | | | | | |
| | | | International Corp. | | | 20,130,870 | | | | 21,217,560 | |
| | | | Specialty Insurance — 0.4% | | | | | | | | |
| | 99,500 | | PICO Holdings, Inc.* | | | 3,324,239 | | | | 3,318,325 | |
| | | | | | | | | | | | |
| HEALTH SERVICES SECTOR — 3.4% | | | | | | | | |
| | | | Health Industry Services — 3.4% | | | | | | | | |
| | 240,600 | | CareFusion Corp.* | | | 4,523,742 | | | | 5,245,080 | |
| | 447,000 | | Covance Inc.* | | | 18,586,653 | | | | 24,205,050 | |
| | | | | | | 23,110,395 | | | | 29,450,130 | |
| HEALTH TECHNOLOGY SECTOR — 4.8% | | | | | | | | |
| | | | Medical Specialties — 4.8% | | | | | | | | |
| | 344,000 | | Beckman Coulter, Inc. | | | 18,317,121 | | | | 23,715,360 | |
| | 98,000 | | Bio-Rad | | | | | | | | |
| | | | Laboratories, Inc.* | | | 6,196,411 | | | | 9,004,240 | |
| | 223,000 | | West Pharmaceutical | | | | | | | | |
| | | | Services, Inc. | | | 8,467,722 | | | | 9,056,030 | |
| | | | | | | 32,981,254 | | | | 41,775,630 | |
| INDUSTRIAL SERVICES SECTOR — 5.2% | | | | | | | | |
| | | | Environmental Services — 1.0% | | | | | | | | |
| | 313,000 | | Waste Connections, Inc.* | | | 8,199,158 | | | | 9,033,180 | |
| | | | Oilfield Services/Equipment — 4.2% | | | | | | | | |
| | 563,000 | | Bristow Group, Inc.* | | | 17,329,479 | | | | 16,715,470 | |
| | 630,000 | | Dresser-Rand Group, Inc.* | | | 12,918,848 | | | | 19,574,100 | |
| | | | | | | 30,248,327 | | | | 36,289,570 | |
| PROCESS INDUSTRIES SECTOR — 10.1% | | | | | | | | |
| | | | Chemicals: Specialty — 2.5% | | | | | | | | |
| | 412,000 | | Sigma-Aldrich Corp. | | | 19,750,784 | | | | 22,239,760 | |
| | | | Containers/Packaging — 4.3% | | | | | | | | |
| | 555,000 | | AptarGroup, Inc. | | | 14,551,060 | | | | 20,734,800 | |
| | 634,000 | | Bemis Company, Inc. | | | 15,660,386 | | | | 16,426,940 | |
| | | | | | | 30,211,446 | | | | 37,161,740 | |
| | | | Industrial Specialties — 3.3% | | | | | | | | |
| | 405,000 | | Cabot Microelectronics | | | | | | | | |
| | | | Corp.* | | | 12,346,855 | | | | 14,118,300 | |
| | 536,000 | | Valspar Corp. | | | 12,319,588 | | | | 14,745,360 | |
| | | | | | | 24,666,443 | | | | 28,863,660 | |
| PRODUCER MANUFACTURING SECTOR — 9.8% | | | | | | | | |
| | | | Electrical Products — 2.7% | | | | | | | | |
| | 1,262,000 | | Molex Inc. Cl A | | | 23,273,920 | | | | 23,712,980 | |
| | | | Industrial Machinery — 3.7% | | | | | | | | |
| | 444,000 | | Graco Inc. | | | 9,606,318 | | | | 12,374,280 | |
| | 394,000 | | Rockwell | | | | | | | | |
| | | | Automation, Inc. | | | 10,078,674 | | | | 16,784,400 | |
| | 132,900 | | Rofin-Sinar | | | | | | | | |
| | | | Technologies, Inc.* | | | 1,821,801 | | | | 3,051,384 | |
| | | | | | | 21,506,793 | | | | 32,210,064 | |
| | | | Miscellaneous Manufacturing — 2.4% | | | | | | | | |
| | 619,000 | | Carlisle Companies Inc. | | | 16,426,240 | | | | 20,990,290 | |
| | | | Office Equipment/Supplies — 1.0% | | | | | | | | |
| | 353,000 | | HNI Corp. | | | 6,049,548 | | | | 8,330,800 | |
| | | | | | | | | | | | |
| RETAIL TRADE SECTOR — 8.7% | | | | | | | | |
| | | | Discount Stores — 2.7% | | | | | | | | |
| | 884,000 | | Family Dollar Stores, Inc. | | | 22,581,501 | | | | 23,337,600 | |
| | | | Food Retail — 2.2% | | | | | | | | |
| | 255,800 | | Ruddick Corp. | | | 6,319,509 | | | | 6,809,396 | |
| | 977,000 | | Winn-Dixie Stores, Inc.* | | | 14,783,561 | | | | 12,818,240 | |
| | | | | | | 21,103,070 | | | | 19,627,636 | |
| | | | Specialty Stores — 3.8% | | | | | | | | |
| | 392,000 | | Group 1 Automotive, Inc. | | | 4,979,910 | | | | 10,525,200 | |
| | 1,029,000 | | PetSmart, Inc. | | | 24,869,234 | | | | 22,380,750 | |
| | | | | | | 29,849,144 | | | | 32,905,950 | |
| TECHNOLOGY SERVICES SECTOR — 4.8% | | | | | | | | |
| | | | Data Processing Services — 2.1% | | | | | | | | |
| | 399,000 | | DST Systems, Inc.* | | | 21,004,837 | | | | 17,875,200 | |
| | | | Information Technology Services — 2.7% | | | | | | | | |
| | 1,015,000 | | Jack Henry & | | | | | | | | |
| | | | Associates, Inc. | | | 20,286,037 | | | | 23,822,050 | |
| | | | | | | | | | | | |
| TRANSPORTATION SECTOR — 3.9% | | | | | | | | |
| | | | Marine Shipping — 1.4% | | | | | | | | |
| | 332,000 | | Kirby Corp.* | | | 10,558,141 | | | | 12,224,240 | |
| | | | Trucking — 2.5% | | | | | | | | |
| | 687,000 | | Hunt (J.B.) Transport | | | | | | | | |
| | | | Services, Inc. | | | 16,951,153 | | | | 22,073,310 | |
| | | | Total common stocks | | | 666,616,443 | | | | 785,364,548 | |
SHORT-TERM INVESTMENTS — 9.8% (a) | | | | | | | | |
| | | | Commercial Paper — 9.8% | | | | | | | | |
| $ | 85,200,000 | | U.S. Bank, N.A., | | | | | | | | |
| | | | 0.04%, due 10/01/09 | | | 85,200,000 | | | | 85,200,000 | |
| | | | Total short-term | | | | | | | | |
| | | | investments | | | 85,200,000 | | | | 85,200,000 | |
| | | | Total investments — | | | | | | | | |
| | | | 99.8% | | $ | 751,816,443 | | | | 870,564,548 | |
| | | | Cash and receivables, | | | | | | | | |
| | | | less liabilities — 0.2% (a) | | | | | | | 1,992,302 | |
| | | | TOTAL NET ASSETS — | | | | | | | | |
| | | | 100.0% | | | | | | $ | 872,556,850 | |
| * | Non-income producing security. |
| (a) | Percentages for the various classifications relate to net assets. |
The accompanying notes to financial statements are an integral part of this schedule.
FMI Common Stock Fund, Inc.
STATEMENT OF OPERATIONS
For the Year Ended September 30, 2009
| INCOME: | | | |
| Dividends | | $ | 8,126,246 | |
| Interest | | | 180,266 | |
| Total income | | | 8,306,512 | |
| EXPENSES: | | | | |
| Management fees | | | 5,276,115 | |
| Transfer agent fees | | | 604,297 | |
| Administrative and accounting services | | | 278,805 | |
| Registration fees | | | 135,270 | |
| Custodian fees | | | 124,729 | |
| Printing and postage expense | | | 81,890 | |
| Professional fees | | | 51,480 | |
| Insurance expense | | | 29,756 | |
| Board of Directors fees | | | 29,000 | |
| Other expenses | | | 19,253 | |
| Total expenses | | | 6,630,595 | |
| NET INVESTMENT INCOME | | | 1,675,917 | |
| NET REALIZED LOSS ON INVESTMENTS | | | (18,956,823 | ) |
| NET INCREASE IN UNREALIZED APPRECIATION ON INVESTMENTS | | | 112,714,790 | |
| NET GAIN ON INVESTMENTS | | | 93,757,967 | |
| NET INCREASE IN NET ASSETS RESULTING FROM OPERATIONS | | $ | 95,433,884 | |
STATEMENTS OF CHANGES IN NET ASSETS
For the Years Ended September 30, 2009 and 2008
| | | 2009 | | | 2008 | |
| OPERATIONS: | | | | | | |
| Net investment income | | $ | 1,675,917 | | | $ | 1,404,080 | |
| Net realized (loss) gain on investments | | | (18,956,823 | ) | | | 19,288,248 | |
| Net increase (decrease) in unrealized appreciation on investments | | | 112,714,790 | | | | (56,336,476 | ) |
| Net increase (decrease) in net assets from operations | | | 95,433,884 | | | | (35,644,148 | ) |
| DISTRIBUTIONS TO SHAREHOLDERS: | | | | | | | | |
| Distributions from net investment income ($0.0640 and $0.0838 per share, respectively) | | | (1,547,406 | ) | | | (1,505,374 | ) |
| Distributions from net realized gains ($0.9746 and $3.6644 per share, respectively) | | | (23,329,791 | ) | | | (66,149,992 | ) |
| Total distributions | | | (24,877,197 | ) | | | (67,655,366 | ) |
| FUND SHARE ACTIVITIES: | | | | | | | | |
| Proceeds from shares issued (29,122,596 and 3,820,664 shares, respectively) | | | 505,213,575 | | | | 83,226,514 | |
| Net asset value of shares issued in distributions reinvested | | | | | | | | |
| (1,574,742 and 2,878,822 shares, respectively) | | | 24,455,393 | | | | 64,977,258 | |
| Cost of shares redeemed (8,711,902 and 5,763,498 shares, respectively) | | | (139,465,589 | ) | | | (125,122,688 | ) |
| Net increase in net assets derived from Fund share activities | | | 390,203,379 | | | | 23,081,084 | |
| TOTAL INCREASE (DECREASE) | | | 460,760,066 | | | | (80,218,430 | ) |
| NET ASSETS AT THE BEGINNING OF THE YEAR | | | 411,796,784 | | | | 492,015,214 | |
| NET ASSETS AT THE END OF THE YEAR (Includes undistributed | | | | | | | | |
| net investment income of $1,532,554 and $1,404,043, respectively) | | $ | 872,556,850 | | | $ | 411,796,784 | |
The accompanying notes to financial statements are an integral part of these statements.
FMI Common Stock Fund, Inc.
FINANCIAL HIGHLIGHTS
(Selected data for each share of the Fund outstanding throughout each year)
| | | Years Ended September 30, | |
| | | 2009 | | | 2008 | | | 2007 | | | 2006 | | | 2005 | |
| PER SHARE OPERATING PERFORMANCE: | | | | | | | | | | | | | | | |
| Net asset value, beginning of year | | $ | 21.20 | | | $ | 26.61 | | | $ | 26.49 | | | $ | 26.58 | | | $ | 24.08 | |
| Income from investment operations: | | | | | | | | | | | | | | | | | | | | |
| Net investment income (loss) | | | 0.05 | | | | 0.08 | | | | 0.08 | | | | 0.09 | | | | (0.02 | ) |
| Net realized and unrealized gains (loss) on investments | | | 0.86 | | | | (1.74 | ) | | | 3.08 | | | | 2.79 | | | | 3.73 | |
| Total from investment operations | | | 0.91 | | | | (1.66 | ) | | | 3.16 | | | | 2.88 | | | | 3.71 | |
| Less distributions: | | | | | | | | | | | | | | | | | | | | |
| Distributions from net investment income | | | (0.06 | ) | | | (0.08 | ) | | | (0.07 | ) | | | (0.02 | ) | | | — | |
| Distributions from net realized gains | | | (0.98 | ) | | | (3.67 | ) | | | (2.97 | ) | | | (2.95 | ) | | | (1.21 | ) |
| Total from distributions | | | (1.04 | ) | | | (3.75 | ) | | | (3.04 | ) | | | (2.97 | ) | | | (1.21 | ) |
| Net asset value, end of year | | $ | 21.07 | | | $ | 21.20 | | | $ | 26.61 | | | $ | 26.49 | | | $ | 26.58 | |
| TOTAL RETURN | | | 6.04% | | | | (7.00% | ) | | | 12.81% | | | | 12.62% | | | | 16.11% | |
| RATIOS/SUPPLEMENTAL DATA: | | | | | | | | | | | | | | | | | | | | |
| Net assets, end of year (in 000’s $) | | | 872,557 | | | | 411,797 | | | | 492,015 | | | | 462,978 | | | | 440,669 | |
| Ratio of expenses to average net assets | | | 1.26% | | | | 1.22% | | | | 1.20% | | | | 1.21% | | | | 1.21% | |
| Ratio of net investment income (loss) | | | | | | | | | | | | | | | | | | | | |
| to average net assets | | | 0.32% | | | | 0.35% | | | | 0.30% | | | | 0.35% | | | | (0.06% | ) |
| Portfolio turnover rate | | | 35% | | | | 40% | | | | 50% | | | | 38% | | | | 34% | |
The accompanying notes to financial statements are an integral part of this statement.
NOTES TO FINANCIAL STATEMENTS
| (1) | Summary of Significant Accounting Policies — |
The following is a summary of significant accounting policies of the FMI Common Stock Fund, Inc. (the “Fund”), which is registered as a diversified, open-end management investment company under the Investment Company Act of 1940 (the “Act”), as amended. The Fund was incorporated under the laws of Wisconsin on July 29, 1981. The investment objective of the Fund is to produce long-term capital appreciation principally through investing in common stocks.
| | (a) | Each security, excluding short-term investments, is valued at the last sale price reported by the principal security exchange on which the issue is traded. Securities that are traded on the Nasdaq Markets are valued at the Nasdaq Official Closing Price or if no sale is reported, the latest bid price. Securities which are traded over-the-counter are valued at the latest bid price. Securities for which quotations are not readily available are valued at fair value as determined by the investment adviser under the supervision of the Board of Directors. The fair value of a security is the amount which the Fund might reasonably expect to receive upon a current sale. The fair value of a security may differ from the last quoted price and the Fund may not be able to sell a security at the estimated fair value. Market quotations may not be available, for example, if trading in particular securities was halted during the day and not resumed prior to the close of trading on the New York Stock Exchange. As of September 30, 2009, there were no securities that were internally fair valued. Variable rate demand notes are recorded at par value which approximates market value. Short-term investments with maturities of 60 days or less are valued at amortized cost, which approximates value. For financial reporting purposes, investment transactions are recorded on the trade date. |
| | | The Fund adopted the provisions of the Financial Accounting Standards Board (“FASB”) Accounting Standards Codification “Fair Value Measurements and Disclosures” Topic 820 (“ASC 820”), effective October 1, 2008. Under ASC 820, fair value is defined as the price that would be received to sell an asset or paid to transfer a liability (i.e., the “exit price”) in an orderly transaction between market participants at the measurement date. |
FMI Common Stock Fund, Inc.
NOTES TO FINANCIAL STATEMENTS (Continued)
| (1) | Summary of Significant Accounting Policies — (Continued) |
| | In determining fair value, the Fund uses various valuation approaches. ASC 820 establishes a fair value hierarchy for inputs used in measuring fair value that maximizes the use of observable inputs and minimizes the use of unobservable inputs by requiring that the most observable inputs be used when available. Observable inputs are those that market participants would use in pricing the asset or liability based on market data obtained from sources independent of the Fund. Unobservable inputs reflect the Fund’s assumptions about the inputs market participants would use in pricing the asset or liability developed based on the best information available in the circumstances. The inputs or methodologies used for valuing securities are not necessarily an indication of the risks associated with investing in those securities. |
The fair value hierarchy is categorized into three levels based on the inputs as follows:
| | Level 1 — | Valuations based on unadjusted quoted prices in active markets for identical assets. |
| | Level 2 — | Valuations based on quoted prices in markets that are not active or for which all significant inputs are observable, either directly or indirectly. |
| | Level 3 — | Valuations based on inputs that are unobservable and significant to the overall fair value measurement. |
The following table summarizes the Fund’s investments as of September 30, 2009, based on the inputs used to value them:
| Valuation Inputs | | Investments in Securities | |
| Level 1 — Common Stocks | | $ | 785,364,548 | |
| Level 2 — Short-Term Commercial Paper | | | 85,200,000 | |
| Level 3 — | | | — | |
| Total | | $ | 870,564,548 | |
| | (b) | Net realized gains and losses on sales of securities are computed on the identified cost basis. |
| | (c) | Dividend income is recorded on the ex-dividend date. Interest income is recorded on an accrual basis. |
| | (d) | The Fund may have investments in short-term variable rate demand notes, which are unsecured instruments. The Fund may be susceptible to credit risk with respect to these notes to the extent the issuer defaults on its payment obligation. The Fund’s policy is to monitor the creditworthiness of the issuer and nonperformance by these issuers is not anticipated. |
| | (e) | Accounting principles generally accepted in the United States of America (“GAAP”) require that permanent differences between income for financial reporting and tax purposes be reclassified in the capital accounts. |
| | (f) | The preparation of financial statements in conformity with GAAP requires management to make estimates and assumptions that affect the reported amounts of assets and liabilities and disclosure of contingent assets and liabilities at the date of the financial statements and the reported amounts of revenues and expenses during the reporting period. Actual results could differ from these estimates. |
| | (g) | No provision has been made for Federal income taxes since the Fund has elected to be taxed as a “regulated investment company” and intends to distribute substantially all net investment company taxable income and net capital gains to its shareholders and otherwise comply with the provisions of the Internal Revenue Code applicable to regulated investment companies. |
| | (h) | The Fund has reviewed all open tax years and major jurisdictions, which include Federal and the state of Wisconsin, and concluded that there are no significant uncertain tax positions that would require recognition in the financial statements. Open tax years are those that are open for exam by taxing authorities and, as of September 30, 2009, open Federal tax years include the tax years ended September 30, 2006 through 2009. The Fund has no examinations in progress and is also not aware of any tax positions for which it is reasonably possible that the total amounts of unrecognized tax benefits will significantly change in the next twelve months. |
FMI Common Stock Fund, Inc.
NOTES TO FINANCIAL STATEMENTS (Continued)
| (2) | Investment Adviser and Management Agreement and Transactions With Related Parties — |
The Fund has a management agreement with Fiduciary Management, Inc. (“FMI”), with whom certain officers and directors of the Fund are affiliated, to serve as investment adviser and manager. Under the terms of the agreement, the Fund will pay FMI a monthly management fee at the annual rate of 1% of the daily net assets of the Fund. The Fund has an administrative agreement with FMI to supervise all aspects of the Fund’s operations except those performed by FMI pursuant to the management agreement. Under the terms of the agreement, the Fund paid FMI a monthly administrative fee at the annual rate of 0.1% of the daily net assets up to and including $30,000,000 and 0.05% of the daily net assets of the Fund in excess of $30,000,000.
Under the management agreement, FMI will reimburse the Fund for expenses over 1.3% of the daily net assets of the Fund. No such reimbursements were required for the year ended September 30, 2009.
Under the Fund’s organizational documents, each director, officer, employee or other agent of the Fund (including the Fund’s investment manager) is indemnified, to the extent permitted by the Act, against certain liabilities that may arise out of performance of their duties to the Fund. Additionally, in the normal course of business, the Fund enters into contracts that contain a variety of indemnification clauses. The Fund’s maximum exposure under these arrangements is unknown as this would involve future claims that may be made against the Fund that have not yet occurred. However, the Fund has not had prior claims or losses pursuant to these contracts and believes the risk of loss to be remote.
U.S. Bank, N.A. has made available to the Fund a $25,000,000 credit facility pursuant to a Credit Agreement (“Agreement”) effective July 14, 2008 for the purposes of having cash available to satisfy redemption requests. Principal and interest of such loan under the Agreement are due not more than 31 days after the date of the loan. Amounts under the credit facility bear interest at a rate per annum equal to the current prime rate minus one percent on the amount borrowed. Advances will be collateralized by securities owned by the Fund. During the year ended September 30, 2009, the Fund did not borrow against the Agreement. The Credit Agreement expires on June 5, 2010.
| (4) | Distributions to Shareholders — |
Net investment income and net realized gains, if any, are distributed to shareholders at least annually. On October 29, 2009, the Fund declared distributions of $1,532,554 from net investment income ($0.036561 per share) and $308,861 from long-term realized gains ($0.00737 per share). The distributions will be paid on October 30, 2009 to shareholders of record on October 28, 2009.
| (5) | Investment Transactions — |
For the year ended September 30, 2009, purchases and proceeds of sales of investment securities (excluding short-term investments) were $504,097,540 and $171,108,900, respectively.
| (6) | Income Tax Information — |
The following information for the Fund is presented on an income tax basis as of September 30, 2009:
| | | | Gross | | Gross | | Net Unrealized | | Distributable | | Distributable | |
| | Cost of | | Unrealized | | Unrealized | | Appreciation | | Ordinary | | Long-Term | |
| | Investments | | Appreciation | | Depreciation | | on Investments | | Income | | Capital Gains | |
| | $763,059,472 | | $141,363,113 | | $33,858,037 | | $107,505,076 | | $1,532,554 | | $308,861 | |
The difference between the cost amount for financial statement and federal income tax purposes is due primarily to timing differences in recognizing certain gains and losses on security transactions.
FMI Common Stock Fund, Inc.
NOTES TO FINANCIAL STATEMENTS (Continued)
| (6) | Income Tax Information — (Continued) |
The tax components of dividends paid during the years ended September 30, 2009 and 2008, capital loss carryovers, which may be used to offset future capital gains, subject to Internal Revenue Code limitations, as of September 30, 2009, and tax basis post-October losses as of September 30, 2009, which are not recognized for tax purposes until the first day of the following fiscal year are:
| | September 30, 2009 | | September 30, 2008 | |
| | Ordinary | | Long-Term | | Net Capital | | | | Ordinary | | Long-Term | |
| | Income | | Capital Gains | | Loss | | Post-October | | Income | | Capital Gains | |
| | Distributions | | Distributions | | Carryovers | | Losses | | Distributions | | Distributions | |
| | $6,067,868 | | $18,809,329 | | $— | | $15,446,735 | | $18,511,918 | | $49,143,448 | |
For corporate shareholders of the Fund, the percentage of dividend income distributed for the year ended September 30, 2009 which is designated as qualifying for the dividends received deduction is 80.4% (unaudited).
For all shareholders of the Fund, the percentage of dividend income distributed for the year ended September 30, 2009 which is designated as qualified dividend income under the Jobs and Growth Tax Relief Act of 2003, is 80.4% (unaudited).
Effective October 1, 2009, U.S. Bancorp Fund Services, LLC, began serving as the administrator and accounting services agent for the Fund.
Effective December 31, 2009, the Fund will be closed to new investors.
Subsequent events have been evaluated through October 30, 2009, which is the date the financial statements were issued. Subsequent events have not been evaluated after this date.
REPORT OF INDEPENDENT REGISTERED PUBLIC ACCOUNTING FIRM
To the Board of Directors and Shareholders
of FMI Common Stock Fund, Inc.
In our opinion, the accompanying statement of assets and liabilities, including the schedule of investments, and the related statements of operations and of changes in net assets and the financial highlights present fairly, in all material respects, the financial position of FMI Common Stock Fund, Inc. (the “Fund”) at September 30, 2009, the results of its operations for the year then ended, the changes in its net assets for each of the two years in the period then ended and the financial highlights for each of the five years in the period then ended, in conformity with accounting principles generally accepted in the United States of America. These financial statements and financial highlights (hereafter referred to as “financial statements”) are the responsibility of the Fund’s management; our responsibility is to express an opinion on these financial statements based on our audits. We conducted our audits of these financial statements in accordance with the standards of the Public Company Accounting Oversight Board (United States). Those standards require that we plan and perform the audit to obtain reasonable assurance about whether the financial statements are free of material misstatement. An audit includes examining, on a test basis, evidence supporting the amounts and disclosures in the financial statements, assessing the accounting principles used and significant estimates made by management, and evaluating the overall financial statement presentation. We believe that our audits, which included confirmation of securities at September 30, 2009 by correspondence with the custodian and brokers, provide a reasonable basis for our opinion.

Milwaukee, Wisconsin
October 30, 2009
FMI Common Stock Fund, Inc.
| | | Term of | Principal | # of Funds | Other |
| | Position | Office and | Occupation(s) | in Complex | Directorships |
| Name, Age | Held with | Length of | During Past | Overseen | Held by |
| and Address | the Fund | Time Served | Five Years | by Director | Director |
Non-Interested Directors | | | | | |
| Barry K. Allen, 61 | Director | Indefinite Term | Mr. Allen is President of Allen | 4 | BCE, Inc. (Bell |
| c/o Fiduciary | | Since 1996 | Enterprises, LLC (Brookfield, WI) a | | Canada Enterprise), |
| Management, Inc. | | | private equity investments management | | Harley-Davidson, |
| 100 E. Wisconsin Ave. | | | company, and Senior Advisor for | | Inc., FMI Funds, Inc. |
| Suite 2200 | | | Providence Equity Partners (Providence, | | and FMI Mutual |
| Milwaukee, WI 53202 | | | RI) since September, 2007. He was | | Funds, Inc. |
| | | | Executive Vice President of Qwest | | |
| | | | Communications International, Inc. | | |
| | | | (Denver, CO) from September, 2002 to | | |
| | | | June, 2007. | | |
| Robert C. Arzbaecher, 49 | Director | Indefinite Term | Mr. Arzbaecher is President and | 4 | Actuant Corporation, |
| c/o Fiduciary | | Since 2007 | Chief Executive Officer of Actuant | | CF Industries |
| Management, Inc. | | | Corporation (Butler, WI), a | | Holdings, Inc., |
| 100 E. Wisconsin Ave. | | | manufacturer of a broad range of | | FMI Funds, Inc. |
| Suite 2200 | | | industrial products and systems, and | | and FMI Mutual |
| Milwaukee, WI 53202 | | | the Chairman of the Board of Directors | | Funds, Inc. |
| | | | of Actuant Corporation. | | |
| Gordon H. | Director | Indefinite Term | Mr. Gunnlaugsson retired from M&I | 4 | FMI Funds, Inc. |
| Gunnlaugsson, 65 | | Since 2001 | Corporation (Milwaukee, WI) | | and FMI Mutual |
| c/o Fiduciary | | | in December, 2000. | | Funds, Inc. |
| Management, Inc. | | | | | |
| 100 E. Wisconsin Ave. | | | | | |
| Suite 2200 | | | | | |
Milwaukee, WI 53202 | | | | | |
| Paul S. Shain, 46 | Director | Indefinite Term | Mr. Shain is President and Chief | 4 | FMI Funds, Inc. and |
| c/o Fiduciary | | Since 2001 | Executive Officer of Singlewire | | FMI Mutual Funds, |
| Management, Inc. | | | Software, LLC (Madison, WI), a provider | | Inc. |
| 100 E. Wisconsin Ave. | | | of IP-based paging and emergency | | |
| Suite 2200 | | | notification systems. Prior to joining | | |
| Milwaukee, WI 53202 | | | Singlewire in April, 2009, Mr. Shain was | | |
| | | | Senior Vice President of CDW | | |
| | | | Corporation (Vernon Hills, IL) and Chief | | |
| | | | Executive Officer of Berbee Information | | |
| | | | Networks, a strategic business unit of | | |
| | | | CDW which CDW acquired in 2006. | | |
| | | | Mr. Shain was employed in various capacities | | |
| | | | by CDW and Berbee Information Networks | | |
| | | | from January, 2000 to October, 2008. | | |
FMI Common Stock Fund, Inc.
DIRECTORS AND OFFICERS (Continued)
| | | | | | Other |
| | | Term of | Principal | # of Funds | Directorships |
| | Position | Office and | Occupation(s) | in Complex | Held by |
| Name, Age | Held with | Length of | During Past | Overseen | Director |
| and Address | the Fund | Time Served | Five Years | by Director | or Officer |
Interested Directors | | | | | |
| Patrick J. English,* 48 | Director | Indefinite Term | Mr. English is President of Fiduciary | 3 | FMI Funds, Inc. |
| c/o Fiduciary | | Since 1997 | Management, Inc. and has been employed | | |
| Management, Inc. | Vice | One Year Term | by the Adviser in various capacities | | |
| 100 E. Wisconsin Ave. | President | Since 1996 | since December, 1986. | | |
| Suite 2200 | | | | | |
Milwaukee, WI 53202 | | | | | |
| Ted D. Kellner,* 63 | Director | Indefinite Term | Mr. Kellner is Chairman of the Board | 3 | Marshall & Ilsley |
| c/o Fiduciary | | Since 1981 | and Chief Executive Officer of Fiduciary | | Corporation |
| Management, Inc. | President | One Year Term | Management, Inc. which he co-founded | | and FMI Funds, Inc. |
| 100 E. Wisconsin Ave. | and | Since 1981 | in 1980. | | |
| Suite 2200 | Treasurer | | | | |
Milwaukee, WI 53202 | | | | | |
| Donald S. Wilson,* 66 | Director | Indefinite Term | Mr. Wilson is Vice Chairman, Treasurer | 2 | FMI Mutual Funds, |
| c/o Fiduciary | | Since 1981 | and Chief Compliance Officer of | | Inc. |
| Management, Inc. | Vice | One Year Term | Fiduciary Management, Inc. | | |
| 100 E. Wisconsin Ave. | President | Since 1981 | which he co-founded in 1980. | | |
| Suite 2200 | and | | | | |
Milwaukee, WI 53202 | Secretary | | | | |
Other Officers | | | | | |
| John S. Brandser, 47 | Vice | One Year Term | Mr. Brandser is Senior Vice President, | N/A | FMI Mutual Funds, |
| c/o Fiduciary | President | Since 2008 | Secretary and Chief Operating Officer | | Inc. |
| Management, Inc. | | | of Fiduciary Management, Inc. and | | |
| 100 E. Wisconsin Ave. | | | has been employed by the Adviser in | | |
| Suite 2200 | | | various capacities since March, 1995. | | |
Milwaukee, WI 53202 | | | | | |
| Kathleen M. Lauters, 57 | Chief | At Discretion | Ms. Lauters has been the Fund’s Chief | N/A | None |
| c/o Fiduciary | Compliance | of Board | Compliance Officer since | | |
| Management, Inc. | Officer | Since 2004 | September, 2004 | | |
| 100 E. Wisconsin Ave. | | | | | |
| Suite 2200 | | | | | |
| Milwaukee, WI 53202 | | | | | |
__________
| * | Messrs. English, Kellner and Wilson are interested directors of the Fund because they are officers of the Fund and the Adviser. |
For additional information about the Directors and Officers or for a description of the policies and procedures that the Fund uses to determine how to vote proxies relating to portfolio securities, please call (800) 811-5311 and request a Statement of Additional Information. One will be mailed to you free of charge. The Statement of Additional Information is also available on the website of the Securities and Exchange Commission (the “Commission”) at http://www.sec.gov. Information on how the Fund voted proxies relating to portfolio securities is available on the Fund’s website at http://www.fmifunds.com or the website of the Commission no later than August 31 for the prior 12 months ending June 30. The Fund files its complete schedule of portfolio holdings with the Commission for the first and third quarters of each fiscal year on Form N-Q. The Fund’s Form N-Q is available on the Commission’s website. The Fund’s Form N-Q may be reviewed and copied at the Commission’s Public Reference Room in Washington, D.C., and that information on the operation of the Public Reference Room may be obtained by calling 1-800-SEC-0330.
FMI Common Stock Fund, Inc.
100 East Wisconsin Avenue, Suite 2200
Milwaukee, Wisconsin 53202
www.fmifunds.com
414-226-4555
BOARD OF DIRECTORS
BARRY K. ALLEN
ROBERT C. ARZBAECHER
PATRICK J. ENGLISH
GORDON H. GUNNLAUGSSON
TED D. KELLNER
PAUL S. SHAIN
DONALD S. WILSON
INVESTMENT ADVISER
FIDUCIARY MANAGEMENT, INC.
100 East Wisconsin Avenue, Suite 2200
Milwaukee, Wisconsin 53202
TRANSFER AGENT AND
DIVIDEND DISBURSING AGENT
U.S. BANCORP FUND SERVICES, LLC
615 East Michigan Street
Milwaukee, Wisconsin 53202
800-811-5311
or
414-765-4124
CUSTODIAN
U.S. BANK, N.A.
1555 North RiverCenter Drive, Suite 302
Milwaukee, Wisconsin 53212
INDEPENDENT REGISTERED
PUBLIC ACCOUNTING FIRM
PRICEWATERHOUSECOOPERS LLP
100 East Wisconsin Avenue, Suite 1800
Milwaukee, Wisconsin 53202
LEGAL COUNSEL
FOLEY & LARDNER LLP
777 East Wisconsin Avenue
Milwaukee, Wisconsin 53202
This report is not authorized for use as an offer of sale or a solicitation of an offer to buy shares of FMI Common Stock Fund unless accompanied or preceded by the Fund’s current prospectus. Performance data quoted represents past performance; past performance does not guarantee future results. The investment return and principal value of an investment will fluctuate so that an investor’s shares, when redeemed, may be worth more or less than their original cost. Current performance of the Fund may be lower or higher than the performance quoted. Performance data current to the most recent month end may be obtained by visiting www.fmifunds.com.
Item 2. Code of Ethics.
Registrant has adopted a code of ethics. See attached Exhibit 12 (a)(1).
Item 3. Audit Committee Financial Expert.
Registrant’s Board of Directors has determined that Mr. Gordon Gunnlaugsson, a member of its audit committee, is an audit committee financial expert. Mr. Gunnlaugsson is “independent” as such term is defined in Form N-CSR.
Item 4. Principal Accountant Fees and Services.
(a) Audit Fees
$20,713 (FY 2009) and $19,281 (FY 2008) are the aggregate fees billed for each of the last two fiscal years for professional services rendered by the principal accountant to the registrant for the audit of the registrant’s annual financial statements or services that are normally provided by the accountant in connection with statutory and regulatory filings or engagements for those fiscal years.
(b) Audit-Related Fees
There were no fees billed in the last two fiscal years for Audit-Related Fees.
There were no fees billed in the last two fiscal years for professional services rendered by the principal accountant to the registrant for tax compliance, tax advice, tax planning and tax return preparation.
There were no fees billed in the last two fiscal years for professional services rendered by the principal accountant to registrant’s investment adviser for tax compliance, tax advice and tax planning that were required to be approved by the audit committee pursuant to paragraph (c)(7)(ii) of Rule 2-01 of Regulation S-X.
(d) All Other Fees
There were no fees billed in the last two fiscal years for products and services provided by the principal accountant to the registrant, other than the services reported in paragraphs (a) – (c) of this Item 4.
There were no fees billed in the last two fiscal years for products and services provided by the principal accountant to registrant’s investment adviser, which were required to be approved by the audit committee pursuant to paragraph (c)(7)(ii) or Rule 2-01 or Regulation S-X.
(e) (1) None
(e) (2) None
(f) Not applicable.
(g) See the tax fees disclosed in paragraph (c) of this Item 4.
(h) Not applicable, as no non-audit services were provided to registrant’s investment adviser.
Item 5. Audit Committee of Listed Registrants.
Not applicable.
Item 6. Schedule of Investments.
(a) The Schedule of Investments in securities of unaffiliated issuers is included as part of the report to shareholders filed under Item 1of this Form.
(b) Not applicable.
Item 7. Disclosure of Proxy Voting Policies and Procedures for Closed-End Management Investment Companies
Not applicable.
Item 8. Portfolio Managers of Closed-End Management Investment Companies.
Not applicable.
Item 9. Purchases of Equity Securities By Closed-End Management Investment Company and Affiliated Purchasers.
Not applicable.
Item 10. Submission of Matters to a Vote of Security Holders.
None.
Item 11. Controls and Procedures.
| (a) | The disclosure controls and procedures of the FMI Common Stock Fund, Inc. are periodically evaluated. As of September 30, 2009, the date of the last evaluation, we concluded that our disclosure controls and procedures are adequate. |
| (b) | The internal controls of the FMI Common Stock Fund, Inc. are periodically evaluated. There were no changes to FMI Common Stock Fund’s internal control over financial reporting that occurred during the second fiscal quarter of the period covered by this report that have materially affected, or are reasonably likely to materially affect, such controls. |
Item 12. Exhibits.
| (a) | (1) Any code of ethics or amendment thereto. Filed herewith. |
| | (2) Certifications pursuant to Section 302 of the Sarbanes-Oxley Act of 2002. Filed herewith. |
| (3) | Any written solicitation to purchase securities under Rule 23c-1 under the Act sent or given during the period covered by the report by or on behalf of the Registrant to 10 or more persons. Not Applicable. |
| (b) | Certification pursuant to Section 906 of the Sarbanes-Oxley Act of 2002. Furnished herewith. |
SIGNATURES
Pursuant to the requirements of the Securities Exchange Act of 1934 and the Investment Company Act of 1940, the registrant has duly caused this report to be signed on its behalf by the undersigned, thereunto duly authorized.
FMI Common Stock Fund, Inc.
Registrant
By /s/Ted D. Kellner
Ted D. Kellner, Principal Executive Officer
Date November 13, 2009
Pursuant to the requirements of the Securities Exchange Act of 1934 and the Investment Company Act of 1940, this report has been signed below by the following persons on behalf of the registrant and in the capacities and on the dates indicated.
FMI Common Stock Fund, Inc.
Registrant
By /s/Ted D. Kellner
Ted D. Kellner, Principal Financial Officer
Date November 13, 2009