UNITED STATES
SECURITIES AND EXCHANGE COMMISSION
Washington, D.C. 20549
FORM N-CSR
CERTIFIED SHAREHOLDER REPORT OF REGISTERED
MANAGEMENT INVESTMENT COMPANIES
Investment Company Act file number
811-03235
FMI Common Stock Fund, Inc.
(Exact name of registrant as specified in charter)
100 East Wisconsin Avenue, Suite 2200
Milwaukee, WI 53202
(Address of principal executive offices) (Zip code)
Ted D. Kellner
Fiduciary Management, Inc.
100 East Wisconsin Avenue, Suite 2200
Milwaukee, WI 53202
(Name and address of agent for service)
(414) 226-4555
Registrant's telephone number, including area code:
Date of fiscal year end: September 30
Date of reporting period: September 30, 2008
Item 1. Reports to Stockholders.
ANNUAL REPORT
September 30, 2008
FMI
Common Stock
Fund, Inc.
A NO-LOAD
MUTUAL FUND
FMI
Common Stock
Fund, Inc.
October 1, 2008
Dear Fellow Shareholders:
The FMI Common Stock Fund was up 4.43% in the September quarter compared to a decline of 1.17% for the Russell 2000 Index. Stocks that detracted from performance included Bristow Group and Protective Life. Our significant underweight position in energy was a plus in the quarter, but Bristow, a supplier of helicopter services to the oil industry, still hurt. Protective Life’s stock declined due to their investment portfolio positions in firms such as Lehman and Washington Mutual. The company remains financially strong and we are still committed to both this stock and Bristow. Beacon Roofing, HNI Corp. and Family Dollar advanced strongly in the quarter after experiencing significant weakness in prior periods. Volatility remains very high in the small cap arena. The past several quarters have been difficult for stocks as investors grapple with a number of uncommon issues. The FMI Common Stock Fund has held its value better than the market in this tumultuous period. Volatile prices have also enabled us to take advantage of some good values, two of which we will discuss shortly.
The aftermath of the bursting of the speculative housing bubble turned downright ugly in the September quarter. It’s difficult to use the word chaotic in an investment letter, but unfortunately it describes the recent credit and equity markets. The Russell 2000, for example, was down 6.7% and up 3.3% on the last two days of the quarter. As recently as three months ago, it appeared that the credit crunch was more a media phrase than an economic reality, and manageable within the normal boundaries of our financial system. A rapid spreading of fear and diminished liquidity resulted in a bona fide credit crisis, which has culminated, so far, in the $613 billion bankruptcy of Lehman (largest ever), the “rescue” of Fannie Mae, Freddie Mac and AIG, the shotgun marriage of Merrill Lynch to Bank of America, and the Fed engineered takeovers of Washington Mutual and Wachovia. Goldman Sachs and Morgan Stanley recently obtained equity infusions and rushed to obtain a commercial bank charter (Wal-Mart has been trying for five years to get one; Goldman Sachs and Morgan Stanley got theirs in a day!)
As this letter is written (October 1), the $700 billion “bailout” bill remains hung up in Congress, but it looks like something will be passed shortly. As the program was initially crafted, we had serious reservations. Based on what we know now, it looks somewhat more palatable; however, the government could still end up buying a tremendous amount of paper with dubious value, which of course would result in a heavy burden on taxpayers. The optimists believe a large buyer will stabilize asset prices, which eventually could even lead to a profit for the Treasury. We are not holding our collective breaths. Aside from this program, taxpayers are already taking the brunt of the cost of the $30 billion Bear Stearns takeover, the $85 billion AIG seizure and the $200 billion Fannie Mae and Freddie Mac nationalizations.
Dozens of articles will be written in coming weeks about the financial crisis, the bailouts and who is to blame. The media has already framed this as a failure of the free market system, with the solution, of course, being more regulation. Several new programs and agencies have already been created and more will undoubtedly follow. These programs come with bureaucracy, expense, and the usual government inefficiency and we can’t help but fear that the cure may be worse than the disease. While rapid developments in high finance over the past decade have certainly exposed some holes in the regulatory system, the root of this
problem appears to be a breakdown of existing oversight and gross negligence on the part of Congress with respect to the government sponsored enterprises (Fannie Mae and Freddie Mac).
Allowing Fannie and Freddie to essentially underwrite, subsidize and invest in mortgages with the implied backing of the Federal government created the mother-of-all moral hazards. These organizations became obsolete years ago, as a large, well-financed and competitive private mortgage industry had developed. Rather than dismantle these institutions, Congress watched them expand, all the while feeding off their political largess. Under the banner of providing “affordable housing” their charters effectively expanded and the risks escalated dramatically. Efforts to rein them in were stymied. Wall Street then did what it does best – exploited an opportunity. With Fannie’s and Freddie’s imprimatur, the great Wall Street debt machine took flight. Aided by a feckless Fed (1% Fed Funds rate) and greed that resulted in a mad dash for yield and fees, underwriting became an afterthought. Huge leverage and impossible complexity compounded the issue and resulted in an enormous problem that now requires various government bailouts.
While some may accuse us of oversimplifying the issues, much of the crisis flows from the mortgage moral hazard described above. Adjunct developments, such as managing counter party risk in the $60 trillion credit derivative swaps market, ensuring liquidity in money market funds, and bolstering FDIC funding are all serious issues with no easy solutions. We’ve addressed a couple of these problems in previous letters and more will certainly be said in coming pieces. Our historical letters can be found at www.fmifunds.com.
Regardless of what role the government takes during this crisis, it will likely take years to sort out. A significant deleveraging is under way and this won’t be good for growth, although it may be needed to restore balance sheets and get the economy poised for the next up cycle. The Bernanke Fed is adamant about avoiding deflation, which often accompanies deleveraging. The Fed Chairman is acutely aware of the Japanese experience over the past seventeen years and doesn’t want it repeated here. Going overboard to avoid deflation, however, could result in the opposite: a dollar crisis and inflation (most likely stagflation), which would be tough on valuations.
Financial crises, while not common, have occurred many times in our history. We’ve survived all of them and there is little doubt we will get through this one, too. We remain optimistic about the long-term prospects of equity investing. Poor returns usually follow periods of outsized gains and the opposite is also true. Most of the indices have had a difficult run for the better part of a decade. We think the next decade will be better.
As is our custom, we have highlighted a couple of our small cap investments below.
JACK HENRY & ASSOCIATES, INC. (JKHY)
Description
Jack Henry & Associates is a leading provider of integrated computer systems and services. Over the years, the company has developed and acquired a number of strong banking and credit union software systems. Jack Henry’s revenues are primarily generated by marketing its systems to financial institutions in the U.S., providing conversion and implementation services, as well as ongoing support/services to customers either on an in-house or outsourced basis.
Good Business
| • | Jack Henry’s revenue stream is approximately 70% recurring in nature and diversified across more than 8,700 financial services organizations of all asset sizes. |
| • | Jack Henry’s core solutions are a necessity for its bank/credit union client base. |
| • | Jack Henry’s customer service is unparalleled in its industry and client retention is extremely high (99%). |
| • | The company earns solid returns on invested capital (ROIC). Jack Henry’s ROIC was 17.1% in fiscal year 2007 and has averaged 15.3% over the past five years. |
| • | The business generates solid free cash flow (FCF) and isn’t capital intensive. |
| • | Management has been using free cash to acquire bolt-on products, increase the dividend and execute share repurchases. |
| • | The balance sheet has virtually no leverage. |
Valuation
| • | Jack Henry’s shares trade approximately 30% below their all-time high reached in November 2007, and near the bottom of their 52-week range. Jack Henry has underperformed the Russell 2000 by 20% over the past five years. |
| • | The stock trades at 16.0x fiscal year 2009 consensus earnings per share (EPS), and offers a 6.8% FCF yield. |
| • | On an enterprise value-to-earnings before interest, taxes, depreciation and amortization (EV/EBITDA) multiple basis, Jack Henry’s shares trade for 7.1x fiscal year 2009 estimated EBITDA. The trailing 5-year average multiple is 12.4x. |
| • | From 1995-2007, the mean and median EV/EBITDA multiples on 16 comparable company transactions were 11.7x and 11.0x, respectively. |
Management
| • | Jack Henry’s CEO is Jack Prim. Jack has over 30 years of experience in the financial industry. |
| • | Positively, the CEO, CFO, and President receive incentive compensation based on operating income growth and ROIC. Insiders own 9.1% of diluted shares. |
| • | Overall, company management is highly respected in the industry. |
Investment Thesis
The current turmoil in the financial services industry is causing pressure on Jack Henry’s shares. Expected banking consolidation poses a threat to Jack Henry, as it may lead to turnover in its existing customer base. However, we believe that due to the company’s strong product offerings and customer service, the current market environment actually presents Jack Henry with the opportunity to strengthen its long-term competitive position.
CARLISLE COMPANIES INC. (CSL)
Description
Carlisle is a diversified manufacturer of products used across a broad range of industries including commercial roofing, lawn and garden, foodservice, and aerospace. The company largely serves the North American market, with the U.S. accounting for more than 90% of revenue.
Good Business
| • | Carlisle has leadership positions in niche markets, deriving approximately two-thirds of its sales from products where it is the number one or two player. |
| • | Roofing, a basic necessity, derives one-half of sales from replacement demand. Tires & wheels, wires & cables, and foodservice products are low-ticket items that similarly have a recurring component to their revenue stream. |
| • | ROIC easily covers the company’s cost of capital, and should improve over time as Carlisle focuses on organic growth, margin improvement, and reduces the working capital intensity of the business. |
| • | The new CEO is taking steps to simplify the story. |
| • | The company maintains a strong, flexible balance sheet, and generates significant cash flow. |
Valuation
| • | Carlisle has declined significantly from its high due to concerns regarding the potential for a significant contraction in the non-residential construction market. |
| • | The stock appears to reflect a great deal of weakness. Carlisle trades at more than one standard deviation below its long-term average on an EV/sales and EV/EBITDA basis. |
| • | Carlisle trades at a 35-40% discount to its peer group on a forward price-to-earnings (P/E) basis. |
| • | The stock could double over the next four to five years. |
Management
| • | Dave Roberts, 60, joined Carlisle as CEO in June 2007 following a successful six-year stint as CEO of Graco. |
| • | Roberts has hired executives to fortify what were underperforming businesses, and has reorganized the leadership. |
| • | Under Roberts’ leadership, the compensation plan has been changed to focus on quantitative factors such as organic growth, margin improvement, better cash management, and higher returns. |
Investment Thesis
This new CEO at the helm is looking to shape Carlisle into a more focused, higher-margin enterprise with improved cash flow-generating ability. Concern regarding the outlook for the non-residential construction market has provided us with an opportunity to establish a position in the stock.
Our Board of Directors has declared distributions effective October 30, 2008 of $0.058654 per share from net investment income, $0.18885 per share from short-term capital gains, which will be treated as ordinary income, and $0.78575 per share from net long-term capital gains, payable October 31, 2008, to shareholders of record on October 29, 2008.
Thank you for your support of the FMI Common Stock Fund.
Sincerely,
 |  |  |
| Ted D. Kellner, CFA | Donald S. Wilson, CFA | Patrick J. English, CFA |
| President and | Vice President | Vice President and |
| Portfolio Manager | | Portfolio Manager |
100 E. Wisconsin Ave., Suite 2200 • Milwaukee, WI 53202 • 414-226-4555
www.fmifunds.com
FMI Common Stock Fund, Inc.
COST DISCUSSION
As a shareholder of the Fund you incur ongoing costs, including management fees and other Fund expenses. You do not incur transaction costs such as sales charges (loads) on purchase payments, reinvested dividends, or other distributions; redemption fees; and exchange fees because the Fund does not charge these fees. This example is intended to help you understand your ongoing costs (in dollars) of investing in FMI Common Stock Fund and to compare these costs with the ongoing costs of investing in other mutual funds.
The example is based on an investment of $1,000 invested at the beginning of the period and held for the entire period from April 1, 2008 through September 30, 2008.
Industry Sectors as of September 30, 2008
Actual Expenses
The first line of the table below provides information about actual account values and actual expenses. You may use the information in this line, together with the amount you invested, to estimate the expenses that you paid over the period. Simply divide your account value by $1,000 (for example, an $8,600 account value divided by $1,000 = 8.6), then multiply the result by the number in the first line under the heading entitled “Expenses Paid During Period” to estimate the expenses you paid on your account during this period.
In addition to the costs highlighted and described below, the only Fund transaction costs you might currently incur would be wire fees ($15 per wire), if you choose to have proceeds from a redemption wired to your bank account instead of receiving a check. Additionally, U.S. Bank charges an annual processing fee ($15) if you maintain an IRA account with the Fund. To determine your total costs of investing in the Fund, you would need to add any applicable wire or IRA processing fees you’ve incurred during the period to the costs provided in the example at the end of this article.
Hypothetical Example for Comparison Purposes
The second line of the table below provides information about hypothetical account values and hypothetical expenses based on the Fund’s actual expense ratio and an assumed rate of return of 5% per year before expenses, which is not the Fund’s actual return. The hypothetical account values and expenses may not be used to estimate the actual ending account balance or expenses you paid for the period. You may use this information to compare the ongoing costs of investing in the Fund and other funds. To do so, compare this 5% hypothetical example with the 5% hypothetical examples that appear in the shareholder reports of the other funds.
Please note that the expenses shown in the table are meant to highlight your ongoing costs only and do not reflect any transactional costs, such as sales charges (loads), redemption fees or exchange fees. Therefore, the second line of the table is useful in comparing ongoing costs only, and will not help you determine the relative total costs of owning different funds. In addition, if these transactional costs were included, your costs would have been higher.
| | | Beginning | | | Ending | | | Expenses Paid | |
| | | Account | | | Account | | | During Period* | |
| | | Value 4/01/08 | | | Value 9/30/08 | | | 4/01/08-9/30/08 | |
| FMI Common Stock Fund Actual | | $ | 1,000.00 | | | $ | 1,020.20 | | | $ | 6.06 | |
| Hypothetical (5% return before expenses) | | $ | 1,000.00 | | | $ | 1,019.00 | | | $ | 6.05 | |
| * | Expenses are equal to the Fund’s annualized expense ratio of 1.20%, multiplied by the average account value over the period, multiplied by 183/366 (to reflect the one-half year period between April 1, 2008 and September 30, 2008). |
FMI Common Stock Fund, Inc.
MANAGEMENT’S DISCUSSION OF FUND PERFORMANCE
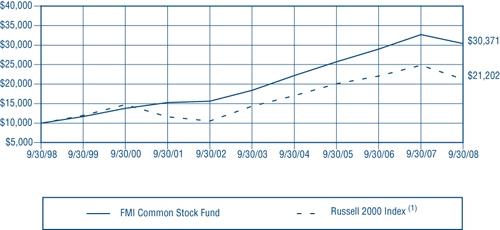
During the fiscal year ended September 30, 2008, the FMI Common Stock Fund had a total return of negative 7.00%. Transportation, Health Technology and Energy Materials contributed positive absolute results in the period. Underweight positions in Electronic Technology and Producer Manufacturing aided performance relative to the benchmark Russell 2000. JB Hunt, Watsco and Watson Wyatt were some of the strongest individual contributors. Imation, Pacer, Liz Claiborne and Ethan Allen were all sold during the fiscal year due to fundamental considerations. Watson Wyatt and Ruddick were sold due to valuation. Sectors detracting from performance included Finance, Consumer Durables and Consumer Services. Old Republic’s mortgage insurance operation hurt that stock significantly. Meredith declined sharply on economic fears. The Fund remained underweight Energy and Finance and overweight Retail Trade and Commercial Services. Worries about employment negatively affected MPS Group and G&K Services. Concerns about the economy and technology spending hurt Arrow Electronics. Overall, the Fund remains exposed to most of the major industrial sectors of the economy. The Russell 2000 returned negative 14.48% during the fiscal year, hurt primarily by a significant decline in Transportation, Retail and Technology Services. Given the substantial declines in the market, Fund management believes there are more attractive opportunities today than there were twelve months ago. The Fund continues to sell at a discount to the Russell 2000, based on most valuation measures. Over long time periods, lower valuation stocks have outperformed higher valuation stocks. Future results, however, may differ from the past.
| | COMPARISON OF CHANGE IN VALUE OF $10,000 INVESTMENT IN FMI COMMON STOCK FUND AND THE RUSSELL 2000 INDEX(1) | |
| | | | | | | |
| | | | Past performance does not predict future performance. The graph and the table do not reflect the deduction of taxes that a shareholder would pay on Fund distributions or the redemption of Fund shares. | | | |
| | (1) | The Russell 2000 Index measures the performance of the 2,000 smallest companies in the Russell 3000 Index, which comprises the 3,000 largest U.S. companies based on total market capitalization. | |
| AVERAGE ANNUAL TOTAL RETURN |
| 1-Year | 5-Year | 10-Year |
| -7.00% | 10.54% | 11.75% |
FMI Common Stock Fund, Inc.
STATEMENT OF ASSETS AND LIABILITIES
| ASSETS: | | | |
| Investments in securities, at value (cost $406,807,608) | | $ | 412,840,923 | |
| Receivable from shareholders for purchases | | | 6,098,560 | |
| Receivable from investments sold | | | 3,852,093 | |
| Dividends and interest receivable | | | 465,968 | |
| Total assets | | $ | 423,257,544 | |
| LIABILITIES: | | | | |
| Payable to brokers for securities purchased | | $ | 9,142,753 | |
| Payable to shareholders for redemptions | | | 1,926,862 | |
| Payable to adviser for management and administrative fees | | | 323,982 | |
| Other liabilities | | | 67,163 | |
| Total liabilities | | | 11,460,760 | |
| NET ASSETS: | | | | |
| Capital Stock, $0.01 par value; indefinite shares authorized; 19,424,292 shares outstanding | | | 388,453,712 | |
| Net unrealized appreciation on investments | | | 6,033,315 | |
| Accumulated net realized gain on investments | | | 15,905,714 | |
| Undistributed net investment income | | | 1,404,043 | |
| Net assets | | | 411,796,784 | |
| Total liabilities and net assets | | $ | 423,257,544 | |
| CALCULATION OF NET ASSET VALUE PER SHARE: | | | | |
| Net asset value, offering and redemption price per share ($411,796,784 ÷ 19,424,292 shares outstanding) | | $ | 21.20 | |
The accompanying notes to financial statements are an integral part of this statement.
SCHEDULE OF INVESTMENTS
| Shares | | | | Cost | | | Value | |
| COMMON STOCKS — 87.2% (a) | | | | | | |
| COMMERCIAL SERVICES SECTOR — 12.5% | | | | | | |
| | | Advertising/Marketing Services — 2.2% | | | | | | |
| | 887,900 | | Harte-Hanks, Inc. | | $ | 16,213,591 | | | $ | 9,207,523 | |
| | | | Miscellaneous Commercial Services — 1.8% | | | | | | | | |
| | 219,300 | | G & K Services, Inc. | | | 6,444,368 | | | | 7,247,865 | |
| | | | Personnel Services — 8.5% | | | | | | | | |
| | 617,700 | | AMN Healthcare | | | | | | | | |
| | | | Services, Inc.* | | | 12,788,105 | | | | 10,852,989 | |
| | 625,800 | | Korn/Ferry International* | | | 10,588,104 | | | | 11,151,756 | |
| | 1,306,100 | | MPS Group, Inc.* | | | 13,511,701 | | | | 13,165,488 | |
| | | | | | | 36,887,910 | | | | 35,170,233 | |
| CONSUMER SERVICES SECTOR — 2.9% | | | | | | | | |
| | | | Publishing: Books/Magazines — 1.9% | | | | | | | | |
| | 280,600 | | Meredith Corp. | | | 8,735,217 | | | | 7,868,024 | |
| | | | Restaurants — 1.0% | | | | | | | | |
| | 87,300 | | Chipotle Mexican | | | | | | | | |
| | | | Grill, Inc. Cl B* | | | 4,390,094 | | | | 4,081,275 | |
| DISTRIBUTION SERVICES SECTOR — 8.9% | | | | | | | | |
| | | | Electronics Distributors — 5.2% | | | | | | | | |
| | 458,100 | | Arrow Electronics, Inc.* | | | 10,077,504 | | | | 12,011,382 | |
| | 319,900 | | ScanSource, Inc.* | | | 8,053,563 | | | | 9,209,921 | |
| | | | | | | 18,131,067 | | | | 21,221,303 | |
| | | | Wholesale Distributors — 3.7% | | | | | | | | |
| | 569,500 | | Beacon Roofing | | | | | | | | |
| | | | Supply, Inc.* | | | 6,468,138 | | | | 8,895,590 | |
| | 133,300 | | United Stationers Inc.* | | | 5,486,613 | | | | 6,375,739 | |
| | | | | | | 11,954,751 | | | | 15,271,329 | |
| ELECTRONIC TECHNOLOGY SECTOR — 0.9% | | | | | | | | |
| | | | Electronic Production Equipment — 0.9% | | | | | | | | |
| | 213,700 | | ATMI, Inc.* | | | 4,137,683 | | | | 3,842,326 | |
| ENERGY MINERALS SECTOR — 1.5% | | | | | | | | |
| | | | Oil & Gas Production — 1.5% | | | | | | | | |
| | 174,800 | | St. Mary Land & | | | | | | | | |
| | | | Exploration Co. | | | 6,519,573 | | | | 6,231,620 | |
| FINANCE SECTOR — 13.1% | | | | | | | | |
| | | | Insurance Brokers/Services — 3.9% | | | | | | | | |
| | 621,900 | | Arthur J. | | | | | | | | |
| | | | Gallagher & Co. | | | 17,801,619 | | | | 15,957,954 | |
| | | | Investment Managers — 2.3% | | | | | | | | |
| | 114,275 | | Affiliated Managers | | | | | | | | |
| | | | Group, Inc.* | | | 10,287,248 | | | | 9,467,684 | |
| | | | Life/Health Insurance — 2.8% | | | | | | | | |
| | 408,200 | | Protective Life Corp. | | | 13,091,276 | | | | 11,637,782 | |
FMI Common Stock Fund, Inc.
SCHEDULE OF INVESTMENTS (Continued)
| Shares | | | | Cost | | | Value | |
| COMMON STOCKS — 87.2% (a) (Continued) | | | | | | |
| FINANCE SECTOR — 13.1% (Continued) | | | | | | |
| | | Property/Casualty Insurance — 2.9% | | | | | | |
| | 919,350 | | Old Republic | | | | | | |
| | | | International Corp. | | $ | 11,330,057 | | | $ | 11,721,712 | |
| | | | Regional Banks — 1.2% | | | | | | | | |
| | 246,500 | | Associated Banc-Corp | | | 3,880,738 | | | | 4,917,675 | |
| HEALTH TECHNOLOGY SECTOR — 2.6% | | | | | | | | |
| | | | Medical Specialties — 2.6% | | | | | | | | |
| | 68,100 | | Beckman Coulter, Inc. | | | 3,698,417 | | | | 4,834,419 | |
| | 122,000 | | West Pharmaceutical | | | | | | | | |
| | | | Services, Inc. | | | 4,704,247 | | | | 5,956,040 | |
| | | | | | | 8,402,664 | | | | 10,790,459 | |
| INDUSTRIAL SERVICES SECTOR — 5.8% | | | | | | | | |
| | | | Environmental Services — 2.7% | | | | | | | | |
| | 322,450 | | Waste Connections, Inc.* | | | 8,307,430 | | | | 11,060,035 | |
| | | | Oilfield Services/Equipment — 3.1% | | | | | | | | |
| | 187,000 | | Bristow Group, Inc.* | | | 7,142,417 | | | | 6,328,080 | |
| | 205,000 | | Dresser-Rand | | | | | | | | |
| | | | Group, Inc.* | | | 4,173,205 | | | | 6,451,350 | |
| | | | | | | 11,315,622 | | | | 12,779,430 | |
| PROCESS INDUSTRIES SECTOR — 8.9% | | | | | | | | |
| | | | Containers/Packaging — 4.8% | | | | | | | | |
| | 173,300 | | AptarGroup, Inc. | | | 2,439,418 | | | | 6,777,763 | |
| | 489,000 | | Bemis Company, Inc. | | | 12,921,863 | | | | 12,816,690 | |
| | | | | | | 15,361,281 | | | | 19,594,453 | |
| | | | Industrial Specialties — 4.1% | | | | | | | | |
| | 172,850 | | Cabot Microelectronics | | | | | | | | |
| | | | Corp.* | | | 5,590,882 | | | | 5,545,028 | |
| | 518,700 | | Valspar Corp. | | | 13,046,356 | | | | 11,561,823 | |
| | | | | | | 18,637,238 | | | | 17,106,851 | |
| PRODUCER MANUFACTURING SECTOR — 12.4% | | | | | | | | |
| | | | Building Products — 2.7% | | | | | | | | |
| | 223,200 | | Watsco, Inc. | | | 9,835,662 | | | | 11,222,496 | |
| | | | Electrical Products — 4.1% | | | | | | | | |
| | 81,300 | | Acuity Brands, Inc. | | | 1,916,040 | | | | 3,395,088 | |
| | 124,700 | | Littelfuse, Inc.* | | | 4,030,368 | | | | 3,707,331 | |
| | 459,200 | | Molex Inc. Cl A | | | 11,982,169 | | | | 9,555,952 | |
| | | | | | | 17,928,577 | | | | 16,658,371 | |
| | | | Industrial Machinery — 1.0% | | | | | | | | |
| | 137,350 | | IDEX Corp. | | | 1,701,776 | | | | 4,260,597 | |
| | | | Miscellaneous Manufacturing — 1.6% | | | | | | | | |
| | 220,700 | | Carlisle Companies Inc. | | | 6,673,698 | | | | 6,614,379 | |
| | | | Office Equipment/Supplies — 3.0% | | | | | | | | |
| | 486,000 | | HNI Corp. | | | 12,371,673 | | | | 12,315,240 | |
| RETAIL TRADE SECTOR — 8.1% | | | | | | | | |
| | | | Discount Stores — 2.5% | | | | | | | | |
| | 423,700 | | Family Dollar | | | | | | | | |
| | | | Stores, Inc. | | | 8,620,203 | | | 10,041,690 | |
| | | | Food Retail — 1.6% | | | | | | | | |
| | 481,400 | | Winn-Dixie Stores, Inc.* | | | 8,091,484 | | | | 6,691,460 | |
| | | | Specialty Stores — 4.0% | | | | | | | | |
| | 305,300 | | Group 1 Automotive, Inc. | | | 6,854,267 | | | | 6,634,169 | |
| | 400,900 | | PetSmart, Inc. | | | 11,931,134 | | | | 9,906,239 | |
| | | | | | | 18,785,401 | | | | 16,540,408 | |
| TECHNOLOGY SERVICES SECTOR — 7.2% | | | | | | | | |
| | | | Data Processing Services — 2.5% | | | | | | | | |
| | 182,100 | | DST Systems, Inc.* | | | 12,097,238 | | | | 10,195,779 | |
| | | | Information Technology Services — 4.7% | | | | | | | | |
| | 406,600 | | Jack Henry & | | | | | | | | |
| | | | Associates, Inc. | | | 8,534,607 | | | | 8,266,178 | |
| | 632,500 | | Perot Systems Corp.* | | | 9,955,715 | | | | 10,973,875 | |
| | | | | | | 18,490,322 | | | | 19,240,053 | |
| TRANSPORTATION SECTOR — 2.4% | | | | | | | | |
| | | | Trucking — 2.4% | | | | | | | | |
| | 298,200 | | Hunt (J.B.) Transport | | | | | | | | |
| | | | Services, Inc. | | | 6,448,164 | | | | 9,950,934 | |
| | | | Total common stocks | | | 352,873,625 | | | | 358,906,940 | |
| SHORT-TERM INVESTMENTS — 13.1% (a) | | | | | | | | |
| Commercial Paper — 8.7% | | | | | | | | |
| $ | 18,000,000 | | General Electric Capital | | | | | | | | |
| | | | Corp., 1.65%-1.90%, | | | | | | | | |
| | | | due 10/02/08 | | | 17,999,140 | | | | 17,999,140 | |
| | 18,000,000 | | JP Morgan Chase | | | | | | | | |
| | | | & Co., 1.85%, | | | | | | | | |
| | | | due 10/02/08 | | | 17,999,075 | | | | 17,999,075 | |
| | | | Total commercial paper | | | 35,998,215 | | | | 35,998,215 | |
| Variable Rate Demand Note — 4.4% | | | | | | | | |
| | 17,935,768 | | U.S. Bank, N.A., 3.68% | | | 17,935,768 | | | | 17,935,768 | |
| | | | Total short-term | | | | | | | | |
| | | | investments | | | 53,933,983 | | | | 53,933,983 | |
| | | | Total investments — | | | | | | | | |
| | | | 100.3% | | $ | 406,807,608 | | | | 412,840,923 | |
| | | | Liabilities, less cash and | | | | | | | | |
| | | | receivables — (0.3%) (a) | | | | | | | (1,044,139 | ) |
| | | | TOTAL NET | | | | | | | | |
| | | | ASSETS — 100.0% | | | | | | $ | 411,796,784 | |
| * | | Non-income producing security. |
| (a) | | Percentages for the various classifications relate to net assets. |
The accompanying notes to financial statements are an integral part of this schedule.
FMI Common Stock Fund, Inc.
STATEMENT OF OPERATIONS
For the Year Ended September 30, 2008
| INCOME: | | | |
| Dividends | | $ | 5,909,090 | |
| Interest | | | 430,987 | |
| Total income | | | 6,340,077 | |
| EXPENSES: | | | | |
| Management fees | | | 4,057,973 | |
| Transfer agent fees | | | 363,435 | |
| Administrative and accounting services | | | 217,899 | |
| Custodian fees | | | 86,429 | |
| Printing and postage expense | | | 47,588 | |
| Professional fees | | | 45,344 | |
| Registration fees | | | 43,098 | |
| Board of Directors fees | | | 31,300 | |
| Insurance expense | | | 25,520 | |
| Other expenses | | | 17,411 | |
| Total expenses | | | 4,935,997 | |
| NET INVESTMENT INCOME | | | 1,404,080 | |
| NET REALIZED GAIN ON INVESTMENTS | | | 19,288,248 | |
| NET DECREASE IN UNREALIZED APPRECIATION ON INVESTMENTS | | | (56,336,476 | ) |
| NET LOSS ON INVESTMENTS | | | (37,048,228 | ) |
| NET DECREASE IN NET ASSETS RESULTING FROM OPERATIONS | | $ | (35,644,148 | ) |
STATEMENTS OF CHANGES IN NET ASSETS
For the Years Ended September 30, 2008 and 2007
| | | 2008 | | | 2007 | |
| OPERATIONS: | | | | | | |
| Net investment income | | $ | 1,404,080 | | | $ | 1,505,343 | |
| Net realized gain on investments | | | 19,288,248 | | | | 66,293,913 | |
| Net decrease in unrealized appreciation on investments | | | (56,336,476 | ) | | | (8,888,380 | ) |
| Net (decrease) increase in net assets from operations | | | (35,644,148 | ) | | | 58,910,876 | |
| DISTRIBUTIONS TO SHAREHOLDERS: | | | | | | | | |
| Distributions from net investment income ($0.0838 and $0.0741 per share, respectively) | | | (1,505,374 | ) | | | (1,293,547 | ) |
| Distributions from net realized gains ($3.6644 and $2.9665 per share, respectively) | | | (66,149,992 | ) | | | (52,093,185 | ) |
| Total distributions | | | (67,655,366 | ) | | | (53,386,732 | ) |
| FUND SHARE ACTIVITIES: | | | | | | | | |
| Proceeds from shares issued (3,820,664 and 1,876,289 shares, respectively) | | | 83,226,514 | | | | 50,284,805 | |
| Net asset value of shares issued in distributions reinvested | | | | | | | | |
| (2,878,822 and 2,070,712 shares, respectively) | | | 64,977,258 | | | | 51,540,070 | |
| Cost of shares redeemed (5,763,498 and 2,938,288 shares, respectively) | | | (125,122,688 | ) | | | (78,311,570 | ) |
| Net increase in net assets derived from Fund share activities | | | 23,081,084 | | | | 23,513,305 | |
| TOTAL (DECREASE) INCREASE | | | (80,218,430 | ) | | | 29,037,449 | |
| NET ASSETS AT THE BEGINNING OF THE YEAR | | | 492,015,214 | | | | 462,977,765 | |
| NET ASSETS AT THE END OF THE YEAR (Includes undistributed | | | | | | | | |
| net investment income of $1,404,043 and $1,505,337, respectively) | | $ | 411,796,784 | | | $ | 492,015,214 | |
The accompanying notes to financial statements are an integral part of these statements.
FMI Common Stock Fund, Inc.
FINANCIAL HIGHLIGHTS
(Selected data for each share of the Fund outstanding throughout each year)
| | | Years Ended September 30, | |
| | | 2008 | | | 2007 | | | 2006 | | | 2005 | | | 2004 | |
| PER SHARE OPERATING PERFORMANCE: | | | | | | | | | | | | | | | |
| Net asset value, beginning of year | | $ | 26.61 | | | $ | 26.49 | | | $ | 26.58 | | | $ | 24.08 | | | $ | 20.47 | |
| Income from investment operations: | | | | | | | | | | | | | | | | | | | | |
| Net investment income (loss) | | | 0.08 | | | | 0.08 | | | | 0.09 | | | | (0.02 | ) | | | (0.08 | ) |
| Net realized and unrealized | | | | | | | | | | | | | | | | | | | | |
| (loss) gains on investments | | | (1.74 | ) | | | 3.08 | | | | 2.79 | | | | 3.73 | | | | 4.17 | |
| Total from investment operations | | | (1.66 | ) | | | 3.16 | | | | 2.88 | | | | 3.71 | | | | 4.09 | |
| Less distributions: | | | | | | | | | | | | | | | | | | | | |
| Distributions from net investment income | | | (0.08 | ) | | | (0.07 | ) | | | (0.02 | ) | | | — | | | | — | |
| Distributions from net realized gains | | | (3.67 | ) | | | (2.97 | ) | | | (2.95 | ) | | | (1.21 | ) | | | (0.48 | ) |
| Total from distributions | | | (3.75 | ) | | | (3.04 | ) | | | (2.97 | ) | | | (1.21 | ) | | | (0.48 | ) |
| Net asset value, end of year | | $ | 21.20 | | | $ | 26.61 | | | $ | 26.49 | | | $ | 26.58 | | | $ | 24.08 | |
| TOTAL RETURN | | | (7.00% | ) | | | 12.81% | | | | 12.62% | | | | 16.11% | | | | 20.33% | |
| RATIOS/SUPPLEMENTAL DATA: | | | | | | | | | | | | | | | | | | | | |
| Net assets, end of year (in 000’s $) | | | 411,797 | | | | 492,015 | | | | 462,978 | | | | 440,669 | | | | 400,864 | |
| Ratio of expenses to average net assets | | | 1.22% | | | | 1.20% | | | | 1.21% | | | | 1.21% | | | | 1.23% | |
| Ratio of net investment income (loss) | | | | | | | | | | | | | | | | | | | | |
| to average net assets | | | 0.35% | | | | 0.30% | | | | 0.35% | | | | (0.06% | ) | | | (0.33% | ) |
| Portfolio turnover rate | | | 40% | | | | 50% | | | | 38% | | | | 34% | | | | 39% | |
The accompanying notes to financial statements are an integral part of this statement.
NOTES TO FINANCIAL STATEMENTS
| (1) | Summary of Significant Accounting Policies — |
| | The following is a summary of significant accounting policies of the FMI Common Stock Fund, Inc. (the “Fund”), which is registered as a diversified, open-end management investment company under the Investment Company Act of 1940, as amended. The Fund was incorporated under the laws of Wisconsin on July 29, 1981. The investment objective of the Fund is to produce long-term capital appreciation principally through investing in common stocks. |
| (a) | Each security, excluding short-term investments, is valued at the last sale price reported by the principal security exchange on which the issue is traded. Securities that are traded on the Nasdaq Markets are valued at the Nasdaq Official Closing Price or if no sale is reported, the latest bid price. Securities which are traded over-the-counter are valued at the latest bid price. Securities for which quotations are not readily available are valued at fair value as determined by the investment adviser under the supervision of the Board of Directors. The fair value of a security is the amount which the Fund might reasonably expect to receive upon a current sale. The fair value of a security may differ from the last quoted price and the Fund may not be able to sell a security at the fair value. Market quotations may not be available, for example, if trading in particular securities was halted during the day and not resumed prior to the close of trading on the New York Stock Exchange. Variable rate demand notes are recorded at par value which approximates market value. Short-term investments with maturities of 60 days or less are valued at amortized cost, which approximates value. For financial reporting purposes, investment transactions are recorded on the trade date. |
| | In September 2006, the Financial Accounting Standards Board (“FASB”) issued Statement of Financial Accounting Standards (“SFAS”) No. 157, “Fair Value Measurements.” This standard establishes a single authoritative definition of fair value, sets out a framework for measuring fair value and requires additional disclosures about fair value measurements. SFAS No. 157 applies to fair value measurements already required or permitted by existing standards. |
FMI Common Stock Fund, Inc.
NOTES TO FINANCIAL STATEMENTS (Continued)
| (1) | Summary of Significant Accounting Policies — (Continued) |
| | SFAS No. 157 is effective for financial statements issued for fiscal years beginning after November 15, 2007 and interim periods within those fiscal years. The changes to current generally accepted accounting principles from the application of this standard relate to the definition of fair value, the methods used to measure fair value, and the expanded disclosures about fair value measurements. The adoption of SFAS No. 157 will not impact the financial statement amounts; however, additional disclosures will be required regarding the inputs used to develop the measurements and the effect of certain of the measurements included within the Statement of Operations. |
| (b) | Net realized gains and losses on sales of securities are computed on the identified cost basis. |
| (c) | Dividend income is recorded on the ex-dividend date. Interest income is recorded on an accrual basis. |
| (d) | The Fund has investments in short-term variable rate demand notes, which are unsecured instruments. The Fund may be susceptible to credit risk with respect to these notes to the extent the issuer defaults on its payment obligation. The Fund’s policy is to monitor the creditworthiness of the issuer and nonperformance by these issuers is not anticipated. |
| (e) | Accounting principles generally accepted in the United States of America (“GAAP”) require that permanent differences between income for financial reporting and tax purposes be reclassified in the capital accounts. |
| (f) | The preparation of financial statements in conformity with GAAP requires management to make estimates and assumptions that affect the reported amounts of assets and liabilities and disclosure of contingent assets and liabilities at the date of the financial statements and the reported amounts of revenues and expenses during the reporting period. Actual results could differ from these estimates. |
| (g) | No provision has been made for Federal income taxes since the Fund has elected to be taxed as a “regulated investment company” and intends to distribute substantially all net investment company taxable income and net capital gains to its shareholders and otherwise comply with the provisions of the Internal Revenue Code applicable to regulated investment companies. |
| (h) | Effective March 31, 2008, the Fund adopted FASB Interpretation No. 48 (FIN 48), “Accounting for Uncertainty in Income Taxes”. FIN 48 requires the evaluation of tax positions taken on previously filed tax returns or expected to be taken on future returns. These positions must meet a “more-likely-than-not” standard that, based on the technical merits, have a more than fifty percent likelihood of being sustained upon examination. In evaluating whether a tax position has met the recognition threshold, the Fund must presume that the position will be examined by the appropriate taxing authority that has full knowledge of all relevant information. Tax positions not deemed to meet the “more-likely-than-not” threshold are recorded as a tax expense in the current year. |
| | FIN 48 requires the Fund to analyze all open tax years, as defined by the Statute of Limitations, for all major jurisdictions. Open tax years are those that are open for exam by taxing authorities. Major jurisdictions for the Fund include Federal and the state of Wisconsin. As of September 30, 2008, open Federal and Wisconsin tax years include the tax years ended September 30, 2005 through 2008. The Fund has no examinations in progress. |
| | The Fund has reviewed all open tax years and major jurisdictions and concluded that the adoption of FIN 48 resulted in no effect to the Fund’s financial position or results of operations. There is no tax liability resulting from unrecognized tax benefits relating to uncertain income tax positions taken or expected to be taken on the tax return for the fiscal year-end September 30, 2008. The Fund is also not aware of any tax positions for which it is reasonably possible that the total amounts of unrecognized tax benefits will significantly change in the next twelve months. |
FMI Common Stock Fund, Inc.
NOTES TO FINANCIAL STATEMENTS (Continued)
| (2) | Investment Adviser and Management Agreement and Transactions With Related Parties — |
| | The Fund has a management agreement with Fiduciary Management, Inc. (“FMI”), with whom certain officers and directors of the Fund are affiliated, to serve as investment adviser and manager. Under the terms of the agreement, the Fund will pay FMI a monthly management fee at the annual rate of 1% of the daily net assets of the Fund. The Fund has an administrative agreement with FMI to supervise all aspects of the Fund’s operations except those performed by FMI pursuant to the management agreement. Under the terms of the agreement, the Fund will pay FMI a monthly administrative fee at the annual rate of 0.1% of the daily net assets up to and including $30,000,000 and 0.05% of the daily net assets of the Fund in excess of $30,000,000. |
| Under the management agreement, FMI will reimburse the Fund for expenses over 1.3% of the daily net assets of the Fund. No such reimbursements were required for the year ended September 30, 2008. |
| | Under the Fund’s organizational documents, each Director, officer, employee or other agent of the Fund (including the Fund’s investment manager) is indemnified, to the extent permitted by the Act, against certain liabilities that may arise out of performance of their duties to the Fund. Additionally, in the normal course of business, the Fund enters into contracts that contain a variety of indemnification clauses. The Fund’s maximum exposure under these arrangements is unknown as this would involve future claims that may be made against the Fund that have not yet occurred. However, the Fund has not had prior claims or losses pursuant to these contracts and believes the risk of loss to be remote. |
| U.S. Bank, N.A. has made available to the Fund a $17,600,000 credit facility pursuant to a Credit Agreement (“Agreement”) effective July 14, 2008 for the purposes of having cash available to satisfy redemption requests. Principal and interest of such loan under the Agreement are due not more than 31 days after the date of the loan. Amounts under the credit facility bear interest at a rate per annum equal to the current prime rate minus one on the amount borrowed. Advances will be collateralized by securities owned by the Fund. During the year ended September 30, 2008, the Fund did not borrow against the Agreement. The Credit Agreement expires on June 5, 2009. |
| (4) | Distributions to Shareholders — |
| | Net investment income and net realized gains, if any, are distributed to shareholders at least annually. On October 30, 2008, the Fund declared distributions of $1,404,043 from net investment income ($0.058654 per share), $4,520,462 from net short-term realized gains ($0.18885 per share) and $18,809,213 from long-term realized gains ($0.78575 per share). The distributions will be paid on October 31, 2008 to shareholders of record on October 29, 2008. |
| (5) | Investment Transactions — |
| | For the year ended September 30, 2008, purchases and proceeds of sales of investment securities (excluding short-term investments) were $156,660,300 and $229,833,715, respectively. |
| (6) | Income Tax Information — |
| The following information for the Fund is presented on an income tax basis as of September 30, 2008: |
| | | Gross | | Gross | | Net Unrealized | | Distributable | | Distributable |
| Cost of | | Unrealized | | Unrealized | | Appreciation | | Ordinary | | Long-Term |
| Investments | | Appreciation | | Depreciation | | on Investments | | Income | | Capital Gains |
| $406,822,709 | | $38,713,137 | | $32,694,923 | | $6,018,214 | | $5,924,505 | | $18,809,213 |
| The difference between the cost amount for financial statement and federal income tax purposes is due primarily to timing differences in recognizing certain gains and losses on security transactions. For the fiscal year ended September 30, 2008, the Fund had $7,408,862 of post-30 wash sale loss deferrals that will increase the tax cost basis of securities acquired during the fiscal year ending September 30, 2009. |
FMI Common Stock Fund, Inc.
NOTES TO FINANCIAL STATEMENTS (Continued)
| (6) | Income Tax Information — (Continued) |
| | The tax components of dividends paid during the years ended September 30, 2008 and 2007, capital loss carryovers, which may be used to offset future capital gains, subject to Internal Revenue Code limitations, as of September 30, 2008, and tax basis post-October losses as of September 30, 2008, which are not recognized for tax purposes until the first day of the following fiscal year are: |
| September 30, 2008 | | September 30, 2007 |
| Ordinary | | Long-Term | | Net Capital | | | | Ordinary | | Long-Term |
| Income | | Capital Gains | | Loss | | Post-October | | Income | | Capital Gains |
| Distributions | | Distributions | | Carryovers | | Losses | | Distributions | | Distributions |
| $18,511,918 | | $49,143,448 | | $— | | $— | | $11,262,611 | | $42,124,121 |
| For corporate shareholders of the Fund, the percentage of dividend income distributed for the year ended September 30, 2008 which is designated as qualifying for the dividends received deduction is 36% (unaudited). |
| | For all shareholders of the Fund, the percentage of dividend income distributed for the year ended September 30, 2008 which is designated as qualified dividend income under the Jobs and Growth Tax Relief Act of 2003, is 36% (unaudited). |
REPORT OF INDEPENDENT REGISTERED PUBLIC ACCOUNTING FIRM
To the Board of Directors and Shareholders
of FMI Common Stock Fund, Inc.
In our opinion, the accompanying statement of assets and liabilities, including the schedule of investments, and the related statements of operations and of changes in net assets and the financial highlights present fairly, in all material respects, the financial position of FMI Common Stock Fund, Inc. (the “Fund”) at September 30, 2008, the results of its operations for the year then ended, the changes in its net assets for each of the two years in the period then ended and the financial highlights for each of the five years in the period then ended, in conformity with accounting principles generally accepted in the United States of America. These financial statements and financial highlights (hereafter referred to as “financial statements”) are the responsibility of the Fund’s management; our responsibility is to express an opinion on these financial statements based on our audits. We conducted our audits of these financial statements in accordance with the standards of the Public Company Accounting Oversight Board (United States). Those standards require that we plan and perform the audit to obtain reasonable assurance about whether the financial statements are free of material misstatement. An audit includes examining, on a test basis, evidence supporting the amounts and disclosures in the financial statements, assessing the accounting principles used and significant estimates made by management, and evaluating the overall financial statement presentation. We believe that our audits, which included confirmation of securities at September 30, 2008 by correspondence with the custodian and brokers, provide a reasonable basis for our opinion.

Milwaukee, Wisconsin
October 30, 2008
FMI Common Stock Fund, Inc.
DIRECTORS AND OFFICERS
| | | Term of | Principal | # of Funds | Other |
| | Position | Office and | Occupation(s) | in Complex | Directorships |
| Name, Age | Held with | Length of | During Past | Overseen | Held by |
| and Address | the Fund | Time Served | Five Years | by Director | Director |
| Non-Interested Directors | | | | | |
| Barry K. Allen, 60 | Director | Indefinite Term | Mr. Allen is President of Allen | 4 | Harley-Davidson, |
| c/o Fiduciary | | Since 1996 | Enterprises, LLC (Brookfield, WI) a | | Inc., FMI Funds, |
| Management, Inc. | | | private equity investments management | | Inc. and |
| 100 E. Wisconsin Ave. | | | company, and Senior Advisor for | | FMI Mutual Funds, |
| Suite 2200 | | | Providence Equity Partners (Providence, | | Inc. |
| Milwaukee, WI 53202 | | | RI) since September 2007. He was | | |
| | | | Executive Vice President of Qwest | | |
| | | | Communications International, Inc. | | |
| | | | (Denver, CO) from September 2002 to | | |
| | | | June 2007. | | |
| Robert C. Arzbaecher, 48 | Director | Indefinite Term | Mr. Arzbaecher is President and | 4 | Actuant Corporation, |
| c/o Fiduciary | | Since 2007 | Chief Executive Officer of Actuant | | CF Industries |
| Management, Inc. | | | Corporation (Butler, WI), a | | Holdings, Inc., |
| 100 E. Wisconsin Ave. | | | manufacturer of a broad range of | | FMI Funds, Inc. |
| Suite 2200 | | | industrial products and systems, and | | and FMI Mutual |
| Milwaukee, WI 53202 | | | the Chairman of the Board of Directors | | Funds, Inc. |
| | | | of Actuant Corporation. | | |
| George D. Dalton, 80 | Director | Indefinite Term | Mr. Dalton is Chairman and Chief | 4 | FMI Funds, Inc. |
| c/o Fiduciary | | Since 1997 | Executive Officer of NOVO1 | | and FMI Mutual |
| Management, Inc. | | | (Waukesha, WI) a privately held | | Funds, Inc. |
| 100 E. Wisconsin Ave. | | | company specializing in teleservices | | |
| Suite 2200 | | | call centers since January 2000. | | |
Milwaukee, WI 53202 | | | | | |
| Gordon H. | Director | Indefinite Term | Mr. Gunnlaugsson retired from M&I | 4 | Renaissance Learning |
| Gunnlaugsson, 64 | | Since 2001 | Corporation (Milwaukee, WI) | | Systems, Inc., FMI |
| c/o Fiduciary | | | in December 2000. | | Funds, Inc. and FMI |
| Management, Inc. | | | | | Mutual Funds, Inc. |
| 100 E. Wisconsin Ave. | | | | | |
| Suite 2200 | | | | | |
Milwaukee, WI 53202 | | | | | |
| Paul S. Shain, 45 | Director | Indefinite Term | Mr. Shain is Senior Vice President of | 4 | FMI Funds, Inc. and |
| c/o Fiduciary | | Since 2001 | CDW Corporation (Vernon Hills, IL) | | FMI Mutual Funds, |
| Management, Inc. | | | and Chief Executive Officer of CDW | | Inc. |
| 100 E. Wisconsin Ave. | | | Berbee (f/k/a/ Berbee Information | | |
| Suite 2200 | | | Networks Corporation), a strategic | | |
| Milwaukee, WI 53202 | | | business unit of CDW Corporation. | | |
| | | | CDW Berbee is a leading provider of | | |
| | | | Information Technology Services | | |
| | | | including unified communications, | | |
| | | | infrastructure integration, and hosting | | |
| | | | and managed services. He has been | | |
| | | | employed by such firm in various | | |
| | | | capacities since January 2000. | | |
FMI Common Stock Fund, Inc.
DIRECTORS AND OFFICERS (Continued)
| | | | | | Other |
| | | Term of | Principal | # of Funds | Directorships |
| | Position | Office and | Occupation(s) | in Complex | Held by |
| Name, Age | Held with | Length of | During Past | Overseen | Director |
| and Address | the Fund | Time Served | Five Years | by Director | or Officer |
| Interested Directors | | | | | |
| Patrick J. English,* 47 | Director | Indefinite Term | Mr. English is President of Fiduciary | 3 | FMI Funds, Inc. |
| c/o Fiduciary | | Since 1997 | Management, Inc. and has been employed | | |
| Management, Inc. | Vice | One Year Term | by the Adviser in various capacities | | |
| 100 E. Wisconsin Ave. | President | Since 1996 | since December, 1986. | | |
| Suite 2200 | | | | | |
Milwaukee, WI 53202 | | | | | |
| Ted D. Kellner,* 62 | Director | Indefinite Term | Mr. Kellner is Chairman of the Board | 3 | Marshall & Ilsley |
| c/o Fiduciary | | Since 1981 | and Chief Executive Officer of Fiduciary | | Corporation, |
| Management, Inc. | President | One Year Term | Management, Inc. which he co-founded | | Metavante |
| 100 E. Wisconsin Ave. | and | Since 1981 | in 1980. | | Technologies, Inc. |
| Suite 2200 | Treasurer | | | | and FMI Funds, Inc. |
Milwaukee, WI 53202 | | | | | |
| Donald S. Wilson,* 65 | Director | Indefinite Term | Mr. Wilson is Vice Chairman, Treasurer | 2 | FMI Mutual Funds, |
| c/o Fiduciary | | Since 1981 | and Chief Compliance Officer of | | Inc. |
| Management, Inc. | Vice | One Year Term | Fiduciary Management, Inc. | | |
| 100 E. Wisconsin Ave. | President | Since 1981 | which he co-founded in 1980. | | |
| Suite 2200 | and | | | | |
| Milwaukee, WI 53202 | Secretary | | | | |
| Other Officers | | | | | |
| Kathleen M. Lauters, 56 | Chief | At Discretion | Ms. Lauters is the Fund’s Chief | N/A | None |
| c/o Fiduciary | Compliance | of Board | Compliance Officer since September 2004. | | |
| Management, Inc. | Officer | Since 2004 | From June 1995 to September 2004 Ms. | | |
| 100 E. Wisconsin Ave. | | | Lauters was employed by Strong Capital | | |
| Suite 2200 | | | Management, most recently as Senior | | |
| Milwaukee, WI 53202 | | | Compliance Analyst. | | |
| Camille F. Wildes, 56 | Vice | One Year Term | Ms. Wildes is Vice-President of | N/A | None |
| c/o Fiduciary | President | Since 1999 | Fiduciary Management, Inc. and has | | |
| Management, Inc. | and | | been employed by the Adviser in various | | |
| 100 E. Wisconsin Ave. | Assistant | | capacities since December, 1982. | | |
| Suite 2200 | Treasurer | | | | |
| Milwaukee, WI 53202 | | | | | |
__________
| * | Messrs. English, Kellner and Wilson are interested directors of the Fund because they are officers of the Fund and the Adviser. |
For additional information about the Directors and Officers or for a description of the policies and procedures that the Fund uses to determine how to vote proxies relating to portfolio securities, please call (800) 811-5311 and request a Statement of Additional Information. One will be mailed to you free of charge. The Statement of Additional Information is also available on the website of the Securities and Exchange Commission (the “Commission”) at http://www.sec.gov. Information on how the Fund voted proxies relating to portfolio securities is available on the Fund’s website at http://www.fmifunds.com or the website of the Commission no later than August 31 for the prior 12 months ending June 30. The Fund files its complete schedule of portfolio holdings with the Commission for the first and third quarters of each fiscal year on Form N-Q. The Fund’s Form N-Q is available on the Commission’s website. The Fund’s Form N-Q may be reviewed and copied at the Commission’s Public Reference Room in Washington, D.C., and that information on the operation of the Public Reference Room may be obtained by calling 1-800-SEC-0330.
FMI Common Stock Fund, Inc.
100 East Wisconsin Avenue, Suite 2200
Milwaukee, Wisconsin 53202
www.fmifunds.com
414-226-4555
BOARD OF DIRECTORS
BARRY K. ALLEN
ROBERT C. ARZBAECHER
GEORGE D. DALTON
PATRICK J. ENGLISH
GORDON H. GUNNLAUGSSON
TED D. KELLNER
PAUL S. SHAIN
DONALD S. WILSON
INVESTMENT ADVISER
AND ADMINISTRATOR
FIDUCIARY MANAGEMENT, INC.
100 East Wisconsin Avenue, Suite 2200
Milwaukee, Wisconsin 53202
TRANSFER AGENT AND
DIVIDEND DISBURSING AGENT
U.S. BANCORP FUND SERVICES, LLC
615 East Michigan Street
Milwaukee, Wisconsin 53202
800-811-5311
or
414-765-4124
CUSTODIAN
U.S. BANK, N.A.
1555 North RiverCenter Drive, Suite 302
Milwaukee, Wisconsin 53212
INDEPENDENT REGISTERED PUBLIC ACCOUNTING FIRM
PRICEWATERHOUSECOOPERS LLP
100 East Wisconsin Avenue, Suite 1800
Milwaukee, Wisconsin 53202
LEGAL COUNSEL
FOLEY & LARDNER LLP
777 East Wisconsin Avenue
Milwaukee, Wisconsin 53202
This report is not authorized for use as an offer of sale or a solicitation of an offer to buy shares of FMI Common Stock Fund unless accompanied or preceded by the Fund’s current prospectus. Performance data quoted represents past performance; past performance does not guarantee future results. The investment return and principal value of an investment will fluctuate so that an investor’s shares, when redeemed, may be worth more or less than their original cost. Current performance of the Fund may be lower or higher than the performance quoted. Performance data current to the most recent month end may be obtained by visiting www.fmifunds.com.
Item 2. Code of Ethics.
Registrant has adopted a code of ethics. See attached Exhibit 12 (a).
Item 3. Audit Committee Financial Expert.
Registrant’s Board of Directors has determined that Mr. Gordon Gunnlaugsson, a member of its audit committee, is an audit committee financial expert. Mr. Gunnlaugsson is “independent” as such term is defined in Form N-CSR.
Item 4. Principal Accountant Fees and Services.
(a) Audit Fees
$19,143 (FY 2008) and $17,116 (FY 2007) are the aggregate fees billed for each of the last two fiscal years for professional services rendered by the principal accountant to the registrant for the audit of the registrant’s annual financial statements or services that are normally provided by the accountant in connection with statutory and regulatory filings or engagements for those fiscal years.
(b) Audit-Related Fees
There were no fees billed in each of the last two fiscal years for Audit-Related Fees.
$0 (FY 2008) and $6,150 (FY 2007) are the aggregate fees billed in each of the last two fiscal years for professional services rendered by the principal accountant to the registrant for tax compliance, tax advice, tax planning and tax return preparation.
There were no fees billed in each of the last two fiscal years for professional services rendered by the principal accountant to registrant’s investment adviser for tax compliance, tax advice and tax planning that were required to be approved by the audit committee pursuant to paragraph (c)(7)(ii) of Rule 2-01 of Regulation S-X.
(d) All Other Fees
There were no fees billed in each of the last two fiscal years for products and services provided by the principal accountant to the registrant, other than the services reported in paragraphs (a) – (c) of this Item 4.
There were no fees billed in each of the last two fiscal years for products and services provided by the principal accountant to registrant’s investment adviser, which were required to be approved by the audit committee pursuant to paragraph (c)(7)(ii) or Rule 2-01 or Regulation S-X.
(e) (1) None
(e) (2) None
(f) Not applicable.
(g) See the tax fees disclosed in paragraph (c) of this Item 4.
(h) Not applicable, as no non-audit services were provided to registrant’s investment adviser.
Item 5. Audit Committee of Listed Registrants.
Not applicable.
Item 6. Schedule of Investments.
The schedule of investments in securities of unaffiliated issuers is included as part of the report to shareholders filed under Item 1.
(a) Not applicable.
(b) None
Item 7. Disclosure of Proxy Voting Policies and Procedures for Closed-End Management Investment Companies
Not applicable.
Item 8. Portfolio Managers of Closed-End Management Investment Companies.
Not applicable.
Item 9. Purchases of Equity Securities By Closed-End Management Investment Company and Affiliated Purchasers.
Not applicable.
Item 10. Submission of Matters to a Vote of Security Holders.
None.
Item 11. Controls and Procedures.
| (a) | The disclosure controls and procedures of the FMI Common Stock Fund, Inc. are periodically evaluated. As of October 1, 2008, the date of the last evaluation, we concluded that our disclosure controls and procedures are adequate. |
| (b) | The internal controls of the FMI Common Stock Fund, Inc. are periodically evaluated. There were no changes to FMI Common Stock Fund’s internal control over financial reporting that occurred during the second fiscal quarter of the period covered by this report that have materially affected, or are reasonably likely to materially affect, such controls. |
Item 12. Exhibits.
| (a) | Any code of ethics or amendment thereto. Filed herewith. |
| (b) | Certifications pursuant to Section 302 of the Sarbanes-Oxley Act of 2002. Filed herewith. |
| (c) | Certification pursuant to Section 906 of the Sarbanes-Oxley Act of 2002. Filed herewith. |
SIGNATURES
Pursuant to the requirements of the Securities Exchange Act of 1934 and the Investment Company Act of 1940, the registrant has duly caused this report to be signed on its behalf by the undersigned, thereunto duly authorized.
FMI Common Stock Fund, Inc.
Registrant
By /s/Ted D. Kellner
Ted D. Kellner, Principal Executive Officer
Date 11-11-08
Pursuant to the requirements of the Securities Exchange Act of 1934 and the Investment Company Act of 1940, this report has been signed below by the following persons on behalf of the registrant and in the capacities and on the dates indicated.
FMI Common Stock Fund, Inc.
Registrant
By /s/Ted D. Kellner
Ted D. Kellner, Principal Financial Officer
Date 11-11-08