UNITED STATES
SECURITIES AND EXCHANGE COMMISSION
Washington, D.C. 20549
FORM N-CSR
CERTIFIED SHAREHOLDER REPORT OF REGISTERED MANAGEMENT INVESTMENT COMPANIES
Investment Company Act file number 811-03235
FMI Common Stock Fund, Inc.
(Exact name of registrant as specified in charter)
100 East Wisconsin Avenue, Suite 2200
Milwaukee, WI 53202
(Address of principal executive offices) (Zip code)
Ted D. Kellner
Fiduciary Management, Inc.
100 East Wisconsin Avenue, Suite 2200
Milwaukee, WI 53202
(Name and address of agent for service)
(414) 226-4555
Registrant's telephone number, including area code:
Date of fiscal year end: September 30
Date of reporting period: September 30, 2010
Item 1. Reports to Stockholders.
ANNUAL REPORT
September 30, 2010
FMI
Common Stock
Fund, Inc.
(FMIMX)
A NO-LOAD
MUTUAL FUND
FMI
Common Stock
Fund, Inc.
September 30, 2010
Dear Fellow Shareholders:
The FMI Common Stock Fund returned 8.24%(1) in the quarter, compared to 11.29%(2) for the Russell 2000 Index. Health Technology, Health Services, Non-Energy Minerals and Energy Minerals were the groups that trailed the benchmark in the quarter. Beckman Coulter and West Pharmaceutical both stumbled in the period but in our opinion, remain solid long-term investment ideas. Eagle Materials and Carlisle continue to feel the effects of weak housing and real estate construction. Both of these stocks were purchased into the teeth of the downturn. We don’t know how long the environment will remain depres sed, but both are strong companies that can weather difficult times. On the plus side, Finance and Industrial Services were relatively strong, led by Affiliated Managers Group, Dresser Rand and Bristow Group.
Shareholders should note that our September 30 and March 31 letters offer a brief commentary followed by an equally brief discussion of an investment idea or two. The December 31 and June 30 letters are typically longer and delve into various subjects in more detail. Incidentally, quarterly commentaries for ten years are available on our website, www.fmifunds.com.
At the recent price of $676, the Russell 2000 is not far above the $614 it hit in March of 2000. Since then, owners of this index have just a slight price gain plus a meager yield from the dividend. Many stock investors have lost hope over this very difficult period; indeed, the past 10-year period is one of the worst on record. The mood of the day is captured by Byron Wein (formerly Morgan Stanley’s strategist, now with Blackstone) in a piece entitled “Two Gloomy Afternoons.” On two successive recent Fridays, Mr. Wein convened (as he has for 25 years) a group of investors to discuss the investment landscape. The group articulated a host of worries, including uncontrolled debt expansion, the onset of another recession, an anti-business bias in Washington, onerous regulations, and a general feeling that the U.S. had lost its way. If that wasn’t gloomy enough, Albert Edwards, of Société Générale, weighed in on the subject, saying equities were locked in a “Vulcan death grip.”
| Monthly Net New Cash Flows to Equity Funds 2000 - August 2010 (mil) |
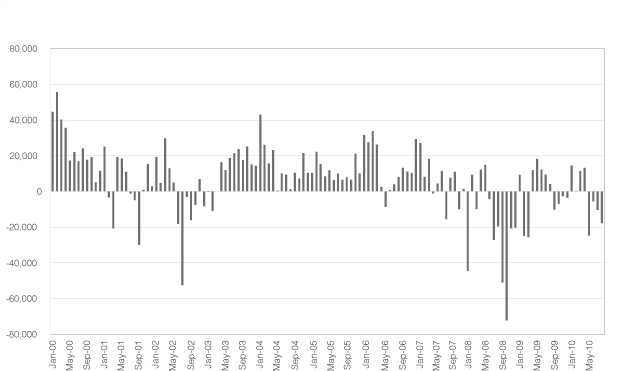 |
Source: Investment Company Institute |
These sentiments are reflected by net negative equity fund flows in recent years, particularly over the last few months. According to the Investment Company Institute (ICI), $57 billion has been withdrawn from equity mutual funds just since May. A mirror image of this phenomenon has taken place in the bond market. Performance has been excellent, with the 10 Year Treasury bond achieving an annualized 7.3% return over the past ten years (the Standard & Poor’s 500 Index delivered a negative 1.8%). Recently,
| (1) | The average annual total returns of the FMI Common Stock Fund for 1 year, 5 year and 10 year periods (annualized) ended September 30, 2010 were: 9.30%, 6.49% and 9.84%, respectively. |
| (2) | The average annual total returns of the Russell 2000 Index for 1 year, 5 year and 10 year periods (annualized) ended September 30, 2010 were: 13.35%, 1.60% and 4.00%, respectively. |
fund flows into the bond market have hit record levels. From May through August, ICI reported that $81 billion has moved into bond funds, and since 2008, a staggering $590 billion. In August, Bloomberg reported that according to Deutsche Bank, the ten lowest yielding U.S. corporate new issues in history have been sold in the past 14 months.
Monthly Net New Cash Flows to Bond Funds 2000 - August 2010 (mil) |
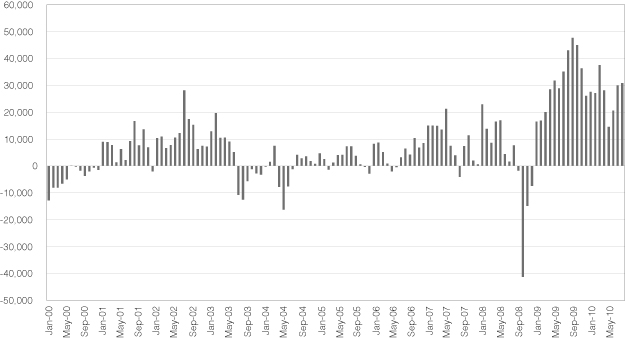 |
Source: Investment Company Institute |
Unfortunately, the track record of the typical investor is not very good; if history is any guide, these fund flows will be poorly timed. Each year, Dalbar, a financial services firm, measures how fund investors actually perform, based on flow-of-funds data, compared to the stated index returns. Basically, the firm weights returns by when the flows occur. Over the 20 years ending last December, Dalbar figured investors compounded their money at 3.2%, rather than the stated S&P 500 return of 8.2%. Most investors seem incapable of avoiding the herd mentality. A brief recap of money flows shows lousy timing with respect to popular investment themes in biotechnology, technology/telecom, emerging markets, and real estate/financial s. Recently, Fortune’s very funny Stanley Bing penned a piece called “Come Back, Little Investor!” He suggests ten simple steps Wall Street can take to win back the small investor, including quarterly pancake breakfasts, but we like the last one best: Stop losing my $%*#@ money! Not following the crowd is the first step.
Our contrary indicator light is blinking bright yellow. Rather than chasing the final leg of one of the greatest bond markets in history, we think investors should remain engaged or even increase equity exposure. The stock market has more going for it than is popularly believed. After a long period of low or negative growth, revenues have been growing for three straight quarters, according to The Leuthold Group. Through June, the top 300 U.S. companies grew at 9% and the next largest 900 firms, at 9.9%. Corporate profitability and cash flow is also quite good. Credit Suisse reports that free cash flow as a percent of GDP is about twice its long-term average. This money will flow toward buy-backs, dividends a nd acquisitions. Deals have been heating up recently on Wall Street, with a total value through September 20 of $516 billion, including several high profile ones such as Alcon, purchased by Novartis, Smith International, acquired by Schlumberger, and Millipore, bought by Merck AG. Valuations, which for years were near the high end of their long-term ranges, are now about average on most measures. Deflation, which seems to be on everyone’s mind, is still a concept and not a reality. Inflation is low, but above zero. As we said in last quarter’s letter, mild deflation has historically been pretty good for stocks. We anticipate an inflation pick-up over the long run, due to profligate fiscal and monetary policies, but we believe stocks are the best way to deal with that outcome anyway. Consumers are repairing their balance sheets, albeit slowly. Unfortunately, the same can’t be said for governments, but many politicia ns appear to be getting the message that we’ve crossed the line on deficit spending. The elections in November will be a pivotal referendum on spending.
| | | | | | | | Annual | | |
| | | | 10 Year | | | | Compound | Total | |
| Past Ten Years | | | Return | Return | |
| Q2 1929 | to | Q2 1939 | -3.65 | Q2 1939 | to | Q2 1949 | 8.62 | 128.54 | |
| Q1 1929 | to | Q1 1939 | -2.79 | Q1 1939 | to | Q1 1949 | 9.12 | 139.36 | |
| Q3 1929 | to | Q3 1939 | -2.74 | Q3 1939 | to | Q3 1949 | 7.74 | 110.79 | |
| Q1 1928 | to | Q1 1938 | -2.54 | Q1 1938 | to | Q1 1948 | 11.76 | 203.87 | |
| Q1 1930 | to | Q1 1940 | -1.42 | Q1 1940 | to | Q1 1950 | 9.65 | 151.31 | |
| Q2 1930 | to | Q2 1940 | -1.42 | Q2 1940 | to | Q2 1950 | 12.19 | 215.88 | |
| Q4 1928 | to | Q4 1938 | -0.65 | Q4 1938 | to | Q4 1948 | 7.21 | 100.63 | WORST |
| Q3 1928 | to | Q3 1938 | -0.10 | Q3 1938 | to | Q3 1948 | 8.12 | 118.31 | |
| Q3 1930 | to | Q3 1940 | 0.18 | Q3 1940 | to | Q3 1950 | 12.57 | 226.85 | |
| Q4 1927 | to | Q4 1937 | 0.20 | Q4 1937 | to | Q4 1947 | 9.61 | 150.39 | |
| Q4 1929 | to | Q4 1939 | 0.23 | Q4 1939 | to | Q4 1949 | 9.09 | 138.67 | |
| Q2 1928 | to | Q2 1938 | 0.44 | Q2 1938 | to | Q2 1948 | 9.52 | 148.39 | |
| Q3 1964 | to | Q3 1974 | 0.49 | Q3 1974 | to | Q3 1984 | 15.58 | 325.30 | BEST |
| Q1 1931 | to | Q1 1941 | 0.71 | Q1 1941 | to | Q1 1951 | 14.47 | 286.14 | |
| Q4 1964 | to | Q4 1974 | 1.24 | Q4 1974 | to | Q4 1984 | 14.76 | 296.23 | |
| Q4 1998 | to | Q4 2008 | -1.38 | Q4 2008 | to | Q4 2018 | ? | ? | |
| Q1 1999 | to | Q1 2009 | -2.99 | Q1 2009 | to | Q1 2019 | ? | ? | |
| Q2 1999 | to | Q2 2009 | -2.22 | Q2 2009 | to | Q2 2019 | ? | ? | |
| Q3 1999 | to | Q3 2009 | -0.15 | Q3 2009 | to | Q3 2019 | ? | ? | |
| Q4 1999 | to | Q4 2009 | -0.95 | Q4 2009 | to | Q4 2019 | ? | ? | |
| Q1 2000 | to | Q1 2010 | -0.65 | Q1 2010 | to | Q1 2020 | ? | ? | |
| Q2 2000 | to | Q2 2010 | -1.58 | Q2 2010 | to | Q2 2020 | ? | ? | |
| | | | | | | Average | 10.67 | 182.71 | |
Source: The Leuthold Group
Certainly many negatives that were highlighted and harangued over the last few years in these letters remain. Some issues need to turn around before the economy and the market regain solid footing; specifically, businesses must feel more confident about regulations and taxes in order to hire new employees or invest in capital and research & development. The government and the Federal Reserve also have to back off. History demonstrates, however, that if investors wait for an “all clear” sign, a large part of the upturn will be missed. In the accompanying table, we have updated and reprinted data from our March 2009 letter showing 10-year stock returns following the 15 worst 10-year periods (measured by quarters, so there are nearly 300 data sets). While there are obviously no guarantees in the equity business, we like the odds that the next 10 years’ return will fall within the range of the worst, 7.2% and the best, 15.6%.
Below we highlight a recent investment idea.
WOODWARD GOVERNOR CO.
Business Description
Woodward Governor is a leading designer and manufacturer of energy control systems and components for aircraft and industrial turbines, reciprocating engines and other power generation equipment. Woodward has four primary operating segments: Turbine Systems (43% of sales) - energy control systems to OEMs of industrial gas, aircraft, and steam turbines; Airframe Systems (22%) - actuation systems, cockpit and motion control systems, and electromechanical components; Electrical Power Systems (14%) - products that assist in the generation, distribution, and conversion of electric power; and Engine Systems (21%) - products for reciprocating engines, including products for gas and diesel engines.
Good Business
| | • | Woodward is a key supplier of energy control systems and components to virtually every major engine and turbine manufacturer. Over the years, the company has developed a sizable installed base of systems, which generate a steady stream of high margin aftermarket revenues. |
| | • | Approximately 30-35% of total revenue is generated through the sale of aftermarket parts and maintenance, repair and overhaul services, and can be considered recurring in nature. |
| | • | Woodward’s return on invested capital (ROIC) comfortably exceeds its cost of capital. Over the trailing 5-year and 10-year periods, the company’s ROIC has averaged 13.7% and 11.0%, respectively. |
| | • | The business is not capital intensive, which leads to a significant amount of excess free cash flow (FCF) generation. For instance, in fiscal 2009, Woodward’s FCF was $190 million or $2.70 per share. |
Valuation
| | • | Since September 2008, Woodward’s common stock has underperformed the Russell 2000 Index by 2500 basis points. |
| | • | We estimate Woodward’s normalized FCF is approximately $150 million, or greater than $2.00 per share. The stock currently trades for 14.0 times our estimate of normalized FCF. |
| | • | Over the trailing 5 and 10-year periods, Woodward’s price-to-earnings (P/E) multiple has averaged 18.0 and 15.5, respectively. Thus, the company’s current P/E multiple is in-line with historical averages. However, we estimate that in fiscal 2010, Woodward’s organic sales will have declined by a cumulative 15-20% from the peak in fiscal 2008. This suggests that the company’s current earnings are very depressed. |
Management
| | • | Current CEO, Tom Gendron, has been employed by Woodward for the past 18 years and has significant industry experience. He owns approximately 900,000 shares outright, which represents 1.3% of total shares. |
| | • | Previous Chairman and CEO, John Halbrook, remains a key director of the company. He continues to own approximately 2,100,000 shares outright, which represents 3.0% of total shares. |
| | • | Woodward has a shareholder ownership culture across the entire organization. For example, the company’s profit sharing plan owns 7,500,000 shares, which represents 11.0% of total shares. |
| | • | Importantly,executive compensation has a significant link to ROIC and long-term EPS growth. |
Investment Thesis
Woodward Governor’s current share price is 40% below its all-time high reached in 2008. The sharp decline was driven by the global economic crisis and its negative impact on global infrastructure spending, as well as the commercial aerospace cycle. Despite short-term worries about the economy, we believe Woodward is attractively positioned to outperform during the next up-cycle in both the commercial aerospace and power generation market.
******
Distribution: Our Board of Directors has declared a distribution effective October 29, 2010, of $0.54941 per share from short-term capital gains, which will be treated as ordinary income and $0.25075 per share from net long-term capital gains, payable October 29, 2010 to shareholders of record on October 28, 2010.
******
Adviser Note: Pat English, Chief Investment Officer, has directed the investments of Fiduciary Management (the Fund’s adviser) for over twenty years and will continue to do so. Through his leadership, we have built an excellent research team that is fully inculcated into the Fiduciary Management investment culture. Pat has functioned as both the Chief Investment Officer and a critical decision maker, along with John Brandser, Chief Operating Officer, across a variety of strategic and tactical matters for many years. Those familiar with Fiduciary Management know that Pat and Ted Kellner have been operating in a state that is akin to co-CEOs for a long time. T ed has been more of an external CEO and Pat more internal. Pat now officially adds the title of CEO and Ted becomes Executive Chairman. John adds the title of President. Our thirty-year commitment to superior investment performance remains steadfast.
Thank you for your continued support of the FMI Common Stock Fund.
Sincerely,
| | |
 |  |
| | |
| Ted D. Kellner, CFA | Patrick J. English, CFA |
| Executive Chairman | CEO & Chief Investment Officer |
;
The returns do not reflect the deduction of taxes that a shareholder would pay on Fund distributions or the redemption of Fund shares. Performance data quoted represents past performance; past performance does not guarantee future results. The investment return and principal value of an investment will fluctuate so that an investor’s shares, when redeemed, may be worth more or less than their original cost. Current performance of the Fund may be lower or higher than the performance quoted. Performance data current to the most recent month-end may be obtained by visiting www.fmifunds.com or by calling 1-800-811-5311. As of th e Fund’s Prospectus dated January 29, 2010, the Fund’s annual operating expense ratio is 1.26%.
As of September 30, 2010, the security holdings mentioned in this report represented the following percentage of the Fund’s total assets: Affiliated Managers Group, Inc. 3.3%; Alliant Techsystems Inc. 2.7%; Arrow Electronics, Inc. 3.8%; Beckman Coulter, Inc. 2.2%; Bristow Group, Inc. 2.2%; Carlisle Companies Inc. 2.0%; Dresser-Rand Group, Inc. 2.5%; Eagle Materials Inc. 1.6%; Family Dollar Stores, Inc. 3.0%; PetSmart, Inc. 2.7%; ScanSource, Inc. 1.9%; West Pharmaceutical Services, Inc. 0.8%; and Woodward Governor Co. 1.2%. Securities named in this report but not listed here are not held in the Fund as of the date of this disclosure.
Portfolio holdings are subject to change without notice and are not intended as recommendations of individual securities.
For more information about the FMI Common Stock Fund, call (800) 811-5311 for a free prospectus. Please read the prospectus carefully to consider the investment objectives, risks, charges and expenses, before investing or sending money. The prospectus contains this and more information about the FMI Common Stock Fund. Please read the prospectus carefully before investing.
Distributed By Rafferty Capital Markets, LLC
100 E. Wisconsin Ave., Suite 2200 • Milwaukee, WI 53202 • 414-226-4555
www.fmifunds.com
FMI Common Stock Fund, Inc.
As a shareholder of the Fund you incur ongoing costs, including management fees and other Fund expenses. You do not incur transaction costs such as sales charges (loads) on purchase payments, reinvested dividends, or other distributions; redemption fees; and exchange fees because the Fund does not charge these fees. This example is intended to help you understand your ongoing costs (in dollars) of investing in FMI Common Stock Fund and to compare these costs with the ongoing costs of investing in other mutual funds.
The example is based on an investment of $1,000 invested at the beginning of the period and held for the entire period from April 1, 2010 through September 30, 2010.
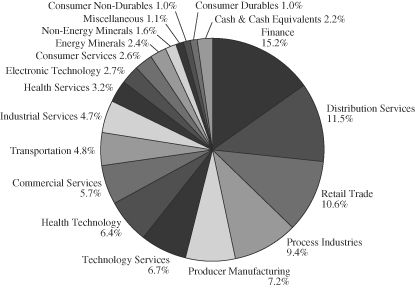
Industry Sectors as of September 30, 2010
Actual Expenses
The first line of the table below provides information about actual account values and actual expenses. You may use the information in this line, together with the amount you invested, to estimate the expenses that you paid over the period. Simply divide your account value by $1,000 (for example, an $8,600 account value divided by $1,000 = 8.6), then multiply the result by the number in the first line under the heading entitled “Expenses Paid During Period” to estimate the expenses you paid on your account during this period.
In addition to the costs highlighted and described below, the only Fund transaction costs you might currently incur would be wire fees ($15 per wire), if you choose to have proceeds from a redemption wired to your bank account instead of receiving a check. Additionally, U.S. Bank charges an annual processing fee ($15) if you maintain an IRA account with the Fund. To determine your total costs of investing in the Fund, you would need to add any applicable wire or IRA processing fees you’ve incurred during the period to the costs provided in the example at the end of this article.
Hypothetical Example for Comparison Purposes
The second line of the table below provides information about hypothetical account values and hypothetical expenses based on the Fund’s actual expense ratio and an assumed rate of return of 5% per year before expenses, which is not the Fund’s actual return. The hypothetical account values and expenses may not be used to estimate the actual ending account balance or expenses you paid for the period. You may use this information to compare the ongoing costs of investing in the Fund and other funds. To do so, compare this 5% hypothetical example with the 5% hypothetical examples that appear in the shareholder reports of the other funds.
Please note that the expenses shown in the table are meant to highlight your ongoing costs only and do not reflect any transactional costs, such as sales charges (loads), redemption fees or exchange fees. Therefore, the second line of the table is useful in comparing ongoing costs only, and will not help you determine the relative total costs of owning different funds. In addition, if these transactional costs were included, your costs would have been higher.
| | Beginning | Ending | Expenses Paid |
| | Account | Account | During Period* |
| | Value 4/01/10 | Value 9/30/10 | 4/01/10-9/30/10 |
| FMI Common Stock Fund Actual | $1,000.00 | $ 993.10 | $6.15 |
| Hypothetical (5% return before expenses) | $1,000.00 | $1,018.90 | $6.23 |
| * | Expenses are equal to the Fund’s annualized expense ratio of 1.23%, multiplied by the average account value over the period, multiplied by 183/365 (to reflect the one-half year period between April 1, 2010 and September 30, 2010). |
FMI Common Stock Fund, Inc.
MANAGEMENT’S DISCUSSION OF FUND PERFORMANCE
During the fiscal year ended September 30, 2010, the FMI Common Stock Fund (the “Fund”) had a total return of 9.30%. The benchmark Russell 2000 returned 13.35% in the same period. Distribution Services, Electronic Technology, Health Technology and Technology Services all trailed the corresponding benchmark sector results. Stock selection was the primary factor in the underperformance in these areas, with Arrow Electronics, ScanSource, Alliant Techsystems, West Pharmaceutical Services and Beckman Coulter all having a negative return for the period. Management believes these investments continue to have solid long-term investment potential. A secondary factor in the underperformance was being underweight the strongly performing technology related sectors. Groups that outperformed the benchmark in the twelve months ending September 30 i ncluded Retail Trade, Industrial Services and Finance. Family Dollar, PetSmart, Bristow Group, and Affiliated Managers Group were the notable positive contributors in these sectors. Stock selection was the primary factor in these positive relative sectors, although our overweight position in Retail and underweight position in Finance also contributed. Stocks that reached full valuation and were sold included Rofin-Sinar, Waste Connections, Rockwell, Graco and Gartner. Old Republic and HNI were sold due to our belief that the fundamentals of their respective businesses were impaired. MPS Group was sold after Adecco announced it was buying the company. The Fund is underweight Finance, Electronic Technology and Consumer Durables and overweight Distribution Services, Retail Trade and Process Industries. Our contrarian instincts cause us to view the industry’s negative equity mutual fund flows positively, although we remain wary of huge government deficits and Federal Reserve policy. T he Fund continues to sell at a discount to the Russell 2000, based on most valuation measures. Over long time periods, lower valuation stocks have outperformed higher valuation stocks. Future results, however, may differ from the past.
| |
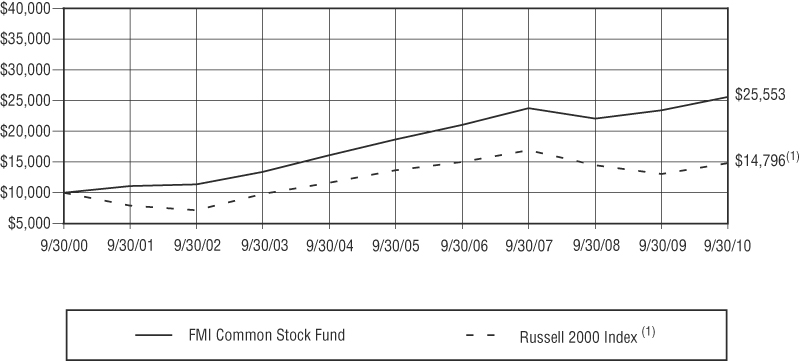
COMPARISON OF CHANGE IN VALUE OF $10,000 INVESTMENT IN
FMI COMMON STOCK FUND AND THE RUSSELL 2000 INDEX(1)
|
| | Past performance does not predict future performance. The graph and the table do not reflect the deduction of taxes that a shareholder would pay on Fund distribution or the redemption of Fund shares. |
| (1) | The Russell 2000 Index measures the performance of the 2,000 smallest companies in the Russell 3000 Index, which comprises the 3,000 largest U.S. companies based on total market capitalization. |
| AVERAGE ANNUAL TOTAL RETURN |
| 1-Year | 5-Year | 10-Year |
| 9.30% | 6.49% | 9.84% |
FMI Common Stock Fund, Inc.
STATEMENT OF ASSETS AND LIABILITIES
| ASSETS: | | | |
| Investments in securities, at value (cost $784,963,523) | | $ | 924,770,482 | |
| Dividends receivable | | | 1,101,02 | |
| Receivable from shareholders for purchases | | | 825,698 | |
| Cash | | | 50,439 | |
| Total assets | | $ | 926,747,639 | |
| | | | | |
| LIABILITIES: | | | | |
| Payable to adviser for management fees | | $ | 626,031 | |
| Payable to shareholders for redemptions | | | 278,104 | |
| Other liabilities | | | 213,043 | |
| Total liabilities | | | 1,117,178 | |
| | | | | |
| NET ASSETS: | | | | |
| Capital Stock, $0.01 par value; indefinite shares authorized; 40,280,932 shares outstanding | | | 761,019,364 | |
| Net unrealized appreciation on investments | | | 139,806,959 | |
| Accumulated net realized gain on investments | | | 24,804,138 | |
| Net assets | | | 925,630,461 | |
| Total liabilities and net assets | | $ | 926,747,639 | |
| CALCULATION OF NET ASSET VALUE PER SHARE: | | | | |
| Net asset value, offering and redemption price per share ($925,630,461 ÷ 40,280,932 shares outstanding) | | $ | 22.98 | |
The accompanying notes to financial statements are an integral part of this statement.
FMI Common Stock Fund, Inc.
SCHEDULE OF INVESTMENTS
| Shares | | | | Cost | | | Value | |
| COMMON STOCKS — 97.8% (a) | | | | | | |
| | | | | | | |
| COMMERCIAL SERVICES SECTOR — 5.7% | | | | | | |
| | | Advertising/Marketing Services — 1.9% | | | | | | |
| | 1,516,000 | | Harte-Hanks, Inc. | | $ | 21,049,041 | | | $ | 17,691,720 | |
| | | | Miscellaneous Commercial Services — 3.1% | | | | | | | | |
| | 731,000 | | Cintas Corp. | | | 17,769,949 | | | | 20,139,050 | |
| | 545,000 | | TeleTech Holdings, Inc.* | | | 9,342,636 | | | | 8,087,800 | |
| | | | | | | 27,112,585 | | | | 28,226,850 | |
| | | | Personnel Services — 0.7% | | | | | | | | |
| | 405,350 | | Korn/Ferry International* | | | 4,666,881 | | | | 6,704,489 | |
| | | | | | | | | |
| CONSUMER DURABLES SECTOR — 1.0% | | | | | | | | |
| | | | Automotive Aftermarket — 0.4% | | | | | | | | |
| | 83,950 | | CLARCOR Inc. | | | 2,517,585 | | | | 3,242,988 | |
| | | | Other Consumer Specialties — 0.6% | | | | | | | | |
| | 208,950 | | Mine Safety Appliances Co. | | | 5,621,349 | | | | 5,662,545 | |
| | | | | | | | | |
| CONSUMER NON-DURABLES SECTOR — 1.0% | | | | | | | | |
| | | | Food: Specialty/Candy — 1.0% | | | | | | | | |
| | 381,000 | | Flowers Foods, Inc. | | | 9,847,083 | | | | 9,464,040 | |
| | | | | | | | | |
| CONSUMER SERVICES SECTOR — 2.6% | | | | | | | | |
| | | | Publishing: Books/Magazines — 2.6% | | | | | | | | |
| | 719,000 | | Meredith Corp. | | | 18,445,510 | | | | 23,949,890 | |
| | | | | | | | | |
| DISTRIBUTION SERVICES SECTOR — 11.5% | | | | | | | | |
| | | | Electronics Distributors — 5.7% | | | | | | | | |
| | 1,303,000 | | Arrow Electronics, Inc.* | | | 24,227,536 | | | | 34,829,190 | |
| | 648,000 | | ScanSource, Inc.* | | | 15,894,735 | | | | 17,975,520 | |
| | | | | | | 40,122,271 | | | | 52,804,710 | |
| | | | Medical Distributors — 3.3% | | | | | | | | |
| | 1,059,000 | | Patterson Companies Inc. | | | 23,208,063 | | | | 30,340,350 | |
| | | | Wholesale Distributors — 2.5% | | | | | | | | |
| | 617,000 | | Beacon Roofing | | | | | | | | |
| | | | Supply, Inc.* | | | 8,798,061 | | | | 8,989,690 | |
| | 269,000 | | United Stationers Inc.* | | | 10,887,604 | | | | 14,394,190 | |
| | | | | | | 19,685,665 | | | | 23,383,880 | |
| ELECTRONIC TECHNOLOGY SECTOR — 2.7% | | | | | | | | |
| | | | Aerospace & Defense — 2.7% | | | | | | | | |
| | 326,000 | | Alliant Techsystems Inc.* | | | 26,521,823 | | | | 24,580,400 | |
| | | | | | | | | |
| ENERGY MINERALS SECTOR — 2.4% | | | | | | | | |
| | | | Oil & Gas Production — 2.4% | | | | | | | | |
| | 598,000 | | SM Energy Co. | | | 11,254,631 | | | | 22,401,080 | |
| | | | | | | | | |
| FINANCE SECTOR — 15.2% | | | | | | | | |
| | | | Insurance Brokers/Services — 3.7% | | | | | | | | |
| | 1,286,000 | | Arthur J. | | | | | | | | |
| | | | Gallagher & Co. | | | 30,217,444 | | | | 33,911,820 | |
| | | | Investment Managers — 3.3% | | | | | | | | |
| | 393,000 | | Affiliated Managers | | | | | | | | |
| | | | Group, Inc.* | | | 18,280,150 | | | | 30,657,930 | |
| | | | Life/Health Insurance — 2.9% | | | | | | | | |
| | 1,254,000 | | Protective Life Corp. | | | 25,546,466 | | | | 27,287,040 | |
| | | | Property/Casualty Insurance — 3.3% | | | | | | | | |
| | 1,135,000 | | W.R. Berkley Corp. | | | 29,005,212 | | | | 30,724,450 | |
| | | | Real Estate Development — 2.0% | | | | | | | | |
| | 747,000 | | The St. Joe Co.* | | | 22,281,803 | | | | 18,577,890 | |
| | | | | | | | | |
| HEALTH SERVICES SECTOR — 3.2% | | | | | | | | |
| | | | Health Industry Services — 2.2% | | | | | | | | |
| | 447,000 | | Covance Inc.* | | | 18,606,960 | | | | 20,915,130 | |
| | | | Medical/Nursing Services — 1.0% | | | | | | | | |
| | 433,000 | | VCA Antech, Inc.* | | | 8,997,895 | | | | 9,131,970 | |
| | | | | | | | | |
| HEALTH TECHNOLOGY SECTOR — 6.4% | | | | | | | | |
| | | | Medical Specialties — 6.4% | | | | | | | | |
| | 424,000 | | Beckman Coulter, Inc. | | | 22,966,746 | | | | 20,686,960 | |
| | 142,000 | | Bio-Rad | | | | | | | | |
| | | | Laboratories, Inc.* | | | 10,323,168 | | | | 12,852,420 | |
| | 718,000 | | CareFusion Corp.* | | | 17,200,287 | | | | 17,835,120 | |
| | 228,000 | | West Pharmaceutical | | | | | | | | |
| | | | Services, Inc. | | | 8,657,193 | | | | 7,822,680 | |
| | | | | | | 59,147,394 | | | | 59,197,180 | |
| INDUSTRIAL SERVICES SECTOR — 4.7% | | | | | | | | |
| | | | Oilfield Services/Equipment — 4.7% | | | | | | | | |
| | 563,000 | | Bristow Group, Inc.* | | | 16,893,272 | | | | 20,313,040 | |
| | 632,000 | | Dresser-Rand | | | | | | | | |
| | | | Group, Inc.* | | | 12,958,849 | | | | 23,314,480 | |
| | | | | | | 29,852,121 | | | | 43,627,520 | |
| MISCELLANEOUS SECTOR — 1.1% | | | | | | | | |
| | | | Investment Trusts/Mutual Funds — 1.1% | | | | | | | | |
| | 345,000 | | PICO Holdings, Inc.* | | | 11,459,207 | | | | 10,301,700 | |
| | | | | | | | | |
| NON-ENERGY MINERALS SECTOR — 1.6% | | | | | | | | |
| | | | Construction Materials — 1.6% | | | | | | | | |
| | 623,000 | | Eagle Materials Inc. | | | 18,460,712 | | | | 14,765,100 | |
| | | | | | | | | | | | |
| | | | | | | | | | | | |
| | | | | | | | | | | | |
FMI Common Stock Fund, Inc.
SCHEDULE OF INVESTMENTS (Continued)
| Shares or Principal Amount | | Cost | | | Value | |
| COMMON STOCKS — 97.8% (a) (Continued) | | | | | | |
| | | | | | | |
| PROCESS INDUSTRIES SECTOR — 9.4% | | | | | | |
| | | Chemicals: Specialty — 2.7% | | | | | | |
| | 414,000 | | Sigma-Aldrich Corp. | | $ | 19,850,449 | | | $ | 24,997,320 | |
| | | | Containers/Packaging — 4.9% | | | | | | |
| | 557,000 | | AptarGroup, Inc. | | | 14,661,777 | | | | 25,438,190 | |
| | 624,000 | | Bemis Company, Inc. | | | 15,404,312 | | | | 19,812,000 | |
| | | | | | | 30,066,089 | | | | 45,250,190 | |
| | | | Industrial Specialties — 1.8% | | | | | | | | |
| | 538,000 | | Valspar Corp. | | | 12,397,778 | | | | 17,135,300 | |
| | | | | | | | | |
| PRODUCER MANUFACTURING SECTOR — 7.2% | | | | | | | | |
| | | | Electrical Products — 2.4% | | | | | | | | |
| | 1,257,000 | | Molex Inc. Cl A | | | 22,642,796 | | | | 21,972,360 | |
| | | | Industrial Conglomerates — 1.7% | | | | | | | | |
| | 244,825 | | SPX Corporation | | | 12,778,859 | | | | 15,492,526 | |
| | | | Industrial Machinery — 1.1% | | | | | | | | |
| | 333,000 | | Woodward Governor Co. | | | 9,119,789 | | | | 10,795,860 | |
| | | | Miscellaneous Manufacturing — 2.0% | | | | | | | | |
| | 621,000 | | Carlisle Companies Inc. | | | 16,556,740 | | | | 18,598,950 | |
| | | | | | | | | |
| RETAIL TRADE SECTOR — 10.6% | | | | | | | | |
| | | | Catalog/Specialty Distribution — 1.0% | | | | | | | | |
| | 318,600 | | HSN, Inc.* | | | 8,653,114 | | | | 9,526,140 | |
| | | | Discount Stores — 3.0% | | | | | | | | |
| | 627,000 | | Family Dollar | | | | | | | | |
| | | | Stores, Inc. | | | 15,074,375 | | | | 27,688,320 | |
| | | | Food Retail — 2.4% | | | | | | | | |
| | 466,650 | | Ruddick Corp. | | | 11,902,111 | | | | 16,183,422 | |
| | 799,350 | | Winn-Dixie | | | | | | | | |
| | | | Stores, Inc.* | | | 11,424,042 | | | | 5,699,366 | |
| | | | | | | 23,326,153 | | | | 21,882,788 | |
| | | | Specialty Stores — 4.2% | | | | | | | | |
| | 475,200 | | Group 1 Automotive, Inc.* | | | 7,065,494 | | | | 14,198,976 | |
| | 709,000 | | PetSmart, Inc. | | | 15,047,516 | | | | 24,815,000 | |
| | | | | | | 22,113,010 | | | | 39,013,976 | |
| TECHNOLOGY SERVICES SECTOR — 6.7% | | | | | | | | |
| | | | Data Processing Services — 3.9% | | | | | | | | |
| | 786,000 | | Broadridge Financial | | | | | | | | |
| | | | Solutions Inc. | | | 16,876,639 | | | | 17,975,820 | |
| | 401,000 | | DST Systems, Inc. | | | 20,456,893 | | | | 17,980,840 | |
| | | | | | | 37,333,532 | | | | 35,956,660 | |
| | | | Information Technology Services — 2.8% | | | | | | | | |
| | 1,009,000 | | Jack Henry & | | | | | | | | |
| | | | Associates, Inc. | | | 20,135,508 | | | | 25,729,500 | |
| | | | | | | | | |
| TRANSPORTATION SECTOR — 4.8% | | | | | | | | |
| | | | Marine Shipping — 2.2% | | | | | | | | |
| | 507,000 | | Kirby Corp.* | | | 16,960,076 | | | | 20,310,420 | |
| | | | Trucking — 2.6% | | | | | | | | |
| | 685,000 | | J.B. Hunt Transport | | | | | | | | |
| | | | Services, Inc. | | | 16,947,404 | | | | 23,769,500 | |
| | | | Total common stocks | | | 765,863,523 | | | | 905,670,482 | |
| SHORT-TERM INVESTMENTS — 2.1% (a) | | | | | | | | |
| | | | Commercial Paper — 2.1% | | | | | | | | |
| $ | 19,100,000 | | U.S. Bank, N.A., 0.10%, | | | | | | | | |
| | | | due 10/01/10 | | | 19,100,000 | | | | 19,100,000 | |
| | | | Total short-term | | | | | | | | |
| | | | investments | | | 19,100,000 | | | | 19,100,000 | |
| | | | Total investments — | | | | | | | | |
| | | | 99.9% | | $ | 784,963,523 | | | | 924,770,482 | |
| | | | Cash and receivables, | | | | | | | | |
| | | | less liabilities — | | | | | | | | |
| | | | 0.1% (a) | | | | | | | 859,979 | |
| | | | TOTAL NET ASSETS — | | | | | | | | |
| | | | 100.0% | | | | | | $ | 925,630,461 | |
| | | | | | | | | | | | |
| | | | | | | | | | | | |
| * | Non-income producing security. |
| (a) | Percentages for the various classifications relate to net assets. |
The accompanying notes to financial statements are an integral part of this statement
FMI Common Stock Fund, Inc.
STATEMENT OF OPERATIONS
For the Year Ended September 30, 2010
INCOME:
| Dividends | | $ | 10,865,868 | |
| Interest | | | 61,195 | |
| Total income | | | 10,927,063 | |
| EXPENSES: | | | | |
| Management fees | | | 8,895,150 | |
| Transfer agent fees | | | 1,074,808 | |
| Administrative and accounting services | | | 459,758 | |
| Custodian fees | | | 182,591 | |
| Registration fees | | | 104,678 | |
| Printing and postage expense | | | 103,742 | |
| Professional fees | | | 50,716 | |
| Insurance expense | | | 34,195 | |
| Board of Directors fees | | | 26,865 | |
| Other expenses | | | 60,668 | |
| Total expenses | | | 10,993,171 | |
| NET INVESTMENT LOSS | | | (66,108 | ) |
| NET REALIZED GAIN ON INVESTMENTS | | | 51,560,102 | |
| NET INCREASE IN UNREALIZED APPRECIATION ON INVESTMENTS | | | 21,058,854 | |
| NET GAIN ON INVESTMENTS | | | 72,618,956 | |
| NET INCREASE IN NET ASSETS RESULTING FROM OPERATIONS | | $ | 72,552,848 | |
STATEMENTS OF CHANGES IN NET ASSETS
For the Years Ended September 30, 2010 and 2009
| | | 2010 | | | 2009 | |
| OPERATIONS: | | | | | | |
| Net investment (loss) income | | $ | (66,108 | ) | | $ | 1,675,917 | |
| Net realized gain (loss) on investments | | | 51,560,102 | | | | (18,956,823 | ) |
| Net increase in unrealized appreciation on investments | | | 21,058,854 | | | | 112,714,790 | |
| Net increase in net assets from operations | | | 72,552,848 | | | | 95,433,884 | |
| DISTRIBUTIONS TO SHAREHOLDERS: | | | | | | | | |
| Distributions from net investment income ($0.0366 and $0.0640 per share, respectively) | | | (1,532,573 | ) | | | (1,547,406 | ) |
| Distributions from net realized gains ($0.0074 and $0.9746 per share, respectively) | | | (308,937 | ) | | | (23,329,791 | ) |
| Total distributions | | | (1,841,510 | ) | | | (24,877,197 | ) |
| FUND SHARE ACTIVITIES: | | | | | | | | |
| Proceeds from shares issued (15,960,389 and 29,122,596 shares, respectively) | | | 349,212,093 | | | | 505,213,575 | |
| Net asset value of shares issued in distributions reinvested | | | | | | | | |
| (86,999 and 1,574,742 shares, respectively) | | | 1,806,091 | | | | 24,455,393 | |
| Cost of shares redeemed (17,176,184 and 8,711,902 shares, respectively) | | | (368,655,911 | ) | | | (139,465,589 | ) |
| Net (decrease) increase in net assets derived from Fund share activities | | | (17,637,727 | ) | | | 390,203,379 | |
| TOTAL INCREASE | | | 53,073,611 | | | | 460,760,066 | |
| NET ASSETS AT THE BEGINNING OF THE YEAR | | | 872,556,850 | | | | 411,796,784 | |
| NET ASSETS AT THE END OF THE YEAR (Includes undistributed | | | | | | | | |
| net investment income of $0 and $1,532,554, respectively) | | $ | 925,630,461 | | | $ | 872,556,850 | |
The accompanying notes to financial statements are an integral part of these statements.
FMI Common Stock Fund, Inc.
FINANCIAL HIGHLIGHTS
(Selected data for each share of the Fund outstanding throughout each year)
| | Years Ended September 30, | |
| | 2010 | | 2009 | | 2008 | | 2007 | | 2006 | |
PER SHARE OPERATING PERFORMANCE: | | | | | | | | | | |
| Net asset value, beginning of year | $21.07 | | $21.20 | | $26.61 | | $26.49 | | $26.58 | |
| Income from investment operations: | | | | | | | | | | |
| Net investment (loss) income | (0.00)* | | 0.05 | | 0.08 | | 0.08 | | 0.09 | |
| Net realized and unrealized gains (loss) on investments | 1.96 | | 0.86 | | (1.74) | | 3.08 | | 2.79 | |
| Total from investment operations | 1.96 | | 0.91 | | (1.66) | | 3.16 | | 2.88 | |
| Less distributions: | | | | | | | | | | |
| Distributions from net investment income | (0.04) | | (0.06) | | (0.08) | | (0.07) | | (0.02) | |
| Distributions from net realized gains | (0.01) | | (0.98) | | (3.67) | | (2.97) | | (2.95) | |
| Total from distributions | (0.05) | | (1.04) | | (3.75) | | (3.04) | | (2.97) | |
| Net asset value, end of year | $22.98 | | $21.07 | | $21.20 | | $26.61 | | $26.49 | |
| TOTAL RETURN | 9.30% | | 6.04% | | (7.00%) | | 12.81% | | 12.62% | |
| RATIOS/SUPPLEMENTAL DATA: | | | | | | | | | | |
| Net assets, end of year (in 000’s $) | 925,630 | | 872,557 | | 411,797 | | 492,015 | | 462,978 | |
| Ratio of expenses to average net assets | 1.24% | | 1.26% | | 1.22% | | 1.20% | | 1.21% | |
| Ratio of net investment (loss) income | | | | | | | | | | |
| to average net assets | (0.01%) | | 0.32% | | 0.35% | | 0.30% | | 0.35% | |
| Portfolio turnover rate | 30% | | 35% | | 40% | | 50% | | 38% | |
| * | Amount less than $0.005 per share. |
The accompanying notes to financial statements are an integral part of this statement.
NOTES TO FINANCIAL STATEMENTS
September 30, 2010
(1) Summary of Significant Accounting Policies —
The following is a summary of significant accounting policies of the FMI Common Stock Fund, Inc. (the “Fund”), which is registered as a diversified, open-end management investment company under the Investment Company Act of 1940 (the “Act”), as amended. The Fund was incorporated under the laws of Wisconsin on July 29, 1981. Effective December 31, 2009, the Fund is closed to new investors. The investment objective of the Fund is to produce long-term capital appreciation principally through investing in common stocks.
| (a) | Each security, excluding short-term investments, is valued at the last sale price reported by the principal security exchange on which the issue is traded. Securities that are traded on the Nasdaq Markets are valued at the Nasdaq Official Closing Price or if no sale is reported, the latest bid price. Securities which are traded over-the-counter are valued at the latest bid price. Securities for which quotations are not readily available are valued at fair value as determined by the investment adviser under the supervision of the Board of Directors. The fair value of a security is the amount which the Fund might reasonably expect to receive upon a current sale. The fair value of a security may differ from the last quoted price and the Fund may not be able to sell a security at the estimated fair value. Market quotations may not be available, for example, if trading in particular securities was halted during the day and not resumed prior to the close of trading on the New York Stock Exchange. As of September 30, 2010, there were no securities that were internally fair valued. Variable rate demand notes are recorded at par value which approximates market value. Short-term investments with maturities of 60 days or less are valued at amortized cost, which approximates value. For financial reporting purposes, investment transactions are recorded on the trade date. |
| | The Fund applies the provisions of the Financial Accounting Standards Board (“FASB”) Accounting Standards Codification “Fair Value Measurements and Disclosures” Topic 820 (“ASC 820”), which defines fair value as the price |
FMI Common Stock Fund, Inc.
NOTES TO FINANCIAL STATEMENTS
September 30, 2010
(1) Summary of Significant Accounting Policies — (Continued)
| | that would be received to sell an asset or paid to transfer a liability (i.e., the “exit price”) in an orderly transaction between market participants at the measurement date. |
| | In determining fair value, the Fund uses various valuation approaches. ASC 820 establishes a fair value hierarchy for inputs used in measuring fair value that maximizes the use of observable inputs and minimizes the use of unobservable inputs by requiring that the most observable inputs be used when available. Observable inputs are those that market participants would use in pricing the asset or liability based on market data obtained from sources independent of the Fund. Unobservable inputs reflect the Fund’s assumptions about the inputs market participants would use in pricing the asset or liability developed based on the best information available in the circumstances. The inputs or methodologies used for valuing securities are not necessarily an indication of the risks associated with investing in those securities. |
| | The fair value hierarchy is categorized into three levels based on the inputs as follows: |
| | Level 1 — Valuations based on unadjusted quoted prices in active markets for identical assets. |
| | Level 2 — Valuations based on quoted prices for similar securities or in markets that are not active or for which all significant inputs are observable, either directly or indirectly. |
| | Level 3 — Valuations based on inputs that are unobservable and significant to the overall fair value measurement. |
| | The following table summarizes the Fund’s investments as of September 30, 2010, based on the inputs used to value them: |
| | Valuation Inputs | Investments in Securities |
| | Level 1 — Common Stocks | | $905,670,482 | |
| | Level 2 — Short-Term Commercial Paper | | 19,100,000 | |
| | Level 3 — | | — | |
| | Total | | $924,770,482 | |
| | See the Schedule of Investment for the investments detailed by industry classification. |
| (b) | New Accounting Pronouncements: |
| | In January, 2010, FASB issued Accounting Standards Update No. 2010-06, Improving Disclosures about Fair Value Measurements (“ASU 2010-06”). ASU 2010-06 will require new disclosures regarding transfers into and out of Levels 1 and 2 (effective for interim and annual periods beginning after December 15, 2009) as well as additional details regarding Level 3 transaction activity (effective for interim and annual periods beginning after December 15, 2010). Management is currently evaluating the effect that this additional requirement will have on the Fund’s financial statements. |
| (c) | Net realized gains and losses on sales of securities are computed on the identified cost basis. |
| (d) | Dividend income is recorded on the ex-dividend date. Interest income is recorded on an accrual basis. |
| (e) | The Fund may have investments in short-term variable rate demand notes, which are unsecured instruments. The Fund may be susceptible to credit risk with respect to these notes to the extent the issuer defaults on its payment obligation. The Fund’s policy is to monitor the creditworthiness of the issuer and nonperformance by these issuers is not anticipated. |
| (f) | Accounting principles generally accepted in the United States of America (“GAAP”) require that permanent differences between income for financial reporting and tax purposes be reclassified in the capital accounts. |
| (g) | The preparation of financial statements in conformity with GAAP requires management to make estimates and assumptions that affect the reported amounts of assets and liabilities and disclosure of contingent assets and liabilities at the date of the financial statements and the reported amounts of revenues and expenses during the reporting period. Actual results could differ from these estimates. |
FMI Common Stock Fund, Inc.
NOTES TO FINANCIAL STATEMENTS (Continued)
September 30, 2010
| (1) | Summary of Significant Accounting Policies — (Continued) |
| (h) | No provision has been made for Federal income taxes since the Fund has elected to be taxed as a “regulated investment company” and intends to distribute substantially all net investment company taxable income and net capital gains to its shareholders and otherwise comply with the provisions of the Internal Revenue Code applicable to regulated investment companies. |
| (i) | TheFund has reviewed all open tax years and major jurisdictions, which include Federal and the state of Wisconsin, and concluded that there are no significant uncertain tax positions that would require recognition in the financial statements. Open tax years are those that are open for exam by taxing authorities and, as of September 30, 2010, open Federal tax years include the tax years ended September 30, 2007 through 2010. The Fund has no examinations in progress and is also not aware of any tax positions for which it is reasonably possible that the total amounts of unrecognized tax benefits will significantly change in the next twelve months. |
| (2) | Investment Adviser and Management Agreement and Transactions With Related Parties — |
| | The Fund has a management agreement with Fiduciary Management, Inc. (“FMI”), with whom certain officers and directors of the Fund are affiliated, to serve as investment adviser and manager. Under the terms of the agreement, the Fund will pay FMI a monthly management fee at the annual rate of 1% of the daily net assets of the Fund. The Fund is responsible for paying its proportionate share of the compensation, benefits and expenses of its Chief Compliance Officer. For administrative convenience, FMI initially makes these payments and is later reimbursed by the Fund. |
| | Under the management agreement, FMI will reimburse the Fund for expenses over 1.3% of the daily net assets of the Fund. No such reimbursements were required for the year ended September 30, 2010. |
| | Under the Fund’s organizational documents, each director, officer, employee or other agent of the Fund (including the Fund’s investment manager) is indemnified, to the extent permitted by the Act, against certain liabilities that may arise out of performance of their duties to the Fund. Additionally, in the normal course of business, the Fund enters into contracts that contain a variety of indemnification clauses. The Fund’s maximum exposure under these arrangements is unknown as this would involve future claims that may be made against the Fund that have not yet occurred. However, the Fund has not had prior claims or losses pursuant to these contracts and believes the risk of loss to be remote. |
| | U.S. Bank, N.A. has made available to the Fund a $50,000,000 credit facility pursuant to a Credit Agreement (“Agreement”) effective July 14, 2008 for the purposes of having cash available to satisfy redemption requests. Principal and interest of such loan under the Agreement are due not more than 31 days after the date of the loan. Amounts under the credit facility bear interest at a rate per annum equal to the current prime rate minus one percent on the amount borrowed. Advances will be collateralized by securities owned by the Fund. During the year ended September 30, 2010, the Fund did not borrow against the Agreement. The Credit Agreement is renewable annually on June 5. |
| (4) | Distributions to Shareholders — |
| | Net investment income and net realized gains, if any, are distributed to shareholders at least annually. On October 29, 2010, the Fund declared distributions of $22,178,652 from short-term realized gains ($0.54941 per share) and $10,122,067 from long-term realized gains ($0.25075 per share). The distributions will be paid on October 29, 2010 to shareholders of record on October 28, 2010. |
| (5) | Investment Transactions — |
| | For the year ended September 30, 2010, purchases and proceeds of sales of investment securities (excluding short-term investments) were $290,474,587 and $242,787,393, respectively. |
FMI Common Stock Fund, Inc.
NOTES TO FINANCIAL STATEMENTS (Continued)
(6) Income Tax Information —
The following information for the Fund is presented on an income tax basis as of September 30, 2010:
| | Gross | Gross | Net Unrealized | Distributable | Distributable |
| Cost of | Unrealized | Unrealized | Appreciation | Ordinary | Long-Term |
| Investments | Appreciation | Depreciation | on Investments | Income | Capital Gains |
| $792,460,106 | $180,919,619 | $48,609,243 | $132,310,376 | $22,178,652 | $10,122,067 |
The difference between the cost amount for financial statement and federal income tax purposes is due primarily to timing differences in recognizing certain gains and losses on security transactions.
| | The tax components of dividends paid during the years ended September 30, 2010 and 2009, capital loss carryovers, which may be used to offset future capital gains, subject to Internal Revenue Code limitations, as of September 30, 2010, and tax basis post-October losses as of September 30, 2010, which are not recognized for tax purposes until the first day of the following fiscal year are: |
| September 30, 2010 | | September 30, 2009 |
| Ordinary | Long-Term | Net Capital | Ordinary | | Long-Term | |
| Income | Capital Gains | Loss | Post-October | | Income | Capital Gains |
| Distributions | Distributions | Carryovers | Losses | | Distributions | Distributions |
| $1,532,573 | $308,937 | $— | $— | | $6,067,868 | $18,809,329 |
For corporate shareholders of the Fund, the percentage of dividend income distributed for the year ended September 30, 2010 which is designated as qualifying for the dividends received deduction is 97% (unaudited).
For all shareholders of the Fund, the percentage of dividend income distributed for the year ended September 30, 2010 which is designated as qualified dividend income under the Jobs and Growth Tax Relief Act of 2003, is 97% (unaudited).
FMI Common Stock Fund, Inc.
REPORT OF INDEPENDENT REGISTERED PUBLIC ACCOUNTING FIRM
To the Board of Directors and Shareholdersof FMI Common Stock Fund, Inc.:
In our opinion, the accompanying statement of assets and liabilities, including the schedule of investments, and the related statements of operations and of changes in net assets and the financial highlights present fairly, in all material respects, the financial position of FMI Common Stock Fund, Inc. (the “Fund”) at September 30, 2010, the results of its operations for the year then ended, the changes in its net assets for each of the two years in the period then ended and the financial highlights for each of the five years in the period then ended, in conformity with accounting principles generally accepted in the United States of America. These financial statements and financial highlights (hereafter referred to as “financial statements”) are the responsibility of the Fund’s management; our responsibility is to express an opinion on these financial statements based on our audits. We conducted our audits of these financial statements in accordance with the standards of the Public Company Accounting Oversight Board (United States). Those standards require that we plan and perform the audit to obtain reasonable assurance about whether the financial statements are free of material misstatement. An audit includes examining, on a test basis, evidence supporting the amounts and disclosures in the financial statements, assessing the accounting principles used and significant estimates made by management, and evaluating the overall financial statement presentation. We believe that our audits, which included confirmation of securities at September 30, 2010 by correspondence with the custodian, provide a reasonable basis for our opinion.

Milwaukee, Wisconsin
October 29, 2010
FMI Common Stock Fund, Inc.
| | | | | # of Funds | Other |
| | Position | Office and | Occupation(s) | in Complex | Directorships |
| Name, Age | Held with | Length of | During Past | Overseen | Held by |
| and Address | the Fund | Time Served | Five Years | by Director | Director |
| Non-Interested Directors | | | | | |
| Barry K. Allen, 62 | Director | Indefinite Term | Mr. Allen is President of Allen | 4 | BCE, Inc. (Bell |
| c/o Fiduciary | | Since 1996 | Enterprises, LLC (Boca Grande, FL) | | Canada Enterprise), |
| Management, Inc. | | | a private equity investments and | | Harley-Davidson, |
| 100 E. Wisconsin Ave. | | | management company, and Senior | | Inc., FMI Funds, Inc |
| Suite 2200 | | | Advisor for Providence Equity | | and FMI Mutual |
| Milwaukee, WI 53202 | | | Partners (Providence, RI) since | | Funds, Inc. |
| | | | September, 2007. He was | | |
| | | | Executive Vice President of Qwest | | |
| | | | Communications International, Inc. | | |
| | | | (Denver, CO) from September, 2002 to | | |
| | | | June, 2007. | | |
| | | | | | |
| Robert C. Arzbaecher, 50 | Director | Indefinite Term | Mr. Arzbaecher is President and | 4 | Actuant Corporation, |
| c/o Fiduciary | | Since 2007 | Chief Executive Officer of Actuant | | CF Industries |
| Management, Inc. | | | Corporation (Butler, WI), a | | Holdings, Inc., |
| 100 E. Wisconsin Ave. | | | manufacturer of a broad range of | | FMI Funds, Inc. |
| Suite 2200 | | | industrial products and systems, and | | and FMI Mutual |
| Milwaukee, WI 53202 | | | the Chairman of the Board of Directors | | Funds, Inc. |
| | | | of Actuant Corporation. | | |
| | | | | | |
| Gordon H. | Director | Indefinite Term | Mr. Gunnlaugsson retired from M&I | 4 | FMI Funds, Inc. |
| Gunnlaugsson, 66 | | Since 2001 | Corporation (Milwaukee, WI) | | and FMI Mutual |
| c/o Fiduciary | | | in December, 2000. | | Funds, Inc |
| Management, Inc. | | | | | |
| 100 E. Wisconsin Ave. | | | | | |
| Suite 2200 | | | | | |
| Milwaukee, WI 53202 | | | | | |
| | | | | | |
| Paul S. Shain, 47 | Director | Indefinite Term | Mr. Shain is President and Chief | 4 | FMI Funds, Inc. and |
| c/o Fiduciary | | Since 2001 | Executive Officer of Singlewire | | FMI Mutual Funds, |
| Management, Inc. | | | Software, LLC (Madison, WI), a provider | | Inc. |
| 100 E. Wisconsin Ave. | | | of IP-based paging and emergency | | |
| Suite 2200 | | | notification systems. Prior to joining | | |
| Milwaukee, WI 53202 | | | Singlewire in April, 2009, Mr. Shain was | | |
| | | | Senior Vice President of CDW | | |
| | | | Corporation (Vernon Hills, IL) and Chief | | |
| | | | Executive Officer of Berbee Information | | |
| | | | Networks, a strategic business unit of | | |
| | | | CDW which CDW acquired in 2006. | | |
| | | | Mr. Shain was employed in various capacities | | |
| | | | by CDW and Berbee Information Networks | | |
| | | | from January, 2000 to October, 2008. | | |
FMI Common Stock Fund, Inc.
DIRECTORS AND OFFICERS (Continued)
| | | | | | Other |
| | | | Principal | # of Funds | Directorships |
| | Position | Office and | Occupation(s) | in Complex | Held by |
| Name, Age | Held with | Length of | During Past | Overseen | Director |
| and Address | the Fund | Time Served | Five Years | by Director | or Officer |
| Interested Directors | | | | | |
| | | | | | |
| John S. Brandser,* 48 | Director | Indefinite Term | Mr. Brandser is President, Secretary, | 2 | FMI Mutual Funds, |
| c/o Fiduciary | | Since 2009 | Chief Operating Officer and Chief | | Inc. |
| Management, Inc. | Vice | One Year Term | Compliance Officer of Fiduciary | | |
| 100 E. Wisconsin Ave. | President | Since 2008 | Management, Inc. and has been | | |
| Suite 2200 | and | One Year Term | employed by the Adviser in various | | |
| Milwaukee, WI 53202 | Secretary | Since 2009 | capacities since March, 1995. | | |
| | | | | | |
| Patrick J. English,* 49 | Director | Indefinite Term | Mr. English is Chief Executive Officer, | 3 | FMI Funds, Inc. |
| c/o Fiduciary | | Since 1997 | Chief Investment Officer and Treasurer | | |
| Management, Inc. | Vice | One Year Term | of Fiduciary Management, Inc. and has | | |
| 100 E. Wisconsin Ave. | President | Since 1996 | been employed by the Adviser in | | |
| Suite 2200 | | . | various capacities since December, 1986 | | |
| Milwaukee, WI 53202 | | | | | |
| | | | | | |
| Ted D. Kellner,* 64 | Director | Indefinite Term | Mr. Kellner is Executive Chairman of | 3 | Marshall & Ilsley |
| c/o Fiduciary | | | Fiduciary Management, Inc. which he | | Corporation |
| Management, Inc. | President | One Year Term | co-founded in 1980. | | and FMI Funds, Inc. |
| 100 E. Wisconsin Ave. | and | Since 1981 | | | |
| Suite 2200 | Treasurer | | | | |
| Milwaukee, WI 53202 | | | | | |
| | | | | | |
| Other Officers | | | | | |
| | | | | | |
| Kathleen M. Lauters, 58 | Chief | At Discretion | Ms. Lauters has been the Fund’s Chief | N/A | None |
| c/o Fiduciary | Compliance | of Board | Compliance Officer since | | |
| Management, Inc. | Officer | Since 2004 | September, 2004 | | |
| 100 E. Wisconsin Ave. | | | | | |
| Suite 2200 | | | | | |
| Milwaukee, WI 53202 | | | | | |
| * | Messrs. Brandser, English and Kellner are interested directors of the Fund because they are officers of the Fund and the Adviser. |
For additional information about the Directors and Officers or for a description of the policies and procedures that the Fund uses to determine how to vote proxies relating to portfolio securities, please call (800) 811-5311 and request a Statement of Additional Information. One will be mailed to you free of charge. The Statement of Additional Information is also available on the website of the Securities and Exchange Commission (the “Commission”) at http://www.sec.gov. Information on how the Fund voted proxies relating to portfolio securities is available on the Fund’s website at http://www.fmifunds.com or the website of the Commission no later than August 31 for the prior 12 months ending June 30. The Fund files its complete schedule of portfolio holdings with the Com mission for the first and third quarters of each fiscal year on Form N-Q. The Fund’s Form N-Q is available on the Commission’s website. The Fund’s Form N-Q may be reviewed and copied at the Commission’s Public Reference Room in Washington, D.C., and that information on the operation of the Public Reference Room may be obtained by calling 1-800-SEC-0330.
Protecting the privacy of our shareholders is important to us. This notice describes the practices and policies through which we maintain the confidentiality and protect the security of your non-public personal information.
What Information We Collect
In the course of providing services to you, we may collect the following types of “non-public personal information” about you:
| • | Information we receive from you on applications or other forms, such as your name, address and social security number, the types and amounts of investments and bank account information, and |
| • | Information about your transactions with us, our affiliates and others, as well as other account data. |
What Information We Disclose
We do not disclose any nonpublic personal information about our current or former shareholders to anyone, except as permitted by law. For example, we are permitted by law to disclose all of the information we collect, as described above, to our transfer agent to process your transactions. Furthermore, we restrict access to your nonpublic personal information to those persons who require such information to provide products or services to you. We maintain physical, electronic and procedural safeguards that comply with federal standards to guard your nonpublic personal information.
In the event that you hold shares of the Fund through a financial intermediary, including, but not limited to, a broker-dealer, bank or trust company, the privacy policy of your financial intermediary may govern how your nonpublic personal information would be shared with nonaffiliated third parties.
IMPORTANT NOTICE REGARDING DELIVERY OF SHAREHOLDER DOCUMENTS
In order to reduce expenses, we will deliver a single copy of prospectuses, proxies, financial reports, and other communication to shareholders with the same residential address, provided they have the same last name or we reasonably believe them to be members of the same family. Unless we are notified otherwise, we will continue to send you only one copy of these materials for as long as you remain a shareholder of the Fund. If you would like to receive individual mailings, please call (800) 811-5311 and we will begin sending you separate copies of these materials within 30 days after we receive your request.
Thank you for allowing us to serve your investment needs.
FMI Common Stock Fund, Inc.
100 East Wisconsin Avenue, Suite 2200
Milwaukee, Wisconsin 53202
www.fmifunds.com
414-226-4555
BOARD OF DIRECTORS
BARRY K. ALLEN
ROBERT C. ARZBAECHER
JOHN S. BRANDSER
PATRICK J. ENGLISH
GORDON H. GUNNLAUGSSON
TED D. KELLNER
PAUL S. SHAIN
INVESTMENT ADVISER
FIDUCIARY MANAGEMENT, INC.
100 East Wisconsin Avenue, Suite 2200
Milwaukee, Wisconsin 53202
ADMINISTRATOR, ACCOUNTANT, TRANSFER
AGENT AND DIVIDEND DISBURSING AGENT
U.S. BANCORP FUND SERVICES, LLC
615 East Michigan Street
Milwaukee, Wisconsin 53202
800-811-5311 or 414-765-4124
CUSTODIAN
U.S. BANK, N.A.
1555 North RiverCenter Drive, Suite 302
Milwaukee, Wisconsin 53212
DISTRIBUTOR
RAFFERTY CAPITAL MARKETS, LLC
59 Hilton Avenue
Garden City, New York 11530
INDEPENDENT REGISTERED
PUBLIC ACCOUNTING FIRM
PRICEWATERHOUSECOOPERS LLP
100 East Wisconsin Avenue, Suite 1800
Milwaukee, Wisconsin 53202
LEGAL COUNSEL
FOLEY & LARDNER LLP
777 East Wisconsin Avenue
Milwaukee, Wisconsin 53202
This report is not authorized for use as an offer of sale or a solicitation of an offer to buy shares of FMI Common Stock Fund unless accompanied or preceded by the Fund’s current prospectus. Performance data quoted represents past performance; past performance does not guarantee future results. The investment return and principal value of an investment will fluctuate so that an investor’s shares, when redeemed, may be worth more or less than their original cost. Current performance of the Fund may be lower or higher than the performance quoted. Performance data current to the most recent month end may be obtained by visiting www.fmifunds.com.
Item 2. Code of Ethics.
Registrant has adopted a code of ethics. See attached Exhibit 12 (a) (1).
Item 3. Audit Committee Financial Expert.
Registrant’s Board of Directors has determined that Mr. Gordon Gunnlaugsson, a member of its audit committee, is an audit committee financial expert. Mr. Gunnlaugsson is “independent” as such term is defined in Form N-CSR.
Item 4. Principal Accountant Fees and Services.
(a) Audit Fees
$20,170 (FY 2010) and $20,388 (FY 2009) are the aggregate fees billed for each of the last two fiscal years for professional services rendered by the principal accountant to the registrant for the audit of the registrant’s annual financial statements or services that are normally provided by the accountant in connection with statutory and regulatory filings or engagements for those fiscal years.
(b) Audit-Related Fees
There were no fees billed in the last two fiscal years for Audit-Related Fees.
(c) Tax Fees
There were no fees billed in the last two fiscal years for professional services rendered by the principal accountant to the registrant for tax compliance, tax advice, tax planning and tax return preparation.
There were no fees billed in the last two fiscal years for professional services rendered by the principal accountant to registrant’s investment adviser for tax compliance, tax advice and tax planning that were required to be approved by the audit committee pursuant to paragraph (c)(7)(ii) of Rule 2-01 of Regulation S-X.
(d) All Other Fees
There were no other fees billed in the last two fiscal years for products and services provided by the principal accountant to the registrant, other than the services reported in paragraphs (a) – (c) of this Item 4.
There were no fees billed in the last two fiscal years for products and services provided by the principal accountant to registrant’s investment adviser, which were required to be approved by the audit committee pursuant to paragraph (c)(7)(ii) or Rule 2-01 or Regulation S-X.
(e) (1) None
(e) (2) None
(f) Not applicable.
(g) See the tax fees disclosed in paragraph (c) of this Item 4.
(h) Not applicable, as no non-audit services were provided to registrant’s investment adviser.
Item 5. Audit Committee of Listed Registrants.
Not applicable.
Item 6. Schedule of Investments.
(a) The Schedule of Investments in securities of unaffiliated issuers is included as part of the report to shareholders filed under Item 1 of this Form.
Item 7. Disclosure of Proxy Voting Policies and Procedures for Closed-End Management Investment Companies
Not applicable.
Item 8. Portfolio Managers of Closed-End Management Investment Companies.
Not applicable.
Item 9. Purchases of Equity Securities By Closed-End Management Investment Company and Affiliated Purchasers.
Not applicable.
Item 10. Submission of Matters to a Vote of Security Holders.
None.
Item 11. Controls and Procedures.
| (a) | The Registrant’s disclosure controls and procedures are periodically evaluated. As of November 10, 2010, the date of the last evaluation, the Registrant’s officers have concluded that the Registrant’s disclosure controls and procedures are adequate. |
| (b) | The Registrant’s internal controls are periodically evaluated. There were no changes in the Registrant’s internal control over financial reporting that occurred during the second fiscal quarter of the period covered by this report that have materially affected, or are reasonably likely to materially affect, such controls. |
Item 12. Exhibits.
| (a) | (1) | Any code of ethics or amendment thereto. Filed herewith. |
| | (2) | Certifications pursuant to Section 302 of the Sarbanes-Oxley Act of 2002. Filed herewith. |
| | (3) | Any written solicitation to purchase securities under Rule 23c-1 under the Act sent or given during the period covered by the report by or on behalf of the Registrant to 10 or more persons. Not applicable to open-end investment companies. |
| (b) | Certification pursuant to Section 906 of the Sarbanes-Oxley Act of 2002. Furnished herewith. |
SIGNATURES
Pursuant to the requirements of the Securities Exchange Act of 1934 and the Investment Company Act of 1940, the registrant has duly caused this report to be signed on its behalf by the undersigned, thereunto duly authorized.
FMI Common Stock Fund, Inc.
Registrant
By /s/ Ted D. Kellner
Ted D. Kellner, Principal Executive Officer
Date November 12, 2010
Pursuant to the requirements of the Securities Exchange Act of 1934 and the Investment Company Act of 1940, this report has been signed below by the following persons on behalf of the registrant and in the capacities and on the dates indicated.
FMI Common Stock Fund, Inc.
Registrant
By /s/ Ted D. Kellner
Ted D. Kellner, Principal Executive Officer