UNITED STATES
SECURITIES AND EXCHANGE COMMISSION
Washington, D.C. 20549
FORM N-CSR
CERTIFIED SHAREHOLDER REPORT OF REGISTERED
MANAGEMENT INVESTMENT COMPANIES
Investment Company Act file number 811-03235
FMI Common Stock Fund, Inc.
(Exact name of registrant as specified in charter)
100 East Wisconsin Avenue, Suite 2200
Milwaukee, WI 53202
(Address of principal executive offices) (Zip code)
Ted D. Kellner
Fiduciary Management, Inc.
100 East Wisconsin Avenue, Suite 2200
Milwaukee, WI 53202
(Name and address of agent for service)
(414) 226-4555
Registrant's telephone number, including area code:
Date of fiscal year end: September 30
Date of reporting period: September 30, 2013
Item 1. Reports to Stockholders.
ANNUAL REPORT
September 30, 2013
FMI Large Cap Fund
(FMIHX)
FMI Common Stock Fund
(FMIMX)
FMI International Fund
(FMIJX)
| | |
 | FMI Funds
Advised by Fiduciary Management, Inc. www.fmifunds.com |
| | |
FMI Funds
TABLE OF CONTENTS
| FMI Large Cap Fund | | |
| Shareholder Letter | | 3 |
| Management’s Discussion of Fund Performance | | 7 |
| Schedule of Investments | | 8 |
| Industry Sectors | | 10 |
| | | |
| FMI Common Stock Fund | | |
| Shareholder Letter | | 11 |
| Management’s Discussion of Fund Performance | | 16 |
| Schedule of Investments | | 17 |
| Industry Sectors | | 19 |
| | | |
| FMI International Fund | | |
| Shareholder Letter | | 20 |
| Management’s Discussion of Fund Performance | | 25 |
| Schedule of Investments | | 26 |
| Industry Sectors | | 28 |
| | | |
| Financial Statements | | |
| Statements of Assets and Liabilities | | 29 |
| Statements of Operations | | 30 |
| Statements of Changes in Net Assets | | 31 |
| Financial Highlights | | 32 |
| Notes to Financial Statements | | 33 |
| | | |
| Report of Independent Registered Public Accounting Firm | | 38 |
| Cost Discussion | | 39 |
| Directors and Officers | | 40 |
| Additional Information | | 41 |
| Disclosure Information | | 41 |
| Notice of Privacy Policy | | 43 |
| Householding Notice | | 43 |
FMI
Large Cap
Fund
September 30, 2013
Dear Fellow Shareholders:
The FMI Large Cap Fund gained 4.48% in the September quarter compared to 5.24% for the benchmark Standard & Poor’s 500 Index. Stock market sectors aiding relative performance included Industrial Services, Energy Minerals and Consumer Non-Durables. Areas hurting relative performance included Process Industries, Health Technology and Technology Services. Schlumberger gained significantly in the quarter, however, Potash Corporation declined meaningfully. The year-to-date gain of the Fund and the S&P 500 has been spectacular, continuing an unusual and almost unbroken run from the March 9, 2009 lows. Since that time, the Fund is up approximately168% and the S&P 500 is up approximately 174%. As an aside, we are satisfied to have only modestly lagged during this remarkable period, as our conservative style doesn’t lend itself to keeping up in a runaway market. If the market continues to soar, however, we are likely to lag. According to statistics compiled by the Leuthold Group, the gain in the stock market over the past four and half years is roughly double the median gain of the 15 bull markets since 1929. The composite of the approximately four dozen different valuation measures that we monitor quarterly dipped to the 5th decile in early 2009 and is now in the 8th decile (the 10th decile being the most expensive). Moreover, as mentioned in last quarter’s letter, the broad expansion of multiples across the vast majority of sectors leaves most median valuation measures equal to or higher than what existed in the 1999-2000 tech/telecom/internet bubble top. Additionally, the underlying fundamentals of the U.S. and European economies are sluggish, while the BRIC countries (Brazil, Russia, India and China) have seen slowing. While some individual companies are thriving, on average they are either in slow growth mode or are stagnant. The overriding determinant of recent and expected near-term performance appears to be monetary policy, specifically easy money. This policy, in our opinion, is largely experimental and has already artificially inflated assets across a broad spectrum; it grossly misallocates resources, makes “the rich” richer (they own the inflating assets, not the middle class), has little “wealth-effect” on spending and long-term, could potentially spur difficult–to-control inflation.

By Permission of Chip Bok and Creators Syndicate, Inc.
Economic Growth and Labor
The U.S. economy remains stuck in a pattern of very low growth. The current Bloomberg estimate for 2013 real GDP growth is 1.6%. This recovery has averaged about 2% growth, which is less than half that of a normal recovery. Real wages have been falling. Labor Department data shows that adjusted for inflation, average hourly pay has declined 0.9% since the end of the recession in 2009. The headline unemployment rate of 7.3% has fallen, but the broader official Bureau of Labor measure of unemployment and underemployment, U6, shows a 14% rate. Remarkably, including people who are “long-term” discouraged, the figure is unofficially approximately 23% and has actually been rising during this so-called recovery, as can be seen in the nearby chart. A startlingly high number of people appear to be simply giving up
their job search. This is unprecedented in the post-WWII period and reflects just how broken the job creation machine has become.
The labor participation rate continues to fall and is at a multi-generational low of 63.2%. Weak labor figures, combined with tepid capital formation, virtually doom the economy to slow growth. The last decade has been one of the slowest periods of fixed business investment as a percentage of GDP in the past six decades. After the initial spike off the 2009 bottom, sales and earnings growth for corporations has dropped significantly. According to the Leuthold Group, twelve month trailing Standard & Poor’s 500 Index earnings per share (EPS) are $89.18, essentially flat from the fourth quarter of 2011.
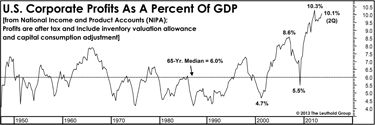
Profit Margins
The fourth quarter of 2011 turned out to be the peak quarter of profitability in this cycle. Corporate profits reached 10.3% compared to the prior high of 8.6% (see chart). Today margins stand at 10.1%.
The Leuthold Group points out that contrary to what the experts believe, most of the margin expansion over the past fifteen years is not due to dramatic increases in corporate efficiency or outsourcing manufacturing to lower labor cost countries, but rather, decreases in interest rates and corporate taxes. Below is a table breaking out the difference between 1997 margins and 2013 margins. Net interest payments as a percent of sales dropped from 4.8% to 2.7%. Corporate taxes dropped from 2.9% to 2.5%. Indeed, a look at EBIT margins (earnings before interest and taxes), shows an increase of only 20 basis points since the tech era profitability peak.
Long-term interest rates have already moved sharply off the bottom. The 10-Year Treasury yield was 1.62% a year ago and now sits at 2.63%. This compares to the median rate of 5.95% since 1957. Corporate tax rates do not appear to be going higher, but the absence of a decline will make for more difficult comparative earnings growth rates. Unless there is a magical gain in revenue growth or productivity, it certainly looks like profit margins are headed lower. EPS growth is obviously going to be difficult given this backdrop.
The Stock Market
In spite of weak underlying fundamentals, the stock market continues to move higher. Words of caution are increasingly viewed with snobbish derision, as bullish investors become more emboldened by the day. Enormous faith has been put in the hands of our monetary and fiscal authorities and the minute any unpleasantness surfaces, they are expected to provide easy money or delay budgetary discipline. They have obliged (including the highly politicized sinking of the nomination of Lawrence Summers to lead the Fed, virtually handing the nomination to one of the most dovish Fed members). This self-fulfilling prophesy creates unreal expectations, which is currently manifested by high valuations. It is hard to imagine that the policy mistakes that led to the bubble of 2004-2007 could be repeated so soon. As mentioned earlier, our quarterly composite of 48 different valuation measures has moved into the 8th decile, reducing the downside protection for the market. One of the most difficult aspects of this market is the widespread lack of value. Normally, even in a bull market, there are a number of sectors that get beaten up, giving long-term investors opportunities to make contrary bets. These sectors are few and far between presently. Our stocks trade at a significant discount to the benchmark, but remain above average from an absolute historical perspective. We have an extensive list of terrific and durable business franchises we would like to own in the event their stock prices decline significantly. History shows markets to be much more volatile and varying than they have been over the past four years. We are ready for a return to volatility!
Below we highlight two investments.
Potash Corporation (POT)
(Analyst: Karl Poehls)
Description
Potash Corporation is the world’s largest fertilizer company by capacity and produces the following three primary crop nutrients: potash (K), phosphate (P) and nitrogen (N). The company has operations and business interests in seven countries and sells globally.
Good Business
| | • | Fertilizer roughly doubles the productivity of crop land, yet only accounts for approximately 20% of farmers’ costs. Thus, it is an absolute necessity in the ongoing quest to feed an increasing world population, and is an excellent value. |
| | • | Potash Corporation is the world’s largest potash producer with 17 million tons of total capacity planned for 2015, and has access to more than 65 years worth of scarce potash reserves in Canada. |
| | • | The company benefits from high barriers to entry in potash and phosphate rock production. It takes at least seven years to construct a conventional potash mine and costs more than $4 billion. |
| | • | Over the trailing 5-year and 10-year periods, Potash Corporation’s return on invested capital (ROIC) has averaged 22% and 17%, respectively. Therefore, its ROIC handsomely exceeds its cost of capital. |
| | • | The company maintains a strong balance sheet with net debt of $2.8 billion, which is less than one times estimated 2013 EBITDA (earnings before interest, taxes, depreciation and amortization). Potash Corporation’s interest coverage ratio exceeds 25 times. |
Valuation
| | • | Over the trailing 1-year, 2-year and 5-year periods, the stock has lagged the price return of the S&P 500 Index by 43%, 82% and 81%, respectively. This is significant underperformance. |
| | • | Potash Corporation’s forward price-to-earnings multiple (P/E) is 13.6 times. Since December 2004, the stock has traded for an average earnings multiple of 22.4 times. |
| | • | A conservative estimate of the replacement cost of the company’s assets is more than 50% higher than the current stock price. |
| | • | We expect free cash flow to approach $2.5-3.0 billion by 2015 as the company’s massive potash expansion project is completed. The current dividend yield is 4.3%. |
Management
| | • | The company is led by CEO Bill Doyle and CFO Wayne Brownlee. Both executives have been in senior leadership positions at Potash Corporation since the initial public offering of stock in 1989. |
| | • | Mr. Doyle has 39 years of experience in the fertilizer industry and is well respected among his peers. |
| | • | As of 2012 year-end, Mr. Doyle beneficially owned close to $100 million of the company’s stock. |
| | • | A significant component of executive compensation is directly linked to ROIC. |
Investment Thesis
Over the past 5 years, POT’s common stock has lagged the price performance of the S&P 500 by 80%+. Investors have been concerned about potential over-capacity in the potash industry as well as a recent announcement by a key competitor to pursue a volume-over-price strategy. We believe these fears are overblown and potash prices will remain strong enough to generate attractive profits. At today’s valuation, Potash Corporation’s stock trades for more than 50% below a conservative estimate of the replacement value of its assets. We believe this presents an adequate margin of safety and think the stock is attractive for long-term investors.
Bank of New York Mellon (BK)
(Analyst: Matthew Goetzinger)
Description
The Bank of New York Mellon is the world’s largest custodian bank, with over $26 trillion in assets under custody, and is one of the largest asset management companies, with $1.4 trillion under management. The company has the most diverse service offering within the trust bank industry. BK’s primary businesses are Investment Services — core custody, back and middle office outsourcing, securities clearing, execution, foreign exchange, debt issuance and trust services (72% of revenues); and Investment Management (28% of revenues).
Good Business
| | • | In the custodial bank arena, BK operates within a rational oligopoly industry structure. The company commands leading market shares in each of its diversified businesses. |
| | • | Scale, long-tenured client relationships, deeply intertwined technology platforms and a global resource base all represent significant durable competitive advantages. |
| | • | Recurring fee-based businesses comprise over 80% of the company’s revenues. |
| | • | The company’s long-term average return on tangible common equity is over 30% and recently has been 25%, depressed by the unusual rate environment. |
| | • | BK is securely financed with a Basel III capital ratio of 9.3%. The company generates significant excess capital, which eventually should come back to shareholders. |
| | • | Historically trust banks have traded in line with the S&P 500 on a P/E basis. On depressed earnings BK trades at a 4 multiple point discount to the market. |
| | • | Giving effect to a normalization in interest rates, BK’s earnings power is in excess of $4.00 per share. At a more normal P/E multiple, BK’s fair value is 50-100% higher than the current price. |
| | • | Over the past ten years BK has held a median book multiple of 1.9 times, ranging from the current low of 1.1 times to a high of over 3 times. |
Management
| | • | Gerald Hassell has been the company’s CEO since September 2011. Since joining BK thirty years ago, Mr. Hassell has had direct management responsibility for the company’s broad range of investment service businesses and owns roughly one million shares outright. |
| | • | Todd Gibbons is the company’s current CFO and previously served as the company’s Chief Risk Officer. |
| | • | Management is focused on driving organic growth, improving margins, and returns on capital, while at the same time returning excess capital to shareholders. Management incentive compensation is tied to return on equity capital. |
Investment Thesis
BK’s numerous capital-light financial processing franchises are significantly underappreciated by the market. Despite operating with significant scale as the market leader in many recurring fee-based businesses, BK’s valuation is comparable to that of a conventional bank. Over the next three to five years, BK’s growth rate and multiple should expand as international economies and capital market sophistication improve, interest rates return to normal, and operating leverage allows for higher dividends and share repurchases.
The Fund’s Board of Directors has declared a distribution effective December 20, 2013, payable on December 20, 2013 to shareholders of record on December 19, 2013. The distribution amounts will be determined at that time and will be posted to the Fund’s website www.fmifunds.com when available.
Thank you for your confidence in the FMI Large Cap Fund.
100 E. Wisconsin Ave., Suite 2200 • Milwaukee, WI 53202 • 414-226-4555
www.fmifunds.com
This shareholder letter is unaudited.
FMI Large Cap Fund
MANAGEMENT’S DISCUSSION OF FUND PERFORMANCE
During the fiscal year ended September 30, 2013, the FMI Large Cap Fund (the “Fund”) had a total return of 20.94%. The benchmark S&P 500 returned 19.34% in the same period. Process Industries, Retail Trade and an elevated cash position all hurt relative performance. Potash Corporation declined in the period but we remain optimistic about the long-term prospects for this investment. Wal-Mart was up during the fiscal year, but lagged its industry group and the market. Devon Energy also trailed the overall Energy Minerals sector during the fiscal year. Electronic Technology, Producer Manufacturing and Distribution Services all aided relative performance. TE Connectivity, 3M and AmerisourceBergen were all up significantly in the period. Monsanto, Kimberly-Clark, Automatic Data Processing Inc., Ingersoll Rand and Omnicom were among those sold over the past year. Most of these sales were due to the stocks reaching or exceeding our determination of full value. Danone, PACCAR and Potash Corporation were among stocks added during the fiscal year. At September 30, 2013 the overweighted sectors included Producer Manufacturing and Distribution Services and the underweighted sectors included Electronic Technology, Communications and Utilities. The stock market continued its extraordinary rise in fiscal 2013, which we believe had more to do with monetary actions, i.e. quantitative easing, than meaningful improvement in either the underlying fundamentals of the economy or U.S. corporations. Real GDP growth remained anemic and broad measures of employment remained exceptionally weak. The debt crises showed little improvement in Europe, the United States or Japan over the fiscal year. Additionally, China appears to have much more debt than the official statistics would suggest. A credit-fueled boom in real estate and other infrastructure projects in China have increased the risk of significant negative consequences, not unlike those seen in the U.S. and Europe in 2009. In the U.S., valuations have moved higher from a year ago and fundamentals have not kept pace. Sales and earnings growth rates have fallen and profit margins for U.S. companies have weakened while at the same time valuations have expanded. From a macroeconomic and policy perspective, we do not see the fiscal or monetary initiatives of the past several years as being conducive to good long-term economic growth and employment. The high level of government liabilities and the rapid growth of regulations are particularly worrisome. While we continue to believe stocks have the best chance to adjust to a dynamic environment, and are thus attractive from a long-term perspective, we are less optimistic about the near-term. The Fund continues to sell at significant discount to the S&P 500 on most valuation measures and currently carries an above average level of cash.
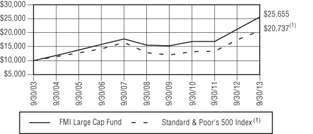
COMPARISON OF CHANGE IN VALUE OF $10,000 INVESTMENT IN
FMI LARGE CAP FUND AND STANDARD & POOR’S 500 INDEX(1)
| AVERAGE ANNUALIZED TOTAL RETURN |
| | | | | Since |
| | | | | Inception |
| | 1-Year | 5-Year | 10-Year | 12/31/01 |
| FMI Large Cap Fund | 20.94% | 10.55% | 9.88% | 8.38% |
| S&P 500 Index | 19.34% | 10.02% | 7.57% | 5.39% |
The graph and the table do not reflect the deduction of taxes that a shareholder would pay on Fund distributions or the redemption of Fund shares. Performance data quoted represents past performance; past performance does not guarantee future results. Investment return and principal value of an investment will fluctuate so that an investor’s shares, when redeemed, may be worth more or less than their original cost. Current performance of a Fund may be lower or higher than the performance quoted. The total returns do not reflect the deduction of taxes that a shareholder would pay on Fund distributions or the redemption of Fund shares. Total return includes change in share prices and in each case includes reinvestments of any dividends, interest and capital gain distributions. Performance data current to the most recent month-end may be obtained by visiting www.fmifunds.com or by calling 1-800-811-5311.
| (1) | The Standard & Poor’s 500 Index consists of 500 selected common stocks, most of which are listed on the New York Stock Exchange. The Standard & Poor’s Ratings Group designates the stocks to be included in the Index on a statistical basis. A particular stock’s weighting in the Index is based on its relative total market value (i.e., its market price per share times the number of shares outstanding). Stocks may be added or deleted from the Index from time to time. |
| An investment cannot be made directly into an index. | |
This page is unaudited.
FMI Large Cap Fund
SCHEDULE OF INVESTMENTS
September 30, 2013
| | Shares | | | | Cost | | | Value | |
| | |
| COMMON STOCKS — 87.0% (a) | |
| | |
| COMMERCIAL SERVICES SECTOR — 2.9% | |
| | | | Miscellaneous Commercial Services — 2.9% | |
| | | 4,520,000 | | Cintas Corp. | | $ | 130,932,811 | | | $ | 231,424,000 | |
| | |
| CONSUMER NON-DURABLES SECTOR — 6.1% | |
| | | | | Food: Major Diversified — 6.1% | |
| | | 18,850,000 | | Danone S.A. - SP-ADR | | | 264,458,375 | | | | 283,504,000 | |
| | | 3,056,000 | | Nestlé S.A. - SP-ADR | | | 143,118,869 | | | | 212,697,600 | |
| | | | | | | | 407,577,244 | | | | 496,201,600 | |
| CONSUMER SERVICES SECTOR — 2.6% | | | | | |
| | | | | Media Conglomerates — 2.6% | |
| | | 3,175,000 | | Time Warner Inc. | | | 83,095,288 | | | | 208,946,750 | |
| | |
| DISTRIBUTION SERVICES SECTOR — 5.7% | |
| | | | | Food Distributors — 2.4% | | | | | | | | |
| | | 6,210,000 | | Sysco Corp. | | | 168,159,594 | | | | 197,664,300 | |
| | | | | Medical Distributors — 3.3% | |
| | | 4,350,000 | | AmerisourceBergen Corp. | | | 131,156,744 | | | | 265,785,000 | |
| | |
| ELECTRONIC TECHNOLOGY SECTOR — 4.4% | |
| | | | | Electronic Components — 4.4% | |
| | | 6,946,000 | | TE Connectivity Ltd. | | | 183,234,855 | | | | 359,663,880 | |
| | |
| ENERGY MINERALS SECTOR — 4.2% | |
| | | | | Oil & Gas Production — 4.2% | |
| | | 5,915,000 | | Devon Energy Corp. | | | 362,217,764 | | | | 341,650,400 | |
| | |
| FINANCE SECTOR — 13.4% | |
| | | | | Financial Conglomerates — 3.3% | |
| | | 3,493,000 | | American Express Co. | | | 133,581,258 | | | | 263,791,360 | |
| | | | | Insurance Brokers/Services — 2.2% | |
| | | 4,176,000 | | Willis Group Holdings PLC | | | 159,709,388 | | | | 180,946,080 | |
| | | | | Major Banks — 7.9% | | | | | | | | |
| | | 12,135,000 | | Bank of New York Mellon Corp. | | | 295,617,813 | | | | 366,355,650 | |
| | | 7,010,000 | | Comerica Inc. | | | 216,460,410 | | | | 275,563,100 | |
| | | | | | | | 512,078,223 | | | | 641,918,750 | |
| HEALTH SERVICES SECTOR — 0.6% | |
| | | | | Managed Health Care — 0.6% | |
| | | 705,825 | | UnitedHealth Group Inc. | | | 50,656,535 | | | | 50,544,128 | |
| | |
| HEALTH TECHNOLOGY SECTOR — 6.2% | |
| | | | | Medical Specialties — 4.2% | |
| | | 5,569,000 | | Covidien PLC | | | 267,686,148 | | | | 339,374,860 | |
| | | | | Pharmaceuticals: Major — 2.0% | |
| | | 3,169,000 | | GlaxoSmithKline PLC - SP-ADR | | | 135,415,103 | | | | 158,988,730 | |
| | |
| INDUSTRIAL SERVICES SECTOR — 4.4% | |
| | | | | Oilfield Services/Equipment — 4.4% | |
| | | 4,000,000 | | Schlumberger Ltd. | | | 264,608,708 | | | | 353,440,000 | |
| | |
| PROCESS INDUSTRIES SECTOR — 5.2% | |
| | | | | Chemicals: Agricultural — 5.2% | |
| | | 13,560,000 | | Potash Corp. of Saskatchewan Inc. | | | 520,655,448 | | | | 424,156,800 | |
| | |
| PRODUCER MANUFACTURING SECTOR — 17.5% | |
| | | | | Industrial Conglomerates — 9.9% | |
| | | 3,457,000 | | 3M Co. | | | 263,778,954 | | | | 412,800,370 | |
FMI Large Cap Fund
SCHEDULE OF INVESTMENTS (Continued)
September 30, 2013
| Shares or Principal Amount | | Cost | | | Value | |
| | | | | | | |
| COMMON STOCKS — 87.0% (a) (Continued) | | | | | | |
| | | | | | | |
| PRODUCER MANUFACTURING SECTOR — 17.5% (Continued) | | | | | | |
| | | | Industrial Conglomerates — 9.9% (Continued) | |
| | | 3,477,000 | | Berkshire Hathaway Inc. - Cl B* | | $ | 250,004,548 | | | $ | 394,674,270 | |
| | | | | | | | 513,783,502 | | | | 807,474,640 | |
| | | | | Industrial Machinery — 4.9% | | | | | | | | |
| | | 5,160,000 | | Illinois Tool Works Inc. | | | 270,600,843 | | | | 393,553,200 | |
| | | | | Trucks/Construction/Farm Machinery — 2.7% | |
| | | 4,000,000 | | PACCAR Inc. | | | 170,974,477 | | | | 222,640,000 | |
| | |
| RETAIL TRADE SECTOR — 3.6% | |
| | | | | Discount Stores — 3.6% | | | | | | | | |
| | | 3,960,000 | | Wal-Mart Stores Inc. | | | 217,791,075 | | | | 292,881,600 | |
| | |
| TECHNOLOGY SERVICES SECTOR — 6.9% | |
| | | | | Information Technology Services — 4.4% | | | | | | | | |
| | | 4,860,000 | | Accenture PLC | | | 229,681,105 | | | | 357,890,400 | |
| | | | | Packaged Software — 2.5% | | | | | | | | |
| | | 6,158,000 | | Microsoft Corp. | | | 174,803,525 | | | | 205,122,980 | |
| | |
| TRANSPORTATION SECTOR — 3.3% | |
| | | | | Air Freight/Couriers — 3.3% | | | | | | | | |
| | | 6,150,000 | | Expeditors International of Washington Inc. | | | 231,833,459 | | | | 270,969,000 | |
| | | | | Total common stocks | | | 5,320,233,097 | | | | 7,065,028,458 | |
| | |
| SHORT-TERM INVESTMENTS — 13.0% (a) | |
| | | | | Commercial Paper — 2.5% | | | | | | | | |
| | $ | 129,000,000 | | U.S. Bank N.A., 0.01%, due 10/01/13 | | | 129,000,000 | | | | 129,000,000 | |
| | | 75,000,000 | | General Electric Co., 0.02%, due 10/09/13 | | | 74,999,667 | | | | 74,999,667 | |
| | | | | Total commercial paper | | | 203,999,667 | | | | 203,999,667 | |
| | | | | U.S. Treasury Securities — 10.5% | | | | | | | | |
| | | 375,000,000 | | U.S. Treasury Bills, 0.0050%, due 10/10/13 | | | 374,999,531 | | | | 374,999,531 | |
| | | 475,000,000 | | U.S. Treasury Bills, 0.0030%, due 10/24/13 | | | 474,999,090 | | | | 474,999,090 | |
| | | | | Total U.S. treasury securities | | | 849,998,621 | | | | 849,998,621 | |
| | | | | Total short-term investments | | | 1,053,998,288 | | | | 1,053,998,288 | |
| | | | | Total investments — 100.0% | | $ | 6,374,231,385 | | | | 8,119,026,746 | |
| | | | | Other assets, less liabilities — 0.0% (a)(b) | | | | | | | 2,989,010 | |
| | | | | TOTAL NET ASSETS — 100.0% | | | | | | $ | 8,122,015,756 | |
| * | | Non-income producing security. |
| (a) | | Percentages for the various classifications relate to net assets. |
| (b) | | Less than 0.05% of net assets. |
PLC – Public Limited Company
SP-ADR – Sponsored American Depositary Receipt
The accompanying notes to financial statements are an integral part of this schedule.
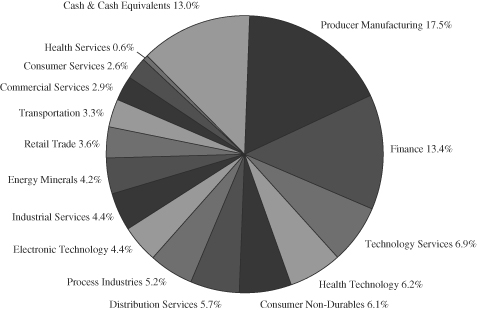
FMI Large Cap Fund
INDUSTRY SECTORS
as of September 30, 2013 (Unaudited)
FMI
Common Stock
Fund
September 30, 2013
Dear Fellow Shareholders:
The FMI Common Stock Fund gained 9.75% in the September quarter compared to 10.21% for the benchmark Russell 2000 Index. Stock market sectors aiding relative performance included Producer Manufacturing, Energy Minerals and Finance. In addition to abnormally high cash levels, sectors hurting relative performance included Health Technology, Process Industries and Distribution Services. Both Kaydon and Molex were acquired at significant premiums in the quarter and proceeds have not yet been redeployed. Compass Minerals declined in the period but we remain constructive on its prospects. McDermott also hurt performance in the September quarter and our reevaluation of its long-term outlook led to its removal. The year-to-date gain of the Fund and the Russell 2000 have been spectacular, continuing an unusual and almost unbroken run from the March 9, 2009 lows. Since that time, the Fund is up approximately 209% and the Russell 2000, up approximately 233%. As an aside, we are satisfied to have only modestly lagged during this remarkable period, as our conservative style doesn’t lend itself to keeping up in a runaway market. Today, we feel the benchmark Russell 2000 is loaded with overpriced and speculative merchandise. If, however, that index continues to soar, we will undoubtedly lag.
According to statistics compiled by the Leuthold Group, the gain in the stock market over the past four and half years is roughly double the median gain of the 15 bull markets since 1929. The composite of the approximately four dozen different valuation measures that we monitor quarterly dipped to the 5th decile in early 2009 and is now in the 8th decile (the 10th decile being the most expensive). Moreover, as mentioned in last quarter’s letter, the broad expansion of multiples across the vast majority of sectors leaves most median valuation measures equal to or higher than what existed in the 1999-2000 tech/telecom/internet bubble top. Additionally, the underlying fundamentals of the U.S. and European economies are sluggish, while the BRIC countries (Brazil, Russia, India and China) have seen slowing. While some individual companies are thriving, on average they are either in slow growth mode or are stagnant. The overriding determinant of recent and expected near-term performance appears to be monetary policy, specifically easy money. This policy, in our opinion, is largely experimental and has already artificially inflated assets across a broad spectrum; it grossly misallocates resources, makes “the rich” richer (they own the inflating assets, not the middle class), has little “wealth-effect” on spending and long-term, could potentially spur difficult–to-control inflation.
By Permission of Chip Bok and Creators Syndicate, Inc.
Economic Growth and Labor
The U.S. economy remains stuck in a pattern of very low growth. The current Bloomberg estimate for 2013 real GDP growth is 1.6%. This recovery has averaged about 2% growth, which is less than half that of a normal recovery. Real wages have been falling. Labor Department data shows that adjusted for inflation, average hourly pay has declined 0.9% since the end of the recession in 2009. The headline unemployment rate of 7.3% has fallen, but the broader official Bureau of Labor measure of unemployment and underemployment, U6, shows a 14% rate. Remarkably, including people who are “long-term” discouraged, the figure is unofficially approximately 23% and has actually been rising during this so-called
recovery, as can be seen in the chart on the previous page. A startlingly high number of people appear to be simply giving up their job search. This is unprecedented in the post-WWII period and reflects just how broken the job creation machine has become.
The labor participation rate continues to fall and is at a multi-generational low of 63.2%. Weak labor figures, combined with tepid capital formation, virtually doom the economy to slow growth. The last decade has been one of the slowest periods of fixed business investment as a percentage of GDP in the past six decades. After the initial spike off the 2009 bottom, sales and earnings growth for corporations has dropped significantly. According to the Leuthold Group, twelve month trailing Standard & Poor’s 500 Index earnings per share (EPS) are $89.18, essentially flat from the fourth quarter of 2011.
Profit Margins
The fourth quarter of 2011 turned out to be the peak quarter of profitability in this cycle. Corporate profits reached 10.3% compared to the prior high of 8.6% (see chart). Today margins stand at 10.1%.
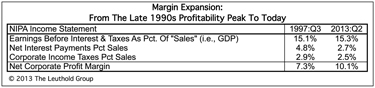
The Leuthold Group points out that contrary to what the experts believe, most of the margin expansion over the past fifteen years is not due to dramatic increases in corporate efficiency or outsourcing manufacturing to lower labor cost countries, but rather, decreases in interest rates and corporate taxes. Below is a table breaking out the difference between 1997 margins and 2013 margins. Net interest payments as a percent of sales dropped from 4.8% to 2.7%. Corporate taxes dropped from 2.9% to 2.5%. Indeed, a look at EBIT margins (earnings before interest and taxes), shows an increase of only 20 basis points since the tech era profitability peak.
Long-term interest rates have already moved sharply off the bottom. The 10-Year Treasury yield was 1.62% a year ago and now sits at 2.63%. This compares to the median rate of 5.95% since 1957. Corporate tax rates do not appear to be going higher, but the absence of a decline will make for more difficult comparative earnings growth rates. Unless there is a magical gain in revenue growth or productivity, it certainly looks like profit margins are headed lower. EPS growth is obviously going to be difficult given this backdrop.
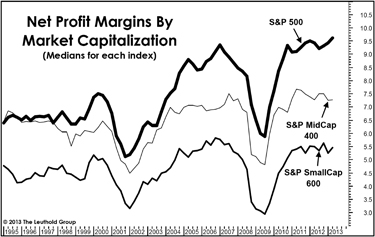
The margin data cited above are aggregate figures compiled by the National Income and Product Accounts (NIPA). It is also interesting to note how the margin picture looks based on company size. The graph on the left of the three S&P 500 indices (S&P 500, S&P MidCap 400 and S&P SmallCap
600). In recent periods the smaller cap companies’ margins have significantly lagged their bigger cap brethren. Additionally, smaller cap companies’ historically superior earnings growth rate has virtually disappeared over the past decade. Yet despite much lower relative growth and thinner margins, as well as being less liquid, small cap stocks continue to trade at a significant premium to large cap stocks. These realities, combined with great difficulty finding small caps that fit our fundamental and valuation criteria, leave the portfolio with higher-than-normal cash and a greater-than-normal aggregate market cap.
The Stock Market
In spite of weak underlying fundamentals, the stock market continues to move higher. Words of caution are increasingly viewed with snobbish derision, as bullish investors become more emboldened by the day. Enormous faith has been put in the hands of our monetary and fiscal authorities and the minute any unpleasantness surfaces, they are expected to provide easy money or delay budgetary discipline. They have obliged (including the highly politicized sinking of the nomination of Lawrence Summers to lead the Fed, virtually handing the nomination to one of the most dovish Fed members). This self-fulfilling prophesy creates unreal expectations, which is currently manifested by high valuations. It is hard to imagine that the policy mistakes that led to the bubble of 2004-2007 could be repeated so soon. As mentioned earlier, our quarterly composite of 48 different valuation measures has moved into the 8th decile, reducing the downside protection for the market. One of the most difficult aspects of this market is the widespread lack of value. Normally, even in a bull market, there are a number of sectors that get beaten up, giving long-term investors opportunities to make contrary bets. These sectors are few and far between presently. Our stocks trade at a significant discount to the benchmark, but remain above average from an absolute historical perspective. We have an extensive list of terrific and durable business franchises we would like to own in the event their stock prices decline significantly. History shows markets to be much more volatile and varying than they have been over the past four years. We are ready for a return to volatility!
Below we highlight two investments.
Broadridge Financial Solutions (BR)
(Analyst: Rob Helf)
Description
Broadridge Financial Solutions is a leading provider of investor communications and technology-driven processing solutions to banks, broker dealers, mutual funds and corporate issuers. Broadridge has significant market share in proxy distribution, proxy vote tabulation and other important communication as it sits between issuers and investors. The company serves over 800 bank customers, representing over 13,000 issuers. Additionally, the company provides securities transaction processing (order capture and execution, trade confirmation, settlement and accounting) and outsourcing for broker dealers and banks.
| | • | Broadridge provides a necessary service to public companies and the investment community. |
| | • | The company is a market leader by a wide margin in its core business of providing distribution and processing services in a highly regulated part of the financial service sector. The company’s technology is facilitating the move to electronic proxy and potentially greater participation in the proxy process. |
| | • | Broadridge has a high degree of recurring revenue, high customer retention rates and a scalable business model. |
| | • | The company expects to increase margins from already respectable levels. |
| | • | The business generates an ROIC (return on invested capital) of 15-16%, which is well in excess of its cost of capital. |
| | • | Broadridge produces very strong and highly predictable levels of cash flow. Free cash flow has exceeded net income by $30-50 million per annum over the past decade. |
| | • | Broadridge returns capital to its shareholders. In the most recent quarter, the company repurchased 3.3 million shares and increased its dividend by 17%. The current $0.84 annual dividend yields 2.7% and the payout ratio approximates 40%. |
| | • | The company is currently valued at approximately 15 times EPS (earnings per share), 8.2 times EBITDA (earnings before interest, taxes, depreciation and amortization) and 1.6 times sales. These metrics compare favorably to the general small and mid cap universe that currently trades at least 30% higher. |
| | • | Based on where similar businesses have been acquired, Broadridge appears to be trading at a significant discount to the current stock price. |
Management
| | • | Leslie Brun, age 61, is Broadridge’s Chairman and has served on the Board of Directors since 2007. Mr. Brun has served as a director of ADP (former parent of Broadridge) and as ADP’s Chairman since 2007. |
| | • | Richard Daly, age 60, is Broadridge’s CEO and has been a member of the Board of Directors since 2007. Prior to the March 2007 spin-off of Broadridge from ADP, Mr. Daly served as Group President of the Brokerage Services Group of ADP. |
| | • | John Hogan, age 64, is Broadridge’s President and COO. Prior to the spin-off, Mr. Hogan served along with Richard Daly as Group President of Brokerage Services. |
| | • | Dan Sheldon, age 56, is Broadridge’s Corporate VP and Chief Financial Officer. |
Investment Thesis
Broadridge has a very attractive recurring revenue business model with high ROICs and significant barriers to entry. The company should be able to grow revenues 4-5% organically and earnings at 10%, which compares favorably to the overall market. Some recent revenue drivers include: 1) the Broadridge/Accenture post-trade processing alliance, which targets European and Asian banks; and 2) an overall healthy securities trading environment. The shares have an attractive reward/risk profile based on the current valuation, business model and dividend yield/share repurchase program.
Arrow Electronics, Inc. (ARW)
(Analyst: Matt Sullivan)
Description
Arrow Electronics is a leading global distributor of semiconductors, passive and other electronic components, and midrange computing products. The company also offers a variety of value-added services including programming, system training and certification, solutions testing, and inventory and supply chain management. Arrow distributes these products and services to over 100,000 industrial and commercial customers spanning across 85 different countries.
Good Business
| | • | As a distributor of electronics and technology systems, Arrow Electronics benefits from the global growth in high technology without being exposed to the same obsolescence risk as technology manufacturers. |
| | • | Arrow is the second largest global IT distributor and controls a large market share position in the industry. It has stood the test of time, having incorporated in 1946. |
| | • | The company has a diversified set of vendors, customers and end markets. Arrow serves over 100,000 customers in 85 countries, including 12,000 value-added resellers. No single supplier accounts for more than 9% of overall revenues, and no single customer accounts for more than 3% of overall revenues. |
| | • | Arrow’s size and product offerings create a competitive advantage that translates into better margins than most of its smaller competitors. |
| | • | Over time, the company has proven its ability to consistently earn a return-on-capital that exceeds its cost-of-capital. |
| | • | The balance sheet is modestly levered with a debt-to-total capital ratio of approximately 35%. |
Valuation
| | • | Arrow is valued at 10.3 times forward EPS estimates and 0.33 times enterprise value-to-sales. |
| | • | The mean valuation for the company over the past 10 years has been 11.8 times forward EPS estimates and 0.33 times enterprise value-to-sales. |
| | • | The company trades at 7.5 times EBITDA compared to a 10-year average of 8 times. |
| | • | Michael Long is Chairman, President, and Chief Executive Officer. He has been CEO since 2009, and has been with the company since 1991. Prior to working at Arrow Electronics, Mr. Long worked at Schweber Electronics from 1983 until it merged with Arrow in 1991. |
| | • | Paul Reilly is Executive Vice President of Finance and Operations, and Chief Financial officer. He has held the position of CFO since 2001 and has been with the company since 1991. |
Investment Thesis
Arrow Electronics is one of the world’s largest distributors of electronic components and enterprise computing solutions. As a distributor of electronics, the company is in the advantageous position of benefitting from global technology growth, without being directly exposed to the short product cycles and cut-throat competition that exist for the innovators of technology. The cyclical downturn in the global components industry presented us with an opportunity to buy Arrow at an attractive price, which we believe will appreciate as some of the current trends begin to reverse.
The Fund’s Board of Directors has declared a distribution effective December 20, 2013, payable on December 20, 2013 to shareholders of record on December 19, 2013. The distribution amounts will be determined at that time and will be posted to the Fund’s website www.fmifunds.com when available.
Thank you for your confidence in the FMI Common Stock Fund.
100 E. Wisconsin Ave., Suite 2200 • Milwaukee, WI 53202 • 414-226-4555
www.fmifunds.com
This shareholder letter is unaudited.
FMI Common Stock Fund
MANAGEMENT’S DISCUSSION OF FUND PERFORMANCE
During the fiscal year ended September 30, 2013, the FMI Common Stock Fund (the “Fund”) had a total return of 26.63%. The benchmark Russell 2000 returned 30.06% in the same period. Higher than normal cash holdings were the primary reason for underperformance versus the benchmark. Additionally, Industrial Services, Process Industries and Consumer Services all hurt relative performance. McDermott, Compass Minerals and AptarGroup lagged in the period. McDermott was sold due to a significant change in the long-term fundamental outlook. Sectors that helped performance included Finance, Energy Minerals and Producer Manufacturing. Protective Life, Cimarex Energy and Molex were the prime contributors in these sectors. Stocks sold in the period included Covance, VCA Antech, West Pharmaceutical Services, Bio-Rad Laboratories, SPX Corp., Molex, Sigma-Aldrich and Bristow. A large number of companies reached or exceeded what we felt were full values. New purchases included Zions Bancorp, Greenlight Capital and Varian Medical. At September 30, the overweighted sectors included Commercial Services, Process Industries and Distribution Services. Underweighted sectors included Finance, Consumer Services and Electronic Technology. The stock market continued its extraordinary rise, which we believe had more to do with monetary actions, i.e. quantitative easing, than meaningful improvement in either the underlying fundamentals of the economy or U.S. corporations. Real GDP growth has been anemic and broad measures of employment remained exceptionally weak. The debt crises showed little improvement in Europe, the United States or Japan over the fiscal year. Additionally, China appears to have much more debt than the official statistics would suggest. A credit-fueled boom in real estate and other infrastructure projects in China has increased the risk of significant negative consequences, not unlike those seen in the U.S. and Europe in 2009. In the U.S., valuations have moved higher from a year ago and fundamentals have not kept pace. Small cap stocks appear especially vulnerable given profit margins that are weakening, growth rates that are slowing and valuations that are high from a historical basis. From a macroeconomic and policy perspective, we do not see the fiscal or monetary initiatives of the past several years as being conducive to good long-term economic growth and employment. The high level of government liabilities and the rapid growth of regulations are particularly worrisome. While we continue to believe stocks have the best chance to adjust to a dynamic environment, and are thus attractive from a long-term perspective, we are less optimistic about the near-term. The Fund continues to sell at significant discount to the Russell 2000 on most valuation measures and currently carries an above average level of cash.
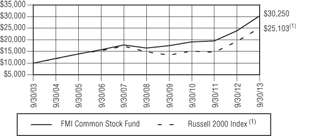
COMPARISON OF CHANGE IN VALUE OF $10,000 INVESTMENT IN
FMI COMMON STOCK FUND AND THE RUSSELL 2000 INDEX(1)
| AVERAGE ANNUALIZED TOTAL RETURN |
| | | | | Since |
| | | | | Inception |
| | 1-Year | 5-Year | 10-Year | 12/18/81 |
| FMI Common | | | | |
| Stock Fund | 26.63% | 12.88% | 11.70% | 12.40% |
| Russell 2000 Index | 30.06% | 11.15% | 9.64% | 10.60% |
The graph and the table do not reflect the deduction of taxes that a shareholder would pay on Fund distributions or the redemption of Fund shares. Performance data quoted represents past performance; past performance does not guarantee future results. Investment return and principal value of an investment will fluctuate so that an investor’s shares, when redeemed, may be worth more or less than their original cost. Current performance of a Fund may be lower or higher than the performance quoted. The total returns do not reflect the deduction of taxes that a shareholder would pay on Fund distributions or the redemption of Fund shares. Total return includes change in share prices and in each case includes reinvestments of any dividends, interest and capital gain distributions. Performance data current to the most recent month-end may be obtained by visiting www.fmifunds.com or by calling 1-800-811-5311.
| (1) | The Russell 2000 Index measures the performance of the 2,000 smallest companies in the Russell 3000 Index, which comprises the 3,000 largest U.S. companies based on total market capitalization. |
An investment cannot be made directly into an index.
This page is unaudited.
FMI Common Stock Fund
SCHEDULE OF INVESTMENTS
September 30, 2013
| | Shares | | | | Cost | | | Value | |
| | |
| COMMON STOCKS — 80.4% (a) | |
| | |
| COMMERCIAL SERVICES SECTOR — 7.3% | |
| | | | Financial Publishing/Services — 2.3% | | | | | | |
| | | 272,000 | | The Dun & Bradstreet Corp. | | $ | 18,520,002 | | | $ | 28,247,200 | |
| | | | | Miscellaneous Commercial Services — 3.7% | | | | | | | | |
| | | 741,000 | | Cintas Corp. | | | 20,332,081 | | | | 37,939,200 | |
| | | 492,000 | | RPX Corp.* | | | 8,350,644 | | | | 8,624,760 | |
| | | | | | | | 28,682,725 | | | | 46,563,960 | |
| | | | | Personnel Services — 1.3% | | | | | | | | |
| | | 425,000 | | Robert Half International Inc. | | | 11,128,001 | | | | 16,587,750 | |
| | |
| CONSUMER DURABLES SECTOR — 0.4% | |
| | | | | Other Consumer Specialties — 0.4% | | | | | | | | |
| | | 95,350 | | Mine Safety Appliances Co. | | | 2,530,688 | | | | 4,921,014 | |
| | |
| DISTRIBUTION SERVICES SECTOR — 18.4% | |
| | | | | Electronics Distributors — 10.9% | | | | | | | | |
| | | 515,000 | | Anixter International Inc.* | | | 34,020,675 | | | | 45,144,900 | |
| | | 1,293,000 | | Arrow Electronics Inc.* | | | 26,779,111 | | | | 62,749,290 | |
| | | 857,000 | | ScanSource Inc.* | | | 22,062,384 | | | | 29,652,200 | |
| | | | | | | | 82,862,170 | | | | 137,546,390 | |
| | | | | Medical Distributors — 5.5% | | | | | | | | |
| | | 690,000 | | Owens & Minor Inc. | | | 19,866,306 | | | | 23,867,100 | |
| | | 1,113,000 | | Patterson Cos. Inc. | | | 24,876,228 | | | | 44,742,600 | |
| | | | | | | | 44,742,534 | | | | 68,609,700 | |
| | | | | Wholesale Distributors — 2.0% | | | | | | | | |
| | | 676,000 | | World Fuel Services Corp. | | | 27,739,331 | | | | 25,221,560 | |
| | |
| ELECTRONIC TECHNOLOGY SECTOR — 1.3% | |
| | | | | Electronic Production Equipment — 1.3% | | | | | | | | |
| | | 620,000 | | MKS Instruments Inc. | | | 16,677,639 | | | | 16,485,800 | |
| | |
| ENERGY MINERALS SECTOR — 4.2% | |
| | | | | Oil & Gas Production — 4.2% | | | | | | | | |
| | | 552,000 | | Cimarex Energy Co. | | | 31,659,276 | | | | 53,212,800 | |
| | |
| FINANCE SECTOR — 16.8% | |
| | | | | Finance/Rental/Leasing — 2.6% | | | | | | | | |
| | | 550,000 | | Ryder System Inc. | | | 24,635,921 | | | | 32,835,000 | |
| | | | | Insurance Brokers/Services — 1.5% | | | | | | | | |
| | | 423,000 | | Arthur J. Gallagher & Co. | | | 8,259,786 | | | | 18,463,950 | |
| | | | | Life/Health Insurance — 3.1% | | | | | | | | |
| | | 927,000 | | Protective Life Corp. | | | 14,744,788 | | | | 39,443,850 | |
| | | | | Property/Casualty Insurance — 4.7% | | | | | | | | |
| | | 804,000 | | Greenlight Capital Re Ltd.* | | | 19,808,449 | | | | 22,865,760 | |
| | | 840,000 | | W.R. Berkley Corp. | | | 20,975,570 | | | | 36,002,400 | |
| | | | | | | | 40,784,019 | | | | 58,868,160 | |
| | | | | Regional Banks — 4.9% | | | | | | | | |
| | | 605,000 | | Cullen/Frost Bankers Inc. | | | 35,152,346 | | | | 42,682,750 | |
| | | 680,000 | | Zions Bancorporation | | | 16,146,199 | | | | 18,645,600 | |
| | | | | | | | 51,298,545 | | | | 61,328,350 | |
| HEALTH TECHNOLOGY SECTOR — 2.6% | |
| | | | | Medical Specialties — 2.6% | | | | | | | | |
| | | 440,000 | | Varian Medical Systems Inc.* | | | 32,168,403 | | | | 32,881,200 | |
FMI Common Stock Fund
SCHEDULE OF INVESTMENTS (Continued)
| Shares or Principal Amount | | Cost | | | Value | |
| | |
| COMMON STOCKS — 80.4% (a) (Continued) | |
| | |
| PROCESS INDUSTRIES SECTOR — 12.6% | |
| | | | Chemicals: Agriculture — 1.3% | | | | | | |
| | | 550,150 | | Sociedad Quimica y Minera de Chile SA | | $ | 17,377,335 | | | $ | 16,807,083 | |
| | | | | Chemicals: Specialty — 4.2% | | | | | | | | |
| | | 380,000 | | Compass Minerals International Inc. | | | 27,626,318 | | | | 28,982,600 | |
| | | 446,000 | | Innophos Holdings Inc. | | | 22,106,901 | | | | 23,539,880 | |
| | | | | | | | 49,733,219 | | | | 52,522,480 | |
| | | | | Containers/Packaging — 4.2% | | | | | | | | |
| | | 320,000 | | AptarGroup Inc. | | | 6,630,305 | | | | 19,241,600 | |
| | | 776,000 | | Avery Dennison Corp. | | | 22,252,409 | | | | 33,771,520 | |
| | | | | | | | 28,882,714 | | | | 53,013,120 | |
| | | | | Industrial Specialties — 2.9% | | | | | | | | |
| | | 814,000 | | H.B. Fuller Co. | | | 23,274,847 | | | | 36,784,660 | |
| | |
| PRODUCER MANUFACTURING SECTOR — 6.4% | |
| | | | | Industrial Machinery — 3.0% | | | | | | | | |
| | | 840,000 | | Kennametal Inc. | | | 33,600,357 | | | | 38,304,000 | |
| | | | | Miscellaneous Manufacturing — 3.4% | | | | | | | | |
| | | 616,000 | | Carlisle Cos. Inc. | | | 18,825,955 | | | | 43,298,640 | |
| | |
| RETAIL TRADE SECTOR — 3.0% | |
| | | | | Discount Stores — 3.0% | | | | | | | | |
| | | 527,000 | | Family Dollar Stores Inc. | | | 21,060,256 | | | | 37,954,540 | |
| | |
| TECHNOLOGY SERVICES SECTOR — 3.8% | |
| | | | | Data Processing Services — 3.8% | | | | | | | | |
| | | 1,491,850 | | Broadridge Financial Solutions Inc. | | | 32,858,473 | | | | 47,366,237 | |
| | |
| TRANSPORTATION SECTOR — 3.6% | |
| | | | | Air Freight/Couriers — 1.1% | | | | | | | | |
| | | 352,000 | | Forward Air Corp. | | | 11,267,415 | | | | 14,203,200 | |
| | | | | Marine Shipping — 2.5% | | | | | | | | |
| | | 358,000 | | Kirby Corp.* | | | 15,889,528 | | | | 30,984,900 | |
| | | | | Total common stocks | | | 689,203,927 | | | | 1,012,455,544 | |
| | |
| SHORT-TERM INVESTMENTS — 21.3% (a) | |
| | | | | Commercial Paper — 5.4% | | | | | | | | |
| | $ | 48,300,000 | | U.S. Bank N.A., 0.01%, due 10/01/13 | | | 48,300,000 | | | | 48,300,000 | |
| | | 20,000,000 | | General Electric Co., 0.02%, due 10/09/13 | | | 19,999,911 | | | | 19,999,911 | |
| | | | | Total commercial paper | | | 68,299,911 | | | | 68,299,911 | |
| | | | | U.S. Treasury Securities — 15.9% | | | | | | | | |
| | | 25,000,000 | | U.S. Treasury Bills, 0.0050%, due 10/10/13 | | | 24,999,969 | | | | 24,999,969 | |
| | | 100,000,000 | | U.S. Treasury Bills, 0.0025%, due 10/17/13 | | | 99,999,889 | | | | 99,999,889 | |
| | | 75,000,000 | | U.S. Treasury Bills, 0.0030%, due 10/24/13 | | | 74,999,856 | | | | 74,999,856 | |
| | | | | Total U.S. treasury securities | | | 199,999,714 | | | | 199,999,714 | |
| | | | | Total short-term investments | | | 268,299,625 | | | | 268,299,625 | |
| | | | | Total investments — 101.7% | | $ | 957,503,552 | | | | 1,280,755,169 | |
| | | | | Liabilities, less other assets — (1.7%) (a) | | | | | | | (21,596,678 | ) |
| | | | | TOTAL NET ASSETS — 100.0% | | | | | | $ | 1,259,158,491 | |
| * | | Non-income producing security. |
| (a) | | Percentages for the various classifications relate to net assets. |
The accompanying notes to financial statements are an integral part of this schedule.
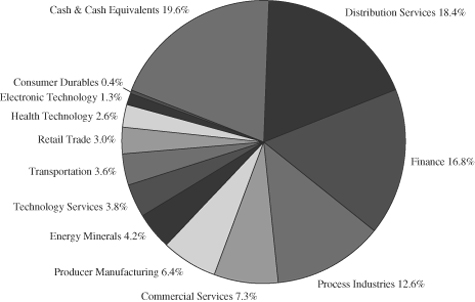
FMI Common Stock Fund
INDUSTRY SECTORS
as of September 30, 2013 (Unaudited)
FMI
International
Fund
September 30, 2013
Dear Fellow Shareholders:
The FMI International Fund (FMIJX) returned 4.32% in the three months ending September 30, 2013, which compares with the MSCI EAFE Index gain of 7.50% in local currency and 11.56% in U.S. Dollars (USD). Stock markets continued to soar in the quarter, with indices in Germany, France, the UK and Japan advancing by 7.98%, 11.07%, 5.70%, and 5.98%, respectively.(1) FMIJX was led by strong individual gains from Adecco, WPP and Electrocomponents, which were partially offset by losses from Potash, Shin-Etsu and Unilever. The Commercial Services, Industrial Services and Health Technology sectors performed well on a relative basis, while Process Industries, Finance and Consumer Non-Durables all lagged. A higher-than-normal cash position also weighed on the Fund’s relative performance. Calendar year-to-date, FMIJX has advanced by 16.14% while the MSCI EAFE is up 19.34% in local currency and 16.14% in USD.
Stock valuations remain elevated, and market exuberance continues to manifest itself at the will of central banks. The disconnect between stock prices and fundamentals is increasing as the proliferation of easy money and low interest rates has led to widespread asset inflation (as intended), which may soon prove to be a very dangerous game. Contrary to historical norms, stock prices have continued to rally even while economic forecasts repeatedly fall short of expectations, with the common belief that governments and central banks will come to the rescue. We are over four years removed from the biggest financial crisis of our generation, four years into an economic recovery, yet somehow GDP growth, employment and capital investment remain anemic, despite unprecedented accommodative policies. Is it time to admit that these policies are not working, and perhaps try something different (e.g., lower taxes, less regulation, incentives for capital investment)? We certainly believe the answer is a resounding YES, but we are not holding our breath.
Eurozone: Third Time A Charm?
The eurozone is showing some signs of life, with quarter-over-quarter GDP growth(2) (1.1% annualized) for the first time in seven quarters, ending the longest recession in the bloc’s history. Consumer confidence is on the rise, and the Markit manufacturing PMI(3) has tallied two consecutive months above 50 (51.4 in August, 50.3 in July), which implies expansion, after 23 straight months of contraction. However, we question whether Europe is out of the woods just yet. The European Central Bank (ECB) still predicts that eurozone GDP will contract by 0.4% over the full year, and unemployment remains at a record high of 12.1%(4), with nearly 20 million people still out of work. Youth unemployment in many countries tops 25%. Eurozone property prices hit a 7-year low in July, putting bank balance sheets further at risk. Paradoxically, European bank stock prices have surged 11% in the quarter and 28% over the past year,(5) outperforming the broader market. Spain, Italy and the Netherlands, which are the third, fourth and fifth largest economies in the eurozone, remain in a recession, and France is not far removed. France faces an uphill battle in terms of competitiveness, with high labor costs, low labor flexibility, early retirement (60 years), a 35-hour work week, 6+ weeks of paid vacation, high taxes, heavy public spending, et al. France’s new 10-year industrial plan provides little to instill confidence. Meanwhile in Germany, which is the bloc’s pillar of strength, the Bundesbank is predicting a slowdown in growth in the third quarter, and GDP growth of just 0.3% for the full year, a threshold which is underwhelming at best.
____________
(1)The following market indexes are being referred to above: Germany DAX, France CAC, FTSE All-Share (UK), and Japan TOPIX.
(2)As of June 2013 quarter.
(3)Purchasing Managers Index.
(4)As of July 2013.
(5)According to FTSE Eurofirst 300 banks index.
Let’s also not forget about Greece, which has been known to send ripples through the market from time to time. In August, Mr. Wolfgang Schäuble, Germany’s finance minister, publicly admitted that Greece will need a third bailout. This notion was quickly brushed under the rug, receiving minimal press coverage at the time. At this point it appears inevitable that Greece’s first two bailouts of ?73 billion and ?173 billion will come up short. While Mr. Schäuble commented that the International Monetary Fund (IMF) estimate of another ?11 billion through 2016 “appears reasonable,” Carsten Schneider, the spokesman on budget issues for Germany’s Social Democrat Party, has publicly argued that Greece’s financing needs are actually closer to ?77 billion. The Financial Times reports that “The IMF has insisted that any new programme must also ultimately deal with Greece’s massive debt pile, which despite unprecedented austerity and history’s largest sovereign default has only continued to rise.”(6) Government debt is now 175% of GDP which compares with 157% at the end of 2012. It certainly appears that the IMF, ECB and respective eurozone countries will continue to throw good money after bad, and another round of painful restructuring will eventually be in the cards.
While Greece Prime Minister Antonis Samaras and other European leaders are now calling for an end to austerity, a recent Forbes article(7) debunks a common perception that austerity in Europe has not worked: “Austerity hasn’t failed, it hasn’t even been tried,” writes Jeffrey Dorfman, a professor of economics at the University of Georgia. “In reality, few countries in Europe have actually reduced government spending. For those that have, economic growth is generally better than it is in countries that have continued to expand government spending. Data on 30 European countries from Eurostat, the official statistics agency of the European Union, show that only 8 countries reduced government spending between 2008 and 2012 […] Many countries that have purportedly tried austerity and failed are not on the above list. Greece, Spain, Italy and Portugal all increased government spending […] Austerity can indeed work if a country is willing to try it. Trying austerity means actually cutting government spending, not just slowing the growth in government spending. Austerity cannot have failed in countries where it was never tried.”
Japan: Booming Exports?
Thus far in 2013, Japan’s reported GDP growth(8) has been surprisingly strong, at 4.1% in the first quarter and 3.8% in the second quarter. Investors have been rewarded handsomely, with the TOPIX index gaining approximately 41% year-to-date and 63% from November 5, 2012. As mentioned in our June letter, however, we do not buy into the long-term efficacy of the “Abenomics” money printing experiment. Papering over deep structural problems is not a sustainable solution.
Recent export data calls into question the initial level of success of Prime Minister Abe’s program. As illustrated in the Japan Export Growth table, despite a sharp depreciation of the yen from November of 2012, export volumes have been weak, with only two months of positive volume growth (modest at that) over this time period. While headline export numbers (total export value) have looked strong, the reality is that foreigners have not been buying more products made in Japan over the past year. Instead, sales are simply being translated into more yen due to stronger foreign currencies. Thus far, it does not appear Japanese companies are using yen depreciation to become more competitive and go after market share, but instead are padding reported profits through currency translation. With weak volume growth, there is little incentive to invest in new domestic manufacturing capacity, which would create new jobs and spur domestic consumption. As a result, the long-term impact on the domestic economy may be less favorable than anticipated. It is worth noting that as of August, Japan has reported a trade deficit for 14 consecutive months, matching a 1979-1980 record set during the global oil shock.(9) For an economy that has long been heavily dependent upon exports, this is a concern, as rising input costs (e.g. energy imports) are offsetting gains made overseas (exports). Trade is becoming a drag on GDP instead of a growth driver, putting more pressure on Japan’s domestic consumer, which has historically been challenged, to carry the load.
____________
(6)“Third time lucky? The latest plan to rescue Greece” by Peter Spiegel. Financial Times, September 17, 2013.
(7)“Austerity Hasn’t Failed, It Hasn’t Even Been Tried” By Jeffrey Dorfman. Forbes, September 2, 2013.
(8)Quarter-over-quarter, annualized, expenditure approach.
(9)Japan’s August trade deficit (¥960 billion) rose by 25% year-over-year.
| Japan Export Growth: Year-over-year percentage change (%) |
| | Total Export | Export | Implied Price & |
| Date | Value (¥) | Volume | FX Impact |
| 8/13 | 14.70% | 1.90% | 12.80% |
| 7/13 | 12.20% | 1.80% | 10.40% |
| 6/13 | 7.40% | -5.00% | 12.40% |
| 5/13 | 10.10% | -1.20% | 11.30% |
| 4/13 | 3.80% | -3.00% | 6.80% |
| 3/13 | 1.10% | -7.10% | 8.20% |
| 2/13 | -2.90% | -12.80% | 9.90% |
| 1/13 | 6.40% | -1.50% | 7.90% |
| 12/12 | -5.80% | -11.80% | 6.00% |
| 11/12 | -4.10% | -7.70% | 3.60% |
| 10/12 | -6.50% | -8.50% | 2.00% |
| 9/12 | -10.30% | -11.60% | 1.30% |
| | | | |
Source: Bloomberg
We are also troubled by Japan’s level of corporate capital investment, which was flat in the second quarter after declining by 3.9% and 8.7% in the prior two quarters.(10) This calls into question the long-term confidence of Japanese corporations, as their lack of investment suggests that they, too, may be skeptical of the ability of “Abenomics” to generate sustainable growth. Mr. Abe, on the other hand, appears to have enough confidence in the outlook to implement an increase in the sales tax from 5% today to 8% by April 2014, and 10% by October 2015. If indeed the long-term health of the Japanese economy is weaker than perceived, an increase in the sales taxes would likely stunt domestic consumption, further compounding Japan’s long list of problems. Stay tuned.
China: More of the same
Optically it appears that China may be turning the corner, with HSBC (Hong Kong and Shanghai Banking Corporation) PMI(11) readings above 50 for two consecutive months, and reported gains in August in industrial output, retail sales and exports. While it’s possible that their supposed “recovery” is organic, we believe that China is resorting to its age-old playbook of excessive capital investment and persistent government stimulus. From our perspective, the risk of a housing and/or credit bubble in China remains very real. Real estate prices continue to rise, with residential properties in China’s three biggest cities (Beijing, Shanghai and Shenzen) up by 18% in August, and 6% in smaller cities. Ghost cities are still empty, and a lack of affordability remains. At the same time, The Wall Street Journal reports that credit is growing over two times faster than the economy, at 20% in the first half of 2013 compared with 7.6% GDP growth. This trend is unsustainable, especially considering that China’s total debt(12) to GDP is now believed to be over 200%.(13) Fitch Ratings argues that China is getting less bang for each buck, as much of the new credit is being used to refinance existing loans, which will not drive growth. They fear that problems could arise if financial conditions tighten, as borrowers would struggle to service their debt, which could lead to default, or even worse, a credit crisis. All bets are off if the housing bubble bursts, as it could potentially make the U.S. housing collapse look like a walk in the park.
The health of China’s banks is also a concern, as it is widely perceived that they are understating the true extent of their underperforming loans, hiding significant off-balance-sheet risk. The Financial Times reports that China’s commercial bank non-performing loans ratio was 1.1% in 2012, down from 17.9% in 2003. This figure appears suspect, especially considering widespread overcapacity and the vast number of low-quality investments that have been made in recent years. Many analysts believe that Chinese banks are far more exposed to shadow banking loans than is commonly perceived, and the practice of disguising “sizeable credit exposure as investments in wealth management products”(14) is running rampant. As China now accounts for over 13% of world GDP, the ripple effects of a banking crisis would be felt across the globe.
____________
(10)Year-over-year.
(11)Purchasing Managers Index.
(12)Total debt includes government, corporate and consumer credit.
(13)Goldman Sachs “Top of Mind” report, August 5, 2013.
(14)Standard & Poor’s Ratings Services report, cited in The Wall Street Journal article, “Fear Rises in China Over Bad Loans.” August 29, 2013.
As market bulls embrace an overly optimistic view through their quintessential rose-colored glasses (a.k.a. “Fed Goggles”), we remain skeptical and see growing risks to the downside. As a result, we will continue to remain cautious and prudent, building out our bench for a more favorable risk-to-reward environment. In the meantime, we expect FMIJX’s relative performance to be consistent with the firm’s long-term track record in domestic equities, lagging in periods of market euphoria (i.e. today) and outperforming in periods of market turmoil. While finding both quality and value in today’s stock markets is as challenging as we can remember, here are two FMIJX holdings that we believe fit the bill:
Potash Corporation (POT)
(Analyst: Karl Poehls)
Description
Potash Corporation is the world’s largest fertilizer company by capacity and produces the following three primary crop nutrients: potash (K), phosphate (P) and nitrogen (N). The company has operations and business interests in seven countries and sells globally.
Good Business
| | • | Fertilizer roughly doubles the productivity of crop land, yet only accounts for approximately 20% of farmers’ costs. Thus, it is an absolute necessity in the ongoing quest to feed an increasing world population, and is an excellent value. |
| | • | Potash Corporation is the world’s largest potash producer with 17 million tons of total capacity planned for 2015, and has access to more than 65 years worth of scarce potash reserves in Canada. |
| | • | The company benefits from high barriers to entry in potash and phosphate rock production. It takes at least seven years to construct a conventional potash mine and costs more than $4 billion. |
| | • | Over the trailing 5-year and 10-year periods, Potash Corporation’s return on invested capital (ROIC) has averaged 22% and 17%, respectively. Therefore, its ROIC handsomely exceeds its cost of capital. |
| | • | The company maintains a strong balance sheet with net debt of $2.8 billion, which is less than one times estimated 2013 EBITDA (earnings before interest, taxes, depreciation and amortization). Potash Corporation’s interest coverage ratio exceeds 25 times. |
Valuation
| | • | Over the trailing 1-year, 2-year and 5-year periods, the stock has lagged the price return of the S&P 500 Index by 43%, 82% and 81%, respectively. This is significant underperformance. |
| | • | Potash Corporation’s forward price-to-earnings multiple (P/E) is 13.6 times. Since December 2004, the stock has traded for an average earnings multiple of 22.4 times. |
| | • | A conservative estimate of the replacement cost of the company’s assets is more than 50% higher than the current stock price. |
| | • | We expect free cash flow to approach $2.5-3.0 billion by 2015 as the company’s massive potash expansion project is completed. The current dividend yield is 4.3%. |
Management
| | • | The company is led by CEO Bill Doyle and CFO Wayne Brownlee. Both executives have been in senior leadership positions at Potash Corporation since the initial public offering of stock in 1989. |
| | • | Mr. Doyle has 39 years of experience in the fertilizer industry and is well respected among his peers. |
| | • | As of 2012 year-end, Mr. Doyle beneficially owned close to $100 million of the company’s stock. |
| | • | A significant component of executive compensation is directly linked to ROIC. |
Investment Thesis
Over the past 5 years, POT’s common stock has lagged the price performance of the S&P 500 by 80%+. Investors have been concerned about potential over-capacity in the potash industry as well as a recent announcement by a key competitor to pursue a volume-over-price strategy. We believe these fears are overblown and potash prices will remain strong enough to generate attractive profits. At today’s valuation, Potash Corporation’s stock trades for more than 50% below a conservative estimate of the replacement value of its assets. We believe this presents an adequate margin of safety and think the stock is attractive for long-term investors.
Fairfax Financial Holdings (FFH)
(Analyst: Matthew Goetzinger)
Description
Fairfax is a multinational property/casualty insurance holding company run under the venerable investment sage Prem Watsa. The company’s primary operating units are: Northbridge Financial, operating in Canada; OdysseyRe, a specialty reinsurer; and Crum & Forster, a U.S. primary insurer. Approximately 50% of insurance premiums come from the U.S., with the remainder split between the Canadian and international markets. The business is balanced between short and longer-tailed risks.
Good Business
| | • | Fairfax’s operating businesses occupy leading market positions in durable niches within the global insurance market. |
| | • | The company’s business is predictable when viewed over the course of a cycle. |
| | • | Fairfax’s business provides necessary insurance coverages to enterprises globally. |
| | • | Over the past 27 years, Fairfax has delivered a 23% compound annual growth rate (CAGR) in book value per share. Management targets a long-term return on shareholder’s equity of at least 15%. |
| | • | Fairfax maintains a strong cash-rich balance sheet. Claims reserves have proven conservative through time. Current net premiums written are a small fraction of statutory capital. |
| | • | The company’s business model is transparent and fairly easy to understand. |
Valuation
| | • | Over the past five years, Fairfax has traded for an average discounted valuation of 1.1 times book value. |
| | • | Given the longer-term outlook of a 13-15% return on equity, the company’s fair value is 1.4-1.5 times accounting book value. |
| | • | Fairfax has considerable value not accurately captured by traditional GAAP (generally accepted accounting principals), including investment float, subsidiary company holdings and macroeconomic hedges. |
Management
| | • | Since 1985, Fairfax has been managed by Prem Watsa under the same guiding principles, that honesty and integrity are essential in all relationships, and will never be compromised. Prem owns 1.5% of the company outright. |
| | • | The company is managed under a conservative underwriting culture, with operating business units determining risk exposures. |
| | • | Fairfax has never lost a president or officer. |
| | • | Executives are long-term owners. Incentive stock options are inconsequential. |
Investment Thesis
Fairfax represents a conservative means to gain exposure to a resurgent global business environment through necessity insurance coverages. The company’s conservative underwriting culture positions Fairfax to benefit from a hardening of the insurance market. Despite a challenged near-term environment, we believe the company’s proven investment team will enable the company to navigate through a choppy market with decent returns.
The Fund’s Board of Directors has declared a distribution effective December 20, 2013, payable on December 20, 2013 to shareholders of record on December 19, 2013. The distribution amounts will be determined at that time and will be posted to the Fund’s website www.fmifunds.com when available.
Thank you for your continued support of the FMI International Fund.
100 E. Wisconsin Ave., Suite 2200 • Milwaukee, WI 53202 • 414-226-4555
www.fmifunds.com
This shareholder letter is unaudited.
FMI International Fund
MANAGEMENT’S DISCUSSION OF FUND PERFORMANCE
The FMI International Fund (the “Fund”) gained 20.87% in the fiscal year ended September 30, 2013. This compares to the 28.31% return of the MSCI EAFE Index (local currency) and the 23.77% of the MSCI EAFE Index (U.S. Dollar). Commercial Services, Non-Energy Minerals and Producer Manufacturing were among the outperforming sectors in the period. WPP PLC, SMC Corp., and TE Connectivity were up significantly in the period. Sectors that underperformed included Finance, Process Industries and Retail Trade. Higher-than-normal cash levels also hurt performance. Potash Corp. and Tesco declined during the fiscal year. Tesco was sold as our assessment of its long-term prospects diminished significantly. We remain optimistic about the long-term investment merits of Potash Corp. Brookfield Asset Management, Shimano, Ingersoll-Rand and SGS were sold in the fiscal year, all due to reaching our assessment of full value. New purchases this fiscal year included Amorepacific Preferred, Genting Malaysia Berhad, Taiwan Secom and Hyundai Greenfood. As of September 30, 2013, overweighted sectors included Commercial Services, Process Industries and Consumer Non-Durables. Underweighted groups included Finance, Health Technology and Producer Manufacturing. Stock markets around the globe were generally strong over the fiscal year, with exceptional performance from Japan. We believe markets were responding more to easy monetary policies than to true underlying improvement in the fundamentals. European economic growth remains weak, although the June quarter was the first positive GDP report in nearly two years. The United States GDP growth continues to be weak. Japan’s GDP growth has improved but the numbers are highly influenced by currency translation. China appears to be reigniting government stimulus programs to counter weaker economic growth. Broad measures of unemployment, in both Europe and the United States remains highly elevated. The debt crisis shows little sign of improvement in the Eurozone, or elsewhere across the globe. The United States was in the midst of a second major budget crisis as the fiscal year ended. Valuations have moved higher from a year ago and this presents the Fund with a less attractive investment landscape. While we continue to believe stocks have the best chance to adjust to a dynamic environment, and are thus attractive from a long-term perspective, we are less optimistic about the near-term. The Fund continues to sell at a discount to the MSCI EAFE on most valuation measures.
COMPARISON OF CHANGE IN VALUE OF $10,000 INVESTMENT IN
FMI INTERNATIONAL FUND AND MSCI EAFE(1)
| AVERAGE ANNUALIZED TOTAL RETURN |
| | | Since |
| | | Inception |
| | 1-Year | 12/31/10 |
| FMI International Fund | 20.87% | 11.48% |
MSCI EAFE (LOC)(1)(a) | 28.31% | 7.82% |
MSCI EAFE (USD)(1)(b) | 23.77% | 6.77% |
The graph and the table do not reflect the deduction of taxes that a shareholder would pay on Fund distributions or the redemption of Fund shares. Performance data quoted represents past performance; past performance does not guarantee future results. Investment return and principal value of an investment will fluctuate so that an investor’s shares, when redeemed, may be worth more or less than their original cost. Current performance of a Fund may be lower or higher than the performance quoted. The total returns do not reflect the deduction of taxes that a shareholder would pay on Fund distributions or the redemption of Fund shares. Total return includes change in share prices and in each case includes reinvestments of any dividends, interest and capital gain distributions. Performance data current to the most recent month-end may be obtained by visiting www.fmifunds.com or by calling 1-800-811-5311.
(1) The MSCI EAFE Index (Europe, Australasia, Far East) is a free float-adjusted market capitalization index that is designed to measure the equity market performance of developed markets, excluding the U.S. and Canada. As of May 27, 2010 the MSCI EAFE Index consisted of the following 22 developed market country indices: Australia, Austria, Belgium, Denmark, Finland, France, Germany, Greece, Hong Kong, Ireland, Israel, Italy, Japan, the Netherlands, New Zealand, Norway, Portugal, Singapore, Spain, Sweden, Switzerland and the United Kingdom. The MSCI EAFE Index is unmanaged and investors cannot invest directly in the Index. Index results are inclusive of dividends and net of foreign withholding taxes. The reported figures include reinvestment of dividends and capital gains distributions and do not reflect any fees or expenses.
The MSCI EAFE Index is calculated in local currency as well as in U.S. dollars (USD). The concept of a local currency calculation excludes the impact of currency fluctuations. All currencies of listing are considered in the Index calculation in local currency where current prices (t) and previous day prices (t-1) are converted into USD using the same exchange rate (exchange rate t-1) in the numerator and denominator. As a consequence, the FX factor drops out of the equation. The USD calculation includes exchange rates at t and t-1. Therefore, the local currency calculation only represents the price appreciation or depreciation of the securities, whereas the USD calculation also accounts for the performance of the currency (or currencies) relative to the USD. MSCI EAFE is a service mark of MSCI Barra.
An investment cannot be made directly into an index.
This page is unaudited.
FMI International Fund
SCHEDULE OF INVESTMENTS
| | Shares | | | | Cost | | | Value | |
| | |
| LONG-TERM INVESTMENTS — 92.3% (a) | |
| COMMON STOCKS — 88.7% (a) | | | | | | |
| | | | | | | |
| COMMERCIAL SERVICES SECTOR — 11.7% | | | | | | |
| | | | Advertising/Marketing Services — 3.7% | | | | | | |
| | | 248,000 | | WPP PLC (Jersey) (b) | | $ | 3,411,293 | | | $ | 5,096,442 | |
| | | | | Miscellaneous Commercial Services — 4.1% | | | | | | | | |
| | | 63,000 | | Secom Co. Ltd. (Japan) (b) | | | 3,134,242 | | | | 3,948,711 | |
| | | 698,000 | | Taiwan Secom (Taiwan) (b) | | | 1,633,345 | | | | 1,669,237 | |
| | | | | | | | 4,767,587 | | | | 5,617,948 | |
| | | | | Personnel Services — 3.9% | | | | | | | | |
| | | 74,500 | | Adecco S.A. (Switzerland) (b) | | | 3,510,341 | | | | 5,314,534 | |
| | | | | | | | | |
| CONSUMER DURABLES SECTOR — 5.5% | | | | | | | | |
| | | | | Automotive Aftermarket — 3.8% | | | | | | | | |
| | | 408,000 | | Pirelli & C. SpA (Italy) (b) | | | 4,472,614 | | | | 5,312,686 | |
| | | | | Other Consumer Specialties — 1.7% | | | | | | | | |
| | | 830,000 | | Samsonite International S.A. (Luxembourg) (b) | | | 1,742,260 | | | | 2,320,474 | |
| | | | | | | | | |
| CONSUMER NON-DURABLES SECTOR — 12.8% | | | | | | | | |
| | | | | Food: Major Diversified — 8.3% | | | | | | | | |
| | | 64,500 | | Danone S.A. - SP-ADR (France) (b) | | | 4,498,570 | | | | 4,856,447 | |
| | | 41,500 | | Nestlé S.A. (Switzerland) (b) | | | 2,487,120 | | | | 2,893,966 | |
| | | 94,500 | | Unilever PLC (Britain) (b) | | | 3,574,074 | | | | 3,674,206 | |
| | | | | | | | 10,559,764 | | | | 11,424,619 | |
| | | | | Household/Personal Care — 4.5% | | | | | | | | |
| | | 70,500 | | Henkel AG & Co. KGaA (Germany) (b) | | | 4,379,178 | | | | 6,245,814 | |
| | | | | | | | | |
| CONSUMER SERVICES SECTOR — 7.3% | | | | | | | | |
| | | | | Hotels/Resorts/Cruiselines — 3.6% | | | | | | | | |
| | | 3,804,000 | | Genting Malaysia Berhad (Malaysia) (b) | | | 4,907,289 | | | | 4,927,678 | |
| | | | | Restaurants — 3.7% | | | | | | | | |
| | | 373,000 | | Compass Group PLC (Britain) (b) | | | 3,883,079 | | | | 5,131,007 | |
| | | | | | | | | |
| DISTRIBUTION SERVICES SECTOR — 2.2% | | | | �� | | | | |
| | | | | Wholesale Distributors — 2.2% | | | | | | | | |
| | | 680,000 | | Electrocomponents PLC (Britain) (b) | | | 2,449,471 | | | | 3,037,973 | |
| | | | | | | | | |
| ELECTRONIC TECHNOLOGY SECTOR — 6.7% | | | | | | | | |
| | | | | Aerospace & Defense — 2.5% | | | | | | | | |
| | | 189,000 | | Rolls-Royce Holdings PLC (Britain)*(b) | | | 2,362,079 | | | | 3,400,480 | |
| | | | | Electronic Components — 4.2% | | | | | | | | |
| | | 111,000 | | TE Connectivity Ltd. (Switzerland) | | | 3,962,593 | | | | 5,747,580 | |
| | | | | | | | | |
| ENERGY MINERALS SECTOR — 2.7% | | | | | | | | |
| | | | | Integrated Oil — 2.7% | | | | | | | | |
| | | 113,000 | | Royal Dutch Shell PLC (Britain) (b) | | | 3,875,932 | | | | 3,725,126 | |
| | | | | | | | | |
| FINANCE SECTOR — 7.5% | | | | | | | | |
| | | | | Insurance Brokers/Services — 2.2% | | | | | | | | |
| | | 70,500 | | Willis Group Holdings PLC (Ireland) | | | 2,675,045 | | | | 3,054,765 | |
| | | | | Property/Casualty Insurance — 5.3% | | | | | | | | |
| | | 18,000 | | Fairfax Financial Holdings Ltd. (Canada) | | | 7,073,151 | | | | 7,279,336 | |
| | | | | | | | | |
| HEALTH TECHNOLOGY SECTOR — 5.6% | | | | | | | | |
| | | | | Medical Specialties — 3.7% | | | | | | | | |
| | | 84,000 | | Covidien PLC (Ireland) | | | 4,450,727 | | | | 5,118,960 | |
| | | | | Pharmaceuticals: Major — 1.9% | | | | | | | | |
| | | 106,500 | | GlaxoSmithKline PLC (Britain) (b) | | | 2,385,580 | | | | 2,677,717 | |
FMI International Fund
SCHEDULE OF INVESTMENTS (Continued)
| Shares or Principal Amount | | Cost | | | Value | |
| | | | | | | |
| LONG-TERM INVESTMENTS — 92.3% (a) (Continued) | | | | | | |
| COMMON STOCKS — 88.7% (a) (Continued) | | | | | | |
| | | | | | | |
| INDUSTRIAL SERVICES SECTOR — 4.1% | | | | | | |
| | | | Oilfield Services/Equipment — 4.1% | | | | | | |
| | | 63,500 | | Schlumberger Ltd. (Curacao) | | $ | 4,508,529 | | | $ | 5,610,860 | |
| | | | | | | | | |
| NON-ENERGY MINERALS SECTOR — 2.9% | | | | | | | | |
| | | | | Construction Materials — 2.9% | | | | | | | | |
| | | 168,000 | | CRH PLC (Ireland) (b) | | | 3,259,722 | | | | 4,035,059 | |
| | | | | | | | | |
| PROCESS INDUSTRIES SECTOR — 9.0% | | | | | | | | |
| | | | | Chemicals: Agricultural — 4.9% | | | | | | | | |
| | | 218,000 | | Potash Corp. of Saskatchewan Inc. (Canada) | | | 8,258,134 | | | | 6,819,040 | |
| | | | | Chemicals: Specialty — 1.3% | | | | | | | | |
| | | 30,000 | | Shin-Etsu Chemical Co. Ltd. (Japan) (b) | | | 1,661,800 | | | | 1,840,683 | |
| | | | | Industrial Specialties — 2.8% | | | | | | | | |
| | | 58,500 | | Akzo Nobel N.V. (Netherlands) (b) | | | 3,325,646 | | | | 3,843,487 | |
| | | | | | | | | |
| PRODUCER MANUFACTURING SECTOR — 3.2% | | | | | | | | |
| | | | | Industrial Machinery — 3.2% | | | | | | | | |
| | | 9,500 | | Schindler Holding AG (Switzerland) (b) | | | 1,091,082 | | | | 1,427,464 | |
| | | 12,500 | | SMC Corp. (Japan) (b) | | | 2,033,246 | | | | 2,983,321 | |
| | | | | | | | 3,124,328 | | | | 4,410,785 | |
| | | | | | | | | |
| RETAIL TRADE SECTOR — 3.2% | | | | | | | | |
| | | | | Department Stores — 3.2% | | | | | | | | |
| | | 275,000 | | Hyundai Greenfood Co. Ltd. (South Korea) (b) | | | 4,223,532 | | | | 4,399,167 | |
| | | | | | | | | |
| TECHNOLOGY SERVICES SECTOR — 4.3% | | | | | | | | |
| | | | | Information Technology Services — 4.3% | | | | | | | | |
| | | 81,500 | | Accenture PLC (Ireland) | | | 5,279,683 | | | | 6,001,660 | |
| | | | | Total common stocks | | | 104,509,357 | | | | 122,393,880 | |
| | | | | | | | | |
| PREFERRED STOCKS — 2.9% (a) | | | | | | | | |
| | | | | | | | | |
| CONSUMER NON-DURABLES SECTOR — 2.9% | | | | | | | | |
| | | | | Household/Personal Care — 2.9% | | | | | | | | |
| | | 6,000 | | Amorepacific Corp. (South Korea) (b) | | | 1,849,782 | | | | 1,898,905 | |
| | | 10,500 | | LG Household & Health Care Ltd. (South Korea) (b) | | | 1,822,341 | | | | 2,052,345 | |
| | | | | Total preferred stocks | | | 3,672,123 | | | | 3,951,250 | |
| | | | | | | | | |
| SAVINGS SHARES — 0.7% (a) | | | | | | | | |
| | | | | | | | | |
| CONSUMER DURABLES SECTOR — 0.7% | | | | | | | | |
| | | | | Automotive Aftermarket — 0.7% | | | | | | | | |
| | | 111,000 | | Pirelli & C. SpA (Italy) (b) - RSP | | | 929,593 | | | | 1,000,874 | |
| | | | | Total savings shares | | | 929,593 | | | | 1,000,874 | |
| | | | | Total long-term investments | | | 109,111,073 | | | | 127,346,004 | |
| | | | | | | | | |
| SHORT-TERM INVESTMENTS — 8.9% (a) | | | | | | | | |
| | | | | Commercial Paper — 5.3% | | | | | | | | |
| | $ | 2,300,000 | | U.S. Bank N.A., 0.01%, due 10/01/13 | | | 2,300,000 | | | | 2,300,000 | |
| | | 5,000,000 | | General Electric Co., 0.02%, due 10/09/13 | | | 4,999,978 | | | | 4,999,978 | |
| | | | | Total commercial paper | | | 7,299,978 | | | | 7,299,978 | |
FMI International Fund
SCHEDULE OF INVESTMENTS (Continued)
| Shares or Principal Amount | | Cost | | | Value | |
| | | | | |
| SHORT-TERM INVESTMENTS — 8.9% (a) (Continued) | | | | |
| | | U.S. Treasury Securities — 3.6% | | | | | | |
| $ | 5,000,000 | | U.S. Treasury Bills, 0.0030%, due 10/24/13 | | $ | 4,999,990 | | | $ | 4,999,990 | |
| | | | Total short-term investments | | | 12,299,968 | | | | 12,299,968 | |
| | | | Total investments — 101.2% | | $ | 121,411,041 | | | | 139,645,972 | |
| | | | Liabilities, less other assets — (1.2%) (a) | | | | | | | (1,739,771 | ) |
| | | | TOTAL NET ASSETS — 100.0% | | | | | | $ | 137,906,201 | |
| * | | Non-income producing security. |
| (a) | | Percentages for the various classifications relate to net assets. |
| (b) | | Security does not trade during New York Stock Exchange hours and has been valued in accordance with the procedures discussed in Note 1(a) to the financial statements and has been classified as level 2. As of September 30, 2013 the aggregate value of these securities was $87,713,803. |
PLC – Public Limited Company
RSP – Risparmio (Savings)
SP-ADR – Sponsored American Depositary Receipt
SCHEDULE OF FORWARD CURRENCY CONTRACTS
| | | | | U.S. $ Value on | | | | U.S. $ Value on | | | | |
| | | | | September 30, 2013 | | | | September 30, 2013 | | | Unrealized | |
| Settlement | | Currency to | | of Currency to | | Currency to | | of Currency to | | | Appreciation | |
| Date | Counterparty | be Delivered | | be Delivered | | be Received | | be Received | | | (Depreciation) | |
| 10/25/13 | State Street Global | | | | | | | | | | | |
| | Markets, LLC | 17,000,000 British Pound | | $ | 27,515,485 | | 26,087,265 U.S. Dollar | | $ | 26,087,265 | | | $ | (1,428,220 | ) |
| 10/25/13 | U.S. Bank, N.A. | 6,500,000 Canadian Dollar | | | 6,306,427 | | 6,292,352 U.S. Dollar | | | 6,292,352 | | | | (14,075 | ) |
| 10/25/13 | Bank of New York | 12,800,000 Euro | | | 17,317,545 | | 16,911,360 U.S. Dollar | | | 16,911,360 | | | | (406,185 | ) |
| 10/25/13 | U.S. Bank, N.A. | 675,000,000 Japanese Yen | | | 6,868,164 | | 6,736,527 U.S. Dollar | | | 6,736,527 | | | | (131,637 | ) |
| 10/25/13 | Bank of New York | 14,800,000 Malaysian Ringgit | | | 4,532,309 | | 4,607,304 U.S. Dollar | | | 4,607,304 | | | | 74,995 | |
| 10/25/13 | Bank of New York | 8,300,000,000 South Korean Won | | | 7,709,432 | | 7,384,341 U.S. Dollar | | | 7,384,341 | | | | (325,091 | ) |
| 10/25/13 | U.S. Bank, N.A. | 7,500,000 Swiss Franc | | | 8,294,980 | | 8,012,820 U.S. Dollar | | | 8,012,820 | | | | (282,160 | ) |
| 10/25/13 | Bank of New York | 40,400,000 Taiwan Dollar | | | 1,366,963 | | 1,344,426 U.S. Dollar | | | 1,344,426 | | | | (22,537 | ) |
| | | | | $ | 79,911,305 | | | | $ | 77,376,395 | | | $ | (2,534,910 | ) |
The accompanying notes to financial statements are an integral part of these schedules.
as of September 30, 2013 (Unaudited)
FMI Funds
STATEMENTS OF ASSETS AND LIABILITIES
| | | FMI | | | FMI | | | FMI | |
| | | Large Cap | | | Common Stock | | | International | |
| | | Fund | | | Fund | | | Fund | |
| ASSETS: | | | | | | | | | |
Investments in securities, at value (a) | | $ | 8,119,026,746 | | | $ | 1,280,755,169 | | | $ | 139,645,972 | |
Receivable from shareholders for purchases | | | 20,501,970 | | | | 453,606 | | | | 535,700 | |
Dividends and interest receivable | | | 9,068,218 | | | | 544,780 | | | | 231,893 | |
Receivable for forward currency contracts | | | — | | | | — | | | | 74,995 | |
Prepaid expenses | | | 131,738 | | | | 44,786 | | | | 14,832 | |
Cash | | | 86,561 | | | | 81,401 | | | | 96,064 | |
Total assets | | $ | 8,148,815,233 | | | $ | 1,281,879,742 | | | $ | 140,599,456 | |
| LIABILITIES: | | | | | | | | | | | | |
Payable to brokers for investments purchased | | $ | 16,306,638 | | | $ | 20,192,962 | | | $ | — | |
Payable to shareholders for redemptions | | | 4,794,538 | | | | 1,379,601 | | | | — | |
Payable to adviser for management fees | | | 3,744,446 | | | | 882,835 | | | | 28,044 | |
Payable for forward currency contracts | | | — | | | | — | | | | 2,609,905 | |
Other liabilities | | | 1,953,855 | | | | 265,853 | | | | 55,306 | |
Total liabilities | | | 26,799,477 | | | | 22,721,251 | | | | 2,693,255 | |
| NET ASSETS: | | | | | | | | | | | | |
Capital Stock (b) | | | 5,873,061,658 | | | | 817,998,178 | | | | 116,102,252 | |
Net unrealized appreciation (depreciation) on investments: | | | | | | | | | | | | |
Securities | | | 1,744,795,361 | | | | 323,251,617 | | | | 18,234,931 | |
Forward currency contracts | | | — | | | | — | | | | (2,534,910 | ) |
Foreign currency transactions | | | — | | | | — | | | | 2,947 | |
Accumulated net realized gain | | | 457,986,896 | | | | 114,909,937 | | | | 2,999,372 | |
Undistributed net investment income | | | 46,171,841 | | | | 2,998,759 | | | | 3,101,609 | |
Net assets | | | 8,122,015,756 | | | | 1,259,158,491 | | | | 137,906,201 | |
Total liabilities and net assets | | $ | 8,148,815,233 | | | $ | 1,281,879,742 | | | $ | 140,599,456 | |
| CALCULATION OF NET ASSET VALUE PER SHARE: | | | | | | | | | | | | |
Net asset value, offering and redemption price per share | | | | | | | | | | | | |
(Net assets ÷ shares outstanding) | | $ | 20.52 | | | $ | 29.05 | | | $ | 26.34 | |
| | | | | | | | | | | | | |
| (a) Identified cost of investments | | $ | 6,374,231,385 | | | $ | 957,503,552 | | | $ | 121,411,041 | |
| (b) Par value | | $ | 0.0001 | | | $ | 0.01 | | | $ | 0.0001 | |
| Shares authorized | | | 500,000,000 | | | Indefinite | | | | 300,000,000 | |
| Shares outstanding | | | 395,836,428 | | | | 43,351,637 | | | | 5,235,557 | |
The accompanying notes to financial statements are an integral part of these statements.
FMI Funds
STATEMENTS OF OPERATIONS
For the Year Ended September 30, 2013
| | | FMI | | | FMI | | | FMI | |
| | | Large Cap | | | Common Stock | | | International | |
| | | Fund | | | Fund | | | Fund | |
| | | | | | | | | | |
| INCOME: | | | | | | | | | |
Dividends | | $ | 136,904,972 | | | $ | 16,965,496 | | | $ | 2,045,899 | * |
Interest | | | 235,029 | | | | 61,580 | | | | 5,336 | |
Total income | | | 137,140,001 | | | | 17,027,076 | | | | 2,051,235 | |
| EXPENSES: | | | | | | | | | | | | |
Management fees | | | 53,745,186 | | | | 11,758,185 | | | | 754,606 | |
Transfer agent fees | | | 9,600,409 | | | | 1,296,294 | | | | 87,680 | |
Administration and accounting services | | | 3,667,012 | | | | 602,909 | | | | 135,424 | |
Printing and postage expense | | | 831,340 | | | | 94,600 | | | | 9,179 | |
Custodian fees | | | 304,994 | | | | 52,824 | | | | 42,953 | |
Registration fees | | | 293,763 | | | | 50,646 | | | | 42,572 | |
Professional fees | | | 57,659 | | | | 46,748 | | | | 41,535 | |
Board of Directors fees | | | 48,400 | | | | 43,600 | | | | 10,000 | |
Other expenses | | | 208,619 | | | | 82,511 | | | | 31,139 | |
Total expenses before reimbursement | | | 68,757,382 | | | | 14,028,317 | | | | 1,155,088 | |
Less expenses reimbursed by adviser | | | — | | | | — | | | | (148,911 | ) |
Net expenses | | | 68,757,382 | | | | 14,028,317 | | | | 1,006,177 | |
| NET INVESTMENT INCOME | | | 68,382,619 | | | | 2,998,759 | | | | 1,045,058 | |
| NET REALIZED GAIN ON INVESTMENTS: | | | | | | | | | | | | |
Securities | | | 470,091,161 | | | | 118,919,635 | | | | 2,876,727 | |
Forward currency contracts | | | — | | | | — | | | | 601,266 | |
Foreign currency transactions | | | — | | | | — | | | | 527,811 | |
| NET REALIZED GAIN ON INVESTMENTS | | | 470,091,161 | | | | 118,919,635 | | | | 4,005,804 | |
| NET CHANGE IN UNREALIZED | | | | | | | | | | | | |
| APPRECIATION (DEPRECIATION) OF INVESTMENTS: | | | | | | | | | | | | |
Securities | | | 803,855,501 | | | | 157,041,927 | | | | 13,970,190 | |
Forward currency contracts | | | — | | | | — | | | | (1,193,197 | ) |
Foreign currency transactions | | | — | | | | — | | | | 2,550 | |
| NET CHANGE IN UNREALIZED APPRECIATION (DEPRECIATION) | | | 803,855,501 | | | | 157,041,927 | | | | 12,779,543 | |
| NET GAIN ON INVESTMENTS | | | 1,273,946,662 | | | | 275,961,562 | | | | 16,785,347 | |
| NET INCREASE IN NET ASSETS RESULTING FROM OPERATIONS | | $ | 1,342,329,281 | | | $ | 278,960,321 | | | $ | 17,830,405 | |
* Net withholding taxes of $220,181.
The accompanying notes to financial statements are an integral part of these statements.
FMI Funds
STATEMENTS OF CHANGES IN NET ASSETS
For the Years Ended September 30, 2013 and 2012
| | | FMI | | | FMI | | | FMI | |
| | | Large Cap | | | Common Stock | | | International | |
| | | Fund | | | Fund | | | Fund | |
| | | | | | | | | | | | | | | | | | | |
| | | 2013 | | | 2012 | | | 2013 | | | 2012 | | | 2013 | | | 2012 | |
| OPERATIONS: | | | | | | | | | | | | | | | | | | |
Net investment income | | $ | 68,382,619 | | | $ | 64,095,788 | | | $ | 2,998,759 | | | $ | 4,270,449 | | | $ | 1,045,058 | | | $ | 401,433 | |
Net realized gain on investments | | | 470,091,161 | | | | 97,601,348 | | | | 118,919,635 | | | | 113,867,695 | | | | 4,005,804 | | | | 1,787,474 | |
Net change in unrealized | | | | | | | | | | | | | | | | | | | | | | | | |
appreciation on investments | | | 803,855,501 | | | | 957,131,983 | | | | 157,041,927 | | | | 90,965,301 | | | | 12,779,543 | | | | 4,331,720 | |
Net increase in net assets | | | | | | | | | | | | | | | | | | | | | | | | |
from operations | | | 1,342,329,281 | | | | 1,118,829,119 | | | | 278,960,321 | | | | 209,103,445 | | | | 17,830,405 | | | | 6,520,627 | |
| DISTRIBUTIONS TO SHAREHOLDERS: | | | | | | | | | | | | | | | | | | | | | | | | |
Distributions from | | | | | | | | | | | | | | | | | | | | | | | | |
net investment income | | | (70,248,746 | ) | | | (50,344,376 | ) | | | (3,755,898 | ) | | | (1,924,012 | ) | | | (276,470 | ) | | | (124,040 | ) |
Distributions from net realized gains | | | (76,074,311 | ) | | | (119,091,898 | ) | | | (104,459,853 | ) | | | (85,397,192 | ) | | | (780,403 | ) | | | — | |
Total distributions | | | (146,323,057 | ) | | | (169,436,274 | ) | | | (108,215,751 | ) | | | (87,321,204 | ) | | | (1,056,873 | ) | | | (124,040 | ) |
| FUND SHARE ACTIVITIES: | | | | | | | | | | | | | | | | | | | | | | | | |
Proceeds from shares issued | | | 2,042,367,387 | | | | 2,281,908,015 | | | | 156,410,362 | | | | 163,903,550 | | | | 59,962,904 | | | | 50,654,509 | |
Net asset value of shares issued | | | | | | | | | | | | | | | | | | | | | | | | |
in distributions reinvested | | | 134,676,458 | | | | 150,413,804 | | | | 105,591,665 | | | | 85,133,428 | | | | 1,034,508 | | | | 123,122 | |
Cost of shares redeemed | | | (1,418,847,676 | ) | | | (1,222,659,690 | ) | | | (292,088,719 | ) | | | (198,309,108 | ) | | | (7,180,587 | ) | | | (3,372,226 | ) |
Net increase (decrease) in net assets | | | | | | | | | | | | | | | | | | | | | | | | |
derived from Fund share activities | | | 758,196,169 | | | | 1,209,662,129 | | | | (30,086,692 | ) | | | 50,727,870 | | | | 53,816,825 | | | | 47,405,405 | |
TOTAL INCREASE | | | 1,954,202,393 | | | | 2,159,054,974 | | | | 140,657,878 | | | | 172,510,111 | | | | 70,590,357 | | | | 53,801,992 | |
| NET ASSETS AT THE | | | | | | | | | | | | | | | | | | | | | | | | |
| BEGINNING OF THE YEAR | | | 6,167,813,363 | | | | 4,008,758,389 | | | | 1,118,500,613 | | | | 945,990,502 | | | | 67,315,844 | | | | 13,513,852 | |
| NET ASSETS AT THE | | | | | | | | | | | | | | | | | | | | | | | | |
| END OF THE YEAR | | $ | 8,122,015,756 | | | $ | 6,167,813,363 | | | $ | 1,259,158,491 | | | $ | 1,118,500,613 | | | $ | 137,906,201 | | | $ | 67,315,844 | |
Undistributed net investment income | | $ | 46,171,841 | | | $ | 48,037,968 | | | $ | 2,998,759 | | | $ | 3,755,898 | | | $ | 3,101,609 | | | $ | 1,336,517 | |
| FUND SHARE TRANSACTIONS: | | | | | | | | | | | | | | | | | | | | | | | | |
Shares sold | | | 108,297,779 | | | | 140,809,873 | | | | 6,051,371 | | | | 6,533,630 | | | | 2,432,360 | | | | 2,441,371 | |
Shares issued in | | | | | | | | | | | | | | | | | | | | | | | | |
distributions reinvested | | | 8,008,684 | | | | 9,775,503 | | | | 4,598,940 | | | | 3,614,947 | | | | 47,537 | | | | 6,340 | |
Less shares redeemed | | | (75,281,300 | ) | | | (75,867,253 | ) | | | (11,290,353 | ) | | | (7,952,752 | ) | | | (287,112 | ) | | | (153,047 | ) |
Net increase (decrease) | | | | | | | | | | | | | | | | | | | | | | | | |
in shares outstanding | | | 41,025,163 | | | | 74,718,123 | | | | (640,042 | ) | | | 2,195,825 | | | | 2,192,785 | | | | 2,294,664 | |
The accompanying notes to financial statements are an integral part of these statements.
FMI Large Cap Fund
FINANCIAL HIGHLIGHTS
(Selected data for each share of the Fund outstanding throughout each year)
| | | Years Ended September 30, | |
| | | 2013 | | | 2012 | | | 2011 | | | 2010 | | | 2009 | |
| PER SHARE OPERATING PERFORMANCE: | | | | | | | | | | | | | | | |
| Net asset value, beginning of year | | $ | 17.38 | | | $ | 14.31 | | | $ | 14.46 | | | $ | 13.27 | | | $ | 13.65 | |
| Income from investment operations: | | | | | | | | | | | | | | | | | | | | |
| Net investment income | | | 0.18 | | | | 0.20 | | | | 0.16 | | | | 0.17 | | | | 0.20 | |
| Net realized and unrealized gains (losses) on investments | | | 3.37 | | | | 3.46 | | | | (0.17 | ) | | | 1.19 | | | | (0.47 | ) |
| Total from investment operations | | | 3.55 | | | | 3.66 | | | | (0.01 | ) | | | 1.36 | | | | (0.27 | ) |
| Less distributions: | | | | | | | | | | | | | | | | | | | | |
| Distributions from net investment income | | | (0.20 | ) | | | (0.17 | ) | | | (0.14 | ) | | | (0.17 | ) | | | (0.11 | ) |
| Distributions from net realized gains | | | (0.21 | ) | | | (0.42 | ) | | | — | | | | — | | | | — | |
| Total from distributions | | | (0.41 | ) | | | (0.59 | ) | | | (0.14 | ) | | | (0.17 | ) | | | (0.11 | ) |
| Net asset value, end of year | | $ | 20.52 | | | $ | 17.38 | | | $ | 14.31 | | | $ | 14.46 | | | $ | 13.27 | |
| TOTAL RETURN | | | 20.94 | % | | | 26.17 | % | | | (0.13 | %) | | | 10.33 | % | | | (1.79 | %) |
| RATIOS/SUPPLEMENTAL DATA: | | | | | | | | | | | | | | | | | | | | |
| Net assets, end of year (in 000’s $) | | | 8,122,016 | | | | 6,167,813 | | | | 4,008,758 | | | | 3,318,364 | | | | 2,051,701 | |
| Ratio of expenses to average net assets | | | 0.96 | % | | | 0.96 | % | | | 0.97 | % | | | 0.97 | % | | | 0.97 | % |
| Ratio of net investment income to average net assets | | | 0.95 | % | | | 1.25 | % | | | 1.03 | % | | | 1.18 | % | | | 1.80 | % |
| Portfolio turnover rate | | | 30 | % | | | 21 | % | | | 28 | % | | | 20 | % | | | 32 | % |
FINANCIAL HIGHLIGHTS
(Selected data for each share of the Fund outstanding throughout each year)
| | | Years Ended September 30, | |
| | | 2013 | | | 2012 | | | 2011 | | | 2010 | | | 2009 | |
| PER SHARE OPERATING PERFORMANCE: | | | | | | | | | | | | | | | |
| Net asset value, beginning of year | | $ | 25.43 | | | $ | 22.63 | | | $ | 22.98 | | | $ | 21.07 | | | $ | 21.20 | |
| Income from investment operations: | | | | | | | | | | | | | | | | | | | | |
| Net investment income (loss) | | | 0.07 | | | | 0.09 | | | | 0.03 | | | | (0.00 | )* | | | 0.05 | |
| Net realized and unrealized gains on investments | | | 6.05 | | | | 4.79 | | | | 0.44 | | | | 1.96 | | | | 0.86 | |
| Total from investment operations | | | 6.12 | | | | 4.88 | | | | 0.47 | | | | 1.96 | | | | 0.91 | |
| Less distributions: | | | | | | | | | | | | | | | | | | | | |
| Distributions from net investment income | | | (0.09 | ) | | | (0.04 | ) | | | — | | | | (0.04 | ) | | | (0.06 | ) |
| Distributions from net realized gains | | | (2.41 | ) | | | (2.04 | ) | | | (0.82 | ) | | | (0.01 | ) | | | (0.98 | ) |
| Total from distributions | | | (2.50 | ) | | | (2.08 | ) | | | (0.82 | ) | | | (0.05 | ) | | | (1.04 | ) |
| Net asset value, end of year | | $ | 29.05 | | | $ | 25.43 | | | $ | 22.63 | | | $ | 22.98 | | | $ | 21.07 | |
| TOTAL RETURN | | | 26.63 | % | | | 22.38 | % | | | 2.03 | % | | | 9.30 | % | | | 6.04 | % |
| RATIOS/SUPPLEMENTAL DATA: | | | | | | | | | | | | | | | | | | | | |
| Net assets, end of year (in 000’s $) | | | 1,259,158 | | | | 1,118,501 | | | | 945,991 | | | | 925,630 | | | | 872,557 | |
| Ratio of expenses to average net assets | | | 1.19 | % | | | 1.20 | % | | | 1.21 | % | | | 1.24 | % | | | 1.26 | % |
| Ratio of net investment income (loss) to average net assets | | | 0.26 | % | | | 0.38 | % | | | 0.13 | % | | | (0.01 | %) | | | 0.32 | % |
| Portfolio turnover rate | | | 24 | % | | | 43 | % | | | 26 | % | | | 30 | % | | | 35 | % |
*Amount is less than $0.005 per share.
The accompanying notes to financial statements are an integral part of these statements.
FMI International Fund
FINANCIAL HIGHLIGHTS
(Selected data for each share of the Fund outstanding throughout each period)
| | | | | | | | | For the Period from | |
| | | | | | | | | December 31, | |
| | | Years Ended September 30, | | | 2010* to | |
| | | | | | | | | September 30, | |
| | | 2013 | | | 2012 | | | 2011 | |
| PER SHARE OPERATING PERFORMANCE: | | | | | | | | | |
| Net asset value, beginning of period | | $ | 22.12 | | | $ | 18.06 | | | $ | 20.00 | |
| Income from investment operations: | | | | | | | | | | | | |
| Net investment income | | | 0.25 | | | | 0.22 | | | | 0.16 | |
| Net realized and unrealized gains (loss) on investments | | | 4.29 | | | | 4.00 | | | | (2.10 | ) |
| Total from investment operations | | | 4.54 | | | | 4.22 | | | | (1.94 | ) |
| Less distributions: | | | | | | | | | | | | |
| Distributions from net investment income | | | (0.08 | ) | | | (0.16 | ) | | | — | |
| Distributions from net realized gains | | | (0.24 | ) | | | — | | | | — | |
| Total from distributions | | | (0.32 | ) | | | (0.16 | ) | | | — | |
| Net asset value, end of period | | $ | 26.34 | | | $ | 22.12 | | | $ | 18.06 | |
| TOTAL RETURN | | | 20.87 | % | | | 23.52 | % | | | (9.70 | %)(1) |
| RATIOS/SUPPLEMENTAL DATA: | | | | | | | | | | | | |
| Net assets, end of period (in 000’s $) | | | 137,906 | | | | 67,316 | | | | 13,514 | |
| Ratio of expense to average net assets: | | | | | | | | | | | | |
| Before expense reimbursement | | | 1.15 | % | | | 1.45 | % | | | 2.91 | %(2) |
| After expense reimbursement | | | 1.00 | % | | | 1.00 | % | | | 1.00 | %(2) |
| Ratio of net investment income (loss) to average net assets: | | | | | | | | | | | | |
| Before expense reimbursement | | | 0.89 | % | | | 0.62 | % | | | (0.86 | )%(2) |
| After expense reimbursement | | | 1.04 | % | | | 1.07 | % | | | 1.05 | %(2) |
| Portfolio turnover rate | | | 21 | % | | | 20 | % | | | 12 | %(1) |
| * | | Commencement of Operations. |
| (1) | | Not annualized. |
| (2) | | Annualized. |
The accompanying notes to financial statements are an integral part of this statement.
NOTES TO FINANCIAL STATEMENTS
| (1) | Summary of Significant Accounting Policies — |
| | The following is a summary of significant accounting policies of the FMI Large Cap Fund, the FMI Common Stock Fund, Inc. and the FMI International Fund (collectively the “Funds” or the “Fund”). The FMI Large Cap Fund (the “Large Cap Fund”) and the FMI International Fund (the “International Fund”) are each a series of FMI Funds, Inc. (the “Company”). Both Funds are registered as non-diversified, open-end management investment companies under the Investment Company Act of 1940 (the “Act”), as amended. The Company was incorporated under the laws of Maryland on September 5, 1996 and the Large Cap Fund commenced operations on December 31, 2001 and the International Fund on December 31, 2010. The Large Cap Fund is currently closed to new investors. The assets and liabilities of each Fund in the Company are segregated and a shareholder’s interest is limited to the Fund in which the shareholder owns shares. The FMI Common Stock Fund, Inc. (the “Common Stock Fund”), is registered as a diversified open-end management investment company under the Act. The Common Stock Fund was incorporated under the laws of Wisconsin on July 29, 1981 and is currently closed to new investors. The investment objective of the Large Cap Fund is to seek long-term capital appreciation by investing mainly in a limited number of large capitalization value stocks. The investment objective of the Common Stock Fund is to seek long-term capital appreciation by investing mainly in small to medium capitalization value stocks. The investment objective of the International Fund is to seek capital appreciation by investing mainly in a limited number of large capitalization value stocks of non-U.S. companies. |
| | (a) | Each security, excluding short-term investments, is valued at the last sale price reported by the principal security exchange on which the issue is traded. Securities that are traded on the Nasdaq Markets are valued at the Nasdaq Official Closing Price, or if no sale is reported, the latest bid price. Securities that are traded over-the-counter are valued at the latest bid price. For the International Fund only, securities sold short which are listed on a national securities exchange or the Nasdaq Stock Market, but which were not traded on the valuation date, are valued at the most recent ask price. Unlisted equity securities for which market quotations are readily |
FMI Funds
NOTES TO FINANCIAL STATEMENTS (Continued)
| (1) | Summary of Significant Accounting Policies — (Continued) |
| | | available are valued at the most recent bid price. For the International Fund only, options purchased or written by the Fund are valued at the average of the most recent bid and ask prices. Securities for which quotations are not readily available are valued at fair value as determined by the investment adviser in accordance with procedures approved by the Board of Directors. The fair value of a security is the amount which a Fund might reasonably expect to receive upon a current sale. The fair value of a security may differ from the last quoted price and a Fund may not be able to sell a security at the fair value. Market quotations may not be available, for example, if trading in particular securities was halted during the day and not resumed prior to the close of trading on the New York Stock Exchange. For the International Fund only, for securities that do not trade during New York Stock Exchange hours, fair value determinations are based on analyses of market movements after the close of those securities’ primary markets, and may include reviews of developments in foreign markets, the performance of U.S. securities markets, and the performance of instruments trading in U.S. markets that represent foreign securities and baskets of foreign securities. The Board utilizes a service provided by an independent third party to assist in fair valuation of certain securities for the International Fund. As of September 30, 2013, there were no securities that were internally fair valued. Short-term investments with maturities of 60 days or less are valued at amortized cost which approximates value. For financial reporting purposes, investment transactions are recorded on the trade date. |
| | | The Funds apply the provisions of the Financial Accounting Standards Board (“FASB”) Accounting Standards Codification “Fair Value Measurements and Disclosures” Topic 820 (“ASC 820”), which defines fair value as the price that would be received to sell an asset or paid to transfer a liability (i.e., the “exit price”) in an orderly transaction between market participants at the measurement date. |
| | | In determining fair value, the Funds use various valuation approaches. ASC 820 establishes a fair value hierarchy for inputs used in measuring fair value that maximizes the use of observable inputs and minimizes the use of unobservable inputs by generally requiring that the most observable inputs be used when available. Observable inputs are those that market participants would use in pricing the asset or liability based on market data obtained from sources independent of the Funds. Unobservable inputs reflect the Funds’ assumptions about the inputs market participants would use in pricing the asset or liability developed based on the best information available in the circumstances. The inputs or methodologies used for valuing securities are not necessarily an indication of the risks associated with investing in those securities. For the International Fund only, over the counter derivatives such as forward currency contracts may be valued using quantitative models. These models may use pricing curves based on market inputs including current exchange rates or indices. These curves are combined with volatility factors to value the overall positions. The market inputs are generally significant and can be corroborated with observable market data and therefore are classified in level 2. |
| | | The fair value hierarchy is categorized into three levels based on the inputs as follows: |
| | Level 1 — | Valuations based on unadjusted quoted prices in active markets for identical assets. |
| | Level 2 — | Valuations based on quoted prices for similar securities or in markets that are not active or for which all significant inputs are observable, either directly or indirectly. |
| | Level 3 — | Valuations based on inputs that are unobservable and significant to the overall fair value measurement. |
| | The following table summarizes the Fund’s investments as of September 30, 2013, based on the inputs used to value them: |
| | | | Large Cap Fund | | | Common Stock Fund | | | International Fund | | | International Fund | |
| | | | Investments | | | Investments | | | Investments | | | Other Financial | |
| | Valuation Inputs | | in Securities | | | in Securities | | | in Securities | | | Instruments* | |
| | Assets: | | | | | | | | | | | | |
| | Level 1 — Common Stocks | | $ | 7,065,028,458 | | | $ | 1,012,455,544 | | | $ | 39,632,201 | | | $ | — | |
| | Level 2 — Common Stocks | | | — | | | | — | | | | 82,761,679 | | | | — | |
| | Preferred Stocks | | | — | | | | — | | | | 3,951,250 | | | | — | |
| | Savings Shares | | | — | | | | — | | | | 1,000,874 | | | | — | |
| | Short-Term Commercial Paper | | | 203,999,667 | | | | 68,299,911 | | | | 7,299,978 | | | | — | |
| | Short-Term U.S. Treasury Securities | | | 849,998,621 | | | | 199,999,714 | | | | 4,999,990 | | | | | |
| | Forward Currency Contracts | | | — | | | | — | | | | — | | | | 74,995 | |
| | Total Level 2 | | | 1,053,998,288 | | | | 268,299,625 | | | | 100,013,771 | | | | 74,995 | |
| | Level 3 — | | | — | | | | — | | | | — | | | | — | |
| | Liabilities: | | | | | | | | | | | | | | | | |
| | Level 2 — Forward Currency Contracts | | | — | | | | — | | | | — | | | | (2,609,905 | ) |
| | Total | | $ | 8,119,026,746 | | | $ | 1,280,755,169 | | | $ | 139,645,972 | | | $ | (2,534,910 | ) |
| | * | Other financial instruments are derivative instruments, specifically forward currency contracts, which are valued at the unrealized appreciation/(depreciation) on the instrument. |
FMI Funds
NOTES TO FINANCIAL STATEMENTS (Continued)
| (1) | Summary of Significant Accounting Policies — (Continued) |
| | | It is the Funds’ policy to recognize transfers between levels at the end of the reporting period. There were no transfers between levels during the fiscal year ended September 30, 2013. |
| | | See the Schedules of Investments for investments detailed by industry classifications. |
| | | In December 2011, the FASB issued an Accounting Standards Update No. 2011-11 (“ASU No. 2011-11”) to enhance disclosures requiring improved information about financial instruments and derivative instruments that are subject to offsetting (“netting”) on the Statements of Assets and Liabilities. This information will enable users of the entity’s financial statements to evaluate the effect or potential effect of netting arrangements on the entity’s financial position. ASU No. 2011-11 is effective prospectively during interim or annual periods beginning on or after January 1, 2013. At this time, management is evaluating the implications of these changes on the financial statements. |
| | | In January 2013, the FASB issued ASU 2013-01, which amends ASU 2011-11 to clarify that the scope applies to derivatives, repurchase and reverse repurchase agreements, and securities borrowing and lending transactions that are either offset in accordance with Section 210-20-45 or Section 815-10-45 or subject to master netting or similar arrangements. The amendments are effective prospectively for interim or annual periods beginning on or after January 1, 2013. At this time, management is evaluating the implications of these changes on the financial statements. |
| | (b) | Net realized gains and losses on sales of securities are computed on the identified cost basis. |
| | (c) | Dividend income is recorded on the ex-dividend date. Interest income is recorded on an accrual basis. |
| | (d) | The International Fund may enter into forward currency contracts in order to hedge its exposure to changes in foreign currency rates on its foreign portfolio holdings or to hedge certain purchase and sale commitments denominated in foreign currencies. A forward currency contract is a commitment to purchase or sell a foreign currency at a future date at a negotiated rate. These contracts are valued daily and the asset or liability therein represents unrealized gain or loss on the contracts as measured by the difference between the forward foreign exchange rates at the dates of entry into the contracts and the forward rates at the reporting date. There were on average seven forward currency contracts outstanding during the year ended September 30, 2013. |
| | | The fair value of the forward currency contracts as of September 30, 2013 is included in the following locations on the International Fund’s statement of assets and liabilities: |
| | | | Fair Value of | | Fair Value of |
| | | | Asset Forward | | (Liability) Forward |
| | | Location | Currency Contracts | Location | Currency Contracts |
| | Forward currency | Receivable for | $74,995 | Payable for | $(2,609,905) |
| | contracts | forward currency | | forward currency | |
| | | contracts | | contracts | |
| | Realized and unrealized gains and losses on forward currency contracts entered into during the period ending September 30, 2013 by the International Fund are recorded in the following locations on the statement of operations: |
| | | | Realized | | Unrealized |
| | | Location | Gain | Location | (Loss) |
| | Forward currency | Net realized gain on forward | $601,266 | Net change in unrealized | $(1,193,197) |
| | contracts | currency contracts | | depreciation on forward | |
| | | | | currency contracts | |
| | | These instruments involve market risk, credit risk, or both kinds of risks, in excess of the amount recognized in the International Fund’s statement of assets and liabilities. Risks arise from the possible inability of counterparties to meet the terms of their contracts and from movement in currency and securities values and interest rates. |
| | | |
| | (e) | The preparation of financial statements in conformity with accounting principles generally accepted in the United States of America (“GAAP”) requires management to make estimates and assumptions that affect the reported amounts of assets and liabilities and disclosure of contingent assets and liabilities at the date of the financial statements and the reported amounts of revenues and expenses during the reporting period. Actual results could differ from these estimates. |
| | | |
| | (f) | The Large Cap Fund may own certain securities that are restricted. Restricted securities include Section 4(2) commercial paper, securities issued in a private placement, or securities eligible for resale pursuant to Rule 144A under the Securities Act of 1933 (the “1933 Act”). A restricted security cannot be resold to the general public without prior registration under the 1933 Act or pursuant to the resale limitations provided by Rule 144A under the 1933 Act, or an exemption from the registration requirements of the 1933 Act. The Fund did not hold any restricted securities as of September 30, 2013. |
FMI Funds
NOTES TO FINANCIAL STATEMENTS (Continued)
| (1) | Summary of Significant Accounting Policies — (Continued) |
| | (g) | No provision has been made for Federal income taxes since the Funds have elected to be taxed as “regulated investment companies.” The Funds intend to distribute substantially all net investment company taxable income and net capital gains to their respective shareholders and otherwise comply with the provisions of the Internal Revenue Code applicable to regulated investment companies. |
| | (h) | The Funds have reviewed all open tax years and major jurisdictions, which include Federal and the state of Maryland for the Large Cap Fund and International Fund and Federal and the state of Wisconsin for the Common Stock Fund, and concluded that there are no significant uncertain tax positions that would require recognition in the financial statements. Open tax years are those that are open for exam by taxing authorities and, as of September 30, 2013, open Federal tax years include the tax years ended September 30, 2010 through 2013 for the Large Cap Fund and the Common Stock Fund and tax years ended September 30, 2011 through 2013 only for the International Fund. The Funds have no examinations in progress and are also not aware of any tax positions for which it is reasonably possible that the total amounts of unrecognized tax benefits will significantly change in the next twelve months. |
| | (i) | GAAP requires that permanent differences between income for financial reporting and tax purposes be reclassified in the capital accounts. During the fiscal year ended September 30, 2013, the reclassifications were as follows: |
| | | Undistributed Net | Accumulated Net | |
| | | Investment Income | Realized Gain/(Loss) | Paid In Capital |
| | Large Cap Fund | $ — | $ — | $ — |
| | Common Stock Fund | — | — | — |
| | International Fund | 996,504 | (996,504) | — |
| (2) | Investment Adviser and Management Agreements and Transactions With Related Parties — |
| | The Funds each have a management agreement with Fiduciary Management, Inc. (“FMI”), with whom certain officers and directors of the Funds are affiliated, to serve as investment adviser and manager. Under the terms of the agreements, the Large Cap Fund and International Fund will each pay FMI a monthly management fee at the annual rate of 0.75% of the daily net assets of such Fund and the Common Stock Fund will pay a monthly management fee at the annual rate of 1% of the daily net assets of such Fund. The Funds are responsible for paying their proportionate share of the compensation, benefits and expenses of the Funds’ Chief Compliance Officer. For administrative convenience, FMI initially makes these payments and is later reimbursed by the Funds. |
| | Under the respective management agreements, FMI will reimburse the Large Cap Fund for expenses over 1.20% of the daily net assets of such Fund, 1.30% for the Common Stock Fund and 1.75% for the International Fund. In addition to the reimbursement required under each management agreement, FMI will voluntarily reimburse the Large Cap Fund and the International Fund for expenses over 1.00% of such Fund’s daily net assets. For the year ended September 30, 2013 there were no contractual or voluntary reimbursements required for the Large Cap Fund or the Common Stock Fund. For the International Fund, all such reimbursements amounted to $148,911 for the year ended September 30, 2013. |
| | The Large Cap Fund and the International Fund have each entered into a Distribution Plan (the “Plan”), pursuant to Rule 12b-1 under the Act. Each Plan provides that such Fund may incur certain costs which may not exceed the lesser of a monthly amount equal to 0.25% of such Fund’s daily net assets or the actual distribution costs incurred during the year. Amounts payable under each Plan are paid monthly for any activities or expenses primarily intended to result in the sale of shares of such Fund. For the year ended September 30, 2013, no such expenses were incurred by either Fund. |
| | Under the Funds’ organizational documents, each director, officer, employee or other agent of any Fund (including the Funds’ investment manager) is indemnified, to the extent permitted by the Act, against certain liabilities that may arise out of performance of their duties to the Funds. Additionally, in the normal course of business, the Funds enter into contracts that contain a variety of indemnification clauses. The Funds’ maximum exposure under these arrangements is unknown as this would involve future claims that may be made against such Fund that have not yet occurred. However, the Funds have not had prior claims or losses pursuant to these contracts and believe the risk of loss to be remote. |
| | At September 30, 2013, three financial intermediaries are the record owners of approximately 7%, 6% and 6% of the Large Cap Fund’s shares and one financial intermediary is record owner of approximately 10% of the Common Stock Fund’s shares. At September 30, 2013, one of the International Fund’s Directors owned directly and indirectly approximately 12% of such Fund’s shares. |
FMI Funds
NOTES TO FINANCIAL STATEMENTS (Continued)
| (3) | Credit Agreements — |
| | U.S. Bank, N.A. has made available to the Large Cap Fund, the Common Stock Fund and the International Fund a $675,000,000, $50,000,000 and $10,000,000 credit facility, respectively, pursuant to separate Credit Agreements (“Agreements”) effective July 14, 2008 for the Large Cap Fund and the Common Stock Fund and June 10, 2011 for the International Fund for the purposes of having cash available to satisfy redemption requests. Principal and interest of such loans under the Agreements are due not more than 20 days after the date of the loan. Amounts under the credit facility bear interest at a rate per annum equal to the current prime rate minus one percent on the amount borrowed. Advances will be collateralized by securities owned by such Fund. During the year ended September 30, 2013, none of the Funds borrowed against their Agreement. The Credit Agreements are renewable annually on June 5. |
| (4) | Distribution to Shareholders — |
| | Net investment income and net realized gains, if any, are distributed to shareholders at least annually. |
| (5) | Investment Transactions — |
| | For the year ended September 30, 2013, purchases and proceeds of sales of investment securities (excluding short-term investments) were as follows: |
| | | Large Cap Fund | Common Stock Fund | International Fund |
| | Purchases | $2,027,778,859 | $240,945,666 | $70,101,728 |
| | Sales | 1,926,014,750 | 527,393,785 | 18,073,022 |
| (6) | Income Tax Information — |
| | The following information for the Funds is presented on an income tax basis as of September 30, 2013: |
| | | | | | | Gross | | | Gross | | | Net Unrealized | | | Distributable | | | Distributable | | | Other | |
| | | | Cost of | | | Unrealized | | | Unrealized | | | Appreciation | | | Ordinary | | | Long-Term | | | Accumulated | |
| | | | Investments | | | Appreciation | | | Depreciation | | | on Investments | | | Income | | | Capital Gains | | | Gains | |
| | Large Cap Fund | | $ | 6,382,628,798 | | | $ | 1,872,232,895 | | | $ | (135,834,947 | ) | | $ | 1,736,397,948 | | | $ | 102,906,982 | | | $ | 409,649,168 | | | $ | — | |
| | Common Stock Fund | | | 960,063,792 | | | | 324,139,902 | | | | (3,448,525 | ) | | | 320,691,377 | | | | 19,927,612 | | | | 100,541,324 | | | | — | |
| | International Fund | | | 121,497,568 | | | | 22,901,856 | | | | (4,753,452 | ) | | | 18,148,404 | | | | 1,828,680 | | | | 1,771,460 | | | | 55,405 | |
| | The difference between the cost amounts for financial statement and federal income tax purposes is due primarily to timing differences in recognizing certain gains and losses on security transactions. |
| | |
| | The tax components of dividends paid during the years ended September 30, 2013 and 2012, capital loss carryovers, which may be used to offset future capital gains, subject to Internal Revenue Code limitations, as of September 30, 2013, and tax basis post-October losses as of September 30, 2013, which are not recognized for tax purposes until the first day of the following fiscal year are: |
| | | | September 30, 2013 | | | September 30, 2012 | |
| | | | Ordinary | | | Long-Term | | | Net | | | | | | Ordinary | | | Long-Term | |
| | | | Income | | | Capital Gains | | | Capital Loss | | | Post-October | | | Income | | | Capital Gains | |
| | | | Distributions | | | Distributions | | | Carryovers | | | Losses | | | Distributions | | | Distributions | |
| | Large Cap Fund | | $ | 103,929,009 | | | $ | 42,394,048 | | | $ | — | | | $ | — | | | $ | 52,548,400 | | | $ | 116,887,874 | |
| | Common Stock Fund | | | 16,078,830 | | | | 92,136,921 | | | | — | | | | — | | | | 12,922,882 | | | | 74,398,322 | |
| | International Fund | | | 787,842 | | | | 269,031 | | | | — | | | | — | | | | 124,040 | | | | — | |
| | For corporate shareholders of the Large Cap Fund, the Common Stock Fund and the International Fund, the percentage of dividend income distributed for the year ended September 30, 2013 which is designated as qualifying for the dividends received deduction is 72.3%, 95.9% and 0%, respectively (unaudited). The International Fund intends to elect to pass-through to shareholders the income tax credit for taxes paid to foreign countries. For the year ended September 30, 2013, the foreign source income was $2,138,479 (unaudited) and the foreign tax expense was $121,992 (unaudited). The pass-through of the foreign tax credit will only affect those persons who are shareholders on the dividend record dates. |
| | |
| | For all shareholders of the Large Cap Fund, the Common Stock Fund and the International Fund, the percentage of dividend income distributed for the year ended September 30, 2013 which is designated as qualified dividend income under the Jobs and Growth Tax Relief Act of 2003, is 100%, 95.9% and 96.3%, respectively (unaudited). |
FMI Funds
NOTES TO FINANCIAL STATEMENTS (Continued)
| (7) | Subsequent Event — |
| | On September 27, 2013, the Board of Directors unanimously approved an Agreement and Plan of Reorganization (the “Agreement”) pursuant to which the FMI Common Stock Fund would transfer all of its assets and liabilities (the “Reorganization”) to FMI Common Stock Fund, a new series of FMI Funds, Inc. (the “Acquiring Fund”). The Agreement requires approval of the FMI Common Stock Fund’s shareholders and will be submitted to the shareholders for their consideration at a meeting to be held on November 25, 2013. In the event the shareholders approve the Agreement, upon closing of the Reorganization, shareholders of the FMI Common Stock Fund would receive shares of the Acquiring Fund in exchange for their shares of the FMI Common Stock Fund and the FMI Common Stock Fund would liquidate and cease operations. |
REPORT OF INDEPENDENT REGISTERED PUBLIC ACCOUNTING FIRM
To the Board of Directors and Shareholders of
FMI Large Cap Fund, FMI Common Stock Fund, Inc. and FMI International Fund:
In our opinion, the accompanying statements of assets and liabilities, including the schedules of investments, and the related statements of operations and of changes in net assets and the financial highlights present fairly, in all material respects, the financial position of FMI Large Cap Fund (a series of FMI Funds, Inc.), FMI Common Stock Fund, Inc. and FMI International Fund (also a series of FMI Funds, Inc.) (hereinafter collectively referred to as the “Funds”) at September 30, 2013, the results of each of their operations for the year then ended, the changes in each of their net assets for each of the two years in the period then ended and the financial highlights for each of the periods presented, in conformity with accounting principles generally accepted in the United States of America. These financial statements and financial highlights (hereafter referred to as “financial statements”) are the responsibility of the Funds’ management; our responsibility is to express an opinion on these financial statements based on our audits. We conducted our audits of these financial statements in accordance with the standards of the Public Company Accounting Oversight Board (United States). Those standards require that we plan and perform the audit to obtain reasonable assurance about whether the financial statements are free of material misstatement. An audit includes examining, on a test basis, evidence supporting the amounts and disclosures in the financial statements, assessing the accounting principles used and significant estimates made by management, and evaluating the overall financial statement presentation. We believe that our audits, which included confirmation of securities at September 30, 2013 by correspondence with the custodian and brokers, provide a reasonable basis for our opinion.
As disclosed in Note 7, the Board of Directors approved an agreement and plan of reorganization on September 27, 2013 of the FMI Common Stock Fund which will be subject to the approval of the Fund’s shareholders on November 25, 2013. In the event the shareholders approve the agreement, upon closing of the reorganization the shareholders of the FMI Common Stock Fund, Inc. would receive a corresponding number of shares of the FMI Common Stock Fund, a new series of FMI Funds, Inc., in exchange for their shares and the Fund would liquidate and cease operations.
Milwaukee, Wisconsin
November 1, 2013
FMI Funds
COST DISCUSSION
As a shareholder of the FMI Funds you incur ongoing costs, including management fees and other Fund expenses. You do not incur transaction costs such as sales charges (loads) on purchase payments, reinvested dividends, or other distributions; redemption fees; and exchange fees because the Funds do not charge these fees. This example is intended to help you understand your ongoing costs (in dollars) of investing in each Fund and to compare these costs with the ongoing costs of investing in other mutual funds. The example is based on an investment of $1,000 invested at the beginning of the period and held for the entire period from April 1, 2013 through September 30, 2013.
Actual Expenses
The table below provides information about actual account values and actual expenses. You may use the information in these lines, together with the amount you invested, to estimate the expenses that you paid over the period. Simply divide your account value by $1,000 (for example, an $8,600 account value divided by $1,000 = 8.6), then multiply the result by the number in the line under the heading entitled “Actual Expenses Paid During Period” to estimate the expenses you paid on your account during this period.
In addition to the costs highlighted and described below, the only Fund transaction costs you might currently incur would be wire fees ($15 per wire), if you choose to have proceeds from a redemption wired to your bank account instead of receiving a check. Additionally, U.S. Bank charges an annual processing fee ($15) if you maintain an IRA account with the Fund. To determine your total costs of investing in a Fund, you would need to add any applicable wire or IRA processing fees you’ve incurred during the period to the costs provided in the example at the end of this article.
Hypothetical Example for Comparison Purposes
The table below provides information about hypothetical account values and hypothetical expenses based on each Fund’s actual expense ratio and an assumed rate of return of 5% per year before expenses, which is not the Fund’s actual return. The hypothetical account values and expenses may not be used to estimate the actual ending account balance or expenses you paid for the period. You may use this information to compare the ongoing costs of investing in a Fund and other funds. To do so, compare this 5% hypothetical example with the 5% hypothetical examples that appear in the shareholder reports of the other funds.
Please note that the expenses shown in the table are meant to highlight your ongoing costs only and do not reflect any transactional costs, such as sales charges (loads), redemption fees or exchange fees. Therefore, the hypothetical line of the table is useful in comparing ongoing costs only, and will not help you determine the relative total costs of owning different funds. In addition, if these transactional costs were included, your costs would have been higher.
| | FMI | FMI | FMI |
| | Large Cap | Common Stock | International |
| | Fund | Fund | Fund |
| | | | |
| Actual Beginning Account Value 4/01/13 | $1,000.00 | $1,000.00 | $1,000.00 |
| | | | |
| Actual Ending Account Value 9/30/13 | $1,077.20 | $1,102.00 | $1,053.60 |
| | | | |
| Actual Expenses Paid During Period* 4/01/13-9/30/13 | $ 5.05 | $ 6.27 | $ 5.15 |
| | | | |
| Hypothetical Beginning Account Value 4/01/13 | $1,000.00 | $1,000.00 | $1,000.00 |
| | | | |
| Hypothetical Ending Account Value 9/30/13 | $1,020.21 | $1,019.10 | $1,020.05 |
| | | | |
| Hypothetical Expenses Paid During Period* 4/01/13-9/30/13 | $ 4.91 | $ 6.02 | $ 5.06 |
| | | | |
| Annualized Expense Ratio* | 0.97% | 1.19% | 1.00% |
| * | Expenses are equal to the Fund’s annualized expense ratio, multiplied by the average account value over the period, multiplied by 183/365 (to reflect the one-half year period between April 1, 2013 and September 30, 2013). |
FMI Funds
DIRECTORS AND OFFICERS
| | | Term of | Principal | # of Funds | Other |
| | Positions | Office and | Occupation(s) | in Complex | Directorships |
| Name, Age | Held with | Length of | During Past | Overseen | Held by |
| and Address* | the Funds | Time Served | Five Years | by Director | Director or Officer |
| Non-Interested Directors | | | | | |
| Barry K. Allen, 65 | Director | Indefinite Term | Mr. Allen is President of Allen Enterprises, LLC | 4 | BCE, Inc. (Bell |
| | | Since 2001 | (Boca Grande, FL) a private equity investments | | Canada Enterprise), |
| | | | and management company, and Senior Advisor | | CDW Corp. and |
| | | | for Providence Equity Partners (Providence, RI) | | Harley-Davidson, |
| | | | since September, 2007. | | Inc. |
| | | | | | |
| Robert C. Arzbaecher, 53 | Director | Indefinite Term | Mr. Arzbaecher is Chief Executive Officer of | 4 | Actuant Corporation |
| | | Since 2007 | Actuant Corporation (Menomonee Falls, WI), | | and CF Industries |
| | | | a manufacturer of a broad range of industrial | | Holdings, Inc. |
| | | | products and systems, and the Chairman of the | | |
| | | | Board of Directors of Actuant Corporation. | | |
| | | | | | |
| Gordon H. | Director | Indefinite Term | Mr. Gunnlaugsson retired from M&I Corporation | 4 | None |
| Gunnlaugsson, 69 | | Since 2001 | (Milwaukee, WI) in December, 2000. | | |
| | | | | | |
| Paul S. Shain, 50 | Director | Indefinite Term | Mr. Shain is President and Chief Executive Officer | 4 | None |
| | | Since 2001 | of Singlewire Software, LLC (Madison, WI), a | | |
| | | | provider of IP-based paging and emergency | | |
| | | | notification systems. Prior to joining Singlewire in | | |
| | | | April, 2009, Mr. Shain was Senior Vice President | | |
| | | | of CDW Corporation (Vernon Hills, IL) and Chief | | |
| | | | Executive Officer of Berbee Information Networks, | | |
| | | | a strategic business unit of CDW which CDW | | |
| | | | acquired in 2006. Mr. Shain was employed in | | |
| | | | various capacities by CDW and Berbee Information | | |
| | | | Networks from January, 2000 to October, 2008. | | |
| | | | | | |
| Interested Directors | | | | | |
| John S. Brandser,** 51 | Director | Indefinite Term | Mr. Brandser is President, Secretary, Chief | 1 | None |
| | | Since 2009 | Operating Officer, and Chief Compliance Officer | | |
| | Vice | One Year Term | of Fiduciary Management, Inc. and has been | | |
| | President | Since 2008 | employed by the Adviser in various capacities | | |
| | and | One Year Term | since March, 1995 and a Director for only FMI | | |
| | Secretary | Since 2009 | Common Stock Fund, Inc. | | |
| | | | | | |
| Patrick J. English,** 52 | Director | Indefinite Term | Mr. English is Chief Executive Officer, Chief | 4 | None |
| | | Since 2001 | Investment Officer and Treasurer of Fiduciary | | |
| | Vice | One Year Term | Management, Inc. and has been employed by the | | |
| | President | Since 2001 | Adviser in various capacities since December, 1986. | | |
| | | | | | |
| Ted D. Kellner,** 67 | Director | Indefinite Term | Mr. Kellner is Executive Chairman of Fiduciary | 4 | None |
| | | Since 2001 | Management, Inc. which he co-founded in 1980. | | |
| | President | One Year Term | | | |
| | and | Since 2001 | | | |
| | Treasurer | | | | |
| | | | | | |
| Richard E. Lane,** 57 | Director | Indefinite Term | Mr. Lane is President of Broadview Advisors, LLC, | 3 | None |
| | | Since 2001 | the sub-adviser to the FMI Focus Fund and a | | |
| | | | Director for only FMI Funds, Inc. | | |
FMI Funds
DIRECTORS AND OFFICERS (Continued)
| | | Term of | Principal | # of Funds | Other |
| | Positions | Office and | Occupation(s) | in Complex | Directorships |
| Name, Age | Held with | Length of | During Past | Overseen | Held by |
| and Address* | the Funds | Time Served | Five Years | by Director | Director or Officer |
| Other Officer | | | | | |
| Kathleen M. Lauters, 61 | Chief | At Discretion | Ms. Lauters has been the Fund’s Chief Compliance | N/A | None |
| | Compliance | of Board | Officer since September, 2004. | | |
| | Officer | Since 2004 | | | |
________
* The address of each Director and Officer is c/o Fiduciary Management, Inc., 100 E. Wisconsin Ave., Suite 2200, Milwaukee, WI 53202.
** Messrs. Brandser, English and Kellner are interested directors of the Funds because they are officers of the Funds and the Adviser. Mr. Brandser is a director of the FMI Common Stock Fund, Inc. only. Mr. Lane is an interested director of only the FMI Funds, Inc. which includes the FMI Large Cap Fund and the FMI International Fund, because he is an officer of the FMI Focus Fund’s sub-adviser.
ADDITIONAL INFORMATION
For additional information about the Directors and Officers or for a description of the policies and procedures that the Funds use to determine how to vote proxies relating to portfolio securities, please call (800) 811-5311 and request Statements of Additional Information. They will be mailed to you free of charge. The Statements of Additional Information are also available on the website of the Securities and Exchange Commission (the “Commission”) at http://www.sec.gov. Information on how each of the Funds voted proxies relating to portfolio securities is available on the Funds’ website at http://www.fmifunds.com or the website of the Commission no later than August 31 for the prior 12 months ending June 30. The Funds file their complete schedules of portfolio holdings with the Commission for the first and third quarters of each fiscal year on Form N-Q. The Funds’ Forms N-Q are available on the Commission’s website. The Funds’ Forms N-Q may be reviewed and copied at the Commission’s Public Reference Room in Washington, D.C., and that information on the operation of the Public Reference Room may be obtained by calling 1-800-SEC-0330.
DISCLOSURE INFORMATION
Securities named in the Letters to Shareholders or in the Management Discussions, but not listed in the Schedules of Investments are not held in the Funds as of the date of this disclosure. Portfolio holdings are subject to change without notice and are not intended as recommendations of individual securities.
As of the Funds’ Prospectuses dated January 31, 2013, the FMI Large Cap Fund, FMI Common Stock Fund and FMI International Fund’s annual operating expense ratios are 0.96%, 1.20% and 1.00%, respectively. FMI International Fund’s (“FMIJX”) annual operating expense ratio is 1.45%, less an expense reimbursement of 0.45% for a net operating expense ratio of 1.00%. Fiduciary Management, Inc. (“FMI”) has contractually agreed to waive its advisory fee to the extent necessary to ensure that net expenses of FMIJX do not exceed 1.75% of the average daily net assets. In addition to the reimbursement required under the FMIJX investment advisory agreement, FMI will reimburse FMIJX for expenses in excess of 1.00% of the daily net assets. FMI will not terminate this reimbursement prior to January 31, 2014.
FMI Funds
DISCLOSURE INFORMATION (Continued)
Risks associated with investing in the Funds are as follows:
| | FMI Large Cap Fund: Stock Market Risk, Medium and Large Capitalization Companies Risks, Value Investing Risk, Foreign Securities Risk (fluctuation of currency, different financial standards, and political instability) and Non-Diversification Risk. Non-Diversified Funds are subject to higher volatility than funds that are invested more broadly. |
| | FMI Common Stock Fund: Stock Market Risk, Medium and Small Capitalization Companies Risks, Value Investing Risk and Foreign Securities Risk (fluctuation of currency, different financial standards, and political instability). |
| | FMI International Fund: Stock Market Risk, Value Investing Risk, Foreign Securities Risk (fluctuation of currency, different financial standards, and political instability), Geographic Concentration Risk, Currency Hedging Risk, Large Capitalization Companies Risk and Non-Diversified Risk. Non-Diversified Funds are subject to higher volatility than funds that are invested more broadly. |
For details regarding these risks, please refer to the Funds’ Prospectuses or Summary Prospectuses dated January 31, 2013.
Please note the FMI Common Stock Fund and the FMI Large Cap Fund are currently closed to new investors.
This report is not authorized for use as an offer of sale or a solicitation of an offer to buy shares of the Fund unless accompanied or preceded by the Fund’s current prospectus.
For more information about the FMI Funds, call 1-800-811-5311 for a free Prospectus or Summary Prospectus. Please read these Prospectuses carefully to consider the investment objectives, risks, charges and expenses, before investing or sending money. These Prospectuses contain this and more information about the FMI Funds. Please read the Prospectuses or Summary Prospectuses carefully before investing.
The TOPIX, also known as the Tokyo Stock Price Index, is a capitalization weighted index of all companies listed on the First Section of the Tokyo Stock Exchange. The index is supplemented by the sub-indices of the 33 industry sectors. The index calculation excludes temporary issues and preferred stocks, and has a base value of 100 as of January 4, 1968.
The FTSE 100 Index is a capitalization-weighted index of the 100 most highly capitalized companies traded on the London Stock Exchange. The equities use an investibility weighting in the index calculation. The index was developed with a base level of 1000 as of January 3, 1984. The index is maintained by the FTSE Group, a subsidiary of the London Stock Exchange Group.
An investment cannot be made directly into an Index.
Reference definitions found at Investopedia.com
P/E ratio (forward 4 quarters) – Price to Earnings ratio (forward 4 quarters) is a measure of the price-to-earnings ratio (P/E) using forecasted earnings for the P/E calculation. While the earnings used are just an estimate and are not as reliable as current earnings data, there is still a benefit in estimated P/E analysis. The forecasted earnings used in the formula can either be for the next 12 months or for the next full-year fiscal period.
EBIT – Earnings Before Interest & Tax – An indicator of a company’s profitability, calculated as revenue minus expenses, excluding tax and interest.
EV/EBITDA – Enterprise Value to Earnings Before Interest Taxes Depreciation and Amortization is a measure of the value of a stock that compares a company’s enterprise value (market cap plus debt, minority interest and preferred shares, minus total cash and cash equivalents) to its earnings before interest taxes depreciation and amortization. EV/EBITDA is one of several fundamental indicators that investors use to determine whether a stock is priced well. The EV/EBITDA multiple is also often used to determine a company’s valuation in the case of a potential acquisition.
EV/Sales – Enterprise-Value-To-Sales – A valuation measure that compares the enterprise value of a company to the company’s sales. EV/sales gives investors an idea of how much it costs to buy the company’s sales.
EBITDA – Earnings Before Interest Taxes Depreciation and Amortization is essentially net income with interest, taxes, depreciation, and amortization added back to it, and can be used to analyze and compare profitability between companies and industries because it eliminates the effects of financing and accounting decisions.
ROIC – Return On Invested Capital – A calculation used to assess a company’s efficiency at allocating the capital under its control to profitable investments. The return on invested capital measure gives a sense of how well a company is using its money to generate returns.
Distributed by Rafferty Capital Markets, LLC
FMI Funds
NOTICE OF PRIVACY POLICY
Protecting the privacy of our shareholders is important to us. This notice describes the practices and policies through which we maintain the confidentiality and protect the security of your non-public personal information.
What Information We Collect
In the course of providing services to you, we may collect the following types of “non-public personal information” about you:
| • | Information we receive from you on applications or other forms, such as your name, address and social security number, the types and amounts of investments and bank account information, and |
| • | Information about your transactions with us, our affiliates and others, as well as other account data. |
What Information We Disclose
We do not disclose any nonpublic personal information about our current or former shareholders to anyone, except as permitted by law. For example, we are permitted by law to disclose all of the information we collect, as described above, to our transfer agent to process your transactions. Furthermore, we restrict access to your nonpublic personal information to those persons who require such information to provide products or services to you. We maintain physical, electronic and procedural safeguards that comply with federal standards to guard your nonpublic personal information.
In the event that you hold shares of any Fund through a financial intermediary, including, but not limited to, a broker-dealer, bank or trust company, the privacy policy of your financial intermediary may govern how your nonpublic personal information would be shared with nonaffiliated third parties.
IMPORTANT NOTICE REGARDING DELIVERY OF SHAREHOLDER DOCUMENTS
In order to reduce expenses, we will deliver a single copy of prospectuses, proxies, financial reports, and other communication to shareholders with the same residential address, provided they have the same last name or we reasonably believe them to be members of the same family. Unless we are notified otherwise, we will continue to send you only one copy of these materials for as long as you remain a shareholder of the Funds. If you would like to receive individual mailings, please call (800) 811-5311 and we will begin sending you separate copies of these materials within 30 days after we receive your request.
Thank you for allowing us to serve your investment needs.
| FMI Common Stock Fund | FMI International Fund |
| | 100 East Wisconsin Avenue, Suite 2200 | |
| | Milwaukee, Wisconsin 53202 | |
| | www.fmifunds.com | |
| | 414-226-4555 | |
| | BOARD OF DIRECTORS | |
| | BARRY K. ALLEN | | GORDON H. GUNNLAUGSSON | |
| | ROBERT C. ARZBAECHER | | TED D. KELLNER | |
| | JOHN S. BRANDSER* | | RICHARD E. LANE** | |
| | PATRICK J. ENGLISH | | PAUL S. SHAIN | |
| | * | | Common Stock Fund only | |
| | ** | | Large Cap Fund and International Fund only | |
INVESTMENT ADVISER
FIDUCIARY MANAGEMENT, INC.
100 East Wisconsin Avenue, Suite 2200
Milwaukee, Wisconsin 53202
ADMINISTRATOR, ACCOUNTANT, TRANSFER
AGENT AND DIVIDEND DISBURSING AGENT
U.S. BANCORP FUND SERVICES, LLC
615 East Michigan Street
Milwaukee, Wisconsin 53202
800-811-5311 or 414-765-4124
| CUSTODIAN | INDEPENDENT REGISTERED |
| U.S. BANK, N.A. | PUBLIC ACCOUNTING FIRM |
| | PRICEWATERHOUSECOOPERS LLP |
| DISTRIBUTOR | |
| RAFFERTY CAPITAL | LEGAL COUNSEL |
| MARKETS, LLC | FOLEY & LARDNER LLP |
| | |
| FMI Funds 1-800-811-5311 |
| | |
Item 2. Code of Ethics.
Registrant has adopted a code of ethics. See attached Exhibit 12 (a) (1).
Item 3. Audit Committee Financial Expert.
Registrant’s Board of Directors has determined that Mr. Gordon Gunnlaugsson, a member of its audit committee, is an audit committee financial expert. Mr. Gunnlaugsson is “independent” as such term is defined in Form N-CSR.
Item 4. Principal Accountant Fees and Services.
(a) Audit Fees
$18,707 (FY 2013) and $20,628 (FY 2012) are the aggregate fees billed for each of the last two fiscal years for professional services rendered by the principal accountant to the registrant for the audit of the registrant’s annual financial statements or services that are normally provided by the accountant in connection with statutory and regulatory filings or engagements for those fiscal years.
(b) Audit-Related Fees
There were no fees billed in the last two fiscal years for Audit-Related Fees.
There were no fees billed in the last two fiscal years for professional services rendered by the principal accountant to the registrant for tax compliance, tax advice, tax planning and tax return preparation.
There were no fees billed in the last two fiscal years for professional services rendered by the principal accountant to registrant’s investment adviser for tax compliance, tax advice and tax planning that were required to be approved by the audit committee pursuant to paragraph (c)(7)(ii) of Rule 2-01 of Regulation S-X.
(d) All Other Fees
There were no other fees billed in the last two fiscal years for products and services provided by the principal accountant to the registrant, other than the services reported in paragraphs (a) – (c) of this Item 4.
There were no fees billed in the last two fiscal years for products and services provided by the principal accountant to registrant’s investment adviser, which were required to be approved by the audit committee pursuant to paragraph (c)(7)(ii) or Rule 2-01 or Regulation S-X.
(e) (1) None
(e) (2) None
(f) Not applicable.
(g) See the tax fees disclosed in paragraph (c) of this Item 4.
(h) Not applicable, as no non-audit services were provided to registrant’s investment adviser.
Item 5. Audit Committee of Listed Registrants.
Not applicable to registrants who are not listed issuers (as defined in Rule 10A-3 under the Securities Exchange Act of 1934).
Item 6. Schedule of Investments.
| (a) | The Schedule of Investments in securities of unaffiliated issuers is included as part of the report to shareholders filed under Item 1 of this Form. |
Item 7. Disclosure of Proxy Voting Policies and Procedures for Closed-End Management Investment Companies
Not applicable.
Item 8. Portfolio Managers of Closed-End Management Investment Companies.
Not applicable.
Item 9. Purchases of Equity Securities By Closed-End Management Investment Company and Affiliated Purchasers.
Not applicable.
Item 10. Submission of Matters to a Vote of Security Holders.
None.
Item 11. Controls and Procedures.
| (a) | The Registrant’s disclosure controls and procedures are periodically evaluated. As of November 4, 2013, the date of the last evaluation, the Registrant’s officers have concluded that the Registrant’s disclosure controls and procedures are adequate. |
| (b) | The Registrant’s internal controls are periodically evaluated. There were no changes in the Registrant’s internal control over financial reporting that occurred during the second fiscal quarter of the period covered by this report that have materially affected, or are reasonably likely to materially affect, such controls. |
Item 12. Exhibits.
| (a) | (1) Any code of ethics or amendment thereto. Filed herewith. |
| | (2) Certifications pursuant to Section 302 of the Sarbanes-Oxley Act of 2002. Filed herewith. |
| (3) | Any written solicitation to purchase securities under Rule 23c-1 under the Act sent or given during the period covered by the report by or on behalf of the Registrant to 10 or more persons. Not applicable to open-end investment companies. |
| (b) | Certification pursuant to Section 906 of the Sarbanes-Oxley Act of 2002. Furnished herewith. |
SIGNATURES
Pursuant to the requirements of the Securities Exchange Act of 1934 and the Investment Company Act of 1940, the registrant has duly caused this report to be signed on its behalf by the undersigned, thereunto duly authorized.
FMI Common Stock Fund, Inc.
Registrant
By /s/Ted D. Kellner
Ted D. Kellner, Principal Executive Officer
Date November 5, 2013
Pursuant to the requirements of the Securities Exchange Act of 1934 and the Investment Company Act of 1940, this report has been signed below by the following persons on behalf of the registrant and in the capacities and on the dates indicated.
FMI Common Stock Fund, Inc.
Registrant
By /s/Ted D. Kellner
Ted D. Kellner, Principal Financial Officer