ANNUAL REPORT
September 30, 2012
FMI Large Cap Fund
(FMIHX)
FMI Common Stock Fund
(FMIMX)
FMI International Fund
(FMIJX)
| | |
| | |
 | FMI Funds Advised by Fiduciary Management, Inc. |
| | |
| | |
FMI Funds
| FMI Large Cap Fund | |
| Shareholder Letter | 3 |
| Management’s Discussion of Fund Performance | 8 |
| Schedule of Investments | 9 |
| Industry Sectors | 10 |
| | |
| FMI Common Stock Fund | |
| Shareholder Letter | 11 |
| Management’s Discussion of Fund Performance | 16 |
| Schedule of Investments | 17 |
| Industry Sectors | 18 |
| | |
| FMI International Fund | |
| Shareholder Letter | 19 |
| Management’s Discussion of Fund Performance | 23 |
| Schedule of Investments | 24 |
| Industry Sectors | 25 |
| | |
| Financial Statements | |
| Statements of Assets and Liabilities | 26 |
| Statements of Operations | 27 |
| Statements of Changes in Net Assets | 28 |
| Financial Highlights | 29 |
| Notes to Financial Statements | 30 |
| | |
| Report of Independent Registered Public Accounting Firm | 35 |
| Cost Discussion | 36 |
| Directors and Officers | 37 |
| Additional Information | 38 |
| Disclosure Information | 38 |
| Notice of Privacy Policy | 39 |
| Householding Notice | 39 |
FMI
Large Cap
Fund
September 30, 2012
Dear Fellow Shareholders,
The FMI Large Cap Fund gained 4.76% in the quarter ending September 30, 2012 compared to the benchmark Standard & Poor’s 500 Index return of 6.35%. For the calendar nine months, the Fund advanced 13.97% which lagged the 16.44% gain in the S&P 500. From a group standpoint, Finance, Distribution Services, Energy Minerals and Technology Services hurt relative performance, while Consumer Services and Process Industries helped. Staples Corp. continued to perform poorly in the period and the challenges at this company now appear to be more structural and longer term in nature; we decided to sell that position. Our initial foray into Expeditors International proved premature as the slowdown in trade between Asia and the U.S., which we thought was adequately discounted in the price, was not. With economic weakness seeming to accelerate toward the end of the quarter, the takeoff for this stock may be bumpy and elongated. It’s an excellent company, however, and has strong management and a gold-plated balance sheet, so we will ride out the cyclical weakness. We’ve highlighted the stock below. The last stock on the “perp walk” is Willis Group Holdings. They have struggled to integrate a domestic acquisition and effectively manage a couple of restructurings. While the numbers haven’t turned yet, a late September presentation by the company was more encouraging with respect to a U.S. turnaround. The performance of the strategy year-to-date is about what we would expect. Historically we have generally lagged in strong up markets (while more than making up for it in difficult markets). It’s not to say we haven’t made mistakes, as the scorecard would attest. Our style, however, does seem to be somewhat out-of-favor, with growth stocks significantly outperforming value stocks in recent periods. Finally, the recent rally seems to be more about financial engineering by the Fed than anything fundamental. We’re not confident that this “Bernanke trade” will outlast the deteriorating economic and corporate earnings picture.
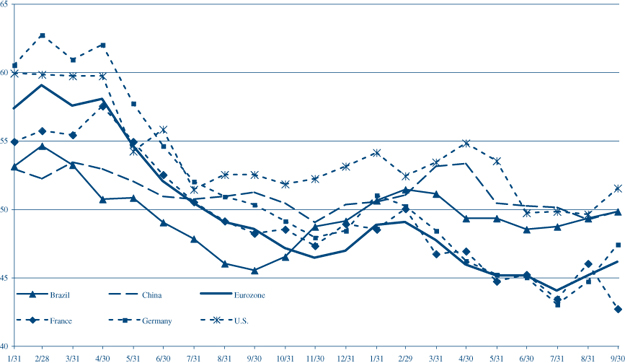
Most of the major regions of the world seem to be slowing or already experiencing recessionary conditions. The eurozone appears to be in a full-blown recession. China and Brazil have slowed significantly. The United States is sputtering. Economists pay attention to the Purchasing Managers Index (PMI) as an indicator of whether economic conditions are improving or deteriorating (numbers less than 50 indicate deterioration). The United States, China, Germany, Japan, the United Kingdom, Italy, Brazil, Australia, Canada and most of the large countries have PMIs less than 50.
The recent stabilization of the unemployment rate in the U.S. is undermined by a plunge in the labor force (the denominator in the calculation). The labor participation rate of 63.5% is the lowest in over 30 years. 11.2% of the labor force is out of work, if we include the 7 million no longer seeking employment. The key leading indicator of business capital spending slid 3.4% in July and has been down four of the past five months. Housing has certainly bounced off the bottom, but with true unemployment so high and the economy weakening, we have doubts about a continuing recovery in this sector. Business capital expenditures,
| |
| Manufacturing PMI |
| 1/31/2011 - 9/30/2012 |
| |
 |
| |
Source: Bloomberg
incidentally, are 7% of GDP whereas housing is only 2% of GDP. Household net worth is down significantly over the past five years and real incomes have fallen. In short, the economic picture, both here and abroad, is not very good.
The Fed, European Central Bank (ECB) and other central bankers have taken it upon themselves to fix this problem. That is the way they think. Both the fiscal and monetary authorities look to governments to solve fundamental problems, reflecting a general lack of trust in classic economic policies and free markets. To Mr. Bernanke, the fact that four years of unprecedented stimulus yielded little in the way of results (and has perhaps dangerous long term consequences) is not a reason to stop and reassess. It’s an opportunity to say that not enough has been done; it’s a call to action. The latest iteration of money printing, QE3, is now underway, with the Fed expanding its balance sheet once again to the tune of an additional $40 billion per month ($85 billion per month in total) indefinitely. Mario Draghi, the head of the ECB, is using the same playbook. He’s doing “whatever it takes” to solve the eurozone problem, including an “unlimited” bond buying program. Japan recently followed with a $126 billion “asset purchasing program.” Brazil is talking up the same game. Even Switzerland has begun their own version of quantitative easing. In the long run, easy money policies rarely achieve their objectives and often have very serious repercussions. Yet stock markets seem to be cheering it on in the short run.
With the constant calling for governments and central banks to do more, perhaps it would be useful to talk briefly about the potential downside of these policies. Fiscal challenges have been addressed repeatedly in recent letters and will be put aside here, save this one statement: historically, U.S. federal government spending has been about 19-20% of GDP; today it is 24%. From a monetary perspective, we quote the highly respected economist David Malpass: “Whatever the Fed’s theory, the reality is that its attempts to prime the pump haven’t worked. They distort and weaken the economy and chase capital into such job losers as gold, government bonds, and factories abroad.” Today’s ground-hugging interest rate policies have decimated the saver and the risk averse. Horizon Kinetics, in their July report, estimates that the U.S. bond market is approximately $36.9 trillion with about 37% ($13.65 trillion) maturing over the next 60 months. The average coupon on maturing bonds is about 4.27% and these are being replaced by bonds with an average coupon of 1.55%. The difference in these two coupons means that if interest rates remain roughly where they are today, $371 billion of income will be lost each and every year for the next five years. That is 2.45% of GDP lost each year (of course, there is an offsetting impact to borrowers). Imagine the fallout if one introduced a tax of this magnitude! Most likely related to quantitative easing, commodity prices have also skyrocketed over the past few years. This has had a very negative impact with respect to food and gasoline prices. It’s tantamount to a significant regressive tax. At the same time, the leveraged hedge fund speculators and Wall Street “carry traders” win big from the Bernanke rally. The very people the administration demonizes are the same ones for whom the Fed is throwing a party. It’s fascinating, not to mention ironic, to see leaders who denigrated trickle down economic growth theories emanating from lower tax rates now embrace trickle down wealth theories coming from the Fed. Long term it seems logical to expect what has nearly always happened when governments print money at a far greater rate than the underlying economies are growing: inflation and currency debasement. Interestingly, despite extensive economic weakness, the September eurozone inflation rate is expected to rise to 2.8%, up from 2.6% in August and well above the ECB’s target of 2.0%.
Howard Marks, who has managed money for forty years and is one of the great investors of our time, recently made this statement: “The world seems more uncertain today than at any other time in my life.” We confess to similar sentiments, but there is always the chance that we are misreading the tea leaves and that the stock market gains anticipate a better economic environment in 2013. Perhaps following the elections Congress will address the so-called fiscal cliff with sensible compromises. Perhaps the leaders will come to acceptable pathways that will reduce deficits and corral the many unfunded liabilities. Perhaps Europe will somehow stem their fiscal and monetary crises and not drag the Federal Reserve into the fray. Every investor has to ask whether these events are likely and whether the 2012 stock market rally already discounts it.
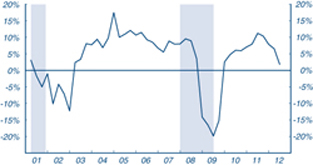
This stock market move, which began in March of 2009, recently hit 43 months, which is the median duration of 15 bull markets since 1929. The 129.6% gain in the current stretch compares to a median of 83.1%. There is nothing magical or predictive from these facts other than to point out that it might take some fundamental improvement in earnings, sales growth or productivity to keep it going. The economic outlook today, both here and abroad, does not look like it will provide much lift in the near term and unfortunately, both sales growth and profit margins appear to be headed the other way, as the charts on the following page depict.
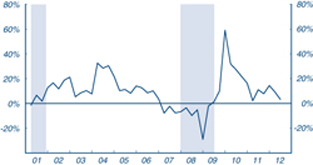
| S&P 500 Sales Per Share | Corporate Profits |
| Year to Year Percentage Change | Year to Year Percentage Change |
| | |
 |  |
| | |
| Source: Standard & Poor’s Corporation | Source: Bureau of Economic Analysis |
| Shaded areas represent recessionary periods. | Corporate Profits: After Tax with Inventory Valuation |
| | and Capital Consumption Adjustments |
| | Shaded areas represent recessionary periods. |
A large number of transportation and industrial stocks are announcing poor earnings outlooks and orders. FedEx, Norfolk Southern, Expeditors, Forward Air, Caterpillar, Navistar, Joy Global, Steel Dynamics, Rockwell and many others have had recent confessions. Stocks that depend on better employment or capital spending have been especially hurt. Business confidence is slipping. It is getting to be an old story but it’s impossible to say when it will end. The best we can do in the interim is to let valuation and long term “strength of franchise” be our guide. Higher multiple stocks, lower quality balance sheet stocks, and money losing enterprises have been among the big winners so far in 2012. Valuations remain elevated. We think investors should be wary and stay focused on quality, even if that results in near term underperformance. Somewhat paradoxically, considering the near term economic outlook, the portfolio might begin to tilt more heavily in coming periods toward some of the cyclical companies as their stocks come under increasing pressure. There is always a tug-of-war between valuation and fundamentals and having a long term investment time horizon gives us opportunities to buy superior cyclical franchises when their near term operating environment is weak. We’ve highlighted one such idea below, Expeditors International.
While today is very cloudy, we do expect sunnier economic times to eventually return, along with better underlying business fundamentals. Why? Business people want to grow. They want to invest. They want to build and they are willing to add labor… when they feel the systems and environment will reward such activity. This will be a far sturdier foundation for equity performance than government stimulus or Federal Reserve financial engineering.
Expeditors International of Washington
(Analyst: Rob Helf)
Description
Seattle-based Expeditors is a $6 billion, international, non-asset-based global logistics provider focused primarily on air and ocean freight forwarding and customs brokerage. The company utilizes its strong relationships with airline and ocean freight carriers, as well as its sophisticated IT systems and professional workforce, to earn strong margins and returns.
Good Business
| | • | Expeditors is a leading provider of international freight forwarding and logistics services. |
| | • | The company benefits from the growth of global trade and complex supply chains. Shippers should continue to increase their reliance on leading logistics partners to ease international trade issues. |
| | • | The business model is asset-light as the company owns no planes or ships and relies on capacity owners to move the freight. This results in high returns and cash flow. |
| | • | Expeditors has built a superior global business platform through organic growth, an integrated IT platform and a committed professional staff. |
| | • | The company has ample opportunity to grow as it generates $6 billion in gross revenues, which represents less than 5% of the $150 billion air and ocean freight market. |
| | • | The company has an outstanding track record of growth of both sales and profits. |
| | • | The business model generates strong returns and cash flow. Historically, Expeditors’ return-on-capital has been in the 15-20% range. |
| | • | The balance sheet has a large cash balance ($1.4 billion) and no debt. |
Valuation
| | • | Expeditors currently trades at 1.1 times enterprise value-to-sales (EV/S) and 22 times depressed 2012 earnings per share (EPS). On a cash-adjusted basis, the stock trades at 18 times EPS. |
| | • | Historically, the stock has traded at 1.6 times EV/S and 33 times EPS. The shares are at a discount to one standard deviation below their historical mean. |
Management
| | • | Expeditors’ management team has delivered steady growth and profitability for years. Importantly, management takes a long-term view of the company, eschews a short-term, Wall Street mentality and uses compensation as a powerful tool to incentivize its professional staff. The company has maintained a consistent compensation philosophy which includes a modest base salary and the opportunity to share in a fixed percentage of profits generated. This has resulted in superior value creation for shareholders and has motivated employees. |
| | • | Mr. Peter Rose is Chairman and CEO of Expeditors. He has served as a director and officer of the company since 1981. |
| | • | Mr. James Wang is President-Asia Pacific and has served as a director since 1988. Mr. R. Jordan Gates is President and COO. He is also a director and joined the company in 1991. |
Investment Thesis
Expeditors has built an enviable international forwarding platform with both strong customer and asset-owner relationships. It has grown at above-average rates over the past decade while generating high returns-on-capital. The shares, which historically have carried a large growth premium, are down substantially. Recent concerns over international trade volumes, particularly coming east from Asia, and paradoxically (given economic weakness) tight commercial airlines lift capacity, have provided an entry point for this strong franchise. Over the long run, we expect Asian growth to resume, and for Expeditors to regain some of its former premium.
Sysco Corp.
(Analyst: Karl Poehls)
Description
Sysco is the largest provider of foodservice products in the U.S. and Canada, distributing more than 300,000 products to 400,000 restaurants, schools, hotels, health-care institutions, and other foodservice customers. Restaurants account for two-thirds of Sysco’s annual sales, with independents contributing 60% of restaurant sales and chains making up the rest. The company’s SYGMA network focuses on serving large chain restaurants in the quick-service or quick-family markets (13% of revenues).
Good Business:
| | • | Sysco is a dominant franchise and industry leader; it is the largest foodservice distributor in the U.S. with 18% market share, and benefits from significant economies of scale. Evidence can be found in the company’s operating margin, which is roughly 3 times its closest competitor. |
| | • | The company provides products that are necessities for daily life, and is an easy business to understand. |
| | • | Sysco has a long history of generating extremely consistent revenues and earnings. |
| | • | Sysco generated a strong return on invested capital (ROIC) of 14.8% in fiscal 2012 versus a 5-year and 10-year average ROIC of 17.6% and 20.0%, respectively. |
| | • | Generation of excess free cash flow in conjunction with modest capital requirements has allowed the company to return 67% of net income to shareholders over the past 5 years, through a combination of dividends and share repurchases. |
| | • | The balance sheet is conservatively financed and Sysco maintains an A+ senior bond rating from Standard & Poor’s. |
Valuation
| | • | Sysco’s stock is trading 24% below its all-time high and has been a laggard for a number of years. |
| | • | The company’s current EV/S multiple is 0.46 times which is one standard deviation below its 10-year average multiple of 0.63 times. |
| | • | Sysco’s current EV/EBITDA (earnings before interest, taxes, depreciation and amortization) multiple is 8.4 times, nearly one standard deviation below its 10-year average multiple of 10.4 times. |
| | • | The company’s fiscal year 2013 price-to-earnings (P/E) multiple is 15.6 times very depressed earnings, which compare to the trailing 5-year and 10-year average P/E multiples of 15.2 times and 19.9 times, respectively. Further, the company’s substantial business transformation investment is expected to depress fiscal 2013 earnings by $0.30 per share. |
| | • | Precedent mergers and acquisitions transactions announced for 12 comparable companies between 2000 and 2007 were executed at a median EV/EBITDA multiple of 11.0 times. |
| | • | Sysco’s common shares have an attractive 3.5% dividend yield. |
| | • | A conservative discounted cash flow (DCF) valuation yields a per share value 30% higher than the current stock price. |
Management
| | • | Sysco’s top 10 executive managers have been with the company for an average of 20 years. |
| | • | Executive management is compensated based on three key operating metrics: earnings per share growth, return on equity, and operating company performance. |
Investment Thesis
Over the past 5 years, the U.S. casual dining industry has experienced an unprecedented downturn with 20 consecutive quarters of negative traffic growth before seeing slight improvement in 2011. This headwind has brought the historically strong growth in Sysco’s revenues and earnings to a near standstill. In addition, the company is investing north of $1 billion to improve its internal operations, including the implementation of a company-wide enterprise resource planning (ERP) system, which has led to elevated operating expenses. These factors have limited investor excitement about Sysco’s near-term outlook. However, the company continues to strengthen its competitive position and its shares are available at an attractive valuation.
******
Distributions: Our Board of Directors has declared a distribution effective October 31, 2012, of $0.13009458 per share from net investment income; $0.08634 per share from short-term capital gains which will be treated as ordinary income; and $0.11869 per share from net long-term capital gains, payable October 31, 2012 to shareholders of record on October 26, 2012.
Thank you for your continued support of the FMI Large Cap Fund.
100 E. Wisconsin Ave., Suite 2200 • Milwaukee, WI 53202 • 414-226-4555
www.fmifunds.com
This shareholder letter is unaudited.
FMI Large Cap Fund
MANAGEMENT’S DISCUSSION OF FUND PERFORMANCE
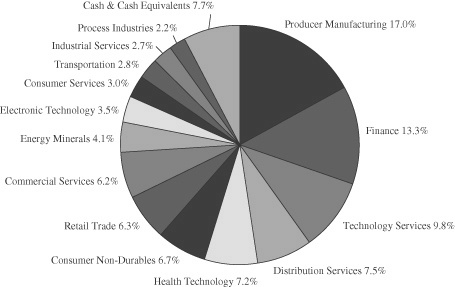
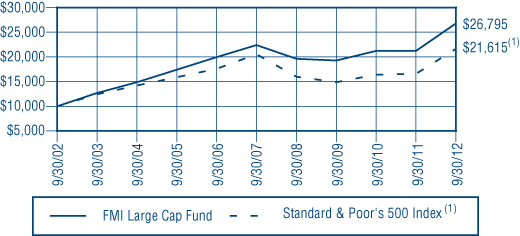
During the fiscal year ended September 30, 2012, the FMI Large Cap Fund (the “Fund”) had a total return of 26.17%. The benchmark Standard & Poor’s 500 Index(1) returned 30.20% in the same period. Finance, Retail, Electronic Technology and excess cash all hurt relative performance. Underweighted positions in Finance and Electronic Technology, two strong areas for the market, exacerbated the relative underperformance coming from stock selection. Producer Manufacturing, Consumer Non-Durables, Utilities, and Technology Services all aided relative performance. Stock selection was an important factor in the positive relative performance of all of these sectors except for Utilities, where our underweighted position was the helping factor. Willis Group, Staples, Expeditors International, GlaxoSmithKline, and Devon Energy were all negative contributors. Ingersoll-Rand, Illinois Tool Works and Covidien were positive contributors. Diageo and Rockwell were sold during the fiscal year because of valuation. Staples was sold because we underestimated the secular challenges to this business. UPS was sold partly due to valuation but also due to an escalating problem with their exposure to multi-employer pension plan liabilities. Kohl’s, Illinois Tool Works and Expeditors International were among stocks added during the fiscal year. At September 30, 2012, the overweighted sectors included Producer Manufacturing and Commercial Services and the underweighted sectors included Electronic Technology, Communications and Utilities. The stock market rebounded significantly in fiscal 2012, which we believe had more to do with monetary actions, i.e. quantitative easing, than any meaningful improvement in underlying fundamentals. As the fiscal year ended, economic activity had weakened across a broad spectrum of geographies. The debt crisis showed little sign of improvement in Europe, the United States or Japan. Valuations have moved higher from a year ago and do not look particularly attractive from a long term historical basis. From a macroeconomic and policy perspective, we do not see the fiscal or monetary initiatives of the past several years as being conducive to good long-term growth and employment. The explosive growth in government liabilities is particularly worrisome. Despite these negatives, we believe equities are the most attractive asset class over a long term investment time horizon. The Fund continues to sell at a discount to the S&P 500 on most valuation measures. Over long periods of time, lower valuation securities tend to outperform higher valuation ones. Future results, however, may differ from the past.
| | | |
| | COMPARISON OF CHANGE IN VALUE OF $10,000 INVESTMENT IN | |
| | FMI LARGE CAP FUND AND STANDARD & POOR’S 500 INDEX(1) | |
| | | |
| |  | |
| | | |
AVERAGE ANNUALIZED TOTAL RETURN |
| | | | | Since |
| | | | | Inception |
| | 1-Year | 5-Year | 10-Year | 12/31/01 |
| FMI Large Cap Fund | 26.17% | 3.61% | 10.36% | 7.28% |
| S&P 500 Index | 30.20% | 1.05% | 8.01% | 4.18% |
| | | | | |
| | The graph and the table do not reflect the deduction of taxes that a shareholder would pay on Fund distributions or the redemption of Fund shares. Performance data quoted represents past performance; past performance does not guarantee future results. Investment return and principal value of an investment will fluctuate so that an investor’s shares, when redeemed, may be worth more or less than their original cost. Current performance of a Fund may be lower or higher than the performance quoted. The total returns do not reflect the deduction of taxes that a shareholder would pay on Fund distributions or the redemption of Fund shares. Total return includes change in share prices and in each case includes reinvestments of any dividends, interest and capital gain distributions. Performance data current to the most recent month-end may be obtained by visiting www.fmifunds.com or by calling 1-800-811-5311.
(1) The Standard & Poor’s 500 Index consists of 500 selected common stocks, most of which are listed on the New York Stock Exchange. The Standard & Poor’s Ratings Group designates the stocks to be included in the Index on a statistical basis. A particular stock’s weighting in the Index is based on its relative total market value (i.e., its market price per share times the number of shares outstanding). Stocks may be added or deleted from the Index from time to time. An investment cannot be made directly into an index. | |
| | | |
This page is unaudited.
FMI Large Cap Fund
SCHEDULE OF INVESTMENTS
| Shares | | | | Cost | | | Value | |
| | | | | | | | | |
| COMMON STOCKS — 92.3% (a) | | | | | | |
| | | | | | | |
| COMMERCIAL SERVICES SECTOR — 6.2% | | | | | | |
| | | Advertising/Marketing | | | | | | |
| | | Services — 3.5% | | | | | | |
| 4,149,000 | | Omnicom Group Inc. | | $ | 182,382,769 | | | $ | 213,922,440 | |
| | | Miscellaneous | | | | | | | | |
| | | Commercial Services — 2.7% | | | | | | | | |
| 4,068,000 | | Cintas Corp. | | | 110,867,898 | | | | 168,618,600 | |
| | | | | | | | | | | |
| CONSUMER NON-DURABLES SECTOR — 6.7% | | | | | | | | |
| | | Food: Major Diversified — 2.9% | | | | | | | | |
| 2,841,000 | | Nestlé S.A. - SP-ADR | | | 128,338,653 | | | | 179,579,610 | |
| | | Household/Personal Care — 3.8% | | | | | | | | |
| 2,748,000 | | Kimberly-Clark Corp. | | | 176,119,404 | | | | 235,723,440 | |
| | | | | | | | | | | |
| CONSUMER SERVICES SECTOR — 3.0% | | | | | | | | |
| | | Media Conglomerates — 3.0% | | | | | | | | |
| 4,015,700 | | Time Warner Inc. | | | 111,845,669 | | | | 182,031,681 | |
| | | | | | | | | | | |
| DISTRIBUTION SERVICES SECTOR — 7.5% | | | | | | | | |
| | | Food Distributors — 4.4% | | | | | | | | |
| 8,735,000 | | Sysco Corp. | | | 245,074,325 | | | | 273,143,450 | |
| | | Medical Distributors — 3.1% | | | | | | | | |
| 4,923,000 | | AmerisourceBergen | | | | | | | | |
| | | Corp. | | | 151,151,247 | | | | 190,569,330 | |
| | | | | | | | | | | |
| ELECTRONIC TECHNOLOGY SECTOR — 3.5% | | | | | | | | |
| | | Electronic Components — 3.5% | | | | | | | | |
| 6,408,150 | | TE Connectivity Ltd. | | | 165,976,687 | | | | 217,941,182 | |
| | | | | | | | | | | |
| ENERGY MINERALS SECTOR — 4.1% | | | | | | | | |
| | | Oil & Gas Production — 4.1% | | | | | | | | |
| 4,205,000 | | Devon Energy Corp. | | | 269,151,300 | | | | 254,402,500 | |
| | | | | | | | | | | |
| FINANCE SECTOR — 13.3% | | | | | | | | |
| | | Financial Conglomerates — 3.0% | | | | | | | | |
| 3,218,000 | | American | | | | | | | | |
| | | Express Co. | | | 114,851,027 | | | | 182,975,480 | |
| | | Insurance Brokers/Services — 2.1% | | | | | | | | |
| 3,504,400 | | Willis Group | | | | | | | | |
| | | Holdings PLC | | | 133,437,529 | | | | 129,382,448 | |
| | | Major Banks — 8.2% | | | | | | | | |
| 13,500,000 | | Bank of New York | | | | | | | | |
| | | Mellon Corp. | | | 348,544,627 | | | | 305,369,999 | |
| 6,485,000 | | Comerica Inc. | | | 197,278,667 | | | | 201,359,250 | |
| | | | | | 545,823,294 | | | | 506,729,249 | |
| HEALTH TECHNOLOGY SECTOR — 7.2% | | | | | | | | |
| | | Medical Specialties — 3.9% | | | | | | | | |
| 3,994,000 | | Covidien PLC | | | 186,511,636 | | | | 237,323,480 | |
| | | Pharmaceuticals: Major — 3.3% | | | | | | | | |
| 4,348,000 | | GlaxoSmithKline | | | | | | | | |
| | | PLC - SP-ADR | | | 188,235,705 | | | | 201,051,520 | |
| | | | | | | | | | | |
| INDUSTRIAL SERVICES SECTOR — 2.7% | | | | | | | | |
| | | Oilfield Services/Equipment — 2.7% | | | | | | | | |
| 2,270,000 | | Schlumberger Ltd. | | | 138,319,400 | | | | 164,189,100 | |
| | | | | | | | | | | |
| PROCESS INDUSTRIES SECTOR — 2.2% | | | | | | | | |
| | | Chemicals: Agricultural — 2.2% | | | | | | | | |
| 1,522,550 | | Monsanto Co. | | | 89,141,027 | | | | 138,582,501 | |
| | | | | | | | | | | |
| PRODUCER MANUFACTURING SECTOR — 17.0% | | | | | | | | |
| | | Industrial Conglomerates — 13.0% | | | | | | | | |
| 3,580,000 | | 3M Co. | | | 275,417,164 | | | | 330,863,600 | |
| 3,550,000 | | Berkshire Hathaway | | | | | | | | |
| | | Inc. - Cl B* | | | 256,260,087 | | | | 313,110,000 | |
| 3,510,000 | | Ingersoll-Rand PLC | | | 152,875,444 | | | | 157,318,200 | |
| | | | | | 684,552,695 | | | | 801,291,800 | |
| | | Industrial Machinery — 4.0% | | | | | | | | |
| 4,170,000 | | Illinois Tool | | | | | | | | |
| | | Works Inc. | | | 207,181,092 | | | | 247,989,900 | |
| | | | | | | | | | | |
| RETAIL TRADE SECTOR — 6.3% | | | | | | | | |
| | | Department Stores — 2.4% | | | | | | | | |
| 2,855,000 | | Kohl’s Corp. | | | 144,031,851 | | | | 146,233,100 | |
| | | Discount Stores — 3.9% | | | | | | | | |
| 3,252,000 | | Wal-Mart Stores Inc. | | | 163,607,247 | | | | 239,997,600 | |
| | | | | | | | | |
| | | Data Processing Services — 2.9% | | | | | | | | |
| 3,031,000 | | Automatic Data | | | | | | | | |
| | | Processing Inc. | | | 125,616,368 | | | | 177,798,460 | |
| | | Information Technology Services — 4.2% | | | | | | | | |
| 3,681,000 | | Accenture PLC | | | 146,245,819 | | | | 257,780,430 | |
| | | Packaged Software — 2.7% | | | | | | | | |
| 5,673,000 | | Microsoft Corp. | | | 159,469,971 | | | | 168,941,940 | |
| | | | | | | | | |
| | | Air Freight/Couriers — 2.8% | | | | | | | | |
| 4,820,000 | | Expeditors International | | | | | | | | |
| | | of Washington Inc. | | | 182,581,968 | | | | 175,255,200 | |
| | | Total common stocks | | | 4,750,514,581 | | | | 5,691,454,441 | |
FMI Large Cap Fund
SCHEDULE OF INVESTMENTS (Continued)
| Principal Amount | | | | Cost | | | Value | |
| SHORT-TERM INVESTMENTS — 7.5% (a) | | | | | | |
| | | Commercial Paper — 7.5% | | | | | | |
| $265,200,000 | | U.S. Bank, N.A., 0.05%, | | | | | | |
| | | due 10/01/12 | | $ | 265,200,000 | | | $ | 265,200,000 | |
| 200,000,000 | | GE Capital Corp., 0.04%, | | | | | | | | |
| | | due 10/12/12 | | | 199,997,556 | | | | 199,997,556 | |
| | | Total short-term | | | | | | | | |
| | | investments | | | 465,197,556 | | | | 465,197,556 | |
| | | Total investments | | | | | | | | |
| | | — 99.8% | | $ | 5,215,712,137 | | | | 6,156,651,997 | |
| | | Other assets, | | | | | | | | |
| | | less liabilities | | | | | | | | |
| | | — 0.2% (a) | | | | | | | 11,161,366 | |
| | | TOTAL NET | | | | | | | | |
| | | ASSETS — 100.0% | | | | | | $ | 6,167,813,363 | |
| * | | Non-income producing security. |
| (a) | | Percentages for the various classifications relate to net assets. |
| PLC – Public Limited Company |
| SP-ADR – Sponsored American Depositary Receipt |
| | | |
The accompanying notes to financial statements are an integral part of this schedule.
as of September 30, 2012 (Unaudited)
FMI
Common Stock
Fund
September 30, 2012
Dear Fellow Shareholders,
The FMI Common Stock Fund gained 1.15% in the quarter ended September 30, 2012 compared to the benchmark Russell 2000 Index return of 5.25%. For the calendar nine months, the Fund advanced 5.65% which lagged the 14.23% gain in the benchmark. From a group standpoint, Process Industries, Finance, and Distribution Services hurt relative performance, while Transportation and Industrial Services helped. There was an inordinate amount of activity late in the second quarter and through most of the third quarter as the rally allowed us to harvest winners such as Lancaster, Valspar, PetSmart, and Eagle Materials. Additionally, after reunderwriting a number of stocks, we also sold Bemis, United Stationers, TeleTech and two other equities that were not yet completed by the end of the quarter. These five stocks face more challenging fundamentals than we originally anticipated. This activity resulted in a relatively high level of cash, which hurt investment performance. Additionally, our technology related distribution stocks, including a new purchase, Anixter, significantly underperformed year-to-date as worries about the economy and technology spending escalated. We like our investments in this space even though Wall Street currently does not. Below we highlight Anixter. Similarly, cyclical concerns clipped Kennametal and Kirby, but both of these companies are strong and can weather bumpy times. In short, we didn’t get much right in the quarter or in the year-to-date period and 2012 looks like a mirror image of 2011’s strong relative performance. Adding salt to the wounds, our style seems to be somewhat out of favor, with so-called growth stocks significantly outperforming value stocks in recent periods. Valuations, however, are stretched for the stocks that make up the benchmark Russell 2000. Additionally, the strong move in the Russell so far this year seems to be a low quality affair; 510 out of the stocks in the benchmark are losing money and those stocks were up nearly 30% on a year-to-date basis. Historically we have generally lagged in strong up markets (while more than making up for it in difficult markets), but of course, there are no guarantees. Finally, the recent rally seems to be more about financial engineering by the Fed than anything fundamental. We’re not confident that this “Bernanke trade” will outlast the deteriorating economic picture.
Most of the major regions of the world seem to be slowing or already experiencing recessionary conditions. The eurozone appears to be in a full-blown recession. China and Brazil have slowed significantly. The United States is sputtering. Economists pay attention to the Purchasing Managers Index (PMI) as an indicator of whether economic conditions are improving or deteriorating (numbers less than 50 indicate deterioration). The United States, China, Germany, Japan, the United Kingdom, Italy, Brazil, Australia, Canada and most of the large countries have PMIs less than 50.
Manufacturing PMI
1/31/2011 - 9/30/2012
Source: Bloomberg
The recent stabilization of the unemployment rate in the U.S. is undermined by a plunge in the labor force (the denominator in the calculation). The labor participation rate of 63.5% is the lowest in over 30 years. 11.2% of the labor force is out of work, if we include the 7 million no longer seeking employment. The key leading indicator of business capital spending slid 3.4% in July and has been down four of the past five months. Housing has certainly bounced off the bottom, but with true unemployment so high and the economy weakening, we have doubts about a continuing recovery in this sector. Business capital expenditures, incidentally, are 7% of GDP whereas housing is only 2% of GDP. Household net worth is down significantly over the past five years and real incomes have fallen. In short, the economic picture, both here and abroad, is not very good.
The Fed, European Central Bank (ECB) and other central bankers have taken it upon themselves to fix this problem. That is the way they think. Both the fiscal and monetary authorities look to governments to solve fundamental problems, reflecting a general lack of trust in classic economic policies and free markets. To Mr. Bernanke, the fact that four years of unprecedented stimulus yielded little in the way of results (and has perhaps dangerous long term consequences) is not a reason to stop and reassess. It’s an opportunity to say that not enough has been done; it’s a call to action. The latest iteration of money printing, QE3, is now underway, with the Fed expanding its balance sheet once again to the tune of an additional $40 billion per month ($85 billion per month in total) indefinitely. Mario Draghi, the head of the ECB, is using the same playbook. He’s doing “whatever it takes” to solve the eurozone problem, including an “unlimited” bond buying program. Japan recently followed with a $126 billion “asset purchasing program.” Brazil is talking up the same game. Even Switzerland has begun their own version of quantitative easing. In the long run, easy money policies rarely achieve their objectives and often have very serious repercussions. Yet stock markets seem to be cheering it on in the short run.
With the constant calling for governments and central banks to do more, perhaps it would be useful to talk briefly about the potential downside of these policies. Fiscal challenges have been addressed repeatedly in recent letters and will be put aside here, save this one statement: historically, U.S. federal government spending has been about 19-20% of GDP; today it is 24%. From a monetary perspective, we quote the highly respected economist David Malpass: “Whatever the Fed’s theory, the reality is that its attempts to prime the pump haven’t worked. They distort and weaken the economy and chase capital into such job losers as gold, government bonds, and factories abroad.” Today’s ground-hugging interest rate policies have decimated the saver and the risk averse. Horizon Kinetics, in their July report, estimates that the U.S. bond market is approximately $36.9 trillion with about 37% ($13.65 trillion) maturing over the next 60 months. The average coupon on maturing bonds is about 4.27% and these are being replaced by bonds with an average coupon of 1.55%. The difference in these two coupons means that if interest rates remain roughly where they are today, $371 billion of income will be lost each and every year for the next five years. That is 2.45% of GDP lost each year (of course, there is an offsetting impact to borrowers). Imagine the fallout if one introduced a tax of this magnitude! Most likely related to quantitative easing, commodity prices have also skyrocketed over the past few years. This has had a very negative impact with respect to food and gasoline prices. It’s tantamount to a significant regressive tax. At the same time, the leveraged hedge fund speculators and Wall Street “carry traders” win big from the Bernanke rally. The very people the administration demonizes are the same ones for whom the Fed is throwing a party. It’s fascinating, not to mention ironic, to see leaders who denigrated trickle down economic growth theories emanating from lower tax rates now embrace trickle down wealth theories coming from the Fed. Long term it seems logical to expect what has nearly always happened when governments print money at a far greater rate than the underlying economies are growing: inflation and currency debasement. Interestingly, despite extensive economic weakness, the September eurozone inflation rate is expected to rise to 2.8%, up from 2.6% in August and well above the ECB’s target of 2.0%.
Howard Marks, who has managed money for forty years and is one of the great investors of our time, recently made this statement: “The world seems more uncertain today than at any other time in my life.” We confess to similar sentiments, but there is always the chance that we are misreading the tea leaves and that the stock market gains anticipate a better economic environment in 2013. Perhaps following the elections Congress will address the so-called fiscal cliff with sensible compromises. Perhaps the leaders will come to acceptable pathways that will reduce deficits and corral the many unfunded liabilities. Perhaps Europe will somehow stem their fiscal and monetary crises and not drag the Federal Reserve into the fray. Every investor has to ask whether these events are likely and whether the 2012 stock market rally already discounts it.
This stock market move, which began in March of 2009, recently hit 43 months, which is the median duration of 15 bull markets since 1929. The 129.6% gain in the current stretch compares to a median of 83.1%. There is nothing magical or predictive from these facts other than to point out that it might take some fundamental improvement in earnings, sales growth or productivity to keep it going. The economic outlook today, both here and abroad, does not look like it will provide much lift in the near term and unfortunately, both sales growth and profit margins appear to be headed the other way, as the charts on the following page depict.
| | |
| S&P 500 Sales Per Share | Corporate Profits |
| Year to Year Percentage Change | Year to Year Percentage Change |
| | |
| |
| | |
| Source: Standard & Poor’s Corporation | Source: Bureau of Economic Analysis |
| Shaded areas represent recessionary periods. | Corporate Profits: After Tax with Inventory Valuation |
| | and Capital Consumption Adjustments |
| | Shaded areas represent recessionary periods. |
A large number of transportation and industrial stocks are announcing poor earnings outlooks and orders. FedEx, Norfolk Southern, Expeditors, Forward Air, Caterpillar, Navistar, Joy Global, Steel Dynamics, Rockwell and many others have had recent confessions. Stocks that depend on better employment or capital spending have been especially hurt. Business confidence is slipping. It is getting to be an old story but it’s impossible to say when it will end. The best we can do in the interim is to let valuation and long term “strength of franchise” be our guide. Higher multiple stocks, lower quality balance sheet stocks, and money losing enterprises have been among the big winners so far in 2012. Valuations remain elevated. We think investors should be wary and stay focused on quality, even if that results in near term underperformance. Somewhat paradoxically, considering the near term economic outlook, the portfolio might begin to tilt more heavily in coming periods toward some of the cyclical companies as their stocks come under increasing pressure. There is always a tug-of-war between valuation and fundamentals and having a long term investment time horizon gives us opportunities to buy superior cyclical franchises when their near term operating environment is weak. We’ve highlighted one such idea below, Anixter International.
While today is very cloudy, we do expect sunnier economic times to eventually return, along with better underlying business fundamentals. Why? Business people want to grow. They want to invest. They want to build and they are willing to add labor… when they feel the systems and environment will reward such activity. This will be a far sturdier foundation for equity performance than government stimulus or Federal Reserve financial engineering.
Anixter International
(Analyst: Rob Helf)
Description
Anixter is a leading global distributor of communications infrastructure products (55% of sales), which includes cabling and security systems, as well as industrial wire and cable (26%) and fasteners/other components to original equipment manufacturers (OEMs) for use in assembled products. Anixter distributes more than 450,000 products to an estimated $50-$60 billion combined addressable market from over 7,000 suppliers through locations in 263 cities in 50 countries. Anixter sells across a wide variety of geographies including North America (71% of sales), Europe (19%) and Asia/Latin America (10%).
Good Business
| | • | Anixter is a leader in the distribution of cabling and wiring around the globe. |
| | • | The company has a global infrastructure of 225 strategically located facilities worldwide. Additionally, the company has a common, proprietary IT system connecting its infrastructure. |
| | • | The company distributes 450,000 products to 100,000 customers from 7,000 suppliers, and the top five largest suppliers represent 30% of sales. Project exposure averages 15% of revenue. |
| | • | The products that Anixter distributes represent a small percentage of customers’ total expenditures. |
| | • | Organic growth should be better than average as the company benefits from the secular expansion of data/communication and security as well as the company’s emerging market initiatives. Over the last 10 years, Anixter has grown sales and earnings per share (EPS) at 8% and 17%, respectively. |
| | • | Anixter has generated an average return on invested capital (ROIC) of approximately 10% over the past 12 years. This is above the company’s weighted average cost of capital. |
| | • | The balance sheet is appropriately levered. |
Valuation
| | • | Anixter currently trades at approximately 0.47 times enterprise value (EV)-to-revenues, 7.4 times earnings before interest, taxes, depreciation and amortization (EBITDA) and 10 times forward earnings per share (EPS) estimates. |
| | • | Historically, the company has traded at 0.5 times revenues, 10 times EBITDA and 15 times EPS. |
Management
| | • | Mr. Robert Eck, 52 years old, is President, Chief Executive Officer and a Director of the company. He has been with Anixter since 1989. Prior to his current position, Eck was Executive VP and COO of Enterprise Cabling and Security Solutions. Eck joined the company in 1989 and during his tenure he has held several executive positions including Senior VP-Supply Chain Solutions and Regional VP. |
| | • | Mr. Ted Dosch, 51, is Executive VP and CFO. He joined the company in January 2009 from Whirlpool. His experience includes Corporate VP-Global Productivity at Whirlpool; CFO-North America and VP-Maytag Integration at Whirlpool and other executive positions. Since his hiring, Mr. Dosch has been involved in working capital management and financial performance measurement. |
| | • | Mr. Sam Zell has been Chairman since 1985. He owns 5 million shares, or 14% of the company. |
| | • | Management incentives are based on targeted goals for each executive and generally include a return on capital component. The company has exhibited capital discipline in the past, including special dividends, share repurchases and acquisitions/divestitures. |
Investment Thesis
Anixter should be able grow sales, earnings and cash flow at above-average rates through organic expansion and acquisitions, while generating a return on capital in excess of its cost of capital. Anixter provides a low tech avenue to higher technology spending growth. The company has built a global distribution network which benefits from secular trends and emerging market expansion. Importantly, the experienced management team has demonstrated fiscal discipline, including debt management in periods of expansion and contraction as well as returning capital to shareholders through buybacks and special dividends.
Advance Auto Parts Inc.
(Analyst: Dan Sievers)
Description
Advance Auto Parts is a leading specialty retailer of automotive aftermarket parts, accessories, batteries and maintenance items with over 3,600 stores and a #1 market position in the Northeast, Mid-Atlantic, and Southeast United States. Advance was constructed as a do-it-yourself (DIY) retail concept, but entered the larger and somewhat faster growing commercial do-it-for-me (DIFM) market in 1996, leveraging an enhanced retail infrastructure to sell to a large and highly fragmented market of small automotive garages. DIFM sales represented 34% of the total in 2011 (up from 25% in 2007), and 38% of the total sales in the first half of 2012. DIFM delivery programs exist at about 90% of its stores.
Good Business
| | • | In geographies representing 78% of sales, Advance commands the leading #1 market position. |
| | • | The company’s traffic and transactions are often based on need (batteries, starters, alternators, belts & hoses, mufflers, etc.), producing a low correlation between sales and consumer discretionary spending. |
| | • | Auto parts retailing is inventory intensive (parts availability is paramount), which limits the economic case for traditional e-commerce models. Additional limiting characteristics include strong customer service intensity, the frequent need for immediate installation, and the “high-weight-to-value” of most parts (which limits a vendor’s ability to offer low-cost shipping options). |
| | • | We expect continued share gains by each of the top three hybrid-DIY/DIFM players, as each has built an advantaged supply chain and distribution system when compared to many small competitors. |
| | • | This is an easy business to understand and favorable industry trends include: (1) record average vehicle age, (2) growing miles driven, (3) and OEM dealership consolidation. |
| | • | Including the heavy burden of capitalized operating leases, we estimate that Advance generates an average ROIC of greater than 10%. |
Valuation
| | • | At 6.0 times EV/EBITDA, Advance trades at one standard deviation below the 5 and 10 year averages of 7.1 times and 8.4 times, respectively (competitors AutoZone and O’Reilly trade above 9 times). |
| | • | The 0.82 times EV/Sales multiple appears out of step with the company’s improving profitability (10.8% EBIT margin in 2011), which we believe can reach 12% over the next few years. |
| | • | Based on 2011 results, the stock offers an attractive 11% free cash flow yield. |
Management
| | • | Darren Jackson, 47, has served as CEO since January 2008. Mr. Jackson, previously EVP at Best Buy, has brought increased focus on merchandising and supply chain initiatives, while driving the company towards a 50/50 balance between retail DIY and commercial DIFM sales. He has done an admirable job shifting corporate focus away from heavy new store growth and towards improving operating margins, working capital efficiency, and returns on invested capital (ROIC). |
| | • | Management’s current initiatives aiming at daily store replenishment are significant and should increase the company’s competitive position in coming years. |
| | • | Advance has opportunistically repurchased and retired 41% of the 2004 share base at an average price of $43, a shrewd use of capital benefitting long-term shareholders. |
| | • | Economic value added (EVA) became the governor of long-term incentive compensation in 2008. |
Investment Thesis
Advance Auto Parts is a good-quality provider of automotive aftermarket parts with good balance between the DIY and DIFM channels, which together represent a relatively stable though mature end market. Large players like Advance, AutoZone and O’Reilly enjoy a significant competitive advantage versus smaller local players and hold a combined market share of 33% in the DIY space and just under 11% in the DIFM space, according to the Automotive Aftermarket Industry Association (AAIA). 2012 industry trends have been soft, exacerbated by weather-related inventory issues. Additionally, Advance faces a potential competitive incursion in Florida from O’Reilly. Though we do not expect an immediate rebound in same store sales, we believe that investor focus on the weak near term results has offered the opportunity to invest in a solid and increasingly well-managed franchise at an attractive 11% free cash flow yield.
******
Distributions: Our Board of Directors has declared a distribution effective October 31, 2012, of $0.08649616 per share from net investment income; $0.28379 per share from short-term capital gains which will be treated as ordinary income; and $2.12186 per share from net long-term capital gains, payable October 31, 2012 to shareholders of record on October 26, 2012.
Thank you for your support of the FMI Common Stock Fund.
100 E. Wisconsin Ave., Suite 2200 • Milwaukee, WI 53202 • 414-226-4555
www.fmifunds.com
This shareholder letter is unaudited.
FMI Common Stock Fund
MANAGEMENT’S DISCUSSION OF FUND PERFORMANCE
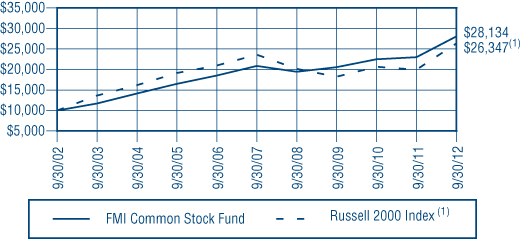
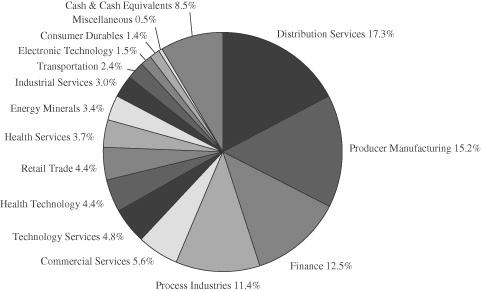
During the fiscal year ended September 30, 2012, the FMI Common Stock Fund (the “Fund”) had a total return of 22.38%. The benchmark Russell 2000 Index(1) returned 31.91% in the same period. Distribution Services, Health Services, Finance, Health Technology, Process Industries and cash were among the several sectors that underperformed the benchmark. Stock selection and relative weightings both contributed significantly to the underperformance. Harte-Hanks, Kennametal, Bemis, AptarGroup, Patterson, ScanSource, Covance and others hurt relative performance. Sectors that helped performance included Non-Energy Minerals, Electronic Technology, and Producer Manufacturing. Eagle Materials, Carlisle, and Woodward aided relative performance. Woodward, Lancaster, JB Hunt, Federated Investors, United Stationers, Bemis and Alliant Techsystems were among stocks that were sold during the fiscal year. The first three, Woodward, Lancaster and JB Hunt, were sold due to valuation. The others listed were sold due to a reassessment of the long term fundamentals. New purchases included H.B. Fuller, Innophos, Cimarex, and Gentex. At September 30, the overweighted sectors included Producer Manufacturing, Process Industries and Distribution Services. Underweighted sectors included Finance, Consumer Non-Durables and Consumer Services. The stock market rebounded significantly in fiscal 2012, which we believe had more to do with monetary actions, i.e. quantitative easing, than any meaningful improvement in underlying fundamentals. As the fiscal year ended, economic activity had weakened across a broad spectrum of geographies. The debt crisis showed little sign of improvement in Europe, the United States or Japan. Valuations have moved higher from a year ago and do not look particularly attractive from a long term historical basis. From a macroeconomic and policy perspective, we do not see the fiscal or monetary initiatives of the past several years as being conducive to good long-term growth and employment. The explosive growth in government liabilities is particularly worrisome. Despite these negatives, we believe equities are the most attractive asset class over a long term investment time horizon. The Fund continues to sell at a discount to the Russell 2000 on most valuation measures. Over long periods of time, lower valuation securities tend to outperform higher valuation ones. Future results, however, may differ from the past.
COMPARISON OF CHANGE IN VALUE OF $10,000 INVESTMENT IN
FMI COMMON STOCK FUND AND THE RUSSELL 2000 INDEX(1)
AVERAGE ANNUALIZED TOTAL RETURN |
| | | | | Since |
| | | | | Inception |
| | 1-Year | 5-Year | 10-Year | 12/18/81 |
| FMI Common | | | | |
| Stock Fund | 22.38% | 6.12% | 10.90% | 11.96% |
| Russell 2000 Index | 31.91% | 2.21% | 10.17% | 10.02% |
The graph and the table do not reflect the deduction of taxes that a shareholder would pay on Fund distributions or the redemption of Fund shares. Performance data quoted represents past performance; past performance does not guarantee future results. Investment return and principal value of an investment will fluctuate so that an investor’s shares, when redeemed, may be worth more or less than their original cost. Current performance of a Fund may be lower or higher than the performance quoted. The total returns do not reflect the deduction of taxes that a shareholder would pay on Fund distributions or the redemption of Fund shares. Total return includes change in share prices and in each case includes reinvestments of any dividends, interest and capital gain distributions. Performance data current to the most recent month-end may be obtained by visiting www.fmifunds.com or by calling 1-800-811-5311.
(1) The Russell 2000 Index measures the performance of the 2,000 smallest companies in the Russell 3000 Index, which comprises the 3,000 largest U.S. companies based on total market capitalization.
An investment cannot be made directly into an index.
This page is unaudited.
FMI Common Stock Fund
SCHEDULE OF INVESTMENTS
| Shares | | | | Cost | | | Value | |
| COMMON STOCKS — 91.5% (a) | | | | | | |
| | | | | | | |
| COMMERCIAL SERVICES SECTOR — 5.6% | | | | | | |
| | | Advertising/Marketing | | | | | | |
| | | Services — 0.8% | | | | | | |
| 1,233,075 | | Harte-Hanks Inc. | | $ | 14,015,785 | | | $ | 8,545,210 | |
| | | Financial Publishing/ | | | | | | | | |
| | | Services — 2.1% | | | | | | | | |
| 290,000 | | The Dun & Bradstreet | | | | | | | | |
| | | Corp. | | | 19,868,506 | | | | 23,089,800 | |
| | | Miscellaneous Commercial | | | | | | | | |
| | | Services — 2.7% | | | | | | | | |
| 736,000 | | Cintas Corp. | | | 17,929,877 | | | | 30,507,200 | |
| | | | | | | | | | | |
| CONSUMER DURABLES SECTOR — 1.4% | | | | | | | | |
| | | Other Consumer | | | | | | | | |
| | | Specialties — 1.4% | | | | | | | | |
| 414,000 | | Mine Safety | | | | | | | | |
| | | Appliances Co. | | | 12,032,362 | | | | 15,429,780 | |
| | | | | | | | | | | |
| DISTRIBUTION SERVICES SECTOR — 17.3% | | | | | | | | |
| | | Electronics | | | | | | | | |
| | | Distributors — 8.9% | | | | | | | | |
| 425,000 | | Anixter | | | | | | | | |
| | | International Inc. | | | 28,156,288 | | | | 24,420,500 | |
| 1,403,000 | | Arrow | | | | | | | | |
| | | Electronics Inc.* | | | 31,275,434 | | | | 47,295,130 | |
| 882,000 | | ScanSource Inc.* | | | 22,931,882 | | | | 28,241,640 | |
| | | | | | 82,363,604 | | | | 99,957,270 | |
| | | Medical Distributors — 6.6% | | | | | | | | |
| 585,000 | | Owens & Minor Inc. | | | 16,778,650 | | | | 17,479,800 | |
| 1,631,000 | | Patterson Cos. Inc. | | | 40,534,664 | | | | 55,845,440 | |
| | | | | | 57,313,314 | | | | 73,325,240 | |
| | | Wholesale | | | | | | | | |
| | | Distributors — 1.8% | | | | | | | | |
| 566,000 | | World Fuel Services | | | | | | | | |
| | | Corp. | | | 23,216,290 | | | | 20,155,260 | |
| | | | | | | | | | | |
| ELECTRONIC TECHNOLOGY SECTOR — 1.5% | | | | | | | | |
| | | Electronic Production | | | | | | | | |
| | | Equipment — 1.5% | | | | | | | | |
| 635,000 | | MKS Instruments Inc. | | | 17,090,625 | | | | 16,186,150 | |
| | | | | | | | | | | |
| ENERGY MINERALS SECTOR — 3.4% | | | | | | | | |
| | | Oil & Gas Production — 3.4% | | | | | | | | |
| 652,000 | | Cimarex Energy Co. | | | 37,798,978 | | | | 38,174,600 | |
| FINANCE SECTOR — 12.5% | | | | | | | | |
| | | Finance/Rental/ | | | | | | | | |
| | | Leasing — 1.7% | | | | | | | | |
| 494,000 | | Ryder System Inc. | | | 20,780,371 | | | | 19,295,640 | |
| | | Insurance Brokers/ | | | | | | | | |
| | | Services — 2.4% | | | | | | | | |
| 763,000 | | Arthur J. | | | | | | | | |
| | | Gallagher & Co. | | | 16,392,496 | | | | 27,330,660 | |
| | | Life/Health | | | | | | | | |
| | | Insurance — 2.3% | | | | | | | | |
| 997,000 | | Protective Life Corp. | | | 15,983,284 | | | | 26,131,370 | |
| | | Property/Casualty | | | | | | | | |
| | | Insurance — 3.0% | | | | | | | | |
| 905,000 | | W.R. Berkley Corp. | | | 22,734,967 | | | | 33,928,450 | |
| | | Regional Banks — 3.1% | | | | | | | | |
| 604,000 | | Cullen/Frost | | | | | | | | |
| | | Bankers Inc. | | | 35,205,404 | | | | 34,687,720 | |
| | | | | | | | | | | |
| HEALTH SERVICES SECTOR — 3.7% | | | | | | | | |
| | | Health Industry | | | | | | | | |
| | | Services — 2.3% | | | | | | | | |
| 552,000 | | Covance Inc.* | | | 23,637,911 | | | | 25,772,880 | |
| | | Medical/Nursing | | | | | | | | |
| | | Services — 1.4% | | | | | | | | |
| 809,000 | | VCA Antech Inc.* | | | 16,997,846 | | | | 15,961,570 | |
| | | | | | | | | | | |
| HEALTH TECHNOLOGY SECTOR — 4.4% | | | | | | | | |
| | | Medical Specialties — 4.4% | | | | | | | | |
| 258,875 | | Bio-Rad | | | | | | | | |
| | | Laboratories Inc.* | | | 22,127,426 | | | | 27,627,140 | |
| 408,000 | | West Pharmaceutical | | | | | | | | |
| | | Services Inc. | | | 16,327,619 | | | | 21,652,560 | |
| | | | | | 38,455,045 | | | | 49,279,700 | |
| INDUSTRIAL SERVICES SECTOR — 3.0% | | | | | | | | |
| | | Oilfield Services/ | | | | | | | | |
| | | Equipment — 3.0% | | | | | | | | |
| 313,000 | | Bristow Group Inc. | | | 8,134,903 | | | | 15,822,150 | |
| 1,458,000 | | McDermott | | | | | | | | |
| | | International Inc.* | | | 18,965,858 | | | | 17,816,760 | |
| | | | | | 27,100,761 | | | | 33,638,910 | |
| MISCELLANEOUS SECTOR — 0.5% | | | | | | | | |
| | | Investment Trusts/ | | | | | | | | |
| | | Mutual Funds — 0.5% | | | | | | | | |
| 267,950 | | PICO Holdings Inc.* | | | 8,444,922 | | | | 6,114,619 | |
| | | | | | | | | | | |
| PROCESS INDUSTRIES SECTOR — 11.4% | | | | | | | | |
| | | Chemicals: Specialty — 6.3% | | | | | | | | |
| 333,000 | | Compass Minerals | | | | | | | | |
| | | International Inc. | | | 24,168,637 | | | | 24,838,470 | |
| 476,000 | | Innophos | | | | | | | | |
| | | Holdings Inc. | | | 23,636,301 | | | | 23,081,240 | |
| 315,000 | | Sigma-Aldrich Corp. | | | 15,670,380 | | | | 22,670,550 | |
| | | | | | 63,475,318 | | | | 70,590,260 | |
| | | Containers/Packaging — 3.0% | | | | | | | | |
| 651,000 | | AptarGroup Inc. | | | 19,162,286 | | | | 33,663,210 | |
| | | Industrial Specialties — 2.1% | | | | | | | | |
| 752,000 | | H.B. Fuller Co. | | | 20,886,926 | | | | 23,071,360 | |
| | | | | | | | | | | |
| PRODUCER MANUFACTURING SECTOR — 15.2% | | | | | | | | |
| | | Auto Parts: OEM — 1.6% | | | | | | | | |
| 1,068,000 | | Gentex Corp. | | | 20,602,809 | | | | 18,166,680 | |
FMI Common Stock Fund
SCHEDULE OF INVESTMENTS (Continued)
| | Shares or | | | | | | | | | |
| | Principal Amount | | | | Cost | | | | Value | |
| COMMON STOCKS — 91.5% (a) (Continued) | | | | | | |
| | | | | | | |
| PRODUCER MANUFACTURING SECTOR — 15.2% (Continued) | | | | | | |
| | | Electrical Products — 3.4% | | | | | | |
| | 1,735,000 | | Molex Inc. - Cl A | | $ | 31,532,890 | | | $ | 37,684,200 | |
| | | | Industrial | | | | | | | | |
| | | | Conglomerates — 2.4% | | | | | | | | |
| | 407,000 | | SPX Corp. | | | 22,883,026 | | | | 26,621,870 | |
| | | | Industrial Machinery — 3.1% | | | | | | | | |
| | 923,000 | | Kennametal Inc. | | | 37,218,259 | | | | 34,224,840 | |
| | | | Miscellaneous | | | | | | | | |
| | | | Manufacturing — 2.9% | | | | | | | | |
| | 626,000 | | Carlisle Cos. Inc. | | | 16,800,707 | | | | 32,501,920 | |
| | | | Office Equipment/ | | | | | | | | |
| | | | Supplies — 1.8% | | | | | | | | |
| | 619,000 | | Avery Dennison Corp. | | | 16,602,918 | | | | 19,696,580 | |
| | | | | | | | | | | | |
| RETAIL TRADE SECTOR — 4.4% | | | | | | | | |
| | | | Discount Stores — 1.5% | | | | | | | | |
| | 252,000 | | Family Dollar | | | | | | | | |
| | | | Stores Inc. | | | 4,945,740 | | | | 16,707,600 | |
| | | | Specialty Stores — 2.9% | | | | | | | | |
| | 475,000 | | Advance Auto | | | | | | | | |
| | | | Parts Inc. | | | 32,193,067 | | | | 32,509,000 | |
| | | | | | | | | | | | |
| TECHNOLOGY SERVICES SECTOR — 4.8% | | | | | | | | |
| | | | Data Processing | | | | | | | | |
| | | | Services — 3.0% | | | | | | | | |
| | 1,434,000 | | Broadridge Financial | | | | | | | | |
| | | | Solutions Inc. | | | 30,925,092 | | | | 33,455,220 | |
| | | | Information Technology | | | | | | | | |
| | | | Services — 1.8% | | | | | | | | |
| | 531,000 | | Jack Henry & | | | | | | | | |
| | | | Associates Inc. | | | 9,767,741 | | | | 20,124,900 | |
| | | | | | | | | | | | |
| TRANSPORTATION SECTOR — 2.4% | | | | | | | | |
| | | | Air Freight/Couriers — 1.0% | | | | | | | | |
| | 352,000 | | Forward Air Corp. | | | 11,267,415 | | | | 10,704,320 | |
| | | | Marine Shipping — 1.4% | | | | | | | | |
| | 285,000 | | Kirby Corp.* | | | 11,152,557 | | | | 15,754,800 | |
| | | | Total common stocks | | | 856,779,099 | | | | 1,022,988,789 | |
| | | | | | | | | | | | |
| SHORT-TERM INVESTMENTS — 8.4% (a) | | | | | | | | |
| | | | Commercial Paper — 8.4% | | | | | | | | |
| $ | 68,700,000 | | U.S. Bank, N.A., 0.05%, | | | | | | | | |
| | | | due 10/01/12 | | | 68,700,000 | | | | 68,700,000 | |
| | 25,000,000 | | GE Capital Corp., 0.04%, | | | | | | | | |
| | | | due 10/12/12 | | | 24,999,694 | | | | 24,999,694 | |
| | | | Total short-term | | | | | | | | |
| | | | investments | | | 93,699,694 | | | | 93,699,694 | |
| | | | Total investments | | | | | | | | |
| | | | — 99.9% | | $ | 950,478,793 | | | | 1,116,688,483 | |
| | | | Other assets, | | | | | | | | |
| | | | less liabilities | | | | | | | | |
| | | | — 0.1% (a) | | | | | | | 1,812,130 | |
| | | | TOTAL NET | | | | | | | | |
| | | | ASSETS — 100.0% | | | | | | $ | 1,118,500,613 | |
| | | | | | | | | | | | |
* | Non-income producing security. |
(a) Percentages for the various classifications relate to net assets.
The accompanying notes to financial statements are an integral part of this schedule.
as of September 30, 2012 (Unaudited)
FMI
International
Fund
September 30, 2012
Dear Fellow Shareholders,
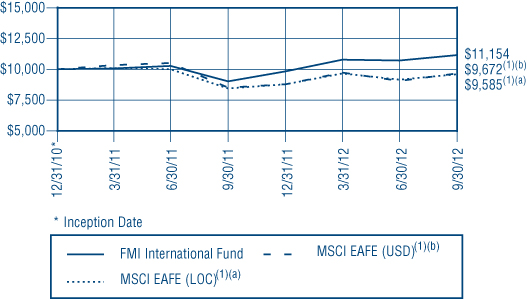
The FMI International Fund gained 4.09% in the three months ending September 30, 2012, compared with the MSCI EAFE Index’s return of 4.67% in local currency and 6.92% in U.S. Dollars (USD). Through nine months, the Fund has advanced 13.55% while the benchmarks, MSCI EAFE local and USD, are up 9.10% and 10.08%, respectively. While unprecedented monetary action by the European Central Bank (ECB), U.S. Federal Reserve (Fed), and Bank of Japan have helped fuel the recent stock rally, the core economic environment and employment landscape remain weak. With a number of significant macro concerns still outstanding, we will continue to proceed with heightened caution and prudence.
In the third quarter, strong individual stock performance was generated by Henkel, Adecco and Tesco, while SMC Corp, CRH, and Rolls Royce all lagged. Positive sector contributions from Consumer Non-Durables, Commercial Services and Process Industries were partially offset by weaker relative performance in Finance, Producer Manufacturing, and Health Technology.
We welcome new shareholders and remind them that the last year of our shareholder letters for the Fund – as well as the FMI Common Stock Fund and the FMI Large Cap Fund – are accessible on our website at www.fmifunds.com.
Ladies & Gentlemen: Start Your Printing Presses!
In a continuing Pavlovian response to fundamental economic weakness and unemployment, governments are “stimulating” on the fiscal front and “accommodating” on the monetary front. The third quarter was a busy one, with four new initiatives announced in September alone. The ECB unveiled a potentially unlimited bond-buying program, China announced ¥1 trillion ($157 billion) of infrastructure stimulus, the Fed launched QE3 with $40 billion of mortgage purchases per month, and the Bank of Japan (BOJ) added ¥10 trillion ($126 billion) to its asset-purchasing program, which now totals ¥80 trillion ($1 trillion). While these measures may have bought some time and helped boost stock prices in the near-term, they are, unfortunately, unlikely to solve the underlying problems. China is a special case, but with respect to other major developed areas mentioned above, the structural debt issues and lack of competitiveness won’t be ameliorated by the wave of a government magic wand.
In Europe, ECB President Mario Draghi overcame a clash with Germany’s Bundesbank and has pushed through a bond-buying program aimed at lowering the borrowing cost of troubled eurozone countries. Before Draghi’s pledge on July 26 to do “whatever it takes to preserve the euro,” Spain and Italy’s 10-year bond yields had peaked at 7.6% and 6.6%, respectively, levels which are deemed unsustainable.(1) The ECB’s assertion that buying short-term sovereign debt (less than 3 years) is an act of providing liquidity, and does not violate its restriction on financing governments, would be laughable under normal circumstances, but instead reveals the degree to which expediency rules the day. Draghi is now “All In,” with no real “Plan B” in sight. The ECB will be taking on meaningful credit risk, making a promise that puts every eurozone country, particularly Germany, in jeopardy, and there is little doubt, at least in our minds, that should the monetary union collapse, it will come back on the United States. Draghi knows that in a widespread European financial panic, the U.S. will be the backstop. The Fed has done it before and given Mr. Bernanke’s philosophical bent, is likely to do it again – only the problem is significantly bigger this time. While we will have to wait and see what the market will say over time, we expect that investors will continue to differentiate between eurozone sovereigns, and that the latest ECB “solution” will not put an end to the debt crisis. Financial engineering does little to make the European fundamentals brighter.
The economy in Europe continues to reflect tough times. The eurozone appears to be in its second recession in three years (flat real GDP growth in the first quarter, -0.5% growth in the second quarter, and a Bloomberg survey of -0.8% growth in the third quarter)(2). Even Germany looks to be turning down. In September, Germany’s Manufacturing Purchasing
_________________
| (1) | | On September 30, 2012, Spain and Italy’s 10-year bond yields had dropped to 5.9% and 5.1%, respectively. |
| (2) | | Growth is reported year-over-year. |
Manufacturing PMI
1/31/2011 - 9/30/2012
Source: Bloomberg
Managers Index (PMI) reading(3) of 47.4 showed that the manufacturing sector has contracted for 7 straight months (10 out of the last 12), hitting a three-year low in July (43.0). The eurozone’s PMI figures tell a similar story (see chart), with manufacturing contracting for 14 straight months, also reaching a 3-year low in July (44.0). Good news is hard to find in Europe and we would expect this reality to eventually outweigh the money printing rally.
Our observations in Asia also give us some cause for concern. For the same reasons that we have highlighted in prior shareholder letters, China’s economy continues to slow sharply. We can now add FedEx, Dow Chemical, and Applied Materials to the growing list of multinational companies citing a slowdown in China. The country’s playbook of stimulative fixed investment may not be sustainable. There appears to be a tug-of-war going on in China between the Keynesians and the free marketers. The $157 billion infrastructure stimulus program is far less than the $586 billion spent in 2008-09. Perhaps some of the central planners recognize the danger in empty high rise apartment buildings, bridges to nowhere and bullet trains with few riders. With political turmoil intensifying in the midst of the once-a-decade change in communist leadership, China’s outlook remains unsettled. We quickly add, however, that longer term we are more positive on China. We never want to underestimate a country that values education, sacrifice and hard work.
In Japan, real GDP growth(4) is expected to slow from 3% in the first half of 2012 to 1.6%(5) in the second half of the year, driven by weak exports and soft consumer spending. A strengthening yen continues to disadvantage exporters, while challenging demographics (a shrinking population) hinders domestic growth opportunities. Japan’s debt level as a percentage of GDP is by far the highest of any major developed economy, projected to be upwards of 230% by 2013, and no real efforts are being made to address what has likely become an insurmountable burden. The International Monetary Fund (IMF) is projecting 1.5% real GDP growth in Japan in 2013, an uninspiring figure, but one which may prove to be overly optimistic if a global recovery does not start to take form.
While we may come across as overly bearish at the macro level, we do see attractive investment prospects when evaluating specific stock ideas. Some of the market’s best opportunities come during times of fear and uncertainty, and FMI has shown in the past that we have the ability to make money for our shareholders through difficult times. We strive to identify high-quality businesses that can withstand almost any economic environment, and buy them at discount valuations. We evaluate companies from the bottom-up with a focus on in-depth security analysis, striving to generate above-average returns while taking below-average risk. As always, we will continue to “eat our own cooking” and invest alongside our shareholders. Below we highlight two of the Fund’s investments:
CRH PLC
(Analyst: Karl Poehls)
Description
CRH PLC is a company based in Dublin, Ireland, which manufactures and distributes building material products. The company’s products include cement, aggregates, asphalt, ready-mixed concrete, agricultural and chemical lime, and concrete
| (3) | | A reading of less than 50 implies contraction and greater than 50 implies expansion. |
| (4) | | Growth is reported year-over-year. |
| (5) | | According to a Bloomberg survey on September 20, 2012. |
products. The company also offers concrete paving and landscaping; precast concrete products; clay bricks, pavers, roofing tiles, and blocks; prepackaged concrete mixes; glass fabrication; and construction accessories. In addition, CRH markets and sells builders’ supplies to the construction industry as well as the do-it-yourself (DIY) market. The company’s earnings before interest, taxes, depreciation and amortization (EBITDA) can be segmented geographically as follows: 50% North America; 35% Western Europe; and 15% Emerging Regions, including Poland, China, and India.
Good Business:
| | • | CRH’s aggregates, asphalt, and cement products are absolutely necessary elements of global infrastructure. Therefore, as buildings, roads, highways, and bridges wear out over time, replacement demand will ultimately translate into increased revenue for the company. |
| | • | CRH owns or leases 14 billion tons of aggregates reserves globally and is a top 10 cement producer in Western Europe. In the U.S., CRH operates as Oldcastle Inc. and is the third largest aggregates producer as well as the market leader in asphalt. |
| | • | We estimate that CRH’s weighted average cost of capital is approximately 7-8%. Over the past 10 years, the company’s return on invested capital (ROIC) has averaged 9%. |
| | • | The company generates considerable excess free cash flow (FCF). Over the past 5 years, CRH’s FCF has averaged €1.1 billion. This funds the annual dividend, which currently yields 4%. |
| | • | CRH has a solid balance sheet with net debt of €3.9 billion. As of June 2012, CRH’s interest coverage and financial leverage ratios were 6.7 times and 2.4 times, respectively. |
Valuation
| | • | At the current price, the company’s stock is 58% below its all-time high of €36 achieved in 2007. |
| | • | CRH currently trades for 1.1 times price-to-book value (P/B). This is below its trailing 7-year and 10-year average P/B multiples of 1.4 times and 1.5 times, respectively. |
| | • | We estimate the company’s aggregates reserves are worth €6.5-7.0 billion or €9 per share, which provides downside support. |
| | • | Over the past 20 years, CRH’s shares have traded for an average price-to-cash flow (P/CF) multiple of 7-8 times. Based on normalized operating cash flow of €1.8-€2.0 billion, we calculate the company’s intrinsic value is over 50% greater than the current stock price. |
Management
| | • | Mr. Myles Lee was appointed Group Chief Executive (CEO) in January 2009. He joined CRH in 1982 and has held various management roles within the company over the past 30 years. |
| | • | Mr. Mark Towe was appointed a CRH Board Director in July 2008; he joined the company in 1997. In July 2008, he was named CEO of the company’s U.S. subsidiary, Oldcastle Inc. Mr. Towe brings valuable insight to the company, with his 40 years of experience in the building materials industry. |
| | • | A meaningful portion of executive compensation is directly tied to return on net assets. |
Investment Thesis
In CRH’s core geographic regions, construction and housing markets are in disarray and threatened by government austerity measures. Moreover, U.S. aggregates consumption, a proxy for infrastructure spending, has seen its worst volume decline since the Great Depression. This has negatively impacted CRH’s financial results and driven its valuation to multi-decade lows. As a result, we are presented with the opportunity to invest in a top-notch building materials company at an attractive valuation. In addition, the current dividend payment provides a 4% annual return while we wait for end markets to normalize.
SMC Corp.
(Analyst: Jonathan Bloom)
Description
With a 32% global market share, SMC Corp. is the world leader in pneumatic control technology, producing crucial components used in factory automation worldwide. Pneumatic technology is essentially the use of compressed air to transmit power, through the utilization of air compressors, air preparation equipment, air line equipment, direction control components
and actuators. In the fiscal year ending March of 2012, the company generated sales of ¥341.9 billion ($4.4 billion) with operating profits of ¥88.1 billion ($1.1 billion, 25.8% margin). Over 60% of sales came from overseas, with geographic distribution reported as follows: Japan (39%), Asia (28%), Europe (16%), North America (13%), and Other (4%).
Good Business:
| | • | Attractive returns: 5- and 10-year average return on invested capital (ROIC) of 13.3% and 15.0%, respectively, exceeding the company’s cost of capital. |
| | • | Economies of scale: At approximately 2 times the market share of its closest global competitor (Festo AG, based in Germany) and 4 times the share of its next closest competitor (Parker Hannifin, U.S.), SMC is believed to be the industry’s low-cost producer, benefiting from economies of scale. |
| | • | Industry leading profitability: 5-year average operating margins are virtually double those of its peers: SMC: 20.9%, Parker Hannifin: 10.9%, CKD (Japan): 6.5%. Festo AG is private. |
| | • | Barriers to entry: It would take a significant amount of time and money to develop an equivalent range of products (over 600,000 SKUs), engineering and industry expertise, manufacturing efficiencies, sales force, and customer trust. |
| | • | Robust balance sheet: Total debt/capital of ~5%. Net cash of ¥285.8 billion ($3.7 billion), including ¥100 billion ($1.3 billion) of “refundable insurance payments,” which is similar to a whole life insurance cash value. |
| | • | Easy to understand, control of destiny: One core competency (automation control) with a narrow focus, unlike many Japanese companies. SMC sells crucial products with low technology risk. |
Valuation
| | • | Enterprise value-to-sales (EV/S) ratio of 1.8 times and EV/EBITDA of 6.2 times, around a standard deviation below 10-year averages. This compares with 5- and 10-year average operating margins of 20.9% and 21.9%. |
| | • | Price-to-earnings ratio (P/E) for fiscal year 3/2013 is 14.6 times, below its 10-year median of 19.0 times. P/E (FY3/2013, adjusted for cash and equivalents) is only 9.2 times. |
| | • | Trading at a 5.3% free cash flow (FCF) yield on an EV basis, based on a 5-year average of FCF. |
| | • | Dividend yield is 1.1%. P/B is 1.5 times, a ~25% discount to its 10-year average of 2.0 times. |
Management
| | • | Mr. Yoshiyuki Takada, 86, founded the company in 1959, and has been the Chairman of the Board since July 2004. Previous titles: Senior Managing Director, Chief Director of Sales, and President. The Takada family has skin in the game, owning ~11% of the total shares outstanding. |
| | • | Mr. Katsunori Maruyama, 65, has been the President since July 2004. He joined SMC in 1970. His previous titles were Senior Managing Director and Vice President. |
Investment Thesis
SMC provides crucial low-cost products for factory automation, an industry which is likely to have solid growth prospects (10-year historical sales compound annual growth rate, or CAGR, of 6.4%) as emerging markets increase manufacturing capacity, and labor costs continue to rise. At 1.8 times EV/S and less than 10 times earnings after adjusting for cash, the current valuation is compelling. Unlike many Japanese companies, SMC has a track record of delivering value for shareholders. SMC provides a favorable risk/reward over a 3- to 5-year investment time horizon.
******
Distributions: Our Board of Directors has declared a distribution effective October 31, 2012, of $0.01549646 per share from net investment income; $0.15902 per share from short-term capital gains which will be treated as ordinary income; and $0.08366 per share from net long-term capital gains, payable October 31, 2012 to shareholders of record on October 26, 2012.
Thank you for your continued support of the FMI International Fund.
100 E. Wisconsin Ave., Suite 2200 • Milwaukee, WI 53202 • 414-226-4555
www.fmifunds.com
This shareholder letter is unaudited.
FMI International Fund
Management’s Discussion of Fund Performance
The FMI International Fund (the “Fund”) gained 23.52% in the fiscal year ended September 30, 2012. This compares to the 13.54% return of the benchmark MSCI EAFE Index (local currency)(1) and the 13.75% of the MSCI EAFE Index (US Dollar)(1). Electronic Technology, Consumer Non-Durables and Non-Energy Minerals were among the outperforming sectors in the period. Stock selection was the primary factor in these results. Stocks that had significant positive impact included Rolls-Royce, Henkel and Compass Group. Sectors that underperformed included Finance, Retail Trade and Energy Minerals. Excess cash also hurt performance. Fairfax Financial, Tesco and Royal Dutch Shell were negative contributors. TNT Express, Diageo and Syngenta were sold during the fiscal year. UPS made a bid for TNT Express and we sold on that news. Diageo and Syngenta were sold due to valuation concerns. New purchases this fiscal year included Royal Dutch Shell, Akzo Nobel, WPP PLC, Unilever and Pirelli. As of September 30, 2012, overweighted sectors included Commercial Services and Producer Manufacturing. Underweighted groups included Finance, Energy Minerals, Communications and Utilities. Stock markets around the globe were generally strong over the fiscal year, which we believe had more to do with monetary actions, i.e. quantitative easing, than any meaningful improvement in underlying fundamentals. As the fiscal year ended, economic activity had weakened across a broad spectrum of geographies. The debt crisis showed little sign of improvement in Europe, the United States or Japan. China’s economy appears to have slowed significantly. Valuations have moved higher from a year ago and while less attractive, do not appear extreme. From a macroeconomic and policy perspective, we do not see the fiscal or monetary initiatives of the past several years as being conducive to good long-term growth and employment. The explosive growth in developed countries government liabilities is particularly worrisome. Despite these negatives, we believe equities are the most attractive asset class over a long term investment time horizon. The Fund continues to sell at a discount to the MSCI EAFE benchmarks on most valuation measures. Over long periods of time, lower valuation securities tend to outperform higher valuation ones. Future results, however, may differ from the past.
COMPARISON OF CHANGE IN VALUE OF $10,000 INVESTMENT IN
FMI INTERNATIONAL FUND AND MSCI EAFE(1)
TOTAL RETURN – NOT ANNUALIZED |
| | | Since |
| | | Inception |
| | 1-Year | 12/31/10 |
| FMI International Fund | 23.52% | 6.45% |
MSCI EAFE (LOC)(1)(a) | 13.54% | (2.40%) |
MSCI EAFE (USD)(1)(b) | 13.75% | (1.89%) |
The graph and the table do not reflect the deduction of taxes that a shareholder would pay on Fund distributions or the redemption of Fund shares. Performance data quoted represents past performance; past performance does not guarantee future results. Investment return and principal value of an investment will fluctuate so that an investor’s shares, when redeemed, may be worth more or less than their original cost. Current performance of a Fund may be lower or higher than the performance quoted. The total returns do not reflect the deduction of taxes that a shareholder would pay on Fund distributions or the redemption of Fund shares. Total return includes change in share prices and in each case includes reinvestments of any dividends, interest and capital gain distributions. Performance data current to the most recent month-end may be obtained by visiting www.fmifunds.com or by calling 1-800-811-5311.
| (1) | | The MSCI EAFE Index (Europe, Australasia, Far East) is a free float-adjusted market capitalization index that is designed to measure the equity market performance of developed markets, excluding the U.S. and Canada. As of May 27, 2010 the MSCI EAFE Index consisted of the following 22 developed market country indices: Australia, Austria, Belgium, Denmark, Finland, France, Germany, Greece, Hong Kong, Ireland, Israel, Italy, Japan, the Netherlands, New Zealand, Norway, Portugal, Singapore, Spain, Sweden, Switzerland and the United Kingdom. The MSCI EAFE Index is unmanaged and investors cannot invest directly in the Index. Index results are inclusive of dividends and net of foreign withholding taxes. The reported figures include reinvestment of dividends and capital gains distributions and do not reflect any fees or expenses. |
| | | The MSCI EAFE Index is calculated in local currency as well as in U.S. dollars (USD). The concept of a local currency calculation excludes the impact of currency fluctuations. All currencies of listing are considered in the Index calculation in local currency where current prices (t) and previous day prices (t-1) are converted into USD using the same exchange rate (exchange rate t-1) in the numerator and denominator. As a consequence, the FX factor drops out of the equation. The USD calculation includes exchange rates at t and t-1. Therefore, the local currency calculation only represents the price appreciation or depreciation of the securities, whereas the USD calculation also accounts for the performance of the currency (or currencies) relative to the USD. MSCI EAFE is a service mark of MSCI Barra. |
An investment cannot be made directly into an index. |
This page is unaudited.
FMI International Fund
SCHEDULE OF INVESTMENTS
| Shares | | | | Cost | | | Value | |
| COMMON STOCKS — 87.0% (a) | | | | | | |
| | | | | | | |
| COMMERCIAL SERVICES SECTOR — 13.2% | | | | | | |
| | | Advertising/Marketing | | | | | | |
| | | Services — 3.4% | | | | | | |
| | 166,750 | | WPP PLC | | | | | | |
| | | | (United Kingdom) (b) | | $ | 2,070,295 | | | $ | 2,271,287 | |
| | | | Miscellaneous Commercial | | | | | | | | |
| | | | Services — 5.6% | | | | | | | | |
| | 40,700 | | Secom Co. Ltd. | | | | | | | | |
| | | | (Japan) (b) | | | 1,906,569 | | | | 2,121,391 | |
| | 800 | | SGS S.A. | | | | | | | | |
| | | | (Switzerland) (b) | | | 1,434,872 | | | | 1,645,146 | |
| | | | | | | 3,341,441 | | | | 3,766,537 | |
| | | | Personnel Services — 4.2% | | | | | | | | |
| | 58,625 | | Adecco S.A. | | | | | | | | |
| | | | (Switzerland) (b) | | | 2,623,735 | | | | 2,798,398 | |
| | | | | | | | | | | | |
| CONSUMER DURABLES SECTOR — 4.2% | | | | | | | | |
| | | | Automotive Aftermarket — 2.3% | | | | | | | | |
| | 144,900 | | Pirelli & C. SpA | | | | | | | | |
| | | | (Italy) (b) | | | 1,677,010 | | | | 1,563,592 | |
| | | | Recreational Products — 1.9% | | | | | | | | |
| | 17,600 | | Shimano Inc. | | | | | | | | |
| | | | (Japan) (b) | | | 873,634 | | | | 1,277,871 | |
| | | | | | | | | | | | |
| CONSUMER NON-DURABLES SECTOR — 9.6% | | | | | | | | |
| | | | Food: Major Diversified — 5.3% | | | | | | | | |
| | 30,600 | | Nestlé S.A. | | | | | | | | |
| | | | (Switzerland) (b) | | | 1,758,233 | | | | 1,930,780 | |
| | 45,150 | | Unilever PLC | | | | | | | | |
| | | | (United Kingdom) (b) | | | 1,632,289 | | | | 1,648,519 | |
| | | | | | | 3,390,522 | | | | 3,579,299 | |
| | | | Household/Personal | | | | | | | | |
| | | | Care — 4.3% | | | | | | | | |
| | 44,075 | | Henkel AG & Co. KGaA | | | | | | | | |
| | | | (Germany) (b) | | | 2,337,305 | | | | 2,876,671 | |
| | | | | | | | | | | | |
| CONSUMER SERVICES SECTOR — 4.7% | | | | | | | | |
| | | | Restaurants — 4.7% | | | | | | | | |
| | 287,800 | | Compass Group PLC | | | | | | | | |
| | | | (United Kingdom) (b) | | | 2,809,891 | | | | 3,181,422 | |
| | | | | | | | | | | | |
| ELECTRONIC TECHNOLOGY SECTOR — 6.2% | | | | | | | | |
| | | | Aerospace & Defense — 2.7% | | | | | | | | |
| | 135,075 | | Rolls-Royce Holdings PLC | | | | | | | | |
| | | | (United Kingdom)* (b) | | | 1,495,644 | | | | 1,842,657 | |
| | | | Electronic Components — 3.5% | | | | | | | | |
| | 68,800 | | TE Connectivity Ltd. | | | | | | | | |
| | | | (Switzerland) | | | 2,327,386 | | | | 2,339,888 | |
| | | | | | | | | | | | |
| ENERGY MINERALS SECTOR — 3.3% | | | | | | | | |
| | | | Integrated Oil — 3.3% | | | | | | | | |
| | 63,850 | | Royal Dutch Shell PLC | | | | | | | | |
| | | | (United Kingdom) (b) | | | 2,247,207 | | | | 2,212,793 | |
| | | | | | | | | | | | |
| FINANCE SECTOR — 9.3% | | | | | | | | |
| | | | Financial Conglomerates — 2.7% | | | | | | | | |
| | 53,575 | | Brookfield Asset | | | | | | | | |
| | | | Management Inc. | | | | | | | | |
| | | | (Canada) | | | 1,582,167 | | | | 1,849,594 | |
| | | | Insurance Brokers/ | | | | | | | | |
| | | | Services — 3.0% | | | | | | | | |
| | 55,500 | | Willis Group Holdings PLC | | | | | | | | |
| | | | (Ireland) | | | 2,096,237 | | | | 2,049,060 | |
| | | | Property/Casualty | | | | | | | | |
| | | | Insurance — 3.6% | | | | | | | | |
| | 6,200 | | Fairfax Financial Holdings Ltd. | | | | | | | | |
| | | | (Canada) | | | 2,496,049 | | | | 2,394,798 | |
| | | | | | | | | | | | |
| HEALTH TECHNOLOGY SECTOR — 7.8% | | | | | | | | |
| | | | Medical Specialties — 3.9% | | | | | | | | |
| | 43,825 | | Covidien PLC | | | | | | | | |
| | | | (Ireland) | | | 2,190,783 | | | | 2,604,081 | |
| | | | Pharmaceuticals: Major — 3.9% | | | | | | | | |
| | 112,275 | | GlaxoSmithKline PLC | | | | | | | | |
| | | | (United Kingdom) (b) | | | 2,512,651 | | | | 2,591,609 | |
| | | | | | | | | | | | |
| INDUSTRIAL SERVICES SECTOR — 2.8% | | | | | | | | |
| | | | Oilfield Services/ | | | | | | | | |
| | | | Equipment — 2.8% | | | | | | | | |
| | 25,975 | | Schlumberger Ltd. | | | | | | | | |
| | | | (Curacao) | | | 1,730,084 | | | | 1,878,772 | |
| | | | | | | | | | | | |
| NON-ENERGY MINERALS SECTOR — 3.5% | | | | | | | | |
| | | | Construction Materials — 3.5% | | | | | | | | |
| | 123,150 | | CRH PLC | | | | | | | | |
| | | | (Ireland) (b) | | | 2,346,773 | | | | 2,370,710 | |
| | | | | | | | | | | | |
| PROCESS INDUSTRIES SECTOR — 5.1% | | | | | | | | |
| | | | Chemicals: Specialty — 1.7% | | | | | | | | |
| | 20,300 | | Shin-Etsu Chemical Co. Ltd. | | | | | | | | |
| | | | (Japan) (b) | | | 1,063,466 | | | | 1,140,841 | |
| | | | Industrial Specialties — 3.4% | | | | | | | | |
| | 40,475 | | Akzo Nobel N.V. | | | | | | | | |
| | | | (Netherlands) (b) | | | 2,219,895 | | | | 2,285,493 | |
| | | | | | | | | | | | |
| PRODUCER MANUFACTURING SECTOR — 10.0% | | | | | | | | |
| | | | Industrial Conglomerates — 3.2% | | | | | | | | |
| | 48,675 | | Ingersoll-Rand PLC | | | | | | | | |
| | | | (Ireland) | | | 2,000,865 | | | | 2,181,614 | |
| | | | Industrial Machinery — 6.8% | | | | | | | | |
| | 14,050 | | Schindler Holding AG | | | | | | | | |
| | | | (Switzerland) (b) | | | 1,615,114 | | | | 1,729,867 | |
| | 17,700 | | SMC Corp. | | | | | | | | |
| | | | (Japan) (b) | | | 2,891,531 | | | | 2,848,527 | |
| | | | | | | 4,506,645 | | | | 4,578,394 | |
| RETAIL TRADE SECTOR — 3.1% | | | | | | | | |
| | | | Food Retail — 3.1% | | | | | | | | |
| | 389,600 | | Tesco PLC | | | | | | | | |
| | | | (United Kingdom) (b) | | | 2,115,570 | | | | 2,092,163 | |
FMI International Fund
SCHEDULE OF INVESTMENTS (Continued)
| Shares or | | | | | | |
| Principal Amount | | Cost | | | Value | |
| COMMON STOCKS — 87.0% (a) (Continued) | | | | | |
| | | | | | |
| TECHNOLOGY SERVICES SECTOR — 4.2% | | | | | |
| | | Information Technology | | | | | |
| | | Services — 4.2% | | | | | |
| 40,150 | | Accenture PLC | | | | | |
| | | (Ireland) | $ | 2,219,252 | | | $ | 2,811,704 | |
| | | Total common stocks | | 54,274,507 | | | | 58,539,248 | |
| SHORT-TERM INVESTMENTS — 14.8% (a) | | | | | | | |
| | | Commercial Paper — 14.8% | | | | | | | |
| $5,000,000 | | U.S. Bank, N.A., 0.05%, | | | | | | | |
| | | due 10/01/12 | | 5,000,000 | | | | 5,000,000 | |
| 5,000,000 | | GE Capital Corp., 0.04%, | | | | | | | |
| | | due 10/12/12 | | 4,999,939 | | | | 4,999,939 | |
| | | Total short-term | | | | | | | |
| | | investments | | 9,999,939 | | | | 9,999,939 | |
| | | Total investments | | | | | | | |
| | | — 101.8% | $ | 64,274,446 | | | | 68,539,187 | |
| | | Liabilities, less | | | | | | | |
| | | other assets | | | | | | | |
| | | — (1.8%) (a) | | | | | | (1,223,343 | ) |
| | | TOTAL NET | | | | | | | |
| | | ASSETS — 100.0% | | | | | $ | 67,315,844 | |
| * | | Non-income producing security. |
| (a) | | Percentages for the various classifications relate to net assets. |
| (b) | | Security does not trade during New York Stock Exchange hours and has been valued in accordance with the procedures discussed in Note 1(a) to the financial statements and has been classified as level 2. As of September 30, 2012 the aggregate value of these securities was $40,429,737. |
| | | PLC – Public Limited Company |
SCHEDULE OF FORWARD CURRENCY CONTRACTS
| | | | | | | U.S. $ Value at | | | | | | U.S. $ Value at | | | | |
| Settlement | | Currency to | | September 30, | | Currency to | | September 30, | | | Unrealized | |
| Date | Counterparty | be Delivered | | 2012 | | be Received | | 2012 | | | Depreciation | |
| 10/26/12 | U.S. Bank, N.A. | 9,800,000 | | British Pound | | $ | 15,823,640 | | 15,236,990 | | U.S. Dollar | | $ | 15,236,990 | | | $ | (586,650 | ) |
| 10/26/12 | BMO/M&I | 4,200,000 | | Canadian Dollar | | | 4,269,600 | | 4,117,324 | | U.S. Dollar | | | 4,117,324 | | | | (152,276 | ) |
| 10/26/12 | Bank of New York | 3,700,000 | | Euro | | | 4,756,053 | | 4,490,579 | | U.S. Dollar | | | 4,490,579 | | | | (265,474 | ) |
| 10/26/12 | U.S. Bank, N.A. | 1,300,000 | | Euro | | | 1,671,045 | | 1,661,660 | | U.S. Dollar | | | 1,661,660 | | | | (9,385 | ) |
| 10/26/12 | Bank of New York | 460,000,000 | | Japanese Yen | | | 5,895,808 | | 5,884,535 | | U.S. Dollar | | | 5,884,535 | | | | (11,273 | ) |
| 10/26/12 | Bank of New York | 6,500,000 | | Swiss Franc | | | 6,915,033 | | 6,598,378 | | U.S. Dollar | | | 6,598,378 | | | | (316,655 | ) |
| | | | | | | $ | 39,331,179 | | | | | | $ | 37,989,466 | | | $ | (1,341,713 | ) |
The accompanying notes to financial statements are an integral part of these schedules.
as of September 30, 2012 (Unaudited)
FMI Funds
STATEMENTS OF ASSETS AND LIABILITIES
| | | | FMI | | | FMI | | | FMI | |
| | | | Large Cap | | | Common Stock | | | International | |
| | | | Fund | | | Fund | | | Fund | |
| | | | | | | | | | | |
| ASSETS: | | | | | | | | | | |
| Investments in securities, at value | (a) | | $ | 6,156,651,997 | | | $ | 1,116,688,483 | | | $ | 68,539,187 | |
| Receivable from shareholders for purchases | | | | 20,319,735 | | | | 1,219,187 | | | | 94,659 | |
| Dividends and interest receivable | | | | 10,829,653 | | | | 1,185,085 | | | | 161,660 | |
| Receivable from investments sold | | | | — | | | | 807,592 | | | | — | |
| Prepaid expenses | | | | 136,749 | | | | 42,839 | | | | 5,900 | |
| Cash | | | | 573,221 | | | | 15,393 | | | | 59,177 | |
| Total assets | | | $ | 6,188,511,355 | | | $ | 1,119,958,579 | | | $ | 68,860,583 | |
| LIABILITIES: | | | | | | | | | | | | | |
| Payable to brokers for investments purchased | | | $ | 10,373,379 | �� | | $ | — | | | $ | 134,953 | |
| Payable to shareholders for redemptions | | | | 6,261,353 | | | | 458,114 | | | | — | |
| Payable to adviser for management fees | | | | 2,835,309 | | | | 792,757 | | | | 27,633 | |
| Payable for forward currency contracts | | | | — | | | | — | | | | 1,341,713 | |
| Other liabilities | | | | 1,227,951 | | | | 207,095 | | | | 40,440 | |
| Total liabilities | | | | 20,697,992 | | | | 1,457,966 | | | | 1,544,739 | |
| NET ASSETS: | | | | | | | | | | | | | |
| Capital Stock | (b) | | | 5,114,865,489 | | | | 848,084,870 | | | | 62,285,427 | |
| Net unrealized appreciation | | | | 940,939,860 | | | | 166,209,690 | | | | 2,923,425 | |
| Accumulated net realized gain | | | | 63,970,046 | | | | 100,450,155 | | | | 770,475 | |
| Undistributed net investment income | | | | 48,037,968 | | | | 3,755,898 | | | | 1,336,517 | |
| Net assets | | | | 6,167,813,363 | | | | 1,118,500,613 | | | | 67,315,844 | |
| Total liabilities and net assets | | | $ | 6,188,511,355 | | | $ | 1,119,958,579 | | | $ | 68,860,583 | |
| CALCULATION OF NET ASSET VALUE PER SHARE: | | | | | | | | | | | | | |
| Net asset value, offering and redemption price per share | | | | | | | | | | | | | |
| (Net assets ÷ shares outstanding) | | | $ | 17.38 | | | $ | 25.43 | | | $ | 22.12 | |
| | | | | | | | | | | | | | |
| (a) Identified cost of investments | | | $ | 5,215,712,137 | | | $ | 950,478,793 | | | $ | 64,274,446 | |
| (b) Par value | | | $ | 0.0001 | | | $ | 0.01 | | | $ | 0.0001 | |
| Shares authorized | | | | 400,000,000 | | | indefinite | | | | 300,000,000 | |
| Shares outstanding | | | | 354,811,265 | | | | 43,991,679 | | | | 3,042,772 | |
| | | | | | | | | | | | | | |
The accompanying notes to financial statements are an integral part of these statements.
FMI Funds
STATEMENTS OF OPERATIONS
For the Year Ended September 30, 2012
| | | FMI | | | FMI | | | FMI | |
| | | Large Cap | | | Common Stock | | | International | |
| | | Fund | | | Fund | | | Fund | |
| | | | | | | | | | |
| INCOME: | | | | | | | | | |
| Dividends | | $ | 113,398,629 | | | $ | 17,564,073 | | | $ | 775,082 | * |
| Interest | | | 153,417 | | | | 47,689 | | | | 2,081 | |
| Total income | | | 113,552,046 | | | | 17,611,762 | | | | 777,163 | |
| EXPENSES: | | | | | | | | | | | | |
| Management fees | | | 38,502,794 | | | | 11,160,005 | | | | 281,797 | |
| Transfer agent fees | | | 6,819,808 | | | | 1,248,037 | | | | 36,737 | |
| Administrative and accounting services | | | 2,650,853 | | | | 573,000 | | | | 71,775 | |
| Printing and postage expense | | | 620,659 | | | | 118,835 | | | | 4,999 | |
| Custodian fees | | | 338,737 | | | | 75,802 | | | | 30,235 | |
| Registration fees | | | 295,314 | | | | 20,776 | | | | 23,731 | |
| Board of Directors fees | | | 48,400 | | | | 43,600 | | | | 10,000 | |
| Professional fees | | | 47,357 | | | | 42,057 | | | | 37,352 | |
| Other expenses | | | 132,336 | | | | 59,201 | | | | 30,162 | |
| Amortization of offering expenses | | | — | | | | — | | | | 16,140 | |
| Total expenses before reimbursement | | | 49,456,258 | | | | 13,341,313 | | | | 542,928 | |
| Less expenses reimbursed by adviser | | | — | | | | — | | | | (167,198 | ) |
| Net expenses | | | 49,456,258 | | | | 13,341,313 | | | | 375,730 | |
| NET INVESTMENT INCOME | | | 64,095,788 | | | | 4,270,449 | | | | 401,433 | |
| NET REALIZED GAIN ON INVESTMENTS: | | | | | | | | | | | | |
| Securities | | | 97,601,348 | | | | 113,867,695 | | | | 784,399 | |
| Forward currency contracts | | | — | | | | — | | | | 532,601 | |
| Foreign currency transactions | | | — | | | | — | | | | 470,474 | |
| NET REALIZED GAIN ON INVESTMENTS | | | 97,601,348 | | | | 113,867,695 | | | | 1,787,474 | |
| NET CHANGE IN UNREALIZED | | | | | | | | | | | | |
| APPRECIATION (DEPRECIATION) OF INVESTMENTS: | | | | | | | | | | | | |
| Securities | | | 957,131,983 | | | | 90,965,301 | | | | 5,740,094 | |
| Forward currency contracts | | | — | | | | — | | | | (1,409,705 | ) |
| Foreign currency transactions | | | — | | | | — | | | | 1,331 | |
| NET CHANGE IN UNREALIZED APPRECIATION (DEPRECIATION) | | | 957,131,983 | | | | 90,965,301 | | | | 4,331,720 | |
| NET GAIN ON INVESTMENTS | | | 1,054,733,331 | | | | 204,832,996 | | | | 6,119,194 | |
| NET INCREASE IN NET ASSETS | | | | | | | | | | | | |
| RESULTING FROM OPERATIONS | | $ | 1,118,829,119 | | | $ | 209,103,445 | | | $ | 6,520,627 | |
* Net of withholding taxes $78,024.
The accompanying notes to financial statements are an integral part of these statements.
FMI Funds
STATEMENTS OF CHANGES IN NET ASSETS
For the Years Ended September 30, 2012 and 2011
| | | FMI | | | FMI | | | FMI | |
| | | Large Cap | | | Common Stock | | | International | |
| | | Fund | | | Fund | | | Fund | |
| | | | | | | | | | | | | | | | | | | |
| | | 2012 | | | 2011 | | | 2012 | | | 2011 | | | 2012 | | | | 2011* | |
| OPERATIONS: | | | | | | | | | | | | | | | | | | | |
| Net investment income | | $ | 64,095,788 | | | $ | 41,137,796 | | | $ | 4,270,449 | | | $ | 1,409,461 | | | $ | 401,433 | | | $ | 90,691 | |
| Net realized gain (loss) on investments | | | 97,601,348 | | | | 166,134,864 | | | | 113,867,695 | | | | 80,575,987 | | | | 1,787,474 | | | | (48,566 | ) |
| Net change in unrealized appreciation | | | | | | | | | | | | | | | | | | | | | | | | |
| (depreciation) on investments | | | 957,131,983 | | | | (299,268,485 | ) | | | 90,965,301 | | | | (64,562,570 | ) | | | 4,331,720 | | | | (1,408,295 | ) |
| Net increase (decrease) in | | | | | | | | | | | | | | | | | | | | | | | | |
| net assets from operations | | | 1,118,829,119 | | | | (91,995,825 | ) | | | 209,103,445 | | | | 17,422,878 | | | | 6,520,627 | | | | (1,366,170 | ) |
| DISTRIBUTIONS TO SHAREHOLDERS: | | | | | | | | | | | | | | | | | | | | | | | | |
| Distributions from | | | | | | | | | | | | | | | | | | | | | | | | |
| net investment income | | | (50,344,376 | ) | | | (31,698,426 | ) | | | (1,924,012 | ) | | | — | | | | (124,040 | ) | | | — | |
| Distributions from net realized gains | | | (119,091,898 | ) | | | — | | | | (85,397,192 | ) | | | (33,400,471 | ) | | | — | | | | — | |
| Total distributions | | | (169,436,274 | ) | | | (31,698,426 | ) | | | (87,321,204 | ) | | | (33,400,471 | ) | | | (124,040 | ) | | | — | |
| FUND SHARE ACTIVITIES: | | | | | | | | | | | | | | | | | | | | | | | | |
| Proceeds from shares issued | | | 2,281,908,015 | | | | 1,745,177,576 | | | | 163,903,550 | | | | 212,892,998 | | | | 50,654,509 | | | | 15,282,839 | |
| Net asset value of shares issued | | | | | | | | | | | | | | | | | | | | | | | | |
| in distributions reinvested | | | 150,413,804 | | | | 26,370,980 | | | | 85,133,428 | | | | 32,736,051 | | | | 123,122 | | | | — | |
| Cost of shares redeemed | | | (1,222,659,690 | ) | | | (957,460,090 | ) | | | (198,309,108 | ) | | | (209,291,415 | ) | | | (3,372,226 | ) | | | (402,817 | ) |
| Net increase in net assets derived | | | | | | | | | | | | | | | | | | | | | | | | |
| from Fund share activities | | | 1,209,662,129 | | | | 814,088,466 | | | | 50,727,870 | | | | 36,337,634 | | | | 47,405,405 | | | | 14,880,022 | |
| TOTAL INCREASE | | | 2,159,054,974 | | | | 690,394,215 | | | | 172,510,111 | | | | 20,360,041 | | | | 53,801,992 | | | | 13,513,852 | |
| NET ASSETS AT THE | | | | | | | | | | | | | | | | | | | | | | | | |
| BEGINNING OF THE PERIOD | | | 4,008,758,389 | | | | 3,318,364,174 | | | | 945,990,502 | | | | 925,630,461 | | | | 13,513,852 | | | | — | |
| NET ASSETS AT THE | | | | | | | | | | | | | | | | | | | | | | | | |
| END OF THE PERIOD | | $ | 6,167,813,363 | | | $ | 4,008,758,389 | | | $ | 1,118,500,613 | | | $ | 945,990,502 | | | $ | 67,315,844 | | | $ | 13,513,852 | |
| Undistributed net investment income | | $ | 48,037,968 | | | $ | 34,286,556 | | | $ | 3,755,898 | | | $ | 1,409,461 | | | $ | 1,336,517 | | | $ | 90,691 | |
| FUND SHARE TRANSACTIONS: | | | | | | | | | | | | | | | | | | | | | | | | |
| Shares sold | | | 140,809,873 | | | | 109,851,394 | | | | 6,533,630 | | | | 8,423,257 | | | | 2,441,371 | | | | 768,348 | |
| Shares issued in | | | | | | | | | | | | | | | | | | | | | | | | |
| distributions reinvested | | | 9,775,503 | | | | 1,765,679 | | | | 3,614,947 | | | | 1,427,037 | | | | 6,340 | | | | — | |
| Less shares redeemed | | | (75,867,253 | ) | | | (60,971,489 | ) | | | (7,952,752 | ) | | | (8,335,372 | ) | | | (153,047 | ) | | | (20,240 | ) |
| Net increase in shares outstanding | | | 74,718,123 | | | | 50,645,584 | | | | 2,195,825 | | | | 1,514,922 | | | | 2,294,664 | | | | 748,108 | |
* For the Period from December 31, 2010 (Commencement of Operations) to September 30, 2011.
The accompanying notes to financial statements are an integral part of these statements.
FMI Large Cap Fund
FINANCIAL HIGHLIGHTS
(Selected data for each share of the Fund outstanding throughout each year)
| | | Years Ended September 30, | |
| | | 2012 | | | 2011 | | | 2010 | | | 2009 | | | 2008 | |
| PER SHARE OPERATING PERFORMANCE: | | | | | | | | | | | | | | | |
| Net asset value, beginning of year | | $ | 14.31 | | | $ | 14.46 | | | $ | 13.27 | | | $ | 13.65 | | | $ | 16.18 | |
| Income from investment operations: | | | | | | | | | | | | | | | | | | | | |
| Net investment income | | | 0.20 | | | | 0.16 | | | | 0.17 | | | | 0.20 | | | | 0.17 | |
| Net realized and unrealized gains (losses) on investments | | | 3.46 | | | | (0.17 | ) | | | 1.19 | | | | (0.47 | ) | | | (2.14 | ) |
| Total from investment operations | | | 3.66 | | | | (0.01 | ) | | | 1.36 | | | | (0.27 | ) | | | (1.97 | ) |
| Less distributions: | | | | | | | | | | | | | | | | | | | | |
| Distributions from net investment income | | | (0.17 | ) | | | (0.14 | ) | | | (0.17 | ) | | | (0.11 | ) | | | (0.13 | ) |
| Distributions from net realized gains | | | (0.42 | ) | | | — | | | | — | | | | — | | | | (0.43 | ) |
| Total from distributions | | | (0.59 | ) | | | (0.14 | ) | | | (0.17 | ) | | | (0.11 | ) | | | (0.56 | ) |
| Net asset value, end of year | | $ | 17.38 | | | $ | 14.31 | | | $ | 14.46 | | | $ | 13.27 | | | $ | 13.65 | |
| TOTAL RETURN | | | 26.17 | % | | | (0.13 | %) | | | 10.33 | % | | | (1.79 | %) | | | (12.58 | %) |
| RATIOS/SUPPLEMENTAL DATA: | | | | | | | | | | | | | | | | | | | | |
| Net assets, end of year (in 000’s $) | | | 6,167,813 | | | | 4,008,758 | | | | 3,318,364 | | | | 2,051,701 | | | | 1,140,200 | |
| Ratio of expenses (after reimbursement) to average net assets (a) | | | 0.96 | % | | | 0.97 | % | | | 0.97 | % | | | 0.97 | % | | | 1.00 | % |
| Ratio of net investment income to average net assets (b) | | | 1.25 | % | | | 1.03 | % | | | 1.18 | % | | | 1.80 | % | | | 1.13 | % |
| Portfolio turnover rate | | | 21 | % | | | 28 | % | | | 20 | % | | | 32 | % | | | 30 | % |
| (a) | | Computed after giving effect to adviser’s expense limitation undertaking. If the Fund had paid all of its expenses for the year ended September 30, 2008, the ratio would have been 1.02%. |
| (b) | | If the Fund had paid all of its expenses for the year ended September 30, 2008, the ratio would have been 1.11%. |
FINANCIAL HIGHLIGHTS
(Selected data for each share of the Fund outstanding throughout each year)
| | | Years Ended September 30, | |
| | | 2012 | | | 2011 | | | 2010 | | | 2009 | | | 2008 | |
| PER SHARE OPERATING PERFORMANCE: | | | | | | | | | | | | | | | |
| Net asset value, beginning of year | | $ | 22.63 | | | $ | 22.98 | | | $ | 21.07 | | | $ | 21.20 | | | $ | 26.61 | |
| Income from investment operations: | | | | | | | | | | | | | | | | | | | | |
| Net investment Income (loss) | | | 0.09 | | | | 0.03 | | | | (0.00 | )* | | | 0.05 | | | | 0.08 | |
| Net realized and unrealized gains (loss) on investments | | | 4.79 | | | | 0.44 | | | | 1.96 | | | | 0.86 | | | | (1.74 | ) |
| Total from investment operations | | | 4.88 | | | | 0.47 | | | | 1.96 | | | | 0.91 | | | | (1.66 | ) |
| Less distributions: | | | | | | | | | | | | | | | | | | | | |
| Distributions from net investment income | | | (0.04 | ) | | | — | | | | (0.04 | ) | | | (0.06 | ) | | | (0.08 | ) |
| Distributions from net realized gains | | | (2.04 | ) | | | (0.82 | ) | | | (0.01 | ) | | | (0.98 | ) | | | (3.67 | ) |
| Total from distributions | | | (2.08 | ) | | | (0.82 | ) | | | (0.05 | ) | | | (1.04 | ) | | | (3.75 | ) |
| Net asset value, end of year | | $ | 25.43 | | | $ | 22.63 | | | $ | 22.98 | | | $ | 21.07 | | | $ | 21.20 | |
| TOTAL RETURN | | | 22.38 | % | | | 2.03 | % | | | 9.30 | % | | | 6.04 | % | | | (7.00 | %) |
| RATIOS/SUPPLEMENTAL DATA: | | | | | | | | | | | | | | | | | | | | |
| Net assets, end of year (in 000’s $) | | | 1,118,501 | | | | 945,991 | | | | 925,630 | | | | 872,557 | | | | 411,797 | |
| Ratio of expenses to average net assets | | | 1.20 | % | | | 1.21 | % | | | 1.24 | % | | | 1.26 | % | | | 1.22 | % |
| Ratio of net investment income (loss) to average net assets | | | 0.38 | % | | | 0.13 | % | | | (0.01 | %) | | | 0.32 | % | | | 0.35 | % |
| Portfolio turnover rate | | | 43 | % | | | 26 | % | | | 30 | % | | | 35 | % | | | 40 | % |
| * | | Amount less than $0.005 per share. |
The accompanying notes to financial statements are an integral part of these statements.
FINANCIAL HIGHLIGHTS
(Selected data for each share of the Fund outstanding throughout each period)
| | | | | | For the Period from | |
| | | For the Year Ended | | | December 31, 2010* | |
| | | September 30, 2012 | | | to September 30, 2011 | |
| PER SHARE OPERATING PERFORMANCE: | | | | | | |
| Net asset value, beginning of period | | $ | 18.06 | | | $ | 20.00 | |
| Income from investment operations: | | | | | | | | |
| Net investment income | | | 0.22 | | | | 0.16 | |
| Net realized and unrealized gain (loss) on investments | | | 4.00 | | | | (2.10 | ) |
| Total from investment operations | | | 4.22 | | | | (1.94 | ) |
| Less distributions: | | | | | | | | |
| Distributions from net investment income | | | (0.16 | ) | | | — | |
| Distributions from net realized gains | | | — | | | | — | |
| Total from distributions | | | (0.16 | ) | | | — | |
| Net asset value, end of period | | $ | 22.12 | | | $ | 18.06 | |
| TOTAL RETURN | | | 23.52 | % | | | (9.70 | %)(1) |
| RATIOS/SUPPLEMENTAL DATA: | | | | | | | | |
| Net assets, end of period (in 000’s $) | | | 67,316 | | | | 13,514 | |
| Ratio of expenses (after reimbursement) to average net assets(a) | | | 1.00 | % | | | 1.00 | %(2) |
| Ratio of net investment income to average net assets(b) | | | 1.07 | % | | | 1.05 | %(2) |
| Portfolio turnover rate | | | 20 | % | | | 12 | % |
| * | | Commencement of Operations |
| (1) | | Not annualized. |
| (2) | | Annualized. |
| (a) | | Computed after giving effect to adviser’s expense limitation undertaking. If the Fund had paid all of its expenses for the year ended September 30, 2012 and for the period from December 31, 2010* to September 30, 2011, the ratios would have been 1.45% and 2.91%(2), respectively. |
| (b) | | If the Fund had paid all of its expenses for the year ended September 30, 2012 and for the period December 31, 2010* to September 30, 2011, the ratios would have been 0.62% and (0.86%)(2), respectively. |
The accompanying notes to financial statements are an integral part of this statement.
NOTES TO FINANCIAL STATEMENTS
| (1) | | Summary of Significant Accounting Policies — |
| | | The following is a summary of significant accounting policies of the FMI Large Cap Fund, the FMI Common Stock Fund, Inc. and the FMI International Fund (collectively the “Funds” or the “Fund”). The FMI Large Cap Fund (the “Large Cap Fund”) and the FMI International Fund (the “International Fund”) are each a series of FMI Funds, Inc. (the “Company”). Both Funds are registered as non-diversified, open-end management investment companies under the Investment Company Act of 1940 (the “Act”), as amended. The Company was incorporated under the laws of Maryland on September 5, 1996 and the Large Cap Fund commenced operations on December 31, 2001 and the International Fund on December 31, 2010. The assets and liabilities of each Fund in the Company are segregated and a shareholder’s interest is limited to the Fund in which the shareholder owns shares. The FMI Common Stock Fund, Inc. (the “Common Stock Fund”), is registered as a diversified open-end management investment company under the Act. The Common Stock Fund was incorporated under the laws of Wisconsin on July 29, 1981 and is currently closed to new investors. The investment objective of the Large Cap Fund is to seek long-term capital appreciation by investing mainly in a limited number of large capitalization value stocks. The investment objective of the Common Stock Fund is to seek long-term capital appreciation by investing mainly in small to medium capitalization value stocks. The investment objective of the International Fund is to seek capital appreciation by investing mainly in a limited number of large capitalization value stocks of non-U.S. companies. |
| | (a) | | Each security, excluding short-term investments, is valued at the last sale price reported by the principal security exchange on which the issue is traded. Securities that are traded on the Nasdaq Markets are valued at the Nasdaq Official Closing Price, or if no sale is reported, the latest bid price. Securities that are traded over-the-counter are valued at the latest bid price. For the International Fund only, securities sold short which are listed on a national securities exchange or the Nasdaq Stock Market, but which were not traded |
FMI Funds
NOTES TO FINANCIAL STATEMENTS (Continued)
| (1) | | Summary of Significant Accounting Policies — (Continued) | |
| | | on the valuation date, are valued at the most recent ask price. Unlisted equity securities for which market quotations are readily available are valued at the most recent bid price. For the International Fund only, options purchased or written by the Fund are valued at the average of the most recent bid and ask prices. Securities for which quotations are not readily available are valued at fair value as determined by the investment adviser in accordance with procedures approved by the Board of Directors. The fair value of a security is the amount which a Fund might reasonably expect to receive upon a current sale. The fair value of a security may differ from the last quoted price and a Fund may not be able to sell a security at the fair value. Market quotations may not be available, for example, if trading in particular securities was halted during the day and not resumed prior to the close of trading on the New York Stock Exchange. For the International Fund only, for securities that do not trade during New York Stock Exchange hours, fair value determinations are based on analyses of market movements after the close of those securities’ primary markets, and may include reviews of developments in foreign markets, the performance of U.S. securities markets, and the performance of instruments trading in U.S. markets that represent foreign securities and baskets of foreign securities. The Board may also utilize a service provided by an independent third party to assist in fair valuation of certain securities for the International Fund. As of September 30, 2012, there were no securities that were internally fair valued. Variable rate demand notes are recorded at par value which approximates market value. Short-term investments with maturities of 60 days or less are valued at amortized cost which approximates value. For financial reporting purposes, investment transactions are recorded on the trade date. |
| | | The Funds apply the provisions of the Financial Accounting Standards Board (“FASB”) Accounting Standards Codification “Fair Value Measurements and Disclosures” Topic 820 (“ASC 820”), which defines fair value as the price that would be received to sell an asset or paid to transfer a liability (i.e., the “exit price”) in an orderly transaction between market participants at the measurement date. |
| | | In determining fair value, the Funds use various valuation approaches. ASC 820 establishes a fair value hierarchy for inputs used in measuring fair value that maximizes the use of observable inputs and minimizes the use of unobservable inputs by generally requiring that the most observable inputs be used when available. Observable inputs are those that market participants would use in pricing the asset or liability based on market data obtained from sources independent of the Funds. Unobservable inputs reflect the Funds’ assumptions about the inputs market participants would use in pricing the asset or liability developed based on the best information available in the circumstances. The inputs or methodologies used for valuing securities are not necessarily an indication of the risks associated with investing in those securities. For the International Fund only, over the counter derivatives such as forward currency contracts may be valued using quantitative models. These models may use pricing curves based on market inputs including current exchange rates or indices. These curves are combined with volatility factors to value the overall positions. The market inputs are generally significant and can be corroborated with observable market data and therefore are classified in level 2. |
| | | The fair value hierarchy is categorized into three levels based on the inputs as follows: |
| | Level 1 — | Valuations based on unadjusted quoted prices in active markets for identical assets. |
| | Level 2 — | Valuations based on quoted prices for similar securities or in markets that are not active or for which all significant inputs are observable, either directly or indirectly. |
| | Level 3 — | Valuations based on inputs that are unobservable and significant to the overall fair value measurement. |
| | | The following table summarizes the Funds’ investments as of September 30, 2012, based on the inputs used to value them: |
| | | | Large Cap Fund | | | Common Stock Fund | | | International Fund | | | International Fund | |
| | | | Investments | | | Investments | | | Investments | | | Other Financial | |
| | Valuation Inputs | | in Securities | | | in Securities | | | in Securities | | | Instruments* | |
| | Level 1 — Common Stocks | | $ | 5,691,454,441 | | | $ | 1,022,988,789 | | | $ | 18,109,511 | | | $ | — | |
| | Level 2 — Common Stocks | | | — | | | | — | | | | 40,429,737 | | | | — | |
| | Short-Term Commercial Paper | | | 465,197,556 | | | | 93,699,694 | | | | 9,999,939 | | | | — | |
| | Forward Currency Contracts | | | — | | | | — | | | | — | | | | (1,341,713 | ) |
| | Total Level 2 | | | 465,197,556 | | | | 93,699,694 | | | | 50,429,676 | | | | (1,341,713 | ) |
| | Level 3 — | | | — | | | | — | | | | — | | | | — | |
| | Total | | $ | 6,156,651,997 | | | $ | 1,116,688,483 | | | $ | 68,539,187 | | | $ | (1,341,713 | ) |
| | * | Other financial instruments are derivative instruments not reflected in the Schedule of Investments, include forward currency contracts, which are valued at the unrealized appreciation/(depreciation) on the instrument. |
| | | |
| | | It is the Funds’ policy to recognize transfers between levels at the end of the quarterly reporting period. There were no transfers between levels during the year ended September 30, 2012. |
NOTES TO FINANCIAL STATEMENTS (Continued)
| (1) | | Summary of Significant Accounting Policies — (Continued) |
| | | See the Schedules of Investments for investments detailed by industry classifications. |
| | | On May 12, 2011, the FASB issued Accounting Standards Update No. 2011-04 (“ASU No. 2011-04”) modifying ASC 820. At the same time, the International Accounting Standards Board (“IASB”) issued International Financial Reporting Standard (“IFRS”) 13, Fair Value Measurement. The objective of the FASB and IASB is convergence of their guidance on fair value measurements and disclosures. Specifically, the ASU requires reporting entities to: i) disclose the amounts of any transfers between Level 1 and Level 2, and the reasons for the transfers; ii) disclose for Level 3 fair value measurements: a) quantitative information about significant unobservable inputs used; b) a description of the valuation processes used by the reporting entity and; c) a narrative description of the sensitivity of the fair value measurement to changes in unobservable inputs if a change in those inputs might result in a significantly higher or lower fair value measurement. The effective date of ASU No. 2011-04 is for interim and annual periods beginning after December 15, 2011. ASU No. 2011-04 has been adopted by the Funds and there has been no material impact to the disclosures. |
| | | In December 2011, the FASB issued an Accounting Standards Update (“ASU”) to enhance disclosures requiring improved information about financial instruments and derivative instruments that are subject to offsetting (“netting”) on the Statements of Assets and Liabilities. This information will enable users of the entity’s financial statements to evaluate the effect or potential effect of netting arrangements on the entity’s financial position. The ASU is effective prospectively during interim or annual periods beginning on or after January 1, 2013. At this time, management is evaluating the implications of these changes on the financial statements. |
| | (b) | Net realized gains and losses on sales of securities are computed on the identified cost basis. |
| | (c) | Dividend income is recorded on the ex-dividend date. Interest income is recorded on an accrual basis. |
| | (d) | The Funds may have investments in short-term variable rate demand notes, which are unsecured instruments. The Funds may be susceptible to credit risk with respect to these notes to the extent the issuer defaults on its payment obligation. The Funds’ policy is to monitor the creditworthiness of the issuer and nonperformance by these issuers is not anticipated. |
| | (e) | The International Fund may enter into forward currency contracts in order to hedge its exposure to changes in foreign currency rates on its foreign portfolio holdings or to hedge certain purchase and sale commitments denominated in foreign currencies. A forward currency contract is a commitment to purchase or sell a foreign currency at a future date at a negotiated rate. These contracts are valued daily and the asset or liability therein represents unrealized gain or loss on the contracts as measured by the difference between the forward foreign exchange rates at the dates of entry into the contracts and the forward rates at the reporting date. There were on average six forward currency contracts outstanding during the year ended September 30, 2012. |
| | | The fair value of the forward currency contracts as of September 30, 2012 is included in the following locations on the International Fund’s statement of assets and liabilities: |
| | | | Fair Value of | | Fair Value of |
| | | | Asset Forward | | Liability Forward |
| | | Location | Currency Contracts | Location | Currency Contracts |
| | Forward currency | Receivable for | $— | Payable for | $1,341,713 |
| | Contracts | forward currency | | forward currency | |
| | | contracts | | contracts | |
| | Realized and unrealized gains and losses on forward currency contracts entered into during the year ended September 30, 2012 by the International Fund are recorded in the following locations on the statement of operations: |
| | | | Realized | | Unrealized |
| | | Location | Gain | Location | (Loss) |
| | Forward currency | Net realized gain on forward | $532,601 | Net change in unrealized | $(1,409,705) |
| | Contracts | currency contracts | | appreciation (depreciation) on | |
| | | | | forward currency contracts | |
| | | These instruments involve market risk, credit risk, or both kinds of risks, in excess of the amount recognized in the International Fund’s statement of assets and liabilities. Risks arise from the possible inability of counterparties to meet the terms of their contracts and from movement in currency and securities values and interest rates. |
| | | |
| | (f) | The preparation of financial statements in conformity with accounting principles generally accepted in the United States of America (“GAAP”) requires management to make estimates and assumptions that affect the reported amounts of assets and liabilities and disclosure of contingent assets and liabilities at the date of the financial statements and the reported amounts of revenues and expenses during the reporting period. Actual results could differ from these estimates. |
FMI Funds
NOTES TO FINANCIAL STATEMENTS (Continued)
| (1) | | Summary of Significant Accounting Policies — (Continued) |
| | (g) | The Large Cap Fund may own certain securities that are restricted. Restricted securities include Section 4(2) commercial paper, securities issued in a private placement, or securities eligible for resale pursuant to Rule 144A under the Securities Act of 1933 (the “1933 Act”). A restricted security cannot be resold to the general public without prior registration under the 1933 Act or pursuant to the resale limitations provided by Rule 144A under the 1933 Act, or an exemption from the registration requirements of the 1933 Act. The Fund did not hold any restricted securities as of September 30, 2012. |
| | (h) | No provision has been made for Federal income taxes since the Funds have elected to be taxed as “regulated investment companies.” The Funds intend to distribute substantially all net investment company taxable income and net capital gains to their respective shareholders and otherwise comply with the provisions of the Internal Revenue Code applicable to regulated investment companies. |
| | (i) | The Funds have reviewed all open tax years and major jurisdictions, which include Federal and the state of Maryland for the Large Cap Fund and International Fund and Federal and the state of Wisconsin for the Common Stock Fund, and concluded that there are no significant uncertain tax positions that would require recognition in the financial statements. Open tax years are those that are open for exam by taxing authorities and, as of September 30, 2012, open Federal tax years include the tax years ended September 30, 2009 through 2012 for the Large Cap Fund and the Common Stock Fund and tax years ended September 30, 2011 through 2012 only for the International Fund. The Funds have no examinations in progress and are also not aware of any tax positions for which it is reasonably possible that the total amounts of unrecognized tax benefits will significantly change in the next twelve months. |
| | (j) | GAAP requires that permanent differences between income for financial reporting and tax purposes be reclassified in the capital accounts. During the fiscal year ended September 30, 2012, the reclassifications were as follows: |
| | | | Undistributed Net | | | Accumulated Net | | | | |
| | | | Investment Income | | | Realized Gain/(Loss) | | | Paid In Capital | |
| | Large Cap Fund | | $ | — | | | $ | — | | | $ | — | |
| | Common Stock Fund | | $ | — | | | $ | (2 | ) | | $ | 2 | |
| | International Fund | | $ | 1,003,076 | | | $ | (1,003,076 | ) | | $ | — | |
| | (k) | The International Fund incurred $64,562 of offering costs which were being amortized over a period of 12 months. For the year ended September 30, 2012, the International Fund expensed the remaining $16,140. |
| (2) | | Investment Adviser and Management Agreements and Transactions With Related Parties — |
| | The Funds each have a management agreement with Fiduciary Management, Inc. (“FMI”), with whom certain officers and directors of the Funds are affiliated, to serve as investment adviser and manager. Under the terms of the agreements, the Large Cap Fund and International Fund will each pay FMI a monthly management fee at the annual rate of 0.75% of the daily net assets of such Fund and the Common Stock Fund will pay a monthly management fee at the annual rate of 1% of the daily net assets of such Fund. The Funds are responsible for paying their proportionate share of the compensation, benefits and expenses of the Funds’ Chief Compliance Officer. For administrative convenience, FMI initially makes these payments and is later reimbursed by the Funds. |
| | Under the respective management agreements, FMI will reimburse the Large Cap Fund for expenses over 1.20% of the daily net assets of such Fund, 1.30% for the Common Stock Fund and 1.75% for the International Fund. In addition to the reimbursement required under each management agreement, FMI will voluntarily reimburse the Large Cap Fund and the International Fund for expenses over 1.00% of such Fund’s daily net assets. For the year ended September 30, 2012 there were no contractual or voluntary reimbursements required for the Large Cap Fund or the Common Stock Fund. For the International Fund, all such reimbursements amounted to $167,198 for the year ended September 30, 2012. |
| | The Large Cap Fund and the International Fund have each entered into a Distribution Plan (the “Plan”), pursuant to Rule 12b-1 under the Act. Each Plan provides that such Fund may incur certain costs which may not exceed the lesser of a monthly amount equal to 0.25% of such Fund’s daily net assets or the actual distribution costs incurred during the year. Amounts payable under each Plan are paid monthly for any activities or expenses primarily intended to result in the sale of shares of such Fund. For the year ended September 30, 2012, no such expenses were incurred by either Fund. |
| | Under the Funds’ organizational documents, each director, officer, employee or other agent of any Fund (including the Funds’ investment manager) is indemnified, to the extent permitted by the Act, against certain liabilities that may arise out of performance of their duties to the Funds. Additionally, in the normal course of business, the Funds enter into contracts that contain a variety of indemnification clauses. The Funds’ maximum exposure under these arrangements is unknown as this would involve future claims that may be made against such Fund that have not yet occurred. However, the Funds have not had prior claims or losses pursuant to these contracts and believe the risk of loss to be remote. |
FMI Funds
NOTES TO FINANCIAL STATEMENTS (Continued)
| (2) | | Investment Adviser and Management Agreements and Transactions With Related Parties — (Continued) |
| | At September 30, 2012, three financial intermediaries are the record owners of approximately 6%, 8% and 9% of the Large Cap Fund’s shares and one financial intermediary is the record owner of approximately 8% of the Common Stock Fund’s shares. At September 30, 2012, one of the International Fund’s Directors owned directly and indirectly approximately 15% of such Fund’s shares. |
| | U.S. Bank, N.A. has made available to the Large Cap Fund, the Common Stock Fund and the International Fund a $400,000,000, $50,000,000 and $2,000,000 credit facility, respectively, pursuant to separate Credit Agreements (“Agreements”) effective July 14, 2008 for the Large Cap Fund and the Common Stock Fund and June 10, 2011 for the International Fund for the purposes of having cash available to satisfy redemption requests. Principal and interest of such loans under the Agreements are due not more than 20 days after the date of the loan. Amounts under the credit facility bear interest at a rate per annum equal to the current prime rate minus one percent on the amount borrowed. Advances will be collateralized by securities owned by such Fund. During the year ended September 30, 2012, none of the Funds borrowed against their Agreement. The Credit Agreements are renewable annually on June 5. |
| (4) | | Distribution to Shareholders — |
| | | Net investment income and net realized gains, if any, are distributed to shareholders at least annually. On October 31, 2012, the following distributions were declared and will be paid on October 31, 2012 to shareholders of record of the respective Funds on October 26, 2012: |
| | | Large Cap Fund | Common Stock Fund | International Fund |
| | Net Investment Income | $46,467,568 | $3,755,898 | $49,833 |
| | Per Share Amount | $0.13009458 | $0.08649616 | $0.01549646 |
| | Short-Term Realized Gain | $30,835,693 | $12,322,921 | $511,365 |
| | Per Share Amount | $0.08634 | $0.28379 | $0.15902 |
| | Long-Term Realized Gain | $42,392,949 | $92,136,703 | $269,002 |
| | Per Share Amount | $0.11869 | $2.12186 | $0.08366 |
| (5) | | Investment Transactions — |
| | For the year ended September 30, 2012, purchases and proceeds of sales of investment securities (excluding short-term investments) were as follows: |
| | | | Large Cap Fund | | | Common Stock Fund | | | International Fund | |
| | Purchases | | $ | 1,868,797,135 | | | $ | 430,855,179 | | | $ | 47,353,773 | |
| | Sales | | | 995,194,140 | | | | 467,366,973 | | | | 6,528,361 | |
| (6) | | Income Tax Information — |
| | | The following information for the Large Cap Fund is presented on an income tax basis as of September 30, 2012: |
| | | Gross | Gross | Net Unrealized | Distributable | Distributable |
| | Cost of | Unrealized | Unrealized | Appreciation | Ordinary | Long-Term |
| | Investments | Appreciation | Depreciation | on Investments | Income | Capital Gains |
| | $5,223,400,333 | $1,048,377,429 | $(115,125,765) | $933,251,664 | $77,303,261 | $42,392,949 |
| | The following information for the Common Stock Fund is presented on an income tax basis as of September 30, 2012: |
| | | Gross | Gross | Net Unrealized | Distributable | Distributable |
| | Cost of | Unrealized | Unrealized | Appreciation | Ordinary | Long-Term |
| | Investments | Appreciation | Depreciation | on Investments | Income | Capital Gains |
| | $954,488,262 | $199,668,985 | $(37,468,764) | $162,200,221 | $16,078,819 | $92,136,703 |
| | The following information for the International Fund is presented on an income tax basis as of September 30, 2012: |
| | | Gross | Gross | Net Unrealized | Distributable | Distributable |
| | Cost of | Unrealized | Unrealized | Appreciation | Ordinary | Long-Term |
| | Investments | Appreciation | Depreciation | on Investments | Income | Capital Gains |
| | $64,339,367 | $5,099,710 | $(899,493) | $4,200,217 | $561,198 | $269,002 |
| | The difference between the cost amounts for financial statements and federal income tax purposes is due primarily to timing differences in recognizing certain gains and losses on security transactions. |
FMI Funds
NOTES TO FINANCIAL STATEMENTS (Continued)
| (6) | | Income Tax Information — (Continued) |
| | | On December 22, 2010, the Regulated Investment Company Modernization Act of 2010 (the “RIC Act”) was enacted, which changed various technical rules governing the tax treatment of RICs. The changes are generally effective for taxable years beginning after the date of enactment. Capital losses incurred in taxable years beginning after the date of enactment may now be carried forward indefinitely, and retain the character of the original loss. Post-enactment losses must be utilized prior to pre-enactment losses. Under pre-enactment law, capital losses could be carried forward for up to eight years, and carried forward as short-term capital loss, irrespective of the character of the original loss. The RIC Act now allows RICs to elect to “push” to the first day of the next taxable year all or part of any late year ordinary loss, which is defined as the sum of the specified post-October losses and other post-December ordinary losses, over the specified post-October gains and other post-December ordinary gains. This reduces the circumstances under which a RIC might be required to file amended Forms 1099 to restate previously reported distributions. |
| | | |
| | | The tax components of dividends paid during the years ended September 30, 2012 and 2011, capital loss carryovers, which may be used to offset future capital gains, subject to Internal Revenue Code limitations, tax basis post-October losses as of September 30, 2012, which are not recognized for tax purposes until the first day of the following fiscal year, and late year ordinary losses are: |
| | | | September 30, 2012 | | | September 30, 2011 | |
| | | | Ordinary | | | Long-Term | | | | | | | | | Ordinary | | | Long-Term | |
| | | | Income | | | Capital Gains | | | Capital Loss | | | Post-October | | | Income | | | Capital Gains | |
| | | | Distributions | | | Distributions | | | Carryovers | | | Losses | | | Distributions | | | Distributions | |
| | Large Cap Fund | | $ | 52,548,400 | | | $ | 116,887,874 | | | $ | — | | | $ | — | | | $ | 31,698,426 | | | $ | — | |
| | Common Stock Fund | | | 12,922,882 | | | | 74,398,322 | | | | — | | | | — | | | | 22,444,545 | | | | 10,955,926 | |
| | International Fund | | 124,040 | | | | — | | | | — | | | | — | | | | — | | | | — | |
| | For corporate shareholders of the Large Cap Fund, Common Stock Fund and International Fund, the percentage of dividend income distributed for the year ended September 30, 2012 which is designated as qualifying for the dividends received deduction is 94.5%, 99.3% and 0%, respectively (unaudited). The International Fund intends to elect to pass-through to shareholders the income tax credit for taxes paid to foreign countries. For the year ended September 30, 2012, the foreign source income was $853,106 (unaudited) and the foreign tax expense was $50,130 (unaudited). The pass-through of the foreign tax credit will only affect those persons who are shareholders on the dividend record dates. |
| | |
| | For all shareholders of the Large Cap Fund, Common Stock Fund and International Fund, the percentage of dividend income distributed for the year ended September 30, 2012 which is designated as qualified dividend income under the Jobs and Growth Tax Relief Act of 2003, is 100%, 99.3% and 100%, respectively (unaudited). |
REPORT OF INDEPENDENT REGISTERED PUBLIC ACCOUNTING FIRM