UNITED STATES
SECURITIES AND EXCHANGE COMMISSION
Washington, D.C. 20549
FORM N-CSR
CERTIFIED SHAREHOLDER REPORT OF REGISTERED
MANAGEMENT INVESTMENT COMPANIES
Investment Company Act file number
811-03235
FMI Common Stock Fund, Inc.
(Exact name of registrant as specified in charter)
100 East Wisconsin Avenue, Suite 2200
Milwaukee, WI 53202
(Address of principal executive offices) (Zip code)
Ted D. Kellner
Fiduciary Management, Inc.
100 East Wisconsin Avenue, Suite 2200
Milwaukee, WI 53202
(Name and address of agent for service)
(414) 226-4555
Registrant's telephone number, including area code:
Date of fiscal year end: September 30
Date of reporting period: September 30, 2007
Item 1. Reports to Stockholders.
ANNUAL REPORT
September 30, 2007
FMI
Common Stock
Fund, Inc.
A NO-LOAD
MUTUAL FUND
FMI
Common Stock
Fund, Inc.
October 1, 2007
Dear Fellow Shareholders:
The September quarter was difficult for the FMI Common Stock Fund as it declined 6.24%, compared to the 3.09% decline in the benchmark Russell 2000 Index and the 6.26% decline in the Russell 2000 Value Index. Calendar year-to-date, the Fund was up 4.72% and the Russell 2000 Index was up 3.16%.
A number of factors impacted the third quarter. In response to turbulent credit conditions and perhaps a weakening economy, the Federal Reserve Board first lowered the discount rate by 50 basis points in August, then another 50 in September, when they also dropped the federal funds rate by 50 basis points. The thought of 1998 and the Long Term Capital Management crisis likely weighed heavily on their decision. The Fed’s action was a booster shot for growth stocks nine years ago and it has been recently, too. Most of the growth stock indices were strong in September, continuing a move away from value stocks this year. While this relative movement was a factor in our third quarter results, we also simply had more than our share of poorly performing stocks.
We are confident that the underperforming companies in the Fund will improve, but there is no way to gauge how long the market will favor growth. It is déjà vu to see investors bidding up the stocks of companies that are “hitting their numbers” even though the multiples in many cases are already very high. It is reminiscent of the 1995-1999 period, and it remains to be seen whether there will be significant fund flows from value pools to growth pools. After the mortgage debacle and credit scare in July and August, it is amazing, and somewhat frustrating, to observe that the market seems little concerned about these warning shots across the bow. Perhaps faith in Bernanke (rates) and the government (borrower bailouts) is enough to justify this attitude. Even the derivative difficulties seemed to have passed without a lot of damage. So far.
We still believe in Economics 101. Excesses and imbalances tend to swing the other way over time. We are beginning to see the pendulum swing back in the housing and mortgage markets. Credit quality may also be on the verge of meaningfully deteriorating. The dollar has been extremely weak. Last quarter’s letter articulates our position on some of these issues in more detail, but suffice it to say, we remain somewhat cautious about a few of the macro issues, as well as the overall stock market. Valuations also do not appear to incorporate much bad news. The companies in the FMI Common Stock Fund, on the other hand, are sound, well-financed all-terrain vehicles that we feel will perform nicely, at least on a relative basis, over a long-term time frame. They are not Ferraris, however, so if we are entering a growth and momentum environment, the Fund is likely to underperform.
Before delving into a couple of relatively new holdings, a sentence or two about some of the difficult stocks in the quarter is appropriate. MPS Group, Inc. and Korn/Ferry International are both fundamentally sound companies with great balance sheets, but the stocks have come under more severe pressure than we anticipated, related to fears of a weakening economy and a tougher labor market. Although we recognize the macro environment could continue to hurt these companies in the short run, the stocks have declined to very attractive levels and we have been adding to our positions.
Similar macro fears have impacted a number of other holdings, including Acuity Brands, Inc., HNI Corp., Family Dollar Stores, Inc., Harte-Hanks, Inc. and the transportation sector. While we may make a modest change in our transportation lineup, we feel good about the financial strength and long-term success of each of these companies. Our contrarian instincts proved deficient, at least in the short run, with our recent purchases of Beacon Roofing Supply, Inc. and Watsco, Inc. Both sell “aftermarket” home supplies — roofing materials and HVAC (heating, ventilation and air conditioning) equipment. While there is a certain inevitability to the demand for their products, our belief that most of the bad news was already in the stocks proved wrong. Today’s valuation for both of these companies is compelling. Additionally, we may have misjudged either the quality of the management or the true nature of some of the project work at Navigant Consulting, Inc. That stock is under review.
It is never pleasant to air dirty laundry. While this was a tough quarter, it is certainly possible, and even probable, that we will have additional poor quarters from time to time — and even tough years. We do hope our clients are mindful of our superior long-term record and the fact that we employ a disciplined approach to investing that has not changed in 27 years. We feel the companies in our Fund portfolio today are attractive. In fact, there are only three of the 42 stocks with a higher P/E (price-to-earnings) ratio than the Russell 2000, based on 2008 estimates. Other valuation measures show a similar relative attractiveness.
Our custom is to address macroeconomic and other broader topical issues following the December and June quarters, and discuss individual companies in more detail following the March and September quarters.
ETHAN ALLEN INTERIORS INC.
Description
Ethan Allen Interiors Inc. (ETH) is a vertically integrated designer, manufacturer and marketer of branded furniture and home accent products through one of the largest networks of home furnishing retail stores. The company’s main product lines are case goods (44%), upholstered products (38%) and higher-margined home accessories (18%). Wholesale manufacturing (48% of revenues, 15% margins) produces 60% of the company’s product through nine manufacturing plants based in the United States, with the remainder of goods being imported. Retail stores account for the remaining 52% of revenues and generate 2.2% margins, due in large measure to the company’s store reinvestments.
Good Business
| | • | Ethan Allen has established a durable business model with an increasingly diverse product set sold at “everyday best prices” by trained professional interior designers. |
| | | |
| | • | Approximately 80% of the company’s merchandise has been introduced or refined within the last 3 years. The average order approximates $1,200 to $1,800 with available non-recourse financing. |
| | | |
| | • | Over the past 6 years the company’s ROIC (return on invested capital) has averaged 16%. |
| | | |
| | • | The company retains an A- rated balance sheet with a leverage ratio of 1.3. |
| | | |
| | • | Ethan Allen controls its own destiny with a single brand and a proprietary retail distribution channel. |
Valuation
| | • | Ethan Allen’s forward P/E (price-to-earnings) ratio of 12 compares favorably to the company’s 10-year average of 15 (range 10-19), and that of its competitors, at 18. |
| | | |
| | • | Over the past 5 years the company’s EV/sales (enterprise value-to-sales) multiple has averaged 1.3, ranging from 1.1 to 1.7. The shares currently trade at more than one standard deviation below the company’s 5-year average. |
| | • | Over the past 10 years, Ethan Allen has traded for an average of 8.2 times trailing 12-months’ EBIDTA (earnings before interest, taxes, depreciation and amortization), ranging from a low of 6 times to a high of 14 times. The shares presently trade at 7.4 times. |
Management
| | • | Farooq Kathwari has been President and Chief Executive Officer since 1988, although his affiliation with Ethan Allen dates back to the early 1970s. Mr. Kathwari has made good strategic decisions that have distanced the company from the pack. He owns nearly 9% of the company outright — and with options, approximately 14.7%. |
| | | |
| | • | Jeffery Hoyt serves as the company’s Chief Financial Officer, having formerly worked for KPMG. |
| | | |
| | • | Craig Stout is Vice President of Case Goods Merchandising, and has been with Ethan Allen since 1972. |
| | | |
| | • | Ed Teplitz has served as Vice President of the Retail division since May of 2003. Teplitz joined the company in 2001 as VP of Finance, later becoming CFO. Prior to joining the corporate division, Ed was an Ethan Allen licensee in Pittsburgh, Pennsylvania and Cleveland, Ohio. |
Investment Thesis
Ethan Allen has carved out a defendable niche in the upper middle-to-lower high-end segment of the furniture industry, where a stylistically diverse, high quality product is delivered through a knowledgeable and trained professional sales force. The company appears to be effectively addressing their manufacturing footprint, incorporating appropriate low cost production with timely delivery of standard and tailored solutions. Retail store efficiency continues to lag. The stock is very depressed, reflecting housing and economic worries. As these issues subside over the next few years and the company’s retail stores improve, the stock should be rewarding.
AMN HEALTHCARE SERVICES, INC.
Description
AMN Healthcare Services, Inc. (AHS) is the leading provider of traveling nurse, physician and allied (nonprofessional medical) staffing services in the United States. The company recruits healthcare professionals, and supplies hospitals, other healthcare facilities and physician practice groups with trained workers. The traveling nurse industry is roughly $2.5 billion, with AMN Healthcare controlling close to 40%. The locum tenens (physician staffing) market is about $1.6 billion and AMN Healthcare has the largest share at roughly 17%. Customers use staffing services to cost-effectively manage short- and long-term shortages. Healthcare professionals are attracted to the “travel temp” lifestyle by its flexibility and skill-enhancing opportunities.
Good Business
| | • | AMN Healthcare has leading brands in multiple markets and geographies. |
| | | |
| | • | The company enjoys economies of scale. |
| | | |
| | • | Revenue can be viewed as generally recurring, as assignments are usually multiple weeks, and visibility to the next assignment is typically very good. |
| | | |
| | • | The company earns its cost of capital, and ROIC should expand over the next few years. |
| | | |
| | • | While the company cannot really influence prevailing wage rates, they can manage the spread between bill and pay rates, thus they have reasonably good control of their destiny. |
| | | |
| | • | The business is easy to understand. |
| | | |
| | • | The balance sheet is appropriately levered (37% debt-to-capital; EBIT/Interest expense of 4.7). |
Valuation
| | • | The P/E ratio of 18 is on the low end of the range since the company went public in 2001. The 5-year range is 17-28. |
| | | |
| | • | The 2007 estimated EV/EBITDA ratio of 9.5 compares to the 5-year average of 13. |
| | | |
| | • | The price-to-sales ratio is 0.56 in a 5-year range of 0.55-1.34. |
| | | |
| | • | AMN Healthcare is attractively priced relative to other health care and business services stocks and the market. |
| | | |
| | • | The stock is 40-50% undervalued, based on our discounted cash flow analysis. |
Management
| | • | Susan Nowakowski, 42, has been Chief Executive Officer since 2005. She joined the company in 1990 and previously served as Chief Operating Officer and Executive VP of Business Development, and CFO. |
| | | |
| | • | David Dreyer, 51, has been Chief Financial Officer since 2004. He was previously with Sicor, a manufacturer of pharmaceuticals that was acquired by Teva, and began his career with Arthur Anderson. |
Investment Thesis
The demand for nursing and physician services is likely to remain strong over the next decade. Strong demographic trends and the desire for a flexible work environment bode well for the future. The AMN Healthcare business model provides real benefits to both recruited professionals and end customers. Scale and brand awareness should work in the company’s favor. The stock had over-ambitious expectations when it went public in 2001, but today, trades at an attractive level for long-term investors.
Our Board of Directors has declared distributions on October 30, 2007 of $0.08375 per share from net investment income, $0.83556 per share from short-term capital gains, which will be treated as ordinary income and $2.6573 per share from net long-term capital gains, payable October 31, 2007, to shareholders of record on October 29, 2007.
Thank you for your confidence in FMI Common Stock Fund, Inc.
Sincerely,
| |  |  |  |
| | Ted D. Kellner, CFA | Donald S. Wilson, CFA | Patrick J. English, CFA |
| | President and | Vice President | Vice President and |
| | Portfolio Manager | | Portfolio Manager |
100 E. Wisconsin Ave., Suite 2200 • Milwaukee, WI 53202 • 414-226-4555
www.fmifunds.com
FMI Common Stock Fund, Inc. COST DISCUSSION
As a shareholder of the Fund you incur ongoing costs, including management fees and other Fund expenses. You do not incur transaction costs such as sales charges (loads) on purchase payments, reinvested dividends, or other distributions; redemption fees; and exchange fees because the Fund does not charge these fees. This example is intended to help you understand your ongoing costs (in dollars) of investing in FMI Common Stock Fund and to compare these costs with the ongoing costs of investing in other mutual funds.
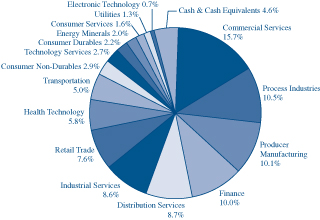
Industry Sectors as of September 30, 2007
The example is based on an investment of $1,000 invested at the beginning of the period and held for the entire period from April 1, 2007 through September 30, 2007.
Actual Expenses
The first line of the table below provides information about actual account values and actual expenses. You may use the information in this line, together with the amount you invested, to estimate the expenses that you paid over the period. Simply divide your account value by $1,000 (for example, an $8,600 account value divided by $1,000 = 8.6), then multiply the result by the number in the first line under the heading entitled “Expenses Paid During Period” to estimate the expenses you paid on your account during this period.
In addition to the costs highlighted and described below, the only Fund transaction costs you might currently incur would be wire fees ($15 per wire), if you choose to have proceeds from a redemption wired to your bank account instead of receiving a check. Additionally, U.S. Bank charges an annual processing fee ($15) if you maintain an IRA account with the Fund. To determine your total costs of investing in the Fund, you would need to add any applicable wire or IRA processing fees you’ve incurred during the period to the costs provided in the example at the end of this article.
Hypothetical Example for Comparison Purposes
The second line of the table below provides information about hypothetical account values and hypothetical expenses based on the Fund’s actual expense ratio and an assumed rate of return of 5% per year before expenses, which is not the Fund’s actual return. The hypothetical account values and expenses may not be used to estimate the actual ending account balance or expenses you paid for the period. You may use this information to compare the ongoing costs of investing in the Fund and other funds. To do so, compare this 5% hypothetical example with the 5% hypothetical examples that appear in the shareholder reports of the other funds.
Please note that the expenses shown in the table are meant to highlight your ongoing costs only and do not reflect any transactional costs, such as sales charges (loads), redemption fees or exchange fees. Therefore, the second line of the table is useful in comparing ongoing costs only, and will not help you determine the relative total costs of owning different funds. In addition, if these transactional costs were included, your costs would have been higher.
| | Beginning | Ending | Expenses Paid |
| | Account | Account | During Period* |
| | Value 4/01/07 | Value 9/30/07 | 4/01/07-9/30/07 |
| FMI Common Stock Fund Actual | $1,000.00 | $ 992.20 | $5.99 |
| Hypothetical (5% return before expenses) | $1,000.00 | $1,019.10 | $6.07 |
| * | Expenses are equal to the Fund’s annualized expense ratio of 1.20%, multiplied by the average account value over the period, multiplied by 183/365 (to reflect the one-half year period between April 1, 2007 and September 30, 2007). |
FMI Common Stock Fund, Inc. MANAGEMENT’S DISCUSSION OF FUND PERFORMANCE
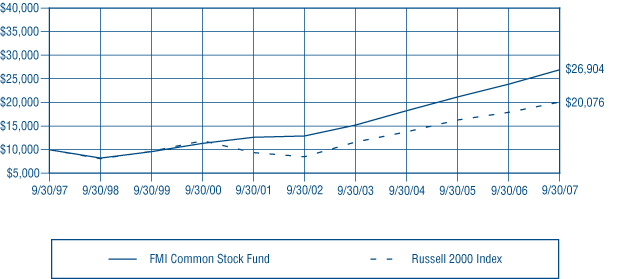
During the fiscal year ended September 30, 2007, the FMI Common Stock Fund had a total return of 12.81%. Finance, Industrial Services, Consumer Services and Retail were the primary drivers of positive performance. For the third year in a row, takeovers had a sizeable impact on the results. Investors Financial, ServiceMaster, Option Care, Global Imaging and Adesa were all involved in transactions. Other strong stocks in the period included Beckman Coulter and AptarGroup. Commercial Services, Electronic Technology and Producer Manufacturing detracted from the return in the period. Individual stocks contributing negatively to performance included MPS Group, Liz Claiborne, Bemis, and Navigant Consulting. The benchmark Russell 2000 returned 12.34% during the fiscal year and was driven by Electronic Technology, Health Technology, and Producer Manufacturing. Technology stocks have been especially strong and the Fund remains underweight in this area. Additionally, the market in general appears to have shifted to a so-called growth and momentum style and away from a value style over the past twelve months and particularly over the last three months. As long as this dynamic prevails, there is a strong probability that the Fund will underperform. Small capitalization stocks also slightly underperformed large capitalization stocks for the fiscal year. Using a variety of valuation measures, the FMI Common Stock Fund trades at a significant discount to the benchmark Russell 2000. Over long periods of time, lower valuation stocks have outperformed higher valuation stocks. Future results, however, may differ from the past.
| | | | |
COMPARISON OF CHANGE IN VALUE OF $10,000 INVESTMENT IN |
FMI COMMON STOCK FUND AND THE RUSSELL 2000 INDEX(1) |
| | | | |
|
| | | | |
| | | | |
AVERAGE ANNUAL TOTAL RETURN |
| | 1-Year | 5-Year | 10-Year |
| | 12.81% | 15.89% | 10.40% |
| | | | |
| | Past performance does not predict future performance. The graph and the table do not reflect the deduction of taxes that a shareholder would pay on Fund distributions or the redemption of Fund shares. | |
| | (1) | The Russell 2000 Index measures the performance of the 2,000 smallest companies in the Russell 3000 Index, which comprises the 3,000 largest U.S. companies based on total market capitalization. | |
| | | | |
FMI Common Stock Fund, Inc. STATEMENT OF NET ASSETS
September 30, 2007
Shares | | | | Cost | | | Value | |
| | | | | | | | | |
COMMON STOCKS — 95.4% (a) | | | | | | |
| | | | | | | |
COMMERCIAL SERVICES SECTOR — 15.7% | | | | | | |
| | | Advertising/Marketing Services — 2.6% | | | | | | |
| | 663,100 | | Harte-Hanks, Inc. | | $ | 16,502,652 | | | $ | 13,049,808 | |
| | | | | | | | | | | | |
| | | | Miscellaneous Commercial Services — 3.6% | | | | | | | | |
| | 249,300 | | G & K Services, Inc. | | | 7,490,993 | | | | 10,021,860 | |
| | 513,500 | | Navigant | | | | | | | | |
| | | | Consulting, Inc.* | | | 9,453,061 | | | | 6,500,910 | |
| | 56,000 | | Universal Technical | | | | | | | | |
| | | | Institute Inc.* | | | 1,291,150 | | | | 1,008,000 | |
| | | | | | | 18,235,204 | | | | 17,530,770 | |
| | | | Personnel Services — 9.5% | | | | | | | | |
| | 617,700 | | AMN Healthcare | | | | | | | | |
| | | | Services, Inc.* | | | 12,788,105 | | | | 11,569,521 | |
| | 578,900 | | Korn/Ferry | | | | | | | | |
| | | | International* | | | 9,756,322 | | | | 9,557,639 | |
| | 1,486,100 | | MPS Group, Inc.* | | | 16,080,540 | | | | 16,570,015 | |
| | 200,100 | | Watson Wyatt | | | | | | | | |
| | | | Worldwide Inc. | | | 4,455,449 | | | | 8,992,494 | |
| | | | | | | 43,080,416 | | | | 46,689,669 | |
CONSUMER DURABLES SECTOR — 2.2% | | | | | | | | |
| | | | Home Furnishings — 2.2% | | | | | | | | |
| | 330,900 | | Ethan Allen | | | | | | | | |
| | | | Interiors Inc. | | | 12,353,118 | | | | 10,817,121 | |
| | | | | | | | | |
CONSUMER NON-DURABLES SECTOR — 2.9% | | | | | | | | |
| | | | Apparel/Footwear — 2.9% | | | | | | | | |
| | 420,500 | | Liz Claiborne, Inc. | | | 13,246,544 | | | | 14,435,765 | |
| | | | | | | | | |
CONSUMER SERVICES SECTOR — 1.6% | | | | | | | | |
| | | | Publishing: Books/Magazines — 1.6% | | | | | | | | |
| | 136,300 | | Meredith Corp. | | | 7,605,105 | | | | 7,809,990 | |
| | | | | | | | | |
DISTRIBUTION SERVICES SECTOR — 8.7% | | | | | | | | |
| | | | Electronics Distributors — 4.8% | | | | | | | | |
| | 319,200 | | Arrow Electronics, Inc.* | | | 5,820,562 | | | | 13,572,384 | |
| | 366,200 | | ScanSource, Inc.* | | | 9,733,390 | | | | 10,293,882 | |
| | | | | | | 15,553,952 | | | | 23,866,266 | |
| | | | Wholesale Distributors — 3.9% | | | | | | | | |
| | 542,200 | | Beacon Roofing | | | | | | | | |
| | | | Supply, Inc.* | | | 8,118,095 | | | | 5,541,284 | |
| | 246,800 | | United Stationers Inc.* | | | 10,338,715 | | | | 13,702,336 | |
| | | | | | | 18,456,810 | | | | 19,243,620 | |
ELECTRONIC TECHNOLOGY SECTOR — 0.7% | | | | | | | | |
| | | | Computer Peripherals — 0.7% | | | | | | | | |
| | 138,200 | | Imation Corp. | | | 4,619,779 | | | | 3,390,046 | |
| | | | | | | | | |
ENERGY MINERALS SECTOR — 2.0% | | | | | | | | |
| | | | Oil & Gas Production — 2.0% | | | | | | | | |
| | 279,600 | | St. Mary Land & | | | | | | | | |
| | | | Exploration Co. | | | 7,252,589 | | | | 9,973,332 | |
| | | | | | | | | |
FINANCE SECTOR — 10.0% | | | | | | | | |
| | | | Insurance Brokers/Services — 3.7% | | | | | | | | |
| | 633,000 | | Arthur J. Gallagher & Co. | | | 18,180,677 | | | | 18,338,010 | |
| | | | | | | | | | | | |
| | | | Life/Health Insurance — 3.6% | | | | | | | | |
| | 414,900 | | Protective Life Corp. | | | 14,477,462 | | | | 17,608,356 | |
| | | | | | | | | | | | |
| | | | Property/Casualty Insurance — 2.7% | | | | | | | | |
| | 702,350 | | Old Republic | | | | | | | | |
| | | | International Corp. | | | 11,161,423 | | | | 13,162,039 | |
| | | | | | | | | |
HEALTH TECHNOLOGY SECTOR — 5.8% | | | | | | | | |
| | | | Medical Specialties — 5.8% | | | | | | | | |
| | 213,200 | | Beckman Coulter, Inc. | | | 12,351,695 | | | | 15,725,632 | |
| | 142,100 | | Bio-Rad | | | | | | | | |
| | | | Laboratories, Inc.* | | | 10,406,712 | | | | 12,860,050 | |
| | | | | | | 22,758,407 | | | | 28,585,682 | |
INDUSTRIAL SERVICES SECTOR — 8.6% | | | | | | | | |
| | | | Environmental Services — 2.4% | | | | | | | | |
| | 366,450 | | Waste Connections, Inc.* | | | 9,403,767 | | | | 11,638,452 | |
| | | | | | | | | | | | |
| | | | Oilfield Services/Equipment — 6.2% | | | | | | | | |
| | 281,000 | | Bristow Group, Inc.* | | | 10,351,342 | | | | 12,282,510 | |
| | 433,000 | | Dresser-Rand | | | | | | | | |
| | | | Group, Inc.* | | | 9,374,442 | | | | 18,493,430 | |
| | | | | | | 19,725,784 | | | | 30,775,940 | |
PROCESS INDUSTRIES SECTOR — 10.5% | | | | | | | | |
| | | | Containers/Packaging — 5.3% | | | | | | | | |
| | 303,200 | | AptarGroup, Inc. | | | 4,434,188 | | | | 11,482,184 | |
| | 504,700 | | Bemis Company, Inc. | | | 13,466,423 | | | | 14,691,817 | |
| | | | | | | 17,900,611 | | | | 26,174,001 | |
| | | | Industrial Specialties — 5.2% | | | | | | | | |
| | 234,400 | | Cabot Microelectronics | | | | | | | | |
| | | | Corp.* | | | 7,659,963 | | | | 10,020,600 | |
| | 568,700 | | Valspar Corp. | | | 14,473,834 | | | | 15,474,327 | |
| | | | | | | 22,133,797 | | | | 25,494,927 | |
FMI Common Stock Fund, Inc. STATEMENT OF NET ASSETS (Continued)
September 30, 2007
Shares | | | | Cost | | | Value | |
| | | | | | | | | |
COMMON STOCKS — 95.4% (a) (Continued) | | | | | | |
| | | | | | | |
PRODUCER MANUFACTURING SECTOR — 10.1% | | | | | | |
| | | Building Products — 3.0% | | | | | | |
| | 313,400 | | Watsco, Inc. | | $ | 15,475,028 | | | $ | 14,551,162 | |
| | | | | | | | | | | | |
| | | | Electrical Products — 4.1% | | | | | | | | |
| | 149,000 | | Acuity Brands, Inc. | | | 4,085,323 | | | | 7,521,520 | |
| | 504,200 | | Molex Inc. Cl A | | | 13,212,235 | | | | 12,786,512 | |
| | | | | | | 17,297,558 | | | | 20,308,032 | |
| | | | Industrial Machinery — 1.2% | | | | | | | | |
| | 157,350 | | IDEX Corp. | | | 1,950,206 | | | | 5,725,967 | |
| | | | | | | | | | | | |
| | | | Office Equipment/Supplies — 1.8% | | | | | | | | |
| | 249,100 | | HNI Corp. | | | 10,625,168 | | | | 8,967,600 | |
| | | | | | | | | |
RETAIL TRADE SECTOR — 7.6% | | | | | | | | |
| | | | Discount Stores — 2.6% | | | | | | | | |
| | 486,100 | | Family Dollar Stores, Inc. | | | 10,832,319 | | | | 12,910,816 | |
| | | | | | | | | | | | |
| | | | Food Retail — 2.8% | | | | | | | | |
| | 408,000 | | Ruddick Corp. | | | 8,452,562 | | | | 13,684,320 | |
| | | | | | | | | | | | |
| | | | Specialty Stores — 2.2% | | | | | | | | |
| | 333,700 | | PetSmart, Inc. | | | 9,810,416 | | | | 10,645,030 | |
| | | | | | | | | |
TECHNOLOGY SERVICES SECTOR — 2.7% | | | | | | | | |
| | | | Information Technology Services — 2.7% | | | | | | | | |
| | 774,700 | | Perot Systems Corp.* | | | 12,357,349 | | | | 13,100,177 | |
| | | | | | | | | |
TRANSPORTATION SECTOR — 5.0% | | | | | | | | |
| | | | Air Freight/Couriers — 1.0% | | | | | | | | |
| | 246,900 | | Pacer | | | | | | | | |
| | | | International, Inc. | | | 4,721,067 | | | | 4,703,445 | |
| | | | | | | | | | | | |
| | | | Trucking — 4.0% | | | | | | | | |
| | 577,300 | | Hunt (J.B.) Transport | | | | | | | | |
| | | | Services, Inc. | | | 12,957,401 | | | | 15,182,990 | |
| | 261,400 | | Werner Enterprises, Inc. | | | 4,888,575 | | | | 4,483,010 | |
| | | | | | | 17,845,976 | | | | 19,666,000 | |
UTILITIES SECTOR — 1.3% | | | | | | | | |
| | | | Gas Distributors — 1.3% | | | | | | | | |
| | 137,800 | | Northwest | | | | | | | | |
| | | | Natural Gas Co. | | | 4,758,266 | | | | 6,297,460 | |
| | | | Total common stocks | | | 406,774,012 | | | | 469,143,803 | |
| | | | | | | | | | | | |
| | | | | | | | | | | | |
Principal | | | | | | | | | | |
Amount | | | | | | | | |
| | | | | | | | | | | | |
SHORT-TERM INVESTMENTS — 6.0% (a) | | | | | | | | |
| | | | Commercial Paper — 5.7% | | | | | | | | |
| $ | 7,000,000 | | AIG Funding Inc., | | | | | | | | |
| | | | 4.70%, due 10/02/07 | | | 6,999,086 | | | | 6,999,086 | |
| | 7,000,000 | | General Electric | | | | | | | | |
| | | | Capital Corp., | | | | | | | | |
| | | | 4.58%, due 10/02/07 | | | 6,999,109 | | | | 6,999,109 | |
| | 7,000,000 | | Prudential Funding LLC, | | | | | | | | |
| | | | 4.58%, due 10/02/07 | | | 6,999,109 | | | | 6,999,109 | |
| | 7,000,000 | | Toyota Motor | | | | | | | | |
| | | | Credit Corp., | | | | | | | | |
| | | | 4.62%, due 10/02/07 | | | 6,999,102 | | | | 6,999,102 | |
| | | | Total commercial paper | | | 27,996,406 | | | | 27,996,406 | |
| | | | | | | | | | | | |
| | | | Variable Rate Demand Note — 0.3% | | | | | | | | |
| | 1,517,970 | | U.S. Bank, N.A., 4.88% | | | 1,517,970 | | | | 1,517,970 | |
| | | | Total short-term | | | | | | | | |
| | | | investments | | | 29,514,376 | | | | 29,514,376 | |
| | | | Total investments | | $ | 436,288,388 | | | | 498,658,179 | |
| | | | Liabilities, less cash and | | | | | | | | |
| | | | Receivables — (1.4%) (a) | | | | | | | (6,642,965 | ) |
| | | | Net Assets | | | | | | $ | 492,015,214 | |
| | | | Net Asset Value Per Share | | | | | | | | |
| | | | ($0.01 par value, indefinite | | | | | | | | |
| | | | shares authorized), offering | | | | | | | | |
| | | | and redemption price | | | | | | | | |
| | | | ($492,015,214 ÷ 18,488,304 | | | | | | | | |
| | | | shares outstanding) | | | | | �� | $ | 26.61 | |
| * | Non-income producing security. |
| (a) | Percentages for the various classifications relate to net assets. |
The accompanying notes to financial statements are an integral part of this statement.
FMI Common Stock Fund, Inc. STATEMENT OF OPERATIONS
For the Year Ended September 30, 2007
INCOME: | | | |
| Dividends | | $ | 5,148,760 | |
| Interest | | | 2,475,355 | |
| Total income | | | 7,624,115 | |
| | | | | |
EXPENSES: | | | | |
| Management fees | | | 5,078,379 | |
| Transfer agent fees | | | 450,952 | |
| Administrative and accounting services | | | 268,918 | |
| Custodian fees | | | 109,160 | |
| Printing and postage expense | | | 65,785 | |
| Registration fees | | | 39,188 | |
| Professional fees | | | 38,731 | |
| Insurance expense | | | 29,118 | |
| Board of Directors fees | | | 18,000 | |
| Other expenses | | | 20,541 | |
| Total expenses | | | 6,118,772 | |
NET INVESTMENT INCOME | | | 1,505,343 | |
NET REALIZED GAIN ON INVESTMENTS | | | 66,293,913 | |
NET DECREASE IN UNREALIZED APPRECIATION ON INVESTMENTS | | | (8,888,380 | ) |
NET GAIN ON INVESTMENTS | | | 57,405,533 | |
NET INCREASE IN NET ASSETS RESULTING FROM OPERATIONS | | $ | 58,910,876 | |
STATEMENTS OF CHANGES IN NET ASSETS
For the Years Ended September 30, 2007 and 2006
| | | 2007 | | | 2006 | |
OPERATIONS: | | | | | | |
| Net investment income | | $ | 1,505,343 | | | $ | 1,579,500 | |
| Net realized gain on investments | | | 66,293,913 | | | | 60,560,485 | |
| Net decrease in unrealized appreciation on investments | | | (8,888,380 | ) | | | (8,979,508 | ) |
| Net increase in net assets from operations | | | 58,910,876 | | | | 53,160,477 | |
| | | | | | | | | |
DISTRIBUTIONS TO SHAREHOLDERS: | | | | | | | | |
| Distributions from net investment income ($0.0741 and $0.0160 per share, respectively) | | | (1,293,547 | ) | | | (285,959 | ) |
| Distributions from net realized gains ($2.9665 and $2.9507 per share, respectively) | | | (52,093,185 | ) | | | (49,389,802 | ) |
| Total distributions | | | (53,386,732 | )* | | | (49,675,761 | )* |
| | | | | | | | | |
FUND SHARE ACTIVITIES: | | | | | | | | |
| Proceeds from shares issued (1,876,289 and 2,006,733 shares, respectively) | | | 50,284,805 | | | | 51,182,074 | |
| Net asset value of shares issued in distributions reinvested | | | | | | | | |
| (2,070,712 and 2,061,437 shares, respectively) | | | 51,540,070 | | | | 48,115,686 | |
| Cost of shares redeemed (2,938,288 and 3,165,073 shares, respectively) | | | (78,311,570 | ) | | | (80,474,016 | ) |
| Net increase in net assets derived from Fund share activities | | | 23,513,305 | | | | 18,823,744 | |
| TOTAL INCREASE | | | 29,037,449 | | | | 22,308,460 | |
| NET ASSETS AT THE BEGINNING OF THE YEAR | | | 462,977,765 | | | | 440,669,305 | |
| NET ASSETS AT THE END OF THE YEAR (Includes undistributed | | | | | | | | |
| net investment income of $1,505,337 and $1,293,541, respectively) | | $ | 492,015,214 | | | $ | 462,977,765 | |
The accompanying notes to financial statements are an integral part of these statements.
FMI Common Stock Fund, Inc. FINANCIAL HIGHLIGHTS
(Selected data for each share of the Fund outstanding throughout each year)
| | | Years Ended September 30, | |
| | | 2007 | | | 2006 | | | 2005 | | | 2004 | | | 2003 | |
PER SHARE OPERATING PERFORMANCE: | | | | | | | | | | | | | | | |
| Net asset value, beginning of year | | $ | 26.49 | | | $ | 26.58 | | | $ | 24.08 | | | $ | 20.47 | | | $ | 17.38 | |
| | | | | | | | | | | | | | | | | | | | | |
| Income from investment operations: | | | | | | | | | | | | | | | | | | | | |
| Net investment income (loss) | | | 0.08 | | | | 0.09 | | | | (0.02 | ) | | | (0.08 | ) | | | (0.09 | ) |
| Net realized and unrealized | | | | | | | | | | | | | | | | | | | | |
| gains on investments | | | 3.08 | | | | 2.79 | | | | 3.73 | | | | 4.17 | | | | 3.18 | |
| Total from investment operations | | | 3.16 | | | | 2.88 | | | | 3.71 | | | | 4.09 | | | | 3.09 | |
| | | | | | | | | | | | | | | | | | | | | |
| Less distributions: | | | | | | | | | | | | | | | | | | | | |
| Distributions from net investment income | | | (0.07 | ) | | | (0.02 | ) | | | — | | | | — | | | | — | |
| Distributions from net realized gains | | | (2.97 | ) | | | (2.95 | ) | | | (1.21 | ) | | | (0.48 | ) | | | — | |
| Total from distributions | | | (3.04 | ) | | | (2.97 | ) | | | (1.21 | ) | | | (0.48 | ) | | | — | |
| Net asset value, end of year | | $ | 26.61 | | | $ | 26.49 | | | $ | 26.58 | | | $ | 24.08 | | | $ | 20.47 | |
| | | | | | | | | | | | | | | | | | | | | |
TOTAL RETURN | | | 12.81% | | | | 12.62% | | | | 16.11% | | | | 20.33% | | | | 17.78% | |
| | | | | | | | | | | | | | | | | | | | | |
RATIOS/SUPPLEMENTAL DATA: | | | | | | | | | | | | | | | | | | | | |
| Net assets, end of year (in 000’s $) | | | 492,015 | | | | 462,978 | | | | 440,669 | | | | 400,864 | | | | 221,919 | |
| Ratio of expenses to average net assets | | | 1.20% | | | | 1.21% | | | | 1.21% | | | | 1.23% | | | | 1.25% | |
| Ratio of net investment income (loss) | | | | | | | | | | | | | | | | | | | | |
| to average net assets | | | 0.30% | | | | 0.35% | | | | (0.06% | ) | | | (0.33% | ) | | | (0.46% | ) |
| Portfolio turnover rate | | | 49.6% | | | | 38.4% | | | | 34.2% | | | | 39.4% | | | | 34.0% | |
The accompanying notes to financial statements are an integral part of this statement.
NOTES TO FINANCIAL STATEMENTS
September 30, 2007
| (1) | Summary of Significant Accounting Policies — |
The following is a summary of significant accounting policies of the FMI Common Stock Fund, Inc. (the “Fund”), which is registered as a diversified, open-end management investment company under the Investment Company Act of 1940, as amended. The Fund was incorporated under the laws of Wisconsin on July 29, 1981. Effective April 15, 2004, the Fund closed to new investors. The investment objective of the Fund is to produce long-term capital appreciation principally through investing in common stocks.
| | (a) | Each security, excluding short-term investments, is valued at the last sale price reported by the principal security exchange on which the issue is traded. Securities that are traded on the Nasdaq Markets are valued at the Nasdaq Official Closing Price or if no sale is reported, the latest bid price. Securities which are traded over-the-counter are valued at the latest bid price. Securities for which quotations are not readily available are valued at fair value as determined by the investment adviser under the supervision of the Board of Directors. The fair value of a security is the amount which the Fund might reasonably expect to receive upon a current sale. The fair value of a security may differ from the last quoted price and the Fund may not be able to sell a security at the fair value. Market quotations may not be available, for example, if trading in particular securities was halted during the day and not resumed prior to the close of trading on the New York Stock Exchange. Short-term investments with maturities of 60 days or less are valued at amortized cost, which approximates value. For financial reporting purposes, investment transactions are recorded on the trade date. |
FMI Common Stock Fund, Inc. NOTES TO FINANCIAL STATEMENTS (Continued)
September 30, 2007
| (1) | Summary of Significant Accounting Policies — (Continued) |
| | | In September 2006, the Financial Accounting Standards Board (“FASB”) issued Statement of Financial Accounting Standards (“SFAS”) No. 157, “Fair Value Measurements.” This standard establishes a single authoritative definition of fair value, sets out a framework for measuring fair value and requires additional disclosures about fair value measurements. SFAS No. 157 applies to fair value measurements already required or permitted by existing standards. SFAS No. 157 is effective for financial statements issued for fiscal years beginning after November 15, 2007 and interim periods within those fiscal years. The changes to current generally accepted accounting principles from the application of this standard relate to the definition of fair value, the methods used to measure fair value, and the expanded disclosures about fair value measurements. The Fund does not believe the adoption of SFAS No. 157 will impact the financial statement amounts; however, additional disclosures may be required about the inputs used to develop the measurements and the effect of certain of the measurements included within the Statement of Operations for the period. |
| | | |
| | (b) | Net realized gains and losses on sales of securities are computed on the identified cost basis. |
| | | |
| | (c) | Dividend income is recorded on the ex-dividend date. Interest income is recorded on an accrual basis. |
| | | |
| | (d) | The Fund has investments in short-term variable rate demand notes, which are unsecured instruments. The Fund may be susceptible to credit risk with respect to these notes to the extent the issuer defaults on its payment obligation. The Fund’s policy is to monitor the creditworthiness of the issuer and nonperformance by these issuers is not anticipated. |
| | | |
| | (e) | Accounting principles generally accepted in the United States of America (“GAAP”) require that permanent differences between income for financial reporting and tax purposes be reclassified in the capital accounts. |
| | | |
| | (f) | The preparation of financial statements in conformity with GAAP requires management to make estimates and assumptions that affect the reported amounts of assets and liabilities and disclosure of contingent assets and liabilities at the date of the financial statements and the reported amounts of revenues and expenses during the reporting period. Actual results could differ from these estimates. |
| | | |
| | (g) | No provision has been made for Federal income taxes since the Fund has elected to be taxed as a “regulated investment company” and intends to distribute substantially all net investment company taxable income and net capital gains to its shareholders and otherwise comply with the provisions of the Internal Revenue Code applicable to regulated investment companies. |
| | | |
| | | On July 13, 2006, the FASB released FASB Interpretation No. 48 “Accounting for Uncertainty in Income Taxes” (“FIN 48”). FIN 48 provides guidance for how uncertain tax positions should be recognized, measured, presented and disclosed in the financial statements. FIN 48 requires the evaluation of tax positions taken or expected to be taken in the course of preparing the Fund’s tax return to determine whether the tax positions are “more-likely-than-not” of being sustained by the applicable tax authority. Tax positions not deemed to meet the more-likely-than-not threshold would be recorded as a tax benefit or expense in the current year. Adoption of FIN 48 is required for fiscal years beginning after December 15, 2006 and is to be applied to all open tax years as of the effective date. Recent SEC guidance allows funds to delay implementing FIN 48 into NAV calculations until the fund’s last NAV calculations in the first required financial statement reporting period. As a result, the Fund must begin to incorporate FIN 48 into its NAV calculations by March 31, 2008. At this time, management is continuing to evaluate the implications of FIN 48 and does not expect the adoption of FIN 48 will have a significant impact on the net assets or results of operations of the Fund. |
| (2) | Investment Adviser and Management Agreement and Transactions With Related Parties — |
The Fund has a management agreement with Fiduciary Management, Inc. (“FMI”), with whom certain officers and directors of the Fund are affiliated, to serve as investment adviser and manager. Under the terms of the agreement, the Fund will pay FMI a monthly management fee at the annual rate of 1% of the daily net assets of the Fund. The Fund has an administrative agreement with FMI to supervise all aspects of the Fund’s operations except those performed by FMI
FMI Common Stock Fund, Inc.
NOTES TO FINANCIAL STATEMENTS (Continued)
September 30, 2007
| (2) | Investment Adviser and Management Agreement and Transactions With Related Parties — (Continued) |
pursuant to the management agreement. Under the terms of the agreement, the Fund will pay FMI a monthly administrative fee at the annual rate of 0.1% of the daily net assets up to and including $30,000,000 and 0.05% of the daily net assets of the Fund in excess of $30,000,000.
Under the management agreement, FMI will reimburse the Fund for expenses over 1.3% of the daily net assets of the Fund. No such reimbursements were required for the year ended September 30, 2007.
In the normal course of business the Fund enters into contracts with service providers that contain general indemnification clauses. The Fund’s maximum exposure under these arrangements is unknown as this would involve future claims that may be made against the Fund that have not yet occurred. However, based on experience, the Fund expects the risk of loss to be remote.
| (3) | Distributions to Shareholders — |
Net investment income and net realized gains, if any, are distributed to shareholders at least annually. On October 30, 2007, the Fund will distribute $1,505,337 from net investment income ($0.08375 per share), $15,018,772 from net short-term realized gains ($0.83556 per share) and $47,763,787 from long-term realized gains ($2.6573 per share). The distributions will be paid on October 31, 2007 to shareholders of record on October 29, 2007.
| (4) | Investment Transactions — |
For the year ended September 30, 2007, purchases and proceeds of sales of investment securities (excluding short-term investments) were $227,950,121 and $259,113,968, respectively.
| (5) | Accounts Payable and Accrued Liabilities — |
As of September 30, 2007, liabilities of the Fund included the following:
| Due to custodian | | $ | 3,853,776 | |
| Payable to brokers for investments purchased | | | 3,749,774 | |
| Payable to FMI for management and administrative fees | | | 387,895 | |
| Payable to shareholders for redemptions | | | 59,268 | |
| Other liabilities | | | 94,224 | |
| (6) | Sources of Net Assets — |
As of September 30, 2007, the sources of net assets were as follows:
| Fund shares issued and outstanding | | $ | 365,372,628 | |
| Net unrealized appreciation on investments | | | 62,369,791 | |
| Undistributed net realized gains on investments | | | 62,767,458 | |
| Undistributed net investment income | | | 1,505,337 | |
| | | $ | 492,015,214 | |
| (7) | Income Tax Information — |
The following information for the Fund is presented on an income tax basis as of September 30, 2007:
| | | Gross | Gross | Net Unrealized | Distributable | Distributable |
| | Cost of | Unrealized | Unrealized | Appreciation | Ordinary | Long-Term |
| | Investments | Appreciation | Depreciation | on Investments | Income | Capital Gains |
| | $436,303,489 | $84,058,069 | $21,703,379 | $62,354,690 | $16,524,109 | $47,763,787 |
FMI Common Stock Fund, Inc.NOTES TO FINANCIAL STATEMENTS (Continued)
September 30, 2007
| (7) | Income Tax Information — (Continued) |
The difference between the cost amount for financial statement and federal income tax purposes is due primarily to timing differences in recognizing certain gains and losses on security transactions.
The tax components of dividends paid during the years ended September 30, 2007 and 2006, capital loss carryovers, which may be used to offset future capital gains, subject to Internal Revenue Code limitations, as of September 30, 2007, and tax basis post-October losses as of September 30, 2007, which are not recognized for tax purposes until the first day of the following fiscal year are:
September 30, 2007 | | September 30, 2006 |
Ordinary | Long-Term | Net Capital | | | Ordinary | Long-Term |
Income | Capital Gains | Loss | Post-October | | Income | Capital Gains |
Distributions | Distributions | Carryovers | Losses | | Distributions | Distributions |
| $11,262,611 | $42,124,121 | $— | $— | | $9,612,105 | $40,063,656 |
For corporate shareholders of the Fund, the percentage of dividend income distributed for the year ended September 30, 2007 which is designated as qualifying for the dividends received deduction is 51% (unaudited).
For all shareholders of the Fund, the percentage of dividend income distributed for the year ended September 30, 2007 which is designated as qualified dividend income under the Jobs and Growth Tax Relief Act of 2003, is 51% (unaudited).
REPORT OF INDEPENDENT REGISTERED PUBLIC ACCOUNTING FIRM
To the Board of Directors and Shareholders
of FMI Common Stock Fund, Inc.
In our opinion, the accompanying statement of net assets and the related statements of operations and of changes in net assets and the financial highlights present fairly, in all material respects, the financial position of FMI Common Stock Fund, Inc. (the “Fund”) at September 30, 2007, the results of its operations for the year then ended, the changes in its net assets for each of the two years in the period then ended and the financial highlights for each of the five years in the period then ended, in conformity with accounting principles generally accepted in the United States of America. These financial statements and financial highlights (hereafter referred to as “financial statements”) are the responsibility of the Fund’s management; our responsibility is to express an opinion on these financial statements based on our audits. We conducted our audits of these financial statements in accordance with the standards of the Public Company Accounting Oversight Board (United States). Those standards require that we plan and perform the audit to obtain reasonable assurance about whether the financial statements are free of material misstatement. An audit includes examining, on a test basis, evidence supporting the amounts and disclosures in the financial statements, assessing the accounting principles used and significant estimates made by management, and evaluating the overall financial statement presentation. We believe that our audits, which included confirmation of securities at September 30, 2007 by correspondence with the custodian and brokers, provide a reasonable basis for our opinion.

Milwaukee, Wisconsin
October 30, 2007
FMI Common Stock Fund, Inc.
DIRECTORS AND OFFICERS
| | | Term of | Principal | # of Funds | Other |
| | Position | Office and | Occupation(s) | in Complex | Directorships |
Name, Age | Held with | Length of | During Past | Overseen | Held by |
and Address | the Fund | Time Served | Five Years | by Director | Director or Officer |
| | | | | | |
Non-Interested Directors | | | | | |
| | | | | | |
| Barry K. Allen, 59 | Director | Indefinite Term | Mr. Allen is President of Allen | 4 | Harley-Davidson, |
| c/o Fiduciary | | Since 1996 | Enterprises, LLC (Brookfield, WI) a | | Inc., FMI Funds, |
| Management, Inc. | | | private equity investments management | | Inc. and |
| 100 E. Wisconsin Ave. | | | company, and Senior Advisor for | | FMI Mutual Funds, |
| Suite 2200 | | | Providence Equity Partners (Providence, | | Inc. |
| Milwaukee, WI 53202 | | | RI) since September 2007. He was | | |
| | | | Executive Vice President of Qwest | | |
| | | | Communications International, Inc. | | |
| | | | (Denver, CO) from September 2002 to | | |
| | | | June 2007. | | |
| | | | | | |
| George D. Dalton, 79 | Director | Indefinite Term | Mr. Dalton is Chairman and Chief | 4 | FMI Funds, Inc., |
| c/o Fiduciary | | Since 1998 | Executive Officer of NOVO1 | | and FMI Mutual |
| Management, Inc. | | | (Waukesha, WI) a privately held company | | Funds, Inc. |
| 100 E. Wisconsin Ave. | | | specializing in teleservices call centers | | |
| Suite 2200 | | | since January 2000. | | |
| Milwaukee, WI 53202 | | | | | |
| | | | | | |
| Gordon H. | Director | Indefinite Term | Mr. Gunnlaugsson retired from M&I | 4 | Renaissance Learning |
| Gunnlaugsson, 63 | | Since 2001 | Corporation (Milwaukee, WI) | | Systems, Inc., FMI |
| c/o Fiduciary | | | in December 2000. | | Funds, Inc. and FMI |
| Management, Inc. | | | | | Mutual Funds, Inc. |
| 100 E. Wisconsin Ave. | | | | | |
| Suite 2200 | | | | | |
| Milwaukee, WI 53202 | | | | | |
| | | | | | |
| Paul S. Shain, 44 | Director | Indefinite Term | Mr. Shain is Senior Vice President of | 4 | FMI Funds, Inc. and |
| c/o Fiduciary | | Since 2001 | CDW Corporation (Vernon Hills, IL) and | | FMI Mutual Funds, |
| Management, Inc. | | | Chief Executive Officer of CDW Berbee | | Inc. |
| 100 E. Wisconsin Ave. | | | (f/k/a/ Berbee Information Networks | | |
| Suite 2200 | | | Corporation), a strategic business unit of | | |
| Milwaukee, WI 53202 | | | CDW Corporation. CDW Berbee is a | | |
| | | | leading provider of Information | | |
| | | | Technology Services including unified communications, infrastructure integration, | | |
| | | | and hosting and managed services. He | | |
| | | | has been employed by such firm in various | | |
| | | | capacities since January 2000. | | |
FMI Common Stock Fund, Inc. DIRECTORS AND OFFICERS (Continued)
| | | | | | Other |
| | | Term of | Principal | # of Funds | Directorships |
| | Position | Office and | Occupation(s) | in Complex | Held by |
Name, Age | Held with | Length of | During Past | Overseen | Director |
and Address | the Fund | Time Served | Five Years | by Director | or Officer |
| | | | | | |
Interested Directors | | | | | |
| | | | | | |
| Patrick J. English,* 46 | Director | Indefinite Term | Mr. English is President of Fiduciary | 3 | FMI Funds, Inc. |
| c/o Fiduciary | | Since 1998 | Management, Inc. and has been employed | | |
| Management, Inc. | Vice | One Year Term | by the Adviser in various capacities | | |
| 100 E. Wisconsin Ave. | President | Since 1996 | since December, 1986. | | |
| Suite 2200 | | | | | |
| Milwaukee, WI 53202 | | | | | |
| | | | | | |
| Ted D. Kellner,* 61 | Director | Indefinite Term | Mr. Kellner is Chairman of the Board | 3 | Marshall & Ilsley |
| c/o Fiduciary | | Since 1981 | and Chief Executive Officer of Fiduciary | | Corporation and |
| Management, Inc. | President | One Year Term | Management, Inc. which he co-founded | | FMI Funds, Inc. |
| 100 E. Wisconsin Ave. | and | Since 1981 | in 1980. | | |
| Suite 2200 | Treasurer | | | | |
| Milwaukee, WI 53202 | | | | | |
| | | | | | |
| Donald S. Wilson,* 64 | Director | Indefinite Term | Mr. Wilson is Vice Chairman, Treasurer | 2 | FMI Mutual Funds, |
| c/o Fiduciary | | Since 1981 | and Chief Compliance Officer of | | Inc. |
| Management, Inc. | Vice | One Year Term | Fiduciary Management, Inc. | | |
| 100 E. Wisconsin Ave. | President | Since 1981 | which he co-founded in 1980. | | |
| Suite 2200 | and | | | | |
| Milwaukee, WI 53202 | Secretary | | | | |
| | | | | | |
Other Officers | | | | | |
| | | | | | |
| Kathleen M. Lauters, 55 | Chief | At Discretion | Ms. Lauters is the Fund’s Chief | N/A | None |
| c/o Fiduciary | Compliance | of Board | Compliance Officer since September 2004. | | |
| Management, Inc. | Officer | Since 2004 | From June 1995 to September 2004 Ms. | | |
| 100 E. Wisconsin Ave. | | | Lauters was employed by Strong Capital | | |
| Suite 2200 | | | Management, most recently as Senior | | |
| Milwaukee, WI 53202 | | | Compliance Analyst. | | |
| | | | | | |
| Camille F. Wildes, 55 | Vice | One Year Term | Ms. Wildes is Vice-President of | N/A | None |
| c/o Fiduciary | President | Since 1999 | Fiduciary Management, Inc. and has | | |
| Management, Inc. | and | | been employed by the Adviser in various | | |
| 100 E. Wisconsin Ave. | Assistant | | capacities since December, 1982. | | |
| Suite 2200 | Treasurer | | | | |
| Milwaukee, WI 53202 | | | | | |
| * | Messrs. English, Kellner and Wilson are interested directors of the Fund because they are officers of the Fund and the Adviser. |
For additional information about the Directors and Officers or for a description of the policies and procedures that the Fund uses to determine how to vote proxies relating to portfolio securities, please call (800) 811-5311 and request a Statement of Additional Information. One will be mailed to you free of charge. The Statement of Additional Information is also available on the website of the Securities and Exchange Commission (the “Commission”) at http://www.sec.gov. Information on how the Fund voted proxies relating to portfolio securities is available on the Fund’s website at http://www.fmifunds.com or the website of the Commission no later than August 31 for the prior 12 months ending June 30. The Fund files its complete schedule of portfolio holdings with the Commission for the first and third quarters of each fiscal year on Form N-Q. The Fund’s Form N-Q is available on the Commission’s website. The Fund’s Form N-Q may be reviewed and copied at the Commission’s Public Reference Room in Washington, D.C., and that information on the operation of the Public Reference Room may be obtained by calling 1-800-SEC-0330.
FMI Common Stock Fund, Inc.
100 East Wisconsin Avenue, Suite 2200
Milwaukee, Wisconsin 53202
www.fmifunds.com
414-226-4555
BOARD OF DIRECTORS
BARRY K. ALLEN
GEORGE D. DALTON
PATRICK J. ENGLISH
GORDON H. GUNNLAUGSSON
TED D. KELLNER
PAUL S. SHAIN
DONALD S. WILSON
INVESTMENT ADVISER
AND ADMINISTRATOR
FIDUCIARY MANAGEMENT, INC.
100 East Wisconsin Avenue, Suite 2200
Milwaukee, Wisconsin 53202
TRANSFER AGENT AND
DIVIDEND DISBURSING AGENT
U.S. BANCORP FUND SERVICES, LLC
615 East Michigan Street
Milwaukee, Wisconsin 53202
800-811-5311
or
414-765-4124
CUSTODIAN
U.S. BANK, N.A.
1555 North RiverCenter Drive, Suite 302
Milwaukee, Wisconsin 53212
INDEPENDENT REGISTERED PUBLIC ACCOUNTING FIRM
PRICEWATERHOUSECOOPERS LLP
100 East Wisconsin Avenue, Suite 1800
Milwaukee, Wisconsin 53202
LEGAL COUNSEL
FOLEY & LARDNER LLP
777 East Wisconsin Avenue
Milwaukee, Wisconsin 53202
This report is not authorized for use as an offer of sale or a solicitation of an offer to buy shares of FMI Common Stock Fund unless accompanied or preceded by the Fund’s current prospectus. Performance data quoted represents past performance; past performance does not guarantee future results. The investment return and principal value of an investment will fluctuate so that an investor’s shares, when redeemed, may be worth more or less than their original cost. Current performance of the Fund may be lower or higher than the performance quoted. Performance data current to the most recent month end may be obtained by visiting www.fmifunds.com.
Item 2. Code of Ethics.
Registrant has adopted a code of ethics. See attached Exhibit 12 (a).
Item 3. Audit Committee Financial Expert.
Registrant’s Board of Directors has determined that Mr. Gordon Gunnlaugsson, a member of its audit committee, is an audit committee financial expert. Mr. Gunnlaugsson is “independent” as such term is defined in Form N-CSR.
Item 4. Principal Accountant Fees and Services.
(a) Audit Fees
$17,116 (FY 2007) and $16,332 (FY 2006) are the aggregate fees billed for each of the last two fiscal years for professional services rendered by the principal accountant to the registrant for the audit of the registrant’s annual financial statements or services that are normally provided by the accountant in connection with statutory and regulatory filings or engagements for those fiscal years.
(b) Audit-Related Fees
There were no fees billed in each of the last two fiscal years for Audit-Related Fees.
$6,150 (FY 2007) and $5,600 (FY 2006) are the aggregate fees billed in each of the last two fiscal years for professional services rendered by the principal accountant to the registrant for tax compliance, tax advice, tax planning and tax return preparation.
There were no fees billed in each of the last two fiscal years for professional services rendered by the principal accountant to registrant’s investment adviser for tax compliance, tax advice and tax planning that were required to be approved by the audit committee pursuant to paragraph (c)(7)(ii) of Rule 2-01 of Regulation S-X.
(d) All Other Fees
There were no fees billed in each of the last two fiscal years for products and services provided by the principal accountant to the registrant, other than the services reported in paragraphs (a) – (c) of this Item 4.
There were no fees billed in each of the last two fiscal years for products and services provided by the principal accountant to registrant’s investment adviser, which were required to be approved by the audit committee pursuant to paragraph (c)(7)(ii) or Rule 2-01 or Regulation S-X.
(e) (1) None
(e) (2) None
(f) Not applicable.
(g) See the tax fees disclosed in paragraph (c) of this Item 4.
(h) Not applicable, as no non-audit services were provided to registrant’s investment adviser.
Item 5. Audit Committee of Listed Registrants.
Not applicable.
Item 6. Schedule of Investments.
Not applicable.
Item 7. Disclosure of Proxy Voting Policies and Procedures for Closed-End Management Investment Companies
Not applicable.
Item 8. Portfolio Managers of Closed-End Management Investment Companies.
Not applicable.
Item 9. Purchases of Equity Securities By Closed-End Management Investment Company and Affiliated Purchasers.
Not applicable.
Item 10. Submission of Matters to a Vote of Security Holders.
None.
Item 11. Controls and Procedures.
| (a) | The disclosure controls and procedures of the FMI Common Stock Fund, Inc. are periodically evaluated. As of October 1, 2007, the date of the last evaluation, we concluded that our disclosure controls and procedures are adequate. |
| (b) | The internal controls of the FMI Common Stock Fund, Inc. are periodically evaluated. There were no changes to FMI Common Stock Fund’s internal control over financial reporting that occurred during the second fiscal quarter of the period covered by this report that have materially affected, or are reasonably likely to materially affect, such controls. |
Item 12. Exhibits.
(a) | Any code of ethics or amendment thereto. Filed herewith. |
(b) | Certifications pursuant to Section 302 of the Sarbanes-Oxley Act of 2002. Filed herewith. |
(c) | Certification pursuant to Section 906 of the Sarbanes-Oxley Act of 2002. Filed herewith. |
SIGNATURES
Pursuant to the requirements of the Securities Exchange Act of 1934 and the Investment Company Act of 1940, the registrant has duly caused this report to be signed on its behalf by the undersigned, thereunto duly authorized.
FMI Common Stock Fund, Inc.
Registrant
By /s/Ted D. Kellner
Ted D. Kellner, Principal Executive Officer
Date 11-15-07
Pursuant to the requirements of the Securities Exchange Act of 1934 and the Investment Company Act of 1940, this report has been signed below by the following persons on behalf of the registrant and in the capacities and on the dates indicated.
FMI Common Stock Fund, Inc.
Registrant
By /s/Ted D. Kellner
Ted D. Kellner, Principal Financial Officer
Date 11-15-07