UNITED STATES
SECURITIES AND EXCHANGE COMMISSION
Washington, D.C. 20549
FORM N-CSR
CERTIFIED SHAREHOLDER REPORT OF REGISTERED
MANAGEMENT INVESTMENT COMPANIES
Investment Company Act file number
811-03235
FMI Common Stock Fund, Inc.
(Exact name of registrant as specified in charter)
100 East Wisconsin Avenue, Suite 2200
Milwaukee, WI 53202
(Address of principal executive offices) (Zip code)
Ted D. Kellner
Fiduciary Management, Inc.
100 East Wisconsin Avenue, Suite 2200
Milwaukee, WI 53202
(Name and address of agent for service)
(414) 226-4555
Registrant's telephone number, including area code:
Date of fiscal year end: September 30
Date of reporting period: March 31, 2009
Item 1. Reports to Stockholders.
SEMIANNUAL REPORT
March 31, 2009
FMI
Common Stock
Fund, Inc.
A NO-LOAD
MUTUAL FUND
FMI
Common Stock
Fund, Inc.
March 31, 2009
Dear Fellow Shareholders:
The FMI Common Stock Fund declined 9.23% in the March quarter compared to minus 14.95% for the Russell 2000 Index. Finance, Distribution Services and Industrial Services drove relative performance. Affiliated Managers, Arrow Electronics, and Dresser-Rand were the standout contributors. On the down side, Technology Services, Electronic Technology and Commercial Services were the worst relative sectors. Protective Life, Winn-Dixie and AMN Healthcare all stumbled significantly in the quarter. We have “reunderwritten” each of these companies and continue to like the risk to reward equation. We have added to a great many of our investments as prices have fallen and our optimism about their long-term prospects remains unshaken. Energy related stocks were also under severe pressure in the quarter as commodity prices fell and demand declined. This gave us an opportunity to increase our position in St. Mary Land & Exploration.
The stock market continued its mercurial way, recently bouncing 20% off the early March lows. This trough followed an approximate 20% gain in the last six weeks of 2008. We’ve now had four rallies of this magnitude over the past eighteen months, and all of them have buckled to varying degrees so far. There is, of course, no way to know when a bear market will end, but if the amount of damage is any indication, we should be awfully close. According to The Leuthold Group, the S&P 500’s ten-year total return ending March 6 was negative 4.4% per year, or a cumulative loss of 36.3%. It was the worst ten-year stretch in U.S. stock market history, including the Great Depression.
Ten years ago, in the Securities Industry Association’s annual expectations survey, 1,500 investors were asked, “How well do you generally expect your investments to perform?” The average of their responses was plus 30%! It should have come as no surprise that, after a period of unprecedented returns (late 1990s), record high valuations, and unrealistically lofty expectations (as evidenced by this survey), we were on the cusp of a very difficult period. First the tech bubble deflated; then, following a period of easy money and unsustainable credit expansion, the housing bubble popped. Jeremy Grantham, a well known Wall Street investor, calls the 2003-07 period “the greatest sucker rally in history.” As you can see from the accompanying chart, stocks have given back most of the gains from the 1990s bull market.
Source: Standard & Poor’s Corporation
Shaded Areas – U.S. Recessions, Dashed Line – Beginning of Latest Recession
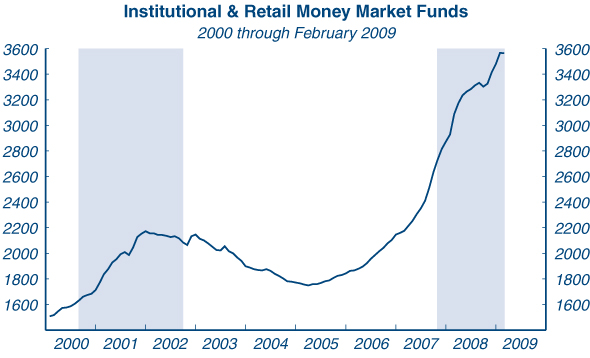
We’ve not seen any recent investment surveys but we’re quite sure they would reveal very low expected returns. But talk is cheap. Ten years ago cash levels were near record lows; today cash levels are pushing toward record highs (see chart on following page), and Treasury bill yields are near zero. Fear has metastasized to nearly every sector of the market.
Shaded areas represent Bear Markets. • Data: Billions of Dollars
Source: Federal Reserve Board
Valuations were extremely high ten years ago versus quite low today. Sentiment was very positive in 1999 and today it is near a record low. History shows time and time again that low returns follow high valuations and lofty expectations and high returns follow low valuations and pessimistic expectations. The table below depicts the ten-year annual compound returns for stocks following the fifteen worst ten-year periods in U.S. history. Following these poor returns, the lowest ten-year period compounded at 7.21% and the highest earned a 15.58% return. We believe the next ten years will fall into this range.
No two bear markets are exactly alike, however, and there is a tendency for investors to believe that “this one is really different.” Today, the inability to corral so-called toxic assets, the deterioration of credit quality, a collapse in corporate earnings, growing protectionism, a political assault on business interests, and breathtaking spending initiatives under the guise of “Keynesian Economics” have investors rattled. We’ve analyzed a number of financial panics going back to the beginning of the 19th century; with very few exceptions, panics were characterized by periods of excessive borrowing and over-speculation in real estate, precious metals and stocks (canals, railroads, automobiles, technology). The ensuing bear markets precipitated a raft of damaging governmental actions (unintended consequences) that typically slowed or thwarted corrective market responses. Despite this, the fundamentals eventually recovered and importantly, the stock market anticipated this in advance.
| | | | | | | | | | | | | | | | Annual | | | |
| | | | | | | | 10 Year | | | | | | | | Compound | | Total | |
| | Past Ten Years | | ACR | | Next Ten Years | | Return | | Return | |
| | Q2 | 1929 | to | Q2 | 1939 | | -3.65 | | Q2 | 1939 | to | Q2 | 1949 | | 8.62 | | 128.54 | |
| | Q1 | 1929 | to | Q1 | 1939 | | -2.79 | | Q1 | 1939 | to | Q1 | 1949 | | 9.12 | | 139.36 | |
| | Q3 | 1929 | to | Q3 | 1939 | | -2.74 | | Q3 | 1939 | to | Q3 | 1949 | | 7.74 | | 110.79 | |
| | Q1 | 1928 | to | Q1 | 1938 | | -2.54 | | Q1 | 1938 | to | Q1 | 1948 | | 11.76 | | 203.87 | |
| | Q1 | 1930 | to | Q1 | 1940 | | -1.42 | | Q1 | 1940 | to | Q1 | 1950 | | 9.65 | | 151.31 | |
| | Q2 | 1930 | to | Q2 | 1940 | | -1.42 | | Q2 | 1940 | to | Q2 | 1950 | | 12.19 | | 215.88 | |
| | Q4 | 1928 | to | Q4 | 1938 | | -0.65 | | Q4 | 1938 | to | Q4 | 1948 | | 7.21 | | 100.63 | « WORST |
| | Q3 | 1928 | to | Q3 | 1938 | | -0.10 | | Q3 | 1938 | to | Q3 | 1948 | | 8.12 | | 118.31 | |
| | Q3 | 1930 | to | Q3 | 1940 | | 0.18 | | Q3 | 1940 | to | Q3 | 1950 | | 12.57 | | 226.85 | |
| | Q4 | 1927 | to | Q4 | 1937 | | 0.20 | | Q4 | 1937 | to | Q4 | 1947 | | 9.61 | | 150.39 | |
| | Q4 | 1929 | to | Q4 | 1939 | | 0.23 | | Q4 | 1939 | to | Q4 | 1949 | | 9.09 | | 138.67 | |
| | Q2 | 1928 | to | Q2 | 1938 | | 0.44 | | Q2 | 1938 | to | Q2 | 1948 | | 9.52 | | 148.39 | |
| | Q3 | 1964 | to | Q3 | 1974 | | 0.49 | | Q3 | 1974 | to | Q3 | 1984 | | 15.58 | | 325.30 | « BEST |
| | Q1 | 1931 | to | Q1 | 1941 | | 0.71 | | Q1 | 1941 | to | Q1 | 1951 | | 14.47 | | 286.14 | |
| | Q4 | 1964 | to | Q4 | 1974 | | 1.24 | | Q4 | 1974 | to | Q4 | 1984 | | 14.76 | | 296.23 | |
| | | | | | | | | | | | | | Average | | 10.67 | | 182.71 | |
The Leuthold Group – March 2009
Of course we don’t know exactly how this bear market will transpire. Investing is a bit of a faith-based initiative, to borrow a popular phrase. The faith is born out of a belief that capitalism and freedom will ultimately prevail. A strong work ethic and desire to “improve one’s position,” as Adam Smith said, will drive success. The age of the imperial CEO and boards of directors that rubber-stamp ridiculous pay packages are on the run — and should be. Unfortunately, when populism runs too hot, people lose sight of the fact that private sector businesses create the wealth, employment and tax revenue, not the government. What the government gives to Peter, it must take from Paul.
Following TARP and TALF, as part of the Financial Stability Plan (and alongside the American Recovery and Reinvestment Act), the Treasury department recently introduced the Public-Private Investment Partnership, or PPIP. Barron’s recently quipped that PPIP should be renamed PIMP because the government is cheaply renting its balance sheet to private investors! Of course it’s easy to take potshots at the confusing myriad of government bailout programs introduced over the past year, but of all of them so far, the PPIP seems to make the most sense. Without getting into the details, we think the program will help the financial system reach price discovery in the troubled assets, an important first step in the recovery process.
For the benefit of new shareholders, the March and September letters deal with companies, and the June and December pieces discuss macro or market related subjects in more detail. Below we have highlighted two of our investments.
ROFIN-SINAR TECHNOLOGIES, INC.
Description
Rofin engages in the engineering, manufacture, and marketing of industrial lasers and supplies used for materials processing applications worldwide. The company offers laser products to machine tool and automotive markets, for cutting and welding metals applications, and laser marking products to semiconductor and electronics markets, for marking integrated circuits, electronic components, smart cards, labels, and car components. It also provides laser products for spot welding, fine cutting, and micro-structuring applications used in dentistry, jewelry, medical components, semiconductors, electronics and consumer goods markets.
Good Business
| • | Rofin provides lasers and laser systems that are highly valued by customers, allowing them to lower costs and increase efficiencies. |
| • | Rofin’s current installed base is greater than 31,000 laser units. The company generates recurring revenues from these units through the sale of components, replacement parts, and services, which accounted for 35% of fiscal 2008 revenues. |
| • | The world market for industrial laser materials processing is expected to grow approximately 10% on average over the next decade, as lasers continue to replace traditional machine tools in certain manufacturing applications. Rofin is strongly positioned to benefit from this industry growth with its quality, diverse product portfolio and technological leadership. |
| • | Rofin comfortably earns its cost of capital. The company has averaged a return on invested capital (ROIC) of 13.8% and 11.2% over the trailing five- and ten-year periods, respectively. |
| • | Rofin’s business is not very capital-intensive and generates excess free cash flow. In November 2007, the board authorized a $120 million share repurchase program. This program was completed by June 2008 and resulted in a 6% reduction in shares. |
| • | It is conservatively financed, with net cash of $50 million on its balance sheet. |
Valuation
| • | Over the past twelve months, Rofin’s shares have fallen 63.7%, and are down 69.3% from their all-time high of $48.83 reached in December 2007. |
| • | The stock sells for approximately 0.7x enterprise value-to-sales (EV/Sales), 3.5x enterprise value-to-earnings before interest, taxes, depreciation and amortization (EV/EBITDA), and 7.1x trailing earnings. Since Rofin became a public company in 1996, the average multiples have been 1.3x EV/Sales, 8.4x EV/EBITDA, and 18.7x earnings. |
| • | A list of thirteen recent industry acquisitions completed since 2003 yields median multiples of 1.7x EV/Sales and 11.9x EV/EBITDA. Rofin’s private market value appears to be at least $30.00 per share. |
Management
| • | Rofin’s management has extensive industry experience. Chairman Peter Wirth has been with the company for 30 years. CEO Gunther Braun has a 20-year tenure. Current board member Carl Baasel has over 30 years of industry experience. |
| • | Management has received high marks from various industry sources. They have been good stewards of capital. |
Investment Thesis
Rofin’s long-term business prospects are attractive as the company is well positioned to benefit from secular growth in the laser industry. The steep worldwide economic decline, however, has recently resulted in severe revenue and earnings shortfalls. Capital spending of all varieties is being delayed or cancelled. Rofin is taking aggressive action to size their business so as to remain profitable in this down cycle. They have the balance sheet to get through this extremely difficult period. The valuation is attractive for investors with a three- to five-year time horizon.
BIO-RAD LABORATORIES, INC.
Description
Bio-Rad is a leading global provider of a broad array of instruments and recurring consumables to the life sciences, clinical and molecular diagnostic laboratory end-markets. The company operates in two segments, Clinical Diagnostics (63% of revenues, 79% of earnings) and Life Sciences. The Diagnostics business supplies reagents, instruments and software for patient testing, diagnosis and disease monitoring. Life Sciences supplies tools for separation, purification and analysis of biological materials used in disease and drug discovery research. Broadly, company revenues can be attributed to hospital labs (30%), academia (25%), reference labs (17%), biopharma (13%), industrial (8%), and transfusion labs (7%). Bio-Rad generates 65% of its sales outside the United States (43% Europe, 16% Pacific Rim, 6% other).
Good Business
| • | Bio-Rad generates over 60% of its sales from market-leading products, including autoimmune diagnostics, diabetes monitoring, hospital infection testing and other specialty diagnostic testing markets. |
| • | Over 70% of revenues are recurring. Sales are highly diversified with over 8,000 products. No individual customer accounts for more than 2% of revenues. Instrument placements are sticky, as researchers and clinicians are loath to revalidate their procedures and test results on other vendors’ equipment. |
| • | Adjusted ROIC has averaged 10%. Incremental returns on capital are significantly better than 10%. |
| • | Bio-Rad maintains a strong balance sheet. |
| • | The company provides critical necessities and it is an understandable business. |
Valuation
| • | Bio-Rad is trading at the low end of its long-term price-to-earnings (P/E) range (14-25). The stock’s average P/E has been approximately 18. |
| • | Bio-Rad’s EV/Sales ratio is also on the low end of its long-term range (1.0 to 2.2). |
| • | Its private market value is substantially above the current public market valuation, based on transactions consummated over the past several years. |
Management
| • | Norman Schwartz is the current CEO, having spent the past 30 years alternatively managing the Life Sciences and Diagnostics businesses. |
| • | Brad Crutchfield and John Goetz, both long time employees, lead the Life Sciences and Diagnostic businesses, respectively. |
| • | Christine Tsingos has been the company’s CFO since 2002. |
Investment Thesis
Bio-Rad is a broadly diversified life sciences and diagnostics company with an attractive business model. The company generates a majority of its revenues from market-leading positions in niche specialized products. Revenues are highly recurring and stand to benefit from broad trends within health care — including an increased focus on early diagnosis, preventative medicine, bio-markers and general innovation in the pharma and bioscience industries. The valuation is reasonable for a high quality franchise.
* * * * *
Finally, in the aftermath of the Madoff and Stanford Financial Group frauds, among others, some of our shareholders have asked about the safeguards of the FMI Common Stock Fund. Like all mutual funds, it is regulated under the Investment Company Act of 1940. It is a public entity that files regularly with the Securities and Exchange Commission and these documents are available for all to see. Fiduciary Management, Inc., the investment adviser, does not custody the assets; U.S. Bank, N.A. holds the securities. There is complete pricing transparency as the net asset value is calculated and published every day. The securities are liquid and the FMI Common Stock Fund does not use leverage. The Fund has a board with a majority of independent directors and is audited by PricewaterhouseCoopers LLP. The portfolio managers, analysts and employees of Fiduciary Management, Inc. have a significant portion of their net worth invested in the FMI Common Stock Fund and have recently increased that investment.
Thank you for your support of the FMI Common Stock Fund, Inc.
Sincerely,
 |  |  |
| Ted D. Kellner, CFA | Donald S. Wilson, CFA | Patrick J. English, CFA |
| President and | Vice President | Vice President and |
| Portfolio Manager | | Portfolio Manager |
100 E. Wisconsin Ave., Suite 2200 • Milwaukee, WI 53202 • 414-226-4555
www.fmifunds.com
FMI Common Stock Fund, Inc.
COST DISCUSSION
Industry Sectors as of March 31, 2009
As a shareholder of the Fund you incur ongoing costs, including management fees and other Fund expenses. You do not incur transaction costs such as sales charges (loads) on purchase payments, reinvested dividends, or other distributions; redemption fees; and exchange fees because the Fund does not charge these fees. This example is intended to help you understand your ongoing costs (in dollars) of investing in FMI Common Stock Fund and to compare these costs with the ongoing costs of investing in other mutual funds.
The example is based on an investment of $1,000 invested at the beginning of the period and held for the entire period from October 1, 2008 through March 31, 2009.
Actual Expenses
The first line of the table below provides information about actual account values and actual expenses. You may use the information in this line, together with the amount you invested, to estimate the expenses that you paid over the period. Simply divide your account value by $1,000 (for example, an $8,600 account value divided by $1,000 = 8.6), then multiply the result by the number in the first line under the heading entitled “Expenses Paid During Period” to estimate the expenses you paid on your account during this period.
In addition to the costs highlighted and described below, the only Fund transaction costs you might currently incur would be wire fees ($15 per wire), if you choose to have proceeds from a redemption wired to your bank account instead of receiving a check. Additionally, U.S. Bank charges an annual processing fee ($15) if you maintain an IRA account with the Fund. To determine your total costs of investing in the Fund, you would need to add any applicable wire or IRA processing fees you’ve incurred during the period to the costs provided in the example at the end of this article.
Hypothetical Example for Comparison Purposes
The second line of the table below provides information about hypothetical account values and hypothetical expenses based on the Fund’s actual expense ratio and an assumed rate of return of 5% per year before expenses, which is not the Fund’s actual return. The hypothetical account values and expenses may not be used to estimate the actual ending account balance or expenses you paid for the period. You may use this information to compare the ongoing costs of investing in the Fund and other funds. To do so, compare this 5% hypothetical example with the 5% hypothetical examples that appear in the shareholder reports of the other funds.
Please note that the expenses shown in the table are meant to highlight your ongoing costs only and do not reflect any transactional costs, such as sales charges (loads), redemption or exchange fees. Therefore, the second line of the table is useful in comparing ongoing costs only, and will not help you determine the relative total costs of owning different funds. In addition, if these transactional costs were included, your costs would have been higher.
| | | Beginning | | | Ending | | | Expenses Paid | |
| | | Account | | | Account | | | During Period* | |
| | | Value 10/01/08 | | | Value 3/31/09 | | | 10/01/08-3/31/09 | |
| FMI Common Stock Fund Actual | | $ | 1,000.00 | | | $ | 727.20 | | | $ | 5.51 | |
| Hypothetical (5% return before expenses) | | $ | 1,000.00 | | | $ | 1,018.50 | | | $ | 6.44 | |
| * | Expenses are equal to the Fund’s annualized expense ratio of 1.28%, multiplied by the average account value over the period, multiplied by 182/365 (to reflect the one-half year period between October 1, 2008 and March 31, 2009). |
FMI Common Stock Fund, Inc.
STATEMENT OF ASSETS AND LIABILITIES
March 31, 2009 (Unaudited)
| ASSETS: | | | |
| Investments in securities, at value (cost $546,210,398) | | $ | 430,869,252 | |
| Receivable from shareholders for purchases | | | 1,918,323 | |
| Receivable from investments sold | | | 543,147 | |
| Dividends and interest receivable | | | 414,690 | |
| Cash | | | 10,052 | |
| Other assets | | | 28 | |
| Total assets | | $ | 433,755,492 | |
| LIABILITIES: | | | | |
| Payable to shareholders for redemptions | | $ | 492,142 | |
| Payable to adviser for management and administrative fees | | | 307,417 | |
| Other liabilities | | | 94,459 | |
| Total liabilities | | | 894,018 | |
| NET ASSETS: | | | | |
| Capital Stock, $0.01 par value; indefinite shares authorized; 29,965,043 shares outstanding | | | 564,676,214 | |
| Net unrealized depreciation on investments | | | (115,341,146 | ) |
| Accumulated net realized loss on investments | | | (17,513,405 | ) |
| Undistributed net investment income | | | 1,039,811 | |
| Net assets | | | 432,861,474 | |
| Total liabilities and net assets | | $ | 433,755,492 | |
| CALCULATION OF NET ASSET VALUE PER SHARE: | | | | |
| Net asset value, offering and redemption price per share ($432,861,474 ÷ 29,965,043 shares outstanding) | | $ | 14.45 | |
The accompanying notes to financial statements are an integral part of this statement.
FMI Common Stock Fund, Inc.
SCHEDULE OF INVESTMENTS
March 31, 2009 (Unaudited)
| Shares | | | | Cost | | | Value | |
| COMMON STOCKS — 90.4% (a) | | | | | | |
COMMERCIAL SERVICES SECTOR — 8.8% | | | | | | |
| | | Advertising/Marketing Services — 1.4% | | | | | | |
| | 1,138,000 | | Harte-Hanks, Inc. | | $ | 17,852,748 | | | $ | 6,088,300 | |
| | | | Miscellaneous Commercial Services — 2.0% | | | | | | | | |
| | 351,000 | | Cintas Corp. | | | 8,205,415 | | | | 8,676,720 | |
| | | | Personnel Services — 5.4% | | | | | | | | |
| | 836,000 | | AMN Healthcare | | | | | | | | |
| | | | Services, Inc.* | | | 14,928,552 | | | | 4,263,600 | |
| | 864,000 | | Korn/Ferry International* | | | 13,468,499 | | | | 7,827,840 | |
| | 1,867,000 | | MPS Group, Inc.* | | | 17,750,738 | | | | 11,108,650 | |
| | | | | | | 46,147,789 | | | | 23,200,090 | |
| CONSUMER SERVICES SECTOR — 2.1% | | | | | | | | |
| | | | Publishing: Books/Magazines — 2.1% | | | | | | | | |
| | 533,000 | | Meredith Corp. | | | 13,357,757 | | | | 8,869,120 | |
DISTRIBUTION SERVICES SECTOR — 11.4% | | | | | | | | |
| | | | Electronics Distributors — 5.9% | | | | | | | | |
| | 879,000 | | Arrow Electronics, Inc.* | | | 13,556,821 | | | | 16,753,740 | |
| | 477,000 | | ScanSource, Inc.* | | | 11,308,694 | | | | 8,862,660 | |
| | | | | | | 24,865,515 | | | | 25,616,400 | |
| | | | Medical Distributors — 2.8% | | | | | | | | |
| | 628,300 | | Patterson | | | | | | | | |
| | | | Companies Inc.* | | | 12,718,947 | | | | 11,849,738 | |
| | | | Wholesale Distributors — 2.7% | | | | | | | | |
| | 481,000 | | Beacon Roofing | | | | | | | | |
| | | | Supply, Inc.* | | | 4,970,729 | | | | 6,440,590 | |
| | 188,000 | | United Stationers Inc.* | | | 7,406,425 | | | | 5,279,040 | |
| | | | | | | 12,377,154 | | | | 11,719,630 | |
| ELECTRONIC TECHNOLOGY SECTOR — 4.8% | | | | | | | | |
| | | | Computer Peripherals — 1.0% | | | | | | | | |
| | 222,300 | | Zebra Technologies | | | | | | | | |
| | | | Corp.* | | | 3,888,457 | | | | 4,228,146 | |
| | | | Electronic Equipment/Instruments — 2.6% | | | | | | | | |
| | 523,900 | | Rockwell | | | | | | | | |
| | | | Automation, Inc. | | | 13,589,280 | | | | 11,441,976 | |
| | | | Electronic Production Equipment — 1.2% | | | | | | | | |
| | 321,600 | | ATMI, Inc.* | | | 5,523,878 | | | | 4,962,288 | |
ENERGY MINERALS SECTOR — 2.2% | | | | | | | | |
| | | | Oil & Gas Production — 2.2% | | | | | | | | |
| | 715,200 | | St. Mary Land & | | | | | | | | |
| | | | Exploration Co. | | | 17,136,307 | | | | 9,462,096 | |
FINANCE SECTOR — 11.7% | | | | | | | | |
| | | | Insurance Brokers/Services — 2.2% | | | | | | | | |
| | 555,500 | | Arthur J. | | | | | | | | |
| | | | Gallagher & Co. | | | 13,184,976 | | | | 9,443,500 | |
| | | | Investment Managers — 4.2% | | | | | | | | |
| | 434,000 | | Affiliated Managers | | | | | | | | |
| | | | Group, Inc.* | | | 24,508,442 | | | | 18,102,140 | |
| | | | Life/Health Insurance — 0.9% | | | | | | | | |
| | 729,000 | | Protective Life Corp. | | | 17,414,895 | | | | 3,827,250 | |
| | | | Property/Casualty Insurance — 3.1% | | | | | | | | |
| | 1,272,000 | | Old Republic | | | | | | | | |
| | | | International Corp. | | | 15,046,617 | | | | 13,763,040 | |
| | | | Regional Banks — 1.3% | | | | | | | | |
| | 363,000 | | Associated Banc-Corp | | | 6,069,355 | | | | 5,604,720 | |
HEALTH SERVICES SECTOR — 1.5% | | | | | | | | |
| | | | Health Industry Services — 1.5% | | | | | | | | |
| | 184,000 | | Covance Inc.* | | | 7,368,296 | | | | 6,555,920 | |
HEALTH TECHNOLOGY SECTOR — 4.7% | | | | | | | | |
| | | | Medical Specialties — 4.7% | | | | | | | | |
| | 203,000 | | Beckman Coulter, Inc. | | | 10,008,326 | | | | 10,355,030 | |
| | 71,200 | | Bio-Rad | | | | | | | | |
| | | | Laboratories, Inc.* | | | 4,035,072 | | | | 4,692,080 | |
| | 166,000 | | West Pharmaceutical | | | | | | | | |
| | | | Services, Inc. | | | 6,349,388 | | | | 5,446,460 | |
| | | | | | | 20,392,786 | | | | 20,493,570 | |
| INDUSTRIAL SERVICES SECTOR — 6.1% | | | | | | | | |
| | | | Environmental Services — 1.3% | | | | | | | | |
| | 228,000 | | Waste Connections, Inc.* | | | 5,868,802 | | | | 5,859,600 | |
| | | | Oilfield Services/Equipment — 4.8% | | | | | | | | |
| | 280,000 | | Bristow Group, Inc.* | | | 9,493,047 | | | | 6,000,400 | |
| | 667,000 | | Dresser-Rand | | | | | | | | |
| | | | Group, Inc.* | | | 13,043,518 | | | | 14,740,700 | |
| | | | | | | 22,536,565 | | | | 20,741,100 | |
| PROCESS INDUSTRIES SECTOR — 7.6% | | | | | | | | |
| | | | Containers/Packaging — 4.1% | | | | | | | | |
| | 327,000 | | AptarGroup, Inc. | | | 7,063,371 | | | | 10,182,780 | |
| | 372,000 | | Bemis Company, Inc. | | | 9,003,788 | | | | 7,800,840 | |
| | | | | | | 16,067,159 | | | | 17,983,620 | |
| | | | Industrial Specialties — 3.5% | | | | | | | | |
| | 296,000 | | Cabot Microelectronics | | | | | | | | |
| | | | Corp.* | | | 8,896,010 | | | | 7,112,880 | |
| | 394,000 | | Valspar Corp. | | | 8,722,175 | | | | 7,868,180 | |
| | | | | | | 17,618,185 | | | | 14,981,060 | |
| PRODUCER MANUFACTURING SECTOR — 11.3% | | | | | | | | |
| | | | Building Products — 2.8% | | | | | | | | |
| | 351,000 | | Watsco, Inc.* | | | 14,889,614 | | | | 11,944,530 | |
| | | | Electrical Products — 3.0% | | | | | | | | |
| | 124,200 | | Littelfuse, Inc.* | | | 1,593,841 | | | | 1,364,958 | |
| | 920,000 | | Molex Inc. Cl A | | | 17,759,239 | | | | 11,628,800 | |
| | | | | | | 19,353,080 | | | | 12,993,758 | |
FMI Common Stock Fund, Inc.
SCHEDULE OF INVESTMENTS (Continued)
March 31, 2009 (Unaudited)
| Shares/Principal Amount | | | | Cost | | | Value | |
| COMMON STOCKS — 90.4% (a) (Continued) | | | | | | |
PRODUCER MANUFACTURING SECTOR — 11.3% (Continued) | | | | | | |
| | | Industrial Machinery — 2.3% | | | | | | |
| | 326,000 | | Graco Inc. | | $ | 6,679,037 | | | $ | 5,564,820 | |
| | 279,000 | | Rofin-Sinar | | | | | | | | |
| | | | Technologies, Inc.* | | | 3,932,044 | | | | 4,497,480 | |
| | | | | | | 10,611,081 | | | | 10,062,300 | |
| | | | Miscellaneous Manufacturing — 1.4% | | | | | | | | |
| | 319,000 | | Carlisle Companies Inc. | | | 8,900,948 | | | | 6,261,970 | |
| | | | Office Equipment/Supplies — 1.8% | | | | | | | | |
| | 730,000 | | HNI Corp. | | | 16,677,765 | | | | 7,592,000 | |
RETAIL TRADE SECTOR — 8.9% | | | | | | | | |
| | | | Discount Stores — 2.1% | | | | | | | | |
| | 278,000 | | Family Dollar Stores, Inc. | | | 5,642,489 | | | | 9,276,860 | |
| | | | Food Retail — 1.6% | | | | | | | | |
| | 720,000 | | Winn-Dixie Stores, Inc.* | | | 11,316,572 | | | | 6,883,200 | |
| | | | Specialty Stores — 5.2% | | | | | | | | |
| | 658,000 | | Group 1 Automotive, Inc. | | | 10,728,055 | | | | 9,192,260 | |
| | 626,000 | | PetSmart, Inc. | | | 16,424,543 | | | | 13,120,960 | |
| | | | | | | 27,152,598 | | | | 22,313,220 | |
| TECHNOLOGY SERVICES SECTOR — 6.5% | | | | | | | | |
| | | | Data Processing Services — 2.2% | | | | | | | | |
| | 271,000 | | DST Systems, Inc.* | | | 15,726,906 | | | | 9,382,020 | |
| | | | Information Technology Services — 4.3% | | | | | | | | |
| | 613,000 | | Jack Henry & | | | | | | | | |
| | | | Associates, Inc. | | | 12,256,679 | | | | 10,004,160 | |
| | 688,000 | | Perot Systems Corp.* | | | 10,684,819 | | | | 8,861,440 | |
| | | | | | | 22,941,498 | | | | 18,865,600 | |
| TRANSPORTATION SECTOR — 2.8% | | | | | | | | |
| | | | Trucking — 2.8% | | | | | | | | |
| | 507,000 | | Hunt (J.B.) Transport | | | | | | | | |
| | | | Services, Inc. | | | 11,658,522 | | | | 12,223,770 | |
| | | | Total common stocks | | | 506,610,398 | | | | 391,269,252 | |
| | | | | | | | | | | | |
| SHORT-TERM INVESTMENTS — 9.1% (a) | | | | | | | | |
| | | | Commercial Paper — 9.1% | | | | | | | | |
| $ | 39,600,000 | | U.S. Bancorp, 0.01%, | | | | | | | | |
| | | | due 4/01/09 | | | 39,600,000 | | | | 39,600,000 | |
| | | | Total short-term | | | | | | | | |
| | | | investments | | | 39,600,000 | | | | 39,600,000 | |
| | | | Total investments — | | | | | | | | |
| | | | 99.5% | | $ | 546,210,398 | | | | 430,869,252 | |
| | | | Cash and receivables, | | | | | | | | |
| | | | less liabilities — | | | | | | | | |
| | | | 0.5% (a) | | | | | | | 1,992,222 | |
| | | | | | | | | | | | |
| | | | TOTAL NET | | | | | | | | |
| | | | ASSETS — | | | | | | | | |
| | | | 100.0% | | | | | | $ | 432,861,474 | |
| * | Non-income producing security. |
| (a) | Percentages for the various classifications relate to net assets. |
The accompanying notes to financial statements are an integral part of this schedule.
FMI Common Stock Fund, Inc.
STATEMENT OF OPERATIONS
For the Six Month Period Ending March 31, 2009 (Unaudited)
| INCOME: | | | |
| Dividends | | $ | 3,605,422 | |
| Interest | | | 150,154 | |
| Total income | | | 3,755,576 | |
| EXPENSES: | | | | |
| Management fees | | | 2,002,321 | |
| Transfer agent fees | | | 234,194 | |
| Administrative and accounting services | | | 107,595 | |
| Registration fees | | | 63,377 | |
| Custodian fees | | | 51,076 | |
| Printing and postage expense | | | 42,331 | |
| Professional fees | | | 29,556 | |
| Board of Directors fees | | | 17,000 | |
| Insurance expense | | | 11,487 | |
| Other expenses | | | 13,705 | |
| Total expenses | | | 2,572,642 | |
| NET INVESTMENT INCOME | | | 1,182,934 | |
| NET REALIZED LOSS ON INVESTMENTS | | | (10,089,088 | ) |
| NET DECREASE IN UNREALIZED APPRECIATION ON INVESTMENTS | | | (121,374,461 | ) |
| NET LOSS ON INVESTMENTS | | | (131,463,549 | ) |
| NET DECREASE IN NET ASSETS RESULTING FROM OPERATIONS | | $ | (130,280,615 | ) |
STATEMENTS OF CHANGES IN NET ASSETS
For the Six Month Period Ending March 31, 2009 (Unaudited) and For the Year Ended September 30, 2008
| | | 2009 | | | 2008 | |
| OPERATIONS: | | | | | | |
| Net investment income | | $ | 1,182,934 | | | $ | 1,404,080 | |
| Net realized (loss) gain on investments | | | (10,089,088 | ) | | | 19,288,248 | |
| Net decrease in unrealized appreciation on investments | | | (121,374,461 | ) | | | (56,336,476 | ) |
| Net (decrease) in net assets from operations | | | (130,280,615 | ) | | | (35,644,148 | ) |
| DISTRIBUTIONS TO SHAREHOLDERS: | | | | | | | | |
| Distributions from net investment income ($0.0640 and $0.0838 per share, respectively) | | | (1,547,166 | ) | | | (1,505,374 | ) |
| Distributions from net realized gains ($0.9746 and $3.6644 per share, respectively) | | | (23,330,031 | ) | | | (66,149,992 | ) |
| Total distributions | | | (24,877,197 | ) | | | (67,655,366 | ) |
| FUND SHARE ACTIVITIES: | | | | | | | | |
| Proceeds from shares issued (14,139,898 and 3,820,664 shares, respectively) | | | 226,242,129 | | | | 83,226,514 | |
| Net asset value of shares issued in distributions reinvested | | | | | | | | |
| (1,574,731 and 2,878,822 shares, respectively) | | | 24,455,218 | | | | 64,977,258 | |
| Cost of shares redeemed (5,173,878 and 5,763,498 shares, respectively) | | | (74,474,845 | ) | | | (125,122,688 | ) |
| Net increase in net assets derived from Fund share activities | | | 176,222,502 | | | | 23,081,084 | |
| TOTAL INCREASE (DECREASE) | | | 21,064,690 | | | | (80,218,430 | ) |
| NET ASSETS AT THE BEGINNING OF THE PERIOD | | | 411,796,784 | | | | 492,015,214 | |
| NET ASSETS AT THE END OF THE PERIOD (Includes undistributed | | | | | | | | |
| net investment income of $1,039,811 and $1,404,043, respectively) | | $ | 432,861,474 | | | $ | 411,796,784 | |
The accompanying notes to financial statements are an integral part of these statements.
FMI Common Stock Fund, Inc.
FINANCIAL HIGHLIGHTS
(Selected data for each share of the Fund outstanding throughout each period)
| | | (Unaudited) | | | | | | | | | | | | | | | | |
| | | For the Six Month | | | | | | | | | | | | | | | | |
| | | Period Ending | | | | | | | | | | | | | | | | |
| | | March 31, | | | Years Ended September 30, | |
| | | 2009 | | | 2008 | | | 2007 | | | 2006 | | | 2005 | | | 2004 | |
| PER SHARE OPERATING PERFORMANCE: | | | | | | | | | | | | | | | | | | |
| Net asset value, beginning of period | | $ | 21.20 | | | $ | 26.61 | | | $ | 26.49 | | | $ | 26.58 | | | $ | 24.08 | | | $ | 20.47 | |
| Income from investment operations: | | | | | | | | | | | | | | | | | | | | | | | | |
| Net investment income (loss) | | | 0.04 | | | | 0.08 | | | | 0.08 | | | | 0.09 | | | | (0.02 | ) | | | (0.08 | ) |
| Net realized and unrealized | | | | | | | | | | | | | | | | | | | | | | | | |
| (losses) gains on investments | | | (5.76 | ) | | | (1.74 | ) | | | 3.08 | | | | 2.79 | | | | 3.73 | | | | 4.17 | |
| Total from investment operations | | | (5.72 | ) | | | (1.66 | ) | | | 3.16 | | | | 2.88 | | | | 3.71 | | | | 4.09 | |
| Less distributions: | | | | | | | | | | | | | | | | | | | | | | | | |
| Distributions from net investment income | | | (0.06 | ) | | | (0.08 | ) | | | (0.07 | ) | | | (0.02 | ) | | | — | | | | — | |
| Distributions from net realized gains | | | (0.97 | ) | | | (3.67 | ) | | | (2.97 | ) | | | (2.95 | ) | | | (1.21 | ) | | | (0.48 | ) |
| Total from distributions | | | (1.03 | ) | | | (3.75 | ) | | | (3.04 | ) | | | (2.97 | ) | | | (1.21 | ) | | | (0.48 | ) |
| Net asset value, end of period | | $ | 14.45 | | | $ | 21.20 | | | $ | 26.61 | | | $ | 26.49 | | | $ | 26.58 | | | $ | 24.08 | |
| TOTAL RETURN | | | (27.28% | )(1) | | | (7.00% | ) | | | 12.81% | | | | 12.62% | | | | 16.11% | | | | 20.33% | |
| RATIOS/SUPPLEMENTAL DATA: | | | | | | | | | | | | | | | | | | | | | | | | |
| Net assets, end of period (in 000’s $) | | | 432,861 | | | | 411,797 | | | | 492,015 | | | | 462,978 | | | | 440,669 | | | | 400,864 | |
| Ratio of expenses to average net assets | | | 1.28% | (2) | | | 1.22% | | | | 1.20% | | | | 1.21% | | | | 1.21% | | | | 1.23% | |
| Ratio of net investment income (loss) | | | | | | | | | | | | | | | | | | | | | | | | |
| to average net assets | | | 0.59% | (2) | | | 0.35% | | | | 0.30% | | | | 0.35% | | | | (0.06% | ) | | | (0.33% | ) |
| Portfolio turnover rate | | | 17% | | | | 40% | | | | 50% | | | | 38% | | | | 34% | | | | 39% | |
The accompanying notes to financial statements are an integral part of this statement.
NOTES TO FINANCIAL STATEMENTS
March 31, 2009 (Unaudited)
| (1) | Summary of Significant Accounting Policies — |
The following is a summary of significant accounting policies of the FMI Common Stock Fund, Inc. (the “Fund”), which is registered as a diversified, open-end management investment company under the Investment Company Act of 1940, as amended. The Fund was incorporated under the laws of Wisconsin on July 29, 1981. The investment objective of the Fund is to produce long-term capital appreciation principally through investing in common stocks.
| (a) | Each security, excluding short-term investments, is valued at the last sale price reported by the principal security exchange on which the issue is traded. Securities that are traded on the Nasdaq Markets are valued at the Nasdaq Official Closing Price or if no sale is reported, the latest bid price. Securities which are traded over-the-counter are valued at the latest bid price. Securities for which quotations are not readily available are valued at fair value as determined by the investment adviser under the supervision of the Board of Directors. The fair value of a security is |
FMI Common Stock Fund, Inc.
NOTES TO FINANCIAL STATEMENTS (Continued)
March 31, 2009 (Unaudited)
| (1) | Summary of Significant Accounting Policies — (Continued) |
| | the amount which the Fund might reasonably expect to receive upon a current sale. The fair value of a security may differ from the last quoted price and the Fund may not be able to sell a security at the fair value. Market quotations may not be available, for example, if trading in particular securities was halted during the day and not resumed prior to the close of trading on the New York Stock Exchange. Variable rate demand notes are recorded at par value which approximates market value. Short-term investments with maturities of 60 days or less are valued at amortized cost, which approximates value. For financial reporting purposes, investment transactions are recorded on the trade date. |
| | The Fund adopted the provisions of Statement of Financial Accounting Standards No. 157, “Fair Value Measurements” (“SFAS No. 157”), effective October 1, 2008. Under SFAS No. 157, fair value is defined as the price that would be received to sell an asset or paid to transfer a liability (i.e., the “exit price”) in an orderly transaction between market participants at the measurement date. |
| | In determining fair value, the Fund uses various valuation approaches. SFAS No. 157 establishes a fair value hierarchy for inputs used in measuring fair value that maximizes the use of observable inputs and minimizes the use of unobservable inputs by requiring that the most observable inputs be used when available. Observable inputs are those that market participants would use in pricing the asset or liability based on market data obtained from sources independent of the Fund. Unobservable inputs reflect the Fund’s assumptions about the inputs market participants would use in pricing the asset or liability developed based on the best information available in the circumstances. |
| | The fair value hierarchy is categorized into three levels based on the inputs as follows: |
| Level 1 — | Valuations based on unadjusted quoted prices in active markets for identical assets. |
| Level 2 — | Valuations based on quoted prices in markets that are not active or for which all significant inputs are observable, either directly or indirectly. |
| Level 3 — | Valuations based on inputs that are unobservable and significant to the overall fair value measurement. |
| | The securities in the Fund that are classified as Level 1 consist of publicly-traded common stock securities. The securities classified as Level 2 consist of short-term commercial paper. |
| | The following table summarizes the Fund’s investments as of March 31, 2009, based on the inputs used to value them: |
| Valuation Inputs | | Investments in Securities | |
| Level 1 — Quoted prices | | $ | 391,269,252 | |
| Level 2 — Other significant observable inputs | | | 39,600,000 | |
| Level 3 — Significant unobservable inputs | | | — | |
| Total | | $ | 430,869,252 | |
| (b) | Net realized gains and losses on sales of securities are computed on the identified cost basis. |
| (c) | Dividend income is recorded on the ex-dividend date. Interest income is recorded on an accrual basis. |
| (d) | The Fund may own investments in short-term variable rate demand notes, which are unsecured instruments. The Fund may be susceptible to credit risk with respect to these notes to the extent the issuer defaults on its payment obligation. The Fund’s policy is to monitor the creditworthiness of the issuer and nonperformance by these issuers is not anticipated. |
| (e) | Accounting principles generally accepted in the United States of America (“GAAP”) require that permanent differences between income for financial reporting and tax purposes be reclassified in the capital accounts. |
FMI Common Stock Fund, Inc.
NOTES TO FINANCIAL STATEMENTS (Continued)
March 31, 2009 (Unaudited)
| (1) | Summary of Significant Accounting Policies — (Continued) |
| (f) | The preparation of financial statements in conformity with GAAP requires management to make estimates and assumptions that affect the reported amounts of assets and liabilities and disclosure of contingent assets and liabilities at the date of the financial statements and the reported amounts of revenues and expenses during the reporting period. Actual results could differ from these estimates. |
| (g) | No provision has been made for Federal income taxes since the Fund has elected to be taxed as a “regulated investment company” and intends to distribute substantially all net investment company taxable income and net capital gains to its shareholders and otherwise comply with the provisions of the Internal Revenue Code applicable to regulated investment companies. |
| (h) | Effective March 31, 2008, the Fund adopted Financial Accounting Standards Board Interpretation No. 48 (FIN 48), “Accounting for Uncertainty in Income Taxes”. FIN 48 requires the evaluation of tax positions taken on previously filed tax returns or expected to be taken on future returns. These positions must meet a “more-likely-than-not” standard that, based on the technical merits, have a more than fifty percent likelihood of being sustained upon examination. In evaluating whether a tax position has met the recognition threshold, the Fund must presume that the position will be examined by the appropriate taxing authority that has full knowledge of all relevant information. Tax positions not deemed to meet the “more-likely-than-not” threshold are recorded as a tax expense in the current year. |
| | FIN 48 requires the Fund to analyze all open tax years, as defined by the Statute of Limitations, for all major jurisdictions. Open tax years are those that are open for exam by taxing authorities. Major jurisdictions for the Fund include Federal and the state of Wisconsin. As of March 31, 2009, open Federal and Wisconsin tax years include the tax years ended September 30, 2005 through 2008. The Fund has no examinations in progress. |
| | The Fund has reviewed all open tax years and major jurisdictions and concluded that the adoption of FIN 48 resulted in no effect to the Fund’s financial position or results of operations. There is no tax liability resulting from unrecognized tax benefits relating to uncertain income tax positions taken or expected to be taken on the tax return for the fiscal year-end September 30, 2009. The Fund is also not aware of any tax positions for which it is reasonably possible that the total amounts of unrecognized tax benefits will significantly change in the next twelve months. |
| (2) | Investment Adviser and Management Agreement and Transactions With Related Parties — |
The Fund has a management agreement with Fiduciary Management, Inc. (“FMI”), with whom certain officers and directors of the Fund are affiliated, to serve as investment adviser and manager. Under the terms of the agreement, the Fund will pay FMI a monthly management fee at the annual rate of 1% of the daily net assets of the Fund. The Fund has an administrative agreement with FMI to supervise all aspects of the Fund’s operations except those performed by FMI pursuant to the management agreement. Under the terms of the agreement, the Fund will pay FMI a monthly administrative fee at the annual rate of 0.1% of the daily net assets up to and including $30,000,000 and 0.05% of the daily net assets of the Fund in excess of $30,000,000.
Under the management agreement, FMI will reimburse the Fund for expenses over 1.3% of the daily net assets of the Fund. No such reimbursements were required for the six month period ending March 31, 2009.
Under the Fund’s organizational documents, each Director, officer, employee or other agent of the Fund (including the Fund’s investment manager) is indemnified, to the extent permitted by the Act, against certain liabilities that may arise out of performance of their duties to the Fund. Additionally, in the normal course of business, the Fund enters into contracts that contain a variety of indemnification clauses. The Fund’s maximum exposure under these arrangements is unknown as this would involve future claims that may be made against the Fund that have not yet occurred. However, the Fund has not had prior claims or losses pursuant to these contracts and believes the risk of loss to be remote.
FMI Common Stock Fund, Inc.
NOTES TO FINANCIAL STATEMENTS (Continued)
March 31, 2009 (Unaudited)
U.S. Bank, N.A. has made available to the Fund a $17,600,000 credit facility pursuant to a Credit Agreement (“Agreement”) effective July 14, 2008 for the purposes of having cash available to satisfy redemption requests. Principal and interest of such loan under the Agreement are due not more than 31 days after the date of the loan. Amounts under the credit facility bear interest at a rate per annum equal to the current prime rate minus one on the amount borrowed. Advances will be collateralized by securities owned by the Fund. During the six month period ending March 31, 2009, the Fund did not borrow against the Agreement. The Credit Agreement expires on June 5, 2009.
| (4) | Distributions to Shareholders — |
Net investment income and net realized gains, if any, are distributed to shareholders at least annually.
| (5) | Investment Transactions — |
For the six month period ending March 31, 2009, purchases and proceeds of sales of investment securities (excluding short-term investments) were $225,807,126 and $61,981,266, respectively.
| (6) | Income Tax Information — |
The following information for the Fund is presented on an income tax basis as of March 31, 2009:
| | | | Gross | | Gross | | Net Unrealized | |
| | Cost of | | Unrealized | | Unrealized | | Depreciation | |
| | Investments | | Appreciation | | Depreciation | | on Investments | |
| | $556,113,742 | | $22,381,188 | | $147,625,678 | | $125,244,490 | |
The following information for the Fund is presented on an income tax basis as of September 30, 2008:
| | | Gross | | Gross | | Net Unrealized | | Distributable | | Distributable |
| Cost of | | Unrealized | | Unrealized | | Appreciation | | Ordinary | | Long-Term |
| Investments | | Appreciation | | Depreciation | | on Investments | | Income | | Capital Gains |
| $406,822,709 | | $38,713,137 | | $32,694,923 | | $6,018,214 | | $5,924,505 | | $18,809,213 |
The difference between the cost amount for financial statement and federal income tax purposes is due primarily to timing differences in recognizing certain gains and losses on security transactions. For the fiscal year ended September 30, 2008, the Fund had $7,408,862 of post-30 wash sale loss deferrals that will increase the tax cost basis of securities acquired during the fiscal year ending September 30, 2009.
The tax components of dividends paid during the years ended September 30, 2008 and 2007, capital loss carryovers, which may be used to offset future capital gains, subject to Internal Revenue Code limitations, as of September 30, 2008, and tax basis post-October losses as of September 30, 2008, which are not recognized for tax purposes until the first day of the following fiscal year are:
| September 30, 2008 | | September 30, 2007 |
| Ordinary | | Long-Term | | Net Capital | | | | Ordinary | | Long-Term |
| Income | | Capital Gains | | Loss | | Post-October | | Income | | Capital Gains |
| Distributions | | Distributions | | Carryovers | | Losses | | Distributions | | Distributions |
| $18,511,918 | | $49,143,448 | | $— | | $— | | $11,262,611 | | $42,124,121 |
For corporate shareholders of the Fund, the percentage of dividend income distributed for the year ended September 30, 2008 which is designated as qualifying for the dividends received deduction is 36% (unaudited).
For all shareholders of the Fund, the percentage of dividend income distributed for the year ended September 30, 2008 which is designated as qualified dividend income under the Jobs and Growth Tax Relief Act of 2003, is 36% (unaudited).
FMI Common Stock Fund, Inc.
ADVISORY AGREEMENT
On December 19, 2008, the Board of Directors of FMI Common Stock Fund, Inc. (“Directors”) approved the continuation of the Fund’s investment advisory agreement with Fiduciary Management, Inc. Prior to approving the continuation of the investment advisory agreement, the Directors considered:
| | the nature, extent and quality of the services provided by Fiduciary Management, Inc. |
| • | the investment performance of the Fund |
| • | the cost of the services to be provided and profits to be realized by Fiduciary Management, Inc. from its relationship with the Fund |
| • | the extent to which economies of scale would be realized as the Fund grew and whether fee levels reflect any economies of scale |
| • | the expense ratio of the Fund |
| • | the manner in which portfolio transactions for the Fund were conducted, including the use of soft dollars |
In considering the nature, extent and quality of the services provided by Fiduciary Management, Inc., the Directors reviewed a report describing the portfolio management, shareholder communication and servicing, prospective shareholder assistance and regulatory compliance services provided by Fiduciary Management, Inc. to the Fund. The Directors concluded that Fiduciary Management, Inc. was providing essential services to the Fund. In particular, the Directors concluded that Fiduciary Management, Inc. was preparing reports to shareholders in addition to those required by law, and was providing services to the Fund that were in addition to the services investment advisers typically provided its non-mutual fund clients.
The Directors compared the performance of the Fund to benchmark indices over various periods of time and concluded that the performance of the Fund warranted the continuation of the advisory agreement.
In concluding that the advisory fees payable by the Fund were reasonable, the Directors reviewed a report that concluded that the profits Fiduciary Management, Inc. realized from its relationship with the Fund, expressed as a percentage of pre-tax revenues, were generally less than that of publicly traded investment advisers. The Directors also reviewed reports comparing the Fund’s expense ratio and advisory fees paid by the Fund to those of other comparable mutual funds and concluded that the advisory fee paid by the Fund and the Fund’s expense ratio were within the range of comparable mutual funds. The Directors noted that the investment advisory fee was not adjusted if economies of scale were realized as the Fund grew, but did not consider that factor to be significant in light of the other factors considered.
Finally, the Directors reviewed reports discussing the manner in which portfolio transactions for the Fund were conducted, including the use of soft dollars. Based on these reports, the Directors concluded that the research obtained by Fiduciary Management, Inc. was beneficial to the Fund and that Fiduciary Management, Inc. was executing the Fund’s portfolio transactions in a manner designed to obtain best execution for the Fund.
For additional information about the Directors and Officers or for a description of the policies and procedures that the Fund uses to determine how to vote proxies relating to portfolio securities, please call (800) 811-5311 and request a Statement of Additional Information. One will be mailed to you free of charge. The Statement of Additional Information is also available on the website of the Securities and Exchange Commission (the “Commission”) at http://www.sec.gov. Information on how the Fund voted proxies relating to portfolio securities is available on the Fund’s website at http://www.fmifunds.com or the website of the Commission no later than August 31 for the prior 12 months ending June 30. The Fund files its complete schedule of portfolio holdings with the Commission for the first and third quarters of each fiscal year on Form N-Q. The Fund’s Form N-Q is available on the Commission’s website. The Fund’s Form N-Q may be reviewed and copied at the Commission’s Public Reference Room in Washington, D.C., and that information on the operation of the Public Reference Room may be obtained by calling 1-800-SEC-0330.
FMI Common Stock Fund, Inc.
100 East Wisconsin Avenue, Suite 2200
Milwaukee, Wisconsin 53202
www.fmifunds.com
414-226-4555
BOARD OF DIRECTORS
BARRY K. ALLEN
ROBERT C. ARZBAECHER
PATRICK J. ENGLISH
GORDON H. GUNNLAUGSSON
TED D. KELLNER
PAUL S. SHAIN
DONALD S. WILSON
INVESTMENT ADVISER
AND ADMINISTRATOR
FIDUCIARY MANAGEMENT, INC.
100 East Wisconsin Avenue, Suite 2200
Milwaukee, Wisconsin 53202
TRANSFER AGENT AND
DIVIDEND DISBURSING AGENT
U.S. BANCORP FUND SERVICES, LLC
615 East Michigan Street
Milwaukee, Wisconsin 53202
800-811-5311
or
414-765-4124
CUSTODIAN
U.S. BANK, N.A.
1555 North RiverCenter Drive, Suite 302
Milwaukee, Wisconsin 53212
INDEPENDENT REGISTERED PUBLIC ACCOUNTING FIRM
PRICEWATERHOUSECOOPERS LLP
100 East Wisconsin Avenue, Suite 1800
Milwaukee, Wisconsin 53202
LEGAL COUNSEL
FOLEY & LARDNER LLP
777 East Wisconsin Avenue
Milwaukee, Wisconsin 53202
This report is not authorized for use as an offer of sale or a solicitation of an offer to buy shares of FMI Common Stock Fund unless accompanied or preceded by the Fund’s current prospectus. Performance data quoted represents past performance; past performance does not guarantee future results. The investment return and principal value of an investment will fluctuate so that an investor’s shares, when redeemed, may be worth more or less than their original cost. Current performance of the Fund may be lower or higher than the performance quoted. Performance data current to the most recent month end may be obtained by visiting www.fmifunds.com.
Item 2. Code of Ethics.
Not applicable.
Item 3. Audit Committee Financial Expert.
Not applicable.
Item 4. Principal Accountant Fees and Services.
Not applicable.
Item 5. Audit Committee of Listed Registrants.
Not applicable.
Item 6. Schedule of Investments.
The schedule of investments in securities of unaffiliated issuers is included as part of the report to shareholders filed under Item 1.
Item 7. Disclosure of Proxy Voting Policies and Procedures for Closed-End Management Investment Companies
Not applicable.
Item 8. Portfolio Managers of Closed-End Management Investment Companies.
Not applicable.
Item 9. Purchases of Equity Securities By Closed-End Management Investment Company and Affiliated Purchasers.
Not applicable.
Item 10. Submission of Matters to a Vote of Security Holders.
None.
Item 11. Controls and Procedures.
| (a) | The disclosure controls and procedures of the FMI Common Stock Fund, Inc. are periodically evaluated. As of March 27, 2009, the date of the last evaluation, we concluded that our disclosure controls and procedures are adequate. |
| (b) | The internal controls of the FMI Common Stock Fund, Inc. are periodically evaluated. There were no changes to FMI Common Stock Fund’s internal control over financial reporting that occurred during the first fiscal quarter of the period covered by this report that have materially affected, or are reasonably likely to materially affect, such controls. |
Item 12. Exhibits.
| (a) | Any code of ethics or amendment thereto. Not applicable. |
| (b) | Certifications pursuant to Section 302 of the Sarbanes-Oxley Act of 2002. Filed herewith. |
| (c) | Certification pursuant to Section 906 of the Sarbanes-Oxley Act of 2002. Filed herewith. |
SIGNATURES
Pursuant to the requirements of the Securities Exchange Act of 1934 and the Investment Company Act of 1940, the registrant has duly caused this report to be signed on its behalf by the undersigned, thereunto duly authorized.
FMI Common Stock Fund, Inc.
Registrant
By /s/Ted D. Kellner
Ted D. Kellner, Principal Executive Officer
Date May 4, 2009
Pursuant to the requirements of the Securities Exchange Act of 1934 and the Investment Company Act of 1940, this report has been signed below by the following persons on behalf of the registrant and in the capacities and on the dates indicated.
FMI Common Stock Fund, Inc.
Registrant
By /s/Ted D. Kellner
Ted D. Kellner, Principal Financial Officer
Date May 4, 2009