UNITED STATES
SECURITIES AND EXCHANGE COMMISSION
Washington, D.C. 20549
FORM N-CSR
CERTIFIED SHAREHOLDER REPORT OF REGISTERED
MANAGEMENT INVESTMENT COMPANIES
Investment Company Act file number 811-03235
FMI Common Stock Fund, Inc.
(Exact name of registrant as specified in charter)
100 East Wisconsin Avenue, Suite 2200
Milwaukee, WI 53202
(Address of principal executive offices) (Zip code)
Ted D. Kellner
Fiduciary Management, Inc.
100 East Wisconsin Avenue, Suite 2200
Milwaukee, WI 53202
(Name and address of agent for service)
(414) 226-4555
Registrant's telephone number, including area code:
Date of fiscal year end: September 30
Date of reporting period: March 31, 2010
Item 1. Reports to Stockholders.
SEMIANNUAL REPORT
March 31, 2010
FMI
Common Stock
Fund, Inc.
(FMIMX)
A NO-LOAD
MUTUAL FUND
FMI
Common Stock
Fund, Inc.
March 31, 2010
Dear Fellow Shareholders:
The FMI Common Stock Fund gained 8.79%(1) in the quarter ending March 31. The benchmark Russell 2000 advanced 8.85%(2), driven by excellent results from technology, industrials and financials. We had relatively strong performance in the retail and commercial services segments, but lagged in the health technology and technology services arenas. Stocks that detracted from performance, including DST Systems and Molex, were offset by the strong showing in Family Dollar and Gartner. From the bottom of the market just over a year ago, the Russell 2000 has gained approximately 100%. As this bull market adva nces, we would not be surprised if it becomes more difficult to keep pace with the benchmark. This has been a typical pattern for the FMI Common Stock Fund for the better part of 25 years; we usually do better in sideways and down markets and modestly lag the benchmark in strong up markets. We feel fortunate to have only trailed the market by a few percentage points since the bottom on March 9, 2009, but knowing today how hard it is to find high quality, cheap stocks tells us we may be due for either a breather or else a move into a higher valuation, growth stock-driven market phase. Of course, which outcome is impossible to predict.
We do know that elongated rallies often result in extended valuations. Even though earnings have recovered dramatically from a year ago, most measures of value, as articulated in our December letter, remain in the upper quartile, when viewed from a long-term perspective. While the market advance has been very broad, junk bonds and highly-levered business enterprises have had spectacular moves. At $31.5 billion, March actually eclipsed November of 2006 for the record in new junk bond issuance. These investments have benefited from the highly accommodative Federal Reserve and U.S. Government. If rates rise and the yield curve flattens, continuing its recent trend, it might not be as hospitable for these types of securities in the future.
As a reminder, our March and September letters are generally shorter and highlight a couple of our investments, while the December and June letters typically deal with topics in more depth. The top-down musings you see each quarter are interesting and useful, because they help keep the macro environment in perspective, but the money is made with good stock picking and that has always been the number one priority of the team. As a further aside, the research team at Fiduciary Management, Inc. (FMI) has been strengthened over the past six months with two additional analysts.
The U.S. economy has continued its gradual recovery from the extremely depressed levels of a year ago. Inventories, which were depleted, are now rebounding in numerous industries. Demand for automobiles, while nowhere near 2007 levels, is improving. Durable goods orders advanced for the third straight month recently, although construction demand remains depressed. Demand for electronics and semiconductor components grew nicely over the past six months and order books are reasonably healthy. Demand for technology consulting also appears to be growing, which foreshadows better hardware and software sales down the road. Surprisingly, retail sales have been higher than expected, despite relatively low consumer sentiment figures. Banks and other financials have been huge beneficiaries of the Fed’s zero percent interest rate policy and a steep yield curve. Many of the banks have paid back borrowed TARP funds and we gladly eat our words regarding the bank portion of the TARP bailouts. That said, it remains to be seen how the mortgage interventions and the massive monetary easing policies will play out in the long run.
Housing remains very difficult. New home sales recently touched 308,000, the lowest figure since records have been kept (1962). Currently there are 3.25 million homes for sale and an additional 5-5.5 million that are in late stages of
___________________
| (1) | The average annual total returns of the FMI Common Stock Fund for 1 year and annualized 5- and 10-year periods ended March 31, 2010 were 60.48%, 7.83% and 10.40%, respectively. |
| (2) | The average annual total returns of the Russell 2000 for 1 year and annualized 5- and 10-year periods ended March 31, 2010 were 62.76%, 3.36% and 3.68%, respectively. |
delinquency or early foreclosure, presenting a huge overhang of inventory. Foreclosures have worsened for seven consecutive quarters and foreclosure rates are still near record highs, despite the government’s mitigation efforts. Fannie and Freddie, the de facto housing authorities (together with the Federal Housing Administration (FHA) and Veterans Administration, these government agencies are funding over 90% of new mortgages), remain an absolute disaster from a credit quality standpoint. Nonperforming loans recently totaled over $317 billion within these entities. Moreover, the FHA is essentially broke and will need additional taxpayer assistance. The administration recently unveiled yet another housing bailout plan, despite abysmal results for the plans advanced so far. Sixty percent of the borrowers who took advantage of the first loan modification plan in the fourth quarter of 2008 have redefaulted, according to the Office of the Comptroller of the Currency. Despite a 31% drop in home prices from the peak, according to Case-Shiller, home prices remain 28% ahead of the Consumer Price Index over the past two decades. We continue to believe that housing will take several years to get back into a healthy state. Furthermore, we really don’t understand why so many people seem to think that home ownership is a birthright. Promulgating policies that encourage uncreditworthy people to own homes hurts everybody. What’s wrong with renting?
Unemployment remains very high with just a dollop of improvement coming from temporary hours and hiring sentiment. Fear of greater mandates (health care), regulatory burdens (environmental) and taxes continue to concern the business community. Corporate executives express frustration with what appears to be an anti-business stance by Congress and the administration. This has to ameliorate before a meaningful employment recovery can begin.
Of course, the elephant in the room is the U.S. debt load and the staggering annual deficit, which is now $1.4 trillion and rising. The recent health care bill will likely add significantly to a deficit that is already running over 40% of the budget. Except for the smallest companies, if an employer is paying $10,000 for an employee’s health benefit and is going to be fined $2,000 for not providing coverage, it is pretty easy to see what is going to happen. This is a public option in drag. Trying to fund it with punitive taxes on “high earning” individuals will likely result in the usual outcome when tax rates are raised: less-than-expected tax income generated. High-income workers will take tax mitigating steps such as delaying capital gains, shifting to municipal bonds from corporates, shifting their tax reporting structure, opting for leisure, etc. It’s essentially a foregone conclusion that the current $12 trillion debt load, which doesn’t even account for unfunded Social Security benefits and other “off-balance sheet” obligations, is going to rise significantly. At some point, it simply becomes too much. We may be at this juncture today. If interest rates stay low (not likely in our opinion), the debt service pain may be manageable. If rates rise significantly, the burden could be severe.
Major foreign economies are mixed, which is not unusual. Japan remains weak and heavily indebted, despite running large trade surpluses. Brazil and some Asian countries, including India, have recovered nicely from the trough. Global trade has bounced back, particularly in the emerging Asian economies. Western European economies, however, are struggling with many of the same fiscal woes as the United States. Deficits have ballooned in the United Kingdom and across most of the Continent, as generous welfare and public employee benefits meet tax revenues that are depressed. The European Union and the common currency regime are being stretched thin by Greece and other countries with particularly high deficits and poor economic performance. Germany is being as ked to sacrifice for the sake of the Union and the Euro, but politically that is very unpopular. Angela Merkel, Germany’s Chancellor, is trying to drag the International Monetary Fund (IMF) into a bailout of Greece (and likely Portugal). Should this come to pass, the United States would take yet another hit, as we are the biggest contributor to the IMF.
The China economic miracle continues, seemingly uninterrupted by the events of 2008-2009. While the long-term outlook for China remains positive, owing to its strong work ethic, cheap labor and educational achievement, we’ve become more skeptical of the near-term situation. China’s “aggressive mercantilism,” as some call it, is obviously constrained if the demand for Chinese goods is weaker. With the U.S. and Western Europe on a lower growth plane, China needs other countries (including itself) to increase consumption of Chinese-made goods. Moreover, huge infrastructure expenditures had a correspondingly large positive economic impact, when China was capital-starved. Productivity expanded dramatically. Today this is not the case, y et China continues to use the old playbook, spending massive government funds on projects with suspect economic value. Real estate prices have escalated dramatically and there are eerie signs of property bubbles in many of the bigger cities, even while reports keep coming back highlighting large numbers of empty high rise apartment buildings and idle plant capacity. The government’s apparent orchestrated effort to thwart foreign joint venture partners and tilt the
playing field in its favor is worrisome and may be the manifestations of a country that sees their GDP growth trajectory falling. Again, we view this more as a short-term risk than a long-term structural change. If worldwide economic growth recovers more rapidly in the next year or two, there might not be much negative fallout.
Some U.S. economists and government leaders seem to be blaming China for our economic shortcomings and are pushing China to revalue their currency (one Nobel Laureate suggested by 25%). It is hard to know for sure whether such a policy would help the United States (historically, so-called beggar-thy-neighbor policies have not been effective), and as John Mauldin, the thoughtful writer of the FrontLine Newsletter, pointed out recently, Japan has been pressured to revalue their currency for much of the past forty years. In 1971, the yen was 350 to the dollar and Japan ran trade surpluses. Today the yen is under 90 (a 75% rise) and Japan is still running trade surpluses with the U.S. Japan is obviously still selling goods (even at much higher prices) that we desire. Given the large advantage China has in labor and their willingness to run at lower profit margins, it is hard to imagine anything but a dramatic revaluation making a dent in our trade deficit. What may be more likely, if the peg is removed and the yuan floats higher, is China exporting inflation to the United States (assuming Chinese companies raise prices to offset the currency hit). The U.S. may want to heed the Chinese proverb: “Be careful what you wish for. It may be granted.”
Globalization has made it necessary for us to spend more of our time analyzing foreign events, economies and industries. Most of our companies compete worldwide and a few have greater shares of revenue and earnings coming from abroad than from the U.S. Ironically, this isn’t the case with the two companies below, PICO Holdings and W.R. Berkley Corporation, but since they are relatively new to the portfolio, we wanted to highlight them. The research team has identified a number of other companies that look promising, but we are being patient with respect to valuations.
PICO HOLDINGS, INC.
Description
PICO Holdings, Inc. is a diversified holding company. PICO seeks to acquire, build, and operate businesses where significant value can be created from the development of unique assets, and to acquire businesses that the company identifies as undervalued and where management participation in operations can aid in the recognition of the businesses’ fair value, as well as create additional value. Currently PICO’s two major businesses are Vidler Water Company, a significant private sector owner of water resources and water storage operations in Nevada, Arizona, Idaho, Colorado, and New Mexico, and Union Community Partners, a developer of residential lots in selected California markets.
Good Business
| | • | PICO’s competitive advantages include its industry and operational expertise, financial wherewithal, and ability to engage key decision makers. |
| | • | Water is a critical asset that has no substitute, and the cost to the end user is relatively small. |
| | • | The financial metric for any asset or business that PICO acquires is that it has to have a minimum internal rate of return (IRR) of 20% unleveraged. |
| | • | The businesses are easy to understand. |
| | • | Cash totals $96.8 million net of debt. Due to PICO’s financial structure, it is under no pressure to sell any asset at less than full value. |
Valuation
| | • | PICO is trading for 1.43x book value of $25.79 per share. This is a slight premium to the 5-year average multiple of 1.33. The only time the stock dropped well below 1.0x book during this 5-year stretch was during the recent market turmoil in December 2008 (0.58) and March 2009 (0.74) quarters. |
| | • | The company’s water and real estate assets are carried at cost. The majority of these assets was either acquired well before the run up in asset prices or after the decline in residential real estate was well underway, and at substantial discounts to current replacement values. In addition, value has been added as a result of PICO’s development efforts for some assets. Marking the water and real estate assets to market gives us a value of $52 per share. Thus, the shares trade for 70% of adjusted book. |
Management
| | • | Company founder and board member Ron Langley, 65, and President and CEO John Hart, 50, are disciples of Graham and Dodd. |
| | • | The management bench is deep, many of whom were groomed by Langley. Through a combination of team-oriented culture and attractive compensation, PICO has been able to retain key employees and preserve institutional knowledge. |
| | • | Max Webb, 48, is CFO. Rich Sharpe, 54, is COO. Damian Georgino, 49, is Executive Vice President of Corporate Development and Chief Legal Officer. |
| | • | Annual incentive awards are designed to motivate executive officers to increase PICO’s book value per share. |
| | • | Executive officers and directors as a group own 4.7% of the company, so they have skin in the game. |
Investment Thesis
As a developer of water rights in the southwest U.S., PICO is poised to benefit from the increasing scarcity of water. PICO has also taken advantage of a collapse in California residential real estate prices, by acquiring developable land and partially developed and finished lots in attractive medium-sized markets. Furthermore, the company’s water and land assets are undervalued on the balance sheet. By virtue of its ownership of these hard assets, PICO should be a beneficiary of inflationary pressures, which is a likely byproduct of the government ramping up the printing presses.
W.R. BERKLEY CORP.
Description
W.R. Berkley Corp. is an industry leading multi-line property and casualty insurance company. The firm operates five main segments: Specialty (37% of net premiums), Regional (29%), Alternative Risk (15%), Reinsurance (12%), and International (7%). The company’s reputation for prudent underwriting and astute investment acumen has produced one of the industry’s strongest return-on-equity (ROE) track records. The majority of policies are focused on small- to middle-market commercial risks with retention limits of $1 million.
Good Business
| | • | Berkley holds a dominant position in a number of specialty niche markets. The company’s unique decentralized operating structure and compensation policies provide the proper incentive to retain talent and deliver top-tier solutions. The casualty focus of Berkley’s business generates attractive float income, relatively non-correlated risks and an efficient use of capital. |
| | • | Their products are economic necessities. |
| | • | Berkley generates full-cycle ROE comfortably above its peers and the market. Over the trailing 10 years the business has generated a 17% average ROE, with book value expanding by 17% annually. |
| | • | The company maintains a conservative balance sheet with debt-to-total capital of 26%. Standard & Poor’s and A.M. Best rate Berkley A+. |
| | • | Berkley is substantially underlevered, with approximately $500 million of excess capital and meaningful investment positions in low yielding cash. |
| | • | The company’s current premium-to-surplus ratio of 1.1 can expand to 2.0 in a hard market, effectively growing the company’s business by 80% without the need for any additional capital. |
| | • | Over each of the past three years, Berkley has generated approximately $1.6 billion in operating cash flow. |
| | • | This is an easy business to understand. |
Valuation
| | • | The stock is approximately 37% below its all-time high. |
| | • | Over the past 10 years, Berkley has traded for an average price-to-book value (P/BV) multiple of 1.6, ranging from just below today’s 1.0 multiple to 3.0. The stock would have to advance 60% to reach its average P/BV. |
| | • | The industry is also depressed and all players should benefit from a revaluation when the economy gets healthier. |
Management
| | • | Bill Berkley is W.R. Berkley’s founder, Chairman and CEO. He owns 15% of the company’s outstanding equity. |
| | • | Executive compensation is tied to ROE and 5-year growth in book value per share. |
| | • | Outside of the CEO, executives own an average equivalent of 8.5 times their salary in stock. |
Investment Thesis
Berkley’s shares have lagged the broader market, as investors anticipate yet another year of soft industry pricing. Berkley is a high-quality franchise with significant excess capital, low leverage, and a conservative balance sheet. The company trades at a significant historical discount despite unsustainable lows in major external drivers (units, pricing and interest rates) of its business. Over time, the company’s decentralized specialty underwriting businesses will continue to generate industry-leading returns.
Thank you for your confidence in the FMI Common Stock Fund.
Sincerely,
 |  |
| Ted D. Kellner, CFA | Patrick J. English, CFA |
| Chairman & CEO | President & Chief Investment Officer |
| Fiduciary Management, Inc. (Adviser) | Fiduciary Management, Inc. (Adviser) |
100 E. Wisconsin Ave., Suite 2200 • Milwaukee, WI 53202 • 414-226-4555
www.fmifunds.com
FMI Common Stock Fund, Inc.
COST DISCUSSION
As a shareholder of the Fund you incur ongoing costs, including management fees and other Fund expenses. You do not incur transaction costs such as sales charges (loads) on purchase payments, reinvested dividends, or other distributions; redemption fees; and exchange fees because the Fund does not charge these fees. This example is intended to help you understand your ongoing costs (in dollars) of investing in FMI Common Stock Fund and to compare these costs with the ongoing costs of investing in other mutual funds.
The example is based on an investment of $1,000 invested at the beginning of the period and held for the entire period from October 1, 2009 through March 31, 2010.
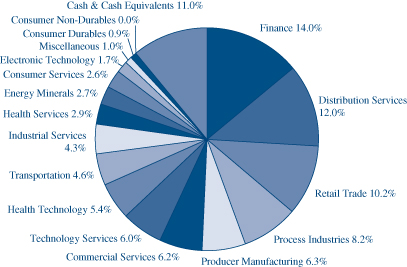
Industry Sectors as of March 31, 2010
Actual Expenses
The first line of the table below provides information about actual account values and actual expenses. You may use the information in this line, together with the amount you invested, to estimate the expenses that you paid over the period. Simply divide your account value by $1,000 (for example, an $8,600 account value divided by $1,000 = 8.6), then multiply the result by the number in the first line under the heading entitled “Expenses Paid During Period” to estimate the expenses you paid on your account during this period.
In addition to the costs highlighted and described below, the only Fund transaction costs you might currently incur would be wire fees ($15 per wire), if you choose to have proceeds from a redemption wired to your bank account instead of receiving a check. Additionally, U.S. Bank charges an annual processing fee ($15) if you maintain an IRA account with the Fund. To determine your total costs of investing in the Fund, you would need to add any applicable wire or IRA processing fees you’ve incurred during the period to the costs provided in the example at the end of this article.
Hypothetical Example for Comparison Purposes
The second line of the table below provides information about hypothetical account values and hypothetical expenses based on the Fund’s actual expense ratio and an assumed rate of return of 5% per year before expenses, which is not the Fund’s actual return. The hypothetical account values and expenses may not be used to estimate the actual ending account balance or expenses you paid for the period. You may use this information to compare the ongoing costs of investing in the Fund and other funds. To do so, compare this 5% hypothetical example with the 5% hypothetical examples that appear in the shareholder reports of the other funds.
Please note that the expenses shown in the table are meant to highlight your ongoing costs only and do not reflect any transactional costs, such as sales charges (loads), redemption fees or exchange fees. Therefore, the second line of the table is useful in comparing ongoing costs only, and will not help you determine the relative total costs of owning different funds. In addition, if these transactional costs were included, your costs would have been higher.
| | Beginning | Ending | Expenses Paid |
| | Account | Account | During Period* |
| | Value 10/01/09 | Value 3/31/10 | 10/01/09-3/31/10 |
| FMI Common Stock Fund Actual | $1,000.00 | $1,100.60 | $6.55 |
| Hypothetical (5% return before expenses) | $1,000.00 | $1,018.70 | $6.29 |
| * | Expenses are equal to the Fund’s annualized expense ratio of 1.25%, multiplied by the average account value over the period, multiplied by 182/365 (to reflect the one-half year period between October 1, 2009 and March 31, 2010). |
FMI Common Stock Fund, Inc.
STATEMENT OF ASSETS AND LIABILITIES
March 31, 2010 (Unaudited)
| ASSETS: | | | |
| Investments in securities, at value (cost $784,999,257) | | $ | 958,302,475 | |
| Receivable from shareholders for purchases | | | 1,296,663 | |
| Receivable from investments sold | | | 1,156,502 | |
| Dividends receivable | | | 1,151,393 | |
| Cash | | | 238,884 | |
| Total assets | | $ | 962,145,917 | |
| | | | | |
| LIABILITIES: | | | | |
| Payable to brokers for investments purchased | | $ | 19,033,803 | |
| Payable to shareholders for redemptions | | | 863,174 | |
| Payable to adviser for management fees | | | 721,891 | |
| Other liabilities | | | 245,863 | |
| Total liabilities | | | 20,864,731 | |
| | | | | |
| NET ASSETS: | | | | |
| Capital Stock, $0.01 par value; indefinite shares authorized; 40,675,468 shares outstanding | | | 767,442,948 | |
| Net unrealized appreciation on investments | | | 173,303,218 | |
| Accumulated net realized gain on investments | | | 117,031 | |
| Undistributed net investment income | | | 417,989 | |
| Net assets | | | 941,281,186 | |
| Total liabilities and net assets | | $ | 962,145,917 | |
| | | | | |
| CALCULATION OF NET ASSET VALUE PER SHARE: | | | | |
| Net asset value, offering and redemption price per share ($941,281,186 ÷ 40,675,468 shares outstanding) | | $ | 23.14 | |
The accompanying notes to financial statements are an integral part of this statement.
FMI Common Stock Fund, Inc.
SCHEDULE OF INVESTMENTS
March 31, 2010 (Unaudited)
| Shares | | | | Cost | | | Value | |
| COMMON STOCKS — 89.0% (a) | | | | | | |
COMMERCIAL SERVICES SECTOR — 6.2% | | | | | | |
| | | Advertising/Marketing Services — 2.1% | | | | | | |
| | 1,516,000 | | Harte-Hanks, Inc. | | $ | 21,049,041 | | | $ | 19,495,760 | |
| | | | Miscellaneous Commercial Services — 2.9% | | | | | | | | |
| | 721,000 | | Cintas Corp. | | | 17,509,472 | | | | 20,252,890 | |
| | 354,000 | | Gartner, Inc.* | | | 5,350,148 | | | | 7,872,960 | |
| | | | | | | 22,859,620 | | | | 28,125,850 | |
| | | | Personnel Services — 1.2% | | | | | | | | |
| | 618,000 | | Korn/Ferry International* | | | 7,964,733 | | | | 10,907,700 | |
CONSUMER DURABLES SECTOR — 0.9% | | | | | | | | |
| | | | Automotive Aftermarket — 0.3% | | | | | | | | |
| | 83,950 | | CLARCOR Inc. | | | 2,517,585 | | | | 2,895,435 | |
| | | | Other Consumer Specialties — 0.6% | | | | | | | | |
| | 184,200 | | Mine Safety Appliances Co. | | | 4,937,237 | | | | 5,150,232 | |
CONSUMER NON-DURABLES SECTOR — 0.0% | | | | | | | | |
| | | | Food: Specialty/Candy — 0.0% | | | | | | | | |
| | 15,500 | | Flowers Foods, Inc. | | | 363,081 | | | | 383,470 | |
CONSUMER SERVICES SECTOR — 2.6% | | | | | | | | |
| | | | Publishing: Books/Magazines — 2.6% | | | | | | | | |
| | 709,000 | | Meredith Corp. | | | 18,115,742 | | | | 24,396,690 | |
DISTRIBUTION SERVICES SECTOR — 12.0% | | | | | | | | |
| | | | Electronics Distributors — 5.6% | | | | | | | | |
| | 1,131,000 | | Arrow | | | | | | | | |
| | | | Electronics, Inc.* | | | 19,746,102 | | | | 34,077,030 | |
| | 638,000 | | ScanSource, Inc.* | | | 15,637,012 | | | | 18,361,640 | |
| | | | | | | 35,383,114 | | | | 52,438,670 | |
| | | | Medical Distributors — 3.4% | | | | | | | | |
| | 1,045,000 | | Patterson | | | | | | | | |
| | | | Companies Inc. | | | 22,796,426 | | | | 32,447,250 | |
| | | | Wholesale Distributors — 3.0% | | | | | | | | |
| | 658,000 | | Beacon Roofing | | | | | | | | |
| | | | Supply, Inc.* | | | 7,772,084 | | | | 12,587,540 | |
| | 262,000 | | United Stationers Inc.* | | | 10,484,808 | | | | 15,418,700 | |
| | | | | | | 18,256,892 | | | | 28,006,240 | |
| ELECTRONIC TECHNOLOGY SECTOR — 1.7% | | | | | | | | |
| | | | Aerospace & Defense — 1.7% | | | | | | | | |
| | 202,000 | | Alliant Techsystems Inc.* | | | 17,422,646 | | | | 16,422,600 | |
ENERGY MINERALS SECTOR — 2.7% | | | | | | | | |
| | | | Oil & Gas Production — 2.7% | | | | | | | | |
| | 725,000 | | St. Mary Land & | | | | | | | | |
| | | | Exploration Co. | | | 14,683,426 | | | | 25,237,250 | |
FINANCE SECTOR — 14.0% | | | | | | | | |
| | | | Insurance Brokers/Services — 2.6% | | | | | | | | |
| | 1,004,000 | | Arthur J. Gallagher & Co. | | | 23,061,501 | | | | 24,648,200 | |
| | | | Investment Managers — 3.2% | | | | | | | | |
| | 383,000 | | Affiliated Managers | | | | | | | | |
| | | | Group, Inc.* | | | 17,552,598 | | | | 30,257,000 | |
| | | | Life/Health Insurance — 2.9% | | | | | | | | |
| | 1,229,000 | | Protective Life Corp. | | | 25,039,093 | | | | 27,025,710 | |
| | | | Property/Casualty Insurance — 4.2% | | | | | | | | |
| | 1,727,000 | | Old Republic | | | | | | | | |
| | | | International Corp. | | | 19,631,116 | | | | 21,898,360 | |
| | 685,000 | | W.R. Berkley Corp. | | | 16,826,871 | | | | 17,871,650 | |
| | | | | | | 36,457,987 | | | | 39,770,010 | |
| | | | Real Estate Development — 1.1% | | | | | | | | |
| | 325,000 | | The St. Joe Co.* | | | 10,460,121 | | | | 10,513,750 | |
HEALTH SERVICES SECTOR — 2.9% | | | | | | | | |
| | | | Health Industry Services — 2.9% | | | | | | | | |
| | 437,000 | | Covance Inc.* | | | 18,082,860 | | | | 26,827,430 | |
HEALTH TECHNOLOGY SECTOR — 5.4% | | | | | | | | |
| | | | Medical Specialties — 5.4% | | | | | | | | |
| | 339,000 | | Beckman Coulter, Inc. | | | 17,901,549 | | | | 21,289,200 | |
| | 98,000 | | Bio-Rad Laboratories, Inc.* | | | 6,196,410 | | | | 10,144,960 | |
| | 372,000 | | CareFusion Corp.* | | | 7,747,684 | | | | 9,831,960 | |
| | 223,000 | | West Pharmaceutical | | | | | | | | |
| | | | Services, Inc. | | | 8,455,718 | | | | 9,354,850 | |
| | | | | | | 40,301,361 | | | | 50,620,970 | |
| INDUSTRIAL SERVICES SECTOR — 4.3% | | | | | | | | |
| | | | Oilfield Services/Equipment — 4.3% | | | | | | | | |
| | 548,000 | | Bristow Group, Inc.* | | | 16,411,728 | | | | 20,676,040 | |
| | 620,000 | | Dresser-Rand | | | | | | | | |
| | | | Group, Inc.* | | | 12,592,714 | | | | 19,480,400 | |
| | | | | | | 29,004,442 | | | | 40,156,440 | |
| MISCELLANEOUS SECTOR — 1.0% | | | | | | | | |
| | | | Investment Trusts/Mutual Funds — 1.0% | | | | | | | | |
| | 258,000 | | PICO Holdings, Inc.* | | | 8,660,826 | | | | 9,595,020 | |
PROCESS INDUSTRIES SECTOR — 8.2% | | | | | | | | |
| | | | Chemicals: Specialty — 2.3% | | | | | | | | |
| | 407,000 | | Sigma-Aldrich Corp. | | | 19,487,027 | | | | 21,839,620 | |
| | | | Containers/Packaging — 4.2% | | | | | | | | |
| | 545,000 | | AptarGroup, Inc. | | | 14,188,510 | | | | 21,445,750 | |
| | 624,000 | | Bemis Company, Inc. | | | 15,404,313 | | | | 17,921,280 | |
| | | | | | | 29,592,823 | | | | 39,367,030 | |
| | | | Industrial Specialties — 1.7% | | | | | | | | |
| | 531,000 | | Valspar Corp. | | | 12,182,751 | | | | 15,653,880 | |
| | | | | | | | | | | | |
| PRODUCER MANUFACTURING SECTOR — 6.3% | | | | | | | | |
| | | | Electrical Products — 2.3% | | | | | | | | |
| | 1,242,000 | | Molex Inc. Cl A | | | 22,382,919 | | | | 21,921,300 | |
The accompanying notes to financial statements are an integral part of this schedule.
FMI Common Stock Fund, Inc.
SCHEDULE OF INVESTMENTS (Continued)
March 31, 2010 (Unaudited)
| Shares | | | | Cost | | | Value | |
| COMMON STOCKS — 89.0% (a) (Continued) | | | | | | |
PRODUCER MANUFACTURING SECTOR — 6.3% (Continued) | | | | | | |
| | | Industrial Machinery — 1.5% | | | | | | |
| | 429,000 | | Graco Inc. | | $ | 9,163,198 | | | $ | 13,728,000 | |
| | | | Miscellaneous Manufacturing — 2.5% | | | | | | | | |
| | 609,000 | | Carlisle Companies Inc. | | | 16,105,771 | | | | 23,202,900 | |
RETAIL TRADE SECTOR — 10.2% | | | | | | | | |
| | | | Discount Stores — 3.7% | | | | | | | | |
| | 972,000 | | Family Dollar Stores, Inc. | | | 25,155,780 | | | | 35,584,920 | |
| | | | Food Retail — 2.8% | | | | | | | | |
| | 446,650 | | Ruddick Corp. | | | 11,229,369 | | | | 14,132,006 | |
| | 967,000 | | Winn-Dixie Stores, Inc.* | | | 14,534,667 | | | | 12,077,830 | |
| | | | | | | 25,764,036 | | | | 26,209,836 | |
| | | | Specialty Stores — 3.7% | | | | | | | | |
| | 387,000 | | Group 1 Automotive, Inc.* | | | 4,850,604 | | | | 12,329,820 | |
| | 693,000 | | PetSmart, Inc. | | | 14,537,249 | | | | 22,148,280 | |
| | | | | | | 19,387,853 | | | | 34,478,100 | |
| TECHNOLOGY SERVICES SECTOR — 6.0% | | | | | | | | |
| | | | Data Processing Services — 3.4% | | | | | | | | |
| | 766,000 | | Broadridge Financial | | | | | | | | |
| | | | Solutions Inc. | | | 16,467,943 | | | | 16,377,080 | |
| | 394,000 | | DST Systems, Inc. | | | 20,193,304 | | | | 16,331,300 | |
| | | | | | | 36,661,247 | | | | 32,708,380 | |
| | | | Information Technology Services — 2.6% | | | | | | | | |
| | 1,000,000 | | Jack Henry & | | | | | | | | |
| | | | Associates, Inc. | | | 19,920,999 | | | | 24,060,000 | |
TRANSPORTATION SECTOR — 4.6% | | | | | | | | |
| | | | Marine Shipping — 2.0% | | | | | | | | |
| | 499,000 | | Kirby Corp.* | | | 16,650,123 | | | | 19,036,850 | |
| | | | Trucking — 2.6% | | | | | | | | |
| | 677,000 | | J.B. Hunt Transport | | | | | | | | |
| | | | Services, Inc. | | | 16,675,176 | | | | 24,290,760 | |
| | | | Total common stocks | | | 664,100,035 | | | | 837,403,253 | |
| | | | | | | | | | | | |
Principal Amount | | | | | | | | | | |
| SHORT-TERM INVESTMENTS — 12.8% (a) | | | | | | | | |
| | | | Commercial Paper — 12.8% | | | | | | | | |
| $ | 95,900,000 | | U.S. Bank, N.A., | | | | | | | | |
| | | | 0.05%, due 04/01/10 | | | 95,900,000 | | | | 95,900,000 | |
| | 25,000,000 | | GE Capital Corp., | | | | | | | | |
| | | | 0.08%, due 04/15/10 | | | 24,999,222 | | | | 24,999,222 | |
| | | | Total short-term | | | | | | | | |
| | | | investments | | | 120,899,222 | | | | 120,899,222 | |
| | | | Total investments — | | | | | | | | |
| | | | 101.8% | | $ | 784,999,257 | | | | 958,302,475 | |
| | | | Liabilities, less cash and | | | | | | | | |
| | | | receivables — (1.8%)(a) | | | | | | | (17,021,289 | ) |
| | | | TOTAL NET ASSETS — | | | | | | | | |
| | | | 100.0% | | | | | | $ | 941,281,186 | |
| * | Non-income producing security. |
| (a) | Percentages for the various classifications relate to net assets. |
The accompanying notes to financial statements are an integral part of this schedule.
FMI Common Stock Fund, Inc.
STATEMENT OF OPERATIONS
For the Six Month Period Ending March 31, 2010 (Unaudited)
| INCOME: | | | |
| Dividends | | $ | 5,746,918 | |
| Interest | | | 20,849 | |
| Total income | | | 5,767,767 | |
| | | | | |
| EXPENSES: | | | | |
| Management fees | | | 4,289,306 | |
| Transfer agent fees | | | 537,079 | |
| Administrative and accounting services | | | 221,945 | |
| Custodian fees | | | 88,121 | |
| Registration fees | | | 62,790 | |
| Printing and postage expense | | | 47,479 | |
| Professional fees | | | 30,631 | |
| Insurance expense | | | 19,470 | |
| Board of Directors fees | | | 17,600 | |
| Other expenses | | | 35,338 | |
| Total expenses | | | 5,349,759 | |
| NET INVESTMENT INCOME | | | 418,008 | |
| NET REALIZED GAIN ON INVESTMENTS | | | 26,806,868 | |
| NET INCREASE IN UNREALIZED APPRECIATION ON INVESTMENTS | | | 54,555,113 | |
| NET GAIN ON INVESTMENTS | | | 81,361,981 | |
| NET INCREASE IN NET ASSETS RESULTING FROM OPERATIONS | | $ | 81,779,989 | |
STATEMENTS OF CHANGES IN NET ASSETS
For the Six Month Period Ending March 31, 2010 (Unaudited) and For the Year Ended September 30, 2009
| | | 2010 | | | 2009 | |
| OPERATIONS: | | | | | | |
| Net investment income | | $ | 418,008 | | | $ | 1,675,917 | |
| Net realized gain (loss) on investments | | | 26,806,868 | | | | (18,956,823 | ) |
| Net increase in unrealized appreciation on investments | | | 54,555,113 | | | | 112,714,790 | |
| Net increase in net assets from operations | | | 81,779,989 | | | | 95,433,884 | |
| | | | | | | | | |
| DISTRIBUTIONS TO SHAREHOLDERS: | | | | | | | | |
| Distributions from net investment income ($0.0366 and $0.0640 per share, respectively) | | | (1,532,573 | ) | | | (1,547,406 | ) |
| Distributions from net realized gains ($0.0074 and $0.9746 per share, respectively) | | | (308,937 | ) | | | (23,329,791 | ) |
| Total distributions | | | (1,841,510 | ) | | | (24,877,197 | ) |
| | | | | | | | | |
| FUND SHARE ACTIVITIES: | | | | | | | | |
| Proceeds from shares issued (11,621,263 and 29,122,596 shares, respectively) | | | 250,223,775 | | | | 505,213,575 | |
| Net asset value of shares issued in distributions reinvested | | | | | | | | |
| (86,999 and 1,574,742 shares, respectively) | | | 1,806,091 | | | | 24,455,393 | |
| Cost of shares redeemed (12,442,522 and 8,711,902 shares, respectively) | | | (263,244,009 | ) | | | (139,465,589 | ) |
| Net (decrease) increase in net assets derived from Fund share activities | | | (11,214,143 | ) | | | 390,203,379 | |
| TOTAL INCREASE | | | 68,724,336 | | | | 460,760,066 | |
| NET ASSETS AT THE BEGINNING OF THE PERIOD | | | 872,556,850 | | | | 411,796,784 | |
| NET ASSETS AT THE END OF THE PERIOD (Includes undistributed | | | | | | | | |
| net investment income of $417,989 and $1,532,554, respectively) | | $ | 941,281,186 | | | $ | 872,556,850 | |
The accompanying notes to financial statements are an integral part of these statements.
FMI Common Stock Fund, Inc.
FINANCIAL HIGHLIGHTS
(Selected data for each share of the Fund outstanding throughout each period)
| | | (Unaudited) | | | | | | | | | | | | | | | | |
| | | For the Six Month | | | | | | | | | | | | | | | | |
| | | Period Ending | | | | | | | | | | | | | | | | |
| | | March 31, | | | Years Ended September 30, | |
| | | 2010 | | | 2009 | | | 2008 | | | 2007 | | | 2006 | | | 2005 | |
| PER SHARE OPERATING PERFORMANCE: | | | | | | | | | | | | | | | | | | |
| Net asset value, beginning of period | | $ | 21.07 | | | $ | 21.20 | | | $ | 26.61 | | | $ | 26.49 | | | $ | 26.58 | | | $ | 24.08 | |
| Income from investment operations: | | | | | | | | | | | | | | | | | | | | | | | | |
| Net investment income (loss) | | | 0.01 | | | | 0.05 | | | | 0.08 | | | | 0.08 | | | | 0.09 | | | | (0.02 | ) |
| Net realized and unrealized gains | | | | | | | | | | | | | | | | | | | | | | | | |
| (losses) on investments | | | 2.10 | | | | 0.86 | | | | (1.74 | ) | | | 3.08 | | | | 2.79 | | | | 3.73 | |
| Total from investment operations | | | 2.11 | | | | 0.91 | | | | (1.66 | ) | | | 3.16 | | | | 2.88 | | | | 3.71 | |
| Less distributions: | | | | | | | | | | | | | | | | | | | | | | | | |
| Distributions from net investment income | | | (0.03 | ) | | | (0.06 | ) | | | (0.08 | ) | | | (0.07 | ) | | | (0.02 | ) | | | — | |
| Distributions from net realized gains | | | (0.01 | ) | | | (0.98 | ) | | | (3.67 | ) | | | (2.97 | ) | | | (2.95 | ) | | | (1.21 | ) |
| Total from distributions | | | (0.04 | ) | | | (1.04 | ) | | | (3.75 | ) | | | (3.04 | ) | | | (2.97 | ) | | | (1.21 | ) |
| Net asset value, end of period | | $ | 23.14 | | | $ | 21.07 | | | $ | 21.20 | | | $ | 26.61 | | | $ | 26.49 | | | $ | 26.58 | |
| | | | | | | | | | | | | | | | | | | | | | | | | |
| TOTAL RETURN | | | 10.06% | (1) | | | 6.04% | | | | (7.00% | ) | | | 12.81% | | | | 12.62% | | | | 16.11% | |
| | | | | | | | | | | | | | | | | | | | | | | | | |
| RATIOS/SUPPLEMENTAL DATA: | | | | | | | | | | | | | | | | | | | | | | | | |
| Net assets, end of period (in 000’s $) | | | 941,281 | | | | 872,557 | | | | 411,797 | | | | 492,015 | | | | 462,978 | | | | 440,669 | |
| Ratio of expenses to average net assets | | | 1.25% | (2) | | | 1.26% | | | | 1.22% | | | | 1.20% | | | | 1.21% | | | | 1.21% | |
| Ratio of net investment income (loss) | | | | | | | | | | | | | | | | | | | | | | | | |
| to average net assets | | | 0.10% | (2) | | | 0.32% | | | | 0.35% | | | | 0.30% | | | | 0.35% | | | | (0.06% | ) |
| Portfolio turnover rate | | | 16% | | | | 35% | | | | 40% | | | | 50% | | | | 38% | | | | 34% | |
The accompanying notes to financial statements are an integral part of this statement.
NOTES TO FINANCIAL STATEMENTSMarch 31, 2010 (Unaudited)
| (1) | Summary of Significant Accounting Policies — |
| | | The following is a summary of significant accounting policies of the FMI Common Stock Fund, Inc. (the “Fund”), which is registered as a diversified, open-end management investment company under the Investment Company Act of 1940 (the “Act”), as amended. The Fund was incorporated under the laws of Wisconsin on July 29, 1981. Effective December 31, 2009, the Fund closed to new investors subject to certain conditions. The investment objective of the Fund is to produce long-term capital appreciation principally through investing in common stocks. |
| | (a) | Each security, excluding short-term investments, is valued at the last sale price reported by the principal security exchange on which the issue is traded. Securities that are traded on the Nasdaq Markets are valued at the Nasdaq Official Closing Price or if no sale is reported, the latest bid price. Securities which are traded over-the-counter are valued at the latest bid price. Securities for which quotations are not readily available are valued at fair value as determined by the investment adviser under the supervision of the Board of Directors. The fair value of a security is the amount which the Fund might reasonably expect to receive upon a current sale. The fair value of a security may differ from the last quoted price and the Fund may not be able to sell a security at the esti mated fair value. Market quotations |
FMI Common Stock Fund, Inc.
NOTES TO FINANCIAL STATEMENTS (Continued)
March 31, 2010 (Unaudited)
| (1) | Summary of Significant Accounting Policies — (Continued) |
| | | may not be available, for example, if trading in particular securities was halted during the day and not resumed prior to the close of trading on the New York Stock Exchange. As of March 31, 2010, there were no securities that were internally fair valued. Variable rate demand notes are recorded at par value which approximates market value. Short-term investments with maturities of 60 days or less are valued at amortized cost, which approximates value. For financial reporting purposes, investment transactions are recorded on the trade date. |
| | | The Fund adopted the provisions of the Financial Accounting Standards Board (“FASB”) Accounting Standards Codification “Fair Value Measurements and Disclosures” Topic 820 (“ASC 820”), effective October 1, 2008. Under ASC 820, fair value is defined as the price that would be received to sell an asset or paid to transfer a liability (i.e., the “exit price”) in an orderly transaction between market participants at the measurement date. |
| | | In determining fair value, the Fund uses various valuation approaches. ASC 820 establishes a fair value hierarchy for inputs used in measuring fair value that maximizes the use of observable inputs and minimizes the use of unobservable inputs by requiring that the most observable inputs be used when available. Observable inputs are those that market participants would use in pricing the asset or liability based on market data obtained from sources independent of the Fund. Unobservable inputs reflect the Fund’s assumptions about the inputs market participants would use in pricing the asset or liability developed based on the best information available in the circumstances. The inputs or methodologies used for valuing securities are not necessarily an indication of the risks associated with investi ng in those securities. |
The fair value hierarchy is categorized into three levels based on the inputs as follows:
| | Level 1 — | Valuations based on unadjusted quoted prices in active markets for identical assets. |
| | Level 2 — | Valuations based on quoted prices in markets that are not active or for which all significant inputs are observable, either directly or indirectly. |
| | Level 3 — | Valuations based on inputs that are unobservable and significant to the overall fair value measurement. |
The following table summarizes the Fund’s investments as of March 31, 2010, based on the inputs used to value them:
| Valuation Inputs | | Investments in Securities | |
| Level 1 — Common Stocks | | $ | 837,403,253 | |
| Level 2 — Short-Term Commercial Paper | | | 120,899,222 | |
| Level 3 — | | | — | |
| Total | | $ | 958,302,475 | |
| | (b) | Net realized gains and losses on sales of securities are computed on the identified cost basis. |
| | (c) | Dividend income is recorded on the ex-dividend date. Interest income is recorded on an accrual basis. |
| | (d) | The Fund may have investments in short-term variable rate demand notes, which are unsecured instruments. The Fund may be susceptible to credit risk with respect to these notes to the extent the issuer defaults on its payment obligation. The Fund’s policy is to monitor the creditworthiness of the issuer and nonperformance by these issuers is not anticipated. |
| | (e) | Accounting principles generally accepted in the United States of America (“GAAP”) require that permanent differences between income for financial reporting and tax purposes be reclassified in the capital accounts. |
| | (f) | The preparation of financial statements in conformity with GAAP requires management to make estimates and assumptions that affect the reported amounts of assets and liabilities and disclosure of contingent assets and liabilities at the date of the financial statements and the reported amounts of revenues and expenses during the reporting period. Actual results could differ from these estimates. |
FMI Common Stock Fund, Inc.
NOTES TO FINANCIAL STATEMENTS (Continued)
March 31, 2010 (Unaudited)
| (1) | Summary of Significant Accounting Policies — (Continued) |
| | (g) | No provision has been made for Federal income taxes since the Fund has elected to be taxed as a “regulated investment company” and intends to distribute substantially all net investment company taxable income and net capital gains to its shareholders and otherwise comply with the provisions of the Internal Revenue Code applicable to regulated investment companies. |
| | (h) | The Fund has reviewed all open tax years and major jurisdictions, which include Federal and the state of Wisconsin, and concluded that there are no significant uncertain tax positions that would require recognition in the financial statements. Open tax years are those that are open for exam by taxing authorities and, as of March 31, 2010, open Federal tax years include the tax years ended September 30, 2006 through 2009. The Fund has no examinations in progress and is also not aware of any tax positions for which it is reasonably possible that the total amounts of unrecognized tax benefits will significantly change in the next twelve months. |
| (2) | Investment Adviser and Management Agreement and Transactions With Related Parties — |
The Fund has a management agreement with Fiduciary Management, Inc. (“FMI”), with whom certain officers and directors of the Fund are affiliated, to serve as investment adviser and manager. Under the terms of the agreement, the Fund will pay FMI a monthly management fee at the annual rate of 1% of the daily net assets of the Fund. The Fund is responsible for paying its proportionate share of the compensation, benefits and expenses of its Chief Compliance Officer. For administrative convenience, FMI initially makes these payments and is later reimbursed by the Fund.
Under the management agreement, FMI will reimburse the Fund for expenses over 1.3% of the daily net assets of the Fund. No such reimbursements were required for the six month period ending March 31, 2010.
Under the Fund’s organizational documents, each director, officer, employee or other agent of the Fund (including the Fund’s investment manager) is indemnified, to the extent permitted by the Act, against certain liabilities that may arise out of performance of their duties to the Fund. Additionally, in the normal course of business, the Fund enters into contracts that contain a variety of indemnification clauses. The Fund’s maximum exposure under these arrangements is unknown as this would involve future claims that may be made against the Fund that have not yet occurred. However, the Fund has not had prior claims or losses pursuant to these contracts and believes the risk of loss to be remote.
U.S. Bank, N.A. has made available to the Fund a $25,000,000 credit facility pursuant to a Credit Agreement (“Agreement”) effective July 14, 2008 for the purposes of having cash available to satisfy redemption requests. Principal and interest of such loan under the Agreement are due not more than 31 days after the date of the loan. Amounts under the credit facility bear interest at a rate per annum equal to the current prime rate minus one percent on the amount borrowed. Advances will be collateralized by securities owned by the Fund. During the six month period ending March 31, 2010, the Fund did not borrow against the Agreement. The Credit Agreement expires on June 5, 2010.
| (4) | Distributions to Shareholders — |
Net investment income and net realized gains, if any, are distributed to shareholders at least annually.
| (5) | Investment Transactions — |
For the six month period ending March 31, 2010, purchases and proceeds of sales of investment securities (excluding short-term investments) were $124,327,749 and $153,651,026, respectively.
FMI Common Stock Fund, Inc.
NOTES TO FINANCIAL STATEMENTS (Continued)
March 31, 2010 (Unaudited)
| (6) | Income Tax Information — |
The following information for the Fund is presented on an income tax basis as of September 30, 2009:
| | | | Gross | | Gross | | Net Unrealized | | Distributable | | Distributable | |
| | Cost of | | Unrealized | | Unrealized | | Appreciation | | Ordinary | | Long-Term | |
| | Investments | | Appreciation | | Depreciation | | on Investments | | Income | | Capital Gains | |
| | $763,059,472 | | $141,363,113 | | $33,858,037 | | $107,505,076 | | $1,532,554 | | $308,861 | |
The difference between the cost amount for financial statement and federal income tax purposes is due primarily to timing differences in recognizing certain gains and losses on security transactions.
The tax components of dividends paid during the years ended September 30, 2009 and 2008, capital loss carryovers, which may be used to offset future capital gains, subject to Internal Revenue Code limitations, as of September 30, 2009, and tax basis post-October losses as of September 30, 2009, which are not recognized for tax purposes until the first day of the following fiscal year are:
| | September 30, 2009 | | September 30, 2008 | |
| | Ordinary | | Long-Term | | Net Capital | | | | Ordinary | | Long-Term | |
| | Income | | Capital Gains | | Loss | | Post-October | | Income | | Capital Gains | |
| | Distributions | | Distributions | | Carryovers | | Losses | | Distributions | | Distributions | |
| | $6,067,868 | | $18,809,329 | | $— | | $15,446,735 | | $18,511,918 | | $49,143,448 | |
For corporate shareholders of the Fund, the percentage of dividend income distributed for the year ended September 30, 2009 which is designated as qualifying for the dividends received deduction is 80.4% (unaudited).
For all shareholders of the Fund, the percentage of dividend income distributed for the year ended September 30, 2009 which is designated as qualified dividend income under the Jobs and Growth Tax Relief Act of 2003, is 80.4% (unaudited).
Management has evaluated related events and transactions that occurred subsequent to March 31, 2010 through the date of issuance of the Fund’s financial statements. There were no events or transactions that occurred during this period that materially impacted the amounts or disclosures in the Fund’s financial statements.
FMI Common Stock Fund, Inc.
ADVISORY AGREEMENT
On December 18, 2009, the Board of Directors of FMI Common Stock Fund, Inc. (“Directors”) approved the continuation of the Fund’s investment advisory agreement with Fiduciary Management, Inc. (“FMI”). Prior to approving the continuation of the investment advisory agreement, the Directors considered:
| | • | the nature, extent and quality of the services provided by FMI |
| | • | the investment performance of the Fund |
| | • | the cost of the services to be provided and profits to be realized by FMI from its relationship with the Fund |
| | • | the extent to which economies of scale would be realized as the Fund grew and whether fee levels reflect any economies of scale |
| | • | the expense ratio of the Fund |
| | • | the manner in which portfolio transactions for the Fund were conducted, including the use of soft dollars |
In considering the nature, extent and quality of the services provided by FMI, the Directors reviewed a report describing the portfolio management, shareholder communication and servicing, prospective shareholder assistance and regulatory compliance services provided by FMI to the Fund. The Directors concluded that FMI was providing essential services to the Fund. In particular, the Directors concluded that FMI was preparing reports to shareholders in addition to those required by law, and was providing services to the Fund that were in addition to the services investment advisers typically provided its non-mutual fund clients.
The Directors compared the performance of the Fund to the benchmark index over various periods of time and concluded that the performance of the Fund warranted the continuation of the advisory agreement.
In concluding that the advisory fees payable by the Fund were reasonable, the Directors reviewed a report that concluded that the profits FMI realized from its relationship with the Fund, expressed as a percentage of pre-tax revenues, were generally comparable to that of publicly traded investment advisers. The Directors also reviewed reports comparing the Fund’s expense ratio and advisory fees paid by the Fund to those of other comparable mutual funds and concluded that the advisory fee paid by the Fund and the Fund’s expense ratio were within the range of comparable mutual funds. The Directors noted that the investment advisory fee was not adjusted if economies of scale were realized as the Fund grew, but did not consider that factor to be significant in light of the other facto rs considered.
Finally, the Directors reviewed reports discussing the manner in which portfolio transactions for the Fund were conducted, including the use of soft dollars. Based on these reports, the Directors concluded that the research obtained by FMI was beneficial to the Fund and that FMI was executing the Fund’s portfolio transactions in a manner designed to obtain best execution for the Fund.
For additional information about the Directors and Officers or for a description of the policies and procedures that the Fund uses to determine how to vote proxies relating to portfolio securities, please call (800) 811-5311 and request a Statement of Additional Information. One will be mailed to you free of charge. The Statement of Additional Information is also available on the website of the Securities and Exchange Commission (the “Commission”) at http://www.sec.gov. Information on how the Fund voted proxies relating to portfolio securities is available on the Fund’s website at http://www.fmifunds.com or the website of the Commission no later than August 31 for the prior 12 months ending June 30. The Fund files its complete schedule of portfolio hold ings with the Commission for the first and third quarters of each fiscal year on Form N-Q. The Fund’s Form N-Q is available on the Commission’s website. The Fund’s Form N-Q may be reviewed and copied at the Commission’s Public Reference Room in Washington, D.C., and that information on the operation of the Public Reference Room may be obtained by calling 1-800-SEC-0330.
FMI Common Stock Fund, Inc.
100 East Wisconsin Avenue, Suite 2200
Milwaukee, Wisconsin 53202
www.fmifunds.com
414-226-4555
BOARD OF DIRECTORS
BARRY K. ALLEN
ROBERT C. ARZBAECHER
JOHN S. BRANDSER
PATRICK J. ENGLISH
GORDON H. GUNNLAUGSSON
TED D. KELLNER
PAUL S. SHAIN
INVESTMENT ADVISER
FIDUCIARY MANAGEMENT, INC.
100 East Wisconsin Avenue, Suite 2200
Milwaukee, Wisconsin 53202
ADMINISTRATOR, ACCOUNTANT, TRANSFER
AGENT AND DIVIDEND DISBURSING AGENT
U.S. BANCORP FUND SERVICES, LLC
615 East Michigan Street
Milwaukee, Wisconsin 53202
800-811-5311
or
414-765-4124
CUSTODIAN
U.S. BANK, N.A.
1555 North RiverCenter Drive, Suite 302
Milwaukee, Wisconsin 53212
INDEPENDENT REGISTERED
PUBLIC ACCOUNTING FIRM
PRICEWATERHOUSECOOPERS LLP
100 East Wisconsin Avenue, Suite 1800
Milwaukee, Wisconsin 53202
LEGAL COUNSEL
FOLEY & LARDNER LLP
777 East Wisconsin Avenue
Milwaukee, Wisconsin 53202
This report is not authorized for use as an offer of sale or a solicitation of an offer to buy shares of FMI Common Stock Fund unless accompanied or preceded by the Fund’s current prospectus. Performance data quoted represents past performance; past performance does not guarantee future results. The investment return and principal value of an investment will fluctuate so that an investor’s shares, when redeemed, may be worth more or less than their original cost. Current performance of the Fund may be lower or higher than the performance quoted. Performance data current to the most recent month end may be obtained by visiting www.fmifunds.com.
Item 2. Code of Ethics.
Not applicable.
Item 3. Audit Committee Financial Expert.
Not applicable.
Item 4. Principal Accountant Fees and Services.
Not applicable.
Item 5. Audit Committee of Listed Registrants.
Not applicable.
Item 6. Schedule of Investments.
| (a) | The Schedule of Investments in securities of unaffiliated issuers is included as part of the report to shareholders filed under Item 1 of this Form. |
Item 7. Disclosure of Proxy Voting Policies and Procedures for Closed-End Management Investment Companies
Not applicable.
Item 8. Portfolio Managers of Closed-End Management Investment Companies.
Not applicable.
Item 9. Purchases of Equity Securities By Closed-End Management Investment Company and Affiliated Purchasers.
Not applicable.
Item 10. Submission of Matters to a Vote of Security Holders.
None.
Item 11. Controls and Procedures.
| (a) | The disclosure controls and procedures of the FMI Common Stock Fund, Inc. are periodically evaluated. As of May 3, 2010, the date of the last evaluation, we concluded that our disclosure controls and procedures are adequate. |
| (b) | The internal controls of the FMI Common Stock Fund, Inc. are periodically evaluated. There were no changes to FMI Common Stock Fund’s internal control over financial reporting that occurred during the first fiscal quarter of the period covered by this report that have materially affected, or are reasonably likely to materially affect, such controls. |
Item 12. Exhibits.
| (a) | (1) Any code of ethics or amendment thereto. Not applicable. |
(2) Certifications pursuant to Section 302 of the Sarbanes-Oxley Act of 2002. Filed herewith.
(3) Any written solicitation to purchase securities under Rule 23c-1 under the Act sent or given during the period covered by the report by or on behalf of the Registrant to 10 or more persons. Not Applicable.
| (b) | Certification pursuant to Section 906 of the Sarbanes-Oxley Act of 2002. Furnished herewith. |
SIGNATURES
Pursuant to the requirements of the Securities Exchange Act of 1934 and the Investment Company Act of 1940, the registrant has duly caused this report to be signed on its behalf by the undersigned, thereunto duly authorized.
FMI Common Stock Fund, Inc.
Registrant
By /s/Ted D. Kellner
Ted D. Kellner, Principal Executive Officer
Date May 3, 2010
Pursuant to the requirements of the Securities Exchange Act of 1934 and the Investment Company Act of 1940, this report has been signed below by the following persons on behalf of the registrant and in the capacities and on the dates indicated.
FMI Common Stock Fund, Inc.
Registrant
By /s/Ted D. Kellner
Ted D. Kellner, Principal Financial Officer
Date May 3, 2010