UNITED STATES
SECURITIES AND EXCHANGE COMMISSION
Washington, D.C. 20549
FORM N-CSR
CERTIFIED SHAREHOLDER REPORT OF REGISTERED
MANAGEMENT INVESTMENT COMPANIES
Investment Company Act file number 811-03235
FMI Common Stock Fund, Inc.
(Exact name of registrant as specified in charter)
100 East Wisconsin Avenue, Suite 2200
Milwaukee, WI 53202
(Address of principal executive offices) (Zip code)
Ted D. Kellner
Fiduciary Management, Inc.
100 East Wisconsin Avenue, Suite 2200
Milwaukee, WI 53202
(Name and address of agent for service)
(414) 226-4555
(Registrant's telephone number, including area code)
Date of fiscal year end: September 30
Date of reporting period: March 31, 2013
Item 1. Reports to Stockholders.
SEMIANNUAL REPORT
March 31, 2013
FMI Large Cap Fund
(FMIHX)
FMI Common Stock Fund
(FMIMX)
FMI International Fund
(FMIJX)
 | |
| |
| |
| |
| |
| |
| |
| FMI Funds |
| |
| Advised by Fiduciary Management, Inc. |
| |
| www.fmifunds.com |
| |
| |
| |
FMI Funds
TABLE OF CONTENTS
| FMI Large Cap Fund | | | |
| Shareholder Letter | | | 3 | |
| Schedule of Investments | | | 8 | |
| Industry Sectors | | | 9 | |
| | | | | |
| FMI Common Stock Fund | | | | |
| Shareholder Letter | | | 10 | |
| Schedule of Investments | | | 15 | |
| Industry Sectors | | | 16 | |
| | | | | |
| FMI International Fund | | | | |
| Shareholder Letter | | | 17 | |
| Schedule of Investments | | | 23 | |
| Industry Sectors | | | 25 | |
| | | | | |
| Financial Statements | | | | |
| Statements of Assets and Liabilities | | | 26 | |
| Statements of Operations | | | 27 | |
| Statements of Changes in Net Assets | | | 28 | |
| Financial Highlights | | | 29 | |
| Notes to Financial Statements | | | 32 | |
| | | | | |
| Additional Information | | | 36 | |
| Cost Discussion | | | 37 | |
| Advisory Agreements | | | 38 | |
| Disclosure Information | | | 38 | |
FMI
Large Cap
Fund
March 31, 2013
Dear Fellow Shareholders:
The FMI Large Cap Fund (FMIHX) gained 11.40%(1) in the quarter ending March 31, 2013. This compared to the benchmark Standard & Poor’s 500 Index return of 10.61%(2). Both the S&P 500 and the Fund benefitted from expanding multiples as fundamental sales and earnings growth remained in the low to mid-single-digit range. Sectors that contributed meaningfully to FMIHX returns included Electronic Technology, Finance, and Commercial Services. Finance was a significant relative detractor for the Fund last year as many lower quality financial stocks that had collapsed in 2008 and early 2009 continued to rebound (with a big assist from the Fed). We are hopeful that the better recent performance from this sector is a harbinger of what is to come. Comerica and Willis performed nicely in the March quarter, as did Berkshire Hathaway, 3M and Omnicom. On the flip side, Transportation, Health Technology and Energy Minerals had negative relative performance. Expeditors International, GlaxoSmithKline and Devon all lagged their respective sectors and the market. Near-term concerns about China and world economic growth are affecting Expeditors; Glaxo is suffering from ongoing negative European pricing trends; and Devon faces the near-term taint of being levered to natural gas, which is currently priced very low. We remain optimistic about the long-term prospects for Expeditors and Devon. Glaxo is a more complicated case where the stock is cheap but the growing uncertainties around paying for health care worldwide and the continuing lack of productivity in drug research is causing us to tread cautiously. Overall, we contend the FMI Large Cap Fund contains many good businesses. Relative to the benchmark, valuations are attractive but are somewhat above average from an absolute standpoint. As mentioned in the December letter (and the same situation applies today), overall market valuations are elevated from a historical perspective.
Some have questioned why we are not jumping on the stock market bandwagon. After all, housing is rebounding, employment is steady if not growing ever so slightly, corporate cash and cash flows are high, earnings yields are much greater than bond yields, and the public appears to be coming back to the market. Taking the first two together, housing is indeed continuing to bounce off of a very depressed bottom. Unusually low mortgage rates and FHA insurance (future bailout to follow) are assisting the housing market. Housing-related stocks have been huge winners over the past few years and seem to be discounting an environment that is much stronger than we envision. Over ten million households continue to owe more than their homes are worth. Shadow inventory remains high. A sustained improvement in housing will likely require stronger economic growth and better employment. Three things can drive economic growth: more people working, people working more hours, and more capital deployed. On the first item there has been a little progress, but as the nearby chart shows, declining labor participation is offsetting this improvement; on the second item, hours worked have been flat to down; and on the third item, fixed business investment orders have been falling, as articulated in our December letter. Gross domestic product (GDP) growth remains anemic in the 0-2% range.
Corporate cash and cash flow has been solid. A large portion of the cash is overseas and will incur a 35% tax upon repatriation. Unless tax laws change, these monies are unlikely to see our shores. Part of the cash flow dynamic reflects caution about spending on capital and people, as well as the desire for managements to continue to squeeze their cost structures as tightly as possible. This has enabled margins and earnings to remain near peak levels but this strategy cannot stay effective over the long run. Without increased capital, research and development (R&D) and people investment, sales and earnings growth degrades. In fact, sales growth and margins for the market (companies within the benchmark) peaked over a year ago. Health care mandates and higher tax rates have induced further caution in the executive and entrepreneurial ranks.
| (1) | The Fund’s 1-year and annualized 5-year and 10-year returns through March 31, 2013 were: 15.20%, 7.73% and 11.15%, respectively. |
| (2) | The S&P 500 Index, benchmark for FMIHX 1-year and annualized 5-year and 10-year returns through March 31, 2013 were: 13.96%, 5.81% and 8.53%, respectively. |
The Standard & Poor’s 500 Index consists of 500 selected common stocks, most of which are listed on the New York Stock Exchange. The Standard & Poor’s Ratings Group designates the stocks to be included in the Index on a statistical basis. A particular stock’s weighting in the Index is based on its relative total market value (i.e., its market price per share times the number of shares outstanding). Stocks may be added or deleted from the Index from time to time. An investment cannot be made directly into an Index.
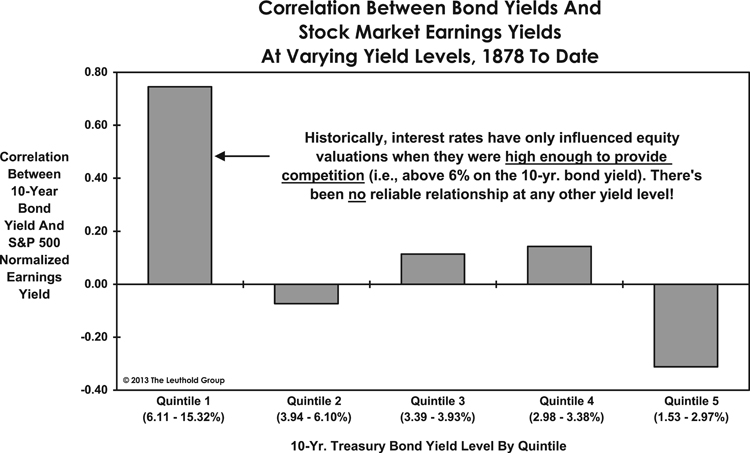
Many stock market prognosticators wax endlessly about the fact that the earnings yield (earnings per share divided by the stock price) is higher than the bond yield (10 Year Treasuries), with the implication that this means stocks are cheap. Comparing a fully priced asset (stocks) to a wildly overvalued asset (bonds) does not make stocks any cheaper. The Leuthold Group recently analyzed this phenomenon and determined that only when 10 Year Treasury yields are higher than 6%, when they pose true competition to stocks, is there even a relationship between these two yields. Eighty percent of the time there is no correlation between these ratios and they don’t seem to influence one another at all. Their conclusion: bond yields today are simply too low to matter.
Finally, we are left with the notion that positive equity fund flows will drive stock market performance. The excitement around this phenomenon seems to be related to the fact that equity mutual fund flows recently turned positive after a multi-year period of being negative. What is missing in this analysis is the role of Exchange Traded Funds (ETFs). The following chart measures fund flows broadly (equity mutual funds and equity ETFs together) along with equity returns. There are no clear discernible trends in this data; if anything, fund flows seem more apt to follow rather than lead equity returns. This
notion is supported by various studies showing the public’s actual long-term equity returns are only 30-40% of mutual fund returns, proving that they are terrible market timers. It is hard for us to get excited about the continuation of a bull market that has already outlasted the duration (48 months versus 43 months) and magnitude (153% vs. 83%) of the median of fifteen bull markets since 1929.

Investors always have to weigh the competing forces of fundamentals and valuation. Are there positives in the current environment? Of course; we articulated several of these in the December letter. Do we believe in stocks for the long run? Absolutely! Yet stocks are up over ten percent this quarter without much progress on the fundamentals, and valuations are extended. Economic growth and employment are relatively stagnant. The big problems – deficit spending, entitlements, debt, Eurozone, monetary debasement — are not going away. Investors appear to be putting an undue amount of faith in central bankers. Even if one believed money printing was a legitimate approach to “jump starting” the economy, how many times do you pull the crank before deciding that a new battery is needed? We’ve been at this for over four years. Perhaps more importantly, how do the Federal Reserve, the European Central Bank and the Bank of Japan undo what they’ve done? How do the leaders have so much confidence in ivory tower theories — the same ones that did not anticipate the housing or banking debacles — such that they can risk currency wars, misaligned investments, and inflation?
We continue to believe that despite the headwinds, stocks remain the best place to put long-term money. We are gratified that the Fund is mostly keeping up in this bull market that unfortunately seems to have a lot of air underneath it. We think the stocks we own will hold up better than most when trouble returns, but there are no guarantees. Bonds look vulnerable: ground-hugging yields and no inflation protection. Timber and agricultural land have had spectacular moves and now have low yields. Gold has no yield. Industrial and other precious metals look expensive. Much of the real estate world suffers with low cap rates. Art, particularly the contemporary variety, is very high. So, as always, we put our collective heads down and try to find good businesses at reasonable prices. Here are two stocks from the portfolio that we feel fit that bill.
3M Company (MMM)
(Analyst: Karl Poehls)
Description
3M Company, formerly known as Minnesota Mining and Manufacturing Company, operates a diversified set of industrial companies worldwide. 3M’s operations are divided into five business units: Industrial (33% of 2012 sales), Health Care (17%), Consumer (14%), Safety & Graphics (18%), and Electronics & Energy (18%). 3M is truly a global leader with approximately two-thirds of revenues generated outside the U.S.
Good Business
| | • | In 2012, 3M generated $30 billion in revenues, and greater than 60% of the total was through the sale of consumable products. |
| | • | The company is widely regarded as an innovation leader with its world-class R&D platform. In 2012, 3M ranked #3 on Booz & Company’s list of most innovative companies, behind Apple and Google. |
| | • | Over the past 10 years, 3M has consistently earned returns above its cost of capital. For the trailing 5-year and 10-year periods, the company’s return on invested capital has averaged 19% and 22%, respectively. |
| | • | 3M generates a significant amount of excess free cash flow. Over the past three years, the company has returned ~$10 billion of cash to shareholders via dividends and share buybacks. |
| | • | The company has a strong balance sheet with virtually zero net debt. 3M’s long-term debt is rated AA- at S&P and Aa2 at Moody’s. |
Valuation
| | • | The company’s current enterprise value-to-sales multiple is 2.3 times. This compares to 3M’s trailing 5-year average operating margin of 21.3%. |
| | • | 3M’s enterprise value-to-sales multiple is 15% below its trailing 10-year average of 2.7 times. |
| | • | Since 1989, 3M’s price-to-earnings (P/E) multiple has averaged 18.9 times. This compares to the company’s current P/E multiple of 15.3 times. |
Management
| | • | In early 2012, Inge Thulin was named CEO of 3M and succeeded George Buckley. Mr. Thulin joined the company in 1979 and had previously served as head of the International operations. |
| | • | Over the past three years, management has allocated capital efficiently and returned approximately 90% of free cash flow to shareholders in the form of dividends and share buybacks. |
| | • | Executive compensation is closely linked to economic profit growth and organic sales growth. |
Investment Thesis
3M is a leading global industrial franchise with a strong mix of consumable products. Slowing growth in Europe and Asia, as well as concerns over the U.S. budget sequester, are weighing on the top-line growth of major industrial companies. Further, the sluggish growth in the technology industry is pressuring 3M’s electronics revenue. This presents us with the opportunity to invest in a very strong global franchise at a historically low valuation level.
PACCAR Inc. (PCAR)
(Analyst: Dan Sievers)
Description
PACCAR (PCAR) is a highly efficient manufacturer and distributor of premium quality medium and heavy duty commercial trucks and related aftermarket parts. Its financial services company financed or leased 31% of the 140,400 trucks delivered in 2012. In 2012, the United States accounted for 44% of truck deliveries, and the U.S. and Canada together represented 57% of revenues. Europe contributed 24.5% of revenues; and Mexico, South America, Australia, and other geographies contributed 18.5% of revenues. The company controls three coveted brands in Kenworth (North America, South America, Australia), DAF (Europe, Mexico, South America, Australia), and Peterbilt (U.S. & Canada only), each supported by strong dealer networks. In 2012, PCAR’s share of the heavy duty U.S. & Canada market and the Western & Central European market was 28.9% and 16.0% respectively (both record levels).
Good Business
| | • | Trucking is a necessary business and market level replacement demand is estimable. |
| | • | PCAR has been a long-term organic share gainer in every one of its markets, aided by a strong R&D culture, rapid new product development, and the most profitable and well-capitalized dealer network. Through recent investments, the company is expanding into Russia, Brazil, and greater South America. |
| | • | Increasing truck sophistication raises revenue per truck, naturally lifts the aftermarket, and provides PCAR with opportunities to add proprietary content (producing further aftermarket lift). |
| | • | Aftermarket parts sales have compounded at 10% over the past 10 years with low sales and gross margin volatility. Parts contributed 40-108% of truck segment gross profit from 2007-2011 (5-year period). |
| | • | In North America, the truck manufacturing business is highly consolidated (4 main players). It requires few plants, little inventory (3- to 5-month lead times), and often generates negative working capital (cash in before delivery). As such, PCAR’s truck manufacturing return on invested capital (ROIC) is north of 20%. |
| | • | PCAR’s self-funding financial services arm has a stellar track record of low-losses and solid returns. |
Valuation
| | • | PCAR shares sell for 24% less than their 2007 high, though the S&P 500 has surpassed its high from the same period. The company trades at a reasonable 16 times trailing P/E multiple, though its 2012 truck gross margin remains 36% below the 2004-2007 (4-year period) average, as truck volumes remain at or below replacement demand in its main markets. |
| | • | PCAR trades at a discount to its 10-year average price to tangible book and enterprise value (EV) to sales multiples. |
Management
| | • | Mark Pigott (age 58), great grandson of founder William Pigott, has been Chairman and CEO since 1997, a PCAR employee for 32 years, and personally owns over $250 million in PCAR stock. The Pigott family holds two board seats and about 30% of the shares (between 36 family members). |
| | • | Growth has been organic since the 1996 DAF acquisition in Europe. |
| | • | PCAR pays regular and special dividends (50% average payout ratio) and has reduced the share count through opportunistic buybacks. |
| | • | Executive compensation is tied to returns on capital. |
Investment Thesis
PCAR is a high-quality, high-return manufacturing business that utilizes and develops industry-leading technology. PCAR’s management team has an excellent track record and continues to win market share and expand globally in a prudent way. The truck industry is cyclical and is currently producing units somewhat below the replacement level of demand across PCAR’s main markets. Given truck volumes and truck gross margins that are far from peak levels, we believe that PCAR is attractively priced below its average 10-year price to tangible book and EV to sales multiples.
Thank you for your confidence in the FMI Large Cap Fund.
100 E. Wisconsin Ave., Suite 2200 • Milwaukee, WI 53202 • 414-226-4555
www.fmifunds.com
FMI Large Cap Fund
SCHEDULE OF INVESTMENTS
March 31, 2013 (Unaudited)
| Shares | | | | Cost | | | Value | |
| | | | | | | |
| COMMON STOCKS — 93.4% (a) | | | | | | |
| | | | | | | |
| COMMERCIAL SERVICES SECTOR — 6.5% | | | | | | |
| | | Advertising/Marketing | | | | | | |
| | | Services — 3.9% | | | | | | |
| | 4,788,000 | | Omnicom | | �� | | | | |
| | | | Group Inc. | | $ | 218,697,298 | | | $ | 282,013,200 | |
| | | | Miscellaneous Commercial | | | | | | | | |
| | | | Services — 2.6% | | | | | | | | |
| | 4,208,000 | | Cintas Corp. | | | 116,881,902 | | | | 185,699,040 | |
| | | | | | | | | | | | |
| CONSUMER NON-DURABLES SECTOR — 8.2% | | | | | | | | |
| | | | Food: Major | | | | | | | | |
| | | | Diversified — 5.7% | | | | | | | | |
| | 14,225,000 | | Danone | | | | | | | | |
| | | | S.A. - SP-ADR | | | 192,894,496 | | | | 199,576,750 | |
| | 2,921,000 | | Nestlé | | | | | | | | |
| | | | S.A. - SP-ADR | | | 133,781,245 | | | | 211,684,870 | |
| | | | | | | 326,675,741 | | | | 411,261,620 | |
| | | | Household/Personal | | | | | | | | |
| | | | Care — 2.5% | | | | | | | | |
| | 1,855,000 | | Kimberly-Clark | | | | | | | | |
| | | | Corp. | | | 111,334,017 | | | | 181,752,900 | |
| | | | | | | | | | | | |
| CONSUMER SERVICES SECTOR — 3.3% | | | | | | | | |
| | | | Media Conglomerates — 3.3% | | | | | | | | |
| | 4,090,700 | | Time Warner Inc. | | | 115,891,986 | | | | 235,706,134 | |
| | | | | | | | | | | | |
| DISTRIBUTION SERVICES SECTOR — 7.0% | | | | | | | | |
| | | | Food Distributors — 4.0% | | | | | | | | |
| | 8,262,100 | | Sysco Corp. | | | 229,863,313 | | | | 290,578,057 | |
| | | | Medical Distributors — 3.0% | | | | | | | | |
| | 4,196,000 | | AmerisourceBergen | | | | | | | | |
| | | | Corp. | | | 122,884,492 | | | | 215,884,200 | |
| | | | | | | | | | | | |
| ELECTRONIC TECHNOLOGY SECTOR — 4.3% | | | | | | | | |
| | | | Electronic Components — 4.3% | | | | | | | | |
| | 7,326,000 | | TE Connectivity Ltd. | | | 197,410,912 | | | | 307,179,180 | |
| | | | | | | | | | | | |
| ENERGY MINERALS SECTOR — 3.4% | | | | | | | | |
| | | | Oil & Gas Production — 3.4% | | | | | | | | |
| | 4,320,000 | | Devon Energy Corp. | | | 275,601,136 | | | | 243,734,400 | |
| | | | | | | | | | | | |
| FINANCE SECTOR — 13.6% | | | | | | | | |
| | | | Financial Conglomerates — 3.1% | | | | | | | | |
| | 3,303,000 | | American | | | | | | | | |
| | | | Express Co. | | | 120,045,248 | | | | 222,820,380 | |
| | | | Insurance Brokers/Services — 2.0% | | | | | | | | |
| | 3,609,400 | | Willis Group | | | | | | | | |
| | | | Holdings PLC | | | 137,409,444 | | | | 142,535,206 | |
| | | | Major Banks — 8.5% | | | | | | | | |
| | 13,500,000 | | Bank of New York | | | | | | | | |
| | | | Mellon Corp. | | | 348,544,628 | | | | 377,865,000 | |
| | 6,610,000 | | Comerica Inc. | | | 201,481,212 | | | | 237,629,500 | |
| | | | | | | 550,025,840 | | | | 615,494,500 | |
| HEALTH TECHNOLOGY SECTOR — 6.7% | | | | | | | | |
| | | | Medical Specialties — 3.8% | | | | | | | | |
| | 4,079,000 | | Covidien PLC | | | 191,739,030 | | | | 276,719,360 | |
| | | | Pharmaceuticals: Major — 2.9% | | | | | | | | |
| | 4,458,000 | | GlaxoSmithKline | | | | | | | | |
| | | | PLC - SP-ADR | | | 193,185,051 | | | | 209,124,780 | |
| | | | | | | | | | | | |
| INDUSTRIAL SERVICES SECTOR — 3.0% | | | | | | | | |
| | | | Oilfield Services/Equipment — 3.0% | | | | | | | | |
| | 2,890,000 | | Schlumberger Ltd. | | | 184,323,009 | | | | 216,432,100 | |
| | | | | | | | | | | | |
| PROCESS INDUSTRIES SECTOR — 2.3% | | | | | | | | |
| | | | Chemicals: Agricultural — 2.3% | | | | | | | | |
| | 1,577,550 | | Monsanto Co. | | | 94,402,548 | | | | 166,636,607 | |
| | | | | | | | | | | | |
| PRODUCER MANUFACTURING SECTOR — 19.2% | | | | | | | | |
| | | | Industrial Conglomerates — 13.4% | | | | | | | | |
| | 3,660,000 | | 3M Co. | | | 283,403,903 | | | | 389,094,600 | |
| | 3,640,000 | | Berkshire Hathaway | | | | | | | | |
| | | | Inc. — Cl B* | | | 264,916,749 | | | | 379,288,000 | |
| | 3,615,000 | | Ingersoll-Rand PLC | | | 155,985,518 | | | | 198,861,150 | |
| | | | | | | 704,306,170 | | | | 967,243,750 | |
| | | | Industrial Machinery — 3.6% | | | | | | | | |
| | 4,275,000 | | Illinois Tool | | | | | | | | |
| | | | Works Inc. | | | 213,555,494 | | | | 260,518,500 | |
| | | | Trucks/Construction/Farm | | | | | | | | |
| | | | Machinery — 2.2% | | | | | | | | |
| | 3,060,000 | | PACCAR Inc. | | | 124,301,868 | | | | 154,713,600 | |
| | | | | | | | | | | | |
| RETAIL TRADE SECTOR — 3.5% | | | | | | | | |
| | | | Discount Stores — 3.5% | | | | | | | | |
| | 3,327,000 | | Wal-Mart | | | | | | | | |
| | | | Stores Inc. | | | 169,116,849 | | | | 248,959,410 | |
| | | | | | | | | | | | |
| TECHNOLOGY SERVICES SECTOR — 10.0% | | | | | | | | |
| | | | Data Processing Services — 2.8% | | | | | | | | |
| | 3,106,000 | | Automatic Data | | | | | | | | |
| | | | Processing Inc. | | | 130,171,113 | | | | 201,952,120 | |
| | | | Information Technology | | | | | | | | |
| | | | Services — 4.9% | | | | | | | | |
| | 4,643,000 | | Accenture PLC | | | 212,895,022 | | | | 352,728,710 | |
| | | | Packaged Software — 2.3% | | | | | | | | |
| | 5,818,000 | | Microsoft Corp. | | | 163,583,765 | | | | 166,452,980 | |
| | | | | | | | | | | | |
| TRANSPORTATION SECTOR — 2.4% | | | | | | | | |
| | | | Air Freight/Couriers — 2.4% | | | | | | | | |
| | 4,935,000 | | Expeditors | | | | | | | | |
| | | | International of | | | | | | | | |
| | | | Washington Inc. | | | 186,888,816 | | | | 176,228,850 | |
| | | | Total common stocks | | | 5,091,190,064 | | | | 6,732,369,584 | |
FMI Large Cap Fund
SCHEDULE OF INVESTMENTS (Continued)
March 31, 2013 (Unaudited)
| Principal Amount | | | Cost | | | Value | |
| | | | | | | | |
| | | | | | | | |
| SHORT-TERM INVESTMENTS — 6.0% (a) | | | | |
| | | | | |
| | | U.S. Treasury Securities — 5.5% | | | | | |
| $ | 100,000,000 | | U.S. Treasury Bills, | | | | | |
| | | | | 0.0075%, | | | | | |
| | | | due 04/04/13 | $ | 99,999,937 | | | $ | 99,999,937 | |
| | 100,000,000 | | U.S. Treasury Bills, | | | | | | | |
| | | | | 0.0250%, | | | | | | | |
| | | | due 04/11/13 | | 99,999,305 | | | | 99,999,305 | |
| | 100,000,000 | | U.S. Treasury Bills, | | | | | | | |
| | | | | 0.0550%, | | | | | | | |
| | | | due 04/18/13 | | 99,997,403 | | | | 99,997,403 | |
| | 100,000,000 | | U.S. Treasury Bills, | | | | | | | |
| | | | | 0.0600%, | | | | | | | |
| | | | due 04/25/13 | | 99,996,000 | | | | 99,996,000 | |
| | | | Total U.S. | | | | | | | |
| | | | Treasury Securities | | 399,992,645 | | | | 399,992,645 | |
| | | | | | | | | | | | |
| | | | Commercial Paper — 0.5% | | | | | | | |
| | 35,500,000 | | U.S. Bank, N.A., 0.02%, | | | | | | | |
| | | | due 04/01/13 | | 35,500,000 | | | | 35,500,000 | |
| | | | Total short-term | | | | | | | |
| | | | investments | | 435,492,645 | | | | 435,492,645 | |
| | | | Total investments | | | | | | | |
| | | | | — 99.4% | $ | 5,526,682,709 | | | | 7,167,862,229 | |
| | | | Other assets, | | | | | | | |
| | | | less liabilities | | | | | | | |
| | | | | — 0.6% (a) | | | | | | 42,649,450 | |
| | | | TOTAL NET | | | | | | | |
| | | | ASSETS — 100.0% | | | | | $ | 7,210,511,679 | |
| | | | | | | | | | | | |
| * | Non-income producing security. |
| (a) | Percentages for the various classifications relate to net assets. |
PLC – Public Limited Company
SP-ADR – Sponsored American Depositary Receipt
The accompanying notes to financial statements are an integral part of this schedule.
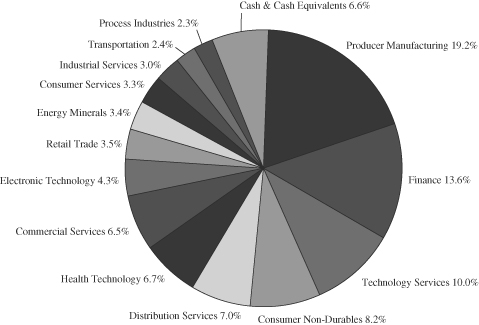
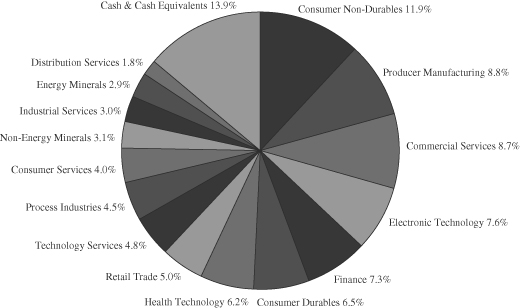
INDUSTRY SECTORS
as of March 31, 2013 (Unaudited)
FMI
Common Stock
Fund
March 31, 2013
Dear Fellow Shareholders:
The FMI Common Stock Fund (FMIMX) gained 10.20%(1) in the quarter ending March 31, 2013. This compared to the benchmark Russell 2000 Index return of 12.39%(2). Both the Russell 2000 and the FMI Common Stock Fund benefitted from expanding multiples as fundamental sales and earnings growth remained in the low to mid-single-digit range. Sectors that contributed meaningfully to FMIMX returns included Energy Minerals, Finance, and Electronic Technology. Finance was a significant relative detractor for the Fund last year as many lower quality financial stocks that had collapsed in 2008 and early 2009 continued to rebound (with a big assist from the Fed). We are hopeful that the better recent performance from this sector is a harbinger of what is to come. Protective Life and Ryder System performed nicely in the March quarter, as did Arthur Gallagher, Mine Safety, AptarGroup and Innophos Holdings. On the flip side, some of the distribution companies, including ScanSource and World Fuel Services, lagged in the quarter. Retail Trade and Commercial Services also detracted from performance. Family Dollar and Dun & Bradstreet were the culprits here. Some of the industrial and technology stocks are feeling the effects of a sluggish economy; Kennametal, Arrow and Molex were subpar performers in the March quarter. We remain optimistic about the long-term prospects for these companies. We took advantage of the bull market to sell several stocks this quarter that have reached our valuation limits. Overall, we contend the FMI Common Stock Fund contains many good businesses. Relative to the benchmark, valuations are very attractive but are somewhat above average from an absolute standpoint. As mentioned in the December letter (and the same situation applies today), overall market valuations are elevated from a historical perspective.
Some have questioned why we are not jumping on the stock market bandwagon. After all, housing is rebounding, employment is steady if not growing ever so slightly, corporate cash and cash flows are high, earnings yields are much greater than bond yields, and the public appears to be coming back to the market. Taking the first two together, housing is indeed continuing to bounce off of a very depressed bottom. Unusually low mortgage rates and FHA insurance (future bailout to follow) are assisting the housing market. Housing-related stocks have been huge winners over the past few years and seem to be discounting an environment that is much stronger than we envision. Over ten million households continue to owe more than their homes are worth. Shadow inventory remains high. A sustained improvement in housing will likely require stronger economic growth and better employment. Three things can drive economic growth: more people working, people working more hours, and more capital deployed. On the first item there has been a little progress, but as the nearby chart shows, declining labor participation is offsetting this improvement; on the second item, hours worked have been flat to down; and on the third item, fixed business investment orders have been falling, as articulated in our December letter. Gross domestic product (GDP) growth remains anemic in the 0-2% range.
Corporate cash and cash flow has been solid. A large portion of the cash is overseas and will incur a 35% tax upon repatriation. Unless tax laws change, these monies are unlikely to see our shores. Part of the cash flow dynamic reflects caution about spending on capital and people, as well as the desire for managements to continue to squeeze their cost structures as tightly as possible. This has enabled margins and earnings to remain near peak levels but this strategy cannot stay effective over the long run. Without increased capital, research and development (R&D) and people investment, sales and earnings growth degrades. In fact, sales growth and margins for the market (companies within the benchmark) peaked over a year ago. Health care mandates and higher tax rates have induced further caution in the executive and entrepreneurial ranks.
| (1) | The Fund’s 1-year and annualized 5-year and 10-year returns through March 31, 2013 were: 10.31%, 11.15%, and 12.46%, respectively. |
| (2) | The Russell 2000 Index, benchmark for FMIMX 1-year and annualized 5-year and 10-year returns through March 31, 2013 were: 16.30%, 8.24% and 11.52%, respectively. |
The Russell 2000 Index measures the performance of the 2,000 smallest companies in the Russell 3000 Index which comprises the 3,000 largest U.S. companies based on total market capitalization. An investment cannot be made directly into an index.
Many stock market prognosticators wax endlessly about the fact that the earnings yield (earnings per share divided by the stock price) is higher than the bond yield (10 Year Treasuries), with the implication that this means stocks are cheap. Comparing a fully priced asset (stocks) to a wildly overvalued asset (bonds) does not make stocks any cheaper. The Leuthold Group recently analyzed this phenomenon and determined that only when 10 Year Treasury yields are higher than 6%, when they pose true competition to stocks, is there even a relationship between these two yields. Eighty percent of the time there is no correlation between these ratios and they don’t seem to influence one another at all. Their conclusion: bond yields today are simply too low to matter.
Finally, we are left with the notion that positive equity fund flows will drive stock market performance. The excitement around this phenomenon seems to be related to the fact that equity mutual fund flows recently turned positive after a multi-year period of being negative. What is missing in this analysis is the role of Exchange Traded Funds (ETFs). The following chart measures fund flows broadly (equity mutual funds and equity ETFs together) along with equity returns. There are no clear discernible trends in this data; if anything, fund flows seem more apt to follow rather than lead equity returns. This
notion is supported by various studies showing the public’s actual long-term equity returns are only 30-40% of mutual fund returns, proving that they are terrible market timers. It is hard for us to get excited about the continuation of a bull market that has already outlasted the duration (48 months versus 43 months) and magnitude (153% vs. 83%) of the median of fifteen bull markets since 1929.
Investors always have to weigh the competing forces of fundamentals and valuation. Are there positives in the current environment? Of course; we articulated several of these in the December letter. Do we believe in stocks for the long run? Absolutely! Yet stocks are up over ten percent this quarter without much progress on the fundamentals, and valuations are extended. Economic growth and employment are relatively stagnant. The big problems – deficit spending, entitlements, debt, Eurozone, monetary debasement — are not going away. Investors appear to be putting an undue amount of faith in central bankers. Even if one believed money printing was a legitimate approach to “jump starting” the economy, how many times do you pull the crank before deciding that a new battery is needed? We’ve been at this for over four years. Perhaps more importantly, how do the Federal Reserve, the European Central Bank and the Bank of Japan undo what they’ve done? How do the leaders have so much confidence in ivory tower theories — the same ones that did not anticipate the housing or banking debacles — such that they can risk currency wars, misaligned investments, and inflation?
We continue to believe that despite the headwinds, stocks remain the best place to put long-term money. We are gratified that the Fund is mostly keeping up in this bull market that unfortunately seems to have a lot of air underneath it. We think the stocks we own will hold up better than most when trouble returns, but there are no guarantees. Bonds look vulnerable: ground-hugging yields and no inflation protection. Timber and agricultural land have had spectacular moves and now have low yields. Gold has no yield. Industrial and other precious metals look expensive. Much of the real estate world suffers with low cap rates. Art, particularly the contemporary variety, is very high. So, as always, we put our collective heads down and try to find good businesses at reasonable prices. Here are two stocks from the portfolio that we feel fit that bill.
MKS Instruments, Inc. (MKSI)
(Analyst: Dan Sievers)
Description
MKS Instruments, Inc. is a 50-year-old Andover, Massachusetts company, and the global leader in developing and providing instruments, components, and subsystems that measure, control, power, sterilize, and monitor the critical parameters of semiconductor manufacturing (64% of revenue) and other precision-controlled manufacturing industries (36%
of revenues), such as LED, data storage, medical, biopharma, solar, environmental, and purification. MKSI’s products are generally critical in the effort to enhance yield, throughput, and uptime of manufacturing tools and equipment in the industries served.
Good Business
| | • | MKSI claims a leading 34% global market share (equal to the next 5 competitors combined) in its core semiconductor markets, and is #1 or #2 in ten of its twelve main product lines. |
| | • | Manufacturing innovation demands increasing process chamber control, which has tended to benefit MKSI in terms of new products, new applications, and increased content. |
| | • | Relative to the greater semiconductor industry, MKSI’s products are easy to understand and there is a low risk of technological obsolescence. |
| | • | MKSI leverages consistent research and development (R&D) spending (7%-14% of cyclical revenues) outside of semiconductor markets, which will continue to be a driver of organic growth (and services growth), customer diversification, and high incremental returns on R&D spending. |
| | • | Returns on invested capital, though volatile, have averaged 16% and 13% over the past 5 and 10-year periods after adjusting for excess cash (operating cash assumed equal to 5% of sales). |
| | • | Net balance sheet cash equals 45% of MKSI’s market value. The company has a regular dividend (2.4% yield) and a history of share repurchases. |
Valuation
| | • | Adjusting for $11.80/share in net cash, MKSI trades for 9.2 times the FY2014 EPS estimate. |
| | • | Over the past nine years (following three weak years for semis), MKSI operating margins have averaged 13.4%. Margins fluctuate with the cycle, but structural margins have improved. MKSI’s profitability compares favorably to an enterprise value-to-sales multiple of 1.2. |
| | • | MKSI trades for 1.7 times its tangible book value ($16.10/share) vs. a 10-year average of 2.2 times. |
| | • | Over the past five years, free cash flow totaled $487 million (62% of the enterprise value). |
Management
| | • | Management’s reputation is excellent and executive turnover is remarkably low. |
| | • | CEO Leo Berlinghieri (58) has 32 years of MKSI experience, and former CEO and Chairman John Bertucci (71) has 42 years. |
| | • | Management invests with a long-term focus, facilitated by a conservative balance sheet. Financial presentations utilize few adjustments and MKSI compensation programs are well-designed – MKSI grants restricted stock units (RSUs), but not options. |
Investment Thesis
MKS is a durable and well-managed franchise with a leading global market position that should experience solid, though highly cyclical, growth in and out of semiconductor end-markets. Cyclically weak earnings and analyst and investor focus on timing the semiconductor cycle have resulted in shares that are cheap on an absolute basis, particularly when compared to MKSI’s historical price to tangible book multiples (or most other metrics that capture MKSI’s large cash hoard), and this provides an attractive entry point for longer-term investors.
McDermott International Inc.
(Analyst: Dan Sievers)
Description
McDermott International (MDR), based in Houston, Texas, has provided global engineering, procurement, construction & fabrication, marine installation (EPCI), and other marine services to the upstream offshore oil & gas industry since the industry’s advent in 1947. In this space, MDR continues to be one of five global leaders, generating $3.6 billion in 2012 revenues. When compared to the broader engineering & construction (E&C) industry, the barriers to entering MDR’s markets and bidding effectively are substantially higher given the criticality of the marine vessel fleet in providing end-to-end project solutions to offshore oil & gas customers. In any given year, MDR is likely to work on 30 to 40 projects, with 6 to 10 projects accounting for up to 75% of revenue.
Good Business
| | • | MDR is a leader in a necessary industry, which offers good visibility relative to other E&C markets, and a strong multi-year spending cycle appears to be accelerating. |
| | • | MDR is well-positioned in geographies where new projects are expected to be plentiful. |
| | • | Net balance sheet cash and equivalents account for 23% of market capitalization. |
| | • | Over the past eight years, MDR has had success earning low-to-mid-teen returns on its invested capital while managing the challenges inherent in fixed-price contracting (60-70% of revenues). This has been achieved, despite ownership of more physical assets (marine vessels), and higher net cash than a typical E&C company. |
Valuation
| | • | Premature exuberance for a strong spending cycle bid MDR shares to $25.00 following solid 2010 execution and backlog growth. Since April 2011, MDR shares have fallen 58% because of lower vessel utilization, three smaller problem contracts, and lumpy award bookings. |
| | • | MDR earned an 8.8% operating margin in 2012, but its targeted 10%-12% operating margin range looks achievable going forward (and in line with the 8-year average), leaving the business attractively priced at just 0.6 times enterprise value-to-sales; 4.5 times enterprise value-to-earnings before interest, taxes, depreciation and amortization (EV/EBITDA); and 1.3 times price-to-book. |
| | • | MDR’s Atlantic segment and its two young joint ventures showed losses in each of the past three years, although a reasonable spending cycle should correct this. |
Management
| | • | CEO Steve Johnson (61) had over 25 years of related industry experience at Fluor and URS before joining MDR in 2009. |
| | • | MDR management stresses return on capital, which became a compensation metric in 2011. |
| | • | Management has exhibited a solid price discipline early in the spending cycle, focusing on profitable favorably-priced contracts (occasionally working against bookings). |
Investment Thesis
Over the past eight years, MDR has achieved nearly the center of its 10%-12% long-term operating margin target on a GAAP basis (including impairment charges), although recent operational hiccups and low vessel utilization yielded 7.3% and 8.8% operating margins in 2011 and 2012, respectively. Over the same period, management has right-sized the vessel fleet and reduced fixed costs while adding to MDR’s solid deepwater competencies, but progress has been somewhat masked by trough activity in the Gulf of Mexico (made worse by the 2010 Macondo disaster) and losses at MDR’s young joint ventures. Positively, one of MDR’s major competitors recently announced that it will begin bidding more conservatively (for margin rather than market share), which may lend greater discipline to the industry. Earnings for 2013 continue to look depressed, but could easily double by 2015. With the backdrop of favorable industry spending, the shares provide an attractive risk/reward.
Thank you for your support of the FMI Common Stock Fund.
100 E. Wisconsin Ave., Suite 2200 • Milwaukee, WI 53202 • 414-226-4555
www.fmifunds.com
FMI Common Stock Fund
SCHEDULE OF INVESTMENTS
March 31, 2013 (Unaudited)
| Shares | | | | Cost | | | Value | |
| | | | | | | | | |
| COMMON STOCKS — 87.9% (a) | | | | | | |
| | | | | | | |
| COMMERCIAL SERVICES SECTOR — 5.7% | | | | | | |
| | | Financial Publishing/ | | | | | | |
| | | Services — 1.9% | | | | | | |
| | 272,000 | | The Dun & | | | | | | |
| | | | Bradstreet Corp. | | $ | 18,520,002 | | | $ | 22,752,800 | |
| | | | Miscellaneous Commercial | | | | | | | | |
| | | | Services — 2.4% | | | | | | | | |
| | 646,000 | | Cintas Corp. | | | 15,472,786 | | | | 28,507,980 | |
| | | | Personnel Services — 1.4% | | | | | | | | |
| | 425,000 | | Robert Half | | | | | | | | |
| | | | International Inc. | | | 11,128,001 | | | | 15,950,250 | |
| | | | | | | | | | | | |
| CONSUMER DURABLES SECTOR — 1.6% | | | | | | | | |
| | | | Other Consumer | | | | | | | | |
| | | | Specialties — 1.6% | | | | | | | | |
| | 384,000 | | Mine Safety | | | | | | | | |
| | | | Appliances Co. | | | 10,977,247 | | | | 19,054,080 | |
| | | | | | | | | | | | |
| DISTRIBUTION SERVICES SECTOR — 17.1% | | | | | | | | |
| | | | Electronics Distributors — 9.4% | | | | | | | | |
| | 515,000 | | Anixter | | | | | | | | |
| | | | International Inc. | | | 34,020,675 | | | | 36,008,800 | |
| | 1,273,000 | | Arrow | | | | | | | | |
| | | | Electronics Inc.* | | | 26,008,249 | | | | 51,709,260 | |
| | 857,000 | | ScanSource Inc.* | | | 22,062,384 | | | | 24,184,540 | |
| | | | | | | 82,091,308 | | | | 111,902,600 | |
| | | | Medical Distributors — 5.4% | | | | | | | | |
| | 690,000 | | Owens & Minor Inc. | | | 19,866,306 | | | | 22,466,400 | |
| | 1,093,000 | | Patterson Cos. Inc. | | | 24,131,228 | | | | 41,577,720 | |
| | | | | | | 43,997,534 | | | | 64,044,120 | |
| | | | Wholesale Distributors — 2.3% | | | | | | | | |
| | 676,000 | | World Fuel | | | | | | | | |
| | | | Services Corp. | | | 27,739,331 | | | | 26,850,720 | |
| | | | | | | | | | | | |
| ELECTRONIC TECHNOLOGY SECTOR — 1.4% | | | | | | | | |
| | | | Electronic Production | | | | | | | | |
| | | | Equipment — 1.4% | | | | | | | | |
| | 620,000 | | MKS | | | | | | | | |
| | | | Instruments Inc. | | | 16,677,639 | | | | 16,864,000 | |
| | | | | | | | | | | | |
| ENERGY MINERALS SECTOR — 4.1% | | | | | | | | |
| | | | Oil & Gas Production — 4.1% | | | | | | | | |
| | 651,000 | | Cimarex Energy Co. | | | 37,691,540 | | | | 49,111,440 | |
| | | | | | | | | | | | |
| FINANCE SECTOR — 14.8% | | | | | | | | |
| | | | Finance/Rental/Leasing — 2.3% | | | | | | | | |
| | 464,000 | | Ryder System Inc. | | | 19,491,481 | | | | 27,724,000 | |
| | | | Insurance Brokers/ | | | | | | | | |
| | | | Services — 2.4% | | | | | | | | |
| | 698,000 | | Arthur J. | | | | | | | | |
| | | | Gallagher & Co. | | | 14,790,790 | | | | 28,834,380 | |
| | | | Life/Health Insurance — 2.8% | | | | | | | | |
| | 912,000 | | Protective Life Corp. | | | 14,176,471 | | | | 32,649,600 | |
| | | | | | | | | | | | |
| | | | Property/Casualty | | | | | | | | |
| | | | Insurance — 3.4% | | | | | | | | |
| | 125,050 | | Greenlight | | | | | | | | |
| | | | Capital Re Ltd.* | | | 3,062,989 | | | | 3,057,473 | |
| | 840,000 | | W.R. Berkley Corp. | | | 20,975,570 | | | | 37,270,800 | |
| | | | | | | 24,038,559 | | | | 40,328,273 | |
| | | | Regional Banks — 3.9% | | | | | | | | |
| | 605,000 | | Cullen/Frost | | | | | | | | |
| | | | Bankers Inc. | | | 35,152,346 | | | | 37,830,650 | |
| | 356,600 | | Zions Bancorporation | | | 7,544,247 | | | | 8,911,434 | |
| | | | | | | 42,696,593 | | | | 46,742,084 | |
| HEALTH TECHNOLOGY SECTOR — 2.5% | | | | | | | | |
| | | | Medical Specialties — 2.5% | | | | | | | | |
| | 239,000 | | Bio-Rad | | | | | | | | |
| | | | Laboratories Inc.* | | | 19,891,707 | | | | 30,114,000 | |
| | | | | | | | | | | | |
| INDUSTRIAL SERVICES SECTOR — 3.4% | | | | | | | | |
| | | | Oilfield Services/ | | | | | | | | |
| | | | Equipment — 3.4% | | | | | | | | |
| | 303,000 | | Bristow Group Inc. | | | 7,828,242 | | | | 19,979,820 | |
| | 1,824,000 | | McDermott | | | | | | | | |
| | | | International Inc.* | | | 22,912,791 | | | | 20,045,760 | |
| | | | | | | 30,741,033 | | | | 40,025,580 | |
| PROCESS INDUSTRIES SECTOR — 11.5% | | | | | | | | |
| | | | Chemicals: Specialty — 6.0% | | | | | | | | |
| | 313,000 | | Compass Minerals | | | | | | | | |
| | | | International Inc. | | | 22,650,054 | | | | 24,695,700 | |
| | 446,000 | | Innophos | | | | | | | | |
| | | | Holdings Inc. | | | 22,106,900 | | | | 24,333,760 | |
| | 285,000 | | Sigma-Aldrich Corp. | | | 13,854,975 | | | | 22,138,800 | |
| | | | | | | 58,611,929 | | | | 71,168,260 | |
| | | | Containers/Packaging — 2.9% | | | | | | | | |
| | 596,000 | | AptarGroup Inc. | | | 16,512,515 | | | | 34,180,600 | |
| | | | Industrial Specialties — 2.6% | | | | | | | | |
| | 789,000 | | H.B. Fuller Co. | | | 22,295,817 | | | | 30,834,120 | |
| | | | | | | | | | | | |
| PRODUCER MANUFACTURING SECTOR — 14.7% | | | | | | | | |
| | | | Auto Parts: OEM — 2.5% | | | | | | | | |
| | 1,507,000 | | Gentex Corp. | | | 28,762,937 | | | | 30,155,070 | |
| | | | Electrical Products — 3.4% | | | | | | | | |
| | 1,645,000 | | Molex Inc. — Cl A | | | 29,088,904 | | | | 39,677,400 | |
| | | | Industrial Machinery — 2.8% | | | | | | | | |
| | 840,000 | | Kennametal Inc. | | | 33,600,357 | | | | 32,793,600 | |
| | | | Metal Fabrication — 0.1% | | | | | | | | |
| | 47,975 | | Kaydon Corp. | | | 1,231,903 | | | | 1,227,200 | |
| | | | Miscellaneous | | | | | | | | |
| | | | Manufacturing — 3.1% | | | | | | | | |
| | 546,000 | | Carlisle Cos. Inc. | | | 14,007,132 | | | | 37,013,340 | |
| | | | Office Equipment/Supplies — 2.8% | | | | | | | | |
| | 776,000 | | Avery | | | | | | | | |
| | | | Dennison Corp. | | | 22,252,409 | | | | 33,422,320 | |
FMI Common Stock Fund
SCHEDULE OF INVESTMENTS (Continued)
March 31, 2013 (Unaudited)
| Shares | | | | Cost | | | Value | |
| | | | | | | | | |
| | | | | | | | | |
| COMMON STOCKS — 87.9% (a) (Continued) | | | | | | |
| | | | | | | |
| RETAIL TRADE SECTOR — 3.6% | | | | | | |
| | | Apparel/Footwear | | | | | | |
| | | Retail — 1.0% | | | | | | |
| | 281,000 | | Jos. A. Bank | | | | | | |
| | | | Clothiers Inc.* | | $ | 11,283,515 | | | $ | 11,211,900 | |
| | | | Discount Stores — 2.6% | | | | | | | | |
| | 527,000 | | Family Dollar | | | | | | | | |
| | | | Stores Inc. | | | 21,060,256 | | | | 31,119,350 | |
| | | | | | | | | | | | |
| TECHNOLOGY SERVICES SECTOR — 4.1% | | | | | | | | |
| | | | Data Processing Services — 3.0% | | | | | | | | |
| | 1,421,000 | | Broadridge Financial | | | | | | | | |
| | | | Solutions Inc. | | | 30,627,063 | | | | 35,297,640 | |
| | | | Information Technology | | | | | | | | |
| | | | Services — 1.1% | | | | | | | | |
| | 276,000 | | Jack Henry & | | | | | | | | |
| | | | Associates Inc. | | | 4,854,788 | | | | 12,753,960 | |
| | | | | | | | | | | | |
| TRANSPORTATION SECTOR — 3.4% | | | | | | | | |
| | | | Air Freight/Couriers — 1.1% | | | | | | | | |
| | 352,000 | | Forward Air Corp. | | | 11,267,415 | | | | 13,126,080 | |
| | | | Marine Shipping — 2.3% | | | | | | | | |
| | 358,000 | | Kirby Corp.* | | | 15,889,528 | | | | 27,494,400 | |
| | | | Total common stocks | | | 751,468,490 | | | | 1,042,931,147 | |
| | | | | | | | | | | | |
| SHORT-TERM INVESTMENTS — 12.3% (a) | | | | | | | | |
| | | | | | | | | |
| | | | U.S. Treasury Securities — 10.5% | | | | | | | | |
| $ | 25,000,000 | | U.S. Treasury Bills, | | | | | | | | |
| | | | 0.0075%, | | | | | | | | |
| | | | due 04/04/13 | | | 24,999,984 | | | | 24,999,984 | |
| | 25,000,000 | | U.S. Treasury Bills, | | | | | | | | |
| | | | 0.0250%, | | | | | | | | |
| | | | due 04/11/13 | | | 24,999,826 | | | | 24,999,826 | |
| | 25,000,000 | | U.S. Treasury Bills, | | | | | | | | |
| | | | 0.0550%, | | | | | | | | |
| | | | due 04/18/13 | | | 24,999,351 | | | | 24,999,351 | |
| | 50,000,000 | | U.S. Treasury Bills, | | | | | | | | |
| | | | 0.0600%, | | | | | | | | |
| | | | due 04/25/13 | | | 49,998,000 | | | | 49,998,000 | |
| | | | Total U.S. | | | | | | | | |
| | | | Treasury Securities | | | 124,997,161 | | | | 124,997,161 | |
| | | | Commercial Paper — 1.8% | | | | | | | | |
| | 21,700,000 | | U.S. Bank, N.A., 0.02%, | | | | | | | | |
| | | | due 04/01/13 | | | 21,700,000 | | | | 21,700,000 | |
| | | | Total short-term | | | | | | | | |
| | | | investments | | | 146,697,161 | | | | 146,697,161 | |
| | | | Total investments | | | | | | | | |
| | | | — 100.2% | | $ | 898,165,651 | | | | 1,189,628,308 | |
| | | | Liabilities, less other | | | | | | | | |
| | | | assets — (0.2%) (a) | | | | | | | (2,908,445 | ) |
| | | | TOTAL NET | | | | | | | | |
| | | | ASSETS — 100.0% | | | | | | $ | 1,186,719,863 | |
| * | Non-income producing security. |
| (a) | Percentages for the various classifications relate to net assets. |
The accompanying notes to financial statements are an integral part of this schedule.
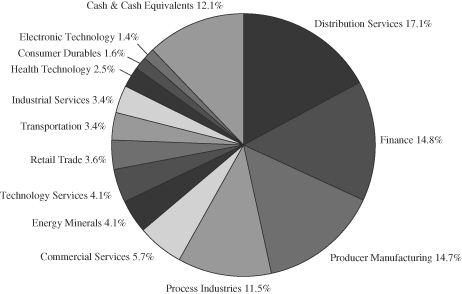
INDUSTRY SECTORS
as of March 31, 2013 (Unaudited)
FMI
International
Fund
March 31, 2013
Dear Fellow Shareholders:
After a strong showing in 2012, international markets continued to soar in the first quarter of 2013. The FMI International Fund (FMIJX) gained 10.23%(1) in the quarter, which compares with the MSCI EAFE Index return of 9.67%(2) in local currency and 5.13%(3) in U.S. Dollars (USD). The Japanese market led the charge (in the quarter), with the TOPIX Index advancing 21.37% on the back of “Abenomics” and a rapidly depreciating yen (more on this later). The UK also posted strong returns, with the FTSE 100 Index up 9.97%, while several European markets rose in the low- to mid-single-digits. The Fund’s performance was led by the Non-Energy Minerals, Electronic Technology, and Technology Services sectors, with strong contributions from CRH, Rolls-Royce, and Accenture. Health Technology, Distribution Services and an elevated cash position all detracted from relative performance, with Pirelli and Royal Dutch Shell generating the weakest absolute returns.
We sold our position in Brookfield Asset Management in March and rolled the proceeds into a greater ownership stake in Fairfax Financial. We initially trimmed Brookfield back in the third quarter of 2012 after it became public that the company was attempting to acquire the portion of General Growth Properties that it did not already own. We were concerned that the size and complexity was seemingly escalating with each incremental transaction at Brookfield. Then, in conjunction with the reporting of its fourth quarter and full year 2012 earnings in February, Brookfield changed the way in which it presents results, further reducing transparency into the underlying operations. In addition to these developments, the company has been a beneficiary of a historically low cap rate environment, and this was reflected in the significant appreciation of the stock price. We believe that Fairfax has a more realistic view of the world, as management is hedging their exposure to both equities and inflation. If we enter a period of rising interest rates, peer insurance underwriters may become capital constrained, while Fairfax should largely remain unscathed. With a stronger relative capital position, the company would have the ability to write significantly more quality business, as others are forced out of the market. The continued firming in commercial property and casualty pricing should also accrue to the company’s benefit, which we view as an additional positive over the long term.
Our general view is that the global stock market rally has outpaced the underlying fundamentals, which is now reflected in more expensive stock valuations. Investors can thank the Fed, European Central Bank (ECB), Bank of England (BOE) and Bank of Japan (BOJ) for the rapid price appreciation of a wide range of asset classes. Stock markets have been fueled by easy money and the notion that governments will continue to prop up struggling economies and businesses. However, this patchwork solution is not sustainable in our view. Ultimately, Europe remains a dysfunctional mess, Japan still faces massive secular issues, and China may be in the midst of a housing bubble which could dwarf that of the U.S. On balance, we believe
| (1) | The Fund’s 1-year and annualized since inception (12-31-10) returns through March 31, 2013 were: 18.63% and 11.60%, respectively. |
| (2) | The MSCI EAFE Index (LOC), benchmark for FMIJX 1-year return and annualized since inception (12-31-10) returns through March 31, 2013 were: 16.73% and 5.60%, respectively. |
| (3) | The MSCI EAFE Index (USD), benchmark for FMIJX 1-year return and annualized since inception (12-31-10) returns through March 31, 2013 were: 11.25% and 3.64%, respectively. |
The MSCI EAFE Index (Europe, Australasia, Far East) is a free float-adjusted market capitalization index that is designed to measure the equity market performance of developed markets, excluding the U.S. and Canada. As of May 27, 2010 the MSCI EAFE Index consisted of the following 22 developed market country indices: Australia, Austria, Belgium, Denmark, Finland, France, Germany, Greece, Hong Kong, Ireland, Israel, Italy, Japan, the Netherlands, New Zealand, Norway, Portugal, Singapore, Spain, Sweden, Switzerland and the United Kingdom. The MSCI EAFE Index is unmanaged and investors cannot invest directly in the Index. Index results are inclusive of dividends and net of foreign withholding taxes. The reported figures include reinvestment of dividends and capital gains distributions and do not reflect any fees or expenses.
The MSCI EAFE Index is calculated in local currency as well as in U.S. dollars (USD). The concept of a local currency calculation excludes the impact of currency fluctuations. All currencies of listing are considered in the Index calculation in local currency where current prices (t) and previous day prices (t-1) are converted into USD using the same exchange rate (exchange rate t-1) in the numerator and denominator. As a consequence, the FX factor drops out of the equation. The USD calculation includes exchange rates at t and t-1. Therefore, the local currency calculation only represents the price appreciation or depreciation of the securities, whereas the USD calculation also accounts for the performance of the currency (or currencies) relative to the USD.
MSCI EAFE is a service mark of MSCI Barra.
that there is more risk than opportunity, so we remain cautious. We have rarely seen an investment environment where there has been so little that meets our eye. As a result, we are holding a larger cash position than we would like, but we will be ready to pounce when the opportunity arises.
Europe: Risks Remain
A common perception is that the worst in Europe is behind us, with disaster averted last summer when Mario Draghi pledged to do “whatever it takes” to protect the eurozone from collapse. Despite complacency in Europe with lower sovereign yields and rising stock markets, we have not seen anything to suggest that the European economic situation can be managed without a political and fiscal union. It remains fragile, and the recent Cyprus debacle is a stark reminder of how little it takes to rattle the market.
The fundamentals in the eurozone are deteriorating, with the recession deepening in the fourth quarter as gross domestic product (GDP) shrunk by 0.6% sequentially. The Markit Flash Eurozone Purchasing Managers Index (PMI) in March was 46.5 (below 50 implies contraction), a 4-month low. Unemployment rates in Greece and Spain continue to climb, both now above 26%, and France’s economy has come to a screeching halt, declining sequentially in three of the last four quarters (-0.3% in the fourth quarter), forcing President Francois Hollande to warn that the country will miss its budget target of 3% by 2013. While Germany is still pushing for austerity, France has been pounding the table for government stimulus, and Italy’s national election essentially rebuffed austerity as well. There are growing divisions among the eurozone’s three largest economies (Germany, France and Italy), and great uncertainty remains.
Unfortunately, markets have come to expect a culture of bailouts and low interest rates, both of which we believe will be detrimental over the long run. The bailouts create a moral hazard, a frequent topic during the initial stages of the U.S. bailout, but one that has faded from public view in recent years. The Wikipedia definition says it all: “A situation where a party will have a tendency to take risks because the costs that could incur will not be felt by the party taking the risk.” The eurozone epitomizes the notion of moral hazard, with the excess spending, massive budget deficits and ballooning debt levels in the Southern European countries now falling on the shoulders of its Northern neighbors. Without deep, structural changes to the eurozone, we fear that leaders will simply continue to make politically expedient decisions and history will likely repeat itself.
Low interest rates and company bailouts can also lead to a proliferation of “zombie” companies, those which are barely profitable (or losing money) and would have gone out of business in a more normalized environment. These companies often struggle to service their debt, and are only able to do so because interest rates are unsustainably low. In a normal interest rate environment, they would be insolvent. They are neither investing in capital equipment nor hiring new employees, and compete away the returns of healthier, more viable businesses as they simply linger along, destroying economic value. Capitalism works in part because the lousy businesses are meant to fail, not be propped up by artificial means. Both Europe and Japan already have their fare share of zombies, and current policies will surely lead to more.
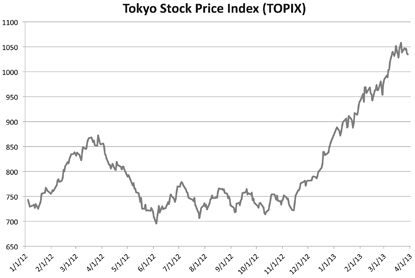
Japan: Easy Money
On November 15, 2012, Mr. Shinzo Abe, Japan’s leading candidate for Prime Minister (he was elected on December 26) called for “unlimited” monetary easing, which helped spark a 4-month rally (+42%) in the Tokyo Stock Price Index (TOPIX) and a 14% depreciation of the yen. He has since called for a 2% inflation target, and appointed Mr. Haruhiko Kuroda as governor of the Bank of Japan to push his agenda. The hope is to improve the competitiveness of Japan’s exporters, spur domestic demand, and put an end to the deflationary spiral.
Source: Bloomberg
It appears Mr. Abe is not going to address entitlements, government spending, and Japan’s mountain of debt, but instead, debase the currency and try to print his way out. Does this sound familiar? Perhaps he has learned a few tricks from the U.S. and Europe. The problem is that we are now seeing country after country doing virtually nothing to address the actual underlying problems, which by definition, suggests that the problems will become worse. It appears that everyone has the same playbook, which in the end will lead (or has already led) to a currency war, and race to the bottom.
This is a particularly dangerous game for Japan considering the massive size of its balance sheet. The risk was well articulated by Scott Minerd in a March 21, 2013 Financial Times article: “The current size of Japan’s public debt is approximately 230 percent of GDP, with total interest expense on JGBs [Japanese Government Bonds] representing about 40 percent of government receipts. Were interest rates to increase by 300 basis points over the next five years, which is in line with Mr. Abe’s stated objective of bringing inflation from -1% to 2%, interest expense would expand to approximately 80 percent of present total government revenues, with the prospect that this ratio could continue to rise.” Clearly this would not be sustainable. Should this scenario play out, a sovereign default or hyperinflation may be the end game.
China: Bubble Still Looms
We first highlighted the risk of a potential China property bubble in our March 2010 domestic shareholder letters (and several times since), and we remain concerned today. A recent “60 Minutes” segment which aired on CBS on March 3, 2013 provided additional data points, describing the building of yet another “ghost city of new towers with no residents, desolate condos and vacant subdivisions uninhabited for miles, and miles, and miles, and miles of empty apartments.” CBS interviewed Mr. Gillem Tulloch, a Hong Kong based financial analyst, who contends that, “Property values have doubled and tripled and more – so people in the middle class have sunk every last penny into buying five, even 10 apartments, fueling a building bonanza unprecedented in human history… They’re building somewhere between 12 and 24 new cities every single year.” He fears, when the bubble bursts, that “There are multiple classes of people that are going to get wiped out by this. People who have invested three generations worth of savings – so grandparents, parents and children – into properties, will see their savings evaporate. And then, of course, 50 million construction workers who are working on all these projects around China.” CBS also interviewed Mr. Wang Shi, the CEO of Vanke, China’s largest home builder, who acknowledged that there was a property bubble, and confirmed that prices in Shanghai were more than 45 times the average resident’s annual salary. To put this in perspective, this imbalance would be the equivalent to a U.S. worker with a $45,000 salary buying one or more investment properties for over $2 million, with the expectation for continued house price appreciation in the future. We have seen this story before (i.e. “U.S. housing prices have never gone down”) and it doesn’t end well. Real prices will inevitably come back down to earth, and it will be painful for the last ones standing.
While China’s central government has been taking action to help reduce property speculation (with limited success), they remain obsessed with growing their economy, especially after 2012 GDP expanded at the slowest rate in over a decade, at 7.8%. Unfortunately, fixed investments such as infrastructure and real estate, and not domestic consumption, continue to be the key engines of growth. It may be a telling sign that China’s ¥1 trillion ($157 billion) of infrastructure stimulus announced in the third quarter of 2012 pales in comparison to the $586 billion spent in 2008-09. Perhaps they realize that the empty cities, trains and roads to nowhere, and millions of vacant apartment buildings have gotten out of hand, and fear taking the same path once again. Additionally, despite what the government would like to have the general public believe, inflation in China is not under control (just ask any U.S. company that does business there), and this remains an area of concern. While we remain more positive on China over the long term, the short-term risks are continuing to mount and warrant added caution.
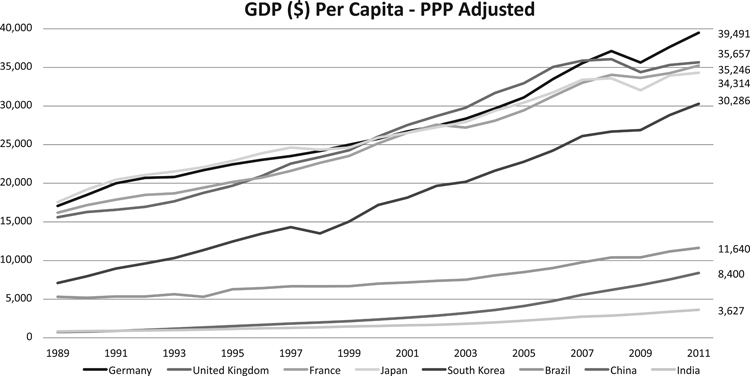
South Korea: Finding Value
While value is getting harder to find around the world, we have come across a number of intriguing opportunities in South Korea, which we recently visited during a research trip to Asia. We should note that we do not manage our portfolios to the benchmark, and try to find great multinational businesses regardless of geographies. We do not consider South Korea an emerging market, as the country is already the fifteenth largest economy measured by GDP, twelfth largest in terms of purchasing power parity, seventh largest importer, tenth largest exporter, and home to the thirteenth largest stock market (third largest in Asia Pacific). It is a member of the Organisation for Economic Co-operation and Development (OECD) and is ranked among the G-20 major economies based on the strength and size of its economy.(4) Additionally, when compared with emerging markets such as China, Brazil and India, GDP per capita is far more advanced in South Korea, and more in line with the developed world (see graph on next page).
| (4) | “Classifying South Korea as a Developed Market.” White paper report by FTSE publications. January 2013. |
Source: Bloomberg
In the March quarter we made our first investment in South Korea through Hyundai Greenfood. The company functions as a holding company for the Hyundai Department Store (HDS) Group, the third largest retail conglomerate in South Korea. The HDS Group split off from the larger Hyundai chaebol in the late 1990s. In essence, Greenfood offers access to three main businesses: catering and food distribution (Greenfood, 45% of fair value); department stores (Hyundai Department Store, 20% of fair value); and home shopping (Hyundai Home Shopping, 16% of fair value). These easy-to-understand businesses earn high returns on capital and enjoy strong competitive advantages. At our purchase price, Greenfood traded at 4.4 times enterprise value-to-earnings before interest and tax (EV/EBIT) after subtracting out the value of the company’s publicly traded entities and adjusting for taxes. Moreover, the main publicly traded entities, Hyundai Department Store and Hyundai Home Shopping, traded at a 70% and 43% discount to global peers, despite significantly better profitability. Lastly, in South Korea, corporate governance matters. Greenfood’s prominent place in the HDS Group, and the controlling family’s high direct ownership, provides excellent alignment with the controlling shareholders. Given the quality of the businesses, the attractive valuation, and the family’s strong track record, we initiated a 2.5% position.
Outlined below are detailed descriptions of two additional recent additions to the portfolio.
Danone S.A.
(Analyst: Karl Poehls)
Description
Danone S.A. engages in the food processing industry, operating through the following segments: Fresh Dairy Products (56% of 2012 sales), Waters (18%), Baby Nutrition (20%), and Medical Nutrition (6%). The Fresh Dairy Products segment produces and markets yogurts, fermented fresh dairy products, and other specialized fresh dairy products. The Waters segment comprises plain bottled water as well as flavored and vitamin-enriched water products. The Baby Nutrition segment focuses on specialized food for infants and toddlers, manufacturing infant formula, cereal snacks, biscuits, and other food products. The Medical Nutrition segment sells products that are designed to treat disease-related malnutrition by satisfying special food needs.
Good Business
| | • | Danone enjoys the following leadership positions worldwide: #1 in fresh dairy products, #3 in packaged water, and #2 in baby nutrition. |
| | • | In 2012, Forbes ranked Danone as the 25th most innovative company (up from 35th in 2011) and the 58th most powerful brand in the world. |
| | • | The company’s entire product portfolio is focused on health and wellness categories. Additionally, Danone’s products provide consumers with access to affordable, basic necessities. |
| | • | The business is easy to understand. |
| | • | Danone generates returns on invested capital that exceed its cost of capital. |
| | • | The company’s balance sheet is solid. As of 2012 year-end, net financial debt was €3.0 billion, which was equivalent to operating income. Further, Danone’s interest coverage ratio exceeded 10 times. |
Valuation
| | • | Over the past 5 years, Danone’s stock price has fallen 10% from its previous peak of €60 per share achieved in 2008. During this time, earnings per share have increased by more than 25%. |
| | • | The company’s forward price-to-earnings (P/E) multiple is 17.4 times. Over the trailing 10-year period, Danone’s price-to-earnings multiple has averaged 18.7 times. |
| | • | Since 2005, Danone’s enterprise value-to-earnings before interest, taxes, depreciation and amortization (EV/EBITDA) multiple has averaged 12.3 times. This compares to the current EV/EBITDA multiple of 9.8 times. |
| | • | At the current share price, Danone’s free cash flow yield is 6% and the dividend yield is 3%. |
| | • | Over the past 10 years, global food and consumer packaged goods companies have been acquired at an average EV/EBITDA multiple of 15 times. |
Management
| | • | Danone has been led by its Chairman and CEO, Franck Riboud, since 1996. Under his leadership, the company’s common stock has provided shareholders with a total return of 10.9% compounded annually. This compares to a total return of 6.0% per annum for the Standard & Poor’s 500 Index over a comparable timeframe. |
| | • | Trian Partners, led by activist Nelson Peltz, recently disclosed a 1% stake in Danone. We are hopeful that Trian’s involvement will lead to better discipline in regard to capital allocation. |
Investment Thesis
Today, investors are concerned with negative sales growth in Southern Europe for Danone’s Fresh Dairy business. Pricing pressure from private label products has forced Danone to cut prices in Spain and Italy, and drove a sizable reduction in management’s margin guidance in 2012. We believe that investors are overly focused on these headwinds and undervaluing the progress being made in Russia, the U.S., Brazil, and China. Danone’s stock offers an attractive 6% free cash flow yield and the potential for future cash flow growth of 5-10% per annum. Lastly, Danone sells basic necessities (yogurt, water, and milk formula) that consumers will continue to buy irrespective of how the global economy is performing. This is a defensive business trading at a discount to its intrinsic value.
Pirelli & C. S.p.A.
(Analyst: Jonathan Bloom)
Description
Pirelli is the world’s fifth largest tire manufacturer, with 2012 sales of € 6.1 billion and earnings before interest and tax (EBIT) of €781 million (12.9% margin). The company generated 73% of sales (78% of EBIT) in its consumer division (car and motorcycle), with the balance (27% and 22%) in its industrial division (truck and agriculture). Sales by channel were 24% original equipment and 76% replacement, with sales by geography as follows: Europe (34%), South America (34%), North America (12%), Middle East/Africa (9%), and Asia Pacific (7%). In 2012, approximately 38% of EBIT was generated in mature markets, with the remaining 62% coming from rapidly developing economies (RDEs). The company has focused on the high-end “premium” segment of the market (high performance, winter, SUV, run-flat tires, et al.), which accounts for approximately 50% of car sales and 80% of car EBIT. Pirelli estimates its market share to be 50% in the “prestige” tire market (i.e. Ferrari, Bentley, et al.) and 12-13% in “premium” (i.e. BMW, Mercedes, Audi, et al.).
Good Business
| | • | Improving returns: 2012 return on invested capital (ROIC) of 12% should continue to improve, exceeding the company’s cost of capital. |
| | • | Recurring revenue: 76% of sales are replacement. Premium tires wear faster than standard grade. |
| | • | Brand strength: Particularly strong brand positions in Europe and South America. High brand loyalty and awareness among high-income earners. Exclusive supplier for Formula 1 and World SBK. |
| | • | Customer captivity: Penetrating the original equipment manufacturer (OEM) relationships is difficult. Performance and safety are important. Emerging Asian competitors have penetrated standard tires, but premium has proven to be more difficult. |
| | • | Technology barriers: Advanced engineering, performance requirements, formulation and tread, industry know-how, etc. |
| | • | Understandable business: Pure play tire manufacturer. Relatively easy to understand. High return on invested time (ROIT). |
| | • | Reasonable balance sheet: Debt-to-capital of 51%. Interest coverage of approximately 5 times. |
Valuation
| | • | An enterprise value-to-sales ratio of 1.0 times compares favorably with 2012 EBIT margins of 12.9%. |
| | • | The company’s forward price-to-earnings multiple is 8.9 times, a deep discount to 5- and 10-year historical median of 10.7 times and 13.9 times. We believe a price-to-earnings multiple of 8.9 times is too low for a business growing the top-line at mid-to-high single digits while expanding margins. The quality of the business justifies a double-digit multiple, in our opinion. |
| | • | An enterprise value-to-EBIT of 7.6 times is attractive for a business of this quality. |
| | • | At the current share price, Pirelli’s dividend yield is 3.9%. |
| | • | Management’s mid-term margin targets imply ROIC improvement of more than 300 basis points. |
Management
| | • | Chairman and CEO Mr. Marco Tronchetti Provera has significant skin in the game, as he is believed to own between 6% and 7% of the shares outstanding. As the company’s largest shareholder, he controls ~26% of the shares outstanding through the holding company Camfin. |
| | • | Pirelli has sold off non-core assets in recent years (real estate, broadband, etc.) to become a pure play tire manufacturer. We have a favorable view of management’s strategic direction. |
| | • | Compensation is performance-driven, with economic value added (EVA) among the evaluation metrics. There is no stock option plan. |
| | • | Of the 20 board directors, 11 are independent. A shareholder’s agreement controls 45.5% of the shares. |
Investment Thesis
Pirelli’s premium mix (faster growth, higher margin, more difficult to penetrate) enhances the quality of the business beyond that of most peers. While the valuation implies that the business is equivalent to a subpar auto supplier, in our view, the discount is not justified. Pirelli’s brand has significant value, and its high exposure to the replacement market (76% of sales) reduces cyclicality and diminishes the OEMs’ ability to extract value. Pirelli’s valuation is attractive on both an enterprise value and price-to-earnings basis, providing an attractive risk/reward opportunity over a 3-5 year investment horizon.
Thank you for your continued support of the FMI International Fund.
100 E. Wisconsin Ave., Suite 2200 • Milwaukee, WI 53202 • 414-226-4555
www.fmifunds.com
FMI International Fund
SCHEDULE OF INVESTMENTS
March 31, 2013 (Unaudited)
| Shares | | | | Cost | | | Value | |
| | | | | | | |
| COMMON STOCKS — 86.1% (a) | | | | | | |
| | | | | | | |
| COMMERCIAL SERVICES SECTOR — 8.7% | | | | | | |
| | | Advertising/Marketing | | | | | | |
| | | Services — 2.9% | | | | | | |
| | 183,100 | | WPP PLC (Jersey) (b) | | $ | 2,314,690 | | | $ | 2,926,142 | |
| | | | Miscellaneous Commercial | | | | | | | | |
| | | | Services — 2.2% | | | | | | | | |
| | 43,600 | | Secom Co. Ltd. | | | | | | | | |
| | | | (Japan) (b) | | | 2,049,066 | | | | 2,250,219 | |
| | | | Personnel Services — 3.6% | | | | | | | | |
| | 66,500 | | Adecco S.A. | | | | | | | | |
| | | | (Switzerland) (b) | | | 3,056,927 | | | | 3,647,407 | |
| | | | | | | | | | | | |
| CONSUMER DURABLES SECTOR — 6.5% | | | | | | | | |
| | | | Automotive Aftermarket — 2.4% | | | | | | | | |
| | 235,300 | | Pirelli & C. SpA | | | | | | | | |
| | | | (Italy) (b) | | | 2,656,415 | | | | 2,475,494 | |
| | | | Other Consumer Specialties — 2.5% | | | | | | | | |
| | 996,000 | | Samsonite | | | | | | | | |
| | | | International S.A. | | | | | | | | |
| | | | (Luxembourg) (b) | | | 2,010,073 | | | | 2,499,468 | |
| | | | Recreational Products — 1.6% | | | | | | | | |
| | 19,800 | | Shimano Inc. | | | | | | | | |
| | | | (Japan) (b) | | | 1,026,478 | | | | 1,620,710 | |
| | | | | | | | | | | | |
| CONSUMER NON-DURABLES SECTOR — 11.9% | | | | | | | | |
| | | | Food: Major Diversified — 7.7% | | | | | | | | |
| | 41,000 | | Danone S.A. - SP-ADR | | | | | | | | |
| | | | (France) (b) | | | 2,730,424 | | | | 2,854,789 | |
| | 33,700 | | Nestlé S.A. | | | | | | | | |
| | | | (Switzerland) (b) | | | 1,967,261 | | | | 2,439,025 | |
| | 58,200 | | Unilever PLC | | | | | | | | |
| | | | (Britain) (b) | | | 2,140,764 | | | | 2,461,705 | |
| | | | | | | 6,838,449 | | | | 7,755,519 | |
| | | | Household/Personal Care — 4.2% | | | | | | | | |
| | 53,900 | | Henkel AG & Co. | | | | | | | | |
| | | | KGaA (Germany) (b) | | | 3,022,101 | | | | 4,260,301 | |
| | | | | | | | | | | | |
| CONSUMER SERVICES SECTOR — 4.0% | | | | | | | | |
| | | | Restaurants — 4.0% | | | | | | | | |
| | 318,500 | | Compass Group | | | | | | | | |
| | | | PLC (United | | | | | | | | |
| | | | Kingdom) (b) | | | 3,177,110 | | | | 4,076,577 | |
| | | | | | | | | | | | |
| DISTRIBUTION SERVICES SECTOR — 1.8% | | | | | | | | |
| | | | Wholesale Distributors — 1.8% | | | | | | | | |
| | 476,200 | | Electrocomponents | | | | | | | | |
| | | | PLC (United | | | | | | | | |
| | | | Kingdom) (b) | | | 1,662,398 | | | | 1,816,926 | |
| | | | | | | | | | | | |
| ELECTRONIC TECHNOLOGY SECTOR — 7.6% | | | | | | | | |
| | | | Aerospace & Defense — 2.6% | | | | | | | | |
| | 151,500 | | Rolls-Royce Holdings | | | | | | | | |
| | | | PLC (United | | | | | | | | |
| | | | Kingdom)* (b) | | | 1,723,172 | | | | 2,606,894 | |
| | | | | | | | | | | | |
| | | | Electronic Components — 5.0% | | | | | | | | |
| | 120,100 | | TE Connectivity Ltd. | | | | | | | | |
| | | | (Switzerland) | | | 4,259,549 | | | | 5,035,793 | |
| | | | | | | | | | | | |
| ENERGY MINERALS SECTOR — 2.9% | | | | | | | | |
| | | | Integrated Oil — 2.9% | | | | | | | | |
| | 89,900 | | Royal Dutch Shell | | | | | | | | |
| | | | PLC (United | | | | | | | | |
| | | | Kingdom) (b) | | | 3,117,278 | | | | 2,914,876 | |
| | | | | | | | | | | | |
| FINANCE SECTOR — 7.3% | | | | | | | | |
| | | | Insurance Brokers/ | | | | | | | | |
| | | | Services — 2.5% | | | | | | | | |
| | 62,800 | | Willis Group Holdings | | | | | | | | |
| | | | PLC (Ireland) | | | 2,358,636 | | | | 2,479,972 | |
| | | | Property/Casualty | | | | | | | | |
| | | | Insurance — 4.8% | | | | | | | | |
| | 12,500 | | Fairfax Financial Holdings | | | | | | | | |
| | | | Ltd. (Canada) | | | 4,892,422 | | | | 4,880,888 | |
| | | | | | | | | | | | |
| HEALTH TECHNOLOGY SECTOR — 6.2% | | | | | | | | |
| | | | Medical Specialties — 3.2% | | | | | | | | |
| | 47,100 | | Covidien PLC (Ireland) | | | 2,390,861 | | | | 3,195,264 | |
| | | | Pharmaceuticals: | | | | | | | | |
| | | | Major — 3.0% | | | | | | | | |
| | 129,500 | | GlaxoSmithKline | | | | | | | | |
| | | | PLC (United | | | | | | | | |
| | | | Kingdom) (b) | | | 2,902,105 | | | | 3,032,520 | |
| | | | | | | | | | | | |
| INDUSTRIAL SERVICES SECTOR — 3.0% | | | | | | | | |
| | | | Oilfield Services/ | | | | | | | | |
| | | | Equipment — 3.0% | | | | | | | | |
| | 40,500 | | Schlumberger Ltd. | | | | | | | | |
| | | | (Curacao) | | | 2,815,409 | | | | 3,033,045 | |
| | | | | | | | | | | | |
| NON-ENERGY MINERALS SECTOR — 3.1% | | | | | | | | |
| | | | Construction Materials — 3.1% | | | | | | | | |
| | 142,800 | | CRH PLC (Ireland) (b) | | | 2,747,837 | | | | 3,160,246 | |
| | | | | | | | | | | | |
| PROCESS INDUSTRIES SECTOR — 4.5% | | | | | | | | |
| | | | Chemicals: Specialty — 1.5% | | | | | | | | |
| | 23,600 | | Shin-Etsu Chemical Co. | | | | | | | | |
| | | | Ltd. (Japan) (b) | | | 1,261,816 | | | | 1,565,216 | |
| | | | Industrial Specialties — 3.0% | | | | | | | | |
| | 48,100 | | Akzo Nobel N.V. | | | | | | | | |
| | | | (Netherlands) (b) | | | 2,714,111 | | | | 3,056,104 | |
| | | | | | | | | | | | |
| PRODUCER MANUFACTURING SECTOR — 8.8% | | | | | | | | |
| | | | Industrial Conglomerates — 3.0% | | | | | | | | |
| | 54,600 | | Ingersoll-Rand | | | | | | | | |
| | | | PLC (Ireland) | | | 2,276,552 | | | | 3,003,546 | |
| | | | Industrial Machinery — 5.8% | | | | | | | | |
| | 12,400 | | Schindler Holding AG | | | | | | | | |
| | | | (Switzerland) (b) | | | 1,446,111 | | | | 1,818,773 | |
| | 20,600 | | SMC Corp. | | | | | | | | |
| | | | (Japan) (b) | | | 3,388,311 | | | | 4,000,268 | |
| | | | | | | 4,834,422 | | | | 5,819,041 | |
FMI International Fund
SCHEDULE OF INVESTMENTS (Continued)
March 31, 2013 (Unaudited)
| Shares | | | | Cost | | | Value | |
| | | | | | | | | |
| COMMON STOCKS — 86.1% (a) (Continued) | | | | | |
| | | | | | |
| RETAIL TRADE SECTOR — 5.0% | | | | | | |
| | | Department Stores — 2.5% | | | | | | |
| | 165,000 | | Hyundai Greenfood | | | | | | |
| | | | Co. Ltd. (South | | | | | | |
| | | | Korea) (b) | | $ | 2,511,073 | | | $ | 2,519,701 | |
| | | | Food Retail — 2.5% | | | | | | | | |
| | 437,100 | | Tesco PLC (United | | | | | | | | |
| | | | Kingdom) (b) | | | 2,381,470 | | | | 2,540,932 | |
| | | | | | | | | | | | |
| TECHNOLOGY SERVICES SECTOR — 4.8% | | | | | | | | |
| | | | Information Technology | | | | | | | | |
| | | | Services — 4.8% | | | | | | | | |
| | 63,300 | | Accenture PLC | | | | | | | | |
| | | | (Ireland) | | | 3,865,107 | | | | 4,808,901 | |
| | | | Total common stocks | | | 74,865,527 | | | | 86,981,702 | |
| | | | | | | | | | | | |
| SHORT-TERM INVESTMENTS — 11.7% (a) | | | | | | | | |
| | | | U.S. Treasury Securities — 9.9% | | | | | | | | |
| $ | 5,000,000 | | U.S. Treasury Bills, | | | | | | | | |
| | | | | 0.0075%, | | | | | | | | |
| | | | due 04/04/13 | | | 4,999,997 | | | | 4,999,997 | |
| | 5,000,000 | | U.S. Treasury Bills, | | | | | | | | |
| | | | | 0.0250%, | | | | | | | | |
| | | | due 04/11/13 | | | 4,999,965 | | | | 4,999,965 | |
| | | | Total U.S. | | | | | | | | |
| | | | Treasury Securities | | | 9,999,962 | | | | 9,999,962 | |
| | | | Commercial Paper — 1.8% | | | | | | | | |
| | 1,800,000 | | U.S. Bank, N.A., 0.02%, | | | | | | | | |
| | | | due 04/01/13 | | | 1,800,000 | | | | 1,800,000 | |
| | | | Total short-term | | | | | | | | |
| | | | investments | | | 11,799,962 | | | | 11,799,962 | |
| | | | Total investments | | | | | | | | |
| | | | | — 97.8% | | $ | 86,665,489 | | | | 98,781,664 | |
| | | | Other assets, | | | | | | | | |
| | | | less liabilities | | | | | | | | |
| | | | | — 2.2% (a) | | | | | | | 2,198,364 | |
| | | | TOTAL NET | | | | | | | | |
| | | | ASSETS — 100.0% | | | | | | $ | 100,980,028 | |
| * | Non-income producing security. |
| (a) | Percentages for the various classifications relate to net assets. |
| (b) | Security does not trade during New York Stock Exchange hours and has been valued in accordance with the procedures discussed in Note 1(a) to the financial statements and has been classified as level 2. As of March 31, 2013 the aggregate value of these securities was $60,544,293. |
PLC – Public Limited Company
SP-ADR – Sponsored American Depositary Receipt
SCHEDULE OF FORWARD CURRENCY CONTRACTS
| | | | | | | | U.S. $ Value on | | | | | | | U.S. $ Value on | | | | |
| | | | | | | | March 31, 2013 | | | | | | | March 31, 2013 | | | Unrealized | |
| Settlement | | | Currency to | | of Currency to | | | Currency to | | of Currency to | | | Appreciation | |
| Date | Counterparty | | be Delivered | | be Delivered | | | be Received | | be Received | | | (Depreciation) | |
| 4/26/13 | Bank of New York | | | 15,200,000 | | British Pound | | $ | 23,092,004 | | | | 23,832,160 | | U.S. Dollar | | $ | 23,832,160 | | | $ | 740,156 | |
| 4/26/13 | Bank of New York | | | 4,000,000 | | Canadian Dollar | | | 3,935,136 | | | | 3,992,813 | | U.S. Dollar | | | 3,992,813 | | | | 57,677 | |
| 4/26/13 | U.S. Bank, N.A. | | | 300,000 | | Canadian Dollar | | | 295,135 | | | | 291,857 | | U.S. Dollar | | | 291,857 | | | | (3,278 | ) |
| 4/26/13 | U.S. Bank, N.A. | | | 8,500,000 | | Euro | | | 10,897,785 | | | | 11,291,700 | | U.S. Dollar | | | 11,291,700 | | | | 393,915 | |
| 4/26/13 | U.S. Bank, N.A. | | | 780,000,000 | | Japanese Yen | | | 8,287,532 | | | | 8,674,400 | | U.S. Dollar | | | 8,674,400 | | | | 386,868 | |
| 4/26/13 | Bank of New York | | | 2,650,000,000 | | South Korean Won | | | 2,377,884 | | | | 2,421,823 | | U.S. Dollar | | | 2,421,823 | | | | 43,939 | |
| 4/26/13 | U.S. Bank, N.A. | | | 6,900,000 | | Swiss Franc | | | 7,271,176 | | | | 7,411,271 | | U.S. Dollar | | | 7,411,271 | | | | 140,095 | |
| | | | | | | | | $ | 56,156,652 | | | | | | | | $ | 57,916,024 | | | $ | 1,759,372 | |
| | | | | | | | | | | | | | | | | | | | | | | | |
The accompanying notes to financial statements are an integral part of these schedules.
FMI International Fund
INDUSTRY SECTORS
as of March 31, 2013 (Unaudited)
FMI Funds
STATEMENTS OF ASSETS AND LIABILITIES
March 31, 2013 (Unaudited)
| | | | FMI | | | FMI | | | FMI | |
| | | | Large Cap | | | Common Stock | | | International | |
| | | | Fund | | | Fund | | | Fund | |
| | | | | | | | | | | |
| ASSETS: | | | | | | | | | | |
| Investments in securities, at value | (a) | | $ | 7,167,862,229 | | | $ | 1,189,628,308 | | | $ | 98,781,664 | |
| Receivables from shareholders for purchases | | | | 13,540,707 | | | | 782,862 | | | | 117,858 | |
| Dividends and interest receivable | | | | 15,474,878 | | | | 1,021,250 | | | | 309,844 | |
| Receivable for investments sold | | | | 23,938,506 | | | | — | | | | — | |
| Receivable for forward currency contracts | | | | — | | | | — | | | | 1,762,650 | |
| Prepaid expenses | | | | 184,565 | | | | 50,973 | | | | 36,363 | |
| Cash | | | | 870,291 | | | | 79,788 | | | | 61,084 | |
| Total assets | | | $ | 7,221,871,176 | | | $ | 1,191,563,181 | | | $ | 101,069,463 | |
| LIABILITIES: | | | | | | | | | | | | | |
| Payable to brokers for investments purchased | | | $ | — | | | $ | 2,609,140 | | | $ | — | |
| Payable to shareholders for redemptions | | | | 6,519,496 | | | | 1,123,661 | | | | — | |
| Payable to adviser for management fees | | | | 3,525,778 | | | | 866,544 | | | | 48,080 | |
| Payable for forward currency contracts | | | | — | | | | — | | | | 3,278 | |
| Other liabilities | | | | 1,314,223 | | | | 243,973 | | | | 38,077 | |
| Total liabilities | | | | 11,359,497 | | | | 4,843,318 | | | | 89,435 | |
| NET ASSETS: | | | | | | | | | | | | | |
| Capital Stock | (b) | | $ | 5,534,461,730 | | | $ | 867,433,011 | | | $ | 85,423,800 | |
| Net unrealized appreciation | | | | 1,641,179,520 | | | | 291,462,657 | | | | 13,872,236 | |
| Accumulated net realized gain | | | | 21,581,729 | | | | 25,140,328 | | | | 334,396 | |
| Undistributed net investment income | | | | 13,288,700 | | | | 2,683,867 | | | | 1,349,596 | |
| Net assets | | | | 7,210,511,679 | | | | 1,186,719,863 | | | | 100,980,028 | |
| Total liabilities and net assets | | | $ | 7,221,871,176 | | | $ | 1,191,563,181 | | | $ | 101,069,463 | |
| CALCULATION OF NET ASSET VALUE PER SHARE: | | | | | | | | | | | | | |
| Net asset value, offering and redemption price per share | | | | | | | | | | | | | |
| (Net assets ÷ shares outstanding) | | | $ | 19.05 | | | $ | 26.36 | | | $ | 25.00 | |
| | | | | | | | | | | | | | |
| (a) Identified cost of investments | | | $ | 5,526,682,709 | | | $ | 898,165,651 | | | $ | 86,665,489 | |
| (b) Par value | | | $ | 0.0001 | | | $ | 0.01 | | | $ | 0.0001 | |
| Shares authorized | | | | 400,000,000 | | | Indefinite | | | | 300,000,000 | |
| Shares outstanding | | | | 378,414,182 | | | | 45,024,809 | | | | 4,038,688 | |
The accompanying notes to financial statements are an integral part of these statements.
FMI Funds
STATEMENTS OF OPERATIONS
For the Six Month Period Ending March 31, 2013 (Unaudited)
| | | FMI | | | FMI | | | FMI | |
| | | Large Cap | | | Common Stock | | | International | |
| | | Fund | | | Fund | | | Fund | |
| | | | | | | | | | |
| INCOME: | | | | | | | | | |
| Dividends | | $ | 66,111,478 | | | $ | 9,372,481 | | | $ | 689,964 | * |
| Interest | | | 127,671 | | | | 33,672 | | | | 3,307 | |
| Total income | | | 66,239,149 | | | | 9,406,153 | | | | 693,271 | |
| EXPENSES: | | | | | | | | | | | | |
| Management fees | | | 24,224,620 | | | | 5,627,358 | | | | 302,791 | |
| Transfer agent fees | | | 4,100,052 | | | | 623,760 | | | | 26,363 | |
| Administration and accounting services | | | 1,656,860 | | | | 288,847 | | | | 59,977 | |
| Printing and postage expense | | | 348,590 | | | | 53,549 | | | | 3,180 | |
| Custodian fees | | | 171,584 | | | | 33,164 | | | | 16,803 | |
| Registration fees | | | 89,665 | | | | 12,795 | | | | 9,172 | |
| Professional fees | | | 24,988 | | | | 22,316 | | | | 19,896 | |
| Board of Directors fees | | | 24,133 | | | | 21,740 | | | | 4,987 | |
| Other expenses | | | 99,179 | | | | 38,757 | | | | 15,491 | |
| Total expenses before reimbursement | | | 30,739,671 | | | | 6,722,286 | | | | 458,660 | |
| Less expenses reimbursed by adviser | | | — | | | | — | | | | (54,938 | ) |
| Net expenses | | | 30,739,671 | | | | 6,722,286 | | | | 403,722 | |
| NET INVESTMENT INCOME | | | 35,499,478 | | | | 2,683,867 | | | | 289,549 | |
| NET REALIZED GAIN (LOSS) ON INVESTMENTS: | | | | | | | | | | | | |
| Securities | | | 33,685,994 | | | | 29,150,026 | | | | 828,206 | |
| Forward currency contracts | | | — | | | | — | | | | (397,223 | ) |
| Foreign currency transactions | | | — | | | | — | | | | (86,659 | ) |
| NET REALIZED GAIN ON INVESTMENTS | | | 33,685,994 | | | | 29,150,026 | | | | 344,324 | |
| NET CHANGE IN UNREALIZED | | | | | | | | | | | | |
| APPRECIATION (DEPRECIATION) OF INVESTMENTS: | | | | | | | | | | | | |
| Securities | | | 700,239,660 | | | | 125,252,967 | | | | 7,851,434 | |
| Forward currency contracts | | | — | | | | — | | | | 3,101,085 | |
| Foreign currency transactions | | | — | | | | — | | | | (3,708 | ) |
| NET CHANGE IN UNREALIZED APPRECIATION (DEPRECIATION) | | | 700,239,660 | | | | 125,252,967 | | | | 10,948,811 | |
| NET GAIN ON INVESTMENTS | | | 733,925,654 | | | | 154,402,993 | | | | 11,293,135 | |
| NET INCREASE IN NET ASSETS RESULTING FROM OPERATIONS | | $ | 769,425,132 | | | $ | 157,086,860 | | | $ | 11,582,684 | |
| * | Net withholding taxes of $77,295. |
The accompanying notes to financial statements are an integral part of these statements.
FMI Funds
STATEMENTS OF CHANGES IN NET ASSETS
For the Six Month Period Ending March 31, 2013 (Unaudited) and For the Year Ended September 30, 2012
| | | FMI | | | FMI | | | FMI | |
| | | Large Cap | | | Common Stock | | | International | |
| | | Fund | | | Fund | | | Fund | |
| | | 2013 | | | 2012 | | | 2013 | | | 2012 | | | 2013 | | | 2012 | |
| OPERATIONS: | | | | | | | | | | | | | | | | | | |
| Net investment income | | $ | 35,499,478 | | | $ | 64,095,788 | | | $ | 2,683,867 | | | $ | 4,270,449 | | | $ | 289,549 | | | $ | 401,433 | |
| Net realized gain on investments | | | 33,685,994 | | | | 97,601,348 | | | | 29,150,026 | | | | 113,867,695 | | | | 344,324 | | | | 1,787,474 | |
| Net change in unrealized | | | | | | | | | | | | | | | | | | | | | | | | |
| appreciation on investments | | | 700,239,660 | | | | 957,131,983 | | | | 125,252,967 | | | | 90,965,301 | | | | 10,948,811 | | | | 4,331,720 | |
| Net increase in net assets | | | | | | | | | | | | | | | | | | | | | | | | |
| from operations | | | 769,425,132 | | | | 1,118,829,119 | | | | 157,086,860 | | | | 209,103,445 | | | | 11,582,684 | | | | 6,520,627 | |
| DISTRIBUTIONS TO SHAREHOLDERS: | | | | | | | | | | | | | | | | | | | | | | | | |
| Distributions from | | | | | | | | | | | | | | | | | | | | | | | | |
| net investment income | | | (70,248,746 | ) | | | (50,344,376 | ) | | | (3,755,898 | ) | | | (1,924,012 | ) | | | (276,470 | ) | | | (124,040 | ) |
| Distributions from net realized gains | | | (76,074,311 | ) | | | (119,091,898 | ) | | | (104,459,853 | ) | | | (85,397,192 | ) | | | (780,403 | ) | | | — | |
| Total distributions | | | (146,323,057 | ) | | | (169,436,274 | ) | | | (108,215,751 | ) | | | (87,321,204 | ) | | | (1,056,873 | ) | | | (124,040 | ) |
| FUND SHARE ACTIVITIES: | | | | | | | | | | | | | | | | | | | | | | | | |
| Proceeds from shares issued | | | 945,180,942 | | | | 2,281,908,015 | | | | 64,925,474 | | | | 163,903,550 | | | | 24,017,467 | | | | 50,654,509 | |
| Net asset value of shares issued | | | | | | | | | | | | | | | | | | | | | | | | |
| in distributions reinvested | | | 134,676,458 | | | | 150,413,804 | | | | 105,591,664 | | | | 85,133,428 | | | | 1,034,508 | | | | 123,122 | |
| Cost of shares redeemed | | | (660,261,159 | ) | | | (1,222,659,690 | ) | | | (151,168,997 | ) | | | (198,309,108 | ) | | | (1,913,602 | ) | | | (3,372,226 | ) |
| Net increase in net assets derived | | | | | | | | | | | | | | | | | | | | | | | | |
| from Fund share activities | | | 419,596,241 | | | | 1,209,662,129 | | | | 19,348,141 | | | | 50,727,870 | | | | 23,138,373 | | | | 47,405,405 | |
| TOTAL INCREASE | | | 1,042,698,316 | | | | 2,159,054,974 | | | | 68,219,250 | | | | 172,510,111 | | | | 33,664,184 | | | | 53,801,992 | |
| NET ASSETS AT THE | | | | | | | | | | | | | | | | | | | | | | | | |
| BEGINNING OF THE PERIOD | | | 6,167,813,363 | | | | 4,008,758,389 | | | | 1,118,500,613 | | | | 945,990,502 | | | | 67,315,844 | | | | 13,513,852 | |
| NET ASSETS AT THE | | | | | | | | | | | | | | | | | | | | | | | | |
| END OF THE PERIOD | | $ | 7,210,511,679 | | | $ | 6,167,813,363 | | | $ | 1,186,719,863 | | | $ | 1,118,500,613 | | | $ | 100,980,028 | | | $ | 67,315,844 | |
| Undistributed net investment income | | $ | 13,288,700 | | | $ | 48,037,968 | | | $ | 2,683,867 | | | $ | 3,755,898 | | | $ | 1,349,596 | | | $ | 1,336,517 | |
| | | | | | | | | | | | | | | | | | | | | | | | | |
| FUND SHARE TRANSACTIONS: | | | | | | | | | | | | | | | | | | | | | | | | |
| Shares sold | | | 53,219,914 | | | | 140,809,873 | | | | 2,643,578 | | | | 6,533,630 | | | | 1,032,193 | | | | 2,441,371 | |
| Shares issued in | | | | | | | | | | | | | | | | | | | | | | | | |
| distributions reinvested | | | 8,008,684 | | | | 9,775,503 | | | | 4,598,940 | | | | 3,614,947 | | | | 47,537 | | | | 6,340 | |
| Less shares redeemed | | | (37,625,681 | ) | | | (75,867,253 | ) | | | (6,209,388 | ) | | | (7,952,752 | ) | | | (83,814 | ) | | | (153,047 | ) |
| Net increase in shares outstanding | | | 23,602,917 | | | | 74,718,123 | | | | 1,033,130 | | | | 2,195,825 | | | | 995,916 | | | | 2,294,664 | |
| | | | | | | | | | | | | | | | | | | | | | | | | |
The accompanying notes to financial statements are an integral part of these statements.
FMI Large Cap Fund
FINANCIAL HIGHLIGHTS
(Selected data for each share of the Fund outstanding throughout each period)
| | | (Unaudited) | | | | | | | | | | | | | | | | |
| | | For the Six Month | | | | | | | | | | | | | | | | |
| | | Period Ending | | | Years Ended September 30, | |
| | | March 31, 2013 | | | 2012 | | | 2011 | | | 2010 | | | 2009 | | | 2008 | |
| PER SHARE OPERATING PERFORMANCE: | | | | | | | | | | | | | | | | | | |
| Net asset value, beginning of period | | $ | 17.38 | | | $ | 14.31 | | | $ | 14.46 | | | $ | 13.27 | | | $ | 13.65 | | | $ | 16.18 | |
| Income from investment operations: | | | | | | | | | | | | | | | | | | | | | | | | |
| Net investment income | | | 0.10 | | | | 0.20 | | | | 0.16 | | | | 0.17 | | | | 0.20 | | | | 0.17 | |
| Net realized and unrealized gains (losses) on investments | | 1.98 | | | | 3.46 | | | | (0.17 | ) | | | 1.19 | | | | (0.47 | ) | | | (2.14 | ) |
| Total from investment operations | | | 2.08 | | | | 3.66 | | | | (0.01 | ) | | | 1.36 | | | | (0.27 | ) | | | (1.97 | ) |
| Less distributions: | | | | | | | | | | | | | | | | | | | | | | | | |
| Distributions from net investment income | | | (0.20 | ) | | | (0.17 | ) | | | (0.14 | ) | | | (0.17 | ) | | | (0.11 | ) | | | (0.13 | ) |
| Distributions from net realized gains | | | (0.21 | ) | | | (0.42 | ) | | | — | | | | — | | | | — | | | | (0.43 | ) |
| Total from distributions | | | (0.41 | ) | | | (0.59 | ) | | | (0.14 | ) | | | (0.17 | ) | | | (0.11 | ) | | | (0.56 | ) |
| Net asset value, end of period | | $ | 19.05 | | | $ | 17.38 | | | $ | 14.31 | | | $ | 14.46 | | | $ | 13.27 | | | $ | 13.65 | |
| TOTAL RETURN | | | 12.28 | %(1) | | | 26.17 | % | | | (0.13 | %) | | | 10.33 | % | | | (1.79 | %) | | | (12.58 | %) |
| RATIOS/SUPPLEMENTAL DATA: | | | | | | | | | | | | | | | | | | | | | | | | |
| Net assets, end of period (in 000’s $) | | | 7,210,512 | | | | 6,167,813 | | | | 4,008,758 | | | | 3,318,364 | | | | 2,051,701 | | | | 1,140,200 | |
| Ratio of expenses (after reimbursement) to average net assets (a) | | | 0.95 | %(2) | | | 0.96 | % | | | 0.97 | % | | | 0.97 | % | | | 0.97 | % | | | 1.00 | % |
| Ratio of net investment income to average net assets (b) | | | 1.10 | %(2) | | | 1.25 | % | | | 1.03 | % | | | 1.18 | % | | | 1.80 | % | | | 1.13 | % |
| Portfolio turnover rate | | | 5 | % | | | 21 | % | | | 28 | % | | | 20 | % | | | 32 | % | | | 30 | % |
| (a) | Computed after giving effect to adviser’s expense limitation undertaking. If the Fund had paid all of its expenses for the year ended September 30, 2008, the ratio would have been 1.02%. |
| (b) | If the Fund had paid all of its expenses for the year ended September 30, 2008, the ratio would have been 1.11%. |
The accompanying notes to financial statements are an integral part of this statement.
FMI Common Stock Fund
FINANCIAL HIGHLIGHTS
(Selected data for each share of the Fund outstanding throughout each period)
| | | (Unaudited) | | | | | | | | | | | | | | | | |
| | | For the Six Month | | | | |
| | | Period Ending | | | Years Ended September 30, | |
| | | March 31, 2013 | | | 2012 | | | 2011 | | | 2010 | | | 2009 | | | 2008 | |
| PER SHARE OPERATING PERFORMANCE: | | | | | | | | | | | | | | | | | | |
| Net asset value, beginning of period | | $ | 25.43 | | | $ | 22.63 | | | $ | 22.98 | | | $ | 21.07 | | | $ | 21.20 | | | $ | 26.61 | |
| Income from investment operations: | | | | | | | | | | | | | | | | | | | | | | | | |
| Net investment income (loss) | | | 0.06 | | | | 0.09 | | | | 0.03 | | | | (0.00 | )* | | | 0.05 | | | | 0.08 | |
| Net realized and unrealized gains (loss) on investments | | | 3.37 | | | | 4.79 | | | | 0.44 | | | | 1.96 | | | | 0.86 | | | | (1.74 | ) |
| Total from investment operations | | | 3.43 | | | | 4.88 | | | | 0.47 | | | | 1.96 | | | | 0.91 | | | | (1.66 | ) |
| Less distributions: | | | | | | | | | | | | | | | | | | | | | | | | |
| Distributions from net investment income | | | (0.09 | ) | | | (0.04 | ) | | | — | | | | (0.04 | ) | | | (0.06 | ) | | | (0.08 | ) |
| Distributions from net realized gains | | | (2.41 | ) | | | (2.04 | ) | | | (0.82 | ) | | | (0.01 | ) | | | (0.98 | ) | | | (3.67 | ) |
| Total from distributions | | | (2.50 | ) | | | (2.08 | ) | | | (0.82 | ) | | | (0.05 | ) | | | (1.04 | ) | | | (3.75 | ) |
| Net asset value, end of period | | $ | 26.36 | | | $ | 25.43 | | | $ | 22.63 | | | $ | 22.98 | | | $ | 21.07 | | | $ | 21.20 | |
| TOTAL RETURN | | | 14.91 | %(1) | | | 22.38 | % | | | 2.03 | % | | | 9.30 | % | | | 6.04 | % | | | (7.00 | %) |
| RATIOS/SUPPLEMENTAL DATA: | | | | | | | | | | | | | | | | | | | | | | | | |
| Net assets, end of period (in 000’s $) | | | 1,186,720 | | | | 1,118,501 | | | | 945,991 | | | | 925,630 | | | | 872,557 | | | | 411,797 | |
| Ratio of expenses to average net assets | | | 1.19 | %(2) | | | 1.20 | % | | | 1.21 | % | | | 1.24 | % | | | 1.26 | % | | | 1.22 | % |
| Ratio of net investment income (loss) to average net assets | | | 0.48 | %(2) | | | 0.38 | % | | | 0.13 | % | | | (0.01 | %) | | | 0.32 | % | | | 0.35 | % |
| Portfolio turnover rate | | | 10 | % | | | 43 | % | | | 26 | % | | | 30 | % | | | 35 | % | | | 40 | % |
| * | Amount is less than $0.005. |
The accompanying notes to financial statements are an integral part of this statement.
FMI International Fund
FINANCIAL HIGHLIGHTS
(Selected data for each share of the Fund outstanding throughout each period)
| | | (Unaudited) | | | | | | For the Period from | |
| | | For the Six Month | | | For the | | | December 31, | |
| | | Period Ending | | | Year Ended | | | 2010* to | |
| | | March 31, | | | September 30, | | | September 30, | |
| | | 2013 | | | 2012 | | | 2011 | |
| PER SHARE OPERATING PERFORMANCE: | | | | | | | | | |
| Net asset value, beginning of period | | $ | 22.12 | | | $ | 18.06 | | | $ | 20.00 | |
| Income from investment operations: | | | | | | | | | | | | |
| Net investment income | | | 0.08 | | | | 0.22 | | | | 0.16 | |
| Net realized and unrealized gains (loss) on investments | | | 3.12 | | | | 4.00 | | | | (2.10 | ) |
| Total from investment operations | | | 3.20 | | | | 4.22 | | | | (1.94 | ) |
| Less distributions: | | | | | | | | | | | | |
| Distributions from net investment income | | | (0.08 | ) | | | (0.16 | ) | | | — | |
| Distributions from net realized gains | | | (0.24 | ) | | | — | | | | — | |
| Total from distributions | | | (0.32 | ) | | | (0.16 | ) | | | — | |
| Net asset value, end of period | | $ | 25.00 | | | $ | 22.12 | | | $ | 18.06 | |
| TOTAL RETURN | | | 14.72 | %(1) | | | 23.52 | % | | | (9.70 | %)(1) |
| RATIOS/SUPPLEMENTAL DATA: | | | | | | | | | | | | |
| Net assets, end of period (in 000’s $) | | | 100,980 | | | | 67,316 | | | | 13,514 | |
| Ratio of expenses (after reimbursement) to average net assets (a) | | | 1.00 | %(2) | | | 1.00 | % | | | 1.00 | %(2) |
| Ratio of net investment income to average net assets (b) | | | 0.72 | %(2) | | | 1.07 | % | | | 1.05 | %(2) |
| Portfolio turnover rate | | | 6 | % | | | 20 | % | | | 12 | % |
| * | Commencement of Operations. |
| (a) | Computed after giving effect to adviser’s expense limitation undertaking. If the Fund had paid all of its expenses for the six month period ending March 31, 2013, for the year ended September 30, 2012 and for the period from December 31, 2010* to September 30, 2011, the ratios would have been 1.14%(2), 1.45% and 2.91%(2), respectively. |
| (b) | If the Fund had paid all of its expenses for the six month period ending March 31, 2013, for the year ended September 30, 2012 and for the period December 31, 2010* to September 30, 2011, the ratios would have been 0.58%(2), 0.62% and (0.86%)(2), respectively. |
The accompanying notes to financial statements are an integral part of this statement.
FMI Funds
NOTES TO FINANCIAL STATEMENTS
March 31, 2013 (Unaudited)
| (1) | Summary of Significant Accounting Policies — |
The following is a summary of significant accounting policies of the FMI Large Cap Fund, the FMI Common Stock Fund, Inc. and the FMI International Fund (collectively the “Funds” or the “Fund”). The FMI Large Cap Fund (the “Large Cap Fund”) and the FMI International Fund (the “International Fund”) are each a series of FMI Funds, Inc. (the “Company”). Both Funds are registered as non-diversified, open-end management investment companies under the Investment Company Act of 1940 (the “Act”), as amended. The Company was incorporated under the laws of Maryland on September 5, 1996 and the Large Cap Fund commenced operations on December 31, 2001 and the International Fund on December 31, 2010. The assets and liabilities of each Fund in the Company are segregated and a shareholder’s interest is limited to the Fund in which the shareholder owns shares. The FMI Common Stock Fund, Inc. (the “Common Stock Fund”), is registered as a diversified open-end management investment company under the Act. The Common Stock Fund was incorporated under the laws of Wisconsin on July 29, 1981 and is currently closed to new investors. The investment objective of the Large Cap Fund is to seek long-term capital appreciation by investing mainly in a limited number of large capitalization value stocks. The investment objective of the Common Stock Fund is to seek long-term capital appreciation by investing mainly in small to medium capitalization value stocks. The investment objective of the International Fund is to seek capital appreciation by investing mainly in a limited number of large capitalization value stocks of non-U.S. companies.
| | (a) | Each security, excluding short-term investments, is valued at the last sale price reported by the principal security exchange on which the issue is traded. Securities that are traded on the Nasdaq Markets are valued at the Nasdaq Official Closing Price, or if no sale is reported, the latest bid price. Securities that are traded over-the-counter are valued at the latest bid price. For the International Fund only, securities sold short which are listed on a national securities exchange or the Nasdaq Stock Market, but which were not traded on the valuation date, are valued at the most recent ask price. Unlisted equity securities for which market quotations are readily available are valued at the most recent bid price. For the International Fund only, options purchased or written by the Fund are valued at the average of the most recent bid and ask prices. Securities for which quotations are not readily available are valued at fair value as determined by the investment adviser in accordance with procedures approved by the Board of Directors. The fair value of a security is the amount which a Fund might reasonably expect to receive upon a current sale. The fair value of a security may differ from the last quoted price and a Fund may not be able to sell a security at the fair value. Market quotations may not be available, for example, if trading in particular securities was halted during the day and not resumed prior to the close of trading on the New York Stock Exchange. For the International Fund only, for securities that do not trade during New York Stock Exchange hours, fair value determinations are based on analyses of market movements after the close of those securities’ primary markets, and may include reviews of developments in foreign markets, the performance of U.S. securities markets, and the performance of instruments trading in U.S. markets that represent foreign securities and baskets of foreign securities. The Board may also utilize a service provided by an independent third party to assist in fair valuation of certain securities for the International Fund. As of March 31, 2013, there were no securities that were internally fair valued. Variable rate demand notes are recorded at par value which approximates market value. Short-term investments with maturities of 60 days or less are valued at amortized cost which approximates value. For financial reporting purposes, investment transactions are recorded on the trade date. |
| | | The Funds apply the provisions of the Financial Accounting Standards Board (“FASB”) Accounting Standards Codification “Fair Value Measurements and Disclosures” Topic 820 (“ASC 820”), which defines fair value as the price that would be received to sell an asset or paid to transfer a liability (i.e., the “exit price”) in an orderly transaction between market participants at the measurement date. |
| | | In determining fair value, the Funds use various valuation approaches. ASC 820 establishes a fair value hierarchy for inputs used in measuring fair value that maximizes the use of observable inputs and minimizes the use of unobservable inputs by generally requiring that the most observable inputs be used when available. Observable inputs are those that market participants would use in pricing the asset or liability based on market data obtained from sources independent of the Funds. Unobservable inputs reflect the Funds’ assumptions about the inputs market participants would use in pricing the asset or liability developed based on the best information available in the circumstances. The inputs or methodologies used for valuing securities are not necessarily an indication of the risks associated with investing in those securities. For the International Fund only, over the counter derivatives such as forward currency contracts may be valued using quantitative models. These models may use pricing curves based on market inputs including current exchange rates or indices. These curves are combined with volatility factors to value the overall positions. The market inputs are generally significant and can be corroborated with observable market data and therefore are classified in level 2. |
| | | The fair value hierarchy is categorized into three levels based on the inputs as follows: |
| | Level 1 — | Valuations based on unadjusted quoted prices in active markets for identical assets. |
| | Level 2 — | Valuations based on quoted prices for similar securities or in markets that are not active or for which all significant inputs are observable, either directly or indirectly. |
| Level 3 — | Valuations based on inputs that are unobservable and significant to the overall fair value measurement. |
NOTES TO FINANCIAL STATEMENTS (Continued)
March 31, 2013 (Unaudited)
| (1) | Summary of Significant Accounting Policies — (Continued) |
| | | The following table summarizes the Funds’ investments as of March 31, 2013, based on the inputs used to value them: |
| | | | Large Cap Fund | | | Common Stock Fund | | | International Fund | | | International Fund | |
| | | | Investments | | | Investments | | | Investments | | | Other Financial | |
| | Valuation Inputs | | in Securities | | | in Securities | | | in Securities | | | Instruments* | |
| | Level 1 — Common Stocks | | $ | 6,732,369,584 | | | $ | 1,042,931,147 | | | $ | 26,437,409 | | | $ | — | |
| | Level 2 — Common Stocks | | | — | | | | — | | | | 60,544,293 | | | | — | |
| | Short-Term U.S. Treasury Securities | | | 399,992,645 | | | | 124,997,161 | | | | 9,999,962 | | | | — | |
| | Short-Term Commercial Paper | | | 35,500,000 | | | | 21,700,000 | | | | 1,800,000 | | | | — | |
| | Forward Currency Contracts | | | — | | | | — | | | | — | | | | 1,759,372 | |
| | Total Level 2 | | | 435,492,645 | | | | 146,697,161 | | | | 72,344,255 | | | | 1,759,372 | |
| | Level 3 — | | | — | | | | — | | | | — | | | | — | |
| | Total | | $ | 7,167,862,229 | | | $ | 1,189,628,308 | | | $ | 98,781,664 | | | $ | 1,759,372 | |
| | * | Other financial instruments are derivative instruments not reflected in the Schedule of Investments, such as forward currency contracts, which are valued at the unrealized appreciation/(depreciation) on the instrument. |
| | | It is the Funds’ policy to recognize transfers between levels at the end of the quarterly reporting period. There were no transfers between levels during the period ending March 31, 2013. |
| | | See the Schedules of Investments for investments detailed by industry classifications. |
| | | In December 2011, the FASB issued an Accounting Standards Update No. 2011-11 (“ASU No. 2011-11”) to enhance disclosures requiring improved information about financial instruments and derivative instruments that are subject to offsetting (“netting”) on the Statements of Assets and Liabilities. This information will enable users of the entity’s financial statements to evaluate the effect or potential effect of netting arrangements on the entity’s financial position. ASU No. 2011-11 is effective prospectively during interim or annual periods beginning on or after January 1, 2013. At this time, management is evaluating the implications of these changes on the financial statements. |
| | (b) | Net realized gains and losses on sales of securities are computed on the identified cost basis. |
| | (c) | Dividend income is recorded on the ex-dividend date. Interest income is recorded on an accrual basis. |
| | (d) | The Funds may have investments in short-term variable rate demand notes, which are unsecured instruments. The Funds may be susceptible to credit risk with respect to these notes to the extent the issuer defaults on its payment obligation. The Funds’ policy is to monitor the creditworthiness of the issuer and nonperformance by these issuers is not anticipated. |
| | (e) | The International Fund may enter into forward currency contracts in order to hedge its exposure to changes in foreign currency rates on its foreign portfolio holdings or to hedge certain purchase and sale commitments denominated in foreign currencies. A forward currency contract is a commitment to purchase or sell a foreign currency at a future date at a negotiated rate. These contracts are valued daily and the asset or liability therein represents unrealized gain or loss on the contracts as measured by the difference between the forward foreign exchange rates at the dates of entry into the contracts and the forward rates at the reporting date. There were on average seven forward currency contracts outstanding during the period September 30, 2012 to March 31, 2013. |
| | | The fair value of the forward currency contracts as of March 31, 2013 is included in the following locations on the International Fund’s statement of assets and liabilities: |
| | | | Fair Value of | | Fair Value of |
| | | | Asset Forward | | Liability Forward |
| | | Location | | | |
| | Forward currency | Receivable for | $1,762,650 | Payable for | $3,278 |
| | contracts | forward currency | | forward currency | |
| | | contracts | | contracts | |
FMI Funds
NOTES TO FINANCIAL STATEMENTS (Continued)
March 31, 2013 (Unaudited)
| (1) | Summary of Significant Accounting Policies — (Continued) |
| | | Realized and unrealized gains and losses on forward currency contracts entered into during the six month period ending March 31, 2013 by the International Fund are recorded in the following locations on the statement of operations: |
| | | | | | Unrealized |
| | | Location | (Loss) | Location | Gain |
| | Forward currency | Net realized loss on forward | $(397,223) | Net change in unrealized | $3,101,085 |
| | contracts | currency contracts | | appreciation on forward | |
| | | | | currency contracts | |
| | | These instruments involve market risk, credit risk, or both kinds of risks, in excess of the amount recognized in the International Fund’s statement of assets and liabilities. Risks arise from the possible inability of counterparties to meet the terms of their contracts and from movement in currency and securities values and interest rates. |
| | (f) | The preparation of financial statements in conformity with accounting principles generally accepted in the United States of America (“GAAP”) requires management to make estimates and assumptions that affect the reported amounts of assets and liabilities and disclosure of contingent assets and liabilities at the date of the financial statements and the reported amounts of revenues and expenses during the reporting period. Actual results could differ from these estimates. |
| | (g) | The Large Cap Fund may own certain securities that are restricted. Restricted securities include Section 4(2) commercial paper, securities issued in a private placement, or securities eligible for resale pursuant to Rule 144A under the Securities Act of 1933 (the “1933 Act”). A restricted security cannot be resold to the general public without prior registration under the 1933 Act or pursuant to the resale limitations provided by Rule 144A under the 1933 Act, or an exemption from the registration requirements of the 1933 Act. The Fund did not hold any restricted securities as of March 31, 2013. |
| | (h) | No provision has been made for Federal income taxes since the Funds have elected to be taxed as “regulated investment companies.” The Funds intend to distribute substantially all net investment company taxable income and net capital gains to their respective shareholders and otherwise comply with the provisions of the Internal Revenue Code applicable to regulated investment companies. |
| | (i) | The Funds have reviewed all open tax years and major jurisdictions, which include Federal and the state of Maryland for the Large Cap Fund and International Fund and Federal and the state of Wisconsin for the Common Stock Fund, and concluded that there are no significant uncertain tax positions that would require recognition in the financial statements. Open tax years are those that are open for exam by taxing authorities and, as of March 31, 2013, open Federal tax years include the tax years ended September 30, 2009 through 2012 for the Large Cap Fund and the Common Stock Fund and tax years ended September 30, 2011 through 2012 only for the International Fund. The Funds have no examinations in progress and are also not aware of any tax positions for which it is reasonably possible that the total amounts of unrecognized tax benefits will significantly change in the next twelve months. |
| | (j) | GAAP requires that permanent differences between income for financial reporting and tax purposes be reclassified in the capital accounts. During the fiscal year ended September 30, 2012, the reclassifications were as follows: |
| | | | Undistributed Net | | | Accumulated Net | | | | |
| | | | Investment Income | | | Realized Gain/(Loss) | | | Paid In Capital | |
| | Large Cap Fund | | $ | — | | | $ | — | | | $ | — | |
| | Common Stock Fund | | $ | — | | | $ | (2 | ) | | $ | 2 | |
| | International Fund | | $ | 1,003,076 | | | $ | (1,003,076 | ) | | $ | — | |
| (2) | Investment Adviser and Management Agreements and Transactions With Related Parties — |
The Funds each have a management agreement with Fiduciary Management, Inc. (“FMI”), with whom certain officers and directors of the Funds are affiliated, to serve as investment adviser and manager. Under the terms of the agreements, the Large Cap Fund and International Fund will each pay FMI a monthly management fee at the annual rate of 0.75% of the daily net assets of such Fund and the Common Stock Fund will pay a monthly management fee at the annual rate of 1% of the daily net assets of such Fund. The Funds are responsible for paying their proportionate share of the compensation, benefits and expenses of the Funds’ Chief Compliance Officer. For administrative convenience, FMI initially makes these payments and is later reimbursed by the Funds.
Under the respective management agreements, FMI will reimburse the Large Cap Fund for expenses over 1.20% of the daily net assets of such Fund, 1.30% for the Common Stock Fund and 1.75% for the International Fund. In addition to the reimbursement required under each management agreement, FMI will voluntarily reimburse the Large Cap Fund and the International Fund for expenses over 1.00% of such Fund’s daily net assets. For the six month period ending March 31, 2013 there were no contractual or voluntary reimbursements required for the Large Cap Fund or the Common Stock Fund. For the International Fund, all such reimbursements amounted to $54,938 for the six month period ending March 31, 2013.
FMI Funds
NOTES TO FINANCIAL STATEMENTS (Continued)
March 31, 2013 (Unaudited)
| (2) | Investment Adviser and Management Agreements and Transactions With Related Parties — (Continued) |
The Large Cap Fund and the International Fund have each entered into a Distribution Plan (the “Plan”), pursuant to Rule 12b-1 under the Act. Each Plan provides that such Fund may incur certain costs which may not exceed the lesser of a monthly amount equal to 0.25% of such Fund’s daily net assets or the actual distribution costs incurred during the year. Amounts payable under each Plan are paid monthly for any activities or expenses primarily intended to result in the sale of shares of such Fund. For the six month period ending March 31, 2013, no such expenses were incurred by either Fund.
Under the Funds’ organizational documents, each director, officer, employee or other agent of any Fund (including the Funds’ investment manager) is indemnified, to the extent permitted by the Act, against certain liabilities that may arise out of performance of their duties to the Funds. Additionally, in the normal course of business, the Funds enter into contracts that contain a variety of indemnification clauses. The Funds’ maximum exposure under these arrangements is unknown as this would involve future claims that may be made against such Fund that have not yet occurred. However, the Funds have not had prior claims or losses pursuant to these contracts and believe the risk of loss to be remote.
At March 31, 2013, three financial intermediaries are the record owners of approximately 7%, 7% and 6% of the Large Cap Fund’s shares and one financial intermediary is the record owner of approximately 7% of the Common Stock Fund’s shares. At March 31, 2013, one of the International Fund’s Directors owned directly and indirectly approximately 12% of such Fund’s shares.
U.S. Bank, N.A. has made available to the Large Cap Fund, the Common Stock Fund and the International Fund a $400,000,000, $50,000,000 and $2,000,000 credit facility, respectively, pursuant to separate Credit Agreements (“Agreements”) effective July 14, 2008 for the Large Cap Fund and the Common Stock Fund and June 10, 2011 for the International Fund for the purposes of having cash available to satisfy redemption requests. Principal and interest of such loans under the Agreements are due not more than 20 days after the date of the loan. Amounts under the credit facility bear interest at a rate per annum equal to the current prime rate minus one percent on the amount borrowed. Advances will be collateralized by securities owned by such Fund. During the six month period ending March 31, 2013, none of the Funds borrowed against their Agreement. The Credit Agreements are renewable annually on June 5.
| (4) | Distribution to Shareholders — |
Net investment income and net realized gains, if any, are distributed to shareholders at least annually.
| (5) | Investment Transactions — |
For the six month period ending March 31, 2013, purchases and proceeds of sales of investment securities (excluding short-term investments) were as follows:
| | Large Cap Fund | Common Stock Fund | International Fund |
| Purchases | $615,176,340 | $105,457,066 | $24,137,356 |
| Sales | 306,050,050 | 239,871,012 | 4,333,947 |
| (6) | Income Tax Information — |
The following information for the Funds is presented on an income tax basis as of September 30, 2012:
| | | | | | Gross | | | Gross | | | Net Unrealized | | | Distributable | | | Distributable | |
| | | Cost of | | | Unrealized | | | Unrealized | | | Appreciation | | | Ordinary | | | Long-Term | |
| | | Investments | | | Appreciation | | | Depreciation | | | on Investments | | | Income | | | Capital Gains | |
| Large Cap Fund | | $ | 5,223,400,333 | | | $ | 1,048,377,429 | | | $ | (115,125,765 | ) | | $ | 933,251,664 | | | $ | 77,303,261 | | | $ | 42,392,949 | |
| Common Stock Fund | | | 954,488,262 | | | | 199,668,985 | | | | (37,468,764 | ) | | | 162,200,221 | | | | 16,078,819 | | | | 92,136,703 | |
| International Fund | | | 64,339,367 | | | | 5,099,710 | | | | (899,493 | ) | | | 4,200,217 | | | | 561,198 | | | | 269,002 | |
The difference between the cost amounts for financial statement and federal income tax purposes is due primarily to timing differences in recognizing certain gains and losses on security transactions.
On December 22, 2010, the Regulated Investment Company Modernization Act of 2010 (the “RIC Act”) was enacted, which changed various technical rules governing the tax treatment of RICs. The changes are generally effective for taxable years beginning after the date of enactment. Capital losses incurred in taxable years beginning after the date of enactment may now be carried forward indefinitely, and retain the character of the original loss. Post-enactment losses must be utilized prior to pre-enactment losses. Under pre-enactment law, capital losses could be carried forward for up to eight years, and carried forward as short-term capital loss, irrespective of the character of the original loss. The RIC Act now allows RICs to elect to “push” to the first day of the next taxable year all or part of any late year ordinary
FMI Funds
NOTES TO FINANCIAL STATEMENTS (Continued)
March 31, 2013 (Unaudited)
| (6) | Income Tax Information — (Continued) |
loss, which is defined as the sum of the specified post-October losses and other post-December ordinary losses, over the specified post- October gains and other post-December ordinary gains. This reduces the circumstances under which a RIC might be required to file amended Forms 1099 to restate previously reported distributions.
The tax components of dividends paid during the years ended September 30, 2012 and 2011, capital loss carryovers, which may be used to offset future capital gains, subject to Internal Revenue Code limitations and tax basis post-October losses as of September 30, 2012, which are not recognized for tax purposes until the first day of the following fiscal year are:
| | | September 30, 2012 | | | September 30, 2011 | |
| | | Ordinary | | | Long-Term | | | | | | | | | Ordinary | | | Long-Term | |
| | | Income | | | Capital Gains | | | Capital Loss | | | Post-October | | | Income | | | Capital Gains | |
| | | Distributions | | | Distributions | | | Carryovers | | | Losses | | | Distributions | | | Distributions | |
| Large Cap Fund | | $ | 52,548,400 | | | $ | 116,887,874 | | | $ | — | | | $ | — | | | $ | 31,698,426 | | | $ | — | |
| Common Stock Fund | | | 12,922,882 | | | | 74,398,322 | | | | — | | | | — | | | | 22,444,545 | | | | 10,955,926 | |
| International Fund | | | 124,040 | | | | — | | | | — | | | | — | | | | — | | | | — | |
For corporate shareholders of the Large Cap Fund, Common Stock Fund and International Fund, the percentage of dividend income distributed for the year ended September 30, 2012 which is designated as qualifying for the dividends received deduction is 94.5%, 99.3% and 0%, respectively (unaudited). The International Fund intends to elect to pass-through to shareholders the income tax credit for taxes paid to foreign countries. For the year ended September 30, 2012, the foreign source income was $853,106 (unaudited) and the foreign tax expense was $50,130 (unaudited). The pass-through of the foreign tax credit will only affect those persons who are shareholders on the dividend record dates.
For all shareholders of the Large Cap Fund, Common Stock Fund and International Fund, the percentage of dividend income distributed for the year ended September 30, 2012 which is designated as qualified dividend income under the Jobs and Growth Tax Relief Act of 2003, is 100%, 99.3% and 100%, respectively (unaudited).
Effective June 30, 2013, the Large Cap Fund will be closed to new investors, whether owning shares of record or through a processing intermediary, except as indicated in the supplement to the Prospectus dated April 15, 2013.
ADDITIONAL INFORMATION
For additional information about the Directors and Officers or for a description of the policies and procedures that the Funds use to determine how to vote proxies relating to portfolio securities, please call (800) 811-5311 and request Statements of Additional Information. They will be mailed to you free of charge. The Statements of Additional Information are also available on the website of the Securities and Exchange Commission (the “Commission”) at http://www.sec.gov. Information on how each of the Funds voted proxies relating to portfolio securities is available on the Funds’ website at http://www.fmifunds.com or the website of the Commission no later than August 31 for the prior 12 months ending June 30. The Funds file their complete schedules of portfolio holdings with the Commission for the first and third quarters of each fiscal year on Form N-Q. The Funds’ Forms N-Q are available on the Commission’s website. The Funds’ Forms N-Q may be reviewed and copied at the Commission’s Public Reference Room in Washington, D.C., and that information on the operation of the Public Reference Room may be obtained by calling 1-800-SEC-0330.
FMI Funds
As a shareholder of the FMI Funds you incur ongoing costs, including management fees and other Fund expenses. You do not incur transaction costs such as sales charges (loads) on purchase payments, reinvested dividends, or other distributions; redemption fees; and exchange fees because the Funds do not charge these fees. This example is intended to help you understand your ongoing costs (in dollars) of investing in each Fund and to compare these costs with the ongoing costs of investing in other mutual funds.
The example is based on an investment of $1,000 invested at the beginning of the period and held for the entire period from October 1, 2012 through March 31, 2013.
Actual Expenses
The table below provides information about actual account values and actual expenses. You may use the information in these lines, together with the amount you invested, to estimate the expenses that you paid over the period. Simply divide your account value by $1,000 (for example, an $8,600 account value divided by $1,000 = 8.6), then multiply the result by the number in the line under the heading entitled “Actual Expenses Paid During Period” to estimate the expenses you paid on your account during this period.
In addition to the costs highlighted and described below, the only Fund transaction costs you might currently incur would be wire fees ($15 per wire), if you choose to have proceeds from a redemption wired to your bank account instead of receiving a check. Additionally, U.S. Bank charges an annual processing fee ($15) if you maintain an IRA account with the Fund. To determine your total costs of investing in a Fund, you would need to add any applicable wire or IRA processing fees you’ve incurred during the period to the costs provided in the example at the end of this article.
Hypothetical Example for Comparison Purposes
The table below provides information about hypothetical account values and hypothetical expenses based on each Fund’s actual expense ratio and an assumed rate of return of 5% per year before expenses, which is not the Fund’s actual return. The hypothetical account values and expenses may not be used to estimate the actual ending account balance or expenses you paid for the period. You may use this information to compare the ongoing costs of investing in a Fund and other funds. To do so, compare this 5% hypothetical example with the 5% hypothetical examples that appear in the shareholder reports of the other funds.
Please note that the expenses shown in the table are meant to highlight your ongoing costs only and do not reflect any transactional costs, such as sales charges (loads), redemption fees or exchange fees. Therefore, the hypothetical line of the table is useful in comparing ongoing costs only, and will not help you determine the relative total costs of owning different funds. In addition, if these transactional costs were included, your costs would have been higher.
| | | FMI | | | FMI | | | FMI | |
| | | Large Cap | | | Common Stock | | | International | |
| | | Fund | | | Fund | | | Fund | |
| | | | | | | | | | |
| Actual Beginning Account Value 10/01/12 | | $ | 1,000.00 | | | $ | 1,000.00 | | | $ | 1,000.00 | |
| | | | | | | | | | | | | |
| Actual Ending Account Value 3/31/13 | | $ | 1,122.80 | | | $ | 1,149.10 | | | $ | 1,147.20 | |
| | | | | | | | | | | | | |
| Actual Expenses Paid During Period* 10/01/12-3/31/13 | | $ | 5.03 | | | $ | 6.38 | | | $ | 5.35 | |
| | | | | | | | | | | | | |
| Hypothetical Beginning Account Value 10/01/12 | | $ | 1,000.00 | | | $ | 1,000.00 | | | $ | 1,000.00 | |
| | | | | | | | | | | | | |
| Hypothetical Ending Account Value 3/31/13 | | $ | 1,020.19 | | | $ | 1,019.00 | | | $ | 1,019.95 | |
| | | | | | | | | | | | | |
| Hypothetical Expenses Paid During Period* 10/01/12-3/31/13 | | $ | 4.78 | | | $ | 5.99 | | | $ | 5.04 | |
| | | | | | | | | | | | | |
| Annualized Expense Ratio* | | | 0.95 | % | | | 1.19 | % | | | 1.00 | % |
| | | | | | | | | | | | | |
| * | Expenses are equal to the Fund’s annualized expense ratio, multiplied by the average account value over the period, multiplied by 182/365 (to reflect the one-half year period between October 1, 2012 and March 31, 2013). |
FMI Funds
ADVISORY AGREEMENTS
On December 21, 2012, the Boards of Directors of FMI Common Stock Fund, Inc. and FMI Funds, Inc. (the “Directors”) approved the continuation of the investment advisory agreements for the FMI Common Stock Fund, the FMI Large Cap Fund and the FMI International Fund (collectively the “Funds”, or the, “Fund”) with Fiduciary Management, Inc. (“FMI”). Prior to approving the continuation of the investment advisory agreements, the Directors considered:
•the nature, extent and quality of the services provided by FMI
•the investment performance of each of the Funds
•the cost of the services to be provided and profits to be realized by FMI from its relationship with the Funds
•the extent to which economies of scale would be realized as each Fund grew and whether fee levels reflect any economies of scale
•the expense ratios of each of the Funds
•the manner in which portfolio transactions for the Funds were conducted, including the use of soft dollars
In considering the nature, extent and quality of the services provided by FMI, the Directors reviewed a report describing the portfolio management, shareholder communication and servicing, prospective shareholder assistance and regulatory compliance services provided by FMI to the Funds. The Directors concluded that FMI was providing essential services to the Funds. In particular, the Directors concluded that FMI was preparing reports to shareholders in addition to those required by law, and was providing services to the Funds that were in addition to the services investment advisers typically provided to non-mutual fund clients.
The Directors compared the performance of each of the Funds to benchmark indices over various periods of time and concluded that the performance of each Fund warranted the continuation of the agreements.
In concluding that the advisory fees payable by each Fund were reasonable, the Directors reviewed a report that concluded that FMI was reimbursing the International Fund to maintain an expense ratio of 1.00% and that the profits FMI realized with respect to the Common Stock Fund and Large Cap Fund expressed as a percentage of pre-tax revenues were generally comparable to that of publicly traded investment advisers. The Directors also reviewed reports comparing each Fund’s expense ratio and advisory fees paid by each Fund to those of other comparable mutual funds and concluded that the advisory fee paid by each Fund and each Fund’s expense ratio were within the range of comparable mutual funds. The Directors noted that the investment advisory fee for each of the Funds was not adjusted if the Funds grew, but did not consider that factor to be significant because of the other factors considered.
Finally, the Directors reviewed reports discussing the manner in which portfolio transactions for the Funds were conducted, including the use of soft dollars. Based on these reports, the Directors concluded that the research obtained by FMI was beneficial to each of the Funds and that FMI was executing the Funds’ portfolio transactions in a manner designed to obtain best execution for each of the Funds.
DISCLOSURE INFORMATION
This report is not authorized for use as an offer of sale or a solicitation of an offer to buy shares of the Fund unless accompanied or preceded by the Fund’s current prospectus.
Performance data quoted represents past performance; past performance does not guarantee future results. Investment return and principal value of an investment will fluctuate so that an investor’s shares, when redeemed, may be worth more or less than their original cost. Current performance of a Fund may be lower or higher than the performance quoted. The returns do not reflect the deduction of taxes that a shareholder would pay on Fund distributions or the redemption of Fund shares. Performance data current to the most recent month-end may be obtained by visiting www.fmifunds.com or by calling 1-800-811-5311.
As of the Funds’ Prospectuses dated January 31, 2013, the FMI Large Cap Fund, FMI Common Stock Fund and FMI International Fund’s annual operating expense ratios are 0.96%, 1.20% and 1.00%, respectively. FMI International Fund’s (“FMIJX”) annual operating expense ratio is 1.45%, less an expense reimbursement of 0.45% for a net operating expense ratio of 1.00%. Fiduciary Management, Inc. (“FMI”) has
FMI Funds
DISCLOSURE INFORMATION (Continued)
contractually agreed to waive its advisory fee to the extent necessary to ensure that net expenses of the FMIJX do not exceed 1.75% of the average daily net assets. In addition to the reimbursement required under the FMIJX investment advisory agreement, FMI will reimburse FMIJX for expenses in excess of 1.00% of the daily net assets. FMI will not terminate this reimbursement prior to January 31, 2014.
For more information about the FMI Funds, call 1-800-811-5311 for a free Prospectus or Summary Prospectus. Please read these Prospectuses carefully to consider the investment objectives, risks, charges and expenses, before investing or sending money. These Prospectuses contain this and more information about the FMI Funds. Please read the Prospectuses or Summary Prospectuses carefully before investing.
Please note the FMI Common Stock Fund, Inc. is currently closed to new investors.
Securities named in the Letters to Shareholders, but not listed in the Schedules of Investments are not held in the Funds as of the date of this disclosure. Portfolio holdings are subject to change without notice and are not intended as recommendations of individual securities.
Risks associated with investing in the Funds are as follows:
FMI Large Cap Fund: Stock Market Risk, Medium and Large Capitalization Companies Risks, Non-Diversification Risk, Value Investing Risk and Foreign Securities Risk.
FMI Common Stock Fund: Stock Market Risk, Medium and Small Capitalization Companies Risks, Value Investing Risk and Foreign Securities Risk.
FMI International Fund: Stock Market Risk, Non-Diversification Risk, Value Investing Risk, Foreign Securities Risk, Geographic Concentration Risk, Currency Hedging Risk and Large Capitalization Companies Risk.
For details regarding these risks, please refer to the Funds’ Prospectuses or Summary Prospectuses dated January 31, 2013.
The TOPIX, also known as the Tokyo Stock Price Index, is a capitalization weighted index of all companies listed on the First Section of the Tokyo Stock Exchange. The index is supplemented by the sub-indices of the 33 industry sectors. The index calculation excludes temporary issues and preferred stocks, and has a base value of 100 as of January 4, 1968.
The FTSE 100 Index is a capitalization-weighted index of the 100 most highly capitalized companies traded on the London Stock Exchange. The equities use an investibility weighting in the index calculation. The index was developed with a base level of 1000 as of January 3, 1984. The index is maintained by the FTSE Group, a subsidiary of the London Stock Exchange Group.
Reference definitions found at Investopedia.com
P/E ratio (forward 4 quarters) – Price to Earnings ratio (forward 4 quarters) is a measure of the price-to-earnings ratio (P/E) using forecasted earnings for the P/E calculation. While the earnings used are just an estimate and are not as reliable as current earnings data, there is still a benefit in estimated P/E analysis. The forecasted earnings used in the formula can either be for the next 12 months or for the next full-year fiscal period.
EBIT – Earnings Before Interest & Tax – An indicator of a company’s profitability, calculated as revenue minus expenses, excluding tax and interest.
EV/EBITDA – Enterprise Value to Earnings Before Interest Taxes Depreciation and Amortization is a measure of the value of a stock that compares a company’s enterprise value (market cap plus debt, minority interest and preferred shares, minus total cash and cash equivalents) to its earnings before interest taxes depreciation and amortization. EV/EBITDA is one of several fundamental indicators that investors use to determine whether a stock is priced well. The EV/EBITDA multiple is also often used to determine a company’s valuation in the case of a potential acquisition.
EV/Sales – Enterprise-Value-To-Sales – A valuation measure that compares the enterprise value of a company to the company’s sales. EV/Sales gives investors an idea of how much it costs to buy the company’s sales.
ROIC – Return On Invested Capital – A calculation used to assess a company’s efficiency at allocating the capital under its control to profitable investments. The return on invested capital measure gives a sense of how well a company is using its money to generate returns.
OEM – Original Equipment Manufacturer
Distributed by Rafferty Capital Markets, LLC
| FMI Large Cap Fund | FMI Common Stock Fund | FMI International Fund |
100 East Wisconsin Avenue, Suite 2200
Milwaukee, Wisconsin 53202
www.fmifunds.com
414-226-4555
BOARD OF DIRECTORS
| | BARRY K. ALLEN | GORDON H. GUNNLAUGSSON | |
| | ROBERT C. ARZBAECHER | TED D. KELLNER | |
| | JOHN S. BRANDSER* | RICHARD E. LANE** | |
| | PATRICK J. ENGLISH | PAUL S. SHAIN | |
| ** | Large Cap Fund and International Fund only |
INVESTMENT ADVISER
FIDUCIARY MANAGEMENT, INC.
100 East Wisconsin Avenue, Suite 2200
Milwaukee, Wisconsin 53202
ADMINISTRATOR, ACCOUNTANT, TRANSFER
AGENT AND DIVIDEND DISBURSING AGENT
U.S. BANCORP FUND SERVICES, LLC
615 East Michigan Street
Milwaukee, Wisconsin 53202
800-811-5311 or 414-765-4124
| | CUSTODIAN | INDEPENDENT REGISTERED | |
| | U.S. BANK, N.A. | PUBLIC ACCOUNTING FIRM | |
| | | PRICEWATERHOUSECOOPERS LLP | |
| | DISTRIBUTOR | | |
| | RAFFERTY CAPITAL | LEGAL COUNSEL | |
| | MARKETS, LLC | FOLEY & LARDNER LLP | |
| | | | |
| | | | |
| | |
| |
| |
| |
| |
| |
| |
| FMI Funds |
| |
| 1-800-811-5311 |
| |
| www.fmifunds.com |
| |
| |
| |
Not applicable for semi-annual reports.
Item 3. Audit Committee Financial Expert.
Not applicable for semi-annual reports.
Item 4. Principal Accountant Fees and Services.
Not applicable for semi-annual reports.
Item 5. Audit Committee of Listed Registrants.
Not applicable to registrants who are not listed issuers (as defined in Rule 10A-3 under the Securities Exchange Act of 1934).
Item 6. Schedule of Investments.
| (a) | The Schedule of Investments in securities of unaffiliated issuers is included as part of the report to shareholders filed under Item 1 of this Form. |
Item 7. Disclosure of Proxy Voting Policies and Procedures for Closed-End Management Investment Companies
Not applicable.
Item 8. Portfolio Managers of Closed-End Management Investment Companies.
Not applicable.
Item 9. Purchases of Equity Securities by Closed-End Management Investment Company and Affiliated Purchasers.
Not applicable.
Item 10. Submission of Matters to a Vote of Security Holders.
None.
Item 11. Controls and Procedures.
| (a) | The Registrant’s disclosure controls and procedures are periodically evaluated. As of April 22, 2013, the date of the last evaluation, the Registrant’s officers have concluded that the Registrant’s disclosure controls and procedures are adequate. |
| (b) | The Registrant’s internal controls are periodically evaluated. There were no changes in the Registrant’s internal control over financial reporting that occurred during the second fiscal quarter of the period covered by this report that have materially affected, or are reasonably likely to materially affect, such controls. |
Item 12. Exhibits.
| (a) | (1) Any code of ethics or amendment thereto. Not applicable. |
(2) | Certifications pursuant to Section 302 of the Sarbanes-Oxley Act of 2002. Filed herewith. |
| (3) | Any written solicitation to purchase securities under Rule 23c-1 under the Act sent or given during the period covered by the report by or on behalf of the Registrant to 10 or more persons. Not applicable to open-end investment companies. |
| (b) | Certification pursuant to Section 906 of the Sarbanes-Oxley Act of 2002. Furnished herewith. |
SIGNATURES
Pursuant to the requirements of the Securities Exchange Act of 1934 and the Investment Company Act of 1940, the registrant has duly caused this report to be signed on its behalf by the undersigned, thereunto duly authorized.
FMI Common Stock Fund, Inc.
Registrant
By /s/ Ted D. Kellner
Ted D. Kellner, Principal Executive Officer
Date 4/26/13
Pursuant to the requirements of the Securities Exchange Act of 1934 and the Investment Company Act of 1940, this report has been signed below by the following persons on behalf of the registrant and in the capacities and on the dates indicated.
FMI Common Stock Fund, Inc.
Registrant
By /s/ Ted D. Kellner
Ted D. Kellner, Principal Financial Officer
Date 4/26/13