UNITED STATES
SECURITIES AND EXCHANGE COMMISSION
Washington, D.C. 20549
FORM N-CSR
CERTIFIED SHAREHOLDER REPORT OF REGISTERED
MANAGEMENT INVESTMENT COMPANIES
Investment Company Act file number 811-03235
FMI Common Stock Fund, Inc.
(Exact name of registrant as specified in charter)
100 East Wisconsin Avenue, Suite 2200
Milwaukee, WI 53202
(Address of principal executive offices) (Zip code)
Ted D. Kellner
Fiduciary Management, Inc.
100 East Wisconsin Avenue, Suite 2200
Milwaukee, WI 53202
(Name and address of agent for service)
(414) 226-4555
Registrant's telephone number, including area code:
Date of fiscal year end: September 30
Date of reporting period: March 31, 2011
Item 1. Reports to Stockholders.
SEMIANNUAL REPORT
March 31, 2011
FMI
Common Stock
Fund, Inc.
(FMIMX)
A NO-LOAD
MUTUAL FUND
FMI
Common Stock
Fund, Inc.
March 31, 2011
Dear Fellow Shareholders:
The FMI Common Stock Fund gained 6.82%(1) in the quarter compared to 7.94%(2) for the Russell 2000 Index. The first two months of the quarter were similar to last year in that higher beta situations, levered cyclicals, technology and energy-related stocks did well. More defensive stocks continued to underperform. With Middle East conflicts escalating and the terrible tragedy in Japan unfolding, there was some flight back to perceived safety. We were pleased to have not lost too much ground given our conservative, defensive posture. Overall, we have been surprised at the magnitude and duration of the equity rally, now over two years old. Valuations are once again stretched for the market as a whole, particularly given the grave nature of developed country finances.
Easy Solutions?
If you ask the proverbial average American how many people in the U.S. make over $1 million per year, the number would likely be a lot greater than 321,294. Yet that is indeed the figure.(3) The IRS shows adjusted gross income for this group of $1.076 trillion. They paid federal income taxes of $260 billion. So, think about the math. One could increase taxes on this group of people by 50% and assume they do not take any mitigating actions (defer income, hide income, delay capital gains, opt for leisure, etc.), and the additional income generated would be $130 billion. That is less than 10% of this year’s budget deficit of $1.5 trillion. Forget about the $14.3 trillion of debt and any hope of chipping away at that.
4,376,000 filers make more than $200,000 per year. Their adjusted gross income in 2008 was $2.462 trillion. They paid $544 billion in taxes. Again, we could raise tax rates by 50%, assume they take no mitigating actions, and only $272 billion more in taxes would be raised. This is 18% of the current budget deficit. Incidentally, these 4.4 million filers, 1.5% of the population, paid 50% of the total federal income taxes.
There are certainly some high income filers who have found or exploited ways to avoid paying statutory rates (all the more reason to reform the tax code), but odd as it may seem, even doubling their tax rate barely dents the deficit. 13,000 filers made more than $10 million in 2008, generating taxable income of $348 billion and paying $88 billion in federal income tax. Double their tax rate and it would amount to 6% of this year’s deficit.
Some say the answer is to just tax corporations at a higher rate. There are all sorts of issues with this idea, not the least of which is that corporate taxes bring in less than $200 billion annually, just 13% of this year’s deficit, and the U.S. corporate tax rate of 35% is already the second highest amongst the 30 OECD (Organisation for Economic Co-operation & Development) countries. Many companies have moved operations or headquarters overseas to avoid getting taxed at the U.S. rate for income they do not generate in the U.S. Armies of tax lawyers and lobbyists are employed to reduce corporate taxes and this has the effect of favoring
| (1) | The Fund’s one-year and annualized 5-year and 10-year returns through March 31, 2011 were: 19.95%, 8.00% and 11.25%, respectively. |
| (2) | The Russell 2000 Index one-year and annualized 5-year and 10-year returns through March 31, 2011 were 25.79%, 3.35% and 7.87%, respectively. |
| (3) | The IRS data is for 2008, the most recent available. Actual millionaires may be slightly higher in the cases where both spouses earn over $1 million and are filing jointly. |
not only certain types of businesses over others, but large corporations over small. President Obama seems open to reducing corporate tax rates to make the U.S. more competitive. Reducing or eliminating the corporate tax, combined with a much flatter individual tax and the elimination of tax breaks, would also be more equitable and could generate more income over time. In a sense, corporations really don’t pay taxes; they simply pass the burden onto consumers. Raising the corporate tax rate doesn’t affect the CEO’s income at all, but it does hurt the little guy, who pays more for a loaf of bread or possibly loses his job because his unit is moved offshore. Corporations are not living citizens. They are owned by living citizens who pay taxes on distributed corporate income and capital gains. If tax rates on dividends and capital gains migrated toward a broad-based flat tax rate, income would accrue to the owners, suppliers and employees and very possibly tax revenue would rise, in addition to being less regressive.
“We know what it will take for America to win the future. We need to out-innovate, we need to out-educate, we need to out-build our competitors. We need an economy that’s based not on what we consume and borrow from other nations, but what we make and what we sell around the world. We need to make America the best place on Earth to do business… Another barrier government can remove is a burdensome corporate tax code with one of the highest rates in the world.”
– President Barack Obama (February 7, 2011)
No discussion of the budget deficit can progress unless people understand this basic math: approximately 58% of the budget is Medicare, Federal Medicaid, Social Security, and unemployment entitlements. Defense is 20%. If a budget discussion fails to address 78% of the budget, it fails.
According to a recent survey by the Tarrance Group, a majority of voters (63%) incorrectly believes the federal government spends more on defense than it does on Medicare and Social Security. The hard reality is that there are no easy solutions. No sound bite call to tax the rich or stick it to corporations really addresses the problem at all. The issue has been and continues to be excessive government spending.
As this letter is being written, Congress is haggling back and forth about whether federal spending growth will be reduced by $62 billion or $10 billion (1.7% or 0.4% of the total budget, respectively). With little recognition or admission of the underlying fiscal realities, and almost nothing of substance being done about it (in fact, large protests against spending cuts are now commonplace), our macro outlook continues to be guarded. Stock valuations have moved considerably higher over the past year and the combo platter of a fiscal mess, an untenable monetary policy and a stretched market translates into a more cautious investment outlook. Of course, experience tells us there will always be interesting investment ideas, regardless of the big picture. Below we have highlighted two. Additionally, at http://www.fiduciarymgt.com/institutional-investors/additional-resources, we have posted the support work for this letter as well as some other interesting data. We thank one of our team members, Dan Sievers, for compiling this information.
SANDERSON FARMS, INC.
Analyst: Andy Ramer
Description
Sanderson Farms is a vertically integrated poultry company engaged in the production, processing, marketing and distribution of fresh and frozen chicken products, as well as prepared chicken. The firm is the fourth largest producer of chicken in the U.S., with a 6.5% share of the domestic market.
Good Business
| | • | Sanderson Farms is a low-cost operator. The business periodically requires significant capital outlays, and incumbents have established long-term contracts and relationships with their customers, which raises the barriers to entry. |
| | • | Chicken is a reasonably priced consumer staple. It is the most efficiently produced popular protein with a feed-to-weight gain ratio of 2:1 compared to pork at 3.5:1 and beef at 8:1. |
| | • | Sanderson Farms earns its cost of capital over a cycle. The company generated a ROIC of 21.9% in fiscal 2010 compared to the 5- and 10-year averages of 10.9% and 15.8%, respectively. |
| | • | The business is easy to understand. |
| | • | There is $10.3 million in net cash on the balance sheet. |
Valuation
| | • | The stock trades near the low-end of its 52-week range, has declined 34% from its 52-week high, and since July 1, 2010 has underperformed the S&P 500 and Russell 2000 by 35% and 42%, respectively. |
| | • | Sanderson Farms trades for 1.33x book, which is near the low-end of its 5- and 10-year average ranges of 2.60-1.33 and 2.84-1.42, respectively. There is no goodwill on the balance sheet. |
| | • | If the company were able to replicate its historical performance and grow its book value/share by 10% over the next five years, and if the shares were to return to their 5-year average price/book multiple of 1.9, the stock would double. |
Management
| | • | Senior management is well-regarded by Wall Street. The company is led by Chairman & CEO Joe F. Sanderson, Jr., 63; President & COO Lampkin Butts, 59; and CFO Mike Cockrell, 53. Their philosophy is to manage the firm for the long term. |
| | • | Sanderson Farms prefers to grow organically. |
| | • | Compensation is tied in part to ROE. All directors and executive officers as a group own 6.5% of the stock, and the ESOP (employee stock ownership plan) owns an additional 8.4% of the shares, for total insider ownership of 14.9%. Joe Sanderson owns 5.3% of the company. |
Investment Thesis
The shares of Sanderson Farms have come under pressure due to the chicken cycle rolling over. The fiscal fourth quarter, which ended in October 2010, likely represented a cyclical peak for the business. Market participants are now losing money as chicken production grows, bird weights increase, and feed costs rise. Although it may take a year or more before supply and demand rebalance, we believe that most of the bad news is already reflected in the valuation. Sanderson Farms’ status as a low-cost operator and its debt-free balance sheet position it well to weather the downturn.
CULLEN/FROST BANKERS, INC.
Analyst: Matthew Goetzinger
Description
Cullen/Frost Bankers (CFR) is a leading independent Texas-based regional bank focused on commercial lending. CFR operates over 110 branches across Texas. Major markets include San Antonio (32% of total deposits), Fort Worth (20%), Houston (18%), Austin (10%), Corpus Christi (6%), Dallas (6%) and the Rio Grande Valley (3%). Non-interest fee income accounts for over 30% of revenues, with trust and insurance brokerage as primary contributors. Frost Bank became chartered within the national banking association in 1899.
Good Business
| | • | CFR has established a durable business model focused on middle market relationship-based lending to commercial customers with $10-100 million in annual revenues. |
| • | Over 30% of the company’s revenues are generated through fee-based income. |
| • | Commercial lending relationships average over 10 years. |
| • | Over the past 5- and 10-year timeframes, CFR has averaged a ROE of 14.4% and 16.0%, respectively. |
| • | The company’s balance sheet boasts strong capital levels (13.8% Tier 1 Risk Based Capital), low and declining nonperforming assets and strong reserves. |
| • | The company is conservatively managed and is easy to understand. |
Valuation
| • | CFR is trading on the low-end of its historical price-to-book value range. |
| • | The P/E is at the midpoint of its historical range, but the company’s earnings are depressed. |
| • | Takeovers for other good Texas banks have taken place at 3.2-4.3x tangible book compared to 2.1x for CFR. |
| • | CFR is the last independent bank of size left in Texas. |
Management
| • | Richard W. Evans, Jr., 63, has been a Director since 1993 and the Chairman and CEO since 1997. |
| • | Patrick B. Frost, 49, is viewed as a likely successor to Evans; he has been President of Frost Bank since 1993 and an Officer since 1985. |
| • | Both Evans and the Chief Credit Officer were previously bank examiners. |
| • | Cumulative employee ownership is 13.5%. |
Investment Thesis
Cullen/Frost Bankers is a high quality lender focused on commercial and industrial loans, and is positioned to benefit from a rebound in the Texas economy. Credit quality has been outstanding, with just 50 basis points (“bps”) of net charge-offs. The loan loss reserve is three times the charge-off run rate. Capital is robust (est. $150-300 million of excess capital) and the company’s low cost deposit franchise generates low cost funding (20 bps average). A steepening yield curve and inflation (commodity rich Texas economy) will also accrue to the benefit of CFR.
Thank you for your confidence in the FMI Common Stock Fund.
| | |
 |  |
| Ted D. Kellner, CFA | Patrick J. English, CFA |
| Executive Chairman | CEO & Chief Investment Officer |
The returns do not reflect the deduction of taxes that a shareholder would pay on Fund distributions or the redemption of Fund shares. Performance data quoted represents past performance; past performance does not guarantee future results. The investment return and principal value of an investment will fluctuate so that an investor’s shares, when redeemed, may be worth more or less than their original cost. Current performance since the above time period may be lower or higher than the performance quoted. Performance data current to the most recent month-end may be obtained by visiting www.fmifunds.com or by calling 1-800-811-5311. As of the Fund’s Prospectus dated January 31, 2011, the Fund’s annual operating expense ratio is 1.24%.
As of March 31, 2011, the security holdings mentioned above represented the following percentage of the Fund’s total assets: Cullen/Frost Bankers, Inc. 1.0%; Sanderson Farms, Inc. 1.3%. Portfolio holdings are subject to change without notice and are not intended as recommendations of individual securities.
For more information about the FMI Common Stock Fund, call (800) 811-5311 for a free prospectus. Please read the prospectus carefully to consider the investment objectives, risks, charges and expenses, before investing or sending money. The prospectus contains this and more information about the FMI Common Stock Fund. Please read the prospectus carefully before investing.
Distributed by Rafferty Capital Markets, LLC
100 E. Wisconsin Ave., Suite 2200 • Milwaukee, WI 53202 • 414-226-4555
www.fmifunds.com
FMI Common Stock Fund, Inc.
COST DISCUSSION
As a shareholder of the Fund you incur ongoing costs, including management fees and other Fund expenses. You do not incur transaction costs such as sales charges (loads) on purchase payments, reinvested dividends, or other distributions; redemption fees; and exchange fees because the Fund does not charge these fees. This example is intended to help you understand your ongoing costs (in dollars) of investing in FMI Common Stock Fund and to compare these costs with the ongoing costs of investing in other mutual funds.
The example is based on an investment of $1,000 invested at the beginning of the period and held for the entire period from October 1, 2010 through March 31, 2011.
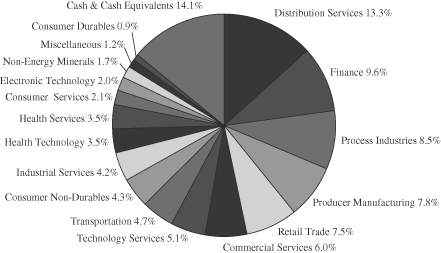
Industry Sectors as of March 31, 2011
Actual Expenses
The first line of the table below provides information about actual account values and actual expenses. You may use the information in this line, together with the amount you invested, to estimate the expenses that you paid over the period. Simply divide your account value by $1,000 (for example, an $8,600 account value divided by $1,000 = 8.6), then multiply the result by the number in the first line under the heading entitled “Expenses Paid During Period” to estimate the expenses you paid on your account during this period.
In addition to the costs highlighted and described below, the only Fund transaction costs you might currently incur would be wire fees ($15 per wire), if you choose to have proceeds from a redemption wired to your bank account instead of receiving a check. Additionally, U.S. Bank charges an annual processing fee ($15) if you maintain an IRA account with the Fund. To determine your total costs of investing in the Fund, you would need to add any applicable wire or IRA processing fees you’ve incurred during the period to the costs provided in the example at the end of this article.
Hypothetical Example for Comparison Purposes
The second line of the table below provides information about hypothetical account values and hypothetical expenses based on the Fund’s actual expense ratio and an assumed rate of return of 5% per year before expenses, which is not the Fund’s actual return. The hypothetical account values and expenses may not be used to estimate the actual ending account balance or expenses you paid for the period. You may use this information to compare the ongoing costs of investing in the Fund and other funds. To do so, compare this 5% hypothetical example with the 5% hypothetical examples that appear in the shareholder reports of the other funds.
Please note that the expenses shown in the table are meant to highlight your ongoing costs only and do not reflect any transactional costs, such as sales charges (loads), redemption fees or exchange fees. Therefore, the second line of the table is useful in comparing ongoing costs only, and will not help you determine the relative total costs of owning different funds. In addition, if these transactional costs were included, your costs would have been higher.
| | | Beginning | | | Ending | | | Expenses Paid | |
| | | Account | | | Account | | | During Period* | |
| | | Value 10/01/10 | | | Value 3/31/11 | | | 10/01/10-3/31/11 | |
| FMI Common Stock Fund Actual | | $1,000.00 | | | $1,207.80 | | | $6.72 | |
| Hypothetical (5% return before expenses) | | $1,000.00 | | | $1,018.80 | | | $6.14 | |
| * | Expenses are equal to the Fund’s annualized expense ratio of 1.22%, multiplied by the average account value over the period, multiplied by 182/365 (to reflect the one-half year period between October 1, 2010 and March 31, 2011). |
FMI Common Stock Fund, Inc.
STATEMENT OF ASSETS AND LIABILITIES
March 31, 2011 (Unaudited)
| ASSETS: | | | |
| Investments in securities, at value (cost $857,529,733) | | $ | 1,130,338,057 | |
| Dividends receivable | | | 1,319,006 | |
| Receivable from shareholders for purchases | | | 1,269,334 | |
| Cash | | | 43,726 | |
| Total assets | | $ | 1,132,970,123 | |
| | | | | |
| LIABILITIES: | | | | |
| Payable to adviser for management fees | | $ | 819,745 | |
| Payable to shareholders for redemptions | | | 606,188 | |
| Other liabilities | | | 220,698 | |
| Total liabilities | | | 1,646,631 | |
| | | | | |
| NET ASSETS: | | | | |
| Capital Stock, $0.01 par value; indefinite shares authorized; 42,223,086 shares outstanding | | | 806,919,373 | |
| Net unrealized appreciation on investments | | | 272,808,324 | |
| Accumulated net realized gain on investments | | | 51,218,543 | |
| Undistributed net investment income | | | 377,252 | |
| Net assets | | | 1,131,323,492 | |
| Total liabilities and net assets | | $ | 1,132,970,123 | |
| | | | | |
| CALCULATION OF NET ASSET VALUE PER SHARE: | | | | |
| Net asset value, offering and redemption price per share ($1,131,323,492 ÷ 42,223,086 shares outstanding) | | $ | 26.79 | |
The accompanying notes to financial statements are an integral part of this statement.
FMI Common Stock Fund, Inc.
SCHEDULE OF INVESTMENTS
March 31, 2011 (Unaudited)
| Shares | | | | | | | Value | |
| | | | | | | | | |
| COMMON STOCKS — 85.9% (a) | | | | | | |
| | | | | | | |
| COMMERCIAL SERVICES SECTOR — 6.0% | | | | | | |
| | | | Advertising/Marketing Services — 1.6% | | | | | | | | |
| | 1,516,000 | | Harte-Hanks, Inc. | | $ | 21,049,041 | | | $ | 18,040,400 | |
| | | | Financial Publishing/Services — 1.5% | | | | | | | | |
| | 208,000 | | The Dun & Bradstreet | | | | | | | | |
| | | | Corporation | | | 16,900,173 | | | | 16,689,920 | |
| | | | Miscellaneous Commercial Services — 2.9% | | | | | | | | |
| | 731,000 | | Cintas Corp. | | | 17,769,949 | | | | 22,127,370 | |
| | 545,000 | | TeleTech | | | | | | | | |
| | | | Holdings, Inc.* | | | 9,342,636 | | | | 10,562,100 | |
| | | | | | | 27,112,585 | | | | 32,689,470 | |
| CONSUMER DURABLES SECTOR — 0.9% | | | | | | | | |
| | | | Other Consumer Specialties — 0.9% | | | | | | | | |
| | 274,950 | | Mine Safety | | | | | | | | |
| | | | Appliances Co. | | | 7,478,037 | | | | 10,082,416 | |
| | | | | | | | | | | | |
| CONSUMER NON-DURABLES SECTOR — 4.3% | | | | | | | | |
| | | | Food: Meat/Fish/Dairy — 1.3% | | | | | | | | |
| | 332,000 | | Sanderson Farms, Inc. | | | 13,326,266 | | | | 15,245,440 | |
| | | | Food: Specialty/Candy — 3.0% | | | | | | | | |
| | 830,000 | | Flowers Foods, Inc. | | | 21,578,819 | | | | 22,600,900 | |
| | 188,000 | | Lancaster Colony | | | | | | | | |
| | | | Corporation | | | 9,488,698 | | | | 11,392,800 | |
| | | | | | | 31,067,517 | | | | 33,993,700 | |
| CONSUMER SERVICES SECTOR — 2.1% | | | | | | | | |
| | | | Publishing: Books/Magazines — 2.1% | | | | | | | | |
| | 719,000 | | Meredith Corp. | | | 18,445,510 | | | | 24,388,480 | |
| | | | | | | | | | | | |
| DISTRIBUTION SERVICES SECTOR — 13.3% | | | | | | | | |
| | | | Electronics Distributors — 7.0% | | | | | | | | |
| | 1,303,000 | | Arrow | | | | | | | | |
| | | | Electronics, Inc.* | | | 24,227,536 | | | | 54,569,640 | |
| | 648,000 | | ScanSource, Inc.* | | | 15,894,735 | | | | 24,617,520 | |
| | | | | | | 40,122,271 | | | | 79,187,160 | |
| | | | Medical Distributors — 3.5% | | | | | | | | |
| | 1,236,000 | | Patterson | | | | | | | | |
| | | | Companies Inc. | | | 28,272,243 | | | | 39,786,840 | |
| | | | Wholesale Distributors — 2.8% | | | | | | | | |
| | 617,000 | | Beacon Roofing | | | | | | | | |
| | | | Supply, Inc.* | | | 8,798,061 | | | | 12,629,990 | |
| | 269,000 | | United | | | | | | | | |
| | | | Stationers Inc. | | | 10,887,604 | | | | 19,112,450 | |
| | | | | | | 19,685,665 | | | | 31,742,440 | |
| | | | | | | | | | | | |
| ELECTRONIC TECHNOLOGY SECTOR — 2.0% | | | | | | | | |
| | | | Aerospace & Defense — 2.0% | | | | | | | | |
| | 326,000 | | Alliant | | | | | | | | |
| | | | Techsystems Inc. | | | 26,521,823 | | | | 23,038,420 | |
| | | | | | | | | | | | |
| FINANCE SECTOR — 9.6% | | | | | | | | |
| | | | Insurance Brokers/Services — 3.5% | | | | | | | | |
| | 1,286,000 | | Arthur J. | | | | | | | | |
| | | | Gallagher & Co. | | | 30,217,445 | | | | 39,107,260 | |
| | | | Life/Health Insurance — 1.9% | | | | | | | | |
| | 798,000 | | Protective Life Corp. | | | 11,805,993 | | | | 21,186,900 | |
| | | | Property/Casualty Insurance — 3.2% | | | | | | | | |
| | 1,135,000 | | W.R. Berkley Corp. | | | 29,005,212 | | | | 36,558,350 | |
| | | | Regional Banks — 1.0% | | | | | | | | |
| | 189,175 | | Cullen/Frost | | | | | | | | |
| | | | | | | 11,020,044 | | | | 11,165,108 | |
| | | | | | | | | | | | |
| HEALTH SERVICES SECTOR — 3.5% | | | | | | | | |
| | | | Health Industry Services — 2.2% | | | | | | | | |
| | 447,000 | | Covance Inc.* | | | 18,606,960 | | | | 24,459,840 | |
| | | | Medical/Nursing Services — 1.3% | | | | | | | | |
| | 568,000 | | VCA Antech, Inc.* | | | 12,414,640 | | | | 14,302,240 | |
| | | | | | | | | | | | |
| HEALTH TECHNOLOGY SECTOR — 3.5% | | | | | | | | |
| | | | Medical Specialties — 3.5% | | | | | | | | |
| | 196,000 | | Bio-Rad | | | | | | | | |
| | | | Laboratories, Inc.* | | | 16,203,236 | | | | 23,547,440 | |
| | 354,200 | | West Pharmaceutical | | | | | | | | |
| | | | Services, Inc. | | | 13,960,541 | | | | 15,857,534 | |
| | | | | | | 30,163,777 | | | | 39,404,974 | |
INDUSTRIAL SERVICES SECTOR — 4.2% | | | | | | | | |
| | | | Oilfield Services/Equipment — 4.2% | | | | | | | | |
| | 563,000 | | Bristow | | | | | | | | |
| | | | Group, Inc.* | | | 16,893,272 | | | | 26,629,900 | |
| | 394,000 | | Dresser-Rand | | | | | | | | |
| | | | Group, Inc.* | | | 6,771,070 | | | | 21,126,280 | |
| | | | | | | 23,664,342 | | | | 47,756,180 | |
| MISCELLANEOUS SECTOR — 1.2% | | | | | | | | |
| | | | Investment Trusts/Mutual Funds — 1.2% | | | | | | | | |
| | 447,000 | | PICO | | | | | | | | |
| | | | Holdings, Inc.* | | | 14,527,819 | | | | 13,436,820 | |
| | | | | | | | | | | | |
| NON-ENERGY MINERALS SECTOR — 1.7% | | | | | | | | |
| | | | Construction Materials — 1.7% | | | | | | | | |
| | 623,000 | | Eagle Materials Inc. | | | 18,460,712 | | | | 18,851,980 | |
FMI Common Stock Fund, Inc.
SCHEDULE OF INVESTMENTS (Continued)
March 31, 2011 (Unaudited)
Shares or | | | | | | | | | | |
| Principal Amount | | | | | Cost | | | | Value | |
| | | | | | | | | | | | |
| COMMON STOCKS — 85.9% (a) (Continued) | | | | | | | | |
| | | | | | | | | |
| PROCESS INDUSTRIES SECTOR — 8.5% | | | | | | | | |
| | | | Chemicals: Specialty — 2.3% | | | | | | | | |
| | 414,000 | | Sigma-Aldrich | | | | | | | | |
| | | | Corp. | | $ | | | | $ | 26,346,960 | |
| | | | Containers/Packaging — 4.3% | | | | | | | | |
| | 557,000 | | AptarGroup, Inc. | | | 14,661,777 | | | | 27,922,410 | |
| | 624,000 | | Bemis | | | | | | | | |
| | | | Company, Inc. | | | | | | | 20,473,440 | |
| | | | | | | | | | | 48,395,850 | |
| | | | Industrial Specialties — 1.9% | | | | | | | | |
| | 538,000 | | Valspar Corp. | | | 12,397,778 | | | | 21,035,800 | |
| | | | | | | | | |
PRODUCER MANUFACTURING SECTOR — 7.8% | | | | | | | | |
| | | | Electrical Products — 2.3% | | | | | | | | |
| | 1,257,000 | | Molex Inc. Cl A | | | 22,642,796 | | | | 26,007,330 | |
| | | | Industrial Conglomerates — 2.1% | | | | | | | | |
| | 306,825 | | SPX Corporation | | | 16,919,436 | | | | 24,358,837 | |
| | | | Industrial Machinery — 1.0% | | | | | | | | |
| | 333,000 | | Woodward Inc. | | | 9,119,789 | | | | 11,508,480 | |
| | | | Miscellaneous Manufacturing — 2.4% | | | | | | | | |
| | 621,000 | | Carlisle | | | | | | | | |
| | | | | | | | | | | 27,665,550 | |
| | | | | | | | | |
| RETAIL TRADE SECTOR — 7.5% | | | | | | | | |
| | | | Catalog/Specialty Distribution — 1.4% | | | | | | | | |
| | 507,600 | | HSN, Inc.* | | | 13,853,973 | | | | 16,258,428 | |
| | | | Discount Stores — 1.9% | | | | | | | | |
| | 415,000 | | Family Dollar | | | | | | | | |
| | | | Stores, Inc. | | | | | | | 21,297,800 | |
| | | | Food Retail — 1.6% | | | | | | | | |
| | 466,650 | | Ruddick Corp. | | | 11,902,111 | | | | 18,008,024 | |
| | | | Specialty Stores — 2.6% | | | | | | | | |
| | 709,000 | | PetSmart, Inc. | | | 15,047,516 | | | | 29,033,550 | |
| | | | | | | | | |
| TECHNOLOGY SERVICES SECTOR — 5.1% | | | | | | | | |
| | | | Data Processing Services — 2.1% | | | | | | | | |
| | 1,027,000 | | Broadridge Financial | | | | | | | | |
| | | | Solutions Inc. | | | | | | | 23,302,630 | |
| | | | Information Technology Services — 3.0% | | | | | | | | |
| | 1,009,000 | | Jack Henry & | | | | | | | | |
| | | | Associates, Inc. | | | | | | | 34,195,010 | |
| TRANSPORTATION SECTOR — 4.7% | | | | | | | | |
| | | | Marine Shipping — 2.6% | | | | | | | | |
| | 507,000 | | Kirby Corp.* | | | 16,960,076 | | | | 29,046,030 | |
| | | | Trucking — 2.1% | | | | | | | | |
| | 532,000 | | J.B. Hunt Transport | | | | | | | | |
| | | | Services, Inc. | | | 12,229,105 | | | | | |
| | | | | | | | | | | | |
| | | | Total common | | | | | | | | |
| | | | stocks | | | 698,929,733 | | | | | |
| | | | | | | | | |
| SHORT-TERM INVESTMENTS — 14.0% (a) | | | | | | | | |
| | | | Commercial Paper — 14.0% | | | | | | | | |
| | $158,600,000 | | | | | | | | | | |
| | | | 0.02%, | | | | | | | | |
| | | | due 04/01/11 | | | 158,600,000 | | | | 158,600,000 | |
| | | | | | | | | | | | |
| | | | Total short-term | | | | | | | | |
| | | | investments | | | 158,600,000 | | | | | |
| | | | | | | | | | | | |
| | | | Total investments — | | | | | | | | |
| | | | 99.9% | | $ | 857,529,733 | | | | 1,130,338,057 | |
| | | | | | | | | | | | |
| | | | | | | | | | | | |
| | | | Cash and receivables, | | | | | | | | |
| | | | less liabilities — | | | | | | | | |
| | | | 0.1% (a) | | | | | | | 985,435 | |
| | | | | | | | | | | | |
| | | | TOTAL NET ASSETS — | | | | | | | | |
| | | | 100.0% | | | | | | | $1,131,323,492 | |
| | | | | | | | | | | | |
| | | | | | | | | | | | |
| | | | | | | | | | | | |
| * | Non-income producing security. |
| (a) | Percentages for the various classifications relate to net assets. |
The accompanying notes to financial statements are an integral part of this schedule
FMI Common Stock Fund, Inc.
STATEMENT OF OPERATIONS
For the Six Month Period Ending March 31, 2011 (Unaudited)
| INCOME: | | | |
| Dividends | | $ | 6,614,919 | |
| Interest | | | 60,207 | |
| Total income | | | 6,675,126 | |
| | | | | |
| EXPENSES: | | | | |
| Management fees | | | 5,181,819 | |
| Transfer agent fees | | | 585,200 | |
| Administrative and accounting services | | | 266,570 | |
| Custodian fees | | | 76,900 | |
| Printing and postage expense | | | 68,800 | |
| Professional fees | | | 26,390 | |
| Registration fees | | | 33,715 | |
| Insurance expense | | | 16,380 | |
| Board of Directors fees | | | 18,200 | |
| Other expenses | | | 23,900 | |
| Total expenses | | | 6,297,874 | |
| NET INVESTMENT INCOME | | | 377,252 | |
| NET REALIZED GAIN ON INVESTMENTS | | | 59,814,876 | |
| NET INCREASE IN UNREALIZED APPRECIATION ON INVESTMENTS | | | 133,001,365 | |
| NET GAIN ON INVESTMENTS | | | 192,816,241 | |
| NET INCREASE IN NET ASSETS RESULTING FROM OPERATIONS | | $ | 193,193,493 | |
STATEMENTS OF CHANGES IN NET ASSETS
For the Six Month Period Ending March 31, 2011 (Unaudited) and For the Year Ended September 30, 2010
| | | 2011 | | | 2010 | |
| OPERATIONS: | | | | | | |
| Net investment income (loss) | | $ | 377,252 | | | $ | (66,108 | ) |
| Net realized gain on investments | | | 59,814,876 | | | | 51,560,102 | |
| Net increase in unrealized appreciation on investments | | | 133,001,365 | | | | 21,058,854 | |
| Net increase in net assets from operations | | | 193,193,493 | | | | 72,552,848 | |
| DISTRIBUTIONS TO SHAREHOLDERS: | | | | | | | | |
| Distributions from net investment income ($0.0366 per share) | | | — | | | | (1,532,573 | ) |
| Distributions from net realized gains ($0.8264 and $0.0074 per share, respectively) | | | (33,400,471 | ) | | | (308,937 | ) |
| Total distributions | | | (33,400,471 | ) | | | (1,841,510 | ) |
| FUND SHARE ACTIVITIES: | | | | | | | | |
| Proceeds from shares issued (4,569,448 and 15,960,389 shares, respectively) | | | 114,093,424 | | | | 349,212,093 | |
| Net asset value of shares issued in distributions reinvested | | | | | | | | |
| (1,427,037 and 86,999 shares, respectively) | | | 32,736,051 | | | | 1,806,091 | |
| Cost of shares redeemed (4,054,331 and 17,176,184 shares, respectively) | | | (100,929,466 | ) | | | (368,655,911 | ) |
| Net increase (decrease) in net assets derived from Fund share activities | | | 45,900,009 | | | | (17,637,727 | ) |
| TOTAL INCREASE | | | 205,693,031 | | | | 53,073,611 | |
| NET ASSETS AT THE BEGINNING OF THE PERIOD | | | 925,630,461 | | | | 872,556,850 | |
| NET ASSETS AT THE END OF THE PERIOD (Includes undistributed | | | | | | | | |
| net investment income of $377,252 and $0, respectively) | | $ | 1,131,323,492 | | | $ | 925,630,461 | |
The accompanying notes to financial statements are an integral part of these statements.
FMI Common Stock Fund, Inc.
FINANCIAL HIGHLIGHTS
(Selected data for each share of the Fund outstanding throughout each period)
| | | (Unaudited) | | | | | | | | | | | | | | | | |
| | | For the Six Month | | | | | | | | | | | | | | | | |
| | | | | | Years Ended September 30, | |
| | | March 31, | | | | | | | | | | | | | | | | |
| | | | | | | | | | | | | | | | | | 2006 | |
| PER SHARE OPERATING PERFORMANCE: | | | | | | | | | | | | | | | | | | |
| Net asset value, beginning of period | | $ | 22.98 | | | $ | 21.07 | | | $ | 21.20 | | | $ | 26.61 | | | $ | 26.49 | | | $ | 26.58 | |
| Income from investment operations: | | | | | | | | | | | | | | | | | | | | | | | | |
| Net investment income (loss) | | | 0.01 | | | | (0.00 | )* | | | 0.05 | | | | 0.08 | | | | 0.08 | | | | 0.09 | |
| Net realized and unrealized gains (loss) | | | | | | | | | | | | | | | | | | | | | | | | |
| on investments | | | 4.63 | | | | 1.96 | | | | 0.86 | | | | (1.74 | ) | | | 3.08 | | | | 2.79 | |
| Total from investment operations | | | 4.64 | | | | 1.96 | | | | 0.91 | | | | (1.66 | ) | | | 3.16 | | | | 2.88 | |
| Less distributions: | | | | | | | | | | | | | | | | | | | | | | | | |
| Distributions from net investment income | | | — | | | | (0.04 | ) | | | (0.06 | ) | | | (0.08 | ) | | | (0.07 | ) | | | (0.02 | ) |
| Distributions from net realized gains | | | (0.83 | ) | | | (0.01 | ) | | | (0.98 | ) | | | (3.67 | ) | | | (2.97 | ) | | | (2.95 | ) |
| Total from distributions | | | (0.83 | ) | | | (0.05 | ) | | | (1.04 | ) | | | (3.75 | ) | | | (3.04 | ) | | | (2.97 | ) |
| Net asset value, end of period | | $ | 26.79 | | | $ | 22.98 | | | $ | 21.07 | | | $ | 21.20 | | | $ | 26.61 | | | $ | 26.49 | |
| TOTAL RETURN | | | 20.78 | %(1) | | | 9.30 | % | | | 6.04 | % | | | (7.00 | %) | | | 12.81 | % | | | 12.62 | % |
| RATIOS/SUPPLEMENTAL DATA: | | | | | | | | | | | | | | | | | | | | | | | | |
| Net assets, end of period (in 000’s $) | | | 1,131,323 | | | | 925,630 | | | | 872,557 | | | | 411,797 | | | | 492,015 | | | | 462,978 | |
| Ratio of expenses to average net assets | | | 1.22 | %(2) | | | 1.24 | % | | | 1.26 | % | | | 1.22 | % | | | 1.20 | % | | | 1.21 | % |
| Ratio of net investment income (loss) | | | | | | | | | | | | | | | | | | | | | | | | |
| to average net assets | | | 0.07 | %(2) | | | (0.01 | %) | | | 0.32 | % | | | 0.35 | % | | | 0.30 | % | | | 0.35 | % |
| Portfolio turnover rate | | | 11 | % | | | 30 | % | | | 35 | % | | | 40 | % | | | 50 | % | | | 38 | % |
| * | Amount less than $0.005 per share. |
The accompanying notes to financial statements are an integral part of this statement.
NOTES TO FINANCIAL STATEMENTS
March 31, 2011 (Unaudited)
(1) Summary of Significant Accounting Policies —
The following is a summary of significant accounting policies of the FMI Common Stock Fund, Inc. (the “Fund”), which is registered as a diversified, open-end management investment company under the Investment Company Act of 1940 (the “Act”), as amended. The Fund was incorporated under the laws of Wisconsin on July 29, 1981. Effective December 31, 2009, the Fund is closed to new investors. The investment objective of the Fund is to produce long-term capital appreciation principally through investing in common stocks.
| | (a) | Each security, excluding short-term investments, is valued at the last sale price reported by the principal security exchange on which the issue is traded. Securities that are traded on the Nasdaq Markets are valued at the Nasdaq Official Closing Price or if no sale is reported, the latest bid price. Securities which are traded over-the-counter are valued at the latest bid price. Securities for which quotations are not readily available are valued at fair value as determined by the investment adviser under the supervision of the Board of Directors. The fair value of a security is the |
FMI Common Stock Fund, Inc.
NOTES TO FINANCIAL STATEMENTS (Continued)
March 31, 2011 (Unaudited)
| (1) | Summary of Significant Accounting Policies — (Continued) |
| | | amount which the Fund might reasonably expect to receive upon a current sale. The fair value of a security may differ from the last quoted price and the Fund may not be able to sell a security at the estimated fair value. Market quotations may not be available, for example, if trading in particular securities was halted during the day and not resumed prior to the close of trading on the New York Stock Exchange. As of March 31, 2011, there were no securities that were internally fair valued. Variable rate demand notes are recorded at par value which approximates market value. Short-term investments with maturities of 60 days or less are valued at amortized cost, which approximates value. For financial reporting purposes, investment transactions are recorded on the trade date. |
| | | The Fund applies the provisions of the Financial Accounting Standards Board (“FASB”) Accounting Standards Codification “Fair Value Measurements and Disclosures” Topic 820 (“ASC 820”), which defines fair value as the price that would be received to sell an asset or paid to transfer a liability (i.e., the “exit price”) in an orderly transaction between market participants at the measurement date. |
| | | In determining fair value, the Fund uses various valuation approaches. ASC 820 establishes a fair value hierarchy for inputs used in measuring fair value that maximizes the use of observable inputs and minimizes the use of unobservable inputs by requiring that the most observable inputs be used when available. Observable inputs are those that market participants would use in pricing the asset or liability based on market data obtained from sources independent of the Fund. Unobservable inputs reflect the Fund’s assumptions about the inputs market participants would use in pricing the asset or liability developed based on the best information available in the circumstances. The inputs or methodologies used for valuing securities are not necessarily an indication of the risks associated with investing in those securities. |
| | The fair value hierarchy is categorized into three levels based on the inputs as follows: |
| | Level 1 — | Valuations based on unadjusted quoted prices in active markets for identical assets. |
| | Level 2 — | Valuations based on quoted prices for similar securities or in markets that are not active or for which all significant inputs are observable, either directly or indirectly. |
| | Level 3 — | Valuations based on inputs that are unobservable and significant to the overall fair value measurement. |
| The following table summarizes the Fund’s investments as of March 31, 2011, based on the inputs used to value them: |
| | Valuation Inputs | Investments in Securities | |
| | Level 1 — Common Stocks | | $ | 971,738,057 | |
| | Level 2 — Short-Term Commercial Paper | | | 158,600,000 | |
| | Level 3 — | | | — | |
| | Total | | $ | 1,130,338,057 | |
| | | It is the Fund’s policy to recognize transfers between levels at the end of the quarterly reporting period. There were no transfers between levels during the six month period ending March 31, 2011. |
| | See the Schedule of Investments for the investments detailed by industry classification. |
| (b) | Net realized gains and losses on sales of securities are computed on the identified cost basis. |
| (c) | Dividend income is recorded on the ex-dividend date. Interest income is recorded on an accrual basis. |
| (d) | The Fund may have investments in short-term variable rate demand notes, which are unsecured instruments. The Fund may be susceptible to credit risk with respect to these notes to the extent the issuer defaults on its payment obligation. The Fund’s policy is to monitor the creditworthiness of the issuer and nonperformance by these issuers is not anticipated. |
| (e) | Accounting principles generally accepted in the United States of America (“GAAP”) require that permanent differences between income for financial reporting and tax purposes be reclassified in the capital accounts. |
FMI Common Stock Fund, Inc.
NOTES TO FINANCIAL STATEMENTS (Continued)
March 31, 2011 (Unaudited)
(1) Summary of Significant Accounting Policies — (Continued)
| | (f) | The preparation of financial statements in conformity with GAAP requires management to make estimates and assumptions that affect the reported amounts of assets and liabilities and disclosure of contingent assets and liabilities at the date of the financial statements and the reported amounts of revenues and expenses during the reporting period. Actual results could differ from these estimates. |
| | (g) | No provision has been made for Federal income taxes since the Fund has elected to be taxed as a “regulated investment company” and intends to distribute substantially all net investment company taxable income and net capital gains to its shareholders and otherwise comply with the provisions of the Internal Revenue Code applicable to regulated investment companies. |
| | (h) | The Fund has reviewed all open tax years and major jurisdictions, which include Federal and the state of Wisconsin, and concluded that there are no significant uncertain tax positions that would require recognition in the financial statements. Open tax years are those that are open for exam by taxing authorities and, as of March 31, 2011, open Federal tax years include the tax years ended September 30, 2007 through 2010. The Fund has no examinations in progress and is also not aware of any tax positions for which it is reasonably possible that the total amounts of unrecognized tax benefits will significantly change in the next twelve months. |
(2) Investment Adviser and Management Agreement and Transactions With Related Parties —
The Fund has a management agreement with Fiduciary Management, Inc. (“FMI”), with whom certain officers and directors of the Fund are affiliated, to serve as investment adviser and manager. Under the terms of the agreement, the Fund will pay FMI a monthly management fee at the annual rate of 1% of the daily net assets of the Fund. The Fund is responsible for paying its proportionate share of the compensation, benefits and expenses of its Chief Compliance Officer. For administrative convenience, FMI initially makes these payments and is later reimbursed by the Fund.
Under the management agreement, FMI will reimburse the Fund for expenses over 1.3% of the daily net assets of the Fund. No such reimbursements were required for the six month period ending March 31, 2011.
Under the Fund’s organizational documents, each director, officer, employee or other agent of the Fund (including the Fund’s investment manager) is indemnified, to the extent permitted by the Act, against certain liabilities that may arise out of performance of their duties to the Fund. Additionally, in the normal course of business, the Fund enters into contracts that contain a variety of indemnification clauses. The Fund’s maximum exposure under these arrangements is unknown as this would involve future claims that may be made against the Fund that have not yet occurred. However, the Fund has not had prior claims or losses pursuant to these contracts and believes the risk of loss to be remote.
(3) Credit Agreement —
U.S. Bank, N.A. has made available to the Fund a $50,000,000 credit facility pursuant to a Credit Agreement (“Agreement”) effective July 14, 2008 for the purposes of having cash available to satisfy redemption requests. Principal and interest of such loan under the Agreement are due not more than 31 days after the date of the loan. Amounts under the credit facility bear interest at a rate per annum equal to the current prime rate minus one percent on the amount borrowed. Advances will be collateralized by securities owned by the Fund. During the six month period ending March 31, 2011, the Fund did not borrow against the Agreement. The Credit Agreement is renewable annually on June 5.
(4) Distributions to Shareholders —
Net investment income and net realized gains, if any, are distributed to shareholders at least annually.
(5) Investment Transactions —
For the six month period ending March 31, 2011, purchases and proceeds of sales of investment securities (excluding short-term investments) were $101,626,249 and $228,362,511, respectively.
FMI Common Stock Fund, Inc.
NOTES TO FINANCIAL STATEMENTS (Continued)
March 31, 2011 (Unaudited)
(6) Income Tax Information —
The following information for the Fund is presented on an income tax basis as of September 30, 2010:
| | Gross | Gross | Net Unrealized | Distributable | Distributable |
| Cost of | Unrealized | Unrealized | Appreciation | Ordinary | Long-Term |
| Investments | Appreciation | Depreciation | on Investments | Income | Capital Gains |
| $792,460,106 | $180,919,619 | $48,609,243 | $132,310,376 | $22,178,652 | $10,122,067 |
The difference between the cost amount for financial statement and federal income tax purposes is due primarily to timing differences in recognizing certain gains and losses on security transactions.
The tax components of dividends paid during the years ended September 30, 2010 and 2009, capital loss carryovers, which may be used to offset future capital gains, subject to Internal Revenue Code limitations, as of September 30, 2010, and tax basis post-October losses as of September 30, 2010, which are not recognized for tax purposes until the first day of the following fiscal year are:
| September 30, 2010 | | September 30, 2009 |
| Ordinary | Long-Term | Net Capital | | | Ordinary | Long-Term |
| Income | Capital Gains | Loss | Post-October | | Income | Capital Gains |
| Distributions | Distributions | Carryovers | Losses | | Distributions | Distributions |
| $1,532,573 | $308,937 | $— | $— | | | $18,809,329 |
For corporate shareholders of the Fund, the percentage of dividend income distributed for the year ended September 30, 2010 which is designated as qualifying for the dividends received deduction is 97% (unaudited).
For all shareholders of the Fund, the percentage of dividend income distributed for the year ended September 30, 2010 which is designated as qualified dividend income under the Jobs and Growth Tax Relief Act of 2003, is 97% (unaudited).
FMI Common Stock Fund, Inc.
ADVISORY AGREEMENT
On December 17, 2010, the Board of Directors of FMI Common Stock Fund, Inc. (“Directors”) approved the continuation of the Fund’s investment advisory agreement with Fiduciary Management, Inc. (“FMI”). Prior to approving the continuation of the investment advisory agreement, the Directors considered:
•the nature, extent and quality of the services provided by FMI
•the investment performance of the Fund
•the cost of the services to be provided and profits to be realized by FMI from its relationship with the Fund
•the extent to which economies of scale would be realized as the Fund grew and whether fee levels reflect any economies of scale
•the expense ratio of the Fund
•the manner in which portfolio transactions for the Fund were conducted, including the use of soft dollars
In considering the nature, extent and quality of the services provided by FMI, the Directors reviewed a report describing the portfolio management, shareholder communication and servicing, prospective shareholder assistance and regulatory compliance services provided by FMI to the Fund. The Directors concluded that FMI was providing essential services to the Fund. In particular, the Directors concluded that FMI was, or will be, preparing reports to shareholders in addition to those required by law, and was providing services to the Fund that were in addition to the services investment advisers typically provided its non-mutual fund clients.
The Directors compared the performance of the Fund to the benchmark index over various periods of time and concluded that the performance of the Fund warranted the continuation of the advisory agreement.
In concluding that the advisory fees payable by the Fund were reasonable, the Directors reviewed a report that concluded that the profits FMI realized from its relationship with the Fund, expressed as a percentage of pre-tax revenues, were generally comparable to that of publicly traded investment advisers. The Directors also reviewed reports comparing the Fund’s expense ratio and advisory fees paid by the Fund to those of other comparable mutual funds and concluded that the advisory fee paid by the Fund and the Fund’s expense ratio were within the range of comparable mutual funds. The Directors noted that the investment advisory fee was not adjusted if the Fund grew, but did not consider that factor to be significant because of the other factors considered.
Finally, the Directors reviewed reports discussing the manner in which portfolio transactions for the Fund were conducted, including the use of soft dollars. Based on these reports, the Directors concluded that the research obtained by FMI was beneficial to the Fund and that FMI was executing the Fund’s portfolio transactions in a manner designed to obtain best execution for the Fund.
For additional information about the Directors and Officers or for a description of the policies and procedures that the Fund uses to determine how to vote proxies relating to portfolio securities, please call (800) 811-5311 and request a Statement of Additional Information. One will be mailed to you free of charge. The Statement of Additional Information is also available on the website of the Securities and Exchange Commission (the “Commission”) at http://www.sec.gov. Information on how the Fund voted proxies relating to portfolio securities is available on the Fund’s website at http://www.fmifunds.com or the website of the Commission no later than August 31 for the prior 12 months ending June 30. The Fund files its complete schedule of portfolio holdings with the Commission for the first and third quarters of each fiscal year on Form N-Q. The Fund’s Form N-Q is available on the Commission’s website. The Fund’s Form N-Q may be reviewed and copied at the Commission’s Public Reference Room in Washington, D.C., and that information on the operation of the Public Reference Room may be obtained by calling 1-800-SEC-0330.
FMI Common Stock Fund, Inc.
100 East Wisconsin Avenue, Suite 2200
Milwaukee, Wisconsin 53202
www.fmifunds.com
414-226-4555
BOARD OF DIRECTORS
BARRY K. ALLEN
ROBERT C. ARZBAECHER
JOHN S. BRANDSER
PATRICK J. ENGLISH
GORDON H. GUNNLAUGSSON
TED D. KELLNER
PAUL S. SHAIN
INVESTMENT ADVISER
FIDUCIARY MANAGEMENT, INC.
100 East Wisconsin Avenue, Suite 2200
Milwaukee, Wisconsin 53202
ADMINISTRATOR, ACCOUNTANT, TRANSFER
AGENT AND DIVIDEND DISBURSING AGENT
U.S. BANCORP FUND SERVICES, LLC
615 East Michigan Street
Milwaukee, Wisconsin 53202
800-811-5311 or 414-765-4124
CUSTODIAN
U.S. BANK, N.A.
1555 North RiverCenter Drive, Suite 302
Milwaukee, Wisconsin 53212
DISTRIBUTOR
RAFFERTY CAPITAL MARKETS, LLC
59 Hilton Avenue
Garden City, New York 11530
INDEPENDENT REGISTERED
PUBLIC ACCOUNTING FIRM
PRICEWATERHOUSECOOPERS LLP
100 East Wisconsin Avenue, Suite 1800
Milwaukee, Wisconsin 53202
LEGAL COUNSEL
FOLEY & LARDNER LLP
777 East Wisconsin Avenue
Milwaukee, Wisconsin 53202
This report is not authorized for use as an offer of sale or a solicitation of an offer to buy shares of FMI Common Stock Fund unless accompanied or preceded by the Fund’s current prospectus. Performance data quoted represents past performance; past performance does not guarantee future results. The investment return and principal value of an investment will fluctuate so that an investor’s shares, when redeemed, may be worth more or less than their original cost. Current performance of the Fund may be lower or higher than the performance quoted. Performance data current to the most recent month end may be obtained by visiting www.fmifunds.com.
Item 2. Code of Ethics.
Not applicable for semi-annual reports.
Item 3. Audit Committee Financial Expert.
Not applicable for semi-annual reports.
Item 4. Principal Accountant Fees and Services.
Not applicable for semi-annual reports.
Item 5. Audit Committee of Listed Registrants.
Not applicable to registrants who are not listed issuers (as defined in Rule 10A-3 under the Securities Exchange Act of 1934).
Item 6. Schedule of Investments.
| (a) | The Schedule of Investments in securities of unaffiliated issuers is included as part of the report to shareholders filed under Item 1 of this Form. |
Item 7. Disclosure of Proxy Voting Policies and Procedures for Closed-End Management Investment Companies
Not applicable.
Item 8. Portfolio Managers of Closed-End Management Investment Companies.
Not applicable.
Item 9. Purchases of Equity Securities By Closed-End Management Investment Company and Affiliated Purchasers.
Not applicable.
Item 10. Submission of Matters to a Vote of Security Holders.
None.
Item 11. Controls and Procedures.
| (a) | The Registrant’s disclosure controls and procedures are periodically evaluated. As of April 15, 2011, the date of the last evaluation, the Registrant’s officers have concluded that the Registrant’s disclosure controls and procedures are adequate. |
| (b) | The Registrant’s internal controls are periodically evaluated. There were no changes in the Registrant’s internal control over financial reporting that occurred during the second fiscal quarter of the period covered by this report that have materially affected, or are reasonably likely to materially affect, such controls. |
Item 12. Exhibits.
| (a) | (1) Any code of ethics or amendment thereto. Not applicable. |
| | (2) Certifications pursuant to Section 302 of the Sarbanes-Oxley Act of 2002. Filed herewith. |
| | (3) | Any written solicitation to purchase securities under Rule 23c-1 under the Act sent or given during the period covered by the report by or on behalf of the Registrant to 10 or more persons. Not applicable to open-end investment companies. |
| (b) | Certification pursuant to Section 906 of the Sarbanes-Oxley Act of 2002. Furnished herewith. |
SIGNATURES
Pursuant to the requirements of the Securities Exchange Act of 1934 and the Investment Company Act of 1940, the registrant has duly caused this report to be signed on its behalf by the undersigned, thereunto duly authorized.
FMI Common Stock Fund, Inc.
Registrant
By /s/ Ted D. Kellner
Ted D. Kellner, President, Principal Executive Officer
Date 05/4/11
Pursuant to the requirements of the Securities Exchange Act of 1934 and the Investment Company Act of 1940, this report has been signed below by the following persons on behalf of the registrant and in the capacities and on the dates indicated.
FMI Common Stock Fund, Inc.
Registrant
By /s/ Ted D. Kellner
Ted D. Kellner, President, Principal Executive Officer
Date 05/4/11
FMI Common Stock Fund, Inc.
Registrant
By /s/ Ted D. Kellner
Ted D. Kellner, Treasurer, Principal Financial Officer
Date 05/4/11