UNITED STATES
SECURITIES AND EXCHANGE COMMISSION
Washington, D.C. 20549
FORM N-CSR
CERTIFIED SHAREHOLDER REPORT OF REGISTERED
MANAGEMENT INVESTMENT COMPANIES
Investment Company Act file number 811-03235
FMI Common Stock Fund, Inc.
(Exact name of registrant as specified in charter)
100 East Wisconsin Avenue, Suite 2200
Milwaukee, WI 53202
(Address of principal executive offices) (Zip code)
Ted D. Kellner
Fiduciary Management, Inc.
100 East Wisconsin Avenue, Suite 2200
Milwaukee, WI 53202
(Name and address of agent for service)
(414) 226-4555
Registrant's telephone number, including area code:
Date of fiscal year end: September 30
Date of reporting period: March 31, 2012
Item 1. Reports to Stockholders.
SEMIANNUAL REPORT
March 31, 2012
FMI Large Cap Fund
(FMIHX)
FMI Common Stock Fund
(FMIMX)
FMI International Fund
(FMIJX)
 | FMI Funds |
| Advised by Fiduciary Management, Inc. |
| www.fmifunds.com |
| |
TABLE OF CONTENTS
| FMI Large Cap Fund | |
| | |
| Shareholder Letter | 3 |
| | |
| Schedule of Investments | 7 |
| | |
| Industry Sectors | 8 |
| | |
| | |
| FMI Common Stock Fund | |
| | |
| Shareholder Letter | 9 |
| | |
| Schedule of Investments | 13 |
| | |
| Industry Sectors | 15 |
| | |
| | |
| FMI International Fund | |
| | |
| Shareholder Letter | 16 |
| | |
| Schedule of Investments | 20 |
| | |
| Industry Sectors | 21 |
| | |
| | |
| Financial Statements | |
| | |
| Statements of Assets and Liabilities | 22 |
| | |
| Statements of Operations | 23 |
| | |
| Statements of Changes in Net Assets | 24 |
| | |
| Financial Highlights | 26 |
| | |
| Notes to Financial Statements | 28 |
| | |
| | |
| Cost Discussion | 33 |
| | |
| Advisory Agreements | 34 |
| | |
| Additional Information | 35 |
| | |
| Disclosure Information | 35 |
FMI
Large Cap
Fund
March 31, 2012
Dear Fellow Shareholders:
The FMI Large Cap Fund (“FMIHX”) gained 11.08%(1) in the quarter ending March 31. While positive on an absolute basis, it was behind the 12.59%(2) return of the Standard & Poor’s 500 Index. From a sector standpoint, our exposure in Finance, Electronic Technology and Retail Trade lagged the market. So-called high beta stocks were the primary drivers of performance in the S&P 500 this quarter and included a number of stocks that aren’t our type of investments such as Bank of America (+72.34%), Citigroup (+38.96%), Apple (+48.04%) and Sears (+108.46%). Apple alone accounted for 1.54% of the performance of the benchmark, so not owning that was a large factor in itself. Of course the Monday morning quarterback would say we were idiots for not owning these stocks but investing is a forward looking endeavor and as we look at the picture today, we believe the stocks we have in each of the aforementioned sectors have a superior 3-4 year outlook, taking the quality of the business franchise, downside risk and valuation into account.
Stocks of homebuilders and those leveraged to a housing recovery have also had a sharp bounce off the bottom and we don’t have significant exposure to this area. Weather and consumer confidence were more favorable recently, which aided the optics around this business, but we do not think the data supports a sustained improvement in home building or prices in the near term. We do expect existing home turnover to continue to improve. While people can argue about the exact numbers, it would appear that there are somewhere between 11 and 14 million homes that are in foreclosure, delinquent, or “under water” (market value less than mortgage value). Corelogic and Amherst Securities report that there are 11.2 million homes “in jeopardy,” including 4.8 million mortgages that are nonperforming with an expected default rate of 95%. There are between two and three million vacant homes, depending on whose figures are used. New home starts are running at approximately 0.5 million. We think the shadow inventory is very significant and will continue to depress new home building and prices for quite some time. Despite the favorable weather, new home sales were down 5.4% in January and 1.6% in February.
On the positive side, sectors that contributed nicely to our performance in the quarter included Energy Minerals, Producer Manufacturing and Health Technology. Overall, we feel the portfolio of companies is strong and best suited to perform in a bumpy or trendless stock market. If the recent rally is the start of a growth stock-driven environment characterized by expanding valuations, there is a high probability that we will underperform, just as we did in the March quarter. For years we have monitored The Leuthold Group’s 46 different fundamental valuation measures for the stock market. These data series typically go back fifty to eighty years. As of the most recent period measured (12/31/11), the average valuation was in the seventh decile (one being the cheapest, ten being the most expensive). While not “negative” on the stock market, we don’t think valuations will be a tailwind given very substantial ongoing macro concerns.
For new investors, the March and September letters include just a brief overview of pertinent investment topics before a couple of specific investment ideas are discussed. The June and December letters are generally longer and usually delve into various macro concepts in more detail.
Investors seem more hopeful that the February employment numbers indicate that the United States is on a healthier economic trajectory. Nonfarm payrolls gained 227,000 in February and finally, both the employment-to-population ratio and labor participation rate inched higher. With over 20 million people unemployed or underemployed, it is a long road back. The labor numbers, however, are notoriously volatile; a year ago we had an almost identical February employment report and then the numbers slipped significantly. One labor commentator indicated that adjusting for this year’s balmy winter weather would have resulted in a 90,000 nonfarm gain instead of 227,000 and that if the household survey’s figures were replaced by
| (1) | The Fund’s 1-year and annualized 5-year and 10-year returns through March 31, 2012 were: 7.64%, 4.01% and 7.29%, respectively. |
| (2) | The S&P 500 Index, benchmark for FMIHX 1-year and annualized 5-year and 10-year returns through March 31, 2012 were: 8.54%, 2.01% and 4.12%, respectively. |
The Standard & Poor’s 500 Index consists of 500 selected common stocks, most of which are listed on the New York Stock Exchange. The Standard & Poor’s Ratings Group designates the stock to be included in the Index on a statistical basis. A particular stock’s weighting in the Index is based on its relative total market value (i.e., its market price per share times the number of shares outstanding). Stocks may be added or deleted from the Index from time to time.
the payroll figures, the unemployment rate would be over 9% rather than 8.3%. Our conversations with businesspeople, with respect to hiring, have turned from uniformly negative over most of last year to more of a mixed bag today. Employment feels like it is getting better, but it is worth noting that wage rates, otherwise known as the price of labor, remain weak.
In spite of the sense that there is a more positive tilt to the employment picture, GDP revisions haven’t reflected this over the past six months in the United States. A Bloomberg News survey of 63 economists last September averaged 2.2% for estimated 2012 real GDP growth; the March survey had the exact same estimate for 2012. The March 22 report from FedEx, normally a harbinger of near term economic activity, showed a weaker U.S. outlook. Grainger and some other broad-based companies are not seeing a slowdown, however. European and Chinese growth rates, on the other hand, have slowed significantly. Europe may be in a recession right now and China is undoubtedly weakening, although the reliability of their statistics remains very suspect. This fact was revealed recently in a separate Bloomberg News story, where the following was stated: “In 2011, the 31 provincial-level governments reported a combined GDP of 51.8 trillion yuan ($8.2 trillion), 4.6 trillion yuan higher than the national figure calculated by the statistics bureau, the state-backed Economic Daily reported in February.” Anecdotally, Clarcor, Otis (United Technologies) and a host of other global players are reporting significant declines in their Chinese orders, and real estate prices continue to fall.
The severe debt and budgetary problems across Europe, the United States and Japan have not improved and are likely to continue to weigh on growth. Various programs, such as the European Central Bank’s long-term refinancing operation (LTRO), mimic the Fed’s monetary actions and have provided a temporary respite from having to actually solve real spending and taxation problems. Greece defaulted, as expected, but what may say more about the future of Greece and perhaps other “peripheral” countries is the fact that the newly issued (post default) Greek debt securities are trading at 29 cents on the dollar. Uncompetitive countries, with structurally high labor rates and high government employment ratios, which are also tied to a high-priced currency, have little chance of establishing a sustainable growth model. The U.S. and Japan continue to pile on debt at a record clip. It is our feeling that the press and the public have grown weary of the debt discussion. Just about the time complacency sets in, we are apt to see something shake us back to reality. The U.S. and Japan are not likely to restructure, and politics are preventing progress towards even balancing budgets, much less reducing debt, so this problem may be with us for a long time.
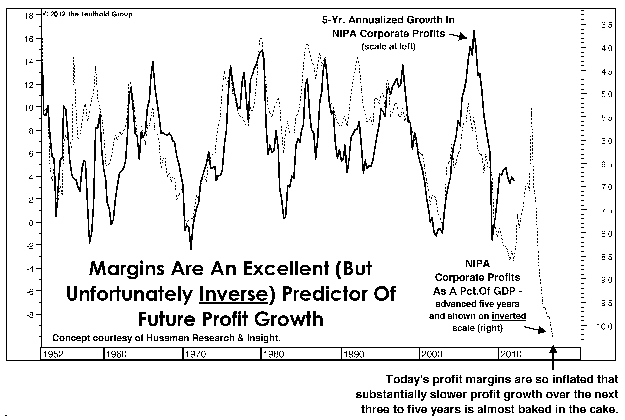
One of the few economic bright spots over the past several years has been corporate profit margins. As long as they stay near a record high, it makes the valuation argument less negative. Historically, however, profit margins have been quite
volatile and unfortunately, have been inversely correlated with future growth. In other words, competitive pressures eventually eat away at high margins, negatively impacting growth, as illustrated in the nearby chart. In a recent article in The Wall Street Journal, Brown Brothers reports that corporate profits fell 40 basis points in the December quarter. We’ll continue to carefully watch this situation.
This background discussion illuminates why we see uneven terrain for investors. We don’t think the big issues are quite yet in the rear view mirror, although we hasten to add that historically we have made money for our investors through some pretty rough market environments. We approach investing with a 3-5 year time frame, knowing there will be periods when we are either out of favor or lose money. Below we highlight a couple of companies that we like for the long haul.
Comerica, Incorporated (CMA)
(Analyst: Matthew Goetzinger)
Description
Comerica is a leading super regional bank headquartered in Dallas, Texas with $61 billion in assets. As a relationship based lender, Comerica provides a full range of traditional banking services, focusing the majority of its resources on its core business of commercial banking. The company’s geographies include Michigan, California, Texas, Arizona, and Florida. Commercial and industrial loans comprise 56% of total loans, with commercial real estate (25%), consumer (6%), construction (5%), residential mortgage (4%), leases (3%) and international loans (1%) accounting for the remainder.
Good Business
| | • | Geographically, Comerica is one of the more attractively positioned banking franchises. The company benefits from a strong low cost deposit base (80% of funding), with 40% from non-interest bearing accounts. |
| | • | Relationship based commercial lending has proven to be durable and recurring in nature. |
| | • | Comerica has an enviable track record of credit quality, meaningfully outperforming its peers. |
| | • | Commercial and Industrial (C&I) lending exhibits one of the highest returns of any lending product, with returns on equity (ROE) typically in the mid-to-upper teens. |
| | • | The company has averaged a 16%+ return on tangible capital. |
| | • | Comerica is among the strongest capitalized banks in the industry, with a tier 1 ratio made up of 100% common equity. Balance sheet leverage is below average. Recent “stress tests” highlighted the company’s position of strength, with the Fed approving its dividend and share repurchasing programs. |
Valuation
| | • | The 10-year (’95-’06) median large cap bank price-to-earnings ratio (P/E) is 12.8. While the stock currently trades at approximately this P/E, it is only 7 times our estimate of earning power. |
| | • | Comerica trades at 90% of book value compared to its 10-year median of 124%. |
| | • | Strong commercial banks have historically been acquired for two to three times tangible book value, or alternatively, for a 25-35% premium to core deposits. Currently Comerica is valued at tangible book value and parity with core deposits. |
Management
| | • | Ralph Babb, 63, has been the bank’s President and CEO since January 2002. Babb has successfully managed the bank through a number of difficult environments. |
| | • | Karen Parkhill, formerly CFO of Commercial Banking at JP Morgan, recently joined Comerica as CFO. Her background is investment banking, but the recent dialogue has been about improving operating efficiencies and ROE. |
| | • | Lars Anderson, 51, formerly with BB&T, joined the company in 2010 and looks like the heir apparent to Babb. His public comments seem to point toward an organic growth focus. |
| | • | A significant component of management compensation is tied to ROE. |
Investment Thesis
Comerica is levered to a recovery in commercial and industrial lending, most notably in attractive markets like Texas and the Western U.S. Relative to the broader industry, the company is not particularly reliant on retail or commercial real estate banking, two areas that continue to suffer from excess capacity. In addition, Comerica’s capital rich balance sheet will allow the bank to capitalize on a resumption of loan demand, and return cash to shareholders. A rebound in profitability should yield an attractive return on equity and an average to above-average valuation.
Illinois Tool Works Inc. (ITW)
(Analyst: Karl Poehls)
Description
Illinois Tool Works is a broadly diversified manufacturer with more than 800 operating units. The company’s major product lines include consumer and industrial packaging products and systems; construction tools and fasteners; engineered automotive components; foodservice equipment and service; adhesives, sealants, and cleaners; test and measurement equipment; and welding and electronics. Consumables and service & parts account for 66% and 10% of sales, respectively. A disciplined acquisition program complements organic growth and helped drive sales from $5 billion in 1998 to $18 billion in 2011.
Good Business
| | • | Approximately two-thirds of revenue can be considered recurring in nature. The company’s sales tend to be more correlated with overall industrial activity than with the more volatile capital goods spending cycle. |
| | • | Management operates a disciplined acquisition program, which has added significant economic value over time. |
| | • | The company’s return on invested capital (ROIC) is meaningfully above its cost of capital and has averaged 15.7% and 14.8% over the trailing 5-year and 10-year periods, respectively. |
| | • | Illinois Tool Works generates a considerable amount of excess free cash flow each year, which we estimate will exceed $2 billion in 2012. Over the past decade, the company has returned 60% of free cash flow to shareholders via dividends and share repurchases. |
| | • | The balance sheet is solid with $2.8 billion of net debt outstanding. The company’s senior unsecured debt is rated A+ by Standard and Poor’s and A1 by Moody’s. |
Valuation
| | • | Illinois Tool Works’ stock trades for 13.7 times estimated 2012 earnings. This compares to its trailing 5-year and 10-year average P/E multiples of 16.7 and 18.6, respectively. |
| | • | Over the past decade, the company’s operating margin has averaged 15.5%. It was 15.4% in 2011. This compares to a current enterprise value-to-sales multiple of 1.60 times and the 10-year average of 1.96 times. |
| | • | Since 2001, the company’s earnings and book value per share have grown at compounded annual rates of 11% and 8%, respectively. Further, the dividend yield is 2.5%. |
Management
| | • | The company is led by CEO David Speer, who has been employed at the company since 1978. Over his 34-year career, Mr. Speer has held numerous management roles, was named CEO in 2005 and became Chairman in 2006. |
| | • | The company is also led by three Vice Chairmen: Thomas Hansen, Scott Santi, and David Parry. These three executives have been employed by Illinois Tool Works for an average of 25 years. |
| | • | The company’s executive compensation program includes a direct link to ROIC and management appears to be intensely focused on generating positive economic value for shareholders. |
Investment Thesis
Recent concerns about a recession in Europe and Illinois Tool Works’ sizable exposure to that region have weighed on the stock’s performance. Additionally, the company has about 20% of its business exposed to construction, which continues to be weak. There are also some lingering questions about how to optimize the operating structure of the company. We think these concerns are manageable. Historically, management has employed a highly effective “80/20” approach to improving both the mix and profitability of the business. At our purchase price, we were able to invest in a highly diversified global industrial franchise, with leading returns on capital, and at a valuation that was near decade lows.
Thank you for your support of the FMI Large Cap Fund.
100 E. Wisconsin Ave., Suite 2200 • Milwaukee, WI 53202 • 414-226-4555
www.fmifunds.com
FMI Large Cap Fund
SCHEDULE OF INVESTMENTS
March 31, 2012 (Unaudited)
| Shares | | | | Cost | | | Value | |
| | | | | | | |
| COMMON STOCKS — 94.4% (a) | | | | | | |
| | | | | | | |
| COMMERCIAL SERVICES SECTOR — 6.3% | | | | | | |
| | | Advertising/Marketing | | | | | | |
| | | Services — 3.5% | | | | | | |
| | 3,714,000 | | Omnicom Group Inc. | | $ | 161,635,490 | | | $ | 188,114,100 | |
| | | | | | | | | | | | |
| | | | Miscellaneous Commercial | | | | | | | | |
| | | | Services — 2.8% | | | | | | | | |
| | 3,763,000 | | Cintas Corp. | | | 99,634,046 | | | | 147,208,560 | |
| | | | | | | | | | | | |
| CONSUMER NON-DURABLES SECTOR — 9.3% | | | | | | | | |
| | | | Beverages: Alcoholic — 2.1% | | | | | | | | |
| | 1,142,000 | | Diageo | | | | | | | | |
| | | | PLC - SP-ADR | | | 68,687,070 | | | | 110,203,000 | |
| | | | | | | | | | | | |
| | | | Food: Major Diversified — 3.8% | | | | | | | | |
| | 3,214,000 | | Nestlé | | | | | | | | |
| | | | S.A. - SP-ADR | | | 146,803,977 | | | | 202,482,000 | |
| | | | | | | | | | | | |
| | | | Household/Personal Care — 3.4% | | | | | | | | |
| | 2,453,000 | | Kimberly-Clark Corp. | | | 152,045,453 | | | | 181,252,170 | |
| | | | | | | | | | | | |
| CONSUMER SERVICES SECTOR — 3.3% | | | | | | | | |
| | | | Media Conglomerates — 3.3% | | | | | | | | |
| | 4,716,000 | | Time Warner Inc. | | | 136,004,020 | | | | 178,029,000 | |
| | | | | | | | | | | | |
| DISTRIBUTION SERVICES SECTOR — 7.7% | | | | | | | | |
| | | | Food Distributors — 4.4% | | | | | | | | |
| | 7,810,000 | | Sysco Corp. | | | 218,266,717 | | | | 233,206,600 | |
| | | | | | | | | | | | |
| | | | Medical Distributors — 3.3% | | | | | | | | |
| | 4,413,000 | | AmerisourceBergen | | | | | | | | |
| | | | Corp. | | | 131,713,360 | | | | 175,107,840 | |
| | | | | | | | | | | | |
| ELECTRONIC TECHNOLOGY SECTOR — 3.5% | | | | | | | | |
| | | | Electronic Components — 3.5% | | | | | | | | |
| | 5,060,950 | | TE Connectivity | | | | | | | | |
| | | | Limited | | | 122,447,890 | | | | 185,989,912 | |
| | | | | | | | | | | | |
| ENERGY MINERALS SECTOR — 3.9% | | | | | | | | |
| | | | Oil & Gas Production — 3.9% | | | | | | | | |
| | 2,900,000 | | Devon Energy | | | | | | | | |
| | | | Corporation | | | 194,139,248 | | | | 206,248,000 | |
| | | | | | | | | | | | |
| FINANCE SECTOR — 16.9% | | | | | | | | |
| | | | Financial Conglomerates — 3.1% | | | | | | | | |
| | 2,873,000 | | American | | | | | | | | |
| | | | Express Co. | | | 95,616,570 | | | | 166,231,780 | |
| | | | | | | | | | | | |
| | | | Insurance Brokers/Services — 2.1% | | | | | | | | |
| | 3,141,000 | | Willis Group | | | | | | | | |
| | | | Holdings PLC | | | 120,379,100 | | | | 109,872,180 | |
| | | | | | | | | | | | |
| | | | Major Banks — 7.5% | | | | | | | | |
| | 8,896,000 | | Bank of New York | | | | | | | | |
| | | | Mellon Corp. | | | 246,370,824 | | | | 214,660,480 | |
| | 5,785,000 | | Comerica, | | | | | | | | |
| | | | Incorporated | | | 176,482,212 | | | | 187,202,600 | |
| | | | | | | 422,853,036 | | | | 401,863,080 | |
| | | | Property/Casualty Insurance — 4.2% | | | | | | | | |
| | 2,769,000 | | Berkshire Hathaway | | | | | | | | |
| | | | Inc. - Cl B* | | | 192,352,041 | | | | 224,704,350 | |
| | | | | | | | | | | | |
| HEALTH TECHNOLOGY SECTOR — 6.5% | | | | | | | | |
| | | | Medical Specialties — 3.2% | | | | | | | | |
| | 3,133,000 | | Covidien PLC | | | 138,891,399 | | | | 171,312,440 | |
| | | | | | | | | | | | |
| | | | Pharmaceuticals: Major — 3.3% | | | | | | | | |
| | 3,873,000 | | GlaxoSmithKline | | | | | | | | |
| | | | PLC - SP-ADR | | | 166,834,427 | | | | 173,936,430 | |
| | | | | | | | | | | | |
| INDUSTRIAL SERVICES SECTOR — 1.9% | | | | | | | | |
| | | | Oilfield Services/Equipment — 1.9% | | | | | | | | |
| | 1,440,000 | | Schlumberger | | | | | | | | |
| | | | Limited | | | 86,302,832 | | | | 100,699,200 | |
| | | | | | | | | | | | |
| PROCESS INDUSTRIES SECTOR — 2.0% | | | | | | | | |
| | | | Chemicals: Agricultural — 2.0% | | | | | | | | |
| | 1,329,000 | | Monsanto Co. | | | 73,322,361 | | | | 106,001,040 | |
| | | | | | | | | | | | |
| PRODUCER MANUFACTURING SECTOR — 10.7% | | | | | | | | |
| | | | Industrial Conglomerates — 7.5% | | | | | | | | |
| | 3,014,000 | | 3M Co. | | | 224,956,602 | | | | 268,878,940 | |
| | 3,135,000 | | Ingersoll-Rand PLC | | | 137,617,756 | | | | 129,632,250 | |
| | | | | | | 362,574,358 | | | | 398,511,190 | |
| | | | Industrial Machinery — 3.2% | | | | | | | | |
| | 3,030,000 | | Illinois Tool | | | | | | | | |
| | | | Works Inc. | | | 142,244,764 | | | | 173,073,600 | |
| | | | | | | | | | | | |
| RETAIL TRADE SECTOR — 8.3% | | | | | | | | |
| | | | Discount Stores — 4.4% | | | | | | | | |
| | 3,804,000 | | Wal-Mart | | | | | | | | |
| | | | Stores, Inc. | | | 195,538,642 | | | | 232,804,800 | |
| | | | | | | | | | | | |
| | | | Specialty Stores — 3.9% | | | | | | | | |
| | 13,033,000 | | Staples, Inc. | | | 252,898,498 | | | | 210,873,940 | |
| | | | | | | | | | | | |
| TECHNOLOGY SERVICES SECTOR — 9.8% | | | | | | | | |
| | | | Data Processing Services — 2.8% | | | | | | | | |
| | 2,706,000 | | Automatic Data | | | | | | | | |
| | | | Processing, Inc. | | | 108,026,585 | | | | 149,344,140 | |
| | | | | | | | | | | | |
| | | | Information Technology Services — 4.0% | | | | | | | | |
| | 3,273,000 | | Accenture PLC | | | 122,658,987 | | | | 211,108,500 | |
| | | | | | | | | | | | |
| | | | Packaged Software — 3.0% | | | | | | | | |
| | 5,068,000 | | Microsoft | | | | | | | | |
| | | | Corporation | | | 141,597,436 | | | | 163,443,000 | |
| | | | | | | | | | | | |
| TRANSPORTATION SECTOR — 4.3% | | | | | | | | |
| | | | Air Freight/Couriers — 4.3% | | | | | | | | |
| | 2,815,000 | | United Parcel | | | | | | | | |
| | | | Service, Inc. - Cl B | | | 176,780,713 | | | | 227,226,800 | |
| | | | Total common stocks | | | 4,230,249,020 | | | | 5,028,847,652 | |
FMI Large Cap Fund
SCHEDULE OF INVESTMENTS (Continued)
March 31, 2012 (Unaudited)
| Principal | | | | | | | | |
| Amount | | | | Cost | | | Value | |
| | | | | | | | | |
| SHORT-TERM INVESTMENTS — 6.0% (a) | | | | | | |
| | | Commercial Paper — 6.0% | | | | | | |
| $ | 119,100,000 | | U.S. Bank, N.A., 0.02%, | | | | | | |
| | | | due 04/02/12 | | $ | 119,099,934 | | | $ | 119,099,934 | |
| | 200,000,000 | | GE Capital Corp., 0.04%, | | | | | | | | |
| | | | due 04/10/12 | | | 199,998,000 | | | | 199,998,000 | |
| | | | Total short-term | | | | | | | | |
| | | | investments | | | 319,097,934 | | | | 319,097,934 | |
| | | | Total investments | | | | | | | | |
| | | | — 100.4% | | $ | 4,549,346,954 | | | | 5,347,945,586 | |
| | | | Liabilities, less cash | | | | | | | | |
| | | | and receivables | | | | | | | | |
| | | | — (0.4%) (a) | | | | | | | (20,635,399 | ) |
| | | | TOTAL NET | | | | | | | | |
| | | | ASSETS — 100.0% | | | | | | $ | 5,327,310,187 | |
| | | | | | | | | | | | |
| * | Non-income producing security. |
| (a) | Percentages for the various classifications relate to net assets. |
PLC – Public Limited Company
SP-ADR – Sponsored American Depositary Receipts
The accompanying notes to financial statements are an integral part of this schedule.
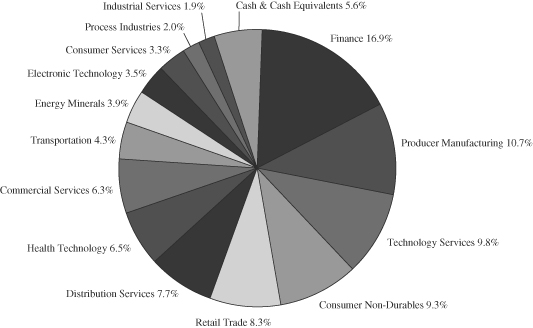
INDUSTRY SECTORS
as of March 31, 2012 (Unaudited)
FMI
Common Stock
Fund
March 31, 2012
Dear Fellow Shareholders:
The FMI Common Stock Fund (“FMIMX”) gained 10.05%(1) in the quarter ending March 31. While positive on an absolute basis, it was behind the 12.44%(2) return of the Russell 2000 Index. From a sector standpoint, our exposure in Retail Trade, Technology Services and Health Services lagged the market. So-called high beta stocks were significant drivers of performance in the Russell 2000 this quarter and included a number of stocks that aren’t our type of investments, such as Hot Topic (+55.05%), SourceFire (+48.64%), and eResearch Technology (+66.74%). Of course the Monday morning quarterback would say we were idiots for not owning these stocks but investing is a forward looking endeavor and as we look at the picture today, we believe the stocks we have in each of the aforementioned sectors have a superior 3-4 year outlook, taking the quality of the business franchise, downside risk and valuation into account.
Stocks of homebuilders and those leveraged to a housing recovery have also had a sharp bounce off the bottom and we don’t have significant exposure to this area. Weather and consumer confidence were more favorable recently, which aided the optics around this business, but we do not think the data supports a sustained improvement in home building or prices in the near term. We do expect existing home turnover to continue to improve. While people can argue about the exact numbers, it would appear that there are somewhere between 11 and 14 million homes that are in foreclosure, delinquent, or “under water” (market value less than mortgage value). Corelogic and Amherst Securities report that there are 11.2 million homes “in jeopardy,” including 4.8 million mortgages that are nonperforming with an expected default rate of 95%. There are between two and three million vacant homes, depending on whose figures are used. New home starts are running at approximately 0.5 million. We think the shadow inventory is very significant and will continue to depress new home building and prices for quite some time. Despite the favorable weather, new home sales were down 5.4% in January and 1.6% in February.
On the positive side, sectors that contributed nicely to our performance in the quarter included Energy Minerals, Producer Manufacturing and Utilities. Overall, we feel the portfolio of companies is strong and best suited to perform in a bumpy or trendless stock market. If the recent rally is the start of a growth stock-driven environment characterized by expanding valuations, there is a high probability that we will underperform, just as we did in the March quarter. For years we have monitored The Leuthold Group’s 46 different fundamental valuation measures for the stock market. These data series typically go back fifty to eighty years. As of the most recent period measured (12/31/11), the average valuation was in the seventh decile (one being the cheapest, ten being the most expensive). While not “negative” on the stock market, we don’t think valuations will be a tailwind given very substantial ongoing macro concerns.
For new investors, the March and September letters include just a brief overview of pertinent investment topics before a couple of specific investment ideas are discussed. The June and December letters are generally longer and usually delve into various macro concepts in more detail.
Investors seem more hopeful that the February employment numbers indicate that the United States is on a healthier economic trajectory. Nonfarm payrolls gained 227,000 in February and finally, both the employment-to-population ratio and labor participation rate inched higher. With over 20 million people unemployed or underemployed, it is a long road back. The labor numbers, however, are notoriously volatile; a year ago we had an almost identical February employment report and then the numbers slipped significantly. One labor commentator indicated that adjusting for this year’s balmy winter weather would have resulted in a 90,000 nonfarm gain instead of 227,000 and that if the household survey’s figures were replaced by the payroll figures, the unemployment rate would be over 9% rather than 8.3%. Our conversations with businesspeople, with respect to hiring, have turned from uniformly negative over most of last year to more of a mixed bag today. Employment feels like it is getting better, but it is worth noting that wage rates, otherwise known as the price of labor, remain weak.
__________
| (1) | The Fund’s 1-year and annualized 5-year and 10-year returns through March 31, 2012 were: 7.69%, 6.82%, and 9.46%, respectively. |
| (2) | The Russell 2000 Index, benchmark for FMIMX 1-year and annualized 5-year and 10-year returns through March 31, 2012 were: -0.18%, 2.13% and 6.45%, respectively. |
The Russell 2000 Index measures the performance of the 2,000 smallest companies in the Russell 3000 Index which comprises the 3,000 largest U.S. companies based on total market capitalization.
In spite of the sense that there is a more positive tilt to the employment picture, GDP revisions haven’t reflected this over the past six months in the United States. A Bloomberg News survey of 63 economists last September averaged 2.2% for estimated 2012 real GDP growth; the March survey had the exact same estimate for 2012. The March 22 report from FedEx, normally a harbinger of near term economic activity, showed a weaker U.S. outlook. Grainger and some other broad-based companies are not seeing a slowdown, however. European and Chinese growth rates, on the other hand, have slowed significantly. Europe may be in a recession right now and China is undoubtedly weakening, although the reliability of their statistics remains very suspect. This fact was revealed recently in a separate Bloomberg News story, where the following was stated: “In 2011, the 31 provincial-level governments reported a combined GDP of 51.8 trillion yuan ($8.2 trillion), 4.6 trillion yuan higher than the national figure calculated by the statistics bureau, the state-backed Economic Daily reported in February.” Anecdotally, Clarcor, Otis (United Technologies) and a host of other global players are reporting significant declines in their Chinese orders, and real estate prices continue to fall.
The severe debt and budgetary problems across Europe, the United States and Japan have not improved and are likely to continue to weigh on growth. Various programs, such as the European Central Bank’s long-term refinancing operation (LTRO), mimic the Fed’s monetary actions and have provided a temporary respite from having to actually solve real spending and taxation problems. Greece defaulted, as expected, but what may say more about the future of Greece and perhaps other “peripheral” countries is the fact that the newly issued (post default) Greek debt securities are trading at 29 cents on the dollar. Uncompetitive countries, with structurally high labor rates and high government employment ratios, which are also tied to a high-priced currency, have little chance of establishing a sustainable growth model. The U.S. and Japan continue to pile on debt at a record clip. It is our feeling that the press and the public have grown weary of the debt discussion. Just about the time complacency sets in, we are apt to see something shake us back to reality. The U.S. and Japan are not likely to restructure, and politics are preventing progress towards even balancing budgets, much less reducing debt, so this problem may be with us for a long time.
One of the few economic bright spots over the past several years has been corporate profit margins. As long as they stay near a record high, it makes the valuation argument less negative. Historically, however, profit margins have been quite volatile and unfortunately, have been inversely correlated with future growth. In other words, competitive pressures eventually eat away at high margins, negatively impacting growth, as illustrated in the nearby chart. In a recent article in The Wall Street Journal, Brown Brothers reports that corporate profits fell 40 basis points in the December quarter. We’ll continue to carefully watch this situation.
This background discussion illuminates why we see uneven terrain for investors. We don’t think the big issues are quite yet in the rear view mirror, although we hasten to add that historically we have made money for our investors through some pretty rough market environments. We approach investing with a 3-5 year time frame, knowing there will be periods when we are either out of favor or lose money. Below we highlight a couple of companies that we like for the long haul.
Innophos Holdings, Inc. (IPHS)
(Analyst: Jonathan Bloom)
Description
Innophos Holdings is one of the world’s leading producers of specialty grade phosphates for food, beverage, pharmaceutical, oral care and industrial end markets. The group reports four product lines: specialty ingredients (60% of 2011 sales), food & technical grade purified phosphoric acid (17%), technical grade sodium tripolyphosphate (STPP) & detergent grade acid (11%), and granular triple super phosphate (GTSP) & other (12%), which is a non-core co-product. Innophos’ products provide critical functionality, nutritional value, and consumer benefits including enhanced taste, texture and performance. Products include flavor enhancers in beverages, electrolytes in sports drinks, texture modifiers in cheeses, leavening agents in baked goods, calcium and phosphorus sources for nutritional supplements, pharmaceutical excipients, cleaning agents in toothpaste, et al. In 2011, approximately 74% of sales were completed in North America (U.S., Mexico, Canada) with 26% overseas.
Good Business
| | • | Return on invested capital (ROIC) has averaged 16% in 2010-11, with Innophos targeting over 20%. |
| | • | There are significant barriers to entry, including a very high cost to establish manufacturing. |
| | • | Competition from China is limited. Their technology is more energy intensive and polluting. |
| | • | The products are modestly priced and often represent less than 1% of a customer’s cost of goods sold. |
| | • | With high switching costs customers have little incentive to switch suppliers, which has resulted in a customer retention rate of over 90%. |
| | • | Innophos and Israel Chemicals Ltd. (ICL) control ~70% of the U.S. specialty phosphate market, operating in a virtual duopoly. |
| | • | Nearly half of the company’s sales are sold to food, beverage, pharmaceutical, and oral care end markets, which are defensive in nature. Some industrial uses such as water purification are also defensive. |
| | • | Reasonable balance sheet: Debt/Capital: 0.28; interest coverage (earnings before interest and tax [EBIT]/Interest Expense): 23.4. |
Valuation
| | • | The price-to-earnings (P/E) ratio (2012E) of 12.8 is undemanding for a quality business with attractive growth prospects. Earnings per share (EPS) is expected to grow in the high single digits (annually) over the medium term. |
| | • | An enterprise value-to-sales (EV/S) multiple of 1.5 compares favorably with 2010 and 2011 operating margins of 16%. |
| | • | An EV/EBIT of 9.3 times compares with ICL’s 2005 acquisition of Astaris (#2 player in U.S.) at 12 times, so the stock trades at a significant discount to private market value. |
Management
Management has deleveraged the balance sheet, improved execution, and focused on value-added higher-margin consumer end markets while phasing out more commoditized products (STPP). The long-term incentive plan is based on ROIC and contribution margin (sales less variable costs). The company’s stock ownership policy requires the CEO to own 5 times base salary, with the CFO and general counsel at 2 times, and other executives at 1 times.
Investment Thesis
With limited sell-side coverage and a steadier business than historic financial statements might imply, Innophos is underappreciated and is priced at a discount to its intrinsic value. It has many characteristics of a quality business, as demonstrated by the company’s ability to generate a ROIC well above its cost of capital. The company sells modestly priced products to captive customers, creating a stream of recurring revenue with an implied retention ratio of over 90%. More than half of the company’s sales are defensive in nature, which is a valuable attribute during uncertain times. At 12.8 times 2012 EPS estimates with attractive growth prospects, Innophos provides a favorable investment opportunity over a 3-5 year time horizon.
ScanSource, Inc. (SCSC)
(Analyst: Rob Helf)
Description
ScanSource (Greenville, SC) is a leading value-added distributor of specialty technology products in North America, Europe and Latin America. The company’s two major segments are Automatic ID/IP Security products and Communication Systems. ScanSource distributes bar code printers, scanning devices, point of sale terminals, receipt printers, Internet protocol (IP) video cameras and voice over IP (VOIP) communication systems. The company sells over 68,000 products from 220 vendors to 30,000 value-added resellers. Key vendors include: Motorola, Avaya, Zebra, Intermec, Polycom, Honeywell and Cisco.
Good Business
| | • | As a distributor of technology products, ScanSource has a higher degree of predictability and a lower degree of risk than inventors of technology. |
| | • | The company has a diversified lineup of vendors, customers and end-markets. No customer is greater than 6% of overall revenues. |
| | • | The company has a distinct size advantage over the competition, allowing it favorable procurement costs, greater inventory and technology support. |
| | • | ScanSource consistently generates a return-on-capital in the low teens, which is greater than its cost-of-capital. Management compensation is based on return-on-capital. |
| | • | Over the past 10 years, sales, EPS and cash flow have grown at 11-14% per annum and we anticipate above average growth rates in the future. |
| | • | The balance sheet is modestly levered with a debt-to-total capital ratio under 15%. |
| | • | The business requires very little capital to maintain and grow. Growth should come from international markets, a greater reliance on the distribution channel by vendors and new product areas. |
Valuation
| | • | ScanSource is valued at 13 times forward EPS estimates and 0.3 times revenues. |
| | • | The mean valuation for the company over the past 10 years has been 15 times EPS and 0.4 times sales. The P/E range has been 13-23 over the past 10 years. |
| | • | The company trades at 1.6 times book value compared to a 10-year average of 2.2. |
Management
| | • | Michael Baur, 54, is a co-founder and CEO. He had prior experience at Gates/Arrow. Much of Baur’s career has been in technology and specifically value-added distribution. |
| | • | Scott Benbenek, 55, has served as President of the company since 2007. He joined SCSC in 1998 from Gates/Arrow. |
| | • | Richard Cleys, 60, has been ScanSource’s CFO since November 2002. Prior to ScanSource, Mr. Cleys was Controller of Lanier, an office product distributor. |
Investment Thesis
ScanSource is a leading, niche distributor in growing technology markets. Many technology companies struggle to earn their cost of capital as they chase short product cycles and face obsolescence. The company gives a relatively low risk pathway to capturing technology growth. The stock trades at an attractive valuation relative to its historic parameters and at a discount to smaller cap companies.
Thank you for your support of the FMI Common Stock Fund.
100 E. Wisconsin Ave., Suite 2200 • Milwaukee, WI 53202 • 414-226-4555
www.fmifunds.com
FMI Common Stock Fund
SCHEDULE OF INVESTMENTS
March 31, 2012 (Unaudited)
| Shares | | | | Cost | | | Value | |
| | | | | | | |
| COMMON STOCKS — 85.2% (a) | | | | | | |
| | | | | | | |
| COMMERCIAL SERVICES SECTOR — 8.8% | | | | | | |
| | | Advertising/Marketing | | | | | | |
| | | Services — 1.2% | | | | | | |
| | 1,556,000 | | Harte-Hanks, Inc. | | $ | 21,392,465 | | | $ | 14,081,800 | |
| | | | | | | | | | | | |
| | | | Financial Publishing/ | | | | | | | | |
| | | | Services — 3.9% | | | | | | | | |
| | 549,000 | | The Dun & Bradstreet | | | | | | | | |
| | | | Corporation | | | 40,656,954 | | | | 46,516,770 | |
| | | | | | | | | | | | |
| | | | Miscellaneous Commercial | | | | | | | | |
| | | | Services — 3.7% | | | | | | | | |
| | 736,000 | | Cintas Corp. | | | 17,929,877 | | | | 28,792,320 | |
| | 1,000,000 | | TeleTech | | | | | | | | |
| | | | Holdings, Inc.* | | | 17,263,845 | | | | 16,100,000 | |
| | | | | | | 35,193,722 | | | | 44,892,320 | |
| CONSUMER DURABLES SECTOR — 1.4% | | | | | | | | |
| | | | Other Consumer | | | | | | | | |
| | | | Specialties — 1.4% | | | | | | | | |
| | 414,000 | | Mine Safety | | | | | | | | |
| | | | Appliances Co. | | | 12,032,362 | | | | 17,007,120 | |
| | | | | | | | | | | | |
| CONSUMER NON-DURABLES SECTOR — 1.1% | | | | | | | | |
| | | | Food: Specialty/Candy — 1.1% | | | | | | | | |
| | 193,125 | | Lancaster Colony | | | | | | | | |
| | | | Corporation | | | 9,803,522 | | | | 12,835,088 | |
| | | | | | | | | | | | |
| DISTRIBUTION SERVICES SECTOR — 12.4% | | | | | | | | |
| | | | Electronics | | | | | | | | |
| | | | Distributors — 7.0% | | | | | | | | |
| | 60,400 | | Anixter | | | | | | | | |
| | | | International Inc.* | | | 4,099,415 | | | | 4,380,812 | |
| | 1,248,000 | | Arrow | | | | | | | | |
| | | | Electronics, Inc.* | | | 25,084,996 | | | | 52,378,560 | |
| | 751,000 | | ScanSource, Inc.* | | | 19,289,793 | | | | 28,027,320 | |
| | | | | | | 48,474,204 | | | | 84,786,692 | |
| | | | Medical Distributors — 4.0% | | | | | | | | |
| | 1,433,000 | | Patterson | | | | | | | | |
| | | | Companies Inc. | | | 34,064,024 | | | | 47,862,200 | |
| | | | | | | | | | | | |
| | | | Wholesale | | | | | | | | |
| | | | Distributors — 1.4% | | | | | | | | |
| | 538,000 | | United | | | | | | | | |
| | | | Stationers Inc. | | | 10,887,604 | | | | 16,694,140 | |
| | | | | | | | | | | | |
| ENERGY MINERALS SECTOR — 3.4% | | | | | | | | |
| | | | Oil & Gas Production — 3.4% | | | | | | | | |
| | 536,000 | | Cimarex Energy Co. | | | 32,137,151 | | | | 40,451,920 | |
| | | | | | | | | | | | |
| FINANCE SECTOR — 10.1% | | | | | | | | |
| | | | Insurance Brokers/ | | | | | | | | |
| | | | Services — 2.3% | | | | | | | | |
| | 763,000 | | Arthur J. | | | | | | | | |
| | | | Gallagher & Co. | | | 16,392,496 | | | | 27,269,620 | |
| | | | | | | | | | | | |
| | | | Life/Health | | | | | | | | |
| | | | Insurance — 2.5% | | | | | | | | |
| | 997,000 | | Protective Life Corp. | | | 15,983,284 | | | 29,531,140 | |
| | | | | | | | | | | |
| | | | Property/Casualty | | | | | | | | |
| | | | Insurance — 3.4% | | | | | | | | |
| | 1,145,000 | | W.R. Berkley Corp. | | | 29,330,749 | | | | 41,357,400 | |
| | | | | | | | | | | | |
| | | | Regional Banks — 1.9% | | | | | | | | |
| | 402,000 | | Cullen/Frost | | | | | | | | |
| | | | Bankers, Inc. | | | 23,461,976 | | | | 23,392,380 | |
| | | | | | | | | | | | |
| HEALTH SERVICES SECTOR — 3.7% | | | | | | | | |
| | | | Health Industry | | | | | | | | |
| | | | Services — 2.2% | | | | | | | | |
| | 552,000 | | Covance Inc.* | | | 23,637,911 | | | | 26,291,760 | |
| | | | | | | | | | | | |
| | | | Medical/Nursing | | | | | | | | |
| | | | Services — 1.5% | | | | | | | | |
| | 809,000 | | VCA Antech, Inc.* | | | 16,997,846 | | | | 18,776,890 | |
| | | | | | | | | | | | |
| HEALTH TECHNOLOGY SECTOR — 3.4% | | | | | | | | |
| | | | Medical Specialties — 3.4% | | | | | | | | |
| | 227,875 | | Bio-Rad | | | | | | | | |
| | | | Laboratories, Inc.* | | | 19,173,850 | | | | 23,628,359 | |
| | 408,000 | | West Pharmaceutical | | | | | | | | |
| | | | Services, Inc. | | | 16,327,619 | | | | 17,352,240 | |
| | | | | | | 35,501,469 | | | | 40,980,599 | |
| INDUSTRIAL SERVICES SECTOR — 2.7% | | | | | | | | |
| | | | Oilfield Services/ | | | | | | | | |
| | | | Equipment — 2.7% | | | | | | | | |
| | 313,000 | | Bristow Group, Inc. | | | 8,134,902 | | | | 14,939,490 | |
| | 87,000 | | Dresser-Rand | | | | | | | | |
| | | | Group, Inc.* | | | 1,319,296 | | | | 4,035,930 | |
| | 1,101,600 | | McDermott | | | | | | | | |
| | | | International, Inc.* | | | 14,264,872 | | | | 14,111,496 | |
| | | | | | | 23,719,070 | | | | 33,086,916 | |
| MISCELLANEOUS SECTOR — 0.9% | | | | | | | | |
| | | | Investment Trusts/ | | | | | | | | |
| | | | Mutual Funds — 0.9% | | | | | | | | |
| | 457,000 | | PICO Holdings, Inc.* | | | 14,826,764 | | | | 10,716,650 | |
| | | | | | | | | | | | |
| NON-ENERGY MINERALS SECTOR — 1.0% | | | | | | | | |
| | | | Construction | | | | | | | | |
| | | | Materials — 1.0% | | | | | | | | |
| | 365,000 | | Eagle Materials Inc. | | | 6,125,450 | | | | 12,683,750 | |
| | | | | | | | | | | | |
| PROCESS INDUSTRIES SECTOR — 12.2% | | | | | | | | |
| | | | Chemicals: Specialty — 3.9% | | | | | | | | |
| | 476,000 | | Innophos | | | | | | | | |
| | | | Holdings, Inc. | | | 23,636,301 | | | | 23,857,120 | |
| | 315,000 | | Sigma-Aldrich Corp. | | | 15,670,380 | | | | 23,013,900 | |
| | | | | | | 39,306,681 | | | | 46,871,020 | |
FMI Common Stock Fund
SCHEDULE OF INVESTMENTS (Continued)
March 31, 2012 (Unaudited)
Shares or Principal Amount | | | | Cost | | | Value | |
| | | | | | | | | |
| COMMON STOCKS — 85.2% (a) (Continued) | | | | | | |
| | | | | | | |
| PROCESS INDUSTRIES SECTOR — 12.2% (Continued) | | | | | | |
| | | Containers/Packaging — 4.7% | | | | | | |
| | 651,000 | | AptarGroup, Inc. | | $ | 19,162,286 | | | $ | 35,655,270 | |
| | 638,000 | | Bemis Company, Inc. | | | 15,865,413 | | | | 20,601,020 | |
| | | | | | | 35,027,699 | | | | 56,256,290 | |
| | | | Industrial Specialties — 3.6% | | | | | | | | |
| | 307,950 | | H.B. Fuller Company | | | 8,007,094 | | | | 10,109,998 | |
| | 702,000 | | Valspar Corp. | | | 18,970,075 | | | | 33,899,580 | |
| | | | | | | 26,977,169 | | | | 44,009,578 | |
| PRODUCER MANUFACTURING SECTOR — 13.0% | | | | | | | | |
| | | | Electrical Products — 3.4% | | | | | | | | |
| | 1,735,000 | | Molex Inc. Cl A | | | 31,532,890 | | | | 40,685,750 | |
| | | | | | | | | | | | |
| | | | Industrial | | | | | | | | |
| | | | Conglomerates — 2.6% | | | | | | | | |
| | 407,000 | | SPX Corporation | | | 22,883,026 | | | | 31,554,710 | |
| | | | | | | | | | | | |
| | | | Industrial Machinery — 2.9% | | | | | | | | |
| | 772,000 | | Kennametal Inc. | | | 30,686,433 | | | | 34,377,160 | |
| | | | | | | | | | | | |
| | | | Miscellaneous | | | | | | | | |
| | | | Manufacturing — 2.6% | | | | | | | | |
| | 626,000 | | Carlisle | | | | | | | | |
| | | | Companies Inc. | | | 16,800,707 | | | | 31,249,920 | |
| | | | | | | | | | | | |
| | | | Office Equipment/ | | | | | | | | |
| | | | Supplies — 1.5% | | | | | | | | |
| | 619,000 | | Avery Dennison | | | | | | | | |
| | | | Corporation | | | 16,602,918 | | | | 18,650,470 | |
| | | | | | | | | | | | |
| RETAIL TRADE SECTOR — 5.8% | | | | | | | | |
| | | | Discount Stores — 3.2% | | | | | | | | |
| | 613,000 | | Family Dollar | | | | | | | | |
| | | | Stores, Inc. | | | 20,395,783 | | | | 38,790,640 | |
| | | | | | | | | | | | |
| | | | Food Retail — 1.6% | | | | | | | | |
| | 471,650 | | Ruddick Corp. | | | 12,112,374 | | | | 18,913,165 | |
| | | | | | | | | | | | |
| | | | Specialty Stores — 1.0% | | | | | | | | |
| | 221,000 | | PetSmart, Inc. | | | 4,231,444 | | | | 12,645,620 | |
| | | | | | | | | | | | |
| TECHNOLOGY SERVICES SECTOR — 4.4% | | | | | | | |
| | | Data Processing Services — 2.9% | | | | | | | |
| | 1,434,000 | | Broadridge Financial | | | | | | | |
| | | | Solutions Inc. | | | 30,925,092 | | | | 34,286,940 | |
| | | | | | | | | | | | |
| | | | Information Technology | | | | | | | | |
| | | | Services — 1.5% | | | | | | | | |
| | 531,000 | | Jack Henry & | | | | | | | | |
| | | | Associates, Inc. | | | 9,767,741 | | | | 18,117,720 | |
| | | | | | | | | | | | |
| TRANSPORTATION SECTOR — 0.9% | | | | | | | | |
| | | | Marine Shipping — 0.9% | | | | | | | | |
| | 168,000 | | Kirby Corp.* | | | 5,162,620 | | | | 11,052,720 | |
| | | | Total common stocks | | | 753,031,600 | | | | 1,026,676,858 | |
| | | | | | | | | | | | |
| SHORT-TERM INVESTMENTS — 14.3% (a) | | | | | | | | |
| | | | Commercial Paper — 14.3% | | | | | | | | |
| $ | 72,100,000 | | U.S. Bank, N.A., 0.02%, | | | | | | | | |
| | | | due 04/02/12 | | | 72,099,960 | | | | 72,099,960 | |
| | 100,000,000 | | GE Capital Corp., 0.04%, | | | | | | | | |
| | | | due 04/10/12 | | | 99,999,000 | | | | 99,999,000 | |
| | | | Total short-term | | | | | | | | |
| | | | investments | | | 172,098,960 | | | | 172,098,960 | |
| | | | Total investments | | | | | | | | |
| | | | — 99.5% | | $ | 925,130,560 | | | | 1,198,775,818 | |
| | | | Cash and receivables, | | | | | | | | |
| | | | less liabilities | | | | | | | | |
| | | | — 0.5% (a) | | | | | | | 5,656,198 | |
| | | | TOTAL NET | | | | | | | | |
| | | | ASSETS — 100.0% | | | | | | $ | 1,204,432,016 | |
| * | Non-income producing security. |
| (a) | Percentages for the various classifications relate to net assets. |
The accompanying notes to financial statements are an integral part of this schedule.
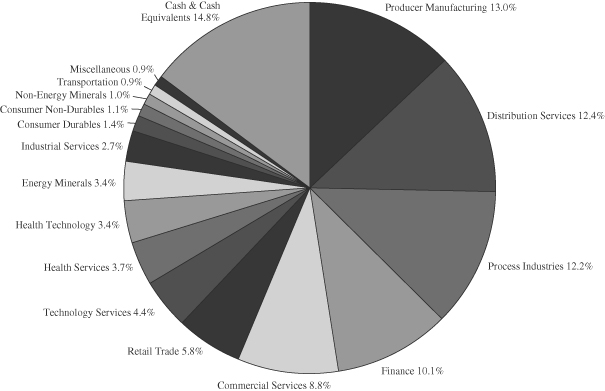
FMI Common Stock Fund
INDUSTRY SECTORS
as of March 31, 2012 (Unaudited)
FMI
International
Fund
March 31, 2012
Dear Fellow Shareholders:
In the first quarter of 2012, the FMI International Fund (“FMIJX”) gained 9.80%(1) while the benchmark MSCI EAFE Index rose by 10.22%(2) in local currency and 10.86%(3) in U.S. Dollars (USD). International stock markets surged in the period, with the more volatile, high beta stocks leading the charge. The best performing indexes included Japan, Germany and Brazil, with advances of approximately 20%, 18%, and 14%, respectively. France, Switzerland, the United Kingdom, and China accelerated at a slower pace, with returns of approximately 9%, 7%, 5%, and 3%, respectively.
For FMIJX, top performers included Ingersoll-Rand, SHIMANO and Henkel, while Tesco, Willis Group, and Fairfax Financial lagged the group. Strong sector contributions were generated in Consumer Non-Durables, Electronic Technology, and Commercial Services, with weaker results coming in Finance, Retail Trade, and Industrial Services. Since inception, the performance of the Fund has been consistent with FMI’s long-term track record in domestic equities, generally outperforming in periods of distress, while lagging during sharp market rallies. Of course, there is no guarantee that future returns will always adhere to this pattern.
For new investors, the March and September letters include a brief overview of pertinent investment topics before a couple of specific investment ideas are discussed. The June and December letters are generally longer and usually delve into various macro concepts in more detail.
Eurozone Developments
As we foreshadowed in recent letters, Greece did indeed default in the March quarter. After a Greek debt swap (exchanging old bonds for new ones) and the ensuing credit default swap (CDS) auction, the implied recovery rate for Greek bondholders was 21.5%, or a loss of 78.5%. A pretty good sign that Greece’s underlying problems are not solved is the price investors are now willing to pay for post restructured long-term bonds – less than 30 cents on the dollar.
We have little confidence that Greece will return to growth, as its currency (euro) cannot adjust and its labor rates are not competitive. With a high cost structure and unrest in the streets, Greece will not be the place businesses will look to relocate. GDP contracted by 7% in 2011 and unemployment now exceeds 20%. Greece has entered into a dangerous phase that will likely continue to weigh on the eurozone. With growth slowing in Europe, one has to question the outlook for Portugal, Spain and Italy, given their precarious public debt burdens.
The European Central Bank (ECB) has followed the path of the Fed and opted for monetary stimulus. The ECB has introduced a new long-term refinancing operation (LTRO), where it has loaned more than €1 trillion to eurozone banks at roughly 1% for up to three years. The hope is that the banks will earn their way out of their capital hole by using the cash to buy higher-yielding assets (carry trade), or lend it to businesses and consumers to spur economic growth. Most of the banks
| (1) | The Fund’s 1-year and annualized since inception (12-31-10) returns through March 31, 2012 were: 7.05% and 6.26%, respectively. |
| (2) | The MSCI EAFE Index (LOC), benchmark for FMIJX 1-year return and annualized since inception (12-31-10) returns through March 31, 2012 were: |
| | -4.12%, and -2.56%, respectively. |
| (3) | The MSCI EAFE Index (USD), benchmark for FMIJX 1-year return and annualized since inception (12-31-10) returns through March 31, 2012 were: |
| | -5.77% and -2.09% respectively. |
The MSCI EFE Index (Europe, Australasia, Far East) is a free float-adjusted market capitalization index that is designed to measure the equity market performance of developed markets, excluding the U.S. and Canada. As of May 27, 2010 the MSCI EAFE Index consisted of the following 22 developed market country indices: Australia, Austria, Belgium, Denmark, Finland, France, Germany, Greece, Hong Kong, Ireland, Israel, Italy, Japan, the Netherlands, New Zealand, Norway, Portugal, Singapore, Spain, Sweden, Switzerland and the United Kingdom. The MSCI EAFE Index is unmanaged and investors cannot invest directly in the Index. Index results are inclusive of dividends and net of foreign withholding taxes. The reported figures include reinvestment of dividends and capital gains distributions and do not reflect any fees or expenses.
The MSCI EAFE Index is calculated in local currency as well as in U.S. dollars (USD). The concept of a local currency calculation excludes the impact of currency fluctuations. All currencies of listing are considered in the Index calculation in local currency where current prices (t) and previous day prices (t-1) are converted into USD using the same exchange rate (exchange rate t-1) in the numerator and denominator. As a consequence, the FX factor drops out of the equation. The USD calculation includes exchange rates at t and t-1. Therefore, the local currency calculation only represents the price appreciation or depreciation of the securities, whereas the USD calculation also accounts for the performance of the currency (or currencies) relative to the USD.
MSCI EAFE is a service mark of MSCI Barra.
are hoarding the cash, however, and using it to bolster their balance sheets in the event of a liquidity crisis. After a second LTRO tranche in early March, the ECB’s balance sheet had ballooned to over €3 trillion (~$4 trillion), which exceeds the Fed’s balance sheet of $2.9 trillion and Germany’s GDP (€2.3 trillion) by more than 30%.
The ECB is employing what amounts to an age-old strategy, money printing, in an attempt to forestall what is likely inevitable – a restructuring of the eurozone. Actually, the restructuring has already started (Greece) and will likely continue for years. From our standpoint, the ECB’s actions are largely cosmetic and do not address the root of the problem, which are fiscal and structural in nature. No one wants to take the necessary austerity path because of political expediency and potential social unrest. Leaders hide behind worn-out Keynesian notions that austerity will plunge economies into the abyss. We certainly acknowledge potentially difficult short-term implications of austerity, but once the private sector recognizes that governments are serious about living within a budget, hiring and capital investment would likely ensue. It’s ironic that the press and the political leaders are convinced that reducing government spending would be disastrous even though that very spending in the first place failed to meaningfully grow the economy or forestall the mess that exists today.
Until Europe embarks on a sound fiscal and monetary path, which we just do not see happening in the near term, we expect a difficult, bumpy road, with uneven growth at best.
China Concerns
In previous letters, we expressed our concerns about China’s real estate market and the likelihood of a slowdown in their economy. There is little question today that China’s growth is deteriorating, and unless domestic Chinese consumption increases rapidly, we would expect much slower than historical GDP growth. The National Bureau of Statistics has reported that real estate sales in January/February have dropped by over 20% from the prior year, while in March HSBC’s preliminary China Purchasing Managers Index (PMI), a gauge of manufacturing activity, fell to 48.1 from 49.6 in February. A reading of less than 50 indicates that the market is contracting, and this is the fifth consecutive month below the threshold. Steel production is down, copper inventories are piling up, car sales have weakened and cement production has dropped. China has reduced its 2012 economic growth target to 7.5% from 8%, a target which had been in place since 2005.
Of course, the reliability of the statistics coming out of China is always a concern. A recent Bloomberg News report stated, “In 2011, the 31 provincial level governments reported a combined GDP of 51.8 trillion yuan ($8.2 trillion), 4.6 trillion yuan higher than the national figure calculated by the Statistics Bureau, the state-backed Economic Daily reported in February.” A nearly 10% discrepancy in the country’s GDP estimate is extraordinary. Additionally, we are skeptical of China’s reported 3.2% inflation rate in February, which was at a 20-month low. With a historic rise of raw material prices over the past five years, a jump in oil prices over the last six months, and most multinational companies reporting at least 12% wage inflation, we struggle to see how inflation can be less than 4%.
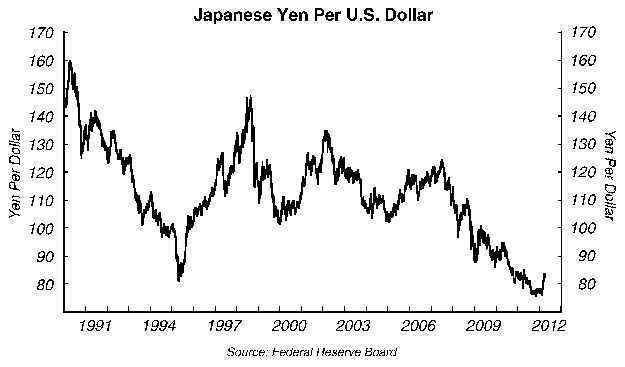
Japan Progress
Given the massive public sector debt load of Japan, we continue to question the relatively high value of the yen. It started to pull back in the first quarter, dropping from 76.91 yen per dollar on December 30, 2011 to 82.86 yen per dollar on March 31, 2012. A sustained retreat would likely boost Japan’s exporters, who have been facing an uphill battle of an appreciating yen for decades.
Initially we thought Japan would come back stronger after the tsunami last March, with more unity, willpower and vigor. Unfortunately this does not appear to be the case, although very recently there appears to be improvement in Sendai and some other cities in the stricken prefectures. Overall GDP growth has remained weak, contracting in four of the last five quarters.
The biggest challenge in Japan could end up being power generation, with nuclear energy accounting for approximately 30% of the country’s total electricity production. There were plans to increase nuclear energy to 41% by 2017, and 50% by 2030, but after the Fukushima incident, the program is in doubt, with current expectations that Japan will look to reduce its reliance on nuclear power. Incidentally, we recently added Royal Dutch Shell to the FMIJX portfolio, in recognition of a series of key company-specific attributes, one of which is that they are the global leader in liquid natural gas (LNG) production. We expect that Japan will be a huge buyer of LNG in the years to come.
Despite the very significant problems Japan faces, it won’t keep us from investing in a number of outstanding global business franchises headquartered there. Valuations remain attractive.
With extreme fiscal problems in three huge economic areas, the United States, Europe and Japan; China slowing; and monetary policy being conducted in uncharted territory, we will continue to operate cautiously. We don’t think the coast is clear. We’ll continue to strive to identify high-quality, durable franchises that can withstand turbulence and that are trading at a discount to intrinsic value. Outlined below are a couple of investments which we think are attractive over our customary three to five year investment horizon.
Tesco PLC (TSCO – GB)
(Analyst: Matthew Goetzinger)
Description
Tesco is the largest United Kingdom grocery chain with approximately 30% market share. Combined with the company’s burgeoning Services business, the company’s overall UK business contributes two-thirds of total revenues and three-quarters of profits. The Services business encompasses retail banking and insurance, mobile telephony, Internet fulfillment, and Dunnhumby, the company’s proprietary loyalty card database business. Tesco International (50% Eastern Europe/50% Asia) accounts for the remaining 30% of revenues, and represents Tesco’s main avenue for new store growth. Lastly, the company’s small but growing U.S. Fresh & Easy concept contributes approximately 1% of group sales but is currently unprofitable.
Good Business
| | • | Tesco maintains leadership positions across its key markets, focusing on consistent low prices. |
| | • | Scale and scope provide natural advantages in terms of sourcing, logistics and supply chain leverage. |
| | • | The majority of revenues are derived from recurring consumables, with broad appeal and low price points. |
| | • | Tesco has historically earned a return on total invested capital (ROIC) in excess of 10%. Management aspires to earn a mid-teens ROIC. |
| | • | Year-end net debt of £6.8 billion is approximately 1.3 times annual earnings before interest, taxes, depreciation and amortization (EBITDA). The company is rated as an A- credit. After £3.7 billion of capex, annual free cash flow (FCF) totals £1.1 billion. |
Valuation
| | • | Tesco’s forward price-to-earnings (P/E) ratio is at the low end of the company’s 5-year range of 9 to 18 (average 12.2). |
| | • | The company trades at its lowest multiple to sales and EBITDA of any time during the past 10 years and both figures are approximately 30% below their 10-year averages. |
| | • | The company’s near all time high 4.4% dividend yield provides downside margin of safety. |
| | • | The estimated value of Tesco’s real estate and other fixed assets approximates the market value of the company’s outstanding equity. |
Management
| | • | Philip Clarke was promoted to CEO in March 2011, after having led the International and IT businesses. More recently, Clarke also assumed management responsibilities of the company’s UK grocery business, which has recently stumbled. |
| | • | The company appears to have a good management team focused and compensated on returns. |
| | • | Insiders own approximately £60 million worth of stock. |
Investment Thesis
Global food retailing is an out-of-favor industry with Tesco’s shares trading near a historical valuation low due to concerns over market saturation, challenged global economies, and heightened competition. While these concerns are valid, the company’s track record suggests they are up to the challenge. Management is aggressively addressing their UK business with significant investments in service and merchandising. They are reducing losses in North America and growing the franchise in Eastern Europe and Asia. Tesco’s scale, local market knowledge, strong balance sheet and improving return on capital should yield a good investment over time. Additionally, we like the defensive nature of the business.
Brookfield Asset Management Inc. (BAM.A TSE)
(Analyst: Andy Ramer)
Description
Brookfield is a global alternative asset manager with approximately $150 billion in assets under management. The company has over a 100-year history of owning and operating tangible assets that form part of the critical backbone of economic activity, including renewable power (hydroelectric, wind), commercial properties (office, retail), infrastructure (utilities, timber), and agriculture.
Good Business
| | • | Brookfield’s assets typically benefit from some form of barrier to entry or regulatory regime, and the company benefits from its core competency as an operator, restructuring expertise, ability and willingness to underwrite complex transactions, and full access to a variety of capital sources. |
| | • | The revenue streams in Brookfield’s core businesses are largely contracted or regulated, which in turn provides stable and predictable cash flows. |
| | • | Brookfield earns its cost of capital over a cycle, which reflects its focus on acquiring assets at discounts to their replacement cost. |
| | • | These high-quality real assets are simple to understand and are generally related to economic necessities. |
| | • | The company conservatively finances its operations primarily at the asset level on a long-term, investment grade, non-recourse basis. |
Valuation
| | • | The intrinsic value of Brookfield’s common equity was $41.00 per share at December 31, 2011. This includes net tangible asset value of $34.50 per share and $6.50 per share related to the company’s asset management franchise. The shares trade at a 20% discount to our intrinsic value. |
| | • | The company’s primary long-term goal is to achieve 12-15% compound annual growth in the underlying value of the business as measured on a per share basis. |
Management
| | • | Brookfield employs a value-oriented investment philosophy. The company focuses on assets with the potential to earn solid cash returns while emphasizing downside protection of the capital employed. |
| | • | Insiders have skin in the game, as management and directors own 19% of the common stock. |
| | • | Bruce Flatt became CEO of Brookfield in February 2002. He played a key role in the transformation of the company from a conglomerate that was predominantly in natural resources-based and financial businesses into a focused manager of alternative assets. |
Investment Thesis
Current times favor Brookfield’s investment approach. The company should be able to take advantage of assets that are excessively leveraged, were previously acquired for too high a price, and where investors had overly exuberant expectations for future growth. Acquiring assets through distressed situations allows Brookfield to do so at meaningful discounts to intrinsic value. Furthermore, by investing in, operating, and managing long-duration hard assets, the company has the added benefit of serving as an inflation hedge for the portfolio.
Thank you for your support of the FMI International Fund.
100 E. Wisconsin Ave., Suite 2200 • Milwaukee, WI 53202 • 414-226-4555
www.fmifunds.com
FMI International Fund
SCHEDULE OF INVESTMENTS
March 31, 2012 (Unaudited)
| Shares | | | | Cost | | | Value | |
| | | | | | | |
| COMMON STOCKS — 89.9% (a) | | | | | | |
| | | | | | | |
| COMMERCIAL SERVICES SECTOR — 9.8% | | | | | | |
| | | Miscellaneous Commercial | | | | | | |
| | | Services — 5.8% | | | | | | |
| | 24,900 | | SECOM Co., | | | | | | |
| | | | Ltd. (Japan) (b) | | $ | 1,152,580 | | | $ | 1,226,983 | |
| | 550 | | SGS S.A. | | | | | | | | |
| | | | (Switzerland) (b) | | | 963,459 | | | | 1,069,563 | |
| | | | | | | 2,116,039 | | | | 2,296,546 | |
| | | | Personnel Services — 4.0% | | | | | | | | |
| | 30,250 | | Adecco S.A. | | | | | | | | |
| | | | (Switzerland) (b) | | | 1,461,569 | | | | 1,584,377 | |
| | | | | | | | | | | | |
| CONSUMER DURABLES SECTOR — 3.7% | | | | | | | | |
| | | | Recreational Products — 3.7% | | | | | | | | |
| | 24,600 | | SHIMANO Inc. | | | | | | | | |
| | | | (Japan) (b) | | | 1,220,907 | | | | 1,487,423 | |
| | | | | | | | | | | | |
| CONSUMER NON-DURABLES SECTOR — 11.0% | | | | | | | | |
| | | | Beverages: Alcoholic — 2.1% | | | | | | | | |
| | 34,000 | | Diageo PLC (United | | | | | | | | |
| | | | Kingdom) (b) | | | 687,216 | | | | 818,572 | |
| | | | | | | | | | | | |
| | | | Food: Major Diversified — 4.0% | | | | | | | | |
| | 25,450 | | Nestlé S.A. | | | | | | | | |
| | | | (Switzerland) (b) | | | 1,457,349 | | | | 1,601,227 | |
| | | | | | | | | | | | |
| | | | Household/ | | | | | | | | |
| | | | Personal Care — 4.9% | | | | | | | | |
| | 31,150 | | Henkel AG & Co. | | | | | | | | |
| | | | KGaA (Germany) (b) | | | 1,589,254 | | | | 1,944,010 | |
| | | | | | | | | | | | |
| CONSUMER SERVICES SECTOR — 5.0% | | | | | | | | |
| | | | Restaurants — 5.0% | | | | | | | | |
| | 188,425 | | Compass Group | | | | | | | | |
| | | | PLC (United | | | | | | | | |
| | | | Kingdom) (b) | | | 1,777,290 | | | | 1,975,344 | |
| | | | | | | | | | | | |
| ELECTRONIC TECHNOLOGY SECTOR — 7.7% | | | | | | | | |
| | | | Aerospace & Defense — 4.4% | | | | | | | | |
| | 133,625 | | Rolls-Royce Holdings | | | | | | | | |
| | | | PLC (United | | | | | | | | |
| | | | Kingdom)* (b) | | | 1,480,864 | | | | 1,735,905 | |
| | | | | | | | | | | | |
| | | | Electronic Components — 3.3% | | | | | | | | |
| | 35,700 | | TE Connectivity Limited | | | | | | | | |
| | | | (Switzerland) | | | 1,237,528 | | | | 1,311,975 | |
| | | | | | | | | | | | |
| ENERGY MINERALS SECTOR — 3.2% | | | | | | | | |
| | | | Integrated Oil — 3.2% | | | | | | | | |
| | 36,075 | | Royal Dutch Shell | | | | | | | | |
| | | | PLC (United | | | | | | | | |
| | | | Kingdom) (b) | | | 1,287,838 | | | | 1,261,756 | |
| | | | | | | | | | | | |
| FINANCE SECTOR — 11.6% | | | | | | | | |
| | | | Financial Conglomerates — 4.5% | | | | | | | | |
| | 56,175 | | Brookfield Asset | | | | | | | | |
| | | | Management Inc. | | | | | | | | |
| | | | (Canada) | | | 1,687,273 | | | | 1,772,347 | |
| | | | | | | | | | | | |
| | | | Insurance Brokers/ | | | | | | | | |
| | | | Services — 3.0% | | | | | | | | |
| | 33,900 | | Willis Group Holdings | | | | | | | | |
| | | | PLC (Ireland) | | | 1,314,976 | | | | 1,185,822 | |
| | | | | | | | | | | | |
| | | | Property/Casualty | | | | | | | | |
| | | | Insurance — 4.1% | | | | | | | | |
| | 4,075 | | Fairfax Financial | | | | | | | | |
| | | | Holdings Limited | | | | | | | | |
| | | | (Canada) | | | 1,667,905 | | | | 1,644,748 | |
| | | | | | | | | | | | |
| HEALTH TECHNOLOGY SECTOR — 7.8% | | | | | | | | |
| | | | Medical Specialties — 3.9% | | | | | | | | |
| | 28,600 | | Covidien PLC | | | | | | | | |
| | | | (Ireland) | | | 1,368,571 | | | | 1,563,848 | |
| | | | | | | | | | | | |
| | | | Pharmaceuticals: | | | | | | | | |
| | | | Major — 3.9% | | | | | | | | |
| | 68,475 | | GlaxoSmithKline | | | | | | | | |
| | | | PLC (United | | | | | | | | |
| | | | Kingdom) (b) | | | 1,521,865 | | | | 1,530,803 | |
| | | | | | | | | | | | |
| INDUSTRIAL SERVICES SECTOR — 2.4% | | | | | | | | |
| | | | Oilfield Services/ | | | | | | | | |
| | | | Equipment — 2.4% | | | | | | | | |
| | 13,675 | | Schlumberger | | | | | | | | |
| | | | Limited (Curaco) | | | 911,738 | | | | 956,293 | |
| | | | | | | | | | | | |
| NON-ENERGY MINERALS SECTOR — 3.9% | | | | | | | | |
| | | | Construction Materials — 3.9% | | | | | | | | |
| | 76,050 | | CRH PLC | | | | | | | | |
| | | | (Ireland) (b) | | | 1,492,855 | | | | 1,558,099 | |
| | | | | | | | | | | | |
| PROCESS INDUSTRIES SECTOR — 7.5% | | | | | | | | |
| | | | Chemicals: Agricultural — 2.4% | | | | | | | | |
| | 2,825 | | Syngenta AG | | | | | | | | |
| | | | (Switzerland) (b) | | | 860,598 | | | | 973,445 | |
| | | | | | | | | | | | |
| | | | Chemicals: Specialty — 2.1% | | | | | | | | |
| | 14,400 | | Shin-Etsu Chemical Co., | | | | | | | | |
| | | | Ltd. (Japan) (b) | | | 742,527 | | | | 837,934 | |
| | | | | | | | | | | | |
| | | | Industrial Specialties — 3.0% | | | | | | | | |
| | 20,350 | | Akzo Nobel N.V. | | | | | | | | |
| | | | (Netherlands) (b) | | | 1,219,746 | | | | 1,202,086 | |
| | | | | | | | | | | | |
| PRODUCER MANUFACTURING SECTOR — 9.4% | | | | | | | | |
| | | | Industrial | | | | | | | | |
| | | | Conglomerates — 2.2% | | | | | | | | |
| | 21,200 | | Ingersoll-Rand | | | | | | | | |
| | | | PLC (Ireland) | | | 842,569 | | | | 876,620 | |
| | | | | | | | | | | | |
| | | | Industrial Machinery — 7.2% | | | | | | | | |
| | 10,675 | | Schindler Holding AG | | | | | | | | |
| | | | (Switzerland) (b) | | | 1,226,339 | | | | 1,284,055 | |
| | 9,900 | | SMC Corporation | | | | | | | | |
| | | | (Japan) (b) | | | 1,645,160 | | | | 1,584,304 | |
| | | | | | | 2,871,499 | | | | 2,868,359 | |
| | | | | | | | | | | | |
FMI International Fund
SCHEDULE OF INVESTMENTS (Continued)
March 31, 2012 (Unaudited)
Shares or Principal Amount | | | | Cost | | | Value | |
| | | | | | | | | |
| COMMON STOCKS — 89.9% (a) (Continued) | | | | | | |
| | | | | | | | | |
| RETAIL TRADE SECTOR — 2.7% | | | | | | |
| | | Food Retail — 2.7% | | | | | | |
| | 207,100 | | Tesco PLC (United | | | | | | |
| | | | Kingdom) (b) | | $ | 1,207,163 | | | $ | 1,093,070 | |
| | | | | | | | | | | | |
| TECHNOLOGY SERVICES SECTOR — 4.2% | | | | | | | | |
| | | | Information Technology Services — 4.2% | | | | | | | | |
| | 26,200 | | Accenture | | | | | | | | |
| | | | PLC (Ireland) | | | 1,393,447 | | | | 1,689,900 | |
| | | | Total common stocks | | | 33,418,586 | | | | 35,770,509 | |
| SHORT-TERM INVESTMENTS — 11.3% (a) | | | | | | |
| | | | | | | | | |
| | | Commercial Paper — 11.3% | | | | | | |
| $ | 4,500,000 | | U.S. Bank, N.A., 0.02%, | | | | | | |
| | | | due 04/02/12 | | | 4,499,998 | | | | 4,499,998 | |
| | | | Total short-term | | | | | | | | |
| | | | investments | | | 4,499,998 | | | | 4,499,998 | |
| | | | Total investments | | | | | | | | |
| | | | — 101.2% | | $ | 37,918,584 | | | | 40,270,507 | |
| | | | Liabilities, less cash | | | | | | | | |
| | | | and receivables | | | | | | | | |
| | | | — (1.2%) (a) | | | | | | | (490,472 | ) |
| | | | TOTAL NET | | | | | | | | |
| | | | ASSETS — 100.0% | | | | | | $ | 39,780,035 | |
| * | Non-income producing security. |
| (a) | Percentages for the various classifications relate to net assets. |
| (b) | Security does not trade during New York Stock Exchange hours and has been valued in accordance with the procedures discussed in Note 1(a) to the financial statements and has been classified as level 2. As of March 31, 2012 the aggregate value of these securities was $24,768,956. |
PLC – Public Limited Company
SCHEDULE OF FORWARD CURRENCY CONTRACTS
| | | | | | | | | | | | | | Unrealized | |
| Settlement | | | Currency to | | | U.S. $ Value at | | Currency to | | U.S. $ Value at | | | Appreciation | |
| Date | Counterparty | | be Delivered | | | March 31, 2012 | | be Received | | March 31, 2012 | | | (Depreciation) | |
| 4/27/12 | U.S. Bank, N.A. | | 5,300,000 British Pound | | | $ | 8,475,896 | | 8,314,870 U.S. Dollar | | $ | 8,314,870 | | | $ | (161,026 | ) |
| 4/27/12 | U.S. Bank, N.A. | | 3,000,000 Canadian Dollar | | | | 3,006,011 | | 2,992,021 U.S. Dollar | | | 2,992,021 | | | | (13,990 | ) |
| 4/27/12 | Bank of New York | | 1,700,000 Euro | | | | 2,267,568 | | 2,230,840 U.S. Dollar | | | 2,230,840 | | | | (36,728 | ) |
| 4/27/12 | U.S. Bank, N.A. | | 900,000 Euro | | | | 1,200,477 | | 1,199,367 U.S. Dollar | | | 1,199,367 | | | | (1,110 | ) |
| 4/27/12 | Bank of New York | | 338,000,025 Japanese Yen | | | | 4,084,665 | | 4,404,261 U.S. Dollar | | | 4,404,261 | | | | 319,596 | |
| 4/27/12 | Bank of New York | | 5,000,000 Swiss Franc | | | | 5,540,802 | | 5,439,749 U.S. Dollar | | | 5,439,749 | | | | (101,053 | ) |
| | | | | | | $ | 24,575,419 | | | | $ | 24,581,108 | | | $ | 5,689 | |
| 4/27/12 | BMO/M&I | | 663,000 U.S. Dollar | | | | 663,000 | | 500,000 Euro | | | 666,932 | | | | 3,932 | |
| | | | | | | | $ | 25,238,419 | | | | $ | 25,248,040 | | | $ | 9,621 | |
The accompanying notes to financial statements are an integral part of these schedules.
as of March 31, 2012 (Unaudited)
FMI Funds
STATEMENTS OF ASSETS AND LIABILITIES
March 31, 2012 (Unaudited)
| | | | FMI | | | FMI | | | FMI | |
| | | | Large Cap | | | Common Stock | | | International | |
| | | | Fund | | | Fund | | | Fund | |
| | | | | | | | | | | |
| ASSETS: | | | | | | | | | | |
| Investments in securities, at value | (a) | | $ | 5,347,945,586 | | | $ | 1,198,775,818 | | | $ | 40,270,507 | |
| Receivable from shareholders for purchases | | | | 10,690,609 | | | | 5,755,384 | | | | 2,300 | |
| Dividends and interest receivable | | | | 13,949,607 | | | | 1,434,311 | | | | 159,362 | |
| Receivable for investments sold | | | | — | | | | 10,185,897 | | | | — | |
| Receivable for forward currency contracts | | | | — | | | | — | | | | 323,528 | |
| Receivable for brokers for foreign currency | | | | — | | | | — | | | | 1,477 | |
| Cash | | | | 594,693 | | | | 18,301 | | | | 86,862 | |
| Total assets | | | $ | 5,373,180,495 | | | $ | 1,216,169,711 | | | $ | 40,844,036 | |
| LIABILITIES: | | | | | | | | | | | | | |
| Payable to brokers for investments purchased | | | $ | 37,897,511 | | | $ | 9,916,172 | | | $ | 731,094 | |
| Payable to shareholders for redemptions | | | | 4,598,590 | | | | 623,902 | | | | 6,000 | |
| Payable for forward currency contracts | | | | — | | | | — | | | | 313,907 | |
| Payable to adviser for management fees | | | | 2,610,563 | | | | 868,695 | | | | 7,893 | |
| Other liabilities | | | | 763,644 | | | | 328,926 | | | | 5,107 | |
| Total liabilities | | | | 45,870,308 | | | | 11,737,695 | | | | 1,064,001 | |
| NET ASSETS: | | | | | | | | | | | | | |
| Capital Stock | (b) | | | 4,458,014,646 | | | | 885,001,941 | | | | 37,010,860 | |
| Net unrealized appreciation | | | | 798,598,632 | | | | 273,645,258 | | | | 2,363,260 | |
| Accumulated net realized gain | | | | 56,683,887 | | | | 44,877,516 | | | | 254,410 | |
| Undistributed net investment income | | | | 14,013,022 | | | | 907,301 | | | | 151,505 | |
| Net assets | | | | 5,327,310,187 | | | | 1,204,432,016 | | | | 39,780,035 | |
| Total liabilities and net assets | | | $ | 5,373,180,495 | | | $ | 1,216,169,711 | | | $ | 40,844,036 | |
| | | | | | | | | | | | | | |
| CALCULATION OF NET ASSET VALUE PER SHARE: | | | | | | | | | | | | | |
| Net asset value, offering and redemption price per share | | | | | | | | | | | | | |
| (Net assets ÷ shares outstanding) | | | $ | 16.94 | | | $ | 26.49 | | | $ | 21.39 | |
| | | | | | | | | | | | | | |
| (a) Identified cost of investments | | | $ | 4,549,346,954 | | | $ | 925,130,560 | | | $ | 37,918,584 | |
| (b) Par value | | | $ | 0.0001 | | | $ | 0.01 | | | $ | 0.0001 | |
| Shares authorized | | | | 400,000,000 | | | indefinite | | | | 300,000,000 | |
| Shares outstanding | | | | 314,560,405 | | | | 45,475,177 | | | | 1,859,985 | |
The accompanying notes to financial statements are an integral part of these statements.
FMI Funds
STATEMENTS OF OPERATIONS
For the Six Month Period Ending March 31, 2012 (Unaudited)
| | | FMI | | | FMI | | | FMI | |
| | | Large Cap | | | Common Stock | | | International | |
| | | Fund | | | Fund | | | Fund | |
| | | | | | | | | | |
| INCOME: | | | | | | | | | |
| Dividends | | $ | 52,044,120 | | | $ | 8,065,664 | | | $ | 302,005 | * |
| Interest | | | 44,881 | | | | 18,744 | | | | 251 | |
| Total income | | | 52,089,001 | | | | 8,084,408 | | | | 302,256 | |
| EXPENSES: | | | | | | | | | | | | |
| Management fees | | | 17,483,732 | | | | 5,492,251 | | | | 88,051 | |
| Transfer agent fees | | | 2,662,731 | | | | 650,492 | | | | 11,766 | |
| Administrative and accounting services | | | 1,207,582 | | | | 282,113 | | | | 25,592 | |
| Custodian fees | | | 222,819 | | | | 59,989 | | | | 13,542 | |
| Printing and postage expense | | | 198,233 | | | | 58,820 | | | | 1,999 | |
| Registration fees | | | 119,900 | | | | 36,061 | | | | 5,805 | |
| Professional fees | | | 24,356 | | | | 22,731 | | | | 17,816 | |
| Board of Directors fees | | | 24,200 | | | | 21,799 | | | | 5,000 | |
| Amortization of offering expenses | | | — | | | | — | | | | 16,140 | |
| Other expenses | | | 74,606 | | | | 38,300 | | | | 14,879 | |
| Total expenses before reimbursement | | | 22,018,159 | | | | 6,662,556 | | | | 200,590 | |
| Less expenses reimbursed by adviser | | | — | | | | — | | | | (83,188 | ) |
| Net expenses | | | 22,018,159 | | | | 6,662,556 | | | | 117,402 | |
| NET INVESTMENT INCOME | | | 30,070,842 | | | | 1,421,852 | | | | 184,854 | |
| NET REALIZED GAIN (LOSS) ON INVESTMENTS: | | | | | | | | | | | | |
| Investments | | | 90,315,189 | | | | 58,295,055 | | | | 351,440 | |
| Forward currency contracts | | | — | | | | — | | | | (96,305 | ) |
| Foreign currency transactions | | | — | | | | — | | | | 47,841 | |
| NET REALIZED GAIN ON INVESTMENTS | | | 90,315,189 | | | | 58,295,055 | | | | 302,976 | |
| NET CHANGE IN UNREALIZED | | | | | | | | | | | | |
| APPRECIATION OF INVESTMENTS: | | | | | | | | | | | | |
| Investments | | | 814,790,755 | | | | 198,400,869 | | | | 3,760,217 | |
| Forward currency contracts | | | — | | | | — | | | | 9,621 | |
| Foreign currency transactions | | | — | | | | — | | | | 1,717 | |
| NET CHANGE IN UNREALIZED APPRECIATION | | | 814,790,755 | | | | 198,400,869 | | | | 3,771,555 | |
| NET GAIN ON INVESTMENTS | | | 905,105,944 | | | | 256,695,924 | | | | 4,074,531 | |
| NET INCREASE IN NET ASSETS | | | | | | | | | | | | |
| RESULTING FROM OPERATIONS | | $ | 935,176,786 | | | $ | 258,117,776 | | | $ | 4,259,385 | |
| * | Net withholding taxes of $27,497. |
The accompanying notes to financial statements are an integral part of these statements.
FMI Funds
STATEMENTS OF CHANGES IN NET ASSETS
For the Six Month Period Ending March 31, 2012 (Unaudited) and For the Year Ended September 30, 2011
| | | FMI | |
| | | Large Cap | |
| | | Fund | |
| | | | | | | |
| | | 2012 | | | 2011 | |
| OPERATIONS: | | | | | | |
| Net investment income | | $ | 30,070,842 | | | $ | 41,137,796 | |
| Net realized gain (loss) on investments | | | 90,315,189 | | | | 166,134,864 | |
| Net realized gain on foreign currency transactions | | | — | | | | — | |
| Net realized (loss) on forward currency contracts | | | — | | | | — | |
| Net increase (decrease) in unrealized appreciation on investments | | | 814,790,755 | | | | (299,268,485 | ) |
| Net increase in unrealized appreciation on forward currency contracts | | | — | | | | — | |
| Net increase (decrease) in unrealized appreciation on foreign currency transactions | | | — | | | | — | |
| Net increase (decrease) in net assets from operations | | | 935,176,786 | | | | (91,995,825 | ) |
| DISTRIBUTIONS TO SHAREHOLDERS: | | | | | | | | |
| Distributions from net investment income | | | (50,344,376 | ) | | | (31,698,426 | ) |
| Distributions from net realized gains | | | (119,091,898 | ) | | | — | |
| Total distributions | | | (169,436,274 | ) | | | (31,698,426 | ) |
| FUND SHARE ACTIVITIES: | | | | | | | | |
| Proceeds from shares issued | | | 1,052,506,922 | | | | 1,745,177,576 | |
| Net asset value of shares issued in distributions reinvested | | | 150,413,804 | | | | 26,370,980 | |
| Cost of shares redeemed | | | (650,109,440 | ) | | | (957,460,090 | ) |
| Net increase in net assets derived from Fund share activities | | | 552,811,286 | | | | 814,088,466 | |
| TOTAL INCREASE | | | 1,318,551,798 | | | | 690,394,215 | |
| NET ASSETS AT THE BEGINNING OF THE PERIOD | | | 4,008,758,389 | | | | 3,318,364,174 | |
| NET ASSETS AT THE END OF THE PERIOD | | $ | 5,327,310,187 | | | $ | 4,008,758,38 | |
| Undistributed net investment income | | $ | 14,013,022 | | | $ | 34,286,556 | |
| FUND SHARE TRANSACTIONS: | | | | | | | | |
| Shares sold | | | 66,328,917 | | | | 109,851,394 | |
| Shares issued in distributions reinvested | | | 9,775,503 | | | | 1,765,679 | |
| Less shares redeemed | | | (41,637,157 | ) | | | (60,971,489 | ) |
| Net increase in shares outstanding | | | 34,467,263 | | | | 50,645,584 | |
| | | | | | | | | |
The accompanying notes to financial statements are an integral part of these statements.
FMI Funds
STATEMENTS OF CHANGES IN NET ASSETS
For the Six Month Period Ending March 31, 2012 (Unaudited) and For the Year Ended September 30, 2011
| | | | | | | | | | | |
| FMI | | | FMI | |
| Common Stock | | | International | |
| Fund | | | Fund | |
| | | | | | | | | | | |
| 2012 | | | 2011 | | | 2012 | | | | 2011* | |
| $ | 1,421,852 | | | $ | 1,409,461 | | | $ | 184,854 | | | $ | 90,691 | |
| | 58,295,055 | | | | 80,575,987 | | | | 351,440 | | | | (13,923 | ) |
| | — | | | | — | | | | 47,841 | | | | 9,958 | |
| | — | | | | — | | | | (96,305 | ) | | | (44,601 | ) |
| | 198,400,869 | | | | (64,562,570 | ) | | | 3,760,217 | | | | (1,475,353 | ) |
| | — | | | | — | | | | 9,621 | | | | 67,992 | |
| | — | | | | — | | | | 1,717 | | | | (934 | ) |
| | 258,117,776 | | | | 17,422,878 | | | | 4,259,385 | | | | (1,366,170 | ) |
| | | | | | | | | | | | | | | |
| | (1,924,012 | ) | | | — | | | | (124,040 | ) | | | — | |
| | (85,397,193 | ) | | | (33,400,471 | ) | | | — | | | | — | |
| | (87,321,205 | ) | | | (33,400,471 | ) | | | (124,040 | ) | | | — | |
| | 104,834,427 | | | | 212,892,998 | | | | 22,541,146 | | | | 15,282,839 | |
| | 85,133,429 | | | | 32,736,051 | | | | 123,122 | | | | — | |
| | (102,322,913 | ) | | | (209,291,415 | ) | | | (533,430 | ) | | | (402,817 | ) |
| | 87,644,943 | | | | 36,337,634 | | | | 22,130,838 | | | | 14,880,022 | |
| | 258,441,514 | | | | 20,360,041 | | | | 26,266,183 | | | | 13,513,852 | |
| | 945,990,502 | | | | 925,630,461 | | | | 13,513,852 | | | | — | |
| $ | 1,204,432,016 | | | $ | 945,990,502 | | | $ | 39,780,035 | | | $ | 13,513,852 | |
| $ | 907,301 | | | $ | 1,409,461 | | | $ | 151,505 | | | $ | 90,691 | |
| | | | | | | | | | | | | | | |
| | 4,211,350 | | | | 8,423,257 | | | | 1,131,494 | | | | 768,348 | |
| | 3,614,947 | | | | 1,427,037 | | | | 6,340 | | | | — | |
| | (4,146,974 | ) | | | (8,335,372 | ) | | | (25,957 | ) | | | (20,240 | ) |
| | 3,679,323 | | | | 1,514,922 | | | | 1,111,877 | | | | 748,108 | |
| * | For the Period from December 31, 2010 (Commencement of Operations) to September 30, 2011. |
The accompanying notes to financial statements are an integral part of these statements.
FMI Large Cap Fund
FINANCIAL HIGHLIGHTS
(Selected data for each share of the Fund outstanding throughout each period)
| | (Unaudited) | | | | | | | | | | | |
| | For the Six Month | | | | | | | | | | | |
| | Period Ending | | | |
| | March 31, | | Years Ended September 30, | |
| | 2012 | | 2011 | | 2010 | | 2009 | | 2008 | | 2007 | |
| PER SHARE OPERATING PERFORMANCE: | | | | | | | | | | | | |
| Net asset value, beginning of period | $ | 14.31 | | $ | 14.46 | | $ | 13.27 | | $ | 13.65 | | $ | 16.18 | | $ | 14.79 | |
| Income from investment operations: | | | | | | | | | | | | | | | | | | |
| Net investment income | | 0.10 | | | 0.16 | | | 0.17 | | | 0.20 | | | 0.17 | | | 0.17 | |
| Net realized and unrealized gains (losses) on investments | | 3.12 | | | (0.17 | ) | | 1.19 | | | (0.47 | ) | | (2.14 | ) | | 1.65 | |
| Total from investment operations | | 3.22 | | | (0.01 | ) | | 1.36 | | | (0.27 | ) | | (1.97 | ) | | 1.82 | |
| Less distributions: | | | | | | | | | | | | | | | | | | |
| Distributions from net investment income | | (0.17 | ) | | (0.14 | ) | | (0.17 | ) | | (0.11 | ) | | (0.13 | ) | | (0.10 | ) |
| Distributions from net realized gains | | (0.42 | ) | | — | | | — | | | — | | | (0.43 | ) | | (0.33 | ) |
| Total from distributions | | (0.59 | ) | | (0.14 | ) | | (0.17 | ) | | (0.11 | ) | | (0.56 | ) | | (0.43 | ) |
| Net asset value, end of period | $ | 16.94 | | $ | 14.31 | | $ | 14.46 | | $ | 13.27 | | $ | 13.65 | | $ | 16.18 | |
| TOTAL RETURN | | 22.98 | %(1) | | (0.13 | %) | | 10.33 | % | | (1.79 | %) | | (12.58 | %) | | 12.52 | % |
| RATIOS/SUPPLEMENTAL DATA: | | | | | | | | | | | | | | | | | | |
| Net assets, end of period (in 000’s $) | | 5,327,310 | | | 4,008,758 | | | 3,318,364 | | | 2,051,701 | | | 1,140,200 | | | 638,875 | |
Ratio of expenses (after reimbursement) to average net assets (a) | | 0.94 | %(2) | | 0.97 | % | | 0.97 | % | | 0.97 | % | | 1.00 | % | | 1.00 | % |
Ratio of net investment income to average net assets (b) | | 1.29 | %(2) | | 1.03 | % | | 1.18 | % | | 1.80 | % | | 1.13 | % | | 1.06 | % |
| Portfolio turnover rate | | 8 | % | | 28 | % | | 20 | % | | 32 | % | | 30 | % | | 19 | % |
| (a) | Computed after giving effect to adviser’s expense limitation undertaking. If the Fund had paid all of its expenses for the years ended September 30, 2008 and 2007, the ratios would have been 1.02% and 1.03%, respectively. |
| (b) | If the Fund had paid all of its expenses for the years ended September 30, 2008 and 2007, the ratios would have been 1.11% and 1.03%, respectively. |
The accompanying notes to financial statements are an integral part of this statement.
FMI Common Stock Fund
FINANCIAL HIGHLIGHTS
(Selected data for each share of the Fund outstanding throughout each period)
| | | (Unaudited) | | | | | | | | | | | |
| | | For the Six Month | | | | | | | | | | | |
| | | Period Ending | | | | | | | | | | | |
| | | March 31, | | Years Ended September 30, | |
| | | 2012 | | 2011 | | 2010 | | 2009 | | 2008 | | 2007 | |
| PER SHARE OPERATING PERFORMANCE: | | | | | | | | | | | | | |
| Net asset value, beginning of period | | $ | 22.63 | | $ | 22.98 | | $ | 21.07 | | $ | 21.20 | | $ | 26.61 | | $ | 26.49 | |
| Income from investment operations: | | | | | | | | | | | | | | | | | | | |
| Net investment income (loss) | | | 0.03 | | | 0.03 | | | (0.00 | )* | | 0.05 | | | 0.08 | | | 0.08 | |
| Net realized and unrealized gains (loss) on investments | | | 5.91 | | | 0.44 | | | 1.96 | | | 0.86 | | | (1.74 | ) | | 3.08 | |
| Total from investment operations | | | 5.94 | | | 0.47 | | | 1.96 | | | 0.91 | | | (1.66 | ) | | 3.16 | |
| Less distributions: | | | | | | | | | | | | | | | | | | | |
| Distributions from net investment income | | | (0.04 | ) | | — | | | (0.04 | ) | | (0.06 | ) | | (0.08 | ) | | (0.07 | ) |
| Distributions from net realized gains | | | (2.04 | ) | | (0.82 | ) | | (0.01 | ) | | (0.98 | ) | | (3.67 | ) | | (2.97 | ) |
| Total from distributions | | | (2.08 | ) | | (0.82 | ) | | (0.05 | ) | | (1.04 | ) | | (3.75 | ) | | (3.04 | ) |
| Net asset value, end of period | | $ | 26.49 | | $ | 22.63 | | $ | 22.98 | | $ | 21.07 | | $ | 21.20 | | $ | 26.61 | |
| TOTAL RETURN | | | 27.49 | %(1) | | 2.03 | % | | 9.30 | % | | 6.04 | % | | (7.00 | %) | | 12.81 | % |
| RATIOS/SUPPLEMENTAL DATA: | | | | | | | | | | | | | | | | | | | |
| Net assets, end of period (in 000’s $) | | | 1,204,432 | | | 945,991 | | | 925,630 | | | 872,557 | | | 411,797 | | | 492,015 | |
| Ratio of expenses to average net assets | | | 1.21 | %(2) | | 1.21 | % | | 1.24 | % | | 1.26 | % | | 1.22 | % | | 1.20 | % |
| Ratio of net investment income (loss) to average net assets | | | 0.26 | %(2) | | 0.13 | % | | (0.01 | %) | | 0.32 | % | | 0.35 | % | | 0.30 | % |
| Portfolio turnover rate | | | 18 | % | | 26 | % | | 30 | % | | 35 | % | | 40 | % | | 50 | % |
| * | Amount less than $0.005 per share. |
The accompanying notes to financial statements are an integral part of this statement.
FMI International Fund
FINANCIAL HIGHLIGHTS
(Selected data for each share of the Fund outstanding throughout each period)
| | | (Unaudited) | | | | |
| | | For the Six Month | | | For the Period from | |
| | | Period Ending | | | December 31, 2010* | |
| | | March 31, 2012 | | | to September 30, 201 | |
| PER SHARE OPERATING PERFORMANCE: | | | | | | |
| Net asset value, beginning of period | | $ | 18.06 | | | $ | 20.00 | |
| Income from investment operations: | | | | | | | | |
| Net investment income | | | 0.16 | | | | 0.16 | |
| Net realized and unrealized gain (loss) on investments | | | 3.33 | | | | (2.10 | ) |
| Total from investment operations | | | 3.49 | | | | (1.94 | ) |
| Less distributions: | | | | | | | | |
| Distributions from net investment income | | | (0.16 | ) | | | — | |
| Distributions from net realized gains | | | — | | | | — | |
| Total from distributions | | | (0.16 | ) | | | — | |
| Net asset value, end of period | | $ | 21.39 | | | $ | 18.06 | |
| TOTAL RETURN | | | 19.44 | %(1) | | | (9.70 | %)(1) |
| RATIOS/SUPPLEMENTAL DATA: | | | | | | | | |
| Net assets, end of period (in 000’s $) | | | 39,780 | | | | 13,514 | |
| Ratio of expenses (after reimbursement) to average net assets (a) | | | 1.00 | %(2) | | | 1.00 | %(2) |
| Ratio of net investment income to average net assets (b) | | | 1.57 | %(2) | | | 1.05 | %(2) |
| Portfolio turnover rate | | | 7 | % | | | 12 | % |
| * | Commencement of Operations |
| (a) | Computed after giving effect to adviser’s expense limitation undertaking. If the Fund had paid all of its expenses for the six month period ending March 31, 2012 and for the period from December 31, 2010* to September 30, 2011, the ratios would have been 1.71%(2) and 2.91%(2), respectively. |
| (b) | If the Fund had paid all of its expenses for the six month period ending March 31, 2012 and for the period December 31, 2010* to September 30, 2011, the ratios would have been 0.86%(2) and (0.86%)(2), respectively. |
The accompanying notes to financial statements are an integral part of this statement.
FMI Funds
NOTES TO FINANCIAL STATEMENTS
March 31, 2012 (Unaudited)
| (1) | Summary of Significant Accounting Policies — |
The following is a summary of significant accounting policies of the FMI Large Cap Fund, the FMI Common Stock Fund, Inc. and the FMI International Fund (collectively the “Funds” or the “Fund”). The FMI Large Cap Fund (the “Large Cap Fund”) and the FMI International Fund (the “International Fund”) are each a series of FMI Funds, Inc. (the “Company”). Both Funds are registered as non-diversified, open-end management investment companies under the Investment Company Act of 1940 (the “Act”), as amended. The Company was incorporated under the laws of Maryland on September 5, 1996 and the Large Cap Fund commenced operations on December 31, 2001 and the International Fund on December 31, 2010. The assets and liabilities of each Fund in the Company are segregated and a shareholder’s interest is limited to the Fund in which the shareholder owns shares. The FMI Common Stock Fund, Inc. (the “Common Stock Fund”), is registered as a diversified open-end management investment company under the Act. The Common Stock Fund was incorporated under the laws of Wisconsin on July 29, 1981 and is currently closed to new investors. The investment objective of the Large Cap Fund is to seek long-term capital appreciation by investing mainly in a limited number of large capitalization value stocks. The investment objective of the Common Stock Fund is to seek long-term capital appreciation by investing mainly in small to medium capitalization value stocks. The investment objective of the International Fund is to seek capital appreciation by investing mainly in a limited number of large capitalization value stocks of non-U.S. companies.
| | (a) | Each security, excluding short-term investments, is valued at the last sale price reported by the principal security exchange on which the issue is traded. Securities that are traded on the Nasdaq Markets are valued at the Nasdaq Official Closing Price, or if no sale is reported, the latest bid price. Securities that are traded over-the-counter are valued at the latest bid price. For the International Fund only, securities sold short which are listed on a national securities exchange or the Nasdaq Stock Market, but which were not traded on the valuation date, are valued at the most recent ask price. Unlisted equity securities for which market quotations are readily available are valued at the most recent bid price. For the International Fund only, options purchased or written by the Fund are valued at the average of the most recent bid and ask prices. Securities for which quotations are not readily available are valued at fair value as determined by the investment adviser in accordance with procedures approved by the Board of Directors. |
FMI Funds
NOTES TO FINANCIAL STATEMENTS (Continued)
March 31, 2012 (Unaudited)
| (1) | Summary of Significant Accounting Policies — (Continued) |
| | | The fair value of a security is the amount which a Fund might reasonably expect to receive upon a current sale. The fair value of a security may differ from the last quoted price and a Fund may not be able to sell a security at the fair value. Market quotations may not be available, for example, if trading in particular securities was halted during the day and not resumed prior to the close of trading on the New York Stock Exchange. For the International Fund only, for securities that do not trade during New York Stock Exchange hours, fair value determinations are based on analyses of market movements after the close of those securities’ primary markets, and may include reviews of developments in foreign markets, the performance of U.S. securities markets, and the performance of instruments trading in U.S. markets that represent foreign securities and baskets of foreign securities. The Board may also utilize a service provided by an independent third party to assist in fair valuation of certain securities for the International Fund. As of March 31, 2012, there were no securities that were internally fair valued. Variable rate demand notes are recorded at par value which approximates market value. Short-term investments with maturities of 60 days or less are valued at amortized cost which approximates value. For financial reporting purposes, investment transactions are recorded on the trade date. |
| | | The Funds apply the provisions of the Financial Accounting Standards Board (“FASB”) Accounting Standards Codification “Fair Value Measurements and Disclosures” Topic 820 (“ASC 820”), which defines fair value as the price that would be received to sell an asset or paid to transfer a liability (i.e., the “exit price”) in an orderly transaction between market participants at the measurement date. |
| | | In determining fair value, the Funds use various valuation approaches. ASC 820 establishes a fair value hierarchy for inputs used in measuring fair value that maximizes the use of observable inputs and minimizes the use of unobservable inputs by generally requiring that the most observable inputs be used when available. Observable inputs are those that market participants would use in pricing the asset or liability based on market data obtained from sources independent of the Funds. Unobservable inputs reflect the Funds’ assumptions about the inputs market participants would use in pricing the asset or liability developed based on the best information available in the circumstances. The inputs or methodologies used for valuing securities are not necessarily an indication of the risks associated with investing in those securities. For the International Fund only, over the counter derivatives such as forward currency contracts may be valued using quantitative models. These models may use pricing curves based on market inputs including current exchange rates or indices. These curves are combined with volatility factors to value the overall positions. The market inputs are generally significant and can be corroborated with observable market data and therefore are classified in level 2. |
| | | The fair value hierarchy is categorized into three levels based on the inputs as follows: |
| Level 1 — | Valuations based on unadjusted quoted prices in active markets for identical assets. |
| Level 2 — | Valuations based on quoted prices for similar securities or in markets that are not active or for which all significant inputs are observable, either directly or indirectly. |
| Level 3 — | Valuations based on inputs that are unobservable and significant to the overall fair value measurement. |
| | | The following table summarizes the Funds’ investments as of March 31, 2012, based on the inputs used to value them: |
| | | Large Cap Fund | | | | | | International Fund | | | International Fund | |
| | | Investments | | | | | | | | | Other Financial | |
| Valuation Inputs | | in Securities | | | in Securities | | | in Securities | | | Instruments* | |
| Level 1 — Common Stocks | | $ | 5,028,847,652 | | | $ | 1,026,676,858 | | | $ | 11,001,553 | | | $ | — | |
| Level 2 — Common Stocks | | | — | | | | — | | | | 24,768,956 | | | | — | |
| Short-Term Commercial Paper | | | 319,097,934 | | | | 172,098,960 | | | | 4,499,998 | | | | — | |
| Forward Currency Contracts | | | — | | | | — | | | | — | | | | 9,621 | |
| Total Level 2 | | | 319,097,934 | | | | 172,098,960 | | | | 29,268,954 | | | | 9,621 | |
| Level 3 — | | | — | | | | — | | | | — | | | | — | |
| Total | | $ | 5,347,945,586 | | | $ | 1,198,775,818 | | | $ | 40,270,507 | | | $ | 9,621 | |
| | * | Other financial instruments are derivative instruments not reflected in the Schedule of Investments, such as forward currency contracts, which are valued at the unrealized appreciation/(depreciation) on the instrument. |
| | | It is the Funds’ policy to recognize transfers between levels at the end of the quarterly reporting period. There were no transfers between levels during the period ending March 31, 2012. |
| | | See the Schedules of Investments for investments detailed by industry classifications. |
| | | On May 12, 2011, the FASB issued Accounting Standards Update No. 2011-04 (“ASU No. 2011-04”) modifying ASC 820. At the same time, the International Accounting Standards Board (“IASB”) issued International Financial Reporting Standard (“IFRS”) 13, Fair Value Measurement. The objective of the FASB and IASB is convergence of their guidance on fair value measurements and disclosures. Specifically, the ASU requires reporting entities to: i) disclose the amounts of any transfers between Level 1 and Level 2, and the reasons for the transfers; ii) disclose for Level 3 fair value measurements: a) quantitative information about significant unobservable inputs used; b) a description of the valuation processes used by the reporting entity and; c) a narrative description of the sensitivity of the fair value measurement to changes in unobservable inputs if a change in those inputs might result in a significantly higher or lower fair value measurement. The effective date of ASU No. 2011-04 is for interim and annual periods beginning after December 15, 2011. ASU No. 2011-04 has been adopted by the Funds and there has been no material impact to the disclosures. |
| | (b) | Net realized gains and losses on sales of securities are computed on the identified cost basis. |
FMI Funds
NOTES TO FINANCIAL STATEMENTS (Continued)
March 31, 2012 (Unaudited)
| (1) | Summary of Significant Accounting Policies — (Continued) |
| | (c) | Dividend income is recorded on the ex-dividend date. Interest income is recorded on an accrual basis. |
| | (d) | The Funds may have investments in short-term variable rate demand notes, which are unsecured instruments. The Funds may be susceptible to credit risk with respect to these notes to the extent the issuer defaults on its payment obligation. The Funds’ policy is to monitor the creditworthiness of the issuer and nonperformance by these issuers is not anticipated. |
| | (e) | The International Fund may enter into forward currency contracts in order to hedge its exposure to changes in foreign currency rates on its foreign portfolio holdings or to hedge certain purchase and sale commitments denominated in foreign currencies. A forward currency contract is a commitment to purchase or sell a foreign currency at a future date at a negotiated rate. These contracts are valued daily and the asset or liability therein represents unrealized gain or loss on the contracts as measured by the difference between the forward foreign exchange rates at the dates of entry into the contracts and the forward rates at the reporting date. There were on average six forward currency contracts outstanding during the period September 30, 2011 to March 31, 2012. |
| | | The fair value of the forward currency contracts as of March 31, 2012 is included in the following locations on the International Fund’s statement of assets and liabilities: |
| | | Fair Value of | | Fair Value of |
| | | Asset Forward | | Liability Forward |
| | Location | | | |
| Forward currency | Receivable for | $323,528 | Payable for | $313,907 |
| contracts | forward currency | | forward currency | |
| | contracts | | contracts | |
| | | Realized and unrealized gains and losses on forward currency contracts entered into during the six month period ending March 31, 2012 by the International Fund are recorded in the following locations on the statement of operations: |
| | | Realized | | Unrealized |
| | Location | | | |
| Forward currency | Net realized loss on forward | $(96,305) | Net change in unrealized | $9,621 |
| contracts | currency contracts | | appreciation on forward | |
| | contracts | | currency | |
| | | These instruments involve market risk, credit risk, or both kinds of risks, in excess of the amount recognized in the International Fund’s statement of assets and liabilities. Risks arise from the possible inability of counterparties to meet the terms of their contracts and from movement in currency and securities values and interest rates. |
| | (f) | The preparation of financial statements in conformity with accounting principles generally accepted in the United States of America (“GAAP”) requires management to make estimates and assumptions that affect the reported amounts of assets and liabilities and disclosure of contingent assets and liabilities at the date of the financial statements and the reported amounts of revenues and expenses during the reporting period. Actual results could differ from these estimates. |
| | (g) | The Large Cap Fund may own certain securities that are restricted. Restricted securities include Section 4(2) commercial paper, securities issued in a private placement, or securities eligible for resale pursuant to Rule 144A under the Securities Act of 1933 (the “1933 Act”). A restricted security cannot be resold to the general public without prior registration under the 1933 Act or pursuant to the resale limitations provided by Rule 144A under the 1933 Act, or an exemption from the registration requirements of the 1933 Act. The Fund did not hold any restricted securities as of March 31, 2012. |
| | (h) | No provision has been made for Federal income taxes since the Funds have elected to be taxed as “regulated investment companies.” The Funds intend to distribute substantially all net investment company taxable income and net capital gains to their respective shareholders and otherwise comply with the provisions of the Internal Revenue Code applicable to regulated investment companies. |
| | (i) | The Funds have reviewed all open tax years and major jurisdictions, which include Federal and the state of Maryland for the Large Cap Fund and International Fund and Federal and the state of Wisconsin for the Common Stock Fund, and concluded that there are no significant uncertain tax positions that would require recognition in the financial statements. Open tax years are those that are open for exam by taxing authorities and, as of March 31, 2012, open Federal tax years include the tax years ended September 30, 2008 through 2011 for the Large Cap Fund and the Common Stock Fund and September 30, 2011 only for the International Fund. The Funds have no examinations in progress and are also not aware of any tax positions for which it is reasonably possible that the total amounts of unrecognized tax benefits will significantly change in the next twelve months. |
| | (j) | GAAP requires that permanent differences between income for financial reporting and tax purposes be reclassified in the capital accounts. During the fiscal year ended September 30, 2011, the reclassifications were as follows: |
| | Undistributed Net | Accumulated Net | |
| | Investment Income | | Paid In Capital |
| Large Cap Fund | $ — | $ — | $— |
| Common Stock Fund | $ — | $ — | $— |
| International Fund | $(34,643) | $34,643 | $— |
FMI Funds
NOTES TO FINANCIAL STATEMENTS (Continued)
March 31, 2012 (Unaudited)
| (1) | Summary of Significant Accounting Policies — (Continued) |
| | (k) | The International Fund incurred $64,562 of offering costs which are being amortized over a period of 12 months. For the period from September 30, 2011 to March 31, 2012, the International Fund expensed the remaining $16,140. |
| (2) | Investment Adviser and Management Agreements and Transactions With Related Parties — |
The Funds each have a management agreement with Fiduciary Management, Inc. (“FMI”), with whom certain officers and directors of the Funds are affiliated, to serve as investment adviser and manager. Under the terms of the agreements, the Large Cap Fund and International Fund will each pay FMI a monthly management fee at the annual rate of 0.75% of the daily net assets of such Fund and the Common Stock Fund will pay a monthly management fee at the annual rate of 1% of the daily net assets of such Fund. The Funds are responsible for paying their proportionate share of the compensation, benefits and expenses of the Funds’ Chief Compliance Officer. For administrative convenience, FMI initially makes these payments and is later reimbursed by the Funds.
Under the respective management agreements, FMI will reimburse the Large Cap Fund for expenses over 1.20% of the daily net assets of such Fund, 1.30% for the Common Stock Fund and 1.75% for the International Fund. In addition to the reimbursement required under each management agreement, FMI will voluntarily reimburse the Large Cap Fund and the International Fund for expenses over 1.00% of such Fund’s daily net assets. For the six month period ending March 31, 2012 there were no contractual or voluntary reimbursements required for the Large Cap Fund or the Common Stock Fund. For the International Fund, all such reimbursements amounted to $83,188 for the six month period ending March 31, 2012.
The Large Cap Fund and the International Fund have each entered into a Distribution Plan (the “Plan”), pursuant to Rule 12b-1 under the Act. Each Plan provides that such Fund may incur certain costs which may not exceed the lesser of a monthly amount equal to 0.25% of such Fund’s daily net assets or the actual distribution costs incurred during the year. Amounts payable under each Plan are paid monthly for any activities or expenses primarily intended to result in the sale of shares of such Fund. For the six month period ending March 31, 2012, no such expenses were incurred by either Fund.
Under the Funds’ organizational documents, each director, officer, employee or other agent of any Fund (including the Funds’ investment manager) is indemnified, to the extent permitted by the Act, against certain liabilities that may arise out of performance of their duties to the Funds. Additionally, in the normal course of business, the Funds enter into contracts that contain a variety of indemnification clauses. The Funds’ maximum exposure under these arrangements is unknown as this would involve future claims that may be made against such Fund that have not yet occurred. However, the Funds have not had prior claims or losses pursuant to these contracts and believe the risk of loss to be remote.
At March 31, 2012, one financial intermediary is the record owner of approximately 11% of the Large Cap Fund’s shares. At March 31, 2012, one of the International Fund’s Directors owned directly and indirectly approximately 21% of such Fund’s shares.
U.S. Bank, N.A. has made available to the Large Cap Fund, the Common Stock Fund and the International Fund a $400,000,000, $50,000,000 and $1,000,000 credit facility, respectively, pursuant to separate Credit Agreements (“Agreements”) effective July 14, 2008 for the Large Cap Fund and the Common Stock Fund and June 10, 2011 for the International Fund for the purposes of having cash available to satisfy redemption requests. Principal and interest of such loans under the Agreements are due not more than 31 days after the date of the loan. Amounts under the credit facility bear interest at a rate per annum equal to the current prime rate minus one percent on the amount borrowed. Advances will be collateralized by securities owned by such Fund. During the six month period ending March 31, 2012, none of the Funds borrowed against their Agreement. The Credit Agreements are renewable annually on June 5.
| (4) | Distribution to Shareholders — |
Net investment income and net realized gains, if any, are distributed to shareholders at least annually.
| (5) | Investment Transactions — |
For the six month period ending March 31, 2012, purchases and proceeds of sales of investment securities (excluding short-term investments) were as follows:
| | Large Cap Fund | | International Fund |
| Purchases | $707,772,167 | $173,935,864 | $21,830,710 |
| Sales | 347,148,574 | 258,622,747 | 1,521,758 |
| (6) | Income Tax Information — |
The following information for the Large Cap Fund is presented on an income tax basis as of September 30, 2011:
| | Gross | Gross | Net Unrealized | | Distributable |
| Cost of | Unrealized | Unrealized | Depreciation | Ordinary | Long-Term |
| Investments | Appreciation | Depreciation | on Investments | Income | Capital Gains |
| $4,011,085,112 | $386,704,863 | $(413,424,594) | $(26,719,731) | $34,286,556 | $95,988,205 |
FMI Funds
NOTES TO FINANCIAL STATEMENTS (Continued)
March 31, 2012 (Unaudited)
| (6) | Income Tax Information — (Continued) |
The following information for the Common Stock Fund is presented on an income tax basis as of September 30, 2011:
| | Gross | Gross | Net Unrealized | Distributable | Distributable |
| Cost of | Unrealized | Unrealized | Appreciation | Ordinary | Long-Term |
| Investments | Appreciation | Depreciation | on Investments | Income | Capital Gains |
| $874,028,015 | $152,460,884 | $(82,021,209) | $70,439,675 | $10,684,092 | $67,509,736 |
The following information for the International Fund is presented on an income tax basis as of September 30, 2011:
| | Gross | Gross | Net Unrealized | | Distributable |
| Cost of | Unrealized | Unrealized | Depreciation | Ordinary | Long-Term |
| Investments | Appreciation | Depreciation | on Investments | Income | Capital Gains |
| $14,869,484 | $75,782 | $(1,558,367) | $(1,482,585) | $124,041 | $— |
The difference between the cost amounts for financial statement and federal income tax purposes is due primarily to timing differences in recognizing certain gains and losses on security transactions.
The tax components of dividends paid during the years ended September 30, 2011 and 2010, capital loss carryovers, which may be used to offset future capital gains, subject to Internal Revenue Code limitations, as of September 30, 2011, and tax basis post-October losses as of September 30, 2011, which are not recognized for tax purposes until the first day of the following fiscal year are:
| Large Cap Fund |
| September 30, 2011 | | September 30, 2010 |
| Ordinary | Long-Term | Net Capital | | | Ordinary | Long-Term |
| Income | Capital Gains | Loss | Post-October | | Income | Capital Gains |
| Distributions | Distributions | Carryovers | Losses | | Distributions | Distributions |
| $31,698,426 | $— | $— | $— | | $28,040,866 | $— |
| |
| Common Stock Fund |
| September 30, 2011 | | September 30, 2010 |
| Ordinary | Long-Term | Net Capital | | | Ordinary | Long-Term |
| Income | Capital Gains | Loss | Post-October | | Income | Capital Gains |
| Distributions | Distributions | Carryovers | Losses | | Distributions | Distributions |
| $22,444,545 | $10,955,926 | $— | $— | | $1,532,573 | $308,937 |
| International Fund September 30, 2011 |
| Ordinary | Long-Term | Net Capital | |
| Income | Capital Gains | Loss | Post-October |
| Distributions | Distributions | Carryovers | Losses |
| $— | $— | $— | $6,691 |
For corporate shareholders of the Large Cap Fund and the Common Stock Fund, the percentage of dividend income distributed for the year ended September 30, 2011 which is designated as qualifying for the dividends received deduction is 100% and 49.56%, respectively (unaudited).
For all shareholders of the Large Cap Fund and Common Stock Fund, the percentage of dividend income distributed for the year ended September 30, 2011 which is designated as qualified dividend income under the Jobs and Growth Tax Relief Act of 2003, is 100% and 49.56%, respectively (unaudited).
FMI Funds
As a shareholder of the FMI Funds you incur ongoing costs, including management fees and other Fund expenses. You do not incur transaction costs such as sales charges (loads) on purchase payments, reinvested dividends, or other distributions; redemption fees; and exchange fees because the Funds do not charge these fees. This example is intended to help you understand your ongoing costs (in dollars) of investing in each Fund and to compare these costs with the ongoing costs of investing in other mutual funds.
The example is based on an investment of $1,000 invested at the beginning of the period and held for the entire period from October 1, 2011 through March 31, 2012.
Actual Expenses
The table below provides information about actual account values and actual expenses. You may use the information in these lines, together with the amount you invested, to estimate the expenses that you paid over the period. Simply divide your account value by $1,000 (for example, an $8,600 account value divided by $1,000 = 8.6), then multiply the result by the number in the line under the heading entitled “Actual Expenses Paid During Period” to estimate the expenses you paid on your account during this period.
In addition to the costs highlighted and described below, the only Fund transaction costs you might currently incur would be wire fees ($15 per wire), if you choose to have proceeds from a redemption wired to your bank account instead of receiving a check. Additionally, U.S. Bank charges an annual processing fee ($15) if you maintain an IRA account with the Fund. To determine your total costs of investing in a Fund, you would need to add any applicable wire or IRA processing fees you’ve incurred during the period to the costs provided in the example at the end of this article.
Hypothetical Example for Comparison Purposes
The table below provides information about hypothetical account values and hypothetical expenses based on each Fund’s actual expense ratio and an assumed rate of return of 5% per year before expenses, which is not the Fund’s actual return. The hypothetical account values and expenses may not be used to estimate the actual ending account balance or expenses you paid for the period. You may use this information to compare the ongoing costs of investing in a Fund and other funds. To do so, compare this 5% hypothetical example with the 5% hypothetical examples that appear in the shareholder reports of the other funds.
Please note that the expenses shown in the table are meant to highlight your ongoing costs only and do not reflect any transactional costs, such as sales charges (loads), redemption fees or exchange fees. Therefore, the hypothetical line of the table is useful in comparing ongoing costs only, and will not help you determine the relative total costs of owning different funds. In addition, if these transactional costs were included, your costs would have been higher.
| | | FMI | | | FMI | | | FMI | |
| | | Large Cap | | | Common Stock | | | International | |
| | | Fund | | | Fund | | | Fund | |
| | | | | | | | | | |
| Actual Beginning Account Value 10/01/11 | | $ | 1,000.00 | | | $ | 1,000.00 | | | $ | 1,000.00 | |
| | | | | | | | | | | | | |
| Actual Ending Account Value 3/31/12 | | $ | 1,229.80 | | | $ | 1,274.90 | | | $ | 1,194.40 | |
| | | | | | | | | | | | | |
| Actual Expenses Paid During Period* 10/01/11-3/31/12 | | $ | 5.24 | | | $ | 6.88 | | | $ | 5.48 | |
| | | | | | | | | | | | | |
| Hypothetical Beginning Account Value 10/01/11 | | $ | 1,000.00 | | | $ | 1,000.00 | | | $ | 1,000.00 | |
| | | | | | | | | | | | | |
| Hypothetical Ending Account Value 3/31/12 | | $ | 1,020.30 | | | $ | 1,018.90 | | | $ | 1,020.00 | |
| | | | | | | | | | | | | |
| Hypothetical Expenses Paid During Period* 10/01/11-3/31/12 | | $ | 4.75 | | | $ | 6.10 | | | $ | 5.05 | |
| | | | | | | | | | | | | |
| Annualized Expense Ratio* | | | 0.94 | % | | | 1.21 | % | | | 1.00 | % |
| * | Expenses are equal to each Fund’s annualized expense ratio, multiplied by the average account value over the period, multiplied by 183/366 (to reflect the one-half year period between October 1, 2011 and March 31, 2012). |
FMI Funds
On December 16, 2011, the Boards of Directors of FMI Common Stock Fund, Inc. and FMI Funds, Inc. (the “Directors”) approved the continuation of the investment advisory agreements for the FMI Common Stock Fund, the FMI Large Cap Fund and the FMI International Fund (collectively the “Funds”, or the, “Fund”) with Fiduciary Management, Inc. (“FMI”). Prior to approving the continuation of the investment advisory agreements, the Directors considered:
| | • | the nature, extent and quality of the services provided by FMI |
| | • | the investment performance of each of the Funds |
| | • | the cost of the services to be provided and profits to be realized by FMI from its relationship with the Funds |
| | • | the extent to which economies of scale would be realized as each Fund grew and whether fee levels reflect any economies of scale |
| | • | the expense ratios of each of the Funds |
| | • | the manner in which portfolio transactions for the Funds were conducted, including the use of soft dollars |
In considering the nature, extent and quality of the services provided by FMI, the Directors reviewed a report describing the portfolio management, shareholder communication and servicing, prospective shareholder assistance and regulatory compliance services provided by FMI to the Funds. The Directors concluded that FMI was providing essential services to the Funds. In particular, the Directors concluded that FMI was preparing reports to shareholders in addition to those required by law, and was providing services to the Funds that were in addition to the services investment advisers typically provided to non-mutual fund clients.
The Directors compared the performance of each of the Funds to benchmark indices over various periods of time and concluded that the performance of each Fund warranted the continuation of the agreements.
In concluding that the advisory fees payable by each Fund were reasonable, the Directors reviewed a report that concluded that FMI was reimbursing the International Fund in an amount in excess of its investment advisory fee, and that the profits FMI realized with respect to the Common Stock Fund and Large Cap Fund expressed as a percentage of pre-tax revenues were generally comparable to that of publicly traded investment advisers. The Directors also reviewed reports comparing each Fund’s expense ratio and advisory fees paid by each Fund to those of other comparable mutual funds and concluded that the advisory fee paid by each Fund and each Fund’s expense ratio were within the range of comparable mutual funds. The Directors also noted that the investment advisory fee for each of the Funds was not adjusted if the Funds grew, but did not consider that factor to be significant because of the other factors considered.
Finally, the Directors reviewed reports discussing the manner in which portfolio transactions for the Funds were conducted, including the use of soft dollars. Based on these reports, the Directors concluded that the research obtained by FMI was beneficial to each of the Funds and that FMI was executing the Funds’ portfolio transactions in a manner designed to obtain best execution for each of the Funds.
FMI Funds
For additional information about the Directors and Officers or for a description of the policies and procedures that the Funds use to determine how to vote proxies relating to portfolio securities, please call (800) 811-5311 and request Statements of Additional Information. They will be mailed to you free of charge. The Statements of Additional Information are also available on the website of the Securities and Exchange Commission (the “Commission”) at http://www.sec.gov. Information on how each of the Funds voted proxies relating to portfolio securities is available on the Funds’ website at http://www.fmifunds.com or the website of the Commission no later than August 31 for the prior 12 months ending June 30. The Funds file their complete schedules of portfolio holdings with the Commission for the first and third quarters of each fiscal year on Form N-Q. The Funds’ Forms N-Q are available on the Commission’s website. The Funds’ Forms N-Q may be reviewed and copied at the Commission’s Public Reference Room in Washington, D.C., and that information on the operation of the Public Reference Room may be obtained by calling 1-800-SEC-0330.
This report is not authorized for use as an offer of sale or a solicitation of an offer to buy shares of the FMI Funds unless accompanied or preceded by such Fund’s current prospectus.
Performance data quoted represents past performance; past performance does not guarantee future results. Investment return and principal value of an investment will fluctuate so that an investor’s shares, when redeemed, may be worth more or less than their original cost. Current performance of a Fund may be lower or higher than the performance quoted. The returns do not reflect the deduction of taxes that a shareholder would pay on Fund distributions or the redemption of Fund shares. Performance data current to the most recent month end may be obtained by visiting www.fmifunds.com or by calling 1-800-811-5311.
As of the Funds’ Prospectuses dated January 31, 2012, the FMI Large Cap Fund and FMI Common Stock Fund’s annual operating expense ratios are 0.97% and 1.21%, respectively. FMI International Fund’s annual operating expense ratio is 2.91%, less an expense reimbursement of 1.91% for a net operating expense ratio of 1.00%. FMI has contractually agreed to waive its advisory fee to the extent necessary to ensure that net expenses of the FMI International Fund do not exceed 1.75% of the average daily net assets. In addition to the reimbursement required under the FMI International Fund’s investment advisory agreement, FMI will reimburse FMI International Fund for expenses in excess of 1.00% of the daily net assets. FMI will not terminate this reimbursement prior to January 31, 2013.
For more information about the FMI Funds, call 1-800-811-5311 for free prospectuses. Please read the prospectuses carefully to consider the investment objectives, risks, charges and expenses, before investing or sending money. The prospectuses contain this and more information about the FMI Funds. Please read the prospectuses carefully before investing.
Please note the FMI Common Stock Fund, Inc. is currently closed to new investors.
Securities named in the Letters to Shareholders, but not listed in the Schedules of Investments are not held in the Funds as of the date of this disclosure. Portfolio holdings are subject to change without notice and are not intended as recommendations of individual securities.
Risks associated with investing in the Funds are as follows:
| | FMI Large Cap Fund: Stock Market Risk, Medium Capitalization Companies Risk, Non-Diversification Risk, Value Investing Risk, Foreign Securities Risk and Market Timing Risk. |
| | FMI Common Stock Fund: Stock Market Risk, Medium and Small Capitalization Companies Risk, Value Investing Risk, Foreign Securities Risk, and Market Timing Risk. |
| | FMI International Fund: Stock Market Risk, Non-Diversification Risk, Value Investing Risk, Foreign Securities Risk, Geographic Concentration Risk, Currency Hedging Risk, and Market Timing Risk. |
Distributed by Rafferty Capital Markets, LLC
FMI Large Cap FundFMI Common Stock FundFMI International Fund
100 East Wisconsin Avenue, Suite 2200
Milwaukee, Wisconsin 53202
www.fmifunds.com
414-226-4555
BOARD OF DIRECTORS
| BARRY K. ALLEN | GORDON H. GUNNLAUGSSON |
| ROBERT C. ARZBAECHER | TED D. KELLNER |
| JOHN S. BRANDSER* | RICHARD E. LANE** |
| PATRICK J. ENGLISH | PAUL S. SHAIN |
* Common Stock Fund only
** Large Cap Fund and International Fund only
INVESTMENT ADVISER
FIDUCIARY MANAGEMENT, INC.
100 East Wisconsin Avenue, Suite 2200
Milwaukee, Wisconsin 53202
ADMINISTRATOR, ACCOUNTANT, TRANSFER
AGENT AND DIVIDEND DISBURSING AGENT
U.S. BANCORP FUND SERVICES, LLC
615 East Michigan Street
Milwaukee, Wisconsin 53202
800-811-5311 or 414-765-4124
| CUSTODIAN | INDEPENDENT REGISTERED |
| U.S. BANK, N.A. | PUBLIC ACCOUNTING FIRM |
| | PRICEWATERHOUSECOOPERS LLP |
| DISTRIBUTOR | |
| RAFFERTY CAPITAL | LEGAL COUNSEL |
| MARKETS, LLC | FOLEY & LARDNER LLP |
| | FMI Funds |
| Advised by Fiduciary Management, Inc. |
| www.fmifunds.com |
| |
Item 2. Code of Ethics.
Not applicable for semi-annual reports.
Item 3. Audit Committee Financial Expert.
Not applicable for semi-annual reports.
Item 4. Principal Accountant Fees and Services.
Not applicable for semi-annual reports.
Item 5. Audit Committee of Listed Registrants.
Not applicable to registrants who are not listed issuers (as defined in Rule 10A-3 under the Securities Exchange Act of 1934).
Item 6. Schedule of Investments.
| (a) | The Schedule of Investments in securities of unaffiliated issuers is included as part of the report to shareholders filed under Item 1 of this Form. |
Item 7. Disclosure of Proxy Voting Policies and Procedures for Closed-End Management Investment Companies
Not applicable.
Item 8. Portfolio Managers of Closed-End Management Investment Companies.
Not applicable.
Item 9. Purchases of Equity Securities By Closed-End Management Investment Company and Affiliated Purchasers.
Not applicable.
Item 10. Submission of Matters to a Vote of Security Holders.
None.
Item 11. Controls and Procedures.
| (a) | The Registrant’s disclosure controls and procedures are periodically evaluated. As of April 30, 2012, the date of the last evaluation, the Registrant’s officers have concluded that the Registrant’s disclosure controls and procedures are adequate. |
| (b) | The Registrant’s internal controls are periodically evaluated. There were no changes in the Registrant’s internal control over financial reporting that occurred during the second fiscal quarter of the period covered by this report that have materially affected, or are reasonably likely to materially affect, such controls. |
Item 12. Exhibits.
| (a) | (1) Any code of ethics or amendment thereto. Not applicable. |
| | (2) Certifications pursuant to Section 302 of the Sarbanes-Oxley Act of 2002. Filed herewith. |
| | (3) Any written solicitation to purchase securities under Rule 23c-1 under the Act sent or given during the period covered by the report by or on behalf of the Registrant to 10 or more persons. Not applicable to open-end investment companies. |
| (b) | Certification pursuant to Section 906 of the Sarbanes-Oxley Act of 2002. Furnished herewith. |
SIGNATURES
Pursuant to the requirements of the Securities Exchange Act of 1934 and the Investment Company Act of 1940, the registrant has duly caused this report to be signed on its behalf by the undersigned, thereunto duly authorized.
FMI Common Stock Fund, Inc.
Registrant
By /s/ Ted D. Kellner
Ted D. Kellner, President, Principal Executive Officer
Date 5/1/12
Pursuant to the requirements of the Securities Exchange Act of 1934 and the Investment Company Act of 1940, this report has been signed below by the following persons on behalf of the registrant and in the capacities and on the dates indicated.
FMI Common Stock Fund, Inc.
Registrant
By /s/ Ted D. Kellner
Ted D. Kellner, President, Principal Executive Officer
FMI Common Stock Fund, Inc.
Registrant
By /s/ Ted D. Kellner
Ted D. Kellner, President, Principal Financial Officer