Michael Hanley
Executive Vice President and Chief Financial Officer
Alcan Investor Workshop
Toronto, October 3, 2006

© 2 0 06 A L C A N I N C.Slide 2
Statements made in the course of this presentation which describe
the Company's or management’s objectives, projections, estimates,
expectations or predictions may be "forward-looking statements"
within the meaning of securities laws. All statements that address the
Company's expectations or projections about the future including
statements about the Company's growth, cost reduction goals,
operations reorganization plans, expenditures and financial results
are forward-looking statements. nature, forward-looking statements involve risk and uncertainty and
actual actions or results could differ materially. Reference should be
made to the most recent Form 10-Q or 10-K for a summary of
factors that could cause such differences. In addition, certain
non-GAAP measures are used which are reconciled to the
comparable GAAP measures herein or on the Company’s website at
www.alcan.com in the “Investors” section.
Forward Looking Statements

© 2 0 06 A L C A N I N C.Slide 3
Well Positioned for Profitable Growth
Agenda
n
Business Context
n
Performance Against Targets
n
Business Process Excellence
n
Risk Management
n
Capital Allocation
n
Investment Thesis
© 2 0 06 A L C A N I N C.Slide 4
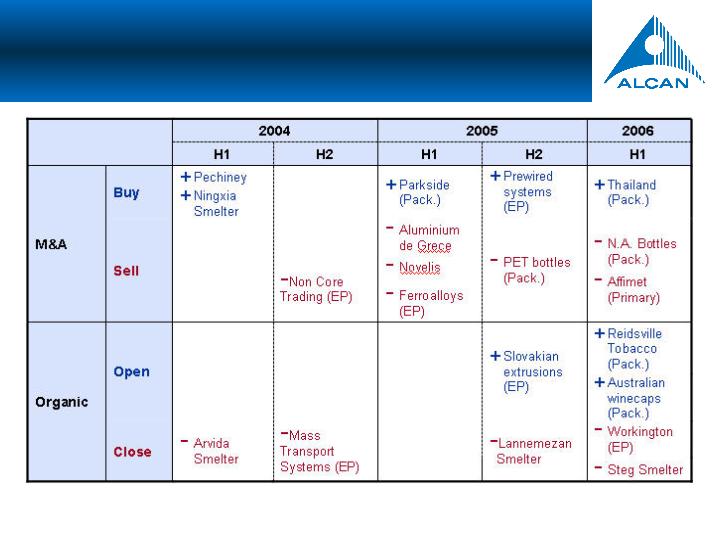
Business Context
Portfolio Optimization

© 2 0 06 A L C A N I N C.Slide 5
2004 vs. 2003 | 2005 vs. 2004 | 2006 Forecast vs. 2005 | |
% | |||
Aluminum | +21 | +10 | +35 |
Currencies | |||
CAD | +7 | +7 | +7 |
AUD | +12 | +3 | -2 |
Euro-like | +9 | - | +1 |
Input Costs | |||
Resins | +18 | +15 | +15 |
Oil | +33 | +41 | +19 |
Caustic | -14 | +150 | -4 |
Coke | +10 | +21 | +2 |
Gas | +12 | +46 | -22 |
Business Context
Margins Expanding With Favourable 2006 Trends

© 2 0 06 A L C A N I N C.Slide 6
Metric | Target | 1H-06 | 2005 |
Return on capital employed (1) | Cover COC by 2008 | 13.5% (2) | 6.7% |
Operating EPS growth (3) | 15% / year | 76% | 39% |
Cash from continuing operations | Min. $2B from 2006 | $1.1B | $1.5B |
Debt to Capital | 35% | 35% | 40% |
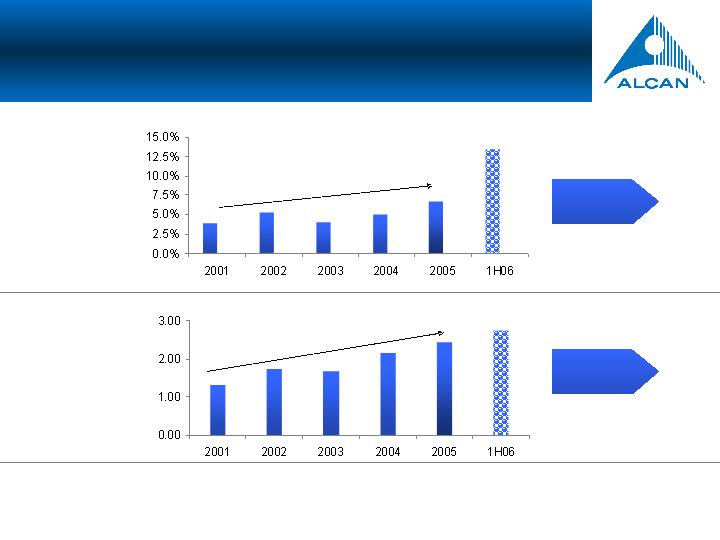
Performance Against Targets
(1) Operating – see definition in Appendix
(2) Annualized
(3) Trailing 4 quarters adjusted for spin-off of Novelis
Note: Targets based on 5-year plans and
forward rates for currency and metal as at
September 2005
September 2005
© 2 0 06 A L C A N I N C.Slide 7
ROCE* (%)
Operating EPS
(US$ / share)
CAGR = 17%
Note: 2001-2004 results include Novelis
CAGR = 15%
Earn cost of
capital by 2008
15% growth per
year
Performance Against Targets
* See definition
in Appendix
© 2 0 06 A L C A N I N C.Slide 8
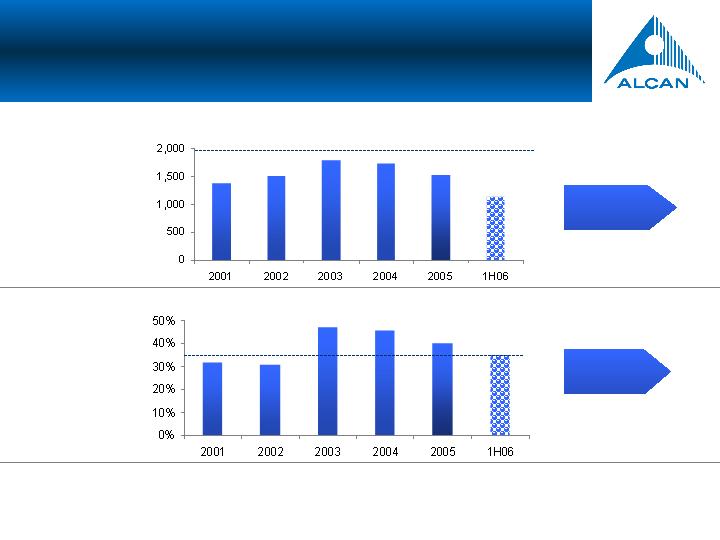
Cash from
Operations
(US$M)
(US$M)
Debt to Capital
(%)
Note: 2001-2004 results include Novelis
Minimum $2b
starting in 2006
35%
Performance Against Targets

© 2 0 06 A L C A N I N C.Slide 9
Business Process Excellence
Controllable Value Drivers
An update on progress from last year…
n
BGP margin improvement
n
Procurement excellence
n
Continuous improvement
n
SG&A optimization
n
Working capital management
n
Capital spending management
© 2 0 06 A L C A N I N C.Slide 10
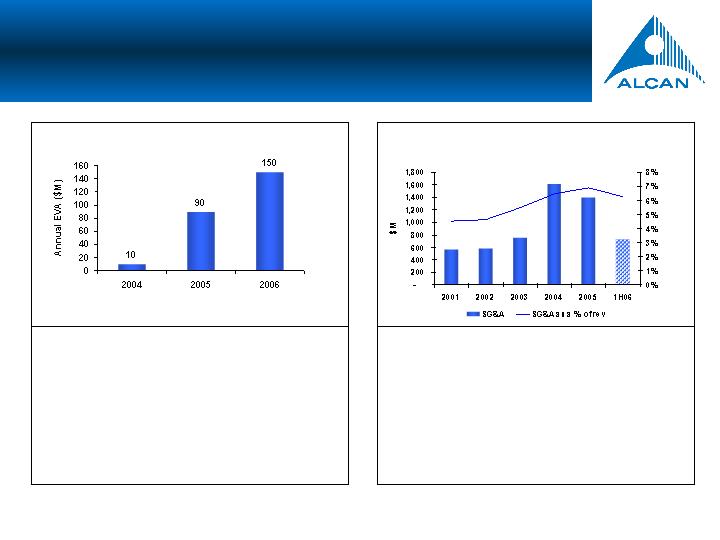
Business Process Excellence
SG&A Expenses
Ø
Comprehensive, focused cost
management program in place
Ø
Clearly defined strategies to reduce costs
over next 2-3 years
Ø
Progress already made toward target of
6% of revenues by end of 2007 (2005:
6.9%, 2006 ytd: 6.3%)
6.9%, 2006 ytd: 6.3%)
Continuous Improvement
Ø
A potential additional $100 M in projects
underway
Ø
400 active black belts trained or in training
Ø
2600 green belts trained or in training
Ø
400 executives trained as yellow belts
Implemented Projects
© 2 0 06 A L C A N I N C.Slide 11
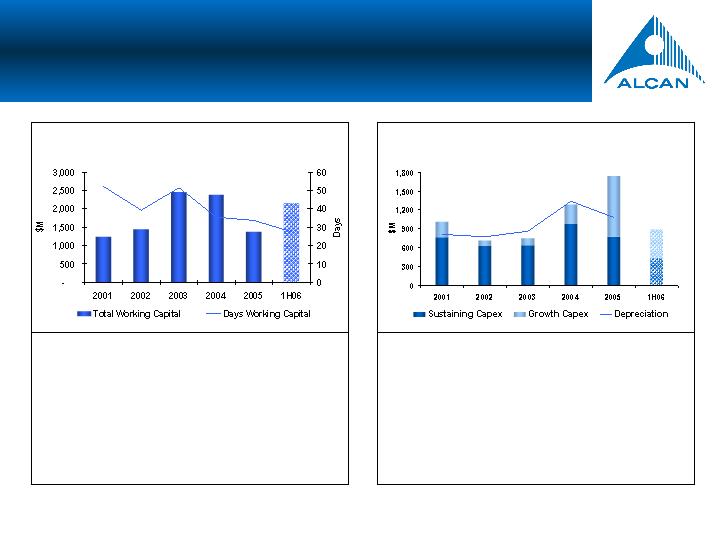
Business Process Excellence
Working Capital Management
Capital Expenditure Management
Ø
Disciplined management:
•
positive trend in days working capital
•
working capital down in 2005 despite
high aluminum prices
Ø
First half of 2006 reflects normal
seasonal build up and high aluminum
prices
prices
Ø
Sustaining capex signficantly below
depreciation
Ø
Sustaining capex continues to be subject
to discliplined process
© 2 0 06 A L C A N I N C.Slide 12
Measurement
Strategy
definition
Strategy
execution
Compliance
monitoring
“Cash flow at risk” methodology
n
Gross and net exposures
n
Scenario simulations
n
Acceptable cash flow volatility
n
Risk Management Committee
n
Board of Directors
n
Executive Committee/Board of Directors: portfolio
composition
n
Business Groups: operations
n
Corporate Finance: capital structure, insurance, derivatives
n
Risk Measurement and
Control Group
n
Internal audit
n
Business Group Finance
Directors
A Complete and Integrated Process
Risk Management
© 2 0 06 A L C A N I N C.Slide 13
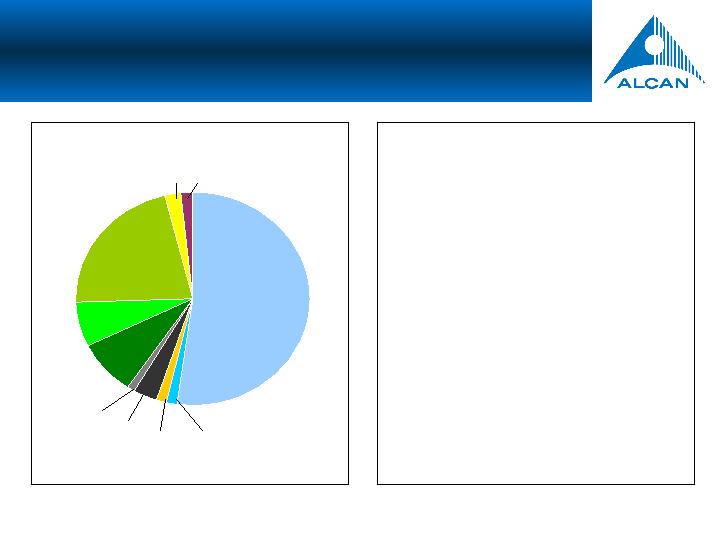
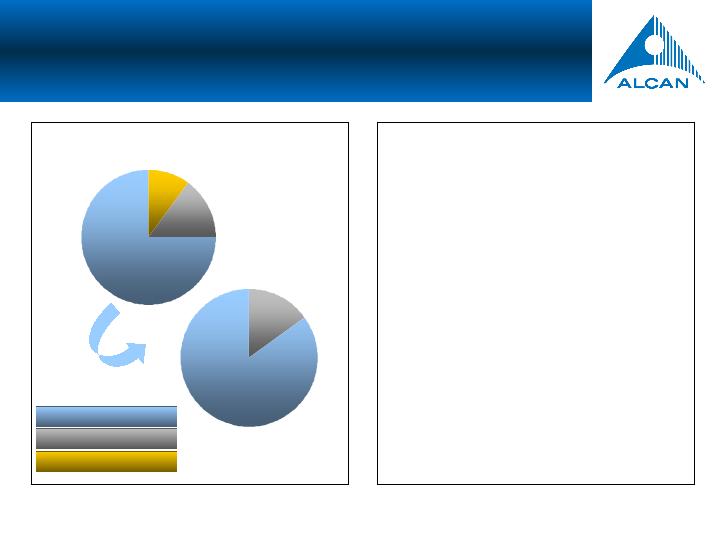
Risk Management
Key Relative Cash Flow Exposures
CAD
Gas
Aluminum
Oil
Euro-li
ke
ke
AUD
Pitch
Caustic
Coke
Alumina
Ø
Aluminum represents over 50% of
Alcan’s total cash flow exposure
Ø
Canadian dollar, Australian dollar and
Euro-like currency exposures combined
are also significant…
are also significant…
Ø
However, currency correlation with LME
provides some degree of “natural” cash
flow volatility reduction.
flow volatility reduction.
© 2 0 06 A L C A N I N C.Slide 14
Risk Management
Hedged and Fixed-Price Sales
Ø
Change in approach in late 2005
Ø
Previous approach maintained a degree
of LME hedged sales plus “natural” fixed
price sales obtained through normal
business operations
price sales obtained through normal
business operations
Ø
Current approach maintains only “natural”
fixed price sales as they are entered into
during normal course of business
during normal course of business
Ø
LME hedged sales run out by 2008
Ø
Weighted average price of remaining LME
hedged sales is around $1,750/t
Ø
Average maturity of fixed price sales
around 2-3 quarters
2006-7
2008
Sale type as % of primary production
75%
LME 3-mnth +
Premia
15%
Fixed Price Sales
10%
85%
15%
LME Hedged Sales
© 2 0 06 A L C A N I N C.Slide 15
Operating
Cash Flow
less
Sustaining
Capital
less
Sustaining
Capital
Growth
Initiatives
Return to
Share-hold
er
er
B/S
Streng-then
ing
ing
Organic
M&A
Dividends
Share
Buybacks
Debt
Reduction
Pensions
Balancing Profitable Growth, Shareholder Returns and a Strong Balance
Sheet
Capital Allocation

© 2 0 06 A L C A N I N C.Slide 16
Well Positioned for Profitable growth
Alcan Investment Thesis
n
Modern and cost efficient upstream assets
Ø
Opportunities to reach and maintain 1st quartile positions
Ø
Technology and power advantages
n
Downstream businesses in profitable markets with competitive
positions
Ø
Significant margin improvement potential
Ø
Leading technology and market positions in selected segments
n
Financial strength and flexibility to pursue profitable growth without
compromising financial and capital allocation discipline
n
Proven track record in managing for value

© 2 0 06 A L C A N I N C.Slide 17
APPENDIX

© 2 0 06 A L C A N I N C.Slide 18
Change in Full Year Average | NI ($M) | EPS ($/share) | |
Aluminum | +US$100/mt | $170 | $0.45 |
Currency | |||
CAD | +US$0.10 | $(110) | $(0.29) |
European | +US$0.10 | $(56) | $(0.15) |
AUD | +US$0.10 | $(40) | $(0.11) |
Key Economic Sensitivities

© 2 0 06 A L C�� A N I N C.Slide 19
Income = |
Operating earnings |
+ Minority interest |
+ Interest (after-tax) |
Average Capital Employed = |
Total debt and borrowings |
+ Net deferred income taxes |
+ Minority interests |
+ Preference shares |
+ Common shareholders’ equity |
Return on Capital Employed Definition
© 2 0 06 A L C A N I N C.Slide 20