Jacynthe Côté
President – Bauxite and Alumina
Alcan Investor Workshop
Toronto, October 3, 2006

© 2 0 06 A L C A N I N C.Slide 2
Statements made in the course of this presentation which describe
the Company's or management’s objectives, projections, estimates,
expectations or predictions may be "forward-looking statements"
within the meaning of securities laws. All statements that address the
Company's expectations or projections about the future including
statements about the Company's growth, cost reduction goals,
operations reorganization plans, expenditures and financial results
are forward-looking statements. nature, forward-looking statements involve risk and uncertainty and
actual actions or results could differ materially. Reference should be
made to the most recent Form 10-Q and 10-K for a summary of
factors that could cause such differences. In addition, certain
non-GAAP measures are used which are reconciled to the
comparable GAAP measures herein or on the Company’s website at
www.alcan.com in the “Investors” section.
Forward Looking Statements

© 2 0 06 A L C A N I N C.Slide 3
Discussion Topics
n
Group Performance
n
Update on Current Portfolio
n
Alumina Market / China
n
Additional Growth Opportunities
n
Summary
© 2 0 06 A L C A N I N C.Slide 4
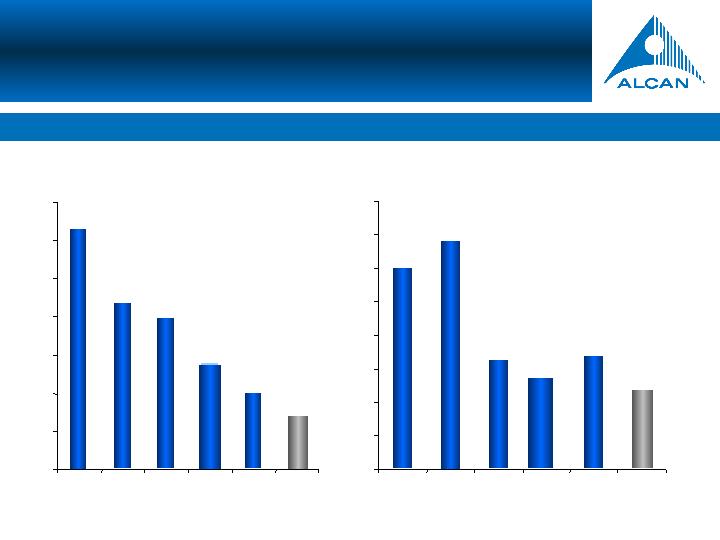
Recordable Case Rate
2.23
6.3
4.34
3.96
2.74
1.89
1.6
0
1
2
3
4
5
6
7
2001
2002
2003
2004
2005
2006
YTD
LTII Cases
1.2
1.36
0.65
0.54
0.65
0.48
0
0.2
0.4
0.6
0.8
1
1.2
1.4
1.6
2001
2002
2003
2004
2005
YTD
2006
Improving trend on environment, health and safety performance
EHS Performance
© 2 0 06 A L C A N I N C.Slide 5
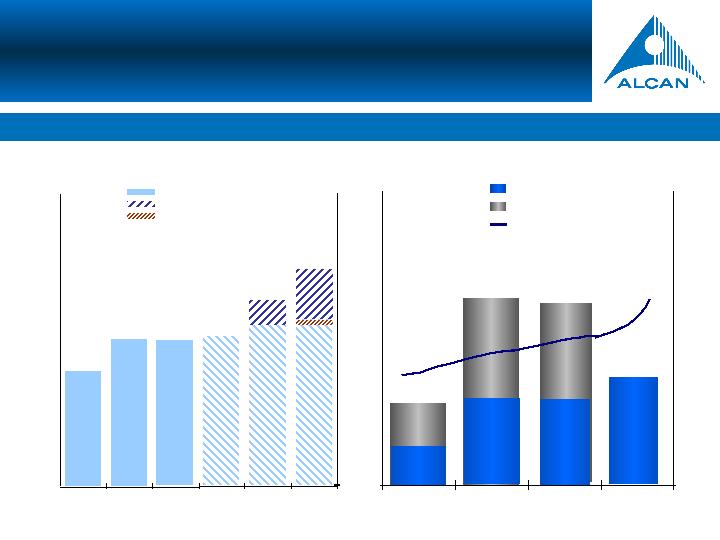
Alumina Production & Revenues
Strong B&A production growth
LME
B&A SGA Production (Kt)
Gove expansion (Kt)
Alumar expansion (Kt)
Production
Production (Kt)
3,992
5,052
4,992
1,000
2,000
3,000
4,000
5,000
6,000
7,000
8,000
9,000
10,000
2003
2004
2005
2006
2007
2008
500
1,000
1,500
2,000
2,500
3,000
3,500
4,000
Revenues $M // LME
273
100
200
300
400
500
600
700
2003
2004
2005
2006
BGP $M
BGP, Revenues & LME
BGP H1
BGP H2
199
242
200
278
108
111
1,427
1,721
1,899
2,562

© 2 0 06 A L C A N I N C.Slide 6
Balance of Bauxite Portfolio (Kt) | Current | Post-Approved Expansions |
Internal Production | 16,500 | 19,900 |
Internal Demand | 13,500 | 17,300 |
Internal Balance | 3,000 | 2,600 |
Balance of Alumina Portfolio (Kt) | ||
Internal Production | 5,200 | 7,200 |
Internal Demand | 6,600 | 7,100 |
Internal Balance | (1,400) | 100 |
Alcan Bauxite and Alumina Balance

© 2 0 06 A L C A N I N C.Slide 7
Key Competitive Advantages
n
Low cost position
Ø
with completion of the Gove expansion, the gas to Gove project
and the Alumar expansion, B&A will have 50% of its production in
lowest cost quartile
lowest cost quartile
n
Technology/engineering capabilities
Ø
best commercially available technology
n
Preferred partner
Ø
sustainability consolidates our “license to operate” and supports
access to new resources
© 2 0 06 A L C A N I N C.Slide 8
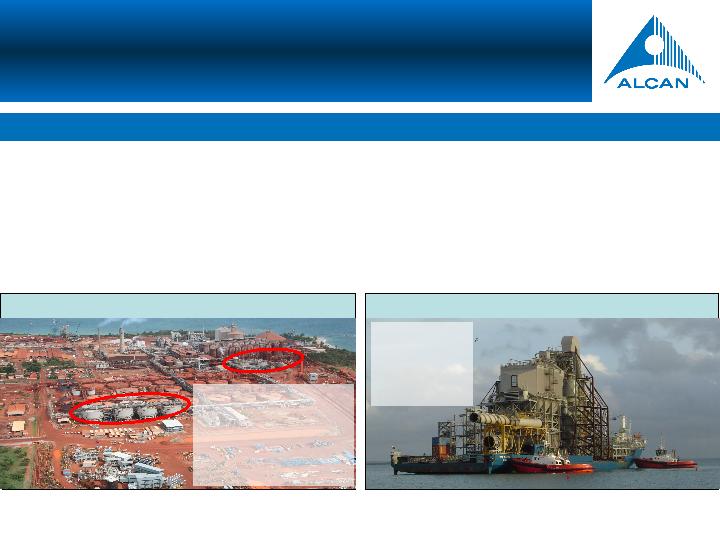
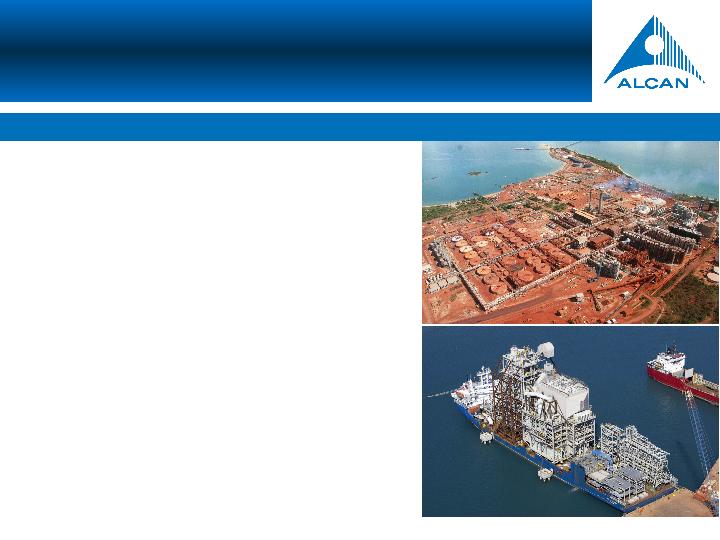
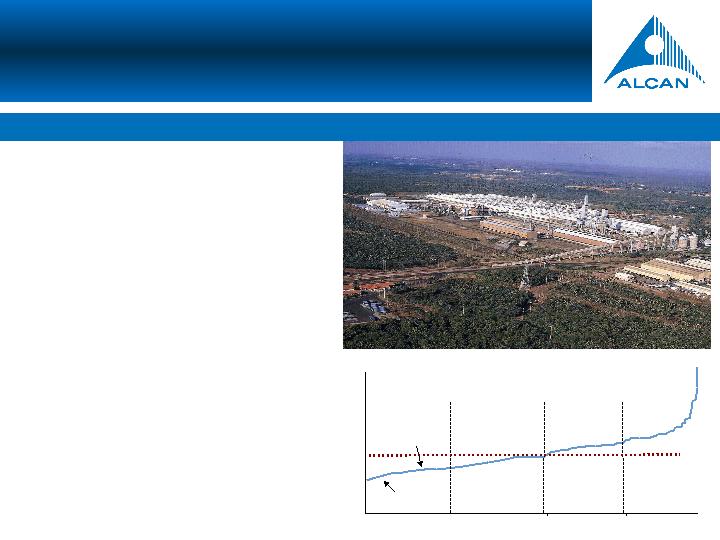
Alcan’s technology is well-recognized
Process improvement
n
These 8 new grey tanks will
replace all 28 old tanks in the
centre of the picture while:
centre of the picture while:
•
Increasing production from
2m Mt to 3.8m Mt and
•
Freeing up space for
another possible expansion
and reducing capital cost
and reducing capital cost
Capex reduction
n
Low-cost country
sourcing of major
modules helped
reduce schedule
and exposure to
Australian market
conditions
modules helped
reduce schedule
and exposure to
Australian market
conditions
n
Breakthroughs are being realized in process improvement with impact on
capital costs, footprint and schedule
n
Alcan uses advanced exploration techniques with the contribution of satellite
imaging and 3D modelling, providing a new, sophisticated, low-cost
exploration approach
exploration approach
Technology and Innovation
© 2 0 06 A L C A N I N C.Slide 9
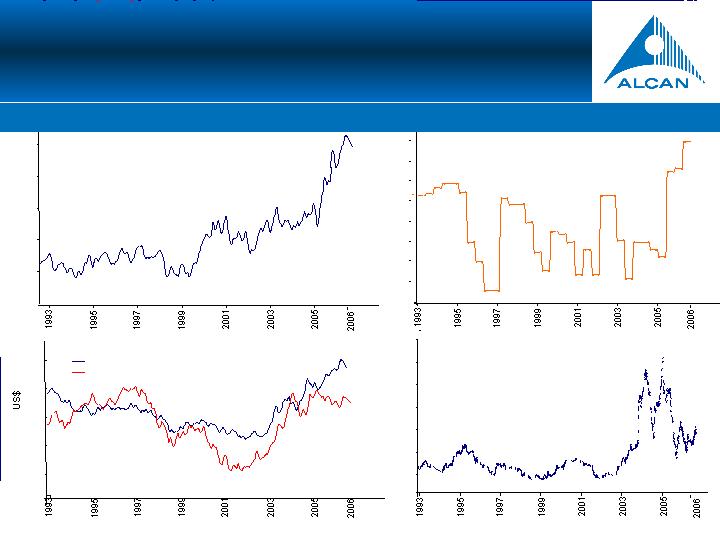
Raw Material Price & Currency
Volatility
Oil: SING 380 (US$/bbl)
CAGR Jan 98 - Aug 06: 19%
10
20
30
40
50
60
0.40
0.50
0.60
0.70
0.80
0.90
CAN$
AUS$
Caustic: ASP North America (US$/DMT)
CAGR Jan 00- Aug 06: 22%
0
50
100
150
200
250
300
350
400
450
Freight: BDI Index ($/day)
CAGR Jan 98 - Aug 06: 13%
1,000
2,000
3,000
4,000
5,000
6,000
7,000
1.00
1.00
1.00
1.00
The alumina industry has been affected by unprecedented price increases…
© 2 0 06 A L C A N I N C.Slide 10
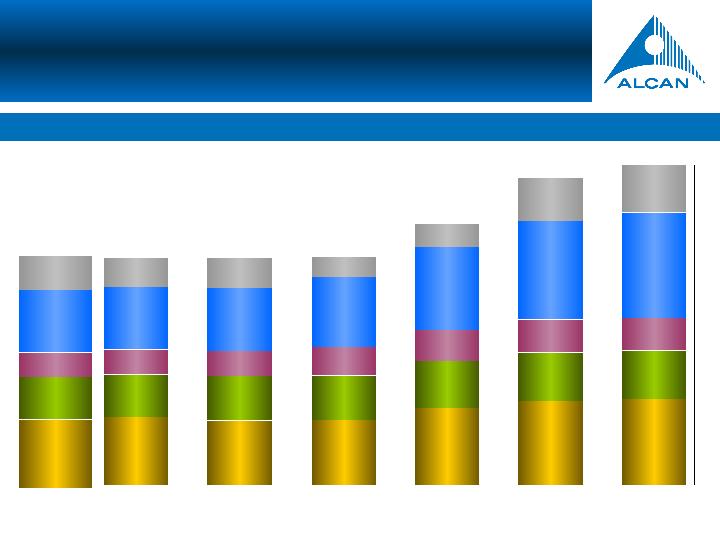
Alumina Industry Block Cost
2001-2006
… impacting substantially the industry cost curve
Source: CRU
40.63
38.45
38.98
46.02
50.31
51.31
25.50
26.72
26.81
28.03
28.91
28.94
14.77
15.12
16.73
18.78
19.60
19.63
37.35
37.36
41.96
49.71
58.82
63.30
17.7
18.1
12.1
13.6
25.8
28.3
2001
2002
2003
2004
2005
2006
136 $/t
136 $/t
137 $/t
156 $/t
183 $/t
191 $/t
Industry AVG
Cash Cost
$/t
Bauxite
Caustic
Energy
Labour
Maintenance
& Materials
© 2 0 06 A L C A N I N C.Slide 11
World Ranking Site Operating Costs, 2005
Source: CRU & Alcan Internal.
Target 50% of production in 1st quartile by 2009
0
50
100
150
200
250
300
350
400
0
20
40
60
80
100
Cumulative
Production (%)
Industry Average ‘05: 184
$/t
Alcan ‘05: 191 $/t
Industry Average ‘04: 157
$/t
Alcan ‘04:
155 $/t
Alcan ‘05 1st
Quartile 33%
Alcan ‘05 2nd
Quartile 3%
Alcan ‘05 3rd
Quartile 37%
Alcan ‘05 4th
Quartile 27%
Improveme
nt range
nt range
Target 2010
50% ~ 60%
Target 2010
20% ~ 30%
Target 2010
0%
Target 2010
20%
Evolution of Competitive Position 2005
-2010
© 2 0 06 A L C A N I N C.Slide 12
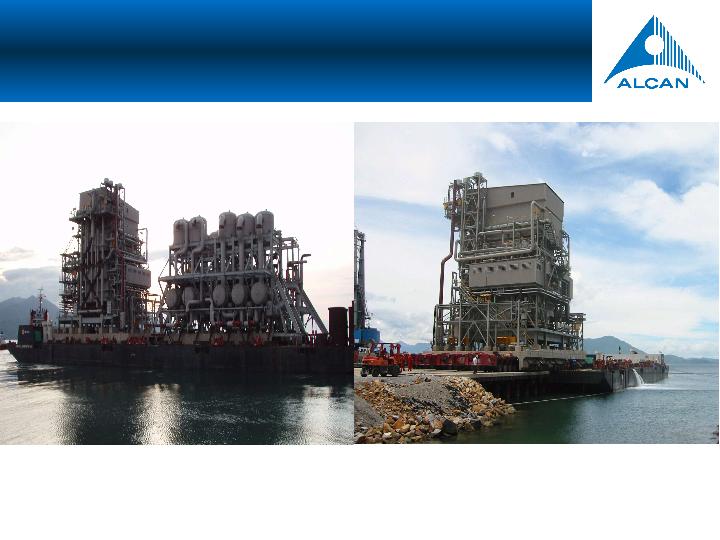
Gove Expansion
Project on schedule despite challenging industrial environment in Australia
n
Excellent EHS performance
n
Some 25-30% of the capital cost enhances current
operating efficiency and environmental performance
n
Assembly of modules in low-cost countries allowed
for:
•
Rapid construction schedule (27 months)
•
Partial mitigation of exposure to high-cost
environment in Australia
n
Unplanned hours for brownfield work became
obvious in July-August as we started commissioning
of some systems
of some systems
n
Expansion reduces cash cost by 30$/t
n
Gas conversion is also exposed to tight construction
environment in Australia and we are assessing other
options while maintaining support for PNG
options while maintaining support for PNG
© 2 0 06 A L C A N I N C.Slide 13
Gove Expansion
© 2 0 06 A L C A N I N C.Slide 14
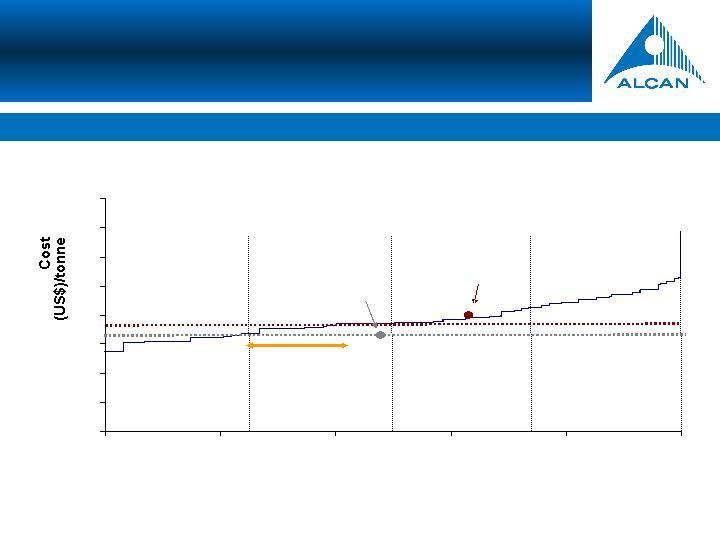
n
Expansion of 2.1 Mt from existing
capacity of 1.4 Mt.
n
Alcan owns 10% with Alcoa and BHP
holding the remaining 90%
n
Construction underway (20% in overall
progress) with outstanding EHS
performance
performance
n
First production in Q3-2008 (expected
33-month construction)
Cumulative Production
Alumar current
Conversion Cost
Post-expansion
Conversion Cost
0
50
100
150
200
250
300
25%
50%
75%
Industry Conversion Costs, Forecast 2008
Source: CRU
$/t
Construction underway with excellent EHS performance
Alumar

© 2 0 06 A L C A N I N C.Slide 15
Cost Optimization
n
Gardanne
n
Continue concentration on value-added products
n
Closure of UPCA and migration of products to Gardanne
n
Vaudreuil
n
Productivity improvements and cost cutting measures being
implemented
•
Hydrate production increased by 11% in the last two
years
n
Increased outsourcing offering reduced labour cost and flexibility
to adjust to changing market conditions
© 2 0 06 A L C A N I N C.Slide 16
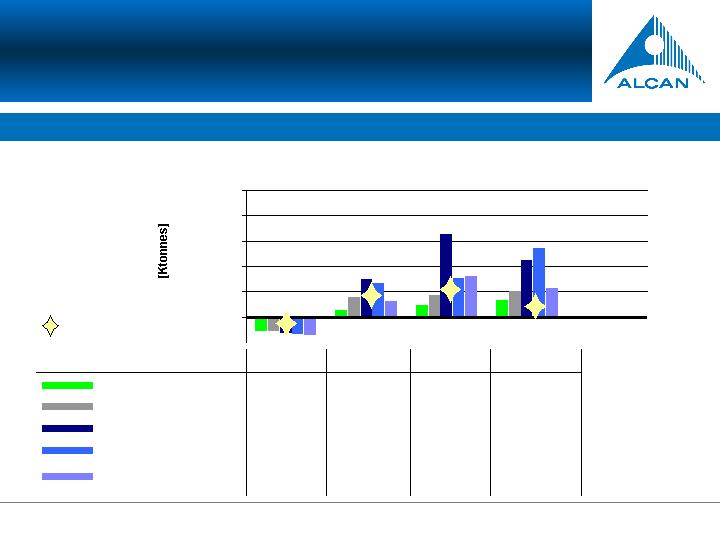
Sources : CRU, Metal Bulletin (MBR), Brook Hunt, Macquarie Bank, James F. King
Alcan
Moving from supply deficit to near-term surplus
Alumina World Market Balance Forecast
-2,000
-
2,000
4,000
6,000
8,000
10,000
-1,121
-1,104
-1,338
-1,361
-1,486
2005
447
1,483
2,999
2,626
1,178
2006
929
1,673
6,468
3,079
3,116
2007
1,285
2,015
4,452
5,337
2,221
2008
Macquarie Bank – July 06
CRU - Apr 06
MBR - Sept 06
Brook Hunt - Aug. 06
James F. King – Aug 06
Alumina World Balance
© 2 0 06 A L C A N I N C.Slide 17
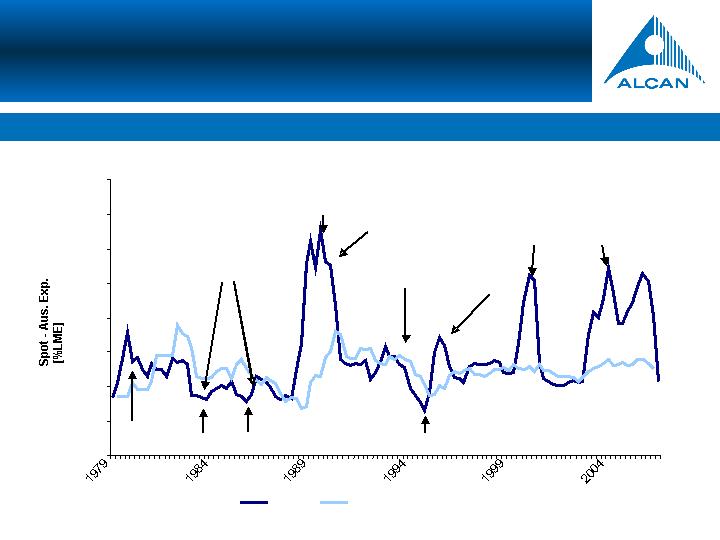
Market returns to surplus – immediate impact on spot prices
Spot and Australian Export Price Evolution
Spot
Aus. Export Price
0.0%
5.0%
10.0%
15.0%
20.0%
25.0%
30.0%
35.0%
40.0%
San Ciprian
Aughinish
Worsley
Alumina
oversupply
High metal
prices
Hurricane
Eastern block
sell-down
Hurricane
Gramercy
explosion
Structural
tightness
(China)
Alunorte
Source: CRU
Historical Prices
© 2 0 06 A L C A N I N C.Slide 18
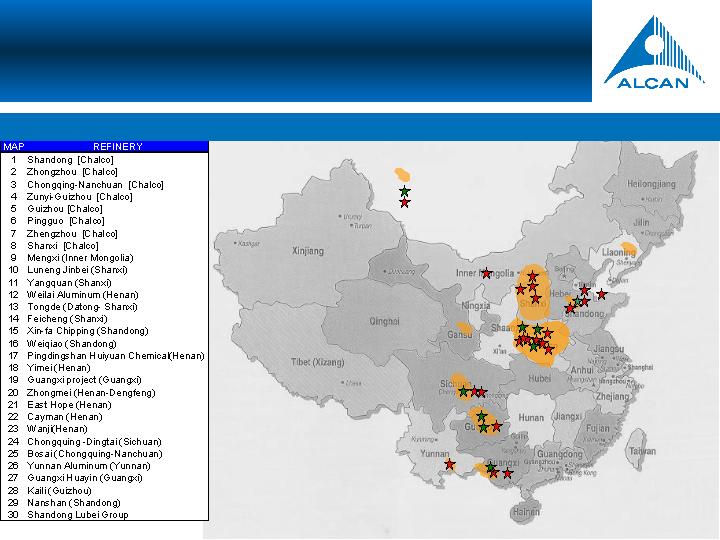
27
21
22
23
18
17
20
29
10
13
25
15
16
26
1
2
7
30
3
28
4
5
6
8
9
11
12
14
19
24
Non-Chalco
Chalco
Known Bauxite Reserves
Source : B&A Analysis, Brook Hunt
China could have up to 30 alumina refineries up and running by 2010
China Alumina Landscape
© 2 0 06 A L C A N I N C.Slide 19
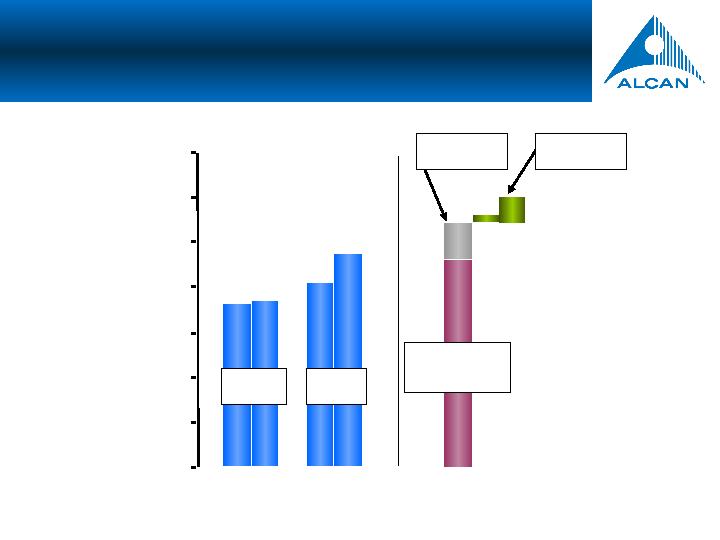
China New Alumina Refineries
Cash costs
Domestic Prices
Min
Max
Min
Max
USD/t
Min
Max
Transport to
smelters
0
50
100
150
200
250
300
350
domestic
bauxite
imported
bauxite
tax+freight
premium
International
Spot Price
230$/t
© 2 0 06 A L C A N I N C.Slide 20
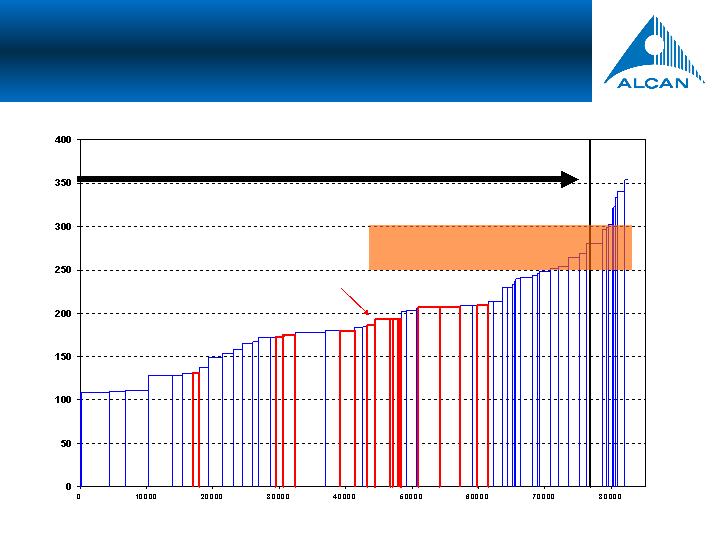
USD/t
2007 Alumina Cash Cost
Curve
tpy of production
Chinese capacity
Price zone
Alumina Demand

© 2 0 06 A L C A N I N C.Slide 21
Market Outlook
n
Alumina market expected in surplus for the next 2~3 years
n
China alone will represent more than 50% of the global growth in
supply and demand
n
Chinese alumina imports expected to decrease
n
Due to the poor quality of the Chinese bauxite and the use of
imported bauxite, the Chinese refineries are expected to be on the
3rd and 4th quartile of the industry cost curve
3rd and 4th quartile of the industry cost curve
n
Self-regulating price is expected to remain in the 250~300$/mt
range
© 2 0 06 A L C A N I N C.Slide 22
•
Potential development of a large-scale integrated aluminium
facility (bauxite mine + alumina refinery + aluminium smelter)
•
Large high-quality bauxite resources (in excess of 500 Mt)
Utkal
•
Greenfield project of 1.5 Mt in the province of Orissa, India
•
Alcan owns 45% with Hindalco holding the other 55%
•
Investment decision expected by H1-2007
Guinea
•
Greenfield project of 1.5Mt in Guinea
•
Alcan to own 40% with Alcoa holding another 40%
•
Basic Agreement with the Government of Guinea now effective
•
Expect to make a decision on DFS by the end of 2006
Cameroon
Project
Description and Benefits
Ghana
•
MoU signed for the analysis of a mine and an alumina refinery
project in joint venture with the State
•
Conceptual and pre-feasibility studies underway
Additional Growth Opportunities
Opportunities in lowest cost quartile

© 2 0 06 A L C A N I N C.Slide 23
Summary and Key Priorities
n
Leverage AIMS – operational excellence
n
Complete construction and start-up of Gove
n
Complete expansion of Alumar
n
Continue action on high-cost facilities
n
Leverage our sustainability & technology/engineering know-how to
pursue growth opportunities of large-scale assets in lowest cost
quartile
quartile

© 2 0 06 A L C A N I N C.Slide 24
APPENDIX
© 2 0 06 A L C A N I N C.Slide 25
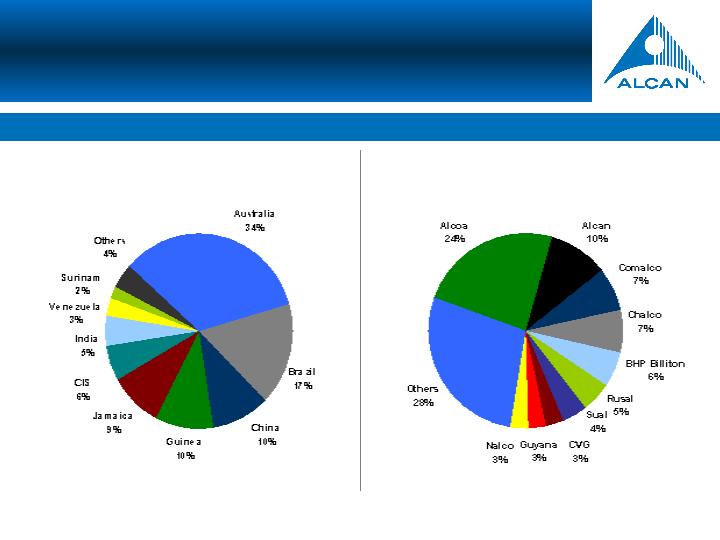
Source: James King, B&A analysis
Bauxite
10% of world bauxite production
Bauxite Production by Country
Bauxite Production by Company
© 2 0 06 A L C A N I N C.Slide 26
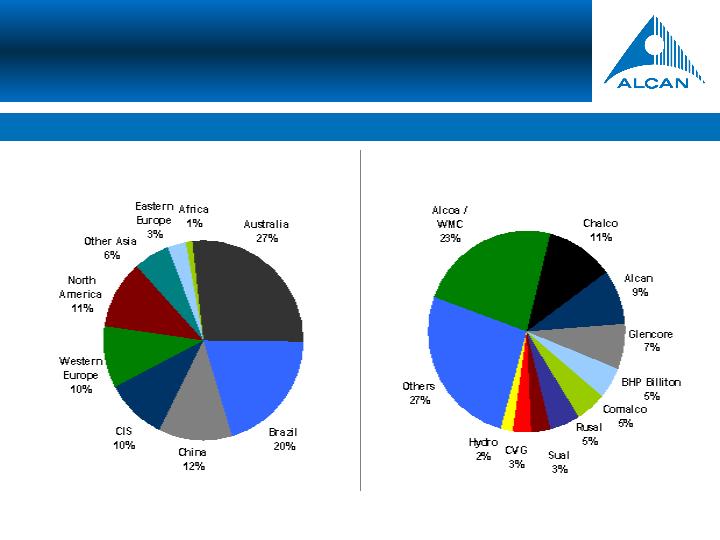
Source: James King, B&A analysis
Alumina
Alumina Production by Region
Alumina Production by Company
9% of world alumina production
© 2 0 06 A L C A N I N C.Slide 27