
Neuberger Berman
Equity Funds
Investor Class Shares
Trust Class Shares
Advisor Class Shares
Institutional Class Shares
Dividend Growth Fund
Emerging Markets Equity Fund
Equity Income Fund
Focus Fund
Genesis Fund
Global Equity Fund
Global Real Estate Fund
Greater China Equity Fund
Guardian Fund
International Equity Fund
Class A Shares
Class C Shares
Class R3 Shares
Class R6 Shares
International Select Fund
International Small Cap Fund
Intrinsic Value Fund
Large Cap Value Fund
Mid Cap Growth Fund
Mid Cap Intrinsic Value Fund
Multi-Cap Opportunities Fund
Real Estate Fund
Small Cap Growth Fund
Sustainable Equity Fund
Annual Report
August 31, 2019
Beginning on January 1, 2021, as permitted by regulations adopted by the U.S. Securities and Exchange Commission, paper copies of the Fund's annual and semi-annual shareholder reports will no longer be sent by mail, unless you specifically request paper copies of the reports. Instead, the reports will be made available on the Fund's website www.nb.com/fundliterature, and you will be notified by mail each time a report is posted and provided with a website link to access the report.
If you already elected to receive shareholder reports electronically, you will not be affected by this change and you need not take any action. You may elect to receive shareholder reports and other communications from the Fund electronically anytime by contacting your financial intermediary (such as a broker-dealer or bank) or, if you are a direct investor, by calling 800.877.9700 or by sending an e-mail request to fundinfo@nb.com.
Beginning on January 1, 2019, you may elect to receive all future reports in paper free of charge. If you invest through a financial intermediary, you can contact your financial intermediary to request that you continue to receive paper copies of your shareholder reports. If you invest directly with the Fund, you can call 800.877.9700 or send an email request to fundinfo@nb.com to inform the Fund that you wish to continue receiving paper copies of your shareholder reports. Your election to receive reports in paper will apply to all funds held in your account if you invest through your financial intermediary or all funds held with the fund complex if you invest directly with the Fund.
Contents
THE FUNDS
President's Letter | 1 | ||||||
PORTFOLIO COMMENTARY | |||||||
Dividend Growth Fund | 2 | ||||||
Emerging Markets Equity Fund | 5 | ||||||
Equity Income Fund | 9 | ||||||
Focus Fund | 13 | ||||||
Genesis Fund | 16 | ||||||
Global Equity Fund^ | 20 | ||||||
Global Real Estate Fund | 24 | ||||||
Greater China Equity Fund | 28 | ||||||
Guardian Fund | 32 | ||||||
International Equity Fund | 35 | ||||||
International Select Fund | 38 | ||||||
International Small Cap Fund | 41 | ||||||
Intrinsic Value Fund | 45 | ||||||
Large Cap Value Fund | 48 | ||||||
Mid Cap Growth Fund | 51 | ||||||
Mid Cap Intrinsic Value Fund | 54 | ||||||
Multi-Cap Opportunities Fund | 58 | ||||||
Real Estate Fund | 61 | ||||||
Small Cap Growth Fund | 64 | ||||||
Sustainable Equity Fund | 67 | ||||||
FUND EXPENSE INFORMATION | 77 | ||||||
LEGEND | 81 | ||||||
SCHEDULE OF INVESTMENTS | |||||||
Dividend Growth Fund | 82 | ||||||
Emerging Markets Equity Fund | 84 | ||||||
Positions by Industry | 87 | ||||||
Equity Income Fund | 90 | ||||||
Focus Fund | 95 | ||||||
Genesis Fund | 98 | ||||||
Global Equity Fund^ | 101 | ||||||
Positions by Industry | 103 | ||||||
Global Real Estate Fund | 105 | ||||||
Positions by Sector | 107 | ||||||
Greater China Equity Fund | 109 | ||||||
Guardian Fund | 111 | ||||||
International Equity Fund | 117 | ||||||
Positions by Industry | 119 | ||||||
International Select Fund | 121 | ||||||
Positions by Industry | 123 | ||||||
International Small Cap Fund | 125 | ||||||
Positions by Industry | 127 | ||||||
Intrinsic Value Fund | 129 | ||||||
Large Cap Value Fund | 132 | ||||||
Mid Cap Growth Fund | 135 | ||||||
Mid Cap Intrinsic Value Fund | 138 | ||||||
Multi-Cap Opportunities Fund | 140 | ||||||
Real Estate Fund | 142 | ||||||
Small Cap Growth Fund | 144 | ||||||
Sustainable Equity Fund | 146 | ||||||
FINANCIAL STATEMENTS | 149 | ||||||
FINANCIAL HIGHLIGHTS (ALL CLASSES)/PER SHARE DATA | |||||||
Dividend Growth Fund | 211 | ||||||
Emerging Markets Equity Fund | 213 | ||||||
Equity Income Fund | 215 | ||||||
Focus Fund | 215 | ||||||
Genesis Fund | 219 | ||||||
Global Equity Fund^ | 221 | ||||||
Global Real Estate Fund | 221 | ||||||
Greater China Equity Fund | 223 | ||||||
Guardian Fund | 225 | ||||||
International Equity Fund | 227 | ||||||
International Select Fund | 229 | ||||||
International Small Cap Fund | 233 | ||||||
Intrinsic Value Fund | 233 | ||||||
Large Cap Value Fund | 235 | ||||||
Mid Cap Growth Fund | 239 | ||||||
Mid Cap Intrinsic Value Fund | 241 | ||||||
Multi-Cap Opportunities Fund | 245 | ||||||
Real Estate Fund | 245 | ||||||
Small Cap Growth Fund | 249 | ||||||
Sustainable Equity Fund | 251 | ||||||
Reports of Independent Registered Public Accounting Firms | 260 | ||||||
Directory | 264 | ||||||
Trustees and Officers | 265 | ||||||
Proxy Voting Policies and Procedures | 276 | ||||||
Quarterly Portfolio Schedule | 276 | ||||||
Notice to Shareholders | 277 | ||||||
^ As previously announced, as of September 3, 2019, Neuberger Berman Global Equity Fund changed its name to Neuberger Berman Integrated Large Cap Fund, and changed its investment strategy, portfolio management team and fees and expenses.
The "Neuberger Berman" name and logo and "Neuberger Berman Investment Advisers LLC" name are registered service marks of Neuberger Berman Group LLC. The individual Fund names in this piece are either service marks or registered service marks of Neuberger Berman Investment Advisers LLC, an affiliate of Neuberger Berman BD LLC, distributor, member FINRA. ©2019 Neuberger Berman BD LLC, distributor. All rights reserved.
President's Letter
Dear Shareholder,
Equity markets shifted over the course of this fiscal period. In 2018, investors already distressed about indications of a global economic slowdown weighed the potential multiplier effects of the U.S./China trade war and delivered the first full calendar year loss for the S&P 500® Index since the financial crisis. In 2019, though these macroeconomic issues and other geopolitical tensions continued to create uncertainty and volatility, markets rallied, particularly in January and June, on apparent breaks in trade tensions and as the U.S. Federal Reserve Board (Fed) first hinted, and then lowered rates.
Current data suggests we are navigating a later-stage market cycle. While the U.S. economy remains healthy, there are signs of deceleration. Second quarter 2019 GDP growth slowed to 2.0%, down from 3.1% in first quarter and 2.9% for all of 2018. In August, the Institute for Supply Management reported slowing in manufacturing activity. August's job growth data slowed in manufacturing and declined in commodity-related sectors.
The trade war continues to weigh on both the U.S. and global economies—in the U.S., on farmers, consumers' finances and confidence, on steel, oil, and other economically sensitive commodities, on ports, trucking and railways, and on business decision-making. Outside the U.S., export-driven economies, including Germany and China, have shown signs of stress. Global interest rates are already low, giving the Fed and other central banks, including the European Central Bank, which in July committed to a "highly accommodative" stance, limited stimulus firepower should the economy stall.
At the same time, a feared decline in second quarter corporate earnings did not materialize. Earnings were flat-to-up, aligned with guidance for the rest of the year. This, along with an attentive Fed, suggests we may avoid the recession forecasted by the bond market via an inverted yield curve. Further, job growth in the service sector remained healthy in August, the unemployment rate was at a low 3.7%, and wages were increasing.
With the S&P 500 Index up 18.34% year-to-date through the end of August against earnings growth in the single digits, valuations and risk are high. From Brexit and tumult in Parliament, to protests in Hong Kong, to worsening relations between the U.S. and Iran, to North Korean missile tests, to the U.S. election cycle—there is plenty of fodder for disruption in a headline-driven, reactive market. At the same time, bond yields are low, supporting equities as an asset class.
With tested strategies intended to outperform over the longer term and an emphasis on fundamentals, our teams rely on independent research—as they weigh potential benefits against macro-level and company-specific risk factors, and as they work to buy and sell opportunistically. Until markets return to a more fundamentals-driven standard, our teams will continue using volatility in their efforts to strengthen and fine-tune portfolios for the longer term.
Thank you for your confidence in Neuberger Berman.
Sincerely,

JOSEPH V. AMATO
PRESIDENT AND CEO
NEUBERGER BERMAN EQUITY FUNDS
1
Dividend Growth Fund Commentary (Unaudited)
Neuberger Berman Dividend Growth Fund Institutional Class generated a –2.45% total return for the fiscal year ended August 31, 2019, underperforming its benchmark, the S&P 500® Index (the Index), which posted a 2.92% total return for the same period. (Performance for all share classes is provided in the table immediately following this letter.)
By late-July, the market set a new all-time high (as measured by the Index) as the economy's expansion officially became the longest in U.S. history, driven by "growth" stocks with limited or, in many cases, no dividend programs. However, in late July equities experienced headwinds as investors grappled with an uptick in volatility tied to fears surrounding waning global growth, and geopolitical headwinds.
The Fund seeks to provide gross current income in-line with its benchmark, while seeking capital appreciation driven by dividend per share growth. This approach seeks to identify companies with strong business models generating cash to grow their businesses while providing rising dividend distributions to shareholders. Overall, we look for companies with strong balance sheets, solid management teams, attractive free cash flow yields, and clear capital allocation strategies.
From a portfolio construction standpoint, the largest equity sectors on average during the fiscal year included Information Technology ~20%, Financials ~14%, and Health Care ~13%. This reporting period, the bulk of relative returns were generated from stock selection across Real Estate, Financials, and Utilities—while selection within Consumer Staples, Consumer Discretionary, and Energy weighed on results versus the Index.
While the broader commodity complex experienced downward pressure, negative stock selection across our Materials holdings were partially offset by outsized returns from Wheaton Precious Metals. This holding proved to be our top overall performer, and provided a revenue stream tied to high-quality gold, platinum, palladium, and copper mines. The business does not incur ongoing exploration costs faced by traditional mining companies. This position sharply advanced as global central banks purchased a record $15 billion of the precious metal in the first half of 2019. We believe this exposure could provide a hedge to potential inflationary pressures.
Our Energy names negatively impacted both absolute and relative performance. Within this space, Devon Energy fell among our laggards. This upstream business experienced selling pressure despite beating production expectations. While the recent environment has been challenging, we remain encouraged by improving well productivity from Delaware Basin and STACK plays (i.e., Anadarko Basin area of Oklahoma). From a capital allocation perspective, management continues to divest non-core assets while rewarding shareholders through stock buybacks and dividend increases, making this, we believe, an ideal position given our investment mandate.
The health of the U.S. economy seems mixed. The consumer remains in a strong position, with low unemployment and modestly growing wages. However, the industrial economy seems to be facing challenges, in part due to the U.S.-China tariff dispute. In our view, valuations across equities remain reasonable, and when evaluating investment candidates, we continue to identify pockets of value across stable businesses with clear capital allocation plans exhibiting dividend growth potential. We acknowledge potential weakness stemming from geopolitical tensions, and believe distortions from central banks continue to drive the hunt for yield amid aging global demographics. Today, we believe the Fund remains positioned to navigate cross-currents given our focus on what we believe to be high-quality cash-generative companies.
In closing, we thank you for investing in our Fund.
Sincerely,
DAVID A. KIEFER AND WILLIAM D. HUNTER
PORTFOLIO MANAGERS
Information about principal risks of investing in the Fund is set forth in the prospectus and statement of additional information.
The portfolio composition, industries and holdings of the Fund are subject to change without notice.
The opinions expressed are those of the Fund's portfolio manager(s). The opinions are as of the date of this report and are subject to change without notice.
2
Dividend Growth Fund (Unaudited)
TICKER SYMBOLS
Institutional Class | NDGIX | ||||||
Class A | NDGAX | ||||||
Class C | NDGCX | ||||||
Class R6 | NRDGX | ||||||
SECTOR ALLOCATION
(as a % of Total Investments*) | |||||||
Communication Services | 5.4 | % | |||||
Consumer Discretionary | 7.7 | ||||||
Consumer Staples | 9.4 | ||||||
Energy | 7.6 | ||||||
Financials | 15.5 | ||||||
Health Care | 12.6 | ||||||
Industrials | 4.2 | ||||||
Information Technology | 20.3 | ||||||
Materials | 3.8 | ||||||
Real Estate | 5.1 | ||||||
Utilities | 2.3 | ||||||
Short-Term Investments | 6.1 | ||||||
Total | 100.0 | % | |||||
* Derivatives (other than options purchased), if any, are excluded from this chart.
PERFORMANCE HIGHLIGHTS
| Average Annual Total Return Ended 08/31/2019 | |||||||||||||||
| Inception Date | 1 Year | Life of Fund | |||||||||||||
At NAV | |||||||||||||||
Institutional Class | 12/15/2015 | –2.45 | % | 9.87 | % | ||||||||||
Class A | 12/15/2015 | –2.75 | % | 9.50 | % | ||||||||||
Class C | 12/15/2015 | –3.55 | % | 8.64 | % | ||||||||||
Class R6 | 12/15/2015 | –2.33 | % | 9.95 | % | ||||||||||
With Sales Charge | |||||||||||||||
Class A | –8.35 | % | 7.76 | % | |||||||||||
Class C | –4.47 | % | 8.64 | % | |||||||||||
Index | |||||||||||||||
| S&P 500® Index1,15 | 2.92 | % | 12.75 | % | |||||||||||
The performance data quoted represent past performance and do not indicate future results. Current performance may be lower or higher than the performance data quoted. For performance data current to the most recent month-end, please visit www.nb.com/performance.
The results shown in the table reflect the reinvestment of income dividends and other distributions, if any. The results do not reflect the effect of taxes a shareholder would pay on Fund distributions or on the redemption of Fund shares.
The investment return and principal value of an investment will fluctuate and shares, when redeemed, may be worth more or less than their original cost.
Returns would have been lower if Neuberger Berman Investment Advisers LLC ("Management") had not reimbursed certain expenses and/or waived a portion of the investment management fees during certain of the periods shown. Repayment by a class (of expenses previously reimbursed and/or fees previously waived by Management) will decrease the class's returns. Please see Note B in the Notes to Financial Statements for specific information regarding expense reimbursement and/or fee waiver arrangements.
As stated in the Fund's most recent prospectus, the total annual operating expense ratios for fiscal year 2018 were 1.24%, 1.68%, 2.35% and 1.17% for Institutional Class, Class A, Class C and Class R6 shares, respectively (before expense reimbursements and/or fee waivers, if any, and after restatement for Class R6 shares). The expense ratios were 0.70%, 1.06%, 1.81% and 0.60% for Institutional Class, Class A, Class C and Class R6 shares, respectively, after expense reimbursements and/or fee waivers and/or restatement. The expense ratios for the annual period ended August 31, 2019 can be found in the Financial Highlights section of this report.
Returns shown with a sales charge reflect the deduction of the current maximum initial sales charge of 5.75% for Class A shares and the contingent deferred sales charge (CDSC) for Class C shares. The CDSC for Class C shares is 1.00%, which is reduced to 0% after 1 year. The performance of the Fund's share classes will differ primarily due to different sales charge structures and class expenses. Please see the prospectus for more information about sales charge structures, if any, and class expenses for your share class.
3
Dividend Growth Fund (Unaudited)
COMPARISON OF A $1,000,000 INVESTMENT
(000's omitted)
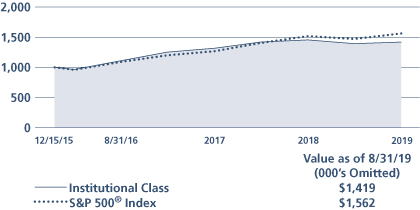
This graph shows the change in value of a hypothetical $1,000,000 investment in the Fund over the past 10 fiscal years, or since the Fund's inception if it has not operated for 10 years. The graph is based on the Institutional Class shares only; the performance of the Fund's share classes will differ primarily due to different sales charge structures and class expenses (see Performance Highlights chart on previous page). The result is compared with benchmarks, which include a broad-based market index and may include a more narrowly based index. Market indices have not been reduced to reflect any of the fees and costs of investing. The results shown in the graph reflect the reinvestment of income dividends and other distributions, if any. The results do not reflect the effect of taxes a shareholder would pay on Fund distributions or on the redemption of Fund shares. Results represent past performance and do not indicate future results.
4
Emerging Markets Equity Fund Commentary (Unaudited)
Neuberger Berman Emerging Markets Equity Fund Institutional Class generated a total return of –1.56% for the fiscal year ended August 31, 2019, outperforming its benchmark, the MSCI Emerging Markets Index (Net) (the Index), which reported a total return of –4.36% for the same period. (Performance for all share classes is provided in the table immediately following this letter.)
Emerging markets (EM) equities trailed the U.S. (as measured by the S&P 500® Index) and developed international equities (as measured by the MSCI EAFE® Index) this fiscal year, closing with a loss. Sentiment suffered early in the period as trade tensions between the U.S. and China exacerbated concerns about a global economic slowdown. Oil prices and U.S. interest rates increased early on as well, adding to pressures. Calendar year-to-date, however, EM returns were positive, with rallies in January and June as dovish signals from global central banks and temporary breaks in trade tensions quieted some of the market's noise.
On a sector level within the Index, defensive areas, including Utilities and Consumer Staples, posted positive results. The sharpest losses occurred within Health Care—as various regulatory changes negatively impacted EM pharmaceuticals—and Materials. By country, Brazil, Russia and Turkey posted the strongest results in the Index while smaller markets, Pakistan and Argentina, along with global-trade driven Korea saw the largest declines.
The Fund's performance advantage resulted primarily from stock selection, with sector allocation a secondary benefit. Information Technology (IT), Consumer Staples and Financials holdings were standouts. By country, Brazilian, Taiwanese and Polish names outperformed relative to the Index.
Key individual contributors included Brazil's B3 and Energisa, and Ping An, a Chinese property and casualty insurer. B3, the Brazilian financial exchange provider, posted solid revenue growth figures, and benefited from positive sentiment about Brazilian equities. Electric power distributor Energisa rallied on solid earnings and profit figures. Ping An delivered better-than-expected earnings, aided by sustained new business value growth despite a drop in premiums, along with solid investment returns.
Stock selection in Communications Services, Materials and Industrials detracted the most from relative returns, and from a country perspective, headwinds included Chinese, South African and Indonesian holdings.
Detractors included Baidu, Sasol and Samsung. Baidu, the Chinese Internet search leader, sold off as trade tensions caused uncertainty about Chinese economic growth. This uncertainty weighed on advertising revenues while expenses continued to increase due to investments in newer initiatives. We exited the position. We also sold Sasol, the South African energy and chemicals firm, as cost overruns on a large project reduced our conviction in the firm's management team. Samsung, the Korean consumer electronics and chip manufacturer, fell along with the broader semiconductor sub-sector, on lower demand and pricing projections.
Looking ahead, we see continued U.S. trade tensions and weaker global growth data tempered by central bankers' shifts toward easing. While trade tensions have immediate negative impacts—with firms delaying investments and decisions—monetary policy measures may take longer to positively impact economies. As such, the team will continue closely monitoring both global and local domestic monetary, regulatory and fiscal policies.
Aggregate changes to the portfolio in recent months resulted from individual stock decisions. The team is currently emphasizing growing consumer-driven areas such as Consumer Staples and Communication Services. The portfolio also remains overweight IT versus the Index, with new additions offset by trims and sales. We maintain an underweight to cyclical areas such as Energy and Materials, and some subsectors within Consumer Discretionary.
We believe the current portfolio is well positioned to capture strong relative long-term returns driven by earnings trajectories, while remaining relatively insulated from the macroeconomic distractions that impacted short-term market movement this period.
5
Sincerely,
CONRAD SALDANHA
PORTFOLIO MANAGER
Information about principal risks of investing in the Fund is set forth in the prospectus and statement of additional information.
The portfolio composition, industries and holdings of the Fund are subject to change without notice.
The opinions expressed are those of the Fund's portfolio manager(s). The opinions are as of the date of this report and are subject to change without notice.
6
Emerging Markets Equity Fund (Unaudited)
TICKER SYMBOLS
Institutional Class | NEMIX | ||||||
Class A | NEMAX | ||||||
Class C | NEMCX | ||||||
Class R3 | NEMRX | ||||||
Class R6 | NREMX | ||||||
PERFORMANCE HIGHLIGHTS9
| Average Annual Total Return Ended 08/31/2019 | |||||||||||||||||||||||
| Inception Date | 1 Year | 5 Years | 10 Years | Life of Fund | |||||||||||||||||||
At NAV | |||||||||||||||||||||||
Institutional Class | 10/08/2008 | –1.56 | % | 1.76 | % | 4.42 | % | 7.63 | % | ||||||||||||||
Class A | 10/08/2008 | –1.77 | % | 1.50 | % | 4.17 | % | 7.37 | % | ||||||||||||||
Class C | 10/08/2008 | –2.50 | % | 0.74 | % | 3.39 | % | 6.57 | % | ||||||||||||||
| Class R310 | 06/21/2010 | –2.19 | % | 1.10 | % | 3.79 | % | 7.03 | % | ||||||||||||||
| Class R621 | 03/15/2013 | –1.45 | % | 1.83 | % | 4.48 | % | 7.68 | % | ||||||||||||||
With Sales Charge | |||||||||||||||||||||||
Class A | –7.44 | % | 0.30 | % | 3.55 | % | 6.79 | % | |||||||||||||||
Class C | –3.47 | % | 0.74 | % | 3.39 | % | 6.57 | % | |||||||||||||||
Index | |||||||||||||||||||||||
| MSCI Emerging Markets Index (Net)1,15 | –4.36 | % | 0.38 | % | 4.07 | % | 6.28 | % | |||||||||||||||
The performance data quoted represent past performance and do not indicate future results. Current performance may be lower or higher than the performance data quoted. For performance data current to the most recent month-end, please visit www.nb.com/performance.
The results shown in the table reflect the reinvestment of income dividends and other distributions, if any. The results do not reflect the effect of taxes a shareholder would pay on Fund distributions or on the redemption of Fund shares.
The investment return and principal value of an investment will fluctuate and shares, when redeemed, may be worth more or less than their original cost.
Returns would have been lower if Neuberger Berman Investment Advisers LLC ("Management") had not reimbursed certain expenses and/or waived a portion of the investment management fees during certain of the periods shown. Repayment by a class (of expenses previously reimbursed and/or fees previously waived by Management) will decrease the class's returns. Please see Note B in the Notes to Financial Statements for specific information regarding expense reimbursement and/or fee waiver arrangements.
As stated in the Fund's most recent prospectus, the total annual operating expense ratios for fiscal year 2018 were 1.29%, 1.66%, 2.38%, 1.92% and 1.17% for Institutional Class, Class A, Class C, Class R3 and Class R6 shares, respectively (before expense reimbursements and/or fee waivers, if any, and after restatement for Class R6 shares). The expense ratios were 1.26%, 1.51%, 2.26% and 1.16% for Institutional Class, Class A, Class C and Class R6 shares, respectively, after expense reimbursements and/or fee waivers and/or restatement. The expense ratios for the annual period ended August 31, 2019 can be found in the Financial Highlights section of this report.
Returns shown with a sales charge reflect the deduction of the current maximum initial sales charge of 5.75% for Class A shares and the contingent deferred sales charge (CDSC) for Class C shares. The CDSC for Class C shares is 1.00%, which is reduced to 0% after 1 year. The performance of the Fund's share classes will differ primarily due to different sales charge structures and class expenses. Please see the prospectus for more information about sales charge structures, if any, and class expenses for your share class.
7
Emerging Markets Equity Fund (Unaudited)
COMPARISON OF A $1,000,000 INVESTMENT
(000's omitted)
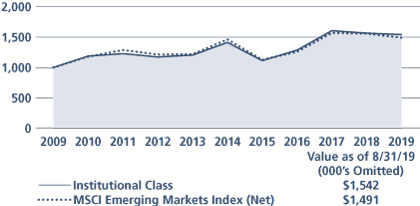
This graph shows the change in value of a hypothetical $1,000,000 investment in the Fund over the past 10 fiscal years, or since the Fund's inception if it has not operated for 10 years. The graph is based on the Institutional Class shares only; the performance of the Fund's share classes will differ primarily due to different sales charge structures and class expenses (see Performance Highlights chart on previous page). The result is compared with benchmarks, which include a broad-based market index and may include a more narrowly based index. Market indices have not been reduced to reflect any of the fees and costs of investing. The results shown in the graph reflect the reinvestment of income dividends and other distributions, if any. The results do not reflect the effect of taxes a shareholder would pay on Fund distributions or on the redemption of Fund shares. Results represent past performance and do not indicate future results.
8
Equity Income Fund Commentary (Unaudited)
Neuberger Berman Equity Income Fund Institutional Class generated a 3.06% total return for the fiscal year ended August 31, 2019, outperforming its benchmark, the S&P 500® Index (the Index), which posted a 2.92% total return for the same period. (Performance for all share classes is provided in the table immediately following this letter.)
By late-July, the market set a new all-time high (as measured by the Index) as the economy's expansion officially became the longest in U.S. history, driven by "growth" stocks with limited or, in many cases, no dividend programs. However, in late July, equities experienced headwinds as investors grappled with an uptick in volatility tied to fears surrounding waning global growth, and geopolitical headwinds.
The Fund is an objective-based strategy, striving for a total return between stocks and bonds with limited volatility relative to the Index. This portfolio is diversified among dividend-paying stocks and convertible securities, selected through extensive analysis of cash flow prospects, which we believe have the ability to sustain and grow dividends.
From a portfolio construction standpoint, the largest equity sectors on average during the fiscal year included Utilities ~16%, Real Estate ~12%, and Financials ~10%. During the period, the Fund also maintained a 9% average allocation to convertible bonds, which we believe provides a differentiated approach to an equity income portfolio. Additionally, the Fund's ability to own securities issued under Rule 144A, where retail investors often have limited direct exposure, allows diversified exposure to the asset class.
The Fund generated the bulk of its absolute and relative returns versus the Index from its allocation to Utilities. Stock selection across our carefully selected electric/gas names generated gains driven by names tied to infrastructure modernization. This space benefitted from risk-aversion as investors favored defensive sectors amid turbulent market conditions. From a portfolio construction standpoint, Utilities often serve as a defensive ballast and therefore, NextEra Energy was our top performer. The common thread across our holdings is exposure to earnings per share and dividend growth above the sector average—fueled in part by renewable energy initiatives. The Fund also saw relative gains from its Real Estate and Industrials holdings.
On the commodity front, West Texas Intermediate oil prices experienced headwinds during the end of 2018, posting their worst calendar year decline since 2015, before recovering somewhat in 2019. Lower energy prices were driven by increased output coupled with fears of a global economic slowdown. In aggregate, our oil/gas holdings outperformed the broader Energy sector, however, Canada's Suncor Energy, weighed on our results. We believe our diversified holdings in the Energy and Materials sectors help to provide a potential hedge to inflationary pressures. Stock selection in Consumer Discretionary and Financials also detracted from relative returns.
Elsewhere, exposure to convertible bonds versus the Index was accretive to absolute results as this eclectic asset class dampened volatility. In retrospect, 2018 was a banner year for new issuance as U.S. companies sold over $30 billion of convertible securities. This was the fastest pace of new issuance in nearly a decade and the Fund capitalized on an uptick of quality issuance within this space. Historically, this asset class has been among the most conservative aspects of the Fund as we favor convertibles trading at a discount to par value with attractive conversion premiums.
The Fund's use of written options contributed positively to performance during the period.
The health of the U.S. economy seems mixed. The consumer remains in a strong position, with low unemployment and modestly growing wages. However, the industrial economy seems to be facing challenges, in part due to the U.S.-China tariff dispute. In our view, valuations across equities remain reasonable, and when evaluating investment candidates, we continue to identify pockets of value, across stable businesses with clear capital allocation plans exhibiting dividend growth potential. We acknowledge potential weakness stemming from geopolitical tensions, and believe distortions from central banks continue to drive the hunt for yield amid aging global demographics. Today, we believe the Fund remains positioned to navigate potential cross-currents given our focus on what we believe to be high-quality cash-generative companies.
In closing, we thank you for investing in our Fund.
9
Sincerely,
RICHARD LEVINE AND SANDY POMEROY
PORTFOLIO MANAGERS
Information about principal risks of investing in the Fund is set forth in the prospectus and statement of additional information.
The portfolio composition, industries and holdings of the Fund are subject to change without notice.
The opinions expressed are those of the Fund's portfolio manager(s). The opinions are as of the date of this report and are subject to change without notice.
10
Equity Income Fund (Unaudited)
TICKER SYMBOLS
Institutional Class | NBHIX | ||||||
Class A | NBHAX | ||||||
Class C | NBHCX | ||||||
Class R3 | NBHRX | ||||||
SECTOR ALLOCATION
(as a % of Total Investments*) | |||||||
Communication Services | 4.6 | % | |||||
Consumer Discretionary | 4.9 | ||||||
Consumer Staples | 5.3 | ||||||
Energy | 7.2 | ||||||
Financials | 9.4 | ||||||
Health Care | 7.9 | ||||||
Industrials | 7.0 | ||||||
Information Technology | 7.8 | ||||||
Materials | 3.3 | ||||||
Real Estate | 13.1 | ||||||
Utilities | 16.0 | ||||||
Convertible Bonds | 9.4 | ||||||
Short-Term Investments | 4.1 | ||||||
Total | 100.0 | % | |||||
* Derivatives (other than options purchased), if any, are excluded from this chart.
PERFORMANCE HIGHLIGHTS9
| Average Annual Total Return Ended 08/31/2019 | |||||||||||||||||||||||
| Inception Date* | 1 Year | 5 Years | 10 Years | Life of Fund | |||||||||||||||||||
At NAV | |||||||||||||||||||||||
| Institutional Class13 | 06/09/2008 | 3.06 | % | 6.51 | % | 10.10 | % | 7.56 | % | ||||||||||||||
| Class A13 | 06/09/2008 | 2.68 | % | 6.12 | % | 9.69 | % | 7.20 | % | ||||||||||||||
| Class C13 | 06/09/2008 | 1.91 | % | 5.34 | % | 8.89 | % | 6.52 | % | ||||||||||||||
| Class R313 | 06/21/2010 | 2.40 | % | 5.84 | % | 9.44 | % | 7.06 | % | ||||||||||||||
With Sales Charge | |||||||||||||||||||||||
| Class A13 | –3.21 | % | 4.87 | % | 9.05 | % | 6.71 | % | |||||||||||||||
| Class C13 | 0.95 | % | 5.34 | % | 8.89 | % | 6.52 | % | |||||||||||||||
Index | |||||||||||||||||||||||
| S&P 500® Index1,15 | 2.92 | % | 10.11 | % | 13.45 | % | 8.37 | % | |||||||||||||||
*The performance data for each class includes the performance of the Fund's oldest share class, Trust Class, from November 2, 2006 through June 9, 2008. The performance data for Class R3 also includes the performance of the Fund's Institutional Class from June 9, 2008 through June 21, 2010. See endnote 13 for information about the effects of the different fees paid by each class.
The performance data quoted represent past performance and do not indicate future results. Current performance may be lower or higher than the performance data quoted. For performance data current to the most recent month-end, please visit www.nb.com/performance.
The results shown in the table reflect the reinvestment of income dividends and other distributions, if any. The results do not reflect the effect of taxes a shareholder would pay on Fund distributions or on the redemption of Fund shares.
The investment return and principal value of an investment will fluctuate and shares, when redeemed, may be worth more or less than their original cost.
Returns would have been lower if Neuberger Berman Investment Advisers LLC ("Management") had not reimbursed certain expenses and/or waived a portion of the investment management fees during certain of the periods shown. Repayment by a class (of expenses previously reimbursed and/or fees previously waived by Management) will decrease the class's returns. Please see Note B in the Notes to Financial Statements for specific information regarding expense reimbursement and/or fee waiver arrangements.
As stated in the Fund's most recent prospectus, the total annual operating expense ratios for fiscal year 2018 were 0.69%, 1.05%, 1.80% and 1.33% for Institutional Class, Class A, Class C and Class R3 shares, respectively (before expense reimbursements and/or fee waivers, if any). The expense ratios for the annual period ended August 31, 2019 can be found in the Financial Highlights section of this report.
Returns shown with a sales charge reflect the deduction of the current maximum initial sales charge of 5.75% for Class A shares and the contingent deferred sales charge (CDSC) for Class C shares. The CDSC for Class C shares is 1.00%, which is reduced to 0% after 1 year. The performance of the Fund's share classes will differ primarily due to different sales charge structures and class expenses. Please see the prospectus for more information about sales charge structures, if any, and class expenses for your share class.
11
Equity Income Fund (Unaudited)
COMPARISON OF A $1,000,000 INVESTMENT13
(000's omitted)
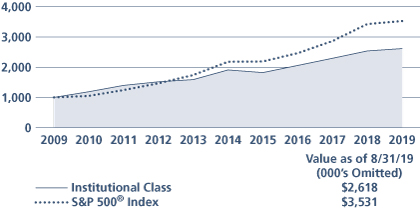
This graph shows the change in value of a hypothetical $1,000,000 investment in the Fund over the past 10 fiscal years, or since the Fund's inception if it has not operated for 10 years. The graph is based on the Institutional Class shares only; the performance of the Fund's share classes will differ primarily due to different sales charge structures and class expenses (see Performance Highlights chart on previous page). The result is compared with benchmarks, which include a broad-based market index and may include a more narrowly based index. Market indices have not been reduced to reflect any of the fees and costs of investing. The results shown in the graph reflect the reinvestment of income dividends and other distributions, if any. The results do not reflect the effect of taxes a shareholder would pay on Fund distributions or on the redemption of Fund shares. Results represent past performance and do not indicate future results.
12
Focus Fund Commentary (Unaudited)
Neuberger Berman Focus Fund Investor Class generated a –2.35% total return for the fiscal year ended August 31, 2019, underperforming its benchmark, the S&P 500® Index (the Index), which provided a 2.92% total return for the same period. (Performance for all share classes is provided in the table immediately following this letter.)
The overall U.S. stock market experienced periods of elevated volatility, but generated a modest gain during the reporting period. While the market posted positive returns over eight of the twelve months covered by this report, most of those gains were given back during several sharp downturns. These setbacks were triggered by a number of factors, including concerns over the escalating trade war between the U.S. and China, signs of moderating global growth and a host of geopolitical issues. Against this backdrop, the U.S. Federal Reserve Board (Fed) had a "dovish pivot" in January 2019, as it announced a pause from raising rates. Late in the reporting period, the yield curve inverted, which has typically foreshadowed more difficult economy conditions going forward. Then, as expected, the Fed lowered rates at its meeting in July 2019—the first cut since 2008.
Both stock selection and sector allocation detracted from relative performance versus the Index during the reporting period. In terms of stock selection, holdings in the Consumer Discretionary, Health Care and Energy sectors were the largest detractors from relative returns. In the Consumer Discretionary sector, the Fund's position in cruise ship company Carnival Corp. performed poorly. Within the Health Care sector, shares of pharmaceuticals company Pfizer, Inc. fell sharply. Within the Energy sector, several holdings in the Oil, Gas & Consumable Fuels industry performed poorly. In terms of sector allocation, underweights to Real Estate and Information Technology (IT), along with an overweight to Energy, were the largest detractors from relative performance.
On the upside, holdings in the Communication Services, IT and Materials sectors added the most relative value. In Communication Services, our position in entertainment company Activision Blizzard, Inc. was rewarded. Within IT, the Fund's position in Motorola Solutions, Inc., a data communications and telecommunications equipment provider, was the most beneficial for returns. Within the Materials sector, one of our holdings in the Chemicals industry rallied and aided the Fund's performance. From a sector allocation perspective, overweights to Communication Services and Industrials versus the Index were the only meaningful contributors to results.
The Fund's use of written options contributed positively to performance during the period.
Looking ahead, we remain cautious on the growth prospects for the U.S. economy given leading indicators that are slowing, uncertainties regarding the trade war between the U.S. and China and the inversion of the yield curve. While we do not believe a recession will occur in the short-term, we believe the pace of the U.S. economic expansion could further moderate in 2020. In our view, increased market volatility will continue as the year progresses. Against this backdrop, we anticipate an increase in price dislocations that could turn into attractive investment opportunities. We remain disciplined bottom-up managers, looking for opportunities to buy stocks that are trading below their fair value to generate results for the Fund's shareholders. We also believe that equities remain the most appropriate asset class over the long term given their potential to generate capital appreciation.
Sincerely,
TIMOTHY CREEDON AND DAVID LEVINE
PORTFOLIO MANAGERS
Information about principal risks of investing in the Fund is set forth in the prospectus and statement of additional information.
The portfolio composition, industries and holdings of the Fund are subject to change without notice.
The opinions expressed are those of the Fund's portfolio manager(s). The opinions are as of the date of this report and are subject to change without notice.
13
Focus Fund (Unaudited)
TICKER SYMBOLS
Investor Class | NBSSX | ||||||
Trust Class | NBFCX | ||||||
Advisor Class | NBFAX | ||||||
Institutional Class | NFALX | ||||||
Class A | NFAAX | ||||||
Class C | NFACX | ||||||
SECTOR ALLOCATION
(as a % of Total Investments*) | |||||||
Communication Services | 16.5 | % | |||||
Consumer Discretionary | 12.2 | ||||||
Consumer Staples | 6.1 | ||||||
Energy | 4.6 | ||||||
Financials | 15.4 | ||||||
Health Care | 13.4 | ||||||
Industrials | 6.5 | ||||||
Information Technology | 17.9 | ||||||
Materials | 2.7 | ||||||
Utilities | 3.5 | ||||||
Short-Term Investments | 1.2 | ||||||
Total | 100.0 | % | |||||
* Derivatives (other than options purchased), if any, are excluded from this chart.
PERFORMANCE HIGHLIGHTS8
| Average Annual Total Return Ended 08/31/2019 | |||||||||||||||||||||||
| Inception Date | 1 Year | 5 Years | 10 Years | Life of Fund | |||||||||||||||||||
At NAV | |||||||||||||||||||||||
Investor Class | 10/19/1955 | –2.35 | % | 6.69 | % | 10.92 | % | 10.32 | % | ||||||||||||||
| Trust Class3 | 08/30/1993 | –2.52 | % | 6.50 | % | 10.70 | % | 10.29 | % | ||||||||||||||
| Advisor Class4 | 09/03/1996 | –2.68 | % | 6.34 | % | 10.52 | % | 10.23 | % | ||||||||||||||
| Institutional Class5 | 06/21/2010 | –2.15 | % | 6.87 | % | 11.10 | % | 10.34 | % | ||||||||||||||
| Class A19 | 06/21/2010 | –2.51 | % | 6.48 | % | 10.73 | % | 10.29 | % | ||||||||||||||
| Class C19 | 06/21/2010 | –3.25 | % | 5.69 | % | 9.98 | % | 10.17 | % | ||||||||||||||
With Sales Charge | |||||||||||||||||||||||
| Class A19 | –8.12 | % | 5.23 | % | 10.08 | % | 10.19 | % | |||||||||||||||
| Class C19 | –4.14 | % | 5.69 | % | 9.98 | % | 10.17 | % | |||||||||||||||
Index | |||||||||||||||||||||||
| S&P 500® Index1,15 | 2.92 | % | 10.11 | % | 13.45 | % | 10.20 | % | |||||||||||||||
The performance data quoted represent past performance and do not indicate future results. Current performance may be lower or higher than the performance data quoted. For performance data current to the most recent month-end, please visit www.nb.com/performance.
The results shown in the table reflect the reinvestment of income dividends and other distributions, if any. The results do not reflect the effect of taxes a shareholder would pay on Fund distributions or on the redemption of Fund shares.
The investment return and principal value of an investment will fluctuate and shares, when redeemed, may be worth more or less than their original cost.
Returns would have been lower if Neuberger Berman Investment Advisers LLC ("Management") had not reimbursed certain expenses and/or waived a portion of the investment management fees during certain of the periods shown. Repayment by a class (of expenses previously reimbursed and/or fees previously waived by Management) will decrease the class's returns. Please see Note B in the Notes to Financial Statements for specific information regarding expense reimbursement and/or fee waiver arrangements.
As stated in the Fund's most recent prospectus, the total annual operating expense ratios for fiscal year 2018 were 0.92%, 1.10%, 1.26%, 0.76%, 1.13%, and 1.88% for Investor Class, Trust Class, Advisor Class, Institutional Class, Class A and Class C shares, respectively (before expense reimbursements and/or fee waivers, if any). The expense ratios were 0.76%, 1.12% and 1.87% for Institutional Class, Class A and Class C shares, respectively, after expense reimbursements and/or fee waivers. The total annual operating expense ratio for Institutional Class includes the class' repayment of expenses previously reimbursed and/or fees previously waived by Management. The expense ratios for the annual period ended August 31, 2019 can be found in the Financial Highlights section of this report.
Returns shown with a sales charge reflect the deduction of the current maximum initial sales charge of 5.75% for Class A shares and the contingent deferred sales charge (CDSC) for Class C shares. The CDSC for Class C shares is 1.00%, which is reduced to 0% after 1 year. The performance of the Fund's share classes will differ primarily due to different sales charge structures and class expenses. Please see the prospectus for more information about sales charge structures, if any, and class expenses for your share class.
14
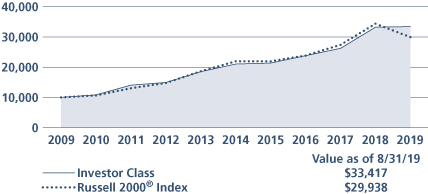
Focus Fund (Unaudited)
COMPARISON OF A $10,000 INVESTMENT
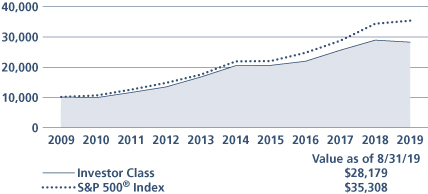
This graph shows the change in value of a hypothetical $10,000 investment in the Fund over the past 10 fiscal years, or since the Fund's inception if it has not operated for 10 years. The graph is based on the Investor Class shares only; the performance of the Fund's share classes will differ primarily due to different sales charge structures and class expenses (see Performance Highlights chart on previous page). The result is compared with benchmarks, which include a broad-based market index and may include a more narrowly based index. Market indices have not been reduced to reflect any of the fees and costs of investing. The results shown in the graph reflect the reinvestment of income dividends and other distributions, if any. The results do not reflect the effect of taxes a shareholder would pay on Fund distributions or on the redemption of Fund shares. Results represent past performance and do not indicate future results.
15
Genesis Fund Commentary (Unaudited)
Neuberger Berman Genesis Fund Investor Class generated a 0.53% total return for the fiscal year ended August 31, 2019, outperforming its benchmark, the Russell 2000® Index (the Index), which provided a –12.89% total return for the same period. (Performance for all share classes is provided in the table immediately following this letter.)
The overall U.S. stock market, as measured by the S&P 500® Index, experienced periods of elevated volatility, but generated a modest gain during the reporting period. While the market posted positive returns over eight of the twelve months covered by this report, most of those gains were given back during several sharp downturns. These setbacks were triggered by a number of factors, including concerns over the escalating trade war between the U.S. and China, signs of moderating global growth and a host of geopolitical issues. Against this backdrop, the U.S. Federal Reserve Board (Fed) had a "dovish pivot" in January 2019, as it announced a pause from raising rates. Then, as expected, the Fed lowered rates at its meeting in July 2019—the first cut since 2008. All told, the S&P 500 Index returned 2.92% during the reporting period. In contrast, small cap stocks, as measured by the Index, posted a negative return.
The Fund outperformed the Index during the reporting period. Stock selection contributed to relative results, whereas sector allocation modestly detracted from performance. We focus on investing in high quality companies, which we define as companies with the ability to generate significant free cash flow, above-average profitability supported by competitive barriers to entry, generally strong balance sheets, and less volatile/less economically sensitive businesses. Our style of investing was in favor during the period and acted as a tailwind to our absolute and relative performance. In terms of stock selection, holdings in the Health Care, Consumer Discretionary and Financials sectors were the most additive to results. In Health Care, several positions in the Heath Care Equipment & Supplies industry added the most value. In Consumer Discretionary, the Fund benefited from solid performance across several industries. In Financials, our Capital Markets holdings and Regional Bank positions outperformed. Among the various other sectors within the Index, none meaningfully detracted from relative stock selection results during the reporting period.
From a sector allocation perspective, the lack of exposure to bond proxies, namely real estate investment trusts (REITs) and Utilities, negatively impacted the Fund's returns. However, we do not typically own REITs as they do not meet our investment criteria and we felt there were better opportunities outside of Utilities. On the upside, an overweight to Information Technology, specifically Software, contributed to relative returns. Elsewhere, a lack of exposure to low quality biotechnology and pharmaceutical companies were additive for performance as they posted very poor results.
Evidence of moderating global economic growth continues to mount. Globally, long-term interest rates have responded by falling sharply. As a result, the Fed, as well as other central banks, have indicated a willingness to pursue more accommodative monetary policies, including possible rate cuts. Such actions could help prolong the economic expansion, but recessionary fears have risen as the U.S. yield curve has inverted. Meanwhile, the trade war between the U.S. and China remains an important wildcard. While both sides have political motivation for wanting an agreement, this is far from guaranteed and the chances for a resolution seem to change daily. Regardless of what happens in the near-term, it is our view that the relationship between the U.S. and China is likely to remain strained given significant differences in areas such as intellectual property.
While the nonstop news flow has led to elevated market volatility, we continue to see signs that lead us to believe that investors are increasingly favoring higher-quality businesses. Whether this will continue depends on a myriad of factors, including economic growth, trends for inflation/interest rates and investor sentiment. Despite aggressive central bank easing policies, there is evidence that capital markets are tightening to some degree. This is most prevalent in the private equity markets, where previously highly valued but money losing business models are rushing to go public to less than friendly public equity investors. Regardless, we believe that the key to outperformance over the long term will be driven by owning companies with superior business models that are defended by durable competitive moats and that enjoy attractive financial attributes, such as conservative balance sheets, high returns on capital, and above-market earnings and free cash flow growth. We seek to continually emphasize businesses with these characteristics for the Fund.
16
Sincerely,
JUDITH M. VALE, ROBERT W. D'ALELIO, BRETT S. REINER AND GREGORY G. SPIEGEL
PORTFOLIO CO-MANAGERS
Information about principal risks of investing in the Fund is set forth in the prospectus and statement of additional information.
The portfolio composition, industries and holdings of the Fund are subject to change without notice.
The opinions expressed are those of the Fund's portfolio manager(s). The opinions are as of the date of this report and are subject to change without notice.
17
Genesis Fund (Unaudited)
TICKER SYMBOLS
Investor Class | NBGNX | ||||||
Trust Class | NBGEX | ||||||
Advisor Class | NBGAX | ||||||
Institutional Class | NBGIX | ||||||
Class R6 | NRGSX | ||||||
SECTOR ALLOCATION
(as a % of Total Investments*) | |||||||
Communication Services | 2.7 | % | |||||
Consumer Discretionary | 11.1 | ||||||
Consumer Staples | 5.3 | ||||||
Energy | 2.1 | ||||||
Financials | 16.1 | ||||||
Health Care | 15.7 | ||||||
Industrials | 16.9 | ||||||
Information Technology | 23.1 | ||||||
Materials | 5.2 | ||||||
Real Estate | 1.0 | ||||||
Short-Term Investments | 0.8 | ||||||
Total | 100.0 | % | |||||
* Derivatives (other than options purchased), if any, are excluded from this chart.
PERFORMANCE HIGHLIGHTS
| Average Annual Total Return Ended 08/31/2019 | |||||||||||||||||||||||
| Inception Date | 1 Year | 5 Years | 10 Years | Life of Fund | |||||||||||||||||||
At NAV | |||||||||||||||||||||||
Investor Class | 09/27/1988 | 0.53 | % | 9.69 | % | 12.82 | % | 12.15 | % | ||||||||||||||
| Trust Class3 | 08/26/1993 | 0.43 | % | 9.60 | % | 12.73 | % | 12.12 | % | ||||||||||||||
| Advisor Class4 | 04/02/1997 | 0.18 | % | 9.31 | % | 12.43 | % | 11.90 | % | ||||||||||||||
| Institutional Class5 | 07/01/1999 | 0.69 | % | 9.88 | % | 13.02 | % | 12.30 | % | ||||||||||||||
| Class R622 | 03/15/2013 | 0.80 | % | 9.97 | % | 13.00 | % | 12.21 | % | ||||||||||||||
Index | |||||||||||||||||||||||
| Russell 2000® Index1,15 | –12.89 | % | 6.41 | % | 11.59 | % | 9.34 | % | |||||||||||||||
The performance data quoted represent past performance and do not indicate future results. Current performance may be lower or higher than the performance data quoted. For performance data current to the most recent month-end, please visit www.nb.com/performance.
The results shown in the table reflect the reinvestment of income dividends and other distributions, if any. The results do not reflect the effect of taxes a shareholder would pay on Fund distributions or on the redemption of Fund shares.
The investment return and principal value of an investment will fluctuate and shares, when redeemed, may be worth more or less than their original cost.
Returns would have been lower if Neuberger Berman Investment Advisers LLC ("Management") had not reimbursed certain expenses and/or waived a portion of the investment management fees during certain of the periods shown. Repayment by a class (of expenses previously reimbursed and/or fees previously waived by Management) will decrease the class's returns. Please see Note B in the Notes to Financial Statements for specific information regarding expense reimbursement and/or fee waiver arrangements.
As stated in the Fund's most recent prospectus, the total annual operating expense ratios for fiscal year 2018 were 1.02%, 1.10%, 1.35%, 0.85% and 0.75% for Investor Class, Trust Class, Advisor Class, Institutional Class and Class R6 shares, respectively (before expense reimbursements and/or fee waivers, if any, and after restatement for Class R6 shares). The expense ratios for the annual period ended August 31, 2019 can be found in the Financial Highlights section of this report.
18
Genesis Fund (Unaudited)
COMPARISON OF A $10,000 INVESTMENT
This graph shows the change in value of a hypothetical $10,000 investment in the Fund over the past 10 fiscal years, or since the Fund's inception if it has not operated for 10 years. The graph is based on the Investor Class shares only; the performance of the Fund's share classes will differ primarily due to different class expenses (see Performance Highlights chart on previous page). The result is compared with benchmarks, which include a broad-based market index and may include a more narrowly based index. Market indices have not been reduced to reflect any of the fees and costs of investing. The results shown in the graph reflect the reinvestment of income dividends and other distributions, if any. The results do not reflect the effect of taxes a shareholder would pay on Fund distributions or on the redemption of Fund shares. Results represent past performance and do not indicate future results.
19
Global Equity Fund* Commentary (Unaudited)
Neuberger Berman Global Equity Fund Institutional Class generated a total return of –3.74% for the fiscal year ended August 31, 2019, trailing the –0.28% total return of its benchmark, the MSCI All Country World Index (Net) (the Index) for the same period. (Performance for all share classes is provided in the table immediately following this letter.)
As this reporting period began, signs of a global economic slowdown coupled with a damaging trade war between the world's largest economies weighed on investor sentiment and shook global markets. As the new year arrived, although these issues and others—including what path Brexit would take—persisted, sentiment improved on indications that central bankers were trending toward a more stimulative posture, and on periodic breaks in trade tensions. In the U.S., the S&P 500® Index outperformed developed international markets (as measured by the MSCI EAFE® Index) during this reporting period, and both the U.S. and developed international markets outperformed emerging markets (as measured by the MSCI Emerging Markets Index).
The Index saw a wide disparity in returns this period. The defensive and generally higher yielding Utilities, Real Estate and Consumer Staples sectors ended the fiscal year up by double digits. Energy posted a double-digit decline, with Materials and Financials also showing losses. By country, Argentina, Brazil and Russia led the Index, while Pakistan, Korea and Chile lagged.
The shortfall in relative performance versus the Index resulted primarily from stock selection within Energy, Communication Services and Consumer Discretionary holdings where global growth concerns weighed on several names. By country, underweights and stock selection in the U.S. and Germany, and stock selection in Hong Kong were a headwind to relative returns.
Individual detractors included Samsonite, Centene and EOG Resources. Samsonite, a Hong Kong-based luggage manufacturer, sold off on trade disputes between the U.S. and China, as tariffs caused retailers to defer orders, and on weakness in Europe. Centene, a U.S. managed care provider reported slower organic growth. EOG, an unconventional U.S. energy explorer, posted strong earnings but declined as oil prices fell.
Stock selection benefited relative performance within Materials and Industrials. An overweight to Information Technology (IT) versus the Index was also positive. On a country basis, holdings in Japan, an overweight to the Netherlands, and a zero weight to Korea were beneficial.
Key contributors included U.S. holdings, Estee Lauder and CDW, and Sonova, based in Switzerland. Beauty and skin care leader, Estee Lauder, reported robust growth in luxury skin care in Asia and Europe. CDW, a value-added reseller of IT solutions, announced solid earnings benefiting from sustained U.S. IT spending growth and market share gains. Hearing aid specialist Sonova continued to benefit from recent product launches, accelerating growth and profit margins.
Looking ahead, despite a historically wide valuation gap between value and growth stocks, we remain committed to our "Quality at a Reasonable Price" discipline, focusing on profitability and cash flows that may be under-recognized by the market. We seek to avoid deep value areas of the market where structural challenges may be a factor, and are wary of high-flying growth stocks where valuations seem disconnected from fundamentals.
Our focus remains on quality companies with strong balance sheets, continuing long-term growth opportunities, solid recurring revenues, and management teams that we believe can enhance shareholder value. We also favor multinationals, as geographically diversified revenues can help limit exposure to any single 'at-risk' country within the current macro environment.
We are comfortable paying a modest valuation premium for companies we believe offer superior characteristics, and believe that a diversified and risk-managed portfolio of such names will be well positioned for the medium to longer-term.
20
Sincerely,
BENJAMIN SEGAL AND ELIAS COHEN
PORTFOLIO MANAGERS
* As previously announced, as of September 3, 2019, Neuberger Berman Global Equity Fund changed its name to Neuberger Berman Integrated Large Cap Fund, and changed its investment strategy, portfolio management team and fees and expenses.
Information about principal risks of investing in the Fund is set forth in the prospectus and statement of additional information.
The portfolio composition, industries and holdings of the Fund are subject to change without notice.
The opinions expressed are those of the Fund's portfolio manager(s). The opinions are as of the date of this report and are subject to change without notice.
21
Global Equity Fund (Unaudited)
TICKER SYMBOLS
Institutional Class | NGQIX | ||||||
Class A | NGQAX | ||||||
Class C | NGQCX | ||||||
PERFORMANCE HIGHLIGHTS9
| Average Annual Total Return Ended 08/31/2019 | |||||||||||||||||||
| Inception Date | 1 Year | 5 Years | Life of Fund | ||||||||||||||||
At NAV | |||||||||||||||||||
Institutional Class | 06/30/2011 | –3.74 | % | 5.39 | % | 6.12 | % | ||||||||||||
Class A | 06/30/2011 | –4.19 | % | 5.04 | % | 5.75 | % | ||||||||||||
Class C | 06/30/2011 | –4.84 | % | 4.23 | % | 4.95 | % | ||||||||||||
With Sales Charge | |||||||||||||||||||
Class A | –9.71 | % | 3.80 | % | 4.98 | % | |||||||||||||
Class C | –5.74 | % | 4.23 | % | 4.95 | % | |||||||||||||
Index | |||||||||||||||||||
| MSCI All Country World Index (Net)1,15 | –0.28 | % | 5.51 | % | 7.40 | % | |||||||||||||
The performance data quoted represent past performance and do not indicate future results. Current performance may be lower or higher than the performance data quoted. For performance data current to the most recent month-end, please visit www.nb.com/performance.
The results shown in the table reflect the reinvestment of income dividends and other distributions, if any. The results do not reflect the effect of taxes a shareholder would pay on Fund distributions or on the redemption of Fund shares.
The investment return and principal value of an investment will fluctuate and shares, when redeemed, may be worth more or less than their original cost.
Returns would have been lower if Neuberger Berman Investment Advisers LLC ("Management") had not reimbursed certain expenses and/or waived a portion of the investment management fees during certain of the periods shown. Repayment by a class (of expenses previously reimbursed and/or fees previously waived by Management) will decrease the class's returns. Please see Note B in the Notes to Financial Statements for specific information regarding expense reimbursement and/or fee waiver arrangements.
As stated in the Fund's most recent prospectus, the estimated total annual operating expense ratios for fiscal year 2019 are 6.14%, 6.36% and 7.27% for Institutional Class, Class A and Class C shares, respectively (before expense reimbursements and/or fee waivers, if any, and after restatement). The estimated expense ratios for fiscal year 2019 are 0.41%, 0.77% and 1.52% for Institutional Class, Class A and Class C shares, respectively, after expense reimbursements and/or fee waivers and/or restatement. The expense ratios for the annual period ended August 31, 2019 can be found in the Financial Highlights section of this report.
Returns shown with a sales charge reflect the deduction of the current maximum initial sales charge of 5.75% for Class A shares and the contingent deferred sales charge (CDSC) for Class C shares. The CDSC for Class C shares is 1.00%, which is reduced to 0% after 1 year. The performance of the Fund's share classes will differ primarily due to different sales charge structures and class expenses. Please see the prospectus for more information about sales charge structures, if any, and class expenses for your share class.
22
Global Equity Fund (Unaudited)
COMPARISON OF A $1,000,000 INVESTMENT
(000's omitted)
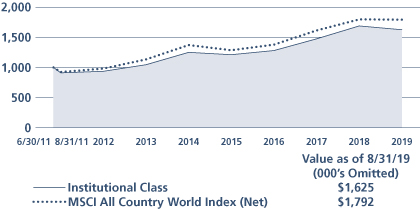
This graph shows the change in value of a hypothetical $1,000,000 investment in the Fund over the past 10 fiscal years, or since the Fund's inception if it has not operated for 10 years. The graph is based on the Institutional Class shares only; the performance of the Fund's share classes will differ primarily due to different sales charge structures and class expenses (see Performance Highlights chart on previous page). The result is compared with benchmarks, which include a broad-based market index and may include a more narrowly based index. Market indices have not been reduced to reflect any of the fees and costs of investing. The results shown in the graph reflect the reinvestment of income dividends and other distributions, if any. The results do not reflect the effect of taxes a shareholder would pay on Fund distributions or on the redemption of Fund shares. Results represent past performance and do not indicate future results.
23
Global Real Estate Fund Commentary (Unaudited)
The Neuberger Berman Global Real Estate Fund Institutional Class generated a 14.01% total return for the fiscal year ended August 31, 2019, outperforming its benchmark, the FTSE EPRA/Nareit Developed Index (Net) (the Index), which generated an 8.12% total return for the same period. (Performance for all share classes is provided in the table immediately following this letter.)
The global stock market (as measured by the MSCI All Country World Index (Net)) experienced periods of elevated volatility and generated a modest decline during the reporting period. While the market posted positive returns over several months covered by this report, those gains were given back during several sharp downturns. These setbacks were triggered by a number of factors, including concerns over the escalating trade war between the U.S. and China, signs of moderating global growth, the potential for a "hard Brexit" and political unrest in Hong Kong. Against this backdrop, the U.S. Federal Reserve Board (Fed) and a number of central banks announced that they would ease monetary policy in an attempt to stimulate growth. For example, the Fed lowered rates at its meeting in July 2019—the first cut since 2008. Comparatively, global real estate investment trusts (REITs) saw very strong results during the period.
The Fund outperformed the Index during the reporting period. Stock selection, overall, was the largest contributor to the Fund's relative results versus the Index. In particular, holdings in the Specialty, Residential and Diversified sectors were the most additive for returns. In terms of individual holdings, American Tower Corp., Equinix, Inc., Equity LifeStyle Properties, Inc., SBA Communications Corp. and Nippon Accommodations Fund, Inc. were the largest contributors to performance. The only sector detractors from relative results were the Fund's holdings in the Real Estate Holding & Development and Real Estate Services sectors. Several individual holdings were also negative for results, including Deutsche Wohnen SE, ADO Properties S.A., Gecina SA, Zayo Group Holdings, Inc. and Interxion Holding N.V—all of these positions were exited during the reporting period.
The Fund's positioning from a country perspective modestly detracted from results. In particular, versus the Index, an overweight in the UK, an underweight in Switzerland and an overweight in Spain were the largest detractors from relative performance. On the upside, underweights to Hong Kong and France, and an overweight to Belgium were the most additive for results. Meanwhile, while an underweight to the U.S. was a small headwind for relative performance, this was more than offset by very strong stock selection in the country.
Looking ahead, we anticipate continued, but modest economic growth for the U.S. for the rest of 2019. Many economic indicators point to good tenant demand for real estate. However, headwinds including slowing global growth, turmoil in Washington, and ongoing U.S.-China trade tension threaten to derail the long-lasting U.S. recovery. As the Fed tries to balance these factors it has signaled a more flexible stance for policy changes and rates. Resolution of some of these headwinds could be a catalyst for the capital markets. On balance, we believe solid real estate fundamentals, strong private market demand for real estate and a more dovish Fed will be supportive of the U.S. listed real estate market.
Overseas, in the UK and Europe equity markets are facing pressure from a number of areas, namely Brexit, political unrest in France, unstable Italian politics, trade disruption and slower growth. In order to position for these challenging times, we plan to continue to focus on businesses where we see a structural growth angle and a strong rental growth profile. Japan stands out to us as the more appealing opportunity within the Asia-Pacific region. The pricing of Japan's real estate, while looking pricey in historical terms, is reasonable relative to fundamentals. In Hong Kong, share prices have reflected the sharp housing price bounce in the first quarter of 2019. As such, they are no longer overly compelling, in our opinion, and a China slowdown will likely pose a material drag on demand. In addition, social discontent may give rise to slower housing sales. Singapore's residential market has significantly cooled in volume terms following government intervention in mid-2018 and stock valuation has returned to a reasonably attractive level. We believe the premium valuation of Australian REITs is well supported by bond yield declines this year.
24
Sincerely,
STEVE SHIGEKAWA, BRIAN C. JONES, GILLIAN TILTMAN AND ANTON KWANG
PORTFOLIO MANAGERS
Information about principal risks of investing in the Fund is set forth in the prospectus and statement of additional information.
The portfolio composition, industries and holdings of the Fund are subject to change without notice.
The opinions expressed are those of the Fund's portfolio manager(s). The opinions are as of the date of this report and are subject to change without notice.
25
Global Real Estate Fund (Unaudited)
TICKER SYMBOLS
Institutional Class | NGRIX | ||||||
Class A | NGRAX | ||||||
Class C | NGRCX | ||||||
PERFORMANCE HIGHLIGHTS9
| Average Annual Total Return Ended 08/31/2019 | |||||||||||||||
| Inception Date | 1 Year | Life of Fund | |||||||||||||
At NAV | |||||||||||||||
Institutional Class | 12/30/2014 | 14.01 | % | 6.87 | % | ||||||||||
Class A | 12/30/2014 | 13.65 | % | 6.48 | % | ||||||||||
Class C | 12/30/2014 | 12.75 | % | 5.70 | % | ||||||||||
With Sales Charge | |||||||||||||||
Class A | 7.13 | % | 5.14 | % | |||||||||||
Class C | 11.75 | % | 5.70 | % | |||||||||||
Index | |||||||||||||||
| FTSE EPRA/Nareit Developed Index (Net)1,15 | 8.12 | % | 4.79 | % | |||||||||||
The performance data quoted represent past performance and do not indicate future results. Current performance may be lower or higher than the performance data quoted. For performance data current to the most recent month-end, please visit www.nb.com/performance.
The results shown in the table reflect the reinvestment of income dividends and other distributions, if any. The results do not reflect the effect of taxes a shareholder would pay on Fund distributions or on the redemption of Fund shares.
The investment return and principal value of an investment will fluctuate and shares, when redeemed, may be worth more or less than their original cost.
Returns would have been lower if Neuberger Berman Investment Advisers LLC ("Management") had not reimbursed certain expenses and/or waived a portion of the investment management fees during certain of the periods shown. Repayment by a class (of expenses previously reimbursed and/or fees previously waived by Management) will decrease the class's returns. Please see Note B in the Notes to Financial Statements for specific information regarding expense reimbursement and/or fee waiver arrangements.
As stated in the Fund's most recent prospectus, the total annual operating expense ratios for fiscal year 2018 were 11.12%, 11.57% and 12.21% for Institutional Class, Class A and Class C shares, respectively (before expense reimbursements and/or fee waivers, if any). The expense ratios were 1.01%, 1.37% and 2.12% for Institutional Class, Class A and Class C shares, respectively, after expense reimbursements and/or fee waivers. The expense ratios for the annual period ended August 31, 2019 can be found in the Financial Highlights section of this report.
Returns shown with a sales charge reflect the deduction of the current maximum initial sales charge of 5.75% for Class A shares and the contingent deferred sales charge (CDSC) for Class C shares. The CDSC for Class C shares is 1.00%, which is reduced to 0% after 1 year. The performance of the Fund's share classes will differ primarily due to different sales charge structures and class expenses. Please see the prospectus for more information about sales charge structures, if any, and class expenses for your share class.
26
Global Real Estate Fund (Unaudited)
COMPARISON OF A $1,000,000 INVESTMENT
(000's omitted)
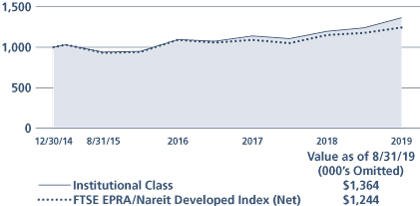
This graph shows the change in value of a hypothetical $1,000,000 investment in the Fund over the past 10 fiscal years, or since the Fund's inception if it has not operated for 10 years. The graph is based on the Institutional Class shares only; the performance of the Fund's share classes will differ primarily due to different sales charge structures and class expenses (see Performance Highlights chart on previous page). The result is compared with benchmarks, which include a broad-based market index and may include a more narrowly based index. Market indices have not been reduced to reflect any of the fees and costs of investing. The results shown in the graph reflect the reinvestment of income dividends and other distributions, if any. The results do not reflect the effect of taxes a shareholder would pay on Fund distributions or on the redemption of Fund shares. Results represent past performance and do not indicate future results.
27
Greater China Equity Fund Commentary (Unaudited)
Neuberger Berman Greater China Equity Fund Institutional Class generated a –1.03% total return for the fiscal year ended August 31, 2019, outperforming its benchmark, the MSCI China Index (Net) (the Index), which returned –5.25% over the same period. (Performance for all share classes is provided in the table immediately following this letter.)
During the Fund's reporting period, the China equity markets experienced extreme volatility. In September 2018, the State Council announced supportive policies to boost consumption, lower tariffs and provide incentives for foreign investments. In addition, the announcement of the Financial Times Stock Exchange Group (FTSE) to include A-shares starting from June 2019 and MSCI to increase A-shares weighting and expand its universe to mid-caps and ChiNext stocks as of May, August and November 2019 helped investor sentiment. Markets declined sharply in October 2018 despite a round of reserve requirement ratio (RRR) cuts as equity markets globally suffered from a sell-off over further interest rate hikes and U.S. Treasury yields increasing. Worse than expected third quarter 2018 corporate results also suggested that the China-U.S. trade war may have started to tangibly impact company earnings. The China equity markets exhibited mixed results in November 2018 as on one hand, a stronger U.S. dollar, declines in commodity futures prices and disappointing China macroeconomic data weighed on sentiment, but later in the month, both domestic and offshore markets climbed higher as investors settled risk positions ahead of the G20 meeting and the U.S. Federal Reserve Board (Fed) Chairman Powell delivered dovish comments. After a lack of meaningful concessions at the G20 between Presidents Trump and Xi, and the worsening of China-U.S. relations after Huawei's CFO was detained in Canada for allegedly violating U.S. trade sanctions, the markets continued their sell-offs. Discouraging November 2018 macroeconomic data, lack of further supportive policies from Xi's speech at the 40th Anniversary of Reform and Opening Up and concerns over the slowing global economic growth resulted in broad based weakness through December 2018. In January 2019, the China equity markets set off on a strong rally due to easing trade tensions, the People's Bank of China announcement of a 100 basis point cut in RRR and plans to set up central bank bills swap aimed at improving liquidity of banks' perpetual bonds. Although February demonstrated continued softening of macroeconomic data, investors became optimistic on trade agreement, expectations of additional policy support and the dovish shift in the Fed's policy. A significant increase in retail participation and leverage onshore coupled with inflows ahead of the MSCI inclusion decision led the domestic China A-shares market to surge and outperform global indices.
Chinese equities retreated in early March primarily because trade headlines turned negative, the U.S. dollar strengthened and there was a decline in global bond yields after easing from the European Central Bank, but they then gained upward momentum starting mid-March after the conclusion of the National People's Congress and anticipation of the Shanghai Stock Exchange's Science and Technology Innovation Board. In April, Chinese equities continued their momentum as March Purchasing Managers Index (PMI) rebounded stronger than expected, but then drifted lower later in the month despite better trade activity and financing data, and progress in China-U.S. trade discussions. The China equity markets pulled back sharply in May as the U.S. imposed tariffs on another $200 billion worth of Chinese goods and blacklisted Huawei from procuring components from American firms. China retaliated with 25% tariffs on $60 billion worth of American goods, put soy buying on hold and considered rare earth export curbs. Towards month-end, the domestic A-shares market declined further despite an announcement of target RRR cuts and the MSCI rebalancing of A-shares as the inclusion factor increased from 5% to 10%. Markets rebounded in June from optimism on additional stimulus policy, launch of the Sci-Tech Board and anticipation of a trade resolution ahead of the G20 meeting. In the beginning of July, Chinese equities extended gains as trade talks at the G20 were better than expected, and President Trump lifted some of the export bans on Huawei, but markets drifted lower later in the month due to economic data worsening, increasing expectations of rate cuts by the Fed, liquidity concerns in relation to the launch of the STAR Market in Shanghai and caution amid ongoing second quarter 2019 results. Despite supportive policies by the Chinese government and generally solid first half company earnings, markets declined in August due to increased concerns over trade war escalation, collapse in global bond yields, sharp depreciation of the renminbi, softer macroeconomic data published and social unrest in Hong Kong.
For the Fund's reporting period, contributors to performance relative to the Index included Consumer Staples (a significant overweight and stock selection in the Food, Beverage & Tobacco industry group), Communication Services
28
(a significant underweight and stock selection, primarily in Diversified Telecommunication Services and Interactive Media & Services), Industrials (stock selection in the Transportation industry group) and Real Estate (stock selection). Detractors from performance relative to the Index included Financials (stock selection among Insurance and Banks) and Health Care (overweight and stock selection in Pharmaceuticals).
The Fund continues to focus on companies that we believe have sustainable top and bottom line growth by looking at the companies' operating cash flow from their recurring core businesses. As of August 31, 2019, the Fund's largest sector overweight relative to the Index was Consumer Staples, followed by Consumer Discretionary and Materials. The largest sector underweight was Communication Services, followed by Information Technology and Utilities. The Fund's top 10 positions comprised more than approximately 52% of total net assets of the Fund at the end of August 2019.
Economic growth in China likely softened in the second quarter of 2019 with median estimates of GDP growth pointing at 6.2% year over year. This aligned with activity that had been registered across various major economic indicators, such as a decline in fixed asset investment to 5.6% year over year due to moderation of growth in infrastructure and property investment and industrial production slowing to 5.0% year over year in May 2019, impacted by a slowdown in downstream production within export oriented segments. Real retail sales grew by 6.4% in May and improved to 6.7% in June. Ongoing trade war uncertainty is likely to continue to sap business confidence as reflected in sluggish manufacturing PMI of 49.4 and non-manufacturing PMI of 54.2 in June. While it was agreed at the G20 between Presidents Xi and Trump for China and the U.S. to resume trade talks and delay additional U.S. tariffs, little real progress has been made. In the face of ongoing economic headwinds, policymakers are anticipated to step-up stimulus efforts on several fronts. For example, the Chinese government announced in early-June that proceeds from local government special bonds may be used as equity capital for certain infrastructure projects with more accommodative regulations and monetary policy for local government special bonds issuance and financing, which we believe could buoy additional credit growth and stimulate investment activity. On the fiscal front, the National Development & Reform Commission has also announced the roll-out of a pro-consumption package aimed at encouraging new consumer spending for the autos and home appliances sectors. Depending on economic conditions, additional fiscal stimulus and monetary loosening may be anticipated, including the possiblity of further RRR cuts.
Without a doubt, the prevailing trade and geopolitical tensions have complicated the more constructive outlook held by market participants earlier in the year. This has also been reflected in ongoing market gyrations within both China A-Shares and their offshore traded counterparts. In spite of this, it is a worthy reminder that the scale and diversity of China's economy means that certain industries are more resilient to exogenous shocks, especially those industries that are more domestically oriented. Moreover, industry leaders may also benefit from consolidation amidst periods of negative cyclicality. Owning domestically-oriented, high quality industry-leading companies has always been an area of focus for the Fund. As such, we anticipate the businesses held within the portfolio will be relatively insulated from the effects of a protracted trade war, and, in our opinion, are more capable of weathering the economic uncertainty that lies ahead.
Sincerely,
LIHUI TANG AND FRANK YAO
PORTFOLIO MANAGERS
Information about principal risks of investing in the Fund is set forth in the prospectus and statement of additional information.
The portfolio composition, industries and holdings of the Fund are subject to change without notice.
The opinions expressed are those of the Fund's portfolio manager(s). The opinions are as of the date of this report and are subject to change without notice.
29
Greater China Equity Fund (Unaudited)
TICKER SYMBOLS
Institutional Class | NCEIX | ||||||
Class A | NCEAX | ||||||
Class C | NCECX | ||||||
SECTOR ALLOCATION
(as a % of Total Investments*) | |||||||
Communication Services | 8.8 | % | |||||
Consumer Discretionary | 30.2 | ||||||
Consumer Staples | 10.6 | ||||||
Energy | 2.5 | ||||||
Financials | 21.0 | ||||||
Health Care | 5.8 | ||||||
Industrials | 8.7 | ||||||
Materials | 5.3 | ||||||
Real Estate | 6.0 | ||||||
Utilities | 0.3 | ||||||
Short-Term Investments | 0.8 | ||||||
Total | 100.0 | % | |||||
* Derivatives (other than options purchased), if any, are excluded from this chart.
EXCHANGE ALLOCATION
(as a % of Long Term Investments) | |||||||
Mainland China | 19.0 | % | |||||
Hong Kong | 62.9 | ||||||
United States | 18.1 | ||||||
Total | 100.0 | % | |||||
PERFORMANCE HIGHLIGHTS
| Average Annual Total Return Ended 08/31/2019 | |||||||||||||||||||
| Inception Date | 1 Year | 5 Years | Life of Fund | ||||||||||||||||
At NAV | |||||||||||||||||||
Institutional Class | 07/17/2013 | –1.03 | % | 10.37 | % | 12.15 | % | ||||||||||||
Class A | 07/17/2013 | –1.40 | % | 10.05 | % | 11.84 | % | ||||||||||||
Class C | 07/17/2013 | –2.13 | % | 9.15 | % | 10.93 | % | ||||||||||||
With Sales Charge | |||||||||||||||||||
Class A | –7.06 | % | 8.75 | % | 10.76 | % | |||||||||||||
Class C | –2.74 | % | 9.15 | % | 10.93 | % | |||||||||||||
Index | |||||||||||||||||||
| MSCI China Index (Net)1,15 | –5.25 | % | 4.66 | % | 7.38 | % | |||||||||||||
The performance data quoted represent past performance and do not indicate future results. Current performance may be lower or higher than the performance data quoted. For performance data current to the most recent month-end, please visit www.nb.com/performance.
The results shown in the table reflect the reinvestment of income dividends and other distributions, if any. The results do not reflect the effect of taxes a shareholder would pay on Fund distributions or on the redemption of Fund shares.
The investment return and principal value of an investment will fluctuate and shares, when redeemed, may be worth more or less than their original cost.
Returns would have been lower if Neuberger Berman Investment Advisers LLC ("Management") had not reimbursed certain expenses and/or waived a portion of the investment management fees during certain of the periods shown. Repayment by a class (of expenses previously reimbursed and/or fees previously waived by Management) will decrease the class's returns. Please see Note B in the Notes to Financial Statements for specific information regarding expense reimbursement and/or fee waiver arrangements.
As stated in the Fund's most recent prospectus, the total annual operating expense ratios for fiscal year 2018 were 1.58%, 2.01% and 2.80% for Institutional Class, Class A and Class C shares, respectively (before expense reimbursements and/or fee waivers, if any). The expense ratios were 1.51%, 1.87% and 2.62% for Institutional Class, Class A and Class C shares, respectively, after expense reimbursements and/or fee waivers. The expense ratios for the annual period ended August 31, 2019 can be found in the Financial Highlights section of this report.
Returns shown with a sales charge reflect the deduction of the current maximum initial sales charge of 5.75% for Class A shares and the contingent deferred sales charge (CDSC) for Class C shares. The CDSC for Class C shares is 1.00%, which is reduced to 0% after 1 year. The performance of the Fund's share classes will differ primarily due to different sales charge structures and class expenses. Please see the prospectus for more information about sales charge structures, if any, and class expenses for your share class.
30
Greater China Equity Fund (Unaudited)
COMPARISON OF A $1,000,000 INVESTMENT
(000's omitted)

This graph shows the change in value of a hypothetical $1,000,000 investment in the Fund over the past 10 fiscal years, or since the Fund's inception if it has not operated for 10 years. The graph is based on the Institutional Class shares only; the performance of the Fund's share classes will differ primarily due to different sales charge structures and class expenses (see Performance Highlights chart on previous page). The result is compared with benchmarks, which include a broad-based market index and may include a more narrowly based index. Market indices have not been reduced to reflect any of the fees and costs of investing. The results shown in the graph reflect the reinvestment of income dividends and other distributions, if any. The results do not reflect the effect of taxes a shareholder would pay on Fund distributions or on the redemption of Fund shares. Results represent past performance and do not indicate future results.
31
Guardian Fund Commentary (Unaudited)
Neuberger Berman Guardian Fund Investor Class generated a 4.03% total return for the fiscal year ended August 31, 2019, outperforming the 2.92% total return of its benchmark, the S&P 500® Index (the Index) for the same period. (Performance for all share classes is provided in the table immediately following this letter.)
The overall U.S. stock market experienced periods of elevated volatility, but generated a modest gain during the reporting period. While the market posted positive returns over eight of the twelve months covered by this report, most of those gains were given back during several sharp downturns. These setbacks were triggered by a number of factors, including concerns over the escalating trade war between the U.S. and China, signs of moderating global growth and a host of geopolitical issues. Against this backdrop, the U.S. Federal Reserve Board (Fed) had a "dovish pivot" in January 2019, as it announced a pause from raising rates. Then, as expected, the Fed lowered rates at its meeting in July 2019—the first cut since 2008.
The Fund's investments fall into three buckets: Growth, Total Return and Opportunistic. Growth companies are those companies that are growing their revenues and, as they do so, generate free cash flow that is reinvested in the business at what we identify as attractive risk-adjusted returns. Total Return investments demonstrate sustainable and/or growing streams of income that are underpinned by asset value and which may result in growing cash returns to shareholders (e.g., increased dividends, share repurchases, return of capital). Finally, Opportunistic investments are those with identifiable catalysts. This bucket may include companies with management changes, company reorganizations, merger and acquisition activity, "hidden assets", or other market dislocations that have the potential to unlock intrinsic value.1
Sector allocation, overall, drove the Fund's outperformance versus the Index during the reporting period. This was primarily driven by underweights to Energy and Financials. Conversely, the Fund's cash position and an underweight to Real Estate were the largest detractors to results.
Stock selection, overall, also contributed to the Fund's results during the reporting period. In particular, stock selection in the Financials, Information Technology and Health Care sectors were the most beneficial for relative returns. Conversely, holdings in the Communication Services, Consumer Discretionary and Consumer Staples sectors were the largest headwinds for results.
The Fund's use of purchased and written options detracted from performance during the period.
Despite some softer economic data, we were encouraged by steady U.S. economic expansion, growth in capital expenditures, and a continued pro-business environment in the U.S. While we believe that the U.S. economy will grow at a slower rate in 2019 versus 2018, it continues to far outpace other developed economies. Quarter-to-quarter growth in 2019 is anticipated to lose momentum and be choppy throughout the year, partially due to uncertainty related to trade and geopolitical risks. In these difficult economic and financial conditions, we remain dedicated to thinking deeply and creatively and strive to always deliver attractive risk-adjusted returns. Given the vicissitudes of an increasingly global economy, we will also remain flexible in our decisions and open-minded to new ideas across different sectors, asset classes and geographies.
Sincerely,
CHARLES KANTOR
PORTFOLIO MANAGER
1 Intrinsic value reflects the portfolio management team's analysis and estimates of a company's value. There is no guarantee that any intrinsic values will be realized; security prices may decrease regardless of intrinsic values.
Information about principal risks of investing in the Fund is set forth in the prospectus and statement of additional information.
The portfolio composition, industries and holdings of the Fund are subject to change without notice.
The opinions expressed are those of the Fund's portfolio manager(s). The opinions are as of the date of this report and are subject to change without notice.
32
Guardian Fund (Unaudited)
TICKER SYMBOLS
Investor Class | NGUAX | ||||||
Trust Class | NBGTX | ||||||
Advisor Class | NBGUX | ||||||
Institutional Class | NGDLX | ||||||
Class A | NGDAX | ||||||
Class C | NGDCX | ||||||
Class R3 | NGDRX | ||||||
Class R6 | NGRDX | ||||||
SECTOR ALLOCATION
(as a % of Total Investments*) | |||||||
Communication Services | 12.3 | % | |||||
Consumer Discretionary | 19.0 | ||||||
Consumer Staples | 3.1 | ||||||
Energy | 1.6 | ||||||
Financials | 10.1 | ||||||
Health Care | 9.2 | ||||||
Industrials | 13.7 | ||||||
Information Technology | 18.2 | ||||||
Materials | 2.4 | ||||||
Utilities | 3.1 | ||||||
Options Purchased | 0.1 | ||||||
Short-Term Investments | 7.2 | ||||||
Total | 100.0 | % | |||||
* Derivatives (other than options purchased), if any, are excluded from this chart.
PERFORMANCE HIGHLIGHTS11
| Average Annual Total Return Ended 08/31/2019 | |||||||||||||||||||||||
| Inception Date | 1 Year | 5 Years | 10 Years | Life of Fund | |||||||||||||||||||
At NAV | |||||||||||||||||||||||
Investor Class | 06/01/1950 | 4.03 | % | 9.41 | % | 12.92 | % | 11.11 | % | ||||||||||||||
| Trust Class3 | 08/03/1993 | 3.77 | % | 9.22 | % | 12.72 | % | 11.05 | % | ||||||||||||||
| Advisor Class4 | 09/03/1996 | 3.41 | % | 8.90 | % | 12.34 | % | 10.90 | % | ||||||||||||||
| Institutional Class5 | 05/27/2009 | 4.19 | % | 9.61 | % | 13.12 | % | 11.14 | % | ||||||||||||||
| Class A19 | 05/27/2009 | 3.79 | % | 9.20 | % | 12.69 | % | 11.08 | % | ||||||||||||||
| Class C19 | 05/27/2009 | 3.00 | % | 8.38 | % | 11.86 | % | 10.95 | % | ||||||||||||||
| Class R316 | 05/27/2009 | 3.51 | % | 8.89 | % | 12.40 | % | 11.03 | % | ||||||||||||||
| Class R622 | 03/29/2019 | 4.08 | % | 9.42 | % | 12.92 | % | 11.11 | % | ||||||||||||||
With Sales Charge | |||||||||||||||||||||||
| Class A19 | –2.18 | % | 7.91 | % | 12.03 | % | 10.98 | % | |||||||||||||||
| Class C19 | 2.07 | % | 8.38 | % | 11.86 | % | 10.95 | % | |||||||||||||||
Index | |||||||||||||||||||||||
| S&P 500® Index1,15 | 2.92 | % | 10.11 | % | 13.45 | % | 11.13 | % | |||||||||||||||
The performance data quoted represent past performance and do not indicate future results. Current performance may be lower or higher than the performance data quoted. For performance data current to the most recent month-end, please visit www.nb.com/performance.
The results shown in the table reflect the reinvestment of income dividends and other distributions, if any. The results do not reflect the effect of taxes a shareholder would pay on Fund distributions or on the redemption of Fund shares.
The investment return and principal value of an investment will fluctuate and shares, when redeemed, may be worth more or less than their original cost.
Returns would have been lower if Neuberger Berman Investment Advisers LLC ("Management") had not reimbursed certain expenses and/or waived a portion of the investment management fees during certain of the periods shown. Repayment by a class (of expenses previously reimbursed and/or fees previously waived by Management) will decrease the class's returns. Please see Note B in the Notes to Financial Statements for specific information regarding expense reimbursement and/or fee waiver arrangements.
As stated in the Fund's most recent prospectus, the total annual operating expense ratios for fiscal year 2018 were 0.89%, 1.06%, 1.40%, 0.71%, 1.09%, 1.83% and 1.37% for Investor Class, Trust Class, Advisor Class, Institutional Class, Class A, Class C and Class R3 shares, respectively, and the estimated total annual operating expense ratio for fiscal year 2019 is 0.62% for Class R6 (before expense reimbursements and/or fee waivers, if any, and after restatement for Class R6 shares). The expense ratios for the annual period ended August 31, 2019 can be found in the Financial Highlights section of this report.
Returns shown with a sales charge reflect the deduction of the current maximum initial sales charge of 5.75% for Class A shares and the contingent deferred sales charge (CDSC) for Class C shares. The CDSC for Class C shares is 1.00%, which is reduced to 0% after 1 year. The performance of the Fund's share classes will differ primarily due to different sales charge structures and class expenses. Please see the prospectus for more information about sales charge structures, if any, and class expenses for your share class.
33
Guardian Fund (Unaudited)
COMPARISON OF A $10,000 INVESTMENT

This graph shows the change in value of a hypothetical $10,000 investment in the Fund over the past 10 fiscal years, or since the Fund's inception if it has not operated for 10 years. The graph is based on the Investor Class shares only; the performance of the Fund's share classes will differ primarily due to different sales charge structures and class expenses (see Performance Highlights chart on previous page). The result is compared with benchmarks, which include a broad-based market index and may include a more narrowly based index. Market indices have not been reduced to reflect any of the fees and costs of investing. The results shown in the graph reflect the reinvestment of income dividends and other distributions, if any. The results do not reflect the effect of taxes a shareholder would pay on Fund distributions or on the redemption of Fund shares. Results represent past performance and do not indicate future results.
34
International Equity Fund Commentary (Unaudited)
Neuberger Berman International Equity Fund Institutional Class generated a total return of –3.95% for the fiscal year ended August 31, 2019, underperforming its benchmark, the MSCI EAFE® Index (the Index), which generated a total return of –3.26% for the same period. (Performance for all share classes is provided in the table immediately following this letter.)
Following sharp losses in the fourth quarter of 2018, developed international equity markets improved in 2019, as dovish news from central banks, including the U.S. Federal Reserve Board and the European Central Bank, and periodic breaks in trade tensions buoyed sentiment. However, facing ongoing macroeconomic and political pressures including uncertainty around Brexit and signs of a global economic slowdown aggravated by trade policy, international equities closed this volatile fiscal year with a small loss. The Index trailed the U.S. markets (as measured by the S&P 500® Index) but outperformed emerging markets (as measured by the MSCI Emerging Markets Index).
More defensive, higher yielding sectors led the Index this period, with investors attracted to Utilities, Consumer Staples and Health Care against a backdrop of share price volatility and falling interest rates. More cyclically-exposed sectors such as Energy, Financials and Materials posted the largest losses. By country, Switzerland, New Zealand and Italy led the Index, while Austria, Israel and Finland declined the most.
The Fund benefited from stock selection, particularly within the Financials, Communication Services and Materials sectors. By country, Japan, the Netherlands and UK-based holdings added most to results relative to the Index.
Top contributing holdings included the London Stock Exchange, Aon and Sonova. The London Stock Exchange rose following reports of a potentially attractive acquisition. Sonova, the Swiss hearing aid specialist, continued to benefit from recent product launches, driving growth and profit margins higher. Aon, the UK-headquartered, U.S.-listed global insurance brokerage and risk consultancy, experienced good organic growth and margin expansion and continued to buy back stock.
Stock selection within the Energy, Consumer Discretionary, and Utilities sectors, along with an underweight to Utilities versus the Index, detracted from relative returns. By country, Danish holdings, an underweight to Australia, and our opportunistic allocation to China were headwinds.
Detractors included Samsonite, Baidu and Core Labs. Samsonite, the Hong Kong-based luggage manufacturer, sold off on trade disputes between the U.S. and China, as tariffs caused retailers to defer orders, and on weakness in Europe. Baidu, the Chinese Internet search leader, sold off as trade tensions caused uncertainty about Chinese economic growth. This uncertainty weighed on advertising revenues while expenses continued to increase due to investments in newer initiatives. We exited the position. Core Labs, the Netherlands-headquartered oil services company, sold off following the sharp fall in oil prices given both supply and demand concerns.
A combination of higher equity prices and negative earnings revisions thus far in 2019 has led to higher multiples. Earnings forecasts appear modest however, with the risk from geopolitical and trade tensions greater in some countries and industries than others.
Our preference is for quality companies with strong balance sheets, continuing long-term growth opportunities, niche product offerings, solid recurring revenues, or strong management teams than can enhance shareholder value. Many of these businesses are multinationals, with geographically diversified revenues, limiting end-market exposure to any single potentially 'at-risk' country. We are comfortable paying a modest valuation premium (relative to the broader market) for companies with these superior characteristics, and believe that investors will benefit from the resulting diversified and risk-managed portfolio over the medium to longer-term.
Sincerely,
BENJAMIN SEGAL AND ELIAS COHEN
PORTFOLIO MANAGERS
Information about principal risks of investing in the Fund is set forth in the prospectus and statement of additional information.
The portfolio composition, industries and holdings of the Fund are subject to change without notice.
The opinions expressed are those of the Fund's portfolio manager(s). The opinions are as of the date of this report and are subject to change without notice.
35
International Equity Fund (Unaudited)
TICKER SYMBOLS
Investor Class | NIQVX | ||||||
Trust Class | NIQTX | ||||||
Institutional Class | NBIIX | ||||||
Class A | NIQAX | ||||||
Class C | NIQCX | ||||||
Class R6 | NRIQX | ||||||
PERFORMANCE HIGHLIGHTS7
| Average Annual Total Return Ended 08/31/2019 | |||||||||||||||||||||||
| Inception Date | 1 Year | 5 Years | 10 Years | Life of Fund | |||||||||||||||||||
At NAV | |||||||||||||||||||||||
| Investor Class12 | 01/28/2013 | –4.23 | % | 3.25 | % | 6.63 | % | 4.64 | % | ||||||||||||||
| Trust Class12 | 01/28/2013 | –4.35 | % | 3.18 | % | 6.58 | % | 4.61 | % | ||||||||||||||
Institutional Class | 06/17/2005 | –3.95 | % | 3.41 | % | 6.75 | % | 4.72 | % | ||||||||||||||
| Class A12 | 01/28/2013 | –4.30 | % | 3.03 | % | 6.49 | % | 4.55 | % | ||||||||||||||
| Class C12 | 01/28/2013 | –5.05 | % | 2.27 | % | 5.97 | % | 4.18 | % | ||||||||||||||
| Class R621 | 09/03/2013 | –3.95 | % | 3.49 | % | 6.80 | % | 4.76 | % | ||||||||||||||
With Sales Charge | |||||||||||||||||||||||
| Class A12 | –9.79 | % | 1.82 | % | 5.86 | % | 4.11 | % | |||||||||||||||
| Class C12 | –6.00 | % | 2.27 | % | 5.97 | % | 4.18 | % | |||||||||||||||
Index | |||||||||||||||||||||||
| MSCI EAFE® Index (Net)1,15 | –3.26 | % | 1.89 | % | 5.00 | % | 4.44 | % | |||||||||||||||
The performance data quoted represent past performance and do not indicate future results. Current performance may be lower or higher than the performance data quoted. For performance data current to the most recent month-end, please visit www.nb.com/performance.
The results shown in the table reflect the reinvestment of income dividends and other distributions, if any. The results do not reflect the effect of taxes a shareholder would pay on Fund distributions or on the redemption of Fund shares.
The investment return and principal value of an investment will fluctuate and shares, when redeemed, may be worth more or less than their original cost.
Returns would have been lower if Neuberger Berman Investment Advisers LLC ("Management") had not reimbursed certain expenses and/or waived a portion of the investment management fees during certain of the periods shown. Repayment by a class (of expenses previously reimbursed and/or fees previously waived by Management) will decrease the class's returns. Please see Note B in the Notes to Financial Statements for specific information regarding expense reimbursement and/or fee waiver arrangements.
As stated in the Fund's most recent prospectus, the total annual operating expense ratios for fiscal year 2018 were 1.20%, 1.24%, 1.00%, 1.36%, 2.12% and 0.90% for Investor Class, Trust Class, Institutional Class, Class A, Class C and Class R6 shares, respectively (before expense reimbursements and/or fee waivers, if any, and after restatement for Class R6 shares). The expense ratios were 0.86%, 1.22%, 1.97% and 0.76% for Institutional Class, Class A, Class C and Class R6 shares, respectively, after expense reimbursements and/or fee waivers and/or restatement. The expense ratios for the annual period ended August 31, 2019 can be found in the Financial Highlights section of this report.
Returns shown with a sales charge reflect the deduction of the current maximum initial sales charge of 5.75% for Class A shares and the contingent deferred sales charge (CDSC) for Class C shares. The CDSC for Class C shares is 1.00%, which is reduced to 0% after 1 year. The performance of the Fund's share classes will differ primarily due to different sales charge structures and class expenses. Please see the prospectus for more information about sales charge structures, if any, and class expenses for your share class.
36
International Equity Fund (Unaudited)
COMPARISON OF A $1,000,000 INVESTMENT
(000's omitted)
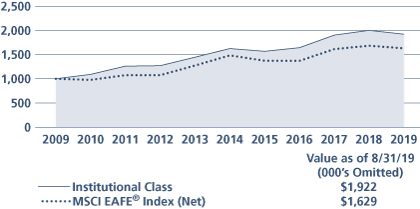
This graph shows the change in value of a hypothetical $1,000,000 investment in the Fund over the past 10 fiscal years, or since the Fund's inception if it has not operated for 10 years. The graph is based on the Institutional Class shares only; the performance of the Fund's share classes will differ primarily due to different sales charge structures and class expenses (see Performance Highlights chart on previous page). The result is compared with benchmarks, which include a broad-based market index and may include a more narrowly based index. Market indices have not been reduced to reflect any of the fees and costs of investing. The results shown in the graph reflect the reinvestment of income dividends and other distributions, if any. The results do not reflect the effect of taxes a shareholder would pay on Fund distributions or on the redemption of Fund shares. Results represent past performance and do not indicate future results.
37
International Select Fund Commentary (Unaudited)
Neuberger Berman International Select Fund Trust Class generated a total return of –3.58% for the fiscal year ended August 31, 2019, underperforming its benchmark, the MSCI EAFE® Index (the Index), which generated a total return of –3.26% for the same period. (Performance for all share classes is provided in the table immediately following this letter.)
Following sharp losses in the fourth quarter of 2018, developed international equity markets improved in 2019, as dovish news from central banks, including the U.S. Federal Reserve Board and the European Central Bank, and periodic breaks in trade tensions buoyed sentiment. However, facing ongoing macroeconomic and political pressures including uncertainty around Brexit and signs of a global economic slowdown aggravated by trade policy, international equities closed this volatile fiscal year with a small loss. The Index trailed the U.S. markets (as measured by the S&P 500® Index) but outperformed emerging markets (as measured by the MSCI Emerging Markets Index).
More defensive, higher yielding sectors led the Index this period, with investors attracted to Utilities, Consumer Staples and Health Care against a backdrop of share price volatility and falling interest rates. More cyclically-exposed sectors such as Energy, Financials and Materials posted the largest losses. By country, Switzerland, New Zealand and Italy led the Index, while Austria, Israel and Finland declined the most.
The Fund benefited from stock selection, particularly within the Financials, Health Care and Materials sectors. By country, holdings based in Japan, the Netherlands and the UK were the largest benefit to performance relative to the Index.
Top individual contributors included Aon, Sonova, and the London Stock Exchange. Aon, the UK-headquartered, U.S.-listed global insurance brokerage and risk consultancy, experienced good organic growth and margin expansion and continued to buy back stock. Sonova, the Swiss hearing aid specialist, continued to benefit from recent product launches, driving growth and profit margins higher. The London Stock Exchange rose following reports of a potentially attractive acquisition.
Stock selection within Energy and Consumer Discretionary sectors and a zero allocation to Utilities were headwinds to relative performance. By country, our underweight to Australia versus the Index and stock selection in Hong Kong and Denmark detracted.
Individual detractors for the period included Samsonite, Core Labs and Baidu. Samsonite, the Hong Kong-based luggage manufacturer, sold off on trade disputes between the U.S. and China, as tariffs caused retailers to defer orders, and on weakness in Europe. Core Labs, the Netherlands-headquartered oil services company, sold off following the sharp fall in oil prices given both supply and demand concerns. Baidu, the Chinese Internet search leader, sold off as trade tensions caused uncertainty about Chinese economic growth. This uncertainty weighed on advertising revenues while expenses continued to increase due to investments in newer initiatives. We exited the position.
A combination of higher equity prices and negative earnings revisions thus far in 2019 has led to higher multiples. Earnings forecasts appear modest however, with the risk from geopolitical and trade tensions greater in some countries and industries than others.
Our preference is for quality companies with strong balance sheets, continuing long-term growth opportunities, niche product offerings, solid recurring revenues, or strong management teams than can enhance shareholder value. Many of these businesses are multinationals, with geographically diversified revenues, limiting end-market exposure to any single potentially 'at-risk' country. We are comfortable paying a modest valuation premium (relative to the broader market) for companies with these superior characteristics, and believe that investors will benefit from the resulting diversified and risk-managed portfolio over the medium to longer-term.
Sincerely,
BENJAMIN SEGAL AND ELIAS COHEN
PORTFOLIO MANAGERS
Information about principal risks of investing in the Fund is set forth in the prospectus and statement of additional information.
The portfolio composition, industries and holdings of the Fund are subject to change without notice.
The opinions expressed are those of the Fund's portfolio manager(s). The opinions are as of the date of this report and are subject to change without notice.
38
International Select Fund (Unaudited)
TICKER SYMBOLS
Trust Class | NILTX | ||||||
Institutional Class | NILIX | ||||||
Class A | NBNAX | ||||||
Class C | NBNCX | ||||||
Class R3 | NBNRX | ||||||
Class R6 | NRILX | ||||||
PERFORMANCE HIGHLIGHTS7
| Average Annual Total Return Ended 08/31/2019 | |||||||||||||||||||||||
| Inception Date | 1 Year | 5 Years | 10 Years | Life of Fund | |||||||||||||||||||
At NAV | |||||||||||||||||||||||
Trust Class | 08/01/2006 | –3.58 | % | 3.02 | % | 5.58 | % | 3.11 | % | ||||||||||||||
| Institutional Class6 | 10/06/2006 | –3.29 | % | 3.37 | % | 5.95 | % | 3.47 | % | ||||||||||||||
| Class A14 | 12/20/2007 | –3.58 | % | 2.99 | % | 5.57 | % | 3.11 | % | ||||||||||||||
| Class C14 | 12/20/2007 | –4.32 | % | 2.23 | % | 4.78 | % | 2.42 | % | ||||||||||||||
| Class R314 | 05/27/2009 | –3.81 | % | 2.75 | % | 5.30 | % | 2.90 | % | ||||||||||||||
| Class R623 | 04/17/2017 | –3.11 | % | 3.24 | % | 5.69 | % | 3.20 | % | ||||||||||||||
With Sales Charge | |||||||||||||||||||||||
| Class A14 | –9.16 | % | 1.78 | % | 4.95 | % | 2.65 | % | |||||||||||||||
| Class C14 | –5.27 | % | 2.23 | % | 4.78 | % | 2.42 | % | |||||||||||||||
Index | |||||||||||||||||||||||
| MSCI EAFE® Index (Net)1,15 | –3.26 | % | 1.89 | % | 5.00 | % | 2.86 | % | |||||||||||||||
The performance data quoted represent past performance and do not indicate future results. Current performance may be lower or higher than the performance data quoted. For performance data current to the most recent month-end, please visit www.nb.com/performance.
The results shown in the table reflect the reinvestment of income dividends and other distributions, if any. The results do not reflect the effect of taxes a shareholder would pay on Fund distributions or on the redemption of Fund shares.
The investment return and principal value of an investment will fluctuate and shares, when redeemed, may be worth more or less than their original cost.
Returns would have been lower if Neuberger Berman Investment Advisers LLC ("Management") had not reimbursed certain expenses and/or waived a portion of the investment management fees during certain of the periods shown. Repayment by a class (of expenses previously reimbursed and/or fees previously waived by Management) will decrease the class's returns. Please see Note B in the Notes to Financial Statements for specific information regarding expense reimbursement and/or fee waiver arrangements.
As stated in the Fund's most recent prospectus, the total annual operating expense ratios for fiscal year 2018 were 1.39%, 0.94%, 1.32%, 2.07%, 1.56% and 0.85% for Trust Class, Institutional Class, Class A, Class C, Class R3 and Class R6 shares, respectively (before expense reimbursements and/or fee waivers, if any, and after restatement for Class R6 shares). The expense ratios were 1.16%, 0.81%, 1.17%, 1.92%, 1.42% and 0.71% for Trust Class, Institutional Class, Class A, Class C, Class R3 and Class R6 shares, respectively, after expense reimbursements and/or fee waivers and/or restatement. The expense ratios for the annual period ended August 31, 2019 can be found in the Financial Highlights section of this report.
Returns shown with a sales charge reflect the deduction of the current maximum initial sales charge of 5.75% for Class A shares and the contingent deferred sales charge (CDSC) for Class C shares. The CDSC for Class C shares is 1.00%, which is reduced to 0% after 1 year. The performance of the Fund's share classes will differ primarily due to different sales charge structures and class expenses. Please see the prospectus for more information about sales charge structures, if any, and class expenses for your share class.
39
International Select Fund (Unaudited)
COMPARISON OF A $10,000 INVESTMENT
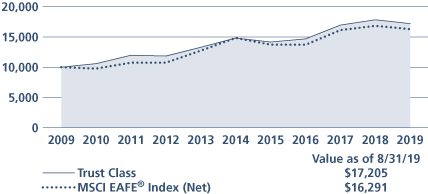
This graph shows the change in value of a hypothetical $10,000 investment in the Fund over the past 10 fiscal years, or since the Fund's inception if it has not operated for 10 years. The graph is based on the Trust Class shares only; the performance of the Fund's share classes will differ primarily due to different sales charge structures and class expenses (see Performance Highlights chart on previous page). The result is compared with benchmarks, which include a broad-based market index and may include a more narrowly based index. Market indices have not been reduced to reflect any of the fees and costs of investing. The results shown in the graph reflect the reinvestment of income dividends and other distributions, if any. The results do not reflect the effect of taxes a shareholder would pay on Fund distributions or on the redemption of Fund shares. Results represent past performance and do not indicate future results.
40
International Small Cap Fund Commentary (Unaudited)
Neuberger Berman International Small Cap Fund Institutional Class generated a total return of –11.26% for the fiscal year ended August 31, 2019, trailing the –9.16% total return of its benchmark, the MSCI EAFE® Small Cap Index (Net) (the Index), for the same period. (Performance for all share classes is provided in the table immediately following this letter.)
International equity markets rallied in 2019, but not enough to erase earlier losses caused as fears of slowing global growth were multiplied by the potential impacts of a U.S./China trade war. Markets remained volatile as global macroeconomic issues and distracting headlines continued, but rallied on intermittent signs that trade hostilities might end, and as global central banks shifted toward dovishness. International small cap stocks trailed larger peers (as measured by the MSCI EAFE® Index) as investors viewed a weaker U.S. dollar and the supportive direction of interest rates as more beneficial to larger, global companies than smaller names focused on their respective domestic markets.
The defensive Real Estate and Utilities sectors led Index returns this period. All other sectors lost value, especially Energy—as the price of oil declined on global growth worries—followed by Financials and Materials. Looking at individual markets, Israel, New Zealand and Singapore posted the strongest gains versus the Index and Denmark, Norway and Ireland declined most.
Stock selection was a headwind for the Fund this period, with Real Estate, Consumer Discretionary and Health Care holdings lagging their Index peers. Our underweight to the strong Real Estate and Utilities sectors versus the Index was another detractor. By country, stock selection plus an overweight in Switzerland, stock selection in Germany, and holdings in out-of-benchmark Canada hurt relative performance.
WashTec, Komax and Ascom were the largest detractors this period. WashTec, the German manufacturer of cleaning machinery for transport equipment, declined on concerns about slowing growth both locally and across Europe. Komax, the Switzerland-based supplier of wire and cable assembly machinery saw orders decrease due to deteriorating near-term car sales. We believe prospects could reverse for their specific products given our anticipation for continued growth of electric car sales. Ascom, the Swiss on-site hospital communications provider disappointed investors with poor results, leading to an investment review and exit of the position.
The Fund's stocks outperformed within Materials and Industrials, and overall sector allocation was advantageous, with our overweight to Information Technology and underweight Financials the biggest benefits. By country, holdings based in Japan, the UK and Denmark were additive to relative returns.
Standout contributors included Prestige International, Amano Corporation, and Games Workshop. Prestige, the Japanese call center manager, continued benefiting from structural outsourcing growth in roadside assistance. Amano, the Japanese provider of time recording information systems enjoyed consistent demand in its small-business human resource offering. Games Workshop, the British designer of tabletop games and miniatures, saw strong revenue growth and margins improvement.
Looking ahead, we remain committed to our "Quality at a Reasonable Price" discipline, focusing on profitability and cash flows that may be under-recognized by the market. We seek to avoid deep value areas of the market where structural challenges may be a factor, and high-flying growth stocks where valuations seem disconnected from fundamentals.
Although the Fund lagged for the fiscal year, performance is ahead of the Index year-to-date in 2019 through the end of August. Anticipating that the market may continue to be volatile and reactive, we remain focused on what we believe are quality companies with strong balance sheets, continuing long-term growth opportunities, solid recurring revenues, and skilled management teams. We also favor multinationals, whose geographically diversified revenues can help limit exposure to any single 'at-risk' country. We believe that a diversified and risk-managed portfolio of such names will be well positioned for the medium to longer-term.
41
Sincerely,
BENJAMIN SEGAL AND DAVID BUNAN
CO-PORTFOLIO MANAGERS
Information about principal risks of investing in the Fund is set forth in the prospectus and statement of additional information.
The portfolio composition, industries and holdings of the Fund are subject to change without notice.
The opinions expressed are those of the Fund's portfolio manager(s). The opinions are as of the date of this report and are subject to change without notice.
42
International Small Cap Fund (Unaudited)
TICKER SYMBOLS
Institutional Class | NIOIX | ||||||
Class A | NIOAX | ||||||
Class C | NIOCX | ||||||
Class R6 | NIORX | ||||||
PERFORMANCE HIGHLIGHTS9
| Average Annual Total Return Ended 08/31/2019 | |||||||||||||||
| Inception Date | 1 Year | Life of Fund | |||||||||||||
At NAV | |||||||||||||||
Institutional Class | 12/08/2016 | –11.26 | % | 7.97 | % | ||||||||||
Class A | 12/08/2016 | –11.49 | % | 7.57 | % | ||||||||||
Class C | 12/08/2016 | –12.22 | % | 6.78 | % | ||||||||||
Class R6 | 12/08/2016 | –11.13 | % | 8.05 | % | ||||||||||
With Sales Charge | |||||||||||||||
Class A | –16.59 | % | 5.27 | % | |||||||||||
Class C | –13.08 | % | 6.78 | % | |||||||||||
Index | |||||||||||||||
| MSCI EAFE® Small Cap Index (Net)1,15 | –9.16 | % | 7.09 | % | |||||||||||
The performance data quoted represent past performance and do not indicate future results. Current performance may be lower or higher than the performance data quoted. For performance data current to the most recent month-end, please visit www.nb.com/performance.
The results shown in the table reflect the reinvestment of income dividends and other distributions, if any. The results do not reflect the effect of taxes a shareholder would pay on Fund distributions or on the redemption of Fund shares.
The investment return and principal value of an investment will fluctuate and shares, when redeemed, may be worth more or less than their original cost.
Returns would have been lower if Neuberger Berman Investment Advisers LLC ("Management") had not reimbursed certain expenses and/or waived a portion of the investment management fees during certain of the periods shown. Repayment by a class (of expenses previously reimbursed and/or fees previously waived by Management) will decrease the class's returns. Please see Note B in the Notes to Financial Statements for specific information regarding expense reimbursement and/or fee waiver arrangements.
As stated in the Fund's most recent prospectus, the total annual operating expense ratios for fiscal year 2018 were 7.03%, 7.57%, 8.16% and 6.95% for Institutional Class, Class A, Class C and Class R6 shares, respectively (before expense reimbursements and/or fee waivers, if any, and after restatement for Class R6 shares). The expense ratios were 1.06%, 1.42%, 2.17% and 0.96% for Institutional Class, Class A, Class C and Class R6 shares, respectively, after expense reimbursements and/or fee waivers and/or restatement. The expense ratios for the annual period ended August 31, 2019 can be found in the Financial Highlights section of this report.
Returns shown with a sales charge reflect the deduction of the current maximum initial sales charge of 5.75% for Class A shares and the contingent deferred sales charge (CDSC) for Class C shares. The CDSC for Class C shares is 1.00%, which is reduced to 0% after 1 year. The performance of the Fund's share classes will differ primarily due to different sales charge structures and class expenses. Please see the prospectus for more information about sales charge structures, if any, and class expenses for your share class.
43
International Small Cap Fund (Unaudited)
COMPARISON OF A $1,000,000 INVESTMENT
(000's omitted)

This graph shows the change in value of a hypothetical $1,000,000 investment in the Fund over the past 10 fiscal years, or since the Fund's inception if it has not operated for 10 years. The graph is based on the Institutional Class shares only; the performance of the Fund's share classes will differ primarily due to different sales charge structures and class expenses (see Performance Highlights chart on previous page). The result is compared with benchmarks, which include a broad-based market index and may include a more narrowly based index. Market indices have not been reduced to reflect any of the fees and costs of investing. The results shown in the graph reflect the reinvestment of income dividends and other distributions, if any. The results do not reflect the effect of taxes a shareholder would pay on Fund distributions or on the redemption of Fund shares. Results represent past performance and do not indicate future results.
44
Intrinsic Value Fund Commentary (Unaudited)
Neuberger Berman Intrinsic Value Fund Institutional Class generated a –10.83% total return for the fiscal year ended August 31, 2019, outperforming its benchmark, the Russell 2000® Value Index (the Index), which returned –14.89% for the same period. (Performance for all share classes is provided in the table immediately following this letter.)
Hindsight understates the roller coaster performance small cap investors experience nearly every quarter now. A powerful correction roiled equity markets in the fourth quarter of 2018. Small caps, viewed as proxies for the domestic economy, were particularly hard hit. Global equity markets rebounded sharply from December's lows during the first quarter of 2019, and the Fund generated a strong return. In the second quarter of 2019, the Fund generated a modest loss, however, this doesn't capture the Fund's nearly double digit intra-quarter decline or the close to two-thirds recovery from the low in May. Equity markets, especially small caps, declined again in August as escalating trade tensions between the U.S. and China coupled with investor fears of an economic slowdown led to a market sell-off that affected most sectors. In our opinion, this see-saw pattern reflects the growing use of small cap Exchange Traded Funds as a proxy for economic optimism or alternatively, pessimism and after a ten-year recovery in equity valuations without a recession who can blame investors for being a bit skittish.
In this seemingly later cycle economic environment, our strategy has three components: stay with what we believe is working; create our own catalysts within the existing portfolio; and new ideas that require above average growth potential or valuation discounts. In the 'stay with what's working camp' we place names like Ciena, Avery Dennison, Crown Holdings, Teledyne Technologies and Mercury Systems. These companies have been core holdings for many years with improving returns on capital and growth profiles. With respect to 'creating our own catalysts' we participated in the equity offerings at Hertz and Babcock & Wilcox, helping both companies achieve their turnarounds, and we recently concluded our proxy effort for enhanced financial disclosure and board refreshment at Verint Systems.
There were notable disappointments during the period. Cloudera, a provider of data analytics, lost more than half of its value due to challenges arising from its merger with competitor Hortonworks. When initially conceived, the business rationale for combining seemed compelling. Clients and customers have taken a more conservative view of the deal and appear to be holding off on software purchases until the product roadmap for the new entity becomes more attractive. Investing in the generic pharmaceutical space has been treacherous as regulators and plaintiff's attorneys investigate price fixing allegations and pursue opioid litigation. Amneal Pharmaceuticals and Mallinckrodt have different exposures on both counts but right now the market is taking no prisoners. Retailer Party City has to deal with mounting concerns around its financial leverage. The well-regarded CEO of Conduent resigned in an apparent disagreement with their Board on the progress of the company's restructuring.
What lies ahead for the market remains a matter of debate. Attractive free cash flow multiples for many value stocks suggests to us that merger and acquisition activity could be a surprise to the upside. Companies may try to make deals while rates are low and the regulatory environment is relatively favorable. We believe that the economy is good, employment trends are encouraging, and there is an absence of speculative bubbles or excesses that warrant caution. Nevertheless, owing to a climate of uncertainty, several of our companies have reset earnings expectations lower. Be it China tariffs, a "hard Brexit", or rancorous domestic political debates, an air of conservatism has been overtaking the pro-business sentiment that prevailed since the election in 2016. Our best guess—be prepared to stay on the roller coaster.
We thank you for your investment in our Fund and look forward to reporting our future results.
Sincerely,
BENJAMIN H. NAHUM, JAMES F. MCAREE AND AMIT SOLOMON
PORTFOLIO CO-MANAGERS
Information about principal risks of investing in the Fund is set forth in the prospectus and statement of additional information.
The portfolio composition, industries and holdings of the Fund are subject to change without notice.
The opinions expressed are those of the Fund's portfolio manager(s). The opinions are as of the date of this report and are subject to change without notice.
45
Intrinsic Value Fund (Unaudited)
TICKER SYMBOLS
Institutional Class | NINLX | ||||||
Class A | NINAX | ||||||
Class C | NINCX | ||||||
Class R6 | NRINX | ||||||
SECTOR ALLOCATION
(as a % of Total Investments*) | |||||||
Communication Services | 1.3 | % | |||||
Consumer Discretionary | 5.4 | ||||||
Consumer Staples | 2.0 | ||||||
Energy | 2.2 | ||||||
Financial Services | 4.4 | ||||||
Health Care | 13.7 | ||||||
Industrials | 16.7 | ||||||
Information Technology | 40.1 | ||||||
Materials | 7.5 | ||||||
Real Estate | 0.3 | ||||||
Utilities | 4.3 | ||||||
Convertible Bonds | 1.1 | ||||||
Short-Term Investments | 1.0 | ||||||
Total | 100.0 | % | |||||
* Derivatives (other than options purchased), if any, are excluded from this chart.
PERFORMANCE HIGHLIGHTS
| Average Annual Total Return Ended 08/31/2019 | |||||||||||||||||||||||
| Inception Date* | 1 Year | 5 Years | 10 Years | Life of Fund | |||||||||||||||||||
At NAV | |||||||||||||||||||||||
| Institutional Class18 | 05/10/2010 | –10.83 | % | 5.60 | % | 10.63 | % | 10.54 | % | ||||||||||||||
| Class A18 | 05/10/2010 | –11.18 | % | 5.21 | % | 10.25 | % | 10.37 | % | ||||||||||||||
| Class C18 | 05/10/2010 | –11.78 | % | 4.44 | % | 9.51 | % | 10.03 | % | ||||||||||||||
| Class R618,21 | 01/18/2019 | –10.71 | % | 5.63 | % | 10.65 | % | 10.55 | % | ||||||||||||||
With Sales Charge | |||||||||||||||||||||||
| Class A18 | –16.27 | % | 3.97 | % | 9.60 | % | 10.08 | % | |||||||||||||||
| Class C18 | –12.55 | % | 4.44 | % | 9.51 | % | 10.03 | % | |||||||||||||||
Index | |||||||||||||||||||||||
| Russell 2000® Value Index1,15 | –14.89 | % | 4.63 | % | 10.05 | % | 8.07 | % | |||||||||||||||
| Russell 2000® Index1,15 | –12.89 | % | 6.41 | % | 11.59 | % | 7.58 | % | |||||||||||||||
*The inception date for Neuberger Berman Intrinsic Value Fund Institutional Class, Class A, and Class C shares is May 10, 2010. The performance data for Class R6 also includes the performance of the Fund's Institutional Class from May 10, 2010 through January 18, 2019. Performance prior to May 10, 2010 is that of the Fund's predecessor, the DJG Small Cap Value Fund L.P., an unregistered limited partnership ("DJG Fund"); DJG Fund was the successor to The DJG Small Cap Value Fund, an unregistered commingled investment account ("DJG Account"), which had similar investment goals, strategies, and portfolio management team. See endnote 18 for more information.
The performance data quoted represent past performance and do not indicate future results. Current performance may be lower or higher than the performance data quoted. For performance data current to the most recent month-end, please visit www.nb.com/performance.
The results shown in the table reflect the reinvestment of income dividends and other distributions, if any. The results do not reflect the effect of taxes a shareholder would pay on Fund distributions or on the redemption of Fund shares.
The investment return and principal value of an investment will fluctuate and shares, when redeemed, may be worth more or less than their original cost.
Returns would have been lower if Neuberger Berman Investment Advisers LLC ("Management") had not reimbursed certain expenses and/or waived a portion of the investment management fees during certain of the periods shown. Repayment by a class (of expenses previously reimbursed and/or fees previously waived by Management) will decrease the class's returns. Please see Note B in the Notes to Financial Statements for specific information regarding expense reimbursement and/or fee waiver arrangements.
As stated in the Fund's most recent prospectus, the total annual operating expense ratios for fiscal year 2018 were 1.03%, 1.42% and 2.14% for Institutional Class, Class A and Class C shares, respectively, and the estimated total annual operating expense ratio for fiscal year 2019 is 0.92% for Class R6 (before expense reimbursements and/or fee waivers, if any, and after restatement for Class R6 shares). The expense ratios were 1.01%, 1.37% and 2.12% for Institutional Class, Class A and Class C shares, respectively, and the estimated total annual operating expense ratio for fiscal year 2019 is 0.91% for Class R6 after expense reimbursements and/or fee waivers and/or restatement. The expense ratios for the annual period ended August 31, 2019 can be found in the Financial Highlights section of this report.
Returns shown with a sales charge reflect the deduction of the current maximum initial sales charge of 5.75% for Class A shares and the contingent deferred sales charge (CDSC) for Class C shares. The CDSC for Class C shares is 1.00%, which is reduced to 0% after 1 year. The performance of the Fund's share classes will differ primarily due to different sales charge structures and class expenses. Please see the prospectus for more information about sales charge structures, if any, and class expenses for your share class.
46
Intrinsic Value Fund (Unaudited)
COMPARISON OF A $1,000,000 INVESTMENT18
(000's omitted)
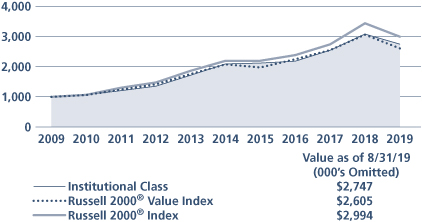
This graph shows the change in value of a hypothetical $1,000,000 investment in the Fund over the past 10 fiscal years, or since the Fund's inception if it has not operated for 10 years. The graph is based on the Institutional Class shares only; the performance of the Fund's share classes will differ primarily due to different sales charge structures and class expenses (see Performance Highlights chart on previous page). The result is compared with benchmarks, which include a broad-based market index and may include a more narrowly based index. Market indices have not been reduced to reflect any of the fees and costs of investing. The results shown in the graph reflect the reinvestment of income dividends and other distributions, if any. The results do not reflect the effect of taxes a shareholder would pay on Fund distributions or on the redemption of Fund shares. Results represent past performance and do not indicate future results.
47
Large Cap Value Fund Commentary (Unaudited)
Neuberger Berman Large Cap Value Fund Investor Class generated a 6.25% total return for the fiscal year ended August 31, 2019, outperforming its benchmark, the Russell 1000® Value Index (the Index), which returned 0.62% for the same period. (Performance for all share classes is provided in the table immediately following this letter.)
The overall U.S. stock market, as measured by the S&P 500® Index, experienced periods of elevated volatility but generated a modest gain during the reporting period. While the market posted positive returns over eight of the twelve months covered by this report, most of those gains were given back during several sharp downturns. These setbacks were triggered by a number of factors, including concerns over the escalating trade war between the U.S. and China, signs of moderating global growth and a host of geopolitical issues. Against this backdrop, the U.S. Federal Reserve Board (Fed) had a "dovish pivot" in January 2019, as it announced a pause from raising rates. Then, as expected, the Fed lowered rates at its meeting in July 2019—the first cut since 2008. Late in the reporting period, the yield curve inverted, which has typically foreshadowed more difficult economic conditions going forward. All told, the S&P 500 Index returned 2.92% during the reporting period. In contrast, large cap value stocks, as measured by the Index, lagged the broader market.
The Fund outperformed the Index during the reporting period, driven by strong sector allocation and stock selection. From a sector allocation perspective, overweights to Consumer Staples and Utilities, along with an underweight to Financials, were the largest contributors to relative performance. In terms of stock selection, holdings in the Materials, Energy and Financials sectors added the most value. Within the Materials sector, the Fund's Metals & Mining positions contributed the most to performance. Looking at the Energy sector, a lack of exposure to several weak performers in the Oil, Gas & Consumable Fuels industry added to relative results. In the Financials sector, the Fund's holding in Citigroup was beneficial to returns.
On the downside, stock selection in the Health Care, Industrials and Consumer Discretionary sectors were the largest detractors from relative returns over the period. In the Health Care sector, several holdings in the Health Care Providers & Services industry were headwinds for performance. Within the Industrials sector, Delta Air Lines generated poor results. In the Consumer Discretionary sector, the Fund's position in retailer Tiffany & Co. was not rewarded as its shares fell sharply. Finally, in terms of sector allocation, an underweight to Information Technology, an overweight to Materials and an underweight to Consumer Discretionary were the largest detractors from relative results.
Looking ahead, we remain cautious on the growth prospects for the U.S. economy given leading indicators that are slowing, uncertainties regarding the trade war between the U.S. and China and the inversion of the yield curve. While we do not believe a recession will occur in the short-term, we believe the pace of the U.S. economic expansion could further moderate in 2020. In our view, increased market volatility will continue as the year progresses. Against this backdrop, we anticipate an increase in price dislocations that could turn into attractive investment opportunities. We remain disciplined value managers, looking for opportunities to buy stocks that are below their normalized valuations to generate results for the Fund's shareholders. We also believe that equities remain the most appropriate asset class over the long term given their potential to generate capital appreciation.
Sincerely,
ELI M. SALZMANN
PORTFOLIO MANAGER
Information about principal risks of investing in the Fund is set forth in the prospectus and statement of additional information.
The portfolio composition, industries and holdings of the Fund are subject to change without notice.
The opinions expressed are those of the Fund's portfolio manager(s). The opinions are as of the date of this report and are subject to change without notice.
48
Large Cap Value Fund (Unaudited)
TICKER SYMBOLS
Investor Class | NPRTX | ||||||
Trust Class | NBPTX | ||||||
Advisor Class | NBPBX | ||||||
Institutional Class | NBPIX | ||||||
Class A | NPNAX | ||||||
Class C | NPNCX | ||||||
Class R3 | NPNRX | ||||||
Class R6 | NRLCX | ||||||
SECTOR ALLOCATION
(as a % of Total Investments*) | |||||||
Communication Services | 7.6 | % | |||||
Consumer Discretionary | 2.5 | ||||||
Consumer Staples | 18.0 | ||||||
Energy | 6.8 | ||||||
Financials | 15.4 | ||||||
Health Care | 8.2 | ||||||
Industrials | 5.2 | ||||||
Materials | 9.7 | ||||||
Real Estate | 7.3 | ||||||
Utilities | 9.4 | ||||||
Short-Term Investments | 9.9 | ||||||
Total | 100.0 | % | |||||
* Derivatives (other than options purchased), if any, are excluded from this chart.
PERFORMANCE HIGHLIGHTS
| Average Annual Total Return Ended 08/31/2019 | |||||||||||||||||||||||
| Inception Date | 1 Year | 5 Years | 10 Years | Life of Fund | |||||||||||||||||||
At NAV | |||||||||||||||||||||||
Investor Class | 01/20/19752 | 6.25 | % | 7.86 | % | 10.70 | % | 12.41 | % | ||||||||||||||
| Trust Class3 | 08/30/1993 | 6.04 | % | 7.67 | % | 10.50 | % | 12.31 | % | ||||||||||||||
| Advisor Class4 | 08/16/1996 | 5.90 | % | 7.51 | % | 10.33 | % | 12.18 | % | ||||||||||||||
| Institutional Class5 | 06/07/2006 | 6.41 | % | 8.04 | % | 10.88 | % | 12.46 | % | ||||||||||||||
| Class A19 | 06/21/2010 | 5.99 | % | 7.62 | % | 10.47 | % | 12.35 | % | ||||||||||||||
| Class C19 | 06/21/2010 | 5.24 | % | 6.84 | % | 9.72 | % | 12.18 | % | ||||||||||||||
| Class R316 | 06/21/2010 | 5.74 | % | 7.33 | % | 10.20 | % | 12.29 | % | ||||||||||||||
| Class R622 | 01/18/2019 | 6.40 | % | 7.89 | % | 10.72 | % | 12.41 | % | ||||||||||||||
With Sales Charge | |||||||||||||||||||||||
| Class A19 | –0.11 | % | 6.35 | % | 9.82 | % | 12.21 | % | |||||||||||||||
| Class C19 | 4.31 | % | 6.84 | % | 9.72 | % | 12.18 | % | |||||||||||||||
Index | |||||||||||||||||||||||
| Russell 1000® Value Index1,15 | 0.62 | % | 6.59 | % | 11.49 | % | N/A | ||||||||||||||||
The performance data quoted represent past performance and do not indicate future results. Current performance may be lower or higher than the performance data quoted. For performance data current to the most recent month-end, please visit www.nb.com/performance.
The results shown in the table reflect the reinvestment of income dividends and other distributions, if any. The results do not reflect the effect of taxes a shareholder would pay on Fund distributions or on the redemption of Fund shares.
The investment return and principal value of an investment will fluctuate and shares, when redeemed, may be worth more or less than their original cost.
Returns would have been lower if Neuberger Berman Investment Advisers LLC ("Management") had not reimbursed certain expenses and/or waived a portion of the investment management fees during certain of the periods shown. Repayment by a class (of expenses previously reimbursed and/or fees previously waived by Management) will decrease the class's returns. Please see Note B in the Notes to Financial Statements for specific information regarding expense reimbursement and/or fee waiver arrangements.
As stated in the Fund's most recent prospectus, the total annual operating expense ratios for fiscal year 2018 were 0.88%, 1.06%, 1.21%, 0.71%, 1.09%, 1.83% and 1.37% for Investor Class, Trust Class, Advisor Class, Institutional Class, Class A, Class C and Class R3 shares, respectively, and the estimated total annual operating expense ratio for fiscal year 2019 is 0.61% for Class R6 (before expense reimbursements and/or fee waivers, if any, and after restatement for Class R6 shares). The expense ratio was 1.36% for Class R3 shares after expense reimbursements and/or fee waivers and/or restatement. The total annual operating expense ratio for Institutional Class includes the class's repayment of expenses previously reimbursed and/or fees previously waived by Management. The expense ratios for the annual period ended August 31, 2019 can be found in the Financial Highlights section of this report.
Returns shown with a sales charge reflect the deduction of the current maximum initial sales charge of 5.75% for Class A shares and the contingent deferred sales charge (CDSC) for Class C shares. The CDSC for Class C shares is 1.00%, which is reduced to 0% after 1 year. The performance of the Fund's share classes will differ primarily due to different sales charge structures and class expenses. Please see the prospectus for more information about sales charge structures, if any, and class expenses for your share class.
49
Large Cap Value Fund (Unaudited)
COMPARISON OF A $10,000 INVESTMENT
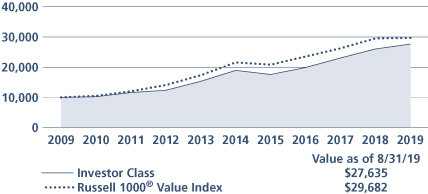
This graph shows the change in value of a hypothetical $10,000 investment in the Fund over the past 10 fiscal years, or since the Fund's inception if it has not operated for 10 years. The graph is based on the Investor Class shares only; the performance of the Fund's share classes will differ primarily due to different sales charge structures and class expenses (see Performance Highlights chart on previous page). The result is compared with benchmarks, which include a broad-based market index and may include a more narrowly based index. Market indices have not been reduced to reflect any of the fees and costs of investing. The results shown in the graph reflect the reinvestment of income dividends and other distributions, if any. The results do not reflect the effect of taxes a shareholder would pay on Fund distributions or on the redemption of Fund shares. Results represent past performance and do not indicate future results.
50
Mid Cap Growth Fund Commentary (Unaudited)
Neuberger Berman Mid Cap Growth Fund Investor Class generated a 4.84% total return for the fiscal year ended August 31, 2019, trailing its benchmark, the Russell Midcap® Growth Index (the Index), which returned 5.96% for the same period. (Performance for all share classes is provided in the table immediately following this letter.)
While the trailing twelve months continued to largely be a positive environment for equities, thanks in part to a dovish turn by the U.S. Federal Reserve Board (Fed), worries around trade and the potential for decelerating economic growth prompted shifts in investor risk sentiment and meaningful bouts of rotational volatility at the end of 2018 and again at the end of the 12-month reporting period. However, despite potential signs of a broader late-cycle slowdown, compelling growth could still be found across our investable universe as favorable long-term trends combined with intriguing and potentially underappreciated catalysts to deliver top- and bottom-line results that exceeded the expectations of a market still largely willing to reward execution and positive differentiation.
During the period the Fund remained focused on Information Technology (IT), Health Care, Industrials and Consumer Discretionary names, and those allocation decisions were generally reflective of the positive secular trends, intriguing catalysts and compelling underlying fundamentals that we continued to see in those sectors. Our underperformance to the Index can be largely attributed to the market volatility of the fourth quarter of 2018, which was further amplified within the portfolio by several stock-specific negative developments, such as the CFO of Square resigning and Tivity's surprising, and not well-received, acquisition of Nutrisystem. Tivity was sold during the period. At the industry level, the strong performance of several holdings resulted in the IT Services segment being the leading contributor to relative performance, while it was an unfavorable combination of what we did and did not own that resulted in our allocation to the Hotels, Restaurants & Leisure segment of Consumer Discretionary being the leading detractor. Drilling down to our holdings, Okta, Inc. was the top contributor to performance while SVB Financial Group was the leading detractor. Okta, a provider of enterprise-grade security identity and login management services, continued to gain market share and exceed top- and bottom-line expectations as the market and demand for identity access security has continued to rapidly expand. On the other hand, SVB, a diversified financial services company offering a range of banking and financial products and services, fell victim to the pressures of heightened street "whisper" expectations and the net interest rate margin implications of the Fed's pivot to a more accommodative monetary path.
Looking ahead, we are cautiously optimistic that over the near-term we will remain in a constructive environment for small- and mid-cap growth stocks, even if the overall pace of economic growth continues to moderately decelerate. With a discriminating market and increasingly cautious commentary from more GDP-growth dependent companies underscoring the importance of balancing risk and reward, we are also going to be mindful of the potential for additional volatility in the form of either persistent valuation resets or possibly a sustained rotation away from the more traditional growth segments of the market. That said, we still believe that the most compelling catalysts are to be found in IT and Health Care, that long-term trends continue to hold more promise than cyclical in an uncertain geopolitical environment and that if a scarcity of economic and corporate growth is looming, then the market will likely continue to seek out and favor higher qualitative growth companies capable of consistently exceeding expectations.
Sincerely,
KENNETH J. TUREK
PORTFOLIO MANAGER
Information about principal risks of investing in the Fund is set forth in the prospectus and statement of additional information.
The portfolio composition, industries and holdings of the Fund are subject to change without notice.
The opinions expressed are those of the Fund's portfolio manager(s). The opinions are as of the date of this report and are subject to change without notice.
51
Mid Cap Growth Fund (Unaudited)
TICKER SYMBOLS
Investor Class | NMANX | ||||||
Trust Class | NBMTX | ||||||
Advisor Class | NBMBX | ||||||
Institutional Class | NBMLX | ||||||
Class A | NMGAX | ||||||
Class C | NMGCX | ||||||
Class R3 | NMGRX | ||||||
Class R6 | NRMGX | ||||||
SECTOR ALLOCATION
(as a % of Total Investments*) | |||||||
Communication Services | 5.1 | % | |||||
Consumer Discretionary | 13.6 | ||||||
Consumer Staples | 2.3 | ||||||
Energy | 0.6 | ||||||
Financials | 4.4 | ||||||
Health Care | 16.4 | ||||||
Industrials | 19.1 | ||||||
Information Technology | 31.3 | ||||||
Materials | 2.0 | ||||||
Utilities | 1.0 | ||||||
Short-Term Investments | 4.2 | ||||||
Total | 100.0 | % | |||||
* Derivatives (other than options purchased), if any, are excluded from this chart.
PERFORMANCE HIGHLIGHTS7
| Average Annual Total Return Ended 08/31/2019 | |||||||||||||||||||||||
| Inception Date | 1 Year | 5 Years | 10 Years | Life of Fund | |||||||||||||||||||
At NAV | |||||||||||||||||||||||
Investor Class | 03/01/19792 | 4.84 | % | 10.87 | % | 14.14 | % | 11.87 | % | ||||||||||||||
| Trust Class3 | 08/30/1993 | 4.78 | % | 10.81 | % | 14.08 | % | 11.79 | % | ||||||||||||||
| Advisor Class4 | 09/03/1996 | 4.53 | % | 10.52 | % | 13.74 | % | 11.58 | % | ||||||||||||||
| Institutional Class5 | 04/19/2007 | 5.09 | % | 11.09 | % | 14.40 | % | 11.96 | % | ||||||||||||||
| Class A19 | 05/27/2009 | 4.65 | % | 10.66 | % | 13.98 | % | 11.83 | % | ||||||||||||||
| Class C19 | 05/27/2009 | 3.91 | % | 9.83 | % | 13.13 | % | 11.62 | % | ||||||||||||||
| Class R316 | 05/27/2009 | 4.41 | % | 10.39 | % | 13.70 | % | 11.76 | % | ||||||||||||||
| Class R622 | 03/15/2013 | 5.20 | % | 11.17 | % | 14.35 | % | 11.92 | % | ||||||||||||||
With Sales Charge | |||||||||||||||||||||||
| Class A19 | –1.34 | % | 9.36 | % | 13.31 | % | 11.67 | % | |||||||||||||||
| Class C19 | 2.98 | % | 9.83 | % | 13.13 | % | 11.62 | % | |||||||||||||||
Index | |||||||||||||||||||||||
| Russell Midcap® Growth Index1,15 | 5.96 | % | 10.72 | % | 14.85 | % | N/A | ||||||||||||||||
| Russell Midcap® Index1,15 | 0.54 | % | 7.94 | % | 13.48 | % | 13.04 | % | |||||||||||||||
The performance data quoted represent past performance and do not indicate future results. Current performance may be lower or higher than the performance data quoted. For performance data current to the most recent month-end, please visit www.nb.com/performance.
The results shown in the table reflect the reinvestment of income dividends and other distributions, if any. The results do not reflect the effect of taxes a shareholder would pay on Fund distributions or on the redemption of Fund shares.
The investment return and principal value of an investment will fluctuate and shares, when redeemed, may be worth more or less than their original cost.
Returns would have been lower if Neuberger Berman Investment Advisers LLC ("Management") had not reimbursed certain expenses and/or waived a portion of the investment management fees during certain of the periods shown. Repayment by a class (of expenses previously reimbursed and/or fees previously waived by Management) will decrease the class's returns. Please see Note B in the Notes to Financial Statements for specific information regarding expense reimbursement and/or fee waiver arrangements.
As stated in the Fund's most recent prospectus, the total annual operating expense ratios for fiscal year 2018 were 0.91%, 0.96%, 1.22%, 0.71%, 1.08%, 1.86%, 1.37% and 0.61% for Investor Class, Trust Class, Advisor Class, Institutional Class, Class A, Class C, Class R3 and Class R6 shares, respectively (before expense reimbursements and/or fee waivers, if any, and after restatement for Class R6 shares). The total annual operating expense ratio for each of Class C and Class R3 includes the class's repayment of expenses previously reimbursed and/or fees previously waived by Management. The expense ratios for the annual period ended August 31, 2019 can be found in the Financial Highlights section of this report.
Returns shown with a sales charge reflect the deduction of the current maximum initial sales charge of 5.75% for Class A shares and the contingent deferred sales charge (CDSC) for Class C shares. The CDSC for Class C shares is 1.00%, which is reduced to 0% after 1 year. The performance of the Fund's share classes will differ primarily due to different sales charge structures and class expenses. Please see the prospectus for more information about sales charge structures, if any, and class expenses for your share class.
52
Mid Cap Growth Fund (Unaudited)
COMPARISON OF A $10,000 INVESTMENT

This graph shows the change in value of a hypothetical $10,000 investment in the Fund over the past 10 fiscal years, or since the Fund's inception if it has not operated for 10 years. The graph is based on the Investor Class shares only; the performance of the Fund's share classes will differ primarily due to different sales charge structures and class expenses (see Performance Highlights chart on previous page). The result is compared with benchmarks, which include a broad-based market index and may include a more narrowly based index. Market indices have not been reduced to reflect any of the fees and costs of investing. The results shown in the graph reflect the reinvestment of income dividends and other distributions, if any. The results do not reflect the effect of taxes a shareholder would pay on Fund distributions or on the redemption of Fund shares. Results represent past performance and do not indicate future results.
53
Mid Cap Intrinsic Value Fund Commentary (Unaudited)
Neuberger Berman Mid Cap Intrinsic Value Fund Investor Class generated a –12.97% total return for the fiscal year ended August 31, 2019, underperforming its benchmark, the Russell Midcap® Value Index (the Index), which returned –3.13% for the same period. (Performance for all share classes is provided in the table immediately following this letter.)
During the final quarter of 2018, a powerful market correction led to a sharp decline in equities. Stocks rebounded sharply from December lows in the first quarter of 2019. Equities continued to rise during the second quarter of 2019 despite a meaningful decline in May attributed to the failure of the U.S. and China to reach a trade deal and threats by the Trump administration to further increase tariffs. In June and July, the market resumed its upward trend; however equity markets declined again in August due to escalating trade tensions between the U.S. and China.
Our strategy, with an emphasis on out of favor contrarian investments selling at material discounts to our estimates of intrinsic value1 was hard hit, particularly during periods of market decline. Valuation of the portfolio and individual stock positions remain extremely attractive on a discount to intrinsic value, price to earnings and a cash flow basis, albeit in an investment environment where cheap valuations are passed over. Rather, companies possessing growth and momentum factors are bid-up indiscriminately, while traditional value characteristics such as cash flow generation are ignored. Also, companies that are already selling at deeply depressed valuation levels have been severely punished in the market when reporting disappointing news, such as missing short-term quarterly earnings forecasts.
In addition, our sector weightings, which are mostly a by-product of our bottom-up stock selection process, were also out-of-synch with the performance drivers of the Index during the period. In particular, our significant underweights versus the Index in Utilities and Real Estate, the Index's two best performing sectors, and overweights in Energy and Consumer Discretionary, the two worst performing sectors, adversely impacted relative performance.
The top performers for the period all reacted positively to better than expected earnings reports while individual stocks that had disappointing earnings and/or financial reports sold off dramatically. Ciena and Itron were our best performers. Both companies continue to execute well and demand remains healthy. In addition, Itron's integration of Silver Spring is underway and merger synergies are becoming visible. At the end of the March, we made a small commitment to a SPAC (Special Purpose Acquisition Corporation) which acquired the largest operator of spas to the cruise ship industry, OneSpaWorld. We subsequently sold the position in mid-August after the stock appreciated by more than 50%. Party City, Conduent and LionsGate were among the worst performers. Party City reported earnings below expectations as the helium shortage continued into the first half of 2019; the well-regarded CEO of Conduent resigned in an apparent disagreement with their Board on the progress of the company's restructuring; and LionsGate shares traded down due to earnings misses, concerns about forward growth, balance sheet leverage, insider trading and competitive positioning.
Bond and equity markets continue to diverge. In the bond market, the U.S. 10-year Treasury yield has dropped below 2% and the yield curve has inverted from time to time, both of which are suggestive of slowing or possibly declining economic growth ahead. Despite these concerns, in the U.S., consumer confidence has remained strong driven by higher wages and historically low unemployment. In addition, the U.S. Federal Reserve Board hinted at another 25 basis point rate cut in September with a second cut possible before year-end, which we believe should help U.S. corporations by lowering financing costs. In Europe, the European Central Bank is also anticipated to lower interest rates. However, even with new monetary stimulus, negative effects from the U.S.-China trade war, coupled with political uncertainties both at home and abroad, could likely lead to continued volatility.
54
Sincerely,
MICHAEL C. GREENE
PORTFOLIO MANAGER
1 Intrinsic value reflects the portfolio management team's analysis and estimates of a company's value. There is no guarantee that any intrinsic values will be realized; security prices may decrease regardless of intrinsic values.
Information about principal risks of investing in the Fund is set forth in the prospectus and statement of additional information.
The portfolio composition, industries and holdings of the Fund are subject to change without notice.
The opinions expressed are those of the Fund's portfolio manager(s). The opinions are as of the date of this report and are subject to change without notice.
55
Mid Cap Intrinsic Value Fund (Unaudited)
TICKER SYMBOLS
Investor Class | NBRVX | ||||||
Trust Class | NBREX | ||||||
Institutional Class | NBRTX | ||||||
Class A | NBRAX | ||||||
Class C | NBRCX | ||||||
Class R3 | NBRRX | ||||||
Class R6 | NBMRX | ||||||
SECTOR ALLOCATION
(as a % of Total Investments*) | |||||||
Communication Services | 1.7 | % | |||||
Consumer Discretionary | 16.7 | ||||||
Consumer Staples | 6.4 | ||||||
Energy | 8.7 | ||||||
Financial Services | 14.0 | ||||||
Health Care | 6.8 | ||||||
Industrials | 20.7 | ||||||
Information Technology | 17.5 | ||||||
Materials | 1.9 | ||||||
Real Estate | 0.7 | ||||||
Utilities | 4.7 | ||||||
Short-Term Investments | 0.2 | ||||||
Total | 100.0 | % | |||||
* Derivatives (other than options purchased), if any, are excluded from this chart.
PERFORMANCE HIGHLIGHTS7
| Average Annual Total Return Ended 08/31/2019 | |||||||||||||||||||||||
| Inception Date | 1 Year | 5 Years | 10 Years | Life of Fund | |||||||||||||||||||
At NAV | |||||||||||||||||||||||
Investor Class | 06/01/1999 | –12.97 | % | 3.68 | % | 10.65 | % | 8.49 | % | ||||||||||||||
| Trust Class3 | 06/10/1999 | –13.03 | % | 3.54 | % | 10.51 | % | 8.40 | % | ||||||||||||||
| Institutional Class5 | 03/08/2010 | –12.70 | % | 3.96 | % | 10.94 | % | 8.63 | % | ||||||||||||||
| Class A19 | 06/21/2010 | –13.03 | % | 3.58 | % | 10.56 | % | 8.44 | % | ||||||||||||||
| Class C19 | 06/21/2010 | –13.69 | % | 2.80 | % | 9.80 | % | 8.08 | % | ||||||||||||||
| Class R316 | 06/21/2010 | –13.21 | % | 3.32 | % | 10.31 | % | 8.32 | % | ||||||||||||||
| Class R622 | 03/29/2019 | –12.81 | % | 3.72 | % | 10.67 | % | 8.50 | % | ||||||||||||||
With Sales Charge | |||||||||||||||||||||||
| Class A19 | –18.03 | % | 2.36 | % | 9.90 | % | 8.13 | % | |||||||||||||||
| Class C19 | –14.49 | % | 2.80 | % | 9.80 | % | 8.08 | % | |||||||||||||||
Index | |||||||||||||||||||||||
| Russell Midcap® Value Index1,15 | –3.13 | % | 5.88 | % | 12.46 | % | 8.94 | % | |||||||||||||||
| Russell Midcap® Index1,15 | 0.54 | % | 7.94 | % | 13.48 | % | 8.97 | % | |||||||||||||||
The performance data quoted represent past performance and do not indicate future results. Current performance may be lower or higher than the performance data quoted. For performance data current to the most recent month-end, please visit www.nb.com/performance.
The results shown in the table reflect the reinvestment of income dividends and other distributions, if any. The results do not reflect the effect of taxes a shareholder would pay on Fund distributions or on the redemption of Fund shares.
The investment return and principal value of an investment will fluctuate and shares, when redeemed, may be worth more or less than their original cost.
Returns would have been lower if Neuberger Berman Investment Advisers LLC ("Management") had not reimbursed certain expenses and/or waived a portion of the investment management fees during certain of the periods shown. Repayment by a class (of expenses previously reimbursed and/or fees previously waived by Management) will decrease the class's returns. Please see Note B in the Notes to Financial Statements for specific information regarding expense reimbursement and/or fee waiver arrangements.
As stated in the Fund's most recent prospectus, the total annual operating expense ratios for fiscal year 2018 were 1.21%, 1.38%, 1.02%, 1.40%, 2.15% and 1.65% for Investor Class, Trust Class, Institutional Class, Class A, Class C and Class R3 shares, respectively, and the estimated total annual operating expense ratio for fiscal year 2019 is 0.89% for Class R6 (before expense reimbursements and/or fee waivers, if any, and after restatement for Class R6 shares). The expense ratios were 1.26%, 0.85%, 1.22%, 1.97% and 1.46% for Trust Class, Institutional Class, Class A, Class C and Class R3 shares, respectively, and the estimated total annual operating expense ratio for fiscal year 2019 is 0.75% for Class R6 after expense reimbursements and/or fee waivers and/or restatement. The expense ratios for the annual period ended August 31, 2019 can be found in the Financial Highlights section of this report.
Returns shown with a sales charge reflect the deduction of the current maximum initial sales charge of 5.75% for Class A shares and the contingent deferred sales charge (CDSC) for Class C shares. The CDSC for Class C shares is 1.00%, which is reduced to 0% after 1 year. The performance of the Fund's share classes will differ primarily due to different sales charge structures and class expenses. Please see the prospectus for more information about sales charge structures, if any, and class expenses for your share class.
56
Mid Cap Intrinsic Value Fund (Unaudited)
COMPARISON OF A $10,000 INVESTMENT
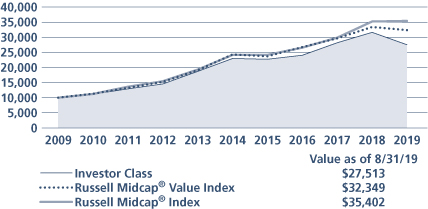
This graph shows the change in value of a hypothetical $10,000 investment in the Fund over the past 10 fiscal years, or since the Fund's inception if it has not operated for 10 years. The graph is based on the Investor Class shares only; the performance of the Fund's share classes will differ primarily due to different sales charge structures and class expenses (see Performance Highlights chart on previous page). The result is compared with benchmarks, which include a broad-based market index and may include a more narrowly based index. Market indices have not been reduced to reflect any of the fees and costs of investing. The results shown in the graph reflect the reinvestment of income dividends and other distributions, if any. The results do not reflect the effect of taxes a shareholder would pay on Fund distributions or on the redemption of Fund shares. Results represent past performance and do not indicate future results.
57
Multi-Cap Opportunities Fund Commentary (Unaudited)
Neuberger Berman Multi-Cap Opportunities Fund Institutional Class generated a 2.91% total return for the fiscal year ended August 31, 2019, versus a 2.92% total return for its benchmark, the S&P 500® Index (the Index) for the same period. (Performance for all share classes is provided in the table immediately following this letter.)
Over the trailing twelve months, U.S. equity market volatility increased as investor focus fluctuated between macro concerns and underlying company fundamentals. Correspondingly, performance results within the Index were mixed. For the Fund, Communication Services, Consumer Staples, Information Technology (IT), Real Estate and Utilities outperformed relative to the Index. Sector performance in Consumer Discretionary, Energy, Financials, Health Care, Industrials, and Materials lagged the Index. We believe the backdrop for U.S. equities remains strong. While U.S. equities have been supported by continued economic growth and generally healthy company fundamentals, equity markets may continue to experience periods of volatility. We believe we can effectively navigate the current environment through our disciplined active management.
Within the Fund, stock selection benefitted relative performance, primarily due to strong selection within Consumer Discretionary, Consumer Staples, IT and Materials. Portfolio positioning detracted from relative performance due to an overweight position to Financials versus the Index and having no exposure to Real Estate or Utilities. The Fund benefitted from an underweight to Energy. The Fund ended the fiscal year with an overweight, relative to the Index, in the Financials, Industrials, and Materials sectors. The Fund ended the fiscal year with an underweight, relative to the Index, in the Communication Services, Consumer Discretionary, Consumer Staples, Energy, Health Care and IT sectors. The Fund had no exposure to the Real Estate or Utilities sectors.
Portfolio construction is an important component of our investment process and consists of three distinct investment categories: Special Situations, Opportunistic, and Classic. Special Situations have unique attributes (e.g., restructuring, spin-offs, post-bankruptcy equities) that require specific valuation methodologies and customized investment research. Opportunistic investments are companies that have become inexpensive for a tangible reason that we believe is temporary. Classic investments are those companies with long histories of shareholder friendly policies, high quality management teams and exceptional operating performance. We believe maintaining a balance of these three categories helps to mitigate risk within the portfolio. We continue to pursue investment opportunities across each investment category with attractive risk/return profiles.
We believe the current environment is attractive for free cash flow oriented investing. Many company balance sheets appear healthy and free cash flow generation has been strong. As a result, we believe management teams have a significant opportunity to create value for shareholders by allocating capital effectively. Dividend increases, share repurchase programs, cash accumulation, debt retirement, organic growth initiatives, and selective and highly accretive acquisitions—all can accrue to the benefit of equity holders. When company specific drivers are in focus, it is our view that high conviction active managers have the potential to add value for their clients through stock selection. We believe deep fundamental analysis centered on free cash flow and capital structure efficiency may be an important driver of performance going forward.
Our style of investing is based on rigorous fundamental research. The analysis centers on the business model and a company's ability to generate and effectively utilize free cash flow. As we evaluate both potential new positions and current portfolio holdings, we will continue to do so with a long-term investment perspective in mind. As always, our focus is to grow the Fund's assets through the disciplined application of our investment philosophy and process.
Sincerely,
RICHARD S. NACKENSON
PORTFOLIO MANAGER
Information about principal risks of investing in the Fund is set forth in the prospectus and statement of additional information.
The portfolio composition, industries and holdings of the Fund are subject to change without notice.
The opinions expressed are those of the Fund's portfolio manager(s). The opinions are as of the date of this report and are subject to change without notice.
58
Multi-Cap Opportunities Fund (Unaudited)
TICKER SYMBOLS
Institutional Class | NMULX | ||||||
Class A | NMUAX | ||||||
Class C | NMUCX | ||||||
SECTOR ALLOCATION
(as a % of Total Investments*) | |||||||
Communication Services | 9.5 | % | |||||
Consumer Discretionary | 8.1 | ||||||
Consumer Staples | 7.5 | ||||||
Energy | 1.5 | ||||||
Financials | 21.7 | ||||||
Health Care | 8.3 | ||||||
Industrials | 15.8 | ||||||
Information Technology | 19.8 | ||||||
Materials | 6.4 | ||||||
Short-Term Investments | 1.4 | ||||||
Total | 100.0 | % | |||||
* Derivatives (other than options purchased), if any, are excluded from this chart.
PERFORMANCE HIGHLIGHTS9
| Average Annual Total Return Ended 08/31/2019 | |||||||||||||||||||||||
| Inception Date* | 1 Year | 5 Years | 10 Years | Life of Fund | |||||||||||||||||||
At NAV | |||||||||||||||||||||||
| Institutional Class17 | 12/21/2009 | 2.91 | % | 9.55 | % | 13.53 | % | 8.99 | % | ||||||||||||||
| Class A17 | 12/21/2009 | 2.54 | % | 9.15 | % | 13.13 | % | 8.69 | % | ||||||||||||||
| Class C17 | 12/21/2009 | 1.78 | % | 8.35 | % | 12.32 | % | 8.08 | % | ||||||||||||||
With Sales Charge | |||||||||||||||||||||||
| Class A17 | –3.37 | % | 7.87 | % | 12.47 | % | 8.19 | % | |||||||||||||||
| Class C17 | 0.86 | % | 8.35 | % | 12.32 | % | 8.08 | % | |||||||||||||||
Index | |||||||||||||||||||||||
| S&P 500® Index1,15 | 2.92 | % | 10.11 | % | 13.45 | % | 8.37 | % | |||||||||||||||
*Prior to December 14, 2009, the Fund had different investment goals, strategies, and portfolio management team. The performance data for each class includes the performance of the Fund's oldest share class, Trust Class, from November 2, 2006 through December 21, 2009. See endnote 17 for information about the effects of the different fees paid by each class.
The performance data quoted represent past performance and do not indicate future results. Current performance may be lower or higher than the performance data quoted. For performance data current to the most recent month-end, please visit www.nb.com/performance.
The results shown in the table reflect the reinvestment of income dividends and other distributions, if any. The results do not reflect the effect of taxes a shareholder would pay on Fund distributions or on the redemption of Fund shares.
The investment return and principal value of an investment will fluctuate and shares, when redeemed, may be worth more or less than their original cost.
Returns would have been lower if Neuberger Berman Investment Advisers LLC ("Management") had not reimbursed certain expenses and/or waived a portion of the investment management fees during certain of the periods shown. Repayment by a class (of expenses previously reimbursed and/or fees previously waived by Management) will decrease the class's returns. Please see Note B in the Notes to Financial Statements for specific information regarding expense reimbursement and/or fee waiver arrangements.
As stated in the Fund's most recent prospectus, the total annual operating expense ratios for fiscal year 2018 were 0.72%, 1.10% and 1.83% for Institutional Class, Class A and Class C shares, respectively (before expense reimbursements and/or fee waivers, if any). The expense ratios for the annual period ended August 31, 2019 can be found in the Financial Highlights section of this report.
Returns shown with a sales charge reflect the deduction of the current maximum initial sales charge of 5.75% for Class A shares and the contingent deferred sales charge (CDSC) for Class C shares. The CDSC for Class C shares is 1.00%, which is reduced to 0% after 1 year. The performance of the Fund's share classes will differ primarily due to different sales charge structures and class expenses. Please see the prospectus for more information about sales charge structures, if any, and class expenses for your share class.
59
Multi-Cap Opportunities Fund (Unaudited)
COMPARISON OF A $1,000,000 INVESTMENT17
(000's omitted)
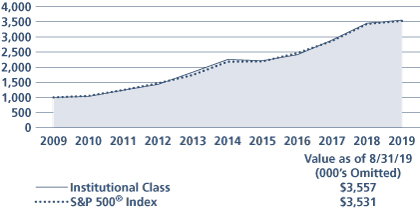
This graph shows the change in value of a hypothetical $1,000,000 investment in the Fund over the past 10 fiscal years, or since the Fund's inception if it has not operated for 10 years. The graph is based on the Institutional Class shares only; the performance of the Fund's share classes will differ primarily due to different sales charge structures and class expenses (see Performance Highlights chart on previous page). The result is compared with benchmarks, which include a broad-based market index and may include a more narrowly based index. Market indices have not been reduced to reflect any of the fees and costs of investing. The results shown in the graph reflect the reinvestment of income dividends and other distributions, if any. The results do not reflect the effect of taxes a shareholder would pay on Fund distributions or on the redemption of Fund shares. Results represent past performance and do not indicate future results.
60
Real Estate Fund Commentary (Unaudited)
Neuberger Berman Real Estate Fund Trust Class generated a 21.21% total return for the fiscal year ended August 31, 2019, outperforming its benchmark, the FTSE Nareit All Equity REITs Index (the Index), which generated a 15.57% total return for the same period. (Performance for all share classes is provided in the table immediately following this letter.)
The overall U.S. stock market experienced periods of elevated volatility, but generated a modest gain during the reporting period. While the market posted positive returns over eight of the twelve months covered by this report, most of those gains were given back during several sharp downturns. These setbacks were triggered by a number of factors, including concerns over the escalating trade war between the U.S. and China, signs of moderating global growth and a host of geopolitical issues. Against this backdrop, the U.S. Federal Reserve Board (Fed) had a "dovish pivot" in January 2019, as it announced a pause from raising rates. Then, as expected, the Fed lowered rates at its meeting in July 2019—the first cut since 2008. All told, the S&P 500® Index returned 2.92% for the 12-month period. Comparatively, real estate investment trusts (REITs) posted superior results during the period. This was partially due to strong demand and declining interest rates in the U.S.
The Fund generated a positive return and outperformed the Index during the reporting period. Sector positioning versus the Index, overall, was the largest contributor to performance. In particular, an underweight to Lodging/Resorts, an overweight to Manufactured Homes and an underweight to Regional Malls were the most beneficial for relative performance. Conversely, the Fund's small cash position and an underweight to Health Care were the only meaningful headwinds from returns.
Stock selection, overall, was also beneficial for results. Contributing the most to results were our holdings in the Infrastructure, Office, Regional Malls and Data Centers sectors. In terms of individual holdings, American Tower Corp., SBA Communications Corp., Equinix, Inc., Essex Property Trust, Inc. and Equity Residential were the most additive to returns. On the downside, holdings within the Specialty, Single Family Homes and Free Standing sectors were the largest detractors from performance. Several individual holdings were also negative for results, including Zayo Group Holdings, Inc. (sold during the period), Sunstone Hotel Investors, Inc. (sold during the period), Simon Property Group, Inc., Weyerhaeuser Co. and Macerich Co.
Looking ahead, we anticipate continued but modest economic growth for the U.S. for 2019. We believe many economic indicators, including high consumer confidence, strong non-residential fixed investment, and modest inflation, point to good tenant demand for real estate. However, we believe headwinds including slowing global growth, turmoil in Washington, and ongoing U.S.-China trade tensions threaten to derail the long-lasting U.S. recovery. As the Fed tries to balance these factors it has signaled a more flexible stance for policy changes and rates. Resolution of some of these headwinds could be a catalyst for the capital markets. On balance, we believe continued solid real estate fundamentals, strong private market demand for real estate and a more dovish Fed to be supportive of the U.S. listed real estate market.
Sincerely,
STEVE SHIGEKAWA AND BRIAN C. JONES
PORTFOLIO CO-MANAGERS
Information about principal risks of investing in the Fund is set forth in the prospectus and statement of additional information.
The portfolio composition, industries and holdings of the Fund are subject to change without notice.
The opinions expressed are those of the Fund's portfolio manager(s). The opinions are as of the date of this report and are subject to change without notice.
61
Real Estate Fund (Unaudited)
TICKER SYMBOLS
Trust Class | NBRFX | ||||||
Institutional Class | NBRIX | ||||||
Class A | NREAX | ||||||
Class C | NRECX | ||||||
Class R3 | NRERX | ||||||
Class R6 | NRREX | ||||||
SECTOR ALLOCATION
(as a % of Total Investments*) | |||||||
Apartments | 13.5 | % | |||||
Data Centers | 12.1 | ||||||
Diversified | 1.5 | ||||||
Free Standing | 6.1 | ||||||
Health Care | 7.7 | ||||||
Industrial | 8.0 | ||||||
Infrastructure | 17.5 | ||||||
Lodging/Resorts | 1.3 | ||||||
Manufactured Homes | 6.6 | ||||||
Office | 6.0 | ||||||
Regional Malls | 2.9 | ||||||
Self Storage | 6.5 | ||||||
Shopping Centers | 2.5 | ||||||
Single Family Homes | 3.5 | ||||||
Timber | 3.0 | ||||||
Short-Term Investments | 1.3 | ||||||
Total | 100.0 | % | |||||
* Derivatives (other than options purchased), if any, are excluded from this chart.
PERFORMANCE HIGHLIGHTS7,20
| Average Annual Total Return Ended 08/31/2019 | |||||||||||||||||||||||
| Inception Date | 1 Year | 5 Years | 10 Years | Life of Fund | |||||||||||||||||||
At NAV | |||||||||||||||||||||||
Trust Class | 05/01/2002 | 21.21 | % | 9.41 | % | 13.50 | % | 11.45 | % | ||||||||||||||
| Institutional Class6 | 06/04/2008 | 21.44 | % | 9.62 | % | 13.70 | % | 11.59 | % | ||||||||||||||
| Class A14 | 06/21/2010 | 21.01 | % | 9.23 | % | 13.31 | % | 11.35 | % | ||||||||||||||
| Class C14 | 06/21/2010 | 20.12 | % | 8.43 | % | 12.54 | % | 10.91 | % | ||||||||||||||
| Class R314 | 06/21/2010 | 20.76 | % | 8.96 | % | 13.05 | % | 11.20 | % | ||||||||||||||
| Class R623 | 03/15/2013 | 21.55 | % | 9.71 | % | 13.70 | % | 11.57 | % | ||||||||||||||
With Sales Charge | |||||||||||||||||||||||
| Class A14 | 14.09 | % | 7.94 | % | 12.64 | % | 10.97 | % | |||||||||||||||
| Class C14 | 19.12 | % | 8.43 | % | 12.54 | % | 10.91 | % | |||||||||||||||
Index | |||||||||||||||||||||||
| FTSE Nareit All Equity REITs Index1,15 | 15.57 | % | 9.39 | % | 14.08 | % | 10.44 | % | |||||||||||||||
The performance data quoted represent past performance and do not indicate future results. Current performance may be lower or higher than the performance data quoted. For performance data current to the most recent month-end, please visit www.nb.com/performance.
The results shown in the table reflect the reinvestment of income dividends and other distributions, if any. The results do not reflect the effect of taxes a shareholder would pay on Fund distributions or on the redemption of Fund shares.
The investment return and principal value of an investment will fluctuate and shares, when redeemed, may be worth more or less than their original cost.
Returns would have been lower if Neuberger Berman Investment Advisers LLC ("Management") had not reimbursed certain expenses and/or waived a portion of the investment management fees during certain of the periods shown. Repayment by a class (of expenses previously reimbursed and/or fees previously waived by Management) will decrease the class's returns. Please see Note B in the Notes to Financial Statements for specific information regarding expense reimbursement and/or fee waiver arrangements.
As stated in the Fund's most recent prospectus, the total annual operating expense ratios for fiscal year 2018 were 1.42%, 1.07%, 1.43%, 2.19%, 1.69% and 0.97% for Trust Class, Institutional Class, Class A, Class C, Class R3 and Class R6 shares, respectively (before expense reimbursements and/or fee waivers, if any, and after restatement for Class R6 shares). The expense ratios were 0.86%, 1.22%, 1.97%, 1.47% and 0.76% for Institutional Class, Class A, Class C, Class R3 and Class R6 shares, respectively, after expense reimbursements and/or fee waivers and/or restatement. The expense ratios for the annual period ended August 31, 2019 can be found in the Financial Highlights section of this report.
Returns shown with a sales charge reflect the deduction of the current maximum initial sales charge of 5.75% for Class A shares and the contingent deferred sales charge (CDSC) for Class C shares. The CDSC for Class C shares is 1.00%, which is reduced to 0% after 1 year. The performance of the Fund's share classes will differ primarily due to different sales charge structures and class expenses. Please see the prospectus for more information about sales charge structures, if any, and class expenses for your share class.
62
Real Estate Fund (Unaudited)
COMPARISON OF A $10,000 INVESTMENT
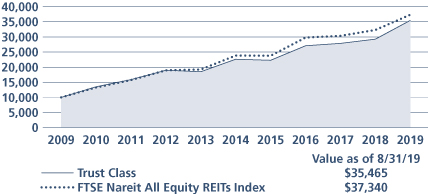
This graph shows the change in value of a hypothetical $10,000 investment in the Fund over the past 10 fiscal years, or since the Fund's inception if it has not operated for 10 years. The graph is based on the Trust Class shares only; the performance of the Fund's share classes will differ primarily due to different sales charge structures and class expenses (see Performance Highlights chart on previous page). The result is compared with benchmarks, which include a broad-based market index and may include a more narrowly based index. Market indices have not been reduced to reflect any of the fees and costs of investing. The results shown in the graph reflect the reinvestment of income dividends and other distributions, if any. The results do not reflect the effect of taxes a shareholder would pay on Fund distributions or on the redemption of Fund shares. Results represent past performance and do not indicate future results.
63
Small Cap Growth Fund Commentary (Unaudited)
Neuberger Berman Small Cap Growth Fund Investor Class generated a 4.06% total return for the fiscal year ended August 31, 2019, outperforming its benchmark, the Russell 2000® Growth Index (the Index), which returned –11.02% for the same period. (Performance for all share classes is provided in the table immediately following this letter.)
While the trailing twelve months continued to largely be a positive environment for equities, thanks in part to a dovish turn by the U.S. Federal Reserve Board (Fed), worries around trade and the potential for decelerating economic growth prompted shifts in investor risk sentiment and meaningful bouts of rotational volatility at the end of 2018 and again at the end of the 12-month reporting period. However, despite potential signs of a broader late-cycle slowdown, compelling growth could still be found across our investable universe as favorable long-term trends combined with intriguing and potentially underappreciated catalysts to deliver top- and bottom-line results that exceeded the expectations of a market still largely willing to reward execution and positive differentiation.
During the period, the Fund remained focused on Information Technology (IT), Health Care, Industrials and Consumer Discretionary names and those allocation decisions were generally reflective of the positive long-term trends, intriguing catalysts and compelling underlying fundamentals that we continued to see in those sectors. With respect to performance, strong stock selection within Health Care, IT, Industrials and Consumer Discretionary drove our absolute and relative outperformance, effectively navigating both risk-on and risk-off environments and more than compensating for any areas of selection or allocation weakness across the portfolio. At the industry-level, the Software and Biotechnology segments were the leading contributors to performance, offsetting stock-specific weakness within our Financials allocation and the performance drag associated with our cash position, which was elevated in response to the increased market volatility. Drilling down to our holdings, Fluidigm Corp, which develops, manufactures and markets innovative technologies, instruments and consumables for life sciences research, continued to exceed revenue expectations and was the leading contributor to performance, while Aerie Pharmaceuticals, which is focused on the development and commercialization of therapies for glaucoma, struggled to overcome market concerns that their recently approved second therapy would ultimately cannibalize sales of their first drug. While doctor and patient feedback has been positive, the persistent negative market sentiment around their ultimate market share potential eventually led us to exit our position.
Looking ahead, we are cautiously optimistic that over the near-term we will remain in a constructive environment for small-cap growth stocks, even if the overall pace of economic growth continues to moderately decelerate. With a discriminating market and increasingly cautious commentary from more GDP-growth dependent companies underscoring the importance of balancing risk and reward, we are also going to be mindful of the potential for additional volatility in the form of either persistent valuation resets or possibly a sustained rotation away from the more traditional growth segments of the market. That said, we still believe that the most compelling catalysts are to be found in IT and Health Care, that long-term trends continue to hold more promise than cyclical in an uncertain geopolitical environment and that if a scarcity of economic and corporate growth is looming, then the market will likely continue to seek out and favor higher qualitative growth companies capable of consistently exceeding expectations.
Sincerely,
KENNETH J. TUREK
PORTFOLIO MANAGER
Information about principal risks of investing in the Fund is set forth in the prospectus and statement of additional information.
The portfolio composition, industries and holdings of the Fund are subject to change without notice.
The opinions expressed are those of the Fund's portfolio manager(s). The opinions are as of the date of this report and are subject to change without notice.
64
Small Cap Growth Fund (Unaudited)
TICKER SYMBOLS
Investor Class | NBMIX | ||||||
Trust Class | NBMOX | ||||||
Advisor Class | NBMVX | ||||||
Institutional Class | NBSMX | ||||||
Class A | NSNAX | ||||||
Class C | NSNCX | ||||||
Class R3 | NSNRX | ||||||
Class R6 | NSRSX | ||||||
SECTOR ALLOCATION
(as a % of Total Investments*) | |||||||
Communication Services | 5.8 | % | |||||
Consumer Discretionary | 12.3 | ||||||
Consumer Staples | 3.1 | ||||||
Financials | 1.8 | ||||||
Health Care | 26.5 | ||||||
Industrials | 19.6 | ||||||
Information Technology | 23.8 | ||||||
Materials | 0.5 | ||||||
Real Estate | 0.8 | ||||||
Short-Term Investments | 5.8 | ||||||
Total | 100.0 | % | |||||
* Derivatives (other than options purchased), if any, are excluded from this chart.
PERFORMANCE HIGHLIGHTS
| Average Annual Total Return Ended 08/31/2019 | |||||||||||||||||||||||
| Inception Date | 1 Year | 5 Years | 10 Years | Life of Fund | |||||||||||||||||||
At NAV | |||||||||||||||||||||||
Investor Class | 10/20/1998 | 4.06 | % | 12.88 | % | 14.35 | % | 9.73 | % | ||||||||||||||
| Trust Class3 | 11/03/1998 | 3.99 | % | 12.71 | % | 14.12 | % | 9.59 | % | ||||||||||||||
| Advisor Class4 | 05/03/2002 | 3.81 | % | 12.55 | % | 13.94 | % | 9.48 | % | ||||||||||||||
| Institutional Class5 | 04/01/2008 | 4.38 | % | 13.23 | % | 14.66 | % | 9.91 | % | ||||||||||||||
| Class A19 | 05/27/2009 | 4.01 | % | 12.82 | % | 14.25 | % | 9.69 | % | ||||||||||||||
| Class C19 | 05/27/2009 | 3.20 | % | 11.98 | % | 13.39 | % | 9.28 | % | ||||||||||||||
| Class R316 | 05/27/2009 | 3.73 | % | 12.55 | % | 13.97 | % | 9.55 | % | ||||||||||||||
| Class R622 | 09/07/2018 | 4.48 | % | 12.97 | % | 14.40 | % | 9.76 | % | ||||||||||||||
With Sales Charge | |||||||||||||||||||||||
| Class A19 | –1.97 | % | 11.49 | % | 13.58 | % | 9.38 | % | |||||||||||||||
| Class C19 | 2.36 | % | 11.98 | % | 13.39 | % | 9.28 | % | |||||||||||||||
Index | |||||||||||||||||||||||
| Russell 2000® Growth Index1,15 | –11.02 | % | 8.06 | % | 13.06 | % | 7.90 | % | |||||||||||||||
| Russell 2000® Index1,15 | –12.89 | % | 6.41 | % | 11.59 | % | 8.60 | % | |||||||||||||||
The performance data quoted represent past performance and do not indicate future results. Current performance may be lower or higher than the performance data quoted. For performance data current to the most recent month-end, please visit www.nb.com/performance.
The results shown in the table reflect the reinvestment of income dividends and other distributions, if any. The results do not reflect the effect of taxes a shareholder would pay on Fund distributions or on the redemption of Fund shares.
The investment return and principal value of an investment will fluctuate and shares, when redeemed, may be worth more or less than their original cost.
Returns would have been lower if Neuberger Berman Investment Advisers LLC ("Management") had not reimbursed certain expenses and/or waived a portion of the investment management fees during certain of the periods shown. Repayment by a class (of expenses previously reimbursed and/or fees previously waived by Management) will decrease the class's returns. Please see Note B in the Notes to Financial Statements for specific information regarding expense reimbursement and/or fee waiver arrangements.
As stated in the Fund's most recent prospectus, the total annual operating expense ratios for fiscal year 2018 were 1.76%, 1.87%, 2.04%, 1.51%, 1.89%, 2.63% and 2.18% for Investor Class, Trust Class, Advisor Class, Institutional Class, Class A, Class C and Class R3 shares, respectively, and the estimated total annual operating expense ratio for fiscal year 2019 is 1.37% for Class R6 (before expense reimbursements and/or fee waivers, if any, and after restatement for Class R6 shares). The expense ratios were 1.31%, 1.41%, 1.61%, 0.91%, 1.27%, 2.02% and 1.52% for Investor Class, Trust Class, Advisor Class, Institutional Class, Class A, Class C and Class R3 shares, respectively, and the estimated total annual operating expense ratio for fiscal year 2019 is 0.81% for Class R6 after expense reimbursements and/or fee waivers and/or restatement. The expense ratios for the annual period ended August 31, 2019 can be found in the Financial Highlights section of this report.
Returns shown with a sales charge reflect the deduction of the current maximum initial sales charge of 5.75% for Class A shares and the contingent deferred sales charge (CDSC) for Class C shares. The CDSC for Class C shares is 1.00%, which is reduced to 0% after 1 year. The performance of the Fund's share classes will differ primarily due to different sales charge structures and class expenses. Please see the prospectus for more information about sales charge structures, if any, and class expenses for your share class.
65
Small Cap Growth Fund (Unaudited)
COMPARISON OF A $10,000 INVESTMENT
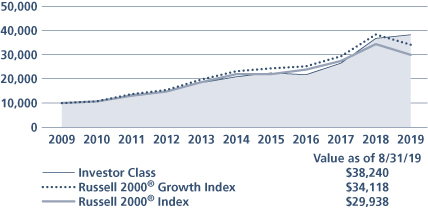
This graph shows the change in value of a hypothetical $10,000 investment in the Fund over the past 10 fiscal years, or since the Fund's inception if it has not operated for 10 years. The graph is based on the Investor Class shares only; the performance of the Fund's share classes will differ primarily due to different sales charge structures and class expenses (see Performance Highlights chart on previous page). The result is compared with benchmarks, which include a broad-based market index and may include a more narrowly based index. Market indices have not been reduced to reflect any of the fees and costs of investing. The results shown in the graph reflect the reinvestment of income dividends and other distributions, if any. The results do not reflect the effect of taxes a shareholder would pay on Fund distributions or on the redemption of Fund shares. Results represent past performance and do not indicate future results.
66
Sustainable Equity Fund Commentary (Unaudited)
Neuberger Berman Sustainable Equity Fund Investor Class generated a total return of –2.70% for the fiscal year ended August 31, 2019, trailing the 2.92% total return of the S&P 500® Index (the Index) for the same period. (Performance for all share classes is provided in the table immediately following this letter.)
Equity markets improved after a difficult first half, bringing this period to a mildly positive close. Just as trade policy and geopolitical uncertainty caused the first half's losses, a temporary break in tensions and the announcement of a more accommodative stance by the U. S. Federal Reserve Board provided relief to investors in 2019. Volatility remained high, however, as tariff concerns resulted in lowered business confidence and heightened global economic uncertainty.
Despite volatility, returns continued to be narrow, with Information Technology (roughly 22% of the Index on average during the period) contributing more than half of the Index's total return this period. The market has perceived this sector to be insulated from concerns around geopolitical risks, trade disruptions, and fears of a material economic slowdown that impacted investor sentiment elsewhere.
While the growth momentum driven market backdrop continues to pose headwinds for valuation-sensitive investors like us, heightened volatility presents opportunities to add high quality businesses to the portfolio at attractive valuations.
Stock selection within Industrials and Energy was the most significant factor in the Fund's underperformance. Our holdings continued to perform well as businesses, but their stocks trailed Index peers.
Individual detractors included EQT and Schlumberger, both impacted by weak energy and commodity prices on concerns of slower global growth; and Ryanair, impacted by rising fuel costs and investor concerns around unionization. We believe the company can balance union demands with capital efficiency.
Stock selection drove relative outperformance within Financials and Communications Services. Top contributors included Danaher, benefiting from the announcement of its planned acquisition of GE's healthcare assets; Comcast, supported by strong performance in broadband; and Intercontinental Exchange, which delivered strong organic revenue growth in its data business.
Complete sales this period included eBay, Equitrans, Fastenal, Cimarex, J.B. Hunt, and 3M. New purchases included Cigna, Manpower, Stanley Black & Decker, Vestas Wind Systems, United Rentals, Microsoft, Zebra Technologies, CSX, and Arista Networks.
Despite the current healthy economic fundamentals, we anticipate a continued slow growth environment. In our view, a tight labor market indicating reduced slack and a potential drag on economic growth due to trade protectionism could dampen economic growth. On the international front, we believe geopolitical volatility—particularly the Chinese economic slowdown, continued uncertainty created by Brexit, and any potential disruptions to global trade as a result of the current U.S. administration's trade policies could be sources of continued market volatility and weights on global economic growth.
Given the above outlook and our long-term investment time horizon, we continue to focus on owning what we believe are best-in-class businesses that are exposed to long-term growth trends (energy efficiency, health and nutrition, accelerating innovation, etc.) that should enable them to grow and increase market share within a slower growth backdrop. We believe the fundamentals of the businesses we own can translate this top-line growth into stronger, advantaged bottom-line growth, supported by competitive advantages, attractive return on capital profiles, and demonstrated leadership in environmental, social and governance (ESG) practices.
We continually engage with companies addressing key sustainability themes in their business operations as well as through their products and services. As of December 31, 2018, the Fund was 78% less carbon intensive than the Index, 75% of the Fund's holdings by weight had been recognized for favorable workplace practices, and 100% of the Fund's holdings had one or more women on the board of directors.
67
Sincerely,
INGRID S. DYOTT AND SAJJAD S. LADIWALA
CO-PORTFOLIO MANAGERS
Information about principal risks of investing in the Fund is set forth in the prospectus and statement of additional information.
The portfolio composition, industries and holdings of the Fund are subject to change without notice.
The opinions expressed are those of the Fund's portfolio manager(s). The opinions are as of the date of this report and are subject to change without notice.
68
Sustainable Equity Fund (Unaudited)
TICKER SYMBOLS
Investor Class | NBSRX | ||||||
Trust Class | NBSTX | ||||||
Institutional Class | NBSLX | ||||||
Class A | NRAAX | ||||||
Class C | NRACX | ||||||
Class R3 | NRARX | ||||||
Class R6 | NRSRX | ||||||
SECTOR ALLOCATION
(as a % of Total Investments*) | |||||||
Communication Services | 7.4 | % | |||||
Consumer Discretionary | 11.1 | ||||||
Consumer Staples | 6.3 | ||||||
Energy | 3.7 | ||||||
Financials | 14.4 | ||||||
Health Care | 20.0 | ||||||
Industrials | 12.5 | ||||||
Information Technology | 17.0 | ||||||
Materials | 4.6 | ||||||
Real Estate | 1.5 | ||||||
Short-Term Investments | 1.5 | ||||||
Total | 100.0 | % | |||||
* Derivatives (other than options purchased), if any, are excluded from this chart.
PERFORMANCE HIGHLIGHTS7
| Average Annual Total Return Ended 08/31/2019 | |||||||||||||||||||||||
| Inception Date | 1 Year | 5 Years | 10 Years | Life of Fund | |||||||||||||||||||
At NAV | |||||||||||||||||||||||
Investor Class | 03/16/1994 | –2.70 | % | 7.70 | % | 12.05 | % | 9.08 | % | ||||||||||||||
| Trust Class3 | 03/03/1997 | –2.86 | % | 7.52 | % | 11.86 | % | 8.90 | % | ||||||||||||||
| Institutional Class5 | 11/28/2007 | –2.52 | % | 7.90 | % | 12.26 | % | 9.17 | % | ||||||||||||||
| Class A19 | 05/27/2009 | –2.90 | % | 7.50 | % | 11.84 | % | 9.00 | % | ||||||||||||||
| Class C19 | 05/27/2009 | –3.62 | % | 6.69 | % | 10.99 | % | 8.67 | % | ||||||||||||||
| Class R316 | 05/27/2009 | –3.12 | % | 7.23 | % | 11.57 | % | 8.89 | % | ||||||||||||||
| Class R622 | 03/15/2013 | –2.44 | % | 7.97 | % | 12.23 | % | 9.15 | % | ||||||||||||||
With Sales Charge | |||||||||||||||||||||||
| Class A19 | –8.49 | % | 6.23 | % | 11.17 | % | 8.75 | % | |||||||||||||||
| Class C19 | –4.50 | % | 6.69 | % | 10.99 | % | 8.67 | % | |||||||||||||||
Index | |||||||||||||||||||||||
| S&P 500® Index1,15 | 2.92 | % | 10.11 | % | 13.45 | % | 9.57 | % | |||||||||||||||
The performance data quoted represent past performance and do not indicate future results. Current performance may be lower or higher than the performance data quoted. For performance data current to the most recent month-end, please visit www.nb.com/performance.
The results shown in the table reflect the reinvestment of income dividends and other distributions, if any. The results do not reflect the effect of taxes a shareholder would pay on Fund distributions or on the redemption of Fund shares.
The investment return and principal value of an investment will fluctuate and shares, when redeemed, may be worth more or less than their original cost.
Returns would have been lower if Neuberger Berman Investment Advisers LLC ("Management") had not reimbursed certain expenses and/or waived a portion of the investment management fees during certain of the periods shown. Repayment by a class (of expenses previously reimbursed and/or fees previously waived by Management) will decrease the class's returns. Please see Note B in the Notes to Financial Statements for specific information regarding expense reimbursement and/or fee waiver arrangements.
As stated in the Fund's most recent prospectus, the total annual operating expense ratios for fiscal year 2018 were 0.86%, 1.02%, 0.67%, 1.04%, 1.78%, 1.28% and 0.57% for Investor Class, Trust Class, Institutional Class, Class A, Class C, Class R3 and Class R6 shares, respectively (before expense reimbursements and/or fee waivers, if any, and after restatement for Class R6 shares). The expense ratios for the annual period ended August 31, 2019 can be found in the Financial Highlights section of this report.
Returns shown with a sales charge reflect the deduction of the current maximum initial sales charge of 5.75% for Class A shares and the contingent deferred sales charge (CDSC) for Class C shares. The CDSC for Class C shares is 1.00%, which is reduced to 0% after 1 year. The performance of the Fund's share classes will differ primarily due to different sales charge structures and class expenses. Please see the prospectus for more information about sales charge structures, if any, and class expenses for your share class.
69
Sustainable Equity Fund (Unaudited)
COMPARISON OF A $10,000 INVESTMENT

This graph shows the change in value of a hypothetical $10,000 investment in the Fund over the past 10 fiscal years, or since the Fund's inception if it has not operated for 10 years. The graph is based on the Investor Class shares only; the performance of the Fund's share classes will differ primarily due to different sales charge structures and class expenses (see Performance Highlights chart on previous page). The result is compared with benchmarks, which include a broad-based market index and may include a more narrowly based index. Market indices have not been reduced to reflect any of the fees and costs of investing. The results shown in the graph reflect the reinvestment of income dividends and other distributions, if any. The results do not reflect the effect of taxes a shareholder would pay on Fund distributions or on the redemption of Fund shares. Results represent past performance and do not indicate future results.
70
Endnotes
1 Please see "Glossary of Indices" on page 74 for a description of indices. Please note that individuals cannot invest directly in any index. The indices described in this report do not take into account any fees, expenses or tax consequences of investing in the individual securities that they track. Data about the performance of an index are prepared or obtained by Neuberger Berman Investment Advisers LLC ("Management") and reflect the reinvestment of income dividends and other distributions, if any. The Fund may invest in securities not included in a described index and generally does not invest in all securities included in a described index.
2 This date reflects when Management first became the investment manager to the Fund.
3 The performance information for the Trust Class prior to the class's inception date is that of the Fund's Investor Class. The performance information for the Investor Class has not been adjusted to take into account differences in class specific operating expenses. The Investor Class has lower expenses and typically higher returns than the Trust Class.
4 The performance information for the Advisor Class prior to the class's inception date is that of the Fund's Investor Class. The performance information for the Investor Class has not been adjusted to take into account differences in class specific operating expenses. The Investor Class has lower expenses and typically higher returns than the Advisor Class.
5 The performance information for the Institutional Class prior to the class's inception date is that of the Fund's Investor Class. The performance information for the Investor Class has not been adjusted to take into account differences in class specific operating expenses. The Investor Class has higher expenses and typically lower returns than the Institutional Class.
6 The performance information for the Institutional Class prior to the class's inception date is that of the Fund's Trust Class. The performance information for the Trust Class has not been adjusted to take into account differences in class specific operating expenses. The Trust Class has higher expenses and typically lower returns than the Institutional Class.
7 The investments for the Fund are managed by the same portfolio manager(s) who manage(s) one or more other registered funds that have names, investment objectives and investment styles that are similar to those of the Fund. You should be aware that the Fund is likely to differ from those other mutual fund(s) in size, cash flow pattern and tax matters. Accordingly, the holdings and performance of the Fund can be expected to vary from those of the other mutual fund(s).
8 The Fund had a policy of investing mainly in large-cap stocks prior to September 1998 and investing 90% of its assets in no more than six economic sectors prior to December 17, 2007. As of April 2, 2001, the Fund changed its investment policy to become "non-diversified" under the Investment Company Act of 1940 ("1940 Act"). Performance prior to these changes might have been different if current policies had been in effect. However, by operation of law under the 1940 Act, the Fund subsequently became, and currently operates as, a diversified fund. Please see the notes to the financial statements for information on a non-diversified fund becoming a diversified fund by operation of law.
9 Neuberger Berman Global Equity, Neuberger Berman Global Real Estate Fund and Neuberger Berman International Small Cap Fund are each relatively small. Each of Neuberger Berman Emerging Markets Equity Fund, Neuberger Berman Equity Income Fund and Neuberger Berman Multi-Cap Opportunities Fund were relatively small prior to September 2010, June 2008 and January 2010, respectively. The same techniques used to produce returns in a small fund may not work to produce similar returns in a larger fund and could have an impact on performance.
10 The performance information for Class R3 prior to the class's inception date is that of the Fund's Institutional Class. The performance information for the Institutional Class has not been adjusted to take into account differences in
71
Endnotes (cont'd)
class specific operating expenses (such as Rule 12b-1 fees). The Institutional Class has lower expenses and typically higher returns than Class R3.
11 The Fund had a policy of investing mainly in large-cap stocks prior to December 2002. Its performance prior to that date might have been different if current policies had been in effect.
12 The performance information for Class A, Class C, Investor Class, and Trust Class prior to the classes' inception date is that of the Fund's Institutional Class. The performance information for the Institutional Class has been adjusted to reflect the appropriate sales charges applicable to Class A and Class C shares, but has not been adjusted to take into account differences in class specific operating expenses (such as Rule 12b-1 fees). The Institutional Class has lower expenses and typically higher returns than Class A, Class C, Investor Class, and Trust Class.
13 The performance information for Institutional Class, Class A, Class C and Class R3 prior to June 9, 2008 is that of the Fund's Trust Class, which had an inception date of November 2, 2006, and converted into the Institutional Class on June 9, 2008. During the period from November 2, 2006 through June 9, 2008, the Trust Class had only one investor, which could have impacted Fund performance. The performance information for the Trust Class has been adjusted to reflect the appropriate sales charges applicable to Class A and Class C shares, but has not been adjusted to take into account differences in class specific operating expenses (such as Rule 12b-1 fees). The Trust Class had higher expenses and typically lower returns than the Institutional Class. The Trust Class had lower expenses and typically higher returns than Class A, Class C and Class R3. The performance information for Class R3 from June 9, 2008 to the class's inception date is that of the Fund's Institutional Class. The performance information for the Institutional Class has not been adjusted to take into account differences in class specific operating expenses (such as Rule 12b-1 fees). The Institutional Class has lower expenses and typically higher returns than Class R3.
14 The performance information for Class A, Class C and Class R3 prior to the classes' respective inception dates is that of the Fund's Trust Class. The performance information for the Trust Class has been adjusted to reflect the appropriate sales charges applicable to Class A and Class C shares, but has not been adjusted to take into account differences in class specific operating expenses (such as Rule 12b-1 fees). The Trust Class has lower expenses and typically higher returns than Class A, Class C and Class R3.
15 The date used to calculate Life of Fund performance for the index is the inception date of the oldest share class.
16 The performance information for Class R3 prior to the class's inception date is that of the Fund's Investor Class. The performance information for the Investor Class has not been adjusted to take into account differences in class specific operating expenses (such as Rule 12b-1 fees). The Investor Class has lower expenses and typically higher returns than Class R3.
17 Prior to December 14, 2009, the Fund had different investment goals, strategies and portfolio management team. The performance information for Institutional Class, Class A and Class C prior to December 21, 2009 is that of the Fund's Trust Class, which had an inception date of November 2, 2006, and converted into the Institutional Class on December 21, 2009. During the period from November 2, 2006 through December 21, 2009, the Trust Class had only one investor, which could have impacted Fund performance. The performance information for the Trust Class has been adjusted to reflect the appropriate sales charges applicable to Class A and Class C shares, but has not been adjusted to take into account differences in class specific operating expenses (such as Rule 12b-1 fees). Management had previously capped Trust Class expenses; absent this arrangement, the returns would have been lower. The Trust Class had lower capped expenses and typically higher returns than Class A and Class C. The Trust Class had equivalent capped expenses and typically similar returns to the Institutional Class.
18 The performance information for Institutional Class, Class A and Class C prior to the classes' inception date is that of the Fund's predecessor, the DJG Small Cap Value Fund L.P., an unregistered limited partnership ("DJG Fund");
72
Endnotes (cont'd)
DJG Fund was the successor to The DJG Small Cap Value Fund, an unregistered commingled investment account ("DJG Account"). The performance from July 8, 1997 (the commencement of operations) to September 11, 2008 is that of DJG Account, and the performance from September 12, 2008 to May 10, 2010 is that of DJG Fund. On May 10, 2010, the DJG Fund transferred its assets to the Fund in exchange for the Fund's Institutional Class shares. The investment policies, objectives, guidelines and restrictions of the Fund are in all material respects equivalent to those of DJG Fund and DJG Account (the "Predecessors"). As a mutual fund registered under the 1940 Act, the Fund is subject to certain restrictions under the 1940 Act and the Internal Revenue Code ("Code") to which the Predecessors were not subject. Had the Predecessors been registered under the 1940 Act and been subject to the provisions of the 1940 Act and the Code, their investment performance may have been adversely affected. The performance information reflects the actual expenses of the Predecessors, which were generally lower than those of the Fund. The performance for Class R6 from May 10, 2010 to January 18, 2019 includes the performance of the Fund's Institutional Class, and prior to May 10, 2010 includes the performance of the Predecessors, as noted above.
19 The performance information for Class A and Class C prior to the classes' inception date is that of the Fund's Investor Class. The performance information for the Investor Class has been adjusted to reflect the appropriate sales charges applicable to Class A and Class C shares, but has not been adjusted to take into account differences in class specific operating expenses (such as Rule 12b-1 fees). The Investor Class has lower expenses and typically higher returns than Class A and Class C.
20 As of June 19, 2012, the Fund changed its investment policy to become "non-diversified" under the 1940 Act. A non-diversified fund is able to invest larger percentages of its assets in the securities of a single issuer, which could increase the fund's risk of loss. Performance prior to this change might have been different if current policies had been in effect.
21 The performance information for Class R6 prior to the class's inception date is that of the Fund's Institutional Class. The performance information for the Institutional Class has not been adjusted to take into account differences in class specific operating expenses. The Institutional Class has higher expenses and typically lower returns than Class R6.
22 The performance information for Class R6 prior to the class's inception date is that of the Fund's Investor Class. The performance information for the Investor Class has not been adjusted to take into account differences in class specific operating expenses. The Investor Class has higher expenses and typically lower returns than Class R6.
23 The performance information for Class R6 prior to the class's inception date is that of the Fund's Trust Class. The performance information for the Trust Class has not been adjusted to take into account differences in class specific operating expenses. The Trust Class has higher expenses and typically lower returns than Class R6.
For more complete information on any of the Neuberger Berman Equity Funds, call us at (800) 877-9700, or visit our website at www.nb.com.
73
Glossary of Indices
FTSE EPRA/Nareit Developed Index (Net): | The index is a free float-adjusted market capitalization-weighted index that is designed to measure the performance of listed real estate companies and real estate investment trusts (REITs) in developed markets. Net total return indexes reinvest dividends after the deduction of withholding taxes, using (for international indexes) a tax rate applicable to non-resident institutional investors who do not benefit from double taxation treaties. | ||||||
FTSE Nareit All Equity REITs Index: | The index is a free-float adjusted, market capitalization-weighted index that tracks the performance of all equity real estate investment trusts (REITs) that are listed on the New York Stock Exchange, the NYSE Arca or the NASDAQ National Market List. Equity REITs include all tax-qualified REITs with more than 50 percent of total assets in qualifying real estate assets other than mortgages secured by real property. | ||||||
MSCI All Country World Index (Net): | The index is a free float-adjusted market capitalization-weighted index that is designed to measure the equity market performance of developed and emerging markets. The index consists of 49 country indexes comprising 23 developed and 26 emerging market country indexes. The developed market country indexes included are: Australia, Austria, Belgium, Canada, Denmark, Finland, France, Germany, Hong Kong, Ireland, Israel, Italy, Japan, the Netherlands, New Zealand, Norway, Portugal, Singapore, Spain, Sweden, Switzerland, the United Kingdom and the United States. The emerging market country indexes included are: Argentina, Brazil, Chile, China, Colombia, Czech Republic, Egypt, Greece, Hungary, India, Indonesia, Korea, Malaysia, Mexico, Pakistan, Peru, the Philippines, Poland, Qatar, Russia, Saudi Arabia, South Africa, Taiwan, Thailand, Turkey, and the UAE. China A shares are included starting from June 1, 2018 and are partially represented at 15% of their free float-adjusted market capitalization as of August 2019. Net total return indexes reinvest dividends after the deduction of withholding taxes, using (for international indexes) a tax rate applicable to non-resident institutional investors who do not benefit from double taxation treaties. | ||||||
MSCI China Index (Net): | The index is a free float-adjusted market capitalization-weighted index that is designed to measure the equity market performance of Chinese securities readily accessible to nondomestic investors. The index includes equity securities issued by companies incorporated in the People's Republic of China ("PRC"), and listed in the form of China B shares on the Shanghai Stock Exchange (in US$) or Shenzhen Stock Exchange (in HK$), or China H shares on the Hong Kong Stock Exchange (in HK$) and other foreign exchanges. It also includes Red-Chips and P-Chips, which are not incorporated in the PRC and are listed on the Hong Kong Stock Exchange. Red-Chips include companies that are directly or indirectly controlled by organizations or enterprises that are owned by the state, provinces, or municipalities of the PRC. P-Chips include non-state-owned Chinese companies incorporated outside the mainland and traded in Hong Kong. U.S.-listed China stocks are also included in the index. China A shares are included starting from June 1, 2018 and are partially represented at 15% of their free float-adjusted market capitalization as of August 2019. Net total return indexes reinvest dividends after the deduction of withholding taxes, using (for international indexes) a tax rate applicable to non-resident institutional investors who do not benefit from double taxation treaties. | ||||||
74
Glossary of Indices (cont'd)
| MSCI EAFE® Index (Net) (Europe, Australasia, Far East): | The index is a free float-adjusted market capitalization-weighted index that is designed to measure the equity market performance of developed markets, excluding the United States and Canada. The index consists of the following 21 developed market country indexes: Australia, Austria, Belgium, Denmark, Finland, France, Germany, Hong Kong, Ireland, Israel, Italy, Japan, the Netherlands, New Zealand, Norway, Portugal, Singapore, Spain, Sweden, Switzerland, and the United Kingdom. Net total return indexes reinvest dividends after the deduction of withholding taxes, using (for international indexes) a tax rate applicable to non-resident institutional investors who do not benefit from double taxation treaties. | ||||||
MSCI Emerging Markets Index (Net): | The index is a free float-adjusted market capitalization-weighted index that is designed to measure the equity market performance of emerging markets. The index consists of the following 26 emerging market country indexes: Argentina, Brazil, Chile, China, Colombia, Czech Republic, Egypt, Greece, Hungary, India, Indonesia, Korea, Malaysia, Mexico, Pakistan, Peru, the Philippines, Poland, Qatar, Russia, Saudi Arabia, South Africa, Taiwan, Thailand, Turkey, and the UAE. China A shares are included starting from June 1, 2018 and are partially represented at 15% of their free float-adjusted market capitalization as of August 2019. Net total return indexes reinvest dividends after the deduction of withholding taxes, using (for international indexes) a tax rate applicable to non-resident institutional investors who do not benefit from double taxation treaties. | ||||||
| MSCI EAFE® Small Cap Index (Net): | The index is a free float-adjusted market capitalization-weighted index that is designed to measure the equity market performance of the small cap segment of developed markets, excluding the United States and Canada. The index consists of the following 21 developed market country indices: Australia, Austria, Belgium, Denmark, Finland, France, Germany, Hong Kong, Ireland, Israel, Italy, Japan, the Netherlands, New Zealand, Norway, Portugal, Singapore, Spain, Sweden, Switzerland, and the United Kingdom. Net total return indexes reinvest dividends after the deduction of withholding taxes, using (for international indexes) a tax rate applicable to non-resident institutional investors who do not benefit from double taxation treaties. | ||||||
| Russell 1000® Index: | The index is a float-adjusted market capitalization-weighted index that measures the performance of the large-cap segment of the U.S. equity market. It includes approximately 1,000 of the largest securities in the Russell 3000® Index (which measures the performance of the 3,000 largest U.S. public companies based on total market capitalization). The index is rebalanced annually in June. | ||||||
| Russell 1000® Value Index: | The index is a float-adjusted market capitalization-weighted index that measures the performance of the large-cap value segment of the U.S. equity market. It includes those Russell 1000 Index companies with lower price-to-book ratios and lower forecasted growth rates. The index is rebalanced annually in June. | ||||||
| Russell 2000® Index: | The index is a float-adjusted market capitalization-weighted index that measures the performance of the small-cap segment of the U.S. equity market. It includes approximately 2,000 of the smallest securities in the Russell 3000 Index (which measures the performance of the 3,000 largest U.S. public companies based on total market capitalization). The index is rebalanced annually in June. | ||||||
| Russell 2000® Growth Index: | The index is a float-adjusted market capitalization-weighted index that measures the performance of the small-cap growth segment of the U.S. equity market. It includes those Russell 2000 Index companies with higher price-to-book ratios and higher forecasted growth rates. The index is rebalanced annually in June. | ||||||
75
Glossary of Indices (cont'd)
| Russell 2000® Value Index: | The index is a float-adjusted market capitalization-weighted index that measures the performance of the small-cap value segment of the U.S. equity market. It includes those Russell 2000 Index companies with lower price-to-book ratios and lower forecasted growth rates. The index is rebalanced annually in June. | ||||||
| Russell Midcap® Index: | The index is a float-adjusted market capitalization-weighted index that measures the performance of the mid-cap segment of the U.S. equity market. It includes approximately 800 of the smallest securities in the Russell 1000 Index. The index is rebalanced annually in June. | ||||||
| Russell Midcap® Growth Index: | The index is a float-adjusted market capitalization-weighted index that measures the performance of the mid-cap growth segment of the U.S. equity market. It includes those Russell Midcap Index companies with higher price-to-book ratios and higher forecasted growth rates. The index is rebalanced annually in June. | ||||||
| Russell Midcap® Value Index: | The index is a float-adjusted market capitalization-weighted index that measures the performance of the mid-cap value segment of the U.S. equity market. It includes those Russell Midcap Index companies with lower price-to-book ratios and lower forecasted growth rates. The index is rebalanced annually in June. | ||||||
| S&P 500® Index: | The index is a float-adjusted market capitalization-weighted index that focuses on the large-cap segment of the U.S. equity market, and includes a significant portion of the total value of the market. | ||||||
76
Information About Your Fund's Expenses (Unaudited)
As a Fund shareholder, you incur two types of costs: (1) transaction costs, including sales charges (loads) on purchase payments or redemption proceeds (if applicable); and (2) ongoing costs, including management fees, distribution and/or service (12b-1) fees (if applicable), and other Fund expenses. This example is intended to help you understand your ongoing costs (in U.S. dollars) of investing in a Fund and compare these costs with the ongoing costs of investing in other mutual funds.
This table is designed to provide information regarding costs related to your investments. The following examples are based on an investment of $1,000 made at the beginning of the six month period ended August 31, 2019 and held for the entire period. The table illustrates the Fund's costs in two ways:
Actual Expenses and Performance: | The first section of the table provides information about actual account values and actual expenses in dollars, based on the Fund's actual performance during the period indicated. You may use the information in this line, together with the amount you invested, to estimate the expenses you paid over the period. Simply divide your account value by $1,000 (for example, an $8,600 account value divided by $1,000 = 8.6), then multiply the result by the number in the first section of the table under the heading entitled "Expenses Paid During the Period" to estimate the expenses you paid over the period. | ||||||
Hypothetical Example for Comparison Purposes: | The second section of the table provides information about hypothetical account values and hypothetical expenses based on the Fund's actual expense ratio and an assumed rate of return at 5% per year before expenses. This return is not the Fund's actual return. The hypothetical account values and expenses may not be used to estimate the actual ending account balance or expenses you paid for the period. You may use this information to compare the ongoing costs of investing in a Fund versus other funds. To do so, compare the expenses shown in this 5% hypothetical example with the 5% hypothetical examples that appear in the shareholder reports of other funds. | ||||||
Please note that the expenses in the table are meant to highlight your ongoing costs only and do not include any transaction costs, such as sales charges (loads) (if applicable). Therefore, the information under the heading "Hypothetical (5% annual return before expenses)" is useful in comparing ongoing costs only, and will not help you determine the relative total costs of owning different funds. In addition, if these transaction costs were included, your costs would have been higher.
77
Expense Example (Unaudited)
Neuberger Berman Equity Funds | |||||||||||||||||||||||||||||||||||
ACTUAL | HYPOTHETICAL (5% ANNUAL RETURN BEFORE EXPENSES) | ||||||||||||||||||||||||||||||||||
| Beginning Account Value 3/1/19 | Ending Account Value 8/31/19 | Expenses Paid During the Period(1) 3/1/19 - 8/31/19 | Expense Ratio | Beginning Account Value 3/1/19 | Ending Account Value 8/31/19 | Expenses Paid During the Period(2) 3/1/19 - 8/31/19 | Expense Ratio | ||||||||||||||||||||||||||||
Dividend Growth Fund | |||||||||||||||||||||||||||||||||||
Institutional Class | $ | 1,000.00 | $ | 1,018.30 | $ | 3.51 | 0.69 | % | $ | 1,000.00 | $ | 1,021.73 | $ | 3.52 | 0.69 | % | |||||||||||||||||||
Class A | $ | 1,000.00 | $ | 1,015.90 | $ | 5.34 | 1.05 | % | $ | 1,000.00 | $ | 1,019.91 | $ | 5.35 | 1.05 | % | |||||||||||||||||||
Class C | $ | 1,000.00 | $ | 1,012.00 | $ | 9.13 | 1.80 | % | $ | 1,000.00 | $ | 1,016.13 | $ | 9.15 | 1.80 | % | |||||||||||||||||||
Class R6 | $ | 1,000.00 | $ | 1,018.30 | $ | 3.05 | 0.60 | % | $ | 1,000.00 | $ | 1,022.18 | $ | 3.06 | 0.60 | % | |||||||||||||||||||
Emerging Markets Equity Fund | |||||||||||||||||||||||||||||||||||
Institutional Class | $ | 1,000.00 | $ | 981.70 | $ | 6.24 | 1.25 | % | $ | 1,000.00 | $ | 1,018.90 | $ | 6.36 | 1.25 | % | |||||||||||||||||||
Class A | $ | 1,000.00 | $ | 980.70 | $ | 7.49 | 1.50 | % | $ | 1,000.00 | $ | 1,017.64 | $ | 7.63 | 1.50 | % | |||||||||||||||||||
Class C | $ | 1,000.00 | $ | 976.60 | $ | 11.21 | 2.25 | % | $ | 1,000.00 | $ | 1,013.86 | $ | 11.42 | 2.25 | % | |||||||||||||||||||
Class R3 | $ | 1,000.00 | $ | 978.70 | $ | 9.53 | 1.91 | % | $ | 1,000.00 | $ | 1,015.58 | $ | 9.70 | 1.91 | % | |||||||||||||||||||
Class R6 | $ | 1,000.00 | $ | 982.20 | $ | 5.75 | 1.15 | % | $ | 1,000.00 | $ | 1,019.41 | $ | 5.85 | 1.15 | % | |||||||||||||||||||
Equity Income Fund | |||||||||||||||||||||||||||||||||||
Institutional Class | $ | 1,000.00 | $ | 1,038.50 | $ | 3.60 | 0.70 | % | $ | 1,000.00 | $ | 1,021.68 | $ | 3.57 | 0.70 | % | |||||||||||||||||||
Class A | $ | 1,000.00 | $ | 1,036.80 | $ | 5.44 | 1.06 | % | $ | 1,000.00 | $ | 1,019.86 | $ | 5.40 | 1.06 | % | |||||||||||||||||||
Class C | $ | 1,000.00 | $ | 1,032.40 | $ | 9.27 | 1.81 | % | $ | 1,000.00 | $ | 1,016.08 | $ | 9.20 | 1.81 | % | |||||||||||||||||||
Class R3 | $ | 1,000.00 | $ | 1,035.60 | $ | 6.93 | 1.35 | % | $ | 1,000.00 | $ | 1,018.40 | $ | 6.87 | 1.35 | % | |||||||||||||||||||
Focus Fund | |||||||||||||||||||||||||||||||||||
Investor Class | $ | 1,000.00 | $ | 1,021.40 | $ | 4.69 | 0.92 | % | $ | 1,000.00 | $ | 1,020.57 | $ | 4.69 | 0.92 | % | |||||||||||||||||||
Trust Class | $ | 1,000.00 | $ | 1,020.60 | $ | 5.60 | 1.10 | % | $ | 1,000.00 | $ | 1,019.66 | $ | 5.60 | 1.10 | % | |||||||||||||||||||
Advisor Class | $ | 1,000.00 | $ | 1,019.40 | $ | 6.46 | 1.27 | % | $ | 1,000.00 | $ | 1,018.80 | $ | 6.46 | 1.27 | % | |||||||||||||||||||
Institutional Class | $ | 1,000.00 | $ | 1,022.60 | $ | 3.82 | 0.75 | % | $ | 1,000.00 | $ | 1,021.42 | $ | 3.82 | 0.75 | % | |||||||||||||||||||
Class A | $ | 1,000.00 | $ | 1,020.30 | $ | 5.65 | 1.11 | % | $ | 1,000.00 | $ | 1,019.61 | $ | 5.65 | 1.11 | % | |||||||||||||||||||
Class C | $ | 1,000.00 | $ | 1,016.80 | $ | 9.46 | 1.86 | % | $ | 1,000.00 | $ | 1,015.83 | $ | 9.45 | 1.86 | % | |||||||||||||||||||
Genesis Fund | |||||||||||||||||||||||||||||||||||
Investor Class | $ | 1,000.00 | $ | 1,063.80 | $ | 5.25 | 1.01 | % | $ | 1,000.00 | $ | 1,020.11 | $ | 5.14 | 1.01 | % | |||||||||||||||||||
Trust Class | $ | 1,000.00 | $ | 1,063.20 | $ | 5.72 | 1.10 | % | $ | 1,000.00 | $ | 1,019.66 | $ | 5.60 | 1.10 | % | |||||||||||||||||||
Advisor Class | $ | 1,000.00 | $ | 1,061.90 | $ | 7.02 | 1.35 | % | $ | 1,000.00 | $ | 1,018.40 | $ | 6.87 | 1.35 | % | |||||||||||||||||||
Institutional Class | $ | 1,000.00 | $ | 1,064.60 | $ | 4.42 | 0.85 | % | $ | 1,000.00 | $ | 1,020.92 | $ | 4.33 | 0.85 | % | |||||||||||||||||||
Class R6 | $ | 1,000.00 | $ | 1,065.20 | $ | 3.90 | 0.75 | % | $ | 1,000.00 | $ | 1,021.42 | $ | 3.82 | 0.75 | % | |||||||||||||||||||
Global Equity Fund | |||||||||||||||||||||||||||||||||||
Institutional Class | $ | 1,000.00 | $ | 1,022.50 | $ | 3.87 | 0.76 | % | $ | 1,000.00 | $ | 1,021.37 | $ | 3.87 | 0.76 | % | |||||||||||||||||||
Class A | $ | 1,000.00 | $ | 1,019.70 | $ | 5.70 | 1.12 | % | $ | 1,000.00 | $ | 1,019.56 | $ | 5.70 | 1.12 | % | |||||||||||||||||||
Class C | $ | 1,000.00 | $ | 1,015.80 | $ | 9.50 | 1.87 | % | $ | 1,000.00 | $ | 1,015.78 | $ | 9.50 | 1.87 | % | |||||||||||||||||||
Global Real Estate Fund | |||||||||||||||||||||||||||||||||||
Institutional Class | $ | 1,000.00 | $ | 1,100.60 | $ | 5.35 | 1.01 | % | $ | 1,000.00 | $ | 1,020.11 | $ | 5.14 | 1.01 | % | |||||||||||||||||||
Class A | $ | 1,000.00 | $ | 1,099.10 | $ | 7.25 | 1.37 | % | $ | 1,000.00 | $ | 1,018.30 | $ | 6.97 | 1.37 | % | |||||||||||||||||||
Class C | $ | 1,000.00 | $ | 1,094.50 | $ | 11.19 | 2.12 | % | $ | 1,000.00 | $ | 1,014.52 | $ | 10.76 | 2.12 | % | |||||||||||||||||||
Greater China Equity Fund | |||||||||||||||||||||||||||||||||||
Institutional Class | $ | 1,000.00 | $ | 992.50 | $ | 7.58 | 1.51 | % | $ | 1,000.00 | $ | 1,017.59 | $ | 7.68 | 1.51 | % | |||||||||||||||||||
Class A | $ | 1,000.00 | $ | 991.40 | $ | 9.39 | 1.87 | % | $ | 1,000.00 | $ | 1,015.78 | $ | 9.50 | 1.87 | % | |||||||||||||||||||
Class C | $ | 1,000.00 | $ | 987.50 | $ | 13.13 | 2.62 | % | $ | 1,000.00 | $ | 1,012.00 | $ | 13.29 | 2.62 | % | |||||||||||||||||||
78
Expense Example (Unaudited) (cont'd)
| Neuberger Berman Equity Funds | |||||||||||||||||||||||||||||||||||
ACTUAL | HYPOTHETICAL (5% ANNUAL RETURN BEFORE EXPENSES) | ||||||||||||||||||||||||||||||||||
| Beginning Account Value 3/1/19 | Ending Account Value 8/31/19 | Expenses Paid During the Period(1) 3/1/19 - 8/31/19 | Expense Ratio | Beginning Account Value 3/1/19 | Ending Account Value 8/31/19 | Expenses Paid During the Period(2) 3/1/19 - 8/31/19 | Expense Ratio | ||||||||||||||||||||||||||||
Guardian Fund | |||||||||||||||||||||||||||||||||||
Investor Class | $ | 1,000.00 | $ | 1,124.80 | $ | 4.77 | 0.89 | % | $ | 1,000.00 | $ | 1,020.72 | $ | 4.53 | 0.89 | % | |||||||||||||||||||
Trust Class | $ | 1,000.00 | $ | 1,123.50 | $ | 5.73 | 1.07 | % | $ | 1,000.00 | $ | 1,019.81 | $ | 5.45 | 1.07 | % | |||||||||||||||||||
Advisor Class | $ | 1,000.00 | $ | 1,121.40 | $ | 7.75 | 1.45 | % | $ | 1,000.00 | $ | 1,017.90 | $ | 7.37 | 1.45 | % | |||||||||||||||||||
Institutional Class | $ | 1,000.00 | $ | 1,125.30 | $ | 3.86 | 0.72 | % | $ | 1,000.00 | $ | 1,021.58 | $ | 3.67 | 0.72 | % | |||||||||||||||||||
Class A | $ | 1,000.00 | $ | 1,123.50 | $ | 5.83 | 1.09 | % | $ | 1,000.00 | $ | 1,019.71 | $ | 5.55 | 1.09 | % | |||||||||||||||||||
Class C | $ | 1,000.00 | $ | 1,118.70 | $ | 9.83 | 1.84 | % | $ | 1,000.00 | $ | 1,015.93 | $ | 9.35 | 1.84 | % | |||||||||||||||||||
Class R3 | $ | 1,000.00 | $ | 1,121.90 | $ | 7.27 | 1.36 | % | $ | 1,000.00 | $ | 1,018.35 | $ | 6.92 | 1.36 | % | |||||||||||||||||||
Class R6 | $ | 1,000.00 | $ | 1,125.30 | $ | 2.95 | (3) | 0.65 | % | $ | 1,000.00 | $ | 1,021.93 | $ | 3.31 | 0.65 | % | ||||||||||||||||||
International Equity Fund | |||||||||||||||||||||||||||||||||||
Investor Class | $ | 1,000.00 | $ | 1,014.60 | $ | 5.59 | 1.10 | % | $ | 1,000.00 | $ | 1,019.66 | $ | 5.60 | 1.10 | % | |||||||||||||||||||
Trust Class | $ | 1,000.00 | $ | 1,013.80 | $ | 5.74 | 1.13 | % | $ | 1,000.00 | $ | 1,019.51 | $ | 5.75 | 1.13 | % | |||||||||||||||||||
Institutional Class | $ | 1,000.00 | $ | 1,015.50 | $ | 4.32 | 0.85 | % | $ | 1,000.00 | $ | 1,020.92 | $ | 4.33 | 0.85 | % | |||||||||||||||||||
Class A | $ | 1,000.00 | $ | 1,013.80 | $ | 6.14 | 1.21 | % | $ | 1,000.00 | $ | 1,019.11 | $ | 6.16 | 1.21 | % | |||||||||||||||||||
Class C | $ | 1,000.00 | $ | 1,010.60 | $ | 9.93 | 1.96 | % | $ | 1,000.00 | $ | 1,015.32 | $ | 9.96 | 1.96 | % | |||||||||||||||||||
Class R6 | $ | 1,000.00 | $ | 1,016.30 | $ | 3.81 | 0.75 | % | $ | 1,000.00 | $ | 1,021.42 | $ | 3.82 | 0.75 | % | |||||||||||||||||||
International Select Fund | |||||||||||||||||||||||||||||||||||
Trust Class | $ | 1,000.00 | $ | 1,017.40 | $ | 5.85 | 1.15 | % | $ | 1,000.00 | $ | 1,019.41 | $ | 5.85 | 1.15 | % | |||||||||||||||||||
Institutional Class | $ | 1,000.00 | $ | 1,019.10 | $ | 4.07 | 0.80 | % | $ | 1,000.00 | $ | 1,021.17 | $ | 4.08 | 0.80 | % | |||||||||||||||||||
Class A | $ | 1,000.00 | $ | 1,017.50 | $ | 5.90 | 1.16 | % | $ | 1,000.00 | $ | 1,019.36 | $ | 5.90 | 1.16 | % | |||||||||||||||||||
Class C | $ | 1,000.00 | $ | 1,013.50 | $ | 9.69 | 1.91 | % | $ | 1,000.00 | $ | 1,015.58 | $ | 9.70 | 1.91 | % | |||||||||||||||||||
Class R3 | $ | 1,000.00 | $ | 1,016.80 | $ | 7.17 | 1.41 | % | $ | 1,000.00 | $ | 1,018.10 | $ | 7.17 | 1.41 | % | |||||||||||||||||||
Class R6 | $ | 1,000.00 | $ | 1,019.90 | $ | 3.56 | 0.70 | % | $ | 1,000.00 | $ | 1,021.68 | $ | 3.57 | 0.70 | % | |||||||||||||||||||
International Small Cap Fund | |||||||||||||||||||||||||||||||||||
Institutional Class | $ | 1,000.00 | $ | 1,022.70 | $ | 5.40 | 1.06 | % | $ | 1,000.00 | $ | 1,019.86 | $ | 5.40 | 1.06 | % | |||||||||||||||||||
Class A | $ | 1,000.00 | $ | 1,020.90 | $ | 7.23 | 1.42 | % | $ | 1,000.00 | $ | 1,018.05 | $ | 7.22 | 1.42 | % | |||||||||||||||||||
Class C | $ | 1,000.00 | $ | 1,017.50 | $ | 11.03 | 2.17 | % | $ | 1,000.00 | $ | 1,014.27 | $ | 11.02 | 2.17 | % | |||||||||||||||||||
Class R6 | $ | 1,000.00 | $ | 1,022.60 | $ | 4.89 | 0.96 | % | $ | 1,000.00 | $ | 1,020.37 | $ | 4.89 | 0.96 | % | |||||||||||||||||||
Intrinsic Value Fund | |||||||||||||||||||||||||||||||||||
Institutional Class | $ | 1,000.00 | $ | 911.40 | $ | 4.87 | 1.01 | % | $ | 1,000.00 | $ | 1,020.11 | $ | 5.14 | 1.01 | % | |||||||||||||||||||
Class A | $ | 1,000.00 | $ | 909.30 | $ | 6.59 | 1.37 | % | $ | 1,000.00 | $ | 1,018.30 | $ | 6.97 | 1.37 | % | |||||||||||||||||||
Class C | $ | 1,000.00 | $ | 906.40 | $ | 10.19 | 2.12 | % | $ | 1,000.00 | $ | 1,014.52 | $ | 10.76 | 2.12 | % | |||||||||||||||||||
Class R6 | $ | 1,000.00 | $ | 912.10 | $ | 4.39 | 0.91 | % | $ | 1,000.00 | $ | 1,020.62 | $ | 4.63 | 0.91 | % | |||||||||||||||||||
Large Cap Value Fund | |||||||||||||||||||||||||||||||||||
Investor Class | $ | 1,000.00 | $ | 1,039.40 | $ | 4.42 | 0.86 | % | $ | 1,000.00 | $ | 1,020.87 | $ | 4.38 | 0.86 | % | |||||||||||||||||||
Trust Class | $ | 1,000.00 | $ | 1,038.40 | $ | 5.34 | 1.04 | % | $ | 1,000.00 | $ | 1,019.96 | $ | 5.30 | 1.04 | % | |||||||||||||||||||
Advisor Class | $ | 1,000.00 | $ | 1,038.00 | $ | 6.11 | 1.19 | % | $ | 1,000.00 | $ | 1,019.21 | $ | 6.06 | 1.19 | % | |||||||||||||||||||
Institutional Class | $ | 1,000.00 | $ | 1,040.10 | $ | 3.55 | 0.69 | % | $ | 1,000.00 | $ | 1,021.73 | $ | 3.52 | 0.69 | % | |||||||||||||||||||
Class A | $ | 1,000.00 | $ | 1,038.40 | $ | 5.55 | 1.08 | % | $ | 1,000.00 | $ | 1,019.76 | $ | 5.50 | 1.08 | % | |||||||||||||||||||
Class C | $ | 1,000.00 | $ | 1,034.50 | $ | 9.33 | 1.82 | % | $ | 1,000.00 | $ | 1,016.03 | $ | 9.25 | 1.82 | % | |||||||||||||||||||
Class R3 | $ | 1,000.00 | $ | 1,037.30 | $ | 7.04 | 1.37 | % | $ | 1,000.00 | $ | 1,018.30 | $ | 6.97 | 1.37 | % | |||||||||||||||||||
Class R6 | $ | 1,000.00 | $ | 1,040.80 | $ | 3.14 | 0.61 | % | $ | 1,000.00 | $ | 1,022.13 | $ | 3.11 | 0.61 | % | |||||||||||||||||||
79
Expense Example (Unaudited) (cont'd)
| Neuberger Berman Equity Funds | |||||||||||||||||||||||||||||||||||
ACTUAL | HYPOTHETICAL (5% ANNUAL RETURN BEFORE EXPENSES) | ||||||||||||||||||||||||||||||||||
| Beginning Account Value 3/1/19 | Ending Account Value 8/31/19 | Expenses Paid During the Period(1) 3/1/19 - 8/31/19 | Expense Ratio | Beginning Account Value 3/1/19 | Ending Account Value 8/31/19 | Expenses Paid During the Period(2) 3/1/19 - 8/31/19 | Expense Ratio | ||||||||||||||||||||||||||||
Mid Cap Growth Fund | |||||||||||||||||||||||||||||||||||
Investor Class | $ | 1,000.00 | $ | 1,087.90 | $ | 4.68 | 0.89 | % | $ | 1,000.00 | $ | 1,020.72 | $ | 4.53 | 0.89 | % | |||||||||||||||||||
Trust Class | $ | 1,000.00 | $ | 1,087.30 | $ | 5.05 | 0.96 | % | $ | 1,000.00 | $ | 1,020.37 | $ | 4.89 | 0.96 | % | |||||||||||||||||||
Advisor Class | $ | 1,000.00 | $ | 1,086.30 | $ | 6.36 | 1.21 | % | $ | 1,000.00 | $ | 1,019.11 | $ | 6.16 | 1.21 | % | |||||||||||||||||||
Institutional Class | $ | 1,000.00 | $ | 1,089.10 | $ | 3.74 | 0.71 | % | $ | 1,000.00 | $ | 1,021.63 | $ | 3.62 | 0.71 | % | |||||||||||||||||||
Class A | $ | 1,000.00 | $ | 1,086.80 | $ | 5.63 | 1.07 | % | $ | 1,000.00 | $ | 1,019.81 | $ | 5.45 | 1.07 | % | |||||||||||||||||||
Class C | $ | 1,000.00 | $ | 1,082.90 | $ | 9.56 | 1.82 | % | $ | 1,000.00 | $ | 1,016.03 | $ | 9.25 | 1.82 | % | |||||||||||||||||||
Class R3 | $ | 1,000.00 | $ | 1,085.80 | $ | 6.94 | 1.32 | % | $ | 1,000.00 | $ | 1,018.55 | $ | 6.72 | 1.32 | % | |||||||||||||||||||
Class R6 | $ | 1,000.00 | $ | 1,089.60 | $ | 3.21 | 0.61 | % | $ | 1,000.00 | $ | 1,022.13 | $ | 3.11 | 0.61 | % | |||||||||||||||||||
Mid Cap Intrinsic Value Fund | |||||||||||||||||||||||||||||||||||
Investor Class | $ | 1,000.00 | $ | 915.60 | $ | 5.60 | 1.16 | % | $ | 1,000.00 | $ | 1,019.36 | $ | 5.90 | 1.16 | % | |||||||||||||||||||
Trust Class | $ | 1,000.00 | $ | 915.60 | $ | 6.18 | 1.28 | % | $ | 1,000.00 | $ | 1,018.75 | $ | 6.51 | 1.28 | % | |||||||||||||||||||
Institutional Class | $ | 1,000.00 | $ | 917.30 | $ | 4.25 | 0.88 | % | $ | 1,000.00 | $ | 1,020.77 | $ | 4.48 | 0.88 | % | |||||||||||||||||||
Class A | $ | 1,000.00 | $ | 915.60 | $ | 5.94 | 1.23 | % | $ | 1,000.00 | $ | 1,019.00 | $ | 6.26 | 1.23 | % | |||||||||||||||||||
Class C | $ | 1,000.00 | $ | 912.10 | $ | 9.59 | 1.99 | % | $ | 1,000.00 | $ | 1,015.17 | $ | 10.11 | 1.99 | % | |||||||||||||||||||
Class R3 | $ | 1,000.00 | $ | 914.40 | $ | 7.19 | 1.49 | % | $ | 1,000.00 | $ | 1,017.69 | $ | 7.58 | 1.49 | % | |||||||||||||||||||
Class R6 | $ | 1,000.00 | $ | 942.40 | $ | 3.24 | (3) | 0.78 | % | $ | 1,000.00 | $ | 1,021.27 | $ | 3.97 | 0.78 | % | ||||||||||||||||||
Multi-Cap Opportunities Fund | |||||||||||||||||||||||||||||||||||
Institutional Class | $ | 1,000.00 | $ | 1,045.40 | $ | 3.92 | 0.76 | % | $ | 1,000.00 | $ | 1,021.37 | $ | 3.87 | 0.76 | % | |||||||||||||||||||
Class A | $ | 1,000.00 | $ | 1,043.60 | $ | 5.87 | 1.14 | % | $ | 1,000.00 | $ | 1,019.46 | $ | 5.80 | 1.14 | % | |||||||||||||||||||
Class C | $ | 1,000.00 | $ | 1,039.70 | $ | 9.67 | 1.88 | % | $ | 1,000.00 | $ | 1,015.73 | $ | 9.55 | 1.88 | % | |||||||||||||||||||
Real Estate Fund | |||||||||||||||||||||||||||||||||||
Trust Class | $ | 1,000.00 | $ | 1,172.80 | $ | 5.70 | 1.04 | % | $ | 1,000.00 | $ | 1,019.96 | $ | 5.30 | 1.04 | % | |||||||||||||||||||
Institutional Class | $ | 1,000.00 | $ | 1,174.00 | $ | 4.66 | 0.85 | % | $ | 1,000.00 | $ | 1,020.92 | $ | 4.33 | 0.85 | % | |||||||||||||||||||
Class A | $ | 1,000.00 | $ | 1,171.90 | $ | 6.62 | 1.21 | % | $ | 1,000.00 | $ | 1,019.11 | $ | 6.16 | 1.21 | % | |||||||||||||||||||
Class C | $ | 1,000.00 | $ | 1,168.00 | $ | 10.71 | 1.96 | % | $ | 1,000.00 | $ | 1,015.32 | $ | 9.96 | 1.96 | % | |||||||||||||||||||
Class R3 | $ | 1,000.00 | $ | 1,170.90 | $ | 7.99 | 1.46 | % | $ | 1,000.00 | $ | 1,017.85 | $ | 7.43 | 1.46 | % | |||||||||||||||||||
Class R6 | $ | 1,000.00 | $ | 1,174.50 | $ | 4.11 | 0.75 | % | $ | 1,000.00 | $ | 1,021.42 | $ | 3.82 | 0.75 | % | |||||||||||||||||||
Small Cap Growth Fund | |||||||||||||||||||||||||||||||||||
Investor Class | $ | 1,000.00 | $ | 1,016.40 | $ | 6.00 | 1.18 | % | $ | 1,000.00 | $ | 1,019.26 | $ | 6.01 | 1.18 | % | |||||||||||||||||||
Trust Class | $ | 1,000.00 | $ | 1,016.20 | $ | 6.56 | 1.29 | % | $ | 1,000.00 | $ | 1,018.70 | $ | 6.56 | 1.29 | % | |||||||||||||||||||
Advisor Class | $ | 1,000.00 | $ | 1,015.40 | $ | 7.32 | 1.44 | % | $ | 1,000.00 | $ | 1,017.95 | $ | 7.32 | 1.44 | % | |||||||||||||||||||
Institutional Class | $ | 1,000.00 | $ | 1,018.20 | $ | 4.58 | 0.90 | % | $ | 1,000.00 | $ | 1,020.67 | $ | 4.58 | 0.90 | % | |||||||||||||||||||
Class A | $ | 1,000.00 | $ | 1,016.40 | $ | 6.40 | 1.26 | % | $ | 1,000.00 | $ | 1,018.85 | $ | 6.41 | 1.26 | % | |||||||||||||||||||
Class C | $ | 1,000.00 | $ | 1,012.20 | $ | 10.19 | 2.01 | % | $ | 1,000.00 | $ | 1,015.07 | $ | 10.21 | 2.01 | % | |||||||||||||||||||
Class R3 | $ | 1,000.00 | $ | 1,014.80 | $ | 7.67 | 1.51 | % | $ | 1,000.00 | $ | 1,017.59 | $ | 7.68 | 1.51 | % | |||||||||||||||||||
Class R6 | $ | 1,000.00 | $ | 1,018.70 | $ | 4.19 | 0.81 | % | $ | 1,000.00 | $ | 1,021.12 | $ | 4.13 | 0.81 | % | |||||||||||||||||||
Sustainable Equity Fund | |||||||||||||||||||||||||||||||||||
Investor Class | $ | 1,000.00 | $ | 1,020.40 | $ | 4.33 | 0.85 | % | $ | 1,000.00 | $ | 1,020.92 | $ | 4.33 | 0.85 | % | |||||||||||||||||||
Trust Class | $ | 1,000.00 | $ | 1,019.20 | $ | 5.24 | 1.03 | % | $ | 1,000.00 | $ | 1,020.01 | $ | 5.24 | 1.03 | % | |||||||||||||||||||
Institutional Class | $ | 1,000.00 | $ | 1,021.20 | $ | 3.46 | 0.68 | % | $ | 1,000.00 | $ | 1,021.78 | $ | 3.47 | 0.68 | % | |||||||||||||||||||
Class A | $ | 1,000.00 | $ | 1,019.20 | $ | 5.34 | 1.05 | % | $ | 1,000.00 | $ | 1,019.91 | $ | 5.35 | 1.05 | % | |||||||||||||||||||
Class C | $ | 1,000.00 | $ | 1,015.20 | $ | 9.09 | 1.79 | % | $ | 1,000.00 | $ | 1,016.18 | $ | 9.10 | 1.79 | % | |||||||||||||||||||
Class R3 | $ | 1,000.00 | $ | 1,017.80 | $ | 6.61 | 1.30 | % | $ | 1,000.00 | $ | 1,018.65 | $ | 6.61 | 1.30 | % | |||||||||||||||||||
Class R6 | $ | 1,000.00 | $ | 1,021.50 | $ | 2.96 | 0.58 | % | $ | 1,000.00 | $ | 1,022.28 | $ | 2.96 | 0.58 | % | |||||||||||||||||||
(1) For each class, expenses are equal to the annualized expense ratio for the class, multiplied by the average account value over the period, multiplied by 184/365 (to reflect the one-half year period shown), unless otherwise indicated.
(2) Hypothetical expenses are equal to the annualized expense ratios for each class, multiplied by the average account value over the period (assuming a 5% annual return), multiplied by 184/365 (to reflect the one-half year period shown).
(3) Expenses are equal to the annualized expense ratio for the class, multiplied by the average account value over the period, multiplied by 156/365 (to reflect the period shown of March 29, 2019 (Commencement of Operations) to August 31, 2019).
80
Legend August 31, 2019 (Unaudited)
Neuberger Berman Equity Funds | |||
Counterparties:
SSB = State Street Bank and Trust Company
81
Schedule of Investments Dividend Growth Fund^ August 31, 2019
Number of Shares | Value (000's) | ||||||||||
Common Stocks 92.9% | |||||||||||
Aerospace & Defense 2.0% | |||||||||||
| General Dynamics Corp. | 5,900 | $ | 1,129 | ||||||||
Auto Components 2.2% | |||||||||||
Aptiv PLC | 14,500 | 1,206 | |||||||||
Banks 5.8% | |||||||||||
Citigroup, Inc. | 15,900 | 1,023 | |||||||||
Comerica, Inc. | 16,800 | 1,036 | |||||||||
| JPMorgan Chase & Co. | 10,700 | 1,175 | |||||||||
3,234 | |||||||||||
Beverages 1.6% | |||||||||||
Coca-Cola Co. | 16,300 | 897 | |||||||||
Biotechnology 2.2% | |||||||||||
Gilead Sciences, Inc. | 19,100 | 1,214 | |||||||||
Capital Markets 3.1% | |||||||||||
Morgan Stanley | 23,900 | 992 | |||||||||
| Virtu Financial, Inc. Class A | 39,500 | 742 | |||||||||
1,734 | |||||||||||
Communications Equipment 2.0% | |||||||||||
Cisco Systems, Inc. | 23,500 | 1,100 | |||||||||
Diversified Consumer Services 1.8% | |||||||||||
| Service Corp. International | 21,800 | 1,009 | |||||||||
Diversified Financial Services 2.2% | |||||||||||
| AXA Equitable Holdings, Inc. | 59,000 | 1,225 | |||||||||
Electronic Equipment, Instruments & Components 3.4% | |||||||||||
| Amphenol Corp. Class A | 9,100 | 797 | |||||||||
Corning, Inc. | 38,200 | 1,064 | |||||||||
1,861 | |||||||||||
Entertainment 3.2% | |||||||||||
Viacom, Inc. Class B | 37,000 | 924 | |||||||||
Walt Disney Co. | 6,200 | 851 | |||||||||
1,775 | |||||||||||
Equity Real Estate Investment Trusts 5.1% | |||||||||||
| American Tower Corp. | 5,650 | 1,300 | |||||||||
Equinix, Inc. | 2,680 | 1,491 | |||||||||
2,791 | |||||||||||
Food & Staples Retailing 3.9% | |||||||||||
| Walgreens Boots Alliance, Inc. | 17,300 | 886 | |||||||||
Walmart, Inc. | 11,300 | 1,291 | |||||||||
2,177 | |||||||||||
Number of Shares | Value (000's) | ||||||||||
Food Products 2.1% | |||||||||||
| Mondelez International, Inc. Class A | 20,750 | $ | 1,146 | ||||||||
Health Care Equipment & Supplies 2.0% | |||||||||||
STERIS PLC | 7,200 | 1,112 | |||||||||
Hotels, Restaurants & Leisure 3.6% | |||||||||||
Carnival Corp. | 19,600 | 864 | |||||||||
| MGM Resorts International | 40,000 | 1,122 | |||||||||
1,986 | |||||||||||
Industrial Conglomerates 2.1% | |||||||||||
| Honeywell International, Inc. | 7,000 | 1,152 | |||||||||
Insurance 4.1% | |||||||||||
Aon PLC | 5,800 | 1,130 | |||||||||
| Hartford Financial Services Group, Inc. | 19,900 | 1,160 | |||||||||
2,290 | |||||||||||
IT Services 4.5% | |||||||||||
| Automatic Data Processing, Inc. | 8,200 | 1,393 | |||||||||
| InterXion Holding NV* | 13,700 | 1,109 | |||||||||
2,502 | |||||||||||
Media 2.1% | |||||||||||
| Comcast Corp. Class A | 26,500 | 1,173 | |||||||||
Metals & Mining 3.8% | |||||||||||
| First Quantum Minerals Ltd. | 115,200 | 706 | |||||||||
| Wheaton Precious Metals Corp. | 47,400 | 1,394 | |||||||||
2,100 | |||||||||||
Multi-Utilities 2.4% | |||||||||||
Sempra Energy | 9,500 | 1,346 | |||||||||
Oil, Gas & Consumable Fuels 7.5% | |||||||||||
| Brigham Minerals, Inc. Class A | 36,600 | 731 | |||||||||
Devon Energy Corp. | 40,100 | 882 | |||||||||
EOG Resources, Inc. | 10,300 | 764 | |||||||||
Suncor Energy, Inc. | 32,900 | 962 | |||||||||
Williams Cos., Inc. | 34,200 | 807 | |||||||||
4,146 | |||||||||||
Pharmaceuticals 8.3% | |||||||||||
| AstraZeneca PLC ADR | 29,500 | 1,328 | |||||||||
| Bristol-Myers Squibb Co. | 27,800 | 1,336 | |||||||||
Novartis AG ADR | 12,700 | 1,145 | |||||||||
Pfizer, Inc. | 21,700 | 772 | |||||||||
4,581 | |||||||||||
Number of Shares | Value (000's) | ||||||||||
Semiconductors & Semiconductor Equipment 5.0% | |||||||||||
| ASML Holding NV | 4,500 | $ | 1,002 | ||||||||
| Maxim Integrated Products, Inc. | 16,600 | 905 | |||||||||
| Taiwan Semiconductor Manufacturing Co. Ltd. ADR | 20,600 | 878 | |||||||||
2,785 | |||||||||||
Software 2.9% | |||||||||||
Microsoft Corp. | 11,700 | 1,613 | |||||||||
Technology Hardware, Storage & Peripherals 2.3% | |||||||||||
Apple, Inc. | 5,975 | 1,247 | |||||||||
Tobacco 1.7% | |||||||||||
| Philip Morris International, Inc. | 13,200 | 952 | |||||||||
| Total Common Stocks (Cost $46,746) | 51,483 | ||||||||||
Short-Term Investments 6.1% | |||||||||||
Investment Companies 6.1% | |||||||||||
| State Street Institutional Treasury Money Market Fund Premier Class, 2.03%(a) (Cost $3,350) | 3,350,438 | 3,350 | |||||||||
| Total Investments 99.0% (Cost $50,096) | 54,833 | ||||||||||
| Other Assets Less Liabilities 1.0% | 558 | ||||||||||
Net Assets 100.0% | $ | 55,391 | |||||||||
See Notes to Financial Statements
82
Schedule of Investments Dividend Growth Fund^ (cont'd)
* Non-income producing security.
(a) Represents 7-day effective yield as of August 31, 2019.
The following is a summary, categorized by Level (see Note A of Notes to Financial Statements), of inputs used to value the Fund's investments as of August 31, 2019:
Asset Valuation Inputs | |||||||||||||||||||
(000's omitted) | Level 1 | Level 2 | Level 3 | Total | |||||||||||||||
Investments: | |||||||||||||||||||
| Common Stocks(a) | $ | 51,483 | $ | — | $ | — | $ | 51,483 | |||||||||||
Short-Term Investments | — | 3,350 | — | 3,350 | |||||||||||||||
Total Investments | $ | 51,483 | $ | 3,350 | $ | — | $ | 54,833 | |||||||||||
(a) The Schedule of Investments provides information on the industry categorization for the portfolio.
^ A balance indicated with a "—", reflects either a zero balance or an amount that rounds to less than 1.
See Notes to Financial Statements
83
Schedule of Investments Emerging Markets Equity Fund^ August 31, 2019
Number of Shares | Value (000's) | ||||||||||
Common Stocks 95.6% | |||||||||||
Australia 1.0% | |||||||||||
Rio Tinto PLC | 261,291 | $ | 13,193 | ||||||||
Brazil 7.7% | |||||||||||
Atacadao SA | 2,675,400 | 14,408 | |||||||||
| B3 SA—Brasil Bolsa Balcao | 2,023,941 | 21,896 | |||||||||
| BK Brasil Operacao e Assessoria a Restaurantes SA | 2,391,567 | 11,146 | |||||||||
Energisa SA | 1,751,231 | 20,084 | |||||||||
| Itau Unibanco Holding SA, Preference Shares | 1,826,600 | 14,971 | |||||||||
| Localiza Rent a Car SA | 666,500 | 7,571 | |||||||||
| Pagseguro Digital Ltd. Class A* | 280,400 | 14,009 | |||||||||
104,085 | |||||||||||
Canada 0.6% | |||||||||||
| Parex Resources, Inc.* | 571,525 | 8,753 | |||||||||
China 25.8% | |||||||||||
| 3SBio, Inc.*(a) | 5,729,500 | 8,828 | |||||||||
| A-Living Services Co. Ltd., H Shares(a) | 4,215,000 | 8,258 | |||||||||
| Alibaba Group Holding Ltd. ADR* | 199,652 | 34,945 | |||||||||
| China Everbright International Ltd. | 13,831,900 | 10,850 | |||||||||
| China Mobile Ltd. | 3,745,500 | 31,028 | |||||||||
CNOOC Ltd. | 10,416,600 | 15,544 | |||||||||
| Ctrip.com International Ltd. ADR* | 137,923 | 4,466 | |||||||||
| Huaneng Renewables Corp. Ltd., H Shares | 1,800,000 | 498 | |||||||||
| Huatai Securities Co. Ltd., H Shares(a) | 9,822,800 | 14,307 | |||||||||
HUYA, Inc. ADR* | 9,001 | 227 | |||||||||
| Industrial & Commercial Bank of China Ltd., H Shares | 37,650,400 | 23,770 | |||||||||
Number of Shares | Value (000's) | ||||||||||
| Midea Real Estate Holding Ltd.(a) | 511,127 | $ | 1,243 | ||||||||
Momo, Inc. ADR | 404,030 | 14,860 | |||||||||
| NARI Technology Co. Ltd., Class A | 4,054,123 | 9,816 | |||||||||
| Ping An Insurance Group Co. of China Ltd., H Shares | 3,280,500 | 37,615 | |||||||||
| Sinopharm Group Co. Ltd., H Shares | 2,229,600 | 8,062 | |||||||||
| Sunny Optical Technology Group Co. Ltd. | 1,504,300 | 20,856 | |||||||||
| Tencent Holdings Ltd. | 1,659,000 | 68,726 | |||||||||
| Weibo Corp. ADR*(c) | 219,456 | 9,079 | |||||||||
| Zhejiang Huace Film & TV Co. Ltd., Class A | 8,974,821 | 8,039 | |||||||||
| Zhuzhou CRRC Times Electric Co. Ltd., H Shares | 2,472,100 | 9,837 | |||||||||
| ZTO Express Cayman, Inc. ADR | 340,236 | 6,978 | |||||||||
347,832 | |||||||||||
Czech Republic 0.7% | |||||||||||
| Komercni Banka A/S | 275,420 | 9,777 | |||||||||
Hong Kong 3.3% | |||||||||||
| ASM Pacific Technology Ltd. | 1,118,200 | 12,814 | |||||||||
| China Gas Holdings Ltd. | 2,670,000 | 11,034 | |||||||||
| Haier Electronics Group Co. Ltd. | 2,568,500 | 6,683 | |||||||||
| Hang Lung Properties Ltd. | 488,000 | 1,103 | |||||||||
Link REIT | 1,198,674 | 13,454 | |||||||||
45,088 | |||||||||||
Hungary 0.1% | |||||||||||
| MOL Hungarian Oil & Gas PLC | 68,799 | 673 | |||||||||
India 9.1% | |||||||||||
| Cummins India Ltd. | 936,143 | 7,538 | |||||||||
| GRUH Finance Ltd. | 1,701,287 | 6,133 | |||||||||
HDFC Bank Ltd. | 582,802 | 18,216 | |||||||||
Number of Shares | Value (000's) | ||||||||||
| Housing Development Finance Corp. Ltd. | 628,845 | $ | 19,066 | ||||||||
ICICI Bank Ltd. | 3,496,162 | 20,140 | |||||||||
JM Financial Ltd. | 1,741,982 | 1,786 | |||||||||
| Mahindra & Mahindra Ltd. | 907,654 | 6,734 | |||||||||
| Metropolis Healthcare Ltd.*(a) | 242,352 | 3,943 | |||||||||
| National Stock Exchange*(d)(e)(i) | 1,063,830 | 13,839 | |||||||||
| Power Grid Corp. of India Ltd. | 5,356,323 | 15,111 | |||||||||
| State Bank of India | 2,655,951 | 10,169 | |||||||||
122,675 | |||||||||||
Indonesia 2.3% | |||||||||||
| PT Astra International Tbk | 22,621,400 | 10,645 | |||||||||
| PT Bank Rakyat Indonesia Persero Tbk | 51,329,400 | 15,451 | |||||||||
| PT Map Aktif Adiperkasa*(b) | 13,221,800 | 5,290 | |||||||||
31,386 | |||||||||||
Korea 13.8% | |||||||||||
Com2uS Corp. | 114,753 | 8,906 | |||||||||
| DB Insurance Co. Ltd. | 248,606 | 9,831 | |||||||||
| Hyundai Motor Co. | 39,204 | 4,159 | |||||||||
LG Chem Ltd. | 40,072 | 10,934 | |||||||||
Medy-Tox, Inc. | 29,632 | 8,611 | |||||||||
NAVER Corp. | 136,256 | 16,480 | |||||||||
Orion Corp. | 151,705 | 11,285 | |||||||||
| Samsung Electronics Co. Ltd. | 1,531,315 | 55,627 | |||||||||
SK Hynix, Inc. | 280,375 | 17,916 | |||||||||
| SK Telecom Co. Ltd. | 63,806 | 12,616 | |||||||||
| Woongjin Coway Co. Ltd. | 246,345 | 17,125 | |||||||||
| Woori Financial Group, Inc. | 1,337,163 | 13,137 | |||||||||
186,627 | |||||||||||
Malaysia 0.6% | |||||||||||
| Inari Amertron Bhd | 20,202,125 | 7,830 | |||||||||
Mexico 3.0% | |||||||||||
| Fomento Economico Mexicano SAB de CV | 1,909,644 | 17,466 | |||||||||
See Notes to Financial Statements
84
Schedule of Investments Emerging Markets Equity Fund^ (cont'd)
Number of Shares | Value (000's) | ||||||||||
| Grupo Financiero Banorte SAB de CV, O Shares | 2,266,908 | $ | 12,232 | ||||||||
| Infraestructura Energetica Nova SAB de CV* | 2,472,878 | 10,424 | |||||||||
40,122 | |||||||||||
Peru 1.1% | |||||||||||
Credicorp Ltd. | 72,358 | 14,987 | |||||||||
Philippines 1.7% | |||||||||||
Ayala Corp. | 251,000 | 4,460 | |||||||||
| GT Capital Holdings, Inc. | 381,714 | 6,658 | |||||||||
| Metropolitan Bank & Trust Co. | 8,865,583 | 12,074 | |||||||||
23,192 | |||||||||||
Poland 2.4% | |||||||||||
| Dino Polska SA*(a) | 468,837 | 18,113 | |||||||||
| Powszechny Zaklad Ubezpieczen SA | 1,459,772 | 13,711 | |||||||||
31,824 | |||||||||||
Russia 6.3% | |||||||||||
| Detsky Mir PJSC(a)(d) | 3,121,210 | 4,220 | |||||||||
LUKOIL PJSC ADR | 68,894 | 5,572 | |||||||||
LUKOIL PJSC ADR | 262,580 | 21,096 | |||||||||
| Sberbank of Russia PJSC(d) | 2,814,296 | 9,458 | |||||||||
| TCS Group Holding PLC(d)(f) | 367,288 | 6,832 | |||||||||
| X5 Retail Group NV GDR(a) | 499,275 | 17,185 | |||||||||
| Yandex NV Class A* | 551,528 | 20,462 | |||||||||
84,825 | |||||||||||
Number of Shares | Value (000's) | ||||||||||
South Africa 4.9% | |||||||||||
Barloworld Ltd. | 591,105 | $ | 4,318 | ||||||||
Bid Corp. Ltd. | 625,514 | 13,402 | |||||||||
FirstRand Ltd. | 2,864,677 | 11,329 | |||||||||
JSE Ltd. | 662,695 | 5,636 | |||||||||
| Naspers Ltd., N Shares | 136,609 | 31,105 | |||||||||
65,790 | |||||||||||
Taiwan 8.1% | |||||||||||
| Accton Technology Corp. | 2,465,600 | 12,991 | |||||||||
| Elite Material Co. Ltd. | 1,738,100 | 7,304 | |||||||||
| eMemory Technology, Inc. | 659,400 | 7,652 | |||||||||
| LandMark Optoelectronics Corp. | 829,000 | 6,849 | |||||||||
| Makalot Industrial Co. Ltd. | 1,209,750 | 7,125 | |||||||||
| Parade Technologies Ltd. | 726,000 | 12,574 | |||||||||
| Taiwan Semiconductor Manufacturing Co. Ltd. | 6,509,839 | 53,679 | |||||||||
| Uni-President Enterprises Corp. | 668,000 | 1,629 | |||||||||
109,803 | |||||||||||
Thailand 2.2% | |||||||||||
| Bangkok Bank PCL | 776,900 | 4,358 | |||||||||
| CP ALL PCL(d) | 7,300,200 | 20,058 | |||||||||
| PTT Exploration & Production PCL | 823,800 | 3,355 | |||||||||
| Srisawad Corp. PCL(d) | 1,265,200 | 2,307 | |||||||||
30,078 | |||||||||||
Number of Shares | Value (000's) | ||||||||||
Turkey 0.7% | |||||||||||
| Mavi Giyim Sanayi Ve Ticaret A/S Class B*(a) | 460,345 | $ | 2,917 | ||||||||
| Sok Marketler Ticaret A/S* | 3,574,914 | 6,473 | |||||||||
9,390 | |||||||||||
United Arab Emirates 0.2% | |||||||||||
| Network International Holdings PLC*(a) | 410,578 | 3,003 | |||||||||
| Total Common Stocks (Cost $1,213,250) | 1,290,933 | ||||||||||
Short-Term Investments 4.6% | |||||||||||
Investment Companies 4.6% | |||||||||||
| State Street Institutional Treasury Money Market Fund Premier Class, 2.03%(g) | 54,007,020 | 54,007 | |||||||||
| State Street Navigator Securities Lending Government Money Market Portfolio, 2.12%(g)(h) | 9,007,153 | 9,007 | |||||||||
| Total Short-Term Investments (Cost $63,014) | 63,014 | ||||||||||
| Total Investments 100.2% (Cost $1,276,264) | 1,353,947 | ||||||||||
| Liabilities Less Other Assets (0.2)% | (3,249 | ) | |||||||||
Net Assets 100.0% | $ | 1,350,698 | |||||||||
* Non-income producing security.
(a) Security exempt from registration pursuant to Regulation S under the Securities Act of 1933, as amended. Regulation S applies to securities offerings that are made outside of the United States and do not involve directed selling efforts in the United States and as such may have restrictions on resale. Total value of all such securities at August 31, 2019 amounted to approximately $82,017,000, which represents 6.1% of net assets of the Fund.
(b) Illiquid security.
See Notes to Financial Statements
85
Schedule of Investments Emerging Markets Equity Fund^ (cont'd)
(c) The security or a portion of this security is on loan at August 31, 2019. Total value of all such securities at August 31, 2019 amounted to approximately $8,768,000 for the Fund (see Note A of the Notes to Financial Statements).
(d) Security fair valued as of August 31, 2019 in accordance with procedures approved by the Board of Trustees. Total value of all such securities at August 31, 2019 amounted to approximately $56,714,000, which represents 4.2% of net assets of the Fund.
(e) Value determined using significant unobservable inputs.
(f) Securities were purchased under Rule 144A of the Securities Act of 1933, as amended, or are otherwise restricted and, unless registered under the Securities Act of 1933 or exempted from registration, may only be sold to qualified institutional investors or may have other restrictions on resale. At August 31, 2019, these securities amounted to approximately $6,832,000, which represents 0.5% of net assets of the Fund. Securities denoted with (f) but without (b), if any, have been deemed by the investment manager to be liquid.
(g) Represents 7-day effective yield as of August 31, 2019.
(h) Represents investment of cash collateral received from securities lending.
(i) This security has been deemed by the investment manager to be illiquid, and is subject to restrictions on resale.
At August 31, 2019, this security amounted to approximately $13,839,000, which represents 1.0% of net assets of the Fund.
| (000's omitted) Restricted Security | Acquisition Date | Acquisition Cost | Acquisition Cost Percentage of Net Assets | Value as of 8/31/2019 | Fair Value Percentage of Net Assets as of 8/31/2019 | ||||||||||||||||||
National Stock Exchange | 4/13/2018 | $ | 15,536 | 1.1 | % | $ | 13,839 | 1.0 | % | ||||||||||||||
Total | $ | 15,536 | 1.1 | % | $ | 13,839 | 1.0 | % | |||||||||||||||
See Notes to Financial Statements
86
Schedule of Investments Emerging Markets Equity Fund^ (cont'd)
POSITIONS BY INDUSTRY
Industry | Investments at Value (000's omitted) | Percentage of Net Assets | |||||||||
Banks | $ | 185,572 | 13.7 | % | |||||||
Interactive Media & Services | 129,607 | 9.6 | % | ||||||||
Semiconductors & Semiconductor Equipment | 111,484 | 8.3 | % | ||||||||
Food & Staples Retailing | 89,639 | 6.6 | % | ||||||||
Internet & Direct Marketing Retail | 70,516 | 5.2 | % | ||||||||
Insurance | 61,157 | 4.5 | % | ||||||||
Capital Markets | 57,464 | 4.2 | % | ||||||||
Technology Hardware, Storage & Peripherals | 55,627 | 4.1 | % | ||||||||
Oil, Gas & Consumable Fuels | 54,993 | 4.1 | % | ||||||||
Wireless Telecommunication Services | 43,644 | 3.2 | % | ||||||||
Electronic Equipment, Instruments & Components | 35,990 | 2.7 | % | ||||||||
Electric Utilities | 35,195 | 2.6 | % | ||||||||
Thrifts & Mortgage Finance | 25,199 | 1.9 | % | ||||||||
Household Durables | 23,808 | 1.8 | % | ||||||||
Automobiles | 21,538 | 1.6 | % | ||||||||
Gas Utilities | 21,458 | 1.6 | % | ||||||||
Electrical Equipment | 19,653 | 1.4 | % | ||||||||
Commercial Services & Supplies | 19,108 | 1.4 | % | ||||||||
Beverages | 17,466 | 1.3 | % | ||||||||
Biotechnology | 17,439 | 1.3 | % | ||||||||
Entertainment | 17,172 | 1.3 | % | ||||||||
IT Services | 17,012 | 1.3 | % | ||||||||
Equity Real Estate Investment Trusts | 13,454 | 1.0 | % | ||||||||
Metals & Mining | 13,193 | 1.0 | % | ||||||||
Communications Equipment | 12,991 | 1.0 | % | ||||||||
Food Products | 12,914 | 1.0 | % | ||||||||
Health Care Providers & Services | 12,005 | 0.9 | % | ||||||||
Diversified Financial Services | 11,329 | 0.8 | % | ||||||||
Hotels, Restaurants & Leisure | 11,146 | 0.8 | % | ||||||||
Industrial Conglomerates | 11,118 | 0.8 | % | ||||||||
Chemicals | 10,934 | 0.8 | % | ||||||||
Textiles, Apparel & Luxury Goods | 10,042 | 0.7 | % | ||||||||
Specialty Retail | 9,510 | 0.7 | % | ||||||||
Road & Rail | 7,571 | 0.6 | % | ||||||||
Machinery | 7,538 | 0.6 | % | ||||||||
Air Freight & Logistics | 6,978 | 0.5 | % | ||||||||
Trading Companies & Distributors | 4,318 | 0.3 | % | ||||||||
Real Estate Management & Development | 2,346 | 0.2 | % | ||||||||
Consumer Finance | 2,307 | 0.2 | % | ||||||||
Independent Power and Renewable Electricity Producers | 498 | 0.0 | % | ||||||||
Short-Term Investments and Other Liabilities—Net | 59,765 | 4.4 | % | ||||||||
$ | 1,350,698 | 100.0 | % | ||||||||
See Notes to Financial Statements
87
Schedule of Investments Emerging Markets Equity Fund^ (cont'd)
The following is a summary, categorized by Level (see Note A of Notes to Financial Statements), of inputs used to value the Fund's investments as of August 31, 2019:
Asset Valuation Inputs | |||||||||||||||||||
(000's omitted) | Level 1 | Level 2 | Level 3(b) | Total | |||||||||||||||
Investments: | |||||||||||||||||||
Common Stocks | |||||||||||||||||||
India | $ | 108,836 | $ | — | $ | 13,839 | $ | 122,675 | |||||||||||
Russia | 64,315 | 20,510 | — | 84,825 | |||||||||||||||
Thailand | 7,713 | 22,365 | — | 30,078 | |||||||||||||||
Turkey | — | 9,390 | — | 9,390 | |||||||||||||||
| Other Common Stocks(a) | 1,043,965 | — | — | 1,043,965 | |||||||||||||||
Total Common Stocks | 1,224,829 | 52,265 | 13,839 | 1,290,933 | |||||||||||||||
Short-Term Investments | — | 63,014 | — | 63,014 | |||||||||||||||
Total Investments | $ | 1,224,829 | $ | 115,279 | $ | 13,839 | $ | 1,353,947 | |||||||||||
(a) The Schedule of Investments provides a geographic categorization as well as a Positions by Industry summary.
(b) The following is a reconciliation between the beginning and ending balances of investments in which unobservable inputs (Level 3) were used in determining value:
| Beginning balance, as of 9/1/2018 | Accrued discounts/ (premiums) | Realized gain/ (loss) | Change in unrealized appreciation/ (depreciation) | Purchases | Sales | Transfers into Level 3 | Transfers out of Level 3 | Balance, as of 8/31/2019 | Net change in unrealized appreciation/ (depreciation) from investments still held as of 8/31/2019 | ||||||||||||||||||||||||||||||||||
| Investments in Securities: (000's omitted) | |||||||||||||||||||||||||||||||||||||||||||
| Common Stocks | |||||||||||||||||||||||||||||||||||||||||||
India | $ | 14,099 | $ | — | $ | — | $ | (260 | ) | $ | — | $ | — | $ | — | $ | — | $ | 13,839 | $ | (260 | ) | |||||||||||||||||||||
Total | $ | 14,099 | $ | — | $ | — | $ | (260 | ) | $ | — | $ | — | $ | — | $ | — | $ | 13,839 | $ | (260 | ) | |||||||||||||||||||||
See Notes to Financial Statements
88
Schedule of Investments Emerging Markets Equity Fund^ (cont'd)
The following table presents additional information about the valuation approach and inputs used for investments that are measured at fair value and categorized within Level 3 as of August 31, 2019:
| Asset class | Fair value at 8/31/2019 | Valuation approach | Unobservable input | Amount or range per unit | Input value per unit | Impact to valuation from increase in input(c) | |||||||||||||||||||||
| Common Stocks | $ | 13,838,766 | Market Approach | Transaction Price | $ | 13.01 | $ | 13.01 | Increase | ||||||||||||||||||
(c) Represents the expected directional change in the fair value of the Level 3 investments that would result from an increase in the corresponding input. A decrease to the unobservable input would have the opposite effect. Significant changes in these inputs could result in significantly higher or lower fair value measurements.
^ A balance indicated with a "—", reflects either a zero balance or an amount that rounds to less than 1.
See Notes to Financial Statements
89
Schedule of Investments Equity Income Fund^ August 31, 2019
Number of Shares | Value (000's) | ||||||||||
Common Stocks 86.5% | |||||||||||
Aerospace & Defense 2.4% | |||||||||||
| Lockheed Martin Corp. | 93,000 | $ | 35,722 | ||||||||
Banks 5.3% | |||||||||||
Citigroup, Inc. | 321,700 | 20,701 | |||||||||
Comerica, Inc. | 260,250 | 16,045 | |||||||||
| JPMorgan Chase & Co.(a) | 374,000 | 41,088 | |||||||||
77,834 | |||||||||||
Beverages 2.1% | |||||||||||
Coca-Cola Co. | 568,000 | 31,263 | |||||||||
Biotechnology 1.6% | |||||||||||
| Gilead Sciences, Inc. | 371,000 | 23,573 | |||||||||
Capital Markets 1.4% | |||||||||||
| Virtu Financial, Inc. Class A | 1,045,000 | 19,646 | |||||||||
Chemicals 1.9% | |||||||||||
Nutrien Ltd. | 551,000 | 27,748 | |||||||||
Communications Equipment 2.1% | |||||||||||
| Cisco Systems, Inc.(a) | 643,000 | 30,099 | |||||||||
Construction & Engineering 1.4% | |||||||||||
Ferrovial SA | 733,000 | 20,841 | |||||||||
Diversified Telecommunication Services 3.0% | |||||||||||
TELUS Corp. | 200,000 | 7,245 | |||||||||
| Verizon Communications, Inc. | 640,000 | 37,222 | |||||||||
44,467 | |||||||||||
Electric Utilities 6.3% | |||||||||||
Evergy, Inc. | 464,000 | 30,160 | |||||||||
Exelon Corp. | 244,000 | 11,532 | |||||||||
| NextEra Energy, Inc. | 234,400 | 51,352 | |||||||||
93,044 | |||||||||||
Energy Equipment & Services 0.9% | |||||||||||
Schlumberger Ltd. | 422,400 | 13,698 | |||||||||
| Equity Real Estate Investment Trusts 12.6% | |||||||||||
| Alexandria Real Estate Equities, Inc. | 182,000 | 27,271 | |||||||||
| Americold Realty Trust | 453,400 | 16,513 | |||||||||
| Crown Castle International Corp. | 196,000 | 28,453 | |||||||||
| Equinix, Inc.(a) | 27,800 | 15,465 | |||||||||
Number of Shares | Value (000's) | ||||||||||
| Equity LifeStyle Properties, Inc. | 155,000 | $ | 20,882 | ||||||||
| National Retail Properties, Inc. | 271,000 | 15,217 | |||||||||
| Outfront Media, Inc. | 550,000 | 15,114 | |||||||||
| STORE Capital Corp. | 473,500 | 17,879 | |||||||||
| Terreno Realty Corp. | 103,300 | 5,223 | |||||||||
| Weyerhaeuser Co. | 870,900 | 22,913 | |||||||||
184,930 | |||||||||||
Food & Staples Retailing 2.2% | |||||||||||
Walmart, Inc. | 280,000 | 31,993 | |||||||||
Food Products 1.0% | |||||||||||
| Flowers Foods, Inc. | 660,000 | 15,048 | |||||||||
Hotels, Restaurants & Leisure 1.5% | |||||||||||
| Cracker Barrel Old Country Store, Inc. | 132,000 | 21,833 | |||||||||
Insurance 1.2% | |||||||||||
| Hartford Financial Services Group, Inc. | 305,000 | 17,775 | |||||||||
IT Services 2.2% | |||||||||||
Paychex, Inc. | 399,400 | 32,631 | |||||||||
Media 1.6% | |||||||||||
| Interpublic Group of Cos., Inc. | 1,139,500 | 22,653 | |||||||||
Metals & Mining 1.4% | |||||||||||
| Rio Tinto PLC ADR | 414,450 | 20,963 | |||||||||
Mortgage Real Estate Investment 1.5% | |||||||||||
| Blackstone Mortgage Trust, Inc. Class A | 648,900 | 22,582 | |||||||||
Multi-Utilities 9.7% | |||||||||||
Ameren Corp. | 205,000 | 15,816 | |||||||||
| Dominion Energy, Inc. | 275,400 | 21,379 | |||||||||
DTE Energy Co. | 266,000 | 34,490 | |||||||||
NiSource, Inc. | 1,250,000 | 36,938 | |||||||||
Sempra Energy | 173,000 | 24,502 | |||||||||
| WEC Energy Group, Inc. | 96,600 | 9,251 | |||||||||
142,376 | |||||||||||
Number of Shares | Value (000's) | ||||||||||
Oil, Gas & Consumable Fuels 6.3% | |||||||||||
ONEOK, Inc. | 314,700 | $ | 22,432 | ||||||||
| Pembina Pipeline Corp. | 710,000 | 25,992 | |||||||||
| Suncor Energy, Inc. | 883,500 | 25,824 | |||||||||
| Williams Cos., Inc. | 785,000 | 18,526 | |||||||||
92,774 | |||||||||||
Pharmaceuticals 6.3% | |||||||||||
| AstraZeneca PLC ADR | 772,300 | 34,777 | |||||||||
| Bristol-Myers Squibb Co. | 140,700 | 6,763 | |||||||||
| Johnson & Johnson | 207,500 | 26,635 | |||||||||
Pfizer, Inc. | 691,000 | 24,565 | |||||||||
92,740 | |||||||||||
Real Estate Management & Development 0.5% | |||||||||||
| Kennedy-Wilson Holdings, Inc. | 340,000 | 7,133 | |||||||||
Road & Rail 1.3% | |||||||||||
| Kyushu Railway Co. | 372,000 | 11,153 | |||||||||
| Union Pacific Corp. | 52,000 | 8,422 | |||||||||
19,575 | |||||||||||
Semiconductors & Semiconductor Equipment 1.9% | |||||||||||
| Maxim Integrated Products, Inc. | 213,900 | 11,666 | |||||||||
QUALCOMM, Inc. | 110,600 | 8,601 | |||||||||
| Texas Instruments, Inc. | 61,800 | 7,648 | |||||||||
27,915 | |||||||||||
Software 1.6% | |||||||||||
| Microsoft Corp.(a) | 171,400 | 23,629 | |||||||||
Specialty Retail 3.5% | |||||||||||
Foot Locker, Inc. | 622,000 | 22,510 | |||||||||
Home Depot, Inc. | 123,500 | 28,147 | |||||||||
50,657 | |||||||||||
Trading Companies & Distributors 1.1% | |||||||||||
Watsco, Inc. | 99,700 | 16,306 | |||||||||
Transportation Infrastructure 0.7% | |||||||||||
Sydney Airport | 1,771,137 | 10,055 | |||||||||
| Total Common Stocks (Cost $1,002,549) | 1,271,503 | ||||||||||
See Notes to Financial Statements
90
Schedule of Investments Equity Income Fund^ (cont'd)
Principal Amount | Value (000's) | ||||||||||
Convertible Bonds 9.4% | |||||||||||
Banks 0.1% | |||||||||||
| Hope Bancorp, Inc., 2.00%, due 5/15/2038 | $ | 940,000 | $ | 856 | |||||||
Biotechnology 0.3% | |||||||||||
| BioMarin Pharmaceutical, Inc., 0.60%, due 8/1/2024 | 4,565,000 | 4,613 | |||||||||
Communications Equipment 0.2% | |||||||||||
| Finisar Corp., 0.50%, due 12/15/2036 | 2,685,000 | 2,603 | |||||||||
Electronic Equipment, Instruments & Components 1.0% | |||||||||||
| Vishay Intertechnology, Inc., 2.25%, due 6/15/2025 | 16,000,000 | 14,853 | |||||||||
Health Care Equipment & Supplies 0.2% | |||||||||||
| CONMED Corp., 2.63%, due 2/1/2024(b) | 2,755,000 | 3,514 | |||||||||
Independent Power and Renewable Electricity Producers 1.2% | |||||||||||
| NextEra Energy Partners L.P., 1.50%, due 9/15/2020(b) | 16,535,000 | 17,162 | |||||||||
Interactive Media & Services 1.1% | |||||||||||
| LinkedIn Corp., 0.50%, due 11/1/2019(c) | 8,600,000 | 8,595 | |||||||||
| Zillow Group, Inc., 1.50%, due 7/1/2023 | 8,405,000 | 7,822 | |||||||||
16,417 | |||||||||||
Principal Amount | Value (000's) | ||||||||||
Internet 0.2% | |||||||||||
| Proofpoint, Inc., 0.25%, due 8/15/2024(b) | $ | 2,330,000 | $ | 2,415 | |||||||
Machinery 0.1% | |||||||||||
| Fortive Corp., 0.88%, due 2/15/2022(b) | 2,300,000 | 2,309 | |||||||||
Media 1.3% | |||||||||||
| GCI Liberty, Inc., 1.75%, due 9/30/2046(b) | 913,000 | 1,109 | |||||||||
| Liberty Media Corp., 2.13%, due 3/31/2048(b) | 17,425,000 | 17,784 | |||||||||
18,893 | |||||||||||
Metals & Mining 1.0% | |||||||||||
| Endeavour Mining Corp., 3.00%, due 2/15/2023(b) | 13,765,000 | 14,591 | |||||||||
Oil, Gas & Consumable Fuels 0.5% | |||||||||||
| Golar LNG Ltd., 2.75%, due 2/15/2022 | 8,950,000 | 7,721 | |||||||||
Semiconductors & Semiconductor Equipment 0.1% | |||||||||||
| Rambus, Inc., 1.38%, due 2/1/2023 | 1,378,000 | 1,358 | |||||||||
Software 2.1% | |||||||||||
| DocuSign, Inc., 0.50%, due 9/15/2023(b) | 925,000 | 937 | |||||||||
| Envestnet, Inc., 1.75%, due 6/1/2023 | 5,000,000 | 5,446 | |||||||||
Principal Amount | Value (000's) | ||||||||||
| Guidewire Software, Inc., 1.25%, due 3/15/2025 | $ | 9,000,000 | $ | 9,875 | |||||||
| Splunk, Inc., 0.50%, due 9/15/2023(b) | 4,620,000 | 4,894 | |||||||||
| Verint Systems, Inc., 1.50%, due 6/1/2021 | 8,700,000 | 9,289 | |||||||||
30,441 | |||||||||||
| Total Convertible Bonds (Cost $133,879) | 137,746 | ||||||||||
| Number of Shares | |||||||||||
Short-Term Investments 4.1% | |||||||||||
Investment Companies 4.1% | |||||||||||
| State Street Institutional Treasury Money Market Fund Premier Class, 2.03%(d)(e) (Cost $60,900) | 60,899,625 | 60,900 | |||||||||
| Total Investments 100.0% (Cost $1,197,328) | 1,470,149 | ||||||||||
| Other Assets Less Liabilities 0.0%(f)(g) | 285 | ||||||||||
Net Assets 100.0% | $ | 1,470,434 | |||||||||
(a) All or a portion of the security is pledged as collateral for options written.
(b) Securities were purchased under Rule 144A of the Securities Act of 1933, as amended, or are otherwise restricted and, unless registered under the Securities Act of 1933 or exempted from registration, may only be sold to qualified institutional investors or may have other restrictions on resale. At August 31, 2019, these securities amounted to approximately $64,715,000, which represents 4.4% of net assets of the Fund. Securities denoted with (b) but without (c), if any, have been deemed by the investment manager to be liquid.
(c) Illiquid security.
(d) Represents 7-day effective yield as of August 31, 2019.
(e) All or a portion of this security is segregated in connection with obligations for options written with a total value of approximately $60,900,000.
(f) Represents less than 0.05% of net assets of the Fund.
(g) Includes the impact of the Fund's open positions in derivatives at August 31, 2019.
See Notes to Financial Statements
91
Schedule of Investments Equity Income Fund^ (cont'd)
Derivative Instruments
Written option contracts ("options written")
At August 31, 2019, the Fund had outstanding options written as follows:
Description | Number of Contracts | Notional Amount | Exercise Price | Expiration Date | Value | ||||||||||||||||||
Calls | |||||||||||||||||||||||
Aerospace & Defense | |||||||||||||||||||||||
Lockheed Martin Corp. | 100 | $ | (3,841,100 | ) | $ | 370 | 12/20/2019 | $ | (265,000 | ) | |||||||||||||
Lockheed Martin Corp. | 100 | (3,841,100 | ) | 390 | 1/17/2020 | (164,000 | ) | ||||||||||||||||
Lockheed Martin Corp. | 100 | (3,841,100 | ) | 425 | 3/20/2020 | (79,500 | ) | ||||||||||||||||
(508,500 | ) | ||||||||||||||||||||||
Beverages | |||||||||||||||||||||||
Coca-Cola Co. | 250 | (1,376,000 | ) | 57.5 | 1/17/2020 | (26,750 | ) | ||||||||||||||||
Coca-Cola Co. | 250 | (1,376,000 | ) | 60 | 2/21/2020 | (17,000 | ) | ||||||||||||||||
(43,750 | ) | ||||||||||||||||||||||
Electric Utilities | |||||||||||||||||||||||
Evergy, Inc. | 250 | (1,625,000 | ) | 70 | 3/20/2020 | (31,250 | ) | ||||||||||||||||
NextEra Energy, Inc. | 1 | (21,908 | ) | 200 | 9/20/2019 | (1,955 | ) | ||||||||||||||||
NextEra Energy, Inc. | 150 | (3,286,200 | ) | 220 | 1/17/2020 | (146,250 | ) | ||||||||||||||||
NextEra Energy, Inc. | 150 | (3,286,200 | ) | 240 | 3/20/2020 | (57,750 | ) | ||||||||||||||||
(237,205 | ) | ||||||||||||||||||||||
Equity Real Estate Investment Trusts | |||||||||||||||||||||||
Crown Castle International Corp. | 200 | (2,903,400 | ) | 140 | 10/18/2019 | (151,000 | ) | ||||||||||||||||
Crown Castle International Corp. | 200 | (2,903,400 | ) | 155 | 1/17/2020 | (72,000 | ) | ||||||||||||||||
Equinix, Inc. | 100 | (5,562,800 | ) | 620 | 12/20/2019 | (66,500 | ) | ||||||||||||||||
Equity LifeStyle Properties, Inc. | 150 | (2,020,800 | ) | 145 | 2/21/2020 | (33,750 | ) | ||||||||||||||||
(323,250 | ) | ||||||||||||||||||||||
Food & Staples Retailing | |||||||||||||||||||||||
Walmart, Inc. | 150 | (1,713,900 | ) | 115 | 12/20/2019 | (74,250 | ) | ||||||||||||||||
Walmart, Inc. | 150 | (1,713,900 | ) | 120 | 12/20/2019 | (41,175 | ) | ||||||||||||||||
Walmart, Inc. | 150 | (1,713,900 | ) | 130 | 3/20/2020 | (24,225 | ) | ||||||||||||||||
(139,650 | ) | ||||||||||||||||||||||
Insurance | |||||||||||||||||||||||
Hartford Financial Services Group, Inc. | 150 | (874,200 | ) | 60 | 12/20/2019 | (25,200 | ) | ||||||||||||||||
Hartford Financial Services Group, Inc. | 150 | (874,200 | ) | 60 | 1/17/2020 | (32,025 | ) | ||||||||||||||||
Hartford Financial Services Group, Inc. | 150 | (874,200 | ) | 65 | 3/20/2020 | (16,425 | ) | ||||||||||||||||
(73,650 | ) | ||||||||||||||||||||||
IT Services | |||||||||||||||||||||||
Paychex, Inc. | 250 | (2,042,500 | ) | 82.5 | 9/20/2019 | (28,125 | ) | ||||||||||||||||
Paychex, Inc. | 250 | (2,042,500 | ) | 90 | 1/17/2020 | (24,375 | ) | ||||||||||||||||
(52,500 | ) | ||||||||||||||||||||||
See Notes to Financial Statements
92
Schedule of Investments Equity Income Fund^ (cont'd)
Description | Number of Contracts | Notional Amount | Exercise Price | Expiration Date | Value | ||||||||||||||||||
Multi-Utilities | |||||||||||||||||||||||
Ameren Corp. | 250 | $ | (1,928,750 | ) | $ | 80 | 12/20/2019 | $ | (37,500 | ) | |||||||||||||
DTE Energy Co. | 250 | (3,241,500 | ) | 135 | 10/18/2019 | (20,625 | ) | ||||||||||||||||
Sempra Energy | 200 | (2,832,600 | ) | 135 | 10/18/2019 | (151,000 | ) | ||||||||||||||||
Sempra Energy | 200 | (2,832,600 | ) | 145 | 1/17/2020 | (80,000 | ) | ||||||||||||||||
WEC Energy Group, Inc. | 200 | (1,915,400 | ) | 80 | 10/18/2019 | (331,000 | ) | ||||||||||||||||
(620,125 | ) | ||||||||||||||||||||||
Pharmaceuticals | |||||||||||||||||||||||
AstraZeneca PLC | 250 | (1,125,750 | ) | 50 | 1/17/2020 | (15,625 | ) | ||||||||||||||||
Software | |||||||||||||||||||||||
Microsoft Corp. | 250 | (3,446,500 | ) | 130 | 10/18/2019 | (256,250 | ) | ||||||||||||||||
Microsoft Corp. | 100 | (1,378,600 | ) | 145 | 10/18/2019 | (16,250 | ) | ||||||||||||||||
Microsoft Corp. | 100 | (1,378,600 | ) | 150 | 10/18/2019 | (6,150 | ) | ||||||||||||||||
Microsoft Corp. | 200 | (2,757,200 | ) | 155 | 12/20/2019 | (30,100 | ) | ||||||||||||||||
Microsoft Corp. | 200 | (2,757,200 | ) | 150 | 1/17/2020 | (67,500 | ) | ||||||||||||||||
(376,250 | ) | ||||||||||||||||||||||
Specialty Retail | |||||||||||||||||||||||
Home Depot, Inc. | 150 | (3,418,650 | ) | 230 | 1/17/2020 | (154,500 | ) | ||||||||||||||||
Home Depot, Inc. | 150 | (3,418,650 | ) | 240 | 2/21/2020 | (109,125 | ) | ||||||||||||||||
(263,625 | ) | ||||||||||||||||||||||
Total calls | $ | (2,654,130 | ) | ||||||||||||||||||||
Puts | |||||||||||||||||||||||
Hotels, Restaurants & Leisure | |||||||||||||||||||||||
Cracker Barrel Old Country Store, Inc. | 150 | $ | (2,481,000 | ) | $ | 147 | 12/20/2019 | $ | (43,875 | ) | |||||||||||||
Industrial Conglomerates | |||||||||||||||||||||||
3M Co. | 100 | (1,617,200 | ) | 165 | 10/18/2019 | (66,500 | ) | ||||||||||||||||
Machinery | |||||||||||||||||||||||
Caterpillar, Inc. | 150 | (1,785,000 | ) | 90 | 1/17/2020 | (20,250 | ) | ||||||||||||||||
Caterpillar, Inc. | 150 | (1,785,000 | ) | 85 | 2/21/2020 | (19,425 | ) | ||||||||||||||||
(39,675 | ) | ||||||||||||||||||||||
Total puts | $ | (150,050 | ) | ||||||||||||||||||||
Total options written (premium received $1,171,549) | $ | (2,804,180 | ) | ||||||||||||||||||||
For the year ended August 31, 2019, the Fund had an average market value of $(1,522,321) in options written. At August 31, 2019, the Fund had securities pledged in the amount of $29,231,771 to cover collateral requirements for options written.
See Notes to Financial Statements
93
Schedule of Investments Equity Income Fund^ (cont'd)
The following is a summary, categorized by Level (see Note A of Notes to Financial Statements), of inputs used to value the Fund's investments as of August 31, 2019:
Asset Valuation Inputs | |||||||||||||||||||
(000's omitted) | Level 1 | Level 2 | Level 3 | Total | |||||||||||||||
Investments: | |||||||||||||||||||
| Common Stocks(a) | $ | 1,271,503 | $ | — | $ | — | $ | 1,271,503 | |||||||||||
| Convertible Bonds(a) | — | 137,746 | — | 137,746 | |||||||||||||||
Short-Term Investments | — | 60,900 | — | 60,900 | |||||||||||||||
Total Investments | $ | 1,271,503 | $ | 198,646 | $ | — | $ | 1,470,149 | |||||||||||
(a) The Schedule of Investments provides information on the industry categorization for the portfolio.
The following is a summary, categorized by Level (see Note A of Notes to Financial Statements), of inputs used to value the Fund's derivatives as of August 31, 2019:
Other Financial Instruments | |||||||||||||||||||
(000's omitted) | Level 1 | Level 2 | Level 3 | Total | |||||||||||||||
Options Written | |||||||||||||||||||
Liabilities | $ | (2,804 | ) | $ | — | $ | — | $ | (2,804 | ) | |||||||||
Total | $ | (2,804 | ) | $ | — | $ | — | $ | (2,804 | ) | |||||||||
^ A balance indicated with a "—", reflects either a zero balance or an amount that rounds to less than 1.
See Notes to Financial Statements
94
Schedule of Investments Focus Fund^ August 31, 2019
Number of Shares | Value (000's) | ||||||||||
Common Stocks 98.4% | |||||||||||
Auto Components 1.2% | |||||||||||
Aptiv PLC | 100,000 | $ | 8,317 | ||||||||
Banks 6.5% | |||||||||||
Comerica, Inc. | 307,500 | 18,957 | |||||||||
| JPMorgan Chase & Co. | 229,000 | 25,158 | |||||||||
44,115 | |||||||||||
Biotechnology 4.1% | |||||||||||
| Alexion Pharmaceuticals, Inc.* | 60,000 | 6,046 | |||||||||
| Gilead Sciences, Inc. | 340,000 | 21,603 | |||||||||
27,649 | |||||||||||
Building Products 1.7% | |||||||||||
| Johnson Controls International PLC | 271,000 | 11,569 | |||||||||
Capital Markets 6.7% | |||||||||||
| Blackstone Group, Inc. Class A | 154,000 | 7,663 | |||||||||
| Intercontinental Exchange, Inc. | 303,000 | 28,324 | |||||||||
Morgan Stanley | 232,000 | 9,626 | |||||||||
45,613 | |||||||||||
Chemicals 2.7% | |||||||||||
| Air Products & Chemicals, Inc. | 42,000 | 9,489 | |||||||||
| Ashland Global Holdings, Inc. | 118,000 | 8,642 | |||||||||
18,131 | |||||||||||
Commercial Services 0.4% | |||||||||||
| LegalZoom.com, Inc.*(a)(b)(e) | 286,288 | 2,820 | |||||||||
Communications Equipment 6.3% | |||||||||||
| Motorola Solutions, Inc. | 235,000 | 42,514 | |||||||||
Distributors 3.0% | |||||||||||
LKQ Corp.* | 770,000 | 20,228 | |||||||||
Entertainment 3.2% | |||||||||||
| Activision Blizzard, Inc. | 426,000 | 21,556 | |||||||||
Food & Staples Retailing 1.4% | |||||||||||
Walmart, Inc. | 84,000 | 9,598 | |||||||||
Food Products 4.7% | |||||||||||
| Mondelez International, Inc. Class A | 580,000 | 32,028 | |||||||||
Health Care Equipment & Supplies 3.4% | |||||||||||
| Zimmer Biomet Holdings, Inc. | 167,000 | 23,246 | |||||||||
Number of Shares | Value (000's) | ||||||||||
Health Care Providers & Services 3.0% | |||||||||||
Cigna Corp. | 134,000 | $ | 20,632 | ||||||||
Hotels, Restaurants & Leisure 1.7% | |||||||||||
Carnival Corp. | 269,000 | 11,857 | |||||||||
Household Durables 0.9% | |||||||||||
| Lennar Corp. Class A | 125,000 | 6,375 | |||||||||
Insurance 2.2% | |||||||||||
| Athene Holding Ltd. Class A* | 252,500 | 9,812 | |||||||||
| Hartford Financial Services Group, Inc. | 86,000 | 5,012 | |||||||||
14,824 | |||||||||||
Interactive Media & Services 6.1% | |||||||||||
| Alphabet, Inc. Class A* | 17,100 | 20,358 | |||||||||
| Alphabet, Inc. Class C* | 17,600 | 20,911 | |||||||||
41,269 | |||||||||||
Internet & Direct Marketing Retail 4.5% | |||||||||||
| Amazon.com, Inc.* | 17,000 | 30,197 | |||||||||
IT Services 4.7% | |||||||||||
Black Knight, Inc.* | 186,000 | 11,578 | |||||||||
| Fidelity National Information Services, Inc. | 147,663 | 20,115 | |||||||||
31,693 | |||||||||||
Machinery 1.1% | |||||||||||
| Gates Industrial Corp. PLC* | 840,000 | 7,308 | |||||||||
Media 2.6% | |||||||||||
| Altice USA, Inc. Class A* | 608,500 | 17,573 | |||||||||
Multi-Utilities 3.5% | |||||||||||
DTE Energy Co. | 183,000 | 23,728 | |||||||||
Oil, Gas & Consumable Fuels 4.7% | |||||||||||
| Cabot Oil & Gas Corp. | 610,000 | 10,443 | |||||||||
| Concho Resources, Inc. | 81,000 | 5,925 | |||||||||
Phillips 66 | 83,000 | 8,187 | |||||||||
WPX Energy, Inc.* | 654,000 | 7,037 | |||||||||
31,592 | |||||||||||
Pharmaceuticals 2.8% | |||||||||||
Pfizer, Inc. | 543,000 | 19,304 | |||||||||
Road & Rail 3.7% | |||||||||||
CSX Corp. | 374,000 | 25,065 | |||||||||
Number of Shares | Value (000's) | ||||||||||
Semiconductors & Semiconductor Equipment 3.1% | |||||||||||
| Analog Devices, Inc. | 193,000 | $ | 21,197 | ||||||||
Software 2.3% | |||||||||||
Autodesk, Inc.* | 107,000 | 15,282 | |||||||||
Technology Hardware, Storage & Peripherals 1.6% | |||||||||||
| Western Digital Corp. | 185,000 | 10,595 | |||||||||
| Wireless Telecommunication Services 4.6% | |||||||||||
T-Mobile US, Inc.* | 404,000 | 31,532 | |||||||||
| Total Common Stocks (Cost $546,035) | 667,407 | ||||||||||
Preferred Stocks 0.4% | |||||||||||
Food Products 0.4% | |||||||||||
| Sweetgreen, Inc. Ser. D*(a)(b)(e) (Cost $3,000) | 250,000 | 3,000 | |||||||||
Short-Term Investments 1.2% | |||||||||||
Investment Companies 1.2% | |||||||||||
| State Street Institutional U.S. Government Money Market Fund Premier Class, 2.07%(c) (Cost $8,287) | 8,287,441 | 8,287 | |||||||||
| Total Investments 100.0% (Cost $557,322) | 678,694 | ||||||||||
| Liabilities Less Other Assets (0.0)%(d) | (265 | ) | |||||||||
Net Assets 100.0% | $ | 678,429 | |||||||||
See Notes to Financial Statements
95
Schedule of Investments Focus Fund^ (cont'd)
* Non-income producing security.
(a) Security fair valued as of August 31, 2019 in accordance with procedures approved by the Board of Trustees. Total value of all such securities at August 31, 2019 amounted to approximately $5,820,000, which represents 0.8% of net assets of the Fund.
(b) Value determined using significant unobservable inputs.
(c) Represents 7-day effective yield as of August 31, 2019.
(d) Represents less than 0.05% of net assets of the Fund.
(e) These securities have been deemed by the investment manager to be illiquid, and are subject to restrictions on resale.
At August 31, 2019, these securities amounted to approximately $5,820,000, which represents 0.8% of net assets of the Fund.
| (000's omitted) Restricted Security | Acquisition Date | Acquisition Cost | Acquisition Cost Percentage of Net Assets | Value as of 8/31/2019 | Fair Value Percentage of Net Assets as of 8/31/2019 | ||||||||||||||||||
LegalZoom.com, Inc. | 8/22/2018 | $ | 2,820 | 0.4 | % | $ | 2,820 | 0.4 | % | ||||||||||||||
| Sweetgreen, Inc. (Ser. D Preferred Shares) | 11/30/2018 | 3,000 | 0.4 | % | 3,000 | 0.4 | % | ||||||||||||||||
Total | $ | 5,820 | 0.8 | % | $ | 5,820 | 0.8 | % | |||||||||||||||
Derivative Instruments
Written option contracts ("options written")
At August 31, 2019, the Fund did not have any outstanding options written. For the year ended August 31, 2019, the Fund had an average market value of $(357,528) in options written.
The following is a summary, categorized by Level (see Note A of Notes to Financial Statements), of inputs used to value the Fund's investments as of August 31, 2019:
Asset Valuation Inputs | |||||||||||||||||||
(000's omitted) | Level 1 | Level 2 | Level 3(b) | Total | |||||||||||||||
Investments: | |||||||||||||||||||
Common Stocks | |||||||||||||||||||
Commercial Services | $ | — | $ | — | $ | 2,820 | $ | 2,820 | |||||||||||
| Other Common Stocks(a) | 664,587 | — | — | 664,587 | |||||||||||||||
Total Common Stocks | 664,587 | — | 2,820 | 667,407 | |||||||||||||||
| Preferred Stocks(a) | — | — | 3,000 | 3,000 | |||||||||||||||
Short-Term Investments | — | 8,287 | — | 8,287 | |||||||||||||||
Total Investments | $ | 664,587 | $ | 8,287 | $ | 5,820 | $ | 678,694 | |||||||||||
See Notes to Financial Statements
96
Schedule of Investments Focus Fund^ (cont'd)
(a) The Schedule of Investments provides information on the industry categorization for the portfolio.
(b) The following is reconciliation between the beginning and ending balances of investments in which unobservable inputs (Level 3) were used in determining value:
| Beginning balance, as of 9/1/2018 | Accrued discounts/ (premiums) | Realized gain/ (loss) | Change in unrealized appreciation/ (depreciation) | Purchases | Sales | Transfers into Level 3 | Transfers out of Level 3 | Balance, as of 8/31/2019 | Net change in unrealized appreciation/ (depreciation) from investments still held as of 8/31/2019 | ||||||||||||||||||||||||||||||||||
| Investments in Securities: (000's omitted) | |||||||||||||||||||||||||||||||||||||||||||
| Common Stocks | |||||||||||||||||||||||||||||||||||||||||||
| Commercial Services | $ | 3,000 | $ | — | $ | — | $ | (180 | ) | $ | — | $ | — | $ | — | $ | — | $ | 2,820 | $ | (180 | ) | |||||||||||||||||||||
| Preferred Stocks | |||||||||||||||||||||||||||||||||||||||||||
| Food Products | — | — | — | — | 3,000 | — | — | — | 3,000 | — | |||||||||||||||||||||||||||||||||
Total | $ | 3,000 | $ | — | $ | — | $ | (180 | ) | $ | 3,000 | $ | — | $ | — | $ | — | $ | 5,820 | $ | (180 | ) | |||||||||||||||||||||
The following table presents additional information about the valuation approach and inputs used for investments that are measured at fair value and categorized within Level 3 as of August 31, 2019:
| Asset class | Fair value at 8/31/2019 | Valuation approach | Unobservable input | Amount or range per unit | Input value per unit | Impact to valuation from increase in input(c) | |||||||||||||||||||||
| Common Stocks | $ | 2,819,507 | Market Approach | Adjusted Transaction Price | $ | 9.85 | $ | 9.85 | Increase | ||||||||||||||||||
| Preferred Stocks | 3,000,000 | Market Approach | Transaction Price | 12.00 | 12.00 | Increase | |||||||||||||||||||||
(c) Represents the expected directional change in the fair value of the Level 3 investments that would result from an increase in the corresponding input. A decrease to the unobservable input would have the opposite effect. Significant changes in these inputs could result in significantly higher or lower fair value measurements.
^ A balance indicated with a "—", reflects either a zero balance or an amount that rounds to less than 1.
See Notes to Financial Statements
97
Schedule of Investments Genesis Fund^ August 31, 2019
Number of Shares | Value (000's) | ||||||||||
Common Stocks 99.0% | |||||||||||
Aerospace & Defense 0.3% | |||||||||||
| Astronics Corp.* | 924,662 | $ | 25,438 | ||||||||
Air Freight & Logistics 0.5% | |||||||||||
| Forward Air Corp. | 852,384 | 53,104 | |||||||||
Airlines 0.6% | |||||||||||
| Allegiant Travel Co. | 432,859 | 61,462 | |||||||||
Auto Components 2.3% | |||||||||||
| Fox Factory Holding Corp.*(a) | 2,287,406 | 164,785 | |||||||||
LCI Industries | 868,536 | 73,608 | |||||||||
238,393 | |||||||||||
Banks 10.5% | |||||||||||
| Bank of Hawaii Corp. | 1,716,137 | 141,890 | |||||||||
Bank OZK | 2,281,998 | 58,876 | |||||||||
| BOK Financial Corp. | 975,168 | 74,249 | |||||||||
| Columbia Banking System, Inc. | 2,341,934 | 80,820 | |||||||||
| Community Bank System, Inc. | 1,564,022 | 95,390 | |||||||||
| Cullen/Frost Bankers, Inc. | 1,241,803 | 103,082 | |||||||||
| CVB Financial Corp. | 4,992,592 | 102,698 | |||||||||
| First Financial Bankshares, Inc. | 4,048,335 | 123,960 | |||||||||
| First Hawaiian, Inc. | 4,644,289 | 119,358 | |||||||||
| Glacier Bancorp, Inc. | 1,777,289 | 70,541 | |||||||||
| Lakeland Financial Corp. | 735,104 | 31,117 | |||||||||
| LegacyTexas Financial Group, Inc. | 1,756,936 | 70,980 | |||||||||
1,072,961 | |||||||||||
Beverages 0.3% | |||||||||||
| MGP Ingredients, Inc. | 646,644 | 31,149 | |||||||||
Biotechnology 0.9% | |||||||||||
Abcam PLC | 1,949,926 | 27,452 | |||||||||
| Emergent BioSolutions, Inc.* | 1,569,980 | 68,765 | |||||||||
96,217 | |||||||||||
Number of Shares | Value (000's) | ||||||||||
Building Products 1.1% | |||||||||||
AAON, Inc. | 2,237,589 | $ | 107,337 | ||||||||
| Patrick Industries, Inc.* | 266,608 | 9,635 | |||||||||
116,972 | |||||||||||
Capital Markets 3.8% | |||||||||||
| Artisan Partners Asset Management, Inc. Class A | 1,151,032 | 30,663 | |||||||||
| BrightSphere Investment Group, Inc. | 2,045,511 | 18,594 | |||||||||
| FactSet Research Systems, Inc. | 244,320 | 66,477 | |||||||||
| Hamilton Lane, Inc. Class A | 106,425 | 6,613 | |||||||||
| Houlihan Lokey, Inc. | 1,133,423 | 50,075 | |||||||||
| MarketAxess Holdings, Inc. | 545,743 | 216,998 | |||||||||
389,420 | |||||||||||
Chemicals 2.1% | |||||||||||
| Chase Corp.(a) | 518,410 | 51,955 | |||||||||
Ingevity Corp.* | 501,390 | 38,191 | |||||||||
| NewMarket Corp. | 117,534 | 55,799 | |||||||||
| Quaker Chemical Corp. | 453,049 | 71,972 | |||||||||
217,917 | |||||||||||
Commercial Services & Supplies 3.6% | |||||||||||
IAA, Inc.* | 1,158,280 | 56,582 | |||||||||
MSA Safety, Inc. | 989,043 | 104,473 | |||||||||
Rollins, Inc. | 3,437,036 | 112,769 | |||||||||
Tetra Tech, Inc. | 444,065 | 36,023 | |||||||||
UniFirst Corp. | 307,914 | 60,323 | |||||||||
370,170 | |||||||||||
Communications Equipment 0.9% | |||||||||||
| NetScout Systems, Inc.*(a) | 4,017,461 | 88,987 | |||||||||
Construction & Engineering 0.8% | |||||||||||
| Valmont Industries, Inc. | 632,151 | 85,656 | |||||||||
Construction Materials 1.0% | |||||||||||
| Eagle Materials, Inc. | 1,249,344 | 105,182 | |||||||||
Containers & Packaging 1.4% | |||||||||||
AptarGroup, Inc. | 1,145,904 | 140,052 | |||||||||
Distributors 2.7% | |||||||||||
Pool Corp. | 1,422,199 | 279,291 | |||||||||
Number of Shares | Value (000's) | ||||||||||
Diversified Consumer Services 1.6% | |||||||||||
| Bright Horizons Family Solutions, Inc.* | 984,640 | $ | 162,515 | ||||||||
Electrical Equipment 0.3% | |||||||||||
AZZ, Inc. | 618,924 | 25,543 | |||||||||
Electronic Equipment, Instruments & Components 5.6% | |||||||||||
Cognex Corp. | 2,055,095 | 92,644 | |||||||||
Littelfuse, Inc. | 736,147 | 114,890 | |||||||||
nLight, Inc.* | 924,223 | 11,941 | |||||||||
Novanta, Inc.* | 1,255,487 | 94,161 | |||||||||
| Rogers Corp.*(a) | 1,247,581 | 165,205 | |||||||||
| Zebra Technologies Corp. Class A* | 482,997 | 99,029 | |||||||||
577,870 | |||||||||||
Energy Equipment & Services 1.1% | |||||||||||
Apergy Corp.* | 1,224,165 | 31,804 | |||||||||
| Cactus, Inc. Class A* | 1,400,794 | 35,678 | |||||||||
| Pason Systems, Inc. | 3,779,391 | 44,764 | |||||||||
112,246 | |||||||||||
Food & Staples Retailing 0.3% | |||||||||||
| Grocery Outlet Holding Corp.* | 736,228 | 29,780 | |||||||||
Food Products 2.1% | |||||||||||
| Calavo Growers, Inc. | 683,644 | 60,605 | |||||||||
| J & J Snack Foods Corp. | 380,810 | 73,519 | |||||||||
| Lancaster Colony Corp. | 576,630 | 84,131 | |||||||||
218,255 | |||||||||||
| Health Care Equipment & Supplies 8.8% | |||||||||||
| Atrion Corp.(a) | 116,385 | 90,449 | |||||||||
| Cantel Medical Corp. | 1,210,954 | 111,323 | |||||||||
| Haemonetics Corp.* | 1,503,119 | 200,711 | |||||||||
Heska Corp.* | 382,967 | 26,880 | |||||||||
| IDEXX Laboratories, Inc.* | 591,483 | 171,376 | |||||||||
Neogen Corp.* | 750,094 | 52,897 | |||||||||
| West Pharmaceutical Services, Inc. | 1,668,314 | 242,673 | |||||||||
896,309 | |||||||||||
Health Care Providers & Services 3.3% | |||||||||||
Chemed Corp. | 484,360 | 207,999 | |||||||||
Henry Schein, Inc.* | 166,041 | 10,232 | |||||||||
See Notes to Financial Statements
98
Schedule of Investments Genesis Fund^ (cont'd)
Number of Shares | Value (000's) | ||||||||||
| National Research Corp. | 359,619 | $ | 23,026 | ||||||||
| U.S. Physical Therapy, Inc.(a) | 739,606 | 98,752 | |||||||||
340,009 | |||||||||||
Health Care Technology 0.1% | |||||||||||
| Simulations Plus, Inc. | 224,070 | 8,091 | |||||||||
Hotels, Restaurants & Leisure 0.7% | |||||||||||
| Texas Roadhouse, Inc. | 1,439,214 | 74,062 | |||||||||
Household Products 2.6% | |||||||||||
| Church & Dwight Co., Inc. | 1,838,030 | 146,638 | |||||||||
WD-40 Co. | 649,182 | 118,346 | |||||||||
264,984 | |||||||||||
Industrial Conglomerates 0.3% | |||||||||||
| Raven Industries, Inc. | 999,973 | 29,169 | |||||||||
Insurance 1.8% | |||||||||||
| AMERISAFE, Inc.(a) | 1,040,545 | 71,485 | |||||||||
RLI Corp. | 1,266,451 | 115,969 | |||||||||
187,454 | |||||||||||
IT Services 1.3% | |||||||||||
| Computer Services, Inc. | 120,870 | 5,197 | |||||||||
| Jack Henry & Associates, Inc. | 881,519 | 127,785 | |||||||||
132,982 | |||||||||||
Life Sciences Tools & Services 2.5% | |||||||||||
Bio-Techne Corp. | 937,153 | 179,530 | |||||||||
ICON PLC* | 522,322 | 80,537 | |||||||||
260,067 | |||||||||||
Machinery 5.8% | |||||||||||
Graco, Inc. | 1,344,972 | 61,290 | |||||||||
Kadant, Inc. | 232,079 | 19,098 | |||||||||
Lindsay Corp. | 457,440 | 40,374 | |||||||||
Middleby Corp.* | 690,039 | 75,670 | |||||||||
Nordson Corp. | 642,633 | 87,372 | |||||||||
| RBC Bearings, Inc.* | 998,052 | 159,219 | |||||||||
Toro Co. | 2,046,527 | 147,371 | |||||||||
590,394 | |||||||||||
Media 2.7% | |||||||||||
Cable One, Inc. | 68,532 | 88,929 | |||||||||
| Gray Television, Inc.* | 2,398,429 | 36,696 | |||||||||
Number of Shares | Value (000's) | ||||||||||
| Nexstar Media Group, Inc. Class A | 1,548,553 | $ | 153,136 | ||||||||
278,761 | |||||||||||
Multiline Retail 0.4% | |||||||||||
| Ollie's Bargain Outlet Holdings, Inc.* | 672,760 | 37,305 | |||||||||
Oil, Gas & Consumable Fuels 1.1% | |||||||||||
| Matador Resources Co.* | 3,394,420 | 53,123 | |||||||||
| WPX Energy, Inc.* | 4,989,136 | 53,683 | |||||||||
106,806 | |||||||||||
Paper & Forest Products 0.7% | |||||||||||
| Stella-Jones, Inc.(b) | 2,347,673 | 69,104 | |||||||||
Professional Services 1.8% | |||||||||||
| Exponent, Inc.(a) | 2,614,602 | 185,349 | |||||||||
Real Estate Management & Development 1.0% | |||||||||||
FirstService Corp. | 981,269 | 101,944 | |||||||||
Semiconductors & Semiconductor Equipment 3.7% | |||||||||||
| Cabot Microelectronics Corp. | 1,050,117 | 130,897 | |||||||||
| MKS Instruments, Inc. | 963,791 | 75,455 | |||||||||
| Power Integrations, Inc.(a) | 1,983,657 | 176,585 | |||||||||
382,937 | |||||||||||
Software 11.5% | |||||||||||
| Altair Engineering, Inc. Class A* | 1,347,187 | 46,289 | |||||||||
| Aspen Technology, Inc. * | 2,134,276 | 284,286 | |||||||||
Fair Isaac Corp.* | 724,653 | 255,600 | |||||||||
| Manhattan Associates, Inc.* | 2,992,169 | 247,243 | |||||||||
Model N, Inc.* | 1,070,171 | 30,639 | |||||||||
Qualys, Inc.* | 1,606,299 | 127,893 | |||||||||
| Tyler Technologies, Inc.* | 730,025 | 187,281 | |||||||||
1,179,231 | |||||||||||
Specialty Retail 3.3% | |||||||||||
| Asbury Automotive Group, Inc.* | 788,543 | 74,360 | |||||||||
Number of Shares | Value (000's) | ||||||||||
| Floor & Decor Holdings, Inc. Class A* | 1,351,901 | $ | 66,540 | ||||||||
| Lithia Motors, Inc. Class A | 529,237 | 69,367 | |||||||||
Monro, Inc. | 931,689 | 72,411 | |||||||||
| Tractor Supply Co. | 555,319 | 56,576 | |||||||||
339,254 | |||||||||||
Trading Companies & Distributors 1.8% | |||||||||||
| Applied Industrial Technologies, Inc. | 373,512 | 19,942 | |||||||||
| Richelieu Hardware Ltd.(b) | 1,577,672 | 30,335 | |||||||||
| SiteOne Landscape Supply, Inc.* | 632,930 | 49,495 | |||||||||
Watsco, Inc. | 500,157 | 81,801 | |||||||||
181,573 | |||||||||||
| Total Common Stocks (Cost $5,467,822) | 10,144,365 | ||||||||||
Short-Term Investments 0.8% | |||||||||||
Investment Companies 0.8% | |||||||||||
| State Street Institutional Treasury Money Market Fund Premier Class, 2.03%(c) | 5,558,295 | 5,558 | |||||||||
| State Street Institutional Treasury Plus Money Market Fund Premier Class, 2.05%(c) | 78,176,191 | 78,176 | |||||||||
| Total Short-Term Investments (Cost $83,734) | 83,734 | ||||||||||
| Total Investments 99.8% (Cost $5,551,556) | 10,228,099 | ||||||||||
| Other Assets Less Liabilities 0.2% | 18,477 | ||||||||||
Net Assets 100.0% | $ | 10,246,576 | |||||||||
See Notes to Financial Statements
99
Schedule of Investments Genesis Fund^ (cont'd)
* Non-income producing security.
(a) Affiliated company (see Note F of Notes to Financial Statements).
(b) Security fair valued as of August 31, 2019 in accordance with procedures approved by the Board of Trustees. Total value of all such securities at August 31, 2019 amounted to approximately $99,439,000, which represents 1.0% of net assets of the Fund.
(c) Represents 7-day effective yield as of August 31, 2019.
The following is a summary, categorized by Level (see Note A of Notes to Financial Statements), of inputs used to value the Fund's investments as of August 31, 2019:
Asset Valuation Inputs | |||||||||||||||||||
(000's omitted) | Level 1 | Level 2 | Level 3 | Total | |||||||||||||||
Investments: | |||||||||||||||||||
Common Stocks | |||||||||||||||||||
Paper & Forest Products | $ | — | $ | 69,104 | $ | — | $ | 69,104 | |||||||||||
Trading Companies & Distributors | 151,238 | 30,335 | — | 181,573 | |||||||||||||||
| Other Common Stocks(a) | 9,893,688 | — | — | 9,893,688 | |||||||||||||||
Total Common Stocks | 10,044,926 | 99,439 | — | 10,144,365 | |||||||||||||||
Short-Term Investments | — | 83,734 | — | 83,734 | |||||||||||||||
Total Investments | $ | 10,044,926 | $ | 183,173 | $ | — | $ | 10,228,099 | |||||||||||
(a) The Schedule of Investments provides information on the industry categorization for the portfolio.
^ A balance indicated with a "—", reflects either a zero balance or an amount that rounds to less than 1.
See Notes to Financial Statements
100
Schedule of Investments Global Equity Fund^ August 31, 2019
Number of Shares | Value (000's) | ||||||||||
Common Stocks 97.9% | |||||||||||
Australia 0.7% | |||||||||||
| Insurance Australia Group Ltd. | 4,460 | $ | 24 | ||||||||
Belgium 0.8% | |||||||||||
KBC Group NV | 490 | 28 | |||||||||
Canada 4.9% | |||||||||||
| Alimentation Couche-Tard, Inc. Class B | 731 | 46 | |||||||||
Kinaxis, Inc.* | 804 | 47 | |||||||||
Suncor Energy, Inc. | 678 | 20 | |||||||||
| Waste Connections, Inc. | 682 | 62 | |||||||||
175 | |||||||||||
China 1.8% | |||||||||||
| Alibaba Group Holding Ltd. ADR* | 360 | 63 | |||||||||
Germany 3.5% | |||||||||||
Continental AG | 165 | 20 | |||||||||
Gerresheimer AG | 351 | 27 | |||||||||
| Infineon Technologies AG | 2,210 | 38 | |||||||||
SAP SE ADR | 318 | 38 | |||||||||
123 | |||||||||||
Hong Kong 3.6% | |||||||||||
AIA Group Ltd. | 4,400 | 43 | |||||||||
| Haier Electronics Group Co. Ltd. | 10,350 | 27 | |||||||||
| Techtronic Industries Co. Ltd. | 8,500 | 59 | |||||||||
129 | |||||||||||
Ireland 1.6% | |||||||||||
CRH PLC | 1,126 | 37 | |||||||||
| Kerry Group PLC Class A | 165 | 20 | |||||||||
57 | |||||||||||
Israel 1.3% | |||||||||||
| Check Point Software Technologies Ltd.* | 416 | 45 | |||||||||
Japan 8.6% | |||||||||||
Bridgestone Corp. | 730 | 28 | |||||||||
| Daikin Industries Ltd. | 350 | 43 | |||||||||
Hoya Corp. | 500 | 41 | |||||||||
Ichigo, Inc. | 11,100 | 45 | |||||||||
Kao Corp. | 200 | 14 | |||||||||
Kose Corp. | 325 | 56 | |||||||||
| Sanwa Holdings Corp. | 3,050 | 34 | |||||||||
| Toyota Motor Corp. | 700 | 46 | |||||||||
307 | |||||||||||
Number of Shares | Value (000's) | ||||||||||
Mexico 0.5% | |||||||||||
| Infraestructura Energetica Nova SAB de CV | 4,528 | $ | 19 | ||||||||
Netherlands 6.3% | |||||||||||
| AerCap Holdings NV* | 1,043 | 56 | |||||||||
| ASML Holding NV | 337 | 75 | |||||||||
Heineken NV | 263 | 28 | |||||||||
| Intertrust NV(a) | 1,118 | 23 | |||||||||
| NXP Semiconductors NV | 420 | 43 | |||||||||
225 | |||||||||||
Norway 0.7% | |||||||||||
| Sbanken ASA(a) | 3,492 | 24 | |||||||||
Singapore 0.9% | |||||||||||
| DBS Group Holdings Ltd. | 1,900 | 34 | |||||||||
Sweden 0.8% | |||||||||||
| Assa Abloy AB Class B | 1,301 | 27 | |||||||||
Switzerland 7.9% | |||||||||||
| Cie Financiere Richemont SA | 408 | 32 | |||||||||
Givaudan SA | 9 | 24 | |||||||||
| Julius Baer Group Ltd.* | 835 | 33 | |||||||||
Lonza Group AG* | 101 | 36 | |||||||||
Novartis AG | 306 | 27 | |||||||||
Roche Holding AG | 151 | 41 | |||||||||
SGS SA | 10 | 25 | |||||||||
Sonova Holding AG | 264 | 61 | |||||||||
279 | |||||||||||
United Kingdom 7.6% | |||||||||||
Aon PLC | 267 | 52 | |||||||||
Bunzl PLC | 964 | 24 | |||||||||
| Compass Group PLC | 1,833 | 46 | |||||||||
| Fevertree Drinks PLC | 1,060 | 29 | |||||||||
Linde PLC | 148 | 28 | |||||||||
Prudential PLC | 1,772 | 30 | |||||||||
RELX PLC | 1,272 | 30 | |||||||||
| St. James's Place PLC | 2,604 | 29 | |||||||||
268 | |||||||||||
United States 46.4% | |||||||||||
| Activision Blizzard, Inc. | 865 | 44 | |||||||||
| Alexion Pharmaceuticals, Inc.* | 434 | 44 | |||||||||
| Alphabet, Inc. Class A* | 29 | 35 | |||||||||
Number of Shares | Value (000's) | ||||||||||
| Alphabet, Inc. Class C* | 29 | $ | 34 | ||||||||
Amazon.com, Inc.* | 58 | 103 | |||||||||
Apple, Inc. | 329 | 69 | |||||||||
BlackRock, Inc. | 100 | 42 | |||||||||
| Cabot Oil & Gas Corp. | 1,755 | 30 | |||||||||
CDW Corp. | 410 | 47 | |||||||||
Centene Corp.* | 795 | 37 | |||||||||
Cognex Corp. | 740 | 33 | |||||||||
Comerica, Inc. | 396 | 24 | |||||||||
| Core Laboratories NV | 111 | 4 | |||||||||
CVS Health Corp. | 506 | 31 | |||||||||
EOG Resources, Inc. | 453 | 34 | |||||||||
| Estee Lauder Cos., Inc. Class A | 343 | 68 | |||||||||
Expedia Group, Inc. | 113 | 15 | |||||||||
Exxon Mobil Corp. | 578 | 40 | |||||||||
Ferguson PLC | 781 | 57 | |||||||||
| Fidelity National Information Services, Inc. | 463 | 63 | |||||||||
First Republic Bank | 279 | 25 | |||||||||
Gilead Sciences, Inc. | 543 | 34 | |||||||||
Graco, Inc. | 970 | 44 | |||||||||
Halliburton Co. | 535 | 10 | |||||||||
Henry Schein, Inc.* | 620 | 38 | |||||||||
| Intercontinental Exchange, Inc. | 715 | 67 | |||||||||
| JPMorgan Chase & Co. | 505 | 56 | |||||||||
| Kontoor Brands, Inc.* | 57 | 2 | |||||||||
Medtronic PLC | 566 | 61 | |||||||||
| Motorola Solutions, Inc. | 130 | 24 | |||||||||
| RPM International, Inc. | 670 | 45 | |||||||||
| Samsonite International SA(a) | 16,195 | 31 | |||||||||
Sealed Air Corp. | 890 | 35 | |||||||||
| Sensata Technologies Holding PLC* | 1,469 | 67 | |||||||||
| Service Corp. International | 734 | 34 | |||||||||
| SVB Financial Group* | 118 | 23 | |||||||||
T-Mobile US, Inc.* | 700 | 55 | |||||||||
VF Corp. | 410 | 34 | |||||||||
Visa, Inc. Class A | 416 | 75 | |||||||||
| Western Digital Corp. | 585 | 34 | |||||||||
1,648 | |||||||||||
| Total Common Stocks (Cost $2,882) | 3,475 | ||||||||||
See Notes to Financial Statements
101
Schedule of Investments Global Equity Fund^ (cont'd)
Number of Shares | Value (000's) | ||||||||||
Short-Term Investments 3.5% | |||||||||||
Investment Companies 3.5% | |||||||||||
| State Street Institutional Treasury Money Market Fund Premier Class, 2.03%(b) (Cost $124) | 124,472 | $ | 124 | ||||||||
| Total Investments 101.4% (Cost $3,006) | 3,599 | ||||||||||
| Liabilities Less Other Assets (1.4)% | (51 | ) | |||||||||
Net Assets 100.0% | $ | 3,548 | |||||||||
* Non-income producing security.
(a) Security exempt from registration pursuant to Regulation S under the Securities Act of 1933, as amended. Regulation S applies to securities offerings that are made outside of the United States and do not involve directed selling efforts in the United States and as such may have restrictions on resale. Total value of all such securities at August 31, 2019 amounted to approximately $78,000, which represents 2.2% of net assets of the Fund.
(b) Represents 7-day effective yield as of August 31, 2019.
See Notes to Financial Statements
102
Schedule of Investments Global Equity Fund^ (cont'd)
POSITIONS BY INDUSTRY
Industry | Investments at Value (000's omitted) | Percentage of Net Assets | |||||||||
Banks | $ | 213 | 6.0 | % | |||||||
Internet & Direct Marketing Retail | 181 | 5.1 | % | ||||||||
Capital Markets | 171 | 4.8 | % | ||||||||
Health Care Equipment & Supplies | 163 | 4.6 | % | ||||||||
Semiconductors & Semiconductor Equipment | 156 | 4.4 | % | ||||||||
Insurance | 149 | 4.2 | % | ||||||||
IT Services | 138 | 3.9 | % | ||||||||
Personal Products | 138 | 3.9 | % | ||||||||
Trading Companies & Distributors | 137 | 3.9 | % | ||||||||
Software | 130 | 3.7 | % | ||||||||
Oil, Gas & Consumable Fuels | 124 | 3.5 | % | ||||||||
Health Care Providers & Services | 106 | 3.0 | % | ||||||||
Building Products | 104 | 2.9 | % | ||||||||
Technology Hardware, Storage & Peripherals | 103 | 2.9 | % | ||||||||
Machinery | 103 | 2.9 | % | ||||||||
Textiles, Apparel & Luxury Goods | 99 | 2.8 | % | ||||||||
Chemicals | 97 | 2.7 | % | ||||||||
Electronic Equipment, Instruments & Components | 80 | 2.2 | % | ||||||||
Biotechnology | 78 | 2.2 | % | ||||||||
Professional Services | 78 | 2.2 | % | ||||||||
Interactive Media & Services | 69 | 1.9 | % | ||||||||
Pharmaceuticals | 68 | 1.9 | % | ||||||||
Electrical Equipment | 67 | 1.9 | % | ||||||||
Life Sciences Tools & Services | 63 | 1.8 | % | ||||||||
Commercial Services & Supplies | 62 | 1.7 | % | ||||||||
Beverages | 57 | 1.6 | % | ||||||||
Wireless Telecommunication Services | 55 | 1.5 | % | ||||||||
Auto Components | 48 | 1.4 | % | ||||||||
Automobiles | 46 | 1.3 | % | ||||||||
Food & Staples Retailing | 46 | 1.3 | % | ||||||||
Hotels, Restaurants & Leisure | 46 | 1.3 | % | ||||||||
Real Estate Management & Development | 45 | 1.3 | % | ||||||||
Entertainment | 44 | 1.2 | % | ||||||||
Construction Materials | 37 | 1.0 | % | ||||||||
Containers & Packaging | 35 | 1.0 | % | ||||||||
Diversified Consumer Services | 34 | 1.0 | % | ||||||||
Household Durables | 27 | 0.8 | % | ||||||||
Communications Equipment | 24 | 0.7 | % | ||||||||
Food Products | 20 | 0.6 | % | ||||||||
Gas Utilities | 19 | 0.5 | % | ||||||||
Energy Equipment & Services | 15 | 0.4 | % | ||||||||
Short-Term Investments and Other Liabilities—Net | 73 | 2.1 | % | ||||||||
$ | 3,548 | 100.0 | % | ||||||||
See Notes to Financial Statements
103
Schedule of Investments Global Equity Fund^ (cont'd)
The following is a summary, categorized by Level (see Note A of Notes to Financial Statements), of inputs used to value the Fund's investments as of August 31, 2019:
Asset Valuation Inputs | |||||||||||||||||||
(000's omitted) | Level 1 | Level 2 | Level 3 | Total | |||||||||||||||
Investments: | |||||||||||||||||||
| Common Stocks(a) | $ | 3,475 | $ | — | $ | — | $ | 3,475 | |||||||||||
Short-Term Investments | — | 124 | — | 124 | |||||||||||||||
Total Investments | $ | 3,475 | $ | 124 | $ | — | $ | 3,599 | |||||||||||
(a) The Schedule of Investments provides a geographic categorization as well as a Positions by Industry summary.
^ A balance indicated with a "—", reflects either a zero balance or an amount that rounds to less than 1.
See Notes to Financial Statements
104
Schedule of Investments Global Real Estate Fund^ August 31, 2019
| Number of Shares | Value (000's) | ||||||||||
Common Stocks 100.0% | |||||||||||
Australia 5.3% | |||||||||||
Dexus | 7,113 | $ | 62 | ||||||||
Goodman Group | 12,214 | 119 | |||||||||
GPT Group | 9,263 | 40 | |||||||||
221 | |||||||||||
Belgium 2.0% | |||||||||||
| Shurgard Self Storage SA | 2,582 | 85 | |||||||||
Canada 3.6% | |||||||||||
| Allied Properties Real Estate Investment Trust | 1,176 | 46 | |||||||||
| Brookfield Asset Management, Inc. Class A | 715 | 37 | |||||||||
| Canadian Apartment Properties REIT | 1,657 | 67 | |||||||||
150 | |||||||||||
France 1.8% | |||||||||||
ICADE | 833 | 74 | |||||||||
Germany 1.9% | |||||||||||
| ADLER Real Estate AG* | 3,073 | 39 | |||||||||
LEG Immobilien AG | 345 | 40 | |||||||||
79 | |||||||||||
Hong Kong 5.1% | |||||||||||
| CK Asset Holdings Ltd. | 14,487 | 98 | |||||||||
| Sun Hung Kai Properties Ltd. | 8,250 | 117 | |||||||||
215 | |||||||||||
Japan 11.7% | |||||||||||
| Comforia Residential REIT, Inc. | 18 | 57 | |||||||||
| Japan Real Estate Investment Corp. | 10 | 66 | |||||||||
| Mitsubishi Estate Co. Ltd. | 3,950 | 76 | |||||||||
| Mitsui Fudosan Co. Ltd. | 5,191 | 124 | |||||||||
| Nippon Accommodations Fund, Inc. | 17 | 107 | |||||||||
| Sumitomo Realty & Development Co. Ltd. | 1,521 | 57 | |||||||||
487 | |||||||||||
| Number of Shares | Value (000's) | ||||||||||
Singapore 2.4% | |||||||||||
| Ascendas Real Estate Investment Trust | 18,159 | $ | 40 | ||||||||
CapitaLand Ltd. | 24,300 | 61 | |||||||||
101 | |||||||||||
Spain 1.3% | |||||||||||
| Merlin Properties Socimi SA | 3,938 | 53 | |||||||||
Sweden 1.5% | |||||||||||
| Hufvudstaden AB, A Shares | 3,385 | 63 | |||||||||
United Kingdom 8.2% | |||||||||||
| Safestore Holdings PLC | 9,127 | 74 | |||||||||
SEGRO PLC | 15,870 | 152 | |||||||||
UNITE Group PLC | 9,254 | 118 | |||||||||
344 | |||||||||||
United States 55.2% | |||||||||||
| American Homes 4 Rent Class A | 3,288 | 84 | |||||||||
| American Tower Corp. | 874 | 201 | |||||||||
| Apartment Investment & Management Co. Class A | 1,477 | 75 | |||||||||
| Crown Castle International Corp. | 773 | 112 | |||||||||
CyrusOne, Inc. | 1,123 | 83 | |||||||||
| Digital Realty Trust, Inc. | 486 | 60 | |||||||||
| Douglas Emmett, Inc. | 1,464 | 62 | |||||||||
Equinix, Inc. | 263 | 146 | |||||||||
| Equity Lifestyle Properties, Inc. | 1,062 | 143 | |||||||||
Equity Residential | 1,587 | 135 | |||||||||
| Essex Property Trust, Inc. | 346 | 111 | |||||||||
| Extra Space Storage, Inc. | 411 | 50 | |||||||||
HCP, Inc. | 1,722 | 60 | |||||||||
| Healthcare Trust of America, Inc. Class A | 1,437 | 41 | |||||||||
| Highwoods Properties, Inc. | 656 | 28 | |||||||||
| Hyatt Hotels Corp. Class A | 416 | 30 | |||||||||
| Liberty Property Trust | 1,162 | 61 | |||||||||
Macerich Co. | 669 | 19 | |||||||||
| National Retail Properties, Inc. | 1,542 | 87 | |||||||||
| Number of Shares | Value (000's) | ||||||||||
Prologis, Inc. | 1,518 | $ | 127 | ||||||||
Public Storage | 423 | 112 | |||||||||
| Regency Centers Corp. | 927 | 60 | |||||||||
| SBA Communications Corp. | 368 | 97 | |||||||||
| Simon Property Group, Inc. | 365 | 54 | |||||||||
| SL Green Realty Corp. | 640 | 51 | |||||||||
| Spirit Realty Capital, Inc. | 1,150 | 55 | |||||||||
Welltower, Inc. | 995 | 89 | |||||||||
Weyerhaeuser Co. | 2,672 | 70 | |||||||||
2,303 | |||||||||||
| Total Common Stocks (Cost $3,628) | 4,175 | ||||||||||
Short-Term Investments 1.6% | |||||||||||
Investment Companies 1.6% | |||||||||||
| State Street Institutional U.S. Government Money Market Fund Premier Class, 2.07%(a) (Cost $67) | 67,038 | 67 | |||||||||
| Total Investments 101.6% (Cost $3,695) | 4,242 | ||||||||||
| Liabilities Less Other Assets (1.6)% | (68 | ) | |||||||||
Net Assets 100.0% | $ | 4,174 | |||||||||
See Notes to Financial Statements
105
Schedule of Investments Global Real Estate Fund^ (cont'd)
* Non-income producing security.
(a) Represents 7-day effective yield as of August 31, 2019.
See Notes to Financial Statements
106
Schedule of Investments Global Real Estate Fund^ (cont'd)
POSITIONS BY SECTOR
Sector | Investments at Value (000's omitted) | Percentage of Net Assets | |||||||||
Specialty REITs | $ | 1,094 | 26.2 | % | |||||||
Industrial & Office REITs | 808 | 19.4 | % | ||||||||
Real Estate Holding & Development | 797 | 19.1 | % | ||||||||
Residential REITs | 779 | 18.7 | % | ||||||||
Retail REITs | 315 | 7.5 | % | ||||||||
Diversified REITs | 234 | 5.6 | % | ||||||||
Hotel & Lodging REITs | 148 | 3.5 | % | ||||||||
Short-Term Investments and Other Liabilities—Net | (1 | ) | (0.0 | )% | |||||||
$ | 4,174 | 100.0 | % | ||||||||
See Notes to Financial Statements
107
Schedule of Investments Global Real Estate Fund^ (cont'd)
The following is a summary, categorized by Level (see Note A of Notes to Financial Statements), of inputs used to value the Fund's investments as of August 31, 2019:
Asset Valuation Inputs | |||||||||||||||||||
(000's omitted) | Level 1 | Level 2 | Level 3 | Total | |||||||||||||||
Investments: | |||||||||||||||||||
| Common Stocks(a) | $ | 4,175 | $ | — | $ | — | $ | 4,175 | |||||||||||
Short-Term Investments | — | 67 | — | 67 | |||||||||||||||
Total Investments | $ | 4,175 | $ | 67 | $ | — | $ | 4,242 | |||||||||||
(a) The Schedule of Investments provides a geographic categorization as well as a Positions by Sector summary.
^ A balance indicated with a "—", reflects either a zero balance or an amount that rounds to less than 1.
See Notes to Financial Statements
108
Schedule of Investments Greater China Equity Fund^ August 31, 2019
| Number of Shares | Value (000's) | ||||||||||
Common Stocks 94.9% | |||||||||||
Air Freight & Logistics 4.9% | |||||||||||
| ZTO Express Cayman, Inc. ADR | 122,227 | $ | 2,507 | ||||||||
Auto Components 0.7% | |||||||||||
| Minth Group Ltd. | 114,000 | 345 | |||||||||
Automobiles 5.6% | |||||||||||
| Brilliance China Automotive Holdings Ltd. | 1,128,000 | 1,198 | |||||||||
| Guangzhou Automobile Group Co. Ltd., H Shares | 1,644,000 | 1,657 | |||||||||
2,855 | |||||||||||
Banks 10.3% | |||||||||||
| China Construction Bank Corp., H Shares | 3,863,000 | 2,867 | |||||||||
| China Merchants Bank Co. Ltd., H Shares | 195,000 | 888 | |||||||||
| Industrial & Commercial Bank of China Ltd., H Shares | 2,415,000 | 1,525 | |||||||||
5,280 | |||||||||||
Beverages 6.6% | |||||||||||
| China Resources Beer Holdings Co. Ltd. | 194,000 | 1,101 | |||||||||
| Kweichow Moutai Co. Ltd. Class A | 14,500 | 2,318 | |||||||||
3,419 | |||||||||||
Commercial Services & Supplies 2.9% | |||||||||||
| China Everbright International Ltd. | 1,909,370 | 1,498 | |||||||||
Construction Materials 5.1% | |||||||||||
| Anhui Conch Cement Co. Ltd. Class A | 328,000 | 1,810 | |||||||||
| China National Building Material Co. Ltd., H Shares | 954,000 | 818 | |||||||||
2,628 | |||||||||||
| Number of Shares | Value (000's) | ||||||||||
Electrical Equipment 0.5% | |||||||||||
| Zhuzhou CRRC Times Electric Co. Ltd., H Shares | 63,400 | $ | 252 | ||||||||
Food Products 3.5% | |||||||||||
| Inner Mongolia Yili Industrial Group Co. Ltd. Class A | 450,400 | 1,806 | |||||||||
Hotels, Restaurants & Leisure 2.6% | |||||||||||
| Huazhu Group Ltd. ADR | 22,814 | 753 | |||||||||
| Yum China Holdings, Inc. | 13,200 | 600 | |||||||||
1,353 | |||||||||||
Household Durables 5.4% | |||||||||||
| Gree Electric Appliances, Inc. of Zhuhai Class A | 97,495 | 757 | |||||||||
| Haier Smart Home Co. Ltd. Class A | 901,800 | 2,008 | |||||||||
2,765 | |||||||||||
Independent Power and Renewable Electricity Producers 0.3% | |||||||||||
| China Everbright Greentech Ltd.(a) | 271,469 | 166 | |||||||||
Insurance 9.8% | |||||||||||
| China Pacific Insurance Group Co. Ltd., H Shares | 418,600 | 1,676 | |||||||||
| China Taiping Insurance Holdings Co. Ltd. | 636,400 | 1,434 | |||||||||
| Ping An Insurance Group Co. of China Ltd., H Shares | 170,500 | 1,955 | |||||||||
5,065 | |||||||||||
Interactive Media & Services 8.4% | |||||||||||
| Tencent Holdings Ltd. | 103,900 | 4,304 | |||||||||
| Internet & Direct Marketing Retail 10.8% | |||||||||||
| Alibaba Group Holding Ltd. ADR* | 28,900 | 5,058 | |||||||||
| Baozun, Inc. ADR* | 10,752 | 492 | |||||||||
5,550 | |||||||||||
| Number of Shares | Value (000's) | ||||||||||
Oil, Gas & Consumable Fuels 2.4% | |||||||||||
| China Petroleum & Chemical Corp., H Shares | 2,068,000 | $ | 1,211 | ||||||||
Pharmaceuticals 5.6% | |||||||||||
| China Medical System Holdings Ltd. | 796,000 | 993 | |||||||||
| CSPC Pharmaceutical Group Ltd. | 936,000 | 1,872 | |||||||||
2,865 | |||||||||||
Real Estate Management & Development 5.7% | |||||||||||
| China Resources Land Ltd. | 484,000 | 1,969 | |||||||||
| Longfor Group Holdings Ltd.(a) | 270,500 | 965 | |||||||||
2,934 | |||||||||||
Textiles, Apparel & Luxury Goods 3.8% | |||||||||||
| Shenzhou International Group Holdings Ltd. | 145,200 | 1,972 | |||||||||
| Total Common Stocks (Cost $51,323) | 48,775 | ||||||||||
Short-Term Investments 0.7% | |||||||||||
Investment Companies 0.7% | |||||||||||
| State Street Institutional U.S. Government Money Market Fund Premier Class, 2.07%(b) (Cost $381) | 381,258 | 381 | |||||||||
| Total Investments 95.6% (Cost $51,704) | 49,156 | ||||||||||
| Other Assets Less Liabilities 4.4% | 2,259 | ||||||||||
Net Assets 100.0% | $ | 51,415 | |||||||||
See Notes to Financial Statements
109
Schedule of Investments Greater China Equity Fund^ (cont'd)
* Non-income producing security.
(a) Security exempt from registration pursuant to Regulation S under the Securities Act of 1933, as amended. Regulation S applies to securities offerings that are made outside of the United States and do not involve directed selling efforts in the United States and as such may have restrictions on resale. Total value of all such securities at August 31, 2019 amounted to approximately $1,131,000, which represents 2.2% of net assets of the Fund.
(b) Represents 7-day effective yield as of August 31, 2019.
The following is a summary, categorized by Level (see Note A of Notes to Financial Statements), of inputs used to value the Fund's investments as of August 31, 2019:
Asset Valuation Inputs | |||||||||||||||||||
(000's omitted) | Level 1 | Level 2 | Level 3 | Total | |||||||||||||||
Investments: | |||||||||||||||||||
| Common Stocks(a) | $ | 48,775 | $ | — | $ | — | $ | 48,775 | |||||||||||
Short-Term Investments | — | 381 | — | 381 | |||||||||||||||
Total Investments | $ | 48,775 | $ | 381 | $ | — | $ | 49,156 | |||||||||||
(a) The Schedule of Investments provides information on the industry categorization for the portfolio.
^ A balance indicated with a "—", reflects either a zero balance or an amount that rounds to less than 1.
See Notes to Financial Statements
110
Schedule of Investments Guardian Fund^ August 31, 2019
| Number of Shares | Value (000's) | ||||||||||
Common Stocks 95.3% | |||||||||||
Aerospace & Defense 3.2% | |||||||||||
Boeing Co. | 43,820 | $ | 15,954 | ||||||||
| General Dynamics Corp. | 100,600 | 19,242 | |||||||||
Raytheon Co. | 28,595 | 5,299 | |||||||||
40,495 | |||||||||||
Airlines 2.0% | |||||||||||
| Delta Air Lines, Inc.(a) | 438,540 | 25,374 | |||||||||
Biotechnology 2.1% | |||||||||||
| Gilead Sciences, Inc. | 305,020 | 19,381 | |||||||||
| Moderna, Inc.*(b) | 434,549 | 6,835 | |||||||||
26,216 | |||||||||||
Capital Markets 10.2% | |||||||||||
BlackRock, Inc. | 47,585 | 20,107 | |||||||||
| Blackstone Group, Inc. Class A | 604,420 | 30,076 | |||||||||
| Brookfield Asset Management, Inc. Class A(b) | 680,175 | 35,104 | |||||||||
CME Group, Inc. | 99,940 | 21,716 | |||||||||
S&P Global, Inc. | 64,070 | 16,670 | |||||||||
| Tradeweb Markets, Inc. Class A | 118,590 | 5,051 | |||||||||
128,724 | |||||||||||
Chemicals 2.4% | |||||||||||
| Ashland Global Holdings, Inc. | 418,220 | 30,630 | |||||||||
Commercial Services 1.7% | |||||||||||
| LegalZoom.com, Inc.*(c)(d)(k) | 2,176,736 | 21,438 | |||||||||
Diversified Consumer Services 0.5% | |||||||||||
| OneSpaWorld Holdings Ltd.* | 399,680 | 6,275 | |||||||||
Electric Utilities 1.5% | |||||||||||
| NextEra Energy, Inc. | 87,345 | 19,136 | |||||||||
Electronic Equipment, Instruments & Components 2.4% | |||||||||||
CDW Corp. | 259,340 | 29,954 | |||||||||
Entertainment 4.2% | |||||||||||
| Activision Blizzard, Inc. | 557,675 | 28,219 | |||||||||
| Spotify Technology SA* | 181,950 | 24,554 | |||||||||
52,773 | |||||||||||
| Number of Shares | Value (000's) | ||||||||||
Food & Staples Retailing 1.8% | |||||||||||
| Costco Wholesale Corp. | 64,655 | $ | 19,058 | ||||||||
Walmart, Inc. | 30,000 | 3,428 | |||||||||
22,486 | |||||||||||
Food Products 1.5% | |||||||||||
| Conagra Brands, Inc.(a) | 650,980 | 18,462 | |||||||||
Health Care Equipment & Supplies 2.7% | |||||||||||
| Baxter International, Inc. | 129,445 | 11,385 | |||||||||
Medtronic PLC | 210,385 | 22,698 | |||||||||
34,083 | |||||||||||
Health Care Providers & Services 3.9% | |||||||||||
| CVS Health Corp. | 223,295 | 13,603 | |||||||||
Humana, Inc. | 64,940 | 18,392 | |||||||||
| UnitedHealth Group, Inc. | 73,040 | 17,091 | |||||||||
49,086 | |||||||||||
Holding Companies—Diversified 0.2% | |||||||||||
| Act II Global Acquisition Corp.*(e) | 288,800 | 2,943 | |||||||||
Hotels, Restaurants & Leisure 3.2% | |||||||||||
| Domino's Pizza, Inc. | 20,675 | 4,690 | |||||||||
| McDonald's Corp. | 160,500 | 34,984 | |||||||||
39,674 | |||||||||||
Interactive Media & Services 8.6% | |||||||||||
| Alphabet, Inc. Class A* | 55,370 | 65,920 | |||||||||
| Facebook, Inc. Class A* | 227,065 | 42,159 | |||||||||
108,079 | |||||||||||
Internet & Direct Marketing Retail 7.1% | |||||||||||
| Alibaba Group Holding Ltd. ADR* | 34,840 | 6,098 | |||||||||
| Amazon.com, Inc* | 27,685 | 49,177 | |||||||||
| Booking Holdings, Inc.* | 14,610 | 28,729 | |||||||||
| Chewy, Inc. Class A*(b) | 180,000 | 5,940 | |||||||||
89,944 | |||||||||||
| Number of Shares | Value (000's) | ||||||||||
IT Services 5.2% | |||||||||||
| Druva Technologies Pte. Ltd. Ser.4 Preference Shares*(c)(d)(k) | 287,787 | $ | 1,500 | ||||||||
| PayPal Holdings, Inc.* | 47,150 | 5,142 | |||||||||
| Repay Pipe*(c)(k) | 1,510,680 | 18,355 | |||||||||
| Visa, Inc. Class A(a) | 222,200 | 40,178 | |||||||||
65,175 | |||||||||||
Life Sciences Tools & Services 0.8% | |||||||||||
| Thermo Fisher Scientific, Inc. | 35,920 | 10,311 | |||||||||
Machinery 0.3% | |||||||||||
| Gates Industrial Corp. PLC* | 377,660 | 3,286 | |||||||||
Multi-Utilities 1.7% | |||||||||||
| Brookfield Infrastructure Partners LP | 464,410 | 21,827 | |||||||||
Oil, Gas & Consumable Fuels 1.6% | |||||||||||
Enbridge, Inc. | 538,625 | 18,022 | |||||||||
| Venture Global LNG, Inc. Ser. C*(c)(d)(k) | 329 | 2,303 | |||||||||
20,325 | |||||||||||
Professional Services 6.4% | |||||||||||
Equifax, Inc. | 205,840 | 30,131 | |||||||||
IHS Markit Ltd.* | 632,955 | 41,528 | |||||||||
| Verisk Analytics, Inc. | 55,530 | 8,970 | |||||||||
80,629 | |||||||||||
Road & Rail 0.6% | |||||||||||
| CSX Corp.(a) | 121,135 | 8,118 | |||||||||
Software 8.1% | |||||||||||
Elastic NV* | 97,020 | 8,527 | |||||||||
Microsoft Corp. | 484,000 | 66,724 | |||||||||
| salesforce.com, Inc.* | 174,720 | 27,269 | |||||||||
102,520 | |||||||||||
Specialty Retail 4.4% | |||||||||||
Home Depot, Inc. | 68,570 | 15,628 | |||||||||
| Hudson Ltd. Class A* | 416,650 | 4,520 | |||||||||
Lowe's Cos., Inc. | 276,000 | 30,967 | |||||||||
| Tractor Supply Co.(a) | 44,000 | 4,483 | |||||||||
55,598 | |||||||||||
Technology Hardware, Storage & Peripherals 3.1% | |||||||||||
Apple, Inc. | 184,735 | 38,562 | |||||||||
See Notes to Financial Statements
111
Schedule of Investments Guardian Fund^ (cont'd)
| Number of Shares | Value (000's) | ||||||||||
Textiles, Apparel & Luxury Goods 2.2% | |||||||||||
NIKE, Inc. Class B | 260,000 | $ | 21,970 | ||||||||
| PVH Corp.(a) | 79,250 | 6,007 | |||||||||
27,977 | |||||||||||
Trading Companies & Distributors 1.7% | |||||||||||
| HD Supply Holdings, Inc.* | 549,000 | 21,362 | |||||||||
| Total Common Stocks (Cost $897,593) | 1,201,462 | ||||||||||
Preferred Stocks 0.6% | |||||||||||
Food Products 0.6% | |||||||||||
| Sweetgreen, Inc. Ser. D*(c)(d)(k) (Cost $7,520) | 626,667 | 7,520 | |||||||||
Warrants 0.1% | |||||||||||
IT Services 0.1% | |||||||||||
| Repay Pipe Expires 1/1/2025* (Cost $—) | 1,510,680 | 1,163 | |||||||||
| Total Options Purchased(f) 0.1% (Cost $1,452) | 1,777 | ||||||||||
| Number of Shares | Value (000's) | ||||||||||
Short-Term Investments 7.5% | |||||||||||
Investment Companies 7.5% | |||||||||||
| State Street Institutional Treasury Money Market Fund Premier Class, 2.03%(g)(h) | 51,395,971 | $ | 51,396 | ||||||||
| State Street Navigator Securities Lending Government Money Market Portfolio, 2.12%(g)(i) | 43,104,368 | 43,104 | |||||||||
| Total Short-Term Investments (Cost $94,500) | 94,500 | ||||||||||
| Total Investments 103.6% (Cost $1,001,065) | 1,306,422 | ||||||||||
| Liabilities Less Other Assets(j) (3.6)% | (45,016 | ) | |||||||||
Net Assets 100.0% | $ | 1,261,406 | |||||||||
* Non-income producing security.
(a) All or a portion of the security is pledged as collateral for options written.
(b) The security or a portion of this security is on loan at August 31, 2019. Total value of all such securities at August 31, 2019 amounted to approximately $42,609,000 for the Fund (see Note A of the Notes to Financial Statements).
(c) Security fair valued as of August 31, 2019 in accordance with procedures approved by the Board of Trustees. Total value of all such securities at August 31, 2019 amounted to approximately $51,116,000, which represents 4.1% of net assets of the Fund.
(d) Value determined using significant unobservable inputs.
(e) Illiquid security.
(f) See "Purchased option contracts" under Derivative Instruments.
(g) Represents 7-day effective yield as of August 31, 2019.
(h) All or a portion of this security is segregated in connection with obligations for options written with a total value of approximately $51,396,000.
(i) Represents investment of cash collateral received from securities lending.
(j) Includes the impact of the Fund's open positions in derivatives at August 31, 2019.
See Notes to Financial Statements
112
Schedule of Investments Guardian Fund^ (cont'd)
(k) These securities have been deemed by the investment manager to be illiquid, and are subject to restrictions on resale.
At August 31, 2019, these securities amounted to approximately $51,116,000, which represents 4.1% of net assets of the Fund.
| (000's omitted) Restricted Security | Acquisition Date | Acquisition Cost | Acquisition Cost Percentage of Net Assets | Value as of 8/31/2019 | Fair Value Percentage of Net Assets as of 8/31/2019 | ||||||||||||||||||
Druva Technologies Pte. Ltd. | 6/14/2019 | $ | 1,500 | 0.1 | % | $ | 1,500 | 0.1 | % | ||||||||||||||
LegalZoom.com, Inc. | 8/22/2018 | 21,438 | 1.7 | % | 21,438 | 1.7 | % | ||||||||||||||||
Repay Pipe | 7/10/2019 | 15,107 | 1.2 | % | 18,355 | 1.5 | % | ||||||||||||||||
Sweetgreen, Inc. (Ser. D Preferred Shares) | 11/30/2018 | 7,520 | 0.6 | % | 7,520 | 0.6 | % | ||||||||||||||||
Venture Global LNG, Inc. | 11/21/2018 | 2,303 | 0.2 | % | 2,303 | 0.2 | % | ||||||||||||||||
Total | $ | 47,868 | 3.8 | % | $ | 51,116 | 4.1 | % | |||||||||||||||
Derivative Instruments
Purchased option contracts ("options purchased")
At August 31, 2019, the Fund had outstanding options purchased as follows:
Description | Number of Contracts | Notional Amount | Exercise Price | Expiration Date | Value | ||||||||||||||||||
Calls | |||||||||||||||||||||||
Capital Markets | |||||||||||||||||||||||
Blackstone Group, Inc. | 457 | $ | 2,274,032 | $ | 47 | 9/20/2019 | $ | 143,955 | |||||||||||||||
Chemicals | |||||||||||||||||||||||
Ashland Global Holdings, Inc. | 1,096 | 8,027,104 | 75 | 10/18/2019 | 230,160 | ||||||||||||||||||
Health Care Providers & Services | |||||||||||||||||||||||
CVS Health Corp. | 650 | 3,959,800 | 60 | 2/21/2020 | 310,375 | ||||||||||||||||||
Machinery | |||||||||||||||||||||||
Deere & Co. | 360 | 5,576,760 | 170 | 1/17/2020 | 173,700 | ||||||||||||||||||
Professional Services | |||||||||||||||||||||||
Equifax, Inc. | 366 | 5,357,508 | 130 | 10/18/2019 | 649,650 | ||||||||||||||||||
Road & Rail | |||||||||||||||||||||||
CSX Corp. | 424 | 2,841,648 | 72.5 | 1/17/2020 | 90,948 | ||||||||||||||||||
Textiles, Apparel & Luxury Goods | |||||||||||||||||||||||
PVH Corp. | 295 | 2,236,100 | 110 | 9/20/2019 | — | (a)(b) | |||||||||||||||||
Total calls | $ | 1,598,788 | |||||||||||||||||||||
Puts | |||||||||||||||||||||||
Trading Companies & Distributors | |||||||||||||||||||||||
HD Supply Holdings, Inc. | 2,095 | $ | 8,151,645 | $ | 37.5 | 9/20/2019 | $ | 178,075 | |||||||||||||||
Total puts | $ | 178,075 | |||||||||||||||||||||
Total options purchased (cost $1,452,245) | $ | 1,776,863 | |||||||||||||||||||||
(a) Security fair valued as of August 31, 2019 in accordance with procedures approved by the Board of Trustees.
(b) Value determined using significant unobservable inputs.
See Notes to Financial Statements
113
Schedule of Investments Guardian Fund^ (cont'd)
Written option contracts ("options written")
At August 31, 2019, the Fund had outstanding options written as follows:
Description | Number of Contracts | Notional Amount | Exercise Price | Expiration Date | Value | ||||||||||||||||||
Calls | |||||||||||||||||||||||
Trading Companies & Distributors | |||||||||||||||||||||||
HD Supply Holdings, Inc. | 2,095 | $ | (8,151,645 | ) | $ | 42.5 | 3/20/2020 | $ | (398,050 | ) | |||||||||||||
Total calls | $ | (398,050 | ) | ||||||||||||||||||||
Puts | |||||||||||||||||||||||
Chemicals | |||||||||||||||||||||||
Ashland Global Holdings, Inc. | 1,096 | $ | (8,027,104 | ) | $ | 65 | 1/17/2020 | $ | (178,100 | ) | |||||||||||||
Ashland Global Holdings, Inc. | 457 | (3,347,068 | ) | 75 | 1/17/2020 | (251,350 | ) | ||||||||||||||||
(429,450 | ) | ||||||||||||||||||||||
Machinery | |||||||||||||||||||||||
Deere & Co. | 360 | (5,576,760 | ) | 135 | 3/20/2020 | (220,500 | ) | ||||||||||||||||
Specialty Retail | |||||||||||||||||||||||
Party City Holdco, Inc. | 5,200 | (2,444,000 | ) | 7.5 | 10/18/2019 | (1,482,000 | ) | ||||||||||||||||
Textiles, Apparel & Luxury Goods | |||||||||||||||||||||||
PVH Corp. | 745 | (5,647,100 | ) | 55 | 1/17/2020 | (80,088 | ) | ||||||||||||||||
Total puts | $ | (2,212,038 | ) | ||||||||||||||||||||
| Total options written (premium received $1,492,274) | $ | (2,610,088 | ) | ||||||||||||||||||||
For the year ended August 31, 2019, the Fund had an average market value of $1,120,835 in options purchased and $(1,825,674) in options written. At August 31, 2019, the Fund had securities pledged in the amount of $28,638,341 to cover collateral requirements for options written.
The following is a summary, categorized by Level (see Note A of Notes to Financial Statements), of inputs used to value the Fund's investments as of August 31, 2019:
Asset Valuation Inputs | |||||||||||||||||||
(000's omitted) | Level 1 | Level 2 | Level 3(c) | Total | |||||||||||||||
Investments: | |||||||||||||||||||
Common Stocks | |||||||||||||||||||
Commercial Services | $ | — | $ | — | $ | 21,438 | $ | 21,438 | |||||||||||
IT Services | 45,320 | 18,355 | 1,500 | 65,175 | |||||||||||||||
Oil, Gas & Consumable Fuels | 18,022 | — | 2,303 | 20,325 | |||||||||||||||
| Other Common Stocks(a) | 1,094,524 | — | — | 1,094,524 | |||||||||||||||
Total Common Stocks | 1,157,866 | 18,355 | 25,241 | 1,201,462 | |||||||||||||||
| Preferred Stocks(a) | — | — | 7,520 | 7,520 | |||||||||||||||
| Warrants(a) | 1,163 | — | — | 1,163 | |||||||||||||||
| Options Purchased(b) | 1,777 | — | — | 1,777 | |||||||||||||||
Short-Term Investments | — | 94,500 | — | 94,500 | |||||||||||||||
Total Investments | $ | 1,160,806 | $ | 112,855 | $ | 32,761 | $ | 1,306,422 | |||||||||||
See Notes to Financial Statements
114
Schedule of Investments Guardian Fund^ (cont'd)
(a) The Schedule of Investments provides information on the industry categorization for the portfolio.
(b) The "Purchased option contracts" table under Derivative Instruments provides information on the industry or sector categorization for the portfolio.
(c) The following is a reconciliation between the beginning and ending balances of investments in which unobservable inputs (Level 3) were used in determining value:
| Beginning balance, as of 9/1/2018 | Accrued discounts/ (premiums) | Realized gain/ (loss) | Change in unrealized appreciation/ (depreciation) | Purchases | Sales | Transfers into Level 3 | Transfers out of Level 3 | Balance, as of 8/31/2019 | Net change in unrealized appreciation/ (depreciation) from investments still held as of 8/31/2019 | ||||||||||||||||||||||||||||||||||
| Investments in Securities: (000's omitted) | |||||||||||||||||||||||||||||||||||||||||||
| Common Stocks | |||||||||||||||||||||||||||||||||||||||||||
| Commercial Services | $ | 22,812 | $ | — | $ | — | $ | (1,374 | ) | $ | — | $ | — | $ | — | $ | — | $ | 21,438 | $ | — | ||||||||||||||||||||||
IT Services | — | — | — | — | 1,500 | — | — | — | 1,500 | — | |||||||||||||||||||||||||||||||||
| Oil, Gas & Consumable Fuels | — | — | — | — | 2,303 | — | — | — | 2,303 | — | |||||||||||||||||||||||||||||||||
| Preferred Stocks | |||||||||||||||||||||||||||||||||||||||||||
| Food Products | — | — | — | — | 7,520 | — | — | — | 7,520 | — | |||||||||||||||||||||||||||||||||
| Health Care | 10,698 | — | — | (1,268 | ) | — | (9,430 | ) | — | — | — | — | |||||||||||||||||||||||||||||||
Total | $ | 33,510 | $ | — | $ | — | $ | (2,642 | ) | $ | 11,323 | $ | (9,430 | ) | $ | — | $ | — | $ | 32,761 | $ | — | |||||||||||||||||||||
The following table presents additional information about the valuation approach and inputs used for investments that are measured at fair value and categorized within Level 3 as of August 31, 2019.
| Asset class | Fair value at 8/31/2019 | Valuation approach | Unobservable input | Amount or range per unit | Input value per unit | Impact to valuation from Increase in input(a) | |||||||||||||||||||||
| Common Stocks | $ | 1,500,003 | Market Approach | Transaction Price | $ | 5.21 | $ | 5.21 | Increase | ||||||||||||||||||
| Common Stocks | 2,303,000 | Market Approach | Transaction Price | 7,000.00 | 7,000.00 | Increase | |||||||||||||||||||||
| Common Stocks | 21,437,585 | Market Approach | Adjusted Transaction Price | 9.85 | 9.85 | Increase | |||||||||||||||||||||
| Preferred Stocks | 7,520,004 | Market Approach | Transaction Price | 12.00 | 12.00 | Increase | |||||||||||||||||||||
See Notes to Financial Statements
115
Schedule of Investments Guardian Fund^ (cont'd)
(a) Represents the expected directional change in the fair value of the Level 3 investments that would result from an increase in the corresponding input. A decrease to the unobservable input would have the opposite effect. Significant changes in these inputs could result in significantly higher or lower fair value measurements.
The following is a summary, categorized by Level (see Note A of Notes to Financial Statements), of inputs used to value the Fund's derivatives as of August 31, 2019:
Other Financial Instruments | |||||||||||||||||||
(000's omitted) | Level 1 | Level 2 | Level 3(a) | Total | |||||||||||||||
Options Written | |||||||||||||||||||
Liabilities | $ | (2,610 | ) | $ | — | $ | — | $ | (2,610 | ) | |||||||||
Total | $ | (2,610 | ) | $ | — | $ | — | $ | (2,610 | ) | |||||||||
(a) The following is reconciliation between the beginning and ending balances of investments in which unobservable inputs (Level 3) were used in determining value:
| Beginning balance, as of 9/1/2018 | Accrued discounts/ (premiums) | Realized gain/ (loss) | Change in unrealized appreciation/ (depreciation) | Purchases | Sales | Transfers into Level 3 | Transfers out of Level 3 | Balance, as of 8/31/2019 | Net change in unrealized appreciation/ (depreciation) from investments still held as of 8/31/2019 | ||||||||||||||||||||||||||||||||||
| Other Financial Instruments: (000's omitted) | |||||||||||||||||||||||||||||||||||||||||||
| Options Written(b) | |||||||||||||||||||||||||||||||||||||||||||
Food Products | $ | — | $ | — | $ | 56 | $ | (56 | ) | $ | — | $ | — | $ | — | $ | — | $ | — | $ | — | ||||||||||||||||||||||
Total | $ | — | $ | — | $ | 56 | $ | (56 | ) | $ | — | $ | — | $ | — | $ | — | $ | — | $ | — | ||||||||||||||||||||||
(b) At the beginning of the year, these investments were valued in accordance with the procedures approved by the Board of Trustees. The Fund held no Level 3 investments at August 31, 2019.
^ A balance indicated with a "—", reflects either a zero balance or an amount that rounds to less than 1.
See Notes to Financial Statements
116
Schedule of Investments International Equity Fund^ August 31, 2019
| Number of Shares | Value (000's) | ||||||||||
Common Stocks 99.5% | |||||||||||
Australia 0.7% | |||||||||||
| Insurance Australia Group Ltd. | 2,320,960 | $ | 12,598 | ||||||||
Austria 1.2% | |||||||||||
| BAWAG Group AG*(a) | 550,987 | 20,904 | |||||||||
Belgium 1.2% | |||||||||||
KBC Group NV | 371,630 | 21,500 | |||||||||
Canada 3.5% | |||||||||||
| Alimentation Couche-Tard, Inc. Class B | 368,503 | 23,194 | |||||||||
Kinaxis, Inc.* | 391,093 | 22,783 | |||||||||
| Suncor Energy, Inc. | 583,923 | 17,078 | |||||||||
63,055 | |||||||||||
China 1.9% | |||||||||||
| Alibaba Group Holding Ltd. ADR* | 196,469 | 34,388 | |||||||||
Finland 0.7% | |||||||||||
Huhtamaki OYJ | 334,225 | 12,901 | |||||||||
France 4.8% | |||||||||||
Air Liquide SA | 89,503 | 12,458 | |||||||||
Arkema SA | 110,285 | 9,667 | |||||||||
Pernod-Ricard SA | 212,408 | 40,550 | |||||||||
TOTAL SA | 457,481 | 22,822 | |||||||||
85,497 | |||||||||||
Germany 10.4% | |||||||||||
Brenntag AG | 443,308 | 21,355 | |||||||||
Continental AG | 114,854 | 13,855 | |||||||||
| CTS Eventim AG & Co. KGaA | 555,020 | 30,378 | |||||||||
| Deutsche Boerse AG | 88,352 | 12,987 | |||||||||
Gerresheimer AG | 354,540 | 26,750 | |||||||||
| Infineon Technologies AG | 1,370,380 | 23,718 | |||||||||
SAP SE ADR | 270,054 | 32,177 | |||||||||
| Scout24 AG*(a) | 319,914 | 18,916 | |||||||||
Stabilus SA | 132,155 | 5,935 | |||||||||
186,071 | |||||||||||
Hong Kong 3.5% | |||||||||||
AIA Group Ltd. | 1,761,600 | 17,132 | |||||||||
HKBN Ltd. | 6,139,300 | 11,009 | |||||||||
| Techtronic Industries Co. Ltd. | 4,913,800 | 33,969 | |||||||||
62,110 | |||||||||||
| Number of Shares | Value (000's) | ||||||||||
Ireland 3.2% | |||||||||||
CRH PLC | 700,372 | $ | 23,325 | ||||||||
| Kerry Group PLC Class A | 277,465 | 33,026 | |||||||||
56,351 | |||||||||||
Israel 1.3% | |||||||||||
| Check Point Software Technologies Ltd.* | 215,146 | 23,171 | |||||||||
Italy 0.7% | |||||||||||
| Nexi SpA*(a) | 1,223,715 | 13,331 | |||||||||
Japan 16.3% | |||||||||||
Bridgestone Corp. | 687,200 | 26,218 | |||||||||
| Daikin Industries Ltd. | 236,400 | 29,273 | |||||||||
Hoya Corp. | 272,300 | 22,169 | |||||||||
Ichigo, Inc. | 7,693,200 | 30,994 | |||||||||
Kao Corp. | 181,800 | 13,133 | |||||||||
Keyence Corp. | 30,400 | 17,999 | |||||||||
Kose Corp. | 171,300 | 29,427 | |||||||||
| Persol Holdings Co. Ltd. | 484,000 | 9,827 | |||||||||
| Sanwa Holdings Corp. | 1,954,800 | 21,750 | |||||||||
| Shionogi & Co. Ltd. | 396,000 | 21,229 | |||||||||
SMC Corp. | 41,900 | 15,832 | |||||||||
| TechnoPro Holdings, Inc. | 238,700 | 13,863 | |||||||||
Terumo Corp. | 473,400 | 13,756 | |||||||||
| Toyota Motor Corp. | 383,700 | 25,138 | |||||||||
290,608 | |||||||||||
Luxembourg 0.8% | |||||||||||
| Befesa SA(a) | 442,689 | 15,083 | |||||||||
Mexico 0.7% | |||||||||||
| Infraestructura Energetica Nova SAB de CV* | 2,985,750 | 12,586 | |||||||||
Netherlands 8.2% | |||||||||||
| AerCap Holdings NV* | 612,964 | 32,867 | |||||||||
| ASML Holding NV | 223,098 | 49,591 | |||||||||
Heineken NV | 302,123 | 32,129 | |||||||||
| Intertrust NV(a) | 708,085 | 14,685 | |||||||||
| NXP Semiconductors NV | 166,570 | 17,013 | |||||||||
146,285 | |||||||||||
Norway 0.7% | |||||||||||
| Sbanken ASA(a)(b) | 1,817,945 | 12,569 | |||||||||
| Number of Shares | Value (000's) | ||||||||||
Portugal 1.0% | |||||||||||
| Galp Energia SGPS SA | 1,190,560 | $ | 17,089 | ||||||||
Singapore 1.2% | |||||||||||
| DBS Group Holdings Ltd. | 1,200,500 | 21,220 | |||||||||
Sweden 0.8% | |||||||||||
| Assa Abloy AB Class B | 665,992 | 13,904 | |||||||||
Switzerland 14.2% | |||||||||||
Alcon, Inc.* | 37,479 | 2,283 | |||||||||
| Cie Financiere Richemont SA | 171,559 | 13,312 | |||||||||
Givaudan SA | 5,259 | 14,219 | |||||||||
| Julius Baer Group Ltd.* | 466,879 | 18,458 | |||||||||
Lonza Group AG* | 49,393 | 17,457 | |||||||||
Novartis AG | 304,407 | 27,376 | |||||||||
| Partners Group Holding AG | 31,628 | 25,647 | |||||||||
| Roche Holding AG | 103,967 | 28,425 | |||||||||
SGS SA | 7,203 | 17,685 | |||||||||
| SIG Combibloc Group AG* | 1,403,196 | 18,516 | |||||||||
| Sonova Holding AG | 133,355 | 30,949 | |||||||||
Tecan Group AG | 97,246 | 23,345 | |||||||||
UBS Group AG* | 1,441,864 | 15,223 | |||||||||
252,895 | |||||||||||
United Kingdom 18.1% | |||||||||||
Aon PLC | 158,246 | 30,834 | |||||||||
| Biffa PLC(a) | 2,510,726 | 6,067 | |||||||||
Bunzl PLC | 1,236,268 | 30,281 | |||||||||
| Clinigen Group PLC | 1,779,993 | 19,168 | |||||||||
| Compass Group PLC | 1,449,886 | 36,749 | |||||||||
DCC PLC | 240,369 | 20,427 | |||||||||
| Electrocom- ponents PLC | 1,875,896 | 13,262 | |||||||||
| Fevertree Drinks PLC | 570,662 | 15,693 | |||||||||
| London Stock Exchange Group PLC | 284,873 | 24,105 | |||||||||
Prudential PLC | 1,354,793 | 22,552 | |||||||||
| Reckitt Benckiser Group PLC | 293,711 | 22,869 | |||||||||
RELX PLC | 1,122,162 | 26,852 | |||||||||
| Rentokil Initial PLC | 3,315,320 | 18,161 | |||||||||
Spectris PLC | 383,309 | 10,779 | |||||||||
| St. James's Place PLC | 1,670,513 | 18,656 | |||||||||
| Trainline PLC*(a) | 1,037,484 | 6,003 | |||||||||
322,458 | |||||||||||
See Notes to Financial Statements
117
Schedule of Investments International Equity Fund^ (cont'd)
| Number of Shares | Value (000's) | ||||||||||
United States 4.4% | |||||||||||
| Core Laboratories NV | 54,033 | $ | 2,139 | ||||||||
Ferguson PLC | 398,604 | 29,315 | |||||||||
| Samsonite International SA(a) | 11,287,048 | 21,335 | |||||||||
| Sensata Technologies Holding PLC* | 565,443 | 25,773 | |||||||||
78,562 | |||||||||||
| Total Common Stocks (Cost $1,690,118) | 1,775,136 | ||||||||||
| Number of Shares | Value (000's) | ||||||||||
Short-Term Investments 0.2% | |||||||||||
Investment Companies 0.2% | |||||||||||
| State Street Institutional Treasury Money Market Fund Premier Class, 2.03%(c) (Cost $4,506) | 4,506,033 | $ | 4,506 | ||||||||
| Total Investments 99.7% (Cost $1,694,624) | 1,779,642 | ||||||||||
| Other Assets Less Liabilities 0.3% | 4,774 | ||||||||||
Net Assets 100.0% | $ | 1,784,416 | |||||||||
* Non-income producing security.
(a) Security exempt from registration pursuant to Regulation S under the Securities Act of 1933, as amended. Regulation S applies to securities offerings that are made outside of the United States and do not involve directed selling efforts in the United States and as such may have restrictions on resale. Total value of all such securities at August 31, 2019 amounted to approximately $128,893,000, which represents 7.2% of net assets of the Fund.
(b) Illiquid security.
(c) Represents 7-day effective yield as of August 31, 2019.
See Notes to Financial Statements
118
Schedule of Investments International Equity Fund^ (cont'd)
POSITIONS BY INDUSTRY
Industry | Investments at Value (000's omitted) | Percentage of Net Assets | |||||||||
Capital Markets | $ | 115,076 | 6.4 | % | |||||||
Trading Companies & Distributors | 113,818 | 6.4 | % | ||||||||
Semiconductors & Semiconductor Equipment | 90,322 | 5.1 | % | ||||||||
Beverages | 88,372 | 5.0 | % | ||||||||
Life Sciences Tools & Services | 86,720 | 4.9 | % | ||||||||
Insurance | 83,116 | 4.7 | % | ||||||||
Professional Services | 82,912 | 4.6 | % | ||||||||
Software | 78,131 | 4.4 | % | ||||||||
Pharmaceuticals | 77,030 | 4.3 | % | ||||||||
Banks | 76,193 | 4.3 | % | ||||||||
Health Care Equipment & Supplies | 69,157 | 3.9 | % | ||||||||
Building Products | 64,927 | 3.6 | % | ||||||||
Oil, Gas & Consumable Fuels | 56,989 | 3.2 | % | ||||||||
Machinery | 55,736 | 3.1 | % | ||||||||
Personal Products | 42,560 | 2.4 | % | ||||||||
Electronic Equipment, Instruments & Components | 42,040 | 2.4 | % | ||||||||
Internet & Direct Marketing Retail | 40,391 | 2.3 | % | ||||||||
Auto Components | 40,073 | 2.2 | % | ||||||||
Commercial Services & Supplies | 39,311 | 2.2 | % | ||||||||
Hotels, Restaurants & Leisure | 36,749 | 2.1 | % | ||||||||
Chemicals | 36,344 | 2.0 | % | ||||||||
Textiles, Apparel & Luxury Goods | 34,647 | 1.9 | % | ||||||||
Food Products | 33,026 | 1.9 | % | ||||||||
Containers & Packaging | 31,417 | 1.8 | % | ||||||||
Real Estate Management & Development | 30,994 | 1.7 | % | ||||||||
Entertainment | 30,378 | 1.7 | % | ||||||||
Electrical Equipment | 25,773 | 1.4 | % | ||||||||
Automobiles | 25,138 | 1.4 | % | ||||||||
Construction Materials | 23,325 | 1.3 | % | ||||||||
Food & Staples Retailing | 23,194 | 1.3 | % | ||||||||
Household Products | 22,869 | 1.3 | % | ||||||||
Industrial Conglomerates | 20,427 | 1.1 | % | ||||||||
Interactive Media & Services | 18,916 | 1.1 | % | ||||||||
IT Services | 13,331 | 0.7 | % | ||||||||
Gas Utilities | 12,586 | 0.7 | % | ||||||||
Diversified Telecommunication Services | 11,009 | 0.6 | % | ||||||||
Energy Equipment & Services | 2,139 | 0.1 | % | ||||||||
Short-Term Investments and Other Assets—Net | 9,280 | 0.5 | % | ||||||||
$ | 1,784,416 | 100.0 | % | ||||||||
See Notes to Financial Statements
119
Schedule of Investments International Equity Fund^ (cont'd)
The following is a summary, categorized by Level (see Note A of Notes to Financial Statements), of inputs used to value the Fund's investments as of August 31, 2019:
Asset Valuation Inputs | |||||||||||||||||||
(000's omitted) | Level 1 | Level 2 | Level 3 | Total | |||||||||||||||
Investments: | |||||||||||||||||||
| Common Stocks(a) | $ | 1,775,136 | $ | — | $ | — | $ | 1,775,136 | |||||||||||
Short-Term Investments | — | 4,506 | — | 4,506 | |||||||||||||||
Total Investments | $ | 1,775,136 | $ | 4,506 | $ | — | $ | 1,779,642 | |||||||||||
(a) The Schedule of Investments provides a geographic categorization as well as a Positions by Industry summary.
^ A balance indicated with a "—", reflects either a zero balance or an amount that rounds to less than 1.
See Notes to Financial Statements
120
Schedule of Investments International Select Fund^ August 31, 2019
Number of Shares | Value (000's) | ||||||||||
Common Stocks 96.8% | |||||||||||
Australia 0.7% | |||||||||||
| Insurance Australia Group Ltd. | 230,124 | $ | 1,249 | ||||||||
Austria 1.3% | |||||||||||
| BAWAG Group AG*(a) | 56,700 | 2,151 | |||||||||
Belgium 1.2% | |||||||||||
KBC Group NV | 34,610 | 2,002 | |||||||||
Canada 2.4% | |||||||||||
| Alimentation Couche-Tard, Inc. Class B | 34,784 | 2,189 | |||||||||
| Suncor Energy, Inc. | 65,434 | 1,914 | |||||||||
4,103 | |||||||||||
China 2.3% | |||||||||||
| Alibaba Group Holding Ltd. ADR* | 22,489 | 3,936 | |||||||||
France 6.9% | |||||||||||
Air Liquide SA | 10,403 | 1,448 | |||||||||
Arkema SA | 11,166 | 979 | |||||||||
L'Oreal SA | 6,590 | 1,801 | |||||||||
| Pernod-Ricard SA | 16,246 | 3,101 | |||||||||
| Schneider Electric SE | 16,507 | 1,382 | |||||||||
TOTAL SA | 58,330 | 2,910 | |||||||||
11,621 | |||||||||||
Germany 10.6% | |||||||||||
Brenntag AG | 41,163 | 1,983 | |||||||||
Continental AG | 10,827 | 1,306 | |||||||||
| CTS Eventim AG & Co. KGaA | 51,217 | 2,803 | |||||||||
| Deutsche Boerse AG | 11,375 | 1,672 | |||||||||
| Gerresheimer AG | 39,147 | 2,954 | |||||||||
| Infineon Technologies AG | 129,375 | 2,239 | |||||||||
SAP SE ADR | 27,614 | 3,290 | |||||||||
| Scout24 AG*(a) | 29,687 | 1,756 | |||||||||
18,003 | |||||||||||
Hong Kong 3.3% | |||||||||||
AIA Group Ltd. | 208,300 | 2,026 | |||||||||
| Techtronic Industries Co. Ltd. | 524,600 | 3,626 | |||||||||
5,652 | |||||||||||
Number of Shares | Value (000's) | ||||||||||
Ireland 3.4% | |||||||||||
CRH PLC | 79,544 | $ | 2,649 | ||||||||
| Kerry Group PLC Class A | 26,213 | 3,120 | |||||||||
5,769 | |||||||||||
Israel 1.8% | |||||||||||
| Check Point Software Technologies Ltd.* | 27,743 | 2,988 | |||||||||
Italy 0.7% | |||||||||||
| Nexi SpA*(a) | 113,655 | 1,238 | |||||||||
Japan 14.8% | |||||||||||
| Bridgestone Corp. | 55,000 | 2,098 | |||||||||
| Daikin Industries Ltd. | 22,000 | 2,724 | |||||||||
Hoya Corp. | 32,500 | 2,646 | |||||||||
Kao Corp. | 27,600 | 1,994 | |||||||||
Keyence Corp. | 2,800 | 1,658 | |||||||||
Kose Corp. | 16,000 | 2,749 | |||||||||
| Persol Holdings Co. Ltd. | 67,400 | 1,368 | |||||||||
| Sanwa Holdings Corp. | 181,500 | 2,019 | |||||||||
| Shionogi & Co. Ltd. | 44,400 | 2,380 | |||||||||
SMC Corp. | 4,700 | 1,776 | |||||||||
Terumo Corp. | 44,800 | 1,302 | |||||||||
| Toyota Motor Corp. | 35,700 | 2,339 | |||||||||
25,053 | |||||||||||
Netherlands 7.8% | |||||||||||
| AerCap Holdings NV* | 56,954 | 3,054 | |||||||||
| ASML Holding NV | 23,037 | 5,121 | |||||||||
Heineken NV | 32,683 | 3,476 | |||||||||
| NXP Semiconductors NV | 15,719 | 1,605 | |||||||||
13,256 | |||||||||||
Portugal 0.7% | |||||||||||
| Galp Energia SGPS SA | 87,263 | 1,253 | |||||||||
Singapore 1.5% | |||||||||||
| DBS Group Holdings Ltd. | 138,700 | 2,452 | |||||||||
Sweden 1.2% | |||||||||||
| Assa Abloy AB Class B | 61,969 | 1,294 | |||||||||
| Swedbank AB, A Shares | 59,501 | 764 | |||||||||
2,058 | |||||||||||
Number of Shares | Value (000's) | ||||||||||
Switzerland 14.7% | |||||||||||
Alcon, Inc.* | 5,823 | $ | 355 | ||||||||
| Cie Financiere Richemont SA | 16,237 | 1,260 | |||||||||
Givaudan SA | 494 | 1,336 | |||||||||
| Julius Baer Group Ltd.* | 43,078 | 1,703 | |||||||||
| Lonza Group AG* | 5,860 | 2,071 | |||||||||
Novartis AG | 38,416 | 3,455 | |||||||||
| Partners Group Holding AG | 2,917 | 2,365 | |||||||||
| Roche Holding AG | 12,176 | 3,329 | |||||||||
SGS SA | 832 | 2,043 | |||||||||
| SIG Combibloc Group AG* | 144,562 | 1,907 | |||||||||
| Sonova Holding AG | 14,813 | 3,438 | |||||||||
UBS Group AG* | 167,462 | 1,768 | |||||||||
25,030 | |||||||||||
United Kingdom 16.9% | |||||||||||
Aon PLC | 14,758 | 2,876 | |||||||||
Bunzl PLC | 133,723 | 3,275 | |||||||||
| Compass Group PLC | 133,142 | 3,375 | |||||||||
DCC PLC | 24,307 | 2,066 | |||||||||
| Electrocomponents PLC | 176,135 | 1,245 | |||||||||
| Fevertree Drinks PLC | 55,021 | 1,513 | |||||||||
| London Stock Exchange Group PLC | 26,927 | 2,278 | |||||||||
Prudential PLC | 125,589 | 2,091 | |||||||||
| Reckitt Benckiser Group PLC | 33,357 | 2,597 | |||||||||
RELX PLC | 120,147 | 2,875 | |||||||||
| Rentokil Initial PLC | 313,628 | 1,718 | |||||||||
Spectris PLC | 39,227 | 1,103 | |||||||||
| St. James's Place PLC | 155,522 | 1,737 | |||||||||
28,749 | |||||||||||
United States 4.6% | |||||||||||
| Core Laboratories NV | 6,762 | 268 | |||||||||
Ferguson PLC | 36,962 | 2,718 | |||||||||
| Samsonite International SA(a) | 1,047,941 | 1,981 | |||||||||
| Sensata Technologies Holding PLC* | 60,732 | 2,768 | |||||||||
7,735 | |||||||||||
| Total Common Stocks (Cost $158,662) | 164,298 | ||||||||||
See Notes to Financial Statements
121
Schedule of Investments International Select Fund^ (cont'd)
Number of Shares | Value (000's) | ||||||||||
Short-Term Investments 0.5% | |||||||||||
Investment Companies 0.5% | |||||||||||
| State Street Institutional Treasury Money Market Fund Premier Class, 2.03%(b) (Cost $926) | 926,217 | $ | 926 | ||||||||
| Total Investments 97.3% (Cost $159,588) | 165,224 | ||||||||||
| Other Assets Less Liabilities 2.7% | 4,584 | ||||||||||
Net Assets 100.0% | $ | 169,808 | |||||||||
* Non-income producing security.
(a) Security exempt from registration pursuant to Regulation S under the Securities Act of 1933, as amended. Regulation S applies to securities offerings that are made outside of the United States and do not involve directed selling efforts in the United States and as such may have restrictions on resale. Total value of all such securities at August 31, 2019 amounted to approximately $7,126,000, which represents 4.2% of net assets of the Fund.
(b) Represents 7-day effective yield as of August 31, 2019.
See Notes to Financial Statements
122
Schedule of Investments International Select Fund^ (cont'd)
POSITIONS BY INDUSTRY
Industry | Investments at Value (000's omitted) | Percentage of Net Assets | |||||||||
Capital Markets | $ | 11,523 | 6.8 | % | |||||||
Trading Companies & Distributors | 11,030 | 6.5 | % | ||||||||
Pharmaceuticals | 9,164 | 5.4 | % | ||||||||
Semiconductors & Semiconductor Equipment | 8,965 | 5.3 | % | ||||||||
Insurance | 8,242 | 4.8 | % | ||||||||
Beverages | 8,090 | 4.8 | % | ||||||||
Health Care Equipment & Supplies | 7,741 | 4.6 | % | ||||||||
Banks | 7,369 | 4.3 | % | ||||||||
Personal Products | 6,544 | 3.8 | % | ||||||||
Professional Services | 6,286 | 3.7 | % | ||||||||
Software | 6,278 | 3.7 | % | ||||||||
Oil, Gas & Consumable Fuels | 6,077 | 3.6 | % | ||||||||
Building Products | 6,037 | 3.6 | % | ||||||||
Machinery | 5,402 | 3.2 | % | ||||||||
Life Sciences Tools & Services | 5,025 | 3.0 | % | ||||||||
Electrical Equipment | 4,150 | 2.4 | % | ||||||||
Electronic Equipment, Instruments & Components | 4,006 | 2.4 | % | ||||||||
Internet & Direct Marketing Retail | 3,936 | 2.3 | % | ||||||||
Chemicals | 3,763 | 2.2 | % | ||||||||
Auto Components | 3,404 | 2.0 | % | ||||||||
Hotels, Restaurants & Leisure | 3,375 | 2.0 | % | ||||||||
Textiles, Apparel & Luxury Goods | 3,241 | 1.9 | % | ||||||||
Food Products | 3,120 | 1.8 | % | ||||||||
Entertainment | 2,803 | 1.7 | % | ||||||||
Construction Materials | 2,649 | 1.6 | % | ||||||||
Household Products | 2,597 | 1.5 | % | ||||||||
Automobiles | 2,339 | 1.4 | % | ||||||||
Food & Staples Retailing | 2,189 | 1.3 | % | ||||||||
Industrial Conglomerates | 2,066 | 1.2 | % | ||||||||
Containers & Packaging | 1,907 | 1.1 | % | ||||||||
Interactive Media & Services | 1,756 | 1.0 | % | ||||||||
Commercial Services & Supplies | 1,718 | 1.0 | % | ||||||||
IT Services | 1,238 | 0.7 | % | ||||||||
Energy Equipment & Services | 268 | 0.2 | % | ||||||||
Short-Term Investments and Other Assets—Net | 5,510 | 3.2 | % | ||||||||
$ | 169,808 | 100.0 | % | ||||||||
See Notes to Financial Statements
123
Schedule of Investments International Select Fund^ (cont'd)
The following is a summary, categorized by Level (see Note A of Notes to Financial Statements), of inputs used to value the Fund's investments as of August 31, 2019:
Asset Valuation Inputs | |||||||||||||||||||
(000's omitted) | Level 1 | Level 2 | Level 3 | Total | |||||||||||||||
Investments: | |||||||||||||||||||
| Common Stocks(a) | $ | 164,298 | $ | — | $ | — | $ | 164,298 | |||||||||||
Short-Term Investments | — | 926 | — | 926 | |||||||||||||||
Total Investments | $ | 164,298 | $ | 926 | $ | — | $ | 165,224 | |||||||||||
(a) The Schedule of Investments provides a geographic categorization as well as a Positions by Industry summary.
^ A balance indicated with a "—", reflects either a zero balance or an amount that rounds to less than 1.
See Notes to Financial Statements
124
Schedule of Investments International Small Cap Fund^ August 31, 2019
Number of Shares | Value (000's) | ||||||||||
Common Stocks 94.2% | |||||||||||
Australia 1.5% | |||||||||||
| ARB Corp. Ltd.(a) | 3,497 | $ | 43 | ||||||||
| Steadfast Group Ltd. | 16,975 | 43 | |||||||||
86 | |||||||||||
Austria 0.8% | |||||||||||
| Schoeller-Bleckmann Oilfield Equipment AG | 730 | 46 | |||||||||
Belgium 1.1% | |||||||||||
| Shurgard Self Storage SA | 2,015 | 66 | |||||||||
Canada 4.6% | |||||||||||
| Colliers International Group, Inc. | 1,255 | 85 | |||||||||
| Computer Modelling Group Ltd. | 10,801 | 55 | |||||||||
| Enghouse Systems Ltd. | 1,711 | 49 | |||||||||
Kinaxis, Inc.* | 1,378 | 80 | |||||||||
269 | |||||||||||
China 0.6% | |||||||||||
| Xiabuxiabu Catering Management China Holdings Co. Ltd.*(b) | 29,000 | 37 | |||||||||
Denmark 1.5% | |||||||||||
Schouw & Co. A/S | 808 | 55 | |||||||||
SimCorp A/S | 341 | 32 | |||||||||
87 | |||||||||||
Finland 1.3% | |||||||||||
Kemira OYJ | 5,397 | 76 | |||||||||
France 5.7% | |||||||||||
Esker SA | 488 | 44 | |||||||||
Lectra | 2,190 | 44 | |||||||||
Lumibird* | 2,396 | 43 | |||||||||
| Pharmagest Interactive | 607 | 35 | |||||||||
| Sopra Steria Group | 365 | 47 | |||||||||
| Tikehau Capital SCA | 1,917 | 36 | |||||||||
Virbac SA* | 460 | 85 | |||||||||
334 | |||||||||||
Germany 5.1% | |||||||||||
| Dermapharm Holding SE | 1,099 | 39 | |||||||||
Isra Vision AG | 1,211 | 44 | |||||||||
Jenoptik AG | 1,780 | 43 | |||||||||
Number of Shares | Value (000's) | ||||||||||
Nexus AG | 1,372 | $ | 43 | ||||||||
Stabilus SA | 784 | 35 | |||||||||
STRATEC SE | 664 | 47 | |||||||||
Washtec AG | 842 | 45 | |||||||||
296 | |||||||||||
Ireland 1.8% | |||||||||||
Applegreen PLC | 12,427 | 69 | |||||||||
Uniphar PLC* | 5,844 | 7 | |||||||||
Uniphar PLC* | 22,077 | 28 | |||||||||
104 | |||||||||||
Italy 2.9% | |||||||||||
| Anima Holding SpA(b) | 9,991 | 36 | |||||||||
| Carel Industries SpA(b) | 6,159 | 75 | |||||||||
Cerved Group SpA | 7,518 | 61 | |||||||||
172 | |||||||||||
Japan 22.3% | |||||||||||
| Aeon Delight Co. Ltd. | 2,150 | 66 | |||||||||
Amano Corp. | 2,900 | 87 | |||||||||
| Ariake Japan Co. Ltd. | 1,200 | 91 | |||||||||
Azbil Corp. | 3,200 | 82 | |||||||||
CKD Corp. | 3,100 | 31 | |||||||||
| EM Systems Co. Ltd.(a) | 1,300 | 22 | |||||||||
| Ichigo, Inc.(a) | 15,500 | 62 | |||||||||
Konishi Co. Ltd. | 2,100 | 29 | |||||||||
Medikit Co. Ltd. | 900 | 56 | |||||||||
| Nagaileben Co. Ltd. | 2,000 | 39 | |||||||||
Nakanishi, Inc. | 2,300 | 38 | |||||||||
| Nihon Parkerizing Co. Ltd. | 2,700 | 30 | |||||||||
Nohmi Bosai Ltd. | 4,400 | 90 | |||||||||
| Okamoto Industries, Inc. | 700 | 26 | |||||||||
| Optex Group Co. Ltd. | 2,400 | 32 | |||||||||
| Prestige International, Inc. | 6,000 | 106 | |||||||||
Relo Group, Inc. | 3,800 | 96 | |||||||||
| SHO-BOND Holdings Co. Ltd. | 2,400 | 84 | |||||||||
| Shoei Co. Ltd.(a) | 1,800 | 78 | |||||||||
| Software Service, Inc. | 500 | 52 | |||||||||
| Sun Frontier Fudousan Co. Ltd. | 4,900 | 56 | |||||||||
TKC Corp. | 1,100 | 47 | |||||||||
1,300 | |||||||||||
Jersey 0.9% | |||||||||||
Sanne Group PLC | 8,703 | 55 | |||||||||
Korea 0.8% | |||||||||||
Dentium Co. Ltd. | 800 | 45 | |||||||||
Number of Shares | Value (000's) | ||||||||||
Luxembourg 1.0% | |||||||||||
| Befesa SA(b) | 1,671 | $ | 57 | ||||||||
Netherlands 2.4% | |||||||||||
Corbion NV | 2,290 | 65 | |||||||||
| Intertrust NV(b) | 3,520 | 73 | |||||||||
138 | |||||||||||
Norway 2.2% | |||||||||||
Borregaard ASA | 6,835 | 69 | |||||||||
| Sbanken ASA(b) | 8,554 | 59 | |||||||||
128 | |||||||||||
Singapore 1.7% | |||||||||||
Haw Par Corp. Ltd. | 9,900 | 97 | |||||||||
Spain 1.3% | |||||||||||
Applus Services SA | 5,900 | 78 | |||||||||
Sweden 6.2% | |||||||||||
| Cloetta AB, B Shares | 23,254 | 69 | |||||||||
| Dustin Group AB(b) | 9,470 | 78 | |||||||||
| IAR Systems Group AB | 1,475 | 35 | |||||||||
KNOW IT AB | 1,547 | 28 | |||||||||
| Sweco AB, B Shares | 3,210 | 84 | |||||||||
| Thule Group AB(b) | 3,282 | 65 | |||||||||
359 | |||||||||||
Switzerland 9.4% | |||||||||||
Belimo Holding AG | 13 | 66 | |||||||||
| Bossard Holding AG Class A | 307 | 42 | |||||||||
Inficon Holding AG | 92 | 58 | |||||||||
Interroll Holding AG | 42 | 78 | |||||||||
Kardex AG | 392 | 55 | |||||||||
| Komax Holding AG(a) | 188 | 35 | |||||||||
| Medacta Group SA*(b) | 371 | 29 | |||||||||
| Medartis Holding AG*(b) | 981 | 43 | |||||||||
Tecan Group AG | 336 | 81 | |||||||||
VZ Holding AG | 207 | 61 | |||||||||
548 | |||||||||||
Taiwan 0.6% | |||||||||||
Bioteque Corp. | 8,000 | 34 | |||||||||
United Kingdom 18.5% | |||||||||||
| Biffa PLC(b) | 24,471 | 59 | |||||||||
| Big Yellow Group PLC | 5,320 | 69 | |||||||||
| Bloomsbury Publishing PLC | 10,600 | 30 | |||||||||
| Charter Court Financial Services Group PLC(b) | 8,195 | 26 | |||||||||
| Clinigen Group PLC | 7,024 | 76 | |||||||||
See Notes to Financial Statements
125
Schedule of Investments International Small Cap Fund^ (cont'd)
Number of Shares | Value (000's) | ||||||||||
Craneware PLC | 1,250 | $ | 28 | ||||||||
| Dechra Pharmaceuticals PLC | 2,489 | 91 | |||||||||
Diploma PLC | 3,650 | 70 | |||||||||
Essentra PLC | 14,187 | 69 | |||||||||
| Games Workshop Group PLC | 1,243 | 66 | |||||||||
GB Group PLC | 7,036 | 50 | |||||||||
Genus PLC | 1,959 | 63 | |||||||||
| Gocompare.Com Group PLC | 59,273 | 54 | |||||||||
Ideagen PLC | 8,120 | 15 | |||||||||
| Johnson Service Group PLC | 45,807 | 92 | |||||||||
| Learning Technologies Group PLC(a) | 49,715 | 75 | |||||||||
Restore PLC | 15,260 | 75 | |||||||||
| Sensyne Health Ltd.* | 20,655 | 37 | |||||||||
| Trainline PLC*(b) | 5,785 | 34 | |||||||||
1,079 | |||||||||||
| Total Common Stocks (Cost $5,705) | 5,491 | ||||||||||
Number of Shares | Value (000's) | ||||||||||
Short-Term Investments 12.4% | |||||||||||
Investment Companies 12.4% | |||||||||||
| State Street Institutional Treasury Money Market Fund Premier Class, 2.03%(c) | 466,636 | $ | 467 | ||||||||
| State Street Navigator Securities Lending Government Money Market Portfolio, 2.12%(c)(d) | 253,991 | 254 | |||||||||
| Total Short-Term Investments (Cost $721) | 721 | ||||||||||
| Total Investments 106.6% (Cost $6,426) | 6,212 | ||||||||||
| Liabilities Less Other Assets (6.6)% | (383 | ) | |||||||||
Net Assets 100.0% | $ | 5,829 | |||||||||
* Non-income producing security.
(a) The security or a portion of this security is on loan at August 31, 2019. Total value of all such securities at August 31, 2019 amounted to approximately $241,000 for the Fund (see Note A of the Notes to Financial Statements).
(b) Security exempt from registration pursuant to Regulation S under the Securities Act of 1933, as amended. Regulation S applies to securities offerings that are made outside of the United States and do not involve directed selling efforts in the United States and as such may have restrictions on resale. Total value of all such securities at August 31, 2019 amounted to approximately $671,000, which represents 11.5% of net assets of the Fund.
(c) Represents 7-day effective yield as of August 31, 2019.
(d) Represents investment of cash collateral received from securities lending.
See Notes to Financial Statements
126
Schedule of Investments International Small Cap Fund^ (cont'd)
POSITIONS BY INDUSTRY
Industry | Investments at Value (000's omitted) | Percentage of Net Assets | |||||||||
Electronic Equipment, Instruments & Components | $ | 554 | 9.5 | % | |||||||
Commercial Services & Supplies | 455 | 7.8 | % | ||||||||
Software | 424 | 7.3 | % | ||||||||
Real Estate Management & Development | 365 | 6.3 | % | ||||||||
Chemicals | 364 | 6.2 | % | ||||||||
Health Care Equipment & Supplies | 331 | 5.7 | % | ||||||||
Pharmaceuticals | 312 | 5.4 | % | ||||||||
Machinery | 279 | 4.8 | % | ||||||||
Health Care Technology | 217 | 3.7 | % | ||||||||
Food Products | 215 | 3.7 | % | ||||||||
Capital Markets | 188 | 3.2 | % | ||||||||
Construction & Engineering | 168 | 2.9 | % | ||||||||
Internet & Direct Marketing Retail | 166 | 2.8 | % | ||||||||
Life Sciences Tools & Services | 157 | 2.7 | % | ||||||||
Professional Services | 151 | 2.6 | % | ||||||||
Leisure Products | 131 | 2.2 | % | ||||||||
IT Services | 122 | 2.1 | % | ||||||||
Auto Components | 121 | 2.1 | % | ||||||||
Trading Companies & Distributors | 112 | 1.9 | % | ||||||||
Energy Equipment & Services | 101 | 1.7 | % | ||||||||
Equity Real Estate Investment Trusts | 69 | 1.2 | % | ||||||||
Specialty Retail | 69 | 1.2 | % | ||||||||
Building Products | 66 | 1.1 | % | ||||||||
Biotechnology | 63 | 1.1 | % | ||||||||
Diversified Financial Services | 61 | 1.1 | % | ||||||||
Banks | 59 | 1.0 | % | ||||||||
Insurance | 43 | 0.7 | % | ||||||||
Hotels, Restaurants & Leisure | 37 | 0.6 | % | ||||||||
Health Care Providers & Services | 35 | 0.6 | % | ||||||||
Media | 30 | 0.5 | % | ||||||||
Thrifts & Mortgage Finance | 26 | 0.5 | % | ||||||||
Short-Term Investments and Other Liabilities—Net | 338 | 5.8 | % | ||||||||
$ | 5,829 | 100.0 | % | ||||||||
See Notes to Financial Statements
127
Schedule of Investments International Small Cap Fund^ (cont'd)
The following is a summary, categorized by Level (see Note A of Notes to Financial Statements), of inputs used to value the Fund's investments as of August 31, 2019:
Asset Valuation Inputs | |||||||||||||||||||
(000's omitted) | Level 1 | Level 2 | Level 3(b) | Total | |||||||||||||||
Investments: | |||||||||||||||||||
| Common Stocks(a) | $ | 5,491 | $ | — | $ | — | $ | 5,491 | |||||||||||
Short-Term Investments | — | 721 | — | 721 | |||||||||||||||
Total Investments | $ | 5,491 | $ | 721 | $ | — | $ | 6,212 | |||||||||||
(a) The Schedule of Investments provides a geographic categorization as well as a Positions by Industry summary.
(b) The following is a reconciliation between the beginning and ending balances of investments in which unobservable inputs (Level 3) were used in determining value:
| Beginning balance, as of 9/1/2018 | Accrued discounts/ (premiums) | Realized gain/ (loss) | Change in unrealized appreciation/ (depreciation) | Purchases | Sales | Transfers into Level 3 | Transfers out of Level 3 | Balance, as of 8/31/2019 | Net change in unrealized appreciation/ (depreciation) from investments still held as of 8/31/2019 | ||||||||||||||||||||||||||||||||||
| Investments in Securities: (000's omitted) | |||||||||||||||||||||||||||||||||||||||||||
| Common Stocks(c) | |||||||||||||||||||||||||||||||||||||||||||
Ireland | $ | 89 | $ | — | $ | — | $ | — | $ | — | $ | — | $ | — | $ | (89 | ) | $ | — | $ | — | ||||||||||||||||||||||
Total | $ | 89 | $ | — | $ | — | $ | — | $ | — | $ | — | $ | — | $ | (89 | ) | $ | — | $ | — | ||||||||||||||||||||||
(c) At the beginning of the year, these investments were valued in accordance with the procedures approved by the Board of Trustees. The Fund held no Level 3 investments at August 31, 2019.
^ A balance indicated with a "—", reflects either a zero balance or an amount that rounds to less than 1.
See Notes to Financial Statements
128
Schedule of Investments Intrinsic Value Fund^ August 31, 2019
Number of Shares | Value (000's) | ||||||||||
Common Stocks 97.9% | |||||||||||
Aerospace & Defense 3.9% | |||||||||||
| Mercury Systems, Inc.* | 77,947 | $ | 6,675 | ||||||||
| Spirit AeroSystems Holdings, Inc. Class A | 130,290 | 10,501 | |||||||||
| Teledyne Technologies, Inc.* | 22,252 | 6,867 | |||||||||
24,043 | |||||||||||
Banks 4.4% | |||||||||||
BankUnited, Inc. | 170,004 | 5,399 | |||||||||
Comerica, Inc. | 66,774 | 4,117 | |||||||||
| Huntington Bancshares, Inc. | 413,130 | 5,474 | |||||||||
| TCF Financial Corp. | 198,870 | 7,668 | |||||||||
| Texas Capital Bancshares, Inc.* | 78,500 | 4,230 | |||||||||
26,888 | |||||||||||
Building Products 0.7% | |||||||||||
| Resideo Technologies, Inc.* | 322,200 | 4,440 | |||||||||
| Capital Markets 0.0%(a) | |||||||||||
| Alimco Financial Corp.*(b) | 6,537 | 53 | |||||||||
Chemicals 0.5% | |||||||||||
| Innophos Holdings, Inc. | 107,900 | 3,031 | |||||||||
Commercial Services & Supplies 4.4% | |||||||||||
| Clean Harbors, Inc.* | 121,514 | 8,937 | |||||||||
| Covanta Holding Corp. | 411,900 | 7,085 | |||||||||
Stericycle, Inc.* | 247,500 | 11,110 | |||||||||
27,132 | |||||||||||
Communications Equipment 6.9% | |||||||||||
Ciena Corp.* | 594,800 | 24,345 | |||||||||
Infinera Corp.* | 1,124,900 | 5,996 | |||||||||
| Ribbon Communications, Inc.* | 737,999 | 3,815 | |||||||||
| Viavi Solutions, Inc.* | 590,099 | 8,197 | |||||||||
42,353 | |||||||||||
Construction & Engineering 0.7% | |||||||||||
| Valmont Industries, Inc. | 29,300 | 3,970 | |||||||||
Number of Shares | Value (000's) | ||||||||||
Containers & Packaging 6.1% | |||||||||||
| Avery Dennison Corp. | 129,836 | $ | 15,005 | ||||||||
| Crown Holdings, Inc.* | 333,726 | 21,973 | |||||||||
36,978 | |||||||||||
Electrical Equipment 0.2% | |||||||||||
| Babcock & Wilcox Enterprises, Inc.* | 404,281 | 1,488 | |||||||||
Electronic Equipment, Instruments & Components 4.2% | |||||||||||
II-VI, Inc.* | 91,130 | 3,418 | |||||||||
Itron, Inc.* | 196,231 | 13,628 | |||||||||
| OSI Systems, Inc.* | 80,200 | 8,422 | |||||||||
25,468 | |||||||||||
Energy Equipment & Services 2.2% | |||||||||||
Dril-Quip, Inc.* | 83,900 | 3,847 | |||||||||
| Forum Energy Technologies, Inc.* | 519,400 | 732 | |||||||||
| ION Geophysical Corp.* | 124,331 | 960 | |||||||||
| McDermott International, Inc.* | 447,571 | 2,113 | |||||||||
| Oil States International, Inc.* | 182,700 | 2,519 | |||||||||
| Patterson-UTI Energy, Inc. | 239,200 | 2,069 | |||||||||
| TETRA Technologies, Inc.* | 664,392 | 1,103 | |||||||||
13,343 | |||||||||||
Equity Real Estate Investment Trusts 0.3% | |||||||||||
Uniti Group, Inc. | 274,800 | 2,031 | |||||||||
Food Products 2.0% | |||||||||||
| Hain Celestial Group, Inc.* | 261,000 | 4,972 | |||||||||
| TreeHouse Foods, Inc.* | 142,100 | 7,197 | |||||||||
12,169 | |||||||||||
Health Care Equipment & Supplies 2.0% | |||||||||||
Accuray, Inc.* | 1,507,839 | 4,041 | |||||||||
AtriCure, Inc.* | 215,100 | 5,892 | |||||||||
Nuvectra Corp.* | 185,200 | 361 | |||||||||
| OraSure Technologies, Inc.* | 271,600 | 1,792 | |||||||||
12,086 | |||||||||||
Number of Shares | Value (000's) | ||||||||||
Health Care Providers & Services 4.3% | |||||||||||
| Acadia Healthcare Co., Inc.* | 302,800 | $ | 8,012 | ||||||||
MEDNAX, Inc.* | 216,500 | 4,564 | |||||||||
| Molina Healthcare, Inc.* | 58,361 | 7,603 | |||||||||
| Patterson Cos., Inc. | 348,200 | 5,822 | |||||||||
26,001 | |||||||||||
Hotels, Restaurants & Leisure 1.5% | |||||||||||
| International Game Technology PLC | 215,200 | 2,578 | |||||||||
| SeaWorld Entertainment, Inc.* | 225,200 | 6,533 | |||||||||
9,111 | |||||||||||
Household Durables 1.4% | |||||||||||
| Tempur Sealy International, Inc.* | 113,200 | 8,730 | |||||||||
Independent Power and Renewable Electricity Producers 4.3% | |||||||||||
| Atlantic Power Corp.* | 1,966,535 | 4,504 | |||||||||
| Ormat Technologies, Inc. | 127,741 | 9,487 | |||||||||
| Vistra Energy Corp. | 483,931 | 12,074 | |||||||||
26,065 | |||||||||||
IT Services 6.2% | |||||||||||
Conduent, Inc.* | 690,000 | 4,492 | |||||||||
CoreLogic, Inc.* | 250,325 | 12,116 | |||||||||
KBR, Inc. | 521,100 | 13,298 | |||||||||
| Repay Pipe*(c)(f) | 453,947 | 5,515 | |||||||||
Unisys Corp.* | 356,700 | 2,333 | |||||||||
37,754 | |||||||||||
Life Sciences Tools & Services 6.6% | |||||||||||
| Charles River Laboratories International, Inc.* | 134,071 | 17,590 | |||||||||
Fluidigm Corp.* | 1,460,000 | 8,147 | |||||||||
Luminex Corp. | 274,400 | 5,625 | |||||||||
| NanoString Technologies, Inc.* | 338,000 | 8,612 | |||||||||
39,974 | |||||||||||
See Notes to Financial Statements
129
Schedule of Investments Intrinsic Value Fund^ (cont'd)
Number of Shares | Value (000's) | ||||||||||
Machinery 3.8% | |||||||||||
| Actuant Corp. Class A | 260,775 | $ | 5,792 | ||||||||
Harsco Corp.* | 278,900 | 4,992 | |||||||||
Lydall, Inc.* | 235,100 | 4,728 | |||||||||
Twin Disc, Inc.* | 119,209 | 1,205 | |||||||||
Welbilt, Inc.* | 403,000 | 6,343 | |||||||||
23,060 | |||||||||||
| Marine 0.0%(a) | |||||||||||
Danaos Corp.* | 28,382 | 204 | |||||||||
Media 1.3% | |||||||||||
Criteo SA ADR* | 248,700 | 4,830 | |||||||||
| MSG Networks, Inc. Class A* | 183,953 | 3,017 | |||||||||
7,847 | |||||||||||
Metals & Mining 0.9% | |||||||||||
| Cleveland-Cliffs, Inc. | 710,700 | 5,643 | |||||||||
Pharmaceuticals 0.9% | |||||||||||
| Amneal Pharmaceuticals, Inc.* | 1,003,410 | 2,559 | |||||||||
| Intersect ENT, Inc.* | 173,388 | 2,840 | |||||||||
| Mallinckrodt PLC* | 136,200 | 353 | |||||||||
5,752 | |||||||||||
Road & Rail 2.9% | |||||||||||
| Avis Budget Group, Inc.* | 217,500 | 5,388 | |||||||||
| Hertz Global Holdings, Inc.* | 602,717 | 7,299 | |||||||||
| Ryder System, Inc. | 100,004 | 4,817 | |||||||||
17,504 | |||||||||||
Semiconductors & Semiconductor Equipment 9.6% | |||||||||||
CEVA, Inc.* | 126,000 | 3,958 | |||||||||
| Cypress Semiconductor Corp. | 250,735 | 5,769 | |||||||||
Entegris, Inc. | 112,900 | 4,835 | |||||||||
Impinj, Inc.* | 62,100 | 2,259 | |||||||||
| MACOM Technology Solutions Holdings, Inc.* | 446,418 | 8,768 | |||||||||
| Mellanox Technologies Ltd.* | 175,000 | 18,734 | |||||||||
Rambus, Inc.* | 761,144 | 9,545 | |||||||||
| Veeco Instruments, Inc.* | 535,300 | 4,957 | |||||||||
58,825 | |||||||||||
Number of Shares | Value (000's) | ||||||||||
Software 11.1% | |||||||||||
Cloudera, Inc.* | 1,048,200 | $ | 7,484 | ||||||||
FireEye, Inc.* | 713,000 | 9,575 | |||||||||
| Nuance Communications, Inc.* | 897,900 | 15,094 | |||||||||
OneSpan, Inc.* | 333,900 | 4,508 | |||||||||
TiVo Corp. | 833,030 | 6,273 | |||||||||
| Verint Systems, Inc.* | 470,261 | 25,060 | |||||||||
67,994 | |||||||||||
Specialty Retail 2.5% | |||||||||||
Chico's FAS, Inc. | 528,800 | 1,650 | |||||||||
| Children's Place, Inc. | 63,800 | 5,566 | |||||||||
Express, Inc.* | 422,800 | 896 | |||||||||
Office Depot, Inc. | 1,806,667 | 2,349 | |||||||||
| Party City Holdco, Inc.* | 934,690 | 4,393 | |||||||||
| RTW RetailWinds, Inc.* | 235,700 | 238 | |||||||||
15,092 | |||||||||||
Technology Hardware, Storage & Peripherals 2.1% | |||||||||||
| Diebold Nixdorf, Inc.* | 610,500 | 6,844 | |||||||||
Quantum Corp.* | 185,075 | 1,109 | |||||||||
Stratasys Ltd.* | 196,700 | 4,685 | |||||||||
12,638 | |||||||||||
| Total Common Stocks (Cost $525,785) | 597,667 | ||||||||||
| Principal Amount | |||||||||||
Convertible Bonds 0.8% | |||||||||||
Electronic Equipment, Instruments & Components 0.8% | |||||||||||
| Maxwell Technologies, Inc., 5.50%, due 9/15/2022(b)(d) (Cost $4,500) | $ | 4,500,000 | 4,665 | ||||||||
Corporate Bonds 0.3% | |||||||||||
Oil & Gas Services 0.3% | |||||||||||
| SESI LLC, 7.13% due 12/15/2021 (Cost $2,076) | 3,000,000 | 2,115 | |||||||||
Number of Shares | Value (000's) | ||||||||||
Warrants 0.1% | |||||||||||
| Diversified Consumer Services 0.0%(a) | |||||||||||
| OneSpaWorld Holdings Ltd. Expires 3/19/2024* | 55,184 | $ | 276 | ||||||||
IT Services 0.1% | |||||||||||
| Repay Pipe Expires 1/1/2025* | 453,947 | 350 | |||||||||
| Total Warrants (Cost $—) | 626 | ||||||||||
Short-Term Investments 1.0% | |||||||||||
Investment Companies 1.0% | |||||||||||
| State Street Institutional Treasury Money Market Fund Premier Class, 2.03%(e) (Cost $6,098) | 6,097,626 | 6,098 | |||||||||
| Total Investments 100.1% (Cost $538,459) | 611,171 | ||||||||||
| Liabilities Less Other Assets (0.1)% | (382 | ) | |||||||||
Net Assets 100.0% | $ | 610,789 | |||||||||
See Notes to Financial Statements
130
Schedule of Investments Intrinsic Value Fund^ (cont'd)
* Non-income producing security.
(a) Represents less than 0.05% of net assets of the Fund.
(b) Illiquid security.
(c) Security fair valued as of August 31, 2019 in accordance with procedures approved by the Board of Trustees. Total value of all such securities at August 31, 2019 amounted to approximately $5,515,000, which represents 0.9% of net assets of the Fund.
(d) Securities were purchased under Rule 144A of the Securities Act of 1933, as amended, or are otherwise restricted and, unless registered under the Securities Act of 1933 or exempted from registration, may only be sold to qualified institutional investors or may have other restrictions on resale. At August 31, 2019, these securities amounted to approximately $4,665,000, which represents 0.8% of net assets of the Fund.
(e) Represents 7-day effective yield as of August 31, 2019.
(f) This security has been deemed by the investment manager to be illiquid, and is subject to restrictions on resale.
At August 31, 2019, this security amounted to approximately $5,515,000, which represents 0.9% of net assets of the Fund.
| (000's omitted) Restricted Security | Acquisition Date | Acquisition Cost | Acquisition Cost Percentage of Net Assets | Value as of 8/31/2019 | Fair Value Percentage of Net Assets as of 8/31/2019 | ||||||||||||||||||
Repay Pipe | 7/10/2019 | $ | 4,540 | 0.7 | % | $ | 5,515 | 0.9 | % | ||||||||||||||
Total | $ | 4,540 | 0.7 | % | $ | 5,515 | 0.9 | % | |||||||||||||||
The following is a summary, categorized by Level (see Note A of Notes to Financial Statements), of inputs used to value the Fund's investments as of August 31, 2019:
Asset Valuation Inputs | |||||||||||||||||||
(000's omitted) | Level 1 | Level 2 | Level 3 | Total | |||||||||||||||
Investments: | |||||||||||||||||||
Common Stocks | |||||||||||||||||||
IT Services | $ | 32,239 | $ | 5,515 | $ | — | $ | 37,754 | |||||||||||
| Other Common Stocks(a) | 559,913 | — | — | 559,913 | |||||||||||||||
Total Common Stocks | 592,152 | 5,515 | — | 597,667 | |||||||||||||||
| Convertible Bonds(a) | — | 4,665 | — | 4,665 | |||||||||||||||
| Corporate Bonds(a) | — | 2,115 | — | 2,115 | |||||||||||||||
| Warrants(a) | 626 | — | — | 626 | |||||||||||||||
Short-Term Investments | — | 6,098 | — | 6,098 | |||||||||||||||
Total Investments | $ | 592,778 | $ | 18,393 | $ | — | $ | 611,171 | |||||||||||
(a) The Schedule of Investments provides information on the industry categorization for the portfolio.
^ A balance indicated with a "—", reflects either a zero balance or an amount that rounds to less than 1.
See Notes to Financial Statements
131
Schedule of Investments Large Cap Value Fund^ August 31, 2019
Number of Shares | Value (000's) | ||||||||||
Common Stocks 94.6% | |||||||||||
Aerospace & Defense 0.9% | |||||||||||
| United Technologies Corp. | 126,296 | $ | 16,449 | ||||||||
Airlines 1.9% | |||||||||||
| Delta Air Lines, Inc. | 147,501 | 8,534 | |||||||||
| United Airlines Holdings, Inc.* | 293,790 | 24,770 | |||||||||
33,304 | |||||||||||
Banks 7.1% | |||||||||||
| Bank of America Corp. | 599,929 | 16,504 | |||||||||
Citigroup, Inc. | 371,034 | 23,876 | |||||||||
| JPMorgan Chase & Co. | 777,319 | 85,396 | |||||||||
125,776 | |||||||||||
Beverages 0.8% | |||||||||||
PepsiCo, Inc. | 107,106 | 14,645 | |||||||||
Capital Markets 2.9% | |||||||||||
| Blackstone Group, Inc. Class A | 274,973 | 13,683 | |||||||||
| Goldman Sachs Group, Inc. | 188,682 | 38,474 | |||||||||
52,157 | |||||||||||
Diversified Telecommunication Services 4.3% | |||||||||||
AT&T, Inc. | 1,301,909 | 45,906 | |||||||||
| Verizon Communications, Inc. | 513,603 | 29,871 | |||||||||
75,777 | |||||||||||
Electric Utilities 6.4% | |||||||||||
| American Electric Power Co., Inc. | 205,426 | 18,725 | |||||||||
| Duke Energy Corp. | 264,532 | 24,533 | |||||||||
Exelon Corp. | 806,773 | 38,128 | |||||||||
FirstEnergy Corp. | 413,001 | 18,998 | |||||||||
| NextEra Energy, Inc. | 60,930 | 13,348 | |||||||||
113,732 | |||||||||||
Electrical Equipment 0.5% | |||||||||||
AMETEK, Inc. | 100,578 | 8,643 | |||||||||
Equity Real Estate Investment Trusts 7.6% | |||||||||||
| Alexandria Real Estate Equities, Inc. | 36,870 | 5,525 | |||||||||
Number of Shares | Value (000's) | ||||||||||
| American Homes 4 Rent Class A | 345,770 | $ | 8,845 | ||||||||
| Equity Lifestyle Properties, Inc. | 86,943 | 11,713 | |||||||||
| Equity Residential | 229,136 | 19,422 | |||||||||
| Essex Property Trust, Inc. | 17,856 | 5,736 | |||||||||
Prologis, Inc. | 404,310 | 33,808 | |||||||||
Public Storage | 144,802 | 38,335 | |||||||||
Ventas, Inc. | 168,692 | 12,380 | |||||||||
135,764 | |||||||||||
Food & Staples Retailing 3.3% | |||||||||||
Walmart, Inc. | 515,885 | 58,945 | |||||||||
Food Products 5.1% | |||||||||||
| Mondelez International, Inc. Class A | 976,808 | 53,939 | |||||||||
Nestle SA ADR | 330,838 | 37,183 | |||||||||
91,122 | |||||||||||
Health Care Equipment & Supplies 3.7% | |||||||||||
| Abbott Laboratories | 321,468 | 27,428 | |||||||||
| Baxter International, Inc. | 435,822 | 38,330 | |||||||||
65,758 | |||||||||||
Health Care Providers & Services 2.0% | |||||||||||
CVS Health Corp. | 285,762 | 17,409 | |||||||||
| HCA Healthcare, Inc. | 149,663 | 17,989 | |||||||||
35,398 | |||||||||||
Household Durables 1.4% | |||||||||||
PulteGroup, Inc. | 753,496 | 25,468 | |||||||||
Household Products 7.1% | |||||||||||
| Colgate- Palmolive Co. | 472,844 | 35,061 | |||||||||
| Kimberly-Clark Corp. | 99,632 | 14,059 | |||||||||
| Procter & Gamble Co. | 639,071 | 76,836 | |||||||||
125,956 | |||||||||||
Industrial Conglomerates 2.2% | |||||||||||
| General Electric Co. | 2,652,533 | 21,884 | |||||||||
| Honeywell International, Inc. | 104,825 | 17,256 | |||||||||
39,140 | |||||||||||
Number of Shares | Value (000's) | ||||||||||
Insurance 6.2% | |||||||||||
| American International Group, Inc. | 678,437 | $ | 35,306 | ||||||||
Aon PLC | 91,426 | 17,814 | |||||||||
Assurant, Inc. | 136,633 | 16,806 | |||||||||
Chubb Ltd. | 157,329 | 24,588 | |||||||||
MetLife, Inc. | 357,049 | 15,817 | |||||||||
110,331 | |||||||||||
Interactive Media & Services 1.4% | |||||||||||
| Snap, Inc. Class A*(a) | 1,178,661 | 18,658 | |||||||||
Twitter, Inc.* | 167,525 | 7,145 | |||||||||
25,803 | |||||||||||
Media 1.4% | |||||||||||
| Comcast Corp. Class A | 562,751 | 24,907 | |||||||||
Metals & Mining 10.2% | |||||||||||
| BHP Group Ltd. ADR(a) | 1,395,661 | 68,611 | |||||||||
| Franco-Nevada Corp. | 120,031 | 11,722 | |||||||||
| Newmont Goldcorp Corp. | 1,813,540 | 72,342 | |||||||||
| Southern Copper Corp. | 924,665 | 29,220 | |||||||||
181,895 | |||||||||||
Multi-Utilities 3.5% | |||||||||||
Ameren Corp. | 253,188 | 19,533 | |||||||||
DTE Energy Co. | 224,033 | 29,048 | |||||||||
Sempra Energy | 93,489 | 13,241 | |||||||||
61,822 | |||||||||||
Oil, Gas & Consumable Fuels 7.1% | |||||||||||
Exxon Mobil Corp. | 1,461,440 | 100,079 | |||||||||
Phillips 66 | 277,601 | 27,380 | |||||||||
127,459 | |||||||||||
Pharmaceuticals 2.9% | |||||||||||
| Johnson & Johnson | 263,768 | 33,857 | |||||||||
Merck & Co., Inc. | 212,333 | 18,361 | |||||||||
52,218 | |||||||||||
Specialty Retail 1.2% | |||||||||||
Tiffany & Co. | 243,870 | 20,697 | |||||||||
Tobacco 2.6% | |||||||||||
| Philip Morris International, Inc. | 652,551 | 47,042 | |||||||||
Wireless Telecommunication Services 0.9% | |||||||||||
T-Mobile US, Inc.* | 207,997 | 16,234 | |||||||||
| Total Common Stocks (Cost $1,506,818) | 1,686,442 | ||||||||||
See Notes to Financial Statements
132
Schedule of Investments Large Cap Value Fund^ (cont'd)
Number of Shares | Value (000's) | ||||||||||
Short-Term Investments 10.4% | |||||||||||
Investment Companies 10.4% | |||||||||||
| State Street Institutional U.S. Government Money Market Fund Premier Class, 2.07%(b) | 98,217,494 | $ | 98,217 | ||||||||
| State Street Navigator Securities Lending Government Money Market Portfolio, 2.12%(b)(c) | 87,880,585 | 87,881 | |||||||||
| Total Short-Term Investments (Cost $186,098) | 186,098 | ||||||||||
| Total Investments 105.0% (Cost $1,692,916) | 1,872,540 | ||||||||||
| Liabilities Less Other Assets (5.0)% | (88,947 | ) | |||||||||
Net Assets 100.0% | $ | 1,783,593 | |||||||||
* Non-income producing security.
(a) The security or a portion of this security is on loan at August 31, 2019. Total value of all such securities at August 31, 2019 amounted to approximately $87,260,000 for the Fund (see Note A of the Notes to Financial Statements).
(b) Represents 7-day effective yield as of August 31, 2019.
(c) Represents investment of cash collateral received from securities lending.
See Notes to Financial Statements
133
Schedule of Investments Large Cap Value Fund^ (cont'd)
Derivative Instruments
Written option contracts ("options written")
At August 31, 2019, the Fund did not have any outstanding options written. For the year ended August 31, 2019, the Fund had an average market value of $0 in options written.
The following is a summary, categorized by Level (see Note A of Notes to Financial Statements), of inputs used to value the Fund's investments as of August 31, 2019:
Asset Valuation Inputs | |||||||||||||||||||
(000's omitted) | Level 1 | Level 2 | Level 3 | Total | |||||||||||||||
Investments: | |||||||||||||||||||
| Common Stocks(a) | $ | 1,686,442 | $ | — | $ | — | $ | 1,686,442 | |||||||||||
Short-Term Investments | — | 186,098 | — | 186,098 | |||||||||||||||
Total Investments | $ | 1,686,442 | $ | 186,098 | $ | — | $ | 1,872,540 | |||||||||||
(a) The Schedule of Investments provides information on the industry categorization for the portfolio.
^ A balance indicated with a "—", reflects either a zero balance or an amount that rounds to less than 1.
See Notes to Financial Statements
134
Schedule of Investments Mid Cap Growth Fund^ August 31, 2019
| Number of Shares | Value (000's) | ||||||||||
Common Stocks 97.3% | |||||||||||
Aerospace & Defense 4.1% | |||||||||||
| Axon Enterprise, Inc.* | 105,000 | $ | 6,296 | ||||||||
HEICO Corp. | 150,000 | 21,700 | |||||||||
| L3Harris Technologies, Inc. | 112,500 | 23,784 | |||||||||
| Teledyne Technologies, Inc.* | 25,000 | 7,715 | |||||||||
59,495 | |||||||||||
Airlines 0.5% | |||||||||||
| Alaska Air Group, Inc. | 117,000 | 6,987 | |||||||||
Auto Components 0.7% | |||||||||||
Aptiv PLC | 125,000 | 10,396 | |||||||||
Banks 0.9% | |||||||||||
| SVB Financial Group* | 62,500 | 12,164 | |||||||||
Biotechnology 2.7% | |||||||||||
| Alexion Pharmaceuticals, Inc.* | 50,000 | 5,038 | |||||||||
| BioMarin Pharmaceutical, Inc.* | 100,000 | 7,506 | |||||||||
| Exact Sciences Corp.* | 100,000 | 11,922 | |||||||||
Incyte Corp.* | 130,000 | 10,637 | |||||||||
| Neurocrine Biosciences, Inc.* | 39,000 | 3,877 | |||||||||
38,980 | |||||||||||
Capital Markets 3.0% | |||||||||||
| Cboe Global Markets, Inc. | 125,000 | 14,895 | |||||||||
| MarketAxess Holdings, Inc. | 35,000 | 13,916 | |||||||||
| Raymond James Financial, Inc. | 180,000 | 14,132 | |||||||||
42,943 | |||||||||||
Commercial Services & Supplies 3.9% | |||||||||||
Cintas Corp. | 100,000 | 26,380 | |||||||||
IAA, Inc.* | 170,000 | 8,305 | |||||||||
| Waste Connections, Inc. | 225,000 | 20,677 | |||||||||
55,362 | |||||||||||
Communications Equipment 1.9% | |||||||||||
| Motorola Solutions, Inc. | 150,000 | 27,137 | |||||||||
Construction & Engineering 1.1% | |||||||||||
MasTec, Inc.* | 250,000 | 15,718 | |||||||||
| Number of Shares | Value (000's) | ||||||||||
Containers & Packaging 2.0% | |||||||||||
Ball Corp. | 200,000 | $ | 16,082 | ||||||||
| Packaging Corp. of America | 125,000 | 12,573 | |||||||||
28,655 | |||||||||||
Diversified Consumer Services 3.3% | |||||||||||
| Bright Horizons Family Solutions, Inc.* | 162,000 | 26,738 | |||||||||
Chegg, Inc.* | 150,000 | 5,946 | |||||||||
| Service Corp. International | 330,000 | 15,279 | |||||||||
47,963 | |||||||||||
Electrical Equipment 1.3% | |||||||||||
AMETEK, Inc. | 225,000 | 19,334 | |||||||||
Electronic Equipment, Instruments & Components 5.8% | |||||||||||
| Amphenol Corp. Class A | 209,500 | 18,340 | |||||||||
CDW Corp. | 247,500 | 28,586 | |||||||||
| Keysight Technologies, Inc.* | 220,000 | 21,309 | |||||||||
Trimble, Inc.* | 410,000 | 15,383 | |||||||||
83,618 | |||||||||||
Entertainment 2.2% | |||||||||||
| Take-Two Interactive Software, Inc.* | 150,000 | 19,795 | |||||||||
| World Wrestling Entertainment, Inc. Class A(a) | 160,000 | 11,429 | |||||||||
31,224 | |||||||||||
Food & Staples Retailing 0.7% | |||||||||||
| BJ's Wholesale Club Holdings, Inc.* | 387,500 | 10,176 | |||||||||
Food Products 0.6% | |||||||||||
| Lamb Weston Holdings, Inc. | 130,000 | 9,151 | |||||||||
Health Care Equipment & Supplies 7.2% | |||||||||||
Alcon, Inc.* | 125,000 | 7,620 | |||||||||
| Haemonetics Corp.* | 70,000 | 9,347 | |||||||||
| Hill-Rom Holdings, Inc. | 135,000 | 14,537 | |||||||||
| IDEXX Laboratories, Inc.* | 55,000 | 15,936 | |||||||||
Insulet Corp.* | 135,000 | 20,813 | |||||||||
Masimo Corp.* | 50,000 | 7,662 | |||||||||
Penumbra, Inc.* | 85,000 | 12,372 | |||||||||
Teleflex, Inc. | 42,500 | 15,466 | |||||||||
103,753 | |||||||||||
| Number of Shares | Value (000's) | ||||||||||
Health Care Providers & Services 1.4% | |||||||||||
| Encompass Health Corp. | 100,000 | $ | 6,079 | ||||||||
| Guardant Health, Inc.* | 75,000 | 6,565 | |||||||||
| WellCare Health Plans, Inc.* | 27,500 | 7,445 | |||||||||
20,089 | |||||||||||
Health Care Technology 2.2% | |||||||||||
| Teladoc Health, Inc.*(a) | 120,000 | 6,945 | |||||||||
| Veeva Systems, Inc. Class A* | 155,000 | 24,859 | |||||||||
31,804 | |||||||||||
Hotels, Restaurants & Leisure 3.6% | |||||||||||
| Eldorado Resorts, Inc.*(a) | 140,000 | 5,391 | |||||||||
| Norwegian Cruise Line Holdings Ltd.* | 300,000 | 15,225 | |||||||||
| Planet Fitness, Inc. Class A* | 105,000 | 7,414 | |||||||||
| Red Rock Resorts, Inc. Class A | 375,000 | 7,819 | |||||||||
Vail Resorts, Inc. | 65,000 | 15,358 | |||||||||
51,207 | |||||||||||
Household Products 1.0% | |||||||||||
| Church & Dwight Co., Inc. | 175,000 | 13,962 | |||||||||
Independent Power and Renewable Electricity Producers 1.0% | |||||||||||
| Vistra Energy Corp. | 577,000 | 14,396 | |||||||||
Industrial Conglomerates 1.7% | |||||||||||
| Roper Technologies, Inc. | 68,000 | 24,940 | |||||||||
Insurance 0.6% | |||||||||||
Assurant, Inc. | 75,000 | 9,225 | |||||||||
Interactive Media & Services 1.2% | |||||||||||
| IAC/ InterActiveCorp* | 70,000 | 17,825 | |||||||||
Internet & Direct Marketing Retail 0.7% | |||||||||||
Etsy, Inc.* | 185,000 | 9,766 | |||||||||
IT Services 9.4% | |||||||||||
| EPAM Systems, Inc.* | 82,500 | 15,785 | |||||||||
Fiserv, Inc.* | 175,000 | 18,714 | |||||||||
| Global Payments, Inc. | 125,000 | 20,747 | |||||||||
Okta, Inc.* | 160,000 | 20,240 | |||||||||
| Square, Inc. Class A* | 230,000 | 14,223 | |||||||||
See Notes to Financial Statements
135
Schedule of Investments Mid Cap Growth Fund^ (cont'd)
| Number of Shares | Value (000's) | ||||||||||
| Total System Services, Inc. | 125,000 | $ | 16,778 | ||||||||
| Twilio, Inc. Class A*(a) | 167,500 | 21,854 | |||||||||
Wix.com Ltd.* | 45,000 | 6,311 | |||||||||
134,652 | |||||||||||
Life Sciences Tools & Services 2.6% | |||||||||||
| Bio-Rad Laboratories, Inc. Class A* | 72,500 | 24,484 | |||||||||
| PRA Health Sciences, Inc.* | 130,000 | 12,849 | |||||||||
37,333 | |||||||||||
Machinery 3.5% | |||||||||||
Fortive Corp. | 100,000 | 7,090 | |||||||||
IDEX Corp. | 130,000 | 21,412 | |||||||||
| Stanley Black & Decker, Inc. | 77,500 | 10,297 | |||||||||
Xylem, Inc. | 140,000 | 10,725 | |||||||||
49,524 | |||||||||||
Media 1.7% | |||||||||||
| Altice USA, Inc. Class A* | 600,000 | 17,328 | |||||||||
| Nexstar Media Group, Inc. Class A | 77,500 | 7,664 | |||||||||
24,992 | |||||||||||
Oil, Gas & Consumable Fuels 0.6% | |||||||||||
| Cheniere Energy, Inc.* | 70,000 | 4,180 | |||||||||
ONEOK, Inc. | 65,000 | 4,633 | |||||||||
8,813 | |||||||||||
Pharmaceuticals 0.6% | |||||||||||
Catalent, Inc.* | 150,000 | 7,911 | |||||||||
Professional Services 2.1% | |||||||||||
| CoStar Group, Inc.* | 50,000 | 30,744 | |||||||||
Road & Rail 0.6% | |||||||||||
| Old Dominion Freight Line, Inc. | 50,000 | 8,188 | |||||||||
Semiconductors & Semiconductor Equipment 5.7% | |||||||||||
| Advanced Micro Devices, Inc.* | 950,000 | 29,877 | |||||||||
KLA Corp. | 90,000 | 13,311 | |||||||||
| Monolithic Power Systems, Inc. | 135,000 | 20,326 | |||||||||
Xilinx, Inc. | 175,000 | 18,211 | |||||||||
81,725 | |||||||||||
| Number of Shares | Value (000's) | ||||||||||
Software 9.0% | |||||||||||
HubSpot, Inc.* | 55,000 | $ | 10,982 | ||||||||
| Paylocity Holding Corp.* | 100,000 | 10,922 | |||||||||
Proofpoint, Inc.* | 137,500 | 15,621 | |||||||||
| Q2 Holdings, Inc.* | 150,000 | 13,493 | |||||||||
| RingCentral, Inc. Class A* | 190,000 | 26,815 | |||||||||
Splunk, Inc.* | 170,000 | 19,009 | |||||||||
| Trade Desk, Inc. Class A* | 50,000 | 12,289 | |||||||||
Zendesk, Inc.* | 155,000 | 12,431 | |||||||||
Zscaler, Inc.* | 120,000 | 8,249 | |||||||||
129,811 | |||||||||||
Specialty Retail 5.0% | |||||||||||
| Burlington Stores, Inc.* | 110,000 | 22,274 | |||||||||
Five Below, Inc.* | 132,500 | 16,280 | |||||||||
| O'Reilly Automotive, Inc.* | 41,000 | 15,734 | |||||||||
Ross Stores, Inc. | 75,000 | 7,951 | |||||||||
| Ulta Beauty, Inc.* | 37,500 | 8,915 | |||||||||
71,154 | |||||||||||
Textiles, Apparel & Luxury Goods 0.6% | |||||||||||
| Columbia Sportswear Co. | 90,000 | 8,441 | |||||||||
Trading Companies & Distributors 0.6% | |||||||||||
| United Rentals, Inc.* | 75,000 | 8,442 | |||||||||
| Total Common Stocks (Cost $977,062) | 1,398,000 | ||||||||||
| Number of Shares | Value (000's) | ||||||||||
Short-Term Investments 4.2% | |||||||||||
Investment Companies 4.2% | |||||||||||
| State Street Institutional U.S. Government Money Market Fund Premier Class, 2.07%(b) | 40,203,792 | $ | 40,204 | ||||||||
| State Street Navigator Securities Lending Government Money Market Portfolio, 2.12%(b)(c) | 20,415,604 | 20,416 | |||||||||
| Total Short-Term Investments (Cost $60,620) | 60,620 | ||||||||||
| Total Investments 101.5% (Cost $1,037,682) | 1,458,620 | ||||||||||
| Liabilities Less Other Assets (1.5)% | (21,016 | ) | |||||||||
Net Assets 100.0% | $ | 1,437,604 | |||||||||
See Notes to Financial Statements
136
Schedule of Investments Mid Cap Growth Fund^ (cont'd)
* Non-income producing security.
(a) The security or a portion of this security is on loan at August 31, 2019. Total value of all such securities at August 31, 2019 amounted to approximately $19,924,000 for the Fund (see Note A of the Notes to Financial Statements).
(b) Represents 7-day effective yield as of August 31, 2019.
(c) Represents investment of cash collateral received from securities lending.
The following is a summary, categorized by Level (see Note A of Notes to Financial Statements), of inputs used to value the Fund's investments as of August 31, 2019:
Asset Valuation Inputs | |||||||||||||||||||
(000's omitted) | Level 1 | Level 2 | Level 3 | Total | |||||||||||||||
Investments: | |||||||||||||||||||
| Common Stocks(a) | $ | 1,398,000 | $ | — | $ | — | $ | 1,398,000 | |||||||||||
Short-Term Investments | — | 60,620 | — | 60,620 | |||||||||||||||
Total Investments | $ | 1,398,000 | $ | 60,620 | $ | — | $ | 1,458,620 | |||||||||||
(a) The Schedule of Investments provides information on the industry categorization for the portfolio.
^ A balance indicated with a "—", reflects either a zero balance or an amount that rounds to less than 1.
See Notes to Financial Statements
137
Schedule of Investments Mid Cap Intrinsic Value Fund^ August 31, 2019
Number of Shares | Value (000's) | ||||||||||
Common Stocks 99.7% | |||||||||||
Aerospace & Defense 7.8% | |||||||||||
| General Dynamics Corp. | 19,550 | $ | 3,739 | ||||||||
Hexcel Corp. | 24,300 | 2,045 | |||||||||
| Spirit AeroSystems Holdings, Inc. Class A | 17,600 | 1,419 | |||||||||
7,203 | |||||||||||
Airlines 2.3% | |||||||||||
| American Airlines Group, Inc. | 33,300 | 876 | |||||||||
| JetBlue Airways Corp.* | 69,600 | 1,206 | |||||||||
2,082 | |||||||||||
Auto Components 1.5% | |||||||||||
Aptiv PLC | 16,100 | 1,339 | |||||||||
Banks 9.4% | |||||||||||
BankUnited, Inc. | 69,400 | 2,204 | |||||||||
BB&T Corp. | 38,900 | 1,854 | |||||||||
Comerica, Inc. | 39,600 | 2,441 | |||||||||
KeyCorp | 128,900 | 2,140 | |||||||||
8,639 | |||||||||||
Beverages 2.2% | |||||||||||
| Molson Coors Brewing Co. Class B | 39,300 | 2,018 | |||||||||
Biotechnology 2.1% | |||||||||||
| Alexion Pharmaceuticals, Inc.* | 19,200 | 1,935 | |||||||||
Building Products 1.5% | |||||||||||
| Johnson Controls International PLC | 32,600 | 1,392 | |||||||||
Capital Markets 2.0% | |||||||||||
State Street Corp. | 35,200 | 1,806 | |||||||||
Chemicals 1.9% | |||||||||||
| Ashland Global Holdings, Inc. | 24,400 | 1,787 | |||||||||
| Commercial Services & Supplies 2.8% | |||||||||||
| Covanta Holding Corp. | 114,900 | 1,976 | |||||||||
| KAR Auction Services, Inc. | 24,400 | 648 | |||||||||
2,624 | |||||||||||
Communications Equipment 1.6% | |||||||||||
Ciena Corp.* | 35,600 | 1,457 | |||||||||
Construction & Engineering 2.2% | |||||||||||
| Valmont Industries, Inc. | 15,100 | 2,046 | |||||||||
Electric Utilities 2.3% | |||||||||||
Evergy, Inc. | 33,200 | 2,158 | |||||||||
Number of Shares | Value (000's) | ||||||||||
Electronic Equipment, Instruments & Components 3.5% | |||||||||||
Itron, Inc.* | 46,200 | $ | 3,209 | ||||||||
Entertainment 1.6% | |||||||||||
| Lions Gate Entertainment Corp. Class A | 27,700 | 250 | |||||||||
| Lions Gate Entertainment Corp. Class B | 152,700 | 1,274 | |||||||||
1,524 | |||||||||||
| Equity Real Estate Investment Trusts 0.7% | |||||||||||
CoreCivic, Inc. | 40,600 | 688 | |||||||||
Food Products 4.2% | |||||||||||
| Hain Celestial Group, Inc.* | 97,500 | 1,857 | |||||||||
| TreeHouse Foods, Inc.* | 39,900 | 2,021 | |||||||||
3,878 | |||||||||||
| Health Care Equipment & Supplies 3.7% | |||||||||||
| Zimmer Biomet Holdings, Inc. | 24,400 | 3,396 | |||||||||
Health Care Providers & Services 1.0% | |||||||||||
MEDNAX, Inc.* | 43,700 | 921 | |||||||||
Hotels, Restaurants & Leisure 8.4% | |||||||||||
| International Game Technology PLC | 178,400 | 2,137 | |||||||||
| MGM Resorts International | 86,600 | 2,430 | |||||||||
| Wyndham Destinations, Inc. | 72,700 | 3,224 | |||||||||
7,791 | |||||||||||
Independent Power and Renewable Electricity Producers 2.4% | |||||||||||
AES Corp. | 70,900 | 1,087 | |||||||||
Vistra Energy Corp. | 44,600 | 1,113 | |||||||||
2,200 | |||||||||||
IT Services 2.6% | |||||||||||
Amdocs Ltd. | 18,400 | 1,191 | |||||||||
Conduent, Inc.* | 188,300 | 1,226 | |||||||||
2,417 | |||||||||||
Mortgage Real Estate Investment 2.7% | |||||||||||
| Starwood Property Trust, Inc. | 105,500 | 2,472 | |||||||||
Oil, Gas & Consumable Fuels 8.7% | |||||||||||
| Cabot Oil & Gas Corp. | 97,500 | 1,669 | |||||||||
| Devon Energy Corp. | 77,800 | 1,711 | |||||||||
ONEOK, Inc. | 36,100 | 2,573 | |||||||||
Williams Cos., Inc. | 88,300 | 2,084 | |||||||||
8,037 | |||||||||||
Number of Shares | Value (000's) | ||||||||||
Semiconductors & Semiconductor Equipment 2.8% | |||||||||||
| ON Semiconductor Corp.* | 78,300 | $ | 1,394 | ||||||||
| Skyworks Solutions, Inc. | 16,400 | 1,234 | |||||||||
2,628 | |||||||||||
Software 4.6% | |||||||||||
| Nuance Communications, Inc.* | 161,700 | 2,718 | |||||||||
Teradata Corp.* | 48,200 | 1,488 | |||||||||
4,206 | |||||||||||
Specialty Retail 6.7% | |||||||||||
Best Buy Co., Inc. | 20,400 | 1,298 | |||||||||
Chico's FAS, Inc. | 205,100 | 640 | |||||||||
| Children's Place, Inc. | 24,900 | 2,173 | |||||||||
| Party City Holdco, Inc.* | 442,400 | 2,079 | |||||||||
6,190 | |||||||||||
Technology Hardware, Storage & Peripherals 2.4% | |||||||||||
| Western Digital Corp. | 38,636 | 2,213 | |||||||||
| Trading Companies & Distributors 4.1% | |||||||||||
| AerCap Holdings NV* | 70,700 | 3,791 | |||||||||
| Total Common Stocks (Cost $88,657) | 92,047 | ||||||||||
Warrants 0.1% | |||||||||||
Diversified Consumer Services 0.1% | |||||||||||
| OneSpaWorld Holdings Ltd. Expires 3/19/2024* (Cost $—) | 18,168 | 91 | |||||||||
Short-Term Investments 0.2% | |||||||||||
Investment Companies 0.2% | |||||||||||
| State Street Institutional U.S. Government Money Market Fund Premier Class, 2.07%(a) (Cost $211) | 211,177 | 211 | |||||||||
| Total Investments 100.0% (Cost $88,868) | 92,349 | ||||||||||
| Liabilities Less Other Assets (0.0)%(b) | (45 | ) | |||||||||
Net Assets 100.0% | $ | 92,304 | |||||||||
See Notes to Financial Statements
138
Schedule of Investments Mid Cap Intrinsic Value Fund^ (cont'd)
* Non-income producing security.
(a) Represents 7-day effective yield as of August 31, 2019.
(b) Represents less than 0.05% of net assets of the Fund.
The following is a summary, categorized by Level (see Note A of Notes to Financial Statements), of inputs used to value the Fund's investments as of August 31, 2019:
Asset Valuation Inputs | |||||||||||||||||||
(000's omitted) | Level 1 | Level 2 | Level 3 | Total | |||||||||||||||
Investments: | |||||||||||||||||||
| Common Stocks(a) | $ | 92,047 | $ | — | $ | — | $ | 92,047 | |||||||||||
| Warrants(a) | 91 | — | — | 91 | |||||||||||||||
Short-Term Investments | — | 211 | — | 211 | |||||||||||||||
Total Investments | $ | 92,138 | $ | 211 | $ | — | $ | 92,349 | |||||||||||
(a) The Schedule of Investments provides information on the industry categorization for the portfolio.
^ A balance indicated with a "—", reflects either a zero balance or an amount that rounds to less than 1.
See Notes to Financial Statements
139
Schedule of Investments Multi-Cap Opportunities Fund^ August 31, 2019
Number of Shares | Value (000's) | ||||||||||
Common Stocks 98.5% | |||||||||||
Aerospace & Defense 5.3% | |||||||||||
Boeing Co. | 102,000 | $ | 37,137 | ||||||||
Raytheon Co. | 138,000 | 25,574 | |||||||||
62,711 | |||||||||||
Banks 4.6% | |||||||||||
| JPMorgan Chase & Co. | 500,000 | 54,930 | |||||||||
Capital Markets 8.8% | |||||||||||
| Brookfield Asset Management, Inc. Class A | 1,170,000 | 60,384 | |||||||||
| Charles Schwab Corp. | 780,000 | 29,850 | |||||||||
| Goldman Sachs Group, Inc. | 69,000 | 14,070 | |||||||||
104,304 | |||||||||||
Chemicals 2.4% | |||||||||||
Methanex Corp. | 145,000 | 4,707 | |||||||||
| Sherwin-Williams Co. | 46,000 | 24,230 | |||||||||
28,937 | |||||||||||
Communications Equipment 7.7% | |||||||||||
| Cisco Systems, Inc. | 890,000 | 41,661 | |||||||||
| Motorola Solutions, Inc. | 275,000 | 49,750 | |||||||||
91,411 | |||||||||||
Construction Materials 0.6% | |||||||||||
| Eagle Materials, Inc. | 90,000 | 7,577 | |||||||||
Containers & Packaging 3.3% | |||||||||||
Ball Corp. | 490,000 | 39,401 | |||||||||
Diversified Financial Services 5.1% | |||||||||||
| Berkshire Hathaway, Inc. Class B* | 300,000 | 61,023 | |||||||||
Electrical Equipment 1.9% | |||||||||||
| Rockwell Automation, Inc. | 145,000 | 22,155 | |||||||||
Entertainment 1.6% | |||||||||||
| Activision Blizzard, Inc. | 385,000 | 19,481 | |||||||||
Food & Staples Retailing 5.2% | |||||||||||
| US Foods Holding Corp.* | 1,530,000 | 61,889 | |||||||||
Number of Shares | Value (000's) | ||||||||||
Food Products 2.3% | |||||||||||
| Lamb Weston Holdings, Inc. | 130,000 | $ | 9,151 | ||||||||
| Mondelez International, Inc. Class A | 330,000 | 18,222 | |||||||||
27,373 | |||||||||||
| Health Care Equipment & Supplies 1.5% | |||||||||||
| Hill-Rom Holdings, Inc. | 160,000 | 17,229 | |||||||||
Health Care Providers & Services 4.5% | |||||||||||
| HCA Healthcare, Inc. | 345,000 | 41,469 | |||||||||
| Universal Health Services, Inc. Class B | 85,000 | 12,289 | |||||||||
53,758 | |||||||||||
Hotels, Restaurants & Leisure 3.9% | |||||||||||
Aramark | 565,000 | 23,086 | |||||||||
McDonald's Corp. | 105,000 | 22,887 | |||||||||
45,973 | |||||||||||
Industrial Conglomerates 1.0% | |||||||||||
3M Co. | 71,000 | 11,482 | |||||||||
Insurance 3.2% | |||||||||||
Chubb Ltd. | 240,000 | 37,507 | |||||||||
Interactive Media & Services 4.9% | |||||||||||
| Alphabet, Inc. Class C* | 49,000 | 58,217 | |||||||||
IT Services 2.0% | |||||||||||
| PayPal Holdings, Inc.* | 215,000 | 23,446 | |||||||||
Machinery 4.1% | |||||||||||
| Allison Transmission Holdings, Inc. | 260,000 | 11,552 | |||||||||
| Stanley Black & Decker, Inc. | 275,000 | 36,536 | |||||||||
48,088 | |||||||||||
Media 3.0% | |||||||||||
| Comcast Corp. Class A | 790,000 | 34,965 | |||||||||
Oil, Gas & Consumable Fuels 1.4% | |||||||||||
| EOG Resources, Inc. | 230,000 | 17,064 | |||||||||
Number of Shares | Value (000's) | ||||||||||
Pharmaceuticals 2.3% | |||||||||||
Pfizer, Inc. | 765,000 | $ | 27,196 | ||||||||
Road & Rail 3.6% | |||||||||||
CSX Corp. | 635,000 | 42,558 | |||||||||
Semiconductors & Semiconductor Equipment 2.1% | |||||||||||
| Analog Devices, Inc. | 228,000 | 25,041 | |||||||||
Software 4.0% | |||||||||||
Microsoft Corp. | 343,000 | 47,286 | |||||||||
Specialty Retail 1.8% | |||||||||||
Lowe's Cos., Inc. | 190,000 | 21,318 | |||||||||
Technology Hardware, Storage & Peripherals 4.0% | |||||||||||
Apple, Inc. | 230,000 | 48,010 | |||||||||
Textiles, Apparel & Luxury Goods 2.4% | |||||||||||
| NIKE, Inc. Class B | 340,000 | 28,730 | |||||||||
| Total Common Stocks (Cost $677,320) | 1,169,060 | ||||||||||
Short-Term Investments 1.4% | |||||||||||
Investment Companies 1.4% | |||||||||||
| State Street Institutional Treasury Money Market Fund Premier Class, 2.03%(a) (Cost $16,859) | 16,858,718 | 16,859 | |||||||||
| Total Investments 99.9% (Cost $694,179) | 1,185,919 | ||||||||||
| Other Assets Less Liabilities 0.1% | 1,500 | ||||||||||
Net Assets 100.0% | $ | 1,187,419 | |||||||||
See Notes to Financial Statements
140
Schedule of Investments Multi-Cap Opportunities Fund^ (cont'd)
* Non-income producing security.
(a) Represents 7-day effective yield as of August 31, 2019.
The following is a summary, categorized by Level (see Note A of Notes to Financial Statements), of inputs used to value the Fund's investments as of August 31, 2019:
Asset Valuation Inputs | |||||||||||||||||||
(000's omitted) | Level 1 | Level 2 | Level 3 | Total | |||||||||||||||
Investments: | |||||||||||||||||||
| Common Stocks(a) | $ | 1,169,060 | $ | — | $ | — | $ | 1,169,060 | |||||||||||
Short-Term Investments | — | 16,859 | — | 16,859 | |||||||||||||||
Total Investments | $ | 1,169,060 | $ | 16,859 | $ | — | $ | 1,185,919 | |||||||||||
(a) The Schedule of Investments provides information on the industry categorization for the portfolio.
^ A balance indicated with a "—", reflects either a zero balance or an amount that rounds to less than 1.
See Notes to Financial Statements
141
Schedule of Investments Real Estate Fund^ August 31, 2019
Number of Shares | Value (000's) | ||||||||||
Common Stocks 98.6% | |||||||||||
Apartments 13.5% | |||||||||||
| Apartment Investment & Management Co. Class A | 310,442 | $ | 15,833 | ||||||||
Equity Residential | 338,606 | 28,700 | |||||||||
| Essex Property Trust, Inc. | 77,626 | 24,938 | |||||||||
69,471 | |||||||||||
Data Centers 11.0% | |||||||||||
CyrusOne, Inc. | 252,585 | 18,555 | |||||||||
| Digital Realty Trust, Inc. | 90,412 | 11,178 | |||||||||
Equinix, Inc. | 48,120 | 26,768 | |||||||||
56,501 | |||||||||||
Free Standing 6.1% | |||||||||||
| Four Corners Property Trust, Inc. | 237,570 | 6,768 | |||||||||
| National Retail Properties, Inc. | 252,051 | 14,153 | |||||||||
| Spirit Realty Capital, Inc. | 216,975 | 10,402 | |||||||||
31,323 | |||||||||||
Health Care 7.6% | |||||||||||
HCP, Inc. | 362,848 | 12,595 | |||||||||
| Healthcare Trust of America, Inc. Class A | 332,229 | 9,422 | |||||||||
Welltower, Inc. | 192,109 | 17,205 | |||||||||
39,222 | |||||||||||
Hotels, Restaurants & Leisure 1.3% | |||||||||||
| Hyatt Hotels Corp. Class A | 92,439 | 6,669 | |||||||||
Industrial 8.0% | |||||||||||
| Liberty Property Trust | 231,190 | 12,049 | |||||||||
Prologis, Inc. | 261,851 | 21,896 | |||||||||
| Rexford Industrial Realty, Inc. | 160,639 | 7,099 | |||||||||
41,044 | |||||||||||
Number of Shares | Value (000's) | ||||||||||
Infrastructure 17.5% | |||||||||||
| American Tower Corp. | 197,628 | $ | 45,492 | ||||||||
| Crown Castle International Corp. | 159,482 | 23,152 | |||||||||
| SBA Communications Corp. | 79,944 | 20,980 | |||||||||
89,624 | |||||||||||
IT Services 1.1% | |||||||||||
| InterXion Holding NV* | 70,938 | 5,742 | |||||||||
Manufactured Homes 6.6% | |||||||||||
| Equity LifeStyle Properties, Inc. | 156,386 | 21,068 | |||||||||
| Sun Communities, Inc. | 84,825 | 12,537 | |||||||||
33,605 | |||||||||||
Office 6.0% | |||||||||||
| Douglas Emmett, Inc. | 357,848 | 15,101 | |||||||||
| Highwoods Properties, Inc. | 141,414 | 6,111 | |||||||||
| SL Green Realty Corp. | 118,200 | 9,482 | |||||||||
30,694 | |||||||||||
Real Estate Management & Development 1.5% | |||||||||||
| Brookfield Asset Management, Inc. Class A | 148,305 | 7,654 | |||||||||
Regional Malls 2.9% | |||||||||||
Macerich Co. | 100,611 | 2,870 | |||||||||
| Simon Property Group, Inc. | 81,279 | 12,106 | |||||||||
14,976 | |||||||||||
Self Storage 6.5% | |||||||||||
| Extra Space Storage, Inc. | 88,458 | 10,785 | |||||||||
Public Storage | 84,731 | 22,431 | |||||||||
33,216 | |||||||||||
Number of Shares | Value (000's) | ||||||||||
Shopping Centers 2.5% | |||||||||||
| Kimco Realty Corp. | 262,055 | $ | 4,817 | ||||||||
| Regency Centers Corp. | 125,741 | 8,111 | |||||||||
12,928 | |||||||||||
Single Family Homes 3.5% | |||||||||||
| American Homes 4 Rent Class A | 697,667 | 17,847 | |||||||||
Timber 3.0% | |||||||||||
Weyerhaeuser Co. | 578,743 | 15,227 | |||||||||
| Total Common Stocks (Cost $404,707) | 505,743 | ||||||||||
Short-Term Investments 1.3% | |||||||||||
Investment Companies 1.3% | |||||||||||
| State Street Institutional U.S. Government Money Market Fund Premier Class, 2.07%(a) (Cost $6,842) | 6,842,409 | 6,842 | |||||||||
| Total Investments 99.9% (Cost $411,549) | 512,585 | ||||||||||
| Other Assets Less Liabilities 0.1% | 345 | ||||||||||
Net Assets 100.0% | $ | 512,930 | |||||||||
See Notes to Financial Statements
142
Schedule of Investments Real Estate Fund^ (cont'd)
* Non-income producing security.
(a) Represents 7-day effective yield as of August 31, 2019.
The following is a summary, categorized by Level (see Note A of Notes to Financial Statements), of inputs used to value the Fund's investments as of August 31, 2019:
Asset Valuation Inputs | |||||||||||||||||||
(000's omitted) | Level 1 | Level 2 | Level 3 | Total | |||||||||||||||
Investments: | |||||||||||||||||||
| Common Stocks(a) | $ | 505,743 | $ | — | $ | — | $ | 505,743 | |||||||||||
Short-Term Investments | — | 6,842 | — | 6,842 | |||||||||||||||
Total Investments | $ | 505,743 | $ | 6,842 | $ | — | $ | 512,585 | |||||||||||
(a) The Schedule of Investments provides information on the industry categorization for the portfolio.
^ A balance indicated with a "—", reflects either a zero balance or an amount that rounds to less than 1.
See Notes to Financial Statements
143
Schedule of Investments Small Cap Growth Fund^ August 31, 2019
Number of Shares | Value (000's) | ||||||||||
Common Stocks 101.1% | |||||||||||
Aerospace & Defense 4.0% | |||||||||||
| Axon Enterprise, Inc.* | 43,800 | $ | 2,627 | ||||||||
Cubic Corp. | 41,300 | 2,861 | |||||||||
| Mercury Systems, Inc.* | 46,600 | 3,990 | |||||||||
9,478 | |||||||||||
Auto Components 0.3% | |||||||||||
| Dorman Products, Inc.* | 11,900 | 846 | |||||||||
Banks 0.5% | |||||||||||
| Pinnacle Financial Partners, Inc. | 24,600 | 1,296 | |||||||||
Beverages 0.7% | |||||||||||
| Boston Beer Co., Inc. Class A* | 3,700 | 1,622 | |||||||||
Biotechnology 15.9% | |||||||||||
| ACADIA Pharmaceuticals, Inc.* | 50,300 | 1,391 | |||||||||
| Alder Biopharmaceuticals, Inc.* | 267,500 | 2,394 | |||||||||
| Amarin Corp. PLC ADR*(a) | 156,500 | 2,346 | |||||||||
| Amicus Therapeutics, Inc.* | 312,300 | 3,089 | |||||||||
| Arena Pharmaceuticals, Inc.* | 66,900 | 3,538 | |||||||||
| Biohaven Pharmaceutical Holding Co. Ltd.* | 53,100 | 2,081 | |||||||||
| Blueprint Medicines Corp.* | 26,100 | 2,001 | |||||||||
| Fate Therapeutics, Inc.* | 107,400 | 1,753 | |||||||||
| Global Blood Therapeutics, Inc.* | 72,000 | 3,311 | |||||||||
| KalVista Pharmaceuticals, Inc.* | 89,500 | 1,398 | |||||||||
| Krystal Biotech, Inc.*(a) | 40,600 | 1,827 | |||||||||
| Portola Pharmaceuticals, Inc.*(a) | 124,000 | 3,604 | |||||||||
| PTC Therapeutics, Inc.* | 50,200 | 2,237 | |||||||||
Repligen Corp.* | 45,400 | 4,214 | |||||||||
| Stemline Therapeutics, Inc.* | 107,400 | 1,279 | |||||||||
Number of Shares | Value (000's) | ||||||||||
Veracyte, Inc.* | 55,900 | $ | 1,481 | ||||||||
37,944 | |||||||||||
Building Products 1.8% | |||||||||||
Trex Co., Inc.* | 51,500 | 4,405 | |||||||||
Chemicals 0.5% | |||||||||||
Ingevity Corp.* | 17,000 | 1,295 | |||||||||
Commercial Services & Supplies 4.5% | |||||||||||
| Casella Waste Systems, Inc. Class A* | 76,100 | 3,462 | |||||||||
| Heritage-Crystal Clean, Inc.* | 48,200 | 1,181 | |||||||||
IAA, Inc.* | 62,500 | 3,053 | |||||||||
MSA Safety, Inc. | 28,400 | 3,000 | |||||||||
10,696 | |||||||||||
Construction & Engineering 1.5% | |||||||||||
MasTec, Inc.* | 55,500 | 3,489 | |||||||||
Consumer Finance 0.5% | |||||||||||
| OneMain Holdings, Inc. | 35,900 | 1,287 | |||||||||
Diversified Consumer Services 4.6% | |||||||||||
| Bright Horizons Family Solutions, Inc.* | 15,000 | 2,476 | |||||||||
Chegg, Inc.* | 95,400 | 3,781 | |||||||||
| Grand Canyon Education, Inc.* | 18,000 | 2,261 | |||||||||
| OneSpaWorld Holdings Ltd.*(a) | 161,400 | 2,534 | |||||||||
11,052 | |||||||||||
Diversified Telecommunication Services 3.5% | |||||||||||
| Bandwidth, Inc. Class A* | 94,800 | 8,266 | |||||||||
Entertainment 1.4% | |||||||||||
Marcus Corp. | 41,700 | 1,399 | |||||||||
| World Wrestling Entertainment, Inc. Class A | 28,400 | 2,029 | |||||||||
3,428 | |||||||||||
Food & Staples Retailing 0.7% | |||||||||||
| BJ's Wholesale Club Holdings, Inc.* | 68,000 | 1,786 | |||||||||
Health Care Equipment & Supplies 5.0% | |||||||||||
| Haemonetics Corp.* | 20,800 | 2,778 | |||||||||
| iRhythm Technologies, Inc.* | 31,400 | 2,390 | |||||||||
| Mesa Laboratories, Inc.(a) | 5,000 | 1,106 | |||||||||
Number of Shares | Value (000's) | ||||||||||
| Oxford Immunotec Global PLC* | 143,200 | $ | 1,913 | ||||||||
| Tandem Diabetes Care, Inc.* | 23,500 | 1,702 | |||||||||
| Wright Medical Group NV* | 100,600 | 2,098 | |||||||||
11,987 | |||||||||||
Health Care Providers & Services 2.4% | |||||||||||
HealthEquity, Inc.* | 26,100 | 1,549 | |||||||||
R1 RCM, Inc.* | 355,800 | 4,149 | |||||||||
5,698 | |||||||||||
Health Care Technology 2.6% | |||||||||||
| HMS Holdings Corp.* | 57,300 | 2,093 | |||||||||
| Inspire Medical Systems, Inc.* | 43,900 | 3,052 | |||||||||
| Teladoc Health, Inc.*(a) | 16,800 | 972 | |||||||||
6,117 | |||||||||||
Hotels, Restaurants & Leisure 2.8% | |||||||||||
Denny's Corp.* | 62,000 | 1,462 | |||||||||
| Eldorado Resorts, Inc.*(a) | 26,200 | 1,009 | |||||||||
| Planet Fitness, Inc. Class A* | 29,700 | 2,097 | |||||||||
| Red Rock Resorts, Inc. Class A | 96,200 | 2,006 | |||||||||
6,574 | |||||||||||
Household Durables 1.2% | |||||||||||
| Skyline Champion Corp.* | 105,200 | 2,946 | |||||||||
Insurance 0.9% | |||||||||||
Primerica, Inc. | 17,600 | 2,097 | |||||||||
| Internet & Direct Marketing Retail 2.0% | |||||||||||
Etsy, Inc.* | 89,900 | 4,746 | |||||||||
Life Sciences Tools & Services 0.7% | |||||||||||
Fluidigm Corp.* | 107,500 | 600 | |||||||||
| NeoGenomics, Inc.* | 42,000 | 1,049 | |||||||||
1,649 | |||||||||||
Machinery 3.5% | |||||||||||
| Evoqua Water Technologies Corp.* | 86,000 | 1,329 | |||||||||
Proto Labs, Inc.* | 18,700 | 1,772 | |||||||||
Rexnord Corp.* | 83,500 | 2,186 | |||||||||
Woodward, Inc. | 27,500 | 2,966 | |||||||||
8,253 | |||||||||||
Marine 0.9% | |||||||||||
Kirby Corp.* | 30,200 | 2,222 | |||||||||
See Notes to Financial Statements
144
Schedule of Investments Small Cap Growth Fund^ (cont'd)
Number of Shares | Value (000's) | ||||||||||
Media 1.3% | |||||||||||
Cardlytics, Inc.* | 41,700 | $ | 1,566 | ||||||||
| Nexstar Media Group, Inc. Class A | 15,600 | 1,543 | |||||||||
3,109 | |||||||||||
Multiline Retail 0.6% | |||||||||||
| Ollie's Bargain Outlet Holdings, Inc.* | 25,000 | 1,386 | |||||||||
Personal Products 1.0% | |||||||||||
Inter Parfums, Inc. | 35,500 | 2,282 | |||||||||
Pharmaceuticals 1.9% | |||||||||||
| Axsome Therapeutics, Inc.*(a) | 32,900 | 837 | |||||||||
| GW Pharmaceuticals PLC ADR* | 5,200 | 741 | |||||||||
| Horizon Therapeutics PLC* | 72,900 | 2,014 | |||||||||
| Reata Pharmaceuticals, Inc. Class A* | 11,200 | 864 | |||||||||
4,456 | |||||||||||
Professional Services 2.6% | |||||||||||
Exponent, Inc. | 51,300 | 3,637 | |||||||||
Insperity, Inc. | 24,900 | 2,466 | |||||||||
6,103 | |||||||||||
Number of Shares | Value (000's) | ||||||||||
Real Estate Management & Development 0.8% | |||||||||||
| Redfin Corp.*(a) | 114,100 | $ | 1,927 | ||||||||
Semiconductors & Semiconductor Equipment 4.3% | |||||||||||
| Lattice Semiconductor Corp.* | 217,300 | 4,279 | |||||||||
| Monolithic Power Systems, Inc. | 21,700 | 3,267 | |||||||||
Semtech Corp.* | 64,400 | 2,703 | |||||||||
10,249 | |||||||||||
Software 21.2% | |||||||||||
Anaplan, Inc.* | 54,200 | 2,945 | |||||||||
Avalara, Inc.* | 52,000 | 4,386 | |||||||||
| CyberArk Software Ltd.* | 27,200 | 3,056 | |||||||||
| Descartes Systems Group, Inc.* | 79,300 | 2,813 | |||||||||
Envestnet, Inc.* | 28,100 | 1,608 | |||||||||
Everbridge, Inc.* | 75,300 | 6,491 | |||||||||
Globant SA* | 40,000 | 3,797 | |||||||||
HubSpot, Inc.* | 13,000 | 2,596 | |||||||||
LivePerson, Inc.* | 100,600 | 3,998 | |||||||||
Q2 Holdings, Inc.* | 61,500 | 5,532 | |||||||||
Rapid7, Inc.* | 83,000 | 4,456 | |||||||||
| Smartsheet, Inc. Class A* | 101,000 | 4,908 | |||||||||
| Upland Software, Inc.* | 103,900 | 3,948 | |||||||||
50,534 | |||||||||||
Number of Shares | Value (000's) | ||||||||||
Specialty Retail 1.7% | |||||||||||
Five Below, Inc.* | 12,400 | $ | 1,523 | ||||||||
Monro, Inc. | 31,300 | 2,433 | |||||||||
3,956 | |||||||||||
Tobacco 1.0% | |||||||||||
| Turning Point Brands, Inc.(a) | 65,400 | 2,345 | |||||||||
Trading Companies & Distributors 2.3% | |||||||||||
Air Lease Corp. | 83,000 | 3,448 | |||||||||
| H&E Equipment Services, Inc. | 85,700 | 2,081 | |||||||||
5,529 | |||||||||||
| Total Common Stocks (Cost $233,558) | 241,055 | ||||||||||
Short-Term Investments 6.2% | |||||||||||
Investment Companies 6.2% | |||||||||||
| State Street Navigator Securities Lending Government Money Market Portfolio, 2.12%(b)(c) (Cost $14,921) | 14,920,969 | 14,921 | |||||||||
| Total Investments 107.3% (Cost $248,479) | 255,976 | ||||||||||
| Liabilities Less Other Assets (7.3)% | (17,509 | ) | |||||||||
Net Assets 100.0% | $ | 238,467 | |||||||||
* Non-income producing security.
(a) The security or a portion of this security is on loan at August 31, 2019. Total value of all such securities at August 31, 2019 amounted to approximately $14,531,000 for the Fund (see Note A of the Notes to Financial Statements).
(b) Represents 7-day effective yield as of August 31, 2019.
(c) Represents investment of cash collateral received from securities lending.
The following is a summary, categorized by Level (see Note A of Notes to Financial Statements), of inputs used to value the Fund's investments as of August 31, 2019:
Asset Valuation Inputs | |||||||||||||||||||
(000's omitted) | Level 1 | Level 2 | Level 3 | Total | |||||||||||||||
Investments: | |||||||||||||||||||
| Common Stocks(a) | $ | 241,055 | $ | — | $ | — | $ | 241,055 | |||||||||||
Short-Term Investments | — | 14,921 | — | 14,921 | |||||||||||||||
Total Investments | $ | 241,055 | $ | 14,921 | $ | — | $ | 255,976 | |||||||||||
(a) The Schedule of Investments provides information on the industry categorization for the portfolio.
^ A balance indicated with a "—", reflects either a zero balance or an amount that rounds to less than 1.
See Notes to Financial Statements
145
Schedule of Investments Sustainable Equity Fund^ August 31, 2019
Number of Shares | Value (000's) | ||||||||||
Common Stocks 98.3% | |||||||||||
Airlines 1.6% | |||||||||||
| Ryanair Holdings PLC ADR* | 493,623 | $ | 28,285 | ||||||||
Auto Components 3.2% | |||||||||||
Aptiv PLC | 694,952 | 57,799 | |||||||||
Banks 5.8% | |||||||||||
| JPMorgan Chase & Co. | 509,772 | 56,004 | |||||||||
U.S. Bancorp | 907,370 | 47,809 | |||||||||
103,813 | |||||||||||
Capital Markets 4.2% | |||||||||||
| Intercontinental Exchange, Inc. | 794,727 | 74,291 | |||||||||
Chemicals 2.6% | |||||||||||
| Sherwin-Williams Co. | 88,845 | 46,799 | |||||||||
Communications Equipment 0.9% | |||||||||||
| Arista Networks, Inc.* | 69,148 | 15,670 | |||||||||
Consumer Finance 1.9% | |||||||||||
| American Express Co. | 279,051 | 33,589 | |||||||||
Electrical Equipment 1.9% | |||||||||||
| Vestas Wind Systems A/S | 453,575 | 33,327 | |||||||||
Electronic Equipment, Instruments & Components 1.4% | |||||||||||
| Zebra Technologies Corp. Class A* | 120,093 | 24,623 | |||||||||
Energy Equipment & Services 1.2% | |||||||||||
Schlumberger Ltd. | 686,616 | 22,267 | |||||||||
| Equity Real Estate Investment Trusts 1.5% | |||||||||||
| Weyerhaeuser Co. | 1,044,384 | 27,478 | |||||||||
Food & Staples Retailing 2.8% | |||||||||||
Kroger Co. | 2,149,115 | 50,891 | |||||||||
Health Care Equipment & Supplies 10.0% | |||||||||||
| Becton, Dickinson & Co. | 237,740 | 60,367 | |||||||||
Danaher Corp. | 407,776 | 57,941 | |||||||||
Medtronic PLC | 559,395 | 60,353 | |||||||||
178,661 | |||||||||||
Health Care Providers & Services 7.2% | |||||||||||
| AmerisourceBergen Corp. | 637,503 | 52,448 | |||||||||
Cigna Corp. | 337,242 | 51,925 | |||||||||
| Premier, Inc. Class A* | 713,622 | 25,162 | |||||||||
129,535 | |||||||||||
Number of Shares | Value (000's) | ||||||||||
Hotels, Restaurants & Leisure 2.8% | |||||||||||
| Compass Group PLC | 1,953,931 | $ | 49,524 | ||||||||
Insurance 2.5% | |||||||||||
Progressive Corp. | 590,094 | 44,729 | |||||||||
Interactive Media & Services 3.3% | |||||||||||
| Alphabet, Inc. Class A* | 50,221 | 59,790 | |||||||||
IT Services 4.7% | |||||||||||
| Cognizant Technology Solutions Corp. Class A | 607,674 | 37,305 | |||||||||
| MasterCard, Inc. Class A | 167,047 | 47,002 | |||||||||
84,307 | |||||||||||
Machinery 3.3% | |||||||||||
| Stanley Black & Decker, Inc. | 449,495 | 59,720 | |||||||||
Media 4.0% | |||||||||||
| Comcast Corp. Class A | 1,614,784 | 71,470 | |||||||||
Oil, Gas & Consumable Fuels 2.4% | |||||||||||
EQT Corp. | 1,283,514 | 13,053 | |||||||||
| Noble Energy, Inc. | 1,343,218 | 30,330 | |||||||||
43,383 | |||||||||||
Personal Products 3.5% | |||||||||||
Unilever NV | 994,678 | 61,760 | |||||||||
Pharmaceuticals 2.7% | |||||||||||
| Roche Holding AG | 176,931 | 48,373 | |||||||||
Professional Services 0.9% | |||||||||||
| Manpower Group, Inc. | 186,507 | 15,245 | |||||||||
Road & Rail 0.9% | |||||||||||
CSX Corp. | 233,576 | 15,654 | |||||||||
Semiconductors & Semiconductor Equipment 4.3% | |||||||||||
| Texas Instruments, Inc. | 616,707 | 76,318 | |||||||||
Software 5.7% | |||||||||||
Intuit, Inc. | 145,676 | 42,007 | |||||||||
Microsoft Corp. | 434,263 | 59,868 | |||||||||
101,875 | |||||||||||
Specialty Chemicals 2.0% | |||||||||||
| Novozymes A/S B Shares | 828,573 | 35,331 | |||||||||
Specialty Retail 3.5% | |||||||||||
| Advance Auto Parts, Inc. | 449,161 | 61,962 | |||||||||
Number of Shares | Value (000's) | ||||||||||
Textiles, Apparel & Luxury Goods 1.6% | |||||||||||
| Gildan Activewear, Inc. | 798,556 | $ | 29,291 | ||||||||
Trading Companies & Distributors 4.0% | |||||||||||
| United Rentals, Inc.* | 303,938 | 34,211 | |||||||||
| W.W. Grainger, Inc. | 135,614 | 37,111 | |||||||||
71,322 | |||||||||||
| Total Common Stocks (Cost $1,299,256) | 1,757,082 | ||||||||||
| Principal Amount | |||||||||||
Short-Term Investments 1.5% | |||||||||||
| Certificates of Deposit 0.0%(a) | |||||||||||
| Carver Federal Savings Bank, 0.25%, due 9/23/2019 | $ | 100,000 | 100 | ||||||||
| Self Help Federal Credit Union, 0.25%, due 9/21/2019 | 250,000 | 250 | |||||||||
| Self Help Credit Union, 0.25%, due 11/16/2019 | 250,000 | 250 | |||||||||
600 | |||||||||||
| Number of Shares | |||||||||||
Investment Companies 1.5% | |||||||||||
| State Street Institutional Treasury Money Market Fund Premier Class, 2.03%(b) | 26,513,258 | 26,513 | |||||||||
| Total Short-Term Investments (Cost $27,113) | 27,113 | ||||||||||
| Total Investments 99.8% (Cost $1,326,369) | 1,784,195 | ||||||||||
| Other Assets Less Liabilities 0.2% | 3,852 | ||||||||||
Net Assets 100.0% | $ | 1,788,047 | |||||||||
See Notes to Financial Statements
146
Schedule of Investments Sustainable Equity Fund^ (cont'd)
* Non-income producing security.
(a) Represents less than 0.05% of net assets of the Fund.
(b) Represents 7-day effective yield as of August 31, 2019.
The following is a summary, categorized by Level (see Note A of Notes to Financial Statements), of inputs used to value the Fund's investments as of August 31, 2019:
Asset Valuation Inputs | |||||||||||||||||||
(000's omitted) | Level 1 | Level 2 | Level 3 | Total | |||||||||||||||
Investments: | |||||||||||||||||||
| Common Stocks(a) | $ | 1,757,082 | $ | — | $ | — | $ | 1,757,082 | |||||||||||
Short-Term Investments | — | 27,113 | — | 27,113 | |||||||||||||||
Total Investments | $ | 1,757,082 | $ | 27,113 | $ | — | $ | 1,784,195 | |||||||||||
(a) The Schedule of Investments provides information on the industry categorization for the portfolio.
^ A balance indicated with a "—", reflects either a zero balance or an amount that rounds to less than 1.
See Notes to Financial Statements
147
This page has been left blank intentionally
148
Statements of Assets and Liabilities
Neuberger Berman Equity Funds
(000's omitted except per share amounts)
| DIVIDEND GROWTH FUND | EMERGING MARKETS EQUITY FUND | EQUITY INCOME FUND | FOCUS FUND | GENESIS FUND | |||||||||||||||||||
| August 31, 2019 | August 31, 2019 | August 31, 2019 | August 31, 2019 | August 31, 2019 | |||||||||||||||||||
Assets | |||||||||||||||||||||||
Investments in securities, at value*† (Notes A & F)—see Schedule of Investments: | |||||||||||||||||||||||
| Unaffiliated issuers(a) | $ | 54,833 | $ | 1,353,947 | $ | 1,470,149 | $ | 678,694 | $ | 9,134,547 | |||||||||||||
| Affiliated issuers(b) | — | — | — | — | 1,093,552 | ||||||||||||||||||
54,833 | 1,353,947 | 1,470,149 | 678,694 | 10,228,099 | |||||||||||||||||||
| Foreign currency(c) | — | 4,544 | 7,074 | — | — | ||||||||||||||||||
Dividends and interest receivable | 103 | 3,574 | 5,004 | 730 | 7,483 | ||||||||||||||||||
Receivable for securities sold | 525 | 3,613 | 39 | — | 31,129 | ||||||||||||||||||
Receivable for Fund shares sold | 33 | 546 | 517 | 27 | 4,369 | ||||||||||||||||||
Receivable from Management—net (Note B) | 4 | — | — | — | — | ||||||||||||||||||
Receivable for securities lending income (Note A) | — | 2 | — | — | — | ||||||||||||||||||
Prepaid expenses and other assets | 11 | 81 | 66 | 66 | 319 | ||||||||||||||||||
Total Assets | 55,509 | 1,366,307 | 1,482,849 | 679,517 | 10,271,399 | ||||||||||||||||||
Liabilities | |||||||||||||||||||||||
Payable to investment manager—net (Note B) | 23 | 1,114 | 612 | 303 | 5,768 | ||||||||||||||||||
| Option contracts written, at value(d) (Note A) | — | — | 2,804 | — | — | ||||||||||||||||||
Due to custodian | — | — | 13 | — | — | ||||||||||||||||||
Payable for securities purchased | — | 3,378 | 7,074 | — | 5,665 | ||||||||||||||||||
Payable for Fund shares redeemed | — | 1,422 | 1,278 | 394 | 10,749 | ||||||||||||||||||
Payable to administrator—net (Note B) | — | 163 | 399 | 160 | 1,505 | ||||||||||||||||||
Payable to trustees | 5 | 5 | 5 | 5 | 5 | ||||||||||||||||||
Payable for loaned securities collateral (Note A) | — | 9,007 | — | — | — | ||||||||||||||||||
Payable for audit fees | 52 | 58 | 65 | 60 | 65 | ||||||||||||||||||
Payable for custodian fees | 17 | 323 | 47 | 25 | 253 | ||||||||||||||||||
Payable for legal fees | 12 | 12 | 12 | 12 | 16 | ||||||||||||||||||
Payable for shareholder servicing fees | 1 | 61 | 64 | 87 | 207 | ||||||||||||||||||
Other accrued expenses and payables | 8 | 66 | 42 | 42 | 590 | ||||||||||||||||||
Total Liabilities | 118 | 15,609 | 12,415 | 1,088 | 24,823 | ||||||||||||||||||
Net Assets | $ | 55,391 | $ | 1,350,698 | $ | 1,470,434 | $ | 678,429 | $ | 10,246,576 | |||||||||||||
Net Assets consist of: | |||||||||||||||||||||||
Paid-in capital | $ | 50,440 | $ | 1,341,081 | $ | 1,156,827 | $ | 552,189 | $ | 5,075,519 | |||||||||||||
Total distributable earnings/(losses) | 4,951 | 9,617 | 313,607 | 126,240 | 5,171,057 | ||||||||||||||||||
Net Assets | $ | 55,391 | $ | 1,350,698 | $ | 1,470,434 | $ | 678,429 | $ | 10,246,576 | |||||||||||||
Net Assets | |||||||||||||||||||||||
Investor Class | $ | — | $ | — | $ | — | $ | 617,572 | $ | 1,649,326 | |||||||||||||
Trust Class | — | — | — | 46,428 | 1,409,315 | ||||||||||||||||||
Advisor Class | — | — | — | 1,627 | 157,025 | ||||||||||||||||||
Institutional Class | 51,260 | 1,077,044 | 1,147,430 | 8,909 | 2,809,812 | ||||||||||||||||||
Class A | 1,442 | 44,565 | 142,668 | 2,651 | — | ||||||||||||||||||
Class C | 2,652 | 9,064 | 178,465 | 1,242 | — | ||||||||||||||||||
Class R3 | — | 961 | 1,871 | — | — | ||||||||||||||||||
Class R6 | 37 | 219,064 | — | — | 4,221,098 | ||||||||||||||||||
See Notes to Financial Statements
149
| GLOBAL EQUITY FUND | GLOBAL REAL ESTATE FUND | GREATER CHINA EQUITY FUND | GUARDIAN FUND | INTERNATIONAL EQUITY FUND | |||||||||||||||||||
| August 31, 2019 | August 31, 2019 | August 31, 2019 | August 31, 2019 | August 31, 2019 | |||||||||||||||||||
Assets | |||||||||||||||||||||||
Investments in securities, at value*† (Notes A & F)—see Schedule of Investments: | |||||||||||||||||||||||
| Unaffiliated issuers(a) | $ | 3,599 | $ | 4,242 | $ | 49,156 | $ | 1,306,422 | $ | 1,779,642 | |||||||||||||
| Affiliated issuers(b) | — | — | — | — | — | ||||||||||||||||||
3,599 | 4,242 | 49,156 | 1,306,422 | 1,779,642 | |||||||||||||||||||
| Foreign currency(c) | — | 1 | 2,012 | — | 252 | ||||||||||||||||||
Dividends and interest receivable | 9 | 6 | 23 | 1,796 | 5,796 | ||||||||||||||||||
Receivable for securities sold | — | — | 728 | 671 | 821 | ||||||||||||||||||
Receivable for Fund shares sold | 1 | — | 6 | 266 | 833 | ||||||||||||||||||
Receivable from Management—net (Note B) | 31 | 17 | 5 | — | — | ||||||||||||||||||
Receivable for securities lending income (Note A) | — | — | — | 5 | — | ||||||||||||||||||
Prepaid expenses and other assets | 24 | 9 | 27 | 141 | 76 | ||||||||||||||||||
Total Assets | 3,664 | 4,275 | 51,957 | 1,309,301 | 1,787,420 | ||||||||||||||||||
Liabilities | |||||||||||||||||||||||
Payable to investment manager—net (Note B) | 2 | 3 | 48 | 530 | 970 | ||||||||||||||||||
| Option contracts written, at value(d) (Note A) | — | — | — | 2,610 | — | ||||||||||||||||||
Due to custodian | — | — | — | — | — | ||||||||||||||||||
Payable for securities purchased | — | — | 369 | 298 | 490 | ||||||||||||||||||
Payable for Fund shares redeemed | — | — | 12 | 723 | 993 | ||||||||||||||||||
Payable to administrator—net (Note B) | — | — | — | 279 | 232 | ||||||||||||||||||
Payable to trustees | 5 | 5 | 5 | 5 | 5 | ||||||||||||||||||
Payable for loaned securities collateral (Note A) | — | — | — | 43,104 | — | ||||||||||||||||||
Payable for audit fees | 56 | 55 | 55 | 60 | 61 | ||||||||||||||||||
Payable for custodian fees | 20 | 17 | 25 | 40 | 100 | ||||||||||||||||||
Payable for legal fees | 23 | 12 | 14 | 12 | 14 | ||||||||||||||||||
Payable for shareholder servicing fees | — | — | 3 | 164 | 28 | ||||||||||||||||||
Other accrued expenses and payables | 10 | 9 | 11 | 70 | 111 | ||||||||||||||||||
Total Liabilities | 116 | 101 | 542 | 47,895 | 3,004 | ||||||||||||||||||
Net Assets | $ | 3,548 | $ | 4,174 | $ | 51,415 | $ | 1,261,406 | $ | 1,784,416 | |||||||||||||
Net Assets consist of: | |||||||||||||||||||||||
Paid-in capital | $ | 2,564 | $ | 3,600 | $ | 65,015 | $ | 894,291 | $ | 1,682,892 | |||||||||||||
Total distributable earnings/(losses) | 984 | 574 | (13,600 | ) | 367,115 | 101,524 | |||||||||||||||||
Net Assets | $ | 3,548 | $ | 4,174 | $ | 51,415 | $ | 1,261,406 | $ | 1,784,416 | |||||||||||||
Net Assets | |||||||||||||||||||||||
Investor Class | $ | — | $ | — | $ | — | $ | 1,125,679 | $ | 93,320 | |||||||||||||
Trust Class | — | — | — | 45,554 | 30,094 | ||||||||||||||||||
Advisor Class | — | — | — | 157 | — | ||||||||||||||||||
Institutional Class | 3,167 | 3,445 | 45,152 | 83,931 | 1,518,790 | ||||||||||||||||||
Class A | 282 | 387 | 6,094 | 4,072 | 52,178 | ||||||||||||||||||
Class C | 99 | 342 | 169 | 1,840 | 9,621 | ||||||||||||||||||
Class R3 | — | — | — | 146 | — | ||||||||||||||||||
Class R6 | — | — | — | 27 | 80,413 | ||||||||||||||||||
150
Statements of Assets and Liabilities (cont'd)
Neuberger Berman Equity Funds (cont'd)
(000's omitted except per share amounts)
| DIVIDEND GROWTH FUND | EMERGING MARKETS EQUITY FUND | EQUITY INCOME FUND | FOCUS FUND | GENESIS FUND | GLOBAL EQUITY FUND | GLOBAL REAL ESTATE FUND | GREATER CHINA EQUITY FUND | GUARDIAN FUND | |||||||||||||||||||||||||||||||
| August 31, 2019 | August 31, 2019 | August 31, 2019 | August 31, 2019 | August 31, 2019 | August 31, 2019 | August 31, 2019 | August 31, 2019 | August 31, 2019 | |||||||||||||||||||||||||||||||
Shares Outstanding ($.001 par value; unlimited shares authorized) | |||||||||||||||||||||||||||||||||||||||
Investor Class | — | — | — | 23,988 | 28,174 | — | — | — | 61,526 | ||||||||||||||||||||||||||||||
Trust Class | — | — | — | 1,806 | 24,073 | — | — | — | 2,492 | ||||||||||||||||||||||||||||||
Advisor Class | — | — | — | 63 | 2,692 | — | — | — | 9 | ||||||||||||||||||||||||||||||
Institutional Class | 4,002 | 57,405 | 88,368 | 345 | 48,049 | 411 | 288 | 4,866 | 4,582 | ||||||||||||||||||||||||||||||
Class A | 113 | 2,369 | 11,033 | 103 | — | 36 | 32 | 662 | 223 | ||||||||||||||||||||||||||||||
Class C | 209 | 483 | 13,906 | 49 | — | 13 | 29 | 19 | 102 | ||||||||||||||||||||||||||||||
Class R3 | — | 51 | 145 | — | — | — | — | — | 8 | ||||||||||||||||||||||||||||||
Class R6 | 3 | 11,670 | — | — | 72,222 | — | — | — | 1 | ||||||||||||||||||||||||||||||
Net Asset Value, offering and redemption price per share | |||||||||||||||||||||||||||||||||||||||
Investor Class | $ | — | $ | — | $ | — | $ | 25.74 | $ | 58.54 | $ | — | $ | — | $ | — | $ | 18.30 | |||||||||||||||||||||
Trust Class | — | — | — | 25.71 | 58.54 | — | — | — | 18.28 | ||||||||||||||||||||||||||||||
Advisor Class | — | — | — | 25.69 | 58.32 | — | — | — | 18.20 | ||||||||||||||||||||||||||||||
Institutional Class | 12.81 | 18.76 | 12.98 | 25.79 | 58.48 | 7.71 | 11.94 | 9.28 | 18.32 | ||||||||||||||||||||||||||||||
Class R3 | — | 18.83 | 12.90 | — | — | — | — | — | 18.22 | ||||||||||||||||||||||||||||||
Class R6 | 12.82 | 18.77 | — | — | 58.45 | — | — | — | 18.32 | ||||||||||||||||||||||||||||||
Net Asset Value and redemption price per share | |||||||||||||||||||||||||||||||||||||||
Class A | $ | 12.81 | $ | 18.82 | $ | 12.93 | $ | 25.69 | $ | — | $ | 7.75 | $ | 11.93 | $ | 9.21 | $ | 18.28 | |||||||||||||||||||||
Offering Price per share | |||||||||||||||||||||||||||||||||||||||
Class A‡ | $ | 13.59 | $ | 19.97 | $ | 13.72 | $ | 27.26 | $ | — | $ | 8.22 | $ | 12.66 | $ | 9.77 | $ | 19.40 | |||||||||||||||||||||
Net Asset Value and offering price per share | |||||||||||||||||||||||||||||||||||||||
Class C^ | $ | 12.70 | $ | 18.77 | $ | 12.83 | $ | 25.42 | $ | — | $ | 7.70 | $ | 11.89 | $ | 8.68 | $ | 18.10 | |||||||||||||||||||||
†Securities on loan, at value: | |||||||||||||||||||||||||||||||||||||||
Unaffiliated issuers | $ | — | $ | 8,768 | $ | — | $ | — | $ | — | $ | — | $ | — | $ | — | $ | 42,609 | |||||||||||||||||||||
*Cost of Investments: | |||||||||||||||||||||||||||||||||||||||
(a) Unaffiliated issuers | $ | 50,096 | $ | 1,276,264 | $ | 1,197,328 | $ | 557,322 | $ | 4,868,795 | $ | 3,006 | $ | 3,695 | $ | 51,704 | $ | 1,001,065 | |||||||||||||||||||||
(b) Affiliated issuers | — | — | — | — | 682,761 | — | — | — | — | ||||||||||||||||||||||||||||||
Total cost of investments | $ | 50,096 | $ | 1,276,264 | $ | 1,197,328 | $ | 557,322 | $ | 5,551,556 | $ | 3,006 | $ | 3,695 | $ | 51,704 | $ | 1,001,065 | |||||||||||||||||||||
(c) Total cost of foreign currency | $ | — | $ | 4,544 | $ | 7,078 | $ | — | $ | — | $ | — | $ | 1 | $ | 2,029 | $ | — | |||||||||||||||||||||
(d) Premium received from option contracts written | $ | — | $ | — | $ | 1,172 | $ | — | $ | — | $ | — | $ | — | $ | — | $ | 1,492 | |||||||||||||||||||||
‡ On single retail sales of less than $50,000. On sales of $50,000 or more or in certain other circumstances described in the Fund's prospectus, offering price is reduced.
^ Redemption price per share is equal to net asset value less any applicable contingent deferred sales charge.
See Notes to Financial Statements
151
| INTERNATIONAL EQUITY FUND | |||||||
| August 31, 2019 | |||||||
Shares Outstanding ($.001 par value; unlimited shares authorized) | |||||||
Investor Class | 7,485 | ||||||
Trust Class | 2,414 | ||||||
Advisor Class | — | ||||||
Institutional Class | 121,688 | ||||||
Class A | 4,187 | ||||||
Class C | 777 | ||||||
Class R3 | — | ||||||
Class R6 | 6,436 | ||||||
Net Asset Value, offering and redemption price per share | |||||||
Investor Class | $ | 12.47 | |||||
Trust Class | 12.46 | ||||||
Advisor Class | — | ||||||
Institutional Class | 12.48 | ||||||
Class R3 | — | ||||||
Class R6 | 12.49 | ||||||
Net Asset Value and redemption price per share | |||||||
Class A | $ | 12.46 | |||||
Offering Price per share | |||||||
Class A‡ | $ | 13.22 | |||||
Net Asset Value and offering price per share | |||||||
Class C^ | $ | 12.39 | |||||
†Securities on loan, at value: | |||||||
Unaffiliated issuers | $ | — | |||||
*Cost of Investments: | |||||||
(a) Unaffiliated issuers | $ | 1,694,624 | |||||
(b) Affiliated issuers | — | ||||||
Total cost of investments | $ | 1,694,624 | |||||
(c) Total cost of foreign currency | $ | 253 | |||||
(d) Premium received from option contracts written | $ | — | |||||
152
Statements of Assets and Liabilities (cont'd)
Neuberger Berman Equity Funds
(000's omitted except per share amounts)
| INTERNATIONAL SELECT FUND | INTERNATIONAL SMALL CAP FUND | INTRINSIC VALUE FUND | LARGE CAP VALUE FUND | MID CAP GROWTH FUND | |||||||||||||||||||
| August 31, 2019 | August 31, 2019 | August 31, 2019 | August 31, 2019 | August 31, 2019 | |||||||||||||||||||
Assets | |||||||||||||||||||||||
Investments in securities, at value*† (Notes A & F)—see Schedule of Investments: | |||||||||||||||||||||||
| Unaffiliated issuers(a) | $ | 165,224 | $ | 6,212 | $ | 611,171 | $ | 1,872,540 | $ | 1,458,620 | |||||||||||||
| Affiliated issuers(b) | — | — | — | — | — | ||||||||||||||||||
165,224 | 6,212 | 611,171 | 1,872,540 | 1,458,620 | |||||||||||||||||||
| Foreign currency(c) | 23 | 1 | — | — | — | ||||||||||||||||||
Dividends and interest receivable | 849 | 14 | 400 | 5,758 | 538 | ||||||||||||||||||
Receivable for securities sold | 3,954 | — | — | 24,252 | — | ||||||||||||||||||
Receivable for Fund shares sold | 5 | — | 458 | 1,295 | 833 | ||||||||||||||||||
Receivable from Management—net (Note B) | — | 22 | — | — | — | ||||||||||||||||||
Receivable for securities lending income (Note A) | — | 1 | — | 17 | 7 | ||||||||||||||||||
Prepaid expenses and other assets | 57 | 11 | 43 | 142 | 88 | ||||||||||||||||||
Total Assets | 170,112 | 6,261 | 612,072 | 1,904,004 | 1,460,086 | ||||||||||||||||||
Liabilities | |||||||||||||||||||||||
Payable to investment manager—net (Note B) | 80 | 4 | 431 | 715 | 600 | ||||||||||||||||||
| Option contracts written, at value(d) (Note A) | — | — | — | — | — | ||||||||||||||||||
Due to custodian | — | — | — | — | — | ||||||||||||||||||
Payable for securities purchased | 36 | 75 | — | 29,356 | — | ||||||||||||||||||
Payable for Fund shares redeemed | 52 | — | 606 | 1,544 | 924 | ||||||||||||||||||
Payable to administrator—net (Note B) | 4 | — | 91 | 435 | 262 | ||||||||||||||||||
Payable to trustees | 5 | 5 | 5 | 5 | 5 | ||||||||||||||||||
Payable for loaned securities collateral (Note A) | — | 254 | — | 87,881 | 20,416 | ||||||||||||||||||
Payable for audit fees | 60 | 49 | 25 | 59 | 25 | ||||||||||||||||||
Payable for custodian fees | 32 | 22 | 25 | 49 | 43 | ||||||||||||||||||
Payable for legal fees | 12 | 12 | 12 | 44 | 12 | ||||||||||||||||||
Payable for shareholder servicing fees | 2 | — | 5 | 161 | 103 | ||||||||||||||||||
Other accrued expenses and payables | 21 | 11 | 83 | 162 | 92 | ||||||||||||||||||
Total Liabilities | 304 | 432 | 1,283 | 120,411 | 22,482 | ||||||||||||||||||
Net Assets | $ | 169,808 | $ | 5,829 | $ | 610,789 | $ | 1,783,593 | $ | 1,437,604 | |||||||||||||
Net Assets consist of: | |||||||||||||||||||||||
Paid-in capital | $ | 162,323 | $ | 6,508 | $ | 527,209 | $ | 1,563,070 | $ | 956,788 | |||||||||||||
Total distributable earnings/(losses) | 7,485 | (679 | ) | 83,580 | 220,523 | 480,816 | |||||||||||||||||
Net Assets | $ | 169,808 | $ | 5,829 | $ | 610,789 | $ | 1,783,593 | $ | 1,437,604 | |||||||||||||
Net Assets | |||||||||||||||||||||||
Investor Class | $ | — | $ | — | $ | — | $ | 1,174,305 | $ | 513,277 | |||||||||||||
Trust Class | 4,962 | — | — | 81,681 | 77,724 | ||||||||||||||||||
Advisor Class | — | — | — | 114,848 | 11,960 | ||||||||||||||||||
Institutional Class | 128,149 | 5,343 | 574,140 | 339,623 | 273,406 | ||||||||||||||||||
Class A | 3,238 | 139 | 19,665 | 52,463 | 32,991 | ||||||||||||||||||
Class C | 1,530 | 121 | 16,814 | 19,668 | 10,785 | ||||||||||||||||||
Class R3 | 2,308 | — | — | 745 | 56,380 | ||||||||||||||||||
Class R6 | 29,621 | 226 | 170 | 260 | 461,081 | ||||||||||||||||||
See Notes to Financial Statements
153
| MID CAP INTRINSIC VALUE FUND | MULTI-CAP OPPORTUNITIES FUND | REAL ESTATE FUND | SMALL CAP GROWTH FUND | SUSTAINABLE EQUITY FUND | |||||||||||||||||||
| August 31, 2019 | August 31, 2019 | August 31, 2019 | August 31, 2019 | August 31, 2019 | |||||||||||||||||||
Assets | |||||||||||||||||||||||
Investments in securities, at value*† (Notes A & F)—see Schedule of Investments: | |||||||||||||||||||||||
| Unaffiliated issuers(a) | $ | 92,349 | $ | 1,185,919 | $ | 512,585 | $ | 255,976 | $ | 1,784,195 | |||||||||||||
| Affiliated issuers(b) | — | — | — | — | — | ||||||||||||||||||
92,349 | 1,185,919 | 512,585 | 255,976 | 1,784,195 | |||||||||||||||||||
| Foreign currency(c) | — | — | — | — | 1 | ||||||||||||||||||
Dividends and interest receivable | 94 | 2,111 | 336 | 174 | 3,614 | ||||||||||||||||||
Receivable for securities sold | — | — | — | 2,127 | 13,485 | ||||||||||||||||||
Receivable for Fund shares sold | 23 | 552 | 1,734 | 404 | 1,437 | ||||||||||||||||||
Receivable from Management—net (Note B) | — | — | — | 3 | — | ||||||||||||||||||
Receivable for securities lending income (Note A) | — | — | — | 8 | — | ||||||||||||||||||
Prepaid expenses and other assets | 53 | 46 | 49 | 75 | 97 | ||||||||||||||||||
Total Assets | 92,519 | 1,188,628 | 514,704 | 258,767 | 1,802,829 | ||||||||||||||||||
Liabilities | |||||||||||||||||||||||
Payable to investment manager—net (Note B) | — | 552 | 339 | 182 | 739 | ||||||||||||||||||
| Option contracts written, at value(d) (Note A) | — | — | — | — | — | ||||||||||||||||||
Due to custodian | — | — | — | 349 | — | ||||||||||||||||||
Payable for securities purchased | — | — | — | — | 8,486 | ||||||||||||||||||
Payable for Fund shares redeemed | 100 | 283 | 1,241 | 4,739 | 4,849 | ||||||||||||||||||
Payable to administrator—net (Note B) | 23 | 202 | 42 | — | 393 | ||||||||||||||||||
Payable to trustees | 5 | 5 | 5 | 5 | 5 | ||||||||||||||||||
Payable for loaned securities collateral (Note A) | — | — | — | 14,921 | — | ||||||||||||||||||
Payable for audit fees | 26 | 26 | 59 | 25 | 26 | ||||||||||||||||||
Payable for custodian fees | 20 | 37 | 23 | 24 | 66 | ||||||||||||||||||
Payable for legal fees | 12 | 12 | 12 | 12 | 12 | ||||||||||||||||||
Payable for shareholder servicing fees | 14 | 11 | 11 | 26 | 79 | ||||||||||||||||||
Other accrued expenses and payables | 15 | 81 | 42 | 17 | 127 | ||||||||||||||||||
Total Liabilities | 215 | 1,209 | 1,774 | 20,300 | 14,782 | ||||||||||||||||||
Net Assets | $ | 92,304 | $ | 1,187,419 | $ | 512,930 | $ | 238,467 | $ | 1,788,047 | |||||||||||||
Net Assets consist of: | |||||||||||||||||||||||
Paid-in capital | $ | 91,223 | $ | 499,814 | $ | 402,666 | $ | 222,262 | $ | 1,172,985 | |||||||||||||
Total distributable earnings/(losses) | 1,081 | 687,605 | 110,264 | 16,205 | 615,062 | ||||||||||||||||||
Net Assets | $ | 92,304 | $ | 1,187,419 | $ | 512,930 | $ | 238,467 | $ | 1,788,047 | |||||||||||||
Net Assets | |||||||||||||||||||||||
Investor Class | $ | 34,486 | $ | — | $ | — | $ | 65,574 | $ | 446,114 | |||||||||||||
Trust Class | 7,956 | — | 130,334 | 4,587 | 161,261 | ||||||||||||||||||
Advisor Class | — | — | — | 2,787 | — | ||||||||||||||||||
Institutional Class | 40,212 | 1,098,186 | 213,625 | 87,746 | 768,280 | ||||||||||||||||||
Class A | 6,231 | 49,864 | 63,938 | 50,052 | 95,064 | ||||||||||||||||||
Class C | 1,482 | 39,369 | 10,496 | 4,247 | 47,434 | ||||||||||||||||||
Class R3 | 1,913 | — | 20,523 | 2,447 | 31,825 | ||||||||||||||||||
Class R6 | 24 | — | 74,014 | 21,027 | 238,069 | ||||||||||||||||||
154
Statements of Assets and Liabilities (cont'd)
Neuberger Berman Equity Funds (cont'd)
(000's omitted except per share amounts)
| INTERNATIONAL SELECT FUND | INTERNATIONAL SMALL CAP FUND | INTRINSIC VALUE FUND | LARGE CAP VALUE FUND | MID CAP GROWTH FUND | MID CAP INTRINSIC VALUE FUND | MULTI-CAP OPPORTUNITIES FUND | REAL ESTATE FUND | SMALL CAP GROWTH FUND | |||||||||||||||||||||||||||||||
| August 31, 2019 | August 31, 2019 | August 31, 2019 | August 31, 2019 | August 31, 2019 | August 31, 2019 | August 31, 2019 | August 31, 2019 | August 31, 2019 | |||||||||||||||||||||||||||||||
Shares Outstanding ($.001 par value; unlimited shares authorized) | |||||||||||||||||||||||||||||||||||||||
Investor Class | — | — | — | 38,401 | 32,160 | 1,785 | — | — | 1,733 | ||||||||||||||||||||||||||||||
Trust Class | 403 | — | — | 2,670 | 4,876 | 412 | — | 8,612 | 122 | ||||||||||||||||||||||||||||||
Advisor Class | — | — | — | 3,754 | 754 | — | — | — | 74 | ||||||||||||||||||||||||||||||
Institutional Class | 10,432 | 474 | 39,592 | 11,108 | 17,068 | 2,083 | 58,928 | 14,064 | 2,306 | ||||||||||||||||||||||||||||||
Class A | 265 | 12 | 1,362 | 1,715 | 2,074 | 323 | 2,674 | 4,225 | 1,324 | ||||||||||||||||||||||||||||||
Class C | 128 | 11 | 1,173 | 643 | 688 | 77 | 2,118 | 693 | 114 | ||||||||||||||||||||||||||||||
Class R3 | 191 | — | — | 24 | 3,563 | 99 | — | 1,359 | 65 | ||||||||||||||||||||||||||||||
Class R6 | 2,410 | 20 | 12 | 8 | 28,732 | 1 | — | 4,874 | 552 | ||||||||||||||||||||||||||||||
Net Asset Value, offering and redemption price per share | |||||||||||||||||||||||||||||||||||||||
Investor Class | $ | — | $ | — | $ | — | $ | 30.58 | $ | 15.96 | $ | 19.32 | $ | — | $ | — | $ | 37.83 | |||||||||||||||||||||
Trust Class | 12.30 | — | — | 30.59 | 15.94 | 19.32 | — | 15.13 | 37.75 | ||||||||||||||||||||||||||||||
Advisor Class | — | — | — | 30.60 | 15.86 | — | — | — | 37.64 | ||||||||||||||||||||||||||||||
Institutional Class | 12.28 | 11.28 | 14.50 | 30.57 | 16.02 | 19.31 | 18.64 | 15.19 | 38.06 | ||||||||||||||||||||||||||||||
Class R3 | 12.10 | — | — | 30.62 | 15.82 | 19.33 | — | 15.10 | 37.61 | ||||||||||||||||||||||||||||||
Class R6 | 12.29 | 11.29 | 14.52 | 30.59 | 16.05 | 19.32 | — | 15.19 | 38.10 | ||||||||||||||||||||||||||||||
Net Asset Value and redemption price per share | |||||||||||||||||||||||||||||||||||||||
Class A | $ | 12.21 | $ | 11.24 | $ | 14.44 | $ | 30.59 | $ | 15.90 | $ | 19.32 | $ | 18.65 | $ | 15.13 | $ | 37.80 | |||||||||||||||||||||
Offering Price per share | |||||||||||||||||||||||||||||||||||||||
Class A‡ | $ | 12.95 | $ | 11.93 | $ | 15.32 | $ | 32.46 | $ | 16.87 | $ | 20.50 | $ | 19.79 | $ | 16.05 | $ | 40.11 | |||||||||||||||||||||
Net Asset Value and offering price per share | |||||||||||||||||||||||||||||||||||||||
Class C^ | $ | 11.99 | $ | 11.06 | $ | 14.34 | $ | 30.61 | $ | 15.67 | $ | 19.29 | $ | 18.59 | $ | 15.16 | $ | 37.25 | |||||||||||||||||||||
†Securities on loan, at value: | |||||||||||||||||||||||||||||||||||||||
Unaffiliated issuers | $ | — | $ | 241 | $ | — | $ | 87,260 | $ | 19,924 | $ | — | $ | — | $ | — | $ | 14,531 | |||||||||||||||||||||
*Cost of Investments: | |||||||||||||||||||||||||||||||||||||||
(a) Unaffiliated issuers | $ | 159,588 | $ | 6,426 | $ | 538,459 | $ | 1,692,916 | $ | 1,037,682 | $ | 88,868 | $ | 694,179 | $ | 411,549 | $ | 248,479 | |||||||||||||||||||||
(b) Affiliated issuers | — | — | — | — | — | — | — | — | — | ||||||||||||||||||||||||||||||
Total cost of investments | $ | 159,588 | $ | 6,426 | $ | 538,459 | $ | 1,692,916 | $ | 1,037,682 | $ | 88,868 | $ | 694,179 | $ | 411,549 | $ | 248,479 | |||||||||||||||||||||
(c) Total cost of foreign currency | $ | 23 | $ | 1 | $ | — | $ | — | $ | — | $ | — | $ | — | $ | — | $ | — | |||||||||||||||||||||
(d) Premium received from option contracts written | $ | — | $ | — | $ | — | $ | — | $ | — | $ | — | $ | — | $ | — | $ | — | |||||||||||||||||||||
‡ On single retail sales of less than $50,000. On sales of $50,000 or more or in certain other circumstances described in the Fund's prospectus, offering price is reduced.
^ Redemption price per share is equal to net asset value less any applicable contingent deferred sales charge.
See Notes to Financial Statements
155
| SUSTAINABLE EQUITY FUND | |||||||
| August 31, 2019 | |||||||
Shares Outstanding ($.001 par value; unlimited shares authorized) | |||||||
Investor Class | 12,032 | ||||||
Trust Class | 4,346 | ||||||
Advisor Class | — | ||||||
Institutional Class | 20,754 | ||||||
Class A | 2,564 | ||||||
Class C | 1,287 | ||||||
Class R3 | 858 | ||||||
Class R6 | 6,432 | ||||||
Net Asset Value, offering and redemption price per share | |||||||
Investor Class | $ | 37.08 | |||||
Trust Class | 37.10 | ||||||
Advisor Class | — | ||||||
Institutional Class | 37.02 | ||||||
Class R3 | 37.10 | ||||||
Class R6 | 37.01 | ||||||
Net Asset Value and redemption price per share | |||||||
Class A | $ | 37.08 | |||||
Offering Price per share | |||||||
Class A‡ | $ | 39.34 | |||||
Net Asset Value and offering price per share | |||||||
Class C^ | $ | 36.85 | |||||
†Securities on loan, at value: | |||||||
Unaffiliated issuers | $ | — | |||||
*Cost of Investments: | |||||||
(a) Unaffiliated issuers | $ | 1,326,369 | |||||
(b) Affiliated issuers | — | ||||||
Total cost of investments | $ | 1,326,369 | |||||
(c) Total cost of foreign currency | $ | 1 | |||||
(d) Premium received from option contracts written | $ | — | |||||
156
Statements of Operations
Neuberger Berman Equity Funds
(000's omitted)
| DIVIDEND GROWTH FUND | EMERGING MARKETS EQUITY FUND | EQUITY INCOME FUND | FOCUS FUND | GENESIS FUND | |||||||||||||||||||
| For the Year Ended August 31, 2019 | For the Year Ended August 31, 2019 | For the Year Ended August 31, 2019 | For the Year Ended August 31, 2019 | For the Year Ended August 31, 2019 | |||||||||||||||||||
Investment Income: | |||||||||||||||||||||||
Income (Note A): | |||||||||||||||||||||||
Dividend income—unaffiliated issuers | $ | 1,231 | $ | 36,852 | $ | 44,637 | $ | 9,610 | $ | 99,361 | |||||||||||||
Dividend income—affiliated issuers (Note F) | — | — | — | — | 9,640 | ||||||||||||||||||
Interest and other income—unaffiliated issuers | 55 | 1,809 | 4,311 | 231 | 2,287 | ||||||||||||||||||
Income from securities loaned—net | — | 39 | — | 7 | — | ||||||||||||||||||
Foreign taxes withheld | (19 | ) | (3,800 | ) | (689 | ) | — | (708 | ) | ||||||||||||||
Total income | $ | 1,267 | $ | 34,900 | $ | 48,259 | $ | 9,848 | $ | 110,580 | |||||||||||||
Expenses: | |||||||||||||||||||||||
Investment management fees (Note B) | 272 | 13,280 | 7,270 | 3,651 | 66,977 | ||||||||||||||||||
Administration fees (Note B): | |||||||||||||||||||||||
Investor Class | — | — | — | 1,633 | 4,320 | ||||||||||||||||||
Trust Class | — | — | — | 200 | 5,477 | ||||||||||||||||||
Advisor Class | — | — | — | 7 | 667 | ||||||||||||||||||
Institutional Class | 75 | 1,753 | 1,677 | 13 | 4,296 | ||||||||||||||||||
Class A | 4 | 118 | 374 | 8 | — | ||||||||||||||||||
Class C | 8 | 26 | 556 | 4 | — | ||||||||||||||||||
Class R3 | — | 3 | 5 | — | — | ||||||||||||||||||
Class R6 | — | 103 | — | — | 2,349 | ||||||||||||||||||
Distribution fees (Note B): | |||||||||||||||||||||||
Trust Class | — | — | — | 50 | — | ||||||||||||||||||
Advisor Class | — | — | — | 4 | 417 | ||||||||||||||||||
Class A | 4 | 113 | 360 | 7 | — | ||||||||||||||||||
Class C | 29 | 101 | 2,139 | 14 | — | ||||||||||||||||||
Class R3 | — | 6 | 9 | — | — | ||||||||||||||||||
Shareholder servicing agent fees: | |||||||||||||||||||||||
Investor Class | — | — | — | 371 | 981 | ||||||||||||||||||
Trust Class | — | — | — | 1 | 11 | ||||||||||||||||||
Advisor Class | — | — | — | — | 9 | ||||||||||||||||||
Institutional Class | 1 | 221 | 8 | 1 | 26 | ||||||||||||||||||
Class A | 1 | 12 | 10 | — | — | ||||||||||||||||||
Class C | — | — | 5 | — | — | ||||||||||||||||||
Class R3 | — | 1 | 1 | — | — | ||||||||||||||||||
Class R6 | — | 6 | — | — | 11 | ||||||||||||||||||
Audit fees | 53 | 58 | 65 | 60 | 66 | ||||||||||||||||||
Custodian and accounting fees | 67 | 1,271 | 189 | 101 | 1,027 | ||||||||||||||||||
Insurance expense | 2 | 48 | 52 | 24 | 348 | ||||||||||||||||||
Legal fees | 53 | 56 | 56 | 53 | 58 | ||||||||||||||||||
Registration and filing fees | 62 | 178 | 102 | 99 | 257 | ||||||||||||||||||
| Repayment to Management of expenses previously assumed by Management (Note B) | — | 69 | — | — | — | ||||||||||||||||||
Shareholder reports | 4 | 115 | 133 | 46 | 726 | ||||||||||||||||||
Trustees' fees and expenses | 49 | 51 | 52 | 50 | 69 | ||||||||||||||||||
Interest expense | — | 1 | 10 | 2 | 1 | ||||||||||||||||||
Miscellaneous | 11 | 157 | 135 | 64 | 797 | ||||||||||||||||||
Total expenses | 695 | 17,747 | 13,208 | 6,463 | 88,890 | ||||||||||||||||||
See Notes to Financial Statements
157
| GLOBAL EQUITY FUND | GLOBAL REAL ESTATE FUND | GREATER CHINA EQUITY FUND | GUARDIAN FUND | INTERNATIONAL EQUITY FUND | |||||||||||||||||||
| For the Year Ended August 31, 2019 | For the Year Ended August 31, 2019 | For the Year Ended August 31, 2019 | For the Year Ended August 31, 2019 | For the Year Ended August 31, 2019 | |||||||||||||||||||
Investment Income: | |||||||||||||||||||||||
Income (Note A): | |||||||||||||||||||||||
Dividend income—unaffiliated issuers | $ | 74 | $ | 88 | $ | 1,529 | $ | 16,689 | $ | 36,428 | |||||||||||||
Dividend income—affiliated issuers (Note F) | — | — | — | — | — | ||||||||||||||||||
Interest and other income—unaffiliated issuers | 2 | 2 | 13 | 988 | 702 | ||||||||||||||||||
Income from securities loaned—net | — | — | — | 162 | 238 | ||||||||||||||||||
Foreign taxes withheld | (4 | ) | (5 | ) | (101 | ) | (278 | ) | (3,032 | ) | |||||||||||||
Total income | $ | 72 | $ | 85 | $ | 1,441 | $ | 17,561 | $ | 34,336 | |||||||||||||
Expenses: | |||||||||||||||||||||||
Investment management fees (Note B) | 26 | 28 | 669 | 6,091 | 13,784 | ||||||||||||||||||
Administration fees (Note B): | |||||||||||||||||||||||
Investor Class | — | — | — | 2,812 | 248 | ||||||||||||||||||
Trust Class | — | — | — | 192 | 134 | ||||||||||||||||||
Advisor Class | — | — | — | 1 | — | ||||||||||||||||||
Institutional Class | 6 | 4 | 81 | 117 | 2,233 | ||||||||||||||||||
Class A | 1 | 1 | 18 | 12 | 146 | ||||||||||||||||||
Class C | — | 1 | — | 5 | 29 | ||||||||||||||||||
Class R3 | — | — | — | 1 | — | ||||||||||||||||||
Class R6 | — | — | — | — | 45 | ||||||||||||||||||
Distribution fees (Note B): | |||||||||||||||||||||||
Trust Class | — | — | — | 48 | — | ||||||||||||||||||
Advisor Class | — | — | — | 1 | — | ||||||||||||||||||
Class A | 1 | 1 | 17 | 11 | 141 | ||||||||||||||||||
Class C | 1 | 3 | 2 | 18 | 111 | ||||||||||||||||||
Class R3 | — | — | — | 1 | — | ||||||||||||||||||
Shareholder servicing agent fees: | |||||||||||||||||||||||
Investor Class | — | — | — | 728 | 104 | ||||||||||||||||||
Trust Class | — | — | — | 1 | 1 | ||||||||||||||||||
Advisor Class | — | — | — | 1 | — | ||||||||||||||||||
Institutional Class | — | — | 2 | 1 | 12 | ||||||||||||||||||
Class A | 1 | 1 | 8 | 1 | 3 | ||||||||||||||||||
Class C | — | — | — | — | 1 | ||||||||||||||||||
Class R3 | — | — | — | — | — | ||||||||||||||||||
Class R6 | — | — | — | — | 4 | ||||||||||||||||||
Audit fees | 56 | 55 | 55 | 61 | 61 | ||||||||||||||||||
Custodian and accounting fees | 82 | 67 | 97 | 158 | 436 | ||||||||||||||||||
Insurance expense | — | — | 3 | 41 | 62 | ||||||||||||||||||
Legal fees | 68 | 54 | 77 | 103 | 58 | ||||||||||||||||||
Registration and filing fees | 50 | 46 | 51 | 125 | 222 | ||||||||||||||||||
| Repayment to Management of expenses previously assumed by Management (Note B) | — | — | — | — | — | ||||||||||||||||||
Shareholder reports | 4 | 2 | 4 | 84 | 190 | ||||||||||||||||||
Trustees' fees and expenses | 49 | 49 | 49 | 51 | 52 | ||||||||||||||||||
Interest expense | — | — | 8 | (Note E) | 1 | 5 | |||||||||||||||||
Miscellaneous | 10 | 9 | 15 | 112 | 177 | ||||||||||||||||||
Total expenses | 355 | 321 | 1,156 | 10,778 | 18,259 | ||||||||||||||||||
158
Statements of Operations (cont'd)
Neuberger Berman Equity Funds (cont'd)
(000's omitted)
| DIVIDEND GROWTH FUND | EMERGING MARKETS EQUITY FUND | EQUITY INCOME FUND | FOCUS FUND | GENESIS FUND | |||||||||||||||||||
| For the Year Ended August 31, 2019 | For the Year Ended August 31, 2019 | For the Year Ended August 31, 2019 | For the Year Ended August 31, 2019 | For the Year Ended August 31, 2019 | |||||||||||||||||||
Expenses reimbursed by Management (Note B) | (279 | ) | (61 | ) | — | (1 | ) | (3 | ) | ||||||||||||||
Investment management fees waived (Note B) | — | — | — | — | — | ||||||||||||||||||
Total net expenses | 416 | 17,686 | 13,208 | 6,462 | 88,887 | ||||||||||||||||||
Net investment income/(loss) | $ | 851 | $ | 17,214 | $ | 35,051 | $ | 3,386 | $ | 21,693 | |||||||||||||
Realized and Unrealized Gain/(Loss) on Investments (Note A): | |||||||||||||||||||||||
Net realized gain/(loss) on: | |||||||||||||||||||||||
Transactions in investment securities of unaffiliated issuers | (621 | ) | (45,215 | )* | 45,223 | 3,500 | 824,887 | ||||||||||||||||
Transactions in investment securities of affiliated issuers | — | — | — | — | 33,263 | ||||||||||||||||||
Redemption in-kind | — | — | — | — | 51,385 | ||||||||||||||||||
Settlement of foreign currency transactions | — | (1,176 | ) | (106 | ) | (15 | ) | (18 | ) | ||||||||||||||
Expiration or closing of option contracts written | — | — | 2,113 | 176 | — | ||||||||||||||||||
Change in net unrealized appreciation/(depreciation) in value of: | |||||||||||||||||||||||
Investment securities of unaffiliated issuers | (2,017 | ) | 6,506 | ** | (48,208 | ) | (27,699 | ) | (1,022,290 | ) | |||||||||||||
Investment securities of affiliated issuers | — | — | — | — | 81,284 | ||||||||||||||||||
Foreign currency translations | — | 4 | 16 | — | 1 | ||||||||||||||||||
Option contracts written | — | — | (815 | ) | — | — | |||||||||||||||||
Net gain/(loss) on investments | (2,638 | ) | (39,881 | ) | (1,777 | ) | (24,038 | ) | (31,488 | ) | |||||||||||||
Net increase/(decrease) in net assets resulting from operations | $ | (1,787 | ) | $ | (22,667 | ) | $ | 33,274 | $ | (20,652 | ) | $ | (9,795 | ) | |||||||||
* Net of foreign capital gains tax of $5,326.
** Change in accrued foreign capital gains tax amounted to $139,255.
See Notes to Financial Statements
159
| GLOBAL EQUITY FUND | GLOBAL REAL ESTATE FUND | GREATER CHINA EQUITY FUND | GUARDIAN FUND | INTERNATIONAL EQUITY FUND | |||||||||||||||||||
| For the Year Ended August 31, 2019 | For the Year Ended August 31, 2019 | For the Year Ended August 31, 2019 | For the Year Ended August 31, 2019 | For the Year Ended August 31, 2019 | |||||||||||||||||||
Expenses reimbursed by Management (Note B) | (317 | ) | (281 | ) | (206 | ) | — | (969 | ) | ||||||||||||||
Investment management fees waived (Note B) | — | — | — | — | (1,611 | ) | |||||||||||||||||
Total net expenses | 38 | 40 | 950 | 10,778 | 15,679 | ||||||||||||||||||
Net investment income/(loss) | $ | 34 | $ | 45 | $ | 491 | $ | 6,783 | $ | 18,657 | |||||||||||||
Realized and Unrealized Gain/(Loss) on Investments (Note A): | |||||||||||||||||||||||
Net realized gain/(loss) on: | |||||||||||||||||||||||
Transactions in investment securities of unaffiliated issuers | 402 | 78 | (2,510 | ) | 78,602 | 4,635 | |||||||||||||||||
Transactions in investment securities of affiliated issuers | — | — | — | — | — | ||||||||||||||||||
Redemption in-kind | — | — | — | — | — | ||||||||||||||||||
Settlement of foreign currency transactions | (1 | ) | (1 | ) | (35 | ) | (3 | ) | 417 | ||||||||||||||
Expiration or closing of option contracts written | — | — | — | 1,762 | — | ||||||||||||||||||
Change in net unrealized appreciation/(depreciation) in value of: | |||||||||||||||||||||||
Investment securities of unaffiliated issuers | (662 | ) | 360 | (3,418 | ) | (44,775 | ) | (131,862 | ) | ||||||||||||||
Investment securities of affiliated issuers | — | — | — | — | — | ||||||||||||||||||
Foreign currency translations | — | — | (22 | ) | (1 | ) | (63 | ) | |||||||||||||||
Option contracts written | — | — | — | (1,644 | ) | — | |||||||||||||||||
Net gain/(loss) on investments | (261 | ) | 437 | (5,985 | ) | 33,941 | (126,873 | ) | |||||||||||||||
Net increase/(decrease) in net assets resulting from operations | $ | (227 | ) | $ | 482 | $ | (5,494 | ) | $ | 40,724 | $ | (108,216 | ) | ||||||||||
160
Statements of Operations (cont'd)
Neuberger Berman Equity Funds
(000's omitted)
| INTERNATIONAL SELECT FUND | INTERNATIONAL SMALL CAP FUND | INTRINSIC VALUE FUND | LARGE CAP VALUE FUND | MID CAP GROWTH FUND | |||||||||||||||||||
| For the Year Ended August 31, 2019 | For the Year Ended August 31, 2019 | For the Year Ended August 31, 2019 | For the Year Ended August 31, 2019 | For the Year Ended August 31, 2019 | |||||||||||||||||||
Investment Income: | |||||||||||||||||||||||
Income (Note A): | |||||||||||||||||||||||
Dividend income—unaffiliated issuers | $ | 3,734 | $ | 126 | $ | 4,746 | $ | 41,332 | $ | 7,153 | |||||||||||||
Dividend income—affiliated issuers (Note F) | — | — | — | — | — | ||||||||||||||||||
Interest and other income—unaffiliated issuers | 124 | 7 | 476 | 2,111 | 866 | ||||||||||||||||||
Income from securities loaned—net | 24 | 5 | — | 120 | 27 | ||||||||||||||||||
Foreign taxes withheld | (315 | ) | (16 | ) | — | (28 | ) | (22 | ) | ||||||||||||||
Total income | $ | 3,567 | $ | 122 | $ | 5,222 | $ | 43,535 | $ | 8,024 | |||||||||||||
Expenses: | |||||||||||||||||||||||
Investment management fees (Note B) | 921 | 51 | 5,213 | 7,603 | 6,798 | ||||||||||||||||||
Administration fees (Note B): | |||||||||||||||||||||||
Investor Class | — | — | — | 3,004 | 1,262 | ||||||||||||||||||
Trust Class | 27 | — | — | 297 | 295 | ||||||||||||||||||
Advisor Class | — | — | — | 468 | 53 | ||||||||||||||||||
Institutional Class | 200 | 8 | 904 | 280 | 432 | ||||||||||||||||||
Class A | 9 | 1 | 58 | 40 | 93 | ||||||||||||||||||
Class C | 5 | — | 52 | 16 | 27 | ||||||||||||||||||
Class R3 | 7 | — | — | 1 | 106 | ||||||||||||||||||
Class R6 | 10 | — | — | — | 245 | ||||||||||||||||||
Distribution fees (Note B): | |||||||||||||||||||||||
Trust Class | 7 | — | — | 74 | — | ||||||||||||||||||
Advisor Class | — | — | — | 293 | 33 | ||||||||||||||||||
Class A | 8 | 1 | 55 | 38 | 89 | ||||||||||||||||||
Class C | 19 | 1 | 202 | 62 | 104 | ||||||||||||||||||
Class R3 | 14 | — | — | 3 | 203 | ||||||||||||||||||
Shareholder servicing agent fees: | |||||||||||||||||||||||
Investor Class | — | — | — | 680 | 408 | ||||||||||||||||||
Trust Class | 7 | — | — | 2 | 1 | ||||||||||||||||||
Advisor Class | — | — | — | 2 | 1 | ||||||||||||||||||
Institutional Class | 1 | — | 8 | 3 | 9 | ||||||||||||||||||
Class A | — | — | 7 | 3 | 4 | ||||||||||||||||||
Class C | — | — | 1 | 1 | 1 | ||||||||||||||||||
Class R3 | 1 | — | — | — | 5 | ||||||||||||||||||
Class R6 | — | — | — | — | 12 | ||||||||||||||||||
Audit fees | 61 | 49 | 25 | 60 | 25 | ||||||||||||||||||
Custodian and accounting fees | 126 | 83 | 103 | 187 | 173 | ||||||||||||||||||
Insurance expense | 6 | — | 26 | 49 | 45 | ||||||||||||||||||
Legal fees | 57 | 54 | 56 | 85 | 72 | ||||||||||||||||||
Registration and filing fees | 110 | 63 | 86 | 141 | 153 | ||||||||||||||||||
| Repayment to Management of expenses previously assumed by Management (Note B) | — | — | — | — | 1 | ||||||||||||||||||
Shareholder reports | 9 | 3 | 146 | 107 | 140 | ||||||||||||||||||
Trustees' fees and expenses | 49 | 49 | 50 | 52 | 51 | ||||||||||||||||||
Interest expense | 1 | — | 19 | — | — | ||||||||||||||||||
Miscellaneous | 35 | 10 | 57 | 125 | 116 | ||||||||||||||||||
Total expenses | 1,690 | 373 | 7,068 | 13,676 | 10,957 | ||||||||||||||||||
See Notes to Financial Statements
161
| MID CAP INTRINSIC VALUE FUND | MULTI-CAP OPPORTUNITIES FUND | REAL ESTATE FUND | SMALL CAP GROWTH FUND | SUSTAINABLE EQUITY FUND | |||||||||||||||||||
| For the Year Ended August 31, 2019 | For the Year Ended August 31, 2019 | For the Year Ended August 31, 2019 | For the Year Ended August 31, 2019 | For the Year Ended August 31, 2019 | |||||||||||||||||||
Investment Income: | |||||||||||||||||||||||
Income (Note A): | |||||||||||||||||||||||
Dividend income—unaffiliated issuers | $ | 2,259 | $ | 22,196 | $ | 10,451 | $ | 374 | $ | 33,988 | |||||||||||||
Dividend income—affiliated issuers (Note F) | — | — | — | — | — | ||||||||||||||||||
Interest and other income—unaffiliated issuers | 100 | 277 | 134 | 227 | 547 | ||||||||||||||||||
Income from securities loaned—net | — | — | — | 37 | — | ||||||||||||||||||
Foreign taxes withheld | (1 | ) | (188 | ) | (14 | ) | — | (765 | ) | ||||||||||||||
Total income | $ | 2,358 | $ | 22,285 | $ | 10,571 | $ | 638 | $ | 33,770 | |||||||||||||
Expenses: | |||||||||||||||||||||||
Investment management fees (Note B) | 620 | 8,033 | 3,605 | 1,209 | 9,599 | ||||||||||||||||||
Administration fees (Note B): | |||||||||||||||||||||||
Investor Class | 111 | — | — | 167 | 1,351 | ||||||||||||||||||
Trust Class | 35 | — | 491 | 17 | 756 | ||||||||||||||||||
Advisor Class | — | — | — | 10 | — | ||||||||||||||||||
Institutional Class | 70 | 2,082 | 267 | 61 | 1,283 | ||||||||||||||||||
Class A | 27 | 150 | 152 | 59 | 270 | ||||||||||||||||||
Class C | 5 | 107 | 30 | 9 | 141 | ||||||||||||||||||
Class R3 | 6 | — | 47 | 8 | 83 | ||||||||||||||||||
Class R6 | — | — | 35 | 1 | 158 | ||||||||||||||||||
Distribution fees (Note B): | |||||||||||||||||||||||
Trust Class | 9 | — | 123 | 4 | 189 | ||||||||||||||||||
Advisor Class | — | — | — | 6 | — | ||||||||||||||||||
Class A | 26 | 144 | 146 | 57 | 259 | ||||||||||||||||||
Class C | 19 | 413 | 114 | 36 | 544 | ||||||||||||||||||
Class R3 | 11 | — | 91 | 15 | 160 | ||||||||||||||||||
Shareholder servicing agent fees: | |||||||||||||||||||||||
Investor Class | 44 | — | — | 81 | 410 | ||||||||||||||||||
Trust Class | 1 | — | 26 | 1 | 6 | ||||||||||||||||||
Advisor Class | — | — | — | 1 | — | ||||||||||||||||||
Institutional Class | 1 | 31 | 4 | 1 | 13 | ||||||||||||||||||
Class A | 1 | 10 | 4 | 9 | 13 | ||||||||||||||||||
Class C | — | 2 | 2 | — | 3 | ||||||||||||||||||
Class R3 | 1 | — | 5 | 3 | 3 | ||||||||||||||||||
Class R6 | — | — | 2 | — | 11 | ||||||||||||||||||
Audit fees | 25 | 25 | 59 | 25 | 26 | ||||||||||||||||||
Custodian and accounting fees | 77 | 167 | 91 | 90 | 261 | ||||||||||||||||||
Insurance expense | 4 | 55 | 15 | 4 | 72 | ||||||||||||||||||
Legal fees | 87 | 56 | 53 | 95 | 53 | ||||||||||||||||||
Registration and filing fees | 111 | 89 | 112 | 136 | 177 | ||||||||||||||||||
| Repayment to Management of expenses previously assumed by Management (Note B) | — | — | — | — | — | ||||||||||||||||||
Shareholder reports | 20 | 89 | 60 | 19 | 176 | ||||||||||||||||||
Trustees' fees and expenses | 49 | 52 | 50 | 49 | 53 | ||||||||||||||||||
Interest expense | 12 | 98 | 3 | — | 3 | ||||||||||||||||||
Miscellaneous | 18 | 132 | 43 | 19 | 173 | ||||||||||||||||||
Total expenses | 1,390 | 11,735 | 5,630 | 2,192 | 16,246 | ||||||||||||||||||
162
Statements of Operations (cont'd)
Neuberger Berman Equity Funds (cont'd)
(000's omitted)
| INTERNATIONAL SELECT FUND | INTERNATIONAL SMALL CAP FUND | INTRINSIC VALUE FUND | LARGE CAP VALUE FUND | MID CAP GROWTH FUND | |||||||||||||||||||
| For the Year Ended August 31, 2019 | For the Year Ended August 31, 2019 | For the Year Ended August 31, 2019 | For the Year Ended August 31, 2019 | For the Year Ended August 31, 2019 | |||||||||||||||||||
Expenses reimbursed by Management (Note B) | (288 | ) | (309 | ) | (271 | ) | — | — | |||||||||||||||
Investment management fees waived (Note B) | — | — | — | — | — | ||||||||||||||||||
Total net expenses | 1,402 | 64 | 6,797 | 13,676 | 10,957 | ||||||||||||||||||
Net investment income/(loss) | $ | 2,165 | $ | 58 | $ | (1,575 | ) | $ | 29,859 | $ | (2,933 | ) | |||||||||||
Realized and Unrealized Gain/(Loss) on Investments (Note A): | |||||||||||||||||||||||
Net realized gain/(loss) on: | |||||||||||||||||||||||
Transactions in investment securities of unaffiliated issuers | 131 | (503 | ) | 38,499 | 36,137 | 88,646 | |||||||||||||||||
Transactions in investment securities of affiliated issuers | — | — | — | — | — | ||||||||||||||||||
Redemption in-kind | — | — | — | — | — | ||||||||||||||||||
Settlement of foreign currency transactions | (38 | ) | (1 | ) | — | — | — | ||||||||||||||||
Expiration or closing of option contracts written | — | — | — | 84 | — | ||||||||||||||||||
Change in net unrealized appreciation/(depreciation) in value of: | |||||||||||||||||||||||
Investment securities of unaffiliated issuers | (7,394 | ) | (335 | ) | (127,170 | ) | 30,096 | (25,530 | ) | ||||||||||||||
Investment securities of affiliated issuers | — | — | — | — | — | ||||||||||||||||||
Foreign currency translations | 10 | — | — | — | — | ||||||||||||||||||
Option contracts written | — | — | — | — | — | ||||||||||||||||||
Net gain/(loss) on investments | (7,291 | ) | (839 | ) | (88,671 | ) | 66,317 | 63,116 | |||||||||||||||
Net increase/(decrease) in net assets resulting from operations | $ | (5,126 | ) | $ | (781 | ) | $ | (90,246 | ) | $ | 96,176 | $ | 60,183 | ||||||||||
See Notes to Financial Statements
163
| MID CAP INTRINSIC VALUE FUND | MULTI-CAP OPPORTUNITIES FUND | REAL ESTATE FUND | SMALL CAP GROWTH FUND | SUSTAINABLE EQUITY FUND | |||||||||||||||||||
| For the Year Ended August 31, 2019 | For the Year Ended August 31, 2019 | For the Year Ended August 31, 2019 | For the Year Ended August 31, 2019 | For the Year Ended August 31, 2019 | |||||||||||||||||||
Expenses reimbursed by Management (Note B) | (67 | ) | — | (1,156 | ) | (555 | ) | — | |||||||||||||||
Investment management fees waived (Note B) | (110 | ) | — | — | — | — | |||||||||||||||||
Total net expenses | 1,213 | 11,735 | 4,474 | 1,637 | 16,246 | ||||||||||||||||||
Net investment income/(loss) | $ | 1,145 | $ | 10,550 | $ | 6,097 | $ | (999 | ) | $ | 17,524 | ||||||||||||
Realized and Unrealized Gain/(Loss) on Investments (Note A): | |||||||||||||||||||||||
Net realized gain/(loss) on: | |||||||||||||||||||||||
Transactions in investment securities of unaffiliated issuers | (1,169 | ) | 297,663 | 16,084 | 13,324 | 225,546 | |||||||||||||||||
Transactions in investment securities of affiliated issuers | — | — | — | — | — | ||||||||||||||||||
Redemption in-kind | — | — | — | — | 26,393 | ||||||||||||||||||
Settlement of foreign currency transactions | — | — | (3 | ) | — | (44 | ) | ||||||||||||||||
Expiration or closing of option contracts written | — | — | — | — | — | ||||||||||||||||||
Change in net unrealized appreciation/(depreciation) in value of: | |||||||||||||||||||||||
Investment securities of unaffiliated issuers | (15,882 | ) | (302,361 | ) | 65,965 | (11,696 | ) | (352,913 | ) | ||||||||||||||
Investment securities of affiliated issuers | — | — | — | — | — | ||||||||||||||||||
Foreign currency translations | — | — | — | — | (28 | ) | |||||||||||||||||
Option contracts written | — | — | — | — | — | ||||||||||||||||||
Net gain/(loss) on investments | (17,051 | ) | (4,698 | ) | 82,046 | 1,628 | (101,046 | ) | |||||||||||||||
Net increase/(decrease) in net assets resulting from operations | $ | (15,906 | ) | $ | 5,852 | $ | 88,143 | $ | 629 | $ | (83,522 | ) | |||||||||||
164
Statements of Changes in Net Assets
Neuberger Berman Equity Funds
(000's omitted)
DIVIDEND GROWTH FUND | EMERGING MARKETS EQUITY FUND | EQUITY INCOME FUND | |||||||||||||||||||||||||
| Fiscal Year Ended August 31, 2019 | Fiscal Year Ended August 31, 2018 | Fiscal Year Ended August 31, 2019 | Fiscal Year Ended August 31, 2018 | Fiscal Year Ended August 31, 2019 | Fiscal Year Ended August 31, 2018 | ||||||||||||||||||||||
Increase/(Decrease) in Net Assets: | |||||||||||||||||||||||||||
From Operations Note A: | |||||||||||||||||||||||||||
Net investment income/(loss) | $ | 851 | $ | 742 | $ | 17,214 | $ | 11,458 | $ | 35,051 | $ | 38,077 | |||||||||||||||
Net realized gain/(loss) on investments | (621 | ) | 2,730 | (46,391 | ) | 17,698 | 47,230 | 83,988 | |||||||||||||||||||
| Change in net unrealized appreciation/(depreciation) of investments | (2,017 | ) | 1,307 | 6,510 | (107,491 | ) | (49,007 | ) | 43,315 | ||||||||||||||||||
Net increase/(decrease) in net assets resulting from operations | (1,787 | ) | 4,779 | (22,667 | ) | (78,335 | ) | 33,274 | 165,380 | ||||||||||||||||||
Distributions to Shareholders From (Note A): | |||||||||||||||||||||||||||
Distributable earnings: | |||||||||||||||||||||||||||
Investor Class | — | — | — | — | — | — | |||||||||||||||||||||
Trust Class | — | — | — | — | — | — | |||||||||||||||||||||
Advisor Class | — | — | — | — | — | — | |||||||||||||||||||||
Institutional Class | (2,645 | ) | (1,042 | ) | (10,212 | ) | (5,443 | ) | (75,479 | ) | (81,637 | ) | |||||||||||||||
Class A | (83 | ) | (42 | ) | (222 | ) | (229 | ) | (10,531 | ) | (11,944 | ) | |||||||||||||||
Class C | (140 | ) | (46 | ) | — | (22 | ) | (12,834 | ) | (15,405 | ) | ||||||||||||||||
Class R3 | — | — | — | (5 | ) | (116 | ) | (100 | ) | ||||||||||||||||||
Class R6 | (1 | ) | — | (1,646 | ) | (1,139 | ) | — | — | ||||||||||||||||||
Total distributions to shareholders | (2,869 | ) | (1,130 | ) | (12,080 | ) | (6,838 | ) | (98,960 | ) | (109,086 | ) | |||||||||||||||
From Fund Share Transactions (Note D): | |||||||||||||||||||||||||||
Proceeds from shares sold: | |||||||||||||||||||||||||||
Investor Class | — | — | — | — | — | — | |||||||||||||||||||||
Trust Class | — | — | — | — | — | — | |||||||||||||||||||||
Advisor Class | — | — | — | — | — | — | |||||||||||||||||||||
Institutional Class | 12,175 | 21,342 | 523,280 | 782,707 | 218,363 | 151,932 | |||||||||||||||||||||
Class A | 146 | 1,090 | 22,366 | 42,405 | 53,057 | 25,357 | |||||||||||||||||||||
Class C | 99 | 124 | 2,372 | 6,015 | 10,407 | 9,342 | |||||||||||||||||||||
Class R3 | — | — | 589 | 606 | 933 | 1,027 | |||||||||||||||||||||
Class R6 | 12 | — | 92,467 | 83,104 | — | — | |||||||||||||||||||||
Proceeds from reinvestment of dividends and distributions: | |||||||||||||||||||||||||||
Investor Class | — | — | — | — | — | — | |||||||||||||||||||||
Trust Class | — | — | — | — | — | — | |||||||||||||||||||||
Advisor Class | — | — | — | — | — | — | |||||||||||||||||||||
Institutional Class | 2,645 | 1,042 | 4,226 | 2,159 | 65,239 | 69,404 | |||||||||||||||||||||
Class A | 81 | 41 | 141 | 162 | 9,046 | 10,549 | |||||||||||||||||||||
Class C | 140 | 46 | — | 9 | 9,790 | 11,703 | |||||||||||||||||||||
Class R3 | — | — | — | 3 | 81 | 51 | |||||||||||||||||||||
Class R6 | — | — | 1,646 | 1,139 | — | — | |||||||||||||||||||||
See Notes to Financial Statements
165
FOCUS FUND | GENESIS FUND | GLOBAL EQUITY FUND | |||||||||||||||||||||||||
| Fiscal Year Ended August 31, 2019 | Fiscal Year Ended August 31, 2018 | Fiscal Year Ended August 31, 2019 | Fiscal Year Ended August 31, 2018 | Fiscal Year Ended August 31, 2019 | Fiscal Year Ended August 31, 2018 | ||||||||||||||||||||||
Increase/(Decrease) in Net Assets: | |||||||||||||||||||||||||||
From Operations Note A: | |||||||||||||||||||||||||||
Net investment income/(loss) | $ | 3,386 | $ | 3,117 | $ | 21,693 | $ | 26,015 | $ | 34 | $ | 35 | |||||||||||||||
Net realized gain/(loss) on investments | 3,661 | 59,547 | 909,517 | 1,471,513 | 401 | 341 | |||||||||||||||||||||
| Change in net unrealized appreciation/(depreciation) of investments | (27,699 | ) | 29,330 | (941,005 | ) | 1,112,922 | (662 | ) | 311 | ||||||||||||||||||
Net increase/(decrease) in net assets resulting from operations | (20,652 | ) | 91,994 | (9,795 | ) | 2,610,450 | (227 | ) | 687 | ||||||||||||||||||
Distributions to Shareholders From (Note A): | |||||||||||||||||||||||||||
Distributable earnings: | |||||||||||||||||||||||||||
Investor Class | (47,553 | ) | (52,413 | ) | (163,651 | ) | (228,148 | ) | — | — | |||||||||||||||||
Trust Class | (3,793 | ) | (8,081 | ) | (133,145 | ) | (187,683 | ) | — | — | |||||||||||||||||
Advisor Class | (130 | ) | (1,095 | ) | (16,627 | ) | (25,755 | ) | — | — | |||||||||||||||||
Institutional Class | (594 | ) | (710 | ) | (289,491 | ) | (451,315 | ) | (280 | ) | (25 | ) | |||||||||||||||
Class A | (237 | ) | (403 | ) | — | — | (22 | ) | (1 | ) | |||||||||||||||||
Class C | (111 | ) | (635 | ) | — | — | (6 | ) | — | ||||||||||||||||||
Class R3 | — | — | — | — | — | — | |||||||||||||||||||||
Class R6 | — | — | (401,114 | ) | (462,929 | ) | — | — | |||||||||||||||||||
Total distributions to shareholders | (52,418 | ) | (63,337 | ) | (1,004,028 | ) | (1,355,830 | ) | (308 | ) | (26 | ) | |||||||||||||||
From Fund Share Transactions (Note D): | |||||||||||||||||||||||||||
Proceeds from shares sold: | |||||||||||||||||||||||||||
Investor Class | 3,001 | 3,861 | 82,220 | 127,479 | — | — | |||||||||||||||||||||
Trust Class | 576 | 2,281 | 218,867 | 130,291 | — | — | |||||||||||||||||||||
Advisor Class | 193 | 340 | 16,047 | 30,289 | — | — | |||||||||||||||||||||
Institutional Class | 2,749 | 2,598 | 495,866 | 506,405 | 107 | 36 | |||||||||||||||||||||
Class A | 258 | 821 | — | — | 64 | 682 | |||||||||||||||||||||
Class C | 124 | 75 | — | — | — | 31 | |||||||||||||||||||||
Class R3 | — | — | — | — | — | — | |||||||||||||||||||||
Class R6 | — | — | 522,496 | 874,418 | — | — | |||||||||||||||||||||
Proceeds from reinvestment of dividends and distributions: | |||||||||||||||||||||||||||
Investor Class | 43,189 | 47,309 | 158,366 | 220,105 | — | — | |||||||||||||||||||||
Trust Class | 3,772 | 8,037 | 132,025 | 186,190 | — | — | |||||||||||||||||||||
Advisor Class | 130 | 1,093 | 15,820 | 24,454 | — | — | |||||||||||||||||||||
Institutional Class | 548 | 586 | 260,982 | 413,091 | 280 | 25 | |||||||||||||||||||||
Class A | 205 | 342 | — | — | 18 | 1 | |||||||||||||||||||||
Class C | 106 | 609 | — | — | 2 | — | |||||||||||||||||||||
Class R3 | — | — | — | — | — | — | |||||||||||||||||||||
Class R6 | — | — | 398,405 | 462,309 | — | — | |||||||||||||||||||||
166
Statements of Changes in Net Assets (cont'd)
Neuberger Berman Equity Funds (cont'd)
(000's omitted)
DIVIDEND GROWTH FUND | EMERGING MARKETS EQUITY FUND | EQUITY INCOME FUND | |||||||||||||||||||||||||
| Fiscal Year Ended August 31, 2019 | Fiscal Year Ended August 31, 2018 | Fiscal Year Ended August 31, 2019 | Fiscal Year Ended August 31, 2018 | Fiscal Year Ended August 31, 2019 | Fiscal Year Ended August 31, 2018 | ||||||||||||||||||||||
| Proceeds from shares issued in connection with tax-free reorganization (Note H): | |||||||||||||||||||||||||||
Institutional Class | — | — | — | — | — | — | |||||||||||||||||||||
Class A | — | — | — | — | — | — | |||||||||||||||||||||
Class C | — | — | — | — | — | — | |||||||||||||||||||||
Payments for shares redeemed: | |||||||||||||||||||||||||||
Investor Class | — | — | — | — | — | — | |||||||||||||||||||||
Trust Class | — | — | — | — | — | — | |||||||||||||||||||||
Advisor Class | — | — | — | — | — | — | |||||||||||||||||||||
Institutional Class | (12,723 | ) | (4,765 | ) | (570,931 | ) | (231,337 | ) | (264,669 | ) | (298,102 | ) | |||||||||||||||
Class A | (435 | ) | (1,134 | ) | (24,253 | ) | (58,033 | ) | (94,313 | ) | (56,187 | ) | |||||||||||||||
Class C | (637 | ) | (196 | ) | (3,917 | ) | (1,857 | ) | (78,723 | ) | (65,530 | ) | |||||||||||||||
Class R3 | — | — | (1,011 | ) | (603 | ) | (1,247 | ) | (736 | ) | |||||||||||||||||
Class R6 | — | — | (37,798 | ) | (42,487 | ) | — | — | |||||||||||||||||||
Net increase/(decrease) from Fund share transactions | 1,503 | 17,590 | 9,177 | 583,992 | (72,036 | ) | (141,190 | ) | |||||||||||||||||||
Net Increase/(Decrease) in Net Assets | (3,153 | ) | 21,239 | (25,570 | ) | 498,819 | (137,722 | ) | (84,896 | ) | |||||||||||||||||
Net Assets: | |||||||||||||||||||||||||||
Beginning of year | 58,544 | 37,305 | 1,376,268 | 877,449 | 1,608,156 | 1,693,052 | |||||||||||||||||||||
End of year | $ | 55,391 | $ | 58,544 | $ | 1,350,698 | $ | 1,376,268 | $ | 1,470,434 | $ | 1,608,156 | |||||||||||||||
See Notes to Financial Statements
167
FOCUS FUND | GENESIS FUND | GLOBAL EQUITY FUND | |||||||||||||||||||||||||
| Fiscal Year Ended August 31, 2019 | Fiscal Year Ended August 31, 2018 | Fiscal Year Ended August 31, 2019 | Fiscal Year Ended August 31, 2018 | Fiscal Year Ended August 31, 2019 | Fiscal Year Ended August 31, 2018 | ||||||||||||||||||||||
| Proceeds from shares issued in connection with tax-free reorganization (Note H): | |||||||||||||||||||||||||||
Institutional Class | — | — | — | — | — | — | |||||||||||||||||||||
Class A | — | — | — | — | — | — | |||||||||||||||||||||
Class C | — | — | — | — | — | — | |||||||||||||||||||||
Payments for shares redeemed: | |||||||||||||||||||||||||||
Investor Class | (53,311 | ) | (58,503 | ) | (332,034 | ) | (423,896 | ) | — | — | |||||||||||||||||
Trust Class | (10,057 | ) | (14,814 | ) | (367,208 | ) | (508,027 | ) | — | — | |||||||||||||||||
Advisor Class | (816 | ) | (1,836 | ) | (54,040 | ) | (81,711 | ) | — | — | |||||||||||||||||
Institutional Class | (2,244 | ) | (2,759 | ) | (895,208 | ) | (1,703,085 | ) | (1,500 | ) | (111 | ) | |||||||||||||||
Class A | (905 | ) | (830 | ) | — | — | (182 | ) | (633 | ) | |||||||||||||||||
Class C | (480 | ) | (476 | ) | — | — | (16 | ) | (26 | ) | |||||||||||||||||
Class R3 | — | — | — | — | — | — | |||||||||||||||||||||
Class R6 | — | — | (697,138 | ) | (1,027,844 | ) | — | — | |||||||||||||||||||
Net increase/(decrease) from Fund share transactions | (12,962 | ) | (11,266 | ) | (44,534 | ) | (769,532 | ) | (1,227 | ) | 5 | ||||||||||||||||
Net Increase/(Decrease) in Net Assets | (86,032 | ) | 17,391 | (1,058,357 | ) | 485,088 | (1,762 | ) | 666 | ||||||||||||||||||
Net Assets: | |||||||||||||||||||||||||||
Beginning of year | 764,461 | 747,070 | 11,304,933 | 10,819,845 | 5,310 | 4,644 | |||||||||||||||||||||
End of year | $ | 678,429 | $ | 764,461 | $ | 10,246,576 | $ | 11,304,933 | $ | 3,548 | $ | 5,310 | |||||||||||||||
168
Statements of Changes in Net Assets (cont'd)
Neuberger Berman Equity Funds
(000's omitted)
| GLOBAL REAL ESTATE FUND | GREATER CHINA EQUITY FUND | GUARDIAN FUND | |||||||||||||||||||||||||
| Fiscal Year Ended August 31, 2019 | Fiscal Year Ended August 31, 2018 | Fiscal Year Ended August 31, 2019 | Fiscal Year Ended August 31, 2018 | Fiscal Year Ended August 31, 2019 | Fiscal Year Ended August 31, 2018 | ||||||||||||||||||||||
Increase/(Decrease) in Net Assets: | |||||||||||||||||||||||||||
From Operations Note A: | |||||||||||||||||||||||||||
Net investment income/(loss) | $ | 45 | $ | 41 | $ | 491 | $ | (66 | ) | $ | 6,783 | $ | 7,794 | ||||||||||||||
Net realized gain/(loss) on investments | 77 | 84 | (2,545 | ) | 33,504 | 80,361 | 101,373 | ||||||||||||||||||||
| Change in net unrealized appreciation/(depreciation) of investments | 360 | 6 | (3,440 | ) | (23,420 | ) | (46,420 | ) | 140,229 | ||||||||||||||||||
Net increase/(decrease) in net assets resulting from operations | 482 | 131 | (5,494 | ) | 10,018 | 40,724 | 249,396 | ||||||||||||||||||||
Distributions to Shareholders From (Note A): | |||||||||||||||||||||||||||
Distributable earnings: | |||||||||||||||||||||||||||
Investor Class | — | — | — | — | (97,976 | ) | (72,319 | ) | |||||||||||||||||||
Trust Class | — | — | — | — | (4,378 | ) | (5,879 | ) | |||||||||||||||||||
Advisor Class | — | — | — | — | (26 | ) | (12 | ) | |||||||||||||||||||
Institutional Class | (89 | ) | (64 | ) | (22,190 | ) | (12,035 | ) | (7,149 | ) | (4,992 | ) | |||||||||||||||
Class A | (10 | ) | (7 | ) | (2,407 | ) | (2,323 | ) | (467 | ) | (551 | ) | |||||||||||||||
Class C | (7 | ) | (5 | ) | (66 | ) | (29 | ) | (141 | ) | (137 | ) | |||||||||||||||
Class R3 | — | — | — | — | (27 | ) | (33 | ) | |||||||||||||||||||
Class R6 | — | — | — | — | — | — | |||||||||||||||||||||
Total distributions to shareholders | (106 | ) | (76 | ) | (24,663 | ) | (14,387 | ) | (110,164 | ) | (83,923 | ) | |||||||||||||||
From Fund Share Transactions (Note D): | |||||||||||||||||||||||||||
Proceeds from shares sold: | |||||||||||||||||||||||||||
Investor Class | — | — | — | — | 11,461 | 11,911 | |||||||||||||||||||||
Trust Class | — | — | — | — | 1,983 | 3,580 | |||||||||||||||||||||
Advisor Class | — | — | — | — | 136 | 23 | |||||||||||||||||||||
Institutional Class | 899 | 47 | 8,394 | 5,552 | 15,665 | 16,287 | |||||||||||||||||||||
Class A | 53 | 27 | — | 4,771 | 1,759 | 1,039 | |||||||||||||||||||||
Class C | 1 | 31 | — | 14 | 434 | 172 | |||||||||||||||||||||
Class R3 | — | — | — | — | 78 | 41 | |||||||||||||||||||||
Class R6 | — | — | — | — | 25 | — | |||||||||||||||||||||
Proceeds from reinvestment of dividends and distributions: | |||||||||||||||||||||||||||
Investor Class | — | — | — | — | 92,683 | 68,235 | |||||||||||||||||||||
Trust Class | — | — | — | — | 4,325 | 5,813 | |||||||||||||||||||||
Advisor Class | — | — | — | — | 25 | 12 | |||||||||||||||||||||
Institutional Class | 89 | 64 | 21,068 | 11,338 | 7,064 | 4,838 | |||||||||||||||||||||
Class A | 4 | 3 | 2,279 | 2,261 | 442 | 523 | |||||||||||||||||||||
Class C | 3 | 3 | 56 | 25 | 130 | 127 | |||||||||||||||||||||
Class R3 | — | — | — | — | 17 | 23 | |||||||||||||||||||||
Class R6 | — | — | — | — | — | — | |||||||||||||||||||||
See Notes to Financial Statements
169
| INTERNATIONAL EQUITY FUND | INTERNATIONAL SELECT FUND | INTERNATIONAL SMALL CAP FUND | |||||||||||||||||||||||||
| Fiscal Year Ended August 31, 2019 | Fiscal Year Ended August 31, 2018 | Fiscal Year Ended August 31, 2019 | Fiscal Year Ended August 31, 2018 | Fiscal Year Ended August 31, 2019 | Fiscal Year Ended August 31, 2018 | ||||||||||||||||||||||
Increase/(Decrease) in Net Assets: | |||||||||||||||||||||||||||
From Operations Note A: | |||||||||||||||||||||||||||
Net investment income/(loss) | $ | 18,657 | $ | 19,623 | $ | 2,165 | $ | 2,107 | $ | 58 | $ | 37 | |||||||||||||||
Net realized gain/(loss) on investments | 5,052 | 116,356 | 93 | 48,215 | (504 | ) | 85 | ||||||||||||||||||||
| Change in net unrealized appreciation/(depreciation) of investments | (131,925 | ) | (45,513 | ) | (7,384 | ) | (36,156 | ) | (335 | ) | (120 | ) | |||||||||||||||
Net increase/(decrease) in net assets resulting from operations | (108,216 | ) | 90,466 | (5,126 | ) | 14,166 | (781 | ) | 2 | ||||||||||||||||||
Distributions to Shareholders From (Note A): | |||||||||||||||||||||||||||
Distributable earnings: | |||||||||||||||||||||||||||
Investor Class | (936 | ) | (286 | ) | — | — | — | — | |||||||||||||||||||
Trust Class | (329 | ) | (74 | ) | (113 | ) | (65 | ) | — | — | |||||||||||||||||
Advisor Class | — | — | — | — | — | — | |||||||||||||||||||||
Institutional Class | (20,276 | ) | (14,148 | ) | (2,535 | ) | (2,374 | ) | (102 | ) | (66 | ) | |||||||||||||||
Class A | (543 | ) | (69 | ) | (51 | ) | (41 | ) | (3 | ) | (20 | ) | |||||||||||||||
Class C | (34 | ) | — | (22 | ) | (2 | ) | (2 | ) | (8 | ) | ||||||||||||||||
Class R3 | — | — | (36 | ) | (28 | ) | — | — | |||||||||||||||||||
Class R6 | (1,072 | ) | (2,084 | ) | (169 | ) | (116 | ) | (5 | ) | (18 | ) | |||||||||||||||
Total distributions to shareholders | (23,190 | ) | (16,661 | ) | (2,926 | ) | (2,626 | ) | (112 | ) | (112 | ) | |||||||||||||||
From Fund Share Transactions (Note D): | |||||||||||||||||||||||||||
Proceeds from shares sold: | |||||||||||||||||||||||||||
Investor Class | 2,058 | 5,762 | — | — | — | — | |||||||||||||||||||||
Trust Class | 1,584 | 6,248 | 154 | 149 | — | — | |||||||||||||||||||||
Advisor Class | — | — | — | — | — | — | |||||||||||||||||||||
Institutional Class | 662,224 | 651,839 | 20,113 | 17,951 | 42 | 5,506 | |||||||||||||||||||||
Class A | 11,407 | 25,730 | 456 | 1,347 | 17 | 66 | |||||||||||||||||||||
Class C | 1,122 | 4,054 | 205 | 159 | — | 28 | |||||||||||||||||||||
Class R3 | — | — | 525 | 953 | — | — | |||||||||||||||||||||
Class R6 | 27,204 | 87,406 | 21,500 | 190 | — | — | |||||||||||||||||||||
Proceeds from reinvestment of dividends and distributions: | |||||||||||||||||||||||||||
Investor Class | 893 | 273 | — | — | — | — | |||||||||||||||||||||
Trust Class | 310 | 70 | 74 | 62 | — | — | |||||||||||||||||||||
Advisor Class | — | — | — | — | — | — | |||||||||||||||||||||
Institutional Class | 14,015 | 11,700 | 2,481 | 2,312 | 102 | 67 | |||||||||||||||||||||
Class A | 157 | 30 | 38 | 36 | 1 | 9 | |||||||||||||||||||||
Class C | 25 | — | 11 | 1 | — | — | |||||||||||||||||||||
Class R3 | — | — | 28 | 23 | — | — | |||||||||||||||||||||
Class R6 | 1,072 | 2,084 | 169 | 115 | — | — | |||||||||||||||||||||
170
Statements of Changes in Net Assets (cont'd)
Neuberger Berman Equity Funds (cont'd)
(000's omitted)
| GLOBAL REAL ESTATE FUND | GREATER CHINA EQUITY FUND | GUARDIAN FUND | |||||||||||||||||||||||||
| Fiscal Year Ended August 31, 2019 | Fiscal Year Ended August 31, 2018 | Fiscal Year Ended August 31, 2019 | Fiscal Year Ended August 31, 2018 | Fiscal Year Ended August 31, 2019 | Fiscal Year Ended August 31, 2018 | ||||||||||||||||||||||
| Proceeds from shares issued in connection with tax-free reorganization (Note H): | |||||||||||||||||||||||||||
Institutional Class | — | — | — | — | — | — | |||||||||||||||||||||
Class A | — | — | — | — | — | — | |||||||||||||||||||||
Class C | — | — | — | — | — | — | |||||||||||||||||||||
Payments for shares redeemed: | |||||||||||||||||||||||||||
Investor Class | — | — | — | — | (104,354 | ) | (94,582 | ) | |||||||||||||||||||
Trust Class | — | — | — | — | (14,134 | ) | (15,794 | ) | |||||||||||||||||||
Advisor Class | — | — | — | — | (169 | ) | (9 | ) | |||||||||||||||||||
Institutional Class | (120 | ) | (39 | ) | (35,994 | ) | (43,135 | ) | (17,146 | ) | (19,040 | ) | |||||||||||||||
Class A | (15 | ) | (210 | ) | (3,582 | ) | (18,374 | ) | (3,095 | ) | (2,155 | ) | |||||||||||||||
Class C | — | — | (64 | ) | (77 | ) | (482 | ) | (305 | ) | |||||||||||||||||
Class R3 | — | — | — | — | (333 | ) | (161 | ) | |||||||||||||||||||
Class R6 | — | — | — | — | — | — | |||||||||||||||||||||
Net increase/(decrease) from Fund share transactions | 914 | (74 | ) | (7,843 | ) | (37,625 | ) | (3,486 | ) | (19,422 | ) | ||||||||||||||||
Net Increase/(Decrease) in Net Assets | 1,290 | (19 | ) | (38,000 | ) | (41,994 | ) | (72,926 | ) | 146,051 | |||||||||||||||||
Net Assets: | |||||||||||||||||||||||||||
Beginning of year | 2,884 | 2,903 | 89,415 | 131,409 | 1,334,332 | 1,188,281 | |||||||||||||||||||||
End of year | $ | 4,174 | $ | 2,884 | $ | 51,415 | $ | 89,415 | $ | 1,261,406 | $ | 1,334,332 | |||||||||||||||
See Notes to Financial Statements
171
| INTERNATIONAL EQUITY FUND | INTERNATIONAL SELECT FUND | INTERNATIONAL SMALL CAP FUND | |||||||||||||||||||||||||
| Fiscal Year Ended August 31, 2019 | Fiscal Year Ended August 31, 2018 | Fiscal Year Ended August 31, 2019 | Fiscal Year Ended August 31, 2018 | Fiscal Year Ended August 31, 2019 | Fiscal Year Ended August 31, 2018 | ||||||||||||||||||||||
| Proceeds from shares issued in connection with tax-free reorganization (Note H): | |||||||||||||||||||||||||||
Institutional Class | — | — | — | — | — | — | |||||||||||||||||||||
Class A | — | — | — | — | — | — | |||||||||||||||||||||
Class C | — | — | — | — | — | — | |||||||||||||||||||||
Payments for shares redeemed: | |||||||||||||||||||||||||||
Investor Class | (10,562 | ) | (14,869 | ) | — | — | — | — | |||||||||||||||||||
Trust Class | (10,327 | ) | (13,234 | ) | (2,761 | ) | (791 | ) | — | — | |||||||||||||||||
Advisor Class | — | — | — | — | — | — | |||||||||||||||||||||
Institutional Class | (815,615 | ) | (393,626 | ) | (29,863 | ) | (102,410 | ) | (180 | ) | (71 | ) | |||||||||||||||
Class A | (22,624 | ) | (33,923 | ) | (941 | ) | (2,627 | ) | (64 | ) | (177 | ) | |||||||||||||||
Class C | (4,893 | ) | (3,521 | ) | (915 | ) | (360 | ) | (16 | ) | — | ||||||||||||||||
Class R3 | — | — | (1,570 | ) | (2,748 | ) | — | — | |||||||||||||||||||
Class R6 | (18,009 | ) | (158,868 | ) | (1,320 | ) | (1,000 | ) | — | — | |||||||||||||||||
Net increase/(decrease) from Fund share transactions | (159,959 | ) | 177,155 | 8,384 | (86,638 | ) | (98 | ) | 5,428 | ||||||||||||||||||
Net Increase/(Decrease) in Net Assets | (291,365 | ) | 250,960 | 332 | (75,098 | ) | (991 | ) | 5,318 | ||||||||||||||||||
Net Assets: | |||||||||||||||||||||||||||
Beginning of year | 2,075,781 | 1,824,821 | 169,476 | 244,574 | 6,820 | 1,502 | |||||||||||||||||||||
End of year | $ | 1,784,416 | $ | 2,075,781 | $ | 169,808 | $ | 169,476 | $ | 5,829 | $ | 6,820 | |||||||||||||||
172
Statements of Changes in Net Assets (cont'd)
Neuberger Berman Equity Funds
(000's omitted)
INTRINSIC VALUE FUND | LARGE CAP VALUE FUND | MID CAP GROWTH FUND | |||||||||||||||||||||||||
| Fiscal Year Ended August 31, 2019 | Fiscal Year Ended August 31, 2018 | Fiscal Year Ended August 31, 2019 | Fiscal Year Ended August 31, 2018 | Fiscal Year Ended August 31, 2019 | Fiscal Year Ended August 31, 2018 | ||||||||||||||||||||||
Increase/(Decrease) in Net Assets: | |||||||||||||||||||||||||||
From Operations Note A: | |||||||||||||||||||||||||||
Net investment income/(loss) | $ | (1,575 | ) | $ | (3,268 | ) | $ | 29,859 | $ | 20,674 | $ | (2,933 | ) | $ | (2,052 | ) | |||||||||||
Net realized gain/(loss) on investments | 38,499 | 92,774 | 36,221 | 171,588 | 88,646 | 141,296 | |||||||||||||||||||||
| Change in net unrealized appreciation/(depreciation) of investments | (127,170 | ) | 71,486 | 30,096 | (15,860 | ) | (25,530 | ) | 173,664 | ||||||||||||||||||
Net increase/(decrease) in net assets resulting from operations | (90,246 | ) | 160,992 | 96,176 | 176,402 | 60,183 | 312,908 | ||||||||||||||||||||
Distributions to Shareholders From (Note A): | |||||||||||||||||||||||||||
Distributable earnings: | |||||||||||||||||||||||||||
Investor Class | — | — | (135,000 | ) | (93,531 | ) | (44,035 | ) | (39,598 | ) | |||||||||||||||||
Trust Class | — | — | (7,863 | ) | (6,005 | ) | (6,739 | ) | (5,336 | ) | |||||||||||||||||
Advisor Class | — | — | (13,649 | ) | (11,211 | ) | (1,304 | ) | (1,205 | ) | |||||||||||||||||
Institutional Class | (66,824 | ) | (43,660 | ) | (13,795 | ) | (7,533 | ) | (30,078 | ) | (28,019 | ) | |||||||||||||||
Class A | (2,298 | ) | (908 | ) | (546 | ) | (230 | ) | (3,791 | ) | (3,926 | ) | |||||||||||||||
Class C | (2,355 | ) | (1,255 | ) | (266 | ) | (180 | ) | (980 | ) | (859 | ) | |||||||||||||||
Class R3 | — | — | (41 | ) | (17 | ) | (1,260 | ) | (1,127 | ) | |||||||||||||||||
Class R6 | — | — | — | — | (37,921 | ) | (24,371 | ) | |||||||||||||||||||
Total distributions to shareholders | (71,477 | ) | (45,823 | ) | (171,160 | ) | (118,707 | ) | (126,108 | ) | (104,441 | ) | |||||||||||||||
From Fund Share Transactions (Note D): | |||||||||||||||||||||||||||
Proceeds from shares sold: | |||||||||||||||||||||||||||
Investor Class | — | — | 57,038 | 8,101 | 14,157 | 12,268 | |||||||||||||||||||||
Trust Class | — | — | 24,969 | 4,087 | 12,926 | 23,437 | |||||||||||||||||||||
Advisor Class | — | — | 10,000 | 5,499 | 4,249 | 5,456 | |||||||||||||||||||||
Institutional Class | 199,421 | 177,678 | 268,690 | 37,581 | 59,510 | 77,662 | |||||||||||||||||||||
Class A | 30,510 | 11,603 | 47,687 | 1,809 | 7,660 | 12,576 | |||||||||||||||||||||
Class C | 2,034 | 3,472 | 14,187 | 423 | 828 | 1,428 | |||||||||||||||||||||
Class R3 | — | — | 784 | 172 | 39,801 | 4,513 | |||||||||||||||||||||
Class R6 | 173 | — | 258 | — | 114,860 | 144,101 | |||||||||||||||||||||
Proceeds from reinvestment of dividends and distributions: | |||||||||||||||||||||||||||
Investor Class | — | — | 130,095 | 90,111 | 41,799 | 37,431 | |||||||||||||||||||||
Trust Class | — | — | 7,710 | 5,920 | 6,736 | 5,323 | |||||||||||||||||||||
Advisor Class | — | — | 13,624 | 11,200 | 819 | 787 | |||||||||||||||||||||
Institutional Class | 57,901 | 39,433 | 12,692 | 6,871 | 29,536 | 27,748 | |||||||||||||||||||||
Class A | 2,242 | 876 | 366 | 200 | 3,663 | 3,767 | |||||||||||||||||||||
Class C | 2,090 | 1,115 | 148 | 127 | 945 | 831 | |||||||||||||||||||||
Class R3 | — | — | 34 | 12 | 1,164 | 1,015 | |||||||||||||||||||||
Class R6 | — | — | — | — | 36,543 | 24,101 | |||||||||||||||||||||
See Notes to Financial Statements
173
| MID CAP INTRINSIC VALUE FUND | MULTI-CAP OPPORTUNITIES FUND | REAL ESTATE FUND | |||||||||||||||||||||||||
| Fiscal Year Ended August 31, 2019 | Fiscal Year Ended August 31, 2018 | Fiscal Year Ended August 31, 2019 | Fiscal Year Ended August 31, 2018 | Fiscal Year Ended August 31, 2019 | Fiscal Year Ended August 31, 2018 | ||||||||||||||||||||||
Increase/(Decrease) in Net Assets: | |||||||||||||||||||||||||||
From Operations Note A: | |||||||||||||||||||||||||||
Net investment income/(loss) | $ | 1,145 | $ | 639 | $ | 10,550 | $ | 11,256 | $ | 6,097 | $ | 7,613 | |||||||||||||||
Net realized gain/(loss) on investments | (1,169 | ) | 8,362 | 297,663 | 179,589 | 16,081 | 26,044 | ||||||||||||||||||||
| Change in net unrealized appreciation/(depreciation) of investments | (15,882 | ) | 3,283 | (302,361 | ) | 154,176 | 65,965 | (12,168 | ) | ||||||||||||||||||
Net increase/(decrease) in net assets resulting from operations | (15,906 | ) | 12,284 | 5,852 | 345,021 | 88,143 | 21,489 | ||||||||||||||||||||
Distributions to Shareholders From (Note A): | |||||||||||||||||||||||||||
Distributable earnings: | |||||||||||||||||||||||||||
Investor Class | (2,762 | ) | (2,645 | ) | — | — | — | — | |||||||||||||||||||
Trust Class | (668 | ) | (859 | ) | — | — | (7,852 | ) | (9,106 | ) | |||||||||||||||||
Advisor Class | — | — | — | — | — | — | |||||||||||||||||||||
Institutional Class | (3,918 | ) | (2,609 | ) | (147,622 | ) | (188,278 | ) | (11,383 | ) | (11,703 | ) | |||||||||||||||
Class A | (528 | ) | (720 | ) | (6,424 | ) | (5,812 | ) | (3,521 | ) | (4,640 | ) | |||||||||||||||
Class C | (137 | ) | (188 | ) | (3,583 | ) | (4,128 | ) | (667 | ) | (898 | ) | |||||||||||||||
Class R3 | (155 | ) | (115 | ) | — | — | (1,017 | ) | (1,057 | ) | |||||||||||||||||
Class R6 | — | — | — | — | (3,773 | ) | (3,179 | ) | |||||||||||||||||||
Total distributions to shareholders | (8,168 | ) | (7,136 | ) | (157,629 | ) | (198,218 | ) | (28,213 | ) | (30,583 | ) | |||||||||||||||
From Fund Share Transactions (Note D): | |||||||||||||||||||||||||||
Proceeds from shares sold: | |||||||||||||||||||||||||||
Investor Class | 27,827 | 998 | — | — | — | — | |||||||||||||||||||||
Trust Class | 797 | 398 | — | — | 17,380 | 14,986 | |||||||||||||||||||||
Advisor Class | — | — | — | — | — | — | |||||||||||||||||||||
Institutional Class | 17,697 | 27,310 | 161,758 | 153,353 | 57,811 | 60,254 | |||||||||||||||||||||
Class A | 16,035 | 3,941 | 15,497 | 36,164 | 20,390 | 15,061 | |||||||||||||||||||||
Class C | 375 | 329 | 5,226 | 6,748 | 442 | 241 | |||||||||||||||||||||
Class R3 | 379 | 1,160 | — | — | 5,904 | 4,732 | |||||||||||||||||||||
Class R6 | 25 | — | — | — | 21,078 | 29,533 | |||||||||||||||||||||
Proceeds from reinvestment of dividends and distributions: | |||||||||||||||||||||||||||
Investor Class | 2,646 | 2,513 | — | — | — | — | |||||||||||||||||||||
Trust Class | 657 | 847 | — | — | 7,805 | 9,054 | |||||||||||||||||||||
Advisor Class | — | — | — | — | — | — | |||||||||||||||||||||
Institutional Class | 3,906 | 2,588 | 137,938 | 178,195 | 10,228 | 10,556 | |||||||||||||||||||||
Class A | 405 | 587 | 5,674 | 5,235 | 3,379 | 4,447 | |||||||||||||||||||||
Class C | 122 | 164 | 3,274 | 3,762 | 595 | 793 | |||||||||||||||||||||
Class R3 | 134 | 92 | — | — | 967 | 988 | |||||||||||||||||||||
Class R6 | — | — | — | — | 3,773 | 3,178 | |||||||||||||||||||||
174
Statements of Changes in Net Assets (cont'd)
Neuberger Berman Equity Funds (cont'd)
(000's omitted)
INTRINSIC VALUE FUND | LARGE CAP VALUE FUND | MID CAP GROWTH FUND | |||||||||||||||||||||||||
| Fiscal Year Ended August 31, 2019 | Fiscal Year Ended August 31, 2018 | Fiscal Year Ended August 31, 2019 | Fiscal Year Ended August 31, 2018 | Fiscal Year Ended August 31, 2019 | Fiscal Year Ended August 31, 2018 | ||||||||||||||||||||||
| Proceeds from shares issued in connection with tax-free reorganization (Note H): | |||||||||||||||||||||||||||
Institutional Class | — | — | 25,810 | — | — | — | |||||||||||||||||||||
Class A | — | — | 3,922 | — | — | — | |||||||||||||||||||||
Class C | — | — | 4,058 | — | — | — | |||||||||||||||||||||
Payments for shares redeemed: | |||||||||||||||||||||||||||
Investor Class | — | — | (108,103 | ) | (132,889 | ) | (48,184 | ) | (42,932 | ) | |||||||||||||||||
Trust Class | — | — | (15,949 | ) | (19,162 | ) | (15,662 | ) | (13,534 | ) | |||||||||||||||||
Advisor Class | — | — | (26,840 | ) | (40,447 | ) | (7,652 | ) | (5,383 | ) | |||||||||||||||||
Institutional Class | (210,936 | ) | (490,716 | ) | (66,594 | ) | (30,147 | ) | (140,737 | ) | (126,889 | ) | |||||||||||||||
Class A | (26,719 | ) | (13,148 | ) | (3,471 | ) | (1,907 | ) | (26,028 | ) | (26,324 | ) | |||||||||||||||
Class C | (6,739 | ) | (5,400 | ) | (814 | ) | (938 | ) | (1,881 | ) | (1,861 | ) | |||||||||||||||
Class R3 | — | — | (407 | ) | (58 | ) | (9,434 | ) | (5,362 | ) | |||||||||||||||||
Class R6 | — | — | — | — | (109,689 | ) | (52,519 | ) | |||||||||||||||||||
Net increase/(decrease) from Fund share transactions | 49,977 | (275,087 | ) | 399,894 | (53,435 | ) | 15,929 | 107,640 | |||||||||||||||||||
Net Increase/(Decrease) in Net Assets | (111,746 | ) | (159,918 | ) | 324,910 | 4,260 | (49,996 | ) | 316,107 | ||||||||||||||||||
Net Assets: | |||||||||||||||||||||||||||
Beginning of year | 722,535 | 882,453 | 1,458,683 | 1,454,423 | 1,487,600 | 1,171,493 | |||||||||||||||||||||
End of year | $ | 610,789 | $ | 722,535 | $ | 1,783,593 | $ | 1,458,683 | $ | 1,437,604 | $ | 1,487,600 | |||||||||||||||
See Notes to Financial Statements
175
| MID CAP INTRINSIC VALUE FUND | MULTI-CAP OPPORTUNITIES FUND | REAL ESTATE FUND | |||||||||||||||||||||||||
| Fiscal Year Ended August 31, 2019 | Fiscal Year Ended August 31, 2018 | Fiscal Year Ended August 31, 2019 | Fiscal Year Ended August 31, 2018 | Fiscal Year Ended August 31, 2019 | Fiscal Year Ended August 31, 2018 | ||||||||||||||||||||||
| Proceeds from shares issued in connection with tax-free reorganization (Note H): | |||||||||||||||||||||||||||
Institutional Class | — | — | — | — | — | — | |||||||||||||||||||||
Class A | — | — | — | — | — | — | |||||||||||||||||||||
Class C | — | — | — | — | — | — | |||||||||||||||||||||
Payments for shares redeemed: | |||||||||||||||||||||||||||
Investor Class | (27,914 | ) | (5,671 | ) | — | — | — | — | |||||||||||||||||||
Trust Class | (1,810 | ) | (2,306 | ) | — | — | (43,660 | ) | (44,221 | ) | |||||||||||||||||
Advisor Class | — | — | — | — | — | — | |||||||||||||||||||||
Institutional Class | (22,720 | ) | (8,770 | ) | (926,729 | ) | (431,903 | ) | (56,374 | ) | (82,169 | ) | |||||||||||||||
Class A | (18,400 | ) | (3,437 | ) | (39,626 | ) | (24,170 | ) | (26,352 | ) | (41,552 | ) | |||||||||||||||
Class C | (949 | ) | (757 | ) | (10,965 | ) | (9,355 | ) | (5,200 | ) | (5,979 | ) | |||||||||||||||
Class R3 | (451 | ) | (502 | ) | — | — | (6,941 | ) | (6,518 | ) | |||||||||||||||||
Class R6 | — | — | — | — | (16,506 | ) | (20,531 | ) | |||||||||||||||||||
Net increase/(decrease) from Fund share transactions | (1,239 | ) | 19,484 | (647,953 | ) | (81,971 | ) | (5,281 | ) | (47,147 | ) | ||||||||||||||||
Net Increase/(Decrease) in Net Assets | (25,313 | ) | 24,632 | (799,730 | ) | 64,832 | 54,649 | (56,241 | ) | ||||||||||||||||||
Net Assets: | |||||||||||||||||||||||||||
Beginning of year | 117,617 | 92,985 | 1,987,149 | 1,922,317 | 458,281 | 514,522 | |||||||||||||||||||||
End of year | $ | 92,304 | $ | 117,617 | $ | 1,187,419 | $ | 1,987,149 | $ | 512,930 | $ | 458,281 | |||||||||||||||
176
Statements of Changes in Net Assets (cont'd)
Neuberger Berman Equity Funds
(000's omitted)
| SMALL CAP GROWTH FUND | SUSTAINABLE EQUITY FUND | ||||||||||||||||||
| Fiscal Year Ended August 31, 2019 | Fiscal Year Ended August 31, 2018 | Fiscal Year Ended August 31, 2019 | Fiscal Year Ended August 31, 2018 | ||||||||||||||||
Increase/(Decrease) in Net Assets: | |||||||||||||||||||
From Operations Note A: | |||||||||||||||||||
Net investment income/(loss) | $ | (999 | ) | $ | (808 | ) | $ | 17,524 | $ | 14,867 | |||||||||
Net realized gain/(loss) on investments | 13,324 | 18,089 | 251,895 | 226,047 | |||||||||||||||
| Change in net unrealized appreciation/(depreciation) of investments | (11,696 | ) | 10,573 | (352,941 | ) | 164,375 | |||||||||||||
Net increase/(decrease) in net assets resulting from operations | 629 | 27,854 | (83,522 | ) | 405,289 | ||||||||||||||
Distributions to Shareholders From (Note A): | |||||||||||||||||||
Distributable earnings: | |||||||||||||||||||
Investor Class | (10,344 | ) | (749 | ) | (47,002 | ) | (44,085 | ) | |||||||||||
Trust Class | (673 | ) | (49 | ) | (16,512 | ) | (13,644 | ) | |||||||||||
Advisor Class | (382 | ) | (37 | ) | — | — | |||||||||||||
Institutional Class | (2,842 | ) | (180 | ) | (76,097 | ) | (52,580 | ) | |||||||||||
Class A | (822 | ) | (48 | ) | (9,516 | ) | (6,950 | ) | |||||||||||
Class C | (539 | ) | (42 | ) | (4,557 | ) | (3,146 | ) | |||||||||||
Class R3 | (274 | ) | (24 | ) | (2,534 | ) | (2,203 | ) | |||||||||||
Class R6 | (4 | ) | — | (23,974 | ) | (22,818 | ) | ||||||||||||
Total distributions to shareholders | (15,880 | ) | (1,129 | ) | (180,192 | ) | (145,426 | ) | |||||||||||
From Fund Share Transactions (Note D): | |||||||||||||||||||
Proceeds from shares sold: | |||||||||||||||||||
Investor Class | 5,799 | 4,272 | 25,001 | 56,624 | |||||||||||||||
Trust Class | 753 | 100 | 18,117 | 30,425 | |||||||||||||||
Advisor Class | 1,855 | 833 | — | — | |||||||||||||||
Institutional Class | 95,021 | 2,713 | 183,454 | 223,902 | |||||||||||||||
Class A | 73,671 | 3,414 | 20,718 | 28,735 | |||||||||||||||
Class C | 1,891 | 851 | 4,916 | 6,581 | |||||||||||||||
Class R3 | 5,274 | 1,595 | 8,547 | 16,496 | |||||||||||||||
Class R6 | 21,713 | — | 98,445 | 113,355 | |||||||||||||||
Proceeds from reinvestment of dividends and distributions: | |||||||||||||||||||
Investor Class | 10,178 | 736 | 45,674 | 43,405 | |||||||||||||||
Trust Class | 642 | 47 | 16,406 | 13,567 | |||||||||||||||
Advisor Class | 382 | 37 | — | — | |||||||||||||||
Institutional Class | 2,797 | 177 | 68,421 | 48,046 | |||||||||||||||
Class A | 804 | 47 | 8,676 | 6,304 | |||||||||||||||
Class C | 508 | 41 | 4,059 | 2,762 | |||||||||||||||
Class R3 | 248 | 17 | 2,370 | 2,076 | |||||||||||||||
Class R6 | — | — | 23,974 | 22,818 | |||||||||||||||
See Notes to Financial Statements
177
Statements of Changes in Net Assets (cont'd)
Neuberger Berman Equity Funds (cont'd)
(000's omitted)
| SMALL CAP GROWTH FUND | SUSTAINABLE EQUITY FUND | ||||||||||||||||||
| Fiscal Year Ended August 31, 2019 | Fiscal Year Ended August 31, 2018 | Fiscal Year Ended August 31, 2019 | Fiscal Year Ended August 31, 2018 | ||||||||||||||||
| Proceeds from shares issued in connection with tax-free reorganization (Note H): | |||||||||||||||||||
Institutional Class | — | — | — | — | |||||||||||||||
Class A | — | — | — | — | |||||||||||||||
Class C | — | — | — | — | |||||||||||||||
Payments for shares redeemed: | |||||||||||||||||||
Investor Class | (8,500 | ) | (6,627 | ) | (230,755 | ) | (231,636 | ) | |||||||||||
Trust Class | (678 | ) | (797 | ) | (79,130 | ) | (73,283 | ) | |||||||||||
Advisor Class | (1,650 | ) | (663 | ) | — | — | |||||||||||||
Institutional Class | (23,030 | ) | (2,711 | ) | (328,752 | ) | (270,163 | ) | |||||||||||
Class A | (27,770 | ) | (2,793 | ) | (45,597 | ) | (39,847 | ) | |||||||||||
Class C | (834 | ) | (543 | ) | (16,910 | ) | (9,878 | ) | |||||||||||
Class R3 | (4,969 | ) | (934 | ) | (11,720 | ) | (27,732 | ) | |||||||||||
Class R6 | (474 | ) | — | (171,115 | ) | (208,482 | ) | ||||||||||||
Net increase/(decrease) from Fund share transactions | 153,631 | (188 | ) | (355,201 | ) | (245,925 | ) | ||||||||||||
Net Increase/(Decrease) in Net Assets | 138,380 | 26,537 | (618,915 | ) | 13,938 | ||||||||||||||
Net Assets: | |||||||||||||||||||
Beginning of year | 100,087 | 73,550 | 2,406,962 | 2,393,024 | |||||||||||||||
End of year | $ | 238,467 | $ | 100,087 | $ | 1,788,047 | $ | 2,406,962 | |||||||||||
See Notes to Financial Statements
178
Notes to Financial Statements Equity Funds
Note A—Summary of Significant Accounting Policies:
1 General: Neuberger Berman Equity Funds (the "Trust") is a Delaware statutory trust organized pursuant to an Amended and Restated Trust Instrument dated March 27, 2014. The Trust is registered as an open-end management investment company under the Investment Company Act of 1940, as amended (the "1940 Act"), and its shares are registered under the Securities Act of 1933, as amended (the "1933 Act"). Neuberger Berman Dividend Growth Fund ("Dividend Growth"), Neuberger Berman Emerging Markets Equity Fund ("Emerging Markets Equity"), Neuberger Berman Equity Income Fund ("Equity Income"), Neuberger Berman Focus Fund ("Focus"), Neuberger Berman Genesis Fund ("Genesis"), Neuberger Berman Global Equity Fund ("Global Equity"), Neuberger Berman Global Real Estate Fund ("Global Real Estate"), Neuberger Berman Greater China Equity Fund ("Greater China Equity"), Neuberger Berman Guardian Fund ("Guardian"), Neuberger Berman International Equity Fund ("International Equity"), Neuberger Berman International Select Fund ("International Select"), Neuberger Berman International Small Cap Fund ("International Small Cap"), Neuberger Berman Intrinsic Value Fund ("Intrinsic Value"), Neuberger Berman Large Cap Value Fund ("Large Cap Value"), Neuberger Berman Mid Cap Growth Fund ("Mid Cap Growth"), Neuberger Berman Mid Cap Intrinsic Value Fund ("Mid Cap Intrinsic Value"), Neuberger Berman Multi-Cap Opportunities Fund ("Multi-Cap Opportunities"), Neuberger Berman Real Estate Fund ("Real Estate"), Neuberger Berman Small Cap Growth Fund ("Small Cap Growth") and Neuberger Berman Sustainable Equity Fund ("Sustainable Equity") (each individually a "Fund," and collectively, the "Funds") are separate operating series of the Trust, each of which (except Greater China Equity and Real Estate) is diversified. Under the 1940 Act, the status of a Fund that was registered as non-diversified may, under certain circumstances, change to that of a diversified fund (Global Real Estate and Multi-Cap Opportunities became diversified in December 2017 and December 2012, respectively). Nine Funds offer Investor Class shares, eleven offer Trust Class shares, six offer Advisor Class shares, twenty offer Institutional Class shares, nineteen offer Class A shares, nineteen offer Class C shares, ten offer Class R3 shares and fourteen offer Class R6 shares. The Trust's Board of Trustees (the "Board") may establish additional series or classes of shares without the approval of shareholders. As previously announced, as of September 3, 2019, Neuberger Berman Global Equity Fund changed its name to Neuberger Berman Integrated Large Cap Fund, and changed its investment strategy, portfolio management team and fees and expenses.
A balance indicated with a "—", reflects either a zero balance or a balance that rounds to less than 1.
The assets of each Fund belong only to that Fund, and the liabilities of each Fund are borne solely by that Fund and no other.
Each Fund is an investment company and accordingly follows the investment company accounting and reporting guidance of the Financial Accounting Standards Board ("FASB") Accounting Standards Codification ("ASC") Topic 946 "Financial Services—Investment Companies."
The preparation of financial statements in accordance with U.S. generally accepted accounting principles ("GAAP") requires Neuberger Berman Investment Advisers LLC ("Management") to make estimates and assumptions at the date of the financial statements. Actual results could differ from those estimates.
2 Portfolio valuation: In accordance with ASC 820 "Fair Value Measurement" ("ASC 820"), all investments held by each of the Funds are carried at the value that Management believes a Fund would receive upon selling an investment in an orderly transaction to an independent buyer in the principal or most advantageous market for the investment under current market conditions. Various inputs, including the volume and level of activity for the asset or liability in the market, are considered in valuing the Funds' investments, some of which are discussed below. Significant Management judgment may be necessary to value investments in accordance with ASC 820.
ASC 820 established a three-tier hierarchy of inputs to create a classification of value measurements for disclosure purposes. The three-tier hierarchy of inputs is summarized in the three broad Levels listed below.
179
• Level 1 – quoted prices in active markets for identical investments
• Level 2 – other observable inputs (including quoted prices for similar investments, interest rates, prepayment speeds, credit risk, amortized cost, etc.)
• Level 3 – unobservable inputs (including a Fund's own assumptions in determining the fair value of investments)
The inputs or methodology used for valuing an investment are not necessarily an indication of the risk associated with investing in those securities.
The value of the Funds' investments in equity securities, preferred stocks, warrants, exchange-traded options purchased and written, for which market quotations are readily available, is generally determined by Management by obtaining valuations from independent pricing services based on the latest sale price quoted on a principal exchange or market for that security (Level 1 inputs). Securities traded primarily on the NASDAQ Stock Market are normally valued at the NASDAQ Official Closing Price ("NOCP") provided by NASDAQ each business day. The NOCP is the most recently reported price as of 4:00:02 p.m., Eastern Time, unless that price is outside the range of the "inside" bid and asked prices (i.e., the bid and asked prices that dealers quote to each other when trading for their own accounts); in that case, NASDAQ will adjust the price to equal the inside bid or asked price, whichever is closer. Because of delays in reporting trades, the NOCP may not be based on the price of the last trade to occur before the market closes. If there is no sale of a security on a particular day, the independent pricing services may value the security based on market quotations.
The value of the Funds' investments in debt securities is determined by Management primarily by obtaining valuations from independent pricing services based on readily available bid or offer quotations, respectively, or if quotations are not available, by methods which include various considerations based on security type (generally Level 2 inputs). In addition to the consideration of yields or prices of securities of comparable quality, coupon, maturity and type, indications as to values from dealers, and general market conditions, the following is a description of other Level 2 inputs and related valuation techniques used by independent pricing services to value certain types of debt securities held by the Funds:
Corporate Bonds. Inputs used to value corporate debt securities generally include relative credit information, observed market movements, sector news, U.S. Treasury yield curve or relevant benchmark curve, and other market information, which may include benchmark yield curves, reported trades, broker-dealer quotes, issuer spreads, comparable securities, and reference data, such as market research publications, when available ("Other Market Information").
Convertible Bonds. Inputs used to value convertible bonds generally include underlying stock data, dealer quotes, conversion premiums, listed bond and preferred stock prices and other market information, which may include benchmark curves, trade execution data, and sensitivity analysis, when available.
High Yield Securities. Inputs used to value high yield securities generally include a number of observations of equity and credit default swap curves related to the issuer and Other Market Information.
Management has developed a process to periodically review information provided by independent pricing services for all types of securities.
Certificates of deposit are valued at amortized cost (Level 2 inputs).
Investments in non-exchange traded investment companies are valued using the respective fund's daily calculated net asset value ("NAV") per share (Level 2 inputs).
If a valuation is not available from an independent pricing service, or if Management has reason to believe that the valuation received does not represent the amount a Fund might reasonably expect to receive on a current sale in an orderly transaction, Management seeks to obtain quotations from brokers or dealers (generally considered Level 2 or Level 3 inputs depending on the number of quotes available). If such quotations are not readily available, the security is valued using methods the Board has approved in the good-faith belief that the resulting valuation will
180
reflect the fair value of the security. Numerous factors may be considered when determining the fair value of a security based on Level 2 or Level 3 inputs, including available analyst, media or other reports, securities within the same industry with recent highly correlated performance, trading in futures or American Depositary Receipts and whether the issuer of the security being fair valued has other securities outstanding.
The value of the Funds' investments in foreign securities is generally determined using the same valuation methods and inputs as other Fund investments, as discussed above. Foreign security prices expressed in local currency values are normally translated from the local currency into U.S. dollars using the exchange rates as of 4:00 p.m., Eastern Time on days the New York Stock Exchange ("NYSE") is open for business. The Board has approved the use of ICE Data Pricing and Reference Data LLC ("ICE") to assist in determining the fair value of foreign equity securities when changes in the value of a certain index suggest that the closing prices on the foreign exchanges may no longer represent the amount that a Fund could expect to receive for those securities or on days when foreign markets are closed and U.S. markets are open. In each of these events, ICE will provide adjusted prices for certain foreign equity securities using a statistical analysis of historical correlations of multiple factors (Level 2 inputs). The Board has also approved the use of ICE to evaluate the prices of foreign debt securities as of the time as of which a Fund's share price is calculated. ICE utilizes benchmark spread and yield curves and evaluates available market activity from the local close to the time as of which a Fund's share price is calculated (Level 2 inputs) to assist in determining prices for certain foreign debt securities. In the case of both foreign equity and foreign debt securities, in the absence of precise information about the market values of these foreign securities as of the time as of which a Fund's share price is calculated, the Board has determined on the basis of available data that prices adjusted or evaluated in this way are likely to be closer to the prices a Fund could realize on a current sale than are the prices of those securities established at the close of the foreign markets in which the securities primarily trade.
Fair value prices are necessarily estimates, and there is no assurance that such a price will be at or close to the price at which the security is next quoted or next trades.
3 Foreign currency translations: The accounting records of the Funds are maintained in U.S. dollars. Foreign currency amounts are normally translated into U.S. dollars using the exchange rate as of 4:00 p.m. Eastern Time, on days the NYSE is open for business, to determine the value of investments, other assets and liabilities. Purchase and sale prices of securities, and income and expenses, are translated into U.S. dollars at the prevailing rate of exchange on the respective dates of such transactions. Net unrealized foreign currency gain/(loss), if any, arises from changes in the value of assets and liabilities, other than investments in securities, as a result of changes in exchange rates and is stated separately in the Statements of Operations.
4 Securities transactions and investment income: Securities transactions are recorded on trade date for financial reporting purposes. Dividend income is recorded on the ex-dividend date or, for certain foreign dividends, as soon as the Fund becomes aware of the dividends. Non-cash dividends included in dividend income, if any, are recorded at the fair market value of the securities received. Interest income, including accretion of discount (adjusted for original issue discount, where applicable) and amortization of premium, where applicable, is recorded on the accrual basis. Realized gains and losses from securities transactions and foreign currency transactions, if any, are recorded on the basis of identified cost and stated separately in the Statements of Operations. Included in net realized gain/(loss) on investments are proceeds from the settlement of class action litigation(s) in which certain of the Funds participated as class members. The amounts of such proceeds for the year ended August 31, 2019, were $81,067, $7,655, $750,062, $952, $415,854, $51,765, $4,355, $622,995, $38,718, $339, $6,395, $116,781, and $1,121, for Equity Income, Focus, Genesis, Guardian, International Equity, International Select, Intrinsic Value, Large Cap Value, Mid Cap Growth, Mid Cap Intrinsic Value, Multi-Cap Opportunities, Small Cap Growth and Sustainable Equity, respectively.
5 Income tax information: Each Fund is treated as a separate entity for U.S. federal income tax purposes. It is the policy of each Fund to continue to qualify for treatment as a regulated investment company ("RIC") by complying
181
with the requirements of the U.S. Internal Revenue Code applicable to RICs and to distribute substantially all of its net investment income and net realized capital gains to its shareholders. To the extent a Fund distributes substantially all of its net investment income and net realized capital gains to shareholders, no federal income or excise tax provision is required.
The Funds have adopted the provisions of ASC 740 "Income Taxes" ("ASC 740"). ASC 740 sets forth a minimum threshold for financial statement recognition of a tax position taken, or expected to be taken, in a tax return. The Funds recognize interest and penalties, if any, related to unrecognized tax positions as an income tax expense in the Statements of Operations. The Funds are subject to examination by U.S. federal and state tax authorities for returns filed for the tax years for which the applicable statutes of limitations have not yet expired. As of August 31, 2019, the Funds did not have any unrecognized tax positions.
At August 31, 2019, selected Fund information for all long security positions and derivative instruments, if any, for U.S. federal income tax purposes was as follows:
| (000's omitted) | Cost | Gross Unrealized Appreciation | Gross Unrealized Depreciation | Net Unrealized Appreciation/ (Depreciation) | |||||||||||||||
Dividend Growth | $ | 50,169 | $ | 7,773 | $ | 3,109 | $ | 4,664 | |||||||||||
Emerging Markets Equity | 1,278,194 | 164,842 | 89,089 | 75,753 | |||||||||||||||
Equity Income | 1,196,275 | 296,439 | 24,197 | 272,242 | |||||||||||||||
Focus | 558,108 | 164,347 | 43,760 | 120,587 | |||||||||||||||
Genesis | 5,566,216 | 4,950,652 | 288,769 | 4,661,883 | |||||||||||||||
Global Equity | 3,019 | 791 | 212 | 579 | |||||||||||||||
Global Real Estate | 3,765 | 576 | 99 | 477 | |||||||||||||||
Greater China Equity | 52,434 | 3,100 | 6,378 | (3,278 | ) | ||||||||||||||
Guardian | 1,003,665 | 333,045 | 31,406 | 301,639 | |||||||||||||||
International Equity | 1,698,042 | 197,900 | 116,300 | 81,600 | |||||||||||||||
International Select | 159,965 | 16,935 | 11,676 | 5,259 | |||||||||||||||
International Small Cap | 6,440 | 406 | 633 | (227 | ) | ||||||||||||||
Intrinsic Value | 543,723 | 172,270 | 104,822 | 67,448 | |||||||||||||||
Large Cap Value | 1,698,323 | 212,007 | 37,790 | 174,217 | |||||||||||||||
Mid Cap Growth | 1,037,576 | 439,965 | 18,921 | 421,044 | |||||||||||||||
Mid Cap Intrinsic Value | 89,242 | 14,721 | 11,614 | 3,107 | |||||||||||||||
Multi-Cap Opportunities | 694,034 | 492,769 | 884 | 491,885 | |||||||||||||||
Real Estate | 411,980 | 107,796 | 7,192 | 100,604 | |||||||||||||||
Small Cap Growth | 248,757 | 21,595 | 14,376 | 7,219 | |||||||||||||||
Sustainable Equity | 1,327,270 | 568,478 | 111,553 | 456,925 | |||||||||||||||
Income distributions and capital gain distributions are determined in accordance with income tax regulations, which may differ from GAAP. These differences are primarily due to differing treatments of income and gains on various investment securities held by each Fund, timing differences and differing characterization of distributions made by each Fund. The Funds may also utilize earnings and profits distributed to shareholders on redemption of their shares as a part of the dividends-paid deduction for income tax purposes.
Any permanent differences resulting from different book and tax treatment are reclassified at year-end and have no impact on net income, NAV or NAV per share of the Funds. For the year ended August 31, 2019, the Funds recorded the following permanent reclassifications primarily related to one or more of the following: deemed distributions on shareholder redemptions, net operating losses written off, differences transferred to a surviving
182
fund following a merger, non-deductible expenses from partnerships, and adjustments from securities redeemed in-kind. For the year ended August 31, 2019, the Funds recorded the following permanent reclassifications:
Paid-in Capital | Total Distributable Earnings/(Losses) | ||||||||||
Dividend Growth | $ | 520 | $ | (520 | ) | ||||||
Emerging Markets Equity | — | — | |||||||||
Equity Income | 6,743,896 | (6,743,896 | ) | ||||||||
Focus | 1,196,242 | (1,196,242 | ) | ||||||||
Genesis | 145,409,906 | (145,409,906 | ) | ||||||||
Global Equity | — | — | |||||||||
Global Real Estate | 5 | (5 | ) | ||||||||
Greater China Equity | — | — | |||||||||
Guardian | 4,500,089 | (4,500,089 | ) | ||||||||
International Equity | 3,714,010 | (3,714,010 | ) | ||||||||
International Select | 215,645 | (215,645 | ) | ||||||||
International Small Cap | — | — | |||||||||
Intrinsic Value | 6,179,223 | (6,179,223 | ) | ||||||||
Large Cap Value | 8,971,478 | (8,971,478 | ) | ||||||||
Mid Cap Growth | 8,540,569 | (8,540,569 | ) | ||||||||
Mid Cap Intrinsic Value | (13,704 | ) | 13,704 | ||||||||
Multi-Cap Opportunities | 64,277,035 | (64,277,035 | ) | ||||||||
Real Estate | 2,131,350 | (2,131,350 | ) | ||||||||
Small Cap Growth | 3,478,342 | (3,478,342 | ) | ||||||||
Sustainable Equity | 65,481,908 | (65,481,908 | ) | ||||||||
The tax character of distributions paid during the years ended August 31, 2019, and August 31, 2018, was as follows:
Distributions Paid From: | |||||||||||||||||||||||||||||||||||
Ordinary Income | Long-Term Capital Gain | Return of Capital | Total | ||||||||||||||||||||||||||||||||
2019 | 2018 | 2019 | 2018 | 2019 | 2018 | 2019 | 2018 | ||||||||||||||||||||||||||||
Dividend Growth | $ | 878,382 | $ | 505,410 | $ | 1,990,913 | $ | 624,343 | $ | — | $ | — | $ | 2,869,295 | $ | 1,129,753 | |||||||||||||||||||
| Emerging Markets Equity | 12,080,438 | 6,837,681 | — | — | — | — | 12,080,438 | 6,837,681 | |||||||||||||||||||||||||||
Equity Income | 33,714,658 | 45,816,093 | 65,245,087 | 63,269,560 | — | — | 98,959,745 | 109,085,653 | |||||||||||||||||||||||||||
Focus | 18,916,856 | 33,895,157 | 33,501,189 | 29,442,423 | — | — | 52,418,045 | 63,337,580 | |||||||||||||||||||||||||||
Genesis | 20,419,535 | 63,910,574 | 983,608,714 | 1,291,918,972 | — | — | 1,004,028,249 | 1,355,829,546 | |||||||||||||||||||||||||||
Global Equity | 75,450 | 26,186 | 232,764 | — | — | — | 308,214 | 26,186 | |||||||||||||||||||||||||||
Global Real Estate | 73,452 | 51,623 | 33,173 | 24,773 | — | — | 106,625 | 76,396 | |||||||||||||||||||||||||||
| Greater China Equity | 11,364,203 | 8,294,757 | 13,298,695 | 6,092,283 | — | — | 24,662,898 | 14,387,040 | |||||||||||||||||||||||||||
Guardian | 29,808,349 | 21,564,458 | 80,355,254 | 62,358,000 | — | — | 110,163,603 | 83,922,458 | |||||||||||||||||||||||||||
| International Equity | 18,471,465 | 16,661,495 | 4,719,319 | — | — | — | 23,190,784 | 16,661,495 | |||||||||||||||||||||||||||
| International Select | 1,242,508 | 2,625,735 | 1,682,857 | — | — | — | 2,925,365 | 2,625,735 | |||||||||||||||||||||||||||
| International Small Cap | 15,182 | 112,414 | 96,500 | — | — | — | 111,682 | 112,414 | |||||||||||||||||||||||||||
Intrinsic Value | 11,727,225 | 5,894,092 | 59,749,691 | 39,928,465 | — | — | 71,476,916 | 45,822,557 | |||||||||||||||||||||||||||
183
Distributions Paid From: | |||||||||||||||||||||||||||||||||||
Ordinary Income | Long-Term Capital Gain | Return of Capital | Total | ||||||||||||||||||||||||||||||||
2019 | 2018 | 2019 | 2018 | 2019 | 2018 | 2019 | 2018 | ||||||||||||||||||||||||||||
Large Cap Value | $ | 48,424,781 | $ | 58,656,776 | $ | 122,735,314 | $ | 60,050,227 | $ | — | $ | — | $ | 171,160,095 | $ | 118,707,003 | |||||||||||||||||||
Mid Cap Growth | 20,803,058 | 10,423,416 | 105,305,351 | 94,016,995 | — | — | 126,108,409 | 104,440,411 | |||||||||||||||||||||||||||
| Mid Cap Intrinsic Value | 3,594,717 | 1,057,152 | 4,572,879 | 6,079,356 | — | — | 8,167,596 | 7,136,508 | |||||||||||||||||||||||||||
| Multi-Cap Opportunities | 11,530,044 | 10,555,931 | 146,099,376 | 187,661,598 | — | — | 157,629,420 | 198,217,529 | |||||||||||||||||||||||||||
Real Estate | 6,014,323 | 7,230,660 | 22,198,825 | 23,352,045 | — | — | 28,213,148 | 30,582,705 | |||||||||||||||||||||||||||
Small Cap Growth | 10,737,489 | — | 5,142,955 | 1,129,421 | — | — | 15,880,444 | 1,129,421 | |||||||||||||||||||||||||||
Sustainable Equity | 11,102,674 | 31,075,924 | 169,089,043 | 114,350,242 | — | — | 180,191,717 | 145,426,166 | |||||||||||||||||||||||||||
As of August 31, 2019, the components of distributable earnings (accumulated losses) on a U.S. federal income tax basis were as follows:
| Undistributed Ordinary Income | Undistributed Long-Term Capital Gain | Unrealized Appreciation/ (Depreciation) | Loss Carryforwards and Deferrals | Other Temporary Differences | Total | ||||||||||||||||||||||
Dividend Growth | $ | 826,026 | $ | — | $ | 4,664,017 | $ | (538,359 | ) | $ | — | $ | 4,951,684 | ||||||||||||||
| Emerging Markets Equity | 12,296,996 | — | 75,740,302 | (78,400,665 | ) | (19,592 | ) | 9,617,041 | |||||||||||||||||||
Equity Income | 3,925,399 | 37,428,678 | 272,253,224 | — | — | 313,607,301 | |||||||||||||||||||||
Focus | 3,361,783 | 2,384,426 | 120,586,822 | — | (93,052 | ) | 126,239,979 | ||||||||||||||||||||
Genesis | 11,081,971 | 498,092,485 | 4,661,883,108 | — | — | 5,171,057,564 | |||||||||||||||||||||
Global Equity | 28,103 | 376,486 | 579,180 | — | — | 983,769 | |||||||||||||||||||||
Global Real Estate | 51,947 | 47,091 | 477,318 | — | (1,784 | ) | 574,572 | ||||||||||||||||||||
Greater China Equity | 453,480 | — | (3,294,512 | ) | (10,741,550 | ) | (17,525 | ) | (13,600,107 | ) | |||||||||||||||||
Guardian | 24,613,618 | 40,887,423 | 301,639,013 | — | (25,218 | ) | 367,114,836 | ||||||||||||||||||||
International Equity | 15,829,475 | 4,157,167 | 81,538,286 | — | (331 | ) | 101,524,597 | ||||||||||||||||||||
International Select | 1,957,837 | 289,184 | 5,250,082 | — | (11,955 | ) | 7,485,148 | ||||||||||||||||||||
| International Small Cap | 50,883 | — | (227,302 | ) | (502,768 | ) | — | (679,187 | ) | ||||||||||||||||||
Intrinsic Value | 2,473,029 | 13,732,506 | 67,448,301 | — | (74,200 | ) | 83,579,636 | ||||||||||||||||||||
Large Cap Value | 23,826,214 | 22,479,704 | 174,216,641 | — | — | 220,522,559 | |||||||||||||||||||||
Mid Cap Growth | — | 62,345,876 | 421,044,393 | (2,574,094 | ) | — | 480,816,175 | ||||||||||||||||||||
| Mid Cap Intrinsic Value | 527,332 | (2,553,157 | ) | 3,106,642 | — | — | 1,080,817 | ||||||||||||||||||||
| Multi-Cap Opportunities | 6,875,456 | 188,844,424 | 491,885,207 | — | — | 687,605,087 | |||||||||||||||||||||
Real Estate | — | 9,659,294 | 100,604,434 | — | — | 110,263,728 | |||||||||||||||||||||
Small Cap Growth | 7,202,678 | 1,782,696 | 7,218,928 | — | — | 16,204,302 | |||||||||||||||||||||
Sustainable Equity | 11,213,620 | 146,938,088 | 456,910,093 | — | — | 615,061,801 | |||||||||||||||||||||
The temporary differences between book basis and tax basis distributable earnings are primarily due to: losses disallowed and/or recognized on wash sales and straddles, capital loss carryforwards, amortization of organization expenses, partnership basis adjustments, convertible bond adjustments, loss limitation due to
184
ownership change, tax adjustments related to real estate investment trusts ("REITs") and mark to market adjustments on forwards, passive foreign investment companies and other investments.
To the extent each Fund's net realized capital gains, if any, can be offset by capital loss carryforwards, it is the policy of each Fund not to distribute such gains. Capital loss carryforward rules allow for RICs to carry forward capital losses indefinitely and to retain the character of capital loss carryforwards as short-term or long-term. As determined at August 31, 2019, the following Funds had unused capital loss carryforwards available for federal income tax purposes to offset net realized capital gains, if any, as follows:
Capital Loss Carryforwards | |||||||||||
Long-Term | Short-Term | ||||||||||
Dividend Growth | $ | 53,083 | $ | 485,276 | |||||||
Emerging Markets Equity | 31,538,458 | 46,862,207 | |||||||||
Greater China Equity | 2,609,992 | * | 8,131,557 | * | |||||||
International Small Cap | 117,597 | 385,171 | |||||||||
* Future utilization is limited under current tax regulation.
Under current tax regulations, capital losses realized on investment transactions after October 31 may be deferred and treated as occurring on the first day of the following fiscal year. Under The Regulated Investment Company Modernization Act of 2010, the Funds may also defer any realized late-year ordinary losses as occurring on the first day of the following fiscal year. Late-year ordinary losses represent ordinary losses realized on investment transactions after December 31 and specified losses (ordinary losses from the sale, exchange, or other disposition of property, net foreign currency losses and net passive foreign investment company mark to market losses) realized on investment transactions after October 31. For the year ended August 31, 2019, the Funds elected to defer the following late-year ordinary losses and post October capital losses:
| Late-Year Ordinary Loss | Post October Capital Loss Deferral | ||||||||||||||
Deferral | Long-Term | Short-Term | |||||||||||||
Mid Cap Growth | $ | 2,574,094 | $ | — | $ | — | |||||||||
Mid Cap Intrinsic Value | — | 2,298,359 | 254,798 | ||||||||||||
6 Foreign taxes: Foreign taxes withheld, if any, represent amounts withheld by foreign tax authorities, net of refunds recoverable.
Emerging Markets Equity accrues capital gains tax on unrealized and realized gains for certain securities. For the year ended August 31, 2019, Emerging Markets Equity had realized capital gains taxes of $5,326, which is reflected in the Statements of Operations.
7 Distributions to shareholders: Each Fund may earn income, net of expenses, daily on its investments.
Distributions from net investment income and net realized capital gains, if any, are generally distributed once a year (usually in December) and are recorded on the ex-date. However, Equity Income, Global Real Estate and Real Estate generally distribute net investment income, if any, at the end of each calendar quarter.
For Funds that invest in REITs, it is the policy to pass through to its shareholders substantially all REIT distributions and other income it receives, less operating expenses. The distributions received from REITs are generally composed of income, capital gains, and/or return of REIT capital, but the REITs do not report this information to these Funds until the following calendar year. At August 31, 2019, these Funds estimated these amounts for the period January 1, 2019 to August 31, 2019 within the financial statements because the 2019 information is not available from the REITs until after each Fund's fiscal year-end. All estimates are based upon REIT information sources available to these Funds together with actual IRS Forms 1099-DIV received to date. For the year ended August 31, 2019, the character of distributions, if any, paid to shareholders of these Funds disclosed
185
within the Statements of Changes in Net Assets is based on estimates made at that time. Based on past experience it is possible that a portion of these Funds' distributions during the current fiscal year, if any, will be considered tax return of capital, but the actual amount of the tax return of capital, if any, is not determinable until after each Fund's fiscal year-end. After calendar year-end, when these Funds learn the nature of the distributions paid by REITs during that year, distributions previously identified as income are often recharacterized as return of capital and/or capital gain. After all applicable REITs have informed these Funds of the actual breakdown of distributions paid to these Funds during their fiscal year, estimates previously recorded are adjusted on the books of these Funds to reflect actual results. As a result, the composition of these Funds' distributions as reported herein may differ from the final composition determined after calendar year-end and reported to these Funds shareholders on IRS Form 1099-DIV.
8 Expense allocation: Certain expenses are applicable to multiple funds within the complex of related investment companies. Expenses directly attributable to a fund are charged to that fund. Expenses of the Trust that are not directly attributable to a particular series of the Trust (e.g., a Fund) are allocated among the series of the Trust, on the basis of relative net assets, except where a more appropriate allocation of expenses to each of the series can otherwise be made fairly. Expenses borne by the complex of related investment companies, which includes open-end and closed-end investment companies for which Management serves as investment manager, that are not directly attributable to a particular investment company in the complex (e.g., the Trust) or series thereof are allocated among the investment companies in the complex or series thereof on the basis of relative net assets, except where a more appropriate allocation of expenses to each of the investment companies in the complex or series thereof can otherwise be made fairly. Each Fund's expenses (other than those specific to each class) are allocated proportionally each day among the classes based upon the relative net assets of each class.
9 Investments in foreign securities: Investing in foreign securities may involve sovereign and other risks, in addition to the credit and market risks normally associated with domestic securities. These additional risks include the possibility of adverse political and economic developments (including political instability, nationalization, expropriation, or confiscatory taxation) and the potentially adverse effects of unavailability of public information regarding issuers, less governmental supervision and regulation of financial markets, reduced liquidity of certain financial markets, and the lack of uniform accounting, auditing, and financial reporting standards or the application of standards that are different or less stringent than those applied in the United States. Foreign securities also may experience greater price volatility, higher rates of inflation, and delays in settlement.
10 Investment company securities and exchange-traded funds: The Funds may invest in shares of other registered investment companies, including exchange-traded funds ("ETFs"), within the limitations prescribed by the 1940 Act, the exemptive order from the Securities and Exchange Commission ("SEC") that permits the Funds to invest in both affiliated and unaffiliated investment companies, including ETFs, in excess of the limits in Section 12(d)(1)(A) of the 1940 Act, subject to the terms and conditions of such order, or the ETF's exemptive order. Some ETFs seek to track the performance of a particular market index. These indices include both broad-based market indices and more narrowly-based indices, including those relating to particular sectors, markets, regions or industries. However, some ETFs have an actively-managed investment objective. ETF shares are traded like traditional equity securities on a national securities exchange or NASDAQ. A Fund will indirectly bear its proportionate share of any management fees and other expenses paid by such other investment companies, which will decrease returns.
11 Derivative instruments: Certain Funds' use of derivatives during the year ended August 31, 2019, is described below. Please see the Schedule of Investments for each Fund's open positions in derivatives, if any, at August 31, 2019. The Funds have adopted the provisions of ASC 815 "Derivatives and Hedging" ("ASC 815"). The disclosure requirements of ASC 815 distinguish between derivatives that qualify for hedge accounting and those that do not. Because investment companies value their derivatives at fair value and recognize changes in fair value through the Statements of Operations, they do not qualify for hedge accounting. Accordingly, even though a Fund's investments in derivatives may represent economic hedges, they are considered non-hedge transactions for purposes of this disclosure.
186
Options: Equity Income used options written to generate incremental returns. Focus used options written to enhance total return; written calls were used for hedging purposes and to manage the risk profile of the Fund, and written puts were used to enhance total return and to gain exposure to certain securities. Guardian used options written to enhance total return, to gain exposure more efficiently than through a direct purchase of the underlying security, to gain exposure to securities, markets, sectors or geographical areas and to manage or adjust the risk profile of the Fund or the risk of individual positions. Guardian used options purchased to gain exposure more efficiently than through a direct purchase of the underlying security, to gain exposure to securities, markets, sectors or geographical areas and to manage or adjust the risk profile of the Fund or the risk of individual positions. Large Cap Value used options written to enhance total return and to efficiently manage risk exposures.
Premiums paid by a Fund upon purchasing a call or put option are recorded in the asset section of the Fund's Statement of Assets and Liabilities and are subsequently adjusted to the current market value. When an option is exercised, closed, or expired, a Fund realizes a gain or loss and the asset is eliminated. For purchased call options, a Fund's loss is limited to the amount of the option premium paid.
Premiums received by a Fund upon writing a call option or a put option are recorded in the liability section of the Fund's Statement of Assets and Liabilities and are subsequently adjusted to the current market value. When an option is exercised, closed, or expired, a Fund realizes a gain or loss and the liability is eliminated.
When a fund writes a call option on an underlying asset it does not own, its exposure on such an option is theoretically unlimited. When writing a covered call option, a Fund, in return for the premium, gives up the opportunity for profit from a price increase in the underlying security above the exercise price, but conversely retains the risk of loss should the price of the security decline. When writing a put option, a Fund, in return for the premium, takes the risk that it must purchase the underlying security at a price that may be higher than the current market price of the security. If a call or put option that a Fund has written expires unexercised, a Fund will realize a gain for the amount of the premium. All securities covering outstanding written options are held in escrow by the custodian bank.
At August 31, 2019, the Funds listed below had the following derivatives (which did not qualify as hedging instruments under ASC 815), grouped by primary risk exposure:
Asset Derivatives
(000's omitted)
Derivative Type | Statements of Assets and Liabilities Location | Equity Risk | Total | ||||||||||||
Guardian | |||||||||||||||
Options purchased | Investments in securities, at value | $ | 1,777 | $ | 1,777 | ||||||||||
Total Value—Assets | $ | 1,777 | $ | 1,777 | |||||||||||
Liability Derivatives
(000's omitted)
Derivative Type | Statements of Assets and Liabilities Location | Equity Risk | Total | ||||||||||||
Equity Income | |||||||||||||||
Options written | Option contracts written, at value | $ | (2,804 | ) | $ | (2,804 | ) | ||||||||
Total Value—Liabilities | $ | (2,804 | ) | $ | (2,804 | ) | |||||||||
Guardian | |||||||||||||||
Options written | Option contracts written, at value | $ | (2,610 | ) | $ | (2,610 | ) | ||||||||
Total Value—Liabilities | $ | (2,610 | ) | $ | (2,610 | ) | |||||||||
187
The impact of the use of derivative instruments on the Statements of Operations during the year ended August 31, 2019, was as follows:
Realized Gain/(Loss)
(000's omitted)
Derivative Type | Statements of Operations Location | Equity Risk | Total | ||||||||||||
Equity Income | |||||||||||||||
Options written | Net realized gain/(loss) on: Expiration or closing of option contracts written | $ | 2,113 | $ | 2,113 | ||||||||||
Total Realized Gain/(Loss) | $ | 2,113 | $ | 2,113 | |||||||||||
Focus | |||||||||||||||
Options written | Net realized gain/(loss) on: Expiration or closing of option contracts written | $ | 176 | $ | 176 | ||||||||||
Total Realized Gain/(Loss) | $ | 176 | $ | 176 | |||||||||||
Guardian | |||||||||||||||
Options purchased | Net realized gain/(loss) on: Transactions in investment securities of unaffiliated issuers | $ | (1,262 | ) | $ | (1,262 | ) | ||||||||
Options written | Net realized gain/(loss) on: Expiration or closing of option contracts written | 1,762 | 1,762 | ||||||||||||
Total Realized Gain/(Loss) | $ | 500 | $ | 500 | |||||||||||
Realized Gain/(Loss)
(000's omitted)
Derivative Type | Statements of Operations Location | Equity Risk | Total | ||||||||||||
Large Cap Value | |||||||||||||||
Options written | Net realized gain/(loss) on: Expiration or closing of option contracts written | $ | 84 | $ | 84 | ||||||||||
Total Realized Gain/(Loss) | $ | 84 | $ | 84 | |||||||||||
Change in Appreciation/(Depreciation)
(000's omitted)
Derivative Type | Statements of Operations Location | Equity Risk | Total | ||||||||||||
Equity Income | |||||||||||||||
Options written | Change in net unrealized appreciation/(depreciation) in value of: Option contracts written | $ | (815 | ) | $ | (815 | ) | ||||||||
Total Change in Appreciation/(Depreciation) | $ | (815 | ) | $ | (815 | ) | |||||||||
Guardian | |||||||||||||||
Options purchased | Change in net unrealized appreciation/(depreciation) in value of: Investment securities of unaffiliated issuers | $ | 489 | $ | 489 | ||||||||||
Options written | Change in net unrealized appreciation/(depreciation) in value of: Option contracts written | (1,644 | ) | (1,644 | ) | ||||||||||
Total Change in Appreciation/(Depreciation) | $ | (1,155 | ) | $ | (1,155 | ) | |||||||||
While the Funds may receive rights and warrants in connection with their investments in securities, these rights and warrants are not considered "derivative instruments" under ASC 815. Management has concluded that the Funds, except Equity Income, Focus, Guardian and Large Cap Value did not hold any derivative instruments during the year ended August 31, 2019, that require additional disclosures pursuant to ASC 815.
12 Securities lending: Each Fund, using State Street Bank and Trust Company ("State Street") as its lending agent, may loan securities to qualified brokers and dealers in exchange for negotiated lender's fees. These fees, if any,
188
would be disclosed within the Statements of Operations under the caption "Income from securities loaned—net" and are net of expenses retained by State Street as compensation for its services as lending agent. For the year ended August 31, 2019, the Funds listed below received income under the securities lending arrangement as follows:
(000's omitted) | |||||||
Emerging Markets Equity | $ | 39 | |||||
Focus | 7 | ||||||
Guardian | 162 | ||||||
International Equity | 238 | ||||||
International Select | 24 | ||||||
International Small Cap | 5 | ||||||
Large Cap Value | 120 | ||||||
Mid Cap Growth | 27 | ||||||
Small Cap Growth | 37 | ||||||
The initial cash collateral received by a Fund at the beginning of each transaction shall have a value equal to at least 102% of the prior day's market value of the loaned securities (105% in the case of international securities). Thereafter, the value of the cash collateral is monitored on a daily basis, and cash collateral is moved daily between a counterparty and a Fund until the close of the transaction. A Fund may only receive collateral in the form of cash (U.S. dollars). Cash collateral is generally invested in a money market fund registered under the 1940 Act that is managed by an affiliate of State Street. The risks associated with lending portfolio securities include, but are not limited to, possible delays in receiving additional collateral or in the recovery of the loaned securities. Any increase or decrease in the fair value of the securities loaned and any interest earned or dividends paid or owed on those securities during the term of the loan would accrue to the Fund.
As of August 31, 2019, the Funds listed below had outstanding loans of securities to certain approved brokers each with a value as follows:
(000's omitted) | Value of Securities Loaned | ||||||
Emerging Markets Equity | $ | 8,768 | |||||
Guardian | 42,609 | ||||||
International Small Cap | 241 | ||||||
Large Cap Value | 87,260 | ||||||
Mid Cap Growth | 19,924 | ||||||
Small Cap Growth | 14,531 | ||||||
As of August 31, 2019, the Funds listed below had outstanding loans of securities to certain approved brokers for which each received collateral as follows:
Remaining Contractual Maturity of the Agreements | |||||||||||||||||||||||
(000's omitted) | Overnight and Continuous | Less Than 30 Days | Between 30 & 90 Days | Greater Than 90 Days | Total | ||||||||||||||||||
| Securities Lending Transactions(a) | |||||||||||||||||||||||
Common Stocks | |||||||||||||||||||||||
Emerging Markets Equity | $ | 9,007 | $ | — | $ | — | $ | — | $ | 9,007 | |||||||||||||
Guardian | 43,104 | — | — | — | 43,104 | ||||||||||||||||||
International Small Cap | 254 | — | — | — | 254 | ||||||||||||||||||
189
Remaining Contractual Maturity of the Agreements | |||||||||||||||||||||||
(000's omitted) | Overnight and Continuous | Less Than 30 Days | Between 30 & 90 Days | Greater Than 90 Days | Total | ||||||||||||||||||
Large Cap Value | $ | 87,881 | $ | — | $ | — | $ | — | $ | 87,881 | |||||||||||||
Mid Cap Growth | 20,416 | — | — | — | 20,416 | ||||||||||||||||||
Small Cap Growth | 14,921 | — | — | — | 14,921 | ||||||||||||||||||
(a) Amounts represent the payable for loaned securities collateral received.
The Funds are required to disclose both gross and net information for assets and liabilities related to derivatives, repurchase and reverse repurchase agreements, and securities lending and securities borrowing transactions that are eligible for offset or subject to an enforceable master netting or similar agreement. Emerging Markets Equity, Guardian, International Small Cap, Large Cap Value, Mid Cap Growth and Small Cap Growth held one or more of these investments at August 31, 2019. The Funds' security lending assets and liabilities at fair value are reported gross in the Statements of Assets and Liabilities. The following tables present securities lending assets and liabilities by counterparty, net of amounts available for offset under a master netting or similar agreement and net of the related collateral received by a Fund for assets and pledged by a Fund for liabilities as of August 31, 2019.
| Description (000's omitted) | Gross Amounts of Recognized Assets | Gross Amounts Offset in the Statements of Assets and Liabilities | Net Amounts of Assets Presented in the Statements of Assets and Liabilities | ||||||||||||
Emerging Markets Equity | |||||||||||||||
Securities Lending | $ | 8,768 | $ | — | $ | 8,768 | |||||||||
Total | $ | 8,768 | $ | — | $ | 8,768 | |||||||||
Guardian | |||||||||||||||
Securities Lending | $ | 42,609 | $ | — | $ | 42,609 | |||||||||
Total | $ | 42,609 | $ | — | $ | 42,609 | |||||||||
International Small Cap | |||||||||||||||
Securities Lending | $ | 241 | $ | — | $ | 241 | |||||||||
Total | $ | 241 | $ | — | $ | 241 | |||||||||
Large Cap Value | |||||||||||||||
Securities Lending | $ | 87,260 | $ | — | $ | 87,260 | |||||||||
Total | $ | 87,260 | $ | — | $ | 87,260 | |||||||||
Mid Cap Growth | |||||||||||||||
Securities Lending | $ | 19,924 | $ | — | $ | 19,924 | |||||||||
Total | $ | 19,924 | $ | — | $ | 19,924 | |||||||||
Small Cap Growth | |||||||||||||||
Securities Lending | $ | 14,531 | $ | — | $ | 14,531 | |||||||||
Total | $ | 14,531 | $ | — | $ | 14,531 | |||||||||
Gross Amounts Not Offset in the Statements of Assets and Liabilities
| Counterparty (000's omitted) | Net Amounts of Assets Presented in the Statements of Assets and Liabilities | Liabilities Available for Offset | Cash Collateral Received(a) | Net Amount(b) | |||||||||||||||
Emerging Markets Equity | |||||||||||||||||||
SSB | $ | 8,768 | $ | — | $ | (8,768 | ) | $ | — | ||||||||||
Total | $ | 8,768 | $ | — | $ | (8,768 | ) | $ | — | ||||||||||
Guardian | |||||||||||||||||||
SSB | $ | 42,609 | $ | — | $ | (42,609 | ) | $ | — | ||||||||||
Total | $ | 42,609 | $ | — | $ | (42,609 | ) | $ | — | ||||||||||
190
Gross Amounts Not Offset in the Statements of Assets and Liabilities
| Counterparty (000's omitted) | Net Amounts of Assets Presented in the Statements of Assets and Liabilities | Liabilities Available for Offset | Cash Collateral Received(a) | Net Amount(b) | |||||||||||||||
International Small Cap | |||||||||||||||||||
SSB | $ | 241 | $ | — | $ | (241 | ) | $ | — | ||||||||||
Total | $ | 241 | $ | — | $ | (241 | ) | $ | — | ||||||||||
Large Cap Value | |||||||||||||||||||
SSB | $ | 87,260 | $ | — | $ | (87,260 | ) | $ | — | ||||||||||
Total | $ | 87,260 | $ | — | $ | (87,260 | ) | $ | — | ||||||||||
Mid Cap Growth | |||||||||||||||||||
SSB | $ | 19,924 | $ | — | $ | (19,924 | ) | $ | — | ||||||||||
Total | $ | 19,924 | $ | — | $ | (19,924 | ) | $ | — | ||||||||||
Small Cap Growth | |||||||||||||||||||
SSB | $ | 14,531 | $ | — | $ | (14,531 | ) | $ | — | ||||||||||
Total | $ | 14,531 | $ | — | $ | (14,531 | ) | $ | — | ||||||||||
(a) Collateral received (or pledged) is limited to an amount not to exceed 100% of the net amount of assets (or liabilities) in the tables presented above.
(b) Net Amount represents amounts subject to loss at August 31, 2019, in the event of a counterparty failure.
13 Indemnifications: Like many other companies, the Trust's organizational documents provide that its officers ("Officers") and trustees ("Trustees") are indemnified against certain liabilities arising out of the performance of their duties to the Trust. In addition, both in some of its principal service contracts and in the normal course of its business, the Trust enters into contracts that provide indemnifications to other parties for certain types of losses or liabilities. The Trust's maximum exposure under these arrangements is unknown as this could involve future claims against the Trust.
14 In-kind subscriptions: Under certain circumstances, and when considered to be in the best interest of a Fund, a Fund may accept portfolio securities rather than cash as payment for the purchase of Fund shares ("in-kind subscription"). For financial reporting and tax purposes, the cost basis of contributed securities is equal to the market value of the securities, less any applicable foreign security taxes, on the date of contribution. In-kind subscriptions result in no gain or loss and no tax consequences for a Fund. During the year ended August 31, 2018, Genesis accepted $117,648,065 of in-kind subscriptions.
15 In-kind redemptions: In accordance with guidelines described in a Fund's prospectus and in accordance with procedures adopted by the Board, a Fund may distribute portfolio securities rather than cash as payment for a redemption of Fund shares ("in-kind redemption"). For financial reporting purposes, the Fund recognizes a gain on in-kind redemptions to the extent the value of the distributed securities on the date of redemption exceeds the cost of those securities. Gains and losses realized on in-kind redemptions are not recognized for tax purposes and are reclassified from undistributed realized gain/(loss) to paid-in capital. During the year ended August 31, 2018, Genesis, International Equity, International Select and Sustainable Equity realized net gains of $266,798,836, $37,148,378, $22,204,328 and $39,512,498, respectively, on $475,404,196, $122,988,128, $70,976,192 and $103,913,811, respectively, of in-kind redemptions. During the year ended August 31, 2019, Genesis and Sustainable Equity realized net gains of $51,385,073 and $26,393,200, respectively, on $88,171,756 and $74,230,454, respectively, of in-kind redemptions.
16 Other: All net investment income and realized and unrealized capital gains and losses of each Fund are allocated, on the basis of relative net assets, pro rata among its respective classes.
191
Note B—Investment Management Fees, Administration Fees, Distribution Arrangements, and Other Transactions with Affiliates:
Each Fund retains Management as its investment manager under a Management Agreement. For such investment management services, each Fund pays Management an investment management fee as a percentage of average daily net assets according to the following table:
| First $250 million | Next $250 million | Next $250 million | Next $250 million | Next $500 million | Next $500 million | Next $500 million | Next $1.5 billion | Thereafter | |||||||||||||||||||||||||||||||
For Genesis, Intrinsic Value, and Small Cap Growth: | |||||||||||||||||||||||||||||||||||||||
0.85 | % | 0.80 | % | 0.75 | % | 0.70 | % | 0.65 | % | 0.65 | % | 0.65 | % | 0.65 | % | 0.65 | % | ||||||||||||||||||||||
For Emerging Markets Equity: | |||||||||||||||||||||||||||||||||||||||
1.00 | % | 0.975 | % | 0.95 | % | 0.925 | % | 0.90 | % | 0.875 | % | 0.875 | % | 0.875 | % | 0.85 | % | ||||||||||||||||||||||
For Global Real Estate and Real Estate: | |||||||||||||||||||||||||||||||||||||||
0.80 | % | 0.80 | % | 0.80 | % | 0.80 | % | 0.80 | % | 0.80 | % | 0.80 | % | 0.80 | % | 0.80 | % | ||||||||||||||||||||||
| For International Equity(a): | |||||||||||||||||||||||||||||||||||||||
0.85 | % | 0.825 | % | 0.80 | % | 0.775 | % | 0.75 | % | 0.725 | % | 0.725 | % | 0.70 | % | 0.70 | % | ||||||||||||||||||||||
For International Small Cap: | |||||||||||||||||||||||||||||||||||||||
0.85 | % | 0.825 | % | 0.80 | % | 0.775 | % | 0.75 | % | 0.725 | % | 0.725 | % | 0.725 | % | 0.70 | % | ||||||||||||||||||||||
| For Equity Income, Focus, Guardian, International Select, Large Cap Value, Mid Cap Growth, Mid Cap Intrinsic Value(a) and Sustainable Equity: | |||||||||||||||||||||||||||||||||||||||
0.55 | % | 0.525 | % | 0.50 | % | 0.475 | % | 0.45 | % | 0.425 | % | 0.425 | % | 0.425 | % | 0.40 | % | ||||||||||||||||||||||
For Multi-Cap Opportunities: | |||||||||||||||||||||||||||||||||||||||
0.60 | % | 0.575 | % | 0.55 | % | 0.525 | % | 0.50 | % | 0.475 | % | 0.475 | % | 0.475 | % | 0.45 | % | ||||||||||||||||||||||
| For Global Equity(b): | |||||||||||||||||||||||||||||||||||||||
0.55 | % | 0.55 | % | 0.55 | % | 0.55 | % | 0.55 | % | 0.55 | % | 0.55 | % | 0.55 | % | 0.55 | % | ||||||||||||||||||||||
For Greater China Equity: | |||||||||||||||||||||||||||||||||||||||
1.10 | % | 1.10 | % | 1.10 | % | 1.10 | % | 0.95 | % | 0.95 | % | 0.95 | % | 0.95 | % | 0.95 | % | ||||||||||||||||||||||
For Dividend Growth: | |||||||||||||||||||||||||||||||||||||||
0.50 | % | 0.50 | % | 0.50 | % | 0.50 | % | 0.50 | % | 0.475 | % | 0.475 | % | 0.475 | % | 0.45 | % | ||||||||||||||||||||||
(a) Management has voluntarily agreed to waive and/or reimburse its management fee for the below Funds. Management may, at its sole discretion, modify or terminate the voluntary waiver and/or reimbursement without notice to these respective Funds. Fees voluntarily waived and/or reimbursed are not subject to recovery by Management.
| Fund | Percentage of Average Daily Net Assets Waived and/or Reimbursed | Effective Date(s) | Management Fees Waived and/or Reimbursed for Year Ended August 31, 2019 | ||||||||||||
International Equity | 0.14 | % | 4/5/19 | $ | 1,611,037 | ||||||||||
| 0.07 | % | 11/15/18 – 4/4/19 | ||||||||||||
| 0.04 | % | 11/1/17 – 11/14/18 | ||||||||||||
192
Fund | Percentage of Average Daily Net Assets Waived and/or Reimbursed | Effective Date(s) | Management Fees Waived and/or Reimbursed for Year Ended August 31, 2019 | ||||||||||||
| Mid Cap Intrinsic Value(c) | 3.73 | % | 8/30/19 – 8/31/19 | $ | 110,106 | ||||||||||
| 0.33 | % | 6/18/19 – 8/29/19 | ||||||||||||
| 0.05 | % | 4/5/19 – 6/17/19 | ||||||||||||
| 0.03 | % | 11/15/18 – 4/4/19 | ||||||||||||
(b) For the period September 1, 2019, to September 2, 2019, Management voluntarily reduced its management fee by 0.55% of the Fund's average daily net assets. Effective September 3, 2019, the investment management fee is 0.20% of the Fund's average daily net assets.
(c) Effective September 1, 2019, Management changed the voluntary waiver to 0.33% of average daily net assets.
Accordingly, for the year ended August 31, 2019, the investment management fee pursuant to the Management Agreement was equivalent to an annual effective rate of each Fund's average daily net assets, as follows:
| Effective Rate | Effective Rate | ||||||||||||||
Dividend Growth | 0.50 | % | International Small Cap | 0.85 | % | ||||||||||
Emerging Markets Equity | 0.94 | % | Intrinsic Value | 0.81 | % | ||||||||||
Equity Income | 0.49 | % | Large Cap Value | 0.49 | % | ||||||||||
Focus | 0.53 | % | Mid Cap Growth | 0.50 | % | ||||||||||
Genesis | 0.66 | % | Mid Cap Intrinsic Value | 0.55 | %(b) | ||||||||||
Greater China Equity | 1.10 | % | Multi-Cap Opportunities | 0.54 | % | ||||||||||
Guardian | 0.50 | % | Small Cap Growth | 0.85 | % | ||||||||||
International Equity | 0.78 | %(a) | Sustainable Equity | 0.47 | % | ||||||||||
International Select | 0.55 | % | |||||||||||||
(a) 0.69% annual effective net rate of the Fund's average daily net assets.
(b) 0.45% annual effective net rate of the Fund's average daily net assets.
Each Fund retains Management as its administrator under an Administration Agreement. The administration fee is assessed at the Class level and each share class of a Fund, as applicable, pays Management an annual administration fee equal to the following: 0.26% for each of Investor Class, Class A, Class C and Class R3; 0.40% for Trust Class and Advisor Class; 0.15% for Institutional Class; and 0.05% for Class R6 (0.08% prior to December 6, 2018), each as a percentage of its average daily net assets. Additionally, Management retains State Street as its sub-administrator under a Sub-Administration Agreement. Management pays State Street a fee for all services received under the Sub-Administration Agreement.
Management has contractually agreed to waive fees and/or reimburse certain expenses of the Investor Class of each of International Equity, Mid Cap Intrinsic Value and Small Cap Growth and the Trust Class, Advisor Class, Institutional Class, Class A, Class C, Class R3 and Class R6 of each Fund that offers those classes so that the total annual operating expenses of those classes do not exceed the expense limitations as detailed in the following table. These undertakings apply to a Fund's direct expenses and exclude interest, taxes, brokerage commissions, acquired fund fees and expenses, extraordinary expenses, and dividend and interest expenses relating to short sales, if any (commitment fees relating to borrowings are treated as interest for purposes of this exclusion) ("annual operating expenses"); consequently, net expenses may exceed the contractual expense limitations.
193
| Expenses Reimbursed in Year Ended August 31, | |||||||||||||||||||||||
2017 | 2018 | 2019 | |||||||||||||||||||||
| Subject to Repayment until August 31, | |||||||||||||||||||||||
Class | Contractual Expense Limitation(a) | Expiration | 2020 | 2021 | 2022 | ||||||||||||||||||
Dividend Growth Institutional Class | 0.69 | % | 8/31/22 | $ | 258,355 | $ | 245,104 | $ | 253,857 | ||||||||||||||
Dividend Growth Class A | 1.05 | % | 8/31/22 | 8,372 | 11,408 | 9,695 | |||||||||||||||||
Dividend Growth Class C | 1.80 | % | 8/31/22 | 20,432 | 17,402 | 15,075 | |||||||||||||||||
Dividend Growth Class R6 | 0.59 | %(b) | 8/31/22 | 484 | 158 | 158 | |||||||||||||||||
Emerging Markets Equity Institutional Class | 1.25 | % | 8/31/22 | 460,088 | 231,794 | — | |||||||||||||||||
Emerging Markets Equity Class A | 1.50 | % | 8/31/22 | 91,792 | 92,255 | 51,901 | |||||||||||||||||
Emerging Markets Equity Class C | 2.25 | % | 8/31/22 | 11,097 | 12,202 | 9,302 | |||||||||||||||||
Emerging Markets Equity Class R3 | 1.91 | % | 8/31/22 | 1,161 | 24 | 245 | |||||||||||||||||
Emerging Markets Equity Class R6 | 1.15 | %(b) | 8/31/22 | 88,158 | 7,769 | — | |||||||||||||||||
Equity Income Institutional Class | 0.80 | % | 8/31/22 | — | — | — | |||||||||||||||||
Equity Income Class A | 1.16 | % | 8/31/22 | — | — | — | |||||||||||||||||
Equity Income Class C | 1.91 | % | 8/31/22 | — | — | — | |||||||||||||||||
Equity Income Class R3 | 1.41 | % | 8/31/22 | — | — | — | |||||||||||||||||
Focus Trust Class | 1.50 | % | 8/31/22 | — | — | — | |||||||||||||||||
Focus Advisor Class | 1.50 | % | 8/31/22 | — | — | — | |||||||||||||||||
Focus Institutional Class | 0.75 | % | 8/31/22 | 209 | — | 114 | |||||||||||||||||
Focus Class A | 1.11 | % | 8/31/22 | 580 | 312 | 261 | |||||||||||||||||
Focus Class C | 1.86 | % | 8/31/22 | 336 | 137 | 193 | |||||||||||||||||
Genesis Trust Class | 1.50 | % | 8/31/22 | — | — | — | |||||||||||||||||
Genesis Advisor Class | 1.50 | % | 8/31/22 | — | — | — | |||||||||||||||||
Genesis Institutional Class | 0.85 | % | 8/31/22 | — | — | — | |||||||||||||||||
Genesis Class R6 | 0.75 | %(b) | 8/31/22 | — | 872,606 | 3,159 | |||||||||||||||||
Global Equity Institutional Class | 0.75 | %(b)(i) | 8/31/22 | 239,590 | 259,479 | 286,177 | |||||||||||||||||
Global Equity Class A | 1.11 | %(b)(i) | 8/31/22 | 24,676 | 30,042 | 23,143 | |||||||||||||||||
Global Equity Class C | 1.86 | %(b)(i) | 8/31/22 | 8,112 | 6,624 | 7,214 | |||||||||||||||||
Global Real Estate Institutional Class | 1.00 | % | 8/31/22 | 202,973 | 220,996 | 227,837 | |||||||||||||||||
Global Real Estate Class A | 1.36 | % | 8/31/22 | 38,044 | 30,605 | 27,482 | |||||||||||||||||
Global Real Estate Class C | 2.11 | % | 8/31/22 | 25,661 | 28,315 | 26,045 | |||||||||||||||||
Greater China Equity Institutional Class | 1.50 | % | 8/31/22 | 164,058 | 79,507 | 173,901 | |||||||||||||||||
Greater China Equity Class A | 1.86 | % | 8/31/22 | 9,343 | 28,600 | 30,826 | |||||||||||||||||
Greater China Equity Class C | 2.61 | % | 8/31/22 | 321 | 536 | 801 | |||||||||||||||||
Guardian Trust Class | 1.50 | % | 8/31/22 | — | — | — | |||||||||||||||||
Guardian Advisor Class | 1.50 | % | 8/31/22 | — | — | — | |||||||||||||||||
Guardian Institutional Class | 0.75 | % | 8/31/22 | — | — | — | |||||||||||||||||
Guardian Class A | 1.11 | % | 8/31/22 | — | — | — | |||||||||||||||||
Guardian Class C | 1.86 | % | 8/31/22 | — | — | — | |||||||||||||||||
Guardian Class R3 | 1.36 | % | 8/31/22 | 88 | 20 | 91 | |||||||||||||||||
194
| Expenses Reimbursed in Year Ended August 31, | |||||||||||||||||||||||
2017 | 2018 | 2019 | |||||||||||||||||||||
| Subject to Repayment until August 31, | |||||||||||||||||||||||
Class | Contractual Expense Limitation(a) | Expiration | 2020 | 2021 | 2022 | ||||||||||||||||||
Guardian Class R6 | 0.65 | % | 8/31/22 | $ | — | $ | — | $ | 36 | (c) | |||||||||||||
International Equity Investor Class | 1.40 | % | 8/31/22 | — | — | — | |||||||||||||||||
International Equity Trust Class | 2.00 | % | 8/31/22 | — | — | — | |||||||||||||||||
International Equity Institutional Class | 0.85 | % | 8/31/22 | — | 1,186,829 | 877,385 | |||||||||||||||||
International Equity Class A | 1.21 | % | 8/31/22 | — | 59,940 | 35,772 | |||||||||||||||||
International Equity Class C | 1.96 | % | 8/31/22 | — | 12,453 | 7,523 | |||||||||||||||||
International Equity Class R6 | 0.75 | %(b) | 8/31/22 | — | 146,965 | 48,635 | |||||||||||||||||
International Select Trust Class | 1.15 | %(b) | 8/31/22 | 12,594 | 18,565 | 17,860 | |||||||||||||||||
International Select Institutional Class | 0.80 | %(b) | 8/31/22 | 141,368 | 244,239 | 223,768 | |||||||||||||||||
International Select Class A | 1.16 | %(b) | 8/31/22 | 3,083 | 6,671 | 5,946 | |||||||||||||||||
International Select Class C | 1.91 | %(b) | 8/31/22 | 2,278 | 3,656 | 3,369 | |||||||||||||||||
International Select Class R3 | 1.41 | %(b) | 8/31/22 | 3,513 | 6,179 | 5,140 | |||||||||||||||||
International Select Class R6 | 0.70 | %(b) | 8/31/22 | 1,906 | (d) | 13,555 | 31,580 | ||||||||||||||||
International Small Cap Institutional Class | 1.05 | % | 8/31/22 | 159,342 | (e) | 257,330 | 281,758 | ||||||||||||||||
International Small Cap Class A | 1.41 | % | 8/31/22 | 65,158 | (e) | 16,926 | 9,070 | ||||||||||||||||
International Small Cap Class C | 2.16 | % | 8/31/22 | 25,270 | (e) | 8,534 | 6,779 | ||||||||||||||||
International Small Cap Class R6 | 0.95 | %(b) | 8/31/22 | 50,711 | (e) | 15,753 | 11,852 | ||||||||||||||||
Intrinsic Value Institutional Class | 1.00 | % | 8/31/22 | 205,715 | 93,339 | 246,027 | |||||||||||||||||
Intrinsic Value Class A | 1.36 | % | 8/31/22 | 21,955 | 8,931 | 15,978 | |||||||||||||||||
Intrinsic Value Class C | 2.11 | % | 8/31/22 | 9,376 | 4,695 | 8,765 | |||||||||||||||||
Intrinsic Value Class R6 | 0.90 | % | 8/31/22 | — | — | 22 | (f) | ||||||||||||||||
Large Cap Value Trust Class | 1.50 | % | 8/31/22 | — | — | — | |||||||||||||||||
Large Cap Value Advisor Class | 1.50 | % | 8/31/22 | — | — | — | |||||||||||||||||
Large Cap Value Institutional Class | 0.70 | % | 8/31/22 | — | — | — | |||||||||||||||||
Large Cap Value Class A | 1.11 | % | 8/31/22 | — | — | — | |||||||||||||||||
Large Cap Value Class C | 1.86 | % | 8/31/22 | — | — | — | |||||||||||||||||
Large Cap Value Class R3 | 1.36 | % | 8/31/22 | 13 | 3 | — | |||||||||||||||||
Large Cap Value Class R6 | 0.60 | % | 8/31/22 | — | — | 17 | (f) | ||||||||||||||||
Mid Cap Growth Trust Class | 1.50 | % | 8/31/22 | — | — | — | |||||||||||||||||
Mid Cap Growth Advisor Class | 1.50 | % | 8/31/22 | — | — | — | |||||||||||||||||
Mid Cap Growth Institutional Class | 0.75 | % | 8/31/22 | — | — | — | |||||||||||||||||
Mid Cap Growth Class A | 1.11 | % | 8/31/22 | — | — | — | |||||||||||||||||
Mid Cap Growth Class C | 1.86 | % | 8/31/22 | — | — | — | |||||||||||||||||
Mid Cap Growth Class R3 | 1.36 | % | 8/31/22 | — | — | — | |||||||||||||||||
Mid Cap Growth Class R6 | 0.65 | %(b) | 8/31/22 | — | — | — | |||||||||||||||||
Mid Cap Intrinsic Value Investor Class | 1.50 | % | 8/31/22 | — | — | — | |||||||||||||||||
Mid Cap Intrinsic Value Trust Class | 1.25 | % | 8/31/22 | — | 9,030 | 5,026 | |||||||||||||||||
195
| Expenses Reimbursed in Year Ended August 31, | |||||||||||||||||||||||
2017 | 2018 | 2019 | |||||||||||||||||||||
| Subject to Repayment until August 31, | |||||||||||||||||||||||
Class | Contractual Expense Limitation(a) | Expiration | 2020 | 2021 | 2022 | ||||||||||||||||||
Mid Cap Intrinsic Value Institutional Class | 0.85 | % | 8/31/22 | $ | 5,015 | $ | 61,130 | $ | 47,471 | ||||||||||||||
Mid Cap Intrinsic Value Class A | 1.21 | % | 8/31/22 | 4,690 | 13,941 | 9,892 | |||||||||||||||||
Mid Cap Intrinsic Value Class C | 1.96 | % | 8/31/22 | 1,218 | 3,434 | 2,255 | |||||||||||||||||
Mid Cap Intrinsic Value Class R3 | 1.46 | % | 8/31/22 | 629 | 3,348 | 2,681 | |||||||||||||||||
Mid Cap Intrinsic Value Class R6 | 0.75 | % | 8/31/22 | — | — | 45 | (c) | ||||||||||||||||
Multi-Cap Opportunities Institutional Class | 1.00 | % | 8/31/22 | — | — | — | |||||||||||||||||
Multi-Cap Opportunities Class A | 1.36 | % | 8/31/22 | — | — | — | |||||||||||||||||
Multi-Cap Opportunities Class C | 2.11 | % | 8/31/22 | — | — | — | |||||||||||||||||
Real Estate Trust Class | 1.50 | %(g) | 8/31/22 | — | — | — | |||||||||||||||||
Real Estate Institutional Class | 0.85 | % | 8/31/22 | 418,961 | 355,600 | 367,084 | |||||||||||||||||
Real Estate Class A | 1.21 | % | 8/31/22 | 193,727 | 145,323 | 122,879 | |||||||||||||||||
Real Estate Class C | 1.96 | % | 8/31/22 | 47,102 | 33,477 | 25,121 | |||||||||||||||||
Real Estate Class R3 | 1.46 | % | 8/31/22 | 46,018 | 39,632 | 41,328 | |||||||||||||||||
Real Estate Class R6 | 0.75 | %(b) | 8/31/22 | 85,221 | 110,981 | 127,316 | |||||||||||||||||
Small Cap Growth Investor Class | 1.30 | %(g) | 8/31/22 | 221,840 | 248,687 | 176,976 | |||||||||||||||||
Small Cap Growth Trust Class | 1.40 | %(g) | 8/31/22 | 19,320 | 17,589 | 13,037 | |||||||||||||||||
Small Cap Growth Advisor Class | 1.60 | %(g) | 8/31/22 | 8,126 | 8,542 | 6,659 | |||||||||||||||||
Small Cap Growth Institutional Class | 0.90 | % | 8/31/22 | 61,816 | 81,452 | 153,070 | |||||||||||||||||
Small Cap Growth Class A | 1.26 | % | 8/31/22 | 20,750 | 25,896 | 87,247 | |||||||||||||||||
Small Cap Growth Class C | 2.01 | % | 8/31/22 | 11,214 | 14,080 | 16,005 | |||||||||||||||||
Small Cap Growth Class R3 | 1.51 | % | 8/31/22 | 6,935 | 9,492 | 14,401 | |||||||||||||||||
Small Cap Growth Class R6 | 0.80 | % | 8/31/22 | — | — | 5,523 | (b)(h) | ||||||||||||||||
Sustainable Equity Trust Class | 1.50 | % | 8/31/22 | — | — | — | |||||||||||||||||
Sustainable Equity Institutional Class | 0.75 | % | 8/31/22 | — | — | — | |||||||||||||||||
Sustainable Equity Class A | 1.11 | % | 8/31/22 | — | — | — | |||||||||||||||||
Sustainable Equity Class C | 1.86 | % | 8/31/22 | — | — | — | |||||||||||||||||
Sustainable Equity Class R3 | 1.36 | % | 8/31/22 | — | — | — | |||||||||||||||||
Sustainable Equity Class R6 | 0.65 | %(b) | 8/31/22 | — | — | — | |||||||||||||||||
(a) Expense limitation per annum of the respective class's average daily net assets.
(b) Classes that have had changes to their respective limitations are noted below.
| Class | Expense limitation | Prior to | |||||||||
Dividend Growth Class R6 | 0.62 | % | 12/6/18 | ||||||||
Emerging Markets Equity Class R6 | 1.18 | % | 12/6/18 | ||||||||
Genesis Class R6 | 0.78 | % | 10/16/17 | ||||||||
Global Equity Institutional Class | 1.15 | % | 12/8/16 | ||||||||
Global Equity Class A | 1.51 | % | 12/8/16 | ||||||||
196
| Class | Expense limitation | Prior to | |||||||||
Global Equity Class C | 2.26 | % | 12/8/16 | ||||||||
International Equity Class R6 | 0.78 | % | 12/6/18 | ||||||||
International Select Institutional Class | 0.90 | % | 12/8/16 | ||||||||
International Select Trust Class | 1.25 | % | 12/8/16 | ||||||||
International Select Class A | 1.30 | % | 12/8/16 | ||||||||
International Select Class C | 2.00 | % | 12/8/16 | ||||||||
International Select Class R3 | 1.51 | % | 12/8/16 | ||||||||
International Select Class R6 | 0.73 | % | 12/6/18 | ||||||||
International Select Class R6 | 0.83 | % | 12/8/16 | ||||||||
International Small Cap Class R6 | 0.98 | % | 12/6/18 | ||||||||
Mid Cap Growth Class R6 | 0.68 | % | 12/6/18 | ||||||||
Real Estate Class R6 | 0.78 | % | 12/6/18 | ||||||||
Small Cap Growth Class R6 | 0.83 | % | 12/6/18 | ||||||||
Sustainable Equity Class R6 | 0.68 | % | 12/6/18 | ||||||||
(c) Period from March 29, 2019 (Commencement of Operations) to August 31, 2019.
(d) Period from April 17, 2017 (Commencement of Operations) to August 31, 2017.
(e) Period from December 8, 2016 (Commencement of Operations) to August 31, 2017.
(f) Period from January 18, 2019 (Commencement of Operations) to August 31, 2019.
(g) In addition to the contractual undertaking described above, Management has voluntarily undertaken to waive fees and/or reimburse certain expenses so that their Operating Expenses, per annum of their respective average daily net assets, are limited to the percentages indicated below. Voluntary reimbursements are not subject to recovery by Management and are terminable by Management upon notice to the Fund.
Class | Voluntary Expense Limitation | Effective Date(s) | Fees Voluntarily Waived for Year Ended August 31, 2019 | ||||||||||||
Real Estate Trust Class | 1.04 | % | 11/15/18 | $ | 471,881 | ||||||||||
Small Cap Growth Investor Class | 1.18 | % | 11/15/18 | 74,246 | |||||||||||
Small Cap Growth Investor Class | 1.20 | % | 9/7/18 – 11/14/18 | ||||||||||||
Small Cap Growth Investor Class | 1.21 | % | 9/1/18 – 9/6/18 | ||||||||||||
Small Cap Growth Trust Class | 1.29 | % | 9/7/18 | 4,698 | |||||||||||
Small Cap Growth Trust Class | 1.37 | % | 9/1/18 – 9/6/18 | ||||||||||||
Small Cap Growth Advisor Class | 1.44 | % | 9/7/18 | 4,020 | |||||||||||
Small Cap Growth Advisor Class | 1.51 | % | 9/1/18 – 9/6/18 | ||||||||||||
(h) Period from September 7, 2018 (Commencement of Operations) to August 31, 2019.
(i) Effective September 3, 2019, the contractual expense limitation is 0.40% for Institutional Class, 0.76% for Class A and 1.51% for Class C.
Each Fund has agreed that each of its respective classes will repay Management for fees and expenses waived or reimbursed for that class provided that repayment does not cause that class's annual operating expenses to exceed its contractual expense limitation in place at the time the fees and expenses were waived or reimbursed, or the expense limitation in place at the time the Fund repays Management, whichever is lower. Any such repayment must be made within three years after the year in which Management incurred the expense.
197
During the year ended August 31, 2019, the following classes repaid Management under their contractual expense limitation agreements as follows:
Class | Expenses Repaid to Management | ||||||
Emerging Markets Equity Institutional Class | $ | 40,374 | |||||
Emerging Markets Equity Class R6 | 28,306 | ||||||
Large Cap Value Class R3 | 183 | ||||||
Mid Cap Growth Class R3 | 945 | ||||||
Each Fund also has a distribution agreement with Neuberger Berman BD LLC (the "Distributor") with respect to each class of shares. The Distributor acts as agent in arranging for the sale of class shares without sales commission or other compensation, except as described below, and bears the advertising and promotion expenses.
However, the Distributor receives fees from the Trust Class of each of Focus, Guardian, International Select, Large Cap Value, Mid Cap Intrinsic Value, Real Estate, Small Cap Growth and Sustainable Equity, and from the Advisor Class, Class A, Class C and Class R3 of each Fund that offers those classes under their distribution plans (each a "Plan", collectively, the "Plans") pursuant to Rule 12b-1 under the 1940 Act. The Plans provide that, as compensation for administrative and other services provided to these classes, the Distributor's activities and expenses related to the sale and distribution of these classes, and ongoing services provided to investors in these classes, the Distributor receives from each of these respective classes a fee at the annual rate of 0.10% of such Trust Class's, 0.25% of such Advisor Class's, 0.25% of such Class A's, 1.00% of such Class C's and 0.50% of such Class R3's average daily net assets. The Distributor receives this amount to provide distribution and shareholder servicing for these classes and pays a portion of it to institutions that provide such services. Those institutions may use the payments for, among other purposes, compensating employees engaged in sales and/or shareholder servicing. The amount of fees paid by each class during any year may be more or less than the cost of distribution and other services provided to that class. FINRA rules limit the amount of annual distribution fees that may be paid by a mutual fund and impose a ceiling on the cumulative distribution fees paid. The Trust's Plans comply with those rules.
Class A shares of each Fund are generally sold with an initial sales charge of up to 5.75% and no contingent deferred sales charge ("CDSC"), except that a CDSC of 1.00% applies to certain redemptions made within 18 months following purchases of $1 million or more without an initial sales charge. Class C shares of each Fund are sold with no initial sales charge and a 1.00% CDSC if shares are sold within one year after purchase.
For the year ended August 31, 2019, Neuberger Berman, acting as underwriter and broker-dealer, received net initial sales charges from the purchase of Class A shares and CDSCs from the redemption of Class A and Class C shares as follows:
Underwriter | Broker-Dealer | ||||||||||||||||||
| Net Initial Sales Charge | CDSC | Net Initial Sales Charge | CDSC | ||||||||||||||||
Dividend Growth Class A | $ | — | $ | — | $ | — | $ | — | |||||||||||
Dividend Growth Class C | — | 139 | — | — | |||||||||||||||
Emerging Markets Equity Class A | 12,551 | — | — | — | |||||||||||||||
Emerging Markets Equity Class C | — | 5,364 | — | — | |||||||||||||||
Equity Income Class A | 22,327 | — | — | — | |||||||||||||||
Equity Income Class C | — | 4,109 | — | — | |||||||||||||||
Focus Class A | 70 | — | — | — | |||||||||||||||
Focus Class C | — | 100 | — | — | |||||||||||||||
Global Equity Class A | 94 | — | — | — | |||||||||||||||
Global Equity Class C | — | — | — | — | |||||||||||||||
198
Underwriter | Broker-Dealer | ||||||||||||||||||
| Net Initial Sales Charge | CDSC | Net Initial Sales Charge | CDSC | ||||||||||||||||
Global Real Estate Class A | $ | 16 | $ | — | $ | — | $ | — | |||||||||||
Global Real Estate Class C | — | — | — | — | |||||||||||||||
Greater China Equity Class A | — | — | — | — | |||||||||||||||
Greater China Equity Class C | — | 13 | — | — | |||||||||||||||
Guardian Class A | 2,909 | — | — | — | |||||||||||||||
Guardian Class C | — | — | — | — | |||||||||||||||
International Equity Class A | 4,674 | — | — | — | |||||||||||||||
International Equity Class C | — | 5,462 | — | — | |||||||||||||||
International Select Class A | 185 | — | — | — | |||||||||||||||
International Select Class C | — | 1,094 | — | — | |||||||||||||||
International Small Cap Class A | — | — | — | — | |||||||||||||||
International Small Cap Class C | — | 70 | — | — | |||||||||||||||
Intrinsic Value Class A | 14,500 | — | — | — | |||||||||||||||
Intrinsic Value Class C | — | 1,188 | — | — | |||||||||||||||
Large Cap Value Class A | 17,197 | — | — | — | |||||||||||||||
Large Cap Value Class C | — | 1,457 | — | — | |||||||||||||||
Mid Cap Growth Class A | 3,138 | — | — | — | |||||||||||||||
Mid Cap Growth Class C | — | 506 | — | — | |||||||||||||||
Mid Cap Intrinsic Value Class A | 2,759 | — | — | — | |||||||||||||||
Mid Cap Intrinsic Value Class C | — | 411 | — | — | |||||||||||||||
Multi-Cap Opportunities Class A | 20,686 | — | — | — | |||||||||||||||
Multi-Cap Opportunities Class C | — | 3,230 | — | — | |||||||||||||||
Real Estate Class A | 4,776 | — | — | — | |||||||||||||||
Real Estate Class C | — | 714 | — | — | |||||||||||||||
Small Cap Growth Class A | 19,434 | — | — | — | |||||||||||||||
Small Cap Growth Class C | — | 429 | — | — | |||||||||||||||
Sustainable Equity Class A | 28,604 | — | — | — | |||||||||||||||
Sustainable Equity Class C | — | 7,091 | — | — | |||||||||||||||
Note C—Securities Transactions:
During the year ended August 31, 2019, there were purchase and sale transactions of long-term securities (excluding written option contracts) as follows:
(000's omitted) | Purchases | Sales | (000's omitted) | Purchases | Sales | ||||||||||||||||||
Dividend Growth | $ | 23,385 | $ | 25,067 | International Select | $ | 56,338 | $ | 52,131 | ||||||||||||||
Emerging Markets Equity | 555,097 | 493,688 | International Small Cap | 1,850 | 2,111 | ||||||||||||||||||
Equity Income | 529,282 | 676,043 | Intrinsic Value | 141,779 | 173,961 | ||||||||||||||||||
Focus | 136,164 | 192,792 | Large Cap Value | 1,782,503 | 1,613,182 | ||||||||||||||||||
Genesis | 1,395,491 | 2,321,357 | Mid Cap Growth | 645,148 | 759,109 | ||||||||||||||||||
Global Equity | 827 | 2,381 | Mid Cap Intrinsic Value | 66,434 | 60,424 | ||||||||||||||||||
Global Real Estate | 2,156 | 1,282 | Multi-Cap Opportunities | 531,821 | 1,322,653 | ||||||||||||||||||
Greater China Equity | 27,561 | 58,977 | Real Estate | 168,836 | 193,136 | ||||||||||||||||||
Guardian | 429,338 | 539,950 | Small Cap Growth | 358,860 | 218,431 | ||||||||||||||||||
International Equity | 594,447 | 738,112 | Sustainable Equity | 406,043 | 823,954 | ||||||||||||||||||
199
During the year ended August 31, 2019, no brokerage commissions on securities transactions were paid to affiliated brokers.
Note D—Fund Share Transactions:
Share activity for the years ended August 31, 2019, and August 31, 2018, was as follows:
For the Year Ended August 31, 2019 | For the Year Ended August 31, 2018 | ||||||||||||||||||||||||||||||||||||||
(000's omitted) | Shares Sold | Shares Issued on Reinvestment of Dividends and Distributions | Shares Issued in Connection with Tax-Free Reorganization (see Note H) | Shares Redeemed | Total | Shares Sold | Shares Issued on Reinvestment of Dividends and Distributions | Shares Redeemed | Total | ||||||||||||||||||||||||||||||
Dividend Growth | |||||||||||||||||||||||||||||||||||||||
Institutional Class | 989 | 232 | — | (1,056 | ) | 165 | 1,594 | 79 | (351 | ) | 1,322 | ||||||||||||||||||||||||||||
Class A | 11 | 7 | — | (32 | ) | (14 | ) | 80 | 3 | (83 | ) | — | |||||||||||||||||||||||||||
Class C | 8 | 12 | — | (50 | ) | (30 | ) | 9 | 3 | (14 | ) | (2 | ) | ||||||||||||||||||||||||||
Class R6 | 1 | — | — | — | 1 | — | — | — | — | ||||||||||||||||||||||||||||||
| Emerging Markets Equity(a) | |||||||||||||||||||||||||||||||||||||||
Institutional Class | 28,355 | 243 | — | (30,912 | ) | (2,314 | ) | 37,031 | 103 | (11,160 | ) | 25,974 | |||||||||||||||||||||||||||
Class A | 1,187 | 8 | — | (1,300 | ) | (105 | ) | 1,992 | 8 | (2,796 | ) | (796 | ) | ||||||||||||||||||||||||||
Class C | 128 | — | — | (209 | ) | (81 | ) | 281 | — | (89 | ) | 192 | |||||||||||||||||||||||||||
Class R3 | 31 | — | — | (55 | ) | (24 | ) | 29 | — | (29 | ) | — | |||||||||||||||||||||||||||
Class R6 | 4,906 | 95 | — | (2,002 | ) | 2,999 | 3,929 | 55 | (2,000 | ) | 1,984 | ||||||||||||||||||||||||||||
Equity Income | |||||||||||||||||||||||||||||||||||||||
Institutional Class | 17,394 | 5,385 | — | (21,062 | ) | 1,717 | 11,451 | 5,290 | (22,423 | ) | (5,682 | ) | |||||||||||||||||||||||||||
Class A | 4,127 | 754 | — | (7,677 | ) | (2,796 | ) | 1,919 | 806 | (4,251 | ) | (1,526 | ) | ||||||||||||||||||||||||||
Class C | 845 | 824 | — | (6,193 | ) | (4,524 | ) | 713 | 900 | (4,985 | ) | (3,372 | ) | ||||||||||||||||||||||||||
Class R3 | 73 | 7 | — | (100 | ) | (20 | ) | 79 | 4 | (55 | ) | 28 | |||||||||||||||||||||||||||
| Focus(b) | |||||||||||||||||||||||||||||||||||||||
Investor Class | 118 | 1,894 | — | (2,099 | ) | (87 | ) | 140 | 1,793 | (2,136 | ) | (203 | ) | ||||||||||||||||||||||||||
Trust Class | 23 | 165 | — | (394 | ) | (206 | ) | 82 | 305 | (533 | ) | (146 | ) | ||||||||||||||||||||||||||
Advisor Class | 7 | 6 | — | (32 | ) | (19 | ) | 11 | 41 | (64 | ) | (12 | ) | ||||||||||||||||||||||||||
Institutional Class | 109 | 24 | — | (88 | ) | 45 | 95 | 22 | (101 | ) | 16 | ||||||||||||||||||||||||||||
Class A | 10 | 9 | — | (36 | ) | (17 | ) | 29 | 13 | (29 | ) | 13 | |||||||||||||||||||||||||||
Class C | 5 | 5 | — | (20 | ) | (10 | ) | 3 | 23 | (16 | ) | 10 | |||||||||||||||||||||||||||
| Genesis(c) | |||||||||||||||||||||||||||||||||||||||
Investor Class | 1,478 | 3,261 | — | (5,966 | ) | (1,227 | ) | 2,128 | 3,861 | (6,999 | ) | (1,010 | ) | ||||||||||||||||||||||||||
Trust Class | 3,944 | 2,716 | — | (6,502 | ) | 158 | 2,164 | 3,263 | (8,346 | ) | (2,919 | ) | |||||||||||||||||||||||||||
Advisor Class | 292 | 326 | — | (962 | ) | (344 | ) | 505 | 428 | (1,364 | ) | (431 | ) | ||||||||||||||||||||||||||
Institutional Class | 8,955 | 5,386 | — | (16,170 | ) | (1,829 | ) | 8,421 | 7,259 | (27,980 | ) | (12,300 | ) | ||||||||||||||||||||||||||
Class R6 | 9,277 | 8,231 | — | (12,315 | ) | 5,193 | 14,262 | 8,129 | (16,751 | ) | 5,640 | ||||||||||||||||||||||||||||
200
For the Year Ended August 31, 2019 | For the Year Ended August 31, 2018 | ||||||||||||||||||||||||||||||||||||||
(000's omitted) | Shares Sold | Shares Issued on Reinvestment of Dividends and Distributions | Shares Issued in Connection with Tax-Free Reorganization (see Note H) | Shares Redeemed | Total | Shares Sold | Shares Issued on Reinvestment of Dividends and Distributions | Shares Redeemed | Total | ||||||||||||||||||||||||||||||
| Global Equity(a) | |||||||||||||||||||||||||||||||||||||||
Institutional Class | 14 | 41 | — | (197 | ) | (142 | ) | 5 | 3 | (14 | ) | (6 | ) | ||||||||||||||||||||||||||
Class A | 9 | 3 | — | (25 | ) | (13 | ) | 82 | — | (74 | ) | 8 | |||||||||||||||||||||||||||
Class C | — | — | — | (2 | ) | (2 | ) | 4 | — | (3 | ) | 1 | |||||||||||||||||||||||||||
Global Real Estate | |||||||||||||||||||||||||||||||||||||||
Institutional Class | 82 | 8 | — | (11 | ) | 79 | 5 | 6 | (4 | ) | 7 | ||||||||||||||||||||||||||||
Class A | 4 | — | — | (1 | ) | 3 | 3 | — | (20 | ) | (17 | ) | |||||||||||||||||||||||||||
Class C | — | 1 | — | — | 1 | 3 | — | — | 3 | ||||||||||||||||||||||||||||||
Greater China Equity | |||||||||||||||||||||||||||||||||||||||
Institutional Class | 859 | 2,620 | — | (3,950 | ) | (471 | ) | 343 | 732 | (2,643 | ) | (1,568 | ) | ||||||||||||||||||||||||||
Class A | — | 285 | — | (312 | ) | (27 | ) | 296 | 146 | (1,120 | ) | (678 | ) | ||||||||||||||||||||||||||
Class C | — | 7 | — | (6 | ) | 1 | 1 | 2 | (5 | ) | (2 | ) | |||||||||||||||||||||||||||
| Guardian(b) | |||||||||||||||||||||||||||||||||||||||
Investor Class | 666 | 6,183 | — | (6,130 | ) | 719 | 662 | 3,906 | (5,244 | ) | (676 | ) | |||||||||||||||||||||||||||
Trust Class | 115 | 288 | — | (813 | ) | (410 | ) | 197 | 333 | (870 | ) | (340 | ) | ||||||||||||||||||||||||||
Advisor Class | 8 | 1 | — | (10 | ) | (1 | ) | 1 | 1 | — | 2 | ||||||||||||||||||||||||||||
Institutional Class | 930 | 471 | — | (1,040 | ) | 361 | 903 | 277 | (1,054 | ) | 126 | ||||||||||||||||||||||||||||
Class A | 99 | 29 | — | (189 | ) | (61 | ) | 56 | 30 | (118 | ) | (32 | ) | ||||||||||||||||||||||||||
Class C | 28 | 9 | — | (28 | ) | 9 | 9 | 7 | (17 | ) | (1 | ) | |||||||||||||||||||||||||||
Class R3 | 4 | 1 | — | (19 | ) | (14 | ) | 3 | 1 | (9 | ) | (5 | ) | ||||||||||||||||||||||||||
| Class R6(d) | 1 | — | — | — | 1 | — | — | — | — | ||||||||||||||||||||||||||||||
| International Equity(b) | |||||||||||||||||||||||||||||||||||||||
Investor Class | 167 | 81 | — | (869 | ) | (621 | ) | 429 | 21 | (1,121 | ) | (671 | ) | ||||||||||||||||||||||||||
Trust Class | 130 | 28 | — | (853 | ) | (695 | ) | 471 | 5 | (999 | ) | (523 | ) | ||||||||||||||||||||||||||
Institutional Class | 53,998 | 1,269 | — | (68,029 | ) | (12,762 | ) | 48,906 | 889 | (29,829 | ) | 19,966 | |||||||||||||||||||||||||||
Class A | 942 | 14 | — | (1,881 | ) | (925 | ) | 1,947 | 2 | (2,560 | ) | (611 | ) | ||||||||||||||||||||||||||
Class C | 92 | 2 | — | (409 | ) | (315 | ) | 305 | — | (265 | ) | 40 | |||||||||||||||||||||||||||
Class R6 | 2,184 | 97 | — | (1,472 | ) | 809 | 6,784 | 158 | (11,940 | ) | (4,998 | ) | |||||||||||||||||||||||||||
International Select | |||||||||||||||||||||||||||||||||||||||
Trust Class | 13 | 7 | — | (231 | ) | (211 | ) | 11 | 5 | (62 | ) | (46 | ) | ||||||||||||||||||||||||||
Institutional Class | 1,694 | 227 | — | (2,478 | ) | (557 | ) | 1,370 | 180 | (7,831 | ) | (6,281 | ) | ||||||||||||||||||||||||||
Class A | 37 | 4 | — | (80 | ) | (39 | ) | 102 | 3 | (197 | ) | (92 | ) | ||||||||||||||||||||||||||
Class C | 18 | 1 | — | (78 | ) | (59 | ) | 12 | — | (27 | ) | (15 | ) | ||||||||||||||||||||||||||
Class R3 | 45 | 2 | — | (130 | ) | (83 | ) | 74 | 2 | (210 | ) | (134 | ) | ||||||||||||||||||||||||||
Class R6 | 1,782 | 15 | — | (110 | ) | 1,687 | 14 | 9 | (74 | ) | (51 | ) | |||||||||||||||||||||||||||
201
For the Year Ended August 31, 2019 | For the Year Ended August 31, 2018 | ||||||||||||||||||||||||||||||||||||||
(000's omitted) | Shares Sold | Shares Issued on Reinvestment of Dividends and Distributions | Shares Issued in Connection with Tax-Free Reorganization (see Note H) | Shares Redeemed | Total | Shares Sold | Shares Issued on Reinvestment of Dividends and Distributions | Shares Redeemed | Total | ||||||||||||||||||||||||||||||
International Small Cap | |||||||||||||||||||||||||||||||||||||||
Institutional Class | 4 | 10 | — | (17 | ) | (3 | ) | 414 | 5 | (6 | ) | 413 | |||||||||||||||||||||||||||
Class A | 2 | — | — | (6 | ) | (4 | ) | 5 | 1 | (14 | ) | (8 | ) | ||||||||||||||||||||||||||
Class C | — | — | — | (1 | ) | (1 | ) | 2 | — | — | 2 | ||||||||||||||||||||||||||||
Class R6 | — | — | — | — | — | — | — | — | — | ||||||||||||||||||||||||||||||
| Intrinsic Value(a) | |||||||||||||||||||||||||||||||||||||||
Institutional Class | 13,096 | 4,347 | — | (14,420 | ) | 3,023 | 10,567 | 2,425 | (28,642 | ) | (15,650 | ) | |||||||||||||||||||||||||||
Class A | 1,908 | 168 | — | (1,791 | ) | 285 | 683 | 54 | (781 | ) | (44 | ) | |||||||||||||||||||||||||||
Class C | 135 | 157 | — | (442 | ) | (150 | ) | 202 | 68 | (316 | ) | (46 | ) | ||||||||||||||||||||||||||
| Class R6(e) | 12 | — | — | — | 12 | — | — | — | — | ||||||||||||||||||||||||||||||
| Large Cap Value(c) | |||||||||||||||||||||||||||||||||||||||
Investor Class | 1,932 | 4,724 | — | (3,550 | ) | 3,106 | 257 | 2,893 | (4,192 | ) | (1,042 | ) | |||||||||||||||||||||||||||
Trust Class | 839 | 279 | — | (527 | ) | 591 | 127 | 190 | (609 | ) | (292 | ) | |||||||||||||||||||||||||||
Advisor Class | 326 | 494 | — | (874 | ) | (54 | ) | 173 | 359 | (1,279 | ) | (747 | ) | ||||||||||||||||||||||||||
Institutional Class | 8,998 | 462 | 851 | (2,198 | ) | 8,113 | 1,178 | 221 | (956 | ) | 443 | ||||||||||||||||||||||||||||
Class A | 1,566 | 13 | 129 | (117 | ) | 1,591 | 58 | 6 | (59 | ) | 5 | ||||||||||||||||||||||||||||
Class C | 472 | 5 | 134 | (27 | ) | 584 | 13 | 4 | (29 | ) | (12 | ) | |||||||||||||||||||||||||||
Class R3 | 26 | 1 | — | (13 | ) | 14 | 5 | 1 | (2 | ) | 4 | ||||||||||||||||||||||||||||
| Class R6(e) | 8 | — | — | — | 8 | — | — | — | — | ||||||||||||||||||||||||||||||
| Mid Cap Growth(c) | |||||||||||||||||||||||||||||||||||||||
Investor Class | 1,031 | 3,344 | — | (3,303 | ) | 1,072 | 786 | 2,564 | (2,772 | ) | 578 | ||||||||||||||||||||||||||||
Trust Class | 815 | 539 | — | (1,051 | ) | 303 | 1,520 | 365 | (868 | ) | 1,017 | ||||||||||||||||||||||||||||
Advisor Class | 294 | 66 | — | (518 | ) | (158 | ) | 357 | 54 | (346 | ) | 65 | |||||||||||||||||||||||||||
Institutional Class | 3,983 | 2,357 | — | (10,065 | ) | (3,725 | ) | 5,005 | 1,900 | (8,119 | ) | (1,214 | ) | ||||||||||||||||||||||||||
Class A | 504 | 294 | — | (1,796 | ) | (998 | ) | 807 | 258 | (1,718 | ) | (653 | ) | ||||||||||||||||||||||||||
Class C | 55 | 76 | — | (130 | ) | 1 | 90 | 57 | (120 | ) | 27 | ||||||||||||||||||||||||||||
Class R3 | 3,183 | 94 | — | (635 | ) | 2,642 | 293 | 70 | (345 | ) | 18 | ||||||||||||||||||||||||||||
Class R6 | 7,839 | 2,912 | — | (7,481 | ) | 3,270 | 9,212 | 1,651 | (3,366 | ) | 7,497 | ||||||||||||||||||||||||||||
| Mid Cap Intrinsic Value(a) | |||||||||||||||||||||||||||||||||||||||
Investor Class | 1,341 | 143 | — | (1,360 | ) | 124 | 43 | 111 | (244 | ) | (90 | ) | |||||||||||||||||||||||||||
Trust Class | 41 | 35 | — | (87 | ) | (11 | ) | 17 | 37 | (99 | ) | (45 | ) | ||||||||||||||||||||||||||
Institutional Class | 843 | 211 | — | (1,143 | ) | (89 | ) | 1,167 | 115 | (376 | ) | 906 | |||||||||||||||||||||||||||
Class A | 775 | 22 | — | (891 | ) | (94 | ) | 168 | 26 | (146 | ) | 48 | |||||||||||||||||||||||||||
Class C | 20 | 7 | — | (47 | ) | (20 | ) | 13 | 7 | (32 | ) | (12 | ) | ||||||||||||||||||||||||||
Class R3 | 18 | 7 | — | (22 | ) | 3 | 51 | 4 | (22 | ) | 33 | ||||||||||||||||||||||||||||
| Class R6(d) | 1 | — | — | — | 1 | — | — | — | — | ||||||||||||||||||||||||||||||
202
For the Year Ended August 31, 2019 | For the Year Ended August 31, 2018 | ||||||||||||||||||||||||||||||||||||||
(000's omitted) | Shares Sold | Shares Issued on Reinvestment of Dividends and Distributions | Shares Issued in Connection with Tax-Free Reorganization (see Note H) | Shares Redeemed | Total | Shares Sold | Shares Issued on Reinvestment of Dividends and Distributions | Shares Redeemed | Total | ||||||||||||||||||||||||||||||
| Multi-Cap Opportunities(a) | |||||||||||||||||||||||||||||||||||||||
Institutional Class | 9,107 | 8,557 | — | (51,533 | ) | (33,869 | ) | 8,019 | 9,663 | (22,825 | ) | (5,143 | ) | ||||||||||||||||||||||||||
Class A | 853 | 351 | — | (2,292 | ) | (1,088 | ) | 1,898 | 283 | (1,279 | ) | 902 | |||||||||||||||||||||||||||
Class C | 294 | 202 | — | (602 | ) | (106 | ) | 351 | 203 | (486 | ) | 68 | |||||||||||||||||||||||||||
Real Estate | |||||||||||||||||||||||||||||||||||||||
Trust Class | 1,294 | 632 | — | (3,333 | ) | (1,407 | ) | 1,148 | 689 | (3,405 | ) | (1,568 | ) | ||||||||||||||||||||||||||
Institutional Class | 4,273 | 823 | — | (4,302 | ) | 794 | 4,745 | 802 | (6,386 | ) | (839 | ) | |||||||||||||||||||||||||||
Class A | 1,503 | 274 | — | (1,962 | ) | (185 | ) | 1,168 | 338 | (3,275 | ) | (1,769 | ) | ||||||||||||||||||||||||||
Class C | 32 | 49 | — | (397 | ) | (316 | ) | 18 | 60 | (467 | ) | (389 | ) | ||||||||||||||||||||||||||
Class R3 | 455 | 79 | — | (524 | ) | 10 | 369 | 75 | (504 | ) | (60 | ) | |||||||||||||||||||||||||||
Class R6 | 1,556 | 303 | — | (1,215 | ) | 644 | 2,267 | 242 | (1,612 | ) | 897 | ||||||||||||||||||||||||||||
| Small Cap Growth(c) | |||||||||||||||||||||||||||||||||||||||
Investor Class | 155 | 339 | — | (232 | ) | 262 | 112 | 21 | (177 | ) | (44 | ) | |||||||||||||||||||||||||||
Trust Class | 20 | 21 | — | (18 | ) | 23 | 3 | 1 | (22 | ) | (18 | ) | |||||||||||||||||||||||||||
Advisor Class | 49 | 12 | — | (44 | ) | 17 | 21 | 1 | (17 | ) | 5 | ||||||||||||||||||||||||||||
Institutional Class | 2,455 | 92 | — | (606 | ) | 1,941 | 70 | 5 | (70 | ) | 5 | ||||||||||||||||||||||||||||
Class A | 1,905 | 27 | — | (726 | ) | 1,206 | 88 | 1 | (71 | ) | 18 | ||||||||||||||||||||||||||||
Class C | 52 | 17 | — | (23 | ) | 46 | 22 | 1 | (15 | ) | 8 | ||||||||||||||||||||||||||||
Class R3 | 138 | 8 | — | (130 | ) | 16 | 40 | 1 | (23 | ) | 18 | ||||||||||||||||||||||||||||
| Class R6(f) | 564 | — | — | (12 | ) | 552 | — | — | — | — | |||||||||||||||||||||||||||||
| Sustainable Equity(c) | |||||||||||||||||||||||||||||||||||||||
Investor Class | 667 | 1,372 | — | (6,236 | ) | (4,197 | ) | 1,442 | 1,148 | (5,866 | ) | (3,276 | ) | ||||||||||||||||||||||||||
Trust Class | 485 | 492 | — | (2,141 | ) | (1,164 | ) | 773 | 358 | (1,864 | ) | (733 | ) | ||||||||||||||||||||||||||
Institutional Class | 5,025 | 2,061 | — | (9,048 | ) | (1,962 | ) | 5,701 | 1,273 | (6,864 | ) | 110 | |||||||||||||||||||||||||||
Class A | 556 | 260 | — | (1,271 | ) | (455 | ) | 731 | 167 | (1,018 | ) | (120 | ) | ||||||||||||||||||||||||||
Class C | 134 | 122 | — | (462 | ) | (206 | ) | 168 | 73 | (253 | ) | (12 | ) | ||||||||||||||||||||||||||
Class R3 | 233 | 71 | — | (314 | ) | (10 | ) | 416 | 55 | (701 | ) | (230 | ) | ||||||||||||||||||||||||||
Class R6 | 2,655 | 723 | — | (4,622 | ) | (1,244 | ) | 2,887 | 605 | (5,439 | ) | (1,947 | ) | ||||||||||||||||||||||||||
(a) After the close of business on December 7, 2018, the Funds' applicable classes underwent a stock split or reverse stock split. The capital share activity presented here for the year ended August 31, 2019, has been retroactively adjusted to reflect this split. See Note G of the Notes to Financial Statements.
(b) After the close of business on February 23, 2018, the Funds' applicable classes underwent a stock split or reverse stock split. The capital share activity presented here for the year ended August 31, 2018, has been retroactively adjusted to reflect this split. See Note G of the Notes to Financial Statements.
(c) After the close of business on December 8, 2017, the Funds' applicable classes underwent a stock split or reverse stock split. The capital share activity presented here for the year ended August 31, 2018, has been retroactively adjusted to reflect this split. See Note G of the Notes to Financial Statements.
203
(d) Period from March 29, 2019 (Commencement of Operations) to August 31, 2019.
(e) Period from January 18, 2019 (Commencement of Operations) to August 31, 2019.
(f) Period from September 7, 2018 (Commencement of Operations) to August 31, 2019.
Note E—Line of Credit:
At August 31, 2019, each Fund was a participant in a syndicated committed, unsecured $700,000,000 line of credit (the "Credit Facility"), to be used only for temporary or emergency purposes. Series of other investment companies managed by Management also participate in this line of credit on substantially the same terms. Interest is charged on borrowings under this Credit Facility at the highest of (a) a federal funds effective rate plus 1.00% per annum, (b) a Eurodollar rate for a one-month period plus 1.00% per annum, and (c) an overnight bank funding rate plus 1.00% per annum. The Credit Facility has an annual commitment fee of 0.15% per annum of the available line of credit, which is paid quarterly. Each Fund that is a participant has agreed to pay its pro rata share of the annual commitment fee, based on the ratio of its individual net assets to the net assets of all participants at the time the fee is due, and interest charged on any borrowing made by such Fund and other costs incurred by such Fund. Because several mutual funds participate in the Credit Facility, there is no assurance that an individual Fund will have access to all or any part of the $700,000,000 at any particular time. There were no loans outstanding under the Credit Facility at August 31, 2019.
During the year ended August 31, 2019, the following Fund had borrowings under the Credit Facility:
Fund | Number of Days Borrowed | Greatest Amount Borrowed | Average Interest Rate | Interest Paid(1) | |||||||||||||||
Greater China Equity | 3 | $ | 15,700,000 | 3.48 | % | $ | 4,016 | ||||||||||||
(1) Interest paid is reflected in the Statements of Operations under the caption "Interest expense."
Note F—Investments in Affiliates(a):
| Balance of Shares Held August 31, 2018 | Gross Purchases and Additions | Gross Sales and Reductions | Balance of Shares Held August 31, 2019 | Value August 31, 2019 | Distributions from Investments in Affiliated Issuers | Net Realized Gain/(Loss) from Investments in Affiliated Issuers | Change in Net Unrealized Appreciation/ (Depreciation) from Investments in Affiliated Issuers | ||||||||||||||||||||||||||||
Genesis | |||||||||||||||||||||||||||||||||||
| AMERISAFE, Inc. | 794,599 | 330,905 | 84,959 | 1,040,545 | $ | 71,485,442 | $ | 3,427,652 | $ | 338,032 | $ | 4,332,670 | |||||||||||||||||||||||
Atrion Corp. | 96,017 | 22,430 | 2,062 | 116,385 | 90,448,603 | 520,989 | 865,928 | 11,279,626 | |||||||||||||||||||||||||||
Chase Corp. | 371,278 | 162,475 | 15,343 | 518,410 | 51,955,050 | 358,170 | (68,754 | ) | (9,568,686 | ) | |||||||||||||||||||||||||
Exponent, Inc. | 2,752,322 | 101,185 | 238,905 | 2,614,602 | 185,349,136 | 1,574,169 | 11,655,165 | 38,055,042 | |||||||||||||||||||||||||||
| Fox Factory Holding Corp. | 1,568,008 | 862,960 | 143,562 | 2,287,406 | 164,784,728 | — | * | 4,775,251 | 10,676,560 | ||||||||||||||||||||||||||
| NetScout Systems, Inc. | 4,073,838 | 755,650 | 812,027 | 4,017,461 | 88,986,761 | — | * | (6,913,921 | ) | (4,987,028 | ) | ||||||||||||||||||||||||
204
| Balance of Shares Held August 31, 2018 | Gross Purchases and Additions | Gross Sales and Reductions | Balance of Shares Held August 31, 2019 | Value August 31, 2019 | Distributions from Investments in Affiliated Issuers | Net Realized Gain/(Loss) from Investments in Affiliated Issuers | Change in Net Unrealized Appreciation/ (Depreciation) from Investments in Affiliated Issuers | ||||||||||||||||||||||||||||
| Power Integrations, Inc. | 2,093,383 | 103,535 | 213,261 | 1,983,657 | $ | 176,585,146 | $ | 1,367,132 | $ | 5,480,017 | $ | 26,224,018 | |||||||||||||||||||||||
Rogers Corp. | 1,238,614 | 100,900 | 91,933 | 1,247,581 | 165,204,676 | — | * | 4,387,079 | (16,322,400 | ) | |||||||||||||||||||||||||
| U.S. Physical Therapy, Inc. | 632,275 | 169,690 | 62,359 | 739,606 | 98,752,193 | 699,202 | 3,673,436 | 2,192,146 | |||||||||||||||||||||||||||
| Sub-total for affiliates held as of 8/31/19(b) | $ | 1,093,551,735 | $ | 7,947,314 | $ | 24,192,233 | $ | 61,881,948 | |||||||||||||||||||||||||||
AZZ, Inc. | 1,366,653 | 9,425 | 757,154 | 618,924 | $ | 25,542,993 | $ | 825,303 | $ | (10,954,225 | ) | $ | (3,982,598 | ) | |||||||||||||||||||||
| Calavo Growers, Inc. | 881,159 | 6,890 | 204,405 | 683,644 | 60,605,041 | 867,234 | 6,861,256 | (21,930,106 | ) | ||||||||||||||||||||||||||
Heska Corp. | 432,416 | 3,380 | 52,829 | 382,967 | 26,880,454 | — | * | 505,353 | (15,440,577 | ) | |||||||||||||||||||||||||
| Manhattan Associates, Inc. | 3,405,346 | 26,615 | 439,792 | 2,992,169 | 247,242,924 | — | * | 12,658,529 | 60,755,935 | ||||||||||||||||||||||||||
| Sub-total for securities no longer affiliated as of 8/31/19(c) | $ | 360,271,412 | $ | 1,692,537 | $ | 9,070,913 | $ | 19,402,654 | |||||||||||||||||||||||||||
Total | $ | 1,453,823,147 | $ | 9,639,851 | $ | 33,263,146 | $ | 81,284,602 | |||||||||||||||||||||||||||
(a) Affiliated issuers, as defined in the 1940 Act.
(b) At August 31, 2019, these securities amounted to approximately 10.67% of net assets of Genesis.
(c) At August 31, 2019, the issuers of these securities were no longer affiliated with Genesis.
* Non-income producing security.
Other: At August 31, 2019, Neuberger Berman Global Allocation Fund, which is also managed by Management, held 0.07%, 0.01% and 1.06%, of the outstanding shares of Emerging Markets Equity, Genesis and International Select, respectively.
In addition, at August 31, 2019, affiliated investors owned 0.05%, 2.78%, 0.00%, 0.12%, 73.60%, 0.08%, 0.00%, 0.00%, 0.02%, 18.61%, 0.00%, 0.01%, 0.00%, 0.05%, 0.01% and 0.00% of the outstanding shares of Dividend Growth, Emerging Markets Equity, Focus, Genesis, Global Real Estate, Greater China Equity, Guardian, International Equity, International Select, International Small Cap, Intrinsic Value, Large Cap Value, Mid Cap Growth, Mid Cap Intrinsic Value, Small Cap Growth and Sustainable Equity, respectively.
205
Note G—Stock Splits:
In 2018, the Board approved stock splits and reverse stock splits (collectively, the "Stock Split") of the issued and outstanding shares of certain classes of Emerging Markets Equity, Global Equity, Intrinsic Value, Mid Cap Intrinsic Value and Multi-Cap Opportunities (collectively, the "2018 Stock Split Funds"). The Stock Split occurred after the close of business on December 7, 2018. The Stock Split was carried out in accordance with a stock split ratio calculated to result in net asset values per share that better aligned the share class prices of each of the 2018 Stock Split Funds.
After the close of business on December 7, 2018, the following classes of the 2018 Stock Split Funds underwent a stock split or reverse stock split as follows:
Fund Class | Stock Split Ratio (Old to New) | Fund Class | Stock Split Ratio (Old to New) | Fund Class | Stock Split Ratio (Old to New) | ||||||||||||||||||
Emerging Markets Equity Class A | 1 | : 0.9925 | Global Equity Class A | 1 | : 0.9873 | Intrinsic Value Class A | 1 | : 0.9671 | |||||||||||||||
Emerging Markets Equity Class C | 1 | : 0.9490 | Global Equity Class C | 1 | : 0.9346 | Intrinsic Value Class C | 1 | : 0.9007 | |||||||||||||||
Emerging Markets Equity Class R3 | 1 | : 0.9679 | |||||||||||||||||||||
Emerging Markets Equity Class R6 | 1 | : 1.0009 | |||||||||||||||||||||
Fund Class | Stock Split Ratio (Old to New) | Fund Class | Stock Split Ratio (Old to New) | ||||||||||||
Mid Cap Intrinsic Value Investor Class | 1 | : 0.9982 | Multi-Cap Opportunities Class A | 1 | : 0.9915 | ||||||||||
Mid Cap Intrinsic Value Trust Class | 1 | : 0.8078 | Multi-Cap Opportunities Class C | 1 | : 0.9455 | ||||||||||
Mid Cap Intrinsic Value Class A | 1 | : 0.8071 | |||||||||||||
Mid Cap Intrinsic Value Class C | 1 | : 0.7826 | |||||||||||||
Mid Cap Intrinsic Value Class R3 | 1 | : 0.8036 | |||||||||||||
In 2017, the Board approved stock splits and reverse stock splits (collectively, the "Stock Split") of the issued and outstanding shares of certain classes of Focus, Genesis, Guardian, International Equity, Large Cap Value, Mid Cap Growth, Small Cap Growth and Sustainable Equity (collectively, the "2017 Stock Split Funds"). The Stock Split for certain classes of Genesis, Large Cap Value, Mid Cap Growth and Sustainable Equity occurred after the close of business on December 8, 2017. The Stock Split for certain classes of the remaining 2017 Stock Split Funds occurred after the close of the business on February 23, 2018. The Stock Split was carried out in accordance with a stock split ratio calculated to result in net asset values per share that better aligned the share class prices of each of the 2017 Stock Split Funds.
After the close of business on December 8, 2017, the following classes of the 2017 Stock Split Funds underwent a stock split or reverse stock split as follows:
Fund Class | Stock Split Ratio (Old to New) | Fund Class | Stock Split Ratio (Old to New) | Fund Class | Stock Split Ratio (Old to New) | Fund Class | Stock Split Ratio (Old to New) | ||||||||||||||||||||||||
| Genesis Investor Class | 1 | : 0.5760 | Large Cap Value Trust Class | 1 | : 0.6374 | Mid Cap Growth Investor Class | 1 | : 0.9724 | Sustainable Equity Investor Class | 1 | : 0.9982 | ||||||||||||||||||||
| Genesis Trust Class | 1 | : 1.0537 | Large Cap Value Advisor Class | 1 | : 0.4658 | Mid Cap Growth Trust Class | 1 | : 1.7186 | Sustainable Equity Trust Class | 1 | : 0.5700 | ||||||||||||||||||||
| Genesis Advisor Class | 1 | : 0.3915 | Large Cap Value Institutional Class | 1 | : 1.0080 | Mid Cap Growth Advisor Class | 1 | : 1.7406 | Sustainable Equity Class A | 1 | : 0.5631 | ||||||||||||||||||||
| Genesis Class R6 | 1 | : 1.0003 | Large Cap Value Class A | 1 | : 0.6359 | Mid Cap Growth Class A | 1 | : 1.7093 | Sustainable Equity Class C | 1 | : 0.5445 | ||||||||||||||||||||
| Large Cap Value Class C | 1 | : 0.4379 | Mid Cap Growth Class C | 1 | : 1.6694 | Sustainable Equity Class R3 | 1 | : 0.5555 | |||||||||||||||||||||||
| Large Cap Value Class R3 | 1 | : 0.4729 | Mid Cap Growth Class R3 | 1 | : 1.7357 | Sustainable Equity Class R6 | 1 | : 1.0008 | |||||||||||||||||||||||
| Mid Cap Growth Class R6 | 1 | : 1.0040 | |||||||||||||||||||||||||||||
206
After the close of business on February 23, 2018, the following classes of the 2017 Stock Split Funds underwent a stock split or reverse stock split as follows:
Fund Class | Stock Split Ratio (Old to New) | Fund Class | Stock Split Ratio (Old to New) | Fund Class | Stock Split Ratio (Old to New) | Fund Class | Stock Split Ratio (Old to New) | ||||||||||||||||||||||||
| Focus Trust Class | 1 | : 0.5483 | Guardian Trust Class | 1 | : 0.5975 | International Equity Investor Class | 1 | : 1.8904 | Small Cap Growth Trust Class | 1 | : 1.0831 | ||||||||||||||||||||
| Focus Advisor Class | 1 | : 0.1720 | Guardian Advisor Class | 1 | : 0.7858 | International Equity Trust Class | 1 | : 2.1151 | Small Cap Growth Advisor Class | 1 | : 0.6866 | ||||||||||||||||||||
| Focus Institutional Class | 1 | : 1.0011 | Guardian Institutional Class | 1 | : 1.0017 | International Equity Class A | 1 | : 2.0998 | Small Cap Growth Institutional Class | 1 | : 1.0298 | ||||||||||||||||||||
| Focus Class A | 1 | : 0.5403 | Guardian Class A | 1 | : 0.5870 | International Equity Class C | 1 | : 2.0430 | Small Cap Growth Class A | 1 | : 1.0951 | ||||||||||||||||||||
| Focus Class C | 1 | : 0.1542 | Guardian Class C | 1 | : 0.7496 | International Equity Class R6 | 1 | : 1.0085 | Small Cap Growth Class C | 1 | : 0.6571 | ||||||||||||||||||||
| Guardian Class R3 | 1 | : 0.7801 | Small Cap Growth Class R3 | 1 | : 0.6886 | ||||||||||||||||||||||||||
Note H—Reorganizations:
At a meeting held on June 26, 2019, the Board approved a tax-free reorganization of Neuberger Berman Value Fund ("Value Fund") (the "Merging Fund") into Large Cap Value (the "Surviving Fund," and together with the Merging Fund, the "Reorganization Funds"). The Reorganization Funds are each a series of the Trust. After the close of business on August 16, 2019, the Surviving Fund acquired all of the net assets of the Merging Fund in a tax-free exchange of shares pursuant to the Plan of Reorganization and Dissolution approved by the Board. Accordingly, shareholders of the Merging Fund became shareholders of the Surviving Fund.
| Value Fund | Shares Prior to Reorganization | Shares Issued by the Surviving Fund | Net Assets Prior to Reorganization | ||||||||||||
Institutional Class | 1,461,190 | 851,047 | $ | 25,809,513 | |||||||||||
Class A | 222,472 | 129,228 | 3,922,304 | ||||||||||||
Class C | 237,497 | 133,590 | 4,057,725 | ||||||||||||
The appreciation of Value Fund was $1,039,412, as of the date of the reorganization. The combined net assets of the Surviving Fund immediately after the reorganization was $1,763,303,263. For financial reporting purposes, assets received and shares issued by the Surviving Fund were recorded at fair value; however, the cost basis of the investments received from the Merging Fund were carried forward to align ongoing reporting of the Surviving Fund's realized and unrealized gains and losses with amounts distributable to shareholders for tax purposes.
Assuming the acquisition had been completed on September 1, 2018, the beginning of the reporting period of the Surviving Fund, the Surviving Fund's pro forma results of operations for the year ended August 31, 2019, were as follows:
Net Investment Income/(Loss) | $ | 30,241,707 | |||||
Net Realized and Unrealized Gains/(Losses) on Investments and Foreign Currency Transactions | 66,789,022 | ||||||
Net Increase/(Decrease) in Net Assets resulting from Operations | $ | 97,030,729 | |||||
Because the combined investment portfolios have been managed as a single integrated portfolio since the reorganization was completed, it is not practicable to separate the amounts of revenue and earnings of the Merging Fund that have been included in the Surviving Fund's Statements of Operations as of August 31, 2019.
207
Note I—Recent Accounting Pronouncements:
As of November 5, 2018, pursuant to the SEC Release #33-10532 "Disclosure Update and Simplification", funds are no longer required to disclose whether the distributions from earnings are either from net investment income or net realized capital gains. The presentation for the year ended August 31, 2018 has been adjusted for this change in the Statements of Changes in Net Assets. At August 31, 2018, the distributions from net investment income, net realized gain from investments, undistributed net investment income (loss) and distributions in excess of net investment income were as follows:
(000's omitted) | |||||||||||||||||||||||||||||||||||
| Net Investment Income | Investor Class | Trust Class | Advisor Class | Institutional Class | Class A | Class C | Class R3 | Class R6 | |||||||||||||||||||||||||||
Dividend Growth | $ | — | $ | — | $ | — | $ | (472 | ) | $ | (16 | ) | $ | (3 | ) | $ | — | $ | — | ||||||||||||||||
| Emerging Markets Equity | — | — | — | (5,443 | ) | (229 | ) | (22 | ) | (5 | ) | (1,139 | ) | ||||||||||||||||||||||
Equity Income | — | — | — | (35,754 | ) | (4,945 | ) | (5,075 | ) | (42 | ) | — | |||||||||||||||||||||||
Focus | (1,883 | ) | (122 | ) | — | (37 | ) | (6 | ) | — | — | — | |||||||||||||||||||||||
Genesis | (3,296 | ) | (1,254 | ) | (9 | ) | (12,519 | ) | — | — | — | (15,711 | ) | ||||||||||||||||||||||
Global Equity | — | — | — | (25 | ) | (1 | ) | — | — | — | |||||||||||||||||||||||||
Global Real Estate | — | — | — | (43 | ) | (5 | ) | (2 | ) | — | — | ||||||||||||||||||||||||
Greater China Equity | — | — | — | (1,237 | ) | (224 | ) | (1 | ) | — | — | ||||||||||||||||||||||||
Guardian | (6,476 | ) | (394 | ) | — | (554 | ) | (36 | ) | (1 | ) | (1 | ) | ||||||||||||||||||||||
International Equity | (286 | ) | (74 | ) | — | (14,148 | ) | (69 | ) | — | — | (2,084 | ) | ||||||||||||||||||||||
International Select | — | (65 | ) | — | (2,374 | ) | (41 | ) | (2 | ) | (28 | ) | (116 | ) | |||||||||||||||||||||
International Small Cap | — | — | — | (26 | ) | (7 | ) | (3 | ) | — | (7 | ) | |||||||||||||||||||||||
Intrinsic Value | — | — | — | — | — | — | — | — | |||||||||||||||||||||||||||
Large Cap Value | (13,975 | ) | (801 | ) | (1,341 | ) | (1,235 | ) | (30 | ) | (12 | ) | (2 | ) | — | ||||||||||||||||||||
Mid Cap Growth | — | — | — | — | — | — | — | — | |||||||||||||||||||||||||||
Mid Cap Intrinsic Value | (190 | ) | (48 | ) | — | (270 | ) | (39 | ) | — | (4 | ) | — | ||||||||||||||||||||||
| Multi-Cap Opportunities | — | — | — | (10,422 | ) | (134 | ) | — | — | — | |||||||||||||||||||||||||
Real Estate | — | (2,098 | ) | — | (3,032 | ) | (929 | ) | (84 | ) | (191 | ) | (897 | ) | |||||||||||||||||||||
Small Cap Growth | — | — | — | — | — | — | — | — | |||||||||||||||||||||||||||
Sustainable Equity | (5,780 | ) | (1,428 | ) | — | (8,301 | ) | (730 | ) | (101 | ) | (138 | ) | (3,821 | ) | ||||||||||||||||||||
(000's omitted) | |||||||||||||||||||||||||||||||||||
| Net Realized Gain on Investments | Investor Class | Trust Class | Advisor Class | Institutional Class | Class A | Class C | Class R3 | Class R6 | |||||||||||||||||||||||||||
Dividend Growth | $ | — | $ | — | $ | — | $ | (570 | ) | $ | (26 | ) | $ | (43 | ) | $ | — | $ | — | ||||||||||||||||
| Emerging Markets Equity | — | — | — | — | — | — | — | — | |||||||||||||||||||||||||||
Equity Income | — | — | — | (45,883 | ) | (6,999 | ) | (10,330 | ) | (58 | ) | — | |||||||||||||||||||||||
Focus | (50,530 | ) | (7,959 | ) | (1,095 | ) | (673 | ) | (397 | ) | (635 | ) | — | — | |||||||||||||||||||||
Genesis | (224,852 | ) | (186,429 | ) | (25,746 | ) | (438,796 | ) | — | — | — | (447,218 | ) | ||||||||||||||||||||||
Global Equity | — | — | — | — | — | — | — | — | |||||||||||||||||||||||||||
Global Real Estate | — | — | — | (21 | ) | (2 | ) | (3 | ) | — | — | ||||||||||||||||||||||||
208
(000's omitted) | |||||||||||||||||||||||||||||||||||
| Net Realized Gain on Investments | Investor Class | Trust Class | Advisor Class | Institutional Class | Class A | Class C | Class R3 | Class R6 | |||||||||||||||||||||||||||
Greater China Equity | $ | — | $ | — | $ | — | $ | (10,798 | ) | $ | (2,099 | ) | $ | (28 | ) | $ | — | $ | — | ||||||||||||||||
Guardian | (65,843 | ) | (5,485 | ) | (12 | ) | (4,438 | ) | (515 | ) | (136 | ) | (32 | ) | |||||||||||||||||||||
International Equity | — | — | — | — | — | — | — | — | |||||||||||||||||||||||||||
International Select | — | — | — | — | — | — | — | — | |||||||||||||||||||||||||||
International Small Cap | — | — | — | (40 | ) | (13 | ) | (5 | ) | — | (11 | ) | |||||||||||||||||||||||
Intrinsic Value | — | — | — | (43,660 | ) | (908 | ) | (1,255 | ) | — | — | ||||||||||||||||||||||||
Large Cap Value | (79,556 | ) | (5,204 | ) | (9,870 | ) | (6,298 | ) | (200 | ) | (168 | ) | (15 | ) | — | ||||||||||||||||||||
Mid Cap Growth | (39,598 | ) | (5,336 | ) | (1,205 | ) | (28,019 | ) | (3,926 | ) | (859 | ) | (1,127 | ) | (24,371 | ) | |||||||||||||||||||
Mid Cap Intrinsic Value | (2,455 | ) | (811 | ) | — | (2,339 | ) | (681 | ) | (188 | ) | (111 | ) | — | |||||||||||||||||||||
| Multi-Cap Opportunities | — | — | — | (177,856 | ) | (5,678 | ) | (4,128 | ) | — | — | ||||||||||||||||||||||||
Real Estate | — | (7,008 | ) | — | (8,671 | ) | (3,711 | ) | (814 | ) | (866 | ) | (2,282 | ) | |||||||||||||||||||||
Small Cap Growth | (749 | ) | (49 | ) | (37 | ) | (180 | ) | (48 | ) | (42 | ) | (24 | ) | — | ||||||||||||||||||||
Sustainable Equity | (38,305 | ) | (12,216 | ) | — | (44,279 | ) | (6,220 | ) | (3,045 | ) | (2,065 | ) | (18,997 | ) | ||||||||||||||||||||
(000's omitted) | |||||||||||||||||||||||||||||||||||
| Undistributed Net Investment Income/(Loss) at 8/31/18 | Distributions in Excess of Net Investment Income at 8/31/18 | ||||||||||
Dividend Growth | $ | 529 | $ | — | |||||||
Emerging Markets Equity | 8,343 | — | |||||||||
Equity Income | 2,651 | — | |||||||||
Focus | 2,414 | — | |||||||||
Genesis | 12,253 | — | |||||||||
Global Equity | 31 | — | |||||||||
Global Real Estate | — | (16 | ) | ||||||||
Greater China Equity | — | (107 | ) | ||||||||
Guardian | 2,223 | — | |||||||||
International Equity | 15,225 | — | |||||||||
International Select | 1,062 | — | |||||||||
International Small Cap | — | (3 | ) | ||||||||
Intrinsic Value | — | (87 | ) | ||||||||
Large Cap Value | 17,710 | — | |||||||||
Mid Cap Growth | — | — | |||||||||
Mid Cap Intrinsic Value | 376 | — | |||||||||
Multi-Cap Opportunities | 7,856 | — | |||||||||
Real Estate | — | — | |||||||||
Small Cap Growth | — | — | |||||||||
Sustainable Equity | 4,837 | — | |||||||||
In August 2018, FASB issued Accounting Standards Update No. 2018-13, "Fair Value Measurement (Topic 820: Disclosure Framework—Changes to the Disclosure Requirements for Fair Value Measurement") ("ASU 2018-13"). ASU 2018-13 eliminates the requirement to disclose the amount of and reasons for transfers between Level 1 and Level 2 of the fair value hierarchy, the timing of transfers between levels of the fair value hierarchy and the
209
valuation processes for Level 3 fair value measurements. ASU 2018-13 will require the disclosure of the range and weighted average used to develop significant unobservable inputs for Level 3 fair value measurements and the changes in unrealized gains and losses for recurring Level 3 fair value measurements. ASU 2018-13 will also require that information is provided about the measurement uncertainty of Level 3 fair value measurements as of the reporting date. The guidance is effective for fiscal years, and interim periods within those fiscal years, beginning after December 15, 2019, and allows for early adoption of either the entire standard or only the provisions that eliminate or modify the disclosure requirements. Management has elected to adopt early the provisions that eliminate the disclosure requirements. Management is still currently evaluating the impact of applying the rest of the guidance.
210
Financial Highlights
The following tables include selected data for a share outstanding throughout each period and other performance information derived from the Financial Statements. Amounts that do not round to $0.01 or $(0.01) per share are presented as $0.00 or $(0.00), respectively. Ratios that do not round to 0.01% or (0.01)% are presented as 0.00% or (0.00)%, respectively. Net Asset amounts with a zero balance, if any, may reflect actual amounts rounding to less than $0.1 million. A "—" indicates that the line item was not applicable in the corresponding period.
| Net Asset Value, Beginning of Year | Net Investment Income (Loss)@ | Net Gains or Losses on Securities (both realized and unrealized) | Total From Investment Operations | Dividends from Net Investment Income | Distributions from Net Realized Capital Gains | Total Distributions | Voluntary Contribution from Management | Net Asset Value, End of Year | Total Returnab | Net Assets, End of Year (in millions) | Ratio of Gross Expenses to Average Net Assets# | Ratio of Net Expenses to Average Net Assets | Ratio of Net Investment Income/ (Loss) to Average Net Assets | Portfolio Turnover Rate | |||||||||||||||||||||||||||||||||||||||||||||||||
Dividend Growth Fund | |||||||||||||||||||||||||||||||||||||||||||||||||||||||||||||||
Institutional Class | |||||||||||||||||||||||||||||||||||||||||||||||||||||||||||||||
8/31/2019 | $ | 13.93 | $ | 0.21 | $ | (0.64 | ) | $ | (0.43 | ) | $ | (0.13 | ) | $ | (0.56 | ) | $ | (0.69 | ) | $ | — | $ | 12.81 | (2.45 | )% | $ | 51.3 | 1.20 | % | 0.69 | % | 1.63 | % | 45 | % | ||||||||||||||||||||||||||||
8/31/2018 | $ | 12.93 | $ | 0.21 | $ | 1.12 | $ | 1.33 | $ | (0.15 | ) | $ | (0.18 | ) | $ | (0.33 | ) | $ | — | $ | 13.93 | 10.44 | % | $ | 53.4 | 1.23 | % | 0.69 | % | 1.54 | % | 43 | % | ||||||||||||||||||||||||||||||
8/31/2017 | $ | 11.11 | $ | 0.22 | $ | 1.82 | $ | 2.04 | $ | (0.22 | ) | $ | — | $ | (0.22 | ) | $ | — | $ | 12.93 | 18.54 | % | $ | 32.5 | 1.69 | % | 0.69 | % | 1.78 | % | 44 | % | |||||||||||||||||||||||||||||||
| Period from 12/15/2015^ to 8/31/2016 | $ | 10.00 | $ | 0.18 | $ | 0.93 | $ | 1.11 | $ | — | $ | — | $ | — | $ | — | $ | 11.11 | 11.10 | %* | $ | 20.3 | 2.61 | %**‡ | 0.69 | %**‡ | 2.44 | %**‡ | 23 | %* | |||||||||||||||||||||||||||||||||
Class A | |||||||||||||||||||||||||||||||||||||||||||||||||||||||||||||||
8/31/2019 | $ | 13.93 | $ | 0.16 | $ | (0.62 | ) | $ | (0.46 | ) | $ | (0.10 | ) | $ | (0.56 | ) | $ | (0.66 | ) | $ | — | $ | 12.81 | (2.75 | )% | $ | 1.4 | 1.65 | % | 1.05 | % | 1.28 | % | 45 | % | ||||||||||||||||||||||||||||
8/31/2018 | $ | 12.94 | $ | 0.15 | $ | 1.13 | $ | 1.28 | $ | (0.11 | ) | $ | (0.18 | ) | $ | (0.29 | ) | $ | — | $ | 13.93 | 9.98 | % | $ | 1.8 | 1.67 | % | 1.05 | % | 1.14 | % | 43 | % | ||||||||||||||||||||||||||||||
8/31/2017 | $ | 11.09 | $ | 0.18 | $ | 1.81 | $ | 1.99 | $ | (0.14 | ) | $ | — | $ | (0.14 | ) | $ | — | $ | 12.94 | 18.10 | % | $ | 1.6 | 2.14 | % | 1.05 | % | 1.48 | % | 44 | % | |||||||||||||||||||||||||||||||
| Period from 12/15/2015^ to 8/31/2016 | $ | 10.00 | $ | 0.16 | $ | 0.93 | $ | 1.09 | $ | — | $ | — | $ | — | $ | — | $ | 11.09 | 10.90 | %* | $ | 0.2 | 3.36 | %**‡ | 1.05 | %**‡ | 2.14 | %**‡ | 23 | %* | |||||||||||||||||||||||||||||||||
Class C | |||||||||||||||||||||||||||||||||||||||||||||||||||||||||||||||
8/31/2019 | $ | 13.85 | $ | 0.07 | $ | (0.63 | ) | $ | (0.56 | ) | $ | (0.03 | ) | $ | (0.56 | ) | $ | (0.59 | ) | $ | — | $ | 12.70 | (3.55 | )% | $ | 2.7 | 2.32 | % | 1.80 | % | 0.51 | % | 45 | % | ||||||||||||||||||||||||||||
8/31/2018 | $ | 12.87 | $ | 0.05 | $ | 1.12 | $ | 1.17 | $ | (0.01 | ) | $ | (0.18 | ) | $ | (0.19 | ) | $ | — | $ | 13.85 | 9.17 | % | $ | 3.3 | 2.34 | % | 1.80 | % | 0.40 | % | 43 | % | ||||||||||||||||||||||||||||||
8/31/2017 | $ | 11.00 | $ | 0.07 | $ | 1.85 | $ | 1.92 | $ | (0.05 | ) | $ | — | $ | (0.05 | ) | $ | — | $ | 12.87 | 17.47 | % | $ | 3.1 | 2.81 | % | 1.80 | % | 0.61 | % | 44 | % | |||||||||||||||||||||||||||||||
| Period from 12/15/2015^ to 8/31/2016 | $ | 10.00 | $ | 0.08 | $ | 0.92 | $ | 1.00 | $ | — | $ | — | $ | — | $ | — | $ | 11.00 | 10.00 | %* | $ | 0.0 | 4.11 | %**‡ | 1.80 | %**‡ | 1.17 | %**‡ | 23 | %* | |||||||||||||||||||||||||||||||||
Class R6 | |||||||||||||||||||||||||||||||||||||||||||||||||||||||||||||||
8/31/2019 | $ | 13.93 | $ | 0.22 | $ | (0.63 | ) | $ | (0.41 | ) | $ | (0.14 | ) | $ | (0.56 | ) | $ | (0.70 | ) | $ | — | $ | 12.82 | (2.33 | )% | $ | 0.0 | 1.17 | % | 0.60 | % | 1.70 | % | 45 | % | ||||||||||||||||||||||||||||
8/31/2018 | $ | 12.93 | $ | 0.21 | $ | 1.13 | $ | 1.34 | $ | (0.16 | ) | $ | (0.18 | ) | $ | (0.34 | ) | $ | — | $ | 13.93 | 10.51 | % | $ | 0.0 | 1.19 | % | 0.62 | % | 1.58 | % | 43 | % | ||||||||||||||||||||||||||||||
8/31/2017 | $ | 11.11 | $ | 0.23 | $ | 1.81 | $ | 2.04 | $ | (0.22 | ) | $ | — | $ | (0.22 | ) | $ | — | $ | 12.93 | 18.60 | % | $ | 0.0 | 1.65 | % | 0.62 | % | 1.91 | % | 44 | % | |||||||||||||||||||||||||||||||
| Period from 12/15/2015^ to 8/31/2016 | $ | 10.00 | $ | 0.15 | $ | 0.96 | $ | 1.11 | $ | — | $ | — | $ | — | $ | — | $ | 11.11 | 11.10 | %* | $ | 0.1 | 2.75 | %**‡ | 0.62 | %**‡ | 2.06 | %**‡ | 23 | %* | |||||||||||||||||||||||||||||||||
See Notes to Financial Highlights
211
212
Financial Highlights (cont'd)
| Net Asset Value, Beginning of Year | Net Investment Income (Loss)@ | Net Gains or Losses on Securities (both realized and unrealized) | Total From Investment Operations | Dividends from Net Investment Income | Distributions from Net Realized Capital Gains | Total Distributions | Voluntary Contribution from Management | Net Asset Value, End of Year | Total Returnab | Net Assets, End of Year (in millions) | Ratio of Gross Expenses to Average Net Assets# | Ratio of Net Expenses to Average Net Assets | Ratio of Net Investment Income/ (Loss) to Average Net Assets | Portfolio Turnover Rate | |||||||||||||||||||||||||||||||||||||||||||||||||
Emerging Markets Equity Fund | |||||||||||||||||||||||||||||||||||||||||||||||||||||||||||||||
Institutional Class | |||||||||||||||||||||||||||||||||||||||||||||||||||||||||||||||
8/31/2019 | $ | 19.25 | $ | 0.23 | $ | (0.54 | ) | $ | (0.31 | ) | $ | (0.18 | ) | $ | — | $ | (0.18 | ) | $ | — | $ | 18.76 | (1.56 | )% | $ | 1,077.0 | 1.25 | % | 1.25 | %§ | 1.22 | % | 37 | % | |||||||||||||||||||||||||||||
8/31/2018 | $ | 19.87 | $ | 0.20 | $ | (0.68 | ) | $ | (0.48 | ) | $ | (0.14 | ) | $ | — | $ | (0.14 | ) | $ | — | $ | 19.25 | (2.49 | )% | $ | 1,149.4 | 1.28 | % | 1.25 | % | 0.98 | % | 23 | % | |||||||||||||||||||||||||||||
8/31/2017 | $ | 16.01 | $ | 0.17 | $ | 3.77 | $ | 3.94 | $ | (0.08 | ) | $ | — | $ | (0.08 | ) | $ | — | $ | 19.87 | 24.76 | % | $ | 670.6 | 1.36 | % | 1.25 | % | 0.95 | % | 25 | % | |||||||||||||||||||||||||||||||
8/31/2016 | $ | 13.94 | $ | 0.11 | $ | 2.06 | $ | 2.17 | $ | (0.10 | ) | $ | — | $ | (0.10 | ) | $ | — | $ | 16.01 | 15.64 | % | $ | 318.9 | 1.43 | % | 1.25 | % | 0.74 | % | 43 | % | |||||||||||||||||||||||||||||||
8/31/2015 | $ | 17.89 | $ | 0.12 | $ | (3.90 | ) | $ | (3.78 | ) | $ | (0.17 | ) | $ | — | $ | (0.17 | ) | $ | — | $ | 13.94 | (21.22 | )% | $ | 307.5 | 1.43 | % | 1.25 | % | 0.73 | % | 36 | % | |||||||||||||||||||||||||||||
Class A | |||||||||||||||||||||||||||||||||||||||||||||||||||||||||||||||
| 8/31/2019i | $ | 19.26 | $ | 0.17 | $ | (0.52 | ) | $ | (0.35 | ) | $ | (0.09 | ) | $ | — | $ | (0.09 | ) | $ | — | $ | 18.82 | (1.77 | )% | $ | 44.6 | 1.62 | % | 1.50 | % | 0.91 | % | 37 | % | |||||||||||||||||||||||||||||
| 8/31/2018i | $ | 19.90 | $ | 0.10 | $ | (0.64 | ) | $ | (0.54 | ) | $ | (0.10 | ) | $ | — | $ | (0.10 | ) | $ | — | $ | 19.26 | (2.78 | )% | $ | 47.6 | 1.65 | % | 1.50 | % | 0.49 | % | 23 | % | |||||||||||||||||||||||||||||
| 8/31/2017i | $ | 16.04 | $ | 0.13 | $ | 3.78 | $ | 3.91 | $ | (0.05 | ) | $ | — | $ | (0.05 | ) | $ | — | $ | 19.90 | 24.51 | % | $ | 65.1 | 1.73 | % | 1.50 | % | 0.74 | % | 25 | % | |||||||||||||||||||||||||||||||
| 8/31/2016i | $ | 13.98 | $ | 0.09 | $ | 2.03 | $ | 2.12 | $ | (0.06 | ) | $ | — | $ | (0.06 | ) | $ | — | $ | 16.04 | 15.31 | % | $ | 23.5 | 1.82 | % | 1.50 | % | 0.60 | % | 43 | % | |||||||||||||||||||||||||||||||
| 8/31/2015i | $ | 17.94 | $ | 0.08 | $ | (3.91 | ) | $ | (3.83 | ) | $ | (0.13 | ) | $ | — | $ | (0.13 | ) | $ | — | $ | 13.98 | (21.42 | )% | $ | 13.4 | 1.79 | % | 1.50 | % | 0.49 | % | 36 | % | |||||||||||||||||||||||||||||
Class C | |||||||||||||||||||||||||||||||||||||||||||||||||||||||||||||||
| 8/31/2019i | $ | 19.25 | $ | 0.03 | $ | (0.51 | ) | $ | (0.48 | ) | $ | — | $ | — | $ | — | $ | — | $ | 18.77 | (2.50 | )% | $ | 9.1 | 2.35 | % | 2.25 | % | 0.18 | % | 37 | % | |||||||||||||||||||||||||||||||
| 8/31/2018i | $ | 20.00 | $ | (0.02 | ) | $ | (0.68 | ) | $ | (0.70 | ) | $ | (0.05 | ) | $ | — | $ | (0.05 | ) | $ | — | $ | 19.25 | (3.51 | )% | $ | 10.9 | 2.37 | % | 2.25 | % | (0.08 | )% | 23 | % | ||||||||||||||||||||||||||||
| 8/31/2017i | $ | 16.18 | $ | (0.03 | ) | $ | 3.85 | $ | 3.82 | $ | — | $ | — | $ | — | $ | — | $ | 20.00 | 23.57 | % | $ | 7.4 | 2.45 | % | 2.25 | % | (0.18 | )% | 25 | % | ||||||||||||||||||||||||||||||||
| 8/31/2016i | $ | 14.14 | $ | (0.04 | ) | $ | 2.08 | $ | 2.04 | $ | — | $ | — | $ | — | $ | — | $ | 16.18 | 14.46 | % | $ | 5.2 | 2.51 | % | 2.25 | % | (0.30 | )% | 43 | % | ||||||||||||||||||||||||||||||||
| 8/31/2015i | $ | 18.19 | $ | (0.03 | ) | $ | (3.98 | ) | $ | (4.01 | ) | $ | (0.04 | ) | $ | — | $ | (0.04 | ) | $ | — | $ | 14.14 | (22.02 | )% | $ | 6.2 | 2.53 | % | 2.25 | % | (0.20 | )% | 36 | % | ||||||||||||||||||||||||||||
Class R3 | |||||||||||||||||||||||||||||||||||||||||||||||||||||||||||||||
| 8/31/2019i | $ | 19.26 | $ | 0.09 | $ | (0.51 | ) | $ | (0.42 | ) | $ | (0.01 | ) | $ | — | $ | (0.01 | ) | $ | — | $ | 18.83 | (2.19 | )% | $ | 1.0 | 1.94 | % | 1.91 | % | 0.50 | % | 37 | % | |||||||||||||||||||||||||||||
| 8/31/2018i | $ | 19.95 | $ | 0.03 | �� | $ | (0.65 | ) | $ | (0.62 | ) | $ | (0.07 | ) | $ | — | $ | (0.07 | ) | $ | — | $ | 19.26 | (3.16 | )% | $ | 1.4 | 1.91 | % | 1.91 | % | 0.14 | % | 23 | % | ||||||||||||||||||||||||||||
| 8/31/2017i | $ | 16.11 | $ | 0.01 | $ | 3.84 | $ | 3.85 | $ | (0.01 | ) | $ | — | $ | (0.01 | ) | $ | — | $ | 19.95 | 23.94 | % | $ | 1.5 | 2.01 | % | 1.91 | % | 0.08 | % | 25 | % | |||||||||||||||||||||||||||||||
| 8/31/2016i | $ | 14.05 | $ | 0.02 | $ | 2.07 | $ | 2.09 | $ | (0.03 | ) | $ | — | $ | (0.03 | ) | $ | — | $ | 16.11 | 14.88 | % | $ | 1.2 | 2.06 | % | 1.91 | % | 0.16 | % | 43 | % | |||||||||||||||||||||||||||||||
| 8/31/2015i | $ | 18.05 | $ | 0.02 | $ | (3.93 | ) | $ | (3.91 | ) | $ | (0.09 | ) | $ | — | $ | (0.09 | ) | $ | — | $ | 14.05 | (21.70 | )% | $ | 0.8 | 2.09 | % | 1.91 | % | 0.14 | % | 36 | % | |||||||||||||||||||||||||||||
Class R6 | |||||||||||||||||||||||||||||||||||||||||||||||||||||||||||||||
| 8/31/2019i | $ | 19.25 | $ | 0.27 | $ | (0.56 | ) | $ | (0.29 | ) | $ | (0.19 | ) | $ | — | $ | (0.19 | ) | $ | — | $ | 18.77 | (1.45 | )% | $ | 219.1 | 1.16 | % | 1.16 | %§ | 1.42 | % | 37 | % | |||||||||||||||||||||||||||||
| 8/31/2018i | $ | 19.87 | $ | 0.19 | $ | (0.67 | ) | $ | (0.48 | ) | $ | (0.14 | ) | $ | — | $ | (0.14 | ) | $ | — | $ | 19.25 | (2.46 | )% | $ | 166.9 | 1.19 | % | 1.18 | % | 0.91 | % | 23 | % | |||||||||||||||||||||||||||||
| 8/31/2017i | $ | 16.01 | $ | 0.15 | $ | 3.80 | $ | 3.95 | $ | (0.09 | ) | $ | — | $ | (0.09 | ) | $ | — | $ | 19.87 | 24.90 | % | $ | 132.9 | 1.26 | % | 1.18 | % | 0.86 | % | 25 | % | |||||||||||||||||||||||||||||||
| 8/31/2016i | $ | 13.95 | $ | 0.12 | $ | 2.05 | $ | 2.17 | $ | (0.11 | ) | $ | — | $ | (0.11 | ) | $ | — | $ | 16.01 | 15.64 | % | $ | 107.4 | 1.32 | % | 1.18 | % | 0.83 | % | 43 | % | |||||||||||||||||||||||||||||||
| 8/31/2015i | $ | 17.89 | $ | 0.14 | $ | (3.90 | ) | $ | (3.76 | ) | $ | (0.18 | ) | $ | — | $ | (0.18 | ) | $ | — | $ | 13.95 | (21.14 | )% | $ | 88.1 | 1.34 | % | 1.18 | % | 0.88 | % | 36 | % | |||||||||||||||||||||||||||||
See Notes to Financial Highlights
213
214
Financial Highlights (cont'd)
| Net Asset Value, Beginning of Year | Net Investment Income (Loss)@ | Net Gains or Losses on Securities (both realized and unrealized) | Total From Investment Operations | Dividends from Net Investment Income | Distributions from Net Realized Capital Gains | Total Distributions | Voluntary Contribution from Management | Net Asset Value, End of Year | Total Returnab | Net Assets, End of Year (in millions) | Ratio of Gross Expenses to Average Net Assets# | Ratio of Net Expenses to Average Net Assets | Ratio of Net Investment Income/ (Loss) to Average Net Assets | Portfolio Turnover Rate | |||||||||||||||||||||||||||||||||||||||||||||||||
Equity Income Fund | |||||||||||||||||||||||||||||||||||||||||||||||||||||||||||||||
Institutional Class | |||||||||||||||||||||||||||||||||||||||||||||||||||||||||||||||
8/31/2019 | $ | 13.53 | $ | 0.33 | $ | 0.00 | $ | 0.33 | $ | (0.32 | ) | $ | (0.56 | ) | $ | (0.88 | ) | $ | — | $ | 12.98 | 3.06 | % | $ | 1,147.4 | 0.70 | % | 0.70 | % | 2.58 | % | 37 | % | ||||||||||||||||||||||||||||||
8/31/2018 | $ | 13.09 | $ | 0.33 | $ | 1.01 | $ | 1.34 | $ | (0.40 | ) | $ | (0.50 | ) | $ | (0.90 | ) | $ | — | $ | 13.53 | 10.58 | % | $ | 1,172.8 | 0.69 | % | 0.69 | % | 2.52 | % | 41 | % | ||||||||||||||||||||||||||||||
8/31/2017 | $ | 12.45 | $ | 0.38 | $ | 1.01 | $ | 1.39 | $ | (0.33 | ) | $ | (0.42 | ) | $ | (0.75 | ) | $ | 0.00 | $ | 13.09 | 11.56 | %hj | $ | 1,208.7 | 0.69 | % | 0.69 | %e | 2.99 | %e | 53 | % | ||||||||||||||||||||||||||||||
8/31/2016 | $ | 11.74 | $ | 0.37 | $ | 1.08 | $ | 1.45 | $ | (0.32 | ) | $ | (0.42 | ) | $ | (0.74 | ) | $ | — | $ | 12.45 | 13.03 | % | $ | 1,076.5 | 0.69 | % | 0.69 | % | 3.18 | % | 49 | % | ||||||||||||||||||||||||||||||
8/31/2015 | $ | 13.19 | $ | 0.34 | $ | (0.92 | ) | $ | (0.58 | ) | $ | (0.30 | ) | $ | (0.57 | ) | $ | (0.87 | ) | $ | — | $ | 11.74 | (4.60 | )% | $ | 1,443.7 | 0.68 | % | 0.68 | % | 2.66 | % | 48 | % | ||||||||||||||||||||||||||||
Class A | |||||||||||||||||||||||||||||||||||||||||||||||||||||||||||||||
8/31/2019 | $ | 13.48 | $ | 0.28 | $ | 0.01 | $ | 0.29 | $ | (0.28 | ) | $ | (0.56 | ) | $ | (0.84 | ) | $ | — | $ | 12.93 | 2.68 | % | $ | 142.7 | 1.06 | % | 1.06 | % | 2.17 | % | 37 | % | ||||||||||||||||||||||||||||||
8/31/2018 | $ | 13.04 | $ | 0.29 | $ | 1.00 | $ | 1.29 | $ | (0.35 | ) | $ | (0.50 | ) | $ | (0.85 | ) | $ | — | $ | 13.48 | 10.21 | % | $ | 186.5 | 1.05 | % | 1.05 | % | 2.16 | % | 41 | % | ||||||||||||||||||||||||||||||
8/31/2017 | $ | 12.40 | $ | 0.32 | $ | 1.02 | $ | 1.34 | $ | (0.28 | ) | $ | (0.42 | ) | $ | (0.70 | ) | $ | 0.00 | $ | 13.04 | 11.17 | %hj | $ | 200.3 | 1.05 | % | 1.05 | %e | 2.56 | %e | 53 | % | ||||||||||||||||||||||||||||||
8/31/2016 | $ | 11.69 | $ | 0.33 | $ | 1.08 | $ | 1.41 | $ | (0.28 | ) | $ | (0.42 | ) | $ | (0.70 | ) | $ | — | $ | 12.40 | 12.64 | % | $ | 243.1 | 1.07 | % | 1.07 | % | 2.81 | % | 49 | % | ||||||||||||||||||||||||||||||
8/31/2015 | $ | 13.14 | $ | 0.29 | $ | (0.93 | ) | $ | (0.64 | ) | $ | (0.24 | ) | $ | (0.57 | ) | $ | (0.81 | ) | $ | — | $ | 11.69 | (5.02 | )% | $ | 289.5 | 1.05 | % | 1.05 | % | 2.26 | % | 48 | % | ||||||||||||||||||||||||||||
Class C | |||||||||||||||||||||||||||||||||||||||||||||||||||||||||||||||
8/31/2019 | $ | 13.38 | $ | 0.18 | $ | 0.01 | $ | 0.19 | $ | (0.18 | ) | $ | (0.56 | ) | $ | (0.74 | ) | $ | — | $ | 12.83 | 1.91 | % | $ | 178.5 | 1.81 | % | 1.81 | % | 1.45 | % | 37 | % | ||||||||||||||||||||||||||||||
8/31/2018 | $ | 12.95 | $ | 0.18 | $ | 1.00 | $ | 1.18 | $ | (0.25 | ) | $ | (0.50 | ) | $ | (0.75 | ) | $ | — | $ | 13.38 | 9.36 | % | $ | 246.7 | 1.80 | % | 1.80 | % | 1.40 | % | 41 | % | ||||||||||||||||||||||||||||||
8/31/2017 | $ | 12.32 | $ | 0.23 | $ | 1.01 | $ | 1.24 | $ | (0.19 | ) | $ | (0.42 | ) | $ | (0.61 | ) | $ | 0.00 | $ | 12.95 | 10.34 | %hj | $ | 282.3 | 1.80 | % | 1.80 | %e | 1.82 | %e | 53 | % | ||||||||||||||||||||||||||||||
8/31/2016 | $ | 11.62 | $ | 0.24 | $ | 1.07 | $ | 1.31 | $ | (0.19 | ) | $ | (0.42 | ) | $ | (0.61 | ) | $ | — | $ | 12.32 | 11.77 | % | $ | 334.1 | 1.81 | % | 1.81 | % | 2.07 | % | 49 | % | ||||||||||||||||||||||||||||||
8/31/2015 | $ | 13.06 | $ | 0.20 | $ | (0.92 | ) | $ | (0.72 | ) | $ | (0.15 | ) | $ | (0.57 | ) | $ | (0.72 | ) | $ | — | $ | 11.62 | (5.65 | )% | $ | 390.0 | 1.79 | % | 1.79 | % | 1.55 | % | 48 | % | ||||||||||||||||||||||||||||
Class R3 | |||||||||||||||||||||||||||||||||||||||||||||||||||||||||||||||
8/31/2019 | $ | 13.45 | $ | 0.24 | $ | 0.01 | $ | 0.25 | $ | (0.24 | ) | $ | (0.56 | ) | $ | (0.80 | ) | $ | — | $ | 12.90 | 2.40 | % | $ | 1.9 | 1.34 | % | 1.34 | % | 1.91 | % | 37 | % | ||||||||||||||||||||||||||||||
8/31/2018 | $ | 13.01 | $ | 0.25 | $ | 1.01 | $ | 1.26 | $ | (0.32 | ) | $ | (0.50 | ) | $ | (0.82 | ) | $ | — | $ | 13.45 | 9.93 | % | $ | 2.2 | 1.33 | % | 1.33 | % | 1.87 | % | 41 | % | ||||||||||||||||||||||||||||||
8/31/2017 | $ | 12.37 | $ | 0.28 | $ | 1.02 | $ | 1.30 | $ | (0.24 | ) | $ | (0.42 | ) | $ | (0.66 | ) | $ | 0.00 | $ | 13.01 | 10.88 | %hj | $ | 1.8 | 1.34 | % | 1.34 | %e | 2.27 | %e | 53 | % | ||||||||||||||||||||||||||||||
8/31/2016 | $ | 11.67 | $ | 0.30 | $ | 1.07 | $ | 1.37 | $ | (0.25 | ) | $ | (0.42 | ) | $ | (0.67 | ) | $ | — | $ | 12.37 | 12.26 | % | $ | 2.7 | 1.33 | % | 1.33 | % | 2.53 | % | 49 | % | ||||||||||||||||||||||||||||||
8/31/2015 | $ | 13.12 | $ | 0.26 | $ | (0.92 | ) | $ | (0.66 | ) | $ | (0.22 | ) | $ | (0.57 | ) | $ | (0.79 | ) | $ | — | $ | 11.67 | (5.22 | )% | $ | 3.8 | 1.31 | % | 1.31 | % | 2.05 | % | 48 | % | ||||||||||||||||||||||||||||
Focus Fund | |||||||||||||||||||||||||||||||||||||||||||||||||||||||||||||||
Investor Class | |||||||||||||||||||||||||||||||||||||||||||||||||||||||||||||||
8/31/2019 | $ | 28.69 | $ | 0.13 | $ | (1.06 | ) | $ | (0.93 | ) | $ | (0.10 | ) | $ | (1.92 | ) | $ | (2.02 | ) | $ | — | $ | 25.74 | (2.35 | )% | $ | 617.6 | 0.92 | % | 0.92 | % | 0.50 | % | 20 | % | ||||||||||||||||||||||||||||
8/31/2018 | $ | 27.50 | $ | 0.12 | $ | 3.28 | $ | 3.40 | $ | (0.08 | ) | $ | (2.13 | ) | $ | (2.21 | ) | $ | — | $ | 28.69 | 13.05 | % | $ | 690.7 | 0.91 | % | 0.91 | % | 0.43 | % | 59 | % | ||||||||||||||||||||||||||||||
8/31/2017 | $ | 25.81 | $ | 0.07 | $ | 3.93 | $ | 4.00 | $ | (0.09 | ) | $ | (2.22 | ) | $ | (2.31 | ) | $ | 0.00 | $ | 27.50 | 16.81 | %hj | $ | 667.7 | 0.92 | % | 0.91 | %e | 0.28 | %e | 72 | % | ||||||||||||||||||||||||||||||
8/31/2016 | $ | 25.45 | $ | 0.16 | $ | 1.48 | $ | 1.64 | $ | (0.18 | ) | $ | (1.10 | ) | $ | (1.28 | ) | $ | — | $ | 25.81 | 6.68 | % | $ | 626.8 | 0.94 | % | 0.94 | % | 0.63 | % | 89 | % | ||||||||||||||||||||||||||||||
8/31/2015 | $ | 29.77 | $ | 0.21 | $ | (0.15 | ) | $ | 0.06 | $ | (0.16 | ) | $ | (4.22 | ) | $ | (4.38 | ) | $ | — | $ | 25.45 | 0.49 | % | $ | 639.8 | 0.91 | % | 0.91 | % | 0.77 | % | 52 | % | |||||||||||||||||||||||||||||
See Notes to Financial Highlights
215
216
Financial Highlights (cont'd)
| Net Asset Value, Beginning of Year | Net Investment Income (Loss)@ | Net Gains or Losses on Securities (both realized and unrealized) | Total From Investment Operations | Dividends from Net Investment Income | Distributions from Net Realized Capital Gains | Total Distributions | Voluntary Contribution from Management | Net Asset Value, End of Year | Total Returnab | Net Assets, End of Year (in millions) | Ratio of Gross Expenses to Average Net Assets# | Ratio of Net Expenses to Average Net Assets | Ratio of Net Investment Income/ (Loss) to Average Net Assets | Portfolio Turnover Rate | |||||||||||||||||||||||||||||||||||||||||||||||||
Focus Fund (cont'd) | |||||||||||||||||||||||||||||||||||||||||||||||||||||||||||||||
Trust Class | |||||||||||||||||||||||||||||||||||||||||||||||||||||||||||||||
8/31/2019 | $ | 28.66 | $ | 0.08 | $ | (1.05 | ) | $ | (0.97 | ) | $ | (0.06 | ) | $ | (1.92 | ) | $ | (1.98 | ) | $ | — | $ | 25.71 | (2.52 | )% | $ | 46.4 | 1.10 | % | 1.10 | % | 0.32 | % | 20 | % | ||||||||||||||||||||||||||||
| 8/31/2018g | $ | 29.18 | $ | 0.07 | $ | 3.35 | $ | 3.42 | $ | (0.06 | ) | $ | (3.88 | ) | $ | (3.94 | ) | $ | — | $ | 28.66 | 12.88 | % | $ | 57.7 | 1.10 | % | 1.10 | % | 0.25 | % | 59 | % | ||||||||||||||||||||||||||||||
| 8/31/2017g | $ | 29.14 | $ | 0.04 | $ | 4.19 | $ | 4.23 | $ | (0.14 | ) | $ | (4.05 | ) | $ | (4.19 | ) | $ | 0.00 | $ | 29.18 | 16.61 | %hj | $ | 63.0 | 1.10 | % | 1.09 | %e | 0.10 | %e | 72 | % | ||||||||||||||||||||||||||||||
| 8/31/2016g | $ | 29.62 | $ | 0.12 | $ | 1.70 | $ | 1.82 | $ | (0.29 | ) | $ | (2.01 | ) | $ | (2.30 | ) | $ | — | $ | 29.14 | 6.50 | % | $ | 70.4 | 1.11 | % | 1.11 | % | 0.47 | % | 89 | % | ||||||||||||||||||||||||||||||
| 8/31/2015g | $ | 37.64 | $ | 0.18 | $ | (0.23 | ) | $ | (0.05 | ) | $ | (0.27 | ) | $ | (7.70 | ) | $ | (7.97 | ) | $ | — | $ | 29.62 | 0.26 | % | $ | 92.7 | 1.10 | % | 1.10 | % | 0.57 | % | 52 | % | ||||||||||||||||||||||||||||
Advisor Class | |||||||||||||||||||||||||||||||||||||||||||||||||||||||||||||||
8/31/2019 | $ | 28.62 | $ | 0.04 | $ | (1.05 | ) | $ | (1.01 | ) | $ | — | $ | (1.92 | ) | $ | (1.92 | ) | $ | — | $ | 25.69 | (2.68 | )% | $ | 1.6 | 1.27 | % | 1.27 | % | 0.14 | % | 20 | % | |||||||||||||||||||||||||||||
| 8/31/2018g | $ | 37.33 | $ | 0.03 | $ | 3.63 | $ | 3.66 | $ | — | $ | (12.37 | ) | $ | (12.37 | ) | $ | — | $ | 28.62 | 12.62 | % | $ | 2.3 | 1.26 | % | 1.26 | % | 0.09 | % | 59 | % | |||||||||||||||||||||||||||||||
| 8/31/2017g | $ | 45.35 | $ | (0.00 | ) | $ | 5.52 | $ | 5.52 | $ | (0.64 | ) | $ | (12.90 | ) | $ | (13.54 | ) | $ | 0.00 | $ | 37.33 | 16.51 | %hj | $ | 3.5 | 1.26 | % | 1.23 | %e | (0.04 | )%e | 72 | % | |||||||||||||||||||||||||||||
| 8/31/2016g | $ | 50.00 | $ | 0.17 | $ | 2.62 | $ | 2.79 | $ | (1.05 | ) | $ | (6.39 | ) | $ | (7.44 | ) | $ | — | $ | 45.35 | 6.33 | % | $ | 3.9 | 1.26 | % | 1.26 | % | 0.33 | % | 89 | % | ||||||||||||||||||||||||||||||
| 8/31/2015g | $ | 75.76 | $ | 0.23 | $ | (0.52 | ) | $ | (0.29 | ) | $ | (0.93 | ) | $ | (24.54 | ) | $ | (25.47 | ) | $ | — | $ | 50.00 | 0.15 | % | $ | 6.1 | 1.27 | % | 1.27 | % | 0.39 | % | 52 | % | ||||||||||||||||||||||||||||
Institutional Class | |||||||||||||||||||||||||||||||||||||||||||||||||||||||||||||||
8/31/2019 | $ | 28.72 | $ | 0.17 | $ | (1.05 | ) | $ | (0.88 | ) | $ | (0.13 | ) | $ | (1.92 | ) | $ | (2.05 | ) | $ | — | $ | 25.79 | (2.15 | )% | $ | 8.9 | 0.76 | % | 0.75 | % | 0.67 | % | 20 | % | ||||||||||||||||||||||||||||
| 8/31/2018g | $ | 27.53 | $ | 0.16 | $ | 3.27 | $ | 3.43 | $ | (0.12 | ) | $ | (2.12 | ) | $ | (2.24 | ) | $ | — | $ | 28.72 | 13.20 | % | $ | 8.6 | 0.75 | % | 0.75 | %§ | 0.60 | % | 59 | % | ||||||||||||||||||||||||||||||
| 8/31/2017g | $ | 25.83 | $ | 0.11 | $ | 3.95 | $ | 4.06 | $ | (0.14 | ) | $ | (2.22 | ) | $ | (2.36 | ) | $ | 0.00 | $ | 27.53 | 17.04 | %j | $ | 7.8 | 0.76 | % | 0.75 | % | 0.44 | % | 72 | % | ||||||||||||||||||||||||||||||
| 8/31/2016g | $ | 25.47 | $ | 0.22 | $ | 1.46 | $ | 1.68 | $ | (0.22 | ) | $ | (1.10 | ) | $ | (1.32 | ) | $ | — | $ | 25.83 | 6.86 | % | $ | 6.8 | 0.76 | % | 0.75 | % | 0.89 | % | 89 | % | ||||||||||||||||||||||||||||||
| 8/31/2015g | $ | 29.80 | $ | 0.26 | $ | (0.16 | ) | $ | 0.10 | $ | (0.21 | ) | $ | (4.22 | ) | $ | (4.43 | ) | $ | — | $ | 25.47 | 0.65 | % | $ | 28.7 | 0.76 | % | 0.75 | % | 0.96 | % | 52 | % | |||||||||||||||||||||||||||||
Class A | |||||||||||||||||||||||||||||||||||||||||||||||||||||||||||||||
8/31/2019 | $ | 28.65 | $ | 0.08 | $ | (1.05 | ) | $ | (0.97 | ) | $ | (0.07 | ) | $ | (1.92 | ) | $ | (1.99 | ) | $ | — | $ | 25.69 | (2.51 | )% | $ | 2.7 | 1.12 | % | 1.11 | % | 0.32 | % | 20 | % | ||||||||||||||||||||||||||||
| 8/31/2018g | $ | 29.24 | $ | 0.07 | $ | 3.34 | $ | 3.41 | $ | (0.06 | ) | $ | (3.94 | ) | $ | (4.00 | ) | $ | — | $ | 28.65 | 12.80 | % | $ | 3.4 | 1.12 | % | 1.11 | % | 0.23 | % | 59 | % | ||||||||||||||||||||||||||||||
| 8/31/2017g | $ | 29.28 | $ | 0.02 | $ | 4.22 | $ | 4.24 | $ | (0.17 | ) | $ | (4.11 | ) | $ | (4.28 | ) | $ | 0.00 | $ | 29.24 | 16.58 | %j | $ | 3.1 | 1.13 | % | 1.11 | % | 0.07 | % | 72 | % | ||||||||||||||||||||||||||||||
| 8/31/2016g | $ | 29.80 | $ | 0.13 | $ | 1.70 | $ | 1.83 | $ | (0.31 | ) | $ | (2.04 | ) | $ | (2.35 | ) | $ | — | $ | 29.28 | 6.52 | % | $ | 3.2 | 1.15 | % | 1.11 | % | 0.48 | % | 89 | % | ||||||||||||||||||||||||||||||
| 8/31/2015g | $ | 37.94 | $ | 0.19 | $ | (0.24 | ) | $ | (0.05 | ) | $ | (0.28 | ) | $ | (7.81 | ) | $ | (8.09 | ) | $ | — | $ | 29.80 | 0.24 | % | $ | 4.4 | 1.14 | % | 1.11 | % | 0.58 | % | 52 | % | ||||||||||||||||||||||||||||
Class C | |||||||||||||||||||||||||||||||||||||||||||||||||||||||||||||||
8/31/2019 | $ | 28.50 | $ | (0.11 | ) | $ | (1.05 | ) | $ | (1.16 | ) | $ | — | $ | (1.92 | ) | $ | (1.92 | ) | $ | — | $ | 25.42 | (3.25 | )% | $ | 1.2 | 1.88 | % | 1.86 | % | (0.43 | )% | 20 | % | ||||||||||||||||||||||||||||
| 8/31/2018g | $ | 38.78 | $ | (0.16 | ) | $ | 3.68 | $ | 3.52 | $ | — | $ | (13.80 | ) | $ | (13.80 | ) | $ | — | $ | 28.50 | 11.92 | % | $ | 1.7 | 1.87 | % | 1.86 | % | (0.52 | )% | 59 | % | ||||||||||||||||||||||||||||||
| 8/31/2017g | $ | 48.05 | $ | (0.25 | ) | $ | 5.77 | $ | 5.52 | $ | (0.39 | ) | $ | (14.40 | ) | $ | (14.79 | ) | $ | 0.00 | $ | 38.78 | 15.76 | %j | $ | 1.9 | 1.88 | % | 1.86 | % | (0.67 | )% | 72 | % | |||||||||||||||||||||||||||||
| 8/31/2016g | $ | 53.44 | $ | (0.13 | ) | $ | 2.84 | $ | 2.71 | $ | (0.97 | ) | $ | (7.13 | ) | $ | (8.10 | ) | $ | — | $ | 48.05 | 5.75 | % | $ | 2.2 | 1.90 | % | 1.86 | % | (0.27 | )% | 89 | % | |||||||||||||||||||||||||||||
| 8/31/2015g | $ | 82.36 | $ | (0.13 | ) | $ | (0.64 | ) | $ | (0.77 | ) | $ | (0.78 | ) | $ | (27.37 | ) | $ | (28.15 | ) | $ | — | $ | 53.44 | (0.50 | )% | $ | 2.9 | 1.89 | % | 1.86 | % | (0.18 | )% | 52 | % | |||||||||||||||||||||||||||
See Notes to Financial Highlights
217
218
Financial Highlights (cont'd)
| Net Asset Value, Beginning of Year | Net Investment Income (Loss)@ | Net Gains or Losses on Securities (both realized and unrealized) | Total From Investment Operations | Dividends from Net Investment Income | Distributions from Net Realized Capital Gains | Total Distributions | Voluntary Contribution from Management | Net Asset Value, End of Year | Total Returnab | Net Assets, End of Year (in millions) | Ratio of Gross Expenses to Average Net Assets# | Ratio of Net Expenses to Average Net Assets | Ratio of Net Investment Income/ (Loss) to Average Net Assets | Portfolio Turnover Rate | |||||||||||||||||||||||||||||||||||||||||||||||||
Genesis Fund | |||||||||||||||||||||||||||||||||||||||||||||||||||||||||||||||
Investor Class | |||||||||||||||||||||||||||||||||||||||||||||||||||||||||||||||
8/31/2019 | $ | 65.27 | $ | 0.05 | $ | (0.91 | ) | $ | (0.86 | ) | $ | (0.03 | ) | $ | (5.84 | ) | $ | (5.87 | ) | $ | — | $ | 58.54 | 0.53 | % | $ | 1,649.3 | 1.01 | % | 1.01 | % | 0.08 | % | 14 | % | ||||||||||||||||||||||||||||
| 8/31/2018f | $ | 58.73 | $ | 0.07 | $ | 14.47 | $ | 14.54 | $ | (0.11 | ) | $ | (7.89 | ) | $ | (8.00 | ) | $ | — | $ | 65.27 | 26.73 | % | $ | 1,919.1 | 1.02 | % | 1.02 | % | 0.11 | % | 13 | % | ||||||||||||||||||||||||||||||
| 8/31/2017f | $ | 59.25 | $ | 0.12 | $ | 5.73 | $ | 5.85 | $ | (0.26 | ) | $ | (6.11 | ) | $ | (6.37 | ) | $ | — | $ | 58.73 | 10.19 | %h | $ | 1,786.0 | 1.02 | % | 1.01 | %e | 0.21 | %e | 20 | % | ||||||||||||||||||||||||||||||
| 8/31/2016f | $ | 63.04 | $ | 0.16 | $ | 5.95 | $ | 6.11 | $ | (0.26 | ) | $ | (9.64 | ) | $ | (9.90 | ) | $ | — | $ | 59.25 | 11.43 | % | $ | 1,752.8 | 1.03 | % | 1.03 | % | 0.28 | % | 16 | % | ||||||||||||||||||||||||||||||
| 8/31/2015f | $ | 70.99 | $ | 0.19 | $ | 0.62 | $ | 0.81 | $ | (0.24 | ) | $ | (8.52 | ) | $ | (8.76 | ) | $ | — | $ | 63.04 | 1.52 | % | $ | 2,023.6 | 1.01 | % | 1.01 | % | 0.29 | % | 13 | % | ||||||||||||||||||||||||||||||
Trust Class | |||||||||||||||||||||||||||||||||||||||||||||||||||||||||||||||
8/31/2019 | $ | 65.30 | $ | (0.00 | ) | $ | (0.91 | ) | $ | (0.91 | ) | $ | (0.01 | ) | $ | (5.84 | ) | $ | (5.85 | ) | $ | — | $ | 58.54 | 0.43 | % | $ | 1,409.3 | 1.10 | % | 1.10 | % | (0.01 | )% | 14 | % | |||||||||||||||||||||||||||
| 8/31/2018f | $ | 58.73 | $ | 0.02 | $ | 14.49 | $ | 14.51 | $ | (0.05 | ) | $ | (7.89 | ) | $ | (7.94 | ) | $ | — | $ | 65.30 | 26.64 | % | $ | 1,561.6 | 1.10 | % | 1.10 | % | 0.03 | % | 13 | % | ||||||||||||||||||||||||||||||
| 8/31/2017f | $ | 56.48 | $ | 0.08 | $ | 5.54 | $ | 5.62 | $ | (0.03 | ) | $ | (3.34 | ) | $ | (3.37 | ) | $ | — | $ | 58.73 | 10.11 | %h | $ | 1,576.2 | 1.09 | % | 1.08 | %e | 0.13 | %e | 20 | % | ||||||||||||||||||||||||||||||
| 8/31/2016f | $ | 56.00 | $ | 0.11 | $ | 5.67 | $ | 5.78 | $ | (0.03 | ) | $ | (5.27 | ) | $ | (5.30 | ) | $ | — | $ | 56.48 | 11.35 | % | $ | 1,761.0 | 1.10 | % | 1.10 | % | 0.21 | % | 16 | % | ||||||||||||||||||||||||||||||
| 8/31/2015f | $ | 59.99 | $ | 0.11 | $ | 0.60 | $ | 0.71 | $ | (0.04 | ) | $ | (4.66 | ) | $ | (4.70 | ) | $ | — | $ | 56.00 | 1.41 | % | $ | 2,003.4 | 1.10 | % | 1.10 | % | 0.19 | % | 13 | % | ||||||||||||||||||||||||||||||
Advisor Class | |||||||||||||||||||||||||||||||||||||||||||||||||||||||||||||||
8/31/2019 | $ | 65.23 | $ | (0.15 | ) | $ | (0.92 | ) | $ | (1.07 | ) | $ | — | $ | (5.84 | ) | $ | (5.84 | ) | $ | — | $ | 58.32 | 0.18 | % | $ | 157.0 | 1.35 | % | 1.35 | % | (0.26 | )% | 14 | % | ||||||||||||||||||||||||||||
| 8/31/2018f | $ | 58.77 | $ | (0.14 | ) | $ | 14.49 | $ | 14.35 | $ | — | $ | (7.89 | ) | $ | (7.89 | ) | $ | — | $ | 65.23 | 26.31 | % | $ | 198.1 | 1.35 | % | 1.35 | % | (0.23 | )% | 13 | % | ||||||||||||||||||||||||||||||
| 8/31/2017f | $ | 62.10 | $ | (0.08 | ) | $ | 5.93 | $ | 5.85 | $ | (0.19 | ) | $ | (8.99 | ) | $ | (9.18 | ) | $ | — | $ | 58.77 | 9.81 | %h | $ | 203.8 | 1.36 | % | 1.35 | %e | (0.13 | )%e | 20 | % | |||||||||||||||||||||||||||||
| 8/31/2016f | $ | 70.12 | $ | (0.05 | ) | $ | 6.28 | $ | 6.23 | $ | (0.07 | ) | $ | (14.18 | ) | $ | (14.25 | ) | $ | — | $ | 62.10 | 11.06 | % | $ | 264.9 | 1.38 | % | 1.38 | % | (0.07 | )% | 16 | % | |||||||||||||||||||||||||||||
| 8/31/2015f | $ | 82.20 | $ | (0.08 | ) | $ | 0.64 | $ | 0.56 | $ | (0.10 | ) | $ | (12.54 | ) | $ | (12.64 | ) | $ | — | $ | 70.12 | 1.11 | % | $ | 451.3 | 1.39 | % | 1.39 | % | (0.09 | )% | 13 | % | |||||||||||||||||||||||||||||
Institutional Class | |||||||||||||||||||||||||||||||||||||||||||||||||||||||||||||||
8/31/2019 | $ | 65.24 | $ | 0.14 | $ | (0.92 | ) | $ | (0.78 | ) | $ | (0.14 | ) | $ | (5.84 | ) | $ | (5.98 | ) | $ | — | $ | 58.48 | 0.69 | % | $ | 2,809.8 | 0.85 | % | 0.85 | % | 0.25 | % | 14 | % | ||||||||||||||||||||||||||||
8/31/2018 | $ | 58.71 | $ | 0.17 | $ | 14.47 | $ | 14.64 | $ | (0.22 | ) | $ | (7.89 | ) | $ | (8.11 | ) | $ | — | $ | 65.24 | 26.96 | % | $ | 3,253.8 | 0.85 | % | 0.85 | % | 0.28 | % | 13 | % | ||||||||||||||||||||||||||||||
8/31/2017 | $ | 56.64 | $ | 0.22 | $ | 5.56 | $ | 5.78 | $ | (0.19 | ) | $ | (3.52 | ) | $ | (3.71 | ) | $ | — | $ | 58.71 | 10.40 | %h | $ | 3,650.3 | 0.85 | % | 0.84 | %e§ | 0.38 | %e | 20 | % | ||||||||||||||||||||||||||||||
8/31/2016 | $ | 56.48 | $ | 0.25 | $ | 5.67 | $ | 5.92 | $ | (0.21 | ) | $ | (5.55 | ) | $ | (5.76 | ) | $ | — | $ | 56.64 | 11.62 | % | $ | 3,483.9 | 0.85 | % | 0.85 | %§ | 0.47 | % | 16 | % | ||||||||||||||||||||||||||||||
8/31/2015 | $ | 60.72 | $ | 0.26 | $ | 0.60 | $ | 0.86 | $ | (0.19 | ) | $ | (4.91 | ) | $ | (5.10 | ) | $ | — | $ | 56.48 | 1.68 | % | $ | 3,685.0 | 0.85 | % | 0.85 | % | 0.45 | % | 13 | % | ||||||||||||||||||||||||||||||
Class R6 | |||||||||||||||||||||||||||||||||||||||||||||||||||||||||||||||
8/31/2019 | $ | 65.23 | $ | 0.19 | $ | (0.93 | ) | $ | (0.74 | ) | $ | (0.20 | ) | $ | (5.84 | ) | $ | (6.04 | ) | $ | — | $ | 58.45 | 0.80 | % | $ | 4,221.1 | 0.75 | % | 0.75 | % | 0.34 | % | 14 | % | ||||||||||||||||||||||||||||
| 8/31/2018f | $ | 58.70 | $ | 0.23 | $ | 14.46 | $ | 14.69 | $ | (0.27 | ) | $ | (7.89 | ) | $ | (8.16 | ) | $ | — | $ | 65.23 | 27.07 | % | $ | 4,372.3 | 0.78 | % | 0.75 | % | 0.38 | % | 13 | % | ||||||||||||||||||||||||||||||
| 8/31/2017f | $ | 56.63 | $ | 0.26 | $ | 5.56 | $ | 5.82 | $ | (0.23 | ) | $ | (3.52 | ) | $ | (3.75 | ) | $ | — | $ | 58.70 | 10.47 | %h | $ | 3,603.6 | 0.77 | % | 0.77 | %e§ | 0.45 | %e | 20 | % | ||||||||||||||||||||||||||||||
| 8/31/2016f | $ | 56.48 | $ | 0.29 | $ | 5.67 | $ | 5.96 | $ | (0.26 | ) | $ | (5.55 | ) | $ | (5.81 | ) | $ | — | $ | 56.63 | 11.69 | % | $ | 3,381.6 | 0.78 | % | 0.78 | %§ | 0.54 | % | 16 | % | ||||||||||||||||||||||||||||||
| 8/31/2015f | $ | 60.73 | $ | 0.30 | $ | 0.60 | $ | 0.90 | $ | (0.24 | ) | $ | (4.91 | ) | $ | (5.15 | ) | $ | — | $ | 56.48 | 1.75 | % | $ | 2,798.0 | 0.78 | % | 0.78 | % | 0.52 | % | 13 | % | ||||||||||||||||||||||||||||||
See Notes to Financial Highlights
219
220
Financial Highlights (cont'd)
| Net Asset Value, Beginning of Year | Net Investment Income (Loss)@ | Net Gains or Losses on Securities (both realized and unrealized) | Total From Investment Operations | Dividends from Net Investment Income | Distributions from Net Realized Capital Gains | Total Distributions | Voluntary Contribution from Management | Net Asset Value, End of Year | Total Returnab | Net Assets, End of Year (in millions) | Ratio of Gross Expenses to Average Net Assets# | Ratio of Net Expenses to Average Net Assets | Ratio of Net Investment Income/ (Loss) to Average Net Assets | Portfolio Turnover Rate | |||||||||||||||||||||||||||||||||||||||||||||||||
Global Equity Fund | |||||||||||||||||||||||||||||||||||||||||||||||||||||||||||||||
Institutional Class | |||||||||||||||||||||||||||||||||||||||||||||||||||||||||||||||
8/31/2019 | $ | 8.61 | $ | 0.06 | $ | (0.45 | ) | $ | (0.39 | ) | $ | (0.07 | ) | $ | (0.44 | ) | $ | (0.51 | ) | $ | — | $ | 7.71 | (3.74 | )% | $ | 3.2 | 7.48 | % | 0.76 | % | 0.78 | % | 18 | % | ||||||||||||||||||||||||||||
8/31/2018 | $ | 7.56 | $ | 0.06 | $ | 1.04 | $ | 1.10 | $ | (0.05 | ) | $ | (0.00 | ) | $ | (0.05 | ) | $ | — | $ | 8.61 | 14.53 | % | $ | 4.8 | 6.48 | % | 0.75 | % | 0.74 | % | 33 | % | ||||||||||||||||||||||||||||||
8/31/2017 | $ | 6.65 | $ | 0.05 | $ | 0.94 | $ | 0.99 | $ | (0.03 | ) | $ | (0.05 | ) | $ | (0.08 | ) | $ | — | $ | 7.56 | 15.13 | % | $ | 4.2 | 7.05 | % | 0.85 | % | 0.65 | % | 16 | % | ||||||||||||||||||||||||||||||
8/31/2016 | $ | 6.30 | $ | 0.04 | $ | 0.32 | $ | 0.36 | $ | (0.01 | ) | $ | — | $ | (0.01 | ) | $ | — | $ | 6.65 | 5.76 | % | $ | 3.6 | 8.67 | % | 1.15 | % | 0.64 | % | 41 | % | |||||||||||||||||||||||||||||||
8/31/2015 | $ | 11.22 | $ | 0.03 | $ | (0.38 | ) | $ | (0.35 | ) | $ | (0.73 | ) | $ | (3.84 | ) | $ | (4.57 | ) | $ | — | $ | 6.30 | (3.16 | )% | $ | 3.2 | 4.76 | % | 1.15 | % | 0.35 | % | 18 | % | ||||||||||||||||||||||||||||
Class A | |||||||||||||||||||||||||||||||||||||||||||||||||||||||||||||||
| 8/31/2019i | $ | 8.62 | $ | 0.03 | $ | (0.45 | ) | $ | (0.42 | ) | $ | (0.01 | ) | $ | (0.44 | ) | $ | (0.45 | ) | $ | — | $ | 7.75 | (4.19 | )% | $ | 0.3 | 7.96 | % | 1.12 | % | 0.37 | % | 18 | % | ||||||||||||||||||||||||||||
| 8/31/2018i | $ | 7.58 | $ | 0.03 | $ | 1.04 | $ | 1.07 | $ | (0.03 | ) | $ | (0.00 | ) | $ | (0.03 | ) | $ | — | $ | 8.62 | 14.17 | % | $ | 0.4 | 6.70 | % | 1.11 | % | 0.41 | % | 33 | % | ||||||||||||||||||||||||||||||
| 8/31/2017i | $ | 6.65 | $ | 0.01 | $ | 0.97 | $ | 0.98 | $ | — | $ | (0.05 | ) | $ | (0.05 | ) | $ | — | $ | 7.58 | 14.85 | % | $ | 0.3 | 7.74 | % | 1.25 | % | 0.19 | % | 16 | % | |||||||||||||||||||||||||||||||
| 8/31/2016i | $ | 6.31 | $ | 0.02 | $ | 0.32 | $ | 0.34 | $ | (0.00 | ) | $ | (0.00 | ) | $ | (0.00 | ) | $ | — | $ | 6.65 | 5.46 | % | $ | 0.5 | 9.12 | % | 1.51 | % | 0.31 | % | 41 | % | ||||||||||||||||||||||||||||||
| 8/31/2015i | $ | 11.28 | $ | 0.01 | $ | (0.38 | ) | $ | (0.37 | ) | $ | (0.71 | ) | $ | (3.89 | ) | $ | (4.60 | ) | $ | — | $ | 6.31 | (3.47 | )% | $ | 0.4 | 5.24 | % | 1.51 | % | 0.09 | % | 18 | % | ||||||||||||||||||||||||||||
Class C | |||||||||||||||||||||||||||||||||||||||||||||||||||||||||||||||
| 8/31/2019i | $ | 8.61 | $ | (0.03 | ) | $ | (0.44 | ) | $ | (0.47 | ) | $ | — | $ | (0.44 | ) | $ | (0.44 | ) | $ | — | $ | 7.70 | (4.84 | )% | $ | 0.1 | 8.64 | % | 1.87 | % | (0.34 | )% | 18 | % | ||||||||||||||||||||||||||||
| 8/31/2018i | $ | 7.61 | $ | (0.04 | ) | $ | 1.04 | $ | 1.00 | $ | — | $ | (0.00 | ) | $ | — | $ | — | $ | 8.61 | 13.22 | % | $ | 0.1 | 7.61 | % | 1.86 | % | (0.40 | )% | 33 | % | |||||||||||||||||||||||||||||||
| 8/31/2017i | $ | 6.73 | $ | (0.03 | ) | $ | 0.96 | $ | 0.93 | $ | — | $ | (0.05 | ) | $ | (0.05 | ) | $ | — | $ | 7.61 | 13.89 | % | $ | 0.1 | 8.34 | % | 1.98 | % | (0.47 | )% | 16 | % | ||||||||||||||||||||||||||||||
| 8/31/2016i | $ | 6.43 | $ | (0.03 | ) | $ | 0.33 | $ | 0.30 | $ | (0.00 | ) | $ | (0.00 | ) | $ | (0.00 | ) | $ | — | $ | 6.73 | 4.66 | % | $ | 0.2 | 9.80 | % | 2.26 | % | (0.45 | )% | 41 | % | |||||||||||||||||||||||||||||
| 8/31/2015i | $ | 11.65 | $ | (0.05 | ) | $ | (0.40 | ) | $ | (0.45 | ) | $ | (0.66 | ) | $ | (4.11 | ) | $ | (4.77 | ) | $ | — | $ | 6.43 | (4.21 | )% | $ | 0.2 | 6.00 | % | 2.26 | % | (0.68 | )% | 18 | % | |||||||||||||||||||||||||||
Global Real Estate Fund | |||||||||||||||||||||||||||||||||||||||||||||||||||||||||||||||
Institutional Class | |||||||||||||||||||||||||||||||||||||||||||||||||||||||||||||||
8/31/2019 | $ | 10.85 | $ | 0.16 | $ | 1.31 | $ | 1.47 | $ | (0.26 | ) | $ | (0.12 | ) | $ | (0.38 | ) | $ | — | $ | 11.94 | 14.01 | % | $ | 3.4 | 9.11 | % | 1.01 | % | 1.46 | % | 38 | % | ||||||||||||||||||||||||||||||
8/31/2018 | $ | 10.64 | $ | 0.17 | $ | 0.35 | $ | 0.52 | $ | (0.21 | ) | $ | (0.10 | ) | $ | (0.31 | ) | $ | — | $ | 10.85 | 4.98 | % | $ | 2.3 | 11.12 | % | 1.01 | % | 1.62 | % | 48 | % | ||||||||||||||||||||||||||||||
8/31/2017 | $ | 10.62 | $ | 0.17 | $ | 0.22 | $ | 0.39 | $ | (0.33 | ) | $ | (0.04 | ) | $ | (0.37 | ) | $ | — | $ | 10.64 | 4.01 | % | $ | 2.2 | 10.97 | % | 1.01 | % | 1.67 | % | 61 | % | ||||||||||||||||||||||||||||||
8/31/2016 | $ | 9.32 | $ | 0.17 | $ | 1.35 | $ | 1.52 | $ | (0.22 | ) | $ | (0.00 | ) | $ | (0.22 | ) | $ | — | $ | 10.62 | 16.49 | % | $ | 2.1 | 10.93 | % | 1.00 | % | 1.68 | % | 44 | % | ||||||||||||||||||||||||||||||
| Period from 12/30/2014^ to 8/31/2015 | $ | 10.00 | $ | 0.08 | $ | (0.67 | ) | $ | (0.59 | ) | $ | (0.09 | ) | $ | — | $ | (0.09 | ) | $ | — | $ | 9.32 | (5.92 | )%* | $ | 1.9 | 13.21 | %**‡ | 1.00 | %**‡ | 1.22 | %**‡ | 16 | %* | |||||||||||||||||||||||||||||
Class A | |||||||||||||||||||||||||||||||||||||||||||||||||||||||||||||||
8/31/2019 | $ | 10.84 | $ | 0.12 | $ | 1.31 | $ | 1.43 | $ | (0.22 | ) | $ | (0.12 | ) | $ | (0.34 | ) | $ | — | $ | 11.93 | 13.65 | % | $ | 0.4 | 9.72 | % | 1.37 | % | 1.07 | % | 38 | % | ||||||||||||||||||||||||||||||
8/31/2018 | $ | 10.64 | $ | 0.13 | $ | 0.34 | $ | 0.47 | $ | (0.17 | ) | $ | (0.10 | ) | $ | (0.27 | ) | $ | — | $ | 10.84 | 4.47 | % | $ | 0.3 | 11.57 | % | 1.37 | % | 1.23 | % | 48 | % | ||||||||||||||||||||||||||||||
8/31/2017 | $ | 10.61 | $ | 0.14 | $ | 0.22 | $ | 0.36 | $ | (0.29 | ) | $ | (0.04 | ) | $ | (0.33 | ) | $ | — | $ | 10.64 | 3.71 | % | $ | 0.5 | 11.23 | % | 1.37 | % | 1.41 | % | 61 | % | ||||||||||||||||||||||||||||||
8/31/2016 | $ | 9.31 | $ | 0.13 | $ | 1.35 | $ | 1.48 | $ | (0.18 | ) | $ | (0.00 | ) | $ | (0.18 | ) | $ | — | $ | 10.61 | 16.09 | % | $ | 0.7 | 11.31 | % | 1.36 | % | 1.32 | % | 44 | % | ||||||||||||||||||||||||||||||
| Period from 12/30/2014^ to 8/31/2015 | $ | 10.00 | $ | 0.06 | $ | (0.67 | ) | $ | (0.61 | ) | $ | (0.08 | ) | $ | — | $ | (0.08 | ) | $ | — | $ | 9.31 | (6.19 | )%* | $ | 0.6 | 13.62 | %**‡ | 1.36 | %**‡ | 0.94 | %**‡ | 16 | %* | |||||||||||||||||||||||||||||
See Notes to Financial Highlights
221
222
Financial Highlights (cont'd)
| Net Asset Value, Beginning of Year | Net Investment Income (Loss)@ | Net Gains or Losses on Securities (both realized and unrealized) | Total From Investment Operations | Dividends from Net Investment Income | Distributions from Net Realized Capital Gains | Total Distributions | Voluntary Contribution from Management | Net Asset Value, End of Year | Total Returnab | Net Assets, End of Year (in millions) | Ratio of Gross Expenses to Average Net Assets# | Ratio of Net Expenses to Average Net Assets | Ratio of Net Investment Income/ (Loss) to Average Net Assets | Portfolio Turnover Rate | |||||||||||||||||||||||||||||||||||||||||||||||||
Global Real Estate Fund (cont'd) | |||||||||||||||||||||||||||||||||||||||||||||||||||||||||||||||
Class C | |||||||||||||||||||||||||||||||||||||||||||||||||||||||||||||||
8/31/2019 | $ | 10.81 | $ | 0.04 | $ | 1.30 | $ | 1.34 | $ | (0.14 | ) | $ | (0.12 | ) | $ | (0.26 | ) | $ | — | $ | 11.89 | 12.75 | % | $ | 0.3 | 10.43 | % | 2.12 | % | 0.32 | % | 38 | % | ||||||||||||||||||||||||||||||
8/31/2018 | $ | 10.62 | $ | 0.06 | $ | 0.34 | $ | 0.40 | $ | (0.11 | ) | $ | (0.10 | ) | $ | (0.21 | ) | $ | — | $ | 10.81 | 3.81 | % | $ | 0.3 | 12.21 | % | 2.12 | % | 0.53 | % | 48 | % | ||||||||||||||||||||||||||||||
8/31/2017 | $ | 10.59 | $ | 0.06 | $ | 0.23 | $ | 0.29 | $ | (0.22 | ) | $ | (0.04 | ) | $ | (0.26 | ) | $ | — | $ | 10.62 | 2.96 | % | $ | 0.3 | 12.10 | % | 2.12 | % | 0.56 | % | 61 | % | ||||||||||||||||||||||||||||||
8/31/2016 | $ | 9.30 | $ | 0.06 | $ | 1.34 | $ | 1.40 | $ | (0.11 | ) | $ | (0.00 | ) | $ | (0.11 | ) | $ | — | $ | 10.59 | 15.15 | % | $ | 0.3 | 12.04 | % | 2.11 | % | 0.56 | % | 44 | % | ||||||||||||||||||||||||||||||
| Period from 12/30/2014^ to 8/31/2015 | $ | 10.00 | $ | 0.01 | $ | (0.67 | ) | $ | (0.66 | ) | $ | (0.04 | ) | $ | — | $ | (0.04 | ) | $ | — | $ | 9.30 | (6.64 | )%* | $ | 0.2 | 15.16 | %**‡ | 2.11 | %**‡ | 0.11 | %**‡ | 16 | %* | |||||||||||||||||||||||||||||
Greater China Equity Fund | |||||||||||||||||||||||||||||||||||||||||||||||||||||||||||||||
Institutional Class | |||||||||||||||||||||||||||||||||||||||||||||||||||||||||||||||
8/31/2019 | $ | 14.80 | $ | 0.09 | $ | (0.96 | ) | $ | (0.87 | ) | $ | — | $ | (4.65 | ) | $ | (4.65 | ) | $ | — | $ | 9.28 | (1.03 | )% | $ | 45.2 | 1.84 | % | 1.52 | %^^ | 0.85 | % | 46 | % | |||||||||||||||||||||||||||||
8/31/2018 | $ | 15.85 | $ | 0.00 | $ | 0.77 | $ | 0.77 | $ | (0.18 | ) | $ | (1.64 | ) | $ | (1.82 | ) | $ | — | $ | 14.80 | 4.37 | % | $ | 79.0 | 1.58 | % | 1.51 | % | 0.03 | % | 60 | % | ||||||||||||||||||||||||||||||
8/31/2017 | $ | 11.50 | $ | 0.09 | $ | 4.31 | $ | 4.40 | $ | (0.05 | ) | $ | — | $ | (0.05 | ) | $ | — | $ | 15.85 | 38.46 | % | $ | 109.4 | 1.69 | % | 1.51 | %^^ | 0.72 | % | 116 | % | |||||||||||||||||||||||||||||||
8/31/2016 | $ | 11.64 | $ | 0.05 | $ | 1.32 | $ | 1.37 | $ | (0.10 | ) | $ | (1.41 | ) | $ | (1.51 | ) | $ | — | $ | 11.50 | 12.09 | % | $ | 93.3 | 1.76 | % | 1.51 | %^^ | 0.44 | % | 120 | % | ||||||||||||||||||||||||||||||
8/31/2015 | $ | 12.17 | $ | 0.10 | $ | 0.17 | $ | 0.27 | $ | (0.09 | ) | $ | (0.71 | ) | $ | (0.80 | ) | $ | — | $ | 11.64 | 2.15 | % | $ | 103.4 | 1.61 | % | 1.50 | %^^ | 0.75 | % | 176 | % | ||||||||||||||||||||||||||||||
Class A | |||||||||||||||||||||||||||||||||||||||||||||||||||||||||||||||
8/31/2019 | $ | 14.77 | $ | 0.06 | $ | (0.97 | ) | $ | (0.91 | ) | $ | — | $ | (4.65 | ) | $ | (4.65 | ) | $ | — | $ | 9.21 | (1.40 | )% | $ | 6.1 | 2.32 | % | 1.88 | %^^ | 0.54 | % | 46 | % | |||||||||||||||||||||||||||||
8/31/2018 | $ | 15.86 | $ | (0.08 | ) | $ | 0.80 | $ | 0.72 | $ | (0.17 | ) | $ | (1.64 | ) | $ | (1.81 | ) | $ | — | $ | 14.77 | 4.02 | % | $ | 10.2 | 2.01 | % | 1.87 | % | (0.47 | )% | 60 | % | |||||||||||||||||||||||||||||
8/31/2017 | $ | 11.50 | $ | 0.19 | $ | 4.17 | $ | 4.36 | $ | (0.00 | ) | $ | — | $ | (0.00 | ) | $ | — | $ | 15.86 | 37.95 | % | $ | 21.7 | 2.07 | % | 1.86 | %^^ | 1.38 | % | 116 | % | |||||||||||||||||||||||||||||||
8/31/2016 | $ | 11.56 | $ | (0.01 | ) | $ | 1.39 | $ | 1.38 | $ | (0.03 | ) | $ | (1.41 | ) | $ | (1.44 | ) | $ | — | $ | 11.50 | 12.19 | % | $ | 2.1 | 2.19 | % | 1.87 | %^^ | (0.08 | )% | 120 | % | |||||||||||||||||||||||||||||
8/31/2015 | $ | 12.14 | $ | 0.05 | $ | 0.17 | $ | 0.22 | $ | (0.09 | ) | $ | (0.71 | ) | $ | (0.80 | ) | $ | — | $ | 11.56 | 1.68 | % | $ | 4.0 | 2.00 | % | 1.86 | %^^ | 0.34 | % | 176 | % | ||||||||||||||||||||||||||||||
Class C | |||||||||||||||||||||||||||||||||||||||||||||||||||||||||||||||
8/31/2019 | $ | 14.31 | $ | (0.02 | ) | $ | (0.96 | ) | $ | (0.98 | ) | $ | — | $ | (4.65 | ) | $ | (4.65 | ) | $ | — | $ | 8.68 | (2.13 | )% | $ | 0.2 | 3.07 | % | 2.63 | %^^ | (0.19 | )% | 46 | % | ||||||||||||||||||||||||||||
8/31/2018 | $ | 15.43 | $ | (0.16 | ) | $ | 0.75 | $ | 0.59 | $ | (0.07 | ) | $ | (1.64 | ) | $ | (1.71 | ) | $ | — | $ | 14.31 | 3.26 | % | $ | 0.3 | 2.80 | % | 2.62 | % | (0.99 | )% | 60 | % | |||||||||||||||||||||||||||||
8/31/2017 | $ | 11.27 | $ | (0.14 | ) | $ | 4.30 | $ | 4.16 | $ | — | $ | — | $ | — | $ | — | $ | 15.43 | 36.91 | % | $ | 0.3 | 2.80 | % | 2.62 | %^^ | (1.18 | )% | 116 | % | ||||||||||||||||||||||||||||||||
8/31/2016 | $ | 11.45 | $ | (0.07 | ) | $ | 1.30 | $ | 1.23 | $ | — | $ | (1.41 | ) | $ | (1.41 | ) | $ | — | $ | 11.27 | 10.93 | % | $ | 0.1 | 2.86 | % | 2.62 | %^^ | (0.65 | )% | 120 | % | ||||||||||||||||||||||||||||||
8/31/2015 | $ | 12.03 | $ | (0.07 | ) | $ | 0.20 | $ | 0.13 | $ | — | $ | (0.71 | ) | $ | (0.71 | ) | $ | — | $ | 11.45 | 0.93 | % | $ | 0.2 | 2.80 | % | 2.61 | %^^ | (0.52 | )% | 176 | % | ||||||||||||||||||||||||||||||
See Notes to Financial Highlights
223
224
Financial Highlights (cont'd)
| Net Asset Value, Beginning of Year | Net Investment Income (Loss)@ | Net Gains or Losses on Securities (both realized and unrealized) | Total From Investment Operations | Dividends from Net Investment Income | Distributions from Net Realized Capital Gains | Total Distributions | Voluntary Contribution from Management | Net Asset Value, End of Year | Total Returnab | Net Assets, End of Year (in millions) | Ratio of Gross Expenses to Average Net Assets# | Ratio of Net Expenses to Average Net Assets | Ratio of Net Investment Income/ (Loss) to Average Net Assets | Portfolio Turnover Rate | |||||||||||||||||||||||||||||||||||||||||||||||||
Guardian Fund | |||||||||||||||||||||||||||||||||||||||||||||||||||||||||||||||
Investor Class | |||||||||||||||||||||||||||||||||||||||||||||||||||||||||||||||
8/31/2019 | $ | 19.52 | $ | 0.10 | $ | 0.32 | $ | 0.42 | $ | (0.11 | ) | $ | (1.53 | ) | $ | (1.64 | ) | $ | — | $ | 18.30 | 4.03 | % | $ | 1,125.5 | 0.89 | % | 0.89 | % | 0.56 | % | 37 | % | ||||||||||||||||||||||||||||||
8/31/2018 | $ | 17.12 | $ | 0.11 | $ | 3.49 | $ | 3.60 | $ | (0.11 | ) | $ | (1.09 | ) | $ | (1.20 | ) | $ | — | $ | 19.52 | 21.86 | % | $ | 1,187.2 | 0.88 | % | 0.88 | % | 0.62 | % | 41 | % | ||||||||||||||||||||||||||||||
8/31/2017 | $ | 16.45 | $ | 0.12 | $ | 2.51 | $ | 2.63 | $ | (0.11 | ) | $ | (1.85 | ) | $ | (1.96 | ) | $ | — | $ | 17.12 | 17.60 | %h | $ | 1,052.4 | 0.90 | % | 0.89 | %e | 0.77 | %e | 37 | % | ||||||||||||||||||||||||||||||
8/31/2016 | $ | 17.13 | $ | 0.09 | $ | 1.21 | $ | 1.30 | $ | (0.12 | ) | $ | (1.86 | ) | $ | (1.98 | ) | $ | — | $ | 16.45 | 8.45 | % | $ | 993.3 | 0.93 | % | 0.93 | % | 0.58 | % | 99 | % | ||||||||||||||||||||||||||||||
8/31/2015 | $ | 20.43 | $ | 0.12 | $ | (0.64 | ) | $ | (0.52 | ) | $ | (0.15 | ) | $ | (2.63 | ) | $ | (2.78 | ) | $ | — | $ | 17.13 | (3.03 | )% | $ | 1,034.9 | 0.87 | % | 0.87 | % | 0.65 | % | 31 | % | ||||||||||||||||||||||||||||
Trust Class | |||||||||||||||||||||||||||||||||||||||||||||||||||||||||||||||
8/31/2019 | $ | 19.51 | $ | 0.07 | $ | 0.31 | $ | 0.38 | $ | (0.08 | ) | $ | (1.53 | ) | $ | (1.61 | ) | $ | — | $ | 18.28 | 3.77 | % | $ | 45.5 | 1.06 | % | 1.06 | % | 0.38 | % | 37 | % | ||||||||||||||||||||||||||||||
| 8/31/2018g | $ | 17.82 | $ | 0.08 | $ | 3.57 | $ | 3.65 | $ | (0.13 | ) | $ | (1.83 | ) | $ | (1.96 | ) | $ | — | $ | 19.51 | 21.76 | % | $ | 56.6 | 1.06 | % | 1.06 | % | 0.44 | % | 41 | % | ||||||||||||||||||||||||||||||
| 8/31/2017g | $ | 18.34 | $ | 0.10 | $ | 2.64 | $ | 2.74 | $ | (0.16 | ) | $ | (3.10 | ) | $ | (3.26 | ) | $ | — | $ | 17.82 | 17.37 | %h | $ | 57.8 | 1.07 | % | 1.04 | %e | 0.60 | %e | 37 | % | ||||||||||||||||||||||||||||||
| 8/31/2016g | $ | 20.17 | $ | 0.07 | $ | 1.36 | $ | 1.43 | $ | (0.15 | ) | $ | (3.11 | ) | $ | (3.26 | ) | $ | — | $ | 18.34 | 8.31 | % | $ | 70.6 | 1.08 | % | 1.08 | % | 0.41 | % | 99 | % | ||||||||||||||||||||||||||||||
| 8/31/2015g | $ | 25.44 | $ | 0.10 | $ | (0.75 | ) | $ | (0.65 | ) | $ | (0.22 | ) | $ | (4.40 | ) | $ | (4.62 | ) | $ | — | $ | 20.17 | (3.22 | )% | $ | 103.8 | 1.06 | % | 1.06 | % | 0.46 | % | 31 | % | ||||||||||||||||||||||||||||
Advisor Class | |||||||||||||||||||||||||||||||||||||||||||||||||||||||||||||||
8/31/2019 | $ | 19.46 | $ | 0.01 | $ | 0.31 | $ | 0.32 | $ | (0.05 | ) | $ | (1.53 | ) | $ | (1.58 | ) | $ | — | $ | 18.20 | 3.41 | % | $ | 0.2 | 1.40 | % | 1.40 | % | 0.05 | % | 37 | % | ||||||||||||||||||||||||||||||
| 8/31/2018g | $ | 17.36 | $ | 0.02 | $ | 3.52 | $ | 3.54 | $ | (0.05 | ) | $ | (1.39 | ) | $ | (1.44 | ) | $ | — | $ | 19.46 | 21.34 | % | $ | 0.2 | 1.40 | % | 1.40 | % | 0.12 | % | 41 | % | ||||||||||||||||||||||||||||||
| 8/31/2017g | $ | 17.14 | $ | 0.09 | $ | 2.54 | $ | 2.63 | $ | (0.06 | ) | $ | (2.35 | ) | $ | (2.41 | ) | $ | — | $ | 17.36 | 17.26 | %h | $ | 0.1 | 1.38 | % | 1.18 | %e | 0.51 | %e | 37 | % | ||||||||||||||||||||||||||||||
| 8/31/2016g | $ | 18.24 | $ | 0.04 | $ | 1.25 | $ | 1.29 | $ | (0.02 | ) | $ | (2.37 | ) | $ | (2.39 | ) | $ | — | $ | 17.14 | 8.03 | % | $ | 0.2 | 1.31 | % | 1.31 | %§ | 0.20 | % | 99 | % | ||||||||||||||||||||||||||||||
| 8/31/2015g | $ | 22.33 | $ | 0.00 | $ | (0.68 | ) | $ | (0.68 | ) | $ | (0.06 | ) | $ | (3.35 | ) | $ | (3.41 | ) | $ | — | $ | 18.24 | (3.66 | )% | $ | 0.3 | 1.54 | % | 1.50 | % | 0.03 | % | 31 | % | ||||||||||||||||||||||||||||
Institutional Class | |||||||||||||||||||||||||||||||||||||||||||||||||||||||||||||||
8/31/2019 | $ | 19.55 | $ | 0.13 | $ | 0.32 | $ | 0.45 | $ | (0.15 | ) | $ | (1.53 | ) | $ | (1.68 | ) | $ | — | $ | 18.32 | 4.19 | % | $ | 83.9 | 0.71 | % | 0.71 | % | 0.74 | % | 37 | % | ||||||||||||||||||||||||||||||
| 8/31/2018g | $ | 17.13 | $ | 0.14 | $ | 3.51 | $ | 3.65 | $ | (0.14 | ) | $ | (1.09 | ) | $ | (1.23 | ) | $ | — | $ | 19.55 | 22.15 | % | $ | 82.5 | 0.71 | % | 0.71 | % | 0.80 | % | 41 | % | ||||||||||||||||||||||||||||||
| 8/31/2017g | $ | 16.47 | $ | 0.15 | $ | 2.50 | $ | 2.65 | $ | (0.14 | ) | $ | (1.85 | ) | $ | (1.99 | ) | $ | — | $ | 17.13 | 17.72 | %h | $ | 70.2 | 0.72 | % | 0.71 | %e | 0.94 | %e | 37 | % | ||||||||||||||||||||||||||||||
| 8/31/2016g | $ | 17.14 | $ | 0.12 | $ | 1.22 | $ | 1.34 | $ | (0.15 | ) | $ | (1.86 | ) | $ | (2.01 | ) | $ | — | $ | 16.47 | 8.68 | % | $ | 59.0 | 0.72 | % | 0.72 | % | 0.73 | % | 99 | % | ||||||||||||||||||||||||||||||
| 8/31/2015g | $ | 20.44 | $ | 0.16 | $ | (0.65 | ) | $ | (0.49 | ) | $ | (0.18 | ) | $ | (2.63 | ) | $ | (2.81 | ) | $ | — | $ | 17.14 | (2.84 | )% | $ | 94.1 | 0.71 | % | 0.71 | % | 0.82 | % | 31 | % | ||||||||||||||||||||||||||||
Class A | |||||||||||||||||||||||||||||||||||||||||||||||||||||||||||||||
8/31/2019 | $ | 19.50 | $ | 0.06 | $ | 0.33 | $ | 0.39 | $ | (0.08 | ) | $ | (1.53 | ) | $ | (1.61 | ) | $ | — | $ | 18.28 | 3.79 | % | $ | 4.1 | 1.09 | % | 1.09 | % | 0.34 | % | 37 | % | ||||||||||||||||||||||||||||||
| 8/31/2018g | $ | 17.85 | $ | 0.07 | $ | 3.57 | $ | 3.64 | $ | (0.13 | ) | $ | (1.86 | ) | $ | (1.99 | ) | $ | — | $ | 19.50 | 21.67 | % | $ | 5.5 | 1.09 | % | 1.09 | % | 0.41 | % | 41 | % | ||||||||||||||||||||||||||||||
| 8/31/2017g | $ | 18.43 | $ | 0.10 | $ | 2.64 | $ | 2.74 | $ | (0.17 | ) | $ | (3.15 | ) | $ | (3.32 | ) | $ | — | $ | 17.85 | 17.28 | %h | $ | 5.6 | 1.10 | % | 1.09 | %e | 0.56 | %e | 37 | % | ||||||||||||||||||||||||||||||
| 8/31/2016g | $ | 20.31 | $ | 0.05 | $ | 1.39 | $ | 1.44 | $ | (0.15 | ) | $ | (3.17 | ) | $ | (3.32 | ) | $ | — | $ | 18.43 | 8.32 | % | $ | 6.6 | 1.07 | % | 1.07 | % | 0.27 | % | 99 | % | ||||||||||||||||||||||||||||||
| 8/31/2015g | $ | 25.69 | $ | 0.11 | $ | (0.77 | ) | $ | (0.66 | ) | $ | (0.24 | ) | $ | (4.48 | ) | $ | (4.72 | ) | $ | — | $ | 20.31 | (3.23 | )% | $ | 79.3 | 1.07 | % | 1.07 | % | 0.46 | % | 31 | % | ||||||||||||||||||||||||||||
See Notes to Financial Highlights
225
226
Financial Highlights (cont'd)
| Net Asset Value, Beginning of Year | Net Investment Income (Loss)@ | Net Gains or Losses on Securities (both realized and unrealized) | Total From Investment Operations | Dividends from Net Investment Income | Distributions from Net Realized Capital Gains | Total Distributions | Voluntary Contribution from Management | Net Asset Value, End of Year | Total Returnab | Net Assets, End of Year (in millions) | Ratio of Gross Expenses to Average Net Assets# | Ratio of Net Expenses to Average Net Assets | Ratio of Net Investment Income/ (Loss) to Average Net Assets | Portfolio Turnover Rate | |||||||||||||||||||||||||||||||||||||||||||||||||
Guardian Fund (cont'd) | |||||||||||||||||||||||||||||||||||||||||||||||||||||||||||||||
Class C | |||||||||||||||||||||||||||||||||||||||||||||||||||||||||||||||
8/31/2019 | $ | 19.40 | $ | (0.06 | ) | $ | 0.31 | $ | 0.25 | $ | (0.02 | ) | $ | (1.53 | ) | $ | (1.55 | ) | $ | — | $ | 18.10 | 3.00 | % | $ | 1.8 | 1.84 | % | 1.84 | % | (0.38 | )% | 37 | % | |||||||||||||||||||||||||||||
| 8/31/2018g | $ | 17.42 | $ | (0.06 | ) | $ | 3.51 | $ | 3.45 | $ | (0.01 | ) | $ | (1.46 | ) | $ | (1.47 | ) | $ | — | $ | 19.40 | 20.74 | % | $ | 1.8 | 1.83 | % | 1.83 | % | (0.32 | )% | 41 | % | |||||||||||||||||||||||||||||
| 8/31/2017g | $ | 17.38 | $ | (0.03 | ) | $ | 2.58 | $ | 2.55 | $ | (0.04 | ) | $ | (2.47 | ) | $ | (2.51 | ) | $ | — | $ | 17.42 | 16.53 | %h | $ | 1.6 | 1.84 | % | 1.84 | %e | (0.20 | )%e | 37 | % | |||||||||||||||||||||||||||||
| 8/31/2016g | $ | 18.64 | $ | (0.05 | ) | $ | 1.27 | $ | 1.22 | $ | — | $ | (2.48 | ) | $ | (2.48 | ) | $ | — | $ | 17.38 | 7.47 | % | $ | 2.4 | 1.85 | % | 1.85 | % | (0.34 | )% | 99 | % | ||||||||||||||||||||||||||||||
| 8/31/2015g | $ | 22.92 | $ | (0.06 | ) | $ | (0.71 | ) | $ | (0.77 | ) | $ | — | $ | (3.51 | ) | $ | (3.51 | ) | $ | — | $ | 18.64 | (4.01 | )% | $ | 2.4 | 1.83 | % | 1.83 | % | (0.30 | )% | 31 | % | ||||||||||||||||||||||||||||
Class R3 | |||||||||||||||||||||||||||||||||||||||||||||||||||||||||||||||
8/31/2019 | $ | 19.46 | $ | 0.01 | $ | 0.33 | $ | 0.34 | $ | (0.05 | ) | $ | (1.53 | ) | $ | (1.58 | ) | $ | — | $ | 18.22 | 3.51 | % | $ | 0.1 | 1.40 | % | 1.36 | % | 0.06 | % | 37 | % | ||||||||||||||||||||||||||||||
| 8/31/2018g | $ | 17.37 | $ | 0.02 | $ | 3.52 | $ | 3.54 | $ | (0.05 | ) | $ | (1.40 | ) | $ | (1.45 | ) | $ | — | $ | 19.46 | 21.33 | % | $ | 0.4 | 1.37 | % | 1.36 | % | 0.13 | % | 41 | % | ||||||||||||||||||||||||||||||
| 8/31/2017g | $ | 17.20 | $ | 0.05 | $ | 2.55 | $ | 2.60 | $ | (0.06 | ) | $ | (2.37 | ) | $ | (2.43 | ) | $ | — | $ | 17.37 | 17.02 | %h | $ | 0.5 | 1.38 | % | 1.36 | %e | 0.28 | %e | 37 | % | ||||||||||||||||||||||||||||||
| 8/31/2016g | $ | 18.34 | $ | 0.03 | $ | 1.27 | $ | 1.30 | $ | (0.05 | ) | $ | (2.39 | ) | $ | (2.44 | ) | $ | — | $ | 17.20 | 8.00 | % | $ | 0.6 | 1.39 | % | 1.36 | % | 0.15 | % | 99 | % | ||||||||||||||||||||||||||||||
| 8/31/2015g | $ | 22.48 | $ | 0.02 | $ | (0.69 | ) | $ | (0.67 | ) | $ | (0.10 | ) | $ | (3.37 | ) | $ | (3.47 | ) | $ | — | $ | 18.34 | (3.53 | )% | $ | 0.5 | 1.37 | % | 1.36 | % | 0.15 | % | 31 | % | ||||||||||||||||||||||||||||
Class R6 | |||||||||||||||||||||||||||||||||||||||||||||||||||||||||||||||
| Period from 3/29/2019^ to 8/31/2019 | $ | 16.73 | $ | 0.06 | $ | 1.53 | $ | 1.59 | $ | — | $ | — | $ | — | $ | — | $ | 18.32 | 9.50 | %* | $ | 0.0 | 0.97 | %** | 0.65 | %** | 0.75 | %** | 37 | %c | |||||||||||||||||||||||||||||||||
International Equity Fund | |||||||||||||||||||||||||||||||||||||||||||||||||||||||||||||||
Investor Class | |||||||||||||||||||||||||||||||||||||||||||||||||||||||||||||||
8/31/2019 | $ | 13.16 | $ | 0.11 | $ | (0.68 | ) | $ | (0.57 | ) | $ | (0.09 | ) | $ | (0.03 | ) | $ | (0.12 | ) | $ | — | $ | 12.47 | (4.23 | )% | $ | 93.3 | 1.22 | % | 1.13 | % | 0.87 | % | 34 | % | ||||||||||||||||||||||||||||
| 8/31/2018g | $ | 12.58 | $ | 0.10 | $ | 0.51 | $ | 0.61 | $ | (0.03 | ) | $ | — | $ | (0.03 | ) | $ | — | $ | 13.16 | 4.88 | % | $ | 106.7 | 1.20 | % | 1.14 | % | 0.74 | % | 32 | % | |||||||||||||||||||||||||||||||
| 8/31/2017g | $ | 10.90 | $ | 0.15 | $ | 1.58 | $ | 1.73 | $ | (0.05 | ) | $ | — | $ | (0.05 | ) | $ | — | $ | 12.58 | 15.97 | %h | $ | 110.4 | 1.23 | % | 0.73 | %e | 1.34 | %e | 27 | % | |||||||||||||||||||||||||||||||
| 8/31/2016g | $ | 10.46 | $ | 0.13 | $ | 0.36 | $ | 0.49 | $ | (0.05 | ) | $ | — | $ | (0.05 | ) | $ | — | $ | 10.90 | 4.60 | % | $ | 104.0 | 1.26 | % | 1.08 | % | 1.20 | % | 30 | % | |||||||||||||||||||||||||||||||
| 8/31/2015g | $ | 10.95 | $ | 0.10 | $ | (0.51 | ) | $ | (0.41 | ) | $ | (0.08 | ) | $ | — | $ | (0.08 | ) | $ | — | $ | 10.46 | (3.71 | )% | $ | 117.7 | 1.25 | % | 1.02 | % | 0.93 | % | 25 | % | |||||||||||||||||||||||||||||
Trust Class | |||||||||||||||||||||||||||||||||||||||||||||||||||||||||||||||
8/31/2019 | $ | 13.16 | $ | 0.10 | $ | (0.69 | ) | $ | (0.59 | ) | $ | (0.08 | ) | $ | (0.03 | ) | $ | (0.11 | ) | $ | — | $ | 12.46 | (4.35 | )% | $ | 30.1 | 1.26 | % | 1.17 | % | 0.80 | % | 34 | % | ||||||||||||||||||||||||||||
| 8/31/2018g | $ | 12.57 | $ | 0.09 | $ | 0.52 | $ | 0.61 | $ | (0.02 | ) | $ | — | $ | (0.02 | ) | $ | — | $ | 13.16 | 4.84 | % | $ | 40.9 | 1.24 | % | 1.18 | % | 0.71 | % | 32 | % | |||||||||||||||||||||||||||||||
| 8/31/2017g | $ | 10.88 | $ | 0.15 | $ | 1.58 | $ | 1.73 | $ | (0.04 | ) | $ | — | $ | (0.04 | ) | $ | — | $ | 12.57 | 15.92 | %h | $ | 45.7 | 1.27 | % | 0.74 | %e | 1.29 | %e | 27 | % | |||||||||||||||||||||||||||||||
| 8/31/2016g | $ | 10.43 | $ | 0.12 | $ | 0.35 | $ | 0.47 | $ | (0.02 | ) | $ | — | $ | (0.02 | ) | $ | — | $ | 10.88 | 4.59 | % | $ | 48.4 | 1.30 | % | 1.12 | % | 1.15 | % | 30 | % | |||||||||||||||||||||||||||||||
| 8/31/2015g | $ | 10.88 | $ | 0.09 | $ | (0.50 | ) | $ | (0.41 | ) | $ | (0.04 | ) | $ | — | $ | (0.04 | ) | $ | — | $ | 10.43 | (3.82 | )% | $ | 55.3 | 1.36 | % | 1.13 | % | 0.81 | % | 25 | % | |||||||||||||||||||||||||||||
See Notes to Financial Highlights
227
228
Financial Highlights (cont'd)
| Net Asset Value, Beginning of Year | Net Investment Income (Loss)@ | Net Gains or Losses on Securities (both realized and unrealized) | Total From Investment Operations | Dividends from Net Investment Income | Distributions from Net Realized Capital Gains | Total Distributions | Voluntary Contribution from Management | Net Asset Value, End of Year | Total Returnab | Net Assets, End of Year (in millions) | Ratio of Gross Expenses to Average Net Assets# | Ratio of Net Expenses to Average Net Assets | Ratio of Net Investment Income/ (Loss) to Average Net Assets | Portfolio Turnover Rate | |||||||||||||||||||||||||||||||||||||||||||||||||
International Equity Fund (cont'd) | |||||||||||||||||||||||||||||||||||||||||||||||||||||||||||||||
Institutional Class | |||||||||||||||||||||||||||||||||||||||||||||||||||||||||||||||
8/31/2019 | $ | 13.18 | $ | 0.13 | $ | (0.67 | ) | $ | (0.54 | ) | $ | (0.13 | ) | $ | (0.03 | ) | $ | (0.16 | ) | $ | — | $ | 12.48 | (3.95 | )% | $ | 1,518.8 | 1.00 | % | 0.85 | % | 1.08 | % | 34 | % | ||||||||||||||||||||||||||||
8/31/2018 | $ | 12.66 | $ | 0.14 | $ | 0.51 | $ | 0.65 | $ | (0.13 | ) | $ | — | $ | (0.13 | ) | $ | — | $ | 13.18 | 5.12 | % | $ | 1,772.4 | 0.99 | % | 0.85 | % | 1.03 | % | 32 | % | |||||||||||||||||||||||||||||||
8/31/2017 | $ | 11.09 | $ | 0.14 | $ | 1.58 | $ | 1.72 | $ | (0.15 | ) | $ | — | $ | (0.15 | ) | $ | — | $ | 12.66 | 15.82 | %h | $ | 1,449.0 | 1.02 | % | 0.85 | %e§ | 1.19 | %e | 27 | % | |||||||||||||||||||||||||||||||
8/31/2016 | $ | 10.72 | $ | 0.16 | $ | 0.35 | $ | 0.51 | $ | (0.14 | ) | $ | — | $ | (0.14 | ) | $ | — | $ | 11.09 | 4.78 | % | $ | 1,184.3 | 1.03 | % | 0.85 | %§ | 1.46 | % | 30 | % | |||||||||||||||||||||||||||||||
8/31/2015 | $ | 11.32 | $ | 0.13 | $ | (0.53 | ) | $ | (0.40 | ) | $ | (0.20 | ) | $ | — | $ | (0.20 | ) | $ | — | $ | 10.72 | (3.51 | )% | $ | 886.5 | 1.07 | % | 0.85 | %§ | 1.11 | % | 25 | % | |||||||||||||||||||||||||||||
Class A | |||||||||||||||||||||||||||||||||||||||||||||||||||||||||||||||
8/31/2019 | $ | 13.15 | $ | 0.09 | $ | (0.67 | ) | $ | (0.58 | ) | $ | (0.08 | ) | $ | (0.03 | ) | $ | (0.11 | ) | $ | — | $ | 12.46 | (4.30 | )% | $ | 52.2 | 1.37 | % | 1.21 | % | 0.76 | % | 34 | % | ||||||||||||||||||||||||||||
| 8/31/2018g | $ | 12.56 | $ | 0.08 | $ | 0.52 | $ | 0.60 | $ | (0.01 | ) | $ | — | $ | (0.01 | ) | $ | — | $ | 13.15 | 4.77 | % | $ | 67.2 | 1.35 | % | 1.21 | % | 0.63 | % | 32 | % | |||||||||||||||||||||||||||||||
| 8/31/2017g | $ | 10.91 | $ | 0.07 | $ | 1.60 | $ | 1.67 | $ | (0.02 | ) | $ | — | $ | (0.02 | ) | $ | — | $ | 12.56 | 15.32 | % | $ | 71.9 | 1.39 | % | 1.21 | %§ | 0.65 | %e | 27 | % | |||||||||||||||||||||||||||||||
| 8/31/2016g | $ | 10.48 | $ | 0.11 | $ | 0.35 | $ | 0.46 | $ | (0.03 | ) | $ | — | $ | (0.03 | ) | $ | — | $ | 10.91 | 4.48 | % | $ | 104.9 | 1.40 | % | 1.21 | % | 1.05 | % | 30 | % | |||||||||||||||||||||||||||||||
| 8/31/2015g | $ | 10.96 | $ | 0.12 | $ | (0.55 | ) | $ | (0.43 | ) | $ | (0.05 | ) | $ | — | $ | (0.05 | ) | $ | — | $ | 10.48 | (3.90 | )% | $ | 91.0 | 1.43 | % | 1.21 | %§ | 1.09 | % | 25 | % | |||||||||||||||||||||||||||||
Class C | |||||||||||||||||||||||||||||||||||||||||||||||||||||||||||||||
8/31/2019 | $ | 13.09 | $ | (0.00 | ) | $ | (0.67 | ) | $ | (0.67 | ) | $ | (0.00 | ) | $ | (0.03 | ) | $ | (0.03 | ) | $ | — | $ | 12.39 | (5.05 | )% | $ | 9.6 | 2.12 | % | 1.96 | % | (0.02 | )% | 34 | % | |||||||||||||||||||||||||||
| 8/31/2018g | $ | 12.58 | $ | (0.01 | ) | $ | 0.52 | $ | 0.51 | $ | — | $ | — | $ | — | $ | — | $ | 13.09 | 4.05 | % | $ | 14.3 | 2.11 | % | 1.96 | % | (0.06 | )% | 32 | % | ||||||||||||||||||||||||||||||||
| 8/31/2017g | $ | 10.99 | $ | 0.00 | $ | 1.59 | $ | 1.59 | $ | — | $ | — | $ | — | $ | — | $ | 12.58 | 14.48 | % | $ | 13.2 | 2.14 | % | 1.96 | %§ | 0.04 | %e | 27 | % | |||||||||||||||||||||||||||||||||
| 8/31/2016g | $ | 10.60 | $ | 0.04 | $ | 0.35 | $ | 0.39 | $ | — | $ | — | $ | — | $ | — | $ | 10.99 | 3.70 | % | $ | 14.7 | 2.16 | % | 1.96 | % | 0.37 | % | 30 | % | |||||||||||||||||||||||||||||||||
| 8/31/2015g | $ | 11.12 | $ | 0.00 | $ | (0.51 | ) | $ | (0.51 | ) | $ | (0.01 | ) | $ | — | $ | (0.01 | ) | $ | — | $ | 10.60 | (4.61 | )% | $ | 11.2 | 2.18 | % | 1.96 | % | 0.02 | % | 25 | % | |||||||||||||||||||||||||||||
Class R6 | |||||||||||||||||||||||||||||||||||||||||||||||||||||||||||||||
8/31/2019 | $ | 13.20 | $ | 0.16 | $ | (0.70 | ) | $ | (0.54 | ) | $ | (0.14 | ) | $ | (0.03 | ) | $ | (0.17 | ) | $ | — | $ | 12.49 | (3.95 | )% | $ | 80.4 | 0.92 | % | 0.76 | % | 1.28 | % | 34 | % | ||||||||||||||||||||||||||||
| 8/31/2018g | $ | 12.67 | $ | 0.15 | $ | 0.52 | $ | 0.67 | $ | (0.14 | ) | $ | — | $ | (0.14 | ) | $ | — | $ | 13.20 | 5.26 | % | $ | 74.3 | 0.92 | % | 0.78 | % | 1.15 | % | 32 | % | |||||||||||||||||||||||||||||||
| 8/31/2017g | $ | 11.11 | $ | 0.15 | $ | 1.57 | $ | 1.72 | $ | (0.16 | ) | $ | — | $ | (0.16 | ) | $ | — | $ | 12.67 | 15.85 | % | $ | 134.6 | 0.94 | % | 0.77 | % | 1.31 | %e | 27 | % | |||||||||||||||||||||||||||||||
| 8/31/2016g | $ | 10.72 | $ | 0.16 | $ | 0.38 | $ | 0.54 | $ | (0.15 | ) | $ | — | $ | (0.15 | ) | $ | — | $ | 11.11 | 5.02 | % | $ | 46.7 | 0.96 | % | 0.78 | % | 1.49 | % | 30 | % | |||||||||||||||||||||||||||||||
| 8/31/2015g | $ | 11.32 | $ | 0.14 | $ | (0.53 | ) | $ | (0.39 | ) | $ | (0.21 | ) | $ | — | $ | (0.21 | ) | $ | — | $ | 10.72 | (3.49 | )% | $ | 32.7 | 0.99 | % | 0.77 | %§ | 1.24 | % | 25 | % | |||||||||||||||||||||||||||||
International Select Fund | |||||||||||||||||||||||||||||||||||||||||||||||||||||||||||||||
Trust Class | |||||||||||||||||||||||||||||||||||||||||||||||||||||||||||||||
8/31/2019 | $ | 12.97 | $ | 0.12 | $ | (0.61 | ) | $ | (0.49 | ) | $ | (0.05 | ) | $ | (0.13 | ) | $ | (0.18 | ) | $ | — | $ | 12.30 | (3.58 | )% | $ | 5.0 | 1.42 | % | 1.15 | % | 0.97 | % | 32 | % | ||||||||||||||||||||||||||||
8/31/2018 | $ | 12.43 | $ | 0.10 | $ | 0.54 | $ | 0.64 | $ | (0.10 | ) | $ | — | $ | (0.10 | ) | $ | — | $ | 12.97 | 5.17 | % | $ | 8.0 | 1.38 | % | 1.16 | % | 0.74 | % | 44 | % | |||||||||||||||||||||||||||||||
8/31/2017 | $ | 10.88 | $ | 0.10 | $ | 1.57 | $ | 1.67 | $ | (0.12 | ) | $ | — | $ | (0.12 | ) | $ | — | $ | 12.43 | 15.57 | % | $ | 8.2 | 1.34 | % | 1.18 | % | 0.90 | % | 27 | % | |||||||||||||||||||||||||||||||
8/31/2016 | $ | 10.59 | $ | 0.11 | $ | 0.27 | $ | 0.38 | $ | (0.09 | ) | $ | — | $ | (0.09 | ) | $ | — | $ | 10.88 | 3.65 | % | $ | 7.8 | 1.39 | % | 1.25 | % | 1.06 | % | 22 | % | |||||||||||||||||||||||||||||||
8/31/2015 | $ | 11.21 | $ | 0.09 | $ | (0.59 | ) | $ | (0.50 | ) | $ | (0.12 | ) | $ | — | $ | (0.12 | ) | $ | — | $ | 10.59 | (4.47 | )% | $ | 10.2 | 1.33 | % | 1.25 | % | 0.76 | % | 24 | % | |||||||||||||||||||||||||||||
See Notes to Financial Highlights
229
230
Financial Highlights (cont'd)
| Net Asset Value, Beginning of Year | Net Investment Income (Loss)@ | Net Gains or Losses on Securities (both realized and unrealized) | Total From Investment Operations | Dividends from Net Investment Income | Distributions from Net Realized Capital Gains | Total Distributions | Voluntary Contribution from Management | Net Asset Value, End of Year | Total Returnab | Net Assets, End of Year (in millions) | Ratio of Gross Expenses to Average Net Assets# | Ratio of Net Expenses to Average Net Assets | Ratio of Net Investment Income/ (Loss) to Average Net Assets | Portfolio Turnover Rate | |||||||||||||||||||||||||||||||||||||||||||||||||
International Select Fund (cont'd) | |||||||||||||||||||||||||||||||||||||||||||||||||||||||||||||||
Institutional Class | |||||||||||||||||||||||||||||||||||||||||||||||||||||||||||||||
8/31/2019 | $ | 12.96 | $ | 0.15 | $ | (0.60 | ) | $ | (0.45 | ) | $ | (0.10 | ) | $ | (0.13 | ) | $ | (0.23 | ) | $ | — | $ | 12.28 | (3.29 | )% | $ | 128.1 | 0.97 | % | 0.80 | % | 1.27 | % | 32 | % | ||||||||||||||||||||||||||||
8/31/2018 | $ | 12.42 | $ | 0.13 | $ | 0.55 | $ | 0.68 | $ | (0.14 | ) | $ | — | $ | (0.14 | ) | $ | — | $ | 12.96 | 5.52 | % | $ | 142.4 | 0.93 | % | 0.81 | % | 0.99 | % | 44 | % | |||||||||||||||||||||||||||||||
8/31/2017 | $ | 10.86 | $ | 0.14 | $ | 1.58 | $ | 1.72 | $ | (0.16 | ) | $ | — | $ | (0.16 | ) | $ | — | $ | 12.42 | 16.13 | % | $ | 214.4 | 0.90 | % | 0.83 | % | 1.27 | % | 27 | % | |||||||||||||||||||||||||||||||
8/31/2016 | $ | 10.58 | $ | 0.16 | $ | 0.25 | $ | 0.41 | $ | (0.13 | ) | $ | — | $ | (0.13 | ) | $ | — | $ | 10.86 | 3.94 | % | $ | 211.7 | 0.94 | % | 0.90 | % | 1.51 | % | 22 | % | |||||||||||||||||||||||||||||||
8/31/2015 | $ | 11.21 | $ | 0.13 | $ | (0.60 | ) | $ | (0.47 | ) | $ | (0.16 | ) | $ | — | $ | (0.16 | ) | $ | — | $ | 10.58 | (4.18 | )% | $ | 216.4 | 0.93 | % | 0.90 | % | 1.16 | % | 24 | % | |||||||||||||||||||||||||||||
Class A | |||||||||||||||||||||||||||||||||||||||||||||||||||||||||||||||
8/31/2019 | $ | 12.87 | $ | 0.10 | $ | (0.58 | ) | $ | (0.48 | ) | $ | (0.05 | ) | $ | (0.13 | ) | $ | (0.18 | ) | $ | — | $ | 12.21 | (3.58 | )% | $ | 3.2 | 1.35 | % | 1.16 | % | 0.85 | % | 32 | % | ||||||||||||||||||||||||||||
8/31/2018 | $ | 12.34 | $ | 0.08 | $ | 0.55 | $ | 0.63 | $ | (0.10 | ) | $ | — | $ | (0.10 | ) | $ | — | $ | 12.87 | 5.12 | % | $ | 3.9 | 1.31 | % | 1.17 | % | 0.63 | % | 44 | % | |||||||||||||||||||||||||||||||
8/31/2017 | $ | 10.80 | $ | 0.10 | $ | 1.56 | $ | 1.66 | $ | (0.12 | ) | $ | — | $ | (0.12 | ) | $ | — | $ | 12.34 | 15.60 | % | $ | 4.9 | 1.27 | % | 1.19 | % | 0.87 | % | 27 | % | |||||||||||||||||||||||||||||||
8/31/2016 | $ | 10.51 | $ | 0.13 | $ | 0.26 | $ | 0.39 | $ | (0.10 | ) | $ | — | $ | (0.10 | ) | $ | — | $ | 10.80 | 3.69 | % | $ | 4.6 | 1.33 | % | 1.24 | % | 1.25 | % | 22 | % | |||||||||||||||||||||||||||||||
8/31/2015 | $ | 11.14 | $ | 0.08 | $ | (0.59 | ) | $ | (0.51 | ) | $ | (0.12 | ) | $ | — | $ | (0.12 | ) | $ | — | $ | 10.51 | (4.62 | )% | $ | 3.8 | 1.31 | % | 1.24 | % | 0.71 | % | 24 | % | |||||||||||||||||||||||||||||
Class C | |||||||||||||||||||||||||||||||||||||||||||||||||||||||||||||||
8/31/2019 | $ | 12.68 | $ | 0.01 | $ | (0.57 | ) | $ | (0.56 | ) | $ | — | $ | (0.13 | ) | $ | (0.13 | ) | $ | — | $ | 11.99 | (4.32 | )% | $ | 1.5 | 2.09 | % | 1.91 | % | 0.10 | % | 32 | % | |||||||||||||||||||||||||||||
8/31/2018 | $ | 12.16 | $ | (0.00 | ) | $ | 0.53 | $ | 0.53 | $ | (0.01 | ) | $ | — | $ | (0.01 | ) | $ | — | $ | 12.68 | 4.37 | % | $ | 2.4 | 2.06 | % | 1.92 | % | (0.02 | )% | 44 | % | ||||||||||||||||||||||||||||||
8/31/2017 | $ | 10.64 | $ | 0.02 | $ | 1.54 | $ | 1.56 | $ | (0.04 | ) | $ | — | $ | (0.04 | ) | $ | — | $ | 12.16 | 14.70 | % | $ | 2.5 | 2.02 | % | 1.94 | % | 0.16 | % | 27 | % | |||||||||||||||||||||||||||||||
8/31/2016 | $ | 10.36 | $ | 0.04 | $ | 0.26 | $ | 0.30 | $ | (0.02 | ) | $ | — | $ | (0.02 | ) | $ | — | $ | 10.64 | 2.89 | % | $ | 3.2 | 2.06 | % | 2.00 | % | 0.39 | % | 22 | % | |||||||||||||||||||||||||||||||
8/31/2015 | $ | 10.97 | $ | 0.01 | $ | (0.58 | ) | $ | (0.57 | ) | $ | (0.04 | ) | $ | — | $ | (0.04 | ) | $ | — | $ | 10.36 | (5.23 | )% | $ | 3.7 | 2.04 | % | 2.00 | % | 0.06 | % | 24 | % | |||||||||||||||||||||||||||||
Class R3 | |||||||||||||||||||||||||||||||||||||||||||||||||||||||||||||||
8/31/2019 | $ | 12.75 | $ | 0.08 | $ | (0.58 | ) | $ | (0.50 | ) | $ | (0.02 | ) | $ | (0.13 | ) | $ | (0.15 | ) | $ | — | $ | 12.10 | (3.81 | )% | $ | 2.3 | 1.60 | % | 1.41 | % | 0.66 | % | 32 | % | ||||||||||||||||||||||||||||
8/31/2018 | $ | 12.22 | $ | 0.05 | $ | 0.55 | $ | 0.60 | $ | (0.07 | ) | $ | — | $ | (0.07 | ) | $ | — | $ | 12.75 | 4.92 | % | $ | 3.5 | 1.56 | % | 1.42 | % | 0.36 | % | 44 | % | |||||||||||||||||||||||||||||||
8/31/2017 | $ | 10.71 | $ | 0.08 | $ | 1.53 | $ | 1.61 | $ | (0.10 | ) | $ | — | $ | (0.10 | ) | $ | — | $ | 12.22 | 15.26 | % | $ | 5.0 | 1.52 | % | 1.44 | % | 0.70 | % | 27 | % | |||||||||||||||||||||||||||||||
8/31/2016 | $ | 10.43 | $ | 0.10 | $ | 0.25 | $ | 0.35 | $ | (0.07 | ) | $ | — | $ | (0.07 | ) | $ | — | $ | 10.71 | 3.33 | % | $ | 3.8 | 1.57 | % | 1.51 | % | 0.95 | % | 22 | % | |||||||||||||||||||||||||||||||
8/31/2015 | $ | 11.05 | $ | 0.06 | $ | (0.58 | ) | $ | (0.52 | ) | $ | (0.10 | ) | $ | — | $ | (0.10 | ) | $ | — | $ | 10.43 | (4.71 | )% | $ | 3.4 | 1.55 | % | 1.51 | % | 0.56 | % | 24 | % | |||||||||||||||||||||||||||||
Class R6 | |||||||||||||||||||||||||||||||||||||||||||||||||||||||||||||||
8/31/2019 | $ | 12.96 | $ | 0.23 | $ | (0.66 | ) | $ | (0.43 | ) | $ | (0.11 | ) | $ | (0.13 | ) | $ | (0.24 | ) | $ | — | $ | 12.29 | (3.11 | )% | $ | 29.6 | 0.87 | % | 0.71 | % | 1.88 | % | 32 | % | ||||||||||||||||||||||||||||
8/31/2018 | $ | 12.42 | $ | 0.15 | $ | 0.54 | $ | 0.69 | $ | (0.15 | ) | $ | — | $ | (0.15 | ) | $ | — | $ | 12.96 | 5.59 | % | $ | 9.4 | 0.87 | % | 0.74 | % | 1.15 | % | 44 | % | |||||||||||||||||||||||||||||||
| Period from 4/17/2017^ to 8/31/2017 | $ | 11.12 | $ | 0.08 | $ | 1.22 | $ | 1.30 | $ | — | $ | — | $ | — | $ | — | $ | 12.42 | 11.69 | %* | $ | 9.6 | 0.79 | %** | 0.73 | %** | 1.70 | %** | 27 | %c | |||||||||||||||||||||||||||||||||
See Notes to Financial Highlights
231
232
Financial Highlights (cont'd)
| Net Asset Value, Beginning of Year | Net Investment Income (Loss)@ | Net Gains or Losses on Securities (both realized and unrealized) | Total From Investment Operations | Dividends from Net Investment Income | Distributions from Net Realized Capital Gains | Total Distributions | Voluntary Contribution from Management | Net Asset Value, End of Year | Total Returnab | Net Assets, End of Year (in millions) | Ratio of Gross Expenses to Average Net Assets# | Ratio of Net Expenses to Average Net Assets | Ratio of Net Investment Income/ (Loss) to Average Net Assets | Portfolio Turnover Rate | |||||||||||||||||||||||||||||||||||||||||||||||||
International Small Cap Fund | |||||||||||||||||||||||||||||||||||||||||||||||||||||||||||||||
Institutional Class | |||||||||||||||||||||||||||||||||||||||||||||||||||||||||||||||
8/31/2019 | $ | 12.98 | $ | 0.11 | $ | (1.60 | ) | $ | (1.49 | ) | $ | (0.03 | ) | $ | (0.18 | ) | $ | (0.21 | ) | $ | — | $ | 11.28 | (11.26 | )% | $ | 5.3 | 6.24 | % | 1.05 | % | 1.00 | % | 32 | % | ||||||||||||||||||||||||||||
8/31/2018 | $ | 12.74 | $ | 0.11 | $ | 1.02 | $ | 1.13 | $ | (0.35 | ) | $ | (0.54 | ) | $ | (0.89 | ) | $ | — | $ | 12.98 | 9.06 | % | $ | 6.2 | 7.02 | % | 1.05 | % | 0.83 | % | 48 | % | ||||||||||||||||||||||||||||||
| Period from 12/8/2016^ to 8/31/2017 | $ | 10.00 | $ | 0.08 | $ | 2.66 | $ | 2.74 | $ | — | $ | — | $ | — | $ | — | $ | 12.74 | 27.40 | %* | $ | 0.8 | 29.10 | %‡** | 1.05 | %‡** | 0.93 | %‡** | 43 | %* | |||||||||||||||||||||||||||||||||
Class A | |||||||||||||||||||||||||||||||||||||||||||||||||||||||||||||||
8/31/2019 | $ | 12.93 | $ | 0.06 | $ | (1.57 | ) | $ | (1.51 | ) | $ | — | $ | (0.18 | ) | $ | (0.18 | ) | $ | — | $ | 11.24 | (11.49 | )% | $ | 0.1 | 6.77 | % | 1.41 | % | 0.54 | % | 32 | % | |||||||||||||||||||||||||||||
8/31/2018 | $ | 12.70 | $ | 0.02 | $ | 1.05 | $ | 1.07 | $ | (0.30 | ) | $ | (0.54 | ) | $ | (0.84 | ) | $ | — | $ | 12.93 | 8.60 | % | $ | 0.2 | 7.56 | % | 1.41 | % | 0.16 | % | 48 | % | ||||||||||||||||||||||||||||||
| Period from 12/8/2016^ to 8/31/2017 | $ | 10.00 | $ | 0.11 | $ | 2.59 | $ | 2.70 | $ | — | $ | — | $ | — | $ | — | $ | 12.70 | 27.00 | %* | $ | 0.3 | 29.48 | %‡** | 1.41 | %‡** | 1.21 | %‡** | 43 | %* | |||||||||||||||||||||||||||||||||
Class C | |||||||||||||||||||||||||||||||||||||||||||||||||||||||||||||||
8/31/2019 | $ | 12.83 | $ | (0.01 | ) | $ | (1.58 | ) | $ | (1.59 | ) | $ | — | $ | (0.18 | ) | $ | (0.18 | ) | $ | — | $ | 11.06 | (12.22 | )% | $ | 0.1 | 7.38 | % | 2.16 | % | (0.10 | )% | 32 | % | ||||||||||||||||||||||||||||
8/31/2018 | $ | 12.63 | $ | (0.07 | ) | $ | 1.05 | $ | 0.98 | $ | (0.24 | ) | $ | (0.54 | ) | $ | (0.78 | ) | $ | — | $ | 12.83 | 7.89 | % | $ | 0.2 | 8.15 | % | 2.16 | % | (0.53 | )% | 48 | % | |||||||||||||||||||||||||||||
| Period from 12/8/2016^ to 8/31/2017 | $ | 10.00 | $ | (0.02 | ) | $ | 2.65 | $ | 2.63 | $ | — | $ | — | $ | — | $ | — | $ | 12.63 | 26.30 | %* | $ | 0.1 | 30.21 | %‡** | 2.16 | %‡** | (0.19 | )%‡** | 43 | %* | ||||||||||||||||||||||||||||||||
Class R6 | |||||||||||||||||||||||||||||||||||||||||||||||||||||||||||||||
8/31/2019 | $ | 12.98 | $ | 0.12 | $ | (1.59 | ) | $ | (1.47 | ) | $ | (0.04 | ) | $ | (0.18 | ) | $ | (0.22 | ) | $ | — | $ | 11.29 | (11.13 | )% | $ | 0.2 | 6.16 | % | 0.96 | % | 1.09 | % | 32 | % | ||||||||||||||||||||||||||||
8/31/2018 | $ | 12.74 | $ | 0.08 | $ | 1.06 | $ | 1.14 | $ | (0.36 | ) | $ | (0.54 | ) | $ | (0.90 | ) | $ | — | $ | 12.98 | 9.12 | % | $ | 0.3 | 6.97 | % | 0.98 | % | 0.64 | % | 48 | % | ||||||||||||||||||||||||||||||
| Period from 12/8/2016^ to 8/31/2017 | $ | 10.00 | $ | 0.08 | $ | 2.66 | $ | 2.74 | $ | — | $ | — | $ | — | $ | — | $ | 12.74 | 27.40 | %* | $ | 0.3 | 29.02 | %‡** | 0.98 | %‡** | 0.99 | %‡** | 43 | %* | |||||||||||||||||||||||||||||||||
Intrinsic Value Fund | |||||||||||||||||||||||||||||||||||||||||||||||||||||||||||||||
Institutional Class | |||||||||||||||||||||||||||||||||||||||||||||||||||||||||||||||
8/31/2019 | $ | 18.54 | $ | (0.03 | ) | $ | (2.14 | ) | $ | (2.17 | ) | $ | — | $ | (1.87 | ) | $ | (1.87 | ) | $ | — | $ | 14.50 | (10.83 | )% | $ | 574.1 | 1.05 | % | 1.01 | % | (0.20 | )% | 22 | % | ||||||||||||||||||||||||||||
8/31/2018 | $ | 16.12 | $ | (0.06 | ) | $ | 3.33 | $ | 3.27 | $ | — | $ | (0.85 | ) | $ | (0.85 | ) | $ | — | $ | 18.54 | 21.01 | % | $ | 678.0 | 1.02 | % | 1.00 | % | (0.35 | )% | 25 | % | ||||||||||||||||||||||||||||||
8/31/2017 | $ | 14.02 | $ | (0.05 | ) | $ | 2.36 | $ | 2.31 | $ | — | $ | (0.21 | ) | $ | (0.21 | ) | $ | — | $ | 16.12 | 16.59 | % | $ | 841.9 | 1.03 | % | 1.00 | % | (0.35 | )% | 26 | % | ||||||||||||||||||||||||||||||
8/31/2016 | $ | 14.34 | $ | (0.05 | ) | $ | 0.43 | $ | 0.38 | $ | — | $ | (0.70 | ) | $ | (0.70 | ) | $ | — | $ | 14.02 | 2.96 | % | $ | 611.3 | 1.08 | % | 1.00 | % | (0.38 | )% | 17 | % | ||||||||||||||||||||||||||||||
8/31/2015 | $ | 14.98 | $ | (0.06 | ) | $ | 0.21 | $ | 0.15 | $ | — | $ | (0.79 | ) | $ | (0.79 | ) | $ | — | $ | 14.34 | 1.36 | % | $ | 420.3 | 1.10 | % | 1.00 | % | (0.41 | )% | 22 | % | ||||||||||||||||||||||||||||||
See Notes to Financial Highlights
233
234
Financial Highlights (cont'd)
| Net Asset Value, Beginning of Year | Net Investment Income (Loss)@ | Net Gains or Losses on Securities (both realized and unrealized) | Total From Investment Operations | Dividends from Net Investment Income | Distributions from Net Realized Capital Gains | Total Distributions | Voluntary Contribution from Management | Net Asset Value, End of Year | Total Returnab | Net Assets, End of Year (in millions) | Ratio of Gross Expenses to Average Net Assets# | Ratio of Net Expenses to Average Net Assets | Ratio of Net Investment Income/ (Loss) to Average Net Assets | Portfolio Turnover Rate | |||||||||||||||||||||||||||||||||||||||||||||||||
Intrinsic Value Fund (cont'd) | |||||||||||||||||||||||||||||||||||||||||||||||||||||||||||||||
Class A | |||||||||||||||||||||||||||||||||||||||||||||||||||||||||||||||
| 8/31/2019i | $ | 18.54 | $ | (0.09 | ) | $ | (2.14 | ) | $ | (2.23 | ) | $ | — | $ | (1.87 | ) | $ | (1.87 | ) | $ | — | $ | 14.44 | (11.18 | )% | $ | 19.7 | 1.44 | % | 1.37 | % | (0.56 | )% | 22 | % | ||||||||||||||||||||||||||||
| 8/31/2018i | $ | 16.20 | $ | (0.12 | ) | $ | 3.34 | $ | 3.22 | $ | — | $ | (0.88 | ) | $ | (0.88 | ) | $ | — | $ | 18.54 | 20.58 | % | $ | 20.0 | 1.41 | % | 1.36 | % | (0.73 | )% | 25 | % | ||||||||||||||||||||||||||||||
| 8/31/2017i | $ | 14.15 | $ | (0.11 | ) | $ | 2.38 | $ | 2.27 | $ | — | $ | (0.22 | ) | $ | (0.22 | ) | $ | — | $ | 16.20 | 16.20 | % | $ | 18.2 | 1.43 | % | 1.36 | % | (0.68 | )% | 26 | % | ||||||||||||||||||||||||||||||
| 8/31/2016i | $ | 14.54 | $ | (0.10 | ) | $ | 0.43 | $ | 0.33 | $ | — | $ | (0.72 | ) | $ | (0.72 | ) | $ | — | $ | 14.15 | 2.58 | % | $ | 44.5 | 1.48 | % | 1.36 | % | (0.72 | )% | 17 | % | ||||||||||||||||||||||||||||||
| 8/31/2015i | $ | 15.26 | $ | (0.11 | ) | $ | 0.21 | $ | 0.10 | $ | — | $ | (0.82 | ) | $ | (0.82 | ) | $ | — | $ | 14.54 | 0.96 | % | $ | 44.3 | 1.50 | % | 1.36 | % | (0.77 | )% | 22 | % | ||||||||||||||||||||||||||||||
Class C | |||||||||||||||||||||||||||||||||||||||||||||||||||||||||||||||
| 8/31/2019i | $ | 18.54 | $ | (0.20 | ) | $ | (2.13 | ) | $ | (2.33 | ) | $ | — | $ | (1.87 | ) | $ | (1.87 | ) | $ | — | $ | 14.34 | (11.78 | )% | $ | 16.8 | 2.16 | % | 2.12 | % | (1.30 | )% | 22 | % | ||||||||||||||||||||||||||||
| 8/31/2018i | $ | 16.39 | $ | (0.26 | ) | $ | 3.35 | $ | 3.09 | $ | — | $ | (0.94 | ) | $ | (0.94 | ) | $ | — | $ | 18.54 | 19.65 | % | $ | 24.5 | 2.13 | % | 2.11 | % | (1.47 | )% | 25 | % | ||||||||||||||||||||||||||||||
| 8/31/2017i | $ | 14.42 | $ | (0.22 | ) | $ | 2.42 | $ | 2.20 | $ | — | $ | (0.23 | ) | $ | (0.23 | ) | $ | — | $ | 16.39 | 15.36 | % | $ | 22.4 | 2.15 | % | 2.11 | % | (1.45 | )% | 26 | % | ||||||||||||||||||||||||||||||
| 8/31/2016i | $ | 14.97 | $ | (0.20 | ) | $ | 0.43 | $ | 0.23 | $ | — | $ | (0.78 | ) | $ | (0.78 | ) | $ | — | $ | 14.42 | 1.85 | % | $ | 25.2 | 2.20 | % | 2.11 | % | (1.47 | )% | 17 | % | ||||||||||||||||||||||||||||||
| 8/31/2015i | $ | 15.86 | $ | (0.23 | ) | $ | 0.22 | $ | (0.01 | ) | $ | — | $ | (0.88 | ) | $ | (0.88 | ) | $ | — | $ | 14.97 | 0.19 | % | $ | 25.8 | 2.22 | % | 2.11 | % | (1.52 | )% | 22 | % | |||||||||||||||||||||||||||||
Class R6 | |||||||||||||||||||||||||||||||||||||||||||||||||||||||||||||||
| Period from 1/18/2019^ to 8/31/2019 | $ | 14.22 | $ | (0.01 | ) | $ | 0.31 | $ | 0.30 | $ | — | $ | — | $ | — | $ | — | $ | 14.52 | 2.11 | %* | $ | 0.2 | 1.00 | %** | 0.91 | %** | (0.10 | )%** | 22 | %c | ||||||||||||||||||||||||||||||||
Large Cap Value Fund | |||||||||||||||||||||||||||||||||||||||||||||||||||||||||||||||
Investor Class | |||||||||||||||||||||||||||||||||||||||||||||||||||||||||||||||
8/31/2019 | $ | 32.87 | $ | 0.59 | $ | 1.03 | $ | 1.62 | $ | (0.53 | ) | $ | (3.38 | ) | $ | (3.91 | ) | $ | — | $ | 30.58 | 6.25 | % | $ | 1,174.3 | 0.86 | % | 0.86 | % | 1.93 | % | 109 | %k | ||||||||||||||||||||||||||||||
8/31/2018 | $ | 31.61 | $ | 0.46 | $ | 3.47 | $ | 3.93 | $ | (0.40 | ) | $ | (2.27 | ) | $ | (2.67 | ) | $ | — | $ | 32.87 | 12.90 | % | $ | 1,160.3 | 0.87 | % | 0.87 | % | 1.46 | % | 153 | % | ||||||||||||||||||||||||||||||
8/31/2017 | $ | 28.25 | $ | 0.40 | $ | 4.03 | $ | 4.43 | $ | (0.20 | ) | $ | (0.87 | ) | $ | (1.07 | ) | $ | — | $ | 31.61 | 15.88 | %h | $ | 1,148.5 | 0.87 | % | 0.86 | %e | 1.31 | %e | 74 | % | ||||||||||||||||||||||||||||||
8/31/2016 | $ | 27.46 | $ | 0.31 | $ | 2.85 | $ | 3.16 | $ | (0.31 | ) | $ | (2.06 | ) | $ | (2.37 | ) | $ | — | $ | 28.25 | 13.16 | % | $ | 1,069.8 | 0.90 | % | 0.90 | % | 1.20 | % | 126 | % | ||||||||||||||||||||||||||||||
8/31/2015 | $ | 33.92 | $ | 0.33 | $ | (2.51 | ) | $ | (2.18 | ) | $ | (0.29 | ) | $ | (3.99 | ) | $ | (4.28 | ) | $ | — | $ | 27.46 | (7.19 | )% | $ | 1,045.6 | 0.86 | % | 0.86 | % | 1.08 | % | 153 | % | ||||||||||||||||||||||||||||
Trust Class | |||||||||||||||||||||||||||||||||||||||||||||||||||||||||||||||
8/31/2019 | $ | 32.88 | $ | 0.54 | $ | 1.03 | $ | 1.57 | $ | (0.48 | ) | $ | (3.38 | ) | $ | (3.86 | ) | $ | — | $ | 30.59 | 6.04 | % | $ | 81.7 | 1.04 | % | 1.04 | % | 1.75 | % | 109 | %k | ||||||||||||||||||||||||||||||
| 8/31/2018f | $ | 31.63 | $ | 0.40 | $ | 3.47 | $ | 3.87 | $ | (0.35 | ) | $ | (2.27 | ) | $ | (2.62 | ) | $ | — | $ | 32.88 | 12.68 | % | $ | 68.4 | 1.05 | % | 1.05 | % | 1.26 | % | 153 | % | ||||||||||||||||||||||||||||||
| 8/31/2017f | $ | 28.84 | $ | 0.36 | $ | 4.10 | $ | 4.46 | $ | (0.30 | ) | $ | (1.37 | ) | $ | (1.67 | ) | $ | — | $ | 31.63 | 15.77 | %h | $ | 75.0 | 1.05 | % | 1.01 | %e | 1.16 | %e | 74 | % | ||||||||||||||||||||||||||||||
| 8/31/2016f | $ | 29.40 | $ | 0.28 | $ | 2.83 | $ | 3.11 | $ | (0.44 | ) | $ | (3.23 | ) | $ | (3.67 | ) | $ | — | $ | 28.84 | 12.97 | % | $ | 77.6 | 1.07 | % | 1.07 | % | 1.03 | % | 126 | % | ||||||||||||||||||||||||||||||
| 8/31/2015f | $ | 38.50 | $ | 0.30 | $ | (2.73 | ) | $ | (2.43 | ) | $ | (0.41 | ) | $ | (6.26 | ) | $ | (6.67 | ) | $ | — | $ | 29.40 | (7.40 | )% | $ | 108.2 | 1.05 | % | 1.05 | % | 0.88 | % | 153 | % | ||||||||||||||||||||||||||||
See Notes to Financial Highlights
235
236
Financial Highlights (cont'd)
| Net Asset Value, Beginning of Year | Net Investment Income (Loss)@ | Net Gains or Losses on Securities (both realized and unrealized) | Total From Investment Operations | Dividends from Net Investment Income | Distributions from Net Realized Capital Gains | Total Distributions | Voluntary Contribution from Management | Net Asset Value, End of Year | Total Returnab | Net Assets, End of Year (in millions) | Ratio of Gross Expenses to Average Net Assets# | Ratio of Net Expenses to Average Net Assets | Ratio of Net Investment Income/ (Loss) to Average Net Assets | Portfolio Turnover Rate | |||||||||||||||||||||||||||||||||||||||||||||||||
Large Cap Value Fund (cont'd) | |||||||||||||||||||||||||||||||||||||||||||||||||||||||||||||||
Advisor Class | |||||||||||||||||||||||||||||||||||||||||||||||||||||||||||||||
8/31/2019 | $ | 32.88 | $ | 0.49 | $ | 1.04 | $ | 1.53 | $ | (0.43 | ) | $ | (3.38 | ) | $ | (3.81 | ) | $ | — | $ | 30.60 | 5.90 | % | $ | 114.8 | 1.19 | % | 1.19 | % | 1.58 | % | 109 | %k | ||||||||||||||||||||||||||||||
| 8/31/2018f | $ | 31.62 | $ | 0.35 | $ | 3.49 | $ | 3.84 | $ | (0.31 | ) | $ | (2.27 | ) | $ | (2.58 | ) | $ | — | $ | 32.88 | 12.56 | % | $ | 125.2 | 1.20 | % | 1.20 | % | 1.11 | % | 153 | % | ||||||||||||||||||||||||||||||
| 8/31/2017f | $ | 29.45 | $ | 0.30 | $ | 4.15 | $ | 4.45 | $ | (0.41 | ) | $ | (1.87 | ) | $ | (2.28 | ) | $ | — | $ | 31.62 | 15.51 | %h | $ | 144.1 | 1.20 | % | 1.19 | %e | 0.98 | %e | 74 | % | ||||||||||||||||||||||||||||||
| 8/31/2016f | $ | 31.41 | $ | 0.24 | $ | 2.83 | $ | 3.07 | $ | (0.61 | ) | $ | (4.42 | ) | $ | (5.03 | ) | $ | — | $ | 29.45 | 12.81 | % | $ | 145.9 | 1.22 | % | 1.22 | % | 0.88 | % | 126 | % | ||||||||||||||||||||||||||||||
| 8/31/2015f | $ | 43.19 | $ | 0.26 | $ | (2.94 | ) | $ | (2.68 | ) | $ | (0.54 | ) | $ | (8.56 | ) | $ | (9.10 | ) | $ | — | $ | 31.41 | (7.55 | )% | $ | 162.3 | 1.20 | % | 1.20 | % | 0.73 | % | 153 | % | ||||||||||||||||||||||||||||
Institutional Class | |||||||||||||||||||||||||||||||||||||||||||||||||||||||||||||||
8/31/2019 | $ | 32.87 | $ | 0.66 | $ | 1.01 | $ | 1.67 | $ | (0.59 | ) | $ | (3.38 | ) | $ | (3.97 | ) | $ | — | $ | 30.57 | 6.41 | % | $ | 339.6 | 0.69 | % | 0.69 | % | 2.17 | % | 109 | %k | ||||||||||||||||||||||||||||||
| 8/31/2018f | $ | 31.60 | $ | 0.52 | $ | 3.47 | $ | 3.99 | $ | (0.45 | ) | $ | (2.27 | ) | $ | (2.72 | ) | $ | — | $ | 32.87 | 13.11 | % | $ | 98.5 | 0.70 | % | 0.70 | %§ | 1.64 | % | 153 | % | ||||||||||||||||||||||||||||||
| 8/31/2017f | $ | 28.25 | $ | 0.45 | $ | 4.02 | $ | 4.47 | $ | (0.26 | ) | $ | (0.86 | ) | $ | (1.12 | ) | $ | — | $ | 31.60 | 16.04 | %h | $ | 80.6 | 0.70 | % | 0.69 | %e§ | 1.50 | %e | 74 | % | ||||||||||||||||||||||||||||||
| 8/31/2016f | $ | 27.42 | $ | 0.35 | $ | 2.85 | $ | 3.20 | $ | (0.33 | ) | $ | (2.04 | ) | $ | (2.37 | ) | $ | — | $ | 28.25 | 13.38 | % | $ | 56.2 | 0.71 | % | 0.70 | % | 1.38 | % | 126 | % | ||||||||||||||||||||||||||||||
| 8/31/2015f | $ | 33.84 | $ | 0.37 | $ | (2.49 | ) | $ | (2.12 | ) | $ | (0.34 | ) | $ | (3.96 | ) | $ | (4.30 | ) | $ | — | $ | 27.42 | (7.03 | )% | $ | 86.4 | 0.70 | % | 0.70 | %§ | 1.19 | % | 153 | % | ||||||||||||||||||||||||||||
Class A | |||||||||||||||||||||||||||||||||||||||||||||||||||||||||||||||
8/31/2019 | $ | 32.88 | $ | 0.58 | $ | 0.97 | $ | 1.55 | $ | (0.46 | ) | $ | (3.38 | ) | $ | (3.84 | ) | $ | — | $ | 30.59 | 5.99 | % | $ | 52.5 | 1.08 | % | 1.08 | % | 1.89 | % | 109 | %k | ||||||||||||||||||||||||||||||
| 8/31/2018f | $ | 31.62 | $ | 0.39 | $ | 3.48 | $ | 3.87 | $ | (0.34 | ) | $ | (2.27 | ) | $ | (2.61 | ) | $ | — | $ | 32.88 | 12.68 | % | $ | 4.1 | 1.08 | % | 1.08 | % | 1.24 | % | 153 | % | ||||||||||||||||||||||||||||||
| 8/31/2017f | $ | 28.87 | $ | 0.34 | $ | 4.09 | $ | 4.43 | $ | (0.31 | ) | $ | (1.37 | ) | $ | (1.68 | ) | $ | — | $ | 31.62 | 15.65 | %h | $ | 3.8 | 1.07 | % | 1.07 | %e | 1.11 | %e | 74 | % | ||||||||||||||||||||||||||||||
| 8/31/2016f | $ | 29.47 | $ | 0.27 | $ | 2.83 | $ | 3.10 | $ | (0.46 | ) | $ | (3.24 | ) | $ | (3.70 | ) | $ | — | $ | 28.87 | 12.94 | % | $ | 3.2 | 1.09 | % | 1.09 | % | 1.02 | % | 126 | % | ||||||||||||||||||||||||||||||
| 8/31/2015f | $ | 38.61 | $ | 0.32 | $ | (2.77 | ) | $ | (2.45 | ) | $ | (0.42 | ) | $ | (6.27 | ) | $ | (6.69 | ) | $ | — | $ | 29.47 | (7.44 | )% | $ | 2.9 | 1.09 | % | 1.09 | % | 0.96 | % | 153 | % | ||||||||||||||||||||||||||||
Class C | |||||||||||||||||||||||||||||||||||||||||||||||||||||||||||||||
8/31/2019 | $ | 32.87 | $ | 0.33 | $ | 1.02 | $ | 1.35 | $ | (0.23 | ) | $ | (3.38 | ) | $ | (3.61 | ) | $ | — | $ | 30.61 | 5.24 | % | $ | 19.7 | 1.82 | % | 1.82 | % | 1.08 | % | 109 | %k | ||||||||||||||||||||||||||||||
| 8/31/2018f | $ | 31.67 | $ | 0.15 | $ | 3.48 | $ | 3.63 | $ | (0.16 | ) | $ | (2.27 | ) | $ | (2.43 | ) | $ | — | $ | 32.87 | 11.83 | % | $ | 1.9 | 1.82 | % | 1.82 | % | 0.48 | % | 153 | % | ||||||||||||||||||||||||||||||
| 8/31/2017f | $ | 29.66 | $ | 0.11 | $ | 4.18 | $ | 4.29 | $ | (0.29 | ) | $ | (1.99 | ) | $ | (2.28 | ) | $ | — | $ | 31.67 | 14.84 | %h | $ | 2.3 | 1.81 | % | 1.81 | %e | 0.36 | %e | 74 | % | ||||||||||||||||||||||||||||||
| 8/31/2016f | $ | 31.83 | $ | 0.07 | $ | 2.83 | $ | 2.90 | $ | (0.37 | ) | $ | (4.70 | ) | $ | (5.07 | ) | $ | — | $ | 29.66 | 12.09 | % | $ | 2.1 | 1.83 | % | 1.83 | % | 0.26 | % | 126 | % | ||||||||||||||||||||||||||||||
| 8/31/2015f | $ | 44.30 | $ | 0.04 | $ | (3.01 | ) | $ | (2.97 | ) | $ | (0.39 | ) | $ | (9.11 | ) | $ | (9.50 | ) | $ | — | $ | 31.83 | (8.11 | )% | $ | 2.7 | 1.82 | % | 1.82 | %§ | 0.11 | % | 153 | % | ||||||||||||||||||||||||||||
Class R3 | |||||||||||||||||||||||||||||||||||||||||||||||||||||||||||||||
8/31/2019 | $ | 32.89 | $ | 0.43 | $ | 1.06 | $ | 1.49 | $ | (0.38 | ) | $ | (3.38 | ) | $ | (3.76 | ) | $ | — | $ | 30.62 | 5.74 | % | $ | 0.7 | 1.37 | % | 1.37 | %§ | 1.42 | % | 109 | %k | ||||||||||||||||||||||||||||||
| 8/31/2018f | $ | 31.63 | $ | 0.32 | $ | 3.47 | $ | 3.79 | $ | (0.26 | ) | $ | (2.27 | ) | $ | (2.53 | ) | $ | — | $ | 32.89 | 12.39 | % | $ | 0.3 | 1.37 | % | 1.36 | % | 1.00 | % | 153 | % | ||||||||||||||||||||||||||||||
| 8/31/2017f | $ | 29.46 | $ | 0.28 | $ | 4.12 | $ | 4.40 | $ | (0.39 | ) | $ | (1.84 | ) | $ | (2.23 | ) | $ | — | $ | 31.63 | 15.27 | %h | $ | 0.2 | 1.43 | % | 1.36 | %e | 0.90 | %e | 74 | % | ||||||||||||||||||||||||||||||
| 8/31/2016f | $ | 31.34 | $ | 0.21 | $ | 2.81 | $ | 3.02 | $ | (0.55 | ) | $ | (4.35 | ) | $ | (4.90 | ) | $ | — | $ | 29.46 | 12.58 | % | $ | 0.1 | 1.54 | % | 1.36 | % | 0.75 | % | 126 | % | ||||||||||||||||||||||||||||||
| 8/31/2015f | $ | 42.97 | $ | 0.19 | $ | (2.92 | ) | $ | (2.73 | ) | $ | (0.46 | ) | $ | (8.44 | ) | $ | (8.90 | ) | $ | — | $ | 31.34 | (7.64 | )% | $ | 0.1 | 1.51 | % | 1.36 | % | 0.53 | % | 153 | % | ||||||||||||||||||||||||||||
See Notes to Financial Highlights
237
238
Financial Highlights (cont'd)
| Net Asset Value, Beginning of Year | Net Investment Income (Loss)@ | Net Gains or Losses on Securities (both realized and unrealized) | Total From Investment Operations | Dividends from Net Investment Income | Distributions from Net Realized Capital Gains | Total Distributions | Voluntary Contribution from Management | Net Asset Value, End of Year | Total Returnab | Net Assets, End of Year (in millions) | Ratio of Gross Expenses to Average Net Assets# | Ratio of Net Expenses to Average Net Assets | Ratio of Net Investment Income/ (Loss) to Average Net Assets | Portfolio Turnover Rate | |||||||||||||||||||||||||||||||||||||||||||||||||
Large Cap Value Fund (cont'd) | |||||||||||||||||||||||||||||||||||||||||||||||||||||||||||||||
Class R6 | |||||||||||||||||||||||||||||||||||||||||||||||||||||||||||||||
| Period from 1/18/2019^ to 8/31/2019 | $ | 28.19 | $ | 0.45 | $ | 1.95 | $ | 2.40 | $ | — | $ | — | $ | — | $ | — | $ | 30.59 | 8.51 | %* | $ | 0.3 | 0.67 | %** | 0.61 | %** | 2.39 | %** | 109 | %ck | |||||||||||||||||||||||||||||||||
Mid Cap Growth Fund | |||||||||||||||||||||||||||||||||||||||||||||||||||||||||||||||
Investor Class | |||||||||||||||||||||||||||||||||||||||||||||||||||||||||||||||
8/31/2019 | $ | 16.99 | $ | (0.05 | ) | $ | 0.47 | $ | 0.42 | $ | — | $ | (1.45 | ) | $ | (1.45 | ) | $ | — | $ | 15.96 | 4.84 | % | $ | 513.3 | 0.90 | % | 0.90 | % | (0.31 | )% | 48 | % | ||||||||||||||||||||||||||||||
| 8/31/2018f | $ | 14.61 | $ | (0.04 | ) | $ | 3.74 | $ | 3.70 | $ | — | $ | (1.32 | ) | $ | (1.32 | ) | $ | — | $ | 16.99 | 26.75 | % | $ | 528.1 | 0.90 | % | 0.90 | % | (0.25 | )% | 50 | % | ||||||||||||||||||||||||||||||
| 8/31/2017f | $ | 13.25 | $ | (0.04 | ) | $ | 2.04 | $ | 2.00 | $ | — | $ | (0.64 | ) | $ | (0.64 | ) | $ | — | $ | 14.61 | 15.80 | %h | $ | 445.9 | 0.93 | % | 0.91 | %e | (0.28 | )%e | 47 | % | ||||||||||||||||||||||||||||||
| 8/31/2016f | $ | 14.70 | $ | (0.04 | ) | $ | (0.27 | ) | $ | (0.31 | ) | $ | — | $ | (1.15 | ) | $ | (1.15 | ) | $ | 0.01 | $ | 13.25 | (1.70 | )%d | $ | 415.1 | 0.95 | % | 0.95 | % | (0.34 | )% | 63 | % | ||||||||||||||||||||||||||||
| 8/31/2015f | $ | 15.07 | $ | (0.07 | ) | $ | 1.51 | $ | 1.44 | $ | — | $ | (1.81 | ) | $ | (1.81 | ) | $ | — | $ | 14.70 | 10.74 | % | $ | 437.5 | 0.92 | % | 0.92 | % | (0.50 | )% | 50 | % | ||||||||||||||||||||||||||||||
Trust Class | |||||||||||||||||||||||||||||||||||||||||||||||||||||||||||||||
8/31/2019 | $ | 16.98 | $ | (0.06 | ) | $ | 0.47 | $ | 0.41 | $ | — | $ | (1.45 | ) | $ | (1.45 | ) | $ | — | $ | 15.94 | 4.78 | % | $ | 77.7 | 0.95 | % | 0.95 | % | (0.37 | )% | 48 | % | ||||||||||||||||||||||||||||||
| 8/31/2018f | $ | 14.62 | $ | (0.05 | ) | $ | 3.73 | $ | 3.68 | $ | — | $ | (1.32 | ) | $ | (1.32 | ) | $ | — | $ | 16.98 | 26.65 | % | $ | 77.6 | 0.95 | % | 0.95 | % | (0.30 | )% | 50 | % | ||||||||||||||||||||||||||||||
| 8/31/2017f | $ | 12.98 | $ | (0.04 | ) | $ | 2.04 | $ | 2.00 | $ | — | $ | (0.36 | ) | $ | (0.36 | ) | $ | — | $ | 14.62 | 15.75 | %h | $ | 52.0 | 0.97 | % | 0.97 | %e | (0.34 | )%e | 47 | % | ||||||||||||||||||||||||||||||
| 8/31/2016f | $ | 13.91 | $ | (0.05 | ) | $ | (0.25 | ) | $ | (0.30 | ) | $ | — | $ | (0.65 | ) | $ | (0.65 | ) | $ | 0.02 | $ | 12.98 | (1.77 | )%d | $ | 66.7 | 0.98 | % | 0.98 | % | (0.37 | )% | 63 | % | ||||||||||||||||||||||||||||
| 8/31/2015f | $ | 13.58 | $ | (0.08 | ) | $ | 1.43 | $ | 1.35 | $ | — | $ | (1.02 | ) | $ | (1.02 | ) | $ | — | $ | 13.91 | 10.73 | % | $ | 91.7 | 0.99 | % | 0.99 | % | (0.58 | )% | 50 | % | ||||||||||||||||||||||||||||||
Advisor Class | |||||||||||||||||||||||||||||||||||||||||||||||||||||||||||||||
8/31/2019 | $ | 16.94 | $ | (0.09 | ) | $ | 0.46 | $ | 0.37 | $ | — | $ | (1.45 | ) | $ | (1.45 | ) | $ | — | $ | 15.86 | 4.53 | % | $ | 12.0 | 1.21 | % | 1.21 | % | (0.62 | )% | 48 | % | ||||||||||||||||||||||||||||||
| 8/31/2018f | $ | 14.62 | $ | (0.09 | ) | $ | 3.73 | $ | 3.64 | $ | — | $ | (1.32 | ) | $ | (1.32 | ) | $ | — | $ | 16.94 | 26.32 | % | $ | 15.4 | 1.21 | % | 1.21 | % | (0.56 | )% | 50 | % | ||||||||||||||||||||||||||||||
| 8/31/2017f | $ | 13.01 | $ | (0.08 | ) | $ | 2.05 | $ | 1.97 | $ | — | $ | (0.36 | ) | $ | (0.36 | ) | $ | — | $ | 14.62 | 15.47 | %h | $ | 12.4 | 1.23 | % | 1.23 | %e | (0.60 | )%e | 47 | % | ||||||||||||||||||||||||||||||
| 8/31/2016f | $ | 13.97 | $ | (0.08 | ) | $ | (0.25 | ) | $ | (0.33 | ) | $ | — | $ | (0.64 | ) | $ | (0.64 | ) | $ | 0.01 | $ | 13.01 | (2.04 | )%d | $ | 11.5 | 1.24 | % | 1.24 | % | (0.63 | )% | 63 | % | ||||||||||||||||||||||||||||
| 8/31/2015f | $ | 13.66 | $ | (0.12 | ) | $ | 1.44 | $ | 1.32 | $ | — | $ | (1.01 | ) | $ | (1.01 | ) | $ | — | $ | 13.97 | 10.39 | % | $ | 10.7 | 1.25 | % | 1.25 | % | (0.84 | )% | 50 | % | ||||||||||||||||||||||||||||||
Institutional Class | |||||||||||||||||||||||||||||||||||||||||||||||||||||||||||||||
8/31/2019 | $ | 17.01 | $ | (0.02 | ) | $ | 0.48 | $ | 0.46 | $ | — | $ | (1.45 | ) | $ | (1.45 | ) | $ | — | $ | 16.02 | 5.09 | % | $ | 273.4 | 0.70 | % | 0.70 | % | (0.11 | )% | 48 | % | ||||||||||||||||||||||||||||||
8/31/2018 | $ | 14.61 | $ | (0.01 | ) | $ | 3.73 | $ | 3.72 | $ | — | $ | (1.32 | ) | $ | (1.32 | ) | $ | — | $ | 17.01 | 26.93 | % | $ | 353.7 | 0.70 | % | 0.70 | % | (0.05 | )% | 50 | % | ||||||||||||||||||||||||||||||
8/31/2017 | $ | 13.20 | $ | (0.01 | ) | $ | 2.04 | $ | 2.03 | $ | — | $ | (0.62 | ) | $ | (0.62 | ) | $ | — | $ | 14.61 | 16.03 | %h | $ | 321.5 | 0.72 | % | 0.72 | %e | (0.09 | )%e | 47 | % | ||||||||||||||||||||||||||||||
8/31/2016 | $ | 14.59 | $ | (0.02 | ) | $ | (0.27 | ) | $ | (0.29 | ) | $ | — | $ | (1.12 | ) | $ | (1.12 | ) | $ | 0.02 | $ | 13.20 | (1.52 | )%d | $ | 307.6 | 0.75 | % | 0.75 | %§ | (0.14 | )% | 63 | % | ||||||||||||||||||||||||||||
8/31/2015 | $ | 14.89 | $ | (0.05 | ) | $ | 1.51 | $ | 1.46 | $ | — | $ | (1.76 | ) | $ | (1.76 | ) | $ | — | $ | 14.59 | 10.98 | % | $ | 423.3 | 0.75 | % | 0.75 | %§ | (0.34 | )% | 50 | % | ||||||||||||||||||||||||||||||
See Notes to Financial Highlights
239
240
Financial Highlights (cont'd)
| Net Asset Value, Beginning of Year | Net Investment Income (Loss)@ | Net Gains or Losses on Securities (both realized and unrealized) | Total From Investment Operations | Dividends from Net Investment Income | Distributions from Net Realized Capital Gains | Total Distributions | Voluntary Contribution from Management | Net Asset Value, End of Year | Total Returnab | Net Assets, End of Year (in millions) | Ratio of Gross Expenses to Average Net Assets# | Ratio of Net Expenses to Average Net Assets | Ratio of Net Investment Income/ (Loss) to Average Net Assets | Portfolio Turnover Rate | |||||||||||||||||||||||||||||||||||||||||||||||||
Mid Cap Growth Fund (cont'd) | |||||||||||||||||||||||||||||||||||||||||||||||||||||||||||||||
Class A | |||||||||||||||||||||||||||||||||||||||||||||||||||||||||||||||
8/31/2019 | $ | 16.96 | $ | (0.07 | ) | $ | 0.46 | $ | 0.39 | $ | — | $ | (1.45 | ) | $ | (1.45 | ) | $ | — | $ | 15.90 | 4.65 | % | $ | 33.0 | 1.07 | % | 1.07 | % | (0.47 | )% | 48 | % | ||||||||||||||||||||||||||||||
| 8/31/2018f | $ | 14.62 | $ | (0.07 | ) | $ | 3.73 | $ | 3.66 | $ | — | $ | (1.32 | ) | $ | (1.32 | ) | $ | — | $ | 16.96 | 26.48 | % | $ | 52.1 | 1.07 | % | 1.07 | % | (0.42 | )% | 50 | % | ||||||||||||||||||||||||||||||
| 8/31/2017f | $ | 13.00 | $ | (0.06 | ) | $ | 2.04 | $ | 1.98 | $ | — | $ | (0.36 | ) | $ | (0.36 | ) | $ | — | $ | 14.62 | 15.58 | %h | $ | 54.4 | 1.11 | % | 1.11 | %e§ | (0.49 | )%e | 47 | % | ||||||||||||||||||||||||||||||
| 8/31/2016f | $ | 13.95 | $ | (0.06 | ) | $ | (0.25 | ) | $ | (0.31 | ) | $ | — | $ | (0.66 | ) | $ | (0.66 | ) | $ | 0.02 | $ | 13.00 | (1.91 | )%d | $ | 76.9 | 1.11 | % | 1.11 | %§ | (0.51 | )% | 63 | % | ||||||||||||||||||||||||||||
| 8/31/2015f | $ | 13.64 | $ | (0.09 | ) | $ | 1.43 | $ | 1.34 | $ | — | $ | (1.03 | ) | $ | (1.03 | ) | $ | — | $ | 13.95 | 10.55 | % | $ | 102.3 | 1.11 | % | 1.11 | %§ | (0.69 | )% | 50 | % | ||||||||||||||||||||||||||||||
Class C | |||||||||||||||||||||||||||||||||||||||||||||||||||||||||||||||
8/31/2019 | $ | 16.85 | $ | (0.18 | ) | $ | 0.45 | $ | 0.27 | $ | — | $ | (1.45 | ) | $ | (1.45 | ) | $ | — | $ | 15.67 | 3.91 | % | $ | 10.8 | 1.82 | % | 1.82 | % | (1.24 | )% | 48 | % | ||||||||||||||||||||||||||||||
| 8/31/2018f | $ | 14.64 | $ | (0.19 | ) | $ | 3.72 | $ | 3.53 | $ | — | $ | (1.32 | ) | $ | (1.32 | ) | $ | — | $ | 16.85 | 25.49 | % | $ | 11.6 | 1.85 | % | 1.85 | %§ | (1.20 | )% | 50 | % | ||||||||||||||||||||||||||||||
| 8/31/2017f | $ | 13.13 | $ | (0.17 | ) | $ | 2.05 | $ | 1.88 | $ | — | $ | (0.37 | ) | $ | (0.37 | ) | $ | — | $ | 14.64 | 14.69 | % | $ | 9.7 | 1.86 | % | 1.86 | %§ | (1.24 | )% | 47 | % | ||||||||||||||||||||||||||||||
| 8/31/2016f | $ | 14.20 | $ | (0.16 | ) | $ | (0.25 | ) | $ | (0.41 | ) | $ | — | $ | (0.67 | ) | $ | (0.67 | ) | $ | 0.01 | $ | 13.13 | (2.62 | )%d | $ | 10.9 | 1.88 | % | 1.86 | % | (1.24 | )% | 63 | % | ||||||||||||||||||||||||||||
| 8/31/2015f | $ | 13.99 | $ | (0.20 | ) | $ | 1.47 | $ | 1.27 | $ | — | $ | (1.06 | ) | $ | (1.06 | ) | $ | — | $ | 14.20 | 9.72 | % | $ | 8.4 | 1.88 | % | 1.86 | % | (1.45 | )% | 50 | % | ||||||||||||||||||||||||||||||
Class R3 | |||||||||||||||||||||||||||||||||||||||||||||||||||||||||||||||
8/31/2019 | $ | 16.92 | $ | (0.12 | ) | $ | 0.47 | $ | 0.35 | $ | — | $ | (1.45 | ) | $ | (1.45 | ) | $ | — | $ | 15.82 | 4.41 | % | $ | 56.4 | 1.33 | % | 1.33 | %§ | (0.79 | )% | 48 | % | ||||||||||||||||||||||||||||||
| 8/31/2018f | $ | 14.63 | $ | (0.11 | ) | $ | 3.72 | $ | 3.61 | $ | — | $ | (1.32 | ) | $ | (1.32 | ) | $ | — | $ | 16.92 | 26.11 | % | $ | 15.6 | 1.36 | % | 1.36 | %§ | (0.71 | )% | 50 | % | ||||||||||||||||||||||||||||||
| 8/31/2017f | $ | 13.04 | $ | (0.10 | ) | $ | 2.05 | $ | 1.95 | $ | — | $ | (0.36 | ) | $ | (0.36 | ) | $ | — | $ | 14.63 | 15.30 | % | $ | 13.2 | 1.36 | % | 1.36 | % | (0.73 | )% | 47 | % | ||||||||||||||||||||||||||||||
| 8/31/2016f | $ | 14.00 | $ | (0.09 | ) | $ | (0.24 | ) | $ | (0.33 | ) | $ | — | $ | (0.64 | ) | $ | (0.64 | ) | $ | 0.01 | $ | 13.04 | (2.12 | )%d | $ | 13.7 | 1.38 | % | 1.36 | % | (0.74 | )% | 63 | % | ||||||||||||||||||||||||||||
| 8/31/2015f | $ | 13.71 | $ | (0.13 | ) | $ | 1.44 | $ | 1.31 | $ | — | $ | (1.02 | ) | $ | (1.02 | ) | $ | — | $ | 14.00 | 10.29 | % | $ | 12.7 | 1.37 | % | 1.36 | % | (0.95 | )% | 50 | % | ||||||||||||||||||||||||||||||
Class R6 | |||||||||||||||||||||||||||||||||||||||||||||||||||||||||||||||
8/31/2019 | $ | 17.02 | $ | (0.00 | ) | $ | 0.48 | $ | 0.48 | $ | — | $ | (1.45 | ) | $ | (1.45 | ) | $ | — | $ | 16.05 | 5.20 | % | $ | 461.1 | 0.61 | % | 0.61 | % | (0.03 | )% | 48 | % | ||||||||||||||||||||||||||||||
| 8/31/2018f | $ | 14.61 | $ | 0.00 | $ | 3.73 | $ | 3.73 | $ | — | $ | (1.32 | ) | $ | (1.32 | ) | $ | — | $ | 17.02 | 26.99 | % | $ | 433.5 | 0.63 | % | 0.63 | % | 0.02 | % | 50 | % | |||||||||||||||||||||||||||||||
| 8/31/2017f | $ | 13.19 | $ | (0.00 | ) | $ | 2.04 | $ | 2.04 | $ | — | $ | (0.62 | ) | $ | (0.62 | ) | $ | — | $ | 14.61 | 16.13 | %h | $ | 262.4 | 0.65 | % | 0.65 | %e | (0.02 | )%e | 47 | % | ||||||||||||||||||||||||||||||
| 8/31/2016f | $ | 14.56 | $ | (0.00 | ) | $ | (0.26 | ) | $ | (0.26 | ) | $ | — | $ | (1.12 | ) | $ | (1.12 | ) | $ | 0.01 | $ | 13.19 | (1.44 | )%d | $ | 193.7 | 0.66 | % | 0.66 | % | (0.02 | )% | 63 | % | ||||||||||||||||||||||||||||
| 8/31/2015f | $ | 14.85 | $ | (0.04 | ) | $ | 1.50 | $ | 1.46 | $ | — | $ | (1.75 | ) | $ | (1.75 | ) | $ | — | $ | 14.56 | 11.04 | % | $ | 88.6 | 0.67 | % | 0.67 | %§ | (0.26 | )% | 50 | % | ||||||||||||||||||||||||||||||
Mid Cap Intrinsic Value Fund | |||||||||||||||||||||||||||||||||||||||||||||||||||||||||||||||
Investor Class | |||||||||||||||||||||||||||||||||||||||||||||||||||||||||||||||
| 8/31/2019i | $ | 24.16 | $ | 0.19 | $ | (3.39 | ) | $ | (3.20 | ) | $ | (0.13 | ) | $ | (1.51 | ) | $ | (1.64 | ) | $ | — | $ | 19.32 | (12.97 | )% | $ | 34.5 | 1.27 | % | 1.17 | % | 0.93 | % | 56 | % | ||||||||||||||||||||||||||||
| 8/31/2018i | $ | 23.02 | $ | 0.12 | $ | 2.57 | $ | 2.69 | $ | (0.11 | ) | $ | (1.44 | ) | $ | (1.55 | ) | $ | — | $ | 24.16 | 12.20 | % | $ | 40.2 | 1.21 | % | 1.17 | % | 0.49 | % | 36 | % | ||||||||||||||||||||||||||||||
| 8/31/2017i | $ | 19.75 | $ | 0.23 | $ | 3.16 | $ | 3.39 | $ | (0.12 | ) | $ | — | $ | (0.12 | ) | $ | — | $ | 23.02 | 17.19 | %h | $ | 40.3 | 1.25 | % | 1.01 | %e | 1.06 | %e | 31 | % | |||||||||||||||||||||||||||||||
| 8/31/2016i | $ | 21.03 | $ | 0.16 | $ | 0.79 | $ | 0.95 | $ | (0.10 | ) | $ | (2.13 | ) | $ | (2.23 | ) | $ | — | $ | 19.75 | 5.85 | % | $ | 37.9 | 1.30 | % | 1.15 | % | 0.86 | % | 29 | % | ||||||||||||||||||||||||||||||
| 8/31/2015i | $ | 23.60 | $ | 0.08 | $ | (0.36 | ) | $ | (0.28 | ) | $ | (0.21 | ) | $ | (2.08 | ) | $ | (2.29 | ) | $ | — | $ | 21.03 | (1.09 | )% | $ | 42.1 | 1.24 | % | 1.05 | % | 0.37 | % | 50 | % | ||||||||||||||||||||||||||||
See Notes to Financial Highlights
241
242
Financial Highlights (cont'd)
| Net Asset Value, Beginning of Year | Net Investment Income (Loss)@ | Net Gains or Losses on Securities (both realized and unrealized) | Total From Investment Operations | Dividends from Net Investment Income | Distributions from Net Realized Capital Gains | Total Distributions | Voluntary Contribution from Management | Net Asset Value, End of Year | Total Returnab | Net Assets, End of Year (in millions) | Ratio of Gross Expenses to Average Net Assets# | Ratio of Net Expenses to Average Net Assets | Ratio of Net Investment Income/ (Loss) to Average Net Assets | Portfolio Turnover Rate | |||||||||||||||||||||||||||||||||||||||||||||||||
Mid Cap Intrinsic Value Fund (cont'd) | |||||||||||||||||||||||||||||||||||||||||||||||||||||||||||||||
Trust Class | |||||||||||||||||||||||||||||||||||||||||||||||||||||||||||||||
| 8/31/2019i | $ | 24.16 | $ | 0.17 | $ | (3.38 | ) | $ | (3.21 | ) | $ | (0.12 | ) | $ | (1.51 | ) | $ | (1.63 | ) | $ | — | $ | 19.32 | (13.03 | )% | $ | 8.0 | 1.42 | % | 1.27 | % | 0.82 | % | 56 | % | ||||||||||||||||||||||||||||
| 8/31/2018i | $ | 23.35 | $ | 0.10 | $ | 2.61 | $ | 2.71 | $ | (0.12 | ) | $ | (1.78 | ) | $ | (1.90 | ) | $ | — | $ | 24.16 | 12.17 | % | $ | 10.2 | 1.37 | % | 1.25 | % | 0.42 | % | 36 | % | ||||||||||||||||||||||||||||||
| 8/31/2017i | $ | 20.10 | $ | 0.19 | $ | 3.19 | $ | 3.38 | $ | (0.13 | ) | $ | — | $ | (0.13 | ) | $ | — | $ | 23.35 | 16.85 | %h | $ | 10.9 | 1.43 | % | 1.25 | %e§ | 0.82 | %e | 31 | % | |||||||||||||||||||||||||||||||
| 8/31/2016i | $ | 21.92 | $ | 0.15 | $ | 0.79 | $ | 0.94 | $ | (0.12 | ) | $ | (2.64 | ) | $ | (2.76 | ) | $ | — | $ | 20.10 | 5.80 | % | $ | 10.3 | 1.48 | % | 1.25 | % | 0.77 | % | 29 | % | ||||||||||||||||||||||||||||||
| 8/31/2015i | $ | 25.06 | $ | 0.04 | $ | (0.40 | ) | $ | (0.36 | ) | $ | (0.21 | ) | $ | (2.57 | ) | $ | (2.78 | ) | $ | — | $ | 21.92 | (1.31 | )% | $ | 11.9 | 1.48 | % | 1.25 | % | 0.17 | % | 50 | % | ||||||||||||||||||||||||||||
Institutional Class | |||||||||||||||||||||||||||||||||||||||||||||||||||||||||||||||
8/31/2019 | $ | 24.17 | $ | 0.25 | $ | (3.40 | ) | $ | (3.15 | ) | $ | (0.20 | ) | $ | (1.51 | ) | $ | (1.71 | ) | $ | — | $ | 19.31 | (12.70 | )% | $ | 40.2 | 1.07 | % | 0.86 | % | 1.21 | % | 56 | % | ||||||||||||||||||||||||||||
8/31/2018 | $ | 23.00 | $ | 0.19 | $ | 2.59 | $ | 2.78 | $ | (0.17 | ) | $ | (1.44 | ) | $ | (1.61 | ) | $ | — | $ | 24.17 | 12.60 | % | $ | 52.5 | 1.02 | % | 0.85 | % | 0.81 | % | 36 | % | ||||||||||||||||||||||||||||||
8/31/2017 | $ | 19.75 | $ | 0.26 | $ | 3.16 | $ | 3.42 | $ | (0.17 | ) | $ | — | $ | (0.17 | ) | $ | — | $ | 23.00 | 17.40 | %h | $ | 29.1 | 1.05 | % | 0.85 | %e | 1.19 | %e | 31 | % | |||||||||||||||||||||||||||||||
8/31/2016 | $ | 21.02 | $ | 0.22 | $ | 0.79 | $ | 1.01 | $ | (0.15 | ) | $ | (2.13 | ) | $ | (2.28 | ) | $ | — | $ | 19.75 | 6.18 | % | $ | 22.7 | 1.09 | % | 0.85 | % | 1.18 | % | 29 | % | ||||||||||||||||||||||||||||||
8/31/2015 | $ | 23.59 | $ | 0.13 | $ | (0.37 | ) | $ | (0.24 | ) | $ | (0.25 | ) | $ | (2.08 | ) | $ | (2.33 | ) | $ | — | $ | 21.02 | (0.90 | )% | $ | 34.0 | 1.07 | % | 0.85 | % | 0.59 | % | 50 | % | ||||||||||||||||||||||||||||
Class A | |||||||||||||||||||||||||||||||||||||||||||||||||||||||||||||||
| 8/31/2019i | $ | 24.17 | $ | 0.19 | $ | (3.41 | ) | $ | (3.22 | ) | $ | (0.12 | ) | $ | (1.51 | ) | $ | (1.63 | ) | $ | — | $ | 19.32 | (13.03 | )% | $ | 6.2 | 1.40 | % | 1.22 | % | 0.91 | % | 56 | % | ||||||||||||||||||||||||||||
| 8/31/2018i | $ | 23.34 | $ | 0.11 | $ | 2.60 | $ | 2.71 | $ | (0.10 | ) | $ | (1.78 | ) | $ | (1.88 | ) | $ | — | $ | 24.17 | 12.23 | % | $ | 10.1 | 1.39 | % | 1.21 | % | 0.46 | % | 36 | % | ||||||||||||||||||||||||||||||
| 8/31/2017i | $ | 20.08 | $ | 0.20 | $ | 3.20 | $ | 3.40 | $ | (0.14 | ) | $ | — | $ | (0.14 | ) | $ | — | $ | 23.34 | 16.95 | %h | $ | 8.6 | 1.43 | % | 1.21 | %e | 0.89 | %e | 31 | % | |||||||||||||||||||||||||||||||
| 8/31/2016i | $ | 21.93 | $ | 0.16 | $ | 0.77 | $ | 0.93 | $ | (0.14 | ) | $ | (2.64 | ) | $ | (2.78 | ) | $ | — | $ | 20.08 | 5.76 | % | $ | 13.3 | 1.49 | % | 1.21 | % | 0.81 | % | 29 | % | ||||||||||||||||||||||||||||||
| 8/31/2015i | $ | 25.08 | $ | 0.05 | $ | (0.40 | ) | $ | (0.35 | ) | $ | (0.22 | ) | $ | (2.58 | ) | $ | (2.80 | ) | $ | — | $ | 21.93 | (1.25 | )% | $ | 14.8 | 1.47 | % | 1.21 | % | 0.20 | % | 50 | % | ||||||||||||||||||||||||||||
Class C | |||||||||||||||||||||||||||||||||||||||||||||||||||||||||||||||
| 8/31/2019i | $ | 24.18 | $ | 0.02 | $ | (3.39 | ) | $ | (3.37 | ) | $ | (0.01 | ) | $ | (1.51 | ) | $ | (1.52 | ) | $ | — | $ | 19.29 | (13.69 | )% | $ | 1.5 | 2.19 | % | 1.97 | % | 0.10 | % | 56 | % | ||||||||||||||||||||||||||||
| 8/31/2018i | $ | 23.47 | $ | (0.06 | ) | $ | 2.61 | $ | 2.55 | $ | (0.00 | ) | $ | (1.84 | ) | $ | (1.84 | ) | $ | — | $ | 24.18 | 11.37 | % | $ | 2.4 | 2.14 | % | 1.96 | % | (0.29 | )% | 36 | % | |||||||||||||||||||||||||||||
| 8/31/2017i | $ | 20.29 | $ | 0.04 | $ | 3.22 | $ | 3.26 | $ | (0.08 | ) | $ | — | $ | (0.08 | ) | $ | — | $ | 23.47 | 16.09 | %h | $ | 2.5 | 2.18 | % | 1.96 | %e | 0.15 | %e | 31 | % | |||||||||||||||||||||||||||||||
| 8/31/2016i | $ | 22.30 | $ | 0.01 | $ | 0.78 | $ | 0.79 | $ | (0.08 | ) | $ | (2.72 | ) | $ | (2.80 | ) | $ | — | $ | 20.29 | 5.01 | % | $ | 3.7 | 2.23 | % | 1.96 | % | 0.05 | % | 29 | % | ||||||||||||||||||||||||||||||
| 8/31/2015i | $ | 25.56 | $ | (0.12 | ) | $ | (0.40 | ) | $ | (0.52 | ) | $ | (0.08 | ) | $ | (2.66 | ) | $ | (2.74 | ) | $ | — | $ | 22.30 | (2.02 | )% | $ | 3.5 | 2.20 | % | 1.96 | % | (0.53 | )% | 50 | % | |||||||||||||||||||||||||||
Class R3 | |||||||||||||||||||||||||||||||||||||||||||||||||||||||||||||||
| 8/31/2019i | $ | 24.17 | $ | 0.13 | $ | (3.39 | ) | $ | (3.26 | ) | $ | (0.07 | ) | $ | (1.51 | ) | $ | (1.58 | ) | $ | — | $ | 19.33 | (13.21 | )% | $ | 1.9 | 1.70 | % | 1.48 | % | 0.61 | % | 56 | % | ||||||||||||||||||||||||||||
| 8/31/2018i | $ | 23.37 | $ | 0.05 | $ | 2.60 | $ | 2.65 | $ | (0.06 | ) | $ | (1.79 | ) | $ | (1.85 | ) | $ | — | $ | 24.17 | 11.92 | % | $ | 2.3 | 1.65 | % | 1.46 | % | 0.21 | % | 36 | % | ||||||||||||||||||||||||||||||
| 8/31/2017i | $ | 20.15 | $ | 0.13 | $ | 3.20 | $ | 3.33 | $ | (0.11 | ) | $ | — | $ | (0.11 | ) | $ | — | $ | 23.37 | 16.62 | % | $ | 1.5 | 1.69 | % | 1.46 | % | 0.63 | % | 31 | % | |||||||||||||||||||||||||||||||
| 8/31/2016i | $ | 22.03 | $ | 0.11 | $ | 0.77 | $ | 0.88 | $ | (0.11 | ) | $ | (2.65 | ) | $ | (2.76 | ) | $ | — | $ | 20.15 | 5.54 | % | $ | 1.4 | 1.75 | % | 1.46 | % | 0.56 | % | 29 | % | ||||||||||||||||||||||||||||||
| 8/31/2015i | $ | 25.17 | $ | 0.00 | $ | (0.40 | ) | $ | (0.40 | ) | $ | (0.15 | ) | $ | (2.59 | ) | $ | (2.74 | ) | $ | — | $ | 22.03 | (1.49 | )% | $ | 1.2 | 1.73 | % | 1.46 | % | 0.03 | % | 50 | % | ||||||||||||||||||||||||||||
See Notes to Financial Highlights
243
244
Financial Highlights (cont'd)
| Net Asset Value, Beginning of Year | Net Investment Income (Loss)@ | Net Gains or Losses on Securities (both realized and unrealized) | Total From Investment Operations | Dividends from Net Investment Income | Distributions from Net Realized Capital Gains | Total Distributions | Voluntary Contribution from Management | Net Asset Value, End of Year | Total Returnab | Net Assets, End of Year (in millions) | Ratio of Gross Expenses to Average Net Assets# | Ratio of Net Expenses to Average Net Assets | Ratio of Net Investment Income/ (Loss) to Average Net Assets | Portfolio Turnover Rate | |||||||||||||||||||||||||||||||||||||||||||||||||
Mid Cap Intrinsic Value Fund (cont'd) | |||||||||||||||||||||||||||||||||||||||||||||||||||||||||||||||
Class R6 | |||||||||||||||||||||||||||||||||||||||||||||||||||||||||||||||
| Period from 3/29/2019^ to 8/31/2019 | $ | 20.50 | $ | 0.10 | $ | (1.28 | ) | $ | (1.18 | ) | $ | — | $ | — | $ | — | $ | — | $ | 19.32 | (5.76 | )%* | $ | 0.0 | 1.44 | %** | 0.78 | %** | 1.14 | %** | 56 | %c | |||||||||||||||||||||||||||||||
Multi-Cap Opportunities Fund | |||||||||||||||||||||||||||||||||||||||||||||||||||||||||||||||
Institutional Class | |||||||||||||||||||||||||||||||||||||||||||||||||||||||||||||||
8/31/2019 | $ | 20.12 | $ | 0.14 | $ | 0.17 | $ | 0.31 | $ | (0.14 | ) | $ | (1.65 | ) | $ | (1.79 | ) | $ | — | $ | 18.64 | 2.91 | % | $ | 1,098.2 | 0.74 | % | 0.74 | % | 0.75 | % | 36 | % | ||||||||||||||||||||||||||||||
8/31/2018 | $ | 18.67 | $ | 0.12 | $ | 3.28 | $ | 3.40 | $ | (0.11 | ) | $ | (1.84 | ) | $ | (1.95 | ) | $ | — | $ | 20.12 | 19.15 | % | $ | 1,866.7 | 0.72 | % | 0.72 | % | 0.61 | % | 23 | % | ||||||||||||||||||||||||||||||
8/31/2017 | $ | 16.08 | $ | 0.12 | $ | 3.06 | $ | 3.18 | $ | (0.14 | ) | $ | (0.45 | ) | $ | (0.59 | ) | $ | — | $ | 18.67 | 20.27 | %h | $ | 1,828.2 | 0.75 | % | 0.75 | %e | 0.68 | %e | 23 | % | ||||||||||||||||||||||||||||||
8/31/2016 | $ | 15.31 | $ | 0.15 | $ | 1.18 | $ | 1.33 | $ | (0.15 | ) | $ | (0.41 | ) | $ | (0.56 | ) | $ | — | $ | 16.08 | 8.94 | % | $ | 1,757.2 | 0.76 | % | 0.76 | % | 0.99 | % | 18 | % | ||||||||||||||||||||||||||||||
8/31/2015 | $ | 16.27 | $ | 0.13 | $ | (0.43 | ) | $ | (0.30 | ) | $ | (0.15 | ) | $ | (0.51 | ) | $ | (0.66 | ) | $ | — | $ | 15.31 | (1.80 | )% | $ | 2,191.4 | 0.73 | % | 0.73 | % | 0.84 | % | 27 | % | ||||||||||||||||||||||||||||
Class A | |||||||||||||||||||||||||||||||||||||||||||||||||||||||||||||||
| 8/31/2019i | $ | 20.12 | $ | 0.07 | $ | 0.18 | $ | 0.25 | $ | (0.07 | ) | $ | (1.65 | ) | $ | (1.72 | ) | $ | — | $ | 18.65 | 2.54 | % | $ | 49.9 | 1.12 | % | 1.12 | % | 0.38 | % | 36 | % | ||||||||||||||||||||||||||||||
| 8/31/2018i | $ | 18.69 | $ | 0.05 | $ | 3.28 | $ | 3.33 | $ | (0.04 | ) | $ | (1.86 | ) | $ | (1.90 | ) | $ | — | $ | 20.12 | 18.72 | % | $ | 75.7 | 1.09 | % | 1.09 | % | 0.25 | % | 23 | % | ||||||||||||||||||||||||||||||
| 8/31/2017i | $ | 16.09 | $ | 0.06 | $ | 3.06 | $ | 3.12 | $ | (0.07 | ) | $ | (0.45 | ) | $ | (0.52 | ) | $ | — | $ | 18.69 | 19.85 | %h | $ | 53.5 | 1.10 | % | 1.10 | %e | 0.32 | %e | 23 | % | ||||||||||||||||||||||||||||||
| 8/31/2016i | $ | 15.31 | $ | 0.09 | $ | 1.18 | $ | 1.27 | $ | (0.08 | ) | $ | (0.41 | ) | $ | (0.49 | ) | $ | — | $ | 16.09 | 8.53 | % | $ | 73.0 | 1.11 | % | 1.11 | % | 0.62 | % | 18 | % | ||||||||||||||||||||||||||||||
| 8/31/2015i | $ | 16.27 | $ | 0.07 | $ | (0.43 | ) | $ | (0.36 | ) | $ | (0.08 | ) | $ | (0.52 | ) | $ | (0.60 | ) | $ | — | $ | 15.31 | (2.16 | )% | $ | 102.8 | 1.10 | % | 1.10 | % | 0.47 | % | 27 | % | ||||||||||||||||||||||||||||
Class C | |||||||||||||||||||||||||||||||||||||||||||||||||||||||||||||||
| 8/31/2019i | $ | 20.13 | $ | (0.06 | ) | $ | 0.17 | $ | 0.11 | $ | — | $ | (1.65 | ) | $ | (1.65 | ) | $ | — | $ | 18.59 | 1.78 | % | $ | 39.4 | 1.86 | % | 1.86 | % | (0.35 | )% | 36 | % | ||||||||||||||||||||||||||||||
| 8/31/2018i | $ | 18.87 | $ | (0.10 | ) | $ | 3.30 | $ | 3.20 | $ | — | $ | (1.94 | ) | $ | (1.94 | ) | $ | — | $ | 20.13 | 17.83 | % | $ | 44.7 | 1.83 | % | 1.83 | % | (0.49 | )% | 23 | % | ||||||||||||||||||||||||||||||
| 8/31/2017i | $ | 16.31 | $ | (0.07 | ) | $ | 3.11 | $ | 3.04 | $ | (0.00 | ) | $ | (0.48 | ) | $ | (0.48 | ) | $ | — | $ | 18.87 | 18.95 | %h | $ | 40.7 | 1.84 | % | 1.84 | %e | (0.40 | )%e | 23 | % | |||||||||||||||||||||||||||||
| 8/31/2016i | $ | 15.58 | $ | (0.02 | ) | $ | 1.19 | $ | 1.17 | $ | (0.01 | ) | $ | (0.43 | ) | $ | (0.44 | ) | $ | — | $ | 16.31 | 7.73 | % | $ | 39.6 | 1.85 | % | 1.85 | % | (0.11 | )% | 18 | % | |||||||||||||||||||||||||||||
| 8/31/2015i | $ | 16.62 | $ | (0.04 | ) | $ | (0.44 | ) | $ | (0.48 | ) | $ | (0.02 | ) | $ | (0.54 | ) | $ | (0.56 | ) | $ | — | $ | 15.58 | (2.84 | )% | $ | 46.1 | 1.84 | % | 1.84 | % | (0.27 | )% | 27 | % | |||||||||||||||||||||||||||
Real Estate Fund | |||||||||||||||||||||||||||||||||||||||||||||||||||||||||||||||
Trust Class | |||||||||||||||||||||||||||||||||||||||||||||||||||||||||||||||
8/31/2019 | $ | 13.34 | $ | 0.18 | $ | 2.45 | $ | 2.63 | $ | (0.18 | ) | $ | (0.66 | ) | $ | (0.84 | ) | $ | — | $ | 15.13 | 21.21 | % | $ | 130.3 | 1.43 | % | 1.04 | % | 1.32 | % | 38 | % | ||||||||||||||||||||||||||||||
8/31/2018 | $ | 13.52 | $ | 0.20 | $ | 0.45 | $ | 0.65 | $ | (0.19 | ) | $ | (0.64 | ) | $ | (0.83 | ) | $ | — | $ | 13.34 | 5.01 | % | $ | 133.7 | 1.42 | % | 1.04 | % | 1.58 | % | 47 | % | ||||||||||||||||||||||||||||||
8/31/2017 | $ | 15.12 | $ | 0.20 | $ | 0.07 | $ | 0.27 | $ | (0.19 | ) | $ | (1.68 | ) | $ | (1.87 | ) | $ | — | $ | 13.52 | 2.89 | % | $ | 156.6 | 1.42 | % | 1.04 | % | 1.46 | % | 45 | % | ||||||||||||||||||||||||||||||
8/31/2016 | $ | 13.60 | $ | 0.19 | $ | 2.60 | $ | 2.79 | $ | (0.20 | ) | $ | (1.07 | ) | $ | (1.27 | ) | $ | — | $ | 15.12 | 21.59 | % | $ | 212.4 | 1.41 | % | 1.04 | % | 1.34 | % | 49 | % | ||||||||||||||||||||||||||||||
8/31/2015 | $ | 14.70 | $ | 0.18 | $ | (0.37 | ) | $ | (0.19 | ) | $ | (0.18 | ) | $ | (0.73 | ) | $ | (0.91 | ) | $ | — | $ | 13.60 | (1.54 | )% | $ | 250.8 | 1.39 | % | 1.04 | % | 1.24 | % | 33 | % | ||||||||||||||||||||||||||||
See Notes to Financial Highlights
245
246
Financial Highlights (cont'd)
| Net Asset Value, Beginning of Year | Net Investment Income (Loss)@ | Net Gains or Losses on Securities (both realized and unrealized) | Total From Investment Operations | Dividends from Net Investment Income | Distributions from Net Realized Capital Gains | Total Distributions | Voluntary Contribution from Management | Net Asset Value, End of Year | Total Returnab | Net Assets, End of Year (in millions) | Ratio of Gross Expenses to Average Net Assets# | Ratio of Net Expenses to Average Net Assets | Ratio of Net Investment Income/ (Loss) to Average Net Assets | Portfolio Turnover Rate | |||||||||||||||||||||||||||||||||||||||||||||||||
Real Estate Fund (cont'd) | |||||||||||||||||||||||||||||||||||||||||||||||||||||||||||||||
Institutional Class | |||||||||||||||||||||||||||||||||||||||||||||||||||||||||||||||
8/31/2019 | $ | 13.39 | $ | 0.20 | $ | 2.46 | $ | 2.66 | $ | (0.20 | ) | $ | (0.66 | ) | $ | (0.86 | ) | $ | — | $ | 15.19 | 21.44 | % | $ | 213.6 | 1.06 | % | 0.85 | % | 1.49 | % | 38 | % | ||||||||||||||||||||||||||||||
8/31/2018 | $ | 13.56 | $ | 0.23 | $ | 0.46 | $ | 0.69 | $ | (0.22 | ) | $ | (0.64 | ) | $ | (0.86 | ) | $ | — | $ | 13.39 | 5.28 | % | $ | 177.7 | 1.06 | % | 0.85 | % | 1.81 | % | 47 | % | ||||||||||||||||||||||||||||||
8/31/2017 | $ | 15.17 | $ | 0.22 | $ | 0.06 | $ | 0.28 | $ | (0.21 | ) | $ | (1.68 | ) | $ | (1.89 | ) | $ | — | $ | 13.56 | 3.01 | % | $ | 191.3 | 1.05 | % | 0.85 | % | 1.64 | % | 45 | % | ||||||||||||||||||||||||||||||
8/31/2016 | $ | 13.64 | $ | 0.22 | $ | 2.61 | $ | 2.83 | $ | (0.23 | ) | $ | (1.07 | ) | $ | (1.30 | ) | $ | — | $ | 15.17 | 21.84 | % | $ | 259.1 | 1.05 | % | 0.85 | % | 1.53 | % | 49 | % | ||||||||||||||||||||||||||||||
8/31/2015 | $ | 14.74 | $ | 0.21 | $ | (0.37 | ) | $ | (0.16 | ) | $ | (0.21 | ) | $ | (0.73 | ) | $ | (0.94 | ) | $ | — | $ | 13.64 | (1.34 | )% | $ | 336.5 | 1.03 | % | 0.85 | % | 1.42 | % | 33 | % | ||||||||||||||||||||||||||||
Class A | |||||||||||||||||||||||||||||||||||||||||||||||||||||||||||||||
8/31/2019 | $ | 13.34 | $ | 0.15 | $ | 2.46 | $ | 2.61 | $ | (0.16 | ) | $ | (0.66 | ) | $ | (0.82 | ) | $ | — | $ | 15.13 | 21.01 | % | $ | 63.9 | 1.42 | % | 1.21 | % | 1.13 | % | 38 | % | ||||||||||||||||||||||||||||||
8/31/2018 | $ | 13.51 | $ | 0.17 | $ | 0.47 | $ | 0.64 | $ | (0.17 | ) | $ | (0.64 | ) | $ | (0.81 | ) | $ | — | $ | 13.34 | 4.90 | % | $ | 58.8 | 1.42 | % | 1.21 | % | 1.31 | % | 47 | % | ||||||||||||||||||||||||||||||
8/31/2017 | $ | 15.12 | $ | 0.18 | $ | 0.05 | $ | 0.23 | $ | (0.16 | ) | $ | (1.68 | ) | $ | (1.84 | ) | $ | — | $ | 13.51 | 2.63 | % | $ | 83.5 | 1.42 | % | 1.21 | % | 1.32 | % | 45 | % | ||||||||||||||||||||||||||||||
8/31/2016 | $ | 13.60 | $ | 0.17 | $ | 2.60 | $ | 2.77 | $ | (0.18 | ) | $ | (1.07 | ) | $ | (1.25 | ) | $ | — | $ | 15.12 | 21.37 | % | $ | 118.8 | 1.42 | % | 1.21 | % | 1.16 | % | 49 | % | ||||||||||||||||||||||||||||||
8/31/2015 | $ | 14.69 | $ | 0.15 | $ | (0.35 | ) | $ | (0.20 | ) | $ | (0.16 | ) | $ | (0.73 | ) | $ | (0.89 | ) | $ | — | $ | 13.60 | (1.65 | )% | $ | 137.0 | 1.41 | % | 1.21 | % | 1.04 | % | 33 | % | ||||||||||||||||||||||||||||
Class C | |||||||||||||||||||||||||||||||||||||||||||||||||||||||||||||||
8/31/2019 | $ | 13.36 | $ | 0.06 | $ | 2.45 | $ | 2.51 | $ | (0.05 | ) | $ | (0.66 | ) | $ | (0.71 | ) | $ | — | $ | 15.16 | 20.12 | % | $ | 10.5 | 2.18 | % | 1.96 | % | 0.43 | % | 38 | % | ||||||||||||||||||||||||||||||
8/31/2018 | $ | 13.52 | $ | 0.08 | $ | 0.47 | $ | 0.55 | $ | (0.07 | ) | $ | (0.64 | ) | $ | (0.71 | ) | $ | — | $ | 13.36 | 4.14 | % | $ | 13.5 | 2.18 | % | 1.96 | % | 0.59 | % | 47 | % | ||||||||||||||||||||||||||||||
8/31/2017 | $ | 15.12 | $ | 0.08 | $ | 0.05 | $ | 0.13 | $ | (0.05 | ) | $ | (1.68 | ) | $ | (1.73 | ) | $ | — | $ | 13.52 | 1.89 | % | $ | 18.9 | 2.17 | % | 1.96 | % | 0.57 | % | 45 | % | ||||||||||||||||||||||||||||||
8/31/2016 | $ | 13.60 | $ | 0.06 | $ | 2.60 | $ | 2.66 | $ | (0.07 | ) | $ | (1.07 | ) | $ | (1.14 | ) | $ | — | $ | 15.12 | 20.45 | % | $ | 29.3 | 2.17 | % | 1.96 | % | 0.39 | % | 49 | % | ||||||||||||||||||||||||||||||
8/31/2015 | $ | 14.68 | $ | 0.04 | $ | (0.35 | ) | $ | (0.31 | ) | $ | (0.04 | ) | $ | (0.73 | ) | $ | (0.77 | ) | $ | — | $ | 13.60 | (2.38 | )% | $ | 29.9 | 2.17 | % | 1.96 | % | 0.30 | % | 33 | % | ||||||||||||||||||||||||||||
Class R3 | |||||||||||||||||||||||||||||||||||||||||||||||||||||||||||||||
8/31/2019 | $ | 13.31 | $ | 0.12 | $ | 2.45 | $ | 2.57 | $ | (0.12 | ) | $ | (0.66 | ) | $ | (0.78 | ) | $ | — | $ | 15.10 | 20.76 | % | $ | 20.5 | 1.69 | % | 1.46 | % | 0.87 | % | 38 | % | ||||||||||||||||||||||||||||||
8/31/2018 | $ | 13.49 | $ | 0.16 | $ | 0.44 | $ | 0.60 | $ | (0.14 | ) | $ | (0.64 | ) | $ | (0.78 | ) | $ | — | $ | 13.31 | 4.58 | % | $ | 18.0 | 1.69 | % | 1.46 | % | 1.21 | % | 47 | % | ||||||||||||||||||||||||||||||
8/31/2017 | $ | 15.09 | $ | 0.13 | $ | 0.08 | $ | 0.21 | $ | (0.13 | ) | $ | (1.68 | ) | $ | (1.81 | ) | $ | — | $ | 13.49 | 2.45 | % | $ | 19.0 | 1.68 | % | 1.46 | % | 1.01 | % | 45 | % | ||||||||||||||||||||||||||||||
8/31/2016 | $ | 13.58 | $ | 0.12 | $ | 2.60 | $ | 2.72 | $ | (0.14 | ) | $ | (1.07 | ) | $ | (1.21 | ) | $ | — | $ | 15.09 | 21.03 | % | $ | 25.0 | 1.68 | % | 1.46 | % | 0.87 | % | 49 | % | ||||||||||||||||||||||||||||||
8/31/2015 | $ | 14.68 | $ | 0.12 | $ | (0.37 | ) | $ | (0.25 | ) | $ | (0.12 | ) | $ | (0.73 | ) | $ | (0.85 | ) | $ | — | $ | 13.58 | (1.94 | )% | $ | 22.4 | 1.66 | % | 1.46 | % | 0.81 | % | 33 | % | ||||||||||||||||||||||||||||
Class R6 | |||||||||||||||||||||||||||||||||||||||||||||||||||||||||||||||
8/31/2019 | $ | 13.39 | $ | 0.21 | $ | 2.47 | $ | 2.68 | $ | (0.22 | ) | $ | (0.66 | ) | $ | (0.88 | ) | $ | — | $ | 15.19 | 21.55 | % | $ | 74.0 | 0.97 | % | 0.76 | % | 1.55 | % | 38 | % | ||||||||||||||||||||||||||||||
8/31/2018 | $ | 13.56 | $ | 0.23 | $ | 0.47 | $ | 0.70 | $ | (0.23 | ) | $ | (0.64 | ) | $ | (0.87 | ) | $ | — | $ | 13.39 | 5.35 | % | $ | 56.6 | 0.99 | % | 0.78 | % | 1.82 | % | 47 | % | ||||||||||||||||||||||||||||||
8/31/2017 | $ | 15.16 | $ | 0.22 | $ | 0.08 | $ | 0.30 | $ | (0.22 | ) | $ | (1.68 | ) | $ | (1.90 | ) | $ | — | $ | 13.56 | 3.16 | % | $ | 45.2 | 0.98 | % | 0.78 | % | 1.62 | % | 45 | % | ||||||||||||||||||||||||||||||
8/31/2016 | $ | 13.64 | $ | 0.21 | $ | 2.62 | $ | 2.83 | $ | (0.24 | ) | $ | (1.07 | ) | $ | (1.31 | ) | $ | — | $ | 15.16 | 21.85 | % | $ | 45.0 | 0.98 | % | 0.78 | % | 1.48 | % | 49 | % | ||||||||||||||||||||||||||||||
8/31/2015 | $ | 14.74 | $ | 0.21 | $ | (0.36 | ) | $ | (0.15 | ) | $ | (0.22 | ) | $ | (0.73 | ) | $ | (0.95 | ) | $ | — | $ | 13.64 | (1.26 | )% | $ | 29.9 | 0.97 | % | 0.78 | % | 1.40 | % | 33 | % | ||||||||||||||||||||||||||||
See Notes to Financial Highlights
247
248
Financial Highlights (cont'd)
| Net Asset Value, Beginning of Year | Net Investment Income (Loss)@ | Net Gains or Losses on Securities (both realized and unrealized) | Total From Investment Operations | Dividends from Net Investment Income | Distributions from Net Realized Capital Gains | Total Distributions | Voluntary Contribution from Management | Net Asset Value, End of Year | Total Returnab | Net Assets, End of Year (in millions) | Ratio of Gross Expenses to Average Net Assets# | Ratio of Net Expenses to Average Net Assets | Ratio of Net Investment Income/ (Loss) to Average Net Assets | Portfolio Turnover Rate | |||||||||||||||||||||||||||||||||||||||||||||||||
Small Cap Growth Fund | |||||||||||||||||||||||||||||||||||||||||||||||||||||||||||||||
Investor Class | |||||||||||||||||||||||||||||||||||||||||||||||||||||||||||||||
8/31/2019 | $ | 44.96 | $ | (0.30 | ) | $ | 0.29 | $ | (0.01 | ) | $ | — | $ | (7.12 | ) | $ | (7.12 | ) | $ | — | $ | 37.83 | 4.06 | % | $ | 65.6 | 1.58 | % | 1.19 | % | (0.78 | )% | 161 | % | |||||||||||||||||||||||||||||
8/31/2018 | $ | 32.90 | $ | (0.37 | ) | $ | 12.94 | $ | 12.57 | $ | — | $ | (0.51 | ) | $ | (0.51 | ) | $ | — | $ | 44.96 | 38.67 | % | $ | 66.1 | 1.75 | % | 1.21 | % | (0.97 | )% | 217 | % | ||||||||||||||||||||||||||||||
8/31/2017 | $ | 26.97 | $ | (0.26 | ) | $ | 6.19 | $ | 5.93 | $ | — | $ | — | $ | — | $ | — | $ | 32.90 | 21.99 | %h | $ | 49.8 | 1.78 | % | 1.20 | %e | (0.86 | )%e | 215 | % | ||||||||||||||||||||||||||||||||
8/31/2016 | $ | 29.50 | $ | (0.21 | ) | $ | (0.77 | ) | $ | (0.98 | ) | $ | — | $ | (1.55 | ) | $ | (1.55 | ) | $ | — | $ | 26.97 | (3.16 | )% | $ | 44.0 | 1.87 | % | 1.21 | % | (0.83 | )% | 164 | % | ||||||||||||||||||||||||||||
8/31/2015 | $ | 27.44 | $ | (0.28 | ) | $ | 2.34 | $ | 2.06 | $ | — | $ | — | $ | — | $ | — | $ | 29.50 | 7.51 | % | $ | 49.3 | 1.67 | % | 1.21 | % | (0.96 | )% | 336 | % | ||||||||||||||||||||||||||||||||
Trust Class | |||||||||||||||||||||||||||||||||||||||||||||||||||||||||||||||
8/31/2019 | $ | 44.91 | $ | (0.34 | ) | $ | 0.30 | $ | (0.04 | ) | $ | — | $ | (7.12 | ) | $ | (7.12 | ) | $ | — | $ | 37.75 | 3.99 | % | $ | 4.6 | 1.70 | % | 1.29 | % | (0.89 | )% | 161 | % | |||||||||||||||||||||||||||||
| 8/31/2018g | $ | 32.88 | $ | (0.43 | ) | $ | 12.93 | $ | 12.50 | $ | — | $ | (0.47 | ) | $ | (0.47 | ) | $ | — | $ | 44.91 | 38.45 | % | $ | 4.4 | 1.86 | % | 1.37 | % | (1.13 | )% | 217 | % | ||||||||||||||||||||||||||||||
| 8/31/2017g | $ | 27.01 | $ | (0.30 | ) | $ | 6.17 | $ | 5.87 | $ | — | $ | — | $ | — | $ | — | $ | 32.88 | 21.74 | % | $ | 3.9 | 1.88 | % | 1.37 | % | (1.04 | )% | 215 | % | ||||||||||||||||||||||||||||||||
| 8/31/2016g | $ | 29.44 | $ | (0.25 | ) | $ | (0.75 | ) | $ | (1.00 | ) | $ | — | $ | (1.43 | ) | $ | (1.43 | ) | $ | — | $ | 27.01 | (3.27 | )% | $ | 4.4 | 1.93 | % | 1.37 | % | (0.99 | )% | 164 | % | ||||||||||||||||||||||||||||
| 8/31/2015g | $ | 27.44 | $ | (0.34 | ) | $ | 2.34 | $ | 2.00 | $ | — | $ | — | $ | — | $ | — | $ | 29.44 | 7.30 | % | $ | 5.3 | 1.86 | % | 1.40 | % | (1.15 | )% | 336 | % | ||||||||||||||||||||||||||||||||
Advisor Class | |||||||||||||||||||||||||||||||||||||||||||||||||||||||||||||||
8/31/2019 | $ | 44.87 | $ | (0.40 | ) | $ | 0.29 | $ | (0.11 | ) | $ | — | $ | (7.12 | ) | $ | (7.12 | ) | $ | — | $ | 37.64 | 3.81 | % | $ | 2.8 | 1.87 | % | 1.44 | % | (1.04 | )% | 161 | % | |||||||||||||||||||||||||||||
| 8/31/2018g | $ | 33.15 | $ | (0.48 | ) | $ | 12.94 | $ | 12.46 | $ | — | $ | (0.74 | ) | $ | (0.74 | ) | $ | — | $ | 44.87 | 38.26 | % | $ | 2.5 | 2.03 | % | 1.51 | % | (1.27 | )% | 217 | % | ||||||||||||||||||||||||||||||
| 8/31/2017g | $ | 27.27 | $ | (0.35 | ) | $ | 6.23 | $ | 5.88 | $ | — | $ | — | $ | — | $ | — | $ | 33.15 | 21.58 | %h | $ | 1.7 | 2.05 | % | 1.51 | %e | (1.18 | )%e | 215 | % | ||||||||||||||||||||||||||||||||
| 8/31/2016g | $ | 30.63 | $ | (0.29 | ) | $ | (0.81 | ) | $ | (1.10 | ) | $ | — | $ | (2.26 | ) | $ | (2.26 | ) | $ | — | $ | 27.27 | (3.40 | )% | $ | 2.1 | 2.08 | % | 1.51 | % | (1.13 | )% | 164 | % | ||||||||||||||||||||||||||||
| 8/31/2015g | $ | 28.59 | $ | (0.38 | ) | $ | 2.42 | $ | 2.04 | $ | — | $ | — | $ | — | $ | — | $ | 30.63 | 7.13 | % | $ | 2.7 | 2.00 | % | 1.51 | % | (1.26 | )% | 336 | % | ||||||||||||||||||||||||||||||||
Institutional Class | |||||||||||||||||||||||||||||||||||||||||||||||||||||||||||||||
8/31/2019 | $ | 45.06 | $ | (0.17 | ) | $ | 0.29 | $ | 0.12 | $ | — | $ | (7.12 | ) | $ | (7.12 | ) | $ | — | $ | 38.06 | 4.38 | % | $ | 87.7 | 1.28 | % | 0.90 | % | (0.43 | )% | 161 | % | ||||||||||||||||||||||||||||||
| 8/31/2018g | $ | 32.85 | $ | (0.25 | ) | $ | 12.95 | $ | 12.70 | $ | — | $ | (0.49 | ) | $ | (0.49 | ) | $ | — | $ | 45.06 | 39.12 | % | $ | 16.4 | 1.50 | % | 0.90 | % | (0.66 | )% | 217 | % | ||||||||||||||||||||||||||||||
| 8/31/2017g | $ | 26.86 | $ | (0.17 | ) | $ | 6.16 | $ | 5.99 | $ | — | $ | — | $ | — | $ | — | $ | 32.85 | 22.31 | % | $ | 11.8 | 1.50 | % | 0.90 | % | (0.57 | )% | 215 | % | ||||||||||||||||||||||||||||||||
| 8/31/2016g | $ | 29.24 | $ | (0.14 | ) | $ | (0.73 | ) | $ | (0.87 | ) | $ | — | $ | (1.51 | ) | $ | (1.51 | ) | $ | — | $ | 26.86 | (2.82 | )% | $ | 9.4 | 1.55 | % | 0.90 | % | (0.53 | )% | 164 | % | ||||||||||||||||||||||||||||
| 8/31/2015g | $ | 27.11 | $ | (0.19 | ) | $ | 2.32 | $ | 2.13 | $ | — | $ | — | $ | — | $ | — | $ | 29.24 | 7.84 | % | $ | 20.7 | 1.44 | % | 0.90 | % | (0.65 | )% | 336 | % | ||||||||||||||||||||||||||||||||
Class A | |||||||||||||||||||||||||||||||||||||||||||||||||||||||||||||||
8/31/2019 | $ | 44.95 | $ | (0.29 | ) | $ | 0.26 | $ | (0.03 | ) | $ | — | $ | (7.12 | ) | $ | (7.12 | ) | $ | — | $ | 37.80 | 4.01 | % | $ | 50.1 | 1.65 | % | 1.26 | % | (0.76 | )% | 161 | % | |||||||||||||||||||||||||||||
| 8/31/2018g | $ | 32.87 | $ | (0.39 | ) | $ | 12.93 | $ | 12.54 | $ | — | $ | (0.46 | ) | $ | (0.46 | ) | $ | — | $ | 44.95 | 38.60 | % | $ | 5.3 | 1.88 | % | 1.26 | % | (1.02 | )% | 217 | % | ||||||||||||||||||||||||||||||
| 8/31/2017g | $ | 26.97 | $ | (0.27 | ) | $ | 6.17 | $ | 5.90 | $ | — | $ | — | $ | — | $ | — | $ | 32.87 | 21.88 | % | $ | 3.3 | 1.90 | % | 1.26 | % | (0.93 | )% | 215 | % | ||||||||||||||||||||||||||||||||
| 8/31/2016g | $ | 29.36 | $ | (0.23 | ) | $ | (0.74 | ) | $ | (0.97 | ) | $ | — | $ | (1.42 | ) | $ | (1.42 | ) | $ | — | $ | 26.97 | (3.18 | )% | $ | 3.5 | 1.95 | % | 1.26 | % | (0.88 | )% | 164 | % | ||||||||||||||||||||||||||||
| 8/31/2015g | $ | 27.32 | $ | (0.30 | ) | $ | 2.34 | $ | 2.04 | $ | — | $ | — | $ | — | $ | — | $ | 29.36 | 7.45 | % | $ | 5.1 | 1.83 | % | 1.26 | % | (1.01 | )% | 336 | % | ||||||||||||||||||||||||||||||||
See Notes to Financial Highlights
249
250
Financial Highlights (cont'd)
| Net Asset Value, Beginning of Year | Net Investment Income (Loss)@ | Net Gains or Losses on Securities (both realized and unrealized) | Total From Investment Operations | Dividends from Net Investment Income | Distributions from Net Realized Capital Gains | Total Distributions | Voluntary Contribution from Management | Net Asset Value, End of Year | Total Returnab | Net Assets, End of Year (in millions) | Ratio of Gross Expenses to Average Net Assets# | Ratio of Net Expenses to Average Net Assets | Ratio of Net Investment Income/ (Loss) to Average Net Assets | Portfolio Turnover Rate | |||||||||||||||||||||||||||||||||||||||||||||||||
Small Cap Growth Fund (cont'd) | |||||||||||||||||||||||||||||||||||||||||||||||||||||||||||||||
Class C | |||||||||||||||||||||||||||||||||||||||||||||||||||||||||||||||
8/31/2019 | $ | 44.72 | $ | (0.61 | ) | $ | 0.26 | $ | (0.35 | ) | $ | — | $ | (7.12 | ) | $ | (7.12 | ) | $ | — | $ | 37.25 | 3.20 | % | $ | 4.2 | 2.45 | % | 2.01 | % | (1.60 | )% | 161 | % | |||||||||||||||||||||||||||||
| 8/31/2018g | $ | 33.24 | $ | (0.67 | ) | $ | 12.92 | $ | 12.25 | $ | — | $ | (0.77 | ) | $ | (0.77 | ) | $ | — | $ | 44.72 | 37.56 | % | $ | 3.1 | 2.62 | % | 2.01 | % | (1.77 | )% | 217 | % | ||||||||||||||||||||||||||||||
| 8/31/2017g | $ | 27.47 | $ | (0.50 | ) | $ | 6.27 | $ | 5.77 | $ | — | $ | — | $ | — | $ | — | $ | 33.24 | 21.00 | % | $ | 2.0 | 2.63 | % | 2.01 | % | (1.68 | )% | 215 | % | ||||||||||||||||||||||||||||||||
| 8/31/2016g | $ | 31.11 | $ | (0.43 | ) | $ | (0.85 | ) | $ | (1.28 | ) | $ | — | $ | (2.36 | ) | $ | (2.36 | ) | $ | — | $ | 27.47 | (3.92 | )% | $ | 1.8 | 2.68 | % | 2.01 | % | (1.63 | )% | 164 | % | ||||||||||||||||||||||||||||
| 8/31/2015g | $ | 29.16 | $ | (0.55 | ) | $ | 2.50 | $ | 1.95 | $ | — | $ | — | $ | — | $ | — | $ | 31.11 | 6.68 | % | $ | 2.3 | 2.58 | % | 2.01 | % | (1.76 | )% | 336 | % | ||||||||||||||||||||||||||||||||
Class R3 | |||||||||||||||||||||||||||||||||||||||||||||||||||||||||||||||
8/31/2019 | $ | 44.87 | $ | (0.42 | ) | $ | 0.28 | $ | (0.14 | ) | $ | — | $ | (7.12 | ) | $ | (7.12 | ) | $ | — | $ | 37.61 | 3.73 | % | $ | 2.4 | 2.01 | % | 1.51 | % | (1.10 | )% | 161 | % | |||||||||||||||||||||||||||||
| 8/31/2018g | $ | 33.14 | $ | (0.48 | ) | $ | 12.95 | $ | 12.47 | $ | — | $ | (0.74 | ) | $ | (0.74 | ) | $ | — | $ | 44.87 | 38.29 | % | $ | 2.2 | 2.17 | % | 1.51 | % | (1.27 | )% | 217 | % | ||||||||||||||||||||||||||||||
| 8/31/2017g | $ | 27.26 | $ | (0.35 | ) | $ | 6.23 | $ | 5.88 | $ | — | $ | — | $ | — | $ | — | $ | 33.14 | 21.58 | % | $ | 1.0 | 2.19 | % | 1.51 | % | (1.17 | )% | 215 | % | ||||||||||||||||||||||||||||||||
| 8/31/2016g | $ | 30.63 | $ | (0.29 | ) | $ | (0.83 | ) | $ | (1.12 | ) | $ | — | $ | (2.25 | ) | $ | (2.25 | ) | $ | — | $ | 27.26 | (3.44 | )% | $ | 1.1 | 2.24 | % | 1.51 | % | (1.12 | )% | 164 | % | ||||||||||||||||||||||||||||
| 8/31/2015g | $ | 28.56 | $ | (0.39 | ) | $ | 2.46 | $ | 2.07 | $ | — | $ | — | $ | — | $ | — | $ | 30.63 | 7.22 | % | $ | 1.0 | 2.15 | % | 1.51 | % | (1.25 | )% | 336 | % | ||||||||||||||||||||||||||||||||
Class R6 | |||||||||||||||||||||||||||||||||||||||||||||||||||||||||||||||
| Period from 9/7/2018^ to 8/31/2019 | $ | 44.27 | $ | 0.06 | $ | 0.89 | $ | 0.95 | $ | — | $ | (7.12 | ) | $ | (7.12 | ) | $ | — | $ | 38.10 | 6.35 | %* | $ | 21.0 | 1.15 | %** | 0.81 | %** | 0.15 | %** | 161 | %c | |||||||||||||||||||||||||||||||
Sustainable Equity Fund | |||||||||||||||||||||||||||||||||||||||||||||||||||||||||||||||
Investor Class | |||||||||||||||||||||||||||||||||||||||||||||||||||||||||||||||
8/31/2019 | $ | 41.86 | $ | 0.30 | $ | (1.80 | ) | $ | (1.50 | ) | $ | (0.16 | ) | $ | (3.12 | ) | $ | (3.28 | ) | $ | — | $ | 37.08 | (2.70 | )% | $ | 446.1 | 0.86 | % | 0.86 | % | 0.80 | % | 20 | % | ||||||||||||||||||||||||||||
| 8/31/2018f | $ | 37.56 | $ | 0.23 | $ | 6.41 | $ | 6.64 | $ | (0.31 | ) | $ | (2.03 | ) | $ | (2.34 | ) | $ | — | $ | 41.86 | 18.36 | % | $ | 679.3 | 0.85 | % | 0.85 | % | 0.59 | % | 12 | % | ||||||||||||||||||||||||||||||
| 8/31/2017f | $ | 34.56 | $ | 0.24 | $ | 4.31 | $ | 4.55 | $ | (0.23 | ) | $ | (1.32 | ) | $ | (1.55 | ) | $ | — | $ | 37.56 | 13.54 | %h | $ | 732.6 | 0.85 | % | 0.84 | %e | 0.66 | %e | 26 | % | ||||||||||||||||||||||||||||||
| 8/31/2016f | $ | 33.29 | $ | 0.24 | $ | 3.10 | $ | 3.34 | $ | (0.22 | ) | $ | (1.85 | ) | $ | (2.07 | ) | $ | — | $ | 34.56 | 10.49 | % | $ | 739.0 | 0.86 | % | 0.86 | % | 0.74 | % | 25 | % | ||||||||||||||||||||||||||||||
| 8/31/2015f | $ | 37.01 | $ | 0.27 | $ | (0.12 | ) | $ | 0.15 | $ | (0.26 | ) | $ | (3.61 | ) | $ | (3.87 | ) | $ | — | $ | 33.29 | 0.29 | % | $ | 758.0 | 0.85 | % | 0.85 | % | 0.76 | % | 28 | % | |||||||||||||||||||||||||||||
Trust Class | |||||||||||||||||||||||||||||||||||||||||||||||||||||||||||||||
8/31/2019 | $ | 41.88 | $ | 0.24 | $ | (1.80 | ) | $ | (1.56 | ) | $ | (0.10 | ) | $ | (3.12 | ) | $ | (3.22 | ) | $ | — | $ | 37.10 | (2.86 | )% | $ | 161.3 | 1.03 | % | 1.03 | % | 0.65 | % | 20 | % | ||||||||||||||||||||||||||||
| 8/31/2018f | $ | 37.58 | $ | 0.16 | $ | 6.41 | $ | 6.57 | $ | (0.24 | ) | $ | (2.03 | ) | $ | (2.27 | ) | $ | — | $ | 41.88 | 18.13 | % | $ | 230.8 | 1.02 | % | 1.02 | % | 0.42 | % | 12 | % | ||||||||||||||||||||||||||||||
| 8/31/2017f | $ | 35.74 | $ | 0.18 | $ | 4.38 | $ | 4.56 | $ | (0.40 | ) | $ | (2.32 | ) | $ | (2.72 | ) | $ | — | $ | 37.58 | 13.41 | %h | $ | 234.6 | 1.02 | % | 1.01 | %e | 0.51 | %e | 26 | % | ||||||||||||||||||||||||||||||
| 8/31/2016f | $ | 35.91 | $ | 0.19 | $ | 3.25 | $ | 3.44 | $ | (0.37 | ) | $ | (3.24 | ) | $ | (3.61 | ) | $ | — | $ | 35.74 | 10.29 | % | $ | 270.6 | 1.03 | % | 1.03 | % | 0.58 | % | 25 | % | ||||||||||||||||||||||||||||||
| 8/31/2015f | $ | 42.53 | $ | 0.23 | $ | (0.11 | ) | $ | 0.12 | $ | (0.42 | ) | $ | (6.32 | ) | $ | (6.74 | ) | $ | — | $ | 35.91 | 0.12 | % | $ | 318.3 | 1.03 | % | 1.03 | % | 0.58 | % | 28 | % | |||||||||||||||||||||||||||||
See Notes to Financial Highlights
251
252
Financial Highlights (cont'd)
| Net Asset Value, Beginning of Year | Net Investment Income (Loss)@ | Net Gains or Losses on Securities (both realized and unrealized) | Total From Investment Operations | Dividends from Net Investment Income | Distributions from Net Realized Capital Gains | Total Distributions | Voluntary Contribution from Management | Net Asset Value, End of Year | Total Returnab | Net Assets, End of Year (in millions) | Ratio of Gross Expenses to Average Net Assets# | Ratio of Net Expenses to Average Net Assets | Ratio of Net Investment Income/ (Loss) to Average Net Assets | Portfolio Turnover Rate | |||||||||||||||||||||||||||||||||||||||||||||||||
Sustainable Equity Fund (cont'd) | |||||||||||||||||||||||||||||||||||||||||||||||||||||||||||||||
Institutional Class | |||||||||||||||||||||||||||||||||||||||||||||||||||||||||||||||
8/31/2019 | $ | 41.84 | $ | 0.37 | $ | (1.81 | ) | $ | (1.44 | ) | $ | (0.26 | ) | $ | (3.12 | ) | $ | (3.38 | ) | $ | — | $ | 37.02 | (2.52 | )% | $ | 768.3 | 0.68 | % | 0.68 | % | 1.00 | % | 20 | % | ||||||||||||||||||||||||||||
8/31/2018 | $ | 37.55 | $ | 0.30 | $ | 6.41 | $ | 6.71 | $ | (0.39 | ) | $ | (2.03 | ) | $ | (2.42 | ) | $ | — | $ | 41.84 | 18.56 | % | $ | 950.5 | 0.67 | % | 0.67 | % | 0.76 | % | 12 | % | ||||||||||||||||||||||||||||||
8/31/2017 | $ | 34.55 | $ | 0.30 | $ | 4.32 | $ | 4.62 | $ | (0.30 | ) | $ | (1.32 | ) | $ | (1.62 | ) | $ | — | $ | 37.55 | 13.78 | %h | $ | 848.8 | 0.66 | % | 0.66 | %e | 0.84 | %e | 26 | % | ||||||||||||||||||||||||||||||
8/31/2016 | $ | 33.28 | $ | 0.30 | $ | 3.11 | $ | 3.41 | $ | (0.29 | ) | $ | (1.85 | ) | $ | (2.14 | ) | $ | — | $ | 34.55 | 10.70 | % | $ | 745.5 | 0.67 | % | 0.67 | % | 0.93 | % | 25 | % | ||||||||||||||||||||||||||||||
8/31/2015 | $ | 37.00 | $ | 0.33 | $ | (0.12 | ) | $ | 0.21 | $ | (0.33 | ) | $ | (3.60 | ) | $ | (3.93 | ) | $ | — | $ | 33.28 | 0.46 | % | $ | 714.8 | 0.67 | % | 0.67 | % | 0.94 | % | 28 | % | |||||||||||||||||||||||||||||
Class A | |||||||||||||||||||||||||||||||||||||||||||||||||||||||||||||||
8/31/2019 | $ | 41.88 | $ | 0.23 | $ | (1.81 | ) | $ | (1.58 | ) | $ | (0.10 | ) | $ | (3.12 | ) | $ | (3.22 | ) | $ | — | $ | 37.08 | (2.90 | )% | $ | 95.1 | 1.05 | % | 1.05 | % | 0.61 | % | 20 | % | ||||||||||||||||||||||||||||
| 8/31/2018f | $ | 37.58 | $ | 0.16 | $ | 6.41 | $ | 6.57 | $ | (0.24 | ) | $ | (2.03 | ) | $ | (2.27 | ) | $ | — | $ | 41.88 | 18.14 | % | $ | 126.4 | 1.04 | % | 1.04 | % | 0.40 | % | 12 | % | ||||||||||||||||||||||||||||||
| 8/31/2017f | $ | 35.78 | $ | 0.18 | $ | 4.37 | $ | 4.55 | $ | (0.41 | ) | $ | (2.34 | ) | $ | (2.75 | ) | $ | — | $ | 37.58 | 13.36 | %h | $ | 118.0 | 1.03 | % | 1.03 | %e | 0.48 | %e | 26 | % | ||||||||||||||||||||||||||||||
| 8/31/2016f | $ | 36.02 | $ | 0.19 | $ | 3.25 | $ | 3.44 | $ | (0.39 | ) | $ | (3.29 | ) | $ | (3.68 | ) | $ | — | $ | 35.78 | 10.27 | % | $ | 131.6 | 1.05 | % | 1.05 | % | 0.56 | % | 25 | % | ||||||||||||||||||||||||||||||
| 8/31/2015f | $ | 42.73 | $ | 0.23 | $ | (0.11 | ) | $ | 0.12 | $ | (0.44 | ) | $ | (6.39 | ) | $ | (6.83 | ) | $ | — | $ | 36.02 | 0.11 | % | $ | 140.9 | 1.05 | % | 1.05 | % | 0.57 | % | 28 | % | |||||||||||||||||||||||||||||
Class C | |||||||||||||||||||||||||||||||||||||||||||||||||||||||||||||||
8/31/2019 | $ | 41.81 | $ | (0.04 | ) | $ | (1.80 | ) | $ | (1.84 | ) | $ | — | $ | (3.12 | ) | $ | (3.12 | ) | $ | — | $ | 36.85 | (3.62 | )% | $ | 47.4 | 1.79 | % | 1.79 | % | (0.12 | )% | 20 | % | ||||||||||||||||||||||||||||
| 8/31/2018f | $ | 37.63 | $ | (0.14 | ) | $ | 6.42 | $ | 6.28 | $ | (0.07 | ) | $ | (2.03 | ) | $ | (2.10 | ) | $ | — | $ | 41.81 | 17.26 | % | $ | 62.4 | 1.78 | % | 1.78 | % | (0.35 | )% | 12 | % | |||||||||||||||||||||||||||||
| 8/31/2017f | $ | 35.92 | $ | (0.09 | ) | $ | 4.39 | $ | 4.30 | $ | (0.17 | ) | $ | (2.42 | ) | $ | (2.59 | ) | $ | — | $ | 37.63 | 12.53 | %h | $ | 56.6 | 1.78 | % | 1.78 | %e | (0.27 | )%e | 26 | % | |||||||||||||||||||||||||||||
| 8/31/2016f | $ | 36.25 | $ | (0.07 | ) | $ | 3.27 | $ | 3.20 | $ | (0.13 | ) | $ | (3.40 | ) | $ | (3.53 | ) | $ | — | $ | 35.92 | 9.44 | % | $ | 53.5 | 1.79 | % | 1.79 | % | (0.19 | )% | 25 | % | |||||||||||||||||||||||||||||
| 8/31/2015f | $ | 43.29 | $ | (0.08 | ) | $ | (0.09 | ) | $ | (0.17 | ) | $ | (0.26 | ) | $ | (6.61 | ) | $ | (6.87 | ) | $ | — | $ | 36.25 | (0.67 | )% | $ | 52.2 | 1.79 | % | 1.79 | % | (0.18 | )% | 28 | % | |||||||||||||||||||||||||||
Class R3 | |||||||||||||||||||||||||||||||||||||||||||||||||||||||||||||||
8/31/2019 | $ | 41.90 | $ | 0.14 | $ | (1.79 | ) | $ | (1.65 | ) | $ | (0.03 | ) | $ | (3.12 | ) | $ | (3.15 | ) | $ | — | $ | 37.10 | (3.12 | )% | $ | 31.8 | 1.29 | % | 1.29 | % | 0.36 | % | 20 | % | ||||||||||||||||||||||||||||
| 8/31/2018f | $ | 37.59 | $ | 0.06 | $ | 6.42 | $ | 6.48 | $ | (0.14 | ) | $ | (2.03 | ) | $ | (2.17 | ) | $ | — | $ | 41.90 | 17.85 | % | $ | 36.4 | 1.28 | % | 1.28 | % | 0.15 | % | 12 | % | ||||||||||||||||||||||||||||||
| 8/31/2017f | $ | 35.86 | $ | 0.07 | $ | 4.37 | $ | 4.44 | $ | (0.34 | ) | $ | (2.37 | ) | $ | (2.71 | ) | $ | — | $ | 37.59 | 13.04 | %h | $ | 41.3 | 1.28 | % | 1.28 | %e | 0.21 | %e | 26 | % | ||||||||||||||||||||||||||||||
| 8/31/2016f | $ | 36.13 | $ | 0.11 | $ | 3.26 | $ | 3.37 | $ | (0.31 | ) | $ | (3.33 | ) | $ | (3.64 | ) | $ | — | $ | 35.86 | 10.01 | % | $ | 33.3 | 1.29 | % | 1.29 | % | 0.30 | % | 25 | % | ||||||||||||||||||||||||||||||
| 8/31/2015f | $ | 42.93 | $ | 0.13 | $ | (0.09 | ) | $ | 0.04 | $ | (0.36 | ) | $ | (6.48 | ) | $ | (6.84 | ) | $ | — | $ | 36.13 | (0.12 | )% | $ | 30.4 | 1.29 | % | 1.29 | % | 0.31 | % | 28 | % | |||||||||||||||||||||||||||||
Class R6 | |||||||||||||||||||||||||||||||||||||||||||||||||||||||||||||||
8/31/2019 | $ | 41.83 | $ | 0.40 | $ | (1.81 | ) | $ | (1.41 | ) | $ | (0.29 | ) | $ | (3.12 | ) | $ | (3.41 | ) | $ | — | $ | 37.01 | (2.44 | )% | $ | 238.1 | 0.59 | % | 0.59 | % | 1.08 | % | 20 | % | ||||||||||||||||||||||||||||
| 8/31/2018f | $ | 37.54 | $ | 0.32 | $ | 6.41 | $ | 6.73 | $ | (0.41 | ) | $ | (2.03 | ) | $ | (2.44 | ) | $ | — | $ | 41.83 | 18.65 | % | $ | 321.1 | 0.60 | % | 0.60 | % | 0.83 | % | 12 | % | ||||||||||||||||||||||||||||||
| 8/31/2017f | $ | 34.54 | $ | 0.33 | $ | 4.31 | $ | 4.64 | $ | (0.32 | ) | $ | (1.32 | ) | $ | (1.64 | ) | $ | — | $ | 37.54 | 13.84 | %h | $ | 361.3 | 0.59 | % | 0.59 | %e | 0.91 | %e | 26 | % | ||||||||||||||||||||||||||||||
| 8/31/2016f | $ | 33.27 | $ | 0.32 | $ | 3.11 | $ | 3.43 | $ | (0.31 | ) | $ | (1.85 | ) | $ | (2.16 | ) | $ | — | $ | 34.54 | 10.78 | % | $ | 373.4 | 0.60 | % | 0.60 | % | 0.96 | % | 25 | % | ||||||||||||||||||||||||||||||
| 8/31/2015f | $ | 37.00 | $ | 0.36 | $ | (0.14 | ) | $ | 0.22 | $ | (0.35 | ) | $ | (3.60 | ) | $ | (3.95 | ) | $ | — | $ | 33.27 | 0.51 | % | $ | 222.4 | 0.60 | % | 0.60 | % | 1.02 | % | 28 | % | |||||||||||||||||||||||||||||
See Notes to Financial Highlights
253
254
Notes to Financial Highlights Equity Funds
@ Calculated based on the average number of shares outstanding during each fiscal period.
# Represents the annualized ratios of net expenses to average daily net assets if Management had not reimbursed certain expenses and/or waived a portion of the investment management fee and/or if certain Funds had not received refunds, plus interest, from State Street noted in (h) below for custodian out-of-pocket expenses previously paid during the year ended August 31, 2017.
^ The date investment operations commenced.
* Not annualized.
** Annualized.
‡ Organization expense, which is a non-recurring expense, is included in these ratios on a non-annualized basis.
§ After repayment of expenses previously reimbursed and/or fees previously waived by Management, as applicable. Had the Fund not made such repayments, the annualized ratios of net expenses to average daily net assets would have been:
Year Ended August 31, | |||||||||||||||||||||||
2019 | 2018 | 2017 | 2016 | 2015 | |||||||||||||||||||
Emerging Markets Equity Institutional Class | 1.25 | % | — | — | — | — | |||||||||||||||||
Emerging Markets Equity Class R6 | 1.15 | % | — | — | — | — | |||||||||||||||||
Focus Institutional Class | — | 0.75 | % | — | — | — | |||||||||||||||||
Genesis Institutional Class | — | — | 0.84 | % | 0.85 | % | — | ||||||||||||||||
Genesis Class R6 | — | — | 0.77 | % | 0.78 | % | — | ||||||||||||||||
Guardian Advisor Class | — | — | — | 1.26 | % | — | |||||||||||||||||
International Equity Institutional Class | — | — | 0.84 | % | 0.85 | % | 0.83 | % | |||||||||||||||
International Equity Class A | — | — | 1.20 | % | — | 1.20 | % | ||||||||||||||||
International Equity Class C | — | — | 1.96 | % | — | — | |||||||||||||||||
International Equity Class R6 | — | — | — | — | 0.76 | % | |||||||||||||||||
Large Cap Value Institutional Class | — | 0.70 | % | 0.69 | % | — | 0.70 | % | |||||||||||||||
Large Cap Value Class A | — | — | — | — | — | ||||||||||||||||||
Large Cap Value Class C | — | — | — | — | 1.82 | % | |||||||||||||||||
Large Cap Value Class R3 | 1.33 | % | — | — | — | — | |||||||||||||||||
Mid Cap Growth Institutional Class | — | — | — | 0.73 | % | 0.73 | % | ||||||||||||||||
Mid Cap Growth Class A | — | — | 1.09 | % | 1.10 | % | 1.10 | % | |||||||||||||||
Mid Cap Growth Class C | — | 1.82 | % | 1.86 | % | — | — | ||||||||||||||||
Mid Cap Growth Class R3 | 1.33 | % | 1.34 | % | — | — | — | ||||||||||||||||
Mid Cap Growth Class R6 | — | — | — | — | 0.67 | % | |||||||||||||||||
Mid Cap Intrinsic Value Trust Class | — | — | 1.24 | % | — | — | |||||||||||||||||
255
Notes to Financial Highlights Equity Funds (cont'd)
^^ Represents the annualized ratio of net expenses to average daily net assets after utilization of the Line of Credit by Greater China Equity (2019, 2017, 2016 and 2015) and/or reimbursement of expenses and/or waiver of a portion of the investment management fee by Management. The Fund is required to calculate an expense ratio without taking into consideration any expense reductions related to expense offset arrangements. Had Greater China Equity not utilized the Line of Credit, or had Management not undertaken such action, the annualized ratios of net expenses to average daily net assets would have been:
Year Ended August 31, | |||||||||||||||||||||||
2019 | 2018 | 2017 | 2016 | 2015 | |||||||||||||||||||
Greater China Equity Institutional Class | 1.50 | % | — | 1.50 | % | 1.51 | % | 1.50 | % | ||||||||||||||
Greater China Equity Class A | 1.86 | % | — | 1.86 | % | 1.87 | % | 1.86 | % | ||||||||||||||
Greater China Equity Class C | 2.61 | % | — | 2.61 | % | 2.62 | % | 2.61 | % | ||||||||||||||
a Total return based on per share NAV reflects the effects of changes in NAV on the performance of each Fund during each fiscal period. Returns assume income dividends and other distributions, if any, were reinvested, but do not reflect the effect of sales charges. Results represent past performance and do not indicate future results. Current returns may be lower or higher than the performance data quoted. Investment returns and principal will fluctuate and shares, when redeemed, may be worth more or less than original cost. Total return would have been lower if Management had not reimbursed and/or waived certain expenses. Total return would have been higher if Management had not recouped previously reimbursed and/or waived expenses.
b Except for the Fund classes listed below, the class action proceeds listed in Note A of the Notes to Financial Statements, if any, had no impact on the Funds' total returns for the year ended August 31, 2019. Except for the Fund classes listed below, the class action proceeds received in 2018, 2017, 2016 and/or 2015, if any, had no impact on the Funds' total returns for the years ended August 31, 2018, 2017, 2016 and/or 2015. Had the Fund classes listed below not received class action proceeds in 2019, 2018, 2017, 2016 and/or 2015, total return based on per share NAV for the years ended August 31, 2019, 2018, 2017, 2016 and/or 2015 would have been:
Year Ended August 31, | |||||||||||||||||||||||
2019 | 2018 | 2017 | 2016 | 2015 | |||||||||||||||||||
Large Cap Value Investor Class | 6.21 | % | — | — | — | (7.26 | )% | ||||||||||||||||
Large Cap Value Trust Class | 6.00 | % | — | — | — | (7.45 | )% | ||||||||||||||||
Large Cap Value Advisor Class | 5.86 | % | — | — | — | — | |||||||||||||||||
Large Cap Value Institutional Class | — | — | — | — | (7.09 | )% | |||||||||||||||||
Large Cap Value Class A | — | — | — | — | (7.49 | )% | |||||||||||||||||
Large Cap Value Class R3 | — | — | — | — | (7.71 | )% | |||||||||||||||||
Mid Cap Intrinsic Value Class A | — | — | 16.89 | % | — | — | |||||||||||||||||
Small Cap Growth Investor Class | 3.98 | % | — | 21.91 | % | (3.27 | )% | 7.07 | % | ||||||||||||||
Small Cap Growth Trust Class | 3.90 | % | — | 21.68 | % | (3.40 | )% | 6.86 | % | ||||||||||||||
Small Cap Growth Advisor Class | 3.73 | % | — | 21.47 | % | (3.50 | )% | 6.72 | % | ||||||||||||||
Small Cap Growth Institutional Class | 4.35 | % | — | 22.23 | % | (2.99 | )% | 7.41 | % | ||||||||||||||
Small Cap Growth Class A | 3.98 | % | — | 21.81 | % | (3.31 | )% | 7.05 | % | ||||||||||||||
Small Cap Growth Class C | 3.11 | % | — | 20.94 | % | (4.02 | )% | 6.37 | % | ||||||||||||||
Small Cap Growth Class R3 | 3.62 | % | — | 21.47 | % | (3.54 | )% | 6.81 | % | ||||||||||||||
c Portfolio turnover is calculated at the Fund level. Percentage indicated was calculated for the year ended August 31, 2017, for International Select and for the year ended August 31, 2019, for Guardian, Intrinsic Value, Large Cap Value, Mid Cap Intrinsic Value and Small Cap Growth.
256
Notes to Financial Highlights Equity Funds (cont'd)
d Had Mid Cap Growth not received the voluntary contribution in 2016, the total return based on per share NAV for the year ended August 31, 2016, would have been:
Mid Cap Growth Investor Class | (1.78 | )% | |||||
Mid Cap Growth Trust Class | (1.90 | )% | |||||
Mid Cap Growth Advisor Class | (2.13 | )% | |||||
Mid Cap Growth Institutional Class | (1.66 | )% | |||||
Mid Cap Growth Class A | (2.04 | )% | |||||
Mid Cap Growth Class C | (2.66 | )% | |||||
Mid Cap Growth Class R3 | (2.21 | )% | |||||
Mid Cap Growth Class R6 | (1.51 | )% | |||||
e The custodian expenses refund noted in (h) below is non-recurring and is included in these ratios. Had the Funds not received the refund, the annualized ratios of net expenses to average net assets and the annualized ratios of net investment income/(loss) to average net assets would have been:
| Ratio of Net Expenses to Average Net Assets Year Ended August 31, 2017 | Ratio of Net Investment Income/(Loss) to Average Net Assets Year Ended August 31, 2017 | ||||||||||
Equity Income Institutional Class | 0.69 | % | 2.99 | % | |||||||
Equity Income Class A | 1.05 | % | 2.56 | % | |||||||
Equity Income Class C | 1.80 | % | 1.82 | % | |||||||
Equity Income Class R3 | 1.34 | % | 2.27 | % | |||||||
Focus Investor Class | 0.92 | % | 0.27 | % | |||||||
Focus Trust Class | 1.10 | % | 0.09 | % | |||||||
Focus Advisor Class | 1.26 | % | (0.08 | )% | |||||||
Genesis Investor Class | 1.02 | % | 0.21 | % | |||||||
Genesis Trust Class | 1.09 | % | 0.12 | % | |||||||
Genesis Advisor Class | 1.36 | % | (0.14 | )% | |||||||
Genesis Institutional Class | 0.85 | % | 0.38 | % | |||||||
Genesis Class R6 | 0.77 | % | 0.45 | % | |||||||
Guardian Investor Class | 0.90 | % | 0.75 | % | |||||||
Guardian Trust Class | 1.07 | % | 0.57 | % | |||||||
Guardian Advisor Class | 1.38 | % | 0.25 | % | |||||||
Guardian Institutional Class | 0.72 | % | 0.94 | % | |||||||
Guardian Class A | 1.10 | % | 0.55 | % | |||||||
Guardian Class C | 1.84 | % | (0.20 | )% | |||||||
Guardian Class R3 | 1.36 | % | 0.28 | % | |||||||
International Equity Investor Class | 1.05 | % | 0.97 | % | |||||||
International Equity Trust Class | 1.09 | % | 0.91 | % | |||||||
International Equity Institutional Class | 0.85 | % | 1.19 | % | |||||||
257
Notes to Financial Highlights Equity Funds (cont'd)
| Ratio of Net Expenses to Average Net Assets Year Ended August 31, 2017 | Ratio of Net Investment Income/(Loss) to Average Net Assets Year Ended August 31, 2017 | ||||||||||
International Equity Class A | — | 0.65 | % | ||||||||
International Equity Class C | — | 0.04 | % | ||||||||
International Equity Class R6 | — | 1.31 | % | ||||||||
Large Cap Value Investor Class | 0.87 | % | 1.30 | % | |||||||
Large Cap Value Trust Class | 1.05 | % | 1.11 | % | |||||||
| Large Cap Value Advisor Class | 1.20 | % | 0.97 | % | |||||||
Large Cap Value Institutional Class | 0.70 | % | 1.49 | % | |||||||
Large Cap Value Class A | 1.07 | % | 1.11 | % | |||||||
Large Cap Value Class C | 1.81 | % | 0.36 | % | |||||||
Large Cap Value Class R3 | 1.36 | % | 0.90 | % | |||||||
Mid Cap Growth Investor Class | 0.93 | % | (0.30 | )% | |||||||
Mid Cap Growth Trust Class | 0.97 | % | (0.34 | )% | |||||||
Mid Cap Growth Advisor Class | 1.23 | % | (0.60 | )% | |||||||
Mid Cap Growth Institutional Class | 0.72 | % | (0.09 | )% | |||||||
Mid Cap Growth Class A | 1.11 | % | (0.49 | )% | |||||||
Mid Cap Growth Class R6 | 0.65 | % | (0.02 | )% | |||||||
Mid Cap Intrinsic Value Investor Class | 1.07 | % | 1.00 | % | |||||||
Mid Cap Intrinsic Value Trust Class | 1.25 | % | 0.82 | % | |||||||
Mid Cap Intrinsic Value Institutional Class | 0.85 | % | 1.19 | % | |||||||
Mid Cap Intrinsic Value Class A | 1.21 | % | 0.89 | % | |||||||
Mid Cap Intrinsic Value Class C | 1.96 | % | 0.15 | % | |||||||
Multi-Cap Opportunities Institutional Class | 0.75 | % | 0.68 | % | |||||||
Multi-Cap Opportunities Class A | 1.10 | % | 0.32 | % | |||||||
Multi-Cap Opportunities Class C | 1.84 | % | (0.40 | )% | |||||||
Small Cap Growth Investor Class | 1.21 | % | (0.87 | )% | |||||||
Small Cap Growth Advisor Class | 1.51 | % | (1.18 | )% | |||||||
Sustainable Equity Investor Class | 0.85 | % | 0.66 | % | |||||||
Sustainable Equity Trust Class | 1.02 | % | 0.49 | % | |||||||
Sustainable Equity Institutional Class | 0.66 | % | 0.84 | % | |||||||
Sustainable Equity Class A | 1.03 | % | 0.48 | % | |||||||
Sustainable Equity Class C | 1.78 | % | (0.27 | )% | |||||||
Sustainable Equity Class R3 | 1.28 | % | 0.21 | % | |||||||
Sustainable Equity Class R6 | 0.59 | % | 0.91 | % | |||||||
f After the close of business on December 8, 2017, the Funds' applicable classes underwent a stock split or reverse stock split. The per share data presented here has been retroactively adjusted to reflect this split. See Note G of the Notes to Financial Statements.
258
Notes to Financial Highlights Equity Funds (cont'd)
g After the close of business on February 23, 2018, the Funds' applicable classes underwent a stock split or reverse stock split. The per share data presented here has been retroactively adjusted to reflect this split. See Note G of the Notes to Financial Statements.
h In May 2016, the Fund's custodian, State Street, announced that it had identified inconsistencies in the way in which the Funds were invoiced for categories of expenses, particularly those deemed "out-of-pocket" costs, from 1998 through November 2015, and refunded to the Funds certain expenses, plus interest, determined to be payable to the Funds for the period. Except for the Fund classes listed below, these amounts had no impact on the Fund's total return for the year ended August 31, 2017. Had the Funds not received the refund, the total return based on per share NAV would have been:
Year Ended August 31, 2017 | |||||||
Guardian Advisor Class | 17.00 | % | |||||
International Equity Investor Class | 15.58 | % | |||||
International Equity Trust Class | 15.53 | % | |||||
Mid Cap Intrinsic Value Investor Class | 17.14 | % | |||||
i After the close of business on December 7, 2018, the Funds' applicable classes underwent a stock split or reverse stock split. The per share data presented here has been retroactively adjusted to reflect this split. See Note G of the Notes to Financial Statements.
j The voluntary contributions received in 2017 had no impact on the Funds' total returns for Equity Income and Focus for the year ended August 31, 2017.
k After the close of business on August 16, 2019, Large Cap Value acquired all of the net assets of Neuberger Berman Value Fund in a tax-free exchange of shares pursuant to a Plan of Reorganization and Dissolution approved by the Board. Portfolio turnover excludes purchases of $30,333,739 of securities acquired, and there were no sales made following a purchase-of-assets transaction relative to the merger.
259
Report of Independent Registered Public Accounting Firm
To the Board of Trustees of
Neuberger Berman Equity Funds and Shareholders of:
Neuberger Berman Dividend Growth Fund
Neuberger Berman Emerging Markets Equity Fund
Neuberger Berman Equity Income Fund
Neuberger Berman Focus Fund
Neuberger Berman Genesis Fund
Neuberger Berman Global Equity Fund
Neuberger Berman Global Real Estate Fund
Neuberger Berman Greater China Equity Fund
Neuberger Berman Guardian Fund
Neuberger Berman International Equity Fund
Neuberger Berman International Select Fund
Neuberger Berman International Small Cap Fund
Neuberger Berman Large Cap Value Fund
Neuberger Berman Real Estate Fund
Opinion on the Financial Statements
We have audited the accompanying statements of assets and liabilities of Neuberger Berman Dividend Growth Fund, Neuberger Berman Emerging Markets Equity Fund, Neuberger Berman Equity Income Fund, Neuberger Berman Focus Fund, Neuberger Berman Genesis Fund, Neuberger Berman Global Equity Fund, Neuberger Berman Global Real Estate Fund, Neuberger Berman Greater China Equity Fund, Neuberger Berman Guardian Fund, Neuberger Berman International Equity Fund, Neuberger Berman International Select Fund, Neuberger Berman International Small Cap Fund, Neuberger Berman Large Cap Value Fund, and Neuberger Berman Real Estate Fund (collectively referred to as the "Funds") (fourteen of the series constituting Neuberger Berman Equity Funds (the "Trust"), including the schedules of investments, as of August 31, 2019 and the related statement of operations, the statements of changes in net assets, and the financial highlights for each of the periods indicated in the table below and the related notes (collectively referred to as the "financial statements"). In our opinion, the financial statements present fairly, in all material respects, the financial position of each of the Funds (fourteen of the series constituting Neuberger Berman Equity Funds) at August 31, 2019, the results of their operations, changes in net assets and financial highlights for each of the periods indicated in the table below, in conformity with U.S. generally accepted accounting principles.
260
| Individual Fund constituting Neuberger Berman Equity Funds | Statement of operations | Statement of changes in net assets | Financial highlights | ||||||||||||
Neuberger Berman Dividend Growth Fund | For the year ended August 31, 2019 | For each of the two years in the period ended August 31, 2019 | For each of the three years in the period ended August 31, 2019 and the period from December 15, 2015 (commencement of operations) through August 31, 2016 | ||||||||||||
| Neuberger Berman Emerging Markets Equity Fund Neuberger Berman Equity Income Fund Neuberger Berman Focus Fund Neuberger Berman Genesis Fund Neuberger Berman Global Equity Fund Neuberger Berman Greater China Equity Fund Neuberger Berman Guardian Fund Neuberger Berman International Equity Fund Neuberger Berman International Select Fund Neuberger Berman Large Cap Value Fund Neuberger Berman Real Estate Fund | For the year ended August 31, 2019 | For each of the two years in the period ended August 31, 2019 | For each of the five years in the period ended August 31, 2019 | ||||||||||||
Neuberger Berman Global Real Estate Fund | For the year ended August 31, 2019 | For each of the two years in the period ended August 31, 2019 | For each of the four years in the period ended August 31, 2019 and the period from December 30, 2014 (commencement of operations) through August 31, 2015 | ||||||||||||
Neuberger Berman International Small Cap Fund | For the year ended August 31, 2019 | For each of the two years in the period ended August 31, 2019 | For each of the two years in the period ended August 31, 2019 and the period from December 8, 2016 (commencement of operations) through August 31, 2017 | ||||||||||||
Basis for Opinion
These financial statements are the responsibility of the Trust's management. Our responsibility is to express an opinion on each of the Funds' financial statements based on our audits. We are a public accounting firm registered with the Public Company Accounting Oversight Board (United States) ("PCAOB") and are required to be independent with respect to the Trust in accordance with the U.S. federal securities laws and the applicable rules and regulations of the Securities and Exchange Commission and the PCAOB.
261
We conducted our audits in accordance with the standards of the PCAOB. Those standards require that we plan and perform the audit to obtain reasonable assurance about whether the financial statements are free of material misstatement, whether due to error or fraud. The Trust is not required to have, nor were we engaged to perform, an audit of the Trust's internal control over financial reporting. As part of our audits, we are required to obtain an understanding of internal control over financial reporting, but not for the purpose of expressing an opinion on the effectiveness of the Trust's internal control over financial reporting. Accordingly, we express no such opinion.
Our audits included performing procedures to assess the risks of material misstatement of the financial statements, whether due to error or fraud, and performing procedures that respond to those risks. Such procedures included examining, on a test basis, evidence regarding the amounts and disclosures in the financial statements. Our procedures included confirmation of securities owned as of August 31, 2019, by correspondence with the custodian and brokers or by other appropriate auditing procedures where replies from brokers were not received. Our audits also included evaluating the accounting principles used and significant estimates made by management, as well as evaluating the overall presentation of the financial statements. We believe that our audits provide a reasonable basis for our opinion.

We have served as the auditor of one or more Neuberger Berman investment companies since 1954.
Boston, Massachusetts
October 18, 2019
262
Report of Independent Registered Public Accounting Firm
To the Board of Trustees and Shareholders
Neuberger Berman Equity Funds
Opinion on the Financial Statements
We have audited the accompanying statements of assets and liabilities of the Neuberger Berman Intrinsic Value Fund, Neuberger Berman Mid Cap Growth Fund, Neuberger Berman Mid Cap Intrinsic Value Fund, Neuberger Berman Multi-Cap Opportunities Fund, Neuberger Berman Small Cap Growth Fund, and Neuberger Berman Sustainable Equity Fund (the "Funds"), each a series of Neuberger Berman Equity Funds (the "Trust"), including the schedules of investments, as of August 31, 2019, the related statements of operations for the year then ended, the statements of changes in net assets and financial highlights for the periods indicated therein, and the related notes (collectively referred to as the "financial statements"). In our opinion, the financial statements present fairly, in all material respects, the financial position of the Funds as of August 31, 2019, the results of their operations for the year then ended, the changes in their net assets and their financial highlights for the periods indicated therein, in conformity with accounting principles generally accepted in the United States of America.
Basis for Opinion
These financial statements are the responsibility of the Funds' management. Our responsibility is to express an opinion on the Funds' financial statements based on our audits. We are a public accounting firm registered with the Public Company Accounting Oversight Board (United States) ("PCAOB") and are required to be independent with respect to the Funds in accordance with the U.S. federal securities laws and the applicable rules and regulations of the Securities and Exchange Commission and the PCAOB. We have served as the auditor of one or more of the funds in the Trust since 2004.
We conducted our audits in accordance with the standards of the PCAOB. Those standards require that we plan and perform the audits to obtain reasonable assurance about whether the financial statements are free of material misstatement, whether due to error or fraud. The Funds are not required to have, nor were we engaged to perform, an audit of the Funds' internal control over financial reporting. As part of our audits we are required to obtain an understanding of internal control over financial reporting, but not for the purpose of expressing an opinion on the effectiveness of the Funds' internal control over financial reporting. Accordingly, we express no such opinion.
Our audits included performing procedures to assess the risks of material misstatement of the financial statements, whether due to error or fraud, and performing procedures that respond to those risks. Such procedures included examining, on a test basis, evidence regarding the amounts and disclosures in the financial statements. Our audits also included evaluating the accounting principles used and significant estimates made by management, as well as evaluating the overall presentation of the financial statements. Our procedures included confirmation of securities owned as of August 31, 2019 by correspondence with the custodian, transfer agent, and brokers; when replies were not received, we performed other auditing procedures. We believe that our audits provide a reasonable basis for our opinion.

Philadelphia, Pennsylvania
October 18, 2019
263
Directory
Investment Manager and Administrator
Neuberger Berman Investment Advisers LLC
1290 Avenue of the Americas
New York, NY 10104-0002
800.877.9700 or 212.476.8800
Intermediary Client Services 800.366.6264
Distributor
Neuberger Berman BD LLC
1290 Avenue of the Americas
New York, NY 10104-0002
800.877.9700 or 212.476.8800
Intermediary Client Services
800.366.6264
Sub-Adviser
Green Court Capital Management Limited
Suites 4007-4008,
40/F, One Exchange Square
8 Connaught Place,
Central Hong Kong
Custodian
State Street Bank and Trust Company
One Lincoln Street
Boston, MA 02111
Shareholder Servicing Agent
DST Asset Manager Solutions Inc.
430 West 7th Street, Suite 21989
Kansas City, MO 64105-1407
For Investor Class Shareholders
Address correspondence to:
Neuberger Berman Funds
P.O. Box 219189
Kansas City, MO 64121-9189
800.877.9700 or 212.476.8800
For Class A, Class C, Class R3 and Class R6 Shareholders:
Please contact your investment provider
For Trust Class, Advisor Class and Institutional Class Shareholders
Address correspondence to:
Neuberger Berman Investment Advisers LLC
1290 Avenue of the Americas
New York, NY 10104-0002
Attn: Intermediary Client Services
800.366.6264
Legal Counsel
K&L Gates LLP
1601 K Street, NW
Washington, DC 20006-1600
Independent Registered Public Accounting Firms
Ernst & Young LLP
200 Clarendon Street
Boston, MA 02116
Tait, Weller & Baker LLP
Two Liberty Place
50 South 16th Street, Suite 2900
Philadelphia, PA 19102
264
Trustees and Officers
Information about the Board of Trustees
| Name, (Year of Birth), and Address(1) | Position(s) and Length of Time Served(2) | Principal Occupation(s)(3) | Number of Funds in Fund Complex Overseen by Fund Trustee | Other Directorships Held Outside Fund Complex by Fund Trustee(3) | |||||||||||||||
Independent Fund Trustees | |||||||||||||||||||
Michael J. Cosgrove (1949) | Trustee since 2015 | President, Carragh Consulting USA, since 2014; formerly, Executive, General Electric Company, 1970 to 2014, including President, Mutual Funds and Global Investment Programs, GE Asset Management, 2011 to 2014, President and Chief Executive Officer, Mutual Funds and Intermediary Business, GE Asset Management, 2007 to 2011, President, Institutional Sales and Marketing, GE Asset Management, 1998 to 2007, and Chief Financial Officer, GE Asset Management, and Deputy Treasurer, GE Company, 1988 to 1993. | 53 | Director, America Press, Inc. (not-for-profit Jesuit publisher), since 2015; formerly, Director, Fordham University, 2001 to 2018; formerly, Director, The Gabelli Go Anywhere Trust, June 2015 to June 2016; formerly, Director, Skin Cancer Foundation (not-for-profit), 2006 to 2015; formerly, Director, GE Investments Funds, Inc., 1997 to 2014; formerly, Trustee, GE Institutional Funds, 1997 to 2014; formerly, Director, GE Asset Management, 1988 to 2014; formerly, Director, Elfun Trusts, 1988 to 2014; formerly, Trustee, GE Pension & Benefit Plans, 1988 to 2014; formerly, Member of Board of Governors, Investment Company Institute. | |||||||||||||||
265
| Name, (Year of Birth), and Address(1) | Position(s) and Length of Time Served(2) | Principal Occupation(s)(3) | Number of Funds in Fund Complex Overseen by Fund Trustee | Other Directorships Held Outside Fund Complex by Fund Trustee(3) | |||||||||||||||
Marc Gary (1952) | Trustee since 2015 | Executive Vice Chancellor and Chief Operating Officer, Jewish Theological Seminary, since 2012; formerly, Executive Vice President and General Counsel, Fidelity Investments, 2007 to 2012; formerly, Executive Vice President and General Counsel, BellSouth Corporation, 2004 to 2007; formerly, Vice President and Associate General Counsel, BellSouth Corporation, 2000 to 2004; formerly, Associate, Partner, and National Litigation Practice Co-Chair, Mayer, Brown LLP, 1981 to 2000; formerly, Associate Independent Counsel, Office of Independent Counsel, 1990 to 1992. | 53 | Trustee, Jewish Theological Seminary, since 2015; Director, Legility, Inc. (privately held for-profit company), since 2012; Director, Lawyers Committee for Civil Rights Under Law (not-for-profit), since 2005; formerly, Director, Equal Justice Works (not-for-profit), 2005 to 2014; formerly, Director, Corporate Counsel Institute, Georgetown University Law Center, 2007 to 2012; formerly, Director, Greater Boston Legal Services (not-for-profit), 2007 to 2012. | |||||||||||||||
266
| Name, (Year of Birth), and Address(1) | Position(s) and Length of Time Served(2) | Principal Occupation(s)(3) | Number of Funds in Fund Complex Overseen by Fund Trustee | Other Directorships Held Outside Fund Complex by Fund Trustee(3) | |||||||||||||||
Martha C. Goss (1949) | Trustee since 2007 | President, Woodhill Enterprises Inc./Chase Hollow Associates LLC (personal investment vehicle), since 2006; formerly, Consultant, Resources Global Professionals (temporary staffing), 2002 to 2006; formerly, Chief Financial Officer, Booz-Allen & Hamilton, Inc., 1995 to 1999; formerly, Enterprise Risk Officer, Prudential Insurance, 1994 to1995; formerly, President, Prudential Asset Management Company, 1992 to 1994; formerly, President, Prudential Power Funding (investments in electric and gas utilities and alternative energy projects), 1989 to 1992; formerly, Treasurer, Prudential Insurance Company, 1983 to 1989. | 53 | Director, American Water (water utility), since 2003; Director, Allianz Life of New York (insurance), since 2005; Director, Berger Group Holdings, Inc. (engineering consulting firm), since 2013; Director, Financial Women's Association of New York (not-for-profit association), since 2003; Trustee Emerita, Brown University, since 1998; Director, Museum of American Finance (not-for-profit), since 2013; formerly, Non-Executive Chair and Director, Channel Reinsurance (financial guaranty reinsurance), 2006 to 2010; formerly, Director, Ocwen Financial Corporation (mortgage servicing), 2005 to 2010; formerly, Director, Claire's Stores, Inc. (retailer), 2005 to 2007; formerly, Director, Parsons Brinckerhoff Inc. (engineering consulting firm), 2007 to 2010; formerly, Director, Bank Leumi (commercial bank), 2005 to 2007; formerly, Advisory Board Member, Attensity (software developer), 2005 to 2007. | |||||||||||||||
267
| Name, (Year of Birth), and Address(1) | Position(s) and Length of Time Served(2) | Principal Occupation(s)(3) | Number of Funds in Fund Complex Overseen by Fund Trustee | Other Directorships Held Outside Fund Complex by Fund Trustee(3) | |||||||||||||||
Michael M. Knetter (1960) | Trustee since 2007 | President and Chief Executive Officer, University of Wisconsin Foundation, since 2010; formerly, Dean, School of Business, University of Wisconsin—Madison; formerly, Professor of International Economics and Associate Dean, Amos Tuck School of Business—Dartmouth College, 1998 to 2002. | 53 | Director, 1 William Street Credit Income Fund, since 2018; Board Member, American Family Insurance (a mutual company, not publicly traded), since March 2009; formerly, Trustee, Northwestern Mutual Series Fund, Inc., 2007 to 2011; formerly, Director, Wausau Paper, 2005 to 2011; formerly, Director, Great Wolf Resorts, 2004 to 2009. | |||||||||||||||
Deborah C. McLean (1954) | Trustee since 2015 | Member, Circle Financial Group (private wealth management membership practice), since 2011; Managing Director, Golden Seeds LLC (an angel investing group), since 2009; Adjunct Professor, Columbia University School of International and Public Affairs, since 2008; formerly, Visiting Assistant Professor, Fairfield University, Dolan School of Business, Fall 2007; formerly, Adjunct Associate Professor of Finance, Richmond, The American International University in London, 1999 to 2007. | 53 | Board member, Norwalk Community College Foundation, since 2014; Dean's Advisory Council, Radcliffe Institute for Advanced Study, since 2014; formerly, Director and Treasurer, At Home in Darien (not-for-profit), 2012 to 2014; formerly, Director, National Executive Service Corps (not-for-profit), 2012 to 2013; formerly, Trustee, Richmond, The American International University in London, 1999 to 2013. | |||||||||||||||
268
| Name, (Year of Birth), and Address(1) | Position(s) and Length of Time Served(2) | Principal Occupation(s)(3) | Number of Funds in Fund Complex Overseen by Fund Trustee | Other Directorships Held Outside Fund Complex by Fund Trustee(3) | |||||||||||||||
George W. Morriss (1947) | Trustee since 2007 | Adjunct Professor, Columbia University School of International and Public Affairs, since 2012; formerly, Executive Vice President and Chief Financial Officer, People's United Bank, Connecticut (a financial services company), 1991 to 2001. | 53 | Director, 1 William Street Credit Income Fund, since 2018; Director and Chair, Thrivent Church Loan and Income Fund, since 2018; formerly, Trustee, Steben Alternative Investment Funds, Steben Select Multi-Strategy Fund, and Steben Select Multi-Strategy Master Fund, 2013 to 2017; formerly, Treasurer, National Association of Corporate Directors, Connecticut Chapter, 2011 to 2015; formerly, Manager, Larch Lane Multi-Strategy Fund complex (which consisted of three funds), 2006 to 2011; formerly, Member, NASDAQ Issuers' Affairs Committee, 1995 to 2003. | |||||||||||||||
Tom D. Seip (1950) | Trustee since 2000; Chairman of the Board since 2008; formerly Lead Independent Trustee from 2006 to 2008 | Formerly, Managing Member, Ridgefield Farm LLC (a private investment vehicle), 2004 to 2016; formerly, President and CEO, Westaff, Inc. (temporary staffing), May 2001 to January 2002; formerly, Senior Executive, The Charles Schwab Corporation, 1983 to 1998, including Chief Executive Officer, Charles Schwab Investment Management, Inc.; Trustee, Schwab Family of Funds and Schwab Investments, 1997 to 1998; and Executive Vice President-Retail Brokerage, Charles Schwab & Co., Inc., 1994 to 1997. | 53 | Formerly, Director, H&R Block, Inc. (tax services company), 2001 to 2018; formerly, Director, Talbot Hospice Inc., 2013 to 2016; formerly, Chairman, Governance and Nominating Committee, H&R Block, Inc., 2011 to 2015; formerly, Chairman, Compensation Committee, H&R Block, Inc., 2006 to 2010; formerly, Director, Forward Management, Inc. (asset management company), 1999 to 2006. | |||||||||||||||
269
| Name, (Year of Birth), and Address(1) | Position(s) and Length of Time Served(2) | Principal Occupation(s)(3) | Number of Funds in Fund Complex Overseen by Fund Trustee | Other Directorships Held Outside Fund Complex by Fund Trustee(3) | |||||||||||||||
James G. Stavridis (1955) | Trustee since 2015 | Operating Executive, The Carlyle Group, since 2018; Commentator, NBC News, since 2015; formerly, Dean, Fletcher School of Law and Diplomacy, Tufts University, 2013 to 2018; formerly, Admiral, United States Navy, 1976 to 2013, including Supreme Allied Commander, NATO and Commander, European Command, 2009 to 2013, and Commander, United States Southern Command, 2006 to 2009. | 53 | Director, American Water (water utility), since 2018; Director, NFP Corp. (insurance broker and consultant), since 2017; Director, U.S. Naval Institute, since 2014; Director, Onassis Foundation, since 2014; Director, BMC Software Federal, LLC, since 2014; Director, Vertical Knowledge, LLC, since 2013; formerly, Director, Navy Federal Credit Union, 2000-2002. | |||||||||||||||
270
| Name, (Year of Birth), and Address(1) | Position(s) and Length of Time Served(2) | Principal Occupation(s)(3) | Number of Funds in Fund Complex Overseen by Fund Trustee | Other Directorships Held Outside Fund Complex by Fund Trustee(3) | |||||||||||||||
Candace L. Straight (1947) | Trustee since 2000 | Private investor and consultant specializing in the insurance industry; formerly, Advisory Director, Securitas Capital LLC (a global private equity investment firm dedicated to making investments in the insurance sector), 1998 to 2003. | 53 | Director, ERA Coalition (not-for-profit), since January 2019; Director, Re belle Media (a privately held TV and film production company), since 2018; formerly, Public Member, Board of Governors and Board of Trustees, Rutgers University, 2011 to 2016; formerly, Director, Montpelier Re Holdings Ltd. (reinsurance company), 2006 to 2015; formerly, Director, National Atlantic Holdings Corporation (property and casualty insurance company), 2004 to 2008; formerly, Director, The Proformance Insurance Company (property and casualty insurance company), 2004 to 2008; formerly, Director, Providence Washington Insurance Company (property and casualty insurance company), 1998 to 2006; formerly, Director, Summit Global Partners (insurance brokerage firm), 2000 to 2005. | |||||||||||||||
Peter P. Trapp (1944) | Trustee since 2000 | Retired; formerly, Regional Manager for Mid-Southern Region, Ford Motor Credit Company, September 1997 to 2007; formerly, President, Ford Life Insurance Company, April 1995 to August 1997. | 53 | None. | |||||||||||||||
271
| Name, (Year of Birth), and Address(1) | Position(s) and Length of Time Served(2) | Principal Occupation(s)(3) | Number of Funds in Fund Complex Overseen by Fund Trustee | Other Directorships Held Outside Fund Complex by Fund Trustee(3) | |||||||||||||||
Fund Trustees who are "Interested Persons" | |||||||||||||||||||
Joseph V. Amato* (1962) | Chief Executive Officer and President since 2018 and Trustee since 2009 | President and Director, Neuberger Berman Group LLC, since 2009; President and Chief Executive Officer, Neuberger Berman BD LLC ("Neuberger Berman") and Neuberger Berman Holdings LLC (including its predecessor, Neuberger Berman Inc.), since 2007; Chief Investment Officer (Equities) and President (Equities), Neuberger Berman Investment Advisers LLC ("NBIA") (formerly, Neuberger Berman Fixed Income LLC and including predecessor entities), since 2007, and Board Member of NBIA since 2006; formerly, Global Head of Asset Management of Lehman Brothers Holdings Inc.'s ("LBHI") Investment Management Division, 2006 to 2009; formerly, member of LBHI's Investment Management Division's Executive Management Committee, 2006 to 2009; formerly, Managing Director, Lehman Brothers Inc. ("LBI"), 2006 to 2008; formerly, Chief Recruiting and Development Officer, LBI, 2005 to 2006; formerly, Global Head of LBI's Equity Sales and a Member of its Equities Division Executive Committee, 2003 to 2005; President and Chief Executive Officer, twenty-six registered investment companies for which NBIA acts as investment manager and/or administrator. | 53 | Member of Board of Advisors, McDonough School of Business, Georgetown University, since 2001; Member of New York City Board of Advisors, Teach for America, since 2005; Trustee, Montclair Kimberley Academy (private school), since 2007; Member of Board of Regents, Georgetown University, since 2013. | |||||||||||||||
272
| Name, (Year of Birth), and Address(1) | Position(s) and Length of Time Served(2) | Principal Occupation(s)(3) | Number of Funds in Fund Complex Overseen by Fund Trustee | Other Directorships Held Outside Fund Complex by Fund Trustee(3) | |||||||||||||||
Robert Conti* (1956) | Trustee since 2008; prior thereto, Chief Executive Officer and President from 2008 to 2018 | Retired; formerly, Managing Director, Neuberger Berman, 2007 to 2018; formerly, President—Mutual Funds, NBIA, 2008 to 2018; formerly, Senior Vice President, Neuberger Berman, 2003 to 2006; formerly, Vice President, Neuberger Berman, 1999 to 2003. | 53 | Director, Staten Island Mental Health Society, since 1994; formerly, Chairman of the Board, Staten Island Mental Health Society, 2008 to 2011; formerly, Member of the Board of Governors, Investment Company Institute. | |||||||||||||||
(1) The business address of each listed person is 1290 Avenue of the Americas, New York, NY 10104.
(2) Pursuant to the Trust's Amended and Restated Trust Instrument, subject to any limitations on the term of service imposed by the By-Laws or any retirement policy adopted by the Fund Trustees, each Fund Trustee shall hold office for life or until his or her successor is elected or the Trust terminates; except that (a) any Fund Trustee may resign by delivering a written resignation; (b) any Fund Trustee may be removed with or without cause at any time by a written instrument signed by at least two-thirds of the other Fund Trustees; (c) any Fund Trustee who requests to be retired, or who has become unable to serve, may be retired by a written instrument signed by a majority of the other Fund Trustees; and (d) any Fund Trustee may be removed at any shareholder meeting by a vote of at least two-thirds of the outstanding shares.
(3) Except as otherwise indicated, each individual has held the positions shown during at least the last five years.
* Indicates a Fund Trustee who is an "interested person" within the meaning of the 1940 Act. Mr. Amato is an interested person of the Trust by virtue of the fact that he is an officer of NBIA and/or its affiliates. Mr. Conti is an interested person of the Trust by virtue of the fact that he was an officer of NBIA and/or its affiliates until June 2018.
273
Information about the Officers of the Trust
| Name, (Year of Birth), and Address(1) | Position(s) and Length of Time Served(2) | Principal Occupation(s)(3) | |||||||||
Claudia A. Brandon (1956) | Executive Vice President since 2008 and Secretary since inception | Senior Vice President, Neuberger Berman, since 2007 and Employee since 1999; Senior Vice President, NBIA, since 2008 and Assistant Secretary since 2004; formerly, Vice President, Neuberger Berman, 2002 to 2006; formerly, Vice President—Mutual Fund Board Relations, NBIA, 2000 to 2008; formerly, Vice President, NBIA, 1986 to 1999 and Employee, 1984 to 1999; Executive Vice President and Secretary, twenty-six registered investment companies for which NBIA acts as investment manager and/or administrator. | |||||||||
Agnes Diaz (1971) | Vice President since 2013 | Senior Vice President, Neuberger Berman, since 2012; Senior Vice President, NBIA, since 2012 and Employee since 1996; formerly, Vice President, Neuberger Berman, 2007 to 2012; Vice President, ten registered investment companies for which NBIA acts as investment manager and/or administrator. | |||||||||
Anthony DiBernardo (1979) | Assistant Treasurer since 2011 | Senior Vice President, Neuberger Berman, since 2014; Senior Vice President, NBIA, since 2014, and Employee since 2003; formerly, Vice President, Neuberger Berman, 2009 to 2014; Assistant Treasurer, ten registered investment companies for which NBIA acts as investment manager and/or administrator. | |||||||||
Savonne Ferguson (1973) | Chief Compliance Officer since 2018 | Senior Vice President, Chief Compliance Officer (Mutual Funds) and Associate General Counsel, NBIA, since November 2018; formerly, Vice President T. Rowe Price Group, Inc. (2018), Vice President and Senior Legal Counsel, T. Rowe Price Associates, Inc. (2014-2018), Vice President and Director of Regulatory Fund Administration, PNC Capital Advisors, LLC (2009-2014), Secretary, PNC Funds and PNC Advantage Funds (2010-2014); Chief Compliance Officer, twenty-six registered investment companies for which NBIA acts as investment manager and/or administrator. | |||||||||
Corey A. Issing (1978) | Chief Legal Officer since 2016 (only for purposes of sections 307 and 406 of the Sarbanes-Oxley Act of 2002) | General Counsel and Head of Compliance—Mutual Funds since 2016 and Managing Director, NBIA, since 2017; formerly, Associate General Counsel (2015 to 2016), Counsel (2007 to 2015), Senior Vice President (2013-2016), Vice President (2009-2013); Chief Legal Officer (only for purposes of sections 307 and 406 of the Sarbanes-Oxley Act of 2002), twenty-six registered investment companies for which NBIA acts as investment manager and/or administrator. | |||||||||
Sheila R. James (1965) | Assistant Secretary since inception | Vice President, Neuberger Berman, since 2008 and Employee since 1999; Vice President, NBIA, since 2008; formerly, Assistant Vice President, Neuberger Berman, 2007; Employee, NBIA, 1991 to 1999; Assistant Secretary, twenty-six registered investment companies for which NBIA acts as investment manager and/or administrator. | |||||||||
274
| Name, (Year of Birth), and Address(1) | Position(s) and Length of Time Served(2) | Principal Occupation(s)(3) | |||||||||
Brian Kerrane (1969) | Chief Operating Officer since 2015 and Vice President since 2008 | Managing Director, Neuberger Berman, since 2013; Chief Operating Officer—Mutual Funds and Managing Director, NBIA, since 2015; formerly, Senior Vice President, Neuberger Berman, 2006 to 2014; Vice President, NBIA, 2008 to 2015 and Employee since 1991; Chief Operating Officer, ten registered investment companies for which NBIA acts as investment manager and/or administrator; Vice President, twenty-six registered investment companies for which NBIA acts as investment manager and/or administrator. | |||||||||
Anthony Maltese (1959) | Vice President since 2015 | Senior Vice President, Neuberger Berman, since 2014 and Employee since 2000; Senior Vice President, NBIA, since 2014; Vice President, ten registered investment companies for which NBIA acts as investment manager and/or administrator. | |||||||||
Josephine Marone (1963) | Assistant Secretary since 2017 | Senior Paralegal, Neuberger Berman, since 2007 and Employee since 2007; Assistant Secretary, twenty-six registered investment companies for which NBIA acts as investment manager and/or administrator. | |||||||||
Owen F. McEntee, Jr. (1961) | Vice President since 2008 | Vice President, Neuberger Berman, since 2006; Vice President, NBIA, since 2006 and Employee since 1992; Vice President, ten registered investment companies for which NBIA acts as investment manager and/or administrator. | |||||||||
John M. McGovern (1970) | Treasurer and Principal Financial and Accounting Officer since inception | Senior Vice President, Neuberger Berman, since 2007; Senior Vice President, NBIA, since 2007 and Employee since 1993; formerly, Vice President, Neuberger Berman, 2004 to 2006; formerly, Assistant Treasurer, 2002 to 2005; Treasurer and Principal Financial and Accounting Officer, twenty-six registered investment companies for which NBIA acts as investment manager and/or administrator. | |||||||||
Frank Rosato (1971) | Assistant Treasurer since inception | Vice President, Neuberger Berman, since 2006; Vice President, NBIA, since 2006 and Employee since 1995; Assistant Treasurer, ten registered investment companies for which NBIA acts as investment manager and/or administrator. | |||||||||
Niketh Velamoor (1979) | Anti-Money Laundering Compliance Officer since 2018 | Senior Vice President and Associate General Counsel, Neuberger Berman, since July 2018; Assistant United States Attorney, Southern District of New York, 2009 to 2018; Anti-Money Laundering Compliance Officer, four registered investment companies for which NBIA acts as investment manager and/or administrator. | |||||||||
(1) The business address of each listed person is 1290 Avenue of the Americas, New York, NY 10104.
(2) Pursuant to the By-Laws of the Trust, each officer elected by the Fund Trustees shall hold office until his or her successor shall have been elected and qualified or until his or her earlier death, inability to serve, or resignation. Officers serve at the pleasure of the Fund Trustees and may be removed at any time with or without cause.
(3) Except as otherwise indicated, each individual has held the positions shown during at least the last five years.
275
Proxy Voting Policies and Procedures
A description of the policies and procedures that the Trust uses to determine how to vote proxies relating to portfolio securities is available, without charge, by calling 800-877-9700 (toll-free) and on the SEC's website at www.sec.gov. Information regarding how the Trust voted proxies relating to portfolio securities during the most recent 12-month period ended June 30 is also available upon request, without charge, by calling 800-877-9700 (toll-free), on the SEC's website at www.sec.gov, and on Neuberger Berman's website at www.nb.com.
Quarterly Portfolio Schedule
The Trust files a complete schedule of portfolio holdings for each Fund with the SEC for the first and third quarters of each fiscal year as an exhibit to its report on Form N-PORT (Form N-Q for filings prior to March 31, 2019). The Trust's Forms N-Q or N-PORT are available on the SEC's website at www.sec.gov. The portfolio holdings information on Form N-Q or Form N-PORT is available upon request, without charge, by calling 800-877-9700 (toll free).
276
Notice to Shareholders
For the fiscal year ended August 31, 2019, each Fund makes the following designation, or up to the maximum amount of such dividends allowable pursuant to the Internal Revenue Code, as Capital Gains Distributions and Qualified Dividend Income. Complete information regarding each Fund's Qualified Dividend Income distributions during the calendar year 2019 will be reported in conjunction with Form 1099-DIV.
| Capital Gains Distributions | Qualified Dividend Income | ||||||||||
Dividend Growth | $ | 1,990,913 | $ | 1,225,616 | |||||||
Emerging Markets Equity | — | 36,852,435 | |||||||||
Equity Income | 72,048,962 | 44,692,806 | |||||||||
Focus | 34,697,431 | 9,602,498 | |||||||||
Genesis | 1,078,083,509 | 108,571,134 | |||||||||
Global Equity | 232,764 | 74,239 | |||||||||
Global Real Estate | 33,173 | 88,350 | |||||||||
Greater China Equity | 13,298,695 | 1,528,805 | |||||||||
Guardian | 84,792,910 | 16,463,565 | |||||||||
International Equity | 8,433,329 | 36,428,301 | |||||||||
International Select | 1,898,502 | 3,733,288 | |||||||||
International Small Cap | 96,500 | 126,011 | |||||||||
Intrinsic Value | 66,004,672 | 4,628,672 | |||||||||
| Large Cap Value(a) | 131,288,044 | 41,116,349 | |||||||||
Mid Cap Growth | 114,176,511 | 7,181,048 | |||||||||
| Mid Cap Intrinsic Value(a) | 4,572,879 | 2,243,328 | |||||||||
Multi-Cap Opportunities | 210,376,411 | 22,195,283 | |||||||||
Real Estate | 24,229,908 | 10,371,504 | |||||||||
Small Cap Growth | 8,621,297 | 374,369 | |||||||||
Sustainable Equity | 208,404,722 | 33,988,476 | |||||||||
(a) Section 1250 gain distribution of $57,040 and $3,361 for Large Cap Value and Mid Cap Intrinsic Value, respectively.
277
Neuberger Berman Investment Advisers LLC
1290 Avenue of the Americas
New York, NY 10104–0002
Retail Services: 800.877.9700
Broker-Dealer and Institutional Services: 800.366.6264/888.556.9030
Web site: www.nb.com
Statistics and projections in this report are derived from sources deemed to be reliable but cannot be regarded as a representation of future results of the Funds. This report is prepared for the general information of shareholders and is not an offer of shares of the Funds. Shares are sold only through the currently effective prospectus which you can obtain by calling 877.628.2583. An investor should consider carefully a Fund's investment objectives, risks and fees and expenses, which are described in its prospectus, before investing.
 H0599 10/19
| (a) | Based on an evaluation of the disclosure controls and procedures (as defined in Rule 30a-3(c) under the Act) as of a date within 90 days of the filing date of this report, the Chief Executive Officer and President and the Treasurer and Principal Financial and Accounting Officer of the Registrant have concluded that such disclosure controls and procedures are effectively designed to ensure that information required to be disclosed by the Registrant on Form N-CSR is accumulated and communicated to the Registrant’s management to allow timely decisions regarding required disclosure. |
| (b) | There were no significant changes in the Registrant’s internal controls over financial reporting (as defined in Rule 30a-3(d) under the Act) that occurred during the most recent half-year period covered by this report that have materially affected, or are reasonably likely to materially affect, the Registrant’s internal control over financial reporting. |
| (a)(1) | A copy of the Code of Ethics is incorporated by reference to Neuberger Berman Municipal Fund Inc.’s Form N-CSR, Investment Company Act file number 811-21168 (filed January 7, 2019). |
| (a)(2) | The certifications required by Rule 30a-2(a) under the Act and Section 302 of the Sarbanes-Oxley Act of 2002 (“Sarbanes-Oxley Act”) are filed herewith. |
| (a)(3) | Not applicable to the Registrant. |
| (a)(4) | Not applicable to the Registrant. |
| (b) | The certification required by Rule 30a-2(b) under the Act and Section 906 of the Sarbanes-Oxley Act is furnished herewith. |
| By: | /s/ Joseph V. Amato |
| Joseph V. Amato | |
| Chief Executive Officer and President |
| By: | /s/ Joseph V. Amato |
| Joseph V. Amato | |
| Chief Executive Officer and President |
| By: | /s/ John M. McGovern |
| John M. McGovern | |
| Treasurer and Principal Financial and Accounting Officer |