EXPLANATORY NOTE
The Registrant is filing this amendment to its Form N-CSR for the period ended October 31, 2014,
originally filed with the Securities and Exchange Commission on December 23, 2014 (Accession Number
0001145443-14-001595). The sole purpose of this filing is to include attachments inadvertently omitted
in the original filing.
UNITED STATES
SECURITIES AND EXCHANGE COMMISSION
Washington, D.C. 20549
FORM N-CSR
CERTIFIED SHAREHOLDER REPORT OF REGISTERED
MANAGEMENT INVESTMENT COMPANIES
Investment Company Act file number 811- 1677
John Hancock Capital Series
(Exact name of registrant as specified in charter)
601 Congress Street, Boston, Massachusetts 02210
(Address of principal executive offices) (Zip code)
Salvatore Schiavone
Treasurer
601 Congress Street
Boston, Massachusetts 02210
(Name and address of agent for service)
Registrant's telephone number, including area code: 617-663-4497
| Date of fiscal year end: | October 31 |
| Date of reporting period: | October 31, 2014 |
John Hancock
Classic Value Fund
Annual report 10/31/14


A message to shareholders
Dear fellow shareholder,
The economic expansion that began in 2009 continues, with moderate GDP growth in the United States and the unemployment rate down considerably from its peak. However, the scene outside the United States had become less robust by the end of the period. China's economy, a key driver of global demand, was slowing, while Japan's GDP contracted in the second quarter, and the International Monetary Fund warned of another eurozone recession unless more was done to stimulate economic growth there. Meanwhile, bond markets around the world have turned in positive performance as investors pursue yield where they can find it, and the risks of rising interest rates and central bank tightening have been pushed further out into the future.
Whether markets are stable or volatile, we believe investors are well served by sticking to a commonsense, diversified approach, one that includes a mix of equities, fixed-income, and alternative strategies that can offer added diversification potential. Although events like those taking place in Ukraine and the Middle East serve as reminders that all market environments carry risk, we believe the biggest risk investors face in today's market is not staying invested.
A new look
I am pleased to introduce you to our redesigned shareholder reports. As part of an effort to elevate the educational substance in our communications, we undertook an initiative to make our reports more engaging and easier to navigate. Included in the changes are a performance snapshot that shows your fund's performance against that of its benchmark, and a Q&A with your fund's lead portfolio manager. We hope these enhancements give you better insight into your fund's activity and performance.
On behalf of everyone at John Hancock Investments, I'd like to take this opportunity to thank you for the continued trust you've placed in us.
Sincerely,

Andrew G. Arnott
President and Chief Executive Officer
John Hancock Investments
This commentary reflects the CEO's views as of October 31, 2014. They are subject to change at any time. For more up-to-date information, you can visit our website at jhinvestments.com.
John Hancock
Classic Value Fund
Table of contents
| 2 | Your fund at a glance | |
| 4 | Discussion of fund performance | |
| 8 | A look at performance | |
| 10 | Your expenses | |
| 12 | Fund's investments | |
| 15 | Financial statements | |
| 19 | Financial highlights | |
| 29 | Notes to financial statements | |
| 36 | Auditor's report | |
| 37 | Tax information | |
| 38 | Continuation of investment advisory and subadvisory agreements | |
| 44 | Trustees and Officers | |
| 48 | More information |
1
INVESTMENT OBJECTIVE
The fund seeks long-term growth of capital.
AVERAGE ANNUAL TOTAL RETURNS AS OF 10/31/14 (%)
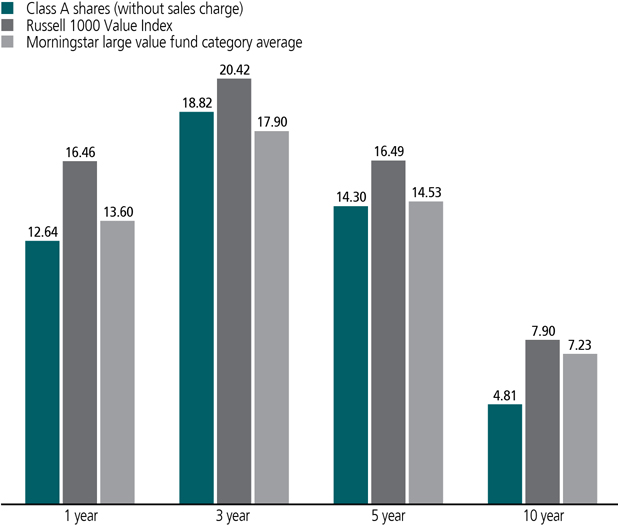
The Russell 1000 Value Index is an unmanaged index containing those securities in the Russell 1000 Index with a less-than-average growth orientation. It is not possible to invest directly in an index.
Figures from Morningstar, Inc. include reinvested distributions and do not take into account sales charges. Actual load-adjusted performance is lower.
The past performance shown here reflects reinvested distributions and the beneficial effect of any expense reductions, and does not guarantee future results. Returns for periods shorter than one year are cumulative, and results for other share classes will vary. Shares will fluctuate in value and, when redeemed, may be worth more or less than their original cost. Current performance may be lower or higher than the performance cited, and can be found at jhinvestments.com or by calling 800-225-5291. For further information on the fund's objectives, risks, and strategy, see the fund's prospectuses.
2
PERFORMANCE HIGHLIGHTS OVER THE LAST TWELVE MONTHS
Fund lagged benchmark index
Stock picking in the consumer discretionary and financials sectors detracted from the fund's performance.
Information technology stocks did well
Strong stock selection and a relative overweight versus the benchmark index produced the largest contribution to overall fund performance.
Energy stocks struggled
Falling oil prices put a damper on energy stock prices.
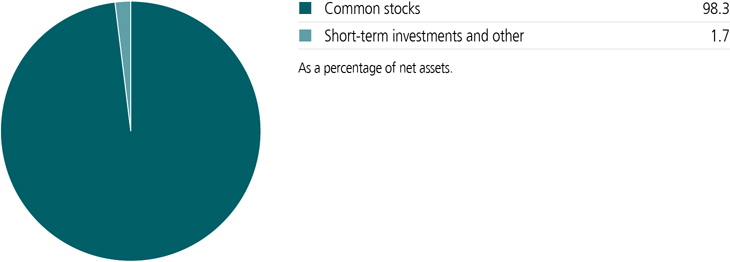
PORTFOLIO COMPOSITION AS OF 10/31/14 (%)
A note about risks
Value stocks may decline in price. Foreign investing has additional risks, such as currency and market volatility and political and social instability. A portfolio concentrated in one sector or that holds a limited number of securities may fluctuate more than a diversified portfolio. Fixed income investments are subject to interest-rate and credit risk; their value will normally decline as interest rates rise or if a creditor, grantor, or counterparty is unable or unwilling to make principal, interest, or settlement payments. Certain market conditions, including reduced trading volume, heightened volatility, or rising interest rates, may impair liquidity, the ability of the fund to sell securities or close derivative positions at advantageous prices. Please see the fund's prospectuses for additional risks.
3

Richard S. Pzena
Portfolio Manager
Pzena Investment Management, LLC

John P. Goetz
Portfolio Manager
Pzena Investment Management, LLC

Benjamin S. Silver, CFA, CPA
Portfolio Manager
Pzena Investment Management, LLC
The fund lagged its benchmark index for the period. What were some of the factors that contributed to this?
Stock selection in the consumer discretionary and financials sectors was the biggest detractor from the fund's relative performance over the past 12 months. The fund's consumer discretionary sector posted the weakest return, driven by Staples, Inc., which saw its shares decline significantly. The company has faced a difficult transition in its North American retail operations as it downsizes its retail footprint. However, it continues to post solid results in its online and direct delivery businesses, where it has a dominant position. We expect sales and profitability to improve as Staples increases its sales in new product categories, and competitive pressures ease as a result of industrywide store closings in the wake of the Office Depot/Office Max merger.
American multinational mass media company News Corp. also posted a decline, primarily due to the slow erosion of its newspaper business, particularly in Australia. Although continuing investment in NewsCorp.'s K-12 education initiative and recent acquisitions led investors to question management's use of cash flow, we see an attractive group of assets, many of which are leaders in their industries, that trade at a significant discount to their underlying value. General Motors Company (GM) struggled as it faced a growing series of vehicle recalls and a challenging operating environment in Europe. Despite the negative headlines and inevitable legal settlements, we believe GM's financial liability related to defects should be limited, as many claims occurred prior to GM's 2009 bankruptcy filing. In addition, the company is restructuring its European operations in response to the sluggish economic environment, and we believe its leading position in North American trucks stands to benefit significantly from a recovery in residential and commercial construction.
4
In the financials sector, the fund's underperformance was driven primarily by its exposure to insurance companies, although the biggest single detractor was Swiss global financial services company UBS AG. UBS posted a decline as it struggled with macroeconomic and regulatory issues in the European market. Although investors are skeptical about the regulatory overhang and structural issues facing the financials sector, we see businesses that have done a significant repair job on their balance sheets. We believe these companies are well positioned to realize a substantial recovery in their profitability as conditions eventually normalize and government intervention runs its course.
Over the course of the year, the energy sector weakened as an increase in supply caused oil prices to fall sharply. Integrated energy companies, which make up the bulk of the fund's holdings, fared better in this environment, as weakness in their exploration and production segments were cushioned by strength in their refining and chemicals businesses. Investors have also penalized energy companies for their lack of returns on years of huge capital expenditures. We believe that the substantial lag between capital expenditures and production (up to ten years for big projects in liquefied natural gas and deepwater exploration) accounts for the current low financial returns for the integrated oil companies as balance sheets expand in advance of increased production. As spending peaks (for most of the fund's holdings it has already peaked), we expect to see years of improving profits as production grows faster than capital expenditures.
What factors added to the fund's performance?
The fund's best performance came from its holdings in the information technology sector, which benefited as enterprise spending picked up in personal computers. Intel Corp., the leading semiconductor manufacturer, was one of the fund's top-performing stocks. Other standouts included Hewlett-Packard Company (HP) and software manufacturer Microsoft Corp. In the
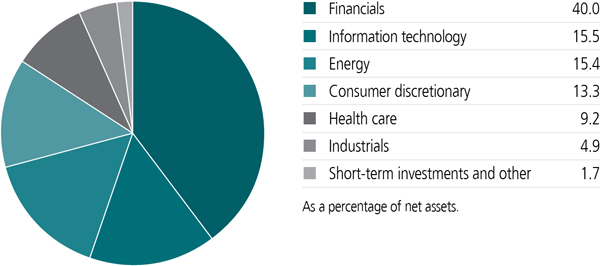
SECTOR COMPOSITION AS OF 10/31/14 (%)
5
consumer discretionary sector, TRW Automotive Holdings Corp. posted a strong return as it benefited from its acquisition by German auto parts maker ZF Friedrichshafen AG. In the healthcare sector, Cigna Corp. rebounded following a weak showing at the end of 2013 caused by losses on its Medicare business.
What were some of the changes you made to the fund over the past 12 months?
One of the key purchases during the period was Intel Corp., which gained share in tablets as well as its core processor business over the past year. Another purchase was Corning, Inc., one of the largest manufacturers of LED and LCD displays. The concern had been that as consumers completed their upgrades to larger televisions, the demand for Corning's product would wane. However, the stock performed in line with the market as pricing remained more stable than expected and volumes came in a bit higher than anticipated.
On the sales side, we liquidated the last of the fund's investments in defense contractors by selling its position in L-3 Communications Holdings, Inc. as it reached our fair value target. Other sales included utility company Entergy Corp., Delphi Automotive PLC, and investment management company Invesco, Ltd.
What is your thinking on the positioning of the fund?
The U.S. equity market posted another strong showing over the past 12 months, although there is a substantial valuation gap between highly valued companies with high dividend payouts and economically sensitive companies that command much cheaper valuations. We believe the fund's major positions in the financials sector are still significantly undervalued and represent attractive opportunities for future performance. We have been judiciously trimming the fund's exposure to technology companies that have appreciated substantially, including HP and Oracle Corp. We have
TOP TEN HOLDINGS AS OF 10/31/14 (%)
| BP PLC, ADR | 4.4 |
| Royal Dutch Shell PLC, ADR | 4.3 |
| Hewlett-Packard Company | 3.9 |
| Cigna Corp. | 3.8 |
| Bank of America Corp. | 3.4 |
| State Street Corp. | 3.4 |
| Citigroup, Inc. | 3.4 |
| American International Group, Inc. | 3.2 |
| Axis Capital Holdings, Ltd. | 3.2 |
| Intel Corp. | 3.1 |
| TOTAL | 36.1 |
| As a percentage of net assets. | |
| Cash and cash equivalents are not included. |
6
added to the energy sector as prices declined and are now looking for attractively valued companies in exploration and production and drilling services as their prices have dropped more than integrated energy companies.
We continue to be excited by the range of opportunities from a valuation perspective in today's markets, as reflected in our emphasis on financials, energy, and mature technology companies.
Were there any substantive changes in the fund's operations during the period?
Antonio DeSpirito III, a member of the portfolio management team, left Pzena in June 2014 and consequently no longer serves as a co-portfolio manager of the fund. Richard S. Pzena, John P. Goetz, and Benjamin S. Silver continue to serve as co-portfolio managers, managing the fund with the same investment philosophy and process that we employed before Antonio's departure.
MANAGED BY
| | Richard S. Pzena On the fund since 1996 Investing since 1980 |
| | John P. Goetz On the fund since 1996 Investing since 1979 |
| | Benjamin S. Silver, CFA, CPA On the fund since 2012 Investing since 1991 |
COUNTRY COMPOSITION AS OF 10/31/14 (%)
| United States | 83.4 |
| United Kingdom | 5.9 |
| Netherlands | 4.3 |
| Switzerland | 3.2 |
| Bermuda | 3.2 |
| Total | 100.0 |
As a percentage of net assets.
7
TOTAL RETURNS FOR THE PERIOD ENDED OCTOBER 31, 2014
| Average annual total returns (%) with maximum sales charge | Cumulative total returns (%) with maximum sales charge | ||||||
| 1-year | 5-year | 10-year | 5-year | 10-year | |||
| Class A | 6.99 | 13.14 | 4.28 | 85.39 | 52.06 | ||
| Class B | 6.79 | 13.20 | 4.19 | 85.91 | 50.80 | ||
| Class C | 10.80 | 13.46 | 4.03 | 87.99 | 48.45 | ||
| Class I1 | 12.95 | 14.69 | 5.21 | 98.42 | 66.12 | ||
| Class R11 | 12.21 | 13.94 | 4.47 | 92.07 | 54.90 | ||
| Class R21,2 | 12.70 | 14.34 | 4.78 | 95.40 | 59.56 | ||
| Class R31,2 | 12.34 | 14.02 | 4.52 | 92.74 | 55.54 | ||
| Class R41,2 | 12.92 | 14.48 | 4.88 | 96.66 | 61.01 | ||
| Class R51,2 | 13.02 | 14.71 | 5.14 | 98.60 | 65.08 | ||
| Class R61,2 | 13.11 | 14.77 | 5.24 | 99.12 | 66.71 | ||
| Index† | 16.46 | 16.49 | 7.90 | 114.51 | 113.93 | ||
Performance of the classes will vary based on the difference in sales charges paid by shareholders investing in the different classes and the fee structure of those classes.
Performance figures assume all distributions have been reinvested. Figures reflect maximum sales charges on Class A shares of 5% and the applicable contingent deferred sales charge (CDSC) on Class B and Class C shares. The Class B shares' CDSC declines annually between years 1 to 6 according to the following schedule: 5%, 4%, 3%, 3%, 2%, 1%. No sales charge will be assessed after the sixth year. Class C shares held for less than one year are subject to a 1% CDSC. Sales charges are not applicable to Class I, Class R1, Class R2, Class R3, Class R4, Class R5, and Class R6 shares.
The expense ratios of the fund, both net (including any fee waivers and/or expense limitations) and gross (excluding any fee waivers and/or expense limitations), are set forth according to the most recent publicly available prospectuses for the fund and may differ from those disclosed in the Financial highlights tables in this report. Had the fee waivers and expense limitations not been in place, gross expenses would apply. The expense ratios are as follows:
| Class A | Class B | Class C | Class I | Class R1 | Class R2 | Class R3 | Class R4* | Class R5 | Class R6 | |
| Gross (%) | 1.22 | 1.97 | 1.97 | 0.95 | 1.59 | 1.34 | 1.49 | 1.19 | 0.89 | 0.84 |
| Net (%) | 1.22 | 1.97 | 1.97 | 0.95 | 1.59 | 1.34 | 1.49 | 1.09 | 0.89 | 0.81 |
Please refer to the most recent prospectus and annual or semiannual report for more information on expenses and any expense limitation arrangements for each class.
| * | The distributor has contractually agreed to waive 0.10% of 12b-1 fees for Class R4 shares until at least February 28, 2015. |
The returns reflect past results and should not be considered indicative of future performance. The return and principal value of an investment will fluctuate so that shares, when redeemed, may be worth more or less than their original cost. Due to market volatility, the fund's current performance may be higher or lower than the performance shown. For current to the most recent month-end performance data, please call 800-225-5291 or visit the fund's website at jhinvestments.com.
The performance table above and the chart on the next page do not reflect the deduction of taxes that a shareholder would pay on fund distributions or the redemption of fund shares. The fund's performance results reflect any applicable fee waivers or expense reductions, without which the expenses increase and results would have been less favorable.
| † | Index is the Russell 1000 Value Index. |
See the following page for footnotes.
8
This chart and table show what happened to a hypothetical $10,000 investment in John Hancock Classic Value Fund for the share classes and periods indicated, assuming all distributions were reinvested. For comparison, we've shown the same investment in the Russell 1000 Value Index.
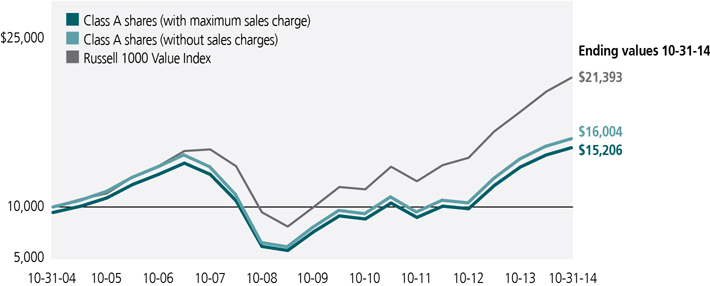
| Start date | With maximum sales charge ($) | Without sales charge ($) | Index ($) | |
| Class B3 | 10-31-04 | 15,080 | 15,080 | 21,393 |
| Class C3 | 10-31-04 | 14,845 | 14,845 | 21,393 |
| Class I1 | 10-31-04 | 16,612 | 16,612 | 21,393 |
| Class R11 | 10-31-04 | 15,490 | 15,490 | 21,393 |
| Class R21,2 | 10-31-04 | 15,956 | 15,956 | 21,393 |
| Class R31,2 | 10-31-04 | 15,554 | 15,554 | 21,393 |
| Class R41,2 | 10-31-04 | 16,101 | 16,101 | 21,393 |
| Class R51,2 | 10-31-04 | 16,508 | 16,508 | 21,393 |
| Class R61,2 | 10-31-04 | 16,671 | 16,671 | 21,393 |
The Russell 1000 Value Index is an unmanaged index containing those securities in the Russell 1000 Index with a less-than-average growth orientation.
It is not possible to invest directly in an index. Index figures do not reflect expenses or sales charges, which would have resulted in lower values.
Footnotes related to performance pages
| 1 | For certain types of investors, as described in the fund's prospectuses. |
| 2 | Class R3, Class R4, and Class R5 shares were first offered on 5-22-09; Class R6 shares were first offered on 9-1-11; Class R2 shares were first offered on 3-1-12. The returns prior to these dates are those of Class A shares that have been recalculated to apply the gross fees and expenses of Class R3, Class R4, Class R5, Class R6, and Class R2 shares, as applicable. |
| 3 | The contingent deferred sales charge is not applicable. |
9
These examples are intended to help you understand your ongoing operating expenses of investing in the fund so you can compare these costs with the ongoing costs of investing in other mutual funds.
Understanding fund expenses
As a shareholder of the fund, you incur two types of costs:
| • | Transaction costs, which include sales charges (loads) on purchases or redemptions (varies by share class), minimum account fee charge, etc. |
| • | Ongoing operating expenses, including management fees, distribution and service fees (if applicable), and other fund expenses. |
We are presenting only your ongoing operating expenses here.
Actual expenses/actual returns
This example is intended to provide information about the fund's actual ongoing operating expenses, and is based on the fund's actual return. It assumes an account value of $1,000.00 on May 1, 2014, with the same investment held until October 31, 2014.
| Account value on 5-1-2014 | Ending value on 10-31-2014 | Expenses paid during period ended 10-31-20141 | Annualized expense ratio | |
| Class A | $1,000.00 | $1,044.10 | $6.08 | 1.18% |
| Class B | 1,000.00 | 1,040.20 | 9.92 | 1.93% |
| Class C | 1,000.00 | 1,040.20 | 9.92 | 1.93% |
| Class I | 1,000.00 | 1,045.60 | 4.74 | 0.92% |
| Class R1 | 1,000.00 | 1,042.00 | 8.03 | 1.56% |
| Class R2 | 1,000.00 | 1,044.00 | 6.49 | 1.26% |
| Class R3 | 1,000.00 | 1,042.50 | 7.46 | 1.45% |
| Class R4 | 1,000.00 | 1,045.20 | 5.05 | 0.98% |
| Class R5 | 1,000.00 | 1,045.60 | 4.33 | 0.84% |
| Class R6 | 1,000.00 | 1,046.00 | 4.13 | 0.80% |
Together with the value of your account, you may use this information to estimate the operating expenses that you paid over the period. Simply divide your account value at October 31, 2014, by $1,000.00, then multiply it by the "expenses paid" for your share class from the table above. For example, for an account value of $8,600.00, the operating expenses should be calculated as follows:
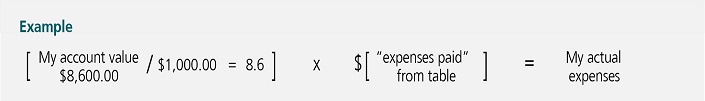
10
Hypothetical example for comparison purposes
This table allows you to compare the fund's ongoing operating expenses with those of any other fund. It provides an example of the fund's hypothetical account values and hypothetical expenses based on each class's actual expense ratio and an assumed 5% annualized return before expenses (which is not the fund's actual return). It assumes an account value of $1,000.00 on May 1, 2014, with the same investment held until October 31, 2014. Look in any other fund shareholder report to find its hypothetical example and you will be able to compare these expenses. Please remember that these hypothetical account values and expenses may not be used to estimate the actual ending account balance or expenses you paid for the period.
| Account value on 5-1-2014 | Ending value on 10-31-2014 | Expenses paid during period ended 10-31-20141 | Annualized expense ratio | |
| Class A | $1,000.00 | $1,019.30 | $6.01 | 1.18% |
| Class B | 1,000.00 | 1,015.50 | 9.80 | 1.93% |
| Class C | 1,000.00 | 1,015.50 | 9.80 | 1.93% |
| Class I | 1,000.00 | 1,020.60 | 4.69 | 0.92% |
| Class R1 | 1,000.00 | 1,017.30 | 7.93 | 1.56% |
| Class R2 | 1,000.00 | 1,018.90 | 6.41 | 1.26% |
| Class R3 | 1,000.00 | 1,017.90 | 7.38 | 1.45% |
| Class R4 | 1,000.00 | 1,020.30 | 4.99 | 0.98% |
| Class R5 | 1,000.00 | 1,021.00 | 4.28 | 0.84% |
| Class R6 | 1,000.00 | 1,021.20 | 4.08 | 0.80% |
Remember, these examples do not include any transaction costs, therefore, these examples will not help you to determine the relative total costs of owning different funds. If transaction costs were included, your expenses would have been higher. See the prospectuses for details regarding transaction costs.
| 1 | Expenses are equal to the fund's annualized expense ratio, multiplied by the average account value over the period, multiplied by 184/365 (to reflect the one-half year period). |
11
Fund's investments
| As of 10-31-14 | |||||||||||||||||
| Shares | Value | ||||||||||||||||
| Common stocks 98.3% | $2,813,147,147 | ||||||||||||||||
| (Cost $2,162,950,913) | |||||||||||||||||
| Consumer discretionary 13.3% | 380,530,977 | ||||||||||||||||
| Auto components 2.5% | |||||||||||||||||
| TRW Automotive Holdings Corp. (I) | 711,929 | 72,154,007 | |||||||||||||||
| Automobiles 1.9% | |||||||||||||||||
| General Motors Company | 1,777,209 | 55,804,363 | |||||||||||||||
| Media 6.5% | |||||||||||||||||
| News Corp., Class A (I) | 3,925,115 | 60,760,780 | |||||||||||||||
| News Corp., Class B (I) | 1,105,809 | 16,642,425 | |||||||||||||||
| Omnicom Group, Inc. | 1,084,239 | 77,913,415 | |||||||||||||||
| The Interpublic Group of Companies, Inc. | 1,525,475 | 29,578,960 | |||||||||||||||
| Specialty retail 2.4% | |||||||||||||||||
| Staples, Inc. | 5,337,305 | 67,677,027 | |||||||||||||||
| Energy 15.4% | 440,927,601 | ||||||||||||||||
| Energy equipment and services 1.9% | |||||||||||||||||
| Baker Hughes, Inc. | 1,034,715 | 54,798,506 | |||||||||||||||
| Oil, gas and consumable fuels 13.5% | |||||||||||||||||
| BP PLC, ADR | 2,871,020 | 124,774,529 | |||||||||||||||
| Exxon Mobil Corp. | 892,241 | 86,288,627 | |||||||||||||||
| Murphy Oil Corp. | 959,700 | 51,238,383 | |||||||||||||||
| Royal Dutch Shell PLC, ADR | 1,724,858 | 123,827,556 | |||||||||||||||
| Financials 40.0% | 1,142,836,229 | ||||||||||||||||
| Banks 13.7% | |||||||||||||||||
| Bank of America Corp. | 5,644,413 | 96,858,127 | |||||||||||||||
| Citigroup, Inc. | 1,791,691 | 95,909,219 | |||||||||||||||
| Comerica, Inc. | 898,481 | 42,893,483 | |||||||||||||||
| JPMorgan Chase & Company | 1,332,186 | 80,570,609 | |||||||||||||||
| The PNC Financial Services Group, Inc. | 868,866 | 75,061,334 | |||||||||||||||
| Capital markets 13.3% | |||||||||||||||||
| Franklin Resources, Inc. | 978,342 | 54,405,599 | |||||||||||||||
| Morgan Stanley | 2,349,471 | 82,114,011 | |||||||||||||||
| State Street Corp. | 1,280,102 | 96,596,497 | |||||||||||||||
| The Goldman Sachs Group, Inc. | 435,403 | 82,722,216 | |||||||||||||||
| UBS AG (I)(L) | 3,665,326 | 63,703,366 | |||||||||||||||
| Diversified financial services 2.7% | |||||||||||||||||
| Voya Financial, Inc. | 1,946,293 | 76,392,000 | |||||||||||||||
| Insurance 10.3% | |||||||||||||||||
| American International Group, Inc. | 1,716,702 | 91,963,726 | |||||||||||||||
| Axis Capital Holdings, Ltd. | 1,884,474 | 90,718,578 | |||||||||||||||
| Shares | Value | ||||||||||||||||
| Financials (continued) | |||||||||||||||||
| Insurance (continued) | |||||||||||||||||
| MetLife, Inc. | 1,283,493 | $69,616,660 | |||||||||||||||
| Willis Group Holdings PLC | 1,068,611 | 43,310,804 | |||||||||||||||
| Health care 9.2% | 264,369,878 | ||||||||||||||||
| Health care equipment and supplies 4.3% | |||||||||||||||||
| Abbott Laboratories | 1,434,177 | 62,515,775 | |||||||||||||||
| Baxter International, Inc. | 79,675 | 5,588,405 | |||||||||||||||
| Becton, Dickinson and Company | 440,885 | 56,741,900 | |||||||||||||||
| Health care providers and services 4.9% | |||||||||||||||||
| Cigna Corp. | 1,106,142 | 110,138,559 | |||||||||||||||
| Laboratory Corp. of America Holdings (I) | 268,874 | 29,385,239 | |||||||||||||||
| Industrials 4.9% | 140,481,318 | ||||||||||||||||
| Building products 2.1% | |||||||||||||||||
| Masco Corp. | 2,752,504 | 60,747,763 | |||||||||||||||
| Machinery 2.8% | |||||||||||||||||
| Parker Hannifin Corp. | 627,675 | 79,733,555 | |||||||||||||||
| Information technology 15.5% | 444,001,144 | ||||||||||||||||
| Electronic equipment, instruments and components 3.1% | |||||||||||||||||
| Corning, Inc. | 2,991,875 | 61,124,006 | |||||||||||||||
| TE Connectivity, Ltd. | 466,630 | 28,525,092 | |||||||||||||||
| Semiconductors and semiconductor equipment 3.1% | |||||||||||||||||
| Intel Corp. | 2,593,873 | 88,217,621 | |||||||||||||||
| Software 5.4% | |||||||||||||||||
| Microsoft Corp. | 1,470,523 | 69,041,055 | |||||||||||||||
| Oracle Corp. | 2,188,864 | 85,475,139 | |||||||||||||||
| Technology hardware, storage and peripherals 3.9% | |||||||||||||||||
| Hewlett-Packard Company | 3,110,876 | 111,618,231 | |||||||||||||||
| Yield (%) | Shares | Value | |||||||||||||||
| Securities lending collateral 0.2% | $6,150,104 | ||||||||||||||||
| (Cost $6,149,982) | |||||||||||||||||
| John Hancock Collateral Investment Trust (W) | 0.1171(Y) | 614,611 | 6,150,104 | ||||||||||||||
| Par value | Value | ||||||||||||||||
| Short-term investments 0.9% | $26,014,000 | ||||||||||||||||
| (Cost $26,014,000) | |||||||||||||||||
| Repurchase agreement 0.9% | 26,014,000 | ||||||||||||||||
| Repurchase Agreement with State Street Corp. dated 10-31-14 at 0.000% to be repurchased at $26,014,000 on 11-3-14, collateralized by $27,045,000 U.S. Treasury Notes, 0.625% due 4-30-18 (valued at $26,539,259, including interest) | 26,014,000 | 26,014,000 | |||||||||||||||
| Par value | Value | ||||||||||||||||
| Repurchase agreement (continued) | |||||||||||||||||
| Total investments (Cost $2,195,114,895)† 99.4% | $2,845,311,251 | ||||||||||||||||
| Other assets and liabilities, net 0.6% | $15,789,062 | ||||||||||||||||
| Total net assets 100.0% | $2,861,100,313 | ||||||||||||||||
| The percentage shown for each investment category is the total value of the category as a percentage of the net assets of the fund. | |||||
| ADR | American Depositary Receipts | ||||
| (I) | Non-income producing security. | ||||
| (L) | A portion of this security is on loan as of 10-31-14. | ||||
| (W) | Investment is an affiliate of the fund, the advisor and/or subadvisor. This investment represents collateral received for securities lending. | ||||
| (Y) | The rate shown is the annualized seven-day yield as of 10-31-14 | ||||
| † | At 10-31-14, the aggregate cost of investment securities for federal income tax purposes was $2,259,536,037. Net unrealized appreciation aggregated $585,775,214, of which $620,788,717 related to appreciated investment securities and $35,013,503 related to depreciated investment securities. | ||||
Financial statements
STATEMENT OF ASSETS AND LIABILITIES 10-31-14
| Assets | ||||||||||||||||||||||||||||||||||||||||
| Investments in unaffiliated issuers, at value (Cost $2,188,964,913) including $6,062,144 of securities loaned | $2,839,161,147 | |||||||||||||||||||||||||||||||||||||||
| Investments in affiliated issuers, at value (Cost $6,149,982) | 6,150,104 | |||||||||||||||||||||||||||||||||||||||
| Total investments, at value (Cost $2,195,114,895) | 2,845,311,251 | |||||||||||||||||||||||||||||||||||||||
| Cash | 754 | |||||||||||||||||||||||||||||||||||||||
| Receivable for investments sold | 28,776,358 | |||||||||||||||||||||||||||||||||||||||
| Receivable for fund shares sold | 3,895,035 | |||||||||||||||||||||||||||||||||||||||
| Dividends and interest receivable | 1,409,066 | |||||||||||||||||||||||||||||||||||||||
| Receivable for securities lending income | 1,259 | |||||||||||||||||||||||||||||||||||||||
| Other receivables and prepaid expenses | 127,985 | |||||||||||||||||||||||||||||||||||||||
| Total assets | 2,879,521,708 | |||||||||||||||||||||||||||||||||||||||
| Liabilities | ||||||||||||||||||||||||||||||||||||||||
| Payable for investments purchased | 5,236,593 | |||||||||||||||||||||||||||||||||||||||
| Payable for fund shares repurchased | 4,157,383 | |||||||||||||||||||||||||||||||||||||||
| Payable upon return of securities loaned | 6,104,000 | |||||||||||||||||||||||||||||||||||||||
| Payable to affiliates | ||||||||||||||||||||||||||||||||||||||||
| Accounting and legal services fees | 33,593 | |||||||||||||||||||||||||||||||||||||||
| Transfer agent fees | 615,744 | |||||||||||||||||||||||||||||||||||||||
| Distribution and service fees | 177,670 | |||||||||||||||||||||||||||||||||||||||
| Investment management fees | 1,757,023 | |||||||||||||||||||||||||||||||||||||||
| Other liabilities and accrued expenses | 339,389 | |||||||||||||||||||||||||||||||||||||||
| Total liabilities | 18,421,395 | |||||||||||||||||||||||||||||||||||||||
| Net assets | $2,861,100,313 | |||||||||||||||||||||||||||||||||||||||
| Net assets consist of | ||||||||||||||||||||||||||||||||||||||||
| Paid-in capital | $4,127,376,530 | |||||||||||||||||||||||||||||||||||||||
| Undistributed net investment income | 20,019,129 | |||||||||||||||||||||||||||||||||||||||
| Accumulated net realized gain (loss) on investments | (1,936,491,702 | ) | ||||||||||||||||||||||||||||||||||||||
| Net unrealized appreciation (depreciation) on investments | 650,196,356 | |||||||||||||||||||||||||||||||||||||||
| Net assets | $2,861,100,313 | |||||||||||||||||||||||||||||||||||||||
STATEMENT OF ASSETS AND LIABILITIES (continued)
| Net asset value per share | ||||||||||||||||||
| Based on net asset values and shares outstanding-the fund has an unlimited number of shares authorized with no par value | ||||||||||||||||||
| Class A ($384,114,337 ÷ 14,875,290 shares)1 | $25.82 | |||||||||||||||||
| Class B ($11,288,358 ÷ 444,983 shares)1 | $25.37 | |||||||||||||||||
| Class C ($101,025,009 ÷ 3,983,761 shares)1 | $25.36 | |||||||||||||||||
| Class I ($2,355,328,194 ÷ 90,951,338 shares) | $25.90 | |||||||||||||||||
| Class R1 ($6,997,601 ÷ 270,874 shares) | $25.83 | |||||||||||||||||
| Class R2 ($421,030 ÷ 16,288 shares) | $25.85 | |||||||||||||||||
| Class R3 ($1,145,584 ÷ 44,490 shares) | $25.75 | |||||||||||||||||
| Class R4 ($57,597 ÷ 2,224 shares) | $25.90 | |||||||||||||||||
| Class R5 ($116,548 ÷ 4,496 shares) | $25.92 | |||||||||||||||||
| Class R6 ($606,055 ÷ 23,367 shares) | $25.94 | |||||||||||||||||
| Maximum offering price per share | ||||||||||||||||||
| Class A (net asset value per share ÷ 95%)2 | $27.18 | |||||||||||||||||
| 1 | Redemption price per share is equal to net asset value less any applicable contingent deferred sales charge. | |||||||
| 2 | On single retail sales of less than $50,000. On sales of $50,000 or more and on group sales the offering price is reduced. | |||||||
STATEMENT OF OPERATIONS For the year ended 10-31-14
| Investment income | ||||||||||||||||||||||||||||||||||||||||
| Dividends | $54,428,673 | |||||||||||||||||||||||||||||||||||||||
| Securities lending | 99,819 | |||||||||||||||||||||||||||||||||||||||
| Less foreign taxes withheld | (243,205 | ) | ||||||||||||||||||||||||||||||||||||||
| Total investment income | 54,285,287 | |||||||||||||||||||||||||||||||||||||||
| Expenses | ||||||||||||||||||||||||||||||||||||||||
| Investment management fees | 21,427,655 | |||||||||||||||||||||||||||||||||||||||
| Distribution and service fees | 2,384,754 | |||||||||||||||||||||||||||||||||||||||
| Accounting and legal services fees | 505,552 | |||||||||||||||||||||||||||||||||||||||
| Transfer agent fees | 3,535,080 | |||||||||||||||||||||||||||||||||||||||
| Trustees' fees | 51,347 | |||||||||||||||||||||||||||||||||||||||
| State registration fees | 203,997 | |||||||||||||||||||||||||||||||||||||||
| Printing and postage | 351,322 | |||||||||||||||||||||||||||||||||||||||
| Professional fees | 129,450 | |||||||||||||||||||||||||||||||||||||||
| Custodian fees | 313,843 | |||||||||||||||||||||||||||||||||||||||
| Registration and filing fees | 48,112 | |||||||||||||||||||||||||||||||||||||||
| Other | 61,000 | |||||||||||||||||||||||||||||||||||||||
| Total expenses | 29,012,112 | |||||||||||||||||||||||||||||||||||||||
| Less expense reductions | (190,977 | ) | ||||||||||||||||||||||||||||||||||||||
| Net expenses | 28,821,135 | |||||||||||||||||||||||||||||||||||||||
| Net investment income | 25,464,152 | |||||||||||||||||||||||||||||||||||||||
| Realized and unrealized gain (loss) | ||||||||||||||||||||||||||||||||||||||||
| Net realized gain (loss) on | ||||||||||||||||||||||||||||||||||||||||
| Investments in unaffiliated issuers | 169,563,268 | |||||||||||||||||||||||||||||||||||||||
| Investments in affiliated issuers | 12,282 | |||||||||||||||||||||||||||||||||||||||
| Redemption in kind | 761,135 | |||||||||||||||||||||||||||||||||||||||
| 170,336,685 | ||||||||||||||||||||||||||||||||||||||||
| Change in net unrealized appreciation (depreciation) of | ||||||||||||||||||||||||||||||||||||||||
| Investments in unaffiliated issuers | 144,724,320 | |||||||||||||||||||||||||||||||||||||||
| Investments in affiliated issuers | (7,663 | ) | ||||||||||||||||||||||||||||||||||||||
| 144,716,657 | ||||||||||||||||||||||||||||||||||||||||
| Net realized and unrealized gain | 315,053,342 | |||||||||||||||||||||||||||||||||||||||
| Increase in net assets from operations | $340,517,494 | |||||||||||||||||||||||||||||||||||||||
STATEMENTS OF CHANGES IN NET ASSETS
| Year ended 10-31-14 | Year ended 10-31-13 | ||||||||||||||||||||||||||||||||||||||||||||||||||||||||||||||||||||||||||||||
| Increase (decrease) in net assets | |||||||||||||||||||||||||||||||||||||||||||||||||||||||||||||||||||||||||||||||
| From operations | |||||||||||||||||||||||||||||||||||||||||||||||||||||||||||||||||||||||||||||||
| Net investment income | $25,464,152 | $24,267,781 | |||||||||||||||||||||||||||||||||||||||||||||||||||||||||||||||||||||||||||||
| Net realized gain | 170,336,685 | 118,512,611 | |||||||||||||||||||||||||||||||||||||||||||||||||||||||||||||||||||||||||||||
| Change in net unrealized appreciation (depreciation) | 144,716,657 | 507,753,273 | |||||||||||||||||||||||||||||||||||||||||||||||||||||||||||||||||||||||||||||
| Increase in net assets resulting from operations | 340,517,494 | 650,533,665 | |||||||||||||||||||||||||||||||||||||||||||||||||||||||||||||||||||||||||||||
| Distributions to shareholders | |||||||||||||||||||||||||||||||||||||||||||||||||||||||||||||||||||||||||||||||
| From net investment income | |||||||||||||||||||||||||||||||||||||||||||||||||||||||||||||||||||||||||||||||
| Class A | (4,109,470 | ) | (4,447,391 | ) | |||||||||||||||||||||||||||||||||||||||||||||||||||||||||||||||||||||||||||
| Class B | (20,261 | ) | (84,926 | ) | |||||||||||||||||||||||||||||||||||||||||||||||||||||||||||||||||||||||||||
| Class C | (117,229 | ) | (294,696 | ) | |||||||||||||||||||||||||||||||||||||||||||||||||||||||||||||||||||||||||||
| Class I | (23,864,080 | ) | (13,972,213 | ) | |||||||||||||||||||||||||||||||||||||||||||||||||||||||||||||||||||||||||||
| Class R1 | (29,251 | ) | (31,871 | ) | |||||||||||||||||||||||||||||||||||||||||||||||||||||||||||||||||||||||||||
| Class R2 | (4,629 | ) | (1,320 | ) | |||||||||||||||||||||||||||||||||||||||||||||||||||||||||||||||||||||||||||
| Class R3 | (2,759 | ) | (891 | ) | |||||||||||||||||||||||||||||||||||||||||||||||||||||||||||||||||||||||||||
| Class R4 | (575 | ) | (514 | ) | |||||||||||||||||||||||||||||||||||||||||||||||||||||||||||||||||||||||||||
| Class R5 | (763 | ) | (624 | ) | |||||||||||||||||||||||||||||||||||||||||||||||||||||||||||||||||||||||||||
| Class R6 | (6,189 | ) | (1,654 | ) | |||||||||||||||||||||||||||||||||||||||||||||||||||||||||||||||||||||||||||
| Total distributions | (28,155,206 | ) | (18,836,100 | ) | |||||||||||||||||||||||||||||||||||||||||||||||||||||||||||||||||||||||||||
| From fund share transactions | (64,376,552 | ) | 470,927,923 | ||||||||||||||||||||||||||||||||||||||||||||||||||||||||||||||||||||||||||||
| Total increase | 247,985,736 | 1,102,625,488 | |||||||||||||||||||||||||||||||||||||||||||||||||||||||||||||||||||||||||||||
| Net assets | |||||||||||||||||||||||||||||||||||||||||||||||||||||||||||||||||||||||||||||||
| Beginning of year | 2,613,114,577 | 1,510,489,089 | |||||||||||||||||||||||||||||||||||||||||||||||||||||||||||||||||||||||||||||
| End of year | $2,861,100,313 | $2,613,114,577 | |||||||||||||||||||||||||||||||||||||||||||||||||||||||||||||||||||||||||||||
| Undistributed net investment income | $20,019,129 | $22,710,183 | |||||||||||||||||||||||||||||||||||||||||||||||||||||||||||||||||||||||||||||
Financial highlights
| Class A Shares Period ended | 10-31-14 | 10-31-13 | 10-31-12 | 10-31-11 | 10-31-10 | |||||||||||||||||||||||||||||||||||||||||||||||||||||||||||||||||||||||||||||||||||||||||||||||||||
| Per share operating performance | ||||||||||||||||||||||||||||||||||||||||||||||||||||||||||||||||||||||||||||||||||||||||||||||||||||||||
| Net asset value, beginning of period | $23.12 | $17.02 | $15.86 | $15.64 | $13.77 | |||||||||||||||||||||||||||||||||||||||||||||||||||||||||||||||||||||||||||||||||||||||||||||||||||
| Net investment income1 | 0.18 | 0.20 | 0.20 | 0.10 | 0.07 | |||||||||||||||||||||||||||||||||||||||||||||||||||||||||||||||||||||||||||||||||||||||||||||||||||
| Net realized and unrealized gain on investments | 2.72 | 6.09 | 1.12 | 0.15 | 1.91 | |||||||||||||||||||||||||||||||||||||||||||||||||||||||||||||||||||||||||||||||||||||||||||||||||||
| Total from investment operations | 2.90 | 6.29 | 1.32 | 0.25 | 1.98 | |||||||||||||||||||||||||||||||||||||||||||||||||||||||||||||||||||||||||||||||||||||||||||||||||||
| Less distributions | ||||||||||||||||||||||||||||||||||||||||||||||||||||||||||||||||||||||||||||||||||||||||||||||||||||||||
| From net investment income | (0.20 | ) | (0.19 | ) | (0.16 | ) | (0.03 | ) | (0.11 | ) | ||||||||||||||||||||||||||||||||||||||||||||||||||||||||||||||||||||||||||||||||||||||||||||||
| Total distributions | (0.20 | ) | (0.19 | ) | (0.16 | ) | (0.03 | ) | (0.11 | ) | ||||||||||||||||||||||||||||||||||||||||||||||||||||||||||||||||||||||||||||||||||||||||||||||
| Net asset value, end of period | $25.82 | $23.12 | $17.02 | $15.86 | $15.64 | |||||||||||||||||||||||||||||||||||||||||||||||||||||||||||||||||||||||||||||||||||||||||||||||||||
| Total return (%)2,3 | 12.64 | 37.32 | 8.45 | 1.59 | 14.48 | |||||||||||||||||||||||||||||||||||||||||||||||||||||||||||||||||||||||||||||||||||||||||||||||||||
| Ratios and supplemental data | ||||||||||||||||||||||||||||||||||||||||||||||||||||||||||||||||||||||||||||||||||||||||||||||||||||||||
| Net assets, end of period (in millions) | $384 | $476 | $417 | $557 | $931 | |||||||||||||||||||||||||||||||||||||||||||||||||||||||||||||||||||||||||||||||||||||||||||||||||||
| Ratios (as a percentage of average net assets): | ||||||||||||||||||||||||||||||||||||||||||||||||||||||||||||||||||||||||||||||||||||||||||||||||||||||||
| Expenses before reductions | 1.19 | 1.25 | 1.31 | 1.30 | 1.41 | |||||||||||||||||||||||||||||||||||||||||||||||||||||||||||||||||||||||||||||||||||||||||||||||||||
| Expenses including reductions | 1.18 | 1.25 | 1.31 | 1.30 | 1.33 | |||||||||||||||||||||||||||||||||||||||||||||||||||||||||||||||||||||||||||||||||||||||||||||||||||
| Net investment income | 0.73 | 1.00 | 1.24 | 0.59 | 0.47 | |||||||||||||||||||||||||||||||||||||||||||||||||||||||||||||||||||||||||||||||||||||||||||||||||||
| Portfolio turnover (%) | 24 | 30 | 37 | 37 | 55 | |||||||||||||||||||||||||||||||||||||||||||||||||||||||||||||||||||||||||||||||||||||||||||||||||||
| 1 | Based on average daily shares outstanding. | |||||||||||||||||||||||||||||||||||
| 2 | Does not reflect the effect of sales charges, if any. | |||||||||||||||||||||||||||||||||||
| 3 | Total returns would have been lower had certain expenses not been reduced during the applicable periods. | |||||||||||||||||||||||||||||||||||
| Class B Shares Period ended | 10-31-14 | 10-31-13 | 10-31-12 | 10-31-11 | 10-31-10 | |||||||||||||||||||||||||||||||||||||||||||||||||||||||||||||||||||||||||||||||||||||||||||||||||||
| Per share operating performance | ||||||||||||||||||||||||||||||||||||||||||||||||||||||||||||||||||||||||||||||||||||||||||||||||||||||||
| Net asset value, beginning of period | $22.72 | $16.73 | $15.58 | $15.45 | $13.62 | |||||||||||||||||||||||||||||||||||||||||||||||||||||||||||||||||||||||||||||||||||||||||||||||||||
| Net investment income (loss)1 | — | 2 | 0.07 | 0.08 | (0.03 | ) | (0.04 | ) | ||||||||||||||||||||||||||||||||||||||||||||||||||||||||||||||||||||||||||||||||||||||||||||||||
| Net realized and unrealized gain on investments | 2.68 | 5.98 | 1.10 | 0.16 | 1.89 | |||||||||||||||||||||||||||||||||||||||||||||||||||||||||||||||||||||||||||||||||||||||||||||||||||
| Total from investment operations | 2.68 | 6.05 | 1.18 | 0.13 | 1.85 | |||||||||||||||||||||||||||||||||||||||||||||||||||||||||||||||||||||||||||||||||||||||||||||||||||
| Less distributions | ||||||||||||||||||||||||||||||||||||||||||||||||||||||||||||||||||||||||||||||||||||||||||||||||||||||||
| From net investment income | (0.03 | ) | (0.06 | ) | (0.03 | ) | — | (0.02 | ) | |||||||||||||||||||||||||||||||||||||||||||||||||||||||||||||||||||||||||||||||||||||||||||||||
| Total distributions | (0.03 | ) | (0.06 | ) | (0.03 | ) | — | (0.02 | ) | |||||||||||||||||||||||||||||||||||||||||||||||||||||||||||||||||||||||||||||||||||||||||||||||
| Net asset value, end of period | $25.37 | $22.72 | $16.73 | $15.58 | $15.45 | |||||||||||||||||||||||||||||||||||||||||||||||||||||||||||||||||||||||||||||||||||||||||||||||||||
| Total return (%)3,4 | 11.79 | 36.30 | 7.62 | 0.84 | 13.63 | |||||||||||||||||||||||||||||||||||||||||||||||||||||||||||||||||||||||||||||||||||||||||||||||||||
| Ratios and supplemental data | ||||||||||||||||||||||||||||||||||||||||||||||||||||||||||||||||||||||||||||||||||||||||||||||||||||||||
| Net assets, end of period (in millions) | $11 | $18 | $25 | $41 | $57 | |||||||||||||||||||||||||||||||||||||||||||||||||||||||||||||||||||||||||||||||||||||||||||||||||||
| Ratios (as a percentage of average net assets): | ||||||||||||||||||||||||||||||||||||||||||||||||||||||||||||||||||||||||||||||||||||||||||||||||||||||||
| Expenses before reductions | 1.94 | 2.00 | 2.06 | 2.05 | 2.16 | |||||||||||||||||||||||||||||||||||||||||||||||||||||||||||||||||||||||||||||||||||||||||||||||||||
| Expenses including reductions | 1.93 | 2.00 | 2.06 | 2.05 | 2.08 | |||||||||||||||||||||||||||||||||||||||||||||||||||||||||||||||||||||||||||||||||||||||||||||||||||
| Net investment income (loss) | 0.01 | 0.34 | 0.50 | (0.16 | ) | (0.29 | ) | |||||||||||||||||||||||||||||||||||||||||||||||||||||||||||||||||||||||||||||||||||||||||||||||||
| Portfolio turnover (%) | 24 | 30 | 37 | 37 | 55 | |||||||||||||||||||||||||||||||||||||||||||||||||||||||||||||||||||||||||||||||||||||||||||||||||||
| 1 | Based on average daily shares outstanding. | |||||||||||||||||||||||||||||||||||
| 2 | Less than $0.005 per share. | |||||||||||||||||||||||||||||||||||
| 3 | Does not reflect the effect of sales charges, if any. | |||||||||||||||||||||||||||||||||||
| 4 | Total returns would have been lower had certain expenses not been reduced during the applicable periods. | |||||||||||||||||||||||||||||||||||
| Class C Shares Period ended | 10-31-14 | 10-31-13 | 10-31-12 | 10-31-11 | 10-31-10 | |||||||||||||||||||||||||||||||||||||||||||||||||||||||||||||||||||||||||||||||||||||||||||||||||||
| Per share operating performance | ||||||||||||||||||||||||||||||||||||||||||||||||||||||||||||||||||||||||||||||||||||||||||||||||||||||||
| Net asset value, beginning of period | $22.71 | $16.73 | $15.58 | $15.44 | $13.61 | |||||||||||||||||||||||||||||||||||||||||||||||||||||||||||||||||||||||||||||||||||||||||||||||||||
| Net investment income (loss)1 | (0.01 | ) | 0.05 | 0.08 | (0.03 | ) | (0.04 | ) | ||||||||||||||||||||||||||||||||||||||||||||||||||||||||||||||||||||||||||||||||||||||||||||||||
| Net realized and unrealized gain on investments | 2.69 | 5.99 | 1.10 | 0.17 | 1.89 | |||||||||||||||||||||||||||||||||||||||||||||||||||||||||||||||||||||||||||||||||||||||||||||||||||
| Total from investment operations | 2.68 | 6.04 | 1.18 | 0.14 | 1.85 | |||||||||||||||||||||||||||||||||||||||||||||||||||||||||||||||||||||||||||||||||||||||||||||||||||
| Less distributions | ||||||||||||||||||||||||||||||||||||||||||||||||||||||||||||||||||||||||||||||||||||||||||||||||||||||||
| From net investment income | (0.03 | ) | (0.06 | ) | (0.03 | ) | — | (0.02 | ) | |||||||||||||||||||||||||||||||||||||||||||||||||||||||||||||||||||||||||||||||||||||||||||||||
| Total distributions | (0.03 | ) | (0.06 | ) | (0.03 | ) | — | (0.02 | ) | |||||||||||||||||||||||||||||||||||||||||||||||||||||||||||||||||||||||||||||||||||||||||||||||
| Net asset value, end of period | $25.36 | $22.71 | $16.73 | $15.58 | $15.44 | |||||||||||||||||||||||||||||||||||||||||||||||||||||||||||||||||||||||||||||||||||||||||||||||||||
| Total return (%)2,3 | 11.80 | 36.24 | 7.62 | 0.91 | 13.64 | |||||||||||||||||||||||||||||||||||||||||||||||||||||||||||||||||||||||||||||||||||||||||||||||||||
| Ratios and supplemental data | ||||||||||||||||||||||||||||||||||||||||||||||||||||||||||||||||||||||||||||||||||||||||||||||||||||||||
| Net assets, end of period (in millions) | $101 | $95 | $81 | $101 | $132 | |||||||||||||||||||||||||||||||||||||||||||||||||||||||||||||||||||||||||||||||||||||||||||||||||||
| Ratios (as a percentage of average net assets): | ||||||||||||||||||||||||||||||||||||||||||||||||||||||||||||||||||||||||||||||||||||||||||||||||||||||||
| Expenses before reductions | 1.94 | 2.00 | 2.06 | 2.05 | 2.16 | |||||||||||||||||||||||||||||||||||||||||||||||||||||||||||||||||||||||||||||||||||||||||||||||||||
| Expenses including reductions | 1.93 | 2.00 | 2.06 | 2.05 | 2.08 | |||||||||||||||||||||||||||||||||||||||||||||||||||||||||||||||||||||||||||||||||||||||||||||||||||
| Net investment income (loss) | (0.04 | ) | 0.25 | 0.47 | (0.16 | ) | (0.29 | ) | ||||||||||||||||||||||||||||||||||||||||||||||||||||||||||||||||||||||||||||||||||||||||||||||||
| Portfolio turnover (%) | 24 | 30 | 37 | 37 | 55 | |||||||||||||||||||||||||||||||||||||||||||||||||||||||||||||||||||||||||||||||||||||||||||||||||||
| 1 | Based on average daily shares outstanding. | |||||||||||||||||||||||||||||||||||
| 2 | Does not reflect the effect of sales charges, if any. | |||||||||||||||||||||||||||||||||||
| 3 | Total returns would have been lower had certain expenses not been reduced during the applicable periods. | |||||||||||||||||||||||||||||||||||
| Class I Shares Period ended | 10-31-14 | 10-31-13 | 10-31-12 | 10-31-11 | 10-31-10 | |||||||||||||||||||||||||||||||||||||||||||||||||||||||||||||||||||||||||||||||||||||||||||||||||||
| Per share operating performance | ||||||||||||||||||||||||||||||||||||||||||||||||||||||||||||||||||||||||||||||||||||||||||||||||||||||||
| Net asset value, beginning of period | $23.19 | $17.07 | $15.93 | $15.70 | $13.81 | |||||||||||||||||||||||||||||||||||||||||||||||||||||||||||||||||||||||||||||||||||||||||||||||||||
| Net investment income1 | 0.24 | 0.25 | 0.26 | 0.16 | 0.12 | |||||||||||||||||||||||||||||||||||||||||||||||||||||||||||||||||||||||||||||||||||||||||||||||||||
| Net realized and unrealized gain on investments | 2.74 | 6.11 | 1.11 | 0.15 | 1.93 | |||||||||||||||||||||||||||||||||||||||||||||||||||||||||||||||||||||||||||||||||||||||||||||||||||
| Total from investment operations | 2.98 | 6.36 | 1.37 | 0.31 | 2.05 | |||||||||||||||||||||||||||||||||||||||||||||||||||||||||||||||||||||||||||||||||||||||||||||||||||
| Less distributions | ||||||||||||||||||||||||||||||||||||||||||||||||||||||||||||||||||||||||||||||||||||||||||||||||||||||||
| From net investment income | (0.27 | ) | (0.24 | ) | (0.23 | ) | (0.08 | ) | (0.16 | ) | ||||||||||||||||||||||||||||||||||||||||||||||||||||||||||||||||||||||||||||||||||||||||||||||
| Total distributions | (0.27 | ) | (0.24 | ) | (0.23 | ) | (0.08 | ) | (0.16 | ) | ||||||||||||||||||||||||||||||||||||||||||||||||||||||||||||||||||||||||||||||||||||||||||||||
| Net asset value, end of period | $25.90 | $23.19 | $17.07 | $15.93 | $15.70 | |||||||||||||||||||||||||||||||||||||||||||||||||||||||||||||||||||||||||||||||||||||||||||||||||||
| Total return (%)2 | 12.95 | 37.76 | 8.78 | 1.98 | 14.95 | |||||||||||||||||||||||||||||||||||||||||||||||||||||||||||||||||||||||||||||||||||||||||||||||||||
| Ratios and supplemental data | ||||||||||||||||||||||||||||||||||||||||||||||||||||||||||||||||||||||||||||||||||||||||||||||||||||||||
| Net assets, end of period (in millions) | $2,355 | $2,018 | $982 | $849 | $994 | |||||||||||||||||||||||||||||||||||||||||||||||||||||||||||||||||||||||||||||||||||||||||||||||||||
| Ratios (as a percentage of average net assets): | ||||||||||||||||||||||||||||||||||||||||||||||||||||||||||||||||||||||||||||||||||||||||||||||||||||||||
| Expenses before reductions | 0.93 | 0.94 | 0.97 | 0.94 | 0.92 | |||||||||||||||||||||||||||||||||||||||||||||||||||||||||||||||||||||||||||||||||||||||||||||||||||
| Expenses including reductions | 0.92 | 0.94 | 0.96 | 0.94 | 0.92 | |||||||||||||||||||||||||||||||||||||||||||||||||||||||||||||||||||||||||||||||||||||||||||||||||||
| Net investment income | 0.97 | 1.24 | 1.55 | 0.95 | 0.83 | |||||||||||||||||||||||||||||||||||||||||||||||||||||||||||||||||||||||||||||||||||||||||||||||||||
| Portfolio turnover (%) | 24 | 30 | 37 | 37 | 55 | |||||||||||||||||||||||||||||||||||||||||||||||||||||||||||||||||||||||||||||||||||||||||||||||||||
| 1 | Based on average daily shares outstanding. | |||||||||||||||||||||||||||||||||||
| 2 | Total returns would have been lower had certain expenses not been reduced during the applicable periods. | |||||||||||||||||||||||||||||||||||
| Class R1 Shares Period ended | 10-31-14 | 10-31-13 | 10-31-12 | 10-31-11 | 10-31-10 | |||||||||||||||||||||||||||||||||||||||||||||||||||||||||||||||||||||||||||||||||||||||||||||||||||
| Per share operating performance | ||||||||||||||||||||||||||||||||||||||||||||||||||||||||||||||||||||||||||||||||||||||||||||||||||||||||
| Net asset value, beginning of period | $23.13 | $17.03 | $15.87 | $15.68 | $13.77 | |||||||||||||||||||||||||||||||||||||||||||||||||||||||||||||||||||||||||||||||||||||||||||||||||||
| Net investment income1 | 0.08 | 0.13 | 0.15 | 0.04 | 0.05 | |||||||||||||||||||||||||||||||||||||||||||||||||||||||||||||||||||||||||||||||||||||||||||||||||||
| Net realized and unrealized gain on investments | 2.73 | 6.10 | 1.11 | 0.15 | 1.92 | |||||||||||||||||||||||||||||||||||||||||||||||||||||||||||||||||||||||||||||||||||||||||||||||||||
| Total from investment operations | 2.81 | 6.23 | 1.26 | 0.19 | 1.97 | |||||||||||||||||||||||||||||||||||||||||||||||||||||||||||||||||||||||||||||||||||||||||||||||||||
| Less distributions | ||||||||||||||||||||||||||||||||||||||||||||||||||||||||||||||||||||||||||||||||||||||||||||||||||||||||
| From net investment income | (0.11 | ) | (0.13 | ) | (0.10 | ) | — | (0.06 | ) | |||||||||||||||||||||||||||||||||||||||||||||||||||||||||||||||||||||||||||||||||||||||||||||||
| Total distributions | (0.11 | ) | (0.13 | ) | (0.10 | ) | — | (0.06 | ) | |||||||||||||||||||||||||||||||||||||||||||||||||||||||||||||||||||||||||||||||||||||||||||||||
| Net asset value, end of period | $25.83 | $23.13 | $17.03 | $15.87 | $15.68 | |||||||||||||||||||||||||||||||||||||||||||||||||||||||||||||||||||||||||||||||||||||||||||||||||||
| Total return (%)2 | 12.21 | 36.84 | 8.06 | 1.21 | 14.08 | |||||||||||||||||||||||||||||||||||||||||||||||||||||||||||||||||||||||||||||||||||||||||||||||||||
| Ratios and supplemental data | ||||||||||||||||||||||||||||||||||||||||||||||||||||||||||||||||||||||||||||||||||||||||||||||||||||||||
| Net assets, end of period (in millions) | $7 | $6 | $4 | $5 | $7 | |||||||||||||||||||||||||||||||||||||||||||||||||||||||||||||||||||||||||||||||||||||||||||||||||||
| Ratios (as a percentage of average net assets): | ||||||||||||||||||||||||||||||||||||||||||||||||||||||||||||||||||||||||||||||||||||||||||||||||||||||||
| Expenses before reductions | 1.57 | 1.60 | 1.65 | 1.64 | 1.48 | 3 | ||||||||||||||||||||||||||||||||||||||||||||||||||||||||||||||||||||||||||||||||||||||||||||||||||
| Expenses including reductions | 1.57 | 1.60 | 1.65 | 1.64 | 1.48 | 3 | ||||||||||||||||||||||||||||||||||||||||||||||||||||||||||||||||||||||||||||||||||||||||||||||||||
| Net investment income | 0.32 | 0.63 | 0.88 | 0.24 | 0.30 | |||||||||||||||||||||||||||||||||||||||||||||||||||||||||||||||||||||||||||||||||||||||||||||||||||
| Portfolio turnover (%) | 24 | 30 | 37 | 37 | 55 | |||||||||||||||||||||||||||||||||||||||||||||||||||||||||||||||||||||||||||||||||||||||||||||||||||
| 1 | Based on average daily shares outstanding. | |||||||||||||||||||||||||||||||||||
| 2 | Total returns would have been lower had certain expenses not been reduced during the applicable periods. | |||||||||||||||||||||||||||||||||||
| 3 | Includes the impact of a revision of 0.25% related to certain expense accruals. Without this adjustment, net investment income and total return for the year ended 10-31-10 would have been lower. | |||||||||||||||||||||||||||||||||||
| Class R2 Shares Period ended | 10-31-14 | 10-31-13 | 10-31-12 | 1 | |||||||||||||||||||||||||||||||||||||||||||||||||||||||||||||||||||||||||||||||
| Per share operating performance | |||||||||||||||||||||||||||||||||||||||||||||||||||||||||||||||||||||||||||||||||||
| Net asset value, beginning of period | $23.16 | $17.05 | $17.08 | ||||||||||||||||||||||||||||||||||||||||||||||||||||||||||||||||||||||||||||||||
| Net investment income2 | 0.17 | 0.18 | 0.13 | ||||||||||||||||||||||||||||||||||||||||||||||||||||||||||||||||||||||||||||||||
| Net realized and unrealized gain (loss) on investments | 2.75 | 6.15 | (0.16 | ) | |||||||||||||||||||||||||||||||||||||||||||||||||||||||||||||||||||||||||||||||
| Total from investment operations | 2.92 | 6.33 | (0.03 | ) | |||||||||||||||||||||||||||||||||||||||||||||||||||||||||||||||||||||||||||||||
| Less distributions | |||||||||||||||||||||||||||||||||||||||||||||||||||||||||||||||||||||||||||||||||||
| From net investment income | (0.23 | ) | (0.22 | ) | — | ||||||||||||||||||||||||||||||||||||||||||||||||||||||||||||||||||||||||||||||
| Total distributions | (0.23 | ) | (0.22 | ) | — | ||||||||||||||||||||||||||||||||||||||||||||||||||||||||||||||||||||||||||||||
| Net asset value, end of period | $25.85 | $23.16 | $17.05 | ||||||||||||||||||||||||||||||||||||||||||||||||||||||||||||||||||||||||||||||||
| Total return (%)3 | 12.70 | 37.53 | (0.18 | ) 4 | |||||||||||||||||||||||||||||||||||||||||||||||||||||||||||||||||||||||||||||||
| Ratios and supplemental data | |||||||||||||||||||||||||||||||||||||||||||||||||||||||||||||||||||||||||||||||||||
| Net assets, end of period (in millions) | — | 5 | — | 5 | — | 5 | |||||||||||||||||||||||||||||||||||||||||||||||||||||||||||||||||||||||||||||
| Ratios (as a percentage of average net assets): | |||||||||||||||||||||||||||||||||||||||||||||||||||||||||||||||||||||||||||||||||||
| Expenses before reductions | 1.19 | 1.13 | 1.13 | 6 | |||||||||||||||||||||||||||||||||||||||||||||||||||||||||||||||||||||||||||||||
| Expenses including reductions | 1.18 | 1.13 | 1.13 | 6 | |||||||||||||||||||||||||||||||||||||||||||||||||||||||||||||||||||||||||||||||
| Net investment income | 0.68 | 0.86 | 1.17 | 6 | |||||||||||||||||||||||||||||||||||||||||||||||||||||||||||||||||||||||||||||||
| Portfolio turnover (%) | 24 | 30 | 37 | 7 | |||||||||||||||||||||||||||||||||||||||||||||||||||||||||||||||||||||||||||||||
| 1 | The inception date for Class R2 shares is 3-1-12. | ||||||||||||||||||||||||||||
| 2 | Based on average daily shares outstanding. | ||||||||||||||||||||||||||||
| 3 | Total returns would have been lower had certain expenses not been reduced during the applicable periods. | ||||||||||||||||||||||||||||
| 4 | Not annualized. | ||||||||||||||||||||||||||||
| 5 | Less than $500,000. | ||||||||||||||||||||||||||||
| 6 | Annualized. | ||||||||||||||||||||||||||||
| 7 | The portfolio turnover is shown for the period from 11-1-11 to 10-31-12. | ||||||||||||||||||||||||||||
| Class R3 Shares Period ended | 10-31-14 | 10-31-13 | 10-31-12 | 10-31-11 | 10-31-10 | |||||||||||||||||||||||||||||||||||||||||||||||||||||||||||||||||||||||||||||||||||||||||||||||||||
| Per share operating performance | ||||||||||||||||||||||||||||||||||||||||||||||||||||||||||||||||||||||||||||||||||||||||||||||||||||||||
| Net asset value, beginning of period | $23.08 | $17.00 | $15.84 | $15.62 | $13.76 | |||||||||||||||||||||||||||||||||||||||||||||||||||||||||||||||||||||||||||||||||||||||||||||||||||
| Net investment income1 | 0.09 | 0.14 | 0.17 | 0.07 | — | 2 | ||||||||||||||||||||||||||||||||||||||||||||||||||||||||||||||||||||||||||||||||||||||||||||||||||
| Net realized and unrealized gain on investments | 2.74 | 6.10 | 1.12 | 0.15 | 1.93 | |||||||||||||||||||||||||||||||||||||||||||||||||||||||||||||||||||||||||||||||||||||||||||||||||||
| Total from investment operations | 2.83 | 6.24 | 1.29 | 0.22 | 1.93 | |||||||||||||||||||||||||||||||||||||||||||||||||||||||||||||||||||||||||||||||||||||||||||||||||||
| Less distributions | ||||||||||||||||||||||||||||||||||||||||||||||||||||||||||||||||||||||||||||||||||||||||||||||||||||||||
| From net investment income | (0.16 | ) | (0.16 | ) | (0.13 | ) | — | (0.07 | ) | |||||||||||||||||||||||||||||||||||||||||||||||||||||||||||||||||||||||||||||||||||||||||||||||
| Total distributions | (0.16 | ) | (0.16 | ) | (0.13 | ) | — | (0.07 | ) | |||||||||||||||||||||||||||||||||||||||||||||||||||||||||||||||||||||||||||||||||||||||||||||||
| Net asset value, end of period | $25.75 | $23.08 | $17.00 | $15.84 | $15.62 | |||||||||||||||||||||||||||||||||||||||||||||||||||||||||||||||||||||||||||||||||||||||||||||||||||
| Total return (%)3 | 12.34 | 37.01 | 8.28 | 1.41 | 14.04 | |||||||||||||||||||||||||||||||||||||||||||||||||||||||||||||||||||||||||||||||||||||||||||||||||||
| Ratios and supplemental data | ||||||||||||||||||||||||||||||||||||||||||||||||||||||||||||||||||||||||||||||||||||||||||||||||||||||||
| Net assets, end of period (in millions) | $1 | — | 4 | — | 4 | — | 4 | — | 4 | |||||||||||||||||||||||||||||||||||||||||||||||||||||||||||||||||||||||||||||||||||||||||||||||
| Ratios (as a percentage of average net assets): | ||||||||||||||||||||||||||||||||||||||||||||||||||||||||||||||||||||||||||||||||||||||||||||||||||||||||
| Expenses before reductions | 1.47 | 1.42 | 1.48 | 1.48 | 2.76 | |||||||||||||||||||||||||||||||||||||||||||||||||||||||||||||||||||||||||||||||||||||||||||||||||||
| Expenses including reductions | 1.47 | 1.41 | 1.48 | 1.48 | 1.73 | |||||||||||||||||||||||||||||||||||||||||||||||||||||||||||||||||||||||||||||||||||||||||||||||||||
| Net investment income | 0.37 | 0.65 | 1.01 | 0.44 | 0.02 | |||||||||||||||||||||||||||||||||||||||||||||||||||||||||||||||||||||||||||||||||||||||||||||||||||
| Portfolio turnover (%) | 24 | 30 | 37 | 37 | 55 | |||||||||||||||||||||||||||||||||||||||||||||||||||||||||||||||||||||||||||||||||||||||||||||||||||
| 1 | Based on average daily shares outstanding. | |||||||||||||||||||||||||||||||||||
| 2 | Less than $0.005 per share. | |||||||||||||||||||||||||||||||||||
| 3 | Total returns would have been lower had certain expenses not been reduced during the applicable periods. | |||||||||||||||||||||||||||||||||||
| 4 | Less than $500,000. | |||||||||||||||||||||||||||||||||||
| Class R4 Shares Period ended | 10-31-14 | 10-31-13 | 10-31-12 | 10-31-11 | 10-31-10 | |||||||||||||||||||||||||||||||||||||||||||||||||||||||||||||||||||||||||||||||||||||||||||||||||||
| Per share operating performance | ||||||||||||||||||||||||||||||||||||||||||||||||||||||||||||||||||||||||||||||||||||||||||||||||||||||||
| Net asset value, beginning of period | $23.19 | $17.07 | $15.90 | $15.64 | $13.77 | |||||||||||||||||||||||||||||||||||||||||||||||||||||||||||||||||||||||||||||||||||||||||||||||||||
| Net investment income1 | 0.23 | 0.25 | 0.23 | 0.13 | 0.05 | |||||||||||||||||||||||||||||||||||||||||||||||||||||||||||||||||||||||||||||||||||||||||||||||||||
| Net realized and unrealized gain on investments | 2.74 | 6.10 | 1.13 | 0.15 | 1.92 | |||||||||||||||||||||||||||||||||||||||||||||||||||||||||||||||||||||||||||||||||||||||||||||||||||
| Total from investment operations | 2.97 | 6.35 | 1.36 | 0.28 | 1.97 | |||||||||||||||||||||||||||||||||||||||||||||||||||||||||||||||||||||||||||||||||||||||||||||||||||
| Less distributions | ||||||||||||||||||||||||||||||||||||||||||||||||||||||||||||||||||||||||||||||||||||||||||||||||||||||||
| From net investment income | (0.26 | ) | (0.23 | ) | (0.19 | ) | (0.02 | ) | (0.10 | ) | ||||||||||||||||||||||||||||||||||||||||||||||||||||||||||||||||||||||||||||||||||||||||||||||
| Total distributions | (0.26 | ) | (0.23 | ) | (0.19 | ) | (0.02 | ) | (0.10 | ) | ||||||||||||||||||||||||||||||||||||||||||||||||||||||||||||||||||||||||||||||||||||||||||||||
| Net asset value, end of period | $25.90 | $23.19 | $17.07 | $15.90 | $15.64 | |||||||||||||||||||||||||||||||||||||||||||||||||||||||||||||||||||||||||||||||||||||||||||||||||||
| Total return (%)2 | 12.92 | 37.66 | 8.69 | 1.77 | 14.38 | |||||||||||||||||||||||||||||||||||||||||||||||||||||||||||||||||||||||||||||||||||||||||||||||||||
| Ratios and supplemental data | ||||||||||||||||||||||||||||||||||||||||||||||||||||||||||||||||||||||||||||||||||||||||||||||||||||||||
| Net assets, end of period (in millions) | — | 3 | — | 3 | — | 3 | — | 3 | — | 3 | ||||||||||||||||||||||||||||||||||||||||||||||||||||||||||||||||||||||||||||||||||||||||||||||
| Ratios (as a percentage of average net assets): | ||||||||||||||||||||||||||||||||||||||||||||||||||||||||||||||||||||||||||||||||||||||||||||||||||||||||
| Expenses before reductions | 1.07 | 1.10 | 1.13 | 1.15 | 2.87 | |||||||||||||||||||||||||||||||||||||||||||||||||||||||||||||||||||||||||||||||||||||||||||||||||||
| Expenses including reductions | 0.96 | 1.00 | 1.09 | 1.15 | 1.43 | |||||||||||||||||||||||||||||||||||||||||||||||||||||||||||||||||||||||||||||||||||||||||||||||||||
| Net investment income | 0.93 | 1.23 | 1.41 | 0.76 | 0.34 | |||||||||||||||||||||||||||||||||||||||||||||||||||||||||||||||||||||||||||||||||||||||||||||||||||
| Portfolio turnover (%) | 24 | 30 | 37 | 37 | 55 | |||||||||||||||||||||||||||||||||||||||||||||||||||||||||||||||||||||||||||||||||||||||||||||||||||
| 1 | Based on average daily shares outstanding. | |||||||||||||||||||||||||||||||||||
| 2 | Total returns would have been lower had certain expenses not been reduced during the applicable periods. | |||||||||||||||||||||||||||||||||||
| 3 | Less than $500,000. | |||||||||||||||||||||||||||||||||||
| �� | ||||||||||||||||||||||||||||||||||||||||||||||||||||||||||||||||||||||||||||||||||||||||||||||||||||||||
| Class R5 Shares Period ended | 10-31-14 | 10-31-13 | 10-31-12 | 10-31-11 | 10-31-10 | |||||||||||||||||||||||||||||||||||||||||||||||||||||||||||||||||||||||||||||||||||||||||||||||||||
| Per share operating performance | ||||||||||||||||||||||||||||||||||||||||||||||||||||||||||||||||||||||||||||||||||||||||||||||||||||||||
| Net asset value, beginning of period | $23.22 | $17.09 | $15.94 | $15.67 | $13.79 | |||||||||||||||||||||||||||||||||||||||||||||||||||||||||||||||||||||||||||||||||||||||||||||||||||
| Net investment income1 | 0.25 | 0.28 | 0.27 | 0.17 | 0.09 | |||||||||||||||||||||||||||||||||||||||||||||||||||||||||||||||||||||||||||||||||||||||||||||||||||
| Net realized and unrealized gain on investments | 2.74 | 6.11 | 1.11 | 0.15 | 1.93 | |||||||||||||||||||||||||||||||||||||||||||||||||||||||||||||||||||||||||||||||||||||||||||||||||||
| Total from investment operations | 2.99 | 6.39 | 1.38 | 0.32 | 2.02 | |||||||||||||||||||||||||||||||||||||||||||||||||||||||||||||||||||||||||||||||||||||||||||||||||||
| Less distributions | ||||||||||||||||||||||||||||||||||||||||||||||||||||||||||||||||||||||||||||||||||||||||||||||||||||||||
| From net investment income | (0.29 | ) | (0.26 | ) | (0.23 | ) | (0.05 | ) | (0.14 | ) | ||||||||||||||||||||||||||||||||||||||||||||||||||||||||||||||||||||||||||||||||||||||||||||||
| Total distributions | (0.29 | ) | (0.26 | ) | (0.23 | ) | (0.05 | ) | (0.14 | ) | ||||||||||||||||||||||||||||||||||||||||||||||||||||||||||||||||||||||||||||||||||||||||||||||
| Net asset value, end of period | $25.92 | $23.22 | $17.09 | $15.94 | $15.67 | |||||||||||||||||||||||||||||||||||||||||||||||||||||||||||||||||||||||||||||||||||||||||||||||||||
| Total return (%)2 | 13.02 | 37.87 | 8.85 | 2.07 | 14.72 | |||||||||||||||||||||||||||||||||||||||||||||||||||||||||||||||||||||||||||||||||||||||||||||||||||
| Ratios and supplemental data | ||||||||||||||||||||||||||||||||||||||||||||||||||||||||||||||||||||||||||||||||||||||||||||||||||||||||
| Net assets, end of period (in millions) | — | 3 | — | 3 | — | 3 | — | 3 | — | 3 | ||||||||||||||||||||||||||||||||||||||||||||||||||||||||||||||||||||||||||||||||||||||||||||||
| Ratios (as a percentage of average net assets): | ||||||||||||||||||||||||||||||||||||||||||||||||||||||||||||||||||||||||||||||||||||||||||||||||||||||||
| Expenses before reductions | 0.84 | 0.85 | 0.90 | 0.90 | 2.64 | |||||||||||||||||||||||||||||||||||||||||||||||||||||||||||||||||||||||||||||||||||||||||||||||||||
| Expenses including reductions | 0.83 | 0.85 | 0.90 | 0.90 | 1.13 | |||||||||||||||||||||||||||||||||||||||||||||||||||||||||||||||||||||||||||||||||||||||||||||||||||
| Net investment income | 1.03 | 1.37 | 1.62 | 1.02 | 0.63 | |||||||||||||||||||||||||||||||||||||||||||||||||||||||||||||||||||||||||||||||||||||||||||||||||||
| Portfolio turnover (%) | 24 | 30 | 37 | 37 | 55 | |||||||||||||||||||||||||||||||||||||||||||||||||||||||||||||||||||||||||||||||||||||||||||||||||||
| 1 | Based on average daily shares outstanding. | |||||||||||||||||||||||||||||||||||
| 2 | Total returns would have been lower had certain expenses not been reduced during the applicable periods. | |||||||||||||||||||||||||||||||||||
| 3 | Less than $500,000. | |||||||||||||||||||||||||||||||||||
| Class R6 Shares Period ended | 10-31-14 | 10-31-13 | 10-31-12 | 10-31-11 | 1 | |||||||||||||||||||||||||||||||||||||||||||||||||||||||||||||||||||||||||||||||||||||||
| Per share operating performance | ||||||||||||||||||||||||||||||||||||||||||||||||||||||||||||||||||||||||||||||||||||||||||||
| Net asset value, beginning of period | $23.21 | $17.09 | $15.93 | $15.38 | ||||||||||||||||||||||||||||||||||||||||||||||||||||||||||||||||||||||||||||||||||||||||
| Net investment income2 | 0.27 | 0.24 | 0.27 | 0.02 | ||||||||||||||||||||||||||||||||||||||||||||||||||||||||||||||||||||||||||||||||||||||||
| Net realized and unrealized gain on investments | 2.74 | 6.13 | 1.12 | 0.53 | ||||||||||||||||||||||||||||||||||||||||||||||||||||||||||||||||||||||||||||||||||||||||
| Total from investment operations | 3.01 | 6.37 | 1.39 | 0.55 | ||||||||||||||||||||||||||||||||||||||||||||||||||||||||||||||||||||||||||||||||||||||||
| Less distributions | ||||||||||||||||||||||||||||||||||||||||||||||||||||||||||||||||||||||||||||||||||||||||||||
| From net investment income | (0.28 | ) | (0.25 | ) | (0.23 | ) | — | |||||||||||||||||||||||||||||||||||||||||||||||||||||||||||||||||||||||||||||||||||||
| Total distributions | (0.28 | ) | (0.25 | ) | (0.23 | ) | — | |||||||||||||||||||||||||||||||||||||||||||||||||||||||||||||||||||||||||||||||||||||
| Net asset value, end of period | $25.94 | $23.21 | $17.09 | $15.93 | ||||||||||||||||||||||||||||||||||||||||||||||||||||||||||||||||||||||||||||||||||||||||
| Total return (%)3 | 13.11 | 37.80 | 8.93 | 3.58 | 4 | |||||||||||||||||||||||||||||||||||||||||||||||||||||||||||||||||||||||||||||||||||||||
| Ratios and supplemental data | ||||||||||||||||||||||||||||||||||||||||||||||||||||||||||||||||||||||||||||||||||||||||||||
| Net assets, end of period (in millions) | $1 | $1 | — | 5 | — | 5 | ||||||||||||||||||||||||||||||||||||||||||||||||||||||||||||||||||||||||||||||||||||||
| Ratios (as a percentage of average net assets): | ||||||||||||||||||||||||||||||||||||||||||||||||||||||||||||||||||||||||||||||||||||||||||||
| Expenses before reductions | 0.83 | 0.85 | 0.89 | 0.87 | 6 | |||||||||||||||||||||||||||||||||||||||||||||||||||||||||||||||||||||||||||||||||||||||
| Expenses including reductions | 0.80 | 0.85 | 0.89 | 0.87 | 6 | |||||||||||||||||||||||||||||||||||||||||||||||||||||||||||||||||||||||||||||||||||||||
| Net investment income | 1.08 | 1.13 | 1.61 | 0.90 | 6 | |||||||||||||||||||||||||||||||||||||||||||||||||||||||||||||||||||||||||||||||||||||||
| Portfolio turnover (%) | 24 | 30 | 37 | 37 | 7 | |||||||||||||||||||||||||||||||||||||||||||||||||||||||||||||||||||||||||||||||||||||||
| 1 | The inception date for Class R6 shares is 9-1-11. | |||||||||||||||||||||||||||||||
| 2 | Based on average daily shares outstanding. | |||||||||||||||||||||||||||||||
| 3 | Total returns would have been lower had certain expenses not been reduced during the applicable periods. | |||||||||||||||||||||||||||||||
| 4 | Not annualized. | |||||||||||||||||||||||||||||||
| 5 | Less than $500,000. | |||||||||||||||||||||||||||||||
| 6 | Annualized. | |||||||||||||||||||||||||||||||
| 7 | The portfolio turnover is shown for the period from 11-1-10 to 10-31-11. | |||||||||||||||||||||||||||||||
Note 1 — Organization
John Hancock Classic Value Fund (the fund) is a series of John Hancock Capital Series (the Trust), an open-end management investment company organized as a Massachusetts business trust and registered under the Investment Company Act of 1940, as amended (the 1940 Act). The investment objective of the fund is to seek long-term growth of capital.
The fund may offer multiple classes of shares. The shares currently offered are detailed in the Statement of assets and liabilities. Class A and Class C shares are offered to all investors. Class B shares are closed to new investors. Class I shares are offered to institutions and certain investors. Class R1, Class R2, Class R3, Class R4, and Class R5 shares are available only to certain retirement plans. Class R6 shares are available only to certain retirement plans, institutions and other investors. Shareholders of each class have exclusive voting rights to matters that affect that class. The distribution and service fees, if any, and transfer agent fees, for each class may differ. Class B shares convert to Class A shares eight years after purchase.
Note 2 — Significant accounting policies
The financial statements have been prepared in conformity with accounting principles generally accepted in the United States of America (US GAAP), which require management to make certain estimates and assumptions as of the date of the financial statements. Actual results could differ from those estimates and those differences could be significant. The fund intends to qualify as an investment company under Topic 946 of Accounting Standards Codification of US GAAP.
Events or transactions occurring after the end of the fiscal period through the date that the financial statements were issued have been evaluated in the preparation of the financial statements. The following summarizes the significant accounting policies of the fund:
Security valuation. Investments are stated at value as of the close of regular trading on the New York Stock Exchange (NYSE), normally at 4:00 p.m., Eastern Time. In order to value the securities, the fund uses the following valuation techniques: Equity securities held by the fund are valued at the last sale price or official closing price on the exchange where the security was acquired or most likely will be sold. In the event there were no sales during the day or closing prices are not available, the securities are valued using the last available bid price. Investments by the fund in open-end mutual funds, including John Hancock Collateral Investment Trust (JHCIT), are valued at their respective net asset values each business day. Foreign securities and currencies are valued in U.S. dollars, based on foreign currency exchange rates supplied by an independent pricing vendor. Certain short-term securities with maturities of 60 days or less at the time of purchase are valued at amortized cost. Other fund securities and assets, for which reliable market quotations are not readily available, are valued at fair value as determined in good faith by the fund's Pricing Committee following procedures established by the Board of Trustees. The frequency with which these fair valuation procedures are used cannot be predicted and fair value of securities may differ significantly from the value that would have been used had a ready market for such securities existed.
The fund uses a three-tier hierarchy to prioritize the pricing assumptions, referred to as inputs, used in valuation techniques to measure fair value. Level 1 includes securities valued using quoted prices in active markets for identical securities. Level 2 includes securities valued using other significant observable inputs. Observable inputs may include quoted prices for similar securities, interest rates, prepayment speeds and credit risk. Prices for securities valued using these inputs are received from independent pricing vendors and brokers and are based on an evaluation of the inputs described. Level 3 includes securities valued using significant unobservable inputs when market prices are not readily available or reliable, including the fund's own assumptions in determining the fair value of investments. Factors used in determining value may include market or issuer specific events or trends, changes in interest rates and credit quality. The inputs or methodology used for valuing securities are not necessarily an indication of the risks associated with investing in those securities. Changes in valuation techniques may result in transfers into or out of an assigned level within the disclosure hierarchy.
As of October 31, 2014, all investments are categorized as Level 1 under the hierarchy described above, except repurchase agreements, which are categorized as Level 2.
Repurchase agreements. The fund may enter into repurchase agreements. When the fund enters into a repurchase agreement, it receives collateral that is held in a segregated account by the fund's custodian. The collateral amount is marked-to-market and monitored on a daily basis to ensure that the collateral held is in an amount not less than the principal
29
amount of the repurchase agreement plus any accrued interest. Collateral received by the fund for repurchase agreements is disclosed in the Fund's investments as part of the caption related to the repurchase agreement.
Repurchase agreements are typically governed by the terms and conditions of the Master Repurchase Agreement and/or Global Master Repurchase Agreement (collectively, MRA). Upon an event of default, the non-defaulting party may close out all transactions traded under the MRA and net amounts owed. Absent an event of default, the MRA does not result in an offset of the reported amounts of assets and liabilities in the Statement of assets and liabilities. In the event of a default by the counterparty, realization of the collateral proceeds could be delayed, during which time the collateral value may decline or the counterparty may have insufficient assets to pay back claims resulting from close-out of the transactions.
Security transactions and related investment income. Investment security transactions are accounted for on a trade date plus one basis for daily net asset value calculations. However, for financial reporting purposes, investment transactions are reported on trade date. Interest income is accrued as earned. Dividend income is recorded on the ex-date, except for dividends of foreign securities where the dividend may not be known until after the ex-date. In those cases, dividend income, net of withholding taxes, is recorded when the fund becomes aware of the dividends. Foreign taxes are provided for based on the fund's understanding of the tax rules and rates that exist in the foreign markets in which it invests. Gains and losses on securities sold are determined on the basis of identified cost and may include proceeds from litigation.
Securities lending. The fund may lend its securities to earn additional income. The fund receives cash collateral from the borrower in an amount not less than the market value of the loaned securities. The fund will invest its collateral in JHCIT, an affiliate of the fund, which has a floating net asset value and is registered with the Securities and Exchange Commission as an investment company. JHCIT invests cash received as collateral as part of the securities lending program in short-term money market investments. The fund will receive the benefit of any gains and bear any losses generated by JHCIT with respect to the cash collateral.
If a borrower fails to return loaned securities when due, then the lending agent is responsible and indemnifies the fund for the lent securities. The lending agent uses the collateral received from the borrower to purchase replacement securities of the same issue, type, class and series of the loaned securities. If the value of the collateral is less than the purchase cost of replacement securities, the lending agent is responsible for satisfying the shortfall but only to the extent that the shortfall is not due to any decrease in the value of JHCIT.
Although the risk of the loss of the securities lent is mitigated by receiving collateral from the borrower and through lending agent indemnification, the fund could experience a delay in recovering securities or could experience a lower than expected return if the borrower fails to return the securities on a timely basis. The fund may receive compensation for lending its securities by retaining a portion of the return on the investment of the collateral and compensation from fees earned from borrowers of the securities. Net income received from JHCIT is a component of securities lending income as recorded on the Statement of Operations.
Obligations to repay collateral received by the fund is shown on the Statement of assets and liabilities as Payable upon return of securities loaned.
Foreign taxes. The fund may be subject to withholding tax on income and/or capital gains or repatriation taxes imposed by certain countries in which the fund invests. Taxes are accrued based upon investment income, realized gains or unrealized appreciation.
Line of credit. The fund may borrow from banks for temporary or emergency purposes, including meeting redemption requests that otherwise might require the untimely sale of securities. Pursuant to the fund's custodian agreement, the custodian may loan money to the fund to make properly authorized payments. The fund is obligated to repay the custodian for any overdraft, including any related costs or expenses. The custodian may have a lien, security interest or security entitlement in any fund property that is not otherwise segregated or pledged, to the maximum extent permitted by law, to the extent of any overdraft.
30
In addition, the fund and other affiliated funds have entered into an agreement with Citibank N.A. that enables them to participate in a $300 million unsecured committed line of credit. A commitment fee, payable at the end of each calendar quarter, based on the average daily unused portion of the line of credit, is charged to each participating fund on a pro rata basis and is reflected in other expenses on the Statement of operations. Commitment fees for the year ended October 31, 2014 were $1,354. For the year ended October 31, 2014, the fund had no borrowings under the line of credit.
Expenses. Within the John Hancock group of funds complex, expenses that are directly attributable to an individual fund are allocated to such fund. Expenses that are not readily attributable to a specific fund are allocated among all funds in an equitable manner, taking into consideration, among other things, the nature and type of expense and the fund's relative net assets. Expense estimates are accrued in the period to which they relate and adjustments are made when actual amounts are known.
Class allocations. Income, common expenses and realized and unrealized gains (losses) are determined at the fund level and allocated daily to each class of shares based on the net assets of the class. Class-specific expenses, such as distribution and service fees, if any, and transfer agent fees, for all classes, are calculated daily at the class level based on the appropriate net assets of each class and the specific expense rates applicable to each class.
Federal income taxes. The fund intends to continue to qualify as a regulated investment company by complying with the applicable provisions of the Internal Revenue Code and will not be subject to federal income tax on taxable income that is distributed to shareholders. Therefore, no federal income tax provision is required.
Under the Regulated Investment Company Modernization Act of 2010, the fund is permitted to carry forward capital losses incurred in taxable years beginning after December 22, 2010 for an unlimited period. Any losses incurred during those taxable years will be required to be utilized prior to the losses incurred in pre-enactment taxable years. As a result of this ordering rule, pre-enactment capital loss carryforwards may be more likely to expire unused. Additionally, post-enactment capital losses that are carried forward will retain their character as either short-term or long-term capital losses rather than being considered all short-term as under previous law.
For federal income tax purposes, as of October 31, 2014, the fund has a capital loss carryforward of $1,872,070,559 available to offset future net realized capital gains. This carryforward expires as follows: October 31, 2016 - $392,858,897 and October 31, 2017 - $1,479,211,662.
As of October 31, 2014, the fund had no uncertain tax positions that would require financial statement recognition, derecognition or disclosure. The fund's federal tax returns are subject to examination by the Internal Revenue Service for a period of three years.
Distribution of income and gains. Distributions to shareholders from net investment income and net realized gains, if any, are recorded on the ex-date. The fund generally declares and pays dividends and capital gain distributions, if any, annually.
The tax character of distributions for the years ended October 31, 2014 and 2013 was as follows:
| October 31, 2014 | October 31, 2013 | |
| Ordinary Income | $28,155,206 | $18,836,100 |
Distributions paid by the fund with respect to each class of shares are calculated in the same manner, at the same time and in the same amount, except for the effect of class level expenses that may be applied differently to each class. As of October 31, 2014, the components of distributable earnings on a tax basis consisted of $20,019,129 of undistributed ordinary income.
Such distributions and distributable earnings, on a tax basis, are determined in conformity with income tax regulations, which may differ from US GAAP. Distributions in excess of tax basis earnings and profits, if any, are reported in the fund's financial statements as a return of capital.
31
Capital accounts within the financial statements are adjusted for permanent book-tax differences. These adjustments have no impact on net assets or the results of operations. Temporary book-tax differences, if any, will reverse in a subsequent period. Book-tax differences are primarily attributable to wash sale loss deferrals and redemptions in kind.
Note 3 — Guarantees and indemnifications
Under the Trust's organizational documents, its Officers and Trustees are indemnified against certain liabilities arising out of the performance of their duties to the Trust, including the fund. Additionally, in the normal course of business, the fund enters into contracts with service providers that contain general indemnification clauses. The fund's maximum exposure under these arrangements is unknown, as this would involve future claims that may be made against the fund that have not yet occurred. The risk of material loss from such claims is considered remote.
Note 4 — Fees and transactions with affiliates
John Hancock Advisers, LLC (the Advisor) serves as investment advisor for the fund. John Hancock Funds, LLC (the Distributor), an affiliate of the Advisor, serves as principal underwriter of the Fund. The Advisor and the Distributor are indirect, wholly owned subsidiaries of Manulife Financial Corporation (MFC).
Management fee. The fund has an investment management agreement with the Advisor under which the fund pays a monthly management fee to the Advisor on an annual basis, to the sum of: (a) 0.750% of the first $2.5 billion of the fund's average daily net assets; (b) 0.740% of the next $2.5 billion of the fund's average daily net assets; and (c) 0.730% of the fund's average daily net assets in excess of $5 billion. The Advisor has a subadvisory agreement with Pzena Investment Management, LLC. The fund is not responsible for payment of the subadvisory fees.
The Advisor has contractually agreed to waive a portion of its management fee and/or reimburse expenses for certain funds of the John Hancock complex, including the fund (the participating portfolios). The waiver equals, on an annualized basis, 0.010% of that portion of the aggregate net assets of all the participating portfolios that exceeds $75 billion but is less than or equal to $125 billion; 0.0125% of that portion of the aggregate net assets of all the participating portfolios that exceeds $125 billion but is less than or equal to $150 billion; and 0.015% of that portion of the aggregate net assets of all the participating portfolios that exceeds $150 billion. The amount of the reimbursement is calculated daily and allocated among all the participating portfolios in proportion to the daily net assets of each fund. This arrangement may be amended or terminated at any time by the Advisor upon notice to the fund and with the approval of the Board of Trustees.
Effective February 1, 2014, for Class R6 shares, the Advisor has contractually agreed to waive and/or reimburse all class specific expenses of the fund, including transfer agency fees and service fees, as applicable, to the extent they exceed 0.00% of average net assets. The fee waiver and/or reimbursement will continue in effect until February 28, 2015, unless renewed by mutual agreement of the fund and Advisor based upon a determination that this is appropriate under the circumstances at the time. This waiver was in effect on a voluntary basis from January 1, 2014 to January 31, 2014.
Effective March 1, 2014, the Advisor has contractually agreed to waive and/or reimburse all class specific expenses for Class B shares of the fund, including Rule 12b-1 fees and transfer agency fees and service fees, as applicable, to the extent they exceed 1.30% of average net assets (on an annualized basis) attributable to Class B shares (the Class Expense Waiver). The Class Expense Waiver expires on February 28, 2015, unless renewed by mutual agreement of the fund and the Advisor based upon a determination that this is appropriate under the circumstances at that time.
For the year ended October 31, 2014, these expense reductions described above amounted to the following:
| Class | Expense reduction | Class | Expense reduction | |
| Class A | $31,511 | Class R3 | $55 | |
| Class B | 902 | Class R4 | 4 | |
| Class C | 6,679 | Class R5 | 5 | |
| Class I | 151,167 | Class R6 | 128 | |
| Class R1 | 445 | Total | $190,922 | |
| Class R2 | 26 |
32
The investment management fees, including the impact of the waivers and reimbursements as described above, incurred for the year ended October 31, 2014 were equivalent to a net annual effective rate of 0.74% of the fund's average daily net assets.
Accounting and legal services. Pursuant to the Accounting and Legal Services Agreement, the fund reimburses the Advisor for all expenses associated with providing the administrative, financial, legal, accounting and recordkeeping services to the fund, including the preparation of all tax returns, periodic reports to shareholders and regulatory reports, among other services. These expenses are allocated to each share class based on its relative net assets at the time the expense was incurred. These accounting and legal services fees incurred for the period ended October 31, 2014 amounted to an annual rate of 0.02% of the fund's average daily net assets.
Distribution and service plans. The fund has a distribution agreement with the Distributor. The fund has adopted distribution and service plans with respect to Class A, Class B, Class C, Class R1, Class R2, Class R3, and Class R4 shares pursuant to Rule 12b-1 under the 1940 Act, to pay the Distributor for services provided as the distributor of shares of the fund. In addition, under a service plan for Class R1, Class R2, Class R3, Class R4 and Class R5 shares, the fund pays for certain other services. The fund may pay up to the following contractual rates of distribution and service fees under these arrangements, expressed as an annual percentage of average daily net assets for each class of the fund's shares.
| Class | Rule 12b-1 fee | Service fee | Class | Rule 12b-1 fee | Service fee | |
| Class A | 0.25% | — | Class R2 | 0.25% | 0.25% | |
| Class B | 1.00% | — | Class R3 | 0.50% | 0.15% | |
| Class C | 1.00% | — | Class R4 | 0.25% | 0.10% | |
| Class R1 | 0.50% | 0.25% | Class R5 | — | 0.05% |
The fund's Distributor has contractually agreed to waive 0.10% of 12b-1 fees for Class R4 shares to limit the 12b-1 fees on Class R4 to 0.15% of the average daily net assets of Class R4 shares, until at least February 28, 2015, unless renewed by mutual agreement of the fund and the Distributor based upon a determination that this is appropriate under the circumstances at the time. Reimbursements related to this contractual waiver amounted to $55 for Class R4 shares for the year ended October 31, 2014.
Sales charges. Class A shares are assessed up-front sales charges, which resulted in payments to the Distributor amounting to $841,679 for the year ended October 31, 2014. Of this amount, $140, 598 was retained and used for printing prospectuses, advertising, sales literature and other purposes, $689,603 was paid as sales commissions to broker-dealers and $11,478 was paid as sales commissions to sales personnel of Signator Investors, Inc., a broker-dealer affiliate of the Advisor.
Class A, Class B and Class C shares may be subject to contingent deferred sales charges (CDSCs). Certain Class A shares that are acquired through purchases of $1 million or more and are redeemed within one year of purchase are subject to a 1.00% sales charge. Class B shares that are redeemed within six years of purchase are subject to CDSCs, at declining rates, beginning at 5.00%. Class C shares that are redeemed within one year of purchase are subject to a 1.00% CDSC. CDSCs are applied to the lesser of the current market value at the time of redemption or the original purchase cost of the shares being redeemed. Proceeds from CDSCs are used to compensate the Distributor for providing distribution-related services in connection with the sale of these shares. During the year ended October 31, 2014, CDSCs received by the Distributor amounted to $1,085, $13,724 and $10,010 for Class A, Class B and Class C shares, respectively.
Transfer agent fees. The fund has a transfer agent agreement with John Hancock Signature Services, Inc. (Signature Services), an affiliate of the Advisor. The transfer agent fees paid to Signature Services are determined based on the cost to Signature Services (Signature Services Cost) of providing recordkeeping services. The Signature Services Cost includes a component of allocated John Hancock corporate overhead for providing transfer agent services to the fund and to all other John Hancock affiliated funds. It also includes out-of-pocket expenses, including payments made to third-parties for recordkeeping services provided to their clients who invest in one or more John Hancock funds. In addition, Signature
33
Services Cost may be reduced by certain fees that Signature Services receives in connection with retirement and small accounts. Signature Services Cost is calculated monthly and allocated, as applicable, to five categories of share classes: Retail Share and Institutional Classes of Non-Municipal Bond Funds, Class R6 Shares, Retirement Share Classes and Municipal Bond Share Classes. Within each of these categories, the applicable costs are allocated to the affected John Hancock affiliated funds and/or classes, based on the relative average daily net assets.
Class level expenses. Class level expenses for the year ended October 31, 2014 were:
| Class | Distribution and service fees | Transfer agent fees |
| Class A | $1,189,764 | $632,145 |
| Class B | 137,341 | 18,273 |
| Class C | 1,001,292 | 133,023 |
| Class I | — | 2,749,982 |
| Class R1 | 49,547 | 1,289 |
| Class R2 | 1,429 | 77 |
| Class R3 | 5,231 | 156 |
| Class R4 | 138 | 11 |
| Class R5 | 12 | 16 |
| Class R6 | — | 108 |
| Total | $2,384,754 | $3,535,080 |
Trustee expenses. The fund compensates each Trustee who is not an employee of the Advisor or its affiliates. The costs of paying Trustee compensation and expenses are allocated to each fund based on its net assets relative to other funds within the John Hancock group of funds complex.
Note 5 — Fund share transactions
Transactions in fund shares for the years ended October 31, 2014 and 2013 were as follows:
| Year ended 10-31-14 | Year ended 10-31-13 | |||||||||||||||||||||||||
| Shares | Amount | Shares | Amount | |||||||||||||||||||||||
| Class A shares | ||||||||||||||||||||||||||
| Sold | 2,393,476 | $58,359,607 | 3,309,755 | $68,198,272 | ||||||||||||||||||||||
| Distributions reinvested | 166,923 | 3,917,695 | 244,120 | 4,242,801 | ||||||||||||||||||||||
| Repurchased | (8,252,020 | ) | (209,538,636 | ) | (7,484,512 | ) | (149,090,184 | ) | ||||||||||||||||||
| Net decrease | (5,691,621 | ) | $(147,261,334 | ) | (3,930,637 | ) | $(76,649,111 | ) | ||||||||||||||||||
| Class B shares | ||||||||||||||||||||||||||
| Sold | 52,852 | $1,296,475 | 83,696 | $1,714,456 | ||||||||||||||||||||||
| Distributions reinvested | 732 | 16,985 | 4,086 | 70,231 | ||||||||||||||||||||||
| Repurchased | (395,219 | ) | (9,464,994 | ) | (807,414 | ) | (15,767,418 | ) | ||||||||||||||||||
| Net decrease | (341,635 | ) | $(8,151,534 | ) | (719,632 | ) | $(13,982,731 | ) | ||||||||||||||||||
| Class C shares | ||||||||||||||||||||||||||
| Sold | 545,108 | $13,266,782 | 411,076 | $8,548,943 | ||||||||||||||||||||||
| Distributions reinvested | 3,925 | 91,077 | 13,083 | 224,894 | ||||||||||||||||||||||
| Repurchased | (728,241 | ) | (17,751,252 | ) | (1,124,381 | ) | (21,924,454 | ) | ||||||||||||||||||
| Net decrease | (179,208 | ) | $(4,393,393 | ) | (700,222 | ) | $(13,150,617 | ) | ||||||||||||||||||
34
| Year ended 10-31-14 | Year ended 10-31-13 | |||||||||||||||||||||||||
| Shares | Amount | Shares | Amount | |||||||||||||||||||||||
| Class I shares | ||||||||||||||||||||||||||
| Sold | 29,657,292 | $734,896,493 | 49,127,030 | $973,418,801 | ||||||||||||||||||||||
| Distributions reinvested | 576,503 | 13,536,284 | 680,619 | 11,835,972 | ||||||||||||||||||||||
| Repurchased | (26,306,871 | ) | (654,126,626 | ) | (20,319,128 | ) | (411,548,827 | ) | ||||||||||||||||||
| Net increase | 3,926,924 | $94,306,151 | 29,488,521 | $573,705,946 | ||||||||||||||||||||||
| Class R1 shares | ||||||||||||||||||||||||||
| Sold | 61,721 | $1,522,821 | 74,870 | $1,571,075 | ||||||||||||||||||||||
| Distributions reinvested | 1,043 | 24,573 | 1,665 | 29,057 | ||||||||||||||||||||||
| Repurchased | (45,226 | ) | (1,126,366 | ) | (75,071 | ) | (1,455,208 | ) | ||||||||||||||||||
| Net increase | 17,538 | $421,028 | 1,464 | $144,924 | ||||||||||||||||||||||
| Class R2 shares | ||||||||||||||||||||||||||
| Sold | 10,770 | $261,314 | 15,670 | $342,245 | ||||||||||||||||||||||
| Distributions reinvested | 127 | 2,974 | — | — | ||||||||||||||||||||||
| Repurchased | (14,328 | ) | (333,734 | ) | (1,806 | ) | (41,038 | ) | ||||||||||||||||||
| Net increase (decrease) | (3,431 | ) | $(69,446 | ) | 13,864 | $301,207 | ||||||||||||||||||||
| Class R3 shares | ||||||||||||||||||||||||||
| Sold | 29,406 | $717,630 | 12,278 | $250,954 | ||||||||||||||||||||||
| Distributions reinvested | 102 | 2,397 | 31 | 536 | ||||||||||||||||||||||
| Repurchased | (1,708 | ) | (41,670 | ) | (1,062 | ) | (22,424 | ) | ||||||||||||||||||
| Net increase | 27,800 | $678,357 | 11,247 | $229,066 | ||||||||||||||||||||||
| Class R5 shares | ||||||||||||||||||||||||||
| Sold | 1,932 | $48,864 | 146 | $3,180 | ||||||||||||||||||||||
| Distributions reinvested | 5 | 109 | 3 | 56 | ||||||||||||||||||||||
| Repurchased | (9 | ) | (239 | ) | (22 | ) | (481 | ) | ||||||||||||||||||
| Net increase | 1,928 | $48,734 | 127 | $2,755 | ||||||||||||||||||||||
| Class R6 Shares | ||||||||||||||||||||||||||
| Sold | 2,995 | $74,411 | 17,218 | $373,839 | ||||||||||||||||||||||
| Distributions reinvested | 185 | 4,345 | — | — | ||||||||||||||||||||||
| Repurchased | (1,365 | ) | (33,871 | ) | (2,168 | ) | (47,355 | ) | ||||||||||||||||||
| Net increase | 1,815 | $44,885 | 15,050 | 326,484 | ||||||||||||||||||||||
| Total net increase (decrease) | (2,239,890 | ) | $(64,376,552 | ) | 24,179,782 | $470,927,923 | ||||||||||||||||||||
On March 14, 2014, the fund had a redemption in kind of $91,420,475, which represented approximately 3% of the fund on that date. For purposes of US GAAP, this transaction was treated as a sale of securities and the resulting gains and losses were recognized based on the market value of the securities on the date of the transfer. For tax purposes, no gains or losses were recognized. Net realized gain resulting from such redemption in kind is shown on the Statement of operations.
Affiliates of the fund owned 36%, 5%, 100%, 49% and 28% of shares of beneficial interest of Class R2, Class R3, Class R4, Class R5, and Class R6, respectively, on October 31, 2014.
Class R4 Shares had no fund share transactions for the years ended October 31, 2014 and 2013.
Note 6 — Purchase and sale of securities
Purchases and sales of securities, other than short-term investments, amounted to $691,786,542 and $677,835,493, respectively, for the year ended October 31, 2014.
35
Report of Independent Registered Public Accounting Firm
To the Board of Trustees of John Hancock Capital Series and Shareholders of
John Hancock Classic Value Fund:
In our opinion, the accompanying statement of assets and liabilities, including the fund's investments, and the related statements of operations and of changes in net assets and the financial highlights present fairly, in all material respects, the financial position of John Hancock Classic Value Fund (the "Fund") at October 31, 2014, the results of its operations for the year then ended, the changes in its net assets for each of the two years in the period then ended and the financial highlights for each of the periods indicated, in conformity with accounting principles generally accepted in the United States of America. These financial statements and financial highlights (hereafter referred to as "financial statements") are the responsibility of the Fund's management. Our responsibility is to express an opinion on these financial statements based on our audits. We conducted our audits of these financial statements in accordance with the standards of the Public Company Accounting Oversight Board (United States). Those standards require that we plan and perform the audit to obtain reasonable assurance about whether the financial statements are free of material misstatement. An audit includes examining, on a test basis, evidence supporting the amounts and disclosures in the financial statements, assessing the accounting principles used and significant estimates made by management, and evaluating the overall financial statement presentation. We believe that our audits, which included confirmation of securities at October 31, 2014 by correspondence with the custodian, transfer agent and brokers, and the application of alternative auditing procedures where securities purchased confirmations had not been received, provide a reasonable basis for our opinion.
PricewaterhouseCoopers LLP
Boston, Massachusetts
December 12, 2014
36
Unaudited
For federal income tax purposes, the following information is furnished with respect to the distributions of the fund, if any, paid during its taxable year ended October 31, 2014.
The fund reports the maximum amount allowable of its net taxable income as eligible for the corporate dividends-received deduction.
The fund reports the maximum amount allowable of its net taxable income as qualified dividend income as provided in the Jobs and Growth Tax Relief Reconciliation Act of 2003.
Eligible shareholders will be mailed a 2014 Form 1099-DIV in early 2015. This will reflect the tax character of all distributions paid in calendar year 2014.
Please consult a tax advisor regarding the tax consequences of your investment in the fund.
37
Continuation of Investment Advisory and Subadvisory Agreements
Evaluation of Advisory and Subadvisory Agreements by the Board of Trustees
This section describes the evaluation by the Board of Trustees (the Board) of Capital Series (the Trust) of the Advisory Agreement (the Advisory Agreement) with John Hancock Advisers, LLC (the Advisor) and the Subadvisory Agreement (the Subadvisory Agreement) with Pzena Investment Management, LLC (the Subadvisor), for John Hancock Classic Value Fund (the fund). The Advisory Agreement and Subadvisory Agreement are collectively referred to as the Agreements. Prior to the June 23-25, 2014 meeting at which the Agreements were approved, the Board also discussed and considered information regarding the proposed continuation of the Agreements at an in-person meeting held on May 27-29, 2014.
Approval of Advisory and Subadvisory Agreements
At in-person meetings held on June 23-25, 2014, the Board, including the Trustees who are not considered to be interested persons of the Trust under the Investment Company Act of 1940, as amended (the 1940 Act) (the Independent Trustees), reapproved for an annual period the continuation of the Advisory Agreement between the Trust and the Advisor and the Subadvisory Agreement between the Advisor and the Subadvisor with respect to the fund.
In considering the Advisory Agreement and the Subadvisory Agreement, the Board received in advance of the meetings a variety of materials relating to the fund, the Advisor and the Subadvisor, including comparative performance, fee and expense information for a peer group of similar funds prepared by an independent third-party provider of fund data, performance information for an applicable benchmark index; and, with respect to the Subadvisor, comparative performance information for comparably managed accounts, as applicable, and other information provided by the Advisor and the Subadvisor regarding the nature, extent and quality of services provided by the Advisor and the Subadvisor under their respective Agreements, as well as information regarding the Advisor's revenues and costs of providing services to the fund and any compensation paid to affiliates of the Advisor. At the meetings at which the renewal of the Advisory Agreement and Subadvisory Agreement are considered, particular focus is given to information concerning fund performance, comparability of fees and total expenses, and profitability. However, the Board notes that the evaluation process with respect to the Advisor and the Subadvisor is an ongoing one. In this regard, the Board also took into account discussions with management and information provided to the Board at prior meetings with respect to the services provided by the Advisor and the Subadvisor to the fund, including quarterly performance reports prepared by management containing reviews of investment results and prior presentations from the Subadvisor with respect to the fund. The Board also considered the nature, quality, and extent of non-advisory services, if any, to be provided to the fund by the Advisor's affiliates, including distribution services.
Throughout the process, the Board asked questions of and requested additional information from management. The Board is assisted by counsel for the Trust and the Independent Trustees are also separately assisted by independent legal counsel throughout the process. The Independent Trustees also received a memorandum from their independent legal counsel discussing the legal standards for their consideration of the proposed continuation of the Agreements and discussed the proposed continuation of the Agreements in private sessions with their independent legal counsel at which no representatives of management were present.
Approval of Advisory Agreement
In approving the Advisory Agreement with respect to the fund, the Board, including the Independent Trustees, considered a variety of factors, including those discussed below. The Board also considered other factors (including conditions and trends prevailing generally in the economy, the securities markets, and the industry) and does not treat any single factor as determinative, and each Trustee may attribute different weights to different factors. The Board's conclusions may be based in part on its consideration of the advisory and subadvisory arrangements in prior years and on the Board's ongoing regular review of fund performance and operations throughout the year.
Nature, extent, and quality of services. Among the information received by the Board from the Advisor relating to the nature, extent, and quality of services provided to the fund, the Board reviewed information provided by the Advisor relating to its
38
operations and personnel, descriptions of its organizational and management structure, and information regarding the Advisor's compliance and regulatory history, including its Form ADV. The Board also noted that on a regular basis it receives and reviews information from the Trust's Chief Compliance Officer (CCO) regarding the fund's compliance policies and procedures established pursuant to Rule 38a-1 under the 1940 Act. The Board also considered the Advisor's risk management processes. The Board considered that the Advisor is responsible for the management of the day-to-day operations of the fund, including, but not limited to, general supervision of and coordination of the services provided by the Subadvisor, and is also responsible for monitoring and reviewing the activities of the Subadvisor and other third-party service providers.
In considering the nature, extent, and quality of the services provided by the Advisor, the Trustees also took into account their knowledge of the Advisor's management and the quality of the performance of the Advisor's duties, through Board meetings, discussions and reports during the preceding year and through each Trustee's experience as a Trustee of the Trust and of the other trusts in the complex.
In the course of their deliberations regarding the Advisory Agreement, the Board considered, among other things:
| (a) | the skills and competency with which the Advisor has in the past managed the Trust's affairs and its subadvisory relationship, the Advisor's oversight and monitoring of the Subadvisor's investment performance and compliance programs, such as the Subadvisor's compliance with fund policies and objectives, review of brokerage matters, including with respect to trade allocation and best execution and the Advisor's timeliness in responding to performance issues; | |
| (b) | the background, qualifications and skills of the Advisor's personnel; | |
| (c) | the Advisor's compliance policies and procedures and its responsiveness to regulatory changes and mutual fund industry developments; | |
| (d) | the Advisor's administrative capabilities, including its ability to supervise the other service providers for the fund; | |
| (e) | the financial condition of the Advisor and whether it has the financial wherewithal to provide a high level and quality of services to the fund; and | |
| (f) | the Advisor's reputation and experience in serving as an investment advisor to the Trust and the benefit to shareholders of investing in funds that are part of a family of funds offering a variety of investments. |
The Board concluded that the Advisor may reasonably be expected to continue to provide a high quality of services under the Advisory Agreement with respect to the fund.
Investment performance. In considering the fund's performance, the Board noted that it reviews at its regularly scheduled meetings information about the fund's performance results. In connection with the consideration of the Advisory Agreement, the Board:
| (a) | reviewed information prepared by management regarding the fund's performance; | |
| (b) | considered the comparative performance of an applicable benchmark index; | |
| (c) | considered the performance of comparable funds, if any, as included in the report prepared by an independent third-party provider of fund data; and | |
| (d) | took into account the Advisor's analysis of the fund's performance and its plans and recommendations regarding the Trust's subadvisory arrangements generally. |
The Board noted that the fund outperformed its benchmark index and the peer group average for the one- and five-year periods ended December 31, 2013 and underperformed its benchmark index and the peer group average for the three-year period ended December 31, 2013. The Board took into account management's discussion of the fund's performance, including the factors that contributed to the fund's performance for the three-year period relative to peers, including any
39
differences in the fund's investment style from peers. The Board noted the fund's favorable performance relative to the benchmark index and the peer group for the one- and five-year periods and that the fund's performance was in the top half of the peer group for the three-year period. The Board concluded that the fund's performance has generally been in line with or outperformed the historical performance of comparable funds and the fund's benchmark index.
Fees and expenses. The Board reviewed comparative information prepared by an independent third-party provider of mutual fund data, including, among other data, the fund's contractual and net management fees (and subadvisory fees, to the extent available) and total expenses as compared to similarly situated investment companies deemed to be comparable to the fund. The Board considered the fund's ranking within a smaller group of peer funds chosen by the independent third-party provider, as well as the fund's ranking within a broader group of funds. In comparing the fund's contractual and net management fees to those of comparable funds, the Board noted that such fees include both advisory and administrative costs. The Board noted that net management fees for the fund are higher than the peer group median and total expenses for the fund are lower than the peer group median.
The Board took into account management's discussion of the fund's expenses. The Board noted that the advisory and subadvisory fee rates were reduced effective June 1, 2013. The Board also took into account management's discussion with respect to the advisory/subadvisory fee structure, including the amount of the advisory fee retained by the Advisor after payment of the subadvisory fee. The Board also noted that the Advisor pays the subadvisory fee, and that such fees are negotiated at arm's length with respect to the Subadvisor. In addition, the Board took into account that management had agreed, effective July 1, 2014, to implement an overall fee waiver across the complex, including the fund, which is discussed further below. The Board also noted actions taken over the past several years to reduce the fund's operating expenses. The Board also noted that, in addition, the Advisor is currently waiving fees and/or reimbursing expenses with respect to the fund and that the fund has breakpoints in its contractual management fee schedule that reduce management fees as assets increase. The Board also noted that the fund's distributor, an affiliate of the Advisor, has agreed to waive a portion of its Rule 12b-1 fee for a share class of the fund. The Board reviewed information provided by the Advisor concerning the investment advisory fee charged by the Advisor or one of its advisory affiliates to other clients (including other funds in the complex) having similar investment mandates, if any. The Board considered any differences between the Advisor's and Subadvisor's services to the fund and the services they provide to other comparable clients or funds. The Board concluded that the advisory fee paid with respect to the fund is reasonable.
Profitability/indirect benefits. In considering the costs of the services to be provided and the profits to be realized by the Advisor and its affiliates from the Advisor's relationship with the Trust, the Board:
| (a) | reviewed financial information of the Advisor; | |||||||
| (b) | reviewed and considered information presented by the Advisor regarding the net profitability to the Advisor and its affiliates with respect to the fund; | |||||||
| (c) | received and reviewed profitability information with respect to the John Hancock fund complex as a whole; | |||||||
| (d) | received information with respect to the Advisor's allocation methodologies used in preparing the profitability data; | |||||||
| (e) | considered that the John Hancock insurance companies that are affiliates of the Advisor, as shareholders of the Trust directly or through their separate accounts, receive certain tax credits or deductions relating to foreign taxes paid and dividends received by certain funds of the Trust and noted that these tax benefits, which are not available to participants in qualified retirement plans under applicable income tax law, are reflected in the profitability analysis reviewed by the Board; | |||||||
| (f) | considered that the Advisor also provides administrative services to the fund on a cost basis pursuant to an administrative services agreement; | |||||||
| (g) | noted that affiliates of the Advisor provide transfer agency services and distribution services to the fund, and that the fund's distributor also receives Rule 12b-1 payments to support distribution of the fund; |
40
| (h) | noted that the Advisor also derives reputational and other indirect benefits from providing advisory services to the fund; | |||||||
| (i) | noted that the subadvisory fee for the fund is paid by the Advisor and is negotiated at arm's length; and | |||||||
| (j) | considered that the Advisor should be entitled to earn a reasonable level of profits in exchange for the level of services it provides to the fund and the entrepreneurial risk that it assumes as Advisor. |
Based upon its review, the Board concluded that the level of profitability, if any, of the Advisor and its affiliates from their relationship with the fund was reasonable and not excessive.
Economies of scale. In considering the extent to which economies of scale would be realized as the fund grows and whether fee levels reflect these economies of scale for the benefit of fund shareholders, the Board:
| (a) | considered that the Advisor has agreed, effective July 1, 2014, to waive a portion of its management fee for the fund and each of the other John Hancock funds in the complex (except for those discussed below) (the Participating Portfolios) or otherwise reimburse the expenses of the Participating Portfolios as follows (the Reimbursement): | ||
| The Reimbursement shall equal, on an annualized basis, 0.01% of that portion of the aggregate net assets of all the Participating Portfolios that exceed $75 billion but is less than or equal to $125 billion, 0.0125% of that portion of the aggregate net assets of all the Participating Portfolios that exceed $125 billion but is less than or equal to $150 billion and 0.015% of that portion of the aggregate net assets of all the Participating Portfolios that exceeds $150 billion. (The funds that are not Participating Portfolios are the funds of funds in the complex, which benefit from such overall management fee waiver through their investment in underlying portfolios that include Participating Portfolios, which are subject to the Reimbursement.) | |||
| (b) | reviewed the fund's advisory fee structure and concluded that: (i) the fund's fee structure contains breakpoints at the subadvisory fee level and that such breakpoints are reflected as breakpoints in the advisory fees for the fund; and (ii) although economies of scale cannot be measured with precision, these arrangements permit shareholders of the fund to benefit from economies of scale if the fund grows. The Board also took into account management's discussion of the fund's advisory fee structure; and | ||
| (c) | the Board also considered the effect of the fund's growth in size on its performance and fees. The Board also noted that if the fund's assets increase over time, the fund may realize other economies of scale. | ||
Approval of Subadvisory Agreement
In making its determination with respect to approval of the Subadvisory Agreement, the Board reviewed:
| (1) | information relating to the Subadvisor's business, including current subadvisory services to the Trust (and other funds in the John Hancock family of funds); | |
| (2) | the historical and current performance of the fund and comparative performance information relating to an applicable benchmark index and comparable funds; | |
| (3) | the subadvisory fee for the fund, including any breakpoints, and to the extent available, comparable fee information prepared by an independent third party provider of fund data; | |
| (4) | information relating to the nature and scope of any material relationships and their significant to the Trust's Advisor and Subadvisor. |
Nature, extent, and quality of services. With respect to the services provided by the Subadvisor, the Board received information provided to the Board by the Subadvisor, including the Subadvisor's Form ADV, as well as took into account
41
information presented throughout the past year. The Board considered the Subadvisor's current level of staffing and its overall resources, as well as received information relating to the Subadvisor's compensation program. The Board reviewed the Subadvisor's history and investment experience, as well as information regarding the qualifications, background, and responsibilities of the Subadvisor's investment and compliance personnel who provide services to the fund. The Board also considered, among other things, the Subadvisor's compliance program and any disciplinary history. The Board also considered the Subadvisor's risk assessment and monitoring process. The Board reviewed the Subadvisor's regulatory history, including whether it was involved in any regulatory actions or investigations as well as material litigation, and any settlements and amelioratory actions undertaken, as appropriate. The Board noted that the Advisor conducts regular, periodic reviews of the Subadvisor and its operations, including regarding investment processes and organizational and staffing matters. The Board also noted that the Trust's CCO and his staff conduct regular, periodic compliance reviews with the Subadvisor and present reports to the Independent Trustees regarding the same, which includes evaluating the regulatory compliance systems of the Subadvisor and procedures reasonably designed to assure compliance with the federal securities laws. The Board also took into account the financial condition of the Subadvisor.
The Board considered the Subadvisor's investment process and philosophy. The Board took into account that the Subadvisor's responsibilities include the development and maintenance of an investment program for the fund that is consistent with the fund's investment objective, the selection of investment securities and the placement of orders for the purchase and sale of such securities, as well as the implementation of compliance controls related to performance of these services. The Board also received information with respect to the Subadvisor's brokerage policies and practices, including with respect to best execution and soft dollars.
Subadvisor compensation. In considering the cost of services to be provided by the Subadvisor and the profitability to the Subadvisor of its relationship with the fund, the Board noted that the fees under the Subadvisory Agreement are paid by the Advisor and not the fund.
The Board also relied on the ability of the Advisor to negotiate the Subadvisory Agreement with the Subadvisor, which is not affiliated with the Advisor, and the fees thereunder at arm's length. As a result, the costs of the services to be provided and the profits to be realized by the Subadvisor from its relationship with the Trust were not a material factor in the Board's consideration of the Subadvisory Agreement.
The Board also received information regarding the nature and scope (including their significance to the Advisor and its affiliates and to the Subadvisor) of any material relationships, if any, with respect to the Subadvisor, which include arrangements in which the Subadvisor or its affiliates provide advisory, distribution, or management services in connection with financial products sponsored by the Advisor or its affiliates, and may include other registered investment companies, a 529 education savings plan, managed separate accounts and exempt group annuity contracts sold to qualified plans. The Board also received information and took into account any other potential conflicts of interest the Advisor might have in connection with the Subadvisory Agreement.
In addition, the Board considered other potential indirect benefits that the Subadvisor and its affiliates may receive from the Subadvisor's relationship with the fund, such as the opportunity to provide advisory services to additional funds in the John Hancock fund complex and reputational benefits.
Subadvisory fees. The Board considered that the fund pays an advisory fee to the Advisor and that, in turn, the Advisor pays a subadvisory fee to the Subadvisor. As noted above, the Board also considered the fund's subadvisory fee as compared to similarly situated investment companies deemed to be comparable to the fund as included in the report prepared by the independent third party provider of fund data, to the extent available. The Board noted that the limited size of the Lipper peer group was not sufficient for comparative purposes. The Board also took into account the subadvisory fees paid by the Advisor to the Subadvisor with respect to the fund to fees charged by the Subadvisor to manage other subadvised portfolios and portfolios not subject to regulation under the 1940 Act, as applicable.
Subadvisor performance. As noted above, the Board considered the fund's performance as compared to the fund's peer group and the benchmark index and noted that the Board reviews information about the fund's performance results at its
42
regularly scheduled meetings. The Board noted the Advisor's expertise and resources in monitoring the performance, investment style and risk-adjusted performance of the Subadvisor. The Board was mindful of the Advisor's focus on the Subadvisor's performance. The Board also noted the Subadvisor's long-term performance record for similar accounts, as applicable.
The Board's decision to approve the Subadvisory Agreement was based on a number of determinations, including the following:
| (1) | the Subadvisor has extensive experience and demonstrated skills as a manager; | |
| (2) | the performance of the fund has generally been in line with or outperformed the historical performance of comparable funds and the fund's benchmark index; | |
| (3) | the subadvisory fee is reasonable in relation to the level and quality of services being provided; and | |
| (4) | subadvisory fee breakpoints are reflected as breakpoints in the advisory fees for the fund in order to permit shareholders to benefit from economies of scale if the fund grows. | |
| * * * | ||
Based on the Board's evaluation of all factors that the Board deemed to be material, including those factors described above, the Board, including the Independent Trustees, concluded that renewal of the Advisory Agreement and the Subadvisory Agreement would be in the best interest of the fund and its shareholders. Accordingly, the Board, and the Independent Trustees voting separately, approved the Advisory Agreement and Subadvisory Agreement for an additional one-year period.
43
This chart provides information about the Trustees and Officers who oversee your John Hancock fund. Officers elected by the Trustees manage the day-to-day operations of the fund and execute policies formulated by the Trustees.
Independent Trustees
| Name, year of birth Position(s) held with fund Principal occupation(s) and other directorships during past 5 years | Trustee of the Trust since1 | Number of John Hancock funds overseen by Trustee |
| James M. Oates, Born: 1946 | 2012 | 227 |
| Trustee and Chairperson of the Board Managing Director, Wydown Group (financial consulting firm) (since 1994); Chairman and Director, Emerson Investment Management, Inc. (since 2000); Independent Chairman, Hudson Castle Group, Inc. (formerly IBEX Capital Markets, Inc.) (financial services company) (1997-2011); Director, Stifel Financial (since 1996); Director, Investor Financial Services Corporation (1995-2007); Director, Connecticut River Bancorp (since 1998); Director, Virtus Funds (formerly Phoenix Mutual Funds) (since 1988). Trustee and Chairperson of the Board, John Hancock retail funds3 (since 2012); Trustee (2005-2006 and since 2012) and Chairperson of the Board (since 2012), John Hancock Funds III; Trustee (since 2004) and Chairperson of the Board (since 2005), John Hancock Variable Insurance Trust; Trustee and Chairperson of the Board, John Hancock Funds II (since 2005). | ||
| Charles L. Bardelis,2 Born: 1941 | 2012 | 227 |
| Trustee Director, Island Commuter Corp. (marine transport). Trustee, John Hancock retail funds3 (since 2012); Trustee, John Hancock Funds III (2005-2006 and since 2012); Trustee, John Hancock Variable Insurance Trust (since 1988); Trustee, John Hancock Funds II (since 2005). | ||
| Peter S. Burgess,2 Born: 1942 | 2012 | 227 |
| Trustee Consultant (financial, accounting, and auditing matters) (since 1999); Certified Public Accountant; Partner, Arthur Andersen (independent public accounting firm) (prior to 1999); Director, Lincoln Educational Services Corporation (since 2004); Director, Symetra Financial Corporation (since 2010); Director, PMA Capital Corporation (2004-2010). Trustee, John Hancock retail funds3 (since 2012); Trustee, John Hancock Funds III (2005-2006 and since 2012); Trustee, John Hancock Variable Insurance Trust and John Hancock Funds II (since 2005). | ||
| William H. Cunningham, Born: 1944 | 2005 | 227 |
| Trustee Professor, University of Texas, Austin, Texas (since 1971); former Chancellor, University of Texas System and former President of the University of Texas, Austin, Texas; Director, LIN Television (since 2009); Chairman (since 2009) and Director (since 2006), Lincoln National Corporation (insurance); Director, Resolute Energy Corporation (since 2009); Director, Southwest Airlines (since 2000); former Director, Introgen (manufacturer of biopharmaceuticals) (until 2008); former Director, Hicks Acquisition Company I, Inc. (until 2007); former Director, Texas Exchange Bank, SSB (formerly Bank of Crowley) (until 2009); former Advisory Director, JP Morgan Chase Bank (formerly Texas Commerce Bank-Austin) (until 2009). Trustee, John Hancock retail funds3 (since 1986); Trustee, John Hancock Variable Insurance Trust (since 2012); Trustee, John Hancock Funds II (2005-2006 and since 2012). | ||
| Grace K. Fey, Born: 1946 | 2012 | 227 |
| Trustee Chief Executive Officer, Grace Fey Advisors (since 2007); Director and Executive Vice President, Frontier Capital Management Company (1988-2007); Director, Fiduciary Trust (since 2009). Trustee, John Hancock retail funds3 (since 2012); Trustee, John Hancock Variable Insurance Trust and John Hancock Funds II (since 2008). | ||
44
Independent Trustees (continued)
| Name, year of birth Position(s) held with fund Principal occupation(s) and other directorships during past 5 years | Trustee of the Trust since1 | Number of John Hancock funds overseen by Trustee |
| Theron S. Hoffman,2 Born: 1947 | 2012 | 227 |
| Trustee Chief Executive Officer, T. Hoffman Associates, LLC (consulting firm) (since 2003); Director, The Todd Organization (consulting firm) (2003-2010); President, Westport Resources Management (investment management consulting firm) (2006-2008); Senior Managing Director, Partner, and Operating Head, Putnam Investments (2000-2003); Executive Vice President, The Thomson Corp. (financial and legal information publishing) (1997-2000). Trustee, John Hancock retail funds3 (since 2012); Trustee, John Hancock Variable Insurance Trust and John Hancock Funds II (since 2008). | ||
| Deborah C. Jackson, Born: 1952 | 2008 | 227 |
| Trustee President, Cambridge College, Cambridge, Massachusetts (since 2011); Chief Executive Officer, American Red Cross of Massachusetts Bay (2002-2011); Board of Directors of Eastern Bank Corporation (since 2001); Board of Directors of Eastern Bank Charitable Foundation (since 2001); Board of Directors of American Student Assistance Corporation (1996-2009); Board of Directors of Boston Stock Exchange (2002-2008); Board of Directors of Harvard Pilgrim Healthcare (health benefits company) (2007-2011). Trustee, John Hancock retail funds3 (since 2008); Trustee of John Hancock Variable Insurance Trust and John Hancock Funds II (since 2012). | ||
| Hassell H. McClellan, Born: 1945 | 2012 | 227 |
| Trustee Trustee, Virtus Variable Insurance Trust (formerly Phoenix Edge Series Funds) (since 2008); Director, The Barnes Group (since 2010); Associate Professor, The Wallace E. Carroll School of Management, Boston College (retired 2013). Trustee, John Hancock retail funds3 (since 2012); Trustee, John Hancock Funds III (2005-2006 and since 2012); Trustee, John Hancock Variable Insurance Trust and John Hancock Funds II (since 2005). | ||
| Steven R. Pruchansky, Born: 1944 | 2005 | 227 |
| Trustee and Vice Chairperson of the Board Chairman and Chief Executive Officer, Greenscapes of Southwest Florida, Inc. (since 2000); Director and President, Greenscapes of Southwest Florida, Inc. (until 2000); Member, Board of Advisors, First American Bank (until 2010); Managing Director, Jon James, LLC (real estate) (since 2000); Director, First Signature Bank & Trust Company (until 1991); Director, Mast Realty Trust (until 1994); President, Maxwell Building Corp. (until 1991). Trustee (since 1992) and Chairperson of the Board (2011-2012), John Hancock retail funds3; Trustee and Vice Chairperson of the Board, John Hancock retail funds3 John Hancock Variable Insurance Trust, and John Hancock Funds II (since 2012). | ||
| Gregory A. Russo, Born: 1949 | 2009 | 227 |
| Trustee Director and Audit Committee Chairman (since 2012), and Member, Audit Committee and Finance Committee (since 2011), NCH Healthcare System, Inc. (holding company for multi-entity healthcare system); Director and Member of Finance Committee, The Moorings, Inc. (nonprofit continuing care community) (since 2012); Vice Chairman, Risk & Regulatory Matters, KPMG LLP (KPMG) (2002-2006); Vice Chairman, Industrial Markets, KPMG (1998-2002); Chairman and Treasurer, Westchester County, New York, Chamber of Commerce (1986-1992); Director, Treasurer, and Chairman of Audit and Finance Committees, Putnam Hospital Center (1989-1995); Director and Chairman of Fundraising Campaign, United Way of Westchester and Putnam Counties, New York (1990-1995). Trustee, John Hancock retail funds3 (since 2008); Trustee, John Hancock Variable Insurance Trust and John Hancock Funds II (since 2012). | ||
45
Non-Independent Trustees4
| Name, year of birth Position(s) held with fund Principal occupation(s) and other directorships during past 5 years | Trustee of the Trust since1 | Number of John Hancock funds overseen by Trustee |
| Craig Bromley, Born: 1966 | 2012 | 227 |
| Non-Independent Trustee President, John Hancock Financial Service (since 2012); Senior Executive Vice President and General Manager, U.S. Division, Manulife Corporation (since 2012); President and Chief Executive Officer, Manulife Insurance Company (Manulife Japan) (2005-2012, including prior positions). Trustee, John Hancock retail funds,3 John Hancock Variable Insurance Trust, and John Hancock Funds II (since 2012). | ||
| Warren A. Thomson, Born: 1955 | 2012 | 227 |
| Non-Independent Trustee Senior Executive Vice President and Chief Investment Officer, Manulife Financial Corporation and The Manufacturers Life Insurance Company (since 2009); Chairman and Chief Executive Officer, Manulife Asset Management (since 2001, including prior positions); Director (since 2006), and President and Chief Executive Officer (since 2013), Manulife Asset Management Limited; Director and Chairman, Hancock Natural Resources Group, Inc. (since 2013). Trustee, John Hancock retail funds,3 John Hancock Variable Insurance Trust, and John Hancock Funds II (since 2012). | ||
Principal officers who are not Trustees
| Name, year of birth Position(s) held with fund Principal occupation(s) and other directorships during past 5 years | Officer of the Trust since |
| Andrew G. Arnott, Born: 1971 | 2007 |
| Executive Vice President President** Senior Vice President, John Hancock Financial Services (since 2009); Director and Executive Vice President, John Hancock Advisers, LLC (since 2005, including prior positions); Director and Executive Vice President, John Hancock Investment Management Services, LLC (since 2006, including prior positions); President, John Hancock Funds, LLC (since 2004, including prior positions); President (effective 3-13-14) and Executive Vice President, John Hancock retail funds,3 John Hancock Variable Insurance Trust, and John Hancock Funds II (since 2007, including prior positions). | |
| **Effective 3-13-14. | |
| John J. Danello, Born: 1955 | 2014 |
| Senior Vice President, Secretary, and Chief Legal Officer Vice President and Chief Counsel, John Hancock Wealth Management (since 2005); Senior Vice President (since 2007) and Chief Legal Counsel (2007-2010), John Hancock Funds, LLC and The Berkeley Financial Group, LLC; Senior Vice President (since 2006, including prior positions) and Chief Legal Officer and Secretary (since 2014), John Hancock retail funds 3 and John Hancock Variable Insurance Trust; Vice President, John Hancock Life & Health Insurance Company (since 2009); Vice President, John Hancock Life Insurance Company (USA) and John Hancock Life Insurance Company of New York (since 2010); and Senior Vice President, Secretary, and Chief Legal Counsel (2007-2014, including prior positions) of John Hancock Advisers, LLC and John Hancock Investment Management Services, LLC. | |
| Francis V. Knox, Jr., Born: 1947 | 2005 |
| Chief Compliance Officer Vice President, John Hancock Financial Services (since 2005); Chief Compliance Officer, John Hancock retail funds,3 John Hancock Variable Insurance Trust, John Hancock Funds II, John Hancock Advisers, LLC, and John Hancock Investment Management Services, LLC (since 2005). | |
46
Principal officers who are not Trustees (continued)
| Name, year of birth Position(s) held with fund Principal occupation(s) and other directorships during past 5 years | Officer of the Trust since |
| Charles A. Rizzo, Born: 1957 | 2007 |
| Chief Financial Officer Vice President, John Hancock Financial Services (since 2008); Senior Vice President, John Hancock Advisers, LLC and John Hancock Investment Management Services, LLC (since 2008); Chief Financial Officer, John Hancock retail funds,3 John Hancock Variable Insurance Trust and John Hancock Funds II (since 2007). | |
| Salvatore Schiavone, Born: 1965 | 2010 |
| Treasurer Assistant Vice President, John Hancock Financial Services (since 2007); Vice President, John Hancock Advisers, LLC and John Hancock Investment Management Services, LLC (since 2007); Treasurer, John Hancock retail funds3 (since 2007, including prior positions); Treasurer, John Hancock Variable Insurance Trust and John Hancock Funds II (since 2010 and 2007-2009, including prior positions). | |
The business address for all Trustees and Officers is 601 Congress Street, Boston, Massachusetts 02210-2805.
The Statement of Additional Information of the fund includes additional information about members of the Board of Trustees of the Trust and is available without charge, upon request, by calling 800-225-5291.
| 1 | Each Trustee holds office until his or her successor is elected and qualified, or until the Trustee's death, retirement, resignation, or removal. |
| 2 | Member of the Audit Committee. |
| 3 | "John Hancock retail funds" comprises John Hancock Funds III and 36 other John Hancock funds consisting of 26 series of other John Hancock trusts and 10 closed-end funds. |
| 4 | The Trustee is a Non-Independent Trustee due to current or former positions with the Advisor and certain affiliates. |
47
Trustees James M. Oates, Chairperson Officers Andrew G. Arnott John J. Danello Francis V. Knox, Jr. Charles A. Rizzo Salvatore Schiavone | Investment advisor John Hancock Advisers, LLC Subadvisor Pzena Investment Management, LLC Principal distributor John Hancock Funds, LLC Custodian State Street Bank and Trust Company Transfer agent John Hancock Signature Services, Inc. Legal counsel K&L Gates LLP Independent registered public accounting firm PricewaterhouseCoopers LLP |
*Member of the Audit Committee
†Non-Independent Trustee
The fund's proxy voting policies and procedures, as well as the fund's proxy voting record for the most recent twelve-month period ended June 30, are available free of charge on the Securities and Exchange Commission (SEC) website at sec.gov or on our website.
The fund's complete list of portfolio holdings, for the first and third fiscal quarters, is filed with the SEC on Form N-Q. The fund's Form N-Q is available on our website and the SEC's website, sec.gov, and can be reviewed and copied (for a fee) at the SEC's Public Reference Room in Washington, DC. Call 800-SEC-0330 to receive information on the operation of the SEC's Public Reference Room.
We make this information on your fund, as well as monthly portfolio holdings, and other fund details available on our website at jhinvestments.com or by calling 800-225-5291.
| You can also contact us: | |||
| 800-225-5291 jhinvestments.com | Regular mail: John Hancock Signature Services, Inc. | Express mail: John Hancock Signature Services, Inc. | |
48
Family of funds
DOMESTIC EQUITY FUNDS Balanced Classic Value Disciplined Value Disciplined Value Mid Cap Fundamental All Cap Core Fundamental Large Cap Core Fundamental Large Cap Value Large Cap Equity Select Growth Small Cap Equity Small Cap Value Small Company Strategic Growth U.S. Equity U.S. Global Leaders Growth Value Equity GLOBAL AND INTERNATIONAL EQUITY FUNDS Disciplined Value International Emerging Markets Global Equity Global Opportunities Global Shareholder Yield Greater China Opportunities International Core International Growth International Growth Equity International Small Company International Value Equity INCOME FUNDS Bond California Tax-Free Income Core High Yield Emerging Markets Debt Floating Rate Income Focused High Yield Global Income Government Income High Yield Municipal Bond Income Investment Grade Bond | INCOME FUNDS (continued) Massachusetts Tax-Free Income Money Market New York Tax-Free Income Short Duration Credit Opportunities Strategic Income Opportunities Tax-Free Bond ALTERNATIVE AND SPECIALTY FUNDS Absolute Return Currency Alternative Asset Allocation Enduring Equity Financial Industries Global Absolute Return Strategies Global Conservative Absolute Return Natural Resources Redwood Regional Bank Seaport Technical Opportunities ASSET ALLOCATION PORTFOLIOS Income Allocation Lifestyle Aggressive Lifestyle Balanced Lifestyle Conservative Lifestyle Growth Lifestyle Moderate Retirement Choices (2010-2055) Retirement Living (2010-2055) Retirement Living II (2010-2055) CLOSED-END FUNDS Financial Opportunities Hedged Equity & Income Income Securities Trust Investors Trust Preferred Income Preferred Income II Preferred Income III Premium Dividend Tax-Advantaged Dividend Income Tax-Advantaged Global Shareholder Yield |
The fund's investment objective, risks, charges, and expenses are included in the prospectuses and should be considered carefully before investing. For a prospectus, call your financial professional, call John Hancock Investments at 800-225-5291, or visit the fund's website at jhinvestments.com. Please read the prospectus carefully before investing or sending money.
John Hancock Investments
A trusted brand
John Hancock has helped individuals and institutions build and protect wealth since 1862. Today, we are one of America's strongest and most-recognized brands.
A better way to invest
As a manager of managers, we search the world to find proven portfolio teams with specialized expertise for every fund we offer, then apply vigorous investment oversight to ensure they continue to meet our uncompromising standards.
Results for investors
Our unique approach to asset management has led to a diverse set of investments deeply rooted in investor needs, along with strong risk-adjusted returns across asset classes.
 | John Hancock Funds, LLC n Member FINRA, SIPC 601 Congress Street n Boston, MA 02210-2805 800-225-5291 n jhinvestments.com | |
| This report is for the information of the shareholders of John Hancock Classic Value Fund. It is not authorized for distribution to prospective investors unless preceded or accompanied by a prospectus. | ||
| MF205609 | 38A 10/14 12/14 | |
John Hancock
U.S. Global Leaders Growth Fund
Annual report 10/31/14
A message to shareholders
Dear fellow shareholder,
The economic expansion that began in 2009 continues, with moderate GDP growth in the United States and the unemployment rate down considerably from its peak. However, the scene outside the United States had become less robust by the end of the period. China's economy, a key driver of global demand, was slowing, while Japan's GDP contracted in the second quarter, and the International Monetary Fund warned of another eurozone recession unless more was done to stimulate economic growth there. Meanwhile, bond markets around the world have turned in positive performance as investors pursue yield where they can find it, and the risks of rising interest rates and central bank tightening have been pushed further out into the future.
Whether markets are stable or volatile, we believe investors are well served by sticking to a commonsense, diversified approach, one that includes a mix of equities, fixed-income, and alternative strategies that can offer added diversification potential. Although events like those taking place in Ukraine and the Middle East serve as reminders that all market environments carry risk, we believe the biggest risk investors face in today's market is not staying invested.
A new look
I am pleased to introduce you to our redesigned shareholder reports. As part of an effort to elevate the educational substance in our communications, we undertook an initiative to make our reports more engaging and easier to navigate. Included in the changes are a performance snapshot that shows your fund's performance against that of its benchmark, and a Q&A with your fund's lead portfolio manager. We hope these enhancements give you better insight into your fund's activity and performance.
On behalf of everyone at John Hancock Investments, I'd like to take this opportunity to thank you for the continued trust you've placed in us.
Sincerely,
Andrew G. Arnott
President and Chief Executive Officer
John Hancock Investments
This commentary reflects the CEO's views as of October 31, 2014. They are subject to change at any time. For more up-to-date information, you can visit our website at jhinvestments.com.
John Hancock
U.S. Global Leaders Growth Fund
Table of contents
| 2 | Your fund at a glance | |
| 4 | Discussion of fund performance | |
| 8 | A look at performance | |
| 10 | Your expenses | |
| 12 | Fund's investments | |
| 15 | Financial statements | |
| 19 | Financial highlights | |
| 25 | Notes to financial statements | |
| 31 | Auditor's report | |
| 32 | Tax information | |
| 33 | Continuation of investment advisory and subadvisory agreements | |
| 39 | Trustees and Officers | |
| 43 | More information |
1
INVESTMENT OBJECTIVE
The fund seeks long-term growth of capital.
AVERAGE ANNUAL TOTAL RETURNS AS OF 10/31/14 (%)
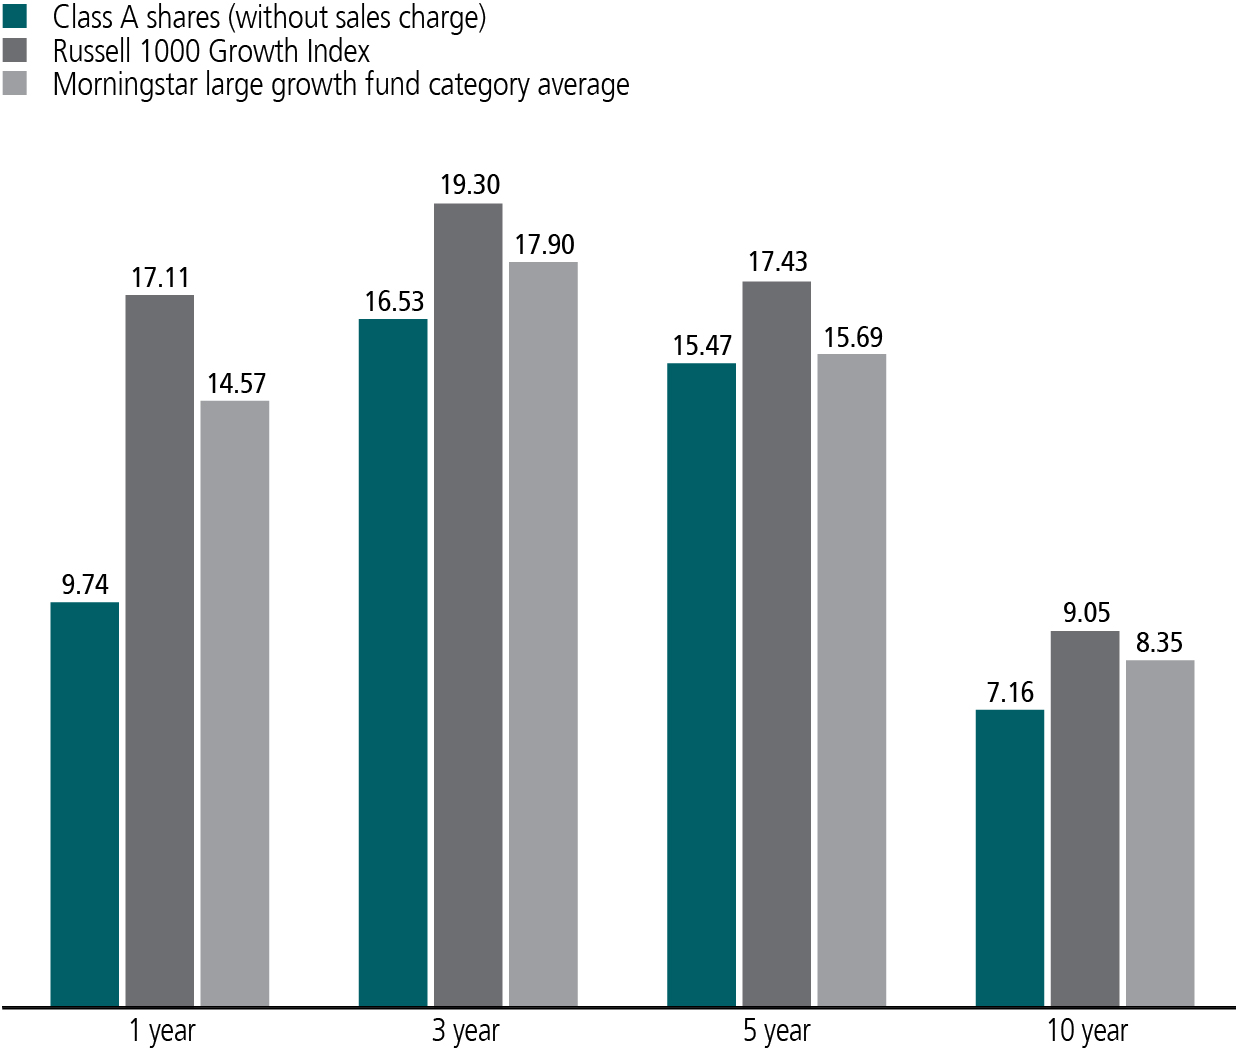
The Russell 1000 Growth Index is an unmanaged index of companies in the Russell 1000 Index (the 1,000 largest U.S. publicly traded companies) with high price-to-book ratios and higher forecasted growth values.
Figures from Morningstar, Inc. include reinvested distributions and do not take into account sales charges. Actual load-adjusted performance is lower.
The past performance shown here reflects reinvested distributions and the beneficial effect of any expense reductions, and does not guarantee future results. Returns for periods shorter than one year are cumulative, and results for other share classes will vary. Shares will fluctuate in value and, when redeemed, may be worth more or less than their original cost. Current performance may be lower or higher than the performance cited, and can be found at jhinvestments.com or by calling 800-225-5291. For further information on the fund's objectives, risks, and strategy, see the fund's prospectuses.
2
PERFORMANCE HIGHLIGHTS OVER THE LAST TWELVE MONTHS
U.S. stocks advanced
Gradually improving economic growth provided a favorable backdrop for U.S. stocks, propelling the major equity indexes to double-digit gains.
Fund underperformed benchmark
The fund underperformed its benchmark, the Russell 1000 Growth Index, for the reporting period despite delivering a positive return.
Market factors and stock selection detracted
Market dynamics favoring lower-quality stocks weighed on relative performance, as did stock selection, particularly in the information technology and healthcare sectors.
PORTFOLIO COMPOSITION AS OF 10/31/14 (%)
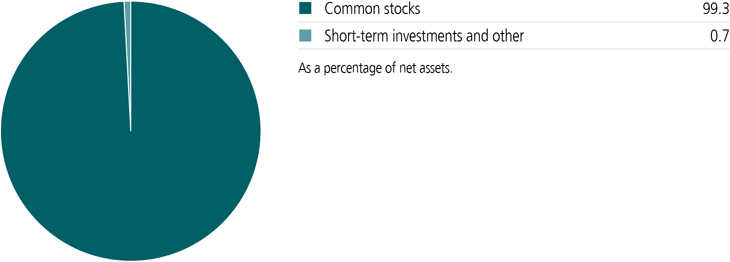
A note about risks
Equity stocks may be more susceptible to earnings disappointments. Large company stocks could fall out of favor. Foreign investing has additional risks, such as currency and market volatility and political and social instability. A portfolio concentrated in one sector or that holds a limited number of securities may fluctuate more than a diversified portfolio. Investments in a non-diversified fund may magnify the fund's losses from adverse events affecting a particular issuer. Please see the fund's prospectuses for additional risks.
3

Gordon M. Marchand, CPA, CFA, CIC
Portfolio Manager
Sustainable Growth Advisors
Despite an absolute return of approximately 10%, the fund underperformed the Russell 1000 Growth Index for the twelve-month period. What factors contributed to this?
Market headwinds and stock-specific factors influenced performance during the period. Our investment strategy is highly selective, as we seek out high-quality companies that are able to consistently sustain robust earnings, revenue, and cash flow growth. Since the beginning of 2013, the market has not favored our approach, as investors have not made distinctions along the lines of quality, consistency, or growth rates. Instead, lesser-quality companies with greater leverage and weak earnings were strongly rewarded as they benefited the most from the U.S. Federal Reserve's economic stimulus measures.
Over the last six months, some of these market factors began to shift back in our favor. But the market dynamics relating to the core tenets of our investment approach—high-quality companies with consistent earnings growth—remained a headwind until September, when earnings growth and strong balance sheets began to make a difference.
You also mentioned stock-specific factors. Can you give an example?
We buy high-quality, secular growth companies for the long term, and sell them when their valuation becomes less attractive or we no longer have confidence in their growth prospects. One example of the latter over the last twelve months was consumer electronics giant Apple, Inc. We originally invested in Apple in early 2008, when lowered earnings expectations led to a sharp decline in the stock. Over the ensuing five-plus years, it was an outstanding performer for the fund.
Over time, we grew concerned about Apple's future growth potential, particularly a lack of visibility and predictability regarding the innovation necessary for the company to grow, and we eliminated it from the portfolio in early 2014. Apple performed well after we sold it, thanks to the announcement of share buybacks and growing excitement surrounding new product offerings. Given that Apple was the largest component in the fund's benchmark, the Russell 1000 Growth Index, not owning the stock had a meaningful negative impact on relative performance.
4
What other holdings detracted from performance versus the benchmark?
Two other notable decliners were natural foods retailer Whole Foods Market, Inc. and enterprise software company SAP SE. We initiated a position in Whole Foods in early 2014 after concerns about increased competition in the natural and organic grocery business created an attractive entry point. The company lowered earnings projections in the second quarter of the year, resulting in a further sell-off in the stock. Consistent with our approach, we added to the fund's holdings on the belief that Whole Foods was taking the appropriate steps to defend its position and gain market share due to its scale, superior product quality, and customer experience. While the plan to leverage the company's scale advantage is likely to negatively impact near-term profits, we believe it will enhance Whole Foods' long-term competitive position in what has become the fastest-growing segment of food retailing.
With regard to SAP, its software products are integral to the back-office operations of many of the world's leading companies, enabling SAP to generate over 60% of its revenues from contractually recurring maintenance and subscription services. During the reporting period, the stock was adversely affected by economic weakness in Europe, a transition from on-premise licenses to cloud subscription services, and its pending acquisition of Concur Technologies, Inc., which makes travel and expense reimbursement software. We view the Concur acquisition favorably and believe SAP's focus on cloud-based software should produce a more stable, predictable revenue stream going forward. Given our positive long-term outlook, we added to the fund's position in the stock as it declined.
SECTOR COMPOSITION AS OF 10/31/14 (%)
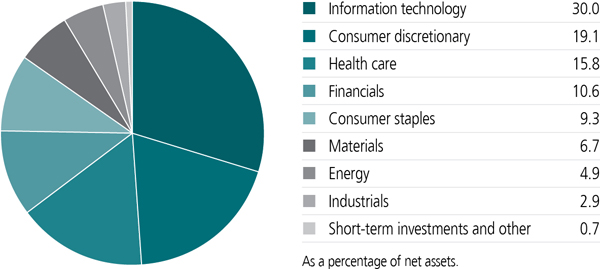
5
Let's shift gears and talk about some positive contributors. What holdings added value during the reporting period?
Biotechnology firm Amgen, Inc. and entertainment conglomerate The Walt Disney Company were among the fund's top contributors. Amgen was added to the portfolio in early 2014 as investors worried about the earnings impact of impending drug patent expirations. The stock rallied over the balance of the period thanks to favorable developments in its pipeline of new medications, including positive indications for drugs treating high cholesterol, multiple myeloma, and osteoporosis. These products should help offset the patent losses and drive future growth for the company.
Disney delivered strong earnings results after completing a large capital spending cycle that included theme park improvements and expansions, as well as new cruise ships. Going forward, we expect lower capital expenditures to result in higher profit margins and free cash flow. We also expect to see improving results from the company's media businesses, particularly on the film side as they begin to benefit from the acquisitions of the Marvel Comics and Lucasfilm franchises.
Historically, the portfolio has had a relatively low turnover rate. How did the portfolio change over the past year?
The fund's turnover rate was in line with its historical average. In a portfolio of approximately thirty stocks, we eliminated nine stocks and added nine new holdings. We sold hotel operator Starwood Hotels & Resorts Worldwide, Inc., veterinary products maker IDEXX Laboratories Inc., industrial gas company Praxair, Inc., and jewelry retailer Tiffany & Company because they reached valuations that we considered to be high. Apple, restaurant chain Yum! Brands, Inc., online auction company eBay, Inc., and energy equipment and services provider National Oilwell Varco, Inc. were sold because of
TOP TEN HOLDINGS AS OF 10/31/14 (%)
| Visa, Inc., Class A | 5.6 |
| Lowe's Companies, Inc. | 5.2 |
| Schlumberger, Ltd. | 4.9 |
| Amgen, Inc. | 4.6 |
| Google, Inc., Class C | 4.5 |
| The Walt Disney Company | 4.1 |
| Colgate-Palmolive Company | 4.0 |
| American Express Company | 4.0 |
| Automatic Data Processing, Inc. | 3.9 |
| Amazon.com, Inc. | 3.7 |
| TOTAL | 44.5 |
| As a percentage of net assets. | |
| Cash and cash equivalents are not included. |
6
concerns about their future growth prospects. Finally, pharmaceutical company Novo Nordisk A/S was sold to reduce overlap with other diabetes-related healthcare holdings in the portfolio.
In addition to Amgen, Disney, and Whole Foods, we added e-commerce leader Amazon.com, Inc., insurance broker AON PLC, open source software provider Red Hat, Inc., chocolate producer The Hershey Company, online travel agency The Priceline Group, Inc., and data center provider Equinix, Inc. over the last twelve months.
As a result of these transactions, we are excited about the level and quality of growth in the portfolio today.
MANAGED BY
 | George P. Fraise On the fund since 2000 Investing since 1987 |
| | Gordon M. Marchand, CPA, CFA, CIC On the fund since 1995 Investing since 1977 |
 | Robert L. Rohn On the fund since 2003 Investing since 1983 |
COUNTRY COMPOSITION AS OF 10/31/14 (%)
| United States | 88.9 |
| France | 3.1 |
| Germany | 3.0 |
| United Kingdom | 3.0 |
| Ireland | 2.0 |
| Total | 100.0 |
As a percentage of net assets.
7
TOTAL RETURNS FOR THE PERIOD ENDED OCTOBER 31, 2014
| Average annual total returns (%) with maximum sales charge | Cumulative total returns (%) with maximum sales charge | ||||||
| 1-year | 5-year | 10-year | 5-year | 10-year | |||
| Class A | 4.26 | 14.29 | 6.61 | 95.02 | 89.72 | ||
| Class B | 3.93 | 14.38 | 6.52 | 95.77 | 88.04 | ||
| Class C | 7.92 | 14.61 | 6.36 | 97.73 | 85.27 | ||
| Class I1 | 10.01 | 15.89 | 7.60 | 109.06 | 107.97 | ||
| Class R21,2 | 9.59 | 15.42 | 7.08 | 104.83 | 98.23 | ||
| Class R61,2 | 10.15 | 15.94 | 7.59 | 109.53 | 107.92 | ||
| Index 1† | 17.11 | 17.43 | 9.05 | 123.32 | 137.89 | ||
| Index 2† | 17.27 | 16.69 | 8.20 | 116.38 | 120.01 | ||
Performance of the classes will vary based on the difference in sales charges paid by shareholders investing in the different classes and the fee structure of those classes.
Performance figures assume all distributions have been reinvested. Figures reflect maximum sales charges on Class A shares of 5% and the applicable contingent deferred sales charge (CDSC) on Class B and Class C shares. The Class B shares' CDSC declines annually between years 1 to 6 according to the following schedule: 5%, 4%, 3%, 3%, 2%, 1%. No sales charge will be assessed after the sixth year. Class C shares sold within one year of purchase are subject to a 1% CDSC. Sales charges are not applicable to Class I, Class R2, and Class R6 shares.
The expense ratios of the fund, both net (including any fee waivers or expense limitations) and gross (excluding any fee waivers or expense limitations), are set forth according to the most recent publicly available prospectuses for the fund and may differ from those disclosed in the Financial highlights tables in this report. Had the fee waivers and expense limitations not been in place, gross expenses would apply. The expense ratios are as follows:
| Class A | Class B | Class C | Class I | Class R2 | Class R6 | |
| Gross (%) | 1.22 | 1.97 | 1.97 | 0.96 | 1.37 | 0.84 |
| Net (%) | 1.22 | 1.97 | 1.97 | 0.96 | 1.37 | 0.81 |
Please refer to the most recent prospectus and annual or semiannual report for more information on expenses and any expense limitation arrangements for each class.
The returns reflect past results and should not be considered indicative of future performance. The return and principal value of an investment will fluctuate so that shares, when redeemed, may be worth more or less than their original cost. Due to market volatility, the fund's current performance may be higher or lower than the performance shown. For current to the most recent month-end performance data, please call 800-225-5291 or visit the fund's website at jhinvestments.com.
The performance table above and the chart on the next page do not reflect the deduction of taxes that a shareholder would pay on fund distributions or the redemption of fund shares. The fund's performance results reflect any applicable fee waivers or expense reductions, without which the expenses increase and results would have been less favorable.
| † | Index 1 is the Russell 1000 Growth Index; Index 2 is the S&P 500 Index. |
See the following page for footnotes.
8
This chart and table show what happened to a hypothetical $10,000 investment in John Hancock U.S. Global Leaders Growth Fund for the share classes and periods indicated, assuming all distributions were reinvested. For comparison, we've shown the same investment in two separate indexes.
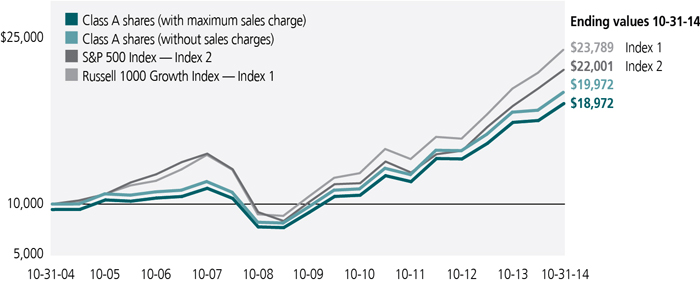
| Start date | With maximum sales charge ($) | Without sales charge ($) | Index 1 ($) | Index 2 ($) | |
| Class B3 | 10-31-04 | 18,804 | 18,804 | 23,789 | 22,001 |
| Class C3 | 10-31-04 | 18,527 | 18,527 | 23,789 | 22,001 |
| Class I1 | 10-31-04 | 20,797 | 20,797 | 23,789 | 22,001 |
| Class R21,2 | 10-31-04 | 19,823 | 19,823 | 23,789 | 22,001 |
| Class R61,2 | 10-31-04 | 20,792 | 20,792 | 23,789 | 22,001 |
The Russell 1000 Growth Index is an unmanaged index of companies in the Russell 1000 Index (the 1,000 largest U.S. publicly traded companies) with high price-to-book ratios and higher forecasted growth values.
The S&P 500 Index is an unmanaged index that includes 500 widely traded common stocks.
It is not possible to invest directly in an index. Index figures do not reflect expenses or sales charges, which would have resulted in lower values.
Footnotes related to performance pages
| 1 | For certain types of investors, as described in the fund's prospectuses. |
| 2 | Class R6 and Class R2 shares were first offered on 9-1-11 and 3-1-12, respectively. The returns prior to these dates are those of Class A shares that have been recalculated to apply the gross fees and expenses of Class R6 and Class R2 shares, as applicable. |
| 3 | The contingent deferred sales charge is not applicable. |
9
These examples are intended to help you understand your ongoing operating expenses of investing in the fund so you can compare these costs with the ongoing costs of investing in other mutual funds.
Understanding fund expenses
As a shareholder of the fund, you incur two types of costs:
| • | Transaction costs, which include sales charges (loads) on purchases or redemptions (varies by share class), minimum account fee charge, etc. |
| • | Ongoing operating expenses, including management fees, distribution and service fees (if applicable), and other fund expenses. |
We are presenting only your ongoing operating expenses here.
Actual expenses/actual returns
This example is intended to provide information about the fund's actual ongoing operating expenses, and is based on the fund's actual return. It assumes an account value of $1,000.00 on May 1, 2014, with the same investment held until October 31, 2014.
| Account value on 5-1-2014 | Ending value on 10-31-2014 | Expenses paid during period ended 10-31-20141 | Annualized expense ratio | |
| Class A | $1,000.00 | $1,086.90 | $6.21 | 1.18% |
| Class B | 1,000.00 | 1,082.80 | 10.13 | 1.93% |
| Class C | 1,000.00 | 1,082.50 | 10.18 | 1.94% |
| Class I | 1,000.00 | 1,088.20 | 4.89 | 0.93% |
| Class R2 | 1,000.00 | 1,085.80 | 7.15 | 1.36% |
| Class R6 | 1,000.00 | 1,089.00 | 4.21 | 0.80% |
Together with the value of your account, you may use this information to estimate the operating expenses that you paid over the period. Simply divide your account value at October 31, 2014, by $1,000.00, then multiply it by the "expenses paid" for your share class from the table above. For example, for an account value of $8,600.00, the operating expenses should be calculated as follows:
10
Hypothetical example for comparison purposes
This table allows you to compare the fund's ongoing operating expenses with those of any other fund. It provides an example of the fund's hypothetical account values and hypothetical expenses based on each class's actual expense ratio and an assumed 5% annualized return before expenses (which is not the fund's actual return). It assumes an account value of $1,000.00 on May 1, 2014, with the same investment held until October 31, 2014. Look in any other fund shareholder report to find its hypothetical example and you will be able to compare these expenses. Please remember that these hypothetical account values and expenses may not be used to estimate the actual ending account balance or expenses you paid for the period.
| Account value on 5-1-2014 | Ending value on 10-31-2014 | Expenses paid during period ended 10-31-20141 | Annualized expense ratio | |
| Class A | $1,000.00 | $1,019.30 | $6.01 | 1.18% |
| Class B | 1,000.00 | 1,015.50 | 9.80 | 1.93% |
| Class C | 1,000.00 | 1,015.40 | 9.86 | 1.94% |
| Class I | 1,000.00 | 1,020.50 | 4.74 | 0.93% |
| Class R2 | 1,000.00 | 1,018.30 | 6.92 | 1.36% |
| Class R6 | 1,000.00 | 1,021.20 | 4.08 | 0.80% |
Remember, these examples do not include any transaction costs, therefore, these examples will not help you to determine the relative total costs of owning different funds. If transaction costs were included, your expenses would have been higher. See the prospectuses for details regarding transaction costs.
| 1 | Expenses are equal to the fund's annualized expense ratio, multiplied by the average account value over the period, multiplied by 184/365 (to reflect the one-half year period). |
11
Fund's investments
| As of 10-31-14 | ||||||||||||||
| Shares | Value | |||||||||||||
| Common stocks 99.3% | $1,107,157,846 | |||||||||||||
| (Cost $817,099,673) | ||||||||||||||
| Consumer discretionary 19.1% | 213,120,929 | |||||||||||||
| Hotels, restaurants and leisure 3.0% | ||||||||||||||
| Starbucks Corp. | 443,380 | 33,501,792 | ||||||||||||
| Internet and catalog retail 6.8% | ||||||||||||||
| Amazon.com, Inc. (I) | 134,550 | 41,099,643 | ||||||||||||
| The Priceline Group, Inc. (I) | 29,070 | 35,064,525 | ||||||||||||
| Media 4.1% | ||||||||||||||
| The Walt Disney Company | 498,740 | 45,574,861 | ||||||||||||
| Specialty retail 5.2% | ||||||||||||||
| Lowe's Companies, Inc. | 1,011,890 | 57,880,108 | ||||||||||||
| Consumer staples 9.3% | 103,614,987 | |||||||||||||
| Food and staples retailing 3.3% | ||||||||||||||
| Whole Foods Market, Inc. | 929,510 | 36,557,628 | ||||||||||||
| Food products 2.0% | ||||||||||||||
| The Hershey Company | 232,110 | 22,261,670 | ||||||||||||
| Household products 4.0% | ||||||||||||||
| Colgate-Palmolive Company | 669,792 | 44,795,689 | ||||||||||||
| Energy 4.9% | 54,451,441 | |||||||||||||
| Energy equipment and services 4.9% | ||||||||||||||
| Schlumberger, Ltd. | 551,910 | 54,451,441 | ||||||||||||
| Financials 10.6% | 118,245,854 | |||||||||||||
| Capital markets 3.6% | ||||||||||||||
| State Street Corp. | 525,440 | 39,649,702 | ||||||||||||
| Consumer finance 4.0% | ||||||||||||||
| American Express Company | 496,160 | 44,629,592 | ||||||||||||
| Insurance 3.0% | ||||||||||||||
| Aon PLC | 394,960 | 33,966,560 | ||||||||||||
| Health care 15.8% | 175,654,863 | |||||||||||||
| Biotechnology 7.0% | ||||||||||||||
| Amgen, Inc. | 314,390 | 50,987,770 | ||||||||||||
| Regeneron Pharmaceuticals, Inc. (I) | 69,480 | 27,355,666 | ||||||||||||
| Health care technology 3.6% | ||||||||||||||
| Cerner Corp. (I) | 623,750 | 39,508,325 | ||||||||||||
| Pharmaceuticals 5.2% | ||||||||||||||
| Perrigo Company PLC | 141,080 | 22,777,366 | ||||||||||||
| Sanofi, ADR | 757,477 | 35,025,736 | ||||||||||||
| Shares | Value | |||||||||||||
| Industrials 2.9% | $31,877,914 | |||||||||||||
| Trading companies and distributors 2.9% | ||||||||||||||
| Fastenal Company (L) | 723,840 | 31,877,914 | ||||||||||||
| Information technology 30.0% | 335,081,402 | |||||||||||||
| Communications equipment 3.0% | ||||||||||||||
| QUALCOMM, Inc. | 431,210 | 33,854,297 | ||||||||||||
| Internet software and services 9.9% | ||||||||||||||
| Equinix, Inc. | 187,860 | 39,243,954 | ||||||||||||
| Google, Inc., Class C (I) | 90,410 | 50,546,423 | ||||||||||||
| LinkedIn Corp., Class A (I) | 90,164 | 20,643,949 | ||||||||||||
| IT services 9.5% | ||||||||||||||
| Automatic Data Processing, Inc. | 535,890 | 43,825,084 | ||||||||||||
| Visa, Inc., Class A | 259,250 | 62,590,728 | ||||||||||||
| Software 7.6% | ||||||||||||||
| Red Hat, Inc. (I) | 471,530 | 27,782,548 | ||||||||||||
| Salesforce.com, Inc. (I) | 368,580 | 23,585,434 | ||||||||||||
| SAP SE, ADR (L) | 484,500 | 33,008,985 | ||||||||||||
| Materials 6.7% | 75,110,456 | |||||||||||||
| Chemicals 6.7% | ||||||||||||||
| Ecolab, Inc. | 332,520 | 36,986,200 | ||||||||||||
| Monsanto Company | 331,400 | 38,124,256 | ||||||||||||
| Yield (%) | Shares | Value | ||||||||||||
| Securities lending collateral 4.7% | $52,185,322 | |||||||||||||
| (Cost $52,184,829) | ||||||||||||||
| John Hancock Collateral Investment Trust (W) | 0.1171(Y | ) | 5,215,142 | 52,185,322 | ||||||||||
| Short-term investments 0.4% | $4,654,393 | |||||||||||||
| (Cost $4,654,393) | ||||||||||||||
| Money market funds 0.4% | 4,654,393 | |||||||||||||
| State Street Institutional U.S. Government Money Market Fund | 0.0000(Y | ) | 4,654,393 | 4,654,393 | ||||||||||
| Total investments (Cost $873,938,895)† 104.4% | $1,163,997,561 | |||||||||||||
| Other assets and liabilities, net (4.4%) | ($49,068,624 | ) | ||||||||||||
| Total net assets 100.0% | $1,114,928,937 | |||||||||||||
| The percentage shown for each investment category is the total value of the category as a percentage of the net assets of the fund. | ||||
| ADR | American Depositary Receipts | |||
| (I) | Non-income producing security. | |||
| (L) | A portion of this security is on loan as of 10-31-14. | |||
| (W) | Investment is an affiliate of the fund, the advisor and/or subadvisor. This investment represents collateral received for securities lending. | |||
| (Y) | The rate shown is the annualized seven-day yield as of 10-31-14. | |||
| † | At 10-31-14, the aggregate cost of investment securities for federal income tax purposes was $877,671,043. Net unrealized appreciation aggregated $286,326,518, of which $303,203,669 related to appreciated investment securities and $16,877,151 related to depreciated investment securities. | |||
Financial statements
STATEMENT OF ASSETS AND LIABILITIES 10-31-14
| Assets | ||||||||||||||||||||||||||||||||||||||||
| Investments in unaffiliated issuers, at value (Cost $821,754,066) including $52,193,815 of securities loaned | $1,111,812,239 | |||||||||||||||||||||||||||||||||||||||
| Investments in affiliated issuers, at value (Cost $52,184,829) | 52,185,322 | |||||||||||||||||||||||||||||||||||||||
| Total investments, at value (Cost $873,938,895) | 1,163,997,561 | |||||||||||||||||||||||||||||||||||||||
| Receivable for investments sold | 2,550,970 | |||||||||||||||||||||||||||||||||||||||
| Receivable for fund shares sold | 1,425,744 | |||||||||||||||||||||||||||||||||||||||
| Dividends and interest receivable | 2,357,939 | |||||||||||||||||||||||||||||||||||||||
| Receivable for securities lending income | 6,216 | |||||||||||||||||||||||||||||||||||||||
| Other receivables and prepaid expenses | 66,429 | |||||||||||||||||||||||||||||||||||||||
| Total assets | 1,170,404,859 | |||||||||||||||||||||||||||||||||||||||
| Liabilities | ||||||||||||||||||||||||||||||||||||||||
| Payable for fund shares repurchased | 1,933,583 | |||||||||||||||||||||||||||||||||||||||
| Payable upon return of securities loaned | 52,193,815 | |||||||||||||||||||||||||||||||||||||||
| Payable to affiliates | ||||||||||||||||||||||||||||||||||||||||
| Accounting and legal services fees | 14,908 | |||||||||||||||||||||||||||||||||||||||
| Transfer agent fees | 237,472 | |||||||||||||||||||||||||||||||||||||||
| Distribution and service fees | 266,170 | |||||||||||||||||||||||||||||||||||||||
| Investment management fees | 670,318 | |||||||||||||||||||||||||||||||||||||||
| Other liabilities and accrued expenses | 159,656 | |||||||||||||||||||||||||||||||||||||||
| Total liabilities | 55,475,922 | |||||||||||||||||||||||||||||||||||||||
| Net assets | $1,114,928,937 | |||||||||||||||||||||||||||||||||||||||
| Net assets consist of | ||||||||||||||||||||||||||||||||||||||||
| Paid-in capital | $677,545,896 | |||||||||||||||||||||||||||||||||||||||
| Undistributed net investment income | 2,548,484 | |||||||||||||||||||||||||||||||||||||||
| Accumulated net realized gain (loss) on investments | 144,775,891 | |||||||||||||||||||||||||||||||||||||||
| Net unrealized appreciation (depreciation) on investments | 290,058,666 | |||||||||||||||||||||||||||||||||||||||
| Net assets | $1,114,928,937 | |||||||||||||||||||||||||||||||||||||||
STATEMENT OF ASSETS AND LIABILITIES (continued)
| Net asset value per share | ||||||||||||||||||
| Based on net asset values and shares outstanding-the fund has an unlimited number of shares authorized with no par value | ||||||||||||||||||
| Class A ($599,858,624 ÷ 13,324,425 shares)1 | $45.02 | |||||||||||||||||
| Class B ($27,341,741 ÷ 670,187 shares)1 | $40.80 | |||||||||||||||||
| Class C ($132,923,428 ÷ 3,256,902 shares)1 | $40.81 | |||||||||||||||||
| Class I ($317,222,816 ÷ 6,731,964 shares) | $47.12 | |||||||||||||||||
| Class R2 ($33,730,915 ÷ 720,447 shares) | $46.82 | |||||||||||||||||
| Class R6 ($3,851,413 ÷ 81,547 shares) | $47.23 | |||||||||||||||||
| Maximum offering price per share | ||||||||||||||||||
| Class A (net asset value per share ÷ 95%)2 | $47.39 | |||||||||||||||||
| 1 | Redemption price per share is equal to net asset value less any applicable contingent deferred sales charge. | |||||||
| 2 | On single retail sales of less than $50,000. On sales of $50,000 or more and on group sales the offering price is reduced. | |||||||
STATEMENT OF OPERATIONS For the year ended 10-31-14
| Investment income | ||||||||||||||||||||||||||||||||||||||||
| Dividends | $17,432,946 | |||||||||||||||||||||||||||||||||||||||
| Securities lending | 231,051 | |||||||||||||||||||||||||||||||||||||||
| Less foreign taxes withheld | (350,815 | ) | ||||||||||||||||||||||||||||||||||||||
| Total investment income | 17,313,182 | |||||||||||||||||||||||||||||||||||||||
| Expenses | ||||||||||||||||||||||||||||||||||||||||
| Investment management fees | 8,782,684 | |||||||||||||||||||||||||||||||||||||||
| Distribution and service fees | 3,491,580 | |||||||||||||||||||||||||||||||||||||||
| Accounting and legal services fees | 225,835 | |||||||||||||||||||||||||||||||||||||||
| Transfer agent fees | 1,505,554 | |||||||||||||||||||||||||||||||||||||||
| Trustees' fees | 22,154 | |||||||||||||||||||||||||||||||||||||||
| State registration fees | 155,306 | |||||||||||||||||||||||||||||||||||||||
| Printing and postage | 133,975 | |||||||||||||||||||||||||||||||||||||||
| Professional fees | 78,517 | |||||||||||||||||||||||||||||||||||||||
| Custodian fees | 140,728 | |||||||||||||||||||||||||||||||||||||||
| Registration and filing fees | 40,957 | |||||||||||||||||||||||||||||||||||||||
| Other | 33,379 | |||||||||||||||||||||||||||||||||||||||
| Total expenses | 14,610,669 | |||||||||||||||||||||||||||||||||||||||
| Less expense reductions | (79,989 | ) | ||||||||||||||||||||||||||||||||||||||
| Net expenses | 14,530,680 | |||||||||||||||||||||||||||||||||||||||
| Net investment income | 2,782,502 | |||||||||||||||||||||||||||||||||||||||
| Realized and unrealized gain (loss) | ||||||||||||||||||||||||||||||||||||||||
| Net realized gain (loss) on | ||||||||||||||||||||||||||||||||||||||||
| Investments in unaffiliated issuers | 151,157,690 | |||||||||||||||||||||||||||||||||||||||
| Investments in affiliated issuers | (1,554 | ) | ||||||||||||||||||||||||||||||||||||||
| 151,156,136 | ||||||||||||||||||||||||||||||||||||||||
| Change in net unrealized appreciation (depreciation) of | ||||||||||||||||||||||||||||||||||||||||
| Investments in unaffiliated issuers | (47,201,290 | ) | ||||||||||||||||||||||||||||||||||||||
| Investments in affiliated issuers | (10,113 | ) | ||||||||||||||||||||||||||||||||||||||
| (47,211,403 | ) | |||||||||||||||||||||||||||||||||||||||
| Net realized and unrealized gain | 103,944,733 | |||||||||||||||||||||||||||||||||||||||
| Increase in net assets from operations | $106,727,235 | |||||||||||||||||||||||||||||||||||||||
STATEMENTS OF CHANGES IN NET ASSETS
| Year ended 10-31-14 | Year ended 10-31-13 | ||||||||||||||||||||||||||||||||||||||||||||||||||||||||
| Increase (decrease) in net assets | |||||||||||||||||||||||||||||||||||||||||||||||||||||||||
| From operations | |||||||||||||||||||||||||||||||||||||||||||||||||||||||||
| Net investment income | $2,782,502 | $693,487 | |||||||||||||||||||||||||||||||||||||||||||||||||||||||
| Net realized gain | 151,156,136 | 35,324,795 | |||||||||||||||||||||||||||||||||||||||||||||||||||||||
| Change in net unrealized appreciation (depreciation) | (47,211,403 | ) | 165,137,065 | ||||||||||||||||||||||||||||||||||||||||||||||||||||||
| Increase in net assets resulting from operations | 106,727,235 | 201,155,347 | |||||||||||||||||||||||||||||||||||||||||||||||||||||||
| Distributions to shareholders | |||||||||||||||||||||||||||||||||||||||||||||||||||||||||
| From net investment income | |||||||||||||||||||||||||||||||||||||||||||||||||||||||||
| Class A | (569,456 | ) | — | ||||||||||||||||||||||||||||||||||||||||||||||||||||||
| Class I | (674,178 | ) | — | ||||||||||||||||||||||||||||||||||||||||||||||||||||||
| Class R2 | (11,535 | ) | — | ||||||||||||||||||||||||||||||||||||||||||||||||||||||
| Class R6 | (10,189 | ) | — | ||||||||||||||||||||||||||||||||||||||||||||||||||||||
| From net realized gain | |||||||||||||||||||||||||||||||||||||||||||||||||||||||||
| Class A | (20,049,098 | ) | (9,612,480 | ) | |||||||||||||||||||||||||||||||||||||||||||||||||||||
| Class B | (999,781 | ) | (711,742 | ) | |||||||||||||||||||||||||||||||||||||||||||||||||||||
| Class C | (4,082,434 | ) | (2,051,288 | ) | |||||||||||||||||||||||||||||||||||||||||||||||||||||
| Class I | (8,473,404 | ) | (4,015,442 | ) | |||||||||||||||||||||||||||||||||||||||||||||||||||||
| Class R2 | (886,864 | ) | (6,742 | ) | |||||||||||||||||||||||||||||||||||||||||||||||||||||
| Class R6 | (101,558 | ) | (47,990 | ) | |||||||||||||||||||||||||||||||||||||||||||||||||||||
| Total distributions | (35,858,497 | ) | (16,445,684 | ) | |||||||||||||||||||||||||||||||||||||||||||||||||||||
| From fund share transactions | (158,965,900 | ) | 324,317,297 | ||||||||||||||||||||||||||||||||||||||||||||||||||||||
| Total increase (decrease) | (88,097,162 | ) | 509,026,960 | ||||||||||||||||||||||||||||||||||||||||||||||||||||||
| Net assets | |||||||||||||||||||||||||||||||||||||||||||||||||||||||||
| Beginning of year | 1,203,026,099 | 693,999,139 | |||||||||||||||||||||||||||||||||||||||||||||||||||||||
| End of year | $1,114,928,937 | $1,203,026,099 | |||||||||||||||||||||||||||||||||||||||||||||||||||||||
| Undistributed net investment income | $2,548,484 | $746,625 | |||||||||||||||||||||||||||||||||||||||||||||||||||||||
Financial highlights
| Class A Shares Period ended | 10-31-14 | 10-31-13 | 10-31-12 | 10-31-11 | 10-31-10 | |||||||||||||||||||||||||||||||||||||||||||||||||||||||||||||||||||||||||||||||||||||||||||||||||||
| Per share operating performance | ||||||||||||||||||||||||||||||||||||||||||||||||||||||||||||||||||||||||||||||||||||||||||||||||||||||||
| Net asset value, beginning of period | $42.25 | $35.04 | $30.97 | $27.83 | $23.89 | |||||||||||||||||||||||||||||||||||||||||||||||||||||||||||||||||||||||||||||||||||||||||||||||||||
| Net investment income (loss)1 | 0.11 | 0.04 | (0.03 | ) | — | 2 | — | 2 | ||||||||||||||||||||||||||||||||||||||||||||||||||||||||||||||||||||||||||||||||||||||||||||||||
| Net realized and unrealized gain on investments | 3.90 | 7.96 | 5.08 | 3.14 | 3.96 | |||||||||||||||||||||||||||||||||||||||||||||||||||||||||||||||||||||||||||||||||||||||||||||||||||
| Total from investment operations | 4.01 | 8.00 | 5.05 | 3.14 | 3.96 | |||||||||||||||||||||||||||||||||||||||||||||||||||||||||||||||||||||||||||||||||||||||||||||||||||
| Less distributions | ||||||||||||||||||||||||||||||||||||||||||||||||||||||||||||||||||||||||||||||||||||||||||||||||||||||||
| From net investment income | (0.03 | ) | — | — | — | (0.02 | ) | |||||||||||||||||||||||||||||||||||||||||||||||||||||||||||||||||||||||||||||||||||||||||||||||||
| From net realized gain | (1.21 | ) | (0.79 | ) | (0.98 | ) | — | — | ||||||||||||||||||||||||||||||||||||||||||||||||||||||||||||||||||||||||||||||||||||||||||||||||
| Total distributions | (1.24 | ) | (0.79 | ) | (0.98 | ) | — | (0.02 | ) | |||||||||||||||||||||||||||||||||||||||||||||||||||||||||||||||||||||||||||||||||||||||||||||||
| Net asset value, end of period | $45.02 | $42.25 | $35.04 | $30.97 | $27.83 | |||||||||||||||||||||||||||||||||||||||||||||||||||||||||||||||||||||||||||||||||||||||||||||||||||
| Total return (%)3,4 | 9.74 | 23.30 | 16.96 | 11.28 | 16.58 | |||||||||||||||||||||||||||||||||||||||||||||||||||||||||||||||||||||||||||||||||||||||||||||||||||
| Ratios and supplemental data | ||||||||||||||||||||||||||||||||||||||||||||||||||||||||||||||||||||||||||||||||||||||||||||||||||||||||
| Net assets, end of period (in millions) | $600 | $697 | $413 | $282 | $264 | |||||||||||||||||||||||||||||||||||||||||||||||||||||||||||||||||||||||||||||||||||||||||||||||||||
| Ratios (as a percentage of average net assets): | ||||||||||||||||||||||||||||||||||||||||||||||||||||||||||||||||||||||||||||||||||||||||||||||||||||||||
| Expenses before reductions | 1.19 | 1.23 | 1.30 | 1.26 | 1.50 | |||||||||||||||||||||||||||||||||||||||||||||||||||||||||||||||||||||||||||||||||||||||||||||||||||
| Expenses including reductions | 1.18 | 1.23 | 1.30 | 1.26 | 1.30 | |||||||||||||||||||||||||||||||||||||||||||||||||||||||||||||||||||||||||||||||||||||||||||||||||||
| Net investment income (loss) | 0.27 | 0.10 | (0.10 | ) | (0.01 | ) | 0.01 | |||||||||||||||||||||||||||||||||||||||||||||||||||||||||||||||||||||||||||||||||||||||||||||||||
| Portfolio turnover (%) | 43 | 30 | 30 | 50 | 33 | |||||||||||||||||||||||||||||||||||||||||||||||||||||||||||||||||||||||||||||||||||||||||||||||||||
| 1 | Based on average daily shares outstanding. | |||||||||||||||||||||||||||||||||||
| 2 | Less than $0.005 per share. | |||||||||||||||||||||||||||||||||||
| 3 | Does not reflect the effect of sales charges, if any. | |||||||||||||||||||||||||||||||||||
| 4 | Total returns would have been lower had certain expenses not been reduced during the applicable periods. | |||||||||||||||||||||||||||||||||||
| Class B Shares Period ended | 10-31-14 | 10-31-13 | 10-31-12 | 10-31-11 | 10-31-10 | |||||||||||||||||||||||||||||||||||||||||||||||||||||||||||||||||||||||||||||||||||||||||||||||||||
| Per share operating performance | ||||||||||||||||||||||||||||||||||||||||||||||||||||||||||||||||||||||||||||||||||||||||||||||||||||||||
| Net asset value, beginning of period | $38.65 | $32.36 | $28.89 | $26.16 | $22.60 | |||||||||||||||||||||||||||||||||||||||||||||||||||||||||||||||||||||||||||||||||||||||||||||||||||
| Net investment loss1 | (0.19 | ) | (0.22 | ) | (0.26 | ) | (0.21 | ) | (0.19 | ) | ||||||||||||||||||||||||||||||||||||||||||||||||||||||||||||||||||||||||||||||||||||||||||||||
| Net realized and unrealized gain on investments | 3.55 | 7.30 | 4.71 | 2.94 | 3.75 | |||||||||||||||||||||||||||||||||||||||||||||||||||||||||||||||||||||||||||||||||||||||||||||||||||
| Total from investment operations | 3.36 | 7.08 | 4.45 | 2.73 | 3.56 | |||||||||||||||||||||||||||||||||||||||||||||||||||||||||||||||||||||||||||||||||||||||||||||||||||
| Less distributions | ||||||||||||||||||||||||||||||||||||||||||||||||||||||||||||||||||||||||||||||||||||||||||||||||||||||||
| From net realized gain | (1.21 | ) | (0.79 | ) | (0.98 | ) | — | — | ||||||||||||||||||||||||||||||||||||||||||||||||||||||||||||||||||||||||||||||||||||||||||||||||
| Total distributions | (1.21 | ) | (0.79 | ) | (0.98 | ) | — | — | ||||||||||||||||||||||||||||||||||||||||||||||||||||||||||||||||||||||||||||||||||||||||||||||||
| Net asset value, end of period | $40.80 | $38.65 | $32.36 | $28.89 | $26.16 | |||||||||||||||||||||||||||||||||||||||||||||||||||||||||||||||||||||||||||||||||||||||||||||||||||
| Total return (%)2,3 | 8.93 | 22.37 | 16.07 | 10.44 | 15.75 | |||||||||||||||||||||||||||||||||||||||||||||||||||||||||||||||||||||||||||||||||||||||||||||||||||
| Ratios and supplemental data | ||||||||||||||||||||||||||||||||||||||||||||||||||||||||||||||||||||||||||||||||||||||||||||||||||||||||
| Net assets, end of period (in millions) | $27 | $33 | $30 | $27 | $39 | |||||||||||||||||||||||||||||||||||||||||||||||||||||||||||||||||||||||||||||||||||||||||||||||||||
| Ratios (as a percentage of average net assets): | ||||||||||||||||||||||||||||||||||||||||||||||||||||||||||||||||||||||||||||||||||||||||||||||||||||||||
| Expenses before reductions | 1.94 | 1.99 | 2.05 | 2.01 | 2.24 | |||||||||||||||||||||||||||||||||||||||||||||||||||||||||||||||||||||||||||||||||||||||||||||||||||
| Expenses including reductions | 1.93 | 1.98 | 2.05 | 2.00 | 2.05 | |||||||||||||||||||||||||||||||||||||||||||||||||||||||||||||||||||||||||||||||||||||||||||||||||||
| Net investment loss | (0.48 | ) | (0.64 | ) | (0.85 | ) | (0.75 | ) | (0.75 | ) | ||||||||||||||||||||||||||||||||||||||||||||||||||||||||||||||||||||||||||||||||||||||||||||||
| Portfolio turnover (%) | 43 | 30 | 30 | 50 | 33 | |||||||||||||||||||||||||||||||||||||||||||||||||||||||||||||||||||||||||||||||||||||||||||||||||||
| 1 | Based on average daily shares outstanding. | |||||||||||||||||||||||||||||||||||
| 2 | Does not reflect the effect of sales charges, if any. | |||||||||||||||||||||||||||||||||||
| 3 | Total returns would have been lower had certain expenses not been reduced during the applicable periods. | |||||||||||||||||||||||||||||||||||
| Class C Shares Period ended | 10-31-14 | 10-31-13 | 10-31-12 | 10-31-11 | 10-31-10 | |||||||||||||||||||||||||||||||||||||||||||||||||||||||||||||||||||||||||||||||||||||||||||||||||||
| Per share operating performance | ||||||||||||||||||||||||||||||||||||||||||||||||||||||||||||||||||||||||||||||||||||||||||||||||||||||||
| Net asset value, beginning of period | $38.66 | $32.37 | $28.90 | $26.16 | $22.61 | |||||||||||||||||||||||||||||||||||||||||||||||||||||||||||||||||||||||||||||||||||||||||||||||||||
| Net investment loss1 | (0.19 | ) | (0.22 | ) | (0.26 | ) | (0.21 | ) | (0.19 | ) | ||||||||||||||||||||||||||||||||||||||||||||||||||||||||||||||||||||||||||||||||||||||||||||||
| Net realized and unrealized gain on investments | 3.55 | 7.30 | 4.71 | 2.95 | 3.74 | |||||||||||||||||||||||||||||||||||||||||||||||||||||||||||||||||||||||||||||||||||||||||||||||||||
| Total from investment operations | 3.36 | 7.08 | 4.45 | 2.74 | 3.55 | |||||||||||||||||||||||||||||||||||||||||||||||||||||||||||||||||||||||||||||||||||||||||||||||||||
| Less distributions | ||||||||||||||||||||||||||||||||||||||||||||||||||||||||||||||||||||||||||||||||||||||||||||||||||||||||
| From net realized gain | (1.21 | ) | (0.79 | ) | (0.98 | ) | — | — | ||||||||||||||||||||||||||||||||||||||||||||||||||||||||||||||||||||||||||||||||||||||||||||||||
| Total distributions | (1.21 | ) | (0.79 | ) | (0.98 | ) | — | — | ||||||||||||||||||||||||||||||||||||||||||||||||||||||||||||||||||||||||||||||||||||||||||||||||
| Net asset value, end of period | $40.81 | $38.66 | $32.37 | $28.90 | $26.16 | |||||||||||||||||||||||||||||||||||||||||||||||||||||||||||||||||||||||||||||||||||||||||||||||||||
| Total return (%)2,3 | 8.92 | 22.36 | 16.07 | 10.47 | 15.70 | |||||||||||||||||||||||||||||||||||||||||||||||||||||||||||||||||||||||||||||||||||||||||||||||||||
| Ratios and supplemental data | ||||||||||||||||||||||||||||||||||||||||||||||||||||||||||||||||||||||||||||||||||||||||||||||||||||||||
| Net assets, end of period (in millions) | $133 | $130 | $81 | $58 | $60 | |||||||||||||||||||||||||||||||||||||||||||||||||||||||||||||||||||||||||||||||||||||||||||||||||||
| Ratios (as a percentage of average net assets): | ||||||||||||||||||||||||||||||||||||||||||||||||||||||||||||||||||||||||||||||||||||||||||||||||||||||||
| Expenses before reductions | 1.94 | 1.98 | 2.05 | 2.01 | 2.23 | |||||||||||||||||||||||||||||||||||||||||||||||||||||||||||||||||||||||||||||||||||||||||||||||||||
| Expenses including reductions | 1.93 | 1.98 | 2.05 | 2.01 | 2.05 | |||||||||||||||||||||||||||||||||||||||||||||||||||||||||||||||||||||||||||||||||||||||||||||||||||
| Net investment loss | (0.48 | ) | (0.65 | ) | (0.85 | ) | (0.75 | ) | (0.76 | ) | ||||||||||||||||||||||||||||||||||||||||||||||||||||||||||||||||||||||||||||||||||||||||||||||
| Portfolio turnover (%) | 43 | 30 | 30 | 50 | 33 | |||||||||||||||||||||||||||||||||||||||||||||||||||||||||||||||||||||||||||||||||||||||||||||||||||
| 1 | Based on average daily shares outstanding. | |||||||||||||||||||||||||||||||||||
| 2 | Does not reflect the effect of sales charges, if any. | |||||||||||||||||||||||||||||||||||
| 3 | Total returns would have been lower had certain expenses not been reduced during the applicable periods. | |||||||||||||||||||||||||||||||||||
| Class I Shares Period ended | 10-31-14 | 10-31-13 | 10-31-12 | 10-31-11 | 10-31-10 | |||||||||||||||||||||||||||||||||||||||||||||||||||||||||||||||||||||||||||||||||||||||||||||||||||
| Per share operating performance | ||||||||||||||||||||||||||||||||||||||||||||||||||||||||||||||||||||||||||||||||||||||||||||||||||||||||
| Net asset value, beginning of period | $44.12 | $36.44 | $32.06 | $28.69 | $24.55 | |||||||||||||||||||||||||||||||||||||||||||||||||||||||||||||||||||||||||||||||||||||||||||||||||||
| Net investment income1 | 0.24 | 0.16 | 0.08 | 0.12 | 0.11 | |||||||||||||||||||||||||||||||||||||||||||||||||||||||||||||||||||||||||||||||||||||||||||||||||||
| Net realized and unrealized gain (loss) on investments | 4.07 | 8.31 | 5.28 | 3.25 | 4.10 | |||||||||||||||||||||||||||||||||||||||||||||||||||||||||||||||||||||||||||||||||||||||||||||||||||
| Total from investment operations | 4.31 | 8.47 | 5.36 | 3.37 | 4.21 | |||||||||||||||||||||||||||||||||||||||||||||||||||||||||||||||||||||||||||||||||||||||||||||||||||
| Less distributions | ||||||||||||||||||||||||||||||||||||||||||||||||||||||||||||||||||||||||||||||||||||||||||||||||||||||||
| From net investment income | (0.10 | ) | — | — | — | (0.07 | ) | |||||||||||||||||||||||||||||||||||||||||||||||||||||||||||||||||||||||||||||||||||||||||||||||||
| From net realized gain | (1.21 | ) | (0.79 | ) | (0.98 | ) | — | — | ||||||||||||||||||||||||||||||||||||||||||||||||||||||||||||||||||||||||||||||||||||||||||||||||
| Total distributions | (1.31 | ) | (0.79 | ) | (0.98 | ) | — | (0.07 | ) | |||||||||||||||||||||||||||||||||||||||||||||||||||||||||||||||||||||||||||||||||||||||||||||||
| Net asset value, end of period | $47.12 | $44.12 | $36.44 | $32.06 | $28.69 | |||||||||||||||||||||||||||||||||||||||||||||||||||||||||||||||||||||||||||||||||||||||||||||||||||
| Total return (%)2 | 10.01 | 23.70 | 17.36 | 11.75 | 17.15 | |||||||||||||||||||||||||||||||||||||||||||||||||||||||||||||||||||||||||||||||||||||||||||||||||||
| Ratios and supplemental data | ||||||||||||||||||||||||||||||||||||||||||||||||||||||||||||||||||||||||||||||||||||||||||||||||||||||||
| Net assets, end of period (in millions) | $317 | $307 | $169 | $55 | $37 | |||||||||||||||||||||||||||||||||||||||||||||||||||||||||||||||||||||||||||||||||||||||||||||||||||
| Ratios (as a percentage of average net assets): | ||||||||||||||||||||||||||||||||||||||||||||||||||||||||||||||||||||||||||||||||||||||||||||||||||||||||
| Expenses before reductions | 0.93 | 0.93 | 0.96 | 0.90 | 0.93 | |||||||||||||||||||||||||||||||||||||||||||||||||||||||||||||||||||||||||||||||||||||||||||||||||||
| Expenses including reductions | 0.92 | 0.93 | 0.94 | 0.85 | 0.85 | |||||||||||||||||||||||||||||||||||||||||||||||||||||||||||||||||||||||||||||||||||||||||||||||||||
| Net investment income | 0.53 | 0.41 | 0.24 | 0.39 | 0.43 | |||||||||||||||||||||||||||||||||||||||||||||||||||||||||||||||||||||||||||||||||||||||||||||||||||
| Portfolio turnover (%) | 43 | 30 | 30 | 50 | 33 | |||||||||||||||||||||||||||||||||||||||||||||||||||||||||||||||||||||||||||||||||||||||||||||||||||
| 1 | Based on average daily shares outstanding. | |||||||||||||||||||||||||||||||||||
| 2 | Total returns would have been lower had certain expenses not been reduced during the applicable periods. | |||||||||||||||||||||||||||||||||||
| Class R2 Shares Period ended | 10-31-14 | 10-31-13 | 10-31-12 | 1 | |||||||||||||||||||||||||||||||||||||||||||||||||||||||||||||||||||||||||||||||
| Per share operating performance | |||||||||||||||||||||||||||||||||||||||||||||||||||||||||||||||||||||||||||||||||||
| Net asset value, beginning of period | $43.93 | $36.40 | $34.46 | ||||||||||||||||||||||||||||||||||||||||||||||||||||||||||||||||||||||||||||||||
| Net investment income (loss)2 | 0.06 | (0.04 | ) | 0.02 | |||||||||||||||||||||||||||||||||||||||||||||||||||||||||||||||||||||||||||||||
| Net realized and unrealized gain on investments | 4.06 | 8.36 | 1.92 | ||||||||||||||||||||||||||||||||||||||||||||||||||||||||||||||||||||||||||||||||
| Total from investment operations | 4.12 | 8.32 | 1.94 | ||||||||||||||||||||||||||||||||||||||||||||||||||||||||||||||||||||||||||||||||
| Less distributions | |||||||||||||||||||||||||||||||||||||||||||||||||||||||||||||||||||||||||||||||||||
| From net investment income | (0.02 | ) | — | — | |||||||||||||||||||||||||||||||||||||||||||||||||||||||||||||||||||||||||||||||
| From net realized gain | (1.21 | ) | (0.79 | ) | — | ||||||||||||||||||||||||||||||||||||||||||||||||||||||||||||||||||||||||||||||
| Total distributions | (1.23 | ) | (0.79 | ) | — | ||||||||||||||||||||||||||||||||||||||||||||||||||||||||||||||||||||||||||||||
| Net asset value, end of period | $46.82 | $43.93 | $36.40 | ||||||||||||||||||||||||||||||||||||||||||||||||||||||||||||||||||||||||||||||||
| Total return (%)3 | 9.59 | 23.31 | 5.63 | 4 | |||||||||||||||||||||||||||||||||||||||||||||||||||||||||||||||||||||||||||||||
| Ratios and supplemental data | |||||||||||||||||||||||||||||||||||||||||||||||||||||||||||||||||||||||||||||||||||
| Net assets, end of period (in millions) | $34 | $32 | — | 5 | |||||||||||||||||||||||||||||||||||||||||||||||||||||||||||||||||||||||||||||||
| Ratios (as a percentage of average net assets): | |||||||||||||||||||||||||||||||||||||||||||||||||||||||||||||||||||||||||||||||||||
| Expenses before reductions | 1.33 | 1.32 | 1.13 | 6 | |||||||||||||||||||||||||||||||||||||||||||||||||||||||||||||||||||||||||||||||
| Expenses including reductions | 1.32 | 1.31 | 1.13 | 6 | |||||||||||||||||||||||||||||||||||||||||||||||||||||||||||||||||||||||||||||||
| Net investment income (loss) | 0.13 | (0.09 | ) | 0.08 | 6 | ||||||||||||||||||||||||||||||||||||||||||||||||||||||||||||||||||||||||||||||
| Portfolio turnover (%) | 43 | 30 | 30 | 7 | |||||||||||||||||||||||||||||||||||||||||||||||||||||||||||||||||||||||||||||||
| 1 | The inception date for Class R2 shares is 3-1-12 | ||||||||||||||||||||||||||||
| 2 | Based on average daily shares outstanding. | ||||||||||||||||||||||||||||
| 3 | Total returns would have been lower had certain expenses not been reduced during the applicable periods. | ||||||||||||||||||||||||||||
| 4 | Not annualized. | ||||||||||||||||||||||||||||
| 5 | Less than $500,000. | ||||||||||||||||||||||||||||
| 6 | Annualized. | ||||||||||||||||||||||||||||
| 7 | The portfolio turnover is shown for the period from 11-1-11 to 10-31-12. | ||||||||||||||||||||||||||||
| Class R6 Shares Period ended | 10-31-14 | 10-31-13 | 10-31-12 | 10-31-11 | 1 | |||||||||||||||||||||||||||||||||||||||||||||||||||||||||||||||||||||||||||||||||||||||
| Per share operating performance | ||||||||||||||||||||||||||||||||||||||||||||||||||||||||||||||||||||||||||||||||||||||||||||
| Net asset value, beginning of period | $44.19 | $36.46 | $32.06 | $30.81 | ||||||||||||||||||||||||||||||||||||||||||||||||||||||||||||||||||||||||||||||||||||||||
| Net investment income2 | 0.28 | 0.18 | 0.11 | 0.03 | ||||||||||||||||||||||||||||||||||||||||||||||||||||||||||||||||||||||||||||||||||||||||
| Net realized and unrealized gain on investments | 4.09 | 8.34 | 5.27 | 1.22 | ||||||||||||||||||||||||||||||||||||||||||||||||||||||||||||||||||||||||||||||||||||||||
| Total from investment operations | 4.37 | 8.52 | 5.38 | 1.25 | ||||||||||||||||||||||||||||||||||||||||||||||||||||||||||||||||||||||||||||||||||||||||
| Less distributions | ||||||||||||||||||||||||||||||||||||||||||||||||||||||||||||||||||||||||||||||||||||||||||||
| From net investment income | (0.12 | ) | — | — | — | |||||||||||||||||||||||||||||||||||||||||||||||||||||||||||||||||||||||||||||||||||||||
| From net realized gain | (1.21 | ) | (0.79 | ) | (0.98 | ) | — | |||||||||||||||||||||||||||||||||||||||||||||||||||||||||||||||||||||||||||||||||||||
| Total distributions | (1.33 | ) | (0.79 | ) | (0.98 | ) | — | |||||||||||||||||||||||||||||||||||||||||||||||||||||||||||||||||||||||||||||||||||||
| Net asset value, end of period | $47.23 | $44.19 | $36.46 | $32.06 | ||||||||||||||||||||||||||||||||||||||||||||||||||||||||||||||||||||||||||||||||||||||||
| Total return (%)3 | 10.15 | 23.83 | 17.42 | 4.06 | 4 | |||||||||||||||||||||||||||||||||||||||||||||||||||||||||||||||||||||||||||||||||||||||
| Ratios and supplemental data | ||||||||||||||||||||||||||||||||||||||||||||||||||||||||||||||||||||||||||||||||||||||||||||
| Net assets, end of period (in millions) | $4 | $4 | — | 5 | — | 5 | ||||||||||||||||||||||||||||||||||||||||||||||||||||||||||||||||||||||||||||||||||||||
| Ratios (as a percentage of average net assets): | ||||||||||||||||||||||||||||||||||||||||||||||||||||||||||||||||||||||||||||||||||||||||||||
| Expenses before reductions | 0.83 | 0.84 | 0.88 | 0.88 | 6 | |||||||||||||||||||||||||||||||||||||||||||||||||||||||||||||||||||||||||||||||||||||||
| Expenses including reductions | 0.80 | 0.84 | 0.85 | 0.85 | 6 | |||||||||||||||||||||||||||||||||||||||||||||||||||||||||||||||||||||||||||||||||||||||
| Net investment income | 0.64 | 0.47 | 0.30 | 0.66 | 6 | |||||||||||||||||||||||||||||||||||||||||||||||||||||||||||||||||||||||||||||||||||||||
| Portfolio turnover (%) | 43 | 30 | 30 | 50 | 7 | |||||||||||||||||||||||||||||||||||||||||||||||||||||||||||||||||||||||||||||||||||||||
| 1 | The inception date for Class R6 shares is 9-1-11. | |||||||||||||||||||||||||||||||
| 2 | Based on average daily shares outstanding. | |||||||||||||||||||||||||||||||
| 3 | Total returns would have been lower had certain expenses not been reduced during the applicable periods. | |||||||||||||||||||||||||||||||
| 4 | Not annualized. | |||||||||||||||||||||||||||||||
| 5 | Less than $500,000. | |||||||||||||||||||||||||||||||
| 6 | Annualized. | |||||||||||||||||||||||||||||||
| 7 | The portfolio turnover is shown for the period from 11-1-10 to 10-31-11. | |||||||||||||||||||||||||||||||
Note 1 — Organization
John Hancock U.S. Global Leaders Growth Fund (the fund) is a series of John Hancock Capital Series (the Trust), an open-end management investment company organized as a Massachusetts business trust and registered under the Investment Company Act of 1940, as amended (the 1940 Act). The investment objective of the fund is to seek long-term growth of capital.
The fund may offer multiple classes of shares. The shares currently offered are detailed in the Statement of assets and liabilities. Class A and Class C shares are offered to all investors. Class B shares are closed to new investors. Class I shares are offered to institutions and certain investors. Class R2 shares are available only to certain retirement plans. Class R6 shares are available only to certain retirement plans, institutions and other investors. Shareholders of each class have exclusive voting rights to matters that affect that class. The distribution and service fees, if any, and transfer agent fees, for each class may differ. Class B shares convert to Class A shares eight years after purchase.
Note 2 — Significant accounting policies
The financial statements have been prepared in conformity with accounting principles generally accepted in the United States of America (US GAAP), which require management to make certain estimates and assumptions as of the date of the financial statements. Actual results could differ from those estimates and those differences could be significant. The fund intends to qualify as an investment company under Topic 946 of Accounting Standards Codification of US GAAP.
Events or transactions occurring after the end of the fiscal period through the date that the financial statements were issued have been evaluated in the preparation of the financial statements. The following summarizes the significant accounting policies of the fund:
Security valuation. Investments are stated at value as of the close of regular trading on the New York Stock Exchange (NYSE), normally at 4:00 p.m., Eastern Time. In order to value the securities, the fund uses the following valuation techniques: Equity securities held by the fund are valued at the last sale price or official closing price on the exchange where the security was acquired or most likely will be sold. In the event there were no sales during the day or closing prices are not available, the securities are valued using the last available bid price. Investments by the fund in open-end mutual funds, including John Hancock Collateral Investment Trust (JHCIT), are valued at their respective net asset values each business day. Certain short-term securities with maturities of 60 days or less at the time of purchase are valued at amortized cost. Other fund securities and assets, for which reliable market quotations are not readily available, are valued at fair value as determined in good faith by the fund's Pricing Committee following procedures established by the Board of Trustees. The frequency with which these fair valuation procedures are used cannot be predicted and fair value of securities may differ significantly from the value that would have been used had a ready market for such securities existed.
The fund uses a three-tier hierarchy to prioritize the pricing assumptions, referred to as inputs, used in valuation techniques to measure fair value. Level 1 includes securities valued using quoted prices in active markets for identical securities. Level 2 includes securities valued using other significant observable inputs. Observable inputs may include quoted prices for similar securities, interest rates, prepayment speeds and credit risk. Prices for securities valued using these inputs are received from independent pricing vendors and brokers and are based on an evaluation of the inputs described. Level 3 includes securities valued using significant unobservable inputs when market prices are not readily available or reliable, including the fund's own assumptions in determining the fair value of investments. Factors used in determining value may include market or issuer specific events or trends, changes in interest rates and credit quality. The inputs or methodology used for valuing securities are not necessarily an indication of the risks associated with investing in those securities. Changes in valuation techniques may result in transfers into or out of an assigned level within the disclosure hierarchy.
As of October 31, 2014, all investments are categorized as Level 1 under the hierarchy described above.
Security transactions and related investment income. Investment security transactions are accounted for on a trade date plus one basis for daily net asset value calculations. However, for financial reporting purposes, investment transactions are reported on trade date. Interest income is accrued as earned. Dividend income is recorded on the ex-date, except for dividends of foreign securities where the dividend may not be known until after the ex-date. In those cases, dividend income,
25
net of withholding taxes, is recorded when the fund becomes aware of the dividends. Foreign taxes are provided for based on the fund's understanding of the tax rules and rates that exist in the foreign markets in which it invests. Gains and losses on securities sold are determined on the basis of identified cost and may include proceeds from litigation.
Securities lending. The fund may lend its securities to earn additional income. The fund receives cash collateral from the borrower in an amount not less than the market value of the loaned securities. The fund will invest its collateral in JHCIT, an affiliate of the fund, which has a floating net asset value and is registered with the Securities and Exchange Commission as an investment company. JHCIT invests cash received as collateral as part of the securities lending program in short-term money market investments. The fund will receive the benefit of any gains and bear any losses generated by JHCIT with respect to the cash collateral.
If a borrower fails to return loaned securities when due, then the lending agent is responsible and indemnifies the fund for the lent securities. The lending agent uses the collateral received from the borrower to purchase replacement securities of the same issue, type, class and series of the loaned securities. If the value of the collateral is less than the purchase cost of replacement securities, the lending agent is responsible for satisfying the shortfall but only to the extent that the shortfall is not due to any decrease in the value of JHCIT.
Although the risk of the loss of the securities lent is mitigated by receiving collateral from the borrower and through lending agent indemnification, the fund could experience a delay in recovering securities or could experience a lower than expected return if the borrower fails to return the securities on a timely basis. The fund may receive compensation for lending its securities by retaining a portion of the return on the investment of the collateral and compensation from fees earned from borrowers of the securities. Net income received from JHCIT is a component of securities lending income as recorded on the Statement of operations.
Obligations to repay collateral received by the fund is shown on the Statement of assets and liabilities as Payable upon return of securities loaned.
Foreign taxes. The fund may be subject to withholding tax on income and/or capital gains or repatriation taxes imposed by certain countries in which the fund invests. Taxes are accrued based upon investment income, realized gains or unrealized appreciation.
Line of credit. The fund may borrow from banks for temporary or emergency purposes, including meeting redemption requests that otherwise might require the untimely sale of securities. Pursuant to the fund's custodian agreement, the custodian may loan money to the fund to make properly authorized payments. The fund is obligated to repay the custodian for any overdraft, including any related costs or expenses. The custodian may have a lien, security interest or security entitlement in any fund property that is not otherwise segregated or pledged, to the maximum extent permitted by law, to the extent of any overdraft.
In addition, the fund and other affiliated funds have entered into an agreement with Citibank N.A. that enables them to participate in a $300 million unsecured committed line of credit. A commitment fee, payable at the end of each calendar quarter, based on the average daily unused portion of the line of credit, is charged to each participating fund on a pro rata basis and is reflected in other expenses on the Statement of operations. Commitment fees for the year ended October 31, 2014 were $840. During the year ended October 31, 2014, the maximum amount borrowed under the line of credit was $14,700,000. This amount was fully repaid within a six day period. Interest paid on the borrowing was $2,201 and is shown in Other expense on the Statement of operations. The average borrowings and effective average interest rate during the period the borrowings were outstanding was $241,644 and 0.91%, respectively.
Expenses. Within the John Hancock group of funds complex, expenses that are directly attributable to an individual fund are allocated to such fund. Expenses that are not readily attributable to a specific fund are allocated among all funds in an equitable manner, taking into consideration, among other things, the nature and type of expense and the fund's relative net assets. Expense estimates are accrued in the period to which they relate and adjustments are made when actual amounts are known.
26
Class allocations. Income, common expenses and realized and unrealized gains (losses) are determined at the fund level and allocated daily to each class of shares based on the net assets of the class. Class-specific expenses, such as distribution and service fees, if any, and transfer agent fees, are calculated daily for each class, based on the net asset value of the class and the applicable specific expense rates.
Federal income taxes. The fund intends to continue to qualify as a regulated investment company by complying with the applicable provisions of the Internal Revenue Code and will not be subject to federal income tax on taxable income that is distributed to shareholders. Therefore, no federal income tax provision is required.
As of October 31, 2014, the fund had no uncertain tax positions that would require financial statement recognition, derecognition or disclosure. The fund's federal tax returns are subject to examination by the Internal Revenue Service for a period of three years.
Distribution of income and gains. Distributions to shareholders from net investment income and net realized gains, if any, are recorded on the ex-date. The fund generally declares and pays dividends and capital gain distributions, if any, annually. The tax character of distributions for the years ended October 31, 2014 and 2013 was as follows:
| October 31, 2014 | October 31, 2013 | |
| Ordinary income | $1,265,358 | $6,928,919 |
| Long-term capital gains | 34,593,139 | 9,516,765 |
| Total | $35,858,497 | $16,445,684 |
Distributions paid by the fund with respect to each class of shares are calculated in the same manner, at the same time and in the same amount, except for the effect of class level expenses that may be applied differently to each class. As of October 31, 2014, the components of distributable earnings on a tax basis consisted of $32,534,017 of undistributed ordinary income and $118,522,506 of undistributed long-term capital gains.
Such distributions and distributable earnings, on a tax basis, are determined in conformity with income tax regulations, which may differ from US GAAP. Distributions in excess of tax basis earnings and profits, if any, are reported in the fund's financial statements as a return of capital.
Capital accounts within the financial statements are adjusted for permanent book-tax differences. These adjustments have no impact on net assets or the results of operations. Temporary book-tax differences, if any, will reverse in a subsequent period. Book-tax differences are primarily attributable to wash sale loss deferrals and litigation proceeds.
Note 3 — Guarantees and indemnifications
Under the Trust's organizational documents, its Officers and Trustees are indemnified against certain liabilities arising out of the performance of their duties to the Trust, including the fund. Additionally, in the normal course of business, the fund enters into contracts with service providers that contain general indemnification clauses. The fund's maximum exposure under these arrangements is unknown, as this would involve future claims that may be made against the fund that have not yet occurred. The risk of material loss from such claims is considered remote.
Note 4 — Fees and transactions with affiliates
John Hancock Advisers, LLC (the Advisor) serves as investment advisor for the fund. John Hancock Funds, LLC (the Distributor), an affiliate of the Advisor, serves as principal underwriter of the Fund. The Advisor and the Distributor are indirect, wholly owned subsidiaries of Manulife Financial Corporation (MFC).
Management fee. The fund has an investment management agreement with the Advisor under which the fund pays a monthly management fee to the Advisor, on an annual basis, to the sum of: (a) 0.75% of the first $500 million of the fund's average daily net assets; (b) 0.73% of the next $500 million of the fund's average daily net assets; (c) 0.71% of the next $1 billion of the fund's average daily net assets; (d) 0.70% of the next $3 billion of the fund's average daily net assets; and (e) 0.65% of the fund's average daily net assets in excess of $5 billion. The Advisor has a subadvisory agreement with Sustainable Growth Advisers, LP. The fund is not responsible for payment of the subadvisory fees.
27
The Advisor has contractually agreed to waive a portion of its management fee and/or reimburse expenses for certain funds of the John Hancock complex, including the fund (the participating portfolios). The waiver equals, on an annualized basis, 0.01% of that portion of the aggregate net assets of all the participating portfolios that exceeds $75 billion but is less than or equal to $125 billion; 0.0125% of that portion of the aggregate net assets of all the participating portfolios that exceeds $125 billion but is less than or equal to $150 billion; and 0.015% of that portion of the aggregate net assets of all the participating portfolios that exceeds $150 billion. The amount of the reimbursement is calculated daily and allocated among all the participating portfolios in proportion to the daily net assets of each fund. This arrangement may be amended or terminated at any time by the Advisor upon notice to the fund and with the approval of the Board of Trustees.
The Advisor has contractually agreed to waive all or a portion of its management fee and/or reimburse or pay operating expenses of the fund to the extent necessary to maintain the fund's total operating expenses at 0.85% for Class R6 shares, excluding certain expenses such as taxes, brokerage commissions, interest expense, litigation and indemnifications expenses and other extraordinary expenses not incurred in the ordinary course of the fund's business, acquired fund fees and expenses paid indirectly and short dividend expense. This expense limitation shall remain in effect until February 28, 2015. Prior to March 1, 2014, the fee waivers and/or reimbursements were such that these expenses would not exceed 1.30%, 2.05%, 2.05%, 0.99% and 1.40% for Class A, Class B, Class C, Class I and Class R2 shares, respectively.
Effective February 1, 2014, for Class R6 shares, the Advisor has contractually agreed to waive and/or reimburse all class specific expenses of the fund, including transfer agency fees and service fees, as applicable, to the extent they exceed 0.00% of average net assets. The agreement expires on February 28, 2015, unless renewed by mutual agreement of the fund and the Advisor based upon a determination that this is appropriate under the circumstances at the time. This waiver was in effect on a voluntary basis from January 1, 2014 to January 31, 2014.
Effective March 1, 2014, for Class B shares, the Advisor has contractually agreed to waive and/or reimburse all class-specific expenses for the fund, including Rule 12b-1 fees and transfer agency fees and service fees, as applicable, to the extent they exceed 1.30% of average net assets (on an annualized basis) attributable to Class B shares (the Class Expense Waiver). The Class Expense Waiver expires on February 28, 2015, unless renewed by mutual agreement to the fund and Advisor based upon a determination that this is appropriate under the circumstances at the time.
For the year ended October 31, 2014, these expense reductions described above amounted to the following:
| Class | Expense reduction | Class | Expense reduction | |
| Class A | $44,275 | Class R2 | $2,435 | |
| Class B | 1,986 | Class R6 | 947 | |
| Class C | 8,881 | Total | $79,989 | |
| Class I | 21,465 |
The investment management fees, including the impact of the waivers and reimbursements as described above, incurred for the year ended October 31, 2014 were equivalent to a net annual effective rate of 0.73% of the fund's average daily net assets.
Accounting and legal services. Pursuant to the Accounting and Legal Services Agreement, the fund reimburses the Advisor for all expenses associated with providing the administrative, financial, legal, accounting and recordkeeping services to the fund, including the preparation of all tax returns, periodic reports to shareholders and regulatory reports, among other services. These expenses are allocated to each share class based on its relative net assets at the time the expense was incurred. These accounting and legal services fees incurred for the period ended October 31, 2014 amounted to an annual rate of 0.02% of the fund's average daily net assets.
Distribution and service plans. The fund has a distribution agreement with the Distributor. The fund has adopted distribution and service plans with respect to Class A, Class B, Class C and Class R2 pursuant to Rule 12b-1 under the 1940 Act, to pay the Distributor for services provided as the distributor of shares of the fund. In addition, under a service plan for Class R2 shares, the fund pays for certain other services. The fund may pay up to the following contractual rates of
28
distribution and service fees under these arrangements, expressed as an annual percentage of average daily net assets for each class of the fund's shares.
| Class | Rule 12b-1 fee | Service fee | Class | Rule 12b-1 fee | Service fee | |
| Class A | 0.25% | — | Class C | 1.00% | — | |
| Class B | 1.00% | — | Class R2 | 0.25% | 0.25% |
Sales charges. Class A shares are assessed up-front sales charges, which resulted in payments to the Distributor amounting to $2,171,423 for the year ended October 31, 2014. Of this amount, $368,100 was retained and used for printing prospectuses, advertising, sales literature and other purposes, $1,769,867 was paid as sales commissions to broker-dealers and $33,456 was paid as sales commissions to sales personnel of Signator Investors, Inc., a broker-dealer affiliate of the Advisor.
Class A, Class B and Class C shares may be subject to contingent deferred sales charges (CDSCs). Certain Class A shares that are acquired through purchases of $1 million or more and are redeemed within one year of purchase are subject to a 1.00% sales charge. Class B shares that are redeemed within six years of purchase are subject to CDSCs, at declining rates, beginning at 5.00%. Class C shares that are redeemed within one year of purchase are subject to a 1.00% CDSC. CDSCs are applied to the lesser of the current market value at the time of redemption or the original purchase cost of the shares being redeemed. Proceeds from CDSCs are used to compensate the Distributor for providing distribution-related services in connection with the sale of these shares. During the year ended October 31, 2014, CDSCs received by the Distributor amounted to $2,494, $58,065 and $15,638 for Class A, Class B and Class C shares, respectively.
Transfer agent fees. The fund has a transfer agent agreement with John Hancock Signature Services, Inc. (Signature Services), an affiliate of the Advisor. The transfer agent fees paid to Signature Services are determined based on the cost to Signature Services (Signature Services Cost) of providing recordkeeping services. The Signature Services Cost includes a component of allocated John Hancock corporate overhead for providing transfer agent services to the fund and to all other John Hancock affiliated funds. It also includes out-of-pocket expenses, including payments made to third-parties for recordkeeping services provided to their clients who invest in one or more John Hancock funds. In addition, Signature Services Cost may be reduced by certain fees that Signature Services receives in connection with retirement and small accounts. Signature Services Cost is calculated monthly and allocated, as applicable, to five categories of share classes: Retail Share and Institutional Classes of Non-Municipal Bond Funds, Class R6 Shares, Retirement Share Classes and Municipal Bond Share Classes. Within each of these categories, the applicable costs are allocated to the affected John Hancock affiliated funds and/or classes, based on the relative average daily net assets.
Class level expenses. Class level expenses for the year ended October 31, 2014 were:
| Class | Distribution and service fees | Transfer agent fees |
| Class A | $1,672,612 | $890,057 |
| Class B | 299,773 | 39,857 |
| Class C | 1,333,905 | 177,324 |
| Class I | — | 390,416 |
| Class R2 | 185,290 | 7,100 |
| Class R6 | — | 800 |
| Total | $3,491,580 | $1,505,554 |
Trustee expenses. The fund compensates each Trustee who is not an employee of the Advisor or its affiliates. The costs of paying Trustee compensation and expenses are allocated to each fund based on its net assets relative to other funds within the John Hancock group of funds complex.
29
Note 5 — Fund share transactions
Transactions in fund shares for the years ended October 31, 2014 and 2013 were as follows:
| Year ended 10-31-14 | Year ended 10-31-13 | |||||||||||||||||||||||||
| Shares | Amount | Shares | Amount | |||||||||||||||||||||||
| Class A shares | ||||||||||||||||||||||||||
| Sold | 3,738,416 | $159,056,967 | 7,552,395 | $285,695,157 | ||||||||||||||||||||||
| Distributions reinvested | 477,472 | 19,810,284 | 260,910 | 9,139,675 | ||||||||||||||||||||||
| Repurchased | (7,393,831 | ) | (314,311,259 | ) | (3,112,320 | ) | (118,601,730 | ) | ||||||||||||||||||
| Net increase (decrease) | (3,177,943 | ) | ($135,444,008 | ) | 4,700,985 | $176,233,102 | ||||||||||||||||||||
| Class B shares | ||||||||||||||||||||||||||
| Sold | 39,779 | $1,546,699 | 216,131 | $7,371,783 | ||||||||||||||||||||||
| Distributions reinvested | 22,554 | 853,437 | 18,877 | 608,972 | ||||||||||||||||||||||
| Repurchased | (235,132 | ) | (9,106,020 | ) | (311,868 | ) | (10,742,604 | ) | ||||||||||||||||||
| Net decrease | (172,799 | ) | ($6,705,884 | ) | (76,860 | ) | ($2,761,849 | ) | ||||||||||||||||||
| Class C shares | ||||||||||||||||||||||||||
| Sold | 583,313 | $22,598,985 | 1,295,938 | $44,579,587 | ||||||||||||||||||||||
| Distributions reinvested | 81,395 | 3,081,624 | 47,542 | 1,534,191 | ||||||||||||||||||||||
| Repurchased | (782,703 | ) | (30,326,973 | ) | (463,049 | ) | (16,202,194 | ) | ||||||||||||||||||
| Net increase (decrease) | (117,995 | ) | ($4,646,364 | ) | 880,431 | $29,911,584 | ||||||||||||||||||||
| Class I shares | ||||||||||||||||||||||||||
| Sold | 3,152,881 | $140,977,893 | 5,193,460 | $203,001,398 | ||||||||||||||||||||||
| Distributions reinvested | 167,837 | 7,270,696 | 97,013 | 3,539,037 | ||||||||||||||||||||||
| Repurchased | (3,557,174 | ) | (160,154,012 | ) | (2,971,409 | ) | (117,155,621 | ) | ||||||||||||||||||
| Net increase (decrease) | (236,456 | ) | ($11,905,423 | ) | 2,319,064 | $89,384,814 | ||||||||||||||||||||
| Class R2 shares | ||||||||||||||||||||||||||
| Sold | 411,884 | $18,203,020 | 795,078 | $32,190,023 | ||||||||||||||||||||||
| Distributions reinvested | 16,421 | 709,383 | 115 | 4,193 | ||||||||||||||||||||||
| Repurchased | (424,932 | ) | (18,951,370 | ) | (86,257 | ) | (3,554,460 | ) | ||||||||||||||||||
| Net increase (decrease) | 3,373 | ($38,967 | ) | 708,936 | $28,639,756 | |||||||||||||||||||||
| Class R6 Shares | ||||||||||||||||||||||||||
| Sold | 25,427 | $1,127,747 | 103,248 | $3,899,717 | ||||||||||||||||||||||
| Distributions reinvested | 2,576 | 111,747 | 1,244 | 45,421 | ||||||||||||||||||||||
| Repurchased | (32,954 | ) | (1,464,748 | ) | (25,992 | ) | (1,035,248 | ) | ||||||||||||||||||
| Net increase (decrease) | (4,951 | ) | ($225,254 | ) | 78,500 | $2,909,890 | ||||||||||||||||||||
| Total net increase (decrease) | (3,706,771 | ) | ($158,965,900 | ) | 8,611,056 | $324,317,297 | ||||||||||||||||||||
Note 6 — Purchase and sale of securities
Purchases and sales of securities, other than short-term investments, amounted to $502,082,194 and $650,640,811, respectively, for the year ended October 31, 2014.
30
Report of Independent Registered Public Accounting Firm
To the Board of Trustees of John Hancock Capital Series and Shareholders of
John Hancock U.S. Global Leaders Growth Fund:
In our opinion, the accompanying statement of assets and liabilities, including the fund's investments, and the related statements of operations and of changes in net assets and the financial highlights present fairly, in all material respects, the financial position of John Hancock U.S. Global Leaders Growth Fund (the "Fund") at October 31, 2014, the results of its operations for the year then ended, the changes in its net assets for each of the two years in the period then ended and the financial highlights for each of the periods indicated, in conformity with accounting principles generally accepted in the United States of America. These financial statements and financial highlights (hereafter referred to as "financial statements") are the responsibility of the Fund's management. Our responsibility is to express an opinion on these financial statements based on our audits. We conducted our audits of these financial statements in accordance with the standards of the Public Company Accounting Oversight Board (United States). Those standards require that we plan and perform the audit to obtain reasonable assurance about whether the financial statements are free of material misstatement. An audit includes examining, on a test basis, evidence supporting the amounts and disclosures in the financial statements, assessing the accounting principles used and significant estimates made by management, and evaluating the overall financial statement presentation. We believe that our audits, which included confirmation of securities at October 31, 2014 by correspondence with the custodian, transfer agent and brokers, provide a reasonable basis for our opinion.
PricewaterhouseCoopers LLP
Boston, Massachusetts
December 12, 2014
31
Unaudited
For federal income tax purposes, the following information is furnished with respect to the distributions of the fund, if any, paid during its taxable year ended October 31, 2014.
The fund reports the maximum amount allowable of its net taxable income as eligible for the corporate dividends-received deduction.
The fund reports the maximum amount allowable of its net taxable income as qualified dividend income as provided in the Jobs and Growth Tax Relief Reconciliation Act of 2003.
The fund paid $34,593,139 in capital gain dividends.
Eligible shareholders will be mailed a 2014 Form 1099-DIV in early 2015. This will reflect the tax character of all distributions paid in calendar year 2014.
Please consult a tax advisor regarding the tax consequences of your investment in the fund.
32
Continuation of Investment Advisory and Subadvisory Agreements
Evaluation of Advisory and Subadvisory Agreements by the Board of Trustees
This section describes the evaluation by the Board of Trustees (the Board) of Capital Series (the Trust) of the Advisory Agreement (the Advisory Agreement) with John Hancock Advisers, LLC (the Advisor) and the Subadvisory Agreement (the Subadvisory Agreement) with Sustainable Growth Advisers, LP (the Subadvisor), for John Hancock U.S. Global Leaders Fund (the fund). The Advisory Agreement and Subadvisory Agreement are collectively referred to as the Agreements. Prior to the June 23-25, 2014 meeting at which the Agreements were approved, the Board also discussed and considered information regarding the proposed continuation of the Agreements at an in-person meeting held on May 27-29, 2014.
Approval of Advisory and Subadvisory Agreements
At in-person meetings held on June 23-25, 2014, the Board, including the Trustees who are not considered to be interested persons of the Trust under the Investment Company Act of 1940, as amended (the 1940 Act) (the Independent Trustees), reapproved for an annual period the continuation of the Advisory Agreement between the Trust and the Advisor and the Subadvisory Agreement between the Advisor and the Subadvisor with respect to the fund.
In considering the Advisory Agreement and the Subadvisory Agreement, the Board received in advance of the meetings a variety of materials relating to the fund, the Advisor and the Subadvisor, including comparative performance, fee and expense information for a peer group of similar funds prepared by an independent third-party provider of fund data, performance information for an applicable benchmark index; and, with respect to the Subadvisor, comparative performance information for comparably managed accounts, as applicable, and other information provided by the Advisor and the Subadvisor regarding the nature, extent and quality of services provided by the Advisor and the Subadvisor under their respective Agreements, as well as information regarding the Advisor's revenues and costs of providing services to the fund and any compensation paid to affiliates of the Advisor. At the meetings at which the renewal of the Advisory Agreement and Subadvisory Agreement are considered, particular focus is given to information concerning fund performance, comparability of fees and total expenses, and profitability. However, the Board notes that the evaluation process with respect to the Advisor and the Subadvisor is an ongoing one. In this regard, the Board also took into account discussions with management and information provided to the Board at prior meetings with respect to the services provided by the Advisor and the Subadvisor to the fund, including quarterly performance reports prepared by management containing reviews of investment results and prior presentations from the Subadvisor with respect to the fund. The Board also considered the nature, quality, and extent of non-advisory services, if any, to be provided to the fund by the Advisor's affiliates, including distribution services.
Throughout the process, the Board asked questions of and requested additional information from management. The Board is assisted by counsel for the Trust and the Independent Trustees are also separately assisted by independent legal counsel throughout the process. The Independent Trustees also received a memorandum from their independent legal counsel discussing the legal standards for their consideration of the proposed continuation of the Agreements and discussed the proposed continuation of the Agreements in private sessions with their independent legal counsel at which no representatives of management were present.
Approval of Advisory Agreement
In approving the Advisory Agreement with respect to the fund, the Board, including the Independent Trustees, considered a variety of factors, including those discussed below. The Board also considered other factors (including conditions and trends prevailing generally in the economy, the securities markets, and the industry) and does not treat any single factor as determinative, and each Trustee may attribute different weights to different factors. The Board's conclusions may be based in part on its consideration of the advisory and subadvisory arrangements in prior years and on the Board's ongoing regular review of fund performance and operations throughout the year.
Nature, extent, and quality of services. Among the information received by the Board from the Advisor relating to the nature, extent, and quality of services provided to the fund, the Board reviewed information provided by the Advisor relating to its
33
operations and personnel, descriptions of its organizational and management structure, and information regarding the Advisor's compliance and regulatory history, including its Form ADV. The Board also noted that on a regular basis it receives and reviews information from the Trust's Chief Compliance Officer (CCO) regarding the fund's compliance policies and procedures established pursuant to Rule 38a-1 under the 1940 Act. The Board also considered the Advisor's risk management processes. The Board considered that the Advisor is responsible for the management of the day-to-day operations of the fund, including, but not limited to, general supervision of and coordination of the services provided by the Subadvisor, and is also responsible for monitoring and reviewing the activities of the Subadvisor and other third-party service providers.
In considering the nature, extent, and quality of the services provided by the Advisor, the Trustees also took into account their knowledge of the Advisor's management and the quality of the performance of the Advisor's duties, through Board meetings, discussions and reports during the preceding year and through each Trustee's experience as a Trustee of the Trust and of the other trusts in the complex.
In the course of their deliberations regarding the Advisory Agreement, the Board considered, among other things:
| (a) | the skills and competency with which the Advisor has in the past managed the Trust's affairs and its subadvisory relationship, the Advisor's oversight and monitoring of the Subadvisor's investment performance and compliance programs, such as the Subadvisor's compliance with fund policies and objectives, review of brokerage matters, including with respect to trade allocation and best execution and the Advisor's timeliness in responding to performance issues; | |
| (b) | the background, qualifications and skills of the Advisor's personnel; | |
| (c) | the Advisor's compliance policies and procedures and its responsiveness to regulatory changes and mutual fund industry developments; | |
| (d) | the Advisor's administrative capabilities, including its ability to supervise the other service providers for the fund; | |
| (e) | the financial condition of the Advisor and whether it has the financial wherewithal to provide a high level and quality of services to the fund; and | |
| (f) | the Advisor's reputation and experience in serving as an investment advisor to the Trust and the benefit to shareholders of investing in funds that are part of a family of funds offering a variety of investments. |
The Board concluded that the Advisor may reasonably be expected to continue to provide a high quality of services under the Advisory Agreement with respect to the fund.
Investment performance. In considering the fund's performance, the Board noted that it reviews at its regularly scheduled meetings information about the fund's performance results. In connection with the consideration of the Advisory Agreement, the Board:
| (a) | reviewed information prepared by management regarding the fund's performance; | |
| (b) | considered the comparative performance of an applicable benchmark index; | |
| (c) | considered the performance of comparable funds, if any, as included in the report prepared by an independent third-party provider of fund data; and | |
| (d) | took into account the Advisor's analysis of the fund's performance and its plans and recommendations regarding the Trust's subadvisory arrangements generally. |
The Board noted that the fund underperformed its benchmark index for the one- and three-year periods ended December 31, 2013 and outperformed its peer group average for the five-year period ended December 31, 2013. The Board also noted that the fund underperformed its peer group average for the one-year period ended December 31, 2013 and outperformed its peer group average for the three- and five-year periods ended December 31, 2013. The Board took into account
34
management's discussion of the fund's more recent performance. The Board noted the fund's favorable performance relative to the benchmark index for the five-year period and peer group for the three- and five-year periods. The Board concluded that the fund's performance is being monitored and reasonably addressed, as appropriate.
Fees and expenses. The Board reviewed comparative information prepared by an independent third-party provider of mutual fund data, including, among other data, the fund's contractual and net management fees (and subadvisory fees, to the extent available) and total expenses as compared to similarly situated investment companies deemed to be comparable to the fund. The Board considered the fund's ranking within a smaller group of peer funds chosen by the independent third-party provider, as well as the fund's ranking within a broader group of funds. In comparing the fund's contractual and net management fees to those of comparable funds, the Board noted that such fees include both advisory and administrative costs. The Board noted that net management fees and total expenses for the fund are higher than the peer group median.
The Board took into account management's discussion of the fund's expenses including the inclusion of additional breakpoints in the advisory fee schedule effective June 1, 2013. The Board noted that the advisory and subadvisory fee rates were reduced effective June 1, 2013. The Board also took into account management's discussion with respect to the advisory/subadvisory fee structure, including the amount of the advisory fee retained by the Advisor after payment of the subadvisory fee. The Board also noted that the Advisor pays the subadvisory fee, and that such fees are negotiated at arm's length with respect to the Subadvisor. In addition, the Board took into account that management had agreed, effective July 1, 2014, to implement an overall fee waiver across the complex, including the fund, which is discussed further below. The Board also noted actions taken over the past several years to reduce the fund's operating expenses. The Board also noted that, in addition, the Advisor is currently waiving fees and/or reimbursing expenses with respect to the fund and that the fund has breakpoints in its contractual management fee schedule that reduce management fees as assets increase. The Board reviewed information provided by the Advisor concerning the investment advisory fee charged by the Advisor or one of its advisory affiliates to other clients (including other funds in the complex) having similar investment mandates, if any. The Board considered any differences between the Advisor's and Subadvisor's services to the fund and the services they provide to other comparable clients or funds. The Board concluded that the advisory fee paid with respect to the fund is reasonable.
Profitability/indirect benefits. In considering the costs of the services to be provided and the profits to be realized by the Advisor and its affiliates from the Advisor's relationship with the Trust, the Board:
| (a) | reviewed financial information of the Advisor; | |||||||
| (b) | reviewed and considered information presented by the Advisor regarding the net profitability to the Advisor and its affiliates with respect to the fund; | |||||||
| (c) | received and reviewed profitability information with respect to the John Hancock fund complex as a whole; | |||||||
| (d) | received information with respect to the Advisor's allocation methodologies used in preparing the profitability data; | |||||||
| (e) | considered that the John Hancock insurance companies that are affiliates of the Advisor, as shareholders of the Trust directly or through their separate accounts, receive certain tax credits or deductions relating to foreign taxes paid and dividends received by certain funds of the Trust and noted that these tax benefits, which are not available to participants in qualified retirement plans under applicable income tax law, are reflected in the profitability analysis reviewed by the Board; | |||||||
| (f) | considered that the Advisor also provides administrative services to the fund on a cost basis pursuant to an administrative services agreement; | |||||||
| (g) | noted that affiliates of the Advisor provide transfer agency services and distribution services to the fund, and that the fund's distributor also receives Rule 12b-1 payments to support distribution of the fund; | |||||||
| (h) | noted that the Advisor also derives reputational and other indirect benefits from providing advisory services to the fund; | |||||||
| (i) | noted that the subadvisory fee for the fund is paid by the Advisor and is negotiated at arm's length; and |
35
| (j) | considered that the Advisor should be entitled to earn a reasonable level of profits in exchange for the level of services it provides to the fund and the entrepreneurial risk that it assumes as Advisor. |
Based upon its review, the Board concluded that the level of profitability, if any, of the Advisor and its affiliates from their relationship with the fund was reasonable and not excessive.
Economies of scale. In considering the extent to which economies of scale would be realized as the fund grows and whether fee levels reflect these economies of scale for the benefit of fund shareholders, the Board:
| (a) | considered that the Advisor has agreed, effective July 1, 2014, to waive a portion of its management fee for the fund and each of the other John Hancock funds in the complex (except for those discussed below) (the Participating Portfolios) or otherwise reimburse the expenses of the Participating Portfolios as follows (the Reimbursement): | ||
| The Reimbursement shall equal, on an annualized basis, 0.01% of that portion of the aggregate net assets of all the Participating Portfolios that exceed $75 billion but is less than or equal to $125 billion, 0.0125% of that portion of the aggregate net assets of all the Participating Portfolios that exceed $125 billion but is less than or equal to $150 billion and 0.015% of that portion of the aggregate net assets of all the Participating Portfolios that exceeds $150 billion. (The funds that are not Participating Portfolios are the funds of funds in the complex, which benefit from such overall management fee waiver through their investment in underlying portfolios that include Participating Portfolios, which are subject to the Reimbursement.) | |||
| (b) | reviewed the fund's advisory fee structure and concluded that: (i) the fund's fee structure contains breakpoints at the subadvisory fee level and that such breakpoints are reflected as breakpoints in the advisory fees for the fund; and (ii) although economies of scale cannot be measured with precision, these arrangements permit shareholders of the fund to benefit from economies of scale if the fund grows. The Board also took into account management's discussion of the fund's advisory fee structure; and | ||
| (c) | the Board also considered the effect of the fund's growth in size on its performance and fees. The Board also noted that if the fund's assets increase over time, the fund may realize other economies of scale. | ||
Approval of Subadvisory Agreement
In making its determination with respect to approval of the Subadvisory Agreement, the Board reviewed:
| (1) | information relating to the Subadvisor's business, including current subadvisory services to the Trust (and other funds in the John Hancock family of funds); | |
| (2) | the historical and current performance of the fund and comparative performance information relating to an applicable benchmark index and comparable funds; | |
| (3) | the subadvisory fee for the fund, including any breakpoints, and to the extent available, comparable fee information prepared by an independent third party provider of fund data; and | |
| (4) | information relating to the nature and scope of any material relationships and their significant to the Trust's Advisor and Subadvisor. |
Nature, extent, and quality of services. With respect to the services provided by the Subadvisor, the Board received information provided to the Board by the Subadvisor, including the Subadvisor's Form ADV, as well as took into account information presented throughout the past year. The Board considered the Subadvisor's current level of staffing and its overall resources, as well as received information relating to the Subadvisor's compensation program. The Board reviewed the Subadvisor's history and investment experience, as well as information regarding the qualifications, background, and responsibilities of the Subadvisor's investment and compliance personnel who provide services to the fund. The Board also
36
considered, among other things, the Subadvisor's compliance program and any disciplinary history. The Board also considered the Subadvisor's risk assessment and monitoring process. The Board reviewed the Subadvisor's regulatory history, including whether it was involved in any regulatory actions or investigations as well as material litigation, and any settlements and amelioratory actions undertaken, as appropriate. The Board noted that the Advisor conducts regular, periodic reviews of the Subadvisor and its operations, including regarding investment processes and organizational and staffing matters. The Board also noted that the Trust's CCO and his staff conduct regular, periodic compliance reviews with the Subadvisor and present reports to the Independent Trustees regarding the same, which includes evaluating the regulatory compliance systems of the Subadvisor and procedures reasonably designed to assure compliance with the federal securities laws. The Board also took into account the financial condition of the Subadvisor.
The Board considered the Subadvisor's investment process and philosophy. The Board took into account that the Subadvisor's responsibilities include the development and maintenance of an investment program for the fund that is consistent with the fund's investment objective, the selection of investment securities and the placement of orders for the purchase and sale of such securities, as well as the implementation of compliance controls related to performance of these services. The Board also received information with respect to the Subadvisor's brokerage policies and practices, including with respect to best execution and soft dollars.
Subadvisor compensation. In considering the cost of services to be provided by the Subadvisor and the profitability to the Subadvisor of its relationship with the fund, the Board noted that the fees under the Subadvisory Agreement are paid by the Advisor and not the fund.
The Board also relied on the ability of the Advisor to negotiate the Subadvisory Agreement with the Subadvisor, which is not affiliated with the Advisor, and the fees thereunder at arm's length. As a result, the costs of the services to be provided and the profits to be realized by the Subadvisor from its relationship with the Trust were not a material factor in the Board's consideration of the Subadvisory Agreement.
The Board also received information regarding the nature and scope (including their significance to the Advisor and its affiliates and to the Subadvisor) of any material relationships, if any, with respect to the Subadvisor, which include arrangements in which the Subadvisor or its affiliates provide advisory, distribution, or management services in connection with financial products sponsored by the Advisor or its affiliates, and may include other registered investment companies, a 529 education savings plan, managed separate accounts and exempt group annuity contracts sold to qualified plans. The Board also received information and took into account any other potential conflicts of interest the Advisor might have in connection with the Subadvisory Agreement.
In addition, the Board considered other potential indirect benefits that the Subadvisor and its affiliates may receive from the Subadvisor's relationship with the fund, such as the opportunity to provide advisory services to additional funds in the John Hancock fund complex and reputational benefits.
Subadvisory fees. The Board considered that the fund pays an advisory fee to the Advisor and that, in turn, the Advisor pays a subadvisory fee to the Subadvisor. As noted above, the Board also considered the fund's subadvisory fee as compared to similarly situated investment companies deemed to be comparable to the fund as included in the report prepared by the independent third party provider of fund data, to the extent available. The Board noted that the limited size of the Lipper peer group was not sufficient for comparative purposes. The Board also took into account the subadvisory fees paid by the Advisor to the Subadvisor with respect to the fund to fees charged by the Subadvisor to manage other subadvised portfolios and portfolios not subject to regulation under the 1940 Act, as applicable.
Subadvisor performance. As noted above, the Board considered the fund's performance as compared to the fund's peer group and the benchmark index and noted that the Board reviews information about the fund's performance results at its regularly scheduled meetings. The Board noted the Advisor's expertise and resources in monitoring the performance, investment style and risk-adjusted performance of the Subadvisor. The Board was mindful of the Advisor's focus on the Subadvisor's performance. The Board also noted the Subadvisor's long-term performance record for similar accounts, as applicable.
37
The Board's decision to approve the Subadvisory Agreement was based on a number of determinations, including the following:
| (1) | the Subadvisor has extensive experience and demonstrated skills as a manager; | |
| (2) | the performance of the fund is being monitored and reasonably addressed, as appropriate; | |
| (3) | the subadvisory fee is reasonable in relation to the level and quality of services being provided; and | |
| (4) | subadvisory fee breakpoints are reflected as breakpoints in the advisory fees for the fund in order to permit shareholders to benefit from economies of scale if the fund grows. | |
| * * * | ||
Based on the Board's evaluation of all factors that the Board deemed to be material, including those factors described above, the Board, including the Independent Trustees, concluded that renewal of the Advisory Agreement and the Subadvisory Agreement would be in the best interest of the fund and its shareholders. Accordingly, the Board, and the Independent Trustees voting separately, approved the Advisory Agreement and Subadvisory Agreement for an additional one-year period.
38
This chart provides information about the Trustees and Officers who oversee your John Hancock fund. Officers elected by the Trustees manage the day-to-day operations of the fund and execute policies formulated by the Trustees.
Independent Trustees
| Name, year of birth Position(s) held with fund Principal occupation(s) and other directorships during past 5 years | Trustee of the Trust since1 | Number of John Hancock funds overseen by Trustee |
| James M. Oates, Born: 1946 | 2012 | 227 |
| Trustee and Chairperson of the Board Managing Director, Wydown Group (financial consulting firm) (since 1994); Chairman and Director, Emerson Investment Management, Inc. (since 2000); Independent Chairman, Hudson Castle Group, Inc. (formerly IBEX Capital Markets, Inc.) (financial services company) (1997-2011); Director, Stifel Financial (since 1996); Director, Investor Financial Services Corporation (1995-2007); Director, Connecticut River Bancorp (since 1998); Director, Virtus Funds (formerly Phoenix Mutual Funds) (since 1988). Trustee and Chairperson of the Board, John Hancock retail funds3 (since 2012); Trustee (2005-2006 and since 2012) and Chairperson of the Board (since 2012), John Hancock Funds III; Trustee (since 2004) and Chairperson of the Board (since 2005), John Hancock Variable Insurance Trust; Trustee and Chairperson of the Board, John Hancock Funds II (since 2005). | ||
| Charles L. Bardelis,2 Born: 1941 | 2012 | 227 |
| Trustee Director, Island Commuter Corp. (marine transport). Trustee, John Hancock retail funds3 (since 2012); Trustee, John Hancock Funds III (2005-2006 and since 2012); Trustee, John Hancock Variable Insurance Trust (since 1988); Trustee, John Hancock Funds II (since 2005). | ||
| Peter S. Burgess,2 Born: 1942 | 2012 | 227 |
| Trustee Consultant (financial, accounting, and auditing matters) (since 1999); Certified Public Accountant; Partner, Arthur Andersen (independent public accounting firm) (prior to 1999); Director, Lincoln Educational Services Corporation (since 2004); Director, Symetra Financial Corporation (since 2010); Director, PMA Capital Corporation (2004-2010). Trustee, John Hancock retail funds3 (since 2012); Trustee, John Hancock Funds III (2005-2006 and since 2012); Trustee, John Hancock Variable Insurance Trust and John Hancock Funds II (since 2005). | ||
| William H. Cunningham, Born: 1944 | 2005 | 227 |
| Trustee Professor, University of Texas, Austin, Texas (since 1971); former Chancellor, University of Texas System and former President of the University of Texas, Austin, Texas; Director, LIN Television (since 2009); Chairman (since 2009) and Director (since 2006), Lincoln National Corporation (insurance); Director, Resolute Energy Corporation (since 2009); Director, Southwest Airlines (since 2000); former Director, Introgen (manufacturer of biopharmaceuticals) (until 2008); former Director, Hicks Acquisition Company I, Inc. (until 2007); former Director, Texas Exchange Bank, SSB (formerly Bank of Crowley) (until 2009); former Advisory Director, JP Morgan Chase Bank (formerly Texas Commerce Bank-Austin) (until 2009). Trustee, John Hancock retail funds3 (since 1986); Trustee, John Hancock Variable Insurance Trust (since 2012); Trustee, John Hancock Funds II (2005-2006 and since 2012). | ||
| Grace K. Fey, Born: 1946 | 2012 | 227 |
| Trustee Chief Executive Officer, Grace Fey Advisors (since 2007); Director and Executive Vice President, Frontier Capital Management Company (1988-2007); Director, Fiduciary Trust (since 2009). Trustee, John Hancock retail funds3 (since 2012); Trustee, John Hancock Variable Insurance Trust and John Hancock Funds II (since 2008). | ||
39
Independent Trustees (continued)
| Name, year of birth Position(s) held with fund Principal occupation(s) and other directorships during past 5 years | Trustee of the Trust since1 | Number of John Hancock funds overseen by Trustee |
| Theron S. Hoffman,2 Born: 1947 | 2012 | 227 |
| Trustee Chief Executive Officer, T. Hoffman Associates, LLC (consulting firm) (since 2003); Director, The Todd Organization (consulting firm) (2003-2010); President, Westport Resources Management (investment management consulting firm) (2006-2008); Senior Managing Director, Partner, and Operating Head, Putnam Investments (2000-2003); Executive Vice President, The Thomson Corp. (financial and legal information publishing) (1997-2000). Trustee, John Hancock retail funds3 (since 2012); Trustee, John Hancock Variable Insurance Trust and John Hancock Funds II (since 2008). | ||
| Deborah C. Jackson, Born: 1952 | 2008 | 227 |
| Trustee President, Cambridge College, Cambridge, Massachusetts (since 2011); Chief Executive Officer, American Red Cross of Massachusetts Bay (2002-2011); Board of Directors of Eastern Bank Corporation (since 2001); Board of Directors of Eastern Bank Charitable Foundation (since 2001); Board of Directors of American Student Assistance Corporation (1996-2009); Board of Directors of Boston Stock Exchange (2002-2008); Board of Directors of Harvard Pilgrim Healthcare (health benefits company) (2007-2011). Trustee, John Hancock retail funds3 (since 2008); Trustee of John Hancock Variable Insurance Trust and John Hancock Funds II (since 2012). | ||
| Hassell H. McClellan, Born: 1945 | 2012 | 227 |
| Trustee Trustee, Virtus Variable Insurance Trust (formerly Phoenix Edge Series Funds) (since 2008); Director, The Barnes Group (since 2010); Associate Professor, The Wallace E. Carroll School of Management, Boston College (retired 2013). Trustee, John Hancock retail funds3 (since 2012); Trustee, John Hancock Funds III (2005-2006 and since 2012); Trustee, John Hancock Variable Insurance Trust and John Hancock Funds II (since 2005). | ||
| Steven R. Pruchansky, Born: 1944 | 2005 | 227 |
| Trustee and Vice Chairperson of the Board Chairman and Chief Executive Officer, Greenscapes of Southwest Florida, Inc. (since 2000); Director and President, Greenscapes of Southwest Florida, Inc. (until 2000); Member, Board of Advisors, First American Bank (until 2010); Managing Director, Jon James, LLC (real estate) (since 2000); Director, First Signature Bank & Trust Company (until 1991); Director, Mast Realty Trust (until 1994); President, Maxwell Building Corp. (until 1991). Trustee (since 1992) and Chairperson of the Board (2011-2012), John Hancock retail funds3; Trustee and Vice Chairperson of the Board, John Hancock retail funds3 John Hancock Variable Insurance Trust, and John Hancock Funds II (since 2012). | ||
| Gregory A. Russo, Born: 1949 | 2009 | 227 |
| Trustee Director and Audit Committee Chairman (since 2012), and Member, Audit Committee and Finance Committee (since 2011), NCH Healthcare System, Inc. (holding company for multi-entity healthcare system); Director and Member of Finance Committee, The Moorings, Inc. (nonprofit continuing care community) (since 2012); Vice Chairman, Risk & Regulatory Matters, KPMG LLP (KPMG) (2002-2006); Vice Chairman, Industrial Markets, KPMG (1998-2002); Chairman and Treasurer, Westchester County, New York, Chamber of Commerce (1986-1992); Director, Treasurer, and Chairman of Audit and Finance Committees, Putnam Hospital Center (1989-1995); Director and Chairman of Fundraising Campaign, United Way of Westchester and Putnam Counties, New York (1990-1995). Trustee, John Hancock retail funds3 (since 2008); Trustee, John Hancock Variable Insurance Trust and John Hancock Funds II (since 2012). | ||
40
Non-Independent Trustees4
| Name, year of birth Position(s) held with fund Principal occupation(s) and other directorships during past 5 years | Trustee of the Trust since1 | Number of John Hancock funds overseen by Trustee |
| Craig Bromley, Born: 1966 | 2012 | 227 |
| Non-Independent Trustee President, John Hancock Financial Service (since 2012); Senior Executive Vice President and General Manager, U.S. Division, Manulife Corporation (since 2012); President and Chief Executive Officer, Manulife Insurance Company (Manulife Japan) (2005-2012, including prior positions). Trustee, John Hancock retail funds,3 John Hancock Variable Insurance Trust, and John Hancock Funds II (since 2012). | ||
| Warren A. Thomson, Born: 1955 | 2012 | 227 |
| Non-Independent Trustee Senior Executive Vice President and Chief Investment Officer, Manulife Financial Corporation and The Manufacturers Life Insurance Company (since 2009); Chairman and Chief Executive Officer, Manulife Asset Management (since 2001, including prior positions); Director (since 2006), and President and Chief Executive Officer (since 2013), Manulife Asset Management Limited; Director and Chairman, Hancock Natural Resources Group, Inc. (since 2013). Trustee, John Hancock retail funds,3 John Hancock Variable Insurance Trust, and John Hancock Funds II (since 2012). | ||
Principal officers who are not Trustees
| Name, year of birth Position(s) held with fund Principal occupation(s) and other directorships during past 5 years | Officer of the Trust since |
| Andrew G. Arnott, Born: 1971 | 2007 |
| Executive Vice President President** Senior Vice President, John Hancock Financial Services (since 2009); Director and Executive Vice President, John Hancock Advisers, LLC (since 2005, including prior positions); Director and Executive Vice President, John Hancock Investment Management Services, LLC (since 2006, including prior positions); President, John Hancock Funds, LLC (since 2004, including prior positions); President (effective 3-13-14) and Executive Vice President, John Hancock retail funds,3 John Hancock Variable Insurance Trust, and John Hancock Funds II (since 2007, including prior positions). | |
| **Effective 3-13-14. | |
| John J. Danello, Born: 1955 | 2014 |
| Senior Vice President, Secretary, and Chief Legal Officer Vice President and Chief Counsel, John Hancock Wealth Management (since 2005); Senior Vice President (since 2007) and Chief Legal Counsel (2007-2010), John Hancock Funds, LLC and The Berkeley Financial Group, LLC; Senior Vice President (since 2006, including prior positions) and Chief Legal Officer and Secretary (since 2014), John Hancock retail funds 3 and John Hancock Variable Insurance Trust; Vice President, John Hancock Life & Health Insurance Company (since 2009); Vice President, John Hancock Life Insurance Company (USA) and John Hancock Life Insurance Company of New York (since 2010); and Senior Vice President, Secretary, and Chief Legal Counsel (2007-2014, including prior positions) of John Hancock Advisers, LLC and John Hancock Investment Management Services, LLC. | |
| Francis V. Knox, Jr., Born: 1947 | 2005 |
| Chief Compliance Officer Vice President, John Hancock Financial Services (since 2005); Chief Compliance Officer, John Hancock retail funds,3 John Hancock Variable Insurance Trust, John Hancock Funds II, John Hancock Advisers, LLC, and John Hancock Investment Management Services, LLC (since 2005). | |
41
Principal officers who are not Trustees (continued)
| Name, year of birth Position(s) held with fund Principal occupation(s) and other directorships during past 5 years | Officer of the Trust since |
| Charles A. Rizzo, Born: 1957 | 2007 |
| Chief Financial Officer Vice President, John Hancock Financial Services (since 2008); Senior Vice President, John Hancock Advisers, LLC and John Hancock Investment Management Services, LLC (since 2008); Chief Financial Officer, John Hancock retail funds,3 John Hancock Variable Insurance Trust and John Hancock Funds II (since 2007). | |
| Salvatore Schiavone, Born: 1965 | 2010 |
| Treasurer Assistant Vice President, John Hancock Financial Services (since 2007); Vice President, John Hancock Advisers, LLC and John Hancock Investment Management Services, LLC (since 2007); Treasurer, John Hancock retail funds3 (since 2007, including prior positions); Treasurer, John Hancock Variable Insurance Trust and John Hancock Funds II (since 2010 and 2007-2009, including prior positions). | |
The business address for all Trustees and Officers is 601 Congress Street, Boston, Massachusetts 02210-2805.
The Statement of Additional Information of the fund includes additional information about members of the Board of Trustees of the Trust and is available without charge, upon request, by calling 800-225-5291.
| 1 | Each Trustee holds office until his or her successor is elected and qualified, or until the Trustee's death, retirement, resignation, or removal. |
| 2 | Member of the Audit Committee. |
| 3 | "John Hancock retail funds" comprises John Hancock Funds III and 36 other John Hancock funds consisting of 26 series of other John Hancock trusts and 10 closed-end funds. |
| 4 | The Trustee is a Non-Independent Trustee due to current or former positions with the Advisor and certain affiliates. |
42
Trustees James M. Oates, Chairperson Officers Andrew G. Arnott John J. Danello Francis V. Knox, Jr. Charles A. Rizzo Salvatore Schiavone | Investment advisor John Hancock Advisers, LLC Subadvisor Sustainable Growth Advisers, LP (SGA) Principal distributor John Hancock Funds, LLC Custodian State Street Bank and Trust Company Transfer agent John Hancock Signature Services, Inc. Legal counsel K&L Gates LLP Independent registered public accounting firm PricewaterhouseCoopers LLP |
*Member of the Audit Committee
†Non-Independent Trustee
The fund's proxy voting policies and procedures, as well as the fund's proxy voting record for the most recent twelve-month period ended June 30, are available free of charge on the Securities and Exchange Commission (SEC) website at sec.gov or on our website.
The fund's complete list of portfolio holdings, for the first and third fiscal quarters, is filed with the SEC on Form N-Q. The fund's Form N-Q is available on our website and the SEC's website, sec.gov, and can be reviewed and copied (for a fee) at the SEC's Public Reference Room in Washington, DC. Call 800-SEC-0330 to receive information on the operation of the SEC's Public Reference Room.
We make this information on your fund, as well as monthly portfolio holdings, and other fund details available on our website at jhinvestments.com or by calling 800-225-5291.
| You can also contact us: | |||
| 800-225-5291 jhinvestments.com | Regular mail: John Hancock Signature Services, Inc. | Express mail: John Hancock Signature Services, Inc. | |
43
Family of funds
DOMESTIC EQUITY FUNDS Balanced Classic Value Disciplined Value Disciplined Value Mid Cap Fundamental All Cap Core Fundamental Large Cap Core Fundamental Large Cap Value Large Cap Equity Select Growth Small Cap Equity Small Cap Value Small Company Strategic Growth U.S. Equity U.S. Global Leaders Growth Value Equity GLOBAL AND INTERNATIONAL EQUITY FUNDS Disciplined Value International Emerging Markets Global Equity Global Opportunities Global Shareholder Yield Greater China Opportunities International Core International Growth International Growth Equity International Small Company International Value Equity INCOME FUNDS Bond California Tax-Free Income Core High Yield Emerging Markets Debt Floating Rate Income Focused High Yield Global Income Government Income High Yield Municipal Bond Income Investment Grade Bond | INCOME FUNDS (continued) Massachusetts Tax-Free Income Money Market New York Tax-Free Income Short Duration Credit Opportunities Strategic Income Opportunities Tax-Free Bond ALTERNATIVE AND SPECIALTY FUNDS Absolute Return Currency Alternative Asset Allocation Enduring Equity Financial Industries Global Absolute Return Strategies Global Conservative Absolute Return Natural Resources Redwood Regional Bank Seaport Technical Opportunities ASSET ALLOCATION PORTFOLIOS Income Allocation Lifestyle Aggressive Lifestyle Balanced Lifestyle Conservative Lifestyle Growth Lifestyle Moderate Retirement Choices (2010-2055) Retirement Living (2010-2055) Retirement Living II (2010-2055) CLOSED-END FUNDS Financial Opportunities Hedged Equity & Income Income Securities Trust Investors Trust Preferred Income Preferred Income II Preferred Income III Premium Dividend Tax-Advantaged Dividend Income Tax-Advantaged Global Shareholder Yield |
The fund's investment objective, risks, charges, and expenses are included in the prospectuses and should be considered carefully before investing. For a prospectus, call your financial professional, call John Hancock Investments at 800-225-5291, or visit the fund's website at jhinvestments.com. Please read the prospectus carefully before investing or sending money.
John Hancock Investments
A trusted brand
John Hancock has helped individuals and institutions build and protect wealth since 1862. Today, we are one of America's strongest and most-recognized brands.
A better way to invest
As a manager of managers, we search the world to find proven portfolio teams with specialized expertise for every fund we offer, then apply vigorous investment oversight to ensure they continue to meet our uncompromising standards.
Results for investors
Our unique approach to asset management has led to a diverse set of investments deeply rooted in investor needs, along with strong risk-adjusted returns across asset classes.
| | John Hancock Funds, LLC n Member FINRA, SIPC 601 Congress Street n Boston, MA 02210-2805 800-225-5291 n jhinvestments.com | |
| This report is for the information of the shareholders of John Hancock U.S. Global Leaders Growth Fund. It is not authorized for distribution to prospective investors unless preceded or accompanied by a prospectus. | ||
| MF205655 | 26A 10/14 12/14 | |
ITEM 2. CODE OF ETHICS.
As of the end of the period, October 31, 2014, the registrant has adopted a code of ethics, as defined in Item 2 of Form N-CSR, that applies to its Chief Executive Officer, Chief Financial Officer and Treasurer (respectively, the principal executive officer, the principal financial officer and the principal accounting officer, the “Senior Financial Officers”). A copy of the code of ethics is filed as an exhibit to this Form N-CSR.
ITEM 3. AUDIT COMMITTEE FINANCIAL EXPERT.
Peter S. Burgess is the audit committee financial expert and is “independent”, pursuant to general instructions on Form N-CSR Item 3.
ITEM 4. PRINCIPAL ACCOUNTANT FEES AND SERVICES.
(a) Audit Fees
The aggregate fees billed for professional services rendered by the principal accountant for the audits of the registrant’s annual financial statements or services that are normally provided by the accountant in connection with statutory and regulatory filings or engagements amounted to the following for the fiscal years ended October 31, 2014 and 2013. These fees were billed to the registrant and were approved by the registrant’s audit committee.
| Fund | October 31, 2014 | October 31, 2013 |
| John Hancock Classic Value Fund | $ 30,442 | $ 30,140 |
| John Hancock U.S. Global Leaders Growth Fund | 28,630 | 28,958 |
| Total | $ 59,072 | $ 59,098 |
(b) Audit-Related Services
Audit-related service fees for assurance and related services by the principal accountant are billed to the registrant or to the registrant's investment adviser (not including any sub-adviser whose role is primarily portfolio management and is subcontracted with or overseen by another investment adviser), and any entity controlling, controlled by, or under common control with the adviser (“control affiliates”) that provides ongoing services to the registrant. The nature of the services provided was affiliated service provider internal controls reviews. In addition, amounts billed to control affiliates for service provider internal controls reviews were $198,642 and $51,270 for the fiscal years ended October 31, 2014 and 2013, respectively.
| Fund | October 31, 2014 | October 31, 2013 |
| John Hancock Classic Value Fund | $ 557 | $ 1,236 |
| John Hancock U.S. Global Leaders Growth Fund | 557 | 1,236 |
| Total | $ 1,114 | $ 2,472 |
(c) Tax Fees
The aggregate fees billed for professional services rendered by the principal accountant for tax compliance, tax advice and tax planning (“tax fees”) amounted to the following for the fiscal years ended October 31, 2014 and 2013. The nature of the services comprising the tax fees was the review of the registrant’s tax returns and tax distribution requirements. These fees were billed to the registrant and were approved by the registrant’s audit committee.
| Fund | October 31, 2014 | October 31, 2013 |
| John Hancock Classic Value Fund | $ 3,450 | $ 3,453 |
| John Hancock U.S. Global Leaders Growth Fund | 3,450 | 3,696 |
| Total | $ 6,900 | $ 7,149 |
(d) All Other Fees
Other fees billed for professional services rendered by the principal accountant to the registrant or to the control affiliates for the fiscal years ended October 31, 2014 and 2013 amounted to the following:
| Fund | October 31, 2014 | October 31, 2013 |
| John Hancock Classic Value Fund | $ 122 | $ 214 |
| John Hancock U.S. Global Leaders Growth Fund | 122 | 213 |
| Total | $ 244 | $ 427 |
(e)(1) Audit Committee Pre-Approval Policies and Procedures:
The trust’s Audit Committee must pre-approve all audit and non-audit services provided by the independent registered public accounting firm (the “Auditor”) relating to the operations or financial reporting of the funds. Prior to the commencement of any audit or non-audit services to a fund, the Audit Committee reviews the services to determine whether they are appropriate and permissible under applicable law.
The trust’s Audit Committee has adopted policies and procedures to, among other purposes, provide a framework for the Committee’s consideration of audit-related and non-audit services by the Auditor. The policies and procedures require that any audit-related and non-audit service provided by the Auditor and any non-audit service provided by the Auditor to a fund service provider that relates directly to the operations and financial reporting of a fund are subject to approval by the Audit Committee before such service is provided. Audit-related services provided by the Auditor that are expected to exceed $25,000 per instance/per fund are subject to specific pre-approval by the Audit Committee. Tax services provided by the Auditor that are expected to exceed $30,000 per instance/per fund are subject to specific pre-approval by the Audit Committee.
All audit services, as well as the audit-related and non-audit services that are expected to exceed the amounts stated above, must be approved in advance of provision of the service by formal resolution of the Audit Committee. At the regularly scheduled Audit Committee meetings, the Committee reviews a report summarizing the services, including fees, provided by the Auditor.
(e)(2) Services approved pursuant to paragraph (c)(7)(i)(C) of Rule 2-01 of Regulation S-X:
Audit-Related Fees, Tax Fees and All Other Fees:
There were no amounts that were approved by the Audit Committee pursuant to the de minimis exception under Rule 2-01 of Regulation S-X.
(f) According to the registrant’s principal accountant, for the fiscal period ended October 31, 2014, the percentage of hours spent on the audit of the registrant's financial statements for the most recent fiscal year that were attributed to work performed by persons who were not full-time, permanent employees of principal accountant was less than 50%.
(g) The aggregate non-audit fees billed by the registrant's accountant for non- audit services rendered to the registrant and rendered to the registrant's control affiliates for the fiscal years ended October 31, 2014 and 2013 amounted to the following:
| Trust | October 31, 2014 | October 31, 2013 |
| John Hancock Capital Series | $ 5,636,068 | $ 4,606,445 |
(h) The audit committee of the registrant has considered the non-audit services provided by the registrant’s principal accountant(s) to the control affiliates and has determined that the services that were not pre-approved are compatible with maintaining the principal accountant(s)' independence.
ITEM 5. AUDIT COMMITTEE OF LISTED REGISTRANTS.
The registrant has a separately-designated standing audit committee comprised of independent trustees. The members of the audit committee are as follows:
Peter S. Burgess - Chairman
Charles L. Bardelis
Theron S. Hoffman
ITEM 6. SCHEDULE OF INVESTMENTS.
| (a) | Not applicable. |
| (b) | Not applicable. |
ITEM 7. DISCLOSURE OF PROXY VOTING POLICIES AND PROCEDURES FOR CLOSED-END MANAGEMENT INVESTMENT COMPANIES.
Not applicable.
ITEM 8. PORTFOLIO MANAGERS OF CLOSED-END MANAGEMENT INVESTMENT COMPANIES.
Not applicable.
ITEM 9. PURCHASES OF EQUITY SECURITIES BY CLOSED-END MANAGEMENT INVESTMENT COMPANY AND AFFILIATED PURCHASERS.
Not applicable.
ITEM 10. SUBMISSION OF MATTERS TO A VOTE OF SECURITY HOLDERS.
There were no material changes to previously disclosed John Hancock Funds – Governance Committee Charter.
ITEM 11. CONTROLS AND PROCEDURES.
(a) Based upon their evaluation of the registrant's disclosure controls and procedures as conducted within 90 days of the filing date of this Form N-CSR, the registrant's principal executive officer and principal financial officer have concluded that those disclosure controls and procedures provide reasonable assurance that the material information required to be disclosed by the registrant on this report is recorded, processed, summarized and reported within the time periods specified in the Securities and Exchange Commission's rules and forms.
(b) There were no changes in the registrant's internal control over financial reporting that occurred during the registrant's most recent fiscal half-year (the registrant's second fiscal half-year in the case of an annual report) that have materially affected, or are reasonably likely to materially affect, the registrant's internal control over financial reporting.
ITEM 12. EXHIBITS.
(a)(1) Code of Ethics for Senior Financial Officers is attached.
(a)(2) Separate certifications for the registrant's principal executive officer and principal financial officer, as required by Section 302 of the Sarbanes-Oxley Act of 2002 and Rule 30a-2(a) under the Investment Company Act of 1940, are attached.
(b) Separate certifications for the registrant's principal executive officer and principal financial officer, as required by 18 U.S.C. Section 1350, as adopted pursuant to Section 906 of the Sarbanes-Oxley Act of 2002, and Rule 30a-2(b) under the Investment Company Act of 1940, are attached. The certifications furnished pursuant to this paragraph are not deemed to be "filed" for purposes of Section 18 of the Securities Exchange Act of 1934, or otherwise subject to the liability of that section. Such certifications are not deemed to be incorporated by reference into any filing under the Securities Act of 1933 or the Securities Exchange Act of 1934, except to the extent that the Registrant specifically incorporates them by reference.
(c)(1) Submission of Matters to a Vote of Security Holders is attached. See attached “John Hancock Funds – Governance Committee Charter”.
(c)(2) Contact person at the registrant.
SIGNATURES
Pursuant to the requirements of the Securities Exchange Act of 1934 and the Investment Company Act of 1940, the registrant has duly caused this report to be signed on its behalf by the undersigned, thereunto duly authorized.
John Hancock Capital Series
| By: | /s/ Andrew Arnott |
| Andrew Arnott | |
| President |
Date: December 12, 2014
Pursuant to the requirements of the Securities Exchange Act of 1934 and the Investment Company Act of 1940, this report has been signed below by the following persons on behalf of the registrant and in the capacities and on the dates indicated.
| By: | /s/ Andrew Arnott |
| Andrew Arnott | |
| President |
Date: December 12, 2014
| By: | /s/ Charles A. Rizzo |
| Charles A. Rizzo | |
| Chief Financial Officer |
Date: December 12, 2014