QuickLinks -- Click here to rapidly navigate through this document
UNITED STATES
SECURITIES AND EXCHANGE COMMISSION
Washington, D.C. 20549
FORM 18-K/A
For Foreign Governments and Political Subdivisions Thereof
AMENDMENT NO. 4
TO
ANNUAL REPORT
of
HYDRO-QUÉBEC
QUÉBEC, CANADA
(Name of Registrant)
Date of end of last fiscal year: December 31, 2005
SECURITIES REGISTERED*
(As of the close of the fiscal year)
|
Title of Issue
| | Amounts as to Which
Registration is Effective
| | Names of Exchanges
on Which Registered
|
|---|
|
| N/A | | N/A | | N/A |
|
Name and address of persons authorized to receive notices
and communications from the Securities and Exchange Commission:
| |
|
|---|
MR. MICHEL ROBITAILLE
Delegate General
Québec Government House
Rockefeller Center
One Rockefeller Plaza
26th Floor
New York, NY 10020-2102 |
Copies to: |
| | | |
MR. ROBERT E. BUCKHOLZ, JR.
Sullivan & Cromwell LLP
125 Broad Street
New York, NY 10004-2498 | | MR. PAUL ROBILLARD
Corporate Treasurer
Hydro-Québec
75 René-Lévesque Boulevard West
Montréal, Québec, Canada H2Z 1A4 |
* The Registrant is filing this annual report on a voluntary basis
The undersigned registrant hereby amends its Annual Report on Form 18-K for the fiscal year ended December 31, 2005 ("Annual Report") as follows:
The Annual Report on Form 18-K and amendments on Form 18-K/A are filed on a voluntary basis.
Pursuant to the requirements of the Securities Exchange Act of 1934, the registrant has duly caused this Amendment No. 4 to be signed on its behalf by its authorized agent.
| | | HYDRO-QUÉBEC |
|
|
By: |
|
/s/ LOUISE GUILLEMETTE
Authorized Officer |
| | | | | Name: Louise Guillemette
Title: Coordinator, Documentation |
Date: November 10, 2006
HYDRO-QUÉBEC
Quarterly Report
Third Quarter 2006
Message from the Chairman of the Board
and the President and Chief Executive Officer
Summary of results
For the period from January 1 to September 30, 2006, income from continuing operations totaled $2,039 million, or $275 million more than last year, primarily because of the recognition, during the second quarter, of a $234-million foreign exchange gain on debts and swaps denominated in U.S. dollars.
Income from discontinued activities was $929 million, an increase of $846 million from 2005, chiefly because of the sale of Transelec in Chile during the second quarter, as well as a gain of approximately $38 million in the third quarter on the sale of our interest in HQI Latin America Ltd. (Fortuna generating station in Panama).
Net income for the first nine months of 2006 was $2,968 million, or $1,121 million more than for the same period of 2005.
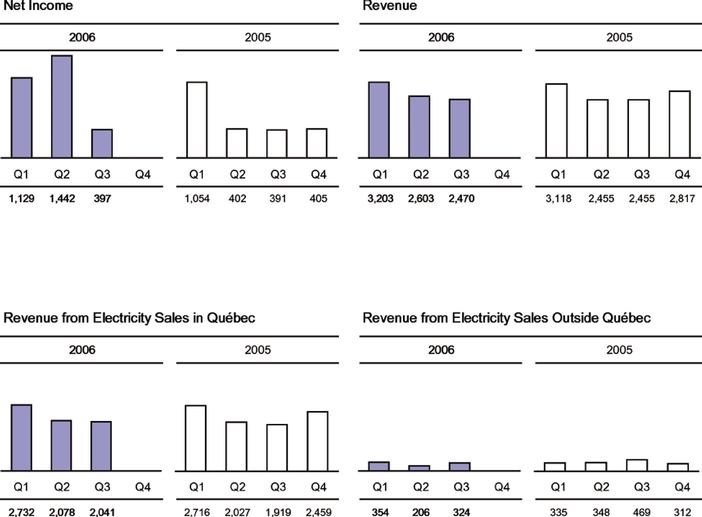
Net income for the quarter ended September 30, 2006, was $397 million, compared to $391 million for the same quarter of 2005. The increase in revenue from electricity sales in Québec was largely offset by the reduction in net electricity exports, reflecting prudent management of our energy reserves as well as the particularly favorable market conditions in summer 2005.
Consolidated results
Revenue for the nine months ended September 30, 2006, totaled $8,276 million, or $248 million more than last year. Revenue from total electricity sales amounted to $7,735 million, a $79-million decrease.
Revenue from electricity sales in Québec was up by $189 million, but on markets outside Québec, electricity sales revenue and purchases were down by $268 million and $131 million respectively.
Other revenue increased, primarily because of the recognition, during the second quarter, of a foreign exchange gain on debts and swaps denominated in U.S. dollars.
Total expenditure was relatively stable at $4,557 million, down 0.5% from last year. The reduction in short-term electricity purchases outside Québec was almost completely offset by the increase in pension expense stemming from the actuarial effect of lower long-term interest rates on financial markets and the rise in depreciation and amortization expense following the commissioning of new facilities, among other things.
Discontinued operations contributed $929 million to net income, for an increase of $846 million over last year. The third-quarter sale of our interest in HQI Latin America Ltd. (Fortuna generating station in Panama) resulted in a gain of approximately $38 million. In the second quarter, the sale of our interest in Transelec in Chile provided us with a gain of $806 million, an amount that was later revised to $813 million following the release of Transelec's final financial statements as at June 30, 2006. In the first quarter, the sale of our interest in the Cross Sound Cable underwater link in the United States yielded a $29-million gain.
It should be noted that the sale of assets held by HydroSolution resulted in a $48-million gain in the third quarter of 2005.
Segmented results
Generation
For the first nine months of 2006, Hydro-Québec Production earned net income of $1,683 million, versus $1,535 million in 2005. This year-over-year increase of $148 million is primarily attributable to the recognition, during the second quarter, of a $234-million foreign exchange gain on debts and swaps denominated in U.S. dollars. However, in the context of prudent management of our energy reserves, this was offset by a reduction in our net exports.
Transmission
Hydro-Québec TransÉnergie's net income amounted to $530 million, up $231 million over last year. Revenue rose to $2,170 million in 2006 from $1,872 million in the same period of 2005, for an increase of $298 million, attributable to a decision handed down by the Régie de l'énergie in April 2006. This decision gave the Transmission Provider, effective January 1, 2005, a $170-million annual increase in transmission revenue for the native load in recognition of the cost of the transmission infrastructure required to meet demand growth in Québec. Of the $298-million increase, $170 million relates to 2005 and $128 million to the first three quarters of 2006. However, the increase in revenue was curbed by a rise in depreciation and amortization expense.
2
Distribution
Hydro-Québec Distribution posted a net loss of $175 million, versus net income of $79 million in 2005. This $254-million decline stems chiefly from the $298-million increase in the cost of transmission service for the native load applicable as of January 1, 2005, following the decision handed down by the Régie de l'énergie in April 2006.
Revenue from electricity sales in Québec was $6,851 million, up $199 million over 2005, essentially owing to the April 2005 and 2006 rate adjustments.
In contrast, sales volume was down 0.6 TWh, standing at 123.4 TWh as at September 30, 2006, mainly as a result of milder temperatures at the beginning of the year, which accounted for a decrease of 2.1 TWh.
Expenditure was up $412 million, largely because of increases of $298 million in the cost of native load transmission service, $71 million in depreciation and amortization expense, and $15 million in pension expense. The Corporation also had to assume expenses of $24 million to restore service following major power failures during the summer.
It should be noted that the 2005 third quarter results included a $48-million gain on the disposal of the assets of HydroSolution.
Construction
The Construction segment comprises the operations of Hydro-Québec Équipement and Société d'énergie de la Baie James.
The volume of activity totaled $1,367 million, compared with $1,409 million in 2005. As in 2005, the current level of activity reflects the fact that several major projects requiring sizable capital outlay are being carried out for Hydro-Québec Production and Hydro-Québec TransÉnergie.
Investment
The investment program for 2006 amounts to $4 billion. Development activities account for almost 60% of this amount, or $2.3 billion, divided up as follows: $1.4 billion for hydro projects — Eastmain-1, Chute-Allard/Rapides-des-Coeurs, Péribonka, and Eastmain-1-A/ Sarcelle/Rupert — and $900 million to bring the new generating stations onto the grid, meet growth in demand from Québec customers and continue the deployment of the Energy Efficiency Plan. A further $1.7 billion will be earmarked for current operations, such as maintaining and upgrading our assets.
As at September 30, 2006, investments in fixed and intangible assets totaled $2,242 million, compared to $2,252 million in 2005. As anticipated, a large portion of this amount was devoted to hydro development projects, including Eastmain-1 and Péribonka. In the area of transmission, work continued to connect generating stations, including Eastmain-1, install de-icing equipment at Lévis substation and build Waskaganish substation as well as the line connecting Nemiscau and Waskaganish substations. In distribution, efforts were maintained to meet growth in baseload demand, improve service quality and achieve the Energy Efficiency Plan's objectives.
3
Financing
The 2006 borrowing program amounts to $3.1 billion. The proceeds will be used to refinance debt maturing this year and to sustain growth in the investment program.
The Corporation did not make any borrowings during the third quarter. It should be noted that, in the first half of the year, borrowings of $2.3 billion were made on the Canadian market. Their average cost in 2006 was 4.93%.
Furthermore, close to $1.8 billion of net proceeds from the disposal of foreign interests was added to the financing obtained since the beginning of the year.
|
|
| /s/ Michael L. Turcotte | /s/ Thierry Vandal |
Michael L. Turcotte
Chairman of the Board |
Thierry Vandal
President and Chief Executive Officer |
November 10, 2006
4
CONSOLIDATED STATEMENTS OF OPERATIONS
In millions of Canadian dollars
(unaudited)
| | | | | Three months ended
September 30 | | Nine months ended
September 30 |
| | | Notes | | 2006 | | 2005 | | 2006 | | 2005 |
| | | | |
| |
|
| Revenue | | | | 2,470 | | 2,455 | | 8,276 | | 8,028 |
Expenditure |
|
|
|
|
|
|
|
|
|
|
| | Operations | | | | 607 | | 564 | | 1,749 | | 1,693 |
| | Electricity and fuel purchases | | | | 304 | | 391 | | 951 | | 1,067 |
| | Depreciation and amortization | | | | 488 | | 469 | | 1,472 | | 1,400 |
| | Taxes | | | | 143 | | 159 | | 385 | | 422 |
| | | | |
| |
| |
| |
|
| | | | | 1,542 | | 1,583 | | 4,557 | | 4,582 |
| Operating income | | | | 928 | | 872 | | 3,719 | | 3,446 |
| Financial expenses | | 3 | | 589 | | 533 | | 1,680 | | 1,682 |
| | | | |
| |
| |
| |
|
| Income from continuing operations | | | | 339 | | 339 | | 2,039 | | 1,764 |
| Discontinued operations | | 4 | | 58 | | 52 | | 929 | | 83 |
| | | | |
| |
| |
| |
|
| Net income | | | | 397 | | 391 | | 2,968 | | 1,847 |
| | | | |
| |
| |
| |
|
CONSOLIDATED STATEMENTS OF RETAINED EARNINGS
In millions of Canadian dollars
(unaudited)
| | | | | Three months ended
September 30 | | Nine months ended
September 30 |
| | | | | 2006 | | 2005 | | 2006 | | 2005 |
| | | | |
| |
|
| Balance at beginning of period | | | | 15,646 | | 13,405 | | 13,075 | | 11,949 |
| Net income | | | | 397 | | 391 | | 2,968 | | 1,847 |
| | | | |
| |
| |
| |
|
| Balance at end of period | | | | 16,043 | | 13,796 | | 16,043 | | 13,796 |
| | | | |
| |
| |
| |
|
The accompanying notes are an integral part of the consolidated financial statements.
5
CONSOLIDATED BALANCE SHEETS
In millions of Canadian dollars
| | |
Notes | | As at September 30
2006
(unaudited
|
)
| As at December 31
2005
(audited
|
)
|
| ASSETS | | | | | | | |
| Property, plant and equipment | | | | 51,412 | | 50,588 | |
Current assets |
|
|
|
|
|
|
|
| | Cash and cash equivalents | | | | 877 | | 16 | |
| | Investments | | | | 1,669 | | 322 | |
| | Accounts receivable | | | | 1,549 | | 1,764 | |
| | Swaps and sinking funds | | | | 984 | | 685 | |
| | Materials, fuel and supplies | | | | 369 | | 343 | |
| | Assets held for sale | | 4 | | 24 | | 145 | |
| | | | |
| |
| |
| | | | | 5,472 | | 3,275 | |
Other long-term assets |
|
|
|
|
|
|
|
| | Investments | | | | 227 | | 221 | |
| | Swaps and sinking funds | | | | 1,731 | | 1,749 | |
| | Goodwill | | | | 10 | | 10 | |
| | Intangible assets | | | | 589 | | 639 | |
| | Other assets | | | | 1,867 | | 1,784 | |
| | Assets held for sale | | 4 | | 178 | | 2,166 | |
| | | | |
| |
| |
| | | | | 4,602 | | 6,569 | |
| | | | | 61,486 | | 60,432 | |
| | | | |
| |
| |
LIABILITIES AND SHAREHOLDER'S EQUITY |
|
|
|
|
|
|
|
| Long-term debt | | | | 33,082 | | 31,279 | |
Current liabilities |
|
|
|
|
|
|
|
| | Borrowings | | | | 57 | | 20 | |
| | Accounts payable and accrued liabilities | | | | 1,354 | | 1,929 | |
| | Dividends payable | | | | — | | 1,126 | |
| | Accrued interest | | | | 587 | | 927 | |
| | Current portion of long-term debt | | | | 2,270 | | 3,148 | |
| | Liabilities related to assets held for sale | | 4 | | 8 | | 172 | |
| | | | |
| |
| |
| | | | | 4,276 | | 7,322 | |
Asset retirement obligations |
|
5 |
|
427 |
|
282 |
|
| Other long-term liabilities | | | | 2,845 | | 2,548 | |
| Long-term liabilities related to assets held for sale | | 4 | | 131 | | 1,213 | |
| Perpetual debt | | | | 324 | | 379 | |
| Non-controlling interest | | | | 7 | | 33 | |
Shareholder's equity |
|
|
|
|
|
|
|
| | Share capital | | | | 4,374 | | 4,374 | |
| | Retained earnings | | | | 16,043 | | 13,075 | |
| | Translation adjustments | | | | (23 | ) | (73 | ) |
| | | | |
| |
| |
| | | | | 20,394 | | 17,376 | |
| | | | | 61,486 | | 60,432 | |
| | | | |
| |
| |
| Commitments and contingencies | | 8 | | | | | |
The accompanying notes are an integral part of the consolidated financial statements.
6
CONSOLIDATED STATEMENTS OF CASH FLOWS
In millions of Canadian dollars
(unaudited)
| | | | | Three months ended
September 30 | | Nine months ended
September 30 | |
| | | Notes | | 2006 | | 2005 | | 2006 | | 2005 | |
| | | | |
| |
| |
| Operating activities | | | | | | | | | | | |
| | Income from continuing operations | | | | 339 | | 339 | | 2,039 | | 1,764 | |
| | Non-cash items | | | | | | | | | | | |
| | | Depreciation and amortization | | | | | | | | | | | |
| | | | Property, plant and equipment | | | | 427 | | 416 | | 1,293 | | 1,255 | |
| | | | Intangible assets | | | | 28 | | 25 | | 85 | | 79 | |
| | | | Regulatory assets | | | | 29 | | 15 | | 80 | | 28 | |
| | | | Deferred charges | | | | 4 | | 2 | | 10 | | 11 | |
| | | | Discounts and other deferred credits related to long-term debt | | | | (84 | ) | (32 | ) | (535 | ) | (93 | ) |
| | | Other | | | | (2 | ) | 86 | | 9 | | 234 | |
| | Change in non-cash working capital items | | | | (362 | ) | 166 | | (714 | ) | (131 | ) |
| | | | |
| |
| |
| |
| |
| | | | | 379 | | 1,017 | | 2,267 | | 3,147 | |
Investing activities |
|
|
|
|
|
|
|
|
|
|
|
| | Property, plant and equipment and intangible assets | | | | (811 | ) | (879 | ) | (2,242 | ) | (2,252 | ) |
| | Long-term investments | | | | 4 | | (2 | ) | 6 | | (2 | ) |
| | Disposal of investments, net of divested cash and cash equivalents | | | | 127 | | — | | 2,069 | | — | |
| | Net change in short-term investments | | | | (616 | ) | — | | (1,323 | ) | 60 | |
| | Other | | | | 13 | | (34 | ) | (48 | ) | (91 | ) |
| | | | |
| |
| |
| |
| |
| | | | | (1,283 | ) | (915 | ) | (1,538 | ) | (2,285 | ) |
Financing activities |
|
|
|
|
|
|
|
|
|
|
|
| | Issuance of long-term debt | | | | 3 | | — | | 2,733 | | 2,767 | |
| | Repayment of long-term debt at maturity and sinking fund redemption | | | | (698 | ) | (737 | ) | (1,359 | ) | (1,526 | ) |
| | Prepayment of long-term debt | | | | (226 | ) | (42 | ) | (447 | ) | (290 | ) |
| | Inflows resulting from credit risk management | | | | 590 | | 25 | | 1,055 | | 315 | |
| | Outflows resulting from credit risk management | | | | (30 | ) | (604 | ) | (760 | ) | (894 | ) |
| | Net change in short-term borrowings | | | | 3 | | 550 | | 40 | | 554 | |
| | Dividends paid | | | | — | | — | | (1,126 | ) | (1,350 | ) |
| | Other | | | | 1 | | 3 | | (1 | ) | 6 | |
| | | | |
| |
| |
| |
| |
| | | | | (357 | ) | (805 | ) | 135 | | (418 | ) |
| Change in foreign exchange on cash and cash equivalents | | | | 2 | | (7 | ) | 1 | | (1 | ) |
| | | | |
| |
| |
| |
| |
| Cash flows from continuing operations | | | | (1,259 | ) | (710 | ) | 865 | | 443 | |
| Cash flows from discontinued operations | | 4 | | (30 | ) | 12 | | (74 | ) | 35 | |
| | | | |
| |
| |
| |
| |
| Net change in cash and cash equivalents | | | | (1,289 | ) | (698 | ) | 791 | | 478 | |
| Cash and cash equivalents at beginning of period | | | | 2,172 | | 1,273 | | 92 | | 97 | |
| | | | |
| |
| |
| |
| |
| Cash and cash equivalents at end of period | | | | 883 | | 575 | | 883 | | 575 | |
| | | | |
| |
| |
| |
| |
Cash and cash equivalents |
|
|
|
|
|
|
|
|
|
|
|
| | Continuing operations | | | | | | | | 877 | | 575 | |
| | Discontinued operations | | | | | | | | 6 | | — | |
| | | | | | | | |
| |
| |
| | | | | | | | | 883 | | 575 | |
| | | | | | | | |
| |
| |
| Supplementary cash flow information | | 6 | | | | | | | | | |
The accompanying notes are an integral part of the consolidated financial statements.
7
NOTES TO CONSOLIDATED FINANCIAL STATEMENTS (unaudited)
Nine-month periods ended September 30, 2006 and 2005
Amounts in tables are in millions of Canadian dollars.
Note 1 — Basis of Presentation
The quarterly consolidated financial statements have been prepared in accordance with Canadian generally accepted accounting principles (GAAP) and reflect the regulatory accounting procedures and practices that are accepted by the Régie de l'énergie (the Régie). These regulatory procedures and practices affect the timing of the recognition of certain costs in the consolidated operations, resulting in the recognition of regulatory assets. The quarterly consolidated financial statements and the present Notes should be read in conjunction with the Consolidated Financial Statements and accompanying Notes in Hydro-Québec's Annual Report 2005.
The accounting policies used to prepare the quarterly consolidated financial statements conform to those described in Hydro-Québec's Annual Report 2005.
Certain figures from corresponding periods of the previous year have been reclassified in order to conform to the presentation adopted for the current year periods.
The Corporation's quarterly financial results are not necessarily indicative of results for the year on account of seasonal temperature fluctuations. Because of higher electricity demand during winter months, revenue from electricity sales in Québec is higher during the first and fourth quarters.
Note 2 — Regulation
TRANSMISSION
In decision D-2006-66 of April 18, 2006, the Régie authorized the Transmission Provider to modify its power transmission rates effective January 1, 2005. The impact of this decision is essentially a $170-million increase in the annual cost of transmission service for the native load, which is not integrated into the Corporation's current electricity rates.
DISTRIBUTION
In decision D-2006-46 of March 20, 2006, the Régie granted an across-the-board increase of 5.33% in the Corporation's electricity rates, effective April 1, 2006. This increase takes into account a 7.75% return on the rate base in 2006, assuming a capital structure with 35% shareholder's equity.
In its 2007-2008 rate application, filed in August with the Régie, the Distributor proposed that the requested rate adjustment take into account the reduction in costs as compared to the forecasted cost of electricity purchases in excess of the heritage pool for 2006. At the date of filing, this reduction was estimated at $182 million. The Distributor also proposed to address, in 2008, the treatment of the retroactive application of the transmission rates for 2005 and 2006, which amount to $340 million. No regulatory asset or liability was recorded with regard to these two elements as at September 30, 2006.
8
Note 3 — Financial Expenses
| | | Three months ended
September 30 | | Nine months ended
September 30 |
| | | 2006 | | 2005 | | 2006 | | 2005 |
| | |
| |
|
| Interest | | | | | | | | |
| | Interest on debt securities | | 668 | | 552 | | 1,847 | | 1,703 |
| | Amortization of discounts and borrowing expenses | | (1 | ) | 6 | | 2 | | 24 |
| | |
| |
| |
| |
|
| | | 667 | | 558 | | 1,849 | | 1,727 |
| | |
| |
| |
| |
|
| Exchange (gain) loss | | (9 | ) | 2 | | (19 | ) | 37 |
| Loan guarantee fees(a) | | 39 | | 39 | | 119 | | 117 |
| | |
| |
| |
| |
|
| | | 30 | | 41 | | 100 | | 154 |
| | |
| |
| |
| |
|
| Less | | | | | | | | |
| | Capitalized financial expenses | | 80 | | 60 | | 224 | | 183 |
| | Net investment income | | 28 | | 6 | | 45 | | 16 |
| | |
| |
| |
| |
|
| | | 108 | | 66 | | 269 | | 199 |
| | |
| |
| |
| |
|
| | | 589 | | 533 | | 1,680 | | 1,682 |
| | |
| |
| |
| |
|
- (a)
- Guarantee fees paid to the shareholder.
9
Note 4 — Discontinued Operations and Assets Held for Sale
2006
In 2005, Hydro-Québec adopted a plan to sell off some of its foreign interests. The related assets and liabilities were therefore classified as being held for sale. Further to the adoption of this plan, the following transactions took place in 2006:
- •
- On January 18, 2006, Hydro-Québec concluded the sale of its interest in Hidroeléctrica Río Lajas S.A., through its wholly owned subsidiary Hydro-Québec International (HQI), for a cash consideration of $5 million, giving rise to a loss on disposal of $0.3 million.
- •
- On February 27, 2006, Hydro-Québec concluded the sale of its interest in Cross-Sound Cable Company, LLC, for a cash consideration of $182 million, giving rise to a $29-million gain on disposal. The transaction includes the sale of units held and the repayment of the loan granted by Hydro-Québec to Cross-Sound Cable Company, LLC.
- •
- On March 29, 2006, Hydro-Québec concluded the sale of its interest in MurrayLink HQI Australia Pty Ltd, through HQI, for a cash consideration of $60 million. This transaction gave rise to a $2-million loss on disposal.
- •
- On June 30, 2006, Hydro-Québec sold its interest in HQI Transelec Chile S.A. (Transelec), held through HQI, for a cash consideration of $1.8 billion. This transaction gave rise to a gain on disposal of $813 million, net of $225 million of related taxes. The sales contract further provides for price adjustments according to the market value of the regulated trunk transmission assets base, which is currently being evaluated by a consortium of independent experts, and to the retroactive effect of this valuation on Transelec's revenue for the period from March 13, 2004, through June 30, 2006. In Management's opinion, these adjustments should result in an additional gain which will be recognized when the final decision of the Chilean regulatory authority is made known.
- •
- On August 1, 2006, Hydro-Québec concluded the sale of its interest in HQI Latin America (Fortuna generating station in Panama), through HQI, for a cash consideration of $113 million. This transaction gave rise to a gain on disposal of some $38 million.
In the second quarter of 2006, Hydro-Québec presented the assets and liabilities of its interest in Consorcio TransMantaro S.A., held through HQI, as assets and liabilities held for sale. On May 16, 2006, it signed an agreement to sell this interest for a consideration of US$67 million. This transaction should result in a gain on disposal that will be recognized at the closing, once the necessary approvals have been obtained from the Peruvian government authority.
In the third quarter of 2006, Hydro-Québec took steps to sell its interest in DirectLink (UJV), which it holds through HQI. The related assets and liabilities are presented as being held for sale.
For purposes of segmented information, the results of foreign interests are classified under Corporate and Other Activities.
2005
On July 15, 2005, Hydro-Québec concluded the sale of the principal assets held by its subsidiary HydroSolution, Limited Partnership, for a cash consideration of $92 million, resulting in a gain on disposal of $48 million. HydroSolution is part of the Distribution segment for the purpose of presenting segmented information.
10
Note 4 — Discontinued Operations and Assets Held for Sale (continued)
The following table presents operating results and cash flows from the interests presented as discontinued operations:
| | | Three months ended
September 30 | | Nine months ended
September 30 | |
| | | 2006 | | 2005 | | 2006 | | 2005 | |
| | |
| |
| |
| Operations | | | | | | | | | |
| | Revenue | | 28 | | 107 | | 289 | | 299 | |
| | |
| |
| |
| |
| |
| | Income before net gain on disposal | | 13 | | 4 | | 51 | | 35 | |
| | Net gain on disposal | | 45 | | 48 | | 878 | | 48 | |
| | |
| |
| |
| |
| |
| | Income from discontinued operations | | 58 | | 52 | | 929 | | 83 | |
| | |
| |
| |
| |
| |
Cash flows |
|
|
|
|
|
|
|
|
|
| | Operating activities | | 127 | | (66 | ) | 102 | | (12 | ) |
| | Investing activities | | (151 | ) | 80 | | (154 | ) | 61 | |
| | Financing activities | | (4 | ) | (11 | ) | (16 | ) | (18 | ) |
| | Change in foreign exchange on cash and cash equivalents | | (2 | ) | 9 | | (6 | ) | 4 | |
| | |
| |
| |
| |
| |
| Cash flows from discontinued operations | | (30 | ) | 12 | | (74 | ) | 35 | |
| | |
| |
| |
| |
| |
| The assets and liabilities sold, as at the disposal date, were as follows: | |
| | Cash and cash equivalents | | | | | | 128 | | | |
| | Other current assets | | | | | | 54 | | | |
| | Long-term assets | | | | | | 2,027 | | 42 | |
| | Current liabilities | | | | | | 184 | | | |
| | Long-term liabilities | | | | | | 1,156 | | | |
| | | | | | |
| |
| |
| | | | | | | 869 | | 42 | |
| | | | | | |
| |
| |
11
Note 5 — Asset Retirement Obligations
As at June 30, 2006, Hydro-Québec revised the principal underlying assumptions for estimating and calculating its obligations related to the dismantling of Gentilly-2 nuclear generating station and the removal of irradiated fuel. The total undiscounted amount of estimated cash flows required to settle the obligations is $1,629 million, compared to $982 million as at December 31, 2005. The additional cash flows were discounted at a rate of 5.5%, resulting in an increase in asset retirement obligations and related fixed assets of $125 million as at June 30, 2006. This revision results in additional expenditure of approximately $16 million in 2006.
Note 6 — Supplementary Cash Flow Information
| | | Three months ended
September 30 | | Nine months ended
September 30 | |
| | | 2006 | | 2005 | | 2006 | | 2005 | |
| | |
| |
| |
| Change in non-cash working capital items | | | | | | | | | |
| | Accounts receivable | | 329 | | 226 | | 370 | | 181 | |
| | Materials, fuel and supplies | | 5 | | (4 | ) | (25 | ) | (8 | ) |
| | Accounts payable and accrued liabilities | | (395 | ) | 238 | | (720 | ) | 56 | |
| | Accrued interest | | (301 | ) | (294 | ) | (339 | ) | (360 | ) |
| | |
| |
| |
| |
| |
| | | (362 | ) | 166 | | (714 | ) | (131 | ) |
| | |
| |
| |
| |
| |
Investing activities not affecting cash |
|
|
|
|
|
|
|
|
|
| | Increase in property, plant and equipment and
intangible assets | | 7 | | (6 | ) | 148 | | 2 | |
| | |
| |
| |
| |
| |
Cash and cash equivalents paid during the period |
|
|
|
|
|
|
|
|
|
| | Interest | | 748 | | 897 | | 1,901 | | 1,995 | |
| | Corporate income tax | | 241 | | 8 | | 245 | | 20 | |
| | |
| |
| |
| |
| |
12
Note 7 — Employee Future Benefits
| | | Three months ended
September 30
|
| | |
2006 | | Pension Plan
2005 | |
2006 | | Other Plans
2005 |
| | |
| |
|
| Accrued benefit cost | | 71 | | 47 | | 21 | | 24 |
| | |
| |
| |
| |
|
| | | Nine months ended
September 30
|
| | |
2006 | | Pension Plan
2005 | |
2006 | | Other Plans
2005 |
| | |
| |
|
| Accrued benefit cost | | 213 | | 142 | | 70 | | 64 |
| | |
| |
| |
| |
|
Note 8 — Commitments and Contingencies
Guarantees
As at September 30, 2006, the potential maximum amount Hydro-Québec could have to pay under letters of credit and guarantees totaled $369 million. Of this amount, $301 million relates to the purchase of energy, for which a liability in the amount of $17 million has been recorded. Some guarantees expire between 2006 and 2019, while others do not have maturity dates.
As at September 30, 2006, Hydro-Québec provided guarantees to the purchasers of its interests concerning all its declarations and guarantees in the sales agreements. The maximum contingent risk under these guarantees represents of approximately $299 million, excluding contingent tax liabilities and certain other customary declarations. The declarations and guarantees of the Corporation apply for a period ending no later than August 1, 2007, except with respect to the contingent tax liabilities and certain other customary declarations which remain in effect until the applicable limitation periods expire.
13
Note 9 — Segmented Information
Since the first quarter of 2006, the Corporate and Other Activities segment has included the Technology Group, largely made up of telecommunications activities.
Three months ended
September 30, 2006
|
| | |
Generation
| |
Transmission
| |
Distribution
| |
Construction
| | Corporate and
Other Activities
| | Intersegment
eliminations
| |
Total
|
| Revenue | | | | | | | | | | | | | | |
| | External customers | | 364 | | 8 | | 2,063 | | — | | 35 | | — | | 2,470 |
| | Intersegment | | 956 | | 659 | | 13 | | 529 | | 296 | | (2,453 | ) | —
|
Income (loss) from continuing operations |
|
342 |
|
103 |
|
(127 |
) |
2 |
|
16 |
|
3 |
|
339 |
| Discontinued operations | | — | | — | | — | | — | | 58 | | — | | 58 |
| Net income (loss) | | 342 | | 103 | | (127 | ) | 2 | | 74 | | 3 | | 397 |
| Total assets as at September 30, 2006 | | 28,183 | | 15,749 | | 10,509 | | 223 | | 7,046 | | (224 | ) | 61,486 |
Three months ended
September 30, 2005
|
| | |
Generation
| |
Transmission
| |
Distribution
| |
Construction
| | Corporate and
Other Activities
| | Intersegment
eliminations
| |
Total
|
| Revenue | | | | | | | | | | | | | | |
| | External customers | | 537 | | 7 | | 1,929 | | 4 | | 4 | | (26 | ) | 2,455 |
| | Intersegment | | 928 | | 619 | | 11 | | 592 | | 259 | | (2,409 | ) | — |
Income (loss) from continuing operations |
|
428 |
|
100 |
|
(160 |
) |
1 |
|
(26 |
) |
(4 |
) |
339 |
| Discontinued operations | | — | | — | | 52 | | — | | — | | — | | 52 |
| Net income (loss) | | 428 | | 100 | | (108 | ) | 1 | | (26 | ) | (4 | ) | 391 |
| Total assets as at September 30, 2005 | | 27,219 | | 15,424 | | 10,053 | | 250 | | 6,977 | | (250 | ) | 59,673 |
14
Note 9 — Segmented information (continued)
Nine months ended
September 30, 2006
|
| | |
Generation
| |
Transmission
| |
Distribution
| |
Construction
| | Corporate and
Other Activities
| | Intersegment
eliminations
| |
Total
|
| Revenue | | | | | | | | | | | | | | |
| | External customers(a) | | 1,275 | | 24 | | 6,912 | | — | | 66 | | (1 | ) | 8,276 |
| | Intersegment | | 3,329 | | 2,146 | | 40 | | 1,367 | | 839 | | (7,721 | ) | —
|
Income (loss) from continuing operations |
|
1,683 |
|
530 |
|
(175 |
) |
2 |
|
(6 |
) |
5 |
|
2,039 |
| Discontinued operations | | — | | — | | — | | — | | 929 | | — | | 929 |
| Net income (loss) | | 1,683 | | 530 | | (175 | ) | 2 | | 923 | | 5 | | 2,968 |
| Total assets as at September 30, 2006 | | 28,183 | | 15,749 | | 10,509 | | 223 | | 7,046 | | (224 | ) | 61,486 |
- (a)
- For the second quarter 2006, a $234-million foreign exchange gain was recognized on debts and swaps denominated in U.S. dollars. In keeping with the adopted hedge accounting treatment, this amount, which represents the realization of a portion of the deferred foreign exchange gain recorded on the balance sheet, has been incorporated into other operating revenue.
Nine months ended
September 30, 2005
|
| | |
Generation
| |
Transmission
| |
Distribution
| |
Construction
| | Corporate and
Other Activities
| | Intersegment
eliminations
| |
Total
|
| Revenue | | | | | | | | | | | | | | |
| | External customers | | 1,328 | | 17 | | 6,705 | | 6 | | 20 | | (48 | ) | 8,028 |
| | Intersegment | | 3,280 | | 1,855 | | 38 | | 1,403 | | 771 | | (7,347 | ) | — |
Income (loss) from continuing operations |
|
1,535 |
|
299 |
|
22 |
|
4 |
|
(90 |
) |
(6 |
) |
1,764 |
| Discontinued operations | | — | | — | | 57 | | — | | 26 | | — | | 83 |
| Net income (loss) | | 1,535 | | 299 | | 79 | | 4 | | (64 | ) | (6 | ) | 1,847 |
| Total assets as at September 30, 2005 | | 27,219 | | 15,424 | | 10,053 | | 250 | | 6,977 | | (250 | ) | 59,673 |
15
CONSOLIDATED FINANCIAL HIGHLIGHTS
In millions of Canadian dollars
(unaudited)
Summary of Operations | | Three months ended
September 30 | | Nine months ended
September 30 |
|
| | | 2006 | | 2005 | | Change (%) | | 2006 | | 2005 | | Change (%) |
|
| Revenue | | 2,470 | | 2,455 | | 0.6 | | UP | | 8,276 | | 8,028 | | 3.1 | | UP |
| Expenditure | | 1,542 | | 1,583 | | 2.6 | | DOWN | | 4,557 | | 4,582 | | 0.5 | | DOWN |
| Financial expenses | | 589 | | 533 | | 10.5 | | UP | | 1,680 | | 1,682 | | 0.1 | | DOWN |
| Discontinued operations | | 58 | | 52 | | 11.5 | | UP | | 929 | | 83 | | 1,019.3 | | UP |
| Net income | | 397 | | 391 | | 1.5 | | UP | | 2,968 | | 1,847 | | 60.7 | | UP |
16
Quarter Highlights
Sale of an investment
In August, Hydro-Québec sold its 16.3% indirect interest in the Fortuna generating station in Panama to Enel Investment Holding, a subsidiary of the Italian energy group Enel, for $113 million. The transaction, which closed on August 1, yielded a profit of about $38 million. Fortuna has an installed capacity of 300 MW and produces close to 30% of Panama's electricity, making it the largest generating station in the country.
Decision by the Régie de l'énergie — Conditions of distribution service
In July, the Régie de l'énergie rendered a favorable decision in response to an application filed by Hydro-Québec Distribution in 2005 to amend the conditions of service stipulated in Bylaw 634 — Conditions for Electrical Service. Overall, the Régie supports the Distributor's proposals. It reiterates its concern, among other things, that customers be informed of costs and details related to the processing of their requests. More specifically, the decision affects the rules pertaining to system extensions and modifications, electricity supply and the cost of work.
Application to the Régie de l'énergie — Conditions of transmission service
In July, Hydro-Québec TransÉnergie applied to the Régie de l'énergie to determine the cost of transmission services for 2007, modify the transmission tariff for 2007 accordingly, and amend some of the conditions in the Hydro-Québec Open Access Transmission Tariff.
Application to the Régie de l'énergie — Rate adjustment
In August, Hydro-Québec Distribution filed its 2007-2008 rate application with the Régie de l'énergie, proposing a 2.8% average adjustment effective April 1, 2007. Hearings on the rate application will be held by the Régie during fall 2006.
Green building
Hydro-Québec and Équiterre have signed an agreement in principle for the construction of a model green building in downtown Montréal, on land belonging to Hydro-Québec in the same block as its head office. It will house a number of organizations active mainly in environmental matters, consumer protection and social development. Équiterre, which is piloting the project, wants the Maison du développement durable (Sustainable Development House) to have LEED Platinum certification, the highest level of green construction. The building will showcase a number of innovative environmental technologies and will be the first of its kind in Québec. Hydro-Québec has signed an emphyteutic lease under which it will lease the land to Équiterre for the sum of $1 a year for the next 50 years.
17
Electric vehicles
In September, Hydro-Québec purchased five Cleanova electric vehicles and added them to its fleet. The vehicles will be on trial for the next three years. The Cleanova, developed by the Société de véhicules électriques of France, uses an electric motor designed and perfected by TM4, a Hydro-Québec joint venture. The motor converts a remarkable 96% of its energy into movement, contrary to the internal combustion engine, which converts a maximum of only 35% of the energy contained in gasoline. The purchase demonstrates Hydro-Québec's commitment to sustainable development.
Hydro-Québec, 75 René-Lévesque Blvd. West, Montréal, Québec H2Z 1A4
Ce document est également publié en français.
www.hydroquebec.com
ISSN 0848-5836
2006G001-3A
18
QuickLinks
NOTES TO CONSOLIDATED FINANCIAL STATEMENTS (unaudited) Nine-month periods ended September 30, 2006 and 2005 Amounts in tables are in millions of Canadian dollars.