UNITED STATES
SECURITIES AND EXCHANGE COMMISSION
Washington, D.C. 20549
FORM 18-K
For Foreign Governments and Political Subdivisions Thereof
ANNUAL REPORT
of
HYDRO-QUÉBEC
QUÉBEC, CANADA
(Name of Registrant)
Date of end of last fiscal year: December 31, 2006
SECURITIES REGISTERED*
(As of the close of the fiscal year)
Title of Issue | | Amounts as to Which
Registration is Effective | | Names of Exchanges
on Which Registered |
N/A | | N/A | | N/A |
Name and address of persons authorized to receive notices
and communications from the Securities and Exchange Commission:
MR. MICHEL ROBITAILLE
Delegate General
Québec Government House
One Rockefeller Plaza
26th Floor
New York, NY 10020-2102
Copies to:
Mr. Robert E. Buckholz, JR. | | Mr. Daniel Garant |
Sullivan & Cromwell LLP | | Chief Financial Officer |
125 Broad Street | | Hydro-Québec |
New York, NY 10004-2498 | | 75 René-Lévesque Boulevard West |
| | Montréal, Québec, Canada H2Z 1A4 |
*The Registrant is filing this annual report on a voluntary basis.
The information set forth below is to be furnished:
1. In respect of each issue of securities of the registrant registered, a brief statement as to:
(a) The general effect of any material modifications, not previously reported, of the rights of the holders of such securities.
Not applicable.
(b) The title and the material provisions of any law, decree or administrative action, not previously reported, by reason of which the security is not being serviced in accordance with the terms thereof.
Not applicable.
(c) The circumstances of any other failure, not previously reported, to pay principal, interest, or any sinking fund or amortization installment.
Not applicable.
2. A statement as of the close of the last fiscal year of the registrant giving the total outstanding of:
(a) Internal funded debt of the registrant. (Total to be stated in the currency of the registrant. If any internal funded debt is payable in foreign currency, it should not be included under this paragraph (a), but under paragraph (b) of this item.)
Reference is made to pages 48 and 62 of Exhibit (d) hereto.
(b) External funded debt of the registrant. (Totals to be stated in the respective currencies in which payable. No statement need be furnished as to intergovernmental debt.)
Reference is made to pages 48, 63 and 64 of Exhibit (d) hereto.
3. A statement giving the title, date of issue, date of maturity, interest rate and amount outstanding, together with the currency or currencies in which payable, of each issue of funded debt of the registrant outstanding as of the close of the last fiscal year of the registrant.
Reference is made to pages 62 to 64 of Exhibit (d) hereto.
4. (a) As to each issue of securities of the registrant which is registered, there should be furnished a break-down of the total amount outstanding, as shown in Item 3, into the following:
(1) Total amount held by or for the account of the registrant.
None.
(2) Total estimated amount held by nationals of the registrant (or if registrant is other than a national government by the nationals of its national government); this estimate need be furnished only if it is practicable to do so.
Not practicable to do so.
(3) Total amount otherwise outstanding.
Not applicable.*
*No securities of the registrant are registered under the U.S. Exchange Act of 1934, as amended.
i
(b) If a substantial amount is set forth in answer to paragraph (a) (1) above, describe briefly the method employed by the registrant to reacquire such securities.
Not applicable.
5. A statement as of the close of the last fiscal year of the registrant giving the estimated total of:
(a) Internal floating indebtedness of the registrant. (Total to be stated in the currency of the registrant.)
$370.1 million (including $345.0 million to one of our subsidiaries). The item “floating indebtedness” refers to indebtedness with an original maturity of less than one year.
(b) External floating indebtedness of the registrant. (Total to be stated in the respective currencies in which payable.)
None.
6. Statements of the receipts, classified by source, and of the expenditures, classified by purpose, of the registrant for each fiscal year of the registrant ended since the close of the latest fiscal year for which such information was previously reported. These statements should be so itemized as to be reasonably informative and should cover both ordinary and extraordinary receipts and expenditures; there should be indicated separately, if practicable, the amount of receipts pledged or otherwise specifically allocated to any issue registered, indicating the issue.
Reference is made to pages 28 to 61 of Exhibit (d) hereto.
7. (a) If any foreign exchange control, not previously reported, has been established by the registrant (or if the registrant is other than a national government, by its national government), briefly describe the effect of any such action, not previously reported.
None.
(b) If any foreign exchange control previously reported has been discontinued or materially modified, briefly describe the effect of any such action, not previously reported.
Not applicable.
This annual report comprises:
(a) The cover page and pages numbered i to iv consecutively.
(b) The following exhibits:
(a) None.
(b) None.
(c) None.
(d) Description of Hydro-Québec, dated as of May 10, 2007, including audited consolidated financial statements of Hydro-Québec for the year ended December 31, 2006.
(e) Consent of KPMG LLP and Ernst & Young LLP and
Consent of Samson Bélair/Deloitte & Touche s.e.n.c.r.l. and PricewaterhouseCoopers LLP.
This annual report is filed subject to the Instructions for Form 18-K for Foreign Governments and Political Subdivisions Thereof.
ii
SIGNATURE
Pursuant to the requirements of the Securities Exchange Act of 1934, the registrant has duly caused this annual report to be signed on its behalf by the undersigned, thereunto duly authorized, in Montréal, Canada, on the 10th day of May 2007.
| | | HYDRO-QUÉBEC |
| | | |
| | | | |
| | By: | /s/ | Daniel Garant |
| | | Daniel Garant |
| | | Chief Financial Officer |
iii
EXHIBIT INDEX
Exhibits | | Description |
| | |
(d) | | Description of Hydro-Québec, dated as of May 10, 2007, including audited consolidated financial statements of
Hydro-Québec for the year ended December 31, 2006. |
| | |
(e) | | Consent of KPMG LLP and Ernst & Young LLP and Consent of Samson Bélair/Deloitte & Touche s.e.n.c.r.l. and PricewaterhouseCoopers LLP. |
iv
EXHIBIT (d)

This description of Hydro-Québec is dated as of May 10, 2007 and appears as Exhibit (d) to Hydro-Québec’s annual report on
Form 18-K to the U.S. Securities and Exchange Commission for the fiscal year ended December 31, 2006.
This document may be delivered to you at any time but you should assume that the information is accurate only as of May 10, 2007. Hydro-Québec’s business, financial condition, results of operations and prospects may have changed since that date.
This document does not constitute an offer to sell or the solicitation of an offer to buy any securities of Hydro-Québec, unless it is included in a registration statement filed under the Securities Act of 1933, as amended.
TABLE OF CONTENTS
| | Page |
FOREIGN EXCHANGE | | 2 |
SUMMARY | | 3 |
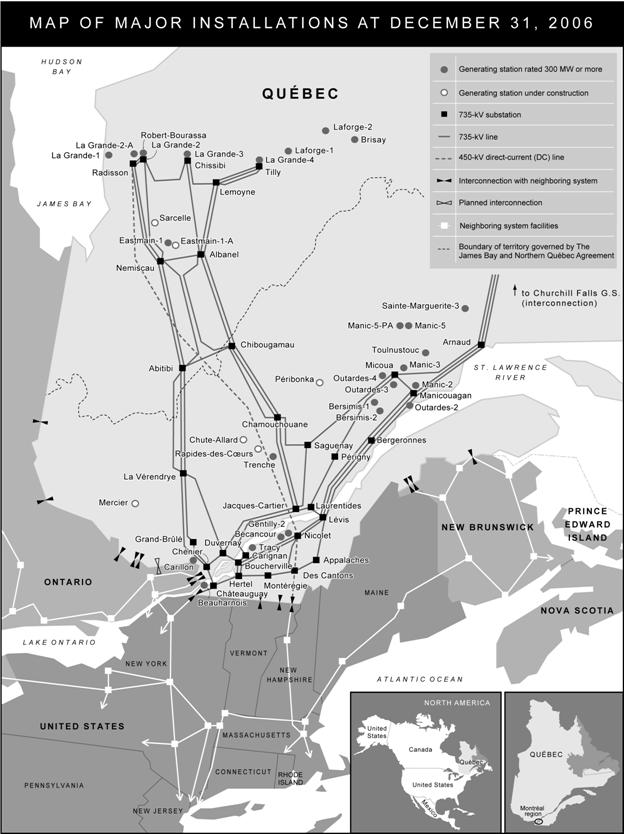
MAP OF MAJOR INSTALLATIONS AT DECEMBER 31, 2006 | | 4 |
HYDRO-QUÉBEC | | 5 |
General | | 5 |
distribution | | 5 |
Facilities | | 5 |
Québec Market | | 5 |
Rates | | 6 |
Electricity Sales and Revenue | | 6 |
transmission | | 7 |
Transmission System | | 7 |
generation | | 8 |
Generation Operations | | 8 |
Wholesale and Trading Operations | | 10 |
construction | | 11 |
corporate and other activities | | 12 |
corporate outlook | | 12 |
Development Strategy | | 12 |
Generations Fund | | 13 |
Capital Investment Program | | 14 |
Regulatory Framework | | 16 |
Litigation | | 18 |
Employees | | 18 |
Management’s Financial Discussion | | 19 |
WHERE YOU CAN FIND MORE INFORMATION | | 24 |
FORWARD-LOOKING STATEMENTS | | 24 |
SUMMARY OF CERTAIN MATERIAL DIFFERENCES BETWEEN CANADIAN GAAP AND US GAAP | | 25 |
AUDITORS’ REPORT | | 27 |
CONSOLIDATED FINANCIAL STATEMENTS | | 28 |
LONG-TERM DEBT BY ISSUE | | 62 |
FOREIGN EXCHANGE
Canada maintains a floating exchange rate for the Canadian dollar in order to permit the rate to be determined by fundamental forces without intervention except as required to maintain orderly conditions. Annual average noon spot exchange rates for major foreign currencies in which the debt of Hydro-Québec is denominated, expressed in Canadian dollars, are shown below.
Foreign Currency | | 2002 | | 2003 | | 2004 | | 2005 | | 2006 | | 2007 (1) | |
| | | | | | | | | | | | | |
United States Dollar | | $ | 1.5704 | | $ | 1.4015 | | $ | 1.3015 | | $ | 1.2116 | | $ | 1.1341 | | $ | 1.1623 | |
Euro | | 1.4832 | | 1.5826 | | 1.6169 | | 1.5090 | | 1.4237 | | 1.5349 | |
Swiss Franc | | 1.0112 | | 1.0418 | | 1.0473 | | 0.9746 | | 0.9050 | | 0.9464 | |
Pound Sterling | | 2.3582 | | 2.2883 | | 2.3842 | | 2.2067 | | 2.0886 | | 2.2817 | |
100 Japanese Yen | | 1.2554 | | 1.2088 | | 1.2035 | | 1.1035 | | 0.9753 | | 0.9746 | |
| | | | | | | | | | | | | | | | | | | |
(1) Monthly average through the end of April 2007.
Source: Bank of Canada.
In this document, unless otherwise specified or the context otherwise requires, all dollar amounts are expressed in Canadian dollars.
2
SUMMARY
The information below is qualified in its entirety by the detailed information contained elsewhere in this document.
| | Years ended December 31 | |
| | 2002 | | 2003 | | 2004 | | 2005 | | 2006 | |
| | (dollar amounts in millions) | |
Statistical Information - Electricity | | | | | | | | | | | |
| | | | | | | | | | | |
Electricity sales (in TWh) | | | | | | | | | | | |
Québec | | 158.6 | | 167.1 | | 165.9 | | 169.2 | | 167.3 | |
Outside Québec. | | 54.2 | | 15.8 | | 14.4 | | 15.3 | | 14.5 | |
| | 212.8 | | 182.9 | | 180.3 | | 184.5 | | 181.8 | |
| | | | | | | | | | | |
Revenue from electricity sales | | | | | | | | | | | |
Québec | | $ | 8,112 | | $ | 8,578 | | $ | 8,922 | | $ | 9,121 | | $ | 9,402 | |
Outside Québec | | 3,466 | | 1,345 | | 1,084 | | 1,464 | | 1,149 | |
| | $ | 11,578 | | $ | 9,923 | | $ | 10,006 | | $ | 10,585 | | $ | 10,551 | |
| | | | | | | | | | | |
Rate increase (Québec) (1) | | nil | | nil | | 4.45 | % | 1.2 | % | 5.33 | % |
| | | | | | | | | | | |
Customer accounts at end of year (in thousands) | | 3,597 | | 3,644 | | 3,701 | | 3,753 | | 3,815 | |
Installed capacity at end of period (in MW) (2) | | 32,661 | | 33,616 | | 33,892 | | 34,571 | | 35,315 | |
Peak power demand in Québec for winter beginning in the preceding December (in MW) | | 34,989 | | 36,268 | | 34,956 | | 33,636 | | 36,251 | |
| | | | | | | | | | | |
Consolidated financial information | | | | | | | | | | | |
| | | | | | | | | | | |
Total revenue | | $ | 11,852 | | $ | 10,197 | | $ | 10,341 | | $ | 10,888 | | $ | 11,161 | |
Interest expenses (including capitalized interest) | | $ | 2,711 | | $ | 2,563 | | $ | 2,382 | | $ | 2,305 | | $ | 2,466 | |
Net income (3)(4) | | $ | 1,585 | | $ | 1,938 | | $ | 2,435 | | $ | 2,252 | | $ | 3,741 | |
Earnings before interest, depreciation, amortization, decommissioning (3) | | $ | 5,852 | | $ | 5,897 | | $ | 6,438 | | $ | 6,308 | | $ | 7,823 | |
Capital expenditures | | $ | 2,256 | | $ | 2,694 | | $ | 2,217 | | $ | 3,399 | | $ | 1,469 | |
Interest coverage (5) | | 1.63 | | 1.73 | | 1.79 | | 2.00 | | 2.06 | |
Total assets (3) | | $ | 59,247 | | $ | 57,823 | | $ | 58,118 | | $ | 60,432 | | $ | 63,248 | |
Long-term and perpetual debt | | $ | 37,386 | | $ | 34,842 | | $ | 32,958 | | $ | 31,658 | | $ | 34,476 | |
Shareholder’s equity (3)(6) | | $ | 14,208 | | $ | 15,128 | | $ | 16,220 | | $ | 17,376 | | $ | 18,840 | |
Capitalization ratio (3)(7)(8) | | 26.2 | % | 29.8 | % | 32.8 | % | 34.2 | % | 36.1 | % |
Permanent employees at end of year (in thousands) (8) | | 18.0 | | 18.3 | | 18.8 | | 19.0 | | 19.1 | |
(1) Effective April 1 except in 2004. For 2004: 3% effective January 1 and 1.41% effective April 1.
(2) Of total installed and minimum firm capacity available at December 31, 2006, 93% was hydroelectric, 5% was thermal and 2% was nuclear. In addition, we have access to 4,765 MW of the generation of the Churchill Falls power plant and we also purchase all the output from six privately-owned wind farms with a total installed capacity of 320 MW. Furthermore, 1,206 MW are available under various agreements with other independent suppliers.
(3) In 2004, financial statements for the years 2002 and 2003 were restated as a result of the retroactive application of a new Canadian accounting standard on asset retirement obligations, which required the recognition and measurement of liabilities for legal obligations associated with the retirement of an asset.
(4) Net income originally reported for the years 2002 and 2003 was $1,526 million and $1,931 million, respectively.
(5) Sum of operating income and net investment income divided by gross interest expense.
(6) Shareholder’s equity originally reported for the years 2002 and 2003 was $14,215 million and $15,127 million, respectively.
(7) Shareholder’s equity divided by the sum of shareholder’s equity, long-term debt, perpetual debt, short-term borrowings and current portion of long-term debt, less swaps and sinking funds.
(8) The capitalization ratio originally reported for the years 2002 and 2003 was 26.2% and 29.9%, respectively.
(9) Excludes employees of subsidiaries and joint ventures.
Units of measurement:
GW: | | gigawatt, or 1 million kilowatts | | | | |
MW: | | megawatt, or 1 million watts | | | | |
kWh: | | kilowatthour, or 1 thousand watthours | | | | |
| | | | | | |
GWh: | | gigawatthour, or 1 million kilowatthours | | | | |
TWh: | | terawatthour, or 1 billion kilowatthours | | | | |
kV: | | kilovolt, or 1 thousand volts | | | | |
3
4
HYDRO-QUÉBEC
General
We operate one of the two largest systems in Canada for the generation and distribution of electric power. We supply virtually all electric power distributed in Québec, the largest province in Canada in land area and the second largest in population.
Hydro-Québec was created in 1944 by the Hydro-Québec Act of the Parliament of Québec and is an agent of Québec. All capital stock of Hydro-Québec is held by the Minister of Finance on behalf of the government of Québec (the “Government”).
Our head office is located at 75 René-Lévesque Boulevard West, Montréal, Québec, Canada H2Z 1A4.
Our operations are allocated among five business segments:
· Distribution: Hydro-Québec Distribution develops and operates our distribution system and is responsible for sales and service to Québec customers. It also has responsibility for ensuring the security of the supply of electricity to the Québec market.
· Transmission: Hydro-Québec TransÉnergie develops and operates our transmission system in Québec.
· Generation: Hydro-Québec Production operates and develops our generation facilities in Québec. It guarantees the supply of heritage pool electricity to the Québec market (see “Regulatory Framework - Energy Board Act”) and it participates in the Québec wholesale market by responding to calls for tenders from Hydro-Québec Distribution. It sells electricity on wholesale markets outside Québec and engages in energy trading activities.
· Construction: Hydro-Québec Équipement and our wholly-owned subsidiary, Société d’énergie de la Baie James (“SEBJ”), provide engineering services and carry out construction projects, mainly for our Transmission and Generation segments.
· Corporate and Other Activities: includes corporate activities related to financial services, human resources, strategic planning and corporate affairs, procurement and telecommunications. It also includes activities related to computer services, research and development of our technologies. In 2005, the operations of TransÉnergie HQ inc. (“TransÉnergie HQ”), which held our interest in the Cross-Sound Cable Company, LLC and those of Hydro-Québec International inc. (“Hydro-Québec International”), which held our interests in Latin America and Australia, were reclassified under Corporate and Other Activities as Assets held for sale (see “Management’s Financial Discussion – Financial Results of the Corporate and Other Activities Business Segment”). As of February 2007, all such assets have been sold.
DISTRIBUTION
The primary responsibility of Hydro-Québec Distribution is to supply Québec customers with the electricity they need. To fulfill this responsibility, the division purchases up to 165 TWh/year of heritage pool electricity from Hydro-Québec Production, at a regulated average fixed price of 2.79 cents per kWh. Beyond this volume, Hydro-Québec Distribution must supply Québec customers by issuing calls for tenders from suppliers in the market (see “Regulatory Framework – Energy Board Act”).
Facilities
Our distribution system is made up of 67,600 miles of medium voltage lines (almost exclusively 25 kV), as well as 37,900 miles of low voltage lines. Approximately 9% of all such lines are underground.
Québec Market
We sell to a wide range of customers, from industrial users, which accounted for 43.8% of sales volume in 2006, to residential customers and farms, which represented 33.9% of sales volume in the same period. Revenues are also derived from sales to commercial and institutional customers as well as municipalities.
Through marketing efforts, we have developed some flexibility in the management of our system. We currently have 1,600 MW of interruptible power and 780 MW of concurrent peak-saving capacity in our residential dual-energy market.
5
We have entered into seven risk and profit-sharing agreements with various industrial customers for whom electricity costs represent a substantial proportion of total production costs. Most of these agreements provide for the sale, on a long-term basis, of firm energy at prices that vary in accordance with a formula based on the market price of aluminum produced by those customers. We manage the exposure to fluctuations in aluminum prices resulting from these contracts by entering into financial transactions, such as futures or swaps (see Note 16 to the 2006 Consolidated Financial Statements). In 2006, deliveries under these agreements accounted for approximately 29% of the total energy deliveries to industrial users.
Further to calls for tenders issued since 2002, Hydro-Québec Distribution signed contracts with Hydro-Québec Production for the supply of 600 MW beginning in March 2007 and with five independent producers for the supply of more than 1,500 MW (including 990 MW of wind-generated electricity) from July 2006 through December 2012. In 2005, Hydro-Québec Distribution issued a call for tenders for an additional 2,000 MW, with deliveries starting no later than September 2010. In 2006, Hydro-Québec Distribution issued two calls for tenders to meet short-term domestic demand for 2006 and part of 2007 and 38 contracts were signed for the supply of up to 500 MW. Also, in March 2007, Hydro-Québec Distribution issued a call for tenders for the sale of excess short-term energy supply. Further to this call for tenders, 35 contracts were signed for a total of 350 MW/month for the period from April through September 2007. We expect that more calls for tenders will be made in the coming years in order to balance energy supply and demand in Québec (see “Regulatory Framework – Energy Board Act”).
Rates
Under the applicable provisions of the Energy Board Act, rates are fixed or modified by the Energy Board (see “Regulatory Framework – Energy Board Act”). Rates are fixed to allow recovery of authorized service costs, including estimated supply costs, and a reasonable rate of return on shareholder’s equity. In February 2007, the Energy Board approved an average rate increase of 1.92% effective April 1, 2007.
The following table shows rate increases applicable for each year from 2002 to 2007 as well as annual inflation rates:
| | 2002 | | 2003 | | 2004 | | 2005 | | 2006 | | 2007 | |
Rate increase (1) | | nil | | nil | | 4.45 | % (2) | 1.2 | % | 5.33 | % | 1.92 | % |
Inflation Rate (3) | | 2.2 | % | 2.8 | % | 1.9 | % | 2.2 | % | 2.0 | % | 2.0 | % (4) |
(1) Effective April 1, except in 2004.
(2) For 2004: 3% effective January 1 and 1.41% effective April 1.
(3) Canadian Consumer Price Index.
(4) Estimate.
Electricity Sales and Revenue
The following table summarizes electricity sales and revenue in Québec by class of customers for the years 2002 through 2006.
ELECTRICITY SALES AND REVENUE IN QUÉBEC
| | 2002 | | 2003 | | 2004 | | 2005 | | 2006 | |
| | (TWh) | |
ELECTRICITY SALES | | | | | | | | | | | |
Residential and farm | | 53.2 | | 57.2 | | 58.0 | | 57.3 | | 56.7 | |
General and institutional | | 31.7 | | 32.3 | | 33.2 | | 33.5 | | 32.4 | |
Industrial | | 68.6 | | 72.6 | | 69.7 | | 73.4 | | 73.3 | |
Other | | 5.1 | | 5.0 | | 5.0 | | 5.0 | | 4.9 | |
TOTAL ELECTRICITY SALES | | 158.6 | | 167.1 | | 165.9 | | 169.2 | | 167.3 | |
| | (millions of dollars) | |
| | | | | | | | | | | |
REVENUE FROM ELECTRICITY SALES | | | | | | | | | | | |
Residential and farm | | $ | 3,246 | | $ | 3,504 | | $ | 3,690 | | $ | 3,690 | | $ | 3,775 | |
General and institutional | | 2,058 | | 2,096 | | 2,234 | | 2,284 | | 2,356 | |
Industrial | | 2,577 | | 2,742 | | 2,751 | | 2,892 | | 3,022 | |
Other | | 231 | | 236 | | 247 | | 255 | | 249 | |
TOTAL REVENUE FROM ELECTRICITY SALES | | $ | 8,112 | | $ | 8,578 | | $ | 8,922 | | $ | 9,121 | | $ | 9,402 | |
| | | | | | | | | | | |
NUMBER OF CUSTOMER ACCOUNTS | | | | | | | | | | | |
Residential and farm | | 3,295,544 | | 3,343,271 | | 3,399,776 | | 3,450,455 | | 3,501,709 | |
General and institutional | | 281,696 | | 281,997 | | 282,748 | | 283,616 | | 295,618 | |
Industrial | | 13,509 | | 13,383 | | 13,117 | | 12,796 | | 12,032 | |
Other | | 5,793 | | 5,812 | | 5,634 | | 5,643 | | 5,767 | |
Total number of customer accounts | | 3,596,542 | | 3,644,463 | | 3,701,275 | | 3,752,510 | | 3,815,126 | |
6
TRANSMISSION
In Québec, Hydro-Québec TransÉnergie provides the following services:
· transmission of electricity to supply local distribution; Hydro-Québec Distribution is the division’s largest customer;
· point-to-point transmission service; as at the end of 2006, Hydro-Québec TransÉnergie had signed transmission service agreements with 30 customers, including Hydro-Québec Production which is the main user of this service; and
· connections of privately-owned generation facilities to our transmission system; we currently serve 27 private producers.
This segment also includes our holding in Cedars Rapids Transmission Company, Limited which operates the interconnection between our Les Cèdres plant and the Cornwall Electric load in Ontario as well as the National Grid network in the U.S.
Transmission System
In Québec, our generation stations are located at substantial distances from consumer centers. As a result, our power transmission system is one of the most extensive and comprehensive in North America, comprising more than 20,000 miles of lines.
This system includes the following facilities as at December 31, 2006.
Voltage | | Substations | | Lines (miles) (1) | |
| | | | | |
765 kV and 735 kV | | 38 | | 7,097 | |
450 kV DC | | 2 | | 757 | |
315 kV | | 63 | | 3,186 | |
230 kV | | 50 | | 1,850 | |
161 kV | | 40 | | 1,165 | |
120 kV | | 213 | | 4,101 | |
69 kV or less | | 102 | | 2,241 | |
TOTAL | | 508 | | 20,397 | |
(1) Miles covered by the transmission system. Many facilities carry two lines on the same infrastructure.
In May 1997, we opened access to our transmission grid in accordance with the Hydro-Québec Open Access Transmission Tariff. Consequently, electricity distributors, producers and marketers in and outside Québec have the option to enter into transactions with distributors and producers located outside Québec to buy or sell electricity and to wheel in, wheel out or wheel through Hydro-Québec TransÉnergie’s transmission lines at specified rates. The capacity available on the system is posted on the OASIS (Open Access Same-Time Information System) website.
Hydro-Québec TransÉnergie’s System Control Center in Montréal and regional telecontrol centers are designed to optimize energy resources, supervise power flow and monitor system security. The transmission system is linked with other major power systems in Canada and the Northeastern United States.
7
The following table shows existing interconnections with neighboring systems outside Québec, excluding the lines to Churchill Falls, as at December 31, 2006.
INTERCONNECTIONS WITH NEIGHBORING SYSTEMS OUTSIDE QUÉBEC
| | Maximum Carrying
Capacity | | Hydro-Québec’s Current
Reception Capacity | | Voltage | |
| | (MW) | | (MW) | | (kV) | |
| | | | | | | |
CANADA | | | | | | | |
Ontario | | 1,295 | (1) | 720 | | 120 and 230 | |
New Brunswick | | 1,200 | | 785 | | 230, 315 and 345 | |
| | | | | | | |
UNITED STATES | | | | | | | |
New York | | 2,125 | (1) | 1,000 | | 120 and 765 | |
New England | | 2,305 | | 1,870 | | 120 and 450 | |
(1) Ontario and New York State are partially served by the same installations, limiting the simultaneous export capacity to these two systems to 3,100 MW.
GENERATION
Hydro-Québec Production supplies electricity to the Québec market and is an active player in energy markets in the northeastern part of North America. We sell surplus electricity generated in Québec, purchase electricity for resale and perform energy trading operations.
The following subsidiaries, affiliates and interests are also part of this segment:
· Bucksport Energy LLC (69.44% interest; cogeneration plant in Maine)
· Churchill Falls (Labrador) Corporation Limited (“CF(L)Co”) (34.2% interest; generation activities)
· Société en commandite Betsiamites (86.31% interest; development and operation of the partial diversion of the Portneuf, Sault aux Cochons and Manouane rivers)
· Gestion Production HQ inc. (wholly-owned; investment in local generation businesses and consulting)
· H.Q. Energy Marketing Inc. (“HQEM”) (wholly-owned; energy trading activities and investment in energy trading companies in other Canadian provinces and the U.S.)
· H.Q. Energy Services (U.S.) Inc. (“HQUS”) (wholly-owned; power marketer in the U.S.)
Generation Operations
Facilities
In Québec, our electric generation system comprises 85 power stations currently in service, of which 55 are hydroelectric, 28 are thermal, one is nuclear and one is a wind farm, with a total installed capacity of 35,315 MW as of December 31, 2006.
8
The following table lists the generation facilities in service as of such date.
GENERATION FACILITIES IN SERVICE IN QUÉBEC (1)
Name of Facility | | Years Commissioned (2) | | Capacity | |
| | | | (MW) | |
| | | | | |
Hydroelectric | | | | | |
Robert-Bourassa | | 1979-1981 | | 5,616 | |
La Grande-4 | | 1984-1986 | | 2,779 | |
La Grande-3 | | 1982-1984 | | 2,417 | |
La Grande-2A | | 1991-1992 | | 2,106 | |
Beauharnois | | 1932 and 1961 | | 1,673 | |
Manic-5 | | 1970-1971 | | 1,528 | |
La Grande-1 | | 1994-1995 | | 1,436 | |
Manic-3 | | 1975-1976 | | 1,244 | |
Bersimis-1 | | 1956-1959 | | 1,125 | |
Manic-5-PA | | 1989-1990 | | 1,064 | |
Manic-2 | | 1965-1967 | | 1,041 | |
Outardes-3 | | 1969 | | 1,026 | |
Others (43 facilities - less than 1,000 MW) (3) | | 1910-2006 | | 9,918 | |
Total | | | | 32,973 | |
| | | | | |
Thermal | | | | | |
Tracy (oil) | | 1964-1968 | | 660 | |
Bécancour, La Citière and Cadillac (gas-turbine) | | 1976-1993 | | 881 | |
Others (24 diesel plants) (3) | | 1946-2001 | | 124 | |
Total | | | | 1,665 | |
| | | | | |
Nuclear | | | | | |
Gentilly-2 (4) | | 1983 | | 675 | |
| | | | | |
Wind Farm | | | | | |
Saint-Ulric (3 wind turbines) | | 2001 | | 2 | |
(1) Installed capacity shown for the generation stations reflects the capacity of alternators operating in winter conditions at a water temperature of 41°F.
(2) Indicates years when facilities began commercial operation.
(3) Some facilities are owned by Hydro-Québec Distribution.
(4) The Gentilly-2 plant has a Canada-Deuterium-Uranium heavy water moderated reactor, using heavy water as a moderator and coolant, and uranium dioxide as fuel.
Power Purchases
We purchase power and energy from the Churchill Falls generation station in Labrador through agreements with CF(L)Co and Newfoundland and Labrador Hydro (“N&LH”). Under an initial power contract with CF(L)Co, we have agreed to purchase annually, through the year 2041, 4,083 MW of power. In June 1999, we signed another agreement with CF(L)Co to guarantee us the availability of 682 MW of additional power until 2041 for each November 1 to March 31 period. In February 2001, we agreed to purchase approximately 1.5 TWh annually from N&LH until March 2004. In 2004, this contract was renewed for the purchase of approximately 1.4 TWh annually for a five-year period. In 2006, purchases under the CF(L)Co and N&LH agreements amounted to 31.2 TWh at a cost of $159 million as compared to 30.1 TWh at a cost of $154 million in 2005.
We have a capacity agreement with New Brunswick Power Generation Corporation (formerly known as New Brunswick Power Corporation) for the purchase of 200 MW annually until October 31, 2011. We also have an agreement with Alcan, which was amended in 2006, for the purchase of 365 MW of peak power and 375 MW of additional peak power until December 31, 2045. Under this 2006 amendment, we agreed to purchase from Alcan 150 MW of additional peak power until January 1st, 2013 which, if certain conditions are met, will be extended until December 31, 2045.
In addition, we purchase power under 84 long-term contracts with independent producers located in Québec. During 2006, 4.0 TWh were purchased under these contracts, at a total cost of $254 million. We expect to purchase approximately 5.3 TWh annually over the initial term of these contracts which extend through 2033; the majority of these contracts include renewal clauses.
We also purchase power in connection with our trading operations (see “Wholesale and Trading Operations”).
9
Peak
We use energy purchased from our neighboring systems, which experience different demand patterns, to meet a portion of our peak power needs in Québec (see “Wholesale and Trading Operations”). The following table summarizes our peak power demand in Québec and installed capacity as at December 31 for the years 2002 through 2006.
| | Peak Power | | Installed | | Total | |
| | Demand (1) | | Capacity (2)(3) | | Average Load (4) | |
| | (MW) | |
2002 | | 34,989 | | 32,661 | | 22,022 | |
2003 | | 36,268 | | 33,616 | | 22,237 | |
2004 | | 34,956 | | 33,892 | | 21,975 | |
2005 | | 33,636 | | 34,571 | | 22,851 | |
2006 | | 36,251 | | 35,315 | | 22,768 | |
(1) Total power demand at the annual domestic peak for the winter beginning in the preceding December, including interruptible power. The 2006-2007 winter peak occurred at 5:30 p.m. on February 5, 2007.
(2) In addition to the installed capacity of our own generation stations, we have access to 4,765 MW of the generation of the Churchill Falls power plant and we also purchase all the output from six privately-owned wind farms with a total installed capacity of 320 MW. Furthermore, 1,206 MW are available under various agreements with other independent suppliers.
(3) Installed capacity shown for the generation stations reflects the capacity of alternators operating in winter conditions at a water temperature of 41°F.
(4) Annual energy demand, including sales outside Québec, divided by the number of hours in the year.
Investment outside Québec
We hold an indirect interest in Bucksport Energy LLC, a thermal energy plant located in Maine, U.S. The plant, which started its commercial operations in January 2001, produces approximately 1.3 TWh of electricity per year. HQUS supplies the plant with natural gas and receives most of the electricity under fifteen-year contracts through January 2016.
Wholesale and Trading Operations
Québec Wholesale Market
The Québec wholesale electricity market has been open since May 1, 1997. This market is comprised of 11 distributors:
Hydro-Québec Distribution, nine distributors operating municipal systems and one regional electricity cooperative. As a result of the opening of the wholesale market, the municipal systems can, subject to the Government’s authorization, purchase electricity from suppliers other than Hydro-Québec Distribution, and independent generators in Québec can sell their electricity on the wholesale market using Hydro-Québec TransÉnergie’s transmission facilities.
Under a call for tenders issued by Hydro-Québec Distribution in 2002, Hydro-Québec Production signed an agreement with
Hydro-Québec Distribution for the supply of 600 MW over a 20-year period starting in March 2007, which is in addition to the heritage pool elecricity.
Markets Outside Québec
Currently, our main markets outside Québec consist of neighboring networks located in Canada and the Northeastern United States.
In 2006, electricity sales outside Québec accounted for 8.0% of our total electricity sales, down from 8.3% in 2005 (see “Management’s Financial Discussion - Financial Results of the Generation Business Segment”). Additional sales commitments were met using electricity purchases and our surplus Québec generation capacity.
Our energy-trading subsidiary, HQUS, is a member of New York ISO, ISO New England, Midwest ISO (which includes all or parts of Illinois, Indiana, Iowa, Kansas, Kentucky, Michigan, Minnesota, Missouri, Montana, Nebraska, North Dakota, Ohio, Pennsylvania, South Dakota, Wisconsin and Manitoba) and PJM Interconnection (which includes all or parts of Delaware, Illinois, Indiana, Kentucky, Maryland, Michigan, New Jersey, North Carolina, Ohio, Pennsylvania, Tennessee, Virginia, West Virginia and the District of Columbia). ISOs, or Independent Systems Operators, and RTOs, or Regional Transmission Organizations, enable participants to buy and sell energy, schedule bilateral transactions and reserve transmission service. HQUS holds a permit from the U.S. Federal Energy Regulatory Commission to sell at market-based rates.
10
HQEM, our wholly-owned energy-trading subsidiary operating in Canada, trades in the Ontario and New Brunswick wholesale markets. HQEM is a member of IESO (the Ontario ISO).
We have two long-term export contracts for the sale of energy or power. The following table summarizes our principal energy export agreements.
PRINCIPAL ENERGY EXPORT AGREEMENTS
| | Expiry
Date | | Power | | Maximum
Annual
Deliveries | |
| | | | (MW) | | (TWh) | |
| | | | | | | |
Long-term sales - power and energy (not interruptible) | | | | | | | |
| | | | | | | |
Cornwall Electric - Canada | | 2019 | | 45 | | 0.2 | |
Vermont Joint Owners (“VJO”) | | 2020 | | 335 | (1) | 2.2 | |
(1) By separate agreement with a VJO Member, 25 MW (0.2 TWh) are being repurchased annually until April 30, 2012.
Electricity Sales and Revenue
The following table summarizes electricity sales and revenue outside Québec by category for the years 2002 through 2006.
ELECTRICITY SALES AND REVENUE OUTSIDE QUÉBEC
| | 2002 | | 2003 | | 2004 | | 2005 | | 2006 | |
| | (TWh) | |
ELECTRICITY SALES | | | | | | | | | | | |
Canada-United States (long-term sales) | | 2.2 | | 2.1 | | 1.9 | | 2.0 | | 2.4 | |
Canada-United States (short-term sales) | | 52.0 | | 13.7 | | 12.5 | | 13.3 | | 12.1 | |
TOTAL ELECTRICITY SALES | | 54.2 | | 15.8 | | 14.4 | | 15.3 | | 14.5 | |
| | (millions of dollars) | |
REVENUE FROM ELECTRICITY SALES | | | | | | | | | | | |
Canada-United States (long-term sales) | | $ | 233 | | $ | 207 | | $ | 179 | | $ | 174 | | $ | 198 | |
Canada-United States (short-term sales) | | 3,233 | | 1,138 | | 905 | | 1,290 | | 951 | |
TOTAL REVENUE FROM ELECTRICITY SALES | | $ | 3,466 | | $ | 1,345 | | $ | 1,084 | | $ | 1,464 | | $ | 1,149 | |
CONSTRUCTION
Hydro-Québec Équipement offers consulting services in engineering, environment and project management and acts as general contractor for our other divisions, mainly Hydro-Québec Production and Hydro-Québec TransÉnergie. SEBJ is primarily engaged in developing projects for us in the territory governed by the James Bay and Northern Québec Agreement.
11
CORPORATE AND OTHER ACTIVITIES
This segment encompasses our Technology Group, which was created in February 2006, and corporate services such as the procurement of goods and services, finance and human resources. The following are under the supervision of the Technology Group:
· Hydro-Québec CapiTech inc. (“HQ CapiTech”) (wholly-owned; a venture capital company investing in businesses that provide energy-related high-technology products and services)
· Hydro-Québec IndusTech inc. (wholly-owned; it holds a 64.2% interest in TM4, a joint venture with Groupe Industriel Marcel Dassault, which is pursuing the development of an electrical motor for automobiles)
· IREQ (our energy-technology research and development division)
In 2006, we sold our interests in foreign holdings previously held through Hydro-Québec International and TransÉnergie HQ for a gain of approximately $917 million (see “Management’s Financial Discussion – Financial Results of the Corporate and Other Activities Business Segment”).
CORPORATE OUTLOOK
Development Strategy
In September 2006, we presented a revised version of our five-year Strategic Plan (the “Strategic Plan”) for the 2006-2010 period. This Strategic Plan was discussed in a parliamentary commission in September 2006 and approved in February 2007 by the Government. Its central theme is sustainable development and it comes in the wake of the Government’s energy strategy, published in May 2006, which emphasizes energy efficiency and the development of renewable energy sources.
The Strategic Plan sets forth three priorities: energy efficiency; complementary development of hydroelectric and wind power, the two main renewable energy sources in Québec, and technological innovation. More specifically, we plan on improving our overall performance in the following areas:
· conservation of energy by investing in energy saving programs;
· increase of our hydroelectric generating capacity by accelerating project development and by creating a portfolio of projects with a total generating capacity of 4,500 MW;
· complementary development of our hydroelectric capacity and of 4,000 MW of wind power by 2015;
· technological innovation to increase the productivity of our generating facilities, reduce losses on our transmission and distribution systems and make buildings more energy-efficient; and
· development of innovative energy efficiency technologies.
As stated in the Strategic Plan, our objective is to maintain net income from continuing operations at approximately $2.5 billion per year from 2006 to 2010, which is a goal set in accordance with our shareholder’s expectations, taking into account the payment of hydraulic charges (see “Generations Fund”). Over the same period, dividends in the aggregate of $6.3 billion, or 50% of total net income (excluding extraordinary gains), are expected to be paid to the shareholder. However, if we include the income of $0.9 billion from the sale of foreign holdings in 2006, total dividends to be paid over the 2006-2010 period are estimated at $7.2 billion. Shareholder’s equity is expected to increase by $6.3 billion over the same period.
Total capital investments are expected to amount to $19.4 billion as a result of the addition of new capacity to the hydroelectric generating facilities, an increase in power transmission capacity and investments in the distribution system to meet growing demand in Québec.
The Strategic Plan assumes that Québec sales will grow by 13.2 TWh between 2005 and 2014, which takes into account the annual energy saving target of 8 TWh by 2015 as proposed in the Québec Energy Strategy 2006-2015. Sales to industrial customers are expected to increase by 6.1 TWh, the smelting and refining industry accounting for 3.8 TWh of this increase. The remaining expected increase in industrial sales would arise from growing industrial output. Sales to residential customers are expected to rise by 4.9 TWh, supported primarily by the home-building sector.
12
The Strategic Plan requires Hydro-Québec Distribution to ensure adequate supply to meet the energy requirements of our Québec market. Our distributor’s main supply is at an average fixed price of 2.79 cents per kWh for 165 TWh (see “Regulatory Framework – Energy Board Act”). Additional power will continue to be obtained through calls for tenders. Furthermore, Hydro-Québec Distribution will continue to offer its customers rates which are among the lowest in North America.
The Strategic Plan restates the three conditions for undertaking new projects: they must be profitable under market conditions, environmentally acceptable and well received by local communities.
Between 2006 and 2014, Hydro-Québec Production intends to increase its annual generating capacity by 15.8 TWh as follows:
· new facilities that are currently under construction for a total capacity of 6.1 TWh;
· the refurbishing of some existing facilities that will add about 1 TWh to the existing generating capacity; and
· the Eastmain-1-A/Sarcelle/Rupert project that will add 8.5 TWh and has been approved by the regulators.
Hydro-Québec TransÉnergie will continue to develop our transmission system to maintain service reliability and quality while meeting growing power transmission needs. Furthermore, investments will be made to keep up with consumption growth in Québec, integrate new hydroelectric and wind power generation capacity, replace equipment and incorporate more efficient technologies. Among these investments, the division plans to build a new 1,250 MW interconnection with the province of Ontario.
Generations Fund
In June 2006, the National Assembly of Québec adopted the Act to reduce the debt and establish the Generations Fund (the “Generations Fund Act”). Hydro-Québec will contribute to the Generations Fund by paying:
· hydraulic charges that Hydro-Québec Production began to pay in January 2007; and
· a portion of the profits that Hydro-Québec will earn on foreign sales of electricity produced from new generating capacity.
Hydro-Québec Production will pay the same charges as those currently paid by private producers of hydro-electricity, i.e. the statutory and contractual charges stipulated by the Watercourses Act (Québec). For 2007, these charges, indexed annually to the Consumer Price Index, consist of:
· a statutory charge of $2.72 per thousand kilowatt-hours of electricity produced; and
· a contractual charge of $0.639 per thousand kilowatt-hours of electricity produced.
Under the Generations Fund Act, payment of these charges is being phased in over two years beginning January 1, 2007 and charges are expected to amount to $265 million for 2007 (which corresponds to half the legal rate) and $545 million for 2008 (which corresponds to the full legal rate).
13
Capital Investment Program
Our capital investment program includes capital expenditures for fixed and intangible assets and other investments, including energy efficiency programs and investments in, and advances to, affiliates. The following table is a summary of our projected capital investments affecting cash for the years 2002 through 2006. The table also includes estimates for 2007 and the three-year period from 2008 to 2010; these estimates are based on, among other things, a projected growth in demand for electricity in Québec of 1.1% yearly for the next four years.
CAPITAL INVESTMENTS AFFECTING CASH
| | | | | | | | | | | | Estimated | |
| | 2002 | | 2003 | | 2004 | | 2005 | | 2006 | | 2007 | | 2008 through
2010 | |
| | (millions of dollars) | |
Fixed and intangible assets | | | | | | | | | | | | | | | |
Distribution | | $ | 540 | | $ | 540 | | $ | 601 | | $ | 645 | | $ | 690 | | $ | 805 | | $ | 2,089 | |
Transmission (1) | | 452 | | 609 | | 541 | | 723 | | 882 | | 931 | | 3,075 | |
Generation | | 1,018 | | 1,428 | | 1,820 | | 1,780 | | 1,615 | | 2,251 | | 6,141 | |
Construction | | 9 | | 4 | | 11 | | 6 | | 4 | | 9 | | 21 | |
Corporate and Other Activities | | 213 | | 158 | | 98 | | 128 | | 157 | | 208 | | 554 | |
| | 2,232 | | 2,739 | | 3,071 | | 3,282 | | 3,348 | | 4,204 | | 11,880 | |
Other (2) | | 24 | | (45 | )(3) | (854 | ) (4) | 117 | | (1,879 | ) (5) | 213 | (6) | 810 | |
Total investments | | $ | 2,256 | | $ | 2,694 | | $ | 2,217 | | $ | 3,399 | | $ | 1,469 | | $ | 4,417 | | $ | 12,690 | |
(1) Includes sub-transmission.
(2) Includes advances to, and participations in, affiliates and energy efficiency programs. The energy efficiency programs are estimated at $245 million for 2007 and a total of $772 million for the 2008 to 2010 period.
(3) Includes intersegment eliminations of $4 million.
(4) Includes proceeds from the sale of our interests in Noverco and our investments in Asia.
(5) Includes proceeds from the sale of our foreign holdings.
(6) Excludes cash flows from discontinued operations, but includes proceeds from the sale of foreign holdings in the first quarter of 2007.
In 2006, capital investments in fixed and intangible assets, excluding Other investments, amounted to $3.3 billion. As at December 31, 2006, we had various projects under construction for an additional total installed capacity of 575 MW and to increase annual output by 3.4 TWh.
The commissioning of the Eastmain-1 powerhouse several months ahead of schedule, added 480 MW to our installed capacity and 2.7 TWh to our annual output. This $2.3 billion development further optimizes the La Grande complex.
Construction, at an estimated cost of $176 million, of the Mercier generation facility in the Outaouais region is in progress. The
51-MW facility, which is expected to be commissioned in 2007, will add 0.3 TWh in annual output.
On the Péribonka River, in the Saguenay-Lac-St-Jean region, we are investing approximately $1.4 billion to build a 385 MW generation facility that will produce 2.2 TWh a year. Reservoir impoundment is scheduled for fall 2007, followed by the commissioning of three generation units in 2007 and early 2008.
Construction of the Chute-Allard and Rapides-des-Coeurs projects on the Saint-Maurice River is ongoing. When these generation facilities come on stream in late 2008, they will supply a combined installed capacity of 139 MW and annual output of 0.9 TWh, for an estimated total capital outlay of approximately $0.7 billion.
The environmental impact assessment of the Romaine hydroelectric complex in the Mingan region is expected to be submitted in the second half of 2007. As currently planned, this complex will consist of four generation facilities with a total installed capacity of 1,550 MW and annual output of 7.7 TWh.
The Government approved the Eastmain-1-A/Sarcelle/Rupert project in November 2006 and the federal authorities issued their approval in December 2006. At a planned cost of $5.0 billion, this project is Québec’s largest hydroelectric facility complex of the decade. Two powerhouses will be constructed, the Rupert River will be partially diverted to the Eastmain-1 reservoir and the output of the three existing generation facilities in the lower Grande Rivière will be increased by the new inflows. When completed, the project will add 893 MW to our installed capacity and 8.5 TWh in annual output. Operation of the diversion and powerhouses will start in stages from the end of 2009 through winter of 2012.
14
We are considering the construction of a 1,500 MW complex on the Petit Mécatina River, about 300 km east of the Romaine River. In 2006, we began studies and conducted surveys to determine the configuration and cost of this complex.
The total estimated cash requirements for 2007 are approximately $6.8 billion, and include approximately $4.4 billion in capital investments, approximately $0.1 billion for long-term debt repayment and sinking fund redemption and approximately $2.3 billion for the payment of dividends for 2006. Our self-financing ratio (defined as cash from operations less dividends paid, divided by the sum of investments (excluding net changes in short-term investments), long-term debt maturities and sinking fund redemption) is expected to be 43.9% in 2007, compared to 86.5% in 2006. The higher ratio in 2006 resulted from proceeds derived from the sale of our foreign holdings.
We estimate that cash requirements for capital investments, long-term debt repayment and sinking fund redemption will amount to approximately $16 billion in aggregate for the period from 2008 through 2010.
Allocation of capital expenditures for our Distribution, Transmission and Generation business segments
The following tables summarize the allocation of estimated capital expenditures for 2007 and for the period of 2008 through 2010 among our three major business segments.
DISTRIBUTION BUSINESS SEGMENT
| | Estimated Capital Expenditures | |
| | 2007 | | 2008 through 2010 | |
| | (millions of dollars) | |
Distribution system (1) | | | | | |
System maintenance | | $ | 203 | | $ | 707 | |
System improvements and demand growth | | 353 | | 1,051 | |
Other | | 249 | (2) | 331 | (3) |
| | $ | 805 | | $ | 2,089 | |
(1) Includes investments in distribution facilities and investments in generation and transmission facilities of our off-grid systems.
(2) Includes 74.5% in equipment, 17.1% in buildings and 8.4% in telecommunications and technology.
(3) Includes 70.7% in equipment, 18.2% in buildings and 11.1% in telecommunications and technology.
TRANSMISSION BUSINESS SEGMENT
| | Planned Date | | Estimated Capital Expenditures | |
| | of Operation | | 2007 | | 2008 through 2010 | |
| | | | (millions of dollars) | |
Transmission facilities (1) | | | | | | | |
| | | | | | | |
Equipment improvement (2) | | Continuous program | | $ | 558 | | $ | 2,025 | |
System improvement program | | | | | | | |
De-icing equipment at Levis substation | | 2007 | | 34 | | — | |
Rapides-des-Coeurs and Chute-Allard integration | | 2007 | | 64 | | 1 | |
Péribonka integration | | 2007-2008 | | 79 | | 11 | |
Ontario interconnection | | 2009-2010 | | 46 | | 524 | |
La Sarcelle integration | | 2010-2011 | | 3 | | 93 | |
Wind Power interconnection | | 2007-2012 | | 87 | | 231 | |
Poste Hauterive (Alcoa) | | 2009-2012 | | 1 | | 54 | |
Other | | | | 59 | (3) | 136 | (4) |
| | | | $ | 931 | | $ | 3,075 | |
(1) Includes sub-transmission facilities.
(2) Includes system maintenance and demand growth.
(3) Includes 53.4% in equipment, 11.7% in buildings and 34.9% in technology.
(4) Includes 57.5% in equipment, 14.1% in buildings and 28.4% in technology.
15
GENERATION BUSINESS SEGMENT
| | Available | | Planned Date | | Estimated Capital Expenditures | |
| | Power | | of Operation | | 2007 | | 2008 through 2010 | |
| | (MW) | | | | (millions of dollars) | |
Main Rehabilitation Projects | | | | | | | | | |
Improvement and rebuilding of facilities | | — | | Continuous
program | | $ | 483 | | $ | 2,056 | |
Ongoing Generation Station and Partial Diversion Projects | | | | | | | | | |
Mercier | | 51 | | 2007 | | 16 | | — | |
Péribonka | | 385 | | 2007-2008 | | 299 | | 131 | |
Chute-Allard and Rapides-des-cœurs | | 139 | | 2008 | | 240 | | 78 | |
Eastmain-1-A/Sarcelle/Rupert powerhouse | | 893 | | 2009-2012 | | 909 | | 3,296 | |
Other projects | | — | | — | | 189 | | 47 | |
Generation Station and Partial Diversion Projects under Study | | | | | | | | | |
Complexe La Romaine | | 1,550 | | — | | 26 | | 400 | |
Other | | — | | — | | 89 | (1) | 133 | (2) |
| | | | | | $ | 2,251 | | $ | 6,141 | |
(1) Includes 90.5% in equipment and 9.5% in buildings.
(2) Includes 81.6% in equipment and 18.4% in buildings.
Regulatory Framework
Hydro-Québec Act
Under the Hydro-Québec Act, our objectives are to supply power and to pursue endeavors in energy-related research and promotion, energy conversion and conservation, and any field connected with or related to power or energy. The Hydro-Québec Act provides that we shall estimate the energy needs of Québec and the means of meeting them within the scope of the Government’s energy policies.
Under the Hydro-Québec Act, the Government is entitled to declare a dividend from Hydro-Québec when certain financial criteria are met (see Note 18 to the 2006 Consolidated Financial Statements).
Energy Board Act
Certain aspects of our activities and those of natural gas distributors in Québec are subject to the jurisdiction of the Energy Board which was established by the Act respecting the Régie de l’énergie (the “Energy Board Act”) enacted in December 1996. The Energy Board consists of seven members appointed by the Government and is charged with reconciling the public interest, consumer protection and the fair treatment of the electric power carrier and of distributors. The Energy Board Act was amended in December 2006 to grant the Energy Board new powers regarding energy efficiency programs and actions as well as mandatory reliability standards.
Under the Energy Board Act, we have been granted exclusive rights for the distribution of electric power throughout Québec, excluding the territories served by distributors operating a municipal or private electric system as of May 13, 1997.
The Energy Board has the authority to:
· fix, or modify, after holding public hearings, our rates and conditions for the transmission and distribution of electric power;
· approve our electric power supply plan;
· designate a reliability coordinator for Québec and adopt the standards of reliability proposed by the designated reliability coordinator;
· authorize our transmission and distribution investment projects;
· approve our distribution commercial programs; and
· rule upon complaints from customers concerning rates or service.
16
Generation. The Energy Board’s jurisdiction does not extend to generation but we are required to supply heritage pool electricity. Heritage pool electricity corresponds to the net annual consumption of Québec markets, up to 165 TWh per year, for which the average cost is set at 2.79 cents per kWh.
Energy generated in excess of the heritage pool electricity may be sold on the market at market-based rates. Purchase and sales transactions outside Québec are unregulated under the Energy Board Act.
Transmission. Transmission rates and service terms and conditions are subject to approval by the Energy Board. In July 2006,
Hydro-Québec TransÉnergie filed with the Energy Board an application to modify its rates and service terms and conditions. On March 18, 2007, the Energy Board approved an annual rate of $70.82/kw/year for firm point-to-point service and an hourly rate of $7.92/MWh, applicable retroactively as of January 1, 2007, and set the amount payable for transmission of the local load supply at $2,539,746,840 per year. The Energy Board also approved the cost allocation methodology of Hydro-Québec TransÉnergie and the proposed terms and conditions for its Open Access Transmission Tariff.
On February 28, 2007, Hydro-Québec TransÉnergie filed with the Energy Board an application to be designated the reliability coordinator for Québec. This application is pending.
Distribution. Electricity required to meet Québec’s needs in excess of the heritage pool electricity must be purchased through a competitive bidding process. The Energy Board approved our Electricity Supply Plan 2005-2014, as well as our Call for Tenders and Contract Awarding Procedure and Code of Ethics on Conducting Calls for Tenders. Purchase contracts for electricity in excess of the heritage pool are subject to the approval of the Energy Board.
In August 2006, Hydro-Québec Distribution filed with the Energy Board an application to modify its rates and certain conditions regarding the distribution of electricity in Québec for the rate year beginning April 1, 2007. The Energy Board rendered its decision on February 27, 2007 and granted to Hydro-Québec Distribution an average rate increase of 1.92%.
National Energy Board Act
Our exports of electric power are subject to the National Energy Board Act which provides that a permit or license must be obtained from the National Energy Board of Canada (the “National Board”) for such exports. We hold the following four permits for short-term exports (contracts of five years or less):
· two permits expiring on December 31, 2010 authorizing us to export annually, for a continuous period of no more than five years for any single contract, up to 30 TWh of interruptible energy and up to 20 TWh of firm energy to the United States;
· two permits granted to our subsidiary, HQEM, expiring on April 7, 2009. These permits allow HQEM, as a power marketer outside Québec, to export annually to the United States up to 30 TWh of firm and interruptible energy from interconnections located in other provinces, under contracts with a term of five years or less.
Each of these permits allows us to take advantage of the spot market in the United States; however‚ long-term export contracts (more than five years) require prior issuance of specific permits or licenses by the National Board.
On March 5, 2007, HQEM’s permit to export natural gas to the United States was renewed for a two-year period.
The National Board also regulates international power lines and we operate our interconnections with the United States in accordance with the terms and conditions of Certificates of Public Convenience and Necessity issued by the National Board.
Environmental Regulation
Our activities are subject to federal and provincial environmental laws and regulations, and, to some extent, municipal by-laws.
Before beginning new construction, our projects are subject to environmental impact assessment studies as well as information and consultation processes. The studies are submitted for review and approval by government departments and agencies responsible for issuing governmental authorizations. In some instances, the approval process includes public hearings by an independent body.
17
We have formal policies, procedures and guidelines regarding environmental matters. Since the early 1970’s, we have responded to environmental concerns in the planning, design and construction of new facilities. For example, we conduct studies and research on mercury levels in reservoirs, the biological effects of electric and magnetic fields of our transmission lines, biodiversity under our transmission lines and greenhouse gas emissions of our hydroelectric generation stations with reservoirs. We publish an annual sustainability report which describes our progress in relation to the environment, society and the Québec economy.
Moreover, all the divisions and units that may have a significant impact on the environment (e.g. distribution, transmission, generation, procurement and construction) have implemented environmental management systems and obtained ISO 14001 certifications. ISO 14001 is the environmental management standard of the International Organization for Standardization.
Litigation
Innu of Takuikan Uashat Mak Mani-Utenam
On December 30, 2003, representatives of the Innus of Takuikan Uashat Mak Mani-Utenam instituted an action against the Attorney-General of Canada, the Attorney-General of Québec and us seeking judicial recognition of their aboriginal rights and of their unextinguished Indian title over certain areas of land in Québec. Plaintiffs who claim not to be parties to the 1975 James Bay and Northern Québec Agreement (the “Agreement”) allege that the Agreement and certain federal and provincial laws are illegal, inoperative, unconstitutional and not binding upon the plaintiffs. The plaintiffs seek various orders, including rendering of accounts and revenue sharing for the unlawful use and management of the lands, notably in respect of hydroelectric facilities on these lands, and awarding damages from Canada, Québec and us, jointly and severally, in an amount of up to $1.5 billion (subject to further increase by the plaintiffs). In June 2005, as requested by the parties, the Québec Superior Court suspended the legal action for five years. Negotiations are ongoing between the governments and the Innus.
Innus of Pessamit
In November 2006, the Innus of Pessamit re-activated an action which was filed in 1998 against the Attorney-General of Canada, the Attorney-General of Québec and us seeking judicial recognition of their aboriginal rights and title over certain areas of land in Québec where our Manicouagan-Outardes hydroelectric facilities are located. The Innus intend to seek various orders including an award of damages against Canada, Québec and us, jointly and severally, in an amount of $11 billion. With Québec, we intend to contest this claim.
Employees
We had 19,116 permanent employees as at December 31, 2006, and an average of 3,799 temporary employees during 2006. These numbers do not include employees of our subsidiaries and joint ventures. Unionized employees represent 85.0% of our work force.
Eight collective agreements govern the working conditions of our unionized employees. These collective agreements provide for a profit-sharing plan tied to the attainment of our business objectives and annual salary increases of 2% annually through 2008, except for our 3,300 specialists who have already agreed to a further 2% increase in 2009.
18
MANAGEMENT’S FINANCIAL DISCUSSION
Financial Objectives
Our business objectives are to promote continuously improved customer service, sustainable growth and profitability. Our ability to meet these objectives and our financial position are dependent upon certain key economic variables, including:
· the rate of economic growth in Québec and, consequently, the growth rate of electricity sales in Québec;
· the average interest rate on our borrowings;
· exchange rates between the Canadian dollar and other currencies; and
· the world price of crude oil and other commodities, upon which electricity prices, under certain sales or purchase contracts, are pegged.
We have been seeking to alleviate the impact of some of these variables by pursuing the following objectives and strategies in managing our debt and financial risk:
· Debt management | | |
| | |
· to maintain our presence and impact in capital markets | | · planning of bond issuance to establish liquid benchmarks; · staggered debt maturities in order to maintain our annual financing program at a stable level; and · focus on strategic capital markets, in particular the Canadian bond market. |
| | |
· to diversify our sources of funding while minimizing foreign exchange risk | | · continued access to foreign capital markets, particularly the U.S. dollar markets; · swaps to hedge foreign financing in currencies other than U.S. dollar; and · financing in the lowest cost market. |
| | |
· to manage our debt effectively | | · debt redemption prior to maturity whenever possible, if such operations allow us to reduce the cost of our debt. |
| | |
· Financial risk management | | |
| | |
· to limit the impact of adverse changes in interest rates, foreign exchange rates and aluminum prices on our financial results | | · short-term: active integrated management to limit impact on our results; and · medium and long-term: risk mitigation such as raising debt in U.S. dollars as a hedge against U.S. dollar sales. |
Consolidated Financial Results for the year ended December 31, 2006
In 2006, our revenue from continuing operations increased to $11.2 billion, from $10.9 billion in 2005, which represents an increase of $273 million, or 2.5%, over 2005, mainly as a result of the recognition of a $234 million foreign exchange gain on debts and swaps denominated in U.S. dollars. Net income for the year was $3.7 billion, including a gain of approximately $917 million from the sale of our foreign holdings, compared to $2.3 billion in 2005. Net income from continuing operations increased by $446 million, or 19.0%, to $2.8 billion, mainly as the result of the recognition of the abovementioned foreign exchange gain. Self-financing (defined as cash from operations less dividends paid, divided by the sum of investments (excluding net change in short-term investments), long-term debt maturities and sinking fund redemption) was 86.5% in 2006, as compared to 58.6% in 2005. The higher ratio in 2006 resulted from proceeds derived from the sale of our foreign holdings.
19
Expenditure
In 2006, expenditure decreased by $198 million, or 3.1%, from 2005 to $6,152 million, largely due to a reduction in short-term electricity purchases by Hydro-Québec Production.
Operating Expenses. In 2006, operating expenses were $2,394 million, higher by $146 million, or 6.5%, as compared to the previous year. Excluding the $80 million increase in pension expense and additional expenses of $27 million incurred to restore service following extreme weather events in 2006, operating expenses would have risen only by 1.9%, which is comparable to the inflation rate during the year.
Electricity and Fuel Purchased. Purchases of electricity and fuel decreased by $181 million, or 12.1%, to $1,315 million, as compared to 2005, in large part as a result of a $238 million reduction in short-term electricity purchases.
Depreciation and Amortization. These expenses decreased from $2,023 million in 2005 to $2,007 million in 2006. In 2005, we reported a final write-off of $115 million for the Grande-Baleine draft-design study and, as a result of the commissioning of the Toulnustouc production facility in 2005 and of Eastmain-1 in the second half of 2006, the depreciation and amortization expenses increased by $99 million. As a result, the net decrease for 2006 was $16 million.
Taxes. Tax expenses decreased by $65 million from 2005 to $529 million in 2006 mainly because of a reduction in the capital tax rate from 0.6% to 0.525%.
Financial Expenses
Financial expenses increased by $25 million, from $2,187 million in 2005 to $2,212 million in 2006; during the year, higher financial expenses were partially offset by income derived from the investment of proceeds from the sale of our foreign holdings.
Segment Information
Our power distribution and transmission activities in Québec are regulated. Consequently, our financial results reflect the following regulated revenues and charges:
· transmission rates approved by the Energy Board;
· electricity rates for Québec customers, frozen from 1998 through December 31, 2003 and since then subject to approval by the Energy Board; and
· an average fixed price of 2.79 cents per kWh to be charged by Hydro-Québec Production to Hydro-Québec Distribution for heritage pool electricity (up to 165 TWh per year), regardless of whether the electricity is generated or purchased.
All intersegment revenue and expenses not related to electricity are valued at full cost. Revenue, operating expenses and purchases of electricity and fuel are earned or incurred directly by the respective segments.
Depreciation and amortization expenses related to fixed or other assets are allocated to the respective segments. Taxes and financial expenses are managed by corporate units but allocated to the operating segments. Taxes are generally allocated according to the net assets managed by the segments. Financial expenses are allocated based on the financing rates applied to the net assets of each segment. Finally, expenses related to corporate activities, or corporate expenses, are generally allocated to the segments based on their operating expenses.
Discontinued Operations
In 2005, we decided to sell most of our investments outside Québec and, consequently, we presented the operating results of those businesses under discontinued operations in 2005 and 2006. Results for 2006 reflect the impact of the sale of those foreign holdings. Consolidated income from discontinued operations for 2006 was $944 million.
20
The following table shows segmented results for the year 2006 and changes from the previous year.
SEGMENT RESULTS FOR 2006
| | Distribution | | Transmission | | Generation | | Construction | | Corporate
and Other
Activities (1) | | Intersegment
eliminations | | Total | |
| | (millions of dollars) | |
Revenue | | | | | | | | | | | | | | | |
External Customers | | 9,488 | | 32 | | 1,594 | | — | | 48 | | (1 | ) | 11,161 | |
Change 2005 -2006 | | 307 | | 5 | | (114 | ) | (6 | ) | 33 | | 48 | | 273 | |
| | | | | | | | | | | | | | | |
Intersegment Revenue | | 55 | | 2,809 | | 4,570 | | 1,999 | (2) | 1,146 | | (10,579 | ) | — | |
| | | | | | | | | | | | | | | |
Change 2005 -2006 | | — | | 342 | | 38 | | (54 | ) | 72 | | (398 | ) | — | |
Total revenue | | 9,543 | | 2,841 | | 6,164 | | 1,999 | (2) | 1,194 | | (10,580 | ) | 11,161 | |
Change 2005-2006 | | 307 | | 347 | | (76 | ) | (60 | ) | 105 | | (350 | ) | 273 | |
| | | | | | | | | | | | | | | |
Income (loss) from continuing operations | | 42 | | 632 | | 2,114 | | 2 | | — | | 7 | | 2,797 | |
Change 2005- 2006 | | (130 | ) | 252 | | 241 | | (3 | ) | 71 | | 15 | | 446 | |
| | | | | | | | | | | | | | | |
Discontinued operations | | — | | — | | — | | — | | 944 | | — | | 944 | |
Net income (loss) | | 42 | | 632 | | 2,114 | | 2 | | 944 | | 7 | | 3,741 | |
Change 2005 -2006 | | (188 | ) | 252 | | 241 | | (3 | ) | 1,172 | | 15 | | 1,489 | |
(1) Includes the results of the Technology Group and the activities of Hydro-Québec International and TransÉnergie HQ.
(2) Intersegment revenue generated by the Construction segment corresponds to capital expenditures for its client segments.
Financial Results of the Distribution Business Segment
In 2006, the segment’s total revenue increased by $307 million to $9,543 million. This segment recorded net income of $42 million as compared to net income of $230 million in 2005. The increase in revenue from electricity sales, mainly as a result of rate increases, were insufficient to fully offset the increase in cost of supply, depreciation and amortization expense and operating expenses. In addition, regulatory deferral related to cost variances for electricity purchases in excess of the heritage pool reduced revenues from electricity sales recognized in 2006. Results for 2005 also included a non-recurring gain of $48 million related to the sale of assets held by HydroSolution.
Electricity Sales in Québec
In 2006, electricity sales in Québec decreased by approximately 1.8 TWh, or 1.1%, to 167.3 TWh and revenue increased by $291 million, or 3.2%, to $9,402 million. The net reduction in sales was mainly the result of mild temperatures in 2006, and consequently lower heating requirements in the residential and farm category, which was partially offset by a 1.5 TWh increase in baseload demand, primarily as a result of housing starts.
The following table shows the variation in sales and revenue by category of customers between 2005 and 2006.
ELECTRICITY SALES IN QUÉBEC, BY CATEGORY
| | Sales | | Revenue | |
| | 2006 | | Change 2005-2006 | | 2006 | | Change 2005-2006 | |
| | (TWh) | | (TWh) | | (%) | | ($M) | | ($M) | | (%) | |
Residential and farm | | 56.7 | | (0.5 | ) | (0.9 | ) | 3,775 | | 85 | | 2.3 | |
General and institutional | | 32.4 | | (1.0 | ) | (3.0 | ) | 2,356 | | 72 | | 3.2 | |
Industrial | | 73.3 | | (0.2 | ) | (0.3 | ) | 3,022 | | 130 | | 4.5 | |
Other | | 4.9 | | (0.1 | ) | (2.0 | ) | 249 | | 4 | | 1.6 | |
Total | | 167.3 | | (1.8 | ) | (1.1 | ) | 9,402 | | 291 | | 3.2 | |
21
Residential and farm Category. Electricity sales to this group of customers decreased by 0.5 TWh, or 0.9%, to 56.7 TWh. Residential construction contributed to an increase in sales of 1.7 TWh and $111 million in revenue. This category’s heating requirements make it the most sensitive to temperature fluctuations and milder temperatures in 2006 are accountable for an estimated reduction in demand of 2.2 TWh and $158 million in revenue. In terms of sales revenue, the rate adjustments account for an increase of $144 million.
General and institutional Category. In this category, we noted a decrease in demand of 0.1 TWh. However, rate increases contributed an additional $95 million in revenue.
Industrial Category. Baseload demand decreased by 0.2 TWh, or 0.3%; however revenue increased by $130 million as a result of rate increases and growth in revenue based on the price of aluminium.
Other Category. This category consists of independent distributors, namely nine municipal networks and one regional cooperative. Revenue increased by $4 million. None of the distributors have taken advantage of the deregulation of the wholesale market which began in May 1997.
Financial Results of the Transmission Business Segment
In 2006, revenue amounted to $2,841 million, an increase of $347 million, or 13.9%, from 2005. The Energy Board authorized an increase in transmission rates for 2005 and 2006, and increase in revenue of $340 million was recorded in 2006 and included $170 million for 2005 and $170 million for 2006. Most of our revenue from transmission was generated by tolling charges collected from Hydro-Québec Distribution and was related to the electricity transmission requirements of our Québec customers. Operating expenses increased by $38 million to $739 million mainly due to an increase of $13 million in pension costs. Depreciation and amortization expense was $535 million, up $40 million as new transmission equipment was commissioned during 2006. Net income increased by $252 million over 2005 to $632 million in 2006.
Financial Results of the Generation Business Segment
In 2006, revenue from electricity sales of $5,669 million was down $275 million from 2005. This decrease in revenue was mostly attributable to a reduction in short-term trading transactions outside Québec. However, net income increased by $241 million, or 12.9%, over 2005, mainly due to the recognition of a $234 million foreign exchange gain on debts and swaps denominated in U.S. dollars.
Electricity and fuel purchases by this segment amounted to $1,190 million in 2006, representing a $194 million decrease from 2005. Electricity purchased for resale on outside markets totaled $371 million for 6.8 TWh in 2006, compared to $609 million for 8.0 TWh in 2005.
Electricity Sales to Hydro-Québec Distribution
Electricity sales to our distribution division amounted to 165.1 TWh, down from 165.9 TWh in 2005, and revenue generated by these sales amounted to $4,520 million, up $40 million from 2005. This increase is attributable to the higher price of aluminium which was partially offset by the stronger Canadian dollar.
Electricity Sales Outside Québec
In 2006, electricity sales outside Québec totaled 14.5 TWh and generated revenue of $1,149 million as compared to sales of 15.3 TWh and revenue of $1,464 million in 2005. These amounts include revenue earned from energy-related derivative instruments.
Net sales outside Québec generated $814 million for a net reservoir drawdown of 7.0 TWh, compared with $830 million for 6.7 TWh in 2005.
Because runoff was below the historical mean in the first three quarters of 2006, we limited net electricity exports. With the commissioning of the Eastmain-1 development in the second half of 2006 and higher-than-average runoff in the fourth quarter, we were able to build up our reserves and increase the volume of exports by year end.
22
Financial Results of the Construction Business Segment
In 2006, the Construction segment completed orders of $1,999 million compared to $2,059 million in 2005. This revenue represents almost entirely charges to other divisions for costs of capital projects undertaken on their behalf. This growth was derived from several large scale Generation and Transmission projects. SEBJ operations generated revenue of $245 million in 2006, compared with $532 million in 2005. This reduction in revenue results from the completion of the Eastmain-1 project.
Financial Results of the Corporate and Other Activities Business Segment
The Corporate and Other Activities segment, which includes corporate activities, the Shared Services Center, the Technology Group and the subsidiaries Hydro-Québec International and TransÉnergie HQ, generated income of $944 million in 2006, compared to a net loss of $228 million in 2005. This increase results mainly from the sale of our foreign assets.
The following table sets forth detailed information on the sale of our foreign assets, including the sale of our last transmission holding in Australia which was concluded at the beginning of 2007.
FOREIGN ASSET SALES
Date of sale | | Operations | | Holding | | Country | | Sale
Proceeds | | Gain (loss)
on disposal | |
| | | | | | | | (millions of dollars) | |
January 18, 2006 | | Generation | | Hidroeléctrica Río Lajas S.A. | | Costa Rica | | 5 | | (0.3 | ) |
February 27, 2006 | | Transmission | | Cross-Sound Cable Company, LLC | | United States | | 182 | | 29 | |
March 29, 2006 | | Transmission | | Murraylink HQI Australia Pty Ltd | | Australia | | 60 | | (2 | ) |
June 30, 2006 | | Transmission | | HQI Transelec Chile S.A. | | Chile | | 1,792 | | 813 | |
August 1, 2006 | | Generation | | HQI Latin America Ltd (Fortuna generating station) | | Panama | | 113 | | 38 | |
December 12, 2006 | | Transmission | | Consorcio TransMantaro S.A. | | Peru | | 84 | | 39 | |
February 28, 2007 | | Transmission | | HQI Australia Pty Ltd (DirectLink) | | Australia | | 52 | | 18 | |
Total | | | | | | | | 2,288 | | 934.7 | |
23
WHERE YOU CAN FIND MORE INFORMATION
This document appears as an exhibit to Hydro-Québec’s annual report filed with the U.S. Securities and Exchange Commission (the “SEC”) on Form 18-K for the fiscal year ended December 31, 2006. Additional information with respect to Hydro-Québec is available in the annual report or in other exhibits or amendments to the annual report.
You may read and copy any document we file with the SEC at the SEC’s public reference rooms in Washington, DC. Please call the SEC’s toll free number at 1-800-SEC-0330 for further information on the public reference room. These filings are also available from the Electronic Document Gathering and Retrieval System, which is commonly known by the acronym EDGAR, through the SEC’s website at http://www.sec.gov.
You may request a copy of these filings at no cost by telephoning Hydro-Québec at (514) 289-2519. This document is also available on our website at www.hydroquebec.com; however, any other information available on our website (such website listed in the 18-K is an inactive textual reference only) shall not be deemed to form a part of this document or the annual report to which it appears as an exhibit.
FORWARD-LOOKING STATEMENTS
Various statements made throughout this document are forward looking and contain information about financial results, economic conditions and trends, including, without limitation, the statements under the caption Corporate Outlook. The words “estimate”, “believe”, “expect”, “forecast”, “anticipate”, “intend” and “plan” and similar expressions identify forward-looking statements. You are cautioned that any such forward-looking statements are not guarantees of future performance. Forward-looking statements involve risks and uncertainties, and actual results may differ materially from those in the forward-looking statements as a result of various factors. Such factors may include, among others, business risks, such as variations in runoff that affect hydroelectric plant performance, and general levels of economic activity which affect demand for electricity, and risks related to economic parameters, such as changes in interest and exchange rates. You are cautioned not to place undue reliance on these forward-looking statements which speak only as of the date of this document. We undertake no obligation to publicly release the result of any revisions to these forward-looking statements which may be made to reflect events or circumstances after the date hereof or to reflect the occurrence of unanticipated events.
24
SUMMARY OF CERTAIN MATERIAL DIFFERENCES BETWEEN CANADIAN GAAP AND US GAAP
BACKGROUND
The Consolidated Financial Statements of Hydro-Québec are prepared in accordance with Canadian generally accepted accounting principles (“Canadian GAAP”) which differ in many instances to accounting principles generally accepted in the United States of America (“US GAAP”). As well, some accounting practices under both Canadian GAAP and US GAAP applicable to regulated entities, such as Hydro-Québec, differ from accounting practices otherwise applied by unregulated companies (see Notes 1 and 3 to the 2006 Consolidated Financial Statements). Certain material differences between Canadian GAAP and US GAAP in relation to the 2006 Consolidated Financial Statements of Hydro-Québec are summarized below; this discussion does not include disclosure differences. The matters discussed below have not been audited and do not necessarily include all applicable differences between Canadian GAAP and US GAAP. The following summary should be read in conjunction with the 2006 Consolidated Financial Statements of Hydro-Québec.
Joint Ventures
Under Canadian GAAP, interests in joint ventures are accounted for using the proportionate consolidation method, whereas, under US GAAP, they are accounted for using the equity method. This results in reclassification in the captions in the consolidated balance sheet and the consolidated statements of operations and cash flows but these reclassifications have no impact on net income and shareholder’s equity.
Foreign Currency Translation
Under Canadian GAAP, exchange gains or losses resulting from the translation of long-term monetary items are included in the consolidated statement of operations. When such items are designated as hedges of future revenue streams in U.S. dollars, related exchange gains or losses are deferred to the year such sales are made when conditions to use hedge accounting are met.
Under US GAAP, firmly committed sales may be designated as a hedged item if hedged by a non-derivative financial instrument and must be in a fair-value hedging relationship. Thus, since Hydro-Québec has not documented the fair-value hedge for US GAAP purposes, related exchange gains or losses resulting from the translation of long-term monetary items would have been included in the consolidated statement of operations.
Property, Plant and Equipment
Under Canadian GAAP, the sinking fund method of depreciation of property, plant and equipment is allowed when a corporation, such as Hydro-Québec, may price its services so as to obtain a constant rate of return on investment in an asset. The sinking fund method is an increasing expense method whereby the annual depreciation expense is equal to a fixed amount plus a variable-compounded interest amount calculated on the accumulated balance of the sinking fund.
Under US GAAP, this method is generally not acceptable.
Internal Use Software
Under Canadian GAAP, computer system development costs for internal use software are capitalized when the project is expected to be of continuing benefit, and otherwise expensed.
Under US GAAP, certain development costs for internal use software, particularly costs associated with the preliminary stage of the project and project overhead costs, should be expensed when incurred.
Defined Benefit Pension and Other Post-Retirement Benefit Plans
Under Canadian GAAP, the accrued benefit asset or liability of defined benefit pension and post-retirement benefit plans, presented in the consolidated balance sheet, consists of the cumulative difference between the benefit cost of the period and the employer’s contributions. The unamortized actuarial gains or losses, unamortized past service costs, unamortized transitional asset or obligation as well as yearly changes in the funded status are presented in the notes to the consolidated financial statements.
25
Under US GAAP, an entity should recognize the over-funded or under-funded status of defined benefit pension and post-retirement benefit plans as an asset or liability in the consolidated balance sheet. The unamortized actuarial gains or losses, unamortized past service costs and unamortized transitional asset or obligation as at December 31, 2006 are presented under accumulated other comprehensive income. In subsequent periods, an entity should recognize as a component of other comprehensive income actuarial gains and losses and prior service costs and credits that arise during the period that are not recognized as components of net periodic costs of the period.
Translation Adjustment
Under Canadian GAAP, the translation adjustment is included as a component of shareholder’s equity. Also, a portion of the translation adjustment is included in income when there is a reduction in a net investment. Such reduction includes both a sale of an investment and a reduction in shareholder’s equity of a foreign operation as a result of dividends and other capital transactions.
Under US GAAP, the translation adjustment is included as a component of other comprehensive income. Also, a portion of the translation adjustment is included in income when there is a sale of part or all of an investment or upon a complete or substantially complete liquidation of an investment.
Derivative Instruments and Hedging Activities including Energy Derivatives
Under Canadian GAAP, for derivatives designated as hedges, gains and losses on such derivatives are recognized in income as the related gains or losses are recorded on the hedged instrument without any measurement of ineffectiveness. In addition, it is not permitted to report separately a derivative instrument embedded in a host contract and to recognize it at fair value.
Under US GAAP, an entity should recognize all derivatives as either assets or liabilities on the balance sheet and measure those instruments at fair value. If certain conditions are met, a derivative may be specifically designated as a hedge. For a derivative designated as a fair value hedge, the change in the fair value of the derivative and the change in the fair value of the hedged instrument attributable to the hedged risk are recognized in income. For a derivative designated as a cash flow hedge, the effective portion of the changes in the fair value that is not reflected in net income against the gain or loss recognized on the hedged instrument is reported as a component of other comprehensive income. The ineffective portion of the gain or loss is reported in net income. Also, contracts that meet the definition of an embedded derivative instrument are separated from the host contract and accounted for as a derivative instrument as discussed above.
Guarantees
Under Canadian GAAP, the guarantor is not required to recognize its obligations relating to guarantees, except if such obligations are recognized as contingent liabilities, in which case they are recognized at the estimated cost to discharge the liability.
Under US GAAP, the guarantor should recognize the fair value of the obligation undertaken in issuing a guarantee at the inception of the guarantee.
Comprehensive Income
Under Canadian GAAP, Hydro-Québec was not required to report comprehensive income in 2006.
Under US GAAP, comprehensive income and its components must be reported in a specific financial statement. Comprehensive income comprises net income and other comprehensive income. Other comprehensive income is a change in equity during the period that arises from transactions, and other events that are related to non-owner sources.
26
Auditors’ Report
To the Minister of Finance of Québec:
We have audited the consolidated balance sheets of Hydro-Québec as at December 31, 2006 and 2005, and the consolidated statements of operations, retained earnings and cash flows for each of the years in the two-year period ended December 31, 2006. These financial statements are the responsibility of Hydro-Québec’s Management. Our responsibility is to express an opinion on these financial statements based on our audits.
We conducted our audits in accordance with Canadian generally accepted auditing standards. Those standards require that we plan and perform an audit to obtain reasonable assurance whether the financial statements are free of material misstatement. An audit includes examining, on a test basis, evidence supporting the amounts and disclosures in the financial statements. An audit also includes assessing the accounting principles used and significant estimates made by Management, as well as evaluating the overall financial statement presentation.
In our opinion, these consolidated financial statements present fairly, in all material respects, the financial position of Hydro-Québec as at December 31, 2006 and 2005, and the results of its operations and its cash flows for each of the years in the two-year period ended December 31, 2006, in accordance with Canadian generally accepted accounting principles. As required by the Auditor General Act (R.S.Q., c. V-5.01), we report that, in our opinion, except for the prospective application of changes in accounting policies described in Note 2 to the consolidated financial statements, these principles have been applied on a basis consistent with that of the preceding year.
The consolidated statements of operations, retained earnings and cash flows for each of the years in the three-year period ended December 31, 2004, prior to adjustments to reflect discontinued operations as described in Note 7, were audited by other auditors, who expressed an unqualified opinion on these statements in their report dated March 16, 2005. We have audited these adjustments for each of the years in the three-year period ended December 31, 2004 and in our opinion, such adjustments, in all material respects, are appropriate and have been properly applied.
KPMG LLP | | Ernst & Young LLP |
Chartered Accountants | | Chartered Accountants |
| | |
Montréal, Québec | | |
February 9, 2007 | | |
To the Minister of Finance of Québec:
We have audited the consolidated statements of operations, retained earnings and cash flows of Hydro-Québec for each of the years in the three-year period ended December 31, 2004 as presented in the 2004 Annual Report on Form 18-K of Hydro-Québec. These consolidated financial statements were prior to adjustments to reflect discontinued operations as described in Note 7 to the consolidated financial statements for the year ended December 31, 2006. These financial statements are the responsibility of
Hydro-Québec’s Management. Our responsibility is to express an opinion on these financial statements based on our audits.
We conducted our audits in accordance with Canadian generally accepted auditing standards. Those standards require that we plan and perform an audit to obtain reasonable assurance whether the financial statements are free of material misstatement. An audit includes examining, on a test basis, evidence supporting the amounts and disclosures in the financial statements. An audit also includes assessing the accounting principles used and significant estimates made by Management, as well as evaluating the overall financial statement presentation.
In our opinion, these consolidated financial statements present fairly, in all material respects, the results of operations and cash flows of Hydro-Québec for each of the years in the three-year period ended December 31, 2004, in accordance with Canadian generally accepted accounting principles. As required by the Auditor General Act (R.S.Q., c. V-5.01), we report that, in our opinion, after giving retroactive effect to the changes in accounting policies and except for the prospective application thereof, as explained in Note 2, these principles have been applied on a basis consistent with that of the preceding year.
Samson Bélair/Deloitte & Touche s.e.n.c.r.l. | | PricewaterhouseCoopers LLP |
Chartered Accountants | | Chartered Accountants |
| | |
Montréal, Québec | | |
March 16, 2005 | | |
27
Consolidated Financial Statements
Consolidated Statements of Operations
| | Years ended December 31 | |
| | | | | | | | (restated - Note 2) | |
| | 2006 | | 2005 | | 2004 | | 2003 | | 2002 | |
| | (in millions of Canadian dollars) | |
Revenue | | $ | 11,161 | | $ | 10,888 | | $ | 10,341 | | $ | 10,197 | | $ | 11,852 | |
| | | | | | | | | | | |
Expenditure | | | | | | | | | | | |
Operations | | 2,394 | | 2,248 | | 2,157 | | 2,070 | | 2,022 | |
Electricity and fuel purchases | | 1,315 | | 1,496 | | 1,464 | | 1,380 | | 3,022 | |
Depreciation and amortization (Note 4) | | 2,007 | | 2,023 | | 1,862 | | 1,768 | | 1,877 | |
Taxes (Note 5) | | 529 | | 594 | | 606 | | 567 | | 537 | |
Regulatory deferrals (Note 3) | | (93 | ) | (11 | ) | — | | — | | — | |
| | 6,152 | | 6,350 | | 6,089 | | 5,785 | | 7,458 | |
| | | | | | | | | | | |
Operating income | | 5,009 | | 4,538 | | 4,252 | | 4,412 | | 4,394 | |
| | | | | | | | | | | |
Financial expenses (Note 6) | | 2,212 | | 2,187 | | 2,084 | | 2,492 | | 2,778 | |
| | | | | | | | | | | |
Income from continuing operations | | 2,797 | | 2,351 | | 2,168 | | 1,920 | | 1,616 | |
| | | | | | | | | | | |
Income (loss) from discontinued operations (Note 7) | | 944 | | (99 | ) | 267 | | 18 | | (31 | ) |
| | | | | | | | | | | |
Net income | | $ | 3,741 | | $ | 2,252 | | $ | 2,435 | | $ | 1,938 | | $ | 1,585 | |
Consolidated Statements of Retained Earnings
| | Years ended December 31 | |
| | | | | | | | (restated - Note 2) | |
| | 2006 | | 2005 | | 2004 | | 2003 | | 2002 | |
| | (in millions of Canadian dollars) | |
Balance at beginning of year, as previously reported | | $ | 13,075 | | $ | 11,949 | | $ | 10,863 | | $ | 9,897 | | $ | 10,460 | |
Adjustment for retroactive application of change in accounting policy (Note 2) | | — | | — | | 1 | | (6 | ) | (1,391 | ) |
Balance at beginning of year, as restated | | 13,075 | | 11,949 | | 10,864 | | 9,891 | | 9,069 | |
| | | | | | | | | | | |
Net income | | 3,741 | | 2,252 | | 2,435 | | 1,938 | | 1,585 | |
| | 16,816 | | 14,201 | | 13,299 | | 11,829 | | 10,654 | |
| | | | | | | | | | | |
Dividends declared (Note 18) | | 2,342 | | 1,126 | | 1,350 | | 965 | | 763 | |
| | | | | | | | | | | |
Balance at end of year | | $ | 14,474 | | $ | 13,075 | | $ | 11,949 | | $ | 10,864 | | $ | 9,891 | |
The accompanying notes are an integral part of the consolidated financial statements.
28
Consolidated Balance Sheets
| | As at December 31 | |
| | 2006 | | 2005 | |
| | (in millions of Canadian dollars) | |
| | | | | |
Assets | | | | | |
| | | | | |
Current assets | | | | | |
Cash and cash equivalents | | $ | 52 | | $ | 16 | |
Short-term investments (Note 16) | | 3,177 | | 322 | |
Accounts receivable | | 1,700 | | 1,764 | |
Swaps | | 1,389 | | 685 | |
Materials, fuel and supplies | | 365 | | 343 | |
Assets held for sale (Note 7) | | 11 | | 145 | |
| | 6,694 | | 3,275 | |
| | | | | |
Property, plant and equipment (Note 8) | | 51,813 | | 50,373 | |
Investments (Note 9) | | 232 | | 221 | |
Swaps | | 1,093 | | 1,749 | |
Intangible assets (Note 10) | | 923 | | 854 | |
Other assets (Note 11) | | 2,462 | | 1,794 | |
Assets held for sale (Note 7) | | 31 | | 2,166 | |
| | $ | 63,248 | | $ | 60,432 | |
| | | | | |
LIABILITIES | | | | | |
| | | | | |
Current liabilities | | | | | |
Borrowings (Note 16) | | $ | 25 | | $ | 20 | |
Accounts payable and accrued liabilities | | 1,833 | | 1,929 | |
Dividends payable (Note 18) | | 2,342 | | 1,126 | |
Accrued interest | | 971 | | 927 | |
Regulatory liability (Note 3) | | 251 | | — | |
Current portion of long-term debt (Note 12) | | 1,352 | | 3,148 | |
Liabilities related to assets held for sale (Note 7) | | 1 | | 172 | |
| | 6,775 | | 7,322 | |
| | | | | |
Long-term debt (Note 12) | | 34,139 | | 31,279 | |
Asset retirement obligations (Note 13) | | 431 | | 282 | |
Other long-term liabilities (Note 14) | | 2,719 | | 2,581 | |
Long-term liabilities related to assets held for sale (Note 7) | | 7 | | 1,213 | |
Perpetual debt (Note 15) | | 337 | | 379 | |
| | 44,408 | | 43,056 | |
| | | | | |
shareholder’s equity (note 18) | | | | | |
| | | | | |
Share capital | | 4,374 | | 4,374 | |
Retained earnings | | 14,474 | | 13,075 | |
Translation adjustments | | (8 | ) | (73 | ) |
| | 18,840 | | 17,376 | |
| | $ | 63,248 | | $ | 60,432 | |
| | | | | | | | | |
Commitments and contingencies (Note 21)
The accompanying notes are an integral part of the consolidated financial statements.
29
Consolidated Statements of Cash Flows
| | Years ended December 31 | |
| | | | | | | | (restated - Note 2) | |
| | 2006 | | 2005 | | 2004 | | 2003 | | 2002 | |
| | (in millions of Canadian dollars) | |
Operating activities | | | | | | | | | | | |
Net income | | $ | 3,741 | | $ | 2,252 | | $ | 2,435 | | $ | 1,938 | | $ | 1,585 | |
(Income) loss from discontinued operations (Note 7) | | (944 | ) | 99 | | (267 | ) | (18 | ) | 31 | |
Income from continuing operations | | 2,797 | | 2,351 | | 2,168 | | 1,920 | | 1,616 | |
Adjustments | | | | | | | | | | | |
Depreciation and amortization (Note 4) | | 2,007 | | 2,023 | | 1,862 | | 1,768 | | 1,877 | |
Amortization of debt premiums, discounts and issue expenses (Note 6) | | 1 | | 28 | | 34 | | 38 | | 39 | |
Exchange gain | | (470 | ) | (99 | ) | (193 | ) | 112 | | 179 | |
Difference between contributions paid and pension cost | | (95 | ) | (155 | ) | (21 | ) | (91 | ) | (117 | ) |
Regulatory deferrals (Note 3) | | (93 | ) | (11 | ) | — | | — | | — | |
Other | | (54 | ) | (15 | ) | 90 | | 122 | | 147 | |
Change in non-cash working capital items (Note 19) | | (87 | ) | 279 | | 77 | | (169 | ) | (59 | ) |
| | 4,006 | | 4,401 | | 4,017 | | 3,700 | | 3,682 | |
| | | | | | | | | | | |
Investing activities | | | | | | | | | | | |
Property, plant and equipment and intangible assets | | (3,348 | ) | (3,282 | ) | (3,071 | ) | (2,739 | ) | (2,232 | ) |
Long-term investments | | 12 | | 8 | | 9 | | 48 | | (27 | ) |
Disposal of investments, net of divested cash and cash equivalents (Note 7) | | 2,022 | | — | | 894 | | — | | — | |
Energy Efficiency Plan (Note 3) | | (149 | ) | (91 | ) | (41 | ) | (10 | ) | (1 | ) |
Net change in short-term investments | | (2,807 | ) | (251 | ) | 159 | | 697 | | (318 | ) |
Other | | (6 | ) | (34 | ) | (8 | ) | 7 | | 4 | |
| | (4,276 | ) | (3,650 | ) | (2,058 | ) | (1,997 | ) | (2,574 | ) |
| | | | | | | | | | | |
Financing activities | | | | | | | | | | | |
Issuance of long-term debt | | 3,781 | | 3,855 | | 1,916 | | 2,146 | | 1,919 | |
Repayment of long-term debt at maturity and sinking fund redemption | | (1,862 | ) | (1,805 | ) | (1,675 | ) | (2,525 | ) | (2,004 | ) |
Redemption of long-term debt | | (789 | ) | (757 | ) | (738 | ) | (885 | ) | (462 | ) |
Inflows resulting from credit risk management | | 1,140 | | 340 | | 135 | | 282 | | 51 | |
Outflows resulting from credit risk management | | (975 | ) | (1,120 | ) | (702 | ) | (25 | ) | — | |
Net change in short-term borrowings | | 5 | | (24 | ) | (74 | ) | 74 | | 2 | |
Dividends paid | | (1,126 | ) | (1,350 | ) | (965 | ) | (763 | ) | (554 | ) |
Other | | 9 | | 5 | | 82 | | 85 | | 7 | |
| | 183 | | (856 | ) | (2,021 | ) | (1,611 | ) | (1,041 | ) |
| | | | | | | | | | | |
Change in foreign exchange on cash and cash equivalents | | — | | (1 | ) | (7 | ) | 5 | | — | |
| | | | | | | | | | | |
Cash flows from continuing operations | | (87 | ) | (106 | ) | (69 | ) | 97 | | 67 | |
Cash flows from discontinued operations (Note 7) | | 52 | | 101 | | (28 | ) | (200 | ) | (23 | ) |
Net change in cash and cash equivalents | | (35 | ) | (5 | ) | (97 | ) | (103 | ) | 44 | |
| | | | | | | | | | | |
Cash and cash equivalents at beginning of year | | 92 | | 97 | | 194 | | 297 | | 254 | |
Cash and cash equivalents at end of year | | 57 | | 92 | | 97 | | 194 | | 298 | |
| | | | | | | | | | | |
Cash and cash equivalents | | | | | | | | | | | |
Continuing operations | | 52 | | 16 | | 97 | | 194 | | 298 | |
Discontinued operations | | 5 | | 76 | | — | | — | | — | |
| | $ | 57 | | $ | 92 | | $ | 97 | | $ | 194 | | $ | 298 | |
Supplementary cash flow information (Note 19)
The accompanying notes are an integral part of the consolidated financial statements.
30
Notes to Consolidated Financial Statements
Under the provisions of the Hydro-Québec Act, the government corporation Hydro-Québec (the “Corporation”) is mandated to supply power and to pursue endeavors in energy-related research and promotion, energy conversion and conservation, and any field connected with or related to power or energy. The Corporation is required, in particular, to supply a base volume of up to 165 TWh a year of heritage pool electricity for the Québec market, as set out in the Act respecting the Régie de l’énergie.
Note 1 Significant Accounting Policies
The consolidated financial statements have been prepared in accordance with Canadian generally accepted accounting principles (GAAP) and reflect the decisions of the Régie de l’énergie (the “Régie”). These decisions affect the timing of the recognition of certain transactions in the consolidated operations, resulting in the recognition of regulatory assets and liabilities, which the Corporation considers it is likely to recover or settle subsequently through the rate-setting process.
Regulation
The Act respecting the Régie de l’énergie grants the Régie exclusive authority to determine or modify the rates and conditions under which electricity is transmitted and distributed by the Corporation. The Corporation’s electricity transmission and distribution activities in Québec are therefore regulated. Under this legislation, rates are set by reasoned decision of three commissioners after public hearings. Moreover, the Act stipulates that rates are determined on a basis that allows for recovery of the cost of service plus a reasonable return on the rate base.
The Régie and the Corporation both belong to the Québec government reporting entity. However, the Régie is an independent, quasi-judicial economic regulatory agency accountable to the National Assembly of Québec through the Minister of Natural Resources and Wildlife.
transmission
The Corporation’s power transmission rates were determined in decision D-2006-66, in which the Régie authorized a modification of power transmission rates effective January 1, 2005. The impact of this decision is essentially a $170-million increase in the annual cost of transmission service for the native load, which is not integrated into the Corporation’s electricity rates. The transmission rates include a 8.34% return on the rate base, as authorized by the Régie following decision D-2005-63. This return assumes a capital structure with 30% shareholder’s equity.
distribution
The Corporation’s electricity rates were determined in decisions D-2005-48 and D-2006-46, in which the Régie granted across-the-board rate increases of 1.2% and 5.33%, effective April 1, 2005, and April 1, 2006, respectively. The return on the rate base authorized by the Régie and set at 8.4% in 2005 was 7.75% in 2006, assuming a capital structure with 35% shareholder’s equity.
Scope of consolidation
The consolidated financial statements include the accounts of the Corporation, its subsidiaries and its joint ventures as well as those of variable interest entities (VIEs) where Hydro-Québec is the primary beneficiary (referred to collectively as Hydro-Québec). Interests in joint ventures are accounted for using the proportionate consolidation method. Investments in companies over which Hydro-Québec can exercise significant influence are accounted for on an equity basis.
Use of estimates
The preparation of consolidated financial statements in accordance with GAAP requires that Management make estimates and assumptions that affect the amounts recognized as assets and liabilities, the disclosures required regarding contingent assets and liabilities at the date of the consolidated financial statements and the amounts recognized as revenue and expenditure for the years in question. The estimates relate to unbilled electricity deliveries, the useful life of property, plant and equipment, asset retirement and employee future benefit obligations, among other things. Actual results could differ from those estimates.
31
Revenue
Revenue is recognized when electricity is delivered or services are rendered. Revenue from sales of electricity in Québec is recorded on the basis of cyclical billings and also includes revenue accrued in respect of unbilled electricity deliveries.
Income taxes
In Canada, the Corporation and most of its holdings are exempt from paying income taxes since they are government-owned. Entities operating in foreign countries pay income taxes according to the tax rules in effect in the country where they derive revenue and the application of a tax treaty between Canada and the country concerned, if any such treaty exists.
The taxable entities use the liability method to account for income taxes.
Foreign currency translation
self-sustaining foreign operations
The financial statements of foreign operations that are self-sustaining in terms of financial and operational management are translated according to the current rate method using the foreign currency as the measuring unit. Under this method, assets and liabilities are translated into Canadian dollars at the exchange rate in effect at the balance sheet date, and revenue and expenditure are translated at the average exchange rates in effect during the period. Exchange gains or losses resulting from the translation of the financial statements of these foreign operations are presented under Translation adjustments in Shareholder’s equity on the balance sheet.
integrated foreign operations and foreign currency transactions
In the case of foreign operations that are integrated in terms of financial and operational management, as well as foreign currency transactions, accounts stated in foreign currencies are translated according to the temporal method. Under this method, monetary assets and liabilities are translated into Canadian dollars at the exchange rate in effect at the balance sheet date, and non-monetary items are translated at the historical rate. Revenue and expenditure resulting from foreign currency transactions are translated into Canadian dollars at the average exchange rates in effect during the period.
The exchange gains or losses resulting from the translation of monetary items are included in the statement of operations, unless they relate to hedging items for future sales in U.S. dollars, in which case they are deferred to the year in which such sales are made in accordance with Accounting Guideline AcG-13 of the Canadian Institute of Chartered Accountants (CICA) Handbook, Hedging Relationships.
Cash, cash equivalents and short-term investments
Cash and cash equivalents consist of cash on hand and liquid short-term investments with a maturity of three months or less from the date of acquisition. Investments with a maturity of more than three months are presented under Short-term investments.
Short-term investments are recorded at the lower of unamortized cost and fair value.
Sinking funds
Sinking funds are made up of Hydro-Québec debentures and are deducted from long-term debt.
Sinking fund securities are carried at unamortized cost. The difference between the cost and the par value at maturity is amortized over the remaining term of the security.
Materials, fuel and supplies
Inventories of materials, fuel and supplies are valued at the lower of cost and net realizable value. Cost is determined by the average cost method.
32
Property, plant and equipment
Property, plant and equipment are carried at cost, which comprises materials, labor, other costs directly related to construction activities, and financial expenses capitalized during construction. Property, plant and equipment also include the discounted value of asset retirement obligations. Contributions from third parties are applied against the cost of the related property, plant and equipment.
Financial expenses capitalized to property, plant and equipment under construction are determined using the average cost of the Corporation’s long-term debt at the end of the previous year. When the property, plant and equipment under construction relate to regulated transmission and distribution activities, such financial expenses take return on shareholder’s equity into account. The portion that corresponds to return on shareholder’s equity is included in Revenue in the consolidated operations.
Property, plant and equipment are depreciated over their useful life, primarily using the sinking fund method, at a rate of 3%. Under the Hydro-Québec Act, the depreciation period is a maximum of 50 years. The depreciation periods for the principal categories of property, plant and equipment are as follows:
Hydraulic generation | | 40 to 50 years |
Thermal generation, including nuclear | | 15 to 50 years |
Transmission substations and lines | | 30 to 50 years |
Distribution substations and lines | | 25 to 40 years |
When unregulated property, plant and equipment are retired, the cost of such assets and the cost of their dismantlement, net of accumulated depreciation and salvage value, are charged to operations for the year. When regulated property, plant and equipment are retired, these costs are charged to a separate account and amortized over a maximum period of 10 years, using the sinking fund method, at a rate of 3%.
Maintenance and repair costs are charged to operations as incurred.
Long-term investments
Hydro-Québec holds an interest in a venture capital company whose mission is to make strategic investments. The investments held by this company, which would normally be consolidated or accounted for on an equity basis or at cost, are accounted for at fair value. The fair value is determined according to the quoted market price at the balance sheet date in the case of listed shares, and according to valuation methods recognized by the financial markets in the case of unlisted shares. Other long-term investments are recorded at cost, unless there has been a loss in value that is other than a temporary decline, in which case the investments are written down to fair value.
Intangible assets
Intangible assets are recorded at cost. This cost includes expenses directly associated with activities for developing or obtaining computer software for internal use. Financial expenses are capitalized over the development period.
Intangible assets with an indefinite useful life are not amortized. These assets are tested for impairment annually or more frequently if events indicate a potential impairment in value. The excess of the carrying amount over the fair value is recorded in the statement of operations for the period in which the impairment is determined.
Intangible assets with a finite useful life are amortized over their useful life. The amortization methods and periods used for these assets are as follows:
Software and licences | | straight-line and sinking fund at 3% | | 3 to 10 years |
Rights | | sinking fund at 3% | | 40 to 50 years |
Environmental studies | | sinking fund at 3% | | 5 years |
Patents | | sinking fund at 3% | | 20 years |
33
Impairment of long-lived assets
Hydro-Québec reviews the carrying amount of its property, plant and equipment and its amortizable intangible assets whenever events or changes in circumstances indicate that the expected undiscounted net cash flows could be lower than the carrying amount of the property and assets. An impairment loss corresponding to the amount by which the carrying amount exceeds fair value is recognized, if applicable.
Employee future benefits
The Corporation offers all of its employees a contributory defined-benefit pension plan based on final pay, as well as other post-retirement and post-employment benefits.
The cost of pension benefits and other post-retirement benefits provided in exchange for services rendered during the year is calculated using the projected benefit method prorated on years of service. It is based on Management’s best assumptions of expected plan asset performance, salary escalation, the increase in health care costs, retirement ages of employees and other actuarial factors.
In order to establish its employee future benefit obligations, the Corporation has adopted the following policies:
· Past service costs arising from plan amendments and transitional balances relating to the pension plan and other post-retirement benefits as at January 1, 1999, are amortized over periods not exceeding active employees’ average remaining years of service, which totaled 12 years as at January 1, 2006 (13 years as at January 1, 2005), using the straight-line method.
· Amortization of actuarial gains or losses is recognized in the statement of operations for the year if the unamortized net actuarial gain or loss at the beginning of the year exceeds 10% of the value of the accrued benefit obligations or 10% of the market-related value of the plan assets, whichever is greater. The amortization corresponds to the excess divided by active employees’ average remaining years of service.
· The expected return on pension plan assets is based on a market-related value determined by using a five-year moving average for equity securities and by valuing other asset classes at fair value.
Asset retirement obligations
The Corporation accounts for asset retirement obligations in the period in which these legal obligations are incurred when a reasonable estimate of their fair value can be made. The corresponding costs of asset retirement are added to the carrying amount of the related asset and are amortized over its useful life. In subsequent financial years, any change due to the passage of time is charged to operating expenses for the current year (accretion expense) and the corresponding amount is added to the carrying amount of the liability. Changes resulting from revisions to the timing or the amount of the undiscounted cash flows are recognized as an increase or decrease in the carrying amount of the liability under Asset retirement obligations, and the corresponding retirement cost adjustment is accounted for as part of the carrying amount of the related asset.
The cash flows required to settle asset retirement obligations are estimated on the basis of studies that use various assumptions concerning the methods and timing to be adopted for the retirement. The Corporation periodically reviews the valuation of these cash flows in light of the underlying assumptions and estimates, possible technological advances, and changes in the standards and regulations governing the decommissioning of nuclear generating stations.
Debt premiums, discounts and issue expenses
Debt premiums, less discounts and issue expenses, are deferred and amortized over the term of the borrowings and presented under Other long-term liabilities.
34
Derivative instruments
As part of its integrated risk management, Hydro-Québec uses various derivative instruments to manage foreign exchange, interest rate and market risk, including exposure to fluctuating energy and commodity prices. In the case of hedging operations, the Corporation formally documents all relationships between hedging instruments and hedged items. Such documentation involves associating all derivatives with forecasted and probable transactions or with specific assets and liabilities on the balance sheet. The Corporation also formally measures the effectiveness of hedging relationships at their inception and then quarterly thereafter.
Derivative instruments designated as hedges in effective hedging relationships are accounted for using hedge accounting. The different types of hedging relationships in which the Corporation engages are as follows:
management of risk associated with long-term debt and sales in u.s. dollars
· Foreign exchange risk — Currency swaps used to manage exchange risk related to long-term debt and sales in U.S. dollars are translated at the closing exchange rates in effect at the balance sheet date. Debit balances are reported as Swaps, while credit balances are presented under Long-term debt. Gains or losses on currency swaps related to long-term debt are included in the statement of operations under Financial expenses, while gains or losses on currency swaps related to U.S.-dollar sales are deferred to maturity and recognized as Revenue in the statement of operations in the year the sales are made.
· Interest rate risk — Interest rate swaps used to modify long-term exposure to interest rate risk are accounted for on an accrual basis and presented in the statement of operations under Financial expenses. The corresponding amounts payable or receivable are recorded as adjustments to accrued interest.
management of short-term financial risk
· Foreign exchange risk — To manage short-term foreign exchange risk, the Corporation transacts options and forwards, which are recorded at cost. Gains or losses realized on these instruments are deferred and recognized in the statement of operations in the same period and component as the hedged item.
· Interest rate risk — The Corporation uses options, interest rate swaps and forward rate agreements to manage short-term interest rate risk. The instruments are accounted for at cost, and the related realized gains or losses are deferred and recognized in the statement of operations in the same period and component as the hedged item.
· Market risk — To manage market risk exposure, the Corporation contracts mainly options, commodity swaps and commodity futures. Risk management instruments for fluctuating energy or aluminum prices are accounted for at cost, and the related gains or losses are deferred and recognized in the statement of operations in the same period and component as the hedged item.
If a derivative instrument no longer satisfies hedging conditions or is sold or liquidated, or if Hydro-Québec terminates its designation as a hedging relationship, hedge accounting ceases to be applied on a prospective basis. The fair value of the derivative instrument is then recorded and deferred to be included in the statements of operations in the periods in which the hedged item affects operations. If the hedged item ceases to exist, the gains or losses previously deferred are immediately recognized in the statement of operations.
For derivative instruments to which hedge accounting cannot be applied, realized and unrealized changes in fair value are recognized in the statement of operations in the periods in which they occur.
The fair value of derivative instruments is based on the spot rates or on the forward rates or prices in effect at market closing at the balance sheet date. In the absence of this information for a given instrument, Management uses the forward rate or price for an equivalent instrument. In the case of options, valuation models recognized by financial markets are used to estimate the fair value.
Comparative information
Certain figures of the previous year have been reclassified in order to conform to the presentation adopted in the current year.
35
Note 2 Changes in Accounting Policies
Recent changes
2006
non-monetary transactions
On January 1, 2006, Hydro-Québec adopted the recommendations of CICA Handbook Section 3831, Non-monetary Transactions, which supersedes Section 3830, also entitled Non-monetary Transactions. This standard requires that a non-monetary asset or liability exchanged or transferred in a non-monetary transaction be measured at its fair value where the criterion of “commercial substance” is met. The adoption of these recommendations had no impact on the consolidated financial statements.
conditional asset retirement obligations
On April 1, 2006, Hydro-Québec adopted the recommendations in the CICA’s Emerging Issues Committee Abstract EIC-159, Conditional Asset Retirement Obligations. This abstract states how to account for conditional asset retirement obligations when the timing and/or method of settlement are conditional on a future event that may or may not be within the control of the entity. A liability for the fair value of an asset retirement obligation must be recognized in the period in which it is incurred when a reasonable estimate of fair value can be made. The adoption of these recommendations had no impact on the consolidated financial statements.
2005
investment companies
On January 1, 2005, Hydro-Québec prospectively adopted the recommendations in CICA Accounting Guideline AcG-18, Investment Companies. Under AcG-18, investment companies are required to account for their investments at fair value in certain cases where these investments would normally have been consolidated or accounted for on an equity basis or at cost. Criteria are provided to determine whether a company should be classified as an investment company. Companies that do not meet the criteria are required to consolidate or account for their investments using the equity method. The guideline also provides instructions for circumstances where fair value must be used in the consolidated financial statements of the parent company or the entity exercising significant influence over the investment company. Since the adoption of this guideline, the venture capital investments held by a subsidiary have been accounted for at fair value, whereas previously, they had been accounted for at cost. The adoption of these recommendations had no significant impact on the consolidated financial statements.
consolidation of variable interest entities
On January 1, 2005, Hydro-Québec retroactively applied the recommendations in CICA Accounting Guideline AcG-15, Consolidation of Variable Interest Entities, without restating the figures for the preceding year. This guideline provides the consolidation principles applicable to certain entities (VIEs) that are subject to control on a basis other than ownership of voting interests. It prescribes consolidation of an entity when the reporting enterprise is the primary beneficiary. The primary beneficiary is the enterprise with variable interests that will absorb a majority of the VIE’s expected losses, receive a majority of its expected residual returns, or both. The guideline also requires disclosure of certain information when the reporting enterprise has a significant variable interest in a VIE that it has not consolidated. The adoption of these recommendations had no significant impact on the consolidated financial statements.
determining whether an arrangement contains a lease
On January 1, 2005, Hydro-Québec adopted the recommendations in the CICA’s Emerging Issues Committee Abstract EIC-150, Determining Whether an Arrangement Contains a Lease. The abstract provides guidance for determining whether an arrangement comprising a transaction or a series of related transactions that does not take the legal form of a lease but conveys a right to use a tangible asset in return for a payment or series of payments is within the scope of CICA Handbook Section 3065, Leases. Since January 1, 2005, the provisions of the abstract have applied to arrangements agreed to, committed to, modified or acquired in business combinations. The adoption of these recommendations had no significant impact on the consolidated financial statements
36
disclosures by entities subject to rate regulation
On December 31, 2005, Hydro-Québec adopted the recommendations in CICA Accounting Guideline AcG-19, Disclosures by Entities Subject to Rate Regulation. AcG-19 recommends that the existence and nature of all forms of rate regulation, as well as their effects on the consolidated financial statements, be disclosed in the notes to the consolidated financial statements.
2004
hedging relationships
On January 1, 2004, Hydro-Québec prospectively adopted the recommendations of CICA Accounting Guideline AcG-13, Hedging Relationships. AcG-13 establishes the conditions for applying hedge accounting. It deals in detail with the identification, designation, documentation and effectiveness of hedging relationships, as well as the discontinuance of hedge accounting. Hedge accounting is applied to derivative instruments used in risk management that conform to hedge accounting eligibility requirements, as described in Note 1. Changes in the fair value of derivative instruments that do not comply with these requirements are charged to operations.
As a result of the adoption of the guideline, hedging relationships that were no longer eligible for hedge accounting were recorded in accordance with the transitional provisions. The difference between the carrying amount and the fair value of a derivative instrument used in these hedging relationships was deferred and is recognized in the statement of operations in the same period as the corresponding gains, losses, revenue or expenditure related to the original hedged item. Accordingly, for hedging relationships canceled as at January 1, 2004, the recognition in the balance sheet of derivative instruments at fair value led to the recording of a deferred loss of approximately $65 million.
impairment of long-lived assets
On January 1, 2004, Hydro-Québec prospectively adopted the recommendations of CICA Handbook Section 3063, Impairment of Long-Lived Assets. This section establishes standards for the recognition, measurement and disclosure of the impairment of long-lived assets, and further states that a long-lived asset must be tested for recoverability whenever events or changes in circumstances indicate that its carrying amount may not be recoverable. The test for recoverability is based on a comparison between the carrying amount of the asset and the expected undiscounted net cash flows which are directly associated with the asset and may result from its use or eventual disposal. If the expected undiscounted net cash flows are less than the carrying amount, an impairment loss corresponding to the amount by which the carrying amount exceeds the fair value is recognized, and the fair value then becomes the new cost base of the asset. Fair value is based on discounted future cash flows if market prices are not available. The adoption of these standards had no impact on the consolidated financial statements.
asset retirement obligations
On January 1, 2004, Hydro-Québec adopted the recommendations of CICA Handbook Section 3110, Asset Retirement Obligations. This standard requires the recognition and measurement of liabilities for legal obligations associated with the retirement of property, plant and equipment. The liability associated with an asset retirement obligation is measured initially at its fair value in the period in which the obligation is incurred, if a reasonable estimate of fair value can be made. A corresponding retirement cost is added to the carrying amount of the related asset and is amortized over its useful life. In subsequent periods, the liability is adjusted to reflect any changes due to the passage of time and to revisions made to the timing of the asset retirement or to the amount of undiscounted cash flows as compared to the original estimate. In accordance with the standard, Hydro-Québec applied these changes retroactively and the figures for the years 2003 and 2002 were restated.
The retroactive application of these recommendations resulted in a $1 million increase in retained earnings as at January 1, 2004. The restatement of the 2003 figures resulted in a $17 million rise in operating expenses, a $24 million decrease in amortization expense, a $29 million increase in fixed assets and a $28 million rise in asset retirement obligations.
The adoption of this standard did not significantly affect net income for 2004. Property, plant and equipment and asset retirement obligations as at December 31, 2004, increased by $43 million and $59 million, respectively.
37
employee future benefits
On June 30, 2004, Hydro-Québec adopted the changes to CICA Handbook Section 3461, Employee Future Benefits, concerning the disclosure of supplementary information intended to help the users of financial statements gain a better understanding of companies’ obligations with respect to employee future benefits.
generally accepted accounting principles and general
standards of financial statement presentation
On January 1, 2004, Hydro-Québec adopted the recommendations of CICA Handbook Sections 1100 and 1400, respectively Generally Accepted Accounting Principles and General Standards of Financial Statement Presentation. Section 1100 describes what constitutes GAAP and the sources thereof. It also provides guidance on sources to consult when selecting accounting policies and determining appropriate disclosures, in cases where a matter is not dealt with explicitly in the primary sources of GAAP, thus establishing a new Canadian GAAP hierarchy. Section 1400 provides general instructions on financial statement presentation, and specifies what constitutes fair presentation in accordance with GAAP. The adoption of these standards had no impact on the consolidated financial statements.
2003
disclosure of guarantees
On January 1, 2003, Hydro-Québec adopted the recommendations of Accounting Guideline AcG-14 of the CICA Handbook, “Disclosure of Guarantees”. Under AcG-14, Hydro-Québec is required to disclose information on the guarantees that it has given, regardless of the probability that it will have to make payments under these guarantees. Note 21, “Commitments and Contingencies,” describes the disclosures required for guarantees.
disposal of long-lived assets and discontinued operations
On May 1, 2003, Hydro-Québec adopted the new recommendations of Section 3475 of the CICA Handbook, “Disposal of Long-Lived Assets and Discontinued Operations.” This section establishes standards for recognition, measurement, presentation and disclosure relating to disposals of long-lived assets. It also provides criteria for classifying assets held for sale and requires that these assets be presented at the lower of cost and fair value, less the cost of disposal. Finally, it provides criteria for classifying a disposal of assets as a discontinued operation and specifies the presentation and disclosure standards for discontinued operations and other disposals of long-lived assets. The adoption of these standards had no impact on the financial statements.
2002
foreign currency translation
The CICA has revised Section 1650 of the CICA Handbook, “Foreign Currency Translation,” effective January 1, 2002. All unrealized exchange gains and losses related to monetary items denominated in foreign currencies must henceforth be charged to income for the year, including gains and losses on long-term monetary assets and liabilities, which were formerly deferred and amortized on a straight-line basis over the remaining term of the corresponding asset or liability. To reduce volatility resulting from the elimination of the deferral and amortization of unrealized gains and losses, the Corporation adapted its foreign exchange risk management strategy in 2002. In accordance with the new standard, Hydro-Québec has applied these changes retroactively and the prior years’ comparative figures have been restated.
goodwill and other intangible assets
On January 1, 2002, Hydro-Québec also adopted the recommendations of Section 3062 of the CICA Handbook, “Goodwill and Other Intangible Assets.” Thus, goodwill and intangible assets with indefinite useful lives are henceforth no longer amortized and are subject to an impairment test.
38
transitional information
The following table presents the impact of the application of the new accounting standards:
| | 2006 | | 2005 | | 2004 | | 2003 | | 2002 | |
| | (in millions of Canadian dollars) | |
Reported net income | | $ 3,741 | | $ 2,252 | | $ 2,435 | | $ 1,931 | | $ 1,526 | |
Adjustment related to asset retirement obligations | | — | | — | | — | | 7 | | 59 | |
Restated net income | | $ 3,741 | | $ 2,252 | | $ 2,435 | | $ 1,938 | | $ 1,585 | |
Future changes
financial instruments, hedges and comprehensive income
In 2005, the CICA released CICA Handbook sections 3855, 3865 and 1530, respectively entitled Financial Instruments – Recognition and Measurement, Hedges and Comprehensive Income.
Section 3855 specifies when a financial instrument must be accounted for on the balance sheet and at what amount: in some cases at fair value, while in other cases at a value based on cost. It also specifies how gains and losses on financial instruments should be presented.
Section 3865 replaces the guidance for hedging relationships that was previously included in AcG-13, in particular the guidance for the designation and documentation of hedging relationships. These new recommendations specify how hedge accounting is applied and the required disclosures to be made by an entity applying hedge accounting.
Section 1530 establishes standards for the reporting and display of comprehensive income. Comprehensive income includes, in addition to net income, all changes in equity during a period attributable to transactions and other events from non-owner sources. Comprehensive income and its components must be presented in a financial statement with the same prominence as the other financial statements.
These sections will apply to the Corporation’s interim and annual financial statements relating to financial years beginning on January 1, 2007, and beyond. The Corporation is currently examining the impact that these new standards will have on its consolidated financial statements.
financial instruments – disclosure and presentation
In 2005, the CICA released CICA Handbook Section 3861, Financial Instruments – Disclosure and Presentation, which supersedes Section 3860, also entitled Financial Instruments – Disclosure and Presentation. This Section establishes standards for presentation of financial instruments and non-financial derivatives, and identifies the information to be disclosed about them. It will apply to the Corporation’s interim and annual financial statements relating to the 2007 financial year. In 2006, the CICA released CICA Handbook sections 3862 and 3863, respectively entitled Financial Instruments – Disclosures and Financial Instruments – Presentation, which supersede Section 3861. Section 3862 amends the disclosure requirements under Section 3861, whereas Section 3863 maintains the presentation requirements in Section 3861. These sections will apply to the Corporation’s interim and annual financial statements relating to financial years beginning on January 1, 2008, and beyond. The CICA allows these sections to be applied to the Corporation’s interim and annual financial statements relating to the 2007 financial year, in place of Section 3861.
equity
In 2005, the CICA released CICA Handbook Section 3251, Equity, which supersedes Section 3250, Surplus. Section 3251 establishes standards for the presentation of equity as a result of the new requirements in Section 1530, Comprehensive Income. It will apply to the Corporation’s interim and annual financial statements relating to financial years beginning on January 1, 2007, and beyond. In 2006, the CICA released CICA Handbook Section 1535, Capital Disclosures, requiring disclosure of how capital is managed by Management. This Section will apply to the Corporation’s interim and annual financial statements relating to financial years beginning on January 1, 2008, and beyond.
39
accounting Changes
In 2006, the CICA released CICA Handbook Section 1506, Accounting Changes. This Section prescribes the criteria for changing accounting policies, together with the accounting treatment and disclosure of changes in accounting policies, changes in accounting estimates and corrections of errors. It will apply to the Corporation’s interim and annual financial statements relating to financial years beginning on January 1, 2007, and beyond. The adoption of the recommendations in this new Section is not expected to have any significant impact on the consolidated financial statements.
Note 3 – Effects of Rate Regulation on the Consolidated Financial Statements
The following information describes the impact on the consolidated financial statements of accounting methods and practices adopted by the Corporation in accordance with decisions handed down by the Régie with respect to regulated activities.
Regulatory assets and liabilities
variances in annual cost of transmission service for the native load
Variances in the annual cost of transmission service for the native load resulting from modification of power transmission rates authorized by the Régie, where electricity rates have already been set, are charged to a separate account. The financial expenses for variances charged to this account are capitalized at the rate of return authorized by the Régie on the rate base until such time as they are included in the rate base and amortization begins. This accounting practice, which relates to the Corporation’s power distribution activities, was authorized by the Régie in decisions D-2003-93 and D-2006-34.
In decision D-2006-66, the Régie authorized a modification of power transmission rates effective January 1, 2005. The impact of this decision is essentially a $170-million increase in the annual cost of transmission service for the native load, which is not integrated into current electricity rates. In application R-3610-2006 filed with the Régie to set the rates applicable as of April 1, 2007, the Corporation in its activities as power distributor proposed that its next application include a mechanism for amortizing the 2005 and 2006 increases, which amount to $340 million, plus capitalized financial expenses of $15 million as at December 31, 2006. Were these activities not regulated, no reduction in expenditure would have been recognized in the consolidated financial statements, and net income for 2006 would have been $355 million lower.
net costs related to retirement of property, plant and equipment and intangible assets
When property, plant and equipment or intangible assets are retired, the cost of such assets and of their dismantlement, net of accumulated amortization and salvage value, are charged to a separate account and amortized over a maximum period of 10 years, using the sinking fund method at a rate of 3%. The Régie authorized this accounting practice in decisions D-2002-95 and D-2003-93, which relate to the Corporation’s power transmission and distribution activities, respectively. Were these activities not regulated, the related costs would be charged to operations for the year, and net income for 2006 would have been $17 million higher ($19 million lower in 2005)
costs related to the energy efficiency plan
The costs related to implementation of the Plan, such as specific energy conservation programs, are charged to a separate account and amortized over 10 years on a straight-line basis, except for the costs incurred prior to January 1, 2006, which are amortized over five years. This period begins in the year after the costs were recorded. For costs charged to this account, the financial expenses are capitalized at the rate of return authorized by the Régie on the rate base until such time as they are included in the rate base and amortization begins. This accounting practice relates to the Corporation’s power distribution activities and was authorized by the Régie in decisions D-2002-25, D-2002-288 and D-2006-56. Were these activities not regulated, the costs would normally be charged to operations in the year in which they are incurred, and net income for 2006 would have been $121 million lower ($80 million in 2005).
40
costs incurred until the rescission of dual-energy rate bt
The costs incurred until the rescission of dual-energy Rate BT were charged to a separate account and have been amortized on a straight-line basis over five years since the rescission date of April 1, 2006. These costs mainly include the deficit resulting from the variance between the supply cost recognized by the Régie and the prevailing price of energy, multiplied by the quantity of electricity delivered to customers at Rate BT between January 1, 2004, and March 31, 2006. For costs charged to this account, the financial expenses were capitalized at the rate of return authorized by the Régie on the rate base until March 31, 2006. This accounting practice was authorized by the Régie in decisions D-2004-47, D-2004-170 and D-2006-34, which relate to the Corporation’s power distribution activities. Were these activities not regulated, the costs would be charged to operations in the year in which they are incurred, and net income for 2006 would have been $49 million lower ($55 million in 2005).
costs related to a major discontinued project
A power transmission system project was discontinued in 2005. The costs deemed to be irrecoverable are deferred and amortized over three years on a straight-line basis. The Régie authorized this accounting practice in decision D-2002-95, which relates to the Corporation’s power transmission activities. Were these activities not regulated, the costs would have been charged to operations for 2005, and net income for 2006 would have been $10 million higher ($20 million lower in 2005).
cost variance related to electricity purchases in excess of the heritage pool
Since January 1, 2005, volume and price variances between the actual costs of electricity purchases in excess of the heritage pool and the costs forecasted in the rate cases and recognized by the Régie for rate-setting purposes have been recorded in a separate account. In 2006, a positive variance between the forecasted costs and actual costs resulted in the recognition of a regulatory liability, whereas in 2005, the opposite situation justified recognition of a regulatory asset. For the 2005 variances charged to this account, financial expenses were capitalized at the rate of return authorized by the Régie on the rate base. This accounting practice was authorized by the Régie in decisions D-2005-34, D-2005-132 and D-2006-34, which relate to the Corporation’s power distribution activities. Were these activities not regulated, the actual costs would be charged to operations in the year in which they are incurred, and net income for 2006 would have been $245 million higher ($13 million lower in 2005).
costs related to the de-icing system at lévis substation
Certain costs related to the Lévis substation de-icing system, a project designed in the wake of the 1998 ice storm to secure the transmission lines supplying the greater Québec City area, have been charged to a separate account. Once the de-icing system is commissioned, these costs will be depreciated according to the sinking fund method at 3%, over a period corresponding to the average remaining useful life of the assets that will be enhanced by this project. For costs charged to this account, the financial expenses are capitalized at the rate of return authorized by the Régie on the rate base until such time as they are included in the rate base and amortization begins. The Régie authorized this accounting practice in decision D-2004-175, which relates to the Corporation’s power transmission activities. Were these activities not regulated, the costs would be charged to operations in the year in which they are incurred, and net income for 2006 would have been $11 million lower ($1 million in 2005).
41
Regulatory assets (liabilities)
| | Expected years of
amortization | | 2006 | | 2005 | |
| | | | (in millions of
Canadian dollars) | |
Variances in annual cost of transmission service for native load (a) | | Conditions to be
determined by the Régie | | $ 355 | | $ — | |
Net costs related to retirement of property, plant and equipment and intangible assets | | 2007-2016 | | 241 | | 258 | |
Costs related to Energy Efficiency Plan | | 2007-2016 | | 252 | | 131 | |
Costs incurred until rescission of dual-energy Rate BT | | 2007-2011 | | 125 | | 76 | |
Costs related to a major discontinued project | | 2007 | | 10 | | 20 | |
Cost variance related to electricity purchases in excess of 2005 heritage pool (a) | | 2007 | | 30 | | 13 | |
Costs related to de-icing system at Lévis substation | | 2007-2047 | | 12 | | 1 | |
| | | | 1,025 | | 499 | |
| | | | | | | |
Cost variance related to electricity purchases in excess of 2006 heritage pool (a) | | Conditions to be | | (251 | ) | — | |
| | determined by the Régie | | (11 | ) | — | |
| | | | (262 | ) | — | |
| | | | $ 763 | | $ 499 | |
(a) Corresponds to Regulatory deferrals of $93 million presented in the Consolidated Statements of Operations, net of financial expenses of $17 million ($11 million and $2 million, respectively, in 2005).
risks and uncertainties
The risks and uncertainties related to the above regulatory assets and liabilities are subject to periodic monitoring and assessment. Once the Corporation considers that it is no longer likely that the net carrying amount of a regulatory asset or liability will be taken into account in setting future rates, this amount is recognized in the statement of operations in the year in which the conclusion is reached.
Other regulatory practices
Under Régie decisions D-2002-95 and D-2003-93, the compensation granted by the Québec government for the 1998 ice storm was applied against the cost of new property, plant and equipment constructed; it is amortized over the remaining life of the retired assets, with the exception of the portion equivalent to the unamortized cost of these assets, which is amortized over 10 years. The sinking fund method, at a rate of 3%, is used in both cases. Were these activities not regulated, the compensation would be amortized over the useful life of the new property, plant and equipment constructed.
In decisions D-2002-95 and D-2004-47, the Régie prescribed capitalizing financial expenses to property, plant and equipment under construction and intangible assets under development according to the authorized rates of return on the rate bases. These rates, which are set using methods approved by the Régie, take into account a component associated with the cost of the debt and a component associated with the return on shareholder’s equity. Were these activities not regulated, financial expenses would be capitalized using the average cost of the Corporation’s long-term debt.
Under Régie decisions D-2002-95 and D-2003-93, the cost of dismantling assets that were retired and replaced, net of the salvage value, is added to the cost of the new assets constructed. Were these activities not regulated, these costs would be charged to operations.
Under Régie decisions D-2006-76 and D-2006-76R, contributions received for relocation or modification projects relating to certain transmission grid assets are charged to a separate account and applied against property, plant and equipment. These contributions are amortized over the average useful life of assets for each project, using the sinking fund method, at a rate of 3%. Were these activities not regulated, the contributions would be amortized over the useful life of each fixed asset concerned.
42
Note 4 Depreciation and Amortization
| | 2006 | | 2005 | | 2004 | | 2003 | | 2002 | |
| | | | | | | | (restated - Note 2) | |
| | (in millions of Canadian dollars) | |
Property, plant and equipment | | $ 1,745 | | $ 1,712 | | $ 1,649 | | $ 1,538 | | $ 1,531 | |
Intangible assets | | 114 | | 109 | | 101 | | 108 | | 121 | |
Regulatory assets | | 111 | | 51 | | 50 | | 65 | | 69 | |
Deferred charges | | 13 | | 16 | | 21 | | 27 | | 51 | |
Write-off of projects | | 24 | | 135 | | 41 | | 30 | | 105 | |
| | $ 2,007 | | $ 2,023 | | $ 1,862 | | $ 1,768 | | $ 1,877 | |
Note 5 Taxes
| | 2006 | | 2005 | | 2004 | | 2003 | | 2002 | |
| | | | | | | | (restated - Note 2) | |
| | (in millions of Canadian dollars) | |
Capital tax | | $ 261 | | $ 330 | | $ 324 | | $ 296 | | $ 276 | |
Tax on public services (a) | | 230 | | 229 | | — | | — | | — | |
Municipal, school and other taxes | | 38 | | 35 | | 33 | | 36 | | 33 | |
Tax on gross revenue | | — | | — | | 249 | | 235 | | 228 | |
| | $ 529 | | $ 594 | | $ 606 | | $ 567 | | $ 537 | |
(a) Replaces the tax on gross revenue.
Note 6 Financial Expenses
| | 2006 | | 2005 | | 2004 | | 2003 | | 2002 | |
| | | | | | | | (restated - Note 2) | |
| | (in millions of Canadian dollars) | |
Interest | | | | | | | | | | | |
Interest on debt securities | | $ 2,465 | | $ 2,277 | | $ 2,348 | | $ 2,525 | | $ 2,672 | |
Amortization of debt premiums, discounts and issue expenses | | 1 | | 28 | | 34 | | 38 | | 39 | |
| | 2,466 | | 2,305 | | 2,382 | | 2,563 | | 2,711 | |
| | | | | | | | | | | |
Exchange (gain) loss | | (21 | ) | (1 | ) | (218 | ) | 117 | | 203 | |
Loan guarantee fees paid to the shareholder | | 158 | | 155 | | 161 | | 184 | | 185 | |
| | 137 | | 154 | | (57 | ) | 301 | | 388 | |
| | | | | | | | | | | |
Less | | | | | | | | | | | |
Capitalized financial expenses | | 312 | | 249 | | 226 | | 347 | | 299 | |
Net investment income | | 79 | | 23 | | 15 | | 25 | | 22 | |
| | 391 | | 272 | | 241 | | 372 | | 321 | |
| | $ 2,212 | | $ 2,187 | | $ 2,084 | | $ 2,492 | | $ 2,778 | |
43
NOTE 7 DISCONTINUED OPERATIONS AND ASSETS HELD FOR SALE
2006
In 2005, Hydro-Québec adopted a plan to sell off some of its foreign holdings. The related assets and liabilities were therefore classified as being held for sale. Further to the adoption of this plan, the following transactions took place in 2006:
· On January 18, 2006, Hydro-Québec concluded the sale of its interest in Hidroeléctrica Río Lajas S.A., through its wholly owned subsidiary Hydro-Québec International (HQI), for a cash consideration of $5 million, giving rise to a loss of $0.3 million.
· On February 27, 2006, Hydro-Québec concluded the sale of its interest in Cross-Sound Cable Company, LLC, for a cash consideration of $182 million, giving rise to a $29-million gain. The transaction included the sale of units held and the repayment of the loan granted by Hydro-Québec to Cross-Sound Cable Company, LLC.
· On March 29, 2006, Hydro-Québec concluded the sale of its interest in MurrayLink HQI Australia Pty Ltd, through HQI, for a cash consideration of $60 million. This transaction gave rise to a $2-million loss.
· On June 30, 2006, Hydro-Québec sold its interest in HQI Transelec Chile S.A. (Transelec), through HQI, for a cash consideration of $1.8 billion. This transaction gave rise to a gain of $813 million, net of $225 million in related income taxes. The sales contract further provides for price adjustments according to the market value of the regulated trunk transmission asset base, which is currently being evaluated by a consortium of independent experts, and to the retroactive effect of this valuation on Transelec’s revenue for the period from March 13, 2004, through June 30, 2006. In Management’s opinion, these adjustments should result in an additional gain which will be recognized when the ministerial order setting the rates is made known.
· On August 1, 2006, Hydro-Québec concluded the sale of its interest in HQI Latin America Ltd. (Fortuna generating station in Panama), through HQI, for a cash consideration of $113 million. This transaction gave rise to a gain of $38 million.
· On December 12, 2006, Hydro-Québec concluded the sale of its interest in Consorcio TransMantaro S.A., through HQI, for a cash consideration of $84 million. This transaction gave rise to a gain of $39 million.
On December 5, 2006, Hydro-Québec signed an agreement to sell its interest in HQI Australia Pty Ltd, held through HQI, for a cash consideration of AU$57 million. This transaction should result in a gain that will be recognized on closing, once the necessary approvals have been obtained from the Australian government. As at December 31, 2006, the related assets and liabilities were presented as being held for sale.
For purposes of segmented information, the results of foreign holdings are classified under Corporate and Other Activities.
2005
On July 15, 2005, Hydro-Québec concluded the sale of the principal assets held by its subsidiary HydroSolution, Limited Partnership, for a cash consideration of $92 million, resulting in a gain of $48 million. HydroSolution is part of the Distribution segment for purposes of segmented information.
2004
On June 30, 2004, Hydro-Québec sold its interest in Noverco Inc., for a cash consideration of $900 million, resulting in a gain on disposal of $265 million. Hydro-Québec sold the 54 common shares it held in Noverco Inc., representing 41.2% of the outstanding shares, together with warrants on an additional portion of 9.2% of the shares and subordinated notes with a face value of $285 million. The Corporation had acquired its interest in Noverco in 1997 for $482 million, as an investment in the Oil and Gas segment.
44
The following table presents operating results and cash flows from the interests presented as discontinued operations:
| | 2006 | | 2005 | | 2004 | | 2003 | | 2002 | |
| | (in millions of Canadian dollars) | |
Operations | | | | | | | | | | | |
Revenue | | $ | 256 | | $ | 347 | | $ | 1,076 | | $ | 1,144 | | $ | 1,060 | |
| | | | | | | | | | | |
Gain (loss) before net gain on disposal | | 27 | | (147 | ) | 2 | | 18 | | (31 | ) |
Gain on disposal | | 917 | (a) | 48 | | 265 | | — | | — | |
Income (loss) from discontinued operations | | 944 | | (99 | ) | 267 | | 18 | | (31 | ) |
| | | | | | | | | | | |
Cash flows | | | | | | | | | | | |
Operating activities | | 11 | | 83 | | 116 | | 224 | | 206 | |
Investing activities | | 64 | | 45 | | (130 | ) | (460 | ) | (241 | ) |
Financing activities | | (18 | ) | (33 | ) | (23 | ) | 44 | | 33 | |
Change in foreign exchange on cash and cash equivalents | | (5 | ) | 6 | | 9 | | (8 | ) | (21 | ) |
Cash flows from discontinued operations | | $ | 52 | | $ | 101 | | $ | (28 | ) | $ | (200 | ) | $ | (23 | ) |
(a) Net of $252 million in related income taxes.
The assets and liabilities sold, as at the disposal date, were as follows:
| | 2006 | | 2005 | | 2004 | |
| | (in millions of Canadian dollars) | |
Cash and cash equivalents | | $ | 135 | | $ | — | | $ | 6 | |
Other current assets | | 69 | | — | | 155 | |
Long-term assets | | 2,176 | | 42 | | 1,491 | |
Current liabilities | | 187 | | — | | 137 | |
Long-term liabilities | | 1,291 | | — | | 1,169 | |
| | $ | 902 | | $ | 42 | | $ | 346 | |
45
NOTE 8 PROPERTY, PLANT AND EQUIPMENT
| | 2006 | |
| | | | Accumulated | | Under | | | |
| | In service | | depreciation | | construction | | Total | |
| | (in millions of Canadian dollars) | |
Generation | | | | | | | | | |
Hydraulic | | $ | 31,132 | | $ | 7,708 | | $ | 2,752 | | $ | 26,176 | |
Thermal, including nuclear | | 2,677 | | 1,755 | | 123 | | 1,045 | |
Other | | 759 | | 322 | | 37 | | 474 | |
| | 34,568 | | 9,785 | | 2,912 | | 27,695 | |
Transmission | | | | | | | | | |
Substations and lines | | 20,186 | | 6,097 | | 594 | | 14,683 | |
Other | | 753 | | 515 | | 30 | | 268 | |
| | 20,939 | | 6,612 | | 624 | | 14,951 | |
Distribution | | | | | | | | | |
Substations and lines | | 10,905 | | 3,940 | | 225 | | 7,190 | |
Other | | 1,803 | | 1,013 | | 101 | | 891 | |
| | 12,708 | | 4,953 | | 326 | | 8,081 | |
| | | | | | | | | |
Construction | | 47 | | 31 | | 1 | | 17 | |
| | | | | | | | | |
Corporate and Other Activities | | 2,111 | | 1,159 | | 117 | | 1,069 | |
| | | | | | | | | |
| | $ | 70,373 | | $ | 22,540 | | $ | 3,980 | | $ | 51,813 | |
| | 2005 | |
| | | | Accumulated | | Under | | | |
| | In service | | depreciation | | construction | | Total | |
| | (in millions of Canadian dollars) | |
Generation | | | | | | | | | |
Hydraulic | | $ | 28,727 | | $ | 7,209 | | $ | 3,528 | | $ | 25,046 | |
Thermal, including nuclear | | 2,538 | | 1,614 | | 95 | | 1,019 | |
Other | | 781 | | 315 | | 26 | | 492 | |
| | 32,046 | | 9,138 | | 3,649 | | 26,557 | |
Transmission | | | | | | | | | |
Substations and lines | | 19,511 | | 5,689 | | 527 | | 14,349 | |
Other | | 752 | | 525 | | 17 | | 244 | |
| | 20,263 | | 6,214 | | 544 | | 14,593 | |
Distribution | | | | | | | | | |
Substations and lines | | 10,463 | | 3,620 | | 219 | | 7,062 | |
Other | | 1,923 | | 1,118 | | 70 | | 875 | |
| | 12,386 | | 4,738 | | 289 | | 7,937 | |
| | | | | | | | | |
Construction | | 51 | | 34 | | 2 | | 19 | |
| | | | | | | | | |
Corporate and Other Activities | | 2,551 | | 1,373 | | 89 | | 1,267 | |
| | | | | | | | | |
| | $ | 67,297 | | $ | 21,497 | | $ | 4,573 | | $ | 50,373 | |
As at December 31, 2006, the Corporation had cumulative costs related to suspended draft-design studies totaling $15 million ($37 million as at December 31, 2005). These costs, for which financial expenses are not capitalized, are presented as property, plant and equipment under construction. As the Corporation anticipates carrying out some of these projects in the longer term, it periodically reviews the cumulative costs of these draft-design studies. During such reviews, Management must use estimates and make assumptions that have an impact on the amounts reported for draft-design studies at the balance sheet date. The projects are assessed in terms of eventual profitability based on the expected prevailing market conditions at the time of their commissioning, compliance with sustainable development principles and how well they are received by local communities. A significant change in the assessment based on these criteria could result in a reduction of the balance for draft-design studies.
46
NOTE 9 INVESTMENTS
| | 2006 | | 2005 | |
| | (in millions of Canadian dollars) | |
At equity | | | | | |
Churchill Falls (Labrador) Corporation Limited (Note 21) | | $ | 69 | | $ | 60 | |
CITEQ inc | | (5 | ) | (5 | ) |
| | 64 | | 55 | |
At cost | | | | | |
Churchill Falls (Labrador) Corporation Limited | | | | | |
Bonds (a) (Note 21) | | 52 | | 54 | |
Other | | 62 | | 63 | |
| | 114 | | 117 | |
At fair value | | | | | |
Venture capital (b) | | 54 | | 49 | |
| | 54 | | 49 | |
| | $ | 232 | | $ | 221 | |
(a) These 7.5% bonds, with a par value of $58 million in 2006 ($59 million in 2005) and due in 2010, are secured by a general mortgage.
(b) Both the gross and net unrealized gains on investments held by the venture capital company amounted to $13 million as at December 31, 2006 (losses of $26 million as at December 31, 2005). Net losses of $2 million were realized in 2006 (gains of $6 million in 2005).
NOTE 10 INTANGIBLE ASSETS
| | 2006 | |
| | | | | | Net | |
| | | | Accumulated | | carrying | |
| | Cost | | amortization | | amount | |
| | (in millions of Canadian dollars) | |
Subject to amortization | | | | | | | |
Software and licences (a) | | $ | 1,147 | | $ | 652 | | $ | 495 | |
Rights | | 113 | | 40 | | 73 | |
Environmental studies | | 134 | | 118 | | 16 | |
Patents | | 8 | | 2 | | 6 | |
| | $ | 1,402 | | $ | 812 | | 590 | |
Not subject to amortization | | | | | | | |
Servitudes | | | | | | 333 | |
| | | | | | $ | 923 | |
(a) The net carrying amount includes $311 million in assets under development.
| | 2005 | |
| | | | | | Net | |
| | | | Accumulated | | carrying | |
| | Cost | | amortization | | amount | |
| | (in millions of Canadian dollars) | |
Subject to amortization | | | | | | | |
Software and licences (a) | | $ | 980 | | $ | 546 | | $ | 434 | |
Rights | | 110 | | 37 | | 73 | |
Environmental studies | | 126 | | 109 | | 17 | |
Patents | | 44 | | 38 | | 6 | |
| | $ | 1,260 | | $ | 730 | | 530 | |
Not subject to amortization | | | | | | | |
Servitudes | | | | | | 324 | |
| | | | | | $ | 854 | |
(a) The net carrying amount includes $215 million in assets under development.
47
NOTE 11 OTHER ASSETS
| | 2006 | | 2005 | |
| | (in millions of Canadian dollars) | |
Accrued benefit assets (Note 20) | | $ | 1,115 | | $ | 1,020 | |
Regulatory assets (Note 3) | | 1,025 | | 499 | |
Deferred charges | | 153 | | 95 | |
Government reimbursement for the 1998 ice storm (a) | | 123 | | 138 | |
Nuclear fuel waste management trust fund (b) | | 36 | | 32 | |
Goodwill (c) | | 10 | | 10 | |
| | $ | 2,462 | | $ | 1,794 | |
(a) Payable in quarterly installments of $6 million until January 15, 2014, and a final installment of $1 million on April 15, 2014. These installments include interest calculated at an annual rate of 7.2%.
(b) In order to meet its financial obligations, the Corporation deposited an initial amount of $20 million in a trust fund in 2002. It is required to deposit an additional $4 million per year in the same trust fund until the Government of Canada decides on the proposal to be adopted, based on the recommendations made by the waste management organization in November 2005. The Corporation has been making the required payments since 2002. The sums are invested in short-term marketable securities, and the interest accrued is kept in the trust fund.
(c) For purposes of segmented information, goodwill is classified under the Generation segment.
NOTE 12 LONG-TERM DEBT
Composition and maturities
Debentures, other long-term debt and swaps representing financial liabilities, translated into Canadian dollars at the closing exchange rates in effect at the balance sheet date, are summarized in the following table. These amounts are presented by year of maturity and take the sinking funds into account.
| | 2006 | | 2005 | |
| | Corporation’s Debt | | | | | | | |
| | Canadian | | U.S. | | Other | | Sinking | | | | | | | | | |
Maturity | | dollars | | dollars | | currencies | | funds | | Total | | Subsidiaries | | Total | | Total | |
| | (in millions of Canadian dollars) | |
2006 | | $ | — | | $ | — | | $ | — | | $ | — | | $ | — | | $ | — | | $ | — | | $ | 3,148 | |
2007 | | 600 | | 734 | | 22 | | (6 | ) | 1,350 | | 2 | | 1,352 | | 1,669 | |
2008 | | 87 | | 182 | | 1,248 | | — | | 1,517 | | 3 | | 1,520 | | 1,289 | |
2009 | | 1,889 | | 35 | | 6 | | (349 | ) | 1,581 | | 4 | | 1,585 | | 1,869 | |
2010 | | 705 | | 29 | | — | | (352 | ) | 382 | | 4 | | 386 | | 684 | |
2011 | | 1,880 | | 1,083 | | 91 | | — | | 3,054 | | 4 | | 3,058 | | — | |
1 to 5 years | | 5,161 | | 2,063 | | 1,367 | | (707 | ) | 7,884 | | 17 | | 7,901 | | 8,659 | |
6 to 10 years | | 1,150 | | 1,949 | | 612 | | — | | 3,711 | | 20 | | 3,731 | | 6,063 | |
11 to 15 years | | 3,045 | | 1,149 | | 11 | | — | | 4,205 | | — | | 4,205 | | 2,396 | |
16 to 20 years | | 1,958 | | 3,305 | | — | | — | | 5,263 | | — | | 5,263 | | 5,549 | |
21 to 25 years | | 1,129 | | 2,660 | | — | | — | | 3,789 | | — | | 3,789 | | 3,291 | |
26 to 30 years | | 4,657 | | 50 | | — | | — | | 4,707 | | — | | 4,707 | | 5,703 | |
31 to 35 years | | 3,790 | | — | | — | | — | | 3,790 | | — | | 3,790 | | 1,765 | |
36 to 40 years | | 1,028 | | — | | — | | — | | 1,028 | | — | | 1,028 | | 12 | |
41 to 45 years | | 98 | | — | | — | | — | | 98 | | — | | 98 | | 70 | |
46 to 50 years | | 56 | | — | | — | | — | | 56 | | — | | 56 | | 28 | |
51 to 55 years | | 507 | | — | | — | | — | | 507 | | — | | 507 | | 479 | |
56 to 60 years | | 416 | | — | | — | | — | | 416 | | — | | 416 | | 412 | |
| | 22,995 | (a) | 11,176 | | 1,990 | | (707 | ) | 35,454 | (b) | 37 | | 35,491 | | 34,427 | |
Less | | | | | | | | | | | | | | | | | |
Current portion | | 600 | | 734 | | 22 | | (6 | ) | 1,350 | | 2 | | 1,352 | | 3,148 | |
| | $ | 22,395 | | $ | 10,442 | | $ | 1,968 | | $ | (701 | ) | $ | 34,104 | | $ | 35 | | $ | 34,139 | | $ | 31,279 | |
(a) Includes $192 million and $419 million in zero-coupon bonds, reported at their discounted value at a semi-annually computed interest rate of 10.95% and 10.67%, respectively. Their par value will reach $282 million and $1,729 million in 2010 and 2020, respectively. Other bonds, reported at their discounted value and amounting to $1,261 million, will have a total par value of $1,333 million at maturity.
(b) Includes $33,436 million in bonds guaranteed by the Québec government as at December 31, 2006 ($32,014 million as at December 31, 2005).
48
Breakdown of debt by currency at time of issuance and impact of swaps and sinking funds
The following table summarizes long-term debt, including the current portion, in Canadian dollars and foreign currencies. Also shown are the effects of currency swaps and sinking funds allocated to repay debt.
| | 2006 | | 2005 | |
| | Long-term debt | | | | | | | |
| | | | At closing | | | | | | | |
| | In Canadian | | exchange rates | | | | | | | |
| | dollars and | | as at the balance | | | | | | | |
| | foreign currency | | sheet date (a) | | Swaps | | Total | | Total | |
| | (in millions of Canadian dollars or millions of currency units) | |
Corporation’s debt | | | | | | | | | | | |
Canadian dollars | | 22,288 | | $ | 22,288 | | $ | — | | $ | 22,288 | | $ | 20,975 | |
| | | | | | | | | | | |
U.S. dollars | | 8,628 | | 11,176 | | (2,279 | ) | 8,897 | | 8,810 | |
| | | | | | | | | | | |
Other currencies | | | | | | | | | | | |
Euros | | 673 | | 1,245 | | (138 | ) | 1,107 | | 1,107 | |
Yen | | 4,500 | | 50 | | — | | 50 | | 336 | |
Pounds sterling | | 240 | | 599 | | (65 | ) | 534 | | 534 | |
Swiss francs | | 96 | | 96 | | — | | 96 | | 96 | |
| | | | 1,990 | | (203 | ) | 1,787 | | 2,073 | |
| | | | 35,454 | | (2,482 | ) | 32,972 | | 31,858 | |
Subsidiaries’ debt | | | | | | | | | | | |
U.S. dollars | | 32 | | 37 | | — | | 37 | | 135 | |
| | | | $ | 35,491 | | $ | (2,482 | ) | $ | 33,009 | | $ | 31,993 | |
(a) Includes $1,400 million in financial liabilities composed of currency swaps and $707 million in Hydro-Québec securities held in the sinking funds as at December 31, 2006 (respectively $1,797 million and $1,070 million as at December 31, 2005).
Breakdown of debt by currency at time of issuance and at time of repayment
The following table shows the breakdown of debt, net of sinking funds, translated into Canadian dollars after taking swaps into account, according to the currency at time of issuance and time of repayment:
| | 2006 | | 2005 | |
| | At time
of issuance | | At time of
repayment | | At time
of issuance | | At time of
repayment | |
| | (in millions of Canadian dollars) | |
Corporation’s debt | | | | | | | | | |
Canadian dollars | | $ | 22,288 | | $ | 29,140 | | $ | 20,975 | | $ | 26,201 | |
U.S. dollars | | 8,897 | | 3,832 | (a) | 8,810 | | 5,657 | (a) |
Other currencies | | 1,787 | | — | | 2,073 | | — | |
| | 32,972 | | 32,972 | | 31,858 | | 31,858 | |
| | | | | | | | | |
Subsidiaries’ debt | | | | | | | | | |
U.S. dollars | | 37 | | 37 | | 135 | | 135 | |
| | $ | 33,009 | | $ | 33,009 | | $ | 31,993 | | $ | 31,993 | |
(a) Of this amount, 98.8% was used to hedge sales in U.S. dollars as at December 31, 2006 (89.8% as at December 31, 2005).
49
Interest rates
The following table shows Hydro-Québec’s interest rates, which take into account nominal interest rates on borrowings, debt premiums, discounts and issue expenses, and the effect of interest rate swaps:
| | 2006 | | 2005 | |
Maturity | | Canadian
dollars | | U.S.
dollars | | Other
currencies | | Weighted
average | | Weighted
average | |
| | (in percentage) | |
1 to 5 years | | 6.38 | | 7.25 | | 6.33 | | 6.51 | | 5.06 | |
6 to 10 years | | 10.76 | | 8.62 | | 11.53 | | 9.83 | | 8.58 | |
11 to 15 years | | 10.78 | | 9.61 | | 4.88 | | 10.46 | | 10.21 | |
16 to 20 years | | 9.93 | | 8.38 | | — | | 8.95 | | 9.61 | |
21 to 25 years | | 6.65 | | 9.24 | | — | | 8.45 | | 8.72 | |
26 to 30 years | | 5.99 | | — | | — | | 5.99 | | 6.11 | |
31 to 35 years | | 5.16 | | — | | — | | 5.16 | | 5.36 | |
36 to 40 years | | 4.80 | | — | | — | | 4.80 | | 6.52 | |
41 to 45 years | | 6.44 | | — | | — | | 6.44 | | 6.44 | |
46 to 50 years | | — | | — | | — | | — | | — | |
51 to 55 years | | 6.62 | | — | | — | | 6.62 | | 6.62 | |
| | | | | | | | | | | |
Weighted average | | 6.90 | | 8.81 | | 9.70 | | 7.51 | | 7.76 | |
The variable-rate portion of Hydro-Québec’s debt amounted to 7.3%, or 8.2% including perpetual debt, as at December 31, 2006 (19.0%, or 20.0% including perpetual debt, as at December 31, 2005). For information purposes, a 1% change in interest rates would have changed the consolidated net income by $31 million ($62 million in 2005), if the impact of derivative instruments used to manage short-term financial risk were excluded (Note 16).
Fair value
As at December 31, 2006, the fair value of Hydro-Québec’s debt amounted to $46,729 million ($44,977 million as at December 31, 2005). Net of sinking funds and after swaps, it totaled $45,626 million ($43,719 million as at December 31, 2005).
Fair value is obtained by discounting future cash flows, based on forward and closing interest rates as at the balance sheet date for similar instruments available on financial markets. Changes in fair value reflect sensitivity to market interest rates. However, Management intends to hold these debt securities until maturity. Therefore, as at December 31, 2006, Hydro-Québec did not foresee any significant repayments that could result in the realization of this fair value.
Hydro-Québec has undrawn standby credit facilities, of which US$2,000 million expires in 2011. Any borrowings under these lines of credit will bear interest at a rate based on the London Interbank Offered Rate (LIBOR). A US$750-million swingline loan at the U.S. base rate is included in the US$2,000-million credit facility
NOTE 13 ASSET RETIREMENT OBLIGATIONS
Liabilities arising from asset retirement obligations relate to the cost of dismantling Gentilly-2 nuclear generating station at the end of its useful life, the removal of irradiated nuclear fuel resulting from its operation and the dismantling of oil tanks and of certain thermal generating stations.
Hydro-Québec has also identified asset retirement obligations relating to thermal generating stations and power transmission lines for which no liability has been recorded since it expects to use these assets for an undetermined period. These relate to property, plant and equipment for which the Corporation does not have sufficient information to accurately establish a maturity schedule for the obligation. A liability stemming from these asset retirement obligations will be accounted for in the period in which there is sufficient information to establish such a schedule.
50
The aggregate carrying amount of the asset retirement obligations is as follows:
| | 2006 | |
| | Dismantling
of nuclear
generating station | | Removal of
irradiated
nuclear fuel | | Dismantling
of other assets | | Total | |
| | (in millions of Canadian dollars) | |
Balance at beginning of year | | $ | 172 | | $ | 92 | | $ | 18 | | $ | 282 | |
Liabilities incurred | | — | | 2 | | — | | 2 | |
Accretion expense | | 14 | | 10 | | 1 | | 25 | |
Liabilities settled | | — | | — | | (3 | ) | (3 | ) |
Revision of estimated cash flows and expected timing of payments | | 102 | | 23 | | — | | 125 | |
Balance at end of year | | $ | 288 | | $ | 127 | | $ | 16 | | $ | 431 | |
| | 2005 | |
| | Dismantling
of nuclear
generating station | | Removal of
irradiated
nuclear fuel | | Dismantling
of other assets | | Total | |
| | (in millions of Canadian dollars) | |
Balance at beginning of year | | $ | 162 | | $ | 82 | | $ | 20 | | $ | 264 | |
Liabilities incurred | | — | | 1 | | — | | 1 | |
Accretion expense | | 10 | | 9 | | 1 | | 20 | |
Liabilities settled | | — | | — | | (3 | ) | (3 | ) |
Balance at end of year | | $ | 172 | | $ | 92 | | $ | 18 | | $ | 282 | |
The carrying amount of the asset retirement obligations is based on the following key assumptions:
| | Dismantling of nuclear
generating station (a) | | Removal of irradiated
nuclear fuel (a) | | Dismantling of
other assets | |
| | (in millions of Canadian dollars) | |
| | | | | | | |
Total undiscounted amount of the estimated cash flows required to settle the obligations | | | | | | | |
As at December 31, 2006 | | $ | 795 | | $ | 598 | | $ | 18 | |
As at December 31, 2005 | | $ | 463 | | $ | 519 | | $ | 21 | |
| | | | | | | |
Expected timing of payment of the cash flows required to settle the obligations | | | | | | | |
As at December 31, 2006 | | Between 2011 and 2057 | | Between 2007 and 2159 | | Between 2007 and 2031 | |
As at December 31, 2005 | | Between 2012 and 2050 | | Between 2012 and 2047 | | Between 2006 and 2031 | |
| | | | | | | |
Credit quality - adjusted risk-free rate at which the estimated cash flows have been discounted (%) | | | | | | | |
Initial recognition of obligations | | 6.4 | | 6.4 | | 6.4 | |
Subsequent recognition of additional obligations | | 5.5 | | 5.5 | | — | |
(a) When Gentilly-2 nuclear generating station was designed, the Corporation planned to operate it for 30 years, until 2013. The Corporation initiated a draft-design study to evaluate whether its useful life could be extended by approximately 28 years through refurbishment. If the refurbishment is not carried out, Management could decide to decommission the station a few years earlier for technical and economic reasons. Pending the decision, the consolidated financial statements reflect end-of-life in 2011 for purposes of calculating the depreciation of the station and the amortization of the decommissioning costs. Consequently, once the decision is made, the estimated undiscounted cash flows and the expected timing of payment of the cash flows required to settle the obligations could change and thus, asset retirement obligations and decommissioning costs as well as the depreciation, amortization and accretion expenses, as recorded in these consolidated financial statements, may vary significantly based on the end-of-life date retained and the increase inherent in the method used to calculate depreciation and amortization. Inflation rates varying between 1.8% and 3.6% were used to determine the asset retirement obligations. As at December 31, 2006, the net carrying amount of Gentilly-2 was $643 million ($623 million as at December 31, 2005).
51
Note 14 Other Long-Term Liabilities
| | 2006 | | 2005 | |
| | (in millions of Canadian dollars) | |
Deferred exchange gain | | $ | 1,229 | | $ | 1,454 | |
Debt premiums, discounts and issue expenses | | 694 | | 322 | |
Accrued benefit liability (Note 20) | | 544 | | 497 | |
Credit risk management | | 128 | | 149 | |
Accounts payable | | 113 | | 159 | |
Regulatory liability (Note 3) | | 11 | | — | |
| | $ | 2,719 | | $ | 2,581 | |
Note 15 Perpetual Debt
Perpetual notes in the amount of US$289 million as at December 31, 2006 (US$325 million as at December 31, 2005) bear interest at a rate determined semi-annually based on LIBOR, plus 0.0625%. They are guaranteed by the Québec government and are redeemable only at the Corporation’s option. In 2006, a portion amounting to US$36 million was redeemed on the secondary market and then canceled. No portion was redeemed in 2005. Various derivative instruments recorded at fair value are used to mitigate the exchange risk associated with this debt.
As at December 31, 2006, the fair value of the perpetual notes was $347 million ($383 million as at December 31, 2005). As at December 31, 2006 and 2005, the rate for these notes was 5.6% and 4.2%, respectively.
Note 16 Financial Instruments
Derivative instruments
Management of risk associated with long-term debt and sales in u.s. dollars
Hydro-Québec engages in currency swaps and forward contracts in order to manage the foreign exchange risk associated with repayments of principal on long-term debt, interest payments and sales in U.S. dollars. In 2006, a $234-million foreign exchange gain was recognized on debts and swaps denominated in U.S. dollars. In keeping with the adopted hedge accounting treatment, this amount, which represents the realization of a portion of the deferred foreign exchange gain recorded on the balance sheet, has been incorporated under Revenue. Firm U.S.-dollar sales extending until 2016 are designated in the Corporation’s hedging relationships. Some currency swaps provide for the exchange of interest rates in order to modify interest rate risk exposure over the long term. Interest rate swaps that do not allow for exchanges of principal are also used to manage this risk.
The valuation of these swaps and forward contracts, with terms to maturity through 2033, indicated a positive fair value of $392 million as at December 31, 2006 (positive fair value of $8 million as at December 31, 2005).
The following table shows the notional amounts of these swaps, expressed in Canadian dollars and other currencies:
| | 2006 (a) | | 2005 (a) | |
| | 1 to 5 | | 6 to 10 | | 11 to 15 | | 16 to 20 | | More than | | | | | |
Maturity | | years | | years | | years | | years | | 20 years | | Total | | Total | |
| | (in millions of Canadian dollars or millions of currency units) | |
| | | | | | | | | | | | | | | |
Swaps | | | | | | | | | | | | | | | |
Canadian dollars | | 1,290 | | (829 | ) | (1,078 | ) | (3,201 | ) | (3,035 | ) | (6,853 | ) | (5,226 | ) |
U.S. dollars | | (1,039 | ) | 395 | | 960 | | 2,650 | | 2,359 | | 5,325 | | 3,617 | |
Other currencies | | | | | | | | | | | | | | | |
Yen | �� | 2,500 | | 1,000 | | 1,000 | | — | | — | | 4,500 | | 25,600 | |
Euros | | 612 | | 61 | | — | | — | | — | | 673 | | 673 | |
Pounds sterling | | 40 | | 200 | | — | | — | | — | | 240 | | 240 | |
Swiss francs | | 97 | | — | | — | | — | | — | | 97 | | 97 | |
Forward contracts | | | | | | | | | | | | | | | |
U.S. dollars | | 36 | | — | | — | | — | | — | | 36 | | 477 | |
(a) Figures in parentheses represent amounts to be paid.
52
management of short-term financial risk
In managing short-term financial risks, Hydro-Québec assesses, on an ongoing basis, the overall impact of variations in exchange rates, interest rates and commodity prices. In order to manage its foreign exchange risk exposure, it traded in options and foreign currency forward contracts. The notional amount of the open positions as at December 31, 2006, was $137 million, with $131 million in purchase contracts and $6 million in sales contracts ($731 million as at December 31, 2005, that is, $389 million in purchase contracts and $342 million in sales contracts). In order to manage fluctuating interest rates, it traded in options, swaps and forward rate agreements. For information purposes, a 1% variance in interest rates would have resulted in a $2-million variance in net income as at December 31, 2006 ($55 million as at December 31, 2005). Finally, to manage the exposure of its revenue to commodity price fluctuations, Hydro-Québec transacted options, swaps and commodity futures for which the open positions as at December 31, 2006, totaled 153,925 tonnes of aluminum (136,500 tonnes of aluminum as at December 31, 2005).
Hydro-Québec also uses derivative instruments to manage market risks resulting from fluctuations in energy prices, and for trading purposes in order to act on business opportunities in markets outside Québec. To hedge these risks, it traded in electricity swaps whose open positions as at December 31, 2006, were for 2.7 TWh (0.3 TWh as at December 31, 2005).
The fair value of these instruments is presented by specific risk in the following table. The amounts maturing in 2007 will total $40 million.
| | 2006 | | 2005 | |
| | Carrying
amount | | Fair
value | | Carrying
amount | | Fair
value | |
| | (in millions of Canadian dollars) | |
| | | | | | | | | |
Foreign exchange risk | | | | | | | | | |
Forward exchange contracts and options | | | | | | | | | |
Financial assets | | $ | — | | $ | — | | $ | — | | $ | 8 | |
Financial liabilities | | — | | — | | — | | (43 | ) |
| | — | | — | | — | | (35 | ) |
| | | | | | | | | |
Interest rate risk | | | | | | | | | |
Forward rate agreements, options and swaps | | | | | | | | | |
Financial assets | | 5 | | 5 | | 24 | | 39 | |
Financial liabilities | | — | | — | | (3 | ) | (4 | ) |
| | 5 | | 5 | | 21 | | 35 | |
| | | | | | | | | |
Risk of changes in energy and commodity prices | | | | | | | | | |
Forward contracts, options and swaps | | | | | | | | | |
Financial assets | | 7 | | 67 | | 16 | | 16 | |
Financial liabilities | | (4 | ) | (32 | ) | (2 | ) | (95 | ) |
| | 3 | | 35 | | 14 | | (79 | ) |
| | $ | 8 | | $ | 40 | | $ | 35 | | $ | (79 | ) |
Other financial instruments
The carrying amount of investments, accounts receivable, the nuclear fuel waste management trust fund, current borrowings, accounts payable and accrued liabilities, dividends payable and accrued interest approximates their fair value, due to their short-term maturities. The carrying amount of the government reimbursement for the 1998 ice storm approximates its fair value, which is estimated by discounting the expected cash flows based on effective interest rates for instruments with similar conditions and maturities. As at December 31, 2006, the weighted average interest rate on short-term investments was 4.19% (3.26% as at December 31, 2005), whereas it was 4.19% on current borrowings (2.81% as at December 31, 2005).
53
Credit risk
Derivative instruments include an element of risk since a counterparty might not meet its obligations. However, this risk is moderate as Hydro-Québec generally deals with Canadian and international financial institutions with high credit ratings. Credit risk exposure is reduced by applying a credit policy to limit credit risk concentration and a counterparty credit risk assessment and monitoring program, as well as by setting credit limits, where necessary. With the main financial institutions with which it engages in derivatives trading, Hydro-Québec enters into agreements limiting the market value of the derivatives portfolio. As at December 31, 2006, no counterparty had defaulted on its obligations toward Hydro-Québec regarding investments and derivatives.
Hydro-Québec is also exposed to credit risk associated with accounts receivable. However, this exposure is limited due to Hydro-Québec’s large and diverse customer base. Consequently, Management does not consider Hydro-Québec to be exposed to a material credit risk.
Note 17 Interests in Joint Ventures
The proportionate share of the joint venture items included in the consolidated financial statements is presented in the table below. These joint ventures consist of the interests managed by the Technology Group and Hydro-Québec Production. In 2005, this share also included interests in various foreign joint ventures, mainly held through HQI, which were disposed of in 2006.
| | 2006 | | 2005 | |
| | (in millions of Canadian dollars) | |
| | | | | |
Operations | | | | | |
Revenue | | $ | 34 | | $ | 21 | |
Expenditure and financial expenses | | 34 | | 19 | |
Income (loss) from discontinued operations | | 43 | | (89 | ) |
Net income (loss) | | $ | 43 | | $ | (87 | ) |
| | | | | |
Balance sheets | | | | | |
Current assets | | $ | 63 | | $ | 56 | |
Long-term assets | | 38 | | 295 | |
Current liabilities | | 25 | | 56 | |
Long-term liabilities | | 34 | | 114 | |
Net assets | | $ | 42 | | $ | 181 | |
| | | | | |
Cash flows | | | | | |
Operating activities | | $ | (4 | ) | $ | (5 | ) |
Investing activities | | (2 | ) | (1 | ) |
Financing activities | | 5 | | 6 | |
Discontinued operations | | 11 | | 5 | |
Net change in cash and cash equivalents | | $ | 10 | | $ | 5 | |
Note 18 Shareholder’s Equity
The authorized share capital consists of 50,000,000 shares with a par value of $100 each, of which 43,741,090 shares were issued and paid-up.
Under the Hydro-Québec Act, the dividends to be paid by the Corporation are declared once a year by the Québec government, which also determines the terms and conditions of payment. For a given financial year, they cannot exceed the distributable surplus, equal to 75% of the year’s net operating revenue and net investment income, less interest on debt securities and amortization of debt premiums, discounts and issue expenses. This calculation is based on the consolidated financial statements.
54
However, in respect of a given financial year, no dividend may be declared in an amount that would have the effect of reducing the capitalization rate to less than 25% at the end of the year. The Québec government declares the dividends for a given year within 30 days after the Corporation has sent it the financial data related to the distributable surplus. Upon expiry of the prescribed period, any portion of the distributable surplus that has not been subject to a dividend declaration may no longer be distributed to the shareholder as a dividend.
For 2006, the Québec government declared dividends of $2,342 million ($1,126 million in 2005), which is less than the maximum permitted.
The dividends declared are deducted from the retained earnings of the year for which they were declared.
Note 19 Supplementary Cash Flow Information
| | 2006 | | 2005 | |
| | (in millions of Canadian dollars) | |
| | | | | |
Change in non-cash working capital items | | | | | |
Accounts receivable | | $ | 114 | | $ | 44 | |
Materials, fuel and supplies | | (20 | ) | (24 | ) |
Accounts payable and accrued liabilities | | (228 | ) | 275 | |
Accrued interest | | 47 | | (16 | ) |
| | $ | (87 | ) | $ | 279 | |
Investing activities not affecting cash | | | | | |
Increase in property, plant and equipment and intangible assets | | $ | 303 | | $ | 29 | |
| | | | | |
Interest paid | | $ | 2,042 | | $ | 2,245 | |
Income taxes paid | | $ | 258 | | $ | 21 | |
Note 20 Employee Future Benefits
The Corporation’s pension plan (the “Pension Plan”) is a funded plan that ensures pension benefits based on the number of years of service and an average of the five best years of earnings. These benefits are indexed annually based on a rate which is the greater of the inflation rate, up to a maximum of 2%, and the inflation rate less 3%.
The Corporation also offers other post-retirement and post-employment benefits. Post-retirement benefits are provided by group life, medical and hospitalization plans, which are contributory plans with contributions adjusted annually. Post-employment benefits are under non-contributory salary insurance plans, which pay short- and long-term disability benefits. Most of these plans are not funded, with the exception of the long-term disability salary insurance plan, which is fully funded, and the supplementary group life insurance plan, which is partially funded.
The Corporation’s employee benefit plans are defined benefit plans. Accrued benefit obligations of these plans, valued by independent actuaries, and assets, at fair value, are valued as at December 31 of each year. The most recent actuarial valuation for purposes of Pension Plan funding was as at December 31, 2005, and the next valuation should be performed no later than December 31, 2008.
55
The following tables present information concerning the Corporation’s employee future benefit plans:
| | Pension Plan | | Other plans | |
| | 2006 | | 2005 | | 2006 | | 2005 | |
| | (in millions of Canadian dollars) | |
| | | | | | | | | |
Accrued benefit obligations | | | | | | | | | |
Balance at beginning of year | | $ | 11,925 | | $ | 10,256 | | $ | 837 | | $ | 688 | |
Current service cost | | 331 | | 293 | | 34 | | 31 | |
Employee contributions | | 54 | | 38 | | — | | — | |
Benefit payments and refunds | | (420 | ) | (387 | ) | (43 | ) | (39 | ) |
Interest on obligations | | 618 | | 616 | | 42 | | 42 | |
Actuarial losses (gains) | | 212 | | 1,109 | | (20 | ) | 115 | |
Balance at end of year | | $ | 12,720 | | $ | 11,925 | | $ | 850 | | $ | 837 | |
| | | | | | | | | |
Plan assets at fair value | | | | | | | | | |
Balance at beginning of year | | $ | 11,331 | | $ | 9,982 | | $ | 51 | | $ | 49 | |
Actual return on plan assets | | 1,497 | | 1,387 | | 2 | | 2 | |
Employee contributions | | 54 | | 38 | | — | | — | |
Current contributions by the Corporation | | 319 | | 307 | | 11 | | 9 | |
Special contributions by the Corporation | | 62 | | 34 | | — | | — | |
Benefit payments and refunds | | (420 | ) | (387 | ) | (8 | ) | (9 | ) |
Administrative fees | | (32 | ) | (30 | ) | — | | — | |
Balance at end of year | | $ | 12,811 | | $ | 11,331 | | $ | 56 | | $ | 51 | |
| | | | | | | | | |
Surplus (deficit) at end of year | | $ | 91 | | $ | (594 | ) | $ | (794 | ) | $ | (786 | ) |
Unamortized past service costs | | 256 | | 295 | | — | | — | |
Unamortized net actuarial loss | | 1,833 | | 2,536 | | 156 | | 181 | |
Unamortized transitional (asset) obligation | | (1,065 | ) | (1,217 | ) | 94 | | 108 | |
Accrued benefit asset (liability) | | $ | 1,115 | | $ | 1,020 | | $ | (544 | ) | $ | (497 | ) |
Additional disclosures with respect to plan assets
At year end, assets of the plans at fair value consisted of:
| | Pension Plan | | Other plans | |
| | 2006 | | 2005 | | 2006 | | 2005 | |
| | (in percentage) | |
Equities | | 53 | | 55 | | — | | — | |
Bonds | | 33 | | 31 | | 91 | | 90 | |
Short-term investments | | 8 | | 8 | | 5 | | 6 | |
Real estate investments | | 5 | | 5 | | — | | — | |
Other | | 1 | | 1 | | 4 | | 4 | |
| | 100 | | 100 | | 100 | | 100 | |
Assets of the plans include the following securities issued by the Corporation and the Québec government:
| | Pension Plan | | Other plans | |
| | 2006 | | 2005 | | 2006 | | 2005 | |
| | (in millions of Canadian dollars) | |
Bonds | | $ | 961 | | $ | 763 | | $ | 51 | | $ | 46 | |
| | | | | | | | | | | | | |
56
Cash payments
Cash payments made by the Corporation for employee benefit plans consist of the contributions paid to funded plans and benefits paid to employees and pensioners under unfunded plans. The cash payment details are as follows:
| | 2006 | | 2005 | |
| | (in millions of Canadian dollars) | |
Contributions by the Corporation | | | | | |
Pension Plan | | $ | 381 | | $ | 341 | |
Other funded plans | | 11 | | 9 | |
Benefit payments | | | | | |
Unfunded plans | | 35 | | 32 | |
Cash payments | | $ | 427 | | $ | 382 | |
The Corporation and its employees resumed their contributions to the Pension Plan on December 15, 2003. The employee and employer contribution rates increase by 1% and 1.8%, respectively, each year up to no more than 5.2% of pensionable earnings. In 2006, contributions amounted to 3% of pensionable earnings for employees and 5.2% for the Corporation (2% and 3.6%, respectively, in 2005).
Moreover, after the actuarial valuation for funding purposes dated December 31, 2005, was submitted to the Régie des rentes du Québec, the Corporation made an additional contribution of $242 million in 2006 to cover current service costs and a special contribution of $62 million to cover the actuarial deficit ($254 million and $34 million, respectively, in 2005).
Elements of accrued benefit cost recognized for the year
| | Pension Plan | | Other plans | |
| | 2006 | | 2005 | | 2006 | | 2005 | |
| | (in millions of Canadian dollars) | |
Current service cost (a) | | $ | 331 | | $ | 293 | | $ | 34 | | $ | 31 | |
Administrative fees (b) | | 32 | | 30 | | — | | — | |
Interest on obligations | | 618 | | 616 | | 42 | | 42 | |
Actual return on plan assets | | (1,497 | ) | (1,387 | ) | (2 | ) | (2 | ) |
Actuarial losses (gains) | | 212 | | 1,109 | | (19 | ) | 115 | |
(Credit) cost before adjustments required to recognize the long-term nature of employee future benefits | | (304 | ) | 661 | | 55 | | 186 | |
Difference between actual and expected return on assets | | 802 | | 703 | | — | | — | |
Difference between actuarial (gains) losses on accrued benefit obligations and actuarial losses recognized | | (99 | ) | (1,070 | ) | 25 | | (114 | ) |
Difference between adjustments for plan amendments and amortization of past service costs | | 39 | | 44 | | — | | — | |
Amortization of transitional (asset) obligation | | (152 | ) | (152 | ) | 14 | | 14 | |
| | 590 | | (475 | ) | 39 | | (100 | ) |
Cost recognized for the year | | $ | 286 | | $ | 186 | | $ | 94 | | $ | 86 | |
a) For the long-term disability salary insurance plan, current service cost corresponds to the cost of new disability cases for the year.
b) Administrative fees billed to the Pension Plan by the Corporation amounted to $12 million for 2006 ($12 million for 2005).
57
Significant actuarial assumptions
The following actuarial assumptions, used to determine the accrued benefit obligations and cost of the plans, result from a weighted average:
| | Pension Plan | | Other plans | |
| | 2006 | | 2005 | | 2006 | | 2005 | |
| | (in percentage) | |
Accrued benefit obligations | | | | | | | | | |
Rate at end of year | | | | | | | | | |
Discount rate | | 5.20 | | 5.30 | | 5.20 | | 5.30 | |
Salary escalation rate (a) | | 3.38 | | 3.89 | | — | | — | |
| | | | | | | | | |
Accrued benefit cost recognized | | | | | | | | | |
Rate at end of prior year | | | | | | | | | |
Discount rate | | 5.30 | | 6.03 | | 5.30 | | 6.03 | |
Expected long-term rate of return on plan assets | | 6.25 | | 6.52 | | 4.07 | | 3.68 | |
Salary escalation rate (a) | | 3.30 | | 3.87 | | — | | — | |
a) This rate takes into account salary increases and promotion opportunities while in service.
As at December 31, 2006, healthcare costs were based on an annual growth rate of 7.6% in 2007. Thereafter, based on the assumption used, this rate will gradually decrease until it ultimately reaches 3.9% in 2015. A 1% change in this annual growth rate would have had the following impact for 2006:
| | 1% increase | | 1% decrease | |
| | (in millions of Canadian dollars) | |
Impact on current service cost and interest cost on accrued benefit obligations for the year | | 4 | | (4 | ) |
Impact on accrued benefit obligations at end of year | | 47 | | (38 | ) |
Note 21 Commitments and Contingencies
Electricity purchases
On May 12, 1969, the Corporation signed a contract with Churchill Falls (Labrador) Corporation Limited (CF(L)Co) whereby the Corporation undertook to purchase substantially all the output from Churchill Falls generating station, which has a rated capacity of 5,428 MW. Expiring in 2016, this contract will be automatically renewed for a further 25 years under agreed-upon terms and conditions. On June 18, 1999, the Corporation and CF(L)Co entered into a contract to guarantee the availability of 682 MW of additional power until 2041 for the November 1 to March 31 winter period.
As at December 31, 2006, the Corporation was committed under 97 contracts to purchase electricity from other power producers, for an installed capacity of about 3,960 MW. It expects to purchase approximately 13 TWh of energy annually over the terms of these contracts, which extend through 2045. The majority of these contracts include renewal clauses.
The Corporation expects to make the following minimum payments on its electricity purchase contracts over the next five years:
| | (in millions of Canadian dollars) | |
2007 | | $ | 942 | |
2008 | | $ | 1,047 | |
2009 | | $ | 1,132 | |
2010 | | $ | 1,166 | |
2011 | | $ | 1,189 | |
58
Guarantees
Hydro-Québec grants guarantees to third parties for indemnification purposes in connection with its energy-related transactions on markets outside Québec. These guarantees are issued under long-term agreements and agreements governing its involvement in organized markets. These markets require that each participant provide guarantees enabling it to meet its obligations in the event of a payment default by another participant. Hydro-Québec also grants guarantees as part of its international operations and in the field of electrotechnology.
As at December 31, 2006, the potential maximum amount Hydro-Québec could have to pay under letters of credit or guarantees totaled $386 million. Of this amount, $313 million relates to the purchase of energy, for which a liability in the amount of $26 million has been recorded. Some guarantees expire between 2007 and 2019, while others do not have maturity dates.
Hydro-Québec provided guarantees to the purchasers of its interests concerning all its representations and warranties in the sales agreements, for which no liability was recorded. The maximum quantifiable contingent risk under these guarantees is approximately $322 million. The representations and warranties of the Corporation apply for a period ending no later than December 12, 2007, except with respect to the contingent tax liabilities and certain other customary representations which remain in effect until the applicable limitation periods expire.
In accordance with the terms and conditions of certain debt securities issued outside Canada, the Corporation has a commitment to increase the amount of interest paid to non-residents in the event of changes to Canadian tax legislation governing the taxation of non-residents’ income. The Corporation cannot estimate the maximum amount it might have to pay under such circumstances. Should an amount become payable, the Corporation has the option of redeeming most of the securities in question.
Under the agreement with CF(L)Co, the Corporation could be required to provide additional funding if CF(L)Co were unable to pay its expenses and service its debt. The maximum amount that the Corporation could be required to pay cannot be reasonably evaluated, however, since it is not stated in the agreement and since the amount payable would depend on the outcome of future events whose nature and probability cannot be determined. To date, the Corporation has not had to pay any amount under this agreement.
Investments
The Corporation expects to invest approximately $4 billion in property, plant and equipment and intangible assets in 2007.
Agreements entered into with Aboriginal communities and regional county municipalities
Hydro-Québec has entered into various agreements related to capital projects and intangible assets with Aboriginal communities and regional county municipalities. The commitments under these agreements are recorded under Long-term debt if they fall within the definition of a liability, and the consideration is accounted for under Property, plant and equipment and Intangible assets.
Litigation
In the normal course of business, Hydro-Québec is sometimes party to claims and legal proceedings. Management is of the opinion that adequate provisions have been made for any disbursements that could result from these legal actions. Consequently, it does not foresee any adverse effect of such contingent liabilities on Hydro-Québec’s consolidated operating results or financial position.
Note 22 related party transactions
In the normal course of business, Hydro-Québec enters into various business transactions with the Québec government and its organizations, as well as with other government corporations. These transactions are measured at the exchange amount. Other transactions with the Québec government are described elsewhere in the consolidated financial statements.
59
Note 23 Segmented Information
Hydro-Québec carries on its activities in the four reportable segments defined below. The non-reportable segments and other activities are grouped together under Corporate and Other Activities for reporting purposes. A Technology Group was formed in 2006, basically covering activities related to technology development and telecommunications. These activities are presented under Corporate and Other Activities and include the transmission system telecommunications activities previously included in the Transmission segment.
Generation: Hydro-Québec Production operates and develops the Corporation’s generating facilities. This division also sells electricity on external markets and engages in energy trading. Hydro-Québec Production provides Hydro-Québec Distribution with a base volume of up to 165 TWh of heritage pool electricity annually at an average price of 2.79¢/kWh. In excess of this volume, it can participate in Hydro-Québec Distribution’s calls for tenders in a context of free market competition.
Transmission: Hydro-Québec TransÉnergie develops and operates the Corporation’s electric power transmission system in Québec.
Distribution: Hydro-Québec Distribution develops and operates the Corporation’s distribution system and is responsible for sales and services to Québec customers. It also ensures the security of the supply of electricity to the Québec market.
Construction: Hydro-Québec Équipement carries out engineering and construction work related to hydroelectric development projects throughout Québec, except on the territory governed by the James Bay and Northern Québec Agreement, where Société d’énergie de la Baie James assumes this responsibility. Hydro-Québec Équipement also carries out projects for the construction of power transmission lines and substations throughout Québec.
Corporate and Other Activities: The corporate units support the divisions in the achievement of their business objectives. They include the Technology Group, the Finance Group, the Human Resources and Shared Services Group, as well as Corporate Affairs and General Secretariat. The Shared Services Centre brings together services offered throughout the Corporation, including goods and services procurement, real estate management, material and transportation service management, and information technology. Corporate and Other Activities also includes activities related to exporting Hydro-Québec’s expertise abroad.
The amounts presented for each segment are based on the financial information used to establish the consolidated financial statements. The accounting policies used to calculate these amounts are as described in notes 1 and 3.
Intersegment transactions related to electricity sales are recorded based on the supply and transmission rates provided for by the Act respecting the Régie de l’énergie. The Act sets a commodity rate for a base volume of up to 165 TWh of heritage pool electricity for the Québec market.
The other intersegment products and services are valued at full cost.
Hydro-Québec derives the bulk of its revenue in Québec, and substantially all its property, plant and equipment is located in the province. In 2006, revenue from outside Québec amounted to $1,368 million, with $1,054 million coming from the United States ($1,665 million and $1,387 million, respectively, in 2005).
60
The following tables contain information related to operations and assets by segment:
| | 2006 | |
Segments | | Generation | | Transmission | | Distribution | | Construction | | Corporate
and Other
Activities | | Intersegment
eliminations | | Total | |
| | (in millions of Canadian dollars) | |
| | | | | | | | | | | | | | | |
Revenue | | | | | | | | | | | | | | | |
External customers | | $ | 1,594 | | $ | 32 | | $ | 9,488 | | $ | — | | $ | 48 | | $ | (1 | ) | $ | 11,161 | |
Intersegment | | $ | 4,570 | | $ | 2,809 | | $ | 55 | | $ | 1,999 | | $ | 1,146 | | $ | (10,579 | ) | $ | — | |
Depreciation and amortization | | $ | 760 | | $ | 535 | | $ | 570 | | $ | 7 | | $ | 144 | | $ | (9 | ) | $ | 2,007 | |
Financial expenses | | $ | 1,058 | | $ | 724 | | $ | 407 | | $ | (1 | ) | $ | 23 | | $ | 1 | | $ | 2,212 | |
Income from continuing operations | | $ | 2,114 | | $ | 632 | | $ | 42 | | $ | 2 | | $ | — | | $ | 7 | | $ | 2,797 | |
Net income | | $ | 2,114 | | $ | 632 | | $ | 42 | | $ | 2 | | $ | 944 | | $ | 7 | | $ | 3,741 | |
Total assets | | $ | 28,674 | | $ | 15,879 | | $ | 11,424 | | $ | 214 | | $ | 7,272 | | $ | (215 | ) | $ | 63,248 | |
Investments in property, plant and equipment and intangible assets | | | | | | | | | | | | | | | |
Affecting cash | | $ | 1,615 | | $ | 882 | | $ | 690 | | $ | 4 | | $ | 157 | | $ | — | | $ | 3,348 | |
Not affecting cash | | $ | 273 | | $ | 14 | | $ | 16 | | $ | — | | $ | — | | $ | — | | $ | 303 | |
| | 2005 | | |
Segments | | Generation | | Transmission | | Distribution | | Construction | | Corporate
and Other
Activities | | Intersegment
eliminations | | Total | | |
| | (in millions of Canadian dollars) | | |
| | | | | | | | | | | | | | | |
Revenue | | | | | | | | | | | | | | | |
External customers | | $ | 1,708 | | $ | 27 | | $ | 9,181 | | $ | 6 | | $ | 15 | | $ | (49 | ) | $ | 10,888 | |
Intersegment | | $ | 4,532 | | $ | 2,467 | | $ | 55 | | $ | 2,053 | | $ | 1,074 | | $ | (10,181 | ) | $ | — | |
Depreciation and amortization | | $ | 882 | | $ | 495 | | $ | 489 | | $ | 5 | | $ | 152 | | $ | — | | $ | 2,023 | |
Financial expenses | | $ | 1,050 | | $ | 691 | | $ | 384 | | $ | — | | $ | 61 | | $ | 1 | | $ | 2,187 | |
Income (loss) from continuing operations | | $ | 1,873 | | $ | 380 | | $ | 172 | | $ | 5 | | $ | (71 | ) | $ | (8 | ) | $ | 2,351 | |
Net income (loss) | | $ | 1,873 | | $ | 380 | | $ | 230 | | $ | 5 | | $ | (228 | ) | $ | (8 | ) | $ | 2,252 | |
Total assets | | $ | 27,482 | | $ | 15,553 | | $ | 10,556 | | $ | 242 | | $ | 6,831 | | $ | (232 | ) | $ | 60,432 | |
Investments in property, plant and equipment and intangible assets | | | | | | | | | | | | | | | |
Affecting cash | | $ | 1,780 | | $ | 723 | | $ | 645 | | $ | 6 | | $ | 128 | | $ | — | | $ | 3,282 | |
Not affecting cash | | $ | 9 | | $ | 12 | | $ | 8 | | $ | — | | $ | — | | $ | — | | $ | 29 | |
| | | | | | | | | | | | | | | | | | | | | | | | | | | | | | | | | | | | | | |
61
LONG-TERM DEBT BY ISSUE
The following table sets forth the non-consolidated long-term debt of Hydro-Québec outstanding as of December 31, 2006, expressed in Canadian dollars and in currency units:
Series | | Maturity
Date | | Issue Date (1) | | Interest
Rate % | | Canadian
Dollars | | CUSIP Number
or ISIN Code | | References (2) | |
| | | | | | | | | | | | | |
Payable in Canadian Dollars | | | | | | | | | | | | | |
| | | | | | | | | | | | | |
JA | | 2007-02-15 | | 1996-10-11 | | 7.000 | | $ | 377,307,000 | | 448814 GJ 6 | | | |
GO | | 2007-02-18 | | 1987-02-18 | | 9.750 | | 3,000,000 | | 448814 DT 7 | | (a)(b) | |
GZ | | 2008-06-01 | | 1988-06-08 | | 11.250 | | 2,000,000 | | 448814 DU 4 | | | |
JH | | 2009-07-15 | | 1999-06-30 | | 6.000 | | 390,000,000 | | 448814 HA 4 | | | |
HN | | 2010-08-16 | | 1990-08-16 | | — | | 191,946,389 | | 448814 DH 3 | | | |
JK | | 2011-02-15 | | 2000-06-12 | | 6.500 | | 1,300,000,000 | | 448814 HG 1 | | | |
HF | | 2011-09-26 | | 1989-09-26 | | 10.000 | | 566,734,596 | | 448814 DD 2 | | | |
GU2 | | 2012-07-16 | | 1987-07-16 | | 10.250 | | 1,117,000,000 | | 448814 CV 3 | | | |
HG | | 2019-11-22 | | 1989-11-22 | | 10.000 | | 100,000,000 | | 448814 DE 0 | | | |
II | | 2020-01-10 | | 1993-07-27 | | 10.250 | | 164,867,773 | | 448814 EF 6 | | | |
HL | | 2020-08-15 | | 1990-08-15 | | 11.000 | | 1,110,000,000 | | 448814 DG 5 | | | |
HM | | 2020-08-15 | | 1990-08-15 | | — | | 419,277,362 | | 448814 DK 6 | | | |
HX | | 2021-10-15 | | 1991-10-15 | | 10.500 | | 1,100,000,000 | | 448814 DW 0 | | | |
IC | | 2022-07-15 | | 1992-07-15 | | 9.625 | | 1,950,000,000 | | 448814 DZ 3 | | | |
IH | | 2031-02-26 | | 1993-07-27 | | 11.000 | | 228,313,315 | | 448814 EG 4 | | | |
JG | | 2031-08-15 | | 1999-01-26 | | 6.000 | | 825,675,000 | | 448814 GY 3 | | | |
JM | | 2045-02-15 | | 2006-10-17 | | 5.000 | | 1,000,000,000 | | CA448814 HZ 92 | | | |
| | | | | | | | | | | | | |
Medium-term notes issued under Canadian MTN program | | | | | | | | | |
| | | | | | | | | | | | | |
0048 | | 2007-03-21 | | 2003-03-21 | | Floating | | 165,800,000 | | 44889Z DT 0 | | | |
0053 | | 2007-06-01 | | 2004-05-04 | | Floating | | 5,000,000 | | 44889Z DY 9 | | (c) | |
0008 | | 2008-02-02 | | 1998-02-02 | | 5.500 | | 10,000,000 | | 44889Z BE 5 | | | |
0050 | | 2008-03-03 | | 2004-03-03 | | 3.406 | | 10,000,000 | | 44889Z DV 5 | | | |
0015 | | 2008-06-02 | | 1998-07-23 | | 5.750 | | 65,000,000 | | 44889Z CH 7 | | | |
0054 | | 2009-10-27 | | 2005-01-27 | | Floating | | 1,500,000,000 | | 44889Z EA 09 | | | |
0010 | | 2010-02-15 | | 1998-02-16 | | 6.000 | | 3,781,000 | | 44889Z BG 0 | | | |
0055 | | 2010-06-21 | | 2005-12-21 | | Floating | | 500,000,000 | | 44889Z EB 81 | | | |
0051 | | 2011-03-03 | | 2004-03-03 | | 4.301 | | 10,000,000 | | 44889Z DW 3 | | | |
0006 | | 2012-02-15 | | 1997-02-14 | | 5.750 | | 15,000,000 | | 44889Z DP 8 | | | |
0052 | | 2014-03-03 | | 2004-03-03 | | 4.783 | | 12,000,000 | | 44889Z DX 1 | | | |
0049 | | 2018-08-15 | | 2003-09-04 | | 5.500 | | 150,000,000 | | 44889Z DU 7 | | | |
0003 | | 2021-08-16 | | 1996-09-27 | | — | | 40,610,522 | | — | | (d) | |
0017 | | 2029-01-16 | | 1999-02-02 | | 6.500 | | 75,000,000 | | 44889Z CK 0 | | | |
0005 | | 2024-11-07 | | 1996-11-07 | | 7.500 | | 25,000,000 | | 44889Z DZ 6 | | | |
0038 | | 2031-08-15 | | 2001-01-17 | | 6.000 | | 4,325,000 | | 44889Z DG 8 | | | |
0009 | | 2035-01-16 | | 1998-02-03 | | 6.500 | | 686,500,000 | | 44889Z BF 2 | | | |
0011 | | 2035-01-16 | | 1998-02-18 | | Various | | 19,472,501 | | 44889Z BH 8 | | (e) | |
0016 | | 2035-01-16 | | 1998-07-27 | | 3.529 | | 101,267,173 | | 44889Z CJ 3 | | (f) | |
0019 | | 2035-02-15 | | 1999-04-30 | | 6.500 | | 3,794,000,000 | | 44889Z CM 6 | | | |
0012 | | 2035-07-16 | | 1998-06-05 | | Various | | 49,444,522 | | 44889Z BJ 4 | | (g) | |
0014 | | 2035-07-16 | | 1998-07-15 | | — | | 18,043,112 | | — | | (h) | |
0020 | | 2040-02-15 | | 1999-05-14 | | 6.000 | | 3,770,500,000 | | 44889Z CN 4 | | | |
0032 | | 2050-02-15 | | 2000-08-01 | | 6.000 | | 50,000,000 | | 44889Z DA 1 | | | |
0033 | | 2060-02-15 | | 2000-11-02 | | Various | | 283,903,409 | | 44889Z DB 9 | | (i) | |
0037 | | 2060-02-15 | | 2001-01-12 | | Various | | 45,693,165 | | 44889Z DF 0 | | (j) | |
0039 | | 2060-02-15 | | 2001-01-19 | | Various | | 171,121,171 | | 44889Z DH 6 | | (k) | |
0040 | | 2060-02-15 | | 2001-01-24 | | Various | | 21,321,370 | | 44889Z DJ 2 | | (l) | |
| | | | | | | | | | | | | |
Opimiscow Agreement | | | | | | | | 31,220,594 | | | | | |
Present value of lease obligations for regional offices and service facilities for a period not exceeding 25 years ending in 2010 | | | | | | | | 17,803,368 | | | | | |
Others | | | | | | | | 496,227,586 | | | | | |
Less: Sinking Funds Investments | | | | | | | | (706,564,025 | ) | | | | |
Debt classified by currency of issue | | | | | | | | 22,287,591,903 | | | | | |
Obligations under swaps | | | | | | | | 6,852,606,239 | | | | | |
Debt and swaps classified by currency of repayment | | | | | | | | 29,140,198,142 | | | | | |
| | | | | | | | | | | | | | |
62
Series | | Maturity
Date | | Issue Date (1) | | Interest
Rate % | | Canadian
Dollars (3) | | Currency Units | | CUSIP Number or
ISIN Code | | References (2) | |
| | | | | | | | | | | | | | | |
Payable in U.S. Dollars | | | | | | | | | | | | | |
| | | | | | | | | | | | | | | |
JL | | 2011-05-11 | | 2001-05-11 | | 6.300 | | $ | 873,975,000 | | US$ | 750,000,000 | | 448814 HR 7 | | | |
FU | | 2012-02-01 | | 1985-02-01 | | 11.750 | | 233,060,000 | | 200,000,000 | | 448814 CF 8 | | (a) | |
IF2 | | 2013-02-01 | | 1993-02-03 | | 8.000 | | 1,165,300,000 | | 1,000,000,000 | | 448814 ED 1 | | | |
IU | | 2016-04-01 | | 1996-04-01 | | 7.500 | | 466,120,000 | | 400,000,000 | | 448814 EK 5 | | | |
HS | | 2021-02-01 | | 1991-02-12 | | 9.400 | | 1,048,770,000 | | 900,000,000 | | 448814 DM 2 | | | |
HY | | 2022-01-15 | | 1992-01-30 | | 8.400 | | 1,165,299,999 | | 1,000,000,000 | | 448814 DX 8 | | | |
IO | | 2024-07-07 | | 1994-07-07 | | 8.050 | | 1,165,241,735 | | 999,950,000 | | 448814 EJ 8 | | | |
GF | | 2026-03-01 | | 1986-03-13 | | 8.875 | | 291,325,000 | | 250,000,000 | | 448814 CP 6 | | (a) | |
GH | | 2026-04-15 | | 1986-04-30 | | 8.250 | | 291,325,000 | | 250,000,000 | | 448814 CS 0 | | (a) | |
GQ | | 2027-01-15 | | 1987-01-29 | | 8.250 | | 291,325,000 | | 250,000,000 | | 448814 CT 8 | | | |
HE | | 2029-06-15 | | 1989-06-22 | | 8.625 | | 291,325,000 | | 250,000,000 | | 448814 DB 6 | | | |
HH | | 2029-12-01 | | 1989-12-07 | | 8.500 | | 582,650,000 | | 500,000,000 | | 448814 DC 4 | | | |
HK | | 2030-04-15 | | 1990-04-18 | | 9.375 | | 582,650,000 | | 500,000,000 | | 448814 DF 7 | | | |
HQ | | 2030-11-15 | | 1990-11-20 | | 9.500 | | 582,650,000 | | 500,000,000 | | 448814 DL 4 | | | |
| | | | | | | | | | | | | | | |
Medium-term notes issued under U.S. MTN program | | | | | | | | | | | |
| | | | | | | | | | | | | | | |
B-129 | | 2007-10-15 | | 1997-10-15 | | 6.750 | | 93,224,000 | | 80,000,000 | | 44881H EY 6 | | | |
B-123 | | 2009-10-05 | | 1994-10-05 | | 9.125 | | 29,132,500 | | 25,000,000 | | 44881H ES 9 | | | |
B-126 | | 2010-04-20 | | 1995-04-20 | | 7.580 | | 17,479,500 | | 15,000,000 | | 44881H EV 2 | | | |
B-30 | | 2011-12-15 | | 1991-12-06 | | 8.620 | | 46,612,000 | | 40,000,000 | | 44881H BD 5 | | | |
B-37 | | 2011-12-15 | | 1991-12-11 | | 8.540 | | 23,306,000 | | 20,000,000 | | 44881H BL 7 | | | |
B-7 | | 2020-12-11 | | 1990-12-10 | | 9.400 | | 11,653,000 | | 10,000,000 | | 44881H AF 1 | | | |
B-48 | | 2021-12-20 | | 1991-12-19 | | 8.680 | | 58,265,000 | | 50,000,000 | | 44881H BX 1 | | | |
B-49 | | 2022-02-15 | | 1992-02-24 | | 9.800 | | 58,265,000 | | 50,000,000 | | 44881H BY 9 | | | |
B-64 | | 2022-05-10 | | 1992-04-30 | | 9.750 | | 23,306,000 | | 20,000,000 | | 44881H CL 6 | | | |
B-124 | | 2024-11-18 | | 1994-11-18 | | 8.910 | | 29,132,500 | | 25,000,000 | | 44881H ET 7 | | | |
B-125 | | 2025-03-28 | | 1995-03-28 | | 8.400 | | 64,091,500 | | 55,000,000 | | 44881H EU 4 | | | |
B-127 | | 2026-01-03 | | 1996-01-03 | | 6.270 | | 58,265,000 | | 50,000,000 | | 44881H EW O | | | |
B-63 | | 2027-04-30 | | 1992-04-30 | | 9.500 | | 23,306,000 | | 20,000,000 | | 44881H CK 8 | | | |
B-130 | | 2028-07-13 | | 1998-07-13 | | 6.625 | | 58,264,999 | | 50,000,000 | | 44881H EZ 3 | | | |
| | | | | | | | | | | | | | | |
Medium-term note issued under Euro MTN program | | | | | | | | | |
35 | | 2007-06-10 | | 1997-06-10 | | 7.010 | | 349,590,000 | | 300,000,000 | | XS0076907970 | | | |
| | | | | | | | | | | | | | | |
Conditional sale transaction (Turbines) | | | | | | | | 78,919,489 | | 67,724,611 | | | | | |
Long-term debt before swaps | | | | | | | | 10,053,829,222 | | 8,627,674,611 | | | | | |
Net currency swaps (4) | | | | | | | | (1,156,189,930 | ) | — | | | | | |
Debt and swaps classified by currency of issue | | | | | | | | 8,897,639,292 | | US$ | 8,627,674,611 | | | | | |
| | | | | | | | | | | | | | | |
Debt and swap classified by currency of repayment | | | | | | | | 3,832,211,205 | | US$ | 3,288,604,827 | | | | | |
| | | | | | | | | | | | | | | |
Payable in Euro | | | | | | | | | | | | | | | |
| | | | | | | | | | | | | | | |
D15B | | 2016-05-01 | | 1986-05-01 | | 6.000 | | $ | 93,075,862 | | € | 60,529,289 | | DE0004780325 | | (a) | |
| | | | | | | | | | | | | | | |
Medium-term notes issued under Euro MTN program | | | | | | | | | | | | | | | |
33 | | 2008-03-13 | | 1997-03-13 | | 5.875 | | 351,631,185 | | 228,673,525 | | XS0074464974 | | | |
36 | | 2008-03-19 | | 1998-03-19 | | 5.375 | | 589,659,984 | | 383,468,910 | | DE0002303708 | | | |
Long-term debt before swaps | | | | | | | | 1,034,367,031 | | 672,671,724 | | | | | |
Net currency swaps (4) | | | | | | | | 73,601,097 | | — | | | | | |
Debt and swaps classified by currency of issue | | | | | | | | 1,107,968,128 | | € | 672,671,724 | | | | | |
| | | | | | | | | | | | | | | |
Debt and swaps classified by currency of repayment | | | | | | | | — | | € | — | | | | | |
| | | | | | | | | | | | | | | |
Payable in Japanese Yen | | | | | | | | | | | | | |
| | | | | | | | | | | | | | | |
Medium-term notes issued under Euro MTN program payable | | | | | | | | | | | |
29 | | 2007-02-13 | | 1997-02-13 | | 3.100 | | $ | 9,790,000 | | ¥ | 1,000,000,000 | | XS0073361106 | | | |
30 | | 2007-02-20 | | 1997-02-20 | | 3.150 | | 9,790,000 | | 1,000,000,000 | | XS0073684705 | | | |
38 | | 2009-10-20 | | 1999-10-20 | | 2.500 | | 4,895,000 | | 500,000,000 | | XS0102907085 | | | |
32 | | 2012-03-05 | | 1997-03-05 | | 4.400 | | 9,790,000 | | 1,000,000,000 | | XS0074215830 | | | |
34 | | 2017-03-17 | | 1997-03-17 | | 4.850 | | 9,790,000 | | 1,000,000,000 | | XS0074480319 | | | |
Long-term debt before swaps | | | | | | | | 44,055,000 | | 4,500,000,000 | | | | | |
Net currency swaps (4) | | | | | | | | 5,688,651 | | — | | | | | |
Debt and swaps classified by currency of issue | | | | | | | | 49,743,651 | | ¥ | 4,500,000,000 | | | | | |
| | | | | | | | | | | | | | | |
Debt and swaps classified by currency of repayment | | | | | | | | — | | ¥ | — | | | | | |
| | | | | | | | | | | | | | | | | | | |
63
Series | | Maturity
Date | | Issue Date (1) | | Interest
Rate % | | Canadian
Dollars (3) | | Currency Units | | CUSIP Number or
ISIN Code | | References (2) | |
Payable in Swiss Francs | | | | | | | | | | | | | | | |
| | | | | | | | | | | | | | | |
Medium-term note issued under Euro MTN program | | | | | | | | | | | | | | | |
37 | | 2008-02-06 | | 1998-04-24 | | 3.600 | | $ | 92,196,066 | | SF | 96,500,000 | | XS0086768529 | | | |
Long-term debt before swaps | | | | | | | | 92,196,066 | | 96,500,000 | | | | | |
Net currency swaps (4) | | | | | | | | 3,298,192 | | — | | | | | |
Debt and swaps classified by currency of issue | | | | | | | | 95,494,258 | | SF | 96,500,000 | | | | | |
| | | | | | | | | | | | | | | |
Debt and swaps classified by currency of repayment | | | | | | | | — | | SF | — | | | | | |
| | | | | | | | | | | | | | | |
Payable in Pounds Sterling | | | | | | | | | | | | | | | |
| | | | | | | | | | | | | | | |
EG | | 2011-05-31 | | 1981-05-20 | | 15.000 | | $ | 91,295,987 | | 40,000,000 | | GB0004494109 | | | |
HI | | 2015-03-08 | | 1990-03-08 | | 12.625 | | 342,359,954 | | 150,000,000 | | XS0015132904 | | (m) | |
FA | | 2015-09-13 | | 1982-09-13 | | 12.750 | | 114,119,984 | | 50,000,000 | | GB0004494216 | | | |
Long-term debt before swaps | | | | | | | | 547,775,925 | | 240,000,000 | | | | | |
Net currency swaps (4) | | | | | | | | (13,788,166 | ) | — | | | | | |
Debt and swaps classified by currency of issue | | | | | | | | 533,987,759 | | £ | 240,000,000 | | | | | |
| | | | | | | | | | | | | | | |
Debt and swaps classified by currency of repayment | | | | | | | | — | | £ | — | | | | | |
| | | | | | | | | | | | | | | |
Total Long-Term Debt | | | | | | | | $ | 32,972,409,347 | | | | | | | |
| | | | | | | | | | | | | | | |
| | | | | | | | | | | | | | | | | | |
(1) If more than one issue date, the date of the first issue is indicated.
(2) Not redeemable unless otherwise specified.
(3) Translated at rates in effect at December 31, 2006.
(4) Difference between the rate established under swaps and the rate at December 31, 2006 applied on the portion of the debt covered by swaps.
(a) Sinking-fund debentures.
(b) Redeemable at par in annual installments for sinking fund purposes one year after the date of issue.
(c) Maximum rate: 4.75% (including the Spread).
(d) Aggregate principal amount of $88 million sold at deep discount maturing semi-annually from February 15, 2011 to August 15, 2021 in equal payments.
(e) Fixed coupon amounts of $1.6 million semi-annually from January 16, 2022.
(f) Interest coupons of $3 million semi-annually from January 16, 1999 to January 16, 2014. Interest coupons of $5.525 million semi-annually from July 16, 2024 to January 16, 2035.
(g) Fixed rate coupon of 6.5% semi-annually commencing on January 16, 2026.
(h) Aggregate principal amount of $73.5 million sold at deep discount maturing semi-annually from January 16, 2025 to July 16, 2035 in various payment amounts.
(i) No interest payment until February 15, 2030 exclusive. Fixed rate coupon of 45% semi-annually commencing on February 15, 2030.
(j) No interest payment until February 15, 2041 exclusive. Interest coupons of $50 million annually from February 15, 2041 to February 15, 2045. Interest coupons of $35 million annually from February 15, 2046 to February 15, 2050. Interest coupons of $20 million annually from February 15, 2051 to February 15, 2055. Interest coupons of $10 million annually from February 15, 2056 to February 15, 2059.
(k) No interest payment until February 15, 2040 exclusive. Fixed rate coupon of 100% semi-annually commencing on February 15, 2040.
(l) No interest payment until February 15, 2050 exclusive. Interest coupons of $45 million annually from February 15, 2050 to February 15, 2052. Interest coupons of $40 million annually from February 15, 2053 to February 15, 2055. Interest coupons of $35 million annually from February 15, 2056 to February 15, 2058. Interest coupon of $30 million on February 15, 2059.
(m) Redeemable anytime at the highest of par or adjusted price as per the Fiscal Agency Agreement at the option of Hydro-Québec.
64
Exhibit (e)
INDEPENDENT AUDITORS’ CONSENT
We consent to the incorporation by reference in Registration statements Nos. 33-76074 and 333-112298 of our report dated February 9, 2007, relating to the consolidated balance sheets of Hydro-Québec as at December 31, 2006 and 2005, and the consolidated statements of operations, retained earnings and cash flows for each of the years in the two-year period ended December 31, 2006 appearing in the Annual Report on Form 18-K of Hydro-Québec for the year ended December 31, 2006.
KPMG LLP | Ernst & Young LLP |
Chartered Accountants | Chartered Accountants |
Montréal, Québec | Montréal, Québec |
| |
| |
May 10, 2007 | |
65
Exhibit (e)
INDEPENDENT AUDITORS’ CONSENT
We consent to the incorporation by reference in Registration Statements Nos. 33-76074 and 333-112298 of our report dated March 16, 2005, relating to the consolidated statements of operations, retained earnings and cash flows of Hydro-Québec for each of the years in the three-year period ended December 31, 2004 appearing in the Annual Report on Form 18-K of Hydro-Québec for the year ended December 31, 2006.
Samson Bélair/Deloitte & Touche s.e.n.c.r.l. | PricewaterhouseCoopers LLP |
Chartered Accountants | Chartered Accountants |
Montréal, Québec | Montréal, Québec |
| |
| |
May 10, 2007 | |
66