QuickLinks -- Click here to rapidly navigate through this document
UNITED STATES
SECURITIES AND EXCHANGE COMMISSION
Washington, D.C. 20549
FORM 18-K/A
For Foreign Governments and Political Subdivisions Thereof
AMENDMENT NO. 3
TO
ANNUAL REPORT
of
HYDRO-QUÉBEC
QUÉBEC, CANADA
(Name of Registrant)
Date of end of last fiscal year: December 31, 2006
SECURITIES REGISTERED*
(As of the close of the fiscal year)
|
Title of Issue
| | Amounts as to Which
Registration is Effective
| | Names of Exchanges
on Which Registered
|
|---|
|
| N/A | | N/A | | N/A |
|
Name and address of persons authorized to receive notices
and communications from the Securities and Exchange Commission:
| |
|
|---|
MR. BRUNO FORTIER
Delegate General
Québec Government House
One Rockefeller Plaza
26th Floor
New York, NY 10020-2102 |
Copies to: |
| | | |
MR. ROBERT E. BUCKHOLZ, JR.
Sullivan & Cromwell LLP
125 Broad Street
New York, NY 10004-2498 | | MR. DANIEL GARANT
Chief Financial Officer
Hydro-Québec
75 René-Lévesque Boulevard West
Montréal, Québec, Canada H2Z 1A4 |
* The Registrant is filing this annual report on a voluntary basis
The undersigned registrant hereby amends its Annual Report on Form 18-K for the fiscal year ended December 31, 2006 ("Annual Report") as follows:
The Annual Report on Form 18-K and amendments on Form 18-K/A are filed on a voluntary basis.
Pursuant to the requirements of the Securities Exchange Act of 1934, the registrant has duly caused this Amendment No. 3 to be signed on its behalf by its authorized agent.
| | | HYDRO-QUÉBEC |
|
|
By: |
|
/s/ LOUISE GUILLEMETTE
Authorized Officer |
| | | | | Name: Louise Guillemette
Title: Coordinator, Documentation |
Date: November 9, 2007
HYDRO-QUÉBEC
Quarterly Report
Third Quarter 2007
Message from the Chairman of the Board
and the President and Chief Executive Officer
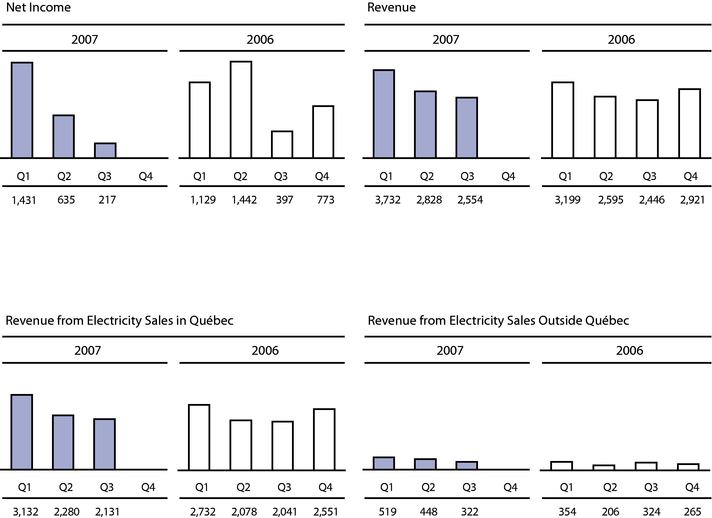
Summary of results for first three quarters
For the period from January 1 to September 30, 2007, income from continuing operations totaled $2,262 million, or $213 million more than for the same period of 2006. This increase is mainly due to growth in net electricity exports by Hydro-Québec Production, which accounted for $216 million, colder temperatures in 2007 than in 2006, which accounted for $158 million, and a positive variance of $211 million in net revenue from special contracts with large-power industrial customers. These factors were mitigated by the introduction, in January 2007, of water-power royalties payable by Hydro-Québec Production to the Québec government, for $199 million. It should also be noted that a $234-million non-recurring foreign exchange gain had been recognized in second quarter 2006 on debts and swaps denominated in U.S. dollars.
Income from discontinued operations was $21 million, compared to $919 million in 2006. The 2007 income resulted primarily from an $18-million gain in the first quarter on the sale of our interest in DirectLink (Australia). The 2006 income was chiefly derived from an $813-million gain on the sale of our interest in Transelec (Chile).
For the period from January 1 to September 30, 2007, net income totaled $2,283 million, as against $2,968 million in 2006.
Third quarter
Income from continuing operations for third quarter 2007 was $217 million, down $117 million from 2006. This result is mainly attributable to a reduction in Hydro-Québec Production's net electricity exports because of purchases made in the third quarter, reflecting prudent management of our energy reserves.
Consolidated results
For the nine months ended September 30, 2007, Revenue amounted to $9,114 million, a year-over-year increase of $874 million. Revenue from electricity sales rose by $1,097 million to $8,832 million. For the Québec market, the total was $7,543 million, up $692 million over 2006. Sales on markets outside Québec generated $1,289 million, an increase of $405 million. Other revenue was down $223 million, primarily because of the recognition on June 30, 2006, of the $234-million non-recurring foreign exchange gain on debts and swaps denominated in U.S. dollars.
In Québec, the $692-million increase in revenue from electricity sales was chiefly due to colder temperatures in 2007, growth in revenue from special contracts with large-power industrial customers and rate adjustments effective April 1, 2006 and 2007.
On markets outside Québec, the $405-million increase was attributable to a higher volume of exports by Hydro-Québec Production and, to a lesser extent, the resale of excess supply by Hydro-Québec Distribution.
Total expenditure was $5,003 million, or $482 million more than in 2006. The difference stems mainly from a $202-million increase in electricity purchases in excess of the heritage pool made by Hydro-Québec Distribution, a $66-million increase in short-term electricity purchases made outside Québec by Hydro-Québec Production and the introduction, in January 2007, of water-power royalties payable by Hydro-Québec Production to the Québec government, for $199 million.
Financial expenses were $1,849 million, up $179 million over 2006. The difference is in part attributable to higher interest rates on capital markets. In addition, the application of new accounting standards for financial instruments, which abolish the transitional rules granted in 2004, gave rise to an upward adjustment of retained earnings as at January 1, 2007, and consequently terminated the amortization of a deferred gain.
Segmented results
Generation
For the first nine months of the year, Hydro-Québec Production posted net income of $1,579 million, compared to $1,684 million in 2006, a year-over-year decrease of $105 million. The difference is mainly owing to the introduction of water-power royalties in January 2007, the increase in financial expenses and the recognition, during second quarter 2006, of the $234-million non-recurring foreign exchange gain on debts and swaps in U.S. dollars. These factors were largely offset by growth in net electricity exports and the increase in net revenue from special contracts with large-power industrial customers.
Transmission
Hydro-Québec TransÉnergie's net income amounted to $381 million for the first three quarters of 2007, a decrease of $149 million from last year.
Revenue was $2,097 million, down $73 million from $2,170 million in 2006. Following a decision of the Régie de l'énergie in April 2006, non-recurring native load transmission revenue of $170 million for 2005 had been recognized in revenue for second quarter 2006. This resulted in a reduction of $170 million in 2007, which was partially offset by additional income of $43 million approved by the Régie in a 2007 decision and by a $54-million increase in revenue generated by point-to-point transmission services, related to the increase in Hydro-Québec Production's exports and the resale of excess supply by Hydro-Québec Distribution. Financial expenses totaled $583 million, or $35 million higher than in 2006.
2
Distribution
Hydro-Québec Distribution posted net income of $287 million, versus a $175-million loss for the first nine months of 2006, a $462-million improvement. This increase is mainly due to higher revenue from electricity sales and a reduction in the cost of native load transmission service stemming from the fact that $170 million in non-recurring transmission costs for 2005 had been recorded in second quarter 2006. However, these factors were partially offset by a higher volume of electricity purchases in excess of the heritage pool and by an increase in financial expenses.
Revenue from electricity sales totaled $7,531 million, up $680 million over last year, basically because of colder temperatures in the first six months of 2007, the increase in revenue from special contracts with large-power industrial customers, and the April 2006 and 2007 rate adjustments. It should be noted that all risks related to special contracts are assumed by Hydro-Québec Production. Sales volume was 126.5 TWh, an increase of 3.1 TWh, attributable mainly to colder temperatures.
Construction
The Construction segment comprises the operations of Hydro-Québec Équipement and Société d'énergie de la Baie James.
For the first nine months of the year, the volume of activity totaled $1,455 million, compared to $1,367 million in 2006. As in 2006, several major projects are being carried out for Hydro-Québec Production and Hydro-Québec TransÉnergie. Noteworthy among them was the start of construction on the Eastmain-1-A/Sarcelle/Rupert project in the first quarter.
Investment
As at September 30, 2007, investments in fixed and intangible assets and in the implementation of the Energy Efficiency Plan totaled $2,473 million, compared to $2,303 million in 2006. As anticipated, a large portion of this amount was devoted to the development projects of Hydro-Québec Production, such as the Eastmain-1-A/Sarcelle/Rupert project and the Péribonka, Chute-Allard and Rapides-des-Coeurs hydroelectric developments.
Hydro-Québec TransÉnergie continued investing in its transmission system to bring new generating facilities onto the grid, to meet growth in demand and to ensure long-term operability. Hydro-Québec Distribution continued to invest to meet growth in demand and improve service quality, notably through deployment of the Energy Efficiency Plan.
3
Financing
In the third quarter, the Corporation reopened the bond offering launched in October 2006 and maturing in February 2045. The $498-million proceeds from this new issue brought total borrowings for the first three quarters to $1,024 million. The average cost of these financings, contracted on the Canadian market, was 4.87%.
The 2007 financing program is relatively modest compared to that of previous years, mainly because of funds available from the disposal of our foreign holdings, which was completed at the end of February 2007. The proceeds from our borrowings will be used to refinance debt maturing this year and to finance the investment program.
| /s/ Michael L. Turcotte | /s/ Thierry Vandal |
Michael L. Turcotte
Chairman of the Board |
Thierry Vandal
President and Chief Executive Officer |
November 9, 2007
4
CONSOLIDATED STATEMENTS OF OPERATIONS
In millions of Canadian dollars
(unaudited)
| | | | | Three months ended September 30 | | Nine months ended September 30 |
| | | Notes | | 2007 | | 2006 | | 2007 | | 2006 |
| | | | |
| |
|
| Revenue | | | | 2,554 | | 2,446 | | 9,114 | | 8,240 |
Expenditure |
|
|
|
|
|
|
|
|
|
|
| | Operations | | | | 597 | | 591 | | 1,820 | | 1,714 |
| | Electricity and fuel purchases | | | | 441 | | 303 | | 1,200 | | 950 |
| | Depreciation and amortization | | 3,4 | | 472 | | 487 | | 1,431 | | 1,472 |
| | Taxes | | | | 200 | | 143 | | 595 | | 385 |
| | Regulatory deferrals | | 3 | | (15 | ) | — | | (43 | ) | — |
| | | | |
| |
| |
| |
|
| | | | | 1,695 | | 1,524 | | 5,003 | | 4,521 |
| Operating income | | | | 859 | | 922 | | 4,111 | | 3,719 |
| Financial expenses | | 5 | | 642 | | 588 | | 1,849 | | 1,670 |
| | | | |
| |
| |
| |
|
| Income from continuing operations | | | | 217 | | 334 | | 2,262 | | 2,049 |
| Income from discontinued operations | | 6 | | — | | 63 | | 21 | | 919 |
| | | | |
| |
| |
| |
|
Net income |
|
|
|
217 |
|
397 |
|
2,283 |
|
2,968 |
| | | | |
| |
| |
| |
|
CONSOLIDATED STATEMENTS OF RETAINED EARNINGS
In millions of Canadian dollars
(unaudited)
| | | | | Three months ended September 30 | | Nine months ended September 30 |
| | | Note | | 2007 | | 2006 | | 2007 | | 2006 |
| | | | |
| |
|
| Balance at beginning of period | | | | 16,838 | | 15,646 | | 14,474 | | 13,075 |
| Adjustments related to the adoption of new accounting policies | | 2 | | — | | — | | 298 | | — |
| Net income | | | | 217 | | 397 | | 2,283 | | 2,968 |
| | | | |
| |
| |
| |
|
| Balance at end of period | | | | 17,055 | | 16,043 | | 17,055 | | 16,043 |
| | | | |
| |
| |
| |
|
The accompanying notes are an integral part of the consolidated financial statements.
5
CONSOLIDATED BALANCE SHEETS
In millions of Canadian dollars
| | |
Notes | | As at September 30,
2007
(unaudited
|
)
| As at December 31,
2006
(audited
|
)
|
| ASSETS | | | | | | | |
Current assets |
|
|
|
|
|
|
|
| | Cash and cash equivalents | | | | 442 | | 52 | |
| | Short-term investments | | | | 1,276 | | 3,178 | |
| | Accounts receivable | | | | 1,384 | | 1,597 | |
| | Derivative instruments | | | | 949 | | 1,491 | |
| | Materials, fuel and supplies | | | | 376 | | 365 | |
| | Assets held for sale | | 6 | | — | | 11 | |
| | | | |
| |
| |
| | | | | 4,427 | | 6,694 | |
Property, plant and equipment |
|
|
|
52,673 |
|
51,813 |
|
| Investments | | | | 227 | | 232 | |
| Derivative instruments | | | | 2,102 | | 1,093 | |
| Intangible assets | | | | 947 | | 923 | |
| Other assets | | | | 2,217 | | 2,462 | |
| Assets held for sale | | 6 | | — | | 31 | |
| | | | |
| |
| |
| | | | | 62,593 | | 63,248 | |
| | | | |
| |
| |
LIABILITIES |
|
|
|
|
|
|
|
Current liabilities |
|
|
|
|
|
|
|
| | Borrowings | | | | 65 | | 25 | |
| | Accounts payable and accrued liabilities | | | | 1,577 | | 1,818 | |
| | Dividends payable | | | | — | | 2,342 | |
| | Accrued interest | | | | 528 | | 936 | |
| | Regulatory liability | | | | 81 | | 251 | |
| | Current portion of long-term debt | | | | 993 | | 1,063 | |
| | Derivative instruments | | | | 521 | | 340 | |
| | Liabilities related to assets held for sale | | 6 | | — | | 1 | |
| | | | |
| |
| |
| | | | | 3,765 | | 6,776 | |
Long-term debt |
|
|
|
32,182 |
|
33,027 |
|
| Derivative instruments | | | | 2,894 | | 1,111 | |
| Asset retirement obligations | | | | 458 | | 431 | |
| Other long-term liabilities | | | | 692 | | 2,719 | |
| Long-term liabilities related to assets held for sale | | 6 | | — | | 7 | |
| Perpetual debt | | | | 287 | | 337 | |
| | | | |
| |
| |
| | | | | 40,278 | | 44,408 | |
| | | | |
| |
| |
SHAREHOLDER'S EQUITY |
|
|
|
|
|
|
|
| Share capital | | | | 4,374 | | 4,374 | |
| Retained earnings | | | | 17,055 | | 14,474 | |
| Accumulated other comprehensive income | | 8 | | 886 | | (8 | ) |
| | | | |
| |
| |
| | | | | 17,941 | | 14,466 | |
| | | | |
| |
| |
| | | | | 22,315 | | 18,840 | |
| | | | |
| |
| |
| | | | | 62,593 | | 63,248 | |
| | | | |
| |
| |
| Commitments and contingencies | | 11 | | | | | |
The accompanying notes are an integral part of the consolidated financial statements.
6
CONSOLIDATED STATEMENTS OF CASH FLOWS
In millions of Canadian dollars
(unaudited)
| | | | | Three months ended
September 30 | | Nine months ended
September 30 | |
| | | Notes | | 2007 | | 2006 | | 2007 | | 2006 | |
| | | | |
| |
| |
| Operating activities | | | | | | | | | | | |
| | Net income | | | | 217 | | 397 | | 2,283 | | 2,968 | |
| | Income from discontinued operations | | 6 | | — | | (63 | ) | (21 | ) | (919 | ) |
| | | | |
| |
| |
| |
| |
| | Income from continuing operations | | | | 217 | | 334 | | 2,262 | | 2,049 | |
| | Adjustments | | | | | | | | | | | |
| | | Depreciation and amortization | | 3, 4 | | 472 | | 487 | | 1,431 | | 1,472 | |
| | | Amortization of debt premiums, discounts and issue expenses | | 5 | | 19 | | 24 | | 80 | | 75 | |
| | | Exchange gain | | | | (45 | ) | (87 | ) | (134 | ) | (484 | ) |
| | | Difference between contributions paid and pension cost | | | | 74 | | (19 | ) | 221 | | (67 | ) |
| | | Regulatory deferrals | | | | (15 | ) | — | | (43 | ) | — | |
| | | Other | | | | 56 | | (14 | ) | 136 | | (56 | ) |
| | Change in non-cash working capital items | | 9 | | 239 | | (99 | ) | (469 | ) | (719 | ) |
| | | | |
| |
| |
| |
| |
| | | | | 1,017 | | 626 | | 3,484 | | 2,270 | |
Investing activities |
|
|
|
|
|
|
|
|
|
|
|
| | Property, plant and equipment and intangible assets | | | | (952 | ) | (811 | ) | (2,395 | ) | (2,242 | ) |
| | Long-term investments | | | | 6 | | 4 | | 30 | | 6 | |
| | Disposal of investments, net of divested cash and cash equivalents | | 6 | | — | | 114 | | 51 | | 1,945 | |
| | Energy Efficiency Plan | | | | (26 | ) | (24 | ) | (78 | ) | (61 | ) |
| | Net (acquisitions) disposals of short-term investments | | | | (1,121 | ) | (616 | ) | 1,929 | | (1,323 | ) |
| | Other | | | | (1 | ) | 35 | | (5 | ) | 46 | |
| | | | |
| |
| |
| |
| |
| | | | | (2,094 | ) | (1,298 | ) | (468 | ) | (1,629 | ) |
Financing activities |
|
|
|
|
|
|
|
|
|
|
|
| | Issuance of long-term debt | | | | 495 | | 3 | | 1,018 | | 2,733 | |
| | Repayment of long-term debt at maturity and sinking fund redemption | | | | (15 | ) | (368 | ) | (992 | ) | (1,029 | ) |
| | Redemption of long-term debt | | | | — | | (226 | ) | — | | (447 | ) |
| | Inflows resulting from credit risk management | | | | 300 | | 425 | | 769 | | 890 | |
| | Outflows resulting from credit risk management | | | | (390 | ) | (195 | ) | (1,110 | ) | (925 | ) |
| | Net change in short-term borrowings | | | | — | | — | | 40 | | 37 | |
| | Dividends paid | | | | — | | — | | (2,342 | ) | (1,126 | ) |
| | Other | | | | (1 | ) | 1 | | (2 | ) | (1 | ) |
| | | | |
| |
| |
| |
| |
| | | | | 389 | | (360 | ) | (2,619 | ) | 132 | |
| Change in foreign exchange on cash and cash equivalents | | | | (12 | ) | 2 | | (13 | ) | 1 | |
| | | | |
| |
| |
| |
| |
| Cash flows from continuing operations | | | | (700 | ) | (1,030 | ) | 384 | | 774 | |
| Cash flows from discontinued operations | | 6 | | — | | (259 | ) | 1 | | 17 | |
| | | | |
| |
| |
| |
| |
| Net change in cash and cash equivalents | | | | (700 | ) | (1,289 | ) | 385 | | 791 | |
| Cash and cash equivalents at beginning of period | | | | 1,142 | | 2,172 | | 57 | | 92 | |
| | | | |
| |
| |
| |
| |
| Cash and cash equivalents at end of period | | | | 442 | | 883 | | 442 | | 883 | |
| | | | |
| |
| |
| |
| |
Cash and cash equivalents |
|
|
|
|
|
|
|
|
|
|
|
| Continuing operations | | | | | | | | 442 | | 877 | |
| Discontinued operations | | | | | | | | — | | 6 | |
| | | | | | | | |
| |
| |
| | | | | | | | | 442 | | 883 | |
| | | | | | | | |
| |
| |
| Supplementary cash flow information | | 9 | | | | | | | | | |
The accompanying notes are an integral part of the consolidated financial statements.
7
CONSOLIDATED STATEMENTS OF COMPREHENSIVE INCOME
In millions of Canadian dollars
(unaudited)
| | | | | Three months ended
September 30 | | Nine months ended
September 30 |
| | | | | 2007 | | 2006 | | 2007 | | 2006 |
| | | | |
| |
|
| Net income | | | | 217 | | 397 | | 2,283 | | 2,968 |
| | | | |
| |
| |
| |
|
Other comprehensive income |
|
|
|
|
|
|
|
|
|
|
| Change in deferred gains on items designated as cash flow hedges | | | | 278 | | — | | 528 | | — |
| Reclassification to operations of deferred gains on items designated as cash flow hedges | | | | (42 | ) | — | | (118 | ) | — |
| | | | |
| |
| |
| |
|
| | | | | 236 | | — | | 410 | | — |
| | | | |
| |
| |
| |
|
| Other | | | | — | | — | | 5 | | — |
| | | | |
| |
| |
| |
|
| Comprehensive income | | | | 453 | | 397 | | 2,698 | | 2,968 |
| | | | |
| |
| |
| |
|
8
NOTES TO CONSOLIDATED FINANCIAL STATEMENTS (unaudited)
Amounts in tables are in millions of Canadian dollars, unless otherwise indicated.
Note 1 — Basis of Presentation
The consolidated financial statements have been prepared in accordance with Canadian generally accepted accounting principles (GAAP) and reflect the decisions of the Régie de l'énergie (the "Régie"). These decisions affect the timing of the recognition of certain transactions in consolidated operations, resulting in the recognition of regulatory assets and regulatory liabilities, which the Corporation considers it is likely to recover or settle subsequently through the rate-setting process. The quarterly consolidated financial statements and the present Notes should be read in conjunction with the Consolidated Financial Statements and accompanying Notes in Hydro-Québec's Annual Report 2006.
The accounting policies used to prepare the quarterly consolidated financial statements conform to those presented in Hydro-Québec's Annual Report 2006, except as regards the changes in accounting policies described in Note 2.
Certain figures from the corresponding period of the previous year have been reclassified in order to conform to the presentation adopted in the current year.
The Corporation's quarterly results are not necessarily indicative of results for the year on account of seasonal temperature fluctuations. Because of higher electricity demand during winter months, revenue from electricity sales in Québec is higher during the first and fourth quarters.
Note 2 — Changes in Accounting Policies
On January 1, 2007, Hydro-Québec adopted the recommendations of the Canadian Institute of Chartered Accountants (CICA) Handbook Section 3855, "Financial Instruments — Recognition and Measurement", which states requirements for the recognition and measurement of financial instruments, and Section 3865, "Hedges", which specifies how hedge accounting may be applied and the required disclosures to be made in this context. It also adopted the recommendations of Section 3861, "Financial Instruments — Disclosure and Presentation", and Section 1530, "Comprehensive Income". This last section establishes standards for the reporting and presentation of comprehensive income, which includes net income and other comprehensive income.
Section 3855 requires that financial instruments be measured at fair value when they are initially recognized. In subsequent periods, the measurement and recognition of changes in the fair value of financial instruments depend on the category in which such instruments are classified, namely, held-to-maturity investments, loans and receivables, financial assets and financial liabilities held for trading, available-for-sale financial assets, and other financial liabilities. Accounts receivable have been classified under loans and receivables, Derivative instruments under financial assets and financial liabilities held for trading, and Short-term investments under available-for-sale financial assets. Accounts payable and accrued liabilities, Current portion of long-term debt, Long-term debt, and Perpetual debt have been classified under other financial liabilities.
All financial instruments, including derivatives, are recorded at fair value at the balance sheet date, with the exception of those classified under held-to-maturity investments, loans and receivables, and other financial liabilities, which are measured at amortized cost, that is, including premiums, discounts and issue expenses. Commodity futures that can be settled net in cash are recorded at the date of settlement if there is a probability of delivery or receipt in accordance with expected requirements.
9
Financial assets held for trading, including derivative instruments, are recorded at fair value at the balance sheet date. Gains and losses arising from changes in fair value are recognized in operations for the period during which they occur, except in the case of derivative instruments designated as hedges in a cash flow hedging relationship accounted for in accordance with Section 3865. Available-for-sale financial assets are recorded at fair value at the balance sheet date. Deferred gains and losses arising from changes in fair value are recorded in Other comprehensive income until they are realized, at which time they are reclassified to operations.
As part of its integrated risk management, Hydro-Québec applies cash flow or fair value hedge accounting to the hedging relationships that meet the conditions established in Section 3865. In the case of a cash flow hedge, the effective portion of changes in the fair value of an instrument designated as a hedge is recorded in Other comprehensive income, and the gains and losses related to the ineffective portion are immediately recognized in operations, under the same line item as the hedged item. Amounts included in Accumulated other comprehensive income are reclassified to operations, also under the same component as the hedged item, during the periods in which the change in cash flows attributable to the hedged item impacts operations. In the case of a fair value hedge, the derivative instrument is recorded at fair value, and gains and losses stemming from changes in the fair value, including those related to the ineffective portion of the hedge, are recognized in operations under the same component as the hedged item. Changes in the fair value of the hedged items attributable to the hedged risk are recognized in operations as adjustments to the hedged item's carrying amount.
In addition, an embedded derivative must be separated from its host contract and recorded at fair value on the balance sheet under certain conditions. Hydro-Québec has chosen to apply this accounting treatment to all host contracts issued, acquired or substantially modified on or after January 1, 2003.
Hydro-Québec also adopted the recommendations of Section 1506, "Accounting Changes", which prescribes the accounting treatment and disclosure of changes in accounting policies, changes in accounting estimates and corrections of errors.
Prior period figures have not been restated in accordance with the new accounting policies, but certain balances on the consolidated balance sheet as at December 31, 2006, have been reclassified. Derivative instruments formerly presented under Accounts receivable, Swaps, Long-term debt, Current portion of long-term debt, Accounts payable and accrued liabilities, and Accrued interest are now reclassified under Derivative instruments on the balance sheet. Translation adjustments, which formerly were presented separately in Shareholder's equity, have been reclassified to Accumulated other comprehensive income.
The impacts of adopting the new accounting policies were as follows, as at January 1, 2007:
- •
- Retained earnings increased by $298 million, owing mainly to the recision of transitional rules related to the application of accounting guideline AcG-13 of the CICA Handbook, "Hedging Relationships", to the cumulative ineffectiveness of hedges, and to the transition from the straight-line method to the effective interest method for the amortization of financial assets and liabilities;
- •
- Accumulated other comprehensive income increased by $479 million, owing mainly to the recording of the effective portion of cash flow hedging relationships;
- •
- Long-term debt increased by $514 million, mainly as a result of being presented at amortized cost using the effective interest method;
- •
- Other long-term liabilities decreased by $2,051 million, owing to the accounting of cash flow hedging relationships, the write-off of unamortized transitional deferred gains related to the application of AcG-13, and the presentation of financial assets and financial liabilities at amortized cost using the effective interest method;
- •
- A decrease of $736 million in the net value of derivative instruments, which represents the variance between the fair value of derivative instruments and the portion already recorded on the balance sheet.
10
Note 3 — Regulatory
TRANSMISSION
In decision D-2007-34 of March 30, 2007, the Régie set the Corporation's power transmission rates effective January 1, 2007. The new rates take into account a 7.78% return on the rate base, assuming a capital structure with 30% shareholder's equity. The impact of this decision is essentially a $57-million increase in the annual cost of native load transmission service, which has not been integrated into the Corporation's current electricity rates.
DISTRIBUTION
In decision D-2007-22 of March 15, 2007, the Régie granted an across-the-board increase of 1.92% in the Corporation's electricity rates, effective April 1, 2007. This increase takes into account a 7.79% return on the rate base in 2007, assuming a capital structure with 35% shareholder's equity.
In accordance with the accounting practices authorized previously by the Régie, variances resulting from any modification of the annual cost of native load transmission service that has not been integrated into current electricity rates, as well as cost variances related to electricity purchases in excess of the heritage pool, give rise to the recognition of regulatory assets or liabilities, with a counterparty entry in Regulatory deferrals in the Consolidated Statements of Operations. The amortization of variances relative to 2005 and 2006 began in 2007. It has yielded credits of $36 million for third quarter 2007 and $108 million for the first nine months of the year. These amounts are included in Depreciation and amortization in the Consolidated Statements of Operations. The regulatory asset resulting from the increase in the annual cost of native load transmission service in 2007 was $44 million as at September 30, 2007, including capitalized financial expenses.
Note 4 — Depreciation and Amortization
| | | Three months ended September 30 | | Nine months ended September 30 |
| | | 2007 | | 2006 | | 2007 | | 2006 |
| | |
| |
|
| Property, plant and equipment | | 445 | | 427 | | 1,350 | | 1,293 |
| Intangible assets | | 28 | | 28 | | 82 | | 85 |
| Regulatory assets and liabilities | | (3 | ) | 29 | | (11 | ) | 80 |
| Deferred charges | | 1 | | 3 | | 8 | | 11 |
| Write-off of projects | | 1 | | — | | 2 | | 3 |
| | |
| |
| |
| |
|
| | | 472 | | 487 | | 1,431 | | 1,472 |
| | |
| |
| |
| |
|
11
Note 5 — Financial Expenses
| | | Three months ended
September 30 | | Nine months ended
September 30 | |
| | | 2007 | | 2006 | | 2007 | | 2006 | |
| | |
| |
| |
| Interest | | | | | | | | | |
| | Interest on debt securities | | 664 | | 638 | | 1,892 | | 1,764 | |
| | Amortization of debt premiums, discounts and issue expenses | | 19 | | 24 | | 80 | | 75 | |
| | |
| |
| |
| |
| |
| | | 683 | | 662 | | 1,972 | | 1,839 | |
| | |
| |
| |
| |
| |
| Net exchange loss (gain) | | 6 | | (9 | ) | 11 | | (19 | ) |
| Loan guarantee fees paid to the shareholder | | 43 | | 40 | | 127 | | 119 | |
| | |
| |
| |
| |
| |
| | | 49 | | 31 | | 138 | | 100 | |
| | |
| |
| |
| |
| |
| Less | | | | | | | | | |
| | Capitalized financial expenses | | 72 | | 80 | | 201 | | 224 | |
| | Net investment income | | 18 | | 25 | | 60 | | 45 | |
| | |
| |
| |
| |
| |
| | | 90 | | 105 | | 261 | | 269 | |
| | |
| |
| |
| |
| |
| | | 642 | | 588 | | 1,849 | | 1,670 | |
| | |
| |
| |
| |
| |
12
Note 6 — Discontinued Operations and Assets Held for Sale
On February 28, 2007, Hydro-Québec concluded the sale of its interest in HQI Australia Pty Ltd (DirectLink), through its wholly owned subsidiary Hydro-Québec International, for a cash consideration of $52 million, which gave rise to a gain of $18 million.
During the first nine months of 2006, Hydro-Québec had concluded the sale of several of its foreign holdings for a total cash consideration of $2.2 billion, resulting in a total gain of $878 million. For purposes of segmented information, the results of foreign holdings are classified under Corporate and Other Activities.
The following table presents operating results and cash flows from the interests presented as discontinued operations:
| | | Three months ended
September 30 | | Six months ended
September 30 | |
| | | 2007 | | 2006 | | 2007 | | 2006 | |
| | |
| |
| |
| Operations | | | | | | | | | |
| | Revenue | | — | | 20 | | 3 | | 289 | |
| | |
| |
| |
| |
| |
| | Income before net gain on disposal | | — | | 18 | | 2 | | 41 | |
| | |
| |
| |
| |
| |
| | Gain on disposal | | — | | 21 | | 19 | | 1,103 | |
| | Income taxes | | — | | 24 | | — | | (225 | ) |
| | |
| |
| |
| |
| |
| | Net gain on disposal | | — | | 45 | | 19 | | 878 | |
| | |
| |
| |
| |
| |
| Income from discontinued operations | | — | | 63 | | 21 | | 919 | |
| | |
| |
| |
| |
| |
| Cash flows | | | | | | | | | |
| | Operating activities | | — | | (115 | ) | 1 | | 69 | |
| | Investing activities | | — | | (136 | ) | — | | (29 | ) |
| | Financing activities | | — | | (5 | ) | — | | (16 | ) |
| | Change in foreign exchange on cash and cash equivalents | | — | | (3 | ) | — | | (7 | ) |
| | |
| |
| |
| |
| |
| Cash flows from discontinued operations | | — | | (259 | ) | 1 | | 17 | |
| | |
| |
| |
| |
| |
As at the disposal date, the assets and liabilities of these interests were as follows: |
|
|
|
| | Cash and cash equivalents | | | | | | 2 | | 128 | |
| | Other current assets | | | | | | 9 | | 54 | |
| | Long-term assets | | | | | | 34 | | 2,027 | |
| | Current liabilities | | | | | | 3 | | 184 | |
| | Long-term liabilities | | | | | | 10 | | 1,156 | |
| | | | | | |
| |
| |
| | | | | | | 32 | | 869 | |
| | | | | | |
| |
| |
13
Note 7 — Financial Instruments
The fair value of derivative instruments, designated or not designated as hedges, was as follows:
| | | As at September 30,
2007 | |
| | |
| |
| Instruments designated as cash flow hedges(a) | | (1,524 | ) |
| Instruments designated as fair value hedges | | (285 | ) |
| Instruments not designated as hedges(b) | | 1,445 | |
| | |
| |
| | | (364 | ) |
| | |
| |
- (a)
- A portion of the long-term debt with a nominal value of US$1,552 million as at September 30, 2007, was also designated as a cash flow hedge.
- (b)
- Transactions carried out as part of the Corporation's risk management, including $1,295 million in consideration of amounts received or disbursed with respect to credit risk mitigation arrangements.
Effect of cash flow hedges on operations
The ineffective portion of cash flow hedges recognized in operations represented a net gain of $3 million for third quarter 2007 and a net gain of $11 million for the first nine months of the year.
Moreover, as at September 30, 2007, Hydro-Québec estimated at $206 million the amount of existing net gains presented in Accumulated other comprehensive income which it expected to reclassify to operations in the next 12 months. At the same date, the maximum period over which Hydro-Québec would hedge its exposure to the variability of future cash flows for anticipated transactions was 23 years.
Effect of fair value hedges on operations
The ineffective portion of fair value hedges recognized in operations represented a net loss of $2 million for third quarter 2007 and a net loss of $5 million for the first nine months of the year.
Effect of revaluation of instruments not designated as hedges on operations
Following the revaluation at fair value of derivative instruments which were not accounted for using hedge accounting, a net gain of $12 million was recognized in operations for third quarter 2007 and a net gain of $33 million was recognized for the first nine months of the year.
14
Note 8 — Accumulated Other Comprehensive Income
| | | As at September 30,
2007 | |
| | |
| |
| | | Cash flow
hedges | |
Other | | | |
Total | |
| | |
| |
| | | |
| |
| Balance at beginning of period | | — | | (8 | ) | (a) | | (8 | ) |
| Adjustments related to the adoption of new accounting policies | | 479 | | — | | | | 479 | |
| Changes during the period | | 410 | | 5 | | | | 415 | |
| | |
| |
| | | |
| |
| Balance at end of period | | 889 | | (3 | ) | | | 886 | |
| | |
| |
| | | |
| |
- (a)
- With the adoption of new accounting policies, $8 million was reclassified to the opening balance of Accumulated other comprehensive income as translation adjustments, which were previously presented separately under Shareholder's Equity.
Note 9 — Supplementary Cash Flow Information
| | | Three months ended
September 30 | | Nine months ended
September 30 | |
| | | 2007 | | 2006 | | 2007 | | 2006 | |
| | |
| |
| |
| |
| |
| Change in non-cash working capital items | | | | | | | | | |
| | Accounts receivable | | 447 | | 347 | | 197 | | 345 | |
| | Materials, fuel and supplies | | 6 | | 5 | | (12 | ) | (25 | ) |
| | Accounts payable and accrued liabilities | | 95 | | (155 | ) | (245 | ) | (706 | ) |
| | Accrued interest | | (309 | ) | (296 | ) | (409 | ) | (333 | ) |
| | |
| |
| |
| |
| |
| | | 239 | | (99 | ) | (469 | ) | (719 | ) |
| | |
| |
| |
| |
| |
Investing activities not affecting cash |
|
|
|
|
|
|
|
|
|
| | Increase in property, plant and equipment and intangible assets | | 9 | | 7 | | 37 | | 148 | |
| | |
| |
| |
| |
| |
| Interest paid | | 847 | | 748 | | 1,969 | | 1,901 | |
| | |
| |
| |
| |
| |
15
Note 10 — Employee Future Benefits
| | | Three months ended
September 30
|
| | |
2007 | | Pension Plan
2006 | |
2007 | | Other Plans
2006 |
| | |
| |
|
| Accrued benefit cost | | 74 | | 71 | | 24 | | 21 |
| | |
| |
| |
| |
|
| | | Nine months ended
September 30
|
| | |
2007 | | Pension Plan
2006 | |
2007 | | Other Plans
2006 |
| | |
| |
|
| Accrued benefit cost | | 227 | | 213 | | 72 | | 70 |
| | |
| |
| |
| |
|
Note 11 — Commitments and Contingencies
Guarantees
As at September 30, 2007, the potential maximum amount Hydro-Québec could have had to pay under letters of credit and guarantees totaled $376 million. Of this amount, $299 million related to the purchase of energy, for which a liability in the amount of $16 million was recorded. Some guarantees expire between 2007 and 2019, while others do not have maturity dates.
Moreover, Hydro-Québec provided guarantees to the purchasers of its interests concerning all its representations and warranties in the sale agreements, for which no liability was recorded. The maximum quantifiable contingent risk under these guarantees is approximately $16 million. The representations and warranties of Hydro-Québec apply for a period ending no later than December 12, 2007, except with respect to the contingent tax liabilities and certain other customary representations which remain in effect until the applicable limitation periods expire.
16
Note 12 — Segmented Information
The following tables contain information related to operations and assets by segment:
Three months ended
September 30, 2007
|
| | |
Generation
| |
Transmission
| |
Distribution
| |
Construction
| |
Corporate and
Other Activities
| | Intersegment
eliminations and
adjustments
| |
Total
|
| Revenue | | | | | | | | | | | | | | |
| | External customers | | 319 | | 9 | | 2,153 | | — | | 23 | | 50 | (a) | 2,554 |
| | Intersegment | | 1,073 | | 679 | | 12 | | 632 | | 302 | | (2,698 | ) | — |
Income (loss) from continuing operations |
|
169 |
|
104 |
|
(85 |
) |
— |
|
27 |
|
2 |
|
217 |
| Net income (loss) | | 169 | | 104 | | (85 | ) | — | | 27 | | 2 | | 217 |
| Total assets as at September 30, 2007 | | 29,196 | | 15,963 | | 11,275 | | 335 | | 6,162 | | (338 | ) | 62,593 |
- (a)
- Resales of excess supply by Hydro-Québec Distribution on outside markets are presented as offsets of electricity purchases rather than under Revenue.
Three months ended
September 30, 2006
|
| | |
Generation
| |
Transmission
| |
Distribution
| |
Construction
| |
Corporate and
Other Activities
| | Intersegment
eliminations and
adjustments
| |
Total
|
| Revenue | | | | | | | | | | | | | | |
| | External customers | | 364 | | 8 | | 2,063 | | — | | 13 | | (2 | ) | 2,446 |
| | Intersegment | | 956 | | 659 | | 13 | | 529 | | 308 | | (2,465 | ) | — |
Income (loss) from continuing operations |
|
342 |
|
103 |
|
(127 |
) |
1 |
|
12 |
|
3 |
|
334 |
| Net income (loss) | | 342 | | 103 | | (127 | ) | 1 | | 75 | | 3 | | 397 |
| Total assets as at September 30, 2006 | | 28,183 | | 15,749 | | 10,509 | | 223 | | 7,045 | | (223 | ) | 61,486 |
17
Note 12 — Segmented Information (continued)
Nine months ended
September 30, 2007
|
| | |
Generation
| |
Transmission
| |
Distribution
| |
Construction
| |
Corporate and
Other Activities
| | Intersegment
eliminations and
adjustments
| |
Total
|
| Revenue | | | | | | | | | | | | | | |
| | External customers | | 1,301 | | 28 | | 7,607 | | — | | 41 | | 137 | (a) | 9,114 |
| | Intersegment | | 3,696 | | 2,069 | | 41 | | 1,455 | | 907 | | (8,168 | ) | — |
| Income from continuing operations | | 1,579 | | 381 | | 287 | | — | | 7 | | 8 | | 2,262 |
| Net income | | 1,579 | | 381 | | 287 | | — | | 28 | | 8 | | 2,283 |
| Total assets as at September 30, 2007 | | 29,196 | | 15,963 | | 11,275 | | 335 | | 6,162 | | (338 | ) | 62,593 |
- (a)
- Resales of excess supply by Hydro-Québec Distribution on outside markets are presented as offsets of electricity purchases rather than under Revenue.
Nine months ended
September 30, 2006
|
| | |
Generation
| |
Transmission
| |
Distribution
| |
Construction
| |
Corporate and
Other Activities
| | Intersegment
eliminations and
adjustments
| |
Total
|
| Revenue | | | | | | | | | | | | | | |
| | External customers | | 1,275 | (b) | 24 | | 6,912 | | — | | 30 | | (1 | ) | 8,240 |
| | Intersegment | | 3,329 | | 2,146 | | 40 | | 1,367 | | 881 | | (7,763 | ) | — |
| Income (loss) from continuing operations | | 1,684 | | 530 | | (175 | ) | 2 | | 3 | | 5 | | 2,049 |
| Net income (loss) | | 1,684 | | 530 | | (175 | ) | 2 | | 922 | | 5 | | 2,968 |
| Total assets as at September 30, 2006 | | 28,183 | | 15,749 | | 10,509 | | 223 | | 7,045 | | (223 | ) | 61,486 |
- (b)
- During the second quarter, a $234-million foreign exchange gain was recognized on debts and swaps denominated in U.S. dollars. In keeping with the adopted hedge accounting treatment, this amount, which represents the realization of a portion of the deferred foreign exchange gain recorded on the balance sheet, was incorporated into other operating revenue.
18
CONSOLIDATED FINANCIAL HIGHLIGHTS
In millions of Canadian dollars
(unaudited)
Summary of Operations | | Three months ended
September 30 | | Nine months ended
September 30 |
|
| | | 2007 | | 2006 | | Change (%) | | 2007 | | 2006 | | Change (%) |
|
| Revenue | | 2,554 | | 2,446 | | 4.4 | | UP | | 9,114 | | 8,240 | | 10.6 | | UP |
| Expenditure | | 1,695 | | 1,524 | | 11.2 | | UP | | 5,003 | | 4,521 | | 10.7 | | UP |
| Financial expenses | | 642 | | 588 | | 9.2 | | UP | | 1,849 | | 1,670 | | 10.7 | | UP |
| Discontinued operations | | — | | 63 | | 100.0 | | DOWN | | 21 | | 919 | | 97.7 | | DOWN |
| Net income | | 217 | | 397 | | 45.3 | | DOWN | | 2,283 | | 2,968 | | 23.1 | | DOWN |
19
Quarter Highlights
Generation
Mercier generating station
The fifth and final generating unit at Mercier came on stream in September. The station has an installed capacity of 51 MW and an annual output of 0.3 TWh.
Péribonka generating station
Impoundment of Péribonka reservoir began in late September. The water level should reach 70 m before the end of the year, allowing the generating units to be commissioned progressively.
Transmission
Vaudreuil-Soulanges substation
In July, Hydro-Québec TransÉnergie asked the Régie de l'énergie to authorize the construction of 120/25-kV Vaudreuil-Soulanges substation and its tie line, thereby creating a loop on the existing Dorion–Rigaud line. The project will cost $29.7 million, and the substation is scheduled for commissioning in 2009.
Saint-Maxime substation — Rebuilding of 25-kV section
In July, the Régie de l'énergie authorized Hydro-Québec TransÉnergie to increase the capacity of Saint-Maxime substation and rebuild its 25-kV section. The project will cost $42 million, and commissioning will take place from 2008 to 2010.
Reliability of transmission in Québec
In August, the Régie de l'énergie designated the Direction — Contrôle des mouvements d'énergie of Hydro-Québec TransÉnergie as transmission reliability coordinator for Québec. This decision confirms the implementation of new mandatory reliability standards in Québec. The division had been adhering to voluntary standards coordinated by the North American Reliability Corporation since 1968, now replaced by the new regime which incorporates all the mandatory reliability standards for power transmission throughout North America.
Distribution
Rate adjustment
In August, Hydro-Québec Distribution filed its 2008-2009 rate application with the Régie de l'énergie, proposing a 2.9% adjustment applicable April 1, 2008. The application will be the subject of public hearings before the Régie this fall.
20
Wind power — Tender call for 2,000 MW
In September, Hydro-Québec Distribution received 66 bids from more than 25 project proponents, for a total of 7,724 MW, in response to its October 2005 call for 2,000 MW of wind power. The division is studying the bids and will make its selection next spring. Once the contracts are signed, they must be approved by the Régie de l'énergie, and the selected proponents must obtain the approvals and permits required for construction of the wind farms.
Kuujjuaq generating station
In September, the Régie de l'énergie authorized Hydro-Québec Distribution to build a thermal generating station at Kuujjuaq to replace the existing one. The new plant will have five generating units for a total installed capacity of 6,425 kW. The $44.3-million facility is slated for commissioning in 2010.
Hydro-Québec, 75 René-Lévesque Blvd. West, Montréal, Québec H2Z 1A4
Ce document est également publié en français.
www.hydroquebec.com
ISSN 0848-5836
2007G001-3A
21
QuickLinks
NOTES TO CONSOLIDATED FINANCIAL STATEMENTS (unaudited) Amounts in tables are in millions of Canadian dollars, unless otherwise indicated.