UNITED STATES
SECURITIES AND EXCHANGE COMMISSION
Washington, D.C. 20549
FORMN-CSR
CERTIFIED SHAREHOLDER REPORT OF REGISTERED MANAGEMENT
INVESTMENT COMPANIES
Investment Company Act file number:811-00558
THE HARTFORD MUTUAL FUNDS II, INC.
(Exact name of registrant as specified in charter)
690 Lee Road, Wayne, Pennsylvania 19087
(Address of Principal Executive Offices) (Zip Code)
Thomas R. Phillips, Esquire
Hartford Funds Management Company, LLC
690 Lee Road
Wayne, Pennsylvania 19087
(Name and Address of Agent for Service)
Copy to:
John V. O’Hanlon, Esq.
Dechert LLP
One International Place, 40th Floor
100 Oliver Street
Boston, MA 02110-2605
Registrant’s telephone number, including area code: (610)386-4068
Date of fiscal year end: September 30
Date of reporting period: September 30, 2019
FormN-CSR is to be used by management investment companies to file reports with the Commission not later than 10 days after the transmission to stockholders of any report that is required to be transmitted to stockholders under Rule30e-1 under the Investment Company Act of 1940 (17 CFR270.30e-1). The Commission may use the information provided on FormN-CSR in its regulatory, disclosure review, inspection, and policymaking roles.
A registrant is required to disclose the information specified by FormN-CSR, and the Commission will make this information public. A registrant is not required to respond to the collection of information contained in FormN-CSR unless the Form displays a currently valid Office of Management and Budget (“OMB”) control number. Please direct comments concerning the accuracy of the information collection burden estimate and any suggestions for reducing the burden to Secretary, Securities and Exchange Commission, 450 Fifth Street, NW, Washington, DC 20549-0609. The OMB has reviewed this collection of information under the clearance requirements of 44 U.S.C. § 3507.
Item 1. Reports to Stockholders.
Hartford Funds
Our benchmark is the investor*.
Hartford Multifactor Funds
Annual Report
September 30, 2019
Hartford Multifactor International Fund
Hartford Multifactor Large Cap Value Fund
Beginning on January 1, 2021, as permitted by regulations adopted by the Securities and Exchange Commission, paper copies of each Fund’s shareholder reports like this one will no longer be sent by mail, unless you specifically request paper copies of the reports from the Fund or from your financial intermediary, such as a broker-dealer or bank. Instead, the reports will be made available on the Funds’ website (www.hartfordfunds.com). You will be notified by mail each time a report is posted and provided with a website link to access the report. You may at any time elect to receive paper copies of all shareholder reports free of charge by contacting your financial intermediary or, if you invest directly with a Fund, by calling 1-888-843-7824. Your election to receive reports in paper will apply to all Hartford Funds held in your account if you invest through your financial intermediary or directly with a Fund.
If you previously elected to receive shareholder reports and other communications electronically, you will not be affected by this change and you need not take any action. You may elect to receive shareholder reports and other communications electronically anytime by contacting your financial intermediary.

A MESSAGE FROM THE PRESIDENT
Dear Fellow Shareholders:
Thank you for investing in Hartford Multifactor Mutual Funds. The following is the Funds’ Annual Report covering the fiscal period ended September 30, 2019.
Market Review
During the 12 months ended September 30, 2019, U.S. stocks, as measured by the S&P 500 Index (the “Index”),1 gained 4.25%.
Political uncertainty remained a core driver of increased market volatility throughout the period. Escalating trade tensions between the U.S. and China, continued debate over how the UK will handle its departure from the European Union, and the September announcement of an impeachment inquiry against President Trump all weighed on markets.
Against this backdrop, however, July 1, 2019 marked a significant milestone: The U.S. entered the longest period of economic expansion on record, according to The National Bureau of Economic Research. Strong consumer spending in the U.S. has continued to buoy the domestic economy, helped by an unemployment rate that stayed at or below 4% throughout the 12-month period ended September 30, 2019.
However, signs of a slowing global economy prompted central banks around the world to shift to more accommodating monetary policy. The U.S. Federal Reserve cut interest rates in July and September 2019, to 1.75-2%, while the European Central Bank, which already had established negative interest rates, further cut its rate to -0.5% as of September 18, 2019.
Politics, both at home and abroad, are likely to continue to play a key role in market movements this year. For this reason, we encourage you to maintain a strong relationship with your financial advisor, who can help guide you through shifting markets confidently. He or she can help you proactively build a portfolio that takes market uncertainty into account, along with your unique investment goals and risk tolerances. Your advisor can help you find a fit within our family of funds as you work toward those goals.
Thank you again for investing in Hartford Multifactor Mutual Funds. For the most up-to-date information on our funds, please take advantage of all the resources available at hartfordfunds.com.

James Davey
President
Hartford Funds
| 1 | S&P 500 Index is a market capitalization-weighted price index composed of 500 widely held common stocks. |
Hartford Multifactor Funds
| 2 | ||||
| 6 | ||||
| 7 | ||||
Financial Statements: | ||||
Schedules of Investments: | ||||
| 8 | ||||
| 14 | ||||
| 17 | ||||
| 18 | ||||
| 19 | ||||
| 20 | ||||
| 21 | ||||
| 22 | ||||
| 32 | ||||
| 33 | ||||
How to Obtain a Copy of each Fund’s Proxy Voting Policies and Voting Records (Unaudited) | 37 | |||
| 37 | ||||
Approval of Investment Management and InvestmentSub-Advisory Agreements (Unaudited) | 38 | |||
The views expressed in each Fund’s Manager Discussion contained in the Fund Overview section are views of that Fund’ssub-adviser and portfolio management team through the end of the period and are subject to change based on market and other conditions. Each Fund’s Manager Discussion is for informational purposes only and does not represent an offer, recommendation or solicitation to buy, hold or sell any security. The specific securities identified and described, if any, do not represent all of the securities purchased or sold and you should not assume that investments in the securities identified and discussed will be profitable.
| Hartford Multifactor International Fund |
September 30, 2019 (Unaudited)
Inception 5/31/2019 (sub-advised by Mellon Investments Corporation) | Investment objective – The Fund seeks to provide investment results that, before fees and expenses, correspond to the total return performance of an index that tracks the performance of companies located in major developed markets of Europe, Canada and the Pacific Region. |
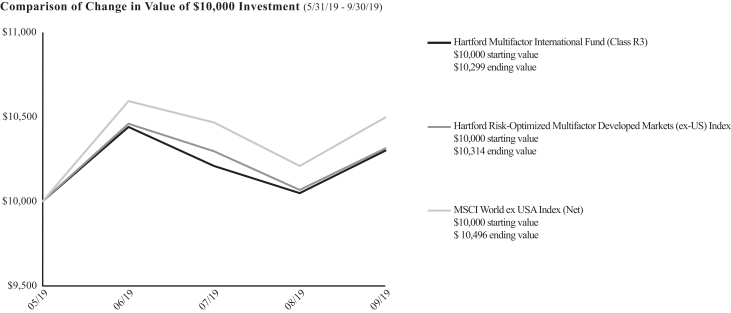
The chart above represents the hypothetical growth of a $10,000 investment in the Fund. The difference in returns between the Fund and the Index was primarily the result of the Fund’s operating expenses, including transaction costs, that are not reflected in the Index’s results.
Cumulative Total Returns
for the Period Ending 9/30/19
| Since Inception1 | ||||
Class R3 | 2.99% | |||
Class R4 | 3.02% | |||
Class R5 | 3.04% | |||
Class R6 | 3.05% | |||
Class Y | 3.04% | |||
Class F | 3.05% | |||
Hartford Risk-Optimized Multifactor Developed Markets (ex-US) Index | 3.14% | |||
MSCI World ex USA Index (Net) | 4.96% | |||
| 1 | Inception: 5/31/2019. Cumulative returns not annualized. |
PERFORMANCE DATA QUOTED REPRESENTS PAST PERFORMANCE AND DOES NOT GUARANTEE FUTURE RESULTS. The investment return and principal value of the investment will fluctuate so that investors’ shares, when redeemed, may be worth more or less than their original cost. The chart and table do not reflect the deductions of taxes that a shareholder would pay on Fund distributions or the redemption or sale of Fund shares. Current performance may be lower or higher than the performance data quoted. To obtain performance data current to the most recentmonth-end, please visit our website hartfordfunds.com.
Total returns presented above were calculated using the Fund’s net asset value available to shareholders for sale or redemption of Fund shares on September 30, 2019, which may exclude investment transactions as of this date. All share class returns assume the reinvestment of all distributions at net asset value and the deduction of all fund expenses.
You cannot invest directly in an index.
See “Benchmark Glossary” for benchmark descriptions.
Performance information may reflect historical or current expense waivers/reimbursements without which performance would have been lower. For more information on current expense waivers/reimbursements, please see the prospectus.
Operating Expenses*
| Gross | Net | |||||||
Class R3 | 1.18% | 1.04% | ||||||
Class R4 | 0.88% | 0.74% | ||||||
Class R5 | 0.58% | 0.44% | ||||||
Class R6 | 0.46% | 0.34% | ||||||
Class Y | 0.57% | 0.44% | ||||||
Class F | 0.46% | 0.34% | ||||||
| * | Expenses as shown in the Fund’s most recent prospectus. Gross expenses do not reflect contractual expense reimbursement arrangements. Net expenses reflect such arrangements in instances when they reduce gross expenses. These arrangements remain in effect until May 31, 2020 unless the Fund’s Board of Directors approves an earlier termination. Actual expenses may be higher or lower. Please see accompanying Financial Highlights for expense ratios for the period ended September 30, 2019. |
| 2 |
|
| Hartford Multifactor International Fund |
Fund Overview – (continued)
September 30, 2019 (Unaudited)
Manager Discussion
Hartford Multifactor International Fund (“the Fund”) seeks to provide investment results that, before fees and expenses, correspond to the total return performance of Hartford Risk-Optimized Multifactor Developed Markets (ex-US) Index (LRODMX) (“the Index”), which tracks the performance of companies located in major developed markets of Europe, Canada, and the Pacific Region.
The Fund seeks to generate returns by investing in index constituents that are selected and weighted through a rules-based methodology that seeks to:
1) Deliberately Allocate Risks by providing exposure to the growth potential of international companies while explicitly seeking to reduce volatility and drawdown risk.
2) Improve Diversification by diversifying exposure across developed market economies and potentially reducing individual country, currency, and individual company risks.
3) Enhance Return Potential by selecting companies with a favorable combination of low valuation (50%), high momentum (30%), and high quality (20%) investment factors.
4) Maintain Consistency by reapplying the index methodology twice a year in March and September to maintain intended investment exposures.
Class F shares of the Fund returned 3.05% at net asset value (“NAV”) for the fiscal period ending September 30, 2019 compared to the Hartford Risk-Optimized Multifactor Developed Markets (ex-US) Index, which returned 3.14% for the same period. The difference in returns between the Fund and the Index was primarily the result of transaction costs and operating expenses that are not reflected in the Index’s results. Derivatives were not used in the Fund in a significant manner and did not affect the Fund’s performance during the period.
Important Risks
Investing involves risk, including the possible loss of principal. Security prices fluctuate in value depending on general market and economic conditions and the prospects of individual companies.• Foreign investments may be more volatile and less liquid than U.S. investments and are subject to the risk of currency fluctuations and adverse political and economic developments.• Investments focused in a sector, industry or group of industries may increase volatility and risk.•The Fund is not actively managed but rather attempts to track the performance of an index. The Fund’s returns may diverge from that of the index.
Composition by Sector(1)
as of September 30, 2019
| Sector | Percentage of Net Assets | |||
Equity Securities |
| |||
Communication Services | 7.0 | % | ||
Consumer Discretionary | 10.1 | |||
Consumer Staples | 9.3 | |||
Energy | 5.0 | |||
Financials | 21.2 | |||
Health Care | 11.8 | |||
Industrials | 13.4 | |||
Information Technology | 5.8 | |||
Materials | 5.2 | |||
Real Estate | 6.2 | |||
Utilities | 6.1 | |||
|
| |||
Total | 101.1 | % | ||
|
| |||
Short-Term Investments | 0.0 | * | ||
Other Assets & Liabilities | (1.1 | ) | ||
|
| |||
Total | 100.0 | % | ||
|
| |||
| * | Percentage rounds to zero. |
| (1) | A sector may be comprised of several industries. For Fund compliance purposes, the Fund may not use the same classification system. These sector classifications are used for financial reporting purposes. |
| 3 |
|
| Hartford Multifactor Large Cap Value Fund |
Fund Overview
September 30, 2019 (Unaudited)
Inception 5/31/2019 (sub-advised by Mellon Investments Corporation) | Investment objective – The Fund seeks to provide investment results that, before fees and expenses, correspond to the total return performance of an index that tracks the performance of exchange traded value-oriented U.S. equity securities. |
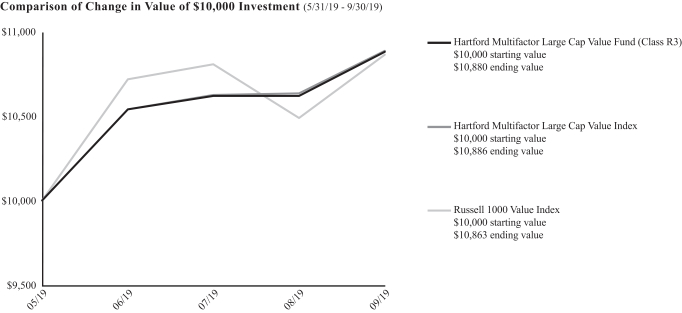
The chart above represents the hypothetical growth of a $10,000 investment in the Fund. The difference in returns between the Fund and the Index was primarily the result of the Fund’s operating expenses, including transaction costs, that are not reflected in the Index’s results.
Cumulative Total Returns
for the Period Ending 9/30/19
| Since Inception1 | ||||
Class R3 | 8.80% | |||
Class R4 | 8.80% | |||
Class R5 | 8.80% | |||
Class R6 | 8.80% | |||
Class Y | 8.80% | |||
Class F | 8.80% | |||
Hartford Multifactor Large Cap Value Index | 8.86% | |||
Russell 1000 Value Index | 8.63% | |||
| 1 | Inception: 5/31/2019. Cumulative returns not annualized. |
PERFORMANCE DATA QUOTED REPRESENTS PAST PERFORMANCE AND DOES NOT GUARANTEE FUTURE RESULTS. The investment return and principal value of the investment will fluctuate so that investors’ shares, when redeemed, may be worth more or less than their original cost. The chart and table do not reflect the deductions of taxes that a shareholder would pay on Fund distributions or the redemption or sale of Fund shares. Current performance may be lower or higher than the performance data quoted. To obtain performance data current to the most recentmonth-end, please visit our website hartfordfunds.com.
Total returns presented above were calculated using the Fund’s net asset value available to shareholders for sale or redemption of Fund shares on September 30, 2019, which may exclude investment transactions as of this date. All share class returns assume the reinvestment of all distributions at net asset value and the deduction of all fund expenses.
You cannot invest directly in an index.
See “Benchmark Glossary” for benchmark descriptions.
Performance information may reflect historical or current expense waivers/reimbursements without which performance would have been lower. For more information on current expense waivers/reimbursements, please see the prospectus.
Operating Expenses*
| Gross | Net | |||||||
Class R3 | 1.08% | 0.94% | ||||||
Class R4 | 0.78% | 0.64% | ||||||
Class R5 | 0.48% | 0.34% | ||||||
Class R6 | 0.36% | 0.24% | ||||||
Class Y | 0.47% | 0.34% | ||||||
Class F | 0.36% | 0.24% | ||||||
| * | Expenses as shown in the Fund’s most recent prospectus. Gross expenses do not reflect contractual expense reimbursement arrangements. Net expenses reflect such arrangements in instances when they reduce gross expenses. These arrangements remain in effect until May 31, 2020 unless the Fund’s Board of Directors approves an earlier termination. Actual expenses may be higher or lower. Please see accompanying Financial Highlights for expense ratios for the period ended September 30, 2019. |
| 4 |
|
| Hartford Multifactor Large Cap Value Fund |
Fund Overview – (continued)
September 30, 2019 (Unaudited)
Manager Discussion
Hartford Multifactor Large Cap Value Fund (“the Fund”) seeks to provide investment results that, before fees and expenses, correspond to the total return performance of Hartford Multifactor Large Cap Value Index (HMLCVX) (“the Index”), which tracks the performance of exchange traded value-oriented US equity securities.
The Fund seeks to generate returns by investing in index constituents that are selected and weighted through a rules-based methodology that seeks to:
1) Deliberately Allocate Risks by providing exposure to the growth potential of value-oriented US companies while explicitly seeking to reduce volatility and drawdown risk.
2) Improve Diversification by diversifying exposure across sectors and potentially reducing individual company risks.
3) Enhance Return Potential by selecting companies with a favorable combination of low valuation (50%), high momentum (30%), and high quality (20%) investment factors.
4) Maintain Consistency by reapplying the index methodology twice a year in March and September to maintain intended investment exposures.
Class F shares of the Fund returned 8.80% at net asset value (“NAV”) for the fiscal period ending September 30, 2019 compared to the Hartford Multifactor Large Cap Value Index, which returned 8.86% for the same period. The difference in returns between the Fund and the Index was primarily the result of transaction costs and operating expenses that are not reflected in the Index’s results. Derivatives were not used in the Fund in a significant manner and did not affect the Fund’s performance during the period.
Important Risks
Investing involves risk, including the possible loss of principal. Security prices fluctuate in value depending on general market and economic conditions and the prospects of individual companies.•Investments focused in a sector, industry or group of industries may increase volatility and risk.•The Fund is not actively managed but rather attempts to track the performance of an index. The Fund’s returns may diverge from that of the index.
Composition by Sector(1)
as of September 30, 2019
| Sector | Percentage of Net Assets | |||
Equity Securities |
| |||
Communication Services | 9.1 | % | ||
Consumer Discretionary | 7.1 | |||
Consumer Staples | 8.8 | |||
Energy | 6.6 | |||
Financials | 27.1 | |||
Health Care | 12.0 | |||
Industrials | 9.4 | |||
Information Technology | 7.7 | |||
Materials | 4.5 | |||
Real Estate | 4.1 | |||
Utilities | 7.2 | |||
|
| |||
Total | 103.6 | % | ||
|
| |||
Short-Term Investments | 0.1 | |||
Other Assets & Liabilities | (3.7 | ) | ||
|
| |||
Total | 100.0 | % | ||
|
| |||
| (1) | A sector may be comprised of several industries. For Fund compliance purposes, the Fund may not use the same classification system. These sector classifications are used for financial reporting purposes. |
| 5 |
|
| Hartford Multifactor Funds |
Hartford Risk-Optimized Multifactor Developed Markets(ex-US) Indexseeks to address risks and opportunities within developed market stocks located outside the United States by selecting equity securities exhibiting a favorable combination of factors, including value, momentum, and quality.
Hartford Multifactor Large Cap Value Index is designed to capture the performance potential of US equities by seeking the enhanced return potential of multiple risk factors while maintaining targeted ranges of exposures across size and sector dimensions.
MSCI World ex USA Index (Net)(reflects no deduction for fees, expenses or other taxes) is a free float-adjusted market capitalization index that is designed to capture large and mid cap representation across developed markets countries – excluding the United States.
Neither MSCI nor any other party involved in or related to compiling, computing or creating the MSCI data makes any express or implied warranties or representations with respect to such data (or the results to be obtained by the use thereof), and all such parties hereby expressly disclaim all warranties of originality, accuracy, completeness, merchantability or fitness for a particular purpose with respect to any of such data. Without limiting any of the foregoing, in no event shall MSCI, any of its affiliates or any third party involved in or related to compiling, computing or creating the data have any liability for any direct, indirect, special, punitive, consequential or any other damages (including lost profits) even if notified of the possibility of such damages. No further distribution or dissemination of the MSCI data is permitted without MSCI’s express written consent.
Russell 1000 Value Index(reflects no deduction for fees, expenses or taxes) is designed to measure the performance of those Russell 1000 Index companies with lowerprice-to-book ratios and lower forecasted growth values. The Russell 1000 Index is designed to measure the performance of the 1,000 largest companies in the Russell 3000 Index based on their market capitalization and current index membership.
| 6 |
|
| Hartford Multifactor Funds |
Your Fund’s Expenses
As a shareholder of a Fund, you incur two types of costs: (1) transaction costs and (2) ongoing costs, including investment management fees, distribution and/or service(12b-1) fees, if any, and other fund expenses. This example is intended to help you understand your ongoing costs (in dollars) of investing in a Fund and to compare these costs with the ongoing costs of investing in other mutual funds. The example is based on an investment of $1,000 invested at the beginning of the period and held for the entire period of May 31, 2019 (commencement of operations) through September 30, 2019, except as indicated below. To the extent a Fund was subject to acquired fund fees and expenses during the period, acquired fund fees and expenses are not included in the annualized expense ratios below.
Actual Expenses
The first set of columns of the table below provides information about actual account values and actual expenses. You may use this information, together with the amount you invested, to estimate the expenses that you paid over the period. Simply divide your account value by $1,000 (for example, an $8,600 account value divided by $1,000 = 8.6), then multiply the result by the number in the line under the heading entitled “Expenses Paid During The Period” to estimate the expenses you paid on your account during this period.
Hypothetical Example for Comparison Purposes
The second set of columns of the table below provides information about hypothetical account values and hypothetical expenses based on a Fund’s actual expense ratio and an assumed rate of return of 5% per year before expenses, which is not the Fund’s actual return. The hypothetical account values and expenses may not be used to estimate the actual ending account balance or expenses you paid for the period. You may use this information to compare the ongoing costs of investing in a Fund and other funds. To do so, compare this 5% hypothetical example with the 5% hypothetical examples that appear in the shareholder reports of the other funds.
Please note that the expenses shown in the table are meant to highlight your ongoing costs only and do not reflect any transactional costs. Therefore, the second set of columns of the table is useful in comparing ongoing costs only, and will not help you determine the relative total costs of owning different funds. In addition, if these transactional costs were included, your costs would be higher. Expenses for a class of a Fund are equal to the class’s annualized expense ratio multiplied by average account value over the period, multiplied by 183/365 (to reflect theone-half year period).
| Actual Return | Hypothetical (5% return before expenses)* | |||||||||||||||||||||||||||
| Beginning Account Value May 31, 2019 | Ending Account Value September 30, 2019 | Expenses paid during the period May 31, 2019 through September 30, 2019(2) | Beginning Account Value April 1, 2019 | Ending Account Value September 30, 2019 | Expenses paid during the period April 1, 2019 through September 30, 2019 | Annualized expense ratio | ||||||||||||||||||||||
Hartford Multifactor International Fund(1) |
| |||||||||||||||||||||||||||
Class R3 | $ | 1,000.00 | $ | 1,029.90 | $ | 1.59 | $ | 1,000.00 | $ | 1,022.71 | $ | 2.38 | 0.47 | % | ||||||||||||||
Class R4 | $ | 1,000.00 | $ | 1,030.20 | $ | 1.39 | $ | 1,000.00 | $ | 1,023.01 | $ | 2.08 | 0.41 | % | ||||||||||||||
Class R5 | $ | 1,000.00 | $ | 1,030.40 | $ | 1.19 | $ | 1,000.00 | $ | 1,023.31 | $ | 1.78 | 0.35 | % | ||||||||||||||
Class R6 | $ | 1,000.00 | $ | 1,030.50 | $ | 1.15 | $ | 1,000.00 | $ | 1,023.36 | $ | 1.72 | 0.34 | % | ||||||||||||||
Class Y | $ | 1,000.00 | $ | 1,030.40 | $ | 1.19 | $ | 1,000.00 | $ | 1,023.31 | $ | 1.78 | 0.35 | % | ||||||||||||||
Class F | $ | 1,000.00 | $ | 1,030.50 | $ | 1.15 | $ | 1,000.00 | $ | 1,023.36 | $ | 1.72 | 0.34 | % | ||||||||||||||
Hartford Multifactor Large Cap Value Fund(1) |
| |||||||||||||||||||||||||||
Class R3 | $ | 1,000.00 | $ | 1,088.00 | $ | 1.29 | $ | 1,000.00 | $ | 1,023.21 | $ | 1.88 | 0.37 | % | ||||||||||||||
Class R4 | $ | 1,000.00 | $ | 1,088.00 | $ | 1.08 | $ | 1,000.00 | $ | 1,023.51 | $ | 1.57 | 0.31 | % | ||||||||||||||
Class R5 | $ | 1,000.00 | $ | 1,088.00 | $ | 0.87 | $ | 1,000.00 | $ | 1,023.82 | $ | 1.27 | 0.25 | % | ||||||||||||||
Class R6 | $ | 1,000.00 | $ | 1,088.00 | $ | 0.84 | $ | 1,000.00 | $ | 1,023.87 | $ | 1.22 | 0.24 | % | ||||||||||||||
Class Y | $ | 1,000.00 | $ | 1,088.00 | $ | 0.87 | $ | 1,000.00 | $ | 1,023.82 | $ | 1.27 | 0.25 | % | ||||||||||||||
Class F | $ | 1,000.00 | $ | 1,088.00 | $ | 0.84 | $ | 1,000.00 | $ | 1,023.87 | $ | 1.22 | 0.24 | % | ||||||||||||||
| * | Please note that while the Funds commenced operations on May 31, 2019, the hypothetical expenses paid during the period reflect projected activity for the full six month period for purposes of comparability. This projection assumes that annualized expense ratios were in effect during the period April 1, 2019 to September 30, 2019. |
| (1) | Commenced operations on May 31, 2019. |
| (2) | Expenses paid during the period May 31, 2019 through September 30, 2019. |
| 7 |
|
Schedule of Investments
September 30, 2019
| Shares or Principal Amount | Market Value† | |||||||
| COMMON STOCKS - 101.1% | ||||||||
| Australia - 8.5% | ||||||||
| 1,040 | AGL Energy Ltd. | $ | 13,455 | |||||
| 594 | Amcor plc | 5,717 | ||||||
| 272 | Ansell Ltd. | 5,035 | ||||||
| 639 | Aurizon Holdings Ltd. | 2,547 | ||||||
| 761 | AusNet Services | 932 | ||||||
| 336 | Australia & New Zealand Banking Group Ltd. | 6,455 | ||||||
| 1,082 | Bendigo & Adelaide Bank Ltd. | 8,395 | ||||||
| 484 | BHP Group Ltd. | 11,960 | ||||||
| 1,079 | Caltex Australia Ltd. | 19,172 | ||||||
| 539 | CIMIC Group Ltd. | 11,453 | ||||||
| 1,159 | Coca-Cola Amatil Ltd. | 8,340 | ||||||
| 55 | Cochlear Ltd. | 7,740 | ||||||
| 237 | Coles Group Ltd. | 2,464 | ||||||
| 152 | Commonwealth Bank of Australia | 8,292 | ||||||
| 48 | CSL Ltd. | 7,589 | ||||||
| 1,060 | Dexus REIT | 8,538 | ||||||
| 1,809 | GPT Group REIT | 7,523 | ||||||
| 388 | Insurance Australia Group Ltd. | 2,070 | ||||||
| 47 | Macquarie Group Ltd. | 4,166 | ||||||
| 3,628 | Mirvac Group REIT | 7,495 | ||||||
| 170 | National Australia Bank Ltd. | 3,409 | ||||||
| 1,623 | Orora Ltd. | 3,167 | ||||||
| 2,583 | Qantas Airways Ltd. | 10,977 | ||||||
| 69 | Ramsay Health Care Ltd. | 3,023 | ||||||
| 4,264 | Scentre Group REIT | 11,313 | ||||||
| 426 | Sonic Healthcare Ltd. | 8,078 | ||||||
| 849 | South32 Ltd. | 1,497 | ||||||
| 1,075 | Stockland REIT | 3,302 | ||||||
| 192 | Suncorp Group Ltd.* | 1,771 | ||||||
| 4,341 | Telstra Corp. Ltd. | 10,290 | ||||||
| 3,618 | Vicinity Centres REIT | 6,277 | ||||||
| 6,441 | Viva Energy Group Ltd.(1) | 8,487 | ||||||
| 49 | Washington H Soul Pattinson & Co., Ltd. | 696 | ||||||
| 854 | Wesfarmers Ltd. | 22,945 | ||||||
| 150 | Westpac Banking Corp. | 2,996 | ||||||
| 537 | Whitehaven Coal Ltd. | 1,129 | ||||||
| 588 | Woolworths Group Ltd. | 14,796 | ||||||
|
| |||||||
| 263,491 | ||||||||
|
| |||||||
| Austria - 0.3% | ||||||||
| 75 | BAWAG Group AG*(1) | 2,951 | ||||||
| 28 | Lenzing AG | 2,697 | ||||||
| 38 | Oesterreichische Post AG | 1,334 | ||||||
| 31 | OMV AG | 1,661 | ||||||
| 145 | UNIQA Insurance Group AG | 1,310 | ||||||
|
| |||||||
| 9,953 | ||||||||
|
| |||||||
| Belgium - 2.0% | ||||||||
| 15 | Ackermans & van Haaren N.V. | 2,278 | ||||||
| 222 | Ageas | 12,307 | ||||||
| 246 | Colruyt S.A. | 13,476 | ||||||
| 27 | Elia System Operator S.A. | 2,207 | ||||||
| 556 | Proximus SADP | 16,521 | ||||||
| 16 | Sofina S.A. | 3,553 | ||||||
| 119 | Telenet Group Holding N.V. | 5,616 | ||||||
| 80 | UCB S.A. | 5,804 | ||||||
|
| |||||||
| 61,762 | ||||||||
|
| |||||||
| Canada - 11.4% | ||||||||
| 193 | Air Canada* | 6,295 | ||||||
| 358 | Alimentation Couche-Tard, Inc. Class B | 10,971 | ||||||
| 75 | Atco Ltd. Class I | 2,744 | ||||||
| 270 | Bank of Montreal | 19,886 | ||||||
| 135 | Bank of Nova Scotia | 7,668 | ||||||
| 263 | BCE, Inc. | 12,721 | ||||||
| 202 | Canadian Apartment Properties REIT | 8,305 | ||||||
| Shares or Principal Amount | Market Value† | |||||||
| COMMON STOCKS - 101.1% - (continued) | ||||||||
| Canada - 11.4% - (continued) | ||||||||
| 29 | Canadian Imperial Bank of Commerce | $ | 2,393 | |||||
| 66 | Canadian Tire Corp. Ltd. Class A | 7,406 | ||||||
| 61 | Canadian Utilities Ltd. Class A | 1,798 | ||||||
| 271 | Capital Power Corp. | 6,276 | ||||||
| 235 | CGI, Inc.* | 18,582 | ||||||
| 4 | Constellation Software, Inc. | 3,995 | ||||||
| 83 | Emera, Inc. | 3,644 | ||||||
| 491 | Empire Co., Ltd. Class A | 13,294 | ||||||
| 5 | Fairfax Financial Holdings Ltd. | 2,204 | ||||||
| 42 | Fortis, Inc. | 1,776 | ||||||
| 162 | George Weston Ltd. | 13,629 | ||||||
| 661 | Great-West Lifeco, Inc. | 15,871 | ||||||
| 316 | Husky Energy, Inc. | 2,223 | ||||||
| 704 | Hydro One Ltd.(1) | 13,013 | ||||||
| 160 | iA Financial Corp., Inc. | 7,281 | ||||||
| 151 | Imperial Oil Ltd. | 3,932 | ||||||
| 65 | Intact Financial Corp. | 6,542 | ||||||
| 209 | Loblaw Cos., Ltd. | 11,904 | ||||||
| 31 | Magna International, Inc. | 1,652 | ||||||
| 468 | Manulife Financial Corp. | 8,584 | ||||||
| 183 | Metro, Inc. | 8,057 | ||||||
| 48 | National Bank of Canada | 2,388 | ||||||
| 13 | Onex Corp. | 806 | ||||||
| 37 | Open Text Corp. | 1,509 | ||||||
| 311 | Parkland Fuel Corp. | 9,974 | ||||||
| 442 | Power Corp. of Canada | 10,182 | ||||||
| 653 | Power Financial Corp. | 15,141 | ||||||
| 43 | Quebecor, Inc. Class B | 976 | ||||||
| 293 | RioCan Real Estate Investment Trust REIT | 5,834 | ||||||
| 240 | Rogers Communications, Inc. Class B | 11,690 | ||||||
| 232 | Royal Bank of Canada | 18,819 | ||||||
| 126 | Saputo, Inc. | 3,873 | ||||||
| 139 | Shaw Communications, Inc. Class B | 2,731 | ||||||
| 404 | Sun Life Financial, Inc. | 18,065 | ||||||
| 178 | Suncor Energy, Inc. | 5,615 | ||||||
| 279 | TELUS Corp. | 9,929 | ||||||
| 29 | Thomson Reuters Corp. | 1,940 | ||||||
| 68 | Toromont Industries Ltd. | 3,285 | ||||||
| 129 | Toronto-Dominion Bank | 7,522 | ||||||
|
| |||||||
| 352,925 | ||||||||
|
| |||||||
| China - 0.3% | ||||||||
| 1,000 | Kerry Logistics Network Ltd. | 1,599 | ||||||
| 8,700 | Yangzijiang Shipbuilding Holdings Ltd. | 6,049 | ||||||
|
| |||||||
| 7,648 | ||||||||
|
| |||||||
| Denmark - 1.9% | ||||||||
| 7 | Carlsberg A/S Class B | 1,035 | ||||||
| 48 | Coloplast A/S Class B | 5,775 | ||||||
| 26 | GN Store Nord A/S | 1,054 | ||||||
| 274 | H. Lundbeck A/S | 9,084 | ||||||
| 206 | ISS A/S | 5,093 | ||||||
| 355 | Novo Nordisk A/S Class B | 18,345 | ||||||
| 70 | Orsted A/S(1) | 6,507 | ||||||
| 18 | Pandora A/S | 722 | ||||||
| 17 | Rockwool International A/S Class B | 3,399 | ||||||
| 92 | Topdanmark A/S | 4,441 | ||||||
| 127 | Tryg A/S | 3,639 | ||||||
|
| |||||||
| 59,094 | ||||||||
|
| |||||||
| Finland - 0.8% | ||||||||
| 223 | DNA Oyj | 5,076 | ||||||
| 50 | Elisa Oyj | 2,578 | ||||||
| 45 | Kesko Oyj Class B | 2,842 | ||||||
| 48 | Kone Oyj Class B | 2,732 | ||||||
| 34 | Neste Oyj | 1,125 | ||||||
The accompanying notes are an integral part of these financial statements.
| 8 |
|
| Hartford Multifactor International Fund |
Schedule of Investments – (continued)
September 30, 2019
| Shares or Principal Amount | Market Value† | |||||||
| COMMON STOCKS - 101.1% - (continued) | ||||||||
| Finland - 0.8% - (continued) | ||||||||
| 64 | Orion Oyj Class B | $ | 2,385 | |||||
| 123 | Sampo Oyj Class A | 4,887 | ||||||
| 127 | Tieto Oyj | 3,253 | ||||||
| 38 | Valmet Oyj | 737 | ||||||
|
| |||||||
| 25,615 | ||||||||
|
| |||||||
| France - 6.1% | ||||||||
| 46 | Air Liquide S.A. | 6,547 | ||||||
| 179 | Alstom S.A. | 7,415 | ||||||
| 8 | Arkema S.A. | 746 | ||||||
| 132 | AXA S.A. | 3,370 | ||||||
| 55 | BioMerieux | 4,549 | ||||||
| 603 | Bouygues S.A. | 24,148 | ||||||
| 76 | Cie de Saint-Gobain | 2,979 | ||||||
| 135 | Cie Generale des Etablissements Michelin SCA | 15,031 | ||||||
| 408 | CNP Assurances | 7,884 | ||||||
| 21 | Covivio REIT | 2,223 | ||||||
| 6 | Eiffage S.A. | 622 | ||||||
| 29 | Eurazeo SE | 2,157 | ||||||
| 59 | Ipsen S.A. | 5,597 | ||||||
| 7 | Klepierre S.A. REIT | 238 | ||||||
| 173 | Korian S.A. | 7,112 | ||||||
| 11 | L’Oreal S.A. | 3,076 | ||||||
| 58 | Nexity S.A. | 2,761 | ||||||
| 595 | Orange S.A. | 9,313 | ||||||
| 135 | Peugeot S.A. | 3,369 | ||||||
| 75 | Rubis SCA | 4,356 | ||||||
| 146 | Sanofi | 13,524 | ||||||
| 20 | Sartorius Stedim Biotech | 2,797 | ||||||
| 10 | Schneider Electric SE | 874 | ||||||
| 374 | SCOR SE | 15,442 | ||||||
| 54 | Sodexo S.A. | 6,062 | ||||||
| 851 | Suez | 13,375 | ||||||
| 54 | Thales S.A. | 6,207 | ||||||
| 308 | TOTAL S.A. | 16,037 | ||||||
| 71 | Veolia Environnement S.A. | 1,799 | ||||||
|
| |||||||
| 189,610 | ||||||||
|
| |||||||
| Germany - 6.1% | ||||||||
| 130 | 1&1 Drillisch AG | 4,052 | ||||||
| 59 | Allianz SE | 13,734 | ||||||
| 373 | Alstria Office AG REIT | 6,399 | ||||||
| 1,629 | Aroundtown S.A. | 13,324 | ||||||
| 27 | BASF SE | 1,888 | ||||||
| 10 | Bayerische Motoren Werke AG | 704 | ||||||
| 16 | Carl Zeiss Meditec AG | 1,824 | ||||||
| 187 | Covestro AG(1) | 9,253 | ||||||
| 821 | Deutsche Telekom AG | 13,771 | ||||||
| 105 | DWS Group GmbH & Co. KGaA(1) | 3,100 | ||||||
| 201 | Evonik Industries AG | 4,962 | ||||||
| 77 | Hannover Rueck SE | 13,014 | ||||||
| 39 | HeidelbergCement AG | 2,818 | ||||||
| 27 | Hochtief AG | 3,077 | ||||||
| 86 | Knorr-Bremse AG | 8,084 | ||||||
| 35 | LEG Immobilien AG | 4,005 | ||||||
| 205 | Merck KGaA | 23,093 | ||||||
| 875 | Metro AG | 13,804 | ||||||
| 65 | Muenchener Rueckversicherungs-Gesellschaft AG in Muenchen | 16,789 | ||||||
| 21 | Rheinmetall AG | 2,656 | ||||||
| 433 | Siemens Healthineers AG(1) | 17,026 | ||||||
| 95 | Talanx AG* | 4,105 | ||||||
| 1,215 | Telefonica Deutschland Holding AG | 3,388 | ||||||
| 79 | Vonovia SE | 4,008 | ||||||
|
| |||||||
| 188,878 | ||||||||
|
| |||||||
| Shares or Principal Amount | Market Value† | |||||||
| COMMON STOCKS - 101.1% - (continued) | ||||||||
| Hong Kong - 4.3% | ||||||||
| 5,000 | Champion REIT | $ | 3,235 | |||||
| 2,200 | Chow Tai Fook Jewellery Group Ltd. | 1,816 | ||||||
| 500 | CK Hutchison Holdings Ltd. | 4,414 | ||||||
| 1,000 | CLP Holdings Ltd. | 10,511 | ||||||
| 600 | Dairy Farm International Holdings Ltd. | 3,782 | ||||||
| 300 | Hang Seng Bank Ltd. | 6,464 | ||||||
| 1,000 | Henderson Land Development Co., Ltd. | 4,658 | ||||||
| 5,000 | HK Electric Investments & HK Electric Investments Ltd. | 4,765 | ||||||
| 1,000 | Hong Kong & China Gas Co., Ltd. | 1,949 | ||||||
| 1,400 | Hongkong Land Holdings Ltd. | 7,871 | ||||||
| 1,000 | Hysan Development Co., Ltd. | 4,033 | ||||||
| 100 | Jardine Matheson Holdings Ltd. | 5,352 | ||||||
| 100 | Jardine Strategic Holdings Ltd. | 2,991 | ||||||
| 1,000 | Link REIT | 11,031 | ||||||
| 4,000 | New World Development Co., Ltd. | 5,195 | ||||||
| 2,000 | NWS Holdings Ltd. | 3,098 | ||||||
| 10,000 | PCCW Ltd. | 5,614 | ||||||
| 2,000 | Sino Land Co., Ltd. | 3,006 | ||||||
| 2,000 | SITC International Holdings Co., Ltd. | 2,060 | ||||||
| 1,000 | Swire Pacific Ltd. Class A | 9,307 | ||||||
| 1,000 | Swire Properties Ltd. | 3,138 | ||||||
| 500 | VTech Holdings Ltd. | 4,364 | ||||||
| 11,500 | WH Group Ltd.(1) | 10,299 | ||||||
| 1,000 | Wharf Real Estate Investment Co., Ltd. | 5,462 | ||||||
| 2,500 | Yue Yuen Industrial Holdings Ltd. | 6,830 | ||||||
|
| |||||||
| 131,245 | ||||||||
|
| |||||||
| Ireland - 0.7% | ||||||||
| 30 | CRH plc | 1,030 | ||||||
| 349 | Glanbia plc | 4,336 | ||||||
| 96 | ICON plc* | 14,145 | ||||||
| 25 | Kerry Group plc Class A | 2,924 | ||||||
|
| |||||||
| 22,435 | ||||||||
|
| |||||||
| Israel - 1.8% | ||||||||
| 103 | Bank Hapoalim BM* | 812 | ||||||
| 1,489 | Bank LeumiLe-Israel BM | 10,601 | ||||||
| 1,111 | Israel Chemicals Ltd. | 5,558 | ||||||
| 3,876 | Israel Discount Bank Ltd. Class A | 17,036 | ||||||
| 487 | Mizrahi Tefahot Bank Ltd. | 12,101 | ||||||
| 95 | Strauss Group Ltd. | 2,989 | ||||||
| 73 | Taro Pharmaceutical Industries Ltd. | 5,508 | ||||||
|
| |||||||
| 54,605 | ||||||||
|
| |||||||
| Italy - 2.9% | ||||||||
| 2,035 | A2A S.p.A. | 3,734 | ||||||
| 39 | ACEA S.p.A. | 779 | ||||||
| 426 | Assicurazioni Generali S.p.A. | 8,256 | ||||||
| 19 | DiaSorin S.p.A. | 2,210 | ||||||
| 1,036 | Enel S.p.A. | 7,738 | ||||||
| 995 | Eni S.p.A. | 15,208 | ||||||
| 1,608 | Italgas S.p.A. | 10,377 | ||||||
| 404 | Pirelli & C. S.p.A.(1) | 2,392 | ||||||
| 951 | Poste Italiane S.p.A.(1) | 10,810 | ||||||
| 168 | Recordati S.p.A. | 7,205 | ||||||
| 1,640 | Unipol Gruppo S.p.A. | 8,733 | ||||||
| 4,319 | UnipolSai Assicurazioni S.p.A. | 11,485 | ||||||
|
| |||||||
| 88,927 | ||||||||
|
| |||||||
| Japan - 21.7% | ||||||||
| 100 | ABC-Mart, Inc. | 6,357 | ||||||
| 100 | Aeon Co., Ltd. | 1,837 | ||||||
| 200 | Alfresa Holdings Corp. | 4,481 | ||||||
| 300 | ANA Holdings, Inc. | 10,107 | ||||||
| 300 | Aozora Bank Ltd. | 7,518 | ||||||
| 200 | Asahi Kasei Corp. | 1,984 | ||||||
The accompanying notes are an integral part of these financial statements.
| 9 |
|
| Hartford Multifactor International Fund |
Schedule of Investments – (continued)
September 30, 2019
| Shares or Principal Amount | Market Value† | |||||||
| COMMON STOCKS - 101.1% - (continued) | ||||||||
| Japan - 21.7% - (continued) | ||||||||
| 700 | Astellas Pharma, Inc. | $ | 10,013 | |||||
| 200 | Azbil Corp. | 5,371 | ||||||
| 200 | Bandai Namco Holdings, Inc. | 12,471 | ||||||
| 300 | Bic Camera, Inc. | 3,168 | ||||||
| 400 | Bridgestone Corp. | 15,566 | ||||||
| 400 | Brother Industries Ltd. | 7,289 | ||||||
| 200 | Canon Marketing Japan, Inc. | 4,264 | ||||||
| 400 | Canon, Inc. | 10,697 | ||||||
| 200 | Dai-ichi Life Holdings, Inc. | 3,041 | ||||||
| 1,800 | Daiwa Securities Group, Inc. | 8,055 | ||||||
| 400 | FUJIFILM Holdings Corp. | 17,620 | ||||||
| 100 | Fujitsu Ltd. | 8,037 | ||||||
| 400 | Hakuhodo DY Holdings, Inc. | 5,812 | ||||||
| 500 | Haseko Corp. | 5,848 | ||||||
| 200 | Heiwa Corp. | 4,125 | ||||||
| 100 | Hitachi High-Technologies Corp. | 5,813 | ||||||
| 200 | Hitachi Ltd. | 7,490 | ||||||
| 400 | Hitachi Metals Ltd. | 4,344 | ||||||
| 100 | Hitachi Transport System Ltd. | 2,929 | ||||||
| 400 | Honda Motor Co., Ltd. | 10,474 | ||||||
| 100 | Hoya Corp. | 8,190 | ||||||
| 400 | Iida Group Holdings Co., Ltd. | 6,531 | ||||||
| 600 | ITOCHU Corp. | 12,428 | ||||||
| 500 | Japan Airlines Co., Ltd. | 14,850 | ||||||
| 600 | Japan Post Holdings Co., Ltd. | 5,537 | ||||||
| 1,800 | JXTG Holdings, Inc. | 8,228 | ||||||
| 800 | K’s Holdings Corp. | 8,713 | ||||||
| 300 | Kajima Corp. | 3,952 | ||||||
| 100 | Kaken Pharmaceutical Co., Ltd. | 4,651 | ||||||
| 100 | Kansai Electric Power Co., Inc. | 1,120 | ||||||
| 300 | KDDI Corp. | 7,828 | ||||||
| 2,600 | Konica Minolta, Inc. | 18,191 | ||||||
| 300 | Kyushu Railway Co. | 9,576 | ||||||
| 100 | Lawson, Inc. | 5,121 | ||||||
| 200 | Marubeni Corp. | 1,334 | ||||||
| 700 | Mazda Motor Corp. | 6,274 | ||||||
| 1,900 | Mebuki Financial Group, Inc. | 4,699 | ||||||
| 400 | Medipal Holdings Corp. | 8,929 | ||||||
| 200 | Mitsubishi Chemical Holdings Corp. | 1,433 | ||||||
| 200 | Mitsubishi Corp. | 4,925 | ||||||
| 200 | Mitsubishi Electric Corp. | 2,668 | ||||||
| 300 | Mitsubishi Heavy Industries Ltd. | 11,792 | ||||||
| 100 | Mitsubishi Tanabe Pharma Corp. | 1,102 | ||||||
| 200 | NEC Corp. | 8,457 | ||||||
| 100 | NH Foods Ltd. | 4,026 | ||||||
| 300 | Nihon Kohden Corp. | 8,841 | ||||||
| 300 | Nikon Corp. | 3,764 | ||||||
| 200 | Nippo Corp. | 3,715 | ||||||
| 300 | Nippon Kayaku Co., Ltd. | 3,597 | ||||||
| 300 | Nippon Telegraph & Telephone Corp. | 14,353 | ||||||
| 500 | Nissan Motor Co., Ltd. | 3,122 | ||||||
| 200 | NTT Data Corp. | 2,596 | ||||||
| 400 | NTT DOCOMO, Inc. | 10,214 | ||||||
| 300 | Obayashi Corp. | 3,000 | ||||||
| 400 | ORIX Corp. | 5,984 | ||||||
| 400 | Osaka Gas Co., Ltd. | 7,683 | ||||||
| 100 | Otsuka Holdings Co., Ltd. | 3,756 | ||||||
| 700 | Panasonic Corp. | 5,705 | ||||||
| 200 | Resona Holdings, Inc. | 861 | ||||||
| 200 | Ricoh Co., Ltd. | 1,809 | ||||||
| 100 | Rohto Pharmaceutical Co., Ltd. | 2,745 | ||||||
| 200 | Sankyo Co., Ltd. | 6,882 | ||||||
| 200 | Sawai Pharmaceutical Co., Ltd. | 10,347 | ||||||
| 100 | Secom Co., Ltd. | 9,151 | ||||||
| 700 | Seiko Epson Corp. | 9,943 | ||||||
| Shares or Principal Amount | Market Value† | |||||||
| COMMON STOCKS - 101.1% - (continued) | ||||||||
| Japan - 21.7% - (continued) | ||||||||
| 100 | Sekisui Chemical Co., Ltd. | $ | 1,556 | |||||
| 700 | Sekisui House Ltd. | 13,812 | ||||||
| 200 | Seven & i Holdings Co., Ltd. | 7,665 | ||||||
| 300 | SG Holdings Co., Ltd. | 7,352 | ||||||
| 100 | Shimamura Co., Ltd. | 7,945 | ||||||
| 200 | Ship Healthcare Holdings, Inc. | 8,527 | ||||||
| 700 | Skylark Holdings Co., Ltd. | 12,745 | ||||||
| 300 | Softbank Corp. | 4,065 | ||||||
| 1,100 | Sojitz Corp. | 3,422 | ||||||
| 500 | Sony Financial Holdings, Inc. | 10,887 | ||||||
| 500 | Subaru Corp. | 14,140 | ||||||
| 200 | Sumitomo Dainippon Pharma Co., Ltd. | 3,309 | ||||||
| 600 | Sumitomo Electric Industries Ltd. | 7,657 | ||||||
| 500 | Sumitomo Forestry Co., Ltd. | 6,676 | ||||||
| 100 | Sumitomo Rubber Industries Ltd. | 1,191 | ||||||
| 200 | Suzuken Co., Ltd. | 10,766 | ||||||
| 100 | Taisei Corp. | 3,892 | ||||||
| 300 | Taiyo Nippon Sanso Corp. | 6,098 | ||||||
| 200 | Teijin Ltd. | 3,860 | ||||||
| 100 | Terumo Corp. | 3,236 | ||||||
| 300 | Tokio Marine Holdings, Inc. | 16,094 | ||||||
| 200 | Tokyo Electric Power Co. Holdings, Inc.* | 981 | ||||||
| 400 | Tokyo Gas Co., Ltd. | 10,117 | ||||||
| 300 | Toyota Boshoku Corp. | 4,219 | ||||||
| 100 | TS Tech Co., Ltd. | 3,059 | ||||||
| 200 | Tsumura & Co. | 5,374 | ||||||
| 200 | TV Asahi Holdings Corp. | 3,157 | ||||||
| 100 | West Japan Railway Co. | 8,461 | ||||||
| 600 | Yamada Denki Co., Ltd. | 2,907 | ||||||
| 200 | Yamazaki Baking Co., Ltd. | 3,577 | ||||||
| 100 | Zensho Holdings Co., Ltd. | 2,160 | ||||||
|
| |||||||
| 672,241 | ||||||||
|
| |||||||
| Luxembourg - 0.2% | ||||||||
| 251 | Grand City Properties S.A. | 5,647 | ||||||
| 750 | L’Occitane International S.A. | 1,492 | ||||||
|
| |||||||
| 7,139 | ||||||||
|
| |||||||
| Netherlands - 3.6% | ||||||||
| 493 | Aegon N.V.(2) | 2,047 | ||||||
| 447 | ASR Nederland N.V. | 16,494 | ||||||
| 132 | GrandVision N.V.(1) | 3,953 | ||||||
| 793 | Koninklijke Ahold Delhaize N.V. | 19,831 | ||||||
| 91 | Koninklijke DSM N.V. | 10,955 | ||||||
| 410 | NN Group N.V. | 14,530 | ||||||
| 342 | Randstad N.V. | 16,791 | ||||||
| 661 | Royal Dutch Shell plc Class A | 19,386 | ||||||
| 91 | Wolters Kluwer N.V. | 6,640 | ||||||
|
| |||||||
| 110,627 | ||||||||
|
| |||||||
| New Zealand - 0.5% | ||||||||
| 473 | Contact Energy Ltd. | 2,530 | ||||||
| 91 | EBOS Group Ltd. | 1,425 | ||||||
| 635 | Fisher & Paykel Healthcare Corp. Ltd. | 6,890 | ||||||
| 59 | Mainfreight Ltd. | 1,475 | ||||||
| 150 | Meridian Energy Ltd. | 488 | ||||||
| 1,013 | Spark New Zealand Ltd.* | 2,797 | ||||||
|
| |||||||
| 15,605 | ||||||||
|
| |||||||
| Norway - 1.4% | ||||||||
| 341 | Austevoll Seafood ASA | 3,238 | ||||||
| 628 | Equinor ASA | 11,896 | ||||||
| 321 | Leroy Seafood Group ASA | 1,953 | ||||||
| 238 | Marine Harvest ASA* | 5,497 | ||||||
| 890 | Orkla ASA | 8,098 | ||||||
| 20 | Salmar ASA | 878 | ||||||
| 210 | SpareBank 1SR-Bank ASA | 2,287 | ||||||
The accompanying notes are an integral part of these financial statements.
| 10 |
|
| Hartford Multifactor International Fund |
Schedule of Investments – (continued)
September 30, 2019
| Shares or Principal Amount | Market Value† | |||||||
| COMMON STOCKS - 101.1% - (continued) | ||||||||
| Norway - 1.4% - (continued) | ||||||||
| 509 | Telenor ASA | $ | 10,212 | |||||
|
| |||||||
| 44,059 | ||||||||
|
| |||||||
| Portugal - 0.5% | ||||||||
| 856 | Galp Energia SGPS S.A. | 12,874 | ||||||
| 614 | NOS SGPS S.A. | 3,352 | ||||||
|
| |||||||
| 16,226 | ||||||||
|
| |||||||
| Russia - 1.2% | ||||||||
| 3,582 | Evraz plc | 20,616 | ||||||
| 331 | Polymetal International plc | 4,649 | ||||||
| 519 | VEON Ltd. | 1,246 | ||||||
| 285 | X5 Retail Group N.V. GDR | 9,966 | ||||||
|
| |||||||
| 36,477 | ||||||||
|
| |||||||
| Singapore - 2.1% | ||||||||
| 6,700 | ComfortDelGro Corp. Ltd. | 11,641 | ||||||
| 400 | DBS Group Holdings Ltd. | 7,236 | ||||||
| 200 | Jardine Cycle & Carriage Ltd. | 4,344 | ||||||
| 1,400 | Mapletree Commercial Trust REIT | 2,321 | ||||||
| 3,100 | NetLink NBN Trust UNIT | 1,996 | ||||||
| 1,300 | Oversea-Chinese Banking Corp. Ltd. | 10,220 | ||||||
| 1,200 | SATS Ltd. | 4,208 | ||||||
| 1,400 | Singapore Airlines Ltd. | 9,260 | ||||||
| 1,100 | Singapore Technologies Engineering Ltd. | 3,057 | ||||||
| 900 | Singapore Telecommunications Ltd. | 2,027 | ||||||
| 700 | Venture Corp. Ltd. | 7,762 | ||||||
|
| |||||||
| 64,072 | ||||||||
|
| |||||||
| Spain - 2.5% | ||||||||
| 111 | Acciona S.A. | 11,747 | ||||||
| 148 | ACS Actividades de Construccion y Servicios S.A. | 5,913 | ||||||
| 103 | Ebro Foods S.A. | 2,059 | ||||||
| 218 | Enagas S.A. | 5,039 | ||||||
| 588 | Endesa S.A. | 15,468 | ||||||
| 1,001 | Gestamp Automocion S.A.(1) | 4,672 | ||||||
| 266 | Iberdrola S.A. | 2,765 | ||||||
| 103 | Inmobiliaria Colonial Socimi S.A. REIT | 1,243 | ||||||
| 1,579 | Mapfre S.A. | 4,253 | ||||||
| 496 | Merlin Properties Socimi S.A. REIT | 6,925 | ||||||
| 1,150 | Prosegur Cash S.A.(1) | 1,652 | ||||||
| 140 | Red Electrica Corp. S.A. | 2,836 | ||||||
| 311 | Repsol S.A. | 4,850 | ||||||
| 755 | Telefonica S.A. | 5,769 | ||||||
| 49 | Viscofan S.A. | 2,296 | ||||||
|
| |||||||
| 77,487 | ||||||||
|
| |||||||
| Sweden - 2.6% | ||||||||
| 74 | Atrium Ljungberg AB Class B | 1,635 | ||||||
| 345 | Axfood AB | 7,325 | ||||||
| 293 | BillerudKorsnas AB | 3,168 | ||||||
| 330 | Castellum AB | 7,065 | ||||||
| 81 | Electrolux AB Class B | 1,919 | ||||||
| 105 | Essity AB Class B | 3,064 | ||||||
| 212 | Fastighets AB Balder Class B* | 8,026 | ||||||
| 227 | Hennes & Mauritz AB Class B | 4,400 | ||||||
| 214 | ICA Gruppen AB | 9,883 | ||||||
| 138 | Loomis AB Class B | 4,846 | ||||||
| 611 | Securitas AB Class B | 9,356 | ||||||
| 38 | Skandinaviska Enskilda Banken AB Class A | 349 | ||||||
| 116 | Skanska AB Class B | 2,349 | ||||||
| 107 | Svenska Handelsbanken AB Class A | 1,001 | ||||||
| 796 | Swedbank AB Class A | 11,464 | ||||||
| 536 | Telia Co., AB | 2,398 | ||||||
| 33 | Volvo AB Class B | 463 | ||||||
| 89 | Wihlborgs Fastigheter AB | 1,446 | ||||||
|
| |||||||
| 80,157 | ||||||||
|
| |||||||
| Shares or Principal Amount | Market Value† | |||||||
| COMMON STOCKS - 101.1% - (continued) | ||||||||
| Switzerland - 6.2% | ||||||||
| 202 | Adecco Group AG | $ | 11,178 | |||||
| 131 | Baloise Holding AG | 23,472 | ||||||
| 4 | Banque Cantonale Vaudoise | 3,061 | ||||||
| 15 | Bucher Industries AG | 4,692 | ||||||
| 33 | Coca-Cola HBC AG* | 1,078 | ||||||
| 1 | Givaudan S.A. | 2,791 | ||||||
| 73 | Helvetia Holding AG | 10,075 | ||||||
| 76 | Julius Baer Group Ltd.* | 3,366 | ||||||
| 85 | Kuehne + Nagel International AG | 12,508 | ||||||
| 86 | Nestle S.A. | 9,327 | ||||||
| 119 | Novartis AG | 10,328 | ||||||
| 51 | PSP Swiss Property AG | 6,475 | ||||||
| 66 | Roche Holding AG | 19,217 | ||||||
| 2 | SGS S.A. | 4,958 | ||||||
| 20 | Sika AG | 2,926 | ||||||
| 25 | Sonova Holding AG | 5,817 | ||||||
| 47 | Swiss Life Holding AG | 22,471 | ||||||
| 113 | Swiss Re AG | 11,791 | ||||||
| 6 | Swisscom AG | 2,960 | ||||||
| 62 | Zurich Insurance Group AG | 23,746 | ||||||
|
| |||||||
| 192,237 | ||||||||
|
| |||||||
| United Kingdom - 11.4% | ||||||||
| 296 | 3i Group plc | 4,236 | ||||||
| 269 | Anglo American plc | 6,182 | ||||||
| 65 | Ashtead Group plc | 1,808 | ||||||
| 121 | AstraZeneca plc | 10,804 | ||||||
| 118 | Auto Trader Group plc(1) | 740 | ||||||
| 2,953 | Avast plc(1) | 14,107 | ||||||
| 552 | Barratt Developments plc | 4,394 | ||||||
| 254 | Bellway plc | 10,442 | ||||||
| 53 | Berkeley Group Holdings plc | 2,721 | ||||||
| 2,389 | BP plc | 15,124 | ||||||
| 583 | Britvic plc | 7,044 | ||||||
| 5,552 | BT Group plc | 12,178 | ||||||
| 32 | Burberry Group plc | 855 | ||||||
| 8,595 | Centrica plc | 7,794 | ||||||
| 162 | Close Brothers Group plc | 2,805 | ||||||
| 49 | Coca-Cola European Partners plc | 2,730 | ||||||
| 475 | Compass Group plc | 12,223 | ||||||
| 103 | Diageo plc | 4,208 | ||||||
| 3,722 | Direct Line Insurance Group plc | 13,732 | ||||||
| 375 | Electrocomponents plc | 2,965 | ||||||
| 133 | Ferguson plc* | 9,706 | ||||||
| 154 | Fiat Chrysler Automobiles N.V. | 1,994 | ||||||
| 499 | GlaxoSmithKline plc | 10,696 | ||||||
| 61 | Hiscox Ltd. | 1,245 | ||||||
| 976 | Howden Joinery Group plc | 6,717 | ||||||
| 811 | HSBC Holdings plc | 6,214 | ||||||
| 2,468 | Kingfisher plc | 6,272 | ||||||
| 6,175 | Legal & General Group plc | 18,848 | ||||||
| 252 | Marks & Spencer Group plc | 571 | ||||||
| 316 | Mondi plc | 6,051 | ||||||
| 683 | National Grid plc | 7,395 | ||||||
| 1,173 | Pearson plc | 10,637 | ||||||
| 126 | Pennon Group plc | 1,281 | ||||||
| 72 | Persimmon plc | 1,920 | ||||||
| 766 | Redrow plc | 5,817 | ||||||
| 475 | RELX plc | 11,281 | ||||||
| 894 | Rentokil Initial plc | 5,140 | ||||||
| 442 | Rio Tinto plc | 22,976 | ||||||
| 3,732 | Royal Mail plc | 9,690 | ||||||
| 720 | RSA Insurance Group plc | 4,724 | ||||||
| 525 | Sage Group plc | 4,461 | ||||||
| 892 | Smith & Nephew plc | 21,481 | ||||||
The accompanying notes are an integral part of these financial statements.
| 11 |
|
| Hartford Multifactor International Fund |
Schedule of Investments – (continued)
September 30, 2019
| Shares or Principal Amount | Market Value† | |||||||
| COMMON STOCKS - 101.1% - (continued) | ||||||||
| United Kingdom - 11.4% - (continued) | ||||||||
| 222 | Spectris plc | $ | 6,664 | |||||
| 130 | SSP Group plc | 990 | ||||||
| 854 | Tate & Lyle plc | 7,726 | ||||||
| 920 | Taylor Wimpey plc | 1,826 | ||||||
| 32 | Travis Perkins plc | 508 | ||||||
| 1,483 | Tritax Big Box plc REIT | 2,728 | ||||||
| 225 | Unilever plc | 13,523 | ||||||
| 241 | WH Smith plc | 5,889 | ||||||
|
| |||||||
| 352,063 | ||||||||
|
| |||||||
| United States - 0.1% | ||||||||
| 22 | Waste Connections, Inc. | 2,021 | ||||||
|
| |||||||
Total Common Stocks | $ | 3,126,599 | ||||||
|
| |||||||
| SHORT-TERM INVESTMENTS - 0.0% | ||||||||
| Other Investment Pools & Funds - 0.0% | ||||||||
| 1,013 | Fidelity Institutional Government Fund, Institutional Class, 1.92%(3) | $ | 1,013 | |||||
|
| |||||||
Total Short-Term Investments | $ | 1,013 | ||||||
|
| |||||||
Total Investments | �� | 101.1 | % | $ | 3,127,612 | |||||||
Other Assets and Liabilities | (1.1 | )% | (35,348 | ) | ||||||||
|
|
|
| |||||||||
Total Net Assets | 100.0 | % | $ | 3,092,264 | ||||||||
|
|
|
| |||||||||
| Note: | Percentage of investments as shown is the ratio of the total market value to total net assets. |
Prices of foreign equities that are principally traded on certain foreign markets will generally be adjusted daily pursuant to a fair value pricing service approved by the Board of Directors in order to reflect an adjustment for factors occurring after the close of certain foreign markets but before the close of the New York Stock Exchange. |
Equity industry classifications used in this report are the Global Industry Classification Standard, which was developed by and is the exclusive property and service mark of MSCI, Inc. and Standard & Poor’s. |
For Fund compliance purposes, the Fund may not use the same classification system. These classifications are used for financial reporting purposes. |
See “Glossary” for abbreviation descriptions. |
| * | Non-income producing. |
| (1) | Security was purchased pursuant to Rule 144A under the Securities Act of 1933 and may be sold in transactions that are exempt from registration (typically only to qualified institutional buyers) or in a public offering registered under the Securities Act of 1933. At September 30, 2019, the aggregate value of these securities was $108,962, representing 3.5% of net assets. |
| (2) | Represents entire or partial securities on loan. See Note 8 in the accompanying Notes to Financial Statements for securities lending information. |
| (3) | Current yield as of period end. |
| † | See Significant Accounting Policies of accompanying Notes to Financial Statements regarding valuation of investments. |
The accompanying notes are an integral part of these financial statements.
| 12 |
|
| Hartford Multifactor International Fund |
Schedule of Investments – (continued)
September 30, 2019
Fair Valuation Summary
The following is a summary of the fair valuations according to the inputs used as of September 30, 2019 in valuing the Fund’s investments.
Description | Total | Level 1 | Level 2 | Level 3(1) | ||||||||||||
Assets |
| |||||||||||||||
Common Stocks |
| |||||||||||||||
Australia | $ | 263,491 | $ | 1,771 | $ | 261,720 | $ | — | ||||||||
Austria | 9,953 | — | 9,953 | — | ||||||||||||
Belgium | 61,762 | 2,207 | 59,555 | — | ||||||||||||
Canada | 352,925 | 352,925 | — | — | ||||||||||||
China | 7,648 | — | 7,648 | — | ||||||||||||
Denmark | 59,094 | — | 59,094 | — | ||||||||||||
Finland | 25,615 | 5,831 | 19,784 | — | ||||||||||||
France | 189,610 | 6,062 | 183,548 | — | ||||||||||||
Germany | 188,878 | 17,871 | 171,007 | — | ||||||||||||
Hong Kong | 131,245 | 4,765 | 126,480 | — | ||||||||||||
Ireland | 22,435 | 21,405 | 1,030 | — | ||||||||||||
Israel | 54,605 | 5,508 | 49,097 | — | ||||||||||||
Italy | 88,927 | — | 88,927 | — | ||||||||||||
Japan | 672,241 | — | 672,241 | — | ||||||||||||
Luxembourg | 7,139 | — | 7,139 | — | ||||||||||||
Netherlands | 110,627 | — | 110,627 | — | ||||||||||||
New Zealand | 15,605 | — | 15,605 | — | ||||||||||||
Norway | 44,059 | — | 44,059 | — | ||||||||||||
Portugal | 16,226 | — | 16,226 | — | ||||||||||||
Russia | 36,477 | 1,246 | 35,231 | — | ||||||||||||
Singapore | 64,072 | 1,996 | 62,076 | — | ||||||||||||
Spain | 77,487 | — | 77,487 | — | ||||||||||||
Sweden | 80,157 | 1,635 | 78,522 | — | ||||||||||||
Switzerland | 192,237 | — | 192,237 | — | ||||||||||||
United Kingdom | 352,063 | 3,275 | 348,788 | — | ||||||||||||
United States | 2,021 | 2,021 | — | — | ||||||||||||
Short-Term Investments | 1,013 | 1,013 | — | — | ||||||||||||
|
|
|
|
|
|
|
| |||||||||
Total | $ | 3,127,612 | $ | 429,531 | $ | 2,698,081 | $ | — | ||||||||
|
|
|
|
|
|
|
| |||||||||
| (1) | For the period ended September 30, 2019, there were no transfers in and out of Level 3. |
The accompanying notes are an integral part of these financial statements.
| 13 |
|
Schedule of Investments
September 30, 2019
| Shares or Principal Amount | Market Value† | |||||||
| COMMON STOCKS - 103.6% | ||||||||
| Automobiles & Components - 1.4% | ||||||||
| 782 | Ford Motor Co. | $ | 7,163 | |||||
| 206 | General Motors Co. | 7,721 | ||||||
|
| |||||||
| 14,884 | ||||||||
|
| |||||||
| Banks - 3.9% | ||||||||
| 76 | BB&T Corp. | 4,056 | ||||||
| 26 | Citigroup, Inc. | 1,796 | ||||||
| 142 | JP Morgan Chase & Co. | 16,712 | ||||||
| 41 | PNC Financial Services Group, Inc. | 5,747 | ||||||
| 123 | US Bancorp | 6,807 | ||||||
| 139 | Wells Fargo & Co. | 7,011 | ||||||
|
| |||||||
| 42,129 | ||||||||
|
| |||||||
| Capital Goods - 6.4% | ||||||||
| 76 | AGCO Corp. | 5,753 | ||||||
| 57 | Dover Corp. | 5,675 | ||||||
| 96 | Eaton Corp. plc | 7,982 | ||||||
| 61 | EMCOR Group, Inc. | 5,253 | ||||||
| 21 | General Dynamics Corp. | 3,837 | ||||||
| 63 | Ingersoll-Rand plc | 7,762 | ||||||
| 181 | Johnson Controls International plc | 7,944 | ||||||
| 83 | PACCAR, Inc. | 5,811 | ||||||
| 122 | Quanta Services, Inc. | 4,612 | ||||||
| 16 | Snap-on, Inc. | 2,505 | ||||||
| 54 | United Technologies Corp. | 7,372 | ||||||
| 11 | Wabco Holdings, Inc.* | 1,471 | ||||||
| 25 | Watsco, Inc. | 4,230 | ||||||
|
| |||||||
| 70,207 | ||||||||
|
| |||||||
| Commercial & Professional Services - 1.5% | ||||||||
| 83 | KAR Auction Services, Inc. | 2,038 | ||||||
| 22 | ManpowerGroup, Inc. | 1,853 | ||||||
| 59 | Republic Services, Inc. | 5,106 | ||||||
| 63 | Waste Management, Inc. | 7,245 | ||||||
|
| |||||||
| 16,242 | ||||||||
|
| |||||||
| Consumer Durables & Apparel - 0.6% | ||||||||
| 13 | Carter’s, Inc. | 1,186 | ||||||
| 154 | PulteGroup, Inc. | 5,629 | ||||||
|
| |||||||
| 6,815 | ||||||||
|
| |||||||
| Consumer Services - 2.4% | ||||||||
| 27 | Cracker Barrel Old Country Store, Inc. | 4,392 | ||||||
| 102 | McDonald’s Corp. | 21,900 | ||||||
|
| |||||||
| 26,292 | ||||||||
|
| |||||||
| Diversified Financials - 8.6% | ||||||||
| 311 | AGNC Investment Corp. REIT | 5,004 | ||||||
| 64 | American Express Co. | 7,570 | ||||||
| 548 | Annaly Capital Management, Inc. REIT | 4,822 | ||||||
| 126 | Berkshire Hathaway, Inc. Class B* | 26,211 | ||||||
| 16 | BlackRock, Inc. | 7,130 | ||||||
| 148 | Blackstone Mortgage Trust, Inc. Class A REIT | 5,306 | ||||||
| 269 | Chimera Investment Corp. REIT | 5,262 | ||||||
| 22 | CME Group, Inc. | 4,649 | ||||||
| 80 | Intercontinental Exchange, Inc. | 7,382 | ||||||
| 704 | MFA Financial, Inc. REIT | 5,181 | ||||||
| 42 | Nasdaq, Inc. | 4,173 | ||||||
| 223 | Starwood Property Trust, Inc. REIT | 5,401 | ||||||
| 167 | Synchrony Financial | 5,693 | ||||||
|
| |||||||
| 93,784 | ||||||||
|
| |||||||
| Energy - 6.6% | ||||||||
| 227 | Chevron Corp. | 26,922 | ||||||
| 367 | Exxon Mobil Corp. | 25,914 | ||||||
| 377 | Kinder Morgan, Inc. | 7,770 | ||||||
| 42 | ONEOK, Inc. | 3,095 | ||||||
| 76 | Phillips 66 | 7,782 | ||||||
|
| |||||||
| 71,483 | ||||||||
|
| |||||||
| Shares or Principal Amount | Market Value† | |||||||
| COMMON STOCKS - 103.6% - (continued) | ||||||||
| Food & Staples Retailing - 3.0% | ||||||||
| 101 | Sysco Corp. | $ | 8,020 | |||||
| 132 | US Foods Holding Corp.* | 5,425 | ||||||
| 165 | Walmart, Inc. | 19,582 | ||||||
|
| |||||||
| 33,027 | ||||||||
|
| |||||||
| Food, Beverage & Tobacco - 3.0% | ||||||||
| 19 | Altria Group, Inc. | 777 | ||||||
| 139 | Archer-Daniels-Midland Co. | 5,709 | ||||||
| 231 | Flowers Foods, Inc. | 5,343 | ||||||
| 109 | Hormel Foods Corp. | 4,766 | ||||||
| 36 | Ingredion, Inc. | 2,943 | ||||||
| 1 | JM Smucker Co. | 110 | ||||||
| 32 | Kellogg Co. | 2,059 | ||||||
| 100 | Mondelez International, Inc. Class A | 5,532 | ||||||
| 57 | Tyson Foods, Inc. Class A | 4,910 | ||||||
|
| |||||||
| 32,149 | ||||||||
|
| |||||||
| Health Care Equipment & Services - 7.2% | ||||||||
| 12 | Anthem, Inc. | 2,881 | ||||||
| 9 | Centene Corp.* | 389 | ||||||
| 79 | Cerner Corp. | 5,385 | ||||||
| 54 | Danaher Corp. | 7,799 | ||||||
| 10 | HCA Healthcare, Inc. | 1,204 | ||||||
| 87 | Henry Schein, Inc.* | 5,525 | ||||||
| 26 | Hill-Rom Holdings, Inc. | 2,736 | ||||||
| 22 | Humana, Inc. | 5,625 | ||||||
| 31 | Laboratory Corp. of America Holdings* | 5,208 | ||||||
| 249 | Medtronic plc | 27,046 | ||||||
| 6 | Molina Healthcare, Inc.* | 658 | ||||||
| 52 | Quest Diagnostics, Inc. | 5,566 | ||||||
| 39 | UnitedHealth Group, Inc. | 8,476 | ||||||
|
| |||||||
| 78,498 | ||||||||
|
| |||||||
| Household & Personal Products - 2.8% | ||||||||
| 53 | Kimberly-Clark Corp. | 7,529 | ||||||
| 187 | Procter & Gamble Co. | 23,259 | ||||||
|
| |||||||
| 30,788 | ||||||||
|
| |||||||
| Insurance - 14.6% | ||||||||
| 151 | Aflac, Inc. | 7,900 | ||||||
| 7 | Alleghany Corp.* | 5,584 | ||||||
| 74 | Allstate Corp. | 8,042 | ||||||
| 52 | American Financial Group, Inc. | 5,608 | ||||||
| 131 | Arch Capital Group Ltd.* | 5,499 | ||||||
| 58 | Arthur J Gallagher & Co. | 5,195 | ||||||
| 83 | Axis Capital Holdings Ltd. | 5,538 | ||||||
| 48 | Chubb Ltd. | 7,749 | ||||||
| 47 | Cincinnati Financial Corp. | 5,484 | ||||||
| 112 | CNA Financial Corp. | 5,516 | ||||||
| 22 | Everest Re Group Ltd. | 5,854 | ||||||
| 118 | Fidelity National Financial, Inc. | 5,240 | ||||||
| 9 | First American Financial Corp. | 531 | ||||||
| 59 | Globe Life, Inc. | 5,650 | ||||||
| 40 | Hanover Insurance Group, Inc. | 5,422 | ||||||
| 108 | Loews Corp. | 5,560 | ||||||
| 5 | Markel Corp.* | 5,910 | ||||||
| 55 | Marsh & McLennan Cos., Inc. | 5,503 | ||||||
| 173 | MetLife, Inc. | 8,159 | ||||||
| 223 | Old Republic International Corp. | 5,256 | ||||||
| 101 | Principal Financial Group, Inc. | 5,771 | ||||||
| 96 | Prudential Financial, Inc. | 8,635 | ||||||
| 35 | Reinsurance Group of America, Inc. | 5,596 | ||||||
| 28 | RenaissanceRe Holdings Ltd. | 5,417 | ||||||
| 51 | Travelers Cos., Inc. | 7,583 | ||||||
| 27 | Willis Towers Watson plc | 5,210 | ||||||
| 74 | WR Berkley Corp. | 5,345 | ||||||
|
| |||||||
| 158,757 | ||||||||
|
| |||||||
The accompanying notes are an integral part of these financial statements.
| 14 |
|
| Hartford Multifactor Large Cap Value Fund |
Schedule of Investments – (continued)
September 30, 2019
| Shares or Principal Amount | Market Value† | |||||||
| COMMON STOCKS - 103.6% - (continued) | ||||||||
| Materials - 4.5% | ||||||||
| 35 | AptarGroup, Inc. | $ | 4,146 | |||||
| 66 | Ball Corp. | 4,805 | ||||||
| 60 | Eastman Chemical Co. | 4,430 | ||||||
| 30 | Ecolab, Inc. | 5,941 | ||||||
| 28 | LyondellBasell Industries N.V. Class A | 2,505 | ||||||
| 11 | NewMarket Corp. | 5,193 | ||||||
| 30 | Packaging Corp. of America | 3,183 | ||||||
| 68 | PPG Industries, Inc. | 8,059 | ||||||
| 54 | Reliance Steel & Aluminum Co. | 5,382 | ||||||
| 95 | Sonoco Products Co. | 5,530 | ||||||
|
| |||||||
| 49,174 | ||||||||
|
| |||||||
| Media & Entertainment - 3.3% | ||||||||
| 2 | Cable One, Inc. | 2,509 | ||||||
| 129 | CBS Corp. Class B | 5,208 | ||||||
| 52 | Cinemark Holdings, Inc. | 2,009 | ||||||
| 293 | Comcast Corp. Class A | 13,208 | ||||||
| 267 | Interpublic Group of Cos., Inc. | 5,757 | ||||||
| 33 | Liberty Media Corp-Liberty SiriusXM* | 1,385 | ||||||
| 70 | Omnicom Group, Inc. | 5,481 | ||||||
|
| |||||||
| 35,557 | ||||||||
|
| |||||||
| Pharmaceuticals, Biotechnology & Life Sciences - 4.8% | ||||||||
| 50 | AbbVie, Inc. | 3,786 | ||||||
| 121 | Gilead Sciences, Inc. | 7,669 | ||||||
| 38 | IQVIA Holdings, Inc.* | 5,677 | ||||||
| 985 | Pfizer, Inc. | 35,391 | ||||||
|
| |||||||
| 52,523 | ||||||||
|
| |||||||
| Real Estate - 4.1% | ||||||||
| 81 | Apartment Investment & Management Co. Class A, REIT | 4,223 | ||||||
| 19 | Apple Hospitality, Inc. REIT | 315 | ||||||
| 13 | AvalonBay Communities, Inc. REIT | 2,799 | ||||||
| 23 | Camden Property Trust REIT | 2,553 | ||||||
| 153 | Equity Commonwealth REIT | 5,240 | ||||||
| 21 | Equity Residential REIT | 1,812 | ||||||
| 16 | Essex Property Trust, Inc. REIT | 5,226 | ||||||
| 131 | Gaming and Leisure Properties, Inc. REIT | 5,009 | ||||||
| 70 | HCP, Inc. REIT | 2,494 | ||||||
| 112 | Host Hotels & Resorts, Inc. REIT | 1,937 | ||||||
| 2 | Lamar Advertising Co., Class A, REIT | 164 | ||||||
| 38 | National Health Investors, Inc. REIT | 3,131 | ||||||
| 87 | National Retail Properties, Inc. REIT | 4,907 | ||||||
| 16 | Realty Income Corp. REIT | 1,227 | ||||||
| 21 | Service Properties Trust REIT | 542 | ||||||
| 19 | Simon Property Group, Inc. REIT | 2,957 | ||||||
|
| |||||||
| 44,536 | ||||||||
|
| |||||||
| Retailing - 2.7% | ||||||||
| 7 | AutoZone, Inc.* | 7,592 | ||||||
| 64 | Best Buy Co., Inc. | 4,415 | ||||||
| 14 | Expedia Group, Inc. | 1,882 | ||||||
| 58 | Genuine Parts Co. | 5,776 | ||||||
| 42 | Kohl’s Corp. | 2,086 | ||||||
| 10 | Macy’s, Inc. | 155 | ||||||
| 71 | Target Corp. | 7,591 | ||||||
|
| |||||||
| 29,497 | ||||||||
|
| |||||||
| Software & Services - 5.9% | ||||||||
| 81 | Amdocs Ltd. | 5,355 | ||||||
| 28 | Automatic Data Processing, Inc. | 4,520 | ||||||
| 7 | CACI International, Inc. Class A* | 1,619 | ||||||
| 55 | Fidelity National Information Services, Inc. | 7,302 | ||||||
| 156 | International Business Machines Corp. | 22,685 | ||||||
| 59 | j2 Global, Inc. | 5,358 | ||||||
| 25 | Leidos Holdings, Inc. | 2,147 | ||||||
| Shares or Principal Amount | Market Value† | |||||||
| COMMON STOCKS - 103.6% - (continued) | ||||||||
| Software & Services - 5.9% - (continued) | ||||||||
| 169 | Oracle Corp. | $ | 9,300 | |||||
| 240 | Western Union Co. | 5,561 | ||||||
|
| |||||||
| 63,847 | ||||||||
|
| |||||||
| Technology Hardware & Equipment - 1.8% | ||||||||
| 65 | Arrow Electronics, Inc.* | 4,848 | ||||||
| 183 | Hewlett Packard Enterprise Co. | 2,776 | ||||||
| 174 | HP, Inc. | 3,292 | ||||||
| 26 | Jabil, Inc. | 930 | ||||||
| 235 | Juniper Networks, Inc. | 5,816 | ||||||
| 9 | Seagate Technology plc | 484 | ||||||
| 16 | Tech Data Corp.* | 1,668 | ||||||
|
| |||||||
| 19,814 | ||||||||
|
| |||||||
| Telecommunication Services - 5.8% | ||||||||
| 702 | AT&T, Inc. | 26,564 | ||||||
| 98 | T-Mobile US, Inc.* | 7,719 | ||||||
| 486 | Verizon Communications, Inc. | 29,335 | ||||||
|
| |||||||
| 63,618 | ||||||||
|
| |||||||
| Transportation - 1.5% | ||||||||
| 9 | AMERCO | 3,510 | ||||||
| 93 | Delta Air Lines, Inc. | 5,357 | ||||||
| 5 | Kansas City Southern | 665 | ||||||
| 5 | Union Pacific Corp. | 810 | ||||||
| 63 | United Airlines Holdings, Inc.* | 5,570 | ||||||
|
| |||||||
| 15,912 | ||||||||
|
| |||||||
| Utilities - 7.2% | ||||||||
| 7 | Ameren Corp. | 560 | ||||||
| 67 | American Electric Power Co., Inc. | 6,277 | ||||||
| 28 | Atmos Energy Corp. | 3,189 | ||||||
| 164 | CenterPoint Energy, Inc. | 4,949 | ||||||
| 49 | CMS Energy Corp. | 3,134 | ||||||
| 81 | Consolidated Edison, Inc. | 7,652 | ||||||
| 18 | Dominion Energy, Inc. | 1,459 | ||||||
| 36 | DTE Energy Co. | 4,787 | ||||||
| 64 | Duke Energy Corp. | 6,135 | ||||||
| 27 | Entergy Corp. | 3,169 | ||||||
| 122 | Exelon Corp. | 5,894 | ||||||
| 93 | Hawaiian Electric Industries, Inc. | 4,242 | ||||||
| 33 | NextEra Energy, Inc. | 7,689 | ||||||
| 29 | Pinnacle West Capital Corp. | 2,815 | ||||||
| 44 | Public Service Enterprise Group, Inc. | 2,731 | ||||||
| 39 | Southern Co. | 2,409 | ||||||
| 73 | WEC Energy Group, Inc. | 6,942 | ||||||
| 60 | Xcel Energy, Inc. | 3,893 | ||||||
|
| |||||||
| 77,926 | ||||||||
|
| |||||||
Total Common Stocks | $ | 1,127,459 | ||||||
|
| |||||||
| SHORT-TERM INVESTMENTS - 0.1% | ||||||||
| Other Investment Pools & Funds - 0.1% | ||||||||
| 1,571 | Fidelity Institutional Government Fund, | $ | 1,571 | |||||
|
| |||||||
Total Short-Term Investments | $ | 1,571 | ||||||
|
| |||||||
Total Investments | 103.7 | % | $ | 1,129,030 | ||||||||
Other Assets and Liabilities | (3.7 | )% | (40,673 | ) | ||||||||
|
|
|
| |||||||||
Total Net Assets | 100.0 | % | $ | 1,088,357 | ||||||||
|
|
|
| |||||||||
The accompanying notes are an integral part of these financial statements.
| 15 |
|
| Hartford Multifactor Large Cap Value Fund |
Schedule of Investments – (continued)
September 30, 2019
| Note: | Percentage of investments as shown is the ratio of the total market value to total net assets. |
Equity industry classifications used in this report are the Global Industry Classification Standard, which was developed by and is the exclusive property and service mark of MSCI, Inc. and Standard & Poor’s. |
For Fund compliance purposes, the Fund may not use the same classification system. These classifications are used for financial reporting purposes. |
See “Glossary” for abbreviation descriptions. |
| * | Non-income producing. |
| (1) | Current yield as of period end. |
| † | See Significant Accounting Policies of accompanying Notes to Financial Statements regarding valuation of investments. |
Fair Valuation Summary
The following is a summary of the fair valuations according to the inputs used as of September 30, 2019 in valuing the Fund’s investments.
Description | Total | Level 1 | Level 2 | Level 3(1) | ||||||||||||
Assets |
| |||||||||||||||
Common Stocks |
| |||||||||||||||
Automobiles & Components | $ | 14,884 | $ | 14,884 | $ | — | $ | — | ||||||||
Banks | 42,129 | 42,129 | — | — | ||||||||||||
Capital Goods | 70,207 | 70,207 | — | — | ||||||||||||
Commercial & Professional Services | 16,242 | 16,242 | — | — | ||||||||||||
Consumer Durables & Apparel | 6,815 | 6,815 | — | — | ||||||||||||
Consumer Services | 26,292 | 26,292 | — | — | ||||||||||||
Diversified Financials | 93,784 | 93,784 | — | — | ||||||||||||
Energy | 71,483 | 71,483 | — | — | ||||||||||||
Food & Staples Retailing | 33,027 | 33,027 | — | — | ||||||||||||
Food, Beverage & Tobacco | 32,149 | 32,149 | — | — | ||||||||||||
Health Care Equipment & Services | 78,498 | 78,498 | — | — | ||||||||||||
Household & Personal Products | 30,788 | 30,788 | — | — | ||||||||||||
Insurance | 158,757 | 158,757 | — | — | ||||||||||||
Materials | 49,174 | 49,174 | — | — | ||||||||||||
Media & Entertainment | 35,557 | 35,557 | — | — | ||||||||||||
Pharmaceuticals, Biotechnology & Life Sciences | 52,523 | 52,523 | — | — | ||||||||||||
Real Estate | 44,536 | 44,536 | — | — | ||||||||||||
Retailing | 29,497 | 29,497 | — | — | ||||||||||||
Software & Services | 63,847 | 63,847 | — | — | ||||||||||||
Technology Hardware & Equipment | 19,814 | 19,814 | — | — | ||||||||||||
Telecommunication Services | 63,618 | 63,618 | — | — | ||||||||||||
Transportation | 15,912 | 15,912 | — | — | ||||||||||||
Utilities | 77,926 | 77,926 | — | — | ||||||||||||
Short-Term Investments | 1,571 | 1,571 | — | — | ||||||||||||
|
|
|
|
|
|
|
| |||||||||
Total | $ | 1,129,030 | $ | 1,129,030 | $ | — | $ | — | ||||||||
|
|
|
|
|
|
|
| |||||||||
| (1) | For the period ended September 30, 2019, there were no transfers in and out of Level 3. |
The accompanying notes are an integral part of these financial statements.
| 16 |
|
| Hartford Multifactor Funds |
Glossary (abbreviations used in the preceding Schedules of Investments)
| Other Abbreviations: | ||
GDR | Global Depositary Receipt | |
REIT | Real Estate Investment Trust | |
| 17 |
|
| Hartford Multifactor Funds |
Statements of Assets and Liabilities
September 30, 2019
| Hartford Multifactor International Fund | Hartford Multifactor Large Cap Value Fund | |||||||
Assets: |
| |||||||
Investments in securities, at market value | $ | 3,127,612 | $ | 1,129,030 | ||||
Foreign currency | 2,131 | — | ||||||
Receivables: |
| |||||||
Dividends and interest | 11,676 | 1,731 | ||||||
Tax reclaims | 589 | — | ||||||
Other assets | 16,636 | 18,070 | ||||||
|
|
|
| |||||
Total assets | 3,158,644 | 1,148,831 | ||||||
|
|
|
| |||||
Liabilities: |
| |||||||
Payables: | ||||||||
Investment management fees | 733 | 169 | ||||||
Transfer agent fees | 20 | 6 | ||||||
Accounting services fees | 46 | 16 | ||||||
Board of Directors’ fees | 5 | 1 | ||||||
Distribution fees | 11 | 11 | ||||||
Accrued expenses | 65,565 | 60,271 | ||||||
|
|
|
| |||||
Total liabilities | 66,380 | 60,474 | ||||||
|
|
|
| |||||
Net assets | $ | 3,092,264 | $ | 1,088,357 | ||||
|
|
|
| |||||
Summary of Net Assets: |
| |||||||
Capital stock andpaid-in-capital | $ | 3,004,169 | $ | 999,807 | ||||
Distributable earnings | 88,095 | 88,550 | ||||||
|
|
|
| |||||
Net assets | $ | 3,092,264 | $ | 1,088,357 | ||||
|
|
|
| |||||
Shares authorized | 300,000,000 | 300,000,000 | ||||||
|
|
|
| |||||
Par value | $ | 0.0001 | $ | 0.0001 | ||||
|
|
|
| |||||
Class R3: Net asset value per share | $ | 10.29 | $ | 10.88 | ||||
|
|
|
| |||||
Shares outstanding | 10,009 | 10,000 | ||||||
|
|
|
| |||||
Net Assets | $ | 103,036 | $ | 108,796 | ||||
|
|
|
| |||||
Class R4: Net asset value per share | $ | 10.29 | $ | 10.88 | ||||
|
|
|
| |||||
Shares outstanding | 10,011 | 10,000 | ||||||
|
|
|
| |||||
Net Assets | $ | 103,056 | $ | 108,819 | ||||
|
|
|
| |||||
Class R5: Net asset value per share | $ | 10.29 | $ | 10.88 | ||||
|
|
|
| |||||
Shares outstanding | 100,139 | 20,000 | ||||||
|
|
|
| |||||
Net Assets | $ | 1,030,768 | $ | 217,684 | ||||
|
|
|
| |||||
Class R6: Net asset value per share | $ | 10.29 | $ | 10.88 | ||||
|
|
|
| |||||
Shares outstanding | 100,147 | 30,000 | ||||||
|
|
|
| |||||
Net Assets | $ | 1,030,788 | $ | 326,531 | ||||
|
|
|
| |||||
Class Y: Net asset value per share | $ | 10.29 | $ | 10.88 | ||||
|
|
|
| |||||
Shares outstanding | 70,097 | 20,000 | ||||||
|
|
|
| |||||
Net Assets | $ | 721,537 | $ | 217,683 | ||||
|
|
|
| |||||
Class F: Net asset value per share | $ | 10.29 | $ | 10.88 | ||||
|
|
|
| |||||
Shares outstanding | 10,015 | 10,000 | ||||||
|
|
|
| |||||
Net Assets | $ | 103,079 | $ | 108,844 | ||||
|
|
|
| |||||
Cost of investments | $ | 3,079,149 | $ | 1,068,482 | ||||
Cost of foreign currency | $ | 2,137 | $ | — | ||||
The accompanying notes are an integral part of these financial statements.
| 18 |
|
| Hartford Multifactor Funds |
For the Period Ended September 30, 2019
| Hartford Multifactor International Fund(1) | Hartford Multifactor Large Cap Value Fund(1) | |||||||
Investment Income: |
| |||||||
Dividends | $ | 37,958 | $ | 9,545 | ||||
Interest | 877 | 301 | ||||||
Less: Foreign tax withheld | (3,872 | ) | — | |||||
|
|
|
| |||||
Total investment income, net | 34,963 | 9,846 | ||||||
|
|
|
| |||||
Expenses: |
| |||||||
Investment management fees | 2,985 | 674 | ||||||
Transfer agent fees |
| |||||||
Class R3 | 1 | 1 | ||||||
Class R4 | 1 | 1 | ||||||
Class R5 | 7 | 1 | ||||||
Class R6 | 5 | 2 | ||||||
Class Y | 5 | 1 | ||||||
Class F | 1 | 1 | ||||||
Distribution fees |
| |||||||
Class R3 | 171 | 177 | ||||||
Class R4 | 86 | 89 | ||||||
Custodian fees | 3,500 | 1,700 | ||||||
Registration and filing fees | 34,970 | 34,970 | ||||||
Accounting services fees | 185 | 64 | ||||||
Board of Directors’ fees | 30 | 10 | ||||||
Audit fees | 26,500 | 23,000 | ||||||
Other expenses | 6,081 | 6,080 | ||||||
|
|
|
| |||||
Total expenses (before waivers, reimbursements and fees paid indirectly) | 74,528 | 66,771 | ||||||
Expense waivers | (70,734 | ) | (65,640 | ) | ||||
Distribution fee reimbursements | (198 | ) | (203 | ) | ||||
|
|
|
| |||||
Total waivers, reimbursements and fees paid indirectly | (70,932 | ) | (65,843 | ) | ||||
|
|
|
| |||||
Total expenses, net | 3,596 | 928 | ||||||
|
|
|
| |||||
Net Investment Income (Loss) | 31,367 | 8,918 | ||||||
|
|
|
| |||||
Net Realized Gain (Loss) on Investments and Foreign Currency Transactions: |
| |||||||
Net realized gain (loss) on investments | 6,209 | 18,891 | ||||||
Net realized gain (loss) on other foreign currency transactions | 6,252 | — | ||||||
|
|
|
| |||||
Net Realized Gain (Loss) on Investments and Foreign Currency Transactions | 12,461 | 18,891 | ||||||
|
|
|
| |||||
Net Changes in Unrealized Appreciation (Depreciation) of Investments and Foreign Currency Transactions: |
| |||||||
Net unrealized appreciation (depreciation) of investments | 48,463 | 60,548 | ||||||
Net unrealized appreciation (depreciation) of translation of other assets and liabilities in foreign currencies | (27 | ) | — | |||||
|
|
|
| |||||
Net Changes in Unrealized Appreciation (Depreciation) of Investments and Foreign Currency Transactions | 48,436 | 60,548 | ||||||
|
|
|
| |||||
Net Gain (Loss) on Investments and Foreign Currency Transactions | 60,897 | 79,439 | ||||||
|
|
|
| |||||
Net Increase (Decrease) in Net Assets Resulting from Operations | $ | 92,264 | $ | 88,357 | ||||
|
|
|
| |||||
| (1) | Commenced operations on May 31, 2019. |
The accompanying notes are an integral part of these financial statements.
| 19 |
|
| Hartford Multifactor Funds |
Statements of Changes in Net Assets
| Hartford Multifactor International Fund | Hartford Multifactor Large Cap Value Fund | |||||||
| For the Period Ended September 30, 2019(1) | For the Period Ended September 30, 2019(1) | |||||||
Operations: |
| |||||||
Net investment income (loss) | $ | 31,367 | $ | 8,918 | ||||
Net realized gain (loss) on investments and foreign currency transactions | 12,461 | 18,891 | ||||||
Net changes in unrealized appreciation (depreciation) of investments and foreign currency transactions | 48,436 | 60,548 | ||||||
|
|
|
| |||||
Net Increase (Decrease) in Net Assets Resulting from Operations | 92,264 | 88,357 | ||||||
|
|
|
| |||||
Distributions to Shareholders: | ||||||||
Class R3 | (94 | ) | — | |||||
Class R4 | (119 | ) | — | |||||
Class R5 | (1,447 | ) | — | |||||
Class R6 | (1,532 | ) | — | |||||
Class Y | (1,012 | ) | — | |||||
Class F | (153 | ) | — | |||||
|
|
|
| |||||
Total distributions | (4,357 | ) | — | |||||
|
|
|
| |||||
Capital Share Transactions: |
| |||||||
Sold | 3,000,060 | 1,000,060 | ||||||
Issued on reinvestment of distributions | 4,357 | — | ||||||
Redeemed | (60 | ) | (60 | ) | ||||
|
|
|
| |||||
Net increase from capital share transactions | 3,004,357 | 1,000,000 | ||||||
|
|
|
| |||||
Net Increase (Decrease) in Net Assets | 3,092,264 | 1,088,357 | ||||||
|
|
|
| |||||
Net Assets: |
| |||||||
Beginning of period | — | — | ||||||
|
|
|
| |||||
End of period | $ | 3,092,264 | $ | 1,088,357 | ||||
|
|
|
| |||||
| (1) | Commenced operations on May 31, 2019. |
The accompanying notes are an integral part of these financial statements.
| 20 |
|
| Hartford Multifactor Funds |
| — Selected Per-Share Data(1) — | — Ratios and Supplemental Data — | |||||||||||||||||||||||||||||||||||||||||||||||||||||||
Class | Net Asset Value at Beginning of Period | Net Investment Income (Loss) | Net Realized and Unrealized Gain (Loss) on Investments | Total from Investment Operations | Dividends from Net Investment Income | Distributions from Capital Gains | Total Dividends and Distributions | Net Asset Value at End of Period | Total Return(2) | Net Assets at End of Period (000s) | Ratio of Expenses to Average Net Assets Before Adjustments(3) | Ratio of Expenses to Average Net Assets After Adjustments(3) | Ratio of Net Investment Income (Loss) to Average Net Assets | Portfolio Turnover | ||||||||||||||||||||||||||||||||||||||||||
| Hartford Multifactor International Fund | ||||||||||||||||||||||||||||||||||||||||||||||||||||||||
For the Period Ended September 30, 2019(4) |
| |||||||||||||||||||||||||||||||||||||||||||||||||||||||
R3 | $ | 10.00 | $ | 0.10 | $ | 0.20 | $ | 0.30 | $ | (0.01 | ) | $ | — | $ | (0.01 | ) | $ | 10.29 | 2.99 | %(5) | $ | 103 | 7.71 | %(6) | 0.47 | %(6) | 2.94 | %(6) | 19 | % | ||||||||||||||||||||||||||
R4 | 10.00 | 0.10 | 0.20 | 0.30 | (0.01 | ) | — | (0.01 | ) | 10.29 | 3.02 | (5) | 103 | 7.47 | (6) | 0.41 | (6) | 2.99 | (6) | 19 | ||||||||||||||||||||||||||||||||||||
R5 | 10.00 | 0.10 | 0.20 | 0.30 | (0.01 | ) | — | (0.01 | ) | 10.29 | 3.04 | (5) | 1,031 | 7.22 | (6) | 0.35 | (6) | 3.05 | (6) | 19 | ||||||||||||||||||||||||||||||||||||
R6 | 10.00 | 0.10 | 0.21 | 0.31 | (0.02 | ) | — | (0.02 | ) | 10.29 | 3.05 | (5) | 1,031 | 7.22 | (6) | 0.34 | (6) | 3.06 | (6) | 19 | ||||||||||||||||||||||||||||||||||||
Y | 10.00 | 0.10 | 0.20 | 0.30 | (0.01 | ) | — | (0.01 | ) | 10.29 | 3.04 | (5) | 722 | 7.22 | (6) | 0.35 | (6) | 3.05 | (6) | 19 | ||||||||||||||||||||||||||||||||||||
F | 10.00 | 0.10 | 0.21 | 0.31 | (0.02 | ) | — | (0.02 | ) | 10.29 | 3.05 | (5) | 103 | 7.22 | (6) | 0.34 | (6) | 3.05 | (6) | 19 | ||||||||||||||||||||||||||||||||||||
| Hartford Multifactor Large Cap Value Fund | ||||||||||||||||||||||||||||||||||||||||||||||||||||||||
For the Period Ended September 30, 2019(4) |
| |||||||||||||||||||||||||||||||||||||||||||||||||||||||
R3 | $ | 10.00 | $ | 0.09 | $ | 0.79 | $ | 0.88 | $ | — | $ | — | $ | — | $ | 10.88 | 8.80 | %(5) | $ | 109 | 19.26 | %(6) | 0.37 | %(6) | 2.41 | %(6) | 31 | % | ||||||||||||||||||||||||||||
R4 | 10.00 | 0.09 | 0.79 | 0.88 | — | — | — | 10.88 | 8.80 | (5) | 109 | 19.01 | (6) | 0.31 | (6) | 2.46 | (6) | 31 | ||||||||||||||||||||||||||||||||||||||
R5 | 10.00 | 0.09 | 0.79 | 0.88 | — | — | — | 10.88 | 8.80 | (5) | 218 | 18.75 | (6) | 0.25 | (6) | 2.53 | (6) | 31 | ||||||||||||||||||||||||||||||||||||||
R6 | 10.00 | 0.09 | 0.79 | 0.88 | — | — | — | 10.88 | 8.80 | (5) | 327 | 18.76 | (6) | 0.24 | (6) | 2.54 | (6) | 31 | ||||||||||||||||||||||||||||||||||||||
Y | 10.00 | 0.09 | 0.79 | 0.88 | — | — | — | 10.88 | 8.80 | (5) | 218 | 18.75 | (6) | 0.25 | (6) | 2.53 | (6) | 31 | ||||||||||||||||||||||||||||||||||||||
F | 10.00 | 0.09 | 0.79 | 0.88 | — | — | — | 10.88 | 8.80 | (5) | 109 | 18.76 | (6) | 0.24 | (6) | 2.54 | (6) | 31 | ||||||||||||||||||||||||||||||||||||||
| (1) | Information presented relates to a share outstanding throughout the indicated period. Net investment income (loss) per share amounts are calculated based on average shares outstanding unless otherwise noted. |
| (2) | Assumes initial investment at net asset value at the beginning of each period, reinvestment of all distributions, the complete redemption of the investment at net asset value at the end of each period and no sales charge. Total return would be reduced if sales charges were taken into account. |
| (3) | Adjustments include waivers and reimbursements, if applicable. Ratios do not include fees paid indirectly (see Expenses in the accompanying Notes to Financial Statements). |
| (4) | Commenced operations on May 31, 2019. |
| (5) | Not annualized. |
| (6) | Annualized. |
The accompanying notes are an integral part of these financial statements.
| 21 |
|
| Hartford Multifactor Funds |
September 30, 2019
| 1. | Organization: |
The Hartford Mutual Funds II, Inc. (the “Company”) is anopen-end registered management investment company comprised of thirteen series as of September 30, 2019. Financial statements for the series of the Company listed below (each, a “Fund” and collectively, the “Funds”) are included in this report.
The Hartford Mutual Funds II, Inc.:
Hartford Multifactor International Fund (the “Multifactor International Fund”)
Hartford Multifactor Large Cap Value Fund (the “Multifactor Large Cap Value Fund”)
The assets of each Fund are separate, and a shareholder’s interest is limited to the Fund in which shares are held. The Company is organized under the laws of the State of Maryland and is registered with the Securities and Exchange Commission (the “SEC”) under the Investment Company Act of 1940, as amended (the “1940 Act”). Each Fund is a diversifiedopen-end management investment company. Each Fund applies specialized accounting and reporting standards under Accounting Standards Codification Topic 946, “Financial Services – Investment Companies”.
The Funds commenced operations on May 31, 2019. Each Fund has registered for sale Class R3, Class R4, Class R5, Class R6, Class Y and Class F shares. These classes of shares do not have a sales charge.
| 2. | Significant Accounting Policies: |
The following is a summary of significant accounting policies of each Fund used in the preparation of its financial statements, which are in accordance with United States Generally Accepted Accounting Principles (“U.S. GAAP”). The preparation of financial statements in accordance with U.S. GAAP may require management to make estimates and assumptions that affect the reported amounts of assets and liabilities and disclosure of contingent assets and liabilities at the date of the financial statements and the reported amounts of increases and decreases in net assets from operations during the reporting period. Actual results could differ from those estimates.
| a) | Determination of Net Asset Value – The net asset value (“NAV”) of each class of each Fund’s shares is determined as of the close of regular trading (normally 4:00 p.m. Eastern Time) (the “NYSE Close”) on each day that the New York Stock Exchange (the “Exchange”) is open. Information that becomes known to the Funds after the NAV has been calculated on a particular day will not generally be used to retroactively adjust the NAV determined earlier that day. |
| b) | Investment Valuation and Fair Value Measurements –For purposes of calculating the NAV of each class of each Fund, portfolio securities and other assets held in the Fund’s portfolio for which market prices are readily available are valued at market value. Market value is generally determined on the basis of official close price or last reported trade price. If no trades were reported, market value is based on prices obtained from a quotation reporting system, established market makers (including evaluated prices), or independent pricing services. Pricing vendors may use matrix pricing or valuation models that utilize certain inputs and assumptions to derive values, including transaction data, credit quality information, general market conditions, news, and other factors and assumptions. |
If market prices are not readily available or are deemed unreliable, a Fund will use the fair value of the security or other instrument as determined in good faith under policies and procedures established by and under the supervision of the Board of Directors of the Company (the “Board of Directors”) (“Valuation Procedures”). Market prices are considered not readily available where there is an absence of current or reliable market-based data (e.g., trade information or broker quotes), including where events occur after the close of the relevant market, but prior to the NYSE Close, that materially affect the values of a Fund’s portfolio holdings or assets. In addition, market prices are considered not readily available when, due to extraordinary circumstances, the exchanges or markets on which the securities or other instruments trade do not open for trading for the entire day and no other market prices are available. Fair value pricing is subjective in nature and the use of fair value pricing by a Fund may cause the NAV of its shares to differ significantly from the NAV that would have been calculated using market prices at the close of the exchange on which a portfolio holding is primarily traded. There can be no assurance that a Fund could obtain the fair value assigned to an investment if the Fund were to sell the investment at approximately the time at which the Fund determines its NAV.
Prices of foreign equities that are principally traded on certain foreign markets will generally be adjusted daily pursuant to a fair value pricing service in order to reflect an adjustment for the factors occurring after the close of certain foreign markets but before the NYSE Close. Securities and other instruments that are primarily traded on foreign markets may trade on days that are not business days of the Funds. The value of the foreign securities or other instruments in which a Fund invests may change on days when a shareholder will not be able to purchase or redeem shares of the Fund.
Fixed income investments (other than short-term obligations) held by a Fund are normally valued at prices supplied by independent pricing services in accordance with the Valuation Procedures. Short-term investments maturing in 60 days or less are generally valued at amortized cost if their original term to maturity was 60 days or less, or by amortizing their value on the 61st day prior to maturity, if the original term exceeded 60 days.
| 22 |
|
| Hartford Multifactor Funds |
Notes to Financial Statements – (continued)
September 30, 2019
Exchange-traded derivatives, such as options, futures and options on futures, are valued at the last sale price determined by the exchange where such instruments principally trade as of the close of such exchange (“Exchange Close”). If a last sale price is not available, the value will be the mean of the most recently quoted bid and ask prices as of the Exchange Close. If a mean of the bid and ask prices cannot be calculated for the day, the value will be the most recently quoted bid price as of the Exchange Close.Over-the-counter derivatives are normally valued based on prices supplied by independent pricing services in accordance with the Valuation Procedures.
Investments valued in currencies other than U.S. dollars are converted to U.S. dollars using the prevailing spot currency exchange rates obtained from independent pricing services for calculation of the NAV. As a result, the NAV of a Fund’s shares may be affected by changes in the value of currencies in relation to the U.S. dollar. The value of securities or other instruments traded in markets outside the United States or denominated in currencies other than the U.S. dollar may be affected significantly on a day that the Exchange is closed and the market value may change on days when an investor is not able to purchase, redeem or exchange shares of a Fund.
Foreign currency contracts represent agreements to exchange currencies on specific future dates at predetermined rates. Foreign currency contracts are valued using foreign currency exchange rates and forward rates as provided by an independent pricing service on the Valuation Date.
Investments inopen-end mutual funds, if any, are valued at the respective NAV of eachopen-end mutual fund on the Valuation Date. Shares of investment companies listed and traded on an exchange are valued in the same manner as any exchange-listed equity security. Suchopen-end mutual funds and listed investment companies may use fair value pricing as disclosed in their prospectuses.
Financial instruments for which prices are not available from an independent pricing service may be valued using market quotations obtained from one or more dealers that make markets in the respective financial instrument in accordance with the Valuation Procedures.
U.S. GAAP defines fair value as the price that a Fund would receive to sell an asset or pay to transfer a liability in an orderly transaction between market participants. The U.S. GAAP fair value measurement standards require disclosure of a fair value hierarchy for each major category of assets and liabilities. Various inputs are used in determining the fair value of each Fund’s investments. These inputs are summarized into three broad hierarchy levels. This hierarchy is based on whether the valuation inputs are observable or unobservable. These levels are:
| • | Level 1 – Quoted prices in active markets for identical investments. Level 1 may include exchange traded instruments, such as domestic equities, some foreign equities, options, futures, mutual funds, exchange traded funds, rights and warrants. |
| • | Level 2 – Observable inputs other than Level 1 prices, such as quoted prices for similar investments; quoted prices in markets that are not active; or other inputs that are observable or can be corroborated by observable market data. Level 2 may include debt investments that are traded less frequently than exchange traded instruments and which are valued using independent pricing services; foreign equities, which are principally traded on certain foreign markets and are adjusted daily pursuant to a fair value pricing service in order to reflect an adjustment for the factors occurring after the close of certain foreign markets but before the NYSE Close; senior floating rate interests, which are valued using an aggregate of dealer bids; short-term investments, which are valued at amortized cost; and swaps, which are valued based upon the terms of each swap contract. |
| • | Level 3 – Significant unobservable inputs that are supported by limited or no market activity. Level 3 may include financial instruments whose values are determined using indicative market quotes or require significant management judgment or estimation. These unobservable valuation inputs may include estimates for current yields, maturity/duration, prepayment speed, and indicative market quotes for comparable investments along with other assumptions relating to credit quality, collateral value, complexity of the investment structure, general market conditions and liquidity. This category may include investments where trading has been halted or there are certain restrictions on trading. While these investments are priced using unobservable inputs, the valuation of these investments reflects the best available data and management believes the prices are a reasonable representation of exit price. |
The Board of Directors has delegated theday-to-day responsibility for implementing the Valuation Procedures to the Valuation Committee. The Valuation Committee will consider all relevant factors in determining an investment’s fair value, and may seek the advice of such Fund’ssub-adviser, knowledgeable brokers, and legal counsel in making such determination. The Valuation Committee reports to the Audit Committee of the Board of Directors.
Valuation levels are not necessarily indicative of the risk associated with investing in such investments. Individual investments within any of the above mentioned asset classes may be assigned a different hierarchical level than those presented above, as individual circumstances dictate.
For additional information, refer to the Fair Valuation Summary and the Level 3 roll-forward reconciliation, if applicable, which follows each Fund’s Schedule of Investments.
| c) | Investment Transactions and Investment Income – Investment transactions are recorded as of the trade date (the date the order to buy or sell is executed) for financial reporting purposes. Investments purchased or sold on a when-issued or delayed-delivery basis may be settled a month or more after the trade date. Realized gains and losses are determined on the basis of identified cost. |
| 23 |
|
| Hartford Multifactor Funds |
Notes to Financial Statements – (continued)
September 30, 2019
Dividend income from domestic securities is accrued on theex-dividend date. In general, dividend income from foreign securities is recorded on theex-date; however, dividend notifications in certain foreign jurisdictions may not be available in a timely manner and as a result, a Fund will record the dividend as soon as the relevant details (i.e., rate per share, payment date, shareholders of record, etc.) are publicly available. Interest income, including amortization of premium, accretion of discounts and additional principal receivedin-kind in lieu of cash, is accrued on a daily basis.
| d) | Taxes – A Fund may be subject to taxes imposed on realized gains on securities of certain foreign countries in which such Fund invests. A Fund may also be subject to taxes withheld on foreign dividends and interest from securities in which a Fund invests. The amount of any foreign taxes withheld and foreign tax expense is included on the accompanying Statements of Operations as a reduction to net investment income or net realized gain on investments in these securities, if applicable. |
| e) | Foreign Currency Transactions – Assets and liabilities denominated in currencies other than U.S. dollars are translated into U.S. dollars at the exchange rates in effect on the Valuation Date. Purchases and sales of investments, income and expenses are translated into U.S. dollars at the exchange rates on the dates of such transactions. |
A Fund does not isolate that portion of portfolio investment valuation resulting from fluctuations in the foreign currency exchange rates from the fluctuations arising from changes in the market prices of investments held. Exchange rate fluctuations are included with the net realized and unrealized gain or loss on investments in the accompanying financial statements.
Net realized foreign exchange gains or losses arise from sales of foreign currencies and the difference between asset and liability amounts initially stated in foreign currencies and the U.S. dollar value of the amounts actually received or paid. Net unrealized foreign exchange gains or losses arise from changes in the value of other assets and liabilities at the end of the reporting period, resulting from changes in the exchange rates.
| f) | Joint Trading Account – A Fund may invest cash balances into a joint trading account that may be invested in one or more repurchase agreements. |
| g) | Fund Share Valuation and Dividend Distributions to Shareholders – Orders for each class of each Fund’s shares are executed in accordance with the investment instructions of the shareholders. The NAV of each class of each Fund’s shares is determined as of the close of business on each business day of the Exchange (see Note 2(a)). The NAV is determined separately for each class of shares of a Fund by dividing the Fund’s net assets attributable to that class by the number of shares of the class outstanding. Each class of shares offered by a Fund has equal rights as to assets and voting privileges (except that shareholders of a class have exclusive voting rights regarding any matter relating solely to that class of shares). Income andnon-class specific expenses are allocated daily to each class on the basis of the relative net assets of the class of the Fund. Realized and unrealized gains and losses are allocated daily based on the relative net assets of each class of shares of each Fund. |
Orders for the purchase of a Fund’s shares received prior to the close of the Exchange on any day the Exchange is open for business are priced at the NAV determined as of the close of the Exchange. Orders received after the close of the Exchange, or on a day on which the Exchange and/or the Funds are not open for business, are priced at the next determined NAV.
Dividends are declared pursuant to a policy adopted by the Company’s Board of Directors. Dividends and/or distributions to shareholders are recorded onex-date. The policy of each Fund is to pay dividends from net investment income and realized gains, if any, at least once a year.
Income dividends and capital gains distributions are determined in accordance with federal income tax regulations, which may differ from U.S. GAAP with respect to character and timing (see Federal Income Taxes: Distributions and Components of Distributable Earnings and Reclassification of Capital Accounts notes).
| 3. | Securities and Other Investments: |
Restricted Securities – Each Fund may invest in securities that are subject to legal or contractual restrictions on resale. These securities generally may be resold in transactions exempt from registration or to the public if the securities are registered. Disposal of these securities may involve time-consuming negotiations and expense, and prompt sale at an acceptable price may be difficult. Information regarding restricted securities, if applicable, is included at the end of each Fund’s Schedule of Investments.
| 4. | Financial Derivative Instruments: |
The following disclosures contain information on how and why a Fund may use derivative instruments, the credit-risk-related contingent features in certain derivative instruments, and how derivative instruments affect a Fund’s financial position and results of operations. The location and fair value amounts of these instruments on the Statements of Assets and Liabilities and the realized gains and losses and changes in unrealized gains and losses on the Statements of Operations, each categorized by type of derivative contract, are included in the following Additional Derivative Instrument Information footnote. The derivative instruments outstanding as ofperiod-end are disclosed in the notes to the Schedules of Investments, if applicable. The amounts of realized gains and losses and changes in unrealized gains and losses on derivative instruments during the period are disclosed in the Statements of Operations.
| 24 |
|
| Hartford Multifactor Funds |
Notes to Financial Statements – (continued)
September 30, 2019
| a) | Foreign Currency Contracts – A Fund may enter into foreign currency contracts that obligate the Fund to purchase or sell currencies at specified future dates. Foreign currency contracts may be used in connection with settling purchases or sales of securities to hedge the currency exposure associated with some or all of a Fund’s investments and/or as part of an investment strategy. Foreign currency contracts are marked to market daily and the change in value is recorded by a Fund as an unrealized gain or loss. A Fund will record a realized gain or loss when the foreign currency contract is settled. |
Foreign currency contracts involve elements of market risk in excess of the amounts reflected in the Statements of Assets and Liabilities. In addition, risks may arise upon entering into these contracts from the potential inability of the counterparties to meet the terms of the contracts and from unanticipated movements in the value of the foreign currencies relative to the U.S. dollar. Upon entering into a foreign currency contract, a Fund may be required to post margin equal to its outstanding exposure thereunder.
During the period ended September 30, 2019, Multifactor International Fund and Multifactor Large Cap Value Fund had not used Foreign Currency Contracts. There were no open contracts at September 30, 2019.
| b) | Futures Contracts – A Fund may enter into futures contracts. A futures contract is an agreement between two parties to buy or sell an asset at a set price on a future date. A Fund may use futures contracts to manage risk or obtain exposure to the investment markets, commodities, or movements in interest rates and currency values. The primary risks associated with the use of futures contracts are the imperfect correlation between the change in market value of the investments held by a Fund and the prices of futures contracts and the possibility of an illiquid market. Upon entering into a futures contract, a Fund is required to deposit with a futures commission merchant (“FCM”) an amount of cash or U.S. Government or Agency Obligations in accordance with the initial margin requirements of the broker or exchange. Futures contracts are marked to market daily and an appropriate amount equal to the change in value (“variation margin”) is paid or received by a Fund. Gains or losses are recognized but not considered realized until the contracts expire or are closed. Futures contracts involve, to varying degrees, risk of loss in excess of the variation margin disclosed on the Statements of Assets and Liabilities. |
During the period ended September 30, 2019, Multifactor International Fund and Multifactor Large Cap Value Fund had not used Futures Contracts. There were no open contracts at September 30, 2019.
| 5. | Principal Risks: |
A Fund’s investments expose it to various types of risks associated with financial instruments and the markets. A Fund may be exposed to the risks described below. Each Fund’s prospectus provides details of its principal risks.
The market values of equity securities, such as common stocks and preferred stocks, or equity related derivative investments, such as futures and options, may decline due to general market conditions which are not specifically related to a particular company, such as real or perceived adverse economic conditions, changes in the general outlook for corporate earnings, changes in interest or currency rates or adverse investor sentiment generally. The market value of equity securities may also decline due to factors which affect a particular industry or industries, such as labor shortages or increased production costs and competitive conditions within an industry. Equity securities and equity related investments generally have greater market price volatility than fixed income securities. The extent of each Fund’s exposure to market risk is the market value of the investments held as shown in the Fund’s Schedule of Investments.
Investing in the securities ofnon-U.S. issuers, whether directly or indirectly, involves certain considerations and risks not typically associated with securities of U.S. issuers. Such risks include, but are not limited to: generally less liquid and less efficient securities markets; generally greater price volatility; exchange rate fluctuations; imposition of restrictions on the expatriation of funds or other protectionist measures; less publicly available information about issuers; the imposition of withholding or other taxes; higher transaction and custody costs; settlement delays and risk of loss attendant in settlement procedures; difficulties in enforcing contractual obligations; less regulation of securities markets; different accounting, disclosure and reporting requirements; more substantial governmental involvement in the economy; higher inflation rates; and greater social, economic and political uncertainties. These risks are heightened for investments in issuers from countries with less developed markets.
Securities lending involves the risk that a Fund may lose money because the borrower of the loaned securities fails to return the securities in a timely manner or at all. A Fund could also lose money in the event of a decline in the value of the collateral provided for the loaned securities or a decline in the value of any investments made with cash collateral. These events could also trigger adverse tax consequences for a Fund that lends its holdings.
| 6. | Federal Income Taxes: |
| a) | Each Fund intends to qualify as a Regulated Investment Company (“RIC”) under Subchapter M of the Internal Revenue Code (“IRC”) by distributing substantially all of its taxable net investment income and net realized capital gains to its shareholders each year. Each Fund has distributed substantially all of its income and capital gains in prior years, if applicable, and intends to distribute substantially all of its income and capital gains during the calendar year ending December 31, 2019. Accordingly, no provision for federal income or excise taxes has been made in the accompanying financial statements. Distributions from short-term capital gains are treated as ordinary income distributions for federal income tax purposes. |
| 25 |
|
| Hartford Multifactor Funds |
Notes to Financial Statements – (continued)
September 30, 2019
| b) | Net Investment Income (Loss), Net Realized Gains (Losses) and Distributions – Net investment income (loss) and net realized gains (losses) may differ for financial statement and tax purposes primarily because of losses deferred due to wash sale adjustments, foreign currency gains and losses, adjustments related to Passive Foreign Investment Companies (“PFICs”), Real Estate Investment Trusts (“REITs”), RICs, certain derivatives and partnerships. The character of distributions made during the year from net investment income or net realized gains may differ from their ultimate characterization for federal income tax purposes. Also, due to the timing of dividend distributions, the fiscal year in which amounts are distributed may differ from the year that the income or realized gains (losses) were recorded by each Fund. |
| c) | Distributions and Components of Distributable Earnings– The tax character of distributions paid by each Fund for the period ended September 30, 2019 is as follows (as adjusted for dividends payable, if applicable): |
| For the Period Ended September 30, 2019 | ||||
Fund | Ordinary Income | |||
Multifactor International Fund | 4,357 | |||
Multifactor Large Cap Value Fund | — | |||
As of September 30, 2019, the components of distributable earnings (deficit) for each Fund on a tax basis are as follows:
Fund | Undistributed Ordinary Income | Undistributed Long-Term Capital Gain | Unrealized Appreciation (Depreciation) on Investments | Total Accumulated Earnings (Deficit) | ||||||||||||
Multifactor International Fund | 41,864 | — | 46,231 | 88,095 | ||||||||||||
Multifactor Large Cap Value Fund | 27,753 | 157 | 60,640 | 88,550 | ||||||||||||
| d) | Reclassification of Capital Accounts– The Funds may record reclassifications in their capital accounts. These reclassifications have no impact on the total net assets of the Funds. Adjustments are made to reflect the impact these items have on current and future distributions to shareholders. Therefore, the source of the Funds’ distributions may be shown in the accompanying Statements of Changes in Net Assets as from distributable earnings or from capital depending on the type of book and tax differences that exist. For the period ended September 30, 2019, the Funds recorded reclassifications to increase (decrease) the accounts listed below: |
Fund | Paid-in-Capital | Distributable Earnings (Loss) | ||||||
Multifactor International Fund | (188 | ) | 188 | |||||
Multifactor Large Cap Value Fund | (193 | ) | 193 | |||||
| e) | Tax Basis of Investments – The aggregate cost of investments for federal income tax purposes at September 30, 2019 is different from book purposes primarily due to wash sale loss deferrals and passive foreign investment company (PFIC) mark-to market adjustments. The net unrealized appreciation/(depreciation) on investments for tax purposes, which consists of gross unrealized appreciation and depreciation, was also different from book purposes primarily due to wash sale loss deferrals and mark-to-market adjustments on futures and PFICs. Both the cost and unrealized appreciation and depreciation for federal income tax purposes are disclosed below: |
Fund | Tax Cost | Gross Unrealized Appreciation | Gross Unrealized Depreciation | Net Unrealized Appreciation/ (Depreciation) | ||||||||||||
Multifactor International Fund | 3,081,354 | 134,399 | (88,142 | ) | 46,257 | |||||||||||
Multifactor Large Cap Value Fund | 1,068,390 | 70,592 | (9,952 | ) | 60,640 | |||||||||||
| f) | Capital Loss Carryforward– The Funds had no capital loss carryforwards for U.S. federal income tax purposes as of September 30, 2019. |
| g) | Accounting for Uncertainty in Income Taxes – Pursuant to provisions set forth by U.S. GAAP, Hartford Funds Management Company, LLC (“HFMC”) reviews each Fund’s tax positions for all open tax years. As of September 30, 2019, HFMC had reviewed the open tax years and concluded that there was no reason to record a liability for net unrecognized tax obligations relating to uncertain income tax positions. Each Fund files U.S. tax returns. Although the statute of limitations for examining a Fund’s U.S. tax returns remains open for 3 years, no examination is currently in progress. The Funds recognize interest and penalties, if any, related to unrecognized tax benefits as income tax expense on the Statements of Operations. During the period ended September 30, 2019, the Funds did not incur any interest or penalties. HFMC is not aware of any tax positions for which it is reasonably possible that the total amounts of unrecognized tax obligations will significantly change in the next twelve months. |
| 26 |
|
| Hartford Multifactor Funds |
Notes to Financial Statements – (continued)
September 30, 2019
| 7. | Expenses: |
| a) | Investment Advisory Agreement– Lattice Strategies LLC (the “Adviser” or “Lattice”) serves as each Fund’s investment adviser pursuant to an Investment Advisory Agreement with the Company. Lattice is a wholly owned subsidiary of Hartford Funds Management Company, LLC, which is an indirect subsidiary of The Hartford Financial Services Group, Inc. (“The Hartford”). Lattice has overall investment supervisory responsibility for each Fund. In addition, Lattice provides administrative personnel, services, equipment, facilities and office space for proper operation of each Fund. Lattice has contracted with Mellon Investments Corporation (“Mellon”) under asub-advisory agreement pursuant to which Mellon performs the daily investment of the assets of each Fund in accordance with each Fund’s investment objective and policies. Each Fund pays a fee to Lattice, a portion of which may be used to compensate Mellon. |
The schedule below reflects the rates of compensation paid to Lattice for investment advisory services rendered as of September 30, 2019; the rates are accrued daily and paid monthly based on each Fund’s average daily net assets, at the following annual rates:
Fund | Management Fee Rates | |
Multifactor International Fund | 0.290% on first $1 billion and; | |
0.280% over $1 billion | ||
Multifactor Large Cap Value Fund | 0.190% on first $1 billion and; | |
0.180% over $1 billion | ||
| b) | Accounting Services Agreement– Pursuant to the Fund Accounting Agreement between HFMC and the Company, on behalf of each Fund, HFMC provides accounting services to each Fund and receives monthly compensation based on each Fund’s average daily net assets at the rates set forth below. Each Fund’s accounting services fees are accrued daily and paid monthly. |
| Average Daily Net Assets | Annual Fees | |||
First $3.5 billion and; | 0.018% | |||
Next $3.5 billion and | 0.014% | |||
Over $7 billion | 0.010% | |||
HFMC has delegated certain accounting and administrative services functions to State Street Bank and Trust Company (“State Street”). The costs and expenses of such delegation are borne by HFMC, not by the Funds, and HFMC compensates State Street for its services out of its own resources.
| c) | Operating Expenses– Allocable expenses incurred by the Company are allocated to each series of the Company, and allocated to classes within each such series, in proportion to the average daily net assets of such series and classes, except where allocation of certain expenses is more fairly made directly to a Fund or to specific classes within a Fund. As of September 30, 2019, Lattice contractually limited the total operating expenses (exclusive of taxes, interest expense, brokerage commissions, acquired fund fees and expenses and extraordinary expenses) through May 31, 2020 as follows: |
| Expense Limit as a Percentage of Average Daily Net Assets | ||||||||||||||||||||||||
Fund | Class R3 | Class R4 | Class R5 | Class R6 | Class Y | Class F | ||||||||||||||||||
Multifactor International Fund | 1.04 | % | 0.74 | % | 0.44 | % | 0.34 | % | 0.44 | % | 0.34 | % | ||||||||||||
Multifactor Large Cap Value Fund | 0.94 | % | 0.64 | % | 0.34 | % | 0.24 | % | 0.34 | % | 0.24 | % | ||||||||||||
| d) | Distribution and Service Plan for Class R3 and R4 Shares – The Board of Directors has approved the adoption of a separate distribution plan (each, a “Plan”) pursuant to Rule12b-1 under the 1940 Act for Class R3 and Class R4 shares. Under a Plan, Class R3 and Class R4 shares of a Fund, as applicable, bear distribution and/or service fees paid to Hartford Funds Distributors, LLC (“HFD”), some of which may be paid to select broker-dealers. Pursuant to the Class R3 Plan, a Fund may pay HFD a fee of up to 0.50% of the average daily net assets attributable to Class R3 shares for distribution financing activities, and up to 0.25% may be used for shareholder account servicing activities. Pursuant to the Class R4 Plan, a Fund may pay HFD a fee of up to 0.25% of the average daily net assets attributable to Class R4 shares for distribution financing activities. The entire amount of the fee may be used for shareholder account servicing activities. EachFund’s 12b-1 fees are accrued daily and paid monthly or at such other intervals as the Company’s Board of Directors may determine. Any 12b-1 fees not paid to a broker-dealer are reimbursed to the Funds by HFD. |
| e) | Other Related Party Transactions– Certain officers of the Company are directors and/or officers of Lattice, HFMC and/or The Hartford or its subsidiaries. For the period ended September 30, 2019, a portion of the Company’s Chief Compliance Officer’s (“CCO”) compensation was paid by all of the investment companies in the Hartford Funds’ fund complex. |
For the period ended September 30, 2019, the Funds did not pay any CCO compensation.
Hartford Administrative Services Company (“HASCO”), an indirect subsidiary of The Hartford, provides transfer agent services to each Fund. Each Fund pays HASCO a transfer agency fee payable monthly based on the lesser of (i) the costs of providing or overseeing transfer agency services provided to each share class of such Fund plus a target profit margin or (ii) a Specified Amount (as defined in the table below). Such fee
| 27 |
|
| Hartford Multifactor Funds |
Notes to Financial Statements – (continued)
September 30, 2019
is intended to compensate HASCO for: (i) fees payable by HASCO to DST Asset Manager Solutions, Inc. (“DST”) (and any other designatedsub-agent) according to the agreed-upon fee schedule under thesub-transfer agency agreement between HASCO and DST (or between HASCO and any other designatedsub-agent, as applicable); (ii)sub-transfer agency fees payable by HASCO to financial intermediaries, according to the agreed-upon terms between HASCO and the financial intermediaries, provided that such payments are within certain limits approved by the Company’s Board of Directors; (iii) certain expenses that HASCO’s parent company, Hartford Funds Management Group, Inc., allocates to HASCO that relate to HASCO’s transfer agency services provided to the Fund; and (iv) a target profit margin.
Share Class | Specified Amount (as a percentage average daily net assets) | |||
Class R3 | 0.22 | % | ||
Class R4 | 0.17 | % | ||
Class R5 | 0.12 | % | ||
Class R6 | 0.004 | % | ||
Class Y | 0.11 | % | ||
Class F | 0.004 | % | ||
Pursuant to asub-transfer agency agreement between HASCO and DST, HASCO has delegated certain transfer agent, dividend disbursing agent and shareholder servicing agent functions to DST. Each Fund does not pay any fee directly to DST; rather, HASCO makes all such payments to DST. These fees are accrued daily and paid monthly.
For the period ended September 30, 2019, the effective rate of compensation paid to HASCO for transfer agency services as a percentage of each Class’ average daily net assets is as follows:
Fund | Class R3 | Class R4 | Class R5 | Class R6 | Class Y | Class F | ||||||||||||||||||
Multifactor International Fund | 0.00 | %* | 0.00 | %* | 0.00 | %* | 0.00 | %* | 0.00 | %* | 0.00 | %* | ||||||||||||
Multifactor Large Cap Value Fund | 0.00 | %* | 0.00 | %* | 0.00 | %* | 0.00 | %* | 0.00 | %* | 0.00 | %* | ||||||||||||
| * | Rounds to less than .005% |
| 8. | Securities Lending: |
A Fund may lend portfolio securities to certain borrowers in U.S. andnon-U.S. markets in an amount not to exceedone-third (33 1/3%) of the value of its total assets. If a Fund security is on loan, under the lending agreement, the borrower is required to deposit cash or liquid securities as collateral at least equal to 100% of the market value of the loaned securities; cash collateral is invested for the benefit of the Fund by the Fund’s lending agent pursuant to collateral investment guidelines. The collateral is marked to market daily, in an amount at least equal to the current market value of the securities loaned.
A Fund is subject to certain risks while its securities are on loan, including the following: (i) the risk that the borrower defaults on the loan and the collateral is inadequate to cover the Fund’s loss; (ii) the risk that the earnings on the collateral invested are not sufficient to pay fees incurred in connection with the loan; (iii) the risk that the principal value of the collateral invested may decline; (iv) the risk that the borrower may use the loaned securities to cover a short sale, which may in turn place downward pressure on the market prices of the loaned securities; (v) the risk that return of loaned securities could be delayed and interfere with portfolio management decisions; and (vi) the risk that any efforts to restrict the securities for purposes of voting may not be effective. These events could also trigger adverse tax consequences for the Fund.
At September 30, 2019, the following Fund had securities on loan at market value, cash collateral andnon-cash collateral as follows:
Fund | Market Value of Securities on Loan(1) | Cash Collateral | Non-Cash Collateral(2) | |||||||||
Multifactor International Fund | $ | 145 | $ | — | $ | 156 | ||||||
| (1) | It is each Fund’s policy to obtain additional collateral from, or return excess collateral to, the borrower by the end of the next business day following the valuation date of the securities loaned. Therefore, the value of the collateral held may be temporarily less than that required under the lending contract. |
| (2) | These securities are held for the benefit of the Fund at the Fund’s custodian. The Fund cannot repledge or resell this collateral. As such, collateral is excluded from the Statement of Assets and Liabilities. |
| 28 |
|
| Hartford Multifactor Funds |
Notes to Financial Statements – (continued)
September 30, 2019
| 9. | Affiliate Holdings: |
As of September 30, 2019, affiliates of The Hartford had ownership of shares in each Fund as follows:
Percentage of a Class:
Fund | Class R3 | Class R4 | Class R5 | Class R6 | Class Y | Class F | ||||||||||||||||||
Multifactor International Fund | 100 | % | 100 | % | 100 | % | 100 | % | 100 | % | 100 | % | ||||||||||||
Multifactor Large Cap Value Fund | 100 | % | 100 | % | 100 | % | 100 | % | 100 | % | 100 | % | ||||||||||||
Percentage of Fund by Class:
Fund | Class R3 | Class R4 | Class R5 | Class R6 | Class Y | Class F | ||||||||||||||||||
Multifactor International Fund | 3 | % | 3 | % | 34 | % | 34 | % | 23 | % | 3 | % | ||||||||||||
Multifactor Large Cap Value Fund | 10 | % | 10 | % | 20 | % | 30 | % | 20 | % | 10 | % | ||||||||||||
| 10. | Investment Transactions: |
For the period ended September 30, 2019, the cost of purchases and proceeds from sales of investment securities (excluding short-term investments) were as follows:
Fund | Cost of Purchases Excluding U.S. Government Obligations | Sales Proceeds Excluding U.S. Government Obligations | Total Cost of Purchases | Total Sales Proceeds | ||||||||||||
Multifactor International Fund | $ | 3,639,678 | $ | 568,000 | $ | 3,639,678 | $ | 568,000 | ||||||||
Multifactor Large Cap Value Fund | 1,380,466 | 332,046 | 1,380,466 | 332,046 | ||||||||||||
| 11. | Capital Share Transactions: |
The following information is for the period ended September 30, 2019:
| For the Period Ended September 30, 2019(1) | ||||||||
| Shares | Amount | |||||||
| Multifactor International Fund | ||||||||
Class R3 | ||||||||
Shares Sold | 10,001 | $ | 100,010 | |||||
Shares Issued for Reinvested Dividends | 9 | 94 | ||||||
Shares Redeemed | (1 | ) | (10 | ) | ||||
|
|
|
| |||||
Net Increase (Decrease) | 10,009 | 100,094 | ||||||
|
|
|
| |||||
Class R4 | ||||||||
Shares Sold | 10,001 | $ | 100,010 | |||||
Shares Issued for Reinvested Dividends | 11 | 119 | ||||||
Shares Redeemed | (1 | ) | (10 | ) | ||||
|
|
|
| |||||
Net Increase (Decrease) | 10,011 | 100,119 | ||||||
|
|
|
| |||||
Class R5 | ||||||||
Shares Sold | 100,001 | $ | 1,000,010 | |||||
Shares Issued for Reinvested Dividends | 139 | 1,447 | ||||||
Shares Redeemed | (1 | ) | (10 | ) | ||||
|
|
|
| |||||
Net Increase (Decrease) | 100,139 | 1,001,447 | ||||||
|
|
|
| |||||
Class R6 | ||||||||
Shares Sold | 100,001 | $ | 1,000,010 | |||||
Shares Issued for Reinvested Dividends | 147 | 1,532 | ||||||
Shares Redeemed | (1 | ) | (10 | ) | ||||
|
|
|
| |||||
Net Increase (Decrease) | 100,147 | 1,001,532 | ||||||
|
|
|
| |||||
Class Y | ||||||||
Shares Sold | 70,001 | $ | 700,010 | |||||
Shares Issued for Reinvested Dividends | 97 | 1,012 | ||||||
Shares Redeemed | (1 | ) | (10 | ) | ||||
|
|
|
| |||||
Net Increase (Decrease) | 70,097 | 701,012 | ||||||
|
|
|
| |||||
| 29 |
|
| Hartford Multifactor Funds |
Notes to Financial Statements – (continued)
September 30, 2019
| For the Period Ended September 30, 2019(1) | ||||||||
| Shares | Amount | |||||||
| Multifactor International Fund – (continued) | ||||||||
Class F | ||||||||
Shares Sold | 10,001 | $ | 100,010 | |||||
Shares Issued for Reinvested Dividends | 15 | 153 | ||||||
Shares Redeemed | (1 | ) | (10 | ) | ||||
|
|
|
| |||||
Net Increase (Decrease) | 10,015 | 100,153 | ||||||
|
|
|
| |||||
Total Net Increase (Decrease) | 300,418 | $ | 3,004,357 | |||||
|
|
|
| |||||
| Multifactor Large Cap Value Fund | ||||||||
Class R3 | ||||||||
Shares Sold | 10,001 | $ | 100,010 | |||||
Shares Redeemed | (1 | ) | (10 | ) | ||||
|
|
|
| |||||
Net Increase (Decrease) | 10,000 | 100,000 | ||||||
|
|
|
| |||||
Class R4 | ||||||||
Shares Sold | 10,001 | $ | 100,010 | |||||
Shares Redeemed | (1 | ) | (10 | ) | ||||
|
|
|
| |||||
Net Increase (Decrease) | 10,000 | 100,000 | ||||||
|
|
|
| |||||
Class R5 | ||||||||
Shares Sold | 20,001 | $ | 200,010 | |||||
Shares Redeemed | (1 | ) | (10 | ) | ||||
|
|
|
| |||||
Net Increase (Decrease) | 20,000 | 200,000 | ||||||
|
|
|
| |||||
Class R6 | ||||||||
Shares Sold | 30,001 | $ | 300,010 | |||||
Shares Redeemed | (1 | ) | (10 | ) | ||||
|
|
|
| |||||
Net Increase (Decrease) | 30,000 | 300,000 | ||||||
|
|
|
| |||||
Class Y | ||||||||
Shares Sold | 20,001 | $ | 200,010 | |||||
Shares Redeemed | (1 | ) | (10 | ) | ||||
|
|
|
| |||||
Net Increase (Decrease) | 20,000 | 200,000 | ||||||
|
|
|
| |||||
Class F | ||||||||
Shares Sold | 10,001 | $ | 100,010 | |||||
Shares Redeemed | (1 | ) | (10 | ) | ||||
|
|
|
| |||||
Net Increase (Decrease) | 10,000 | 100,000 | ||||||
|
|
|
| |||||
Total Net Increase (Decrease) | 100,000 | $ | 1,000,000 | |||||
|
|
|
| |||||
| (1) | Commenced operations on May 31, 2019. |
| 12. | Indemnifications: |
Under the Company’s organizational documents, the Company shall indemnify its officers and directors to the full extent required or permitted under Maryland General Corporation Law and federal securities laws. In addition, the Company, on behalf of each Fund, may enter into contracts that contain a variety of indemnifications. The Company’s maximum exposure under these arrangements is unknown. However, as of the date of these financial statements, the Company has not had prior claims or losses pursuant to these contracts and expects the risk of loss to be remote.
| 13. | Recent Accounting Pronouncement: |
The FASB recently issued ASU2017-08 (the “ASU” or “Update”) to amend the amortization period to the earliest call date for purchased callable debt securities held at a premium. The ASU is effective for public entities for fiscal years beginning after December 15, 2018, and will become effective for private entities one year later. Management is currently evaluating the implication, if any, of additional disclosure and its impact on the Funds’ financial statements.
In August 2018, the FASB issued Accounting Standards Update2018-13, Fair Value Measurement (Topic 820): Disclosure Framework – Changes to the Disclosure Requirements for Fair Value Measurement (“ASU2018-13”). The update introduces new fair value disclosure requirements, eliminates some prior fair value disclosure requirements, and modifies certain existing fair value disclosure requirements.
ASU2018-13 is effective for fiscal years beginning after December 15, 2019 and for interim periods within those fiscal years, however, an entity is permitted to early adopt either the entire standard or only the provisions that eliminate or modify requirements. Management has elected to early adopt the provisions of ASU2018-13 that eliminate disclosure requirements effective with the current reporting period. The impact of each Fund’s
| 30 |
|
| Hartford Multifactor Funds |
Notes to Financial Statements – (continued)
September 30, 2019
early adoption of these provisions was limited to changes in the Fund’s financial statement disclosures regarding fair value, primarily those disclosures related to transfers between Level 1 and Level 2 of the fair value hierarchy and the timing of transfers between levels of the fair value hierarchy. Management is currently evaluating the potential impact of adopting the additional provisions of ASU2018-13.
| 14. | Subsequent Events: |
In connection with the preparation of the financial statements of the Funds as of and for the period ended September 30, 2019, events and transactions subsequent to September 30, 2019, through the date the financial statements were issued have been evaluated by the Funds’ management for possible adjustment and/or disclosure. The following subsequent event requiring financial statement disclosure has been identified.
Effective January 1, 2020, the Fund Accounting Agreement with respect to each Fund will be modified to reflect a new fee structure. Under this revised fee structure, HFMC will be entitled to receive the following fee with respect to each Fund: the sub-accounting fee payable by HFMC to State Street plus the amount of expenses that HFMC allocates for providing the fund accounting services. Each Fund’s fund accounting fees will continue to be accrued daily and paid monthly.
| 31 |
|
To the Shareholders of
Hartford Multifactor International Fund and Hartford Multifactor Large Cap Value Fund and the Board of Directors of Hartford Mutual Funds II, Inc.
Opinion on the Financial Statements
We have audited the accompanying statements of assets and liabilities of Hartford Multifactor International Fund and Hartford Multifactor Large Cap Value Fund (collectively referred to as the “Funds”), (two of the series constituting Hartford Mutual Funds II, Inc (the “Company”)), including the schedules of investments, as of September 30, 2019, and the related statements of operations and changes in net assets, and the financial highlights for the period from May 31, 2019 (commencement of operations) through September 30, 2019, and the related notes (collectively referred to as the “financial statements”). In our opinion, the financial statements present fairly, in all material respects, the financial position of each of the Funds (two of the series constituting Hartford Mutual Funds II, Inc.) at September 30, 2019, the results of their operations, changes in net assets and financial highlights for the period from May 31, 2019 (commencement of operations) through September 30, 2019, in conformity with U.S. generally accepted accounting principles.
Basis for Opinion
These financial statements are the responsibility of the Company’s management. Our responsibility is to express an opinion on each of the Funds’ financial statements based on our audits. We are a public accounting firm registered with the Public Company Accounting Oversight Board (United States) (“PCAOB”) and are required to be independent with respect to the Company in accordance with the U.S. federal securities laws and the applicable rules and regulations of the Securities and Exchange Commission and the PCAOB.
We conducted our audits in accordance with the standards of the PCAOB. Those standards require that we plan and perform the audit to obtain reasonable assurance about whether the financial statements are free of material misstatement, whether due to error or fraud. The Company is not required to have, nor were we engaged to perform, an audit of the Company’s internal control over financial reporting. As part of our audits we are required to obtain an understanding of internal control over financial reporting but not for the purpose of expressing an opinion on the effectiveness of the Company’s internal control over financial reporting. Accordingly, we express no such opinion.
Our audits included performing procedures to assess the risks of material misstatement of the financial statements, whether due to error or fraud, and performing procedures that respond to those risks. Such procedures included examining, on a test basis, evidence regarding the amounts and disclosures in the financial statements. Our procedures included confirmation of securities owned as of September 30, 2019, by correspondence with the custodian and others or by other appropriate auditing procedures where replies from others were not received. Our audits also included evaluating the accounting principles used and significant estimates made by management, as well as evaluating the overall presentation of the financial statements. We believe that our audits provide a reasonable basis for our opinion.

We have served as the auditor of one or more Hartford investment companies since 2002.
Philadelphia, Pennsylvania
November 26, 2019
| 32 |
|
| Hartford Multifactor Funds |
Directors and Officers of the Company (Unaudited)
The Hartford Mutual Funds II, Inc. (the “Company”) is governed by a Board of Directors (the “Directors”). The following tables present certain information regarding the Directors and officers of the Company as of September 30, 2019. For more information regarding the Directors and officers, please refer to the Statement of Additional Information, which is available, without charge, upon request by calling1-888-843-7824.
NAME, YEAR OF BIRTH | POSITION | TERM OF | PRINCIPAL OCCUPATION(S) | NUMBER OF PORTFOLIOS IN FUND COMPLEX(3) OVERSEEN BY DIRECTOR | OTHER DIRECTORSHIPS | |||||
| NON-INTERESTED DIRECTORS | ||||||||||
HILARY E. ACKERMANN (1956) | Director | Since 2014 | Ms. Ackermann served as Chief Risk Officer at Goldman Sachs Bank USA from October 2008 to November 2011. Ms. Ackermann has served as a Director of Vistra Energy Corporation, formerly known as Dynegy, Inc. (an independent power company) since October 2012 and as a Director of Credit Suisse Holdings (USA), Inc. since January 2017. | 81 | Ms. Ackermann serves as a Director of Vistra Energy Corporation (October 2012 to present) and as a Director of Credit Suisse Holdings (USA), Inc. from January 2017 to present. | |||||
ROBIN C. BEERY (1967) | Director | Since 2017 | Ms. Beery has served as a consultant to ArrowMark Partners (an alternative asset manager) since March of 2015 and since November 2018 has been employed by ArrowMark Partners as a Senior Advisor. Previously, she was Executive Vice President, Head of Distribution, for Janus Capital Group, and Chief Executive Officer and President of the Janus Mutual Funds (a global asset manager) from September 2009 to August 2014. | 81 | Ms. Beery serves as a Director of UMB Financial Corporation (January 2015 to present). | |||||
LYNN S. BIRDSONG (1946)(4) | Director and Chairman of the Board | Director since 2003; Chairman since August 2019 | Mr. Birdsong currently serves as a Director of Aberdeen Global and Aberdeen Global II (investment funds) (since September 2014), Aberdeen Islamic SICAV and Aberdeen Liquidity Fund (investment funds) (since 2016), and Aberdeen Alpha Fund (since December 2017). Mr. Birdsong served as an Independent Director of Nomura Partners Funds, Inc. (formerly, The Japan Fund) (April 2003 to February 2015) and as a Director of the Sovereign High Yield Investment Company (April 2010 to June 2014). From 2003 to March 2005, Mr. Birdsong was an Independent Director of the Atlantic Whitehall Funds. From 1979 to 2002, Mr. Birdsong was a Managing Director of Zurich Scudder Investments, an investment management firm. During his employment with Scudder, Mr. Birdsong was an Interested Director of The Japan Fund. From January 1981 through December 2013, Mr. Birdsong was a partner in Birdsong Company, an advertising specialty firm. | 81 | None | |||||
CHRISTINE R. DETRICK (1958) | Director | Since 2016 | Ms. Detrick has served as a Director of Reinsurance Group of America since January 2014. Previously, she was a director of Forest City Realty Trust (a real estate company) from November 2014 to March 2018, a Director of Forethought Financial Group, Inc. (a financial services company) from January 2012 to January 2014, and a Senior Partner/Advisor at Bain & Company (a management consulting firm) from September 2002 to December 2012. | 81 | Ms. Detrick serves as a Director of Reinsurance Group of America (January 2014 to present). | |||||
DUANE E. HILL (1945) | Director | Since 2002 | Mr. Hill is a Partner of TSG Ventures L.P., a private equity investment company. Mr. Hill is a former partner of TSG Capital Group, a private equity investment firm that served as sponsor and lead investor in leveraged buyouts of middle market companies. | 81 | None | |||||
| 33 |
|
| Hartford Multifactor Funds |
Directors and Officers of the Company (Unaudited) – (continued)
NAME, YEAR OF BIRTH | POSITION | TERM OF | PRINCIPAL OCCUPATION(S) | NUMBER OF PORTFOLIOS IN FUND COMPLEX(3) OVERSEEN BY DIRECTOR | OTHER DIRECTORSHIPS | |||||
PHILLIP O. PETERSON (1944)(5) | Director | Since 2000 | Mr. Peterson is a mutual fund industry consultant. He was a partner of KPMG LLP (an accounting firm) until July 1999. From February 2007 to February 2018, Mr. Peterson served as a member of the Board of Trustees of the William Blair Funds. From February 2012 to February 2014, Mr. Peterson served as a Trustee of Symetra Variable Mutual Funds. From January 2004 to April 2005, Mr. Peterson served as Independent President of the Strong Mutual Funds. | 81 | None | |||||
LEMMA W. SENBET (1946) | Director | Since 2005 | Dr. Senbet currently serves as the William E. Mayer Chair Professor of Finance, and previously was the Founding Director, Center for Financial Policy, in the Robert H. Smith School of Business at the University of Maryland. He was chair of the Finance Department Robert H. Smith School of Business at the University of Maryland from 1998 to 2006. In June 2013, he began a sabbatical from the University to serve as Executive Director of the African Economic Research Consortium which focuses on economic policy research and training, which he completed in 2018. Previously, he was a chaired professor of finance at the University of Wisconsin-Madison. Also, he was a Director of the Fortis Funds from March 2000 to July 2002. Dr. Senbet served as Director of the American Finance Association and President of the Western Finance Association. In 2006, Dr. Senbet was inducted Fellow of Financial Management Association International for his career-long distinguished scholarship and professional service. | 81 | None | |||||
DAVID SUNG (1953) | Director | Since 2017 | Mr. Sung has served as a Director of Nippon Wealth Bank since April 2015 and CITIC-Prudential Fund Management Company, Inc. since January 2016. Mr. Sung is an Independent Director of seven investment funds, including twoclosed-end registered investment companies, sponsored by Ironwood Capital Management. Previously, he was a Partner at Ernst & Young LLP from October 1995 to July 2014. | 81 | Mr. Sung serves as a Trustee of Ironwood Institutional Multi-Strategy Fund, LLC and Ironwood Multi-Strategy Fund, LLC (October 2015 to present) (2 portfolios). | |||||
| OFFICERSAND INTERESTED DIRECTORS | ||||||||||
JAMES E. DAVEY(6) (1964) | Director, President and Chief Executive Officer | President and Chief Executive Officer since 2010; Director since 2012 | Mr. Davey serves as Executive Vice President of The Hartford Financial Services Group, Inc. Additionally, Mr. Davey serves as Chairman of the Board, Manager, and Senior Managing Director of Hartford Funds Distributors, LLC (“HFD”). He also currently serves as Director, Chairman of the Board, President and Senior Managing Director of Hartford Administrative Services Company (“HASCO”). Mr. Davey also serves as President, Manager, Chairman of the Board, and Senior Managing Director for Hartford Funds Management Company, LLC (“HFMC”), and Director, Chairman, President, and Senior Managing Director for Hartford Funds Management Group, Inc. (“HFMG”). Mr. Davey also serves as Manager, Chairman of the Board, and President of Lattice Strategies LLC (since July 2016). Mr. Davey has served in various positions within The Hartford and its subsidiaries in connection with the operation of the Hartford Funds. Mr. Davey joined The Hartford in 2002. | 81 | None | |||||
| 34 |
|
| Hartford Multifactor Funds |
Directors and Officers of the Company (Unaudited) – (continued)
NAME, YEAR OF BIRTH | POSITION | TERM OF | PRINCIPAL OCCUPATION(S) | NUMBER OF PORTFOLIOS IN FUND COMPLEX(3) OVERSEEN BY DIRECTOR | OTHER DIRECTORSHIPS | |||||
ANDREW S. DECKER (1963) | AML Compliance Officer | Since 2015 | Mr. Decker serves as Chief Compliance Officer and AML Compliance Officer of HASCO (since April 2015) and Vice President of HASCO (since April 2018). Mr. Decker serves as AML Officer of HFD (since May 2015). Mr. Decker also serves as Vice President of HFMG (since April 2018). Prior to joining The Hartford, Mr. Decker served as Vice President and AML Officer at Janney Montgomery Scott (a broker dealer) from April 2011 to January 2015. Mr. Decker served as AML Compliance and Sanctions Enforcement Officer at SEI Investments from December 2007 to April 2011. | N/A | N/A | |||||
AMY N. FURLONG (1979) | Vice President and Treasurer | Since 2018 | Ms. Furlong serves as Vice President and Assistant Treasurer of HFMC (since September 2019). Ms. Furlong has served in various positions within The Hartford and its subsidiaries in connection with the operation of the Hartford Funds. Ms. Furlong joined The Hartford in 2004. Prior to joining The Hartford, Ms. Furlong worked at KPMG LLP in audit services. | N/A | N/A | |||||
WALTER F. GARGER (1965) | Vice President and Chief Legal Officer | Since 2016 | Mr. Garger serves as Secretary, Managing Director and General Counsel of HFD, HASCO, HFMC and HFMG (since 2013). Mr. Garger also serves as Secretary and General Counsel of Lattice Strategies LLC (since July 2016). Mr. Garger has served in various positions within The Hartford and its subsidiaries in connection with the operation of the Hartford Funds. Mr. Garger joined The Hartford in 1995. | N/A | N/A | |||||
ALBERT Y. LEE (1979) | Vice President and Assistant Treasurer | Since 2017 | Mr. Lee serves as Head of Systemic Strategies and ETF Operations and Senior Vice President of HFMG (since July 2016). Mr. Lee also serves as Senior Vice President of Lattice Strategies LLC (since June 2017). Previously, Mr. Lee served as Managing Director and Chief Operating Officer, Lattice Strategies LLC (2009-2016); Chief Operating Officer at Avicenna Capital Management (2007-2009); and Chief Financial Officer at Steeple Capital LP (2005-2007). | N/A | N/A | |||||
THEODORE J. LUCAS (1966) | Vice President | Since 2017 | Mr. Lucas serves as Executive Vice President of HFMG (since July 2016) and as Executive Vice President of Lattice Strategies LLC (since June 2017). Previously, Mr. Lucas served as Managing Partner of Lattice Strategies LLC (2003 to 2016). | N/A | N/A | |||||
JOSEPH G. MELCHER (1973) | Vice President and Chief Compliance Officer | Since 2013 | Mr. Melcher serves as President (since April 2018), Chief Executive Officer (since April 2018) and Executive Vice President (since December 2013) of HFD. He also serves as Executive Vice President of HFMG and HASCO (since December 2013). Mr. Melcher also serves as Executive Vice President (since December 2013) and Chief Compliance Officer (since December 2012) of HFMC. Mr. Melcher also serves as Executive Vice President and Chief Compliance Officer of Lattice Strategies, LLC (since July 2016). Mr. Melcher has served in various positions within The Hartford and its subsidiaries in connection with the operation of the Hartford Funds since joining The Hartford in 2012. Prior to joining The Hartford, Mr. Melcher worked at Touchstone Investments, a member of the Western & Southern Financial Group, where he held the position of Vice President and Chief Compliance Officer from 2010 through 2012 and Assistant Vice President, Compliance from 2005 to 2010. | N/A | N/A | |||||
| 35 |
|
| Hartford Multifactor Funds |
Directors and Officers of the Company (Unaudited) – (continued)
NAME, YEAR OF BIRTH | POSITION | TERM OF | PRINCIPAL OCCUPATION(S) | NUMBER OF PORTFOLIOS IN FUND COMPLEX(3) OVERSEEN BY DIRECTOR | OTHER DIRECTORSHIPS | |||||
VERNON J. MEYER (1964) | Vice President | Since 2006 | Mr. Meyer serves as Managing Director and Chief Investment Officer of HFMC and Managing Director of HFMG (since 2013). Mr. Meyer has served in various positions within The Hartford and its subsidiaries in connection with the operation of the Hartford Funds. Mr. Meyer joined The Hartford in 2004. | N/A | N/A | |||||
ALICE A. PELLEGRINO (1960) | Vice President and Assistant Secretary | Since 2016 | Ms. Pellegrino serves as Vice President of HFMG (since December 2013). Ms. Pellegrino also serves as Vice President and Assistant Secretary of Lattice Strategies LLC (since June 2017). Ms. Pellegrino is a Senior Counsel and has served in various positions within The Hartford and its subsidiaries in connection with the operation of the Hartford Funds. Ms. Pellegrino joined The Hartford in 2007. | N/A | N/A | |||||
| THOMAS R. PHILLIPS (1960) | Vice President and Secretary | Since 2017 | Mr. Phillips currently serves as Vice President (since February 2017) and Assistant Secretary (since June 2017) for HFMG. Mr. Phillips is Deputy General Counsel for HFMG. Prior to joining HFMG in 2017, Mr. Phillips was a Director and Chief Legal Officer of Saturna Capital Corporation from 2014–2016. Prior to that, Mr. Phillips was a Partner and Deputy General Counsel of Lord, Abbett & Co. LLC. | N/A | N/A | |||||
| (1) | The address for each officer and Director is c/o Hartford Funds 690 Lee Road, Wayne, PA 19087. |
| (2) | Each Director holds an indefinite term until the earlier of (i) the election and qualification of his or her successor or (ii) when the Director turns 75 years of age. Each officer shall serve until his or her successor is elected and qualifies. |
| (3) | The portfolios of the “Fund Complex” are series of The Hartford Mutual Funds, Inc., The Hartford Mutual Funds II, Inc., Hartford Series Fund, Inc., Hartford HLS Series Fund II, Inc., Hartford Funds Master Fund, Lattice Strategies Trust, Hartford Funds Exchange-Traded Trust, Hartford Funds NextShares Trust, and Hartford Schroders Opportunistic Income Fund. |
| (4) | Effective August 7, 2019, Mr. Birdsong has been appointed as Chairman of the Board. |
| (5) | Effective December 5, 2019, Mr. Peterson will retire from the Board of Directors. |
| (6) | “Interested person,” as defined in the 1940 Act, of the Company because of the person’s affiliation with, or equity ownership of, HFMC, HFD or affiliated companies. |
| 36 |
|
| Hartford Multifactor Funds |
HOW TO OBTAIN A COPY OF EACH FUND’S PROXY VOTING POLICIES AND VOTING RECORDS (UNAUDITED)
A description of the policies and procedures that each Fund uses to determine how to vote proxies relating to portfolio securities and information about how each Fund voted proxies relating to portfolio securities during the most recent twelve-month period ended June 30, are available (1) without charge, upon request, by calling 888-843-7824 and (2) on the SEC’s website at http://www.sec.gov.
QUARTERLY PORTFOLIO HOLDINGS INFORMATION (UNAUDITED)
Each Fund will file its complete schedule of portfolio holdings with the SEC for the first and third quarters of each fiscal year as an exhibit to its reports on Form N-PORT. Each Fund’s Form N-PORT reports once filed will be available (1) without charge, upon request, by calling 888-843-7824 and (2) on the SEC’s website at http://www.sec.gov.
| 37 |
|
| Hartford Multifactor Funds |
Approval of Investment Management and InvestmentSub-Advisory Agreements (Unaudited)
The Hartford Mutual Funds II, Inc.
Hartford Multifactor International Fund
Hartford Multifactor Large Cap Value Fund
Section 15(c) of the Investment Company Act of 1940, as amended (the “1940 Act”), requires that each mutual fund’s board of directors, including a majority of those directors who are not “interested persons” of the mutual fund, as defined in the 1940 Act (the “Independent Directors”), initially approve, and annually review and consider the continuation of, the mutual fund’s investment advisory andsub-advisory agreements. At its meeting held on April 30 – May 1, 2019, the Board of Directors (the “Board”) of The Hartford Mutual Funds II, Inc., including each of the Independent Directors, unanimously voted to approve for an initialtwo-year period an investment management agreement for Hartford Multifactor International Fund and Hartford Multifactor Large Cap Value Fund (each, a “Fund” and collectively, the “Funds”) with Lattice Strategies LLC (“Lattice Strategies”), a wholly owned subsidiary of Hartford Funds Management Company, LLC (“HFMC”), and a separate investmentsub-advisory agreement between Lattice Strategies and the Funds’sub-adviser, Mellon Investments Corporation (the“Sub-adviser,” and together with Lattice Strategies, the “Advisers”) on behalf of the Funds (collectively, the “Agreements”).
Prior to approving the Agreements, the Board requested and reviewed written responses from the Advisers to questions posed to them on behalf of the Independent Directors and supporting materials relating to those questions and responses (the “Advisers Materials”). In addition, the Board and its Investment Committee considered the materials and presentations from representatives of Lattice Strategies received at meetings held on February5-6, 2019 and April 30 – May 1, 2019 regarding each Fund and its investment strategy.
In determining whether to approve the Agreements for each Fund, the members of the Board reviewed and evaluated information and factors they believed to be relevant and appropriate through the exercise of their reasonable business judgment. While individual members of the Board may have weighed certain factors differently, the Board’s determination to approve the Agreements was based on a comprehensive consideration of all information provided to the Board with respect to the approval of the Agreements. The Board was also furnished with an analysis of its fiduciary obligations in connection with its evaluation of the Agreements and was assisted by counsel for the Company. The Independent Directors were also separately assisted by independent legal counsel throughout the evaluation process. A more detailed summary of the important, but not necessarily all, factors the Board considered with respect to its approval of the Agreements is provided below.
Nature, Extent and Quality of Services to be Provided by the Advisers
The Board requested and considered information concerning the nature, extent and quality of the services to be provided to each Fund by the Advisers. The Board considered, among other things, the terms of the Agreements and the range of services to be provided by each Adviser. The Board considered each Adviser’s organizational structure, systems and personnel. The Board also considered each Adviser’s reputation and overall financial strength and the Board members’ past experience with each Adviser with respect to the services it provides to other funds managed by Lattice Strategies and its affiliates (the “Hartford Funds”). The Board also considered that, although the Funds would be the first strategic beta mutual funds managed by Lattice Strategies, Lattice Strategies had extensive experience managing strategic beta exchange-traded funds (“ETFs”), including ETFs with similar or substantially similar principal investment strategies to those proposed for the Funds.
With respect to Lattice Strategies, the Board noted that, under the Agreements, Lattice Strategies would be responsible for the management of each Fund, including oversight of fund operations and service providers. The Board also noted that Lattice Strategies would provide administrative services to the Funds as well as investment advisory services in connection with selecting, monitoring and supervising the Funds’sub-adviser, and that Lattice Strategies had recommended to the Board that theSub-adviser be appointed as thesub-adviser to each Fund. In this regard, the Board evaluated information about the nature and extent of responsibilities retained and risks assumed by Lattice Strategies and not delegated to, or assumed by, theSub-adviser. The Board considered that Lattice Strategies is responsible for the creation, maintenance and ongoing monitoring of each Fund’s custom proprietary benchmark index. The Board also considered the proposed services to be provided by Lattice Strategies and, in its consideration of these services, the Board noted Lattice Strategies’ and its affiliates’ ongoing monitoring of people, process and performance, including its quarterly reviews of each of the Hartford Funds, semi-annual meetings with the leaders of each Hartford Fund’s portfolio management team, and oversight of the portfolio managers to the Hartford Funds. The Board considered that Lattice Strategies would oversee theSub-adviser’s investment approach and results, process for monitoring best execution of portfolio trades and other trading operations by theSub-adviser and approach to risk management with respect to each Fund and the service providers to the Funds. The Board also considered that Lattice Strategies would oversee each Fund’s compliance with its investment objective and policies as well as with applicable laws and regulations. In addition, the Board considered that Lattice Strategies or its affiliates would be responsible for providing the Funds’ officers.
With respect to theSub-adviser, which would be responsible for the daily investment of the assets of each Fund, subject to oversight by Lattice Strategies, among the other services set forth in thesub-advisory agreement, the Board considered theSub-adviser’s investment philosophy and process, investment research capabilities and resources, performance record, trade execution capabilities and experience.
The Board also considered information previously provided by the Advisers regarding their compliance policies and procedures and compliance history, and received a representation from Lattice Strategies that the written compliance policies and procedures of each of Lattice Strategies and theSub-adviser are reasonably designed to prevent violations of the federal securities laws. In addition, the Board considered Lattice Strategies’
| 38 |
|
| Hartford Multifactor Funds |
Approval of Investment Management and InvestmentSub-Advisory Agreements (Unaudited) – (continued)
representation that it did not anticipate making any material changes to Lattice Strategies’ and the Hartford Funds’ compliance program as a result of the addition of the Funds.
In considering this information, the Board evaluated not only the information presented to the Board and the Investment Committee in connection with its consideration of the Agreements, but also the Board members’ experience through past interactions with Lattice Strategies and theSub-adviser. Based on these considerations, the Board concluded that it was satisfied with the nature, extent and quality of the services to be provided to the Funds by Lattice Strategies and theSub-adviser.
Performance of theSub-adviser
The Board considered the investment performance of theSub-adviser and its portfolio management team, including, for purposes of considering the investment skill and experience of the Hartford Multifactor Large Cap Value Fund’s portfolio managers, performance data showing the portfolio management team’s capabilities in managing a substantially similar separate account (the “Related Large Cap Value Account”) and the Hartford Multifactor US Equity ETF (the “Related Large Cap Value Fund”), a series of Lattice Strategies Trust. The Board considered that the Related Large Cap Value Account and the Related Large Value Fund are the only accounts subadvised by Mellon and advised by Lattice Strategies or HFMC in Lattice Strategies’ and HFMC’s Multifactor Large Cap Value investment strategy that has investment objectives, policies and strategies similar or substantially similar to those of Hartford Multifactor Large Cap Value Fund. The Board noted that each of the Hartford Multifactor Large Cap Value Fund and the Related Large Cap Value Account seeks to provide investment results that correspond to the total return performance of the Hartford Multifactor Large Cap Value Index (HMLCVX), while the Related Large Cap Value Fund seeks to provide investment results that correspond to the total return performance of a slightly different custom proprietary benchmark index.
For purposes of considering the investment skill and experience of the Hartford Multifactor International Fund’s portfolio managers, the Board considered performance data showing the portfolio management team’s capabilities in managing Hartford Multifactor Developed Markets(ex-US) ETF (the “Related International Fund”), a series of Lattice Strategies Trust. The Board considered that the Related International Fund is the only account subadvised by Mellon and advised by Lattice Strategies in Lattice Strategies’ Multifactor Developed Markets(ex-US) investment strategy that has investment objectives, policies and strategies substantially similar to those of Hartford Multifactor International Fund. The Board also considered that each of the Hartford Multifactor International Fund and the Related International Fund seeks to provide investment results that correspond to the total return performance of the Hartford Risk-Optimized Multifactor Developed Markets(ex-US) Index (LRODMX).
The Board also considered information comparing the Related Large Cap Value Account’s, the Related Large Cap Value Fund’s and the Related International Fund’s performance data to each respective Fund’s proposed custom proprietary benchmark index, including the applicable tracking difference thereof and explanations of the factors contributing to such tracking difference. The Board also considered information with respect to the general tracking difference ranges established for the Funds. Moreover, the Board considered Lattice Strategies’ assessment of the quality of each Fund’s proposed custom proprietary benchmark index.
Based on these considerations, the Board concluded that it was satisfied that Lattice Strategies and theSub-adviser have the capability of providing satisfactory investment performance for each Fund.
Costs of the Services and Profitability of the Advisers
In considering the proposed advisory andsub-advisory fee schedules for each Fund, the Board reviewed information regarding Lattice Strategies’ estimated costs to provide investment management and related services to the Fund and the estimated profitability to Lattice Strategies and its affiliates from all services to be provided to the Fund and all aspects of their relationships with the Fund. In evaluating Lattice Strategies’ estimated profitability, the Board also considered Lattice Strategies’ representation that the level of estimated profitability of each Fund, taking into consideration the revenue and expenses of the Fund, was fair and reasonable based on the nature and quality of the services to be provided to shareholders. The Board also noted that the actual profitability of each Fund to Lattice Strategies would depend on the growth of the Fund’s assets under management. The Board considered representations from Lattice Strategies and theSub-adviser that theSub-adviser’s fees were negotiated at arm’s length and that thesub-advisory fees would be paid by Lattice Strategies and not the Funds. Accordingly, the Board concluded that the profitability of theSub-adviser is a less relevant factor with respect to the Board’s consideration of thesub-advisory agreement.
Based on these considerations, the Board concluded that the profits anticipated to be realized by the Advisers and their affiliates from their relationships with each Fund would not be excessive.
Comparison of Fees and Services to be Provided by the Advisers
The Board considered comparative information that had been provided at meetings on April 30 – May 1, 2019 with respect to the management fees to be paid by each Fund to Lattice Strategies and the expected total expense ratios of the Fund. The Board also considered the proposedsub-advisory fees to be paid by Lattice Strategies to theSub-adviser with respect to each Fund. In this regard, the Board requested and reviewed information from Lattice Strategies and theSub-adviser relating to the proposed management andsub-advisory fees and expected total operating expenses for the Funds. The Board also reviewed information comparing each Fund’s proposed management fees and expected total expenses relative to an
| 39 |
|
| Hartford Multifactor Funds |
Approval of Investment Management and InvestmentSub-Advisory Agreements (Unaudited) – (continued)
appropriate group of peer funds (each, a “Peer Group”) identified by Broadridge Financial Solutions, Inc. (“Broadridge”), an independent provider of investment company data. As part of this review, the Board considered the composition and methodology used to select each Peer Group, which included input from an independent financial services consultant engaged by the Independent Directors to assist them in evaluating each Fund’s proposed management andsub-advisory fees and estimated overall expense ratios. The Board considered the inherent limitations of such comparisons in light of uncertainty as to how the fees of other funds in each Peer Group are set and potentially material differences between each Fund and its comparable mutual funds. The Board considered that each Fund’s Peer Group is an imprecise match for the Fund because each Peer Group consisted of institutional share classes of actively managed mutual funds. In addition, the Board reviewed information comparing each Fund’s proposed management fees and expected total expenses relative to a supplemental group of peer funds (each, a “Supplemental Peer Group”) identified by Broadridge, which consisted solely of strategic beta exchange-traded funds. The Board also considered that Lattice Strategies had contractually agreed to limit the expenses for (i) the Hartford Multifactor International Fund’s Class R3, Class R4, Class R5, Class R6, Class Y and Class F shares to 1.04%, 0.74%, 0.44%, 0.34%, 0.44% and 0.34%, respectively; and (ii) the Hartford Multifactor Large Cap Value Fund’s Class R3, Class R4, Class R5, Class R6, Class Y and Class F shares to 0.94%, 0.64%, 0.34%, 0.24%, 0.34% and 0.24%, respectively. The Board noted that each arrangement would be in place through May 31, 2020 and would automatically renew on an annual basis unless Lattice Strategies provides written notice of termination prior to the start of the next term or upon approval of the Board.
In considering the reasonableness of each Fund’s proposed management andsub-advisory fees and projected total expense ratios, the Board considered that, according to the information provided by Broadridge, each Fund’s proposed weighted management fees were below the average and median of its Peer Group and Supplemental Peer Group for all asset levels. The Board further considered that each Fund’s proposed weighted management fees and estimated total expense ratio for Class R6 shares fell within the 1st quintile of its Peer Group and Supplemental Peer Group for all asset levels.
The Board received information regarding fees charged by Lattice Strategies to the Related Large Cap Value Fund and the Related International Fund. The Board reviewed information about structural, operational and other differences between the Funds and the Related Large Cap Value Fund and the Related International Fund, including differences in the services provided by Lattice Strategies to each type of product and differences in the marketplace in which each type of product must compete.
Based on these considerations, the Board concluded that each Fund’s proposed fees and projected total operating expenses, in conjunction with the information about quality of services, profitability, economies of scale, and other matters discussed, were reasonable in light of the services to be provided.
Economies of Scale
The Board considered information regarding the extent to which economies of scale may be realized as each Fund grows and whether the Funds’ corresponding fee levels reflect these economies of scale for the benefit of the Funds’ future shareholders. The Board reviewed the breakpoint in the proposed management fee schedule for each Fund, which would reduce the fee rate as Fund assets grow over time. The Board considered Lattice Strategies’ representation that each Fund could be expected to share in the benefits from economies of scale as assets in the Fund grow. The Board recognized that a fund with assets beyond the highest breakpoint level would continue to benefit from economies of scale because additional assets are charged the lowest breakpoint fee resulting in lower overall effective management fee rates. The Board recognized that a fee schedule that reaches a lower breakpoint quickly provides shareholders with the benefit of anticipated or potential economies of scale. The Board also considered that expense limitations that reduce each Fund’s expenses at all asset levels can have the same effect as breakpoints in sharing economies of scale with shareholders and provide protection from an increase in expenses if Fund assets decline. The Board also considered that Lattice Strategies and its affiliates have been active in managing expenses for the Hartford Funds. In addition, the Board considered that initially setting competitive fee rates and pricing each Fund to scale at inception are other means of sharing potential economies of scale with shareholders.
The Board also considered how any benefits from economies of scale would be realized by the various parties. The Board reviewed relevant information included in the Advisers Materials regarding comparative breakpoint information for other funds in each Peer Group. Based on these considerations, the Board concluded that it was satisfied with the extent to which economies of scale would be shared for the benefit of each Fund’s future shareholders. The Board noted, however, that it would review future growth in each Fund’s assets and the appropriateness of additional management fee breakpoints as part of its future annual review of the Agreements.
Other Benefits
The Board considered other benefits to the Advisers and their affiliates from their relationships with the Funds.
The Board noted that HFMC would receive fees for fund accounting and related services from the Funds. The Board also considered that Hartford Administrative Services Company, the Funds’ transfer agent and an affiliate of Lattice Strategies, would receive transfer agency compensation from the Funds.
The Board also considered that Hartford Funds Distributors, LLC (“HFD”), an affiliate of Lattice Strategies, would serve as principal underwriter of the Funds. The Board noted that its principal underwriter, HFD would receive distribution and service fees from the Funds.
| 40 |
|
| Hartford Multifactor Funds |
Approval of Investment Management and InvestmentSub-Advisory Agreements (Unaudited) – (continued)
The Board considered the benefits to each Fund’s future shareholders of being part of the Hartford Funds family of funds, including the right to exchange investments between the same class of funds, the ability to reinvest Fund dividends into other Hartford Funds, and the ability to combine holdings in certain shares classes of each Fund with holdings in certain share classes of the other Hartford Funds to obtain a reduced sales charge for Class A shares of such other Hartford Funds. The Board considered Lattice Strategies’ efforts to provide investors in the Hartford Funds family with a broad range of investment opportunities and the assumption of entrepreneurial and other risks by Lattice Strategies in sponsoring new funds to expand these opportunities for shareholders.
* * * *
Based upon its review of these various factors, among others, the Board concluded that it is in the best interests of each Fund for the Board to approve the Agreements. In reaching this decision, the Board did not assign relative weights to the factors discussed above or deem any one or group of them to be controlling in and of themselves. In connection with their deliberations, the Independent Directors met separately in executive session with independent legal counsel to review the relevant materials and consider their responsibilities under relevant laws and regulations.
| 41 |
|
THIS PRIVACY POLICY IS NOT PART OF THIS REPORT
CUSTOMER PRIVACY NOTICE
The Hartford Financial Services Group, Inc. and Affiliates*
(herein called “we, our, and us”)
This Privacy Policy applies to our United States Operations
We value your trust. We are committed to the responsible:
a) management;
b) use; and
c) protection;
ofPersonal Information.
This notice describes how we collect, disclose, and protectPersonal Information.
We collectPersonal Information to:
a) service yourTransactionswith us; and
b) support our business functions.
We may obtainPersonal Information from:
a)You;
b) yourTransactionswith us; and
c) third parties such as a consumer-reporting agency.
Based on the type of product or serviceYou apply for or get from us,Personal Information such as:
a) your name;
b) your address;
c) your income;
d) your payment; or
e) your credit history;
may be gathered from sources such as applications,Transactions, and consumer reports.
To serveYou and service our business, we may share certainPersonal Information. We will sharePersonal Information, only as allowed by law, with affiliates such as:
a) our insurance companies;
b) our employee agents;
c) our brokerage firms; and
d) our administrators.
As allowed by law, we may sharePersonal Financial Information with our affiliates to:
a) market our products; or
b) market our services;
toYou without providingYou with an option to prevent these disclosures.
We may also sharePersonal Information, only as allowed by law, with unaffiliated third parties including:
a) independent agents;
b) brokerage firms;
c) insurance companies;
d) administrators; and
e) service providers;
who help us serveYou and service our business.
When allowed by law, we may share certainPersonal Financial Information with other unaffiliated third parties who assist us by performing services or functions such as:
a) taking surveys;
b) marketing our products or services; or
c) offering financial products or services under a joint agreement between us and one or more financial institutions.
We, and third parties we partner with, may track some of the pagesYou visit through the use of:
a) cookies;
b) pixel tagging; or
c) other technologies;
and currently do not process or comply with any web browser’s “do not track” signal or other similar mechanism that indicates a request to disable online tracking of individual users who visit our websites or use our services.
For more information, our Online Privacy Policy, which governs information we collect on our website and our affiliate websites, is available at https://www.thehartford.com/online-privacy-policy.
We will not sell or share yourPersonal Financial Information with anyone for purposes unrelated to our business functions without offeringYou the opportunity to:
a)“opt-out;” or
b)“opt-in;”
as required by law.
We only disclosePersonal Health Information with:
a) your authorization; or
b) as otherwise allowed or required by law.
Our employees have access toPersonal Information in the course of doing their jobs, such as:
a) underwriting policies;
b) paying claims;
c) developing new products; or
d) advising customers of our products and services.
We use manual and electronic security procedures to maintain:
a) the confidentiality; and
b) the integrity of;
Personal Information that we have. We use these procedures to guard against unauthorized access.
Some techniques we use to protectPersonal Information include:
a) secured files;
b) user authentication;
c) encryption;
d) firewall technology; and
e) the use of detection software.
We are responsible for and must:
a) identify information to be protected;
b) provide an adequate level of protection for that data; and
c) grant access to protected data only to those people who must use it in the performance of theirjob-related duties.
Employees who violate our privacy policies and procedures may be subject to discipline, which may include termination of their employment with us.
We will continue to follow our Privacy Policy regardingPersonal Information even when a business relationship no longer exists between us.
As used in this Privacy Notice:
Application means your request for our product or service.
Personal Financial Information means financial information such as:
a) credit history;
b) income;
c) financial benefits; or
d) policy or claim information.
Personal Financial Informationmay include Social Security Numbers, Driver’s license numbers, or other government-issued identification numbers, or credit, debit card, or bank account numbers.
Personal Health Information means health information such as:
a) your medical records; or
b) information about your illness, disability or injury.
Personal Information means information that identifiesYou personally and is not otherwise available to the public. It includes:
a)Personal Financial Information; and
b)Personal Health Information.
Transaction means your business dealings with us, such as:
a) yourApplication;
b) your request for us to pay a claim; and
c) your request for us to take an action on your account.
You means an individual who has given usPersonal Information in conjunction with:
a) asking about;
b) applying for; or
c) obtaining;
a financial product or service from us if the product or service is used mainly for personal, family, or household purposes.
If you have any questions or comments about this privacy notice, please feel free to contact us at The Hartford – Law Department, Privacy Law, One Hartford Plaza, Hartford, CT 06155, or at CorporatePrivacyOffice@thehartford.com.
This Customer Privacy Notice is being provided on behalf of The Hartford Financial Services Group, Inc. and its affiliates (including the following as of March 2019), to the extent required by the Gramm-Leach-Bliley Act and implementing regulations.
1stAGChoice, Inc.; Access CoverageCorp, Inc.; Access CoverageCorp Technologies, Inc.; Business Management Group, Inc.; Cervus Claim Solutions, LLC; First State Insurance Company; FTC Resolution Company LLC; Hart Re Group L.L.C.; Hartford Accident and Indemnity Company; Hartford Administrative Services Company; Hartford Casualty General Agency, Inc.; Hartford Casualty Insurance Company; Hartford Fire General Agency, Inc.; Hartford Fire Insurance Company; Hartford Funds Distributors, LLC; Hartford Funds Management Company, LLC; Hartford Funds Management Group, Inc.; Hartford Group Benefits Holding Company; Hartford Holdings, Inc.; Hartford Insurance Company of Illinois; Hartford Insurance Company of the Midwest; Hartford Insurance Company of the Southeast; Hartford Insurance, Ltd.; Hartford Integrated Technologies, Inc.; Hartford Investment Management Company; Hartford Life and Accident Insurance Company; Hartford Life, Ltd.; Hartford Lloyd’s Corporation; Hartford Lloyd’s Insurance Company; Hartford Management, Ltd.; Hartford of Texas General Agency, Inc.; Hartford Residual Market, L.C.C.; Hartford Specialty Insurance Services of Texas, LLC; Hartford STAG Ventures LLC; Hartford Strategic Investments, LLC; Hartford Underwriters General Agency, Inc.; Hartford Underwriters Insurance Company; Heritage Holdings, Inc.; Heritage Reinsurance Company, Ltd.; HIMCO Distribution Services Company; HLA LLC; HL Investment Advisors, LLC; Horizon Management Group, LLC; HRA Brokerage Services, Inc.; Lattice Strategies LLC; Maxum Casualty Insurance Company; Maxum Indemnity Company; Maxum Specialty Services Corporation; MPC Resolution Company LLC; New England Insurance Company; New England Reinsurance Corporation; New Ocean Insurance Co., Ltd.; Nutmeg Insurance Agency, Inc.; Nutmeg Insurance Company; Pacific Insurance Company, Limited; Property and Casualty Insurance Company of Hartford; Renato Acquisition Co.; Sentinel Insurance Company, Ltd; Trumbull Flood Management, L.L.C.; Trumbull Insurance Company; Twin City Fire Insurance Company;Y-Risk, LLC.
Revised March 2019
This report is submitted for the general information of the shareholders of the Funds referenced in this report. It is not authorized for distribution to persons who are not shareholders of one or more Funds referenced in this report unless preceded or accompanied by a current prospectus for the relevant Funds. Nothing herein contained is to be considered an offer of sale or a solicitation of an offer to buy shares of any Fund listed in this report. Such offering is only made by prospectus, which includes details as to the offering price and other material information.
The information cannot be used or relied upon for the purpose of avoiding IRS penalties. These materials are not intended to provide tax, accounting or legal advice. As with all matters of a tax or legal nature, you should consult your own tax or legal counsel for advice.
Investors should carefully consider a fund’s investment objectives, risks, charges and expenses. This and other important information is contained in the fund’s prospectus and summary prospectus, which can be obtained by visiting hartfordfunds.com. Please read it carefully before investing.
The Funds are distributed by Hartford Funds Distributors, LLC (HFD), Member FINRA. Lattice Strategies, LLC (Lattice) is the Fund’s investment manager and Mellon Investments Corporation is the Fund’s subadviser. Hartford Funds refers to Hartford Funds Distributors, LLC, Member FINRA, Hartford Funds Management Company, LLC, and Lattice.
MFAR-MLT19 11/19 214008 Printed in U.S.A.

Item 2. Code of Ethics.
| (a) | The registrant, as of the end of the period covered by this report, has adopted a code of ethics that applies to the registrant’s principal executive officer, principal financial officer, principal accounting officer or controller, or persons performing similar functions, regardless of whether these individuals are employed by the registrant or a third party. |
| (b) | Not applicable. |
| (c) | There have been no amendments to the Registrant’s Code of Ethics during the reporting period for this FormN-CSR. |
| (d) | The registrant has not granted any waivers, including an implicit waiver, from a provision of the code of ethics that applies to the registrant’s principal executive officer, principal financial officer, principal accounting officer or controller, or persons performing similar functions, regardless of whether these individuals are employed by the registrant or a third party, that relates to one or more of the items set forth in paragraph (b) of this item’s instructions. |
| (e) | Not applicable |
| (f) | A copy of the code of ethics is filed herewith. |
Item 3. Audit Committee Financial Expert.
The Board of Trustees of the Registrant (the “Board”) has designated David Sung as an Audit Committee Financial Expert. Mr. Sung is considered by the Board to be an independent trustee.
Item 4. Principal Accountant Fees and Services.
| (a) | Audit Fees: The aggregate fees billed in each of the last two fiscal years for professional services rendered by the principal accountant for the audit of the registrant’s annual financial statements or services that are normally provided by the accountant in connection with statutory and regulatory filings or engagements for those fiscal years were: |
Not applicable with respect to the Funds for the fiscal year ended September 30, 2018; $33,500 for the fiscal period May 31, 2019 (commencement of operations of the Funds) through September 30, 2019.
| (b) | Audit Related Fees: The aggregate fees billed in each of the last two fiscal years for assurance and related services by the principal accountant that are reasonably related to the performance of the audit of the registrant’s financial statements and are not reported under paragraph (a) of this Item were: |
Not applicable with respect to the Funds for the fiscal year ended September 30, 2018; $0 for the fiscal period May 31, 2019 (commencement of operations of the Funds) through September 30, 2019. Audit-related services principally in connection with Rule17Ad-13 under the Securities Exchange Act of 1934.
| (c) | Tax Fees: The aggregate fees billed in each of the last two fiscal years for professional services rendered by the principal accountant for tax compliance, tax advice, and tax planning were: |
Not applicable with respect to the Funds for the fiscal year ended September 30, 2018; $0 for the fiscal period May 31, 2019 (commencement of operations of the Funds) through September 30, 2019.Tax-related services are principally in connection with, but not limited to, general tax services, excise tax and Passive Foreign Investment Company (PFIC) analysis.
| (d) | All Other Fees:The aggregate fees billed in each of the last two fiscal years for products and services provided by the principal accountant, other than the services reported in paragraphs (a) through (c) of this Item were: |
Not applicable with respect to the Funds for the fiscal year ended September 30, 2018; $0 for the fiscal period May 31, 2019 (commencement of operations of the Funds) through September 30, 2019.
| (e) | Pre-Approval Policies and Procedures |
(1) ThePre-Approval Policies and Procedures (the “Policy”) adopted by the Audit Committee of the Registrant (also, the “Fund”) sets forth the procedures pursuant to which services performed by the independent registered public accounting firm for the Registrant may bepre-approved. The following are some main provisions from the Policy.
| 1. | The Audit Committee mustpre-approve all audit services andnon-audit services that the independent registered public accounting firm provides to the Fund. |
| 2. | The Audit Committee mustpre-approve any engagement of the independent registered public accounting firm to providenon-audit services to any Service Affiliate (which is defined to include any entity controlling, controlled by, or under common control with the investment adviser that provides ongoing services to the Fund) during the period of the independent registered public accounting firm’s engagement to provide audit services to the Fund, if thenon-audit services to the Service Affiliate directly impact the Fund’s operations and financial reporting. |
| 3. | The Audit Committee shallpre-approve certainnon-audit services to the Fund and its Service Affiliates pursuant to procedures set forth in the Policy. |
| 4. | The Audit Committee, from time to time, may designate one or more of its members who are Independent Trustees (each a “Designated Member”) to consider, on the Audit Committee’s behalf, anynon-audit services, whether to the Fund or to any Service Affiliate, that have not beenpre-approved by the Audit Committee. The Designated Member also shall review, on the Audit Committee’s behalf, any proposed material change in the nature or extent of anynon-audit services previously approved. In considering any requestednon-audit services or proposed material change in such services, the Designated Member shall not authorize services which would exceed $50,000 in fees for such services. |
| 5. | The independent registered public accounting firm may not provide specified prohibitednon-audit services set forth in the Policy to the Fund, the Fund’s investment adviser, the Service Affiliates or any other member of the investment company complex. |
(2) There were nopre-approval requirements waived for the services provided to the Registrant described in paragraphs (b)-(d) of Item 4 by the Audit Committee pursuant to paragraph (c)(7)(i)(C) of Rule2-01 of RegulationS-X (the “De Minimis Rule”). There were no fees billed for services provided to the Adviser described in paragraphs (b)-(d) of Item 4 that were required to bepre-approved by the Audit Committee as described in paragraph (e)(1) of Item 4.
| (f) | None of the hours expended on the principal accountant’s engagement to audit the registrant’s financial statements for the year ended September 30, 2019, were attributed to work performed by persons other than the principal accountant’s full-time, permanent employees. |
| (g) | For the fiscal year ended September 30, 2019, the aggregatenon-audit fees billed by the Registrant’s accountant for services rendered to the Registrant, and rendered to the Registrant’s Adviser (not including anysub-adviser whose role is primarily portfolio management and is subcontracted with or overseen by another investment adviser), and any entity controlling, controlled by, or under common control with the Adviser that provided ongoing services to the Registrant for each of the last two fiscal years of the Registrant were: |
Non-Audit fees: Not applicable with respect to the Funds for the fiscal year ended September 30, 2018; $0 for the fiscal period May 31, 2019 (commencement of operations) through September 30, 2019.
| (h) | The registrant’s audit committee of the board of trustees has considered whether the provision ofnon-audit services that were rendered to the Registrant’s investment adviser (not including anysub-adviser whose role is primarily portfolio management and is subcontracted with or overseen by another investment adviser), and any entity controlling, controlled by, or under |
| common control with the investment adviser that provides ongoing services to the registrant that were notpre-approved pursuant to paragraph (c)(7)(ii) of Rule2-01 of RegulationS-X is compatible with maintaining the principal accountant’s independence. |
Item 5. Audit Committee of Listed Registrants.
| (a) | The Registrant has an audit committee that was established by the Board of Trustees of the Registrant in accordance with Section 3(a)(58)(A) of the Securities Exchange Act of 1934, as amended. The members of the Registrant’s Audit Committee are Hilary E. Ackermann, Lynn S. Birdsong and David Sung. |
| (b) | Not applicable. |
Item 6. Investments.
| (a) | The Schedule of Investments in securities of unaffiliated issuers as of the close of the reporting period is included as part of the annual report filed under Item 1 of this Form. |
| (b) | Not applicable. |
Item 7. Disclosure of Proxy Voting Policies and Procedures forClosed-End Management Investment Companies.
Not applicable.
Item 8. Portfolio Managers ofClosed-End Management Investment Companies.
Not applicable.
Item 9. Purchases of Equity Securities byClosed-End Management Investment Company and Affiliated Purchasers.
Not applicable.
Item 10. Submission of Matters to a Vote of Security Holders.
There have been no material changes to the procedures by which shareholders may recommend nominees to the registrant’s board of directors during the period covered by this report.
Item 11. Controls and Procedures.
| (a) | The registrant’s principal executive and principal financial officers, or persons performing similar functions, have concluded that the registrant’s disclosure controls and procedures (as defined in Rule30a-3(c) under the Investment Company Act of 1940, as amended (the “1940 Act”) (17 CFR270.30a-3(c))) are generally effective to provide reasonable assurance, as of a date within 90 days of the filing date of the report that includes the disclosure required by this paragraph, based on their evaluation of these controls and procedures required by Rule30a-3(b) under the 1940 Act (17 CFR270.30a-3(b)) and Rules13a-15(b) or15d-15(b) under the Securities Exchange Act of 1934, as amended (17 CFR240.13a-15(b) or240.15d-15(b)). |
| (b) | There were no changes in the registrant’s internal control over financial reporting (as defined in Rule30a-3(d) under the 1940 Act (17 CFR270.30a-3(d)) that occurred during the period covered by this report that have materially affected, or are reasonably likely to materially affect, the registrant’s internal control over financial reporting. |
Item 12. Disclosure of Securities Lending Activities forClosed-End Management Investment Companies.
Not applicable.
Item 13. Exhibits.
| (a)(1) | Code of Ethics referred to in Item 2 is attached. |
| (a)(2) | Separate certifications for each principal executive officer and principal financial officer of the registrant as required by Rule30a-2(a) under the 1940 Act (17 CFR270.30a-2(a)) and Section 302 of the Sarbanes-Oxley Act of 2002 are attached hereto. |
| (a)(3) | Not applicable |
| (a)(4) | Change in Registrant’s Independent Public Accountant |
| (b) | Certifications pursuant to Rule30a-2(b) under the 1940 Act and Section 906 of the Sarbanes-Oxley Act of 2002 are attached hereto. |
SIGNATURES
Pursuant to the requirements of the Securities Exchange Act of 1934 and the Investment Company Act of 1940, the registrant has duly caused this report to be signed on its behalf by the undersigned, thereunto duly authorized.
| THE HARTFORD MUTUAL FUNDS II, INC. | ||||
| Date: December 6, 2019 | By: | /s/ James E. Davey | ||
| James E. Davey | ||||
| President and Chief Executive Officer | ||||
Pursuant to the requirements of the Securities Exchange Act of 1934 and the Investment Company Act of 1940, this report has been signed below by the following persons on behalf of the registrant and in the capacities and on the dates indicated.
| Date: December 6, 2019 | By: | /s/ James E. Davey | ||
| James E. Davey | ||||
| President and Chief Executive Officer | ||||
| Date: December 6, 2019 | By: | /s/ Amy N. Furlong | ||
| Amy N. Furlong | ||||
| Treasurer | ||||
(Principal Financial Officer and Principal Accounting Officer) | ||||