UNITED STATES
SECURITIES AND EXCHANGE COMMISSION
Washington, D.C. 20549
FORMN-CSR
CERTIFIED SHAREHOLDER REPORT OF REGISTERED MANAGEMENT
INVESTMENT COMPANIES
Investment Company Act file number:811-00558
THE HARTFORD MUTUAL FUNDS II, INC.
(Exact name of registrant as specified in charter)
690 Lee Road, Wayne, Pennsylvania 19087
(Address of Principal Executive Offices) (Zip Code)
Thomas R. Phillips, Esquire
Hartford Funds Management Company, LLC
690 Lee Road
Wayne, Pennsylvania 19087
(Name and Address of Agent for Service)
Registrant’s telephone number, including area code: (610)386-4068
Date of fiscal year end: October 31
Date of reporting period: October 31, 2019
FormN-CSR is to be used by management investment companies to file reports with the Commission not later than 10 days after the transmission to stockholders of any report that is required to be transmitted to stockholders under Rule30e-1 under the Investment Company Act of 1940 (17 CFR270.30e-1). The Commission may use the information provided on FormN-CSR in its regulatory, disclosure review, inspection, and policymaking roles.
A registrant is required to disclose the information specified by FormN-CSR, and the Commission will make this information public. A registrant is not required to respond to the collection of information contained in FormN-CSR unless the Form displays a currently valid Office of Management and Budget (“OMB”) control number. Please direct comments concerning the accuracy of the information collection burden estimate and any suggestions for reducing the burden to Secretary, Securities and Exchange Commission, 100 F Street, NE, Washington, DC 20549. The OMB has reviewed this collection of information under the clearance requirements of 44 U.S.C. § 3507.
Item 1. Reports to Stockholders.

Dear Fellow Shareholders:
Thank you for investing in Hartford Funds. The following is the Funds’ Annual Report covering the fiscal period from November 1, 2018 to October 31, 2019.
Market Review
During the 12 months ended October 31, 2019, U.S. stocks, as measured by the S&P 500 Index,1 gained 14.33% despite volatility throughout the period.
Political uncertainty has been a core driver of this increased market volatility. Escalating trade tensions between the U.S. and China, continued debate over how
the UK will handle its departure from the European Union, and the September announcement of an impeachment inquiry against President Trump all contributed to choppy market conditions.
However, July 1, 2019 marked a significant milestone: the U.S. entered the longest period of economic expansion on record, according to The National Bureau of Economic Research. Strong consumer spending in the U.S. has continued to buoy the domestic economy, helped by an unemployment rate that stayed at or below 4% throughout the 12 month period ended October 31, 2019.
Nevertheless, signs of a slowing global economy prompted central banks around the world to shift to more accommodating monetary policy. The U.S. Federal Reserve cut interest rates three times in 2019 to bring down the federal funds rate target down to a range of 1.50 – 1.75% as of October 31, 2019, while the European Central Bank, which already had established negative interest rates, further cut its rate to -0.50% as of September 18, 2019.
Politics, both at home and abroad, are likely to continue to play a key role in market movements this year. For this reason, we encourage you to maintain a strong relationship with your financial advisor, who can help guide you through shifting markets confidently. He or she can help you proactively build a portfolio that takes market uncertainty into account, along with your unique investment goals and risk tolerances. Your financial advisor can help you find a fit within our family of funds as you work toward those goals.
Thank you again for investing in Hartford Funds. For the most up-to-date information on our funds, please take advantage of all the resources available at hartfordfunds.com.

James Davey
President
Hartford Funds
| 1 | S&P 500 Index is a market capitalization-weighted price index composed of 500 widely held common stocks. |
The index is unmanaged and not available for direct investment. Past performance is not indicative of future results. |
Hartford Domestic Equity Funds
| 2 | ||||
| 38 | ||||
| 39 | ||||
Financial Statements: | ||||
Schedules of Investments: | ||||
| 42 | ||||
| 47 | ||||
| 50 | ||||
| 53 | ||||
| 55 | ||||
| 58 | ||||
| 61 | ||||
| 64 | ||||
| 66 | ||||
| 68 | ||||
| 71 | ||||
| 73 | ||||
| 76 | ||||
| 77 | ||||
| 81 | ||||
| 83 | ||||
| 87 | ||||
| 100 | ||||
| Report of Independent Registered Public Accounting Firm | 127 | |||
| Directors and Officers (Unaudited) | 128 | |||
How to Obtain a Copy of each Fund’s Proxy Voting Policies and Voting Records (Unaudited) | 132 | |||
| 132 | ||||
| Approval of Investment Management and Investment Sub-Advisory Agreements (Unaudited) | 133 | |||
The views expressed in each Fund’s Manager Discussion contained in the Fund Overview section are views of that Fund’ssub-adviser and portfolio management team through the end of the period and are subject to change based on market and other conditions. Each Fund’s Manager Discussion is for informational purposes only and does not represent an offer, recommendation or solicitation to buy, hold or sell any security. The specific securities identified and described, if any, do not represent all of the securities purchased or sold and you should not assume that investments in the securities identified and discussed will be profitable. Holdings and characteristics are subject to change. Fund performance reflected in each Fund’s Manager Discussion reflects the returns of such Fund’s Class A shares, before sales charges. Returns for such Fund’s other classes differ only to the extent that the classes do not have the same expenses.
| The Hartford Capital Appreciation Fund |
October 31, 2019 (Unaudited)
Inception 7/22/1996 Sub-advised by Wellington Management Company LLP | Investment objective – The Fund seeks growth of capital. |
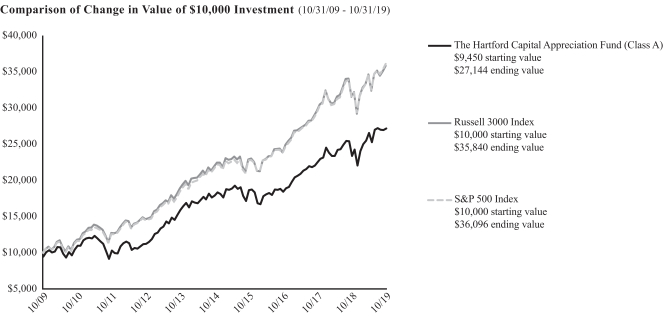
The chart above represents the hypothetical growth of a $10,000 investment in Class A, which includes a sales charge. Growth results in classes other than Class A will vary from what is seen above due to differences in the expenses charged to those share classes.
Average Annual Total Returns
for the Periods Ending 10/31/19
| 1 Year | 5 Years | 10 Years | ||||||||||
Class A1 | 16.32% | 8.72% | 11.12% | |||||||||
Class A2 | 9.86% | 7.50% | 10.50% | |||||||||
Class C1 | 15.45% | 7.94% | 10.33% | |||||||||
Class C2 | 14.49% | 7.94% | 10.33% | |||||||||
Class I1 | 16.66% | 9.04% | 11.45% | |||||||||
Class R31 | 15.91% | 8.37% | 10.79% | |||||||||
Class R41 | 16.27% | 8.71% | 11.13% | |||||||||
Class R51 | 16.64% | 9.03% | 11.46% | |||||||||
Class R61 | 16.74% | 9.13% | 11.57% | |||||||||
Class Y1 | 16.71% | 9.12% | 11.57% | |||||||||
Class F1 | 16.75% | 9.10% | 11.48% | |||||||||
Russell 3000 Index | 13.49% | 10.31% | 13.62% | |||||||||
S&P 500 Index | 14.33% | 10.78% | 13.70% | |||||||||
| 1 | Without sales charge |
| 2 | With sales charge |
PERFORMANCE DATA QUOTED REPRESENTS PAST PERFORMANCE AND DOES NOT GUARANTEE FUTURE RESULTS. The investment return and principal value of the investment will fluctuate so that investors’ shares, when redeemed, may be worth more or less than their original cost. The chart and table do not reflect the deductions of taxes that a shareholder would pay on Fund distributions or the redemption of Fund shares. Current performance may be lower or higher than the performance data quoted. To obtain performance data current to the most recentmonth-end, please visit our website www.hartfordfunds.com.
The initial investment in Class A shares reflects the maximum sales charge of 5.50% and returns for Class C shares reflect a contingent deferred sales charge of up to 1.00% on shares redeemed within twelve months of purchase.
Total returns presented above were calculated using the Fund’s net asset value available to shareholders for sale or redemption of Fund shares on 10/31/19, which may exclude
investment transactions as of this date. All share class returns assume the reinvestment of all distributions at net asset value and the deduction of all fund expenses.
Class R6 shares commenced operations on 11/07/14. Performance prior to that date is that of the Fund’s Class Y shares. Class F shares commenced operations on 2/28/17. Performance prior to that date is that of the Fund’s Class I shares.
To the extent a share class has adopted the prior performance of another share class that had different operating expenses, such performance has not been adjusted to reflect the different operating expenses. If the performance were adjusted, it may have been higher or lower.
You cannot invest directly in an index.
See “Benchmark Glossary” for benchmark descriptions.
Performance information may reflect historical or current expense waivers/reimbursements without which performance would have been lower. For information on current expense waivers/reimbursements, please see the prospectus.
| Operating Expenses* | Gross | Net | ||||||
Class A | 1.07% | 1.07% | ||||||
Class C | 1.82% | 1.82% | ||||||
Class I | 0.79% | 0.79% | ||||||
Class R3 | 1.43% | 1.43% | ||||||
Class R4 | 1.11% | 1.11% | ||||||
Class R5 | 0.81% | 0.81% | ||||||
Class R6 | 0.71% | 0.71% | ||||||
Class Y | 0.80% | 0.75% | ||||||
Class F | 0.71% | 0.71% | ||||||
| * | Expenses as shown in the Fund’s most recent prospectus. Gross expenses do not reflect contractual fee waivers or expense reimbursement arrangements. Net expenses reflect such arrangements only with respect to Class Y. These arrangements remain in effect until 2/29/20 unless the Fund’s Board of Directors approves an earlier termination. Expenses shown include acquired fund fees and expenses. Actual expenses may be higher or lower. Please see accompanying Financial Highlights for expense ratios for the year ended 10/31/19. |
| 2 |
|
| The Hartford Capital Appreciation Fund |
Fund Overview – (continued)
October 31, 2019 (Unaudited)
Portfolio Managers
Gregg R. Thomas, CFA
Senior Managing Director and Director, Investment Strategy
Wellington Management Company LLP
Tom S. Simon, CFA, FRM
Senior Managing Director and Portfolio Manager
Wellington Management Company LLP
Manager Discussion
How did the Fund perform during the period?
The Class A shares of The Hartford Capital Appreciation Fund returned 16.32%, before sales charge, for the twelve-month period ended October 31, 2019, outperforming the Fund’s benchmarks, the Russell 3000 Index and the S&P 500 Index, which returned 13.49% and 14.33%, respectively, for the same period. For the same period, Class A shares of the Fund also outperformed the 11.56% average return of the LipperMulti-Cap Core Funds peer group, a group of funds with investment strategies similar to those of the Fund.
Why did the Fund perform this way?
United States (U.S.) equities, as measured by the S&P 500 Index, posted positive results over the trailing twelve-month period ended October 31, 2019. Towards the end of 2018, volatility was elevated as markets contended with a confluence of slowing growth, tighter liquidity and monetary policy, trade uncertainty, swelling fiscal deficits, and political turmoil. The Federal Reserve (Fed) raised its benchmark interest rate by 0.25% in December 2018. During the first quarter of 2019, U.S. equities rallied to their largest quarterly gain since 2009, lifted by an accommodative shift in Fed policy and guidance, optimism for a U.S.-China trade deal, relatively strong fourth-quarter 2018 earnings, and corporate buybacks. The Fed left its benchmark interest rate unchanged during the first quarter, signaling a more patient approach toward future policy-rate adjustments in response to slowing economic growth and muted inflation. By June 2019, unresolved U.S. trade frictions with China, Mexico, Japan, and the European Union (EU) unsettled markets and raised concerns about the potential risks to U.S. economic growth from increasing cost pressures, supply chain disruptions, and waning business confidence and investment plans. In the third quarter of 2019, U.S. equities rose, with the U.S. economy remaining resilient despite elevated geopolitical uncertainties and slowing global growth. U.S.-China trade relations were particularly volatile in the absence of meaningful compromises on key structural issues. Expectations for a protracted trade war and the potential for a longer-term decoupling of the world’s two largest economies eroded consumer and business confidence and curtailed capital spending. The Fed lowered its benchmark interest rate in July and September 2019 by a combined 0.50% in effort to sustain economic expansion and mitigate the risks of slowing growth and trade frictions. In October, the Fed lowered interest rates for a third time in 2019 by 0.25% and signaled its intention to pause further changes in policy. The U.S. and China made progress towards finalizing sections of a “phase one” trade agreement.
Returns varied by market cap during the period, aslarge-cap stocks, as measured by the S&P 500 Index, outperformed bothmid- andsmall-cap stocks, as measured by the S&P MidCap 400 Index and Russell 2000 Index, respectively.
Ten out of eleven sectors in the Russell 3000 Index posted positive returns during the period. Strong performers included the Real Estate (+25.1%), Utilities (+23.1%), and Information Technology (+22.6%) sectors; the Energy sector(-14.8%) was the sole detractor.
The Fund outperformed the Russell 3000 Index primarily due to strong stock selection within the Healthcare, Consumer Discretionary, and Information Technology sectors. Conversely, weak selection within the Industrials, Communication Services, and the Energy sectors detracted from returns relative to the Russell 3000 Index during the period. Sector allocation, a result ofbottom-up stock selection, was positive during the period primarily due to the Fund’s underweight to the Energy sector. An underweight to the Information Technology sector, as well as an overweight to the Healthcare sector, detracted from performance relative to the Russell 3000 Index.
Top contributors to performance relative to the Russell 3000 Index included Shopify (Information Technology), Insulet (Healthcare), and Chipotle Mexican Grill (Consumer Discretionary). Shopify is a cloud-based commerce platform designed for small- andmedium-sized businesses. The stock price moved significantly higher during the period as the company has consistently outperformed consensus estimates for revenue and gross profits on a quarterly basis. More recently, Shopify’s stock price has moved lower as the market reacted negatively to an announced acquisition and lower-than-expected earnings per share (EPS). We sold the Fund’s position in the stock during the period. Insulet is a medical device company focused on the development of insulin infusion systems for individuals with insulin-dependent diabetes. The stock price moved higher following two consecutive quarters of results coming in above consensus estimates. Management of Insulet also raised guidance for the coming year ending December 2019, as management expects increased adoption rates for its Omnipod product. As of the end of the period, we continued to hold this position in the Fund. Chipotle Mexican Grill is a fast-casual, fresh Mexican food restaurant. The company’s share price marched higher over the period on the back of consistent quarterly results that were in line with or in excess of market expectations. We sold the Fund’s position in this company. American Tower (Real Estate), Chipotle, and Shopify contributed positively to performance on an absolute basis over the period.
We Co. (Industrials), Microsoft (Information Technology), and Uber Technologies (Industrials) were among the top detractors from performance relative to the Russell 3000 Index over the period. The Fund’s position in We Co., a U.S.-based provider of shared workspaces and services, was the top detractor from relative performance during the period. The fair valuation of private placement We Co. declined during the period as the result of various well-publicized negative events that ultimately led to a failed initial public offering (IPO) and the departure of
| 3 |
|
| The Hartford Capital Appreciation Fund |
Fund Overview – (continued)
October 31, 2019 (Unaudited)
the Chief Executive Officer (CEO) and founder. As of the end of the period, we continued to hold this position in the Fund. The Fund’s underweight exposure to Microsoft relative to the Russell 3000 Index was another top detractor from performance. Growth in Azure, Microsoft’s commercial cloud offering, helped propel the stock price higher and helped overcome some of the weakness within Microsoft’s gaming unit. The Fund remained underweight relative to the Russell 3000 Index’s exposure and we trimmed the Fund’s position during the period. Uber Technologies, a technology platform for the mobility of people and things, also detracted from performance relative to the Russell 3000 Index during the period. The company, which is best known for its ride hailing service, delivered mixed results during its first quarterly earnings call as a public company. During the period, the company struggled to show that it could turn a profit and navigate regulatory hurdles such as the classification of drivers as employees. As of the end of the period, we continued to hold this position in the Fund. We Co., Altria Group (Consumer Staples), and Uber Technologies were among the largest detractors from performance on an absolute basis over the period.
Strategies included in the Fund are chosen based on extensive analysis of qualitative and quantitative factors. Risk factors managed within the overall portfolio include but are not limited to: growth, value, momentum, contrarian, high volatility, low volatility, quality and leverage. During the period, factor impact on the Fund was positive. Exposure to value and momentum factors contributed positively to performance, while the Fund’s exposure to higher volatility equities and dividend yield detracted from performance during the period.
International exposure (country and currency) contributed positively to results, particularly driven by exposure to North America (United States and Canada), Europe (Netherlands), and emerging markets (China).
The Fund, at times, used derivative instruments such as currency forwards to hedge currency risk and/or equity index futures to hedge market risk. During the period, the use of these derivatives did not have a significant impact on performance.
What is the outlook as of the end of the period?
Macro challenges continue to weigh on markets; however, we believe that opportunities to generate alpha still exist. In particular, we believe that unresolved trade tensions, slowing global growth, and growing policy uncertainty have dampened investor risk appetite and impacted corporate fundamentals for companies and industries most exposed to these risks. Further, we believe that a multi-strategy factor-based approach to capital allocation can help manage risk amidst uncertainty and reduce excess drawdown in the event of market shocks.
As we look across the factor landscape, we maintain conviction in our diversified factor exposures. We are closely monitoring the Fund’s exposure to trend-following factors (e.g., growth and momentum) as they are exhibiting higher beta, which may also represent more downside risk. Similarly, we have beenre-evaluating the Fund’s more defensive exposures in order to determine whether they will continue to be defensive if market conditions change. Risk-averse factors, such as low volatility, have outperformed recently and appear overvalued on some metrics. However, our research indicates that low volatility (in particular) has historically provided downside protection even in instances where it appeared overvalued. In contrast, value-oriented and
contrarian approaches continue to look attractive on most valuation frameworks. While a catalyst for any value recovery continues to be uncertain, we have maintained the Fund’s exposure as it may help the Fund participate in any potential cyclical rally if the aforementioned macro tensions subside.
At the end of the period, the Fund’s largest overweights were to the Consumer Discretionary and Healthcare sectors, while the Fund’s largest underweights were to Information Technology and Energy sectors, relative to the Russell 3000 Index.
Important Risks
Investing involves risk, including the possible loss of principal. Security prices fluctuate in value depending on general market and economic conditions and the prospects of individual companies.The Fund’s strategy for allocating assets among portfolio management teams may not work as intended.•Mid-cap securities can have greater risks and volatility thanlarge-cap securities.• Foreign investments may be more volatile and less liquid than U.S. investments and are subject to the risk of currency fluctuations and adverse political and economic developments. These risks are generally greater for investments in emerging markets.• The Fund’s focus on investments in particular sectors may increase its volatility and risk of loss if adverse developments occur.
Composition by Sector(1)
as of October 31, 2019
| Sector | Percentage of Net Assets | |||
Equity Securities |
| |||
Communication Services | 8.2 | % | ||
Consumer Discretionary | 14.4 | |||
Consumer Staples | 7.4 | |||
Energy | 1.4 | |||
Financials | 11.6 | |||
Health Care | 16.3 | |||
Industrials | 10.3 | |||
Information Technology | 15.9 | |||
Materials | 3.9 | |||
Real Estate | 4.9 | |||
Utilities | 3.5 | |||
|
| |||
Total | 97.8 | % | ||
|
| |||
Short-Term Investments | 2.5 | |||
Other Assets & Liabilities | (0.3 | ) | ||
|
| |||
Total | 100.0 | % | ||
|
| |||
| (1) | A sector may be comprised of several industries. For Fund compliance purposes, the Fund may not use the same classification system. These sector classifications are used for financial reporting purposes. |
| 4 |
|
| Hartford Core Equity Fund |
Fund Overview
October 31, 2019 (Unaudited)
Inception 4/30/1998 Sub-advised by Wellington Management Company LLP | Investment objective – The Fund seeks growth of capital. |
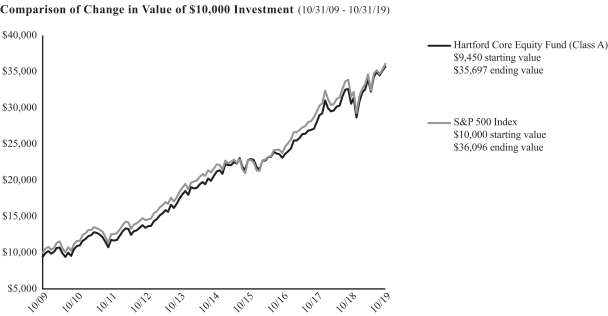
The chart above represents the hypothetical growth of a $10,000 investment in Class A, which includes a sales charge. Growth results in classes other than Class A will vary from what is seen above due to differences in the expenses charged to those share classes.
Average Annual Total Returns
for the Periods Ending 10/31/19
| 1 Year | 5 Years | 10 Years | ||||||||||
Class A1 | 16.60% | 11.60% | 14.21% | |||||||||
Class A2 | 10.19% | 10.35% | 13.57% | |||||||||
Class C1 | 15.71% | 10.79% | 13.39% | |||||||||
Class C2 | 14.71% | 10.79% | 13.39% | |||||||||
Class I1 | 16.91% | 11.87% | 14.35% | |||||||||
Class R31 | 16.18% | 11.25% | 13.93% | |||||||||
Class R41 | 16.59% | 11.60% | 14.28% | |||||||||
Class R51 | 16.90% | 11.92% | 14.62% | |||||||||
Class R61 | 17.01% | 12.00% | 14.69% | |||||||||
Class Y1 | 16.94% | 11.98% | 14.68% | |||||||||
Class F1 | 17.00% | 11.93% | 14.38% | |||||||||
S&P 500 Index | 14.33% | 10.78% | 13.70% | |||||||||
| 1 | Without sales charge |
| 2 | With sales charge |
PERFORMANCE DATA QUOTED REPRESENTS PAST PERFORMANCE AND DOES NOT GUARANTEE FUTURE RESULTS. The investment return and principal value of the investment will fluctuate so that investors’ shares, when redeemed, may be worth more or less than their original cost. The chart and table do not reflect the deductions of taxes that a shareholder would pay on Fund distributions or the redemption of Fund shares. Current performance may be lower or higher than the performance data quoted. To obtain performance data current to the most recentmonth-end, please visit our website www.hartfordfunds.com.
The initial investment in Class A shares reflects the maximum sales charge of 5.50% and returns for Class C shares reflect a contingent deferred sales charge of up to 1.00% on shares redeemed within twelve months of purchase.
Total returns presented above were calculated using the Fund’s net asset value available to shareholders for sale or redemption of Fund shares on 10/31/19, which may exclude investment transactions as of this date. All share class returns assume the reinvestment of all distributions at net asset value and the deduction of all fund expenses.
Class I shares commenced operations on 3/31/15. Performance prior to that date is that of the Fund’s Class A shares (excluding sales charges). Class R6 shares commenced operations on 3/31/15 and performance prior to that date is that of the Fund’s Class Y shares. Class F shares commenced operations on 2/28/17. Performance for Class F shares prior to 2/28/17 reflects the performance of Class I shares from 3/31/15 through 2/27/17 and Class A shares (excluding sales charges) prior to 3/31/15.
To the extent a share class has adopted the prior performance of another share class that had different operating expenses, such performance has not been adjusted to reflect the different operating expenses. If the performance were adjusted, it may have been higher or lower.
You cannot invest directly in an index.
See “Benchmark Glossary” for benchmark descriptions.
Performance information may reflect historical or current expense waivers/reimbursements without which performance would have been lower. For information on current expense waivers/reimbursements, please see the prospectus.
| Operating Expenses* | Gross | Net | ||||||
Class A | 0.75% | 0.75% | ||||||
Class C | 1.49% | 1.49% | ||||||
Class I | 0.47% | 0.47% | ||||||
Class R3 | 1.10% | 1.10% | ||||||
Class R4 | 0.79% | 0.79% | ||||||
Class R5 | 0.49% | 0.49% | ||||||
Class R6 | 0.39% | 0.39% | ||||||
Class Y | 0.48% | 0.45% | ||||||
Class F | 0.39% | 0.39% | ||||||
| * | Expenses as shown in the Fund’s most recent prospectus. Gross expenses do not reflect contractual fee waivers or expense reimbursement arrangements. Net expenses reflect such arrangements only with respect to Class Y. These arrangements remain in effect until 2/29/20 unless the Fund’s Board of Directors approves an earlier termination. Actual expenses may be higher or lower. Please see accompanying Financial Highlights for expense ratios for the year ended 10/31/19. |
| 5 |
|
| Hartford Core Equity Fund |
Fund Overview – (continued)
October 31, 2019 (Unaudited)
Portfolio Managers
Mammen Chally, CFA
Senior Managing Director and Equity Portfolio Manager
Wellington Management Company LLP
David A. Siegle, CFA
Managing Director and Equity Research Analyst
Wellington Management Company LLP
Douglas W. McLane, CFA
Managing Director and Equity Research Analyst
Wellington Management Company LLP
Manager Discussion
How did the Fund perform during the period?
The Class A shares of the Hartford Core Equity Fund returned 16.60%, before sales charge, for the twelve-month period ended October 31, 2019, outperforming the Fund’s benchmark, the S&P 500 Index, which returned 14.33% for the same period. For the same period, Class A shares of the Fund also outperformed the 13.41% average return of the LipperLarge-Cap Core Funds peer group, a group of funds with investment strategies similar to those of the Fund.
Why did the Fund perform this way?
United States (U.S.) equities, as measured by the S&P 500 Index, posted positive results over the trailing twelve-month period ended October 31, 2019. Towards the end of 2018, volatility was elevated as markets contended with a confluence of slowing growth, tighter liquidity and monetary policy, trade uncertainty, swelling fiscal deficits, and political turmoil. The Federal Reserve (Fed) raised its benchmark interest rate by 0.25% in December 2018. During the first quarter of 2019, U.S. equities rallied to their largest quarterly gain since 2009, lifted by a cautious shift in Fed policy and guidance, optimism for a U.S.-China trade deal, relatively strong fourth-quarter 2018 earnings, and corporate buybacks. The Fed left its benchmark interest rate unchanged during the first quarter, signaling a more patient approach toward future policy-rate adjustments in response to slowing economic growth and muted inflation. By June 2019, unresolved U.S. trade frictions with China, Mexico, Japan, and the European Union (EU) unsettled markets and raised concerns about the potential risks to U.S. economic growth from increasing cost pressures, supply chain disruptions, and waning business confidence and investment plans. In the third quarter of 2019, U.S. equities rose, with the U.S. economy remaining resilient despite elevated geopolitical uncertainties and slowing global growth. U.S.-China trade relations were particularly volatile in the absence of meaningful compromises on key structural issues. Expectations for a protracted trade war and the potential for a longer-term decoupling of the world’s two largest economies eroded consumer and business confidence and curtailed capital spending. The Fed lowered its benchmark interest rate in July and September 2019 by a combined 0.50% in effort to sustain economic expansion and mitigate the risks of slowing growth and trade frictions. In October, the Fed lowered interest rates for a third time in 2019 by 0.25% and signaled its intention to pause further changes in policy. The U.S. and China made progress towards finalizing sections of a “phase one” trade agreement.
Returns varied by market cap during the period, aslarge-cap stocks, as measured by the S&P 500 Index, outperformedsmall-cap andmid-cap stocks, as measured by the Russell 2000 Index and S&P MidCap 400 Index, respectively.
Ten out of eleven sectors in the S&P 500 Index rose during the period, with the Real Estate (+27%), Utilities (+24%), Information Technology (+23%), and Consumer Discretionary (+16%) sectors performing the best. The Energy sector(-11%) lagged the broader S&P 500 Index during the period.
Overall, outperformance versus the S&P 500 Index was driven by strong security selection, primarily within the Consumer Staples, Healthcare, and Industrials sectors. This was partially offset by weaker stock selection within the Energy and Consumer Discretionary sectors, which detracted from relative performance. Sector allocation, a result of thebottom-up stock selection process, also contributed positively to relative performance primarily driven by the Fund’s underweight to the Energy sector and overweight allocation to the Utilities sector. This was partially offset by the Fund’s overweight to the Healthcare sector, which detracted from relative performance.
The top contributors to performance relative to the S&P 500 Index were Teradyne (Information Technology), NextEra Energy (Utilities), and not owning Exxon Mobil (Energy), a constituent in the S&P 500 Index. Teradyne is a U.S.-based developer and supplier of automatic test equipment. Shares of the company’s stock rose during the period after reporting strong earnings. NextEra Energy is a U.S.-based company involved in the generation, transmission, distribution, and sale of electric energy in the U.S. and Canada. The company’s stock price outperformed during the period after reporting strong earnings in the last three periods. Shares of U.S.-based global integrated oil and gas company, Exxon Mobil, declined during the period. Despite reporting strong second quarter 2019 results, shares continued to sell off as fears over an escalating trade war between the U.S. and China weighed on investor sentiment. Top absolute contributors included Microsoft (Information Technology) and Procter & Gamble (Consumer Staples).
The top detractors from performance relative to the S&P 500 Index included EOG Resources (Energy), Continental Resources (Energy), and NetApp (Information Technology). EOG Resources is a U.S.-based oil and gas production company. Shares of the company’s stock declined during the period due to prolonged weakness in crude oil pricing, which impacted their upstream energy projects. Shares of Continental
| 6 |
|
| Hartford Core Equity Fund |
Fund Overview – (continued)
October 31, 2019 (Unaudited)
Resources, another U.S.-based oil and gas production company, also fell during the period as a result of negative earnings estimate revisions. The company was also impacted by weaker crude oil and natural gas prices, which more than offset a rise in production. As of the end of the period, we maintained the Fund’s position. Shares of NetApp, aU.S.-based software systems and services provider for the management and storage of customer data, declined during the period. The company announced that sales would be well below expectations in the current year due to broad slowdown in technology hardware spending. We eliminated the Fund’s position in the stock as the industry dynamics have clearly become more competitive. Top absolute detractors for the period included EOG Resources (Energy) and Continental Resources (Energy).
Derivatives were not used in a significant manner in the Fund during the period and did not have a material impact on performance during the period.
What is the outlook as of the end of the period?
Since the middle of 2018, there has been a change to the near-term market outlook, driven by the change in the U.S. bond market yield curve. The10-year Treasury yield is near the lows it experienced in 2016. After nine rate increases in 0.25% increments from late 2015 to late 2018, the Fed has now cut interest rates three times. Through all of this, the U.S. dollar has continued to strengthen against the major currencies and China has allowed its currency to weaken. In the U.S., we are now seeing some weakening of exports and capital investment. However, we believe that indicators such as credit, jobless claims, housing activity, and consumer confidence do not signify a recession at this point. Moreover, our conversations with companies indicate that, in general, competition for labor is among the bigger constraints for growth rather than a decrease in demand.
Against this backdrop, we now have the possibility that the House of Representatives will start impeachment proceedings against President Trump. As investors, we are concerned about potential ramifications on items scheduled on the legislative calendar, such as the necessary ratification of USMCA (United States-Mexico-Canada Agreement, which is the proposed replacement for the North American Free Trade Agreement). We believe the pressure on profits and the need to pass on costs will become critical if we have a combination of tariffs and the lack of a ratified USMCA.
Over the next few quarters, we believe that there will be more to analyze given that we are approaching an election year. It is clear there are several policy proposals that could have an impact on stocks the Fund holds, and while we are working to understand the implications, we believe it is too early to act one way or another.
At the end of the period, the Fund’s largest overweight sectors relative to the S&P 500 Index were to Consumer Staples and Healthcare sectors, while the Fund’s largest underweights were to the Energy and Communication Services sectors.
Important Risks
Investing involves risk, including the possible loss of principal. Security prices fluctuate in value depending on general market and economic conditions and the prospects of individual companies.
Composition by Sector(1)
as of October 31, 2019
| Sector | Percentage of Net Assets | |||
Equity Securities |
| |||
Communication Services | 7.6 | % | ||
Consumer Discretionary | 9.4 | |||
Consumer Staples | 10.3 | |||
Energy | 1.3 | |||
Financials | 13.0 | |||
Health Care | 15.3 | |||
Industrials | 10.0 | |||
Information Technology | 19.5 | |||
Materials | 1.8 | |||
Real Estate | 2.1 | |||
Utilities | 4.8 | |||
|
| |||
Total | 95.1 | % | ||
|
| |||
Short-Term Investments | 5.0 | |||
Other Assets & Liabilities | (0.1 | ) | ||
|
| |||
Total | 100.0 | % | ||
|
| |||
| (1) | A sector may be comprised of several industries. For Fund compliance purposes, the Fund may not use the same classification system. These sector classifications are used for financial reporting purposes. |
| 7 |
|
| The Hartford Dividend and Growth Fund |
Fund Overview
October 31, 2019 (Unaudited)
Inception 7/22/1996 Sub-advised by Wellington Management Company LLP | Investment objective – The Fund seeks a high level of current income consistent with growth of capital. |
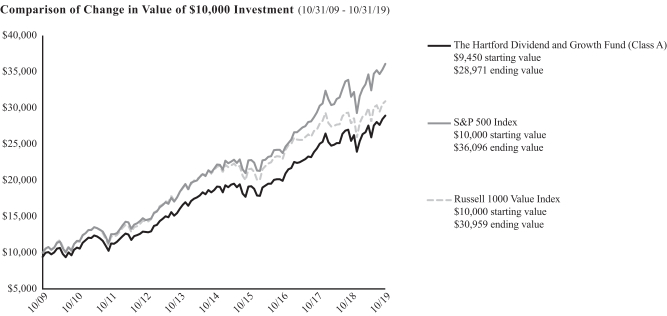
The chart above represents the hypothetical growth of a $10,000 investment in Class A, which includes a sales charge. Growth results in classes other than Class A will vary from what is seen above due to differences in the expenses charged to those share classes.
Average Annual Total Returns
for the Periods Ending 10/31/19
| 1 Year | 5 Years | 10 Years | ||||||||||
Class A1 | 13.75% | 9.17% | 11.85% | |||||||||
Class A2 | 7.49% | 7.94% | 11.22% | |||||||||
Class C1 | 12.92% | 8.35% | 11.03% | |||||||||
Class C2 | 11.92% | 8.35% | 11.03% | |||||||||
Class I1 | 14.08% | 9.43% | 12.13% | |||||||||
Class R31 | 13.33% | 8.79% | 11.50% | |||||||||
Class R41 | 13.71% | 9.12% | 11.85% | |||||||||
Class R51 | 14.05% | 9.46% | 12.19% | |||||||||
Class R61 | 14.16% | 9.54% | 12.28% | |||||||||
Class Y1 | 14.10% | 9.53% | 12.28% | |||||||||
Class F1 | 14.15% | 9.48% | 12.16% | |||||||||
S&P 500 Index | 14.33% | 10.78% | 13.70% | |||||||||
Russell 1000 Value Index | 11.21% | 7.61% | 11.96% | |||||||||
| 1 | Without sales charge |
| 2 | With sales charge |
PERFORMANCE DATA QUOTED REPRESENTS PAST PERFORMANCE AND DOES NOT GUARANTEE FUTURE RESULTS. The investment return and principal value of the investment will fluctuate so that investors’ shares, when redeemed, may be worth more or less than their original cost. The chart and table do not reflect the deductions of taxes that a shareholder would pay on Fund distributions or the redemption of Fund shares. Current performance may be lower or higher than the performance data quoted. To obtain performance data current to the most recentmonth-end, please visit our website www.hartfordfunds.com.
The initial investment in Class A shares reflects the maximum sales charge of 5.50% and returns for Class C shares reflect a contingent deferred sales charge of up to 1.00% on shares redeemed within twelve months of purchase.
Total returns presented above were calculated using the Fund’s net asset value available to shareholders for sale or redemption of Fund shares on 10/31/19, which may exclude
investment transactions as of this date. All share class returns assume the reinvestment of all distributions at net asset value and the deduction of all fund expenses.
Class R6 shares commenced operations on 11/07/14. Performance prior to that date is that of the Fund’s Class Y shares. Class F shares commenced operations on 2/28/17. Performance prior to that date is that of the Fund’s Class I shares.
To the extent a share class has adopted the prior performance of another share class that had different operating expenses, such performance has not been adjusted to reflect the different operating expenses. If the performance were adjusted, it may have been higher or lower.
You cannot invest directly in an index.
See “Benchmark Glossary” for benchmark descriptions.
Performance information may reflect historical or current expense waivers/reimbursements without which performance would have been lower. For information on current expense waivers/reimbursements, please see the prospectus.
| Operating Expenses* | Gross | Net | ||||||
Class A | 1.00% | 1.00% | ||||||
Class C | 1.76% | 1.76% | ||||||
Class I | 0.73% | 0.73% | ||||||
Class R3 | 1.35% | 1.35% | ||||||
Class R4 | 1.05% | 1.05% | ||||||
Class R5 | 0.74% | 0.74% | ||||||
Class R6 | 0.65% | 0.65% | ||||||
Class Y | 0.74% | 0.69% | ||||||
Class F | 0.64% | 0.64% | ||||||
| * | Expenses as shown in the Fund’s most recent prospectus. Gross expenses do not reflect contractual fee waivers or expense reimbursement arrangements. Net expenses reflect such arrangements only with respect to Class Y. These arrangements remain in effect until 2/29/20 unless the Fund’s Board of Directors approves an earlier termination. Actual expenses may be higher or lower. Please see accompanying Financial Highlights for expense ratios for the year ended 10/31/19. |
| 8 |
|
| The Hartford Dividend and Growth Fund |
Fund Overview – (continued)
October 31, 2019 (Unaudited)
Portfolio Managers
Edward P. Bousa, CFA*
Senior Managing Director and Equity Portfolio Manager
Wellington Management Company LLP
Matthew G. Baker
Senior Managing Director and Equity Portfolio Manager
Wellington Management Company LLP
Nataliya Kofman
Managing Director and Equity Portfolio Manager
Wellington Management Company LLP
Mark E. Vincent
Managing Director and Equity Research Analyst
Wellington Management Company LLP
* Mr. Bousa announced his plan to retire, and effective June 30, 2020, he will no longer serve as a portfolio manager for the Fund.
Manager Discussion
How did the Fund perform during the period?
The Class A shares of The Hartford Dividend and Growth Fund returned 13.75%, before sales charge, for the twelve-month period ended October 31, 2019, underperforming one of the Fund’s benchmarks, the S&P 500 Index, which returned 14.33% for the same period. For the same period, Class A shares of the Fund outperformed the Fund’s other benchmark, the Russell 1000 Value Index, which returned 11.21%. For the same period, Class A shares of the Fund outperformed the 10.99% average return of the Lipper Equity Income Funds peer group, a group of funds with investment strategies similar to those of the Fund.
Why did the Fund perform this way?
United States (U.S.) equities, as measured by the S&P 500 Index, posted positive results over the trailing twelve-month period ended October 31, 2019. Towards the end of 2018, volatility was elevated as markets contended with a confluence of slowing growth, tighter liquidity and monetary policy, trade uncertainty, swelling fiscal deficits, and political turmoil. The Federal Reserve (Fed) raised its benchmark interest rate by 0.25% in December 2018. During the first quarter of 2019, U.S. equities rallied to their largest quarterly gain since 2009, lifted by an accommodative shift in Fed policy and guidance, optimism for a U.S.-China trade deal, relatively strong fourth-quarter 2018 earnings, and corporate buybacks. The Fed left its benchmark interest rate unchanged during the first quarter, signaling a more patient approach toward future policy-rate adjustments in response to slowing economic growth and muted inflation. By June 2019, unresolved U.S. trade frictions with China, Mexico, Japan, and the European Union (EU) unsettled markets and raised concerns about the potential risks to U.S. economic growth from increasing cost pressures, supply chain disruptions, and waning business confidence and investment plans. In the third quarter of 2019, U.S. equities rose, with the U.S. economy remaining resilient despite elevated geopolitical uncertainties and slowing global growth. U.S.-China trade relations were particularly volatile in the absence of meaningful compromises on key structural issues. Expectations for a protracted trade war and the potential for a longer-term decoupling of the world’s two largest economies eroded
consumer and business confidence and curtailed capital spending. The Fed lowered its benchmark interest rate in July and September 2019 by a combined 0.50% in effort to sustain economic expansion and mitigate the risks of slowing growth and trade frictions. In October, the Fed lowered interest rates for a third time in 2019 by 0.25% and signaled its intention to pause further changes in policy. The U.S. and China made progress towards finalizing sections of a “phase one” trade agreement.
Returns varied by market cap during the period, aslarge-cap stocks, measured by the S&P 500 Index, outperformedmid- andsmall-cap stocks, measured by the S&P MidCap 400 Index and Russell 2000 Index, respectively.
Ten out of eleven sectors in the S&P 500 Index rose during the period, with the Real Estate (+27%), Utilities (+24%), and Information Technology (+23%) sectors leading the index higher. The Energy sector(-11%) was the only sector to post negative returns during the period.
Security selection contributed positively to performance relative to the S&P 500 Index over the period. Stock selection effects were strongest within the Financials, Energy, Industrials, and Healthcare sectors. This was partially offset by weaker selection within the Real Estate, Utilities, and Information Technology sectors. Sector allocation, a result of thebottom-up stock selection process, detracted from relative performance over the period. An overweight to the Energy sector and an underweight to the Information Technology sector detracted the most from relative returns. This was slightly offset by an overweight to the Utilities sector, which contributed positively to performance relative to the S&P 500 Index.
The Fund’s top detractors from absolute performance as well as from performance relative to the S&P 500 Index included DXC Technology (Information Technology), HP (Information Technology), and EnCana (Energy). DXC Technology detracted from returns relative to the S&P 500 Index, and we eliminated the Fund’s position during the period. We underestimated the impact of the transition to the cloud and the speed at which DXC could transition from legacy to digital technology. As our investment thesis for this position was not materializing, we felt we had better opportunities elsewhere. The Fund’s position in HP detracted from
| 9 |
|
| The Hartford Dividend and Growth Fund |
Fund Overview – (continued)
October 31, 2019 (Unaudited)
returns relative to the S&P 500 Index over the period due to concerns that the printing segment is coming under pressure. HP has recently announced a restructuring program, and while we have trimmed some of the Fund’s position during the period due to the risk in the new printing model, we believe that this turnaround strategy makes sense and as of the end of the period, continued to believe in the longer-term prospects of the company. EnCana detracted from relative returns driven by lower oil prices due to growing concerns around a slowdown in the global macroeconomic environment.
The Fund’s top contributors to relative performance versus the S&P 500 Index during the period were KLA (Information Technology), NextEra Energy (Utilities), and not holding Johnson & Johnson (Healthcare), a constituent of the S&P 500 Index. KLA continued to outperform its semiconductor equipment peer group with strong fiscal fourth quarter 2019 earnings and guidance for September above consensus expectations. As of the end of the period, we continued to maintain the Fund’s position as we believe KLA has a sustainable competitive advantage that is not fully reflected in the current share price. NextEra Energy reported strong third quarter earnings and reaffirmed that it would deliver at the high end of expectations through 2022. Not holding Johnson & Johnson contributed positively to relative performance over the period as the company’s share price has been under pressure due to ongoing litigation risk surrounding its various products. Top absolute performers during the period included Microsoft (Information Technology) and Bank of America (Financials).
Derivatives were not used in a significant manner in the Fund during the period, and did not have a material impact on performance during the period.
What is the outlook as of the end of the period?
We remain cautious on equity markets in the near term as we are beginning to see early signs of pressures on earnings growth. Despite the recent easing of geopolitical tensions between the U.S. and China, we continue to believe that the ongoing trade negotiations between the two countries remain a key input to our outlook, and we expect continued heightened market volatility through the end of the year and into 2020. Should trade policy issues get resolved and interest rates remain at low levels, our outlook on the market would become more constructive.
In our view, the U.S. market is expensive by most measures. We believe traditional defensive areas are highly valued and do not provide the downside protection we seek. We have maintained the Fund’s overweight position in the Financials sector longer than we typically would at this point in the cycle, but we continue to believe that the valuations and the quality of the businesses are attractive in this sector. We have been selectively increasing the Fund’s exposure to the Healthcare sector as opportunities present themselves.
At the end of the period, the Fund’s largest sector overweights relative to the S&P 500 Index were to the Financials, Energy, and Healthcare sectors, while the Fund’s largest underweights were to the Information Technology, Consumer Discretionary, and Consumer Staples sectors.
We continue to rely on our process and philosophy as we construct the Fund.
Important Risks
Investing involves risk, including the possible loss of principal. Security prices fluctuate in value depending on general market and economic conditions and the prospects of individual companies.• For dividend-paying stocks, dividends are not guaranteed and may decrease without notice.•Foreign investments may be more volatile and less liquid than U.S. investments and are subject to the risk of currency fluctuations and adverse political and economic developments.
Composition by Sector(1)
as of October 31, 2019
| Sector | Percentage of Net Assets | |||
Equity Securities |
| |||
Communication Services | 9.9 | % | ||
Consumer Discretionary | 5.2 | |||
Consumer Staples | 5.9 | |||
Energy | 7.1 | |||
Financials | 19.8 | |||
Health Care | 15.3 | |||
Industrials | 8.8 | |||
Information Technology | 13.4 | |||
Materials | 3.7 | |||
Real Estate | 2.8 | |||
Utilities | 4.3 | |||
|
| |||
Total | 96.2 | % | ||
|
| |||
Short-Term Investments | 3.7 | |||
Other Assets & Liabilities | 0.1 | |||
|
| |||
Total | 100.0 | % | ||
|
| |||
| (1) | A sector may be comprised of several industries. For Fund compliance purposes, the Fund may not use the same classification system. These sector classifications are used for financial reporting purposes. |
| 10 |
|
| The Hartford Equity Income Fund |
Fund Overview
October 31, 2019 (Unaudited)
Inception 8/28/2003 Sub-advised by Wellington Management Company LLP | Investment objective – The Fund seeks a high level of current income consistent with growth of capital. |

The chart above represents the hypothetical growth of a $10,000 investment in Class A, which includes a sales charge. Growth results in classes other than Class A will vary from what is seen above due to differences in the expenses charged to those share classes.
Average Annual Total Returns
for the Periods Ending 10/31/19
| 1 Year | 5 Years | 10 Years | ||||||||||
Class A1 | 13.88% | 8.55% | 11.89% | |||||||||
Class A2 | 7.62% | 7.33% | 11.26% | |||||||||
Class C1 | 13.00% | 7.75% | 11.07% | |||||||||
Class C2 | 12.00% | 7.75% | 11.07% | |||||||||
Class I1 | 14.17% | 8.82% | 12.17% | |||||||||
Class R31 | 13.48% | 8.16% | 11.51% | |||||||||
Class R41 | 13.85% | 8.50% | 11.85% | |||||||||
Class R51 | 14.14% | 8.82% | 12.20% | |||||||||
Class R61 | 14.29% | 8.92% | 12.30% | |||||||||
Class Y1 | 14.21% | 8.90% | 12.29% | |||||||||
Class F1 | 14.24% | 8.87% | 12.20% | |||||||||
Russell 1000 Value Index | 11.21% | 7.61% | 11.96% | |||||||||
| 1 | Without sales charge |
| 2 | With sales charge |
PERFORMANCE DATA QUOTED REPRESENTS PAST PERFORMANCE AND DOES NOT GUARANTEE FUTURE RESULTS. The investment return and principal value of the investment will fluctuate so that investors’ shares, when redeemed, may be worth more or less than their original cost. The chart and table do not reflect the deductions of taxes that a shareholder would pay on Fund distributions or the redemption of Fund shares. Current performance may be lower or higher than the performance data quoted. To obtain performance data current to the most recentmonth-end, please visit our website www.hartfordfunds.com.
The initial investment in Class A shares reflects the maximum sales charge of 5.50% and returns for Class C shares reflect a contingent deferred sales charge of up to 1.00% on shares redeemed within twelve months of purchase.
Total returns presented above were calculated using the Fund’s net asset value available to shareholders for sale or redemption of Fund shares on 10/31/19, which may exclude investment transactions as of this date. All share class returns assume the reinvestment of all distributions at net asset value and the deduction of all fund expenses.
Class R6 shares commenced operations on 11/07/14. Performance prior to that date is that of the Fund’s Class Y shares. Class F shares commenced operations on 2/28/17. Performance prior to that date is that of the Fund’s Class I shares.
To the extent a share class has adopted the prior performance of another share class that had different operating expenses, such performance has not been adjusted to reflect the different operating expenses. If the performance were adjusted, it may have been higher or lower.
You cannot invest directly in an index.
See “Benchmark Glossary” for benchmark descriptions.
Performance information may reflect historical or current expense waivers/reimbursements without which performance would have been lower. For information on current expense waivers/reimbursements, please see the prospectus.
| Operating Expenses* | Gross | Net | ||||||
Class A | 1.00% | 1.00% | ||||||
Class C | 1.75% | 1.75% | ||||||
Class I | 0.75% | 0.75% | ||||||
Class R3 | 1.37% | 1.37% | ||||||
Class R4 | 1.06% | 1.06% | ||||||
Class R5 | 0.76% | 0.76% | ||||||
Class R6 | 0.66% | 0.66% | ||||||
Class Y | 0.77% | 0.71% | ||||||
Class F | 0.66% | 0.66% | ||||||
| * | Expenses as shown in the Fund’s most recent prospectus. Gross expenses do not reflect contractual fee waivers or expense reimbursement arrangements. Net expenses reflect such arrangements only with respect to Class Y. These arrangements remain in effect until 2/29/20 unless the Fund’s Board of Directors approves an earlier termination. Actual expenses may be higher or lower. Please see accompanying Financial Highlights for expense ratios for the year ended 10/31/19. |
| 11 |
|
| The Hartford Equity Income Fund |
Fund Overview – (continued)
October 31, 2019 (Unaudited)
Portfolio Managers
W. Michael Reckmeyer, III, CFA
Senior Managing Director and Equity Portfolio Manager
Wellington Management Company LLP
Ian R. Link, CFA*
Senior Managing Director and Equity Portfolio Manager
Wellington Management Company LLP
Adam H. Illfelder, CFA
Managing Director and Equity Portfolio Manager
Wellington Management Company LLP
Matthew Hand, CFA
Managing Director and Equity Research Analyst
Wellington Management Company LLP
* Effective December 31, 2019, Ian R. Link, CFA will no longer serve as a portfolio manager for the Fund.
Manager Discussion
How did the Fund perform during the period?
The Class A shares of The Hartford Equity Income Fund returned 13.88%, before sales charge, for the twelve-month period ended October 31, 2019, outperforming the Fund’s benchmark, the Russell 1000 Value Index, which returned 11.21% for the same period. For the same period, Class A shares of the Fund also outperformed the 10.99% average return of the Lipper Equity Income Funds peer group, a group of funds with investment strategies similar to that of the Fund.
Why did the Fund perform this way?
United States (U.S.) equities, as measured by the S&P 500 Index, posted positive results over the trailing twelve-month period ended October 31, 2019. Towards the end of 2018, volatility was elevated as markets contended with a confluence of slowing growth, tighter liquidity and monetary policy, trade uncertainty, swelling fiscal deficits, and political turmoil. The Federal Reserve (Fed) raised its benchmark interest rate by 0.25% in December 2018. During the first quarter of 2019, U.S. equities rallied to their largest quarterly gain since 2009, lifted by a cautious shift in Fed policy and guidance, optimism for a U.S.-China trade deal, relatively strong fourth-quarter 2018 earnings, and corporate buybacks. The Fed left its benchmark interest rate unchanged during the first quarter, signaling a more patient approach toward future policy-rate adjustments in response to slowing economic growth and muted inflation. By June 2019, unresolved U.S. trade frictions with China, Mexico, Japan, and the European Union (EU) unsettled markets and raised concerns about the potential risks to U.S. economic growth from increasing cost pressures, supply chain disruptions, and waning business confidence and investment plans. In the third quarter of 2019, U.S. equities rose, with the U.S. economy remaining resilient despite elevated geopolitical uncertainties and slowing global growth. U.S.-China trade relations were particularly volatile in the absence of meaningful compromises on key structural issues. Expectations for a protracted trade war and the potential for a longer-term decoupling of the world’s two largest economies eroded consumer and business confidence and curtailed capital spending. The Fed lowered its benchmark interest rate in July and September 2019 by a combined 0.50% in effort to sustain
economic expansion and mitigate the risks of slowing growth and trade frictions. In October, the Fed lowered interest rates for a third time in 2019 by 0.25% and signaled its intention to pause further changes in policy. The U.S. and China made progress towards finalizing sections of a “phase one” trade agreement.
During the period, ten out of eleven sectors within the Russell 1000 Value Index posted positive absolute returns with the Real Estate (+25%), Utilities (+23%), and Information Technology (+22%) sectors performing the best. The Energy(-12%) sector was the only sector that declined during the period.
Outperformance relative to the Russell 1000 Value Index was driven by security selection, primarily within the Energy, Financials, and Healthcare sectors. This more than offset less favorable selection within the Consumer Staples and Materials sectors. Sector allocation, a result of ourbottom-up stock selection process, detracted from relative performance due to the Fund’s underweight position in the Real Estate sector and overweight position in the Energy sector. This was partially offset by the Fund’s overweight positions in the Utilities and Industrials sectors.
Top contributors to performance relative to the Russell 1000 Value Index during the period included KLA (Information Technology), Analog Devices (Information Technology), and Crown Castle (Real Estate). KLA is a leading supplier of process control and yield management equipment for the semiconductor industry. Shares jumped during the third quarter of 2019, a result of strong quarterly results and guidance that was above expectations due to increased development spending by foundry and logic customers. Analog Devices is a U.S.-based company that designs, manufactures, and markets semiconductor equipment and technology. Shares rose during the period as the company posted earnings that beat estimates in each of the last four quarters. Crown Castle is a U.S.-based company, owning a nationwide portfolio of communications infrastructure. The company’s stock rose over the period due to strong earnings and tailwinds from expectations of increased business as customers build out 5G infrastructure.
| 12 |
|
| The Hartford Equity Income Fund |
Fund Overview – (continued)
October 31, 2019 (Unaudited)
Top detractors from results relative to the Russell 1000 Value Index included Suncor Energy (Energy) and not owning benchmark constituents Procter & Gamble (P&G) (Consumer Staples) or AT&T (Communication Services). Suncor Energy is a Canadian company primarily focused on developing petroleum resource basins. Shares have traded lower over the trailing twelve months, and the company reported third-quarter earnings that missed estimates. Integrated companies, like Suncor, were weighed down by the government’s mandatory oil production cuts which sharply reduced the price discount on Canadian versus U.S. oil. Shares of P&G moved higher as strong organic sales growth continued, driven by reinvestment, innovation, and organizational realignment. Growth was broad-based across all ten categories. Additionally, management guidance suggests continued gross margin expansion into fiscal year 2020. AT&T is a U.S.-based provider of telecommunication, media, and technology services. The company has positioned itself competitively in the media streaming space with its acquisition of HBO earlier this year. The stock rose over the period and performance was boosted by third-quarter earnings that beat estimates.
Derivatives were not used in a significant manner in the Fund during the period, and did not have a material impact on performance during the period.
What is the outlook as of the end of the period?
We believe we are in the latter stages of the business cycle. As such, we have positioned the portfolio more defensively as of the end of the period. We have been focusing on companies that appear attractively valued over a variety of potential economic scenarios. While we do not expect a recession in the near term, we are mindful of broader macro and political risks and want to be positioned defensively ahead of any potentially negative developments.
The Healthcare, Information Technology, and Industrials sectors represented the Fund’s largest sector overweights relative to the Russell 1000 Value Index, while the Real Estate, Consumer Discretionary, and Financials sectors were the Fund’s largest underweights at the end of the period.
Important Risks
Investing involves risk, including the possible loss of principal. Security prices fluctuate in value depending on general market and economic conditions and the prospects of individual companies.•For dividend-paying stocks, dividends are not guaranteed and may decrease without notice.•Foreign investments may be more volatile and less liquid than U.S. investments and are subject to the risk of currency fluctuations and adverse political and economic developments.•Different investment styles may go in and out favor, which may cause the Fund to underperform the broader stock market.•The Fund’s focus on investments in particular sectors may increase its volatility and risk of loss if adverse developments occur.
Composition by Sector(1)
as of October 31, 2019
| Sector | Percentage of Net Assets | |||
Equity Securities |
| |||
Communication Services | 6.0 | % | ||
Consumer Discretionary | 3.2 | |||
Consumer Staples | 9.6 | |||
Energy | 8.6 | |||
Financials | 20.5 | |||
Health Care | 16.8 | |||
Industrials | 11.4 | |||
Information Technology | 9.3 | |||
Materials | 2.5 | |||
Real Estate | 2.2 | |||
Utilities | 7.8 | |||
|
| |||
Total | 97.9 | % | ||
| �� | |||
Short-Term Investments | 2.1 | |||
Other Assets & Liabilities | 0.0 | * | ||
|
| |||
Total | 100.0 | % | ||
|
| |||
| * | Percentage rounds to zero. |
| (1) | A sector may be comprised of several industries. For Fund compliance purposes, the Fund may not use the same classification system. These sector classifications are used for financial reporting purposes. |
| 13 |
|
| The Hartford Growth Opportunities Fund |
Fund Overview
October 31, 2019 (Unaudited)
Inception 3/31/1963 Sub-advised by Wellington Management Company LLP | Investment objective – The Fund seeks capital appreciation. |
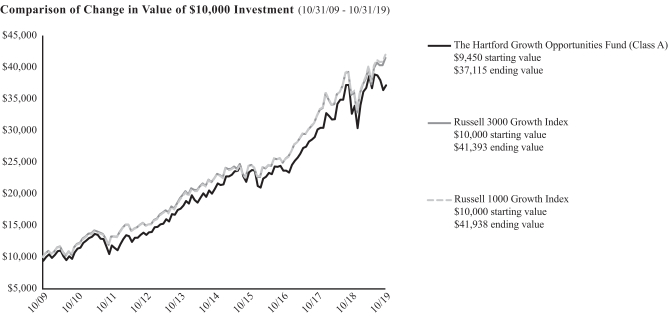
The chart above represents the hypothetical growth of a $10,000 investment in Class A, which includes a sales charge. Growth results in classes other than Class A will vary from what is seen above due to differences in the expenses charged to those share classes.
Average Annual Total Returns
for the Periods Ending 10/31/19
| 1 Year | 5 Years | 10 Years | ||||||||||
Class A1 | 13.64% | 12.29% | 14.65% | |||||||||
Class A2 | 7.33% | 11.02% | 14.01% | |||||||||
Class C1 | 12.79% | 11.46% | 13.83% | |||||||||
Class C2 | 12.04% | 11.46% | 13.83% | |||||||||
Class I1 | 13.94% | 12.56% | 14.96% | |||||||||
Class R31 | 13.25% | 11.92% | 14.32% | |||||||||
Class R41 | 13.57% | 12.25% | 14.67% | |||||||||
Class R51 | 13.92% | 12.58% | 15.01% | |||||||||
Class R61 | 14.03% | 12.69% | 15.12% | |||||||||
Class Y1 | 14.00% | 12.68% | 15.11% | |||||||||
Class F1 | 14.07% | 12.62% | 14.99% | |||||||||
Russell 3000 Growth Index | 16.34% | 13.05% | 15.26% | |||||||||
Russell 1000 Growth Index | 17.10% | 13.43% | 15.41% | |||||||||
| 1 | Without sales charge |
| 2 | With sales charge |
PERFORMANCE DATA QUOTED REPRESENTS PAST PERFORMANCE AND DOES NOT GUARANTEE FUTURE RESULTS. The investment return and principal value of the investment will fluctuate so that investors’ shares, when redeemed, may be worth more or less than their original cost. The chart and table do not reflect the deductions of taxes that a shareholder would pay on Fund distributions or the redemption of Fund shares. Current performance may be lower or higher than the performance data quoted. To obtain performance data current to the most recentmonth-end, please visit our website www.hartfordfunds.com.
The initial investment in Class A shares reflects the maximum sales charge of 5.50% and returns for Class C shares reflect a contingent deferred sales charge of up to 1.00% on shares redeemed within twelve months of purchase.
Total returns presented above were calculated using the Fund’s net asset value available to shareholders for sale or redemption of Fund shares on 10/31/19, which may exclude
investment transactions as of this date. All share class returns assume the reinvestment of all distributions at net asset value and the deduction of all fund expenses.
Class R6 shares commenced operations on 11/07/14. Performance prior to that date is that of the Fund’s Class Y shares. Class F shares commenced operations on 2/28/17. Performance prior to that date is that of the Fund’s Class I shares.
To the extent a share class has adopted the prior performance of another share class that had different operating expenses, such performance has not been adjusted to reflect the different operating expenses. If the performance were adjusted, it may have been higher or lower.
You cannot invest directly in an index.
See “Benchmark Glossary” for benchmark descriptions.
Performance information may reflect historical or current expense waivers/reimbursements without which performance would have been lower. For information on current expense waivers/reimbursements, please see the prospectus.
| Operating Expenses* | Gross | Net | ||||||
Class A | 1.11% | 1.11% | ||||||
Class C | 1.85% | 1.85% | ||||||
Class I | 0.83% | 0.83% | ||||||
Class R3 | 1.46% | 1.46% | ||||||
Class R4 | 1.15% | 1.15% | ||||||
Class R5 | 0.85% | 0.85% | ||||||
Class R6 | 0.74% | 0.74% | ||||||
Class Y | 0.82% | 0.79% | ||||||
Class F | 0.74% | 0.74% | ||||||
| * | Expenses as shown in the Fund’s most recent prospectus. Gross expenses do not reflect contractual fee waivers or expense reimbursement arrangements. Net expenses reflect such arrangements only with respect to Class Y. These arrangements remain in effect until 2/29/20 unless the Fund’s Board of Directors approves an earlier termination. Actual expenses may be higher or lower. Please see accompanying Financial Highlights for expense ratios for the year ended 10/31/19. |
| 14 |
|
| The Hartford Growth Opportunities Fund |
Fund Overview – (continued)
October 31, 2019 (Unaudited)
Portfolio Managers
Michael T. Carmen, CFA*
Senior Managing Director and Equity Portfolio Manager
Wellington Management Company LLP
Stephen Mortimer
Senior Managing Director and Equity Portfolio Manager
Wellington Management Company LLP
Mario E. Abularach, CFA, CMT
Senior Managing Director and Equity Research Analyst
Wellington Management Company LLP
* Effective March 1, 2020, Michael T. Carmen, CFA will no longer serve as a portfolio manager for the Fund.
Manager Discussion
How did the Fund perform during the period?
The Class A shares of The Hartford Growth Opportunities Fund returned 13.64%, before sales charge, for the twelve-month period ended October 31, 2019, underperforming the Fund’s benchmarks, the Russell 3000 Growth Index and the Russell 1000 Growth Index, which returned 16.34% and 17.10%, respectively, for the same period. For the same period, the Class A shares of the Fund underperformed the 14.00% average return of the LipperMulti-Cap Growth Funds peer group, a group of funds with investment strategies similar to those of the Fund.
Why did the Fund perform this way?
United States (U.S.) equities, as measured by the S&P 500 Index, posted positive results over the trailing twelve-month period ended October 31, 2019. Towards the end of 2018, volatility was elevated as markets contended with a confluence of slowing growth, tighter liquidity and monetary policy, trade uncertainty, swelling fiscal deficits, and political turmoil. The Federal Reserve (Fed) raised its benchmark interest rate by 0.25% in December 2018. During the first quarter of 2019, U.S. equities rallied to their largest quarterly gain since 2009, lifted by an accommodative shift in Fed policy and guidance, optimism for a U.S.-China trade deal, relatively strong fourth-quarter 2018 earnings, and corporate buybacks. The Fed left its benchmark interest rate unchanged during the first quarter, signaling a more patient approach toward future policy-rate adjustments in response to slowing economic growth and muted inflation. By June 2019, unresolved U.S. trade frictions with China, Mexico, Japan, and the European Union (EU) unsettled markets and raised concerns about the potential risks to U.S. economic growth from increasing cost pressures, supply chain disruptions, and waning business confidence and investment plans. In the third quarter of 2019, U.S. equities rose, with the U.S. economy remaining resilient despite elevated geopolitical uncertainties and slowing global growth. U.S.-China trade relations were particularly volatile in the absence of meaningful compromises on key structural issues. Expectations for a protracted trade war and the potential for a longer-term decoupling of the world’s two largest economies eroded consumer and business confidence and curtailed capital spending. The Fed lowered its benchmark interest rate in July and September 2019 by a combined 0.50% in effort to sustain economic expansion and mitigate the risks of slowing growth and trade frictions. In October, the Fed lowered interest rates for a third time in 2019 by 0.25% and signaled its
intention to pause further changes in policy. The U.S. and China made progress towards finalizing sections of a “phase one” trade agreement.
Returns varied by market cap during the period, aslarge-cap stocks, measured by the S&P 500 Index, outperformedmid- andsmall-cap stocks, measured by the S&P MidCap 400 Index and Russell 2000 Index, respectively.
Ten out of eleven sectors in the Russell 3000 Growth Index rose during the period, with the Utilities (+34%), Real Estate (+27%), and Materials (+24%) sectors performing the best. The Energy(-22%) sector lagged on a relative basis during the period.
Sector allocation, a result of ourbottom-up stock selection process, detracted from performance relative to the Russell 3000 Growth Index during the period, due to an underweight to the Information Technology sector and an overweight to the Consumer Discretionary sector. This was partially offset by the positive impact of an overweight to the Communication Services sector, which contributed positively to performance relative to the Russell 3000 Growth Index. Security selection contributed positively to performance relative to the Russell 3000 Growth Index during the period, with strong selection in the Healthcare and Information Technology sectors. This positive performance was partially offset by weaker selection within the Communication Services and Industrials sectors, which detracted from performance relative to the Russell 3000 Growth Index.
Top detractors from performance relative to the Russell 3000 Growth Index during the period included Microsoft (Information Technology), We Co. (Industrials), and 2U (Information Technology). The Fund’s lack of exposure to Microsoft negatively affected performance the most. Microsoft delivered impressive results across the board, with acceleration in Office, double-digit growth in Server/Database, high single-digit growth in PC Windows, and operating margin improvement. We Co. is a U.S.-based provider of shared workspaces and services. During the period, the company pulled its initial public offering registration statement filing. Investor concerns over the Chief Executive Officer (CEO) and business model viability (among other things) caused valuations of We Co. to decline. Shares of 2U, a provider of cloud-based software for online education courses, traded down after management meaningfully lowered their full-year guidance and turned focus away fromtop-line growth towards profitability in their July earnings release. The company cited increasing competition in its graduate degree
| 15 |
|
| The Hartford Growth Opportunities Fund |
Fund Overview – (continued)
October 31, 2019 (Unaudited)
segment as a challenge totop-line growth. We Co. (Industrials) and 2U (Information Technology) were among the top absolute detractors during the period.
Top contributors to performance relative to the Russell 3000 Growth Index during the period included Shopify (Information Technology), Insulet (Healthcare), and Advanced Micro Devices (Information Technology). Shares of Shopify, a cloud-based commerce platform operator for small andmedium-sized businesses, rose after announcing a strong fourth quarter of 2018, beating consensus expectations across the board. Net ads, gross merchandise volume (GMV) growth, and merchant growth innon-core geographies all were strong. We eliminated the Fund’s position in Shopify after the stock exceeded our price target. Shares of Insulet, a medical device maker, rose after the company reported quarterly earnings that exceeded both management guidance and market expectations as all three revenue segments outperformed. Notably, adoption rates of the company’s Omnipod DASH system showed signs of growth. Shares of Advanced Micro Devices (AMD), a semiconductor company, rose due to an announced multi-year partnership with Samsung Electronics in ultralow-power, high-performance mobile graphics chips based on AMD Radeon technologies. Additionally, Microsoft unveiled several new Surface laptops using AMD CPU chips. Investors viewed these moves as a positive for AMD’s latest CPUs and its competitive positioning against Intel. We increased the Fund’s position during the period. Shopify (Information Technology) and Advanced Micro Devices (Information Technology) were among the top absolute contributors during the period.
Derivatives were not used in a significant manner in the Fund during the period and did not have a material impact on performance during the period.
What is the outlook as of the end of the period?
In our opinion, there is still much uncertainty surrounding geopolitics globally and the upcoming U.S. presidential election. During the escalating U.S. and China trade tensions, we have been avoiding U.S. companies with notable exposure to China and are focused on idiosyncratic opportunities that we believe are more insulated from geopolitical issues and macro uncertainty. The growth outlook has marginally come down over the past year as a result of trade tensions, but we think recession fears are just suspicions and not a certainty.
We aim to keep a steady hand for the time being until we see significant fundamental change, striving to not be overly reactive to negative market sentiment. Accordingly, we have not made any wholesale changes to the Fund as of the end of the period.
At the end of the period, the Fund’s largest overweights were to the Consumer Discretionary and Healthcare sectors. The Fund’s largest underweight was to the Information Technology sector.
Important Risks
Investing involves risk, including the possible loss of principal. Security prices fluctuate in value depending on general market and economic conditions and the prospects of individual companies.•Foreign investments may be more volatile and less liquid than U.S. investments and are subject to the risk of currency fluctuations and adverse political and economic developments.•Mid-cap securities can have greater risks and volatility thanlarge-cap securities.•The Fund’s focus on
investments in particular sectors may increase its volatility and risk of loss if adverse developments occur.•Different investment styles may go in and out favor, which may cause the Fund to underperform the broader stock market.
Composition by Sector(1)
as of October 31, 2019
| Sector | Percentage of Net Assets | |||
Equity Securities |
| |||
Communication Services | 13.0 | % | ||
Consumer Discretionary | 23.0 | |||
Consumer Staples | 3.1 | |||
Financials | 4.5 | |||
Health Care | 20.3 | |||
Industrials | 6.8 | |||
Information Technology | 28.7 | |||
Real Estate | 0.3 | |||
|
| |||
Total | 99.7 | % | ||
|
| |||
Short-Term Investments | 2.8 | |||
Other Assets & Liabilities | (2.5 | ) | ||
|
| |||
Total | 100.0 | % | ||
|
| |||
| (1) | A sector may be comprised of several industries. For Fund compliance purposes, the Fund may not use the same classification system. These sector classifications are used for financial reporting purposes. |
| 16 |
|
| The Hartford Healthcare Fund |
Fund Overview
October 31, 2019 (Unaudited)
Inception 5/01/2000 Sub-advised by Wellington Management Company LLP | Investment objective – The Fund seeks long-term capital appreciation. |
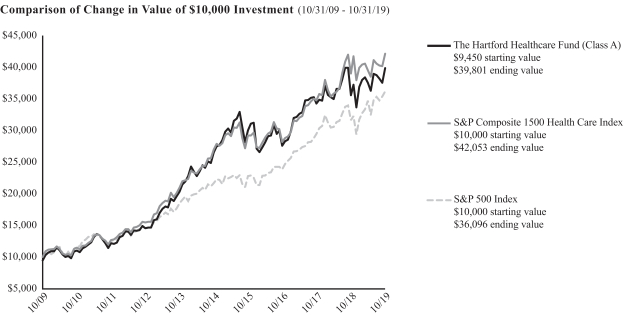
The chart above represents the hypothetical growth of a $10,000 investment in Class A, which includes a sales charge. Growth results in classes other than Class A will vary from what is seen above due to differences in the expenses charged to those share classes.
Average Annual Total Returns
for the Periods Ending 10/31/19
| 1 Year | 5 Years | 10 Years | ||||||||||
Class A1 | 12.02% | 8.51% | 15.46% | |||||||||
Class A2 | 5.86% | 7.28% | 14.81% | |||||||||
Class C1 | 11.17% | 7.71% | 14.64% | |||||||||
Class C2 | 10.17% | 7.71% | 14.64% | |||||||||
Class I1 | 12.36% | 8.80% | 15.80% | |||||||||
Class R31 | 11.66% | 8.17% | 15.16% | |||||||||
Class R41 | 12.00% | 8.49% | 15.51% | |||||||||
Class R51 | 12.32% | 8.81% | 15.85% | |||||||||
Class R61 | 12.42% | 8.92% | 15.95% | |||||||||
Class Y1 | 12.40% | 8.91% | 15.95% | |||||||||
Class F1 | 12.48% | 8.86% | 15.84% | |||||||||
S&P Composite 1500 Health Care Index | 7.94% | 9.31% | 15.45% | |||||||||
S&P 500 Index | 14.33% | 10.78% | 13.70% | |||||||||
| 1 | Without sales charge |
| 2 | With sales charge |
PERFORMANCE DATA QUOTED REPRESENTS PAST PERFORMANCE AND DOES NOT GUARANTEE FUTURE RESULTS. The investment return and principal value of the investment will fluctuate so that investors’ shares, when redeemed, may be worth more or less than their original cost. The chart and table do not reflect the deductions of taxes that a shareholder would pay on Fund distributions or the redemption of Fund shares. Current performance may be lower or higher than the performance data quoted. To obtain performance data current to the most recentmonth-end, please visit our website www.hartfordfunds.com.
The initial investment in Class A shares reflects the maximum sales charge of 5.50% and returns for Class C shares reflect a contingent deferred sales charge of up to 1.00% on shares redeemed within twelve months of purchase.
Total returns presented above were calculated using the Fund’s net asset value available to shareholders for sale or redemption of Fund shares on 10/31/19, which may exclude
investment transactions as of this date. All share class returns assume the reinvestment of all distributions at net asset value and the deduction of all fund expenses.
Class F shares commenced operations on 2/28/17. Performance prior to that date is that of the Fund’s Class I shares. Class R6 shares commenced operations on 2/28/19. Performance prior to that date is that of the Fund’s Class Y shares.
To the extent a share class has adopted the prior performance of another share class that had different operating expenses, such performance has not been adjusted to reflect the different operating expenses. If the performance were adjusted, it may have been higher or lower.
You cannot invest directly in an index.
See “Benchmark Glossary” for benchmark descriptions.
Performance information may reflect historical or current expense waivers/reimbursements without which performance would have been lower. For information on current expense waivers/reimbursements, please see the prospectus.
| Operating Expenses* | Gross | Net | ||||||
Class A | 1.28% | 1.28% | ||||||
Class C | 2.03% | 2.03% | ||||||
Class I | 1.00% | 1.00% | ||||||
Class R3 | 1.61% | 1.61% | ||||||
Class R4 | 1.30% | 1.30% | ||||||
Class R5 | 1.02% | 1.02% | ||||||
Class R6 | 0.90% | 0.90% | ||||||
Class Y | 1.01% | 0.96% | ||||||
Class F | 0.90% | 0.90% | ||||||
| * | Expenses as shown in the Fund’s most recent prospectus. Gross expenses do not reflect contractual fee waivers or expense reimbursement arrangements. Net expenses reflect such arrangements only with respect to Class Y. These arrangements remain in effect until 2/29/20 unless the Fund’s Board of Directors approves an earlier termination. Actual expenses may be higher or lower. Please see accompanying Financial Highlights for expense ratios for the year ended 10/31/19. |
| 17 |
|
| The Hartford Healthcare Fund |
Fund Overview – (continued)
October 31, 2019 (Unaudited)
Portfolio Managers
Jean M. Hynes, CFA
Senior Managing Director and Global Industry Analyst
Wellington Management Company LLP
Ann C. Gallo
Senior Managing Director and Global Industry Analyst
Wellington Management Company LLP
Robert L. Deresiewicz
Senior Managing Director and Global Industry Analyst
Wellington Management Company LLP
Manager Discussion
How did the Fund perform during the period?
The Class A shares of The Hartford Healthcare Fund returned 12.02%, before sales charge, for the twelve-month period ended October 31, 2019, outperforming one of the Fund’s benchmarks, the S&P Composite 1500 Health Care Index, which returned 7.94% for the same period. For the same period, Class A shares of the Fund underperformed the Fund’s other benchmark, the S&P 500 Index, which returned 14.33% for the same period. For the same period, the Class A shares of the Fund outperformed the 9.89% average return of the Lipper Global Health and Biotechnology peer group, a group of funds with investment strategies similar to those of the Fund.
Why did the Fund perform this way?
Healthcare stocks (7.94%) underperformed both the broader U.S. equity market (14.3%) and the global equity market (13.2%) during the period, as measured by the S&P Composite 1500 Health Care Index, the S&P 500 Index, and the MSCI All Country World (ACWI) Index (Gross), respectively.
Within the S&P Composite 1500 Health Care Index, two of the fivesub-sectors posted positive absolute returns during the period. The Medical Technology (+20.7%) andLarge-cap Biopharma (+6.6%)sub-sectors rose during the period. TheSmall-cap Biopharma(-18.9%),Mid-cap Biopharma(-16.5%), and Healthcare Services(-1.8%)sub-sectors posted negative absolute returns during the period.
Security selection was the primary contributor to performance relative to the S&P Composite 1500 Health Care Index during the period, while sector allocation detracted from relative returns. Security selection was strongest insmall-cap andmid-cap biopharmasub-sectors during the period. Within thesub-sector allocation, as a result of ourbottom-up stock selection process, an overweight allocation tomid-cap andsmall-cap biopharma detracted most from performance relative to the S&P Composite 1500 Health Care Index during the period.
Seattle Genetics(mid-cap biopharma), Loxo Oncology(small-cap biopharma), and not owning Johnson & Johnson(large-cap biopharma), a constituent of the S&P Composite 1500 Health Care Index, contributed positively to results relative to the S&P Composite 1500 Health Care Index. Seattle Genetics is a biopharmaceutical company that develops monoclonal antibody-based targeted therapies for the treatment of cancer and autoimmune diseases. Shares of Seattle Genetics
outperformed over the period relative to the S&P Composite 1500 Health Care Index, most notably driven by positive trial results of tucatinib, which satisfied the trial’s primary endpoint of progression-free survival in treating patients with certain types of breast cancer. Loxo Oncology, a U.S.-based oncology-focused biopharmaceutical company, agreed to be acquired by Eli Lilly at a 68% premium in January 2019. We eliminated the Fund’s position during the period to take the acquisition profits. Not owning Johnson & Johnson, a global pharmaceutical and consumer products company, contributed positively to performance relative to the S&P Composite 1500 Health Care Index as shares traded lower on concerns about lawsuits the company faces regarding its talc-based baby powder and role in the opioid crisis. Top absolute contributors to performance included Seattle Genetics, Loxo Oncology, and Abbott Laboratories.
Alkermes(mid-cap biopharma), Merck(large-cap biopharma), and Celgene(large-cap biopharma) were the top detractors from performance relative to the S&P Composite 1500 Health Care Index over the period. Alkermes, a biopharmaceutical company commercializing neuropsychiatric drugs, reported disappointing first-quarter sales for one of its key growth products, Aristada. However, the company has a phase III drug, which is anticipated to be a safer version of the generic drug Zyprexa, used for treating schizophrenia. The drug has shown positive results and is expected to be filed with the FDA by end of the year. Not owning Merck, a U.S.-based pharmaceutical company, detracted from performance relative to the S&P Composite 1500 Health Care Index over the period. Shares of Merck moved higher on FDA approval of Keytruda in combination with chemotherapy for the first-line treatment of metastatic squamousnon-small cell lung cancer. The Fund’s underweight to Celgene detracted from performance relative to the S&P Composite 1500 Health Care Index as shares traded higher on news that Bristol-Myers Squibb was acquiring the firm at a significant premium. Subsequently, we eliminated the position from the Fund after the good news was reflected in the stock price. Alkermes, Amneal Pharmaceuticals, and Mylan were top absolute detractors from performance.
Derivatives were not used in a significant manner in the Fund during the period and did not have a material impact on performance during the period.
What is the outlook as of the end of the period?
With the approaching 2020 presidential election in the U.S., we believe that the macro overhang on healthcare stocks has intensified. Key focus
areas for investors include the proposed nationalization of healthcare in
| 18 |
|
| The Hartford Healthcare Fund |
Fund Overview – (continued)
October 31, 2019 (Unaudited)
the form of “Medicare for All,” as proposed by several leading Democratic candidates for president, as well as the potential for greater governmental involvement in drug pricing, some form of which seems to enjoy bipartisan support. Despite the heightened rhetoric, we continue to believe that fundamental structural reform is unlikely. We believe “Medicare for All” has little chance of becoming law, regardless of the outcome of the 2020 elections. As for drug pricing, we believe that the biotech and pharma industries are willing to forgo some of their profits in order to reduce patientout-of-pocket drug costs and thus hopefully avoid the worst-case outcome of drug price setting by the government. It remains to be seen whether any drug pricing legislation or regulation will come to pass, as we believe Washington, D.C. is currently preoccupied with other issues.
In selecting stocks for the Fund, we seek to find companies that develop innovative products designed to address important unmet medical needs. Over the long term, we believe that the tailwinds of innovation, an aging population, and the globalization of demand for cutting-edge Western-style medicines should continue to drive growth of the sector.
Important Risks
Investing involves risk, including the possible loss of principal. Security prices fluctuate in value depending on general market and economic conditions and the prospects of individual companies.• Risks of focusing investments on the healthcare related sector include regulatory and legal developments, patent considerations, intense competitive pressures, rapid technological changes, potential product obsolescence, and liquidity risk.• Foreign investments may be more volatile and less liquid than U.S. investments and are subject to the risk of currency fluctuations and adverse political and economic developments. These risks may be greater for investments in emerging markets.• Small- andmid-cap securities can have greater risks and volatility thanlarge-cap securities.
Composition by Subsector(1)
as of October 31, 2019
| Subsector | Percentage of Net Assets | |||
Equity Securities |
| |||
Biotechnology | 23.0 | % | ||
Health Care Equipment & Supplies | 24.3 | |||
Health Care Providers & Services | 16.3 | |||
Health Care Technology | 1.5 | |||
Life Sciences Tools & Services | 6.1 | |||
Pharmaceuticals | 26.9 | |||
|
| |||
Total | 98.1 | % | ||
|
| |||
Short-Term Investments | 4.9 | |||
Other Assets & Liabilities | (3.0 | ) | ||
|
| |||
Total | 100.0 | % | ||
|
| |||
| (1) | For Fund compliance purposes, the Fund may not use the same classification system. These subsector classifications are used for financial reporting purposes. |
| 19 |
|
| The Hartford MidCap Fund |
Fund Overview
October 31, 2019 (Unaudited)
Inception 12/31/1997 Sub-advised by Wellington Management Company LLP | Investment objective – The Fund seeks long-term growth of capital. |
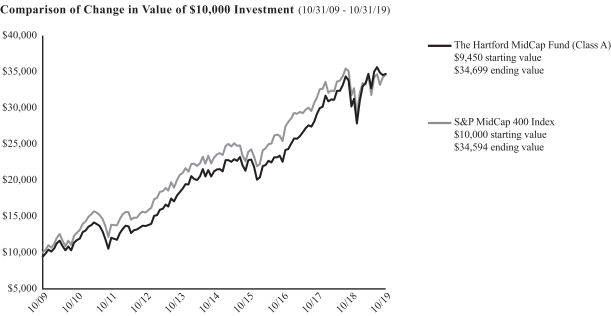
The chart above represents the hypothetical growth of a $10,000 investment in Class A, which includes a sales charge. Growth results in classes other than Class A will vary from what is seen above due to differences in the expenses charged to those share classes.
Average Annual Total Returns
for the Periods Ending 10/31/19
| 1 Year | 5 Years | 10 Years | ||||||||||
Class A1 | 14.93% | 10.34% | 13.89% | |||||||||
Class A2 | 8.61% | 9.10% | 13.25% | |||||||||
Class C1 | 14.10% | 9.52% | 13.08% | |||||||||
Class C2 | 13.14% | 9.52% | 13.08% | |||||||||
Class I1 | 15.25% | 10.60% | 14.18% | |||||||||
Class R31 | 14.54% | 9.97% | 13.55% | |||||||||
Class R41 | 14.89% | 10.31% | 13.90% | |||||||||
Class R51 | 15.23% | 10.64% | 14.24% | |||||||||
Class R61 | 15.37% | 10.75% | 14.36% | |||||||||
Class Y1 | 15.32% | 10.72% | 14.35% | |||||||||
Class F1 | 15.36% | 10.66% | 14.21% | |||||||||
S&P MidCap 400 Index | 9.02% | 8.37% | 13.21% | |||||||||
| 1 | Without sales charge |
| 2 | With sales charge |
PERFORMANCE DATA QUOTED REPRESENTS PAST PERFORMANCE AND DOES NOT GUARANTEE FUTURE RESULTS. The investment return and principal value of the investment will fluctuate so that investors’ shares, when redeemed, may be worth more or less than their original cost. The chart and table do not reflect the deductions of taxes that a shareholder would pay on Fund distributions or the redemption of Fund shares. Current performance may be lower or higher than the performance data quoted. To obtain performance data current to the most recentmonth-end, please visit our website www.hartfordfunds.com.
The initial investment in Class A shares reflects the maximum sales charge of 5.50% and returns for Class C shares reflect a contingent deferred sales charge of up to 1.00% on shares redeemed within twelve months of purchase.
Total returns presented above were calculated using the Fund’s net asset value available to shareholders for sale or redemption of Fund shares on 10/31/19, which may exclude investment transactions as of this date. All share class returns assume the reinvestment of all distributions at net asset value and the deduction of all fund expenses.
Class R6 shares commenced operations on 11/07/14. Performance prior to that date is that of the Fund’s Class Y shares. Class F shares commenced operations on 2/28/17. Performance for Class F shares prior to 2/28/17 reflects the performance of Class I shares.
To the extent a share class has adopted the prior performance of another share class that had different operating expenses, such performance has not been adjusted to reflect the different operating expenses. If the performance were adjusted, it may have been higher or lower.
You cannot invest directly in an index.
See “Benchmark Glossary” for benchmark descriptions.
Performance information may reflect historical or current expense waivers/reimbursements without which performance would have been lower. For information on current expense waivers/reimbursements, please see the prospectus.
| Operating Expenses* | Gross | Net | ||||||
Class A | 1.11% | 1.11% | ||||||
Class C | 1.86% | 1.86% | ||||||
Class I | 0.82% | 0.82% | ||||||
Class R3 | 1.47% | 1.47% | ||||||
Class R4 | 1.16% | 1.16% | ||||||
Class R5 | 0.85% | 0.85% | ||||||
Class R6 | 0.75% | 0.75% | ||||||
Class Y | 0.85% | 0.79% | ||||||
Class F | 0.75% | 0.75% | ||||||
| * | Expenses as shown in the Fund’s most recent prospectus. Gross expenses do not reflect contractual fee waivers or expense reimbursement arrangements. Net expenses reflect such arrangements only with respect to Class Y. These arrangements remain in effect until 2/29/20 unless the Fund’s Board of Directors approves an earlier termination. Actual expenses may be higher or lower. Please see accompanying Financial Highlights for expense ratios for the year ended 10/31/19. |
| 20 |
|
| The Hartford MidCap Fund |
Fund Overview – (continued)
October 31, 2019 (Unaudited)
Portfolio Managers
Philip W. Ruedi, CFA
Senior Managing Director and Equity Portfolio Manager
Wellington Management Company LLP
Mark A. Whitaker, CFA
Senior Managing Director and Equity Portfolio Manager
Wellington Management Company LLP
Manager Discussion
How did the Fund perform during the period?
The Class A shares of The Hartford MidCap Fund returned 14.93%, before sales charge, for the twelve-month period ended October 31, 2019, outperforming the Fund’s benchmark, the S&P MidCap 400 Index, which returned 9.02% for the same period. For the same period, the Class A shares of the Fund underperformed the 15.51% average return of the LipperMid-Cap Growth Funds peer group, a group of funds with investment strategies similar to that of the Fund.
Why did the Fund perform this way?
United States (U.S.) equities, as measured by the S&P 500 Index, posted positive results over the trailing twelve-month period ended October 31, 2019. Towards the end of 2018, volatility was elevated as markets contended with a confluence of slowing growth, tighter liquidity and monetary policy, trade uncertainty, swelling fiscal deficits, and political turmoil. The Federal Reserve (Fed) raised its benchmark interest rate by 0.25% in December 2018. During the first quarter of 2019, U.S. equities rallied to their largest quarterly gain since 2009, lifted by a cautious shift in Fed policy and guidance, optimism for a U.S.-China trade deal, relatively strong fourth-quarter 2018 earnings, and corporate buybacks. The Fed left its benchmark interest rate unchanged during the first quarter, signaling a more patient approach toward future policy-rate adjustments in response to slowing economic growth and muted inflation. By June 2019, unresolved U.S. trade frictions with China, Mexico, Japan, and the European Union (EU) unsettled markets and raised concerns about the potential risks to U.S. economic growth from increasing cost pressures, supply chain disruptions, and waning business confidence and investment plans. In the third quarter of 2019, U.S. equities rose, with the U.S. economy remaining resilient despite elevated geopolitical uncertainties and slowing global growth. U.S.-China trade relations were particularly volatile in the absence of meaningful compromises on key structural issues. Expectations for a protracted trade war and the potential for a longer-term decoupling of the world’s two largest economies eroded consumer and business confidence and curtailed capital spending. The Fed lowered its benchmark interest rate in July and September 2019 by a combined 0.50% in effort to sustain economic expansion and mitigate the risks of slowing growth and trade frictions. In October, the Fed lowered interest rates for a third time in 2019 by 0.25% and signaled its intention to pause further changes in policy. The U.S. and China made progress towards finalizing sections of a “phase one” trade agreement.
Returns varied by market cap during the period, aslarge-cap stocks, as measured by the S&P 500 Index, outperformed small- andmid-cap stocks, as measured by the Russell 2000 Index and S&P MidCap 400 Index, respectively.
Within the S&P MidCap 400 Index, nine of the eleven sectors posted positive returns during the period. The Information Technology (+21%), Industrials (+18%), and Real Estate (+17%) sectors performed best, while the Energy(-47%) and Consumer Staples(-1%) sectors lagged the S&P MidCap 400 Index during the period.
The Fund outperformed the S&P MidCap 400 Index during the period primarily as a result of positive stock selection. Selection effects were particularly strong within the Healthcare, Materials, and Consumer Discretionary sectors. This was partially offset by weak selection in the Information Technology, Communication Services, and Utilities sectors, which detracted from performance. Sector allocation, a result of our bottom up stock selection process, also contributed positively to outperformance relative to the S&P MidCap 400 Index. This was primarily due to an overweight allocation to the Information Technology sector and an underweight to the poorly performing Energy sector. However, this was partially offset by an overweight to the Healthcare sector and an underweight to the Real Estate sector, which detracted from relative performance.
Top contributors to performance relative to the S&P MidCap 400 Index included Roku (Consumer Discretionary), Seattle Genetics (Healthcare), and Genpact (Information Technology). Roku is a manufacturer of a variety of digital media players that allow customers to access internet-streamed video or audio services through televisions. During the period, the stock rose on the back of strong quarterly results which served to reinforce the company’s strong position within the fast-growing video-streaming market. As of the end of the period, the Fund continued to hold the stock. Seattle Genetics is a biotechnology company focused on developing and commercializing innovative, empowered monoclonal antibody-based therapies for the treatment of cancer. Shares of Seattle Genetics rose during the second quarter of 2019 due to the sales growth of the company’s blood cancer drug. Shares of Seattle Genetics continued to climb during the remainder of the period on positive trial results for a combination of one of its drugs with Merck’s immunotherapy Keytruda as a first-line treatment of bladder cancer. Genpact engages in business process management, outsourcing, shared services, and information outsourcing. Shares of Genpact jumped early in 2019 as significant client wins helped drive Genpact’s revenue growth above the consensus and the stock price higher, leading to raised revenue guidance.
Top detractors to performance relative to the S&P MidCap 400 Index included Aerie Pharmaceutical (Healthcare), CommScope Holding (Information Technology), and 2U (Information Technology). Aerie Pharmaceutical is a biotech company focused on diseases of the eye. Shares lowered during the period on concerns that sales of Rhopressa and Rocklatan will not meet expectations; however, as of the end of the period, we have maintained the Fund’s position. CommScope provides
| 21 |
|
| The Hartford MidCap Fund |
Fund Overview – (continued)
October 31, 2019 (Unaudited)
infrastructure for communications networks. While slowing capital expenditure for cable infrastructure has negatively affected the stock price, we added to the Fund’s position as we believe capital expenditure spending in this area will rebound. Lastly, shares of 2U, a cloud-based platform for offering university degree programs online, declined as the company lowered guidance for the full year due to slowdowns in some of its more mature programs. We eliminated the Fund’s position during the period.
Derivatives were not used in a significant manner in the Fund during the period and did not have a material impact on performance during the period.
What is the outlook as of the end of the period?
Our outlook for the U.S. economy is satisfactory, but less positive than it was earlier this year. Several factors may cause volatility in coming quarters, including slowing global growth, trade uncertainties, tariffs, and political developments. At the end of the period, the Fund had its largest overweights to the Information Technology, Healthcare, and Industrials sectors, and had the largest underweights to the Real Estate, Materials, and Financials sectors relative to the S&P MidCap 400 Index.
Important Risks
Investing involves risk, including the possible loss of principal. Security prices fluctuate in value depending on general market and economic conditions and the prospects of individual companies.•Mid-cap securities can have greater risks and volatility thanlarge-cap securities. • The Fund’s focus on investments in particular sectors may increase its volatility and risk of loss if adverse developments occur.
Composition by Sector(1)
as of October 31, 2019
| Sector | Percentage of Net Assets | |||
Equity Securities |
| |||
Communication Services | 3.4 | % | ||
Consumer Discretionary | 10.6 | |||
Energy | 0.7 | |||
Financials | 13.3 | |||
Health Care | 19.0 | |||
Industrials | 17.9 | |||
Information Technology | 27.5 | |||
Materials | 3.0 | |||
Real Estate | 2.1 | |||
Utilities | 2.5 | |||
|
| |||
Total | 100.0 | % | ||
|
| |||
Short-Term Investments | 1.2 | |||
Other Assets & Liabilities | (1.2 | ) | ||
|
| |||
Total | 100.0 | % | ||
|
| |||
| (1) | A sector may be comprised of several industries. For Fund compliance purposes, the Fund may not use the same classification system. These sector classifications are used for financial reporting purposes. |
| 22 |
|
| The Hartford MidCap Value Fund |
Fund Overview
October 31, 2019 (Unaudited)
Inception 4/30/2001 Sub-advised by Wellington Management Company LLP | Investment objective – The Fund seeks long-term capital appreciation. |
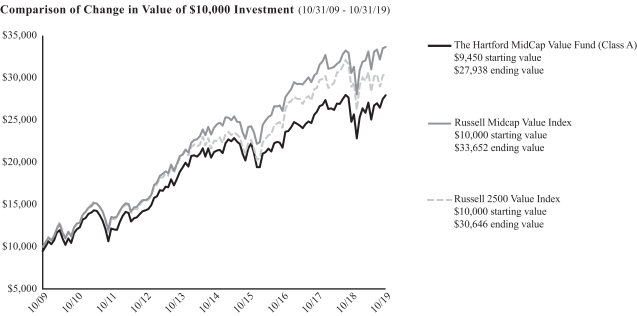
The chart above represents the hypothetical growth of a $10,000 investment in Class A, which includes a sales charge. Growth results in classes other than Class A will vary from what is seen above due to differences in the expenses charged to those share classes.
Average Annual Total Returns
for the Periods Ending 10/31/19
| 1 Year | 5 Years | 10 Years | ||||||||||
Class A1 | 12.74% | 5.70% | 11.45% | |||||||||
Class A2 | 6.54% | 4.51% | 10.82% | |||||||||
Class C1 | 11.99% | 4.93% | 10.64% | |||||||||
Class C2 | 11.03% | 4.93% | 10.64% | |||||||||
Class I1 | 13.20% | 6.00% | 11.79% | |||||||||
Class R31 | 12.42% | 5.39% | 11.21% | |||||||||
Class R41 | 12.77% | 5.72% | 11.54% | |||||||||
Class R51 | 13.14% | 6.04% | 11.85% | |||||||||
Class Y1 | 13.23% | 6.13% | 11.94% | |||||||||
Class F1 | 13.27% | 6.08% | 11.84% | |||||||||
Russell Midcap Value Index | 10.08% | 6.95% | 12.90% | |||||||||
Russell 2500 Value Index | 6.10% | 6.36% | 11.85% | |||||||||
| 1 | Without sales charge |
| 2 | With sales charge |
PERFORMANCE DATA QUOTED REPRESENTS PAST PERFORMANCE AND DOES NOT GUARANTEE FUTURE RESULTS. The investment return and principal value of the investment will fluctuate so that investors’ shares, when redeemed, may be worth more or less than their original cost. The chart and table do not reflect the deductions of taxes that a shareholder would pay on Fund distributions or the redemption of Fund shares. Current performance may be lower or higher than the performance data quoted. To obtain performance data current to the most recentmonth-end, please visit our website www.hartfordfunds.com.
The initial investment in Class A shares reflects the maximum sales charge of 5.50% and returns for Class C shares reflect a contingent deferred sales charge of up to 1.00% on shares redeemed within twelve months of purchase.
Total returns presented above were calculated using the Fund’s net asset value available to shareholders for sale or redemption of Fund shares on 10/31/19, which may exclude investment transactions as of this date. All share class returns assume the reinvestment of all distributions at net asset value and the deduction of all fund expenses.
Class I shares commenced operations on 5/28/10. Performance prior to that date is that of the Fund’s Class A shares (excluding sales charges). Class R3, R4 and R5 shares commenced operations on 5/28/10. Performance prior to that date is that of the Fund’s Class Y shares. Class F shares commenced operations on 2/28/17. Performance for Class F shares prior to 2/28/17 reflects the performance of Class I shares from 5/28/10 through 2/27/17 and Class A shares (excluding sales charges) prior to 5/28/10.
To the extent a share class has adopted the prior performance of another share class that had different operating expenses, such performance has not been adjusted to reflect the different operating expenses. If the performance were adjusted, it may have been higher or lower.
Effective 3/31/19, the Russell 2500 Value Index is no longer one of the Fund’s benchmarks. Hartford Funds Management Company, LLC, the investment manager, believes that the Russell Midcap Value Index better reflects the Fund’s investment strategy.
You cannot invest directly in an index.
See “Benchmark Glossary” for benchmark descriptions.
Performance information may reflect historical or current expense waivers/reimbursements without which performance would have been lower. For information on current expense waivers/reimbursements, please see the prospectus.
| Operating Expenses* | Gross | Net | ||||||
Class A | 1.22% | 1.22% | ||||||
Class C | 1.98% | 1.98% | ||||||
Class I | 0.90% | 0.90% | ||||||
Class R3 | 1.52% | 1.52% | ||||||
Class R4 | 1.22% | 1.22% | ||||||
Class R5 | 0.91% | 0.91% | ||||||
Class Y | 0.91% | 0.85% | ||||||
Class F | 0.80% | 0.80% | ||||||
| * | Expenses as shown in the Fund’s most recent prospectus. Gross expenses do not reflect contractual fee waivers or expense reimbursement arrangements. Net expenses reflect such arrangements only with respect to Class Y. These arrangements remain in effect until 2/29/20 unless the Fund’s Board of Directors approves an earlier termination. Actual expenses may be higher or lower. Please see accompanying Financial Highlights for expense ratios for the year ended 10/31/19. |
| 23 |
|
| The Hartford MidCap Value Fund |
Fund Overview – (continued)
October 31, 2019 (Unaudited)
Portfolio Managers
Gregory J. Garabedian
Managing Director and Equity Portfolio Manager
Wellington Management Company LLP
Manager Discussion
How did the Fund perform during the period?
The Class A shares of The Hartford MidCap Value Fund returned 12.74%, before sales charge, for the twelve-month period ended October 31, 2019, outperforming the Fund’s benchmark, the Russell Midcap Value Index, which returned 10.08% for the same period. For the same period, the Class A shares of the Fund also outperformed the Russell 2500 Value Index, which returned 6.10% for the period, and the 6.34% average return of the LipperMid-Cap Value Fund peer group, a group of funds with investment strategies similar to those of the Fund. Effective March 31, 2019, the Russell 2500 Value Index is no longer one of the Fund’s benchmarks.
Why did the Fund perform this way?
United States (U.S.) equities, as measured by the S&P 500 Index, posted positive results over the trailing twelve-month period ended October 31, 2019. Towards the end of 2018, volatility was elevated as markets contended with a confluence of slowing growth, tighter liquidity and monetary policy, trade uncertainty, swelling fiscal deficits, and political turmoil. The Federal Reserve (Fed) raised its benchmark interest rate by 0.25% in December 2018. During the first quarter of 2019, U.S. equities rallied to their largest quarterly gain since 2009, lifted by an accommodative shift in Fed policy and guidance, optimism for a U.S.-China trade deal, relatively strong fourth-quarter 2018 earnings, and corporate buybacks. The Fed left its benchmark interest rate unchanged during the first quarter, signaling a more patient approach toward future policy-rate adjustments in response to slowing economic growth and muted inflation. By June 2019, unresolved U.S. trade frictions with China, Mexico, Japan, and the European Union (EU) unsettled markets and raised concerns about the potential risks to U.S. economic growth from increasing cost pressures, supply chain disruptions, and waning business confidence and investment plans. In the third quarter of 2019, U.S. equities rose, with the U.S. economy remaining resilient despite elevated geopolitical uncertainties and slowing global growth. U.S.-China trade relations were particularly volatile in the absence of meaningful compromises on key structural issues. Expectations for a protracted trade war and the potential for a longer-term decoupling of the world’s two largest economies eroded consumer and business confidence and curtailed capital spending. The Fed lowered its benchmark interest rate in July and September 2019 by a combined 0.50% in effort to sustain economic expansion and mitigate the risks of slowing growth and trade frictions. In October, the Fed lowered interest rates for a third time in 2019 by 0.25% and signaled its intention to pause further changes in policy. The U.S. and China made progress towards finalizing sections of a “phase one” trade agreement.
Returns varied by market cap during the period;large-cap stocks, as measured by the S&P 500 Index, outperformedmid- andsmall-cap stocks, as measured by the S&P MidCap 400 Index and Russell 2000 Index, respectively. Returns within themid-cap space varied by style, as the Russell Midcap Growth Index outperformed the Russell Midcap Value Index.
Nine of the eleven sectors in the Russell Midcap Value Index gained during the period, with the Real Estate (+24%), Industrials (+21%), and Utilities (+19%) sectors performing the best, while the Energy(-29%) and Communication Services(-3%) sectors lagged during the period.
The Fund’s outperformance relative to the Russell Midcap Value Index over the twelve-month period was driven primarily by security selection within the Information Technology, Materials, and Consumer Staples sectors, which was partially offset by weak selection within the Financials, Utilities, and Energy sectors. Sector allocation, a result of thebottom-up stock selection process, also added to returns relative to the Russell Midcap Value Index, in part due to an overweight to the Information Technology sector and an underweight to the Consumer Staples sector. An underweight to the Utilities sector negatively impacted relative performance.
Top contributors to returns relative to the Russell Midcap Value Index included L3Harris Technologies Industrials), Reliance Steel & Aluminum (Materials), and not owning PG&E (Utilities). Shares of aerospace and defense giant, L3Harris, outperformed during the period. The merger between L3 Technologies and Harris was finalized at the end of June 2019. The post-merger company continued on its positive trajectory over the period, giving the investment community confidence in the combined company’s ability to realize synergies and generate strong free cash flow growth in the coming years. Reliance Steel & Aluminum is a U.S.-based company that distributes and processes steel and aluminum. The company’s stock jumped towards the end of the period after reporting third-quarter results that were ahead of expectations. The company’s results trended down from the previous quarter but we believe this indicated that business is holding up well in a tough operating environment. PG&E is a U.S.-based electric utilities company. Shares of the company’s stock plummeted during the period for being blamed for the California wildfire outbreak, and not holding the stock benefited the Fund.
Top absolute and relative detractors from the Russell Midcap Value Index returns included EnCana (Energy), Diamondback Energy (Energy), and Noble Energy (Energy). Shares of theseoil- andgas-producing companies came under pressure the past year due to a decrease in crude oil and natural gas prices amid escalating concerns of a slowing macroeconomic environment.
Derivatives were not used in a significant manner in the Fund during the period and did not have a material impact on performance during the period.
What is the outlook as of the end of the period?
While we expect continued volatility in the near term, we have continued to seek cyclical opportunities where stock prices appear attractively valued in multiple economic scenarios. At the end of the period, the Information Technology, Materials, and Financials sectors represented the Fund’s largest sector overweights relative to the Russell Midcap Value Index, while the largest underweights were to the Utilities, Consumer Discretionary, and Real Estate sectors.
| 24 |
|
| The Hartford MidCap Value Fund |
Fund Overview – (continued)
October 31, 2019 (Unaudited)
Important Risks
Investing involves risk, including the possible loss of principal. Security prices fluctuate in value depending on general market and economic conditions and the prospects of individual companies.•Mid-cap securities can have greater risks and volatility thanlarge-cap securities. •Foreign investments may be more volatile and less liquid than U.S. investments and are subject to the risk of currency fluctuations and adverse political and economic developments.•The Fund’s focus on investments in particular sectors may increase its volatility and risk of loss if adverse developments occur.•Different investment styles may go in and out favor, which may cause the Fund to underperform the broader stock market.
Composition by Sector(1)
as of October 31, 2019
| Sector | Percentage of Net Assets | |||
Equity Securities |
| |||
Communication Services | 3.9 | % | ||
Consumer Discretionary | 5.1 | |||
Consumer Staples | 2.3 | |||
Energy | 5.7 | |||
Financials | 20.2 | |||
Health Care | 6.9 | |||
Industrials | 12.1 | |||
Information Technology | 11.3 | |||
Materials | 9.3 | |||
Real Estate | 12.8 | |||
Utilities | 6.3 | |||
|
| |||
Total | 95.9 | % | ||
|
| |||
Short-Term Investments | 3.9 | |||
Other Assets & Liabilities | 0.2 | |||
|
| |||
Total | 100.0 | % | ||
|
| |||
| (1) | A sector may be comprised of several industries. For Fund compliance purposes, the Fund may not use the same classification system. These sector classifications are used for financial reporting purposes. |
| 25 |
|
| Hartford Quality Value Fund |
Fund Overview
October 31, 2019 (Unaudited)
Inception 1/02/1996 Sub-advised by Wellington Management Company LLP | Investment objective – The Fund seeks long-term capital appreciation. |
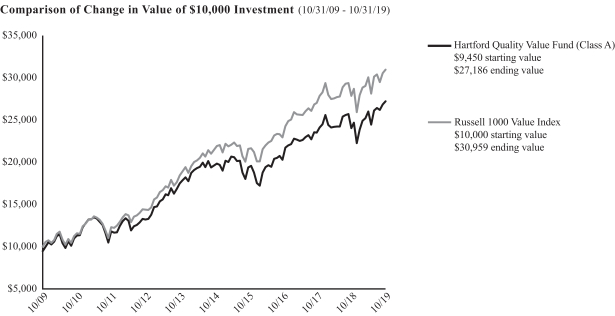
The chart above represents the hypothetical growth of a $10,000 investment in Class A, which includes a sales charge. Growth results in classes other than Class A will vary from what is seen above due to differences in the expenses charged to those share classes.
Average Annual Total Returns (as of 10/31/19)
for the Periods Ending 10/31/19
| 1 Year | 5 Years | 10 Years | ||||||||||
Class A1 | 13.10% | 6.75% | 11.15% | |||||||||
Class A2 | 6.88% | 5.55% | 10.52% | |||||||||
Class C1 | 12.23% | 5.98% | 10.33% | |||||||||
Class C2 | 11.23% | 5.98% | 10.33% | |||||||||
Class I1 | 13.49% | 7.11% | 11.49% | |||||||||
Class R31 | 12.78% | 6.45% | 10.87% | |||||||||
Class R41 | 13.17% | 6.80% | 11.21% | |||||||||
Class R51 | 13.46% | 7.10% | 11.53% | |||||||||
Class R61 | 13.57% | 7.21% | 11.60% | |||||||||
Class Y1 | 13.50% | 7.17% | 11.59% | |||||||||
Class F1 | 13.58% | 7.16% | 11.52% | |||||||||
Russell 1000 Value Index | 11.21% | 7.61% | 11.96% | |||||||||
| 1 | Without sales charge |
| 2 | With sales charge |
PERFORMANCE DATA QUOTED REPRESENTS PAST PERFORMANCE AND DOES NOT GUARANTEE FUTURE RESULTS. The investment return and principal value of the investment will fluctuate so that investors’ shares, when redeemed, may be worth more or less than their original cost. The chart and table do not reflect the deductions of taxes that a shareholder would pay on Fund distributions or the redemption of Fund shares. Current performance may be lower or higher than the performance data quoted. To obtain performance data current to the most recentmonth-end, please visit our website www.hartfordfunds.com.
The initial investment in Class A shares reflects the maximum sales charge of 5.50% and returns for Class C shares reflect a contingent deferred sales charge of up to 1.00% on shares redeemed within twelve months of purchase.
Total returns presented above were calculated using the Fund’s net asset value available to shareholders for sale or redemption of Fund shares on 10/31/19, which may exclude investment transactions as of this date. All share class returns assume the reinvestment of all distributions at net asset value and the deduction of all fund expenses.
The returns include the Fund’s performance when the Fund pursued a different investment objective and principal investment strategy prior to 11/1/17.
Class F shares commenced operations on 2/28/17. Performance prior to that date is that of the Fund’s Class I shares. Class R6 shares commenced operations on 2/28/18. Performance prior to that date is that of the Fund’s Class Y shares.
To the extent a share class has adopted the prior performance of another share class that had different operating expenses, such performance has not been adjusted to reflect the different operating expenses. If the performance were adjusted, it may have been higher or lower.
You cannot invest directly in an index.
See “Benchmark Glossary” for benchmark descriptions.
Performance information may reflect historical or current expense waivers/reimbursements without which performance would have been lower. For information on current expense waivers/reimbursements, please see the prospectus.
| Operating Expenses* | Gross | Net | ||||||
Class A | 0.98% | 0.96% | ||||||
Class C | 1.74% | 1.71% | ||||||
Class I | 0.64% | 0.64% | ||||||
Class R3 | 1.27% | 1.18% | ||||||
Class R4 | 0.97% | 0.88% | ||||||
Class R5 | 0.67% | 0.63% | ||||||
Class R6 | 0.55% | 0.46% | ||||||
Class Y | 0.66% | 0.57% | ||||||
Class F | 0.55% | 0.46% | ||||||
| * | Expenses as shown in the Fund’s most recent prospectus. Gross expenses do not reflect contractual expense reimbursement arrangements. Net expenses reflect such arrangements in instances when they reduce gross expenses. These arrangements remain in effect until 2/29/20 unless the Fund’s Board of Directors approves an earlier termination. Actual expenses may be higher or lower. Please see accompanying Financial Highlights for expense ratios for the year ended 10/31/19. |
| 26 |
|
| Hartford Quality Value Fund |
Fund Overview – (continued)
October 31, 2019 (Unaudited)
Portfolio Managers
Matthew G. Baker
Senior Managing Director and Equity Portfolio Manager
Wellington Management Company LLP
Manager Discussion
How did the Fund perform during the period?
The Class A shares of the Hartford Quality Value Fund returned 13.10%, before sales charge, for the twelve-month period ended October 31, 2019, outperforming its benchmark, the Russell 1000 Value Index, which returned 11.21% for the same period. For the same period, the Class A shares of the Fund outperformed the 10.38% average return of the LipperLarge-Cap Value Fund peer group, a group of funds with investment strategies similar to those of the Fund.
Why did the Fund perform this way?
United States (U.S.) equities, as measured by the S&P 500 Index, posted positive results over the trailing twelve-month period ended October 31, 2019. Towards the end of 2018, volatility was elevated as markets contended with a confluence of slowing growth, tighter liquidity and monetary policy, trade uncertainty, swelling fiscal deficits, and political turmoil. The Federal Reserve (Fed) raised its benchmark interest rate by 0.25% in December 2018. During the first quarter of 2019, U.S. equities rallied to their largest quarterly gain since 2009, lifted by a cautious shift in Fed policy and guidance, optimism for a U.S.-China trade deal, relatively strong fourth-quarter 2018 earnings, and corporate buybacks. The Fed left its benchmark interest rate unchanged during the first quarter, signaling a more patient approach toward future policy-rate adjustments in response to slowing economic growth and muted inflation. By June 2019, unresolved U.S. trade frictions with China, Mexico, Japan, and the European Union (EU) unsettled markets and raised concerns about the potential risks to U.S. economic growth from increasing cost pressures, supply chain disruptions, and waning business confidence and investment plans. In the third quarter of 2019, U.S. equities rose, with the U.S. economy remaining resilient despite elevated geopolitical uncertainties and slowing global growth. U.S.-China trade relations were particularly volatile in the absence of meaningful compromises on key structural issues. Expectations for a protracted trade war and the potential for a longer-term decoupling of the world’s two largest economies eroded consumer and business confidence and curtailed capital spending. The Fed lowered its benchmark interest rate in July and September 2019 by a combined 0.50% in effort to sustain economic expansion and mitigate the risks of slowing growth and trade frictions. In October, the Fed lowered interest rates for a third time in 2019 by 0.25% and signaled its intention to pause further changes in policy. The U.S. and China made progress towards finalizing sections of a “phase one” trade agreement.
Returns varied by market cap during the period, aslarge-cap stocks, measured by the S&P 500 Index, outperformedmid- andsmall-cap stocks, measured by the S&P MidCap 400 Index and Russell 2000 Index, respectively.
Ten out of eleven sectors in the Russell 1000 Value Index rose during the period, with the Real Estate (+25%), Utilities (+23%), and Information
Technology (+22%) sectors performing the best. The Energy(-12%) sector was the only sector that posted negative returns during the period.
Security selection was the primary driver of outperformance relative to the Russell 1000 Value Index over the period. Strong stock selection within the Financials, Information Technology, Industrials, and Healthcare sectors were the top contributors to relative performance. This was partially offset by weaker security selection within the Consumer Staples, Utilities, and Real Estate sectors. Sector allocation, a result of ourbottom-up stock selection process, detracted from performance relative to the Russell 1000 Value Index during the period, due to an underweight to the Real Estate, Utilities, and Communication Services sectors. This was partially offset by an overweight to the Information Technology and Industrials sectors, which contributed positively to relative performance.
Top contributors to performance relative to the Russell 1000 Value Index over the period were KLA (Information Technology), Ball (Materials), and not owning Johnson & Johnson (Healthcare). KLA was the top relative contributor to performance during the period, driving strong performance within the Information Technology sector. The company, which is one of the leading suppliers of process control and yield management solutions to the semiconductor industry, benefited from improving demand trends for chips globally. Additionally, the emergence of the 5th generation (5G) cellular technology, which is beginning to be deployed globally, is also helping demand. Within the Materials sector, the Fund’s overweight to Ball was another top contributor to relative performance over the period. Ball posted solid results this year and continued to demonstrate improved competitive discipline since its merger with Rexam a few years ago. Not holding Johnson & Johnson contributed positively to relative performance over the period, as the company’s share price has been under pressure due to ongoing litigation risk surrounding its various products. KLA, JP Morgan (Financials), and Bank of America (Financials) were the top absolute contributors to performance during the period.
The largest detractors from relative performance were Halliburton (Energy), not holding Procter & Gamble (Consumer Staples), and Methanex (Materials). Halliburton detracted from relative returns as lower oil prices have pressured the company’s stock price over the past year. A lack of an allocation to Procter & Gamble also detracted from relative performance, as the company reported strong first quarter fiscal 2020 results driven by organic sales growth and margin expansion. Methanex was among the top relative detractors during the period and we subsequently eliminated the Fund’s position. The company has struggled to produce adequate returns over the prior two years due to both operational issues and persistently low gas prices. Walgreens (Consumer Staples), Halliburton, and EOG Resources (Energy) were the top absolute detractors from performance during the period.
| 27 |
|
| Hartford Quality Value Fund |
Fund Overview – (continued)
October 31, 2019 (Unaudited)
Derivatives were not used in a significant manner in the Fund during the period and did not have a material impact on performance during the period.
What is the outlook as of the end of the period?
We believe that tariffs remain a major impediment to the continued economic expansion in the U.S., and for the reacceleration of growth globally. We believe tariffs represent a self-imposed limit to economic growth that has the potential to be removed and could serve as a positive catalyst for the economy and stock valuations. In our view, the combination of reduced tariffs and/or trade agreements with China specifically, but also Europe and other regions, combined with global easing by central banks, could provide significant economic stimulus at a time where global growth is sluggish and appears to be slowing. We believe that the probability of a favorable outcome may increase as we move towards the 2020 elections, which may put mounting pressure on President Trump to deliver on economic growth.
However, in the absence of reduced tariffs, U.S. growth is returning to trend levels of approximately 2% after a period of heightened growth since the recent tax reform. While we currently view recessionary risks as contained, largely due to the health of the consumer, we do worry about theknock-on effects of the strength of the dollar, mainly the potential slowing of fixed investment by U.S. companies. This could cause business momentum to slow and lead to less wage growth for consumers, an outcome we think would result in significantly lower equity valuations. However, the Fed appears aware of these risks and is responding in the form of rate cuts to curb slowing investment. A question remains as to how effective these cuts will be.
Furthermore, with an election approaching in the U.S. and the prospect of a wide range of policy outcomes after the election, we are somewhat concerned that equity valuations are not properly discounting this uncertainty. As a result, with the political and economic backdrop being so uncertain at this point, we believe our strategy of focusing on quality businesses, with a history of consistent capital allocation, defensive characteristics, and reasonable valuations is prudent.
At the end of the period, the Fund had the largest overweights in the Information Technology, Industrials, and Healthcare sectors, and the largest underweights in the Communication Services, Real Estate, and Financials sectors, relative to the Russell 1000 Value Index.
Important Risks
Investing involves risk, including the possible loss of principal. Security prices fluctuate in value depending on general market and economic conditions and the prospects of individual companies.• For dividend-paying stocks, dividends are not guaranteed and may decrease without notice.• The Fund’s focus on investments in particular sectors may increase its volatility and risk of loss if adverse developments occur. • Different investment styles may go in and out favor, which may cause the Fund to underperform the broader stock market.
Composition by Sector(1)
as of October 31, 2019
| Sector | Percentage of Net Assets | |||
Equity Securities |
| |||
Communication Services | 5.8 | % | ||
Consumer Discretionary | 4.5 | |||
Consumer Staples | 8.5 | |||
Energy | 8.4 | |||
Financials | 21.9 | |||
Health Care | 13.3 | |||
Industrials | 11.3 | |||
Information Technology | 11.6 | |||
Materials | 2.9 | |||
Real Estate | 3.7 | |||
Utilities | 5.9 | |||
|
| |||
Total | 97.8 | % | ||
|
| |||
Short-Term Investments | 2.2 | |||
Other Assets & Liabilities | 0.0 | * | ||
|
| |||
Total | 100.0 | % | ||
|
| |||
| * | Percentage rounds to zero. |
| (1) | A sector may be comprised of several industries. For Fund compliance purposes, the Fund may not use the same classification system. These sector classifications are used for financial reporting purposes. |
| 28 |
|
| The Hartford Small Cap Growth Fund |
Fund Overview
October 31, 2019 (Unaudited)
Inception 1/04/1988 Sub-advised by Wellington Management Company LLP | Investment objective – The Fund seeks long-term capital appreciation. |
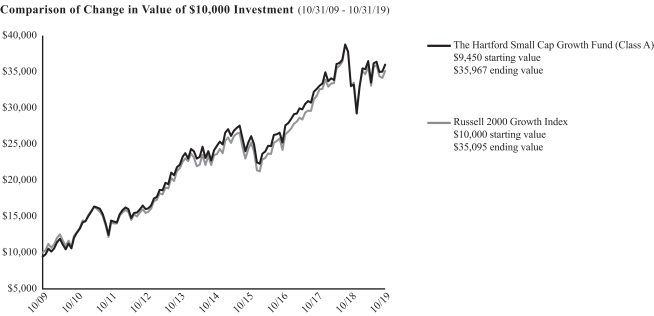
The chart above represents the hypothetical growth of a $10,000 investment in Class A, which includes a sales charge. Growth results in classes other than Class A will vary from what is seen above due to differences in the expenses charged to those share classes.
Average Annual Total Returns
for the Periods Ending 10/31/19
| 1 Year | 5 Years | 10 Years | ||||||||||
Class A1 | 8.99% | 8.28% | 14.30% | |||||||||
Class A2 | 2.99% | 7.06% | 13.66% | |||||||||
Class C1 | 8.27% | 7.54% | 13.50% | |||||||||
Class C2 | 7.54% | 7.54% | 13.50% | |||||||||
Class I1 | 9.41% | 8.62% | 14.65% | |||||||||
Class R31 | 8.72% | 7.99% | 14.02% | |||||||||
Class R41 | 9.05% | 8.33% | 14.38% | |||||||||
Class R51 | 9.40% | 8.66% | 14.72% | |||||||||
Class R61 | 9.49% | 8.74% | 14.82% | |||||||||
Class Y1 | 9.44% | 8.75% | 14.82% | |||||||||
Class F1 | 9.49% | 8.69% | 14.69% | |||||||||
Russell 2000 Growth Index | 6.40% | 8.38% | 13.38% | |||||||||
| 1 | Without sales charge |
| 2 | With sales charge |
PERFORMANCE DATA QUOTED REPRESENTS PAST PERFORMANCE AND DOES NOT GUARANTEE FUTURE RESULTS. The investment return and principal value of the investment will fluctuate so that investors’ shares, when redeemed, may be worth more or less than their original cost. The chart and table do not reflect the deductions of taxes that a shareholder would pay on Fund distributions or the redemption of Fund shares. Current performance may be lower or higher than the performance data quoted. To obtain performance data current to the most recentmonth-end, please visit our website www.hartfordfunds.com.
The initial investment in Class A shares reflects the maximum sales charge of 5.50% and returns for Class C shares reflect a contingent deferred sales charge of up to 1.00% on shares redeemed within twelve months of purchase.
Total returns presented above were calculated using the Fund’s net asset value available to shareholders for sale or redemption of Fund shares on 10/31/19, which may exclude investment transactions as of this date. All share class returns assume the reinvestment of all distributions at net asset value and the deduction of all fund expenses.
Class R6 shares commenced operations on 11/07/14. Performance prior to that date is that of the Fund’s Class Y shares. Class F shares commenced operations on 2/28/17. Performance prior to that date is that of the Fund’s Class I shares.
To the extent a share class has adopted the prior performance of another share class that had different operating expenses, such performance has not been adjusted to reflect the different operating expenses. If the performance were adjusted, it may have been higher or lower.
Performance information includes performance under the Fund’s previous additionalsub-adviser, Hartford Investment Management Company. As of 7/21/10, Hartford Investment Management Company no longer served as asub-adviser to the Fund.
You cannot invest directly in an index.
See “Benchmark Glossary” for benchmark descriptions.
Performance information may reflect historical or current expense waivers/reimbursements without which performance would have been lower. For information on current expense waivers/reimbursements, please see the prospectus.
The Fund is closed to new investors, subject to certain exceptions. For more information, please see the Fund’s prospectus.
| Operating Expenses* | Gross | Net | ||||||
Class A | 1.22% | 1.22% | ||||||
Class C | 1.90% | 1.90% | ||||||
Class I | 0.84% | 0.84% | ||||||
Class R3 | 1.48% | 1.48% | ||||||
Class R4 | 1.17% | 1.17% | ||||||
Class R5 | 0.87% | 0.87% | ||||||
Class R6 | 0.77% | 0.77% | ||||||
Class Y | 0.86% | 0.80% | ||||||
Class F | 0.76% | 0.76% | ||||||
| * | Expenses as shown in the Fund’s most recent prospectus. Gross expenses do not reflect contractual fee waivers or expense reimbursement arrangements. Net expenses reflect such arrangements only with respect to Class Y. These arrangements remain in effect until 2/29/20 unless the Fund’s Board of Directors approves an earlier termination. Expenses shown include acquired fund fees and expenses. Actual expenses may be higher or lower. Please see accompanying Financial Highlights for expense ratios for the year ended 10/31/19. |
| 29 |
|
| The Hartford Small Cap Growth Fund |
Fund Overview – (continued)
October 31, 2019 (Unaudited)
Portfolio Managers
Mammen Chally, CFA
Senior Managing Director and Equity Portfolio Manager
Wellington Management Company LLP
David A. Siegle, CFA
Managing Director and Equity Research Analyst
Wellington Management Company LLP
Douglas W. McLane, CFA
Managing Director and Equity Research Analyst
Wellington Management Company LLP
Manager Discussion
How did the Fund perform during the period?
The Class A shares of The Hartford Small Cap Growth Fund returned 8.99%, before sales charge, for the twelve-month period ended October 31, 2019, outperforming the Fund’s benchmark, the Russell 2000 Growth Index, which returned 6.40%. For the same period, Class A shares of the Fund outperformed the 7.14% average return of the LipperSmall-Cap Growth Funds peer group, a group of funds with investment strategies similar to those of the Fund.
Why did the Fund perform this way?
United States (U.S.) equities, as measured by the S&P 500 Index, posted positive results over the trailing twelve-month period ended October 31, 2019. Towards the end of 2018, volatility was elevated as markets contended with a confluence of slowing growth, tighter liquidity and monetary policy, trade uncertainty, swelling fiscal deficits, and political turmoil. The Federal Reserve (Fed) raised its benchmark interest rate by 0.25% in December 2018. During the first quarter of 2019, U.S. equities rallied to their largest quarterly gain since 2009, lifted by a cautious shift in Fed policy and guidance, optimism for a U.S.-China trade deal, relatively strong fourth-quarter 2018 earnings, and corporate buybacks. The Fed left its benchmark interest rate unchanged during the first quarter, signaling a more patient approach toward future policy-rate adjustments in response to slowing economic growth and muted inflation. By June 2019, unresolved U.S. trade frictions with China, Mexico, Japan, and the European Union (EU) unsettled markets and raised concerns about the potential risks to U.S. economic growth from increasing cost pressures, supply chain disruptions, and waning business confidence and investment plans. In the third quarter of 2019, U.S. equities rose, with the U.S. economy remaining resilient despite elevated geopolitical uncertainties and slowing global growth. U.S.-China trade relations were particularly volatile in the absence of meaningful compromises on key structural issues. Expectations for a protracted trade war and the potential for a longer-term decoupling of the world’s two largest economies eroded consumer and business confidence and curtailed capital spending. The Fed lowered its benchmark interest rate in July and September 2019 by a combined 0.50% in effort to sustain economic expansion and mitigate the risks of slowing growth and trade frictions. In October, the Fed lowered interest rates for a third time in 2019 by 0.25% and signaled its intention to pause further changes in policy. The U.S. and China made progress towards finalizing sections of a “phase one” trade agreement.
Returns varied by market cap during the period, aslarge-cap stocks, as measured by the S&P 500 Index, outperformedmid-cap andsmall-cap stocks, as measured by the S&P MidCap 400 Index and Russell 2000 Index, respectively. Seven out of eleven sectors in the Russell 2000 Growth Index had positive returns during the period. The Utilities (+33%), Information Technology (+22%), and Real Estate (+19%) sectors increased the most, while the Energy(-39%) and Communication Services(-10%) sectors lagged the broader Russell 2000 Growth Index.
Security selection was the primary driver of outperformance relative to the Russell 2000 Growth Index during the period. Strong selection within the Consumer Discretionary, Healthcare, and Industrials sectors contributed positively to relative performance, but was slightly offset by weaker selection in the Communication Services, Financials, and Information Technology sectors, which detracted from relative performance. Sector allocation, a result ofbottom-up stock selection, made a small but positive contribution to relative performance, primarily driven by the Fund’s underweight allocation to the Communication Services sector and an overweight in the Information Technology sector.
The top contributors to performance relative to the Russell 2000 Growth Index during the period were TopBuild (Consumer Discretionary), Reata Pharmaceuticals (Healthcare), and Entegris (Information Technology). Shares of TopBuild, a U.S.-based company that provides insulation and installation services, rose during the period. Reata Pharmaceuticals is a U.S.-based pharmaceuticals company. Shares of Reata surged over 150% towards the end of the period after the company reported positive phase 2 results for omaveloxolone, a treatment for Friendrich’s ataxia, a rare genetic disease. Based on the positive results, and subject to discussions with regulatory authorities, the company plans to proceed with the submission of regulatory filings for marketing approval in the U.S. and internationally. Shares of Entegris, a U.S.-based provider of specialty chemical and materials used in semiconductor manufacturing, rose during the period. The year has been challenging for Entegris as the company reported weaker-than-expected second-quarter 2019 results. However, the company signaled an improving business climate in the second half of 2019. Top contributors to absolute performance for the period included TopBuild (Consumer Discretionary) and Loxo Oncology (Healthcare).
The top detractors from performance relative to the Russell 2000 Growth Index included 2U (Information Technology), Amneal Pharmaceuticals (Healthcare), and ICU Medical (Healthcare). Shares of 2U, a U.S.-based
| 30 |
|
| The Hartford Small Cap Growth Fund |
Fund Overview – (continued)
October 31, 2019 (Unaudited)
online educational services company, fell during the period. The company’s stock plummeted in July after an announcement that it will lower the average enrollment expectations for its core graduate program business due to increased competition. We eliminated the Fund’s position in 2U. Amneal Pharmaceuticals, a U.S.-based generics and specialty pharmaceutical company, declined after the company announced a restructuring effort in light of continued weakness in the generic-drug markets. We eliminated the Fund’s position in this stock. ICU Medical is a U.S.-based company that develops, manufactures, and sells disposable medical connection systems for use in intravenous (IV) therapy applications. ICU shares plunged in August after the company lowered its full-year earnings outlook. As of the end of the period, we maintained the Fund’s position as we believe the company’s new CEO has instilled focus on margin improvements and the company is benefiting from stable demand for its products. Top detractors from absolute performance for the period included Amneal Pharmaceuticals (Healthcare) and Merit Medical System (Healthcare).
Derivatives were not used in a significant manner in the Fund during the period and did not have a material impact on performance during the period.
What is the outlook as of the end of the period?
Since the middle of 2018, there has been a change to the near-term market outlook, led by the change in the U.S. bond market yield curve. The10-year Treasury yield is near the lows it last experienced in 2016. After nine rate increases in 0.25% increments from late 2015 to late 2018, the Fed has now cut interest rates three times. Through all of this, the U.S. dollar has continued to strengthen against the major currencies and China has allowed its currency to weaken. In the U.S., we are now seeing some weakening of exports and capital investment. However, we believe that indicators such as credit, jobless claims, housing activity, and consumer confidence do not signify a recession at this point. Moreover, our conversations with companies indicate that, in general, competition for labor is among the bigger constraints for growth rather than a decrease in demand.
Against this backdrop, we now have the possibility that the House of Representatives will start impeachment proceedings against President Trump. As investors, we are concerned about potential ramifications on items scheduled on the legislative calendar, such as the necessary ratification of USMCA (United States-Mexico-Canada Agreement, which is the proposed replacement for the North American Free Trade Agreement). We believe the pressure on profits and the need to pass on costs will become critical if there is a combination of tariffs and a lack of a ratified USMCA.
Over the next few quarters, we believe that there will be more to analyze given that we are approaching an election year. It is clear there are several policy proposals that could have an impact on stocks the Fund holds, and while we are working to understand the implications, we believe it is too early to act one way or another.
At the end of the period, the Fund’s largest overweights were to the Consumer Discretionary, Financials, and Materials sectors, while the Fund’s largest underweights were to the Utilities, Real Estate, and Communication Services sectors, relative to the Russell 2000 Growth Index.
Important Risks
Investing involves risk, including the possible loss of principal. Security prices fluctuate in value depending on general market and economic conditions and the prospects of individual companies.•Small-cap securities can have greater risks and volatility thanlarge-cap securities. •The Fund’s focus on investments in particular sectors may increase its volatility and risk of loss if adverse developments occur. •Different investment styles may go in and out favor, which may cause the Fund to underperform the broader stock market.
Composition by Sector(1)
as of October 31, 2019
| Sector | Percentage of Net Assets | |||
Equity Securities |
| |||
Communication Services | 1.0 | % | ||
Consumer Discretionary | 14.0 | |||
Consumer Staples | 4.0 | |||
Energy | 0.7 | |||
Financials | 7.7 | |||
Health Care | 28.1 | |||
Industrials | 19.1 | |||
Information Technology | 17.1 | |||
Materials | 3.7 | |||
Real Estate | 3.4 | |||
|
| |||
Total | 98.8 | % | ||
|
| |||
Short-Term Investments | 3.8 | |||
Other Assets & Liabilities | (2.6 | ) | ||
|
| |||
Total | 100.0 | % | ||
|
| |||
| (1) | A sector may be comprised of several industries. For Fund compliance purposes, the Fund may not use the same classification system. These sector classifications are used for financial reporting purposes. |
| 31 |
|
| Hartford Small Cap Value Fund |
Fund Overview
October 31, 2019 (Unaudited)
Inception 1/01/2005 Sub-advised by Wellington Management Company LLP | Investment objective – The Fund seeks long-term capital appreciation. |
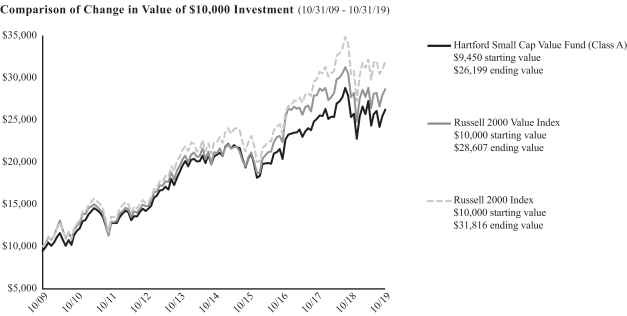
The chart above represents the hypothetical growth of a $10,000 investment in Class A, which includes a sales charge. Growth results in classes other than Class A will vary from what is seen above due to differences in the expenses charged to those share classes.
Average Annual Total Returns
for the Periods Ending 10/31/19
| 1 Year | 5 Years | 10 Years | ||||||||||
Class A1 | 3.46% | 4.89% | 10.74% | |||||||||
Class A2 | -2.23% | 3.71% | 10.11% | |||||||||
Class C1 | 2.60% | 4.10% | 9.92% | |||||||||
Class C2 | 1.87% | 4.10% | 9.92% | |||||||||
Class I1 | 3.77% | 5.18% | 10.89% | |||||||||
Class R31 | 3.31% | 4.68% | 10.65% | |||||||||
Class R41 | 3.52% | 4.97% | 10.90% | |||||||||
Class R51 | 3.82% | 5.28% | 11.17% | |||||||||
Class R61 | 3.99% | 5.36% | 11.22% | |||||||||
Class Y1 | 3.94% | 5.35% | 11.21% | |||||||||
Class F1 | 3.99% | 5.26% | 10.93% | |||||||||
Russell 2000 Value Index | 3.22% | 6.24% | 11.08% | |||||||||
Russell 2000 Index | 4.90% | 7.37% | 12.27% | |||||||||
| 1 | Without sales charge |
| 2 | With sales charge |
PERFORMANCE DATA QUOTED REPRESENTS PAST PERFORMANCE AND DOES NOT GUARANTEE FUTURE RESULTS. The investment return and principal value of the investment will fluctuate so that investors’ shares, when redeemed, may be worth more or less than their original cost. The chart and table do not reflect the deductions of taxes that a shareholder would pay on Fund distributions or the redemption of Fund shares. Current performance may be lower or higher than the performance data quoted. To obtain performance data current to the most recentmonth-end, please visit our website www.hartfordfunds.com.
The initial investment in Class A shares reflects the maximum sales charge of 5.50% and returns for Class C shares reflect a contingent deferred sales charge of up to 1.00% on shares redeemed within twelve months of purchase.
Total returns presented above were calculated using the Fund’s net asset value available to shareholders for sale or redemption of Fund shares on 10/31/19, which may exclude investment transactions as of this date. All share class returns assume the reinvestment of all distributions at net asset value and the deduction of all fund expenses.
Class R3, R4 and R5 shares commenced operations on 9/30/11. Performance prior to that date is that of the Fund’s Class Y shares. Class I shares commenced operations on 03/31/15. Performance prior to that date is that of the Fund’s Class A shares (excluding sales charges). Class F shares commenced operations on 2/28/17. Performance for Class F shares prior to 2/28/17 reflects the performance of Class I shares from 3/31/15 through 2/27/17 and Class A shares (excluding sales charges) prior to 3/31/15. Class R6 shares commenced operations on 2/28/18. Performance prior to that date is that of the Fund’s Class Y shares.
To the extent a share class has adopted the prior performance of another share class that had different operating expenses, such performance has not been adjusted to reflect the different operating expenses. If the performance were adjusted, it may have been higher or lower.
Performance information includes the Fund’s performance when it invested, prior to 2/1/10, at least 80% of its assets in common stocks of mid-capitalization companies and prior to 7/10/15, at least 80% of its assets in common stocks of small-capitalization and mid-capitalization companies. Performance information prior to 11/1/18 includes the Fund’s performance when the Fund used a quantitative multifactor approach to bottom-up stock selection and pursued different principal investment strategies.
Performance information includes performance under the Fund’s previoussub-adviser, Hartford Investment Management Company. As of 6/4/12, Hartford Investment Management Company no longer served as thesub-adviser to the Fund.
Effective 11/1/18, the Fund changed its benchmark to the Russell 2000 Value Index from the Russell 2000 Index because Hartford Funds Management Company, LLC, the investment manager, believes it better reflects the Fund’s revised investment strategy.
You cannot invest directly in an index.
| 32 |
|
| Hartford Small Cap Value Fund |
Fund Overview – (continued)
October 31, 2019 (Unaudited)
See “Benchmark Glossary” for benchmark descriptions.
Performance information may reflect historical or current expense waivers/reimbursements without which performance would have been lower. For information on current expense waivers/reimbursements, please see the prospectus.
| Operating Expenses* | Gross | Net | ||||||
Class A | 1.30% | 1.30% | ||||||
Class C | 2.08% | 2.05% | ||||||
Class I | 0.98% | 0.98% | ||||||
Class R3 | 1.58% | 1.50% | ||||||
Class R4 | 1.28% | 1.20% | ||||||
Class R5 | 0.98% | 0.90% | ||||||
Class R6 | 0.87% | 0.80% | ||||||
Class Y | 0.97% | 0.85% | ||||||
Class F | 0.86% | 0.80% | ||||||
| * | Expenses as shown in the Fund’s most recent prospectus. Gross expenses do not reflect contractual expense reimbursement arrangements. Net expenses reflect such arrangements in instances when they reduce gross expenses. These arrangements remain in effect until 2/29/20 unless the Fund’s Board of Directors approves an earlier termination. Actual expenses may be higher or lower. Please see accompanying Financial Highlights for expense ratios for the year ended 10/31/19. |
Portfolio Managers
Sean M. Kammann
Managing Director, Equity Portfolio Manager
Wellington Management Company LLP
Manager Discussion
How did the Fund perform during the period?
The Class A shares of the Hartford Small Cap Value Fund returned 3.46%, before sales charge, for the twelve-month period ended October 31, 2019, outperforming its benchmark, the Russell 2000 Value Index, which returned 3.22% for the same period. For the same period, the Class A shares of the Fund outperformed the-0.59% average return of the LipperSmall-Cap Value Funds peer group, a group of funds with investment strategies similar to those of the Fund.
Why did the Fund perform this way?
United States (U.S.) equities, as measured by the S&P 500 Index, posted positive results over the trailing twelve-month period ended October 31, 2019. Towards the end of 2018, volatility was elevated as markets contended with a confluence of slowing growth, tighter liquidity and monetary policy, trade uncertainty, swelling fiscal deficits, and political turmoil. The Federal Reserve (Fed) raised its benchmark interest rate by 0.25% in December 2018. During the first quarter of 2019, U.S. equities rallied to their largest quarterly gain since 2009, lifted by a cautious shift in Fed policy and guidance, optimism for a U.S.-China trade deal, relatively strong fourth-quarter 2018 earnings, and corporate buybacks. The Fed left its benchmark interest rate unchanged during the first quarter, signaling a more patient approach toward future policy-rate adjustments in response to slowing economic growth and muted inflation. By June 2019, unresolved U.S. trade frictions with China, Mexico, Japan, and the European Union (EU) unsettled markets and raised concerns about the potential risks to U.S. economic growth from increasing cost pressures, supply chain disruptions, and waning business confidence and investment plans. In the third quarter of 2019, U.S. equities rose, with the U.S. economy remaining resilient despite
elevated geopolitical uncertainties and slowing global growth. U.S.-China trade relations were particularly volatile in the absence of meaningful compromises on key structural issues. Expectations for a protracted trade war and the potential for a longer-term decoupling of the world’s two largest economies eroded consumer and business confidence and curtailed capital spending. The Fed lowered its benchmark interest rate in July and September 2019 by a combined 0.50% in effort to sustain economic expansion and mitigate the risks of slowing growth and trade frictions. In October, the Fed lowered interest rates for a third time in 2019 by 0.25% and signaled its intention to pause further changes in policy. The U.S. and China made progress towards finalizing sections of a “phase one” trade agreement.
Returns varied by market cap during the period, aslarge-cap stocks, as measured by the S&P 500 Index, outperformedmid- andsmall-cap stocks, as measured by the S&P MidCap 400 Index and Russell 2000 Value Index, respectively.
Five of the eleven sectors in the Russell 2000 Value Index rose during the period, with the Information Technology (+27%), Utilities (+21%), and Real Estate (+20%) sectors performing best. Conversely, the Energy(-44%), Healthcare(-18%), and Communication Services(-12%) sectors lagged over the period.
Sector allocation, a result of ourbottom-up stock selection process, contributed to positive returns relative to the Russell 2000 Value Index during the period. The Fund’s lack of a position in the Energy sector and overweight to the Information Technology sector drove relative outperformance, while the Fund’s lack of exposure to the Utilities sector and an underweight to the Real Estate sector partially offset these results. Security selection detracted from results relative to the
| 33 |
|
| Hartford Small Cap Value Fund |
Fund Overview – (continued)
October 31, 2019 (Unaudited)
Russell 2000 Value Index during the period due to weak stock selection in the Consumer Discretionary, Information Technology, and Real Estate sectors, which was partially offset by strong stock selection in the Healthcare, Materials, and Consumer Staples sectors.
The largest contributors to performance relative to the Russell 2000 Value Index over the period were Tempur Sealy (Consumer Discretionary), CSG Systems (Information Technology), and Carriage Services (Consumer Discretionary). Shares of Tempur Sealy, a manufacturer of the TEMPUR, Sealy, and Stearns & Foster bedding/pillow brands, rose over the period as the company recaptured market share, demonstratedre-accelerating revenue growth, and continued to move past shorter-term weakness related to a strategic decision to terminate its relationship with its largest customer, Mattress Firm. CSG Systems provides business support solutions primarily to the communications industry. The stock traded higher over the period on strong earnings and investor optimism around the growing market opportunity amidst some customer consolidation. Carriage Services, a provider of funeral and cemetery services and merchandise, traded higher after posting earnings well above estimates in each of the last two quarters after the company hadpre-announced positive results in January and management conveyed urgency to improve upon fixable operational issues.
The largest detractors from performance relative to the Russell 2000 Value Index during the period were Stamps.com (Consumer Discretionary), Conduent (Information Technology), and Briggs & Stratton (Industrials). Shares of Stamps.com, a provider of internet-based mailing and shipping solutions, fell early in the year when the company announced it would be ending its exclusive partnership with the U.S. Postal Service and highlighted increasing pressure from Amazon’s move into shipping services. The stock was again weighed down in May 2019, when the company cut its profit outlook for the full year. Conduent is a provider of business process outsourcing services. Shares of the company dropped after disappointing first-quarter 2019 results and news that the CEO would be stepping down. Earnings continued to lag estimates in the second quarter of 2019 as the company conducted a strategic review of its business. As of the end of the period, we continued to hold the position in the Fund, as we believe the market is not giving credit for the company’s divesting of the lower growth businesses and we believe revenue is poised tore-accelerate.
Briggs & Stratton is one of the world’s largest producers of gasoline engines for outdoor power equipment. The stock experienced some weakness on the back of disappointing results and expected further softness due to the Sears bankruptcy. We sold the position in the Fund during the period.
Derivatives were not used in a significant manner in the Fund during the period and did not have a material impact on performance during the period.
What is the outlook as of the end of the period?
We see the inversion of the yield curve as a reflection of the growing political uncertainty (globally and within the U.S.) and building fears of a recession. We anticipate the global economy will likely stabilize after a period of deceleration, with expected lower levels of economic growth as our base case.
At the end of the period, the Fund’s largest overweights were in the Information Technology and Industrial sectors, and the Fund’s largest underweights were in the Real Estate, Utilities, and Energy sectors, relative to the Russell 2000 Value Index.
Important Risks
Investing involves risk, including the possible loss of principal. Security prices fluctuate in value depending on general market and economic conditions and the prospects of individual companies.•Small-cap securities can have greater risks and volatility thanlarge-cap securities. • The Fund’s focus on investments in particular sectors may increase its volatility and risk of loss if adverse developments occur.• Foreign investments may be more volatile and less liquid than U.S. investments and are subject to the risk of currency fluctuations and adverse political and economic developments.• Different investment styles may go in and out favor, which may cause the Fund to underperform the broader stock market.
Composition by Sector(1)
as of October 31, 2019
| Sector | Percentage of Net Assets | |||
Equity Securities |
| |||
Communication Services | 1.8 | % | ||
Consumer Discretionary | 11.2 | |||
Consumer Staples | 5.4 | |||
Financials | 29.3 | |||
Health Care | 1.6 | |||
Industrials | 20.7 | |||
Information Technology | 19.2 | |||
Materials | 3.9 | |||
Real Estate | 4.9 | |||
|
| |||
Total | 98.0 | % | ||
|
| |||
Short-Term Investments | 3.7 | |||
Other Assets & Liabilities | (1.7 | ) | ||
|
| |||
Total | 100.0 | % | ||
|
| |||
| (1) | A sector may be comprised of several industries. For Fund compliance purposes, the Fund may not use the same classification system. These sector classifications are used for financial reporting purposes. |
| 34 |
|
| The Hartford Small Company Fund |
Fund Overview
October 31, 2019 (Unaudited)
Inception 7/22/1996 Sub-advised by Wellington Management Company LLP | Investment objective – The Fund seeks growth of capital. |
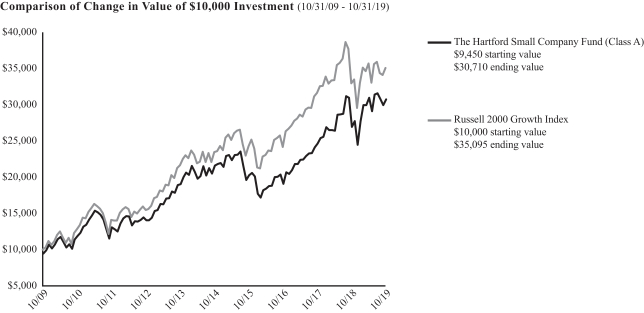
The chart above represents the hypothetical growth of a $10,000 investment in Class A, which includes a sales charge. Growth results in classes other than Class A will vary from what is seen above due to differences in the expenses charged to those share classes.
Average Annual Total Returns
for the Periods Ending 10/31/19
| 1 Year | 5 Years | 10 Years | ||||||||||
Class A1 | 14.08% | 7.29% | 12.50% | |||||||||
Class A2 | 7.75% | 6.08% | 11.87% | |||||||||
Class C1 | 13.24% | 6.49% | 11.68% | |||||||||
Class C2 | 12.33% | 6.49% | 11.68% | |||||||||
Class I1 | 14.48% | 7.56% | 12.79% | |||||||||
Class R31 | 13.84% | 7.07% | 12.29% | |||||||||
Class R41 | 14.20% | 7.40% | 12.63% | |||||||||
Class R51 | 14.56% | 7.72% | 12.96% | |||||||||
Class R61 | 14.60% | 7.79% | 13.06% | |||||||||
Class Y1 | 14.56% | 7.79% | 13.06% | |||||||||
Class F1 | 14.63% | 7.66% | 12.84% | |||||||||
Russell 2000 Growth Index | 6.40% | 8.38% | 13.38% | |||||||||
| 1 | Without sales charge |
| 2 | With sales charge |
PERFORMANCE DATA QUOTED REPRESENTS PAST PERFORMANCE AND DOES NOT GUARANTEE FUTURE RESULTS. The investment return and principal value of the investment will fluctuate so that investors’ shares, when redeemed, may be worth more or less than their original cost. The chart and table do not reflect the deductions of taxes that a shareholder would pay on Fund distributions or the redemption of Fund shares. Current performance may be lower or higher than the performance data quoted. To obtain performance data current to the most recentmonth-end, please visit our website www.hartfordfunds.com.
The initial investment in Class A shares reflects the maximum sales charge of 5.50% and returns for Class C shares reflect a contingent deferred sales charge of up to 1.00% on shares redeemed within twelve months of purchase.
Total returns presented above were calculated using the Fund’s net asset value available to shareholders for sale or redemption of Fund shares on 10/31/19, which may exclude investment transactions as of this date. All share class returns assume the reinvestment of all distributions at net asset value and the deduction of all fund expenses.
Class R6 shares commenced operations on 11/07/14. Performance prior to that date is that of the Fund’s Class Y shares. Class F shares commenced operations on 2/28/17. Performance prior to that date is that of the Fund’s Class I shares.
To the extent a share class has adopted the prior performance of another share class that had different operating expenses, such performance has not been adjusted to reflect the different operating expenses. If the performance were adjusted, it may have been higher or lower.
Performance information includes performance under the Fund’s previous additionalsub-adviser, Hartford Investment Management Company. As of 7/21/10, Hartford Investment Management Company no longer served as asub-adviser to the Fund.
You cannot invest directly in an index.
See “Benchmark Glossary” for benchmark descriptions.
Performance information may reflect historical or current expense waivers/reimbursements without which performance would have been lower. For information on current expense waivers/reimbursements, please see the prospectus.
| Operating Expenses* | Gross | Net | ||||||
Class A | 1.35% | 1.35% | ||||||
Class C | 2.13% | 2.13% | ||||||
Class I | 1.08% | 1.08% | ||||||
Class R3 | 1.64% | 1.56% | ||||||
Class R4 | 1.33% | 1.26% | ||||||
Class R5 | 1.04% | 0.96% | ||||||
Class R6 | 0.92% | 0.91% | ||||||
Class Y | 1.00% | 0.96% | ||||||
Class F | 0.92% | 0.91% | ||||||
| * | Expenses as shown in the Fund’s most recent prospectus. Gross expenses do not reflect contractual expense reimbursement arrangements. Net expenses reflect such arrangements in instances when they reduce gross expenses. These arrangements remain in effect until 2/29/20 unless the Fund’s Board of Directors approves an earlier termination. Expenses shown include acquired fund fees and expenses. Actual expenses may be higher or lower. Please see accompanying Financial Highlights for expense ratios for the year ended 10/31/19. |
| 35 |
|
| The Hartford Small Company Fund |
Fund Overview – (continued)
October 31, 2019 (Unaudited)
Portfolio Managers
Steven C. Angeli, CFA
Senior Managing Director and Equity Portfolio Manager
Wellington Management Company LLP
John V. Schneider, CFA
Vice President and Equity Research Analyst
Wellington Management Company LLP
Manager Discussion
How did the Fund perform during the period?
The Class A shares of The Hartford Small Company Fund returned 14.08%, before sales charge, for the twelve-month period ended October 31, 2019, outperforming its benchmark, the Russell 2000 Growth Index, which returned 6.40%. For the same period, the Class A shares of the Fund also outperformed the 7.14% average return of the LipperSmall-Cap Growth Funds peer group, a group of funds with investment strategies similar to those of the Fund.
Why did the Fund perform this way?
United States (U.S.) equities, as measured by the S&P 500 Index, posted positive results over the trailing twelve-month period ended October 31, 2019. Towards the end of 2018, volatility was elevated as markets contended with a confluence of slowing growth, tighter liquidity and monetary policy, trade uncertainty, swelling fiscal deficits, and political turmoil. The Federal Reserve (Fed) raised its benchmark interest rate by 0.25% in December 2018. During the first quarter of 2019, U.S. equities rallied to their largest quarterly gain since 2009, lifted by an accommodative shift in Fed policy and guidance, optimism for a U.S.-China trade deal, relatively strong fourth-quarter 2018 earnings, and corporate buybacks. The Fed left its benchmark interest rate unchanged during the first quarter, signaling a more patient approach toward future policy-rate adjustments in response to slowing economic growth and muted inflation. By June 2019, unresolved U.S. trade frictions with China, Mexico, Japan, and the European Union (EU) unsettled markets and raised concerns about the potential risks to U.S. economic growth from increasing cost pressures, supply chain disruptions, and waning business confidence and investment plans. In the third quarter of 2019, U.S. equities rose, with the U.S. economy remaining resilient despite elevated geopolitical uncertainties and slowing global growth. U.S.-China trade relations were particularly volatile in the absence of meaningful compromises on key structural issues. Expectations for a protracted trade war and the potential for a longer-term decoupling of the world’s two largest economies eroded consumer and business confidence and curtailed capital spending. The Fed lowered its benchmark interest rate in July and September 2019 by a combined 0.50% in effort to sustain economic expansion and mitigate the risks of slowing growth and trade frictions. In October, the Fed lowered interest rates for a third time in 2019 by 0.25% and signaled its intention to pause further changes in policy. The U.S. and China made progress towards finalizing sections of a “phase one” trade agreement.
Returns varied by market cap during the period, aslarge-cap stocks, as measured by the S&P 500 Index, outperformedmid-cap andsmall-cap stocks, as measured by the S&P MidCap 400 Index and Russell 2000 Index, respectively. Seven out of eleven sectors in the Russell 2000
Growth Index had positive returns during the period. The Utilities (+33%), Information Technology (+22%), and Real Estate (+19%) sectors increased the most, while the Energy(-38%), Communication Services(-10%), and Healthcare(-2%) sectors lagged the broader Russell 2000 Growth Index over the period.
During the period, security selection was the primary driver of outperformance relative to the Russell 2000 Growth Index. Strong selection in the Consumer Discretionary, Healthcare, and Information Technology sectors contributed positively to performance relative to the Russell 2000 Growth Index, but was slightly offset by weak selection in the Industrials, Financials, and Energy sectors. Sector allocation, a result of ourbottom-up stock selection process, also contributed positively to performance relative to the Russell 2000 Growth Index, which was primarily driven by the Fund’s underweight allocation to the Communication Services and Energy sectors.
The top contributors to performance relative to the Russell 2000 Growth Index were Insulet (Healthcare), Globant (Information Technology), and Wayfair (Consumer Discretionary). Shares of Insulet, a medical device maker, rose after the company reported quarterly earnings that exceeded both management guidance and market expectations as all three of its revenue segments outperformed. Notably, adoption rates of the company’s Omnipod DASH system showed signs of growth. Globant, an IT consulting company with global operations, posted solid results and reiterated strong guidance of greater than 20% organic growth. Shares of Wayfair, ane-commerce home furnishings company, rose after the company reported strong fourth quarter 2018 results driven by customer growth and higher gross margins. The company continues to invest heavily in its national distribution network. Top contributors to absolute performance for the period included Insulet (Healthcare), and The Trade Desk (Information Technology).
The top detractors from performance relative to the Russell 2000 Growth Index included Centennial Resource Development (Energy), Merit Medical Systems (Healthcare), and 2U (Information Technology). Shares of Centennial Resource Development, a Permian basin focused oil and gas producer fell early in the period due to concerns about capital efficiency following management’s 2019 production and capital spending guidance. Shares of Merit Medical Systems, a manufacturer of disposable medical devices, declined after management released results that fell below analyst expectations and lowered its 2019 revenue guidance. The company also lowered fiscal year 2019 earnings per share (EPS) amid concerns over the pace of integrating recent acquisitions. Shares of 2U, a provider of cloud-based software for online education courses, traded down after management meaningfully lowered its full-year guidance and turned its focus away fromtop-line growth towards profitability in its July 2019 earnings release. The company cited
| 36 |
|
| The Hartford Small Company Fund |
Fund Overview – (continued)
October 31, 2019 (Unaudited)
increasing competition in its graduate degree segment as a challenge totop-line growth. Top detractors from absolute performance for the period included Centennial Resources (Energy), Merit Medical Systems (Healthcare), and 2U (Information Technology).
Derivatives were not used in a significant manner in the Fund during the period and did not have a material impact on performance during the period.
What is the outlook as of the end of the period?
Overall, we believe the U.S. economy remains healthy, and we continue to monitor policy decisions and economic trends that may impact the Fund’s holdings. We anticipate a more challenging macro environment in the upcoming year. We remain consistent in adhering to our disciplined portfolio construction process that we believe allows us to assess risk, weight individual positions accordingly, and in the process build a Fund that focuses largely on stock selection in seeking to generate outperformance relative to the Russell 2000 Growth Index.
At the end of the period, the Fund’s largest overweights were to the Consumer Discretionary, Financials, and Materials sectors, while the Fund’s largest underweights were to the Utilities, Consumer Staples, and Information Technology sectors, relative to the Russell 2000 Growth Index.
Important Risks
Investing involves risk, including the possible loss of principal. Security prices fluctuate in value depending on general market and economic conditions and the prospects of individual companies.•Small-cap securities can have greater risks and volatility thanlarge-cap securities. •Foreign investments may be more volatile and less liquid than U.S. investments and are subject to the risk of currency fluctuations and adverse political and economic developments.•The Fund’s focus on investments in particular sectors may increase its volatility and risk of loss if adverse developments occur.•Different investment styles may go in and out favor, which may cause the Fund to underperform the broader stock market.
Composition by Sector(1)
as of October 31, 2019
| Sector | Percentage of Net Assets | |||
Equity Securities |
| |||
Communication Services | 1.3 | % | ||
Consumer Discretionary | 18.6 | |||
Consumer Staples | 1.7 | |||
Energy | 0.5 | |||
Financials | 6.6 | |||
Health Care | 25.3 | |||
Industrials | 18.1 | |||
Information Technology | 16.0 | |||
Materials | 3.3 | |||
Real Estate | 4.4 | |||
|
| |||
Total | 95.8 | % | ||
|
| |||
Short-Term Investments | 6.2 | |||
Other Assets & Liabilities | (2.0 | ) | ||
|
| |||
Total | 100.0 | % | ||
|
| |||
| (1) | A sector may be comprised of several industries. For Fund compliance purposes, the Fund may not use the same classification system. These sector classifications are used for financial reporting purposes. |
| 37 |
|
| Hartford Domestic Equity Funds |
Benchmark Glossary (Unaudited)
Russell 1000 Growth Index(reflects no deduction for fees, expenses or taxes) is designed to measure the performance of those Russell 1000 Index companies with higherprice-to-book ratios and higher forecasted growth values. The Russell 1000 Index is designed to measure the performance of the 1,000 largest companies in the Russell 3000 Index based on their market capitalization and current index membership.
Russell 1000 Value Index(reflects no deduction for fees, expenses or taxes) is designed to measure the performance of those Russell 1000 Index companies with lowerprice-to-book ratios and lower forecasted growth values. The Russell 1000 Index is designed to measure the performance of the 1,000 largest companies in the Russell 3000 Index based on their market capitalization and current index membership.
Russell 2000 Growth Index(reflects no deduction for fees, expenses or taxes) is designed to measure the performance of those Russell 2000 Index companies with higherprice-to-book ratios and higher forecasted growth values. The Russell 2000 Index is an index comprised of 2,000 of the smallest U.S.-domiciled company common stocks based on a combination of their market capitalization and current index membership.
Russell 2000 Value Index(reflects no deduction for fees, expenses or taxes) is designed to measure the performance of those Russell 2000 Index companies with lowerprice-to-book ratios and lower forecasted growth values. The Russell 2000 Index is an index comprised of 2,000 of the smallest U.S.-domiciled company common stocks based on a combination of their market capitalization and current index membership.
Russell 2000 Index(reflects no deduction for fees, expenses or taxes) is an index comprised of 2,000 of the smallest U.S.-domiciled company common stocks based on a combination of their market capitalization and current index membership.
Russell 2500 Value Index(reflects no deduction for fees, expenses or taxes) measures the performance of those Russell 2500 Index companies with lowerprice-to-book ratios and lower forecasted growth values. The Russell 2500 Index measures the performance of the 2,500 smallest U.S. companies based on their market capitalization and current index membership.
Russell 3000 Growth Index(reflects no deduction for fees, expenses or taxes) is designed to measure the performance of those Russell 3000 Index companies with higherprice-to-book ratios and higher forecasted growth values. The Russell 3000 Index is designed to measures the performance of the 3,000 largest U.S. companies based on total market capitalization.
Russell 3000 Index(reflects no deduction for fees, expenses or taxes) is designed to measure the performance of the 3,000 largest U.S. companies based on total market capitalization.
Russell Midcap Value Index(reflects no deduction for fees, expenses or taxes)measures the performance of themid-cap value segment of the U.S. equity universe. It includes those Russell Midcap Index companies with lowerprice-to-book ratios and lower forecasted growth values.
S&P 500 Index(reflects no deduction for fees, expenses or taxes)is a float-adjusted market capitalization-weighted index composed of 500 widely held common stocks.
S&P Composite 1500 Health Care Index(reflects no deduction for fees, expenses or taxes)is a float-adjusted market capitalization-weighted index comprised of those companies included in the S&P Composite 1500 that are classified as members of the Global Industry Classification Standard (GICS®) health care sector.
S&P MidCap 400 Index(reflects no deduction for fees, expenses or taxes) is a float-adjusted market capitalization-weighted index designed to measure the performance of themid-cap segment of the market. The index is composed of 400 constituent companies.
| 38 |
|
| Hartford Domestic Equity Funds |
Your Fund’s Expenses
As a shareholder of a Fund, you incur two types of costs: (1) transaction costs, including sales charges (loads) on purchase payments, if any, and contingent deferred sales charges (CDSC), if any, and (2) ongoing costs, including investment management fees, distribution and/or service(12b-1) fees, if any, and other fund expenses. This example is intended to help you understand your ongoing costs (in dollars) of investing in a Fund and to compare these costs with the ongoing costs of investing in other mutual funds. The example is based on an investment of $1,000 invested at the beginning of the period and held for the entire period of May 1, 2019 through October 31, 2019. To the extent a Fund was subject to acquired fund fees and expenses during the period, acquired fund fees and expenses are not included in the annualized expense ratios below.
Actual Expenses
The first set of columns of the table below provides information about actual account values and actual expenses. You may use this information, together with the amount you invested, to estimate the expenses that you paid over the period. Simply divide your account value by $1,000 (for example, an $8,600 account value divided by $1,000 = 8.6), then multiply the result by the number in the line under the heading entitled “Expenses Paid During The Period” to estimate the expenses you paid on your account during this period.
Hypothetical Example for Comparison Purposes
The second set of columns of the table below provides information about hypothetical account values and hypothetical expenses based on a Fund’s actual expense ratio and an assumed rate of return of 5% per year before expenses, which is not the Fund’s actual return. The hypothetical account values and expenses may not be used to estimate the actual ending account balance or expenses you paid for the period. You may use this information to compare the ongoing costs of investing in a Fund and other funds. To do so, compare this 5% hypothetical example with the 5% hypothetical examples that appear in the shareholder reports of the other funds.
Please note that the expenses shown in the table are meant to highlight your ongoing costs only and do not reflect any transactional costs, such as sales charges (front-end sales loads and CDSC). Therefore, the second set of columns of the table is useful in comparing ongoing costs only, and will not help you determine the relative total costs of owning different funds. In addition, if these transactional costs were included, your costs would be higher. Expenses for a class of a Fund are equal to the class’ annualized expense ratio multiplied by average account value over the period, multiplied by 184/365 (to reflect theone-half year period).
| Actual Return | Hypothetical (5% return before expenses) | |||||||||||||||||||||||||||
| Beginning Account Value May 1, 2019 | Ending Account Value October 31, 2019 | Expenses paid during the period May 1, 2019 through October 31, 2019 | Beginning Account Value May 1, 2019 | Ending Account Value October 31, 2019 | Expenses paid during the period May 1, 2019 through October 31, 2019 | Annualized expense ratio | ||||||||||||||||||||||
The Hartford Capital Appreciation Fund |
| |||||||||||||||||||||||||||
Class A | $ | 1,000.00 | $ | 1,022.30 | $ | 5.45 | $ | 1,000.00 | $ | 1,019.81 | $ | 5.45 | 1.07 | % | ||||||||||||||
Class C | $ | 1,000.00 | $ | 1,019.20 | $ | 8.70 | $ | 1,000.00 | $ | 1,016.59 | $ | 8.69 | 1.71 | % | ||||||||||||||
Class I | $ | 1,000.00 | $ | 1,023.90 | $ | 3.98 | $ | 1,000.00 | $ | 1,021.27 | $ | 3.97 | 0.78 | % | ||||||||||||||
Class R3 | $ | 1,000.00 | $ | 1,020.70 | $ | 7.23 | $ | 1,000.00 | $ | 1,018.05 | $ | 7.22 | 1.42 | % | ||||||||||||||
Class R4 | $ | 1,000.00 | $ | 1,022.60 | $ | 5.61 | $ | 1,000.00 | $ | 1,019.66 | $ | 5.60 | 1.10 | % | ||||||||||||||
Class R5 | $ | 1,000.00 | $ | 1,024.00 | $ | 4.03 | $ | 1,000.00 | $ | 1,021.22 | $ | 4.02 | 0.79 | % | ||||||||||||||
Class R6 | $ | 1,000.00 | $ | 1,024.30 | $ | 3.57 | $ | 1,000.00 | $ | 1,021.68 | $ | 3.57 | 0.70 | % | ||||||||||||||
Class Y | $ | 1,000.00 | $ | 1,024.30 | $ | 3.78 | $ | 1,000.00 | $ | 1,021.48 | $ | 3.77 | 0.74 | % | ||||||||||||||
Class F | $ | 1,000.00 | $ | 1,024.40 | $ | 3.57 | $ | 1,000.00 | $ | 1,021.68 | $ | 3.57 | 0.70 | % | ||||||||||||||
Hartford Core Equity Fund |
| |||||||||||||||||||||||||||
Class A | $ | 1,000.00 | $ | 1,049.70 | $ | 3.82 | $ | 1,000.00 | $ | 1,021.48 | $ | 3.77 | 0.74 | % | ||||||||||||||
Class C | $ | 1,000.00 | $ | 1,045.80 | $ | 7.58 | $ | 1,000.00 | $ | 1,017.80 | $ | 7.48 | 1.47 | % | ||||||||||||||
Class I | $ | 1,000.00 | $ | 1,051.10 | $ | 2.43 | $ | 1,000.00 | $ | 1,022.84 | $ | 2.40 | 0.47 | % | ||||||||||||||
Class R3 | $ | 1,000.00 | $ | 1,047.60 | $ | 5.73 | $ | 1,000.00 | $ | 1,019.61 | $ | 5.65 | 1.11 | % | ||||||||||||||
Class R4 | $ | 1,000.00 | $ | 1,049.70 | $ | 3.72 | $ | 1,000.00 | $ | 1,021.58 | $ | 3.67 | 0.72 | % | ||||||||||||||
Class R5 | $ | 1,000.00 | $ | 1,051.10 | $ | 2.53 | $ | 1,000.00 | $ | 1,022.74 | $ | 2.50 | 0.49 | % | ||||||||||||||
Class R6 | $ | 1,000.00 | $ | 1,051.50 | $ | 1.96 | $ | 1,000.00 | $ | 1,023.29 | $ | 1.94 | 0.38 | % | ||||||||||||||
Class Y | $ | 1,000.00 | $ | 1,051.20 | $ | 2.27 | $ | 1,000.00 | $ | 1,022.99 | $ | 2.24 | 0.44 | % | ||||||||||||||
Class F | $ | 1,000.00 | $ | 1,051.40 | $ | 1.96 | $ | 1,000.00 | $ | 1,023.29 | $ | 1.94 | 0.38 | % | ||||||||||||||
| 39 |
|
| Hartford Domestic Equity Funds |
Expense Examples (Unaudited) – (continued)
| Actual Return | Hypothetical (5% return before expenses) | |||||||||||||||||||||||||||
| Beginning Account Value May 1, 2019 | Ending Account Value October 31, 2019 | Expenses paid during the period May 1, 2019 through October 31, 2019 | Beginning Account Value May 1, 2019 | Ending Account Value October 31, 2019 | Expenses paid during the period May 1, 2019 through October 31, 2019 | Annualized expense ratio | ||||||||||||||||||||||
The Hartford Dividend and Growth Fund |
| |||||||||||||||||||||||||||
Class A | $ | 1,000.00 | $ | 1,049.40 | $ | 5.17 | $ | 1,000.00 | $ | 1,020.16 | $ | 5.09 | 1.00 | % | ||||||||||||||
Class C | $ | 1,000.00 | $ | 1,046.20 | $ | 8.82 | $ | 1,000.00 | $ | 1,016.59 | $ | 8.69 | 1.71 | % | ||||||||||||||
Class I | $ | 1,000.00 | $ | 1,051.10 | $ | 3.83 | $ | 1,000.00 | $ | 1,021.48 | $ | 3.77 | 0.74 | % | ||||||||||||||
Class R3 | $ | 1,000.00 | $ | 1,047.90 | $ | 6.97 | $ | 1,000.00 | $ | 1,018.40 | $ | 6.87 | 1.35 | % | ||||||||||||||
Class R4 | $ | 1,000.00 | $ | 1,049.50 | $ | 5.32 | $ | 1,000.00 | $ | 1,020.01 | $ | 5.24 | 1.03 | % | ||||||||||||||
Class R5 | $ | 1,000.00 | $ | 1,051.00 | $ | 3.83 | $ | 1,000.00 | $ | 1,021.48 | $ | 3.77 | 0.74 | % | ||||||||||||||
Class R6 | $ | 1,000.00 | $ | 1,051.50 | $ | 3.31 | $ | 1,000.00 | $ | 1,021.98 | $ | 3.26 | 0.64 | % | ||||||||||||||
Class Y | $ | 1,000.00 | $ | 1,051.20 | $ | 3.57 | $ | 1,000.00 | $ | 1,021.73 | $ | 3.52 | 0.69 | % | ||||||||||||||
Class F | $ | 1,000.00 | $ | 1,051.60 | $ | 3.31 | $ | 1,000.00 | $ | 1,021.98 | $ | 3.26 | 0.64 | % | ||||||||||||||
The Hartford Equity Income Fund |
| |||||||||||||||||||||||||||
Class A | $ | 1,000.00 | $ | 1,039.50 | $ | 5.14 | $ | 1,000.00 | $ | 1,020.16 | $ | 5.09 | 1.00 | % | ||||||||||||||
Class C | $ | 1,000.00 | $ | 1,035.70 | $ | 8.98 | $ | 1,000.00 | $ | 1,016.38 | $ | 8.89 | 1.75 | % | ||||||||||||||
Class I | $ | 1,000.00 | $ | 1,041.70 | $ | 3.65 | $ | 1,000.00 | $ | 1,021.63 | $ | 3.62 | 0.71 | % | ||||||||||||||
Class R3 | $ | 1,000.00 | $ | 1,038.00 | $ | 6.93 | $ | 1,000.00 | $ | 1,018.40 | $ | 6.87 | 1.35 | % | ||||||||||||||
Class R4 | $ | 1,000.00 | $ | 1,039.80 | $ | 5.50 | $ | 1,000.00 | $ | 1,019.81 | $ | 5.45 | 1.07 | % | ||||||||||||||
Class R5 | $ | 1,000.00 | $ | 1,040.90 | $ | 3.91 | $ | 1,000.00 | $ | 1,021.37 | $ | 3.87 | 0.76 | % | ||||||||||||||
Class R6 | $ | 1,000.00 | $ | 1,041.30 | $ | 3.40 | $ | 1,000.00 | $ | 1,021.88 | $ | 3.36 | 0.66 | % | ||||||||||||||
Class Y | $ | 1,000.00 | $ | 1,041.10 | $ | 3.60 | $ | 1,000.00 | $ | 1,021.68 | $ | 3.57 | 0.70 | % | ||||||||||||||
Class F | $ | 1,000.00 | $ | 1,041.50 | $ | 3.40 | $ | 1,000.00 | $ | 1,021.88 | $ | 3.36 | 0.66 | % | ||||||||||||||
The Hartford Growth Opportunities Fund |
| |||||||||||||||||||||||||||
Class A | $ | 1,000.00 | $ | 961.50 | $ | 5.49 | $ | 1,000.00 | $ | 1,019.61 | $ | 5.65 | 1.11 | % | ||||||||||||||
Class C | $ | 1,000.00 | $ | 957.90 | $ | 9.08 | $ | 1,000.00 | $ | 1,015.93 | $ | 9.35 | 1.84 | % | ||||||||||||||
Class I | $ | 1,000.00 | $ | 963.00 | $ | 4.21 | $ | 1,000.00 | $ | 1,020.92 | $ | 4.33 | 0.85 | % | ||||||||||||||
Class R3 | $ | 1,000.00 | $ | 959.80 | $ | 7.31 | $ | 1,000.00 | $ | 1,017.75 | $ | 7.53 | 1.48 | % | ||||||||||||||
Class R4 | $ | 1,000.00 | $ | 961.30 | $ | 5.73 | $ | 1,000.00 | $ | 1,019.36 | $ | 5.90 | 1.16 | % | ||||||||||||||
Class R5 | $ | 1,000.00 | $ | 962.80 | $ | 4.21 | $ | 1,000.00 | $ | 1,020.92 | $ | 4.33 | 0.85 | % | ||||||||||||||
Class R6 | $ | 1,000.00 | $ | 963.20 | $ | 3.71 | $ | 1,000.00 | $ | 1,021.43 | $ | 3.82 | 0.75 | % | ||||||||||||||
Class Y | $ | 1,000.00 | $ | 963.00 | $ | 3.96 | $ | 1,000.00 | $ | 1,021.17 | $ | 4.08 | 0.80 | % | ||||||||||||||
Class F | $ | 1,000.00 | $ | 963.40 | $ | 3.66 | $ | 1,000.00 | $ | 1,021.48 | $ | 3.77 | 0.74 | % | ||||||||||||||
The Hartford Healthcare Fund |
| |||||||||||||||||||||||||||
Class A | $ | 1,000.00 | $ | 1,062.00 | $ | 6.81 | $ | 1,000.00 | $ | 1,018.60 | $ | 6.67 | 1.31 | % | ||||||||||||||
Class C | $ | 1,000.00 | $ | 1,058.10 | $ | 10.53 | $ | 1,000.00 | $ | 1,014.97 | $ | 10.31 | 2.03 | % | ||||||||||||||
Class I | $ | 1,000.00 | $ | 1,063.80 | $ | 5.20 | $ | 1,000.00 | $ | 1,020.16 | $ | 5.09 | 1.00 | % | ||||||||||||||
Class R3 | $ | 1,000.00 | $ | 1,060.30 | $ | 8.41 | $ | 1,000.00 | $ | 1,017.04 | $ | 8.24 | 1.62 | % | ||||||||||||||
Class R4 | $ | 1,000.00 | $ | 1,062.00 | $ | 6.86 | $ | 1,000.00 | $ | 1,018.55 | $ | 6.72 | 1.32 | % | ||||||||||||||
Class R5 | $ | 1,000.00 | $ | 1,063.80 | $ | 5.31 | $ | 1,000.00 | $ | 1,020.06 | $ | 5.19 | 1.02 | % | ||||||||||||||
Class R6 | $ | 1,000.00 | $ | 1,063.90 | $ | 4.73 | $ | 1,000.00 | $ | 1,020.62 | $ | 4.63 | 0.91 | % | ||||||||||||||
Class Y | $ | 1,000.00 | $ | 1,063.90 | $ | 5.10 | $ | 1,000.00 | $ | 1,020.27 | $ | 4.99 | 0.98 | % | ||||||||||||||
Class F | $ | 1,000.00 | $ | 1,064.20 | $ | 4.73 | $ | 1,000.00 | $ | 1,020.62 | $ | 4.63 | 0.91 | % | ||||||||||||||
The Hartford MidCap Fund | ||||||||||||||||||||||||||||
Class A | $ | 1,000.00 | $ | 1,000.30 | $ | 5.60 | $ | 1,000.00 | $ | 1,019.61 | $ | 5.65 | 1.11 | % | ||||||||||||||
Class C | $ | 1,000.00 | $ | 997.10 | $ | 9.26 | $ | 1,000.00 | $ | 1,015.93 | $ | 9.35 | 1.84 | % | ||||||||||||||
Class I | $ | 1,000.00 | $ | 1,001.60 | $ | 4.39 | $ | 1,000.00 | $ | 1,020.82 | $ | 4.43 | 0.87 | % | ||||||||||||||
Class R3 | $ | 1,000.00 | $ | 998.50 | $ | 7.30 | $ | 1,000.00 | $ | 1,017.90 | $ | 7.38 | 1.45 | % | ||||||||||||||
Class R4 | $ | 1,000.00 | $ | 1,000.30 | $ | 5.80 | $ | 1,000.00 | $ | 1,019.41 | $ | 5.85 | 1.15 | % | ||||||||||||||
Class R5 | $ | 1,000.00 | $ | 1,001.60 | $ | 4.29 | $ | 1,000.00 | $ | 1,020.92 | $ | 4.33 | 0.85 | % | ||||||||||||||
Class R6 | $ | 1,000.00 | $ | 1,002.20 | $ | 3.73 | $ | 1,000.00 | $ | 1,021.48 | $ | 3.77 | 0.74 | % | ||||||||||||||
Class Y | $ | 1,000.00 | $ | 1,002.20 | $ | 3.89 | $ | 1,000.00 | $ | 1,021.32 | $ | 3.92 | 0.77 | % | ||||||||||||||
Class F | $ | 1,000.00 | $ | 1,002.20 | $ | 3.73 | $ | 1,000.00 | $ | 1,021.48 | $ | 3.77 | 0.74 | % | ||||||||||||||
| 40 |
|
| Hartford Domestic Equity Funds |
Expense Examples (Unaudited) – (continued)
| Actual Return | Hypothetical (5% return before expenses) | |||||||||||||||||||||||||||
| Beginning Account Value May 1, 2019 | Ending Account Value October 31, 2019 | Expenses paid during the period May 1, 2019 through October 31, 2019 | Beginning Account Value May 1, 2019 | Ending Account Value October 31, 2019 | Expenses paid during the period May 1, 2019 through October 31, 2019 | Annualized expense ratio | ||||||||||||||||||||||
The Hartford MidCap Value Fund |
| |||||||||||||||||||||||||||
Class A | $ | 1,000.00 | $ | 1,032.90 | $ | 6.30 | $ | 1,000.00 | $ | 1,019.01 | $ | 6.26 | 1.23 | % | ||||||||||||||
Class C | $ | 1,000.00 | $ | 1,029.50 | $ | 9.92 | $ | 1,000.00 | $ | 1,015.43 | $ | 9.86 | 1.94 | % | ||||||||||||||
Class I | $ | 1,000.00 | $ | 1,035.50 | $ | 4.46 | $ | 1,000.00 | $ | 1,020.82 | $ | 4.43 | 0.87 | % | ||||||||||||||
Class R3 | $ | 1,000.00 | $ | 1,031.20 | $ | 7.78 | $ | 1,000.00 | $ | 1,017.54 | $ | 7.73 | 1.52 | % | ||||||||||||||
Class R4 | $ | 1,000.00 | $ | 1,033.20 | $ | 6.15 | $ | 1,000.00 | $ | 1,019.16 | $ | 6.11 | 1.20 | % | ||||||||||||||
Class R5 | $ | 1,000.00 | $ | 1,035.30 | $ | 4.57 | $ | 1,000.00 | $ | 1,020.72 | $ | 4.53 | 0.89 | % | ||||||||||||||
Class Y | $ | 1,000.00 | $ | 1,035.20 | $ | 4.36 | $ | 1,000.00 | $ | 1,020.92 | $ | 4.33 | 0.85 | % | ||||||||||||||
Class F | $ | 1,000.00 | $ | 1,035.50 | $ | 4.10 | $ | 1,000.00 | $ | 1,021.17 | $ | 4.08 | 0.80 | % | ||||||||||||||
Hartford Quality Value Fund | ||||||||||||||||||||||||||||
Class A | $ | 1,000.00 | $ | 1,046.10 | $ | 4.69 | $ | 1,000.00 | $ | 1,020.62 | $ | 4.63 | 0.91 | % | ||||||||||||||
Class C | $ | 1,000.00 | $ | 1,042.10 | $ | 8.44 | $ | 1,000.00 | $ | 1,016.94 | $ | 8.34 | 1.64 | % | ||||||||||||||
Class I | $ | 1,000.00 | $ | 1,047.70 | $ | 2.84 | $ | 1,000.00 | $ | 1,022.43 | $ | 2.80 | 0.55 | % | ||||||||||||||
Class R3 | $ | 1,000.00 | $ | 1,044.80 | $ | 5.98 | $ | 1,000.00 | $ | 1,019.36 | $ | 5.90 | 1.16 | % | ||||||||||||||
Class R4 | $ | 1,000.00 | $ | 1,046.30 | $ | 4.44 | $ | 1,000.00 | $ | 1,020.87 | $ | 4.38 | 0.86 | % | ||||||||||||||
Class R5 | $ | 1,000.00 | $ | 1,047.90 | $ | 3.05 | $ | 1,000.00 | $ | 1,022.23 | $ | 3.01 | 0.59 | % | ||||||||||||||
Class R6 | $ | 1,000.00 | $ | 1,048.30 | $ | 2.43 | $ | 1,000.00 | $ | 1,022.84 | $ | 2.40 | 0.47 | % | ||||||||||||||
Class Y | $ | 1,000.00 | $ | 1,047.80 | $ | 2.99 | $ | 1,000.00 | $ | 1,022.28 | $ | 2.96 | 0.58 | % | ||||||||||||||
Class F | $ | 1,000.00 | $ | 1,048.30 | $ | 2.37 | $ | 1,000.00 | $ | 1,022.89 | $ | 2.35 | 0.46 | % | ||||||||||||||
The Hartford Small Cap Growth Fund |
| |||||||||||||||||||||||||||
Class A | $ | 1,000.00 | $ | 986.80 | $ | 6.26 | $ | 1,000.00 | $ | 1,018.90 | $ | 6.36 | 1.25 | % | ||||||||||||||
Class C | $ | 1,000.00 | $ | 984.10 | $ | 9.15 | $ | 1,000.00 | $ | 1,015.98 | $ | 9.30 | 1.83 | % | ||||||||||||||
Class I | $ | 1,000.00 | $ | 988.90 | $ | 4.06 | $ | 1,000.00 | $ | 1,021.12 | $ | 4.13 | 0.81 | % | ||||||||||||||
Class R3 | $ | 1,000.00 | $ | 985.80 | $ | 7.36 | $ | 1,000.00 | $ | 1,017.80 | $ | 7.48 | 1.47 | % | ||||||||||||||
Class R4 | $ | 1,000.00 | $ | 987.20 | $ | 5.81 | $ | 1,000.00 | $ | 1,019.36 | $ | 5.90 | 1.16 | % | ||||||||||||||
Class R5 | $ | 1,000.00 | $ | 988.90 | $ | 4.21 | $ | 1,000.00 | $ | 1,020.97 | $ | 4.28 | 0.84 | % | ||||||||||||||
Class R6 | $ | 1,000.00 | $ | 989.20 | $ | 3.81 | $ | 1,000.00 | $ | 1,021.37 | $ | 3.87 | 0.76 | % | ||||||||||||||
Class Y | $ | 1,000.00 | $ | 989.00 | $ | 3.96 | $ | 1,000.00 | $ | 1,021.22 | $ | 4.02 | 0.79 | % | ||||||||||||||
Class F | $ | 1,000.00 | $ | 989.10 | $ | 3.81 | $ | 1,000.00 | $ | 1,021.37 | $ | 3.87 | 0.76 | % | ||||||||||||||
Hartford Small Cap Value Fund |
| |||||||||||||||||||||||||||
Class A | $ | 1,000.00 | $ | 962.80 | $ | 6.38 | $ | 1,000.00 | $ | 1,018.70 | $ | 6.56 | 1.29 | % | ||||||||||||||
Class C | $ | 1,000.00 | $ | 958.30 | $ | 10.07 | $ | 1,000.00 | $ | 1,014.92 | $ | 10.36 | 2.04 | % | ||||||||||||||
Class I | $ | 1,000.00 | $ | 963.80 | $ | 4.45 | $ | 1,000.00 | $ | 1,020.67 | $ | 4.58 | 0.90 | % | ||||||||||||||
Class R3 | $ | 1,000.00 | $ | 961.50 | $ | 7.12 | $ | 1,000.00 | $ | 1,017.95 | $ | 7.32 | 1.44 | % | ||||||||||||||
Class R4 | $ | 1,000.00 | $ | 962.90 | $ | 5.94 | $ | 1,000.00 | $ | 1,019.16 | $ | 6.11 | 1.20 | % | ||||||||||||||
Class R5 | $ | 1,000.00 | $ | 964.50 | $ | 4.46 | $ | 1,000.00 | $ | 1,020.67 | $ | 4.58 | 0.90 | % | ||||||||||||||
Class R6 | $ | 1,000.00 | $ | 965.40 | $ | 4.01 | $ | 1,000.00 | $ | 1,021.12 | $ | 4.13 | 0.81 | % | ||||||||||||||
Class Y | $ | 1,000.00 | $ | 965.30 | $ | 4.21 | $ | 1,000.00 | $ | 1,020.92 | $ | 4.33 | 0.85 | % | ||||||||||||||
Class F | $ | 1,000.00 | $ | 965.60 | $ | 3.96 | $ | 1,000.00 | $ | 1,021.17 | $ | 4.08 | 0.80 | % | ||||||||||||||
The Hartford Small Company Fund |
| |||||||||||||||||||||||||||
Class A | $ | 1,000.00 | $ | 991.20 | $ | 6.62 | $ | 1,000.00 | $ | 1,018.55 | $ | 6.72 | 1.32 | % | ||||||||||||||
Class C | $ | 1,000.00 | $ | 987.40 | $ | 10.67 | $ | 1,000.00 | $ | 1,014.47 | $ | 10.82 | 2.13 | % | ||||||||||||||
Class I | $ | 1,000.00 | $ | 993.10 | $ | 4.97 | $ | 1,000.00 | $ | 1,020.22 | $ | 5.04 | 0.99 | % | ||||||||||||||
Class R3 | $ | 1,000.00 | $ | 989.80 | $ | 7.77 | $ | 1,000.00 | $ | 1,017.39 | $ | 7.88 | 1.55 | % | ||||||||||||||
Class R4 | $ | 1,000.00 | $ | 991.30 | $ | 6.27 | $ | 1,000.00 | $ | 1,018.90 | $ | 6.36 | 1.25 | % | ||||||||||||||
Class R5 | $ | 1,000.00 | $ | 993.00 | $ | 4.77 | $ | 1,000.00 | $ | 1,020.42 | $ | 4.84 | 0.95 | % | ||||||||||||||
Class R6 | $ | 1,000.00 | $ | 993.10 | $ | 4.52 | $ | 1,000.00 | $ | 1,020.67 | $ | 4.58 | 0.90 | % | ||||||||||||||
Class Y | $ | 1,000.00 | $ | 993.10 | $ | 4.82 | $ | 1,000.00 | $ | 1,020.37 | $ | 4.89 | 0.96 | % | ||||||||||||||
Class F | $ | 1,000.00 | $ | 993.60 | $ | 4.52 | $ | 1,000.00 | $ | 1,020.67 | $ | 4.58 | 0.90 | % | ||||||||||||||
| 41 |
|
Schedule of Investments
October 31, 2019
| Shares or Principal Amount | Market Value† | |||||||
| COMMON STOCKS - 97.0% | ||||||||
| Automobiles & Components - 0.2% | ||||||||
| 195,930 | Aptiv plc | $ | 17,545,532 | |||||
|
| |||||||
| Banks - 3.7% | ||||||||
| 1,310,935 | Bank of America Corp. | 40,992,937 | ||||||
| 376,337 | Comerica, Inc. | 24,619,967 | ||||||
| 293,824 | IBERIABANK Corp. | 21,563,743 | ||||||
| 458,480 | JP Morgan Chase & Co. | 57,273,322 | ||||||
| 1,834,862 | KeyCorp. | 32,972,470 | ||||||
| 297,725 | PNC Financial Services Group, Inc. | 43,676,257 | ||||||
| 728,672 | Zions Bancorp NA | 35,318,732 | ||||||
|
| |||||||
| 256,417,428 | ||||||||
|
| |||||||
| Capital Goods - 6.0% | ||||||||
| 115,273 | Boeing Co. | 39,182,445 | ||||||
| 82,626 | Deere & Co. | 14,388,491 | ||||||
| 144,521 | Dover Corp. | 15,014,287 | ||||||
| 464,434 | Gardner Denver Holdings, Inc.* | 14,782,934 | ||||||
| 327,170 | General Dynamics Corp. | 57,843,656 | ||||||
| 806,800 | HF Global, Inc.(1)(2)(3) | 13,699,464 | ||||||
| 420,352 | Ingersoll-Rand plc | 53,338,465 | ||||||
| 972,468 | JELD-WEN Holding, Inc.* | 16,619,478 | ||||||
| 293,209 | L3Harris Technologies, Inc. | 60,491,949 | ||||||
| 171,404 | Lockheed Martin Corp. | 64,564,459 | ||||||
| 65,281 | Northrop Grumman Corp. | 23,010,247 | ||||||
| 81,970 | Raytheon Co. | 17,394,854 | ||||||
| 560,517 | SPX FLOW, Inc.* | 25,380,210 | ||||||
|
| |||||||
| 415,710,939 | ||||||||
|
| |||||||
| Commercial & Professional Services - 2.4% | ||||||||
| 282,860 | Clean Harbors, Inc.* | 23,324,636 | ||||||
| 200,227 | Copart, Inc.* | 16,546,759 | ||||||
| 31,468 | CoStar Group, Inc.* | 17,292,295 | ||||||
| 149,893 | Equifax, Inc. | 20,491,872 | ||||||
| 4,595 | Klarna Holding AB(1)(2)(3) | 1,077,403 | ||||||
| 498,862 | Republic Services, Inc. | 43,655,414 | ||||||
| 309,325 | TransUnion | 25,556,431 | ||||||
| 203,200 | Waste Connections, Inc. | 18,775,680 | ||||||
|
| |||||||
| 166,720,490 | ||||||||
|
| |||||||
| Consumer Durables & Apparel - 4.0% | ||||||||
| 538,222 | Kontoor Brands, Inc.* | 20,452,436 | ||||||
| 1,031,256 | Lennar Corp. Class A | 61,462,857 | ||||||
| 871,565 | NIKE, Inc. Class B | 78,048,646 | ||||||
| 391,400 | Peloton Interactive, Inc. Class A*(4) | 9,342,718 | ||||||
| 129,030 | Roku, Inc.* | 18,993,216 | ||||||
| 602,183 | Steven Madden Ltd. | 24,797,896 | ||||||
| 973,097 | Under Armour, Inc. Class A*(4) | 20,094,453 | ||||||
| 2,441,884 | Under Armour, Inc. Class C* | 45,174,854 | ||||||
|
| |||||||
| 278,367,076 | ||||||||
|
| |||||||
| Consumer Services - 3.9% | ||||||||
| 784,574 | Aramark | 34,332,958 | ||||||
| 5,654,566 | DraftKings, Inc.(1)(2)(3) | 17,924,974 | ||||||
| 177,849 | Grand Canyon Education, Inc.* | 16,354,994 | ||||||
| 430,775 | Hilton Worldwide Holdings, Inc. | 41,767,944 | ||||||
| 556,076 | Las Vegas Sands Corp. | 34,387,740 | ||||||
| 189,642 | Marriott Vacations Worldwide Corp. | 20,847,345 | ||||||
| 375,234 | McDonald’s Corp. | 73,808,528 | ||||||
| 212,684 | Planet Fitness, Inc. Class A* | 13,539,464 | ||||||
| 64,155 | Vail Resorts, Inc. | 14,907,697 | ||||||
|
| |||||||
| 267,871,644 | ||||||||
|
| |||||||
| Diversified Financials - 2.3% | ||||||||
| 653,974 | American Express Co. | 76,698,071 | ||||||
| 1,589,286 | APi Group Corp.*(1)(2) | 15,654,464 | ||||||
| 308,657 | Blackstone Group, Inc. Class A | 16,408,206 | ||||||
| 1,083,984 | Morgan Stanley | 49,917,463 | ||||||
|
| |||||||
| 158,678,204 | ||||||||
|
| |||||||
| Shares or Principal Amount | Market Value† | |||||||
| COMMON STOCKS - 97.0% - (continued) | ||||||||
| Energy - 1.4% | ||||||||
| 487,596 | Diamondback Energy, Inc. | $ | 41,816,233 | |||||
| 217,200 | Marathon Petroleum Corp. | 13,889,940 | ||||||
| 829,246 | Noble Energy, Inc. | 15,971,278 | ||||||
| 201,416 | Phillips 66 | 23,529,417 | ||||||
|
| |||||||
| 95,206,868 | ||||||||
|
| |||||||
| Food & Staples Retailing - 2.2% | ||||||||
| 574,436 | US Foods Holding Corp.* | 22,787,876 | ||||||
| 1,103,243 | Walmart, Inc. | 129,366,274 | ||||||
|
| |||||||
| 152,154,150 | ||||||||
|
| |||||||
| Food, Beverage & Tobacco - 4.4% | ||||||||
| 1,527,315 | Altria Group, Inc. | 68,408,439 | ||||||
| 1,363,465 | Coca-Cola Co. | 74,213,400 | ||||||
| 1,244,598 | Diageo plc | 50,942,611 | ||||||
| 376,826 | Lamb Weston Holdings, Inc. | 29,407,501 | ||||||
| 361,959 | Monster Beverage Corp.* | 20,316,759 | ||||||
| 443,532 | PepsiCo., Inc. | 60,839,284 | ||||||
|
| |||||||
| 304,127,994 | ||||||||
|
| |||||||
| Health Care Equipment & Services - 9.3% | ||||||||
| 95,513 | ABIOMED, Inc.* | 19,826,589 | ||||||
| 496,490 | Acadia Healthcare Co., Inc.* | 14,889,735 | ||||||
| 324,650 | Alcon, Inc.* | 19,242,005 | ||||||
| 705,678 | Baxter International, Inc. | 54,125,503 | ||||||
| 314,971 | Cerner Corp. | 21,140,854 | ||||||
| 285,378 | Danaher Corp. | 39,330,796 | ||||||
| 73,654 | DexCom, Inc.* | 11,360,393 | ||||||
| 358,552 | Encompass Health Corp. | 22,954,499 | ||||||
| 231,139 | Haemonetics Corp.* | 27,905,411 | ||||||
| 217,650 | Hill-Rom Holdings, Inc. | 22,785,778 | ||||||
| 449,209 | Hologic, Inc.* | 21,701,287 | ||||||
| 288,294 | Insulet Corp.* | 41,894,884 | ||||||
| 39,110 | Intuitive Surgical, Inc.* | 21,625,874 | ||||||
| 1,054,702 | Medtronic plc | 114,857,048 | ||||||
| 148,341 | Penumbra, Inc.* | 23,136,746 | ||||||
| 198,008 | Stryker Corp. | 42,823,190 | ||||||
| 65,765 | Teleflex, Inc. | 22,847,419 | ||||||
| 294,614 | UnitedHealth Group, Inc. | 74,448,958 | ||||||
| 101,364 | Veeva Systems, Inc. Class A* | 14,376,456 | ||||||
| 61,312 | WellCare Health Plans, Inc.* | 18,185,139 | ||||||
|
| |||||||
| 649,458,564 | ||||||||
|
| |||||||
| Household & Personal Products - 0.8% | ||||||||
| 844,558 | Colgate-Palmolive Co. | 57,936,679 | ||||||
|
| |||||||
| Insurance - 5.5% | ||||||||
| 953,232 | Aflac, Inc. | 50,673,813 | ||||||
| 507,174 | Arthur J Gallagher & Co. | 46,264,412 | ||||||
| 180,901 | Assurant, Inc. | 22,806,189 | ||||||
| 443,897 | Chubb Ltd. | 67,658,781 | ||||||
| 1,491,110 | CNO Financial Group, Inc. | 23,335,872 | ||||||
| 349,144 | Lincoln National Corp. | 19,719,653 | ||||||
| 434,727 | Marsh & McLennan Cos., Inc. | 45,046,412 | ||||||
| 161,894 | Reinsurance Group of America, Inc. | 26,302,918 | ||||||
| 1,788,817 | Unum Group | 49,264,020 | ||||||
| 162,621 | Willis Towers Watson plc | 30,393,865 | ||||||
|
| |||||||
| 381,465,935 | ||||||||
|
| |||||||
| Materials - 3.9% | ||||||||
| 403,617 | Cabot Corp. | 17,593,665 | ||||||
| 338,569 | Carpenter Technology Corp. | 16,596,652 | ||||||
| 232,338 | Celanese Corp. | 28,147,749 | ||||||
| 303,235 | CF Industries Holdings, Inc. | 13,751,707 | ||||||
| 204,377 | Eastman Chemical Co. | 15,540,827 | ||||||
| 810,941 | FMC Corp. | 74,201,102 | ||||||
| 514,099 | Linde plc | 101,971,537 | ||||||
|
| |||||||
| 267,803,239 | ||||||||
|
| |||||||
The accompanying notes are an integral part of these financial statements.
| 42 |
|
| The Hartford Capital Appreciation Fund |
Schedule of Investments – (continued)
October 31, 2019
| Shares or Principal Amount | Market Value† | |||||||
| COMMON STOCKS - 97.0% - (continued) | ||||||||
| Media & Entertainment - 6.0% | ||||||||
| 237,928 | Activision Blizzard, Inc. | $ | 13,331,106 | |||||
| 43,214 | Alphabet, Inc. Class A* | 54,397,783 | ||||||
| 568,330 | Cinemark Holdings, Inc. | 20,800,878 | ||||||
| 981,693 | Comcast Corp. Class A | 43,999,480 | ||||||
| 386,086 | Facebook, Inc. Class A* | 73,993,382 | ||||||
| 1,862,198 | Interpublic Group of Cos., Inc. | 40,502,806 | ||||||
| 337,138 | Ocean Outdoor Ltd.*(5) | 2,604,391 | ||||||
| 2,159,890 | Pinterest, Inc. Class A*(4) | 54,299,635 | ||||||
| 275,025 | Spotify Technology S.A.* | 39,686,108 | ||||||
| 302,797 | TripAdvisor, Inc.* | 12,232,999 | ||||||
| 461,021 | Walt Disney Co. | 59,895,848 | ||||||
|
| |||||||
| 415,744,416 | ||||||||
|
| |||||||
| Pharmaceuticals, Biotechnology & Life Sciences - 7.0% | ||||||||
| 251,707 | Agilent Technologies, Inc. | 19,066,805 | ||||||
| 268,273 | Alnylam Pharmaceuticals, Inc.* | 23,270,000 | ||||||
| 372,192 | AstraZeneca plc ADR | 18,248,574 | ||||||
| 1,310,461 | Elanco Animal Health, Inc.* | 35,408,656 | ||||||
| 106,333 | Exact Sciences Corp.* | 9,250,971 | ||||||
| 129,797 | Galapagos N.V.* | 23,897,807 | ||||||
| 176,913 | Heron Therapeutics, Inc.*(4) | 3,759,401 | ||||||
| 310,423 | Ionis Pharmaceuticals, Inc.* | 17,296,770 | ||||||
| 963,187 | Johnson & Johnson | 127,179,212 | ||||||
| 741,031 | Merck & Co., Inc. | 64,217,746 | ||||||
| 27,584 | Mettler-Toledo International, Inc.* | 19,445,065 | ||||||
| 1,733,524 | Pfizer, Inc. | 66,515,316 | ||||||
| 162,039 | Seattle Genetics, Inc.* | 17,402,989 | ||||||
| 127,980 | Thermo Fisher Scientific, Inc. | 38,647,400 | ||||||
|
| |||||||
| 483,606,712 | ||||||||
|
| |||||||
| Real Estate - 4.6% | ||||||||
| 107,349 | Alexandria Real Estate Equities, Inc. REIT | 17,041,654 | ||||||
| 156,826 | American Tower Corp. REIT | 34,200,614 | ||||||
| 232,696 | AvalonBay Communities, Inc. REIT | 50,648,611 | ||||||
| 125,295 | Boston Properties, Inc. REIT | 17,190,474 | ||||||
| 13,494 | Crown Castle International Corp. REIT | 1,872,832 | ||||||
| 43,731 | Equinix, Inc. REIT | 24,785,856 | ||||||
| 679,983 | Gaming and Leisure Properties, Inc. REIT | 27,444,114 | ||||||
| 623,861 | Highwoods Properties, Inc. REIT | 29,196,695 | ||||||
| 124,114 | Jones Lang LaSalle, Inc. REIT | 18,185,183 | ||||||
| 227,805 | Life Storage, Inc. REIT | 24,812,521 | ||||||
| 239,549 | Public Storage REIT | 53,385,890 | ||||||
| 138,759 | Simon Property Group, Inc. REIT | 20,908,206 | ||||||
| 8,145 | We Co. Class A(1)(2)(3) | 89,633 | ||||||
|
| |||||||
| 319,762,283 | ||||||||
|
| |||||||
| Retailing - 6.7% | ||||||||
| 111,436 | Alibaba Group Holding Ltd. ADR* | 19,687,398 | ||||||
| 63,171 | Amazon.com, Inc.* | 112,233,389 | ||||||
| 103,167 | Burlington Stores, Inc.* | 19,825,602 | ||||||
| 305,275 | Delivery Hero SE*(5) | 14,324,323 | ||||||
| 394,041 | Expedia Group, Inc. | 53,849,643 | ||||||
| 127,554 | Five Below, Inc.* | 15,958,281 | ||||||
| 398,508 | Floor & Decor Holdings, Inc. Class A* | 18,263,622 | ||||||
| 128,260 | Home Depot, Inc. | 30,087,231 | ||||||
| 10,615 | JAND, Inc. Class A(1)(2)(3) | 161,985 | ||||||
| 827,482 | Kohl’s Corp. | 42,416,727 | ||||||
| 613,765 | Lowe’s Cos., Inc. | 68,502,312 | ||||||
| 944,594 | TJX Cos., Inc. | 54,455,844 | ||||||
| 316,327 | Tory Burch LLC*(1)(2)(3) | 17,552,967 | ||||||
|
| |||||||
| 467,319,324 | ||||||||
|
| |||||||
| Semiconductors & Semiconductor Equipment - 2.9% | ||||||||
| 1,059,117 | Advanced Micro Devices, Inc.* | 35,935,840 | ||||||
| 310,958 | Analog Devices, Inc. | 33,157,452 | ||||||
| 414,923 | Ichor Holdings Ltd.* | 12,078,408 | ||||||
| 844,535 | Marvell Technology Group Ltd. | 20,598,209 | ||||||
| Shares or Principal Amount | Market Value† | |||||||
| COMMON STOCKS - 97.0% - (continued) | ||||||||
| Semiconductors & Semiconductor Equipment - 2.9% - (continued) | ||||||||
| 1,060,393 | Micron Technology, Inc.* | $ | 50,421,687 | |||||
| 211,643 | MKS Instruments, Inc. | 22,904,005 | ||||||
| 221,542 | NXP Semiconductors N.V. | 25,184,895 | ||||||
|
| |||||||
| 200,280,496 | ||||||||
|
| |||||||
| Software & Services - 8.4% | ||||||||
| 209,981 | Accenture plc Class A | 38,934,677 | ||||||
| 308,284 | Amdocs Ltd. | 20,100,117 | ||||||
| 59,854 | Fair Isaac Corp.* | 18,198,010 | ||||||
| 82,852 | FleetCor Technologies, Inc.* | 24,376,716 | ||||||
| 644,601 | Genpact Ltd. | 25,249,021 | ||||||
| 147,712 | Global Payments, Inc. | 24,989,916 | ||||||
| 638,376 | GoDaddy, Inc. Class A* | 41,513,591 | ||||||
| 266,193 | Guidewire Software, Inc.* | 30,010,599 | ||||||
| 215,197 | Leidos Holdings, Inc. | 18,556,437 | ||||||
| 414,269 | Microsoft Corp. | 59,393,747 | ||||||
| 262,742 | PayPal Holdings, Inc.* | 27,351,442 | ||||||
| 219,098 | ServiceNow, Inc.* | 54,174,172 | ||||||
| 766,130 | Slack Technologies, Inc. Class A*(4) | 16,854,860 | ||||||
| 317,784 | Splunk, Inc.* | 38,121,369 | ||||||
| 227,202 | SS&C Technologies Holdings, Inc. | 11,816,776 | ||||||
| 66,264 | Trade Desk, Inc. Class A* | 13,305,811 | ||||||
| 116,011 | VeriSign, Inc.* | 22,044,410 | ||||||
| 202,227 | Visa, Inc. Class A | 36,170,321 | ||||||
| 82,806 | WEX, Inc.* | 15,665,239 | ||||||
| 275,427 | Workday, Inc. Class A* | 44,663,242 | ||||||
|
| |||||||
| 581,490,473 | ||||||||
|
| |||||||
| Technology Hardware & Equipment - 3.6% | ||||||||
| 200,299 | Apple, Inc. | 49,826,379 | ||||||
| 195,241 | CDW Corp. | 24,973,276 | ||||||
| 102,309 | Coherent, Inc.* | 15,235,856 | ||||||
| 197,411 | Itron, Inc.* | 15,054,563 | ||||||
| 324,443 | Lumentum Holdings, Inc.* | 20,329,599 | ||||||
| 550,984 | TE Connectivity Ltd. | 49,313,068 | ||||||
| 898,541 | Western Digital Corp. | 46,409,643 | ||||||
| 125,601 | Zebra Technologies Corp. Class A* | 29,876,710 | ||||||
|
| |||||||
| 251,019,094 | ||||||||
|
| |||||||
| Telecommunication Services - 1.9% | ||||||||
| 1,659,830 | AT&T, Inc. | 63,886,856 | ||||||
| 514,965 | T-Mobile US, Inc.* | 42,567,007 | ||||||
| 413,108 | Verizon Communications, Inc. | 24,980,641 | ||||||
|
| |||||||
| 131,434,504 | ||||||||
|
| |||||||
| Transportation - 2.4% | ||||||||
| 488,145 | Canadian National Railway Co. | 43,659,161 | ||||||
| 439,735 | CSX Corp. | 30,900,178 | ||||||
| 274,101 | Uber Technologies, Inc.*(4) | 8,634,182 | ||||||
| 1,025,459 | Uber Technologies, Inc.*(2)(3) | 32,194,285 | ||||||
| 288,365 | Union Pacific Corp. | 47,712,873 | ||||||
|
| |||||||
| 163,100,679 | ||||||||
|
| |||||||
| Utilities - 3.5% | ||||||||
| 470,310 | Dominion Energy, Inc. | 38,824,091 | ||||||
| 643,165 | Duke Energy Corp. | 60,624,733 | ||||||
| 529,355 | NRG Energy, Inc. | 21,237,723 | ||||||
| 215,483 | Sempra Energy | 31,139,448 | ||||||
| 1,007,961 | Southern Co. | 63,158,836 | ||||||
| 579,897 | UGI Corp. | 27,643,690 | ||||||
|
| |||||||
| 242,628,521 | ||||||||
|
| |||||||
Total Common Stocks | $ | 6,725,851,244 | ||||||
|
| |||||||
The accompanying notes are an integral part of these financial statements.
| 43 |
|
| The Hartford Capital Appreciation Fund |
Schedule of Investments – (continued)
October 31, 2019
| Shares or Principal Amount | Market Value† | |||||||
| CONVERTIBLE PREFERRED STOCKS - 0.8% | ||||||||
| Commercial & Professional Services - 0.0% | ||||||||
| 33,739 | Rubicon Global Holdings LLC Series C*(1)(2)(3) | $ | 794,553 | |||||
|
| |||||||
| Consumer Services - 0.0% | ||||||||
| 10,074 | Airbnb, Inc. Series E*(1)(2)(3) | 1,268,216 | ||||||
|
| |||||||
| Diversified Financials - 0.1% | ||||||||
| 348,919 | Social Finance, Inc. Series F*(1)(2)(3) | 5,429,180 | ||||||
|
| |||||||
| Real Estate - 0.3% | ||||||||
| 674,436 | WE Co. Series D1*(1)(2)(3) | 9,831,254 | ||||||
| 599,094 | WE Co. Series D2*(1)(2)(3) | 8,732,993 | ||||||
|
| |||||||
| 18,564,247 | ||||||||
|
| |||||||
| Retailing - 0.2% | ||||||||
| 448,670 | Coupang LLC*(1)(2)(3) | 2,382,438 | ||||||
| 278,194 | Honest Co., Inc. Series E*(1)(2)(3) | 10,671,522 | ||||||
| 28,025 | Honest Co., Inc. Series C*(1)(2)(3) | 880,265 | ||||||
| 23,702 | JAND, Inc. Series D*(1)(2)(3) | 365,248 | ||||||
|
| |||||||
| 14,299,473 | ||||||||
|
| |||||||
| Software & Services - 0.2% | ||||||||
| 566,622 | Essence Group Holdings Corp. Series 3*(1)(2)(3) | 1,303,231 | ||||||
| 77,707 | Lookout, Inc. Series F*(1)(2)(3) | 549,388 | ||||||
| 95,031 | MarkLogic Corp. Series F*(1)(2)(3) | 924,652 | ||||||
| 47,064 | Sharecare, Inc. Series B2*(1)(2)(3) | 10,852,958 | ||||||
|
| |||||||
| 13,630,229 | ||||||||
|
| |||||||
Total Convertible Preferred Stocks | $ | 53,985,898 | ||||||
|
| |||||||
| ESCROWS - 0.0%(6) | ||||||||
| Capital Goods - 0.0% | ||||||||
| 372,334 | Lithium Technology Corp.*(1)(2)(3) | $ | 3,723 | |||||
|
| |||||||
| Consumer Durables & Apparel - 0.0% | ||||||||
| 83,332 | One Kings Lane, Inc.*(1)(2)(3) | 13,333 | ||||||
|
| |||||||
| Software & Services - 0.0% | ||||||||
| 143,626 | Birst, Inc.*(1)(2)(3) | 7,469 | ||||||
| 58,205 | Veracode, Inc.*(1)(2)(3) | 31,663 | ||||||
|
| |||||||
| 39,132 | ||||||||
|
| |||||||
Total Escrows | $ | 56,188 | ||||||
|
| |||||||
Total Long-Term Investments | $ | 6,779,893,330 | ||||||
|
| |||||||
| SHORT-TERM INVESTMENTS - 2.5% | ||||||||
| Other Investment Pools & Funds - 2.1% | ||||||||
| 146,649,197 | Fidelity Institutional Government Fund, Institutional Class, 1.70%(7) | $ | 146,649,197 | |||||
|
| |||||||
| Securities Lending Collateral - 0.4% | ||||||||
| 1,579,801 | Citibank NA DDCA, 1.80%, 11/1/2019(7) | 1,579,801 | ||||||
| 22,164,889 | Fidelity Investments Money Market Funds, Government Portfolio, Institutional Class, 1.75%(7) | 22,164,889 | ||||||
| 355,561 | Goldman Sachs Financial Square Funds, Government Fund, Institutional Class, 1.75%(7) | 355,561 | ||||||
| 2,940,109 | Invesco Government & Agency Portfolio, Institutional Class, 1.70%(7) | 2,940,109 | ||||||
| 4,271,614 | Morgan Stanley Institutional Liquidity Funds, Government Portfolio, Institutional Class, 1.69%(7) | 4,271,614 | ||||||
| Shares or Principal Amount | Market Value† | |||||||
| SHORT-TERM INVESTMENTS - 2.5% - (continued) | ||||||||
| Securities Lending Collateral - 0.4% - (continued) | ||||||||
| 284,048 | Western Asset Institutional Government Class A Fund, Institutional Class, 1.68%(7) | $ | 284,048 | |||||
|
| |||||||
| 31,596,022 | ||||||||
|
| |||||||
Total Short-Term Investments | $ | 178,245,219 | ||||||
|
| |||||||
Total Investments | 100.3 | % | $ | 6,958,138,549 | ||||||||
Other Assets and Liabilities | (0.3 | )% | (16,501,249 | ) | ||||||||
|
|
|
| |||||||||
Total Net Assets | 100.0 | % | $ | 6,941,637,300 | ||||||||
|
|
|
| |||||||||
| Note: | Percentage of investments as shown is the ratio of the total market value to total net assets. |
Prices of foreign equities that are principally traded on certain foreign markets will generally be adjusted daily pursuant to a fair value pricing service approved by the Board of Directors in order to reflect an adjustment for factors occurring after the close of certain foreign markets but before the close of the New York Stock Exchange. |
The Fund may refer to any one or more of the industry classifications used by one or more widely recognized market indices, ratings group and/or as defined by Fund management. Industry classifications may not be identical across all security types. |
Equity industry classifications used in this report are the Global Industry Classification Standard, which was developed by and is the exclusive property and service mark of MSCI, Inc. and Standard & Poor’s. |
For Fund compliance purposes, the Fund may not use the same classification system. These classifications are used for financial reporting purposes. |
See “Glossary” for abbreviation descriptions. |
| * | Non-income producing. |
| (1) | Investment valued using significant unobservable inputs. |
| (2) | These securities are valued in good faith at fair value as determined under policies and procedures established by and under the supervision of the Board of Directors. At October 31, 2019, the aggregate fair value of these securities was $152,397,261, which represented 2.2% of total net assets. This amount excludes securities that are principally traded in certain foreign markets and whose prices are adjusted pursuant to a third party pricing service methodology approved by the Board of Directors. |
| (3) | Investment in securities not registered under the Securities Act of 1933 (excluding securities acquired pursuant to Rule 144A and Regulation S). At the end of the period, the value of such restricted securities amounted to $136,742,798 or 2.0% of net assets. |
| Period Acquired | Security Name | Shares/ Par Value | Base Total Cost | Base Market Value | ||||||||||||
| 06/2015 | Airbnb, Inc. Series E Convertible Preferred | 10,074 | $ | 937,833 | $ | 1,268,216 | ||||||||||
| 03/2015 | Birst, Inc. | 143,626 | — | 7,469 | ||||||||||||
| 11/2014 | Coupang LLC Convertible Preferred | 448,670 | 1,396,764 | 2,382,438 | ||||||||||||
| 12/2014 | DraftKings, Inc. | 5,654,566 | 20,596,932 | 17,924,974 | ||||||||||||
| 05/2014 | Essence Group Holdings Corp. Series 3 Convertible Preferred | 566,622 | 895,999 | 1,303,231 | ||||||||||||
| 06/2015 | HF Global, Inc. | 806,800 | 10,846,942 | 13,699,464 | ||||||||||||
The accompanying notes are an integral part of these financial statements.
| 44 |
|
| The Hartford Capital Appreciation Fund |
Schedule of Investments – (continued)
October 31, 2019
| Period Acquired | Security Name | Shares/ Par Value | Base Total Cost | Base Market Value | ||||||||||||
| 08/2015 | Honest Co., Inc. Preferred | 278,194 | $ | 12,728,766 | $ | 10,671,522 | ||||||||||
| 08/2014 | Honest Co., Inc. Series C Convertible Preferred | 28,025 | 758,281 | 880,265 | ||||||||||||
| 04/2015 | JAND, Inc. Class A | 10,615 | 121,916 | 161,985 | ||||||||||||
| 04/2015 | JAND, Inc. Series D Convertible Preferred | 23,702 | 272,225 | 365,248 | ||||||||||||
| 08/2015 | Klarna Holding AB | 4,595 | 503,982 | 1,077,403 | ||||||||||||
| 08/2013 | Lithium Technology Corp. | 372,334 | — | 3,723 | ||||||||||||
| 07/2014 | Lookout, Inc. Series F Convertible Preferred | 77,707 | 887,655 | 549,389 | ||||||||||||
| 04/2015 | MarkLogic Corp. Series F Convertible Preferred | 95,031 | 1,103,709 | 924,652 | ||||||||||||
| 01/2014 | One Kings Lane, Inc. | 83,332 | — | 13,333 | ||||||||||||
| 09/2015 | Rubicon Global Holdings LLC Series C Convertible Preferred | 33,739 | 673,447 | 794,553 | ||||||||||||
| 03/2015 | Sharecare, Inc. Series B2 Convertible Preferred | 47,064 | 11,759,882 | 10,852,958 | ||||||||||||
| 09/2015 | Social Finance, Inc. Series F Convertible Preferred | 348,919 | 5,504,651 | 5,429,180 | ||||||||||||
| 11/2013 | Tory Burch LLC | 316,327 | 24,792,580 | 17,552,967 | ||||||||||||
| 06/2014 | Uber Technologies, Inc. | 1,025,459 | 15,907,997 | 32,194,285 | ||||||||||||
| 04/2017 | Veracode, Inc. | 58,205 | — | 31,663 | ||||||||||||
| 12/2014 | We Co. Class A | 8,145 | 135,624 | 89,633 | ||||||||||||
| 12/2014 | We Co. Series D1 Convertible Preferred | 674,436 | 11,230,142 | 9,831,254 | ||||||||||||
| 12/2014 | We Co. Series D2 Convertible Preferred | 599,094 | 9,975,610 | 8,732,993 | ||||||||||||
|
|
|
| |||||||||||||
| $ | 131,030,937 | $ | 136,742,798 | |||||||||||||
|
|
|
| |||||||||||||
| (4) | Represents entire or partial securities on loan. See Note 8 in the accompanying Notes to Financial Statements for securities lending information. |
| (5) | Security was purchased pursuant to Rule 144A under the Securities Act of 1933 and may be sold in transactions that are exempt from registration (typically only to qualified institutional buyers) or in a public offering registered under the Securities Act of 1933. At October 31, 2019, the aggregate value of these securities was $16,928,714, representing 0.2% of net assets. |
| (6) | Share amount represents shares of the issuer previously held that resulted in receipt of the escrow. |
| (7) | Current yield as of period end. |
| Futures Contracts Outstanding at October 31, 2019 | ||||||||||||||||
Description | Number of Contracts | Expiration Date | Current Notional Amount | Value and Unrealized Appreciation/ (Depreciation) | ||||||||||||
| Long position contracts: | ||||||||||||||||
S&P 500(E-Mini) Future | 776 | 12/20/2019 | $ | 117,789,040 | $ | 1,418,881 | ||||||||||
|
| |||||||||||||||
Total futures contracts |
| $ | 1,418,881 | |||||||||||||
|
| |||||||||||||||
| † | See Significant Accounting Policies of accompanying Notes to Financial Statements regarding valuation of investments. |
The accompanying notes are an integral part of these financial statements.
| 45 |
|
| The Hartford Capital Appreciation Fund |
Schedule of Investments – (continued)
October 31, 2019
Fair Valuation Summary
The following is a summary of the fair valuations according to the inputs used as of October 31, 2019 in valuing the Fund’s investments.
Description | Total | Level 1 | Level 2 | Level 3(1) | ||||||||||||
Assets |
| |||||||||||||||
Common Stocks |
| |||||||||||||||
Automobiles & Components | $ | 17,545,532 | $ | 17,545,532 | $ | — | $ | — | ||||||||
Banks | 256,417,428 | 256,417,428 | — | — | ||||||||||||
Capital Goods | 415,710,939 | 402,011,475 | — | 13,699,464 | ||||||||||||
Commercial & Professional Services | 166,720,490 | 165,643,087 | — | 1,077,403 | ||||||||||||
Consumer Durables & Apparel | 278,367,076 | 278,367,076 | — | — | ||||||||||||
Consumer Services | 267,871,644 | 249,946,670 | — | 17,924,974 | ||||||||||||
Diversified Financials | 158,678,204 | 143,023,740 | — | 15,654,464 | ||||||||||||
Energy | 95,206,868 | 95,206,868 | — | — | ||||||||||||
Food & Staples Retailing | 152,154,150 | 152,154,150 | — | — | ||||||||||||
Food, Beverage & Tobacco | 304,127,994 | 253,185,383 | 50,942,611 | — | ||||||||||||
Health Care Equipment & Services | 649,458,564 | 649,458,564 | — | — | ||||||||||||
Household & Personal Products | 57,936,679 | 57,936,679 | — | — | ||||||||||||
Insurance | 381,465,935 | 381,465,935 | — | — | ||||||||||||
Materials | 267,803,239 | 267,803,239 | — | — | ||||||||||||
Media & Entertainment | 415,744,416 | 415,744,416 | — | — | ||||||||||||
Pharmaceuticals, Biotechnology & Life Sciences | 483,606,712 | 459,708,905 | 23,897,807 | — | ||||||||||||
Real Estate | 319,762,283 | 319,672,650 | — | 89,633 | ||||||||||||
Retailing | 467,319,324 | 435,280,049 | 14,324,323 | 17,714,952 | ||||||||||||
Semiconductors & Semiconductor Equipment | 200,280,496 | 200,280,496 | — | — | ||||||||||||
Software & Services | 581,490,473 | 581,490,473 | — | — | ||||||||||||
Technology Hardware & Equipment | 251,019,094 | 251,019,094 | — | — | ||||||||||||
Telecommunication Services | 131,434,504 | 131,434,504 | — | — | ||||||||||||
Transportation | 163,100,679 | 130,906,394 | 32,194,285 | — | ||||||||||||
Utilities | 242,628,521 | 242,628,521 | — | — | ||||||||||||
Convertible Preferred Stocks | 53,985,898 | — | — | 53,985,898 | ||||||||||||
Escrows | 56,188 | — | — | 56,188 | ||||||||||||
Short-Term Investments | 178,245,219 | 178,245,219 | — | — | ||||||||||||
Futures Contracts(2) | 1,418,881 | 1,418,881 | — | — | ||||||||||||
|
|
|
|
|
|
|
| |||||||||
Total | $ | 6,959,557,430 | $ | 6,717,995,428 | $ | 121,359,026 | $ | 120,202,976 | ||||||||
|
|
|
|
|
|
|
| |||||||||
| (1) | For the year ended October 31, 2019, investments valued at $62,015,157 were transferred out of Level 3 due to the expiration of trading restrictions and to the initiation of a vendor providing prices that are based on market activity which has been determined to be significant observable input. Investments valued at $12,120,837 were transferred into Level 3 due to the unavailability of active market pricing. |
| (2) | Derivative instruments (excluding purchased and written options, if applicable) are valued at the unrealized appreciation/(depreciation) on the investments. |
The following is a rollforward of the Fund’s investments that were valued using unobservable inputs (Level 3) for the year ended October 31, 2019:
| Common Stocks | Convertible Preferred Stocks | Escrows | Total | |||||||||||||
Beginning balance | $ | 50,975,578 | $ | 186,128,188 | $ | 85,346 | $ | 237,189,112 | ||||||||
Purchases | 2,569,647 | — | — | 2,569,647 | ||||||||||||
Sales | (2,571,372 | ) | (12,054,844 | ) | (30,545 | ) | (14,656,761 | ) | ||||||||
Total realized gain/(loss) | 1,778,477 | 4,303,873 | 30,544 | 6,112,894 | ||||||||||||
Net change in unrealized appreciation/(depreciation) | 6,630,621 | (67,719,060 | ) | (29,157 | ) | (61,117,596 | ) | |||||||||
Transfers into Level 3 | 12,120,837 | — | — | 12,120,837 | ||||||||||||
Transfers out of Level 3 | (5,342,898 | ) | (56,672,259 | ) | — | (62,015,157 | ) | |||||||||
|
|
|
|
|
|
|
| |||||||||
Ending balance | $ | 66,160,890 | $ | 53,985,898 | $ | 56,188 | $ | 120,202,976 | ||||||||
|
|
|
|
|
|
|
| |||||||||
The change in net unrealized appreciation/(depreciation) relating to the Level 3 investments held at October 31, 2019 was $(57,749,271).
The accompanying notes are an integral part of these financial statements.
| 46 |
|
Schedule of Investments
October 31, 2019
| Shares or Principal Amount | Market Value† | |||||||
| COMMON STOCKS - 95.1% | ||||||||
| Banks - 7.5% | ||||||||
| 4,381,440 | Bank of America Corp. | $ | 137,007,629 | |||||
| 1,648,114 | Fifth Third Bancorp | 47,927,155 | ||||||
| 1,192,107 | JP Morgan Chase & Co. | 148,918,006 | ||||||
| 647,280 | PNC Financial Services Group, Inc. | 94,955,976 | ||||||
|
| |||||||
| 428,808,766 | ||||||||
|
| |||||||
| Capital Goods - 5.9% | ||||||||
| 696,157 | AMETEK, Inc. | 63,802,789 | ||||||
| 1,186,580 | Fortune Brands Home & Security, Inc. | 71,254,129 | ||||||
| 402,090 | Illinois Tool Works, Inc. | 67,784,332 | ||||||
| 410,590 | Raytheon Co. | 87,131,304 | ||||||
| 288,276 | Snap-on, Inc. | 46,893,857 | ||||||
|
| |||||||
| 336,866,411 | ||||||||
|
| |||||||
| Commercial & Professional Services - 2.7% | ||||||||
| 293,675 | Equifax, Inc. | 40,148,309 | ||||||
| 749,003 | IHS Markit Ltd.* | 52,445,190 | ||||||
| 696,183 | Republic Services, Inc. | 60,922,975 | ||||||
|
| |||||||
| 153,516,474 | ||||||||
|
| |||||||
| Consumer Durables & Apparel - 3.4% | ||||||||
| 869,109 | NIKE, Inc. Class B | 77,828,711 | ||||||
| 601,896 | PVH Corp. | 52,461,255 | ||||||
| 735,282 | VF Corp. | 60,506,356 | ||||||
|
| |||||||
| 190,796,322 | ||||||||
|
| |||||||
| Consumer Services - 2.8% | ||||||||
| 629,931 | Hilton Worldwide Holdings, Inc. | 61,078,110 | ||||||
| 498,173 | McDonald’s Corp. | 97,990,629 | ||||||
|
| |||||||
| 159,068,739 | ||||||||
|
| |||||||
| Diversified Financials - 2.1% | ||||||||
| 493,421 | American Express Co. | 57,868,415 | ||||||
| 644,393 | Capital One Financial Corp. | 60,089,647 | ||||||
|
| |||||||
| 117,958,062 | ||||||||
|
| |||||||
| Energy - 1.3% | ||||||||
| 916,738 | Continental Resources, Inc.* | 27,016,269 | ||||||
| 668,473 | EOG Resources, Inc. | 46,331,863 | ||||||
|
| |||||||
| 73,348,132 | ||||||||
|
| |||||||
| Food & Staples Retailing - 3.1% | ||||||||
| 288,451 | Costco Wholesale Corp. | 85,701,677 | ||||||
| 784,371 | Walmart, Inc. | 91,975,343 | ||||||
|
| |||||||
| 177,677,020 | ||||||||
|
| |||||||
| Food, Beverage & Tobacco - 3.4% | ||||||||
| 354,673 | Constellation Brands, Inc. Class A | 67,504,912 | ||||||
| 1,225,849 | Kellogg Co. | 77,878,187 | ||||||
| 876,344 | Monster Beverage Corp.* | 49,189,189 | ||||||
|
| |||||||
| 194,572,288 | ||||||||
|
| |||||||
| Health Care Equipment & Services - 9.9% | ||||||||
| 890,540 | Abbott Laboratories | 74,458,049 | ||||||
| 206,495 | Anthem, Inc. | 55,563,675 | ||||||
| 1,122,823 | Baxter International, Inc. | 86,120,524 | ||||||
| 390,644 | Danaher Corp. | 53,838,556 | ||||||
| 1,196,831 | Hologic, Inc.* | 57,818,906 | ||||||
| 357,176 | Laboratory Corp. of America Holdings* | 58,851,890 | ||||||
| 791,145 | Medtronic plc | 86,155,690 | ||||||
| 366,905 | UnitedHealth Group, Inc. | 92,716,893 | ||||||
|
| |||||||
| 565,524,183 | ||||||||
|
| |||||||
| Household & Personal Products - 3.8% | ||||||||
| 1,100,392 | Colgate-Palmolive Co. | 75,486,891 | ||||||
| 1,141,835 | Procter & Gamble Co. | 142,169,876 | ||||||
|
| |||||||
| 217,656,767 | ||||||||
|
| |||||||
| Shares or Principal Amount | Market Value† | |||||||
| COMMON STOCKS - 95.1% - (continued) | ||||||||
| Insurance - 3.4% | ||||||||
| 604,670 | Allstate Corp. | $ | 64,348,981 | |||||
| 802,659 | Athene Holding Ltd. Class A* | 34,795,268 | ||||||
| 607,047 | Chubb Ltd. | 92,526,104 | ||||||
|
| |||||||
| 191,670,353 | ||||||||
|
| |||||||
| Materials - 1.8% | ||||||||
| 254,074 | Ecolab, Inc. | 48,799,993 | ||||||
| 417,500 | PPG Industries, Inc. | 52,237,600 | ||||||
|
| |||||||
| 101,037,593 | ||||||||
|
| |||||||
| Media & Entertainment - 5.9% | ||||||||
| 115,761 | Alphabet, Inc. Class A* | 145,719,947 | ||||||
| 31,725 | Alphabet, Inc. Class C* | 39,976,990 | ||||||
| 314,645 | Facebook, Inc. Class A* | 60,301,714 | ||||||
| 687,346 | Walt Disney Co. | 89,299,992 | ||||||
|
| |||||||
| 335,298,643 | ||||||||
|
| |||||||
| Pharmaceuticals, Biotechnology & Life Sciences - 5.4% | ||||||||
| 288,370 | Allergan plc | 50,784,841 | ||||||
| 756,900 | Eli Lilly & Co. | 86,248,755 | ||||||
| 995,922 | Merck & Co., Inc. | 86,306,601 | ||||||
| 279,333 | Thermo Fisher Scientific, Inc. | 84,352,979 | ||||||
|
| |||||||
| 307,693,176 | ||||||||
|
| |||||||
| Real Estate - 2.1% | ||||||||
| 301,909 | American Tower Corp. REIT | 65,840,315 | ||||||
| 403,294 | Boston Properties, Inc. REIT | 55,331,937 | ||||||
|
| |||||||
| 121,172,252 | ||||||||
|
| |||||||
| Retailing - 3.2% | ||||||||
| 39,763 | Amazon.com, Inc.* | 70,645,331 | ||||||
| 19,570 | Booking Holdings, Inc.* | 40,094,429 | ||||||
| 1,195,472 | TJX Cos., Inc. | 68,918,961 | ||||||
|
| |||||||
| 179,658,721 | ||||||||
|
| |||||||
| Semiconductors & Semiconductor Equipment - 3.0% | ||||||||
| 986,364 | Micron Technology, Inc.* | 46,901,608 | ||||||
| 1,565,777 | ON Semiconductor Corp.* | 31,941,851 | ||||||
| 393,582 | QUALCOMM, Inc. | 31,659,736 | ||||||
| 1,018,063 | Teradyne, Inc. | 62,325,817 | ||||||
|
| |||||||
| 172,829,012 | ||||||||
|
| |||||||
| Software & Services - 10.9% | ||||||||
| 430,112 | Global Payments, Inc. | 72,766,348 | ||||||
| 941,279 | GoDaddy, Inc. Class A* | 61,211,373 | ||||||
| 894,554 | Leidos Holdings, Inc. | 77,137,391 | ||||||
| 391,207 | Mastercard, Inc. Class A | 108,290,010 | ||||||
| 1,205,057 | Microsoft Corp. | 172,769,022 | ||||||
| 402,696 | salesforce.com, Inc.* | 63,017,897 | ||||||
| 741,388 | SS&C Technologies Holdings, Inc. | 38,559,590 | ||||||
| 178,161 | Workday, Inc. Class A* | 28,890,588 | ||||||
|
| |||||||
| 622,642,219 | ||||||||
|
| |||||||
| Technology Hardware & Equipment - 5.6% | ||||||||
| 727,105 | Apple, Inc. | 180,874,640 | ||||||
| 430,925 | CDW Corp. | 55,119,617 | ||||||
| 492,473 | Motorola Solutions, Inc. | 81,908,109 | ||||||
|
| |||||||
| 317,902,366 | ||||||||
|
| |||||||
| Telecommunication Services - 1.7% | ||||||||
| 1,637,283 | Verizon Communications, Inc. | 99,006,503 | ||||||
|
| |||||||
| Transportation - 1.4% | ||||||||
| 298,569 | Norfolk Southern Corp. | 54,339,558 | ||||||
| 785,989 | Uber Technologies, Inc.*(1) | 24,758,654 | ||||||
|
| |||||||
| 79,098,212 | ||||||||
|
| |||||||
The accompanying notes are an integral part of these financial statements.
| 47 |
|
| Hartford Core Equity Fund |
Schedule of Investments – (continued)
October 31, 2019
| Shares or Principal Amount | Market Value† | |||||||
| COMMON STOCKS - 95.1% - (continued) | ||||||||
| Utilities - 4.8% | ||||||||
| 1,012,135 | American Electric Power Co., Inc. | $ | 95,535,423 | |||||
| 469,453 | NextEra Energy, Inc. | 111,889,428 | ||||||
| 663,151 | Pinnacle West Capital Corp. | 62,415,772 | ||||||
|
| |||||||
| 269,840,623 | ||||||||
|
| |||||||
Total Common Stocks | $ | 5,413,642,837 | ||||||
|
| |||||||
| SHORT-TERM INVESTMENTS - 5.0% | ||||||||
| Other Investment Pools & Funds - 4.5% | ||||||||
| 257,011,420 | Fidelity Institutional Government Fund, Institutional Class, 1.70%(2) | $ | 257,011,420 | |||||
|
| |||||||
| Securities Lending Collateral - 0.5% | ||||||||
| 1,261,899 | Citibank NA DDCA, 1.80%, 11/1/2019(2) | 1,261,899 | ||||||
| 17,704,664 | Fidelity Investments Money Market Funds, Government Portfolio, Institutional Class, 1.75%(2) | 17,704,664 | ||||||
| 284,012 | Goldman Sachs Financial Square Funds, Government Fund, Institutional Class, 1.75%(2) | 284,012 | ||||||
| 2,348,473 | Invesco Government & Agency Portfolio, Institutional Class, 1.70%(2) | 2,348,473 | ||||||
| 3,412,040 | Morgan Stanley Institutional Liquidity Funds, Government Portfolio, Institutional Class, 1.69%(2) | 3,412,040 | ||||||
| 226,890 | Western Asset Institutional Government Class A Fund, Institutional Class, 1.68%(2) | 226,890 | ||||||
|
| |||||||
| 25,237,978 | ||||||||
|
| |||||||
Total Short-Term Investments | $ | 282,249,398 | ||||||
|
| |||||||
Total Investments | 100.1 | % | $ | 5,695,892,235 | ||||||||
Other Assets and Liabilities | (0.1 | )% | (3,981,477 | ) | ||||||||
|
|
|
| |||||||||
Total Net Assets | 100.0 | % | $ | 5,691,910,758 | ||||||||
|
|
|
| |||||||||
| Note: | Percentage of investments as shown is the ratio of the total market value to total net assets. |
Equity industry classifications used in this report are the Global Industry Classification Standard, which was developed by and is the exclusive property and service mark of MSCI, Inc. and Standard & Poor’s. |
For Fund compliance purposes, the Fund may not use the same classification system. These classifications are used for financial reporting purposes. |
See “Glossary” for abbreviation descriptions. |
| * | Non-income producing. |
| (1) | Represents entire or partial securities on loan. See Note 8 in the accompanying Notes to Financial Statements for securities lending information. |
| (2) | Current yield as of period end. |
| Futures Contracts Outstanding at October 31, 2019 | ||||||||||||||||
Description | Number of Contracts | Expiration Date | Current Notional Amount | Value and Unrealized Appreciation/ (Depreciation) | ||||||||||||
| Long position contracts: | ||||||||||||||||
S&P 500(E-Mini) Future | 845 | 12/20/2019 | $ | 128,262,550 | $ | 1,593,093 | ||||||||||
|
| |||||||||||||||
Total futures contracts |
| $ | 1,593,093 | |||||||||||||
|
| |||||||||||||||
| † | See Significant Accounting Policies of accompanying Notes to Financial Statements regarding valuation of investments. |
The accompanying notes are an integral part of these financial statements.
| 48 |
|
| Hartford Core Equity Fund |
Schedule of Investments – (continued)
October 31, 2019
Fair Valuation Summary
The following is a summary of the fair valuations according to the inputs used as of October 31, 2019 in valuing the Fund’s investments.
Description | Total | Level 1 | Level 2 | Level 3(1) | ||||||||||||
Assets |
| |||||||||||||||
Common Stocks |
| |||||||||||||||
Banks | $ | 428,808,766 | $ | 428,808,766 | $ | — | $ | — | ||||||||
Capital Goods | 336,866,411 | 336,866,411 | — | — | ||||||||||||
Commercial & Professional Services | 153,516,474 | 153,516,474 | — | — | ||||||||||||
Consumer Durables & Apparel | 190,796,322 | 190,796,322 | — | — | ||||||||||||
Consumer Services | 159,068,739 | 159,068,739 | — | — | ||||||||||||
Diversified Financials | 117,958,062 | 117,958,062 | — | — | ||||||||||||
Energy | 73,348,132 | 73,348,132 | — | — | ||||||||||||
Food & Staples Retailing | 177,677,020 | 177,677,020 | — | — | ||||||||||||
Food, Beverage & Tobacco | 194,572,288 | 194,572,288 | — | — | ||||||||||||
Health Care Equipment & Services | 565,524,183 | 565,524,183 | — | — | ||||||||||||
Household & Personal Products | 217,656,767 | 217,656,767 | — | — | ||||||||||||
Insurance | 191,670,353 | 191,670,353 | — | — | ||||||||||||
Materials | 101,037,593 | 101,037,593 | — | — | ||||||||||||
Media & Entertainment | 335,298,643 | 335,298,643 | — | — | ||||||||||||
Pharmaceuticals, Biotechnology & Life Sciences | 307,693,176 | 307,693,176 | — | — | ||||||||||||
Real Estate | 121,172,252 | 121,172,252 | — | — | ||||||||||||
Retailing | 179,658,721 | 179,658,721 | — | — | ||||||||||||
Semiconductors & Semiconductor Equipment | 172,829,012 | 172,829,012 | — | — | ||||||||||||
Software & Services | 622,642,219 | 622,642,219 | — | — | ||||||||||||
Technology Hardware & Equipment | 317,902,366 | 317,902,366 | — | — | ||||||||||||
Telecommunication Services | 99,006,503 | 99,006,503 | — | — | ||||||||||||
Transportation | 79,098,212 | 79,098,212 | — | — | ||||||||||||
Utilities | 269,840,623 | 269,840,623 | — | — | ||||||||||||
Short-Term Investments | 282,249,398 | 282,249,398 | — | — | ||||||||||||
Futures Contracts(2) | 1,593,093 | 1,593,093 | — | — | ||||||||||||
|
|
|
|
|
|
|
| |||||||||
Total | $ | 5,697,485,328 | $ | 5,697,485,328 | $ | — | $ | — | ||||||||
|
|
|
|
|
|
|
| |||||||||
| (1) | For the year ended October 31, 2019, there were no transfers in and out of Level 3. |
| (2) | Derivative instruments (excluding purchased and written options, if applicable) are valued at the unrealized appreciation/(depreciation) on the investments. |
The accompanying notes are an integral part of these financial statements.
| 49 |
|
Schedule of Investments
October 31, 2019
| Shares or Principal Amount | Market Value† | |||||||
| COMMON STOCKS - 96.2% | ||||||||
| Automobiles & Components - 0.5% | ||||||||
| 556,087 | Autoliv, Inc. | $ | 43,285,812 | |||||
|
| |||||||
| Banks - 9.4% | ||||||||
| 10,707,576 | Bank of America Corp. | 334,825,901 | ||||||
| 1,142,657 | Bank of Nova Scotia | 65,508,526 | ||||||
| 2,727,643 | JP Morgan Chase & Co. | 340,737,164 | ||||||
| 757,636 | PNC Financial Services Group, Inc. | 111,145,201 | ||||||
|
| |||||||
| 852,216,792 | ||||||||
|
| |||||||
| Capital Goods - 6.9% | ||||||||
| 724,246 | Deere & Co. | 126,120,198 | ||||||
| 896,000 | Eaton Corp. plc | 78,050,560 | ||||||
| 533,832 | General Dynamics Corp. | 94,381,498 | ||||||
| 1,583,466 | Johnson Controls International plc | 68,611,582 | ||||||
| 181,966 | Lockheed Martin Corp. | 68,542,953 | ||||||
| 306,858 | Raytheon Co. | 65,118,336 | ||||||
| 846,927 | United Technologies Corp. | 121,601,779 | ||||||
|
| |||||||
| 622,426,906 | ||||||||
|
| |||||||
| Consumer Services - 0.9% | ||||||||
| 824,544 | Hilton Worldwide Holdings, Inc. | 79,947,786 | ||||||
|
| |||||||
| Diversified Financials - 4.1% | ||||||||
| 749,754 | American Express Co. | 87,931,149 | ||||||
| 160,493 | BlackRock, Inc. | 74,099,618 | ||||||
| 552,774 | Charles Schwab Corp. | 22,503,430 | ||||||
| 999,224 | Intercontinental Exchange, Inc. | 94,246,808 | ||||||
| 941,656 | Northern Trust Corp. | 93,864,270 | ||||||
|
| |||||||
| 372,645,275 | ||||||||
|
| |||||||
| Energy - 7.1% | ||||||||
| 429,848 | BP plc ADR | 16,295,538 | ||||||
| 1,711,517 | Chevron Corp. | 198,775,584 | ||||||
| 1,396,562 | ConocoPhillips | 77,090,223 | ||||||
| 6,407,362 | Encana Corp.(1) | 25,180,933 | ||||||
| 492,262 | Exxon Mobil Corp. | 33,262,143 | ||||||
| 831,928 | Hess Corp. | 54,699,266 | ||||||
| 697,278 | Marathon Petroleum Corp. | 44,590,928 | ||||||
| 2,368,101 | Noble Energy, Inc. | 45,609,625 | ||||||
| 2,875,893 | Suncor Energy, Inc. | 85,385,263 | ||||||
| 1,230,221 | Total S.A. ADR | 64,746,531 | ||||||
|
| |||||||
| 645,636,034 | ||||||||
|
| |||||||
| Food & Staples Retailing - 2.0% | ||||||||
| 1,194,280 | Sysco Corp. | 95,387,144 | ||||||
| 719,823 | Walmart, Inc. | 84,406,445 | ||||||
|
| |||||||
| 179,793,589 | ||||||||
|
| |||||||
| Food, Beverage & Tobacco - 3.5% | ||||||||
| 2,344,017 | Coca-Cola Co. | 127,584,846 | ||||||
| 1,194,657 | Kellogg Co. | 75,896,559 | ||||||
| 789,189 | PepsiCo., Inc. | 108,253,055 | ||||||
|
| |||||||
| 311,734,460 | ||||||||
|
| |||||||
| Health Care Equipment & Services - 5.9% | ||||||||
| 714,908 | Abbott Laboratories | 59,773,458 | ||||||
| 1,489,750 | CVS Health Corp. | 98,904,503 | ||||||
| 278,008 | HCA Healthcare, Inc. | 37,125,188 | ||||||
| 1,464,732 | Medtronic plc | 159,509,315 | ||||||
| 662,685 | UnitedHealth Group, Inc. | 167,460,499 | ||||||
| 105,614 | Universal Health Services, Inc. Class B | 14,517,700 | ||||||
|
| |||||||
| 537,290,663 | ||||||||
|
| |||||||
| Household & Personal Products - 0.4% | ||||||||
| 594,800 | Unilever N.V. | 35,235,952 | ||||||
|
| |||||||
| Insurance - 6.3% | ||||||||
| 1,735,738 | American International Group, Inc. | 91,924,684 | ||||||
| 300,785 | Arthur J Gallagher & Co. | 27,437,608 | ||||||
| 1,137,602 | Chubb Ltd. | 173,393,297 | ||||||
| Shares or Principal Amount | Market Value† | |||||||
| COMMON STOCKS - 96.2% - (continued) | ||||||||
| Insurance - 6.3% - (continued) | ||||||||
| 479,509 | Marsh & McLennan Cos., Inc. | $ | 49,686,722 | |||||
| 1,342,670 | Principal Financial Group, Inc. | 71,671,725 | ||||||
| 1,732,349 | Prudential Financial, Inc. | 157,886,288 | ||||||
|
| |||||||
| 572,000,324 | ||||||||
|
| |||||||
| Materials - 3.7% | ||||||||
| 490,993 | Celanese Corp. | 59,483,802 | ||||||
| 530,153 | DuPont de Nemours, Inc. | 34,942,384 | ||||||
| 839,416 | FMC Corp. | 76,806,564 | ||||||
| 1,937,688 | International Paper Co. | 84,638,212 | ||||||
| 679,903 | Livent Corp.* | 4,664,135 | ||||||
| 624,884 | PPG Industries, Inc. | 78,185,486 | ||||||
|
| |||||||
| 338,720,583 | ||||||||
|
| |||||||
| Media & Entertainment - 5.6% | ||||||||
| 215,876 | Alphabet, Inc. Class A* | 271,744,709 | ||||||
| 5,296,400 | Comcast Corp. Class A | 237,384,648 | ||||||
|
| |||||||
| 509,129,357 | ||||||||
|
| |||||||
| Pharmaceuticals, Biotechnology & Life Sciences - 9.4% | ||||||||
| 1,084,077 | Agilent Technologies, Inc. | 82,118,833 | ||||||
| 2,952,821 | AstraZeneca plc ADR | 144,776,814 | ||||||
| 1,721,517 | Bristol-Myers Squibb Co. | 98,763,430 | ||||||
| 978,531 | Eli Lilly & Co. | 111,503,607 | ||||||
| 1,459,741 | Merck & Co., Inc. | 126,501,155 | ||||||
| 1,061,487 | Novartis AG ADR | 92,816,423 | ||||||
| 4,919,199 | Pfizer, Inc. | 188,749,666 | ||||||
|
| |||||||
| 845,229,928 | ||||||||
|
| |||||||
| Real Estate - 2.8% | ||||||||
| 352,886 | American Tower Corp. REIT | 76,957,379 | ||||||
| 397,229 | Boston Properties, Inc. REIT | 54,499,819 | ||||||
| 58,385 | Essex Property Trust, Inc. REIT | 19,099,485 | ||||||
| 1,066,990 | Host Hotels & Resorts, Inc. REIT | 17,487,966 | ||||||
| 545,053 | Simon Property Group, Inc. REIT | 82,128,586 | ||||||
|
| |||||||
| 250,173,235 | ||||||||
|
| |||||||
| Retailing - 3.8% | ||||||||
| 345,526 | Expedia Group, Inc. | 47,219,583 | ||||||
| 524,044 | Home Depot, Inc. | 122,930,242 | ||||||
| 807,438 | Lowe’s Cos., Inc. | 90,118,155 | ||||||
| 1,363,402 | TJX Cos., Inc. | 78,600,125 | ||||||
|
| |||||||
| 338,868,105 | ||||||||
|
| |||||||
| Semiconductors & Semiconductor Equipment - 2.5% | ||||||||
| 2,401,611 | Intel Corp. | 135,763,070 | ||||||
| 276,032 | KLA Corp. | 46,660,449 | ||||||
| 914,099 | Micron Technology, Inc.* | 43,465,408 | ||||||
|
| |||||||
| 225,888,927 | ||||||||
|
| |||||||
| Software & Services - 6.2% | ||||||||
| 218,111 | Accenture plc Class A | 40,442,142 | ||||||
| 543,040 | International Business Machines Corp. | 72,620,739 | ||||||
| 3,135,423 | Microsoft Corp. | 449,525,595 | ||||||
|
| |||||||
| 562,588,476 | ||||||||
|
| |||||||
| Technology Hardware & Equipment - 4.7% | ||||||||
| 491,954 | Apple, Inc. | 122,378,477 | ||||||
| 2,584,972 | Cisco Systems, Inc. | 122,812,020 | ||||||
| 3,176,251 | HP, Inc. | 55,171,480 | ||||||
| 739,852 | Motorola Solutions, Inc. | 123,052,184 | ||||||
|
| |||||||
| 423,414,161 | ||||||||
|
| |||||||
| Telecommunication Services - 4.3% | ||||||||
| 2,062,764 | AT&T, Inc. | 79,395,786 | ||||||
| 5,150,816 | Verizon Communications, Inc. | 311,469,844 | ||||||
|
| |||||||
| 390,865,630 | ||||||||
|
| |||||||
The accompanying notes are an integral part of these financial statements.
| 50 |
|
| The Hartford Dividend and Growth Fund |
Schedule of Investments – (continued)
October 31, 2019
| Shares or Principal Amount | Market Value† | |||||||
| COMMON STOCKS - 96.2% - (continued) | ||||||||
| Transportation - 1.9% | ||||||||
| 1,155,507 | Delta Air Lines, Inc. | $ | 63,645,325 | |||||
| 640,080 | Union Pacific Corp. | 105,907,637 | ||||||
|
| |||||||
| 169,552,962 | ||||||||
|
| |||||||
| Utilities - 4.3% | ||||||||
| 1,530,643 | Dominion Energy, Inc. | 126,354,580 | ||||||
| 536,076 | Edison International | 33,719,180 | ||||||
| 2,329,572 | Exelon Corp. | 105,972,230 | ||||||
| 506,323 | NextEra Energy, Inc. | 120,677,024 | ||||||
|
| |||||||
| 386,723,014 | ||||||||
|
| |||||||
Total Common Stocks | $ | 8,693,367,971 | ||||||
|
| |||||||
| SHORT-TERM INVESTMENTS - 3.7% | ||||||||
| Other Investment Pools & Funds - 3.6% | ||||||||
| 332,438,620 | BlackRock Liquidity Funds FedFund Portfolio, Institutional Class, 1.73%(2) | $ | 332,438,620 | |||||
|
| |||||||
| Securities Lending Collateral - 0.1% | ||||||||
| 227,100 | Citibank NA DDCA, 1.80%, 11/1/2019(2) | 227,100 | ||||||
| 3,186,253 | Fidelity Investments Money Market Funds, Government Portfolio, Institutional Class, 1.75%(2) | 3,186,253 | ||||||
| 51,113 | Goldman Sachs Financial Square Funds, Government Fund, Institutional Class, 1.75%(2) | 51,113 | ||||||
| 422,647 | Invesco Government & Agency Portfolio, Institutional Class, 1.70%(2) | 422,647 | ||||||
| 614,054 | Morgan Stanley Institutional Liquidity Funds, Government Portfolio, Institutional Class, 1.69%(2) | 614,054 | ||||||
| 40,833 | Western Asset Institutional Government Class A Fund, Institutional Class, 1.68%(2) | 40,833 | ||||||
|
| |||||||
| 4,542,000 | ||||||||
|
| |||||||
Total Short-Term Investments | $ | 336,980,620 | ||||||
|
| |||||||
Total Investments | 99.9 | % | $ | 9,030,348,591 | ||||||||
Other Assets and Liabilities | 0.1 | % | 12,970,860 | |||||||||
|
|
|
| |||||||||
Total Net Assets | 100.0 | % | $ | 9,043,319,451 | ||||||||
|
|
|
| |||||||||
| Note: | Percentage of investments as shown is the ratio of the total market value to total net assets. |
Equity industry classifications used in this report are the Global Industry Classification Standard, which was developed by and is the exclusive property and service mark of MSCI, Inc. and Standard & Poor’s. |
For Fund compliance purposes, the Fund may not use the same classification system. These classifications are used for financial reporting purposes. |
See “Glossary” for abbreviation descriptions. |
| * | Non-income producing. |
| (1) | Represents entire or partial securities on loan. See Note 8 in the accompanying Notes to Financial Statements for securities lending information. |
| (2) | Current yield as of period end. |
| † | See Significant Accounting Policies of accompanying Notes to Financial Statements regarding valuation of investments. |
The accompanying notes are an integral part of these financial statements.
| 51 |
|
| The Hartford Dividend and Growth Fund |
Schedule of Investments – (continued)
October 31, 2019
Fair Valuation Summary
The following is a summary of the fair valuations according to the inputs used as of October 31, 2019 in valuing the Fund’s investments.
Description | Total | Level 1 | Level 2 | Level 3(1) | ||||||||||||
Assets |
| |||||||||||||||
Common Stocks |
| |||||||||||||||
Automobiles & Components | $ | 43,285,812 | $ | 43,285,812 | $ | — | $ | — | ||||||||
Banks | 852,216,792 | 852,216,792 | — | — | ||||||||||||
Capital Goods | 622,426,906 | 622,426,906 | — | — | ||||||||||||
Consumer Services | 79,947,786 | 79,947,786 | — | — | ||||||||||||
Diversified Financials | 372,645,275 | 372,645,275 | — | — | ||||||||||||
Energy | 645,636,034 | 645,636,034 | — | — | ||||||||||||
Food & Staples Retailing | 179,793,589 | 179,793,589 | — | — | ||||||||||||
Food, Beverage & Tobacco | 311,734,460 | 311,734,460 | — | — | ||||||||||||
Health Care Equipment & Services | 537,290,663 | 537,290,663 | — | — | ||||||||||||
Household & Personal Products | 35,235,952 | 35,235,952 | — | — | ||||||||||||
Insurance | 572,000,324 | 572,000,324 | — | — | ||||||||||||
Materials | 338,720,583 | 338,720,583 | — | — | ||||||||||||
Media & Entertainment | 509,129,357 | 509,129,357 | — | — | ||||||||||||
Pharmaceuticals, Biotechnology & Life Sciences | 845,229,928 | 845,229,928 | — | — | ||||||||||||
Real Estate | 250,173,235 | 250,173,235 | — | — | ||||||||||||
Retailing | 338,868,105 | 338,868,105 | — | — | ||||||||||||
Semiconductors & Semiconductor Equipment | 225,888,927 | 225,888,927 | — | — | ||||||||||||
Software & Services | 562,588,476 | 562,588,476 | — | — | ||||||||||||
Technology Hardware & Equipment | 423,414,161 | 423,414,161 | — | — | ||||||||||||
Telecommunication Services | 390,865,630 | 390,865,630 | — | — | ||||||||||||
Transportation | 169,552,962 | 169,552,962 | — | — | ||||||||||||
Utilities | 386,723,014 | 386,723,014 | — | — | ||||||||||||
Short-Term Investments | 336,980,620 | 336,980,620 | — | — | ||||||||||||
|
|
|
|
|
|
|
| |||||||||
Total | $ | 9,030,348,591 | $ | 9,030,348,591 | $ | — | $ | — | ||||||||
|
|
|
|
|
|
|
| |||||||||
| (1) | For the year ended October 31, 2019, there were no transfers in and out of Level 3. |
The accompanying notes are an integral part of these financial statements.
| 52 |
|
Schedule of Investments
October 31, 2019
| Shares or Principal Amount | Market Value† | |||||||
| COMMON STOCKS - 97.9% | ||||||||
| Automobiles & Components - 0.6% | ||||||||
| 188,231 | Cie Generale des Etablissements Michelin SCA | $ | 22,918,478 | |||||
|
| |||||||
| Banks - 12.8% | ||||||||
| 4,439,311 | Bank of America Corp. | 138,817,255 | ||||||
| 654,873 | BB&T Corp. | 34,741,013 | ||||||
| 1,433,202 | JP Morgan Chase & Co. | 179,035,594 | ||||||
| 323,366 | M&T Bank Corp. | 50,616,480 | ||||||
| 526,648 | PNC Financial Services Group, Inc. | 77,259,261 | ||||||
| 747,808 | U.S. Bancorp | 42,640,012 | ||||||
|
| |||||||
| 523,109,615 | ||||||||
|
| |||||||
| Capital Goods - 10.0% | ||||||||
| 4,338,782 | BAE Systems plc | 32,409,447 | ||||||
| 318,901 | Caterpillar, Inc. | 43,944,558 | ||||||
| 386,587 | Deere & Co. | 67,320,260 | ||||||
| 707,674 | Eaton Corp. plc | 61,645,482 | ||||||
| 245,545 | Honeywell International, Inc. | 42,412,988 | ||||||
| 125,354 | Ingersoll-Rand plc | 15,906,169 | ||||||
| 189,907 | Lockheed Martin Corp. | 71,534,169 | ||||||
| 153,363 | Raytheon Co. | 32,545,162 | ||||||
| 288,442 | United Technologies Corp. | 41,414,502 | ||||||
|
| |||||||
| 409,132,737 | ||||||||
|
| |||||||
| Diversified Financials - 0.5% | ||||||||
| 45,195 | BlackRock, Inc. | 20,866,532 | ||||||
|
| |||||||
| Energy - 8.6% | ||||||||
| 661,301 | Chevron Corp. | 76,803,498 | ||||||
| 1,135,747 | Exxon Mobil Corp. | 76,742,425 | ||||||
| 1,835,900 | Kinder Morgan, Inc. | 36,681,282 | ||||||
| 200,522 | Phillips 66 | 23,424,980 | ||||||
| 2,653,033 | Suncor Energy, Inc. | 78,768,550 | ||||||
| 1,127,461 | TC Energy Corp. | 56,831,019 | ||||||
|
| |||||||
| 349,251,754 | ||||||||
|
| |||||||
| Food & Staples Retailing - 1.5% | ||||||||
| 380,152 | Sysco Corp. | 30,362,740 | ||||||
| 264,877 | Walmart, Inc. | 31,059,477 | ||||||
|
| |||||||
| 61,422,217 | ||||||||
|
| |||||||
| Food, Beverage & Tobacco - 6.2% | ||||||||
| 1,061,672 | Archer-Daniels-Midland Co. | 44,632,691 | ||||||
| 386,160 | Coca-Cola Co. | 21,018,689 | ||||||
| 924,898 | Mondelez International, Inc. Class A | 48,510,900 | ||||||
| 290,397 | Nestle S.A. | 31,067,052 | ||||||
| 280,428 | PepsiCo., Inc. | 38,466,309 | ||||||
| 851,314 | Philip Morris International, Inc. | 69,331,012 | ||||||
|
| |||||||
| 253,026,653 | ||||||||
|
| |||||||
| Health Care Equipment & Services - 6.0% | ||||||||
| 1,270,454 | Koninklijke Philips N.V. | 55,739,988 | ||||||
| 761,773 | Medtronic plc | 82,957,080 | ||||||
| 420,590 | UnitedHealth Group, Inc. | 106,283,093 | ||||||
|
| |||||||
| 244,980,161 | ||||||||
|
| |||||||
| Household & Personal Products - 1.9% | ||||||||
| 1,327,907 | Unilever N.V. | 78,665,211 | ||||||
|
| |||||||
| Insurance - 7.2% | ||||||||
| 687,494 | American International Group, Inc. | 36,409,682 | ||||||
| 270,212 | Chubb Ltd. | 41,185,713 | ||||||
| 380,127 | Marsh & McLennan Cos., Inc. | 39,388,760 | ||||||
| 1,544,557 | MetLife, Inc. | 72,269,822 | ||||||
| 509,359 | Principal Financial Group, Inc. | 27,189,584 | ||||||
| 643,996 | Progressive Corp. | 44,886,521 | ||||||
| 238,403 | Travelers Cos., Inc. | 31,245,097 | ||||||
|
| |||||||
| 292,575,179 | ||||||||
|
| |||||||
| Materials - 2.5% | ||||||||
| 379,921 | Celanese Corp. | 46,027,429 | ||||||
| Shares or Principal Amount | Market Value† | |||||||
| COMMON STOCKS - 97.9% - (continued) | ||||||||
| Materials - 2.5% - (continued) | ||||||||
| 584,116 | Dow, Inc. | $ | 29,492,017 | |||||
| 561,946 | Nutrien Ltd. | 26,855,399 | ||||||
|
| |||||||
| 102,374,845 | ||||||||
|
| |||||||
| Media & Entertainment - 2.7% | ||||||||
| 2,428,156 | Comcast Corp. Class A | 108,829,952 | ||||||
|
| |||||||
| Pharmaceuticals, Biotechnology & Life Sciences - 10.8% | ||||||||
| 957,176 | AstraZeneca plc ADR | 46,930,339 | ||||||
| 729,380 | Bristol-Myers Squibb Co. | 41,844,531 | ||||||
| 470,517 | Eli Lilly & Co. | 53,615,412 | ||||||
| 538,641 | Johnson & Johnson | 71,122,158 | ||||||
| 254,223 | Merck & Co., Inc. | 22,030,965 | ||||||
| 564,887 | Novartis AG | 49,357,113 | ||||||
| 2,607,040 | Pfizer, Inc. | 100,032,125 | ||||||
| 181,646 | Roche Holding AG | 54,667,417 | ||||||
|
| |||||||
| 439,600,060 | ||||||||
|
| |||||||
| Real Estate - 2.2% | ||||||||
| 637,842 | Crown Castle International Corp. REIT | 88,526,091 | ||||||
|
| |||||||
| Retailing - 2.6% | ||||||||
| 339,540 | Home Depot, Inc. | 79,649,293 | ||||||
| 233,073 | Lowe’s Cos., Inc. | 26,013,278 | ||||||
|
| |||||||
| 105,662,571 | ||||||||
|
| |||||||
| Semiconductors & Semiconductor Equipment - 4.8% | ||||||||
| 483,731 | Analog Devices, Inc. | 51,580,237 | ||||||
| 1,405,755 | Intel Corp. | 79,467,330 | ||||||
| 244,860 | KLA Corp. | 41,391,134 | ||||||
| 380,754 | Maxim Integrated Products, Inc. | 22,335,030 | ||||||
|
| |||||||
| 194,773,731 | ||||||||
|
| |||||||
| Technology Hardware & Equipment - 4.5% | ||||||||
| 2,328,909 | Cisco Systems, Inc. | 110,646,467 | ||||||
| 1,268,350 | Corning, Inc. | 37,581,210 | ||||||
| 420,552 | TE Connectivity Ltd. | 37,639,404 | ||||||
|
| |||||||
| 185,867,081 | ||||||||
|
| |||||||
| Telecommunication Services - 3.3% | ||||||||
| 474,495 | BCE, Inc. | 22,508,881 | ||||||
| 1,846,831 | Verizon Communications, Inc. | 111,677,871 | ||||||
|
| |||||||
| 134,186,752 | ||||||||
|
| |||||||
| Transportation - 1.4% | ||||||||
| 336,527 | Union Pacific Corp. | 55,681,757 | ||||||
|
| |||||||
| Utilities - 7.8% | ||||||||
| 518,064 | American Electric Power Co., Inc. | 48,900,061 | ||||||
| 711,980 | Dominion Energy, Inc. | 58,773,949 | ||||||
| 271,256 | Duke Energy Corp. | 25,568,591 | ||||||
| 577,436 | Eversource Energy | 48,354,491 | ||||||
| 178,911 | Exelon Corp. | 8,138,661 | ||||||
| 163,576 | NextEra Energy, Inc. | 38,986,704 | ||||||
| 370,861 | Sempra Energy | 53,593,123 | ||||||
| 753,093 | UGI Corp. | 35,899,943 | ||||||
|
| |||||||
| 318,215,523 | ||||||||
|
| |||||||
Total Common Stocks | $ | 3,989,666,900 | ||||||
|
| |||||||
The accompanying notes are an integral part of these financial statements.
| 53 |
|
| The Hartford Equity Income Fund |
Schedule of Investments – (continued)
October 31, 2019
| Shares or Principal Amount | Market Value† | |||||||
| SHORT-TERM INVESTMENTS - 2.1% | ||||||||
| Other Investment Pools & Funds - 2.1% | ||||||||
| 84,795,511 | Morgan Stanley Institutional Liquidity Funds, Government Portfolio, Institutional Class, 1.69%(1) | $ | 84,795,511 | |||||
|
| |||||||
Total Short-Term Investments | $ | 84,795,511 | ||||||
|
| |||||||
Total Investments | 100.0 | % | $ | 4,074,462,411 | ||||||||
Other Assets and Liabilities | 0.0 | % | 1,147,294 | |||||||||
|
|
|
| |||||||||
Total Net Assets | 100.0 | % | $ | 4,075,609,705 | ||||||||
|
|
|
| |||||||||
| Note: | Percentage of investments as shown is the ratio of the total market value to total net assets. |
Prices of foreign equities that are principally traded on certain foreign markets will generally be adjusted daily pursuant to a fair value pricing service approved by the Board of Directors in order to reflect an adjustment for factors occurring after the close of certain foreign markets but before the close of the New York Stock Exchange. |
Equity industry classifications used in this report are the Global Industry Classification Standard, which was developed by and is the exclusive property and service mark of MSCI, Inc. and Standard & Poor’s. |
For Fund compliance purposes, the Fund may not use the same classification system. These classifications are used for financial reporting purposes. |
See “Glossary” for abbreviation descriptions. |
| (1) | Current yield as of period end. |
| † | See Significant Accounting Policies of accompanying Notes to Financial Statements regarding valuation of investments. |
Fair Valuation Summary
The following is a summary of the fair valuations according to the inputs used as of October 31, 2019 in valuing the Fund’s investments.
Description | Total | Level 1 | Level 2 | Level 3(1) | ||||||||||||
Assets |
| |||||||||||||||
Common Stocks |
| |||||||||||||||
Automobiles & Components | $ | 22,918,478 | $ | — | $ | 22,918,478 | $ | — | ||||||||
Banks | 523,109,615 | 523,109,615 | — | — | ||||||||||||
Capital Goods | 409,132,737 | 376,723,290 | 32,409,447 | — | ||||||||||||
Diversified Financials | 20,866,532 | 20,866,532 | — | — | ||||||||||||
Energy | 349,251,754 | 349,251,754 | — | — | ||||||||||||
Food & Staples Retailing | 61,422,217 | 61,422,217 | — | — | ||||||||||||
Food, Beverage & Tobacco | 253,026,653 | 221,959,601 | 31,067,052 | — | ||||||||||||
Health Care Equipment & Services | 244,980,161 | 189,240,173 | 55,739,988 | — | ||||||||||||
Household & Personal Products | 78,665,211 | 78,665,211 | — | — | ||||||||||||
Insurance | 292,575,179 | 292,575,179 | — | — | ||||||||||||
Materials | 102,374,845 | 102,374,845 | — | — | ||||||||||||
Media & Entertainment | 108,829,952 | 108,829,952 | — | — | ||||||||||||
Pharmaceuticals, Biotechnology & Life Sciences | 439,600,060 | 335,575,530 | 104,024,530 | — | ||||||||||||
Real Estate | 88,526,091 | 88,526,091 | — | — | ||||||||||||
Retailing | 105,662,571 | 105,662,571 | — | — | ||||||||||||
Semiconductors & Semiconductor Equipment | 194,773,731 | 194,773,731 | — | — | ||||||||||||
Technology Hardware & Equipment | 185,867,081 | 185,867,081 | — | — | ||||||||||||
Telecommunication Services | 134,186,752 | 134,186,752 | — | — | ||||||||||||
Transportation | 55,681,757 | 55,681,757 | — | — | ||||||||||||
Utilities | 318,215,523 | 318,215,523 | — | — | ||||||||||||
Short-Term Investments | 84,795,511 | 84,795,511 | — | — | ||||||||||||
|
|
|
|
|
|
|
| |||||||||
Total | $ | 4,074,462,411 | $ | 3,828,302,916 | $ | 246,159,495 | $ | — | ||||||||
|
|
|
|
|
|
|
| |||||||||
| (1) | For the year ended October 31, 2019, there were no transfers in and out of Level 3. |
The accompanying notes are an integral part of these financial statements.
| 54 |
|
Schedule of Investments
October 31, 2019
| Shares or Principal Amount | Market Value† | |||||||
| COMMON STOCKS - 97.9% | ||||||||
| Capital Goods - 5.4% | ||||||||
| 498,453 | Dover Corp. | $ | 51,784,282 | |||||
| 607,813 | Ingersoll-Rand plc | 77,125,392 | ||||||
| 323,406 | L3Harris Technologies, Inc. | 66,721,892 | ||||||
| 278,754 | Raytheon Co. | 59,154,386 | ||||||
|
| |||||||
| 254,785,952 | ||||||||
|
| |||||||
| Commercial & Professional Services - 1.5% | ||||||||
| 634,250 | Copart, Inc.* | 52,414,420 | ||||||
| 63,425 | Klarna Holding AB(1)(2)(3) | 14,871,444 | ||||||
| 569,183 | Landscape Acquisition Holdings Ltd.* | 5,008,810 | ||||||
|
| |||||||
| 72,294,674 | ||||||||
|
| |||||||
| Consumer Durables & Apparel - 4.8% | ||||||||
| 1,435,454 | Lennar Corp. Class A | 85,553,058 | ||||||
| 1,348,856 | Peloton Interactive, Inc. Class A*(4) | 32,197,193 | ||||||
| 312,179 | Roku, Inc.* | 45,952,749 | ||||||
| 1,420,320 | Under Armour, Inc. Class A* | 29,329,608 | ||||||
| 1,858,721 | Under Armour, Inc. Class C* | 34,386,338 | ||||||
|
| |||||||
| 227,418,946 | ||||||||
|
| |||||||
| Consumer Services - 5.3% | ||||||||
| 4,858,252 | DraftKings, Inc.(1)(2)(3) | 15,400,659 | ||||||
| 607,211 | Grand Canyon Education, Inc.* | 55,839,124 | ||||||
| 663,851 | Marriott Vacations Worldwide Corp. | 72,977,140 | ||||||
| 709,476 | Planet Fitness, Inc. Class A* | 45,165,242 | ||||||
| 1,500,000 | Target Hospitality Corp.*(4) | 8,310,000 | ||||||
| 218,217 | Vail Resorts, Inc. | 50,707,084 | ||||||
|
| |||||||
| 248,399,249 | ||||||||
|
| |||||||
| Diversified Financials - 4.5% | ||||||||
| 984,589 | American Express Co. | 115,472,598 | ||||||
| 4,025,679 | APi Group Corp.*(1)(2) | 39,652,938 | ||||||
| 1,052,020 | Blackstone Group, Inc. Class A | 55,925,383 | ||||||
|
| |||||||
| 211,050,919 | ||||||||
|
| |||||||
| Food, Beverage & Tobacco - 3.1% | ||||||||
| 1,289,067 | Lamb Weston Holdings, Inc. | 100,598,789 | ||||||
| 786,901 | Monster Beverage Corp.* | 44,168,753 | ||||||
|
| |||||||
| 144,767,542 | ||||||||
|
| |||||||
| Health Care Equipment & Services - 8.9% | ||||||||
| 265,571 | ABIOMED, Inc.* | 55,127,228 | ||||||
| 249,157 | DexCom, Inc.* | 38,429,976 | ||||||
| 808,562 | Haemonetics Corp.* | 97,617,690 | ||||||
| 1,037,656 | Insulet Corp.* | 150,792,170 | ||||||
| 500,965 | Penumbra, Inc.* | 78,135,511 | ||||||
|
| |||||||
| 420,102,575 | ||||||||
|
| |||||||
| Media & Entertainment - 12.0% | ||||||||
| 852,439 | Activision Blizzard, Inc. | 47,762,157 | ||||||
| 381,049 | Facebook, Inc. Class A* | 73,028,041 | ||||||
| 1,247,687 | Ocean Outdoor Ltd.*(4)(5) | 9,638,382 | ||||||
| 5,210,008 | Pinterest, Inc. Class A* | 130,979,601 | ||||||
| 923,588 | Spotify Technology S.A.* | 133,273,749 | ||||||
| 993,627 | TripAdvisor, Inc.* | 40,142,531 | ||||||
| 1,009,746 | Walt Disney Co. | 131,186,200 | ||||||
|
| |||||||
| 566,010,661 | ||||||||
|
| |||||||
| Pharmaceuticals, Biotechnology & Life Sciences - 11.4% | ||||||||
| 236,736 | Ascendis Pharma A/S ADR* | 26,178,267 | ||||||
| 1,318,838 | AstraZeneca plc ADR | 64,662,627 | ||||||
| 110,878 | Biogen, Inc.* | 33,120,367 | ||||||
| 124,095 | Bluebird Bio, Inc.* | 10,051,695 | ||||||
| 2,660,639 | Elanco Animal Health, Inc.* | 71,890,466 | ||||||
| 357,257 | Exact Sciences Corp.* | 31,081,359 | ||||||
| 451,725 | Galapagos N.V.* | 83,170,157 | ||||||
| 39,452 | Galapagos N.V. ADR*(4) | 7,257,984 | ||||||
| 473,555 | Ionis Pharmaceuticals, Inc.* | 26,386,485 | ||||||
| Shares or Principal Amount | Market Value† | |||||||
| COMMON STOCKS - 97.9% - (continued) | ||||||||
| Pharmaceuticals, Biotechnology & Life Sciences - 11.4% - (continued) | ||||||||
| 156,958 | Sage Therapeutics, Inc.* | $ | 21,291,353 | |||||
| 283,448 | Seattle Genetics, Inc.* | 30,442,315 | ||||||
| 443,724 | Thermo Fisher Scientific, Inc. | 133,995,773 | ||||||
|
| |||||||
| 539,528,848 | ||||||||
|
| |||||||
| Real Estate - 0.1% | ||||||||
| 46,014 | Crown Castle International Corp. REIT | 6,386,283 | ||||||
| 29,564 | We Co. Class A(1)(2)(3) | 325,411 | ||||||
|
| |||||||
| 6,711,694 | ||||||||
|
| |||||||
| Retailing - 13.1% | ||||||||
| 207,348 | Amazon.com, Inc.* | 368,386,898 | ||||||
| 358,618 | Burlington Stores, Inc.* | 68,915,621 | ||||||
| 441,602 | Five Below, Inc.* | 55,248,826 | ||||||
| 1,373,152 | Floor & Decor Holdings, Inc. Class A* | 62,931,556 | ||||||
| 123,196 | JAND, Inc. Class A(1)(2)(3) | 1,879,971 | ||||||
| 448,468 | Lowe’s Cos., Inc. | 50,053,514 | ||||||
| 171,581 | Tory Burch LLC*(1)(2)(3) | 9,521,028 | ||||||
|
| |||||||
| 616,937,414 | ||||||||
|
| |||||||
| Semiconductors & Semiconductor Equipment - 4.1% | ||||||||
| 3,604,587 | Advanced Micro Devices, Inc.* | 122,303,637 | ||||||
| 2,840,331 | Marvell Technology Group Ltd. | 69,275,673 | ||||||
|
| |||||||
| 191,579,310 | ||||||||
|
| |||||||
| Software & Services - 19.1% | ||||||||
| 695,628 | 2U, Inc.* | 12,469,132 | ||||||
| 250,700 | DocuSign, Inc.* | 16,593,833 | ||||||
| 204,164 | Fair Isaac Corp.* | 62,074,022 | ||||||
| 1,206,857 | GoDaddy, Inc. Class A* | 78,481,911 | ||||||
| 922,561 | Guidewire Software, Inc.* | 104,009,527 | ||||||
| 910,364 | PayPal Holdings, Inc.* | 94,768,892 | ||||||
| 454,512 | ServiceNow, Inc.* | 112,382,637 | ||||||
| 2,155,915 | Slack Technologies, Inc. Class A*(4) | 47,430,130 | ||||||
| 1,120,622 | Splunk, Inc.* | 134,429,815 | ||||||
| 260,377 | Trade Desk, Inc. Class A* | 52,283,702 | ||||||
| 918,433 | Workday, Inc. Class A* | 148,933,095 | ||||||
| 513,913 | Zoom Video Communications, Inc. Class A*(4) | 35,917,380 | ||||||
|
| |||||||
| 899,774,076 | ||||||||
|
| |||||||
| Technology Hardware & Equipment - 3.1% | ||||||||
| 867,534 | Western Digital Corp. | 44,808,131 | ||||||
| 424,281 | Zebra Technologies Corp. Class A* | 100,923,722 | ||||||
|
| |||||||
| 145,731,853 | ||||||||
|
| |||||||
| Transportation - 1.5% | ||||||||
| 466,576 | Uber Technologies, Inc.*(4) | 14,697,144 | ||||||
| 1,815,430 | Uber Technologies, Inc.*(2)(3) | 56,995,425 | ||||||
|
| |||||||
| 71,692,569 | ||||||||
|
| |||||||
Total Common Stocks | $ | 4,616,786,282 | ||||||
|
| |||||||
| CONVERTIBLE PREFERRED STOCKS - 1.8% | ||||||||
| Commercial & Professional Services - 0.2% | ||||||||
| 470,535 | Rubicon Global Holdings LLC Series C*(1)(2)(3) | $ | 11,081,099 | |||||
|
| |||||||
| Real Estate - 0.2% | ||||||||
| 404,267 | WE Co. Series D1*(1)(2)(3) | 5,893,000 | ||||||
| 317,638 | WE Co. Series D2*(1)(2)(3) | 4,630,204 | ||||||
|
| |||||||
| 10,523,204 | ||||||||
|
| |||||||
| Retailing - 0.8% | ||||||||
| 4,434,460 | Coupang LLC*(1)(2)(3) | 23,546,983 | ||||||
| 272,032 | Honest Co., Inc. Series C(1)(2)(3) | 8,816,557 | ||||||
| 275,096 | JAND, Inc. Series D*(1)(2)(3) | 4,239,229 | ||||||
|
| |||||||
| 36,602,769 | ||||||||
|
| |||||||
The accompanying notes are an integral part of these financial statements.
| 55 |
|
| The Hartford Growth Opportunities Fund |
Schedule of Investments – (continued)
October 31, 2019
| Shares or Principal Amount | Market Value† | |||||||
| CONVERTIBLE PREFERRED STOCKS - 1.8% - (continued) | ||||||||
| Software & Services - 0.6% | ||||||||
| 5,668,755 | Essence Group Holdings Corp. Series 3*(1)(2)(3) | $ | 13,038,137 | |||||
| 743,470 | Lookout, Inc. Series F*(1)(2)(3) | 5,256,333 | ||||||
| 1,078,374 | MarkLogic Corp. Series F*(1)(2)(3) | 10,492,579 | ||||||
|
| |||||||
| 28,787,049 | ||||||||
|
| |||||||
Total Convertible Preferred Stocks | $ | 86,994,121 | ||||||
|
| |||||||
| ESCROWS - 0.0%(6) | ||||||||
| Capital Goods - 0.0% | ||||||||
| 4,106,956 | Lithium Technology Corp.*(1)(2)(3) | $ | 41,069 | |||||
|
| |||||||
| Consumer Durables & Apparel - 0.0% | ||||||||
| 923,832 | One Kings Lane, Inc.*(1)(2)(3) | 147,813 | ||||||
|
| |||||||
| Software & Services - 0.0% | ||||||||
| 1,526,069 | Birst, Inc.*(1)(2)(3) | 79,356 | ||||||
| 566,228 | Veracode, Inc.*(1)(2)(3) | 308,028 | ||||||
|
| |||||||
| 387,384 | ||||||||
|
| |||||||
Total Escrows | $ | 576,266 | ||||||
|
| |||||||
| WARRANTS - 0.0% | ||||||||
| Commercial & Professional Services - 0.0% | ||||||||
| 1,609,100 | Landscape Acquisition Holdings Ltd. Expires 11/23/22* | $ | 80,455 | |||||
|
| |||||||
| Consumer Services - 0.0% | ||||||||
| 500,000 | Target Hospitality Corp. Expires 3/15/24* | 363,250 | ||||||
|
| |||||||
Total Warrants | $ | 443,705 | ||||||
|
| |||||||
Total Long-Term Investments | $ | 4,704,800,374 | ||||||
|
| |||||||
| SHORT-TERM INVESTMENTS - 2.8% | ||||||||
| Other Investment Pools & Funds - 0.6% | ||||||||
| 25,547,988 | Morgan Stanley Institutional Liquidity Funds, Government Portfolio, Institutional Class, 1.69%(7) | $ | 25,547,988 | |||||
|
| |||||||
| Securities Lending Collateral - 2.2% | ||||||||
| 5,214,168 | Citibank NA DDCA, 1.80%, 11/1/2019(7) | 5,214,168 | ||||||
| 73,155,693 | Fidelity Investments Money Market Funds, Government Portfolio, Institutional Class, 1.75%(7) | 73,155,693 | ||||||
| 1,173,538 | Goldman Sachs Financial Square Funds, Government Fund, Institutional Class, 1.75%(7) | 1,173,538 | ||||||
| 9,703,893 | Invesco Government & Agency Portfolio, Institutional Class, 1.70%(7) | 9,703,893 | ||||||
| 14,098,553 | Morgan Stanley Institutional Liquidity Funds, Government Portfolio, Institutional Class, 1.69%(7) | 14,098,553 | ||||||
| 937,508 | Western Asset Institutional Government Class A Fund, Institutional Class, 1.68%(7) | 937,508 | ||||||
|
| |||||||
| 104,283,353 | ||||||||
|
| |||||||
Total Short-Term Investments | $ | 129,831,341 | ||||||
|
| |||||||
Total Investments | 102.5 | % | $ | 4,834,631,715 | ||||||||
Other Assets and Liabilities | (2.5 | )% | (112,294,006 | ) | ||||||||
|
|
|
| |||||||||
Total Net Assets | 100.0 | % | $ | 4,722,337,709 | ||||||||
|
|
|
| |||||||||
| Note: | Percentage of investments as shown is the ratio of the total market value to total net assets. |
Prices of foreign equities that are principally traded on certain foreign markets will generally be adjusted daily pursuant to a fair value pricing service approved by the Board of Directors in order to reflect an adjustment for factors occurring after the close of certain foreign markets but before the close of the New York Stock Exchange. |
Equity industry classifications used in this report are the Global Industry Classification Standard, which was developed by and is the exclusive property and service mark of MSCI, Inc. and Standard & Poor’s. |
For Fund compliance purposes, the Fund may not use the same classification system. These classifications are used for financial reporting purposes. |
See “Glossary” for abbreviation descriptions. |
| * | Non-income producing. |
| (1) | Investment valued using significant unobservable inputs. |
| (2) | These securities are valued in good faith at fair value as determined under policies and procedures established by and under the supervision of the Board of Directors. At October 31, 2019, the aggregate fair value of these securities was $226,217,263, which represented 4.8% of total net assets. This amount excludes securities that are principally traded in certain foreign markets and whose prices are adjusted pursuant to a third party pricing service methodology approved by the Board of Directors. |
| (3) | Investment in securities not registered under the Securities Act of 1933 (excluding securities acquired pursuant to Rule 144A and Regulation S). At the end of the period, the value of such restricted securities amounted to $186,564,325 or 4.0% of net assets. |
| Period Acquired | Security Name | Shares/ Par Value | Base Total Cost | Base Market Value | ||||||||||||
| 03/2015 | Birst, Inc. | 1,526,069 | $ | — | $ | 79,356 | ||||||||||
| 11/2014 | Coupang LLC Convertible Preferred | 4,434,460 | 13,805,010 | 23,546,983 | ||||||||||||
| 02/2014 | DraftKings, Inc. | 4,858,252 | 7,040,846 | 15,400,659 | ||||||||||||
| 05/2014 | Essence Group Holdings Corp. Series 3 Convertible Preferred | 5,668,755 | 8,964,002 | 13,038,137 | ||||||||||||
| 08/2014 | Honest Co., Inc. Series C Convertible Preferred | 272,032 | 7,360,452 | 8,816,557 | ||||||||||||
| 04/2015 | JAND, Inc. Class A | 123,196 | 1,414,943 | 1,879,971 | ||||||||||||
| 04/2015 | JAND, Inc. Series D Convertible Preferred | 275,096 | 3,159,560 | 4,239,229 | ||||||||||||
| 08/2015 | Klarna Holding AB | 63,425 | 6,956,489 | 14,871,444 | ||||||||||||
| 08/2013 | Lithium Technology Corp. | 4,106,956 | — | 41,069 | ||||||||||||
| 07/2014 | Lookout, Inc. Series F Convertible Preferred | 743,470 | 8,492,732 | 5,256,333 | ||||||||||||
| 04/2015 | MarkLogic Corp. Series F Convertible Preferred | 1,078,374 | 12,524,451 | 10,492,579 | ||||||||||||
| 08/2014 | One Kings Lane, Inc. | 923,832 | — | 147,813 | ||||||||||||
| 09/2015 | Rubicon Global Holdings LLC Series C Convertible Preferred | 470,535 | 9,392,114 | 11,081,099 | ||||||||||||
| 11/2013 | Tory Burch LLC | 171,581 | 13,447,917 | 9,521,028 | ||||||||||||
| 06/2014 | Uber Technologies, Inc. | 1,815,430 | 28,162,857 | 56,995,425 | ||||||||||||
| 08/2014 | Veracode, Inc. | 566,228 | — | 308,028 | ||||||||||||
| 12/2014 | We Co. Class A | 29,564 | 492,275 | 325,411 | ||||||||||||
| 12/2014 | We Co. Series D1 Convertible Preferred | 404,267 | 6,731,515 | 5,893,000 | ||||||||||||
| 12/2014 | We Co. Series D2 Convertible Preferred | 317,638 | 5,289,041 | 4,630,204 | ||||||||||||
|
|
|
| |||||||||||||
| $ | 133,234,204 | $ | 186,564,325 | |||||||||||||
|
|
|
| |||||||||||||
The accompanying notes are an integral part of these financial statements.
| 56 |
|
| The Hartford Growth Opportunities Fund |
Schedule of Investments – (continued)
October 31, 2019
| (4) | Represents entire or partial securities on loan. See Note 8 in the accompanying Notes to Financial Statements for securities lending information. |
| (5) | Security was purchased pursuant to Rule 144A under the Securities Act of 1933 and may be sold in transactions that are exempt from registration (typically only to qualified institutional buyers) or in a public offering registered under the Securities Act of 1933. At October 31, 2019, the aggregate value of this security was $9,638,382, representing 0.2% of net assets. |
| (6) | Share amount represents shares of the issuer previously held that resulted in receipt of the escrow. |
| (7) | Current yield as of period end. |
| † | See Significant Accounting Policies of accompanying Notes to Financial Statements regarding valuation of investments. |
Fair Valuation Summary
The following is a summary of the fair valuations according to the inputs used as of October 31, 2019 in valuing the Fund’s investments.
Description | Total | Level 1 | Level 2 | Level 3(1) | ||||||||||||
Assets |
| |||||||||||||||
Common Stocks |
| |||||||||||||||
Capital Goods | $ | 254,785,952 | $ | 254,785,952 | $ | — | $ | — | ||||||||
Commercial & Professional Services | 72,294,674 | 57,423,230 | — | 14,871,444 | ||||||||||||
Consumer Durables & Apparel | 227,418,946 | 227,418,946 | — | — | ||||||||||||
Consumer Services | 248,399,249 | 232,998,590 | — | 15,400,659 | ||||||||||||
Diversified Financials | 211,050,919 | 171,397,981 | — | 39,652,938 | ||||||||||||
Food, Beverage & Tobacco | 144,767,542 | 144,767,542 | — | — | ||||||||||||
Health Care Equipment & Services | 420,102,575 | 420,102,575 | — | — | ||||||||||||
Media & Entertainment | 566,010,661 | 566,010,661 | — | — | ||||||||||||
Pharmaceuticals, Biotechnology & Life Sciences | 539,528,848 | 456,358,691 | 83,170,157 | — | ||||||||||||
Real Estate | 6,711,694 | 6,386,283 | — | 325,411 | ||||||||||||
Retailing | 616,937,414 | 605,536,415 | — | 11,400,999 | ||||||||||||
Semiconductors & Semiconductor Equipment | 191,579,310 | 191,579,310 | — | — | ||||||||||||
Software & Services | 899,774,076 | 899,774,076 | — | — | ||||||||||||
Technology Hardware & Equipment | 145,731,853 | 145,731,853 | — | — | ||||||||||||
Transportation | 71,692,569 | 14,697,144 | | 56,995,425 | | — | ||||||||||
Convertible Preferred Stocks | 86,994,121 | — | — | 86,994,121 | ||||||||||||
Escrows | 576,266 | — | — | 576,266 | ||||||||||||
Warrants | 443,705 | 443,705 | — | — | ||||||||||||
Short-Term Investments | 129,831,341 | 129,831,341 | — | — | ||||||||||||
|
|
|
|
|
|
|
| |||||||||
Total | $ | 4,834,631,715 | $ | 4,525,244,295 | $ | 140,165,582 | $ | 169,221,838 | ||||||||
|
|
|
|
|
|
|
| |||||||||
| (1) | For the year ended October 31, 2019, investments valued at $106,117,102 were transferred out of Level 3 due to the expiration of trading restrictions and to the initiation of a vendor providing prices that are based on market activity which has been determined to be significant observable input. Investments valued at $30,297,400 were transferred into Level 3 due to the unavailability of active market pricing. |
The following is a rollforward of the Fund’s investments that were valued using unobservable inputs (Level 3) for the year ended October 31, 2019:
| Common Stocks | Convertible Preferred Stocks | Escrows | Total | |||||||||||||
Beginning balance | $ | 52,310,661 | $ | 206,721,740 | $ | 892,602 | $ | 259,925,003 | ||||||||
Purchases | 6,968,802 | — | — | 6,968,802 | ||||||||||||
Sales | — | — | (330,953 | ) | (330,953 | ) | ||||||||||
Total realized gain/(loss) | — | — | 330,953 | 330,953 | ||||||||||||
Net change in unrealized appreciation/(depreciation) | 11,833,539 | (33,369,468 | ) | (316,336 | ) | (21,852,265 | ) | |||||||||
Transfers into Level 3 | 30,297,400 | — | — | 30,297,400 | ||||||||||||
Transfers out of Level 3 | (19,758,951 | ) | (86,358,151 | ) | — | (106,117,102 | ) | |||||||||
|
|
|
|
|
|
|
| |||||||||
Ending balance | $ | 81,651,451 | $ | 86,994,121 | $ | 576,266 | $ | 169,221,838 | ||||||||
|
|
|
|
|
|
|
| |||||||||
The change in net unrealized appreciation/depreciation relating to the Level 3 investments held at October 31, 2019 was $(21,554,406).
The accompanying notes are an integral part of these financial statements.
| 57 |
|
Schedule of Investments
October 31, 2019
| Shares or Principal Amount | Market Value† | |||||||
| COMMON STOCKS - 98.1% | ||||||||
| Biotechnology - 23.0% | ||||||||
| 106,121 | Aimmune Therapeutics, Inc.* | $ | 2,952,286 | |||||
| 715,633 | Alkermes plc* | 13,976,312 | ||||||
| 143,139 | Alnylam Pharmaceuticals, Inc.* | 12,415,877 | ||||||
| 133,112 | Apellis Pharmaceuticals, Inc.* | 3,912,162 | ||||||
| 155,548 | Arena Pharmaceuticals, Inc.* | 7,577,521 | ||||||
| 181,276 | Assembly Biosciences, Inc.* | 2,992,867 | ||||||
| 155,295 | Audentes Therapeutics, Inc.* | 4,177,435 | ||||||
| 135,359 | Bluebird Bio, Inc.* | 10,964,079 | ||||||
| 277,542 | Coherus Biosciences, Inc.* | 4,820,905 | ||||||
| 77,471 | Cyclerion Therapeutics, Inc.* | 185,156 | ||||||
| 590,424 | Forty Seven, Inc.* | 4,079,830 | ||||||
| 368,893 | G1 Therapeutics, Inc.* | 7,827,909 | ||||||
| 37,992 | Galapagos N.V.* | 6,994,965 | ||||||
| 59,160 | Genmab A/S* | 12,926,139 | ||||||
| 218,107 | Genus plc | 8,194,554 | ||||||
| 211,410 | Global Blood Therapeutics, Inc.* | 10,137,109 | ||||||
| 434,966 | GlycoMimetics, Inc.*(1) | 2,296,620 | ||||||
| 217,064 | Heron Therapeutics, Inc.* | 4,612,610 | ||||||
| 105,093 | Incyte Corp.* | 8,819,405 | ||||||
| 829,918 | Ironwood Pharmaceuticals, Inc.*(1) | 8,332,377 | ||||||
| 72,303 | Madrigal Pharmaceuticals, Inc.*(1) | 6,682,966 | ||||||
| 413,857 | Medicines Co.*(1) | 21,723,354 | ||||||
| 773,601 | Momenta Pharmaceuticals, Inc.* | 11,975,343 | ||||||
| 292,240 | Myovant Sciences Ltd.* | 1,595,630 | ||||||
| 96,725 | ObsEva S.A.* | 746,717 | ||||||
| 414,306 | PhaseBio Pharmaceuticals, Inc.*(1) | 1,702,798 | ||||||
| 525,961 | Portola Pharmaceuticals, Inc.* | 15,205,532 | ||||||
| 146,105 | Radius Health, Inc.* | 4,155,226 | ||||||
| 1,515,945 | Rigel Pharmaceuticals, Inc.* | 3,107,687 | ||||||
| 266,802 | Seattle Genetics, Inc.* | 28,654,535 | ||||||
| 578,601 | Syndax Pharmaceuticals, Inc.* | 3,888,199 | ||||||
| 88,063 | Ultragenyx Pharmaceutical, Inc.* | 3,534,849 | ||||||
| 190,604 | UroGen Pharma Ltd.*(1) | 4,313,369 | ||||||
| 181,047 | Vertex Pharmaceuticals, Inc.* | 35,391,068 | ||||||
| 255,204 | Zai Lab Ltd. ADR* | 8,623,343 | ||||||
| 87,928 | Zealand Pharma A/S ADR*(1) | 2,590,359 | ||||||
|
| |||||||
| 292,087,093 | ||||||||
|
| |||||||
| Health Care Distributors - 0.5% | ||||||||
| 1,794,000 | Sinopharm Group Co., Ltd. Class H | 6,424,759 | ||||||
|
| |||||||
| Health Care Equipment - 23.8% | ||||||||
| 747,164 | Abbott Laboratories | 62,470,382 | ||||||
| 242,099 | AtriCure, Inc.* | 6,437,413 | ||||||
| 232,462 | Baxter International, Inc. | 17,829,835 | ||||||
| 2,700 | Becton Dickinson and Co. | 691,200 | ||||||
| 1,047,630 | Boston Scientific Corp.* | 43,686,171 | ||||||
| 265,706 | Danaher Corp. | 36,619,601 | ||||||
| 108,519 | Edwards Lifesciences Corp.* | 25,868,759 | ||||||
| 61,185 | Hill-Rom Holdings, Inc. | 6,405,458 | ||||||
| 90,991 | iRhythm Technologies, Inc.* | 6,080,019 | ||||||
| 524,819 | Medtronic plc | 57,152,789 | ||||||
| 197,222 | NuVasive, Inc.* | 13,912,040 | ||||||
| 377,207 | Smith & Nephew plc | 8,097,280 | ||||||
| 123,458 | Zimmer Biomet Holdings, Inc. | 17,065,599 | ||||||
|
| |||||||
| 302,316,546 | ||||||||
|
| |||||||
| Health Care Facilities - 4.6% | ||||||||
| 325,497 | Acadia Healthcare Co., Inc.* | 9,761,655 | ||||||
| 199,725 | Encompass Health Corp. | 12,786,395 | ||||||
| 199,967 | HCA Healthcare, Inc. | 26,703,593 | ||||||
| 329,604 | NMC Health plc(1) | 9,343,173 | ||||||
|
| |||||||
| 58,594,816 | ||||||||
|
| |||||||
| Health Care Services - 0.5% | ||||||||
| 50,380 | Amedisys, Inc.* | 6,474,838 | ||||||
|
| |||||||
| Shares or Principal Amount | Market Value† | |||||||
| COMMON STOCKS - 98.1% - (continued) | ||||||||
| Health Care Supplies - 0.5% | ||||||||
| 20,046 | Alcon, Inc.* | $ | 1,185,483 | |||||
| 195,200 | Asahi Intecc Co., Ltd. | 5,371,004 | ||||||
|
| |||||||
| 6,556,487 | ||||||||
|
| |||||||
| Health Care Technology - 1.5% | ||||||||
| 6,100 | Health Catalyst, Inc. | 196,176 | ||||||
| 338,264 | HMS Holdings Corp.* | 11,057,850 | ||||||
| 10,400 | Phreesia, Inc.*(1) | 308,152 | ||||||
| 99,671 | Teladoc Health, Inc.*(1) | 7,634,799 | ||||||
|
| |||||||
| 19,196,977 | ||||||||
|
| |||||||
| Life Sciences Tools & Services - 6.1% | ||||||||
| 38,240 | Bio-Techne Corp. | 7,960,421 | ||||||
| 46,463 | ICON plc* | 6,825,415 | ||||||
| 28,453 | Tecan Group AG | 6,731,388 | ||||||
| 160,148 | Thermo Fisher Scientific, Inc. | 48,361,493 | ||||||
| 596,245 | WuXi AppTec Co., Ltd. Class H(2) | 7,188,758 | ||||||
|
| |||||||
| 77,067,475 | ||||||||
|
| |||||||
| Managed Health Care - 10.7% | ||||||||
| 175,839 | Anthem, Inc. | 47,314,758 | ||||||
| 65,994 | Humana, Inc. | 19,415,435 | ||||||
| 44,980 | Molina Healthcare, Inc.* | 5,291,447 | ||||||
| 277,200 | Progyny, Inc.* | 4,554,396 | ||||||
| 154,631 | UnitedHealth Group, Inc. | 39,075,254 | ||||||
| 67,548 | WellCare Health Plans, Inc.* | 20,034,737 | ||||||
|
| |||||||
| 135,686,027 | ||||||||
|
| |||||||
| Pharmaceuticals - 26.9% | ||||||||
| 567,781 | Amneal Pharmaceuticals, Inc.* | 1,748,766 | ||||||
| 801,191 | AstraZeneca plc ADR | 39,282,395 | ||||||
| 1,010,607 | Bristol-Myers Squibb Co. | 57,978,524 | ||||||
| 96,330 | Chugai Pharmaceutical Co., Ltd. | 8,106,725 | ||||||
| 205,075 | Daiichi Sankyo Co., Ltd. | 13,484,458 | ||||||
| 212,175 | Dermira, Inc.* | 1,419,451 | ||||||
| 237,795 | Eisai Co., Ltd. | 17,213,739 | ||||||
| 168,864 | Elanco Animal Health, Inc.* | 4,562,705 | ||||||
| 391,786 | Eli Lilly & Co. | 44,644,015 | ||||||
| 53,156 | Hikma Pharmaceuticals plc | 1,384,330 | ||||||
| 108,050 | Hutchison China MediTech Ltd. ADR* | 2,042,145 | ||||||
| 166,643 | Laboratorios Farmaceuticos Rovi S.A. | 4,107,437 | ||||||
| 906,244 | MediWound Ltd.* | 2,655,295 | ||||||
| 630,709 | Mylan N.V.* | 12,078,077 | ||||||
| 163,537 | MyoKardia, Inc.* | 9,375,576 | ||||||
| 95,941 | Novartis AG | 8,382,864 | ||||||
| 287,605 | Odonate Therapeutics, Inc.* | 9,134,335 | ||||||
| 306,845 | Ono Pharmaceutical Co., Ltd. | 5,779,995 | ||||||
| 1,580,958 | Pfizer, Inc. | 60,661,358 | ||||||
| 291,906 | Revance Therapeutics, Inc.* | 4,571,248 | ||||||
| 137,400 | Satsuma Pharmaceuticals, Inc.* | 1,618,572 | ||||||
| 82,970 | Takeda Pharmaceutical Co., Ltd. | 2,997,959 | ||||||
| 379,240 | Teva Pharmaceutical Industries Ltd. ADR* | 3,090,806 | ||||||
| 200,600 | Theravance Biopharma, Inc.* | 3,233,672 | ||||||
| 237,642 | Tricida, Inc.* | 8,890,187 | ||||||
| 119,748 | UCB S.A. | 9,651,546 | ||||||
| 168,125 | WaVe Life Sciences Ltd.*(1) | 4,251,881 | ||||||
|
| |||||||
| 342,348,061 | ||||||||
|
| |||||||
Total Common Stocks | $ | 1,246,753,079 | ||||||
|
| |||||||
The accompanying notes are an integral part of these financial statements.
| 58 |
|
| The Hartford Healthcare Fund |
Schedule of Investments – (continued)
October 31, 2019
| Shares or Principal Amount | Market Value† | |||||||
| RIGHTS - 0.0% | ||||||||
| Pharmaceuticals, Biotechnology & Life Sciences - 0.0% | ||||||||
| 66,213 | Clementia Pharmaceuticals, Inc.(3)(4) | $ | 89,387 | |||||
|
| |||||||
Total Rights | $ | 89,387 | ||||||
|
| |||||||
Total Long-Term Investments | $ | 1,246,842,466 | ||||||
|
| |||||||
| SHORT-TERM INVESTMENTS - 4.9% | ||||||||
| Other Investment Pools & Funds - 2.2% | ||||||||
| 28,067,686 | Morgan Stanley Institutional Liquidity Funds, Government Portfolio, Institutional Class, 1.69%(5) | $ | 28,067,686 | |||||
|
| |||||||
| Securities Lending Collateral - 2.7% | ||||||||
| 1,712,118 | Citibank NA DDCA, 1.80%, 11/1/2019(5) | 1,712,118 | ||||||
| 24,021,323 | Fidelity Investments Money Market Funds, Government Portfolio, Institutional Class, 1.75%(5) | 24,021,323 | ||||||
| 385,342 | Goldman Sachs Financial Square Funds, Government Fund, Institutional Class, 1.75%(5) | 385,342 | ||||||
| 3,186,360 | Invesco Government & Agency Portfolio, Institutional Class, 1.70%(5) | 3,186,360 | ||||||
| 4,629,385 | Morgan Stanley Institutional Liquidity Funds, Government Portfolio, Institutional Class, 1.69%(5) | 4,629,385 | ||||||
| 307,839 | Western Asset Institutional Government Class A Fund, Institutional Class, 1.68%(5) | 307,839 | ||||||
|
| |||||||
| 34,242,367 | ||||||||
|
| |||||||
Total Short-Term Investments | $ | 62,310,053 | ||||||
|
| |||||||
Total Investments | 103.0 | % | $ | 1,309,152,519 | ||||||||
Other Assets and Liabilities | (3.0 | )% | (37,651,244 | ) | ||||||||
|
|
|
| |||||||||
Total Net Assets | 100.0 | % | $ | 1,271,501,275 | ||||||||
|
|
|
| |||||||||
| Note: | Percentage of investments as shown is the ratio of the total market value to total net assets. |
Prices of foreign equities that are principally traded on certain foreign markets will generally be adjusted daily pursuant to a fair value pricing service approved by the Board of Directors in order to reflect an adjustment for factors occurring after the close of certain foreign markets but before the close of the New York Stock Exchange. |
Equity industry classifications used in this report are the Global Industry Classification Standard, which was developed by and is the exclusive property and service mark of MSCI, Inc. and Standard & Poor’s. |
For Fund compliance purposes, the Fund may not use the same classification system. These classifications are used for financial reporting purposes. |
See “Glossary” for abbreviation descriptions. |
| * | Non-income producing. |
| (1) | Represents entire or partial securities on loan. See Note 8 in the accompanying Notes to Financial Statements for securities lending information. |
| (2) | Security was purchased pursuant to Rule 144A under the Securities Act of 1933 and may be sold in transactions that are exempt from registration (typically only to qualified institutional buyers) or in a public offering registered under the Securities Act of 1933. At October 31, 2019, the aggregate value of this security was $7,188,758, representing 0.6% of net assets. |
| (3) | This security is valued in good faith at fair value as determined under policies and procedures established by and under the supervision of the Board of Directors. At October 31, 2019, the aggregate fair value of this security was $89,387, which represented 0.0% of total net assets. This amount excludes securities that are principally traded in certain foreign markets and whose prices are adjusted pursuant to a third party pricing service methodology approved by the Board of Directors. |
| (4) | Investment valued using significant unobservable inputs. |
| (5) | Current yield as of period end. |
| † | See Significant Accounting Policies of accompanying Notes to Financial Statements regarding valuation of investments. |
The accompanying notes are an integral part of these financial statements.
| 59 |
|
| The Hartford Healthcare Fund |
Schedule of Investments – (continued)
October 31, 2019
Fair Valuation Summary
The following is a summary of the fair valuations according to the inputs used as of October 31, 2019 in valuing the Fund’s investments.
Description | Total | Level 1 | Level 2 | Level 3(1) | ||||||||||||
Assets |
| |||||||||||||||
Common Stocks |
| |||||||||||||||
Biotechnology | $ | 292,087,093 | $ | 263,971,435 | $ | 28,115,658 | $ | — | ||||||||
Health Care Distributors | 6,424,759 | — | 6,424,759 | — | ||||||||||||
Health Care Equipment | 302,316,546 | 294,219,266 | 8,097,280 | — | ||||||||||||
Health Care Facilities | 58,594,816 | 49,251,643 | 9,343,173 | — | ||||||||||||
Health Care Services | 6,474,838 | 6,474,838 | — | — | ||||||||||||
Health Care Supplies | 6,556,487 | — | 6,556,487 | — | ||||||||||||
Health Care Technology | 19,196,977 | 19,196,977 | — | — | ||||||||||||
Life Sciences Tools & Services | 77,067,475 | 63,147,329 | 13,920,146 | — | ||||||||||||
Managed Health Care | 135,686,027 | 135,686,027 | — | — | ||||||||||||
Pharmaceuticals | 342,348,061 | 275,346,445 | 67,001,616 | — | ||||||||||||
Rights | 89,387 | — | — | 89,387 | ||||||||||||
Short-Term Investments | 62,310,053 | 62,310,053 | — | — | ||||||||||||
|
|
|
|
|
|
|
| |||||||||
Total | $ | 1,309,152,519 | $ | 1,169,604,013 | $ | 139,459,119 | $ | 89,387 | ||||||||
|
|
|
|
|
|
|
| |||||||||
| (1) | For the year ended October 31, 2019 there were no transfers in and out of Level 3. |
Level 3 investments at the beginning and/or end of the period in relation to net assets were not significant and accordingly, a reconciliation of Level 3 assets for the year ended October 31, 2019 is not presented.
The accompanying notes are an integral part of these financial statements.
| 60 |
|
Schedule of Investments
October 31, 2019
| Shares or Principal Amount | Market Value† | |||||||
| COMMON STOCKS - 100.0% | ||||||||
| Banks - 5.4% | ||||||||
| 1,443,849 | Cullen/Frost Bankers, Inc. | $ | 130,061,918 | |||||
| 219,543 | First Citizens BancShares, Inc. Class A | 107,997,592 | ||||||
| 1,582,781 | First Republic Bank | 168,344,587 | ||||||
| 887,524 | M&T Bank Corp. | 138,924,132 | ||||||
| 1,872,697 | Prosperity Bancshares, Inc. | 129,253,547 | ||||||
| 1,049,260 | South State Corp. | 82,744,644 | ||||||
|
| |||||||
| 757,326,420 | ||||||||
|
| |||||||
| Capital Goods - 9.7% | ||||||||
| 2,666,161 | Axon Enterprise, Inc.* | 136,320,812 | ||||||
| 4,063,985 | Fastenal Co. | 146,059,621 | ||||||
| 5,091,354 | Gardner Denver Holdings, Inc.* | 162,057,798 | ||||||
| 989,328 | HEICO Corp. Class A | 94,253,279 | ||||||
| 1,464,897 | IDEX Corp. | 227,835,430 | ||||||
| 905,878 | Lennox International, Inc. | 224,077,982 | ||||||
| 1,571,560 | Lincoln Electric Holdings, Inc. | 140,764,629 | ||||||
| 1,615,215 | PACCAR, Inc. | 122,853,253 | ||||||
| 567,554 | Watsco, Inc.(1) | 100,059,770 | ||||||
|
| |||||||
| 1,354,282,574 | ||||||||
|
| |||||||
| Commercial & Professional Services - 6.3% | ||||||||
| 392,025 | Cintas Corp. | 105,325,357 | ||||||
| 229,060 | CoStar Group, Inc.* | 125,873,051 | ||||||
| 2,927,669 | Healthcare Services Group, Inc.(1) | 71,318,017 | ||||||
| 3,238,775 | IAA, Inc.* | 123,559,266 | ||||||
| 5,129,433 | KAR Auction Services, Inc. | 127,517,704 | ||||||
| 2,567,872 | TransUnion | 212,157,585 | ||||||
| 1,171,427 | Waste Connections, Inc. | 108,239,855 | ||||||
|
| |||||||
| 873,990,835 | ||||||||
|
| |||||||
| Consumer Durables & Apparel - 6.2% | ||||||||
| 1,673,152 | Carter’s, Inc. | 167,716,756 | ||||||
| 66,925 | NVR, Inc.* | 243,378,786 | ||||||
| 1,443,847 | PVH Corp. | 125,845,705 | ||||||
| 825,621 | Roku, Inc.* | 121,531,411 | ||||||
| 4,701,159 | Under Armour, Inc. Class C* | 86,971,441 | ||||||
| 3,339,419 | YETI Holdings, Inc.*(1) | 111,236,047 | ||||||
|
| |||||||
| 856,680,146 | ||||||||
|
| |||||||
| Consumer Services - 3.1% | ||||||||
| 2,378,648 | Choice Hotels International, Inc. | 210,462,775 | ||||||
| 4,743,176 | Service Corp. International | 215,719,645 | ||||||
|
| |||||||
| 426,182,420 | ||||||||
|
| |||||||
| Diversified Financials - 2.8% | ||||||||
| 332,604 | Credit Acceptance Corp.* | 145,617,357 | ||||||
| 430,368 | FactSet Research Systems, Inc. | 109,106,896 | ||||||
| 1,345,006 | Northern Trust Corp. | 134,070,198 | ||||||
|
| |||||||
| 388,794,451 | ||||||||
|
| |||||||
| Energy - 0.7% | ||||||||
| 570,301 | Diamondback Energy, Inc. | 48,909,014 | ||||||
| 4,657,505 | WPX Energy, Inc.* | 46,481,900 | ||||||
|
| |||||||
| 95,390,914 | ||||||||
|
| |||||||
| Health Care Equipment & Services - 10.3% | ||||||||
| 1,115,696 | Encompass Health Corp. | 71,426,858 | ||||||
| 1,620,661 | Hill-Rom Holdings, Inc. | 169,667,000 | ||||||
| 2,914,536 | Integra LifeSciences Holdings Corp.* | 169,217,960 | ||||||
| 1,135,796 | Masimo Corp.* | 165,587,699 | ||||||
| 2,722,899 | NuVasive, Inc.* | 192,073,295 | ||||||
| 959,926 | STERIS plc | 135,896,724 | ||||||
| 611,936 | Teleflex, Inc. | 212,592,686 | ||||||
| 1,437,169 | Varian Medical Systems, Inc.* | 173,624,387 | ||||||
| 999,621 | Veeva Systems, Inc. Class A* | 141,776,246 | ||||||
|
| |||||||
| 1,431,862,855 | ||||||||
|
| |||||||
| Shares or Principal Amount | Market Value† | |||||||
| COMMON STOCKS - 100.0% - (continued) | ||||||||
| Insurance - 5.1% | ||||||||
| 152,809 | Alleghany Corp.* | $ | 118,929,716 | |||||
| 2,471,896 | Fidelity National Financial, Inc. | 113,311,713 | ||||||
| 206,520 | Markel Corp.* | 241,834,920 | ||||||
| 115,324 | White Mountains Insurance Group Ltd. | 123,512,004 | ||||||
| 1,675,479 | WR Berkley Corp. | 117,115,982 | ||||||
|
| |||||||
| 714,704,335 | ||||||||
|
| |||||||
| Materials - 3.0% | ||||||||
| 3,123,676 | Ball Corp. | 218,563,610 | ||||||
| 1,205,911 | Packaging Corp. of America | 131,999,018 | ||||||
| 2,197,376 | Silgan Holdings, Inc. | 67,613,259 | ||||||
|
| |||||||
| 418,175,887 | ||||||||
|
| |||||||
| Media & Entertainment - 2.5% | ||||||||
| 105,587 | Cable One, Inc. | 139,941,842 | ||||||
| 2,836,754 | Cargurus, Inc.*(1) | 95,286,567 | ||||||
| 2,884,880 | TripAdvisor, Inc.* | 116,549,152 | ||||||
|
| |||||||
| 351,777,561 | ||||||||
|
| |||||||
| Pharmaceuticals, Biotechnology & Life Sciences - 8.7% | ||||||||
| 2,475,091 | Aerie Pharmaceuticals, Inc.*(1) | 54,922,269 | ||||||
| 1,604,393 | Alnylam Pharmaceuticals, Inc.* | 139,165,049 | ||||||
| 843,818 | Bio-Techne Corp. | 175,657,593 | ||||||
| 1,256,397 | Bluebird Bio, Inc.*(1) | 101,768,157 | ||||||
| 2,598,318 | Ionis Pharmaceuticals, Inc.* | 144,778,279 | ||||||
| 157,828 | Mettler-Toledo International, Inc.* | 111,259,270 | ||||||
| 1,690,901 | PRA Health Sciences, Inc.* | 165,217,937 | ||||||
| 276,656 | Reata Pharmaceuticals, Inc. Class A* | 57,013,269 | ||||||
| 1,214,666 | Repligen Corp.* | 96,553,800 | ||||||
| 99,972 | Sage Therapeutics, Inc.* | 13,561,202 | ||||||
| 1,340,610 | Seattle Genetics, Inc.* | 143,981,514 | ||||||
|
| |||||||
| 1,203,878,339 | ||||||||
|
| |||||||
| Real Estate - 2.1% | ||||||||
| 2,406,674 | Douglas Emmett, Inc. REIT | 104,257,118 | ||||||
| 3,365,496 | Equity Commonwealth REIT | 108,301,661 | ||||||
| 4,514,452 | Redfin Corp.*(1) | 78,506,320 | ||||||
|
| |||||||
| 291,065,099 | ||||||||
|
| |||||||
| Retailing - 2.2% | ||||||||
| 1,477,508 | CarMax, Inc.* | 137,659,420 | ||||||
| 1,513,479 | Etsy, Inc.* | 67,334,681 | ||||||
| 1,244,406 | GrubHub, Inc.*(1) | 42,384,468 | ||||||
| 803,742 | Wayfair, Inc. Class A*(1) | 66,091,705 | ||||||
|
| |||||||
| 313,470,274 | ||||||||
|
| |||||||
| Semiconductors & Semiconductor Equipment - 3.4% | ||||||||
| 1,666,284 | MKS Instruments, Inc. | 180,325,254 | ||||||
| 998,678 | Monolithic Power Systems, Inc. | 149,721,806 | ||||||
| 1,367,670 | Silicon Laboratories, Inc.* | 145,301,261 | ||||||
|
| |||||||
| 475,348,321 | ||||||||
|
| |||||||
| Software & Services - 16.3% | ||||||||
| 1,557,394 | Akamai Technologies, Inc.* | 134,714,581 | ||||||
| 938,767 | Aspen Technology, Inc.* | 108,061,469 | ||||||
| 2,744,548 | Black Knight, Inc.* | 176,199,982 | ||||||
| 2,104,468 | Blackbaud, Inc. | 176,670,089 | ||||||
| 708,218 | EPAM Systems, Inc.* | 124,618,039 | ||||||
| 582,810 | Fair Isaac Corp.* | 177,197,552 | ||||||
| 8,811,130 | Genpact Ltd. | 345,131,962 | ||||||
| 1,651,774 | Guidewire Software, Inc.* | 186,221,001 | ||||||
| 1,689,969 | PTC, Inc.* | 113,075,826 | ||||||
| 1,051,494 | Q2 Holdings, Inc.* | 75,171,306 | ||||||
| 5,770,022 | Teradata Corp.* | 172,696,758 | ||||||
| 872,192 | VeriSign, Inc.* | 165,733,924 | ||||||
| 1,675,250 | WEX, Inc.* | 316,923,795 | ||||||
|
| |||||||
| 2,272,416,284 | ||||||||
|
| |||||||
The accompanying notes are an integral part of these financial statements.
| 61 |
|
| The Hartford MidCap Fund |
Schedule of Investments – (continued)
October 31, 2019
| Shares or Principal Amount | Market Value† | |||||||
| COMMON STOCKS - 100.0% - (continued) | ||||||||
| Technology Hardware & Equipment - 7.8% | ||||||||
| 1,103,373 | CDW Corp. | $ | 141,132,440 | |||||
| 889,101 | Coherent, Inc.* | 132,404,921 | ||||||
| 6,694,507 | CommScope Holding Co., Inc.* | 74,978,478 | ||||||
| 1,208,789 | F5 Networks, Inc.* | 174,162,319 | ||||||
| 4,600,939 | II-VI, Inc.* | 152,521,128 | ||||||
| 1,083,658 | Keysight Technologies, Inc.* | 109,351,929 | ||||||
| 2,491,139 | Lumentum Holdings, Inc.* | 156,094,770 | ||||||
| 3,372,823 | National Instruments Corp. | 139,601,144 | ||||||
|
| |||||||
| 1,080,247,129 | ||||||||
|
| |||||||
| Transportation - 1.9% | ||||||||
| 343,767 | AMERCO | 139,239,386 | ||||||
| 1,137,013 | Genesee & Wyoming, Inc. Class A* | 126,242,553 | ||||||
|
| |||||||
| 265,481,939 | ||||||||
|
| |||||||
| Utilities - 2.5% | ||||||||
| 1,034,276 | Black Hills Corp. | 81,531,977 | ||||||
| 2,073,105 | NiSource, Inc. | 58,129,864 | ||||||
| 4,259,581 | UGI Corp. | 203,054,227 | ||||||
|
| |||||||
| 342,716,068 | ||||||||
|
| |||||||
Total Common Stocks | $ | 13,913,791,851 | ||||||
|
| |||||||
| SHORT-TERM INVESTMENTS - 1.2% | ||||||||
| Other Investment Pools & Funds - 0.0% | ||||||||
| 4,322,079 | BlackRock Liquidity Funds FedFund Portfolio, Institutional Class, 1.73%(2) | $ | 4,322,079 | |||||
|
| |||||||
| Securities Lending Collateral - 1.2% | ||||||||
| 8,203,282 | Citibank NA DDCA, 1.80%, 11/1/2019(2) | 8,203,282 | ||||||
| 115,093,489 | Fidelity Investments Money Market Funds, Government Portfolio, Institutional Class, 1.75%(2) | 115,093,489 | ||||||
| 1,846,290 | Goldman Sachs Financial Square Funds, Government Fund, Institutional Class, 1.75%(2) | 1,846,290 | ||||||
| 15,266,822 | Invesco Government & Agency Portfolio, Institutional Class, 1.70%(2) | 15,266,822 | ||||||
| 22,180,798 | Morgan Stanley Institutional Liquidity Funds, Government Portfolio, Institutional Class, 1.69%(2) | 22,180,798 | ||||||
| 1,474,950 | Western Asset Institutional Government Class A Fund, Institutional Class, 1.68%(2) | 1,474,950 | ||||||
|
| |||||||
| 164,065,631 | ||||||||
|
| |||||||
Total Short-Term Investments | $ | 168,387,710 | ||||||
|
| |||||||
Total Investments | 101.2 | % | $ | 14,082,179,561 | ||||||||
Other Assets and Liabilities | (1.2 | )% | (170,713,778 | ) | ||||||||
|
|
|
| |||||||||
Total Net Assets | 100.0 | % | $ | 13,911,465,783 | ||||||||
|
|
|
| |||||||||
| Note: | Percentage of investments as shown is the ratio of the total market value to total net assets. |
Prices of foreign equities that are principally traded on certain foreign markets will generally be adjusted daily pursuant to a fair value pricing service approved by the Board of Directors in order to reflect an adjustment for factors occurring after the close of certain foreign markets but before the close of the New York Stock Exchange. |
Equity industry classifications used in this report are the Global Industry Classification Standard, which was developed by and is the exclusive property and service mark of MSCI, Inc. and Standard & Poor’s. |
For Fund compliance purposes, the Fund may not use the same classification system. These classifications are used for financial reporting purposes. |
See “Glossary” for abbreviation descriptions. |
| * | Non-income producing. |
| (1) | Represents entire or partial securities on loan. See Note 8 in the accompanying Notes to Financial Statements for securities lending information. |
| (2) | Current yield as of period end. |
| † | See Significant Accounting Policies of accompanying Notes to Financial Statements regarding valuation of investments. |
The accompanying notes are an integral part of these financial statements.
| 62 |
|
| The Hartford MidCap Fund |
Schedule of Investments – (continued)
October 31, 2019
Fair Valuation Summary
The following is a summary of the fair valuations according to the inputs used as of October 31, 2019 in valuing the Fund’s investments.
Description | Total | Level 1 | Level 2 | Level 3(1) | ||||||||||||
Assets |
| |||||||||||||||
Common Stocks |
| |||||||||||||||
Banks | $ | 757,326,420 | $ | 757,326,420 | $ | — | $ | — | ||||||||
Capital Goods | 1,354,282,574 | 1,354,282,574 | — | — | ||||||||||||
Commercial & Professional Services | 873,990,835 | 873,990,835 | — | — | ||||||||||||
Consumer Durables & Apparel | 856,680,146 | 856,680,146 | — | — | ||||||||||||
Consumer Services | 426,182,420 | 426,182,420 | — | — | ||||||||||||
Diversified Financials | 388,794,451 | 388,794,451 | — | — | ||||||||||||
Energy | 95,390,914 | 95,390,914 | — | — | ||||||||||||
Health Care Equipment & Services | 1,431,862,855 | 1,431,862,855 | — | — | ||||||||||||
Insurance | 714,704,335 | 714,704,335 | — | — | ||||||||||||
Materials | 418,175,887 | 418,175,887 | — | — | ||||||||||||
Media & Entertainment | 351,777,561 | 351,777,561 | — | — | ||||||||||||
Pharmaceuticals, Biotechnology & Life Sciences | 1,203,878,339 | 1,203,878,339 | — | — | ||||||||||||
Real Estate | 291,065,099 | 291,065,099 | — | — | ||||||||||||
Retailing | 313,470,274 | 313,470,274 | — | — | ||||||||||||
Semiconductors & Semiconductor Equipment | 475,348,321 | 475,348,321 | — | — | ||||||||||||
Software & Services | 2,272,416,284 | 2,272,416,284 | — | — | ||||||||||||
Technology Hardware & Equipment | 1,080,247,129 | 1,080,247,129 | — | — | ||||||||||||
Transportation | 265,481,939 | 265,481,939 | — | — | ||||||||||||
Utilities | 342,716,068 | 342,716,068 | — | — | ||||||||||||
Short-Term Investments | 168,387,710 | 168,387,710 | — | — | ||||||||||||
|
|
|
|
|
|
|
| |||||||||
Total | $ | 14,082,179,561 | $ | 14,082,179,561 | $ | — | $ | — | ||||||||
|
|
|
|
|
|
|
| |||||||||
| (1) | For the year ended October 31, 2019, there were no transfers in and out of Level 3. |
The accompanying notes are an integral part of these financial statements.
| 63 |
|
Schedule of Investments
October 31, 2019
| Shares or Principal Amount | Market Value† | |||||||
| COMMON STOCKS - 95.9% | ||||||||
| Banks - 9.3% | ||||||||
| 138,056 | Comerica, Inc. | $ | 9,031,623 | |||||
| 91,094 | IBERIABANK Corp. | 6,685,389 | ||||||
| 71,305 | M&T Bank Corp. | 11,161,372 | ||||||
| 432,964 | Sterling Bancorp | 8,507,742 | ||||||
| 242,120 | Synovus Financial Corp. | 8,200,604 | ||||||
| 178,178 | Western Alliance Bancorp | 8,789,521 | ||||||
| 280,668 | Zions Bancorp NA | 13,603,978 | ||||||
|
| |||||||
| 65,980,229 | ||||||||
|
| |||||||
| Capital Goods - 9.8% | ||||||||
| 94,771 | EnerSys | 6,336,389 | ||||||
| 197,494 | Fortune Brands Home & Security, Inc. | 11,859,515 | ||||||
| 292,342 | Gardner Denver Holdings, Inc.* | 9,305,246 | ||||||
| 19,677 | Hubbell, Inc. | 2,788,231 | ||||||
| 305,621 | JELD-WEN Holding, Inc.* | 5,223,063 | ||||||
| 61,229 | L3Harris Technologies, Inc. | 12,632,155 | ||||||
| 87,368 | Moog, Inc. Class A | 7,313,575 | ||||||
| 123,748 | Sensata Technologies Holding plc* | 6,334,660 | ||||||
| 104,651 | Wabtec Corp. | 7,259,640 | ||||||
|
| |||||||
| 69,052,474 | ||||||||
|
| |||||||
| Commercial & Professional Services - 1.4% | ||||||||
| 122,853 | Clean Harbors, Inc.* | 10,130,458 | ||||||
|
| |||||||
| Consumer Durables & Apparel - 3.0% | ||||||||
| 189,656 | Lennar Corp. Class A | 11,303,497 | ||||||
| 239,959 | Steven Madden Ltd. | 9,881,512 | ||||||
|
| |||||||
| 21,185,009 | ||||||||
|
| |||||||
| Consumer Services - 0.8% | ||||||||
| 114,587 | Norwegian Cruise Line Holdings Ltd.* | 5,816,436 | ||||||
|
| |||||||
| Diversified Financials - 1.1% | ||||||||
| 926,046 | SLM Corp. | 7,815,828 | ||||||
|
| |||||||
| Energy - 5.7% | ||||||||
| 200,681 | Delek U.S. Holdings, Inc. | 8,017,206 | ||||||
| 134,934 | Diamondback Energy, Inc. | 11,571,940 | ||||||
| 1,415,292 | Encana Corp. | 5,562,097 | ||||||
| 545,683 | Noble Energy, Inc. | 10,509,855 | ||||||
| 192,286 | Viper Energy Partners L.P. | 4,628,324 | ||||||
|
| |||||||
| 40,289,422 | ||||||||
|
| |||||||
| Food & Staples Retailing - 1.4% | ||||||||
| 245,262 | US Foods Holding Corp.* | 9,729,544 | ||||||
|
| |||||||
| Food, Beverage & Tobacco - 0.9% | ||||||||
| 60,004 | Post Holdings, Inc.* | 6,174,412 | ||||||
|
| |||||||
| Health Care Equipment & Services - 6.9% | ||||||||
| 163,409 | Acadia Healthcare Co., Inc.* | 4,900,636 | ||||||
| 201,580 | Centene Corp.* | 10,699,866 | ||||||
| 156,967 | Encompass Health Corp. | 10,049,027 | ||||||
| 91,960 | Hill-Rom Holdings, Inc. | 9,627,292 | ||||||
| 21,571 | STERIS plc | 3,053,807 | ||||||
| 76,928 | Zimmer Biomet Holdings, Inc. | 10,633,758 | ||||||
|
| |||||||
| 48,964,386 | ||||||||
|
| |||||||
| Insurance - 9.8% | ||||||||
| 122,157 | Arthur J Gallagher & Co. | 11,143,162 | ||||||
| 92,263 | Assurant, Inc. | 11,631,596 | ||||||
| 555,038 | CNO Financial Group, Inc. | 8,686,345 | ||||||
| 75,484 | Hanover Insurance Group, Inc. | 9,941,998 | ||||||
| 110,672 | Kemper Corp. | 7,955,103 | ||||||
| 793,195 | Lancashire Holdings Ltd. | 7,324,539 | ||||||
| 74,958 | Reinsurance Group of America, Inc. | 12,178,426 | ||||||
|
| |||||||
| 68,861,169 | ||||||||
|
| |||||||
| Materials - 9.3% | ||||||||
| 218,313 | Buzzi Unicem S.p.A. | 5,267,591 | ||||||
| 163,917 | Cabot Corp. | 7,145,142 | ||||||
| Shares or Principal Amount | Market Value† | |||||||
| COMMON STOCKS - 95.9% - (continued) | ||||||||
| Materials - 9.3% - (continued) | ||||||||
| 142,122 | Carpenter Technology Corp. | $ | 6,966,820 | |||||
| 115,250 | Celanese Corp. | 13,962,538 | ||||||
| 129,554 | Crown Holdings, Inc.* | 9,436,713 | ||||||
| 149,336 | FMC Corp. | 13,664,244 | ||||||
| 81,351 | Reliance Steel & Aluminum Co. | 9,439,970 | ||||||
|
| |||||||
| 65,883,018 | ||||||||
|
| |||||||
| Media & Entertainment - 2.9% | ||||||||
| 231,941 | Cinemark Holdings, Inc. | 8,489,040 | ||||||
| 73,044 | Electronic Arts, Inc.* | 7,041,442 | ||||||
| 346,499 | TEGNA, Inc. | 5,207,880 | ||||||
|
| |||||||
| 20,738,362 | ||||||||
|
| |||||||
| Real Estate - 12.8% | ||||||||
| 67,395 | Boston Properties, Inc. REIT | 9,246,594 | ||||||
| 382,149 | Brixmor Property Group, Inc. REIT | 8,414,921 | ||||||
| 321,008 | Corporate Office Properties Trust REIT | 9,514,677 | ||||||
| 61,384 | Equity LifeStyle Properties, Inc. REIT | 4,293,197 | ||||||
| 199,563 | First Industrial Realty Trust, Inc. REIT | 8,403,598 | ||||||
| 246,087 | Gaming and Leisure Properties, Inc. REIT | 9,932,071 | ||||||
| 237,157 | Highwoods Properties, Inc. REIT | 11,098,948 | ||||||
| 85,901 | Life Storage, Inc. REIT | 9,356,337 | ||||||
| 178,701 | Park Hotels & Resorts, Inc. REIT | 4,154,798 | ||||||
| 414,849 | Physicians Realty Trust REIT | 7,745,231 | ||||||
| 194,528 | STORE Capital Corp. REIT | 7,878,384 | ||||||
|
| |||||||
| 90,038,756 | ||||||||
|
| |||||||
| Retailing - 1.3% | ||||||||
| 65,168 | Expedia Group, Inc. | 8,905,859 | ||||||
|
| |||||||
| Semiconductors & Semiconductor Equipment - 4.0% | ||||||||
| 39,750 | KLA Corp. | 6,719,340 | ||||||
| 30,584 | Lam Research Corp. | 8,289,488 | ||||||
| 78,222 | MKS Instruments, Inc. | 8,465,185 | ||||||
| 111,407 | Silicon Motion Technology Corp. ADR | 4,684,664 | ||||||
|
| |||||||
| 28,158,677 | ||||||||
|
| |||||||
| Software & Services - 3.2% | ||||||||
| 127,729 | Amdocs Ltd. | 8,327,931 | ||||||
| 97,804 | Leidos Holdings, Inc. | 8,433,639 | ||||||
| 105,934 | SS&C Technologies Holdings, Inc. | 5,509,627 | ||||||
|
| |||||||
| 22,271,197 | ||||||||
|
| |||||||
| Technology Hardware & Equipment - 4.1% | ||||||||
| 64,664 | Arrow Electronics, Inc.* | 5,126,562 | ||||||
| 46,963 | Coherent, Inc.* | 6,993,730 | ||||||
| 91,918 | Itron, Inc.* | 7,009,666 | ||||||
| 156,609 | Lumentum Holdings, Inc.* | 9,813,120 | ||||||
|
| |||||||
| 28,943,078 | ||||||||
|
| |||||||
| Telecommunication Services - 1.0% | ||||||||
| 151,966 | Millicom International Cellular S.A. | 6,927,845 | ||||||
|
| |||||||
| Transportation - 0.9% | ||||||||
| 319,577 | JetBlue Airways Corp.* | 6,167,836 | ||||||
|
| |||||||
| Utilities - 6.3% | ||||||||
| 215,672 | Alliant Energy Corp. | 11,503,944 | ||||||
| 102,586 | Evergy, Inc. | 6,556,271 | ||||||
| 82,662 | Sempra Energy | 11,945,486 | ||||||
| 308,347 | UGI Corp. | 14,698,902 | ||||||
|
| |||||||
| 44,704,603 | ||||||||
|
| |||||||
Total Common Stocks | $ | 676,738,598 | ||||||
|
| |||||||
The accompanying notes are an integral part of these financial statements.
| 64 |
|
| The Hartford MidCap Value Fund |
Schedule of Investments – (continued)
October 31, 2019
| Shares or Principal Amount | Market Value† | |||||||
| SHORT-TERM INVESTMENTS - 3.9% | ||||||||
| Other Investment Pools & Funds - 3.9% | ||||||||
| 27,783,430 | Morgan Stanley Institutional Liquidity Funds, Government Portfolio, Institutional Class, 1.69%(1) | $ | 27,783,430 | |||||
|
| |||||||
Total Short-Term Investments | $ | 27,783,430 | ||||||
|
| |||||||
Total Investments | 99.8 | % | $ | 704,522,028 | ||||||||
Other Assets and Liabilities | 0.2 | % | 1,238,109 | |||||||||
|
|
|
| |||||||||
Total Net Assets | 100.0 | % | $ | 705,760,137 | ||||||||
|
|
|
| |||||||||
| Note: | Percentage of investments as shown is the ratio of the total market value to total net assets. |
Prices of foreign equities that are principally traded on certain foreign markets will generally be adjusted daily pursuant to a fair value pricing service approved by the Board of Directors in order to reflect an adjustment for factors occurring after the close of certain foreign markets but before the close of the New York Stock Exchange. |
Equity industry classifications used in this report are the Global Industry Classification Standard, which was developed by and is the exclusive property and service mark of MSCI, Inc. and Standard & Poor’s. |
For Fund compliance purposes, the Fund may not use the same classification system. These classifications are used for financial reporting purposes. |
See “Glossary” for abbreviation descriptions. |
| * | Non-income producing. |
| (1) | Current yield as of period end. |
| † | See Significant Accounting Policies of accompanying Notes to Financial Statements regarding valuation of investments. |
Fair Valuation Summary
The following is a summary of the fair valuations according to the inputs used as of October 31, 2019 in valuing the Fund’s investments.
Description | Total | Level 1 | Level 2 | Level 3(1) | ||||||||||||
Assets |
| |||||||||||||||
Common Stocks |
| |||||||||||||||
Banks | $ | 65,980,229 | $ | 65,980,229 | $ | — | $ | — | ||||||||
Capital Goods | 69,052,474 | 69,052,474 | — | — | ||||||||||||
Commercial & Professional Services | 10,130,458 | 10,130,458 | — | — | ||||||||||||
Consumer Durables & Apparel | 21,185,009 | 21,185,009 | — | — | ||||||||||||
Consumer Services | 5,816,436 | 5,816,436 | — | — | ||||||||||||
Diversified Financials | 7,815,828 | 7,815,828 | — | — | ||||||||||||
Energy | 40,289,422 | 40,289,422 | — | — | ||||||||||||
Food & Staples Retailing | 9,729,544 | 9,729,544 | — | — | ||||||||||||
Food, Beverage & Tobacco | 6,174,412 | 6,174,412 | — | — | ||||||||||||
Health Care Equipment & Services | 48,964,386 | 48,964,386 | — | — | ||||||||||||
Insurance | 68,861,169 | 61,536,630 | 7,324,539 | — | ||||||||||||
Materials | 65,883,018 | 60,615,427 | 5,267,591 | — | ||||||||||||
Media & Entertainment | 20,738,362 | 20,738,362 | — | — | ||||||||||||
Real Estate | 90,038,756 | 90,038,756 | — | — | ||||||||||||
Retailing | 8,905,859 | 8,905,859 | — | — | ||||||||||||
Semiconductors & Semiconductor Equipment | 28,158,677 | 28,158,677 | — | — | ||||||||||||
Software & Services | 22,271,197 | 22,271,197 | — | — | ||||||||||||
Technology Hardware & Equipment | 28,943,078 | 28,943,078 | — | — | ||||||||||||
Telecommunication Services | 6,927,845 | — | 6,927,845 | — | ||||||||||||
Transportation | 6,167,836 | 6,167,836 | — | — | ||||||||||||
Utilities | 44,704,603 | 44,704,603 | — | — | ||||||||||||
Short-Term Investments | 27,783,430 | 27,783,430 | — | — | ||||||||||||
|
|
|
|
|
|
|
| |||||||||
Total | $ | 704,522,028 | $ | 685,002,053 | $ | 19,519,975 | $ | — | ||||||||
|
|
|
|
|
|
|
| |||||||||
| (1) | For the year ended October 31, 2019, there were no transfers in and out of Level 3. |
The accompanying notes are an integral part of these financial statements.
| 65 | �� |
|
Schedule of Investments
October 31, 2019
| Shares or Principal Amount | Market Value† | |||||||
| COMMON STOCKS - 97.8% | ||||||||
| Banks - 14.8% | ||||||||
| 284,017 | Bank of America Corp. | $ | 8,881,212 | |||||
| 35,864 | Bank of Nova Scotia | 2,056,083 | ||||||
| 66,992 | Citigroup, Inc. | 4,814,045 | ||||||
| 79,369 | JP Morgan Chase & Co. | 9,914,775 | ||||||
| 12,961 | M&T Bank Corp. | 2,028,785 | ||||||
| 21,035 | PNC Financial Services Group, Inc. | 3,085,835 | ||||||
|
| |||||||
| 30,780,735 | ||||||||
|
| |||||||
| Capital Goods - 9.1% | ||||||||
| 17,413 | Deere & Co. | 3,032,300 | ||||||
| 37,418 | Eaton Corp. plc | 3,259,482 | ||||||
| 5,015 | General Dynamics Corp. | 886,652 | ||||||
| 17,508 | Honeywell International, Inc. | 3,024,157 | ||||||
| 58,994 | Johnson Controls International plc | 2,556,210 | ||||||
| 5,833 | Lockheed Martin Corp. | 2,197,174 | ||||||
| 27,471 | United Technologies Corp. | 3,944,286 | ||||||
|
| |||||||
| 18,900,261 | ||||||||
|
| |||||||
| Commercial & Professional Services - 0.8% | ||||||||
| 14,385 | Waste Management, Inc. | 1,614,141 | ||||||
|
| |||||||
| Energy - 8.4% | ||||||||
| 42,231 | Chevron Corp. | 4,904,708 | ||||||
| 26,833 | EOG Resources, Inc. | 1,859,795 | ||||||
| 53,590 | Exxon Mobil Corp. | 3,621,076 | ||||||
| 89,682 | Halliburton Co. | 1,726,379 | ||||||
| 19,077 | Marathon Petroleum Corp. | 1,219,974 | ||||||
| 66,089 | Suncor Energy, Inc. | 1,962,182 | ||||||
| 42,969 | Total S.A. ADR | 2,261,459 | ||||||
|
| |||||||
| 17,555,573 | ||||||||
|
| |||||||
| Food & Staples Retailing - 1.2% | ||||||||
| 99,368 | Kroger Co. | 2,448,428 | ||||||
|
| |||||||
| Food, Beverage & Tobacco - 7.3% | ||||||||
| 50,901 | Altria Group, Inc. | 2,279,856 | ||||||
| 44,326 | General Mills, Inc. | 2,254,420 | ||||||
| 37,265 | Kellogg Co. | 2,367,446 | ||||||
| 39,376 | Mondelez International, Inc. Class A | 2,065,271 | ||||||
| 21,933 | Nestle S.A. ADR | 2,350,340 | ||||||
| 47,184 | Philip Morris International, Inc. | 3,842,665 | ||||||
|
| |||||||
| 15,159,998 | ||||||||
|
| |||||||
| Health Care Equipment & Services - 5.8% | ||||||||
| 20,055 | Hill-Rom Holdings, Inc. | 2,099,558 | ||||||
| 43,330 | Koninklijke Philips N.V. ADR | 1,902,187 | ||||||
| 44,883 | Medtronic plc | 4,887,759 | ||||||
| 12,749 | UnitedHealth Group, Inc. | 3,221,672 | ||||||
|
| |||||||
| 12,111,176 | ||||||||
|
| |||||||
| Insurance - 7.1% | ||||||||
| 55,892 | American International Group, Inc. | 2,960,040 | ||||||
| 23,968 | Chubb Ltd. | 3,653,203 | ||||||
| 28,733 | Marsh & McLennan Cos., Inc. | 2,977,313 | ||||||
| 44,036 | Principal Financial Group, Inc. | 2,350,642 | ||||||
| 30,632 | Prudential Financial, Inc. | 2,791,801 | ||||||
|
| |||||||
| 14,732,999 | ||||||||
|
| |||||||
| Materials - 2.9% | ||||||||
| 8,508 | Celanese Corp. | 1,030,744 | ||||||
| 25,552 | FMC Corp. | 2,338,008 | ||||||
| 21,483 | PPG Industries, Inc. | 2,687,953 | ||||||
|
| |||||||
| 6,056,705 | ||||||||
|
| |||||||
| Media & Entertainment - 2.2% | ||||||||
| 102,589 | Comcast Corp. Class A | 4,598,039 | ||||||
|
| |||||||
| Pharmaceuticals, Biotechnology & Life Sciences - 7.5% | ||||||||
| 7,170 | Allergan plc | 1,262,709 | ||||||
| 68,925 | AstraZeneca plc ADR | 3,379,393 | ||||||
| Shares or Principal Amount | Market Value† | |||||||
| COMMON STOCKS - 97.8% - (continued) | ||||||||
| Pharmaceuticals, Biotechnology & Life Sciences - 7.5% - (continued) | ||||||||
| 43,924 | Merck & Co., Inc. | $ | 3,806,454 | |||||
| 24,669 | Novartis AG ADR | 2,157,057 | ||||||
| 134,092 | Pfizer, Inc. | 5,145,110 | ||||||
|
| |||||||
| 15,750,723 | ||||||||
|
| |||||||
| Real Estate - 3.7% | ||||||||
| 9,472 | American Tower Corp. REIT | 2,065,654 | ||||||
| 64,417 | Corporate Office Properties Trust REIT | 1,909,320 | ||||||
| 101,352 | Host Hotels & Resorts, Inc. REIT | 1,661,159 | ||||||
| 9,049 | Public Storage REIT | 2,016,660 | ||||||
|
| |||||||
| 7,652,793 | ||||||||
|
| |||||||
| Retailing - 4.5% | ||||||||
| 571,800 | Allstar Co.(1)(2)(3) | 131,514 | ||||||
| 21,561 | Expedia Group, Inc. | 2,946,526 | ||||||
| 30,656 | Lowe’s Cos., Inc. | 3,421,516 | ||||||
| 27,207 | Target Corp. | 2,908,701 | ||||||
|
| |||||||
| 9,408,257 | ||||||||
|
| |||||||
| Semiconductors & Semiconductor Equipment - 5.3% | ||||||||
| 101,677 | Intel Corp. | 5,747,801 | ||||||
| 17,951 | KLA Corp. | 3,034,437 | ||||||
| 29,724 | QUALCOMM, Inc. | 2,390,998 | ||||||
|
| |||||||
| 11,173,236 | ||||||||
|
| |||||||
| Software & Services - 3.6% | ||||||||
| 12,628 | Accenture plc Class A | 2,341,484 | ||||||
| 21,256 | International Business Machines Corp. | 2,842,565 | ||||||
| 16,347 | Microsoft Corp. | 2,343,669 | ||||||
|
| |||||||
| 7,527,718 | ||||||||
|
| |||||||
| Technology Hardware & Equipment - 2.7% | ||||||||
| 5,609 | Apple, Inc. | 1,395,295 | ||||||
| 43,277 | Cisco Systems, Inc. | 2,056,090 | ||||||
| 13,187 | Motorola Solutions, Inc. | 2,193,262 | ||||||
|
| |||||||
| 5,644,647 | ||||||||
|
| |||||||
| Telecommunication Services - 3.6% | ||||||||
| 123,634 | Verizon Communications, Inc. | 7,476,148 | ||||||
|
| |||||||
| Transportation - 1.4% | ||||||||
| 19,233 | Delta Air Lines, Inc. | 1,059,354 | ||||||
| 17,033 | United Parcel Service, Inc. Class B | 1,961,690 | ||||||
|
| |||||||
| 3,021,044 | ||||||||
|
| |||||||
| Utilities - 5.9% | ||||||||
| 49,849 | Alliant Energy Corp. | 2,658,946 | ||||||
| 46,127 | Avangrid, Inc. | 2,308,656 | ||||||
| 29,121 | Dominion Energy, Inc. | 2,403,939 | ||||||
| 30,347 | Eversource Energy | 2,541,258 | ||||||
| 50,356 | UGI Corp. | 2,400,470 | ||||||
|
| |||||||
| 12,313,269 | ||||||||
|
| |||||||
Total Common Stocks | $ | 203,925,890 | ||||||
|
| |||||||
| SHORT-TERM INVESTMENTS - 2.2% | ||||||||
| Other Investment Pools & Funds - 2.2% | ||||||||
| 4,644,024 | Morgan Stanley Institutional Liquidity Funds, Government Portfolio, Institutional Class, 1.69%(4) | $ | 4,644,024 | |||||
|
| |||||||
Total Short-Term Investments | $ | 4,644,024 | ||||||
|
| |||||||
Total Investments | 100.0 | % | $ | 208,569,914 | ||||||||
Other Assets and Liabilities | 0.0 | % | 10,463 | |||||||||
|
|
|
| |||||||||
Total Net Assets | 100.0 | % | $ | 208,580,377 | ||||||||
|
|
|
| |||||||||
The accompanying notes are an integral part of these financial statements.
| 66 |
|
| Hartford Quality Value Fund |
Schedule of Investments – (continued)
October 31, 2019
| Note: | Percentage of investments as shown is the ratio of the total market value to total net assets. |
Prices of foreign equities that are principally traded on certain foreign markets will generally be adjusted daily pursuant to a fair value pricing service approved by the Board of Directors in order to reflect an adjustment for factors occurring after the close of certain foreign markets but before the close of the New York Stock Exchange. |
Equity industry classifications used in this report are the Global Industry Classification Standard, which was developed by and is the exclusive property and service mark of MSCI, Inc. and Standard & Poor’s. |
For Fund compliance purposes, the Fund may not use the same classification system. These classifications are used for financial reporting purposes. |
See “Glossary” for abbreviation descriptions. |
| (1) | Investment valued using significant unobservable inputs. |
| (2) | This security is valued in good faith at fair value as determined under policies and procedures established by and under the supervision of the Board of Directors. At October 31, 2019, the aggregate fair value of this security was $131,514, which represented 0.1% of total net assets. This amount excludes securities that are principally traded in certain foreign markets and whose prices are adjusted pursuant to a third party pricing service methodology approved by the Board of Directors. |
| (3) | Investment in securities not registered under the Securities Act of 1933 (excluding securities acquired pursuant to Rule 144A and Regulation S). At the end of the period, the value of such restricted securities amounted to $131,514 or 0.1% of net assets. |
| Period Acquired | Security Name | Shares/ Par Value | Base Total Cost | Base Market Value | ||||||||||||
| 08/2011 | Allstar Co. | 571,800 | $ | 248,744 | $ | 131,514 | ||||||||||
| (4) | Current yield as of period end. |
| † | See Significant Accounting Policies of accompanying Notes to Financial Statements regarding valuation of investments. |
Fair Valuation Summary
The following is a summary of the fair valuations according to the inputs used as of October 31, 2019 in valuing the Fund’s investments.
Description | Total | Level 1 | Level 2 | Level 3(1) | ||||||||||||
Assets |
| |||||||||||||||
Common Stocks |
| |||||||||||||||
Banks | $ | 30,780,735 | $ | 30,780,735 | $ | — | $ | — | ||||||||
Capital Goods | 18,900,261 | 18,900,261 | — | — | ||||||||||||
Commercial & Professional Services | 1,614,141 | 1,614,141 | — | — | ||||||||||||
Energy | 17,555,573 | 17,555,573 | — | — | ||||||||||||
Food & Staples Retailing | 2,448,428 | 2,448,428 | — | — | ||||||||||||
Food, Beverage & Tobacco | 15,159,998 | 15,159,998 | — | — | ||||||||||||
Health Care Equipment & Services | 12,111,176 | 12,111,176 | — | — | ||||||||||||
Insurance | 14,732,999 | 14,732,999 | — | — | ||||||||||||
Materials | 6,056,705 | 6,056,705 | — | — | ||||||||||||
Media & Entertainment | 4,598,039 | 4,598,039 | — | — | ||||||||||||
Pharmaceuticals, Biotechnology & Life Sciences | 15,750,723 | 15,750,723 | — | — | ||||||||||||
Real Estate | 7,652,793 | 7,652,793 | — | — | ||||||||||||
Retailing | 9,408,257 | 9,276,743 | — | 131,514 | ||||||||||||
Semiconductors & Semiconductor Equipment | 11,173,236 | 11,173,236 | — | — | ||||||||||||
Software & Services | 7,527,718 | 7,527,718 | — | — | ||||||||||||
Technology Hardware & Equipment | 5,644,647 | 5,644,647 | — | — | ||||||||||||
Telecommunication Services | 7,476,148 | 7,476,148 | — | — | ||||||||||||
Transportation | 3,021,044 | 3,021,044 | — | — | ||||||||||||
Utilities | 12,313,269 | 12,313,269 | — | — | ||||||||||||
Short-Term Investments | 4,644,024 | 4,644,024 | — | — | ||||||||||||
|
|
|
|
|
|
|
| |||||||||
Total | $ | 208,569,914 | $ | 208,438,400 | $ | — | $ | 131,514 | ||||||||
|
|
|
|
|
|
|
| |||||||||
| (1) | For the year ended October 31, 2019, there were no transfers in and out of Level 3. |
Level 3 investments at the beginning and/or end of the period in relation to net assets were not significant and accordingly, a reconciliation of Level 3 assets for the period ended October 31, 2019 is not presented.
The accompanying notes are an integral part of these financial statements.
| 67 |
|
Schedule of Investments
October 31, 2019
| Shares or Principal Amount | Market Value† | |||||||
| COMMON STOCKS - 98.8% | ||||||||
| Automobiles & Components - 1.2% | ||||||||
| 117,387 | Thor Industries, Inc. | $ | 7,425,902 | |||||
| 54,717 | Visteon Corp.* | 5,089,775 | ||||||
|
| |||||||
| 12,515,677 | ||||||||
|
| |||||||
| Banks - 4.6% | ||||||||
| 186,714 | First Busey Corp. | 4,923,648 | ||||||
| 234,885 | First Hawaiian, Inc. | 6,419,407 | ||||||
| 97,792 | IBERIABANK Corp. | 7,176,955 | ||||||
| 714,954 | MGIC Investment Corp. | 9,802,019 | ||||||
| 196,188 | Seacoast Banking Corp. of Florida* | 5,493,264 | ||||||
| 392,356 | Sterling Bancorp | 7,709,796 | ||||||
| 178,436 | Triumph Bancorp, Inc.* | 5,790,248 | ||||||
|
| |||||||
| 47,315,337 | ||||||||
|
| |||||||
| Capital Goods - 12.9% | ||||||||
| 218,439 | Aerojet Rocketdyne Holdings, Inc.* | 9,443,118 | ||||||
| 226,981 | Altra Industrial Motion Corp. | 6,991,015 | ||||||
| 61,507 | American Woodmark Corp.* | 6,099,034 | ||||||
| 156,218 | Applied Industrial Technologies, Inc. | 9,348,085 | ||||||
| 58,268 | Armstrong World Industries, Inc. | 5,449,806 | ||||||
| 96,105 | Axon Enterprise, Inc.* | 4,913,849 | ||||||
| 120,544 | AZZ, Inc. | 4,675,902 | ||||||
| 63,868 | Curtiss-Wright Corp. | 8,638,147 | ||||||
| 109,763 | EnerSys | 7,338,754 | ||||||
| 118,272 | Generac Holdings, Inc.* | 11,422,710 | ||||||
| 156,779 | ITT, Inc. | 9,320,511 | ||||||
| 73,797 | JELD-WEN Holding, Inc.* | 1,261,191 | ||||||
| 112,281 | John Bean Technologies Corp. | 11,539,118 | ||||||
| 84,800 | Mercury Systems, Inc.* | 6,246,368 | ||||||
| 155,455 | Patrick Industries, Inc.* | 7,681,032 | ||||||
| 247,419 | Rexnord Corp.* | 6,999,483 | ||||||
| 163,666 | SPX Corp.* | 7,453,350 | ||||||
| 135,523 | SPX FLOW, Inc.* | 6,136,481 | ||||||
|
| |||||||
| 130,957,954 | ||||||||
|
| |||||||
| Commercial & Professional Services - 5.3% | ||||||||
| 177,669 | ASGN, Inc.* | 11,297,972 | ||||||
| 109,003 | Clean Harbors, Inc.* | 8,988,387 | ||||||
| 150,352 | Exponent, Inc. | 9,551,863 | ||||||
| 78,327 | Huron Consulting Group, Inc.* | 5,180,548 | ||||||
| 86,691 | Insperity, Inc. | 9,157,170 | ||||||
| 77,005 | MSA Safety, Inc. | 9,245,990 | ||||||
|
| |||||||
| 53,421,930 | ||||||||
|
| |||||||
| Consumer Durables & Apparel - 6.6% | ||||||||
| 552,951 | American Outdoor Brands Corp.* | 3,914,893 | ||||||
| 86,661 | Carter’s, Inc. | 8,686,899 | ||||||
| 121,278 | Oxford Industries, Inc. | 8,351,203 | ||||||
| 318,292 | Steven Madden Ltd. | 13,107,265 | ||||||
| 127,012 | TopBuild Corp.* | 13,200,357 | ||||||
| 407,157 | Wolverine World Wide, Inc. | 12,084,420 | ||||||
| 225,959 | YETI Holdings, Inc.*(1) | 7,526,694 | ||||||
|
| |||||||
| 66,871,731 | ||||||||
|
| |||||||
| Consumer Services - 2.3% | ||||||||
| 81,750 | Dunkin’ Brands Group, Inc. | 6,427,185 | ||||||
| 76,663 | Marriott Vacations Worldwide Corp. | 8,427,563 | ||||||
| 106,223 | Wingstop, Inc. | 8,862,185 | ||||||
|
| |||||||
| 23,716,933 | ||||||||
|
| |||||||
| Diversified Financials - 2.4% | ||||||||
| 224,909 | Blucora, Inc.* | 4,864,781 | ||||||
| 92,931 | Evercore, Inc. Class A | 6,843,439 | ||||||
| 151,064 | OneMain Holdings, Inc. | 6,042,560 | ||||||
| 824,525 | SLM Corp. | 6,958,991 | ||||||
|
| |||||||
| 24,709,771 | ||||||||
|
| |||||||
| Shares or Principal Amount | Market Value† | |||||||
| COMMON STOCKS - 98.8% - (continued) | ||||||||
| Energy - 0.7% | ||||||||
| 738,756 | Kosmos Energy Ltd. | $ | 4,580,287 | |||||
| 119,510 | PDC Energy, Inc.* | 2,384,225 | ||||||
|
| |||||||
| 6,964,512 | ||||||||
|
| |||||||
| Food & Staples Retailing - 1.5% | ||||||||
| 23,948 | Casey’s General Stores, Inc. | 4,090,558 | ||||||
| 266,966 | Performance Food Group Co.* | 11,375,421 | ||||||
|
| |||||||
| 15,465,979 | ||||||||
|
| |||||||
| Food, Beverage & Tobacco - 2.2% | ||||||||
| 170,782 | B&G Foods, Inc.(1) | 2,655,660 | ||||||
| 136,600 | Freshpet, Inc.* | 7,138,716 | ||||||
| 580,535 | Hostess Brands, Inc.* | 7,419,237 | ||||||
| 47,654 | Post Holdings, Inc.* | 4,903,597 | ||||||
|
| |||||||
| 22,117,210 | ||||||||
|
| |||||||
| Health Care Equipment & Services - 12.9% | ||||||||
| 56,655 | Addus HomeCare Corp.* | 4,770,918 | ||||||
| 209,493 | AtriCure, Inc.* | 5,570,419 | ||||||
| 138,160 | Cardiovascular Systems, Inc.* | 6,150,883 | ||||||
| 213,593 | Globus Medical, Inc. Class A* | 11,185,865 | ||||||
| 92,228 | Haemonetics Corp.* | 11,134,686 | ||||||
| 308,468 | HMS Holdings Corp.* | 10,083,819 | ||||||
| 12,776 | ICU Medical, Inc.* | 2,064,729 | ||||||
| 48,803 | Insulet Corp.* | 7,092,052 | ||||||
| 102,747 | Integer Holdings Corp.* | 7,956,728 | ||||||
| 139,948 | Integra LifeSciences Holdings Corp.* | 8,125,381 | ||||||
| 46,741 | iRhythm Technologies, Inc.* | 3,123,234 | ||||||
| 68,170 | LHC Group, Inc.* | 7,564,825 | ||||||
| 13,600 | NuVasive, Inc.* | 959,344 | ||||||
| 168,517 | Omnicell, Inc.* | 11,861,912 | ||||||
| 315,174 | OraSure Technologies, Inc.* | 2,691,586 | ||||||
| 66,023 | Providence Service Corp.* | 4,216,889 | ||||||
| 678,376 | R1 RCM, Inc.* | 7,211,137 | ||||||
| 102,421 | Tandem Diabetes Care, Inc.* | 6,307,085 | ||||||
| 100,937 | Teladoc Health, Inc.*(1) | 7,731,774 | ||||||
| 34,199 | U.S. Physical Therapy, Inc. | 4,838,132 | ||||||
|
| |||||||
| 130,641,398 | ||||||||
|
| |||||||
| Household & Personal Products - 0.3% | ||||||||
| 153,265 | BellRing Brands, Inc. Class A* | 2,677,539 | ||||||
|
| |||||||
| Insurance - 0.7% | ||||||||
| 206,094 | James River Group Holdings Ltd. | 7,380,226 | ||||||
|
| |||||||
| Materials - 3.7% | ||||||||
| 181,221 | Boise Cascade Co. | 6,482,275 | ||||||
| 498,414 | Graphic Packaging Holding Co. | 7,805,163 | ||||||
| 95,319 | Ingevity Corp.* | 8,026,813 | ||||||
| 532,852 | Livent Corp.* | 3,655,365 | ||||||
| 189,607 | Louisiana-Pacific Corp. | 5,542,213 | ||||||
| 205,205 | PolyOne Corp. | 6,576,820 | ||||||
|
| |||||||
| 38,088,649 | ||||||||
|
| |||||||
| Media & Entertainment - 0.8% | ||||||||
| 103,596 | Cardlytics, Inc.* | 4,341,708 | ||||||
| 126,284 | Cargurus, Inc.* | 4,241,880 | ||||||
|
| |||||||
| 8,583,588 | ||||||||
|
| |||||||
| Pharmaceuticals, Biotechnology & Life Sciences - 15.2% | ||||||||
| 198,981 | Abeona Therapeutics, Inc.*(1) | 471,585 | ||||||
| 101,009 | ACADIA Pharmaceuticals, Inc.* | 4,283,792 | ||||||
| 126,629 | Aerie Pharmaceuticals, Inc.* | 2,809,898 | ||||||
| 53,489 | Agios Pharmaceuticals, Inc.*(1) | 1,608,949 | ||||||
| 145,448 | Aimmune Therapeutics, Inc.* | 4,046,363 | ||||||
| 56,969 | Allakos, Inc.*(1) | 3,908,073 | ||||||
| 237,342 | Apellis Pharmaceuticals, Inc.* | 6,975,481 | ||||||
| 156,604 | Arena Pharmaceuticals, Inc.* | 7,628,964 | ||||||
| 134,773 | Audentes Therapeutics, Inc.* | 3,625,394 | ||||||
The accompanying notes are an integral part of these financial statements.
| 68 |
|
| The Hartford Small Cap Growth Fund |
Schedule of Investments – (continued)
October 31, 2019
| Shares or Principal Amount | Market Value† | |||||||
| COMMON STOCKS - 98.8% - (continued) | ||||||||
| Pharmaceuticals, Biotechnology & Life Sciences - 15.2% - (continued) | ||||||||
| 103,673 | Biohaven Pharmaceutical Holding Co., Ltd.* | $ | 4,760,664 | |||||
| 116,476 | Blueprint Medicines Corp.* | 8,018,208 | ||||||
| 97,160 | Catalent, Inc.* | 4,726,834 | ||||||
| 109,315 | G1 Therapeutics, Inc.* | 2,319,664 | ||||||
| 91,013 | Global Blood Therapeutics, Inc.* | 4,364,073 | ||||||
| 294,698 | Heron Therapeutics, Inc.* | 6,262,332 | ||||||
| 165,525 | Intersect ENT, Inc.* | 2,949,656 | ||||||
| 247,864 | Iovance Biotherapeutics, Inc.* | 5,237,366 | ||||||
| 103,800 | Karyopharm Therapeutics, Inc.* | 1,214,460 | ||||||
| 149,400 | Kodiak Sciences, Inc.* | 3,094,074 | ||||||
| 37,465 | Ligand Pharmaceuticals, Inc.* | 4,076,567 | ||||||
| 27,091 | Madrigal Pharmaceuticals, Inc.* | 2,504,021 | ||||||
| 45,725 | Mirati Therapeutics, Inc.* | 4,306,381 | ||||||
| 130,883 | MyoKardia, Inc.* | 7,503,522 | ||||||
| 163,148 | NanoString Technologies, Inc.* | 3,687,145 | ||||||
| 136,032 | Portola Pharmaceuticals, Inc.* | 3,932,685 | ||||||
| 98,211 | Principia Biopharma, Inc.* | 3,467,830 | ||||||
| 153,965 | Radius Health, Inc.* | 4,378,765 | ||||||
| 46,431 | Reata Pharmaceuticals, Inc. Class A* | 9,568,500 | ||||||
| 86,889 | REGENXBIO, Inc.* | 3,101,068 | ||||||
| 44,057 | Repligen Corp.* | 3,502,091 | ||||||
| 228,667 | Revance Therapeutics, Inc.* | 3,580,925 | ||||||
| 146,596 | Rhythm Pharmaceuticals, Inc.* | 3,125,427 | ||||||
| 31,492 | Spark Therapeutics, Inc.* | 3,437,982 | ||||||
| 120,517 | Syneos Health, Inc.* | 6,043,928 | ||||||
| 108,480 | Theravance Biopharma, Inc.* | 1,748,698 | ||||||
| 128,272 | Ultragenyx Pharmaceutical, Inc.* | 5,148,838 | ||||||
| 87,630 | Y-mAbs Therapeutics, Inc.* | 2,729,675 | ||||||
|
| |||||||
| 154,149,878 | ||||||||
|
| |||||||
| Real Estate - 3.4% | ||||||||
| 259,529 | Columbia Property Trust, Inc. REIT | 5,325,535 | ||||||
| 53,383 | Coresite Realty Corp. REIT | 6,272,502 | ||||||
| 197,789 | Corporate Office Properties Trust REIT | 5,862,466 | ||||||
| 129,339 | Independence Realty Trust, Inc. REIT | 1,991,821 | ||||||
| 208,664 | Pebblebrook Hotel Trust REIT | 5,364,751 | ||||||
| 52,581 | PS Business Parks, Inc. REIT | 9,493,500 | ||||||
|
| |||||||
| 34,310,575 | ||||||||
|
| |||||||
| Retailing - 3.9% | ||||||||
| 287,388 | American Eagle Outfitters, Inc. | 4,420,028 | ||||||
| 374,741 | Caleres, Inc. | 8,064,426 | ||||||
| 106,709 | Core-Mark Holding Co., Inc. | 3,256,759 | ||||||
| 147,866 | Floor & Decor Holdings, Inc. Class A* | 6,776,699 | ||||||
| 149,526 | Foot Locker, Inc. | 6,505,876 | ||||||
| 142,433 | Nordstrom, Inc.(1) | 5,113,345 | ||||||
| 177,922 | Urban Outfitters, Inc.* | 5,106,361 | ||||||
|
| |||||||
| 39,243,494 | ||||||||
|
| |||||||
| Semiconductors & Semiconductor Equipment - 2.7% | ||||||||
| 362,344 | Cohu, Inc. | 6,022,157 | ||||||
| 242,359 | Entegris, Inc. | 11,633,232 | ||||||
| 442,562 | FormFactor, Inc.* | 9,661,129 | ||||||
|
| |||||||
| 27,316,518 | ||||||||
|
| |||||||
| Software & Services - 11.0% | ||||||||
| 221,136 | 8x8, Inc.* | 4,272,347 | ||||||
| 132,563 | Blackbaud, Inc. | 11,128,664 | ||||||
| 42,176 | CACI International, Inc. Class A* | 9,436,880 | ||||||
| 99,512 | Everbridge, Inc.* | 6,917,079 | ||||||
| 211,754 | Five9, Inc.* | 11,754,465 | ||||||
| 209,456 | ForeScout Technologies, Inc.* | 6,442,867 | ||||||
| 104,278 | Instructure, Inc.* | 4,872,911 | ||||||
| 102,453 | LiveRamp Holdings, Inc.* | 4,004,888 | ||||||
| 71,105 | Paylocity Holding Corp.* | 7,295,373 | ||||||
| 90,393 | Pegasystems, Inc. | 6,798,457 | ||||||
| Shares or Principal Amount | Market Value† | |||||||
| COMMON STOCKS - 98.8% - (continued) | ||||||||
| Software & Services - 11.0% - (continued) | ||||||||
| 103,085 | PROS Holdings, Inc.* | $ | 5,282,075 | |||||
| 72,773 | Q2 Holdings, Inc.* | 5,202,542 | ||||||
| 111,392 | Rapid7, Inc.* | 5,579,625 | ||||||
| 146,749 | SailPoint Technologies Holding, Inc.* | 2,841,061 | ||||||
| 163,515 | Science Applications International Corp. | 13,509,609 | ||||||
| 340,322 | SVMK, Inc.* | 6,261,925 | ||||||
|
| |||||||
| 111,600,768 | ||||||||
|
| |||||||
| Technology Hardware & Equipment - 3.4% | ||||||||
| 209,998 | CTS Corp. | 5,602,747 | ||||||
| 137,229 | Itron, Inc.* | 10,465,084 | ||||||
| 121,578 | Lumentum Holdings, Inc.* | 7,618,077 | ||||||
| 282,278 | Pure Storage, Inc. Class A* | 5,493,130 | ||||||
| 43,248 | Rogers Corp.* | 5,859,239 | ||||||
|
| |||||||
| 35,038,277 | ||||||||
|
| |||||||
| Telecommunication Services - 0.2% | ||||||||
| 519,375 | ORBCOMM, Inc.* | 2,082,694 | ||||||
|
| |||||||
| Transportation - 0.9% | ||||||||
| 42,020 | Genesee & Wyoming, Inc. Class A* | 4,665,480 | ||||||
| 206,057 | Marten Transport Ltd. | 4,463,195 | ||||||
|
| |||||||
| 9,128,675 | ||||||||
|
| |||||||
Total Common Stocks | $ | 1,004,299,313 | ||||||
|
| |||||||
| SHORT-TERM INVESTMENTS - 3.8% | ||||||||
| Other Investment Pools & Funds - 1.6% | ||||||||
| 16,153,282 | Morgan Stanley Institutional Liquidity Funds, Government Portfolio, Institutional Class, 1.69%(2) | $ | 16,153,282 | |||||
|
| |||||||
| Securities Lending Collateral - 2.2% | ||||||||
| 1,120,426 | Citibank NA DDCA, 1.80%, 11/1/2019(2) | 1,120,426 | ||||||
| 15,719,775 | Fidelity Investments Money Market Funds, Government Portfolio, Institutional Class, 1.75%(2) | 15,719,775 | ||||||
| 252,171 | Goldman Sachs Financial Square Funds, Government Fund, Institutional Class, 1.75%(2) | 252,171 | ||||||
| 2,085,183 | Invesco Government & Agency Portfolio, Institutional Class, 1.70%(2) | 2,085,183 | ||||||
| 3,029,513 | Morgan Stanley Institutional Liquidity Funds, Government Portfolio, Institutional Class, 1.69%(2) | 3,029,513 | ||||||
| 201,453 | Western Asset Institutional Government Class A Fund, Institutional Class, 1.68%(2) | 201,453 | ||||||
|
| |||||||
| 22,408,521 | ||||||||
|
| |||||||
Total Short-Term Investments | $ | 38,561,803 | ||||||
|
| |||||||
Total Investments | 102.6 | % | $ | 1,042,861,116 | ||||||||
Other Assets and Liabilities | (2.6 | )% | (26,727,632 | ) | ||||||||
|
|
|
| |||||||||
Total Net Assets | 100.0 | % | $ | 1,016,133,484 | ||||||||
|
|
|
| |||||||||
| Note: | Percentage of investments as shown is the ratio of the total market value to total net assets. |
Equity industry classifications used in this report are the Global Industry Classification Standard, which was developed by and is the exclusive property and service mark of MSCI, Inc. and Standard & Poor’s. |
For Fund compliance purposes, the Fund may not use the same classification system. These classifications are used for financial reporting purposes. |
See “Glossary” for abbreviation descriptions. |
The accompanying notes are an integral part of these financial statements.
| 69 |
|
| The Hartford Small Cap Growth Fund |
Schedule of Investments – (continued)
October 31, 2019
| * | Non-income producing. |
| (1) | Represents entire or partial securities on loan. See Note 8 in the accompanying Notes to Financial Statements for securities lending information. |
| (2) | Current yield as of period end. |
| † | See Significant Accounting Policies of accompanying Notes to Financial Statements regarding valuation of investments. |
Fair Valuation Summary
The following is a summary of the fair valuations according to the inputs used as of October 31, 2019 in valuing the Fund’s investments.
Description | Total | Level 1 | Level 2 | Level 3(1) | ||||||||||||
Assets |
| |||||||||||||||
Common Stocks |
| |||||||||||||||
Automobiles & Components | $ | 12,515,677 | $ | 12,515,677 | $ | — | $ | — | ||||||||
Banks | 47,315,337 | 47,315,337 | — | — | ||||||||||||
Capital Goods | 130,957,954 | 130,957,954 | — | — | ||||||||||||
Commercial & Professional Services | 53,421,930 | 53,421,930 | — | — | ||||||||||||
Consumer Durables & Apparel | 66,871,731 | 66,871,731 | — | — | ||||||||||||
Consumer Services | 23,716,933 | 23,716,933 | — | — | ||||||||||||
Diversified Financials | 24,709,771 | 24,709,771 | — | — | ||||||||||||
Energy | 6,964,512 | 6,964,512 | — | — | ||||||||||||
Food & Staples Retailing | 15,465,979 | 15,465,979 | — | — | ||||||||||||
Food, Beverage & Tobacco | 22,117,210 | 22,117,210 | — | — | ||||||||||||
Health Care Equipment & Services | 130,641,398 | 130,641,398 | — | — | ||||||||||||
Household & Personal Products | 2,677,539 | 2,677,539 | — | — | ||||||||||||
Insurance | 7,380,226 | 7,380,226 | — | — | ||||||||||||
Materials | 38,088,649 | 38,088,649 | — | — | ||||||||||||
Media & Entertainment | 8,583,588 | 8,583,588 | — | — | ||||||||||||
Pharmaceuticals, Biotechnology & Life Sciences | 154,149,878 | 154,149,878 | — | — | ||||||||||||
Real Estate | 34,310,575 | 34,310,575 | — | — | ||||||||||||
Retailing | 39,243,494 | 39,243,494 | — | — | ||||||||||||
Semiconductors & Semiconductor Equipment | 27,316,518 | 27,316,518 | — | — | ||||||||||||
Software & Services | 111,600,768 | 111,600,768 | — | — | ||||||||||||
Technology Hardware & Equipment | 35,038,277 | 35,038,277 | — | — | ||||||||||||
Telecommunication Services | 2,082,694 | 2,082,694 | — | — | ||||||||||||
Transportation | 9,128,675 | 9,128,675 | — | — | ||||||||||||
Short-Term Investments | 38,561,803 | 38,561,803 | — | — | ||||||||||||
|
|
|
|
|
|
|
| |||||||||
Total | $ | 1,042,861,116 | $ | 1,042,861,116 | $ | — | $ | — | ||||||||
|
|
|
|
|
|
|
| |||||||||
| (1) | For the year ended October 31, 2019, there were no transfers in and out of Level 3. |
The accompanying notes are an integral part of these financial statements.
| 70 |
|
Schedule of Investments
October 31, 2019
| Shares or Principal Amount | Market Value† | |||||||
| COMMON STOCKS - 97.4% | ||||||||
| Automobiles & Components - 1.5% | ||||||||
| 56,356 | Cooper Tire & Rubber Co. | $ | 1,591,493 | |||||
|
| |||||||
| Banks - 18.9% | ||||||||
| 64,391 | Bank OZK | 1,806,811 | ||||||
| 110,588 | Cadence Bancorp | 1,700,843 | ||||||
| 43,839 | First Interstate BancSystem, Inc. Class A | 1,839,484 | ||||||
| 122,438 | FNB Corp. | 1,476,602 | ||||||
| 58,258 | Great Western Bancorp, Inc. | 2,031,457 | ||||||
| 75,069 | Hilltop Holdings, Inc. | 1,753,612 | ||||||
| 87,432 | Opus Bank | 2,167,439 | ||||||
| 104,829 | Radian Group, Inc. | 2,631,208 | ||||||
| 92,683 | Umpqua Holdings Corp. | 1,466,245 | ||||||
| 103,155 | United Financial Bancorp, Inc. | 1,456,549 | ||||||
| 59,814 | Univest Financial Corp. | 1,540,211 | ||||||
|
| |||||||
| 19,870,461 | ||||||||
|
| |||||||
| Capital Goods - 11.6% | ||||||||
| 36,610 | Argan, Inc. | 1,385,689 | ||||||
| 14,692 | EnerSys | 982,307 | ||||||
| 73,161 | JELD-WEN Holding, Inc.* | 1,250,321 | ||||||
| 60,437 | Kennametal, Inc. | 1,870,525 | ||||||
| 20,804 | Moog, Inc. Class A | 1,741,503 | ||||||
| 66,425 | nVent Electric plc | 1,531,761 | ||||||
| 141,966 | REV Group, Inc. | 1,766,057 | ||||||
| 78,804 | Triumph Group, Inc. | 1,636,759 | ||||||
|
| |||||||
| 12,164,922 | ||||||||
|
| |||||||
| Commercial & Professional Services - 9.1% | ||||||||
| 90,763 | BrightView Holdings, Inc.* | 1,615,581 | ||||||
| 41,313 | Deluxe Corp. | 2,141,253 | ||||||
| 43,553 | Kforce, Inc. | 1,781,753 | ||||||
| 81,946 | Knoll, Inc. | 2,191,236 | ||||||
| 24,316 | McGrath Rent Corp. | 1,855,554 | ||||||
|
| |||||||
| 9,585,377 | ||||||||
|
| |||||||
| Consumer Durables & Apparel - 3.6% | ||||||||
| 56,786 | Kontoor Brands, Inc. | 2,157,868 | ||||||
| 35,754 | Sturm Ruger & Co., Inc. | 1,636,103 | ||||||
|
| |||||||
| 3,793,971 | ||||||||
|
| |||||||
| Consumer Services - 3.1% | ||||||||
| 35,117 | Adtalem Global Education, Inc.* | 1,045,784 | ||||||
| 83,855 | Carriage Services, Inc. | 2,160,105 | ||||||
|
| |||||||
| 3,205,889 | ||||||||
|
| |||||||
| Diversified Financials - 5.1% | ||||||||
| 100,703 | Greenhill & Co., Inc. | 1,631,389 | ||||||
| 133,578 | Navient Corp. | 1,839,369 | ||||||
| 56,710 | PRA Group, Inc.* | 1,924,170 | ||||||
|
| |||||||
| 5,394,928 | ||||||||
|
| |||||||
| Food, Beverage & Tobacco - 1.5% | ||||||||
| 127,038 | Hostess Brands, Inc.* | 1,623,546 | ||||||
|
| |||||||
| Health Care Equipment & Services - 1.6% | ||||||||
| 50,747 | Natus Medical, Inc.* | 1,709,159 | ||||||
|
| |||||||
| Household & Personal Products - 3.9% | ||||||||
| 66,754 | Edgewell Personal Care Co.* | 2,336,390 | ||||||
| 40,013 | Energizer Holdings, Inc.(1) | 1,700,152 | ||||||
|
| |||||||
| 4,036,542 | ||||||||
|
| |||||||
| Insurance - 4.7% | ||||||||
| 200,297 | Lancashire Holdings Ltd. | 1,849,587 | ||||||
| 179,088 | MBIA, Inc.*(1) | 1,663,728 | ||||||
| 146,339 | Third Point Reinsurance Ltd.* | 1,388,757 | ||||||
|
| |||||||
| 4,902,072 | ||||||||
|
| |||||||
| Materials - 3.9% | ||||||||
| 33,789 | Compass Minerals International, Inc. | 1,908,403 | ||||||
| Shares or Principal Amount | Market Value† | |||||||
| COMMON STOCKS - 97.4% - (continued) | ||||||||
| Materials - 3.9% - (continued) | ||||||||
| 54,078 | Schweitzer-Mauduit International, Inc. | $ | 2,189,618 | |||||
|
| |||||||
| 4,098,021 | ||||||||
|
| |||||||
| Media & Entertainment - 1.8% | ||||||||
| 123,174 | TEGNA, Inc. | 1,851,305 | ||||||
|
| |||||||
| Real Estate - 4.9% | ||||||||
| 112,574 | CoreCivic, Inc. REIT | 1,717,879 | ||||||
| 64,664 | Outfront Media, Inc. REIT | 1,701,310 | ||||||
| 65,730 | Pebblebrook Hotel Trust REIT | 1,689,918 | ||||||
|
| |||||||
| 5,109,107 | ||||||||
|
| |||||||
| Retailing - 3.0% | ||||||||
| 19,099 | Children’s Place, Inc.(1) | 1,564,399 | ||||||
| 177,938 | Michaels Cos., Inc.* | 1,553,399 | ||||||
|
| |||||||
| 3,117,798 | ||||||||
|
| |||||||
| Semiconductors & Semiconductor Equipment - 7.1% | ||||||||
| 69,839 | Ichor Holdings Ltd.* | 2,033,013 | ||||||
| 43,102 | Silicon Motion Technology Corp. ADR | 1,812,439 | ||||||
| 81,728 | Tower Semiconductor Ltd.* | 1,792,295 | ||||||
| 88,742 | Xperi Corp. | 1,801,907 | ||||||
|
| |||||||
| 7,439,654 | ||||||||
|
| |||||||
| Software & Services - 7.8% | ||||||||
| 50,218 | Cardtronics plc Class A* | 1,720,469 | ||||||
| 178,263 | Conduent, Inc.* | 1,101,665 | ||||||
| 37,263 | CSG Systems International, Inc. | 2,147,839 | ||||||
| 54,019 | EVERTEC, Inc. | 1,652,441 | ||||||
| 192,539 | TiVo Corp. | 1,567,268 | ||||||
|
| |||||||
| 8,189,682 | ||||||||
|
| |||||||
| Technology Hardware & Equipment - 4.3% | ||||||||
| 199,709 | Avid Technology, Inc.* | 1,349,034 | ||||||
| 29,990 | InterDigital, Inc. | 1,608,364 | ||||||
| 39,444 | Plantronics, Inc. | 1,554,883 | ||||||
|
| |||||||
| 4,512,281 | ||||||||
|
| |||||||
Total Common Stocks | $ | 102,196,208 | ||||||
|
| |||||||
| EXCHANGE-TRADED FUNDS - 0.6% | ||||||||
| Other Investment Pools & Funds - 0.6% | ||||||||
| 4,865 | iShares Russell 2000 Value ETF | $ | 595,427 | |||||
|
| |||||||
Total Exchange-Traded Funds | $ | 595,427 | ||||||
|
| |||||||
Total Long-Term Investments | $ | 102,791,635 | ||||||
|
| |||||||
| SHORT-TERM INVESTMENTS - 3.7% | ||||||||
| Other Investment Pools & Funds - 0.8% | ||||||||
| 795,302 | BlackRock Liquidity Funds FedFund Portfolio, Institutional Class, 1.73%(2) | $ | 795,302 | |||||
|
| |||||||
| Securities Lending Collateral - 2.9% | ||||||||
| 153,819 | Citibank NA DDCA, 1.80%, 11/1/2019(2) | 153,819 | ||||||
| 2,158,104 | Fidelity Investments Money Market Funds, Government Portfolio, Institutional Class, 1.75%(2) | 2,158,104 | ||||||
| 34,620 | Goldman Sachs Financial Square Funds, Government Fund, Institutional Class, 1.75%(2) | 34,620 | ||||||
| 286,266 | Invesco Government & Agency Portfolio, Institutional Class, 1.70%(2) | 286,266 | ||||||
| 415,909 | Morgan Stanley Institutional Liquidity Funds, Government Portfolio, Institutional Class, 1.69%(2) | 415,909 | ||||||
The accompanying notes are an integral part of these financial statements.
| 71 |
|
| Hartford Small Cap Value Fund |
Schedule of Investments – (continued)
October 31, 2019
| Shares or Principal Amount | Market Value† | |||||||
| SHORT-TERM INVESTMENTS - 3.7% - (continued) | ||||||||
| Securities Lending Collateral - 2.9% - (continued) | ||||||||
| 27,657 | Western Asset Institutional Government Class A Fund, Institutional Class, 1.68%(2) | $ | 27,657 | |||||
|
| |||||||
| 3,076,375 | ||||||||
|
| |||||||
Total Short-Term Investments | $ | 3,871,677 | ||||||
|
| |||||||
Total Investments | 101.7 | % | $ | 106,663,312 | ||||||||
Other Assets and Liabilities | (1.7 | )% | (1,764,097 | ) | ||||||||
|
|
|
| |||||||||
Total Net Assets | 100.0 | % | $ | 104,899,215 | ||||||||
|
|
|
| |||||||||
| Note: | Percentage of investments as shown is the ratio of the total market value to total net assets. |
Equity industry classifications used in this report are the Global Industry Classification Standard, which was developed by and is the exclusive property and service mark of MSCI, Inc. and Standard & Poor’s. |
For Fund compliance purposes, the Fund may not use the same classification system. These classifications are used for financial reporting purposes. |
See “Glossary” for abbreviation descriptions. |
| * | Non-income producing. |
| (1) | Represents entire or partial securities on loan. See Note 8 in the accompanying Notes to Financial Statements for securities lending information. |
| (2) | Current yield as of period end. |
| † | See Significant Accounting Policies of accompanying Notes to Financial Statements regarding valuation of investments. |
Fair Valuation Summary
The following is a summary of the fair valuations according to the inputs used as of October 31, 2019 in valuing the Fund’s investments.
Description | Total | Level 1 | Level 2 | Level 3(1) | ||||||||||||
Assets |
| |||||||||||||||
Common Stocks |
| |||||||||||||||
Automobiles & Components | $ | 1,591,493 | $ | 1,591,493 | $ | — | $ | — | ||||||||
Banks | 19,870,461 | 19,870,461 | — | — | ||||||||||||
Capital Goods | 12,164,922 | 12,164,922 | — | — | ||||||||||||
Commercial & Professional Services | 9,585,377 | 9,585,377 | — | — | ||||||||||||
Consumer Durables & Apparel | 3,793,971 | 3,793,971 | — | — | ||||||||||||
Consumer Services | 3,205,889 | 3,205,889 | — | — | ||||||||||||
Diversified Financials | 5,394,928 | 5,394,928 | — | — | ||||||||||||
Food, Beverage & Tobacco | 1,623,546 | 1,623,546 | — | — | ||||||||||||
Health Care Equipment & Services | 1,709,159 | 1,709,159 | — | — | ||||||||||||
Household & Personal Products | 4,036,542 | 4,036,542 | — | — | ||||||||||||
Insurance | 4,902,072 | 3,052,485 | 1,849,587 | — | ||||||||||||
Materials | 4,098,021 | 4,098,021 | — | — | ||||||||||||
Media & Entertainment | 1,851,305 | 1,851,305 | — | — | ||||||||||||
Real Estate | 5,109,107 | 5,109,107 | — | — | ||||||||||||
Retailing | 3,117,798 | 3,117,798 | — | — | ||||||||||||
Semiconductors & Semiconductor Equipment | 7,439,654 | 7,439,654 | — | — | ||||||||||||
Software & Services | 8,189,682 | 8,189,682 | — | — | ||||||||||||
Technology Hardware & Equipment | 4,512,281 | 4,512,281 | — | — | ||||||||||||
Exchange-Traded Funds | 595,427 | 595,427 | — | — | ||||||||||||
Short-Term Investments | 3,871,677 | 3,871,677 | — | — | ||||||||||||
|
|
|
|
|
|
|
| |||||||||
Total | $ | 106,663,312 | $ | 104,813,725 | $ | 1,849,587 | $ | — | ||||||||
|
|
|
|
|
|
|
| |||||||||
| (1) | For the year ended October 31, 2019, there were no transfers in and out of Level 3. |
The accompanying notes are an integral part of these financial statements.
| 72 |
|
Schedule of Investments
October 31, 2019
| Shares or Principal Amount | Market Value† | |||||||
| COMMON STOCKS - 95.1% | ||||||||
| Automobiles & Components - 1.2% | ||||||||
| 25,496 | LCI Industries | $ | 2,476,172 | |||||
| 101,490 | Winnebago Industries, Inc. | 4,878,624 | ||||||
|
| |||||||
| 7,354,796 | ||||||||
|
| |||||||
| Banks - 4.6% | ||||||||
| 189,189 | Atlantic Union Bankshares Corp. | 6,973,507 | ||||||
| 232,929 | BancorpSouth Bank | 7,143,932 | ||||||
| 375,148 | MGIC Investment Corp. | 5,143,279 | ||||||
| 442,988 | Sterling Bancorp | 8,704,714 | ||||||
|
| |||||||
| 27,965,432 | ||||||||
|
| |||||||
| Capital Goods - 13.9% | ||||||||
| 263,084 | Actuant Corp. Class A | 6,516,591 | ||||||
| 225,252 | Advanced Drainage Systems, Inc. | 8,338,829 | ||||||
| 127,656 | Aerojet Rocketdyne Holdings, Inc.* | 5,518,569 | ||||||
| 160,224 | Argan, Inc. | 6,064,478 | ||||||
| 85,565 | Axon Enterprise, Inc.* | 4,374,939 | ||||||
| 109,656 | Chart Industries, Inc.* | 6,429,131 | ||||||
| 58,810 | Curtiss-Wright Corp. | 7,954,053 | ||||||
| 98,039 | EnerSys | 6,554,888 | ||||||
| 259,252 | ITT, Inc. | 15,412,531 | ||||||
| 528,808 | Rexnord Corp.* | 14,959,978 | ||||||
| 42,287 | Rush Enterprises, Inc. Class A | 1,847,519 | ||||||
|
| |||||||
| 83,971,506 | ||||||||
|
| |||||||
| Commercial & Professional Services - 4.2% | ||||||||
| 77,795 | Brink’s Co. | 6,609,463 | ||||||
| 137,618 | McGrath Rent Corp. | 10,501,630 | ||||||
| 155,819 | TriNet Group, Inc.* | 8,256,849 | ||||||
|
| |||||||
| 25,367,942 | ||||||||
|
| |||||||
| Consumer Durables & Apparel - 9.4% | ||||||||
| 297,737 | Acushnet Holdings Corp. | 8,470,618 | ||||||
| 213,821 | BRP, Inc. | 9,592,805 | ||||||
| 110,758 | Carter’s, Inc. | 11,102,382 | ||||||
| 32,010 | Cavco Industries, Inc.* | 6,134,716 | ||||||
| 27,376 | Century Communities, Inc.* | 825,934 | ||||||
| 308,632 | Skyline Champion Corp.* | 8,712,681 | ||||||
| 327,671 | Under Armour, Inc. Class C* | 6,061,913 | ||||||
| 179,889 | YETI Holdings, Inc.*(1) | 5,992,103 | ||||||
|
| |||||||
| 56,893,152 | ||||||||
|
| |||||||
| Consumer Services - 6.0% | ||||||||
| 149,930 | Cheesecake Factory, Inc. | 6,265,575 | ||||||
| 204,682 | Chegg, Inc.* | 6,275,550 | ||||||
| 580,284 | DraftKings, Inc.(2)(3)(4) | 1,839,500 | ||||||
| 37,075 | Grand Canyon Education, Inc.* | 3,409,417 | ||||||
| 109,699 | Marriott Vacations Worldwide Corp. | 12,059,211 | ||||||
| 103,727 | Planet Fitness, Inc. Class A* | 6,603,261 | ||||||
|
| |||||||
| 36,452,514 | ||||||||
|
| |||||||
| Diversified Financials - 1.2% | ||||||||
| 123,411 | Ares Management Corp. Class A | 3,649,263 | ||||||
| 106,518 | PRA Group, Inc.* | 3,614,156 | ||||||
|
| |||||||
| 7,263,419 | ||||||||
|
| |||||||
| Energy - 0.5% | ||||||||
| 130,372 | Viper Energy Partners L.P. | 3,138,054 | ||||||
|
| |||||||
| Food & Staples Retailing - 0.7% | ||||||||
| 97,199 | Performance Food Group Co.* | 4,141,649 | ||||||
|
| |||||||
| Food, Beverage & Tobacco - 1.0% | ||||||||
| 52,804 | MGP Ingredients, Inc. | 2,264,763 | ||||||
| 200,433 | Nomad Foods Ltd.* | 3,910,448 | ||||||
|
| |||||||
| 6,175,211 | ||||||||
|
| |||||||
| Health Care Equipment & Services - 13.7% | ||||||||
| 60,520 | Amedisys, Inc.* | 7,778,030 | ||||||
| Shares or Principal Amount | Market Value† | |||||||
| COMMON STOCKS - 95.1% - (continued) | ||||||||
| Health Care Equipment & Services - 13.7% - (continued) | ||||||||
| 125,516 | Globus Medical, Inc. Class A* | $ | 6,573,273 | |||||
| 99,374 | Haemonetics Corp.* | 11,997,423 | ||||||
| 82,231 | Hill-Rom Holdings, Inc. | 8,608,763 | ||||||
| 236,345 | HMS Holdings Corp.* | 7,726,118 | ||||||
| 85,696 | Insulet Corp.* | 12,453,343 | ||||||
| 181,404 | Omnicell, Inc.* | 12,769,028 | ||||||
| 34,583 | Penumbra, Inc.* | 5,393,910 | ||||||
| 162,574 | Tandem Diabetes Care, Inc.* | 10,011,307 | ||||||
|
| |||||||
| 83,311,195 | ||||||||
|
| |||||||
| Insurance - 0.8% | ||||||||
| 133,299 | James River Group Holdings Ltd. | 4,773,437 | ||||||
|
| |||||||
| Materials - 3.3% | ||||||||
| 170,049 | Carpenter Technology Corp. | 8,335,802 | ||||||
| 90,038 | Ingevity Corp.* | 7,582,100 | ||||||
| 135,724 | Louisiana-Pacific Corp. | 3,967,212 | ||||||
|
| |||||||
| 19,885,114 | ||||||||
|
| |||||||
| Media & Entertainment - 0.7% | ||||||||
| 102,030 | Cardlytics, Inc.* | 4,276,077 | ||||||
|
| |||||||
| Pharmaceuticals, Biotechnology & Life Sciences - 11.6% | ||||||||
| 57,969 | ACADIA Pharmaceuticals, Inc.* | 2,458,465 | ||||||
| 77,014 | Aerie Pharmaceuticals, Inc.*(1) | 1,708,941 | ||||||
| 427,441 | Amicus Therapeutics, Inc.* | 3,603,327 | ||||||
| 139,756 | Apellis Pharmaceuticals, Inc.* | 4,107,429 | ||||||
| 121,106 | Arena Pharmaceuticals, Inc.* | 5,899,679 | ||||||
| 25,157 | Ascendis Pharma A/S ADR* | 2,781,861 | ||||||
| 34,120 | Blueprint Medicines Corp.* | 2,348,821 | ||||||
| 98,446 | CytomX Therapeutics, Inc.* | 603,474 | ||||||
| 99,475 | G1 Therapeutics, Inc.* | 2,110,859 | ||||||
| 52,798 | Galapagos N.V. ADR*(1) | 9,713,248 | ||||||
| 155,191 | Heron Therapeutics, Inc.* | 3,297,809 | ||||||
| 139,337 | Iovance Biotherapeutics, Inc.* | 2,944,191 | ||||||
| 168,976 | Karyopharm Therapeutics, Inc.* | 1,977,019 | ||||||
| 63,821 | MyoKardia, Inc.* | 3,658,858 | ||||||
| 219,546 | Orchard Therapeutics plc* | 2,647,725 | ||||||
| 64,035 | PRA Health Sciences, Inc.* | 6,256,860 | ||||||
| 154,548 | Revance Therapeutics, Inc.* | 2,420,222 | ||||||
| 147,213 | Rhythm Pharmaceuticals, Inc.* | 3,138,581 | ||||||
| 22,310 | Sage Therapeutics, Inc.* | 3,026,351 | ||||||
| 374,753 | Sangamo Therapeutics, Inc.* | 3,391,515 | ||||||
| 77,800 | Y-mAbs Therapeutics, Inc.* | 2,423,470 | ||||||
|
| |||||||
| 70,518,705 | ||||||||
|
| |||||||
| Real Estate - 4.4% | ||||||||
| 78,889 | Agree Realty Corp. REIT | 6,214,087 | ||||||
| 211,407 | Hannon Armstrong Sustainable Infrastructure Capital, Inc. REIT | 6,312,613 | ||||||
| 160,321 | NexPoint Residential Trust, Inc. REIT | 7,818,855 | ||||||
| 307,118 | Xenia Hotels & Resorts, Inc. REIT | 6,464,834 | ||||||
|
| |||||||
| 26,810,389 | ||||||||
|
| |||||||
| Retailing - 2.0% | ||||||||
| 3,136,600 | Allstar Co.(2)(3)(4) | 721,418 | ||||||
| 47,251 | Five Below, Inc.* | 5,911,573 | ||||||
| 88,291 | Floor & Decor Holdings, Inc. Class A* | 4,046,377 | ||||||
| 26,907 | Tory Burch LLC*(2)(3)(4) | 1,493,094 | ||||||
|
| |||||||
| 12,172,462 | ||||||||
|
| |||||||
| Semiconductors & Semiconductor Equipment - 2.9% | ||||||||
| 122,715 | Entegris, Inc. | 5,890,320 | ||||||
| 523,252 | Tower Semiconductor Ltd.* | 11,474,916 | ||||||
|
| |||||||
| 17,365,236 | ||||||||
|
| |||||||
| Software & Services - 9.9% | ||||||||
| 113,028 | Endava plc ADR* | 4,861,334 | ||||||
| 16,661 | EPAM Systems, Inc.* | 2,931,670 | ||||||
The accompanying notes are an integral part of these financial statements.
| 73 |
|
| The Hartford Small Company Fund |
Schedule of Investments – (continued)
October 31, 2019
| Shares or Principal Amount | Market Value† | |||||||
| COMMON STOCKS - 95.1% - (continued) | ||||||||
| Software & Services - 9.9% - (continued) | ||||||||
| 10,627 | Fair Isaac Corp.* | $ | 3,231,033 | |||||
| 89,026 | Five9, Inc.* | 4,941,833 | ||||||
| 13,187 | Globant S.A.* | 1,229,820 | ||||||
| 61,905 | Guidewire Software, Inc.* | 6,979,170 | ||||||
| 30,722 | HubSpot, Inc.* | 4,764,982 | ||||||
| 114,354 | LiveRamp Holdings, Inc.* | 4,470,098 | ||||||
| 254,048 | Mimecast Ltd.* | 10,088,246 | ||||||
| 149,634 | Rapid7, Inc.* | 7,495,167 | ||||||
| 106,984 | Science Applications International Corp. | 8,839,018 | ||||||
|
| |||||||
| 59,832,371 | ||||||||
|
| |||||||
| Technology Hardware & Equipment - 2.5% | ||||||||
| 254,942 | Pure Storage, Inc. Class A* | 4,961,171 | ||||||
| 43,233 | Zebra Technologies Corp. Class A* | 10,283,834 | ||||||
|
| |||||||
| 15,245,005 | ||||||||
|
| |||||||
| Telecommunication Services - 0.6% | ||||||||
| 60,875 | Bandwidth, Inc. Class A* | 3,418,131 | ||||||
|
| |||||||
Total Common Stocks | $ | 576,331,797 | ||||||
|
| |||||||
| CONVERTIBLE PREFERRED STOCKS - 0.7% | ||||||||
| Retailing - 0.3% | ||||||||
| 47,489 | Honest Co., Inc. Series E*(2)(3)(4) | $ | 1,821,678 | |||||
|
| |||||||
| Software & Services - 0.4% | ||||||||
| 263,189 | MarkLogic Corp. Series F*(2)(3)(4) | 2,560,829 | ||||||
|
| |||||||
Total Preferred Stocks | $ | 4,382,507 | ||||||
|
| |||||||
| ESCROWS - 0.0%(5) | ||||||||
| Software & Services - 0.0% | ||||||||
| 98,033 | Veracode, Inc.*(2)(3)(4) | $ | 53,330 | |||||
|
| |||||||
Total Escrows | $ | 53,330 | ||||||
|
| |||||||
Total Long-Term Investments | $ | 580,767,634 | ||||||
|
| |||||||
| SHORT-TERM INVESTMENTS - 6.2% | ||||||||
| Other Investment Pools & Funds - 4.6% | ||||||||
| 27,609,793 | Morgan Stanley Institutional Liquidity Funds, Government Portfolio, Institutional Class, 1.69%(6) | $ | 27,609,793 | |||||
|
| |||||||
| Securities Lending Collateral - 1.6% | ||||||||
| 482,745 | Citibank NA DDCA, 1.80%, 11/1/2019(6) | 482,745 | ||||||
| 6,773,003 | Fidelity Investments Money Market Funds, Government Portfolio, Institutional Class, 1.75%(6) | 6,773,003 | ||||||
| 108,650 | Goldman Sachs Financial Square Funds, Government Fund, Institutional Class, 1.75%(6) | 108,650 | ||||||
| 898,420 | Invesco Government & Agency Portfolio, Institutional Class, 1.70%(6) | 898,420 | ||||||
| 1,305,292 | Morgan Stanley Institutional Liquidity Funds, Government Portfolio, Institutional Class, 1.69%(6) | 1,305,292 | ||||||
| 86,798 | Western Asset Institutional Government Class A Fund, Institutional Class, 1.68%(6) | 86,798 | ||||||
|
| |||||||
| 9,654,908 | ||||||||
|
| |||||||
Total Short-Term Investments | $ | 37,264,701 | ||||||
|
| |||||||
Total Investments | 102.0 | % | $ | 618,032,335 | ||||||||
Other Assets and Liabilities | (2.0 | )% | (11,860,686 | ) | ||||||||
|
|
|
| |||||||||
Total Net Assets | 100.0 | % | $ | 606,171,649 | ||||||||
|
|
|
| |||||||||
| Note: | Percentage of investments as shown is the ratio of the total market value to total net assets. |
Prices of foreign equities that are principally traded on certain foreign markets will generally be adjusted daily pursuant to a fair value pricing service approved by the Board of Directors in order to reflect an adjustment for factors occurring after the close of certain foreign markets but before the close of the New York Stock Exchange. |
The Fund may refer to any one or more of the industry classifications used by one or more widely recognized market indices, ratings group and/or as defined by Fund management. Industry classifications may not be identical across all security types. |
Equity industry classifications used in this report are the Global Industry Classification Standard, which was developed by and is the exclusive property and service mark of MSCI, Inc. and Standard & Poor’s. |
For Fund compliance purposes, the Fund may not use the same classification system. These classifications are used for financial reporting purposes. |
See “Glossary” for abbreviation descriptions. |
| * | Non-income producing. |
| (1) | Represents entire or partial securities on loan. See Note 8 in the accompanying Notes to Financial Statements for securities lending information. |
| (2) | Investment valued using significant unobservable inputs. |
| (3)�� | These securities are valued in good faith at fair value as determined under policies and procedures established by and under the supervision of the Board of Directors. At October 31, 2019, the aggregate fair value of these securities was $8,489,849, which represented 1.4% of total net assets. This amount excludes securities that are principally traded in certain foreign markets and whose prices are adjusted pursuant to a third party pricing service methodology approved by the Board of Directors. |
| (4) | Investment in securities not registered under the Securities Act of 1933 (excluding securities acquired pursuant to Rule 144A and Regulation S). At the end of the period, the value of such restricted securities amounted to $8,489,849 or 1.4% of net assets. |
| Period Acquired | Security Name | Shares/ Par Value | Base Total Cost | Base Market Value | ||||||||||||
| 08/2011 | Allstar Co. | 3,136,600 | $ | 1,364,479 | $ | 721,418 | ||||||||||
| 12/2014 | DraftKings, Inc. | 580,284 | 2,187,550 | 1,839,500 | ||||||||||||
| 08/2015 | Honest Co., Inc. Convertible Preferred | 47,489 | 2,172,859 | 1,821,678 | ||||||||||||
| 04/2015 | MarkLogic Corp. Series F Convertible Preferred | 263,189 | 3,056,730 | 2,560,829 | ||||||||||||
| 11/2013 | Tory Burch LLC | 26,907 | 2,108,912 | 1,493,094 | ||||||||||||
| 04/2017 | Veracode, Inc. | 98,033 | — | 53,330 | ||||||||||||
|
|
|
| |||||||||||||
| $ | 10,890,530 | $ | 8,489,849 | |||||||||||||
|
|
|
| |||||||||||||
| (5) | Share amount represents shares of the issuer previously held that resulted in receipt of the escrow. |
| (6) | Current yield as of period end. |
| † | See Significant Accounting Policies of accompanying Notes to Financial Statements regarding valuation of investments. |
The accompanying notes are an integral part of these financial statements.
| 74 |
|
| The Hartford Small Company Fund |
Schedule of Investments – (continued)
October 31, 2019
Fair Valuation Summary
The following is a summary of the fair valuations according to the inputs used as of October 31, 2019 in valuing the Fund’s investments.
Description | Total | Level 1 | Level 2 | Level 3(1) | ||||||||||||
Assets |
| |||||||||||||||
Common Stocks |
| |||||||||||||||
Automobiles & Components | $ | 7,354,796 | $ | 7,354,796 | $ | — | $ | — | ||||||||
Banks | 27,965,432 | 27,965,432 | — | — | ||||||||||||
Capital Goods | 83,971,506 | 83,971,506 | — | — | ||||||||||||
Commercial & Professional Services | 25,367,942 | 25,367,942 | — | — | ||||||||||||
Consumer Durables & Apparel | 56,893,152 | 56,893,152 | — | — | ||||||||||||
Consumer Services | 36,452,514 | 34,613,014 | — | 1,839,500 | ||||||||||||
Diversified Financials | 7,263,419 | 7,263,419 | — | — | ||||||||||||
Energy | 3,138,054 | 3,138,054 | — | — | ||||||||||||
Food & Staples Retailing | 4,141,649 | 4,141,649 | — | — | ||||||||||||
Food, Beverage & Tobacco | 6,175,211 | 6,175,211 | — | — | ||||||||||||
Health Care Equipment & Services | 83,311,195 | 83,311,195 | — | — | ||||||||||||
Insurance | 4,773,437 | 4,773,437 | — | — | ||||||||||||
Materials | 19,885,114 | 19,885,114 | — | — | ||||||||||||
Media & Entertainment | 4,276,077 | 4,276,077 | — | — | ||||||||||||
Pharmaceuticals, Biotechnology & Life Sciences | 70,518,705 | 70,518,705 | — | — | ||||||||||||
Real Estate | 26,810,389 | 26,810,389 | — | — | ||||||||||||
Retailing | 12,172,462 | 9,957,950 | — | 2,214,512 | ||||||||||||
Semiconductors & Semiconductor Equipment | 17,365,236 | 17,365,236 | — | — | ||||||||||||
Software & Services | 59,832,371 | 59,832,371 | — | — | ||||||||||||
Technology Hardware & Equipment | 15,245,005 | 15,245,005 | — | — | ||||||||||||
Telecommunication Services | 3,418,131 | 3,418,131 | — | — | ||||||||||||
Convertible Preferred Stocks | 4,382,507 | — | — | 4,382,507 | ||||||||||||
Escrows | 53,330 | — | — | 53,330 | ||||||||||||
Short-Term Investments | 37,264,701 | 37,264,701 | — | — | ||||||||||||
|
|
|
|
|
|
|
| |||||||||
Total | $ | 618,032,335 | $ | 609,542,486 | $ | — | $ | 8,489,849 | ||||||||
|
|
|
|
|
|
|
| |||||||||
| (1) | For the year ended October 31, 2019, there were no transfers in and out of Level 3. |
The following is a rollforward of the Fund’s investments that were valued using unobservable inputs (Level 3) for the year ended October 31, 2019:
| Common Stocks | Convertible Preferred Stocks | Escrows | Total | |||||||||||||
Beginning balance | $ | 4,284,091 | $ | 4,346,678 | $ | 112,498 | $ | 8,743,267 | ||||||||
Sales | — | — | (65,743 | ) | (65,743 | ) | ||||||||||
Total realized gain/(loss) | — | (291,935 | ) | 65,743 | (226,192 | ) | ||||||||||
Net change in unrealized appreciation/depreciation | (230,079 | ) | 327,764 | (59,168 | ) | 38,517 | ||||||||||
Transfers into Level 3 | — | — | — | — | ||||||||||||
Transfers out of Level 3 | — | — | — | — | ||||||||||||
|
|
|
|
|
|
|
| |||||||||
Ending balance | $ | 4,054,012 | $ | 4,382,507 | $ | 53,330 | $ | 8,489,849 | ||||||||
|
|
|
|
|
|
|
| |||||||||
The change in net unrealized appreciation/(depreciation) relating to the Level 3 investments held at October 31, 2019: was $(194,249).
The accompanying notes are an integral part of these financial statements.
| 75 |
|
| Hartford Domestic Equity Funds |
Glossary (abbreviations used in the preceding Schedules of Investments)
| Currency Abbreviations: | ||
USD | United States Dollar | |
| Index Abbreviations: | ||
S&P | Standard & Poor’s | |
| Other Abbreviations: | ||
ADR | American Depositary Receipt | |
DDCA | Dollars on Deposit in Custody Account | |
ETF | Exchange-Traded Fund | |
REIT | Real Estate Investment Trust | |
| 76 |
|
| Hartford Domestic Equity Funds |
Statements of Assets and Liabilities
October 31, 2019
| The Hartford Capital Appreciation Fund | Hartford Core Equity Fund | The Hartford Dividend and Growth Fund | The Hartford Equity Income Fund | The Hartford Growth Opportunities Fund | The Hartford Healthcare Fund | |||||||||||||||||||
Assets: | ||||||||||||||||||||||||
Investments in securities, at market value(1) | $ | 6,958,138,549 | $ | 5,695,892,235 | $ | 9,030,348,591 | $ | 4,074,462,411 | $ | 4,834,631,715 | $ | 1,309,152,519 | ||||||||||||
Cash collateral due from broker on futures contracts | 4,888,800 | 5,855,850 | — | — | — | — | ||||||||||||||||||
Foreign currency | 1,237 | — | — | 545,760 | 19 | 17 | ||||||||||||||||||
Receivables: | ||||||||||||||||||||||||
Investment securities sold | 31,273,319 | — | 40,389,518 | 3,228,204 | 56,408,193 | 109,999 | ||||||||||||||||||
Fund shares sold | 1,213,552 | 19,508,404 | 9,125,629 | 6,751,411 | 4,066,721 | 701,873 | ||||||||||||||||||
Dividends and interest | 5,087,459 | 4,844,338 | 11,970,375 | 5,461,484 | 1,332,603 | 1,044,415 | ||||||||||||||||||
Securities lending income | 96,048 | 103,592 | 864 | 12 | 229,837 | 7,606 | ||||||||||||||||||
Tax reclaims | 885,375 | — | 1,690,395 | 2,580,306 | 382,404 | 106,798 | ||||||||||||||||||
Other assets | 8,510,931 | 175,459 | 157,881 | 105,386 | 112,581 | 57,299 | ||||||||||||||||||
|
|
|
|
|
|
|
|
|
|
|
| |||||||||||||
Total assets | 7,010,095,270 | 5,726,379,878 | 9,093,683,253 | 4,093,134,974 | 4,897,164,073 | 1,311,180,526 | ||||||||||||||||||
|
|
|
|
|
|
|
|
|
|
|
| |||||||||||||
Liabilities: | ||||||||||||||||||||||||
Obligation to return securities lending collateral | 31,596,022 | 25,237,978 | 4,542,000 | — | 104,283,353 | 34,242,367 | ||||||||||||||||||
Due to custodian | — | — | — | — | 14,164,753 | — | ||||||||||||||||||
Payables: | ||||||||||||||||||||||||
Investment securities purchased | 24,379,368 | — | 28,357,148 | 8,131,289 | 45,573,646 | 1,272,265 | ||||||||||||||||||
Fund shares redeemed | 5,727,244 | 6,013,621 | 10,817,639 | 6,234,574 | 6,349,031 | 2,707,916 | ||||||||||||||||||
Investment management fees | 3,870,179 | 1,593,225 | 4,547,485 | 2,099,325 | 2,783,160 | 890,502 | ||||||||||||||||||
Transfer agent fees | 1,778,465 | 807,900 | 1,503,275 | 730,093 | 1,262,523 | 416,189 | ||||||||||||||||||
Accounting services fees | 116,822 | 77,551 | 110,768 | 59,438 | 82,911 | 18,603 | ||||||||||||||||||
Board of Directors’ fees | 33,080 | 17,150 | 38,378 | 18,659 | 22,632 | 6,390 | ||||||||||||||||||
Variation margin on futures contracts | 465,573 | 507,000 | — | — | — | — | ||||||||||||||||||
Distribution fees | 162,159 | 69,011 | 128,973 | 78,280 | 90,480 | 35,288 | ||||||||||||||||||
Accrued expenses | 329,058 | 145,684 | 318,136 | 173,611 | 213,875 | 89,731 | ||||||||||||||||||
|
|
|
|
|
|
|
|
|
|
|
| |||||||||||||
Total liabilities | 68,457,970 | 34,469,120 | 50,363,802 | 17,525,269 | 174,826,364 | 39,679,251 | ||||||||||||||||||
|
|
|
|
|
|
|
|
|
|
|
| |||||||||||||
Net assets | $ | 6,941,637,300 | $ | 5,691,910,758 | $ | 9,043,319,451 | $ | 4,075,609,705 | $ | 4,722,337,709 | $ | 1,271,501,275 | ||||||||||||
|
|
|
|
|
|
|
|
|
|
|
| |||||||||||||
Summary of Net Assets: | ||||||||||||||||||||||||
Capital stock andpaid-in-capital | $ | 5,823,631,545 | $ | 4,361,944,830 | $ | 6,153,709,066 | $ | 2,917,116,869 | $ | 3,849,269,415 | $ | 984,067,047 | ||||||||||||
Distributable earnings | 1,118,005,755 | 1,329,965,928 | 2,889,610,385 | 1,158,492,836 | 873,068,294 | 287,434,228 | ||||||||||||||||||
|
|
|
|
|
|
|
|
|
|
|
| |||||||||||||
Net assets | $ | 6,941,637,300 | $ | 5,691,910,758 | $ | 9,043,319,451 | $ | 4,075,609,705 | $ | 4,722,337,709 | $ | 1,271,501,275 | ||||||||||||
|
|
|
|
|
|
|
|
|
|
|
| |||||||||||||
Shares authorized | 1,765,000,000 | 850,000,000 | 1,300,000,000 | 800,000,000 | 23,900,000,000 | 610,000,000 | ||||||||||||||||||
|
|
|
|
|
|
|
|
|
|
|
| |||||||||||||
Par value | $ | 0.0010 | $ | 0.0010 | $ | 0.0010 | $ | 0.0010 | $ | 0.0001 | $ | 0.0010 | ||||||||||||
|
|
|
|
|
|
|
|
|
|
|
| |||||||||||||
Class A: Net asset value per share | $ | 37.12 | $ | 33.40 | $ | 25.93 | $ | 19.99 | $ | 39.45 | $ | 35.63 | ||||||||||||
|
|
|
|
|
|
|
|
|
|
|
| |||||||||||||
Maximum offering price per share | $ | 39.28 | $ | 35.34 | $ | 27.44 | $ | 21.15 | $ | 41.75 | $ | 37.70 | ||||||||||||
|
|
|
|
|
|
|
|
|
|
|
| |||||||||||||
Shares outstanding | 130,175,428 | 26,392,943 | 144,214,186 | 78,303,947 | 52,959,484 | 18,696,670 | ||||||||||||||||||
|
|
|
|
|
|
|
|
|
|
|
| |||||||||||||
Net Assets | $ | 4,831,749,011 | $ | 881,587,425 | $ | 3,739,696,353 | $ | 1,565,662,854 | $ | 2,089,245,543 | $ | 666,180,788 | ||||||||||||
|
|
|
|
|
|
|
|
|
|
|
| |||||||||||||
Class C: Net asset value per share | $ | 27.08 | $ | 30.35 | $ | 24.96 | $ | 19.88 | $ | 20.50 | $ | 28.24 | ||||||||||||
|
|
|
|
|
|
|
|
|
|
|
| |||||||||||||
Shares outstanding | 10,281,897 | 12,076,799 | 7,722,046 | 14,705,548 | 13,732,229 | 4,905,550 | ||||||||||||||||||
|
|
|
|
|
|
|
|
|
|
|
| |||||||||||||
Net Assets | $ | 278,393,537 | $ | 366,552,524 | $ | 192,715,028 | $ | 292,388,229 | $ | 281,544,926 | $ | 138,538,836 | ||||||||||||
|
|
|
|
|
|
|
|
|
|
|
| |||||||||||||
Class I: Net asset value per share | $ | 37.36 | $ | 33.50 | $ | 25.80 | $ | 19.88 | $ | 41.95 | $ | 37.68 | ||||||||||||
|
|
|
|
|
|
|
|
|
|
|
| |||||||||||||
Shares outstanding | 17,622,252 | 51,963,767 | 41,866,704 | 48,254,022 | 35,778,603 | 7,881,817 | ||||||||||||||||||
|
|
|
|
|
|
|
|
|
|
|
| |||||||||||||
Net Assets | $ | 658,302,226 | $ | 1,740,668,985 | $ | 1,079,961,623 | $ | 959,142,164 | $ | 1,500,756,353 | $ | 297,000,225 | ||||||||||||
|
|
|
|
|
|
|
|
|
|
|
| |||||||||||||
Class R3: Net asset value per share | $ | 41.47 | $ | 33.86 | $ | 26.32 | $ | 20.02 | $ | 39.41 | $ | 36.56 | ||||||||||||
|
|
|
|
|
|
|
|
|
|
|
| |||||||||||||
Shares outstanding | 1,228,862 | 1,008,905 | 2,512,051 | 2,171,041 | 1,135,789 | 928,570 | ||||||||||||||||||
|
|
|
|
|
|
|
|
|
|
|
| |||||||||||||
Net Assets | $ | 50,956,815 | $ | 34,158,081 | $ | 66,114,658 | $ | 43,473,826 | $ | 44,757,029 | $ | 33,948,339 | ||||||||||||
|
|
|
|
|
|
|
|
|
|
|
| |||||||||||||
Class R4: Net asset value per share | $ | 43.06 | $ | 34.44 | $ | 26.52 | $ | 20.06 | $ | 42.26 | $ | 38.69 | ||||||||||||
|
|
|
|
|
|
|
|
|
|
|
| |||||||||||||
Shares outstanding | 897,186 | 4,359,542 | 4,202,005 | 2,690,264 | 1,587,815 | 690,121 | ||||||||||||||||||
|
|
|
|
|
|
|
|
|
|
|
| |||||||||||||
Net Assets | $ | 38,633,943 | $ | 150,158,993 | $ | 111,450,818 | $ | 53,956,593 | $ | 67,104,053 | $ | 26,698,983 | ||||||||||||
|
|
|
|
|
|
|
|
|
|
|
| |||||||||||||
Class R5: Net asset value per share | $ | 44.04 | $ | 33.75 | $ | 26.64 | $ | 20.16 | $ | 44.78 | $ | 40.71 | ||||||||||||
|
|
|
|
|
|
|
|
|
|
|
| |||||||||||||
Shares outstanding | 881,220 | 6,870,624 | 7,271,853 | 4,055,336 | 567,099 | 151,557 | ||||||||||||||||||
|
|
|
|
|
|
|
|
|
|
|
| |||||||||||||
Net Assets | $ | 38,807,847 | $ | 231,879,196 | $ | 193,706,924 | $ | 81,758,134 | $ | 25,395,925 | $ | 6,169,981 | ||||||||||||
|
|
|
|
|
|
|
|
|
|
|
| |||||||||||||
Class R6: Net asset value per share | $ | 44.34 | $ | 33.91 | $ | 26.64 | $ | 20.21 | $ | 45.62 | $ | 41.28 | ||||||||||||
|
|
|
|
|
|
|
|
|
|
|
| |||||||||||||
Shares outstanding | 1,816,322 | 7,659,057 | 4,472,695 | 2,582,656 | 498,966 | 32,486 | ||||||||||||||||||
|
|
|
|
|
|
|
|
|
|
|
| |||||||||||||
Net Assets | $ | 80,535,206 | $ | 259,706,299 | $ | 119,159,237 | $ | 52,201,302 | $ | 22,765,189 | $ | 1,341,130 | ||||||||||||
|
|
|
|
|
|
|
|
|
|
|
| |||||||||||||
The accompanying notes are an integral part of these financial statements.
| 77 |
|
| Hartford Domestic Equity Funds |
Statements of Assets and Liabilities – (continued)
October 31, 2019
| The Hartford Capital Appreciation Fund | Hartford Core Equity Fund | The Hartford Dividend and Growth Fund | The Hartford Equity Income Fund | The Hartford Growth Opportunities Fund | The Hartford Healthcare Fund | |||||||||||||||||||
Class Y: Net asset value per share | 44.32 | �� | $ | 33.90 | $ | 26.64 | $ | 20.22 | $ | 45.61 | $ | 41.27 | ||||||||||||
|
|
|
|
|
|
|
|
|
|
|
| |||||||||||||
Shares outstanding | 4,236,718 | 10,961,172 | 26,133,280 | 5,194,826 | 3,604,571 | 1,756,993 | ||||||||||||||||||
|
|
|
|
|
|
|
|
|
|
|
| |||||||||||||
Net Assets | $ | 187,754,131 | $ | 371,579,763 | $ | 696,309,176 | $ | 105,014,896 | $ | 164,389,853 | $ | 72,514,537 | ||||||||||||
|
|
|
|
|
|
|
|
|
|
|
| |||||||||||||
Class F: Net asset value per share | $ | 37.36 | $ | 33.52 | $ | 25.78 | $ | 19.87 | $ | 42.09 | $ | 37.79 | ||||||||||||
|
|
|
|
|
|
|
|
|
|
|
| |||||||||||||
Shares outstanding | 20,784,521 | 49,391,142 | 110,333,407 | 46,391,308 | 12,507,144 | 770,342 | ||||||||||||||||||
|
|
|
|
|
|
|
|
|
|
|
| |||||||||||||
Net Assets | $ | 776,504,585 | $ | 1,655,619,492 | $ | 2,844,205,634 | $ | 922,011,707 | $ | 526,378,838 | $ | 29,108,456 | ||||||||||||
|
|
|
|
|
|
|
|
|
|
|
| |||||||||||||
Cost of investments | $ | 6,129,817,307 | $ | 4,511,943,870 | $ | 6,419,720,756 | $ | 3,186,267,130 | $ | 4,254,433,661 | $ | 1,098,477,554 | ||||||||||||
Cost of foreign currency | $ | 1,235 | $ | — | $ | — | $ | 545,988 | $ | 20 | $ | 17 | ||||||||||||
(1) Includes Investment in securities on loan, at market value | $ | 33,237,906 | $ | 22,988,543 | $ | 3,617,565 | $ | — | $ | 98,649,676 | $ | 33,434,256 | ||||||||||||
The accompanying notes are an integral part of these financial statements.
| 78 |
|
| Hartford Domestic Equity Funds |
Statements of Assets and Liabilities – (continued)
October 31, 2019
| The Hartford MidCap Fund | The Hartford MidCap Value Fund | Hartford Quality Value Fund | The Hartford Small Cap Growth Fund | Hartford Small Cap Value Fund | The Hartford Small Company Fund | |||||||||||||||||||
Assets: | ||||||||||||||||||||||||
Investments in securities, at market value(1) | $ | 14,082,179,561 | $ | 704,522,028 | $ | 208,569,914 | $ | 1,042,861,116 | $ | 106,663,312 | $ | 618,032,335 | ||||||||||||
Foreign currency | — | — | 6 | — | — | 5 | ||||||||||||||||||
Receivables: | ||||||||||||||||||||||||
Investment securities sold | 51,879,060 | 5,926,770 | — | 3,976,058 | 1,816,650 | 1,107,570 | ||||||||||||||||||
Fund shares sold | 17,797,456 | 1,313,690 | 25,339 | 408,062 | 16,649 | 686,229 | ||||||||||||||||||
Dividends and interest | 1,623,015 | 221,074 | 243,772 | 262,888 | 20,935 | 72,193 | ||||||||||||||||||
Securities lending income | 263,034 | — | — | 21,524 | 1,005 | 10,969 | ||||||||||||||||||
Tax reclaims | — | — | 115,185 | — | — | — | ||||||||||||||||||
Other assets | 228,788 | 48,541 | 57,969 | 56,928 | 56,822 | 62,752 | ||||||||||||||||||
|
|
|
|
|
|
|
|
|
|
|
| |||||||||||||
Total assets | 14,153,970,914 | 712,032,103 | 209,012,185 | 1,047,586,576 | 108,575,373 | 619,972,053 | ||||||||||||||||||
|
|
|
|
|
|
|
|
|
|
|
| |||||||||||||
Liabilities: | ||||||||||||||||||||||||
Obligation to return securities lending collateral | 164,065,631 | — | — | 22,408,521 | 3,076,375 | 9,654,908 | ||||||||||||||||||
Payables: | ||||||||||||||||||||||||
Investment securities purchased | 53,260,336 | 4,924,328 | — | 5,178,604 | 477,125 | 2,867,872 | ||||||||||||||||||
Fund shares redeemed | 13,154,138 | 651,318 | 214,993 | 2,895,289 | 599 | 578,774 | ||||||||||||||||||
Investment management fees | 8,230,165 | 421,996 | 78,505 | 605,990 | 61,263 | 410,394 | ||||||||||||||||||
Transfer agent fees | 2,788,857 | 159,770 | 89,824 | 262,954 | 31,159 | 176,274 | ||||||||||||||||||
Accounting services fees | 152,411 | 10,510 | 3,140 | 15,370 | 1,575 | 11,104 | ||||||||||||||||||
Board of Directors’ fees | 57,512 | 3,025 | 1,307 | 5,189 | 493 | 2,432 | ||||||||||||||||||
Distribution fees | 143,910 | 10,789 | 5,476 | 8,547 | 1,500 | 10,466 | ||||||||||||||||||
Accrued expenses | 652,171 | 90,230 | 38,563 | 72,628 | 26,069 | 88,180 | ||||||||||||||||||
|
|
|
|
|
|
|
|
|
|
|
| |||||||||||||
Total liabilities | 242,505,131 | 6,271,966 | 431,808 | 31,453,092 | 3,676,158 | 13,800,404 | ||||||||||||||||||
|
|
|
|
|
|
|
|
|
|
|
| |||||||||||||
Net assets | $ | 13,911,465,783 | $ | 705,760,137 | $ | 208,580,377 | $ | 1,016,133,484 | $ | 104,899,215 | $ | 606,171,649 | ||||||||||||
|
|
|
|
|
|
|
|
|
|
|
| |||||||||||||
Summary of Net Assets: | ||||||||||||||||||||||||
Capital stock andpaid-in-capital | $ | 10,658,723,029 | $ | 620,109,232 | $ | 177,257,268 | $ | 881,217,514 | $ | 93,386,765 | $ | 513,814,075 | ||||||||||||
Distributable earnings | 3,252,742,754 | 85,650,905 | 31,323,109 | 134,915,970 | 11,512,450 | 92,357,574 | ||||||||||||||||||
|
|
|
|
|
|
|
|
|
|
|
| |||||||||||||
Net assets | $ | 13,911,465,783 | $ | 705,760,137 | $ | 208,580,377 | $ | 1,016,133,484 | $ | 104,899,215 | $ | 606,171,649 | ||||||||||||
|
|
|
|
|
|
|
|
|
|
|
| |||||||||||||
Shares authorized | 1,230,000,000 | 610,000,000 | 27,160,000,000 | 27,150,000,000 | 1,110,000,000 | 650,000,000 | ||||||||||||||||||
|
|
|
|
|
|
|
|
|
|
|
| |||||||||||||
Par value | $ | 0.0010 | $ | 0.0010 | $ | 0.0001 | $ | 0.0001 | $ | 0.0010 | $ | 0.0010 | ||||||||||||
|
|
|
|
|
|
|
|
|
|
|
| |||||||||||||
Class A: Net asset value per share | $ | 30.34 | $ | 14.43 | $ | 21.11 | $ | 45.71 | $ | 10.35 | $ | 20.35 | ||||||||||||
|
|
|
|
|
|
|
|
|
|
|
| |||||||||||||
Maximum offering price per share | $ | 32.11 | $ | 15.27 | $ | 22.34 | $ | 48.37 | $ | 10.95 | $ | 21.53 | ||||||||||||
|
|
|
|
|
|
|
|
|
|
|
| |||||||||||||
Shares outstanding | 92,980,201 | 21,483,465 | 8,040,749 | 4,272,782 | 4,545,794 | 15,317,771 | ||||||||||||||||||
|
|
|
|
|
|
|
|
|
|
|
| |||||||||||||
Net Assets | $ | 2,820,970,922 | $ | 309,996,296 | $ | 169,771,031 | $ | 195,313,535 | $ | 47,037,140 | $ | 311,741,565 | ||||||||||||
|
|
|
|
|
|
|
|
|
|
|
| |||||||||||||
Class C: Net asset value per share | $ | 20.83 | $ | 11.51 | $ | 18.05 | $ | 30.90 | $ | 8.96 | $ | 13.30 | ||||||||||||
|
|
|
|
|
|
|
|
|
|
|
| |||||||||||||
Shares outstanding | 23,913,590 | 1,382,745 | 378,665 | 508,859 | 414,932 | 746,670 | ||||||||||||||||||
|
|
|
|
|
|
|
|
|
|
|
| |||||||||||||
Net Assets | $ | 498,057,013 | $ | 15,910,491 | $ | 6,834,021 | $ | 15,722,173 | $ | 3,718,946 | $ | 9,928,793 | ||||||||||||
|
|
|
|
|
|
|
|
|
|
|
| |||||||||||||
Class I: Net asset value per share | $ | 31.43 | $ | 14.60 | $ | 20.85 | $ | 48.05 | $ | 10.37 | $ | 21.65 | ||||||||||||
|
|
|
|
|
|
|
|
|
|
|
| |||||||||||||
Shares outstanding | 132,631,757 | 2,135,760 | 613,639 | 3,984,879 | 419,662 | 1,244,417 | ||||||||||||||||||
|
|
|
|
|
|
|
|
|
|
|
| |||||||||||||
Net Assets | $ | 4,168,592,195 | $ | 31,173,180 | $ | 12,795,514 | $ | 191,481,572 | $ | 4,353,873 | $ | 26,938,812 | ||||||||||||
|
|
|
|
|
|
|
|
|
|
|
| |||||||||||||
Class R3: Net asset value per share | $ | 33.98 | $ | 15.22 | $ | 21.45 | $ | 45.05 | $ | 10.73 | $ | 22.29 | ||||||||||||
|
|
|
|
|
|
|
|
|
|
|
| |||||||||||||
Shares outstanding | 2,837,027 | 527,682 | 57,795 | 222,770 | 56,752 | 634,343 | ||||||||||||||||||
|
|
|
|
|
|
|
|
|
|
|
| |||||||||||||
Net Assets | $ | 96,409,245 | $ | 8,033,648 | $ | 1,239,919 | $ | 10,035,742 | $ | 609,003 | $ | 14,141,905 | ||||||||||||
|
|
|
|
|
|
|
|
|
|
|
| |||||||||||||
Class R4: Net asset value per share | $ | 35.57 | $ | 15.58 | $ | 21.68 | $ | 47.69 | $ | 10.89 | $ | 23.88 | ||||||||||||
|
|
|
|
|
|
|
|
|
|
|
| |||||||||||||
Shares outstanding | 7,489,832 | 761,605 | 277,441 | 886,835 | 6,376 | 597,116 | ||||||||||||||||||
|
|
|
|
|
|
|
|
|
|
|
| |||||||||||||
Net Assets | $ | 266,389,855 | $ | 11,865,487 | $ | 6,014,209 | $ | 42,296,454 | $ | 69,441 | $ | 14,261,149 | ||||||||||||
|
|
|
|
|
|
|
|
|
|
|
| |||||||||||||
Class R5: Net asset value per share | $ | 36.77 | $ | 15.82 | $ | 21.87 | $ | 50.57 | $ | 10.87 | $ | 25.40 | ||||||||||||
|
|
|
|
|
|
|
|
|
|
|
| |||||||||||||
Shares outstanding | 13,534,573 | 100,642 | 10,494 | 1,633,850 | 1,030 | 127,526 | ||||||||||||||||||
|
|
|
|
|
|
|
|
|
|
|
| |||||||||||||
Net Assets | $ | 497,712,142 | $ | 1,591,740 | $ | 229,533 | $ | 82,624,233 | $ | 11,192 | $ | 3,238,617 | ||||||||||||
|
|
|
|
|
|
|
|
|
|
|
| |||||||||||||
Class R6: Net asset value per share | $ | 37.22 | $ | — | $ | 21.93 | $ | 51.36 | $ | 10.87 | $ | 25.97 | ||||||||||||
|
|
|
|
|
|
|
|
|
|
|
| |||||||||||||
Shares outstanding | 46,529,194 | — | 1,565 | 1,290,015 | 9,467 | 7,941 | ||||||||||||||||||
|
|
|
|
|
|
|
|
|
|
|
| |||||||||||||
Net Assets | $ | 1,731,889,789 | $ | — | $ | 34,316 | $ | 66,259,503 | $ | 102,885 | $ | 206,207 | ||||||||||||
|
|
|
|
|
|
|
|
|
|
|
| |||||||||||||
The accompanying notes are an integral part of these financial statements.
| 79 |
|
| Hartford Domestic Equity Funds |
Statements of Assets and Liabilities – (continued)
October 31, 2019
| The Hartford MidCap Fund | The Hartford MidCap Value Fund | Hartford Quality Value Fund | The Hartford Small Cap Growth Fund | Hartford Small Cap Value Fund | The Hartford Small Company Fund | |||||||||||||||||||
Class Y: Net asset value per share | $ | 37.17 | $ | 15.87 | $ | 21.91 | $ | 51.39 | $ | 10.86 | $ | 25.95 | ||||||||||||
|
|
|
|
|
|
|
|
|
|
|
| |||||||||||||
Shares outstanding | 42,286,468 | 795,542 | 28,394 | 7,120,079 | 52,642 | 1,251,437 | ||||||||||||||||||
|
|
|
|
|
|
|
|
|
|
|
| |||||||||||||
Net Assets | $ | 1,571,851,005 | $ | 12,623,644 | $ | 622,024 | $ | 365,867,167 | $ | 571,597 | $ | 32,472,137 | ||||||||||||
|
|
|
|
|
|
|
|
|
|
|
| |||||||||||||
Class F: Net asset value per share | $ | 31.52 | $ | 14.60 | $ | 20.83 | $ | 48.23 | $ | 10.38 | $ | 21.76 | ||||||||||||
|
|
|
|
|
|
|
|
|
|
|
| |||||||||||||
Shares outstanding | 71,684,615 | 21,549,746 | 529,958 | 964,764 | 4,667,039 | 8,881,640 | ||||||||||||||||||
|
|
|
|
|
|
|
|
|
|
|
| |||||||||||||
Net Assets | $ | 2,259,593,617 | $ | 314,565,651 | $ | 11,039,810 | $ | 46,533,105 | $ | 48,425,138 | $ | 193,242,464 | ||||||||||||
|
|
|
|
|
|
|
|
|
|
|
| |||||||||||||
Cost of investments | $ | 11,498,992,777 | $ | 635,824,048 | $ | 187,313,410 | $ | 920,127,557 | $ | 101,471,741 | $ | 559,506,582 | ||||||||||||
Cost of foreign currency | $ | — | $ | — | $ | 7 | $ | — | $ | — | $ | 5 | ||||||||||||
(1) Includes Investment in securities on loan, at market value | $ | 151,285,796 | $ | — | $ | — | $ | 22,309,469 | $ | 2,978,115 | $ | 9,309,793 | ||||||||||||
The accompanying notes are an integral part of these financial statements.
| 80 |
|
| Hartford Domestic Equity Funds |
For the Year Ended October 31, 2019
| The Hartford Capital Appreciation Fund | Hartford Core Equity Fund | The Hartford Dividend and Growth Fund | The Hartford Equity Income Fund | The Hartford Growth Opportunities Fund | The Hartford Healthcare Fund | |||||||||||||||||||
Investment Income: | ||||||||||||||||||||||||
Dividends | $ | 101,006,743 | $ | 67,851,392 | $ | 219,258,679 | $ | 121,144,737 | $ | 18,180,375 | $ | 11,915,352 | ||||||||||||
Interest | 3,092,576 | 3,640,621 | 6,139,862 | 1,463,081 | 3,932,219 | 1,077,682 | ||||||||||||||||||
Securities lending | 594,343 | 630,911 | 490,289 | 664,000 | 423,624 | 331,435 | ||||||||||||||||||
Less: Foreign tax withheld | (787,397 | ) | — | (2,000,411 | ) | (2,746,769 | ) | (37,175 | ) | (203,425 | ) | |||||||||||||
|
|
|
|
|
|
|
|
|
|
|
| |||||||||||||
Total investment income, net | 103,906,265 | 72,122,924 | 223,888,419 | 120,525,049 | 22,499,043 | 13,121,044 | ||||||||||||||||||
|
|
|
|
|
|
|
|
|
|
|
| |||||||||||||
Expenses: | ||||||||||||||||||||||||
Investment management fees | 46,378,263 | 15,433,233 | 51,423,104 | 24,737,572 | 34,023,751 | 11,307,230 | ||||||||||||||||||
Transfer agent fees | ||||||||||||||||||||||||
Class A | 5,832,436 | 831,890 | 3,845,989 | 1,438,473 | 2,541,815 | 968,578 | ||||||||||||||||||
Class C | 454,435 | 302,415 | 271,001 | 315,830 | 351,405 | 217,209 | ||||||||||||||||||
Class I | 596,938 | 1,189,594 | 906,603 | 986,336 | 1,690,896 | 340,515 | ||||||||||||||||||
Class R3 | 121,790 | 75,858 | 148,952 | 91,480 | 105,935 | 78,659 | ||||||||||||||||||
Class R4 | 74,054 | 204,798 | 186,808 | 106,030 | 125,619 | 48,782 | ||||||||||||||||||
Class R5 | 36,658 | 224,915 | 160,452 | 82,475 | 25,463 | 8,608 | ||||||||||||||||||
Class R6 | 751 | 6,755 | 4,038 | 1,614 | 778 | 15 | ||||||||||||||||||
Class Y | 142,175 | 230,510 | 476,676 | 82,283 | 135,476 | 36,833 | ||||||||||||||||||
Class F | 2,725 | 1,800 | 9,032 | 3,931 | 1,988 | 295 | ||||||||||||||||||
Distribution fees | ||||||||||||||||||||||||
Class A | 11,949,628 | 1,947,071 | 8,898,245 | 3,788,244 | 5,261,109 | 1,671,243 | ||||||||||||||||||
Class C | 3,493,979 | 3,244,269 | 2,057,077 | 3,101,863 | 3,020,800 | 1,490,797 | ||||||||||||||||||
Class R3 | 275,437 | 171,788 | 342,805 | 223,326 | 238,764 | 185,104 | ||||||||||||||||||
Class R4 | 116,689 | 354,982 | 311,870 | 162,484 | 196,722 | 76,283 | ||||||||||||||||||
Custodian fees | 17,411 | 22,814 | 40,164 | 38,976 | 1,147 | 34,888 | ||||||||||||||||||
Registration and filing fees | 175,557 | 274,550 | 281,494 | 193,112 | 217,328 | 147,010 | ||||||||||||||||||
Accounting services fees | 1,395,596 | 768,672 | 1,268,273 | 700,298 | 1,008,498 | 237,538 | ||||||||||||||||||
Board of Directors’ fees | 223,615 | 138,366 | 271,133 | 128,754 | 155,864 | 42,998 | ||||||||||||||||||
Audit fees | 65,498 | 22,185 | 24,522 | 22,680 | 46,196 | 24,206 | ||||||||||||||||||
Other expenses | 689,005 | 412,965 | 835,720 | 419,629 | 459,318 | 158,483 | ||||||||||||||||||
|
|
|
|
|
|
|
|
|
|
|
| |||||||||||||
Total expenses (before waivers, reimbursements and fees paid indirectly) | 72,042,640 | 25,859,430 | 71,763,958 | 36,625,390 | 49,608,872 | 17,075,274 | ||||||||||||||||||
Transfer agent fee waivers | (74,789 | ) | (81,471 | ) | (171,751 | ) | (26,219 | ) | (58,690 | ) | (9,490 | ) | ||||||||||||
Distribution fee reimbursements | (174,011 | ) | (66,481 | ) | (82,230 | ) | (10,711 | ) | (122,837 | ) | (23,140 | ) | ||||||||||||
Commission recapture | (65,641 | ) | (10,416 | ) | (50,583 | ) | (17,652 | ) | (28,306 | ) | (8,130 | ) | ||||||||||||
|
|
|
|
|
|
|
|
|
|
|
| |||||||||||||
Total waivers, reimbursements and fees paid indirectly | (314,441 | ) | (158,368 | ) | (304,564 | ) | (54,582 | ) | (209,833 | ) | (40,760 | ) | ||||||||||||
|
|
|
|
|
|
|
|
|
|
|
| |||||||||||||
Total expenses, net | 71,728,199 | 25,701,062 | 71,459,394 | 36,570,808 | 49,399,039 | 17,034,514 | ||||||||||||||||||
|
|
|
|
|
|
|
|
|
|
|
| |||||||||||||
Net Investment Income (Loss) | 32,178,066 | 46,421,862 | 152,429,025 | 83,954,241 | (26,899,996 | ) | (3,913,470 | ) | ||||||||||||||||
|
|
|
|
|
|
|
|
|
|
|
| |||||||||||||
Net Realized Gain (Loss) on Investments, Other Financial Instruments and Foreign Currency Transactions: | ||||||||||||||||||||||||
Net realized gain (loss) on investments | 310,050,711 | 88,920,084 | 261,902,400 | 252,121,339 | 328,070,743 | 98,103,643 | ||||||||||||||||||
Net realized gain (loss) on futures contracts | 3,627,613 | 11,571,502 | — | — | — | — | ||||||||||||||||||
Net realized gain (loss) on foreign currency contracts | 31,922 | — | — | — | — | — | ||||||||||||||||||
Net realized gain (loss) on other foreign currency transactions | 47,759 | — | 11,093 | (143,921 | ) | 35,494 | (6,614 | ) | ||||||||||||||||
|
|
|
|
|
|
|
|
|
|
|
| |||||||||||||
Net Realized Gain (Loss) on Investments, Other Financial Instruments and Foreign Currency Transactions | 313,758,005 | 100,491,586 | 261,913,493 | 251,977,418 | 328,106,237 | 98,097,029 | ||||||||||||||||||
|
|
|
|
|
|
|
|
|
|
|
| |||||||||||||
Net Changes in Unrealized Appreciation (Depreciation) of Investments, Other Financial Instruments and Foreign Currency Transactions: | ||||||||||||||||||||||||
Net unrealized appreciation (depreciation) of investments | 692,638,019 | 572,895,896 | 705,555,576 | 185,500,342 | 290,086,086 | 49,128,840 | ||||||||||||||||||
Net unrealized appreciation (depreciation) of futures contracts | 3,412,117 | 5,668,855 | — | — | — | — | ||||||||||||||||||
Net unrealized appreciation (depreciation) of translation of other assets and liabilities in foreign currencies | 98,593 | — | — | 92,278 | 18,348 | 2,202 | ||||||||||||||||||
|
|
|
|
|
|
|
|
|
|
|
| |||||||||||||
Net Changes in Unrealized Appreciation (Depreciation) of Investments, Other Financial Instruments and Foreign Currency Transactions | 696,148,729 | 578,564,751 | 705,555,576 | 185,592,620 | 290,104,434 | 49,131,042 | ||||||||||||||||||
|
|
|
|
|
|
|
|
|
|
|
| |||||||||||||
Net Gain (Loss) on Investments, Other Financial Instruments and Foreign Currency Transactions | 1,009,906,734 | 679,056,337 | 967,469,069 | 437,570,038 | 618,210,671 | 147,228,071 | ||||||||||||||||||
|
|
|
|
|
|
|
|
|
|
|
| |||||||||||||
Net Increase (Decrease) in Net Assets Resulting from Operations | $ | 1,042,084,800 | $ | 725,478,199 | $ | 1,119,898,094 | $ | 521,524,279 | $ | 591,310,675 | $ | 143,314,601 | ||||||||||||
|
|
|
|
|
|
|
|
|
|
|
| |||||||||||||
The accompanying notes are an integral part of these financial statements.
| 81 |
|
| Hartford Domestic Equity Funds |
Statements of Operations – (continued)
For the Year Ended October 31, 2019
| The Hartford MidCap Fund | The Hartford MidCap Value Fund | Hartford Quality Value Fund | The Hartford Small Cap Growth Fund | Hartford Small Cap Value Fund | The Hartford Small Company Fund | |||||||||||||||||||
Investment Income: | ||||||||||||||||||||||||
Dividends | $ | 102,217,874 | $ | 11,898,597 | $ | 6,959,138 | $ | 7,498,099 | $ | 2,221,509 | $ | 3,303,102 | ||||||||||||
Interest | 532,296 | 272,100 | 108,527 | 330,393 | 50,001 | 388,188 | ||||||||||||||||||
Securities lending | 1,551,669 | 16,728 | 4,655 | 381,463 | 7,697 | 63,132 | ||||||||||||||||||
Less: Foreign tax withheld | (419,375 | ) | (87,387 | ) | (97,363 | ) | — | (1,345 | ) | (2,418 | ) | |||||||||||||
|
|
|
|
|
|
|
|
|
|
|
| |||||||||||||
Total investment income, net | 103,882,464 | 12,100,038 | 6,974,957 | 8,209,955 | 2,277,862 | 3,752,004 | ||||||||||||||||||
|
|
|
|
|
|
|
|
|
|
|
| |||||||||||||
Expenses: | ||||||||||||||||||||||||
Investment management fees | 93,262,631 | 4,790,555 | 1,089,860 | 7,454,251 | 709,859 | 4,600,657 | ||||||||||||||||||
Transfer agent fees | ||||||||||||||||||||||||
Class A | 3,146,472 | 533,330 | 324,867 | 468,713 | 110,736 | 557,939 | ||||||||||||||||||
Class C | 651,258 | 32,683 | 16,546 | 25,491 | 11,839 | 25,826 | ||||||||||||||||||
Class I | 4,263,305 | 28,942 | 12,363 | 153,954 | 3,802 | 38,445 | ||||||||||||||||||
Class R3 | 215,355 | 19,639 | 2,360 | 25,423 | 1,267 | 35,454 | ||||||||||||||||||
Class R4 | 467,120 | 17,811 | 8,988 | 88,850 | 97 | 25,941 | ||||||||||||||||||
Class R5 | 511,485 | 4,577 | 581 | 85,110 | 30 | 3,706 | ||||||||||||||||||
Class R6 | 52,642 | — | 1 | 1,225 | — | 8 | ||||||||||||||||||
Class Y | 1,284,598 | 9,764 | 562 | 213,448 | 336 | 11,804 | ||||||||||||||||||
Class F | 7,078 | 2,164 | 125 | 599 | 121 | 1,391 | ||||||||||||||||||
Distribution fees | ||||||||||||||||||||||||
Class A | 6,848,338 | 737,539 | 410,916 | 495,789 | 121,367 | 756,545 | ||||||||||||||||||
Class C | 5,433,142 | 169,883 | 79,181 | 188,802 | 47,788 | 108,381 | ||||||||||||||||||
Class R3 | 516,020 | 44,834 | 5,475 | 58,797 | 2,857 | 80,188 | ||||||||||||||||||
Class R4 | 701,537 | 28,555 | 14,901 | 139,564 | 145 | 38,176 | ||||||||||||||||||
Custodian fees | 78,704 | 13,125 | 3,919 | 16,535 | 8,847 | 7,213 | ||||||||||||||||||
Registration and filing fees | 638,427 | 129,153 | 124,357 | 126,244 | 123,370 | 132,637 | ||||||||||||||||||
Accounting services fees | 1,742,124 | 118,815 | 43,594 | 189,810 | 18,254 | 124,011 | ||||||||||||||||||
Board of Directors’ fees | 424,228 | 21,028 | 8,169 | 33,896 | 3,186 | 17,881 | ||||||||||||||||||
Audit fees | 26,138 | 21,027 | 30,279 | 21,384 | 20,942 | 38,738 | ||||||||||||||||||
Other expenses | 1,738,478 | 183,514 | 36,752 | 135,070 | 21,563 | 145,849 | ||||||||||||||||||
|
|
|
|
|
|
|
|
|
|
|
| |||||||||||||
Total expenses (before waivers, reimbursements and fees paid indirectly) | 122,009,080 | 6,906,938 | 2,213,796 | 9,922,955 | 1,206,406 | 6,750,790 | ||||||||||||||||||
Expense waivers | — | — | (221,412 | ) | — | (94,900 | ) | (40,764 | ) | |||||||||||||||
Transfer agent fee waivers | (590,075 | ) | (3,834 | ) | — | (68,007 | ) | — | — | |||||||||||||||
Distribution fee reimbursements | (97,218 | ) | (6,178 | ) | (7,892 | ) | (13,925 | ) | (4,157 | ) | (13,724 | ) | ||||||||||||
Commission recapture | (63,849 | ) | (11,704 | ) | (1,455 | ) | (12,024 | ) | (560 | ) | (9,727 | ) | ||||||||||||
|
|
|
|
|
|
|
|
|
|
|
| |||||||||||||
Total waivers, reimbursements and fees paid indirectly | (751,142 | ) | (21,716 | ) | (230,759 | ) | (93,956 | ) | (99,617 | ) | (64,215 | ) | ||||||||||||
|
|
|
|
|
|
|
|
|
|
|
| |||||||||||||
Total expenses, net | 121,257,938 | 6,885,222 | 1,983,037 | 9,828,999 | 1,106,789 | 6,686,575 | ||||||||||||||||||
|
|
|
|
|
|
|
|
|
|
|
| |||||||||||||
Net Investment Income (Loss) | (17,375,474 | ) | 5,214,816 | 4,991,920 | (1,619,044 | ) | 1,171,073 | (2,934,571 | ) | |||||||||||||||
|
|
|
|
|
|
|
|
|
|
|
| |||||||||||||
Net Realized Gain (Loss) on Investments and Foreign Currency Transactions: | ||||||||||||||||||||||||
Net realized gain (loss) on investments | 692,360,713 | 15,821,812 | 6,016,325 | 14,715,285 | 5,306,719 | 38,278,420 | ||||||||||||||||||
Net realized gain (loss) on other foreign currency transactions | 28,388 | (25,519 | ) | (2,565 | ) | — | (4,750 | ) | (6,232 | ) | ||||||||||||||
|
|
|
|
|
|
|
|
|
|
|
| |||||||||||||
Net Realized Gain (Loss) on Investments and Foreign Currency Transactions | 692,389,101 | 15,796,293 | 6,013,760 | 14,715,285 | 5,301,969 | 38,272,188 | ||||||||||||||||||
|
|
|
|
|
|
|
|
|
|
|
| |||||||||||||
Net Changes in Unrealized Appreciation (Depreciation) of Investments and Foreign Currency Transactions: | ||||||||||||||||||||||||
Net unrealized appreciation (depreciation) of investments | 1,148,200,359 | 60,486,697 | 18,431,877 | 68,831,465 | (2,603,683 | ) | 34,222,341 | |||||||||||||||||
Net unrealized appreciation (depreciation) of translation of other assets and liabilities in foreign currencies | — | 1,027 | 4,496 | — | — | — | ||||||||||||||||||
|
|
|
|
|
|
|
|
|
|
|
| |||||||||||||
Net Changes in Unrealized Appreciation (Depreciation) of Investments and Foreign Currency Transactions | 1,148,200,359 | 60,487,724 | 18,436,373 | 68,831,465 | (2,603,683 | ) | 34,222,341 | |||||||||||||||||
|
|
|
|
|
|
|
|
|
|
|
| |||||||||||||
Net Gain (Loss) on Investments and Foreign Currency Transactions | 1,840,589,460 | 76,284,017 | 24,450,133 | 83,546,750 | 2,698,286 | 72,494,529 | ||||||||||||||||||
|
|
|
|
|
|
|
|
|
|
|
| |||||||||||||
Net Increase (Decrease) in Net Assets Resulting from Operations | $ | 1,823,213,986 | $ | 81,498,833 | $ | 29,442,053 | $ | 81,927,706 | $ | 3,869,359 | $ | 69,559,958 | ||||||||||||
|
|
|
|
|
|
|
|
|
|
|
| |||||||||||||
The accompanying notes are an integral part of these financial statements.
| 82 |
|
| Hartford Domestic Equity Funds |
Statements of Changes in Net Assets
| The Hartford Capital Appreciation Fund | Hartford Core Equity Fund | The Hartford Dividend and Growth Fund | ||||||||||||||||||||||
| For the Year Ended October 31, 2019 | For the Year Ended October 31, 2018 | For the Year Ended October 31, 2019 | For the Year Ended October 31, 2018 | For the Year Ended October 31, 2019 | For the Year Ended October 31, 2018 | |||||||||||||||||||
Operations: | ||||||||||||||||||||||||
Net investment income (loss) | $ | 32,178,066 | $ | 29,129,541 | $ | 46,421,862 | $ | 29,087,986 | $ | 152,429,025 | $ | 137,264,805 | ||||||||||||
Net realized gain (loss) on investments, other financial instruments and foreign currency transactions | 313,758,005 | 1,049,827,019 | 100,491,586 | 148,389,458 | 261,913,493 | 749,856,902 | ||||||||||||||||||
Net changes in unrealized appreciation (depreciation) of investments, other financial instruments and foreign currency transactions | 696,148,729 | (725,874,806 | ) | 578,564,751 | 121,421,247 | 705,555,576 | (503,569,392 | ) | ||||||||||||||||
|
|
|
|
|
|
|
|
|
|
|
| |||||||||||||
Net Increase (Decrease) in Net Assets Resulting from Operations | 1,042,084,800 | 353,081,754 | 725,478,199 | 298,898,691 | 1,119,898,094 | 383,552,315 | ||||||||||||||||||
|
|
|
|
|
|
|
|
|
|
|
| |||||||||||||
Distributions to Shareholders: | ||||||||||||||||||||||||
Class A | (706,880,408 | ) | (606,326,646 | ) | (32,665,488 | ) | (21,919,937 | ) | (376,562,728 | ) | (392,731,234 | ) | ||||||||||||
Class C | (77,462,288 | ) | (192,535,075 | ) | (13,165,205 | ) | (9,824,353 | ) | (22,753,711 | ) | (47,166,268 | ) | ||||||||||||
Class I | (107,802,788 | ) | (112,999,632 | ) | (58,009,690 | ) | (36,517,509 | ) | (95,343,423 | ) | (89,574,705 | ) | ||||||||||||
Class R3 | (8,221,995 | ) | (8,606,238 | ) | (1,469,253 | ) | (1,304,880 | ) | (7,276,281 | ) | (8,267,443 | ) | ||||||||||||
Class R4 | (6,723,975 | ) | (8,617,809 | ) | (6,169,265 | ) | (5,833,533 | ) | (13,533,303 | ) | (14,963,939 | ) | ||||||||||||
Class R5 | (4,489,300 | ) | (4,727,926 | ) | (10,058,287 | ) | (7,238,859 | ) | (16,252,768 | ) | (14,896,682 | ) | ||||||||||||
Class R6 | (9,472,410 | ) | (8,465,656 | ) | (7,010,180 | ) | (4,628,300 | ) | (9,073,108 | ) | (2,134,094 | ) | ||||||||||||
Class Y | (22,763,013 | ) | (21,588,189 | ) | (11,032,634 | ) | (5,743,412 | ) | (68,670,776 | ) | (67,373,460 | ) | ||||||||||||
Class F | (127,729,846 | ) | (148,455,017 | ) | (33,816,031 | ) | (22,560,533 | ) | (288,913,297 | ) | (294,232,092 | ) | ||||||||||||
|
|
|
|
|
|
|
|
|
|
|
| |||||||||||||
Total distributions | (1,071,546,023 | ) | (1,112,322,188 | ) | (173,396,033 | ) | (115,571,316 | ) | (898,379,395 | ) | (931,339,917 | ) | ||||||||||||
|
|
|
|
|
|
|
|
|
|
|
| |||||||||||||
Capital Share Transactions: |
| |||||||||||||||||||||||
Sold | 488,499,323 | 1,024,978,367 | 2,583,350,592 | 1,034,630,470 | 1,316,713,660 | 1,305,754,651 | ||||||||||||||||||
Issued on reinvestment of distributions | 1,028,835,269 | 1,024,872,512 | 165,763,267 | 110,126,116 | 867,611,541 | 904,747,281 | ||||||||||||||||||
Redeemed | (1,724,498,541 | ) | (2,362,392,164 | ) | (1,079,118,925 | ) | (1,049,713,011 | ) | (1,593,432,163 | ) | (1,815,707,318 | ) | ||||||||||||
|
|
|
|
|
|
|
|
|
|
|
| |||||||||||||
Net increase (decrease) from capital share transactions | (207,163,949 | ) | (312,541,285 | ) | 1,669,994,934 | 95,043,575 | 590,893,038 | 394,794,614 | ||||||||||||||||
|
|
|
|
|
|
|
|
|
|
|
| |||||||||||||
Net Increase (Decrease) in Net Assets | (236,625,172 | ) | (1,071,781,719 | ) | 2,222,077,100 | 278,370,950 | 812,411,737 | (152,992,988 | ) | |||||||||||||||
|
|
|
|
|
|
|
|
|
|
|
| |||||||||||||
Net Assets: |
| |||||||||||||||||||||||
Beginning of period | 7,178,262,472 | 8,250,044,191 | 3,469,833,658 | 3,191,462,708 | 8,230,907,714 | 8,383,900,702 | ||||||||||||||||||
|
|
|
|
|
|
|
|
|
|
|
| |||||||||||||
End of period | $ | 6,941,637,300 | $ | 7,178,262,472 | $ | 5,691,910,758 | $ | 3,469,833,658 | $ | 9,043,319,451 | $ | 8,230,907,714 | ||||||||||||
|
|
|
|
|
|
|
|
|
|
|
| |||||||||||||
The accompanying notes are an integral part of these financial statements.
| 83 |
|
| Hartford Domestic Equity Funds |
Statements of Changes in Net Assets – (continued)
| The Hartford Equity Income Fund | The Hartford Growth Opportunities Fund | The Hartford Healthcare Fund | ||||||||||||||||||||||
| For the Year Ended October 31, 2019 | For the Year Ended October 31, 2018 | For the Year Ended October 31, 2019 | For the Year Ended October 31, 2018 | For the Year Ended October 31, 2019 | For the Year Ended October 31, 2018 | |||||||||||||||||||
Operations: | ||||||||||||||||||||||||
Net investment income (loss) | $ | 83,954,241 | $ | 85,304,100 | $ | (26,899,996 | ) | $ | (26,628,720 | ) | $ | (3,913,470 | ) | $ | (6,298,519 | ) | ||||||||
Net realized gain (loss) on investments, other financial instruments and foreign currency transactions | 251,977,418 | 304,620,363 | 328,106,237 | 1,119,332,875 | 98,097,029 | 111,294,483 | ||||||||||||||||||
Net changes in unrealized appreciation (depreciation) of investments, other financial instruments and foreign currency transactions | 185,592,620 |
| (358,974,067 | ) |
| 290,104,434 |
|
| (691,128,168 | ) | 49,131,042 | (46,256,832 | ) | |||||||||||
|
|
|
|
|
|
|
|
|
|
|
| |||||||||||||
Net Increase (Decrease) in Net Assets Resulting from Operations | 521,524,279 | 30,950,396 | 591,310,675 | 401,575,987 | 143,314,601 | 58,739,132 | ||||||||||||||||||
|
|
|
|
|
|
|
|
|
|
|
| |||||||||||||
Distributions to Shareholders: | ||||||||||||||||||||||||
Class A | (139,419,928 | ) | (110,568,818 | ) | (456,838,651 | ) | (158,556,200 | ) | (48,565,116 | ) | (35,671,123 | ) | ||||||||||||
Class C | (27,745,387 | ) | (26,593,783 | ) | (111,605,001 | ) | (50,309,267 | ) | (13,953,587 | ) | (14,636,384 | ) | ||||||||||||
Class I | (106,057,518 | ) | (80,508,699 | ) | (353,498,531 | ) | (124,475,405 | ) | (25,648,483 | ) | (17,037,825 | ) | ||||||||||||
Class R3 | (4,085,476 | ) | (3,521,663 | ) | (10,699,557 | ) | (4,054,099 | ) | (2,630,413 | ) | (2,149,358 | ) | ||||||||||||
Class R4 | (6,151,808 | ) | (5,230,591 | ) | (17,113,553 | ) | (6,430,582 | ) | (2,166,993 | ) | (1,635,340 | ) | ||||||||||||
Class R5 | (7,636,620 | ) | (5,773,145 | ) | (4,132,294 | ) | (1,298,270 | ) | (547,097 | ) | (311,084 | ) | ||||||||||||
Class R6 | (3,471,599 | ) | (2,239,099 | ) | (2,565,390 | ) | (405,519 | ) | — | — | ||||||||||||||
Class Y | (12,485,702 | ) | (9,816,882 | ) | (24,851,439 | ) | (7,918,200 | ) | (3,369,356 | ) | (2,027,884 | ) | ||||||||||||
Class F | (76,875,225 | ) | (51,013,597 | ) | (88,424,295 | ) | (49,296,790 | ) | (5,165,741 | ) | (3,055,878 | ) | ||||||||||||
|
|
|
|
|
|
|
|
|
|
|
| |||||||||||||
Total distributions | (383,929,263 | ) | (295,266,277 | ) | (1,069,728,711 | ) | (402,744,332 | ) | (102,046,786 | ) | (76,524,876 | ) | ||||||||||||
|
|
|
|
|
|
|
|
|
|
|
| |||||||||||||
Capital Share Transactions: |
| |||||||||||||||||||||||
Sold | 684,129,579 | 873,087,387 | 1,040,653,406 | 969,192,221 | 162,135,540 | 299,018,988 | ||||||||||||||||||
Issued on reinvestment of distributions | 367,118,559 | 282,151,407 | 974,523,793 | 368,471,573 | 97,225,749 | 72,780,594 | ||||||||||||||||||
Redeemed | (1,256,628,479 | ) | (1,058,675,637 | ) | (1,511,405,502 | ) | (1,385,082,501 | ) | (458,221,064 | ) | (429,112,111 | ) | ||||||||||||
|
|
|
|
|
|
|
|
|
|
|
| |||||||||||||
Net increase (decrease) from capital share transactions | (205,380,341 | ) | 96,563,157 | 503,771,697 | (47,418,707 | ) | (198,859,775 | ) | (57,312,529 | ) | ||||||||||||||
|
|
|
|
|
|
|
|
|
|
|
| |||||||||||||
Net Increase (Decrease) in Net Assets | (67,785,325 | ) | (167,752,724 | ) | 25,353,661 | (48,587,052 | ) | (157,591,960 | ) | (75,098,273 | ) | |||||||||||||
|
|
|
|
|
|
|
|
|
|
|
| |||||||||||||
Net Assets: |
| |||||||||||||||||||||||
Beginning of period | 4,143,395,030 | 4,311,147,754 | 4,696,984,048 | 4,745,571,100 | 1,429,093,235 | 1,504,191,508 | ||||||||||||||||||
|
|
|
|
|
|
|
|
|
|
|
| |||||||||||||
End of period | $ | 4,075,609,705 | $ | 4,143,395,030 | $ | 4,722,337,709 | $ | 4,696,984,048 | $ | 1,271,501,275 | $ | 1,429,093,235 | ||||||||||||
|
|
|
|
|
|
|
|
|
|
|
| |||||||||||||
The accompanying notes are an integral part of these financial statements.
| 84 |
|
| Hartford Domestic Equity Funds |
Statements of Changes in Net Assets – (continued)
| The Hartford MidCap Fund | The Hartford MidCap Value Fund | Hartford Quality Value Fund | ||||||||||||||||||||||
| For the Year Ended October 31, 2019 | For the Year Ended October 31, 2018 | For the Year Ended October 31, 2019 | For the Year Ended October 31, 2018 | For the Year Ended October 31, 2019 | For the Year Ended October 31, 2018 | |||||||||||||||||||
Operations: | ||||||||||||||||||||||||
Net investment income (loss) | $ | (17,375,474 | ) | $ | (27,259,243 | ) | $ | 5,214,816 | $ | 2,443,998 | $ | 4,991,920 | $ | 4,688,650 | ||||||||||
Net realized gain (loss) on investments and foreign currency transactions | 692,389,101 | 1,338,169,899 | 15,796,293 | 67,366,569 | 6,013,760 | 13,126,896 | ||||||||||||||||||
Net changes in unrealized appreciation (depreciation) of investments and foreign currency transactions | 1,148,200,359 | (1,053,603,351 | ) |
| 60,487,724 |
|
| (98,187,581 | ) |
| 18,436,373 |
|
| (13,079,872 | ) | |||||||||
|
|
|
|
|
|
|
|
|
|
|
| |||||||||||||
Net Increase (Decrease) in Net Assets Resulting from Operations | 1,823,213,986 | 257,307,305 | 81,498,833 | (28,377,014 | ) | 29,442,053 | 4,735,674 | |||||||||||||||||
|
|
|
|
|
|
|
|
|
|
|
| |||||||||||||
Distributions to Shareholders: | ||||||||||||||||||||||||
Class A | (289,440,848 | ) | (114,449,039 | ) | (31,904,637 | ) | (7,223,583 | ) | (10,328,219 | ) | (8,334,392 | ) | ||||||||||||
Class C | (88,988,927 | ) | (44,224,199 | ) | (2,364,041 | ) | (1,054,080 | ) | (488,659 | ) | (939,316 | ) | ||||||||||||
Class I | (397,398,146 | ) | (137,926,366 | ) | (3,672,119 | ) | (1,061,423 | ) | (854,566 | ) | (739,645 | ) | ||||||||||||
Class R3 | (10,655,554 | ) | (3,811,998 | ) | (947,049 | ) | (281,738 | ) | (61,925 | ) | (51,825 | ) | ||||||||||||
Class R4 | (27,102,479 | ) | (10,885,993 | ) | (1,216,557 | ) | (300,127 | ) | (364,460 | ) | (346,523 | ) | ||||||||||||
Class R5 | (45,165,553 | ) | (14,370,283 | ) | (805,091 | ) | (270,417 | ) | (32,495 | ) | (23,373 | ) | ||||||||||||
Class R6 | (108,955,955 | ) | (19,124,476 | ) | — | — | (650 | ) | — | |||||||||||||||
Class Y | (162,390,598 | ) | (61,748,284 | ) | (1,198,031 | ) | (697,801 | ) | (39,465 | ) | (53,600 | ) | ||||||||||||
Class F | (183,904,712 | ) | (56,547,280 | ) | (29,727,333 | ) | (6,915,715 | ) | (6,128,466 | ) | (2,280,455 | ) | ||||||||||||
|
|
|
|
|
|
|
|
|
|
|
| |||||||||||||
Total distributions | (1,314,002,772 | ) | (463,087,918 | ) | (71,834,858 | ) | (17,804,884 | ) | (18,298,905 | ) | (12,769,129 | ) | ||||||||||||
|
|
|
|
|
|
|
|
|
|
|
| |||||||||||||
Capital Share Transactions: |
| |||||||||||||||||||||||
Sold | 3,932,057,467 | 4,914,460,268 | 140,081,421 | 178,140,524 | 16,762,137 | 99,183,936 | ||||||||||||||||||
Issued on reinvestment of distributions | 1,257,169,368 | 443,523,450 | 70,997,863 | 17,573,868 | 18,080,940 | 12,375,926 | ||||||||||||||||||
Redeemed | (4,084,043,517 | ) | (3,285,208,745 | ) | (145,764,489 | ) | (191,784,914 | ) | (120,327,472 | ) | (59,096,311 | ) | ||||||||||||
|
|
|
|
|
|
|
|
|
|
|
| |||||||||||||
Net increase (decrease) from capital share transactions | 1,105,183,318 | 2,072,774,973 | 65,314,795 | 3,929,478 | (85,484,395 | ) | 52,463,551 | |||||||||||||||||
|
|
|
|
|
|
|
|
|
|
|
| |||||||||||||
Net Increase (Decrease) in Net Assets | 1,614,394,532 | 1,866,994,360 | 74,978,770 | (42,252,420 | ) | (74,341,247 | ) | 44,430,096 | ||||||||||||||||
|
|
|
|
|
|
|
|
|
|
|
| |||||||||||||
Net Assets: |
| |||||||||||||||||||||||
Beginning of period | 12,297,071,251 | 10,430,076,891 | 630,781,367 | 673,033,787 | 282,921,624 | 238,491,528 | ||||||||||||||||||
|
|
|
|
|
|
|
|
|
|
|
| |||||||||||||
End of period | $ | 13,911,465,783 | $ | 12,297,071,251 | $ | 705,760,137 | $ | 630,781,367 | $ | 208,580,377 | $ | 282,921,624 | ||||||||||||
|
|
|
|
|
|
|
|
|
|
|
| |||||||||||||
The accompanying notes are an integral part of these financial statements.
| 85 |
|
| Hartford Domestic Equity Funds |
Statements of Changes in Net Assets – (continued)
| The Hartford Small Cap Growth Fund | Hartford Small Cap Value Fund | The Hartford Small Company Fund | ||||||||||||||||||||||
| For the Year Ended October 31, 2019 | For the Year Ended October 31, 2018 | For the Year Ended October 31, 2019 | For the Year Ended October 31, 2018 | For the Year Ended October 31, 2019 | For the Year Ended October 31, 2018 | |||||||||||||||||||
Operations: | ||||||||||||||||||||||||
Net investment income (loss) | $ | (1,619,044 | ) | $ | (3,618,477 | ) | $ | 1,171,073 | $ | 586,484 | $ | (2,934,571 | ) | $ | (4,075,782 | ) | ||||||||
Net realized gain (loss) on investments, other financial instruments and foreign currency transactions | 14,715,285 | 225,263,306 | 5,301,969 | 24,948,797 | 38,272,188 | 105,808,268 | ||||||||||||||||||
Net changes in unrealized appreciation (depreciation) of investments | 68,831,465 | (183,849,268 | ) | (2,603,683 | ) | (22,059,218 | ) | 34,222,341 | (58,998,231 | ) | ||||||||||||||
|
|
|
|
|
|
|
|
|
|
|
| |||||||||||||
Net Increase (Decrease) in Net Assets Resulting from Operations | 81,927,706 | 37,795,561 | 3,869,359 | 3,476,063 | 69,559,958 | 42,734,255 | ||||||||||||||||||
|
|
|
|
|
|
|
|
|
|
|
| |||||||||||||
Distributions to Shareholders: | ||||||||||||||||||||||||
Class A | (43,413,241 | ) | (10,167,241 | ) | (12,609,836 | ) | (2,315,926 | ) | (50,850,996 | ) | — | |||||||||||||
Class C | (6,352,380 | ) | (2,203,133 | ) | (1,665,307 | ) | (508,602 | ) | (2,799,065 | ) | — | |||||||||||||
Class I | (47,429,264 | ) | (20,092,838 | ) | (1,179,686 | ) | (146,673 | ) | (4,870,629 | ) | — | |||||||||||||
Class R3 | (2,796,540 | ) | (702,522 | ) | (126,981 | ) | (16,003 | ) | (2,677,758 | ) | — | |||||||||||||
Class R4 | (14,166,813 | ) | (3,465,055 | ) | (11,402 | ) | (4,290 | ) | (2,412,769 | ) | — | |||||||||||||
Class R5 | (18,766,338 | ) | (5,057,310 | ) | (8,637 | ) | (2,044 | ) | (403,513 | ) | — | |||||||||||||
Class R6 | (8,767,431 | ) | (548,465 | ) | (2,456 | ) | — | (21,469 | ) | — | ||||||||||||||
Class Y | (69,794,940 | ) | (16,305,895 | ) | (115,661 | ) | (61,224 | ) | (5,332,405 | ) | — | |||||||||||||
Class F | (9,900,355 | ) | (2,220,863 | ) | (9,621,393 | ) | (4,128,489 | ) | (20,116,041 | ) | — | |||||||||||||
|
|
|
|
|
|
|
|
|
|
|
| |||||||||||||
Total distributions | (221,387,302 | ) | (60,763,322 | ) | (25,341,359 | ) | (7,183,251 | ) | (89,484,645 | ) | — | |||||||||||||
|
|
|
|
|
|
|
|
|
|
|
| |||||||||||||
Capital Share Transactions: |
| |||||||||||||||||||||||
Sold | 366,698,768 | 280,228,679 | 24,105,167 | 10,834,354 | 140,460,721 | 123,581,364 | ||||||||||||||||||
Issued on reinvestment of distributions | 209,847,653 | 58,239,385 | 24,897,952 | 7,135,493 | 88,871,747 | — | ||||||||||||||||||
Redeemed | (518,321,132 | ) | (537,355,309 | ) | (24,593,063 | ) | (68,460,953 | ) | (112,635,884 | ) | (128,907,283 | ) | ||||||||||||
|
|
|
|
|
|
|
|
|
|
|
| |||||||||||||
Net increase (decrease) from capital share transactions | 58,225,289 | (198,887,245 | ) | 24,410,056 | (50,491,106 | ) | 116,696,584 | (5,325,919 | ) | |||||||||||||||
|
|
|
|
|
|
|
|
|
|
|
| |||||||||||||
Net Increase (Decrease) in Net Assets | (81,234,307 | ) | (221,855,006 | ) | 2,938,056 | (54,198,294 | ) | 96,771,897 | 37,408,336 | |||||||||||||||
|
|
|
|
|
|
|
|
|
|
|
| |||||||||||||
Net Assets: |
| |||||||||||||||||||||||
Beginning of period | 1,097,367,791 | 1,319,222,797 | 101,961,159 | 156,159,453 | 509,399,752 | 471,991,416 | ||||||||||||||||||
|
|
|
|
|
|
|
|
|
|
|
| |||||||||||||
End of period | $ | 1,016,133,484 | $ | 1,097,367,791 | $ | 104,899,215 | $ | 101,961,159 | $ | 606,171,649 | $ | 509,399,752 | ||||||||||||
|
|
|
|
|
|
|
|
|
|
|
| |||||||||||||
The accompanying notes are an integral part of these financial statements.
| 86 |
|
| Hartford Domestic Equity Funds |
| — SelectedPer-Share Data(1)— | — Ratios and Supplemental Data — | |||||||||||||||||||||||||||||||||||||||||||||||||||||||
Class | Net Asset Value at Beginning of Period | Net Investment Income (Loss) | Net Realized and Unrealized Gain (Loss) on Investments | Total from Investment Operations | Dividends from Net Investment Income | Distributions from Capital Gains | Total Dividends and Distributions | Net Asset Value at End of Period | Total Return(2) | Net Assets at End of Period (000s) | Ratio of Expenses to Average Net Assets Before Adjust- ments(3) | Ratio of Expenses to Average Net Assets After Adjust- ments(3) | Ratio of Net Investment Income (Loss) to Average Net Assets | Portfolio Turnover | ||||||||||||||||||||||||||||||||||||||||||
| The Hartford Capital Appreciation Fund | ||||||||||||||||||||||||||||||||||||||||||||||||||||||||
For the Year Ended October 31, 2019 |
| |||||||||||||||||||||||||||||||||||||||||||||||||||||||
A | $ | 37.88 | $ | 0.15 | $ | 4.81 | $ | 4.96 | $ | (0.11 | ) | $ | (5.61 | ) | $ | (5.72 | ) | $ | 37.12 | 16.32 | % | $ | 4,831,749 | 1.07 | % | 1.07 | % | 0.42 | % | 68 | % | |||||||||||||||||||||||||
C | 29.30 | (0.09 | ) | 3.48 | 3.39 | — | (5.61 | ) | (5.61 | ) | 27.08 | 15.45 | 278,394 | 1.83 | 1.83 | (0.33 | ) | 68 | ||||||||||||||||||||||||||||||||||||||
I | 38.08 | 0.25 | 4.84 | 5.09 | (0.20 | ) | (5.61 | ) | (5.81 | ) | 37.36 | 16.66 | 658,302 | 0.79 | 0.79 | 0.70 | 68 | |||||||||||||||||||||||||||||||||||||||
R3 | 41.62 | 0.03 | 5.43 | 5.46 | — | (5.61 | ) | (5.61 | ) | 41.47 | 15.91 | 50,957 | 1.42 | 1.42 | 0.07 | 68 | ||||||||||||||||||||||||||||||||||||||||
R4 | 42.94 | 0.16 | 5.63 | 5.79 | (0.06 | ) | (5.61 | ) | (5.67 | ) | 43.06 | 16.27 | 38,634 | 1.11 | 1.11 | 0.39 | 68 | |||||||||||||||||||||||||||||||||||||||
R5 | 43.80 | 0.28 | 5.75 | 6.03 | (0.18 | ) | (5.61 | ) | (5.79 | ) | 44.04 | 16.64 | 38,808 | 0.80 | 0.80 | 0.68 | 68 | |||||||||||||||||||||||||||||||||||||||
R6 | 44.07 | 0.33 | 5.78 | 6.11 | (0.23 | ) | (5.61 | ) | (5.84 | ) | 44.34 | 16.74 | 80,535 | 0.70 | 0.70 | 0.78 | 68 | |||||||||||||||||||||||||||||||||||||||
Y | 44.06 | 0.32 | 5.77 | 6.09 | (0.22 | ) | (5.61 | ) | (5.83 | ) | 44.32 | 16.71 | 187,754 | 0.78 | 0.74 | 0.75 | 68 | |||||||||||||||||||||||||||||||||||||||
F | 38.09 | 0.28 | 4.83 | 5.11 | (0.23 | ) | (5.61 | ) | (5.84 | ) | 37.36 | 16.75 | 776,505 | 0.70 | 0.70 | 0.79 | 68 | |||||||||||||||||||||||||||||||||||||||
For the Year Ended October 31, 2018 |
| |||||||||||||||||||||||||||||||||||||||||||||||||||||||
A | $ | 41.86 | $ | 0.15 | $ | 1.45 | $ | 1.60 | $ | (0.26 | ) | $ | (5.32 | ) | $ | (5.58 | ) | $ | 37.88 | 3.92 | % | $ | 4,742,846 | 1.07 | % | 1.06 | % | 0.38 | % | 108 | % | |||||||||||||||||||||||||
C | 33.62 | (0.11 | ) | 1.16 | 1.05 | (0.05 | ) | (5.32 | ) | (5.37 | ) | 29.30 | 3.15 | 426,256 | 1.81 | 1.81 | (0.34 | ) | 108 | |||||||||||||||||||||||||||||||||||||
I | 42.04 | 0.26 | 1.44 | 1.70 | (0.34 | ) | (5.32 | ) | (5.66 | ) | 38.08 | 4.19 | 734,580 | 0.78 | 0.78 | 0.66 | 108 | |||||||||||||||||||||||||||||||||||||||
R3 | 45.39 | 0.02 | 1.56 | 1.58 | (0.03 | ) | (5.32 | ) | (5.35 | ) | 41.62 | 3.57 | 61,882 | 1.42 | 1.41 | 0.04 | 108 | |||||||||||||||||||||||||||||||||||||||
R4 | 46.69 | 0.15 | 1.62 | 1.77 | (0.20 | ) | (5.32 | ) | (5.52 | ) | 42.94 | 3.87 | 51,635 | 1.10 | 1.10 | 0.34 | 108 | |||||||||||||||||||||||||||||||||||||||
R5 | 47.54 | 0.30 | 1.63 | 1.93 | (0.35 | ) | (5.32 | ) | (5.67 | ) | 43.80 | 4.18 | 34,288 | 0.80 | 0.80 | 0.65 | 108 | |||||||||||||||||||||||||||||||||||||||
R6 | 47.80 | 0.35 | 1.64 | 1.99 | (0.40 | ) | (5.32 | ) | (5.72 | ) | 44.07 | 4.29 | 70,935 | 0.70 | 0.70 | 0.75 | 108 | |||||||||||||||||||||||||||||||||||||||
Y | 47.78 | 0.34 | 1.64 | 1.98 | (0.38 | ) | (5.32 | ) | (5.70 | ) | 44.06 | 4.28 | 175,731 | 0.71 | 0.71 | 0.74 | 108 | |||||||||||||||||||||||||||||||||||||||
F | 42.06 | 0.30 | 1.45 | 1.75 | (0.40 | ) | (5.32 | ) | (5.72 | ) | 38.09 | 4.28 | 880,110 | 0.70 | 0.70 | 0.75 | 108 | |||||||||||||||||||||||||||||||||||||||
For the Year Ended October 31, 2017 |
| |||||||||||||||||||||||||||||||||||||||||||||||||||||||
A | $ | 34.49 | $ | 0.13 | $ | 7.39 | $ | 7.52 | $ | (0.15 | ) | $ | — | $ | (0.15 | ) | $ | 41.86 | 21.86 | % | $ | 4,613,982 | 1.09 | %(4) | 1.08 | %(4) | 0.34 | % | 123 | % | ||||||||||||||||||||||||||
C | 27.80 | (0.12 | ) | 5.94 | 5.82 | — | — | — | 33.62 | 20.97 | 1,241,267 | 1.82 | (4) | 1.82 | (4) | (0.39 | ) | 123 | ||||||||||||||||||||||||||||||||||||||
I | 34.65 | 0.25 | 7.40 | 7.65 | (0.26 | ) | — | (0.26 | ) | 42.04 | 22.20 | 846,019 | 0.81 | (4) | 0.81 | (4) | 0.63 | 123 | ||||||||||||||||||||||||||||||||||||||
R3 | 37.38 | 0.01 | 8.01 | 8.02 | (0.01 | ) | — | (0.01 | ) | 45.39 | 21.47 | 75,201 | 1.42 | (4) | 1.40 | (4) | 0.03 | 123 | ||||||||||||||||||||||||||||||||||||||
R4 | 38.39 | 0.14 | 8.23 | 8.37 | (0.07 | ) | — | (0.07 | ) | 46.69 | 21.82 | 74,374 | 1.11 | (4) | 1.11 | (4) | 0.33 | 123 | ||||||||||||||||||||||||||||||||||||||
R5 | 39.15 | 0.28 | 8.37 | 8.65 | (0.26 | ) | — | (0.26 | ) | 47.54 | 22.20 | 40,582 | 0.81 | (4) | 0.80 | (4) | 0.63 | 123 | ||||||||||||||||||||||||||||||||||||||
R6 | 39.36 | 0.31 | 8.42 | 8.73 | (0.29 | ) | — | (0.29 | ) | 47.80 | 22.33 | 70,142 | 0.71 | (4) | 0.71 | (4) | 0.71 | 123 | ||||||||||||||||||||||||||||||||||||||
Y | 39.36 | 0.30 | 8.41 | 8.71 | (0.29 | ) | — | (0.29 | ) | 47.78 | 22.27 | 184,502 | 0.72 | (4) | 0.72 | (4) | 0.70 | 123 | ||||||||||||||||||||||||||||||||||||||
F(5) | 38.15 | 0.18 | 3.73 | 3.91 | — | — | — | 42.06 | 10.28 | (6) | 1,103,972 | 0.71 | (4)(7) | 0.71 | (4)(7) | 0.65 | (7) | 123 | ||||||||||||||||||||||||||||||||||||||
For the Year Ended October 31, 2016 |
| |||||||||||||||||||||||||||||||||||||||||||||||||||||||
A | $ | 38.15 | $ | 0.13 | $ | (0.57 | ) | $ | (0.44 | ) | $ | (0.12 | ) | $ | (3.10 | ) | $ | (3.22 | ) | $ | 34.49 | (0.97 | )% | $ | 4,609,594 | 1.11 | % | 1.11 | %(8) | 0.39 | % | 88 | % | |||||||||||||||||||||||
B | 31.00 | (0.13 | ) | (0.49 | ) | (0.62 | ) | — | (3.10 | ) | (3.10 | ) | 27.28 | (1.82 | ) | 58,647 | 2.00 | 2.00 | (8) | (0.49 | ) | 88 | ||||||||||||||||||||||||||||||||||
C | 31.48 | (0.09 | ) | (0.49 | ) | (0.58 | ) | — | (3.10 | ) | (3.10 | ) | 27.80 | (1.65 | ) | 1,420,171 | 1.83 | 1.83 | (8) | (0.33 | ) | 88 | ||||||||||||||||||||||||||||||||||
I | 38.31 | 0.24 | (0.57 | ) | (0.33 | ) | (0.23 | ) | (3.10 | ) | (3.33 | ) | 34.65 | (0.65 | ) | 1,225,026 | 0.81 | 0.81 | (8) | 0.70 | 88 | |||||||||||||||||||||||||||||||||||
R3 | 41.06 | 0.03 | (0.61 | ) | (0.58 | ) | — | (3.10 | ) | (3.10 | ) | 37.38 | (1.26 | ) | 103,526 | 1.43 | 1.42 | (8) | 0.09 | 88 | ||||||||||||||||||||||||||||||||||||
R4 | 42.07 | 0.15 | (0.63 | ) | (0.48 | ) | (0.10 | ) | (3.10 | ) | (3.20 | ) | 38.39 | (0.95 | ) | 100,426 | 1.12 | 1.12 | (8) | 0.39 | 88 | |||||||||||||||||||||||||||||||||||
R5 | 42.84 | 0.27 | (0.64 | ) | (0.37 | ) | (0.22 | ) | (3.10 | ) | (3.32 | ) | 39.15 | (0.65 | ) | 45,643 | 0.82 | 0.82 | (8) | 0.69 | 88 | |||||||||||||||||||||||||||||||||||
R6 | 43.03 | 0.33 | (0.66 | ) | (0.33 | ) | (0.24 | ) | (3.10 | ) | (3.34 | ) | 39.36 | (0.56 | ) | 57,432 | 0.72 | 0.72 | (8) | 0.85 | 88 | |||||||||||||||||||||||||||||||||||
Y | 43.05 | 0.30 | (0.63 | ) | (0.33 | ) | (0.26 | ) | (3.10 | ) | (3.36 | ) | 39.36 | (0.55 | ) | 939,300 | 0.72 | 0.72 | (8) | 0.78 | 88 | |||||||||||||||||||||||||||||||||||
For the Year Ended October 31, 2015 |
| |||||||||||||||||||||||||||||||||||||||||||||||||||||||
A | $ | 49.44 | $ | 0.13 | $ | 1.27 | $ | 1.40 | $ | (0.13 | ) | $ | (12.56 | ) | $ | (12.69 | ) | $ | 38.15 | 4.20 | % | $ | 5,453,502 | 1.09 | % | 1.09 | % | 0.34 | % | 79 | % | |||||||||||||||||||||||||
B | 42.72 | (0.17 | ) | 1.01 | 0.84 | — | (12.56 | ) | (12.56 | ) | 31.00 | 3.30 | 158,610 | 1.97 | 1.97 | (0.53 | ) | 79 | ||||||||||||||||||||||||||||||||||||||
C | 43.13 | (0.12 | ) | 1.03 | 0.91 | — | (12.56 | ) | (12.56 | ) | 31.48 | 3.47 | 1,799,846 | 1.81 | 1.81 | (0.38 | ) | 79 | ||||||||||||||||||||||||||||||||||||||
I | 49.60 | 0.26 | 1.26 | 1.52 | (0.25 | ) | (12.56 | ) | (12.81 | ) | 38.31 | 4.53 | 1,736,395 | 0.78 | 0.78 | 0.66 | 79 | |||||||||||||||||||||||||||||||||||||||
R3 | 52.24 | 0.01 | 1.37 | 1.38 | — | (12.56 | ) | (12.56 | ) | 41.06 | 3.87 | 124,072 | 1.40 | 1.40 | 0.03 | 79 | ||||||||||||||||||||||||||||||||||||||||
R4 | 53.19 | 0.14 | 1.41 | 1.55 | (0.11 | ) | (12.56 | ) | (12.67 | ) | 42.07 | 4.18 | 179,454 | 1.10 | 1.10 | 0.33 | 79 | |||||||||||||||||||||||||||||||||||||||
R5 | 53.92 | 0.28 | 1.43 | 1.71 | (0.23 | ) | (12.56 | ) | (12.79 | ) | 42.84 | 4.49 | 53,292 | 0.80 | 0.80 | 0.63 | 79 | |||||||||||||||||||||||||||||||||||||||
R6(9) | 54.32 | 0.30 | 1.25 | 1.55 | (0.28 | ) | (12.56 | ) | (12.84 | ) | 43.03 | 4.16 | (6) | 10 | 0.76 | (7) | 0.75 | (7) | 0.70 | (7) | 79 | |||||||||||||||||||||||||||||||||||
Y | 54.12 | 0.32 | 1.45 | 1.77 | (0.28 | ) | (12.56 | ) | (12.84 | ) | 43.05 | 4.60 | 1,253,378 | 0.70 | 0.70 | 0.73 | 79 | |||||||||||||||||||||||||||||||||||||||
The accompanying notes are an integral part of these financial statements.
| 87 |
|
| Hartford Domestic Equity Funds |
Financial Highlights – (continued)
| — SelectedPer-Share Data(1)— | — Ratios and Supplemental Data — | |||||||||||||||||||||||||||||||||||||||||||||||||||||||
Class | Net Asset Value at Beginning of Period | Net Investment Income (Loss) | Net Realized and Unrealized Gain (Loss) on Investments | Total from Investment Operations | Dividends from Net Investment Income | Distributions from Capital Gains | Total Dividends and Distributions | Net Asset Value at End of Period | Total Return(2) | Net Assets at End of Period (000s) | Ratio of Expenses to Average Net Assets Before Adjust- ments(3) | Ratio of Expenses to Average Net Assets After Adjust- ments(3) | Ratio of Net Investment Income (Loss) to Average Net Assets | Portfolio Turnover | ||||||||||||||||||||||||||||||||||||||||||
| Hartford Core Equity Fund | ||||||||||||||||||||||||||||||||||||||||||||||||||||||||
For the Year Ended October 31, 2019 |
| |||||||||||||||||||||||||||||||||||||||||||||||||||||||
A | $ | 30.17 | $ | 0.27 | $ | 4.40 | $ | 4.67 | $ | (0.21 | ) | $ | (1.23 | ) | $ | (1.44 | ) | $ | 33.40 | 16.60 | % | $ | 881,587 | 0.74 | % | 0.73 | % | 0.88 | % | 15 | % | |||||||||||||||||||||||||
C | 27.53 | 0.04 | 4.01 | 4.05 | — | (1.23 | ) | (1.23 | ) | 30.35 | 15.71 | 366,553 | 1.47 | 1.47 | 0.14 | 15 | ||||||||||||||||||||||||||||||||||||||||
I | 30.26 | 0.35 | 4.40 | 4.75 | (0.28 | ) | (1.23 | ) | (1.51 | ) | 33.50 | 16.91 | 1,740,669 | 0.47 | 0.47 | 1.14 | 15 | |||||||||||||||||||||||||||||||||||||||
R3 | 30.52 | 0.16 | 4.48 | 4.64 | (0.07 | ) | (1.23 | ) | (1.30 | ) | 33.86 | 16.18 | 34,158 | 1.10 | 1.10 | 0.52 | 15 | |||||||||||||||||||||||||||||||||||||||
R4 | 31.03 | 0.28 | 4.54 | 4.82 | (0.18 | ) | (1.23 | ) | (1.41 | ) | 34.44 | 16.59 | 150,159 | 0.77 | 0.74 | 0.88 | 15 | |||||||||||||||||||||||||||||||||||||||
R5 | 30.47 | 0.35 | 4.44 | 4.79 | (0.28 | ) | (1.23 | ) | (1.51 | ) | 33.75 | 16.90 | 231,879 | 0.49 | 0.49 | 1.13 | 15 | |||||||||||||||||||||||||||||||||||||||
R6 | 30.61 | 0.38 | 4.46 | 4.84 | (0.31 | ) | (1.23 | ) | (1.54 | ) | 33.91 | 17.01 | 259,706 | 0.38 | 0.38 | 1.22 | 15 | |||||||||||||||||||||||||||||||||||||||
Y | 30.61 | 0.37 | 4.45 | 4.82 | (0.30 | ) | (1.23 | ) | (1.53 | ) | 33.90 | 16.94 | 371,580 | 0.46 | 0.43 | 1.18 | 15 | |||||||||||||||||||||||||||||||||||||||
F | 30.28 | 0.38 | 4.40 | 4.78 | (0.31 | ) | (1.23 | ) | (1.54 | ) | 33.52 | 17.00 | 1,655,619 | 0.38 | 0.38 | 1.21 | 15 | |||||||||||||||||||||||||||||||||||||||
For the Year Ended October 31, 2018 |
| |||||||||||||||||||||||||||||||||||||||||||||||||||||||
A | $ | 28.53 | $ | 0.22 | $ | 2.42 | $ | 2.64 | $ | (0.25 | ) | $ | (0.75 | ) | $ | (1.00 | ) | $ | 30.17 | 9.41 | % | $ | 666,354 | 0.74 | % | 0.74 | % | 0.73 | % | 22 | % | |||||||||||||||||||||||||
C | 26.13 | — | 2.22 | 2.22 | (0.07 | ) | (0.75 | ) | (0.82 | ) | 27.53 | 8.61 | 293,064 | 1.48 | 1.48 | — | 22 | |||||||||||||||||||||||||||||||||||||||
I | 28.60 | 0.30 | 2.43 | 2.73 | (0.32 | ) | (0.75 | ) | (1.07 | ) | 30.26 | 9.72 | 1,130,600 | 0.47 | 0.47 | 1.00 | 22 | |||||||||||||||||||||||||||||||||||||||
R3 | 28.85 | 0.12 | 2.44 | 2.56 | (0.14 | ) | (0.75 | ) | (0.89 | ) | 30.52 | 9.02 | 34,765 | 1.10 | 1.10 | 0.38 | 22 | |||||||||||||||||||||||||||||||||||||||
R4 | 29.32 | 0.22 | 2.48 | 2.70 | (0.24 | ) | (0.75 | ) | (0.99 | ) | 31.03 | 9.37 | 144,866 | 0.79 | 0.76 | 0.72 | 22 | |||||||||||||||||||||||||||||||||||||||
R5 | 28.81 | 0.30 | 2.44 | 2.74 | (0.33 | ) | (0.75 | ) | (1.08 | ) | 30.47 | 9.69 | 201,510 | 0.49 | 0.49 | 0.99 | 22 | |||||||||||||||||||||||||||||||||||||||
R6 | 28.93 | 0.33 | 2.45 | 2.78 | (0.35 | ) | (0.75 | ) | (1.10 | ) | 30.61 | 9.80 | 146,643 | 0.39 | 0.39 | 1.08 | 22 | |||||||||||||||||||||||||||||||||||||||
Y | 28.93 | 0.32 | 2.45 | 2.77 | (0.34 | ) | (0.75 | ) | (1.09 | ) | 30.61 | 9.77 | 216,788 | 0.42 | 0.42 | 1.06 | 22 | |||||||||||||||||||||||||||||||||||||||
F | 28.63 | 0.33 | 2.42 | 2.75 | (0.35 | ) | (0.75 | ) | (1.10 | ) | 30.28 | 9.80 | 635,245 | 0.39 | 0.39 | 1.09 | 22 | |||||||||||||||||||||||||||||||||||||||
For the Year Ended October 31, 2017 |
| |||||||||||||||||||||||||||||||||||||||||||||||||||||||
A | $ | 23.87 | $ | 0.27 | $ | 4.70 | $ | 4.97 | $ | (0.12 | ) | $ | (0.19 | ) | $ | (0.31 | ) | $ | 28.53 | 21.06 | % | $ | 631,817 | 0.75 | % | 0.75 | % | 1.05 | % | 39 | % | |||||||||||||||||||||||||
C | 21.94 | 0.07 | 4.33 | 4.40 | (0.02 | ) | (0.19 | ) | (0.21 | ) | 26.13 | 20.20 | 316,886 | 1.50 | 1.50 | 0.30 | 39 | |||||||||||||||||||||||||||||||||||||||
I | 23.93 | 0.34 | 4.71 | 5.05 | (0.19 | ) | (0.19 | ) | (0.38 | ) | 28.60 | 21.37 | 982,686 | 0.52 | 0.52 | 1.30 | 39 | |||||||||||||||||||||||||||||||||||||||
R3 | 24.18 | 0.19 | 4.77 | 4.96 | (0.10 | ) | (0.19 | ) | (0.29 | ) | 28.85 | 20.71 | 43,004 | 1.11 | 1.09 | 0.72 | 39 | |||||||||||||||||||||||||||||||||||||||
R4 | 24.54 | 0.27 | 4.84 | 5.11 | (0.14 | ) | (0.19 | ) | (0.33 | ) | 29.32 | 21.05 | 172,584 | 0.81 | 0.79 | 1.01 | 39 | |||||||||||||||||||||||||||||||||||||||
R5 | 24.10 | 0.35 | 4.75 | 5.10 | (0.20 | ) | (0.19 | ) | (0.39 | ) | 28.81 | 21.41 | 192,359 | 0.51 | 0.49 | 1.31 | 39 | |||||||||||||||||||||||||||||||||||||||
R6 | 24.19 | 0.37 | 4.77 | 5.14 | (0.21 | ) | (0.19 | ) | (0.40 | ) | 28.93 | 21.52 | 118,527 | 0.41 | 0.41 | 1.38 | 39 | |||||||||||||||||||||||||||||||||||||||
Y | 24.20 | 0.35 | 4.78 | 5.13 | (0.21 | ) | (0.19 | ) | (0.40 | ) | 28.93 | 21.47 | 148,542 | 0.42 | 0.42 | 1.33 | 39 | |||||||||||||||||||||||||||||||||||||||
F(5) | 26.05 | 0.26 | 2.32 | 2.58 | — | — | — | 28.63 | 9.90 | (6) | 585,057 | 0.41 | (7) | 0.41 | (7) | 1.39 | (7) | 39 | ||||||||||||||||||||||||||||||||||||||
For the Year Ended October 31, 2016 |
| |||||||||||||||||||||||||||||||||||||||||||||||||||||||
A | $ | 24.05 | $ | 0.15 | $ | 0.13 | $ | 0.28 | $ | (0.03 | ) | $ | (0.43 | ) | $ | (0.46 | ) | $ | 23.87 | 1.21 | % | $ | 703,896 | 0.80 | % | 0.80 | %(10) | 0.64 | % | 29 | % | |||||||||||||||||||||||||
B | 22.33 | (0.02 | ) | 0.11 | 0.09 | — | (0.43 | ) | (0.43 | ) | 21.99 | 0.43 | 766 | 1.96 | 1.55 | (10) | (0.10 | ) | 29 | |||||||||||||||||||||||||||||||||||||
C | 22.27 | (0.03 | ) | 0.13 | 0.10 | — | (0.43 | ) | (0.43 | ) | 21.94 | 0.47 | 281,383 | 1.55 | 1.55 | (10) | (0.12 | ) | 29 | |||||||||||||||||||||||||||||||||||||
I | 24.09 | 0.21 | 0.13 | 0.34 | (0.07 | ) | (0.43 | ) | (0.50 | ) | 23.93 | 1.47 | 749,824 | 0.55 | 0.55 | (10) | 0.88 | 29 | ||||||||||||||||||||||||||||||||||||||
R3 | 24.44 | 0.08 | 0.13 | 0.21 | (0.04 | ) | (0.43 | ) | (0.47 | ) | 24.18 | 0.89 | 36,012 | 1.14 | 1.10 | (10) | 0.33 | 29 | ||||||||||||||||||||||||||||||||||||||
R4 | 24.73 | 0.15 | 0.14 | 0.29 | (0.05 | ) | (0.43 | ) | (0.48 | ) | 24.54 | 1.21 | 144,490 | 0.83 | 0.80 | (10) | 0.63 | 29 | ||||||||||||||||||||||||||||||||||||||
R5 | 24.25 | 0.22 | 0.14 | 0.36 | (0.08 | ) | (0.43 | ) | (0.51 | ) | 24.10 | 1.52 | 121,871 | 0.53 | 0.50 | (10) | 0.93 | 29 | ||||||||||||||||||||||||||||||||||||||
R6 | 24.33 | 0.24 | 0.13 | 0.37 | (0.08 | ) | (0.43 | ) | (0.51 | ) | 24.19 | 1.55 | 32,059 | 0.43 | 0.43 | (10) | 1.00 | 29 | ||||||||||||||||||||||||||||||||||||||
Y | 24.33 | 0.24 | 0.13 | 0.37 | (0.07 | ) | (0.43 | ) | (0.50 | ) | 24.20 | 1.58 | 281,692 | 0.43 | 0.43 | (10) | 0.99 | 29 | ||||||||||||||||||||||||||||||||||||||
For the Year Ended October 31, 2015 |
| |||||||||||||||||||||||||||||||||||||||||||||||||||||||
A | $ | 22.00 | $ | 0.13 | $ | 2.21 | $ | 2.34 | $ | — | $ | (0.29 | ) | $ | (0.29 | ) | $ | 24.05 | 10.75 | % | $ | 267,237 | 1.03 | % | 0.92 | % | 0.55 | % | 33 | % | ||||||||||||||||||||||||||
B | 20.60 | (0.05 | ) | 2.07 | 2.02 | — | (0.29 | ) | (0.29 | ) | 22.33 | 9.92 | 1,614 | 2.18 | 1.74 | (0.23 | ) | 33 | ||||||||||||||||||||||||||||||||||||||
C | 20.54 | (0.04 | ) | 2.06 | 2.02 | — | (0.29 | ) | (0.29 | ) | 22.27 | 9.95 | 73,070 | 1.73 | 1.62 | (0.17 | ) | 33 | ||||||||||||||||||||||||||||||||||||||
I(11) | 23.30 | 0.12 | 0.67 | 0.79 | — | — | — | 24.09 | 3.39 | (6) | 136,641 | 0.66 | (7) | 0.50 | (7) | 0.85 | (7) | 33 | ||||||||||||||||||||||||||||||||||||||
R3 | 22.41 | 0.06 | 2.26 | 2.32 | — | (0.29 | ) | (0.29 | ) | 24.44 | 10.46 | 5,081 | 1.34 | 1.16 | 0.27 | 33 | ||||||||||||||||||||||||||||||||||||||||
R4 | 22.60 | 0.13 | 2.29 | 2.42 | — | (0.29 | ) | (0.29 | ) | 24.73 | 10.82 | 22,020 | 0.98 | 0.82 | 0.54 | 33 | ||||||||||||||||||||||||||||||||||||||||
R5 | 22.72 | 0.20 | 2.26 | 2.46 | (0.64 | ) | (0.29 | ) | (0.93 | ) | 24.25 | 11.10 | 26,977 | 0.64 | 0.49 | 0.84 | 33 | |||||||||||||||||||||||||||||||||||||||
R6(11) | 23.53 | 0.11 | 0.69 | 0.80 | — | — | — | 24.33 | 3.40 | (6) | 597 | 0.57 | (7) | 0.45 | (7) | 0.78 | (7) | 33 | ||||||||||||||||||||||||||||||||||||||
Y | 22.79 | 0.21 | 2.27 | 2.48 | (0.65 | ) | (0.29 | ) | (0.94 | ) | 24.33 | 11.15 | 18,802 | 0.57 | 0.50 | 0.90 | 33 | |||||||||||||||||||||||||||||||||||||||
The accompanying notes are an integral part of these financial statements.
| 88 |
|
| Hartford Domestic Equity Funds |
Financial Highlights – (continued)
| — SelectedPer-Share Data(1)— | — Ratios and Supplemental Data — | |||||||||||||||||||||||||||||||||||||||||||||||||||||||
Class | Net Asset Value at Beginning of Period | Net Investment Income (Loss) | Net Realized and Unrealized Gain (Loss) on Investments | Total from Investment Operations | Dividends from Net Investment Income | Distributions from Capital Gains | Total Dividends and Distributions | Net Asset Value at End of Period | Total Return(2) | Net Assets at End of Period (000s) | Ratio of Expenses to Average Net Assets Before Adjust- ments(3) | Ratio of Expenses to Average Net Assets After Adjust- ments(3) | Ratio of Net Investment Income (Loss) to Average Net Assets | Portfolio Turnover | ||||||||||||||||||||||||||||||||||||||||||
| The Hartford Dividend and Growth Fund | ||||||||||||||||||||||||||||||||||||||||||||||||||||||||
For the Year Ended October 31, 2019 |
| |||||||||||||||||||||||||||||||||||||||||||||||||||||||
A | $ | 25.63 | $ | 0.40 | $ | 2.63 | $ | 3.03 | $ | (0.38 | ) | $ | (2.35 | ) | $ | (2.73 | ) | $ | 25.93 | 13.75 | % | $ | 3,739,696 | 1.00 | % | 0.99 | % | 1.65 | % | 22 | % | |||||||||||||||||||||||||
C | 24.75 | 0.21 | 2.53 | 2.74 | (0.18 | ) | (2.35 | ) | (2.53 | ) | 24.96 | 12.92 | 192,715 | 1.77 | 1.77 | 0.89 | 22 | |||||||||||||||||||||||||||||||||||||||
I | 25.51 | 0.46 | 2.63 | 3.09 | (0.45 | ) | (2.35 | ) | (2.80 | ) | 25.80 | 14.08 | 1,079,962 | 0.73 | 0.73 | 1.89 | 22 | |||||||||||||||||||||||||||||||||||||||
R3 | 25.97 | 0.32 | 2.67 | 2.99 | (0.29 | ) | (2.35 | ) | (2.64 | ) | 26.32 | 13.33 | 66,115 | 1.36 | 1.35 | 1.30 | 22 | |||||||||||||||||||||||||||||||||||||||
R4 | 26.14 | 0.40 | 2.69 | 3.09 | (0.36 | ) | (2.35 | ) | (2.71 | ) | 26.52 | 13.71 | 111,451 | 1.04 | 1.04 | 1.61 | 22 | |||||||||||||||||||||||||||||||||||||||
R5 | 26.25 | 0.47 | 2.71 | 3.18 | (0.44 | ) | (2.35 | ) | (2.79 | ) | 26.64 | 14.05 | 193,707 | 0.74 | 0.74 | 1.89 | 22 | |||||||||||||||||||||||||||||||||||||||
R6 | 26.25 | 0.50 | 2.71 | 3.21 | (0.47 | ) | (2.35 | ) | (2.82 | ) | 26.64 | 14.16 | 119,159 | 0.64 | 0.64 | 1.98 | 22 | |||||||||||||||||||||||||||||||||||||||
Y | 26.25 | 0.49 | 2.70 | 3.19 | (0.45 | ) | (2.35 | ) | (2.80 | ) | 26.64 | 14.10 | 696,309 | 0.71 | 0.68 | 1.96 | 22 | |||||||||||||||||||||||||||||||||||||||
F | 25.50 | 0.49 | 2.61 | 3.10 | (0.47 | ) | (2.35 | ) | (2.82 | ) | 25.78 | 14.15 | 2,844,206 | 0.64 | 0.64 | 2.00 | 22 | |||||||||||||||||||||||||||||||||||||||
For the Year Ended October 31, 2018 |
| |||||||||||||||||||||||||||||||||||||||||||||||||||||||
A | $ | 27.46 | $ | 0.39 | $ | 0.80 | $ | 1.19 | $ | (0.38 | ) | $ | (2.64 | ) | $ | (3.02 | ) | $ | 25.63 | 4.38 | % | $ | 3,521,062 | 0.99 | % | 0.99 | % | 1.49 | % | 31 | % | |||||||||||||||||||||||||
C | 26.62 | 0.19 | 0.77 | 0.96 | (0.19 | ) | (2.64 | ) | (2.83 | ) | 24.75 | 3.58 | 228,076 | 1.76 | 1.75 | 0.76 | 31 | |||||||||||||||||||||||||||||||||||||||
I | 27.35 | 0.46 | 0.79 | 1.25 | (0.45 | ) | (2.64 | ) | (3.09 | ) | 25.51 | 4.68 | 847,646 | 0.73 | 0.73 | 1.75 | 31 | |||||||||||||||||||||||||||||||||||||||
R3 | 27.78 | 0.30 | 0.81 | 1.11 | (0.28 | ) | (2.64 | ) | (2.92 | ) | 25.97 | 4.03 | 72,723 | 1.35 | 1.35 | 1.13 | 31 | |||||||||||||||||||||||||||||||||||||||
R4 | 27.95 | 0.39 | 0.80 | 1.19 | (0.36 | ) | (2.64 | ) | (3.00 | ) | 26.14 | 4.32 | 131,649 | 1.04 | 1.04 | 1.44 | 31 | |||||||||||||||||||||||||||||||||||||||
R5 | 28.05 | 0.47 | 0.82 | 1.29 | (0.45 | ) | (2.64 | ) | (3.09 | ) | 26.25 | 4.65 | 146,918 | 0.74 | 0.74 | 1.74 | 31 | |||||||||||||||||||||||||||||||||||||||
R6 | 28.05 | 0.49 | 0.82 | 1.31 | (0.47 | ) | (2.64 | ) | (3.11 | ) | 26.25 | 4.76 | 74,795 | 0.64 | 0.64 | 1.84 | 31 | |||||||||||||||||||||||||||||||||||||||
Y | 28.05 | 0.49 | 0.81 | 1.30 | (0.46 | ) | (2.64 | ) | (3.10 | ) | 26.25 | 4.72 | 616,454 | 0.68 | 0.68 | 1.80 | 31 | |||||||||||||||||||||||||||||||||||||||
F | 27.33 | 0.48 | 0.80 | 1.28 | (0.47 | ) | (2.64 | ) | (3.11 | ) | 25.50 | 4.77 | 2,591,584 | 0.64 | 0.64 | 1.84 | 31 | |||||||||||||||||||||||||||||||||||||||
For the Year Ended October 31, 2017 |
| |||||||||||||||||||||||||||||||||||||||||||||||||||||||
A | $ | 23.49 | $ | 0.39 | $ | 4.75 | $ | 5.14 | $ | (0.38 | ) | $ | (0.79 | ) | $ | (1.17 | ) | $ | 27.46 | 22.40 | % | $ | 3,619,123 | 1.00 | % | 1.00 | % | 1.52 | % | 26 | % | |||||||||||||||||||||||||
C | 22.80 | 0.19 | 4.62 | 4.81 | (0.20 | ) | (0.79 | ) | (0.99 | ) | 26.62 | 21.54 | 449,961 | 1.74 | 1.74 | 0.78 | 26 | |||||||||||||||||||||||||||||||||||||||
I | 23.38 | 0.44 | 4.74 | 5.18 | (0.42 | ) | (0.79 | ) | (1.21 | ) | 27.35 | 22.67 | 775,427 | 0.80 | 0.80 | 1.75 | 26 | |||||||||||||||||||||||||||||||||||||||
R3 | 23.75 | 0.30 | 4.81 | 5.11 | (0.29 | ) | (0.79 | ) | (1.08 | ) | 27.78 | 21.97 | 77,175 | 1.35 | 1.35 | 1.17 | 26 | |||||||||||||||||||||||||||||||||||||||
R4 | 23.89 | 0.38 | 4.84 | 5.22 | (0.37 | ) | (0.79 | ) | (1.16 | ) | 27.95 | 22.34 | 142,563 | 1.05 | 1.05 | 1.47 | 26 | |||||||||||||||||||||||||||||||||||||||
R5 | 23.97 | 0.46 | 4.86 | 5.32 | (0.45 | ) | (0.79 | ) | (1.24 | ) | 28.05 | 22.72 | 132,739 | 0.74 | 0.74 | 1.76 | 26 | |||||||||||||||||||||||||||||||||||||||
R6 | 23.97 | 0.46 | 4.88 | 5.34 | (0.47 | ) | (0.79 | ) | (1.26 | ) | 28.05 | 22.83 | 10,957 | 0.65 | 0.64 | 1.75 | 26 | |||||||||||||||||||||||||||||||||||||||
Y | 23.97 | 0.50 | 4.84 | 5.34 | (0.47 | ) | (0.79 | ) | (1.26 | ) | 28.05 | 22.81 | 605,049 | 0.66 | 0.66 | 1.94 | 26 | |||||||||||||||||||||||||||||||||||||||
F(5) | 25.51 | 0.29 | 1.86 | 2.15 | (0.33 | ) | — | (0.33 | ) | 27.33 | 8.49 | (6) | 2,570,906 | 0.64 | (7) | 0.64 | (7) | 1.66 | (7) | 26 | ||||||||||||||||||||||||||||||||||||
For the Year Ended October 31, 2016 |
| |||||||||||||||||||||||||||||||||||||||||||||||||||||||
A | $ | 24.99 | $ | 0.37 | $ | 0.50 | $ | 0.87 | $ | (0.34 | ) | $ | (2.03 | ) | $ | (2.37 | ) | $ | 23.49 | 4.12 | % | $ | 3,501,684 | 1.03 | % | 1.03 | %(12) | 1.59 | % | 22 | % | |||||||||||||||||||||||||
B | 24.55 | 0.16 | 0.47 | 0.63 | (0.11 | ) | (2.03 | ) | (2.14 | ) | 23.04 | 3.12 | 19,716 | 2.01 | 1.96 | (12) | 0.71 | 22 | ||||||||||||||||||||||||||||||||||||||
C | 24.34 | 0.19 | 0.47 | 0.66 | (0.17 | ) | (2.03 | ) | (2.20 | ) | 22.80 | 3.31 | 437,961 | 1.77 | 1.77 | (12) | 0.85 | 22 | ||||||||||||||||||||||||||||||||||||||
I | 24.89 | 0.41 | 0.50 | 0.91 | (0.39 | ) | (2.03 | ) | (2.42 | ) | 23.38 | 4.31 | 1,779,168 | 0.83 | 0.83 | (12) | 1.78 | 22 | ||||||||||||||||||||||||||||||||||||||
R3 | 25.24 | 0.29 | 0.51 | 0.80 | (0.26 | ) | (2.03 | ) | (2.29 | ) | 23.75 | 3.78 | 79,400 | 1.36 | 1.36 | (12) | 1.26 | 22 | ||||||||||||||||||||||||||||||||||||||
R4 | 25.37 | 0.37 | 0.51 | 0.88 | (0.33 | ) | (2.03 | ) | (2.36 | ) | 23.89 | 4.10 | 136,673 | 1.06 | 1.06 | (12) | 1.56 | 22 | ||||||||||||||||||||||||||||||||||||||
R5 | 25.44 | 0.44 | 0.51 | 0.95 | (0.39 | ) | (2.03 | ) | (2.42 | ) | 23.97 | 4.41 | 104,487 | 0.76 | 0.76 | (12) | 1.89 | 22 | ||||||||||||||||||||||||||||||||||||||
R6 | 25.44 | 0.42 | 0.55 | 0.97 | (0.41 | ) | (2.03 | ) | (2.44 | ) | 23.97 | 4.48 | 2,964 | 0.66 | 0.66 | (12) | 1.76 | 22 | ||||||||||||||||||||||||||||||||||||||
Y | 25.45 | 0.46 | 0.51 | 0.97 | (0.42 | ) | (2.03 | ) | (2.45 | ) | 23.97 | 4.50 | 1,460,506 | 0.66 | 0.66 | (12) | 1.95 | 22 | ||||||||||||||||||||||||||||||||||||||
For the Year Ended October 31, 2015 |
| |||||||||||||||||||||||||||||||||||||||||||||||||||||||
A | $ | 27.05 | $ | 0.36 | $ | 0.23 | $ | 0.59 | $ | (0.35 | ) | $ | (2.30 | ) | $ | (2.65 | ) | $ | 24.99 | 2.46 | % | $ | 3,724,804 | 1.02 | % | 1.02 | % | 1.43 | % | 23 | % | |||||||||||||||||||||||||
B | 26.59 | 0.14 | 0.22 | 0.36 | (0.10 | ) | (2.30 | ) | (2.40 | ) | 24.55 | 1.54 | 44,909 | 1.97 | 1.92 | 0.54 | 23 | |||||||||||||||||||||||||||||||||||||||
C | 26.42 | 0.17 | 0.23 | 0.40 | (0.18 | ) | (2.30 | ) | (2.48 | ) | 24.34 | 1.70 | 467,006 | 1.76 | 1.76 | 0.69 | 23 | |||||||||||||||||||||||||||||||||||||||
I | 26.95 | 0.41 | 0.23 | 0.64 | (0.40 | ) | (2.30 | ) | (2.70 | ) | 24.89 | 2.67 | 1,715,056 | 0.81 | 0.81 | 1.64 | 23 | |||||||||||||||||||||||||||||||||||||||
R3 | 27.29 | 0.28 | 0.24 | 0.52 | (0.27 | ) | (2.30 | ) | (2.57 | ) | 25.24 | 2.12 | 85,736 | 1.35 | 1.35 | 1.10 | 23 | |||||||||||||||||||||||||||||||||||||||
R4 | 27.42 | 0.36 | 0.23 | 0.59 | (0.34 | ) | (2.30 | ) | (2.64 | ) | 25.37 | 2.42 | 150,367 | 1.04 | 1.04 | 1.41 | 23 | |||||||||||||||||||||||||||||||||||||||
R5 | 27.49 | 0.44 | 0.23 | 0.67 | (0.42 | ) | (2.30 | ) | (2.72 | ) | 25.44 | 2.73 | 229,206 | 0.74 | 0.74 | 1.70 | 23 | |||||||||||||||||||||||||||||||||||||||
R6(9) | 27.81 | 0.43 | (0.05 | ) | 0.38 | (0.45 | ) | (2.30 | ) | (2.75 | ) | 25.44 | 1.64 | (6) | 10 | 0.71 | (7) | 0.70 | (7) | 1.71 | (7) | 23 | ||||||||||||||||||||||||||||||||||
Y | 27.50 | 0.46 | 0.24 | 0.70 | (0.45 | ) | (2.30 | ) | (2.75 | ) | 25.45 | 2.83 | 1,323,782 | 0.64 | 0.64 | 1.80 | 23 | |||||||||||||||||||||||||||||||||||||||
The accompanying notes are an integral part of these financial statements.
| 89 |
|
| Hartford Domestic Equity Funds |
Financial Highlights – (continued)
| — SelectedPer-Share Data(1)— | — Ratios and Supplemental Data — | |||||||||||||||||||||||||||||||||||||||||||||||||||||||
Class | Net Asset Value at Beginning of Period | Net Investment Income (Loss) | Net Realized and Unrealized Gain (Loss) on Investments | Total from Investment Operations | Dividends from Net Investment Income | Distributions from Capital Gains | Total Dividends and Distributions | Net Asset Value at End of Period | Total Return(2) | Net Assets at End of Period (000s) | Ratio of Expenses to Average Net Assets Before Adjust- ments(3) | Ratio of Expenses to Average Net Assets After Adjust- ments(3) | Ratio of Net Investment Income (Loss) to Average Net Assets | Portfolio Turnover | ||||||||||||||||||||||||||||||||||||||||||
| The Hartford Equity Income Fund | ||||||||||||||||||||||||||||||||||||||||||||||||||||||||
For the Year Ended October 31, 2019 |
| |||||||||||||||||||||||||||||||||||||||||||||||||||||||
A | $ | 19.39 | $ | 0.38 | $ | 2.02 | $ | 2.40 | $ | (0.36 | ) | $ | (1.44 | ) | $ | (1.80 | ) | $ | 19.99 | 13.88 | % | $ | 1,565,663 | 1.00 | % | 1.00 | % | 2.01 | % | 21 | % | |||||||||||||||||||||||||
C | 19.29 | 0.24 | 2.00 | 2.24 | (0.21 | ) | (1.44 | ) | (1.65 | ) | 19.88 | 13.00 | 292,388 | 1.76 | 1.76 | 1.27 | 21 | |||||||||||||||||||||||||||||||||||||||
I | 19.29 | 0.43 | 2.01 | 2.44 | (0.41 | ) | (1.44 | ) | (1.85 | ) | 19.88 | 14.17 | 959,142 | 0.75 | 0.75 | 2.26 | 21 | |||||||||||||||||||||||||||||||||||||||
R3 | 19.41 | 0.32 | 2.02 | 2.34 | (0.29 | ) | (1.44 | ) | (1.73 | ) | 20.02 | 13.48 | 43,474 | 1.36 | 1.36 | 1.66 | 21 | |||||||||||||||||||||||||||||||||||||||
R4 | 19.44 | 0.37 | 2.04 | 2.41 | (0.35 | ) | (1.44 | ) | (1.79 | ) | 20.06 | 13.85 | 53,957 | 1.07 | 1.07 | 1.96 | 21 | |||||||||||||||||||||||||||||||||||||||
R5 | 19.54 | 0.43 | 2.04 | 2.47 | (0.41 | ) | (1.44 | ) | (1.85 | ) | 20.16 | 14.14 | 81,758 | 0.76 | 0.76 | 2.25 | 21 | |||||||||||||||||||||||||||||||||||||||
R6 | 19.58 | 0.45 | 2.05 | 2.50 | (0.43 | ) | (1.44 | ) | (1.87 | ) | 20.21 | 14.29 | 52,201 | 0.66 | 0.66 | 2.33 | 21 | |||||||||||||||||||||||||||||||||||||||
Y | 19.58 | 0.45 | 2.05 | 2.50 | (0.42 | ) | (1.44 | ) | (1.86 | ) | 20.22 | 14.21 | 105,015 | 0.73 | 0.71 | 2.34 | 21 | |||||||||||||||||||||||||||||||||||||||
F | 19.29 | 0.44 | 2.01 | 2.45 | (0.43 | ) | (1.44 | ) | (1.87 | ) | 19.87 | 14.24 | 922,012 | 0.66 | 0.66 | 2.34 | 21 | |||||||||||||||||||||||||||||||||||||||
For the Year Ended October 31, 2018 |
| |||||||||||||||||||||||||||||||||||||||||||||||||||||||
A | $ | 20.64 | $ | 0.38 | $ | (0.24 | ) | $ | 0.14 | $ | (0.35 | ) | $ | (1.04 | ) | $ | (1.39 | ) | $ | 19.39 | 0.49 | % | $ | 1,508,580 | 1.00 | % | 1.00 | % | 1.90 | % | 22 | % | ||||||||||||||||||||||||
C | 20.53 | 0.23 | (0.23 | ) | — | (0.20 | ) | (1.04 | ) | (1.24 | ) | 19.29 | (0.22 | ) | 330,741 | 1.75 | 1.75 | 1.16 | 22 | |||||||||||||||||||||||||||||||||||||
I | 20.54 | 0.43 | (0.24 | ) | 0.19 | (0.40 | ) | (1.04 | ) | (1.44 | ) | 19.29 | 0.77 | 1,157,708 | 0.74 | 0.74 | 2.14 | 22 | ||||||||||||||||||||||||||||||||||||||
R3 | 20.66 | 0.31 | (0.25 | ) | 0.06 | (0.27 | ) | (1.04 | ) | (1.31 | ) | 19.41 | 0.12 | 46,820 | 1.36 | 1.36 | 1.53 | 22 | ||||||||||||||||||||||||||||||||||||||
R4 | 20.69 | 0.37 | (0.24 | ) | 0.13 | (0.34 | ) | (1.04 | ) | (1.38 | ) | 19.44 | 0.43 | 70,446 | 1.06 | 1.06 | 1.83 | 22 | ||||||||||||||||||||||||||||||||||||||
R5 | 20.78 | 0.43 | (0.23 | ) | 0.20 | (0.40 | ) | (1.04 | ) | (1.44 | ) | 19.54 | 0.78 | 79,557 | 0.76 | 0.76 | 2.13 | 22 | ||||||||||||||||||||||||||||||||||||||
R6 | 20.83 | 0.45 | (0.24 | ) | 0.21 | (0.42 | ) | (1.04 | ) | (1.46 | ) | 19.58 | 0.83 | 34,957 | 0.66 | 0.66 | 2.22 | 22 | ||||||||||||||||||||||||||||||||||||||
Y | 20.83 | 0.45 | (0.25 | ) | 0.20 | (0.41 | ) | (1.04 | ) | (1.45 | ) | 19.58 | 0.79 | 140,057 | 0.70 | 0.70 | 2.19 | 22 | ||||||||||||||||||||||||||||||||||||||
F | 20.54 | 0.45 | (0.24 | ) | 0.21 | (0.42 | ) | (1.04 | ) | (1.46 | ) | 19.29 | 0.85 | 774,529 | 0.65 | 0.65 | 2.23 | 22 | ||||||||||||||||||||||||||||||||||||||
For the Year Ended October 31, 2017 |
| |||||||||||||||||||||||||||||||||||||||||||||||||||||||
A | $ | 17.97 | $ | 0.35 | $ | 3.24 | $ | 3.59 | $ | (0.32 | ) | $ | (0.60 | ) | $ | (0.92 | ) | $ | 20.64 | 20.51 | % | $ | 1,685,398 | 1.00 | % | 1.00 | % | 1.83 | % | 16 | % | |||||||||||||||||||||||||
C | 17.89 | 0.21 | 3.21 | 3.42 | (0.18 | ) | (0.60 | ) | (0.78 | ) | 20.53 | 19.56 | 449,104 | 1.74 | 1.74 | 1.09 | 16 | |||||||||||||||||||||||||||||||||||||||
I | 17.89 | 0.39 | 3.23 | 3.62 | (0.37 | ) | (0.60 | ) | (0.97 | ) | 20.54 | 20.76 | 1,111,235 | 0.78 | 0.78 | 2.03 | 16 | |||||||||||||||||||||||||||||||||||||||
R3 | 17.99 | 0.28 | 3.24 | 3.52 | (0.25 | ) | (0.60 | ) | (0.85 | ) | 20.66 | 20.06 | 57,341 | 1.37 | 1.37 | 1.46 | 16 | |||||||||||||||||||||||||||||||||||||||
R4 | 18.02 | 0.34 | 3.24 | 3.58 | (0.31 | ) | (0.60 | ) | (0.91 | ) | 20.69 | 20.39 | 79,632 | 1.06 | 1.06 | 1.77 | 16 | |||||||||||||||||||||||||||||||||||||||
R5 | 18.09 | 0.40 | 3.26 | 3.66 | (0.37 | ) | (0.60 | ) | (0.97 | ) | 20.78 | 20.77 | 83,048 | 0.76 | 0.76 | 2.06 | 16 | |||||||||||||||||||||||||||||||||||||||
R6 | 18.13 | 0.41 | 3.28 | 3.69 | (0.39 | ) | (0.60 | ) | (0.99 | ) | 20.83 | 20.91 | 29,284 | 0.66 | 0.66 | 2.10 | 16 | |||||||||||||||||||||||||||||||||||||||
Y | 18.13 | 0.45 | 3.23 | 3.68 | (0.38 | ) | (0.60 | ) | (0.98 | ) | 20.83 | 20.88 | 141,479 | 0.67 | 0.67 | 2.35 | 16 | |||||||||||||||||||||||||||||||||||||||
F(5) | 19.22 | 0.24 | 1.37 | 1.61 | (0.29 | ) | — | (0.29 | ) | 20.54 | 8.45 | (6) | 674,626 | 0.66 | (7) | 0.66 | (7) | 1.84 | (7) | 16 | ||||||||||||||||||||||||||||||||||||
For the Year Ended October 31, 2016 |
| |||||||||||||||||||||||||||||||||||||||||||||||||||||||
A | $ | 18.70 | $ | 0.36 | $ | 0.64 | $ | 1.00 | $ | (0.33 | ) | $ | (1.40 | ) | $ | (1.73 | ) | $ | 17.97 | 6.13 | % | $ | 1,676,572 | 1.04 | % | 1.04 | % | 2.03 | % | 14 | % | |||||||||||||||||||||||||
B | 18.72 | 0.34 | 0.64 | 0.98 | (0.30 | ) | (1.40 | ) | (1.70 | ) | 18.00 | 6.01 | 6,930 | 1.18 | 1.18 | 1.95 | 14 | |||||||||||||||||||||||||||||||||||||||
C | 18.61 | 0.23 | 0.65 | 0.88 | (0.20 | ) | (1.40 | ) | (1.60 | ) | 17.89 | 5.45 | 452,909 | 1.76 | 1.76 | 1.30 | 14 | |||||||||||||||||||||||||||||||||||||||
I | 18.62 | 0.39 | 0.66 | 1.05 | (0.38 | ) | (1.40 | ) | (1.78 | ) | 17.89 | 6.45 | 966,338 | 0.78 | 0.78 | 2.25 | 14 | |||||||||||||||||||||||||||||||||||||||
R3 | 18.72 | 0.30 | 0.64 | 0.94 | (0.27 | ) | (1.40 | ) | (1.67 | ) | 17.99 | 5.77 | 54,732 | 1.38 | 1.38 | 1.68 | 14 | |||||||||||||||||||||||||||||||||||||||
R4 | 18.74 | 0.35 | 0.65 | 1.00 | (0.32 | ) | (1.40 | ) | (1.72 | ) | 18.02 | 6.14 | 76,745 | 1.07 | 1.07 | 1.98 | 14 | |||||||||||||||||||||||||||||||||||||||
R5 | 18.81 | 0.41 | 0.64 | 1.05 | (0.37 | ) | (1.40 | ) | (1.77 | ) | 18.09 | 6.42 | 65,276 | 0.77 | 0.77 | 2.31 | 14 | |||||||||||||||||||||||||||||||||||||||
R6 | 18.84 | 0.42 | 0.66 | 1.08 | (0.39 | ) | (1.40 | ) | (1.79 | ) | 18.13 | 6.57 | 14,551 | 0.67 | 0.67 | 2.38 | 14 | |||||||||||||||||||||||||||||||||||||||
Y | 18.84 | 0.41 | 0.67 | 1.08 | (0.39 | ) | (1.40 | ) | (1.79 | ) | 18.13 | 6.57 | 386,011 | 0.67 | 0.67 | 2.35 | 14 | |||||||||||||||||||||||||||||||||||||||
For the Year Ended October 31, 2015 |
| |||||||||||||||||||||||||||||||||||||||||||||||||||||||
A | $ | 19.04 | $ | 0.35 | $ | 0.18 | $ | 0.53 | $ | (0.35 | ) | $ | (0.52 | ) | $ | (0.87 | ) | $ | 18.70 | 2.95 | % | $ | 1,757,486 | 1.02 | % | 1.02 | % | 1.87 | % | 20 | % | |||||||||||||||||||||||||
B | 19.05 | 0.33 | 0.18 | 0.51 | (0.32 | ) | (0.52 | ) | (0.84 | ) | 18.72 | 2.82 | 13,915 | 1.16 | 1.16 | 1.75 | 20 | |||||||||||||||||||||||||||||||||||||||
C | 18.96 | 0.21 | 0.18 | 0.39 | (0.22 | ) | (0.52 | ) | (0.74 | ) | 18.61 | 2.18 | 461,099 | 1.76 | 1.76 | 1.12 | 20 | |||||||||||||||||||||||||||||||||||||||
I | 18.97 | 0.40 | 0.17 | 0.57 | (0.40 | ) | (0.52 | ) | (0.92 | ) | 18.62 | 3.18 | 835,297 | 0.76 | 0.76 | 2.13 | 20 | |||||||||||||||||||||||||||||||||||||||
R3 | 19.06 | 0.29 | 0.18 | 0.47 | (0.29 | ) | (0.52 | ) | (0.81 | ) | 18.72 | 2.61 | 56,026 | 1.36 | 1.36 | 1.52 | 20 | |||||||||||||||||||||||||||||||||||||||
R4 | 19.08 | 0.34 | 0.18 | 0.52 | (0.34 | ) | (0.52 | ) | (0.86 | ) | 18.74 | 2.92 | 74,473 | 1.06 | 1.06 | 1.82 | 20 | |||||||||||||||||||||||||||||||||||||||
R5 | 19.15 | 0.40 | 0.18 | 0.58 | (0.40 | ) | (0.52 | ) | (0.92 | ) | 18.81 | 3.22 | 76,741 | 0.76 | 0.76 | 2.15 | 20 | |||||||||||||||||||||||||||||||||||||||
R6(9) | 19.39 | 0.35 | 0.04 | 0.39 | (0.42 | ) | (0.52 | ) | (0.94 | ) | 18.84 | 2.20 | (6) | 13,902 | 0.69 | (7) | 0.69 | (7) | 1.93 | (7) | 20 | |||||||||||||||||||||||||||||||||||
Y | 19.19 | 0.42 | 0.17 | 0.59 | (0.42 | ) | (0.52 | ) | (0.94 | ) | 18.84 | 3.26 | 246,177 | 0.66 | 0.66 | 2.22 | 20 | |||||||||||||||||||||||||||||||||||||||
The accompanying notes are an integral part of these financial statements.
| 90 |
|
| Hartford Domestic Equity Funds |
Financial Highlights – (continued)
| — SelectedPer-Share Data(1)— | — Ratios and Supplemental Data — | |||||||||||||||||||||||||||||||||||||||||||||||||||||||
Class | Net Asset Value at Beginning of Period | Net Investment Income (Loss) | Net Realized and Unrealized Gain (Loss) on Investments | Total from Investment Operations | Dividends from Net Investment Income | Distributions from Capital Gains | Total Dividends and Distributions | Net Asset Value at End of Period | Total Return(2) | Net Assets at End of Period (000s) | Ratio of Expenses to Average Net Assets Before Adjust- ments(3) | Ratio of Expenses to Average Net Assets After Adjust- ments(3) | Ratio of Net Investment Income (Loss) to Average Net Assets | Portfolio Turnover | ||||||||||||||||||||||||||||||||||||||||||
| The Hartford Growth Opportunities Fund | ||||||||||||||||||||||||||||||||||||||||||||||||||||||||
For the Year Ended October 31, 2019 |
| |||||||||||||||||||||||||||||||||||||||||||||||||||||||
A | $ | 45.89 | $ | (0.25 | ) | $ | 4.35 | $ | 4.10 | $ | — | $ | (10.54 | ) | $ | (10.54 | ) | $ | 39.45 | 13.64 | % | $ | 2,089,246 | 1.12 | % | 1.11 | % | (0.64 | )% | 66 | % | |||||||||||||||||||||||||
C | 29.36 | (0.29 | ) | 1.97 | 1.68 | — | (10.54 | ) | (10.54 | ) | 20.50 | 12.79 | 281,545 | 1.86 | 1.86 | (1.39 | ) | 66 | ||||||||||||||||||||||||||||||||||||||
I | 47.99 | (0.16 | ) | 4.66 | 4.50 | — | (10.54 | ) | (10.54 | ) | 41.95 | 13.94 | 1,500,756 | 0.85 | 0.85 | (0.38 | ) | 66 | ||||||||||||||||||||||||||||||||||||||
R3 | 45.98 | (0.39 | ) | 4.36 | 3.97 | — | (10.54 | ) | (10.54 | ) | 39.41 | 13.25 | 44,757 | 1.47 | 1.46 | (1.00 | ) | 66 | ||||||||||||||||||||||||||||||||||||||
R4 | 48.38 | (0.29 | ) | 4.71 | 4.42 | — | (10.54 | ) | (10.54 | ) | 42.26 | 13.57 | 67,104 | 1.15 | 1.15 | (0.69 | ) | 66 | ||||||||||||||||||||||||||||||||||||||
R5 | 50.48 | (0.17 | ) | 5.01 | 4.84 | — | (10.54 | ) | (10.54 | ) | 44.78 | 13.92 | 25,396 | 0.85 | 0.85 | (0.39 | ) | 66 | ||||||||||||||||||||||||||||||||||||||
R6 | 51.18 | (0.13 | ) | 5.12 | 4.99 | — | (10.54 | ) | (10.54 | ) | 45.63 | 14.03 | 22,765 | 0.75 | 0.75 | (0.29 | ) | 66 | ||||||||||||||||||||||||||||||||||||||
Y | 51.18 | (0.15 | ) | 5.13 | 4.98 | — | (10.54 | ) | (10.54 | ) | 45.62 | 14.00 | 164,390 | 0.83 | 0.79 | (0.33 | ) | 66 | ||||||||||||||||||||||||||||||||||||||
F | 48.07 | (0.12 | ) | 4.68 | 4.56 | — | (10.54 | ) | (10.54 | ) | 42.09 | 14.07 | 526,379 | 0.74 | 0.74 | (0.28 | ) | 66 | ||||||||||||||||||||||||||||||||||||||
For the Year Ended October 31, 2018 |
| |||||||||||||||||||||||||||||||||||||||||||||||||||||||
A | $ | 46.20 | $ | (0.29 | ) | $ | 3.86 | $ | 3.57 | $ | — | $ | (3.88 | ) | $ | (3.88 | ) | $ | 45.89 | 8.31 | % | $ | 2,013,200 | 1.11 | % | 1.11 | % | (0.61 | )% | 122 | % | |||||||||||||||||||||||||
C | 31.15 | (0.41 | ) | 2.50 | 2.09 | — | (3.88 | ) | (3.88 | ) | 29.36 | 7.49 | 321,653 | 1.85 | 1.85 | (1.35 | ) | 122 | ||||||||||||||||||||||||||||||||||||||
I | 48.01 | (0.17 | ) | 4.03 | 3.86 | — | (3.88 | ) | (3.88 | ) | 47.99 | 8.62 | 1,674,141 | 0.84 | 0.84 | (0.34 | ) | 122 | ||||||||||||||||||||||||||||||||||||||
R3 | 46.43 | (0.45 | ) | 3.88 | 3.43 | — | (3.88 | ) | (3.88 | ) | 45.98 | 7.94 | 47,707 | 1.46 | 1.45 | (0.95 | ) | 122 | ||||||||||||||||||||||||||||||||||||||
R4 | 48.52 | (0.32 | ) | 4.06 | 3.74 | — | (3.88 | ) | (3.88 | ) | 48.38 | 8.28 | 79,229 | 1.15 | 1.15 | (0.65 | ) | 122 | ||||||||||||||||||||||||||||||||||||||
R5 | 50.31 | (0.18 | ) | 4.23 | 4.05 | — | (3.88 | ) | (3.88 | ) | 50.48 | 8.60 | 19,708 | 0.86 | 0.86 | (0.35 | ) | 122 | ||||||||||||||||||||||||||||||||||||||
R6 | 50.91 | (0.14 | ) | 4.29 | 4.15 | — | (3.88 | ) | (3.88 | ) | 51.18 | 8.71 | 12,061 | 0.75 | 0.75 | (0.26 | ) | 122 | ||||||||||||||||||||||||||||||||||||||
Y | 50.92 | (0.15 | ) | 4.29 | 4.14 | — | (3.88 | ) | (3.88 | ) | 51.18 | 8.68 | 127,721 | 0.78 | 0.78 | (0.28 | ) | 122 | ||||||||||||||||||||||||||||||||||||||
F | 48.05 | (0.12 | ) | 4.02 | 3.90 | — | (3.88 | ) | (3.88 | ) | 48.07 | 8.71 | 401,565 | 0.75 | 0.75 | (0.25 | ) | 122 | ||||||||||||||||||||||||||||||||||||||
For the Year Ended October 31, 2017 |
| |||||||||||||||||||||||||||||||||||||||||||||||||||||||
A | $ | 37.66 | $ | (0.23 | ) | $ | 10.17 | $ | 9.94 | $ | — | $ | (1.40 | ) | $ | (1.40 | ) | $ | 46.20 | 27.40 | % | $ | 1,914,743 | 1.11 | % | 1.10 | % | (0.57 | )% | 119 | % | |||||||||||||||||||||||||
C | 26.03 | (0.36 | ) | 6.88 | 6.52 | — | (1.40 | ) | (1.40 | ) | 31.15 | 26.46 | 412,184 | 1.86 | 1.86 | (1.32 | ) | 119 | ||||||||||||||||||||||||||||||||||||||
I | 39.00 | (0.15 | ) | 10.56 | 10.41 | — | (1.40 | ) | (1.40 | ) | 48.01 | 27.67 | 1,546,058 | 0.89 | 0.89 | (0.35 | ) | 119 | ||||||||||||||||||||||||||||||||||||||
R3 | 37.96 | (0.37 | ) | 10.24 | 9.87 | — | (1.40 | ) | (1.40 | ) | 46.43 | 26.95 | 48,315 | 1.46 | 1.45 | (0.92 | ) | 119 | ||||||||||||||||||||||||||||||||||||||
R4 | 39.50 | (0.26 | ) | 10.68 | 10.42 | — | (1.40 | ) | (1.40 | ) | 48.52 | 27.33 | 81,413 | 1.15 | 1.15 | (0.62 | ) | 119 | ||||||||||||||||||||||||||||||||||||||
R5 | 40.78 | (0.14 | ) | 11.07 | 10.93 | — | (1.40 | ) | (1.40 | ) | 50.31 | 27.74 | 16,530 | 0.86 | 0.85 | (0.32 | ) | 119 | ||||||||||||||||||||||||||||||||||||||
R6 | 41.21 | (0.12 | ) | 11.22 | 11.10 | — | (1.40 | ) | (1.40 | ) | 50.91 | 27.86 | 4,554 | 0.76 | 0.75 | (0.26 | ) | 119 | ||||||||||||||||||||||||||||||||||||||
Y | 41.23 | (0.09 | ) | 11.18 | 11.09 | — | (1.40 | ) | (1.40 | ) | 50.92 | 27.83 | 104,645 | 0.77 | 0.77 | (0.22 | ) | 119 | ||||||||||||||||||||||||||||||||||||||
F(5) | 40.07 | (0.10 | ) | 8.08 | 7.98 | — | — | — | 48.05 | 19.92 | (6) | 617,087 | 0.75 | (7) | 0.75 | (7) | (0.34 | )(7) | 119 | |||||||||||||||||||||||||||||||||||||
For the Year Ended October 31, 2016 |
| |||||||||||||||||||||||||||||||||||||||||||||||||||||||
A | $ | 40.68 | $ | (0.20 | ) | $ | 0.55 | $ | 0.35 | $ | — | $ | (3.37 | ) | $ | (3.37 | ) | $ | 37.66 | 1.04 | % | $ | 1,747,532 | 1.14 | % | 1.14 | %(13) | (0.55 | )% | 117 | % | |||||||||||||||||||||||||
B | 29.08 | (0.37 | ) | 0.35 | (0.02 | ) | — | (3.37 | ) | (3.37 | ) | 25.69 | 0.09 | 4,249 | 2.09 | 2.06 | (13) | (1.45 | ) | 117 | ||||||||||||||||||||||||||||||||||||
C | 29.37 | (0.33 | ) | 0.36 | 0.03 | — | (3.37 | ) | (3.37 | ) | 26.03 | 0.28 | 420,107 | 1.89 | 1.89 | (13) | (1.29 | ) | 117 | |||||||||||||||||||||||||||||||||||||
I | 41.98 | (0.12 | ) | 0.57 | 0.45 | (0.06 | ) | (3.37 | ) | (3.43 | ) | 39.00 | 1.25 | 1,726,408 | 0.93 | 0.93 | (13) | (0.32 | ) | 117 | ||||||||||||||||||||||||||||||||||||
R3 | 41.11 | (0.33 | ) | 0.55 | 0.22 | — | (3.37 | ) | (3.37 | ) | 37.96 | 0.71 | 47,559 | 1.47 | 1.47 | (13) | (0.87 | ) | 117 | |||||||||||||||||||||||||||||||||||||
R4 | 42.51 | (0.22 | ) | 0.58 | 0.36 | — | (3.37 | ) | (3.37 | ) | 39.50 | 1.02 | 72,213 | 1.17 | 1.17 | (13) | (0.57 | ) | 117 | |||||||||||||||||||||||||||||||||||||
R5 | 43.73 | (0.08 | ) | 0.57 | 0.49 | (0.07 | ) | (3.37 | ) | (3.44 | ) | 40.78 | 1.30 | 14,791 | 0.87 | 0.86 | (13) | (0.20 | ) | 117 | ||||||||||||||||||||||||||||||||||||
R6 | 44.15 | (0.07 | ) | 0.61 | 0.54 | (0.11 | ) | (3.37 | ) | (3.48 | ) | 41.21 | 1.40 | 942 | 0.77 | 0.77 | (13) | (0.17 | ) | 117 | ||||||||||||||||||||||||||||||||||||
Y | 44.17 | (0.08 | ) | 0.62 | 0.54 | (0.11 | ) | (3.37 | ) | (3.48 | ) | 41.23 | 1.40 | 231,037 | 0.77 | 0.77 | (13) | (0.19 | ) | 117 | ||||||||||||||||||||||||||||||||||||
For the Year Ended October 31, 2015 |
| |||||||||||||||||||||||||||||||||||||||||||||||||||||||
A | $ | 43.76 | $ | (0.17 | ) | $ | 4.82 | $ | 4.65 | $ | — | $ | (7.73 | ) | $ | (7.73 | ) | $ | 40.68 | 12.72 | % | $ | 1,853,433 | 1.12 | % | 1.12 | % | (0.42 | )% | 93 | % | |||||||||||||||||||||||||
B | 33.71 | (0.39 | ) | 3.49 | 3.10 | — | (7.73 | ) | (7.73 | ) | 29.08 | 11.72 | 15,256 | 2.04 | 2.03 | (1.32 | ) | 93 | ||||||||||||||||||||||||||||||||||||||
C | 33.91 | (0.34 | ) | 3.53 | 3.19 | — | (7.73 | ) | (7.73 | ) | 29.37 | 11.95 | 401,542 | 1.86 | 1.86 | (1.17 | ) | 93 | ||||||||||||||||||||||||||||||||||||||
I | 44.82 | (0.09 | ) | 4.98 | 4.89 | — | (7.73 | ) | (7.73 | ) | 41.98 | 12.99 | 2,433,134 | 0.89 | 0.89 | (0.21 | ) | 93 | ||||||||||||||||||||||||||||||||||||||
R3 | 44.25 | (0.31 | ) | 4.90 | 4.59 | — | (7.73 | ) | (7.73 | ) | 41.11 | 12.39 | 44,347 | 1.45 | 1.45 | (0.76 | ) | 93 | ||||||||||||||||||||||||||||||||||||||
R4 | 45.39 | (0.19 | ) | 5.04 | 4.85 | — | (7.73 | ) | (7.73 | ) | 42.51 | 12.70 | 60,775 | 1.15 | 1.15 | (0.45 | ) | 93 | ||||||||||||||||||||||||||||||||||||||
R5 | 46.36 | (0.07 | ) | 5.17 | 5.10 | — | (7.73 | ) | (7.73 | ) | 43.73 | 13.02 | 123,897 | 0.84 | 0.84 | (0.15 | ) | 93 | ||||||||||||||||||||||||||||||||||||||
R6(9) | 47.09 | (0.06 | ) | 4.85 | 4.79 | — | (7.73 | ) | (7.73 | ) | 44.15 | 12.16 | (6) | 11 | 0.82 | (7) | 0.82 | (7) | (0.14 | )(7) | 93 | |||||||||||||||||||||||||||||||||||
Y | 46.70 | (0.04 | ) | 5.24 | 5.20 | — | (7.73 | ) | (7.73 | ) | 44.17 | 13.16 | 188,938 | 0.75 | 0.75 | (0.09 | ) | 93 | ||||||||||||||||||||||||||||||||||||||
The accompanying notes are an integral part of these financial statements.
| 91 |
|
| Hartford Domestic Equity Funds |
Financial Highlights – (continued)
| — SelectedPer-Share Data(1)— | — Ratios and Supplemental Data — | |||||||||||||||||||||||||||||||||||||||||||||||||||||||
Class | Net Asset Value at Beginning of Period | Net Investment Income (Loss) | Net Realized and Unrealized Gain (Loss) on Investments | Total from Investment Operations | Dividends from Net Investment Income | Distributions from Capital Gains | Total Dividends and Distributions | Net Asset Value at End of Period | Total Return(2) | Net Assets at End of Period (000s) | Ratio of Expenses to Average Net Assets Before Adjust- ments(3) | Ratio of Expenses to Average Net Assets After Adjust- ments(3) | Ratio of Net Investment Income (Loss) to Average Net Assets | Portfolio Turnover | ||||||||||||||||||||||||||||||||||||||||||
| The Hartford Healthcare Fund | ||||||||||||||||||||||||||||||||||||||||||||||||||||||||
For the Year Ended October 31, 2019 |
| |||||||||||||||||||||||||||||||||||||||||||||||||||||||
A | $ | 34.38 | $ | (0.10 | ) | $ | 3.83 | $ | 3.73 | $ | — | $ | (2.48 | ) | $ | (2.48 | ) | $ | 35.63 | 12.02 | % | $ | 666,181 | 1.30 | % | 1.30 | % | (0.30 | )% | 35 | % | |||||||||||||||||||||||||
C | 27.98 | (0.28 | ) | 3.02 | 2.74 | — | (2.48 | ) | (2.48 | ) | 28.24 | 11.17 | 138,539 | 2.05 | 2.05 | (1.06 | ) | 35 | ||||||||||||||||||||||||||||||||||||||
I | 36.11 | 0.00 | (21) | 4.05 | 4.05 | — | (2.48 | ) | (2.48 | ) | 37.68 | 12.36 | 297,000 | 1.01 | 1.01 | (0.01 | ) | 35 | ||||||||||||||||||||||||||||||||||||||
R3 | 35.32 | (0.21 | ) | 3.93 | 3.72 | — | (2.48 | ) | (2.48 | ) | 36.56 | 11.66 | 33,948 | 1.62 | 1.62 | (0.62 | ) | 35 | ||||||||||||||||||||||||||||||||||||||
R4 | 37.12 | (0.12 | ) | 4.17 | 4.05 | — | (2.48 | ) | (2.48 | ) | 38.69 | 12.00 | 26,699 | 1.32 | 1.32 | (0.32 | ) | 35 | ||||||||||||||||||||||||||||||||||||||
R5 | 38.82 | (0.01 | ) | 4.38 | 4.37 | — | (2.48 | ) | (2.48 | ) | 40.71 | 12.32 | 6,170 | 1.02 | 1.02 | (0.04 | ) | 35 | ||||||||||||||||||||||||||||||||||||||
R6(14) | 39.22 | 0.02 | 2.04 | 2.06 | — | — | — | 41.28 | 5.25 | (6) | 1,341 | 0.91 | (7) | 0.91 | (7) | 0.06 | (7) | 35 | ||||||||||||||||||||||||||||||||||||||
Y | 39.29 | 0.01 | 4.45 | 4.46 | — | (2.48 | ) | (2.48 | ) | 41.27 | 12.40 | 72,515 | 0.97 | 0.96 | 0.03 | 35 | ||||||||||||||||||||||||||||||||||||||||
F | 36.17 | 0.02 | 4.08 | 4.10 | — | (2.48 | ) | (2.48 | ) | 37.79 | 12.48 | 29,108 | 0.91 | 0.91 | 0.06 | 35 | ||||||||||||||||||||||||||||||||||||||||
For the Year Ended October 31, 2018 |
| |||||||||||||||||||||||||||||||||||||||||||||||||||||||
A | $ | 34.86 | $ | (0.14 | ) | $ | 1.45 | $ | 1.31 | $ | — | $ | (1.79 | ) | $ | (1.79 | ) | $ | 34.38 | 3.86 | % | $ | 682,175 | 1.28 | % | 1.28 | % | (0.40 | )% | 27 | % | |||||||||||||||||||||||||
C | 28.90 | (0.33 | ) | 1.20 | 0.87 | — | (1.79 | ) | (1.79 | ) | 27.98 | 3.10 | 160,084 | 2.03 | 2.02 | (1.13 | ) | 27 | ||||||||||||||||||||||||||||||||||||||
I | 36.43 | (0.04 | ) | 1.51 | 1.47 | — | (1.79 | ) | (1.79 | ) | 36.11 | 4.15 | 379,392 | 1.00 | 1.00 | (0.11 | ) | 27 | ||||||||||||||||||||||||||||||||||||||
R3 | 35.87 | (0.26 | ) | 1.50 | 1.24 | — | (1.79 | ) | (1.79 | ) | 35.32 | 3.55 | 38,412 | 1.61 | 1.61 | (0.72 | ) | 27 | ||||||||||||||||||||||||||||||||||||||
R4 | 37.50 | (0.16 | ) | 1.57 | 1.41 | — | (1.79 | ) | (1.79 | ) | 37.12 | 3.86 | 32,373 | 1.30 | 1.30 | (0.42 | ) | 27 | ||||||||||||||||||||||||||||||||||||||
R5 | 39.03 | (0.05 | ) | 1.63 | 1.58 | — | (1.79 | ) | (1.79 | ) | 38.82 | 4.15 | 7,757 | 1.02 | 1.02 | (0.13 | ) | 27 | ||||||||||||||||||||||||||||||||||||||
Y | 39.45 | (0.01 | ) | 1.64 | 1.63 | — | (1.79 | ) | (1.79 | ) | 39.29 | 4.24 | 52,896 | 0.92 | 0.92 | (0.03 | ) | 27 | ||||||||||||||||||||||||||||||||||||||
F | 36.45 | — | 1.51 | 1.51 | — | (1.79 | ) | (1.79 | ) | 36.17 | 4.26 | 76,003 | 0.90 | 0.90 | (0.01 | ) | 27 | |||||||||||||||||||||||||||||||||||||||
For the Year Ended October 31, 2017 |
| |||||||||||||||||||||||||||||||||||||||||||||||||||||||
A | $ | 30.96 | $ | (0.12 | ) | $ | 7.04 | $ | 6.92 | $ | — | $ | (3.02 | ) | $ | (3.02 | ) | $ | 34.86 | 24.28 | % | $ | 714,694 | 1.29 | % | 1.29 | % | (0.36 | )% | 23 | % | |||||||||||||||||||||||||
C | 26.34 | (0.30 | ) | 5.88 | 5.58 | — | (3.02 | ) | (3.02 | ) | 28.90 | 23.37 | 242,421 | 2.04 | 2.03 | (1.10 | ) | 23 | ||||||||||||||||||||||||||||||||||||||
I | 32.15 | (0.04 | ) | 7.34 | 7.30 | — | (3.02 | ) | (3.02 | ) | 36.43 | 24.59 | 351,686 | 1.03 | 1.03 | (0.11 | ) | 23 | ||||||||||||||||||||||||||||||||||||||
R3 | 31.87 | (0.23 | ) | 7.25 | 7.02 | — | (3.02 | ) | (3.02 | ) | 35.87 | 23.87 | 45,673 | 1.61 | 1.61 | (0.68 | ) | 23 | ||||||||||||||||||||||||||||||||||||||
R4 | 33.10 | (0.13 | ) | 7.55 | 7.42 | — | (3.02 | ) | (3.02 | ) | 37.50 | 24.22 | 35,927 | 1.31 | 1.31 | (0.38 | ) | 23 | ||||||||||||||||||||||||||||||||||||||
R5 | 34.23 | (0.03 | ) | 7.85 | 7.82 | — | (3.02 | ) | (3.02 | ) | 39.03 | 24.62 | 6,888 | 1.01 | 1.01 | (0.08 | ) | 23 | ||||||||||||||||||||||||||||||||||||||
Y | 34.54 | (0.01 | ) | 7.94 | 7.93 | — | (3.02 | ) | (3.02 | ) | 39.45 | 24.72 | 45,193 | 0.93 | 0.93 | (0.02 | ) | 23 | ||||||||||||||||||||||||||||||||||||||
F(5) | 33.96 | 0.01 | 2.48 | 2.49 | — | — | — | 36.45 | 7.33 | (6) | 61,710 | 0.90 | (7) | 0.90 | (7) | 0.04 | (7) | 23 | ||||||||||||||||||||||||||||||||||||||
For the Year Ended October 31, 2016 |
| |||||||||||||||||||||||||||||||||||||||||||||||||||||||
A | $ | 38.70 | $ | (0.12 | ) | $ | (2.52 | ) | $ | (2.64 | ) | $ | (0.55 | ) | $ | (4.55 | ) | $ | (5.10 | ) | $ | 30.96 | (8.11 | )% | $ | 757,038 | 1.33 | % | 1.33 | % | (0.36 | )% | 35 | % | ||||||||||||||||||||||
B | 33.41 | (0.36 | ) | (2.15 | ) | (2.51 | ) | (0.13 | ) | (4.55 | ) | (4.68 | ) | 26.22 | (8.94 | ) | 2,056 | 2.24 | 2.22 | (1.26 | ) | 35 | ||||||||||||||||||||||||||||||||||
C | 33.73 | (0.31 | ) | (2.15 | ) | (2.46 | ) | (0.38 | ) | (4.55 | ) | (4.93 | ) | 26.34 | (8.78 | ) | 254,009 | 2.06 | 2.06 | (1.10 | ) | 35 | ||||||||||||||||||||||||||||||||||
I | 39.98 | (0.03 | ) | (2.61 | ) | (2.64 | ) | (0.64 | ) | (4.55 | ) | (5.19 | ) | 32.15 | (7.86 | ) | 228,463 | 1.07 | 1.07 | (0.09 | ) | 35 | ||||||||||||||||||||||||||||||||||
R3 | 39.69 | (0.22 | ) | (2.61 | ) | (2.83 | ) | (0.44 | ) | (4.55 | ) | (4.99 | ) | 31.87 | (8.38 | ) | 43,993 | 1.62 | 1.62 | (0.66 | ) | 35 | ||||||||||||||||||||||||||||||||||
R4 | 41.01 | (0.13 | ) | (2.69 | ) | (2.82 | ) | (0.54 | ) | (4.55 | ) | (5.09 | ) | 33.10 | (8.09 | ) | 38,273 | 1.32 | 1.32 | (0.36 | ) | 35 | ||||||||||||||||||||||||||||||||||
R5 | 42.22 | (0.02 | ) | (2.79 | ) | (2.81 | ) | (0.63 | ) | (4.55 | ) | (5.18 | ) | 34.23 | (7.82 | ) | 5,342 | 1.03 | 1.03 | (0.06 | ) | 35 | ||||||||||||||||||||||||||||||||||
Y | 42.54 | 0.02 | (2.80 | ) | (2.78 | ) | (0.67 | ) | (4.55 | ) | (5.22 | ) | 34.54 | (7.72 | ) | 51,125 | 0.92 | 0.92 | 0.05 | 35 | ||||||||||||||||||||||||||||||||||||
For the Year Ended October 31, 2015 |
| |||||||||||||||||||||||||||||||||||||||||||||||||||||||
A | $ | 36.60 | $ | (0.18 | ) | $ | 4.77 | $ | 4.59 | $ | — | $ | (2.49 | ) | $ | (2.49 | ) | $ | 38.70 | 13.19 | % | $ | 914,414 | 1.28 | % | 1.28 | % | (0.46 | )% | 39 | % | |||||||||||||||||||||||||
B | 32.18 | (0.46 | ) | 4.18 | 3.72 | — | (2.49 | ) | (2.49 | ) | 33.41 | 12.23 | 6,239 | 2.15 | 2.15 | (1.35 | ) | 39 | ||||||||||||||||||||||||||||||||||||||
C | 32.42 | (0.41 | ) | 4.21 | 3.80 | — | (2.49 | ) | (2.49 | ) | 33.73 | 12.40 | 310,668 | 2.02 | 2.02 | (1.19 | ) | 39 | ||||||||||||||||||||||||||||||||||||||
I | 37.63 | (0.07 | ) | 4.91 | 4.84 | — | (2.49 | ) | (2.49 | ) | 39.98 | 13.51 | 266,553 | 1.01 | 1.01 | (0.18 | ) | 39 | ||||||||||||||||||||||||||||||||||||||
R3 | 37.58 | (0.31 | ) | 4.91 | 4.60 | — | (2.49 | ) | (2.49 | ) | 39.69 | 12.85 | 59,135 | 1.61 | 1.61 | (0.78 | ) | 39 | ||||||||||||||||||||||||||||||||||||||
R4 | 38.64 | (0.20 | ) | 5.06 | 4.86 | — | (2.49 | ) | (2.49 | ) | 41.01 | 13.19 | 51,253 | 1.30 | 1.30 | (0.48 | ) | 39 | ||||||||||||||||||||||||||||||||||||||
R5 | 39.60 | (0.08 | ) | 5.19 | 5.11 | — | (2.49 | ) | (2.49 | ) | 42.22 | 13.52 | 5,326 | 1.01 | 1.01 | (0.18 | ) | 39 | ||||||||||||||||||||||||||||||||||||||
Y | 39.85 | (0.03 | ) | 5.21 | 5.18 | — | (2.49 | ) | (2.49 | ) | 42.54 | 13.64 | 8,834 | 0.90 | 0.90 | (0.08 | ) | 39 | ||||||||||||||||||||||||||||||||||||||
The accompanying notes are an integral part of these financial statements.
| 92 |
|
| Hartford Domestic Equity Funds |
Financial Highlights – (continued)
| — SelectedPer-Share Data(1)— | — Ratios and Supplemental Data — | |||||||||||||||||||||||||||||||||||||||||||||||||||||||
Class | Net Asset Value at Beginning of Period | Net Investment Income (Loss) | Net Realized and Unrealized Gain (Loss) on Investments | Total from Investment Operations | Dividends from Net Investment Income | Distributions from Capital Gains | Total Dividends and Distributions | Net Asset Value at End of Period | Total Return(2) | Net Assets at End of Period (000s) | Ratio of Expenses to Average Net Assets Before Adjust- ments(3) | Ratio of Expenses to Average Net Assets After Adjust- ments(3) | Ratio of Net Investment Income (Loss) to Average Net Assets | Portfolio Turnover | ||||||||||||||||||||||||||||||||||||||||||
| The Hartford MidCap Fund | ||||||||||||||||||||||||||||||||||||||||||||||||||||||||
For the Year Ended October 31, 2019 |
| |||||||||||||||||||||||||||||||||||||||||||||||||||||||
A | $ | 30.03 | $ | (0.09 | ) | $ | 3.80 | $ | 3.71 | $ | — | $ | (3.40 | ) | $ | (3.40 | ) | $ | 30.34 | 14.93 | % | $ | 2,820,971 | 1.11 | % | 1.10 | % | (0.32 | )% | 31 | % | |||||||||||||||||||||||||
C | 21.90 | (0.22 | ) | 2.55 | 2.33 | — | (3.40 | ) | (3.40 | ) | 20.83 | 14.10 | 498,057 | 1.86 | 1.86 | (1.08 | ) | 31 | ||||||||||||||||||||||||||||||||||||||
I | 30.91 | (0.02 | ) | 3.94 | 3.92 | — | (3.40 | ) | (3.40 | ) | 31.43 | 15.25 | 4,168,592 | 0.85 | 0.85 | (0.06 | ) | 31 | ||||||||||||||||||||||||||||||||||||||
R3 | 33.31 | (0.22 | ) | 4.29 | 4.07 | — | (3.40 | ) | (3.40 | ) | 33.98 | 14.54 | 96,409 | 1.45 | 1.45 | (0.67 | ) | 31 | ||||||||||||||||||||||||||||||||||||||
R4 | 34.59 | (0.12 | ) | 4.50 | 4.38 | — | (3.40 | ) | (3.40 | ) | 35.57 | 14.89 | 266,390 | 1.16 | 1.14 | (0.36 | ) | 31 | ||||||||||||||||||||||||||||||||||||||
R5 | 35.55 | (0.02 | ) | 4.64 | 4.62 | — | (3.40 | ) | (3.40 | ) | 36.77 | 15.23 | 497,712 | 0.84 | 0.84 | (0.07 | ) | 31 | ||||||||||||||||||||||||||||||||||||||
R6 | 35.90 | 0.02 | 4.70 | 4.72 | — | (3.40 | ) | (3.40 | ) | 37.22 | 15.37 | 1,731,890 | 0.74 | 0.74 | 0.04 | 31 | ||||||||||||||||||||||||||||||||||||||||
Y | 35.87 | 0.00 | (21) | 4.70 | 4.70 | — | (3.40 | ) | (3.40 | ) | 37.17 | 15.32 | 1,571,851 | 0.82 | 0.78 | 0.01 | 31 | |||||||||||||||||||||||||||||||||||||||
F | 30.96 | 0.01 | 3.95 | 3.96 | — | (3.40 | ) | (3.40 | ) | 31.52 | 15.36 | 2,259,594 | 0.74 | 0.74 | 0.04 | 31 | ||||||||||||||||||||||||||||||||||||||||
For the Year Ended October 31, 2018 |
| |||||||||||||||||||||||||||||||||||||||||||||||||||||||
A | $ | 30.36 | $ | (0.12 | ) | $ | 1.20 | $ | 1.08 | $ | — | $ | (1.41 | ) | $ | (1.41 | ) | $ | 30.03 | 3.63 | % | $ | 2,592,610 | 1.11 | % | 1.10 | % | (0.39 | )% | 37 | % | |||||||||||||||||||||||||
C | 22.67 | (0.27 | ) | 0.91 | 0.64 | — | (1.41 | ) | (1.41 | ) | 21.90 | 2.84 | 580,708 | 1.85 | 1.85 | (1.14 | ) | 37 | ||||||||||||||||||||||||||||||||||||||
I | 31.12 | (0.03 | ) | 1.23 | 1.20 | — | (1.41 | ) | (1.41 | ) | 30.91 | 3.91 | 3,666,464 | 0.82 | 0.82 | (0.11 | ) | 37 | ||||||||||||||||||||||||||||||||||||||
R3 | 33.64 | (0.26 | ) | 1.34 | 1.08 | — | (1.41 | ) | (1.41 | ) | 33.31 | 3.23 | 102,632 | 1.46 | 1.46 | (0.75 | ) | 37 | ||||||||||||||||||||||||||||||||||||||
R4 | 34.78 | (0.16 | ) | 1.38 | 1.22 | — | �� | (1.41 | ) | (1.41 | ) | 34.59 | 3.57 | 289,049 | 1.16 | 1.15 | (0.43 | ) | 37 | |||||||||||||||||||||||||||||||||||||
R5 | 35.59 | (0.05 | ) | 1.42 | 1.37 | — | (1.41 | ) | (1.41 | ) | 35.55 | 3.89 | 468,146 | 0.85 | 0.85 | (0.13 | ) | 37 | ||||||||||||||||||||||||||||||||||||||
R6 | 35.90 | (0.01 | ) | 1.42 | 1.41 | — | (1.41 | ) | (1.41 | ) | 35.90 | 3.97 | 1,014,518 | 0.75 | 0.75 | (0.04 | ) | 37 | ||||||||||||||||||||||||||||||||||||||
Y | 35.88 | (0.02 | ) | 1.42 | 1.40 | — | (1.41 | ) | (1.41 | ) | 35.87 | 3.95 | 1,934,520 | 0.78 | 0.78 | (0.06 | ) | 37 | ||||||||||||||||||||||||||||||||||||||
F | 31.15 | (0.01 | ) | 1.23 | 1.22 | — | (1.41 | ) | (1.41 | ) | 30.96 | 3.97 | 1,648,425 | 0.75 | 0.75 | (0.03 | ) | 37 | ||||||||||||||||||||||||||||||||||||||
For the Year Ended October 31, 2017 |
| |||||||||||||||||||||||||||||||||||||||||||||||||||||||
A | $ | 24.25 | $ | (0.11 | ) | $ | 7.00 | $ | 6.89 | $ | — | $ | (0.78 | ) | $ | (0.78 | ) | $ | 30.36 | 29.02 | % | $ | 2,482,275 | 1.13 | % | 1.12 | % | (0.38 | )% | 30 | % | |||||||||||||||||||||||||
C | 18.42 | (0.23 | ) | 5.26 | 5.03 | — | (0.78 | ) | (0.78 | ) | 22.67 | 28.07 | 717,521 | 1.87 | 1.87 | (1.12 | ) | 30 | ||||||||||||||||||||||||||||||||||||||
I | 24.79 | (0.05 | ) | 7.16 | 7.11 | — | (0.78 | ) | (0.78 | ) | 31.12 | 29.28 | 2,996,705 | 1.02 | 0.89 | (0.17 | ) | 30 | ||||||||||||||||||||||||||||||||||||||
R3 | 26.88 | (0.22 | ) | 7.76 | 7.54 | — | (0.78 | ) | (0.78 | ) | 33.64 | 28.59 | 90,582 | 1.47 | 1.47 | (0.73 | ) | 30 | ||||||||||||||||||||||||||||||||||||||
R4 | 27.69 | (0.14 | ) | 8.01 | 7.87 | — | (0.78 | ) | (0.78 | ) | 34.78 | 28.95 | 263,236 | 1.16 | 1.16 | (0.43 | ) | 30 | ||||||||||||||||||||||||||||||||||||||
R5 | 28.24 | (0.04 | ) | 8.17 | 8.13 | — | (0.78 | ) | (0.78 | ) | 35.59 | 29.32 | 356,166 | 0.86 | 0.86 | (0.14 | ) | 30 | ||||||||||||||||||||||||||||||||||||||
R6 | 28.45 | (0.05 | ) | 8.28 | 8.23 | — | (0.78 | ) | (0.78 | ) | 35.90 | 29.45 | 431,183 | 0.76 | 0.76 | (0.14 | ) | 30 | ||||||||||||||||||||||||||||||||||||||
Y | 28.44 | (0.01 | ) | 8.23 | 8.22 | — | (0.78 | ) | (0.78 | ) | 35.88 | 29.43 | 1,847,676 | 0.78 | 0.78 | (0.04 | ) | 30 | ||||||||||||||||||||||||||||||||||||||
F(5) | 27.52 | (0.03 | ) | 3.66 | 3.63 | — | — | — | 31.15 | 13.19 | (6) | 1,244,732 | 0.76 | (7) | 0.76 | (7) | (0.15 | )(7) | 30 | |||||||||||||||||||||||||||||||||||||
For the Year Ended October 31, 2016 |
| |||||||||||||||||||||||||||||||||||||||||||||||||||||||
A | $ | 26.47 | $ | (0.07 | ) | $ | (0.22 | ) | $ | (0.29 | ) | $ | — | $ | (1.93 | ) | $ | (1.93 | ) | $ | 24.25 | (0.79 | )% | $ | 2,041,826 | 1.17 | % | 1.17 | % | (0.29 | )% | 31 | % | |||||||||||||||||||||||
B | 20.13 | (0.21 | ) | (0.19 | ) | (0.40 | ) | — | (1.93 | ) | (1.93 | ) | 17.80 | (1.66 | ) | 16,842 | 2.06 | 2.06 | (1.16 | ) | 31 | |||||||||||||||||||||||||||||||||||
C | 20.73 | (0.18 | ) | (0.20 | ) | (0.38 | ) | — | (1.93 | ) | (1.93 | ) | 18.42 | (1.50 | ) | 611,311 | 1.89 | 1.89 | (1.01 | ) | 31 | |||||||||||||||||||||||||||||||||||
I | 26.96 | (0.04 | ) | (0.20 | ) | (0.24 | ) | — | (1.93 | ) | (1.93 | ) | 24.79 | (0.57 | ) | 1,725,700 | 1.02 | 1.02 | (0.18 | ) | 31 | |||||||||||||||||||||||||||||||||||
R3 | 29.20 | (0.16 | ) | (0.23 | ) | (0.39 | ) | — | (1.93 | ) | (1.93 | ) | 26.88 | (1.07 | ) | 71,711 | 1.48 | 1.48 | (0.59 | ) | 31 | |||||||||||||||||||||||||||||||||||
R4 | 29.93 | (0.08 | ) | (0.23 | ) | (0.31 | ) | — | (1.93 | ) | (1.93 | ) | 27.69 | (0.76 | ) | 165,137 | 1.18 | 1.18 | (0.30 | ) | 31 | |||||||||||||||||||||||||||||||||||
R5 | 30.39 | — | (0.22 | ) | (0.22 | ) | — | (1.93 | ) | (1.93 | ) | 28.24 | (0.47 | ) | 193,533 | 0.87 | 0.87 | — | 31 | |||||||||||||||||||||||||||||||||||||
R6 | 30.58 | — | (0.20 | ) | (0.20 | ) | — | (1.93 | ) | (1.93 | ) | 28.45 | (0.36 | ) | 26,352 | 0.77 | 0.77 | 0.01 | 31 | |||||||||||||||||||||||||||||||||||||
Y | 30.57 | 0.03 | (0.23 | ) | (0.20 | ) | — | (1.93 | ) | (1.93 | ) | 28.44 | (0.36 | ) | 1,490,965 | 0.77 | 0.77 | 0.10 | 31 | |||||||||||||||||||||||||||||||||||||
For the Year Ended October 31, 2015 |
| |||||||||||||||||||||||||||||||||||||||||||||||||||||||
A | $ | 27.38 | $ | (0.09 | ) | $ | 1.85 | $ | 1.76 | $ | — | $ | (2.67 | ) | $ | (2.67 | ) | $ | 26.47 | 7.28 | % | $ | 2,048,529 | 1.14 | % | 1.14 | % | (0.35 | )% | 29 | % | |||||||||||||||||||||||||
B | 21.65 | (0.25 | ) | 1.40 | 1.15 | — | (2.67 | ) | (2.67 | ) | 20.13 | 6.28 | 24,665 | 2.03 | 2.03 | (1.22 | ) | 29 | ||||||||||||||||||||||||||||||||||||||
C | 22.18 | (0.23 | ) | 1.45 | 1.22 | — | (2.67 | ) | (2.67 | ) | 20.73 | 6.46 | 626,345 | 1.88 | 1.88 | (1.09 | ) | 29 | ||||||||||||||||||||||||||||||||||||||
I | 27.78 | (0.02 | ) | 1.87 | 1.85 | — | (2.67 | ) | (2.67 | ) | 26.96 | 7.52 | 702,566 | 0.87 | 0.87 | (0.09 | ) | 29 | ||||||||||||||||||||||||||||||||||||||
R3 | 30.02 | (0.20 | ) | 2.05 | 1.85 | — | (2.67 | ) | (2.67 | ) | 29.20 | 6.91 | 76,925 | 1.47 | 1.47 | (0.69 | ) | 29 | ||||||||||||||||||||||||||||||||||||||
R4 | 30.61 | (0.11 | ) | 2.10 | 1.99 | — | (2.67 | ) | (2.67 | ) | 29.93 | 7.26 | 135,698 | 1.16 | 1.16 | (0.39 | ) | 29 | ||||||||||||||||||||||||||||||||||||||
R5 | 30.96 | (0.03 | ) | 2.13 | 2.10 | — | (2.67 | ) | (2.67 | ) | 30.39 | 7.59 | 164,879 | 0.86 | 0.86 | (0.09 | ) | 29 | ||||||||||||||||||||||||||||||||||||||
R6(9) | 31.11 | (0.04 | ) | 2.18 | 2.14 | — | (2.67 | ) | (2.67 | ) | 30.58 | 7.65 | (6) | 1,230 | 0.77 | (7) | 0.77 | (7) | (0.13 | )(7) | 29 | |||||||||||||||||||||||||||||||||||
Y | 31.10 | 0.01 | 2.13 | 2.14 | — | (2.67 | ) | (2.67 | ) | 30.57 | 7.66 | 1,201,917 | 0.76 | 0.76 | 0.04 | 29 | ||||||||||||||||||||||||||||||||||||||||
The accompanying notes are an integral part of these financial statements.
| 93 |
|
| Hartford Domestic Equity Funds |
Financial Highlights – (continued)
| — SelectedPer-Share Data(1)— | — Ratios and Supplemental Data — | |||||||||||||||||||||||||||||||||||||||||||||||||||||||
Class | Net Asset Value at Beginning of Period | Net Investment Income (Loss) | Net Realized and Unrealized Gain (Loss) on Investments | Total from Investment Operations | Dividends from Net Investment Income | Distributions from Capital Gains | Total Dividends and Distributions | Net Asset Value at End of Period | Total Return(2) | Net Assets at End of Period (000s) | Ratio of Expenses to Average Net Assets Before Adjust- ments(3) | Ratio of Expenses to Average Net Assets After Adjust- ments(3) | Ratio of Net Investment Income (Loss) to Average Net Assets | Portfolio Turnover | ||||||||||||||||||||||||||||||||||||||||||
| The Hartford MidCap Value Fund | ||||||||||||||||||||||||||||||||||||||||||||||||||||||||
For the Year Ended October 31, 2019 |
| |||||||||||||||||||||||||||||||||||||||||||||||||||||||
A | $ | 14.54 | $ | 0.08 | $ | 1.44 | $ | 1.52 | $ | (0.04 | ) | $ | (1.59 | ) | $ | (1.63 | ) | $ | 14.43 | 12.74 | % | $ | 309,996 | 1.23 | % | 1.23 | % | 0.61 | % | 55 | % | |||||||||||||||||||||||||
C | 11.97 | (0.02 | ) | 1.15 | 1.13 | — | (1.59 | ) | (1.59 | ) | 11.51 | 11.99 | 15,910 | 1.99 | 1.99 | (0.14 | ) | 55 | ||||||||||||||||||||||||||||||||||||||
I | 14.68 | 0.13 | 1.46 | 1.59 | (0.08 | ) | (1.59 | ) | (1.67 | ) | 14.60 | 13.20 | 31,173 | 0.89 | 0.89 | 0.95 | 55 | |||||||||||||||||||||||||||||||||||||||
R3 | 15.23 | 0.05 | 1.53 | 1.58 | — | (1.59 | ) | (1.59 | ) | 15.22 | 12.42 | 8,034 | 1.52 | 1.52 | 0.33 | 55 | ||||||||||||||||||||||||||||||||||||||||
R4 | 15.55 | 0.09 | 1.57 | 1.66 | (0.04 | ) | (1.59 | ) | (1.63 | ) | 15.58 | 12.77 | 11,865 | 1.21 | 1.21 | 0.64 | 55 | |||||||||||||||||||||||||||||||||||||||
R5 | 15.76 | 0.16 | 1.57 | 1.73 | (0.08 | ) | (1.59 | ) | (1.67 | ) | 15.82 | 13.14 | 1,592 | 0.92 | 0.92 | 1.06 | 55 | |||||||||||||||||||||||||||||||||||||||
Y | 15.80 | 0.15 | 1.60 | 1.75 | (0.09 | ) | (1.59 | ) | (1.68 | ) | 15.87 | 13.23 | 12,624 | 0.89 | 0.85 | 0.98 | 55 | |||||||||||||||||||||||||||||||||||||||
F | 14.69 | 0.14 | 1.46 | 1.60 | (0.10 | ) | (1.59 | ) | (1.69 | ) | 14.60 | 13.27 | 314,566 | 0.80 | 0.80 | 1.03 | 55 | |||||||||||||||||||||||||||||||||||||||
For the Year Ended October 31, 2018 |
| |||||||||||||||||||||||||||||||||||||||||||||||||||||||
A | $ | 15.62 | $ | 0.03 | $ | (0.72 | ) | $ | (0.69 | ) | $ | — | $ | (0.39 | ) | $ | (0.39 | ) | $ | 14.54 | (4.56 | )% | $ | 284,646 | 1.22 | % | 1.22 | % | 0.18 | % | 49 | % | ||||||||||||||||||||||||
C | 13.03 | (0.07 | ) | (0.60 | ) | (0.67 | ) | — | (0.39 | ) | (0.39 | ) | 11.97 | (5.26 | ) | 17,909 | 1.98 | 1.97 | (0.57 | ) | 49 | |||||||||||||||||||||||||||||||||||
I | 15.72 | 0.08 | (0.73 | ) | (0.65 | ) | — | (0.39 | ) | (0.39 | ) | 14.68 | (4.27 | ) | 34,656 | 0.90 | 0.90 | 0.50 | 49 | |||||||||||||||||||||||||||||||||||||
R3 | 16.39 | (0.02 | ) | (0.75 | ) | (0.77 | ) | — | (0.39 | ) | (0.39 | ) | 15.23 | (4.84 | ) | 9,555 | 1.52 | 1.52 | (0.13 | ) | 49 | |||||||||||||||||||||||||||||||||||
R4 | 16.68 | 0.03 | (0.77 | ) | (0.74 | ) | — | (0.39 | ) | (0.39 | ) | 15.55 | (4.52 | ) | 11,639 | 1.22 | 1.22 | 0.18 | 49 | |||||||||||||||||||||||||||||||||||||
R5 | 16.88 | 0.08 | (0.78 | ) | (0.70 | ) | (0.03 | ) | (0.39 | ) | (0.42 | ) | 15.76 | (4.32 | ) | 8,087 | 0.91 | 0.91 | 0.48 | 49 | ||||||||||||||||||||||||||||||||||||
Y | 16.93 | 0.09 | (0.79 | ) | (0.70 | ) | (0.04 | ) | (0.39 | ) | (0.43 | ) | 15.80 | (4.23 | ) | 11,371 | 0.86 | 0.86 | 0.52 | 49 | ||||||||||||||||||||||||||||||||||||
F | 15.76 | 0.10 | (0.73 | ) | (0.63 | ) | (0.05 | ) | (0.39 | ) | (0.44 | ) | 14.69 | (4.18 | ) | 252,917 | 0.80 | 0.80 | 0.61 | 49 | ||||||||||||||||||||||||||||||||||||
For the Year Ended October 31, 2017 |
| |||||||||||||||||||||||||||||||||||||||||||||||||||||||
A | $ | 13.98 | $ | 0.01 | $ | 2.65 | $ | 2.66 | $ | — | $ | (1.02 | ) | $ | (1.02 | ) | $ | 15.62 | 19.67 | % | $ | 291,082 | 1.23 | % | 1.23 | % | 0.06 | % | 40 | % | ||||||||||||||||||||||||||
C | 11.90 | (0.08 | ) | 2.23 | 2.15 | — | (1.02 | ) | (1.02 | ) | 13.03 | 18.66 | 35,520 | 1.96 | 1.96 | (0.67 | ) | 40 | ||||||||||||||||||||||||||||||||||||||
I | 14.09 | 0.03 | 2.67 | 2.70 | (0.05 | ) | (1.02 | ) | (1.07 | ) | 15.72 | 19.81 | 43,342 | 1.20 | 1.10 | 0.20 | 40 | |||||||||||||||||||||||||||||||||||||||
R3 | 14.67 | (0.04 | ) | 2.78 | 2.74 | — | (1.02 | ) | (1.02 | ) | 16.39 | 19.26 | 11,923 | 1.52 | 1.52 | (0.23 | ) | 40 | ||||||||||||||||||||||||||||||||||||||
R4 | 14.87 | 0.01 | 2.82 | 2.83 | — | (1.02 | ) | (1.02 | ) | 16.68 | 19.58 | 12,637 | 1.21 | 1.21 | 0.08 | 40 | ||||||||||||||||||||||||||||||||||||||||
R5 | 15.03 | 0.06 | 2.86 | 2.92 | (0.05 | ) | (1.02 | ) | (1.07 | ) | 16.88 | 20.06 | 11,445 | 0.91 | 0.91 | 0.38 | 40 | |||||||||||||||||||||||||||||||||||||||
Y | 15.07 | 0.08 | 2.86 | 2.94 | (0.06 | ) | (1.02 | ) | (1.08 | ) | 16.93 | 20.10 | 28,403 | 0.82 | 0.82 | 0.48 | 40 | |||||||||||||||||||||||||||||||||||||||
F(5) | 14.97 | 0.05 | 0.74 | 0.79 | — | — | — | 15.76 | 5.28 | (6) | 238,682 | 0.81 | (7) | 0.81 | (7) | 0.46 | (7) | 40 | ||||||||||||||||||||||||||||||||||||||
For the Year Ended October 31, 2016 |
| |||||||||||||||||||||||||||||||||||||||||||||||||||||||
A | $ | 15.11 | $ | 0.03 | $ | (0.03 | ) | $ | — | $ | (0.02 | ) | $ | (1.11 | ) | $ | (1.13 | ) | $ | 13.98 | 0.18 | % | $ | 246,023 | 1.30 | % | 1.30 | %(15) | 0.18 | % | 56 | % | ||||||||||||||||||||||||
B | 13.15 | (0.07 | ) | (0.03 | ) | (0.10 | ) | — | (1.11 | ) | (1.11 | ) | 11.94 | (0.57 | ) | 637 | 2.42 | 2.12 | (15) | (0.63 | ) | 56 | ||||||||||||||||||||||||||||||||||
C | 13.09 | (0.06 | ) | (0.02 | ) | (0.08 | ) | — | (1.11 | ) | (1.11 | ) | 11.90 | (0.42 | ) | 35,965 | 2.02 | 2.02 | (15) | (0.54 | ) | 56 | ||||||||||||||||||||||||||||||||||
I | 15.22 | 0.05 | (0.01 | ) | 0.04 | (0.06 | ) | (1.11 | ) | (1.17 | ) | 14.09 | 0.48 | 83,155 | 1.06 | 1.06 | (15) | 0.39 | 56 | |||||||||||||||||||||||||||||||||||||
R3 | 15.82 | (0.01 | ) | (0.03 | ) | (0.04 | ) | — | (1.11 | ) | (1.11 | ) | 14.67 | (0.07 | ) | 11,396 | 1.56 | 1.56 | (15) | (0.07 | ) | 56 | ||||||||||||||||||||||||||||||||||
R4 | 15.99 | 0.03 | (0.02 | ) | 0.01 | (0.02 | ) | (1.11 | ) | (1.13 | ) | 14.87 | 0.30 | 13,448 | 1.25 | 1.25 | (15) | 0.23 | 56 | |||||||||||||||||||||||||||||||||||||
R5 | 16.15 | 0.08 | (0.03 | ) | 0.05 | (0.06 | ) | (1.11 | ) | (1.17 | ) | 15.03 | 0.54 | 9,831 | 0.95 | 0.95 | (15) | 0.52 | 56 | |||||||||||||||||||||||||||||||||||||
Y | 16.19 | 0.09 | (0.03 | ) | 0.06 | (0.07 | ) | (1.11 | ) | (1.18 | ) | 15.07 | 0.63 | 79,990 | 0.85 | 0.85 | (15) | 0.63 | 56 | |||||||||||||||||||||||||||||||||||||
For the Year Ended October 31, 2015 |
| |||||||||||||||||||||||||||||||||||||||||||||||||||||||
A | $ | 16.73 | $ | 0.02 | $ | 0.25 | $ | 0.27 | $ | (0.02 | ) | $ | (1.87 | ) | $ | (1.89 | ) | $ | 15.11 | 2.28 | % | $ | 229,953 | 1.25 | % | 1.25 | % | 0.11 | % | 33 | % | |||||||||||||||||||||||||
B | 14.91 | (0.10 | ) | 0.21 | 0.11 | — | (1.87 | ) | (1.87 | ) | 13.15 | 1.37 | 1,417 | 2.28 | 2.09 | (0.75 | ) | 33 | ||||||||||||||||||||||||||||||||||||||
C | 14.84 | (0.08 | ) | 0.20 | 0.12 | — | (1.87 | ) | (1.87 | ) | 13.09 | 1.45 | 41,149 | 1.97 | 1.97 | (0.62 | ) | 33 | ||||||||||||||||||||||||||||||||||||||
I | 16.85 | 0.07 | 0.25 | 0.32 | (0.08 | ) | (1.87 | ) | (1.95 | ) | 15.22 | 2.57 | 29,987 | 0.92 | 0.92 | 0.42 | 33 | |||||||||||||||||||||||||||||||||||||||
R3 | 17.45 | (0.03 | ) | 0.27 | 0.24 | — | (1.87 | ) | (1.87 | ) | 15.82 | 1.97 | 10,204 | 1.52 | 1.52 | (0.19 | ) | 33 | ||||||||||||||||||||||||||||||||||||||
R4 | 17.61 | 0.02 | 0.27 | 0.29 | (0.04 | ) | (1.87 | ) | (1.91 | ) | 15.99 | 2.26 | 11,711 | 1.21 | 1.21 | 0.15 | 33 | |||||||||||||||||||||||||||||||||||||||
R5 | 17.75 | 0.07 | 0.28 | 0.35 | (0.08 | ) | (1.87 | ) | (1.95 | ) | 16.15 | 2.62 | 7,564 | 0.92 | 0.92 | 0.44 | 33 | |||||||||||||||||||||||||||||||||||||||
Y | 17.78 | 0.09 | 0.28 | 0.37 | (0.09 | ) | (1.87 | ) | (1.96 | ) | 16.19 | 2.73 | 158,691 | 0.81 | 0.81 | 0.54 | 33 | |||||||||||||||||||||||||||||||||||||||
The accompanying notes are an integral part of these financial statements.
| 94 |
|
| Hartford Domestic Equity Funds |
Financial Highlights – (continued)
| — SelectedPer-Share Data(1)— | — Ratios and Supplemental Data — | |||||||||||||||||||||||||||||||||||||||||||||||||||||||
Class | Net Asset Value at Beginning of Period | Net Investment Income (Loss) | Net Realized and Unrealized Gain (Loss) on Investments | Total from Investment Operations | Dividends from Net Investment Income | Distributions from Capital Gains | Total Dividends and Distributions | Net Asset Value at End of Period | Total Return(2) | Net Assets at End of Period (000s) | Ratio of Expenses to Average Net Assets Before Adjust- ments(3) | Ratio of Expenses to Average Net Assets After Adjust- ments(3) | Ratio of Net Investment Income (Loss) to Average Net Assets | Portfolio Turnover | ||||||||||||||||||||||||||||||||||||||||||
| Hartford Quality Value Fund | ||||||||||||||||||||||||||||||||||||||||||||||||||||||||
For the Year Ended October 31, 2019 |
| |||||||||||||||||||||||||||||||||||||||||||||||||||||||
A | $ | 20.00 | $ | 0.38 | $ | 1.99 | $ | 2.37 | $ | (0.28 | ) | $ | (0.98 | ) | $ | (1.26 | ) | $ | 21.11 | 13.10 | % | $ | 169,771 | 1.00 | % | 0.90 | % | 1.95 | % | 23 | % | |||||||||||||||||||||||||
C | 17.12 | 0.20 | 1.71 | 1.91 | — | (0.98 | ) | (0.98 | ) | 18.05 | 12.23 | 6,834 | 1.76 | 1.67 | 1.21 | 23 | ||||||||||||||||||||||||||||||||||||||||
I | 19.78 | 0.45 | 1.94 | 2.39 | (0.34 | ) | (0.98 | ) | (1.32 | ) | 20.85 | 13.49 | 12,796 | 0.65 | 0.56 | 2.30 | 23 | |||||||||||||||||||||||||||||||||||||||
R3 | 20.29 | 0.34 | 2.01 | 2.35 | (0.21 | ) | (0.98 | ) | (1.19 | ) | 21.45 | 12.78 | 1,240 | 1.27 | 1.16 | 1.69 | 23 | |||||||||||||||||||||||||||||||||||||||
R4 | 20.49 | 0.40 | 2.04 | 2.44 | (0.27 | ) | (0.98 | ) | (1.25 | ) | 21.68 | 13.17 | 6,014 | 0.95 | 0.86 | 1.99 | 23 | |||||||||||||||||||||||||||||||||||||||
R5 | 20.67 | 0.47 | 2.04 | 2.51 | (0.33 | ) | (0.98 | ) | (1.31 | ) | 21.87 | 13.46 | 230 | 0.67 | 0.58 | 2.33 | 23 | |||||||||||||||||||||||||||||||||||||||
R6 | 20.74 | 0.47 | 2.06 | 2.53 | (0.36 | ) | (0.98 | ) | (1.34 | ) | 21.93 | 13.57 | 34 | 0.56 | 0.46 | 2.26 | 23 | |||||||||||||||||||||||||||||||||||||||
Y | 20.72 | 0.47 | 2.05 | 2.52 | (0.35 | ) | (0.98 | ) | (1.33 | ) | 21.91 | 13.50 | 622 | 0.64 | 0.55 | 2.29 | 23 | |||||||||||||||||||||||||||||||||||||||
F | 19.77 | 0.48 | 1.92 | 2.40 | (0.36 | ) | (0.98 | ) | (1.34 | ) | 20.83 | 13.58 | 11,040 | 0.55 | 0.46 | 2.52 | 23 | |||||||||||||||||||||||||||||||||||||||
For the Year Ended October 31, 2018 |
| |||||||||||||||||||||||||||||||||||||||||||||||||||||||
A | $ | 20.49 | $ | 0.31 | $ | 0.16 | $ | 0.47 | $ | (0.20 | ) | $ | (0.76 | ) | $ | (0.96 | ) | $ | 20.00 | 2.25 | % | $ | 164,325 | 1.06 | % | 1.04 | % | 1.52 | % | 85 | % | |||||||||||||||||||||||||
C | 17.67 | 0.14 | 0.15 | 0.29 | (0.08 | ) | (0.76 | ) | (0.84 | ) | 17.12 | 1.53 | 9,082 | 1.81 | 1.79 | 0.80 | 85 | |||||||||||||||||||||||||||||||||||||||
I | 20.25 | 0.38 | 0.16 | 0.54 | (0.25 | ) | (0.76 | ) | (1.01 | ) | 19.78 | 2.60 | 12,974 | 0.71 | 0.69 | 1.87 | 85 | |||||||||||||||||||||||||||||||||||||||
R3 | 20.70 | 0.26 | 0.17 | 0.43 | (0.08 | ) | (0.76 | ) | (0.84 | ) | 20.29 | 2.03 | 1,075 | 1.34 | 1.30 | 1.26 | 85 | |||||||||||||||||||||||||||||||||||||||
R4 | 20.95 | 0.33 | 0.16 | 0.49 | (0.19 | ) | (0.76 | ) | (0.95 | ) | 20.49 | 2.29 | 6,014 | 1.04 | 1.01 | 1.55 | 85 | |||||||||||||||||||||||||||||||||||||||
R5 | 21.13 | 0.38 | 0.17 | 0.55 | (0.25 | ) | (0.76 | ) | (1.01 | ) | 20.67 | 2.57 | 504 | 0.74 | 0.72 | 1.76 | 85 | |||||||||||||||||||||||||||||||||||||||
R6(16) | 20.99 | 0.28 | (0.53 | )(17) | (0.25 | ) | — | — | — | 20.74 | (1.19 | )(6) | 10 | 0.61 | (7) | 0.59 | (7) | 1.95 | (7) | 85 | ||||||||||||||||||||||||||||||||||||
Y | 21.19 | 0.40 | 0.17 | 0.57 | (0.28 | ) | (0.76 | ) | (1.04 | ) | 20.72 | 2.65 | 601 | 0.68 | 0.66 | 1.90 | 85 | |||||||||||||||||||||||||||||||||||||||
F | 20.26 | 0.39 | 0.17 | 0.56 | (0.29 | ) | (0.76 | ) | (1.05 | ) | 19.77 | 2.71 | 88,336 | 0.62 | 0.60 | 1.94 | 85 | |||||||||||||||||||||||||||||||||||||||
For the Year Ended October 31, 2017 |
| |||||||||||||||||||||||||||||||||||||||||||||||||||||||
A | $ | 17.94 | $ | 0.19 | $ | 2.64 | $ | 2.83 | $ | (0.14 | ) | $ | (0.14 | ) | $ | (0.28 | ) | $ | 20.49 | 15.89 | % | $ | 180,059 | 1.20 | % | 1.20 | % | 0.95 | % | 39 | % | |||||||||||||||||||||||||
C | 15.52 | 0.04 | 2.28 | 2.32 | (0.03 | ) | (0.14 | ) | (0.17 | ) | 17.67 | 15.05 | 20,312 | 1.93 | 1.93 | 0.22 | 39 | |||||||||||||||||||||||||||||||||||||||
I | 17.75 | 0.24 | 2.60 | 2.84 | (0.20 | ) | (0.14 | ) | (0.34 | ) | 20.25 | 16.19 | 15,561 | 0.94 | 0.94 | 1.22 | 39 | |||||||||||||||||||||||||||||||||||||||
R3 | 18.13 | 0.13 | 2.66 | 2.79 | (0.08 | ) | (0.14 | ) | (0.22 | ) | 20.70 | 15.48 | 1,448 | 1.54 | 1.53 | 0.63 | 39 | |||||||||||||||||||||||||||||||||||||||
R4 | 18.34 | 0.19 | 2.70 | 2.89 | (0.14 | ) | (0.14 | ) | (0.28 | ) | 20.95 | 15.87 | 7,550 | 1.20 | 1.20 | 0.96 | 39 | |||||||||||||||||||||||||||||||||||||||
R5 | 18.49 | 0.23 | 2.75 | 2.98 | (0.20 | ) | (0.14 | ) | (0.34 | ) | 21.13 | 16.25 | 480 | 0.91 | 0.91 | 1.17 | 39 | |||||||||||||||||||||||||||||||||||||||
Y | 18.55 | 0.27 | 2.73 | 3.00 | (0.22 | ) | (0.14 | ) | (0.36 | ) | 21.19 | 16.32 | 1,052 | 0.83 | 0.83 | 1.31 | 39 | |||||||||||||||||||||||||||||||||||||||
F(5) | 19.58 | 0.16 | 0.52 | 0.68 | — | — | — | 20.26 | 3.47 | (6) | 12,030 | 0.80 | (7) | 0.80 | (7) | 1.17 | (7) | 39 | ||||||||||||||||||||||||||||||||||||||
For the Year Ended October 31, 2016 |
| |||||||||||||||||||||||||||||||||||||||||||||||||||||||
A | $ | 18.66 | $ | 0.16 | $ | 0.57 | $ | 0.73 | $ | (0.21 | ) | $ | (1.24 | ) | $ | (1.45 | ) | $ | 17.94 | 4.71 | % | $ | 187,475 | 1.25 | % | 1.25 | %(18) | 0.93 | % | 41 | % | |||||||||||||||||||||||||
B | 16.45 | 0.02 | 0.48 | 0.50 | (0.01 | ) | (1.24 | ) | (1.25 | ) | 15.70 | 3.75 | 695 | 2.41 | 2.11 | (18) | 0.11 | 41 | ||||||||||||||||||||||||||||||||||||||
C | 16.34 | 0.03 | 0.49 | 0.52 | (0.10 | ) | (1.24 | ) | (1.34 | ) | 15.52 | 3.93 | 22,223 | 1.97 | 1.97 | (18) | 0.21 | 41 | ||||||||||||||||||||||||||||||||||||||
I | 18.47 | 0.21 | 0.57 | 0.78 | (0.26 | ) | (1.24 | ) | (1.50 | ) | 17.75 | 5.03 | 19,139 | 0.92 | 0.92 | (18) | 1.23 | 41 | ||||||||||||||||||||||||||||||||||||||
R3 | 18.83 | 0.11 | 0.58 | 0.69 | (0.15 | ) | (1.24 | ) | (1.39 | ) | 18.13 | 4.39 | 2,783 | 1.54 | 1.54 | (18) | 0.64 | 41 | ||||||||||||||||||||||||||||||||||||||
R4 | 19.03 | 0.17 | 0.59 | 0.76 | (0.21 | ) | (1.24 | ) | (1.45 | ) | 18.34 | 4.73 | 8,720 | 1.22 | 1.22 | (18) | 0.96 | 41 | ||||||||||||||||||||||||||||||||||||||
R5 | 19.19 | 0.22 | 0.59 | 0.81 | (0.27 | ) | (1.24 | ) | (1.51 | ) | 18.49 | 5.04 | 2,025 | 0.92 | 0.92 | (18) | 1.27 | 41 | ||||||||||||||||||||||||||||||||||||||
Y | 19.24 | 0.26 | 0.58 | 0.84 | (0.29 | ) | (1.24 | ) | (1.53 | ) | 18.55 | 5.14 | 845 | 0.81 | 0.81 | (18) | 1.46 | 41 | ||||||||||||||||||||||||||||||||||||||
For the Year Ended October 31, 2015 |
| |||||||||||||||||||||||||||||||||||||||||||||||||||||||
A | $ | 20.45 | $ | 0.21 | $ | (0.47 | ) | $ | (0.26 | ) | $ | (0.13 | ) | $ | (1.40 | ) | $ | (1.53 | ) | $ | 18.66 | (1.20 | )% | $ | 207,339 | 1.21 | % | 1.21 | % | 1.10 | % | 55 | % | |||||||||||||||||||||||
B | 18.22 | 0.03 | (0.40 | ) | (0.37 | ) | — | (1.40 | ) | (1.40 | ) | 16.45 | (1.94 | ) | 1,909 | 2.28 | 1.97 | 0.19 | 55 | |||||||||||||||||||||||||||||||||||||
C | 18.14 | 0.06 | (0.42 | ) | (0.36 | ) | (0.04 | ) | (1.40 | ) | (1.44 | ) | 16.34 | (1.90 | ) | 26,763 | 1.93 | 1.93 | 0.36 | 55 | ||||||||||||||||||||||||||||||||||||
I | 20.25 | 0.27 | (0.45 | ) | (0.18 | ) | (0.20 | ) | (1.40 | ) | (1.60 | ) | 18.47 | (0.78 | ) | 27,168 | 0.88 | 0.88 | 1.41 | 55 | ||||||||||||||||||||||||||||||||||||
R3 | 20.62 | 0.15 | (0.46 | ) | (0.31 | ) | (0.08 | ) | (1.40 | ) | (1.48 | ) | 18.83 | (1.45 | ) | 3,657 | 1.52 | 1.49 | 0.79 | 55 | ||||||||||||||||||||||||||||||||||||
R4 | 20.82 | 0.22 | (0.47 | ) | (0.25 | ) | (0.14 | ) | (1.40 | ) | (1.54 | ) | 19.03 | (1.11 | ) | 11,942 | 1.19 | 1.18 | 1.11 | 55 | ||||||||||||||||||||||||||||||||||||
R5 | 20.95 | 0.28 | (0.48 | ) | (0.20 | ) | (0.16 | ) | (1.40 | ) | (1.56 | ) | 19.19 | (0.87 | ) | 2,487 | 0.90 | 0.88 | 1.41 | 55 | ||||||||||||||||||||||||||||||||||||
Y | 21.03 | 0.30 | (0.49 | ) | (0.19 | ) | (0.20 | ) | (1.40 | ) | (1.60 | ) | 19.24 | (0.77 | ) | 1,618 | 0.79 | 0.79 | 1.50 | 55 | ||||||||||||||||||||||||||||||||||||
The accompanying notes are an integral part of these financial statements.
| 95 |
|
| Hartford Domestic Equity Funds |
Financial Highlights – (continued)
| — SelectedPer-Share Data(1)— | — Ratios and Supplemental Data — | |||||||||||||||||||||||||||||||||||||||||||||||||||||||
Class | Net Asset Value at Beginning of Period | Net Investment Income (Loss) | Net Realized and Unrealized Gain (Loss) on Investments | Total from Investment Operations | Dividends from Net Investment Income | Distributions from Capital Gains | Total Dividends and Distributions | Net Asset Value at End of Period | Total Return(2) | Net Assets at End of Period (000s) | Ratio of Expenses to Average Net Assets Before Adjust- ments(3) | Ratio of Expenses to Average Net Assets After Adjust- ments(3) | Ratio of Net Investment Income (Loss) to Average Net Assets | Portfolio Turnover | ||||||||||||||||||||||||||||||||||||||||||
| The Hartford Small Cap Growth Fund | ||||||||||||||||||||||||||||||||||||||||||||||||||||||||
For the Year Ended October 31, 2019 |
| |||||||||||||||||||||||||||||||||||||||||||||||||||||||
A | $ | 55.20 | $ | (0.21 | ) | $ | 2.62 | $ | 2.41 | $ | — | $ | (11.90 | ) | $ | (11.90 | ) | $ | 45.71 | 8.99 | % | $ | 195,314 | 1.24 | % | 1.24 | % | (0.46 | )% | 48 | % | |||||||||||||||||||||||||
C | 41.81 | (0.34 | ) | 1.33 | 0.99 | — | (11.90 | ) | (11.90 | ) | 30.90 | 8.27 | 15,722 | 1.89 | 1.89 | (1.11 | ) | 48 | ||||||||||||||||||||||||||||||||||||||
I | 57.17 | (0.02 | ) | 2.80 | 2.78 | — | (11.90 | ) | (11.90 | ) | 48.05 | 9.41 | 191,482 | 0.83 | 0.83 | (0.05 | ) | 48 | ||||||||||||||||||||||||||||||||||||||
R3 | 54.70 | (0.31 | ) | 2.56 | 2.25 | — | (11.90 | ) | (11.90 | ) | 45.05 | 8.72 | 10,036 | 1.47 | 1.47 | (0.69 | ) | 48 | ||||||||||||||||||||||||||||||||||||||
R4 | 56.99 | (0.18 | ) | 2.78 | 2.60 | — | (11.90 | ) | (11.90 | ) | 47.69 | 9.05 | 42,296 | 1.17 | 1.17 | (0.39 | ) | 48 | ||||||||||||||||||||||||||||||||||||||
R5 | 59.48 | (0.03 | ) | 3.02 | 2.99 | — | (11.90 | ) | (11.90 | ) | 50.57 | 9.40 | 82,624 | 0.85 | 0.85 | (0.07 | ) | 48 | ||||||||||||||||||||||||||||||||||||||
R6 | 60.16 | 0.00 | (21) | 3.10 | 3.10 | — | (11.90 | ) | (11.90 | ) | 51.36 | 9.49 | 66,260 | 0.76 | 0.76 | 0.01 | 48 | |||||||||||||||||||||||||||||||||||||||
Y | 60.20 | (0.01 | ) | 3.10 | 3.09 | — | (11.90 | ) | (11.90 | ) | 51.39 | 9.44 | 365,867 | 0.82 | 0.80 | (0.01 | ) | 48 | ||||||||||||||||||||||||||||||||||||||
F | 57.30 | 0.01 | 2.82 | 2.83 | — | (11.90 | ) | (11.90 | ) | 48.23 | 9.49 | 46,533 | 0.76 | 0.76 | 0.02 | 48 | ||||||||||||||||||||||||||||||||||||||||
For the Year Ended October 31, 2018 |
| |||||||||||||||||||||||||||||||||||||||||||||||||||||||
A | $ | 57.24 | $ | (0.33 | ) | $ | 1.03 | $ | 0.70 | $ | — | $ | (2.74 | ) | $ | (2.74 | ) | $ | 55.20 | 1.20 | % | $ | 203,297 | 1.21 | % | 1.20 | % | (0.56 | )% | 66 | % | |||||||||||||||||||||||||
C | 44.29 | (0.55 | ) | 0.81 | 0.26 | — | (2.74 | ) | (2.74 | ) | 41.81 | 0.53 | 23,212 | 1.88 | 1.88 | (1.22 | ) | 66 | ||||||||||||||||||||||||||||||||||||||
I | 58.97 | (0.10 | ) | 1.04 | 0.94 | — | (2.74 | ) | (2.74 | ) | 57.17 | 1.59 | 243,340 | 0.82 | 0.82 | (0.16 | ) | 66 | ||||||||||||||||||||||||||||||||||||||
R3 | 56.89 | (0.48 | ) | 1.03 | 0.55 | — | (2.74 | ) | (2.74 | ) | 54.70 | 0.94 | 13,210 | 1.47 | 1.47 | (0.82 | ) | 66 | ||||||||||||||||||||||||||||||||||||||
R4 | 58.98 | (0.31 | ) | 1.06 | 0.75 | — | (2.74 | ) | (2.74 | ) | 56.99 | 1.26 | 69,097 | 1.15 | 1.15 | (0.50 | ) | 66 | ||||||||||||||||||||||||||||||||||||||
R5 | 61.26 | (0.12 | ) | 1.08 | 0.96 | — | (2.74 | ) | (2.74 | ) | 59.48 | 1.56 | 94,887 | 0.85 | 0.85 | (0.20 | ) | 66 | ||||||||||||||||||||||||||||||||||||||
R6 | 61.87 | (0.09 | ) | 1.12 | 1.03 | — | (2.74 | ) | (2.74 | ) | 60.16 | 1.66 | 44,278 | 0.75 | 0.75 | (0.14 | ) | 66 | ||||||||||||||||||||||||||||||||||||||
Y | 61.93 | (0.09 | ) | 1.10 | 1.01 | — | (2.74 | ) | (2.74 | ) | 60.20 | 1.63 | 358,049 | 0.79 | 0.79 | (0.14 | ) | 66 | ||||||||||||||||||||||||||||||||||||||
F | 59.06 | (0.06 | ) | 1.04 | 0.98 | — | (2.74 | ) | (2.74 | ) | 57.30 | 1.66 | 47,999 | 0.75 | 0.75 | (0.10 | ) | 66 | ||||||||||||||||||||||||||||||||||||||
For the Year Ended October 31, 2017 |
| |||||||||||||||||||||||||||||||||||||||||||||||||||||||
A | $ | 44.55 | $ | (0.25 | ) | $ | 13.25 | $ | 13.00 | $ | — | $ | (0.31 | ) | $ | (0.31 | ) | $ | 57.24 | 29.28 | % | $ | 215,743 | 1.17 | % | 1.16 | % | (0.48 | )% | 56 | % | |||||||||||||||||||||||||
C | 34.78 | (0.48 | ) | 10.30 | 9.82 | — | (0.31 | ) | (0.31 | ) | 44.29 | 28.36 | 36,531 | 1.89 | 1.88 | (1.19 | ) | 56 | ||||||||||||||||||||||||||||||||||||||
I | 45.79 | (0.18 | ) | 13.67 | 13.49 | — | (0.31 | ) | (0.31 | ) | 58.97 | 29.56 | 429,401 | 1.03 | 0.95 | (0.33 | ) | 56 | ||||||||||||||||||||||||||||||||||||||
R3 | 44.42 | (0.41 | ) | 13.19 | 12.78 | — | (0.31 | ) | (0.31 | ) | 56.89 | 28.87 | 14,427 | 1.48 | 1.48 | (0.79 | ) | 56 | ||||||||||||||||||||||||||||||||||||||
R4 | 45.90 | (0.26 | ) | 13.65 | 13.39 | — | (0.31 | ) | (0.31 | ) | 58.98 | 29.27 | 76,315 | 1.16 | 1.16 | (0.48 | ) | 56 | ||||||||||||||||||||||||||||||||||||||
R5 | 47.52 | (0.10 | ) | 14.15 | 14.05 | — | (0.31 | ) | (0.31 | ) | 61.26 | 29.67 | 118,794 | 0.86 | 0.86 | (0.17 | ) | 56 | ||||||||||||||||||||||||||||||||||||||
R6 | 47.94 | (0.06 | ) | 14.30 | 14.24 | — | (0.31 | ) | (0.31 | ) | 61.87 | 29.80 | 10,596 | 0.76 | 0.76 | (0.11 | ) | 56 | ||||||||||||||||||||||||||||||||||||||
Y | 48.00 | (0.05 | ) | 14.29 | 14.24 | — | (0.31 | ) | (0.31 | ) | 61.93 | 29.76 | 370,006 | 0.78 | 0.78 | (0.09 | ) | 56 | ||||||||||||||||||||||||||||||||||||||
F(5) | 52.62 | (0.09 | ) | 6.53 | 6.44 | — | — | — | 59.06 | 12.24 | (6) | 47,409 | 0.75 | (7) | 0.75 | (7) | (0.24 | )(7) | 56 | |||||||||||||||||||||||||||||||||||||
For the Year Ended October 31, 2016 |
| |||||||||||||||||||||||||||||||||||||||||||||||||||||||
A | $ | 48.56 | $ | (0.19 | ) | $ | 0.11 | (17) | $ | (0.08 | ) | $ | — | $ | (3.93 | ) | $ | (3.93 | ) | $ | 44.55 | 0.02 | % | $ | 197,738 | 1.25 | % | 1.25 | % | (0.44 | )% | 45 | % | |||||||||||||||||||||||
B | 39.35 | (0.43 | ) | 0.05 | (17) | (0.38 | ) | — | (3.93 | ) | (3.93 | ) | 35.04 | (0.84 | ) | 606 | 2.35 | 2.09 | (1.23 | ) | 45 | |||||||||||||||||||||||||||||||||||
C | 39.03 | (0.39 | ) | 0.07 | (17) | (0.32 | ) | — | (3.93 | ) | (3.93 | ) | 34.78 | (0.65 | ) | 37,807 | 1.94 | 1.94 | (1.13 | ) | 45 | |||||||||||||||||||||||||||||||||||
I | 49.68 | (0.07 | ) | 0.11 | (17) | 0.04 | — | (3.93 | ) | (3.93 | ) | 45.79 | 0.28 | 137,606 | 0.99 | 0.99 | (0.16 | ) | 45 | |||||||||||||||||||||||||||||||||||||
R3 | 48.54 | (0.30 | ) | 0.11 | (17) | (0.19 | ) | — | (3.93 | ) | (3.93 | ) | 44.42 | (0.24 | ) | 12,708 | 1.51 | 1.51 | (0.70 | ) | 45 | |||||||||||||||||||||||||||||||||||
R4 | 49.87 | (0.18 | ) | 0.14 | (17) | (0.04 | ) | — | (3.93 | ) | (3.93 | ) | 45.90 | 0.09 | 66,273 | 1.19 | 1.19 | (0.39 | ) | 45 | ||||||||||||||||||||||||||||||||||||
R5 | 51.35 | (0.04 | ) | 0.14 | (17) | 0.10 | — | (3.93 | ) | (3.93 | ) | 47.52 | 0.40 | 102,166 | 0.89 | 0.89 | (0.09 | ) | 45 | |||||||||||||||||||||||||||||||||||||
R6 | 51.73 | (0.04 | ) | 0.18 | (17) | 0.14 | — | (3.93 | ) | (3.93 | ) | 47.94 | 0.46 | 4,072 | 0.79 | 0.79 | (0.09 | ) | 45 | |||||||||||||||||||||||||||||||||||||
Y | 51.78 | 0.01 | 0.14 | (17) | 0.15 | — | (3.93 | ) | (3.93 | ) | 48.00 | 0.50 | 290,401 | 0.79 | 0.79 | 0.01 | 45 | |||||||||||||||||||||||||||||||||||||||
For the Year Ended October 31, 2015 |
| |||||||||||||||||||||||||||||||||||||||||||||||||||||||
A | $ | 48.63 | $ | (0.20 | ) | $ | 2.25 | $ | 2.05 | $ | — | $ | (2.12 | ) | $ | (2.12 | ) | $ | 48.56 | 4.37 | % | $ | 243,999 | 1.21 | % | 1.21 | % | (0.40 | )% | 70 | % | |||||||||||||||||||||||||
B | 40.12 | (0.48 | ) | 1.83 | 1.35 | — | (2.12 | ) | (2.12 | ) | 39.35 | 3.54 | 1,500 | 2.20 | 2.03 | (1.18 | ) | 70 | ||||||||||||||||||||||||||||||||||||||
C | 39.77 | (0.45 | ) | 1.83 | 1.38 | — | (2.12 | ) | (2.12 | ) | 39.03 | 3.62 | 49,549 | 1.91 | 1.91 | (1.11 | ) | 70 | ||||||||||||||||||||||||||||||||||||||
I | 49.55 | (0.06 | ) | 2.31 | 2.25 | — | (2.12 | ) | (2.12 | ) | 49.68 | 4.70 | 209,184 | 0.92 | 0.92 | (0.13 | ) | 70 | ||||||||||||||||||||||||||||||||||||||
R3 | 48.74 | (0.36 | ) | 2.28 | 1.92 | — | (2.12 | ) | (2.12 | ) | 48.54 | 4.10 | 16,184 | 1.48 | 1.48 | (0.70 | ) | 70 | ||||||||||||||||||||||||||||||||||||||
R4 | 49.86 | (0.20 | ) | 2.33 | 2.13 | — | (2.12 | ) | (2.12 | ) | 49.87 | 4.44 | 74,037 | 1.17 | 1.17 | (0.38 | ) | 70 | ||||||||||||||||||||||||||||||||||||||
R5 | 51.13 | (0.05 | ) | 2.39 | 2.34 | — | (2.12 | ) | (2.12 | ) | 51.35 | 4.74 | 115,719 | 0.87 | 0.87 | (0.10 | ) | 70 | ||||||||||||||||||||||||||||||||||||||
R6(9) | 51.80 | (0.02 | ) | 2.07 | 2.05 | — | (2.12 | ) | (2.12 | ) | 51.73 | 4.13 | (6) | 14 | 0.87 | (7) | 0.87 | (7) | (0.05 | )(7) | 70 | |||||||||||||||||||||||||||||||||||
Y | 51.49 | 0.01 | 2.40 | 2.41 | — | (2.12 | ) | (2.12 | ) | 51.78 | 4.84 | 314,145 | 0.77 | 0.77 | 0.02 | 70 | ||||||||||||||||||||||||||||||||||||||||
The accompanying notes are an integral part of these financial statements.
| 96 |
|
| Hartford Domestic Equity Funds |
Financial Highlights – (continued)
| — SelectedPer-Share Data(1)— | — Ratios and Supplemental Data — | |||||||||||||||||||||||||||||||||||||||||||||||||||||||
Class | Net Asset Value at Beginning of Period | Net Investment Income (Loss) | Net Realized and Unrealized Gain (Loss) on Investments | Total from Investment Operations | Dividends from Net Investment Income | Distributions from Capital Gains | Total Dividends and Distributions | Net Asset Value at End of Period | Total Return(2) | Net Assets at End of Period (000s) | Ratio of Expenses to Average Net Assets Before Adjust- ments(3) | Ratio of Expenses to Average Net Assets After Adjust- ments(3) | Ratio of Net Investment Income (Loss) to Average Net Assets | Portfolio Turnover | ||||||||||||||||||||||||||||||||||||||||||
| Hartford Small Cap Value Fund | ||||||||||||||||||||||||||||||||||||||||||||||||||||||||
For the Year Ended October 31, 2019 |
| |||||||||||||||||||||||||||||||||||||||||||||||||||||||
A | $ | 13.65 | $ | 0.10 | $ | (0.04 | ) | $ | 0.06 | $ | (0.03 | ) | $ | (3.33 | ) | $ | (3.36 | ) | $ | 10.35 | 3.46 | % | $ | 47,037 | 1.37 | % | 1.27 | % | 0.98 | % | 140 | % | ||||||||||||||||||||||||
C | 12.35 | 0.02 | (0.08 | ) | (0.06 | ) | — | (3.33 | ) | (3.33 | ) | 8.96 | 2.60 | 3,719 | 2.14 | 2.04 | 0.26 | 140 | ||||||||||||||||||||||||||||||||||||||
I | 13.68 | 0.14 | (0.05 | ) | 0.09 | (0.07 | ) | (3.33 | ) | (3.40 | ) | 10.37 | 3.77 | 4,354 | 1.00 | 0.90 | 1.34 | 140 | ||||||||||||||||||||||||||||||||||||||
R3 | 14.02 | 0.09 | (0.03 | ) | 0.06 | (0.02 | ) | (3.33 | ) | (3.35 | ) | 10.73 | 3.31 | 609 | 1.62 | 1.42 | 0.82 | 140 | ||||||||||||||||||||||||||||||||||||||
R4 | 14.16 | 0.11 | (0.03 | ) | 0.08 | (0.02 | ) | (3.33 | ) | (3.35 | ) | 10.89 | 3.52 | 69 | 1.31 | 1.20 | 1.01 | 140 | ||||||||||||||||||||||||||||||||||||||
R5 | 14.16 | 0.16 | (0.05 | ) | 0.11 | (0.07 | ) | (3.33 | ) | (3.40 | ) | 10.87 | 3.82 | 11 | 1.01 | 0.90 | 1.44 | 140 | ||||||||||||||||||||||||||||||||||||||
R6 | 14.15 | 0.15 | (0.02 | ) | 0.13 | (0.08 | ) | (3.33 | ) | (3.41 | ) | 10.87 | 3.99 | 103 | 0.89 | 0.80 | 1.39 | 140 | ||||||||||||||||||||||||||||||||||||||
Y | 14.15 | 0.16 | (0.04 | ) | 0.12 | (0.08 | ) | (3.33 | ) | (3.41 | ) | 10.86 | 3.94 | 572 | 0.97 | 0.85 | 1.43 | 140 | ||||||||||||||||||||||||||||||||||||||
F | 13.68 | 0.15 | (0.04 | ) | 0.11 | (0.08 | ) | (3.33 | ) | (3.41 | ) | 10.38 | 3.99 | 48,425 | 0.89 | 0.80 | 1.43 | 140 | ||||||||||||||||||||||||||||||||||||||
For the Year Ended October 31, 2018 |
| |||||||||||||||||||||||||||||||||||||||||||||||||||||||
A | $ | 14.13 | $ | 0.04 | $ | 0.10 | $ | 0.14 | $ | (0.02 | ) | $ | (0.60 | ) | $ | (0.62 | ) | $ | 13.65 | 1.00 | % | $ | 52,406 | 1.35 | % | 1.29 | % | 0.28 | % | 68 | % | |||||||||||||||||||||||||
C | 12.91 | (0.06 | ) | 0.10 | 0.04 | — | (0.60 | ) | (0.60 | ) | 12.35 | 0.27 | 6,444 | 2.13 | 2.04 | (0.44 | ) | 68 | ||||||||||||||||||||||||||||||||||||||
I | 14.15 | 0.09 | 0.10 | 0.19 | (0.06 | ) | (0.60 | ) | (0.66 | ) | 13.68 | 1.33 | 3,756 | 1.02 | 0.95 | 0.62 | 68 | |||||||||||||||||||||||||||||||||||||||
R3 | 14.50 | 0.03 | 0.09 | 0.12 | — | (0.60 | ) | (0.60 | ) | 14.02 | 0.82 | 529 | 1.62 | 1.43 | 0.18 | 68 | ||||||||||||||||||||||||||||||||||||||||
R4 | 14.61 | 0.06 | 0.10 | 0.16 | (0.01 | ) | (0.60 | ) | (0.61 | ) | 14.16 | 1.07 | 48 | 1.32 | 1.20 | 0.41 | 68 | |||||||||||||||||||||||||||||||||||||||
R5 | 14.63 | 0.10 | 0.10 | 0.20 | (0.07 | ) | (0.60 | ) | (0.67 | ) | 14.16 | 1.39 | 36 | 1.02 | 0.90 | 0.71 | 68 | |||||||||||||||||||||||||||||||||||||||
R6(16) | 13.99 | 0.05 | 0.11 | 0.16 | — | — | — | 14.15 | 1.14 | (6) | 10 | 0.91 | (7) | 0.84 | (7) | 0.47 | (7) | 68 | ||||||||||||||||||||||||||||||||||||||
Y | 14.66 | 0.11 | 0.10 | 0.21 | (0.12 | ) | (0.60 | ) | (0.72 | ) | 14.15 | 1.42 | 646 | 0.96 | 0.85 | 0.74 | 68 | |||||||||||||||||||||||||||||||||||||||
F | 14.16 | 0.11 | 0.09 | 0.20 | (0.08 | ) | (0.60 | ) | (0.68 | ) | 13.68 | 1.42 | 38,087 | 0.90 | 0.84 | 0.80 | 68 | |||||||||||||||||||||||||||||||||||||||
For the Year Ended October 31, 2017 |
| |||||||||||||||||||||||||||||||||||||||||||||||||||||||
A | $ | 11.56 | $ | 0.04 | $ | 2.63 | $ | 2.67 | $ | (0.10 | ) | $ | — | $ | (0.10 | ) | $ | 14.13 | 23.19 | % | $ | 53,057 | 1.28 | % | 1.27 | % | 0.32 | % | 83 | % | ||||||||||||||||||||||||||
C | 10.58 | (0.05 | ) | 2.40 | 2.35 | (0.02 | ) | — | (0.02 | ) | 12.91 | 22.24 | 11,081 | 2.03 | 2.01 | (0.41 | ) | 83 | ||||||||||||||||||||||||||||||||||||||
I | 11.58 | 0.08 | 2.63 | 2.71 | (0.14 | ) | — | (0.14 | ) | 14.15 | 23.53 | 3,225 | 1.01 | 1.00 | 0.60 | 83 | ||||||||||||||||||||||||||||||||||||||||
R3 | 11.87 | 0.01 | 2.69 | 2.70 | (0.07 | ) | — | (0.07 | ) | 14.50 | 22.79 | 723 | 1.63 | 1.50 | 0.09 | 83 | ||||||||||||||||||||||||||||||||||||||||
R4 | 11.94 | 0.05 | 2.70 | 2.75 | (0.08 | ) | — | (0.08 | ) | 14.61 | 23.11 | 113 | 1.36 | 1.20 | 0.36 | 83 | ||||||||||||||||||||||||||||||||||||||||
R5 | 11.96 | 0.10 | 2.71 | 2.81 | (0.14 | ) | — | (0.14 | ) | 14.63 | 23.63 | 44 | 1.01 | 0.90 | 0.74 | 83 | ||||||||||||||||||||||||||||||||||||||||
Y | 12.00 | 0.11 | 2.71 | 2.82 | (0.16 | ) | — | (0.16 | ) | 14.66 | 23.58 | 1,242 | 0.86 | 0.85 | 0.78 | 83 | ||||||||||||||||||||||||||||||||||||||||
F(5) | 13.22 | 0.05 | 0.89 | 0.94 | — | — | — | 14.16 | 7.11 | (6) | 86,675 | 0.88 | (7) | 0.85 | (7) | 0.52 | (7) | 83 | ||||||||||||||||||||||||||||||||||||||
For the Year Ended October 31, 2016 |
| |||||||||||||||||||||||||||||||||||||||||||||||||||||||
A | $ | 12.35 | $ | 0.10 | $ | (0.15 | )(17) | $ | (0.05 | ) | $ | (0.02 | ) | $ | (0.72 | ) | $ | (0.74 | ) | $ | 11.56 | (0.22 | )% | $ | 46,270 | 1.35 | % | 1.31 | %(19) | 0.85 | % | 94 | % | |||||||||||||||||||||||
B | 11.58 | 0.01 | (0.14 | )(17) | (0.13 | ) | — | (0.72 | ) | (0.72 | ) | 10.73 | (0.93 | ) | 798 | 2.25 | 2.06 | (19) | 0.10 | 94 | ||||||||||||||||||||||||||||||||||||
C | 11.43 | 0.01 | (0.14 | )(17) | (0.13 | ) | — | (0.72 | ) | (0.72 | ) | 10.58 | (0.94 | ) | 10,410 | 2.08 | 2.06 | (19) | 0.11 | 94 | ||||||||||||||||||||||||||||||||||||
I | 12.38 | 0.13 | (0.15 | )(17) | (0.02 | ) | (0.06 | ) | (0.72 | ) | (0.78 | ) | 11.58 | 0.05 | 2,582 | 1.01 | 1.00 | (19) | 1.17 | 94 | ||||||||||||||||||||||||||||||||||||
R3 | 12.67 | 0.08 | (0.16 | )(17) | (0.08 | ) | — | (0.72 | ) | (0.72 | ) | 11.87 | (0.43 | ) | 734 | 1.61 | 1.51 | (19) | 0.65 | 94 | ||||||||||||||||||||||||||||||||||||
R4 | 12.72 | 0.11 | (0.15 | )(17) | (0.04 | ) | (0.02 | ) | (0.72 | ) | (0.74 | ) | 11.94 | (0.09 | ) | 267 | 1.30 | 1.21 | (19) | 0.96 | 94 | |||||||||||||||||||||||||||||||||||
R5 | 12.78 | 0.13 | (0.14 | )(17) | (0.01 | ) | (0.09 | ) | (0.72 | ) | (0.81 | ) | 11.96 | 0.16 | 44 | 1.00 | 0.91 | (19) | 1.08 | 94 | ||||||||||||||||||||||||||||||||||||
Y | 12.77 | 0.16 | (0.15 | )(17) | 0.01 | (0.06 | ) | (0.72 | ) | (0.78 | ) | 12.00 | 0.31 | 110,028 | 0.88 | 0.86 | (19) | 1.36 | 94 | |||||||||||||||||||||||||||||||||||||
For the Year Ended October 31, 2015 |
| |||||||||||||||||||||||||||||||||||||||||||||||||||||||
A | $ | 13.89 | $ | 0.11 | $ | (0.28 | ) | $ | (0.17 | ) | $ | (0.08 | ) | $ | (1.29 | ) | $ | (1.37 | ) | $ | 12.35 | (1.17 | )% | $ | 51,249 | 1.40 | % | 1.29 | % | 0.85 | % | 112 | % | |||||||||||||||||||||||
B | 13.12 | 0.01 | (0.26 | ) | (0.25 | ) | — | (1.29 | ) | (1.29 | ) | 11.58 | (1.92 | ) | 1,792 | 2.28 | 2.05 | 0.12 | 112 | |||||||||||||||||||||||||||||||||||||
C | 12.96 | 0.01 | (0.25 | ) | (0.24 | ) | — | (1.29 | ) | (1.29 | ) | 11.43 | (1.86 | ) | 12,905 | 2.14 | 2.04 | 0.10 | 112 | |||||||||||||||||||||||||||||||||||||
I(11) | 13.40 | 0.08 | (1.10 | ) | (1.02 | ) | — | — | — | 12.38 | (7.61 | )(6) | 2,429 | 1.12 | (7) | 0.99 | (7) | 1.01 | (7) | 112 | ||||||||||||||||||||||||||||||||||||
R3 | 14.21 | 0.09 | (0.28 | ) | (0.19 | ) | (0.06 | ) | (1.29 | ) | (1.35 | ) | 12.67 | (1.29 | ) | 830 | 1.70 | 1.50 | 0.64 | 112 | ||||||||||||||||||||||||||||||||||||
R4 | 14.26 | 0.13 | (0.27 | ) | (0.14 | ) | (0.11 | ) | (1.29 | ) | (1.40 | ) | 12.72 | (0.97 | ) | 608 | 1.37 | 1.20 | 0.94 | 112 | ||||||||||||||||||||||||||||||||||||
R5 | 14.32 | 0.17 | (0.29 | ) | (0.12 | ) | (0.13 | ) | (1.29 | ) | (1.42 | ) | 12.78 | (0.75 | ) | 218 | 1.06 | 0.90 | 1.23 | 112 | ||||||||||||||||||||||||||||||||||||
Y | 14.31 | 0.16 | (0.27 | ) | (0.11 | ) | (0.14 | ) | (1.29 | ) | (1.43 | ) | 12.77 | (0.71 | ) | 1,312 | 0.96 | 0.85 | 1.23 | 112 | ||||||||||||||||||||||||||||||||||||
The accompanying notes are an integral part of these financial statements.
| 97 |
|
| Hartford Domestic Equity Funds |
Financial Highlights – (continued)
| — SelectedPer-Share Data(1)— | — Ratios and Supplemental Data — | |||||||||||||||||||||||||||||||||||||||||||||||||||||||
Class | Net Asset Value at Beginning of Period | Net Investment Income (Loss) | Net Realized and Unrealized Gain (Loss) on Investments | Total from Investment Operations | Dividends from Net Investment Income | Distributions from Capital Gains | Total Dividends and Distributions | Net Asset Value at End of Period | Total Return(2) | Net Assets at End of Period (000s) | Ratio of Expenses to Average Net Assets Before Adjust- ments(3) | Ratio of Expenses to Average Net Assets After Adjust- ments(3) | Ratio of Net Investment Income (Loss) to Average Net Assets | Portfolio Turnover | ||||||||||||||||||||||||||||||||||||||||||
| The Hartford Small Company Fund | ||||||||||||||||||||||||||||||||||||||||||||||||||||||||
For the Year Ended October 31, 2019 |
| |||||||||||||||||||||||||||||||||||||||||||||||||||||||
A | $ | 22.20 | $ | (0.13 | ) | $ | 2.28 | $ | 2.15 | $ | — | $ | (4.00 | ) | $ | (4.00 | ) | $ | 20.35 | 14.08 | % | $ | 311,742 | 1.33 | % | 1.32 | % | (0.66 | )% | 91 | % | |||||||||||||||||||||||||
C | 16.11 | (0.19 | ) | 1.38 | 1.19 | — | (4.00 | ) | (4.00 | ) | 13.30 | 13.24 | 9,929 | 2.14 | 2.13 | (1.46 | ) | 91 | ||||||||||||||||||||||||||||||||||||||
I | 23.28 | (0.08 | ) | 2.45 | 2.37 | — | (4.00 | ) | (4.00 | ) | 21.65 | 14.48 | 26,939 | 1.04 | 1.03 | (0.37 | ) | 91 | ||||||||||||||||||||||||||||||||||||||
R3 | 23.95 | (0.19 | ) | 2.53 | 2.34 | — | (4.00 | ) | (4.00 | ) | 22.29 | 13.84 | 14,142 | 1.62 | 1.55 | (0.89 | ) | 91 | ||||||||||||||||||||||||||||||||||||||
R4 | 25.28 | (0.14 | ) | 2.74 | 2.60 | — | (4.00 | ) | (4.00 | ) | 23.88 | 14.20 | 14,261 | 1.32 | 1.25 | (0.59 | ) | 91 | ||||||||||||||||||||||||||||||||||||||
R5 | 26.53 | (0.07 | ) | 2.94 | 2.87 | — | (4.00 | ) | (4.00 | ) | 25.40 | 14.56 | 3,239 | 1.02 | 0.95 | (0.29 | ) | 91 | ||||||||||||||||||||||||||||||||||||||
R6 | 27.02 | (0.06 | ) | 3.01 | 2.95 | — | (4.00 | ) | (4.00 | ) | 25.97 | 14.60 | 206 | 0.90 | 0.90 | (0.23 | ) | 91 | ||||||||||||||||||||||||||||||||||||||
Y | 27.01 | (0.06 | ) | 3.00 | 2.94 | — | (4.00 | ) | (4.00 | ) | 25.95 | 14.56 | 32,472 | 0.94 | 0.93 | (0.26 | ) | 91 | ||||||||||||||||||||||||||||||||||||||
F | 23.35 | (0.05 | ) | 2.46 | 2.41 | — | (4.00 | ) | (4.00 | ) | 21.76 | 14.63 | 193,242 | 0.90 | 0.90 | (0.23 | ) | 91 | ||||||||||||||||||||||||||||||||||||||
For the Year Ended October 31, 2018 |
| |||||||||||||||||||||||||||||||||||||||||||||||||||||||
A | $ | 20.34 | $ | (0.20 | ) | $ | 2.06 | $ | 1.86 | $ | — | $ | — | $ | — | $ | 22.20 | 9.20 | % | $ | 283,912 | 1.34 | % | 1.33 | % | (0.87 | )% | 104 | % | |||||||||||||||||||||||||||
C | 14.87 | (0.27 | ) | 1.51 | 1.24 | — | — | — | 16.11 | 8.34 | 11,729 | 2.12 | 2.10 | (1.64 | ) | 104 | ||||||||||||||||||||||||||||||||||||||||
I | 21.27 | (0.14 | ) | 2.15 | 2.01 | — | — | — | 23.28 | 9.45 | 28,540 | 1.07 | 1.05 | (0.60 | ) | 104 | ||||||||||||||||||||||||||||||||||||||||
R3 | 21.98 | (0.27 | ) | 2.24 | 1.97 | — | — | — | 23.95 | 8.92 | 16,386 | 1.63 | 1.55 | (1.09 | ) | 104 | ||||||||||||||||||||||||||||||||||||||||
R4 | 23.14 | (0.20 | ) | 2.34 | 2.14 | — | — | — | 25.28 | 9.25 | 15,295 | 1.32 | 1.25 | (0.79 | ) | 104 | ||||||||||||||||||||||||||||||||||||||||
R5 | 24.21 | (0.14 | ) | 2.46 | 2.32 | — | — | — | 26.53 | 9.58 | 2,678 | 1.03 | 0.95 | (0.51 | ) | 104 | ||||||||||||||||||||||||||||||||||||||||
R6 | 24.64 | (0.12 | ) | 2.50 | 2.38 | — | — | — | 27.02 | 9.66 | 144 | 0.91 | 0.90 | (0.42 | ) | 104 | ||||||||||||||||||||||||||||||||||||||||
Y | 24.64 | (0.12 | ) | 2.49 | 2.37 | — | — | — | 27.01 | 9.66 | 35,351 | 0.92 | 0.90 | (0.44 | ) | 104 | ||||||||||||||||||||||||||||||||||||||||
F | 21.30 | (0.11 | ) | 2.16 | 2.05 | — | — | — | 23.35 | 9.63 | 115,365 | 0.91 | 0.90 | (0.45 | ) | 104 | ||||||||||||||||||||||||||||||||||||||||
For the Year Ended October 31, 2017 |
| |||||||||||||||||||||||||||||||||||||||||||||||||||||||
A | $ | 15.74 | $ | (0.12 | ) | $ | 4.72 | $ | 4.60 | $ | — | $ | — | $ | — | $ | 20.34 | 29.16 | % | $ | 252,187 | 1.39 | % | 1.37 | % | (0.64 | )% | 109 | % | |||||||||||||||||||||||||||
C | 11.60 | (0.19 | ) | 3.46 | 3.27 | — | — | — | 14.87 | �� | 28.19 | 26,529 | 2.12 | 2.10 | (1.40 | ) | 109 | |||||||||||||||||||||||||||||||||||||||
I | 16.43 | (0.10 | ) | 4.94 | 4.84 | — | — | — | 21.27 | 29.40 | 28,052 | 1.49 | 1.15 | (0.51 | ) | 109 | ||||||||||||||||||||||||||||||||||||||||
R3 | 17.05 | (0.17 | ) | 5.10 | 4.93 | — | — | — | 21.98 | 28.91 | 23,932 | 1.63 | 1.55 | (0.84 | ) | 109 | ||||||||||||||||||||||||||||||||||||||||
R4 | 17.89 | (0.11 | ) | 5.36 | 5.25 | — | — | — | 23.14 | 29.29 | 23,080 | 1.32 | 1.25 | (0.53 | ) | 109 | ||||||||||||||||||||||||||||||||||||||||
R5 | 18.67 | (0.04 | ) | 5.58 | 5.54 | — | — | — | 24.21 | 29.67 | 3,263 | 1.06 | 0.95 | (0.20 | ) | 109 | ||||||||||||||||||||||||||||||||||||||||
R6 | 18.99 | (0.09 | ) | 5.74 | 5.65 | — | — | — | 24.64 | 29.75 | 78 | 1.07 | 0.90 | (0.38 | ) | 109 | ||||||||||||||||||||||||||||||||||||||||
Y | 18.99 | (0.02 | ) | 5.67 | 5.65 | — | — | — | 24.64 | 29.70 | 33,040 | 0.94 | 0.90 | (0.08 | ) | 109 | ||||||||||||||||||||||||||||||||||||||||
F(5) | 18.76 | (0.05 | ) | 2.59 | 2.54 | — | — | — | 21.30 | 13.49 | (6) | 81,831 | 0.92 | (7) | 0.90 | (7) | (0.38 | )(7) | 109 | |||||||||||||||||||||||||||||||||||||
For the Year Ended October 31, 2016 |
| |||||||||||||||||||||||||||||||||||||||||||||||||||||||
A | $ | 19.36 | $ | (0.14 | ) | $ | (0.90 | ) | $ | (1.04 | ) | $ | — | $ | (2.58 | ) | $ | (2.58 | ) | $ | 15.74 | (5.73 | )% | $ | 262,618 | 1.45 | % | 1.43 | %(20) | (0.87 | )% | 81 | % | |||||||||||||||||||||||
B | 15.08 | (0.19 | ) | (0.69 | ) | (0.88 | ) | — | (2.58 | ) | (2.58 | ) | 11.62 | (6.40 | ) | 862 | 2.46 | 2.17 | (20) | (1.59 | ) | 81 | ||||||||||||||||||||||||||||||||||
C | 15.06 | (0.19 | ) | (0.69 | ) | (0.88 | ) | — | (2.58 | ) | (2.58 | ) | 11.60 | (6.41 | ) | 25,586 | 2.14 | 2.14 | (20) | (1.58 | ) | 81 | ||||||||||||||||||||||||||||||||||
I | 20.04 | (0.10 | ) | (0.93 | ) | (1.03 | ) | — | (2.58 | ) | (2.58 | ) | 16.43 | (5.45 | ) | 41,881 | 1.24 | 1.18 | (20) | (0.61 | ) | 81 | ||||||||||||||||||||||||||||||||||
R3 | 20.77 | (0.18 | ) | (0.96 | ) | (1.14 | ) | — | (2.58 | ) | (2.58 | ) | 17.05 | (5.83 | ) | 29,662 | 1.62 | 1.58 | (20) | (1.02 | ) | 81 | ||||||||||||||||||||||||||||||||||
R4 | 21.61 | (0.13 | ) | (1.01 | ) | (1.14 | ) | — | (2.58 | ) | (2.58 | ) | 17.89 | (5.58 | ) | 27,834 | 1.31 | 1.28 | (20) | (0.71 | ) | 81 | ||||||||||||||||||||||||||||||||||
R5 | 22.37 | (0.07 | ) | (1.05 | ) | (1.12 | ) | — | (2.58 | ) | (2.58 | ) | 18.67 | (5.27 | ) | 5,283 | 1.00 | 0.97 | (20) | (0.37 | ) | 81 | ||||||||||||||||||||||||||||||||||
R6 | 22.69 | (0.06 | ) | (1.06 | ) | (1.12 | ) | — | (2.58 | ) | (2.58 | ) | 18.99 | (5.18 | ) | 9 | 0.90 | 0.90 | (20) | (0.34 | ) | 81 | ||||||||||||||||||||||||||||||||||
Y | 22.69 | (0.06 | ) | (1.06 | ) | (1.12 | ) | — | (2.58 | ) | (2.58 | ) | 18.99 | (5.18 | ) | 98,620 | 0.90 | 0.90 | (20) | (0.33 | ) | 81 | ||||||||||||||||||||||||||||||||||
For the Year Ended October 31, 2015 |
| |||||||||||||||||||||||||||||||||||||||||||||||||||||||
A | $ | 24.83 | $ | (0.17 | ) | $ | (1.21 | ) | $ | (1.38 | ) | $ | — | $ | (4.09 | ) | $ | (4.09 | ) | $ | 19.36 | (6.22 | )% | $ | 327,509 | 1.34 | % | 1.34 | % | (0.77 | )% | 96 | % | |||||||||||||||||||||||
B | 20.40 | (0.27 | ) | (0.96 | ) | (1.23 | ) | — | (4.09 | ) | (4.09 | ) | 15.08 | (6.98 | ) | 2,531 | 2.30 | 2.13 | (1.56 | ) | 96 | |||||||||||||||||||||||||||||||||||
C | 20.36 | (0.25 | ) | (0.96 | ) | (1.21 | ) | — | (4.09 | ) | (4.09 | ) | 15.06 | (6.87 | ) | 35,455 | 2.04 | 2.04 | (1.47 | ) | 96 | |||||||||||||||||||||||||||||||||||
I | 25.51 | (0.12 | ) | (1.26 | ) | (1.38 | ) | — | (4.09 | ) | (4.09 | ) | 20.04 | (6.03 | ) | 69,569 | 1.11 | 1.11 | (0.55 | ) | 96 | |||||||||||||||||||||||||||||||||||
R3 | 26.39 | (0.23 | ) | (1.30 | ) | (1.53 | ) | — | (4.09 | ) | (4.09 | ) | 20.77 | (6.46 | ) | 35,865 | 1.54 | 1.54 | (0.98 | ) | 96 | |||||||||||||||||||||||||||||||||||
R4 | 27.21 | (0.17 | ) | (1.34 | ) | (1.51 | ) | — | (4.09 | ) | (4.09 | ) | 21.61 | (6.15 | ) | 41,922 | 1.24 | 1.24 | (0.68 | ) | 96 | |||||||||||||||||||||||||||||||||||
R5 | 27.95 | (0.09 | ) | (1.40 | ) | (1.49 | ) | — | (4.09 | ) | (4.09 | ) | 22.37 | (5.88 | ) | 30,053 | 0.97 | 0.95 | (0.35 | ) | 96 | |||||||||||||||||||||||||||||||||||
R6(9) | 28.20 | (0.08 | ) | (1.34 | ) | (1.42 | ) | — | (4.09 | ) | (4.09 | ) | 22.69 | (5.56 | )(6) | 9 | 0.91 | (7) | 0.90 | (7) | (0.32 | )(7) | 96 | |||||||||||||||||||||||||||||||||
Y | 28.27 | (0.07 | ) | (1.42 | ) | (1.49 | ) | — | (4.09 | ) | (4.09 | ) | 22.69 | (5.80 | ) | 279,594 | 0.85 | 0.85 | (0.28 | ) | 96 | |||||||||||||||||||||||||||||||||||
The accompanying notes are an integral part of these financial statements.
| 98 |
|
| Hartford Domestic Equity Funds |
Financial Highlights – (continued)
| (1) | Information presented relates to a share outstanding throughout the indicated period. Net investment income (loss) per share amounts are calculated based on average shares outstanding unless otherwise noted. |
| (2) | Assumes initial investment at net asset value at the beginning of each period, reinvestment of all distributions, the complete redemption of the investment at net asset value at the end of each period and no sales charge. Total return would be reduced if sales charges were taken into account. |
| (3) | Adjustments include waivers and reimbursements, if applicable. Ratios do not include fees paid indirectly (see Expenses in the accompanying Notes to Financial Statements). |
| (4) | Includes interest expense representing less than 0.005%. |
| (5) | Commenced operations on February 28, 2017. |
| (6) | Not annualized. |
| (7) | Annualized. |
| (8) | Excluding the expenses not subject to cap, the ratios would have been 1.09%, 1.98%, 1.81%, 0.79%, 1.40%, 1.10%, 0.80%, 0.70% and 0.70% for Class A, Class B, Class C, Class I, Class R3, Class R4, Class R5, Class R6 and Class Y, respectively. |
| (9) | Commenced operations on November 7, 2014. |
| (10) | Excluding the expenses not subject to cap, the ratios would have been 0.79%, 1.54%, 1.54%, 0.54%, 1.09%, 0.79%, 0.49%, 0.42% and 0.42% for Class A, Class B, Class C, Class I, Class R3, Class R4, Class R5, Class R6 and Class Y, respectively. |
| (11) | Commenced operations on March 31, 2015. |
| (12) | Excluding the expenses not subject to cap, the ratios would have been 1.02%, 1.95%, 1.76%, 0.82%, 1.35%, 1.05%, 0.75%, 0.65% and 0.65% for Class A, Class B, Class C, Class I, Class R3, Class R4, Class R5, Class R6 and Class Y, respectively. |
| (13) | Excluding the expenses not subject to cap, the ratios would have been 1.12%, 2.04%, 1.87%, 0.91%, 1.45%, 1.15%, 0.85%, 0.75% and 0.76% for Class A, Class B, Class C, Class I, Class R3, Class R4, Class R5, Class R6 and Class Y, respectively. |
| (14) | Commenced operations on February 28, 2019. |
| (15) | Excluding the expenses not subject to cap, the ratios would have been 1.28%, 2.10%, 2.00%, 1.04%, 1.54%, 1.23%, 0.93% and 0.83% for Class A, Class B, Class C, Class I, Class R3, Class R4, Class R5 and Class Y, respectively. |
| (16) | Commenced operations on February 28, 2018. |
| (17) | Per share amount was not in accord with the net realized and unrealized gain (loss) for the period because of the timing of transactions in shares of the Fund and the amount and timing of per-share net realized and unrealized gain (loss) on such shares. |
| (18) | Excluding the expenses not subject to cap, the ratios would have been 1.23%, 2.09%, 1.95%, 0.90%, 1.52%, 1.20%, 0.90% and 0.79% for Class A, Class B, Class C, Class I, Class R3, Class R4, Class R5 and Class Y, respectively. |
| (19) | Excluding the expenses not subject to cap, the ratios would have been 1.30%, 2.05%, 2.05%, 0.99%, 1.50%, 1.20%, 0.90% and 0.85% for Class A, Class B, Class C, Class I, Class R3, Class R4, Class R5 and Class Y, respectively. |
| (20) | Excluding the expenses not subject to cap, the ratios would have been 1.40%, 2.15%, 2.11%, 1.15%, 1.55%, 1.25%, 0.95%, 0.88% and 0.88% for Class A, Class B, Class C, Class I, Class R3, Class R4, Class R5, Class R6 and Class Y, respectively. |
| (21) | Amount is less than $0.01 per share. |
The accompanying notes are an integral part of these financial statements.
| 99 |
|
| Hartford Domestic Equity Funds |
October 31, 2019
| 1. | Organization: |
The Hartford Mutual Funds, Inc. and The Hartford Mutual Funds II, Inc. (each, a “Company” and collectively, the “Companies”) are each anopen-end registered management investment company comprised of thirty-eight and thirteen series, respectively, as of October 31, 2019. Financial statements for the series of each Company listed below (each, a “Fund” and collectively, the “Funds”) are included in this report.
The Hartford Mutual Funds, Inc.:
The Hartford Capital Appreciation Fund (the “Capital Appreciation Fund”)
Hartford Core Equity Fund (the “Core Equity Fund”)
The Hartford Dividend and Growth Fund (the “Dividend and Growth Fund”)
The Hartford Equity Income Fund (the “Equity Income Fund”)
The Hartford Healthcare Fund (the “Healthcare Fund”)
The Hartford MidCap Fund (the “MidCap Fund”)
The Hartford MidCap Value Fund (the “MidCap Value Fund”)
Hartford Small Cap Value Fund (the “Small Cap Value Fund”)
The Hartford Small Company Fund (the “Small Company Fund”)
The Hartford Mutual Funds II, Inc.:
The Hartford Growth Opportunities Fund (the “Growth Opportunities Fund”)
Hartford Quality Value Fund (the “Quality Value Fund”)
The Hartford Small Cap Growth Fund (the “Small Cap Growth Fund”)
The assets of each Fund are separate, and a shareholder’s interest is limited to the Fund in which shares are held. Each Company is organized under the laws of the State of Maryland and is registered with the Securities and Exchange Commission (the “SEC”) under the Investment Company Act of 1940, as amended (the “1940 Act”). Each Fund is a diversifiedopen-end management investment company. Each Fund applies specialized accounting and reporting standards under Accounting Standards Codification Topic 946, “Financial Services – Investment Companies”.
Each Fund has registered for sale Class A, Class C, Class I, Class R3, Class R4, Class R5, Class Y and Class F shares. Core Equity Fund has registered for sale Class T shares. As of October 31, 2019, Class T shares have not commenced operations. Each Fund, except the MidCap Value Fund, has registered for sale Class R6 shares. Class A shares are sold with afront-end sales charge of up to 5.50%. Class T shares have afront-end sales charge of up to 2.50%. Class C shares are sold with a contingent deferred sales charge of up to 1.00% on shares redeemed within twelve months of purchase. Effective October 1, 2018, Class C shares automatically convert to Class A shares of the same Fund after ten years provided that the Fund or the financial intermediary has records verifying that the Class C shares have been held for at least ten years. Classes I, R3, R4, R5, R6, Y and F shares do not have a sales charge. The Small Cap Growth Fund is closed to new investors, subject to certain exceptions. For more information please see the Fund’s prospectus.
| 2. | Significant Accounting Policies: |
The following is a summary of significant accounting policies of each Fund used in the preparation of its financial statements, which are in accordance with United States Generally Accepted Accounting Principles (“U.S. GAAP”). The preparation of financial statements in accordance with U.S. GAAP may require management to make estimates and assumptions that affect the reported amounts of assets and liabilities and disclosure of contingent assets and liabilities at the date of the financial statements and the reported amounts of increases and decreases in net assets from operations during the reporting period. Actual results could differ from those estimates.
| a) | Determination of Net Asset Value – The net asset value (“NAV”) of each class of each Fund’s shares is determined as of the close of regular trading (normally 4:00 p.m. Eastern Time) (the “NYSE Close”) on each day that the New York Stock Exchange (the “Exchange”) is open. Information that becomes known to the Funds after the NAV has been calculated on a particular day will not generally be used to retroactively adjust the NAV determined earlier that day. |
| b) | Investment Valuation and Fair Value Measurements– For purposes of calculating the NAV of each class of each Fund, portfolio securities and other assets held in the Fund’s portfolio for which market prices are readily available are valued at market value. Market value is generally determined on the basis of official close price or last reported trade price. If no trades were reported, market value is based on prices obtained from a quotation reporting system, established market makers (including evaluated prices), or independent pricing services. Pricing vendors may use matrix pricing or valuation models that utilize certain inputs and assumptions to derive values, including transaction data, credit quality information, general market conditions, news, and other factors and assumptions. |
If market prices are not readily available or are deemed unreliable, a Fund will use the fair value of the security or other instrument as determined in good faith under policies and procedures established by and under the supervision of the Board of Directors of the respective Company (the “Board of Directors”) (“Valuation Procedures”). Market prices are considered not readily available where there is an absence of current or reliable market-based data (e.g., trade information or broker quotes), including where events occur after the close of
| 100 |
|
| Hartford Domestic Equity Funds |
Notes to Financial Statements – (continued)
October 31, 2019
the relevant market, but prior to the NYSE Close, that materially affect the values of a Fund’s portfolio holdings or assets. In addition, market prices are considered not readily available when, due to extraordinary circumstances, the exchanges or markets on which the securities or other instruments trade do not open for trading for the entire day and no other market prices are available. Fair value pricing is subjective in nature and the use of fair value pricing by a Fund may cause the NAV of its shares to differ significantly from the NAV that would have been calculated using market prices at the close of the exchange on which a portfolio holding is primarily traded. There can be no assurance that a Fund could obtain the fair value assigned to an investment if the Fund were to sell the investment at approximately the time at which the Fund determines its NAV.
Prices of foreign equities that are principally traded on certain foreign markets will generally be adjusted daily pursuant to a fair value pricing service in order to reflect an adjustment for the factors occurring after the close of certain foreign markets but before the NYSE Close. Securities and other instruments that are primarily traded on foreign markets may trade on days that are not business days of the Funds. The value of the foreign securities or other instruments in which a Fund invests may change on days when a shareholder will not be able to purchase or redeem shares of the Fund.
Fixed income investments (other than short-term obligations) held by a Fund are normally valued at prices supplied by independent pricing services in accordance with the Valuation Procedures. Short-term investments maturing in 60 days or less are generally valued at amortized cost if their original term to maturity was 60 days or less, or by amortizing their value on the 61st day prior to maturity, if the original term exceeded 60 days.
Exchange-traded derivatives, such as options, futures and options on futures, are valued at the last sale price determined by the exchange where such instruments principally trade as of the close of such exchange (“Exchange Close”). If a last sale price is not available, the value will be the mean of the most recently quoted bid and ask prices as of the Exchange Close. If a mean of the bid and ask prices cannot be calculated for the day, the value will be the most recently quoted bid price as of the Exchange Close.Over-the-counter derivatives are normally valued based on prices supplied by independent pricing services in accordance with the Valuation Procedures.
Investments valued in currencies other than U.S. dollars are converted to U.S. dollars using the prevailing spot currency exchange rates obtained from independent pricing services for calculation of the NAV. As a result, the NAV of a Fund’s shares may be affected by changes in the value of currencies in relation to the U.S. dollar. The value of securities or other instruments traded in markets outside the United States or denominated in currencies other than the U.S. dollar may be affected significantly on a day that the Exchange is closed and the market value may change on days when an investor is not able to purchase, redeem or exchange shares of a Fund.
Foreign currency contracts represent agreements to exchange currencies on specific future dates at predetermined rates. Foreign currency contracts are valued using foreign currency exchange rates and forward rates as provided by an independent pricing service on the Valuation Date.
Investments inopen-end mutual funds, if any, are valued at the respective NAV of eachopen-end mutual fund on the Valuation Date. Shares of investment companies listed and traded on an exchange are valued in the same manner as any exchange-listed equity security. Suchopen-end mutual funds and listed investment companies may use fair value pricing as disclosed in their prospectuses.
Financial instruments for which prices are not available from an independent pricing service may be valued using market quotations obtained from one or more dealers that make markets in the respective financial instrument in accordance with the Valuation Procedures.
U.S. GAAP defines fair value as the price that a Fund would receive to sell an asset or pay to transfer a liability in an orderly transaction between market participants. The U.S. GAAP fair value measurement standards require disclosure of a fair value hierarchy for each major category of assets and liabilities. Various inputs are used in determining the fair value of each Fund’s investments. These inputs are summarized into three broad hierarchy levels. This hierarchy is based on whether the valuation inputs are observable or unobservable. These levels are:
| • | Level 1 – Quoted prices in active markets for identical investments. Level 1 may include exchange traded instruments, such as domestic equities, some foreign equities, options, futures, mutual funds, exchange traded funds, rights and warrants. |
| • | Level 2 – Observable inputs other than Level 1 prices, such as quoted prices for similar investments; quoted prices in markets that are not active; or other inputs that are observable or can be corroborated by observable market data. Level 2 may include debt investments that are traded less frequently than exchange traded instruments and which are valued using independent pricing services; foreign equities, which are principally traded on certain foreign markets and are adjusted daily pursuant to a fair value pricing service in order to reflect an adjustment for the factors occurring after the close of certain foreign markets but before the NYSE Close; senior floating rate interests, which are valued using an aggregate of dealer bids; short-term investments, which are valued at amortized cost; and swaps, which are valued based upon the terms of each swap contract. |
| • | Level 3 – Significant unobservable inputs that are supported by limited or no market activity. Level 3 may include financial instruments whose values are determined using indicative market quotes or require significant management judgment or estimation. These unobservable valuation inputs may include estimates for current yields, maturity/duration, prepayment speed, and indicative market quotes for comparable investments along with other assumptions relating to credit quality, collateral value, complexity of the investment |
| 101 |
|
| Hartford Domestic Equity Funds |
Notes to Financial Statements – (continued)
October 31, 2019
| structure, general market conditions and liquidity. This category may include investments where trading has been halted or there are certain restrictions on trading. While these investments are priced using unobservable inputs, the valuation of these investments reflects the best available data and management believes the prices are a reasonable representation of exit price. |
The Board of Directors has delegated theday-to-day responsibility for implementing the Valuation Procedures to the Valuation Committee. The Valuation Committee will consider all relevant factors in determining an investment’s fair value, and may seek the advice of such Fund’s sub-adviser(s), as applicable, knowledgeable brokers, and legal counsel in making such determination. The Valuation Committee reports to the Audit Committee of the Board of Directors.
Valuation levels are not necessarily indicative of the risk associated with investing in such investments. Individual investments within any of the above mentioned asset classes may be assigned a different hierarchical level than those presented above, as individual circumstances dictate.
For additional information, refer to the Fair Valuation Summary and the Level 3 roll-forward reconciliation, if applicable, which follows each Fund’s Schedule of Investments.
Growth Opportunities Fund Level 3 Holdings on October 31, 2019
Quantitative Information about Level 3 Fair Value Measurements:
Security Type / Valuation Technique* | Unobservable Input | Input Value(s) Range (Weighted Average) | Fair Value at October 31, 2019 | |||||||
Common Stock | ||||||||||
Market Approach | EV/EBITDA | 11x | $ | 9,521,028 | ||||||
Market Approach | EV/Revenue | 4.11x | 1,879,971 | |||||||
Target Event | Price per share | $3.17 | 15,400,659 | |||||||
Last Trade | Trade Price | $9.85-$234.47 ($70.78) | 54,849,793 | |||||||
|
| |||||||||
Total | $ | 81,651,451 | ||||||||
|
| |||||||||
Escrows | ||||||||||
Future Distribution | Discount | 20% - 50% (31.8%) | $ | 576,266 | ||||||
|
| |||||||||
Total | $ | 576,266 | ||||||||
|
| |||||||||
Convertible Preferred Stock | ||||||||||
Market Approach | EV/Revenue | 1.18x-5.5x (2.26x) | $ | 58,870,749 | ||||||
Market Approach | EV/EBITDA | 7.4x | 6,519,068 | |||||||
Last Trade | Trade price | $11.60-$30.00 ($20.43) | 16,063,754 | |||||||
Market Approach | EV/Sales | 0.8x | 5,540,550 | |||||||
|
| |||||||||
Total | $ | 86,994,121 | ||||||||
|
| |||||||||
Total | $ | 169,221,838 | ||||||||
|
| |||||||||
| * | The Valuation Committee may consider applying appropriate valuation methodologies, which may include, but are not limited to: valuation through use of a “proxy” investment or index, discount from market value of a similar freely traded investment, a discount or premium which may consider market or regulatory sentiment (or other subjective determinations, inputs or factors not otherwise quantifiable), and any other appropriate method. |
| c) | Investment Transactions and Investment Income – Investment transactions are recorded as of the trade date (the date the order to buy or sell is executed) for financial reporting purposes. Investments purchased or sold on a when-issued or delayed-delivery basis may be settled a month or more after the trade date. Realized gains and losses are determined on the basis of identified cost. |
Dividend income from domestic securities is accrued on theex-dividend date. In general, dividend income from foreign securities is recorded on theex-date; however, dividend notifications in certain foreign jurisdictions may not be available in a timely manner and as a result, a Fund will record the dividend as soon as the relevant details (i.e., rate per share, payment date, shareholders of record, etc.) are publicly available.
Interest income, including amortization of premium, accretion of discounts and additional principal receivedin-kind in lieu of cash, is accrued on a daily basis.
Please refer to Note 8 for Securities Lending information.
| 102 |
|
| Hartford Domestic Equity Funds |
Notes to Financial Statements – (continued)
October 31, 2019
| d) | Taxes – A Fund may be subject to taxes imposed on realized gains on securities of certain foreign countries in which such Fund invests. A Fund may also be subject to taxes withheld on foreign dividends from securities in which the Fund invests. The amount of any foreign taxes withheld and foreign tax expense is included on the accompanying Statements of Operations as a reduction to net investment income or net realized or unrealized gain on investments in these securities, if applicable. |
| e) | Foreign Currency Transactions– Assets and liabilities denominated in currencies other than U.S. dollars are translated into U.S. dollars at the exchange rates in effect on the Valuation Date. Purchases and sales of investments, income and expenses are translated into U.S. dollars at the exchange rates on the dates of such transactions. |
A Fund does not isolate that portion of portfolio investment valuation resulting from fluctuations in the foreign currency exchange rates from the fluctuations arising from changes in the market prices of investments held. Exchange rate fluctuations are included with the net realized and unrealized gain or loss on investments in the accompanying financial statements.
Net realized foreign exchange gains or losses arise from sales of foreign currencies and the difference between asset and liability amounts initially stated in foreign currencies and the U.S. dollar value of the amounts actually received or paid. Net unrealized foreign exchange gains or losses arise from changes in the value of other assets and liabilities at the end of the reporting period, resulting from changes in the exchange rates.
| f) | Joint Trading Account – A Fund may invest cash balances into a joint trading account that may be invested in one or more repurchase agreements. |
| g) | Fund Share Valuation and Dividend Distributions to Shareholders – Orders for each class of each Fund’s shares are executed in accordance with the investment instructions of the shareholders. The NAV of each class of each Fund’s shares is determined as of the close of business on each business day of the Exchange (see Note 2(a)). The NAV is determined separately for each class of shares of a Fund by dividing the Fund’s net assets attributable to that class by the number of shares of the class outstanding. Each class of shares offered by a Fund has equal rights as to assets and voting privileges (except that shareholders of a class have exclusive voting rights regarding any matter relating solely to that class of shares). Income andnon-class specific expenses are allocated daily to each class on the basis of the relative net assets of the class of the Fund. Realized and unrealized gains and losses are allocated daily based on the relative net assets of each class of shares of each Fund. |
Orders for the purchase of a Fund’s shares received prior to the close of the Exchange on any day the Exchange is open for business are priced at the NAV determined as of the close of the Exchange. Orders received after the close of the Exchange, or on a day on which the Exchange and/or the Funds are not open for business, are priced at the next determined NAV.
Dividends are declared pursuant to a policy adopted by the respective Company’s Board of Directors. Dividends and/or distributions to shareholders are recorded onex-date. The policy of each Fund, except Dividend and Growth Fund and Equity Income Fund, is to pay dividends from net investment income and realized gains, if any, at least once a year. The policy of Dividend and Growth Fund and Equity Income Fund is to pay dividends from net investment income, if any, quarterly and realized gains, if any, at least once a year.
Income dividends and capital gains distributions are determined in accordance with federal income tax regulations, which may differ from U.S. GAAP with respect to character and timing (see Federal Income Taxes: Distributions and Components of Distributable Earnings and Reclassification of Capital Accounts notes).
| 3. | Securities and Other Investments: |
Restricted Securities– Each Fund may invest in securities that are subject to legal or contractual restrictions on resale. These securities generally may be resold in transactions exempt from registration or to the public if the securities are registered. Disposal of these securities may involve time-consuming negotiations and expense, and prompt sale at an acceptable price may be difficult. Information regarding restricted securities, if applicable, is included at the end of each Fund’s Schedule of Investments.
| 4. | Financial Derivative Instruments: |
The following disclosures contain information on how and why a Fund may use derivative instruments, the credit-risk-related contingent features in certain derivative instruments, and how derivative instruments affect a Fund’s financial position and results of operations. The location and fair value amounts of these instruments on the Statements of Assets and Liabilities and the realized gains and losses and changes in unrealized gains and losses on the Statements of Operations, each categorized by type of derivative contract, are included in the following Additional Derivative Instrument Information footnote. The derivative instruments outstanding as ofperiod-end are disclosed in the notes to the Schedules of Investments, if applicable. The amounts of realized gains and losses and changes in unrealized gains and losses on derivative instruments during the period are disclosed in the Statements of Operations.
| a) | Foreign Currency Contracts – A Fund may enter into foreign currency contracts that obligate the Fund to purchase or sell currencies at specified future dates. Foreign currency contracts may be used in connection with settling purchases or sales of securities to hedge the |
| 103 |
|
| Hartford Domestic Equity Funds |
Notes to Financial Statements – (continued)
October 31, 2019
| currency exposure associated with some or all of a Fund’s investments and/or as part of an investment strategy. Foreign currency contracts are marked to market daily and the change in value is recorded by a Fund as an unrealized gain or loss. A Fund will record a realized gain or loss when the foreign currency contract is settled. |
Foreign currency contracts involve elements of market risk in excess of the amounts reflected in the Statements of Assets and Liabilities. In addition, risks may arise upon entering into these contracts from the potential inability of the counterparties to meet the terms of the contracts and from unanticipated movements in the value of the foreign currencies relative to the U.S. dollar. Upon entering into a foreign currency contract, a Fund may be required to post margin equal to its outstanding exposure thereunder.
During the year ended October 31, 2019, Capital Appreciation Fund had used Foreign Currency Contracts.
| b) | Futures Contracts – A Fund may enter into futures contracts. A futures contract is an agreement between two parties to buy or sell an asset at a set price on a future date. A Fund may use futures contracts to manage risk or obtain exposure to the investment markets, commodities, or movements in interest rates and currency values. The primary risks associated with the use of futures contracts are the imperfect correlation between the change in market value of the investments held by a Fund and the prices of futures contracts and the possibility of an illiquid market. Upon entering into a futures contract, a Fund is required to deposit with a futures commission merchant (“FCM”) an amount of cash or U.S. Government or Agency Obligations in accordance with the initial margin requirements of the broker or exchange. Futures contracts are marked to market daily and an appropriate amount equal to the change in value (“variation margin”) is paid or received by a Fund. Gains or losses are recognized but not considered realized until the contracts expire or are closed. Futures contracts involve, to varying degrees, risk of loss in excess of the variation margin disclosed on the Statements of Assets and Liabilities. |
During the year ended October 31, 2019, each of Capital Appreciation Fund and Core Equity Fund had used Futures Contracts.
| c) | Additional Derivative Instrument Information: |
Capital Appreciation Fund
The Effect of Derivative Instruments on the Statement of Assets and Liabilities as of October 31, 2019:
| Risk Exposure Category | ||||||||||||||||||||||||||||
| Interest Rate Contracts | Foreign Currency Contracts | Credit Contracts | Equity Contracts | Commodity Contracts | Other Contracts | Total | ||||||||||||||||||||||
Assets: | ||||||||||||||||||||||||||||
Unrealized appreciation on futures contracts(1) | $ | — | $ | — | $ | — | $ | 1,418,881 | $ | — | $ | — | $ | 1,418,881 | ||||||||||||||
|
|
|
|
|
|
|
|
|
|
|
|
|
| |||||||||||||||
Total | $ | — | $ | — | $ | — | $ | 1,418,881 | $ | — | $ | — | $ | 1,418,881 | ||||||||||||||
|
|
|
|
|
|
|
|
|
|
|
|
|
| |||||||||||||||
| (1) | Amount represents the cumulative appreciation on futures contracts as disclosed within the Schedule of Investments under the open “Futures Contracts” section. Only current day’s variation margin, if any, is reported within the Statement of Assets and Liabilities. |
The Effect of Derivative Instruments on the Statement of Operations for the year ended October 31, 2019:
| Risk Exposure Category | ||||||||||||||||||||||||||||
| Interest Rate Contracts | Foreign Currency Contracts | Credit Contracts | Equity Contracts | Commodity Contracts | Other Contracts | Total | ||||||||||||||||||||||
Realized Gain (Loss) on Derivatives Recognized as a |
| |||||||||||||||||||||||||||
Net realized gain (loss) on futures contracts | $ | — | $ | — | $ | — | $ | 3,627,613 | $ | — | $ | — | $ | 3,627,613 | ||||||||||||||
Net realized gain (loss) on foreign currency contracts | — | 31,922 | — | — | — | — | 31,922 | |||||||||||||||||||||
|
|
|
|
|
|
|
|
|
|
|
|
|
| |||||||||||||||
Total | $ | — | $ | 31,922 | $ | — | $ | 3,627,613 | $ | — | $ | — | $ | 3,659,535 | ||||||||||||||
|
|
|
|
|
|
|
|
|
|
|
|
|
| |||||||||||||||
Net Change in Unrealized Appreciation (Depreciation) on |
| |||||||||||||||||||||||||||
Net change in unrealized appreciation (depreciation) of futures contracts | $ | — | $ | — | $ | — | $ | 3,412,117 | $ | — | $ | — | $ | 3,412,117 | ||||||||||||||
|
|
|
|
|
|
|
|
|
|
|
|
|
| |||||||||||||||
Total | $ | — | $ | — | $ | — | $ | 3,412,117 | $ | — | $ | — | $ | 3,412,117 | ||||||||||||||
|
|
|
|
|
|
|
|
|
|
|
|
|
| |||||||||||||||
For the year ended October 31, 2019, the average amount or number per contract outstanding for each derivative type was as follows:
Derivative Description | Average Notional Par, Contracts or Face Amount | |||
Futures Contracts Long at Number of Contracts | 723 | |||
Foreign Currency Contracts Purchased at Contract Amount | $ | 2,099,722 | ||
| 104 |
|
| Hartford Domestic Equity Funds |
Notes to Financial Statements – (continued)
October 31, 2019
Core Equity Fund
The Effect of Derivative Instruments on the Statement of Assets and Liabilities as of October 31, 2019:
| Risk Exposure Category | ||||||||||||||||||||||||||||
| Interest Rate Contracts | Foreign Currency Contracts | Credit Contracts | Equity Contracts | Commodity Contracts | Other Contracts | Total | ||||||||||||||||||||||
Assets: |
| |||||||||||||||||||||||||||
Unrealized appreciation on futures contracts(1) | $ | — | $ | — | $ | — | $ | 1,593,093 | $ | — | $ | — | $ | 1,593,093 | ||||||||||||||
|
|
|
|
|
|
|
|
|
|
|
|
|
| |||||||||||||||
Total | $ | — | $ | — | $ | — | $ | 1,593,093 | $ | — | $ | — | $ | 1,593,093 | ||||||||||||||
|
|
|
|
|
|
|
|
|
|
|
|
|
| |||||||||||||||
| (1) | Amount represents the cumulative appreciation on futures contracts as disclosed within the Schedule of Investments under the open “Futures Contracts” section. Only current day’s variation margin, if any, is reported within the Statement of Assets and Liabilities. |
The Effect of Derivative Instruments on the Statement of Operations for the year ended October 31, 2019:
| Risk Exposure Category | ||||||||||||||||||||||||||||
| Interest Rate Contracts | Foreign Currency Contracts | Credit Contracts | Equity Contracts | Commodity Contracts | Other Contracts | Total | ||||||||||||||||||||||
Realized Gain (Loss) on Derivatives Recognized as a | ||||||||||||||||||||||||||||
Net realized gain (loss) on futures contracts | $ | — | $ | — | $ | — | $ | 11,571,502 | $ | — | $ | — | $ | 11,571,502 | ||||||||||||||
|
|
|
|
|
|
|
|
|
|
|
|
|
| |||||||||||||||
Total | $ | — | $ | — | $ | — | $ | 11,571,502 | $ | — | $ | — | $ | 11,571,502 | ||||||||||||||
|
|
|
|
|
|
|
|
|
|
|
|
|
| |||||||||||||||
Net Change in Unrealized Appreciation (Depreciation) on | ||||||||||||||||||||||||||||
Net change in unrealized appreciation (depreciation) of futures contracts | $ | — | $ | — | $ | — | $ | 5,668,855 | $ | — | $ | — | $ | 5,668,855 | ||||||||||||||
|
|
|
|
|
|
|
|
|
|
|
|
|
| |||||||||||||||
Total | $ | — | $ | — | $ | — | $ | 5,668,855 | $ | — | $ | — | $ | 5,668,855 | ||||||||||||||
|
|
|
|
|
|
|
|
|
|
|
|
|
| |||||||||||||||
For the year ended October 31, 2019, the average amount or number per contract outstanding for each derivative type was as follows:
Derivative Description | Average Notional Par, Contracts or Face Amount | |||
Futures Contracts Long at Number of Contracts | 575 | |||
| d) | Balance Sheet Offsetting Information – Set forth below are tables which disclose both gross information and net information about instruments and transactions eligible for offset in the financial statements, and instruments and transactions that are subject to a master netting arrangement, as well as amounts related to margin, reflected as financial collateral (including cash collateral), held at clearing brokers, counterparties and a Fund’s custodian. The master netting arrangements allow the clearing brokers to net any collateral held in or on behalf of a Fund, or liabilities or payment obligations of the clearing brokers to a Fund, against any liabilities or payment obligations of a Fund to the clearing brokers. A Fund is required to deposit financial collateral (including cash collateral) at the Fund’s custodian on behalf of clearing brokers and counterparties to continually meet the original and maintenance requirements established by the clearing brokers and counterparties. Such requirements are specific to the respective clearing broker or counterparty. Certain master netting arrangements may not be enforceable in a bankruptcy. |
The following tables present a Fund’s derivative assets and liabilities, presented on a gross basis as no amounts are netted within the Statements of Assets and Liabilities, by counterparty net of amounts available for offset under a master netting agreement or similar agreement (“MNA”) and net of the related collateral received/pledged by a Fund as of October 31, 2019:
Capital Appreciation Fund
Derivative Financial Instruments: | Assets | Liabilities | ||||||
Futures contracts | $ | 1,418,881 | $ | — | ||||
|
|
|
| |||||
Total gross amount of derivative assets and liabilities in the Statement of Assets and Liabilities | 1,418,881 | — | ||||||
|
|
|
| |||||
Derivatives not subject to a MNA | (1,418,881 | ) | — | |||||
|
|
|
| |||||
Total gross amount of assets and liabilities subject to MNA or similar agreements | $ | — | $ | — | ||||
|
|
|
| |||||
| 105 |
|
| Hartford Domestic Equity Funds |
Notes to Financial Statements – (continued)
October 31, 2019
Core Equity Fund
Derivative Financial Instruments: | Assets | Liabilities | ||||||
Futures contracts | $ | 1,593,093 | $ | — | ||||
|
|
|
| |||||
Total gross amount of derivative assets and liabilities in the Statement of Assets and Liabilities | 1,593,093 | — | ||||||
|
|
|
| |||||
Derivatives not subject to a MNA | (1,593,093 | ) | — | |||||
|
|
|
| |||||
Total gross amount of assets and liabilities subject to MNA or similar agreements | $ | — | $ | — | ||||
|
|
|
| |||||
| 5. | Principal Risks: |
A Fund’s investments expose it to various types of risks associated with financial instruments and the markets. A Fund may be exposed to the risks described below. Each Fund’s prospectus provides details of its principal risks.
The market values of equity securities, such as common stocks and preferred stocks, or equity related derivative investments, such as futures and options, may decline due to general market conditions which are not specifically related to a particular company, such as real or perceived adverse economic conditions, changes in the general outlook for corporate earnings, changes in interest or currency rates or adverse investor sentiment generally. The market value of equity securities may also decline due to factors which affect a particular industry or industries, such as labor shortages or increased production costs and competitive conditions within an industry. Equity securities and equity related investments generally have greater market price volatility than fixed income securities. The extent of each Fund’s exposure to market risk is the market value of the investments held as shown in the Fund’s Schedule of Investments.
Certain investments held by a Fund expose the Fund to various risks which may include, but are not limited to, interest rate, prepayment, and extension risks. Interest rate risk is the risk that fixed income securities will decline in value because of changes in interest rates. As nominal interest rates rise, the values of certain fixed income securities held by a Fund are likely to decrease. A nominal interest rate can be described as the sum of a real interest rate and an expected inflation rate. Fixed income securities with longer durations tend to be more sensitive to changes in interest rates, usually making them more volatile than securities with shorter durations. Duration is useful primarily as a measure of the sensitivity of a fixed income security’s market price to interest rate (i.e., yield) movements. Senior floating rate interests and securities subject to prepayment and extension risk generally offer less potential for gains when interest rates decline. Rising interest rates may cause prepayments to occur at a slower than expected rate, thereby effectively lengthening the maturity of the security and making the security more sensitive to interest rate changes. Prepayment and extension risk are major risks of mortgage-backed securities, senior floating rate interests and certain asset-backed securities. For certain asset-backed securities, the actual maturity may be less than the stated maturity shown in the Schedule of Investments, if applicable. As a result, the timing of income recognition relating to these securities may vary based upon the actual maturity.
Investing in the securities ofnon-U.S. issuers, whether directly or indirectly, involves certain considerations and risks not typically associated with securities of U.S. issuers. Such risks include, but are not limited to: generally less liquid and less efficient securities markets; generally greater price volatility; exchange rate fluctuations; imposition of restrictions on the expatriation of funds or other protectionist measures; less publicly available information about issuers; the imposition of withholding or other taxes; higher transaction and custody costs; settlement delays and risk of loss attendant in settlement procedures; difficulties in enforcing contractual obligations; less regulation of securities markets; different accounting, disclosure and reporting requirements; more substantial governmental involvement in the economy; higher inflation rates; and greater social, economic and political uncertainties. These risks are heightened for investments in issuers from countries with less developed markets.
Credit risk depends largely on the perceived financial health of bond issuers. In general, the credit rating is inversely related to the credit risk of the issuer. Higher rated bonds generally are deemed to have less credit risk, while lower or unrated bonds are deemed to have higher risk of default. The share price, yield and total return of a fund that holds securities with higher credit risk may be more volatile than those of a fund that holds bonds with lower credit risk. A Fund may be exposed to counterparty risk, or the risk that an institution or other entity with which a Fund has unsettled or open transactions will default.
| 6. | Federal Income Taxes: |
| a) | Each Fund intends to continue to qualify as a Regulated Investment Company (“RIC”) under Subchapter M of the Internal Revenue Code (“IRC”) by distributing substantially all of its taxable net investment income and net realized capital gains to its shareholders each year. Each Fund has distributed substantially all of its income and capital gains in prior years, if applicable, and intends to distribute substantially all of its income and capital gains during the calendar year ending December 31, 2019. Accordingly, no provision for federal income or excise taxes has been made in the accompanying financial statements. Distributions from short-term capital gains are treated as ordinary income distributions for federal income tax purposes. |
| b) | Net Investment Income (Loss), Net Realized Gains (Losses) and Distributions – Net investment income (loss) and net realized gains (losses) may differ for financial statement and tax purposes primarily because of losses deferred due to wash sale adjustments, foreign currency gains and losses, adjustments related to Passive Foreign Investment Companies (“PFICs”), Real Estate Investment Trusts (“REITs”), RICs, certain derivatives and partnerships. The character of distributions made during the year from net investment income or net realized gains |
| 106 |
|
| Hartford Domestic Equity Funds |
Notes to Financial Statements – (continued)
October 31, 2019
| may differ from their ultimate characterization for federal income tax purposes. Also, due to the timing of dividend distributions, the fiscal year in which amounts are distributed may differ from the year that the income or realized gains (losses) were recorded by each Fund. |
| c) | Distributions and Components of Distributable Earnings – The tax character of distributions paid by each Fund for the years ended October 31, 2019 and October 31, 2018 are as follows: |
| For the Year Ended October 31, 2019 | For the Year Ended October 31, 2018 | |||||||||||||||
Fund | Ordinary Income | Long-Term Capital Gains | Ordinary Income | Long-Term Capital Gains | ||||||||||||
Capital Appreciation Fund | $ | 448,614,710 | $ | 622,931,313 | $ | 495,689,708 | $ | 616,632,480 | ||||||||
Core Equity Fund | 45,617,203 | 127,778,830 | 62,326,139 | 53,245,177 | ||||||||||||
Dividend and Growth Fund | 146,320,234 | 752,059,161 | 174,669,622 | 756,670,295 | ||||||||||||
Equity Income Fund | 86,893,501 | 297,035,762 | 80,074,856 | 215,191,421 | ||||||||||||
Growth Opportunities Fund | 345,928,919 | 723,799,792 | 114,845,467 | 287,898,865 | ||||||||||||
Healthcare Fund | — | 102,046,786 | 16,867,179 | 59,657,697 | ||||||||||||
MidCap Fund | 94,767,016 | 1,219,235,756 | 62,275,642 | 400,812,276 | ||||||||||||
MidCap Value Fund | 7,032,454 | 64,802,404 | 714,158 | 17,090,726 | ||||||||||||
Quality Value Fund | 9,562,429 | 8,736,476 | 9,640,019 | 3,129,110 | ||||||||||||
Small Cap Growth Fund | 57,817,003 | 163,570,299 | 5,463,339 | 55,299,983 | ||||||||||||
Small Cap Value Fund | 3,160,308 | 22,181,051 | 599,875 | 6,583,376 | ||||||||||||
Small Company Fund | 10,391,373 | 79,093,272 | — | — | ||||||||||||
As of October 31, 2019, the components of distributable earnings (deficit) for each Fund on a tax basis are as follows:
Fund | Undistributed Ordinary Income | Undistributed Long-Term Capital Gains | Late-year Ordinary loss deferrals | Unrealized Appreciation on Investments | Total Accumulated Earnings | |||||||||||||||
Capital Appreciation Fund | $ | 24,707,287 | $ | 304,034,938 | $ | — | $ | 789,263,530 | $ | 1,118,005,755 | ||||||||||
Core Equity Fund | 49,195,750 | 98,071,596 | — | 1,182,698,582 | 1,329,965,928 | |||||||||||||||
Dividend and Growth Fund | 17,606,642 | 260,565,805 | — | 2,611,437,938 | 2,889,610,385 | |||||||||||||||
Equity Income Fund | 6,698,676 | 255,909,196 | — | 895,884,964 | 1,158,492,836 | |||||||||||||||
Growth Opportunities Fund | — | 301,832,065 | (2,579,043 | ) | 573,815,272 | 873,068,294 | ||||||||||||||
Healthcare Fund | 6,049,807 | 77,681,566 | — | 203,702,855 | 287,434,228 | |||||||||||||||
MidCap Fund | — | 703,064,730 | (17,410,935 | ) | 2,567,088,959 | 3,252,742,754 | ||||||||||||||
MidCap Value Fund | 3,778,333 | 16,707,434 | — | 65,165,138 | 85,650,905 | |||||||||||||||
Quality Value Fund | 4,890,997 | 5,794,288 | — | 20,637,824 | 31,323,109 | |||||||||||||||
Small Cap Growth Fund | — | 15,398,688 | (1,796,698 | ) | 121,313,980 | 134,915,970 | ||||||||||||||
Small Cap Value Fund | 987,030 | 5,921,778 | — | 4,603,642 | 11,512,450 | |||||||||||||||
Small Company Fund | — | 36,747,653 | (209,429 | ) | 55,819,350 | 92,357,574 | ||||||||||||||
| d) | Reclassification of Capital Accounts– The Funds may record reclassifications in their capital accounts. These reclassifications have no impact on the total net assets of the Funds. The reclassifications are a result of permanent differences between U.S. GAAP and tax accounting for such items as non-deductible expenses from partnership investments and Net operating losses. Adjustments are made to reflect the impact these items have on current and future distributions to shareholders. Therefore, the source of the Funds’ distributions may be shown in the accompanying Statements of Changes in Net Assets as from distributable earnings or from capital depending on the type of book and tax differences that exist. For the year ended October 31, 2019, the Funds recorded reclassifications to increase (decrease) the accounts listed below: |
Fund | Capital stock and paid-in-capital | Distributable earnings (loss) | ||||||
Capital Appreciation Fund | $ | (59,095 | ) | $ | 59,095 | |||
Growth Opportunities Fund | (41,789 | ) | 41,789 | |||||
Healthcare Fund | 8 | (8 | ) | |||||
Quality Value Fund | 3 | (3 | ) | |||||
Small Cap Growth Fund | (195,386 | ) | 195,386 | |||||
Small Company Fund | (5,014 | ) | 5,014 | |||||
| e) | Tax Basis of Investments – The aggregate cost of investments for federal income tax purposes at October 31, 2019 is different from book purposes primarily due to wash sale loss deferrals, passive foreign investment company (PFIC)mark-to-market adjustments, partnership |
| 107 |
|
| Hartford Domestic Equity Funds |
Notes to Financial Statements – (continued)
October 31, 2019
| adjustments andnon-taxable distributions from underlying investments. The net unrealized appreciation/(depreciation) on investments for tax purposes, which consists of gross unrealized appreciation and depreciation. Both the cost and unrealized appreciation and depreciation for federal income tax purposes are disclosed below: |
Fund | Tax Cost | Gross Unrealized Appreciation | Gross Unrealized (Depreciation) | Net Unrealized Appreciation | ||||||||||||
Capital Appreciation Fund | $ | 6,168,777,654 | $ | 904,731,281 | $ | (115,370,385 | ) | $ | 789,360,896 | |||||||
Core Equity Fund | 4,513,193,653 | 1,247,135,795 | (64,437,213 | ) | 1,182,698,582 | |||||||||||
Dividend and Growth Fund | 6,418,910,653 | 2,722,666,355 | (111,228,417 | ) | 2,611,437,938 | |||||||||||
Equity Income Fund | 3,178,577,611 | 965,179,370 | (69,295,909 | ) | 895,883,461 | |||||||||||
Growth Opportunities Fund | 4,260,793,888 | 729,982,882 | (156,145,055 | ) | 573,837,827 | |||||||||||
Healthcare Fund | 1,105,451,494 | 294,165,540 | (90,464,515 | ) | 203,701,025 | |||||||||||
MidCap Fund | 11,515,090,602 | 3,193,234,452 | (626,145,493 | ) | 2,567,088,959 | |||||||||||
MidCap Value Fund | 639,356,271 | 90,592,406 | (25,427,800 | ) | 65,164,606 | |||||||||||
Quality Value Fund | 187,930,079 | 27,589,419 | (6,949,584 | ) | 20,639,835 | |||||||||||
Small Cap Growth Fund | 921,547,136 | 185,877,935 | (64,563,955 | ) | 121,313,980 | |||||||||||
Small Cap Value Fund | 102,059,670 | 11,269,061 | (6,665,419 | ) | 4,603,642 | |||||||||||
Small Company Fund | 562,212,985 | 79,407,025 | (23,587,675 | ) | 55,819,350 | |||||||||||
| f) | Capital Loss Carryforward – The Funds had no capital loss carryforwards for U.S. federal income tax purposes as of October 31, 2019. |
Under the current tax law, net investment losses realized after December 31 of a Fund’s fiscal year may be deferred and treated as occurring on the first business day of the following fiscal year for tax purposes, often referred to as Late-Year Ordinary Losses. At October 31, 2019, the following Funds elected to defer Late-Year Ordinary Losses:
Fund | Amount | |||
Growth Opportunities Fund | $ | 2,579,043 | ||
MidCap Fund | 17,410,935 | |||
Small Cap Growth Fund | 1,796,698 | |||
Small Company Fund | 209,429 | |||
| g) | Accounting for Uncertainty in Income Taxes – Pursuant to provisions set forth by U.S. GAAP, Hartford Funds Management Company, LLC (“HFMC”) reviews each Fund’s tax positions for all open tax years. As of October 31, 2019, HFMC had reviewed the open tax years and concluded that there was no reason to record a liability for net unrecognized tax obligations relating to uncertain income tax positions. Each Fund files U.S. tax returns. Although the statute of limitations for examining a Fund’s U.S. tax returns remains open for 3 years, no examination is currently in progress. The Funds recognize interest and penalties, if any, related to unrecognized tax benefits as income tax expense on the Statements of Operations. During the period ended October 31, 2019, the Funds did not incur any interest or penalties. HFMC is not aware of any tax positions for which it is reasonably possible that the total amounts of unrecognized tax obligations will significantly change in the next twelve months. |
| 7. | Expenses: |
| a) | Investment Management Agreement – HFMC serves as each Fund’s investment manager. Each Company, on behalf of its respective Funds, has entered into an Investment Management Agreement with HFMC. HFMC is an indirect subsidiary of The Hartford Financial Services Group, Inc. (“The Hartford”). HFMC has overall investment supervisory responsibility for each Fund. In addition, HFMC provides administrative personnel, services, equipment, facilities and office space for proper operation of each Fund. HFMC has contracted with Wellington Management Company LLP (“Wellington Management”) under asub-advisory agreement and Wellington Management performs the daily investment of the assets of each Fund in accordance with the Fund’s investment objective and policies. Each Fund pays a fee to HFMC, a portion of which may be used to compensate Wellington Management. |
The schedule below reflects the rates of compensation paid to HFMC for investment management services rendered as of October 31, 2019; the rates are accrued daily and paid monthly based on each Fund’s average daily net assets, at the following annual rates:
Fund | Management Fee Rates | |
Capital Appreciation Fund | 0.8000% on first $500 million and; | |
0.7000% on next $500 million and; | ||
0.6500% on next $4 billion and; | ||
0.6475% on next $5 billion and; | ||
0.6450% over $10 billion |
| 108 |
|
| Hartford Domestic Equity Funds |
Notes to Financial Statements – (continued)
October 31, 2019
Fund | Management Fee Rates | |
Core Equity Fund | 0.4500% on first $500 million and; | |
0.3500% on next $500 million and; | ||
0.3300% on next $1.5 billion and; | ||
0.3250% on next $2.5 billion and; | ||
0.3225% over $5 billion | ||
Dividend and Growth Fund | 0.7500% on first $500 million and; | |
0.6500% on next $500 million and; | ||
0.6000% on next $1.5 billion and; | ||
0.5950% on next $2.5 billion and; | ||
0.5900% on next $5 billion and; | ||
0.5850% over $10 billion | ||
Equity Income Fund | 0.7500% on first $250 million and; | |
0.7000% on next $250 million and; | ||
0.6500% on next $500 million and; | ||
0.6000% on next $1.5 billion and; | ||
0.5900% on next $2.5 billion and; | ||
0.5875% over $5 billion | ||
Growth Opportunities Fund | 0.8000% on first $250 million and; | |
0.7000% on next $4.75 billion and; | ||
0.6975% on next $5 billion and; | ||
0.6950% over $10 billion | ||
Healthcare Fund | 0.9000% on first $500 million and; | |
0.8500% on next $500 million and; | ||
0.8000% on next $4 billion and; | ||
0.7975% on next $5 billion and; | ||
0.7950% over $10 billion | ||
MidCap Fund | 0.8500% on first $500 million and; | |
0.7500% on next $500 million and; | ||
0.7000% on next $4 billion and; | ||
0.6975% on next $5 billion and; | ||
0.6950% over $10 billion | ||
MidCap Value Fund | 0.7500% on first $500 million and; | |
0.6500% on next $500 million and; | ||
0.6000% on next $1.5 billion and; | ||
0.5950% on next $2.5 billion and; | ||
0.5900% on next $5 billion and; | ||
0.5850% over $10 billion | ||
Quality Value Fund | 0.4500% on first $500 million and; | |
0.3500% on next $500 million and; | ||
0.3300% on next $4 billion and; | ||
0.3250% on next $5 billion and; | ||
0.3225% over $10 billion | ||
Small Cap Growth Fund | 0.9000% on first $100 million and; | |
0.8000% on next $150 million and; | ||
0.7000% on next $250 million and; | ||
0.6500% on next $4.5 billion and; | ||
0.6300% on next $5 billion and; | ||
0.6200% over $10 billion | ||
Small Cap Value Fund | 0.7000% on first $500 million and; | |
0.6500% on next $500 million and; | ||
0.6000% on next $2 billion and; | ||
0.5900% on next $2 billion and; | ||
0.5800% on next $5 billion and; | ||
0.5700% over $10 billion | ||
Small Company Fund | 0.8500% on first $250 million and; | |
0.8000% on next $250 million and; | ||
0.7500% on next $500 million and; | ||
0.7000% on next $500 million and; | ||
0.6500% on next $3.5 billion and; | ||
0.6300% on next $5 billion and; | ||
0.6200% over $10 billion | ||
| 109 |
|
| Hartford Domestic Equity Funds |
Notes to Financial Statements – (continued)
October 31, 2019
| b) | Accounting Services Agreement– Pursuant to the Fund Accounting Agreement between HFMC and each Company, on behalf of its respective Funds, HFMC provides accounting services to each Fund and receives monthly compensation based on each Fund’s average daily net assets at the rates set forth below. Each Fund’s accounting services fees are accrued daily and paid monthly. |
| Capital Appreciation Fund, Growth Opportunities Fund and Small Company Fund | ||||
| Average Daily Net Assets | Annual Fees | |||
first $3.5 billion and; | 0.022% | |||
next $3.5 billion and | 0.018% | |||
Amount over $7 billion | 0.015% | |||
| Core Equity Fund, Dividend and Growth Fund, Equity Income Fund, Healthcare Fund, MidCap Fund, MidCap Value Fund, Quality Value Fund, Small Cap Growth Fund and Small Cap Value Fund | ||||
| Average Daily Net Assets | Annual Fees | |||
first $3.5 billion and; | 0.018% | |||
next $3.5 billion and | 0.014% | |||
Amount over $7 billion | 0.010% | |||
HFMC has delegated certain accounting and administrative services functions to State Street Bank and Trust Company (“State Street”). The costs and expenses of such delegation are borne by HFMC, not by the Funds, and HFMC compensates State Street for its services out of its own resources.
| c) | Operating Expenses– Allocable expenses incurred by each Company are allocated to each series within such Company, and allocated to classes within each such series, in proportion to the average daily net assets of such series and classes, except where allocation of certain expenses is more fairly made directly to a Fund or to specific classes within a Fund. As of October 31, 2019, HFMC contractually limited the total operating expenses (exclusive of taxes, interest expenses, brokerage commissions, acquired fund fees and expenses and extraordinary expenses), through February 29, 2020 as follows for each of the following Funds: |
| Expense Limit as a Percentage of Average Daily Net Assets | ||||||||||||||||||||||||||||||||||||
Fund | Class A | Class C | Class I | Class R3 | Class R4 | Class R5 | Class R6 | Class Y | Class F | |||||||||||||||||||||||||||
Quality Value Fund(1) | 0.96 | % | 1.71 | % | 0.66 | % | 1.18 | % | 0.88 | % | 0.63 | % | 0.46 | % | 0.57 | % | 0.46 | % | ||||||||||||||||||
Small Cap Value Fund(1) | 1.30 | % | 2.05 | % | 1.00 | % | 1.50 | % | 1.20 | % | 0.90 | % | 0.80 | % | 0.85 | % | 0.80 | % | ||||||||||||||||||
Small Company Fund(2) | 1.40 | % | 2.15 | % | 1.15 | % | 1.55 | % | 1.25 | % | 0.95 | % | 0.90 | % | 0.95 | % | 0.90 | % | ||||||||||||||||||
| (1) | Expense limitation was effective from November 1, 2018 through October 31, 2019. |
| (2) | Expense limitation was effective from March 1, 2019 through October 31, 2019. |
From November 1, 2018 through February 28, 2019, HFMC contractually limited the total operating expenses (exclusive of taxes, interest expenses, brokerage commissions, acquired fund fees and expenses and extraordinary expenses) of the following Fund as follows:
| Expense Limit as a Percentage of Average Daily Net Assets | ||||||||||||||||||||||||||||||||||||
Fund | Class A | Class C | Class I | Class R3 | Class R4 | Class R5 | Class R6 | Class Y | Class F | |||||||||||||||||||||||||||
Small Company Fund | 1.40 | % | 2.15 | % | 1.15 | % | 1.55 | % | 1.25 | % | 0.95 | % | 0.90 | % | 0.90 | % | 0.90 | % | ||||||||||||||||||
| d) | Fees Paid Indirectly– Certain Funds have entered into agreements with State Street Global Markets, LLC and Russell Implementation Services, Inc. to partially recapturenon-discounted trade commissions. Such rebates are used to pay a portion of a Fund’s expenses. In addition, the Funds’ custodian bank has agreed to reduce its fees when a Fund maintains cash on deposit in anon-interest-bearing custody account. For the year ended October 31, 2019, these amounts, if any, are included in the Statements of Operations. |
The ratio of expenses to average net assets in the accompanying financial highlights excludes the reduction in expenses related to fees paid indirectly. The annualized expense ratio after waivers reflecting the reduction for fees paid indirectly for the period is as follows:
Fund | Class A | Class C | Class I | Class R3 | Class R4 | Class R5 | Class R6 | Class Y | Class F | |||||||||||||||||||||||||||
Capital Appreciation Fund | 1.07 | % | 1.83 | % | 0.79 | % | 1.42 | % | 1.11 | % | 0.80 | % | 0.70 | % | 0.74 | % | 0.70 | % | ||||||||||||||||||
Core Equity Fund | 0.73 | % | 1.47 | % | 0.47 | % | 1.10 | % | 0.74 | % | 0.49 | % | 0.38 | % | 0.43 | % | 0.38 | % | ||||||||||||||||||
Dividend and Growth Fund | 0.99 | % | 1.77 | % | 0.73 | % | 1.35 | % | 1.04 | % | 0.74 | % | 0.64 | % | 0.68 | % | 0.64 | % | ||||||||||||||||||
Equity Income Fund | 1.00 | % | 1.76 | % | 0.75 | % | 1.36 | % | 1.07 | % | 0.76 | % | 0.66 | % | 0.71 | % | 0.66 | % | ||||||||||||||||||
Growth Opportunities Fund | 1.11 | % | 1.86 | % | 0.85 | % | 1.46 | % | 1.15 | % | 0.85 | % | 0.75 | % | 0.79 | % | 0.74 | % | ||||||||||||||||||
Healthcare Fund | 1.30 | % | 2.05 | % | 1.01 | % | 1.62 | % | 1.31 | % | 1.02 | % | 0.91 | % | 0.95 | % | 0.91 | % | ||||||||||||||||||
MidCap Fund | 1.10 | % | 1.86 | % | 0.85 | % | 1.45 | % | 1.14 | % | 0.84 | % | 0.74 | % | 0.78 | % | 0.74 | % | ||||||||||||||||||
MidCap Value Fund | 1.23 | % | 1.99 | % | 0.89 | % | 1.52 | % | 1.20 | % | 0.91 | % | N/A | 0.85 | % | 0.80 | % | |||||||||||||||||||
Quality Value Fund | 0.90 | % | 1.67 | % | 0.56 | % | 1.16 | % | 0.86 | % | 0.58 | % | 0.46 | % | 0.55 | % | 0.46 | % | ||||||||||||||||||
Small Cap Growth Fund | 1.24 | % | 1.89 | % | 0.83 | % | 1.47 | % | 1.16 | % | 0.85 | % | 0.76 | % | 0.80 | % | 0.76 | % | ||||||||||||||||||
Small Cap Value Fund | 1.27 | % | 2.04 | % | 0.90 | % | 1.42 | % | 1.20 | % | 0.90 | % | 0.80 | % | 0.85 | % | 0.80 | % | ||||||||||||||||||
Small Company Fund | 1.32 | % | 2.13 | % | 1.03 | % | 1.55 | % | 1.25 | % | 0.95 | % | 0.90 | % | 0.93 | % | 0.90 | % | ||||||||||||||||||
| 110 |
|
| Hartford Domestic Equity Funds |
Notes to Financial Statements – (continued)
October 31, 2019
| e) | Sales Charges and Distribution and Service Plan for Class A, T, C, R3 and R4 Shares – Hartford Funds Distributors, LLC (“HFD”), an indirect subsidiary of The Hartford, is the principal underwriter and distributor of each Fund. For the year ended October 31, 2019, HFD receivedfront-end sales charges and contingent deferred sales charges for each Fund as follows: |
Fund | Front-end Sales Charges | Contingent Deferred Sales Charges | ||||||
Capital Appreciation Fund | $ | 1,881,375 | $ | 13,032 | ||||
Core Equity Fund | 2,442,408 | 28,179 | ||||||
Dividend and Growth Fund | 3,276,542 | 24,040 | ||||||
Equity Income Fund | 1,519,170 | 13,307 | ||||||
Growth Opportunities Fund | 2,807,131 | 46,324 | ||||||
Healthcare Fund | 688,543 | 10,069 | ||||||
MidCap Fund | 3,728,257 | 65,966 | ||||||
MidCap Value Fund | 607,969 | 7,669 | ||||||
Quality Value Fund | 112,646 | 517 | ||||||
Small Cap Growth Fund | 49,649 | 917 | ||||||
Small Cap Value Fund | 51,145 | 502 | ||||||
Small Company Fund | 559,942 | 2,353 | ||||||
The Board of Directors of each Company has approved the adoption of a separate distribution plan (each a “Plan”) pursuant to Rule12b-1 under the 1940 Act for each of Class A, T, C, R3 and R4 shares. Under a Plan, Class A, Class T, Class C, Class R3 and Class R4 shares of a Fund, as applicable, bear distribution and/or service fees paid to HFD, some of which may be paid to select broker-dealers. Pursuant to the Class A Plan, a Fund may pay HFD a fee of up to 0.25% of the average daily net assets attributable to Class A shares for distribution financing activities and shareholder account servicing activities. The entire amount of the fee may be used for shareholder servicing expenses and/or distribution expenses. Pursuant to the Class T Plan, a Fund may pay HFD a fee of up to 0.25% of the average daily net assets attributable to Class T shares for distribution financing activities and shareholder account servicing activities. The entire amount of the fee may be used for shareholder servicing expenses and/or distribution expenses. As of October 31, 2019, Class T shares have not commenced operations. Pursuant to the Class C Plan, a Fund may pay HFD a fee of up to 1.00% of the average daily net assets attributable to Class C shares for distribution financing activities, and up to 0.25% may be used for shareholder account servicing activities. The Class C Plan also provides that HFD will receive all contingent deferred sales charges attributable to Class C shares. Pursuant to the Class R3 Plan, a Fund may pay HFD a fee of up to 0.50% of the average daily net assets attributable to Class R3 shares for distribution financing activities, and up to 0.25% may be used for shareholder account servicing activities. Pursuant to the Class R4 Plan, a Fund may pay HFD a fee of up to 0.25% of the average daily net assets attributable to Class R4 shares for distribution financing activities. The entire amount of the fee may be used for shareholder account servicing activities. Each Fund’s12b-1 fees are accrued daily and paid monthly or at such other intervals as the respective Company’s Board of Directors may determine. Any 12b-1 fees attributable to assets held in an account held directly with the Funds’ transfer agent for which there is not a third-party listed as the broker-dealer of record (of HFD does not otherwise have a payment obligation) are generally reimbursed to the applicable Fund. Such amounts are reflected as “Distribution fee reimbursements” on the Statement of Operations.
| f) | Other Related Party Transactions– Certain officers of each Company are directors and/or officers of HFMC and/or The Hartford or its subsidiaries. For the year ended October 31, 2019, a portion of each Company’s Chief Compliance Officer’s (“CCO”) compensation was paid by all of the investment companies in the Hartford fund complex. The portion allocated to each Fund, as represented in other expenses on the Statements of Operations, is outlined in the table below. |
Fund | CCO Compensation Paid by Fund | |||
Capital Appreciation Fund | $ | 16,646 | ||
Core Equity Fund | 9,641 | |||
Dividend and Growth Fund | 19,713 | |||
Equity Income Fund | 9,483 | |||
Growth Opportunities Fund | 11,436 | |||
Healthcare Fund | 3,204 | |||
MidCap Fund | 30,503 | |||
MidCap Value Fund | 1,557 | |||
Quality Value Fund | 618 | |||
Small Cap Growth Fund | 2,560 | |||
Small Cap Value Fund | 240 | |||
Small Company Fund | 1,290 | |||
Hartford Administrative Services Company (“HASCO”), an indirect subsidiary of The Hartford, provides transfer agent services to each Fund. Each Fund pays HASCO a transfer agency fee payable monthly based on the lesser of (i) the costs of providing or overseeing transfer agency services provided to each share class of such Fund plus a target profit margin or (ii) a Specified Amount (as defined in the table below ). Such fee is intended to compensate HASCO for: (i) fees payable by HASCO to DST Asset Manager Solutions, Inc. (“DST”) (and any other designatedsub-agent) according to the agreed-upon fee schedule under thesub-transfer agency agreement between HASCO and DST (or between HASCO and any other designatedsub-agent, as applicable); (ii)sub-transfer agency fees payable by HASCO to financial intermediaries, according to the agreed-upon terms between HASCO and the financial intermediaries, provided that such payments are
| 111 |
|
| Hartford Domestic Equity Funds |
Notes to Financial Statements – (continued)
October 31, 2019
within certain limits approved by the applicable Company’s Board of Directors; (iii) certain expenses that HASCO’s parent company, Hartford Funds Management Group, Inc., allocates to HASCO that relate to HASCO’s transfer agency services provided to the Fund; and (iv) a target profit margin.
Share Class | Specified Amount (as a percentage average daily net assets) | |||
Class A | 0.25 | % | ||
Class C | 0.25 | % | ||
Class I | 0.20 | % | ||
Class Y | 0.11 | %* | ||
Class R3 | 0.22 | % | ||
Class R4 | 0.17 | % | ||
Class R5 | 0.12 | % | ||
Class R6 | 0.004 | % | ||
Class F | 0.004 | % | ||
| * | For the period November 1, 2018 through April 30, 2019, the specified amount for all Class Y shares was equal to 0.06% of average daily net assets. |
Effective March 1, 2019, HASCO has contractually agreed to waive and/or reimburse a portion of the transfer agency fees for the share classes of the Funds listed below to the extent necessary to maintain the transfer agency fees as follows:
Fund | Class I | Class Y | ||||||
Capital Appreciation Fund | N/A | 0.04 | % | |||||
Core Equity Fund | N/A | 0.06 | % | |||||
Dividend and Growth Fund | N/A | 0.05 | % | |||||
Equity Income Fund | N/A | 0.05 | % | |||||
Growth Opportunities Fund | N/A | 0.05 | % | |||||
Healthcare Fund | N/A | 0.06 | % | |||||
MidCap Fund | 0.12 | % | 0.04 | % | ||||
MidCap Value Fund | N/A | 0.05 | % | |||||
Small Cap Growth Fund | N/A | 0.04 | % | |||||
This contractual arrangement for each of these Funds will remain in effect until February 29, 2020 unless the Board of Directors approves its earlier termination.
Pursuant to asub-transfer agency agreement between HASCO and DST, HASCO has delegated certain transfer agent, dividend disbursing agent and shareholder servicing agent functions to DST. Each Fund does not pay any fee directly to DST; rather, HASCO makes all such payments to DST. The accrued amount shown in the Statements of Operations reflects the amounts charged by HASCO. These fees are accrued daily and paid monthly.
For the year ended October 31, 2019, the effective rate of compensation paid to HASCO for transfer agency services as a percentage of each Class’ average daily net assets is as follows:
Fund | Class A | Class C | Class I | Class R3 | Class R4 | Class R5 | Class R6 | Class Y | Class F | |||||||||||||||||||||||||||
Capital Appreciation Fund | 0.12 | % | 0.13 | % | 0.09 | % | 0.22 | % | 0.16 | % | 0.10 | % | 0.00 | % | 0.04 | % | 0.00 | % | ||||||||||||||||||
Core Equity Fund | 0.11 | % | 0.09 | % | 0.09 | % | 0.22 | % | 0.14 | % | 0.11 | % | 0.00 | % | 0.05 | % | 0.00 | % | ||||||||||||||||||
Dividend and Growth Fund | 0.11 | % | 0.13 | % | 0.10 | % | 0.22 | % | 0.15 | % | 0.10 | % | 0.00 | % | 0.05 | % | 0.00 | % | ||||||||||||||||||
Equity Income Fund | 0.09 | % | 0.10 | % | 0.10 | % | 0.20 | % | 0.16 | % | 0.10 | % | 0.00 | % | 0.05 | % | 0.00 | % | ||||||||||||||||||
Growth Opportunities Fund | 0.12 | % | 0.12 | % | 0.11 | % | 0.22 | % | 0.16 | % | 0.11 | % | 0.00 | % | 0.05 | % | 0.00 | % | ||||||||||||||||||
Healthcare Fund | 0.14 | % | 0.15 | % | 0.10 | % | 0.21 | % | 0.16 | % | 0.12 | % | 0.00 | % | 0.05 | % | 0.00 | % | ||||||||||||||||||
MidCap Fund | 0.11 | % | 0.12 | % | 0.11 | % | 0.21 | % | 0.17 | % | 0.10 | % | 0.00 | % | 0.04 | % | 0.00 | % | ||||||||||||||||||
MidCap Value Fund | 0.18 | % | 0.19 | % | 0.09 | % | 0.22 | % | 0.16 | % | 0.12 | % | N/A | 0.05 | % | 0.00 | % | |||||||||||||||||||
Quality Value Fund | 0.20 | % | 0.21 | % | 0.10 | % | 0.22 | % | 0.15 | % | 0.12 | % | 0.00 | % | 0.08 | % | 0.00 | % | ||||||||||||||||||
Small Cap Growth Fund | 0.24 | % | 0.14 | % | 0.07 | % | 0.22 | % | 0.16 | % | 0.09 | % | 0.00 | % | 0.04 | % | 0.00 | % | ||||||||||||||||||
Small Cap Value Fund | 0.23 | % | 0.25 | % | 0.10 | % | 0.22 | % | 0.17 | % | 0.12 | % | 0.00 | % | 0.08 | % | 0.00 | % | ||||||||||||||||||
Small Company Fund | 0.18 | % | 0.24 | % | 0.14 | % | 0.22 | % | 0.17 | % | 0.12 | % | 0.00 | % | 0.04 | % | 0.00 | % | ||||||||||||||||||
| 8. | Securities Lending: |
Each Company has entered into a securities lending agency agreement (“lending agreement”) with Citibank, N.A. (“Citibank”). A Fund may lend portfolio securities to certain borrowers in U.S. andnon-U.S. markets in an amount not to exceedone-third (33 1/3%) of the value of its total assets. If a Fund security is on loan, under the lending agreement, the borrower is required to deposit cash or liquid securities as collateral at least equal to 100% of the market value of the loaned securities; cash collateral is invested for the benefit of the Fund by the Fund’s lending agent pursuant to collateral investment guidelines. The collateral is marked to market daily, in an amount at least equal to the current market value of the securities loaned.
| 112 |
|
| Hartford Domestic Equity Funds |
Notes to Financial Statements – (continued)
October 31, 2019
A Fund is subject to certain risks while its securities are on loan, including the following: (i) the risk that the borrower defaults on the loan and the collateral is inadequate to cover the Fund’s loss; (ii) the risk that the earnings on the collateral invested are not sufficient to pay fees incurred in connection with the loan; (iii) the risk that the principal value of the collateral invested may decline; (iv) the risk that the borrower may use the loaned securities to cover a short sale, which may in turn place downward pressure on the market prices of the loaned securities; (v) the risk that return of loaned securities could be delayed and interfere with portfolio management decisions; and (vi) the risk that any efforts to restrict the securities for purposes of voting may not be effective. These events could also trigger adverse tax consequences for the Fund.
The Funds retain loan fees and the interest on cash collateral investments but are required to pay the borrower a rebate for the use of cash collateral. In cases where the lent security is of high value to borrowers, there may be a negative rebate (i.e., a net payment from the borrower to the Funds). Upon termination of a loan, the Funds are required to return to the borrower an amount equal to the cash collateral, plus any rebate owed to the borrowers.
The net income earned on the securities lending (after payment of rebates and Citibank’s fee) is included on the Statements of Operations as Investment Income from securities lending. The Funds also receive payments from the borrower during the period of the loan, equivalent to dividends and interest earned on the securities loaned, which are recorded as Investment Income from dividends or interest, respectively, on the Statements of Operations.
The following table presents the market value of the Funds’ securities on loan, net of amounts available for offset under the master netting arrangements and any related collateral received by the Funds as of October 31, 2019.
| Investment Securities on Loan, at market value, Presented on the Statement of Assets and Liabilities(1) | Collateral Posted by Borrower(3) | Net Amount(2) | ||||||||||
Capital Appreciation Fund | $ | 33,237,906 | $ | (33,237,906 | ) | $ | — | |||||
Core Equity Fund | 22,988,543 | (22,988,543 | ) | — | ||||||||
Dividend and Growth Fund | 3,617,565 | (3,617,565 | ) | — | ||||||||
Growth Opportunities Fund | 98,649,676 | (98,649,676 | ) | — | ||||||||
Healthcare Fund | 33,434,256 | (33,434,256 | ) | — | ||||||||
MidCap Fund | 151,285,796 | (151,285,796 | ) | — | ||||||||
Small Cap Growth Fund | 22,309,469 | (22,309,469 | ) | — | ||||||||
Small Cap Value Fund | 2,978,115 | (2,978,115 | ) | — | ||||||||
Small Company Fund | 9,309,793 | (9,309,793 | ) | — | ||||||||
| (1) | It is each Fund’s policy to obtain additional collateral from, or return excess collateral to, the borrower by the end of the next business day following the valuation date of the securities loaned. Therefore, the value of the collateral held may be temporarily less than that required under the lending contract. |
| (2) | Net amount represents the net amount receivable due from the counterparty in the event of default. |
| (3) | Collateral received in excess of the market value of securities on loan is not presented in this table. The total cash and non-cash collateral with value of $35,190,576, $25,237,978, $4,542,000, $104,283,353, $34,350,233, $164,065,631, $22,408,521, $3,076,375, and $9,654,908, respectively, has been received by Capital Appreciation Fund, Core Equity Fund, Dividend and Growth Fund, Growth Opportunities Fund, Healthcare Fund, MidCap Fund, Small Cap Growth Fund, Small Cap Value Fund, and Small Company Fund, respectively, in connection with securities lending transactions. |
| 9. | Secured Borrowings: |
The following tables reflect a breakdown of transactions accounted for as secured borrowings, the gross obligation by the type of collateral pledged, and the remaining contractual maturity of those transactions as of October 31, 2019.
Certain Transfers Accounted for as Secured Borrowings
Remaining Contractual Maturity of the Agreements
| Overnight and Continuous | <30 days | Between 30 & 90 days | >90 days | Total | ||||||||||||||||
| Capital Appreciation Fund | ||||||||||||||||||||
Securities Lending Transactions(1) |
| |||||||||||||||||||
Common Stocks | $ | 31,596,022 | $ | — | $ | — | $ | — | $ | 31,596,022 | ||||||||||
|
|
|
|
|
|
|
|
|
| |||||||||||
Total Borrowings | $ | 31,596,022 | $ | — | $ | — | $ | — | $ | 31,596,022 | ||||||||||
|
|
|
|
|
|
|
|
|
| |||||||||||
Gross amount of recognized liabilities for securities lending transactions |
| $ | 31,596,022 | |||||||||||||||||
|
| |||||||||||||||||||
| Core Equity Fund | ||||||||||||||||||||
Securities Lending Transactions(1) |
| |||||||||||||||||||
Common Stocks | $ | 25,237,978 | $ | — | $ | — | $ | — | $ | 25,237,978 | ||||||||||
|
|
|
|
|
|
|
|
|
| |||||||||||
Total Borrowings | $ | 25,237,978 | $ | — | $ | — | $ | — | $ | 25,237,978 | ||||||||||
|
|
|
|
|
|
|
|
|
| |||||||||||
Gross amount of recognized liabilities for securities lending transactions |
| $ | 25,237,978 | |||||||||||||||||
|
| |||||||||||||||||||
| Dividend and Growth Fund | ||||||||||||||||||||
Securities Lending Transactions(1) |
| |||||||||||||||||||
Common Stocks | $ | 4,542,000 | $ | — | $ | — | $ | — | $ | 4,542,000 | ||||||||||
|
|
|
|
|
|
|
|
|
| |||||||||||
Total Borrowings | $ | 4,542,000 | $ | — | $ | — | $ | — | $ | 4,542,000 | ||||||||||
|
|
|
|
|
|
|
|
|
| |||||||||||
Gross amount of recognized liabilities for securities lending transactions |
| $ | 4,542,000 | |||||||||||||||||
|
| |||||||||||||||||||
| 113 |
|
| Hartford Domestic Equity Funds |
Notes to Financial Statements – (continued)
October 31, 2019
| Overnight and Continuous | <30 days | Between 30 & 90 days | >90 days | Total | ||||||||||||||||
| Growth Opportunities Fund | ||||||||||||||||||||
Securities Lending Transactions(1) |
| |||||||||||||||||||
Common Stocks | $ | 104,283,353 | $ | — | $ | — | $ | — | $ | 104,283,353 | ||||||||||
|
|
|
|
|
|
|
|
|
| |||||||||||
Total Borrowings | $ | 104,283,353 | $ | — | $ | — | $ | — | $ | 104,283,353 | ||||||||||
|
|
|
|
|
|
|
|
|
| |||||||||||
Gross amount of recognized liabilities for securities lending transactions |
| $ | 104,283,353 | |||||||||||||||||
|
| |||||||||||||||||||
| Healthcare Fund | ||||||||||||||||||||
Securities Lending Transactions(1) |
| |||||||||||||||||||
Common Stocks | $ | 34,242,367 | $ | — | $ | — | $ | — | $ | 34,242,367 | ||||||||||
|
|
|
|
|
|
|
|
|
| |||||||||||
Total Borrowings | $ | 34,242,367 | $ | — | $ | — | $ | — | $ | 34,242,367 | ||||||||||
|
|
|
|
|
|
|
|
|
| |||||||||||
Gross amount of recognized liabilities for securities lending transactions |
| $ | 34,242,367 | |||||||||||||||||
|
| |||||||||||||||||||
| MidCap Fund | ||||||||||||||||||||
Securities Lending Transactions(1) |
| |||||||||||||||||||
Common Stocks | $ | 164,065,631 | $ | — | $ | — | $ | — | $ | 164,065,631 | ||||||||||
|
|
|
|
|
|
|
|
|
| |||||||||||
Total Borrowings | $ | 164,065,631 | $ | — | $ | — | $ | — | $ | 164,065,631 | ||||||||||
|
|
|
|
|
|
|
|
|
| |||||||||||
Gross amount of recognized liabilities for securities lending transactions |
| $ | 164,065,631 | |||||||||||||||||
|
| |||||||||||||||||||
| Small Cap Growth Fund | ||||||||||||||||||||
Securities Lending Transactions(1) |
| |||||||||||||||||||
Common Stocks | $ | 22,408,521 | $ | — | $ | — | $ | — | $ | 22,408,521 | ||||||||||
|
|
|
|
|
|
|
|
|
| |||||||||||
Total Borrowings | $ | 22,408,521 | $ | — | $ | — | $ | — | $ | 22,408,521 | ||||||||||
|
|
|
|
|
|
|
|
|
| |||||||||||
Gross amount of recognized liabilities for securities lending transactions |
| $ | 22,408,521 | |||||||||||||||||
|
| |||||||||||||||||||
| Small Cap Value Fund | ||||||||||||||||||||
Securities Lending Transactions(1) |
| |||||||||||||||||||
Common Stocks | $ | 3,076,375 | $ | — | $ | — | $ | — | $ | 3,076,375 | ||||||||||
|
|
|
|
|
|
|
|
|
| |||||||||||
Total Borrowings | $ | 3,076,375 | $ | — | $ | — | $ | — | $ | 3,076,375 | ||||||||||
|
|
|
|
|
|
|
|
|
| |||||||||||
Gross amount of recognized liabilities for securities lending transactions |
| $ | 3,076,375 | |||||||||||||||||
|
| |||||||||||||||||||
| Small Company Fund | ||||||||||||||||||||
Securities Lending Transactions(1) |
| |||||||||||||||||||
Common Stocks | $ | 9,654,908 | $ | — | $ | — | $ | — | $ | 9,654,908 | ||||||||||
|
|
|
|
|
|
|
|
|
| |||||||||||
Total Borrowings | $ | 9,654,908 | $ | — | $ | — | $ | — | $ | 9,654,908 | ||||||||||
|
|
|
|
|
|
|
|
|
| |||||||||||
Gross amount of recognized liabilities for securities lending transactions |
| $ | 9,654,908 | |||||||||||||||||
|
| |||||||||||||||||||
| (1) | Amount represents the payable for cash collateral received on securities on loan. This will generally be in the “Overnight and Continuous” column as the securities are typically callable on demand. |
| 10. | Affiliate Holdings: |
As of October 31, 2019, affiliates of The Hartford had ownership of shares in each Fund as follows:
Percentage of a Class:
Fund | Class A | Class C | Class I | Class R3 | Class R4 | Class R5 | Class R6 | Class Y | Class F | |||||||||||||||||||||||||||
Healthcare Fund | — | — | — | — | — | — | 1 | % | — | — | ||||||||||||||||||||||||||
Quality Value Fund | — | — | — | — | — | — | 33 | % | — | — | ||||||||||||||||||||||||||
Small Cap Value Fund | — | — | — | — | — | 100 | % | 10 | % | — | — | |||||||||||||||||||||||||
Percentage of Fund by Class:
Fund | Class A | Class C | Class I | Class R3 | Class R4 | Class R5 | Class R6 | Class Y | Class F | |||||||||||||||||||||||||||
Healthcare Fund | — | — | — | — | — | — | — | %* | — | — | ||||||||||||||||||||||||||
Quality Value Fund | — | — | — | — | — | — | — | %* | — | — | ||||||||||||||||||||||||||
Small Cap Value Fund | — | — | — | — | — | — | %* | — | %* | — | — | |||||||||||||||||||||||||
| * | Percentage rounds to zero. |
| 114 |
|
| Hartford Domestic Equity Funds |
Notes to Financial Statements – (continued)
October 31, 2019
As of October 31, 2019, affiliated funds of funds and certain 529 plans administered by HFMC in the aggregate owned a portion of the Funds identified below. Therefore, these Funds may experience relatively large purchases or redemptions of their shares from these affiliated funds of funds and certain 529 plans administered by HFMC. Affiliated funds of funds and certain 529 plans administered by HFMC owned shares in the Funds listed below as follows:
Funds | Percentage of Fund* | |||
Capital Appreciation Fund | 8 | % | ||
Core Equity Fund | 6 | % | ||
Dividend and Growth Fund | 10 | % | ||
Equity Income Fund | 7 | % | ||
Growth Opportunities Fund | 2 | % | ||
MidCap Fund | 1 | % | ||
MidCap Value Fund | 2 | % | ||
Small Cap Growth Fund | 4 | % | ||
Small Cap Value Fund | 44 | % | ||
Small Company Fund | 10 | % | ||
| * | As of October 31, 2019, affiliated funds of funds and certain 529 plans administered by HFMC invest in Class F shares. |
| 11. | Investment Transactions: |
For the year ended October 31, 2019, the cost of purchases and proceeds from sales of investment securities (excluding short-term investments) were as follows:
Fund | Cost of Purchases Excluding U.S. Government Obligations | Sales Proceeds Excluding U.S. Government Obligations | Cost of Purchases For U.S. Government Obligations | Sales Proceeds For U.S. Government Obligations | Total Cost of Purchases | Total Sales Proceeds | ||||||||||||||||||
Capital Appreciation Fund | $ | 4,644,797,928 | $ | 5,939,939,117 | $ | — | $ | — | $ | 4,644,797,928 | $ | 5,939,939,117 | ||||||||||||
Core Equity Fund | 2,060,243,351 | 635,255,651 | — | — | 2,060,243,351 | 635,255,651 | ||||||||||||||||||
Dividend and Growth Fund | 1,811,327,134 | 2,032,858,469 | — | — | 1,811,327,134 | 2,032,858,469 | ||||||||||||||||||
Equity Income Fund | 840,414,838 | 1,351,434,350 | — | — | 840,414,838 | 1,351,434,350 | ||||||||||||||||||
Growth Opportunities Fund | 3,077,549,603 | 3,670,793,301 | — | — | 3,077,549,603 | 3,670,793,301 | ||||||||||||||||||
Healthcare Fund | 452,657,026 | 716,549,882 | — | — | 452,657,026 | 716,549,882 | ||||||||||||||||||
MidCap Fund | 4,125,522,702 | 4,344,809,659 | — | — | 4,125,522,702 | 4,344,809,659 | ||||||||||||||||||
MidCap Value Fund | 353,462,540 | 371,286,556 | — | — | 353,462,540 | 371,286,556 | ||||||||||||||||||
Quality Value Fund | 54,499,737 | 153,273,647 | — | — | 54,499,737 | 153,273,647 | ||||||||||||||||||
Small Cap Growth Fund | 503,878,112 | 664,491,952 | — | — | 503,878,112 | 664,491,952 | ||||||||||||||||||
Small Cap Value Fund | 139,150,722 | 140,025,664 | — | — | 139,150,722 | 140,025,664 | ||||||||||||||||||
Small Company Fund | 521,501,562 | 493,725,607 | — | — | 521,501,562 | 493,725,607 | ||||||||||||||||||
| 12. | Capital Share Transactions: |
The following information is for the year ended October 31, 2019, and the year ended October 31, 2018:
| For the Year Ended October 31, 2019 | For the Year Ended October 31, 2018 | |||||||||||||||
| Shares | Amount | Shares | Amount | |||||||||||||
| Capital Appreciation Fund | ||||||||||||||||
Class A | ||||||||||||||||
Shares Sold | 6,684,086 | $ | 232,423,382 | 18,627,905 | $ | 720,223,487 | ||||||||||
Shares Issued for Reinvested Dividends | 22,329,307 | 687,462,739 | 15,585,296 | 588,452,604 | ||||||||||||
Shares Redeemed | (24,060,103 | ) | (834,177,503 | ) | (19,213,364 | ) | (759,184,210 | ) | ||||||||
|
|
|
|
|
|
|
| |||||||||
Net Increase (Decrease) | 4,953,290 | 85,708,618 | 14,999,837 | 549,491,881 | ||||||||||||
|
|
|
|
|
|
|
| |||||||||
Class C | ||||||||||||||||
Shares Sold | 1,093,708 | $ | 26,748,681 | 1,048,144 | $ | 31,974,203 | ||||||||||
Shares Issued for Reinvested Dividends | 3,194,762 | 71,977,983 | 6,297,825 | 184,217,448 | ||||||||||||
Shares Redeemed | (8,552,882 | ) | (220,040,659 | ) | (29,715,951 | ) | (896,575,354 | ) | ||||||||
|
|
|
|
|
|
|
| |||||||||
Net Increase (Decrease) | (4,264,412 | ) | (121,313,995 | ) | (22,369,982 | ) | (680,383,703 | ) | ||||||||
|
|
|
|
|
|
|
| |||||||||
Class I | ||||||||||||||||
Shares Sold | 2,525,910 | $ | 87,546,675 | 3,910,878 | $ | 155,382,910 | ||||||||||
Shares Issued for Reinvested Dividends | 2,918,816 | 90,422,933 | 2,472,959 | 93,848,576 | ||||||||||||
Shares Redeemed | (7,113,244 | ) | (243,912,297 | ) | (7,218,834 | ) | (285,577,373 | ) | ||||||||
|
|
|
|
|
|
|
| |||||||||
Net Increase (Decrease) | (1,668,518 | ) | (65,942,689 | ) | (834,997 | ) | (36,345,887 | ) | ||||||||
|
|
|
|
|
|
|
| |||||||||
| 115 |
|
| Hartford Domestic Equity Funds |
Notes to Financial Statements – (continued)
October 31, 2019
| For the Year Ended October 31, 2019 | For the Year Ended October 31, 2018 | |||||||||||||||
| Shares | Amount | Shares | Amount | |||||||||||||
| Capital Appreciation Fund – (continued) | ||||||||||||||||
Class R3 | ||||||||||||||||
Shares Sold | 112,855 | $ | 4,432,352 | 137,040 | $ | 5,957,109 | ||||||||||
Shares Issued for Reinvested Dividends | 236,998 | 8,150,367 | 206,300 | 8,536,924 | ||||||||||||
Shares Redeemed | (607,653 | ) | (23,140,877 | ) | (513,386 | ) | (22,360,490 | ) | ||||||||
|
|
|
|
|
|
|
| |||||||||
Net Increase (Decrease) | (257,800 | ) | (10,558,158 | ) | (170,046 | ) | (7,866,457 | ) | ||||||||
|
|
|
|
|
|
|
| |||||||||
Class R4 | ||||||||||||||||
Shares Sold | 84,709 | $ | 3,432,233 | 186,985 | $ | 8,374,964 | ||||||||||
Shares Issued for Reinvested Dividends | 183,710 | 6,552,532 | 187,519 | 8,012,830 | ||||||||||||
Shares Redeemed | (573,752 | ) | (23,412,700 | ) | (764,944 | ) | (33,903,987 | ) | ||||||||
|
|
|
|
|
|
|
| |||||||||
Net Increase (Decrease) | (305,333 | ) | (13,427,935 | ) | (390,440 | ) | (17,516,193 | ) | ||||||||
|
|
|
|
|
|
|
| |||||||||
Class R5 | ||||||||||||||||
Shares Sold | 181,208 | $ | 7,914,397 | 82,585 | $ | 3,732,482 | ||||||||||
Shares Issued for Reinvested Dividends | 122,722 | 4,476,273 | 108,386 | 4,727,927 | ||||||||||||
Shares Redeemed | (205,507 | ) | (8,681,890 | ) | (261,803 | ) | (11,949,550 | ) | ||||||||
|
|
|
|
|
|
|
| |||||||||
Net Increase (Decrease) | 98,423 | 3,708,780 | (70,832 | ) | (3,489,141 | ) | ||||||||||
|
|
|
|
|
|
|
| |||||||||
Class R6 | ||||||||||||||||
Shares Sold | 267,939 | $ | 11,761,170 | 101,194 | $ | 4,624,485 | ||||||||||
Shares Issued for Reinvested Dividends | 257,757 | 9,465,639 | 192,898 | 8,465,656 | ||||||||||||
Shares Redeemed | (319,035 | ) | (13,587,366 | ) | (151,907 | ) | (6,938,017 | ) | ||||||||
|
|
|
|
|
|
|
| |||||||||
Net Increase (Decrease) | 206,661 | 7,639,443 | 142,185 | 6,152,124 | ||||||||||||
|
|
|
|
|
|
|
| |||||||||
Class Y | ||||||||||||||||
Shares Sold | 941,007 | $ | 38,590,999 | 693,026 | $ | 32,164,734 | ||||||||||
Shares Issued for Reinvested Dividends | 618,487 | 22,707,855 | 477,638 | 20,953,067 | ||||||||||||
Shares Redeemed | (1,311,560 | ) | (54,361,429 | ) | (1,043,499 | ) | (48,018,245 | ) | ||||||||
|
|
|
|
|
|
|
| |||||||||
Net Increase (Decrease) | 247,934 | 6,937,425 | 127,165 | 5,099,556 | ||||||||||||
|
|
|
|
|
|
|
| |||||||||
Class F | ||||||||||||||||
Shares Sold | 2,208,483 | $ | 75,649,434 | 1,570,142 | $ | 62,543,993 | ||||||||||
Shares Issued for Reinvested Dividends | 4,119,442 | 127,618,948 | 2,834,969 | 107,657,480 | ||||||||||||
Shares Redeemed | (8,650,541 | ) | (303,183,820 | ) | (7,542,627 | ) | (297,884,938 | ) | ||||||||
|
|
|
|
|
|
|
| |||||||||
Net Increase (Decrease) | (2,322,616 | ) | (99,915,438 | ) | (3,137,516 | ) | (127,683,465 | ) | ||||||||
|
|
|
|
|
|
|
| |||||||||
Total Net Increase (Decrease) | (3,312,371 | ) | $ | (207,163,949 | ) | (11,704,626 | ) | $ | (312,541,285 | ) | ||||||
|
|
|
|
|
|
|
| |||||||||
| Core Equity Fund | ||||||||||||||||
Class A | ||||||||||||||||
Shares Sold | 8,354,312 | $ | 252,717,104 | 6,126,880 | $ | 186,510,085 | ||||||||||
Shares Issued for Reinvested Dividends | 1,170,588 | 31,856,185 | 734,490 | 21,375,055 | ||||||||||||
Shares Redeemed | (5,215,218 | ) | (160,692,456 | ) | (6,920,178 | ) | (209,143,476 | ) | ||||||||
|
|
|
|
|
|
|
| |||||||||
Net Increase (Decrease) | 4,309,682 | 123,880,833 | (58,808 | ) | (1,258,336 | ) | ||||||||||
|
|
|
|
|
|
|
| |||||||||
Class C | ||||||||||||||||
Shares Sold | 3,448,909 | $ | 95,348,410 | 1,710,493 | $ | 47,235,025 | ||||||||||
Shares Issued for Reinvested Dividends | 502,591 | 12,459,225 | 350,318 | 9,320,524 | ||||||||||||
Shares Redeemed | (2,521,277 | ) | (70,389,801 | ) | (3,541,926 | ) | (97,989,819 | ) | ||||||||
|
|
|
|
|
|
|
| |||||||||
Net Increase (Decrease) | 1,430,223 | 37,417,834 | (1,481,115 | ) | (41,434,270 | ) | ||||||||||
|
|
|
|
|
|
|
| |||||||||
Class I | ||||||||||||||||
Shares Sold | 25,472,720 | $ | 784,168,575 | 13,072,789 | $ | 396,887,616 | ||||||||||
Shares Issued for Reinvested Dividends | 1,993,782 | 54,347,120 | 1,162,130 | 33,875,872 | ||||||||||||
Shares Redeemed | (12,866,239 | ) | (391,201,983 | ) | (11,227,452 | ) | (338,823,716 | ) | ||||||||
|
|
|
|
|
|
|
| |||||||||
Net Increase (Decrease) | 14,600,263 | 447,313,712 | 3,007,467 | 91,939,772 | ||||||||||||
|
|
|
|
|
|
|
| |||||||||
Class R3 | ||||||||||||||||
Shares Sold | 211,237 | $ | 6,632,389 | 207,064 | $ | 6,289,388 | ||||||||||
Shares Issued for Reinvested Dividends | 48,300 | 1,333,045 | 40,040 | 1,179,524 | ||||||||||||
Shares Redeemed | (389,729 | ) | (12,245,081 | ) | (598,704 | ) | (18,364,395 | ) | ||||||||
|
|
|
|
|
|
|
| |||||||||
Net Increase (Decrease) | (130,192 | ) | (4,279,647 | ) | (351,600 | ) | (10,895,483 | ) | ||||||||
|
|
|
|
|
|
|
| |||||||||
Class R4 | ||||||||||||||||
Shares Sold | 1,180,826 | $ | 37,776,886 | 622,611 | $ | 19,301,039 | ||||||||||
Shares Issued for Reinvested Dividends | 208,644 | 5,850,946 | 181,518 | 5,432,028 | ||||||||||||
Shares Redeemed | (1,698,103 | ) | (53,981,141 | ) | (2,022,499 | ) | (62,643,003 | ) | ||||||||
|
|
|
|
|
|
|
| |||||||||
Net Increase (Decrease) | (308,633 | ) | (10,353,309 | ) | (1,218,370 | ) | (37,909,936 | ) | ||||||||
|
|
|
|
|
|
|
| |||||||||
| 116 |
|
| Hartford Domestic Equity Funds |
Notes to Financial Statements – (continued)
October 31, 2019
| For the Year Ended October 31, 2019 | For the Year Ended October 31, 2018 | |||||||||||||||
| Shares | Amount | Shares | Amount | |||||||||||||
| Core Equity Fund – (continued) | ||||||||||||||||
Class R5 | ||||||||||||||||
Shares Sold | 1,436,917 | $ | 45,315,419 | 2,247,746 | $ | 68,256,158 | ||||||||||
Shares Issued for Reinvested Dividends | 323,315 | 8,879,357 | 221,366 | 6,500,244 | ||||||||||||
Shares Redeemed | (1,502,323 | ) | (47,538,353 | ) | (2,532,507 | ) | (76,084,368 | ) | ||||||||
|
|
|
|
|
|
|
| |||||||||
Net Increase (Decrease) | 257,909 | 6,656,423 | (63,395 | ) | (1,327,966 | ) | ||||||||||
|
|
|
|
|
|
|
| |||||||||
Class R6 | ||||||||||||||||
Shares Sold | 4,632,883 | $ | 148,100,189 | 1,801,311 | $ | 54,771,612 | ||||||||||
Shares Issued for Reinvested Dividends | 253,490 | 6,992,185 | 145,967 | 4,302,198 | ||||||||||||
Shares Redeemed | (2,017,998 | ) | (61,880,496 | ) | (1,253,498 | ) | (38,957,594 | ) | ||||||||
|
|
|
|
|
|
|
| |||||||||
Net Increase (Decrease) | 2,868,375 | 93,211,878 | 693,780 | 20,116,216 | ||||||||||||
|
|
|
|
|
|
|
| |||||||||
Class Y | ||||||||||||||||
Shares Sold | 5,881,409 | $ | 182,841,788 | 3,788,002 | $ | 115,773,056 | ||||||||||
Shares Issued for Reinvested Dividends | 370,855 | 10,229,172 | 189,251 | 5,580,138 | ||||||||||||
Shares Redeemed | (2,374,093 | ) | (71,937,946 | ) | (2,029,036 | ) | (61,771,039 | ) | ||||||||
|
|
|
|
|
|
|
| |||||||||
Net Increase (Decrease) | 3,878,171 | 121,133,014 | 1,948,217 | 59,582,155 | ||||||||||||
|
|
|
|
|
|
|
| |||||||||
Class F | ||||||||||||||||
Shares Sold | 33,881,513 | $ | 1,030,449,832 | 4,595,725 | $ | 139,606,491 | ||||||||||
Shares Issued for Reinvested Dividends | 1,240,370 | 33,816,032 | 773,606 | 22,560,533 | ||||||||||||
Shares Redeemed | (6,710,781 | ) | (209,251,668 | ) | (4,825,438 | ) | (145,935,601 | ) | ||||||||
|
|
|
|
|
|
|
| |||||||||
Net Increase (Decrease) | 28,411,102 | 855,014,196 | 543,893 | 16,231,423 | ||||||||||||
|
|
|
|
|
|
|
| |||||||||
Total Net Increase (Decrease) | 55,316,900 | $ | 1,669,994,934 | 3,020,069 | $ | 95,043,575 | ||||||||||
|
|
|
|
|
|
|
| |||||||||
| Dividend and Growth Fund | ||||||||||||||||
Class A | ||||||||||||||||
Shares Sold | 10,848,253 | $ | 260,738,740 | 12,487,323 | $ | 326,156,465 | ||||||||||
Shares Issued for Reinvested Dividends | 16,688,013 | 372,818,519 | 15,040,346 | 388,531,155 | ||||||||||||
Shares Redeemed | (20,698,694 | ) | (499,914,217 | ) | (21,964,648 | ) | (577,481,273 | ) | ||||||||
|
|
|
|
|
|
|
| |||||||||
Net Increase (Decrease) | 6,837,572 | 133,643,042 | 5,563,021 | 137,206,347 | ||||||||||||
|
|
|
|
|
|
|
| |||||||||
Class C | ||||||||||||||||
Shares Sold | 1,414,298 | $ | 32,132,341 | 1,045,131 | $ | 26,546,753 | ||||||||||
Shares Issued for Reinvested Dividends | 1,026,732 | 21,933,732 | 1,845,692 | 46,024,991 | ||||||||||||
Shares Redeemed | (3,932,419 | ) | (91,472,582 | ) | (10,581,892 | ) | (266,750,872 | ) | ||||||||
|
|
|
|
|
|
|
| |||||||||
Net Increase (Decrease) | (1,491,389 | ) | (37,406,509 | ) | (7,691,069 | ) | (194,179,128 | ) | ||||||||
|
|
|
|
|
|
|
| |||||||||
Class I | ||||||||||||||||
Shares Sold | 13,889,977 | $ | 332,507,196 | 8,212,320 | $ | 214,582,901 | ||||||||||
Shares Issued for Reinvested Dividends | 3,988,160 | 88,918,028 | 3,244,516 | 83,455,551 | ||||||||||||
Shares Redeemed | (9,237,704 | ) | (220,366,922 | ) | (6,587,672 | ) | (172,489,960 | ) | ||||||||
|
|
|
|
|
|
|
| |||||||||
Net Increase (Decrease) | 8,640,433 | 201,058,302 | 4,869,164 | 125,548,492 | ||||||||||||
|
|
|
|
|
|
|
| |||||||||
Class R3 | ||||||||||||||||
Shares Sold | 328,462 | $ | 8,057,448 | 521,930 | $ | 14,025,931 | ||||||||||
Shares Issued for Reinvested Dividends | 314,415 | 7,102,460 | 307,181 | 8,034,183 | ||||||||||||
Shares Redeemed | (931,518 | ) | (22,971,895 | ) | (806,690 | ) | (21,481,715 | ) | ||||||||
|
|
|
|
|
|
|
| |||||||||
Net Increase (Decrease) | (288,641 | ) | (7,811,987 | ) | 22,421 | 578,399 | ||||||||||
|
|
|
|
|
|
|
| |||||||||
Class R4 | ||||||||||||||||
Shares Sold | 1,040,819 | $ | 25,469,227 | 961,975 | $ | 25,805,384 | ||||||||||
Shares Issued for Reinvested Dividends | 460,939 | 10,513,161 | 431,814 | 11,371,284 | ||||||||||||
Shares Redeemed | (2,335,283 | ) | (58,396,232 | ) | (1,459,422 | ) | (39,314,657 | ) | ||||||||
|
|
|
|
|
|
|
| |||||||||
Net Increase (Decrease) | (833,525 | ) | (22,413,844 | ) | (65,633 | ) | (2,137,989 | ) | ||||||||
|
|
|
|
|
|
|
| |||||||||
Class R5 | ||||||||||||||||
Shares Sold | 3,271,224 | $ | 81,329,519 | 2,346,568 | $ | 62,962,468 | ||||||||||
Shares Issued for Reinvested Dividends | 245,192 | 5,650,369 | 192,818 | 5,102,053 | ||||||||||||
Shares Redeemed | (1,841,585 | ) | (46,178,130 | ) | (1,674,914 | ) | (45,252,539 | ) | ||||||||
|
|
|
|
|
|
|
| |||||||||
Net Increase (Decrease) | 1,674,831 | 40,801,758 | 864,472 | 22,811,982 | ||||||||||||
|
|
|
|
|
|
|
| |||||||||
Class R6 | ||||||||||||||||
Shares Sold | 2,225,050 | $ | 55,216,561 | 3,017,132 | $ | 82,759,681 | ||||||||||
Shares Issued for Reinvested Dividends | 391,648 | 9,024,849 | 80,479 | 2,134,094 | ||||||||||||
Shares Redeemed | (993,067 | ) | (24,710,883 | ) | (639,176 | ) | (16,937,047 | ) | ||||||||
|
|
|
|
|
|
|
| |||||||||
Net Increase (Decrease) | 1,623,631 | 39,530,527 | 2,458,435 | 67,956,728 | ||||||||||||
|
|
|
|
|
|
|
| |||||||||
| 117 |
|
| Hartford Domestic Equity Funds |
Notes to Financial Statements – (continued)
October 31, 2019
| For the Year Ended October 31, 2019 | For the Year Ended October 31, 2018 | |||||||||||||||
| Shares | Amount | Shares | Amount | |||||||||||||
| Dividend and Growth Fund – (continued) | ||||||||||||||||
Class Y | ||||||||||||||||
Shares Sold | 5,457,856 | $ | 135,046,773 | 6,731,729 | $ | 180,558,797 | ||||||||||
Shares Issued for Reinvested Dividends | 2,777,641 | 63,824,725 | 2,507,887 | 66,367,057 | ||||||||||||
Shares Redeemed | (5,583,324 | ) | (138,468,750 | ) | (7,326,785 | ) | (198,852,639 | ) | ||||||||
|
|
|
|
|
|
|
| |||||||||
Net Increase (Decrease) | 2,652,173 | 60,402,748 | 1,912,831 | 48,073,215 | ||||||||||||
|
|
|
|
|
|
|
| |||||||||
Class F | ||||||||||||||||
Shares Sold | 16,093,030 | $ | 386,215,855 | 14,299,165 | $ | 372,356,271 | ||||||||||
Shares Issued for Reinvested Dividends | 12,928,718 | 287,825,698 | 11,425,655 | 293,726,913 | ||||||||||||
Shares Redeemed | (20,334,098 | ) | (490,952,552 | ) | (18,153,837 | ) | (477,146,616 | ) | ||||||||
|
|
|
|
|
|
|
| |||||||||
Net Increase (Decrease) | 8,687,650 | 183,089,001 | 7,570,983 | 188,936,568 | ||||||||||||
|
|
|
|
|
|
|
| |||||||||
Total Net Increase (Decrease) | 27,502,735 | $ | 590,893,038 | 15,504,625 | $ | 394,794,614 | ||||||||||
|
|
|
|
|
|
|
| |||||||||
| Equity Income Fund | ||||||||||||||||
Class A | ||||||||||||||||
Shares Sold | 6,480,746 | $ | 121,285,443 | 7,054,185 | $ | 141,208,042 | ||||||||||
Shares Issued for Reinvested Dividends | 7,839,935 | 137,242,745 | 5,387,109 | 108,873,865 | ||||||||||||
Shares Redeemed | (13,808,960 | ) | (258,119,451 | ) | (16,310,108 | ) | (330,513,136 | ) | ||||||||
|
|
|
|
|
|
|
| |||||||||
Net Increase (Decrease) | 511,721 | 408,737 | (3,868,814 | ) | (80,431,229 | ) | ||||||||||
|
|
|
|
|
|
|
| |||||||||
Class C | ||||||||||||||||
Shares Sold | 1,403,741 | $ | 25,634,319 | 1,496,750 | $ | 30,142,193 | ||||||||||
Shares Issued for Reinvested Dividends | 1,490,092 | 25,756,245 | 1,234,724 | 24,850,317 | ||||||||||||
Shares Redeemed | (5,337,720 | ) | (99,926,506 | ) | (7,456,596 | ) | (148,401,415 | ) | ||||||||
|
|
|
|
|
|
|
| |||||||||
Net Increase (Decrease) | (2,443,887 | ) | (48,535,942 | ) | (4,725,122 | ) | (93,408,905 | ) | ||||||||
|
|
|
|
|
|
|
| |||||||||
Class I | ||||||||||||||||
Shares Sold | 12,788,727 | $ | 238,778,998 | 17,491,443 | $ | 350,784,723 | ||||||||||
Shares Issued for Reinvested Dividends | 5,610,079 | 97,562,348 | 3,652,614 | 73,362,106 | ||||||||||||
Shares Redeemed | (30,170,664 | ) | (559,232,499 | ) | (15,229,423 | ) | (305,556,437 | ) | ||||||||
|
|
|
|
|
|
|
| |||||||||
Net Increase (Decrease) | (11,771,858 | ) | (222,891,153 | ) | 5,914,634 | 118,590,392 | ||||||||||
|
|
|
|
|
|
|
| |||||||||
Class R3 | ||||||||||||||||
Shares Sold | 201,583 | $ | 3,801,906 | 296,916 | $ | 5,984,389 | ||||||||||
Shares Issued for Reinvested Dividends | 229,662 | 4,011,859 | 167,506 | 3,391,169 | ||||||||||||
Shares Redeemed | (671,796 | ) | (12,589,934 | ) | (828,311 | ) | (16,803,967 | ) | ||||||||
|
|
|
|
|
|
|
| |||||||||
Net Increase (Decrease) | (240,551 | ) | (4,776,169 | ) | (363,889 | ) | (7,428,409 | ) | ||||||||
|
|
|
|
|
|
|
| |||||||||
Class R4 | ||||||||||||||||
Shares Sold | 517,003 | $ | 9,693,018 | 642,122 | $ | 13,016,169 | ||||||||||
Shares Issued for Reinvested Dividends | 271,292 | 4,754,392 | 205,009 | 4,153,860 | ||||||||||||
Shares Redeemed | (1,721,384 | ) | (32,616,945 | ) | (1,072,897 | ) | (21,756,093 | ) | ||||||||
|
|
|
|
|
|
|
| |||||||||
Net Increase (Decrease) | (933,089 | ) | (18,169,535 | ) | (225,766 | ) | (4,586,064 | ) | ||||||||
|
|
|
|
|
|
|
| |||||||||
Class R5 | ||||||||||||||||
Shares Sold | 1,131,152 | $ | 21,619,237 | 1,070,828 | $ | 21,909,354 | ||||||||||
Shares Issued for Reinvested Dividends | 360,589 | 6,368,591 | 237,336 | 4,829,360 | ||||||||||||
Shares Redeemed | (1,508,603 | ) | (28,818,781 | ) | (1,231,998 | ) | (25,045,790 | ) | ||||||||
|
|
|
|
|
|
|
| |||||||||
Net Increase (Decrease) | (16,862 | ) | (830,953 | ) | 76,166 | 1,692,924 | ||||||||||
|
|
|
|
|
|
|
| |||||||||
Class R6 | ||||||||||||||||
Shares Sold | 1,148,910 | $ | 22,234,541 | 624,797 | $ | 12,755,320 | ||||||||||
Shares Issued for Reinvested Dividends | 193,154 | 3,429,995 | 109,860 | 2,239,099 | ||||||||||||
Shares Redeemed | (544,409 | ) | (10,408,102 | ) | (355,527 | ) | (7,261,890 | ) | ||||||||
|
|
|
|
|
|
|
| |||||||||
Net Increase (Decrease) | 797,655 | 15,256,434 | 379,130 | 7,732,529 | ||||||||||||
|
|
|
|
|
|
|
| |||||||||
Class Y | ||||||||||||||||
Shares Sold | 2,508,088 | $ | 47,678,296 | 3,235,467 | $ | 66,523,295 | ||||||||||
Shares Issued for Reinvested Dividends | 658,477 | 11,609,476 | 473,849 | 9,676,818 | ||||||||||||
Shares Redeemed | (5,123,450 | ) | (95,079,692 | ) | (3,349,092 | ) | (68,094,590 | ) | ||||||||
|
|
|
|
|
|
|
| |||||||||
Net Increase (Decrease) | (1,956,885 | ) | (35,791,920 | ) | 360,224 | 8,105,523 | ||||||||||
|
|
|
|
|
|
|
| |||||||||
Class F | ||||||||||||||||
Shares Sold | 10,316,801 | $ | 193,403,821 | 11,490,117 | $ | 230,763,902 | ||||||||||
Shares Issued for Reinvested Dividends | 4,372,836 | 76,382,908 | 2,529,103 | 50,774,813 | ||||||||||||
Shares Redeemed | (8,455,981 | ) | (159,836,569 | ) | (6,712,436 | ) | (135,242,319 | ) | ||||||||
|
|
|
|
|
|
|
| |||||||||
Net Increase (Decrease) | 6,233,656 | 109,950,160 | 7,306,784 | 146,296,396 | ||||||||||||
|
|
|
|
|
|
|
| |||||||||
Total Net Increase (Decrease) | (9,820,100 | ) | $ | (205,380,341 | ) | 4,853,347 | $ | 96,563,157 | ||||||||
|
|
|
|
|
|
|
| |||||||||
| 118 |
|
| Hartford Domestic Equity Funds |
Notes to Financial Statements – (continued)
October 31, 2019
| For the Year Ended October 31, 2019 | For the Year Ended October 31, 2018 | |||||||||||||||
| Shares | Amount | Shares | Amount | |||||||||||||
| Growth Opportunities Fund | ||||||||||||||||
Class A | ||||||||||||||||
Shares Sold | 5,563,708 | $ | 213,086,115 | 5,430,832 | $ | 258,227,081 | ||||||||||
Shares Issued for Reinvested Dividends | 13,501,045 | 442,159,235 | 3,585,086 | 153,656,799 | ||||||||||||
Shares Redeemed | (9,974,318 | ) | (382,016,437 | ) | (6,592,860 | ) | (310,460,365 | ) | ||||||||
|
|
|
|
|
|
|
| |||||||||
Net Increase (Decrease) | 9,090,435 | 273,228,913 | 2,423,058 | 101,423,515 | ||||||||||||
|
|
|
|
|
|
|
| |||||||||
Class C | ||||||||||||||||
Shares Sold | 3,170,815 | $ | 62,375,652 | 2,202,102 | $ | 67,142,214 | ||||||||||
Shares Issued for Reinvested Dividends | 5,635,659 | 96,538,837 | 1,594,478 | 44,007,584 | ||||||||||||
Shares Redeemed | (6,028,908 | ) | (121,531,114 | ) | (6,076,031 | ) | (184,287,489 | ) | ||||||||
|
|
|
|
|
|
|
| |||||||||
Net Increase (Decrease) | 2,777,566 | 37,383,375 | (2,279,451 | ) | (73,137,691 | ) | ||||||||||
|
|
|
|
|
|
|
| |||||||||
Class I | ||||||||||||||||
Shares Sold | 11,781,273 | $ | 478,068,139 | 8,710,241 | $ | 433,216,495 | ||||||||||
Shares Issued for Reinvested Dividends | 8,365,419 | 290,614,670 | 2,290,426 | 102,404,963 | ||||||||||||
Shares Redeemed | (19,254,836 | ) | (785,597,820 | ) | (8,315,111 | ) | (406,512,937 | ) | ||||||||
|
|
|
|
|
|
|
| |||||||||
Net Increase (Decrease) | 891,856 | (16,915,011 | ) | 2,685,556 | 129,108,521 | |||||||||||
|
|
|
|
|
|
|
| |||||||||
Class R3 | ||||||||||||||||
Shares Sold | 218,666 | $ | 8,369,169 | 234,644 | $ | 11,070,881 | ||||||||||
Shares Issued for Reinvested Dividends | 309,474 | 10,153,854 | 87,601 | 3,772,966 | ||||||||||||
Shares Redeemed | (429,915 | ) | (16,932,192 | ) | (325,309 | ) | (15,295,005 | ) | ||||||||
|
|
|
|
|
|
|
| |||||||||
Net Increase (Decrease) | 98,225 | 1,590,831 | (3,064 | ) | (451,158 | ) | ||||||||||
|
|
|
|
|
|
|
| |||||||||
Class R4 | ||||||||||||||||
Shares Sold | 250,422 | $ | 10,352,870 | 228,630 | $ | 11,414,684 | ||||||||||
Shares Issued for Reinvested Dividends | 446,887 | 15,681,250 | 129,500 | 5,853,389 | ||||||||||||
Shares Redeemed | (746,989 | ) | (31,374,403 | ) | (398,588 | ) | (19,861,217 | ) | ||||||||
|
|
|
|
|
|
|
| |||||||||
Net Increase (Decrease) | (49,680 | ) | (5,340,283 | ) | (40,458 | ) | (2,593,144 | ) | ||||||||
|
|
|
|
|
|
|
| |||||||||
Class R5 | ||||||||||||||||
Shares Sold | 186,925 | $ | 8,171,987 | 135,790 | $ | 7,029,897 | ||||||||||
Shares Issued for Reinvested Dividends | 109,194 | 4,050,013 | 27,599 | 1,298,270 | ||||||||||||
Shares Redeemed | (119,452 | ) | (5,325,984 | ) | (101,488 | ) | (5,319,310 | ) | ||||||||
|
|
|
|
|
|
|
| |||||||||
Net Increase (Decrease) | 176,667 | 6,896,016 | 61,901 | 3,008,857 | ||||||||||||
|
|
|
|
|
|
|
| |||||||||
Class R6 | ||||||||||||||||
Shares Sold | 357,710 | $ | 15,726,095 | 157,464 | $ | 8,754,701 | ||||||||||
Shares Issued for Reinvested Dividends | 64,798 | 2,446,116 | 8,512 | 405,519 | ||||||||||||
Shares Redeemed | (159,208 | ) | (7,327,990 | ) | (19,778 | ) | (1,033,651 | ) | ||||||||
|
|
|
|
|
|
|
| |||||||||
Net Increase (Decrease) | 263,300 | 10,844,221 | 146,198 | 8,126,569 | ||||||||||||
|
|
|
|
|
|
|
| |||||||||
Class Y | ||||||||||||||||
Shares Sold | 1,911,323 | $ | 84,186,840 | 928,873 | $ | 50,217,143 | ||||||||||
Shares Issued for Reinvested Dividends | 650,084 | 24,540,654 | 163,706 | 7,802,221 | ||||||||||||
Shares Redeemed | (1,452,543 | ) | (67,133,531 | ) | (651,865 | ) | (34,204,480 | ) | ||||||||
|
|
|
|
|
|
|
| |||||||||
Net Increase (Decrease) | 1,108,864 | 41,593,963 | 440,714 | 23,814,884 | ||||||||||||
|
|
|
|
|
|
|
| |||||||||
Class F | ||||||||||||||||
Shares Sold | 3,874,932 | $ | 160,316,539 | 2,463,128 | $ | 122,119,125 | ||||||||||
Shares Issued for Reinvested Dividends | 2,537,024 | 88,339,164 | 1,101,002 | 49,269,862 | ||||||||||||
Shares Redeemed | (2,258,227 | ) | (94,166,031 | ) | (8,053,486 | ) | (408,108,047 | ) | ||||||||
|
|
|
|
|
|
|
| |||||||||
Net Increase (Decrease) | 4,153,729 | 154,489,672 | (4,489,356 | ) | (236,719,060 | ) | ||||||||||
|
|
|
|
|
|
|
| |||||||||
Total Net Increase (Decrease) | 18,510,962 | $ | 503,771,697 | (1,054,902 | ) | $ | (47,418,707 | ) | ||||||||
|
|
|
|
|
|
|
| |||||||||
| Healthcare Fund | ||||||||||||||||
Class A | ||||||||||||||||
Shares Sold | 1,270,592 | $ | 42,474,857 | 2,816,061 | $ | 101,549,420 | ||||||||||
Shares Issued for Reinvested Dividends | 1,531,546 | 47,003,147 | 1,019,295 | 34,248,296 | ||||||||||||
Shares Redeemed | (3,947,053 | ) | (131,520,198 | ) | (4,495,546 | ) | (158,895,113 | ) | ||||||||
|
|
|
|
|
|
|
| |||||||||
Net Increase (Decrease) | (1,144,915 | ) | (42,042,194 | ) | (660,190 | ) | (23,097,397 | ) | ||||||||
|
|
|
|
|
|
|
| |||||||||
Class C | ||||||||||||||||
Shares Sold | 386,423 | $ | 10,098,608 | 496,990 | $ | 14,452,310 | ||||||||||
Shares Issued for Reinvested Dividends | 549,060 | 13,440,993 | 515,465 | 14,185,595 | ||||||||||||
Shares Redeemed | (1,751,911 | ) | (46,660,248 | ) | (3,680,023 | ) | (107,962,485 | ) | ||||||||
|
|
|
|
|
|
|
| |||||||||
Net Increase (Decrease) | (816,428 | ) | (23,120,647 | ) | (2,667,568 | ) | (79,324,580 | ) | ||||||||
|
|
|
|
|
|
|
| |||||||||
| 119 |
|
| Hartford Domestic Equity Funds |
Notes to Financial Statements – (continued)
October 31, 2019
| For the Year Ended October 31, 2019 | For the Year Ended October 31, 2018 | |||||||||||||||
| Shares | Amount | Shares | Amount | |||||||||||||
| Healthcare Fund – (continued) | ||||||||||||||||
Class I | ||||||||||||||||
Shares Sold | 1,860,549 | $ | 65,494,008 | 3,388,340 | $ | 126,092,031 | ||||||||||
Shares Issued for Reinvested Dividends | 716,965 | 23,208,155 | 437,685 | 15,410,892 | ||||||||||||
Shares Redeemed | (5,201,462 | ) | (180,879,649 | ) | (2,974,436 | ) | (110,211,280 | ) | ||||||||
|
|
|
|
|
|
|
| |||||||||
Net Increase (Decrease) | (2,623,948 | ) | (92,177,486 | ) | 851,589 | 31,291,643 | ||||||||||
|
|
|
|
|
|
|
| |||||||||
Class R3 | ||||||||||||||||
Shares Sold | 140,316 | $ | 4,727,398 | 179,019 | $ | 6,531,072 | ||||||||||
Shares Issued for Reinvested Dividends | 82,110 | 2,592,207 | 61,276 | 2,120,778 | ||||||||||||
Shares Redeemed | (381,548 | ) | (13,280,244 | ) | (425,831 | ) | (15,473,486 | ) | ||||||||
|
|
|
|
|
|
|
| |||||||||
Net Increase (Decrease) | (159,122 | ) | (5,960,639 | ) | (185,536 | ) | (6,821,636 | ) | ||||||||
|
|
|
|
|
|
|
| |||||||||
Class R4 | ||||||||||||||||
Shares Sold | 153,972 | $ | 5,595,659 | 288,491 | $ | 11,080,389 | ||||||||||
Shares Issued for Reinvested Dividends | 61,171 | 2,038,224 | 41,923 | 1,520,963 | ||||||||||||
Shares Redeemed | (397,220 | ) | (14,387,290 | ) | (416,190 | ) | (15,933,796 | ) | ||||||||
|
|
|
|
|
|
|
| |||||||||
Net Increase (Decrease) | (182,077 | ) | (6,753,407 | ) | (85,776 | ) | (3,332,444 | ) | ||||||||
|
|
|
|
|
|
|
| |||||||||
Class R5 | ||||||||||||||||
Shares Sold | 98,097 | $ | 3,776,425 | 130,251 | $ | 5,340,435 | ||||||||||
Shares Issued for Reinvested Dividends | 12,444 | 435,292 | 6,075 | 229,927 | ||||||||||||
Shares Redeemed | (158,841 | ) | (6,002,309 | ) | (112,959 | ) | (4,488,405 | ) | ||||||||
|
|
|
|
|
|
|
| |||||||||
Net Increase (Decrease) | (48,300 | ) | (1,790,592 | ) | 23,367 | 1,081,957 | ||||||||||
|
|
|
|
|
|
|
| |||||||||
Class R6(2) | ||||||||||||||||
Shares Sold | 33,146 | $ | 1,302,429 | — | $ | — | ||||||||||
Shares Redeemed | (660 | ) | (26,300 | ) | — | — | ||||||||||
|
|
|
|
|
|
|
| |||||||||
Net Increase (Decrease) | 32,486 | 1,276,129 | — | — | ||||||||||||
|
|
|
|
|
|
|
| |||||||||
Class Y | ||||||||||||||||
Shares Sold | 669,883 | $ | 26,123,541 | 431,226 | $ | 17,308,437 | ||||||||||
Shares Issued for Reinvested Dividends | 94,877 | 3,362,455 | 52,897 | 2,024,914 | ||||||||||||
Shares Redeemed | (354,102 | ) | (13,626,705 | ) | (283,402 | ) | (11,401,142 | ) | ||||||||
|
|
|
|
|
|
|
| |||||||||
Net Increase (Decrease) | 410,658 | 15,859,291 | 200,721 | 7,932,209 | ||||||||||||
|
|
|
|
|
|
|
| |||||||||
Class F | ||||||||||||||||
Shares Sold | 72,466 | $ | 2,542,615 | 450,646 | $ | 16,664,894 | ||||||||||
Shares Issued for Reinvested Dividends | 158,658 | 5,145,276 | 86,244 | 3,039,229 | ||||||||||||
Shares Redeemed | (1,561,880 | ) | (51,838,121 | ) | (128,688 | ) | (4,746,404 | ) | ||||||||
|
|
|
|
|
|
|
| |||||||||
Net Increase (Decrease) | (1,330,756 | ) | (44,150,230 | ) | 408,202 | 14,957,719 | ||||||||||
|
|
|
|
|
|
|
| |||||||||
Total Net Increase (Decrease) | (5,862,402 | ) | $ | (198,859,775 | ) | (2,115,191 | ) | $ | (57,312,529 | ) | ||||||
|
|
|
|
|
|
|
| |||||||||
| MidCap Fund | ||||||||||||||||
Class A | ||||||||||||||||
Shares Sold | 10,562,439 | $ | 302,872,439 | 15,229,089 | $ | 479,864,863 | ||||||||||
Shares Issued for Reinvested Dividends | 11,616,898 | 286,472,704 | 3,795,999 | 113,272,618 | ||||||||||||
Shares Redeemed | (15,519,945 | ) | (445,949,253 | ) | (14,462,445 | ) | (460,231,010 | ) | ||||||||
|
|
|
|
|
|
|
| |||||||||
Net Increase (Decrease) | 6,659,392 | 143,395,890 | 4,562,643 | 132,906,471 | ||||||||||||
|
|
|
|
|
|
|
| |||||||||
Class C | ||||||||||||||||
Shares Sold | 3,619,415 | $ | 71,020,807 | 6,174,307 | $ | 145,020,804 | ||||||||||
Shares Issued for Reinvested Dividends | 5,087,766 | 86,695,527 | 1,974,728 | 43,246,546 | ||||||||||||
Shares Redeemed | (11,310,026 | ) | (222,847,023 | ) | (13,281,900 | ) | (303,779,827 | ) | ||||||||
|
|
|
|
|
|
|
| |||||||||
Net Increase (Decrease) | (2,602,845 | ) | (65,130,689 | ) | (5,132,865 | ) | (115,512,477 | ) | ||||||||
|
|
|
|
|
|
|
| |||||||||
Class I | ||||||||||||||||
Shares Sold | 42,632,618 | $ | 1,267,074,961 | 51,031,220 | $ | 1,672,961,497 | ||||||||||
Shares Issued for Reinvested Dividends | 15,195,028 | 387,321,276 | 4,404,777 | 134,962,369 | ||||||||||||
Shares Redeemed | (43,805,361 | ) | (1,290,404,699 | ) | (33,111,717 | ) | (1,073,279,042 | ) | ||||||||
|
|
|
|
|
|
|
| |||||||||
Net Increase (Decrease) | 14,022,285 | 363,991,538 | 22,324,280 | 734,644,824 | ||||||||||||
|
|
|
|
|
|
|
| |||||||||
Class R3 | ||||||||||||||||
Shares Sold | 556,017 | $ | 17,863,858 | 1,019,743 | $ | 35,935,089 | ||||||||||
Shares Issued for Reinvested Dividends | 380,030 | 10,526,822 | 112,130 | 3,722,725 | ||||||||||||
Shares Redeemed | (1,180,346 | ) | (38,151,880 | ) | (743,549 | ) | (26,222,686 | ) | ||||||||
|
|
|
|
|
|
|
| |||||||||
Net Increase (Decrease) | (244,299 | ) | (9,761,200 | ) | 388,324 | 13,435,128 | ||||||||||
|
|
|
|
|
|
|
| |||||||||
| 120 |
|
| Hartford Domestic Equity Funds |
Notes to Financial Statements – (continued)
October 31, 2019
| For the Year Ended October 31, 2019 | For the Year Ended October 31, 2018 | |||||||||||||||
| Shares | Amount | Shares | Amount | |||||||||||||
| MidCap Fund – (continued) | ||||||||||||||||
Class R4 | ||||||||||||||||
Shares Sold | 2,008,473 | $ | 67,464,654 | 3,152,179 | $ | 116,185,148 | ||||||||||
Shares Issued for Reinvested Dividends | 881,164 | 25,483,275 | 291,588 | 10,027,716 | ||||||||||||
Shares Redeemed | (3,755,272 | ) | (128,083,303 | ) | (2,657,782 | ) | (97,308,099 | ) | ||||||||
|
|
|
|
|
|
|
| |||||||||
Net Increase (Decrease) | (865,635 | ) | (35,135,374 | ) | 785,985 | 28,904,765 | ||||||||||
|
|
|
|
|
|
|
| |||||||||
Class R5 | ||||||||||||||||
Shares Sold | 5,884,056 | $ | 201,889,123 | 5,438,327 | $ | 205,456,983 | ||||||||||
Shares Issued for Reinvested Dividends | 1,361,847 | 40,610,288 | 353,078 | 12,442,452 | ||||||||||||
Shares Redeemed | (6,880,878 | ) | (238,241,924 | ) | (2,628,190 | ) | (98,094,631 | ) | ||||||||
|
|
|
|
|
|
|
| |||||||||
Net Increase (Decrease) | 365,025 | 4,257,487 | 3,163,215 | 119,804,804 | ||||||||||||
|
|
|
|
|
|
|
| |||||||||
Class R6 | ||||||||||||||||
Shares Sold | 23,570,871 | $ | 824,805,540 | 19,650,032 | $ | 747,342,388 | ||||||||||
Shares Issued for Reinvested Dividends | 3,466,868 | 104,560,740 | 533,890 | 18,985,122 | ||||||||||||
Shares Redeemed | (8,765,259 | ) | (311,279,864 | ) | (3,937,273 | ) | (149,786,078 | ) | ||||||||
|
|
|
|
|
|
|
| |||||||||
Net Increase (Decrease) | 18,272,480 | 618,086,416 | 16,246,649 | 616,541,432 | ||||||||||||
|
|
|
|
|
|
|
| |||||||||
Class Y | ||||||||||||||||
Shares Sold | 13,498,176 | $ | 461,820,073 | 20,799,108 | $ | 797,758,811 | ||||||||||
Shares Issued for Reinvested Dividends | 4,622,179 | 139,266,264 | 1,504,227 | 53,460,224 | ||||||||||||
Shares Redeemed | (29,761,816 | ) | (1,038,153,416 | ) | (19,868,421 | ) | (736,585,618 | ) | ||||||||
|
|
|
|
|
|
|
| |||||||||
Net Increase (Decrease) | (11,641,461 | ) | (437,067,079 | ) | 2,434,914 | 114,633,417 | ||||||||||
|
|
|
|
|
|
|
| |||||||||
Class F | ||||||||||||||||
Shares Sold | 23,838,251 | $ | 717,246,012 | 21,922,976 | $ | 713,934,685 | ||||||||||
Shares Issued for Reinvested Dividends | 6,900,254 | 176,232,472 | 1,741,235 | 53,403,678 | ||||||||||||
Shares Redeemed | (12,295,039 | ) | (370,932,155 | ) | (10,385,273 | ) | (339,921,754 | ) | ||||||||
|
|
|
|
|
|
|
| |||||||||
Net Increase (Decrease) | 18,443,466 | 522,546,329 | 13,278,938 | 427,416,609 | ||||||||||||
|
|
|
|
|
|
|
| |||||||||
Total Net Increase (Decrease) | 42,408,408 | $ | 1,105,183,318 | 58,052,083 | $ | 2,072,774,973 | ||||||||||
|
|
|
|
|
|
|
| |||||||||
| MidCap Value Fund | ||||||||||||||||
Class A | ||||||||||||||||
Shares Sold | 3,015,194 | $ | 39,850,799 | 3,127,684 | $ | 48,813,047 | ||||||||||
Shares Issued for Reinvested Dividends | 2,634,934 | 31,694,686 | 463,385 | 7,173,200 | ||||||||||||
Shares Redeemed | (3,749,358 | ) | (50,258,979 | ) | (2,646,647 | ) | (41,733,967 | ) | ||||||||
|
|
|
|
|
|
|
| |||||||||
Net Increase (Decrease) | 1,900,770 | 21,286,506 | 944,422 | 14,252,280 | ||||||||||||
|
|
|
|
|
|
|
| |||||||||
Class C | ||||||||||||||||
Shares Sold | 219,028 | $ | 2,302,437 | 222,446 | $ | 2,911,223 | ||||||||||
Shares Issued for Reinvested Dividends | 240,187 | 2,313,001 | 80,495 | 1,032,748 | ||||||||||||
Shares Redeemed | (572,160 | ) | (6,156,895 | ) | (1,534,250 | ) | (19,407,687 | ) | ||||||||
|
|
|
|
|
|
|
| |||||||||
Net Increase (Decrease) | (112,945 | ) | (1,541,457 | ) | (1,231,309 | ) | (15,463,716 | ) | ||||||||
|
|
|
|
|
|
|
| |||||||||
Class I | ||||||||||||||||
Shares Sold | 414,930 | $ | 5,677,380 | 552,664 | $ | 8,792,174 | ||||||||||
Shares Issued for Reinvested Dividends | 300,075 | 3,648,250 | 66,767 | 1,040,897 | ||||||||||||
Shares Redeemed | (939,685 | ) | (12,651,962 | ) | (1,015,843 | ) | (16,140,564 | ) | ||||||||
|
|
|
|
|
|
|
| |||||||||
Net Increase (Decrease) | (224,680 | ) | (3,326,332 | ) | (396,412 | ) | (6,307,493 | ) | ||||||||
|
|
|
|
|
|
|
| |||||||||
Class R3 | ||||||||||||||||
Shares Sold | 77,867 | $ | 1,086,097 | 75,953 | $ | 1,256,452 | ||||||||||
Shares Issued for Reinvested Dividends | 72,689 | 922,418 | 16,486 | 268,227 | ||||||||||||
Shares Redeemed | (250,237 | ) | (3,619,666 | ) | (192,290 | ) | (3,197,956 | ) | ||||||||
|
|
|
|
|
|
|
| |||||||||
Net Increase (Decrease) | (99,681 | ) | (1,611,151 | ) | (99,851 | ) | (1,673,277 | ) | ||||||||
|
|
|
|
|
|
|
| |||||||||
Class R4 | ||||||||||||||||
Shares Sold | 125,020 | $ | 1,801,520 | 124,104 | $ | 2,096,722 | ||||||||||
Shares Issued for Reinvested Dividends | 82,313 | 1,068,388 | 16,176 | 267,868 | ||||||||||||
Shares Redeemed | (194,448 | ) | (2,814,110 | ) | (149,407 | ) | (2,527,098 | ) | ||||||||
|
|
|
|
|
|
|
| |||||||||
Net Increase (Decrease) | 12,885 | 55,798 | (9,127 | ) | (162,508 | ) | ||||||||||
|
|
|
|
|
|
|
| |||||||||
Class R5 | ||||||||||||||||
Shares Sold | 68,987 | $ | 961,987 | 105,272 | $ | 1,798,408 | ||||||||||
Shares Issued for Reinvested Dividends | 36,259 | 477,765 | 11,409 | 191,481 | ||||||||||||
Shares Redeemed | (517,692 | ) | (7,282,905 | ) | (281,733 | ) | (4,803,813 | ) | ||||||||
|
|
|
|
|
|
|
| |||||||||
Net Increase (Decrease) | (412,446 | ) | (5,843,153 | ) | (165,052 | ) | (2,813,924 | ) | ||||||||
|
|
|
|
|
|
|
| |||||||||
| 121 |
|
| Hartford Domestic Equity Funds |
Notes to Financial Statements – (continued)
October 31, 2019
| For the Year Ended October 31, 2019 | For the Year Ended October 31, 2018 | |||||||||||||||
| Shares | Amount | Shares | Amount | |||||||||||||
| MidCap Value Fund – (continued) | ||||||||||||||||
Class Y | ||||||||||||||||
Shares Sold | 291,417 | $ | 4,364,547 | 348,742 | $ | 6,063,658 | ||||||||||
Shares Issued for Reinvested Dividends | 90,660 | 1,198,031 | 41,401 | 697,132 | ||||||||||||
Shares Redeemed | (306,083 | ) | (4,432,547 | ) | (1,348,747 | ) | (22,829,991 | ) | ||||||||
|
|
|
|
|
|
|
| |||||||||
Net Increase (Decrease) | 75,994 | 1,130,031 | (958,604 | ) | (16,069,201 | ) | ||||||||||
|
|
|
|
|
|
|
| |||||||||
Class F | ||||||||||||||||
Shares Sold | 6,169,822 | $ | 84,036,654 | 6,696,887 | $ | 106,408,840 | ||||||||||
Shares Issued for Reinvested Dividends | 2,440,229 | 29,675,324 | 441,070 | 6,902,315 | ||||||||||||
Shares Redeemed | (4,278,093 | ) | (58,547,425 | ) | (5,066,647 | ) | (81,143,838 | ) | ||||||||
|
|
|
|
|
|
|
| |||||||||
Net Increase (Decrease) | 4,331,958 | 55,164,553 | 2,071,310 | 32,167,317 | ||||||||||||
|
|
|
|
|
|
|
| |||||||||
Total Net Increase (Decrease) | 5,471,855 | $ | 65,314,795 | 155,377 | $ | 3,929,478 | ||||||||||
|
|
|
|
|
|
|
| |||||||||
| Quality Value Fund | ||||||||||||||||
Class A | ||||||||||||||||
Shares Sold | 515,463 | $ | 10,074,937 | 505,087 | $ | 10,381,769 | ||||||||||
Shares Issued for Reinvested Dividends | 572,123 | 10,176,420 | 401,915 | 8,210,264 | ||||||||||||
Shares Redeemed | (1,261,687 | ) | (24,792,514 | ) | (1,478,660 | ) | (30,431,153 | ) | ||||||||
|
|
|
|
|
|
|
| |||||||||
Net Increase (Decrease) | (174,101 | ) | (4,541,157 | ) | (571,658 | ) | (11,839,120 | ) | ||||||||
|
|
|
|
|
|
|
| |||||||||
Class C | ||||||||||||||||
Shares Sold | 48,982 | $ | 803,712 | 54,734 | $ | 966,801 | ||||||||||
Shares Issued for Reinvested Dividends | 28,768 | 438,130 | 50,041 | 876,084 | ||||||||||||
Shares Redeemed | (229,704 | ) | (3,910,337 | ) | (723,415 | ) | (12,761,532 | ) | ||||||||
|
|
|
|
|
|
|
| |||||||||
Net Increase (Decrease) | (151,954 | ) | (2,668,495 | ) | (618,640 | ) | (10,918,647 | ) | ||||||||
|
|
|
|
|
|
|
| |||||||||
Class I | ||||||||||||||||
Shares Sold | 118,116 | $ | 2,316,278 | 119,419 | $ | 2,435,718 | ||||||||||
Shares Issued for Reinvested Dividends | 47,997 | 841,546 | 28,248 | 569,900 | ||||||||||||
Shares Redeemed | (208,357 | ) | (4,046,731 | ) | (260,204 | ) | (5,290,718 | ) | ||||||||
|
|
|
|
|
|
|
| |||||||||
Net Increase (Decrease) | (42,244 | ) | (888,907 | ) | (112,537 | ) | (2,285,100 | ) | ||||||||
|
|
|
|
|
|
|
| |||||||||
Class R3 | ||||||||||||||||
Shares Sold | 17,295 | $ | 356,081 | 7,767 | $ | 161,342 | ||||||||||
Shares Issued for Reinvested Dividends | 3,279 | 59,308 | 2,430 | 50,174 | ||||||||||||
Shares Redeemed | (15,768 | ) | (322,706 | ) | (27,123 | ) | (563,901 | ) | ||||||||
|
|
|
|
|
|
|
| |||||||||
Net Increase (Decrease) | 4,806 | 92,683 | (16,926 | ) | (352,385 | ) | ||||||||||
|
|
|
|
|
|
|
| |||||||||
Class R4 | ||||||||||||||||
Shares Sold | 27,215 | $ | 549,127 | 58,437 | $ | 1,239,154 | ||||||||||
Shares Issued for Reinvested Dividends | 19,976 | 364,460 | 14,925 | 312,076 | ||||||||||||
Shares Redeemed | (63,260 | ) | (1,291,227 | ) | (140,160 | ) | (2,976,078 | ) | ||||||||
|
|
|
|
|
|
|
| |||||||||
Net Increase (Decrease) | (16,069 | ) | (377,640 | ) | (66,798 | ) | (1,424,848 | ) | ||||||||
|
|
|
|
|
|
|
| |||||||||
Class R5 | ||||||||||||||||
Shares Sold | 1,251 | $ | 24,050 | 24,598 | $ | 514,350 | ||||||||||
Shares Issued for Reinvested Dividends | 1,768 | 32,495 | 1,109 | 23,373 | ||||||||||||
Shares Redeemed | (16,898 | ) | (357,155 | ) | (24,077 | ) | (525,126 | ) | ||||||||
|
|
|
|
|
|
|
| |||||||||
Net Increase (Decrease) | (13,879 | ) | (300,610 | ) | 1,630 | 12,597 | ||||||||||
|
|
|
|
|
|
|
| |||||||||
Class R6(1) | ||||||||||||||||
Shares Sold | 1,060 | $ | 21,715 | 476 | $ | 10,000 | ||||||||||
Shares Issued for Reinvested Dividends | 35 | 650 | — | — | ||||||||||||
Shares Redeemed | (6 | ) | (133 | ) | — | — | ||||||||||
|
|
|
|
|
|
|
| |||||||||
Net Increase (Decrease) | 1,089 | 22,232 | 476 | 10,000 | ||||||||||||
|
|
|
|
|
|
|
| |||||||||
Class Y | ||||||||||||||||
Shares Sold | 27,388 | $ | 566,227 | 30,977 | $ | 668,736 | ||||||||||
Shares Issued for Reinvested Dividends | 2,143 | 39,465 | 2,536 | 53,600 | ||||||||||||
Shares Redeemed | (30,147 | ) | (614,974 | ) | (54,129 | ) | (1,132,320 | ) | ||||||||
|
|
|
|
|
|
|
| |||||||||
Net Increase (Decrease) | (616 | ) | (9,282 | ) | (20,616 | ) | (409,984 | ) | ||||||||
|
|
|
|
|
|
|
| |||||||||
Class F | ||||||||||||||||
Shares Sold | 106,180 | $ | 2,050,010 | 4,026,210 | $ | 82,806,066 | ||||||||||
Shares Issued for Reinvested Dividends | 350,111 | 6,128,466 | 113,052 | 2,280,455 | ||||||||||||
Shares Redeemed | (4,395,222 | ) | (84,991,695 | ) | (264,077 | ) | (5,415,483 | ) | ||||||||
|
|
|
|
|
|
|
| |||||||||
Net Increase (Decrease) | (3,938,931 | ) | (76,813,219 | ) | 3,875,185 | 79,671,038 | ||||||||||
|
|
|
|
|
|
|
| |||||||||
Total Net Increase (Decrease) | (4,331,899 | ) | $ | (85,484,395 | ) | 2,470,116 | $ | 52,463,551 | ||||||||
|
|
|
|
|
|
|
| |||||||||
| 122 |
|
| Hartford Domestic Equity Funds |
Notes to Financial Statements – (continued)
October 31, 2019
| For the Year Ended October 31, 2019 | For the Year Ended October 31, 2018 | |||||||||||||||
| Shares | Amount | Shares | Amount | |||||||||||||
| Small Cap Growth Fund | ||||||||||||||||
Class A | ||||||||||||||||
Shares Sold | 143,713 | $ | 6,367,732 | 211,044 | $ | 12,246,181 | ||||||||||
Shares Issued for Reinvested Dividends | 1,137,942 | 42,820,742 | 181,627 | 10,053,030 | ||||||||||||
Shares Redeemed | (691,468 | ) | (30,501,386 | ) | (478,877 | ) | (28,211,959 | ) | ||||||||
|
|
|
|
|
|
|
| |||||||||
Net Increase (Decrease) | 590,187 | 18,687,088 | (86,206 | ) | (5,912,748 | ) | ||||||||||
|
|
|
|
|
|
|
| |||||||||
Class C | ||||||||||||||||
Shares Sold | 33,213 | $ | 900,484 | 18,189 | $ | 821,537 | ||||||||||
Shares Issued for Reinvested Dividends | 236,201 | 6,042,022 | 50,584 | 2,132,627 | ||||||||||||
Shares Redeemed | (315,783 | ) | (9,391,318 | ) | (338,387 | ) | (14,918,173 | ) | ||||||||
|
|
|
|
|
|
|
| |||||||||
Net Increase (Decrease) | (46,369 | ) | (2,448,812 | ) | (269,614 | ) | (11,964,009 | ) | ||||||||
|
|
|
|
|
|
|
| |||||||||
Class I | ||||||||||||||||
Shares Sold | 2,177,043 | $ | 98,419,282 | 1,423,742 | $ | 86,221,035 | ||||||||||
Shares Issued for Reinvested Dividends | 1,099,491 | 43,341,934 | 342,617 | 19,573,702 | ||||||||||||
Shares Redeemed | (3,548,369 | ) | (163,047,531 | ) | (4,791,619 | ) | (295,297,396 | ) | ||||||||
|
|
|
|
|
|
|
| |||||||||
Net Increase (Decrease) | (271,835 | ) | (21,286,315 | ) | (3,025,260 | ) | (189,502,659 | ) | ||||||||
|
|
|
|
|
|
|
| |||||||||
Class R3 | ||||||||||||||||
Shares Sold | 69,866 | $ | 2,907,966 | 59,892 | $ | 3,502,644 | ||||||||||
Shares Issued for Reinvested Dividends | 60,131 | 2,234,481 | 9,890 | 543,634 | ||||||||||||
Shares Redeemed | (148,734 | ) | (6,537,096 | ) | (81,883 | ) | (4,842,381 | ) | ||||||||
|
|
|
|
|
|
|
| |||||||||
Net Increase (Decrease) | (18,737 | ) | (1,394,649 | ) | (12,101 | ) | (796,103 | ) | ||||||||
|
|
|
|
|
|
|
| |||||||||
Class R4 | ||||||||||||||||
Shares Sold | 285,710 | $ | 12,583,104 | 364,952 | $ | 22,208,659 | ||||||||||
Shares Issued for Reinvested Dividends | 297,846 | 11,687,478 | 47,349 | 2,704,153 | ||||||||||||
Shares Redeemed | (909,172 | ) | (41,585,558 | ) | (493,751 | ) | (30,080,314 | ) | ||||||||
|
|
|
|
|
|
|
| |||||||||
Net Increase (Decrease) | (325,616 | ) | (17,314,976 | ) | (81,450 | ) | (5,167,502 | ) | ||||||||
|
|
|
|
|
|
|
| |||||||||
Class R5 | ||||||||||||||||
Shares Sold | 484,882 | $ | 22,426,482 | 347,713 | $ | 21,980,130 | ||||||||||
Shares Issued for Reinvested Dividends | 397,887 | 16,508,317 | 76,411 | 4,542,635 | ||||||||||||
Shares Redeemed | (844,219 | ) | (41,911,678 | ) | (767,974 | ) | (48,541,480 | ) | ||||||||
|
|
|
|
|
|
|
| |||||||||
Net Increase (Decrease) | 38,550 | (2,976,879 | ) | (343,850 | ) | (22,018,715 | ) | |||||||||
|
|
|
|
|
|
|
| |||||||||
Class R6 | ||||||||||||||||
Shares Sold | 827,350 | $ | 38,567,669 | 686,094 | $ | 43,112,203 | ||||||||||
Shares Issued for Reinvested Dividends | 205,988 | 8,674,158 | 8,749 | 525,615 | ||||||||||||
Shares Redeemed | (479,346 | ) | (23,694,911 | ) | (130,097 | ) | (8,374,078 | ) | ||||||||
|
|
|
|
|
|
|
| |||||||||
Net Increase (Decrease) | 553,992 | 23,546,916 | 564,746 | 35,263,740 | ||||||||||||
|
|
|
|
|
|
|
| |||||||||
Class Y | ||||||||||||||||
Shares Sold | 3,471,469 | $ | 173,976,901 | 1,232,771 | $ | 79,909,898 | ||||||||||
Shares Issued for Reinvested Dividends | 1,656,136 | 69,789,590 | 270,638 | 16,276,162 | ||||||||||||
Shares Redeemed | (3,955,235 | ) | (186,437,170 | ) | (1,530,091 | ) | (96,766,636 | ) | ||||||||
|
|
|
|
|
|
|
| |||||||||
Net Increase (Decrease) | 1,172,370 | 57,329,321 | (26,682 | ) | (580,576 | ) | ||||||||||
|
|
|
|
|
|
|
| |||||||||
Class F | ||||||||||||||||
Shares Sold | 229,925 | $ | 10,549,148 | 169,138 | $ | 10,226,392 | ||||||||||
Shares Issued for Reinvested Dividends | 221,268 | 8,748,931 | 32,992 | 1,887,827 | ||||||||||||
Shares Redeemed | (324,117 | ) | (15,214,484 | ) | (167,224 | ) | (10,322,892 | ) | ||||||||
|
|
|
|
|
|
|
| |||||||||
Net Increase (Decrease) | 127,076 | 4,083,595 | 34,906 | 1,791,327 | ||||||||||||
|
|
|
|
|
|
|
| |||||||||
Total Net Increase (Decrease) | 1,819,618 | $ | 58,225,289 | (3,245,511 | ) | $ | (198,887,245 | ) | ||||||||
|
|
|
|
|
|
|
| |||||||||
| Small Cap Value Fund | ||||||||||||||||
Class A | ||||||||||||||||
Shares Sold | 535,811 | $ | 5,599,188 | 501,586 | $ | 7,095,178 | ||||||||||
Shares Issued for Reinvested Dividends | 1,345,441 | 12,452,725 | 167,649 | 2,291,007 | ||||||||||||
Shares Redeemed | (1,175,436 | ) | (12,205,028 | ) | (584,728 | ) | (8,306,972 | ) | ||||||||
|
|
|
|
|
|
|
| |||||||||
Net Increase (Decrease) | 705,816 | 5,846,885 | 84,507 | 1,079,213 | ||||||||||||
|
|
|
|
|
|
|
| |||||||||
Class C | ||||||||||||||||
Shares Sold | 27,521 | $ | 250,111 | 65,529 | $ | 865,667 | ||||||||||
Shares Issued for Reinvested Dividends | 201,614 | 1,622,991 | 40,074 | 497,721 | ||||||||||||
Shares Redeemed | (336,158 | ) | (3,016,977 | ) | (442,129 | ) | (5,637,431 | ) | ||||||||
|
|
|
|
|
|
|
| |||||||||
Net Increase (Decrease) | (107,023 | ) | (1,143,875 | ) | (336,526 | ) | (4,274,043 | ) | ||||||||
|
|
|
|
|
|
|
| |||||||||
| 123 |
|
| Hartford Domestic Equity Funds |
Notes to Financial Statements – (continued)
October 31, 2019
| For the Year Ended October 31, 2019 | For the Year Ended October 31, 2018 | |||||||||||||||
| Shares | Amount | Shares | Amount | |||||||||||||
| Small Cap Value Fund – (continued) | ||||||||||||||||
Class I | ||||||||||||||||
Shares Sold | 290,021 | $ | 3,176,128 | 114,901 | $ | 1,655,287 | ||||||||||
Shares Issued for Reinvested Dividends | 101,935 | 945,995 | 10,068 | 137,932 | ||||||||||||
Shares Redeemed | (246,872 | ) | (2,384,735 | ) | (78,404 | ) | (1,122,083 | ) | ||||||||
|
|
|
|
|
|
|
| |||||||||
Net Increase (Decrease) | 145,084 | 1,737,388 | 46,565 | 671,136 | ||||||||||||
|
|
|
|
|
|
|
| |||||||||
Class R3 | ||||||||||||||||
Shares Sold | 12,137 | $ | 130,291 | 21,367 | $ | 312,233 | ||||||||||
Shares Issued for Reinvested Dividends | 12,847 | 123,296 | 1,103 | 15,477 | ||||||||||||
Shares Redeemed | (5,951 | ) | (64,581 | ) | (34,579 | ) | (501,272 | ) | ||||||||
|
|
|
|
|
|
|
| |||||||||
Net Increase (Decrease) | 19,033 | 189,006 | (12,109 | ) | (173,562 | ) | ||||||||||
|
|
|
|
|
|
|
| |||||||||
Class R4 | ||||||||||||||||
Shares Sold | 2,596 | $ | 26,803 | 900 | $ | 13,135 | ||||||||||
Shares Issued for Reinvested Dividends | 493 | 4,797 | 114 | 1,619 | ||||||||||||
Shares Redeemed | (92 | ) | (993 | ) | (5,359 | ) | (80,859 | ) | ||||||||
|
|
|
|
|
|
|
| |||||||||
Net Increase (Decrease) | 2,997 | 30,607 | (4,345 | ) | (66,105 | ) | ||||||||||
|
|
|
|
|
|
|
| |||||||||
Class R5 | ||||||||||||||||
Shares Issued for Reinvested Dividends | 888 | $ | 8,638 | 144 | $ | 2,044 | ||||||||||
Shares Redeemed | (2,386 | ) | (24,304 | ) | (649 | ) | (9,287 | ) | ||||||||
|
|
|
|
|
|
|
| |||||||||
Net Increase (Decrease) | (1,498 | ) | (15,666 | ) | (505 | ) | (7,243 | ) | ||||||||
|
|
|
|
|
|
|
| |||||||||
Class R6(1) | ||||||||||||||||
Shares Sold | 8,510 | $ | 91,476 | 715 | $ | 10,000 | ||||||||||
Shares Issued for Reinvested Dividends | 253 | 2,456 | — | — | ||||||||||||
Shares Redeemed | (11 | ) | (110 | ) | — | — | ||||||||||
|
|
|
|
|
|
|
| |||||||||
Net Increase (Decrease) | 8,752 | 93,822 | 715 | 10,000 | ||||||||||||
|
|
|
|
|
|
|
| |||||||||
Class Y | ||||||||||||||||
Shares Sold | 27,569 | $ | 298,131 | 3,238 | $ | 47,858 | ||||||||||
Shares Issued for Reinvested Dividends | 11,902 | 115,661 | 4,305 | 61,224 | ||||||||||||
Shares Redeemed | (32,472 | ) | (375,274 | ) | (46,582 | ) | (673,505 | ) | ||||||||
|
|
|
|
|
|
|
| |||||||||
Net Increase (Decrease) | 6,999 | 38,518 | (39,039 | ) | (564,423 | ) | ||||||||||
|
|
|
|
|
|
|
| |||||||||
Class F | ||||||||||||||||
Shares Sold | 1,466,457 | $ | 14,533,039 | 58,899 | $ | 834,996 | ||||||||||
Shares Issued for Reinvested Dividends | 1,036,113 | 9,621,393 | 301,115 | 4,128,469 | ||||||||||||
Shares Redeemed | (619,373 | ) | (6,521,061 | ) | (3,698,310 | ) | (52,129,544 | ) | ||||||||
|
|
|
|
|
|
|
| |||||||||
Net Increase (Decrease) | 1,883,197 | 17,633,371 | (3,338,296 | ) | (47,166,079 | ) | ||||||||||
|
|
|
|
|
|
|
| |||||||||
Total Net Increase (Decrease) | 2,663,357 | $ | 24,410,056 | (3,599,033 | ) | $ | (50,491,106 | ) | ||||||||
|
|
|
|
|
|
|
| |||||||||
| Small Company Fund | ||||||||||||||||
Class A | ||||||||||||||||
Shares Sold | 1,819,229 | $ | 35,427,303 | 2,270,419 | $ | 52,377,812 | ||||||||||
Shares Issued for Reinvested Dividends | 3,082,592 | 50,462,033 | — | — | ||||||||||||
Shares Redeemed | (2,373,495 | ) | (46,229,828 | ) | (1,882,550 | ) | (42,324,435 | ) | ||||||||
|
|
|
|
|
|
|
| |||||||||
Net Increase (Decrease) | 2,528,326 | 39,659,508 | 387,869 | 10,053,377 | ||||||||||||
|
|
|
|
|
|
|
| |||||||||
Class C | ||||||||||||||||
Shares Sold | 124,624 | $ | 1,583,364 | 161,175 | $ | 2,756,489 | ||||||||||
Shares Issued for Reinvested Dividends | 252,369 | 2,718,019 | — | — | ||||||||||||
Shares Redeemed | (358,239 | ) | (4,604,087 | ) | (1,216,758 | ) | (20,246,713 | ) | ||||||||
|
|
|
|
|
|
|
| |||||||||
Net Increase (Decrease) | 18,754 | (302,704 | ) | (1,055,583 | ) | (17,490,224 | ) | |||||||||
|
|
|
|
|
|
|
| |||||||||
Class I | ||||||||||||||||
Shares Sold | 217,227 | $ | 4,551,958 | 281,342 | $ | 6,659,139 | ||||||||||
Shares Issued for Reinvested Dividends | 279,521 | 4,855,272 | — | — | ||||||||||||
Shares Redeemed | (478,368 | ) | (9,730,251 | ) | (374,450 | ) | (8,896,291 | ) | ||||||||
|
|
|
|
|
|
|
| |||||||||
Net Increase (Decrease) | 18,380 | (323,021 | ) | (93,108 | ) | (2,237,152 | ) | |||||||||
|
|
|
|
|
|
|
| |||||||||
Class R3 | ||||||||||||||||
Shares Sold | 134,256 | $ | 2,730,277 | 110,367 | $ | 2,749,385 | ||||||||||
Shares Issued for Reinvested Dividends | 146,146 | 2,626,237 | — | — | ||||||||||||
Shares Redeemed | (330,361 | ) | (7,087,474 | ) | (514,678 | ) | (12,245,254 | ) | ||||||||
|
|
|
|
|
|
|
| |||||||||
Net Increase (Decrease) | (49,959 | ) | (1,730,960 | ) | (404,311 | ) | (9,495,869 | ) | ||||||||
|
|
|
|
|
|
|
| |||||||||
| 124 |
|
| Hartford Domestic Equity Funds |
Notes to Financial Statements – (continued)
October 31, 2019
| For the Year Ended October 31, 2019 | For the Year Ended October 31, 2018 | |||||||||||||||
| Shares | Amount | Shares | Amount | |||||||||||||
| Small Company Fund – (continued) | ||||||||||||||||
Class R4 | ||||||||||||||||
Shares Sold | 147,445 | $ | 3,466,416 | 121,401 | $ | 3,118,999 | ||||||||||
Shares Issued for Reinvested Dividends | 125,461 | 2,408,843 | — | — | ||||||||||||
Shares Redeemed | (280,883 | ) | (6,458,571 | ) | (513,859 | ) | (13,147,683 | ) | ||||||||
|
|
|
|
|
|
|
| |||||||||
Net Increase (Decrease) | (7,977 | ) | (583,312 | ) | (392,458 | ) | (10,028,684 | ) | ||||||||
|
|
|
|
|
|
|
| |||||||||
Class R5 | ||||||||||||||||
Shares Sold | 62,555 | $ | 1,589,279 | 47,038 | $ | 1,261,080 | ||||||||||
Shares Issued for Reinvested Dividends | 19,819 | 403,513 | — | — | ||||||||||||
Shares Redeemed | (55,755 | ) | (1,415,258 | ) | (80,902 | ) | (2,111,795 | ) | ||||||||
|
|
|
|
|
|
|
| |||||||||
Net Increase (Decrease) | 26,619 | 577,534 | (33,864 | ) | (850,715 | ) | ||||||||||
|
|
|
|
|
|
|
| |||||||||
Class R6 | ||||||||||||||||
Shares Sold | 2,145 | $ | 54,273 | 3,290 | $ | 101,310 | ||||||||||
Shares Issued for Reinvested Dividends | 1,032 | 21,469 | — | — | ||||||||||||
Shares Redeemed | (553 | ) | (14,301 | ) | (1,132 | ) | (30,923 | ) | ||||||||
|
|
|
|
|
|
|
| |||||||||
Net Increase (Decrease) | 2,624 | 61,441 | 2,158 | 70,387 | ||||||||||||
|
|
|
|
|
|
|
| |||||||||
Class Y | ||||||||||||||||
Shares Sold | 165,468 | $ | 4,153,738 | 239,418 | $ | 6,832,724 | ||||||||||
Shares Issued for Reinvested Dividends | 252,900 | 5,260,320 | — | — | ||||||||||||
Shares Redeemed | (475,656 | ) | (10,480,486 | ) | (271,716 | ) | (7,590,782 | ) | ||||||||
|
|
|
|
|
|
|
| |||||||||
Net Increase (Decrease) | (57,288 | ) | (1,066,428 | ) | (32,298 | ) | (758,058 | ) | ||||||||
|
|
|
|
|
|
|
| |||||||||
Class F | ||||||||||||||||
Shares Sold | 4,045,700 | $ | 86,904,113 | 2,020,773 | $ | 47,724,426 | ||||||||||
Shares Issued for Reinvested Dividends | 1,153,443 | 20,116,041 | — | — | ||||||||||||
Shares Redeemed | (1,258,713 | ) | (26,615,628 | ) | (922,181 | ) | (22,313,407 | ) | ||||||||
|
|
|
|
|
|
|
| |||||||||
Net Increase (Decrease) | 3,940,430 | 80,404,526 | 1,098,592 | 25,411,019 | ||||||||||||
|
|
|
|
|
|
|
| |||||||||
Total Net Increase (Decrease) | 6,419,909 | $ | 116,696,584 | (523,003 | ) | $ | (5,325,919 | ) | ||||||||
|
|
|
|
|
|
|
| |||||||||
| (1) | Inception date was February 28, 2018. |
| (2) | Inception date was February 28, 2019. |
| 13. | Line of Credit: |
Each Fund participates in a committed line of credit pursuant to a credit agreement. Each Fund may borrow under the line of credit for temporary or emergency purposes. The Funds (together with certain other Hartford Funds) may borrow up to $370 million in the aggregate, subject to asset coverage and other limitations specified in the credit agreement. The interest rate on borrowings varies depending on the nature of the loan. The facility also charges a commitment fee, which is allocated to each of the funds participating in the line of credit based on average net assets of the funds. During and as of the year ended October 31, 2019, none of the Funds had borrowings under this facility.
| 14. | Indemnifications: |
Under each Company’s organizational documents, the Company shall indemnify its officers and directors to the full extent required or permitted under Maryland General Corporation Law and federal securities laws. In addition, each Company, on behalf of its respective Funds, may enter into contracts that contain a variety of indemnifications. Each Company’s maximum exposure under these arrangements is unknown. However, as of the date of these financial statements, each Company has not had prior claims or losses pursuant to these contracts and expects the risk of loss to be remote.
| 15. | Recent Accounting Pronouncement: |
The FASB recently issued ASU2017-08 (the “ASU” or “Update”) to amend the amortization period to the earliest call date for purchased callable debt securities held at a premium. The ASU is effective for public entities for fiscal years beginning after December 15, 2018, and will become effective for private entities one year later. Management is currently evaluating the implication, if any, of additional disclosure and its impact on the Funds’ financial statements.
In August 2018, the FASB issued Accounting Standards Update2018-13, Fair Value Measurement (Topic 820): Disclosure Framework – Changes to the Disclosure Requirements for Fair Value Measurement (“ASU2018-13”). The update introduces new fair value disclosure requirements, eliminates some prior fair value disclosure requirements, and modifies certain existing fair value disclosure requirements.
| 125 |
|
| Hartford Domestic Equity Funds |
Notes to Financial Statements – (continued)
October 31, 2019
ASU2018-13 is effective for fiscal years beginning after December 15, 2019 and for interim periods within those fiscal years, however, an entity is permitted to early adopt either the entire standard or only the provisions that eliminate or modify requirements. Management has elected to early adopt the provisions of ASU2018-13 that eliminate disclosure requirements effective with the current reporting period. The impact of each Fund’s early adoption of these provisions was limited to changes in the Fund’s financial statement disclosures regarding fair value, primarily those disclosures related to transfers between Level 1 and Level 2 of the fair value hierarchy and the timing of transfers between levels of the fair value hierarchy. Management is currently evaluating the potential impact of adopting the additional provisions of ASU2018-13.
| 16. | Subsequent Events: |
Management has evaluated all subsequent transactions and events through the date on which these financial statements were issued and has determined that no additional items require adjustment to or disclosure in these financial statements.
| 126 |
|
To the Shareholders of
The Hartford Capital Appreciation Fund, Hartford Core Equity Fund, The Hartford Dividend and Growth Fund, The Hartford Equity Income Fund, The Hartford Growth Opportunities Fund, The Hartford Healthcare Fund, The Hartford MidCap Fund, The Hartford MidCap Value Fund, Hartford Quality Value Fund, The Hartford Small Cap Growth Fund, Hartford Small Cap Value Fund (formerly, Hartford Small Cap Core Fund), and The Hartford Small Company Fund and the Board of Directors of The Hartford Mutual Funds, Inc. and The Hartford Mutual Funds II, Inc.
Opinion on the Financial Statements
We have audited the accompanying statements of assets and liabilities of The Hartford Capital Appreciation Fund, Hartford Core Equity Fund, The Hartford Dividend and Growth Fund, The Hartford Equity Income Fund, The Hartford Healthcare Fund, The Hartford MidCap Fund, The Hartford MidCap Value Fund, Hartford Small Cap Value Fund and The Hartford Small Company Fund (nine of the funds constituting The Hartford Mutual Funds, Inc.), and The Hartford Growth Opportunities Fund, Hartford Quality Value Fund and The Hartford Small Cap Growth Fund (three of the funds constituting The Hartford Mutual Funds II, Inc.) (all funds listed above collectively referred to as the “Funds”) (The Hartford Mutual Funds, Inc. and The Hartford Mutual Funds II, Inc. collectively referred to as the “Companies”), including the schedules of investments, as of October 31, 2019, and the related statements of operations for the year then ended, the statements of changes in net assets for each of the two years in the period then ended, the financial highlights for each of the five years in the period then ended and the related notes (collectively referred to as the “financial statements”). In our opinion, the financial statements present fairly, in all material respects, the financial position of each of the Funds (nine of the funds constituting The Hartford Mutual Funds, Inc. and three of the funds constituting The Hartford Mutual Funds II, Inc.) at October 31, 2019, the results of their operations for the year then ended, the changes in their net assets for each of the two years in the period then ended and their financial highlights for each of the five years in the period then ended, in conformity with U.S. generally accepted accounting principles.
Basis for Opinion
These financial statements are the responsibility of the Companies’ management. Our responsibility is to express an opinion on each of the Funds’ financial statements based on our audits. We are a public accounting firm registered with the Public Company Accounting Oversight Board (United States) (“PCAOB”) and are required to be independent with respect to the Companies in accordance with the U.S. federal securities laws and the applicable rules and regulations of the Securities and Exchange Commission and the PCAOB.
We conducted our audits in accordance with the standards of the PCAOB. Those standards require that we plan and perform the audit to obtain reasonable assurance about whether the financial statements are free of material misstatement, whether due to error or fraud. The Companies are not required to have, nor were we engaged to perform, audits of the Companies’ internal control over financial reporting. As part of our audits we are required to obtain an understanding of internal control over financial reporting but not for the purpose of expressing an opinion on the effectiveness of the Companies’ internal control over financial reporting. Accordingly, we express no such opinion.
Our audits included performing procedures to assess the risks of material misstatement of the financial statements, whether due to error or fraud, and performing procedures that respond to those risks. Such procedures included examining, on a test basis, evidence regarding the amounts and disclosures in the financial statements. Our procedures included confirmation of securities owned as of October 31, 2019, by correspondence with the custodian and others or by other appropriate auditing procedures where replies from others were not received. Our audits also included evaluating the accounting principles used and significant estimates made by management, as well as evaluating the overall presentation of the financial statements. We believe that our audits provide a reasonable basis for our opinion.

We have served as the auditor of one or more Hartford investment companies since 2002.
Philadelphia, Pennsylvania
December 30, 2019
| 127 |
|
| Hartford Domestic Equity Funds |
Directors and Officers of each Company (Unaudited)
Each of The Hartford Mutual Funds, Inc. and The Hartford Mutual Funds II, Inc. (each a “Company”) is governed by a Board of Directors (the “Directors”). The following tables present certain information regarding the Directors and officers of each Company as of October 31, 2019. For more information regarding the Directors and officers, please refer to the Statement of Additional Information, which is available, without charge, upon request by calling1-888-843-7824.
NAME, YEAR OF BIRTH | POSITION | TERM OF | PRINCIPAL OCCUPATION(S) | NUMBER OF PORTFOLIOS IN FUND COMPLEX(3) OVERSEEN BY DIRECTOR | OTHER DIRECTORSHIPS | |||||
| NON-INTERESTED DIRECTORS | ||||||||||
HILARY E. ACKERMANN (1956) | Director | Since 2014 | Ms. Ackermann served as Chief Risk Officer at Goldman Sachs Bank USA from October 2008 to November 2011. Ms. Ackermann has served as a Director of Vistra Energy Corporation, formerly known as Dynegy, Inc. (an independent power company) since October 2012 and as a Director of Credit Suisse Holdings (USA), Inc. since January 2017. | 82 | Ms. Ackermann serves as a Director of Vistra Energy Corporation (October 2012 to present) and as a Director of Credit Suisse Holdings (USA), Inc. from January 2017 to present. | |||||
ROBIN C. BEERY (1967) | Director | Since 2017 | Ms. Beery has served as a consultant to ArrowMark Partners (an alternative asset manager) since March of 2015 and since November 2018 has been employed by ArrowMark Partners as a Senior Advisor. Previously, she was Executive Vice President, Head of Distribution, for Janus Capital Group, and Chief Executive Officer and President of the Janus Mutual Funds (a global asset manager) from September 2009 to August 2014. | 82 | Ms. Beery serves as a Director of UMB Financial Corporation (January 2015 to present). | |||||
LYNN S. BIRDSONG (1946) | Director and Chair of the Board | Director since 2003; Chair of the Board since August 2019 | Mr. Birdsong currently serves as a Director of Aberdeen Global and Aberdeen Global II (investment funds) (since September 2014), Aberdeen Islamic SICAV and Aberdeen Liquidity Fund (investment funds) (since 2016), and Aberdeen Alpha Fund (since December 2017). Mr. Birdsong served as an Independent Director of Nomura Partners Funds, Inc. (formerly, The Japan Fund) (April 2003 to February 2015) and as a Director of the Sovereign High Yield Investment Company (April 2010 to June 2014). From 2003 to March 2005, Mr. Birdsong was an Independent Director of the Atlantic Whitehall Funds. From 1979 to 2002, Mr. Birdsong was a Managing Director of Zurich Scudder Investments, an investment management firm. During his employment with Scudder, Mr. Birdsong was an Interested Director of The Japan Fund. From January 1981 through December 2013, Mr. Birdsong was a partner in Birdsong Company, an advertising specialty firm. | 82 | None | |||||
CHRISTINE R. DETRICK (1958) | Director | Since 2016 | Ms. Detrick has served as a Director of Reinsurance Group of America since January 2014. Previously, she was a director of Forest City Realty Trust (a real estate company) from November 2014 to March 2018, a Director of Forethought Financial Group, Inc. (a financial services company) from January 2012 to January 2014, and a Senior Partner/Advisor at Bain & Company (a management consulting firm) from September 2002 to December 2012. | 82 | Ms. Detrick serves as a Director of Reinsurance Group of America (January 2014 to present). | |||||
DUANE E. HILL (1945) | Director | Since 2001(4) Since 2002(5) | Mr. Hill is a Partner of TSG Ventures L.P., a private equity investment company. Mr. Hill is a former partner of TSG Capital Group, a private equity investment firm that served as sponsor and lead investor in leveraged buyouts of middle market companies. | 82 | None | |||||
| 128 |
|
| Hartford Domestic Equity Funds |
Directors and Officers of each Company (Unaudited) – (continued)
NAME, YEAR OF BIRTH | POSITION | TERM OF | PRINCIPAL OCCUPATION(S) | NUMBER OF PORTFOLIOS IN FUND COMPLEX(3) OVERSEEN BY DIRECTOR | OTHER DIRECTORSHIPS | |||||
PHILLIP O. PETERSON(6) (1944) | Director | Since 2002(4) Since 2000(5) | Mr. Peterson is a mutual fund industry consultant. He was a partner of KPMG LLP (an accounting firm) until July 1999. From February 2007 to February 2018, Mr. Peterson served as a member of the Board of Trustees of the William Blair Funds. From February 2012 to February 2014, Mr. Peterson served as a Trustee of Symetra Variable Mutual Funds. From January 2004 to April 2005, Mr. Peterson served as Independent President of the Strong Mutual Funds. | 82 | None | |||||
LEMMA W. SENBET (1946) | Director | Since 2005 | Dr. Senbet currently serves as the William E. Mayer Chair Professor of Finance, and previously was the Founding Director, Center for Financial Policy, in the Robert H. Smith School of Business at the University of Maryland. He was chair of the Finance Department Robert H. Smith School of Business at the University of Maryland from 1998 to 2006. In June 2013, he began a sabbatical from the University to serve as Executive Director of the African Economic Research Consortium which focuses on economic policy research and training, which he completed in 2018. Previously, he was a chaired professor of finance at the University of Wisconsin-Madison. Also, he was a Director of the Fortis Funds from March 2000 to July 2002. Dr. Senbet served as Director of the American Finance Association and President of the Western Finance Association. In 2006, Dr. Senbet was inducted Fellow of Financial Management Association International for his career-long distinguished scholarship and professional service. | 82 | None | |||||
DAVID SUNG (1953) | Director | Since 2017 | Mr. Sung has served as a Director of Nippon Wealth Bank since April 2015 and CITIC-Prudential Fund Management Company, Inc. since January 2016. Mr. Sung is an Independent Director of seven investment funds, including twoclosed-end registered investment companies, sponsored by Ironwood Capital Management. Previously, he was a Partner at Ernst & Young LLP from October 1995 to July 2014. | 82 | Mr. Sung serves as a Trustee of Ironwood Institutional Multi-Strategy Fund, LLC and Ironwood Multi-Strategy Fund, LLC (October 2015 to present) (2 portfolios). | |||||
| OFFICERS AND INTERESTED DIRECTORS | ||||||||||
JAMES E. DAVEY(7) (1964) | Director, President and Chief Executive Officer | President and Chief Executive Officer since 2010; Director since 2012 | Mr. Davey serves as Executive Vice President of The Hartford Financial Services Group, Inc. Additionally, Mr. Davey serves as Chairman of the Board, Manager, and Senior Managing Director of Hartford Funds Distributors, LLC (“HFD”). He also currently serves as Director, Chairman of the Board, President and Senior Managing Director of Hartford Administrative Services Company (“HASCO”). Mr. Davey also serves as President, Manager, Chairman of the Board, and Senior Managing Director for Hartford Funds Management Company, LLC (“HFMC”), and Director, Chairman, President, and Senior Managing Director for Hartford Funds Management Group, Inc. (“HFMG”). Mr. Davey also serves as Manager, Chairman of the Board, and President of Lattice Strategies LLC (since July 2016). Mr. Davey has served in various positions within The Hartford and its subsidiaries in connection with the operation of the Hartford Funds. Mr. Davey joined The Hartford in 2002. | 82 | None | |||||
| 129 |
|
| Hartford Domestic Equity Funds |
Directors and Officers of each Company (Unaudited) – (continued)
NAME, YEAR OF BIRTH | POSITION | TERM OF | PRINCIPAL OCCUPATION(S) | NUMBER OF PORTFOLIOS IN FUND COMPLEX(3) OVERSEEN BY DIRECTOR | OTHER DIRECTORSHIPS | |||||
ANDREW S. DECKER (1963) | AML Compliance Officer | Since 2015 | Mr. Decker serves as Chief Compliance Officer and AML Compliance Officer of HASCO (since April 2015) and Vice President of HASCO (since April 2018). Mr. Decker serves as AML Officer of HFD (since May 2015). Mr. Decker also serves as Vice President of HFMG (since April 2018). Prior to joining The Hartford, Mr. Decker served as Vice President and AML Officer at Janney Montgomery Scott (a broker dealer) from April 2011 to January 2015. Mr. Decker served as AML Compliance and Sanctions Enforcement Officer at SEI Investments from December 2007 to April 2011. | N/A | N/A | |||||
AMY N. FURLONG (1979) | Vice President and Treasurer | Since 2018 | Ms. Furlong serves as Vice President and Assistant Treasurer of HFMC (since September 2019). Ms. Furlong has served in various positions within The Hartford and its subsidiaries in connection with the operation of the Hartford Funds. Ms. Furlong joined The Hartford in 2004. Prior to joining The Hartford, Ms. Furlong worked at KPMG LLP in audit services. | N/A | N/A | |||||
WALTER F. GARGER (1965) | Vice President and Chief Legal Officer | Since 2016 | Mr. Garger serves as Secretary, Managing Director and General Counsel of HFD, HASCO, HFMC and HFMG (since 2013). Mr. Garger also serves as Secretary and General Counsel of Lattice Strategies LLC (since July 2016). Mr. Garger has served in various positions within The Hartford and its subsidiaries in connection with the operation of the Hartford Funds. Mr. Garger joined The Hartford in 1995. | N/A | N/A | |||||
ALBERT Y. LEE (1979) | Vice President and Assistant Treasurer | Since 2017 | Mr. Lee serves as Head of Systemic Strategies and ETF Operations and Senior Vice President of HFMG (since July 2016). Mr. Lee also serves as Senior Vice President of Lattice Strategies LLC (since June 2017). Previously, Mr. Lee served as Managing Director and Chief Operating Officer, Lattice Strategies LLC (2009-2016); Chief Operating Officer at Avicenna Capital Management (2007-2009); and Chief Financial Officer at Steeple Capital LP (2005-2007). | N/A | N/A | |||||
THEODORE J. LUCAS (1966) | Vice President | Since 2017 | Mr. Lucas serves as Executive Vice President of HFMG (since July 2016) and as Executive Vice President of Lattice Strategies LLC (since June 2017). Previously, Mr. Lucas served as Managing Partner of Lattice Strategies LLC (2003 to 2016). | N/A | N/A | |||||
JOSEPH G. MELCHER (1973) | Vice President and Chief Compliance Officer | Since 2013 | Mr. Melcher serves as Executive Vice President of HFD (since December 2013) and has served as President (from April 2018 to June 2019) and Chief Executive Officer (from April 2018 to June 2019) of HFD. He also serves as Executive Vice President of HFMG and HASCO (since December 2013). Mr. Melcher also serves as Executive Vice President (since December 2013) and Chief Compliance Officer (since December 2012) of HFMC. Mr. Melcher also serves as Executive Vice President and Chief Compliance Officer of Lattice Strategies, LLC (since July 2016). Mr. Melcher has served in various positions within The Hartford and its subsidiaries in connection with the operation of the Hartford Funds since joining The Hartford in 2012. Prior to joining The Hartford, Mr. Melcher worked at Touchstone Investments, a member of the Western & Southern Financial Group, where he held the position of Vice President and Chief Compliance Officer from 2010 through 2012 and Assistant Vice President, Compliance from 2005 to 2010. | N/A | N/A | |||||
| 130 |
|
| Hartford Domestic Equity Funds |
Directors and Officers of each Company (Unaudited) – (continued)
NAME, YEAR OF BIRTH | POSITION | TERM OF | PRINCIPAL OCCUPATION(S) | NUMBER OF PORTFOLIOS IN FUND COMPLEX(3) OVERSEEN BY DIRECTOR | OTHER DIRECTORSHIPS | |||||
VERNON J. MEYER (1964) | Vice President | Since 2006 | Mr. Meyer serves as Managing Director and Chief Investment Officer of HFMC and Managing Director of HFMG (since 2013). Mr. Meyer has served in various positions within The Hartford and its subsidiaries in connection with the operation of the Hartford Funds. Mr. Meyer joined The Hartford in 2004. | N/A | N/A | |||||
ALICE A. PELLEGRINO (1960) | Vice President | Since 2016 | Ms. Pellegrino serves as Vice President of HFMG (since December 2013). Ms. Pellegrino also serves as Vice President and Assistant Secretary of Lattice Strategies LLC (since June 2017). Ms. Pellegrino is a Senior Counsel and has served in various positions within The Hartford and its subsidiaries in connection with the operation of the Hartford Funds. Ms. Pellegrino joined The Hartford in 2007. | N/A | N/A | |||||
THOMAS R. PHILLIPS (1960) | Vice President and Secretary | Since 2017 | Mr. Phillips currently serves as Vice President (since February 2017) and Assistant Secretary (since June 2017) for HFMG. Mr. Phillips is Deputy General Counsel for HFMG. Prior to joining HFMG in 2017, Mr. Phillips was a Director and Chief Legal Officer of Saturna Capital Corporation from 2014–2016. Prior to that, Mr. Phillips was a Partner and Deputy General Counsel of Lord, Abbett & Co. LLC. | N/A | N/A | |||||
| (1) | The address for each officer and Director is c/o Hartford Funds 690 Lee Road, Wayne, PA 19087. |
| (2) | Each Director holds an indefinite term until the earlier of (i) the election and qualification of his or her successor or (ii) when the Director turns 75 years of age. Each officer shall serve until his or her successor is elected and qualifies. |
| (3) | The portfolios of the “Fund Complex” are series of The Hartford Mutual Funds, Inc., The Hartford Mutual Funds II, Inc., Hartford Series Fund, Inc., Hartford HLS Series Fund II, Inc., Hartford Funds Master Fund, Lattice Strategies Trust, Hartford Funds Exchange-Traded Trust, Hartford Funds NextShares Trust, and Hartford Schroders Opportunistic Income Fund. |
| (4) | For The Hartford Mutual Funds, Inc. |
| (5) | For The Hartford Mutual Funds II, Inc. |
| (6) | Effective December 5, 2019, Mr. Peterson is retiring from each Company. |
| (7) | “Interested person,” as defined in the 1940 Act, of each Company because of the person’s affiliation with, or equity ownership of, HFMC, HFD or affiliated companies. |
| 131 |
|
| Hartford Domestic Equity Funds |
HOW TO OBTAIN A COPY OF EACH FUND’S PROXY VOTING POLICIES AND VOTING RECORDS (UNAUDITED)
A description of the policies and procedures that each Fund uses to determine how to vote proxies relating to portfolio securities and information about how each Fund voted proxies relating to portfolio securities during the most recent twelve-month period ended June 30 are available (1) without charge, upon request, by calling888-843-7824 and (2) on the SEC’s website at http://www.sec.gov.
QUARTERLY PORTFOLIO HOLDINGS INFORMATION (UNAUDITED)
Each Fund files its complete schedule of portfolio holdings with the SEC for the first and third quarters of each fiscal year as an exhibit to its reports on Form N-PORT. Each Fund’s Form N-PORT reports are available (1) without charge, upon request, by calling 888-843-7824 and (2) on the SEC’s website at http://www.sec.gov.
| 132 |
|
| Hartford Domestic Equity Funds |
Approval of Investment Management and Investment Sub-Advisory Agreements (Unaudited)
The Hartford Mutual Funds, Inc. and The Hartford Mutual Funds II, Inc.
The Hartford Capital Appreciation Fund
Hartford Core Equity Fund
The Hartford Dividend and Growth Fund
The Hartford Equity Income Fund
The Hartford Growth Opportunities Fund
The Hartford Healthcare Fund
The Hartford MidCap Fund
The Hartford MidCap Value Fund
Hartford Quality Value Fund
The Hartford Small Cap Growth Fund
Hartford Small Cap Value Fund
The Hartford Small Company Fund
(each a “Fund” and collectively, the “Funds”)
Section 15(c) of the Investment Company Act of 1940, as amended (the “1940 Act”), requires that each mutual fund’s board of directors, including a majority of those directors who are not “interested persons” of the mutual fund, as defined in the 1940 Act (the “Independent Directors”), annually review and consider the continuation of the mutual fund’s investment advisory andsub-advisory agreements. At their meeting held on August6-7, 2019, the Boards of Directors (collectively, the “Board”) of The Hartford Mutual Funds, Inc. (“HMF”) and The Hartford Mutual Funds II, Inc. (“HMF II”), including each of the Independent Directors, unanimously voted to approve (i) the continuation of an investment management agreement (the “Management Agreement”) by and between Hartford Funds Management Company, LLC (“HFMC”) and each of HMF, on behalf of each of The Hartford Capital Appreciation Fund, Hartford Core Equity Fund, The Hartford Dividend and Growth Fund, The Hartford Equity Income Fund, The Hartford MidCap Fund, The Hartford MidCap Value Fund, and Hartford Small Cap Value Fund, and HMF II, on behalf of each of The Hartford Growth Opportunities Fund, Hartford Quality Value Fund and The Hartford Small Cap Growth Fund; (ii) the continuation of a separate investment management agreement by and between HFMC and HMF, on behalf of each of The Hartford Healthcare Fund and The Hartford Small Company Fund (the “2013 Investment Management Agreement” and collectively with the Management Agreement, the “Management Agreements”); and (iii) the continuation of investmentsub-advisory agreements (each, a“Sub-Advisory Agreement” and collectively with the Management Agreements, the “Agreements”) between HFMC and each Fund’ssub-adviser, Wellington Management Company LLP (the“Sub-adviser,” and together with HFMC, the “Advisers”), with respect to the Funds.
In the months preceding the August6-7, 2019 meeting, the Board requested and reviewed written responses from the Advisers to questions posed to the Advisers on behalf of the Independent Directors and supporting materials relating to those questions and responses. In addition, the Board considered such additional information as it deemed reasonably necessary to evaluate the Agreements, as applicable, with respect to each Fund, which included information furnished to the Board at its meetings throughout the year, as well as information specifically prepared in connection with the approval of the continuation of the Agreements that was presented at the Board’s meetings held on June 18, 2019 and August6-7, 2019. Information provided to the Board at its meetings throughout the year included, among other things, reports on Fund performance, legal, compliance and risk management matters, sales and marketing activity, shareholder services, and the other services provided to each Fund by the Advisers and their affiliates. The Board also considered the materials andin-person presentations by Fund officers and representatives of HFMC received at the Board’s meetings on June 18, 2019 and August6-7, 2019 concerning the Agreements.
The Independent Directors, advised by independent legal counsel throughout the evaluation process, engaged service providers to assist them with evaluating the Agreements with respect to each Fund, as applicable. Broadridge Financial Solutions, Inc. (“Broadridge”), an independent provider of investment company data, was retained to provide the Board with reports on how each Fund’s contractual management fees, actual management fees, transfer agency and othernon-management fees, overall expense ratios and investment performance compared to those of comparable mutual funds with similar investment objectives. The Independent Directors also engaged an independent financial services consultant (the “Consultant”) to assist them in evaluating each Fund’s management fees, transfer agency and othernon-management fees, overall expense ratios and investment performance. In addition, the Consultant reviewed the profitability methodologies utilized by HFMC in connection with the continuation of the Management Agreements.
In determining whether to continue the Agreements for a Fund, the members of the Board reviewed and evaluated information and factors they believed to be relevant and appropriate through the exercise of their reasonable business judgment. While individual members of the Board may have weighed certain factors differently, the Board’s determination to continue the Agreements was based on a comprehensive consideration of all information provided to the Board throughout the year and specifically with respect to the continuation of the Agreements. The Board was also furnished with an analysis of its fiduciary obligations in connection with its evaluation of the Agreements and, throughout the evaluation process, the Board was assisted by counsel for the Funds. The Independent Directors were also separately assisted by independent legal counsel throughout the evaluation process. A more detailed summary of the important, but not necessarily all, factors the Board considered with respect to its approval of the continuation of the Agreements is provided below.
| 133 |
|
| Hartford Domestic Equity Funds |
Approval of Investment Management and Investment Sub-Advisory Agreements (Unaudited) – (continued)
Nature, Extent and Quality of Services Provided by the Advisers
The Board requested and considered information concerning the nature, extent and quality of the services provided to each Fund by the Advisers. The Board considered, among other things, the terms of the Agreements and the range of services provided by the Advisers. The Board considered the Advisers’ professional personnel who provide services to the Funds, including each Adviser’s ability and experience in attracting and retaining qualified personnel to service the Funds. The Board considered each Adviser’s reputation and overall financial strength, as well as its willingness to consider and implement organizational and operational changes designed to enhance services to the funds managed by HFMC and its affiliates (the “Hartford Funds”). In addition, the Board considered the quality of each Adviser’s communications with the Board and responsiveness to Board inquiries and requests made from time to time with respect to the Funds and other Hartford Funds.
The Board also requested and evaluated information concerning each Adviser’s regulatory and compliance environment. In this regard, the Board requested and reviewed information about each Adviser’s compliance policies and procedures, compliance history, and a report from the Funds’ Chief Compliance Officer about each Adviser’s compliance with applicable laws and regulations, including responses to regulatory developments and any compliance or other issues raised by regulators. The Board also noted the Advisers’ support of the Funds’ compliance control structure, as applicable, and, in particular, the resources devoted by the Advisers in support of the Funds’ obligations pursuant toRule 38a-1 under the 1940 Act and the Funds’ liquidity risk management program, as well as the efforts of the Advisers to combat cybersecurity risks and invest in business continuity planning.
With respect to HFMC, the Board noted that, under the Management Agreements, HFMC is responsible for the management of the Funds, including oversight of fund operations and service providers, and the provision of administrative and investment advisory services in connection with selecting, monitoring and supervising theSub-adviser. In this regard, the Board evaluated information about the nature and extent of responsibilities retained and risks assumed by HFMC that were not delegated to or assumed by theSub-adviser. The Board considered HFMC’s ongoing monitoring of people, process and performance, including its quarterly reviews of each of the Hartford Funds,semi-annual meetings with the leaders of each Fund’s portfolio management team, and oversight of the Hartford Funds’ portfolio managers. The Board recognized that HFMC has demonstrated a record of initiating changes to the portfolio management and/or investment strategies of the Hartford Funds when warranted. The Board considered HFMC’s periodic due diligence reviews of theSub-adviser and ongoing oversight of theSub-adviser’s investment approach and results, process for monitoring best execution of portfolio trades and other trading operations by theSub-adviser, and approach to risk management with respect to the Funds and the service providers to the Funds. The Board considered HFMC’s oversight of the Funds’ securities lending program and noted the income earned by the Funds in connection with their participation in the program. The Board also considered HFMC’sday-to-day oversight of each Fund’s compliance with its investment objective and policies as well as with applicable laws and regulations, noting that regulatory and other developments had over time led to an increase in the scope of HFMC’s services in this regard. Moreover, the Board considered HFMC’s oversight of potential conflicts of interest between the Funds’ investments and those of other funds or accounts managed by the Funds’ portfolio management personnel.
In addition, the Board considered HFMC’s ongoing commitment to review and rationalize the Hartford Funds productline-up and the expenses that HFMC had incurred, as well as the risks HFMC had assumed, in connection with the launch of new funds and changes to existing Hartford Funds in recent years. The Board considered that HFMC is responsible for providing the Funds’ officers.
With respect to theSub-adviser, which provides certainday-to-day portfolio management services for the Funds, subject to oversight by HFMC, the Board considered, among other things, theSub-adviser’s investment personnel, its investment philosophy and process, its investment research capabilities and resources, its performance record, its trade execution capabilities and its experience. The Board considered the quality and experience of each Fund’s portfolio manager(s), the number of accounts managed by the portfolio manager(s), and theSub-adviser’s method for compensating the portfolio manager(s). The Board also considered theSub-adviser’s succession planning to ensure continuity of portfolio management services provided to the Funds.
The Board considered the benefits to shareholders of being part of the Hartford Funds family of funds, including, with respect to certain share classes, the right to exchange investments between the same class of shares without a sales charge, the ability to reinvest Fund dividends into other Hartford Funds, and the ability to combine holdings in a Fund with holdings in other Hartford Funds to obtain a reduced sales charge. The Board considered HFMC’s efforts to provide investors in the Hartford Funds with a broad range of investment styles and asset classes and the assumption of entrepreneurial and other risks by HFMC in sponsoring new funds to expand these opportunities for shareholders.
Based on these considerations, the Board concluded that it was satisfied with the nature, extent and quality of the services provided to each Fund by HFMC and theSub-adviser.
Performance of each Fund and the Advisers
The Board considered the investment performance of each Fund. In this regard, the Board reviewed the performance of each Fund over different time periods presented in the materials and evaluated HFMC’s analysis of the Fund’s performance for these time periods. The Board considered information and materials provided to the Board by the Advisers concerning Fund performance, as well as information from Broadridge comparing the investment performance of each Fund to an appropriate universe of peer funds. For details regarding each Fund’s performance, see theFund-by-Fund synopsis below.
| 134 |
|
| Hartford Domestic Equity Funds |
Approval of Investment Management and Investment Sub-Advisory Agreements (Unaudited) – (continued)
The Board considered the detailed investment analytics reports provided by HFMC’s Investment Advisory Group throughout the year, including in connection with the continuation of the approval of the Agreements. These reports included, among other things, information on each Fund’s gross returns and net returns, the Fund’s investment performance relative to an appropriate benchmark and peer group (if available), various statistics concerning the Fund’s portfolio, a narrative summary of various factors affecting Fund performance and commentary on the effect of current and recent market conditions. The Board also noted that, for The Hartford Capital Appreciation Fund, the Fund utilizes a multiple portfolio manager structure and considered the performance attributions of the underlying managers. The Board considered the Advisers’ work with the Investment Committee, which assists the Board in evaluating the performance of each Fund at periodic meetings throughout the year and specifically with respect to the approval of the continuation of the Agreements. The Board also considered the analysis provided by the Consultant relating to each Fund’s performance track record.
In light of all the considerations noted above, the Board concluded that it had continued confidence in HFMC’s and theSub-adviser’s overall capabilities to manage the Funds.
Costs of the Services and Profitability of the Advisers
The Board reviewed information regarding HFMC’s cost to provide investment management and related services to each Fund and HFMC’s profitability, both overall and for each Fund, on apre-tax basis without regard to distribution expenses. The Board also requested and reviewed information about the profitability to HFMC and its affiliates from all services provided to each Fund and all aspects of their relationship with the Fund, including information regarding profitability trends over time. The Board also requested and received information relating to the operations and profitability of theSub-adviser. The Board considered representations from HFMC and theSub-adviser that theSub-adviser’s fees were negotiated at arm’s length on aFund-by-Fund basis and that thesub-advisory fees are paid by HFMC and not the Funds. Accordingly, the Board concluded that the profitability of theSub-adviser is a less relevant factor with respect to the Board’s consideration of theSub-Advisory Agreements.
The Board considered the Consultant’s review of the methodologies and estimates used by HFMC in calculating profitability in connection with the continuation of the Management Agreements, including a description of the methodology used to allocate certain expenses. The Board noted the Consultant’s view that HFMC’s process for calculating and reporting Fund profitability is reasonable and consistent with the process previously reviewed by the Consultant. In this regard, the Board noted that the Consultant had previously performed a full review of this process and reported that such process is sound and consistent with common industry practice.
Based on these considerations, the Board concluded that the profits realized by the Advisers and their affiliates from their relationships with the Funds were not excessive.
Comparison of Fees and Services Provided by the Advisers
The Board considered the comparative information that had been provided at meetings on June 18, 2019 and August6-7, 2019 with respect to the services rendered to and the management fees to be paid by each Fund to HFMC and the total expense ratios of the Fund. The Board also considered comparative information with respect to thesub-advisory fees to be paid by HFMC to theSub-adviser with respect to each Fund. In this regard, the Board requested and reviewed information from HFMC and theSub-adviser relating to the management andsub-advisory fees, including thesub-advisory fee schedule for each Fund and the amount of the management fee retained by HFMC, and total operating expenses for each Fund. The Board also reviewed information from Broadridge comparing each Fund’s contractual management fees, actual management fees and total expense ratios relative to an appropriate group of funds selected by Broadridge, in consultation with the Consultant. For details regarding each Fund’s expenses, see theFund-by-Fund synopsis below.
While the Board recognized that comparisons between a Fund and its peer funds may be imprecise given, among other differences, the different service levels and characteristics of mutual funds and the different business models and cost structures of the Advisers, the comparative information provided by Broadridge assisted the Board in evaluating the reasonableness of each Fund’s fees and total operating expenses. In addition, the Board considered the analysis and recommendations of the Consultant relating to each Fund’s fees and total operating expenses.
The Board also considered that HFMC provides nondiscretionary investment advisory services to a model portfolio that pursues an investment objective and an investment strategy similar to those of the Hartford Core Equity Fund. The Board also received information regarding fees charged by theSub-adviser to any other clients with investment strategies similar to those of the Funds, including institutional separate account clients and registered fund clients for which theSub-adviser serves as either primary investment adviser orsub-adviser. The Board considered the explanations provided by theSub-adviser about any differences between theSub-adviser’s services to the Funds and the services it provides to other types of clients. In this regard, the Board reviewed information about the generally broader scope of services and compliance, reporting and other legal burdens and risks of managing registered funds compared with those associated with managing assets ofnon-registered fund clients such as institutional separate accounts.
Based on these considerations, the Board concluded that each Fund’s fees and total operating expenses, in conjunction with the information about quality of services, profitability, economies of scale, and other matters considered, were reasonable in light of the services provided.
| 135 |
|
| Hartford Domestic Equity Funds |
Approval of Investment Management and Investment Sub-Advisory Agreements (Unaudited) – (continued)
Economies of Scale
The Board considered information regarding the extent to which economies of scale may be realized as a Fund grows and whether fee levels reflect these economies of scale for the benefit of shareholders of the Fund. The Board reviewed the breakpoints in the management fee schedule for each Fund, if any, which reduce fee rates as the Fund’s assets grow over time. The Board recognized that a Fund with assets beyond the highest breakpoint level will continue to benefit from economies of scale because additional assets are charged the lowest breakpoint fee resulting in lower overall effective management fee rates. The Board also recognized that a fee schedule that reaches a breakpoint at a lower asset level provides shareholders with the benefit of anticipated or potential economies of scale. The Board considered that expense limitations and fee waivers that reduce a Fund’s expenses at all asset levels can have the same effect as breakpoints in sharing economies of scale with shareholders and provide protection from an increase in expenses if the Fund’s assets decline. In addition, the Board considered that initially setting competitive fee rates, pricing the Funds to scale at inception and making additional investments intended to enhance services available to shareholders are other means of sharing anticipated or potential economies of scale with shareholders. The Board also considered that HFMC has been active in managing expenses, which has resulted in benefits being realized by shareholders as assets within the Hartford Funds have grown over time, including through lower operating expenses. The Board also noted that, for the Hartford Small Cap Value Fund, the Fund’s current low asset levels have kept the Fund from fully realizing the benefits of anticipated or potential economies of scale.
The Board reviewed and evaluated materials from Broadridge and the Consultant showing how management fee schedules of peer funds reflect economies of scale for the benefit of shareholders as a peer fund’s assets hypothetically increase over time. Based on information provided by HFMC, Broadridge, and the Consultant, the Board recognized that there is no uniform methodology for establishing breakpoints or uniform pattern in asset levels that trigger breakpoints or the amounts of breakpoints triggered.
After considering all of the information available to it, the Board concluded that it was satisfied with the extent to which economies of scale would be shared for the benefit of each Fund’s shareholders based on currently available information and the effective management fees and total expense ratios for the Fund at its current and reasonably anticipated asset levels. The Board noted, however, that it would continue to monitor future growth in each Fund’s assets and the appropriateness of additional management fee breakpoints or other methods to share benefits from economies of scale.
Other Benefits
The Board considered other benefits to the Advisers and their affiliates from their relationships with the Funds.
The Board noted that HFMC receives fees for fund accounting and related services from the Funds, and the Board considered information on profits to HFMC for such services. The Board also considered that each Fund pays a transfer agency fee to Hartford Administrative Services Company (“HASCO”), an affiliate of HFMC, equal to the lesser of: (i) the actual costs incurred by HASCO in connection with the provisions of transfer agency services, including payments made tosub-transfer agents, plus a reasonable target profit margin; or (ii) a specified amount as set forth in the Transfer Agency and Service Agreement by and between HMF and HMF II, on behalf of their respective Funds, and HASCO. The Board reviewed information about the profitability to HASCO of the Funds’ transfer agency function. The Board considered information provided by HASCO indicating that the transfer agency fees charged by HASCO to the Funds were fair and reasonable based on publicly available information. The Board also noted that HFMC and HASCO had delegated certain fund accounting services and transfer agency services, respectively, to external service providers.
The Board also considered that Hartford Funds Distributors, LLC (“HFD”), an affiliate of HFMC, serves as principal underwriter of the Funds. The Board noted that, as principal underwriter, HFD receives distribution and service fees from the Funds and receives all or a portion of the sales charges on sales or redemptions of certain classes of shares.
The Board considered the benefits, if any, to theSub-adviser from any use of a Fund’s brokerage commissions to obtain soft dollar research.
Fund-by-Fund Factors
For purposes of theFund-by-Fund discussion below, Fund performance is referred to as “in line with” a Fund’s benchmark where it was 0.5% above or below the benchmark return, and each Fund’s performance relative to its benchmark reflects the net performance of the Fund’s Class I shares as of March 31, 2019.
The Hartford Capital Appreciation Fund
| • | The Board noted that the Fund’s performance was in the 1st quintile of its performance universe for the1-year period and the 2nd quintile for the3- and5-year periods. The Board also noted that the Fund’s performance was in line with its benchmark for the1- and3-year periods and below its benchmark for the5-year period. The Board noted recent changes to the Fund’s portfolio management team. |
| • | The Board noted that the Fund’s contractual management fee was in the 4th quintile of its expense group, while its actual management fee and total expenses (less12b-1 and shareholder service fees) were in the 3rd quintile. The Board noted that Class Y shares of the Fund have a contractual transfer agency expense cap of 0.04% through February 29, 2020. |
| 136 |
|
| Hartford Domestic Equity Funds |
Approval of Investment Management and Investment Sub-Advisory Agreements (Unaudited) – (continued)
Hartford Core Equity Fund
| • | The Board noted that the Fund’s performance was in the 1st quintile of its performance universe for the1- and5-year periods and the 3rd quintile for the3-year period. The Board also noted that the Fund’s performance was above its benchmark for the1- and5-year periods and below its benchmark for the3-year period. |
| • | The Board noted that the Fund’s contractual management fee, its actual management fee and its total expenses (less12b-1 and shareholder service fees) were in the 1st quintile of its expense group. The Board noted that Class Y shares of the Fund have a contractual transfer agency expense cap of 0.06% through February 29, 2020. |
The Hartford Dividend and Growth Fund
| • | The Board noted that the Fund’s performance was in the 2nd quintile of its performance universe for the1- and5-year periods and the 1st quintile for the3-year period. The Board also noted that the Fund’s performance was below its benchmark for the1-,3- and5-year periods. The Board noted upcoming changes to the Fund’s portfolio management team. |
| • | The Board noted that the Fund’s contractual management fee and actual management fee were in the 4th quintile of its expense group, while its total expenses (less12b-1 and shareholder service fees) were in the 3rd quintile. The Board noted that Class Y shares of the Fund have a contractual transfer agency expense cap of 0.05% through February 29, 2020. |
The Hartford Equity Income Fund
| • | The Board noted that the Fund’s performance was in the 3rd quintile of its performance universe for the1-year period and the 2nd quintile for the3- and5-year periods. The Board also noted that the Fund’s performance was above its benchmark for the1- and5-year periods and in line with its benchmark for the3-year period. The Board noted upcoming changes to the Fund’s portfolio management team. |
| • | The Board noted that the Fund’s contractual management fee and actual management fee were in the 4th quintile of its expense group and its total expenses (less12b-1 and shareholder service fees) were in the 3rd quintile. The Board noted that Class Y shares of the Fund have a contractual transfer agency expense cap of 0.05% through February 29, 2020. |
The Hartford Growth Opportunities Fund
| • | The Board noted that the Fund’s performance was in the 1st quintile of its performance universe for the1-,3- and5-year periods. The Board also noted that the Fund’s performance was above its benchmark for the1-,3- and5-year periods. |
| • | The Board noted that the Fund’s contractual management fee and its actual management fee were in the 4th quintile and its total expenses (less12b-1 and shareholder service fees) were in the 3rd quintile. The Board noted that Class Y shares of the Fund have a contractual transfer agency expense cap of 0.05% through February 29, 2020. |
The Hartford Healthcare Fund
| • | The Board noted that the Fund’s performance was in the 5th quintile of its performance universe for the1-year period and the 2nd quintile for the3- and5-year periods. The Board also noted that the Fund’s performance was below its benchmark for the1-,3- and5-year periods. |
| • | The Board noted that the Fund’s contractual management fee, actual management fee and its total expenses (less12b-1 and shareholder service fees) were in the 4th quintile of its expense group. The Board noted that Class Y shares of the Fund have a contractual transfer agency expense cap of 0.06% through February 29, 2020. |
The Hartford MidCap Fund
| • | The Board noted that the Fund’s performance was in the 4th quintile of its performance universe for the1-year period, the 3rd quintile for the3-year period and the 2nd quintile for the5-year period. The Board also noted that the Fund’s performance was above its benchmark for the1-, 3- and5-year periods. |
| • | The Board noted that the Fund’s contractual management fee was in the 4th quintile of its expense group, while its actual management fee was in the 3rd quintile and its total expenses (less12b-1 and shareholder service fees) were in the 2nd quintile. The Board noted that Class I and Y shares of the Fund have contractual transfer agency expense caps of 0.12% and 0.04%, respectively, through February 29, 2020. |
The Hartford MidCap Value Fund
| • | The Board noted that the Fund’s performance was in the 5th quintile of its performance universe for the1-,3- and5-year periods. The Board also noted that the Fund’s performance was below its benchmark for the1-,3- and5-year periods. |
| 137 |
|
| Hartford Domestic Equity Funds |
Approval of Investment Management and Investment Sub-Advisory Agreements (Unaudited) – (continued)
| • | The Board noted that the Fund’s contractual management fee was in the 1st quintile of its expense group, while its actual management fee and total expenses (less12b-1 and shareholder service fees) were in the 3rd quintile. The Board noted that Class Y shares of the Fund have a transfer agency expense cap of 0.05% through February 29, 2020. |
Hartford Quality Value Fund
| • | The Board noted that the Fund’s performance was in the 3rd quintile of its performance universe for the1- and3-year periods and the 5th quintile for the5-year period. The Board also noted that the Fund’s performance was below its benchmark for the1- and5-year periods and in line with its benchmark for the3-year period. |
| • | The Board noted that the Fund’s contractual management fee, actual management fee and total expenses (less12b-1 and shareholder service fees) were in the 1st quintile of its expense group. In considering the Fund’s expenses, the Board noted the shareholder savings expected to result from a reduction to the contractual investment management fee implemented on September 1, 2018. The Board noted that Class A shares of the Fund have a contractual expense cap of 0.96% through February 29, 2020, and that HFMC had reimbursed the Fund for certain expenses. |
The Hartford Small Cap Growth Fund
| • | The Board noted that the Fund’s performance was in the 5th quintile of its performance universe for the1-year period and the 4th quintile for the3- and5-year periods. The Board also noted that the Fund’s performance was in line with its benchmark for the1-,3- and5- year periods. The Board noted that certain changes had recently been made to the Fund’s principal investment strategy and portfolio management team. |
| • | The Board noted that the Fund’s contractual management fee and actual management fee were in the 2nd quintile of its expense group, while its total expenses (less12b-1 and shareholder service fees) were in the 3rd quintile. The Board noted that Class Y shares of the Fund have a contractual transfer agency expense cap of 0.04% through February 29, 2020. |
Hartford Small Cap Value Fund
| • | The Board noted that the Fund’s performance was in the 1st quintile of its performance universe for the1-year period and the 2nd quintile for the3- and5-year periods. The Board also noted that the Fund’s performance was above its benchmark for the1-year period and below its benchmark for the3- and5-year periods. The Board noted recent changes to the Fund’s portfolio management team. The Board noted that certain changes had recently been made to the Fund’s principal investment strategy. |
| • | The Board noted that the Fund’s contractual management fee was in the 1st quintile of its expense group, while its actual management fee and total expenses (less12b-1 and shareholder service fees) were in the 3rd quintile. In considering the Fund’s expenses, the Board noted the shareholder savings expected to result from a reduction to the contractual investment management fee implemented on September 1, 2018. The Board noted that Class A shares of the Fund have a contractual expense cap of 1.30% through February 29, 2020. |
The Hartford Small Company Fund
| • | The Board noted that the Fund’s performance was in the 1st quintile of its performance universe for the1-year period, the 2nd quintile for the3-year period and the 4th quintile for the5-year period. The Board also noted that the Fund’s performance was above its benchmark for the1- and3-year periods and below its benchmark for the5-year period. The Board noted that certain changes had recently been made to the Fund’s principal investment strategy and portfolio management team. |
| • | The Board noted that the Fund’s contractual management fee was in the 3rd quintile of its expense group, while its actual management fee and total expenses (less12b-1 and shareholder service fees) were in the 4th quintile. The Board noted that Class A shares of the Fund have a contractual expense cap of 1.40% through February 29, 2020, and that HFMC had reimbursed the Fund for certain expenses. |
* * * *
Based upon its review of these various factors, among others, the Board concluded that it is in the best interests of each Fund and its shareholders for the Board to approve the continuation of the Agreements for an additional year. In reaching this decision, the Board did not assign relative weights to the factors discussed above or deem any one or group of them to be controlling in and of themselves. In connection with their deliberations, the Independent Directors met separately in executive session on several occasions, with independent legal counsel and the Consultant, to review the relevant materials and consider their responsibilities under relevant laws and regulations.
| 138 |
|
THIS PRIVACY POLICY IS NOT PART OF THIS REPORT
CUSTOMER PRIVACY NOTICE
The Hartford Financial Services Group, Inc. and its Affiliates*
(herein called “we, our, and us”)
This Privacy Policy applies to our United States Operations
We value your trust. We are committed to the responsible:
a) management;
b) use; and
c) protection;
ofPersonal Information.
This notice describes how we collect, disclose, and protectPersonal Information.
We collectPersonal Information to:
a) service yourTransactionswith us; and
b) support our business functions.
We may obtainPersonal Information from:
a)You;
b) yourTransactionswith us; and
c) third parties such as a consumer-reporting agency.
Based on the type of product or serviceYou apply for or get from us,Personal Information such as:
a) your name;
b) your address;
c) your income;
d) your payment; or
e) your credit history;
may be gathered from sources such as applications,Transactions, and consumer reports.
To serveYou and service our business, we may share certainPersonal Information. We will sharePersonal Information, only as allowed by law, with affiliates such as:
a) our insurance companies;
b) our employee agents;
c) our brokerage firms; and
d) our administrators.
As allowed by law, we may sharePersonal Financial Information with our affiliates to:
a) market our products; or
b) market our services;
toYou without providingYou with an option to prevent these disclosures.
We may also sharePersonal Information, only as allowed by law, with unaffiliated third parties including:
a) independent agents;
b) brokerage firms;
c) insurance companies;
d) administrators; and
e) service providers;
who help us serveYou and service our business.
When allowed by law, we may share certainPersonal Financial Information with other unaffiliated third parties who assist us by performing services or functions such as:
a) taking surveys;
b) marketing our products or services; or
c) offering financial products or services under a joint agreement between us and one or more financial institutions.
We, and third parties we partner with, may track some of the pagesYou visit through the use of:
a) cookies;
b) pixel tagging; or
c) other technologies;
and currently do not process or comply with any web browser’s “do not track” signal or other similar mechanism that indicates a request to disable online tracking of individual users who visit our websites or use our services.
For more information, our Online Privacy Policy, which governs information we collect on our website and our affiliate websites, is available at https://www.thehartford.com/online-privacy-policy.
We will not sell or share yourPersonal Financial Information with anyone for purposes unrelated to our business functions without offeringYou the opportunity to:
a)“opt-out;” or
b)“opt-in;”
as required by law.
We only disclosePersonal Health Information with:
a) your authorization; or
b) as otherwise allowed or required by law.
Our employees have access toPersonal Information in the course of doing their jobs, such as:
a) underwriting policies;
b) paying claims;
c) developing new products; or
d) advising customers of our products and services.
We use manual and electronic security procedures to maintain:
a) the confidentiality; and
b) the integrity of;
Personal Information that we have. We use these procedures to guard against unauthorized access.
Some techniques we use to protectPersonal Information include:
a) secured files;
b) user authentication;
c) encryption;
d) firewall technology; and
e) the use of detection software.
We are responsible for and must:
a) identify information to be protected;
b) provide an adequate level of protection for that data; and
c) grant access to protected data only to those people who must use it in the performance of theirjob-related duties.
Employees who violate our privacy policies and procedures may be subject to discipline, which may include termination of their employment with us.
We will continue to follow our Privacy Policy regardingPersonal Information even when a business relationship no longer exists between us.
As used in this Privacy Notice:
Application means your request for our product or service.
Personal Financial Information means financial information such as:
a) credit history;
b) income;
c) financial benefits; or
d) policy or claim information.
Personal Financial Informationmay include Social Security Numbers, Driver’s license numbers, or other government-issued identification numbers, or credit, debit card, or bank account numbers.
Personal Health Information means health information such as:
a) your medical records; or
b) information about your illness, disability or injury.
Personal Information means information that identifiesYou personally and is not otherwise available to the public. It includes:
a)Personal Financial Information; and
b)Personal Health Information.
Transaction means your business dealings with us, such as:
a) yourApplication;
b) your request for us to pay a claim; and
c) your request for us to take an action on your account.
You means an individual who has given usPersonal Information in conjunction with:
a) asking about;
b) applying for; or
c) obtaining;
a financial product or service from us if the product or service is used mainly for personal, family, or household purposes.
If you have any questions or comments about this privacy notice, please feel free to contact us at The Hartford – Law Department, Privacy Law, One Hartford Plaza, Hartford, CT 06155, or at CorporatePrivacyOffice@thehartford.com.
This Customer Privacy Notice is being provided on behalf of The Hartford Financial Services Group, Inc. and its affiliates (including the following as of March 2019), to the extent required by the Gramm-Leach-Bliley Act and implementing regulations.
1stAGChoice, Inc.; Access CoverageCorp, Inc.; Access CoverageCorp Technologies, Inc.; Business Management Group, Inc.; Cervus Claim Solutions, LLC; First State Insurance Company; FTC Resolution Company LLC; Hart Re Group L.L.C.; Hartford Accident and Indemnity Company; Hartford Administrative Services Company; Hartford Casualty General Agency, Inc.; Hartford Casualty Insurance Company; Hartford Fire General Agency, Inc.; Hartford Fire Insurance Company; Hartford Funds Distributors, LLC; Hartford Funds Management Company, LLC; Hartford Funds Management Group, Inc.; Hartford Group Benefits Holding Company; Hartford Holdings, Inc.; Hartford Insurance Company of Illinois; Hartford Insurance Company of the Midwest; Hartford Insurance Company of the Southeast; Hartford Insurance, Ltd.; Hartford Integrated Technologies, Inc.; Hartford Investment Management Company; Hartford Life and Accident Insurance Company; Hartford Life, Ltd.; Hartford Lloyd’s Corporation; Hartford Lloyd’s Insurance Company; Hartford Management, Ltd.; Hartford of Texas General Agency, Inc.; Hartford Residual Market, L.C.C.; Hartford Specialty Insurance Services of Texas, LLC; Hartford STAG Ventures LLC; Hartford Strategic Investments, LLC; Hartford Underwriters General Agency, Inc.; Hartford Underwriters Insurance Company; Heritage Holdings, Inc.; Heritage Reinsurance Company, Ltd.; HIMCO Distribution Services Company; HLA LLC; HL Investment Advisors, LLC; Horizon Management Group, LLC; HRA Brokerage Services, Inc.; Lattice Strategies LLC; Maxum Casualty Insurance Company; Maxum Indemnity Company; Maxum Specialty Services Corporation; MPC Resolution Company LLC; New England Insurance Company; New England Reinsurance Corporation; New Ocean Insurance Co., Ltd.; Nutmeg Insurance Agency, Inc.; Nutmeg Insurance Company; Pacific Insurance Company, Limited; Property and Casualty Insurance Company of Hartford; Renato Acquisition Co.; Sentinel Insurance Company, Ltd; Trumbull Flood Management, L.L.C.; Trumbull Insurance Company; Twin City Fire Insurance Company;Y-Risk, LLC.
Revised March 2019
This report is submitted for the general information of the shareholders of the Funds referenced in this report. It is not authorized for distribution to persons who are not shareholders of one or more Funds referenced in this report unless preceded or accompanied by a current prospectus for the relevant Funds. Nothing herein contained is to be considered an offer of sale or a solicitation of an offer to buy shares of any Fund listed in this report. Such offering is only made by prospectus, which includes details as to the offering price and other material information.
The information cannot be used or relied upon for the purpose of avoiding IRS penalties. These materials are not intended to provide tax, accounting or legal advice. As with all matters of a tax or legal nature, you should consult your own tax or legal counsel for advice.
Investors should carefully consider the investment objectives, risks, charges and expenses of a Fund. This and other important information is contained in a Fund’s prospectus and summary prospectus, which can be obtained by visiting hartfordfunds.com. Please read it carefully before investing.
The Funds are distributed by Hartford Funds Distributors, LLC (HFD), Member FINRA. Hartford Funds Management Company, LLC (HFMC) is the Funds’ investment manager. The Funds referenced herein are sub-advised by Wellington Management Company LLP. HFD and HFMC are not affiliated with the Funds’ sub-adviser.
MFAR-DE19 12/19 214073 Printed in U.S.A.


Dear Fellow Shareholders:
Thank you for investing in Hartford Funds. The following is the Funds’ Annual Report covering the fiscal period from November 1, 2018 to October 31, 2019.
Market Review
During the 12 months ended October 31, 2019, U.S. stocks, as measured by the S&P 500 Index,1 gained 14.33% despite volatility throughout the period.
Political uncertainty has been a core driver of this increased market volatility. Escalating trade tensions between the U.S. and China, continued debate over how
the UK will handle its departure from the European Union, and the September announcement of an impeachment inquiry against President Trump all contributed to choppy market conditions.
However, July 1, 2019 marked a significant milestone: the U.S. entered the longest period of economic expansion on record, according to The National Bureau of Economic Research. Strong consumer spending in the U.S. has continued to buoy the domestic economy, helped by an unemployment rate that stayed at or below 4% throughout the 12 month period ended October 31, 2019.
Nevertheless, signs of a slowing global economy prompted central banks around the world to shift to more accommodating monetary policy. The U.S. Federal Reserve cut interest rates three times in 2019 to bring down the federal funds rate target down to a range of 1.50 – 1.75% as of October 31, 2019, while the European Central Bank, which already had established negative interest rates, further cut its rate to -0.50% as of September 18, 2019.
Politics, both at home and abroad, are likely to continue to play a key role in market movements this year. For this reason, we encourage you to maintain a strong relationship with your financial advisor, who can help guide you through shifting markets confidently. He or she can help you proactively build a portfolio that takes market uncertainty into account, along with your unique investment goals and risk tolerances. Your financial advisor can help you find a fit within our family of funds as you work toward those goals.
Thank you again for investing in Hartford Funds. For the most up-to-date information on our funds, please take advantage of all the resources available at hartfordfunds.com.
James Davey
President
Hartford Funds
| 1 | S&P 500 Index is a market capitalization-weighted price index composed of 500 widely held common stocks. |
The index is unmanaged and not available for direct investment. Past performance is not indicative of future results. |
Hartford Schroders Funds
| 2 | ||||
| 27 | ||||
| 28 | ||||
Financial Statements: | ||||
Schedules of Investments: | ||||
| 30 | ||||
| 33 | ||||
| 38 | ||||
| 47 | ||||
| 49 | ||||
| 53 | ||||
| 57 | ||||
| 59 | ||||
| 62 | ||||
| 63 | ||||
| 67 | ||||
| 69 | ||||
| 72 | ||||
| 79 | ||||
| 106 | ||||
| 107 | ||||
How to Obtain a Copy of each Fund’s Proxy Voting Policies and Voting Records (Unaudited) | 111 | |||
| 111 | ||||
Approval of Investment Management and Investment Sub-Advisory Agreements (Unaudited) | 112 | |||
The views expressed in each Fund’s Manager Discussion contained in the Fund Overview section are views of that Fund’ssub-adviser andsub-sub-adviser, as applicable, and portfolio management team through the end of the period and are subject to change based on market and other conditions. Each Fund’s Manager Discussion is for informational purposes only and does not represent an offer, recommendation or solicitation to buy, hold or sell any security. The specific securities identified and described, if any, do not represent all of the securities purchased or sold and you should not assume that investments in the securities identified and discussed will be profitable. Holdings and characteristics are subject to change. Fund performance reflected in each Fund’s Manager Discussion reflects the returns of such Fund’s Class A shares, before sales charges. Returns for such Fund’s other classes differ only to the extent that the classes do not have the same expenses.
| Hartford Schroders Emerging Markets Equity Fund |
October 31, 2019 (Unaudited)
Inception 3/31/2006 Sub-advised by Schroder Investment Management North America Inc. and itssub-sub-adviser, Schroder Investment Management North America Limited | Investment objective – The Fund seeks capital appreciation. |
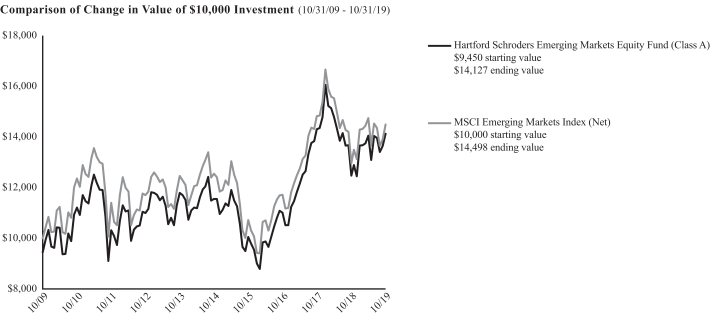
The chart above represents the hypothetical growth of a $10,000 investment in Class A, which includes a sales charge. Growth results in classes other than Class A will vary from what is seen above due to differences in the expenses charged to those share classes.
Average Annual Total Returns
for the Periods Ending 10/31/19
| 1 Year | 5 Years | 10 Years | ||||||||||
Class A1 | 13.27% | 4.10% | 4.10% | |||||||||
Class A2 | 7.04% | 2.93% | 3.52% | |||||||||
Class C1 | 12.50% | 3.75% | 4.06% | |||||||||
Class C2 | 11.50% | 3.75% | 4.06% | |||||||||
Class I1 | 13.54% | 4.33% | 4.35% | |||||||||
Class R31 | 13.01% | 4.09% | 4.23% | |||||||||
Class R41 | 13.78% | 4.26% | 4.31% | |||||||||
Class R51 | 13.61% | 4.37% | 4.36% | |||||||||
Class Y1 | 13.62% | 4.42% | 4.39% | |||||||||
Class F1 | 13.73% | 4.41% | 4.38% | |||||||||
Class SDR1 | 13.71% | 4.49% | 4.42% | |||||||||
MSCI Emerging Markets Index (Net) | 11.86% | 2.93% | 3.78% | |||||||||
| 1 | Without sales charge |
| 2 | With sales charge |
PERFORMANCE DATA QUOTED REPRESENTS PAST PERFORMANCE AND DOES NOT GUARANTEE FUTURE RESULTS. The investment return and principal value of the investment will fluctuate so that investors’ shares, when redeemed, may be worth more or less than their original cost. The chart and table do not reflect the deductions of taxes that a shareholder would pay on Fund distributions or the redemption of Fund shares. Current performance may be lower or higher than the performance data quoted. To obtain performance data current to the most recentmonth-end, please visit our website www.hartfordfunds.com.
The initial investment in Class A shares reflects the maximum sales charge of 5.50% and returns for Class C shares reflect a contingent deferred sales charge of up to 1.00% on shares redeemed within twelve months of purchase.
Total returns presented above were calculated using the Fund’s net asset value available to shareholders for sale or redemption of Fund shares on 10/31/19, which may exclude
investment transactions as of this date. All share class returns assume the reinvestment of all distributions at net asset value and the deduction of all fund expenses.
Effective immediately before the opening of business on 10/24/16, the Schroder Emerging Market Equity Fund (the “Predecessor Fund”) was reorganized into the Fund. The performance information shown for periods prior to 10/24/16 is that of the Predecessor Fund. Prior to 10/24/16, Class A, Class I and Class SDR were called Advisor Shares, Investor Shares and R6 Shares, respectively. Class C, Class R3, Class R4, Class R5, and Class Y shares commenced operations on 10/24/16 and performance prior to this date reflects the performance of the Predecessor Fund’s Investor Shares. Performance for Class SDR shares prior to 12/30/14 (the inception date of the Predecessor Fund’s Class R6 Shares) reflects the performance of the Predecessor Fund’s Investor Shares. Class F shares commenced operations on 2/28/17 and performance prior to that date is that of the Fund’s Class I shares. The returns would be different if the Fund’s fees and expenses were reflected for periods prior to 10/24/16.
You cannot invest directly in an index.
See “Benchmark Glossary” for benchmark descriptions.
Performance information may reflect historical waivers/reimbursements without which performance would have been lower.
Effective on the close of business on 3/15/19, the Fund was closed to new investors, subject to certain exceptions. For more information, please see the Fund’s prospectus.
| 2 |
|
| Hartford Schroders Emerging Markets Equity Fund |
Fund Overview – (continued)
October 31, 2019 (Unaudited)
Operating Expenses*
| Gross | Net | |||||||
Class A | 1.47% | 1.47% | ||||||
Class C | 2.21% | 2.21% | ||||||
Class I | 1.25% | 1.25% | ||||||
Class R3 | 1.82% | 1.82% | ||||||
Class R4 | 1.50% | 1.50% | ||||||
Class R5 | 1.21% | 1.21% | ||||||
Class Y | 1.15% | 1.15% | ||||||
Class F | 1.10% | 1.10% | ||||||
Class SDR | 1.10% | 1.10% | ||||||
| * | Expenses as shown in the Fund’s most recent prospectus. Gross and net expenses are the same. Actual expenses may be higher or lower. Expenses shown include acquired fund fees and expenses. Please see accompanying Financial Highlights for expense ratios for the year ended October 31, 2019. |
Portfolio Managers
Hartford Schroders Emerging Markets Equity Fund’ssub-adviser is Schroder Investment Management North America Inc. and itssub-sub-adviser is Schroder Investment Management North America Limited.
Tom Wilson, CFA
Portfolio Manager
Robert Davy
Portfolio Manager
James Gotto
Portfolio Manager
Waj Hashmi, CFA
Portfolio Manager
Nicholas Field
Portfolio Manager
Manager Discussion
How did the Fund perform during the period?
The Class A shares of the Hartford Schroders Emerging Markets Equity Fund returned 13.27%, before sales charge, for the twelve-month period ended October 31, 2019 compared to the Fund’s benchmark, the MSCI Emerging Markets Index (Net), which returned 11.86% for the same period. For the same period, Class A shares of the Fund outperformed the 12.97% average return of the Lipper Emerging Markets Funds peer group, a group of funds with investment strategies similar to those of the Fund, during the period.
Why did the Fund perform this way?
Global equities recorded a positive return over the twelve-month period as measured by the MSCI World Index (Net). United States (U.S.)-China trade tensions escalated, despite a short truce, and concerns over global growth continued to build. At the end of the period, the U.S. and China indicated that a phase one trade deal was close, but no final agreement has been announced. The U.S. Federal Reserve (Fed) responded to the weaker outlook by ending policy normalization and began to cut interest rates. The European Central Bank (ECB) followed suit, lowering its deposit rate further into negative territory, while also announcing the
restart of its quantitative easing program. Against this backdrop, a number of emerging market central banks began to ease monetary policy. Emerging-market equities registered a positive return over the period. The MSCI Emerging Markets Index decreased in value and underperformed the MSCI World Index during the period.
Within the MSCI Emerging Markets Index (Net), Russia, Egypt, Greece and Indonesia had positive returns. Russia was the best-performing index market, benefiting in part from a rally by Gazprom, which announced a sharp increase in its dividend payout policy. Although economic growth disappointed, later in the period inflation eased and the central bank began to ease monetary policy. Egypt and Greece registered strong returns as both economies continued to recover. In Greece, the outlook was boosted by the election of the center-right New Democracy party, which is expected to accelerate the reform agenda. Indonesia also had positive returns, as concerns over global liquidity tightening eased. Meanwhile, President Widodo wasre-elected in April.
The Taiwan component of the MSCI Emerging Markets Index (Net) performed well, as Technology sector holdings in the Fund exhibited strong earnings after earnings expectations were revised upwards later in the period. Despite slowing economic growth, Indian equities rallied.
| 3 |
|
| Hartford Schroders Emerging Markets Equity Fund |
Fund Overview – (continued)
October 31, 2019 (Unaudited)
Prime Minister Modi’s Bharatiya Janata Party wasre-elected with a stronger-than-expected mandate. Meanwhile, lower crude oil prices were supportive of the public sector and helped to ease inflationary pressure, and the Reserve Bank of India cut interest rates. Later in the period, India’s government announced material cuts to corporate tax rates. Brazil posted a robust return and finished ahead of the MSCI Emerging Markets Index (Net). Equities rallied in November 2018 following Jair Bolsonaro’s presidential election victory in October 2018. Economic growth disappointed, but sentiment was later boosted by the approval of the long-awaited pension reform bill. With inflation controlled, Brazil’s central bank continued to ease monetary policy later in the period.
China outperformed by a more modest margin. Economic growth continued to slow, reaching 6%year-on-year in the third calendar quarter of 2019. In response to slowing activity, the authorities deployed stimulus measures. The U.S. implemented further tariffs to Chinese imports, and added Chinese telecommunications group Huawei to a trade blacklist, citing security concerns. In retaliation, China extended tariffs on U.S. goods to cover $185 billion of imports. It also allowed the renminbi to depreciate beyond the symbolic 7 threshold, leading the U.S. Treasury to label China a currency manipulator. During the period, Morgan Stanley Capital International (MSCI) announced plans to quadruple the weight of ChinaA-shares in its emerging market indexes between May and November 2019.
By contrast, Argentina, which returned to the MSCI Emerging Markets Index in May 2019, fell sharply as surprise primary election results indicated that the opposition Peronist Party would win October 2019 elections. This outcome subsequently materialized, with expectations of significant change to policy. Chilean equities also fell due to civil unrest towards the end of the period, amid wider concerns over inequality and increased uncertainty over the policy outlook. Korea recorded a positive return but underperformed other countries within the MSCI Emerging Markets Index (Net), negatively impacted by slower global trade.
The Fund outperformed the MSCI Emerging Markets Index (Net) over the reporting period. Both country allocation and stock selection added value.
From a country perspective, the Fund’s overweight allocations to Russia and Brazil, both of which outperformed, added value. Lacking allocations to Saudi Arabia, Malaysia and Qatar, which underperformed, was also a positive contributor to relative performance. By contrast, the underweights to India and Taiwan, which outperformed, and the overweight to Korea, which underperformed, detracted from performance relative to the MSCI Emerging Markets Index (Net) during the period.
At a stock level, selection in China and Brazil were top contributors to performance relative to the MSCI Emerging Markets Index (Net) for the period. An underweight to Baidu was positive, as the company’s stock fell on concerns over long-term positioning of the search business in China. Additionally; a position in AIA Group (which was not a constituent of the MSCI Emerging Markets Index (Net)) was also positive, as the company’s stock gained amid continued strong growth in its Hong Kong and China businesses. An overweight position in Lojas Renner was also positive, as the company’s stock gained on expectations that improvement in the Brazilian economy will lead to a recovery in sales, supported by positive execution on incipient online strategy. Raia
Drogasil continued to gain market share, with same store sales growth returning to positive territory in real terms; as a result, the company’s stock contributed positively to returns relative to the MSCI Emerging Markets Index (Net). Stock selection in Taiwan was another positive contributor to relative performance, for example, with an overweight position in TSMC, the leading global semiconductor foundry, as the company’s stock price rallied on improving returns and competitive advantage. Conversely, stock selection in Thailand detracted from relative performance, particularly an overweight in Kasikornbank, as the company’s stock fell amid poor growth and lack of improvement in asset quality due to the lackluster economy.
Derivatives were not used in a significant manner in the Fund during the period and did not have a material impact on performance during the period.
What is the outlook as of the end of the period?
We believe the outlook for 2020 global growth has seen tentative improvement in the past month. U.S. consumption appears to be holding up slightly better than previously anticipated, while global trade looks set to stabilize, as opposed to deteriorate, as previously anticipated. Market expectations for the Fed to ease monetary policy in 2020 have decreased, and there is a risk that less central bank easing will occur. From a U.S. dollar perspective, the outlook is mixed. The U.S. dollar is expensive, but if the growth differential between the U.S. and the rest of the world were to rise, the currency could be somewhat resilient; that said, a global tradepick-up could lead to moderate dollar weakness.
The potential for the signing of a phase one U.S.-China trade agreement is gaining momentum, though the final details could change. While a partial trade settlement now appears likely, there is a risk of ongoing policy uncertainty: the issue of strategic competition between the U.S. and China is highly likely to persist, and related policies have bipartisan support in the U.S.
With regard to China, it has been our expectation for stimulus to remain relatively modest this year, as a function of the existing level of debt and the fragility of the financial system. While we see little change to this outlook, a trade agreement may support stabilization in economic activity, largely as a result of improvement to trade and industrial production.
We continue to be cautious in our outlook, but are sequentially more positive on amonth-on-month basis, given slightly better prospects for global growth and the trade conflict. That said, we believe that markets have moved to price in the impact of some existing tariff removal. We believe that aggregate emerging market valuations remain reasonable, with the MSCI Emerging Markets Index trading on a forward price-earnings ratio of 12x. However we remain concerned about further negative earnings revisions. We remain orientated more to Quality/Growth stocks but are selectively taking profits, while we continue to analyze and add to specific Value opportunities. We are also monitoring geopolitical risk and the policy implications of government change and political protest in certain emerging market countries.
Important Risks
Investing involves risk, including the possible loss of principal. Security prices fluctuate in value depending on general market and economic conditions and the prospects of individual companies.•Foreign
| 4 |
|
| Hartford Schroders Emerging Markets Equity Fund |
Fund Overview – (continued)
October 31, 2019 (Unaudited)
investments may be more volatile and less liquid than U.S. investments and are subject to the risk of currency fluctuations and adverse political and economic developments. These risks may be greater for investments in emerging markets or if the Fund focuses in a particular geographic region or country.•Small- andmid-cap securities can have greater risks and volatility thanlarge-cap securities.•The Fund’s focus on investments in particular sectors may increase its volatility and risk of loss if adverse developments occur.
Composition by Sector(1)
as of October 31, 2019
| Sector | Percentage of Net Assets | |||
Equity Securities | ||||
Communication Services | 9.1 | % | ||
Consumer Discretionary | 16.6 | |||
Consumer Staples | 6.7 | |||
Energy | 11.2 | |||
Financials | 25.9 | |||
Health Care | 1.2 | |||
Industrials | 1.8 | |||
Information Technology | 20.0 | |||
Materials | 4.0 | |||
Real Estate | 0.8 | |||
Utilities | 0.7 | |||
|
| |||
Total | 98.0 | % | ||
|
| |||
Short-Term Investments | 1.8 | |||
Other Assets & Liabilities | 0.2 | |||
|
| |||
Total | 100.0 | % | ||
|
| |||
| (1) | A sector may be comprised of several industries. For Fund compliance purposes, the Fund may not use the same classification system. These sector classifications are used for financial reporting purposes. |
| 5 |
|
| Hartford Schroders Emerging Markets Multi-Sector Bond Fund |
Fund Overview
October 31, 2019 (Unaudited)
Inception 6/25/2013 Sub-advised by Schroder Investment Management North America Inc. | Investment objective – The Fund seeks to provide a return of long-term capital growth and income. |
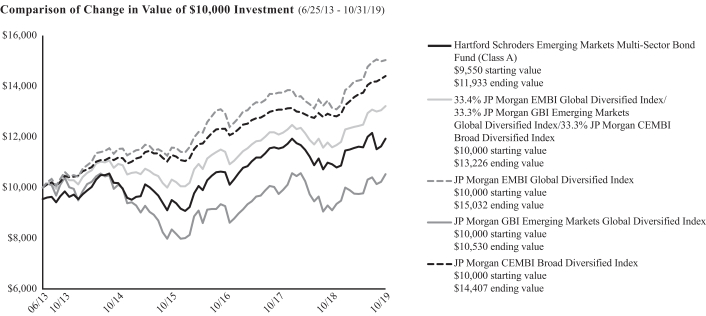
The chart above represents the hypothetical growth of a $10,000 investment in Class A, which includes a sales charge. Growth results in classes other than Class A will vary from what is seen above due to differences in the expenses charged to those share classes.
Average Annual Total Returns
for the Periods Ending 10/31/19
| 1 Year | 5 Years | Since Inception1 | ||||||||||
Class A2 | 9.21% | 3.24% | 3.57% | |||||||||
Class A3 | 4.35% | 2.29% | 2.82% | |||||||||
Class C2 | 8.44% | 2.82% | 3.28% | |||||||||
Class C3 | 7.44% | 2.82% | 3.28% | |||||||||
Class I2 | 9.65% | 3.49% | 3.80% | |||||||||
Class R32 | 9.46% | 3.34% | 3.69% | |||||||||
Class R42 | 9.45% | 3.40% | 3.74% | |||||||||
Class R52 | 9.56% | 3.47% | 3.79% | |||||||||
Class Y2 | 9.61% | 3.50% | 3.82% | |||||||||
Class F2 | 9.66% | 3.51% | 3.82% | |||||||||
Class SDR2 | 9.65% | 3.59% | 3.89% | |||||||||
33.4% JP Morgan EMBI Global Diversified Index/33.3% JP Morgan GBI Emerging Markets Global Diversified Index/33.3% JP Morgan CEMBI Broad Diversified Index4 | 14.10% | 3.88% | 4.50% | |||||||||
JP Morgan EMBI Global Diversified Index | 14.35% | 5.44% | 6.63% | |||||||||
JP Morgan GBI Emerging Markets Global Diversified Index | 15.59% | 0.82% | 0.82% | |||||||||
JP Morgan CEMBI Broad Diversified Index | 12.20% | 5.20% | 5.92% | |||||||||
| 1 | Inception: 06/25/2013 |
| 2 | Without sales charge |
| 3 | With sales charge |
| 4 | Calculated by Hartford Funds Management Company, LLC |
PERFORMANCE DATA QUOTED REPRESENTS PAST PERFORMANCE AND DOES NOT GUARANTEE FUTURE RESULTS. The investment return and principal value of the investment will fluctuate so that investors’ shares, when redeemed, may be worth more or less than their original cost. The chart and table do not reflect the deductions of taxes that a shareholder would pay on Fund distributions or the redemption of Fund shares. Current performance may be lower or higher than the performance data quoted. To obtain performance data current to the most recentmonth-end, please visit our website www.hartfordfunds.com.
The initial investment in Class A shares reflects the maximum sales charge of 4.50% and returns for Class C shares reflect a contingent deferred sales charge of up to 1.00% on shares redeemed within twelve months of purchase.
Total returns presented above were calculated using the Fund’s net asset value available to shareholders for sale or redemption of Fund shares on 10/31/19, which may exclude investment transactions as of this date. All share class returns assume the reinvestment of all distributions at net asset value and the deduction of all fund expenses.
Effective immediately before the opening of business on 10/24/16, the Schroder Emerging Markets Multi-Sector Bond Fund (the “Predecessor Fund”) was reorganized into the Fund. The performance information shown for periods prior to 10/24/16 is that of the Predecessor Fund. Prior to 10/24/16, Class A, Class I and Class SDR were called Advisor Shares, Investor Shares and R6 Shares, respectively. Class C, Class R3, Class R4, Class R5, and Class Y shares commenced operations on 10/24/16 and performance prior to this date reflects the performance of the Predecessor Fund’s Investor Shares. Performance for Class SDR shares prior to 12/30/14 (the inception date of the Predecessor Fund’s Class R6 Shares) reflects the performance of the Predecessor Fund’s Investor Shares. Class F shares commenced operations on 2/28/17 and performance prior to that date is that of the Fund’s Class I shares. The returns would be different if the Fund’s fees and expenses were reflected for periods prior to 10/24/16.
You cannot invest directly in an index.
See “Benchmark Glossary” for benchmark descriptions.
Performance information may reflect historical or current expense waivers/reimbursements without which performance would have been lower. For information on current expense waivers/reimbursements, please see the prospectus.
| 6 |
|
| Hartford Schroders Emerging Markets Multi-Sector Bond Fund |
Fund Overview – (continued)
October 31, 2019 (Unaudited)
Operating Expenses*
| Gross | Net | |||||||
Class A | 1.30% | 1.16% | ||||||
Class C | 2.17% | 1.91% | ||||||
Class I | 1.03% | 0.91% | ||||||
Class R3 | 1.67% | 1.46% | ||||||
Class R4 | 1.36% | 1.16% | ||||||
Class R5 | 1.07% | 0.86% | ||||||
Class Y | 0.97% | 0.86% | ||||||
Class F | 0.95% | 0.76% | ||||||
Class SDR | 0.95% | 0.76% | ||||||
| * | Expenses as shown in the Fund’s most recent prospectus. Gross expenses do not reflect contractual expense reimbursement arrangements. Net expenses reflect such arrangements in instances when they reduce gross expenses. These arrangements remain in effect until 2/29/20 unless the Fund’s Board of Directors approves an earlier termination. Actual expenses may be higher or lower. Expenses shown include acquired fund fees and expenses. Please see accompanying Financial Highlights for expense ratios for the year ended October 31, 2019. |
Portfolio Managers
Hartford Schroders Emerging Markets Multi-Sector Bond Fund’ssub-adviser is Schroder Investment Management North America Inc.
Jim Barrineau
Portfolio Manager
Schroder Investment Management North America Inc.
Fernando Grisales, CFA
Portfolio Manager
Schroder Investment Management North America Inc.
Manager Discussion
How did the Fund perform during the period?
The Class A shares of the Hartford Schroders Emerging Markets Multi-Sector Bond Fund returned 9.21%, before sales charge, for the twelve-month period ended October 31, 2019, underperforming the Fund’s blended benchmark, comprised of the JP Morgan EMBI Global Diversified Index (33.4%), the JP Morgan GBI Emerging Markets Global Diversified Index (33.3%), and the JP Morgan CEMBI Broad Diversified Index (33.3%), which returned 14.10% for the same period. The JP Morgan EMBI Global Diversified Index, the JP Morgan GBI Emerging Markets Global Diversified Index, and the JP Morgan CEMBI Broad Diversified Index returned 14.35%, 15.59%, and 12.20%, respectively, during the period. For the same period, Class A shares of the Fund also underperformed the 11.27% average return of the Lipper International Emerging Markets Hard Currency Debt peer group, a group of funds with investment strategies similar to those of the Fund, during the period.
Why did the Fund perform this way?
Emerging-market debt, as measured by the Fund’s blended benchmark, returned 14.10% for the twelve-month period ended October 31, 2019. After a sharpsell-off in the fourth quarter of 2018, the first nine months of 2019 saw remarkable gains across a variety of asset classes, with emerging markets posting double-digit returns across both hard and local currencies. We believe a large part of this rally is attributable to the notable pivot made by global central banks, with a number of central banks cutting rates during 2019 in response to escalating trade tensions and protracted weakness in global manufacturing. The United States
(U.S.) Federal Reserve (Fed) has been no exception, cutting rates three times so far in 2019.
Security selection in U.S. dollar-denominated sovereigns was the largest detractor from performance relative to the Fund’s blended benchmark for the period, due largely to the Fund’s overweight to Argentina prior to the August primary. On August 11, 2019, Argentinian voters went to polls for the Argentinian primary election (PASO) and decided who would be on the ballot for the official presidential elections. In a widely unexpected turn of events, center-left candidate Alberto Fernández defeated President Macri by a sizeable margin of 15.6%. Against a backdrop of thinner markets during the August 2019 summer period, this widely unexpected result led to a sizeablesell-off across Argentine equity and fixed income markets, as well as the Argentine peso. The peso weakened substantially, depreciating 33% against the dollar in a matter of days during August 2019. The event sent some Argentine sovereign and provincial bonds down dramatically, reacting to the likely return of a leftist government to power. The Fund’s overweight to Lebanese sovereign bonds also detracted from performance relative to the Fund’s blended benchmark for the period, as these bonds underperformed on the back of increased geopolitical tensions. These underperformers were partially offset by positive contributions to relative performance from Saudi Arabia, Brazil and Mexico.
Dollar denominated corporates were positive on the whole, largely due to the Fund’s mix of Latin American corporates. Selection within local currencies had a negative effect on performance relative to the Fund’s
| 7 |
|
| Hartford Schroders Emerging Markets Multi-Sector Bond Fund |
Fund Overview – (continued)
October 31, 2019 (Unaudited)
blended benchmark for the period, with underweight exposure to Thailand, Turkey and Colombia being the leading detractors from relative performance. This was partially offset by the overweight to Mexico which was the largest contributor within local currencies. We continue to maintain a duration overweight in the Fund against the blended benchmark, ending the period 1.4 years overweight. During the period, we used foreign currency forwards in the Fund for the purposes of adding or hedging local currency exposure. These derivatives detracted from relative performance for the period, with foreign currency forwards either hedging or adding exposure to Turkey, Argentina, and South Africa among the leading detractors.
What is the outlook as of the end of the period?
As of the end of the period, emerging-market debt still looks attractive on a macro basis. We believe the returns in the emerging market debt market this year have been mostly due to the global bond rally, and not due to spread tightening specifically in emerging markets. When the Fed clearly changed course in early January 2019, announcing a pause in interest rate hikes before cutting interest rates later in the year, spreads were 400 basis points; as of October 2019 month end, they were 330 basis points. For historical context, the tightest spread was in February 2018 at 225 basis points.
These gains came despite the U.S. dollar rallying over 3% YTD as of October 31, 2019. In our view, with U.S. growth slowing, the dollar at very elevated levels, and rate differentials almost certain to be lower in coming months between the U.S. and the rest of the developed world, the dollar seems unlikely to rise much further. We believe that this should help flows into emerging markets and, if history is any guide, it may help support returns in emerging markets.
Local yields have rallied strongly this year as many large central banks have initiated cutting cycles across emerging markets. We are focused on countries with higher real yields and still attractive nominal yields, in our view, such as Indonesia, Russia, Brazil, Mexico, Turkey and South Africa. As of the end of the period, the Fund is underweight to Europe where yields have already fallen.
Important Risks
Investing involves risk, including the possible loss of principal. Security prices fluctuate in value depending on general market and economic conditions and the prospects of individual companies.•Fixed income security risks include credit, liquidity, call, duration, and interest-rate risk. As interest rates rise, bond prices generally fall.•Investments in high-yield (“junk”) bonds involve greater risk of price volatility, illiquidity, and default than higher-rated debt securities.•Restricted securities may be more difficult to sell and price than other securities.•Derivatives are generally more volatile and sensitive to changes in market or economic conditions than other securities; their risks include currency, leverage, liquidity, index, pricing, and counterparty risk.•Foreign investments may be more volatile and less liquid than U.S. investments and are subject to the risk of currency fluctuations and adverse political and economic developments. These risks may be greater for investments in emerging markets or if the Fund focuses in a particular geographic region or country.•The Fund may have high portfolio turnover, which could increase its transaction costs and an investor’s tax liability.•The Fund invests in a smaller number of issuers, so it may be more exposed to risks and volatility than a more broadly diversified fund.
Composition by Security Type(1)
as of October 31, 2019
| Category | Percentage of Net Assets | |||
Fixed Income Securities |
| |||
Corporate Bonds | 47.9 | % | ||
Foreign Government Obligations | 46.2 | |||
|
| |||
Total | 94.1 | % | ||
|
| |||
Short-Term Investments | 4.9 | |||
Other Assets & Liabilities | 1.0 | |||
|
| |||
Total | 100.0 | % | ||
|
| |||
| (1) | For Fund compliance purposes, the Fund may not use the same classification system. These classifications are used for financial reporting purposes. |
| 8 |
|
| Hartford Schroders International Multi-Cap Value Fund |
Fund Overview
October 31, 2019 (Unaudited)
Inception 8/30/2006 Sub-advised by Schroder Investment Management North America Inc. and itssub-sub-adviser, Schroder Investment Management North America Limited | Investment objective – The Fund seeks long-term capital appreciation. |
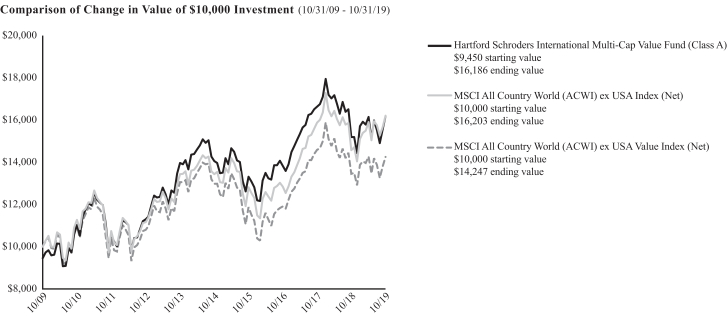
The chart above represents the hypothetical growth of a $10,000 investment in Class A, which includes a sales charge. Growth results in classes other than Class A will vary from what is seen above due to differences in the expenses charged to those share classes.
Average Annual Total Returns
for the Periods Ending 10/31/19
| 1 Year | 5 Years | 10 Years | ||||||||||
Class A1 | 6.61% | 2.87% | 5.53% | |||||||||
Class A2 | 0.77% | 1.71% | 4.93% | |||||||||
Class C1 | 5.91% | 2.48% | 5.47% | |||||||||
Class C2 | 4.91% | 2.48% | 5.47% | |||||||||
Class I1 | 6.98% | 3.14% | 5.81% | |||||||||
Class R31 | 6.36% | 2.77% | 5.62% | |||||||||
Class R41 | 6.57% | 2.93% | 5.70% | |||||||||
Class R51 | 6.97% | 3.10% | 5.79% | |||||||||
Class Y1 | 6.93% | 3.17% | 5.83% | |||||||||
Class F1 | 6.98% | 3.18% | 5.83% | |||||||||
Class SDR1 | 6.99% | 3.23% | 5.86% | |||||||||
MSCI All Country World (ACWI) ex USA Index (Net) | 11.27% | 3.82% | 4.94% | |||||||||
MSCI All Country World (ACWI) ex USA Value Index (Net) | 5.95% | 1.89% | 3.60% | |||||||||
| 1 | Without sales charge |
| 2 | With sales charge |
PERFORMANCE DATA QUOTED REPRESENTS PAST PERFORMANCE AND DOES NOT GUARANTEE FUTURE RESULTS. The investment return and principal value of the investment will fluctuate so that investors’ shares, when redeemed, may be worth more or less than their original cost. The chart and table do not reflect the deductions of taxes that a shareholder would pay on Fund distributions or the redemption of Fund shares. Current performance may be lower or higher than the performance data quoted. To obtain performance data current to the most recentmonth-end, please visit our website www.hartfordfunds.com.
The initial investment in Class A shares reflects the maximum sales charge of 5.50% and returns for Class C shares reflect a contingent deferred sales charge of up to 1.00% on shares redeemed within twelve months of purchase.
Total returns presented above were calculated using the Fund’s net asset value available to shareholders for sale or redemption of Fund shares on 10/31/19, which may exclude investment transactions as of this date. All share class returns assume the reinvestment of all distributions at net asset value and the deduction of all fund expenses.
Effective immediately before the opening of business on 10/24/16, the Schroder International Multi-Cap Value Fund (the “Predecessor Fund”) was reorganized into the Fund. The performance information shown for periods prior to 10/24/16 is that of the Predecessor Fund. Prior to 10/24/16, Class A, Class I and Class SDR were called Advisor Shares, Investor Shares and R6 Shares, respectively. Class C, Class R3, Class R4, Class R5, and Class Y shares commenced operations on 10/24/16 and performance prior to this date reflects the performance of the Predecessor Fund’s Investor Shares. Performance for Class SDR shares prior to 12/30/14 (the inception date of the Predecessor Fund’s Class R6 Shares) reflects the performance of the Predecessor Fund’s Investor Shares. Class F shares commenced operations on 2/28/17 and performance prior to that date is that of the Fund’s Class I shares. The returns would be different if the Fund’s fees and expenses were reflected for periods prior to 10/24/16.
You cannot invest directly in an index.
See “Benchmark Glossary” for benchmark descriptions.
Performance information may reflect historical or current expense waivers/reimbursements without which performance would have been lower. For information on current expense waivers/reimbursements, please see the prospectus.
| 9 |
|
| Hartford Schroders International Multi-Cap Value Fund |
Fund Overview – (continued)
October 31, 2019 (Unaudited)
Operating Expenses*
| Gross | Net | |||||||
Class A | 1.12% | 1.12% | ||||||
Class C | 1.87% | 1.87% | ||||||
Class I | 0.86% | 0.86% | ||||||
Class R3 | 1.49% | 1.49% | ||||||
Class R4 | 1.19% | 1.19% | ||||||
Class R5 | 0.87% | 0.87% | ||||||
Class Y | 0.88% | 0.82% | ||||||
Class F | 0.77% | 0.77% | ||||||
Class SDR | 0.77% | 0.77% | ||||||
| * | Expenses as shown in the Fund’s most recent prospectus. Gross expenses do not reflect contractual fee waivers or expense reimbursement arrangements. Net expenses reflect such arrangements only with respect to Class Y. These arrangements remain in effect until 2/29/20 unless the Fund’s Board of Directors approves an earlier termination. Expenses shown include acquired fund fees and expenses. Actual expenses may be higher or lower. Please see accompanying Financial Highlights for expense ratios for the year ended October 31, 2019. |
Portfolio Managers
Hartford Schroders InternationalMulti-Cap Value Fund’ssub-adviser is Schroder Investment Management North America Inc. and itssub-sub-adviser is Schroder Investment Management North America Limited.
Justin Abercrombie
Portfolio Manager
Stephen Langford, CFA
Portfolio Manager
Michael O’Brien
Portfolio Manager
David Philpotts
Portfolio Manager
Manager Discussion
How did the Fund perform during the period?
The Class A shares of the Hartford Schroders InternationalMulti-Cap Value Fund returned 6.61%, before sales charge, for the twelve-month period ended October 31, 2019, underperforming one of the Fund’s benchmarks, the MSCI All Country World (ACWI) ex USA Index (Net) which returned 11.27% and outperforming the Fund’s secondary benchmark, the MSCI All Country World (ACWI) ex USA Value Index (Net), which returned 5.95% for the same period. For the same period, Class A shares of the Fund outperformed the 5.27% average return of the Lipper InternationalMulti-Cap Value peer group, a group of funds with investment strategies similar to those of the Fund.
Why did the Fund perform this way?
Over the course of the twelve-month period ended October 31, 2019, growth companies were in favor, although we also saw preference for defensiveness as investors second-guessed future United States (U.S.) Federal Reserve (Fed) policy and the ebb and flow of U.S.-Chinese trade talks. Central banks eventually lent support to stock markets by switching to a monetary easing stance. The Fed cut rates three times during the period, including once at the end of October 2019.
From a sector perspective, the Technology sector led the way (up 24.95% for the period), although not without considerable volatility. The Energy sector was the only sector to fall during the period(-1.05%). Regionally, the United Kingdom (U.K.) and Continental Europe lagged the broader index as fears surrounding the U.K.’s exit from the European Union (EU) as well as concerns about the economic slowdown fears weighed on investors.
Stock selection within the Healthcare sector, which we believe is less sensitive to the ongoing trade wars, made the greatest contribution to returns relative to the MSCI ACWI ex USA Index (Net). The Fund’s Healthcare sector holdings in Continental Europe and Japan, such as Sanofi and Astellas, supported relative performance.
Our avoidance of Baidu benefited the Fund, as its price fell drastically over the period because of an increased regulatory environment and negative effects from the trade war. More generally, broad-based holdings within the Communication Services sector also added to relative performance. This was especially the case in the U.K., Japan, and Emerging Markets Asia, where the Fund had an overweight allocation to integrated telecommunication, media and entertainment companies relative to the MSCI ACWI ex USA Index (Net).
| 10 |
|
| Hartford Schroders International Multi-Cap Value Fund |
Fund Overview – (continued)
October 31, 2019 (Unaudited)
The Consumer Discretionary sector and other cyclical stocks were some of the largest detractors from relative performance. Holdings in trade-sensitive areas, such as Asian emerging markets, Asia retail, apparel, and auto parts (Hankook Tire and Stanley Electric) were impacted due to ongoing concerns regarding the ongoing trade wars.
Positions in Financials, particularly banks, performed poorly over the period. These stocks reacted poorly to global central banks’ interest rate cuts, as banks typically derive a significant portion of the revenues from interest on loans. Derivatives were not used in a significant manner in the Fund during the period and did not have a material impact on performance during the period.
What is the outlook as of the end of the period?
We believe there are deeper value opportunities within the Financials sector, Resources sector and currentlyout-of-favor areas of the Consumer Discretionary and Industrials sectors (such as U.K. homebuilders and Asian autos, machinery and transport companies). Within the Resources sector, we retain a preference for miners and oil exploration & production companies globally, as well larger integrated oil companies in all areas. Elsewhere, we are seeking to capitalize on a wide range of options across the quality spectrum within the Financials sector. Although riskier, we believe that there is a higher expected return potential in the European and emerging market banks, where we are seeing selective improvement in asset quality. At the other end of the spectrum, we believe the Fund has broad exposure to high-quality companies trading on attractive valuations, such as life & health insurers within Canada and Continental Europe, as well as in Singaporean banks, where we have been recently building positions as of the end of the reporting period.
Regionally, as of the end of the period, the Fund’s largest overweight positions are in Japan and Pacific ex Japan, and the Fund has underweight positions to Continental Europe, Canada, and Emerging Markets relative to the MSCI ACWI ex USA Index (Net).
Important Risks
Investing involves risk, including the possible loss of principal. Security prices fluctuate in value depending on general market and economic conditions and the prospects of individual companies.•Foreign investments may be more volatile and less liquid than U.S. investments and are subject to the risk of currency fluctuations and adverse political and economic developments. These risks may be greater for investments in emerging markets or if the Fund focuses in a particular geographic region or country.•Small- andmid-cap securities can have greater risks and volatility thanlarge-cap securities.•Different investment styles may go in and out favor, which may cause the Fund to underperform the broader stock market.
Composition by Sector(1)
as of October 31, 2019
| Sector | Percentage of Net Assets | |||
Equity Securities |
| |||
Communication Services | 10.0 | % | ||
Consumer Discretionary | 9.7 | |||
Consumer Staples | 2.1 | |||
Energy | 8.6 | |||
Financials | 22.8 | |||
Health Care | 10.0 | |||
Industrials | 13.4 | |||
Information Technology | 8.1 | |||
Materials | 8.5 | |||
Real Estate | 3.1 | |||
Utilities | 1.9 | |||
|
| |||
Total | 98.2 | % | ||
|
| |||
Short-Term Investments | 1.5 | |||
Other Assets & Liabilities | 0.3 | |||
|
| |||
Total | 100.0 | % | ||
|
| |||
| (1) | A sector may be comprised of several industries. For Fund compliance purposes, the Fund may not use the same classification system. These sector classifications are used for financial reporting purposes. |
| 11 |
|
| Hartford Schroders International Stock Fund |
Fund Overview
October 31, 2019 (Unaudited)
Inception 12/19/1985 Sub-advised by Schroder Investment Management North America Inc. and itssub-sub-adviser, Schroder Investment Management North America Limited | Investment objective – The Fund seeks long-term capital appreciation through investment in securities markets outside the United States. |
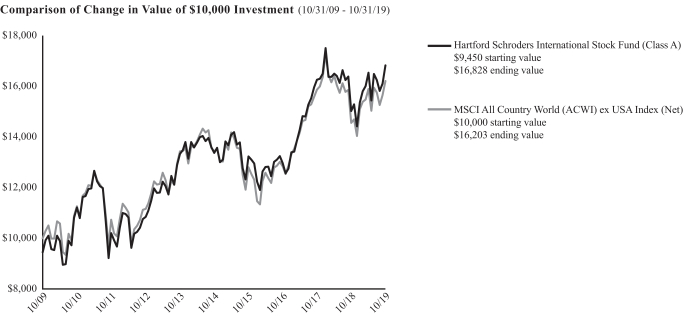
The chart above represents the hypothetical growth of a $10,000 investment in Class A, which includes a sales charge. Growth results in classes other than Class A will vary from what is seen above due to differences in the expenses charged to those share classes.
Average Annual Total Returns
for the Periods Ending 10/31/19
| 1 Year | 5 Years | 10 Years | ||||||||||
Class A1 | 12.04% | 4.70% | 5.94% | |||||||||
Class A2 | 5.84% | 3.53% | 5.34% | |||||||||
Class C1 | 11.16% | 4.35% | 5.89% | |||||||||
Class C2 | 10.16% | 4.35% | 5.89% | |||||||||
Class I1 | 12.39% | 4.98% | 6.21% | |||||||||
Class R31 | 11.93% | 4.82% | 6.13% | |||||||||
Class R41 | 12.15% | 4.91% | 6.17% | |||||||||
Class R51 | 12.33% | 5.00% | 6.22% | |||||||||
Class Y1 | 12.38% | 5.03% | 6.24% | |||||||||
Class F1 | 12.47% | 5.03% | 6.23% | |||||||||
Class SDR1 | 12.45% | 5.08% | 6.26% | |||||||||
MSCI All Country World (ACWI) ex USA Index (Net) | 11.27% | 3.82% | 4.94% | |||||||||
| 1 | Without sales charge |
| 2 | With sales charge |
PERFORMANCE DATA QUOTED REPRESENTS PAST PERFORMANCE AND DOES NOT GUARANTEE FUTURE RESULTS. The investment return and principal value of the investment will fluctuate so that investors’ shares, when redeemed, may be worth more or less than their original cost. The chart and table do not reflect the deductions of taxes that a shareholder would pay on Fund distributions or the redemption of Fund shares. Current performance may be lower or higher than the performance data quoted. To obtain performance data current to the most recentmonth-end, please visit our website www.hartfordfunds.com.
The initial investment in Class A shares reflects the maximum sales charge of 5.50% and returns for Class C shares reflect a contingent deferred sales charge of up to 1.00% on shares redeemed within twelve months of purchase.
Total returns presented above were calculated using the Fund’s net asset value available to shareholders for sale or redemption of Fund shares on 10/31/19, which may exclude
investment transactions as of this date. All share class returns assume the reinvestment of all distributions at net asset value and the deduction of all fund expenses.
Effective immediately before the opening of business on 10/24/16, the Schroder International Alpha Fund (the “Predecessor Fund”) was reorganized into the Fund. The performance information shown for periods prior to 10/24/16 is that of the Predecessor Fund. Prior to 10/24/16, Class A, Class I and Class SDR were called Advisor Shares, Investor Shares and R6 Shares, respectively. Class C, Class R3, Class R4, Class R5, and Class Y shares commenced operations on 10/24/16 and performance prior to this date reflects the performance of the Predecessor Fund’s Investor Shares. Performance for Class SDR shares prior to 12/30/14 (the inception date of the Predecessor Fund’s Class R6 Shares) reflects the performance of the Predecessor Fund’s Investor Shares. Class F shares commenced operations on 2/28/17 and performance prior to that date is that of the Fund’s Class I shares. The returns would be different if the Fund’s fees and expenses were reflected for periods prior to 10/24/16.
You cannot invest directly in an index.
See “Benchmark Glossary” for benchmark descriptions.
Performance information may reflect historical or current expense waivers/reimbursements without which performance would have been lower. For information on current expense waivers/reimbursements, please see the prospectus.
| 12 |
|
| Hartford Schroders International Stock Fund |
Fund Overview – (continued)
October 31, 2019 (Unaudited)
Operating Expenses*
| Gross | Net | |||||||
Class A | 1.17% | 1.15% | ||||||
Class C | 1.93% | 1.93% | ||||||
Class I | 0.85% | 0.85% | ||||||
Class R3 | 1.53% | 1.45% | ||||||
Class R4 | 1.22% | 1.15% | ||||||
Class R5 | 0.93% | 0.85% | ||||||
Class Y | 0.85% | 0.85% | ||||||
Class F | 0.81% | 0.75% | ||||||
Class SDR | 0.81% | 0.75% | ||||||
| * | Expenses as shown in the Fund’s most recent prospectus. Gross expenses do not reflect contractual expense reimbursement arrangements. Net expenses reflect such arrangements in instances when they reduce gross expenses. These arrangements remain in effect until 2/29/20 unless the Fund’s Board of Directors approves an earlier termination. Actual expenses may be higher or lower. Please see accompanying Financial Highlights for expense ratios for the year ended October 31, 2019. |
Portfolio Managers
Hartford Schroders International Stock Fund’ssub-adviser is Schroder Investment Management North America Inc. and itssub-sub-adviser is Schroder Investment Management North America Limited.
Simon Webber, CFA
Portfolio Manager
James Gautrey, CFA
Portfolio Manager
Manager Discussion
How did the Fund perform during the period?
The Class A shares of the Hartford Schroders International Stock Fund returned 12.04%, before sales charge, for the twelve-month period ended October 31, 2019, outperforming the Fund’s benchmark, the MSCI All Country World (ACWI) ex USA Index (Net), which returned 11.27% for the same period. For the same period, Class A shares of the Fund underperformed the 14.88% average return of the Lipper International Large Cap Growth peer group, a group of funds with investment strategies similar to those of the Fund.
Why did the Fund perform this way?
During the period, international equities recovered some of the losses from late 2018 but failed to build significant forward momentum throughout most of 2019. Market volatility was reflective of a finely balanced environment driven by uncertainty about policy, economic growth, and ultimately earnings. Central banks pivoted back toward accommodation amidst a lack of inflationary pressures and sluggish growth. Investors largely maintained a preference for quality growth and defensive stocks, while cyclically exposed companies largely lagged the broader market.
Stock selection was a key driver of outperformance relative to the MSCI ACWI ex USA Index (Net), with the Fund’s sector allocation adding to relative performance. Selection in the Financials, Information Technology and Industrials sectors was particularly positive, while performance of the Fund’s holdings in the Consumer Discretionary sector detracted from relative performance. From a regional perspective,
allocations to Japan and emerging markets added the most value, while selection in Europe was challenging.
Positive contributions to performance relative to the MSCI ACWI ex USA Index (Net) have come from both longstanding core holdings and some new additions. While the capital expenditure investment cycle has turned down, SMC (a pneumatic equipment producer of control systems used in factory automation) performed well during the period, as the company’s model of maintaining wide availability of product and holding inventory close to the customer has enabled them to capture increasing market share. Our purchase in the Fund’s portfolio of Brazilian stock exchange company, B3, in the summer of 2018 proved beneficial over the period. At that time, lack of interest in Brazil had left B3 on a significant discount to global markets, despite two great strengths being the company’s very high share of Brazil listings and clearing, and the potential for development of Brazilian capital markets over time to drive growth. Twelve months on and the market has moved to the other extreme, viewing Brazil as a rare oasis of recovery in a slowing world, and hasre-rated most equities accordingly. Ocado, another name added to the Fund’s portfolio in late 2018, also performed well during the period. As of the end of the period, we remain impressed with the ability of the company to innovate.
Zee Entertainment detracted from the Fund’s performance relative to the MSCI ACWI ex USA Index (Net) amidst debt repayment worries at parent Essel Group. Shares of Zee have been pledged by the promoters of the company to raise money for the group’s infrastructure projects. While Essel’s lenders have agreed to an extension of the loan repayment, uncertainty around Zee’s share pledging remains.
| 13 |
|
| Hartford Schroders International Stock Fund |
Fund Overview – (continued)
October 31, 2019 (Unaudited)
Infineon detracted from the Fund’s performance relative to the MSCI ACWI ex USA Index (Net) after the German chipmaker paid $9 billion to acquire relatively unknownU.S.-based Cypress Semiconductor in a bid to expand its capabilities into autos and internet technologies. The premium that Infineon paid for the acquisition was considered too high by many in the market which, together with its exposure to the Chinese car market amid heightening trade tensions, led to selling pressure.
Norsk Hydro was also a detractor from relative performance as trade tensions between the U.S. and China weighed on metals markets. The aluminum producer also has experienced production weakness attributed primarily to ongoing capacity constraints in its Alunorte plant, which the Brazilian government implemented after alleged leaks of untreated water during heavy rains last February. The Brazilian government has agreed to lift the court embargo subject to a third-party report assessing the safety of the plant running at full capacity again.
Derivatives were not used in the Fund during the period and therefore did not have a material impact on performance.
What is the outlook as of the end of the period?
We believe equity markets remain finely balanced. Valuations are still lower than they were in much of 2018, but earnings estimates are falling amid fading economic growth and geopolitical headwinds. TheU.S.-China trade war remains a major uncertainty, while the U.K.’s path to exit from the European Union remains unclear.
We believe investors have become increasingly fixated on the potential for value to outperform growth in the near term, given that growth stocks have materially outperformed value stocks over the past few years. While predicting the timing of when certain styles (such as growth or value) will be in favor is particularly difficult, we believe that businesses with strong quality characteristics should remain well positioned and may trade at a premium.
We continue to focus on seeking to generate value primarily throughbottom-up stock selection. We have been finding attractive opportunities in our view in some of theout-of-favor cyclical areas outside the U.S. Our focus remains on choosing stocks with strong return on capital, resilient balance sheets, and good cash flows. We believe companies with these positive characteristics are not only more resilient, but should retain greater flexibility to adapt to the evolving competitive landscape.
Important Risks
Investing involves risk, including the possible loss of principal. Security prices fluctuate in value depending on general market and economic conditions and the prospects of individual companies.•Foreign investments may be more volatile and less liquid than U.S. investments and are subject to the risk of currency fluctuations and adverse political and economic developments. These risks may be greater for investments in emerging markets or if the Fund focuses in a particular geographic region or country.•Small- andmid-cap securities can have greater risks and volatility thanlarge-cap securities.
Composition by Sector(1)
as of October 31, 2019
| Sector | Percentage of Net Assets | |||
Equity Securities |
| |||
Communication Services | 4.7 | % | ||
Consumer Discretionary | 22.7 | |||
Consumer Staples | 6.9 | |||
Energy | 3.2 | |||
Financials | 16.7 | |||
Health Care | 11.9 | |||
Industrials | 14.8 | |||
Information Technology | 14.0 | |||
Materials | 3.1 | |||
Real Estate | 1.3 | |||
|
| |||
Total | 99.3 | % | ||
|
| |||
Short-Term Investments | 2.4 | |||
Other Assets & Liabilities | (1.7 | ) | ||
|
| |||
Total | 100.0 | % | ||
|
| |||
| (1) | A sector may be comprised of several industries. For Fund compliance purposes, the Fund may not use the same classification system. These sector classifications are used for financial reporting purposes. |
| 14 |
|
| Hartford Schroders Securitized Income Fund |
Fund Overview
October 31, 2019 (Unaudited)
Inception 2/28/2019 Sub-advised by Schroder Investment Management North America Inc. | Investment objective – The Fund seeks to provide current income and long-term total return consistent with preservation of capital. |
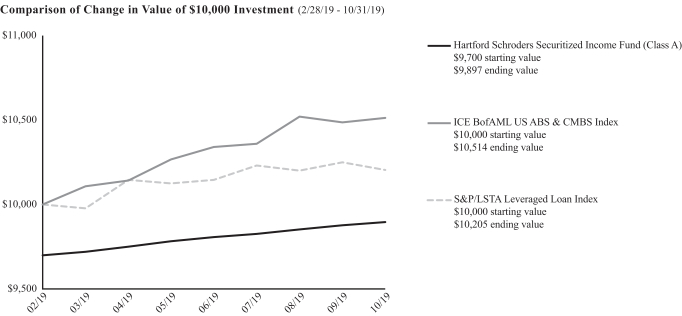
The chart above represents the hypothetical growth of a $10,000 investment in Class A, which includes a sales charge. Growth results in classes other than Class A will vary from what is seen above due to differences in the expenses charged to those share classes.
Cumulative Total Returns
for the Periods Ending 10/31/19
| Since Inception1 | ||||
Class A2 | 2.04% | |||
Class A3 | -1.03% | |||
Class I2 | 2.09% | |||
Class Y2 | 2.13% | |||
Class F2 | 2.06% | |||
Class SDR2 | 2.19% | |||
ICE BofAML US ABS & CMBS Index | 5.14% | |||
S&P/LSTA Leveraged Loan Index | 2.05% | |||
| 1 | Inception: 02/28/2019. Returns are not annualized. |
| 2 | Without sales charge |
| 3 | With sales charge |
PERFORMANCE DATA QUOTED REPRESENTS PAST PERFORMANCE AND DOES NOT GUARANTEE FUTURE RESULTS. The investment return and principal value of the investment will fluctuate so that investors’ shares, when redeemed, may be worth more or less than their original cost. The chart and table do not reflect the deductions of taxes that a shareholder would pay on Fund distributions or the redemption of Fund shares. Current performance may be lower or higher than the performance data quoted. To obtain performance data current to the most recentmonth-end, please visit our website www.hartfordfunds.com.
The initial investment in Class A shares reflects the maximum sales charge of 3.00%.
Total returns presented above were calculated using the Fund’s net asset value available to shareholders for sale or redemption of Fund shares on 10/31/19, which may exclude investment transactions as of this date. All share class returns assume the reinvestment of all distributions at net asset value and the deduction of all fund expenses.
You cannot invest directly in an index.
See “Benchmark Glossary” for benchmark descriptions.
Performance information may reflect historical or current expense waivers/reimbursements without which performance would have been lower. For information on current expense waivers/reimbursements, please see the prospectus.
Operating Expenses*
| Gross | Net | |||||||
Class A | 1.53% | 1.41% | ||||||
Class I | 1.23% | 1.16% | ||||||
Class Y | 1.25% | 1.11% | ||||||
Class F | 1.14% | 1.01% | ||||||
Class SDR | 1.14% | 1.01% | ||||||
| * | Expenses as shown in the Fund’s most recent prospectus. Gross expenses do not reflect contractual expense reimbursement arrangements. Net expenses reflect such arrangements in instances when they reduce gross expenses. These arrangements remain in effect until 02/29/20 unless the Fund’s Board of Directors approves an earlier termination. Actual expenses may be higher or lower. Please see accompanying Financial Highlights for expense ratios for the period ended October 31, 2019. |
| 15 |
|
| Hartford Schroders Securitized Income Fund |
Fund Overview – (continued)
October 31, 2019 (Unaudited)
Portfolio Managers
Hartford Schroders Securitized Income Fund’ssub-adviser is Schroders Investment Management North America Inc.
Michelle Russell-Dowe
Portfolio Manager and Head of Securitized Income
Anthony Breaks, CFA
Portfolio Manager
Manager Discussion
How did the Fund perform during the period?
The Class A shares of the Hartford Schroders Securitized Income Fund returned 2.04%, before sales charge, during the period (February 28, 2019 (the Fund’s inception date) through October 31, 2019 (the Fund’s fiscal year end)). The Class A shares of the Fund underperformed one of the Fund’s benchmarks, the ICE BofAML US ABS & CMBS Index, which returned 5.14% for the same period, and performed in line with the Fund’s other benchmark, S&P/LSTA Leveraged Loan Index, which returned 2.05% for the same period. For the same period, the Class A shares of the Fund underperformed the 2.14% average return of the Lipper Loan Participation Funds peer group, a group of funds with investment strategies similar to those of the Fund.
Why did the Fund perform this way?
The Fund launched on February 28, 2019 and deployed capital to target allocations. Through the end of the period, we continued to allocate to target sectors and deploy inflows in the Fund. Income drove the Fund’s performance for most of the period, while price return also had a positive impact to a lesser degree. On a sector basis, commercial mortgage-backed securities (CMBS) had the largest contribution to performance, given this is a larger exposure in the Fund and offers what we believe to be attractive levels of income. Residential mortgage-backed securities (RMBS) also had strong income, while the Fund’s exposure to asset-backed securities (ABS) and collateralized loan obligations (CLOs) had smaller positive impacts as high-quality securitized spreads were stable throughout the period.
The Fund has increased allocations to more credit-oriented exposures, where we believe that risk compensation offers strong relative value, although the portfolio still maintains a high degree of liquid, high-quality exposure to deploy into credit sectors. The main sectors we view as attractive in credit as of the end of the period are commercial real estate in the form of CMBS single-asset/single-borrower (SASB), where we can be selective, and housing in the form of seasoned credit risk transfers (CRT) that have previously weathered lower rates in 2016, as well as seasonednon-agency mortgage-backed securities (MBS). Given the flatness of the credit curve and the expensive pricing of risks such as credit, term premium or volatility, income is likely to be the main driver of returns in the near term.
During the period, the Fund used U.S. Treasury futures contracts for duration hedging purposes and British pound (GBP)/U.S. dollar (USD) futures for GBP hedging purposes. The Fund’s use of derivatives did not have a material impact on performance during the period.
What is the outlook as of the end of the period?
We continue to expect slower, but positive, economic growth in the U.S., and steady growth for home prices overall. We believe U.S. housing and real estate remain well supported by economic growth. The Fund’s ABS exposures are geared towards senior classes of debt (which take priority over other unsecured or more junior classes of debt), within areas of consumer strength, and we have invested in shorter maturity securities as we favor a shorter-weighted average life and lower volatility portfolio.
We believe valuations look like they are approaching a later part of the credit cycle for the more crowded asset classes, such as equities and corporate debt. When we look more deeply at the disruptors driving valuations and the credit cycle, including the U.S. Federal Reserve’s accommodative stance on interest rates and quantitative easing, we believe it becomes clearer that there are distinct differences across asset classes. In particular, we believe the diverse base of assets underlying ABS, MBS, CMBS, and CLOs offer opportunities in all phases as we stress the importance of evaluating both the collateral and the structure of securities.
We favor positions within the credit sector where we believe the underlying asset (housing or building) should benefit from lower interest rates. For real assets, as interest rates fall, the financing cost for the assets (mortgage rates) decline and, thus, the valuation for the asset has the potential to increase. Commercial real estate credit is attractive in the larger loan markets in our view. In our view, housing credit is also attractive, and asset selection remains critical to total return given an environment with lower income or yield.
Important Risks
Investing involves risk, including the possible loss of principal. Security prices fluctuate in value depending on general market and economic conditions and the prospects of individual companies.•Fixed income security risks include credit, liquidity, call, duration, event andinterest-rate risk. As interest rates rise, bond prices generally fall.•Investments in high-yield (“junk”) bonds involve greater risk of price volatility, illiquidity, and default than higher-rated debt securities.•Obligations of U.S. Government agencies are supported by varying degrees of credit but are generally not backed by the full faith and credit of the U.S. Government.•The risks associated with mortgage-related and asset-backed securities as well as collateralized loan obligations (CLOs) include credit, interest-rate, prepayment, liquidity, default and extension risk.•The purchase of securities in theTo-Be-Announced (TBA) market can result in additional price and counterparty risk.•The Fund may use repurchase agreements, or reverse repurchase agreements, which can increase risk and volatility.•Use of leverage can
| 16 |
|
| Hartford Schroders Securitized Income Fund |
Fund Overview – (continued)
October 31, 2019 (Unaudited)
increase market exposure, magnify investment risks, and cause losses to be realized more quickly.•Derivatives are generally more volatile and sensitive to changes in market or economic conditions than other securities; their risks include currency, leverage, liquidity, index, pricing, and counterparty risk.•Foreign investments may be more volatile and less liquid than U.S. investments and are subject to the risk of currency fluctuations and adverse political and economic developments.•Restricted securities may be more difficult to sell and price than other securities.
Composition by Security Type(1)
as of October 31, 2019
| Category | Percentage of Net Assets | |||
Fixed Income Securities | ||||
Asset & Mortgage Backed Securities | 81.3 | % | ||
Corporate Bonds | 2.3 | |||
U.S. Government Agencies(2) | 12.0 | |||
|
| |||
Total | 95.6 | % | ||
|
| |||
Short-Term Investments | 10.8 | |||
Other Assets & Liabilities | (6.4 | ) | ||
|
| |||
Total | 100.0 | % | ||
|
| |||
| (1) | For Fund compliance purposes, the Fund may not use the same classification system. These classifications are used for financial reporting purposes. |
| (2) | All, or a portion of the securities categorized as U.S. Government Agencies, were agency mortgage backed securities as of October 31, 2019. |
| 17 |
|
| Hartford Schroders Tax-Aware Bond Fund |
Fund Overview
October 31, 2019 (Unaudited)
Inception 10/3/2011 Sub-advised by Schroder Investment Management North America Inc. and itssub-sub-adviser, Schroder Investment Management North America Limited | Investment objective – The Fund seeks total return on anafter-tax basis. |
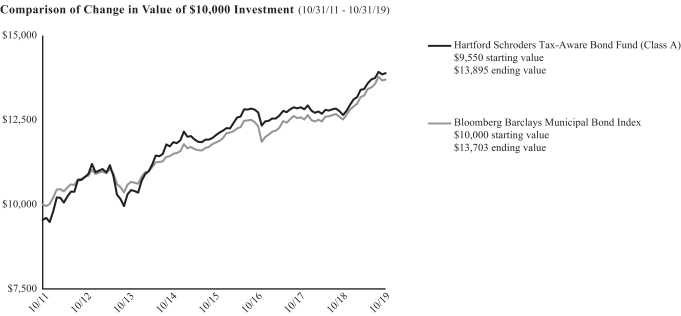
The chart above represents the hypothetical growth of a $10,000 investment in Class A, which includes a sales charge. Growth results in classes other than Class A will vary from what is seen above due to differences in the expenses charged to those share classes.
Average Annual Total Returns
for the Periods Ending 10/31/19
| 1 Year | 5 Years | Since Inception1 | ||||||||||
Class A2 | 9.79% | 3.23% | 4.75% | |||||||||
Class A3 | 4.87% | 2.29% | 4.16% | |||||||||
Class C2 | 8.91% | 2.84% | 4.59% | |||||||||
Class C3 | 7.91% | 2.84% | 4.59% | |||||||||
Class I2 | 9.95% | 3.49% | 5.00% | |||||||||
Class Y2 | 9.98% | 3.49% | 5.00% | |||||||||
Class F2 | 10.06% | 3.51% | 5.01% | |||||||||
Class SDR2 | 10.08% | 3.50% | 5.00% | |||||||||
Bloomberg Barclays Municipal Bond Index | 9.42% | 3.55% | 3.98% | |||||||||
| 1 | Inception: 10/03/2011 |
| 2 | Without sales charge |
| 3 | With sales charge |
PERFORMANCE DATA QUOTED REPRESENTS PAST PERFORMANCE AND DOES NOT GUARANTEE FUTURE RESULTS. The investment return and principal value of the investment will fluctuate so that investors’ shares, when redeemed, may be worth more or less than their original cost. The chart and table do not reflect the deductions of taxes that a shareholder would pay on Fund distributions or the redemption of Fund shares. Current performance may be lower or higher than the performance data quoted. To obtain performance data current to the most recentmonth-end, please visit our website www.hartfordfunds.com.
The initial investment in Class A shares reflects the maximum sales charge of 4.50% and returns for Class C shares reflect a contingent deferred sales charge of up to 1.00% on shares redeemed within twelve months of purchase.
Total returns presented above were calculated using the Fund’s net asset value available to shareholders for sale or redemption of Fund shares on 10/31/19, which may exclude
investment transactions as of this date. All share class returns assume the reinvestment of all distributions at net asset value and the deduction of all fund expenses.
Effective immediately before the opening of business on 10/24/16, the Schroder Broad Tax-Aware Value Bond Fund (the “Predecessor Fund”) was reorganized into the Fund. The performance information shown for periods prior to 10/24/16 is that of the Predecessor Fund and the Predecessor Fund’s predecessor. Prior to 10/24/16, Class A and Class I were called Advisor Shares and Investor Shares, respectively. Performance for Class A shares prior to 12/30/14 (the inception date of the Predecessor Fund’s Advisor Shares) reflects the performance of the Predecessor Fund’s Investor Shares adjusted to reflect the distribution fees of the Predecessor Fund’s Advisor Shares. Class C, Class Y and Class SDR shares commenced operations on 10/24/16 and performance prior to this date reflects the performance of the Predecessor Fund’s Investor Shares. Class F shares commenced operations on 2/28/17 and performance prior to that date is that of the Fund’s Class I shares. The returns would be different if the Fund’s fees and expenses were reflected for periods prior to 10/24/16. Performance for the Fund prior to 6/14/13 reflects performance of the Predecessor Fund’s predecessor, which commenced operations on 10/3/11.
You cannot invest directly in an index.
See “Benchmark Glossary” for benchmark descriptions.
Performance information may reflect historical or current expense waivers/reimbursements without which performance would have been lower. For information on current expense waivers/reimbursements, please see the prospectus.
| 18 |
|
| Hartford Schroders Tax-Aware Bond Fund |
Fund Overview – (continued)
October 31, 2019 (Unaudited)
Operating Expenses*
| Gross | Net | |||||||
Class A | 0.86% | 0.71% | ||||||
Class C | 1.62% | 1.59% | ||||||
Class I | 0.62% | 0.49% | ||||||
Class Y | 0.66% | 0.56% | ||||||
Class F | 0.55% | 0.46% | ||||||
Class SDR | 0.55% | 0.46% | ||||||
| * | Expenses as shown in the Fund’s most recent prospectus. Gross expenses do not reflect contractual expense reimbursement arrangements. Net expenses reflect such arrangements in instances when they reduce gross expenses. These arrangements remain in effect until 2/29/20 unless the Fund’s Board of Directors approves an earlier termination. Actual expenses may be higher or lower. Please see accompanying Financial Highlights for expense ratios for the year ended October 31, 2019. |
Portfolio Managers
Hartford Schroders Tax Aware Bond Fund’ssub-adviser is Schroder Investment Management North America Inc. and itssub-sub-adviser is Schroder Investment Management North America Limited.
Andrew B.J. Chorlton, CFA
Portfolio Manager
Neil G. Sutherland, CFA
Portfolio Manager
Julio C. Bonilla, CFA
Portfolio Manager
Lisa Hornby, CFA
Portfolio Manager
Manager Discussion
How did the Fund perform during the period?
The Class A shares of the Hartford SchrodersTax-Aware Bond Fund returned 9.79%, before sales charge, for the twelve-month period ended October 31, 2019, outperforming the Fund’s benchmark, the Bloomberg Barclays Municipal Bond Index, which returned 9.42% for the same period. For the same period, Class A shares of the Fund also outperformed the 9.26% average return of the Lipper General & Insured Municipal Debt Funds peer group, a group of funds with investment strategies similar to those of the Fund.
Why did the Fund perform this way?
The Fund outperformed the benchmark primarily due to overweighting the Corporate and Treasury sectors. Falling Treasury yields significantly benefited the Fund’s Treasury exposure outside of the Bloomberg Barclays Municipal Bond Index; the Fund’s overweight position in corporates also drove outperformance relative to the Bloomberg Barclays Municipal Bond Index, as the sector benefited from tightening spreads and a positive technical environment.
The first nine months of 2019 saw remarkable gains in various asset classes, with many fixed income sectors posting double-digit returns. The municipal bond market, as measured by the Bloomberg Barclays Municipal Bond Index, generated a 9.42% return for the twelve-month period ending October 31, 2019; U.S. Treasuries (as measured by the
Bloomberg Barclays US Treasury Index) and corporate bonds (as measured by the Bloomberg Barclays Corporate Index) outperformed municipal bonds with returns of 11.08% and 15.37%, respectively. A large part of this rally is attributable to the notable pivot made by global central banks to more accommodative policy, with a number of central banks cutting rates so far through 2019 in response to escalating trade tensions and extended weakness in global manufacturing. The United States (U.S.) Federal Reserve (Fed) has been no exception, cutting rates three times in 2019 and thereby lowering the Federal Funds target rate from2.25-2.50% to1.50-1.75%.
Issue selection within municipals in the Fund was an overall positive contributor to performance relative to the Bloomberg Barclays Municipal Bond Index, but overweights to Housing and Fed AgencyTax-Exempt Municipal sectors detracted, as these sectors lagged the broader municipal market. The Fund’s agency mortgage-backed securities (MBS) allocation also detracted from relative performance, as the sector underperformed Treasuries, corporates, and municipals. Furthermore, the Fund’s short duration curve positioning to the benchmark also slightly detracted from overall returns relative to the Bloomberg Barclays Municipal Bond Index. We continue to maintain this duration underweight in the Fund against the Bloomberg Barclays Municipal Bond Index.
Derivatives, such as futures contracts, were used in the Fund during the period, but did not have a material impact on performance during the period.
| 19 |
|
| Hartford Schroders Tax-Aware Bond Fund |
Fund Overview – (continued)
October 31, 2019 (Unaudited)
What is the outlook as of the end of the period?
We believe that markets will need to navigate various cross-currents in the coming months, including uncertainty with regard to trade, accommodative Fed policy amidst a cyclical slowdown, Brexit and theramp-up of the 2020 U.S. presidential election cycle. Our view is that risk assets will face some challenges ahead. In our view, this is particularly true as valuations in the credit and municipal sectors are now approaching the more expensive end of their cyclical range. In our view, there is ample liquidity in the markets at this time, which will likely keep fixed income assets supported; however, we believe it is difficult to see material appreciation from here absent a change in the underlying fundamentals.
Given the above views, we remain cautious on riskier segments of fixed income, and are hesitant to increase the Fund’s exposure to corporates. We also remain cautious on buying newtax-exempt municipals despite valuations becoming more attractive relative to Treasuries. We prefer MBS over othernon-Treasuries as valuations are near their cheapest levels of the post-crisis period. We believe fundamentals for MBS are also positive as debt growth in the mortgage market has significantly lagged that of the corporate market. We believe higher-quality fixed income products still offer value relative to other asset classes, especially in an environment where volatility is likely to remain high and central banks globally are continuing to embrace easy money.
Important Risks
Investing involves risk, including the possible loss of principal. Security prices fluctuate in value depending on general market and economic conditions and the prospects of individual companies.•Fixed income security risks include credit, liquidity, call, duration, and interest-rate risk. As interest rates rise, bond prices generally fall.•Mortgage-related and asset-backed securities’ risks include credit, interest-rate, prepayment, and extension risk.•Obligations of U.S. Government agencies are supported by varying degrees of credit but are generally not backed by the full faith and credit of the U.S. Government.•The purchase of securities in theTo-Be-Announced (TBA) market can result in additional price and counterparty risk.•Derivatives are generally more volatile and sensitive to changes in market or economic conditions than other securities; their risks include currency, leverage, liquidity, index, pricing, and counterparty risk.•Foreign investments may be more volatile and less liquid than U.S. investments and are subject to the risk of currency fluctuations and adverse political and economic developments.•Municipal securities may be adversely impacted by state/local, political, economic, or market conditions; these risks may be magnified if the Fund focuses its assets in municipal securities of issuers in a few select states. Investors may be subject to the federal Alternative Minimum Tax as well as state and local income taxes. Capital gains, if any, are taxable.•The Fund may have high portfolio turnover, which could increase its transaction costs and an investor’s tax liability.
Composition by Security Type(1)
as of October 31, 2019
| Category | Percentage of Net Assets | |||
Fixed Income Securities |
| |||
Corporate Bonds | 16.9 | % | ||
Municipal Bonds | 64.9 | |||
U.S. Government Agencies(2) | 10.9 | |||
U.S. Government Securities | 4.8 | |||
|
| |||
Total | 97.5 | % | ||
|
| |||
Short-Term Investments | 2.3 | |||
Other Assets & Liabilities | 0.2 | |||
|
| |||
Total | 100.0 | % | ||
|
| |||
| (1) | For Fund compliance purposes, the Fund may not use the same classification system. These classifications are used for financial reporting purposes. |
| (2) | All, or a portion of the securities categorized as U.S. Government Agencies, were agency mortgage backed securities as of October 31, 2019. |
| 20 |
|
| Hartford Schroders US MidCap Opportunities Fund (formerly, Hartford Schroders US Small/Mid Cap Opportunities Fund) |
Fund Overview
October 31, 2019 (Unaudited)
Inception 3/31/2006 Sub-advised by Schroder Investment Management North America Inc. | Investment objective – The Fund seeks capital appreciation. |
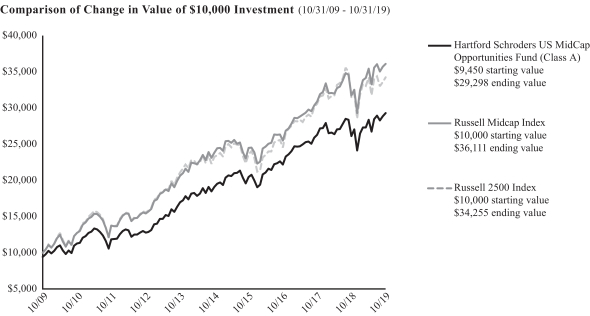
The chart above represents the hypothetical growth of a $10,000 investment in Class A, which includes a sales charge. Growth results in classes other than Class A will vary from what is seen above due to differences in the expenses charged to those share classes.
Average Annual Total Returns
for the Periods Ending 10/31/19
| 1 Year | 5 Years | 10 Years | ||||||||||
Class A1 | 12.12% | 8.90% | 11.98% | |||||||||
Class A2 | 5.92% | 7.68% | 11.35% | |||||||||
Class C1 | 11.29% | 8.49% | 11.92% | |||||||||
Class C2 | 10.29% | 8.49% | 11.92% | |||||||||
Class I1 | 12.41% | 9.17% | 12.27% | |||||||||
Class R31 | 11.69% | 8.76% | 12.06% | |||||||||
Class R41 | 12.09% | 8.97% | 12.16% | |||||||||
Class R51 | 12.32% | 9.14% | 12.25% | |||||||||
Class Y1 | 12.50% | 9.20% | 12.28% | |||||||||
Class F1 | 12.52% | 9.22% | 12.29% | |||||||||
Class SDR1 | 12.49% | 9.28% | 12.32% | |||||||||
Russell Midcap Index | 13.72% | 8.67% | 13.70% | |||||||||
Russell 2500 Index | 8.84% | 8.04% | 13.10% | |||||||||
| 1 | Without sales charge |
| 2 | With sales charge |
PERFORMANCE DATA QUOTED REPRESENTS PAST PERFORMANCE AND DOES NOT GUARANTEE FUTURE RESULTS. The investment return and principal value of the investment will fluctuate so that investors’ shares, when redeemed, may be worth more or less than their original cost. The chart and table do not reflect the deductions of taxes that a shareholder would pay on Fund distributions or the redemption of Fund shares. Current performance may be lower or higher than the performance data quoted. To obtain performance data current to the most recentmonth-end, please visit our website www.hartfordfunds.com.
The initial investment in Class A shares reflects the maximum sales charge of 5.50% and returns for Class C shares reflect a contingent deferred sales charge of up to 1.00% on shares redeemed within twelve months of purchase.
Total returns presented above were calculated using the Fund’s net asset value available to shareholders for sale or redemption of Fund shares on 10/31/19, which may exclude investment transactions as of this date. All share class returns assume the reinvestment of all distributions at net asset value and the deduction of all fund expenses.
Effective immediately before the opening of business on 10/24/16, the Schroder U.S. Small and Mid Cap Opportunities Fund (the “Predecessor Fund”) was reorganized into the Fund. The performance information shown for periods prior to 10/24/16 is that of the Predecessor Fund. Prior to 10/24/16, Class A, Class I and Class SDR were called Advisor Shares, Investor Shares and R6 Shares, respectively. Class C, Class R3, Class R4, Class R5, and Class Y shares commenced operations on 10/24/16 and performance prior to this date reflects the performance of the Predecessor Fund’s Investor Shares. Performance for Class SDR shares prior to 12/30/14 (the inception date of the Predecessor Fund’s Class R6 Shares) reflects the performance of the Predecessor Fund’s Investor Shares. Class F shares commenced operations on 2/28/17 and performance prior to that date is that of the Fund’s Class I shares. The returns would be different if the Fund’s fees and expenses were reflected for periods prior to 10/24/16.
Performance information prior to 5/1/19 reflect when the Fund invested at least 80% of its assets in securities of companies considered by the Fund’s sub-adviser to be small- or mid-cap companies located in the United States. Effective 5/1/19, the Fund changed its primary benchmark to Russell Midcap Index. The Fund’s former primary benchmark, Russell 2500 Index has become the Fund’s secondary benchmark. The Fund changed its benchmarks because Hartford Funds Management Company, LLC, the Fund’s investment manager, believes that the Russell Midcap Index better reflects the Fund’s revised investment strategy.
You cannot invest directly in an index.
See “Benchmark Glossary” for benchmark descriptions.
Performance information may reflect historical or current expense waivers/reimbursements without which performance would have been lower. For information on current expense waivers/reimbursements, please see the prospectus.
| 21 |
|
| Hartford Schroders US MidCap Opportunities Fund (formerly, Hartford Schroders US Small/Mid Cap Opportunities Fund) |
Fund Overview – (continued)
October 31, 2019 (Unaudited)
Operating Expenses*
| Gross | Net | |||||||
Class A | 1.32% | 1.32% | ||||||
Class C | 2.08% | 2.08% | ||||||
Class I | 1.05% | 1.05% | ||||||
Class R3 | 1.69% | 1.69% | ||||||
Class R4 | 1.39% | 1.39% | ||||||
Class R5 | 1.09% | 1.09% | ||||||
Class Y | 1.08% | 1.04% | ||||||
Class F | 0.97% | 0.97% | ||||||
Class SDR | 0.97% | 0.97% | ||||||
| * | Expenses as shown in the Fund’s prospectus dated 3/1/19. Gross expenses do not reflect contractual fee waivers or expense reimbursement arrangements. Net expenses reflect such arrangements only with respect to Class Y. Expenses shown include acquired fund fees and expenses. The Fund filed a prospectus supplement with the U.S. Securities and Exchange Commission on 8/8/19 that reflected changes to the Fund’s contractual investment management fee rate effective 11/1/19. The gross and net expense ratios shown in this supplement are as follows: 1.22% (Class A), 1.97% (Class C), 0.95% (Class I), 1.58% (Class R3), 1.28% (Class R4), 0.98% (Class R5), 0.97% (Class Y), 0.86% (Class F), and 0.86% (Class SDR). However, the information in this annual report is as of 10/31/19 and does not reflect these changes. Actual expenses may be higher or lower. Please see accompanying Financial Highlights for expense ratios for the year ended October 31, 2019. |
Portfolio Manager
Hartford Schroders US MidCap Opportunities Fund’ssub-adviser is Schroder Investment Management North America Inc.
Robert Kaynor, CFA
Portfolio Manager
Manager Discussion
How did the Fund perform during the period?
The Class A shares of the Hartford Schroders US MidCap Opportunities Fund returned 12.12%, before sales charge, for the twelve-month period ended October 31, 2019, underperforming the Fund’s primary benchmark, the Russell Midcap Index, which returned 13.72%, and underperforming the Fund’s secondary benchmark, the Russell 2500 Index, which returned 8.84%, for the same period. Effective May 1, 2019, the Fund changed its primary benchmark to Russell Midcap Index. The Fund’s former primary benchmark, Russell 2500 Index has become the Fund’s secondary benchmark. For the same period, the Class A shares of the Fund also outperformed the 10.16% average return of the LipperMid-Cap Core peer group, a group of funds with investment strategies similar to those of the Fund.
Why did the Fund perform this way?
During the twelve-month period, the U.S. economy remained fundamentally solid, in our view, with strong employment and consumer sentiment leading the way. The period was not without issues, though, particularly in the trade arena, which remains unsettled.
For the twelve-month period, nine of the ten sectors in the Russell Midcap Index delivered positive returns during the period. The lone exception was the Energy sector which in our view has had a horrific year. In the Fund, the strongest returns for the twelve-month period came from the Real Estate, Consumer Staples and Utilities sectors. The Real Estate (+40.21%), Consumer Staples (+24.51%), and Technology
(+19.86%) sectors were the strongest performers during the period. The Energy sector was the clear laggard, returning-26.59% over the period.
Effective May 1, 2019, the Fund modified its principal strategy. Prior to May 1, 2019, the Fund invested at least 80% of its assets in securities of companies considered by the Fund’ssub-adviser, Schroder Investment Management North America Inc., at the time to be small- ormid-cap companies located in the United States. Effective May 1, 2019, the Fund invests at least 80% of its assets in securities ofmid-cap companies located in the United States. For the six months from November 1, 2018 to April 30, 2019, Class A shares of the Fund, before sales charge, returned 8.61% underperforming the Russell 2500 Index, which returned 8.76% for the same period.*
For the ensuing six months (May 1, 2019 to October 31, 2019), Class A shares of the Fund, before sales charge, returned 3.23%, outperforming the Russell Midcap Index, which returned 1.86% for the same period.** On a more granular level, the Fund’s fiscal year began with a very shaky period in the last two months of 2018. At this point, the market was declining sharply. (By way of contrast, the first eight months of 2018 had been strong.) At the beginning of 2019, the market experienced a strong first calendar quarter, followed by more moderate returns in the second and third calendar quarters and in the month of October. However, there
| * | Class A shares, with sales charges, returned 2.61% for the six months from November 1, 2018 to April 30, 2019. |
| ** | Class A shares, with sales charges, returned-2.47% for the six months from May 1, 2019 to October 31, 2019 |
| 22 |
|
| Hartford Schroders US MidCap Opportunities Fund (formerly, Hartford Schroders US Small/Mid Cap Opportunities Fund) |
Fund Overview – (continued)
October 31, 2019 (Unaudited)
was a notable shift in market factors during the third quarter of 2019 when the value factor started to show signs of life after underperforming the growth factor for a significant period of time. The market returns for the first 10 months of 2019 were strong, with many indices achieving returns approaching 20.0%.
For the first six months of the reporting period when the Fund used the Russell 2500 Index as its benchmark, the Healthcare sector was the strongest contributor to relative performance due to the Fund’s holdings in the medical and dental instrument industry. Dentsply Sirona benefited from corporate restructuring, which has begun to show positive momentum. Conversely, a major detractor from relative performance was the Fund’s cash position, which created a portfolio drag given the strong rising markets in the first quarter of 2019.
For the second six months when the Russell Midcap Index was the Fund’s primary benchmark, we saw strong positive contributions from the Consumer Discretionary, Producer Durables and Energy sectors (in the case of the Energy sector, the positive contribution was driven by the Fund’s underweight in this poorly performing sector). Aramark was the Fund’s strongest contributor in the Consumer Discretionary sector; Fortune Brands, which has benefited from new housing demand, was also a strong contributor. Assurant, Inc., a property-casualty insurer, benefited due to a better pricing environment. On the other hand, Teradata, a database provider, reported disappointing earnings during this period, which negatively affected the stock price. However, as of the end of the period, the Fund continued to hold the company.
Top contributors to performance relative to the Russell Midcap Index during the twelve-month period ended October 31, 2019 included Entegris, Inc. (Technology), Dentsply Sirona, Inc. (Health Care) and Crown Holdings, Inc. (Producer Durables). Entegris supplies specialty materials to semiconductor manufacturers. Strong organic demand growth for semiconductor chips was a boost for the company. Dental supplier Dentsply Sirona benefited from corporate restructuring, as discussed above. Crown Holdings, a provider of cans and bottles for the food and beverage industries, issued anin-line earnings report. Additionally, investors responded well to the company’s free cash flow projections for 2019, which is expected to keep the company on track for its 2019 debt reduction target.
The largest detractors from performance during the twelve-month period ended October 31, 2019 were Nordstrom (Consumer Discretionary), Parsley Energy, Inc. (Energy), and Gulfport Energy Corporation (Energy). The price of department store Nordstrom’s stock has suffered as the company has been making significant investments in the business, which has had a negative impact on reported earnings. Additionally, sales comparisons in the company’s “brick and mortar” business have been lackluster. Parsley Energy and Gulfport Energy were both negatively affected by the declining energy prices and overall downward movement of stock prices across the board in exploration and production equities.
Derivatives were not used in a significant manner in the Fund during the period and did not have a material impact on performance during the period.
What is the outlook as of the end of the period?
We believe trade, politics, and central bank policy (in that order) should continue to dictate the willingness of both investors and corporations to deploy capital.
The market volatility experienced in 2019 can be mostly attributed to the ebbs and flows of the ongoing U.S.-China trade disputes and expected accommodation from the U.S. Federal Reserve (Fed). Regarding the latter, we suspect that monetary policy has slowly transitioned from the driver of risk appetite to the stabilizer of risk appetite. We believe the opportunity for the Fed to disappoint the market is greatly diminished.
We believe fixed capital investment has been weaker due to uncertainty surrounding manufacturing activity. Regardless, the markets seem to be discounting a bottom in the manufacturing economy as we see cyclical companies look past bad news in anticipation of a recovery ahead.
What has not surprised us is the health of the U.S. consumer. An extended period of improving employment, modest wage increases, and healthy balance sheets, coupled with declining interest rates has provided a very favorable backdrop for the U.S. consumer (which still represents 70% of the U.S. gross domestic product, or GDP). In order for this economy to remain on solid footing, we believe it is critical that consumer confidence remains unwavering.
Important Risks
Investing involves risk, including the possible loss of principal. Security prices fluctuate in value depending on general market and economic conditions and the prospects of individual companies.•Mid-cap securities can have greater risks and volatility thanlarge-cap securities.•The main risk of real estate related securities is that the value of the underlying real estate may decrease in value.
Composition by Sector(1)
as of October 31, 2019
| Sector | Percentage of Net Assets | |||
Equity Securities | ||||
Consumer Discretionary | 12.9 | % | ||
Consumer Staples | 1.1 | |||
Energy | 1.4 | |||
Financials | 17.4 | |||
Health Care | 10.8 | |||
Industrials | 13.8 | |||
Information Technology | 19.8 | |||
Materials | 5.9 | |||
Real Estate | 7.9 | |||
Utilities | 4.3 | |||
|
| |||
Total | 95.3 | % | ||
|
| |||
Short-Term Investments | 6.6 | |||
Other Assets & Liabilities | (1.9 | ) | ||
|
| |||
Total | 100.0 | % | ||
|
| |||
| (1) | A sector may be comprised of several industries. For Fund compliance purposes, the Fund may not use the same classification system. These sector classifications are used for financial reporting purposes. |
| 23 |
|
| Hartford Schroders US Small Cap Opportunities Fund |
Fund Overview
October 31, 2019 (Unaudited)
Inception 8/6/1993 Sub-advised by Schroder Investment Management North America Inc. | Investment objective – The Fund seeks capital appreciation. |
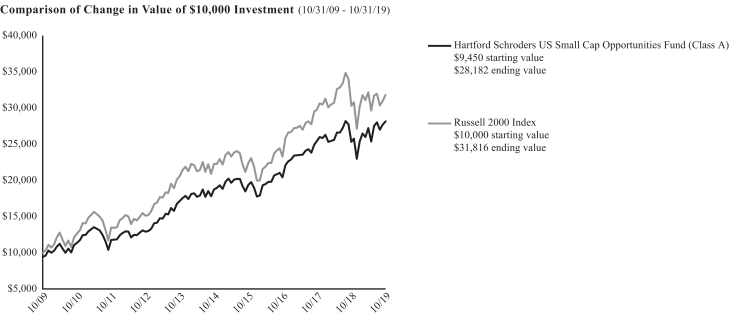
The chart above represents the hypothetical growth of a $10,000 investment in Class A, which includes a sales charge. Growth results in classes other than Class A will vary from what is seen above due to differences in the expenses charged to those share classes.
Average Annual Total Returns
(as of 10/31/19)
| 1 Year | 5 Years | 10 Years | ||||||||||
Class A1 | 11.21% | 8.50% | 11.55% | |||||||||
Class A2 | 5.08% | 7.28% | 10.92% | |||||||||
Class C1 | 10.43% | 8.12% | 11.51% | |||||||||
Class C2 | 9.43% | 8.12% | 11.51% | |||||||||
Class I1 | 11.59% | 8.81% | 11.86% | |||||||||
Class R31 | 10.90% | 8.48% | 11.69% | |||||||||
Class R41 | 11.33% | 8.69% | 11.80% | |||||||||
Class R51 | 11.56% | 8.79% | 11.85% | |||||||||
Class Y1 | 11.62% | 8.84% | 11.88% | |||||||||
Class F1 | 11.69% | 8.86% | 11.89% | |||||||||
Class SDR1 | 11.67% | 8.89% | 11.90% | |||||||||
Russell 2000 Index | 4.90% | 7.37% | 12.27% | |||||||||
| 1 | Without sales charge |
| 2 | With sales charge |
PERFORMANCE DATA QUOTED REPRESENTS PAST PERFORMANCE AND DOES NOT GUARANTEE FUTURE RESULTS. The investment return and principal value of the investment will fluctuate so that investors’ shares, when redeemed, may be worth more or less than their original cost. The chart and table do not reflect the deductions of taxes that a shareholder would pay on Fund distributions or the redemption of Fund shares. Current performance may be lower or higher than the performance data quoted. To obtain performance data current to the most recentmonth-end, please visit our website www.hartfordfunds.com.
The initial investment in Class A shares reflects the maximum sales charge of 5.50% and returns for Class C shares reflect a contingent deferred sales charge of up to 1.00% on shares redeemed within twelve months of purchase.
Total returns presented above were calculated using the Fund’s net asset value available to shareholders for sale or redemption of Fund shares on 10/31/19, which may exclude investment transactions as of this date. All share class returns assume the reinvestment of all distributions at net asset value and the deduction of all fund expenses.
Effective immediately before the opening of business on 10/24/16, the Schroder U.S. Opportunities Fund (the “Predecessor Fund”) was reorganized into the Fund. The performance information shown for periods prior to 10/24/16 is that of the Predecessor Fund. Prior to 10/24/16, Class A, Class I and Class SDR were called Advisor Shares, Investor Shares and R6 Shares, respectively. Class C, Class R3, Class R4, Class R5, and Class Y shares commenced operations on 10/24/16 and performance prior to this date reflects the performance of the Predecessor Fund’s Investor Shares. Performance for Class SDR shares prior to 9/28/15 (the inception date of the Predecessor Fund’s Class R6 Shares) reflects the performance of the Predecessor Fund’s Investor Shares. Class F shares commenced operations on 2/28/17 and performance prior to that date is that of the Fund’s Class I shares. The returns would be different if the Fund’s fees and expenses were reflected for periods prior to 10/24/16.
You cannot invest directly in an index.
See “Benchmark Glossary” for benchmark descriptions.
Performance information may reflect historical or current expense waivers/reimbursements without which performance would have been lower. For information on current expense waivers/reimbursements, please see the prospectus.
| 24 |
|
| Hartford Schroders US Small Cap Opportunities Fund |
Fund Overview – (continued)
October 31, 2019 (Unaudited)
Operating Expenses*
| Gross | Net | |||||||
Class A | 1.50% | 1.42% | ||||||
Class C | 2.25% | 2.17% | ||||||
Class I | 1.19% | 1.17% | ||||||
Class R3 | 1.82% | 1.72% | ||||||
Class R4 | 1.52% | 1.42% | ||||||
Class R5 | 1.22% | 1.12% | ||||||
Class Y | 1.21% | 1.12% | ||||||
Class F | 1.10% | 1.02% | ||||||
Class SDR | 1.10% | 1.02% | ||||||
| * | Expenses as shown in the Fund’s most recent prospectus. Gross expenses do not reflect contractual expense reimbursement arrangements. Net expenses reflect such arrangements in instances when they reduce gross expenses. These arrangements remain in effect until 2/29/20 unless the Fund’s Board of Directors approves an earlier termination. Expenses shown include acquired fund fees and expenses. Actual expenses may be higher or lower. Please see accompanying Financial Highlights for expense ratios for the year ended October 31, 2019. |
Portfolio Manager
Hartford Schroders US Small Cap Opportunities Fund’ssub-adviser is Schroder Investment Management North America Inc.
Robert Kaynor, CFA
Portfolio Manager
Manager Discussion
How did the Fund perform during the period?
The Class A shares of the Hartford Schroders US Small Cap Opportunities Fund returned 11.21%, before sales charge, for the twelve-month period ended October 31, 2019, outperforming the Fund’s benchmark, the Russell 2000 Index, which returned 4.90% for the same period. For the same period, Class A shares of the Fund also outperformed the 4.93% average return of the LipperSmall-Cap Core peer group, a group of funds with investment strategies similar to those of the Fund.
Why did the Fund perform this way?
U.S. small capitalization equities, as measured by the Russell 2000 Index, rose over the twelve-month period ended October 31, 2019. During this twelve-month period, we saw the U.S. economy remain fundamentally solid; however, there were notable changes in market leadership that occurred throughout the year. The Fund’s fiscal year began with a very shaky market environment in the last two months of 2018. After a robust first eight months of 2018, the market began to weaken, and by the fourth quarter of 2018, the market was in retreat. Trade issues were a primary driver for the markets, along with rising concerns about a potential recession; however, this event has fortuitously not come to pass as of the end of the period.
The market experienced a strong first calendar quarter of 2019, followed by more moderate returns in the second and third calendar quarters of 2019 and the month of October 2019. However, there was a notable shift in market factors during third calendar quarter of 2019 when the value factor started to show signs of life after underperforming the growth factor for a significant period of time.
Seven of the ten sectors within the Russell 2000 Index posted positive returns during the period. The Technology (+19.00%), Real Estate (+17.41%), and Utilities (+13.34%) sectors were the strongest performers for during the period. The Energy sector was the clear laggard relative to the Russell 2000 Index, declining-40.76% over the period. Both security selection and allocation added to the Fund’s performance versus the Russell 2000 Index during the period. Stock selection was strongest within the Technology, Producer Durables and Healthcare sectors. The Fund’s holdings only underperformed relative to the Russell 2000 Index in the Consumer Discretionary sector. Sector allocation, a result of the Fund’sbottom-up stock selection, was a positive contributor to returns relative to the Russell 2000 Index over the period, driven by underweights in the Energy and Healthcare sectors.
Top contributors to performance relative to the Russell 2000 Index during the period included Entegris, Inc. (Technology), Palomar Holdings, Inc. (Financial Services), and Generac Holdings Inc. (Producer Durables). Entegris supplies specialty materials to semiconductor manufacturers. Strong organic demand growth for semiconductor chips has been a tailwind for the company. Palomar, a property/casualty company, saw a strong rise in its stock price following its initial public offering (in April 2019), as the company reported a series of positive earnings announcements that beat consensus expectations. Generac, a manufacturer of generators, had benefited from increased demand, especially on the West Coast of the U.S. due to decreasing reliability of traditional electric power suppliers.
The largest detractors from performance relative to the Russell 2000 Index were PlayAGS, Inc. (Consumer Discretionary), Cooper-Standard Holdings Inc. (Consumer Discretionary), and Hudson Ltd. Class A (Consumer Discretionary). PlayAGS designs and manufactures
| 25 |
|
| Hartford Schroders US Small Cap Opportunities Fund |
Fund Overview – (continued)
October 31, 2019 (Unaudited)
electronic gaming machines and reported a significant miss in their quarterly earnings report. Management of the company identified softness in their Oklahoma casinos as the source of the underperformance. Cooper-Standard manufactures sealing, fluid transfer and related components and systems primarily for use in passenger autos and light trucks. The company reported disappointing earnings yet maintained their full year guidance. We added to the position during the period. Hudson is a retailer whose stock declined early in the year with the departure of the CEO (since replaced).
Derivatives were not used in a significant manner in the Fund during the period and did not have a material impact on performance during the period.
What is the outlook as of the end of the period?
We believe trade, politics, and central bank policy (in that order) should continue to dictate the willingness of both investors and corporations to deploy capital.
The market volatility experienced in 2019 can be mostly attributed to the ebbs and flows of the ongoing U.S.-China trade disputes and expected accommodation from the U.S. Federal Reserve (Fed). Regarding the latter, we suspect that monetary policy has slowly transitioned from the driver of risk appetite to the stabilizer of risk appetite. We believe the opportunity for the Fed to disappoint the market is greatly diminished.
We believe fixed capital investment is being stifled in a period of manufacturing uncertainty. Regardless, the markets seem to be discounting a bottom in the manufacturing economy as we see cyclical companies look past bad news in anticipation of a recovery ahead.
What has not surprised us is the health of the U.S. consumer. An extended period of improving employment, modest wage increases, and healthy balance sheets, coupled with declining interest rates has provided a very favorable backdrop for the U.S. consumer (which still represents 70% of the U.S. gross domestic product, or GDP). In order for this economy to remain on solid footing, we believe it is critical that consumer confidence remains unwavering.
Important Risks
Investing involves risk, including the possible loss of principal. Security prices fluctuate in value depending on general market and economic conditions and the prospects of individual companies.•Small-cap securities can have greater risks and volatility thanlarge-cap securities.•The main risk of real estate related securities is that the value of the underlying real estate may decrease in value.
Composition by Sector(1)
as of October 31, 2019
| Sector | Percentage of Net Assets | |||
Equity Securities | ||||
Communication Services | 1.9 | % | ||
Consumer Discretionary | 15.5 | |||
Consumer Staples | 2.7 | |||
Energy | 0.9 | |||
Financials | 20.4 | |||
Health Care | 8.7 | |||
Industrials | 16.8 | |||
Information Technology | 15.6 | |||
Materials | 5.6 | |||
Real Estate | 4.9 | |||
Utilities | 2.3 | |||
|
| |||
Total | 95.3 | % | ||
|
| |||
Short-Term Investments | 8.4 | |||
Other Assets & Liabilities | (3.7 | ) | ||
|
| |||
Total | 100.0 | % | ||
|
| |||
| (1) | A sector may be comprised of several industries. For Fund compliance purposes, the Fund may not use the same classification system. These sector classifications are used for financial reporting purposes. |
| 26 |
|
| Hartford Schroders Funds |
Benchmark Glossary (Unaudited)
Bloomberg Barclays Municipal Bond Index(reflects no deduction for fees, expenses or taxes) is designed to cover theUSD-denominated long-term tax exempt bond market.
ICE BofAML US ABS & CMBS Index (reflects no deduction for fees, expenses or taxes) tracks the performance of US dollar denominated investment grade fixed and floating rate asset backed securities and fixed rate commercial mortgage backed securities publicly issued in the US domestic market. Qualifying securities must have an investment grade rating (based on an average of Moody’s, S&P and Fitch), at least one year remaining term to final stated maturity and at least one month to the last expected cash flow. 144a securities qualify for inclusion in the Index. Callable perpetual securities qualify provided they are at least one year from the first call date. Inverse floating rate, interest only and principal only tranches of qualifying deals are excluded from the Index as are all tranches ofre-securitized deals.
JP Morgan CEMBI Broad Diversified Index(reflects no deduction for fees, expenses or taxes)tracks total returns of U.S. dollar denominated debt instruments issued by corporate entities in Emerging Markets countries.
JP Morgan EMBI Global Diversified Index(reflects no deduction for fees, expenses or taxes) is a uniquely weighted index that tracks total returns for U.S. dollar denominated Brady bonds, Eurobonds, traded loans and local market debt instruments issued by sovereign and quasi-sovereign entities.
JP Morgan GBI Emerging Markets Global Diversified Index(reflects no deduction for fees, expenses or taxes) is a comprehensive global local emerging markets index that consists of regularly traded, liquid fixed-rate, domestic-currency government bonds to which international investors can gain exposure.
MSCI ACWI ex USA Index (Net)(reflects reinvested dividends net of withholding taxes but reflects no deduction for fees, expenses or other taxes)is designed to capture large and mid cap representation across developed markets (excluding the United States) and emerging market countries.
MSCI ACWI ex USA Value Index (Net)(reflects reinvested dividends net of withholding taxes but reflects no deduction for fees, expenses or other taxes) is designed to capture large and mid cap securities exhibiting overall value style characteristics across developed (excluding the U.S.) and emerging market countries. The value investment style characteristics for index construction are defined using three variables: book value to price,12-month forward earnings to price and dividend yield.
MSCI Emerging Markets Index (Net)(reflects reinvested dividends net of withholding taxes but reflects no deduction for fees, expenses or other taxes) is designed to capture large and mid cap representation across emerging market countries.
Russell 2000 Index (reflects no deduction for fees, expenses or taxes) is an index comprised of 2,000 of the smallest U.S.-domiciled company common stocks based on a combination of their market capitalization and current index membership.
Russell 2500 Index(reflects no deduction for fees, expenses or taxes) is designed to measure the performance of the small tomid-cap segment of the U.S. equity universe, commonly referred to as “smid” cap. The Russell 2500 Index is a subset of the Russell 3000 Index and includes approximately 2,500 of the smallest U.S. companies based on a combination of their market capitalization and current index membership.
Russell Midcap Index (reflects no deduction for fees, expenses or taxes) is designed to measure the performance of the mid-cap segment of the U.S. equity universe. The Russell Midcap Index is a subset of the Russell 1000 Index. It includes approximately 800 of the smallest securities based on a combination of their market cap and current index membership.
S&P/LSTA Leveraged Loan Index(reflects no deduction for fees, expenses or taxes) is a market-value-weighted index that is designed to measure the performance of the U.S. leveraged loan market based upon market weightings, spreads and interest payments.
BLOOMBERG® is a trademark and service mark of Bloomberg Finance L.P. and its affiliates (collectively “Bloomberg”). BARCLAYS® is a trademark and service mark of Barclays Bank Plc (collectively with its affiliates, “Barclays”), used under license. Bloomberg or Bloomberg’s licensors, including Barclays, own all proprietary rights in the Bloomberg Barclays Indices. Neither Bloomberg nor Barclays approves or endorses this material, or guarantees the accuracy or completeness of any information herein, or makes any warranty, express or implied, as to the results to be obtained therefrom and, to the maximum extent allowed by law, neither shall have any liability or responsibility for injury or damages arising in connection therewith.
| 27 |
|
| Hartford Schroders Funds |
Your Fund’s Expenses
As a shareholder of a Fund, you incur two types of costs: (1) transaction costs, including sales charges (loads) on purchase payments, if any, and contingent deferred sales charges (CDSC), if any, and (2) ongoing costs, including investment management fees, distribution and/or service(12b-1) fees, if any, and other fund expenses. This example is intended to help you understand your ongoing costs (in dollars) of investing in a Fund and to compare these costs with the ongoing costs of investing in other mutual funds. The example is based on an investment of $1,000 invested at the beginning of the period and held for the entire period of May 1, 2019 through October 31, 2019. To the extent a Fund was subject to acquired fund fees and expenses during the period, acquired fund fees and expenses are not included in the annualized expense ratios below.
Actual Expenses
The first set of columns of the table below provides information about actual account values and actual expenses. You may use this information, together with the amount you invested, to estimate the expenses that you paid over the period. Simply divide your account value by $1,000 (for example, an $8,600 account value divided by $1,000 = 8.6), then multiply the result by the number in the line under the heading entitled “Expenses Paid During The Period” to estimate the expenses you paid on your account during this period.
Hypothetical Example for Comparison Purposes
The second set of columns of the table below provides information about hypothetical account values and hypothetical expenses based on a Fund’s actual expense ratio and an assumed rate of return of 5% per year before expenses, which is not the Fund’s actual return. The hypothetical account values and expenses may not be used to estimate the actual ending account balance or expenses you paid for the period. You may use this information to compare the ongoing costs of investing in a Fund and other funds. To do so, compare this 5% hypothetical example with the 5% hypothetical examples that appear in the shareholder reports of the other funds.
Please note that the expenses shown in the table are meant to highlight your ongoing costs only and do not reflect any transactional costs, such as sales charges (front-end sales loads and CDSC). Therefore, the second set of columns of the table is useful in comparing ongoing costs only, and will not help you determine the relative total costs of owning different funds. In addition, if these transactional costs were included, your costs would be higher. Expenses for a class of a Fund are equal to the class’ annualized expense ratio multiplied by average account value over the period, multiplied by 184/365 (to reflect theone-half year period).
| Actual Return | Hypothetical (5% return before expenses) | |||||||||||||||||||||||||||
| Beginning Account Value May 1, 2019 | Ending Account Value October 31, 2019 | Expenses paid during the period May 1, 2019 through October 31, 2019 | Beginning Account Value May 1, 2019 | Ending Account Value October 31, 2019 | Expenses paid during the period May 1, 2019 through October 31, 2019 | Annualized expense ratio | ||||||||||||||||||||||
Hartford Schroders Emerging Markets Equity Fund |
| |||||||||||||||||||||||||||
Class A | $ | 1,000.00 | $ | 1,005.10 | $ | 7.43 | $ | 1,000.00 | $ | 1,017.80 | $ | 7.48 | 1.47 | % | ||||||||||||||
Class C | $ | 1,000.00 | $ | 1,001.90 | $ | 11.00 | $ | 1,000.00 | $ | 1,014.22 | $ | 11.07 | 2.18 | % | ||||||||||||||
Class I | $ | 1,000.00 | $ | 1,006.40 | $ | 6.27 | $ | 1,000.00 | $ | 1,018.96 | $ | 6.31 | 1.24 | % | ||||||||||||||
Class R3 | $ | 1,000.00 | $ | 1,003.80 | $ | 8.74 | $ | 1,000.00 | $ | 1,016.48 | $ | 8.79 | 1.73 | % | ||||||||||||||
Class R4 | $ | 1,000.00 | $ | 1,010.90 | $ | 2.43 | $ | 1,000.00 | $ | 1,022.79 | $ | 2.45 | 0.48 | % | ||||||||||||||
Class R5 | $ | 1,000.00 | $ | 1,007.00 | $ | 6.07 | $ | 1,000.00 | $ | 1,019.16 | $ | 6.11 | 1.20 | % | ||||||||||||||
Class Y | $ | 1,000.00 | $ | 1,006.40 | $ | 5.97 | $ | 1,000.00 | $ | 1,019.26 | $ | 6.01 | 1.18 | % | ||||||||||||||
Class F | $ | 1,000.00 | $ | 1,007.70 | $ | 5.41 | $ | 1,000.00 | $ | 1,019.81 | $ | 5.45 | 1.07 | % | ||||||||||||||
Class SDR | $ | 1,000.00 | $ | 1,007.60 | $ | 5.41 | $ | 1,000.00 | $ | 1,019.81 | $ | 5.45 | 1.07 | % | ||||||||||||||
Hartford Schroders Emerging Markets Multi-Sector Bond Fund |
| |||||||||||||||||||||||||||
Class A | $ | 1,000.00 | $ | 1,027.60 | $ | 5.52 | $ | 1,000.00 | $ | 1,019.76 | $ | 5.50 | 1.08 | % | ||||||||||||||
Class C | $ | 1,000.00 | $ | 1,023.20 | $ | 9.69 | $ | 1,000.00 | $ | 1,015.63 | $ | 9.65 | 1.90 | % | ||||||||||||||
Class I | $ | 1,000.00 | $ | 1,029.10 | $ | 4.19 | $ | 1,000.00 | $ | 1,021.07 | $ | 4.18 | 0.82 | % | ||||||||||||||
Class R3 | $ | 1,000.00 | $ | 1,028.80 | $ | 4.14 | $ | 1,000.00 | $ | 1,021.12 | $ | 4.13 | 0.81 | % | ||||||||||||||
Class R4 | $ | 1,000.00 | $ | 1,027.60 | $ | 4.14 | $ | 1,000.00 | $ | 1,021.12 | $ | 4.13 | 0.81 | % | ||||||||||||||
Class R5 | $ | 1,000.00 | $ | 1,028.10 | $ | 4.14 | $ | 1,000.00 | $ | 1,021.12 | $ | 4.13 | 0.81 | % | ||||||||||||||
Class Y | $ | 1,000.00 | $ | 1,028.30 | $ | 3.94 | $ | 1,000.00 | $ | 1,021.32 | $ | 3.92 | 0.77 | % | ||||||||||||||
Class F | $ | 1,000.00 | $ | 1,028.50 | $ | 3.83 | $ | 1,000.00 | $ | 1,021.43 | $ | 3.82 | 0.75 | % | ||||||||||||||
Class SDR | $ | 1,000.00 | $ | 1,028.40 | $ | 3.83 | $ | 1,000.00 | $ | 1,021.43 | $ | 3.82 | 0.75 | % | ||||||||||||||
| 28 |
|
| Hartford Schroders Funds |
Expense Examples (Unaudited) – (continued)
| Actual Return | Hypothetical (5% return before expenses) | |||||||||||||||||||||||||||
| Beginning Account Value May 1, 2019 | Ending Account Value October 31, 2019 | Expenses paid during the period May 1, 2019 through October 31, 2019 | Beginning Account Value May 1, 2019 | Ending Account Value October 31, 2019 | Expenses paid during the period May 1, 2019 through October 31, 2019 | Annualized expense ratio | ||||||||||||||||||||||
Hartford Schroders InternationalMulti-Cap Value Fund |
| |||||||||||||||||||||||||||
Class A | $ | 1,000.00 | $ | 1,002.70 | $ | 5.81 | $ | 1,000.00 | $ | 1,019.41 | $ | 5.85 | 1.15 | % | ||||||||||||||
Class C | $ | 1,000.00 | $ | 998.80 | $ | 9.37 | $ | 1,000.00 | $ | 1,015.83 | $ | 9.45 | 1.86 | % | ||||||||||||||
Class I | $ | 1,000.00 | $ | 1,004.00 | $ | 4.34 | $ | 1,000.00 | $ | 1,020.87 | $ | 4.38 | 0.86 | % | ||||||||||||||
Class R3 | $ | 1,000.00 | $ | 1,000.90 | $ | 7.51 | $ | 1,000.00 | $ | 1,017.69 | $ | 7.58 | 1.49 | % | ||||||||||||||
Class R4 | $ | 1,000.00 | $ | 1,002.40 | $ | 6.21 | $ | 1,000.00 | $ | 1,019.01 | $ | 6.26 | 1.23 | % | ||||||||||||||
Class R5 | $ | 1,000.00 | $ | 1,003.80 | $ | 4.44 | $ | 1,000.00 | $ | 1,020.77 | $ | 4.48 | 0.88 | % | ||||||||||||||
Class Y | $ | 1,000.00 | $ | 1,004.30 | $ | 4.09 | $ | 1,000.00 | $ | 1,021.12 | $ | 4.13 | 0.81 | % | ||||||||||||||
Class F | $ | 1,000.00 | $ | 1,004.50 | $ | 3.84 | $ | 1,000.00 | $ | 1,021.37 | $ | 3.87 | 0.76 | % | ||||||||||||||
Class SDR | $ | 1,000.00 | $ | 1,004.50 | $ | 3.89 | $ | 1,000.00 | $ | 1,021.32 | $ | 3.92 | 0.77 | % | ||||||||||||||
Hartford Schroders International Stock Fund |
| |||||||||||||||||||||||||||
Class A | $ | 1,000.00 | $ | 1,017.30 | $ | 5.85 | $ | 1,000.00 | $ | 1,019.41 | $ | 5.85 | 1.15 | % | ||||||||||||||
Class C | $ | 1,000.00 | $ | 1,013.20 | $ | 9.54 | $ | 1,000.00 | $ | 1,015.73 | $ | 9.55 | 1.88 | % | ||||||||||||||
Class I | $ | 1,000.00 | $ | 1,019.60 | $ | 4.28 | $ | 1,000.00 | $ | 1,020.97 | $ | 4.28 | 0.84 | % | ||||||||||||||
Class R3 | $ | 1,000.00 | $ | 1,016.30 | $ | 6.96 | $ | 1,000.00 | $ | 1,018.30 | $ | 6.97 | 1.37 | % | ||||||||||||||
Class R4 | $ | 1,000.00 | $ | 1,017.90 | $ | 5.39 | $ | 1,000.00 | $ | 1,019.86 | $ | 5.40 | 1.06 | % | ||||||||||||||
Class R5 | $ | 1,000.00 | $ | 1,019.50 | $ | 3.92 | $ | 1,000.00 | $ | 1,021.32 | $ | 3.92 | 0.77 | % | ||||||||||||||
Class Y | $ | 1,000.00 | $ | 1,019.50 | $ | 4.33 | $ | 1,000.00 | $ | 1,020.92 | $ | 4.33 | 0.85 | % | ||||||||||||||
Class F | $ | 1,000.00 | $ | 1,019.50 | $ | 3.82 | $ | 1,000.00 | $ | 1,021.43 | $ | 3.82 | 0.75 | % | ||||||||||||||
Class SDR | $ | 1,000.00 | $ | 1,019.50 | $ | 3.82 | $ | 1,000.00 | $ | 1,021.43 | $ | 3.82 | 0.75 | % | ||||||||||||||
Hartford Schroders Securitized Income Fund |
| |||||||||||||||||||||||||||
Class A | $ | 1,000.00 | $ | 1,014.90 | $ | 5.13 | $ | 1,000.00 | $ | 1,020.11 | $ | 5.14 | 1.01 | % | ||||||||||||||
Class I | $ | 1,000.00 | $ | 1,015.20 | $ | 5.28 | $ | 1,000.00 | $ | 1,019.96 | $ | 5.30 | 1.04 | % | ||||||||||||||
Class Y | $ | 1,000.00 | $ | 1,015.60 | $ | 4.72 | $ | 1,000.00 | $ | 1,020.52 | $ | 4.74 | 0.93 | % | ||||||||||||||
Class F | $ | 1,000.00 | $ | 1,014.90 | $ | 4.57 | $ | 1,000.00 | $ | 1,020.67 | $ | 4.58 | 0.90 | % | ||||||||||||||
Class SDR | $ | 1,000.00 | $ | 1,016.10 | $ | 4.47 | $ | 1,000.00 | $ | 1,020.77 | $ | 4.48 | 0.88 | % | ||||||||||||||
Hartford SchrodersTax-Aware Bond Fund |
| |||||||||||||||||||||||||||
Class A | $ | 1,000.00 | $ | 1,035.10 | $ | 3.64 | $ | 1,000.00 | $ | 1,021.63 | $ | 3.62 | 0.71 | % | ||||||||||||||
Class C | $ | 1,000.00 | $ | 1,031.30 | $ | 7.94 | $ | 1,000.00 | $ | 1,017.39 | $ | 7.88 | 1.55 | % | ||||||||||||||
Class I | $ | 1,000.00 | $ | 1,035.40 | $ | 2.51 | $ | 1,000.00 | $ | 1,022.74 | $ | 2.50 | 0.49 | % | ||||||||||||||
Class Y | $ | 1,000.00 | $ | 1,035.90 | $ | 2.98 | $ | 1,000.00 | $ | 1,022.28 | $ | 2.96 | 0.58 | % | ||||||||||||||
Class F | $ | 1,000.00 | $ | 1,036.40 | $ | 2.36 | $ | 1,000.00 | $ | 1,022.89 | $ | 2.35 | 0.46 | % | ||||||||||||||
Class SDR | $ | 1,000.00 | $ | 1,036.50 | $ | 2.36 | $ | 1,000.00 | $ | 1,022.89 | $ | 2.35 | 0.46 | % | ||||||||||||||
Hartford Schroders US MidCap Opportunities Fund |
| |||||||||||||||||||||||||||
Class A | $ | 1,000.00 | $ | 1,032.30 | $ | 6.51 | $ | 1,000.00 | $ | 1,018.80 | $ | 6.46 | 1.27 | % | ||||||||||||||
Class C | $ | 1,000.00 | $ | 1,027.70 | $ | 10.32 | $ | 1,000.00 | $ | 1,015.02 | $ | 10.26 | 2.02 | % | ||||||||||||||
Class I | $ | 1,000.00 | $ | 1,033.00 | $ | 5.18 | $ | 1,000.00 | $ | 1,020.11 | $ | 5.14 | 1.01 | % | ||||||||||||||
Class R3 | $ | 1,000.00 | $ | 1,029.40 | $ | 8.75 | $ | 1,000.00 | $ | 1,016.59 | $ | 8.69 | 1.71 | % | ||||||||||||||
Class R4 | $ | 1,000.00 | $ | 1,031.20 | $ | 6.96 | $ | 1,000.00 | $ | 1,018.35 | $ | 6.92 | 1.36 | % | ||||||||||||||
Class R5 | $ | 1,000.00 | $ | 1,031.70 | $ | 6.09 | $ | 1,000.00 | $ | 1,019.21 | $ | 6.06 | 1.19 | % | ||||||||||||||
Class Y | $ | 1,000.00 | $ | 1,033.00 | $ | 5.07 | $ | 1,000.00 | $ | 1,020.22 | $ | 5.04 | 0.99 | % | ||||||||||||||
Class F | $ | 1,000.00 | $ | 1,033.00 | $ | 4.82 | $ | 1,000.00 | $ | 1,020.47 | $ | 4.79 | 0.94 | % | ||||||||||||||
Class SDR | $ | 1,000.00 | $ | 1,033.60 | $ | 4.82 | $ | 1,000.00 | $ | 1,020.47 | $ | 4.79 | 0.94 | % | ||||||||||||||
Hartford Schroders US Small Cap Opportunities Fund |
| |||||||||||||||||||||||||||
Class A | $ | 1,000.00 | $ | 1,033.80 | $ | 6.92 | $ | 1,000.00 | $ | 1,018.40 | $ | 6.87 | 1.35 | % | ||||||||||||||
Class C | $ | 1,000.00 | $ | 1,030.20 | $ | 10.75 | $ | 1,000.00 | $ | 1,014.62 | $ | 10.66 | 2.10 | % | ||||||||||||||
Class I | $ | 1,000.00 | $ | 1,035.70 | $ | 5.29 | $ | 1,000.00 | $ | 1,020.01 | $ | 5.24 | 1.03 | % | ||||||||||||||
Class R3 | $ | 1,000.00 | $ | 1,032.50 | $ | 8.66 | $ | 1,000.00 | $ | 1,016.69 | $ | 8.59 | 1.69 | % | ||||||||||||||
Class R4 | $ | 1,000.00 | $ | 1,034.20 | $ | 6.92 | $ | 1,000.00 | $ | 1,018.40 | $ | 6.87 | 1.35 | % | ||||||||||||||
Class R5 | $ | 1,000.00 | $ | 1,035.70 | $ | 5.44 | $ | 1,000.00 | $ | 1,019.86 | $ | 5.40 | 1.06 | % | ||||||||||||||
Class Y | $ | 1,000.00 | $ | 1,035.70 | $ | 5.44 | $ | 1,000.00 | $ | 1,019.86 | $ | 5.40 | 1.06 | % | ||||||||||||||
Class F | $ | 1,000.00 | $ | 1,036.40 | $ | 4.88 | $ | 1,000.00 | $ | 1,020.42 | $ | 4.84 | 0.95 | % | ||||||||||||||
Class SDR | $ | 1,000.00 | $ | 1,036.40 | $ | 4.88 | $ | 1,000.00 | $ | 1,020.42 | $ | 4.84 | 0.95 | % | ||||||||||||||
| 29 |
|
Schedule of Investments
October 31, 2019
| Shares or Principal Amount | Market Value† | |||||||
| COMMON STOCKS - 97.7% | ||||||||
| Argentina - 0.2% | ||||||||
| 12,125 | MercadoLibre, Inc.* | $ | 6,323,430 | |||||
|
| |||||||
| Brazil - 11.8% | ||||||||
| 1,109,381 | Ambev S.A. ADR | 4,781,432 | ||||||
| 3,249,229 | B3 S.A. - Brasil Bolsa Balcao | 39,196,534 | ||||||
| 1,914,946 | Banco Bradesco S.A. ADR | 16,774,927 | ||||||
| 990,391 | Equatorial Energia S.A. | 25,159,216 | ||||||
| 3,869,400 | IRB Brasil Resseguros S.A. | 36,460,448 | ||||||
| 8,390,172 | Itau Unibanco Holding S.A. ADR | 75,763,253 | ||||||
| 3,159,197 | Klabin S.A. | 12,461,912 | ||||||
| 4,031,604 | Lojas Renner S.A. | 51,017,056 | ||||||
| 920,893 | Magazine Luiza S.A. | 10,250,259 | ||||||
| 425,652 | Pagseguro Digital Ltd. Class A* | 15,783,176 | ||||||
| 3,673,172 | Petroleo Brasileiro S.A. ADR | 57,944,173 | ||||||
| 1,410,596 | Raia Drogasil S.A. | 38,689,829 | ||||||
| 1,660,347 | Vale S.A. ADR* | 19,492,474 | ||||||
| 3,187,645 | WEG S.A. | 20,268,033 | ||||||
|
| |||||||
| 424,042,722 | ||||||||
|
| |||||||
| Chile - 0.5% | ||||||||
| 760,712 | Banco Santander Chile ADR | 18,432,052 | ||||||
|
| |||||||
| China - 28.0% | ||||||||
| 108,425 | 51job, Inc. ADR* | 8,540,637 | ||||||
| 1,128,599 | Alibaba Group Holding Ltd. ADR* | 199,389,585 | ||||||
| 2,755,000 | Anhui Conch Cement Co., Ltd. Class H | 16,465,881 | ||||||
| 14,624,000 | China Mengniu Dairy Co., Ltd.* | 58,302,150 | ||||||
| 11,970,000 | China Pacific Insurance Group Co., Ltd. Class H | 43,430,613 | ||||||
| 61,245,600 | China Petroleum & Chemical Corp. Class H | 34,834,947 | ||||||
| 35,419,000 | CNOOC Ltd. | 52,712,320 | ||||||
| 14,656,000 | Guangzhou Automobile Group Co., Ltd. Class H | 14,637,467 | ||||||
| 5,663,199 | Huayu Automotive Systems Co., Ltd. Class A | 20,194,356 | ||||||
| 678,247 | JD.com, Inc. ADR* | 21,127,394 | ||||||
| 6,434,000 | Li Ning Co., Ltd. | 21,816,530 | ||||||
| 7,392,306 | Midea Group Co., Ltd. Class A | 58,254,402 | ||||||
| 135,926 | NetEase, Inc. ADR | 38,855,806 | ||||||
| 31,984,000 | PICC Property & Casualty Co., Ltd. Class H | 40,476,337 | ||||||
| 9,027,500 | Ping An Insurance Group Co., of China Ltd. Class H | 104,193,422 | ||||||
| 3,028,500 | Shenzhou International Group Holdings Ltd. | 41,849,776 | ||||||
| 4,823,900 | Tencent Holdings Ltd. | 195,671,437 | ||||||
| 443,874 | WuXi AppTec Co., Ltd. Class A | 5,928,626 | ||||||
| 1,321,900 | Zhejiang Supor Co., Ltd. Class A | 14,023,537 | ||||||
| 3,133,700 | Zhuzhou CRRC Times Electric Co., Ltd. Class H | 11,627,802 | ||||||
|
| |||||||
| 1,002,333,025 | ||||||||
|
| |||||||
| Colombia - 0.3% | ||||||||
| 196,177 | Bancolombia S.A. ADR | 10,177,663 | ||||||
|
| |||||||
| Egypt - 0.7% | ||||||||
| 860,125 | Commercial International Bank Egypt S.A.E. | 4,316,613 | ||||||
| 4,165,780 | Commercial International Bank Egypt S.A.E. GDR | 20,578,953 | ||||||
|
| |||||||
| 24,895,566 | ||||||||
|
| |||||||
| Greece - 1.1% | ||||||||
| 9,021,488 | Alpha Bank A.E.* | 19,249,943 | ||||||
| 7,935,945 | Eurobank Ergasias S.A.* | 8,044,909 | ||||||
| 875,459 | Hellenic Telecommunications Organization S.A. | 13,277,554 | ||||||
|
| |||||||
| 40,572,406 | ||||||||
|
| |||||||
| Hong Kong - 3.9% | ||||||||
| 7,043,800 | AIA Group Ltd. | 70,143,694 | ||||||
| 4,124,500 | China Mobile Ltd. | 33,518,553 | ||||||
| 5,108,000 | China Resources Beer Holdings Co., Ltd. | 26,188,825 | ||||||
| 3,706,000 | Hang Lung Properties Ltd. | 8,146,534 | ||||||
|
| |||||||
| 137,997,606 | ||||||||
|
| |||||||
| Hungary - 1.9% | ||||||||
| 1,824,256 | MOL Hungarian Oil & Gas plc | 18,040,528 | ||||||
| 588,389 | OTP Bank Nyrt | 27,134,698 | ||||||
| Shares or Principal Amount | Market Value† | |||||||
| COMMON STOCKS - 97.7% - (continued) | ||||||||
| Hungary - 1.9% - (continued) | ||||||||
| 1,255,041 | Richter Gedeon Nyrt | $ | 23,259,893 | |||||
|
| |||||||
| 68,435,119 | ||||||||
|
| |||||||
| India - 4.0% | ||||||||
| 2,951,585 | HDFC Bank Ltd. | 51,139,989 | ||||||
| 7,692,148 | ICICI Bank Ltd. | 50,183,135 | ||||||
| 2,127,569 | Infosys Ltd. | 20,458,409 | ||||||
| 697,512 | Tata Consultancy Services Ltd. | 22,319,696 | ||||||
|
| |||||||
| 144,101,229 | ||||||||
|
| |||||||
| Indonesia - 0.6% | ||||||||
| 44,767,100 | Astra International Tbk PT | 22,141,837 | ||||||
|
| |||||||
| Japan - 0.2% | ||||||||
| 534,500 | Nexon Co., Ltd.* | 6,193,916 | ||||||
|
| |||||||
| Kuwait - 0.5% | ||||||||
| 5,740,719 | National Bank of Kuwait SAKP | 17,804,933 | ||||||
|
| |||||||
| Luxembourg - 0.3% | ||||||||
| 583,272 | Ternium S.A. ADR | 11,659,607 | ||||||
|
| |||||||
| Mexico - 1.7% | ||||||||
| 314,526 | America Movil S.A.B. de C.V. Class L, ADR | 4,972,656 | ||||||
| 611,425 | Fomento Economico Mexicano S.A.B. de C.V. ADR | 54,429,054 | ||||||
|
| |||||||
| 59,401,710 | ||||||||
|
| |||||||
| Netherlands - 0.4% | ||||||||
| 218,925 | Prosus N.V.* | 15,096,844 | ||||||
|
| |||||||
| Pakistan - 0.1% | ||||||||
| 3,442,700 | Habib Bank Ltd. | 2,834,751 | ||||||
| 2,668,800 | United Bank Ltd. | 2,360,142 | ||||||
|
| |||||||
| 5,194,893 | ||||||||
|
| |||||||
| Peru - 0.8% | ||||||||
| 130,134 | Credicorp Ltd. | 27,853,881 | ||||||
|
| |||||||
| Poland - 1.1% | ||||||||
| 971,334 | Bank Polska Kasa Opieki S.A. | 27,431,165 | ||||||
| 1,065,666 | Powszechna Kasa Oszczednosci Bank Polski S.A. | 10,640,561 | ||||||
|
| |||||||
| 38,071,726 | ||||||||
|
| |||||||
| Russia - 8.8% | ||||||||
| 6,604,016 | Gazprom PJSC ADR | 52,943,379 | ||||||
| 725,278 | LUKOIL PJSC ADR | 66,836,561 | ||||||
| 8,537,445 | Moscow ExchangeMICEX-RTS PJSC* | 12,652,553 | ||||||
| 253,472 | Novatek PJSC GDR | 54,378,290 | ||||||
| 87,607 | Polyus PJSC* | 10,204,479 | ||||||
| 120,323 | Polyus PJSC GDR | 7,081,009 | ||||||
| 6,282,386 | Sberbank of Russia PJSC ADR | 92,516,288 | ||||||
| 310,010 | X5 Retail Group N.V. GDR | 10,367,271 | ||||||
| 275,950 | Yandex N.V. Class A* | 9,213,970 | ||||||
|
| |||||||
| 316,193,800 | ||||||||
|
| |||||||
| South Africa - 2.0% | ||||||||
| 1,499,325 | AVI Ltd. | 8,594,787 | ||||||
| 1,740,846 | Mediclinic International plc | 8,169,854 | ||||||
| 379,948 | Naspers Ltd. Class N | 53,765,868 | ||||||
|
| |||||||
| 70,530,509 | ||||||||
|
| |||||||
| South Korea - 13.0% | ||||||||
| 354,893 | Hana Financial Group, Inc. | 10,275,054 | ||||||
| 162,114 | Hyundai Mobis Co., Ltd. | 33,060,483 | ||||||
| 63,314 | Korea Zinc Co., Ltd. | 23,592,856 | ||||||
| 165,729 | LG Chem Ltd. | 43,726,771 | ||||||
| 95,720 | LG Innotek Co., Ltd. | 9,942,406 | ||||||
| 25,792 | Medy-Tox, Inc. | 7,298,883 | ||||||
| 5,388,948 | Samsung Electronics Co., Ltd. | 232,909,505 | ||||||
| 182,897 | Samsung SDI Co., Ltd. | 35,691,564 | ||||||
| 51,540 | SK Holdings Co., Ltd. | 11,434,371 | ||||||
| 325,481 | SK Hynix, Inc. | 22,886,509 | ||||||
The accompanying notes are an integral part of these financial statements.
| 30 |
|
| Hartford Schroders Emerging Markets Equity Fund |
Schedule of Investments – (continued)
October 31, 2019
| Shares or Principal Amount | Market Value† | |||||||
| COMMON STOCKS - 97.7% - (continued) | ||||||||
| South Korea - 13.0% - (continued) | ||||||||
| 252,791 | SK Innovation Co., Ltd. | $ | 34,590,787 | |||||
|
| |||||||
| 465,409,189 | ||||||||
|
| |||||||
| Taiwan - 11.2% | ||||||||
| 17,200,036 | ASE Technology Holding, Co., Ltd. | 44,624,307 | ||||||
| 1,298,489 | Cathay Financial Holding Co., Ltd. | 1,718,756 | ||||||
| 33,393,000 | CTBC Financial Holding Co., Ltd. | 23,215,240 | ||||||
| 3,791,000 | Delta Electronics, Inc. | 16,644,324 | ||||||
| 2,807,000 | Hon Hai Precision Industry Co., Ltd. | 7,413,575 | ||||||
| 291,000 | Largan Precision Co., Ltd. | 42,699,680 | ||||||
| 24,549,139 | Taiwan Semiconductor Manufacturing Co., Ltd. | 240,576,603 | ||||||
| 6,555,000 | Uni-President Enterprises Corp. | 16,193,346 | ||||||
| 1,850,000 | Zhen Ding Technology Holding Ltd. | 8,747,529 | ||||||
|
| |||||||
| 401,833,360 | ||||||||
|
| |||||||
| Thailand - 1.8% | ||||||||
| 2,180,400 | Advanced Info Service PCL | 16,536,235 | ||||||
| 3,154,400 | Bangkok Bank PCL NVDR | 18,172,205 | ||||||
| 3,053,025 | Kasikornbank PCL NVDR | 14,048,370 | ||||||
| 6,180,400 | Thai Oil PCL | 14,020,778 | ||||||
|
| |||||||
| 62,777,588 | ||||||||
|
| |||||||
| Turkey - 1.4% | ||||||||
| 15,713,904 | Akbank T.A.S.* | 18,984,988 | ||||||
| 2,403,255 | BIM Birlesik Magazalar A.S. | 19,891,036 | ||||||
| 526,990 | Tupras Turkiye Petrol Rafinerileri A.S. | 11,470,632 | ||||||
|
| |||||||
| 50,346,656 | ||||||||
|
| |||||||
| United Arab Emirates - 1.4% | ||||||||
| 6,883,503 | Abu Dhabi Commercial Bank PJSC | 14,601,993 | ||||||
| 1,160,475 | DP World plc | 15,404,066 | ||||||
| 16,701,662 | Emaar Properties PJSC | 19,410,830 | ||||||
|
| |||||||
| 49,416,889 | ||||||||
|
| |||||||
Total Common Stocks | $ | 3,497,238,156 | ||||||
|
| |||||||
| PREFERRED STOCKS - 0.3% | ||||||||
| South Korea - 0.3% | ||||||||
| 167,128 | Hyundai Motor Co. | $ | 11,368,634 | |||||
|
| |||||||
Total Preferred Stocks | $ | 11,368,634 | ||||||
|
| |||||||
Total Long-Term Investments | $ | 3,508,606,790 | ||||||
|
| |||||||
| SHORT-TERM INVESTMENTS - 1.8% | ||||||||
| Other Investment Pools & Funds - 1.8% | ||||||||
| 61,655,238 | Morgan Stanley Institutional Liquidity Funds, Treasury Portfolio, Institutional Class, 1.65%(1) | $ | 61,655,238 | |||||
|
| |||||||
Total Short-Term Investments | $ | 61,655,238 | ||||||
|
| |||||||
Total Investments | 99.8 | % | $ | 3,570,262,028 | ||||||||
Other Assets and Liabilities | 0.2 | % | 8,670,630 | |||||||||
|
|
|
| |||||||||
Total Net Assets | 100.0 | % | $ | 3,578,932,658 | ||||||||
|
|
|
| |||||||||
| Note: | Percentage of investments as shown is the ratio of the total market value to total net assets. |
Prices of foreign equities that are principally traded on certain foreign markets will generally be adjusted daily pursuant to a fair value pricing service approved by the Board of Directors in order to reflect an adjustment for factors occurring after the close of certain foreign markets but before the close of the New York Stock Exchange. |
The Fund may refer to any one or more of the industry classifications used by one or more widely recognized market indices, ratings group and/or as defined by Fund management. Industry classifications may not be identical across all security types. |
For Fund compliance purposes, the Fund may not use the same classification system. These classifications are used for financial reporting purposes. |
See “Glossary” for abbreviation descriptions. |
| * | Non-income producing. |
| (1) | Current yield as of period end. |
| † | See Significant Accounting Policies of accompanying Notes to Financial Statements regarding valuation of investments. |
The accompanying notes are an integral part of these financial statements.
| 31 |
|
| Hartford Schroders Emerging Markets Equity Fund |
Schedule of Investments – (continued)
October 31, 2019
Fair Valuation Summary
The following is a summary of the fair valuations according to the inputs used as of October 31, 2019 in valuing the Fund’s investments.
Description | Total | Level 1 | Level 2 | Level 3(1) | ||||||||||||
Assets |
| |||||||||||||||
Common Stocks |
| |||||||||||||||
Argentina | $ | 6,323,430 | $ | 6,323,430 | $ | — | $ | — | ||||||||
Brazil | 424,042,722 | 424,042,722 | — | — | ||||||||||||
Chile | 18,432,052 | 18,432,052 | — | — | ||||||||||||
China | 1,002,333,025 | 267,913,422 | 734,419,603 | — | ||||||||||||
Colombia | 10,177,663 | 10,177,663 | — | — | ||||||||||||
Egypt | 24,895,566 | 24,895,566 | — | — | ||||||||||||
Greece | 40,572,406 | — | 40,572,406 | — | ||||||||||||
Hong Kong | 137,997,606 | — | 137,997,606 | — | ||||||||||||
Hungary | 68,435,119 | 23,259,893 | 45,175,226 | — | ||||||||||||
India | 144,101,229 | 22,319,696 | 121,781,533 | — | ||||||||||||
Indonesia | 22,141,837 | — | 22,141,837 | — | ||||||||||||
Japan | 6,193,916 | — | 6,193,916 | — | ||||||||||||
Kuwait | 17,804,933 | 17,804,933 | — | — | ||||||||||||
Luxembourg | 11,659,607 | 11,659,607 | — | — | ||||||||||||
Mexico | 59,401,710 | 59,401,710 | — | — | ||||||||||||
Netherlands | 15,096,844 | 15,096,844 | — | — | ||||||||||||
Pakistan | 5,194,893 | 2,360,142 | 2,834,751 | — | ||||||||||||
Peru | 27,853,881 | 27,853,881 | — | — | ||||||||||||
Poland | 38,071,726 | — | 38,071,726 | — | ||||||||||||
Russia | 316,193,800 | 16,294,979 | 299,898,821 | — | ||||||||||||
South Africa | 70,530,509 | 8,594,787 | 61,935,722 | — | ||||||||||||
South Korea | 465,409,189 | — | 465,409,189 | — | ||||||||||||
Taiwan | 401,833,360 | — | 401,833,360 | — | ||||||||||||
Thailand | 62,777,588 | 30,557,013 | 32,220,575 | — | ||||||||||||
Turkey | 50,346,656 | 19,891,036 | 30,455,620 | — | ||||||||||||
United Arab Emirates | 49,416,889 | — | 49,416,889 | — | ||||||||||||
Preferred Stocks | 11,368,634 | — | 11,368,634 | — | ||||||||||||
Short-Term Investments | 61,655,238 | 61,655,238 | — | — | ||||||||||||
|
|
|
|
|
|
|
| |||||||||
Total | $ | 3,570,262,028 | $ | 1,068,534,614 | $ | 2,501,727,414 | $ | — | ||||||||
|
|
|
|
|
|
|
| |||||||||
| (1) | For the year ended October 31, 2019, there were no transfers in and out of Level 3. |
The accompanying notes are an integral part of these financial statements.
| 32 |
|
Schedule of Investments
October 31, 2019
| Shares or Principal Amount | Market Value† | |||||||||
| CORPORATE BONDS - 47.9% | ||||||||||
| Argentina - 2.8% | ||||||||||
| $ | 1,031,000 | Pampa Energia S.A. 7.38%, 07/21/2023(1)(2) | $ | 896,970 | ||||||
| 1,200,000 | YPF Energia Electrica S.A. 10.00%, 07/25/2026(1) | 906,000 | ||||||||
YPF S.A. |
| |||||||||
| 95,000 | 8.50%, 03/23/2021(1) | 86,687 | ||||||||
| 940,000 | 8.50%, 06/27/2029(1) | 716,468 | ||||||||
|
| |||||||||
| 2,606,125 | ||||||||||
|
| |||||||||
| Austria - 0.8% | ||||||||||
| 700,000 | Klabin Austria GmbH 7.00%, 04/03/2049(1) | 756,007 | ||||||||
|
| |||||||||
| Brazil - 1.5% | ||||||||||
Banco do Brasil S.A. |
| |||||||||
| 230,000 | 6.25%, 04/15/2024, (6.25% fixed rate until 04/15/2024; 10 year USD CMT + 4.398% thereafter)(1)(3)(4) | 228,804 | ||||||||
| 210,000 | 9.00%, 06/18/2024, (9.00% fixed rate until 06/18/2024; 10 year USD CMT + 6.362% thereafter)(1)(2)(3)(4) | 239,190 | ||||||||
| 400,000 | Cemig Geracao e Transmissao S.A. 9.25%, 12/05/2024(1) | 466,404 | ||||||||
| 460,000 | Itau Unibanco Holding S.A. 6.13%, 12/12/2022, (6.13% fixed rate until 12/12/2022; 5 year USD CMT + 3.981% thereafter)(1)(3)(4) | 474,122 | ||||||||
|
| |||||||||
| 1,408,520 | ||||||||||
|
| |||||||||
| British Virgin Islands - 3.4% | ||||||||||
| 1,400,000 | China Great Wall International Holdings Ltd. 3.88%, 08/31/2027(5) | 1,461,402 | ||||||||
| 495,000 | China Railway Xunjie Co., Ltd. 3.25%, 07/28/2026(5) | 501,785 | ||||||||
| 410,000 | Rongshi International Finance Ltd. 3.63%, 05/04/2027(5) | 428,880 | ||||||||
| 730,000 | Sinopec Group Overseas Development ltd. 3.50%, 05/03/2026(1) | 759,834 | ||||||||
|
| |||||||||
| 3,151,901 | ||||||||||
|
| |||||||||
| Canada - 0.9% | ||||||||||
| 870,000 | First Quantum Minerals Ltd. 7.50%, 04/01/2025(1) | 871,088 | ||||||||
|
| |||||||||
| Cayman Islands - 3.8% | ||||||||||
| 540,000 | Baidu, Inc. 4.38%, 05/14/2024 | 574,105 | ||||||||
| 1,040,000 | CSCEC Finance Cayman Ltd. 3.50%, 07/05/2027(5) | 1,074,090 | ||||||||
| 970,000 | CSN Islands Corp. 7.00%, 12/23/2019(1)(3) | 854,439 | ||||||||
| 1,010,000 | Tencent Holdings Ltd. 3.80%, 02/11/2025(1) | 1,065,544 | ||||||||
|
| |||||||||
| 3,568,178 | ||||||||||
|
| |||||||||
| Chile - 3.6% | ||||||||||
| 290,000 | AES Gener S.A. 7.13%, 03/26/2079, (7.13% fixed rate until 04/07/2024; 5 year USD Swap + 4.644% thereafter)(1)(4) | 301,211 | ||||||||
| 1,480,000 | Corp. Nacional del Cobre de Chile 4.38%, 02/05/2049(1) | 1,638,891 | ||||||||
| 960,000 | Empresa de Transporte de Pasajeros Metro S.A. 5.00%, 01/25/2047(1) | 1,125,408 | ||||||||
| 320,000 | Empresa Electrica Angamos S.A. 5.50%, 05/14/2027 | 330,000 | ||||||||
|
| |||||||||
| 3,395,510 | ||||||||||
|
| |||||||||
| Colombia - 2.3% | ||||||||||
| 905,000 | Credivalores-Crediservicios SAS 9.75%, 07/27/2022(1)(2) | 932,159 | ||||||||
| 751,000 | Ecopetrol S.A. 5.88%, 05/28/2045 | 865,715 | ||||||||
| COP | 1,298,000,000 | Empresa de Telecomunicaciones de Bogota | 365,012 | |||||||
|
| |||||||||
| 2,162,886 | ||||||||||
|
| |||||||||
| Shares or Principal Amount | Market Value† | |||||||||
| CORPORATE BONDS - 47.9% - (continued) | ||||||||||
| Hong Kong - 2.0% | ||||||||||
| $ | 1,320,000 | Beijing State-Owned Assets Management Hong Kong Co., Ltd. 4.13%, 05/26/2025(5) | $ | 1,374,005 | ||||||
| 460,000 | CNAC HK Finbridge Co., Ltd. 4.88%, 03/14/2025(5) | 499,213 | ||||||||
|
| |||||||||
| 1,873,218 | ||||||||||
|
| |||||||||
| Indonesia - 3.8% | ||||||||||
| 665,000 | ABM Investama Tbk PT 7.13%, 08/01/2022(1) | 575,243 | ||||||||
| 530,000 | Indonesia Asahan Aluminium Persero PT 6.76%, 11/15/2048(1) | 679,887 | ||||||||
| 270,000 | Pelabuhan Indonesia PT 5.38%, 05/05/2045(1) | 307,125 | ||||||||
| 360,000 | Pertamina Persero PT 6.00%, 05/03/2042(1) | 431,879 | ||||||||
Perusahaan Listrik Negara PT |
| |||||||||
| 400,000 | 5.25%, 10/24/2042(1) | 441,500 | ||||||||
| 400,000 | 5.25%, 05/15/2047(1) | 446,000 | ||||||||
| 550,000 | 6.15%, 05/21/2048(1) | 691,185 | ||||||||
|
| |||||||||
| 3,572,819 | ||||||||||
|
| |||||||||
| Kazakhstan - 0.3% | ||||||||||
| 250,000 | KazMunayGas National Co. JSC 5.75%, 04/19/2047(1) | 292,244 | ||||||||
|
| |||||||||
| Luxembourg - 1.2% | ||||||||||
| 460,000 | Atento Luxco 1 S.A. 6.13%, 08/10/2022(1) | 469,200 | ||||||||
| 200,000 | JSL Europe S.A. 7.75%, 07/26/2024(1)(2) | 212,750 | ||||||||
| 470,000 | Unigel Luxembourg S.A. 8.75%, 10/01/2026(1) | 471,762 | ||||||||
|
| |||||||||
| 1,153,712 | ||||||||||
|
| |||||||||
| Mexico - 14.6% | ||||||||||
| 290,000 | Alfa S.A.B. de C.V. 6.88%, 03/25/2044(1) | 345,541 | ||||||||
| 275,000 | Alpek S.A.B. de C.V. 4.25%, 09/18/2029(1) | 280,088 | ||||||||
| 750,000 | Alpha Holding S.A. de C.V. 10.00%, 12/19/2022(1) | 751,883 | ||||||||
| 380,000 | BBVA Bancomer S.A. 5.88%, 09/13/2034, (5.88% fixed rate until 09/13/2029; 5 year USD CMT + 4.308% thereafter)(1)(4) | 386,080 | ||||||||
| 891,480 | Cometa Energia S.A. de C.V. 6.38%, 04/24/2035(1) | 965,027 | ||||||||
| 790,000 | Credito Real S.A.B. de C.V. SOFOM ER 9.13%, 11/29/2022, (9.13% fixed rate until 11/29/2022; 5 year CMT + 7.026% thereafter)(1)(3)(4) | 816,670 | ||||||||
| 910,000 | Docuformas SAPI de C.V. 10.25%, 07/24/2024(1) | 921,602 | ||||||||
| 200,000 | Elementia S.A.B. de C.V. 5.50%, 01/15/2025(1) | 200,500 | ||||||||
| 530,000 | Metalsa S.A. de C.V. 4.90%, 04/24/2023(1) | 548,550 | ||||||||
| 252,153 | Mexico Generadora de Energia S de rl 5.50%, 12/06/2032(1) | 271,379 | ||||||||
Petroleos Mexicanos |
| |||||||||
| 916,000 | 5.63%, 01/23/2046 | 823,484 | ||||||||
| 945,000 | 6.49%, 01/23/2027(1) | 1,008,787 | ||||||||
| 1,280,000 | 6.88%, 08/04/2026 | 1,400,320 | ||||||||
| 1,740,000 | 7.69%, 01/23/2050(1) | 1,890,754 | ||||||||
| 950,000 | Sixsigma Networks Mexico S.A. de C.V. | 950,000 | ||||||||
| 430,000 | Trust F 6.39%, 01/15/2050(1) | 458,402 | ||||||||
| 870,000 | TV Azteca S.A.B. de C.V. 8.25%, 08/09/2024(5) | 815,634 | ||||||||
| 820,000 | Unifin Financiera S.A.B. de C.V. SOFOM ENR | 841,525 | ||||||||
|
| |||||||||
| 13,676,226 | ||||||||||
|
| |||||||||
| Mult - 0.9% | ||||||||||
| 890,000 | Mongolian Mining Corp/Energy Resources LLC | 833,024 | ||||||||
|
| |||||||||
| Netherlands - 1.5% | ||||||||||
| 900,000 | Ajecorp B.V. 6.50%, 05/14/2022(1) | 879,750 | ||||||||
The accompanying notes are an integral part of these financial statements.
| 33 |
|
| Hartford Schroders Emerging Markets Multi-Sector Bond Fund |
Schedule of Investments – (continued)
October 31, 2019
| Shares or Principal Amount | Market Value† | |||||||||
| CORPORATE BONDS - 47.9% - (continued) | ||||||||||
| Netherlands - 1.5% - (continued) | ||||||||||
| $ | 400,000 | Petrobras Global Finance B.V. 8.75%, 05/23/2026 | $ | 512,000 | ||||||
|
| |||||||||
| 1,391,750 | ||||||||||
|
| |||||||||
| South Korea - 0.5% | ||||||||||
| 470,000 | Korea East-West Power Co., Ltd. 3.88%, 07/19/2023(1) | 495,470 | ||||||||
|
| |||||||||
| Spain - 0.8% | ||||||||||
| 695,000 | AI Candelaria Spain SLU 7.50%, 12/15/2028(1) | 783,613 | ||||||||
|
| |||||||||
| Turkey - 1.0% | ||||||||||
| 870,000 | Yapi ve Kredi Bankasi AS 13.88%, 01/15/2024, (13.88% fixed rate until 01/15/2024; 5 year USD Swap + 11.245% thereafter)(1)(3)(4) | 937,756 | ||||||||
|
| |||||||||
| United Kingdom - 1.0% | ||||||||||
| 950,000 | Vedanta Resources Finance plc 9.25%, 04/23/2026(1)(2) | 952,375 | ||||||||
|
| |||||||||
| United States - 1.2% | ||||||||||
| 510,000 | Gran Tierra Energy, Inc. 7.75%, 05/23/2027(1) | 487,050 | ||||||||
NBM U.S. Holdings, Inc. |
| |||||||||
| 320,000 | 6.63%, 08/06/2029(1) | 333,240 | ||||||||
| 310,000 | 7.00%, 05/14/2026(1) | 328,755 | ||||||||
|
| |||||||||
| 1,149,045 | ||||||||||
|
| |||||||||
Total Corporate Bonds | $ | 45,031,467 | ||||||||
|
| |||||||||
| FOREIGN GOVERNMENT OBLIGATIONS - 46.2% | ||||||||||
| Angola - 1.0% | ||||||||||
| 890,000 | Angolan Government International Bond | $ | 940,241 | |||||||
|
| |||||||||
| Argentina - 3.6% | ||||||||||
| 1,010,000 | Argentine Republic Government International Bond 7.50%, 04/22/2026 | 428,250 | ||||||||
| 978,000 | Provincia de Buenos Aires 7.88%, 06/15/2027(1) | 337,420 | ||||||||
Provincia de Cordoba |
| |||||||||
| 3,290,000 | 7.13%, 06/10/2021(1) | 2,451,083 | ||||||||
| 266,000 | 7.45%, 09/01/2024(1)(2) | 169,178 | ||||||||
|
| |||||||||
| 3,385,931 | ||||||||||
|
| |||||||||
| Brazil - 3.6% | ||||||||||
Brazil Notas do Tesouro Nacional |
| |||||||||
| BRL | 5,571,000 | 10.00%, 01/01/2023 | 1,572,453 | |||||||
| 3,704,000 | 10.00%, 01/01/2025 | 1,084,261 | ||||||||
| 1,226,000 | 10.00%, 01/01/2027 | 369,145 | ||||||||
| $ | 379,000 | Prumo Participacoes e Investimentos S.A | 392,265 | |||||||
|
| |||||||||
| 3,418,124 | ||||||||||
|
| |||||||||
| Cameroon - 0.8% | ||||||||||
| 700,000 | Republic of Cameroon International Bond | 768,887 | ||||||||
|
| |||||||||
| Colombia - 1.2% | ||||||||||
Colombia Government International Bond |
| |||||||||
| COP | 1,867,000,000 | 4.38%, 03/21/2023 | 541,748 | |||||||
| 417,000,000 | 7.75%, 04/14/2021 | 128,287 | ||||||||
| 1,252,000,000 | 9.85%, 06/28/2027 | 464,559 | ||||||||
|
| |||||||||
| 1,134,594 | ||||||||||
|
| |||||||||
| Ecuador - 2.8% | ||||||||||
Ecuador Government International Bond |
| |||||||||
| $ | 1,005,000 | 9.50%, 03/27/2030(1) | 967,312 | |||||||
| 1,368,000 | 9.65%, 12/13/2026(1) | 1,344,074 | ||||||||
| 290,000 | 10.75%, 03/28/2022(1) | 306,678 | ||||||||
|
| |||||||||
| 2,618,064 | ||||||||||
|
| |||||||||
| Shares or Principal Amount | Market Value† | |||||||||
| FOREIGN GOVERNMENT OBLIGATIONS - 46.2% - (continued) | ||||||||||
| Egypt - 1.0% | ||||||||||
| $ | 850,000 | Egypt Government International Bond 8.70%, 03/01/2049(1) | $ | 909,815 | ||||||
|
| |||||||||
| Ghana - 1.0% | ||||||||||
| 960,000 | Ghana Government International Bond 8.63%, 06/16/2049(1) | 957,600 | ||||||||
|
| |||||||||
| Hungary - 1.1% | ||||||||||
| HUF | 277,490,000 | Hungary Government Bond 3.00%, 10/27/2027 | 1,043,367 | |||||||
|
| |||||||||
| Indonesia - 4.3% | ||||||||||
Indonesia Treasury Bond |
| |||||||||
| IDR | 9,123,000,000 | 7.00%, 05/15/2027 | 658,699 | |||||||
| 11,611,000,000 | 7.50%, 08/15/2032 | 836,064 | ||||||||
| 9,807,000,000 | 8.38%, 03/15/2034 | 755,286 | ||||||||
| 12,097,000,000 | 8.75%, 05/15/2031 | 959,750 | ||||||||
| 9,981,000,000 | 9.00%, 03/15/2029 | 803,551 | ||||||||
|
| |||||||||
| 4,013,350 | ||||||||||
|
| |||||||||
| Kenya - 0.5% | ||||||||||
| $ | 470,000 | Kenya Government International Bond | 491,884 | |||||||
|
| |||||||||
| Malaysia - 2.1% | ||||||||||
Malaysia Government Bond |
| |||||||||
| MYR | 3,780,000 | 3.48%, 06/14/2024 | 909,715 | |||||||
| 2,030,000 | 3.90%, 11/30/2026 | 499,113 | ||||||||
| 2,080,000 | 4.64%, 11/07/2033 | 545,694 | ||||||||
|
| |||||||||
| 1,954,522 | ||||||||||
|
| |||||||||
| Mexico - 6.9% | ||||||||||
Mexican Bonos |
| |||||||||
| MXN | 9,675,900 | 5.75%, 03/05/2026 | 478,712 | |||||||
| 33,263,500 | 7.50%, 06/03/2027 | 1,806,896 | ||||||||
| 16,148,200 | 7.75%, 05/29/2031 | 897,740 | ||||||||
| 12,866,000 | 7.75%, 11/13/2042 | 714,441 | ||||||||
| 15,161,400 | 8.00%, 12/07/2023 | 828,480 | ||||||||
| $ | 1,512,000 | Mexico Government International Bond | 1,752,045 | |||||||
|
| |||||||||
| 6,478,314 | ||||||||||
|
| |||||||||
| Nigeria - 0.5% | ||||||||||
| 430,000 | Nigeria Government International Bond | 476,311 | ||||||||
|
| |||||||||
| Peru - 1.3% | ||||||||||
Peru Government Bond |
| |||||||||
| PEN | 1,370,000 | 6.90%, 08/12/2037 | 506,014 | |||||||
| 1,870,000 | 6.95%, 08/12/2031 | 683,719 | ||||||||
|
| |||||||||
| 1,189,733 | ||||||||||
|
| |||||||||
| Poland - 2.3% | ||||||||||
| PLN | 7,880,000 | Republic of Poland Government Bond | 2,140,726 | |||||||
|
| |||||||||
| Russia - 5.8% | ||||||||||
Russian Federal Bond - OFZ |
| |||||||||
| RUB | 26,800,000 | 6.50%, 02/28/2024 | 424,758 | |||||||
| 68,850,000 | 6.90%, 05/23/2029 | 1,113,572 | ||||||||
| 43,980,000 | 7.00%, 12/15/2021 | 700,594 | ||||||||
| 35,690,000 | 7.00%, 01/25/2023 | 572,220 | ||||||||
| 60,390,000 | 7.75%, 09/16/2026 | 1,021,373 | ||||||||
| $ | 1,400,000 | Russian Foreign Bond - Eurobond 5.25%, 06/23/2047(1) | 1,672,020 | |||||||
|
| |||||||||
| 5,504,537 | ||||||||||
|
| |||||||||
| South Africa - 0.7% | ||||||||||
Republic of South Africa Government Bond |
| |||||||||
| ZAR | 9,549,271 | 6.50%, 02/28/2041 | 438,140 | |||||||
| 3,650,000 | 9.00%, 01/31/2040 | 219,805 | ||||||||
|
| |||||||||
| 657,945 | ||||||||||
|
| |||||||||
The accompanying notes are an integral part of these financial statements.
| 34 |
|
| Hartford Schroders Emerging Markets Multi-Sector Bond Fund |
Schedule of Investments – (continued)
October 31, 2019
| Shares or Principal Amount | Market Value† | |||||||||
| FOREIGN GOVERNMENT OBLIGATIONS - 46.2% - (continued) | ||||||||||
| South Korea - 0.7% | ||||||||||
| $ | 670,000 | Korea Hydro & Nuclear Power Co., Ltd. | $ | 704,720 | ||||||
|
| |||||||||
| Thailand - 1.6% | ||||||||||
Thailand Government Bond |
| |||||||||
| THB | 22,160,000 | 2.13%, 12/17/2026 | 763,095 | |||||||
| 17,310,000 | 3.78%, 06/25/2032 | 714,596 | ||||||||
|
| |||||||||
| 1,477,691 | ||||||||||
|
| |||||||||
| Turkey - 2.3% | ||||||||||
| $ | 1,057,000 | Export Credit Bank of Turkey 8.25%, 01/24/2024(1) | 1,127,396 | |||||||
Turkey Government Bond |
| |||||||||
| TRY | 1,010,000 | 8.50%, 09/14/2022 | 161,112 | |||||||
| 2,290,000 | 9.20%, 09/22/2021 | 381,917 | ||||||||
| 3,080,000 | 10.60%, 02/11/2026 | 494,007 | ||||||||
|
| |||||||||
| 2,164,432 | ||||||||||
|
| |||||||||
| Ukraine - 1.1% | ||||||||||
| $ | 1,020,000 | Ukraine Government International Bond | 1,066,918 | |||||||
|
| |||||||||
Total Foreign Government Obligations | $ | 43,497,706 | ||||||||
|
| |||||||||
Total Long-Term Investments | $ | 88,529,173 | ||||||||
|
| |||||||||
| SHORT-TERM INVESTMENTS - 4.9% | ||||||||||
| Other Investment Pools & Funds - 1.1% | ||||||||||
| 1,022,197 | Morgan Stanley Institutional Liquidity Funds, Treasury Portfolio, Institutional Class, 1.65%(6) | $ | 1,022,197 | |||||||
|
| |||||||||
| Securities Lending Collateral - 2.4% | ||||||||||
| 114,829 | Citibank NA DDCA, 1.80%, 11/1/2019(6) | 114,829 | ||||||||
| 1,611,075 | Fidelity Investments Money Market Funds, Government Portfolio, Institutional Class, 1.75%(6) | 1,611,075 | ||||||||
| 25,844 | Goldman Sachs Financial Square Funds, Government Fund, Institutional Class, 1.75%(6) | 25,844 | ||||||||
| 213,704 | Invesco Government & Agency Portfolio, Institutional Class, 1.70%(6) | 213,705 | ||||||||
| 310,486 | Morgan Stanley Institutional Liquidity Funds, Government Portfolio, Institutional Class, 1.69%(6) | 310,486 | ||||||||
| 20,646 | Western Asset Institutional Government Class A Fund, Institutional Class, 1.68%(6) | 20,646 | ||||||||
|
| |||||||||
| 2,296,585 | ||||||||||
|
| |||||||||
| U.S. Treasury - 1.4% | ||||||||||
| U.S. Treasury Bills - 1.4% | ||||||||||
| 600,000 | 1.53%, 12/19/2019(7) | 598,773 | ||||||||
| 415,000 | 1.63%, 11/29/2019(7) | 414,474 | ||||||||
| 250,000 | 1.71%, 11/19/2019(7) | 249,787 | ||||||||
|
| |||||||||
| 1,263,034 | ||||||||||
|
| |||||||||
Total Short-Term Investments | $ | 4,581,816 | ||||||||
|
| |||||||||
Total Investments | 99.0 | % | $ | 93,110,989 | ||||||||||
Other Assets and Liabilities | 1.0 | % | 971,612 | |||||||||||
|
|
|
| |||||||||||
Total Net Assets | 100.0 | % | $ | 94,082,601 | ||||||||||
|
|
|
| |||||||||||
| Note: | Percentage of investments as shown is the ratio of the total market value to total net assets. |
Prices of foreign equities that are principally traded on certain foreign markets will generally be adjusted daily pursuant to a fair value pricing service approved by the Board of Directors in order to reflect an adjustment for factors occurring after the close of certain foreign markets but before the close of the New York Stock Exchange. |
The Fund may refer to any one or more of the industry classifications used by one or more widely recognized market indices, ratings group and/or as defined by Fund management. Industry classifications may not be identical across all security types. |
For Fund compliance purposes, the Fund may not use the same classification system. These classifications are used for financial reporting purposes. |
See “Glossary” for abbreviation descriptions. |
| (1) | Security was purchased pursuant to Rule 144A under the Securities Act of 1933 and may be sold in transactions that are exempt from registration (typically only to qualified institutional buyers) or in a public offering registered under the Securities Act of 1933. At October 31, 2019, the aggregate value of these securities was $49,454,636, representing 52.6% of net assets. |
| (2) | Represents entire or partial securities on loan. See Note 8 in the accompanying Notes to Financial Statements for securities lending information. |
| (3) | Perpetual maturity security. Maturity date shown is the next call date or final legal maturity date, whichever comes first. |
| (4) | Fixed to variable rate investment. The rate shown reflects the fixed rate in effect at October 31, 2019. Rate will reset at a future date. Base lending rates may be subject to a floor or cap. |
| (5) | Security is exempt from registration under Regulation S under the Securities Act of 1933, which exempts from registration securities offered and sold outside of the United States. Security may not be offered or sold in the United States except pursuant to an exemption from, or in a transaction not subject to, the registration requirements of the Securities Act of 1933. At October 31, 2019, the aggregate value of these securities was $6,155,009, representing 6.5% of net assets. |
| (6) | Current yield as of period end. |
| (7) | The rate shown represents current yield to maturity. |
The accompanying notes are an integral part of these financial statements.
| 35 |
|
| Hartford Schroders Emerging Markets Multi-Sector Bond Fund |
Schedule of Investments – (continued)
October 31, 2019
| Futures Contracts Outstanding at October 31, 2019 | ||||||||||||||||
Description | Number of Contracts | Expiration Date | Current Notional Amount | Value and Unrealized Appreciation/ (Depreciation) | ||||||||||||
| Long position contracts: | ||||||||||||||||
U.S. Treasury Long Bond Future | 24 | 12/19/2019 | $ | 3,873,000 | $ | (6,047 | ) | |||||||||
|
| |||||||||||||||
Total futures contracts |
| $ | (6,047 | ) | ||||||||||||
|
| |||||||||||||||
| OTC Credit Default Swap Contracts Outstanding at October 31, 2019 | ||||||||||||||||||||||||||||||||||||
Reference Entity | Counter- party | Notional Amount (a) | (Pay)/Receive Fixed Rate | Expiration Date | Periodic Payment Frequency | Upfront Premiums Paid | Upfront Premiums Received | Market Value† | Unrealized Appreciation/ (Depreciation) | |||||||||||||||||||||||||||
| Credit default swaps on indices: | ||||||||||||||||||||||||||||||||||||
| Buy protection: | ||||||||||||||||||||||||||||||||||||
Republic of South Africa Government Bond | JPM | USD | 3,790,000 | (1.00%) | 12/20/24 | Quarterly | $ | 163,198 | $ | — | $ | 158,776 | $ | (4,422 | ) | |||||||||||||||||||||
|
|
|
|
|
|
|
| |||||||||||||||||||||||||||||
| Sell protection: | ||||||||||||||||||||||||||||||||||||
Petroleo Brasileiro S.A. - Petrobras | JPM | USD | 4,360,000 | 1.00% | 12/20/24 | Quarterly | $ | — | $ | (135,863 | ) | $ | (130,776 | ) | $ | 5,087 | ||||||||||||||||||||
|
|
|
|
|
|
|
| |||||||||||||||||||||||||||||
Total traded indices | $ | 163,198 | $ | (135,863 | ) | $ | 28,000 | $ | 665 | |||||||||||||||||||||||||||
|
|
|
|
|
|
|
| |||||||||||||||||||||||||||||
Total OTC contracts | $ | 163,198 | $ | (135,863 | ) | $ | 28,000 | $ | 665 | |||||||||||||||||||||||||||
|
|
|
|
|
|
|
| |||||||||||||||||||||||||||||
| (a) | The maximum potential amount the Fund could be required to pay as a seller of credit protection or receive as a buyer of credit protection if a credit event occurs as defined under the terms of that particular swap agreement. |
| Foreign Currency Contracts Outstanding at October 31, 2019 | ||||||||||||||||||||||||
| Amount and Description of Currency to be Purchased | Amount and Description of Currency to be Sold | Counterparty | Settlement Date | Appreciation | Depreciation | |||||||||||||||||||
| 6,641,671 | BRL | 1,663,329 | USD | CBK | 11/12/19 | $ | — | $ | (8,542 | ) | ||||||||||||||
| 3,920,000 | CAD | 2,971,775 | USD | JPM | 11/14/19 | 4,547 | — | |||||||||||||||||
| 10,583,480,000 | COP | 3,090,969 | USD | JPM | 11/12/19 | 38,950 | — | |||||||||||||||||
| 2,440,000 | GBP | 3,023,138 | USD | UBS | 11/14/19 | 138,958 | — | |||||||||||||||||
| 106,000,000 | JPY | 1,008,048 | USD | CBK | 11/08/19 | — | (26,022 | ) | ||||||||||||||||
| 210,000,000 | JPY | 1,988,256 | USD | UBS | 11/08/19 | — | (42,734 | ) | ||||||||||||||||
| 212,000,000 | JPY | 1,989,321 | USD | UBS | 01/09/20 | — | (16,442 | ) | ||||||||||||||||
| 19,810,000 | MXN | 987,281 | USD | UBS | 11/22/19 | 38,930 | — | |||||||||||||||||
| 172,690,000 | RUB | 2,609,399 | USD | CBK | 11/12/19 | 79,364 | — | |||||||||||||||||
| 66,440,000 | RUB | 987,735 | USD | CBK | 11/14/19 | 46,445 | — | |||||||||||||||||
| 11,545,000 | TRY | 1,675,131 | USD | CBK | 04/06/20 | 263,701 | — | |||||||||||||||||
| 3,495,000 | TRY | 509,735 | USD | JPM | 04/06/20 | 77,205 | — | |||||||||||||||||
| 1,649,695 | USD | 6,641,671 | BRL | CBK | 11/12/19 | — | (5,092 | ) | ||||||||||||||||
| 2,960,954 | USD | 3,920,000 | CAD | JPM | 11/14/19 | — | (15,368 | ) | ||||||||||||||||
| 3,045,606 | USD | 10,583,480,000 | COP | CBK | 11/12/19 | — | (84,313 | ) | ||||||||||||||||
| 2,959,025 | USD | 2,440,000 | GBP | UBS | 11/14/19 | — | (203,071 | ) | ||||||||||||||||
| 2,011,096 | USD | 212,590,000 | JPY | CBK | 11/08/19 | 41,579 | — | |||||||||||||||||
| 977,020 | USD | 19,810,000 | MXN | CBK | 11/22/19 | — | (49,191 | ) | ||||||||||||||||
| 2,599,579 | USD | 172,690,000 | RUB | JPM | 11/12/19 | — | (89,184 | ) | ||||||||||||||||
| 82,899 | USD | 5,490,000 | RUB | UBS | 11/14/19 | — | (2,556 | ) | ||||||||||||||||
| 902,896 | USD | 60,950,000 | RUB | JPM | 11/14/19 | — | (45,829 | ) | ||||||||||||||||
| 1,905,244 | USD | 15,040,000 | TRY | CBK | 04/06/20 | — | (620,528 | ) | ||||||||||||||||
| 948,166 | USD | 14,050,000 | ZAR | UBS | 12/20/19 | 24,792 | — | |||||||||||||||||
| 14,050,000 | ZAR | 932,552 | USD | JPM | 12/20/19 | — | (9,178 | ) | ||||||||||||||||
|
|
|
| |||||||||||||||||||||
Total | $ | 754,471 | $ | (1,218,050 | ) | |||||||||||||||||||
|
|
|
| |||||||||||||||||||||
| † | See Significant Accounting Policies of accompanying Notes to Financial Statements regarding valuation of investments. |
The accompanying notes are an integral part of these financial statements.
| 36 |
|
| Hartford Schroders Emerging Markets Multi-Sector Bond Fund |
Schedule of Investments – (continued)
October 31, 2019
Fair Valuation Summary
The following is a summary of the fair valuations according to the inputs used as of October 31, 2019 in valuing the Fund’s investments.
Description | Total | Level 1 | Level 2 | Level 3(1) | ||||||||||||
Assets |
| |||||||||||||||
Corporate Bonds | $ | 45,031,467 | $ | — | $ | 45,031,467 | $ | — | ||||||||
Foreign Government Obligations | 43,497,706 | — | 43,497,706 | — | ||||||||||||
Short-Term Investments | 4,581,816 | 3,318,782 | 1,263,034 | — | ||||||||||||
Foreign Currency Contracts(2) | 754,471 | — | 754,471 | — | ||||||||||||
Swaps - Credit Default(2) | 5,087 | — | 5,087 | — | ||||||||||||
|
|
|
|
|
|
|
| |||||||||
Total | $ | 93,870,547 | $ | 3,318,782 | $ | 90,551,765 | $ | — | ||||||||
|
|
|
|
|
|
|
| |||||||||
Liabilities |
| |||||||||||||||
Foreign Currency Contracts(2) | $ | (1,218,050 | ) | $ | — | $ | (1,218,050 | ) | $ | — | ||||||
Futures Contracts(2) | (6,047 | ) | (6,047 | ) | — | — | ||||||||||
Swaps - Credit Default(2) | (4,422 | ) | — | (4,422 | ) | — | ||||||||||
|
|
|
|
|
|
|
| |||||||||
Total | $ | (1,228,519 | ) | $ | (6,047 | ) | $ | (1,222,472 | ) | $ | — | |||||
|
|
|
|
|
|
|
| |||||||||
| (1) | For the year ended October 31, 2019, there were no transfers in and out of Level 3. |
| (2) | Derivative instruments (excluding purchased and written options, if applicable) are valued at the unrealized appreciation/(depreciation) on the investments. |
The accompanying notes are an integral part of these financial statements.
| 37 |
|
Schedule of Investments
October 31, 2019
| Shares or Principal Amount | Market Value† | |||||||
| COMMON STOCKS - 97.6% | ||||||||
| Australia - 2.9% | ||||||||
| 3,440,292 | Beach Energy Ltd. | $ | 5,411,506 | |||||
| 236,339 | BHP Group Ltd. | 5,793,248 | ||||||
| 86,264 | BlueScope Steel Ltd. | 789,676 | ||||||
| 148,658 | BWP Trust REIT | 425,020 | ||||||
| 333,350 | Coca-Cola Amatil Ltd. | 2,339,333 | ||||||
| 61,175 | Collection House Ltd. | 51,379 | ||||||
| 667,562 | Computershare Ltd. | 7,286,746 | ||||||
| 1,205,790 | Fortescue Metals Group Ltd. | 7,380,185 | ||||||
| 346,051 | GWA Group Ltd. | 694,117 | ||||||
| 63,430 | McMillan Shakespeare Ltd. | 701,661 | ||||||
| 69,375 | Mineral Resources Ltd. | 682,367 | ||||||
| 354,503 | Pendal Group Ltd. | 1,750,399 | ||||||
| 35,964 | Perpetual Ltd. | 891,581 | ||||||
| 595,279 | Platinum Asset Management Ltd. | 1,699,974 | ||||||
| 1,513,722 | Resolute Mining Ltd.* | 1,268,053 | ||||||
| 146,999 | Rio Tinto Ltd. | 9,192,285 | ||||||
| 334,969 | Sandfire Resources NL | 1,337,837 | ||||||
| 981,638 | Silver Lake Resources Ltd.* | 785,822 | ||||||
| 153,707 | SmartGroup Corp. Ltd. | 1,209,699 | ||||||
| 1,143,562 | St. Barbara Ltd. | 2,206,167 | ||||||
| 410,234 | Woodside Petroleum Ltd. | 9,092,206 | ||||||
|
| |||||||
| 60,989,261 | ||||||||
|
| |||||||
| Austria - 1.0% | ||||||||
| 27,641 | AT&S Austria Technologie & Systemtechnik AG | 514,364 | ||||||
| 32,991 | BAWAG Group AG*(1) | 1,363,531 | ||||||
| 119,109 | Erste Group Bank AG* | 4,212,629 | ||||||
| 2,087 | Mayr Melnhof Karton AG | 256,505 | ||||||
| 177,808 | OMV AG | 10,394,940 | ||||||
| 199,550 | Raiffeisen Bank International AG | 4,916,768 | ||||||
|
| |||||||
| 21,658,737 | ||||||||
|
| |||||||
| Belgium - 1.1% | ||||||||
| 261,032 | Proximus SADP | 8,021,711 | ||||||
| 11,344 | Sofina S.A. | 2,510,334 | ||||||
| 146,761 | UCB S.A. | 11,828,762 | ||||||
|
| |||||||
| 22,360,807 | ||||||||
|
| |||||||
| Brazil - 0.4% | ||||||||
| 172,000 | Alupar Investimento S.A. | 1,040,878 | ||||||
| 96,800 | Construtora Tenda S.A. | 569,866 | ||||||
| 143,300 | Enauta Participacoes S.A. | 470,223 | ||||||
| 191,400 | Qualicorp Consultoria e Corretora de Seguros S.A. | 1,522,418 | ||||||
| 233,700 | Smiles Fidelidade S.A. | 2,156,065 | ||||||
| 227,300 | Telefonica Brasil S.A. ADR | 2,993,541 | ||||||
| 66,266 | Unipar Carbocloro S.A. | 479,336 | ||||||
|
| |||||||
| 9,232,327 | ||||||||
|
| |||||||
| Cambodia - 0.1% | ||||||||
| 950,000 | NagaCorp Ltd. | 1,726,231 | ||||||
|
| |||||||
| Canada - 3.4% | ||||||||
| 226,300 | Alamos Gold, Inc. Class A | 1,231,927 | ||||||
| 33,676 | Celestica, Inc.* | 243,922 | ||||||
| 168,300 | Centerra Gold, Inc.* | 1,434,978 | ||||||
| 292,100 | CI Financial Corp. | 4,251,429 | ||||||
| 138,200 | Dundee Precious Metals, Inc.* | 481,617 | ||||||
| 200 | E-L Financial Corp. Ltd. | 111,762 | ||||||
| 158,500 | Enerflex Ltd. | 1,241,910 | ||||||
| 87,800 | Ensign Energy Services, Inc. | 178,653 | ||||||
| 133,900 | Fortuna Silver Mines, Inc.*(2) | 426,983 | ||||||
| 130,700 | Genworth MI Canada, Inc.(2) | 5,279,204 | ||||||
| 28,800 | iA Financial Corp., Inc. | 1,386,974 | ||||||
| 259,900 | IAMGOLD Corp.* | 976,771 | ||||||
| 223,500 | Largo Resources Ltd.*(2) | 223,992 | ||||||
| 33,600 | Linamar Corp. | 1,095,680 | ||||||
| 153,000 | Magna International, Inc. | 8,226,756 | ||||||
| Shares or Principal Amount | Market Value† | |||||||
| COMMON STOCKS - 97.6% - (continued) | ||||||||
| Canada - 3.4% - (continued) | ||||||||
| 816,900 | Manulife Financial Corp. | $ | 15,214,150 | |||||
| 42,700 | Martinrea International, Inc. | 348,188 | ||||||
| 1,300 | Morguard Real Estate Investment Trust REIT(2) | 11,242 | ||||||
| 175,000 | Open Text Corp. | 7,071,217 | ||||||
| 174,700 | Parex Resources, Inc.* | 2,367,622 | ||||||
| 172,000 | SEMAFO, Inc.* | 555,007 | ||||||
| 187,800 | Sun Life Financial, Inc. | 8,425,406 | ||||||
| 498,100 | Surge Energy, Inc.(2) | 363,052 | ||||||
| 320,500 | Tamarack Valley Energy Ltd.* | 413,674 | ||||||
| 262,200 | Teck Resources Ltd. Class B | 4,144,715 | ||||||
| 37,500 | TFI International, Inc. | 1,194,955 | ||||||
| 220,800 | Tourmaline Oil Corp. | 1,894,344 | ||||||
| 116,265 | Westshore Terminals Investment Corp.(2) | 2,016,166 | ||||||
|
| |||||||
| 70,812,296 | ||||||||
|
| |||||||
| Chile - 0.2% | ||||||||
| 4,519,302 | Aguas Andinas S.A. Class A | 2,071,956 | ||||||
| 137,700 | Enel Chile S.A. ADR | 571,455 | ||||||
| 1,511,195 | Enel Generacion Chile S.A. | 664,979 | ||||||
| 898,313 | Inversiones Aguas Metropolitanas S.A. | 1,070,729 | ||||||
|
| |||||||
| 4,379,119 | ||||||||
|
| |||||||
| China - 5.3% | ||||||||
| 7,698,000 | Agricultural Bank of China Ltd. Class H | 3,167,754 | ||||||
| 278,000 | Anhui Conch Cement Co., Ltd. Class H | 1,661,530 | ||||||
| 2,344,000 | Anhui Expressway Co., Ltd. Class H | 1,376,668 | ||||||
| 4,667,500 | BAIC Motor Corp. Ltd. Class H(1) | 2,895,283 | ||||||
| 18,819,000 | Bank of China Ltd. Class H | 7,674,101 | ||||||
| 4,323,000 | Bank of Communications Co., Ltd. Class H | 2,952,381 | ||||||
| 30,000 | Baoye Group Co., Ltd. Class H* | 19,631 | ||||||
| 47,600 | Changyou.com Ltd. ADR | 455,056 | ||||||
| 4,676,000 | China BlueChemical Ltd. Class H | 1,137,935 | ||||||
| 1,228,000 | China Conch Venture Holdings Ltd. | 4,805,022 | ||||||
| 14,425,000 | China Construction Bank Corp. Class H | 11,558,326 | ||||||
| 1,478,000 | China Lesso Group Holdings Ltd. | 1,526,204 | ||||||
| 733,000 | China Machinery Engineering Corp. Class H | 288,786 | ||||||
| 3,023,000 | China Medical System Holdings Ltd. | 4,099,561 | ||||||
| 1,710,000 | China Oriental Group Co., Ltd. | 596,785 | ||||||
| 2,176,000 | China Petroleum & Chemical Corp. Class H | 1,237,654 | ||||||
| 510,500 | China Resources Pharmaceutical Group Ltd.(1) | 471,451 | ||||||
| 984,000 | China Shineway Pharmaceutical Group Ltd. | 946,910 | ||||||
| 1,760,000 | CNOOC Ltd. | 2,619,320 | ||||||
| 1,708,000 | Consun Pharmaceutical Group Ltd. | 1,022,376 | ||||||
| 2,324,000 | Dongfeng Motor Group Co., Ltd. Class H | 2,331,233 | ||||||
| 3,193,000 | FIH Mobile Ltd.* | 454,700 | ||||||
| 1,452,000 | Fufeng Group Ltd.* | 669,202 | ||||||
| 3,242,000 | Guangzhou Automobile Group Co., Ltd. Class H | 3,237,900 | ||||||
| 1,092,500 | Hengan International Group Co., Ltd. | 7,627,830 | ||||||
| 17,061,000 | Industrial & Commercial Bank of China Ltd. Class H | 12,222,384 | ||||||
| 1,924,000 | Jiangsu Expressway Co., Ltd. Class H | 2,556,126 | ||||||
| 174,800 | Jumei International Holding Ltd. ADR* | 360,088 | ||||||
| 7,953,000 | Lonking Holdings Ltd. | 2,204,447 | ||||||
| 1,372,000 | Luye Pharma Group Ltd.(1) | 1,014,113 | ||||||
| 1,264,000 | Maanshan Iron & Steel Co., Ltd. Class H(2) | 478,074 | ||||||
| 41,300 | Momo, Inc. ADR | 1,384,376 | ||||||
| 4,480,000 | Sihuan Pharmaceutical Holdings Group Ltd. | 586,969 | ||||||
| 1,755,000 | Sinopec Engineering Group Co., Ltd. Class H | 1,002,555 | ||||||
| 1,030,400 | Sinopharm Group Co., Ltd. Class H | 3,690,118 | ||||||
| 1,167,000 | Sinotrans Ltd. Class H | 343,127 | ||||||
| 1,506,500 | Sinotruk Hong Kong Ltd. | 2,276,424 | ||||||
| 1,021,000 | Tian Ge Interactive Holdings Ltd.*(1) | 273,623 | ||||||
| 1,776,000 | Tiangong International Co., Ltd. | 634,178 | ||||||
| 1,068,000 | Tianneng Power International Ltd. | 697,637 | ||||||
| 328,800 | Vipshop Holdings Ltd. ADR* | 3,794,352 | ||||||
| 4,038,000 | Want Want China Holdings Ltd. | 3,401,647 | ||||||
| 2,376,000 | Weichai Power Co., Ltd. Class H | 3,739,869 | ||||||
The accompanying notes are an integral part of these financial statements.
| 38 |
|
| Hartford Schroders International Multi-Cap Value Fund |
Schedule of Investments – (continued)
October 31, 2019
| Shares or Principal Amount | Market Value† | |||||||
| COMMON STOCKS - 97.6% - (continued) | ||||||||
| China - 5.3% - (continued) | ||||||||
| 1,639,300 | Yangzijiang Shipbuilding Holdings Ltd. | $ | 1,147,653 | |||||
| 172,400 | YiChang HEC ChangJiang Pharmaceutical Co., Ltd. Class H(1) | 1,057,468 | ||||||
| 1,242,000 | Youyuan International Holdings Ltd.*(2)(3)(4) | 26,787 | ||||||
| 2,294,000 | Zhejiang Expressway Co., Ltd. Class H | 1,878,486 | ||||||
| 739,000 | Zoomlion Heavy Industry Science and Technology Co., Ltd. Class H | 542,497 | ||||||
|
| |||||||
| 110,146,597 | ||||||||
|
| |||||||
| Colombia - 0.2% | ||||||||
| 179,300 | Ecopetrol S.A. ADR | 3,272,225 | ||||||
|
| |||||||
| Czech Republic - 0.1% | ||||||||
| 234,223 | Moneta Money Bank AS(1) | 777,648 | ||||||
| 1,266 | Philip Morris CR AS | 755,737 | ||||||
|
| |||||||
| 1,533,385 | ||||||||
|
| |||||||
| Denmark - 0.6% | ||||||||
| 136,112 | H. Lundbeck A/S | 4,651,027 | ||||||
| 79,463 | Pandora A/S | 3,910,059 | ||||||
| 9,697 | Ringkjoebing Landbobank A/S | 669,502 | ||||||
| 116,501 | Scandinavian Tobacco Group A/S Class A(1) | 1,376,523 | ||||||
| 80,953 | Spar Nord Bank A/S | 790,797 | ||||||
|
| |||||||
| 11,397,908 | ||||||||
|
| |||||||
| Finland - 1.2% | ||||||||
| 149,148 | Nokian Renkaat Oyj | 4,262,522 | ||||||
| 281,564 | Nordea Bank Abp | 2,060,861 | ||||||
| 438,312 | Sampo Oyj Class A | 17,961,955 | ||||||
| 47,390 | Tieto Oyj | 1,347,778 | ||||||
|
| |||||||
| 25,633,116 | ||||||||
|
| |||||||
| France - 7.0% | ||||||||
| 82,277 | Atos SE | 6,385,238 | ||||||
| 60,749 | BNP Paribas S.A. | 3,174,715 | ||||||
| 40,601 | Cie Generale des Etablissements Michelin SCA | 4,943,464 | ||||||
| 192,680 | Eutelsat Communications S.A. | 3,655,123 | ||||||
| 116,252 | Faurecia SE | 5,425,265 | ||||||
| 24,836 | Gaztransport Et Technigaz S.A. | 2,265,997 | ||||||
| 82,267 | Ipsen S.A. | 8,768,642 | ||||||
| 25,935 | IPSOS | 781,549 | ||||||
| 19,138 | Kaufman & Broad S.A. | 730,102 | ||||||
| 261,109 | Metropole Television S.A. | 4,593,545 | ||||||
| 223,349 | Peugeot S.A. | 5,656,562 | ||||||
| 388,508 | Publicis Groupe S.A. | 16,720,812 | ||||||
| 80,131 | Quadient | 1,716,106 | ||||||
| 12,552 | Rothschild & Co. | 353,015 | ||||||
| 274,013 | Sanofi | 25,260,454 | ||||||
| 240,908 | Schneider Electric SE | 22,390,076 | ||||||
| 97,733 | Societe BIC S.A. | 6,785,349 | ||||||
| 217,838 | Societe Generale S.A. | 6,195,074 | ||||||
| 4,614 | Sopra Steria Group | 633,369 | ||||||
| 137,757 | Television Francaise 1 S.A. | 1,156,026 | ||||||
| 302,570 | Total S.A. | 15,996,329 | ||||||
| 7,463 | Trigano S.A. | 673,073 | ||||||
|
| |||||||
| 144,259,885 | ||||||||
|
| |||||||
| Georgia - 0.0% | ||||||||
| 46,039 | TBC Bank Group plc | 763,349 | ||||||
|
| |||||||
| Germany - 1.1% | ||||||||
| 42,276 | Bayer AG | 3,279,610 | ||||||
| 415,485 | Deutsche Bank AG | 3,012,985 | ||||||
| 65,346 | Deutz AG | 363,563 | ||||||
| 25,670 | Hochtief AG | 3,207,284 | ||||||
| 256,439 | ProSiebenSat.1 Media SE | 3,786,724 | ||||||
| 40,441 | Rocket Internet SE*(1) | 1,073,925 | ||||||
| 36,039 | Siltronic AG | 3,432,331 | ||||||
| Shares or Principal Amount | Market Value† | |||||||
| COMMON STOCKS - 97.6% - (continued) | ||||||||
| Germany - 1.1% - (continued) | ||||||||
| 150,794 | Software AG | $ | 4,796,907 | |||||
|
| |||||||
| 22,953,329 | ||||||||
|
| |||||||
| Greece - 0.1% | ||||||||
| 83,183 | JUMBO S.A. | 1,620,604 | ||||||
| 12,653 | Motor Oil Hellas Corinth Refineries S.A. | 312,937 | ||||||
| 33,546 | Mytilineos S.A. | 367,642 | ||||||
| 142,374 | Piraeus Bank S.A.* | 496,576 | ||||||
|
| |||||||
| 2,797,759 | ||||||||
|
| |||||||
| Hong Kong - 3.8% | ||||||||
| 606,000 | Allied Properties HK Ltd. | 118,949 | ||||||
| 1,400,000 | BOC Hong Kong Holdings Ltd. | 4,809,873 | ||||||
| 2,116,000 | Brilliance China Automotive Holdings Ltd. | 2,333,469 | ||||||
| 300,000 | China Everbright Ltd. | 444,481 | ||||||
| 2,498,000 | China Overseas Land & Investment Ltd. | 7,882,416 | ||||||
| 1,184,000 | China Resources Cement Holdings Ltd. | 1,296,587 | ||||||
| 4,300,000 | China Travel International Investment Hong Kong Ltd. | 678,822 | ||||||
| 1,618,000 | China Unicom Hong Kong Ltd. | 1,592,919 | ||||||
| 1,403,500 | CK Asset Holdings Ltd. | 9,765,144 | ||||||
| 810,000 | CSI Properties Ltd. | 28,901 | ||||||
| 401,200 | Dah Sing Banking Group Ltd. | 518,669 | ||||||
| 111,600 | Dah Sing Financial Holdings Ltd. | 415,271 | ||||||
| 285,000 | Emperor Entertainment Hotel Ltd. | 58,121 | ||||||
| 417,000 | Hang Lung Group Ltd. | 1,044,432 | ||||||
| 1,045,000 | Henderson Land Development Co., Ltd. | 5,219,335 | ||||||
| 333,000 | Hysan Development Co., Ltd. | 1,312,434 | ||||||
| 1,003,000 | Kerry Properties Ltd. | 3,243,363 | ||||||
| 271,500 | Kingboard Holdings Ltd. | 723,521 | ||||||
| 4,666,000 | Kunlun Energy Co., Ltd. | 4,342,814 | ||||||
| 10,020 | Lai Sun Development Co., Ltd. | 11,994 | ||||||
| 939,000 | Lifestyle International Holdings Ltd. | 988,408 | ||||||
| 962,000 | Pacific Textiles Holdings Ltd. | 699,751 | ||||||
| 929,000 | PAX Global Technology Ltd. | 405,939 | ||||||
| 68,000 | Qingling Motors Co., Ltd. Class H | 16,471 | ||||||
| 648,000 | Shanghai Industrial Holdings Ltd. | 1,206,233 | ||||||
| 648,000 | Shanghai Industrial Urban Development Group Ltd. | 80,862 | ||||||
| 1,528,000 | Sino Land Co., Ltd. | 2,284,157 | ||||||
| 832,000 | Sinopec Kantons Holdings Ltd. | 339,176 | ||||||
| 20,000 | Soundwill Holdings Ltd. | 24,596 | ||||||
| 585,000 | Sun Hung Kai Properties Ltd. | 8,864,684 | ||||||
| 548,600 | Swire Properties Ltd. | 1,725,374 | ||||||
| 41,000 | TAI Cheung Holdings Ltd. | 32,930 | ||||||
| 713,000 | TCL Electronics Holdings Ltd. | 337,925 | ||||||
| 1,200,000 | Wharf Real Estate Investment Co., Ltd. | 7,058,068 | ||||||
| 340,000 | Wheelock & Co., Ltd. | 2,102,764 | ||||||
| 3,604,000 | Xinyi Glass Holdings Ltd. | 4,052,118 | ||||||
| 2,272,000 | Yuexiu Transport Infrastructure Ltd. | 2,097,425 | ||||||
|
| |||||||
| 78,158,396 | ||||||||
|
| |||||||
| India - 0.6% | ||||||||
| 29,838 | GAIL India Ltd. GDR | 344,629 | ||||||
| 874,400 | Infosys Ltd. ADR | 8,385,496 | ||||||
| 726,900 | Wipro Ltd. ADR | 2,893,062 | ||||||
|
| |||||||
| 11,623,187 | ||||||||
|
| |||||||
| Indonesia - 0.5% | ||||||||
| 1,206,600 | Bank Pembangunan Daerah Jawa Timur Tbk PT | 59,320 | ||||||
| 16,252,900 | Panin Financial Tbk PT* | 335,818 | ||||||
| 27,764,800 | Telekomunikasi Indonesia Persero Tbk PT | 8,102,347 | ||||||
| 761,100 | United Tractors Tbk PT | 1,174,781 | ||||||
|
| |||||||
| 9,672,266 | ||||||||
|
| |||||||
| Ireland - 0.3% | ||||||||
| 1,382,892 | AIB Group plc | 4,429,598 | ||||||
| 522,350 | Bank of Ireland Group plc | 2,517,745 | ||||||
|
| |||||||
| 6,947,343 | ||||||||
|
| |||||||
The accompanying notes are an integral part of these financial statements.
| 39 |
|
| Hartford Schroders International Multi-Cap Value Fund |
Schedule of Investments – (continued)
October 31, 2019
| Shares or Principal Amount | Market Value† | |||||||
| COMMON STOCKS - 97.6% - (continued) | ||||||||
| Israel - 1.1% | ||||||||
| 315,108 | Bank Hapoalim BM | $ | 2,522,017 | |||||
| 233,412 | Bank LeumiLe-Israel BM | 1,700,230 | ||||||
| 95,500 | Check Point Software Technologies Ltd.* | 10,735,155 | ||||||
| 276,063 | Israel Discount Bank Ltd. Class A | 1,261,560 | ||||||
| 88,700 | Ituran Location and Control Ltd. | 2,175,811 | ||||||
| 1 | Mehadrin Ltd.* | 41 | ||||||
| 537,782 | Phoenix Holdings Ltd. | 3,280,370 | ||||||
| 23,800 | Taro Pharmaceutical Industries Ltd. | 1,923,992 | ||||||
|
| |||||||
| 23,599,176 | ||||||||
|
| |||||||
| Italy - 1.3% | ||||||||
| 37,763 | ASTM S.p.A. | 1,190,228 | ||||||
| 78,948 | Banca IFIS S.p.A | 1,339,378 | ||||||
| 494,978 | Eni S.p.A. | 7,509,304 | ||||||
| 109,536 | Immobiliare Grande Distribuzione SIIQ S.p.A. REIT | 703,673 | ||||||
| 548,163 | Italgas S.p.A. | 3,528,909 | ||||||
| 227,208 | Maire Tecnimont S.p.A.(2) | 595,351 | ||||||
| 799,639 | Mediaset S.p.A.*(2) | 2,391,529 | ||||||
| 480,578 | Mediobanca Banca di Credito Finanziario S.p.A. | 5,714,710 | ||||||
| 626,278 | Saras S.p.A | 1,202,713 | ||||||
| 87,858 | Societa Cattolica di Assicurazioni S.c.r.l. | 766,404 | ||||||
| 149,124 | UniCredit S.p.A. | 1,891,941 | ||||||
|
| |||||||
| 26,834,140 | ||||||||
|
| |||||||
| Japan - 20.5% | ||||||||
| 26,900 | 77 Bank Ltd. | 423,787 | ||||||
| 107,800 | ADEKA Corp. | 1,542,732 | ||||||
| 5,800 | Aichi Bank Ltd. | 203,726 | ||||||
| 107,500 | Aida Engineering Ltd. | 915,043 | ||||||
| 35,500 | Aisin Seiki Co., Ltd. | 1,416,798 | ||||||
| 26,200 | Akatsuki, Inc. | 1,460,098 | ||||||
| 3,000 | Akita Bank Ltd. | 61,212 | ||||||
| 97,200 | Amada Holdings Co., Ltd. | 1,106,924 | ||||||
| 26,100 | Aozora Bank Ltd. | 669,683 | ||||||
| 34,500 | Arakawa Chemical Industries Ltd. | 505,433 | ||||||
| 2,200 | Arcland Sakamoto Co., Ltd. | 25,952 | ||||||
| 54,300 | Arisawa Manufacturing Co., Ltd. | 541,768 | ||||||
| 75,400 | Asahi Diamond Industrial Co., Ltd. | 469,078 | ||||||
| 23,400 | Asahi Glass Co., Ltd. | 822,746 | ||||||
| 27,200 | Asahi Yukizai Corp. | 383,761 | ||||||
| 1,604,200 | Astellas Pharma, Inc. | 27,532,380 | ||||||
| 175,200 | Ateam, Inc.(2) | 1,710,900 | ||||||
| 1,900 | Atsugi Co., Ltd. | 14,410 | ||||||
| 34,400 | Awa Bank Ltd. | 819,221 | ||||||
| 1,500 | Bando Chemical Industries Ltd. | 12,732 | ||||||
| 65,100 | Belluna Co., Ltd. | 425,592 | ||||||
| 300 | C Uyemura & Co., Ltd. | 18,570 | ||||||
| 25,700 | Canon Electronics, Inc. | 481,149 | ||||||
| 18,000 | Central Glass Co., Ltd. | 433,863 | ||||||
| 82,300 | Central Japan Railway Co. | 16,882,530 | ||||||
| 229,000 | Chiba Bank Ltd. | 1,244,695 | ||||||
| 85,700 | Chugoku Bank Ltd. | 837,449 | ||||||
| 428,100 | Citizen Watch Co., Ltd. | 2,276,017 | ||||||
| 73,400 | CMK Corp. | 444,674 | ||||||
| 592,800 | Concordia Financial Group Ltd. | 2,417,398 | ||||||
| 3,100 | Corona Corp. | 33,227 | ||||||
| 55,700 | Dai Nippon Printing Co., Ltd. | 1,487,663 | ||||||
| 60,900 | Daicel Corp. | 544,411 | ||||||
| 78,200 | Daido Metal Co., Ltd. | 496,064 | ||||||
| 18,200 | Daido Steel Co., Ltd. | 794,212 | ||||||
| 46,300 | Daiho Corp. | 1,308,099 | ||||||
| 46,900 | Daiichi Kigenso Kagaku-Kogyo Co., Ltd. | 366,727 | ||||||
| 146,600 | Daikyonishikawa Corp. | 1,126,266 | ||||||
| 1,800 | Dainichi Co., Ltd. | 11,486 | ||||||
| 26,900 | Dainichiseika Color & Chemicals Manufacturing Co., Ltd. | 809,521 | ||||||
| Shares or Principal Amount | Market Value† | |||||||
| COMMON STOCKS - 97.6% - (continued) | ||||||||
| Japan - 20.5% - (continued) | ||||||||
| 30,400 | Daiseki Co., Ltd. | $ | 883,095 | |||||
| 103,400 | Daiwa House Industry Co., Ltd. | 3,559,554 | ||||||
| 660,800 | Daiwa Securities Group, Inc. | 2,970,165 | ||||||
| 52,200 | Daiwabo Holdings Co., Ltd. | 2,280,936 | ||||||
| 36,000 | Eagle Industry Co., Ltd. | 361,534 | ||||||
| 6,000 | Eidai Co., Ltd. | 19,524 | ||||||
| 61,600 | Exedy Corp. | 1,450,967 | ||||||
| 124,500 | FCC Co., Ltd. | 2,575,947 | ||||||
| 135,600 | Ferrotec Holdings Corp. | 1,344,882 | ||||||
| 23,900 | First Bank of Toyama Ltd. | 73,803 | ||||||
| 34,900 | FJ Next Co., Ltd.(2) | 362,625 | ||||||
| 46,400 | Foster Electric Co., Ltd. | 829,553 | ||||||
| 152,200 | Fuji Media Holdings, Inc. | 2,056,617 | ||||||
| 8,400 | Fujikura Kasei Co., Ltd. | 43,734 | ||||||
| 7,200 | Fujimori Kogyo Co., Ltd. | 254,564 | ||||||
| 1,600 | Fujishoji Co., Ltd. | 14,044 | ||||||
| 1,100 | FuKoKu Co., Ltd.(2) | 7,379 | ||||||
| 123,900 | Furuno Electric Co., Ltd. | 1,280,653 | ||||||
| 29,400 | G-Tekt Corp. | 506,865 | ||||||
| 53,800 | Geo Holdings Corp. | 670,457 | ||||||
| 24,100 | Goldcrest Co., Ltd. | 497,832 | ||||||
| 57,100 | GS Yuasa Corp. | 1,040,948 | ||||||
| 117,000 | Gunma Bank Ltd. | 393,722 | ||||||
| 237,400 | Hachijuni Bank Ltd. | 1,021,213 | ||||||
| 37,600 | Hamakyorex Co., Ltd. | 1,282,935 | ||||||
| 46,800 | Happinet Corp. | 590,460 | ||||||
| 158,200 | Haseko Corp. | 2,041,472 | ||||||
| 226,500 | Hazama Ando Corp. | 1,754,945 | ||||||
| 37,400 | Hirano Tecseed Co., Ltd. | 541,031 | ||||||
| 97,900 | Hitachi Ltd. | 3,653,867 | ||||||
| 252,100 | Honda Motor Co., Ltd. | 6,820,308 | ||||||
| 127,700 | Hosiden Corp. | 1,341,505 | ||||||
| 29,000 | Hosokawa Micron Corp. | 1,054,444 | ||||||
| 10,500 | Imasen Electric Industrial | 90,873 | ||||||
| 1,257,900 | Inpex Corp. | 11,628,628 | ||||||
| 46,700 | Ishihara Sangyo Kaisha Ltd. | 482,126 | ||||||
| 458,400 | Isuzu Motors Ltd. | 5,326,566 | ||||||
| 277,600 | ITOCHU Corp. | 5,804,027 | ||||||
| 1,400 | Iwatsu Electric Co., Ltd. | 10,447 | ||||||
| 324,200 | Iyo Bank Ltd. | 1,712,991 | ||||||
| 75,400 | Japan Aviation Electronics Industry Ltd. | 1,404,612 | ||||||
| 3,900 | Japan Foundation Engineering Co., Ltd. | 14,323 | ||||||
| 86,100 | Japan Petroleum Exploration Co., Ltd. | 2,201,372 | ||||||
| 83,100 | JDC Corp. | 481,846 | ||||||
| 32,700 | Kaga Electronics Co., Ltd. | 633,848 | ||||||
| 42,900 | Kaken Pharmaceutical Co., Ltd. | 2,103,333 | ||||||
| 78,300 | Kamigumi Co., Ltd. | 1,770,452 | ||||||
| 91,000 | Kanamoto Co., Ltd.(2) | 2,432,803 | ||||||
| 63,800 | Kandenko Co., Ltd. | 603,252 | ||||||
| 33,600 | Kanematsu Corp. | 409,343 | ||||||
| 50,600 | Kasai Kogyo Co., Ltd. | 409,535 | ||||||
| 568,800 | KDDI Corp. | 15,739,345 | ||||||
| 69,700 | Keihin Corp. | 1,656,952 | ||||||
| 66,800 | Koa Corp. | 839,440 | ||||||
| 69,200 | Kokuyo Co., Ltd. | 1,015,469 | ||||||
| 14,200 | Krosaki Harima Corp. | 760,858 | ||||||
| 52,700 | Kureha Corp. | 3,368,255 | ||||||
| 1,900 | Kyodo Printing Co., Ltd. | 48,144 | ||||||
| 31,200 | Kyokuto Kaihatsu Kogyo Co., Ltd. | 418,140 | ||||||
| 13,500 | Kyudenko Corp. | 441,134 | ||||||
| 130,200 | Kyushu Financial Group, Inc. | 525,536 | ||||||
| 72,300 | Macromill, Inc. | 643,935 | ||||||
| 36,100 | Maeda Road Construction Co., Ltd. | 776,631 | ||||||
| 36,700 | Makino Milling Machine Co., Ltd. | 1,824,693 | ||||||
| 151,600 | Marubeni Corp. | 1,066,972 | ||||||
The accompanying notes are an integral part of these financial statements.
| 40 |
|
| Hartford Schroders International Multi-Cap Value Fund |
Schedule of Investments – (continued)
October 31, 2019
| Shares or Principal Amount | Market Value† | |||||||
| COMMON STOCKS - 97.6% - (continued) | ||||||||
| Japan - 20.5% - (continued) | ||||||||
| 31,800 | Maxell Holdings Ltd. | $ | 438,897 | |||||
| 253,100 | Mazda Motor Corp. | 2,323,538 | ||||||
| 26,500 | Meiko Electronics Co., Ltd. | 434,615 | ||||||
| 13,700 | Meitec Corp. | 714,185 | ||||||
| 323,400 | Mitsubishi Chemical Holdings Corp. | 2,464,703 | ||||||
| 284,500 | Mitsubishi Gas Chemical Co., Inc. | 4,013,416 | ||||||
| 1,210,900 | Mitsubishi UFJ Financial Group, Inc. | 6,277,655 | ||||||
| 22,200 | Mitsuboshi Belting Ltd. | 417,715 | ||||||
| 221,100 | Mitsui & Co., Ltd. | 3,797,163 | ||||||
| 91,700 | Mitsui Chemicals, Inc. | 2,180,757 | ||||||
| 35,700 | Mitsui Matsushima Holdings Co., Ltd. | 425,690 | ||||||
| 34,600 | Mitsui Sugar Co., Ltd. | 752,345 | ||||||
| 42,100 | Mixi, Inc. | 813,538 | ||||||
| 2,327,500 | Mizuho Financial Group, Inc. | 3,613,387 | ||||||
| 35,400 | Mizuno Corp. | 925,903 | ||||||
| 55,100 | Modec, Inc. | 1,511,408 | ||||||
| 3,900 | Murakami Corp. | 91,204 | ||||||
| 105,800 | Musashi Seimitsu Industry Co., Ltd. | 1,469,716 | ||||||
| 65,700 | Nagase & Co., Ltd. | 993,452 | ||||||
| 2,600 | Natoco Co., Ltd. | 31,155 | ||||||
| 229,000 | NHK Spring Co., Ltd. | 1,870,747 | ||||||
| 21,900 | Nichias Corp. | 462,005 | ||||||
| 4,000 | Nichireki Co., Ltd. | 47,478 | ||||||
| 10,868 | Nichirin Co., Ltd. | 172,588 | ||||||
| 25,900 | Nikkon Holdings Co., Ltd. | 629,572 | ||||||
| 82,400 | Nikon Corp. | 1,050,625 | ||||||
| 49,200 | Nippo Corp. | 1,010,933 | ||||||
| 85,200 | Nippon Carbon Co., Ltd.(2) | 3,268,907 | ||||||
| 22,400 | Nippon Chemical Industrial Co., Ltd. | 659,129 | ||||||
| 71,700 | Nippon Electric Glass Co., Ltd. | 1,615,154 | ||||||
| 969,500 | Nippon Light Metal Holdings Co., Ltd. | 1,885,715 | ||||||
| 31,900 | Nippon Pillar Packing Co., Ltd. | 429,730 | ||||||
| 15,000 | Nippon Soda Co., Ltd. | 399,532 | ||||||
| 185,100 | Nippon Telegraph & Telephone Corp. | 9,188,900 | ||||||
| 122,400 | Nippon Thompson Co., Ltd. | 546,595 | ||||||
| 104,600 | Nishimatsu Construction Co., Ltd. | 2,177,865 | ||||||
| 53,300 | Nishio Rent All Co., Ltd. | 1,431,913 | ||||||
| 13,500 | Nisshin Oillio Group Ltd. | 472,726 | ||||||
| 40,300 | Nissin Kogyo Co., Ltd. | 825,302 | ||||||
| 22,200 | Nitta Corp. | 647,497 | ||||||
| 205,600 | NOK Corp. | 3,220,323 | ||||||
| 12,400 | Noritake Co. Ltd. | 569,676 | ||||||
| 78,500 | NSK Ltd. | 729,925 | ||||||
| 756,700 | NTT DOCOMO, Inc. | 20,745,004 | ||||||
| 373,100 | Obayashi Corp. | 3,839,717 | ||||||
| 537,400 | Oji Holdings Corp. | 2,778,487 | ||||||
| 3,500 | Okinawa Cellular Telephone Co. | 119,613 | ||||||
| 46,700 | Okumura Corp. | 1,322,804 | ||||||
| 20,600 | Okura Industrial Co., Ltd. | 379,101 | ||||||
| 57,000 | Open House Co., Ltd. | 1,456,610 | ||||||
| 139,400 | ORIX Corp. | 2,190,656 | ||||||
| 65,000 | Osaki Electric Co., Ltd. | 450,050 | ||||||
| 175,100 | OSJB Holdings Corp. | 426,302 | ||||||
| 36,000 | Piolax, Inc. | 704,054 | ||||||
| 198,500 | Press Kogyo Co., Ltd. | 841,933 | ||||||
| 159,600 | Rengo Co., Ltd. | 1,157,265 | ||||||
| 25,300 | Ryobi Ltd. | 470,888 | ||||||
| 26,100 | Ryosan Co., Ltd. | 677,624 | ||||||
| 89,300 | San-In Godo Bank Ltd. | 523,802 | ||||||
| 2,000 | Sanko Metal Industrial Co., Ltd. | 48,524 | ||||||
| 18,600 | SEC Carbon Ltd.(2) | 1,428,840 | ||||||
| 321,900 | Seino Holdings Co., Ltd. | 4,138,986 | ||||||
| 29,200 | Sekisui Jushi Corp. | 597,931 | ||||||
| 13,500 | Shibaura Mechatronics Corp. | 449,064 | ||||||
| 35,600 | Shiga Bank Ltd. | 857,924 | ||||||
| Shares or Principal Amount | Market Value† | |||||||
| COMMON STOCKS - 97.6% - (continued) | ||||||||
| Japan - 20.5% - (continued) | ||||||||
| 19,100 | Shikoku Chemicals Corp. | $ | 224,199 | |||||
| 82,900 | Shimizu Corp. | 772,794 | ||||||
| 10,200 | Shindengen Electric Manufacturing Co., Ltd. | 346,651 | ||||||
| 70,600 | Shinnihon Corp. | 554,578 | ||||||
| 76,100 | Shinoken Group Co., Ltd. | 783,266 | ||||||
| 177,100 | Shinsei Bank Ltd. | 2,760,944 | ||||||
| 329,700 | Shionogi & Co., Ltd. | 19,789,543 | ||||||
| 413,200 | Shizuoka Bank Ltd. | 3,139,813 | ||||||
| 50,800 | Shizuoka Gas Co., Ltd. | 439,183 | ||||||
| 154,800 | Showa Corp. | 3,234,488 | ||||||
| 210,600 | Showa Denko KK | 5,908,790 | ||||||
| 44,500 | Sinfonia Technology Co., Ltd. | 546,587 | ||||||
| 43,000 | Sintokogio Ltd. | 414,799 | ||||||
| 600 | SK Kaken Co., Ltd. | 259,468 | ||||||
| 29,500 | SK-Electronics Co., Ltd. | 598,668 | ||||||
| 327,100 | SKY Perfect JSAT Holdings, Inc. | 1,350,922 | ||||||
| 105,300 | Sumco Corp. | 1,749,124 | ||||||
| 230,700 | Sumitomo Chemical Co., Ltd. | 1,055,309 | ||||||
| 167,000 | Sumitomo Corp. | 2,712,479 | ||||||
| 5,200 | Sumitomo Densetsu Co., Ltd. | 108,589 | ||||||
| 512,600 | Sumitomo Electric Industries Ltd. | 7,029,671 | ||||||
| 86,500 | Sumitomo Forestry Co., Ltd. | 1,255,507 | ||||||
| 15,400 | Sumitomo Heavy Industries Ltd. | 478,355 | ||||||
| 146,500 | Sumitomo Mitsui Construction Co., Ltd. | 831,410 | ||||||
| 210,300 | Sumitomo Mitsui Financial Group, Inc. | 7,466,316 | ||||||
| 33,600 | Sumitomo Seika Chemicals Co., Ltd. | 1,069,539 | ||||||
| 32,100 | Sun Frontier Fudousan Co., Ltd. | 390,560 | ||||||
| 20,400 | T-Gaia Corp. | 490,609 | ||||||
| 32,900 | Tachi-S Co., Ltd. | 436,962 | ||||||
| 55,300 | Tadano Ltd.(2) | 501,253 | ||||||
| 19,000 | Taihei Dengyo Kaisha Ltd. | 448,288 | ||||||
| 32,900 | Taisei Corp. | 1,297,359 | ||||||
| 23,400 | Takasago Thermal Engineering Co., Ltd. | 423,337 | ||||||
| 72,500 | Takeuchi Manufacturing Co., Ltd. | 1,132,908 | ||||||
| 98,700 | Tatsuta Electric Wire and Cable Co., Ltd. | 541,247 | ||||||
| 27,500 | TKC Corp. | 1,158,464 | ||||||
| 77,200 | Toagosei Co., Ltd. | 855,667 | ||||||
| 33,000 | Tobishima Corp. | 442,539 | ||||||
| 577,200 | Tokai Carbon Co., Ltd.(2) | 5,829,071 | ||||||
| 41,700 | Tokai Rika Co., Ltd. | 804,822 | ||||||
| 135,600 | Tokyo Broadcasting System Holdings, Inc. | 2,162,199 | ||||||
| 174,300 | Tokyu Construction Co., Ltd. | 1,380,524 | ||||||
| 264,500 | Toppan Printing Co., Ltd. | 4,892,011 | ||||||
| 74,800 | Topre Corp. | 1,297,979 | ||||||
| 25,000 | Torii Pharmaceutical Co., Ltd. | 667,129 | ||||||
| 22,100 | Toshiba Machine Co., Ltd. | 494,539 | ||||||
| 36,100 | Towa Bank Ltd. | 306,522 | ||||||
| 105,600 | Toyo Construction Co., Ltd. | 496,193 | ||||||
| 38,200 | Toyo Ink SC Holdings Co., Ltd. | 931,014 | ||||||
| 22,200 | Toyo Kanetsu KK | 416,774 | ||||||
| 79,400 | Toyo Seikan Group Holdings Ltd. | 1,254,788 | ||||||
| 38,400 | Toyo Tanso Co., Ltd. | 907,296 | ||||||
| 35,100 | Toyo Tire Corp. | 489,584 | ||||||
| 75,800 | Toyobo Co., Ltd. | 1,024,591 | ||||||
| 37,000 | Toyoda Gosei Co., Ltd. | 865,604 | ||||||
| 163,600 | Toyota Boshoku Corp. | 2,403,742 | ||||||
| 70,300 | Toyota Tsusho Corp. | 2,425,246 | ||||||
| 44,400 | TPR Co., Ltd. | 794,851 | ||||||
| 75,800 | TS Tech Co., Ltd. | 2,427,681 | ||||||
| 34,400 | Tsubakimoto Chain Co. | 1,175,307 | ||||||
| 48,200 | TV Asahi Holdings Corp. | 752,832 | ||||||
| 20,200 | Tv Tokyo Holdings Corp. | 420,490 | ||||||
| 62,000 | Ube Industries Ltd. | 1,327,492 | ||||||
| 102,900 | Unipres Corp. | 1,683,000 | ||||||
| 148,200 | Ushio, Inc. | 2,214,825 | ||||||
The accompanying notes are an integral part of these financial statements.
| 41 |
|
| Hartford Schroders International Multi-Cap Value Fund |
Schedule of Investments – (continued)
October 31, 2019
| Shares or Principal Amount | Market Value† | |||||||
| COMMON STOCKS - 97.6% - (continued) | ||||||||
| Japan - 20.5% - (continued) | ||||||||
| 3,100 | Utoc Corp. | $ | 16,005 | |||||
| 71,400 | V Technology Co., Ltd. | 4,247,879 | ||||||
| 92,000 | Wakita & Co., Ltd. | 929,936 | ||||||
| 36,000 | West Holdings Corp. | 531,708 | ||||||
| 48,400 | YAMABIKO Corp. | 549,443 | ||||||
| 172,700 | Yamaguchi Financial Group, Inc. | 1,211,715 | ||||||
| 206,500 | Yamaha Motor Co., Ltd. | 4,041,809 | ||||||
| 66,800 | Yamaichi Electronics Co., Ltd. | 902,954 | ||||||
| 25,800 | Yamanashi Chuo Bank Ltd. | 257,471 | ||||||
| 52,900 | Yokogawa Bridge Holdings Corp. | 968,439 | ||||||
| 18,500 | Yuasa Trading Co., Ltd. | 573,922 | ||||||
| 54,500 | Yurtec Corp. | 336,991 | ||||||
| 54,200 | Zeon Corp. | 617,430 | ||||||
|
| |||||||
| 423,945,909 | ||||||||
|
| |||||||
| Luxembourg - 0.4% | ||||||||
| 51,022 | APERAM S.A. | 1,307,286 | ||||||
| 28,700 | Orion Engineered Carbons S.A. | 475,272 | ||||||
| 107,842 | RTL Group S.A. | 5,479,781 | ||||||
| 36,200 | Ternium S.A. ADR | 723,638 | ||||||
|
| |||||||
| 7,985,977 | ||||||||
|
| |||||||
| Malaysia - 1.1% | ||||||||
| 48,400 | AFFIN Bank Bhd | 22,457 | ||||||
| 396,800 | AMMB Holdings Bhd | 378,493 | ||||||
| 885,300 | Astro Malaysia Holdings Bhd | 286,101 | ||||||
| 709,400 | BerMaz Auto Bhd | 386,821 | ||||||
| 1,777,100 | Genting Bhd | 2,468,589 | ||||||
| 8,364,800 | Hibiscus Petroleum Bhd* | 1,878,476 | ||||||
| 35,200 | Lingkaran Trans Kota Holdings Bhd | 38,835 | ||||||
| 3,204,800 | Malayan Banking Bhd | 6,590,453 | ||||||
| 2,474,800 | Petronas Chemicals Group Bhd | 4,421,513 | ||||||
| 365,700 | Petronas Gas Bhd | 1,456,324 | ||||||
| 525,500 | Public Bank Bhd | 2,550,438 | ||||||
| 1,311,000 | RHB Bank Bhd | 1,804,056 | ||||||
|
| |||||||
| 22,282,556 | ||||||||
|
| |||||||
| Mexico - 0.7% | ||||||||
| 705,000 | Banco del Bajio S.A.(1) | 1,139,053 | ||||||
| 365,201 | Bolsa Mexicana de Valores S.A.B. de C.V. | 799,450 | ||||||
| 287,200 | Concentradora Fibra Danhos S.A. de C.V. REIT | 432,969 | ||||||
| 658,100 | Gentera S.A.B. de C.V. | 650,009 | ||||||
| 155,600 | Grupo Aeroportuario del Centro Norte S.A.B. de C.V. | 1,079,772 | ||||||
| 36,283 | Grupo Aeroportuario del Pacifico S.A.B. de C.V. ADR | 3,791,936 | ||||||
| 22,900 | Grupo Aeroportuario del Sureste S.A.B. de C.V. ADR | 3,749,875 | ||||||
| 1,043,300 | Grupo Financiero Inbursa S.A.B. de C.V. | 1,297,854 | ||||||
| 192,500 | Megacable Holdings S.A.B. de C.V. UNIT | 790,254 | ||||||
| 50 | Urbi Desarrollos Urbanos S.A.B. de C.V.* | 3 | ||||||
|
| |||||||
| 13,731,175 | ||||||||
|
| |||||||
| Monaco - 0.1% | ||||||||
| 138,900 | Costamare, Inc. | 1,091,754 | ||||||
|
| |||||||
| Netherlands - 2.8% | ||||||||
| 51,654 | Aalberts N.V. | 2,081,542 | ||||||
| 18,625 | Aegon N.V. | 80,801 | ||||||
| 359,010 | ASR Nederland N.V. | 13,160,802 | ||||||
| 393,384 | ING Groep N.V. | 4,454,478 | ||||||
| 19,993 | Koninklijke Volkerwessels N.V. | 464,869 | ||||||
| 40,753 | NIBC Holding N.V.(1) | 332,255 | ||||||
| 246,075 | NN Group N.V. | 9,389,458 | ||||||
| 577,619 | Royal Dutch Shell plc Class A | 16,763,129 | ||||||
| 313,657 | Royal Dutch Shell plc Class B | 9,033,247 | ||||||
| 96,633 | Signify N.V.(1) | 2,831,352 | ||||||
|
| |||||||
| 58,591,933 | ||||||||
|
| |||||||
| Shares or Principal Amount | Market Value† | |||||||
| COMMON STOCKS - 97.6% - (continued) | ||||||||
| New Zealand - 0.0% | ||||||||
| 55,177 | Freightways Ltd. | $ | 272,220 | |||||
| 522,838 | SKY Network Television Ltd. | 302,157 | ||||||
|
| |||||||
| 574,377 | ||||||||
|
| |||||||
| Norway - 1.8% | ||||||||
| 2,552,432 | DNO ASA | 3,101,774 | ||||||
| 608,964 | Equinor ASA | 11,305,830 | ||||||
| 54,644 | Salmar ASA | 2,550,111 | ||||||
| 952,670 | Telenor ASA | 17,829,930 | ||||||
| 114,790 | TGS Nopec Geophysical Co. ASA | 2,981,246 | ||||||
|
| |||||||
| 37,768,891 | ||||||||
|
| |||||||
| Peru - 0.2% | ||||||||
| 19,800 | Credicorp Ltd. | 4,237,992 | ||||||
|
| |||||||
| Poland - 0.9% | ||||||||
| 89,684 | Grupa Lotos S.A. | 2,239,685 | ||||||
| 433,393 | PGE Polska Grupa Energetyczna S.A.* | 929,263 | ||||||
| 222,765 | Polski Koncern Naftowy ORLEN S.A. | 6,091,084 | ||||||
| 679,808 | Polskie Gornictwo Naftowe i Gazownictwo S.A. | 837,535 | ||||||
| 832,061 | Powszechna Kasa Oszczednosci Bank Polski S.A. | 8,308,040 | ||||||
| 72,866 | Warsaw Stock Exchange | 737,057 | ||||||
|
| |||||||
| 19,142,664 | ||||||||
|
| |||||||
| Portugal - 0.4% | ||||||||
| 276,935 | Altri SGPS S.A. | 1,690,450 | ||||||
| 4,856,684 | Banco Comercial Portugues S.A. | 1,101,369 | ||||||
| 328,459 | Galp Energia SGPS S.A. | 5,253,627 | ||||||
| 274,006 | Navigator Co. S.A. | 988,809 | ||||||
|
| |||||||
| 9,034,255 | ||||||||
|
| |||||||
| Russia - 1.5% | ||||||||
| 336,999 | Evraz plc | 1,608,144 | ||||||
| 403,549 | Gazprom PJSC ADR | 3,235,190 | ||||||
| 98,972 | Globaltrans Investment plc GDR | 846,211 | ||||||
| 92,760 | LUKOIL PJSC ADR | 8,545,068 | ||||||
| 156,856 | MMC Norilsk Nickel PJSC ADR | 4,350,401 | ||||||
| 208,500 | Mobile TeleSystems PJSC ADR | 1,866,075 | ||||||
| 76,287 | PhosAgro PJSC GDR | 959,691 | ||||||
| 128,401 | Rosneft Oil Co. PJSC GDR | 850,271 | ||||||
| 59,346 | Severstal PJSC GDR | 810,666 | ||||||
| 555,644 | Surgutneftegas PJSC ADR | 3,673,048 | ||||||
| 59,768 | Tatneft PJSC ADR | 4,191,107 | ||||||
|
| |||||||
| 30,935,872 | ||||||||
|
| |||||||
| Singapore - 4.3% | ||||||||
| 31,600 | China Yuchai International Ltd. | 437,660 | ||||||
| 84,400 | City Developments Ltd. | 668,380 | ||||||
| 3,193,300 | ComfortDelGro Corp. Ltd. | 5,392,465 | ||||||
| 1,295,200 | DBS Group Holdings Ltd. | 24,687,638 | ||||||
| 1,041,200 | Hi-P International Ltd. | 1,096,756 | ||||||
| 1,400,000 | IGG, Inc. | 914,881 | ||||||
| 121,600 | Jardine Cycle & Carriage Ltd. | 2,923,524 | ||||||
| 711,100 | Mapletree Industrial Trust REIT | 1,332,009 | ||||||
| 1,941,900 | Oversea-Chinese Banking Corp. Ltd. | 15,611,337 | ||||||
| 6,374,800 | Singapore Telecommunications Ltd. | 15,427,967 | ||||||
| 850,500 | United Overseas Bank Ltd. | 16,744,163 | ||||||
| 472,900 | UOL Group Ltd. | 2,707,769 | ||||||
| 386,400 | Yanlord Land Group Ltd. | 342,955 | ||||||
|
| |||||||
| 88,287,504 | ||||||||
|
| |||||||
| South Africa - 1.9% | ||||||||
| 122,663 | AECI Ltd. | 792,697 | ||||||
| 113,183 | African Rainbow Minerals Ltd. | 1,133,947 | ||||||
| 10,524 | Assore Ltd. | 176,861 | ||||||
| 36,268 | Astral Foods Ltd. | 387,126 | ||||||
| 465,411 | AVI Ltd. | 2,667,940 | ||||||
| 318,237 | Barloworld Ltd. | 2,534,750 | ||||||
The accompanying notes are an integral part of these financial statements.
| 42 |
|
| Hartford Schroders International Multi-Cap Value Fund |
Schedule of Investments – (continued)
October 31, 2019
| Shares or Principal Amount | Market Value† | |||||||
| COMMON STOCKS - 97.6% - (continued) | ||||||||
| South Africa - 1.9% - (continued) | ||||||||
| 235,500 | Harmony Gold Mining Co., Ltd. ADR* | $ | 819,540 | |||||
| 186,995 | Hyprop Investments Ltd. REIT | 730,135 | ||||||
| 135,567 | Kumba Iron Ore Ltd. | 3,303,225 | ||||||
| 309,534 | Momentum Metropolitan Holdings | 413,791 | ||||||
| 1,765,710 | Netcare Ltd. | 1,999,470 | ||||||
| 190,390 | Reunert Ltd. | 900,133 | ||||||
| 1,074,205 | RMB Holdings Ltd. | 5,654,780 | ||||||
| 816,395 | Sanlam Ltd. | 4,296,557 | ||||||
| 417,995 | Standard Bank Group Ltd. | 4,798,685 | ||||||
| 26,502 | Tiger Brands Ltd. | 376,323 | ||||||
| 200,209 | Truworths International Ltd. | 709,595 | ||||||
| 903,171 | Vodacom Group Ltd. | 7,890,393 | ||||||
|
| |||||||
| 39,585,948 | ||||||||
|
| |||||||
| South Korea - 3.3% | ||||||||
| 54,168 | Aekyung Petrochemical Co., Ltd. | 353,482 | ||||||
| 30,450 | Asia Paper Manufacturing Co., Ltd. | 762,498 | ||||||
| 80,121 | BGF Co., Ltd. | 395,453 | ||||||
| 131,840 | BH Co., Ltd.* | 2,577,316 | ||||||
| 81,891 | Daeduck Electronics Co. | 751,310 | ||||||
| 33,811 | Daelim Industrial Co., Ltd. | 2,628,111 | ||||||
| 110,034 | DB HiTek Co., Ltd. | 1,605,197 | ||||||
| 23,015 | ENF Technology Co., Ltd. | 512,907 | ||||||
| 9,400 | Gravity Co., Ltd. ADR*(2) | 313,208 | ||||||
| 6,878 | GS Home Shopping, Inc. | 879,266 | ||||||
| 214,481 | Hana Financial Group, Inc. | 6,209,770 | ||||||
| 18,238 | Handsome Co., Ltd. | 457,051 | ||||||
| 50,393 | Hankook Tire & Technology Co., Ltd. | 1,343,734 | ||||||
| 31,319 | Hanyang Eng Co., Ltd. | 311,453 | ||||||
| 27,797 | Hyundai Department Store Co., Ltd. | 1,764,852 | ||||||
| 35,233 | Hyundai Greenfood Co., Ltd. | 339,149 | ||||||
| 70,754 | ICD Co., Ltd. | 864,404 | ||||||
| 30,973 | INTOPS Co., Ltd. | 365,409 | ||||||
| 178,540 | KB Financial Group, Inc. | 6,427,334 | ||||||
| 31,007 | KC Co., Ltd. | 371,585 | ||||||
| 44,474 | KC Tech Co., Ltd. | 744,712 | ||||||
| 67,782 | Kginicis Co., Ltd. | 950,706 | ||||||
| 90,759 | Kia Motors Corp. | 3,317,002 | ||||||
| 26,466 | Kolmar Korea Holdings Co., Ltd. | 496,918 | ||||||
| 29,278 | Korea Autoglass Corp. | 423,203 | ||||||
| 31,466 | Kortek Corp. | 334,167 | ||||||
| 71,834 | KT&G Corp. | 6,166,345 | ||||||
| 13,393 | Kumho Petrochemical Co., Ltd. | 801,895 | ||||||
| 78,362 | LG Corp. | 4,671,671 | ||||||
| 46,070 | LOTTE Fine Chemical Co., Ltd. | 1,746,797 | ||||||
| 150,677 | Mirae Asset Life Insurance Co., Ltd. | 518,361 | ||||||
| 126,926 | Moorim P&P Co., Ltd. | 485,410 | ||||||
| 38,004 | Orange Life Insurance Ltd.(1) | 913,714 | ||||||
| 200,682 | Power Logics Co., Ltd.* | 1,652,077 | ||||||
| 4,100 | PSK Holdings, Inc. | 29,123 | ||||||
| 36,315 | SammokS-Form Co., Ltd. | 290,339 | ||||||
| 24,136 | Samwha Capacitor Co., Ltd. | 1,022,723 | ||||||
| 244,969 | Seohan Co., Ltd. | 267,905 | ||||||
| 634,176 | Seohee Construction Co., Ltd. | 620,576 | ||||||
| 12,783 | SFA Engineering Corp. | 458,116 | ||||||
| 13,569 | Shindaeyang Paper Co., Ltd. | 729,755 | ||||||
| 145,265 | Shinhan Financial Group Co., Ltd. | 5,292,742 | ||||||
| 16,753 | SK Hynix, Inc. | 1,178,003 | ||||||
| 24,799 | Songwon Industrial Co., Ltd. | 328,363 | ||||||
| 48,632 | Soulbrain Co., Ltd. | 3,146,270 | ||||||
| 16,337 | Spigen Korea Co., Ltd. | 790,934 | ||||||
| 304 | Taekwang Industrial Co., Ltd. | 286,637 | ||||||
| 37,806 | TES Co., Ltd. | 664,800 | ||||||
| 93,560 | Wonik Holdings Co., Ltd.* | 360,247 | ||||||
|
| |||||||
| 67,923,000 | ||||||||
|
| |||||||
| Shares or Principal Amount | Market Value† | |||||||
| COMMON STOCKS - 97.6% - (continued) | ||||||||
| Spain - 2.3% | ||||||||
| 57,174 | Aena SME S.A.(1) | $ | 10,494,975 | |||||
| 119,821 | Atresmedia Corp. de Medios de Comunicacion S.A. | 501,461 | ||||||
| 665,056 | Banco Bilbao Vizcaya Argentaria S.A. | 3,502,735 | ||||||
| 100,643 | Bolsas y Mercados Espanoles SHMSF S.A. | 2,791,758 | ||||||
| 305,678 | Mediaset Espana Comunicacion S.A. | 1,870,400 | ||||||
| 280,716 | Prosegur Cash S.A.(1) | 438,946 | ||||||
| 830,524 | Red Electrica Corp. S.A. | 16,691,472 | ||||||
| 543,972 | Repsol S.A. | 8,964,495 | ||||||
| 312,774 | Zardoya Otis S.A. | 2,371,472 | ||||||
|
| |||||||
| 47,627,714 | ||||||||
|
| |||||||
| Sweden - 1.2% | ||||||||
| 40,186 | Bure Equity AB | 621,150 | ||||||
| 131,982 | Hexpol AB | 1,177,566 | ||||||
| 203,583 | Industrivarden AB Class C | 4,410,961 | ||||||
| 408,634 | Sandvik AB | 7,219,468 | ||||||
| 81,327 | Swedish Match AB | 3,820,608 | ||||||
| 111,733 | Tethys Oil AB | 850,932 | ||||||
| 55,573 | Thule Group AB(1) | 1,131,685 | ||||||
| 349,962 | Volvo AB Class B | 5,244,448 | ||||||
|
| |||||||
| 24,476,818 | ||||||||
|
| |||||||
| Switzerland - 4.5% | ||||||||
| 320,053 | Credit Suisse Group AG* | 3,961,572 | ||||||
| 177,248 | Ferrexpo plc | 290,446 | ||||||
| 14,706 | Flughafen Zurich AG | 2,649,905 | ||||||
| 289,442 | Novartis AG | 25,290,052 | ||||||
| 86,568 | Roche Holding AG | 26,053,142 | ||||||
| 37,859 | Swisscom AG | 19,364,665 | ||||||
| 422,852 | UBS Group AG* | 5,004,521 | ||||||
| 25,682 | Zurich Insurance Group AG | 10,059,640 | ||||||
|
| |||||||
| 92,673,943 | ||||||||
|
| |||||||
| Taiwan - 3.3% | ||||||||
| 191,000 | Anpec Electronics Corp. | 466,142 | ||||||
| 605,000 | Asia Cement Corp. | 854,033 | ||||||
| 416,000 | Catcher Technology Co., Ltd. | 3,526,062 | ||||||
| 178,000 | Chenbro Micom Co., Ltd. | 446,259 | ||||||
| 281,000 | Chia Chang Co., Ltd. | 354,588 | ||||||
| 250,400 | China Motor Corp. | 340,443 | ||||||
| 97,000 | Cleanaway Co., Ltd. | 503,398 | ||||||
| 253,000 | Coretronic Corp. | 326,828 | ||||||
| 1,001,000 | FIT Hon Teng Ltd.(1) | 406,451 | ||||||
| 399,000 | Formosa Sumco Technology Corp. | 1,525,833 | ||||||
| 479,000 | Fusheng Precision Co., Ltd. | 2,790,044 | ||||||
| 1,133,000 | Gamania Digital Entertainment Co., Ltd. | 2,150,946 | ||||||
| 349,000 | Globalwafers Co., Ltd. | 4,164,011 | ||||||
| 1,626,829 | Hannstar Board Corp. | 2,383,439 | ||||||
| 1,832,000 | HannStar Display Corp. | 389,273 | ||||||
| 426,000 | Holtek Semiconductor, Inc. | 928,948 | ||||||
| 404,940 | Innodisk Corp. | 1,771,215 | ||||||
| 399,000 | Kinsus Interconnect Technology Corp. | 630,284 | ||||||
| 1,155,000 | Lite-On Technology Corp. | 1,903,235 | ||||||
| 58,500 | Lumax International Corp. Ltd. | 153,858 | ||||||
| 257,000 | Makalot Industrial Co., Ltd. | 1,434,803 | ||||||
| 253,000 | Mirle Automation Corp. | 322,459 | ||||||
| 744,050 | Mitac Holdings Corp. | 653,895 | ||||||
| 1,218,000 | Nichidenbo Corp. | 1,933,938 | ||||||
| 321,000 | Polytronics Technology Corp. | 721,217 | ||||||
| 1,098,000 | Radiant Opto-Electronics Corp. | 4,359,364 | ||||||
| 362,000 | SCI Pharmtech, Inc. | 1,324,916 | ||||||
| 1,063,000 | Sigurd Microelectronics Corp. | 1,295,599 | ||||||
| 1,335,000 | Sino-American Silicon Products, Inc. | 4,013,702 | ||||||
| 25,600 | Sirtec International Co., Ltd. | 25,674 | ||||||
| 155,000 | Swancor Holding Co., Ltd. | 438,515 | ||||||
| 591,000 | Synnex Technology International Corp. | 704,906 | ||||||
The accompanying notes are an integral part of these financial statements.
| 43 |
|
| Hartford Schroders International Multi-Cap Value Fund |
Schedule of Investments – (continued)
October 31, 2019
| Shares or Principal Amount | Market Value† | |||||||
| COMMON STOCKS - 97.6% - (continued) | ||||||||
| Taiwan - 3.3% - (continued) | ||||||||
| 354,000 | Taiwan PCB Techvest Co., Ltd. | $ | 424,800 | |||||
| 280,000 | Taiwan Secom Co., Ltd. | 801,170 | ||||||
| 162,700 | Taiwan Semiconductor Manufacturing Co., Ltd. ADR | 8,400,201 | ||||||
| 764,000 | Taiwan Styrene Monomer | 541,881 | ||||||
| 675,000 | Teco Electric and Machinery Co., Ltd. | 598,526 | ||||||
| 823,000 | Test Research, Inc. | 1,377,162 | ||||||
| 343,000 | Thinking Electronic Industrial Co., Ltd. | 923,106 | ||||||
| 778,000 | TPK Holding Co., Ltd.* | 1,692,652 | ||||||
| 825,000 | Tripod Technology Corp. | 3,188,480 | ||||||
| 49,500 | TSC Auto ID Technology Co., Ltd. | 404,232 | ||||||
| 98,000 | United Integrated Services Co., Ltd. | 509,650 | ||||||
| 10,288,000 | United Microelectronics Corp. | 4,737,832 | ||||||
| 1,143,000 | Walton Advanced Engineering, Inc. | 346,435 | ||||||
| 152,000 | Yageo Corp. | 1,559,731 | ||||||
|
| |||||||
| 68,750,136 | ||||||||
|
| |||||||
| Thailand - 1.6% | ||||||||
| 1,238,200 | Bangkok Bank PCL NVDR | 7,133,155 | ||||||
| 1,953,400 | Kasikornbank PCL NVDR | 8,988,491 | ||||||
| 6,354,500 | Krung Thai Bank PCL NVDR | 3,493,449 | ||||||
| 1,919,400 | LPN Development PCL NVDR | 298,746 | ||||||
| 1,063,800 | PTT Exploration & Production PCL NVDR | 4,244,028 | ||||||
| 1,549,900 | Siam Commercial Bank PCL NVDR | 5,744,407 | ||||||
| 646,700 | Supalai PCL NVDR | 347,028 | ||||||
| 540,700 | Thanachart Capital PCL NVDR | 949,446 | ||||||
| 5,656,700 | TTW PCL NVDR | 2,547,810 | ||||||
|
| |||||||
| 33,746,560 | ||||||||
|
| |||||||
| Turkey - 0.5% | ||||||||
| 336,191 | Aygaz AS | 640,490 | ||||||
| 3,246,069 | Dogan Sirketler Grubu Holding AS | 981,825 | ||||||
| 4,983 | EGE Endustri VE Ticaret AS | 414,945 | ||||||
| 1,376,071 | Emlak Konut Gayrimenkul Yatirim Ortakligi AS REIT | 291,012 | ||||||
| 1,270,975 | Enka Insaat ve Sanayi AS | 1,282,702 | ||||||
| 1,098,475 | Eregli Demir ve Celik Fabrikalari T.A.S. | 1,255,735 | ||||||
| 499,019 | Iskenderun Demir ve Celik AS | 529,521 | ||||||
| 600,733 | Tekfen Holding AS | 1,778,624 | ||||||
| 91,308 | Tofas Turk Otomobil Fabrikasi AS | 357,041 | ||||||
| 736,891 | Trakya Cam Sanayii AS | 378,429 | ||||||
| 1,282,575 | Turkcell Iletisim Hizmetleri AS | 2,820,138 | ||||||
| 451,430 | Turkiye Halk Bankasi AS* | 413,450 | ||||||
| 64,339 | Vestel Beyaz Esya Sanayi ve Ticaret AS | 167,840 | ||||||
|
| |||||||
| 11,311,752 | ||||||||
|
| |||||||
| United Kingdom - 11.9% | ||||||||
| 246,521 | Anglo American plc | 6,344,734 | ||||||
| 411,793 | Ashmore Group plc | 2,483,799 | ||||||
| 1,143,566 | Aviva plc | 6,163,873 | ||||||
| 225,707 | Babcock International Group plc | 1,621,072 | ||||||
| 2,920,772 | Barclays plc | 6,335,364 | ||||||
| 270,920 | Barratt Developments plc | 2,215,531 | ||||||
| 134,982 | Bellway plc | 5,524,735 | ||||||
| 249,188 | BHP Group plc | 5,285,413 | ||||||
| 141,181 | Bovis Homes Group plc | 2,139,682 | ||||||
| 175,208 | Britvic plc | 2,239,123 | ||||||
| 868,886 | BT Group plc | 2,305,899 | ||||||
| 363,359 | Bunzl plc | 9,452,690 | ||||||
| 162,719 | Card Factory plc | 357,058 | ||||||
| 87,259 | Clinigen Healthcare Ltd.* | 939,143 | ||||||
| 684,618 | Countryside Properties plc(1) | 3,133,454 | ||||||
| 411,695 | Crest Nicholson Holdings plc | 2,074,522 | ||||||
| 200,436 | Forterra plc(1) | 694,523 | ||||||
| 51,424 | Galliford Try plc | 488,080 | ||||||
| 83,239 | Gamesys Group plc* | 870,137 | ||||||
| 1,206,583 | GlaxoSmithKline plc | 27,636,706 | ||||||
| Shares or Principal Amount | Market Value† | |||||||
| COMMON STOCKS - 97.6% - (continued) | ||||||||
| United Kingdom - 11.9% - (continued) | ||||||||
| 132,955 | Gulf Keystone Petroleum Ltd. | $ | 353,717 | |||||
| 2,538,807 | HSBC Holdings plc | 19,171,575 | ||||||
| 115,910 | Hunting plc | 592,334 | ||||||
| 589,727 | IMI plc | 7,668,904 | ||||||
| 146,179 | Imperial Brands plc | 3,206,504 | ||||||
| 2,520,147 | Indivior plc* | 1,276,409 | ||||||
| 4,135,631 | ITV plc | 7,174,344 | ||||||
| 2,488,697 | Legal & General Group plc | 8,507,209 | ||||||
| 253,643 | Micro Focus International plc | 3,481,302 | ||||||
| 711,259 | Mondi plc | 14,747,174 | ||||||
| 498,049 | Moneysupermarket.com Group plc | 2,216,147 | ||||||
| 73,355 | Next plc | 6,256,183 | ||||||
| 32,281 | PayPoint plc | 382,191 | ||||||
| 220,197 | Persimmon plc | 6,494,991 | ||||||
| 304,484 | Petrofac Ltd. | 1,519,638 | ||||||
| 288,231 | Pharos Energy plc | 218,042 | ||||||
| 204,277 | Polypipe Group plc | 1,198,021 | ||||||
| 334,245 | Redrow plc | 2,605,715 | ||||||
| 254,312 | Rio Tinto plc | 13,239,942 | ||||||
| 2,632,048 | Royal Bank of Scotland Group plc | 7,275,608 | ||||||
| 852,352 | Royal Mail plc | 2,332,418 | ||||||
| 530,936 | Smiths Group plc | 11,098,490 | ||||||
| 69,627 | Spectris plc | 2,158,551 | ||||||
| 974,220 | Standard Chartered plc | 8,840,004 | ||||||
| 61,828 | Subsea 7 S.A. | 580,856 | ||||||
| 609,743 | Tate & Lyle plc | 5,318,356 | ||||||
| 1,840,386 | Taylor Wimpey plc | 3,947,080 | ||||||
| 407,099 | TI Fluid Systems plc(1) | 970,298 | ||||||
| 101,531 | Ultra Electronics Holdings plc | 2,564,454 | ||||||
| 250,369 | Victrex plc | 7,112,604 | ||||||
| 394,708 | WPP plc | 4,925,781 | ||||||
|
| |||||||
| 245,740,380 | ||||||||
|
| |||||||
| United States - 0.1% | ||||||||
| 393,300 | Argonaut Gold, Inc.* | 642,013 | ||||||
| 427,535 | Diversified Gas & Oil plc | 592,721 | ||||||
| 1,212,000 | Nexteer Automotive Group Ltd. | 1,129,607 | ||||||
|
| |||||||
| 2,364,341 | ||||||||
|
| |||||||
Total Common Stocks | $ | 2,022,562,290 | ||||||
|
| |||||||
| PREFERRED STOCKS - 0.6% | ||||||||
| Brazil - 0.3% | ||||||||
| 556,600 | Banco do Estado do Rio Grande do Sul S.A. Class B, 4.34% | $ | 3,103,248 | |||||
| 526,051 | Cia de Saneamento do Parana | 2,382,019 | ||||||
|
| |||||||
| 5,485,267 | ||||||||
|
| |||||||
| Germany - 0.3% | ||||||||
| 80,310 | Porsche Automobil Holding SE | 5,913,274 | ||||||
| 181,124 | Schaeffler AG, 4.39% | 1,527,921 | ||||||
|
| |||||||
| 7,441,195 | ||||||||
|
| |||||||
Total Preferred Stocks | $ | 12,926,462 | ||||||
|
| |||||||
| RIGHTS - 0.0% | ||||||||
| Italy - 0.0% | ||||||||
| 799,639 | Mediaset S.p.A.* | $ | — | |||||
|
| |||||||
Total Rights | $ | — | ||||||
|
| |||||||
Total Long-Term Investments | $ | 2,035,488,752 | ||||||
|
| |||||||
The accompanying notes are an integral part of these financial statements.
| 44 |
|
| Hartford Schroders International Multi-Cap Value Fund |
Schedule of Investments – (continued)
October 31, 2019
| Shares or Principal Amount | Market Value† | |||||||
| SHORT-TERM INVESTMENTS - 1.5% | ||||||||
| Other Investment Pools & Funds - 1.1% | ||||||||
| 23,170,748 | Morgan Stanley Institutional Liquidity Funds, Treasury Portfolio, Institutional Class, 1.65%(5) | $ | 23,170,748 | |||||
|
| |||||||
| Securities Lending Collateral - 0.4% | ||||||||
| 392,810 | Citibank NA DDCA, 1.80%, 11/1/2019(5) | 392,810 | ||||||
| 5,511,198 | Fidelity Investments Money Market Funds, Government Portfolio, Institutional Class, 1.75%(5) | 5,511,198 | ||||||
| 88,409 | Goldman Sachs Financial Square Funds, Government Fund, Institutional Class, 1.75%(5) | 88,409 | ||||||
| 731,045 | Invesco Government & Agency Portfolio, Institutional Class, 1.70%(5) | 731,045 | ||||||
| 1,062,117 | Morgan Stanley Institutional Liquidity Funds, Government Portfolio, Institutional Class, 1.69%(5) | 1,062,117 | ||||||
| 70,627 | Western Asset Institutional Government Class A Fund, Institutional Class, 1.68%(5) | 70,627 | ||||||
|
| |||||||
| 7,856,206 | ||||||||
|
| |||||||
Total Short-Term Investments | $ | 31,026,954 | ||||||
|
| |||||||
Total Investments | 99.7 | % | $ | 2,066,515,706 | ||||||||
Other Assets & Liabilities | 0.3 | % | 5,895,350 | |||||||||
|
|
|
| |||||||||
Total Net Assets | 100.0 | % | $ | 2,072,411,056 | ||||||||
|
|
|
| |||||||||
| Note: | Percentage of investments as shown is the ratio of the total market value to total net assets. |
Prices of foreign equities that are principally traded on certain foreign markets will generally be adjusted daily pursuant to a fair value pricing service approved by the Board of Directors in order to reflect an adjustment for factors occurring after the close of certain foreign markets but before the close of the New York Stock Exchange. |
Equity industry classifications used in this report are the Global Industry Classification Standard, which was developed by and is the exclusive property and service mark of MSCI, Inc. and Standard & Poor’s. |
For Fund compliance purposes, the Fund may not use the same classification system. These classifications are used for financial reporting purposes. |
See “Glossary” for abbreviation descriptions. |
| * | Non-income producing. |
| (1) | Security was purchased pursuant to Rule 144A under the Securities Act of 1933 and may be sold in transactions that are exempt from registration (typically only to qualified institutional buyers) or in a public offering registered under the Securities Act of 1933. At October 31, 2019, the aggregate value of these securities was $32,790,271, representing 1.6% of net assets. |
| (2) | Represents entire or partial securities on loan. See Note 8 in the accompanying Notes to Financial Statements for securities lending information. |
| (3) | This security is valued in good faith at fair value as determined under policies and procedures established by and under the supervision of the Board of Directors. At October 31, 2019, the aggregate fair value of this security was $26,787, which represented 0.0% of total net assets. This amount excludes securities that are principally traded in certain foreign markets and whose prices are adjusted pursuant to a third party pricing service methodology approved by the Board of Directors. |
| (4) | Investment valued using significant unobservable inputs. |
| (5) | Current yield as of period end. |
| Foreign Currency Contracts Outstanding at October 31, 2019 | ||||||||||||||||||||||||
| Amount and Description of Currency to be Purchased | Amount and Description of Currency to be Sold | Counterparty | Settlement Date | Appreciation | Depreciation | |||||||||||||||||||
| 2,200,560 | USD | 1,699,800 | GBP | CBK | 12/11/19 | $ | — | $ | (4,386 | ) | ||||||||||||||
| 19,280,547 | USD | 14,936,400 | GBP | UBS | 12/11/19 | — | (94,642 | ) | ||||||||||||||||
|
|
|
| |||||||||||||||||||||
Total | $ | — | $ | (99,028 | ) | |||||||||||||||||||
|
|
|
| |||||||||||||||||||||
| † | See Significant Accounting Policies of accompanying Notes to Financial Statements regarding valuation of investments. |
The accompanying notes are an integral part of these financial statements.
| 45 |
|
| Hartford Schroders International Multi-Cap Value Fund |
Schedule of Investments – (continued)
October 31, 2019
Fair Valuation Summary
The following is a summary of the fair valuations according to the inputs used as of October 31, 2019 in valuing the Fund’s investments.
Description | Total | Level 1 | Level 2 | Level 3(1) | ||||||||||||
Assets |
| |||||||||||||||
Common Stocks |
| |||||||||||||||
Australia | $ | 60,989,261 | $ | — | $ | 60,989,261 | $ | — | ||||||||
Austria | 21,658,737 | 256,505 | 21,402,232 | — | ||||||||||||
Belgium | 22,360,807 | — | 22,360,807 | — | ||||||||||||
Brazil | 9,232,327 | 9,232,327 | — | — | ||||||||||||
Cambodia | 1,726,231 | — | 1,726,231 | — | ||||||||||||
Canada | 70,812,296 | 70,812,296 | — | — | ||||||||||||
Chile | 4,379,119 | 3,308,390 | 1,070,729 | — | ||||||||||||
China | 110,146,597 | 6,267,495 | 103,852,315 | 26,787 | ||||||||||||
Colombia | 3,272,225 | 3,272,225 | — | — | ||||||||||||
Czech Republic | 1,533,385 | 755,737 | 777,648 | — | ||||||||||||
Denmark | 11,397,908 | 2,046,025 | 9,351,883 | — | ||||||||||||
Finland | 25,633,116 | 1,347,778 | 24,285,338 | — | ||||||||||||
France | 144,259,885 | 6,785,349 | 137,474,536 | — | ||||||||||||
Georgia | 763,349 | 763,349 | — | — | ||||||||||||
Germany | 22,953,329 | 3,786,724 | 19,166,605 | — | ||||||||||||
Greece | 2,797,759 | — | 2,797,759 | — | ||||||||||||
Hong Kong | 78,158,396 | — | 78,158,396 | — | ||||||||||||
India | 11,623,187 | 11,623,187 | — | — | ||||||||||||
Indonesia | 9,672,266 | — | 9,672,266 | — | ||||||||||||
Ireland | 6,947,343 | 4,429,598 | 2,517,745 | — | ||||||||||||
Israel | 23,599,176 | 14,834,958 | 8,764,218 | — | ||||||||||||
Italy | 26,834,140 | 1,893,901 | 24,940,239 | — | ||||||||||||
Japan | 423,945,909 | 290,623 | 423,655,286 | — | ||||||||||||
Luxembourg | 7,985,977 | 6,678,691 | 1,307,286 | — | ||||||||||||
Malaysia | 22,282,556 | 3,299,215 | 18,983,341 | — | ||||||||||||
Mexico | 13,731,175 | 13,731,175 | — | — | ||||||||||||
Monaco | 1,091,754 | 1,091,754 | — | — | ||||||||||||
Netherlands | 58,591,933 | — | 58,591,933 | — | ||||||||||||
New Zealand | 574,377 | — | 574,377 | — | ||||||||||||
Norway | 37,768,891 | — | 37,768,891 | — | ||||||||||||
Peru | 4,237,992 | 4,237,992 | — | — | ||||||||||||
Poland | 19,142,664 | — | 19,142,664 | — | ||||||||||||
Portugal | 9,034,255 | — | 9,034,255 | — | ||||||||||||
Russia | 30,935,872 | 12,698,464 | 18,237,408 | — | ||||||||||||
Singapore | 88,287,504 | 437,660 | 87,849,844 | — | ||||||||||||
South Africa | 39,585,948 | 6,888,223 | 32,697,725 | — | ||||||||||||
South Korea | 67,923,000 | 599,845 | 67,323,155 | — | ||||||||||||
Spain | 47,627,714 | — | 47,627,714 | — | ||||||||||||
Sweden | 24,476,818 | — | 24,476,818 | — | ||||||||||||
Switzerland | 92,673,943 | — | 92,673,943 | — | ||||||||||||
Taiwan | 68,750,136 | 9,201,371 | 59,548,765 | — | ||||||||||||
Thailand | 33,746,560 | 2,547,810 | 31,198,750 | — | ||||||||||||
Turkey | 11,311,752 | 1,282,702 | 10,029,050 | — | ||||||||||||
United Kingdom | 245,740,380 | 6,908,340 | 238,832,040 | — | ||||||||||||
United States | 2,364,341 | 642,013 | 1,722,328 | — | ||||||||||||
Preferred Stocks | 12,926,462 | 5,485,267 | 7,441,195 | — | ||||||||||||
Rights | — | — | — | — | ||||||||||||
Short-Term Investments | 31,026,954 | 31,026,954 | — | — | ||||||||||||
|
|
|
|
|
|
|
| |||||||||
Total | $ | 2,066,515,706 | $ | 248,463,943 | $ | 1,818,024,976 | $ | 26,787 | ||||||||
|
|
|
|
|
|
|
| |||||||||
Liabilities |
| |||||||||||||||
Foreign Currency Contracts(2) | $ | (99,028 | ) | $ | — | $ | (99,028 | ) | $ | — | ||||||
|
|
|
|
|
|
|
| |||||||||
Total | $ | (99,028 | ) | $ | — | $ | (99,028 | ) | $ | — | ||||||
|
|
|
|
|
|
|
| |||||||||
| (1) | For the year ended October 31, 2019, there were no transfers in and out of Level 3. |
| (2) | Derivative instruments (excluding purchased and written options, if applicable) are valued at the unrealized appreciation/(depreciation) on the investments. |
Level 3 investments at the beginning and/or end of the period in relation to net assets were not significant and accordingly, a reconciliation of Level 3 assets for the year ended October 31, 2019 is not presented.
The accompanying notes are an integral part of these financial statements.
| 46 |
|
Schedule of Investments
October 31, 2019
| Shares or Principal Amount | Market Value† | |||||||
| COMMON STOCKS - 99.3% | ||||||||
| Austria - 1.5% | ||||||||
| 187,950 | Erste Group Bank AG* | $ | 6,647,387 | |||||
|
| |||||||
| Brazil - 3.6% | ||||||||
| 570,899 | B3 S.A. - Brasil Bolsa Balcao | 6,886,945 | ||||||
| 325,486 | Raia Drogasil S.A. | 8,927,431 | ||||||
|
| |||||||
| 15,814,376 | ||||||||
|
| |||||||
| China - 6.2% | ||||||||
| 71,569 | Alibaba Group Holding Ltd. ADR* | 12,644,095 | ||||||
| 1,363,200 | China Pacific Insurance Group Co., Ltd. Class H | 4,946,083 | ||||||
| 239,600 | Tencent Holdings Ltd. | 9,718,874 | ||||||
|
| |||||||
| 27,309,052 | ||||||||
|
| |||||||
| Denmark - 1.5% | ||||||||
| 81,927 | Vestas Wind Systems A/S(1) | 6,674,412 | ||||||
|
| |||||||
| France - 7.5% | ||||||||
| 52,694 | EssilorLuxottica S.A. | 8,046,073 | ||||||
| 118,923 | Schneider Electric SE | 11,052,746 | ||||||
| 261,125 | Total S.A. | 13,805,207 | ||||||
|
| |||||||
| 32,904,026 | ||||||||
|
| |||||||
| Germany - 14.3% | ||||||||
| 23,321 | adidas AG | 7,200,842 | ||||||
| 100,606 | Bayerische Motoren Werke AG | 7,703,873 | ||||||
| 41,101 | Continental AG | 5,505,100 | ||||||
| 154,153 | Deutsche Wohnen SE | 5,811,940 | ||||||
| 282,594 | GEA Group AG | 8,639,002 | ||||||
| 403,329 | Infineon Technologies AG | 7,811,986 | ||||||
| 82,713 | Knorr-Bremse AG | 8,347,683 | ||||||
| 90,814 | SAP SE | 12,032,986 | ||||||
|
| |||||||
| 63,053,412 | ||||||||
|
| |||||||
| Hong Kong - 4.2% | ||||||||
| 1,294,400 | AIA Group Ltd. | 12,889,917 | ||||||
| 179,800 | Hong Kong Exchanges & Clearing Ltd. | 5,601,495 | ||||||
|
| |||||||
| 18,491,412 | ||||||||
|
| |||||||
| India - 2.2% | ||||||||
| 407,927 | HDFC Bank Ltd. | 7,067,858 | ||||||
| 689,695 | Zee Entertainment Enterprises Ltd. | 2,534,015 | ||||||
|
| |||||||
| 9,601,873 | ||||||||
|
| |||||||
| Japan - 13.2% | ||||||||
| 209,600 | Bridgestone Corp. | 8,708,860 | ||||||
| 23,100 | Nintendo Co., Ltd. | 8,472,788 | ||||||
| 259,100 | Recruit Holdings Co., Ltd. | 8,610,940 | ||||||
| 427,200 | Sekisui Chemical Co., Ltd. | 7,448,547 | ||||||
| 18,500 | SMC Corp. | 7,992,756 | ||||||
| 129,300 | Sony Corp. | 7,870,380 | ||||||
| 253,900 | Takeda Pharmaceutical Co., Ltd. | 9,174,182 | ||||||
|
| |||||||
| 58,278,453 | ||||||||
|
| |||||||
| Netherlands - 3.7% | ||||||||
| 35,125 | ASML Holding N.V. | 9,206,764 | ||||||
| 163,959 | Koninklijke Philips N.V. | 7,193,549 | ||||||
|
| |||||||
| 16,400,313 | ||||||||
|
| |||||||
| New Zealand - 1.8% | ||||||||
| 166,029 | Xero Ltd.* | 7,875,448 | ||||||
|
| |||||||
| Norway - 3.3% | ||||||||
| 461,758 | DNB ASA | 8,407,357 | ||||||
| 1,738,044 | Norsk Hydro ASA | 6,141,481 | ||||||
|
| |||||||
| 14,548,838 | ||||||||
|
| |||||||
| Singapore - 1.8% | ||||||||
| 1,009,500 | Oversea-Chinese Banking Corp. Ltd. | 8,115,580 | ||||||
|
| |||||||
| South Korea - 3.1% | ||||||||
| 315,903 | Samsung Electronics Co., Ltd. | 13,653,279 | ||||||
|
| |||||||
| Shares or Principal Amount | Market Value† | |||||||
| COMMON STOCKS - 99.3% - (continued) | ||||||||
| Spain - 1.6% | ||||||||
| 1,328,658 | Banco Bilbao Vizcaya Argentaria S.A. | $ | 6,997,813 | |||||
|
| |||||||
| Switzerland - 12.1% | ||||||||
| 111,923 | Cie Financiere Richemont S.A. | 8,795,038 | ||||||
| 21,184 | Lonza Group AG*(1) | 7,635,400 | ||||||
| 120,430 | Nestle S.A. | 12,883,759 | ||||||
| 53,961 | Roche Holding AG | 16,239,876 | ||||||
| 31,403 | Schindler Holding AG | 7,693,621 | ||||||
|
| |||||||
| 53,247,694 | ||||||||
|
| |||||||
| Taiwan - 2.5% | ||||||||
| 1,144,000 | Taiwan Semiconductor Manufacturing Co., Ltd. | 11,210,969 | ||||||
|
| |||||||
| United Kingdom - 13.6% | ||||||||
| 343,077 | BHP Group plc | 7,276,849 | ||||||
| 228,493 | Bunzl plc | 5,944,186 | ||||||
| 239,493 | Burberry Group plc | 6,350,627 | ||||||
| 211,625 | Diageo plc | 8,662,018 | ||||||
| 539,798 | GlaxoSmithKline plc | 12,364,038 | ||||||
| 8,678,051 | Lloyds Banking Group plc | 6,383,627 | ||||||
| 317,867 | Ocado Group plc* | 5,478,843 | ||||||
| 144,828 | Whitbread plc | 7,623,258 | ||||||
|
| |||||||
| 60,083,446 | ||||||||
|
| |||||||
| United States - 1.6% | ||||||||
| 3,487 | Booking Holdings, Inc.*(1) | 7,144,061 | ||||||
|
| |||||||
Total Common Stocks | $ | 438,051,844 | ||||||
|
| |||||||
| SHORT-TERM INVESTMENTS - 2.4% | ||||||||
| Other Investment Pools & Funds - 1.7% | ||||||||
| 7,758,228 | Morgan Stanley Institutional Liquidity Funds, Treasury Portfolio, Institutional Class, 1.65%(2) | $ | 7,758,228 | |||||
|
| |||||||
| Securities Lending Collateral - 0.7% | ||||||||
| 150,233 | Citibank NA DDCA, 1.80%, 11/1/2019(2) | 150,233 | ||||||
| 2,107,799 | Fidelity Investments Money Market Funds, Government Portfolio, Institutional Class, 1.75%(2) | 2,107,799 | ||||||
| 33,813 | Goldman Sachs Financial Square Funds, Government Fund, Institutional Class, 1.75%(2) | 33,813 | ||||||
| 279,593 | Invesco Government & Agency Portfolio, Institutional Class, 1.70%(2) | 279,593 | ||||||
| 406,215 | Morgan Stanley Institutional Liquidity Funds, Government Portfolio, Institutional Class, 1.69%(2) | 406,215 | ||||||
| 27,012 | Western Asset Institutional Government Class A Fund, Institutional Class, 1.68%(2) | 27,012 | ||||||
|
| |||||||
| 3,004,665 | ||||||||
|
| |||||||
Total Short-Term Investments | $ | 10,762,893 | ||||||
|
| |||||||
Total Investments | 101.7 | % | $ | 448,814,737 | ||||||||
Other Assets and Liabilities | (1.7 | )% | (7,459,190 | ) | ||||||||
|
|
|
| |||||||||
Total Net Assets | 100.0 | % | $ | 441,355,547 | ||||||||
|
|
|
| |||||||||
| Note: | Percentage of investments as shown is the ratio of the total market value to total net assets. |
Prices of foreign equities that are principally traded on certain foreign markets will generally be adjusted daily pursuant to a fair value pricing service approved by the Board of Directors in order to reflect an adjustment for factors occurring after the close of certain foreign markets but before the close of the New York Stock Exchange. |
Equity industry classifications used in this report are the Global Industry Classification Standard, which was developed by and is the exclusive property and service mark of MSCI, Inc. and Standard & Poor’s. |
The accompanying notes are an integral part of these financial statements.
| 47 |
|
| Hartford Schroders International Stock Fund |
Schedule of Investments – (continued)
October 31, 2019
For Fund compliance purposes, the Fund may not use the same classification system. These classifications are used for financial reporting purposes. |
See “Glossary” for abbreviation descriptions. |
| * | Non-income producing. |
| (1) | Represents entire or partial securities on loan. See Note 8 in the accompanying Notes to Financial Statements for securities lending information. |
| (2) | Current yield as of period end. |
| † | See Significant Accounting Policies of accompanying Notes to Financial Statements regarding valuation of investments. |
Fair Valuation Summary
The following is a summary of the fair valuations according to the inputs used as of October 31, 2019 in valuing the Fund’s investments.
Description | Total | Level 1 | Level 2 | Level 3(1) | ||||||||||||
Assets |
| |||||||||||||||
Common Stocks |
| |||||||||||||||
Austria | $ | 6,647,387 | $ | — | $ | 6,647,387 | $ | — | ||||||||
Brazil | 15,814,376 | 15,814,376 | — | — | ||||||||||||
China | 27,309,052 | 12,644,095 | 14,664,957 | — | ||||||||||||
Denmark | 6,674,412 | — | 6,674,412 | — | ||||||||||||
France | 32,904,026 | — | 32,904,026 | — | ||||||||||||
Germany | 63,053,412 | 24,187,527 | 38,865,885 | — | ||||||||||||
Hong Kong | 18,491,412 | — | 18,491,412 | — | ||||||||||||
India | 9,601,873 | 2,534,015 | 7,067,858 | — | ||||||||||||
Japan | 58,278,453 | — | 58,278,453 | — | ||||||||||||
Netherlands | 16,400,313 | — | 16,400,313 | — | ||||||||||||
New Zealand | 7,875,448 | — | 7,875,448 | — | ||||||||||||
Norway | 14,548,838 | — | 14,548,838 | — | ||||||||||||
Singapore | 8,115,580 | — | 8,115,580 | — | ||||||||||||
South Korea | 13,653,279 | — | 13,653,279 | — | ||||||||||||
Spain | 6,997,813 | — | 6,997,813 | — | ||||||||||||
Switzerland | 53,247,694 | — | 53,247,694 | — | ||||||||||||
Taiwan | 11,210,969 | — | 11,210,969 | — | ||||||||||||
United Kingdom | 60,083,446 | — | 60,083,446 | — | ||||||||||||
United States | 7,144,061 | 7,144,061 | — | — | ||||||||||||
Short-Term Investments | 10,762,893 | 10,762,893 | — | — | ||||||||||||
|
|
|
|
|
|
|
| |||||||||
Total | $ | 448,814,737 | $ | 73,086,967 | $ | 375,727,770 | $ | — | ||||||||
|
|
|
|
|
|
|
| |||||||||
| (1) | For the year ended October 31, 2019, there were no transfers in and out of Level 3. |
The accompanying notes are an integral part of these financial statements.
| 48 |
|
Schedule of Investments
October 31, 2019
| Shares or Principal Amount | Market Value† | |||||||||
| ASSET & MORTGAGE BACKED SECURITIES - 81.3% | ||||||||||
| Asset-Backed - Automobile - 3.5% | ||||||||||
AmeriCredit Automobile Receivables Trust |
| |||||||||
| $ | 210,137 | 1.98%, 12/20/2021 | $ | 210,032 | ||||||
| 587,520 | 2.04%, 07/18/2022 | 587,585 | ||||||||
| 1,019,442 | 3.11%, 01/18/2022 | 1,022,758 | ||||||||
| 521,626 | Hyundai Auto Receivables Trust 3.04%, 06/15/2021 | 523,348 | ||||||||
Santander Drive Auto Receivables Trust |
| |||||||||
| 458,989 | 2.58%, 05/16/2022 | 459,501 | ||||||||
| 540,762 | 2.79%, 08/15/2022 | 541,975 | ||||||||
|
| |||||||||
| 3,345,199 | ||||||||||
|
| |||||||||
| Asset-Backed - Credit Card - 4.5% | ||||||||||
| 3,000,000 | BA Credit Card Trust 1.84%, 01/17/2023 | 2,999,712 | ||||||||
| 766,000 | Capital One Multi-Asset Execution Trust 2.05%, 08/15/2023 | 767,455 | ||||||||
| 500,000 | Chase Issuance Trust 2.77%, 03/15/2023 | 506,500 | ||||||||
|
| |||||||||
| 4,273,667 | ||||||||||
|
| |||||||||
| Asset-Backed - Finance & Insurance - 11.2% | ||||||||||
| 1,000,000 | BlueMountain CLO Ltd. | 999,615 | ||||||||
| 1,500,000 | Carlyle Global Market Strategies CLO Ltd. 2.89%, 01/18/2029, 3 mo. USD LIBOR + 0.890%(1)(2) | 1,491,007 | ||||||||
| 672,568 | Countrywide Asset-Backed Certificates 5.71%, 05/25/2036(3) | 685,381 | ||||||||
| 1,000,000 | Madison Park Funding Ltd. 2.75%, 04/15/2029, 3 mo. USD LIBOR + 0.750%(1)(2) | 991,553 | ||||||||
| 723,875 | Preston Ridge Partners Mortgage Trust LLC 3.35%, 07/25/2024(1)(4) | 725,129 | ||||||||
Towd Point Mortgage Trust |
| |||||||||
| 1,400,000 | 4.25%, 10/25/2058(1)(3) | 1,441,257 | ||||||||
| 919,000 | 4.40%, 11/25/2058(1)(3) | 952,448 | ||||||||
| 1,053,000 | 4.50%, 11/25/2058(1)(3) | 1,099,220 | ||||||||
| 1,000,000 | 5.00%, 11/25/2058(1)(3) | 1,046,484 | ||||||||
| 725,000 | Treman Park CLO Ltd. 3.04%, 10/20/2028, 3 mo. USD LIBOR + 1.070%(1)(2) | 723,411 | ||||||||
| 461,574 | Triton Container Finance VI LLC 3.52%, 06/20/2042(1) | 466,880 | ||||||||
|
| |||||||||
| 10,622,385 | ||||||||||
|
| |||||||||
| Asset-Backed - Home Equity - 7.0% | ||||||||||
CWHEQ Revolving Home Equity Loan Resuritization Trust |
| |||||||||
| 948,873 | 2.06%, 07/15/2036, 1 mo. USD LIBOR + 0.140%(2) | 920,543 | ||||||||
| 718,797 | 2.10%, 11/15/2035, 1 mo. USD LIBOR + 0.190%(1)(2) | 655,767 | ||||||||
| 324,180 | Home Equity Loan Trust 1.95%, 05/25/2036, 1 mo. USD LIBOR + 0.130%(2)(5) | 316,568 | ||||||||
| 1,239,904 | Master Asset Backed Securities Trust 2.32%, 11/25/2035, 1 mo. USD LIBOR + 0.500%(2) | 888,069 | ||||||||
| 893,490 | Morgan Stanley Home Equity Loan Trust 2.10%, 02/25/2036, 1 mo. USD LIBOR + 0.280%(2) | 888,697 | ||||||||
| 800,221 | Nationstar Home Equity Loan Trust 2.07%, 04/25/2037, 1 mo. USD LIBOR + 0.250%(2) | 799,755 | ||||||||
| 1,180,849 | NovaStar Mortgage Funding Trust 2.14%, 05/25/2036, 1 mo. USD LIBOR + 0.320%(2) | 1,166,575 | ||||||||
| 598,569 | Option One Mortgage Loan Trust 5.86%, 01/25/2037(4) | 601,054 | ||||||||
| Shares or Principal Amount | Market Value† | |||||||||
| ASSET & MORTGAGE BACKED SECURITIES - 81.3% - (continued) | ||||||||||
| Asset-Backed - Home Equity - 7.0% - (continued) | ||||||||||
| $ | 440,904 | RASC Trust 2.07%, 08/25/2036, 1 mo. USD LIBOR + 0.250%(2) | $ | 438,378 | ||||||
|
| |||||||||
| 6,675,406 | ||||||||||
|
| |||||||||
| Asset-Backed - Student Loan - 1.1% | ||||||||||
| GBP | 763,490 | Income Contingent Student Loan 1.86%, 07/24/2058(5)(6) | 983,351 | |||||||
|
| |||||||||
| Commercial Mortgage - Backed Securities - 20.9% | ||||||||||
| $ | 698,986 | Bayview Commercial Asset Trust 4.32%, 04/25/2038(1) | 726,660 | |||||||
| 990,000 | Benchmark Mortgage Trust 4.23%, 01/15/2052 | 1,129,383 | ||||||||
| 1,000,000 | BF NYT Mortgage Trust 3.11%, 11/15/2035, 1 mo. USD LIBOR +1.200%(1)(2) | 1,003,758 | ||||||||
BX Commercial Mortgage Trust |
| |||||||||
| 678,000 | 3.45%, 10/15/2036, 1 mo. USD LIBOR + 1.450%(1)(2) | 678,637 | ||||||||
| 785,279 | 3.61%, 11/15/2035, 1 mo. USD LIBOR + 1.170%(1)(2) | 787,741 | ||||||||
| 648,000 | 3.87%, 03/15/2037, 1 mo. USD LIBOR + 1.951%(1)(2) | 649,619 | ||||||||
| 1,015,000 | BX Trust 3.68%, 05/15/2030, 1 mo. USD LIBOR + 1.770%(1)(2) | 1,015,001 | ||||||||
| 1,000,000 | CAMB Commercial Mortgage Trust 4.47%, 12/15/2037, 1 mo. USD LIBOR + 2.550%(1)(2) | 1,010,000 | ||||||||
Citigroup Commercial Mortgage Trust |
| |||||||||
| 500,000 | 3.06%, 12/15/2036, 1 mo. USD LIBOR + 1.150%(1)(2) | 499,531 | ||||||||
| 1,000,000 | 3.52%, 05/10/2035(1)(3) | 1,017,147 | ||||||||
| 500,000 | 4.71%, 12/15/2036, 1 mo. USD LIBOR + 2.800%(1)(2) | 499,999 | ||||||||
COMM Mortgage Trust |
| |||||||||
| 280,000 | 3.92%, 06/15/2034, 1 mo. USD LIBOR + 2.000%(1)(2) | 279,520 | ||||||||
| 536,000 | 4.20%, 10/15/2036, 1 mo. USD LIBOR + 2.200%(1)(2) | 536,014 | ||||||||
| 252,000 | 4.32%, 06/15/2034, 1 mo. USD LIBOR + 2.394%(1)(2) | 251,077 | ||||||||
Core Trust |
| |||||||||
| 1,000,000 | 2.79%, 12/15/2031, 1 mo. USD LIBOR + 0.880%(1)(2) | 999,998 | ||||||||
| 835,000 | 3.81%, 12/15/2031, 1 mo. USD LIBOR + 1.900%(1)(2) | 836,572 | ||||||||
| 897,000 | Credit Suisse Mortgage Capital Certificates 4.06%, 05/15/2036, 1 mo. USD LIBOR + 2.150%(1)(2) | 900,374 | ||||||||
| 1,000,000 | GS Mortgage Securities Corp. Trust 2.86%, 07/15/2035, 1 mo. USD LIBOR + 0.950%(1)(2) | 1,000,830 | ||||||||
| 983,768 | HPLY Trust | 988,703 | ||||||||
| 1,026,431 | Merrill Lynch Mortgage Investors Trust 2.09%, 08/25/2036 | 1,032,221 | ||||||||
Morgan Stanley Capital Trust |
| |||||||||
| 1,000,000 | 2.81%, 07/15/2035, 1 mo. USD LIBOR + 0.900%(1)(2) | 998,121 | ||||||||
| 782,000 | 2.91%, 05/15/2036, 1 mo. USD LIBOR + 1.000%(1)(2) | 781,511 | ||||||||
| 528,000 | 3.56%, 08/15/2033, 1 mo. USD LIBOR + 1.650%(1)(2) | 528,662 | ||||||||
| 250,000 | 4.46%, 07/15/2035, 1 mo. USD LIBOR + 2.550%(1)(2) | 251,095 | ||||||||
The accompanying notes are an integral part of these financial statements.
| 49 |
|
| Hartford Schroders Securitized Income Fund |
Schedule of Investments – (continued)
October 31, 2019
| Shares or Principal Amount | Market Value† | |||||||||
| ASSET & MORTGAGE BACKED SECURITIES - 81.3% - (continued) | ||||||||||
| Commercial Mortgage - Backed Securities - 20.9% - (continued) | ||||||||||
| $ | 1,413,000 | MSSG Trust 3.87%, 09/13/2039(1) | $ | 1,469,531 | ||||||
|
| |||||||||
| 19,871,705 | ||||||||||
|
| |||||||||
| Other ABS - 19.9% | ||||||||||
| 1,110,927 | American Home Mortgage Investment Trust 2.30%, 02/25/2032, 1 mo. USD LIBOR + 0.480%(1)(2) | 1,072,459 | ||||||||
| 1,000,000 | BlueMountain CLO Ltd. 3.20%, 01/20/2029, 3 mo. USD LIBOR + 1.230%(1)(2) | 999,507 | ||||||||
| 2,000,000 | Capital One Multi-Asset Execution Trust 2.43%, 01/15/2025 | 2,029,217 | ||||||||
| 1,750,000 | CBAM Ltd. 2.94%, 07/15/2031, 3 mo. USD LIBOR + 0.940%(1)(2) | 1,746,533 | ||||||||
| 1,500,000 | CIFC Funding Ltd. 2.77%, 01/20/2028, 3 mo. USD LIBOR + 0.800%(1)(2) | 1,495,414 | ||||||||
CWABS Revolving Home Equity Loan Trust |
| |||||||||
| 961,720 | 2.20%, 02/15/2034, 1 mo. USD LIBOR + 0.290%(2) | 958,157 | ||||||||
| 793,428 | 2.21%, 02/15/2034, 1 mo. USD LIBOR + 0.300%(2) | 788,459 | ||||||||
| 939,311 | CWHEQ Revolving Home Equity Loan Trust 2.05%, 01/15/2037, 1 mo. USD LIBOR + 0.140%(2) | 900,733 | ||||||||
| 323,369 | HSI Asset Securitization Corp. Trust 2.01%, 02/25/2036, 1 mo. USD LIBOR + 0.190%(2) | 323,382 | ||||||||
| 750,000 | JP Morgan Mortgage Acquisition Trust 4.89%, 11/25/2036(4) | 804,336 | ||||||||
| 3,000,000 | LCM XIII L.P. 3.11%, 07/19/2027, 3 mo. USD LIBOR + 1.140%(1)(2)(5) | 2,997,282 | ||||||||
| 1,000,000 | LCM XXIII Ltd. 3.37%, 10/20/2029, 3 mo. USD LIBOR + 1.400%(1)(2)(5) | 1,000,060 | ||||||||
| 1,605,000 | MP CLO VIII Ltd. 2.85%, 10/28/2027, 3 mo. USD LIBOR + 0.910%(1)(2) | 1,603,055 | ||||||||
| 460,722 | Preston Ridge Partners Mortgage Trust LLC | 462,533 | ||||||||
| 1,368,326 | VOLT LXII LLC 3.13%, 09/25/2047(1)(4) | 1,369,674 | ||||||||
| 351,634 | Zais CLO Ltd. 3.14%, 07/25/2026, 3 mo. USD LIBOR + 1.200%(1)(2) | 351,837 | ||||||||
|
| |||||||||
| 18,902,638 | ||||||||||
|
| |||||||||
| Whole Loan Collateral CMO - 13.2% | ||||||||||
Alba plc |
| |||||||||
| GBP | 191,320 | 0.95%, 12/15/2038, 3 mo. GBP LIBOR + 0.170%(2)(6) | 233,743 | |||||||
| 347,215 | 0.95%, 03/17/2039, 3 mo. GBP LIBOR + 0.170%(2)(6) | 422,891 | ||||||||
| $ | 309,570 | Banc of America Funding Trust 2.45%, 12/20/2034, 1 mo. USD LIBOR + 0.600%(2) | 309,437 | |||||||
| GBP | 1,400,000 | Dukinfield II plc 4.53%, 12/20/2052, 3 mo. GBP LIBOR + 3.750%(2)(6) | 1,800,395 | |||||||
Fannie Mae Connecticut Avenue Securities |
| |||||||||
| $ | 1,705,589 | 4.42%, 05/25/2024, 1 mo. USD LIBOR + 2.600%(2) | 1,773,192 | |||||||
| 838,520 | 4.82%, 07/25/2024, 1 mo. USD LIBOR + 3.000%(2) | 880,492 | ||||||||
| 1,655,196 | 6.72%, 11/25/2024, 1 mo. USD LIBOR + 4.900%(2) | 1,802,957 | ||||||||
| 414,736 | IndyMac INDX Mortgage Loan Trust | 409,085 | ||||||||
| GBP | 530,000 | Landmark Mortgage Securities No. 2 plc | 641,905 | |||||||
| Shares or Principal Amount | Market Value† | |||||||||
| ASSET & MORTGAGE BACKED SECURITIES - 81.3% - (continued) | ||||||||||
| Whole Loan Collateral CMO - 13.2% - (continued) | ||||||||||
| GBP | 955,486 | Newgate Funding plc 1.78%, 12/15/2050, 3 mo. GBP LIBOR + 1.000%(2)(6) | $ | 1,182,550 | ||||||
| $ | 683,000 | Oaktown Re III Ltd. 3.22%, 07/25/2029, 1 mo. USD LIBOR + 1.400%(1)(2) | 684,017 | |||||||
| GBP | 585,401 | Paragon Mortgages No. 10 plc 1.10%, 06/15/2041, 3 mo. GBP LIBOR + 0.320%(2)(6) | 729,001 | |||||||
| $ | 510,000 | Park Place Securities, Inc. Asset-Backed Pass-Through 2.95%, 03/25/2035, 1 mo. USD LIBOR + 1.125%(2) | 511,276 | |||||||
| 153,759 | Structured Asset Investment Loan Trust | 154,021 | ||||||||
| 973,735 | Structured Asset Securities Corp. Mortgage Loan Trust 2.03%, 11/25/2035, 1 mo. USD LIBOR + 0.210%(2) | 969,919 | ||||||||
|
| |||||||||
| 12,504,881 | ||||||||||
|
| |||||||||
Total Asset & Mortgage Backed Securities | $ | 77,179,232 | ||||||||
|
| |||||||||
| CORPORATE BONDS - 2.3% | ||||||||||
| Insurance - 2.3% | ||||||||||
| 2,112,663 | Ambac LSNI LLC 7.10%, 02/12/2023, 3 mo. USD LIBOR + 5.000%(1)(2) | $ | 2,128,509 | |||||||
|
| |||||||||
Total Corporate Bonds | $ | 2,128,509 | ||||||||
|
| |||||||||
| U.S. GOVERNMENT AGENCIES - 12.0% | ||||||||||
| Mortgage-Backed Agencies - 12.0% | ||||||||||
| FHLMC - 12.0% | ||||||||||
| $ | 1,375,000 | 3.19%, 09/25/2027(3) | $ | 1,476,486 | ||||||
| 1,500,000 | 3.41%, 12/25/2026 | 1,632,830 | ||||||||
| 1,633,000 | 3.43%, 01/25/2027(3) | 1,773,547 | ||||||||
| 1,500,000 | 3.93%, 07/25/2028(3) | 1,696,015 | ||||||||
| 1,000,000 | 4.32%, 03/25/2030, 1 mo. USD LIBOR + 2.500%(2) | 1,020,019 | ||||||||
| 500,000 | 5.42%, 04/25/2024, 1 mo. USD LIBOR + 3.600%(2) | 527,829 | ||||||||
| 477,037 | 5.82%, 08/25/2024, 1 mo. USD LIBOR + 4.000%(2) | 503,121 | ||||||||
| 597,993 | 5.97%, 01/25/2025, 1 mo. USD LIBOR + 4.150%(2) | 618,839 | ||||||||
| 1,003,470 | 6.07%, 11/25/2023, 1 mo. USD LIBOR + 4.250%(2) | 1,082,340 | ||||||||
| 340,000 | 6.32%, 02/25/2024, 1 mo. USD LIBOR + 4.500%(2) | 369,139 | ||||||||
| 638,000 | 6.52%, 04/25/2028, 1 mo. USD LIBOR + 4.700%(2) | 703,356 | ||||||||
|
| |||||||||
| 11,403,521 | ||||||||||
|
| |||||||||
Total U.S. Government Agencies | $ | 11,403,521 | ||||||||
|
| |||||||||
Total Long-Term Investments | $ | 90,711,262 | ||||||||
|
| |||||||||
The accompanying notes are an integral part of these financial statements.
| 50 |
|
| Hartford Schroders Securitized Income Fund |
Schedule of Investments – (continued)
October 31, 2019
| Shares or Principal Amount | Market Value† | |||||||||
| SHORT-TERM INVESTMENTS - 10.8% | ||||||||||
| Other Investment Pools & Funds - 10.8% | ||||||||||
| 10,277,878 | Morgan Stanley Institutional Liquidity Funds, Treasury Portfolio, Institutional Class, 1.65%(7) | $ | 10,277,878 | |||||||
|
| |||||||||
Total Short-Term Investments | $ | 10,277,878 | ||||||||
|
| |||||||||
Total Investments | 106.4 | % | $ | 100,989,140 | ||||||||||
Other Assets and Liabilities | (6.4 | )% | (6,042,415 | ) | ||||||||||
|
|
|
| |||||||||||
Total Net Assets | 100.0 | % | $ | 94,946,725 | ||||||||||
|
|
|
| |||||||||||
| Note: | Percentage of investments as shown is the ratio of the total market value to total net assets. |
The Fund may refer to any one or more of the industry classifications used by one or more widely recognized market indices, ratings group and/or as defined by Fund management. Industry classifications may not be identical across all security types. |
For Fund compliance purposes, the Fund may not use the same classification system. These classifications are used for financial reporting purposes. |
See “Glossary” for abbreviation descriptions. |
| (1) | Security was purchased pursuant to Rule 144A under the Securities Act of 1933 and may be sold in transactions that are exempt from registration (typically only to qualified institutional buyers) or in a public offering registered under the Securities Act of 1933. At October 31, 2019, the aggregate value of these securities was $44,213,752, representing 46.6% of net assets. |
| (2) | Variable rate securities; the rate reported is the coupon rate in effect at October 31, 2019. Base lending rates may be subject to a floor or cap. |
| (3) | Variable or floating rate security, which interest rate adjusts periodically based on changes in current interest rates and prepayments on the underlying pool of assets. Rate shown is the rate in effect as of period end. |
| (4) | Security is a“step-up” bond where coupon increases or steps up at a predetermined date. Rate shown is current coupon rate. |
| (5) | All of the security, was pledged as collateral in connection with reverse repurchase agreements. As of October 31, 2019, the market value of securities pledged was $5,297,261. |
| (6) | Security is exempt from registration under Regulation S under the Securities Act of 1933, which exempts from registration securities offered and sold outside of the United States. Security may not be offered or sold in the United States except pursuant to an exemption from, or in a transaction not subject to, the registration requirements of the Securities Act of 1933. At October 31, 2019, the aggregate value of these securities was $5,993,836, representing 6.3% of net assets. |
| (7) | Current yield as of period end. |
| Reverse Repurchase Agreements Outstanding at October 31, 2019 | ||||||||||||||||||||||||||||
Counterparty | Interest Rate | Settlement Date | Maturity Date | Principal Amount | Value | Value Including Accrued Interest | ||||||||||||||||||||||
JP Morgan Chase Bank | 2.414% | 10/11/19 | 11/08/19 | USD | (3,603,000 | ) | $ | (3,603,000 | ) | $ | (3,608,072 | ) | ||||||||||||||||
JP Morgan Chase Bank | 2.473% | 10/25/19 | 11/22/19 | USD | (293,000 | ) | (293,000 | ) | (293,141 | ) | ||||||||||||||||||
JP Morgan Chase Bank | 1.354% | 10/30/19 | 01/30/20 | GBP | (655,074 | ) | (848,550 | ) | (848,614 | ) | ||||||||||||||||||
|
|
|
| |||||||||||||||||||||||||
Total | $ | (4,744,550 | ) | $ | (4,749,827 | ) | ||||||||||||||||||||||
|
|
|
| |||||||||||||||||||||||||
Securities pledged as collateral against open reverse repurchase agreements are noted in the Schedule of Investments.
| Futures Contracts Outstanding at October 31, 2019 | ||||||||||||||||
Description | Number of Contracts | Expiration Date | Current Notional Amount | Value and Unrealized Appreciation/ (Depreciation) | ||||||||||||
| Short position contracts: | ||||||||||||||||
British Pound Future | 66 | 12/16/2019 | $ | 5,344,763 | $ | (234,239 | ) | |||||||||
|
| |||||||||||||||
Total futures contracts |
| $ | (234,239 | ) | ||||||||||||
|
| |||||||||||||||
| † | See Significant Accounting Policies of accompanying Notes to Financial Statements regarding valuation of investments. |
The accompanying notes are an integral part of these financial statements.
| 51 |
|
| Hartford Schroders Securitized Income Fund |
Schedule of Investments – (continued)
October 31, 2019
Fair Valuation Summary
The following is a summary of the fair valuations according to the inputs used as of October 31, 2019 in valuing the Fund’s investments.
Description | Total | Level 1 | Level 2 | Level 3(1) | ||||||||||||
Assets |
| |||||||||||||||
Asset & Mortgage Backed Securities | $ | 77,179,232 | $ | — | $ | 77,179,232 | $ | — | ||||||||
Corporate Bonds | 2,128,509 | — | 2,128,509 | — | ||||||||||||
U.S. Government Agencies | 11,403,521 | — | 11,403,521 | — | ||||||||||||
Short-Term Investments | 10,277,878 | 10,277,878 | — | — | ||||||||||||
|
|
|
|
|
|
|
| |||||||||
Total | $ | 100,989,140 | $ | 10,277,878 | $ | 90,711,262 | $ | — | ||||||||
|
|
|
|
|
|
|
| |||||||||
Liabilities |
| |||||||||||||||
Futures Contracts(2) | $ | (234,239 | ) | $ | (234,239 | ) | $ | — | $ | — | ||||||
Reverse Repurchase Agreements | (4,744,550 | ) | — | (4,744,550 | ) | — | ||||||||||
|
|
|
|
|
|
|
| |||||||||
Total | $ | (4,978,789 | ) | $ | (234,239 | ) | $ | (4,744,550 | ) | $ | — | |||||
|
|
|
|
|
|
|
| |||||||||
| (1) | For the year ended October 31, 2019, there were no transfers in and out of Level 3. |
| (2) | Derivative instruments (excluding purchased and written options, if applicable) are valued at the unrealized appreciation/(depreciation) on the investments. |
The accompanying notes are an integral part of these financial statements.
| 52 |
|
Schedule of Investments
October 31, 2019
| Shares or Principal Amount | Market Value† | |||||||||
| CORPORATE BONDS - 16.9% | ||||||||||
| Agriculture - 0.3% | ||||||||||
| $ | 941,000 | Altria Group, Inc. 3.80%, 02/14/2024 | $ | 987,243 | ||||||
|
| |||||||||
| Commercial Banks - 10.9% | ||||||||||
| 1,656,000 | Bank of New York Mellon Corp. 1.95%, 08/23/2022 | 1,659,797 | ||||||||
| 2,430,000 | Bank of Nova Scotia 2.38%, 01/18/2023 | 2,453,000 | ||||||||
| 4,485,000 | BB&T Corp. 2.20%, 03/16/2023 | 4,505,810 | ||||||||
| 4,184,000 | Canadian Imperial Bank of Commerce 2.61%, 07/22/2023, (2.61% fixed rate until 07/22/2022; 3 mo. USD LIBOR + 0.785% thereafter)(1) | 4,220,660 | ||||||||
| 1,227,000 | Capital One NA 2.15%, 09/06/2022 | 1,226,572 | ||||||||
| 8,000 | Citigroup, Inc. 6.88%, 06/01/2025 | 9,678 | ||||||||
| 1,159,000 | Fifth Third Bancorp 3.65%, 01/25/2024 | 1,222,545 | ||||||||
| 2,100,000 | HSBC Holdings plc 3.97%, 05/22/2030, (3.97% fixed rate until 05/22/2029; 3 mo. USD LIBOR + 1.610% thereafter)(1) | 2,267,557 | ||||||||
| 2,655,000 | PNC Financial Services Group, Inc. 3.50%, 01/23/2024 | 2,808,483 | ||||||||
| 1,265,000 | Regions Financial Corp. 3.80%, 08/14/2023 | 1,338,669 | ||||||||
| 4,570,000 | Royal Bank of Canada 2.80%, 04/29/2022 | 4,664,051 | ||||||||
| 2,755,000 | SunTrust Bank 2.80%, 05/17/2022 | 2,807,402 | ||||||||
| 5,162,000 | Toronto-Dominion Bank 2.65%, 06/12/2024 | 5,283,016 | ||||||||
| 1,934,000 | Wells Fargo & Co. 3.75%, 01/24/2024 | 2,046,498 | ||||||||
|
| |||||||||
| 36,513,738 | ||||||||||
|
| |||||||||
| Diversified Financial Services - 0.3% | ||||||||||
| 973,000 | Air Lease Corp. 2.25%, 01/15/2023 | 968,596 | ||||||||
|
| |||||||||
| Healthcare-Services - 0.9% | ||||||||||
| 820,000 | CommonSpirit Health 2.76%, 10/01/2024 | 832,348 | ||||||||
| 2,320,000 | UnitedHealth Group, Inc. 2.38%, 08/15/2024 | 2,351,443 | ||||||||
|
| |||||||||
| 3,183,791 | ||||||||||
|
| |||||||||
| Pharmaceuticals - 1.1% | ||||||||||
| 3,550,000 | Bristol-Myers Squibb Co. 2.90%, 07/26/2024(2) | 3,678,911 | ||||||||
|
| |||||||||
| Real Estate Investment Trusts - 1.8% | ||||||||||
| 2,644,000 | Boston Properties L.P. 3.40%, 06/21/2029 | 2,787,857 | ||||||||
| 1,415,000 | ERP Operating L.P. 3.00%, 07/01/2029 | 1,466,320 | ||||||||
| 1,740,000 | Ventas Realty L.P. 2.65%, 01/15/2025 | 1,762,583 | ||||||||
|
| |||||||||
| 6,016,760 | ||||||||||
|
| |||||||||
| Retail - 1.2% | ||||||||||
| 1,540,000 | Home Depot, Inc. 2.95%, 06/15/2029 | 1,624,559 | ||||||||
| 2,136,000 | Walmart, Inc. 2.85%, 07/08/2024 | 2,230,727 | ||||||||
|
| |||||||||
| 3,855,286 | ||||||||||
|
| |||||||||
| Transportation - 0.4% | ||||||||||
| 1,256,000 | United Parcel Service, Inc. 2.20%, 09/01/2024 | 1,267,275 | ||||||||
|
| |||||||||
Total Corporate Bonds | $ | 56,471,600 | ||||||||
|
| |||||||||
| MUNICIPAL BONDS - 64.9% | ||||||||||
| Arizona - 0.4% | ||||||||||
City of Phoenix, AZ, Civic Improvement Corp. |
| |||||||||
| $ | 350,000 | 5.00%, 07/01/2026 | $ | 431,526 | ||||||
| 350,000 | 5.00%, 07/01/2027 | 441,066 | ||||||||
| 460,000 | 5.00%, 07/01/2028 | 575,409 | ||||||||
|
| |||||||||
| 1,448,001 | ||||||||||
|
| |||||||||
| California - 1.6% | ||||||||||
| 20,000 | East Side, CA, Union High School Dist, GO 5.25%, 02/01/2024 | 23,434 | ||||||||
| 1,000,000 | Merced, CA, Union High School Dist, GO 0.00%, 08/01/2034(3) | 700,540 | ||||||||
| 4,675,000 | Moreno Valley, CA, Unified School Dist, GO 0.00%, 08/01/2025(3) | 4,230,501 | ||||||||
| Shares or Principal Amount | Market Value† | |||||||||
| MUNICIPAL BONDS - 64.9% - (continued) | ||||||||||
| California - 1.6% - (continued) | ||||||||||
| $ | 200,000 | North Orange County, CA, Community College Dist, GO 0.00%, 08/01/2028(3) | $ | 170,684 | ||||||
| 300,000 | Rialto, CA, Unified School Dist, GO 0.00%, 08/01/2029(3) | 245,505 | ||||||||
| 55,000 | Southern California Metropolitan Water Dist 5.75%, 07/01/2021 | 57,168 | ||||||||
|
| |||||||||
| 5,427,832 | ||||||||||
|
| |||||||||
| Connecticut - 1.0% | ||||||||||
| 2,915,000 | Connecticut Housing Finance Auth 4.25%, 05/15/2042 | 3,200,699 | ||||||||
|
| |||||||||
| District of Columbia - 0.9% | ||||||||||
| 1,910,000 | Dist of Columbia Housing Finance Agency 2.00%, 09/01/2021(4) | 1,919,073 | ||||||||
| 230,000 | Dist of Columbia Water & Sewer Auth 5.00%, 10/01/2044 | 263,460 | ||||||||
| 600,000 | Dist of Columbia, GO 5.00%, 06/01/2032 | 732,540 | ||||||||
|
| |||||||||
| 2,915,073 | ||||||||||
|
| |||||||||
| Florida - 4.5% | ||||||||||
| 1,025,000 | Florida Housing Finance Corp. 4.00%, 07/01/2049 | 1,111,285 | ||||||||
| 3,485,000 | JEA Water & Sewer System Rev 1.08%, 10/01/2038(4) | 3,485,000 | ||||||||
| 1,930,000 | JEA, FL, Electric System Rev 1.13%, 10/01/2036(4) | 1,930,000 | ||||||||
| 1,840,000 | Miami-Dade County, FL, Transit System 5.00%, 07/01/2042 | 1,994,578 | ||||||||
| 6,630,000 | Orlando, FL, Utilities Commission 1.14%, 10/01/2033(4) | 6,630,000 | ||||||||
|
| |||||||||
| 15,150,863 | ||||||||||
|
| |||||||||
| Georgia - 1.4% | ||||||||||
Georgia Municipal Association, Inc. |
| |||||||||
| 50,000 | 5.00%, 12/01/2026 | 61,777 | ||||||||
| 35,000 | 5.00%, 12/01/2027 | 44,017 | ||||||||
| 25,000 | 5.00%, 12/01/2028 | 31,328 | ||||||||
| 80,000 | 5.00%, 12/01/2029 | 99,753 | ||||||||
| 55,000 | 5.00%, 12/01/2030 | 68,247 | ||||||||
| 55,000 | 5.00%, 12/01/2032 | 67,860 | ||||||||
| 35,000 | 5.00%, 12/01/2033 | 43,097 | ||||||||
| 55,000 | 5.00%, 12/01/2034 | 67,566 | ||||||||
| 3,945,000 | Main Street, GA, Natural Gas, Inc. 4.00%, 08/01/2048(4) | 4,280,364 | ||||||||
|
| |||||||||
| 4,764,009 | ||||||||||
|
| |||||||||
| Illinois - 5.4% | ||||||||||
Champaign County, IL, Community Unit School Dist No. 4 | ||||||||||
| 235,000 | 5.00%, 01/01/2027 | 279,164 | ||||||||
| 475,000 | 5.00%, 01/01/2029 | 561,512 | ||||||||
| 695,000 | Chicago, IL, Metropolitan Water Reclamation Dist, GO 5.25%, 12/01/2032 | 917,344 | ||||||||
| 1,145,000 | Chicago, IL, Transit Auth 5.00%, 06/01/2025 | 1,336,982 | ||||||||
| 1,695,000 | Illinois Housing Dev Auth 4.50%, 10/01/2048 | 1,880,196 | ||||||||
| 8,565,000 | Illinois State Toll Highway Auth 1.13%, 01/01/2031(4) | 8,565,000 | ||||||||
Metropolitan Pier & Exposition Auth, IL |
| |||||||||
| 80,000 | 0.00%, 06/15/2020(3) | 79,125 | ||||||||
| 90,000 | 0.00%, 06/15/2028(3) | 71,708 | ||||||||
| 330,000 | 5.00%, 06/15/2050 | 336,927 | ||||||||
| 1,350,000 | Railsplitter, IL, Tobacco Settlement Auth 5.00%, 06/01/2022 | 1,470,271 | ||||||||
| 2,110,000 | State of Illinois, GO 5.00%, 11/01/2028 | 2,413,671 | ||||||||
|
| |||||||||
| 17,911,900 | ||||||||||
|
| |||||||||
| Indiana - 0.3% | ||||||||||
| 1,070,000 | Indiana Housing & Community Dev Auth 4.00%, 07/01/2048 | 1,160,886 | ||||||||
|
| |||||||||
The accompanying notes are an integral part of these financial statements.
| 53 |
|
| Hartford SchrodersTax-Aware Bond Fund |
Schedule of Investments – (continued)
October 31, 2019
| Shares or Principal Amount | Market Value† | |||||||||
| MUNICIPAL BONDS - 64.9% - (continued) | ||||||||||
| Iowa - 0.3% | ||||||||||
| $ | 855,000 | Iowa Finance Auth 4.00%, 07/01/2048 | $ | 929,300 | ||||||
|
| |||||||||
| Kentucky - 2.8% | ||||||||||
| 6,080,000 | Kentucky Public Energy Auth 4.00%, 12/01/2049(4) | 6,745,699 | ||||||||
Kentucky State Property & Building Commission | ||||||||||
| 660,000 | 5.00%, 05/01/2024 | 759,277 | ||||||||
| 1,175,000 | 5.00%, 08/01/2024 | 1,360,215 | ||||||||
| 445,000 | 5.00%, 05/01/2025 | 523,454 | ||||||||
|
| |||||||||
| 9,388,645 | ||||||||||
|
| |||||||||
| Louisiana - 0.4% | ||||||||||
| 410,000 | Louisiana Housing Corp. 4.50%, 12/01/2047 | 453,427 | ||||||||
| 905,000 | Parish of State John the Baptist, LA 2.10%, 06/01/2037(4) | 907,236 | ||||||||
|
| |||||||||
| 1,360,663 | ||||||||||
|
| |||||||||
| Maine - 0.7% | ||||||||||
| 2,135,000 | Maine State Housing Auth 4.00%, 11/15/2048 | 2,313,977 | ||||||||
|
| |||||||||
| Maryland - 3.4% | ||||||||||
| 2,150,000 | Maryland Community Dev Administration 4.50%, 09/01/2048 | 2,383,210 | ||||||||
| 8,850,000 | Maryland Health & Higher Educational Facs Auth 1.05%, 07/01/2034(4) | 8,850,000 | ||||||||
|
| |||||||||
| 11,233,210 | ||||||||||
|
| |||||||||
| Massachusetts - 7.9% | ||||||||||
Commonwealth of Massachusetts, GO | ||||||||||
| 2,075,000 | 1.08%, 01/01/2021(4) | 2,075,000 | ||||||||
| 1,685,000 | 5.00%, 01/01/2035 | 2,081,750 | ||||||||
| 250,000 | 5.25%, 09/01/2024 | 297,170 | ||||||||
Massachusetts Educational Financing Auth | ||||||||||
| 665,000 | 3.17%, 07/01/2025 | 700,518 | ||||||||
| 510,000 | 3.27%, 07/01/2026 | 543,640 | ||||||||
| 560,000 | 3.38%, 07/01/2027 | 602,330 | ||||||||
| 615,000 | 3.46%, 07/01/2028 | 666,260 | ||||||||
| 490,000 | 3.51%, 07/01/2029 | 532,517 | ||||||||
| 8,875,000 | Massachusetts Health & Educational Facs Auth 1.13%, 07/01/2027(4) | 8,875,000 | ||||||||
| 1,705,000 | Massachusetts Water Resource Auth 1.09%, 08/01/2037(4) | 1,705,000 | ||||||||
| 8,330,000 | University of Massachusetts Building Auth 1.08%, 05/01/2038(4) | 8,330,000 | ||||||||
|
| |||||||||
| 26,409,185 | ||||||||||
|
| |||||||||
| Michigan - 0.3% | ||||||||||
Southgate, MI, Community School Dist, GO | ||||||||||
| 255,000 | 5.00%, 05/01/2024 | 295,040 | ||||||||
| 350,000 | 5.00%, 05/01/2025 | 414,127 | ||||||||
| 320,000 | State of Michigan Rev 5.00%, 03/15/2027 | 397,613 | ||||||||
|
| |||||||||
| 1,106,780 | ||||||||||
|
| |||||||||
| Missouri - 1.3% | ||||||||||
Missouri Housing Dev Commission |
| |||||||||
| 2,135,000 | 4.25%, 05/01/2049 | 2,349,909 | ||||||||
| 1,850,000 | 4.75%, 05/01/2049 | 2,075,460 | ||||||||
|
| |||||||||
| 4,425,369 | ||||||||||
|
| |||||||||
| Nebraska - 0.5% | ||||||||||
| 1,390,000 | Nebraska Investment Finance Auth Rev 4.00%, 09/01/2048 | 1,506,440 | ||||||||
|
| |||||||||
| Nevada - 0.8% | ||||||||||
| 975,000 | Clark County, NV, Airport Rev 1.16%, 07/01/2040(4) | 975,000 | ||||||||
| 1,525,000 | Nevada Housing Division 4.00%, 10/01/2049 | 1,676,310 | ||||||||
|
| |||||||||
| 2,651,310 | ||||||||||
|
| |||||||||
| New Jersey - 2.2% | ||||||||||
| 1,430,000 | Garden State, NJ, Preservation Trust 5.75%, 11/01/2028 | 1,796,137 | ||||||||
| Shares or Principal Amount | Market Value† | |||||||||
| MUNICIPAL BONDS - 64.9% - (continued) | ||||||||||
| New Jersey - 2.2% - (continued) | ||||||||||
New Jersey Economic Dev Auth | ||||||||||
| $ | 70,000 | 5.00%, 03/01/2026 | $ | 76,582 | ||||||
| 285,000 | 5.00%, 06/15/2027 | 338,195 | ||||||||
| 565,000 | 5.00%, 06/15/2028 | 668,158 | ||||||||
New Jersey Transportation Trust Fund Auth | ||||||||||
| 405,000 | 5.00%, 06/15/2024 | 464,717 | ||||||||
| 1,330,000 | 5.00%, 12/15/2028 | 1,599,086 | ||||||||
| 685,000 | 5.50%, 12/15/2022 | 769,728 | ||||||||
New Jersey Turnpike Auth |
| |||||||||
| 110,000 | 5.00%, 01/01/2023 | 122,860 | ||||||||
| 605,000 | 5.00%, 01/01/2029 | 760,872 | ||||||||
| 740,000 | Tobacco Settlement Financing Corp., NJ 5.00%, 06/01/2029 | 908,565 | ||||||||
|
| |||||||||
| 7,504,900 | ||||||||||
|
| |||||||||
| New Mexico - 0.4% | ||||||||||
| 1,130,000 | New Mexico Mortgage Finance Auth 4.00%, 01/01/2049 | 1,230,197 | ||||||||
|
| |||||||||
| New York - 3.6% | ||||||||||
| 8,135,000 | City of New York, NY, GO 1.10%, 04/01/2042(4) | 8,135,000 | ||||||||
| 3,750,000 | New York City, NY, Water & Sewer System 1.11%, 06/15/2041(4) | 3,750,000 | ||||||||
|
| |||||||||
| 11,885,000 | ||||||||||
|
| |||||||||
| North Carolina - 2.6% | ||||||||||
| 8,860,000 | Charlotte, NC, Water & Sewer System Rev 1.16%, 07/01/2036(4) | 8,860,000 | ||||||||
|
| |||||||||
| North Dakota - 1.1% | ||||||||||
| 3,270,000 | North Dakota Housing Finance Agency 4.00%, 01/01/2050 | 3,644,023 | ||||||||
|
| |||||||||
| Ohio - 3.4% | ||||||||||
| 1,825,000 | Ohio Housing Finance Agency 4.50%, 09/01/2048 | 2,019,892 | ||||||||
Ohio State University |
| |||||||||
| 5,000 | 5.00%, 12/01/2021 | 5,391 | ||||||||
| 5,000 | 5.00%, 12/01/2030 | 6,713 | ||||||||
| 5,000 | 5.00%, 12/01/2031 | 6,794 | ||||||||
Ohio Turnpike & Infrastructure Commission |
| |||||||||
| 1,680,000 | 0.00%, 02/15/2038(3) | 1,025,993 | ||||||||
| 1,395,000 | 0.00%, 02/15/2041(3) | 753,956 | ||||||||
| 6,300,000 | Ohio Water Dev Auth Water Pollution Control Loan Fund 1.09%, 12/01/2036(4) | 6,300,000 | ||||||||
| 965,000 | State of Ohio, GO 5.00%, 08/01/2027 | 1,217,473 | ||||||||
|
| |||||||||
| 11,336,212 | ||||||||||
|
| |||||||||
| Pennsylvania - 1.3% | ||||||||||
| 635,000 | Commonwealth Finance Auth, PA 5.00%, 06/01/2032 | 777,932 | ||||||||
| 1,295,000 | Geisinger, PA, Health System Auth 5.00%, 02/15/2032 | 1,562,560 | ||||||||
Pennsylvania Turnpike Commission Rev | ||||||||||
| 240,000 | 5.00%, 12/01/2026 | 293,105 | ||||||||
| 705,000 | 5.00%, 12/01/2027 | 875,173 | ||||||||
| 445,000 | 5.00%, 12/01/2028 | 551,186 | ||||||||
Reading, PA, School Dist, GO | ||||||||||
| 70,000 | 5.00%, 03/01/2025 | 82,272 | ||||||||
| 55,000 | 5.00%, 03/01/2026 | 65,881 | ||||||||
| 50,000 | 5.00%, 03/01/2027 | 61,105 | ||||||||
|
| |||||||||
| 4,269,214 | ||||||||||
|
| |||||||||
| Rhode Island - 0.7% | ||||||||||
| 2,195,000 | Rhode Island Housing & Mortgage Finance Corp. 4.00%, 10/01/2048 | 2,384,999 | ||||||||
|
| |||||||||
| South Carolina - 3.0% | ||||||||||
| 6,375,000 | Patriots Energy Group Financing Agency, SC 4.00%, 10/01/2048(4) | 6,939,187 | ||||||||
| 2,505,000 | South Carolina Jobs-Economic Dev Auth 3.75%, 01/01/2050 | 2,756,502 | ||||||||
The accompanying notes are an integral part of these financial statements.
| 54 |
|
| Hartford SchrodersTax-Aware Bond Fund |
Schedule of Investments – (continued)
October 31, 2019
| Shares or Principal Amount | Market Value† | |||||||||
| MUNICIPAL BONDS - 64.9% - (continued) | ||||||||||
| South Carolina - 3.0% - (continued) | ||||||||||
| $ | 250,000 | Tobacco Settlement Revenue Mgmt Auth, SC 6.38%, 05/15/2030 | $ | 350,770 | ||||||
|
| |||||||||
| 10,046,459 | ||||||||||
|
| |||||||||
| Tennessee - 0.5% | ||||||||||
| 1,505,000 | Tennessee Housing Dev Agency 4.50%, 07/01/2049 | 1,665,418 | ||||||||
|
| |||||||||
| Texas - 6.7% | ||||||||||
| 2,375,000 | Arlington, TX, Higher Education Finance Corp. 5.00%, 12/01/2047 | 2,801,550 | ||||||||
| 705,000 | Bexar County, TX, Hospital Dist, GO 5.00%, 02/15/2030 | 879,755 | ||||||||
| 210,000 | Dallas, TX, Area Rapid Transit Sales Tax Rev 5.25%, 12/01/2030 | 285,375 | ||||||||
| 1,190,000 | Dallas-Fort Worth, TX, International Airport Rev 2.04%, 11/01/2024 | 1,192,820 | ||||||||
Harris County, TX, Cultural Education Facs Finance Corp. |
| |||||||||
| 430,000 | 5.00%, 11/15/2027 | 537,354 | ||||||||
| 450,000 | 5.00%, 11/15/2028 | 559,611 | ||||||||
| 430,000 | 5.00%, 11/15/2029 | 531,742 | ||||||||
| 45,000 | Harris County, TX, Flood Control Dist 5.00%, 10/01/2024 | 46,534 | ||||||||
| 100,000 | North East Texas Independent School Dist 5.25%, 02/01/2027 | 125,715 | ||||||||
| 5,830,000 | State of Texas 4.00%, 08/27/2020 | 5,963,099 | ||||||||
Texas Department of Housing & Community Affairs |
| |||||||||
| 1,310,000 | 4.00%, 03/01/2050 | 1,462,196 | ||||||||
| 1,115,000 | 4.75%, 03/01/2049 | 1,242,144 | ||||||||
| 880,000 | University of Texas 5.00%, 05/15/2035 | 1,072,738 | ||||||||
University of Texas System |
| |||||||||
| 450,000 | 5.00%, 08/15/2027 | 568,584 | ||||||||
| 340,000 | 5.00%, 08/15/2028 | 428,114 | ||||||||
University of Texas, Permanent University Fund |
| |||||||||
| 4,200,000 | 1.10%, 07/01/2037(4) | 4,200,000 | ||||||||
| 480,000 | 5.25%, 07/01/2028 | 628,488 | ||||||||
|
| |||||||||
| 22,525,819 | ||||||||||
|
| |||||||||
| Virginia - 3.4% | ||||||||||
| 2,355,000 | Virginia Public Building Auth 5.00%, 08/01/2029 | 2,961,460 | ||||||||
| 8,505,000 | Virginia Small Business Financing Auth 1.11%, 07/01/2042(4) | 8,505,000 | ||||||||
|
| |||||||||
| 11,466,460 | ||||||||||
|
| |||||||||
| Washington - 1.0% | ||||||||||
| 3,150,000 | Washington State Housing Finance Commission 4.00%, 12/01/2048 | 3,425,562 | ||||||||
|
| |||||||||
| West Virginia - 0.1% | ||||||||||
| 360,000 | West Virginia Commissioner of Highways 5.00%, 09/01/2026 | 442,642 | ||||||||
|
| |||||||||
| Wisconsin - 0.5% | ||||||||||
Wisconsin Health & Educational Facs Auth |
| |||||||||
| 825,000 | 5.00%, 04/01/2032 | 995,363 | ||||||||
| 650,000 | 5.00%, 04/01/2033 | 781,326 | ||||||||
|
| |||||||||
| 1,776,689 | ||||||||||
|
| |||||||||
| Wyoming - 0.5% | ||||||||||
| 1,475,000 | Wyoming Community Dev Auth 4.00%, 06/01/2043 | 1,592,764 | ||||||||
|
| |||||||||
Total Municipal Bonds | $ | 217,360,500 | ||||||||
|
| |||||||||
| U.S. GOVERNMENT AGENCIES - 10.9% | ||||||||||
| FHLMC - 2.3% | ||||||||||
| $ | 3,450,586 | 3.00%, 09/01/2049 | $ | 3,509,894 | ||||||
| 3,891,046 | 3.50%, 03/01/2048 | 4,036,470 | ||||||||
|
| |||||||||
| 7,546,364 | ||||||||||
|
| |||||||||
| Shares or Principal Amount | Market Value† | |||||||||
| U.S. GOVERNMENT AGENCIES - 10.9% - (continued) | ||||||||||
| FNMA - 4.8% | ||||||||||
| $ | 4,039,866 | 3.00%, 09/01/2049 | $ | 4,109,148 | ||||||
| 3,937,779 | 3.50%, 11/01/2047 | 4,076,708 | ||||||||
| 7,731,856 | 4.00%, 08/01/2049 | 8,032,374 | ||||||||
|
| |||||||||
| 16,218,230 | ||||||||||
|
| |||||||||
| GNMA - 3.8% | ||||||||||
| $ | 4,014,478 | 3.50%, 04/20/2043 | $ | 4,243,881 | ||||||
| 3,205,260 | 4.00%, 10/20/2048 | 3,340,162 | ||||||||
| 4,902,920 | 4.00%, 05/20/2049 | 5,106,355 | ||||||||
|
| |||||||||
| 12,690,398 | ||||||||||
|
| |||||||||
Total U.S. Government Agencies | $ | 36,454,992 | ||||||||
|
| |||||||||
| U.S. GOVERNMENT SECURITIES - 4.8% | ||||||||||
| U.S. Treasury Securities - 4.8% | ||||||||||
| U.S. Treasury Bonds - 0.7% | ||||||||||
| $ | 1,700,000 | U.S. Treasury Bonds 4.38%, 05/15/2040 | $ | 2,365,457 | ||||||
|
| |||||||||
| 2,365,457 | ||||||||||
|
| |||||||||
| U.S. Treasury Notes - 4.1% | ||||||||||
| 4,558,477 | 0.75%, 07/15/2028(5) | 4,797,667 | ||||||||
| 5,013,000 | 1.63%, 08/15/2029 | 4,983,040 | ||||||||
| 3,762,000 | 2.50%, 01/31/2024 | 3,911,157 | ||||||||
|
| |||||||||
Total U.S. Government Securities | $ | 16,057,321 | ||||||||
|
| |||||||||
Total Long-Term Investments | $ | 326,344,413 | ||||||||
|
| |||||||||
| SHORT-TERM INVESTMENTS - 2.3% | ||||||||||
| Other Investment Pools & Funds - 2.3% | ||||||||||
| 7,590,621 | Morgan Stanley Institutional Liquidity Funds, Treasury Portfolio, Institutional Class, 1.65%(6) | $ | 7,590,621 | |||||||
|
| |||||||||
Total Short-Term Investments | $ | 7,590,621 | ||||||||
|
| |||||||||
Total Investments | 99.8 | % | $ | 333,935,034 | ||||||||||
Other Assets & Liabilities | 0.2 | % | 613,647 | |||||||||||
|
|
|
| |||||||||||
Total Net Assets | 100.0 | % | $ | 334,548,681 | ||||||||||
|
|
|
| |||||||||||
| Note: | Percentage of investments as shown is the ratio of the total market value to total net assets. |
The Fund may refer to any one or more of the industry classifications used by one or more widely recognized market indices, ratings group and/or as defined by Fund management. Industry classifications may not be identical across all security types. |
For Fund compliance purposes, the Fund may not use the same classification system. These classifications are used for financial reporting purposes. |
See “Glossary” for abbreviation descriptions. |
| (1) | Fixed to variable rate investment. The rate shown reflects the fixed rate in effect at October 31, 2019. Rate will reset at a future date. Base lending rates may be subject to a floor or cap. |
| (2) | Security was purchased pursuant to Rule 144A under the Securities Act of 1933 and may be sold in transactions that are exempt from registration (typically only to qualified institutional buyers) or in a public offering registered under the Securities Act of 1933. At October 31, 2019, the aggregate value of this security was $3,678,911, representing 1.1% of net assets. |
The accompanying notes are an integral part of these financial statements.
| 55 |
|
| Hartford SchrodersTax-Aware Bond Fund |
Schedule of Investments – (continued)
October 31, 2019
| (3) | Security is azero-coupon bond. |
| (4) | Variable or floating rate security, which interest rate adjusts periodically based on changes in current interest rates and prepayments on the underlying pool of assets. Rate shown is the rate in effect as of period end. |
| (5) | The principal amount for this security is adjusted for inflation and the interest payments equal a fixed percentage of the inflation-adjusted principal amount. |
| (6) | Current yield as of period end. |
| Futures Contracts Outstanding at October 31, 2019 | ||||||||||||||||
Description | Number of Contracts | Expiration Date | Current Notional Amount | Value and Unrealized Appreciation/ (Depreciation) | ||||||||||||
| Long position contracts: | ||||||||||||||||
U.S. Treasury5-Year Note Future | 81 | 12/31/2019 | $ | 9,655,453 | $ | 15,609 | ||||||||||
U.S. Treasury10-Year Note Future | 50 | 12/19/2019 | 6,514,844 | 14,309 | ||||||||||||
|
| |||||||||||||||
Total |
| $ | 29,918 | |||||||||||||
|
| |||||||||||||||
| Short position contracts: | ||||||||||||||||
U.S. Treasury2-Year Note Future | 42 | 12/31/2019 | $ | 9,055,266 | $ | (3,363 | ) | |||||||||
|
| |||||||||||||||
Total futures contracts |
| $ | 26,555 | |||||||||||||
|
| |||||||||||||||
| † | See Significant Accounting Policies of accompanying Notes to Financial Statements regarding valuation of investments. |
Fair Valuation Summary
The following is a summary of the fair valuations according to the inputs used as of October 31, 2019 in valuing the Fund’s investments.
Description | Total | Level 1 | Level 2 | Level 3(1) | ||||||||||||
Assets |
| |||||||||||||||
Corporate Bonds | $ | 56,471,600 | $ | — | $ | 56,471,600 | $ | — | ||||||||
Municipal Bonds | 217,360,500 | — | 217,360,500 | — | ||||||||||||
U.S. Government Agencies | 36,454,992 | — | 36,454,992 | — | ||||||||||||
U.S. Government Securities | 16,057,321 | — | 16,057,321 | — | ||||||||||||
Short-Term Investments | 7,590,621 | 7,590,621 | — | — | ||||||||||||
Futures Contracts(2) | 29,918 | 29,918 | — | — | ||||||||||||
|
|
|
|
|
|
|
| |||||||||
Total | $ | 333,964,952 | $ | 7,620,539 | $ | 326,344,413 | $ | — | ||||||||
|
|
|
|
|
|
|
| |||||||||
Liabilities |
| |||||||||||||||
Futures Contracts(2) | $ | (3,363 | ) | $ | (3,363 | ) | $ | — | $ | — | ||||||
|
|
|
|
|
|
|
| |||||||||
Total | $ | (3,363 | ) | $ | (3,363 | ) | $ | — | $ | — | ||||||
|
|
|
|
|
|
|
| |||||||||
| (1) | For the year ended October 31, 2019, there were no transfers in and out of Level 3. |
| (2) | Derivative instruments (excluding purchased and written options, if applicable) are valued at the unrealized appreciation/(depreciation) on the investments. |
The accompanying notes are an integral part of these financial statements.
| 56 |
|
| Hartford Schroders US MidCap Opportunities Fund (formerly Hartford Schroders US Small/Mid Cap Opportunities Fund) |
Schedule of Investments
October 31, 2019
| Shares or Principal Amount | Market Value† | |||||||
| COMMON STOCKS - 95.3% | ||||||||
| Automobiles & Components - 0.9% | ||||||||
| 197,900 | BorgWarner, Inc. | $ | 8,248,472 | |||||
|
| |||||||
| Banks - 5.9% | ||||||||
| 260,192 | Commerce Bancshares, Inc. | 16,745,957 | ||||||
| 91,817 | First Republic Bank | 9,765,656 | ||||||
| 183,428 | TCF Financial Corp. | 7,261,915 | ||||||
| 182,065 | Webster Financial Corp. | 8,029,067 | ||||||
| 233,158 | Zions Bancorp NA | 11,301,168 | ||||||
|
| |||||||
| 53,103,763 | ||||||||
|
| |||||||
| Capital Goods - 8.5% | ||||||||
| 56,288 | Acuity Brands, Inc. | 7,024,179 | ||||||
| 191,389 | BWX Technologies, Inc. | 11,119,701 | ||||||
| 280,316 | Fortune Brands Home & Security, Inc. | 16,832,976 | ||||||
| 155,853 | Hexcel Corp. | 11,629,751 | ||||||
| 73,455 | IDEX Corp. | 11,424,456 | ||||||
| 79,189 | MasTec, Inc.* | 4,984,156 | ||||||
| 327,035 | Pentair plc | 13,562,141 | ||||||
|
| |||||||
| 76,577,360 | ||||||||
|
| |||||||
| Commercial & Professional Services - 3.9% | ||||||||
| 353,182 | KAR Auction Services, Inc. | 8,780,105 | ||||||
| 210,724 | Stericycle, Inc.* | 12,137,702 | ||||||
| 46,516 | Verisk Analytics, Inc. | 6,730,865 | ||||||
| 81,852 | Waste Connections, Inc. | 7,563,125 | ||||||
|
| |||||||
| 35,211,797 | ||||||||
|
| |||||||
| Consumer Durables & Apparel - 3.4% | ||||||||
| 289,920 | Brunswick Corp. | 16,884,941 | ||||||
| 96,215 | Mohawk Industries, Inc.* | 13,795,306 | ||||||
|
| |||||||
| 30,680,247 | ||||||||
|
| |||||||
| Consumer Services - 3.2% | ||||||||
| 254,615 | Aramark | 11,141,952 | ||||||
| 684,000 | Extended Stay America, Inc. | 9,719,640 | ||||||
| 191,752 | ServiceMaster Global Holdings, Inc.* | 7,742,946 | ||||||
|
| |||||||
| 28,604,538 | ||||||||
|
| |||||||
| Diversified Financials - 1.8% | ||||||||
| 108,401 | Raymond James Financial, Inc. | 9,050,400 | ||||||
| 275,151 | Santander Consumer USA Holdings, Inc. | 6,900,787 | ||||||
|
| |||||||
| 15,951,187 | ||||||||
|
| |||||||
| Energy - 1.4% | ||||||||
| 57,803 | Core Laboratories N.V. | 2,545,644 | ||||||
| 259,595 | Jagged Peak Energy, Inc.*(1) | 1,840,528 | ||||||
| 542,949 | Parsley Energy, Inc. Class A | 8,584,024 | ||||||
|
| |||||||
| 12,970,196 | ||||||||
|
| |||||||
| Food & Staples Retailing - 1.1% | ||||||||
| 234,575 | Performance Food Group Co.* | 9,995,241 | ||||||
|
| |||||||
| Health Care Equipment & Services - 8.2% | ||||||||
| 318,612 | Change Healthcare Holdings LLC*(1) | 4,212,051 | ||||||
| 34,936 | Cooper Cos., Inc. | 10,166,376 | ||||||
| 205,110 | DENTSPLY SIRONA, Inc. | 11,235,926 | ||||||
| 204,284 | Encompass Health Corp. | 13,078,262 | ||||||
| 89,315 | LivaNova plc* | 6,317,250 | ||||||
| 66,269 | Masimo Corp.* | 9,661,357 | ||||||
| 74,519 | Universal Health Services, Inc. Class B | 10,243,382 | ||||||
| 61,334 | West Pharmaceutical Services, Inc. | 8,822,282 | ||||||
|
| |||||||
| 73,736,886 | ||||||||
|
| |||||||
| Insurance - 9.7% | ||||||||
| 141,551 | Arthur J Gallagher & Co. | 12,912,282 | ||||||
| 176,571 | Assurant, Inc. | 22,260,306 | ||||||
| 372,689 | Brown & Brown, Inc. | 14,042,922 | ||||||
| Shares or Principal Amount | Market Value† | |||||||
| COMMON STOCKS - 95.3% - (continued) | ||||||||
| Insurance - 9.7% - (continued) | ||||||||
| 170,954 | Globe Life, Inc. | $ | 16,638,953 | |||||
| 131,911 | Reinsurance Group of America, Inc. | 21,431,580 | ||||||
|
| |||||||
| 87,286,043 | ||||||||
|
| |||||||
| Materials - 5.9% | ||||||||
| 178,764 | Ashland Global Holdings, Inc. | 13,830,971 | ||||||
| 139,389 | Crown Holdings, Inc.* | 10,153,095 | ||||||
| 822,688 | Graphic Packaging Holding Co. | 12,883,294 | ||||||
| 147,648 | Steel Dynamics, Inc. | 4,482,593 | ||||||
| 539,130 | Valvoline, Inc. | 11,505,034 | ||||||
|
| |||||||
| 52,854,987 | ||||||||
|
| |||||||
| Pharmaceuticals, Biotechnology & Life Sciences - 2.6% | ||||||||
| 224,207 | Catalent, Inc.* | 10,907,671 | ||||||
| 103,225 | Pacira BioSciences, Inc.* | 4,179,580 | ||||||
| 101,351 | PerkinElmer, Inc. | 8,712,132 | ||||||
|
| |||||||
| 23,799,383 | ||||||||
|
| |||||||
| Real Estate - 7.9% | ||||||||
| 62,663 | Alexandria Real Estate Equities, Inc. REIT | 9,947,751 | ||||||
| 447,679 | Brixmor Property Group, Inc. REIT | 9,857,891 | ||||||
| 294,829 | Douglas Emmett, Inc. REIT | 12,771,992 | ||||||
| 136,772 | Equity LifeStyle Properties, Inc. REIT | 9,565,834 | ||||||
| 116,581 | Lamar Advertising Co., Class A, REIT | 9,327,646 | ||||||
| 59,238 | Mid-America Apartment Communities, Inc. REIT | 8,233,490 | ||||||
| 49,426 | SBA Communications Corp. REIT | 11,894,367 | ||||||
|
| |||||||
| 71,598,971 | ||||||||
|
| |||||||
| Retailing - 5.4% | ||||||||
| 146,340 | Advance Auto Parts, Inc. | 23,777,323 | ||||||
| 425,157 | LKQ Corp.* | 14,451,087 | ||||||
| 302,760 | Nordstrom, Inc.(1) | 10,869,084 | ||||||
|
| |||||||
| 49,097,494 | ||||||||
|
| |||||||
| Semiconductors & Semiconductor Equipment - 4.1% | ||||||||
| 281,171 | Entegris, Inc. | 13,496,208 | ||||||
| 113,979 | Microchip Technology, Inc. | 10,747,080 | ||||||
| 607,081 | ON Semiconductor Corp.* | 12,384,452 | ||||||
|
| |||||||
| 36,627,740 | ||||||||
|
| |||||||
| Software & Services - 10.8% | ||||||||
| 170,239 | Black Knight, Inc.* | 10,929,344 | ||||||
| 92,390 | Cadence Design Systems, Inc.* | 6,037,686 | ||||||
| 134,498 | Fortinet, Inc.* | 10,969,657 | ||||||
| 194,548 | Genpact Ltd. | 7,620,445 | ||||||
| 123,749 | Leidos Holdings, Inc. | 10,670,876 | ||||||
| 143,661 | PTC, Inc.* | 9,612,358 | ||||||
| 602,333 | Sabre Corp. | 14,142,779 | ||||||
| 63,606 | Synopsys, Inc.* | 8,634,514 | ||||||
| 340,215 | Teradata Corp.* | 10,182,635 | ||||||
| 47,784 | VeriSign, Inc.* | 9,079,916 | ||||||
|
| |||||||
| 97,880,210 | ||||||||
|
| |||||||
| Technology Hardware & Equipment - 4.9% | ||||||||
| 180,176 | Arrow Electronics, Inc.* | 14,284,353 | ||||||
| 285,690 | Ciena Corp.* | 10,604,813 | ||||||
| 271,969 | Dolby Laboratories, Inc. Class A | 17,495,766 | ||||||
| 40,700 | FLIR Systems, Inc. | 2,098,492 | ||||||
|
| |||||||
| 44,483,424 | ||||||||
|
| |||||||
| Transportation - 1.4% | ||||||||
| 181,910 | Alaska Air Group, Inc. | 12,630,080 | ||||||
|
| |||||||
| Utilities - 4.3% | ||||||||
| 241,723 | Alliant Energy Corp. | 12,893,505 | ||||||
| 132,654 | Evergy, Inc. | 8,477,917 | ||||||
| 81,750 | IDACORP, Inc. | 8,797,935 | ||||||
The accompanying notes are an integral part of these financial statements.
| 57 |
|
| Hartford Schroders US MidCap Opportunities Fund (formerly Hartford Schroders US Small/Mid Cap Opportunities Fund) |
Schedule of Investments – (continued)
October 31, 2019
| Shares or Principal Amount | Market Value† | |||||||
| COMMON STOCKS - 95.3% - (continued) | ||||||||
| Utilities - 4.3% - (continued) | ||||||||
| 296,813 | NiSource, Inc. | $ | 8,322,636 | |||||
|
| |||||||
| 38,491,993 | ||||||||
|
| |||||||
Total Common Stocks | $ | 859,830,012 | ||||||
|
| |||||||
| SHORT-TERM INVESTMENTS - 6.6% | ||||||||
| Other Investment Pools & Funds - 5.0% | ||||||||
| 45,128,844 | Morgan Stanley Institutional Liquidity Funds, Treasury Portfolio, Institutional Class, 1.65%(2) | $ | 45,128,844 | |||||
|
| |||||||
| Securities Lending Collateral - 1.6% | ||||||||
| 712,985 | Citibank NA DDCA, 1.80%, 11/1/2019(2) | 712,985 | ||||||
| 10,003,306 | Fidelity Investments Money Market Funds, Government Portfolio, Institutional Class, 1.75%(2) | 10,003,306 | ||||||
| 160,470 | Goldman Sachs Financial Square Funds, Government Fund, Institutional Class, 1.75%(2) | 160,470 | ||||||
| 1,326,910 | Invesco Government & Agency Portfolio, Institutional Class, 1.70%(2) | 1,326,910 | ||||||
| 1,927,835 | Morgan Stanley Institutional Liquidity Funds, Government Portfolio, Institutional Class, 1.69%(2) | 1,927,835 | ||||||
| 128,195 | Western Asset Institutional Government Class A Fund, Institutional Class, 1.68%(2) | 128,195 | ||||||
|
| |||||||
| 14,259,701 | ||||||||
|
| |||||||
Total Short-Term Investments | $ | 59,388,545 | ||||||
|
| |||||||
Total Investments | 101.9 | % | $ | 919,218,557 | ||||||||
Other Assets and Liabilities | (1.9 | )% | (16,827,239 | ) | ||||||||
|
|
|
| |||||||||
Total Net Assets | 100.0 | % | $ | 902,391,318 | ||||||||
|
|
|
| |||||||||
| Note: | Percentage of investments as shown is the ratio of the total market value to total net assets. |
Prices of foreign equities that are principally traded on certain foreign markets will generally be adjusted daily pursuant to a fair value pricing service approved by the Board of Directors in order to reflect an adjustment for factors occurring after the close of certain foreign markets but before the close of the New York Stock Exchange. |
The Fund may refer to any one or more of the industry classifications used by one or more widely recognized market indices, ratings group and/or as defined by Fund management. Industry classifications may not be identical across all security types. |
Equity industry classifications used in this report are the Global Industry Classification Standard, which was developed by and is the exclusive property and service mark of MSCI, Inc. and Standard & Poor’s. |
For Fund compliance purposes, the Fund may not use the same classification system. These classifications are used for financial reporting purposes. |
See “Glossary” for abbreviation descriptions. |
| * | Non-income producing. |
| (1) | Represents entire or partial securities on loan. See Note 8 in the accompanying Notes to Financial Statements for securities lending information. |
| (2) | Current yield as of period end. |
| † | See Significant Accounting Policies of accompanying Notes to Financial Statements regarding valuation of investments. |
Fair Valuation Summary
The following is a summary of the fair valuations according to the inputs used as of October 31, 2019 in valuing the Fund’s investments.
Description | Total | Level 1 | Level 2 | Level 3(1) | ||||||||||||
Assets |
| |||||||||||||||
Common Stocks |
| |||||||||||||||
Automobiles & Components | $ | 8,248,472 | $ | 8,248,472 | $ | — | $ | — | ||||||||
Banks | 53,103,763 | 53,103,763 | — | — | ||||||||||||
Capital Goods | 76,577,360 | 76,577,360 | — | — | ||||||||||||
Commercial & Professional Services | 35,211,797 | 35,211,797 | — | — | ||||||||||||
Consumer Durables & Apparel | 30,680,247 | 30,680,247 | — | — | ||||||||||||
Consumer Services | 28,604,538 | 28,604,538 | — | — | ||||||||||||
Diversified Financials | 15,951,187 | 15,951,187 | — | — | ||||||||||||
Energy | 12,970,196 | 12,970,196 | — | — | ||||||||||||
Food & Staples Retailing | 9,995,241 | 9,995,241 | — | — | ||||||||||||
Health Care Equipment & Services | 73,736,886 | 73,736,886 | — | — | ||||||||||||
Insurance | 87,286,043 | 87,286,043 | — | — | ||||||||||||
Materials | 52,854,987 | 52,854,987 | — | — | ||||||||||||
Pharmaceuticals, Biotechnology & Life Sciences | 23,799,383 | 23,799,383 | — | — | ||||||||||||
Real Estate | 71,598,971 | 71,598,971 | — | — | ||||||||||||
Retailing | 49,097,494 | 49,097,494 | — | — | ||||||||||||
Semiconductors & Semiconductor Equipment | 36,627,740 | 36,627,740 | — | — | ||||||||||||
Software & Services | 97,880,210 | 97,880,210 | — | — | ||||||||||||
Technology Hardware & Equipment | 44,483,424 | 44,483,424 | — | — | ||||||||||||
Transportation | 12,630,080 | 12,630,080 | — | — | ||||||||||||
Utilities | 38,491,993 | 38,491,993 | — | — | ||||||||||||
Short-Term Investments | 59,388,545 | 59,388,545 | — | — | ||||||||||||
|
|
|
|
|
|
|
| |||||||||
Total | $ | 919,218,557 | $ | 919,218,557 | $ | — | $ | — | ||||||||
|
|
|
|
|
|
|
| |||||||||
| (1) | For the year ended October 31, 2019, there were no transfers in and out of Level 3. |
The accompanying notes are an integral part of these financial statements.
| 58 |
|
Schedule of Investments
October 31, 2019
| Shares or Principal Amount | Market Value† | |||||||
| COMMON STOCKS - 95.3% | ||||||||
| Automobiles & Components - 1.8% | ||||||||
| 50,898 | Gentherm, Inc.* | $ | 2,126,010 | |||||
| 31,692 | Standard Motor Products, Inc. | 1,659,393 | ||||||
|
| |||||||
| 3,785,403 | ||||||||
|
| |||||||
| Banks - 12.2% | ||||||||
| 30,028 | Atlantic Union Bankshares Corp. | 1,106,832 | ||||||
| 75,883 | CenterState Bank Corp. | 1,924,393 | ||||||
| 5,442 | First Citizens BancShares, Inc. Class A | 2,677,029 | ||||||
| 61,660 | First Interstate BancSystem, Inc. Class A | 2,587,254 | ||||||
| 46,025 | First Merchants Corp. | 1,820,289 | ||||||
| 112,208 | First Midwest Bancorp, Inc. | 2,304,752 | ||||||
| 54,662 | Heritage Financial Corp. | 1,504,845 | ||||||
| 27,510 | Lakeland Financial Corp. | 1,280,590 | ||||||
| 81,342 | OceanFirst Financial Corp. | 1,946,514 | ||||||
| 41,597 | TCF Financial Corp. | 1,646,825 | ||||||
| 78,936 | United Community Banks, Inc. | 2,384,657 | ||||||
| 25,424 | Westamerica Bancorp | 1,678,492 | ||||||
| 54,439 | Western Alliance Bancorp | 2,685,476 | ||||||
|
| |||||||
| 25,547,948 | ||||||||
|
| |||||||
| Capital Goods - 12.9% | ||||||||
| 21,227 | American Woodmark Corp.* | 2,104,869 | ||||||
| 39,799 | Apogee Enterprises, Inc. | 1,494,054 | ||||||
| 45,002 | Comfort Systems USA, Inc. | 2,268,551 | ||||||
| 27,039 | Dycom Industries, Inc.* | 1,232,708 | ||||||
| 39,380 | EnPro Industries, Inc. | 2,738,879 | ||||||
| 29,179 | ESCO Technologies, Inc. | 2,465,334 | ||||||
| 28,594 | Generac Holdings, Inc.* | 2,761,609 | ||||||
| 30,092 | Hexcel Corp. | 2,245,465 | ||||||
| 10,628 | IDEX Corp. | 1,652,973 | ||||||
| 18,327 | MasTec, Inc.* | 1,153,501 | ||||||
| 22,731 | Simpson Manufacturing Co., Inc. | 1,878,490 | ||||||
| 112,424 | Univar Solutions, Inc.* | 2,412,619 | ||||||
| 20,379 | Valmont Industries, Inc. | 2,795,795 | ||||||
|
| |||||||
| 27,204,847 | ||||||||
|
| |||||||
| Commercial & Professional Services - 3.3% | ||||||||
| 72,116 | ASGN, Inc.* | 4,585,856 | ||||||
| 90,665 | KAR Auction Services, Inc. | 2,253,932 | ||||||
|
| |||||||
| 6,839,788 | ||||||||
|
| |||||||
| Consumer Durables & Apparel - 5.8% | ||||||||
| 56,494 | Brunswick Corp. | 3,290,211 | ||||||
| 12,834 | Cavco Industries, Inc.*(1) | 2,459,636 | ||||||
| 30,069 | Oxford Industries, Inc. | 2,070,551 | ||||||
| 71,184 | Skyline Champion Corp.* | 2,009,524 | ||||||
| 58,863 | Steven Madden Ltd. | 2,423,979 | ||||||
|
| |||||||
| 12,253,901 | ||||||||
|
| |||||||
| Consumer Services - 5.6% | ||||||||
| 50,279 | Cheesecake Factory, Inc.(1) | 2,101,159 | ||||||
| 176,552 | Extended Stay America, Inc. | 2,508,804 | ||||||
| 1,852 | Graham Holdings Co. Class B | 1,166,130 | ||||||
| 163,673 | PlayAGS, Inc.* | 1,888,787 | ||||||
| 122,366 | Red Rock Resorts, Inc. Class A | 2,665,132 | ||||||
| 35,132 | ServiceMaster Global Holdings, Inc.* | 1,418,630 | ||||||
|
| |||||||
| 11,748,642 | ||||||||
|
| |||||||
| Diversified Financials - 2.4% | ||||||||
| 84,746 | Compass Diversified Holdings(1) | 1,750,005 | ||||||
| 82,912 | Golub Capital BDC, Inc. | 1,476,663 | ||||||
| 39,185 | Houlihan Lokey, Inc. | 1,851,883 | ||||||
|
| |||||||
| 5,078,551 | ||||||||
|
| |||||||
| Energy - 0.9% | ||||||||
| 33,173 | New Fortress Energy LLC* | 571,902 | ||||||
| 58,605 | ProPetro Holding Corp.* | 454,189 | ||||||
| Shares or Principal Amount | Market Value† | |||||||
| COMMON STOCKS - 95.3% - (continued) | ||||||||
| Energy - 0.9% - (continued) | ||||||||
| 91,228 | Solaris Oilfield Infrastructure, Inc. Class A | $ | 970,666 | |||||
|
| |||||||
| 1,996,757 | ||||||||
|
| |||||||
| Food & Staples Retailing - 1.1% | ||||||||
| 52,891 | Performance Food Group Co.* | 2,253,685 | ||||||
|
| |||||||
| Food, Beverage & Tobacco - 1.6% | ||||||||
| 135,578 | Darling Ingredients, Inc.* | 2,616,655 | ||||||
| 33,623 | Hain Celestial Group, Inc.* | 794,848 | ||||||
|
| |||||||
| 3,411,503 | ||||||||
|
| |||||||
| Health Care Equipment & Services - 2.7% | ||||||||
| 58,028 | Envista Holdings Corp.(1) | 1,701,961 | ||||||
| 9,928 | Masimo Corp.* | 1,447,403 | ||||||
| 173,696 | Sientra, Inc.* | 1,116,866 | ||||||
| 18,972 | Teladoc Health, Inc.*(1) | 1,453,255 | ||||||
|
| |||||||
| 5,719,485 | ||||||||
|
| |||||||
| Insurance - 5.8% | ||||||||
| 30,505 | AMERISAFE, Inc. | 1,937,983 | ||||||
| 45,421 | Axis Capital Holdings Ltd. | 2,699,370 | ||||||
| 61,856 | Brown & Brown, Inc. | 2,330,734 | ||||||
| 24,849 | James River Group Holdings Ltd. | 889,843 | ||||||
| 39,510 | Palomar Holdings, Inc.* | 1,783,876 | ||||||
| 15,264 | Reinsurance Group of America, Inc. | 2,479,942 | ||||||
|
| |||||||
| 12,121,748 | ||||||||
|
| |||||||
| Materials - 5.6% | ||||||||
| 95,171 | Ardagh Group S.A. | 1,776,843 | ||||||
| 32,434 | Ashland Global Holdings, Inc. | 2,509,419 | ||||||
| 174,367 | Graphic Packaging Holding Co. | 2,730,587 | ||||||
| 71,094 | Pretium Resources, Inc.*(1) | 719,471 | ||||||
| 25,694 | Sensient Technologies Corp. | 1,607,417 | ||||||
| 118,636 | Valvoline, Inc. | 2,531,692 | ||||||
|
| |||||||
| 11,875,429 | ||||||||
|
| |||||||
| Media & Entertainment - 1.9% | ||||||||
| 94,552 | Cineplex, Inc.(1) | 1,611,641 | ||||||
| 31,961 | John Wiley & Sons, Inc. Class A | 1,472,443 | ||||||
| 266,012 | MDC Partners, Inc. Class A* | 832,618 | ||||||
|
| |||||||
| 3,916,702 | ||||||||
|
| |||||||
| Pharmaceuticals, Biotechnology & Life Sciences - 6.0% | ||||||||
| 23,489 | Aerie Pharmaceuticals, Inc.* | 521,221 | ||||||
| 10,604 | Bio-Techne Corp. | 2,207,435 | ||||||
| 48,281 | Catalent, Inc.* | 2,348,871 | ||||||
| 51,017 | Flexion Therapeutics, Inc.*(1) | 875,962 | ||||||
| 114,746 | Fluidigm Corp.* | 564,550 | ||||||
| 63,618 | Intra-Cellular Therapies, Inc.* | 588,466 | ||||||
| 29,178 | Pacira BioSciences, Inc.* | 1,181,417 | ||||||
| 21,906 | Repligen Corp.* | 1,741,308 | ||||||
| 49,631 | Syneos Health, Inc.* | 2,488,995 | ||||||
|
| |||||||
| 12,518,225 | ||||||||
|
| |||||||
| Real Estate - 4.9% | ||||||||
| 103,385 | Columbia Property Trust, Inc. REIT | 2,121,460 | ||||||
| 46,516 | Douglas Emmett, Inc. REIT | 2,015,073 | ||||||
| 24,530 | Equity LifeStyle Properties, Inc. REIT | 1,715,628 | ||||||
| 94,821 | Kennedy-Wilson Holdings, Inc. | 2,181,831 | ||||||
| 41,042 | Terreno Realty Corp. REIT | 2,315,180 | ||||||
|
| |||||||
| 10,349,172 | ||||||||
|
| |||||||
| Retailing - 2.3% | ||||||||
| 11,657 | Asbury Automotive Group, Inc.* | 1,202,186 | ||||||
| 80,149 | Caleres, Inc. | 1,724,807 | ||||||
| 157,413 | Hudson Ltd. Class A* | 1,955,069 | ||||||
|
| |||||||
| 4,882,062 | ||||||||
|
| |||||||
The accompanying notes are an integral part of these financial statements.
| 59 |
|
| Hartford Schroders US Small Cap Opportunities Fund |
Schedule of Investments – (continued)
October 31, 2019
| Shares or Principal Amount | Market Value† | |||||||
| COMMON STOCKS - 95.3% - (continued) | ||||||||
| Semiconductors & Semiconductor Equipment - 3.2% | ||||||||
| 62,703 | Entegris, Inc. | $ | 3,009,744 | |||||
| 48,460 | MACOM Technology Solutions Holdings, Inc.* | 1,101,980 | ||||||
| 124,466 | ON Semiconductor Corp.* | 2,539,107 | ||||||
|
| |||||||
| 6,650,831 | ||||||||
|
| |||||||
| Software & Services - 7.2% | ||||||||
| 32,188 | CoreLogic, Inc.* | 1,303,292 | ||||||
| 27,564 | CSG Systems International, Inc. | 1,588,789 | ||||||
| 5,595 | EPAM Systems, Inc.* | 984,496 | ||||||
| 19,686 | Fortinet, Inc.* | 1,605,590 | ||||||
| 35,773 | LiveRamp Holdings, Inc.* | 1,398,367 | ||||||
| 31,838 | Perficient, Inc.* | 1,248,050 | ||||||
| 25,034 | PTC, Inc.* | 1,675,025 | ||||||
| 33,341 | Science Applications International Corp. | 2,754,633 | ||||||
| 42,972 | WNS Holdings Ltd. ADR* | 2,657,388 | ||||||
|
| |||||||
| 15,215,630 | ||||||||
|
| |||||||
| Technology Hardware & Equipment - 5.2% | ||||||||
| 25,891 | Arrow Electronics, Inc.* | 2,052,638 | ||||||
| 53,559 | Ciena Corp.* | 1,988,110 | ||||||
| 207,791 | Extreme Networks, Inc.* | 1,338,174 | ||||||
| 23,877 | Lumentum Holdings, Inc.* | 1,496,133 | ||||||
| 25,510 | Novanta, Inc.* | 2,271,665 | ||||||
| 43,637 | Plantronics, Inc. | 1,720,171 | ||||||
|
| |||||||
| 10,866,891 | ||||||||
|
| |||||||
| Transportation - 0.6% | ||||||||
| 31,974 | Spirit Airlines, Inc.* | 1,200,943 | ||||||
|
| |||||||
| Utilities - 2.3% | ||||||||
| 23,297 | Avista Corp. | 1,118,955 | ||||||
| 22,931 | IDACORP, Inc. | 2,467,834 | ||||||
| 15,894 | SJW Group | 1,149,931 | ||||||
|
| |||||||
| 4,736,720 | ||||||||
|
| |||||||
Total Common Stocks | $ | 200,174,863 | ||||||
|
| |||||||
| SHORT-TERM INVESTMENTS - 8.4% | ||||||||
| Other Investment Pools & Funds - 5.0% | ||||||||
| 10,579,515 | Morgan Stanley Institutional Liquidity Funds, Treasury Portfolio, Institutional Class, 1.65%(2) | $ | 10,579,515 | |||||
|
| |||||||
| Securities Lending Collateral - 3.4% | ||||||||
| 356,003 | Citibank NA DDCA, 1.80%, 11/1/2019(2) | 356,003 | ||||||
| 4,994,779 | Fidelity Investments Money Market Funds, Government Portfolio, Institutional Class, 1.75%(2) | 4,994,779 | ||||||
| 80,125 | Goldman Sachs Financial Square Funds, Government Fund, Institutional Class, 1.75%(2) | 80,125 | ||||||
| 662,543 | Invesco Government & Agency Portfolio, Institutional Class, 1.70%(2) | 662,543 | ||||||
| 962,593 | Morgan Stanley Institutional Liquidity Funds, Government Portfolio, Institutional Class, 1.69%(2) | 962,593 | ||||||
| 64,009 | Western Asset Institutional Government Class A Fund, Institutional Class, 1.68%(2) | 64,009 | ||||||
|
| |||||||
| 7,120,052 | ||||||||
|
| |||||||
Total Short-Term Investments | $ | 17,699,567 | ||||||
|
| |||||||
Total Investments | 103.7 | % | $ | 217,874,430 | ||||||||
Other Assets and Liabilities | (3.7 | )% | (7,684,491 | ) | ||||||||
|
|
|
| |||||||||
Total Net Assets | 100.0 | % | $ | 210,189,939 | ||||||||
|
|
|
| |||||||||
| Note: | Percentage of investments as shown is the ratio of the total market value to total net assets. |
Prices of foreign equities that are principally traded on certain foreign markets will generally be adjusted daily pursuant to a fair value pricing service approved by the Board of Directors in order to reflect an adjustment for factors occurring after the close of certain foreign markets but before the close of the New York Stock Exchange. |
The Fund may refer to any one or more of the industry classifications used by one or more widely recognized market indices, ratings group and/or as defined by Fund management. Industry classifications may not be identical across all security types. |
Equity industry classifications used in this report are the Global Industry Classification Standard, which was developed by and is the exclusive property and service mark of MSCI, Inc. and Standard & Poor’s. |
For Fund compliance purposes, the Fund may not use the same classification system. These classifications are used for financial reporting purposes. |
See “Glossary” for abbreviation descriptions. |
| * | Non-income producing. |
| (1) | Represents entire or partial securities on loan. See Note 8 in the accompanying Notes to Financial Statements for securities lending information. |
| (2) | Current yield as of period end. |
| † | See Significant Accounting Policies of accompanying Notes to Financial Statements regarding valuation of investments. |
The accompanying notes are an integral part of these financial statements.
| 60 |
|
| Hartford Schroders US Small Cap Opportunities Fund |
Schedule of Investments – (continued)
October 31, 2019
Fair Valuation Summary
The following is a summary of the fair valuations according to the inputs used as of October 31, 2019 in valuing the Fund’s investments.
Description | Total | Level 1 | Level 2 | Level 3(1) | ||||||||||||
Assets |
| |||||||||||||||
Common Stocks |
| |||||||||||||||
Automobiles & Components | $ | 3,785,403 | $ | 3,785,403 | $ | — | $ | — | ||||||||
Banks | 25,547,948 | 25,547,948 | — | — | ||||||||||||
Capital Goods | 27,204,847 | 27,204,847 | — | — | ||||||||||||
Commercial & Professional Services | 6,839,788 | 6,839,788 | — | — | ||||||||||||
Consumer Durables & Apparel | 12,253,901 | 12,253,901 | — | — | ||||||||||||
Consumer Services | 11,748,642 | 11,748,642 | — | — | ||||||||||||
Diversified Financials | 5,078,551 | 5,078,551 | — | — | ||||||||||||
Energy | 1,996,757 | 1,996,757 | — | — | ||||||||||||
Food & Staples Retailing | 2,253,685 | 2,253,685 | — | — | ||||||||||||
Food, Beverage & Tobacco | 3,411,503 | 3,411,503 | — | — | ||||||||||||
Health Care Equipment & Services | 5,719,485 | 5,719,485 | — | — | ||||||||||||
Insurance | 12,121,748 | 12,121,748 | — | — | ||||||||||||
Materials | 11,875,429 | 11,875,429 | — | — | ||||||||||||
Media & Entertainment | 3,916,702 | 3,916,702 | — | — | ||||||||||||
Pharmaceuticals, Biotechnology & Life Sciences | 12,518,225 | 12,518,225 | — | — | ||||||||||||
Real Estate | 10,349,172 | 10,349,172 | — | — | ||||||||||||
Retailing | 4,882,062 | 4,882,062 | — | — | ||||||||||||
Semiconductors & Semiconductor Equipment | 6,650,831 | 6,650,831 | — | — | ||||||||||||
Software & Services | 15,215,630 | 15,215,630 | — | — | ||||||||||||
Technology Hardware & Equipment | 10,866,891 | 10,866,891 | — | — | ||||||||||||
Transportation | 1,200,943 | 1,200,943 | — | — | ||||||||||||
Utilities | 4,736,720 | 4,736,720 | — | — | ||||||||||||
Short-Term Investments | 17,699,567 | 17,699,567 | — | — | ||||||||||||
|
|
|
|
|
|
|
| |||||||||
Total | $ | 217,874,430 | $ | 217,874,430 | $ | — | $ | — | ||||||||
|
|
|
|
|
|
|
| |||||||||
| (1) | For the year ended October 31, 2019, there were no transfers in and out of Level 3. |
The accompanying notes are an integral part of these financial statements.
| 61 |
|
| Hartford Schroders Funds |
Glossary (abbreviations used in the preceding Schedules of Investments)
| Counterparty Abbreviations: | ||
CBK | Citibank NA | |
JPM | JP Morgan Chase & Co. | |
UBS | UBS AG | |
| Currency Abbreviations: | ||
BRL | Brazilian Real | |
CAD | Canadian Dollar | |
COP | Colombian Peso | |
GBP | British Pound | |
HUF | Hungarian Forint | |
IDR | Indonesian Rupiah | |
JPY | Japanese Yen | |
MXN | Mexican Peso | |
MYR | Malaysian Ringgit | |
PEN | Peruvian Sol | |
PLN | Polish Zloty | |
RUB | Russian Ruble | |
THB | Thai Baht | |
TRY | Turkish Lira | |
USD | United States Dollar | |
ZAR | South African Rand | |
| Index Abbreviations: | ||
CMT | Constant Maturity Treasury Index | |
| Municipal Abbreviations: | ||
Auth | Authority | |
Dev | Development | |
Dist | District | |
Facs | Facilities | |
GO | General Obligation | |
Rev | Revenue | |
| Other Abbreviations: | ||
ADR | American Depositary Receipt | |
CLO | Collateralized Loan Obligation | |
CMO | Collateralized Mortgage Obligation | |
DDCA | Dollars on Deposit in Custody Account | |
EM | Emerging Markets | |
FHLMC | Federal Home Loan Mortgage Corp. | |
FNMA | Federal National Mortgage Association | |
GDR | Global Depositary Receipt | |
GNMA | Government National Mortgage Association | |
JSC | Joint Stock Company | |
LIBOR | London Interbank Offered Rate | |
NVDR | Non-Voting Depositary Receipt | |
OTC | Over-the-Counter | |
PJSC | Private Joint Stock Company | |
PT | Perseroan Terbatas | |
REIT | Real Estate Investment Trust | |
| 62 |
|
| Hartford Schroders Funds |
Statements of Assets and Liabilities
October 31, 2019
| Hartford Schroders Emerging Markets Equity Fund | Hartford Schroders Emerging Markets Multi- Sector Bond Fund | Hartford Schroders International Multi-Cap Value Fund | Hartford Schroders International Stock Fund | |||||||||||||
Assets: | ||||||||||||||||
Investments in securities, at market value(1) | $ | 3,570,262,028 | $ | 93,110,989 | $ | 2,066,515,706 | $ | 448,814,737 | ||||||||
Cash | — | — | — | — | ||||||||||||
Cash collateral due from broker on futures contracts | — | 72,000 | — | — | ||||||||||||
Cash collateral due from broker on swap contracts | — | 660,000 | — | — | ||||||||||||
Due from broker | — | — | 106,500 | — | ||||||||||||
Due from custodian | — | 70,706 | 986,750 | — | ||||||||||||
Foreign currency | 10,259,679 | 40,707 | 2,417,165 | 423,947 | ||||||||||||
Unrealized appreciation on OTC swap contracts | — | 5,087 | — | — | ||||||||||||
Unrealized appreciation on foreign currency contracts | — | 754,471 | — | — | ||||||||||||
Receivables: | ||||||||||||||||
Investment securities sold | 17,616,316 | 1,482,755 | 9,099,941 | 772,871 | ||||||||||||
Fund shares sold | 2,686,371 | 81,049 | 2,019,335 | 1,052,636 | ||||||||||||
Dividends and interest | 3,411,510 | 1,687,811 | 6,825,058 | 529,762 | ||||||||||||
Securities lending income | 2,913 | 1,783 | 76,014 | 270 | ||||||||||||
Variation margin on futures contracts | — | 74,250 | — | — | ||||||||||||
Tax reclaims | 79,624 | 55,797 | 1,632,777 | 558,434 | ||||||||||||
OTC swap contracts premiums paid | — | 163,198 | — | — | ||||||||||||
Other assets | 774,405 | 77,687 | 426,381 | 117,370 | ||||||||||||
|
|
|
|
|
|
|
| |||||||||
Total assets | 3,605,092,846 | 98,338,290 | 2,090,105,627 | 452,270,027 | ||||||||||||
|
|
|
|
|
|
|
| |||||||||
Liabilities: | ||||||||||||||||
Unrealized depreciation on foreign currency contracts | — | 1,218,050 | 99,028 | — | ||||||||||||
Due to custodian | 694,757 | — | 440,708 | — | ||||||||||||
Obligation to return securities lending collateral | — | 2,296,585 | 7,856,206 | 3,004,665 | ||||||||||||
Unrealized depreciation on OTC swap contracts | — | 4,422 | — | — | ||||||||||||
Payables: | ||||||||||||||||
Investment securities purchased | 15,906,816 | 418,699 | 5,138,272 | 7,194,793 | ||||||||||||
Fund shares redeemed | 2,144,057 | 18,816 | 2,354,432 | 336,931 | ||||||||||||
Investment management fees | 3,022,301 | 56,208 | 1,187,366 | 240,396 | ||||||||||||
Transfer agent fees | 787,208 | 9,381 | 271,715 | 49,202 | ||||||||||||
Accounting services fees | 53,523 | 1,445 | 30,531 | 6,458 | ||||||||||||
Board of Directors’ fees | 16,381 | 484 | 8,906 | 1,213 | ||||||||||||
Foreign taxes | 3,075,783 | 47,635 | 150,219 | 24,778 | ||||||||||||
Distribution fees | 2,795 | 29 | 6,500 | 1,660 | ||||||||||||
Interest on reverse repurchase agreements | — | — | — | — | ||||||||||||
Accrued expenses | 456,567 | 48,072 | 150,688 | 54,384 | ||||||||||||
OTC swap contracts premiums received | — | 135,863 | — | — | ||||||||||||
|
|
|
|
|
|
|
| |||||||||
Total liabilities | 26,160,188 | 4,255,689 | 17,694,571 | 10,914,480 | ||||||||||||
|
|
|
|
|
|
|
| |||||||||
Net assets | $ | 3,578,932,658 | $ | 94,082,601 | $ | 2,072,411,056 | $ | 441,355,547 | ||||||||
|
|
|
|
|
|
|
| |||||||||
Summary of Net Assets: | ||||||||||||||||
Capital stock andpaid-in-capital | $ | 3,045,826,688 | $ | 101,826,567 | $ | 2,188,619,195 | $ | 397,833,773 | ||||||||
Distributable earnings (loss) | 533,105,970 | (7,743,966 | ) | (116,208,139 | ) | 43,521,774 | ||||||||||
|
|
|
|
|
|
|
| |||||||||
Net assets | $ | 3,578,932,658 | $ | 94,082,601 | $ | 2,072,411,056 | $ | 441,355,547 | ||||||||
|
|
|
|
|
|
|
| |||||||||
Shares authorized | 855,000,000 | 600,000,000 | 880,000,000 | 610,000,000 | ||||||||||||
|
|
|
|
|
|
|
| |||||||||
Par value | $ | 0.0001 | $ | 0.0001 | $ | 0.0001 | $ | 0.0001 | ||||||||
|
|
|
|
|
|
|
| |||||||||
Class A: Net asset value per share | $ | 15.78 | $ | 9.12 | $ | 9.05 | $ | 12.91 | ||||||||
|
|
|
|
|
|
|
| |||||||||
Maximum offering price per share | $ | 16.70 | $ | 9.55 | $ | 9.58 | $ | 13.66 | ||||||||
|
|
|
|
|
|
|
| |||||||||
Shares outstanding | 3,823,966 | 200,590 | 11,771,028 | 3,582,484 | ||||||||||||
|
|
|
|
|
|
|
| |||||||||
Net Assets | $ | 60,355,909 | $ | 1,828,722 | $ | 106,529,608 | $ | 46,241,346 | ||||||||
|
|
|
|
|
|
|
| |||||||||
Class C: Net asset value per share | $ | 15.51 | $ | 9.08 | $ | 8.99 | $ | 12.25 | ||||||||
|
|
|
|
|
|
|
| |||||||||
Shares outstanding | 679,264 | 29,320 | 2,391,913 | 288,146 | ||||||||||||
|
|
|
|
|
|
|
| |||||||||
Net Assets | $ | 10,532,459 | $ | 266,200 | $ | 21,500,486 | $ | 3,530,457 | ||||||||
|
|
|
|
|
|
|
| |||||||||
Class I: Net asset value per share | $ | 15.77 | $ | 9.11 | $ | 9.05 | $ | 12.51 | ||||||||
|
|
|
|
|
|
|
| |||||||||
Shares outstanding | 116,527,271 | 3,263,263 | 81,873,469 | 17,463,748 | ||||||||||||
|
|
|
|
|
|
|
| |||||||||
Net Assets | $ | 1,838,076,600 | $ | 29,714,848 | $ | 740,679,796 | $ | 218,391,299 | ||||||||
|
|
|
|
|
|
|
| |||||||||
The accompanying notes are an integral part of these financial statements.
| 63 |
|
| Hartford Schroders Funds |
Statements of Assets and Liabilities – (continued)
October 31, 2019
| Hartford Schroders Emerging Markets Equity Fund | Hartford Schroders Emerging Markets Multi- Sector Bond Fund | Hartford Schroders International Multi-Cap Value Fund | Hartford Schroders International Stock Fund | |||||||||||||
Class R3: Net asset value per share | $ | 15.66 | $ | 9.13 | $ | 9.02 | $ | 12.47 | ||||||||
|
|
|
|
|
|
|
| |||||||||
Shares outstanding | 5,287 | 1,222 | 2,190,384 | 15,229 | ||||||||||||
|
|
|
|
|
|
|
| |||||||||
Net Assets | $ | 82,820 | $ | 11,156 | $ | 19,748,388 | $ | 189,900 | ||||||||
|
|
|
|
|
|
|
| |||||||||
Class R4: Net asset value per share | $ | 15.74 | $ | 9.11 | $ | 9.03 | $ | 12.50 | ||||||||
|
|
|
|
|
|
|
| |||||||||
Shares outstanding | 1,636 | 1,228 | 304,075 | 23,365 | ||||||||||||
|
|
|
|
|
|
|
| |||||||||
Net Assets | $ | 25,745 | $ | 11,195 | $ | 2,746,158 | $ | 291,967 | ||||||||
|
|
|
|
|
|
|
| |||||||||
Class R5: Net asset value per share | $ | 15.78 | $ | 9.10 | $ | 9.04 | $ | 12.52 | ||||||||
|
|
|
|
|
|
|
| |||||||||
Shares outstanding | 38,060 | 1,233 | 2,351,805 | 85,211 | ||||||||||||
|
|
|
|
|
|
|
| |||||||||
Net Assets | $ | 600,448 | $ | 11,226 | $ | 21,261,948 | $ | 1,066,476 | ||||||||
|
|
|
|
|
|
|
| |||||||||
Class Y: Net asset value per share | $ | 15.79 | $ | 9.10 | $ | 9.04 | $ | 12.52 | ||||||||
|
|
|
|
|
|
|
| |||||||||
Shares outstanding | 7,617,177 | 224,712 | 16,211,755 | 53,949 | ||||||||||||
|
|
|
|
|
|
|
| |||||||||
Net Assets | $ | 120,308,281 | $ | 2,045,784 | $ | 146,586,679 | $ | 675,623 | ||||||||
|
|
|
|
|
|
|
| |||||||||
Class F: Net asset value per share | $ | 15.78 | $ | 9.10 | $ | 9.05 | $ | 12.52 | ||||||||
|
|
|
|
|
|
|
| |||||||||
Shares outstanding | 26,578,969 | 2,536,380 | 41,658,787 | 5,613,494 | ||||||||||||
|
|
|
|
|
|
|
| |||||||||
Net Assets | $ | 419,519,741 | $ | 23,084,315 | $ | 377,024,716 | $ | 70,305,310 | ||||||||
|
|
|
|
|
|
|
| |||||||||
Class SDR:Net asset value per share | $ | 15.81 | $ | 9.11 | $ | 9.04 | $ | 12.52 | ||||||||
|
|
|
|
|
|
|
| |||||||||
Shares outstanding | 71,418,845 | 4,073,703 | 70,399,511 | 8,041,271 | ||||||||||||
|
|
|
|
|
|
|
| |||||||||
Net Assets | $ | 1,129,430,655 | $ | 37,109,155 | $ | 636,333,277 | $ | 100,663,169 | ||||||||
|
|
|
|
|
|
|
| |||||||||
Cost of investments | $ | 2,795,744,578 | $ | 91,370,918 | $ | 2,045,090,045 | $ | 401,824,817 | ||||||||
Cost of foreign currency | $ | 10,296,237 | $ | 40,413 | $ | 2,449,674 | $ | 423,900 | ||||||||
(1) Includes Investment in securities on loan, at market value | $ | — | $ | 2,214,352 | $ | 13,061,461 | $ | 2,872,387 | ||||||||
The accompanying notes are an integral part of these financial statements.
| 64 |
|
| Hartford Schroders Funds |
Statements of Assets and Liabilities – (continued)
October 31, 2019
| Hartford Schroders Securitized Income Fund | Hartford Schroders Tax-Aware Bond Fund | Hartford Schroders US MidCap Opportunities Fund | Hartford Schroders US Small Cap Opportunities Fund | |||||||||||||
Assets: | ||||||||||||||||
Investments in securities, at market value(1) | $ | 100,989,140 | $ | 333,935,034 | $ | 919,218,557 | $ | 217,874,430 | ||||||||
Cash | — | — | 34 | — | ||||||||||||
Cash collateral due from broker on futures contracts | 221,488 | 122,172 | — | 4 | ||||||||||||
Cash collateral due from broker on swap contracts | — | — | — | — | ||||||||||||
Due from custodian | — | 180,063 | — | — | ||||||||||||
Foreign currency | 157,992 | — | — | 8,612 | ||||||||||||
Unrealized appreciation on OTC swap contracts | — | — | — | — | ||||||||||||
Unrealized appreciation on foreign currency contracts | — | — | — | — | ||||||||||||
Receivables: | ||||||||||||||||
Investment securities sold | — | — | — | 387,589 | ||||||||||||
Fund shares sold | — | 1,001,597 | 961,389 | 258,013 | ||||||||||||
Dividends and interest | 169,365 | 2,289,697 | 405,273 | 65,967 | ||||||||||||
Securities lending income | — | — | 4,185 | 2,335 | ||||||||||||
Variation margin on futures contracts | 45,449 | 95,367 | — | — | ||||||||||||
Tax reclaims | — | — | — | — | ||||||||||||
OTC swap contracts premiums received | — | — | — | — | ||||||||||||
Other assets | 26,459 | 96,163 | 61,217 | 69,158 | ||||||||||||
|
|
|
|
|
|
|
| |||||||||
Total assets | 101,609,893 | 337,720,093 | 920,650,655 | 218,666,108 | ||||||||||||
|
|
|
|
|
|
|
| |||||||||
Liabilities: | ||||||||||||||||
Unrealized depreciation on foreign currency contracts | — | — | — | — | ||||||||||||
Due to custodian | — | 62 | — | — | ||||||||||||
Obligation to return securities lending collateral | — | — | 14,259,701 | 7,120,052 | ||||||||||||
Reverse repurchase agreements | 4,744,550 | — | — | — | ||||||||||||
Payables: | ||||||||||||||||
Investment securities purchased | 1,764,710 | 2,930,778 | 2,018,821 | 1,062,034 | ||||||||||||
Fund shares redeemed | — | 29,366 | 1,048,292 | 61,788 | ||||||||||||
Investment management fees | 50,881 | 124,763 | 638,962 | 151,617 | ||||||||||||
Transfer agent fees | 842 | 41,409 | 199,626 | 44,333 | ||||||||||||
Accounting services fees | 1,409 | 3,881 | 10,524 | 2,358 | ||||||||||||
Board of Directors’ fees | — | 914 | 4,669 | 771 | ||||||||||||
Foreign taxes | — | — | — | — | ||||||||||||
Distribution fees | 98 | 1,803 | 9,028 | 1,353 | ||||||||||||
Interest on reverse repurchase agreements | 5,277 | — | — | — | ||||||||||||
Accrued expenses | 95,402 | 38,436 | 69,714 | 31,863 | ||||||||||||
OTC swap contracts premiums received | — | — | — | — | ||||||||||||
|
|
|
|
|
|
|
| |||||||||
Total liabilities | 6,663,169 | 3,171,412 | 18,259,337 | 8,476,169 | ||||||||||||
|
|
|
|
|
|
|
| |||||||||
Net assets | $ | 94,946,724 | $ | 334,548,681 | $ | 902,391,318 | $ | 210,189,939 | ||||||||
|
|
|
|
|
|
|
| |||||||||
Summary of Net Assets: | ||||||||||||||||
Capital stock andpaid-in-capital | $ | 94,752,181 | $ | 317,197,115 | $ | 745,055,718 | $ | 163,353,234 | ||||||||
Distributable earnings | 194,543 | 17,351,566 | 157,335,600 | 46,836,705 | ||||||||||||
|
|
|
|
|
|
|
| |||||||||
Net assets | $ | 94,946,724 | $ | 334,548,681 | $ | 902,391,318 | $ | 210,189,939 | ||||||||
|
|
|
|
|
|
|
| |||||||||
Shares authorized | 250,000,000 | 410,000,000 | 600,000,000 | 600,000,000 | ||||||||||||
|
|
|
|
|
|
|
| |||||||||
Par value | $ | 0.0001 | $ | 0.0001 | $ | 0.0001 | $ | 0.0001 | ||||||||
|
|
|
|
|
|
|
| |||||||||
Class A: Net asset value per share | $ | 10.06 | $ | 11.34 | $ | 15.01 | $ | 25.69 | ||||||||
|
|
|
|
|
|
|
| |||||||||
Maximum offering price per share | $ | 10.37 | $ | 11.87 | $ | 15.88 | $ | 27.19 | ||||||||
|
|
|
|
|
|
|
| |||||||||
Shares outstanding | 355,014 | 3,189,951 | 5,852,728 | 814,512 | ||||||||||||
|
|
|
|
|
|
|
| |||||||||
Net Assets | $ | 3,570,992 | $ | 36,158,413 | $ | 87,830,710 | $ | 20,927,950 | ||||||||
|
|
|
|
|
|
|
| |||||||||
Class C: Net asset value per share | $ | — | $ | 11.34 | $ | 15.21 | $ | 26.23 | ||||||||
|
|
|
|
|
|
|
| |||||||||
Shares outstanding | — | 696,302 | 3,956,434 | 270,562 | ||||||||||||
|
|
|
|
|
|
|
| |||||||||
Net Assets | $ | — | $ | 7,893,963 | $ | 60,194,656 | $ | 7,095,876 | ||||||||
|
|
|
|
|
|
|
| |||||||||
Class I: Net asset value per share | $ | 10.06 | $ | 11.34 | $ | 15.63 | $ | 27.00 | ||||||||
|
|
|
|
|
|
|
| |||||||||
Shares outstanding | 460,666 | 18,485,984 | 31,771,365 | 5,186,044 | ||||||||||||
|
|
|
|
|
|
|
| |||||||||
Net Assets | $ | 4,632,662 | $ | 209,719,122 | $ | 496,724,864 | $ | 140,023,583 | ||||||||
|
|
|
|
|
|
|
| |||||||||
Class R3: Net asset value per share | $ | — | $ | — | $ | 15.41 | $ | 26.71 | ||||||||
|
|
|
|
|
|
|
| |||||||||
Shares outstanding | — | — | 92,312 | 4,162 | ||||||||||||
|
|
|
|
|
|
|
| |||||||||
Net Assets | $ | — | $ | — | $ | 1,422,819 | $ | 111,177 | ||||||||
|
|
|
|
|
|
|
| |||||||||
The accompanying notes are an integral part of these financial statements.
| 65 |
|
| Hartford Schroders Funds |
Statements of Assets and Liabilities – (continued)
October 31, 2019
| Hartford Schroders Securitized Income Fund | Hartford Schroders Tax-Aware Bond Fund | Hartford Schroders US MidCap Opportunities Fund | Hartford Schroders US Small Cap Opportunities Fund | |||||||||||||
Class R4: Net asset value per share | $ | — | $ | — | $ | 15.53 | $ | 26.93 | ||||||||
|
|
|
|
|
|
|
| |||||||||
Shares outstanding | — | — | 40,385 | 9,626 | ||||||||||||
|
|
|
|
|
|
|
| |||||||||
Net Assets | $ | — | $ | — | $ | 627,086 | $ | 259,258 | ||||||||
|
|
|
|
|
|
|
| |||||||||
Class R5: Net asset value per share | $ | — | $ | — | $ | 15.60 | $ | 26.98 | ||||||||
|
|
|
|
|
|
|
| |||||||||
Shares outstanding | — | — | 94,589 | 2,906 | ||||||||||||
|
|
|
|
|
|
|
| |||||||||
Net Assets | $ | — | $ | — | $ | 1,475,833 | $ | 78,423 | ||||||||
|
|
|
|
|
|
|
| |||||||||
Class Y: Net asset value per share | $ | 10.06 | $ | 11.35 | $ | 15.63 | $ | 27.00 | ||||||||
|
|
|
|
|
|
|
| |||||||||
Shares outstanding | 356,332 | 17,972 | 7,457,680 | 958,542 | ||||||||||||
|
|
|
|
|
|
|
| |||||||||
Net Assets | $ | 3,583,072 | $ | 203,933 | $ | 116,556,638 | $ | 25,882,595 | ||||||||
|
|
|
|
|
|
|
| |||||||||
Class F: Net asset value per share | $ | 10.05 | $ | 11.35 | $ | 15.64 | $ | 27.03 | ||||||||
|
|
|
|
|
|
|
| |||||||||
Shares outstanding | 253,062 | 1,812,510 | 3,512,943 | 165,878 | ||||||||||||
|
|
|
|
|
|
|
| |||||||||
Net Assets | $ | 2,544,237 | $ | 20,568,611 | $ | 54,954,713 | $ | 4,483,277 | ||||||||
|
|
|
|
|
|
|
| |||||||||
Class SDR:Net asset value per share | $ | 10.05 | $ | 11.34 | $ | 15.67 | $ | 27.06 | ||||||||
|
|
|
|
|
|
|
| |||||||||
Shares outstanding | 8,018,153 | 5,291,888 | 5,270,709 | 418,623 | ||||||||||||
|
|
|
|
|
|
|
| |||||||||
Net Assets | $ | 80,615,761 | $ | 60,004,639 | $ | 82,603,999 | $ | 11,327,800 | ||||||||
|
|
|
|
|
|
|
| |||||||||
Cost of investments | $ | 100,959,391 | $ | 323,950,966 | $ | 768,093,387 | $ | 181,293,235 | ||||||||
Cost of foreign currency | $ | 157,334 | $ | — | $ | — | $ | 8,616 | ||||||||
(1) Includes Investment in securities on loan, at market value | $ | — | $ | — | $ | 14,096,644 | $ | 6,861,411 | ||||||||
The accompanying notes are an integral part of these financial statements.
| 66 |
|
| Hartford Schroders Funds |
For the Year Ended October 31, 2019
| Hartford Schroders Emerging Markets Equity Fund | Hartford Schroders Emerging Markets Multi- Sector Bond Fund | Hartford Schroders International Multi-Cap Value Fund | Hartford Schroders International Stock Fund | |||||||||||||
Investment Income: | ||||||||||||||||
Dividends | $ | 127,736,820 | $ | — | $ | 84,207,996 | $ | 9,189,867 | ||||||||
Interest | 1,405,788 | 7,234,317 | 1,277,137 | 164,818 | ||||||||||||
Securities lending | 88,497 | 17,729 | 1,273,498 | 93,146 | ||||||||||||
Less: Foreign tax withheld | (10,919,693 | ) | (11,687 | ) | (8,190,918 | ) | (926,530 | ) | ||||||||
|
|
|
|
|
|
|
| |||||||||
Total investment income, net | 118,311,412 | 7,240,359 | 78,567,713 | 8,521,301 | ||||||||||||
|
|
|
|
|
|
|
| |||||||||
Expenses: | ||||||||||||||||
Investment management fees | 35,353,873 | 704,335 | 13,650,087 | 2,247,091 | ||||||||||||
Transfer agent fees | ||||||||||||||||
Class A | 72,278 | 3,315 | 104,048 | 33,176 | ||||||||||||
Class C | 10,432 | 460 | 25,980 | 3,830 | ||||||||||||
Class I | 3,101,911 | 24,670 | 780,205 | 128,164 | ||||||||||||
Class R3 | 192 | 13 | 22,825 | 115 | ||||||||||||
Class R4 | 808 | 12 | 3,989 | 60 | ||||||||||||
Class R5 | 667 | 8 | 23,212 | 43 | ||||||||||||
Class Y | 112,958 | 185 | 107,756 | 3,069 | ||||||||||||
Class F | 2,770 | 87 | 4,841 | 79 | ||||||||||||
Class SDR | 2,851 | 153 | 23,542 | 400 | ||||||||||||
Distribution fees | ||||||||||||||||
Class A | 142,126 | 7,247 | 227,814 | 65,133 | ||||||||||||
Class C | 105,607 | 2,140 | 237,583 | 35,071 | ||||||||||||
Class R3 | 438 | 54 | 51,904 | 345 | ||||||||||||
Class R4 | 1,846 | 26 | 5,786 | 167 | ||||||||||||
Custodian fees | 360,311 | 20,102 | 171,378 | 30,288 | ||||||||||||
Registration and filing fees | 221,919 | 135,429 | 290,163 | 141,947 | ||||||||||||
Accounting services fees | 624,047 | 18,112 | 350,738 | 58,603 | ||||||||||||
Board of Directors’ fees | 113,544 | 3,251 | 63,494 | 9,990 | ||||||||||||
Audit fees | 67,207 | 34,684 | 59,693 | 42,723 | ||||||||||||
Other expenses | 485,256 | 17,857 | 188,624 | 46,576 | ||||||||||||
|
|
|
|
|
|
|
| |||||||||
Total expenses (before interest expense) | 40,781,041 | 972,140 | 16,393,662 | 2,846,870 | ||||||||||||
Interest expense | — | — | — | — | ||||||||||||
|
|
|
|
|
|
|
| |||||||||
Total expenses (before waivers, reimbursements and fees paid indirectly) | 40,781,041 | 972,140 | 16,393,662 | 2,846,870 | ||||||||||||
Expense waivers | — | (179,320 | ) | (36,457 | ) | (94,807 | ) | |||||||||
Transfer agent fee waivers | — | — | (50,201 | ) | — | |||||||||||
Distribution fee reimbursements | (123 | ) | (271 | ) | (107 | ) | (112 | ) | ||||||||
|
|
|
|
|
|
|
| |||||||||
Total waivers, reimbursements and fees paid indirectly | (123 | ) | (179,591 | ) | (86,765 | ) | (94,919 | ) | ||||||||
|
|
|
|
|
|
|
| |||||||||
Total expenses, net | 40,780,918 | 792,549 | 16,306,897 | 2,751,951 | ||||||||||||
|
|
|
|
|
|
|
| |||||||||
Net Investment Income (Loss) | 77,530,494 | 6,447,810 | 62,260,816 | 5,769,350 | ||||||||||||
|
|
|
|
|
|
|
| |||||||||
Net Realized Gain (Loss) on Investments, Other Financial Instruments and Foreign Currency Transactions: | ||||||||||||||||
Net realized gain (loss) on investments | (44,592,436 | ) | (2,538,313 | ) | (143,528,302 | ) | (7,882,733 | ) | ||||||||
Less: Foreign taxes paid on realized capital gains | (204,029 | ) | (18,277 | ) | — | (19,721 | ) | |||||||||
Net realized gain (loss) on futures contracts | — | 168,507 | (302,314 | ) | — | |||||||||||
Net realized gain (loss) on swap contracts | — | 184,142 | — | — | ||||||||||||
Net realized gain (loss) on foreign currency contracts | — | (272,726 | ) | (1,755,681 | ) | — | ||||||||||
Net realized gain (loss) on other foreign currency transactions | (1,032,599 | ) | (118,855 | ) | (557,070 | ) | (4,648 | ) | ||||||||
|
|
|
|
|
|
|
| |||||||||
Net Realized Gain (Loss) on Investments, Other Financial Instruments and Foreign Currency Transactions | (45,829,064 | ) | (2,595,522 | ) | (146,143,367 | ) | (7,907,102 | ) | ||||||||
|
|
|
|
|
|
|
| |||||||||
Net Changes in Unrealized Appreciation (Depreciation) of Investments, Other Financial Instruments and Foreign Currency Transactions: | ||||||||||||||||
Net unrealized appreciation (depreciation) of investments* | 401,669,660 | 6,255,143 | 209,792,928 | 42,339,709 | ||||||||||||
Net unrealized appreciation (depreciation) of futures contracts | — | (6,047 | ) | 1,101,839 | — | |||||||||||
Net unrealized appreciation (depreciation) of swap contracts | — | (29,693 | ) | — | — | |||||||||||
Net unrealized appreciation (depreciation) of foreign currency contracts | — | (942,748 | ) | 844,678 | — | |||||||||||
Net unrealized appreciation (depreciation) of translation of other assets and liabilities in foreign currencies | 54,497 | 9,590 | 66,847 | 10,989 | ||||||||||||
|
|
|
|
|
|
|
| |||||||||
Net Changes in Unrealized Appreciation (Depreciation) of Investments, Other Financial Instruments and Foreign Currency Transactions | 401,724,157 | 5,286,245 | 211,806,292 | 42,350,698 | ||||||||||||
|
|
|
|
|
|
|
| |||||||||
Net Gain (Loss) on Investments, Other Financial Instruments and Foreign Currency Transactions | 355,895,093 | 2,690,723 | 65,662,925 | 34,443,596 | ||||||||||||
|
|
|
|
|
|
|
| |||||||||
Net Increase (Decrease) in Net Assets Resulting from Operations | $ | 433,425,587 | $ | 9,138,533 | $ | 127,923,741 | $ | 40,212,946 | ||||||||
|
|
|
|
|
|
|
| |||||||||
*Includes change in unrealized appreciation (depreciation) on deferred capital gains tax of: | $ | (1,338,779 | ) | $ | (47,635 | ) | $ | — | $ | — | ||||||
The accompanying notes are an integral part of these financial statements.
| 67 |
|
| Hartford Schroders Funds |
Statements of Operations – (continued)
For the Year Ended October 31, 2019
| Hartford Schroders Securitized Income Fund(1) | Hartford Schroders Tax-Aware Bond Fund | Hartford Schroders US MidCap Opportunities Fund | Hartford Schroders US Small Cap Opportunities Fund | |||||||||||||
Investment Income: | ||||||||||||||||
Dividends | $ | — | $ | — | $ | 12,327,920 | $ | 2,256,248 | ||||||||
Interest | 1,274,802 | 7,075,271 | 1,263,016 | 255,073 | ||||||||||||
Securities lending | — | 6,057 | 33,199 | 31,845 | ||||||||||||
Less: Foreign tax withheld | — | — | (26,233 | ) | (21,953 | ) | ||||||||||
|
|
|
|
|
|
|
| |||||||||
Total investment income, net | 1,274,802 | 7,081,328 | 13,597,902 | 2,521,213 | ||||||||||||
|
|
|
|
|
|
|
| |||||||||
Expenses: | ||||||||||||||||
Investment management fees | 241,548 | 1,135,796 | 8,189,492 | 1,581,293 | ||||||||||||
Transfer agent fees | ||||||||||||||||
Class A | 1,718 | 13,432 | 102,597 | 28,140 | ||||||||||||
Class C | — | 4,845 | 72,126 | 11,268 | ||||||||||||
Class I | 2,042 | 119,483 | 551,747 | 100,305 | ||||||||||||
Class R3 | — | — | 3,116 | 282 | ||||||||||||
Class R4 | — | — | 1,458 | 172 | ||||||||||||
Class R5 | — | — | 2,332 | 32 | ||||||||||||
Class Y | 384 | 138 | 71,220 | 14,436 | ||||||||||||
Class F | 66 | 22 | 588 | 109 | ||||||||||||
Class SDR | 1,039 | 675 | 2,812 | 248 | ||||||||||||
Distribution fees | ||||||||||||||||
Class A | 5,934 | 62,869 | 225,089 | 43,680 | ||||||||||||
Class C | — | 58,651 | 640,150 | 69,705 | ||||||||||||
Class R3 | — | — | 7,085 | 645 | ||||||||||||
Class R4 | — | — | 2,151 | 258 | ||||||||||||
Custodian fees | 7,165 | 13,370 | 14,413 | 10,871 | ||||||||||||
Registration and filing fees | 55,547 | 94,486 | 180,170 | 118,863 | ||||||||||||
Accounting services fees | 6,689 | 35,336 | 134,987 | 24,598 | ||||||||||||
Board of Directors’ fees | 941 | 7,562 | 32,035 | 5,486 | ||||||||||||
Audit fees | 41,890 | 31,808 | 22,785 | 22,481 | ||||||||||||
Other expenses | 43,555 | 23,331 | 146,050 | 29,377 | ||||||||||||
|
|
|
|
|
|
|
| |||||||||
Total expenses (before interest expense) | 408,518 | 1,601,804 | 10,402,403 | 2,062,249 | ||||||||||||
Interest expense | 63,647 | — | — | — | ||||||||||||
|
|
|
|
|
|
|
| |||||||||
Total expenses (before waivers, reimbursements and fees paid indirectly) | 472,165 | 1,601,804 | 10,402,403 | 2,062,249 | ||||||||||||
Expense waivers | (138,365 | ) | (281,909 | ) | (317 | ) | (125,838 | ) | ||||||||
Transfer agent fee waivers | — | — | (21,119 | ) | — | |||||||||||
Distribution fee reimbursements | (5,178 | ) | (65 | ) | (544 | ) | (625 | ) | ||||||||
|
|
|
|
|
|
|
| |||||||||
Total waivers, reimbursements and fees paid indirectly | (143,543 | ) | (281,974 | ) | (21,980 | ) | (126,463 | ) | ||||||||
|
|
|
|
|
|
|
| |||||||||
Total expenses, net | 328,622 | 1,319,830 | 10,380,423 | 1,935,786 | ||||||||||||
|
|
|
|
|
|
|
| |||||||||
Net Investment Income (Loss) | 946,180 | 5,761,498 | 3,217,479 | 585,427 | ||||||||||||
|
|
|
|
|
|
|
| |||||||||
Net Realized Gain (Loss) on Investments, Other Financial Instruments and Foreign Currency Transactions: | ||||||||||||||||
Net realized gain (loss) on investments | 46,696 | 6,822,946 | 7,531,232 | 10,308,821 | ||||||||||||
Less: Foreign taxes paid on realized capital gains | — | — | — | — | ||||||||||||
Net realized gain (loss) on futures contracts | 289,720 | 88,921 | — | — | ||||||||||||
Net realized gain (loss) on swap contracts | — | — | — | — | ||||||||||||
Net realized gain (loss) on foreign currency contracts | — | — | — | — | ||||||||||||
Net realized gain (loss) on other foreign currency transactions | 14,731 | — | (104 | ) | (2,644 | ) | ||||||||||
|
|
|
|
|
|
|
| |||||||||
Net Realized Gain (Loss) on Investments, Other Financial Instruments and Foreign Currency Transactions | 351,147 | 6,911,867 | 7,531,128 | 10,306,177 | ||||||||||||
|
|
|
|
|
|
|
| |||||||||
Net Changes in Unrealized Appreciation (Depreciation) of Investments, Other Financial Instruments and Foreign Currency Transactions: | ||||||||||||||||
Net unrealized appreciation (depreciation) of investments* | 26,211 | 9,909,778 | 102,046,455 | 8,527,448 | ||||||||||||
Net unrealized appreciation (depreciation) of futures contracts | (234,239 | ) | 22,924 | — | — | |||||||||||
Net unrealized appreciation (depreciation) of swap contracts | — | — | — | — | ||||||||||||
Net unrealized appreciation (depreciation) of foreign currency contracts | — | — | — | — | ||||||||||||
Net unrealized appreciation (depreciation) of translation of other assets and liabilities in foreign currencies | 1,321 | — | — | 22 | ||||||||||||
|
|
|
|
|
|
|
| |||||||||
Net Changes in Unrealized Appreciation (Depreciation) of Investments, Other Financial Instruments and Foreign Currency Transactions | (206,707 | ) | 9,932,702 | 102,046,455 | 8,527,470 | |||||||||||
|
|
|
|
|
|
|
| |||||||||
Net Gain (Loss) on Investments, Other Financial Instruments and Foreign Currency Transactions | 144,440 | 16,844,569 | 109,577,583 | 18,833,647 | ||||||||||||
|
|
|
|
|
|
|
| |||||||||
Net Increase (Decrease) in Net Assets Resulting from Operations | $ | 1,090,620 | $ | 22,606,067 | $ | 112,795,062 | $ | 19,419,074 | ||||||||
|
|
|
|
|
|
|
| |||||||||
(1) Commenced operations on February 28, 2019. | ||||||||||||||||
* Includes change in unrealized appreciation (depreciation) on deferred capital gains tax of: | $ | — | $ | — | $ | — | $ | — | ||||||||
The accompanying notes are an integral part of these financial statements.
| 68 |
|
| Hartford Schroders Funds |
Statements of Changes in Net Assets
| Hartford Schroders Emerging Markets Equity Fund | Hartford Schroders Emerging Markets Multi-Sector Bond Fund | Hartford Schroders International Multi-Cap Value Fund | ||||||||||||||||||||||
| For the Year Ended October 31, 2019 | For the Year Ended October 31, 2018 | For the Year Ended October 31, 2019 | For the Year Ended October 31, 2018 | For the Year Ended October 31, 2019 | For the Year Ended October 31, 2018 | |||||||||||||||||||
Operations: | ||||||||||||||||||||||||
Net investment income (loss) | $ | 77,530,494 | $ | 38,978,171 | $ | 6,447,810 | $ | 6,302,036 | $ | 62,260,816 | $ | 47,367,352 | ||||||||||||
Net realized gain (loss) on investments, other financial instruments and foreign currency transactions | (45,829,064 | ) | (894,376 | ) | (2,595,522 | ) | (8,475,217 | ) | (146,143,367 | ) | 51,335,075 | |||||||||||||
Net changes in unrealized appreciation (depreciation) of investments, other financial instruments and foreign currency transactions | 401,724,157 | (468,028,626 | ) | 5,286,245 | (4,716,081 | ) | 211,806,292 | (284,208,542 | ) | |||||||||||||||
|
|
|
|
|
|
|
|
|
|
|
| |||||||||||||
Net Increase (Decrease) in Net Assets Resulting from Operations | 433,425,587 | (429,944,831 | ) | 9,138,533 | (6,889,262 | ) | 127,923,741 | (185,506,115 | ) | |||||||||||||||
|
|
|
|
|
|
|
|
|
|
|
| |||||||||||||
Distributions to Shareholders: | ||||||||||||||||||||||||
From distributable earnings: | ||||||||||||||||||||||||
Class A | (481,292 | ) | (329,454 | ) | (133,660 | ) | (152,273 | ) | (4,247,199 | ) | (2,195,964 | ) | ||||||||||||
Class C | (46,251 | ) | (19,052 | ) | (7,719 | ) | (11,972 | ) | (1,098,114 | ) | (629,055 | ) | ||||||||||||
Class I | (20,186,735 | ) | (15,686,234 | ) | (1,588,823 | ) | (1,178,698 | ) | (42,940,197 | ) | (32,971,085 | ) | ||||||||||||
Class R3 | (787 | ) | (237 | ) | (536 | ) | (1,169 | ) | (308,569 | ) | (9,338 | ) | ||||||||||||
Class R4 | (45,699 | ) | (985 | ) | (537 | ) | (515 | ) | (96,105 | ) | (26,732 | ) | ||||||||||||
Class R5 | (6,306 | ) | (113 | ) | (548 | ) | (525 | ) | (1,208,181 | ) | (750,152 | ) | ||||||||||||
Class Y | (2,433,096 | ) | (957,311 | ) | (80,113 | ) | (27,778 | ) | (6,351,435 | ) | (1,136,472 | ) | ||||||||||||
Class F | (2,614,489 | ) | (413,171 | ) | (1,396,956 | ) | (1,417,097 | ) | (15,601,049 | ) | (6,809,592 | ) | ||||||||||||
Class SDR | (13,830,184 | ) | (6,831,611 | ) | (1,851,571 | ) | (2,676,307 | ) | (31,533,597 | ) | (20,372,316 | ) | ||||||||||||
From tax return of capital: | ||||||||||||||||||||||||
Class A | — | — | (11,860 | ) | (73,154 | ) | — | — | ||||||||||||||||
Class C | — | — | (685 | ) | (5,752 | ) | — | — | ||||||||||||||||
Class I | — | — | (140,988 | ) | (566,263 | ) | — | — | ||||||||||||||||
Class R3 | — | — | (48 | ) | (562 | ) | — | — | ||||||||||||||||
Class R4 | — | — | (48 | ) | (247 | ) | — | — | ||||||||||||||||
Class R5 | — | — | (49 | ) | (252 | ) | �� | — | — | |||||||||||||||
Class Y | — | — | (7,109 | ) | (13,345 | ) | — | — | ||||||||||||||||
Class F | — | — | (123,963 | ) | (680,794 | ) | — | — | ||||||||||||||||
Class SDR | — | — | (164,304 | ) | (1,285,735 | ) | — | — | ||||||||||||||||
|
|
|
|
|
|
|
|
|
|
|
| |||||||||||||
Total distributions | (39,644,839 | ) | (24,238,168 | ) | (5,509,517 | ) | (8,092,438 | ) | (103,384,446 | ) | (64,900,706 | ) | ||||||||||||
|
|
|
|
|
|
|
|
|
|
|
| |||||||||||||
Capital Share Transactions: | ||||||||||||||||||||||||
Sold | 1,569,572,457 | 1,549,995,802 | 19,812,789 | 79,202,863 | 929,356,674 | 1,230,550,836 | ||||||||||||||||||
Issued in merger | — | — | — | 29,377,678 | — | — | ||||||||||||||||||
Issued on reinvestment of distributions | 24,314,244 | 13,539,981 | 5,473,630 | 6,560,103 | 93,713,594 | 57,364,742 | ||||||||||||||||||
Redeemed | (1,407,536,600 | ) | (866,104,626 | ) | (39,875,815 | ) | (70,344,671 | ) | (841,072,557 | ) | (531,885,780 | ) | ||||||||||||
|
|
|
|
|
|
|
|
|
|
|
| |||||||||||||
Net increase (decrease) from capital share transactions | 186,350,101 | 697,431,157 | (14,589,396 | ) | 44,795,973 | 181,997,711 | 756,029,798 | |||||||||||||||||
|
|
|
|
|
|
|
|
|
|
|
| |||||||||||||
Net Increase (Decrease) in Net Assets | 580,130,849 | 243,248,158 | (10,960,380 | ) | 29,814,273 | 206,537,006 | 505,622,977 | |||||||||||||||||
|
|
|
|
|
|
|
|
|
|
|
| |||||||||||||
Net Assets: | ||||||||||||||||||||||||
Beginning of period | 2,998,801,809 | 2,755,553,651 | 105,042,981 | 75,228,708 | 1,865,874,050 | 1,360,251,073 | ||||||||||||||||||
|
|
|
|
|
|
|
|
|
|
|
| |||||||||||||
End of period | $ | 3,578,932,658 | $ | 2,998,801,809 | $ | 94,082,601 | $ | 105,042,981 | $ | 2,072,411,056 | $ | 1,865,874,050 | ||||||||||||
|
|
|
|
|
|
|
|
|
|
|
| |||||||||||||
The accompanying notes are an integral part of these financial statements.
| 69 |
|
| Hartford Schroders Funds |
Statements of Changes in Net Assets – (continued)
| Hartford Schroders International Stock Fund | Hartford Schroders Securitized Income Fund | Hartford Schroders Tax-Aware Bond Fund | ||||||||||||||||||
| For the Year Ended October 31, 2019 | For the Year Ended October 31, 2018 | For the Period Ended October 31, 2019(1) | For the Year Ended October 31, 2019 | For the Year Ended October 31, 2018 | ||||||||||||||||
Operations: | ||||||||||||||||||||
Net investment income (loss) | $ | 5,769,350 | $ | 3,455,565 | $ | 946,180 | $ | 5,761,498 | $ | 5,302,082 | ||||||||||
Net realized gain (loss) on investments, other financial instruments and foreign currency transactions | (7,907,102 | ) | 19,595,656 | 351,147 | 6,911,867 | 2,287,065 | ||||||||||||||
Net changes in unrealized appreciation (depreciation) of investments, other financial instruments and foreign currency transactions | 42,350,698 | (40,478,154 | ) | (206,707 | ) | 9,932,702 | (11,465,658 | ) | ||||||||||||
|
|
|
|
|
|
|
|
|
| |||||||||||
Net Increase (Decrease) in Net Assets Resulting from Operations | 40,212,946 | (17,426,933 | ) | 1,090,620 | 22,606,067 | (3,876,511 | ) | |||||||||||||
|
|
|
|
|
|
|
|
|
| |||||||||||
Distributions to Shareholders: | ||||||||||||||||||||
Class A | (1,107,203 | ) | (67,385 | ) | (50,264 | ) | (758,076 | ) | (492,532 | ) | ||||||||||
Class C | (157,415 | ) | (6,200 | ) | — | (121,750 | ) | (61,024 | ) | |||||||||||
Class I | (10,142,730 | ) | (1,432,922 | ) | (61,092 | ) | (4,585,616 | ) | (3,137,508 | ) | ||||||||||
Class R3 | (887 | ) | (128 | ) | — | — | — | |||||||||||||
Class R4 | (891 | ) | (136 | ) | — | — | — | |||||||||||||
Class R5 | (901 | ) | (154 | ) | — | — | — | |||||||||||||
Class Y | (416,824 | ) | (3,966 | ) | (53,578 | ) | (7,078 | ) | (4,968 | ) | ||||||||||
Class F | (995,487 | ) | (18,362 | ) | (38,286 | ) | (408,408 | ) | (133,857 | ) | ||||||||||
Class SDR | (5,246,663 | ) | (816,782 | ) | (692,857 | ) | (2,099,274 | ) | (1,519,589 | ) | ||||||||||
|
|
|
|
|
|
|
|
|
| |||||||||||
Total distributions | (18,069,001 | ) | (2,346,035 | ) | (896,077 | ) | (7,980,202 | ) | (5,349,478 | ) | ||||||||||
|
|
|
|
|
|
|
|
|
| |||||||||||
Capital Share Transactions: | ||||||||||||||||||||
Sold | 267,703,140 | 124,402,649 | 94,071,017 | 186,245,249 | 67,286,843 | |||||||||||||||
Issued on reinvestment of distributions | 17,755,039 | 2,300,768 | 691,846 | 6,069,834 | 3,770,799 | |||||||||||||||
Redemption-in-kind | — | — | — | — | — | |||||||||||||||
Redeemed | (91,102,156 | ) | (83,034,179 | ) | (10,682 | ) | (91,171,993 | ) | (91,564,986 | ) | ||||||||||
|
|
|
|
|
|
|
|
|
| |||||||||||
Net increase (decrease) from capital share transactions | 194,356,023 | 43,669,238 | 94,752,181 | 101,143,090 | (20,507,344 | ) | ||||||||||||||
|
|
|
|
|
|
|
|
|
| |||||||||||
Net Increase (Decrease) in Net Assets | 216,499,968 | 23,896,270 | 94,946,724 | 115,768,955 | (29,733,333 | ) | ||||||||||||||
|
|
|
|
|
|
|
|
|
| |||||||||||
Net Assets: | ||||||||||||||||||||
Beginning of period | 224,855,579 | 200,959,309 | — | 218,779,726 | 248,513,059 | |||||||||||||||
|
|
|
|
|
|
|
|
|
| |||||||||||
End of period | $ | 441,355,547 | $ | 224,855,579 | $ | 94,946,724 | $ | 334,548,681 | $ | 218,779,726 | ||||||||||
|
|
|
|
|
|
|
|
|
| |||||||||||
| (1) | Commenced operations on February 28, 2019. |
The accompanying notes are an integral part of these financial statements.
| 70 |
|
| Hartford Schroders Funds |
Statements of Changes in Net Assets – (continued)
| Hartford Schroders US MidCap Opportunities Fund | Hartford Schroders US Small Cap Opportunities Fund | |||||||||||||||
| For the Year Ended October 31, 2019 | For the Year Ended October 31, 2018 | For the Year Ended October 31, 2019 | For the Year Ended October 31, 2018 | |||||||||||||
Operations: | ||||||||||||||||
Net investment income (loss) | $ | 3,217,479 | $ | 2,129,422 | $ | 585,427 | $ | 420,711 | ||||||||
Net realized gain (loss) on investments, other financial instruments and foreign currency transactions | 7,531,128 | 18,419,184 | 10,306,177 | 15,051,127 | ||||||||||||
Net changes in unrealized appreciation (depreciation) of investments, other financial instruments and foreign currency transactions | 102,046,455 | (33,025,099 | ) | 8,527,470 | (14,654,708 | ) | ||||||||||
|
|
|
|
|
|
|
| |||||||||
Net Increase (Decrease) in Net Assets Resulting from Operations | 112,795,062 | (12,476,493 | ) | 19,419,074 | 817,130 | |||||||||||
|
|
|
|
|
|
|
| |||||||||
Distributions to Shareholders: | ||||||||||||||||
Class A | (1,875,469 | ) | (1,736,041 | ) | (1,273,415 | ) | (882,548 | ) | ||||||||
Class C | (1,310,733 | ) | (735,465 | ) | (613,652 | ) | (389,798 | ) | ||||||||
Class I | (13,979,494 | ) | (9,941,376 | ) | (9,398,176 | ) | (10,752,603 | ) | ||||||||
Class R3 | (18,758 | ) | (4,885 | ) | (6,097 | ) | (4,486 | ) | ||||||||
Class R4 | (18,966 | ) | (3,987 | ) | (928 | ) | (893 | ) | ||||||||
Class R5 | (52,582 | ) | (782 | ) | (1,691 | ) | (1,510 | ) | ||||||||
Class Y | (2,455,954 | ) | (197,570 | ) | (2,040,823 | ) | (2,198,416 | ) | ||||||||
Class F | (1,075,458 | ) | (207,551 | ) | (254,541 | ) | (145,891 | ) | ||||||||
Class SDR | (1,352,705 | ) | (417,154 | ) | (959,593 | ) | (2,684,876 | ) | ||||||||
|
|
|
|
|
|
|
| |||||||||
Total distributions | (22,140,119 | ) | (13,244,811 | ) | (14,548,916 | ) | (17,061,021 | ) | ||||||||
|
|
|
|
|
|
|
| |||||||||
Capital Share Transactions: | ||||||||||||||||
Sold | 305,402,261 | 599,268,981 | 60,412,503 | 45,827,567 | ||||||||||||
Issued on reinvestment of distributions | 19,743,423 | 11,791,664 | 14,244,734 | 16,050,612 | ||||||||||||
Redemption-in-kind | — | — | — | (20,194,923 | ) | |||||||||||
Redeemed | (541,524,513 | ) | (384,949,495 | ) | (37,311,741 | ) | (64,015,086 | ) | ||||||||
|
|
|
|
|
|
|
| |||||||||
Net increase (decrease) from capital share transactions | (216,378,829 | ) | 226,111,150 | 37,345,496 | (22,331,830 | ) | ||||||||||
|
|
|
|
|
|
|
| |||||||||
Net Increase (Decrease) in Net Assets | (125,723,886 | ) | 200,389,846 | 42,215,654 | (38,575,721 | ) | ||||||||||
|
|
|
|
|
|
|
| |||||||||
Net Assets: | ||||||||||||||||
Beginning of period | 1,028,115,204 | 827,725,358 | 167,974,285 | 206,550,006 | ||||||||||||
|
|
|
|
|
|
|
| |||||||||
End of period | $ | 902,391,318 | $ | 1,028,115,204 | $ | 210,189,939 | $ | 167,974,285 | ||||||||
|
|
|
|
|
|
|
| |||||||||
| (1) | Commenced operations on February 28, 2019. |
The accompanying notes are an integral part of these financial statements.
| 71 |
|
| Hartford Schroders Funds |
| — SelectedPer-Share Data(1) — | — Ratios and Supplemental Data — | |||||||||||||||||||||||||||||||||||||||||||||||||||||||||||
Class | Net Asset Value at Beginning of Period | Net Investment Income (Loss) | Net Realized and Unrealized Gain (Loss) on Investments | Total from Investment Operations | Dividends from Net Investment Income | Distributions from Capital Gains | Returns of Capital | Total Dividends and Distributions | Net Asset Value at End of Period | Total Return(2) | Net Assets at End of Period (000s) | Ratio of Expenses to Average Net Assets Before Adjust- ments(3) | Ratio of Expenses to Average Net Assets After Adjust- ments(3) | Ratio of Net Investment Income (Loss) to Average Net Assets | Portfolio Turnover | |||||||||||||||||||||||||||||||||||||||||||||
| Hartford Schroders Emerging Markets Equity Fund(4) | ||||||||||||||||||||||||||||||||||||||||||||||||||||||||||||
For the Year Ended October 31, 2019 |
| |||||||||||||||||||||||||||||||||||||||||||||||||||||||||||
A | $ | 14.07 | $ | 0.29 | $ | 1.56 | $ | 1.85 | $ | (0.14 | ) | $ | — | — | $ | (0.14 | ) | $ | 15.78 | 13.27 | % | $ | 60,356 | 1.45 | % | 1.45 | % | 1.95 | % | 43 | % | |||||||||||||||||||||||||||||
C | 13.86 | 0.19 | 1.53 | 1.72 | (0.07 | ) | — | — | (0.07 | ) | 15.51 | 12.50 | 10,532 | 2.17 | 2.17 | 1.27 | 43 | |||||||||||||||||||||||||||||||||||||||||||
I | 14.06 | 0.31 | 1.57 | 1.88 | (0.17 | ) | — | — | (0.17 | ) | 15.77 | 13.54 | 1,838,077 | 1.23 | 1.23 | 2.07 | 43 | |||||||||||||||||||||||||||||||||||||||||||
R3 | 13.98 | 0.23 | 1.57 | 1.80 | (0.12 | ) | — | — | (0.12 | ) | 15.66 | 13.01 | 83 | 1.79 | 1.72 | 1.51 | 43 | |||||||||||||||||||||||||||||||||||||||||||
R4 | 14.02 | (0.05 | ) | 1.95 | 1.90 | (0.18 | ) | — | — | (0.18 | ) | 15.74 | 13.78 | 26 | 1.43 | 1.42 | (0.32 | ) | 43 | |||||||||||||||||||||||||||||||||||||||||
R5 | 14.07 | 0.33 | 1.56 | 1.89 | (0.18 | ) | — | — | (0.18 | ) | 15.78 | 13.61 | 600 | 1.19 | 1.19 | 2.19 | 43 | |||||||||||||||||||||||||||||||||||||||||||
Y | 14.09 | 0.32 | 1.57 | 1.89 | (0.19 | ) | — | — | (0.19 | ) | 15.79 | 13.62 | 120,308 | 1.13 | 1.13 | 2.11 | 43 | |||||||||||||||||||||||||||||||||||||||||||
F | 14.07 | 0.42 | 1.48 | 1.90 | (0.19 | ) | — | — | (0.19 | ) | 15.78 | 13.73 | 419,520 | 1.07 | 1.07 | 2.77 | 43 | |||||||||||||||||||||||||||||||||||||||||||
SDR | 14.10 | 0.34 | 1.56 | 1.90 | (0.19 | ) | — | — | (0.19 | ) | 15.81 | 13.71 | 1,129,431 | 1.07 | 1.07 | 2.28 | 43 | |||||||||||||||||||||||||||||||||||||||||||
For the Year Ended October 31, 2018 |
| |||||||||||||||||||||||||||||||||||||||||||||||||||||||||||
A | $ | 16.23 | $ | 0.16 | $ | (2.22 | ) | $ | (2.06 | ) | $ | (0.10 | ) | $ | — | $ | — | $ | (0.10 | ) | $ | 14.07 | (12.79 | )% | $ | 46,162 | 1.45 | % | 1.45 | % | 0.98 | % | 24 | % | ||||||||||||||||||||||||||
C | 16.08 | 0.07 | (2.22 | ) | (2.15 | ) | (0.07 | ) | — | — | (0.07 | ) | 13.86 | (13.44 | ) | 7,217 | 2.19 | 2.19 | 0.45 | 24 | ||||||||||||||||||||||||||||||||||||||||
I | 16.23 | 0.19 | (2.22 | ) | (2.03 | ) | (0.14 | ) | — | — | (0.14 | ) | 14.06 | (12.66 | ) | 1,733,270 | 1.24 | 1.24 | 1.19 | 24 | ||||||||||||||||||||||||||||||||||||||||
R3 | 16.20 | 0.22 | (2.30 | ) | (2.08 | ) | (0.14 | ) | — | — | (0.14 | ) | 13.98 | (12.99 | ) | 90 | 1.80 | 1.70 | 1.36 | 24 | ||||||||||||||||||||||||||||||||||||||||
R4 | 16.19 | 0.05 | (2.11 | ) | (2.06 | ) | (0.11 | ) | — | — | (0.11 | ) | 14.02 | (12.88 | ) | 3,710 | 1.49 | 1.48 | 0.36 | 24 | ||||||||||||||||||||||||||||||||||||||||
R5 | 16.23 | 0.27 | (2.29 | ) | (2.02 | ) | (0.14 | ) | — | — | (0.14 | ) | 14.07 | (12.56 | ) | 484 | 1.20 | 1.20 | 1.69 | 24 | ||||||||||||||||||||||||||||||||||||||||
Y | 16.25 | 0.23 | (2.24 | ) | (2.01 | ) | (0.15 | ) | — | — | (0.15 | ) | 14.09 | (12.48 | ) | 123,082 | 1.11 | 1.11 | 1.43 | 24 | ||||||||||||||||||||||||||||||||||||||||
F | 16.23 | 0.30 | (2.30 | ) | (2.00 | ) | (0.16 | ) | — | — | (0.16 | ) | 14.07 | (12.48 | ) | 154,306 | 1.08 | 1.08 | 1.89 | 24 | ||||||||||||||||||||||||||||||||||||||||
SDR | 16.26 | 0.23 | (2.23 | ) | (2.00 | ) | (0.16 | ) | — | — | (0.16 | ) | 14.10 | (12.46 | ) | 930,480 | 1.08 | 1.08 | 1.43 | 24 | ||||||||||||||||||||||||||||||||||||||||
For the Year Ended October 31, 2017 |
| |||||||||||||||||||||||||||||||||||||||||||||||||||||||||||
A | $ | 12.59 | $ | 0.10 | $ | 3.62 | $ | 3.72 | $ | (0.08 | ) | $ | — | $ | — | $ | (0.08 | ) | $ | 16.23 | 29.83 | % | $ | 53,107 | 1.56 | % | 1.50 | % | 0.69 | % | 33 | % | ||||||||||||||||||||||||||||
C | 12.58 | 0.04 | 3.57 | 3.61 | (0.11 | ) | — | — | (0.11 | ) | 16.08 | 29.00 | 3,658 | 2.25 | 2.25 | 0.25 | 33 | |||||||||||||||||||||||||||||||||||||||||||
I | 12.59 | 0.14 | 3.61 | 3.75 | (0.11 | ) | — | — | (0.11 | ) | 16.23 | 30.14 | 1,848,368 | 1.35 | 1.25 | 0.98 | 33 | |||||||||||||||||||||||||||||||||||||||||||
R3 | 12.58 | 0.10 | 3.62 | 3.72 | (0.10 | ) | — | — | (0.10 | ) | 16.20 | 29.87 | 13 | 1.86 | 1.48 | 0.71 | 33 | |||||||||||||||||||||||||||||||||||||||||||
R4 | 12.58 | 0.16 | 3.56 | 3.72 | (0.11 | ) | — | — | (0.11 | ) | 16.19 | 29.86 | 136 | 1.52 | 1.50 | 1.11 | 33 | |||||||||||||||||||||||||||||||||||||||||||
R5 | 12.58 | 0.13 | 3.63 | 3.76 | (0.11 | ) | — | — | (0.11 | ) | 16.23 | 30.26 | 13 | 1.25 | 1.20 | 0.97 | 33 | |||||||||||||||||||||||||||||||||||||||||||
Y | 12.58 | 0.26 | 3.53 | 3.79 | (0.12 | ) | — | — | (0.12 | ) | 16.25 | 30.45 | 97,758 | 1.14 | 1.14 | 1.72 | 33 | |||||||||||||||||||||||||||||||||||||||||||
F(5) | 12.98 | 0.16 | 3.09 | 3.25 | — | — | — | — | 16.23 | 25.04 | (6) | 42,462 | 1.10 | (7) | 1.10 | (7) | 1.57 | (7) | 33 | |||||||||||||||||||||||||||||||||||||||||
SDR | 12.60 | 0.15 | 3.63 | 3.78 | (0.12 | ) | — | — | (0.12 | ) | 16.26 | 30.32 | 710,039 | 1.10 | 1.10 | 1.10 | 33 | |||||||||||||||||||||||||||||||||||||||||||
For the Year Ended October 31, 2016 |
| |||||||||||||||||||||||||||||||||||||||||||||||||||||||||||
A | $ | 11.56 | $ | 0.08 | $ | 1.02 | (8) | $ | 1.10 | $ | (0.07 | ) | $ | — | $ | — | $ | (0.07 | ) | $ | 12.59 | 9.59 | % | $ | 38,918 | 1.57 | % | 1.49 | % | 0.71 | % | 47 | % | |||||||||||||||||||||||||||
C(9) | 12.68 | (0.01 | ) | (0.09 | ) | (0.10 | ) | — | — | — | — | 12.58 | (0.79 | )(6) | 10 | 2.06 | (7) | 2.06 | (7) | (2.06 | )(7) | 47 | ||||||||||||||||||||||||||||||||||||||
I | 11.56 | 0.10 | 1.03 | (8) | 1.13 | (0.10 | ) | — | — | (0.10 | ) | 12.59 | 9.94 | 1,020,291 | 1.32 | 1.24 | 0.89 | 47 | ||||||||||||||||||||||||||||||||||||||||||
R3(9) | 12.68 | (0.01 | ) | (0.09 | ) | (0.10 | ) | — | — | — | — | 12.58 | (0.79 | )(6) | 10 | 1.75 | (7) | 1.75 | (7) | (1.75 | )(7) | 47 | ||||||||||||||||||||||||||||||||||||||
R4(9) | 12.68 | (0.01 | ) | (0.09 | ) | (0.10 | ) | — | — | — | — | 12.58 | (0.79 | )(6) | 10 | 1.46 | (7) | 1.46 | (7) | (1.46 | )(7) | 47 | ||||||||||||||||||||||||||||||||||||||
R5(9) | 12.68 | — | (0.10 | ) | (0.10 | ) | — | — | — | — | 12.58 | (0.79 | )(6) | 10 | 1.17 | (7) | 1.17 | (7) | (1.16 | )(7) | 47 | |||||||||||||||||||||||||||||||||||||||
Y(9) | 12.68 | — | (0.10 | ) | (0.10 | ) | — | — | — | — | 12.58 | (0.79 | )(6) | 10 | 1.06 | (7) | 1.06 | (7) | (1.06 | )(7) | 47 | |||||||||||||||||||||||||||||||||||||||
SDR | 11.57 | 0.12 | 1.03 | (8) | 1.15 | (0.12 | ) | — | — | (0.12 | ) | 12.60 | 10.10 | 561,740 | 1.18 | 1.10 | 1.05 | 47 | ||||||||||||||||||||||||||||||||||||||||||
For the Year Ended October 31, 2015 |
| |||||||||||||||||||||||||||||||||||||||||||||||||||||||||||
A | $ | 13.33 | $ | 0.10 | $ | (1.83 | )(8) | $ | (1.73 | ) | $ | (0.04 | ) | $ | — | $ | — | $ | (0.04 | ) | $ | 11.56 | (13.01 | )% | $ | 41,116 | 1.57 | % | 1.49 | % | 0.76 | % | 55 | % | ||||||||||||||||||||||||||
I | 13.40 | 0.13 | (1.85 | )(8) | (1.72 | ) | (0.12 | ) | — | — | (0.12 | ) | 11.56 | (12.88 | ) | 877,480 | 1.33 | 1.24 | 1.05 | 55 | ||||||||||||||||||||||||||||||||||||||||
SDR(10) | 12.60 | 0.14 | (1.17 | )(8) | (1.03 | ) | — | — | — | — | 11.57 | (8.17 | )(6) | 351,836 | 1.21 | (7) | 1.10 | (7) | 1.35 | (7) | 55 | |||||||||||||||||||||||||||||||||||||||
The accompanying notes are an integral part of these financial statements.
| 72 |
|
| Hartford Schroders Funds |
Financial Highlights – (continued)
| — SelectedPer-Share Data(1) — | — Ratios and Supplemental Data — | |||||||||||||||||||||||||||||||||||||||||||||||||||||||||||
Class | Net Asset Value at Beginning of Period | Net Investment Income (Loss) | Net Realized and Unrealized Gain (Loss) on Investments | Total from Investment Operations | Dividends from Net Investment Income | Distributions from Capital Gains | Returns of Capital | Total Dividends and Distributions | Net Asset Value at End of Period | Total Return(2) | Net Assets at End of Period (000s) | Ratio of Expenses to Average Net Assets Before Adjust- ments(3) | Ratio of Expenses to Average Net Assets After Adjust- ments(3) | Ratio of Net Investment Income (Loss) to Average Net Assets | Portfolio Turnover | |||||||||||||||||||||||||||||||||||||||||||||
| Hartford Schroders Emerging Markets Multi-Sector Bond Fund(4) | ||||||||||||||||||||||||||||||||||||||||||||||||||||||||||||
For the Year Ended October 31, 2019 |
| |||||||||||||||||||||||||||||||||||||||||||||||||||||||||||
A | $ | 8.79 | $ | 0.55 | $ | 0.25 | $ | 0.80 | $ | (0.43 | ) | $ | — | $ | (0.04 | ) | $ | (0.47 | ) | $ | 9.12 | 9.21 | % | $ | 1,829 | 1.29 | % | 1.11 | % | 6.12 | % | 240 | % | |||||||||||||||||||||||||||
C | 8.74 | 0.48 | 0.25 | 0.73 | (0.36 | ) | — | (0.03 | ) | (0.39 | ) | 9.08 | 8.44 | 266 | 2.14 | 1.90 | 5.39 | 240 | ||||||||||||||||||||||||||||||||||||||||||
I | 8.78 | 0.58 | 0.25 | 0.83 | (0.46 | ) | — | (0.04 | ) | (0.50 | ) | 9.11 | 9.65 | 29,715 | 1.00 | 0.83 | 6.37 | 240 | ||||||||||||||||||||||||||||||||||||||||||
R3 | 8.80 | 0.57 | 0.25 | 0.82 | (0.45 | ) | — | (0.04 | ) | (0.49 | ) | 9.13 | 9.46 | 11 | 1.55 | 0.88 | 6.33 | 240 | ||||||||||||||||||||||||||||||||||||||||||
R4 | 8.78 | 0.57 | 0.25 | 0.82 | (0.45 | ) | — | (0.04 | ) | (0.49 | ) | 9.11 | 9.45 | 11 | 1.28 | 0.86 | 6.35 | 240 | ||||||||||||||||||||||||||||||||||||||||||
R5 | 8.78 | 0.58 | 0.24 | 0.82 | (0.46 | ) | — | (0.04 | ) | (0.50 | ) | 9.10 | 9.56 | 11 | 1.00 | 0.81 | 6.39 | 240 | ||||||||||||||||||||||||||||||||||||||||||
Y | 8.78 | 0.58 | 0.24 | 0.82 | (0.46 | ) | — | (0.04 | ) | (0.50 | ) | 9.10 | 9.61 | 2,046 | 0.94 | 0.76 | 6.39 | 240 | ||||||||||||||||||||||||||||||||||||||||||
F | 8.78 | 0.58 | 0.25 | 0.83 | (0.47 | ) | — | (0.04 | ) | (0.51 | ) | 9.10 | 9.66 | 23,084 | 0.93 | 0.75 | 6.45 | 240 | ||||||||||||||||||||||||||||||||||||||||||
SDR | 8.79 | 0.58 | 0.25 | 0.83 | (0.47 | ) | — | (0.04 | ) | (0.51 | ) | 9.11 | 9.65 | 37,109 | 0.93 | 0.75 | 6.44 | 240 | ||||||||||||||||||||||||||||||||||||||||||
For the Year Ended October 31, 2018 |
| |||||||||||||||||||||||||||||||||||||||||||||||||||||||||||
A | $ | 9.98 | $ | 0.50 | $ | (1.02 | ) | $ | (0.52 | ) | $ | (0.32 | ) | $ | (0.13 | ) | $ | (0.22 | ) | $ | (0.67 | ) | $ | 8.79 | (5.34 | )% | $ | 3,389 | 1.29 | % | 1.08 | % | 5.42 | % | 285 | % | ||||||||||||||||||||||||
C | 9.95 | 0.41 | (1.01 | ) | (0.60 | ) | (0.28 | ) | (0.13 | ) | (0.20 | ) | (0.61 | ) | 8.74 | (6.27 | ) | 414 | 2.16 | 1.90 | 4.52 | 285 | ||||||||||||||||||||||||||||||||||||||
I | 9.97 | 0.52 | (1.02 | ) | (0.50 | ) | (0.34 | ) | (0.13 | ) | (0.22 | ) | (0.69 | ) | 8.78 | (5.22 | ) | 36,557 | 1.02 | 0.85 | 5.63 | 285 | ||||||||||||||||||||||||||||||||||||||
R3 | 9.97 | 0.50 | (1.03 | ) | (0.53 | ) | (0.30 | ) | (0.13 | ) | (0.21 | ) | (0.64 | ) | 8.80 | (5.43 | ) | 10 | 1.65 | 1.25 | 5.23 | 285 | ||||||||||||||||||||||||||||||||||||||
R4 | 9.97 | 0.52 | (1.03 | ) | (0.51 | ) | (0.33 | ) | (0.13 | ) | (0.22 | ) | (0.68 | ) | 8.78 | (5.25 | ) | 10 | 1.35 | 0.92 | 5.54 | 285 | ||||||||||||||||||||||||||||||||||||||
R5 | 9.97 | 0.53 | (1.03 | ) | (0.50 | ) | (0.34 | ) | (0.13 | ) | (0.22 | ) | (0.69 | ) | 8.78 | (5.23 | ) | 10 | 1.06 | 0.85 | 5.58 | 285 | ||||||||||||||||||||||||||||||||||||||
Y | 9.97 | 0.49 | (0.98 | ) | (0.49 | ) | (0.34 | ) | (0.13 | ) | (0.23 | ) | (0.70 | ) | 8.78 | (5.17 | ) | 970 | 0.95 | 0.77 | 5.29 | 285 | ||||||||||||||||||||||||||||||||||||||
F | 9.96 | 0.53 | (1.01 | ) | (0.48 | ) | (0.34 | ) | (0.13 | ) | (0.23 | ) | (0.70 | ) | 8.78 | (5.04 | ) | 28,842 | 0.94 | 0.75 | 5.67 | 285 | ||||||||||||||||||||||||||||||||||||||
SDR | 9.98 | 0.56 | (1.05 | ) | (0.49 | ) | (0.34 | ) | (0.13 | ) | (0.23 | ) | (0.70 | ) | 8.79 | (5.11 | ) | 34,841 | 0.94 | 0.75 | 5.89 | 285 | ||||||||||||||||||||||||||||||||||||||
For the Year Ended October 31, 2017 |
| |||||||||||||||||||||||||||||||||||||||||||||||||||||||||||
A | $ | 9.79 | $ | 0.55 | $ | 0.27 | $ | 0.82 | $ | (0.53 | ) | $ | (0.10 | ) | $ | — | $ | (0.63 | ) | $ | 9.98 | 8.83 | % | $ | 2,472 | 1.15 | % | 1.03 | % | 5.65 | % | 212 | % | |||||||||||||||||||||||||||
C | 9.78 | 0.46 | 0.29 | 0.75 | (0.48 | ) | (0.10 | ) | — | (0.58 | ) | 9.95 | 8.01 | 73 | 2.03 | 1.90 | 4.72 | 212 | ||||||||||||||||||||||||||||||||||||||||||
I | 9.78 | 0.57 | 0.28 | 0.85 | (0.56 | ) | (0.10 | ) | — | (0.66 | ) | 9.97 | 9.08 | 15,441 | 0.94 | 0.82 | 5.86 | 212 | ||||||||||||||||||||||||||||||||||||||||||
R3 | 9.78 | 0.54 | �� | 0.28 | 0.82 | (0.53 | ) | (0.10 | ) | — | (0.63 | ) | 9.97 | 8.74 | 36 | 1.63 | 1.19 | 5.53 | 212 | |||||||||||||||||||||||||||||||||||||||||
R4 | 9.78 | 0.55 | 0.28 | 0.83 | (0.54 | ) | (0.10 | ) | — | (0.64 | ) | 9.97 | 8.88 | 11 | 1.33 | 1.02 | 5.67 | 212 | ||||||||||||||||||||||||||||||||||||||||||
R5 | 9.78 | 0.57 | 0.27 | 0.84 | (0.55 | ) | (0.10 | ) | — | (0.65 | ) | 9.97 | 9.07 | 11 | 1.04 | 0.85 | 5.82 | 212 | ||||||||||||||||||||||||||||||||||||||||||
Y | 9.78 | 0.57 | 0.28 | 0.85 | (0.56 | ) | (0.10 | ) | — | (0.66 | ) | 9.97 | 9.16 | 122 | 0.91 | 0.79 | 5.81 | 212 | ||||||||||||||||||||||||||||||||||||||||||
F(5) | 9.70 | 0.39 | 0.30 | 0.69 | (0.43 | ) | — | — | (0.43 | ) | 9.96 | 7.22 | (6) | 11 | 0.87 | (7) | 0.75 | (7) | 5.90 | (7) | 212 | |||||||||||||||||||||||||||||||||||||||
SDR | 9.79 | 0.58 | 0.27 | 0.85 | (0.56 | ) | (0.10 | ) | — | (0.66 | ) | 9.98 | 9.16 | 57,054 | 0.87 | 0.75 | 5.93 | 212 | ||||||||||||||||||||||||||||||||||||||||||
For the Year Ended October 31, 2016 |
| |||||||||||||||||||||||||||||||||||||||||||||||||||||||||||
A | $ | 9.04 | $ | 0.52 | $ | 0.51 | $ | 1.03 | $ | (0.28 | ) | $ | — | $ | — | $ | (0.28 | ) | $ | 9.79 | 11.59 | % | $ | 1,707 | 1.82 | % | 1.11 | % | 5.61 | % | 147 | % | ||||||||||||||||||||||||||||
C(9) | 9.87 | 0.02 | (0.11 | ) | (0.09 | ) | — | — | — | — | 9.78 | (0.91 | )(6) | 10 | 1.73 | (7) | 1.73 | (7) | 7.72 | (7) | 147 | |||||||||||||||||||||||||||||||||||||||
I | 9.02 | 0.55 | 0.51 | 1.06 | (0.30 | ) | — | — | (0.30 | ) | 9.78 | 11.94 | 9,218 | 1.54 | 0.85 | 5.89 | 147 | |||||||||||||||||||||||||||||||||||||||||||
R3(9) | 9.87 | 0.02 | (0.11 | ) | (0.09 | ) | — | — | — | — | 9.78 | (0.91 | )(6) | 10 | 1.41 | (7) | 1.41 | (7) | 8.09 | (7) | 147 | |||||||||||||||||||||||||||||||||||||||
R4(9) | 9.87 | 0.02 | (0.11 | ) | (0.09 | ) | — | — | — | — | 9.78 | (0.91 | )(6) | 10 | 1.13 | (7) | 1.13 | (7) | 8.46 | (7) | 147 | |||||||||||||||||||||||||||||||||||||||
R5(9) | 9.87 | 0.02 | (0.11 | ) | (0.09 | ) | — | — | — | — | 9.78 | (0.91 | )(6) | 10 | 0.84 | (7) | 0.84 | (7) | 8.46 | (7) | 147 | |||||||||||||||||||||||||||||||||||||||
Y(9) | 9.87 | 0.02 | (0.11 | ) | (0.09 | ) | — | — | — | — | 9.78 | (0.91 | )(6) | 10 | 0.73 | (7) | 0.73 | (7) | 8.82 | (7) | 147 | |||||||||||||||||||||||||||||||||||||||
SDR | 9.03 | 0.56 | 0.51 | 1.07 | (0.31 | ) | — | — | (0.31 | ) | 9.79 | 12.04 | 51,219 | 1.36 | 0.71 | 5.99 | 147 | |||||||||||||||||||||||||||||||||||||||||||
For the Year Ended October 31, 2015 |
| |||||||||||||||||||||||||||||||||||||||||||||||||||||||||||
A | $ | 9.97 | $ | 0.53 | $ | (1.19 | ) | $ | (0.66 | ) | $ | (0.18 | ) | $ | (0.06 | ) | $ | (0.03 | ) | $ | (0.27 | ) | $ | 9.04 | (6.59 | )% | $ | 1,637 | 2.01 | % | 1.15 | % | 5.75 | % | 209 | % | ||||||||||||||||||||||||
I | 9.96 | 0.53 | (1.17 | ) | (0.64 | ) | (0.22 | ) | (0.06 | ) | (0.02 | ) | (0.30 | ) | 9.02 | (6.47 | ) | 5,980 | 1.68 | 0.90 | 5.66 | 209 | ||||||||||||||||||||||||||||||||||||||
SDR(10) | 9.23 | 0.49 | (0.57 | ) | (0.08 | ) | (0.09 | ) | — | (0.03 | ) | (0.12 | ) | 9.03 | (0.87 | )(6) | 21,171 | 1.66 | (7) | 0.75 | (7) | 6.32 | (7) | 209 | ||||||||||||||||||||||||||||||||||||
The accompanying notes are an integral part of these financial statements.
| 73 |
|
| Hartford Schroders Funds |
Financial Highlights – (continued)
| — SelectedPer-Share Data(1) — | — Ratios and Supplemental Data — | |||||||||||||||||||||||||||||||||||||||||||||||||||||||||||
Class | Net Asset Value at Beginning of Period | Net Investment Income (Loss) | Net Realized and Unrealized Gain (Loss) on Investments | Total from Investment Operations | Dividends from Net Investment Income | Distributions from Capital Gains | Returns of Capital | Total Dividends and Distributions | Net Asset Value at End of Period | Total Return(2) | Net Assets at End of Period (000s) | Ratio of Expenses to Average Net Assets Before Adjust- ments(3) | Ratio of Expenses to Average Net Assets After Adjust- ments(3) | Ratio of Net Investment Income (Loss) to Average Net Assets | Portfolio Turnover | |||||||||||||||||||||||||||||||||||||||||||||
| Hartford Schroders InternationalMulti-Cap Value Fund(4) | ||||||||||||||||||||||||||||||||||||||||||||||||||||||||||||
For the Year Ended October 31, 2019 |
| |||||||||||||||||||||||||||||||||||||||||||||||||||||||||||
A | $ | 8.97 | $ | 0.27 | $ | 0.28 | $ | 0.55 | $ | (0.25 | ) | $ | (0.22 | ) | $ | — | $ | (0.47 | ) | $ | 9.05 | 6.61 | % | $ | 106,530 | 1.12 | % | 1.12 | % | 3.03 | % | 119 | % | |||||||||||||||||||||||||||
C | 8.90 | 0.19 | 0.30 | 0.49 | (0.18 | ) | (0.22 | ) | — | (0.40 | ) | 8.99 | 5.91 | 21,500 | 1.87 | 1.87 | 2.12 | 119 | ||||||||||||||||||||||||||||||||||||||||||
I | 8.96 | 0.28 | 0.30 | 0.58 | (0.27 | ) | (0.22 | ) | — | (0.49 | ) | 9.05 | 6.98 | 740,680 | 0.86 | 0.86 | 3.13 | 119 | ||||||||||||||||||||||||||||||||||||||||||
R3 | 8.94 | 0.28 | 0.25 | 0.53 | (0.23 | ) | (0.22 | ) | — | (0.45 | ) | 9.02 | 6.36 | 19,748 | 1.48 | 1.48 | 3.25 | 119 | ||||||||||||||||||||||||||||||||||||||||||
R4 | 8.95 | 0.26 | 0.29 | 0.55 | (0.25 | ) | (0.22 | ) | — | (0.47 | ) | 9.03 | 6.57 | 2,746 | 1.18 | 1.18 | 3.01 | 119 | ||||||||||||||||||||||||||||||||||||||||||
R5 | 8.95 | 0.26 | 0.32 | 0.58 | (0.27 | ) | (0.22 | ) | — | (0.49 | ) | 9.04 | 6.97 | 21,262 | 0.87 | 0.87 | 2.99 | 119 | ||||||||||||||||||||||||||||||||||||||||||
Y | 8.96 | 0.29 | 0.29 | 0.58 | (0.28 | ) | (0.22 | ) | — | (0.50 | ) | 9.04 | 6.93 | 146,587 | 0.85 | 0.80 | 3.29 | 119 | ||||||||||||||||||||||||||||||||||||||||||
F | 8.97 | 0.29 | 0.29 | 0.58 | (0.28 | ) | (0.22 | ) | — | (0.50 | ) | 9.05 | 6.98 | 377,025 | 0.76 | 0.76 | 3.31 | 119 | ||||||||||||||||||||||||||||||||||||||||||
SDR | 8.96 | 0.29 | 0.29 | 0.58 | (0.28 | ) | (0.22 | ) | — | (0.50 | ) | 9.04 | 6.99 | 636,333 | 0.76 | 0.76 | 3.27 | 119 | ||||||||||||||||||||||||||||||||||||||||||
For the Year Ended October 31, 2018 |
| |||||||||||||||||||||||||||||||||||||||||||||||||||||||||||
A | $ | 10.18 | $ | 0.23 | $ | (1.09 | ) | $ | (0.86 | ) | $ | (0.24 | ) | $ | (0.11 | ) | $ | — | $ | (0.35 | ) | $ | 8.97 | (8.71 | )% | $ | 67,252 | 1.13 | % | 1.10 | % | 2.26 | % | 87 | % | |||||||||||||||||||||||||
C | 10.12 | 0.17 | (1.10 | ) | �� | (0.93 | ) | (0.18 | ) | (0.11 | ) | — | (0.29 | ) | 8.90 | (9.47 | ) | 25,614 | 1.88 | 1.85 | 1.71 | 87 | ||||||||||||||||||||||||||||||||||||||
I | 10.17 | 0.26 | (1.09 | ) | (0.83 | ) | (0.27 | ) | (0.11 | ) | — | (0.38 | ) | 8.96 | (8.47 | ) | 875,109 | 0.87 | 0.84 | 2.64 | 87 | |||||||||||||||||||||||||||||||||||||||
R3 | 10.15 | 0.22 | (1.10 | ) | (0.88 | ) | (0.22 | ) | (0.11 | ) | — | (0.33 | ) | 8.94 | (8.96 | ) | 613 | 1.50 | 1.43 | 2.22 | 87 | |||||||||||||||||||||||||||||||||||||||
R4 | 10.16 | 0.20 | (1.06 | ) | (0.86 | ) | (0.24 | ) | (0.11 | ) | — | (0.35 | ) | 8.95 | (8.76 | ) | 1,312 | 1.20 | 1.16 | 2.03 | 87 | |||||||||||||||||||||||||||||||||||||||
R5 | 10.17 | 0.27 | (1.11 | ) | (0.84 | ) | (0.27 | ) | (0.11 | ) | — | (0.38 | ) | 8.95 | (8.58 | ) | 22,482 | 0.88 | 0.85 | 2.68 | 87 | |||||||||||||||||||||||||||||||||||||||
Y | 10.17 | 0.25 | (1.07 | ) | (0.82 | ) | (0.28 | ) | (0.11 | ) | — | (0.39 | ) | 8.96 | (8.42 | ) | 80,993 | 0.83 | 0.81 | 2.57 | 87 | |||||||||||||||||||||||||||||||||||||||
F | 10.18 | 0.28 | (1.10 | ) | (0.82 | ) | (0.28 | ) | (0.11 | ) | — | (0.39 | ) | 8.97 | (8.38 | ) | 251,677 | 0.78 | 0.75 | 2.78 | 87 | |||||||||||||||||||||||||||||||||||||||
SDR | 10.17 | 0.27 | (1.09 | ) | (0.82 | ) | (0.28 | ) | (0.11 | ) | — | (0.39 | ) | 8.96 | (8.38 | ) | 540,822 | 0.78 | 0.75 | 2.69 | 87 | |||||||||||||||||||||||||||||||||||||||
For the Year Ended October 31, 2017 |
| |||||||||||||||||||||||||||||||||||||||||||||||||||||||||||
A | $ | 8.61 | $ | 0.20 | $ | 1.53 | $ | 1.73 | $ | (0.16 | ) | $ | — | $ | — | $ | (0.16 | ) | $ | 10.18 | 20.26 | % | $ | 58,977 | 1.20 | % | 1.12 | % | 2.08 | % | 63 | % | ||||||||||||||||||||||||||||
C | 8.60 | 0.15 | 1.50 | 1.65 | (0.13 | ) | — | — | (0.13 | ) | 10.12 | 19.31 | 15,580 | 1.93 | 1.85 | 1.51 | 63 | |||||||||||||||||||||||||||||||||||||||||||
I | 8.60 | 0.24 | 1.52 | 1.76 | (0.19 | ) | — | — | (0.19 | ) | 10.17 | 20.47 | 706,652 | 0.91 | 0.82 | 2.48 | 63 | |||||||||||||||||||||||||||||||||||||||||||
R3 | 8.60 | 0.20 | 1.49 | 1.69 | (0.14 | ) | — | — | (0.14 | ) | 10.15 | 19.82 | 105 | 1.58 | 1.42 | 2.03 | 63 | |||||||||||||||||||||||||||||||||||||||||||
R4 | 8.60 | 0.18 | 1.54 | 1.72 | (0.16 | ) | — | — | (0.16 | ) | 10.16 | 20.23 | 809 | 1.24 | 1.15 | 1.83 | 63 | |||||||||||||||||||||||||||||||||||||||||||
R5 | 8.60 | 0.23 | 1.52 | 1.75 | (0.18 | ) | — | — | (0.18 | ) | 10.17 | 20.57 | 14,212 | 0.93 | 0.85 | 2.32 | 63 | |||||||||||||||||||||||||||||||||||||||||||
Y | 8.60 | 0.21 | 1.56 | 1.77 | (0.20 | ) | — | — | (0.20 | ) | 10.17 | 20.80 | 4,440 | 0.84 | 0.76 | 2.30 | 63 | |||||||||||||||||||||||||||||||||||||||||||
F(5) | 9.13 | 0.17 | 1.02 | 1.19 | (0.14 | ) | — | — | (0.14 | ) | 10.18 | 13.07 | (6) | 110,585 | 0.83 | (7) | 0.75 | (7) | 2.60 | (7) | 63 | |||||||||||||||||||||||||||||||||||||||
SDR | 8.60 | 0.23 | 1.53 | 1.76 | (0.19 | ) | — | — | (0.19 | ) | 10.17 | 20.70 | 448,891 | 0.83 | 0.75 | 2.43 | 63 | |||||||||||||||||||||||||||||||||||||||||||
For the Year Ended October 31, 2016 |
| |||||||||||||||||||||||||||||||||||||||||||||||||||||||||||
A | $ | 8.48 | $ | 0.15 | $ | 0.17 | (8) | $ | 0.32 | $ | (0.19 | ) | $ | — | $ | — | $ | (0.19 | ) | $ | 8.61 | 3.88 | % | $ | 27,751 | 1.47 | % | 1.14 | % | 1.80 | % | 94 | % | |||||||||||||||||||||||||||
C(9) | 8.62 | — | (0.02 | ) | (0.02 | ) | — | — | — | — | 8.60 | (0.23 | )(6) | 10 | 1.80 | (7) | 1.80 | (7) | (1.10 | )(7) | 94 | |||||||||||||||||||||||||||||||||||||||
I | 8.47 | 0.18 | 0.16 | (8) | 0.34 | (0.21 | ) | — | — | (0.21 | ) | 8.60 | 4.27 | 183,321 | 1.22 | 0.89 | 2.15 | 94 | ||||||||||||||||||||||||||||||||||||||||||
R3(9) | 8.62 | — | (0.02 | ) | (0.02 | ) | — | — | — | — | 8.60 | (0.23 | )(6) | 10 | 1.48 | (7) | 1.48 | (7) | (0.73 | )(7) | 94 | |||||||||||||||||||||||||||||||||||||||
R4(9) | 8.62 | — | (0.02 | ) | (0.02 | ) | — | — | — | — | 8.60 | (0.23 | )(6) | 10 | 1.19 | (7) | 1.19 | (7) | (0.37 | )(7) | 94 | |||||||||||||||||||||||||||||||||||||||
R5(9) | 8.62 | — | (0.02 | ) | (0.02 | ) | — | — | — | — | 8.60 | (0.23 | )(6) | 10 | 0.91 | (7) | 0.91 | (7) | 0.73 | (7) | 94 | |||||||||||||||||||||||||||||||||||||||
Y(9) | 8.62 | — | (0.02 | ) | (0.02 | ) | — | — | — | — | 8.60 | (0.23 | )(6) | 10 | 0.80 | (7) | 0.80 | (7) | – | (7) | 94 | |||||||||||||||||||||||||||||||||||||||
SDR | 8.46 | 0.20 | 0.16 | (8) | 0.36 | (0.22 | ) | — | — | (0.22 | ) | 8.60 | 4.44 | 221,643 | 1.06 | 0.75 | 2.37 | 94 | ||||||||||||||||||||||||||||||||||||||||||
For the Year Ended October 31, 2015 |
| |||||||||||||||||||||||||||||||||||||||||||||||||||||||||||
A | $ | 9.46 | $ | 0.20 | $ | (0.68 | )(8) | $ | (0.48 | ) | $ | (0.24 | ) | $ | (0.26 | ) | $ | — | $ | (0.50 | ) | $ | 8.48 | (5.27 | )% | $ | 19,330 | 1.48 | % | 1.17 | % | 2.21 | % | 90 | % | |||||||||||||||||||||||||
I | 9.46 | 0.22 | (0.69 | )(8) | (0.47 | ) | (0.26 | ) | (0.26 | ) | — | (0.52 | ) | 8.47 | (5.12 | ) | 218,467 | 1.22 | 0.91 | 2.45 | 90 | |||||||||||||||||||||||||||||||||||||||
SDR(10) | 8.79 | 0.24 | (0.38 | ) | (0.14 | ) | (0.19 | ) | — | — | (0.19 | ) | 8.46 | (1.62 | )(6) | 75,256 | 1.08 | (7) | 0.76 | (7) | 3.18 | (7) | 90 | |||||||||||||||||||||||||||||||||||||
The accompanying notes are an integral part of these financial statements.
| 74 |
|
| Hartford Schroders Funds |
Financial Highlights – (continued)
| — SelectedPer-Share Data(1) — | — Ratios and Supplemental Data — | |||||||||||||||||||||||||||||||||||||||||||||||||||||||||||
Class | Net Asset Value at Beginning of Period | Net Investment Income (Loss) | Net Realized and Unrealized Gain (Loss) on Investments | Total from Investment Operations | Dividends from Net Investment Income | Distributions from Capital Gains | Returns of Capital | Total Dividends and Distributions | Net Asset Value at End of Period | Total Return(2) | Net Assets at End of Period (000s) | Ratio of Expenses to Average Net Assets Before Adjust- ments(3) | Ratio of Expenses to Average Net Assets After Adjust- ments(3) | Ratio of Net Investment Income (Loss) to Average Net Assets | Portfolio Turnover | |||||||||||||||||||||||||||||||||||||||||||||
| Hartford Schroders International Stock Fund(4) | ||||||||||||||||||||||||||||||||||||||||||||||||||||||||||||
For the Year Ended October 31, 2019 |
| |||||||||||||||||||||||||||||||||||||||||||||||||||||||||||
A | $ | 12.46 | $ | 0.17 | $ | 1.18 | $ | 1.35 | $ | (0.15 | ) | $ | (0.75 | ) | $ | — | $ | (0.90 | ) | $ | 12.91 | 12.04 | % | $ | 46,241 | 1.16 | % | 1.14 | % | 1.42 | % | 37 | % | |||||||||||||||||||||||||||
C | 11.90 | 0.10 | 1.10 | 1.20 | (0.10 | ) | (0.75 | ) | — | (0.85 | ) | 12.25 | 11.16 | 3,530 | 1.90 | 1.87 | 0.88 | 37 | ||||||||||||||||||||||||||||||||||||||||||
I | 12.09 | 0.21 | 1.13 | 1.34 | (0.17 | ) | (0.75 | ) | — | (0.92 | ) | 12.51 | 12.39 | 218,391 | 0.86 | 0.83 | 1.81 | 37 | ||||||||||||||||||||||||||||||||||||||||||
R3 | 12.08 | 0.16 | 1.13 | 1.29 | (0.15 | ) | (0.75 | ) | — | (0.90 | ) | 12.47 | 11.93 | 190 | 1.44 | 1.33 | 1.35 | 37 | ||||||||||||||||||||||||||||||||||||||||||
R4 | 12.09 | 0.15 | 1.17 | 1.32 | (0.16 | ) | (0.75 | ) | — | (0.91 | ) | 12.50 | 12.15 | 292 | 1.12 | 1.05 | 1.24 | 37 | ||||||||||||||||||||||||||||||||||||||||||
R5 | 12.10 | 0.15 | 1.19 | 1.34 | (0.17 | ) | (0.75 | ) | — | (0.92 | ) | 12.52 | 12.33 | 1,066 | 0.80 | 0.78 | 1.21 | 37 | ||||||||||||||||||||||||||||||||||||||||||
Y | 12.11 | 0.21 | 1.12 | 1.33 | (0.17 | ) | (0.75 | ) | — | (0.92 | ) | 12.52 | 12.38 | 676 | 0.87 | 0.84 | 1.80 | 37 | ||||||||||||||||||||||||||||||||||||||||||
F | 12.10 | 0.22 | 1.12 | 1.34 | (0.17 | ) | (0.75 | ) | — | (0.92 | ) | 12.52 | 12.47 | 70,305 | 0.78 | 0.76 | 1.85 | 37 | ||||||||||||||||||||||||||||||||||||||||||
SDR | 12.10 | 0.21 | 1.14 | 1.35 | (0.18 | ) | (0.75 | ) | — | (0.93 | ) | 12.52 | 12.45 | 100,663 | 0.80 | 0.76 | 1.80 | 37 | ||||||||||||||||||||||||||||||||||||||||||
For the Year Ended October 31, 2018 |
| |||||||||||||||||||||||||||||||||||||||||||||||||||||||||||
A | $ | 13.62 | $ | 0.19 | $ | (1.22 | ) | $ | (1.03 | ) | $ | (0.13 | ) | $ | — | $ | — | $ | (0.13 | ) | $ | 12.46 | (7.63 | )% | $ | 11,234 | 1.25 | % | 1.16 | % | 1.40 | % | 65 | % | ||||||||||||||||||||||||||
C | 13.11 | 0.13 | (1.21 | ) | (1.08 | ) | (0.13 | ) | — | — | (0.13 | ) | 11.90 | (8.33 | ) | 1,824 | 2.01 | 1.92 | 0.97 | 65 | ||||||||||||||||||||||||||||||||||||||||
I | 13.20 | 0.22 | (1.17 | ) | (0.95 | ) | (0.16 | ) | — | — | (0.16 | ) | 12.09 | (7.32 | ) | 129,528 | 0.93 | 0.85 | 1.70 | 65 | ||||||||||||||||||||||||||||||||||||||||
R3 | 13.19 | 0.21 | (1.19 | ) | (0.98 | ) | (0.13 | ) | — | — | (0.13 | ) | 12.08 | (7.49 | ) | 12 | 1.61 | 1.02 | 1.59 | 65 | ||||||||||||||||||||||||||||||||||||||||
R4 | 13.20 | 0.22 | (1.19 | ) | (0.97 | ) | (0.14 | ) | — | — | (0.14 | ) | 12.09 | (7.42 | ) | 12 | 1.31 | 0.97 | 1.64 | 65 | ||||||||||||||||||||||||||||||||||||||||
R5 | 13.22 | 0.22 | (1.18 | ) | (0.96 | ) | (0.16 | ) | — | — | (0.16 | ) | 12.10 | (7.36 | ) | 12 | 1.01 | 0.90 | 1.69 | 65 | ||||||||||||||||||||||||||||||||||||||||
Y | 13.23 | 0.12 | (1.07 | ) | (0.95 | ) | (0.17 | ) | — | — | (0.17 | ) | 12.11 | (7.32 | ) | 5,693 | 0.90 | 0.81 | 0.97 | 65 | ||||||||||||||||||||||||||||||||||||||||
F | 13.22 | 0.22 | (1.17 | ) | (0.95 | ) | (0.17 | ) | — | — | (0.17 | ) | 12.10 | (7.32 | ) | 9,204 | 0.89 | 0.80 | 1.69 | 65 | ||||||||||||||||||||||||||||||||||||||||
SDR | 13.23 | 0.23 | (1.18 | ) | (0.95 | ) | (0.18 | ) | — | — | (0.18 | ) | 12.10 | (7.33 | ) | 67,339 | 0.89 | 0.80 | 1.71 | 65 | ||||||||||||||||||||||||||||||||||||||||
For the Year Ended October 31, 2017 |
| |||||||||||||||||||||||||||||||||||||||||||||||||||||||||||
A | $ | 11.02 | $ | 0.12 | $ | 2.64 | $ | 2.76 | $ | (0.16 | ) | $ | — | $ | — | $ | (0.16 | ) | $ | 13.62 | 25.41 | % | $ | 5,930 | 1.32 | % | 1.20 | % | 0.98 | % | 53 | % | ||||||||||||||||||||||||||||
C | 10.69 | (0.02 | ) | 2.60 | 2.58 | (0.16 | ) | — | — | (0.16 | ) | 13.11 | 24.60 | 321 | 2.01 | 1.94 | (0.13 | ) | 53 | |||||||||||||||||||||||||||||||||||||||||
I | 10.69 | 0.14 | 2.55 | 2.69 | (0.18 | ) | — | — | (0.18 | ) | 13.20 | 25.69 | 116,660 | 1.02 | 0.95 | 1.24 | 53 | |||||||||||||||||||||||||||||||||||||||||||
R3 | 10.69 | 0.12 | 2.55 | 2.67 | (0.17 | ) | — | — | (0.17 | ) | 13.19 | 25.45 | 13 | 1.62 | 1.18 | 1.04 | 53 | |||||||||||||||||||||||||||||||||||||||||||
R4 | 10.69 | 0.13 | 2.56 | 2.69 | (0.18 | ) | — | — | (0.18 | ) | 13.20 | 25.61 | 13 | 1.34 | 1.08 | 1.15 | 53 | |||||||||||||||||||||||||||||||||||||||||||
R5 | 10.69 | 0.16 | 2.55 | 2.71 | (0.18 | ) | — | — | (0.18 | ) | 13.22 | 25.88 | 13 | 1.02 | 0.90 | 1.34 | 53 | |||||||||||||||||||||||||||||||||||||||||||
Y | 10.69 | 0.13 | 2.59 | 2.72 | (0.18 | ) | — | — | (0.18 | ) | 13.23 | 25.99 | 115 | 0.88 | 0.79 | 1.04 | 53 | |||||||||||||||||||||||||||||||||||||||||||
F(5) | 10.87 | 0.04 | 2.31 | 2.35 | — | — | — | — | 13.22 | 21.62 | (6) | 844 | 0.85 | (7) | 0.80 | (7) | 0.52 | (7) | 53 | |||||||||||||||||||||||||||||||||||||||||
SDR | 10.70 | 0.17 | 2.55 | 2.72 | (0.19 | ) | — | — | (0.19 | ) | 13.23 | 25.88 | 77,051 | 0.86 | 0.80 | 1.45 | 53 | |||||||||||||||||||||||||||||||||||||||||||
For the Year Ended October 31, 2016 |
| |||||||||||||||||||||||||||||||||||||||||||||||||||||||||||
A | $ | 11.35 | $ | 0.12 | $ | (0.35 | )(8) | $ | (0.23 | ) | $ | (0.10 | ) | $ | — | $ | — | $ | (0.10 | ) | $ | 11.02 | (2.01 | )% | $ | 3,217 | 1.45 | % | 1.18 | % | 1.11 | % | 53 | % | ||||||||||||||||||||||||||
C(9) | 10.64 | (0.01 | ) | 0.06 | 0.05 | — | — | — | — | 10.69 | 0.47 | (6) | 10 | 1.77 | (7) | 1.77 | (7) | (1.77 | )(7) | 53 | ||||||||||||||||||||||||||||||||||||||||
I | 11.01 | 0.14 | (0.33 | )(8) | (0.19 | ) | (0.13 | ) | — | — | (0.13 | ) | 10.69 | (1.70 | ) | 82,726 | 1.20 | 0.92 | 1.33 | 53 | ||||||||||||||||||||||||||||||||||||||||
R3(9) | 10.64 | — | 0.05 | 0.05 | — | — | — | — | 10.69 | 0.47 | (6) | 10 | 1.47 | (7) | 1.47 | (7) | (1.47 | )(7) | 53 | |||||||||||||||||||||||||||||||||||||||||
R4(9) | 10.64 | — | 0.05 | 0.05 | — | — | — | — | 10.69 | 0.47 | (6) | 10 | 1.17 | (7) | 1.17 | (7) | (1.17 | )(7) | 53 | |||||||||||||||||||||||||||||||||||||||||
R5(9) | 10.64 | — | 0.05 | 0.05 | — | — | — | — | 10.69 | 0.47 | (6) | 10 | 0.89 | (7) | 0.89 | (7) | (0.87 | )(7) | 53 | |||||||||||||||||||||||||||||||||||||||||
Y(9) | 10.64 | — | 0.05 | 0.05 | — | — | — | — | 10.69 | 0.47 | (6) | 10 | 0.78 | (7) | 0.78 | (7) | (0.78 | )(7) | 53 | |||||||||||||||||||||||||||||||||||||||||
SDR | 11.02 | 0.16 | (0.33 | )(8) | (0.17 | ) | (0.15 | ) | — | — | (0.15 | ) | 10.70 | (1.54 | ) | 64,263 | 1.07 | 0.79 | 1.54 | 53 | ||||||||||||||||||||||||||||||||||||||||
For the Year Ended October 31, 2015 |
| |||||||||||||||||||||||||||||||||||||||||||||||||||||||||||
A | $ | 11.93 | $ | 0.05 | $ | (0.18 | ) | $ | (0.13 | ) | $ | — | $ | (0.45 | ) | $ | — | $ | (0.45 | ) | $ | 11.35 | (1.08 | )% | $ | 3,921 | 1.38 | % | 1.17 | % | 0.46 | % | 45 | % | ||||||||||||||||||||||||||
I | 11.86 | 0.12 | (0.23 | )(8) | (0.11 | ) | (0.29 | ) | (0.45 | ) | — | (0.74 | ) | 11.01 | (0.89 | ) | 104,237 | 1.19 | 0.95 | 1.02 | 45 | |||||||||||||||||||||||||||||||||||||||
SDR(10) | 10.88 | 0.17 | (0.03 | ) | 0.14 | — | — | — | — | 11.02 | 1.29 | (6) | 54,747 | 1.09 | (7) | 0.81 | (7) | 1.78 | (7) | 45 | ||||||||||||||||||||||||||||||||||||||||
| Hartford Schroders Securitized Income Fund | ||||||||||||||||||||||||||||||||||||||||||||||||||||||||||||
For the Period Ended October 31, 2019(11) |
| |||||||||||||||||||||||||||||||||||||||||||||||||||||||||||
A | $ | 10.00 | $ | 0.17 | $ | 0.03 | $ | 0.20 | $ | (0.14 | ) | $ | — | $ | — | $ | (0.14 | ) | $ | 10.06 | 2.04 | %(6) | $ | 3,571 | 1.58 | %(7)(12) | 1.00 | %(7)(13)(14) | 2.49 | %(7)(15) | 35 | % | ||||||||||||||||||||||||||||
I | 10.00 | 0.17 | 0.04 | 0.21 | (0.15 | ) | — | — | (0.15 | ) | 10.06 | 2.09 | (6) | 4,633 | 1.33 | (7)(12) | 0.96 | (7)(13)(14) | 2.52 | (7)(15) | 35 | |||||||||||||||||||||||||||||||||||||||
Y | 10.00 | 0.17 | 0.04 | 0.21 | (0.15 | ) | — | — | (0.15 | ) | 10.06 | 2.13 | (6) | 3,583 | 1.27 | (7)(12) | 0.91 | (7)(13)(14) | 2.58 | (7)(15) | 35 | |||||||||||||||||||||||||||||||||||||||
F | 10.00 | 0.18 | 0.03 | 0.21 | (0.16 | ) | — | — | (0.16 | ) | 10.05 | 2.06 | (6) | 2,544 | 1.26 | (7)(12) | 0.89 | (7)(13)(14) | 2.61 | (7)(15) | 35 | |||||||||||||||||||||||||||||||||||||||
SDR | 10.00 | 0.17 | 0.04 | 0.21 | (0.16 | ) | — | — | (0.16 | ) | 10.05 | 2.19 | (6) | 80,616 | 1.24 | (7)(12) | 0.86 | (7)(13)(14) | 2.55 | (7)(15) | 35 | |||||||||||||||||||||||||||||||||||||||
The accompanying notes are an integral part of these financial statements.
| 75 |
|
| Hartford Schroders Funds |
Financial Highlights – (continued)
| — SelectedPer-Share Data(1) — | — Ratios and Supplemental Data — | |||||||||||||||||||||||||||||||||||||||||||||||||||||||||||
Class | Net Asset Value at Beginning of Period | Net Investment Income (Loss) | Net Realized and Unrealized Gain (Loss) on Investments | Total from Investment Operations | Dividends from Net Investment Income | Distributions from Capital Gains | Returns of Capital | Total Dividends and Distributions | Net Asset Value at End of Period | Total Return(2) | Net Assets at End of Period (000s) | Ratio of Expenses to Average Net Assets Before Adjust- ments(3) | Ratio of Expenses to Average Net Assets After Adjust- ments(3) | Ratio of Net Investment Income (Loss) to Average Net Assets | Portfolio Turnover | |||||||||||||||||||||||||||||||||||||||||||||
| Hartford SchrodersTax-Aware Bond Fund(4) | ||||||||||||||||||||||||||||||||||||||||||||||||||||||||||||
For the Year Ended October 31, 2019 |
| |||||||||||||||||||||||||||||||||||||||||||||||||||||||||||
A | $ | 10.66 | $ | 0.23 | $ | 0.80 | $ | 1.03 | $ | (0.23 | ) | $ | (0.12 | ) | $ | — | $ | (0.35 | ) | $ | 11.34 | 9.79 | % | $ | 36,158 | 0.83 | % | 0.71 | % | 2.08 | % | 161 | % | |||||||||||||||||||||||||||
C | 10.65 | 0.14 | 0.80 | 0.94 | (0.13 | ) | (0.12 | ) | — | (0.25 | ) | 11.34 | 8.91 | 7,894 | 1.61 | 1.54 | 1.26 | 161 | ||||||||||||||||||||||||||||||||||||||||||
I | 10.67 | 0.26 | 0.79 | 1.05 | (0.26 | ) | (0.12 | ) | — | (0.38 | ) | 11.34 | 9.95 | 209,719 | 0.61 | 0.48 | 2.31 | 161 | ||||||||||||||||||||||||||||||||||||||||||
Y | 10.67 | 0.26 | 0.79 | 1.05 | (0.25 | ) | (0.12 | ) | — | (0.37 | ) | 11.35 | 9.98 | 204 | 0.60 | 0.53 | 2.31 | 161 | ||||||||||||||||||||||||||||||||||||||||||
F | 10.67 | 0.26 | 0.80 | 1.06 | (0.26 | ) | (0.12 | ) | — | (0.38 | ) | 11.35 | 10.06 | 20,569 | 0.53 | 0.46 | 2.33 | 161 | ||||||||||||||||||||||||||||||||||||||||||
SDR | 10.66 | 0.26 | 0.80 | 1.06 | (0.26 | ) | (0.12 | ) | — | (0.38 | ) | 11.34 | 10.08 | 60,005 | 0.53 | 0.46 | 2.38 | 161 | ||||||||||||||||||||||||||||||||||||||||||
For the Year Ended October 31, 2018 |
| |||||||||||||||||||||||||||||||||||||||||||||||||||||||||||
A | $ | 11.08 | $ | 0.23 | $ | (0.42 | ) | $ | (0.19 | ) | $ | (0.22 | ) | $ | (0.01 | ) | $ | — | $ | (0.23 | ) | $ | 10.66 | (1.77 | )% | $ | 25,186 | 0.86 | % | 0.71 | % | 2.07 | % | 161 | % | |||||||||||||||||||||||||
C | 11.07 | 0.14 | (0.43 | ) | (0.29 | ) | (0.12 | ) | (0.01 | ) | — | (0.13 | ) | 10.65 | (2.64 | ) | 4,819 | 1.62 | 1.53 | 1.24 | 161 | |||||||||||||||||||||||||||||||||||||||
I | 11.10 | 0.25 | (0.42 | ) | (0.17 | ) | (0.25 | ) | (0.01 | ) | — | (0.26 | ) | 10.67 | (1.59 | ) | 120,282 | 0.62 | 0.46 | 2.31 | 161 | |||||||||||||||||||||||||||||||||||||||
Y | 11.10 | 0.25 | (0.43 | ) | (0.18 | ) | (0.24 | ) | (0.01 | ) | — | (0.25 | ) | 10.67 | (1.63 | ) | 214 | 0.57 | 0.48 | 2.30 | 161 | |||||||||||||||||||||||||||||||||||||||
F | 11.10 | 0.26 | (0.44 | ) | (0.18 | ) | (0.24 | ) | (0.01 | ) | — | (0.25 | ) | 10.67 | (1.60 | ) | 8,689 | 0.55 | 0.46 | 2.36 | 161 | |||||||||||||||||||||||||||||||||||||||
SDR | 11.09 | 0.25 | (0.43 | ) | (0.18 | ) | (0.24 | ) | (0.01 | ) | — | (0.25 | ) | 10.66 | (1.60 | ) | 59,590 | 0.55 | 0.46 | 2.30 | 161 | |||||||||||||||||||||||||||||||||||||||
For the Year Ended October 31, 2017 |
| |||||||||||||||||||||||||||||||||||||||||||||||||||||||||||
A | $ | 11.19 | $ | 0.20 | $ | (0.07 | ) | $ | 0.13 | $ | (0.20 | ) | $ | (0.04 | ) | $ | — | $ | (0.24 | ) | $ | 11.08 | 1.20 | % | $ | 22,948 | 0.86 | % | 0.71 | % | 1.83 | % | 72 | % | ||||||||||||||||||||||||||
C | 11.20 | 0.11 | (0.07 | ) | 0.04 | (0.13 | ) | (0.04 | ) | — | (0.17 | ) | 11.07 | 0.40 | 4,712 | 1.58 | 1.50 | 0.96 | 72 | |||||||||||||||||||||||||||||||||||||||||
I | 11.21 | 0.23 | (0.07 | ) | 0.16 | (0.23 | ) | (0.04 | ) | — | (0.27 | ) | 11.10 | 1.45 | 147,851 | 0.58 | 0.46 | 2.10 | 72 | |||||||||||||||||||||||||||||||||||||||||
Y | 11.20 | 0.23 | (0.07 | ) | 0.16 | (0.22 | ) | (0.04 | ) | — | (0.26 | ) | 11.10 | 1.53 | 10 | 0.54 | 0.46 | 2.08 | 72 | |||||||||||||||||||||||||||||||||||||||||
F(5) | 10.93 | 0.14 | 0.17 | 0.31 | (0.14 | ) | — | — | (0.14 | ) | 11.10 | 2.85 | (6) | 2,377 | 0.53 | (7) | 0.46 | (7) | 1.96 | (7) | 72 | |||||||||||||||||||||||||||||||||||||||
SDR | 11.20 | 0.23 | (0.07 | ) | 0.16 | (0.23 | ) | (0.04 | ) | — | (0.27 | ) | 11.09 | 1.46 | 70,615 | 0.54 | 0.46 | 2.12 | 72 | |||||||||||||||||||||||||||||||||||||||||
For the Year Ended October 31, 2016 |
| |||||||||||||||||||||||||||||||||||||||||||||||||||||||||||
A | $ | 10.84 | $ | 0.25 | $ | 0.35 | $ | 0.60 | $ | (0.25 | ) | $ | — | $ | — | $ | (0.25 | ) | $ | 11.19 | 5.61 | % | $ | 8,648 | 0.90 | % | 0.70 | % | 2.22 | % | 42 | % | ||||||||||||||||||||||||||||
C(9) | 11.23 | — | (0.01 | ) | (0.01 | ) | (0.02 | ) | — | — | (0.02 | ) | 11.20 | (0.10 | )(6) | 10 | 1.46 | (7) | 1.45 | (7) | 1.47 | (7) | 42 | |||||||||||||||||||||||||||||||||||||
I | 10.84 | 0.28 | 0.37 | 0.65 | (0.28 | ) | — | — | (0.28 | ) | 11.21 | 6.02 | 82,088 | 0.66 | 0.45 | 2.55 | 42 | |||||||||||||||||||||||||||||||||||||||||||
Y(9) | 11.23 | 0.01 | (0.02 | ) | (0.01 | ) | (0.02 | ) | — | — | (0.02 | ) | 11.20 | (0.08 | )(6) | 10 | 0.46 | (7) | 0.45 | (7) | 2.56 | (7) | 42 | |||||||||||||||||||||||||||||||||||||
SDR(9) | 11.23 | 0.01 | (0.02 | ) | (0.01 | ) | (0.02 | ) | — | — | (0.02 | ) | 11.20 | (0.08 | )(6) | 66,275 | 0.47 | (7) | 0.46 | (7) | 4.71 | (7) | 42 | |||||||||||||||||||||||||||||||||||||
For the Year Ended October 31, 2015 |
| |||||||||||||||||||||||||||||||||||||||||||||||||||||||||||
A | $ | 10.93 | $ | 0.25 | $ | (0.10 | ) | $ | 0.15 | $ | (0.24 | ) | $ | — | $ | — | $ | (0.24 | ) | $ | 10.84 | 1.42 | %(6) | $ | 1,039 | 1.01 | %(7) | 0.71 | %(7) | 2.77 | %(7) | 36 | % | |||||||||||||||||||||||||||
I | 11.09 | 0.32 | (0.10 | ) | 0.22 | (0.32 | ) | (0.15 | ) | — | (0.47 | ) | 10.84 | 2.00 | 105,036 | 0.70 | 0.46 | 2.93 | 36 | |||||||||||||||||||||||||||||||||||||||||
| Hartford Schroders US MidCap Opportunities Fund(4) | ||||||||||||||||||||||||||||||||||||||||||||||||||||||||||||
For the Year Ended October 31, 2019 |
| |||||||||||||||||||||||||||||||||||||||||||||||||||||||||||
A | $ | 13.68 | $ | 0.02 | $ | 1.58 | $ | 1.60 | $ | — | $ | (0.27 | ) | $ | — | $ | (0.27 | ) | $ | 15.01 | 12.12 | % | $ | 87,831 | 1.27 | % | 1.27 | % | 0.14 | % | 39 | % | ||||||||||||||||||||||||||||
C | 13.97 | (0.09 | ) | 1.60 | 1.51 | — | (0.27 | ) | — | (0.27 | ) | 15.21 | 11.29 | 60,195 | 2.02 | 2.02 | (0.61 | ) | 39 | |||||||||||||||||||||||||||||||||||||||||
I | 14.24 | 0.06 | 1.64 | 1.70 | (0.04 | ) | (0.27 | ) | — | (0.31 | ) | 15.63 | 12.41 | 496,725 | 1.00 | 1.00 | 0.42 | 39 | ||||||||||||||||||||||||||||||||||||||||||
R3 | 14.09 | (0.04 | ) | 1.63 | 1.59 | — | (0.27 | ) | — | (0.27 | ) | 15.41 | 11.69 | 1,423 | 1.62 | 1.62 | (0.25 | ) | 39 | |||||||||||||||||||||||||||||||||||||||||
R4 | 14.17 | 0.01 | 1.64 | 1.65 | (0.02 | ) | (0.27 | ) | — | (0.29 | ) | 15.53 | 12.09 | 627 | 1.32 | 1.32 | 0.09 | 39 | ||||||||||||||||||||||||||||||||||||||||||
R5 | 14.24 | 0.06 | 1.62 | 1.68 | (0.05 | ) | (0.27 | ) | — | (0.32 | ) | 15.60 | 12.32 | 1,476 | 1.02 | 1.02 | 0.39 | 39 | ||||||||||||||||||||||||||||||||||||||||||
Y | 14.24 | 0.07 | 1.64 | 1.71 | (0.05 | ) | (0.27 | ) | — | (0.32 | ) | 15.63 | 12.50 | 116,557 | 0.97 | 0.95 | 0.44 | 39 | ||||||||||||||||||||||||||||||||||||||||||
F | 14.25 | 0.07 | 1.64 | 1.71 | (0.05 | ) | (0.27 | ) | — | (0.32 | ) | 15.64 | 12.52 | 54,955 | 0.91 | 0.91 | 0.48 | 39 | ||||||||||||||||||||||||||||||||||||||||||
SDR | 14.28 | 0.07 | 1.64 | 1.71 | (0.05 | ) | (0.27 | ) | — | (0.32 | ) | 15.67 | 12.49 | 82,604 | 0.91 | 0.91 | 0.48 | 39 | ||||||||||||||||||||||||||||||||||||||||||
For the Year Ended October 31, 2018 |
| |||||||||||||||||||||||||||||||||||||||||||||||||||||||||||
A | $ | 13.97 | $ | 0.01 | $ | (0.10 | ) | $ | (0.09 | ) | $ | — | $ | (0.20 | ) | $ | — | $ | (0.20 | ) | $ | 13.68 | (0.66 | )% | $ | 96,491 | 1.26 | % | 1.25 | % | 0.05 | % | 37 | % | ||||||||||||||||||||||||||
C | 14.37 | (0.11 | ) | (0.09 | ) | (0.20 | ) | — | (0.20 | ) | — | (0.20 | ) | 13.97 | (1.49 | ) | 67,037 | 2.02 | 2.01 | (0.72 | ) | 37 | ||||||||||||||||||||||||||||||||||||||
I | 14.52 | 0.05 | (0.11 | ) | (0.06 | ) | (0.02 | ) | (0.20 | ) | — | (0.22 | ) | 14.24 | (0.44 | ) | 648,971 | 0.99 | 0.98 | 0.31 | 37 | |||||||||||||||||||||||||||||||||||||||
R3 | 14.43 | (0.05 | ) | (0.09 | ) | (0.14 | ) | — | (0.20 | ) | — | (0.20 | ) | 14.09 | (1.06 | ) | 950 | 1.63 | 1.60 | (0.31 | ) | 37 | ||||||||||||||||||||||||||||||||||||||
R4 | 14.48 | — | (0.10 | ) | (0.10 | ) | (0.01 | ) | (0.20 | ) | — | (0.21 | ) | 14.17 | (0.74 | ) | 775 | 1.33 | 1.30 | (0.03 | ) | 37 | ||||||||||||||||||||||||||||||||||||||
R5 | 14.51 | 0.04 | (0.09 | ) | (0.05 | ) | (0.02 | ) | (0.20 | ) | — | (0.22 | ) | 14.24 | (0.42 | ) | 1,864 | 1.03 | 1.00 | 0.26 | 37 | |||||||||||||||||||||||||||||||||||||||
Y | 14.53 | 0.04 | (0.10 | ) | (0.06 | ) | (0.03 | ) | (0.20 | ) | — | (0.23 | ) | 14.24 | (0.46 | ) | 108,680 | 0.96 | 0.94 | 0.25 | 37 | |||||||||||||||||||||||||||||||||||||||
F | 14.53 | 0.06 | (0.11 | ) | (0.05 | ) | (0.03 | ) | (0.20 | ) | — | (0.23 | ) | 14.25 | (0.37 | ) | 45,449 | 0.91 | 0.90 | 0.38 | 37 | |||||||||||||||||||||||||||||||||||||||
SDR | 14.56 | 0.06 | (0.11 | ) | (0.05 | ) | (0.03 | ) | (0.20 | ) | — | (0.23 | ) | 14.28 | (0.37 | ) | 57,898 | 0.91 | 0.90 | 0.38 | 37 | |||||||||||||||||||||||||||||||||||||||
The accompanying notes are an integral part of these financial statements.
| 76 |
|
| Hartford Schroders Funds |
Financial Highlights – (continued)
| — SelectedPer-Share Data(1) — | — Ratios and Supplemental Data — | |||||||||||||||||||||||||||||||||||||||||||||||||||||||||||
Class | Net Asset Value at Beginning of Period | Net Investment Income (Loss) | Net Realized and Unrealized Gain (Loss) on Investments | Total from Investment Operations | Dividends from Net Investment Income | Distributions from Capital Gains | Returns of Capital | Total Dividends and Distributions | Net Asset Value at End of Period | Total Return(2) | Net Assets at End of Period (000s) | Ratio of Expenses to Average Net Assets Before Adjust- ments(3) | Ratio of Expenses to Average Net Assets After Adjust- ments(3) | Ratio of Net Investment Income (Loss) to Average Net Assets | Portfolio Turnover | |||||||||||||||||||||||||||||||||||||||||||||
| Hartford Schroders US MidCap Opportunities Fund(4) – (continued) | ||||||||||||||||||||||||||||||||||||||||||||||||||||||||||||
For the Year Ended October 31, 2017 |
| |||||||||||||||||||||||||||||||||||||||||||||||||||||||||||
A | $ | 11.98 | $ | (0.02 | ) | $ | 2.22 | $ | 2.20 | $ | (0.02 | ) | $ | (0.19 | ) | $ | — | $ | (0.21 | ) | $ | 13.97 | 18.57 | % | $ | 116,594 | 1.28 | % | 1.27 | % | (0.12 | )% | 54 | % | ||||||||||||||||||||||||||
C | 12.41 | (0.13 | ) | 2.31 | 2.18 | (0.03 | ) | (0.19 | ) | — | (0.22 | ) | 14.37 | 17.75 | 48,121 | 2.04 | 2.02 | (0.94 | ) | 54 | ||||||||||||||||||||||||||||||||||||||||
I | 12.42 | 0.02 | 2.30 | 2.32 | (0.03 | ) | (0.19 | ) | — | (0.22 | ) | 14.52 | 18.91 | 620,850 | 1.02 | 1.01 | 0.15 | 54 | ||||||||||||||||||||||||||||||||||||||||||
R3 | 12.41 | (0.07 | ) | 2.30 | 2.23 | (0.02 | ) | (0.19 | ) | — | (0.21 | ) | 14.43 | 18.28 | 425 | 1.64 | 1.60 | (0.49 | ) | 54 | ||||||||||||||||||||||||||||||||||||||||
R4 | 12.42 | (0.04 | ) | 2.31 | 2.27 | (0.02 | ) | (0.19 | ) | — | (0.21 | ) | 14.48 | 18.52 | 274 | 1.39 | 1.30 | (0.28 | ) | 54 | ||||||||||||||||||||||||||||||||||||||||
R5 | 12.42 | 0.02 | 2.29 | 2.31 | (0.03 | ) | (0.19 | ) | — | (0.22 | ) | 14.51 | 18.82 | 56 | 1.14 | 1.00 | 0.18 | 54 | ||||||||||||||||||||||||||||||||||||||||||
Y | 12.42 | 0.02 | 2.31 | 2.33 | (0.03 | ) | (0.19 | ) | — | (0.22 | ) | 14.53 | 19.00 | 11,479 | 0.96 | 0.94 | 0.16 | 54 | ||||||||||||||||||||||||||||||||||||||||||
F(5) | 13.63 | 0.01 | 0.89 | 0.90 | — | — | — | — | 14.53 | 6.60 | (6) | 8,436 | 0.91 | (7) | 0.90 | (7) | 0.14 | (7) | 54 | |||||||||||||||||||||||||||||||||||||||||
SDR | 12.44 | 0.03 | 2.31 | 2.34 | (0.03 | ) | (0.19 | ) | — | (0.22 | ) | 14.56 | 19.06 | 21,490 | 0.91 | 0.90 | 0.24 | 54 | ||||||||||||||||||||||||||||||||||||||||||
For the Year Ended October 31, 2016 |
| |||||||||||||||||||||||||||||||||||||||||||||||||||||||||||
A | $ | 12.36 | $ | 0.02 | $ | 0.89 | (8) | $ | 0.91 | $ | — | $ | (1.29 | ) | $ | — | $ | (1.29 | ) | $ | 11.98 | 8.40 | % | $ | 32,399 | 1.67 | % | 1.26 | % | 0.15 | % | 72 | % | |||||||||||||||||||||||||||
C(9) | 12.49 | (0.01 | ) | (0.07 | ) | (0.08 | ) | — | — | — | — | 12.41 | (0.64 | )(6) | 10 | 1.86 | (7) | 1.86 | (7) | (1.49 | )(7) | 72 | ||||||||||||||||||||||||||||||||||||||
I | 12.74 | 0.05 | 0.92 | (8) | 0.97 | — | (1.29 | ) | — | (1.29 | ) | 12.42 | 8.68 | 177,197 | 1.44 | 1.01 | 0.45 | 72 | ||||||||||||||||||||||||||||||||||||||||||
R3(9) | 12.49 | — | (0.08 | ) | (0.08 | ) | — | — | — | — | 12.41 | (0.64 | )(6) | 10 | 1.54 | (7) | 1.54 | (7) | (1.18 | )(7) | 72 | |||||||||||||||||||||||||||||||||||||||
R4(9) | 12.49 | — | (0.07 | ) | (0.07 | ) | — | — | — | — | 12.42 | (0.56 | )(6) | 10 | 1.25 | (7) | 1.25 | (7) | (0.89 | )(7) | 72 | |||||||||||||||||||||||||||||||||||||||
R5(9) | 12.49 | — | (0.07 | ) | (0.07 | ) | — | — | — | — | 12.42 | (0.56 | )(6) | 10 | 0.97 | (7) | 0.97 | (7) | (0.57 | )(7) | 72 | |||||||||||||||||||||||||||||||||||||||
Y(9) | 12.49 | — | (0.07 | ) | (0.07 | ) | — | — | — | — | 12.42 | (0.56 | )(6) | 10 | 0.86 | (7) | 0.86 | (7) | (0.49 | )(7) | 72 | |||||||||||||||||||||||||||||||||||||||
SDR | 12.76 | 0.06 | 0.92 | (8) | 0.98 | (0.01 | ) | (1.29 | ) | — | (1.30 | ) | 12.44 | 8.77 | 5,111 | 1.33 | 0.88 | 0.47 | 72 | |||||||||||||||||||||||||||||||||||||||||
For the Year Ended October 31, 2015 |
| |||||||||||||||||||||||||||||||||||||||||||||||||||||||||||
A | $ | 13.56 | $ | (0.03 | ) | $ | 0.85 | (8) | $ | 0.82 | $ | — | $ | (2.02 | ) | $ | — | $ | (2.02 | ) | $ | 12.36 | 7.00 | % | $ | 5,541 | 1.85 | % | 1.30 | % | (0.21 | )% | 56 | % | ||||||||||||||||||||||||||
I | 13.89 | 0.01 | 0.86 | (8) | 0.87 | — | (2.02 | ) | — | (2.02 | ) | 12.74 | 7.23 | 50,126 | 1.60 | 1.05 | 0.05 | 56 | ||||||||||||||||||||||||||||||||||||||||||
SDR(10) | 12.36 | — | 0.40 | 0.40 | — | — | — | — | 12.76 | 3.24 | (6) | 1,935 | 1.51 | (7) | 0.90 | (7) | 0.03 | (7) | 56 | |||||||||||||||||||||||||||||||||||||||||
| Hartford Schroders US Small Cap Opportunities Fund(4) | ||||||||||||||||||||||||||||||||||||||||||||||||||||||||||||
For the Year Ended October 31, 2019 |
| |||||||||||||||||||||||||||||||||||||||||||||||||||||||||||
A | $ | 25.55 | $ | 0.02 | $ | 2.38 | $ | 2.40 | $ | (0.01 | ) | $ | (2.25 | ) | $ | — | $ | (2.26 | ) | $ | 25.69 | 11.21 | % | $ | 20,928 | 1.43 | % | 1.35 | % | 0.07 | % | 45 | % | |||||||||||||||||||||||||||
C | 26.20 | (0.16 | ) | 2.44 | 2.28 | — | (2.25 | ) | — | (2.25 | ) | 26.23 | 10.43 | 7,096 | 2.18 | 2.10 | (0.65 | ) | 45 | |||||||||||||||||||||||||||||||||||||||||
I | 26.71 | 0.10 | 2.50 | 2.60 | (0.06 | ) | (2.25 | ) | — | (2.31 | ) | 27.00 | 11.59 | 140,024 | 1.11 | 1.04 | 0.40 | 45 | ||||||||||||||||||||||||||||||||||||||||||
R3 | 26.53 | (0.05 | ) | 2.48 | 2.43 | — | (2.25 | ) | — | (2.25 | ) | 26.71 | 10.90 | 111 | 1.74 | 1.63 | (0.21 | ) | 45 | |||||||||||||||||||||||||||||||||||||||||
R4 | 26.68 | — | 2.54 | 2.54 | (0.04 | ) | (2.25 | ) | — | (2.29 | ) | 26.93 | 11.33 | 259 | 1.44 | 1.31 | (0.01 | ) | 45 | |||||||||||||||||||||||||||||||||||||||||
R5 | 26.70 | 0.08 | 2.51 | 2.59 | (0.06 | ) | (2.25 | ) | — | (2.31 | ) | 26.98 | 11.56 | 78 | 1.12 | 1.05 | 0.31 | 45 | ||||||||||||||||||||||||||||||||||||||||||
Y | 26.73 | 0.11 | 2.50 | 2.61 | (0.09 | ) | (2.25 | ) | — | (2.34 | ) | 27.00 | 11.62 | 25,883 | 1.08 | 1.01 | 0.43 | 45 | ||||||||||||||||||||||||||||||||||||||||||
F | 26.74 | 0.12 | 2.51 | 2.63 | (0.09 | ) | (2.25 | ) | — | (2.34 | ) | 27.03 | 11.69 | 4,483 | 1.02 | 0.95 | 0.47 | 45 | ||||||||||||||||||||||||||||||||||||||||||
SDR | 26.78 | 0.13 | 2.49 | 2.62 | (0.09 | ) | (2.25 | ) | — | (2.34 | ) | 27.06 | 11.67 | 11,328 | 1.02 | 0.95 | 0.50 | 45 | ||||||||||||||||||||||||||||||||||||||||||
For the Year Ended October 31, 2018 |
| |||||||||||||||||||||||||||||||||||||||||||||||||||||||||||
A | $ | 27.97 | $ | (0.02 | ) | $ | (0.04 | ) | $ | (0.06 | ) | $ | — | $ | (2.36 | ) | $ | — | $ | (2.36 | ) | $ | 25.55 | (0.34 | )% | $ | 13,976 | 1.43 | % | 1.34 | % | (0.08 | )% | 42 | % | |||||||||||||||||||||||||
C | 28.82 | (0.23 | ) | (0.03 | ) | (0.26 | ) | — | (2.36 | ) | — | (2.36 | ) | 26.20 | (1.08 | ) | 6,892 | 2.18 | 2.09 | (0.84 | ) | 42 | ||||||||||||||||||||||||||||||||||||||
I | 29.14 | 0.07 | (0.05 | ) | 0.02 | (0.09 | ) | (2.36 | ) | — | (2.45 | ) | 26.71 | (0.05 | ) | 109,710 | 1.12 | 1.04 | 0.25 | 42 | ||||||||||||||||||||||||||||||||||||||||
R3 | 29.06 | (0.08 | ) | (0.05 | ) | (0.13 | ) | (0.04 | ) | (2.36 | ) | — | (2.40 | ) | 26.53 | (0.58 | ) | 66 | 1.75 | 1.58 | (0.30 | ) | 42 | |||||||||||||||||||||||||||||||||||||
R4 | 29.08 | 0.04 | (0.04 | ) | — | (0.04 | ) | (2.36 | ) | — | (2.40 | ) | 26.68 | (0.11 | ) | 11 | 1.45 | 1.13 | 0.12 | 42 | ||||||||||||||||||||||||||||||||||||||||
R5 | 29.11 | 0.07 | (0.05 | ) | 0.02 | (0.07 | ) | (2.36 | ) | — | (2.43 | ) | 26.70 | (0.02 | ) | 19 | 1.15 | 1.05 | 0.23 | 42 | ||||||||||||||||||||||||||||||||||||||||
Y | 29.14 | 0.09 | (0.05 | ) | 0.04 | (0.09 | ) | (2.36 | ) | — | (2.45 | ) | 26.73 | 0.03 | 23,507 | 1.03 | 0.95 | 0.33 | 42 | |||||||||||||||||||||||||||||||||||||||||
F | 29.15 | 0.08 | (0.04 | ) | 0.04 | (0.09 | ) | (2.36 | ) | — | (2.45 | ) | 26.74 | 0.04 | 2,841 | 1.03 | 0.95 | 0.30 | 42 | |||||||||||||||||||||||||||||||||||||||||
SDR | 29.19 | 0.13 | (0.08 | ) | 0.05 | (0.10 | ) | (2.36 | ) | — | (2.46 | ) | 26.78 | 0.07 | 10,952 | 1.03 | 0.95 | 0.44 | 42 | |||||||||||||||||||||||||||||||||||||||||
The accompanying notes are an integral part of these financial statements.
| 77 |
|
| Hartford Schroders Funds |
Financial Highlights – (continued)
| — SelectedPer-Share Data(1) — | — Ratios and Supplemental Data — | |||||||||||||||||||||||||||||||||||||||||||||||||||||||||||
Class | Net Asset Value at Beginning of Period | Net Investment Income (Loss) | Net Realized and Unrealized Gain (Loss) on Investments | Total from Investment Operations | Dividends from Net Investment Income | Distributions from Capital Gains | Returns of Capital | Total Dividends and Distributions | Net Asset Value at End of Period | Total Return(2) | Net Assets at End of Period (000s) | Ratio of Expenses to Average Net Assets Before Adjust- ments(3) | Ratio of Expenses to Average Net Assets After Adjust- ments(3) | Ratio of Net Investment Income (Loss) to Average Net Assets | Portfolio Turnover | |||||||||||||||||||||||||||||||||||||||||||||
| Hartford Schroders US Small Cap Opportunities Fund(4) – (continued) | ||||||||||||||||||||||||||||||||||||||||||||||||||||||||||||
For the Year Ended October 31, 2017 |
| |||||||||||||||||||||||||||||||||||||||||||||||||||||||||||
A | $ | 23.78 | $ | (0.07 | ) | $ | 5.71 | $ | 5.64 | $ | (0.07 | ) | $ | (1.38 | ) | $ | — | $ | (1.45 | ) | $ | 27.97 | 24.43 | % | $ | 17,379 | 1.41 | % | 1.35 | % | (0.25 | )% | 69 | % | ||||||||||||||||||||||||||
C | 24.66 | (0.27 | ) | 5.90 | 5.63 | (0.09 | ) | (1.38 | ) | — | (1.47 | ) | 28.82 | 23.50 | 4,426 | 2.14 | 2.08 | (1.00 | ) | 69 | ||||||||||||||||||||||||||||||||||||||||
I | 24.67 | 0.05 | 5.90 | 5.95 | (0.10 | ) | (1.38 | ) | — | (1.48 | ) | 29.14 | 24.85 | 124,651 | 1.05 | 1.00 | 0.20 | 69 | ||||||||||||||||||||||||||||||||||||||||||
R3 | 24.67 | (0.07 | ) | 5.91 | 5.84 | (0.07 | ) | (1.38 | ) | — | (1.45 | ) | 29.06 | 24.36 | 54 | 1.76 | 1.38 | (0.27 | ) | 69 | ||||||||||||||||||||||||||||||||||||||||
R4 | 24.67 | (0.01 | ) | 5.88 | 5.87 | (0.08 | ) | (1.38 | ) | — | (1.46 | ) | 29.08 | 24.51 | 11 | 1.46 | 1.22 | (0.03 | ) | 69 | ||||||||||||||||||||||||||||||||||||||||
R5 | 24.67 | 0.04 | 5.88 | 5.92 | (0.10 | ) | (1.38 | ) | — | (1.48 | ) | 29.11 | 24.72 | 20 | 1.25 | 1.05 | 0.13 | 69 | ||||||||||||||||||||||||||||||||||||||||||
Y | 24.67 | (0.05 | ) | 6.00 | 5.95 | (0.10 | ) | (1.38 | ) | — | (1.48 | ) | 29.14 | 24.86 | 26,227 | 1.04 | 0.95 | (0.17 | ) | 69 | ||||||||||||||||||||||||||||||||||||||||
F(5) | 26.78 | 0.02 | 2.35 | 2.37 | — | — | — | — | 29.15 | 8.85 | (6) | 1,256 | 1.00 | (7) | 0.96 | (7) | 0.10 | (7) | 69 | |||||||||||||||||||||||||||||||||||||||||
SDR | 24.71 | 0.05 | 5.91 | 5.96 | (0.10 | ) | (1.38 | ) | — | (1.48 | ) | 29.19 | 24.86 | 32,525 | 1.00 | 0.95 | 0.17 | 69 | ||||||||||||||||||||||||||||||||||||||||||
For the Year Ended October 31, 2016 |
| |||||||||||||||||||||||||||||||||||||||||||||||||||||||||||
A | $ | 24.46 | $ | 0.03 | $ | 1.14 | (8) | $ | 1.17 | $ | — | $ | (1.85 | ) | $ | — | $ | (1.85 | ) | $ | 23.78 | 5.33 | % | $ | 2,579 | 1.65 | % | 1.41 | % | 0.12 | % | 51 | % | |||||||||||||||||||||||||||
C(9) | 24.96 | (0.01 | ) | (0.29 | ) | (0.30 | ) | — | — | — | — | 24.66 | (1.20 | )(6) | 10 | 1.90 | (7) | 1.90 | (7) | (1.70 | )(7) | 51 | ||||||||||||||||||||||||||||||||||||||
I | 25.25 | 0.08 | 1.19 | (8) | 1.27 | — | (1.85 | ) | — | (1.85 | ) | 24.67 | 5.58 | 113,072 | 1.41 | 1.16 | 0.33 | 51 | ||||||||||||||||||||||||||||||||||||||||||
R3(9) | 24.96 | (0.01 | ) | (0.28 | ) | (0.29 | ) | — | — | — | — | 24.67 | (1.16 | )(6) | 10 | 1.59 | (7) | 1.59 | (7) | (1.39 | )(7) | 51 | ||||||||||||||||||||||||||||||||||||||
R4(9) | 24.96 | — | (0.29 | ) | (0.29 | ) | — | — | — | — | 24.67 | (1.16 | )(6) | 10 | 1.31 | (7) | 1.31 | (7) | (1.10 | )(7) | 51 | |||||||||||||||||||||||||||||||||||||||
R5(9) | 24.96 | — | (0.29 | ) | (0.29 | ) | — | — | — | — | 24.67 | (1.16 | )(6) | 10 | 1.02 | (7) | 1.02 | (7) | (0.80 | )(7) | 51 | |||||||||||||||||||||||||||||||||||||||
Y(9) | 24.96 | — | (0.29 | ) | (0.29 | ) | — | — | — | — | 24.67 | (1.16 | )(6) | 10 | 0.91 | (7) | 0.91 | (7) | (0.70 | )(7) | 51 | |||||||||||||||||||||||||||||||||||||||
SDR | 25.25 | 0.12 | 1.19 | (8) | 1.31 | — | (1.85 | ) | — | (1.85 | ) | 24.71 | 5.74 | 6,806 | 1.26 | 1.02 | 0.50 | 51 | ||||||||||||||||||||||||||||||||||||||||||
For the Year Ended October 31, 2015 |
| |||||||||||||||||||||||||||||||||||||||||||||||||||||||||||
A | $ | 26.66 | $ | (0.11 | ) | $ | 0.93 | $ | 0.82 | $ | — | $ | (3.02 | ) | $ | — | $ | (3.02 | ) | $ | 24.46 | 3.50 | % | $ | 937 | 1.66 | % | 1.58 | % | (0.46 | )% | 49 | % | |||||||||||||||||||||||||||
I | 27.36 | (0.05 | ) | 0.96 | (8) | 0.91 | — | (3.02 | ) | — | (3.02 | ) | 25.25 | 3.76 | 128,250 | 1.39 | 1.31 | (0.18 | ) | 49 | ||||||||||||||||||||||||||||||||||||||||
SDR(16) | 23.83 | (0.02 | ) | 1.44 | 1.42 | — | — | — | — | 25.25 | 5.96 | (6) | 21 | 1.90 | (7) | 1.05 | (7) | (0.95 | )(7) | 49 | ||||||||||||||||||||||||||||||||||||||||
| (1) | Information presented relates to a share outstanding throughout the indicated period. Net investment income (loss) per share amounts are calculated based on average shares outstanding unless otherwise noted. |
| (2) | Assumes initial investment at net asset value at the beginning of each period, reinvestment of all distributions, the complete redemption of the investment at net asset value at the end of each period and no sales charge. Total return would be reduced if sales charges were taken into account. |
| (3) | Adjustments include waivers and reimbursements, if applicable. Ratios do not include fees paid indirectly (see Expenses in the accompanying Notes to Financial Statements). |
| (4) | Prior to October 24, 2016 this Fund operated under a different name. Effective before the opening of business on October 24, 2016, the Advisor, Investor, and R6 share classes were redesignated as Class A, I, and SDR, respectively. |
| (5) | Commenced operations on February 28, 2017. |
| (6) | Not annualized. |
| (7) | Annualized. |
| (8) | Includes redemption fees. Amount was less than $0.01 per share. |
| (9) | Commenced operations on October 24, 2016. |
| (10) | Commenced operations on December 30, 2014. |
| (11) | Commenced operations on February 28, 2019. |
| (12) | The ratio of expenses before adjustments to average net assets excluding interest expense for the period February 28, 2019 through October 31, 2019 was 1.39%, 1.14%, 1.09%, 1.07% and 1.07% for Class A, Class I, Class Y, Class F and Class SDR, respectively. |
| (13) | The ratio of expenses after adjustments to average net assets excluding interest expense for the period February 28, 2019 through October 31, 2019 was 0.79%, 0.76%, 0.70%, 0.68% and 0.70% for Class A, Class I, Class Y, Class F and Class SDR, respectively. This includes the impact of certainnon-contractual waivers. |
| (14) | Includes the impact of certainnon-contractual waivers. Please see the fee table in the Fund’s prospectus for the Fund’s estimated total annual fund operating expenses (before and after contractual waivers and/or reimbursements). |
| (15) | The ratio of net investment income to average net assets excluding interest expense for the period February 28, 2019 through October 31, 2019 was 2.68%, 2.71%, 2.77%, 2.81% and 2.71% for Class A, Class I, Class Y, Class F and Class SDR, respectively. |
| (16) | Commenced operations on September 28, 2015. |
The accompanying notes are an integral part of these financial statements.
| 78 |
|
| Hartford Schroders Funds |
October 31, 2019
| 1. | Organization: |
The Hartford Mutual Funds II, Inc. (the “Company”) is anopen-end registered management investment company comprised of thirteen series, as of October 31, 2019. Financial statements of each series of the Company listed below (each, a “Fund” and collectively, the “Funds”) are included in this report.
The Hartford Mutual Funds II, Inc.:
Hartford Schroders Emerging Markets Equity Fund (the “Emerging Markets Equity Fund”)
Hartford Schroders Emerging Markets Multi-Sector Bond Fund (the “Emerging Markets Multi-Sector Bond Fund”)
Hartford Schroders InternationalMulti-Cap Value Fund (the “InternationalMulti-Cap Value Fund”)
Hartford Schroders International Stock Fund (the “International Stock Fund”)
Hartford Schroders Securitized Income Fund (the “Securitized Income Fund”)
Hartford SchrodersTax-Aware Bond Fund (the“Tax-Aware Bond Fund”)
Hartford Schroders US MidCap Opportunities Fund (the “US MidCap Opportunities Fund”) (formerly, Hartford Schroders US Small/Mid Cap Opportunities Fund)
Hartford Schroders US Small Cap Opportunities Fund (the “US Small Cap Opportunities Fund”)
The assets of each Fund are separate, and a shareholder’s interest is limited to the Fund in which shares are held. The Company is organized under the laws of the State of Maryland and is registered with the Securities and Exchange Commission (the “SEC”) under the Investment Company Act of 1940, as amended (the “1940 Act”). Each Fund, except Emerging Markets Multi-Sector Bond Fund, is a diversifiedopen-end management investment company. Emerging Markets Multi-Sector Bond Fund is anon-diversifiedopen-end management investment company. Each Fund applies specialized accounting and reporting standards under Accounting Standards Codification-Topic 946, “Financial Services – Investment Companies”.
The Securitized Income Fund commenced operations on February 28, 2019. Each Fund has registered for sale Class A, Class I, Class Y, Class F and Class SDR shares. In addition, each Fund, except Securitized Income Fund andTax-Aware Bond Fund, has registered for sale Class R3, Class R4 and Class R5 shares. Each Fund, except Securitized Income Fund, has also registered for sale Class C shares. Class A shares of each Fund, except Emerging Markets Multi-Sector Bond Fund, Securitized Income Fund andTax-Aware Bond Fund, are sold with afront-end sales charge of up to 5.50%. Class A shares of Emerging Markets Multi-Sector Bond Fund andTax-Aware Bond Fund are sold with afront-end sales charge of up to 4.50%. Class A shares of Securitized Income Fund are sold with afront-end sales charge up to 3.00%. Class C shares are sold with a contingent deferred sales charge of up to 1.00% on shares redeemed within twelve months of purchase. Effective October 1, 2018, Class C shares automatically convert to Class A shares of the same Fund after ten years provided that the Fund or the financial intermediary has records verifying that the Class C shares have been held for at least ten years. Classes I, R3, R4, R5, Y, F and SDR shares do not have a sales charge. Emerging Markets Equity Fund is closed to new investors, subject to certain exceptions. For more information, please see the Fund’s prospectus.
| 2. | Significant Accounting Policies: |
The following is a summary of significant accounting policies of each Fund used in the preparation of its financial statements, which are in accordance with United States Generally Accepted Accounting Principles (“U.S. GAAP”). The preparation of financial statements in accordance with U.S. GAAP may require management to make estimates and assumptions that affect the reported amounts of assets and liabilities and disclosure of contingent assets and liabilities at the date of the financial statements and the reported amounts of increases and decreases in net assets from operations during the reporting period. Actual results could differ from those estimates.
| a) | Determination of Net Asset Value – The net asset value (“NAV”) of each class of each Fund’s shares is determined as of the close of regular trading (normally 4:00 p.m. Eastern Time) (the “NYSE Close”) on each day that the New York Stock Exchange (the “Exchange”) is open. Information that becomes known to the Funds after the NAV has been calculated on a particular day will not generally be used to retroactively adjust the NAV determined earlier that day. |
| b) | Investment Valuation and Fair Value Measurements –For purposes of calculating the NAV of each class of each Fund, portfolio securities and other assets held in the Fund’s portfolio for which market prices are readily available are valued at market value. Market value is generally determined on the basis of official close price or last reported trade price. If no trades were reported, market value is based on prices obtained from a quotation reporting system, established market makers (including evaluated prices), or independent pricing services. Pricing vendors may use matrix pricing or valuation models that utilize certain inputs and assumptions to derive values, including transaction data, credit quality information, general market conditions, news, and other factors and assumptions. |
If market prices are not readily available or are deemed unreliable, a Fund will use the fair value of the security or other instrument as determined in good faith under policies and procedures established by and under the supervision of the Board of the Directors of the Company (the “Board of Directors”) (“Valuation Procedures”). Market prices are considered not readily available where there is an absence of current or reliable market-based data (e.g., trade information or broker quotes), including where events occur after the close of the
| 79 |
|
| Hartford Schroders Funds |
Notes to Financial Statements – (continued)
October 31, 2019
relevant market, but prior to the NYSE Close, that materially affect the values of a Fund’s portfolio holdings or assets. In addition, market prices are considered not readily available when, due to extraordinary circumstances, the exchanges or markets on which the securities or other instruments trade do not open for trading for the entire day and no other market prices are available. Fair value pricing is subjective in nature and the use of fair value pricing by a Fund may cause the NAV of its shares to differ significantly from the NAV that would have been calculated using market prices at the close of the exchange on which a portfolio holding is primarily traded. There can be no assurance that a Fund could obtain the fair value assigned to an investment if the Fund were to sell the investment at approximately the time at which the Fund determines its NAV.
Prices of foreign equities that are principally traded on certain foreign markets will generally be adjusted daily pursuant to a fair value pricing service in order to reflect an adjustment for the factors occurring after the close of certain foreign markets but before the NYSE Close. Securities and other instruments that are primarily traded on foreign markets may trade on days that are not business days of the Funds. The value of the foreign securities or other instruments in which a Fund invests may change on days when a shareholder will not be able to purchase, sell or redeem shares of the Fund.
Fixed income investments (other than short-term obligations) held by a Fund are normally valued at prices supplied by independent pricing services in accordance with the Valuation Procedures. Short-term investments maturing in 60 days or less are generally valued at amortized cost if their original term to maturity was 60 days or less, or by amortizing their value on the 61st day prior to maturity, if the original term exceeded 60 days.
Exchange-traded derivatives, such as options, futures and options on futures, are valued at the last sale price determined by the exchange where such instruments principally trade as of the close of such exchange (“Exchange Close”). If a last sale price is not available, the value will be the mean of the most recently quoted bid and ask prices as of the Exchange Close. If a mean of the bid and ask prices cannot be calculated for the day, the value will be the most recently quoted bid price as of the Exchange Close.Over-the-counter derivatives are normally valued based on prices supplied by independent pricing services in accordance with the Valuation Procedures.
Investments valued in currencies other than U.S. dollars are converted to U.S. dollars using the prevailing spot currency exchange rates obtained from independent pricing services for calculation of the NAV. As a result, the NAV of a Fund’s shares may be affected by changes in the value of currencies in relation to the U.S. dollar. The value of securities or other instruments traded in markets outside the United States or denominated in currencies other than the U.S. dollar may be affected significantly on a day that the Exchange is closed and the market value may change on days when an investor is not able to purchase, redeem or exchange shares of a Fund.
Foreign currency contracts represent agreements to exchange currencies on specific future dates at predetermined rates. Foreign currency contracts are valued using foreign currency exchange rates and forward rates as provided by an independent pricing service on the Valuation Date.
Investments inopen-end mutual funds, if any, are valued at the respective NAV of eachopen-end mutual fund on the Valuation Date. Shares of investment companies listed and traded on an exchange are valued in the same manner as any exchange-listed equity security. Suchopen-end mutual funds and listed investment companies may use fair value pricing as disclosed in their prospectuses.
Financial instruments for which prices are not available from an independent pricing service may be valued using market quotations obtained from one or more dealers that make markets in the respective financial instrument in accordance with the Valuation Procedures.
U.S. GAAP defines fair value as the price that a Fund would receive to sell an asset or pay to transfer a liability in an orderly transaction between market participants. The U.S. GAAP fair value measurement standards require disclosure of a fair value hierarchy for each major category of assets and liabilities. Various inputs are used in determining the fair value of each Fund’s investments. These inputs are summarized into three broad hierarchy levels. This hierarchy is based on whether the valuation inputs are observable or unobservable. These levels are:
| • | Level 1 – Quoted prices in active markets for identical investments. Level 1 may include exchange traded instruments, such as domestic equities, some foreign equities, options, futures, mutual funds, exchange traded funds, rights and warrants. |
| • | Level 2 – Observable inputs other than Level 1 prices, such as quoted prices for similar investments; quoted prices in markets that are not active; or other inputs that are observable or can be corroborated by observable market data. Level 2 may include debt investments that are traded less frequently than exchange traded instruments and which are valued using independent pricing services; foreign equities, which are principally traded on certain foreign markets and are adjusted daily pursuant to a fair value pricing service in order to reflect an adjustment for the factors occurring after the close of certain foreign markets but before the NYSE Close; senior floating rate interests, which are valued using an aggregate of dealer bids; short-term investments, which are valued at amortized cost; and swaps, which are valued based upon the terms of each swap contract. |
| • | Level 3 – Significant unobservable inputs that are supported by limited or no market activity. Level 3 may include financial instruments whose values are determined using indicative market quotes or require significant management judgment or estimation. These unobservable valuation inputs may include estimates for current yields, maturity/duration, prepayment speed, and indicative market quotes for comparable investments along with other assumptions relating to credit quality, collateral value, complexity of the investment |
| 80 |
|
| Hartford Schroders Funds |
Notes to Financial Statements – (continued)
October 31, 2019
| structure, general market conditions and liquidity. This category may include investments where trading has been halted or there are certain restrictions on trading. While these investments are priced using unobservable inputs, the valuation of these investments reflects the best available data and management believes the prices are a reasonable representation of exit price. |
The Board of Directors has delegated theday-to-day responsibility for implementing the Valuation Procedures to the Valuation Committee. The Valuation Committee will consider all relevant factors in determining an investment’s fair value, and may seek the advice of such Fund’ssub-adviser(s), as applicable, knowledgeable brokers, and legal counsel in making such determination. The Valuation Committee reports to the Audit Committee of the Board of Directors.
Valuation levels are not necessarily indicative of the risk associated with investing in such investments. Individual investments within any of the above mentioned asset classes may be assigned a different hierarchical level than those presented above, as individual circumstances dictate.
For additional information, refer to the Fair Valuation Summary and the Level 3 roll-forward reconciliation, if applicable, which follows each Fund’s Schedule of Investments.
| c) | Investment Transactions and Investment Income – Investment transactions are recorded as of the trade date (the date the order to buy or sell is executed) for financial reporting purposes. Investments purchased or sold on a when-issued or delayed-delivery basis may be settled a month or more after the trade date. Realized gains and losses are determined on the basis of identified cost. |
The trade date for senior floating rate interests purchased in the primary loan market is considered the date on which the loan allocations are determined. The trade date for senior floating rate interests purchased in the secondary loan market is the date on which the transaction is entered into.
Dividend income from domestic securities is accrued on theex-dividend date. In general, dividend income from foreign securities is recorded on theex-date; however, dividend notifications in certain foreign jurisdictions may not be available in a timely manner and as a result, a Fund will record the dividend as soon as the relevant details (i.e., rate per share, payment date, shareholders of record, etc.) are publicly available. Interest income, including amortization of premium, accretion of discounts, inflation adjustments and additional principal received in-kind in lieu of cash, is accrued on a daily basis. Paydown gains and losses on mortgage-related and other asset-backed securities are included in interest income in the Statements of Operations, as applicable.
Please refer to Note 8 for Securities Lending Information.
| d) | Taxes – A Fund may be subject to taxes imposed on realized gains on securities of certain foreign countries in which such Fund invests. A Fund may also be subject to taxes withheld on foreign dividends and interest from securities in which a Fund invests. The amount of any foreign taxes withheld and foreign tax expense is included on the accompanying Statements of Operations as a reduction to net investment income or net realized gain on investments in these securities, if applicable. |
| e) | Foreign Currency Transactions – Assets and liabilities denominated in currencies other than U.S. dollars are translated into U.S. dollars at the exchange rates in effect on the Valuation Date. Purchases and sales of investments, income and expenses are translated into U.S. dollars at the exchange rates on the dates of such transactions. |
A Fund does not isolate that portion of portfolio investment valuation resulting from fluctuations in the foreign currency exchange rates from the fluctuations arising from changes in the market prices of investments held. Exchange rate fluctuations are included with the net realized and unrealized gain or loss on investments in the accompanying financial statements.
Net realized foreign exchange gains or losses arise from sales of foreign currencies and the difference between asset and liability amounts initially stated in foreign currencies and the U.S. dollar value of the amounts actually received or paid. Net unrealized foreign exchange gains or losses arise from changes in the value of other assets and liabilities at the end of the reporting period, resulting from changes in the exchange rates.
| f) | Joint Trading Account – A Fund may invest cash balances into a joint trading account that may be invested in one or more repurchase agreements. |
| g) | Fund Share Valuation and Dividend Distributions to Shareholders – Orders for each class of each Fund’s shares are executed in accordance with the investment instructions of the shareholders. The NAV of each class of each Fund’s shares is determined as of the close of business on each business day of the Exchange (see Note 2(a)). The NAV is determined separately for each class of shares of a Fund by dividing the Fund’s net assets attributable to that class by the number of shares of the class outstanding. Each class of shares offered by a Fund has equal rights as to assets and voting privileges (except that shareholders of a class have exclusive voting rights regarding any matter relating solely to that class of shares). Income andnon-class specific expenses are allocated daily to each class on the basis of the relative net assets of the class of the Fund. Realized and unrealized gains and losses are allocated daily based on the relative net assets of each class of shares of each Fund. |
Orders for the purchase of a Fund’s shares received prior to the close of the Exchange on any day the Exchange is open for business are priced at the NAV determined as of the close of the Exchange. Orders received after the close of the Exchange, or on a day on which the Exchange and/or the Funds are not open for business, are priced at the next determined NAV.
| 81 |
|
| Hartford Schroders Funds |
Notes to Financial Statements – (continued)
October 31, 2019
Dividends are declared pursuant to a policy adopted by the Company’s Board of Directors. Dividends and/or distributions to shareholders are recorded onex-date. The policy of Emerging Markets Equity Fund, International Stock Fund, US MidCap Opportunities Fund and US Small Cap Opportunities Fund is to pay dividends from net investment income and realized gains, if any, at least once a year. The policy of Securitized Income Fund andTax-Aware Bond Fund is to pay dividends from net investment income, if any, monthly, and realized gains, if any, at least once a year. The policy of Emerging Markets Multi-Sector Bond Fund and InternationalMulti-Cap Value Fund is to pay dividends from net investment income, if any, quarterly, and realized gains, if any, at least once a year.
Income dividends and capital gains distributions are determined in accordance with federal income tax regulations, which may differ from U.S. GAAP with respect to character and timing (see Federal Income Taxes: Distributions and Components of Distributable Earning and Reclassification of Capital Accounts notes).
| 3. | Securities and Other Investments: |
| a) | Restricted Securities – Each Fund may invest in securities that are subject to legal or contractual restrictions on resale. These securities generally may be resold in transactions exempt from registration or to the public if the securities are registered. Disposal of these securities may involve time-consuming negotiations and expense, and prompt sale at an acceptable price may be difficult. Information regarding restricted securities, if applicable, is included at the end of each Fund’s Schedule of Investments. |
| b) | Investments Purchased on a When-Issued or Delayed-Delivery Basis – Delivery and payment for investments that have been purchased by a Fund on a forward commitment, or when-issued or delayed-delivery basis, take place beyond the customary settlement period. A Fund may dispose of or renegotiate a delayed-delivery transaction after it is entered into, and may sell delayed-delivery investments before they are delivered, which may result in a realized gain or loss. During this period, such investments are subject to market fluctuations, and a Fund identifies investments segregated in its records with a value at least equal to the amount of the commitment. See each Fund’s Schedule of Investments, if applicable, for when-issued or delayed-delivery investments as of October 31, 2019. |
In connection with a Fund’s ability to purchase investments on a when-issued or forward commitment basis, the Fund may enter intoto-be announced (“TBA”) commitments. TBA commitments are forward agreements for the purchase or sale of mortgage-backed securities for a fixed price, with payment and delivery on an agreed-upon future settlement date. The specific securities to be delivered are not identified at the trade date; however, delivered securities must meet specified terms, including issuer, rate and mortgage terms. Although a Fund may enter into TBA commitments with the intention of acquiring or delivering securities for its portfolio, the Fund can extend the settlement date, roll the transaction, or dispose of a commitment prior to settlement if deemed appropriate to do so. If the TBA commitment is closed through the acquisition of an offsetting TBA commitment, a Fund realizes a gain or loss. In a TBA roll transaction, a Fund generally purchases or sells the initial TBA commitment prior to the agreed upon settlement date and enters into a new TBA commitment for future delivery or receipt of the mortgage backed securities. TBA commitments involve a risk of loss if the value of the security to be purchased or sold declines or increases, respectively, prior to settlement date. These transactions are excluded from a Fund’s portfolio turnover rate. See each Fund’s Schedule of Investments, if applicable, for TBA commitments as of October 31, 2019.
| c) | Mortgage-Related and Other Asset-Backed Securities – A Fund may invest in mortgage-related and other asset-backed securities. These securities include mortgage pass-through securities, collateralized mortgage obligations, commercial mortgage-backed securities, stripped mortgage-backed securities, asset-backed securities, collateralized debt obligations and other securities that directly or indirectly represent a participation in, or are secured by and payable from, mortgage loans on real property. Mortgage-related securities are created from pools of residential or commercial mortgage loans, including mortgage loans made by savings and loan institutions, mortgage bankers, commercial banks and others. Asset-backed securities are created from many types of assets, including auto loans, credit card receivables, home equity loans, and student loans. These securities provide a monthly payment that consists of both interest and principal payments. Interest payments may be determined by fixed or adjustable rates. The rate of prepayments on underlying mortgages will affect the price and volatility of a mortgage-related security, and may have the effect of shortening or extending the effective duration of the security relative to what was anticipated at the time of purchase. See each Fund’s Schedule of Investments, if applicable, for mortgage-related and other asset-backed securities as of October 31, 2019. |
| d) | Inflation-Indexed Bonds – A Fund may invest in inflation-indexed bonds. Inflation-indexed bonds are fixed income investments whose principal value is periodically adjusted to the rate of inflation. The interest rate on these bonds is generally fixed at issuance at a rate lower than typical bonds. Over the life of an inflation-indexed bond, however, interest will be paid based on a principal value, which is adjusted for inflation. Any increase or decrease in the principal amount of an inflation-indexed bond will be included as interest income on the Statements of Operations, even though investors do not receive the principal amount until maturity. See each Fund’s Schedule of Investments, if applicable, for inflation-indexed bonds as of October 31, 2019. |
| e) | Reverse Repurchase Agreements – Reverse repurchase agreements involve the sale of securities held by a Fund with an agreement to repurchase the securities at an agreed-upon price, date and interest payment. Reverse repurchase agreements carry the risk that the market value of the securities that a Fund is obligated to repurchase may decline below the repurchase price. A Fund could also lose money if it is unable to recover the securities and the value of any collateral held or assets segregated by the Fund to cover the transaction is less than the value of securities. The use of reverse repurchase agreements may increase the possibility of fluctuation in a Fund’s net asset value. |
| 82 |
|
| Hartford Schroders Funds |
Notes to Financial Statements – (continued)
October 31, 2019
For the period February 28, 2019 (commencement of operations) through October 31, 2019, the Securitized Income Fund had used Reverse Repurchase Agreements.
For the period February 28, 2019 (commencement of operations) through October 31, 2019, the Securitized Income Fund had an outstanding reverse repurchase agreement balance for 245 days. The average amount of borrowings was $1,519,608 and the annualized weighted average interest rate was 2.37% during the 245 days period since inception.
The following table summarizes open reverse repurchase agreements by counterparty which are subject to offset under a master repurchase agreement (“MRA”) and net of the related collateral received/pledged by the Securitized Income Fund as of October 31, 2019:
Counterparty | Reverse Repurchase Agreement | Collateral Pledged1 | Net Amount2 | |||||||||
JP Morgan Chase Bank | $ | 4,744,550 | $ | (4,744,550 | ) | $ | — | |||||
|
|
|
|
|
| |||||||
| $ | 4,744,550 | $ | (4,744,550 | ) | $ | — | ||||||
|
|
|
|
|
| |||||||
| 1 | Collateral with a value of $5,297,261 has been pledged in connection with open reverse repurchase agreements. In some instances, the actual collateral pledged may be more than the amount shown here due to overcollateralization. |
| 2 | Net amount represents the net amount payable due to the counterparty in the event of default. |
| 4. | Financial Derivative Instruments: |
The following disclosures contain information on how and why a Fund may use derivative instruments, the credit-risk-related contingent features in certain derivative instruments, and how derivative instruments affect a Fund’s financial position and results of operations. The location and fair value amounts of these instruments on the Statements of Assets and Liabilities and the realized gains and losses and changes in unrealized gains and losses on the Statements of Operations, each categorized by type of derivative contract, are included in the following Additional Derivative Instrument Information footnote. The derivative instruments outstanding as ofperiod-end are disclosed in the notes to the Schedules of Investments, if applicable. The amounts of realized gains and losses and changes in unrealized gains and losses on derivative instruments during the period are disclosed in the Statements of Operations.
| a) | Foreign Currency Contracts – A Fund may enter into foreign currency contracts that obligate the Fund to purchase or sell currencies at specified future dates. Foreign currency contracts may be used in connection with settling purchases or sales of securities to hedge the currency exposure associated with some or all of a Fund’s investments and/or as part of an investment strategy. Foreign currency contracts are marked to market daily and the change in value is recorded by a Fund as an unrealized gain or loss. A Fund will record a realized gain or loss when the foreign currency contract is settled. |
Foreign currency contracts involve elements of market risk in excess of the amounts reflected in the Statements of Assets and Liabilities. In addition, risks may arise upon entering into these contracts from the potential inability of the counterparties to meet the terms of the contracts and from unanticipated movements in the value of the foreign currencies relative to the U.S. dollar. Upon entering into a foreign currency contract, a Fund may be required to post margin equal to its outstanding exposure thereunder.
During the year ended October 31, 2019, each of Emerging Markets Multi-Sector Bond Fund and InternationalMulti-Cap Value Fund had used Foreign Currency Contracts.
| b) | Futures Contracts – A Fund may enter into futures contracts. A futures contract is an agreement between two parties to buy or sell an asset at a set price on a future date. A Fund may use futures contracts to manage risk or obtain exposure to the investment markets, commodities, or movements in interest rates and currency values. The primary risks associated with the use of futures contracts are the imperfect correlation between the change in market value of the investments held by a Fund and the prices of futures contracts and the possibility of an illiquid market. Upon entering into a futures contract, a Fund is required to deposit with a futures commission merchant (“FCM”) an amount of cash or U.S. Government or Agency Obligations in accordance with the initial margin requirements of the broker or exchange. Futures contracts are marked to market daily and an appropriate amount equal to the change in value (“variation margin”) is paid or received by a Fund. Gains or losses are recognized but not considered realized until the contracts expire or are closed. Futures contracts involve, to varying degrees, risk of loss in excess of the variation margin disclosed on the Statements of Assets and Liabilities. |
During the year or period ended October 31, 2019, each of Emerging Markets Multi-Sector Bond Fund, InternationalMulti-Cap Value Fund, Securitized Income Fund andTax- Aware Bond Fund had used Futures Contracts.
| c) | Swap Contracts – A Fund may invest in swap contracts. Swap contracts are agreements to exchange or swap investment cash flows, assets, foreign currencies or market-linked returns at specified future intervals. Swap contracts are either privately negotiated in theover-the-counter market (“OTC swaps”) or cleared through a central counterparty or derivatives clearing organization (“centrally cleared swaps”). A Fund may enter into credit default, total return, cross-currency, interest rate, inflation and other forms of swap contracts to manage its exposure to credit, currency, interest rate, commodity and inflation risk. Swap contracts are also used to gain exposure to certain markets. In connection with these contracts, investments or cash may be identified as collateral or margin in accordance with the terms of |
| 83 |
|
| Hartford Schroders Funds |
Notes to Financial Statements – (continued)
October 31, 2019
| the respective swap contracts and/or master netting arrangement to provide assets of value and recourse in the event of default or bankruptcy/insolvency. |
Swaps are valued in accordance with the Valuation Procedures. Changes in market value, if any, are reflected as a component of net changes in unrealized appreciation or depreciation on the Statements of Operations. Daily changes in valuation of centrally cleared swaps, if any, are recorded as a receivable or payable for the change in value (“variation margin”) on the Statements of Assets and Liabilities. Realized gains or losses on centrally cleared swaps are recorded upon the termination of the swaps. OTC swap payments received or paid at the beginning of the measurement period are reflected as such on the Statements of Assets and Liabilities and represent premiums paid or received upon entering into the swap contract to compensate for differences between the stated terms of the swap contract and prevailing market conditions (credit spreads, currency exchange rates, interest rates and other relevant factors). These upfront premiums are recorded as realized gains or losses on the Statements of Operations upon termination or maturity of the swap. A liquidation payment received or made at the termination or maturity of the swap is recorded as a realized gain or loss on the Statements of Operations. Net periodic payments received or paid by a Fund are included as part of realized gains or losses on the Statements of Operations.
Entering into these contracts involves, to varying degrees, elements of liquidation, counterparty, credit and market risk in excess of the amounts recognized on the Statements of Assets and Liabilities. Such risks involve the possibility that there will be no liquid market for these contracts, that the counterparty to the contracts may default on its obligation to perform or disagree as to the meaning of contractual terms in the contracts, and that there may be unfavorable changes in market conditions (credit spreads, currency exchange rates, interest rates and other relevant factors).
A Fund’s maximum risk of loss from counterparty risk for OTC swaps is the net value of the discounted cash flows to be received from the counterparty over the contract’s remaining life, and current market value, to the extent that amount is positive. The risk is mitigated by having a master netting arrangement between a Fund and the counterparty, which allows for the netting of payments made or received (although such amounts are presented on a gross basis within the Statements of Assets and Liabilities, as applicable) as well as the posting of collateral to a Fund to cover the Fund’s exposure to the counterparty. In a centrally cleared swap, while a Fund enters into an agreement with a clearing broker to execute contracts with a counterparty, the performance of the swap is guaranteed by the central clearinghouse, which reduces the Fund’s exposure to counterparty risk. However, the Fund is still exposed to a certain amount of counterparty risk through the clearing broker and clearinghouse. The clearinghouse attempts to minimize this risk to its participants through the use of mandatory margin requirements, daily cash settlements and other procedures. Likewise, the clearing broker reduces its risk through margin requirements and required segregation of customer balances.
Credit Default Swap Contracts – The credit default swap market allows a Fund to manage credit risk through buying and selling credit protection on a specific issuer, asset or basket of assets. Certain credit default swaps involve the exchange of a fixed rate premium for protection against the loss in value of an underlying investment or index in the event of a credit event, such as payment default or bankruptcy.
Under a credit default swap contract, one party acts as guarantor by receiving the fixed periodic payment in exchange for the commitment to purchase the underlying investment at par if the defined credit event occurs. Upon the occurrence of a defined credit event, the difference between the value of the reference obligation and the swap’s notional amount is recorded as realized gain or loss on swap transactions in the Statements of Operations. A “buyer” of credit protection agrees to pay a counterparty to assume the credit risk of an issuer upon the occurrence of certain events. The “seller” of the protection receives periodic payments and agrees to assume the credit risk of an issuer upon the occurrence of certain events. Although specified events are contract specific, credit events are generally defined as bankruptcy, failure to pay, restructuring, obligation acceleration, obligation default or repudiation/moratorium. A “seller’s” exposure is limited to the total notional amount of the credit default swap contract. These potential amounts would be partially offset by any recovery values of the respective referenced obligations or upfront payments received upon entering into the contract.
Implied credit spreads, represented in absolute terms, utilized in determining the market value of credit default swap contracts on corporate issues, sovereign government issues or U.S. municipal issues as ofyear-end are disclosed in the notes to the Schedules of Investments, as applicable, and serve as an indicator of the current status of the payment/performance risk and represent the likelihood or risk of default for the credit derivative. The implied credit spread of a particular referenced entity reflects the cost of buying/selling protection and there may also be upfront payments required to be made to enter into the contract. Wider credit spreads represent a deterioration of the referenced entity’s credit soundness and a greater likelihood or risk of default or other credit event occurring as defined under the terms of the contract. For credit default swap contracts on credit indices, the quoted market prices and resulting values serve as the indicator of the current status of the payment/performance risk. Increasing market values, in absolute terms when compared to the notional amount of the swap, represent a deterioration of the referenced equity’s credit soundness and a greater likelihood or risk of default or other credit event occurring as defined under the terms of the contract.
During the year ended October 31, 2019, Emerging Market Multi-Sector Bond Fund had used Credit Default Swaps.
| 84 |
|
| Hartford Schroders Funds |
Notes to Financial Statements – (continued)
October 31, 2019
| d) | Additional Derivative Instrument Information: |
Emerging Markets Multi-Sector Bond Fund
The Effect of Derivative Instruments on the Statement of Assets and Liabilities as of October 31, 2019:
| Risk Exposure Category | ||||||||||||||||||||||||||||
| Interest Rate Contracts | Foreign Currency Contracts | Credit Contracts | Equity Contracts | Commodity Contracts | Other Contracts | Total | ||||||||||||||||||||||
Assets: |
| |||||||||||||||||||||||||||
Unrealized appreciation on foreign currency contracts | $ | — | $ | 754,471 | $ | — | $ | — | $ | — | $ | — | $ | 754,471 | ||||||||||||||
Unrealized appreciation on swap contracts(2) | — | — | 5,087 | — | — | — | 5,087 | |||||||||||||||||||||
|
|
|
|
|
|
|
|
|
|
|
|
|
| |||||||||||||||
Total | $ | — | $ | 754,471 | $ | 5,087 | $ | — | $ | — | $ | — | $ | 759,558 | ||||||||||||||
|
|
|
|
|
|
|
|
|
|
|
|
|
| |||||||||||||||
Liabilities: |
| |||||||||||||||||||||||||||
Unrealized depreciation on futures contracts(1) | $ | 6,047 | $ | — | $ | — | $ | — | $ | — | $ | — | $ | 6,047 | ||||||||||||||
Unrealized depreciation on foreign currency contracts | — | 1,218,050 | — | — | — | — | 1,218,050 | |||||||||||||||||||||
Unrealized depreciation on swap contracts(2) | — | — | 4,422 | — | — | — | 4,422 | |||||||||||||||||||||
|
|
|
|
|
|
|
|
|
|
|
|
|
| |||||||||||||||
Total | $ | 6,047 | $ | 1,218,050 | $ | 4,422 | $ | — | $ | — | $ | — | $ | 1,228,519 | ||||||||||||||
|
|
|
|
|
|
|
|
|
|
|
|
|
| |||||||||||||||
| (1) | Amount represents the cumulative depreciation on futures contracts as disclosed within the Schedule of Investments under the open “Futures Contracts” section. Only current day’s variation margin, if any, is reported within the Statement of Assets and Liabilities. |
| (2) | Amount represents the cumulative appreciation and depreciation on centrally cleared swaps, if applicable, as disclosed within the Schedule of Investments. Only the current day’s variation margin, if any, are reported within the Statements of Assets and Liabilities. OTC swaps are reported within the Statement of Assets and Liabilities within Unrealized appreciation and depreciation on OTC swap contracts, if applicable. |
The Effect of Derivative Instruments on the Statement of Operations for the year ended October 31, 2019:
| Risk Exposure Category | ||||||||||||||||||||||||||||
| Interest Rate Contracts | Foreign Currency Contracts | Credit Contracts | Equity Contracts | Commodity Contracts | Other Contracts | Total | ||||||||||||||||||||||
Realized Gain (Loss) on Derivatives Recognized as a Result of Operations: | ||||||||||||||||||||||||||||
Net realized gain (loss) on futures contracts | $ | 168,507 | $ | — | $ | — | $ | — | $ | — | $ | — | $ | 168,507 | ||||||||||||||
Net realized gain (loss) on swap contracts | — | — | 184,142 | — | — | — | 184,142 | |||||||||||||||||||||
Net realized gain (loss) on foreign currency contracts | — | (272,726 | ) | — | — | — | — | (272,726 | ) | |||||||||||||||||||
|
|
|
|
|
|
|
|
|
|
|
|
|
| |||||||||||||||
Total | $ | 168,507 | $ | (272,726 | ) | $ | 184,142 | $ | — | $ | — | $ | — | $ | 79,923 | |||||||||||||
|
|
|
|
|
|
|
|
|
|
|
|
|
| |||||||||||||||
Net Change in Unrealized Appreciation (Depreciation) on Derivatives Recognized as a Result of Operations: | ||||||||||||||||||||||||||||
Net change in unrealized appreciation (depreciation) of futures contracts | $ | (6,047 | ) | $ | — | $ | — | $ | — | $ | — | $ | — | $ | (6,047 | ) | ||||||||||||
Net change in unrealized appreciation (depreciation) of swap contracts | — | — | (29,693 | ) | — | — | — | (29,693 | ) | |||||||||||||||||||
Net change in unrealized appreciation (depreciation) of foreign currency contracts | — | (942,748 | ) | — | — | — | — | (942,748 | ) | |||||||||||||||||||
|
|
|
|
|
|
|
|
|
|
|
|
|
| |||||||||||||||
Total | $ | (6,047 | ) | $ | (942,748 | ) | $ | (29,693 | ) | $ | — | $ | — | $ | — | $ | (978,488 | ) | ||||||||||
|
|
|
|
|
|
|
|
|
|
|
|
|
| |||||||||||||||
For the year ended October 31, 2019, the average amount or number per contract outstanding for each derivative type was as follows:
Derivative Description | Average Notional Par, Contracts or Face Amount | |||
Futures Contracts Long at Number of Contracts | 23 | |||
Swap Contracts at Notional Amount | $ | 11,204,000 | ||
Foreign Currency Contracts Purchased at Contract Amount | $ | 43,157,527 | ||
Foreign Currency Contracts Sold at Contract Amount | $ | 39,868,612 | ||
| 85 |
|
| Hartford Schroders Funds |
Notes to Financial Statements – (continued)
October 31, 2019
InternationalMulti-Cap Value Fund
The Effect of Derivative Instruments on the Statement of Assets and Liabilities as of October 31, 2019:
| Risk Exposure Category | ||||||||||||||||||||||||||||
| Interest Rate Contracts | Foreign Currency Contracts | Credit Contracts | Equity Contracts | Commodity Contracts | Other Contracts | Total | ||||||||||||||||||||||
Assets: |
| |||||||||||||||||||||||||||
Liabilities: |
| |||||||||||||||||||||||||||
Unrealized depreciation on foreign currency contracts | $ | — | $ | 99,028 | $ | — | $ | — | $ | — | $ | — | $ | 99,028 | ||||||||||||||
|
|
|
|
|
|
|
|
|
|
|
|
|
| |||||||||||||||
Total | $ | — | $ | 99,028 | $ | — | $ | — | $ | — | $ | — | $ | 99,028 | ||||||||||||||
|
|
|
|
|
|
|
|
|
|
|
|
|
| |||||||||||||||
The Effect of Derivative Instruments on the Statement of Operations for the year ended October 31, 2019:
| Risk Exposure Category | ||||||||||||||||||||||||||||
| Interest Rate Contracts | Foreign Currency Contracts | Credit Contracts | Equity Contracts | Commodity Contracts | Other Contracts | Total | ||||||||||||||||||||||
Realized Gain (Loss) on Derivatives Recognized as a Result of Operations: | ||||||||||||||||||||||||||||
Net realized gain (loss) on futures contracts | $ | — | $ | — | $ | — | $ | (302,314 | ) | $ | — | $ | — | $ | (302,314 | ) | ||||||||||||
Net realized gain (loss) on foreign currency contracts | — | (1,755,681 | ) | — | — | — | — | (1,755,681 | ) | |||||||||||||||||||
|
|
|
|
|
|
|
|
|
|
|
|
|
| |||||||||||||||
Total | $ | — | $ | (1,755,681 | ) | $ | — | $ | (302,314 | ) | $ | — | $ | — | $ | (2,057,995 | ) | |||||||||||
|
|
|
|
|
|
|
|
|
|
|
|
|
| |||||||||||||||
Net Change in Unrealized Appreciation (Depreciation) on Derivatives Recognized as a Result of Operations: | ||||||||||||||||||||||||||||
Net change in unrealized appreciation (depreciation) of futures contracts | $ | — | $ | — | $ | — | $ | 1,101,839 | $ | — | $ | — | $ | 1,101,839 | ||||||||||||||
Net change in unrealized appreciation (depreciation) of foreign currency contracts | — | 844,678 | — | — | — | — | 844,678 | |||||||||||||||||||||
|
|
|
|
|
|
|
|
|
|
|
|
|
| |||||||||||||||
Total | $ | — | $ | 844,678 | $ | — | $ | 1,101,839 | $ | — | $ | — | $ | 1,946,517 | ||||||||||||||
|
|
|
|
|
|
|
|
|
|
|
|
|
| |||||||||||||||
For the year ended October 31, 2019, the average amount or number per contract outstanding for each derivative type was as follows:
Derivative Description | Average Notional Par, Contracts or Face Amount | |||
Futures Contracts Long at Number of Contracts | 464 | |||
Foreign Currency Contracts Purchased at Contract Amount | $ | 10,153,135 | ||
Foreign Currency Contracts Sold at Contract Amount | $ | 16,876,330 | ||
Securitized Income Fund
The Effect of Derivative Instruments on the Statement of Assets and Liabilities as of October 31, 2019:
| Risk Exposure Category | ||||||||||||||||||||||||||||
| Interest Rate Contracts | Foreign Currency Contracts | Credit Contracts | Equity Contracts | Commodity Contracts | Other Contracts | Total | ||||||||||||||||||||||
Liabilities: |
| |||||||||||||||||||||||||||
Unrealized depreciation on futures contracts(1) | $ | — | $ | 234,239 | $ | — | $ | — | $ | — | $ | — | $ | 234,239 | ||||||||||||||
|
|
|
|
|
|
|
|
|
|
|
|
|
| |||||||||||||||
Total | $ | — | $ | 234,239 | $ | — | $ | — | $ | — | $ | — | $ | 234,239 | ||||||||||||||
|
|
|
|
|
|
|
|
|
|
|
|
|
| |||||||||||||||
| (1) | Amount represents the cumulative depreciation on futures contracts as disclosed within the Schedule of Investments under the open “Futures Contracts” section. Only current day’s variation margin, if any, is reported within the Statement of Assets and Liabilities. |
| 86 |
|
| Hartford Schroders Funds |
Notes to Financial Statements – (continued)
October 31, 2019
Securitized Income Fund – (continued)
The Effect of Derivative Instruments on the Statement of Operations for the period ended October 31, 2019:
| Risk Exposure Category | ||||||||||||||||||||||||||||
| Interest Rate Contracts | Foreign Currency Contracts | Credit Contracts | Equity Contracts | Commodity Contracts | Other Contracts | Total | ||||||||||||||||||||||
Realized Gain (Loss) on Derivatives Recognized as a Result of Operations: | ||||||||||||||||||||||||||||
Net realized gain (loss) on futures contracts | $ | (71,829 | ) | $ | 361,549 | $ | — | $ | — | $ | — | $ | — | $ | 289,720 | |||||||||||||
|
|
|
|
|
|
|
|
|
|
|
|
|
| |||||||||||||||
Total | $ | (71,829 | ) | $ | 361,549 | $ | — | $ | — | $ | — | $ | — | $ | 289,720 | |||||||||||||
|
|
|
|
|
|
|
|
|
|
|
|
|
| |||||||||||||||
Net Change in Unrealized Appreciation (Depreciation) on Derivatives Recognized as a Result of Operations: | ||||||||||||||||||||||||||||
Net change in unrealized appreciation (depreciation) of futures contracts | $ | — | $ | (234,239 | ) | $ | — | $ | — | $ | — | $ | — | $ | (234,239 | ) | ||||||||||||
|
|
|
|
|
|
|
|
|
|
|
|
|
| |||||||||||||||
Total | $ | — | $ | (234,239 | ) | $ | — | $ | — | $ | — | $ | — | $ | (234,239 | ) | ||||||||||||
|
|
|
|
|
|
|
|
|
|
|
|
|
| |||||||||||||||
For the period ended October 31, 2019, the average amount or number per contract outstanding for each derivative type was as follows:
Derivative Description | Average Notional Par, Contracts or Face Amount | |||
Futures Contracts Long at Number of Contracts | 16 | |||
Futures Contracts Short at Number of Contracts | (91 | ) | ||
Tax-Aware Bond Fund
The Effect of Derivative Instruments on the Statement of Assets and Liabilities as of October 31, 2019:
| Risk Exposure Category | ||||||||||||||||||||||||||||
| Interest Rate Contracts | Foreign Currency Contracts | Credit Contracts | Equity Contracts | Commodity Contracts | Other Contracts | Total | ||||||||||||||||||||||
Assets: |
| |||||||||||||||||||||||||||
Unrealized appreciation on futures contracts(1) | $ | 29,918 | $ | — | $ | — | $ | — | $ | — | $ | — | $ | 29,918 | ||||||||||||||
|
|
|
|
|
|
|
|
|
|
|
|
|
| |||||||||||||||
Total | $ | 29,918 | $ | — | $ | — | $ | — | $ | — | $ | — | $ | 29,918 | ||||||||||||||
|
|
|
|
|
|
|
|
|
|
|
|
|
| |||||||||||||||
Liabilities: |
| |||||||||||||||||||||||||||
Unrealized depreciation on futures contracts(1) | $ | 3,363 | $ | — | $ | — | $ | — | $ | — | $ | — | $ | 3,363 | ||||||||||||||
|
|
|
|
|
|
|
|
|
|
|
|
|
| |||||||||||||||
Total | $ | 3,363 | $ | — | $ | — | $ | — | $ | — | $ | — | $ | 3,363 | ||||||||||||||
|
|
|
|
|
|
|
|
|
|
|
|
|
| |||||||||||||||
| (1) | Amount represents the cumulative appreciation and depreciation on futures contracts as disclosed within the Schedule of Investments under the open “Futures Contracts” section. Only current day’s variation margin, if any, is reported within the Statement of Assets and Liabilities. |
The Effect of Derivative Instruments on the Statement of Operations for the year ended October 31, 2019:
| Risk Exposure Category | ||||||||||||||||||||||||||||
| Interest Rate Contracts | Foreign Currency Contracts | Credit Contracts | Equity Contracts | Commodity Contracts | Other Contracts | Total | ||||||||||||||||||||||
Realized Gain (Loss) on Derivatives Recognized as a Result of Operations: | ||||||||||||||||||||||||||||
Net realized gain (loss) on futures contracts | $ | 88,921 | $ | — | $ | — | $ | — | $ | — | $ | — | $ | 88,921 | ||||||||||||||
|
|
|
|
|
|
|
|
|
|
|
|
|
| |||||||||||||||
Total | $ | 88,921 | $ | — | $ | — | $ | — | $ | — | $ | — | $ | 88,921 | ||||||||||||||
|
|
|
|
|
|
|
|
|
|
|
|
|
| |||||||||||||||
Net Change in Unrealized Appreciation (Depreciation) on Derivatives Recognized as a Result of Operations: | ||||||||||||||||||||||||||||
Net change in unrealized appreciation (depreciation) of futures contracts | $ | 22,924 | $ | — | $ | — | $ | — | $ | — | $ | — | $ | 22,924 | ||||||||||||||
|
|
|
|
|
|
|
|
|
|
|
|
|
| |||||||||||||||
Total | $ | 22,924 | $ | — | $ | — | $ | — | $ | — | $ | — | $ | 22,924 | ||||||||||||||
|
|
|
|
|
|
|
|
|
|
|
|
|
| |||||||||||||||
| 87 |
|
| Hartford Schroders Funds |
Notes to Financial Statements – (continued)
October 31, 2019
Tax-Aware Bond Fund – (continued)
For the year ended October 31, 2019, the average amount or number per contract outstanding for each derivative type was as follows:
Derivative Description | Average Notional Par, Contracts or Face Amount | |||
Futures Contracts Long at Number of Contracts | 71 | |||
Futures Contracts Short at Number of Contracts | (44 | ) | ||
| e) | Balance Sheet Offsetting Information – Set forth below are tables which disclose both gross information and net information about instruments and transactions eligible for offset in the financial statements, and instruments and transactions that are subject to a master netting arrangement, as well as amounts related to margin, reflected as financial collateral (including cash collateral), held at clearing brokers, counterparties and a Fund’s custodian. The master netting arrangements allow the clearing brokers to net any collateral held in or on behalf of a Fund, or liabilities or payment obligations of the clearing brokers to a Fund, against any liabilities or payment obligations of a Fund to the clearing brokers. A Fund is required to deposit financial collateral (including cash collateral) at the Fund’s custodian on behalf of clearing brokers and counterparties to continually meet the original and maintenance requirements established by the clearing brokers and counterparties. Such requirements are specific to the respective clearing broker or counterparty. Certain master netting arrangements may not be enforceable in a bankruptcy. |
The following tables present a Fund’s derivative assets and liabilities, presented on a gross basis as no amounts are netted within the Statements of Assets and Liabilities, by counterparty net of amounts available for offset under a master netting agreement or similar agreement (“MNA”) and net of the related collateral received/pledged by a Fund as of October 31, 2019:
Emerging Markets Multi-Sector Bond Fund
Derivative Financial Instruments: | Assets | Liabilities | ||||||
Foreign currency contracts | $ | 754,471 | $ | (1,218,050 | ) | |||
Futures contracts | — | (6,047 | ) | |||||
Swap contracts | 5,087 | (4,422 | ) | |||||
|
|
|
| |||||
Total gross amount of derivative assets and liabilities in the Statement of Assets and Liabilities | 759,558 | (1,228,519 | ) | |||||
|
|
|
| |||||
Derivatives not subject to a MNA | — | 6,047 | ||||||
|
|
|
| |||||
Total gross amount of assets and liabilities subject to MNA or similar agreements | $ | 759,558 | $ | (1,222,472 | ) | |||
|
|
|
| |||||
Counterparty | Gross Amount of Assets | Financial Instruments and Derivatives Available for Offset | Non-cash Collateral Received* | Cash Collateral Received* | Net Amount of Assets | |||||||||||||||
Citibank NA | $ | 431,089 | $ | (431,089 | ) | $ | — | $ | — | $ | — | |||||||||
JP Morgan Chase & Co. | 125,789 | (125,789 | ) | — | — | — | ||||||||||||||
UBS AG | 202,680 | (202,680 | ) | — | — | — | ||||||||||||||
|
|
|
|
|
|
|
|
|
| |||||||||||
Total | $ | 759,558 | $ | (759,558 | ) | $ | — | $ | — | $ | — | |||||||||
|
|
|
|
|
|
|
|
|
| |||||||||||
Counterparty | Gross Amount of Liabilities | Financial Instruments and Derivatives Available for Offset | Non-cash Collateral Pledged* | Cash Collateral Pledged* | Net Amount of Liabilities | |||||||||||||||
Citibank NA | $ | (793,688 | ) | $ | 431,089 | $ | — | $ | 362,599 | $ | — | |||||||||
JP Morgan Chase & Co. | (163,981 | ) | 125,789 | — | — | (38,192 | ) | |||||||||||||
UBS AG | (264,803 | ) | 202,680 | — | 62,123 | — | ||||||||||||||
|
|
|
|
|
|
|
|
|
| |||||||||||
Total | $ | (1,222,472 | ) | $ | 759,558 | $ | — | $ | 424,722 | $ | (38,192 | ) | ||||||||
|
|
|
|
|
|
|
|
|
| |||||||||||
| * | In some instances, the actual collateral received and/or pledged may be more than the amount shown. |
| 88 |
|
| Hartford Schroders Funds |
Notes to Financial Statements – (continued)
October 31, 2019
InternationalMulti-Cap Value Fund
Derivative Financial Instruments: | Assets | Liabilities | ||||||
Foreign currency contracts | $ | — | $ | (99,028 | ) | |||
Total gross amount of derivative assets and liabilities in the Statement of Assets and Liabilities | — | (99,028 | ) | |||||
Derivatives not subject to a MNA | — | — | ||||||
|
|
|
| |||||
Total gross amount of assets and liabilities subject to MNA or similar agreements | $ | — | $ | (99,028 | ) | |||
|
|
|
| |||||
Counterparty | Gross Amount of Liabilities | Financial Instruments and Derivatives Available for Offset | Non-cash Collateral Pledged* | Cash Collateral Pledged* | Net Amount of Liabilities | |||||||||||||||
Citibank NA | $ | (4,386 | ) | $ | — | $ | — | $ | — | $ | (4,386 | ) | ||||||||
UBS AG | (94,642 | ) | — | — | — | (94,642 | ) | |||||||||||||
|
|
|
|
|
|
|
|
|
| |||||||||||
Total | $ | (99,028 | ) | $ | — | $ | — | $ | — | $ | (99,028 | ) | ||||||||
|
|
|
|
|
|
|
|
|
| |||||||||||
| * | In some instances, the actual collateral received and/or pledged may be more than the amount shown. |
Securitized Income Fund
Derivative Financial Instruments: | Assets | Liabilities | ||||||
Futures contracts | $ | — | $ | (234,239 | ) | |||
Total gross amount of derivative assets and liabilities in the Statement of Assets and Liabilities | — | (234,239 | ) | |||||
Derivatives not subject to a MNA | — | 234,239 | ||||||
|
|
|
| |||||
Total gross amount of assets and liabilities subject to MNA or similar agreements | $ | — | $ | — | ||||
|
|
|
| |||||
Tax-Aware Bond Fund
Derivative Financial Instruments: | Assets | Liabilities | ||||||
Futures contracts | $ | 29,918 | $ | (3,363 | ) | |||
Total gross amount of derivative assets and liabilities in the Statement of Assets and Liabilities | 29,918 | (3,363 | ) | |||||
Derivatives not subject to a MNA | (29,918 | ) | 3,363 | |||||
|
|
|
| |||||
Total gross amount of assets and liabilities subject to MNA or similar agreements | $ | — | $ | — | ||||
|
|
|
| |||||
| 5. | Principal Risks: |
A Fund’s investments expose it to various types of risks associated with financial instruments and the markets. A Fund may be exposed to the risks described below. Each Fund’s prospectus provides details of its principal risks.
The market values of equity securities, such as common stocks and preferred stocks, or equity related derivative investments, such as futures and options, may decline due to general market conditions which are not specifically related to a particular company, such as real or perceived adverse economic conditions, changes in the general outlook for corporate earnings, changes in interest or currency rates or adverse investor sentiment generally. The market value of equity securities may also decline due to factors which affect a particular industry or industries, such as labor shortages or increased production costs and competitive conditions within an industry. Equity securities and equity related investments generally have greater market price volatility than fixed income securities. The extent of each Fund’s exposure to market risk is the market value of the investments held as shown in the Fund’s Schedule of Investments.
Certain investments held by a Fund expose the Fund to various risks which may include, but are not limited to, interest rate, prepayment, and extension risks. Interest rate risk is the risk that fixed income securities will decline in value because of changes in interest rates. As nominal interest rates rise, the values of certain fixed income securities held by a Fund are likely to decrease. A nominal interest rate can be described as the sum of a real interest rate and an expected inflation rate. Fixed income securities with longer durations tend to be more sensitive to changes in interest rates, usually making them more volatile than securities with shorter durations. Duration is useful primarily as a measure of the sensitivity of a fixed income security’s market price to interest rate (i.e., yield) movements. Senior floating rate interests and securities subject to prepayment and extension risk generally offer less potential for gains when interest rates decline. Rising interest rates may cause prepayments to occur at a slower than expected rate, thereby effectively lengthening the maturity of the security and making the security more sensitive to interest rate changes. Prepayment and extension risk are major risks of mortgage-backed securities, senior floating rate interests and certain asset-backed securities. For certain asset-backed securities, the actual maturity may be less than the stated maturity shown in the Schedule of Investments, if applicable. As a result, the timing of income recognition relating to these securities may vary based upon the actual maturity.
Investing in the securities ofnon-U.S. issuers, whether directly or indirectly, involves certain considerations and risks not typically associated with securities of U.S. issuers. Such risks include, but are not limited to: generally less liquid and less efficient securities markets; generally greater
| 89 |
|
| Hartford Schroders Funds |
Notes to Financial Statements – (continued)
October 31, 2019
price volatility; exchange rate fluctuations; imposition of restrictions on the expatriation of funds or other protectionist measures; less publicly available information about issuers; the imposition of withholding or other taxes; higher transaction and custody costs; settlement delays and risk of loss attendant in settlement procedures; difficulties in enforcing contractual obligations; less regulation of securities markets; different accounting, disclosure and reporting requirements; more substantial governmental involvement in the economy; higher inflation rates; and greater social, economic and political uncertainties. These risks are heightened for investments in issuers from countries with less developed markets.
Credit risk depends largely on the perceived financial health of bond issuers. In general, the credit rating is inversely related to the credit risk of the issuer. Higher rated bonds generally are deemed to have less credit risk, while lower or unrated bonds are deemed to have higher risk of default. The share price, yield and total return of a fund that holds securities with higher credit risk may be more volatile than those of a fund that holds bonds with lower credit risk. A Fund may be exposed to counterparty risk, or the risk that an institution or other entity with which a Fund has unsettled or open transactions will default.
| 6. | Federal Income Taxes: |
| a) | Each Fund intends to continue to qualify as a Regulated Investment Company (“RIC”) under Subchapter M of the Internal Revenue Code (“IRC”) by distributing substantially all of its taxable net investment income and net realized capital gains to its shareholders each year. Each Fund has distributed substantially all of its income and capital gains in prior years, if applicable, and intends to distribute substantially all of its income and capital gains during the calendar year ending December 31, 2019. Accordingly, no provision for federal income or excise taxes has been made in the accompanying financial statements. Distributions from short-term capital gains are treated as ordinary income distributions for federal income tax purposes. |
| b) | Net Investment Income (Loss), Net Realized Gains (Losses) and Distributions – Net investment income (loss) and net realized gains (losses) may differ for financial statement and tax purposes primarily because of losses deferred due to wash sale adjustments, foreign currency gains and losses, adjustments related to Passive Foreign Investment Companies (“PFICs”), Real Estate Investment Trusts (“REITs”), RICs, certain derivatives and partnerships. The character of distributions made during the year from net investment income or net realized gains may differ from their ultimate characterization for federal income tax purposes. Also, due to the timing of dividend distributions, the fiscal year in which amounts are distributed may differ from the year that the income or realized gains (losses) were recorded by each Fund. |
| c) | Distributions and Components of Distributable Earnings– The tax character of distributions paid by each Fund for the years ended October 31, 2019 and October 31, 2018 are as follows: |
| For the Period Ended October 31, 2019 | For the Year Ended October 31, 2018 | |||||||||||||||||||||||||||||||
Fund | Tax Exempt Income | Ordinary Income | Long-Term Capital Gains | Tax Return of Capital | Tax Exempt Income | Ordinary Income | Long-Term Capital Gains | Tax Return of Capital | ||||||||||||||||||||||||
Emerging Markets Equity Fund | $ | — | $ | 39,644,839 | $ | — | $ | — | $ | — | $ | 24,238,168 | $ | — | $ | — | ||||||||||||||||
Emerging Markets Multi-Sector Bond Fund | — | 5,060,463 | — | 449,054 | — | 4,432,188 | 1,034,146 | 2,626,104 | ||||||||||||||||||||||||
InternationalMulti-Cap Value Fund | — | 84,909,372 | 18,475,074 | — | — | 64,900,706 | — | — | ||||||||||||||||||||||||
International Stock Fund | — | 9,083,992 | 8,985,009 | — | — | 2,346,035 | — | — | ||||||||||||||||||||||||
Securitized Income Fund | — | 896,077 | — | — | — | — | — | — | ||||||||||||||||||||||||
Tax-Aware Bond Fund | 3,566,783 | 2,140,618 | 2,272,801 | — | 3,817,404 | 1,301,064 | 231,010 | — | ||||||||||||||||||||||||
US MidCap Opportunities Fund | — | 7,239,899 | 14,900,220 | — | — | 9,081,501 | 4,163,310 | — | ||||||||||||||||||||||||
US Small Cap Opportunities Fund | — | 3,576,104 | 10,972,812 | — | — | 3,918,142 | 13,142,879 | — | ||||||||||||||||||||||||
As of October 31, 2019, the components of distributable earnings (deficit) for each Fund on a tax basis are as follows:
Fund | Tax Exempt Income | Undistributed Ordinary Income | Undistributed Long-Term Capital Gain | Accumulated Capital and Other Losses | Other Temporary Differences | Unrealized Appreciation (Depreciation) on Investments | Total Accumulated Earnings (Deficit) | |||||||||||||||||||||
Emerging Markets Equity Fund | $ | — | $ | 81,282,868 | $ | — | $ | (297,956,594 | ) | $ | (2,012 | ) | $ | 749,781,708 | $ | 533,105,970 | ||||||||||||
Emerging Markets Multi-Sector Bond Fund | — | — | — | (9,305,030 | ) | — | 1,561,064 | (7,743,966 | ) | |||||||||||||||||||
InternationalMulti-Cap Value Fund | — | 23,105,815 | — | (140,862,641 | ) | (4,731 | ) | 1,553,418 | (116,208,139 | ) | ||||||||||||||||||
International Stock Fund | — | 5,533,109 | — | (7,362,447 | ) | — | 45,351,112 | 43,521,774 | ||||||||||||||||||||
Securitized Income Fund | — | 63,960 | 33,289 | — | — | 97,294 | 194,543 | |||||||||||||||||||||
Tax-Aware Bond Fund | 409,198 | 3,671,801 | 3,237,890 | — | (10,546 | ) | 10,043,223 | 17,351,566 | ||||||||||||||||||||
US MidCap Opportunities Fund | — | 1,439,632 | 5,998,266 | — | (1,631 | ) | 149,899,333 | 157,335,600 | ||||||||||||||||||||
US Small Cap Opportunities Fund | — | 556,277 | 9,861,157 | — | — | 36,419,271 | 46,836,705 | |||||||||||||||||||||
| d) | Reclassification of Capital Accounts– The Funds may record reclassifications in their capital accounts. These reclassifications have no impact on the total net assets of the Funds. The reclassifications are a result of permanent differences between U.S. GAAP and tax accounting. Adjustments are made to reflect the impact these items have on current and future distributions to shareholders. Therefore, the source of the Funds’ distributions may be shown in the accompanying Statements of Changes in Net Assets as from distributable earnings or |
| 90 |
|
| Hartford Schroders Funds |
Notes to Financial Statements – (continued)
October 31, 2019
| from capital depending on the type of book and tax differences that exist. For the period ended October 31, 2019, the Funds recorded reclassifications to increase (decrease) the accounts listed below: |
Fund | Paid-in-Capital | Distributable earnings (loss) | ||||||
US Small Cap Opportunities Fund | $ | 1,106 | $ | (1,106 | ) | |||
| e) | Tax Basis of Investments– The aggregate cost of investments for federal income tax purposes at October 31, 2019 is different from book purposes primarily due to wash sale loss deferrals, passive foreign investment company (PFIC)mark-to-market adjustments and partnership adjustments. The net unrealized appreciation/(depreciation) on investments for tax purposes, which consists of gross unrealized appreciation and depreciation, was also different from book purposes primarily due to wash sale loss deferrals and mark-to-market adjustments on swaps, forwards, futures, options, and PFICs. Both the cost and unrealized appreciation and depreciation for federal income tax purposes are disclosed below: |
Fund | Tax Cost | Gross Unrealized Appreciation | Gross Unrealized (Depreciation) | Net Unrealized Appreciation/ (Depreciation) | ||||||||||||
Emerging Markets Equity Fund | $ | 2,818,116,264 | $ | 845,394,794 | $ | (93,249,486 | ) | $ | 752,145,308 | |||||||
Emerging Markets Multi-Sector Bond Fund | 91,501,003 | 4,379,148 | (2,769,162 | ) | 1,609,986 | |||||||||||
InternationalMulti-Cap Value Fund | 2,064,873,292 | 122,084,869 | (120,439,580 | ) | 1,645,289 | |||||||||||
International Stock Fund | 403,463,185 | 57,660,777 | (12,311,598 | ) | 45,349,179 | |||||||||||
Securitized Income Fund | 100,959,391 | 577,214 | (477,703 | ) | 99,511 | |||||||||||
Tax-Aware Bond Fund | 323,891,811 | 10,056,410 | (13,187 | ) | 10,043,223 | |||||||||||
US MidCap Opportunities Fund | 769,319,224 | 174,202,296 | (24,302,963 | ) | 149,899,333 | |||||||||||
US Small Cap Opportunities Fund | 181,455,158 | 44,212,631 | (7,793,362 | ) | 36,419,269 | |||||||||||
| f) | Capital Loss Carryforward– Under the Regulated Investment Company Modernization Act of 2010, funds are permitted to carry forward capital losses for an unlimited period. At October 31, 2019 (tax year end), each Fund’s capital loss carryforwards for U.S. federal income tax purposes were as follows: |
Fund | Short-Term Capital Loss Carryforward with No Expiration | Long-Term Capital Loss Carryforward with No Expiration | ||||||
Emerging Markets Equity Fund | $ | 224,002,332 | $ | 73,954,262 | ||||
Emerging Markets Multi-Sector Bond Fund | 6,854,984 | * | 2,450,046 | * | ||||
InternationalMulti-Cap Value Fund | 50,292,899 | 90,569,742 | ||||||
International Stock Fund | 2,117,965 | 5,244,482 | ||||||
| * | Future utilization of losses are subject to limitation under current tax laws. |
The Securitized Income Fund,Tax-Aware Bond Fund, US MidCap Opportunities Fund and US Small Cap Opportunities Fund had no capital loss carryforwards for U.S. federal income tax purposes as of October 31, 2019.
| g) | Accounting for Uncertainty in Income Taxes – Pursuant to provisions set forth by U.S. GAAP, Hartford Funds Management Company, LLC (“HFMC”) reviews each Fund’s tax positions for all open tax years. As of October 31, 2019, HFMC had reviewed the open tax years and concluded that there was no reason to record a liability for net unrecognized tax obligations relating to uncertain income tax positions. Each Fund files U.S. tax returns. Although the statute of limitations for examining a Fund’s U.S. tax returns remains open for 3 years, no examination is currently in progress. The Funds recognize interest and penalties, if any, related to unrecognized tax benefits as income tax expense on the Statements of Operations. During the year ended October 31, 2019, the Funds did not incur any interest or penalties. HFMC is not aware of any tax positions for which it is reasonably possible that the total amounts of unrecognized tax obligations will significantly change in the next twelve months. |
| 7. | Expenses: |
| a) | Investment Management Agreement– HFMC serves as each Fund’s investment manager pursuant to an Investment Management Agreement with the Company. HFMC is an indirect subsidiary of The Hartford Financial Services Group, Inc. (“The Hartford”). HFMC has overall investment supervisory responsibility for each Fund. In addition, HFMC provides administrative personnel, services, equipment, facilities and office space for proper operation of each Fund. HFMC has contracted with Schroder Investment Management North America Inc. (“SIMNA”) under asub-advisory agreement and SIMNA has contracted with Schroder Investment Management North America Limited (“SIMNA Ltd.”) under asub-sub-advisory agreement with respect to certain Funds. SIMNA performs the daily investment of the assets of each Fund in accordance with the Fund’s investment objective and policies. SIMNA Ltd. also performs daily investment of the assets for each of Emerging Markets Equity Fund, InternationalMulti-Cap Value Fund, International Stock Fund and Tax-Aware Bond Fund. Each Fund pays a fee to HFMC, a portion of which may be used to compensate SIMNA. |
| 91 |
|
| Hartford Schroders Funds |
Notes to Financial Statements – (continued)
October 31, 2019
The schedule below reflects the rates of compensation paid to HFMC for investment management services rendered as of October 31, 2019; the rates are accrued daily and paid monthly based on each Fund’s average daily net assets, at the following annual rates:
Fund | Management Fee Rates | |
Emerging Markets Equity Fund | 1.050% on first $1 billion and; | |
1.000% on next $4 billion and; | ||
0.990% on next $5 billion and; | ||
0.985% over $10 billion | ||
Emerging Markets Multi-Sector Bond Fund | 0.700% on first $1 billion and; | |
0.650% on next $4 billion and; | ||
0.640% on next $5 billion and; | ||
0.635% over $10 billion | ||
InternationalMulti-Cap Value Fund | 0.720% on first $1 billion and; | |
0.680% on next $4 billion and; | ||
0.675% on next $5 billion and; | ||
0.670% over $10 billion | ||
International Stock Fund | 0.670% on first $1 billion and; | |
0.650% on next $4 billion and; | ||
0.645% on next $5 billion and; | ||
0.640% over $10 billion | ||
Securitized Income Fund | 0.650% on first $1 billion and; | |
0.600% over $1 billion | ||
Tax-Aware Bond Fund | 0.450% on first $1 billion and; | |
0.430% on next $4 billion and; | ||
0.425% on next $5 billion and; | ||
0.420% over $10 billion | ||
US MidCap Opportunities Fund | 0.850% on first $1 billion and; | |
0.800% on next $4 billion and; | ||
0.790% on next $5 billion and; | ||
0.785% over $10 billion | ||
US Small Cap Opportunities Fund | 0.900% on first $1 billion and; | |
0.890% on next $4 billion and; | ||
0.880% on next $5 billion and; | ||
0.870% over $10 billion | ||
From November 1, 2018 through February 28, 2019, International Stock Fund paid the rate set forth below to HFMC for investment management services rendered. The rate was accrued daily and paid monthly based on the Fund’s average daily net assets.
International Stock Fund | 0.750% on first $1 billion and; | |
0.700% on next $4 billion and; | ||
0.690% on next $5 billion and; | ||
0.685% over $10 billion |
| b) | Accounting Services Agreement– Pursuant to the Fund Accounting Agreement between HFMC and the Company, on behalf of each Fund, HFMC provides accounting services to each Fund and receives monthly compensation based on each Fund’s average daily net assets at the rates set forth below. Each Fund’s accounting services fees are accrued daily and paid monthly. |
| Emerging Markets Equity Fund, Emerging Markets Multi-Sector Bond Fund, InternationalMulti-Cap Value Fund, International Stock Fund and Securitized Income Fund | ||||
| Average Daily Net Assets | Annual Fees | |||
first $3.5 billion and; | 0.018% | |||
next $3.5 billion and; | 0.014% | |||
Amount over $7 billion | 0.010% | |||
| Tax-Aware Bond Fund, US MidCap Opportunities Fund and US Small Cap Opportunities Fund | ||||
| Average Daily Net Assets | Annual Fees | |||
first $3.5 billion and; | 0.014% | |||
next $3.5 billion and; | 0.012% | |||
Amount over $7 billion | 0.010% | |||
HFMC has delegated certain accounting and administrative services functions to State Street Bank and Trust Company (“State Street”). The costs and expenses of such delegation are borne by HFMC, not by the Funds, and HFMC compensates State Street for its services out of its own resources.
| 92 |
|
| Hartford Schroders Funds |
Notes to Financial Statements – (continued)
October 31, 2019
| c) | Operating Expenses – Allocable expenses incurred by the Company are allocated to each series within the Company, and allocated to classes within each such series, in proportion to the average daily net assets of such series and classes, except where allocation of certain expenses is more fairly made directly to a Fund or to specific classes within a Fund. As of October 31, 2019, HFMC contractually limited the total operating expenses (exclusive of taxes, interest expenses, brokerage commissions, acquired fund fees and expenses and extraordinary expenses) through February 29, 2020 as follows for each of the following Funds: |
| Expense Limit as a Percentage of Average Daily Net Assets | ||||||||||||||||||||||||||||||||||||
Fund | Class A | Class C | Class I | Class R3 | Class R4 | Class R5 | Class Y | Class F | Class SDR | |||||||||||||||||||||||||||
Emerging Markets Multi-Sector Bond Fund(1) | 1.15 | % | 1.90 | % | 0.90 | % | 1.45 | % | 1.15 | % | 0.85 | % | 0.85 | % | 0.75 | % | 0.75 | % | ||||||||||||||||||
International Stock Fund(1) | 1.15 | % | 1.95 | % | 0.85 | % | 1.45 | % | 1.15 | % | 0.85 | % | 0.85 | % | 0.75 | % | 0.75 | % | ||||||||||||||||||
Securitized Income Fund(1) | 1.10 | % | N/A | 0.85 | % | N/A | N/A | N/A | 0.80 | % | 0.70 | % | 0.70 | % | ||||||||||||||||||||||
Tax-Aware Bond Fund(1) | 0.71 | % | 1.59 | % | 0.49 | % | N/A | N/A | N/A | 0.56 | % | 0.46 | % | 0.46 | % | |||||||||||||||||||||
US Small Cap Opportunities Fund(1) | 1.35 | % | 2.10 | % | 1.10 | % | 1.65 | % | 1.35 | % | 1.05 | % | 1.05 | % | 0.95 | % | 0.95 | % | ||||||||||||||||||
| (1) | Expense limitation was effective from March 1, 2019 through October 31, 2019. |
From November 1, 2018 through February 28, 2019, except as noted in the footnote below, HFMC contractually limited the total operating expenses (exclusive of taxes, interest expenses, brokerage commissions, acquired fund fees and expenses and extraordinary expenses), as follows for each of the following Funds:
| Expense Limit as a Percentage of Average Daily Net Assets | ||||||||||||||||||||||||||||||||||||
Fund | Class A | Class C | Class I | Class R3 | Class R4 | Class R5 | Class Y | Class F | Class SDR | |||||||||||||||||||||||||||
Emerging Markets Multi-Sector Bond Fund | 1.15 | % | 1.90 | % | 0.90 | % | 1.45 | % | 1.15 | % | 0.85 | % | 0.85 | %(1) | 0.75 | % | 0.75 | % | ||||||||||||||||||
Emerging Markets Equity Fund | 1.50 | % | 2.25 | % | 1.25 | % | 1.80 | % | 1.50 | % | 1.20 | % | 1.15 | % | 1.10 | % | 1.10 | % | ||||||||||||||||||
InternationalMulti-Cap Value Fund | 1.15 | % | 1.97 | % | 0.90 | % | 1.52 | % | 1.22 | % | 0.92 | % | 0.87 | % | 0.75 | % | 0.75 | % | ||||||||||||||||||
International Stock Fund | 1.20 | % | 1.95 | % | 0.95 | % | 1.50 | % | 1.20 | % | 0.90 | % | 0.85 | % | 0.80 | % | 0.80 | % | ||||||||||||||||||
Tax-Aware Bond Fund | 0.71 | % | 1.59 | % | 0.46 | % | N/A | N/A | N/A | 0.54 | % | 0.46 | % | 0.46 | % | |||||||||||||||||||||
US MidCap Opportunities Fund | 1.30 | % | 2.05 | % | 1.05 | % | 1.60 | % | 1.30 | % | 1.00 | % | 0.95 | % | 0.90 | % | 0.90 | % | ||||||||||||||||||
US Small Cap Opportunities Fund | 1.35 | % | 2.10 | % | 1.10 | % | 1.65 | % | 1.35 | % | 1.05 | % | 1.00 | % | 0.95 | % | 0.95 | % | ||||||||||||||||||
| (1) | HFMC has contractually agreed to reimburse expenses (exclusive of taxes, interest expenses, brokerage commissions, extraordinary expenses and acquired fund fees and expenses) to the extent necessary to maintain total annual fund operating expenses for Class Y shares of the Emerging Markets Multi-Sector Bond Fund as follows: 0.80% through May 31, 2019. For periods where multiple expense caps are in effect, the lower cap will apply. |
| d) | Fees Paid Indirectly – Certain Funds have entered into agreements with State Street Global Markets, LLC and Russell Implementation Services, Inc. to partially recapturenon-discounted trade commissions. Such rebates are used to pay a portion of a Fund’s expenses. In addition, the Funds’ custodian bank has agreed to reduce its fees when a Fund maintains cash on deposit in anon-interest-bearing custody account. For the year or period ended October 31, 2019, these amounts, if any, are included in the Statements of Operations. |
The ratio of expenses to average net assets in the accompanying financial highlights excludes the reduction in expenses related to fees paid indirectly. The annualized expense ratio after waivers reflecting the reduction for fees paid indirectly for the period is as follows:
Fund | Class A | Class C | Class I | Class R3 | Class R4 | Class R5 | Class Y | Class F | Class SDR | |||||||||||||||||||||||||||
Emerging Markets Equity Fund | 1.45 | % | 2.17 | % | 1.23 | % | 1.72 | % | 1.42 | % | 1.19 | % | 1.13 | % | 1.07 | % | 1.07 | % | ||||||||||||||||||
Emerging Markets Multi-Sector Bond Fund | 1.11 | % | 1.90 | % | 0.83 | % | 0.88 | % | 0.86 | % | 0.81 | % | 0.76 | % | 0.75 | % | 0.75 | % | ||||||||||||||||||
InternationalMulti-Cap Value Fund | 1.12 | % | 1.87 | % | 0.86 | % | 1.48 | % | 1.18 | % | 0.87 | % | 0.80 | % | 0.76 | % | 0.76 | % | ||||||||||||||||||
International Stock Fund | 1.14 | % | 1.87 | % | 0.83 | % | 1.33 | % | 1.05 | % | 0.78 | % | 0.84 | % | 0.76 | % | 0.76 | % | ||||||||||||||||||
Securitized Income Fund | 0.98 | % | N/A | 0.57 | % | N/A | N/A | N/A | 0.89 | % | 0.87 | % | 0.87 | % | ||||||||||||||||||||||
Tax-Aware Bond Fund | 0.71 | % | 1.54 | % | 0.48 | % | N/A | N/A | N/A | 0.53 | % | 0.46 | % | 0.46 | % | |||||||||||||||||||||
US MidCap Opportunities Fund | 1.27 | % | 2.02 | % | 1.00 | % | 1.62 | % | 1.32 | % | 1.02 | % | 0.95 | % | 0.91 | % | 0.91 | % | ||||||||||||||||||
US Small Cap Opportunities Fund | 1.35 | % | 2.10 | % | 1.04 | % | 1.63 | % | 1.31 | % | 1.05 | % | 1.01 | % | 0.95 | % | 0.95 | % | ||||||||||||||||||
| e) | Sales Charges and Distribution and Service Plan for Class A, C, R3 and R4 Shares – Hartford Funds Distributors, LLC (“HFD”), an indirect subsidiary of The Hartford, is the principal underwriter and distributor of each Fund. For the period ended October 31, 2019, HFD receivedfront-end sales charges and contingent deferred sales charges for each Fund as follows: |
Fund | Front-end Sales Charges | Contingent Deferred Sales Charges | ||||||
Emerging Markets Equity Fund | $ | 60,143 | $ | 5,417 | ||||
Emerging Markets Multi-Sector Bond Fund | 861 | 298 | ||||||
InternationalMulti-Cap Value Fund | 441,476 | 25,128 | ||||||
International Stock Fund | 405,852 | 1,767 | ||||||
Securitized Income Fund | 1 | N/A | ||||||
Tax-Aware Bond Fund | 133,964 | 7,874 | ||||||
US MidCap Opportunities Fund | 180,840 | 11,933 | ||||||
US Small Cap Opportunities Fund | 67,542 | 3,394 | ||||||
| 93 |
|
| Hartford Schroders Funds |
Notes to Financial Statements – (continued)
October 31, 2019
The Board of Directors of the Company has approved the adoption of a separate distribution plan (each a “Plan”) pursuant to Rule12b-1 under the 1940 Act for each of Class A, C, R3 and R4 shares. Under a Plan, Class A, Class C, Class R3 and Class R4 shares of a Fund, as applicable, bear distribution and/or service fees paid to HFD, some of which may be paid to select broker-dealers. Pursuant to the Class A Plan, a Fund may pay HFD a fee of up to 0.25% of the average daily net assets attributable to Class A shares for distribution financing activities and shareholder account servicing activities. The entire amount of the fee may be used for shareholder servicing expenses and/or distribution expenses. Pursuant to the Class C Plan, a Fund may pay HFD a fee of up to 1.00% of the average daily net assets attributable to Class C shares for distribution financing activities, and up to 0.25% may be used for shareholder account servicing activities. The Class C Plan also provides that HFD will receive all contingent deferred sales charges attributable to Class C shares. Pursuant to the Class R3 Plan, a Fund may pay HFD a fee of up to 0.50% of the average daily net assets attributable to Class R3 shares for distribution financing activities, and up to 0.25% may be used for shareholder account servicing activities. Pursuant to the Class R4 Plan, a Fund may pay HFD a fee of up to 0.25% of the average daily net assets attributable to Class R4 shares for distribution financing activities. The entire amount of the fee may be used for shareholder account servicing activities. Each Fund’s12b-1 fees are accrued daily and paid monthly or at such other intervals as the Company’s Board of Directors may determine. Any 12b-1 fees attributable to assets held in an account held directly with the Funds’ transfer agent for which there is not a third-party listed as the broker-dealer of record (or HFD does not otherwise have a payment obligation) are generally reimbursed to the applicable Fund. Such amounts are reflected as “Distribution fee reimbursements” on the Statement of Operations.
| f) | Other Related Party Transactions – Certain officers of the Company are directors and/or officers of HFMC and/or The Hartford or its subsidiaries. For the year or period ended October 31, 2019, a portion of the Company’s Chief Compliance Officer’s (“CCO”) compensation was paid by all of the investment companies in the Hartford fund complex. The portion allocated to each Fund, as represented in other expenses on the Statements of Operations, is outlined in the table below. |
Fund | CCO Compensation Paid by Fund | |||
Emerging Markets Equity Fund | $ | 8,136 | ||
Emerging Markets Multi-Sector Bond Fund | 244 | |||
InternationalMulti-Cap Value Fund | 4,582 | |||
International Stock Fund | 684 | |||
Securitized Income Fund | 59 | |||
Tax-Aware Bond Fund | 539 | |||
US MidCap Opportunities Fund | 2,347 | |||
US Small Cap Opportunities Fund | 407 | |||
Hartford Administrative Services Company (“HASCO”), an indirect subsidiary of The Hartford, provides transfer agent services to each Fund. Each Fund pays HASCO a transfer agency fee payable monthly based on the lesser of (i) the costs of providing or overseeing transfer agency services provided to each share class of such Fund plus a target profit margin or (ii) a Specified Amount (as defined in the table below). Such fee is intended to compensate HASCO for: (i) fees payable by HASCO to DST Asset Manager Solutions, Inc. (“DST”) (and any other designatedsub-agent) according to the agreed-upon fee schedule under thesub-transfer agency agreement between HASCO and DST (or between HASCO and any other designatedsub-agent, as applicable); (ii)sub-transfer agency fees payable by HASCO to financial intermediaries, according to the agreed-upon terms between HASCO and the financial intermediaries, provided that such payments are within certain limits approved by the Company’s Board of Directors; (iii) certain expenses that HASCO’s parent company, Hartford Funds Management Group, Inc., allocates to HASCO that relate to HASCO’s transfer agency services provided to the Fund; and (iv) a target profit margin.
Share Class | Specified Amount (as a percentage average daily net assets) | |||
Class A | 0.25 | % | ||
Class C | 0.25 | % | ||
Class I | 0.20 | % | ||
Class Y | 0.11 | %* | ||
Class R3 | 0.22 | % | ||
Class R4 | 0.17 | % | ||
Class R5 | 0.12 | % | ||
Class F | 0.004 | % | ||
Class SDR | 0.004 | % | ||
| * | For the period November 1, 2018 through April 30, 2019, the specified amount for all Class Y shares was equal to 0.06% of average daily net assets. |
| 94 |
|
| Hartford Schroders Funds |
Notes to Financial Statements – (continued)
October 31, 2019
Effective March 1, 2019, HASCO has contractually agreed to waive and/or reimburse a portion of the transfer agency fees for the share classes of the Funds listed below to the extent necessary to maintain the transfer agency fees as follows:
Fund | Class Y | |||
InternationalMulti-Cap Value Fund | 0.05 | % | ||
US MidCap Opportunities Fund | 0.07 | % | ||
This contractual arrangement for each of these Funds will remain in effect until February 29, 2020 unless the Board of Directors approves its earlier termination.
Pursuant to asub-transfer agency agreement between HASCO and DST, HASCO has delegated certain transfer agent, dividend disbursing agent and shareholder servicing agent functions to DST. Each Fund does not pay any fee directly to DST; rather, HASCO makes all such payments to DST. The accrued amount shown in the Statements of Operations reflects the amounts charged by HASCO. These fees are accrued daily and paid monthly.
For the period ended October 31, 2019, the effective rate of compensation paid to HASCO for transfer agency services as a percentage of each Class’ average daily net assets is as follows:
Fund | Class A | Class C | Class I | Class R3 | Class R4 | Class R5 | Class Y | Class F | Class SDR | |||||||||||||||||||||||||||
Emerging Markets Equity Fund | 0.13 | % | 0.10 | % | 0.17 | % | 0.22 | % | 0.11 | % | 0.12 | % | 0.06 | % | 0.00 | % | 0.00 | % | ||||||||||||||||||
Emerging Markets Multi-Sector Bond Fund | 0.11 | % | 0.21 | % | 0.08 | % | 0.12 | % | 0.11 | % | 0.07 | % | 0.01 | % | 0.00 | % | 0.00 | % | ||||||||||||||||||
InternationalMulti-Cap Value Fund | 0.11 | % | 0.11 | % | 0.10 | % | 0.22 | % | 0.17 | % | 0.11 | % | 0.05 | % | 0.00 | % | 0.00 | % | ||||||||||||||||||
International Stock Fund | 0.13 | % | 0.11 | % | 0.07 | % | 0.17 | % | 0.09 | % | 0.02 | % | 0.07 | % | 0.00 | % | 0.00 | % | ||||||||||||||||||
Securitized Income Fund | 0.07 | % | N/A | 0.07 | % | N/A | N/A | N/A | 0.02 | % | 0.00 | % | 0.00 | % | ||||||||||||||||||||||
Tax-Aware Bond Fund | 0.05 | % | 0.08 | % | 0.08 | % | N/A | N/A | N/A | 0.07 | % | 0.00 | % | 0.00 | % | |||||||||||||||||||||
US MidCap Opportunities Fund | 0.11 | % | 0.11 | % | 0.10 | % | 0.22 | % | 0.17 | % | 0.12 | % | 0.05 | % | 0.00 | % | 0.00 | % | ||||||||||||||||||
US Small Cap Opportunities Fund | 0.16 | % | 0.16 | % | 0.09 | % | 0.22 | % | 0.17 | % | 0.10 | % | 0.06 | % | 0.00 | % | 0.00 | % | ||||||||||||||||||
| 8. | Securities Lending: |
The Company has entered into a securities lending agency agreement (“lending agreement”) with Citibank, N.A. (“Citibank”). Certain Funds may lend portfolio securities to certain borrowers in U.S. andnon-U.S. markets in an amount not to exceedone-third (33 1/3%) of the value of its total assets. If a Fund security is on loan, under the lending agreement, the borrower is required to deposit cash or liquid securities as collateral at least equal to 100% of the market value of the loaned securities; cash collateral is invested for the benefit of the Fund by the Fund’s lending agent pursuant to collateral investment guidelines. The collateral is marked to market daily, in an amount at least equal to the current market value of the securities loaned.
A Fund is subject to certain risks while its securities are on loan, including the following: (i) the risk that the borrower defaults on the loan and the collateral is inadequate to cover the Fund’s loss; (ii) the risk that the earnings on the collateral invested are not sufficient to pay fees incurred in connection with the loan; (iii) the risk that the principal value of the collateral invested may decline; (iv) the risk that the borrower may use the loaned securities to cover a short sale, which may in turn place downward pressure on the market prices of the loaned securities; (v) the risk that return of loaned securities could be delayed and interfere with portfolio management decisions; and (vi) the risk that any efforts to restrict the securities for purposes of voting may not be effective. These events could also trigger adverse tax consequences for the Fund.
The Funds retain loan fees and the interest on cash collateral investments but are required to pay the borrower a rebate for the use of cash collateral. In cases where the lent security is of high value to borrowers, there may be a negative rebate (i.e., a net payment from the borrower to Funds). Upon termination of a loan, the Funds are required to return to the borrower an amount equal to the cash collateral, plus any rebate owed to the borrowers. The net income earned on the securities lending (after payment of rebates and Citibank’s fee) is included on the Statements of Operations as Investment Income from securities lending. The Funds also receive payments from the borrower during the period of the loan, equivalent to dividends and interest earned on the securities loaned, which are recorded as Investment Income from dividends or interest, respectively, on the Statements of Operations.
| 95 |
|
| Hartford Schroders Funds |
Notes to Financial Statements – (continued)
October 31, 2019
The following table presents the market value of the Funds’ securities on loan, net of amounts available for offset under the master netting arrangements and any related collateral received by the Funds as of October 31, 2019.
Fund | Investment Securities on Loan, at market value, Presented on the Statement of Assets and Liabilities(1) | Collateral Posted by Borrower(3) | Net Amount(2) | |||||||||
Emerging Markets Multi-Sector Bond Fund | $ | 2,214,352 | $ | (2,214,352 | ) | $ | — | |||||
InternationalMulti-Cap Value Fund | 13,061,461 | (13,061,461 | ) | — | ||||||||
International Stock Fund | 2,872,387 | (2,872,387 | ) | — | ||||||||
US MidCap Opportunities Fund | 14,096,644 | (14,096,644 | ) | — | ||||||||
US Small Cap Opportunities Fund | 6,861,411 | (6,861,411 | ) | — | ||||||||
| (1) | It is each Fund’s policy to obtain additional collateral from, or return excess collateral to, the borrower by the end of the next business day following the valuation date of the securities loaned. Therefore, the value of the collateral held may be temporarily less than that required under the lending contract. |
| (2) | Net amount represents the net amount receivable due from the counterparty in the event of default. |
| (3) | Collateral received in excess of the market value of securities on loan is not presented in this table. The total cash and non-cash collateral with value of $2,296,585, $15,874,472, $3,004,665, $14,259,701, and $7,120,052, respectively, has been received by Emerging Markets Multi-Sector Bond Fund, International Multi-Cap Value Fund, International Stock Fund, US MidCap Opportunities Fund, and US Small Cap Opportunities Fund, respectively, in connection with securities lending transactions. |
| 9. | Secured Borrowings: |
The following tables reflect a breakdown of transactions accounted for as secured borrowings, the gross obligation by the type of collateral pledged, and the remaining contractual maturity of those transactions as of October 31, 2019.
| Overnight and Continuous | <30 days | Between 30 & 90 days | >90 days | Total | ||||||||||||||||
| Emerging Markets Multi-Sector Bond Fund | ||||||||||||||||||||
Securities Lending Transactions(1) |
| |||||||||||||||||||
Corporate Bonds | $ | 2,200,654 | $ | — | $ | — | $ | — | $ | 2,200,654 | ||||||||||
Foreign Government Obligations | 95,931 | — | — | — | 95,931 | |||||||||||||||
|
|
|
|
|
|
|
|
|
| |||||||||||
Total | $ | 2,296,585 | $ | — | $ | — | $ | — | $ | 2,296,585 | ||||||||||
|
|
|
|
|
|
|
|
|
| |||||||||||
Total Borrowings | $ | 2,296,585 | $ | — | $ | — | $ | — | $ | 2,296,585 | ||||||||||
|
|
|
|
|
|
|
|
|
| |||||||||||
Gross amount of recognized liabilities for securities lending transactions |
| $ | 2,296,585 | |||||||||||||||||
|
| |||||||||||||||||||
| InternationalMulti-Cap Value Fund | ||||||||||||||||||||
Securities Lending Transactions(1) |
| |||||||||||||||||||
Common Stocks | $ | 7,856,206 | $ | — | $ | — | $ | — | $ | 7,856,206 | ||||||||||
|
|
|
|
|
|
|
|
|
| |||||||||||
Total Borrowings | $ | 7,856,206 | $ | — | $ | — | $ | — | $ | 7,856,206 | ||||||||||
|
|
|
|
|
|
|
|
|
| |||||||||||
Gross amount of recognized liabilities for securities lending transactions |
| $ | 7,856,206 | |||||||||||||||||
|
| |||||||||||||||||||
| International Stock Fund | ||||||||||||||||||||
Securities Lending Transactions(1) |
| |||||||||||||||||||
Common Stocks | $ | 3,004,665 | $ | — | $ | — | $ | — | $ | 3,004,665 | ||||||||||
|
|
|
|
|
|
|
|
|
| |||||||||||
Total Borrowings | $ | 3,004,665 | $ | — | $ | — | $ | — | $ | 3,004,665 | ||||||||||
|
|
|
|
|
|
|
|
|
| |||||||||||
Gross amount of recognized liabilities for securities lending transactions |
| $ | 3,004,665 | |||||||||||||||||
|
| |||||||||||||||||||
| Securitized Income Fund | ||||||||||||||||||||
Reverse Repurchase Agreements |
| |||||||||||||||||||
Asset & Mortgage Backed Securities | $ | — | $ | — | $ | 4,744,550 | $ | — | $ | 4,744,550 | ||||||||||
|
|
|
|
|
|
|
|
|
| |||||||||||
Total Borrowings | $ | — | $ | — | $ | 4,744,550 | $ | — | $ | 4,744,550 | ||||||||||
|
|
|
|
|
|
|
|
|
| |||||||||||
Gross amount of recognized liabilities for reverse repurchase agreements | $ | 4,744,550 | ||||||||||||||||||
|
| |||||||||||||||||||
| US MidCap Opportunities Fund | ||||||||||||||||||||
Securities Lending Transactions(1) |
| |||||||||||||||||||
Common Stocks | $ | 14,259,701 | $ | — | $ | — | $ | — | $ | 14,259,701 | ||||||||||
|
|
|
|
|
|
|
|
|
| |||||||||||
Total Borrowings | $ | 14,259,701 | $ | — | $ | — | $ | — | $ | 14,259,701 | ||||||||||
|
|
|
|
|
|
|
|
|
| |||||||||||
Gross amount of recognized liabilities for securities lending transactions |
| $ | 14,259,701 | |||||||||||||||||
|
| |||||||||||||||||||
| US Small Cap Opportunities Fund | ||||||||||||||||||||
Securities Lending Transactions(1) |
| |||||||||||||||||||
Common Stocks | $ | 7,120,052 | $ | — | $ | — | $ | — | $ | 7,120,052 | ||||||||||
|
|
|
|
|
|
|
|
|
| |||||||||||
Total Borrowings | $ | 7,120,052 | $ | — | $ | — | $ | — | $ | 7,120,052 | ||||||||||
|
|
|
|
|
|
|
|
|
| |||||||||||
Gross amount of recognized liabilities for securities lending transactions |
| $ | 7,120,052 | |||||||||||||||||
|
| |||||||||||||||||||
| (1) | Amount represents the payable for cash collateral received on securities on loan. This will generally be in the “Overnight and Continuous” column as the securities are typically callable on demand. |
| 96 |
|
| Hartford Schroders Funds |
Notes to Financial Statements – (continued)
October 31, 2019
| 10. | Affiliate Holdings: |
As of October 31, 2019, affiliates of The Hartford had ownership of shares in each Fund as follows:
Percentage of a Class:
Fund | Class A | Class C | Class I | Class R3 | Class R4 | Class R5 | Class Y | Class F | Class SDR | |||||||||||||||||||||||||||
Emerging Markets Equity Fund | — | — | — | 15 | % | 50 | % | — | — | — | — | |||||||||||||||||||||||||
Emerging Markets Multi-Sector Bond Fund | — | — | — | 100 | % | 100 | % | 100 | % | — | — | — | ||||||||||||||||||||||||
InternationalMulti-Cap Value Fund | — | — | — | — | %* | — | — | — | — | — | ||||||||||||||||||||||||||
International Stock Fund | — | — | — | 7 | % | 4 | % | 1 | % | 2 | % | — | — | |||||||||||||||||||||||
Securitized Income Fund | 100 | % | N/A | 77 | % | N/A | N/A | N/A | 100 | % | 80 | % | — | |||||||||||||||||||||||
Tax-Aware Bond Fund | — | — | — | N/A | N/A | N/A | 5 | % | — | — | ||||||||||||||||||||||||||
US MidCap Opportunities Fund | — | — | — | — | — | 1 | % | — | — | — | ||||||||||||||||||||||||||
US Small Cap Opportunities Fund | — | — | — | 11 | % | 5 | % | 15 | % | — | — | — | ||||||||||||||||||||||||
Percentage of Fund by Class:
Fund | Class A | Class C | Class I | Class R3 | Class R4 | Class R5 | Class Y | Class F | Class SDR | |||||||||||||||||||||||||||
Emerging Markets Equity Fund | — | — | — | — | %* | — | %* | — | — | — | — | |||||||||||||||||||||||||
Emerging Markets Multi-Sector Bond Fund | — | — | — | — | %* | — | %* | — | %* | — | — | — | ||||||||||||||||||||||||
InternationalMulti-Cap Value Fund | — | — | — | — | %* | — | — | — | — | — | ||||||||||||||||||||||||||
International Stock Fund | — | — | — | — | %* | — | %* | — | %* | — | %* | — | — | |||||||||||||||||||||||
Securitized Income Fund | 4 | % | N/A | 4 | % | N/A | N/A | N/A | 4 | % | 2 | % | — | |||||||||||||||||||||||
Tax-Aware Bond Fund | — | — | — | N/A | N/A | N/A | — | %* | — | — | ||||||||||||||||||||||||||
US MidCap Opportunities Fund | — | — | — | — | — | — | %* | — | — | — | ||||||||||||||||||||||||||
US Small Cap Opportunities Fund | — | — | — | — | %* | — | %* | — | %* | — | — | — | ||||||||||||||||||||||||
| * | Percentage rounds to zero. |
As of October 31, 2019, affiliated funds of funds and certain 529 plans administered by HFMC in the aggregate owned a portion of the Funds identified below. Therefore, these Funds may experience relatively large purchases or redemptions of their shares from these affiliated funds of funds and certain 529 plans administered by HFMC. Affiliated funds of funds and certain 529 plans administered by HFMC owned shares in the Funds listed below as follows:
Funds | Percentage of Fund* | |||
Emerging Markets Equity Fund | 1 | % | ||
Emerging Markets Multi-Sector Bond Fund | 25 | % | ||
InternationalMulti-Cap Value Fund | 5 | % | ||
| * | As of October 31, 2019, the affiliated funds of funds and certain 529 plans administered by HFMC were invested in Class F shares. |
| 11. | Investment Transactions: |
For the year or period ended October 31, 2019, the cost of purchases and proceeds from sales of investment securities (excluding short-term investments) were as follows:
Fund | Cost of Purchases Excluding U.S. Government Obligations | Sales Proceeds Excluding U.S. Government Obligations | Cost of Purchases For U.S . Government Obligations | Sales Proceeds For U.S. Government Obligations | Total Cost of Purchases | Total Sales Proceeds | ||||||||||||||||||
Emerging Markets Equity Fund | $ | 1,667,276,217 | $ | 1,456,460,864 | $ | — | $ | — | $ | 1,667,276,217 | $ | 1,456,460,864 | ||||||||||||
Emerging Markets Multi-Sector Bond Fund | 228,986,053 | 243,106,191 | — | — | 228,986,053 | 243,106,191 | ||||||||||||||||||
InternationalMulti-Cap Value Fund | 2,430,363,697 | 2,244,939,907 | — | — | 2,430,363,697 | 2,244,939,907 | ||||||||||||||||||
International Stock Fund | 302,931,968 | 118,886,171 | — | — | 302,931,968 | 118,886,171 | ||||||||||||||||||
Securitized Income Fund | 109,442,038 | 18,758,181 | — | — | 109,442,038 | 18,758,181 | ||||||||||||||||||
Tax-Aware Bond Fund | 211,186,322 | 146,982,977 | 283,967,904 | 249,316,489 | 495,154,226 | 396,299,466 | ||||||||||||||||||
US MidCap Opportunities Fund | 356,759,049 | 557,963,945 | — | — | 356,759,049 | 557,963,945 | ||||||||||||||||||
US Small Cap Opportunities Fund | 100,331,899 | 73,977,069 | — | — | 100,331,899 | 73,977,069 | ||||||||||||||||||
| 97 |
|
| Hartford Schroders Funds |
Notes to Financial Statements – (continued)
October 31, 2019
| 12. | Capital Share Transactions: |
The following information is for the period ended October 31, 2019, and the year ended October 31, 2018:
| For the Year Ended October 31, 2019 | For the Year Ended October 31, 2018 | |||||||||||||||
| Shares | Amount | Shares | Amount | |||||||||||||
| Emerging Markets Equity Fund | ||||||||||||||||
Class A | ||||||||||||||||
Shares Sold | 1,748,349 | $ | 25,903,979 | 1,351,701 | $ | 22,179,102 | ||||||||||
Shares Issued for Reinvested Dividends | 34,398 | 474,696 | 19,652 | 324,655 | ||||||||||||
Shares Redeemed | (1,240,206 | ) | (18,680,319 | ) | (1,361,715 | ) | (22,311,807 | ) | ||||||||
|
|
|
|
|
|
|
| |||||||||
Net Increase (Decrease) | 542,541 | 7,698,356 | 9,638 | 191,950 | ||||||||||||
|
|
|
|
|
|
|
| |||||||||
Class C | ||||||||||||||||
Shares Sold | 351,995 | $ | 5,084,173 | 397,185 | $ | 6,432,700 | ||||||||||
Shares Issued for Reinvested Dividends | 3,391 | 46,251 | 1,164 | 19,052 | ||||||||||||
Shares Redeemed | (196,969 | ) | (2,908,753 | ) | (105,020 | ) | (1,631,048 | ) | ||||||||
|
|
|
|
|
|
|
| |||||||||
Net Increase (Decrease) | 158,417 | 2,221,671 | 293,329 | 4,820,704 | ||||||||||||
|
|
|
|
|
|
|
| |||||||||
Class I | ||||||||||||||||
Shares Sold | 51,189,025 | $ | 762,162,282 | 50,652,325 | $ | 814,813,057 | ||||||||||
Shares Issued for Reinvested Dividends | 516,573 | 7,113,215 | 376,940 | 6,211,965 | ||||||||||||
Shares Redeemed | (58,447,579 | ) | (871,528,570 | ) | (41,674,889 | ) | (687,276,537 | ) | ||||||||
|
|
|
|
|
|
|
| |||||||||
Net Increase (Decrease) | (6,741,981 | ) | (102,253,073 | ) | 9,354,376 | 133,748,485 | ||||||||||
|
|
|
|
|
|
|
| |||||||||
Class R3 | ||||||||||||||||
Shares Sold | 834 | $ | 12,388 | 5,636 | $ | 92,693 | ||||||||||
Shares Issued for Reinvested Dividends | 57 | 787 | 14 | 237 | ||||||||||||
Shares Redeemed | (2,050 | ) | (30,637 | ) | — | — | ||||||||||
|
|
|
|
|
|
|
| |||||||||
Net Increase (Decrease) | (1,159 | ) | (17,462 | ) | 5,650 | 92,930 | ||||||||||
|
|
|
|
|
|
|
| |||||||||
Class R4 | ||||||||||||||||
Shares Sold | 5,127 | $ | 71,225 | 257,038 | $ | 3,790,255 | ||||||||||
Shares Issued for Reinvested Dividends | 3,331 | 45,699 | 60 | 985 | ||||||||||||
Shares Redeemed | (271,528 | ) | (3,755,502 | ) | (764 | ) | (11,085 | ) | ||||||||
|
|
|
|
|
|
|
| |||||||||
Net Increase (Decrease) | (263,070 | ) | (3,638,578 | ) | 256,334 | 3,780,155 | ||||||||||
|
|
|
|
|
|
|
| |||||||||
Class R5 | ||||||||||||||||
Shares Sold | 5,315 | $ | 79,902 | 50,381 | $ | 822,445 | ||||||||||
Shares Issued for Reinvested Dividends | 458 | 6,306 | 7 | 113 | ||||||||||||
Shares Redeemed | (2,130 | ) | (32,680 | ) | (16,767 | ) | (275,709 | ) | ||||||||
|
|
|
|
|
|
|
| |||||||||
Net Increase (Decrease) | 3,643 | 53,528 | 33,621 | 546,849 | ||||||||||||
|
|
|
|
|
|
|
| |||||||||
Class Y | ||||||||||||||||
Shares Sold | 11,244,782 | $ | 164,696,976 | 3,981,181 | $ | 64,579,136 | ||||||||||
Shares Issued for Reinvested Dividends | 117,355 | 1,617,151 | 33,693 | 555,933 | ||||||||||||
Shares Redeemed | (12,480,644 | ) | (190,216,734 | ) | (1,293,384 | ) | (20,507,353 | ) | ||||||||
|
|
|
|
|
|
|
| |||||||||
Net Increase (Decrease) | (1,118,507 | ) | (23,902,607 | ) | 2,721,490 | 44,627,716 | ||||||||||
|
|
|
|
|
|
|
| |||||||||
Class F | ||||||||||||||||
Shares Sold | 22,780,248 | $ | 344,169,329 | 9,323,032 | $ | 160,685,332 | ||||||||||
Shares Issued for Reinvested Dividends | 181,969 | 2,503,890 | 25,086 | 413,171 | ||||||||||||
Shares Redeemed | (7,350,035 | ) | (111,675,098 | ) | (996,887 | ) | (15,984,770 | ) | ||||||||
|
|
|
|
|
|
|
| |||||||||
Net Increase (Decrease) | 15,612,182 | 234,998,121 | 8,351,231 | 145,113,733 | ||||||||||||
|
|
|
|
|
|
|
| |||||||||
Class SDR | ||||||||||||||||
Shares Sold | 18,036,150 | $ | 267,392,203 | 29,358,587 | $ | 476,601,082 | ||||||||||
Shares Issued for Reinvested Dividends | 906,907 | 12,506,249 | 364,477 | 6,013,870 | ||||||||||||
Shares Redeemed | (13,526,435 | ) | (208,708,307 | ) | (7,382,271 | ) | (118,106,317 | ) | ||||||||
|
|
|
|
|
|
|
| |||||||||
Net Increase (Decrease) | 5,416,622 | 71,190,145 | 22,340,793 | 364,508,635 | ||||||||||||
|
|
|
|
|
|
|
| |||||||||
Total Net Increase (Decrease) | 13,608,688 | $ | 186,350,101 | 43,366,462 | $ | 697,431,157 | ||||||||||
|
|
|
|
|
|
|
| |||||||||
| Emerging Markets Multi-Sector Bond Fund | ||||||||||||||||
Class A | ||||||||||||||||
Shares Sold | 148,243 | $ | 1,360,898 | 402,216 | $ | 3,700,507 | ||||||||||
Issued in Merger | — | — | 281,979 | 2,506,424 | ||||||||||||
Shares Issued for Reinvested Dividends | 13,866 | 124,253 | 17,182 | 159,189 | ||||||||||||
Shares Redeemed | (347,011 | ) | (3,150,553 | ) | (563,492 | ) | (5,084,030 | ) | ||||||||
|
|
|
|
|
|
|
| |||||||||
Net Increase (Decrease) | (184,902 | ) | (1,665,402 | ) | 137,885 | 1,282,090 | ||||||||||
|
|
|
|
|
|
|
| |||||||||
| 98 |
|
| Hartford Schroders Funds |
Notes to Financial Statements – (continued)
October 31, 2019
| For the Year Ended October 31, 2019 | For the Year Ended October 31, 2018 | |||||||||||||||
| Shares | Amount | Shares | Amount | |||||||||||||
| Emerging Markets Multi-Sector Bond Fund – (continued) | ||||||||||||||||
Class C | ||||||||||||||||
Shares Sold | 23,237 | $ | 209,450 | 45,422 | $ | 443,068 | ||||||||||
Issued in Merger | — | — | 1,988 | 17,583 | ||||||||||||
Shares Issued for Reinvested Dividends | 944 | 8,404 | 1,946 | 17,725 | ||||||||||||
Shares Redeemed | (42,187 | ) | (373,516 | ) | (9,338 | ) | (84,441 | ) | ||||||||
|
|
|
|
|
|
|
| |||||||||
Net Increase (Decrease) | (18,006 | ) | (155,662 | ) | 40,018 | 393,935 | ||||||||||
|
|
|
|
|
|
|
| |||||||||
Class I | ||||||||||||||||
Shares Sold | 1,631,596 | $ | 14,785,602 | 3,324,341 | $ | 31,531,124 | ||||||||||
Issued in Merger | — | — | 2,872,206 | 25,494,558 | ||||||||||||
Shares Issued for Reinvested Dividends | 191,328 | 1,715,191 | 179,956 | 1,665,910 | ||||||||||||
Shares Redeemed | (2,722,831 | ) | (24,420,037 | ) | (3,761,993 | ) | (34,197,414 | ) | ||||||||
|
|
|
|
|
|
|
| |||||||||
Net Increase (Decrease) | (899,907 | ) | (7,919,244 | ) | 2,614,510 | 24,494,178 | ||||||||||
|
|
|
|
|
|
|
| |||||||||
Class R3 | ||||||||||||||||
Shares Issued for Reinvested Dividends | 65 | $ | 584 | 179 | $ | 1,731 | ||||||||||
Shares Redeemed | — | — | (2,600 | ) | (24,251 | ) | ||||||||||
|
|
|
|
|
|
|
| |||||||||
Net Increase (Decrease) | 65 | 584 | (2,421 | ) | (22,520 | ) | ||||||||||
|
|
|
|
|
|
|
| |||||||||
Class R4 | ||||||||||||||||
Shares Issued for Reinvested Dividends | 65 | $ | 585 | 81 | $ | 761 | ||||||||||
|
|
|
|
|
|
|
| |||||||||
Net Increase (Decrease) | 65 | 585 | 81 | 761 | ||||||||||||
|
|
|
|
|
|
|
| |||||||||
Class R5 | ||||||||||||||||
Shares Issued for Reinvested Dividends | 66 | $ | 597 | 83 | $ | 777 | ||||||||||
|
|
|
|
|
|
|
| |||||||||
Net Increase (Decrease) | 66 | 597 | 83 | 777 | ||||||||||||
|
|
|
|
|
|
|
| |||||||||
Class Y | ||||||||||||||||
Shares Sold | 117,019 | $ | 1,054,550 | 93,767 | $ | 889,901 | ||||||||||
Issued in Merger | — | — | 1,138 | 10,099 | ||||||||||||
Shares Issued for Reinvested Dividends | 9,722 | 87,222 | 4,461 | 41,123 | ||||||||||||
Shares Redeemed | (12,487 | ) | (112,135 | ) | (1,118 | ) | (11,028 | ) | ||||||||
|
|
|
|
|
|
|
| |||||||||
Net Increase (Decrease) | 114,254 | 1,029,637 | 98,248 | 930,095 | ||||||||||||
|
|
|
|
|
|
|
| |||||||||
Class F | ||||||||||||||||
Shares Sold | 127,336 | $ | 1,139,433 | 3,208,154 | $ | 32,021,600 | ||||||||||
Issued in Merger | — | — | 1,141 | 10,124 | ||||||||||||
Shares Issued for Reinvested Dividends | 170,007 | 1,520,919 | 223,980 | 2,097,891 | ||||||||||||
Shares Redeemed | (1,045,807 | ) | (9,496,407 | ) | (149,507 | ) | (1,346,346) | |||||||||
|
|
|
|
|
|
|
| |||||||||
Net Increase (Decrease) | (748,464 | ) | (6,836,055 | ) | 3,283,768 | 32,783,269 | ||||||||||
|
|
|
|
|
|
|
| |||||||||
Class SDR | ||||||||||||||||
Shares Sold | 138,869 | $ | 1,262,856 | 1,095,892 | $ | 10,616,663 | ||||||||||
Issued in Merger | — | — | 150,691 | 1,338,890 | ||||||||||||
Shares Issued for Reinvested Dividends | 224,846 | 2,015,875 | 273,776 | 2,574,996 | ||||||||||||
Shares Redeemed | (254,804 | ) | (2,323,167 | ) | (3,271,657 | ) | (29,597,161 | ) | ||||||||
|
|
|
|
|
|
|
| |||||||||
Net Increase (Decrease) | 108,911 | 955,564 | (1,751,298 | ) | (15,066,612 | ) | ||||||||||
|
|
|
|
|
|
|
| |||||||||
Total Net Increase (Decrease) | (1,627,918 | ) | $ (14,589,396) | 4,420,874 | $ | 44,795,973 | ||||||||||
|
|
|
|
|
|
|
| |||||||||
| InternationalMulti-Cap Value Fund | ||||||||||||||||
Class A | ||||||||||||||||
Shares Sold | 7,308,958 | $ | 64,185,746 | 5,237,138 | $ | 52,561,213 | ||||||||||
Shares Issued for Reinvested Dividends | 497,126 | 4,232,125 | 212,540 | 2,112,982 | ||||||||||||
Shares Redeemed | (3,535,202 | ) | (30,710,971 | ) | (3,744,046 | ) | (37,912,369 | ) | ||||||||
|
|
|
|
|
|
|
| |||||||||
Net Increase (Decrease) | 4,270,882 | 37,706,900 | 1,705,632 | 16,761,826 | ||||||||||||
|
|
|
|
|
|
|
| |||||||||
Class C | ||||||||||||||||
Shares Sold | 804,534 | $ | 6,997,228 | 2,058,261 | $ | 20,826,321 | ||||||||||
Shares Issued for Reinvested Dividends | 130,672 | 1,092,114 | 63,567 | 626,597 | ||||||||||||
Shares Redeemed | (1,419,956 | ) | (12,228,675 | ) | (785,223 | ) | (7,541,845 | ) | ||||||||
|
|
|
|
|
|
|
| |||||||||
Net Increase (Decrease) | (484,750 | ) | (4,139,333 | ) | 1,336,605 | 13,911,073 | ||||||||||
|
|
|
|
|
|
|
| |||||||||
Class I | ||||||||||||||||
Shares Sold | 43,206,748 | $ | 376,911,502 | 61,740,929 | $ | 624,755,143 | ||||||||||
Shares Issued for Reinvested Dividends | 4,390,363 | 37,179,961 | 2,776,417 | 27,546,556 | ||||||||||||
Shares Redeemed | (63,378,109 | ) | (552,346,795 | ) | (36,319,485 | ) | (358,351,808 | ) | ||||||||
|
|
|
|
|
|
|
| |||||||||
Net Increase (Decrease) | (15,780,998 | ) | (138,255,332 | ) | 28,197,861 | 293,949,891 | ||||||||||
|
|
|
|
|
|
|
| |||||||||
| 99 |
|
| Hartford Schroders Funds |
Notes to Financial Statements – (continued)
October 31, 2019
| For the Year Ended October 31, 2019 | For the Year Ended October 31, 2018 | |||||||||||||||
| Shares | Amount | Shares | Amount | |||||||||||||
| InternationalMulti-Cap Value Fund – (continued) | ||||||||||||||||
Class R3 | ||||||||||||||||
Shares Sold | 2,630,986 | $ | 23,971,443 | 77,928 | $ | 778,355 | ||||||||||
Shares Issued for Reinvested Dividends | 35,113 | 308,551 | 951 | 9,338 | ||||||||||||
Shares Redeemed | (544,310 | ) | (4,758,882 | ) | (20,635 | ) | (184,994 | ) | ||||||||
|
|
|
|
|
|
|
| |||||||||
Net Increase (Decrease) | 2,121,789 | 19,521,112 | 58,244 | 602,699 | ||||||||||||
|
|
|
|
|
|
|
| |||||||||
Class R4 | ||||||||||||||||
Shares Sold | 224,145 | $ | 1,920,458 | 100,432 | $ | 979,053 | ||||||||||
Shares Issued for Reinvested Dividends | 11,262 | 96,105 | 2,685 | 26,732 | ||||||||||||
Shares Redeemed | (77,906 | ) | (674,128 | ) | (36,172 | ) | (363,366 | ) | ||||||||
|
|
|
|
|
|
|
| |||||||||
Net Increase (Decrease) | 157,501 | 1,342,435 | 66,945 | 642,419 | ||||||||||||
|
|
|
|
|
|
|
| |||||||||
Class R5 | ||||||||||||||||
Shares Sold | 963,121 | $ | 8,283,064 | 1,439,564 | $ | 14,682,618 | ||||||||||
Shares Issued for Reinvested Dividends | 143,439 | 1,208,180 | 75,708 | 750,152 | ||||||||||||
Shares Redeemed | (1,265,541 | ) | (11,362,022 | ) | (402,498 | ) | (4,044,014 | ) | ||||||||
|
|
|
|
|
|
|
| |||||||||
Net Increase (Decrease) | (158,981 | ) | (1,870,778 | ) | 1,112,774 | 11,388,756 | ||||||||||
|
|
|
|
|
|
|
| |||||||||
Class Y | ||||||||||||||||
Shares Sold | 8,747,939 | $ | 76,763,544 | 9,238,153 | $ | 89,383,046 | ||||||||||
Shares Issued for Reinvested Dividends | 747,314 | 6,345,975 | 110,244 | 1,073,954 | ||||||||||||
Shares Redeemed | (2,324,975 | ) | (20,118,934 | ) | (743,475 | ) | (7,242,053 | ) | ||||||||
|
|
|
|
|
|
|
| |||||||||
Net Increase (Decrease) | 7,170,278 | 62,990,585 | 8,604,922 | 83,214,947 | ||||||||||||
|
|
|
|
|
|
|
| |||||||||
Class F | ||||||||||||||||
Shares Sold | 21,330,908 | $ | 187,800,399 | 18,659,820 | $ | 187,374,609 | ||||||||||
Shares Issued for Reinvested Dividends | 1,474,000 | 12,537,678 | 509,585 | 5,045,453 | ||||||||||||
Shares Redeemed | (9,215,134 | ) | (81,327,657 | ) | (1,964,651 | ) | (19,313,199) | |||||||||
|
|
|
|
|
|
|
| |||||||||
Net Increase (Decrease) | 13,589,774 | 119,010,420 | 17,204,754 | 173,106,863 | ||||||||||||
|
|
|
|
|
|
|
| |||||||||
Class SDR | ||||||||||||||||
Shares Sold | 20,897,933 | $ | 182,523,290 | 23,896,576 | $ | 239,210,478 | ||||||||||
Shares Issued for Reinvested Dividends | 3,624,947 | 30,712,905 | 2,032,136 | 20,172,978 | ||||||||||||
Shares Redeemed | (14,513,700 | ) | (127,544,493) | (9,692,398 | ) | (96,932,132 | ) | |||||||||
|
|
|
|
|
|
|
| |||||||||
Net Increase (Decrease) | 10,009,180 | 85,691,702 | 16,236,314 | 162,451,324 | ||||||||||||
|
|
|
|
|
|
|
| |||||||||
Total Net Increase (Decrease) | 20,894,675 | $ | 181,997,711 | 74,524,051 | $ | 756,029,798 | ||||||||||
|
|
|
|
|
|
|
| |||||||||
| International Stock Fund | ||||||||||||||||
Class A | ||||||||||||||||
Shares Sold | 3,129,557 | $ | 38,300,055 | 707,714 | $ | 9,486,001 | ||||||||||
Shares Issued for Reinvested Dividends | 98,255 | 1,103,348 | 4,896 | 66,926 | ||||||||||||
Shares Redeemed | (546,692 | ) | (6,612,696 | ) | (246,613 | ) | (3,339,586 | ) | ||||||||
|
|
|
|
|
|
|
| |||||||||
Net Increase (Decrease) | 2,681,120 | 32,790,707 | 465,997 | 6,213,341 | ||||||||||||
|
|
|
|
|
|
|
| |||||||||
Class C | ||||||||||||||||
Shares Sold | 266,133 | $ | 2,980,258 | 178,229 | $ | 2,322,991 | ||||||||||
Shares Issued for Reinvested Dividends | 14,715 | 157,415 | 472 | 6,200 | ||||||||||||
Shares Redeemed | (145,940 | ) | (1,679,330 | ) | (49,950 | ) | (629,798 | ) | ||||||||
|
|
|
|
|
|
|
| |||||||||
Net Increase (Decrease) | 134,908 | 1,458,343 | 128,751 | 1,699,393 | ||||||||||||
|
|
|
|
|
|
|
| |||||||||
Class I | ||||||||||||||||
Shares Sold | 11,742,900 | $ | 136,541,482 | 6,517,947 | $ | 85,673,620 | ||||||||||
Shares Issued for Reinvested Dividends | 905,219 | 9,832,890 | 105,001 | 1,388,116 | ||||||||||||
Shares Redeemed | (5,895,649 | ) | (69,641,488 | ) | (4,747,596 | ) | (62,479,932 | ) | ||||||||
|
|
|
|
|
|
|
| |||||||||
Net Increase (Decrease) | 6,752,470 | 76,732,884 | 1,875,352 | 24,581,804 | ||||||||||||
|
|
|
|
|
|
|
| |||||||||
Class R3 | ||||||||||||||||
Shares Sold | 14,183 | $ | 169,465 | 1 | $ | 21 | ||||||||||
Shares Issued for Reinvested Dividends | 82 | 886 | 10 | 128 | ||||||||||||
Shares Redeemed | (3 | ) | (35 | ) | — | (1 | ) | |||||||||
|
|
|
|
|
|
|
| |||||||||
Net Increase (Decrease) | 14,262 | 170,316 | 11 | 148 | ||||||||||||
|
|
|
|
|
|
|
| |||||||||
Class R4 | ||||||||||||||||
Shares Sold | 22,719 | $ | 274,429 | — | $ | — | ||||||||||
Shares Issued for Reinvested Dividends | 82 | 890 | 10 | 136 | ||||||||||||
Shares Redeemed | (402 | ) | (4,890 | ) | — | — | ||||||||||
|
|
|
|
|
|
|
| |||||||||
Net Increase (Decrease) | 22,399 | 270,429 | 10 | 136 | ||||||||||||
|
|
|
|
|
|
|
| |||||||||
| 100 |
|
| Hartford Schroders Funds |
Notes to Financial Statements – (continued)
October 31, 2019
| For the Year Ended October 31, 2019 | For the Year Ended October 31, 2018 | |||||||||||||||
| Shares | Amount | Shares | Amount | |||||||||||||
| International Stock Fund – (continued) | ||||||||||||||||
Class R5 | ||||||||||||||||
Shares Sold | 85,870 | $ | 1,027,962 | — | $ | — | ||||||||||
Shares Issued for Reinvested Dividends | 83 | 901 | 11 | 153 | ||||||||||||
Shares Redeemed | (1,710 | ) | (20,330 | ) | — | — | ||||||||||
|
|
|
|
|
|
|
| |||||||||
Net Increase (Decrease) | 84,243 | 1,008,533 | 11 | 153 | ||||||||||||
|
|
|
|
|
|
|
| |||||||||
Class Y | ||||||||||||||||
Shares Sold | 94,385 | $ | 1,101,980 | 510,721 | $ | 6,495,714 | ||||||||||
Shares Issued for Reinvested Dividends | 38,210 | 416,560 | 300 | 3,965 | ||||||||||||
Shares Redeemed | (548,604 | ) | (6,406,752 | ) | (49,766 | ) | (646,007 | ) | ||||||||
|
|
|
|
|
|
|
| |||||||||
Net Increase (Decrease) | (416,009 | ) | (4,888,212 | ) | 461,255 | 5,853,672 | ||||||||||
|
|
|
|
|
|
|
| |||||||||
Class F | ||||||||||||||||
Shares Sold | 5,309,055 | $ | 62,969,906 | 728,925 | $ | 9,423,787 | ||||||||||
Shares Issued for Reinvested Dividends | 91,563 | 995,486 | 1,388 | 18,362 | ||||||||||||
Shares Redeemed | (547,580 | ) | (6,552,705 | ) | (33,703 | ) | (438,855 | ) | ||||||||
|
|
|
|
|
|
|
| |||||||||
Net Increase (Decrease) | 4,853,038 | 57,412,687 | 696,610 | 9,003,294 | ||||||||||||
|
|
|
|
|
|
|
| |||||||||
Class SDR | ||||||||||||||||
Shares Sold | 2,010,707 | $ | 24,337,603 | 841,004 | $ | 11,000,515 | ||||||||||
Shares Issued for Reinvested Dividends | 482,543 | 5,246,663 | 61,737 | 816,782 | ||||||||||||
Shares Redeemed | (15,335 | ) | (183,930 | ) | (1,165,007 | ) | (15,500,000 | ) | ||||||||
|
|
|
|
|
|
|
| |||||||||
Net Increase (Decrease) | 2,477,915 | 29,400,336 | (262,266 | ) | (3,682,703 | ) | ||||||||||
|
|
|
|
|
|
|
| |||||||||
Total Net Increase (Decrease) | 16,604,346 | $ | 194,356,023 | 3,365,731 | $ | 43,669,238 | ||||||||||
|
|
|
|
|
|
|
| |||||||||
| For the Period Ended October 31, 2019(1) | ||||||||||||||||
| Shares | Amount | |||||||||||||||
Securitized Income Fund | ||||||||||||||||
Class A | ||||||||||||||||
Shares Sold | 350,007 | $ | 3,500,072 | |||||||||||||
Shares Issued for Reinvested Dividends | 5,008 | 50,265 | ||||||||||||||
Shares Redeemed | (1 | ) | (10 | ) | ||||||||||||
|
|
|
| |||||||||||||
Net Increase (Decrease) | 355,014 | 3,550,327 | ||||||||||||||
|
|
|
| |||||||||||||
Class I | ||||||||||||||||
Shares Sold | 455,638 | $ | 4,560,915 | |||||||||||||
Shares Issued for Reinvested Dividends | 6,086 | 61,092 | ||||||||||||||
Shares Redeemed | (1,058 | ) | (10,642 | ) | ||||||||||||
|
|
|
| |||||||||||||
Net Increase (Decrease) | 460,666 | 4,611,365 | ||||||||||||||
|
|
|
| |||||||||||||
Class Y | ||||||||||||||||
Shares Sold | 350,994 | $ | 3,510,010 | |||||||||||||
Shares Issued for Reinvested Dividends | 5,339 | 53,578 | ||||||||||||||
Shares Redeemed | (1 | ) | (10 | ) | ||||||||||||
|
|
|
| |||||||||||||
Net Increase (Decrease) | 356,332 | 3,563,578 | ||||||||||||||
|
|
|
| |||||||||||||
Class F | ||||||||||||||||
Shares Sold | 249,951 | $ | 2,500,010 | |||||||||||||
Shares Issued for Reinvested Dividends | 3,112 | 31,230 | ||||||||||||||
Shares Redeemed | (1 | ) | (10 | ) | ||||||||||||
|
|
|
| |||||||||||||
Net Increase (Decrease) | 253,062 | 2,531,230 | ||||||||||||||
|
|
|
| |||||||||||||
Class SDR | ||||||||||||||||
Shares Sold | 7,968,817 | $ | 80,000,010 | |||||||||||||
Shares Issued for Reinvested Dividends | 49,337 | 495,681 | ||||||||||||||
Shares Redeemed | (1 | ) | (10 | ) | ||||||||||||
|
|
|
| |||||||||||||
Net Increase (Decrease) | 8,018,153 | 80,495,681 | ||||||||||||||
|
|
|
| |||||||||||||
Total Net Increase (Decrease) | 9,443,227 | $ | 94,752,181 | |||||||||||||
|
|
|
| |||||||||||||
| 101 |
|
| Hartford Schroders Funds |
Notes to Financial Statements – (continued)
October 31, 2019
| For the Year Ended October 31, 2019 | For the Year Ended October 31, 2018 | |||||||||||||||
| Shares | Amount | Shares | Amount | |||||||||||||
| Tax-Aware Bond Fund | ||||||||||||||||
Class A | ||||||||||||||||
Shares Sold | 2,534,913 | $ | 28,415,810 | 736,447 | $ | 8,014,736 | ||||||||||
Shares Issued for Reinvested Dividends | 68,930 | 755,814 | 45,271 | 491,932 | ||||||||||||
Shares Redeemed | (1,777,407 | ) | (19,673,697 | ) | (488,611 | ) | (5,343,017 | ) | ||||||||
|
|
|
|
|
|
|
| |||||||||
Net Increase (Decrease) | 826,436 | 9,497,927 | 293,107 | 3,163,651 | ||||||||||||
|
|
|
|
|
|
|
| |||||||||
Class C | ||||||||||||||||
Shares Sold | 325,219 | $ | 3,637,524 | 149,542 | $ | 1,639,240 | ||||||||||
Shares Issued for Reinvested Dividends | 11,164 | 121,750 | 5,616 | 61,024 | ||||||||||||
Shares Redeemed | (92,411 | ) | (1,017,093 | ) | (128,372 | ) | (1,393,639 | ) | ||||||||
|
|
|
|
|
|
|
| |||||||||
Net Increase (Decrease) | 243,972 | 2,742,181 | 26,786 | 306,625 | ||||||||||||
|
|
|
|
|
|
|
| |||||||||
Class I | ||||||||||||||||
Shares Sold | 12,356,423 | $ | 138,106,462 | 4,009,383 | $ | 43,929,544 | ||||||||||
Shares Issued for Reinvested Dividends | 330,094 | 3,631,801 | 227,268 | 2,473,947 | ||||||||||||
Shares Redeemed | (5,474,602 | ) | (60,553,758 | ) | (6,284,851 | ) | (68,659,524 | ) | ||||||||
|
|
|
|
|
|
|
| |||||||||
Net Increase (Decrease) | 7,211,915 | 81,184,505 | �� | (2,048,200 | ) | (22,256,033 | ) | |||||||||
|
|
|
|
|
|
|
| |||||||||
Class Y | ||||||||||||||||
Shares Sold | — | $ | — | 18,665 | $ | 207,182 | ||||||||||
Shares Issued for Reinvested Dividends | 646 | 7,078 | 457 | 4,968 | ||||||||||||
Shares Redeemed | (2,710 | ) | (30,000 | ) | — | — | ||||||||||
|
|
|
|
|
|
|
| |||||||||
Net Increase (Decrease) | (2,064 | ) | (22,922 | ) | 19,122 | 212,150 | ||||||||||
|
|
|
|
|
|
|
| |||||||||
Class F | ||||||||||||||||
Shares Sold | 1,168,928 | $ | 13,046,366 | 729,246 | $ | 7,945,941 | ||||||||||
Shares Issued for Reinvested Dividends | 37,053 | 408,408 | 12,327 | 133,857 | ||||||||||||
Shares Redeemed | (207,705 | ) | (2,288,445 | ) | (141,452 | ) | (1,535,531 | ) | ||||||||
|
|
|
|
|
|
|
| |||||||||
Net Increase (Decrease) | 998,276 | 11,166,329 | 600,121 | 6,544,267 | ||||||||||||
|
|
|
|
|
|
|
| |||||||||
Class SDR | ||||||||||||||||
Shares Sold | 276,460 | $ | 3,039,087 | 511,339 | $ | 5,550,200 | ||||||||||
Shares Issued for Reinvested Dividends | 105,304 | 1,144,983 | 55,527 | 605,071 | ||||||||||||
Shares Redeemed | (678,010 | ) | (7,609,000 | ) | (1,344,527 | ) | (14,633,275 | ) | ||||||||
|
|
|
|
|
|
|
| |||||||||
Net Increase (Decrease) | (296,246 | ) | (3,424,930 | ) | (777,661 | ) | (8,478,004 | ) | ||||||||
|
|
|
|
|
|
|
| |||||||||
Total Net Increase (Decrease) | 8,982,289 | $ | 101,143,090 | (1,886,725 | ) | $ | (20,507,344 | ) | ||||||||
|
|
|
|
|
|
|
| |||||||||
| US MidCap Opportunities Fund | ||||||||||||||||
Class A | ||||||||||||||||
Shares Sold | 1,395,369 | $ | 18,900,433 | 2,985,603 | $ | 42,697,659 | ||||||||||
Shares Issued for Reinvested Dividends | 148,492 | 1,869,520 | 120,938 | 1,713,696 | ||||||||||||
Shares Redeemed | (2,745,633 | ) | (37,795,392 | ) | (4,398,062 | ) | (62,548,289 | ) | ||||||||
|
|
|
|
|
|
|
| |||||||||
Net Increase (Decrease) | (1,201,772 | ) | (17,025,439 | ) | (1,291,521 | ) | (18,136,934 | ) | ||||||||
|
|
|
|
|
|
|
| |||||||||
Class C | ||||||||||||||||
Shares Sold | 724,496 | $ | 10,067,884 | 2,301,458 | $ | 33,701,336 | ||||||||||
Shares Issued for Reinvested Dividends | 101,881 | 1,309,177 | 50,409 | 733,959 | ||||||||||||
Shares Redeemed | (1,670,142 | ) | (23,612,797 | ) | (901,168 | ) | (13,178,215 | ) | ||||||||
|
|
|
|
|
|
|
| |||||||||
Net Increase (Decrease) | (843,765 | ) | (12,235,736 | ) | 1,450,699 | 21,257,080 | ||||||||||
|
|
|
|
|
|
|
| |||||||||
Class I | ||||||||||||||||
Shares Sold | 12,387,001 | $ | 176,704,549 | 21,079,640 | $ | 312,424,602 | ||||||||||
Shares Issued for Reinvested Dividends | 886,035 | 11,590,976 | 577,148 | 8,512,080 | ||||||||||||
Shares Redeemed | (27,060,730 | ) | (392,868,620 | ) | (18,855,618 | ) | (281,085,922 | ) | ||||||||
|
|
|
|
|
|
|
| |||||||||
Net Increase (Decrease) | (13,787,694 | ) | (204,573,095 | ) | 2,801,170 | 39,850,760 | ||||||||||
|
|
|
|
|
|
|
| |||||||||
Class R3 | ||||||||||||||||
Shares Sold | 58,724 | $ | 792,137 | 54,927 | $ | 788,537 | ||||||||||
Shares Issued for Reinvested Dividends | 1,446 | 18,758 | 334 | 4,885 | ||||||||||||
Shares Redeemed | (35,308 | ) | (518,682 | ) | (17,241 | ) | (253,524 | ) | ||||||||
|
|
|
|
|
|
|
| |||||||||
Net Increase (Decrease) | 24,862 | 292,213 | 38,020 | 539,898 | ||||||||||||
|
|
|
|
|
|
|
| |||||||||
Class R4 | ||||||||||||||||
Shares Sold | 18,328 | $ | 258,881 | 45,840 | $ | 679,086 | ||||||||||
Shares Issued for Reinvested Dividends | 1,456 | 18,966 | 271 | 3,987 | ||||||||||||
Shares Redeemed | (34,076 | ) | (503,214 | ) | (10,336 | ) | (152,006 | ) | ||||||||
|
|
|
|
|
|
|
| |||||||||
Net Increase (Decrease) | (14,292 | ) | (225,367 | ) | 35,775 | 531,067 | ||||||||||
|
|
|
|
|
|
|
| |||||||||
| 102 |
|
| Hartford Schroders Funds |
Notes to Financial Statements – (continued)
October 31, 2019
| For the Year Ended October 31, 2019 | For the Year Ended October 31, 2018 | |||||||||||||||
| Shares | Amount | Shares | Amount | |||||||||||||
| US MidCap Opportunities Fund – (continued) | ||||||||||||||||
Class R5 | ||||||||||||||||
Shares Sold | 116,843 | $ | 1,683,332 | 150,186 | $ | 2,197,738 | ||||||||||
Shares Issued for Reinvested Dividends | 4,025 | 52,582 | 53 | 782 | ||||||||||||
Shares Redeemed | (157,215 | ) | (2,369,735 | ) | (23,173 | ) | (344,713 | ) | ||||||||
|
|
|
|
|
|
|
| |||||||||
Net Increase (Decrease) | (36,347 | ) | (633,821 | ) | 127,066 | 1,853,807 | ||||||||||
|
|
|
|
|
|
|
| |||||||||
Class Y | ||||||||||||||||
Shares Sold | 2,387,698 | $ | 34,734,049 | 7,678,679 | $ | 115,062,697 | ||||||||||
Shares Issued for Reinvested Dividends | 187,871 | 2,455,282 | 13,393 | 197,570 | ||||||||||||
Shares Redeemed | (2,747,706 | ) | (40,197,854 | ) | (852,474 | ) | (12,616,689 | ) | ||||||||
|
|
|
|
|
|
|
| |||||||||
Net Increase (Decrease) | (172,137 | ) | (3,008,523 | ) | 6,839,598 | 102,643,578 | ||||||||||
|
|
|
|
|
|
|
| |||||||||
Class F | ||||||||||||||||
Shares Sold | 1,858,107 | $ | 26,939,675 | 2,963,774 | $ | 44,209,743 | ||||||||||
Shares Issued for Reinvested Dividends | 82,249 | 1,075,457 | 14,060 | 207,551 | ||||||||||||
Shares Redeemed | (1,616,038 | ) | (23,787,613 | ) | (369,921 | ) | (5,542,286 | ) | ||||||||
|
|
|
|
|
|
|
| |||||||||
Net Increase (Decrease) | 324,318 | 4,227,519 | 2,607,913 | 38,875,008 | ||||||||||||
|
|
|
|
|
|
|
| |||||||||
Class SDR | ||||||||||||||||
Shares Sold | 2,459,704 | $ | 35,321,321 | 3,165,349 | $ | 47,507,583 | ||||||||||
Shares Issued for Reinvested Dividends | 103,292 | 1,352,705 | 28,219 | 417,154 | ||||||||||||
Shares Redeemed | (1,347,036 | ) | (19,870,606 | ) | (615,226 | ) | (9,227,851 | ) | ||||||||
|
|
|
|
|
|
|
| |||||||||
Net Increase (Decrease) | 1,215,960 | 16,803,420 | 2,578,342 | 38,696,886 | ||||||||||||
|
|
|
|
|
|
|
| |||||||||
Total Net Increase (Decrease) | (14,490,867 | ) | $ | (216,378,829 | ) | 15,187,062 | $ | 226,111,150 | ||||||||
|
|
|
|
|
|
|
| |||||||||
| US Small Cap Opportunities Fund | ||||||||||||||||
Class A | ||||||||||||||||
Shares Sold | 351,863 | $ | 8,393,071 | 236,886 | $ | 6,373,027 | ||||||||||
Shares Issued for Reinvested Dividends | 59,679 | 1,269,289 | 33,968 | 882,482 | ||||||||||||
Shares Redeemed | (144,087 | ) | (3,490,218 | ) | (345,187 | ) | (9,397,408 | ) | ||||||||
|
|
|
|
|
|
|
| |||||||||
Net Increase (Decrease) | 267,455 | 6,172,142 | (74,333 | ) | (2,141,899 | ) | ||||||||||
|
|
|
|
|
|
|
| |||||||||
Class C | ||||||||||||||||
Shares Sold | 87,016 | $ | 2,119,060 | 173,837 | $ | 4,810,296 | ||||||||||
Shares Issued for Reinvested Dividends | 28,097 | 613,652 | 14,534 | 389,798 | ||||||||||||
Shares Redeemed | (107,604 | ) | (2,622,739 | ) | (78,884 | ) | (2,191,742 | ) | ||||||||
|
|
|
|
|
|
|
| |||||||||
Net Increase (Decrease) | 7,509 | 109,973 | 109,487 | 3,008,352 | ||||||||||||
|
|
|
|
|
|
|
| |||||||||
Class I | ||||||||||||||||
Shares Sold | 1,715,671 | $ | 43,830,966 | 1,080,896 | $ | 30,401,988 | ||||||||||
Shares Issued for Reinvested Dividends | 409,497 | 9,144,178 | 383,703 | 10,427,234 | ||||||||||||
Shares Redeemed | (1,046,256 | ) | (25,702,015 | ) | (1,635,729 | ) | (46,128,867 | ) | ||||||||
|
|
|
|
|
|
|
| |||||||||
Net Increase (Decrease) | 1,078,912 | 27,273,129 | (171,130 | ) | (5,299,645 | ) | ||||||||||
|
|
|
|
|
|
|
| |||||||||
Class R3 | ||||||||||||||||
Shares Sold | 4,254 | $ | 102,890 | 476 | $ | 13,064 | ||||||||||
Shares Issued for Reinvested Dividends | 275 | 6,097 | 166 | 4,484 | ||||||||||||
Shares Redeemed | (2,869 | ) | (73,330 | ) | — | (1 | ) | |||||||||
|
|
|
|
|
|
|
| |||||||||
Net Increase (Decrease) | 1,660 | 35,657 | 642 | 17,547 | ||||||||||||
|
|
|
|
|
|
|
| |||||||||
Class R4 | ||||||||||||||||
Shares Sold | 10,994 | $ | 283,414 | — | $ | — | ||||||||||
Shares Issued for Reinvested Dividends | 42 | 928 | 33 | 893 | ||||||||||||
Shares Redeemed | (1,814 | ) | (46,278 | ) | — | — | ||||||||||
|
|
|
|
|
|
|
| |||||||||
Net Increase (Decrease) | 9,222 | 238,064 | 33 | 893 | ||||||||||||
|
|
|
|
|
|
|
| |||||||||
Class R5 | ||||||||||||||||
Shares Sold | 2,106 | $ | 55,043 | 55 | $ | 1,540 | ||||||||||
Shares Issued for Reinvested Dividends | 76 | 1,691 | 56 | 1,510 | ||||||||||||
Shares Redeemed | (5 | ) | (134 | ) | (85 | ) | (2,500 | ) | ||||||||
|
|
|
|
|
|
|
| |||||||||
Net Increase (Decrease) | 2,177 | 56,600 | 26 | 550 | ||||||||||||
|
|
|
|
|
|
|
| |||||||||
Class Y | ||||||||||||||||
Shares Sold | 128,832 | $ | 3,308,681 | 65,961 | $ | 1,851,673 | ||||||||||
Shares Issued for Reinvested Dividends | 91,347 | 2,040,823 | 80,868 | 2,198,416 | ||||||||||||
Shares Redeemed | (140,942 | ) | (3,619,163 | ) | (167,666 | ) | (4,680,293 | ) | ||||||||
|
|
|
|
|
|
|
| |||||||||
Net Increase (Decrease) | 79,237 | 1,730,341 | (20,837 | ) | (630,204 | ) | ||||||||||
|
|
|
|
|
|
|
| |||||||||
| 103 |
|
| Hartford Schroders Funds |
Notes to Financial Statements – (continued)
October 31, 2019
| For the Year Ended October 31, 2019 | For the Year Ended October 31, 2018 | |||||||||||||||
| Shares | Amount | Shares | Amount | |||||||||||||
| US Small Cap Opportunities Fund – (continued) | ||||||||||||||||
Class F | ||||||||||||||||
Shares Sold | 83,264 | $ | 2,135,611 | 75,428 | $ | 2,111,360 | ||||||||||
Shares Issued for Reinvested Dividends | 9,328 | 208,483 | 3,723 | 101,247 | ||||||||||||
Shares Redeemed | (32,939 | ) | (819,850 | ) | (16,013 | ) | (445,068 | ) | ||||||||
|
|
|
|
|
|
|
| |||||||||
Net Increase (Decrease) | 59,653 | 1,524,244 | 63,138 | 1,767,539 | ||||||||||||
|
|
|
|
|
|
|
| |||||||||
Class SDR | ||||||||||||||||
Shares Sold | 7,073 | $ | 183,767 | 9,605 | $ | 264,619 | ||||||||||
Shares Issued for Reinvested Dividends | 42,875 | 959,593 | 75,077 | 2,044,548 | ||||||||||||
SharesRedeemed-In-Kind | — | — | (746,952 | ) | (20,194,924 | ) | ||||||||||
Shares Redeemed | (40,314 | ) | (938,014 | ) | (42,966 | ) | (1,169,206 | ) | ||||||||
|
|
|
|
|
|
|
| |||||||||
Net Increase (Decrease) | 9,634 | 205,346 | (705,236 | ) | (19,054,963 | ) | ||||||||||
|
|
|
|
|
|
|
| |||||||||
Total Net Increase (Decrease) | 1,515,459 | $ | 37,345,496 | (798,210 | ) | $ | (22,331,830 | ) | ||||||||
|
|
|
|
|
|
|
| |||||||||
| (1) | Securitized Income Fund commenced operations on February 28, 2019. |
| 13. | Line of Credit: |
The Funds participate in a committed line of credit pursuant to a credit agreement. The Funds may borrow under the line of credit for temporary or emergency purposes. The Funds (together with certain other Hartford Funds) may borrow up to $370 million in the aggregate, subject to asset coverage and other limitations specified in the credit agreement. The interest rate on borrowings varies depending on the nature of the loan. The facility also charges a commitment fee, which is allocated to each of the funds participating in the line of credit based on average net assets of the funds. During and as of the period ended October 31, 2019, none of the Funds had borrowings under this facility.
| 14. | Indemnifications: |
Under the Company’s organizational documents, the Company shall indemnify its officers and directors to the full extent required or permitted under Maryland General Corporation Law and federal securities laws. In addition, the Company, on behalf of each Fund, may enter into contracts that contain a variety of indemnifications. The Company’s maximum exposure under these arrangements is unknown. However, as of the date of these financial statements, the Company has not had prior claims or losses pursuant to these contracts and expects the risk of loss to be remote.
| 15. | Recent Accounting Pronouncement: |
The FASB recently issued ASU2017-08 (the “ASU” or “Update”) to amend the amortization period to the earliest call date for purchased callable debt securities held at a premium. The ASU is effective for public entities for fiscal years beginning after December 15, 2018, and will become effective for private entities one year later. Management is currently evaluating the implication, if any, of additional disclosure and its impact on the Funds’ financial statements.
In August 2018, the FASB issued Accounting Standards Update2018-13, Fair Value Measurement (Topic 820): Disclosure Framework – Changes to the Disclosure Requirements for Fair Value Measurement (“ASU2018-13”). The update introduces new fair value disclosure requirements, eliminates some prior fair value disclosure requirements, and modifies certain existing fair value disclosure requirements.
ASU2018-13 is effective for fiscal years beginning after December 15, 2019 and for interim periods within those fiscal years, however, an entity is permitted to early adopt either the entire standard or only the provisions that eliminate or modify requirements. Management has elected to early adopt the provisions of ASU2018-13 that eliminate disclosure requirements effective with the current reporting period. The impact of each Fund’s early adoption of these provisions was limited to changes in the Fund’s financial statement disclosures regarding fair value, primarily those disclosures related to transfers between Level 1 and Level 2 of the fair value hierarchy and the timing of transfers between levels of the fair value hierarchy. Management is currently evaluating the potential impact of adopting the additional provisions of ASU2018-13.
| 16. | Subsequent Events: |
In connection with the preparation of the financial statements of the Funds as of and for the year or period ended October 31, 2019, events and transactions subsequent to October 31, 2019, through the date the financial statements were issued have been evaluated by the Funds’ management for possible adjustment and/or disclosure. The following subsequent event requiring financial statement disclosure has been identified.
| 104 |
|
| Hartford Schroders Funds |
Notes to Financial Statements – (continued)
October 31, 2019
Effective November 1, 2019, the management fee of HFMC set forth in the investment management agreement with respect to the US MidCap Opportunities Fund is as follows: 0.7500% of the first $1 billion, 0.7000% of the next $1.5 billion, 0.6500% of the next $2.5 billion, 0.6450% of the next $5 billion and 0.6400% in excess of $10 billion annually of the Fund’s average daily net assets.
| 105 |
|
To the Shareholders of Hartford Schroders Emerging Markets Equity Fund, Hartford Schroders Emerging Markets Multi-Sector Bond Fund, Hartford Schroders InternationalMulti-Cap Value Fund, Hartford Schroders International Stock Fund, Hartford Schroders Securitized Income Fund, Hartford SchrodersTax-Aware Bond Fund, Hartford Schroders US MidCap Opportunities Fund (Formerly, Hartford Schroders US Small/Mid Cap Opportunities Fund) and Hartford Schroders US Small Cap Opportunities Fund and the Board of Directors of The Hartford Mutual Funds II, Inc.
Opinion on the Financial Statements
We have audited the accompanying statements of assets and liabilities of Hartford Schroders Emerging Markets Equity Fund, Hartford Schroders Emerging Markets Multi-Sector Bond Fund, Hartford Schroders InternationalMulti-Cap Value Fund, Hartford Schroders International Stock Fund, Hartford Schroders Securitized Income Fund, Hartford SchrodersTax-Aware Bond Fund, Hartford Schroders US MidCap Opportunities Fund and Hartford Schroders US Small Cap Opportunities Fund (collectively referred to as the “Funds”) (eight of the funds constituting The Hartford Mutual Funds II, Inc. (the “Company”)), including the schedules of investments, as of October 31, 2019, and the related statements of operations and changes in net assets, and the financial highlights for each of the periods indicated in the table below and the related notes (collectively referred to as the “financial statements”). In our opinion, the financial statements present fairly, in all material respects, the financial position of each of the Funds (eight of the funds constituting The Hartford Mutual Funds II, Inc.) at October 31, 2019, and the results of their operations, changes in net assets and financial highlights for each of the periods indicated in the table below, in conformity with U.S. generally accepted accounting principles.
Individual fund constituting The Hartford Mutual Funds II , Inc. | Statement of operations | Statements of changes in net assets | Financial highlights | |||
Hartford SchrodersTax-Aware Bond Fund Hartford Schroders Emerging Markets Equity Fund Hartford Schroders Emerging Markets Multi-Sector Bond Fund Hartford Schroders International Stock Fund Hartford Schroders InternationalMulti-Cap Value Fund Hartford Schroders US MidCap Opportunities Fund Hartford Schroders US Small Cap Opportunities Fund | For the year ended October 31, 2019 | For each of the two years in the period ended October 31, 2019 | For each of the five years in the period ended October 31, 2019 | |||
| Hartford Schroders Securitized Income Fund | For the period from February 28, 2019 (commencement of operations) through October 31, 2019. | For the period from February 28, 2019 (commencement of operations) through October 31, 2019. | For the period from February 28, 2019 (commencement of operations) through October 31, 2019. |
The financial highlights for the period presented through October 31, 2015, were audited by other auditors whose report dated December 22, 2015, expressed an unqualified opinion on those financial highlights.
Basis for Opinion
These financial statements are the responsibility of the Company’s management. Our responsibility is to express an opinion on each of the Funds’ financial statements based on our audits. We are a public accounting firm registered with the Public Company Accounting Oversight Board (United States) (“PCAOB”) and are required to be independent with respect to the Company in accordance with the U.S. federal securities laws and the applicable rules and regulations of the Securities and Exchange Commission and the PCAOB.
We conducted our audits in accordance with the standards of the PCAOB. Those standards require that we plan and perform the audit to obtain reasonable assurance about whether the financial statements are free of material misstatement, whether due to error or fraud. The Company is not required to have, nor were we engaged to perform, an audit of the Company’s internal control over financial reporting. As part of our audits we are required to obtain an understanding of internal control over financial reporting but not for the purpose of expressing an opinion on the effectiveness of the Company’s internal control over financial reporting. Accordingly, we express no such opinion.
Our audits included performing procedures to assess the risks of material misstatement of the financial statements, whether due to error or fraud, and performing procedures that respond to those risks. Such procedures included examining, on a test basis, evidence regarding the amounts and disclosures in the financial statements. Our procedures included confirmation of securities owned as of October 31, 2019, by correspondence with the custodian and others or by other appropriate auditing procedures where replies from others were not received. Our audits also included evaluating the accounting principles used and significant estimates made by management, as well as evaluating the overall presentation of the financial statements. We believe that our audits provide a reasonable basis for our opinion.

We have served as the auditor of one or more Hartford investment companies since 2002.
Philadelphia, Pennsylvania
December 30, 2019
| 106 |
|
| Hartford Schroders Funds |
Directors and Officers of the Company (Unaudited)
The Hartford Mutual Funds II, Inc. (the “Company”) is governed by a Board of Directors (the “Directors”). The following tables present certain information regarding the Directors and officers of the Company as of October 31, 2019. For more information regarding the Directors and officers, please refer to the Statement of Additional Information, which is available, without charge, upon request by calling1-888-843-7824.
NAME, YEAR OF BIRTH | POSITION | TERM OF | PRINCIPAL OCCUPATION(S) DURING PAST 5 YEARS | NUMBER OF PORTFOLIOS IN FUND COMPLEX(3) OVERSEEN BY DIRECTOR | OTHER DIRECTORSHIPS | |||||
| NON-INTERESTED DIRECTORS | ||||||||||
HILARY E. ACKERMANN (1956) | Director | Since 2014 | Ms. Ackermann served as Chief Risk Officer at Goldman Sachs Bank USA from October 2008 to November 2011. Ms. Ackermann has served as a Director of Vistra Energy Corporation, formerly known as Dynegy, Inc. (an independent power company) since October 2012 and as a Director of Credit Suisse Holdings (USA), Inc. since January 2017. | 82 | Ms. Ackermann serves as a Director of Vistra Energy Corporation (October 2012 to present) and as a Director of Credit Suisse Holdings (USA), Inc. from January 2017 to present. | |||||
ROBIN C. BEERY (1967) | Director | Since 2017 | Ms. Beery has served as a consultant to ArrowMark Partners (an alternative asset manager) since March of 2015 and since November 2018 has been employed by ArrowMark Partners as a Senior Advisor. Previously, she was Executive Vice President, Head of Distribution, for Janus Capital Group, and Chief Executive Officer and President of the Janus Mutual Funds (a global asset manager) from September 2009 to August 2014. | 82 | Ms. Beery serves as a Director of UMB Financial Corporation (January 2015 to present). | |||||
LYNN S. BIRDSONG (1946) | Director and Chair of the Board | Director since 2003; Chair of the Board since August 2019 | Mr. Birdsong currently serves as a Director of Aberdeen Global and Aberdeen Global II (investment funds) (since September 2014), Aberdeen Islamic SICAV and Aberdeen Liquidity Fund (investment funds) (since 2016), and Aberdeen Alpha Fund (since December 2017). Mr. Birdsong served as an Independent Director of Nomura Partners Funds, Inc. (formerly, The Japan Fund) (April 2003 to February 2015) and as a Director of the Sovereign High Yield Investment Company (April 2010 to June 2014). From 2003 to March 2005, Mr. Birdsong was an Independent Director of the Atlantic Whitehall Funds. From 1979 to 2002, Mr. Birdsong was a Managing Director of Zurich Scudder Investments, an investment management firm. During his employment with Scudder, Mr. Birdsong was an Interested Director of The Japan Fund. From January 1981 through December 2013, Mr. Birdsong was a partner in Birdsong Company, an advertising specialty firm. | 82 | None | |||||
CHRISTINE R. DETRICK (1958) | Director | Since 2016 | Ms. Detrick has served as a Director of Reinsurance Group of America since January 2014. Previously, she was a director of Forest City Realty Trust (a real estate company) from November 2014 to March 2018, a Director of Forethought Financial Group, Inc. (a financial services company) from January 2012 to January 2014, and a Senior Partner/Advisor at Bain & Company (a management consulting firm) from September 2002 to December 2012. | 82 | Ms. Detrick serves as a Director of Reinsurance Group of America (January 2014 to present). | |||||
DUANE E. HILL (1945) | Director | Since 2002 | Mr. Hill is a Partner of TSG Ventures L.P., a private equity investment company. Mr. Hill is a former partner of TSG Capital Group, a private equity investment firm that served as sponsor and lead investor in leveraged buyouts of middle market companies. | 82 | None | |||||
| 107 |
|
| Hartford Schroders Funds |
Directors and Officers of the Company (Unaudited) – (continued)
NAME, YEAR OF BIRTH | POSITION | TERM OF | PRINCIPAL OCCUPATION(S) DURING PAST 5 YEARS | NUMBER OF PORTFOLIOS IN FUND COMPLEX(3) OVERSEEN BY DIRECTOR | OTHER DIRECTORSHIPS | |||||
PHILLIP O. PETERSON(4) (1944) | Director | Since 2000 | Mr. Peterson is a mutual fund industry consultant. He was a partner of KPMG LLP (an accounting firm) until July 1999. From February 2007 to February 2018, Mr. Peterson served as a member of the Board of Trustees of the William Blair Funds. From February 2012 to February 2014, Mr. Peterson served as a Trustee of Symetra Variable Mutual Funds. From January 2004 to April 2005, Mr. Peterson served as Independent President of the Strong Mutual Funds. | 82 | None | |||||
LEMMA W. SENBET (1946) | Director | Since 2005 | Dr. Senbet currently serves as the William E. Mayer Chair Professor of Finance, and previously was the Founding Director, Center for Financial Policy, in the Robert H. Smith School of Business at the University of Maryland. He was chair of the Finance Department Robert H. Smith School of Business at the University of Maryland from 1998 to 2006. In June 2013, he began a sabbatical from the University to serve as Executive Director of the African Economic Research Consortium which focuses on economic policy research and training, which he completed in 2018. Previously, he was a chaired professor of finance at the University of Wisconsin-Madison. Also, he was a Director of the Fortis Funds from March 2000 to July 2002. Dr. Senbet served as Director of the American Finance Association and President of the Western Finance Association. In 2006, Dr. Senbet was inducted Fellow of Financial Management Association International for his career-long distinguished scholarship and professional service. | 82 | None | |||||
DAVID SUNG (1953) | Director | Since 2017 | Mr. Sung has served as a Director of Nippon Wealth Bank since April 2015 and CITIC-Prudential Fund Management Company, Inc. since January 2016. Mr. Sung is an Independent Director of seven investment funds, including twoclosed-end registered investment companies, sponsored by Ironwood Capital Management. Previously, he was a Partner at Ernst & Young LLP from October 1995 to July 2014. | 82 | Mr. Sung serves as a Trustee of Ironwood Institutional Multi-Strategy Fund, LLC and Ironwood Multi-Strategy Fund, LLC (October 2015 to present) (2 portfolios). | |||||
| OFFICERSAND INTERESTED DIRECTORS | ||||||||||
JAMES E. DAVEY(5) (1964) | Director, President and Chief Executive Officer | President and Chief Executive Officer since 2010; Director since 2012 | Mr. Davey serves as Executive Vice President of The Hartford Financial Services Group, Inc. Additionally, Mr. Davey serves as Chairman of the Board, Manager, and Senior Managing Director of Hartford Funds Distributors, LLC (“HFD”). He also currently serves as Director, Chairman of the Board, President and Senior Managing Director of Hartford Administrative Services Company (“HASCO”). Mr. Davey also serves as President, Manager, Chairman of the Board, and Senior Managing Director for Hartford Funds Management Company, LLC (“HFMC”), and Director, Chairman, President, and Senior Managing Director for Hartford Funds Management Group, Inc. (“HFMG”). Mr. Davey also serves as Manager, Chairman of the Board, and President of Lattice Strategies LLC (since July 2016). Mr. Davey has served in various positions within The Hartford and its subsidiaries in connection with the operation of the Hartford Funds. Mr. Davey joined The Hartford in 2002. | 82 | None | |||||
| 108 |
|
| Hartford Schroders Funds |
Directors and Officers of the Company (Unaudited) – (continued)
NAME, YEAR OF BIRTH | POSITION | TERM OF | PRINCIPAL OCCUPATION(S) DURING PAST 5 YEARS | NUMBER OF PORTFOLIOS IN FUND COMPLEX(3) OVERSEEN BY DIRECTOR | OTHER DIRECTORSHIPS | |||||
ANDREW S. DECKER (1963) | AML Compliance Officer | Since 2015 | Mr. Decker serves as Chief Compliance Officer and AML Compliance Officer of HASCO (since April 2015) and Vice President of HASCO (since April 2018). Mr. Decker serves as AML Officer of HFD (since May 2015). Mr. Decker also serves as Vice President of HFMG (since April 2018). Prior to joining The Hartford, Mr. Decker served as Vice President and AML Officer at Janney Montgomery Scott (a broker dealer) from April 2011 to January 2015. Mr. Decker served as AML Compliance and Sanctions Enforcement Officer at SEI Investments from December 2007 to April 2011. | N/A | N/A | |||||
AMY N. FURLONG (1979) | Vice President and Treasurer | Since 2018 | Ms. Furlong serves as Vice President and Assistant Treasurer of HFMC (since September 2019). Ms. Furlong has served in various positions within The Hartford and its subsidiaries in connection with the operation of the Hartford Funds. Ms. Furlong joined The Hartford in 2004. Prior to joining The Hartford, Ms. Furlong worked at KPMG LLP in audit services. | N/A | N/A | |||||
WALTER F. GARGER (1965) | Vice President and Chief Legal Officer | Since 2016 | Mr. Garger serves as Secretary, Managing Director and General Counsel of HFD, HASCO, HFMC and HFMG (since 2013). Mr. Garger also serves as Secretary and General Counsel of Lattice Strategies LLC (since July 2016). Mr. Garger has served in various positions within The Hartford and its subsidiaries in connection with the operation of the Hartford Funds. Mr. Garger joined The Hartford in 1995. | N/A | N/A | |||||
ALBERT Y. LEE (1979) | Vice President and Assistant Treasurer | Since 2017 | Mr. Lee serves as Head of Systemic Strategies and ETF Operations and Senior Vice President of HFMG (since July 2016). Mr. Lee also serves as Senior Vice President of Lattice Strategies LLC (since June 2017). Previously, Mr. Lee served as Managing Director and Chief Operating Officer, Lattice Strategies LLC (2009-2016); Chief Operating Officer at Avicenna Capital Management (2007-2009); and Chief Financial Officer at Steeple Capital LP (2005-2007). | N/A | N/A | |||||
THEODORE J. LUCAS (1966) | Vice President | Since 2017 | Mr. Lucas serves as Executive Vice President of HFMG (since July 2016) and as Executive Vice President of Lattice Strategies LLC (since June 2017). Previously, Mr. Lucas served as Managing Partner of Lattice Strategies LLC (2003 to 2016). | N/A | N/A | |||||
JOSEPH G. MELCHER (1973) | Vice President and Chief Compliance Officer | Since 2013 | Mr. Melcher serves as Executive Vice President of HFD (since December 2013) and has served as President (from April 2018 to June 2019) and Chief Executive Officer (from April 2018 to June 2019) of HFD. He also serves as Executive Vice President of HFMG and HASCO (since December 2013). Mr. Melcher also serves as Executive Vice President (since December 2013) and Chief Compliance Officer (since December 2012) of HFMC. Mr. Melcher also serves as Executive Vice President and Chief Compliance Officer of Lattice Strategies, LLC (since July 2016). Mr. Melcher has served in various positions within The Hartford and its subsidiaries in connection with the operation of the Hartford Funds since joining The Hartford in 2012. Prior to joining The Hartford, Mr. Melcher worked at Touchstone Investments, a member of the Western & Southern Financial Group, where he held the position of Vice President and Chief Compliance Officer from 2010 through 2012 and Assistant Vice President, Compliance from 2005 to 2010. | N/A | N/A | |||||
| 109 |
|
| Hartford Schroders Funds |
Directors and Officers of the Company (Unaudited) – (continued)
NAME, YEAR OF BIRTH | POSITION | TERM OF | PRINCIPAL OCCUPATION(S) DURING PAST 5 YEARS | NUMBER OF PORTFOLIOS IN FUND COMPLEX(3) OVERSEEN BY DIRECTOR | OTHER DIRECTORSHIPS | |||||
VERNON J. MEYER (1964) | Vice President | Since 2006 | Mr. Meyer serves as Managing Director and Chief Investment Officer of HFMC and Managing Director of HFMG (since 2013). Mr. Meyer has served in various positions within The Hartford and its subsidiaries in connection with the operation of the Hartford Funds. Mr. Meyer joined The Hartford in 2004. | N/A | N/A | |||||
ALICE A. PELLEGRINO (1960) | Vice President | Since 2016 | Ms. Pellegrino serves as Vice President of HFMG (since December 2013). Ms. Pellegrino also serves as Vice President and Assistant Secretary of Lattice Strategies LLC (since June 2017). Ms. Pellegrino is a Senior Counsel and has served in various positions within The Hartford and its subsidiaries in connection with the operation of the Hartford Funds. Ms. Pellegrino joined The Hartford in 2007. | N/A | N/A | |||||
THOMAS R. PHILLIPS (1960) | Vice President and Secretary | Since 2017 | Mr. Phillips currently serves as Vice President (since February 2017) and Assistant Secretary (since June 2017) for HFMG. Mr. Phillips is Deputy General Counsel for HFMG. Prior to joining HFMG in 2017, Mr. Phillips was a Director and Chief Legal Officer of Saturna Capital Corporation from 2014–2016. Prior to that, Mr. Phillips was a Partner and Deputy General Counsel of Lord, Abbett & Co. LLC. | N/A | N/A | |||||
| (1) | The address for each officer and Director is c/o Hartford Funds 690 Lee Road, Wayne, PA 19087. |
| (2) | Each Director holds an indefinite term until the earlier of (i) the election and qualification of his or her successor or (ii) when the Director turns 75 years of age. Each officer shall serve until his or her successor is elected and qualifies. |
| (3) | The portfolios of the “Fund Complex” are series of The Hartford Mutual Funds, Inc., The Hartford Mutual Funds II, Inc., Hartford Series Fund, Inc., Hartford HLS Series Fund II, Inc., Hartford Funds Master Fund, Lattice Strategies Trust, Hartford Funds Exchange-Traded Trust, Hartford Funds NextShares Trust, and Hartford Schroders Opportunistic Income Fund. |
| (4) | Effective December 5, 2019, Mr. Peterson is retiring from the Company. |
| (5) | “Interested person,” as defined in the 1940 Act, of the Company because of the person’s affiliation with, or equity ownership of, HFMC, HFD or affiliated companies. |
| 110 |
|
| Hartford Schroders Funds |
HOW TO OBTAIN A COPY OF EACH FUND’S PROXY VOTING POLICIES AND VOTING RECORDS (UNAUDITED)
A description of the policies and procedures that each Fund uses to determine how to vote proxies relating to portfolio securities and information about how each Fund voted proxies relating to portfolio securities during the most recent twelve-month period ended June 30 are available (1) without charge, upon request, by calling888-843-7824 and (2) on the SEC’s website at http://www.sec.gov.
QUARTERLY PORTFOLIO HOLDINGS INFORMATION (UNAUDITED)
Each Fund files its complete schedule of portfolio holdings with the SEC for the first and third quarters of each fiscal year as an exhibit to its reports on Form N-PORT. Each Fund’s Form N-PORT reports are available (1) without charge, upon request, by calling 888-843-7824 and (2) on the SEC’s website at http://www.sec.gov.
| 111 |
|
| Hartford Schroders Funds |
Approval of Investment Management and InvestmentSub-Advisory Agreements (Unaudited)
The Hartford Mutual Funds II, Inc.
Hartford Schroders Emerging Markets Equity Fund
Hartford Schroders Emerging Markets Multi-Sector Bond Fund
Hartford Schroders InternationalMulti-Cap Value Fund
Hartford Schroders International Stock Fund
Hartford SchrodersTax-Aware Bond Fund
Hartford Schroders US MidCap Opportunities Fund (formerly, Hartford Schroders US Small/Mid Cap Opportunities Fund)
Hartford Schroders US Small Cap Opportunities Fund
Each of the funds listed above (each a “Fund” and collectively, the “Funds”) is the successor to a corresponding series of Schroder Series Trust or Schroder Capital Funds (Delaware) (each a “Predecessor Fund” and collectively, the “Predecessor Funds”), pursuant to a reorganization consummated on October 24, 2016. Each Fund has an investment objective and strategies substantially similar to those of its corresponding Predecessor Fund.
Section 15(c) of the Investment Company Act of 1940, as amended (the “1940 Act”), requires that each mutual fund’s board of directors, including a majority of those directors who are not “interested persons” of the mutual fund, as defined in the 1940 Act (the “Independent Directors”), annually review and consider the continuation of the mutual fund’s investment advisory andsub-advisory agreements. At its meeting held on August6-7, 2019, the Board of Directors (the “Board”) of The Hartford Mutual Funds II, Inc. (“HMF II”), including each of the Independent Directors, unanimously voted to approve (i) the continuation of an investment management agreement by and between Hartford Funds Management Company, LLC (“HFMC”) and each of HMF II, on behalf of each Fund, and The Hartford Mutual Funds, Inc. (“HMF”), on behalf of its series (the “Management Agreement”); (ii) the continuation of an investment sub-advisory agreement by and between HFMC and each Fund’ssub-adviser, Schroder Investment Management North America Inc. (“SIMNA Inc.”) (the“Sub-Advisory Agreement”); and (iii) the continuation of a separatesub-sub-advisory agreement (the“Sub-Sub-Advisory Agreement”) by and between SIMNA Inc. and Schroder Investment Management North America Limited (“SIMNA Ltd.,” together with SIMNA Inc., the“Sub-advisers,” and together with HFMC, the “Advisers”) on behalf of Hartford Schroders Emerging Markets Equity Fund, Hartford Schroders International Stock Fund and Hartford Schroders InternationalMulti-Cap Value Fund (collectively, the“Sub-Sub-Advised Funds”). The Board also unanimously voted to approve an amendment to theSub-Sub-Advisory Agreement appointing SIMNA Ltd. as a secondarysub-adviser for the Hartford SchrodersTax-Aware Bond Fund (the “Amendment” and collectively with the Management Agreement,Sub-Advisory Agreement, and theSub-Sub-Advisory Agreement, the “Agreements”).
In the months preceding the August6-7, 2019 meeting, the Board requested and reviewed written responses from the Advisers to questions posed to the Advisers on behalf of the Independent Directors and supporting materials relating to those questions and responses. In addition, the Board considered such additional information as it deemed reasonably necessary to evaluate the Agreements, as applicable, with respect to each Fund, which included information furnished to the Board at its meetings throughout the year, as well as information specifically prepared in connection with the approval of the continuation of the Agreements that was presented at the Board’s meetings held on June 18, 2019 and August6-7, 2019. Information provided to the Board at its meetings throughout the year included, among other things, reports on Fund performance, legal, compliance and risk management matters, sales and marketing activity, shareholder services, and the other services provided to each Fund by the Advisers and their affiliates. The Board also considered the materials andin-person presentations by Fund officers and representatives of HFMC received at the Board’s meetings on June 18, 2019 and August6-7, 2019 concerning the Agreements.
The Independent Directors, advised by independent legal counsel throughout the evaluation process, engaged service providers to assist them with evaluating the Agreements with respect to each Fund, as applicable. Broadridge Financial Solutions, Inc. (“Broadridge”), an independent provider of investment company data, was retained to provide the Board with reports on how each Fund’s contractual management fees, actual management fees, transfer agency and othernon-management fees, overall expense ratios and investment performance compared to those of comparable mutual funds with similar investment objectives. The Independent Directors also engaged an independent financial services consultant (the “Consultant”) to assist them in evaluating each Fund’s management fees, transfer agency and othernon-management fees, overall expense ratios and investment performance. In addition, the Consultant reviewed the profitability methodologies utilized by HFMC in connection with the continuation of the Management Agreement.
In determining whether to approve the Agreements for a Fund, the members of the Board reviewed and evaluated information and factors they believed to be relevant and appropriate through the exercise of their reasonable business judgment. While individual members of the Board may have weighed certain factors differently, the Board’s determination to approve the Agreements, was based on a comprehensive consideration of all information provided to the Board throughout the year and specifically with respect to the approval of the Agreements. The Board was also furnished with an analysis of its fiduciary obligations in connection with its evaluation of the Agreements and, throughout the evaluation process, the Board was assisted by counsel for the Funds. The Independent Directors were also separately assisted by independent legal counsel throughout the evaluation process. A more detailed summary of the important, but not necessarily all, factors the Board considered with respect to its approval of the continuation of the Agreements is provided below.
| 112 |
|
| Hartford Schroders Funds |
Approval of Investment Management and InvestmentSub-Advisory Agreements (Unaudited) – (continued)
Nature, Extent and Quality of Services Provided by the Advisers
The Board requested and considered information concerning the nature, extent and quality of the services provided to each Fund by the Advisers. The Board considered, among other things, the terms of the Agreements and the range of services provided by the Advisers. The Board considered the Advisers’ professional personnel who provide services to the Funds, including each Adviser’s ability and experience in attracting and retaining qualified personnel to service the Funds. The Board considered each Adviser’s reputation and overall financial strength, as well as its willingness to consider and implement organizational and operational changes designed to enhance services to the funds managed by HFMC and its affiliates (the “Hartford Funds”). In addition, the Board considered the quality of each Adviser’s communications with the Board and responsiveness to Board inquiries and requests made from time to time with respect to the Funds and other Hartford Funds.
The Board also requested and evaluated information concerning each Adviser’s regulatory and compliance environment. In this regard, the Board requested and reviewed information about each Adviser’s compliance policies and procedures, compliance history, and a report from the Funds’ Chief Compliance Officer about each Adviser’s compliance with applicable laws and regulations, including responses to regulatory developments and any compliance or other issues raised by regulators. The Board also noted the Advisers’ support of the Funds’ compliance control structure, as applicable, and, in particular, the resources devoted by the Advisers in support of the Funds’ obligations pursuant toRule 38a-1 under the 1940 Act and the Funds’ liquidity risk management program, as well as the efforts of the Advisers to combat cybersecurity risks and invest in business continuity planning.
With respect to HFMC, the Board noted that, under the Management Agreement, HFMC is responsible for the management of the Funds, including oversight of fund operations and service providers, and the provision of administrative and investment advisory services in connection with selecting, monitoring and supervising theSub-advisers. In this regard, the Board evaluated information about the nature and extent of responsibilities retained and risks assumed by HFMC that were not delegated to or assumed by theSub-advisers. The Board considered HFMC’s ongoing monitoring of people, process and performance, including its quarterly reviews of each of the Hartford Funds,semi-annual meetings with the leaders of each Fund’s portfolio management team, and oversight of the Hartford Funds’ portfolio managers. The Board recognized that HFMC has demonstrated a record of initiating changes to the portfolio management and/or investment strategies of the Hartford Funds when warranted. The Board considered HFMC’s periodic due diligence reviews of eachSub-adviser and ongoing oversight of eachSub-adviser’s investment approach and results, process for monitoring best execution of portfolio trades and other trading operations by eachSub-adviser, and approach to risk management with respect to the Funds and the service providers to the Funds. The Board considered HFMC’s oversight of the Funds’ securities lending program and noted the income earned by the Funds in connection with their participation in the program. The Board also considered HFMC’sday-to-day oversight of each Fund’s compliance with its investment objective and policies as well as with applicable laws and regulations, noting that regulatory and other developments had over time led to an increase in the scope of HFMC’s services in this regard. Moreover, the Board considered HFMC’s oversight of potential conflicts of interest between the Funds’ investments and those of other funds or accounts managed by the Funds’ portfolio management personnel.
In addition, the Board considered HFMC’s ongoing commitment to review and rationalize the Hartford Funds productline-up and the expenses that HFMC had incurred, as well as the risks HFMC had assumed, in connection with the launch of new funds and changes to existing Hartford Funds in recent years. The Board considered that HFMC is responsible for providing the Funds’ officers.
With respect to SIMNA Inc., which provides certainday-to-day portfolio management services for the Funds, and SIMNA Ltd., which provides certainday-to-day portfolio management services for theSub-Sub-Advised Funds and is proposed to provide such services to the Hartford SchrodersTax-Aware Bond Fund, subject to oversight by HFMC, the Board considered, among other things, theSub-adviser’s investment personnel, its investment philosophy and process, its investment research capabilities and resources, its performance record, its trade execution capabilities and its experience. The Board considered the quality and experience of each Fund’s portfolio manager(s), the number of accounts managed by the portfolio manager(s), and eachSub-adviser’s method for compensating the portfolio manager(s). The Board also considered theSub-advisers’ succession planning to ensure continuity of portfolio management services provided to the Funds.
The Board considered the benefits to shareholders of being part of the Hartford Funds family of funds, including, with respect to certain share classes, the right to exchange investments between the same class of shares without a sales charge, the ability to reinvest Fund dividends into other Hartford Funds, and the ability to combine holdings in a Fund with holdings in other Hartford Funds to obtain a reduced sales charge. The Board considered HFMC’s efforts to provide investors in the Hartford Funds with a broad range of investment styles and asset classes and the assumption of entrepreneurial and other risks by HFMC in sponsoring new funds to expand these opportunities for shareholders.
Based on these considerations, the Board concluded that it was satisfied with the nature, extent and quality of the services provided to each Fund by HFMC and theSub-advisers.
Performance of each Fund and the Advisers
The Board considered the investment performance of each Fund, which included the performance of its applicable Predecessor Fund. The Board noted that each Predecessor Fund had been managed by SIMNA Inc., and eachSub-Sub-Advised Fund’s corresponding Predecessor Fund had beensub-advised by SIMNA Ltd. In this regard, the Board reviewed the performance of each Fund over different time periods presented in the materials and evaluated HFMC’s analysis of the Fund’s performance for these time periods. The Board considered information and materials provided to the Board by the Advisers concerning Fund performance, as well as information from Broadridge comparing the investment performance of each Fund to an appropriate universe of peer funds. For details regarding each Fund’s performance, see theFund-by-Fund synopsis below.
| 113 |
|
| Hartford Schroders Funds |
Approval of Investment Management and InvestmentSub-Advisory Agreements (Unaudited) – (continued)
The Board considered the detailed investment analytics reports provided by HFMC’s Investment Advisory Group throughout the year, including in connection with the approval of the continuation of the Agreements. These reports included, among other things, information on each Fund’s gross returns and net returns, the Fund’s investment performance relative to an appropriate benchmark and peer group (if available), various statistics concerning the Fund’s portfolio, a narrative summary of various factors affecting Fund performance and commentary of the effect of current and recent market conditions. The Board considered the Advisers’ work with the Investment Committee, which assists the Board in evaluating the performance of each Fund at periodic meetings throughout the year and specifically with respect to the approval of the continuation of the Agreements. The Board also considered the analysis provided by the Consultant relating to each Fund’s performance track record.
In light of all the considerations noted above, the Board concluded that it had continued confidence in HFMC’s and eachSub-adviser’s overall capabilities to manage the Funds, as applicable.
Costs of the Services and Profitability of the Advisers
The Board reviewed information regarding HFMC’s cost to provide investment management and related services to each Fund and HFMC’s profitability, both overall and for each Fund, on apre-tax basis without regard to distribution expenses. The Board also requested and reviewed information about the profitability to HFMC and its affiliates from all services provided to each Fund and all aspects of their relationship with the Fund, including information regarding profitability trends over time. The Board also requested and received information relating to the operations and profitability of theSub-advisers. The Board considered representations from HFMC and SIMNA Inc. that SIMNA Inc.’s fees were negotiated at arm’s length on aFund-by-Fund basis and that thesub-advisory fees are paid by HFMC and not the Funds. The Board also considered that SIMNA Ltd. is an affiliate of SIMNA Inc. and that SIMNA Ltd.’ssub-sub-advisory fees would be paid by SIMNA Inc., not theSub-Sub-Advised Funds or Hartford SchrodersTax-Aware Bond Fund. Accordingly, the Board concluded that the profitability of theSub-advisers is a less relevant factor with respect to the Board’s consideration of theSub-Advisory Agreement, theSub-Sub-Advisory Agreement, and the Amendment.
The Board considered the Consultant’s review of the methodologies and estimates used by HFMC in calculating profitability in connection with the continuation of the Management Agreement, including a description of the methodology used to allocate certain expenses. The Board noted the Consultant’s view that HFMC’s process for calculating and reporting Fund profitability is reasonable and consistent with the process previously reviewed by the Consultant. In this regard, the Board noted that the Consultant had previously performed a full review of this process and reported that such process is sound and consistent with common industry practice.
Based on these considerations, the Board concluded that the profits realized by the Advisers and their affiliates from their relationships with the Funds were not excessive.
Comparison of Fees and Services Provided by the Advisers
The Board considered the comparative information that had been provided at meetings on June 18, 2019 and August6-7, 2019 with respect to the services rendered to and the management fees to be paid by each Fund to HFMC and the total expense ratios of the Fund. The Board also considered comparative information with respect to thesub-advisory fees to be paid by HFMC to SIMNA Inc. with respect to each Fund. In this regard, the Board requested and reviewed information from HFMC and SIMNA Inc. relating to the management andsub-advisory fees, including thesub-advisory fee schedule for each Fund and the amount of the management fee retained by HFMC, and total operating expenses for each Fund. The Board also reviewed information from Broadridge comparing each Fund’s contractual management fees, actual management fees and total expense ratios relative to an appropriate group of funds selected by Broadridge, in consultation with the Consultant. For details regarding each Fund’s expenses, see theFund-by-Fund synopsis below.
While the Board recognized that comparisons between a Fund and its peer funds may be imprecise given, among other differences, the different service levels and characteristics of mutual funds and the different business models and cost structures of the Advisers, the comparative information provided by Broadridge assisted the Board in evaluating the reasonableness of each Fund’s fees and total operating expenses. In addition, the Board considered the analysis and recommendations of the Consultant relating to each Fund’s fees and total operating expenses.
The Board received information regarding fees charged by HFMC to another Hartford Fund that is an exchange-traded fund (“ETF”) with investment strategies similar to those of the Hartford SchrodersTax-Aware Bond Fund. The Board reviewed information about structural, operational and other differences between the ETF and the Hartford SchrodersTax-Aware Bond Fund, including differences in the marketplace in which each type of product must compete. The Board also received information regarding fees charged by theSub-advisers to any other clients with investment strategies similar to those of the Funds, including institutional separate account clients and registered fund clients for which aSub-adviser serves as either primary investment adviser orsub-adviser. The Board considered the explanations provided by theSub-advisers about any differences between aSub-adviser’s services to the Funds and the services it provides to other types of clients. In this regard, the Board reviewed information about the generally broader scope of services and compliance, reporting and other legal burdens and risks of managing registered funds compared with those associated with managing assets ofnon-registered fund clients such as institutional separate accounts.
Based on these considerations, the Board concluded that each Fund’s fees and total operating expenses, in conjunction with the information about quality of services, profitability, economies of scale, and other matters considered, were reasonable in light of the services provided.
| 114 |
|
| Hartford Schroders Funds |
Approval of Investment Management and InvestmentSub-Advisory Agreements (Unaudited) – (continued)
Economies of Scale
The Board considered information regarding the extent to which economies of scale may be realized as a Fund grows and whether fee levels reflect these economies of scale for the benefit of shareholders of the Fund. The Board reviewed the breakpoints in the management fee schedule for each Fund, if any, which reduce fee rates as the Fund’s assets grow over time. The Board recognized that a Fund with assets beyond the highest breakpoint level will continue to benefit from economies of scale because additional assets are charged the lowest breakpoint fee resulting in lower overall effective management fee rates. The Board also recognized that a fee schedule that reaches a breakpoint at a lower asset level provides shareholders with the benefit of anticipated or potential economies of scale. The Board considered that expense limitations and fee waivers that reduce a Fund’s expenses at all asset levels can have the same effect as breakpoints in sharing economies of scale with shareholders and provide protection from an increase in expenses if the Fund’s assets decline. In addition, the Board considered that initially setting competitive fee rates, pricing the Funds to scale at inception and making additional investments intended to enhance services available to shareholders are other means of sharing anticipated or potential economies of scale with shareholders. The Board also considered that HFMC has been active in managing expenses, which has resulted in benefits being realized by shareholders as assets within the Hartford Funds have grown over time, including through lower operating expenses. The Board also noted that, for each of the Hartford Schroders Emerging Markets Multi-Sector Bond Fund and the Hartford Schroders US Small Cap Opportunities Fund, the Fund’s current low asset levels have kept the Fund from fully realizing the benefits of anticipated or potential economies of scale.
The Board reviewed and evaluated materials from Broadridge and the Consultant showing how management fee schedules of peer funds reflect economies of scale for the benefit of shareholders as a peer fund’s assets hypothetically increase over time. Based on information provided by HFMC, Broadridge, and the Consultant, the Board recognized that there is no uniform methodology for establishing breakpoints or uniform pattern in asset levels that trigger breakpoints or the amounts of breakpoints triggered.
After considering all of the information available to it, the Board concluded that it was satisfied with the extent to which economies of scale would be shared for the benefit of each Fund’s shareholders based on currently available information and the effective management fees and total expense ratios for the Fund at its current and reasonably anticipated asset levels. The Board noted, however, that it would continue to monitor future growth in each Fund’s assets and the appropriateness of additional management fee breakpoints or other methods to share benefits from economies of scale.
Other Benefits
The Board considered other benefits to the Advisers and their affiliates from their relationships with the Funds.
The Board noted that HFMC receives fees for fund accounting and related services from the Funds, and the Board considered information on profits to HFMC for such services. The Board also considered that each Fund pays a transfer agency fee to Hartford Administrative Services Company (“HASCO”), an affiliate of HFMC, equal to the lesser of: (i) the actual costs incurred by HASCO in connection with the provisions of transfer agency services, including payments made tosub-transfer agents, plus a reasonable target profit margin; or (ii) a specified amount as set forth in the Transfer Agency and Service Agreement by and between HMF II, on behalf of its Funds, HMF, on behalf of its series, and HASCO. The Board reviewed information about the profitability to HASCO of the Funds’ transfer agency function. The Board considered information provided by HASCO indicating that the transfer agency fees charged by HASCO to the Funds were fair and reasonable based on publicly available information. The Board also noted that HFMC and HASCO had delegated certain fund accounting services and transfer agency services, respectively, to external service providers.
The Board also considered that Hartford Funds Distributors, LLC (“HFD”), an affiliate of HFMC, serves as principal underwriter of the Funds. The Board noted that, as principal underwriter, HFD receives distribution and service fees from the Funds and receives all or a portion of the sales charges on sales or redemptions of certain classes of shares. The Board also considered that Schroder Fund Advisors LLC (“SFA”), a wholly-owned subsidiary of SIMNA Inc., has entered into an additional compensation arrangement with HFMC and HFD. The Board considered that under this arrangement, SFA is involved in the distribution of the Class SDR shares of the Funds, and HFMC compensates SFA for such services.
The Board considered the benefits, if any, to theSub-advisers from any use of a Fund’s brokerage commissions to obtain soft dollar research. The Board also considered that SIMNA Inc. has entered into a solicitation agreement with HFMC pursuant to which HFMC provides certain marketing support services with respect to an investment strategy model offered by SIMNA Inc. through its managed account platforms.
Fund-by-Fund Factors
For purposes of theFund-by-Fund discussion below, Fund performance is referred to as “in line with” a Fund’s benchmark where it was 0.5% above or below the benchmark return, and each Fund’s performance relative to its benchmark reflects the net performance of the Fund’s Class I shares as of March 31, 2019.
Hartford Schroders Emerging Markets Equity Fund
| • | The Board noted that the Fund’s performance was in the 3rd quintile of its performance universe for the1-year period, the 1st quintile for the3-year period and the 2nd quintile for the5-year period. The Board also noted that the Fund’s performance was below its benchmark for the1-year period and above its benchmark for the3- and5-year periods. |
| 115 |
|
| Hartford Schroders Funds |
Approval of Investment Management and InvestmentSub-Advisory Agreements (Unaudited) – (continued)
| • | The Board noted that the Fund’s contractual management fee and actual management fee were in the 4th quintile of its expense group, while its total expenses (less12b-1 and shareholder service fees) were in the 2nd quintile. |
Hartford Schroders Emerging Markets Multi-Sector Bond Fund
| • | The Board noted that the Fund’s performance was in the 4th quintile of its performance universe for the1-year period, the 2nd quintile for the3-year period and the 3rd quintile for the5-year period. The Board also noted that the Fund’s performance was below its custom blended benchmark for the1-year period, above its custom blended benchmark for the3-year period and in line with its custom blended benchmark for the5-year period. |
| • | The Board noted that the Fund’s contractual management fee was in the 2nd quintile of its expense group, while its actual management fee was in the 4th quintile and its total expenses (less12b-1 and shareholder service fees) were in the 3rd quintile. The Board noted that Class A shares of the Fund have a contractual expense cap of 1.15% through February 29, 2020, which resulted in HFMC reimbursing the Fund for certain expenses. |
Hartford Schroders InternationalMulti-Cap Value Fund
| • | The Board noted that the Fund’s performance was in the 2nd quintile of its performance universe for the1-year period and the 1st quintile for the3- and5-year periods. The Board also noted that the Fund’s performance was below its benchmark for the1- and3-year periods and in line with its benchmark for the5-year period. |
| • | The Board noted that the Fund’s contractual management fee was in the 2nd quintile of its expense group, while its actual management fee was in the 3rd quintile and its total expenses (less12b-1 and shareholder service fees) were in the 1st quintile. The Board noted that Class Y shares of the Fund have a contractual transfer agency expense cap of 0.05% through February 29, 2020. |
Hartford Schroders International Stock Fund
| • | The Board noted that the Fund’s performance was in the 2nd quintile of its performance universe for the1-,3- and5-year periods. The Board also noted that the Fund’s performance was above its benchmark for the1-,3- and5-year periods. |
| • | The Board noted that the Fund’s contractual management fee, actual management fee and total expenses (less12b-1 and shareholder service fees) were in the 1st quintile. In considering the Fund’s expenses, the Board noted the shareholder savings expected to result from a contractual investment management fee reduction implemented March 1, 2019. The Board noted that Class A shares of the Fund have a contractual expense cap of 1.15% through February 29, 2020, which resulted in HFMC reimbursing the Fund for certain expenses. |
Hartford SchrodersTax-Aware Bond Fund
| • | The Board noted that the Fund’s performance was in the 2nd quintile of its performance universe for the1-year period and the 3rd quintile for the3-year period. The Board also noted that the Fund’s performance was in line with its benchmark for the1- and3-year periods and above its benchmark for the5-year period. The Board noted recent changes to the Fund’s portfolio management team. |
| • | The Board noted that the Fund’s contractual management fee was in the 2nd quintile of its expense group, while its actual management fee and its total expenses (less12b-1 and shareholder service fees) were in the 1st quintile. The Board noted that Class A shares of the Fund have a contractual expense cap of 0.71% through February 29, 2020. |
Hartford Schroders US MidCap Opportunities Fund
| • | The Board noted that the Fund’s performance was in the 3rd quintile of its performance universe for the1- and3-year periods and the 1st quintile for the5-year period. The Board also noted that the Fund’s performance was below its benchmark for the1- and3-year periods and above its benchmark for the5-year period. The Board noted recent changes to the Fund’s portfolio management team. The Board also noted that certain changes had recently been made to the Fund’s name, principal investment strategy, and benchmark. |
| • | The Board noted that the Fund’s contractual management fee and total expenses (less12b-1 and shareholder service fees) were in the 4th quintile of its expense group, while its actual management fee was in the 5th quintile. In considering the Fund’s expenses, the Board noted the shareholder savings expected to result from a permanent fee reduction to be implemented in November 2019. The Board noted that Class Y shares of the Fund have a contractual transfer agency expense cap of 0.07% through February 29, 2020. |
Hartford Schroders US Small Cap Opportunities Fund
| • | The Board noted that the Fund’s performance was in the 2nd quintile of its performance universe for the1-,3- and5-year periods. The Board also noted that the Fund’s performance was in line with its benchmark for the1-year period, below its benchmark for the3-year period and above its benchmark for the5-year period. The Board noted recent changes to the Fund’s portfolio management team. |
| 116 |
|
| Hartford Schroders Funds |
Approval of Investment Management and InvestmentSub-Advisory Agreements (Unaudited) – (continued)
| • | The Board noted that the Fund’s contractual management fee and actual management fee were in the 4th quintile of its expense group, while its total expenses (less12b-1 and shareholder service fees) were in the 3rd quintile. The Board noted that Class A shares of the Fund have a contractual expense cap of 1.35% through February 29, 2020, which resulted in HFMC reimbursing the Fund for certain expenses. |
* * * *
Based upon its review of these various factors, among others, the Board concluded that it is in the best interests of each Fund and its shareholders for the Board to approve the continuation of the Agreements. In reaching these decisions, the Board did not assign relative weights to the factors discussed above or deem any one or group of them to be controlling in and of themselves. In connection with their deliberations, the Independent Directors met separately in executive session on several occasions, with independent legal counsel and the Consultant, to review the relevant materials and consider their responsibilities under relevant laws and regulations.
| 117 |
|
THIS PRIVACY POLICY IS NOT PART OF THIS REPORT
CUSTOMER PRIVACY NOTICE
The Hartford Financial Services Group, Inc. and its Affiliates*
(herein called “we, our, and us”)
This Privacy Policy applies to our United States Operations
We value your trust. We are committed to the responsible:
a) management;
b) use; and
c) protection;
ofPersonal Information.
This notice describes how we collect, disclose, and protectPersonal Information.
We collectPersonal Information to:
a) service yourTransactionswith us; and
b) support our business functions.
We may obtainPersonal Information from:
a)You;
b) yourTransactionswith us; and
c) third parties such as a consumer-reporting agency.
Based on the type of product or serviceYou apply for or get from us,Personal Information such as:
a) your name;
b) your address;
c) your income;
d) your payment; or
e) your credit history;
may be gathered from sources such as applications,Transactions, and consumer reports.
To serveYou and service our business, we may share certainPersonal Information. We will sharePersonal Information, only as allowed by law, with affiliates such as:
a) our insurance companies;
b) our employee agents;
c) our brokerage firms; and
d) our administrators.
As allowed by law, we may sharePersonal Financial Information with our affiliates to:
a) market our products; or
b) market our services;
toYou without providingYou with an option to prevent these disclosures.
We may also sharePersonal Information, only as allowed by law, with unaffiliated third parties including:
a) independent agents;
b) brokerage firms;
c) insurance companies;
d) administrators; and
e) service providers;
who help us serveYou and service our business.
When allowed by law, we may share certainPersonal Financial Information with other unaffiliated third parties who assist us by performing services or functions such as:
a) taking surveys;
b) marketing our products or services; or
c) offering financial products or services under a joint agreement between us and one or more financial institutions.
We, and third parties we partner with, may track some of the pagesYou visit through the use of:
a) cookies;
b) pixel tagging; or
c) other technologies;
and currently do not process or comply with any web browser’s “do not track” signal or other similar mechanism that indicates a request to disable online tracking of individual users who visit our websites or use our services.
For more information, our Online Privacy Policy, which governs information we collect on our website and our affiliate websites, is available at https://www.thehartford.com/online-privacy-policy.
We will not sell or share yourPersonal Financial Information with anyone for purposes unrelated to our business functions without offeringYou the opportunity to:
a)“opt-out;” or
b)“opt-in;”
as required by law.
We only disclosePersonal Health Information with:
a) your authorization; or
b) as otherwise allowed or required by law.
Our employees have access toPersonal Information in the course of doing their jobs, such as:
a) underwriting policies;
b) paying claims;
c) developing new products; or
d) advising customers of our products and services.
We use manual and electronic security procedures to maintain:
a) the confidentiality; and
b) the integrity of;
Personal Information that we have. We use these procedures to guard against unauthorized access.
Some techniques we use to protectPersonal Information include:
a) secured files;
b) user authentication;
c) encryption;
d) firewall technology; and
e) the use of detection software.
We are responsible for and must:
a) identify information to be protected;
b) provide an adequate level of protection for that data; and
c) grant access to protected data only to those people who must use it in the performance of theirjob-related duties.
Employees who violate our privacy policies and procedures may be subject to discipline, which may include termination of their employment with us.
We will continue to follow our Privacy Policy regardingPersonal Information even when a business relationship no longer exists between us.
As used in this Privacy Notice:
Application means your request for our product or service.
Personal Financial Information means financial information such as:
a) credit history;
b) income;
c) financial benefits; or
d) policy or claim information.
Personal Financial Informationmay include Social Security Numbers, Driver’s license numbers, or other government-issued identification numbers, or credit, debit card, or bank account numbers.
Personal Health Information means health information such as:
a) your medical records; or
b) information about your illness, disability or injury.
Personal Information means information that identifiesYou personally and is not otherwise available to the public. It includes:
a)Personal Financial Information; and
b)Personal Health Information.
Transaction means your business dealings with us, such as:
a) yourApplication;
b) your request for us to pay a claim; and
c) your request for us to take an action on your account.
You means an individual who has given usPersonal Information in conjunction with:
a) asking about;
b) applying for; or
c) obtaining;
a financial product or service from us if the product or service is used mainly for personal, family, or household purposes.
If you have any questions or comments about this privacy notice, please feel free to contact us at The Hartford – Law Department, Privacy Law, One Hartford Plaza, Hartford, CT 06155, or at CorporatePrivacyOffice@thehartford.com.
This Customer Privacy Notice is being provided on behalf of The Hartford Financial Services Group, Inc. and its affiliates (including the following as of March 2019), to the extent required by the Gramm-Leach-Bliley Act and implementing regulations.
1stAGChoice, Inc.; Access CoverageCorp, Inc.; Access CoverageCorp Technologies, Inc.; Business Management Group, Inc.; Cervus Claim Solutions, LLC; First State Insurance Company; FTC Resolution Company LLC; Hart Re Group L.L.C.; Hartford Accident and Indemnity Company; Hartford Administrative Services Company; Hartford Casualty General Agency, Inc.; Hartford Casualty Insurance Company; Hartford Fire General Agency, Inc.; Hartford Fire Insurance Company; Hartford Funds Distributors, LLC; Hartford Funds Management Company, LLC; Hartford Funds Management Group, Inc.; Hartford Group Benefits Holding Company; Hartford Holdings, Inc.; Hartford Insurance Company of Illinois; Hartford Insurance Company of the Midwest; Hartford Insurance Company of the Southeast; Hartford Insurance, Ltd.; Hartford Integrated Technologies, Inc.; Hartford Investment Management Company; Hartford Life and Accident Insurance Company; Hartford Life, Ltd.; Hartford Lloyd’s Corporation; Hartford Lloyd’s Insurance Company; Hartford Management, Ltd.; Hartford of Texas General Agency, Inc.; Hartford Residual Market, L.C.C.; Hartford Specialty Insurance Services of Texas, LLC; Hartford STAG Ventures LLC; Hartford Strategic Investments, LLC; Hartford Underwriters General Agency, Inc.; Hartford Underwriters Insurance Company; Heritage Holdings, Inc.; Heritage Reinsurance Company, Ltd.; HIMCO Distribution Services Company; HLA LLC; HL Investment Advisors, LLC; Horizon Management Group, LLC; HRA Brokerage Services, Inc.; Lattice Strategies LLC; Maxum Casualty Insurance Company; Maxum Indemnity Company; Maxum Specialty Services Corporation; MPC Resolution Company LLC; New England Insurance Company; New England Reinsurance Corporation; New Ocean Insurance Co., Ltd.; Nutmeg Insurance Agency, Inc.; Nutmeg Insurance Company; Pacific Insurance Company, Limited; Property and Casualty Insurance Company of Hartford; Renato Acquisition Co.; Sentinel Insurance Company, Ltd; Trumbull Flood Management, L.L.C.; Trumbull Insurance Company; Twin City Fire Insurance Company;Y-Risk, LLC.
Revised March 2019
This report is submitted for the general information of the shareholders of the Funds referenced in this report. It is not authorized for distribution to persons who are not shareholders of one or more Funds referenced in this report unless preceded or accompanied by a current prospectus for the relevant Funds. Nothing herein contained is to be considered an offer of sale or a solicitation of an offer to buy shares of any Fund listed in this report. Such offering is only made by prospectus, which includes details as to the offering price and other material information.
The information cannot be used or relied upon for the purpose of avoiding IRS penalties. These materials are not intended to provide tax, accounting or legal advice. As with all matters of a tax or legal nature, you should consult your own tax or legal counsel for advice.
Investors should carefully consider the investment objectives, risks, charges and expenses of a Fund. This and other important information is contained in a Fund’s prospectus and summary prospectus, which can be obtained by visiting hartfordfunds.com. Please read it carefully before investing.
The Funds are distributed by Hartford Funds Distributors, LLC (HFD), Member FINRA. Hartford Funds Management Company, LLC (HFMC) is the Funds’ investment manager. The Funds referenced herein are sub-advised by Schroder Investment Management North America Inc. Schroder Investment Management North America Ltd. serves as a sub-sub adviser to certain Funds. HFD and HFMC are not affiliated with Schroder Investment Management North America Inc. and Schroder Investment Management North America Ltd.
MFAR-HSE19 12/19 214079 Printed in U.S.A.

Item 2. Code of Ethics.
The registrant, as of the end of the period covered by this report, has adopted a code of ethics that applies to the registrant’s principal executive officer, principal financial officer, principal accounting officer or controller, or persons performing similar functions, regardless of whether these individuals are employed by the registrant or a third party. There have been no amendments, during the period covered by this report, to a provision of the code of ethics that applies to the registrant’s principal executive officer, principal financial officer, principal accounting officer or controller, or persons performing similar functions, regardless of whether these individuals are employed by the registrant or a third party, and that relates to any element of the code of ethics description. The registrant has not granted any waivers, including an implicit waiver, from a provision of the code of ethics that applies to the registrant’s principal executive officer, principal financial officer, principal accounting officer or controller, or persons performing similar functions, regardless of whether these individuals are employed by the registrant or a third party, that relates to one or more of the items set forth in paragraph (b) of this item’s instructions. A copy of the code of ethics is filed herewith.
Item 3. Audit Committee Financial Expert.
The Board of Directors of the registrant (the “Board”) designated Phillip Peterson as an Audit Committee Financial Expert. Mr. Peterson, an independent director, retired from the Board effective December 5, 2019. The Board also designated David Sung as an Audit Committee Financial Expert effective November 7, 2019. Mr. Sung is considered by the Board to be an independent director.
Item 4. Principal Accountant Fees and Services.
| (a) | Audit Fees: The aggregate fees billed for each of the last two fiscal years for professional services rendered by the principal accountant for the audit of the registrant’s annual financial statements or services that are normally provided by the accountant in connection with statutory and regulatory filings or engagements for those fiscal years were: |
$230,500 for the fiscal year ended October 31, 2018; $243,000 for the fiscal year ended October 31, 2019.
| (b) | Audit Related Fees: The aggregate fees billed in each of the last two fiscal years for assurance and related services by the principal accountant that are reasonably related to the performance of the audit of the registrant’s financial statements and are not reported under paragraph (a) of this Item were: |
$30,000 for the fiscal year ended October 31, 2018; $0 for the fiscal year ended October 31, 2019. Audit-related services are principally in connection with consents for the registration statements relating to Fund mergers.
| (c) | Tax Fees: The aggregate fees billed in each of the last two fiscal years for professional services rendered by the principal accountant for tax compliance, tax advice, and tax planning were: |
$166,921 for the fiscal year ended October 31, 2018; $98,573 for the fiscal year ended October 31, 2019.Tax-related services are principally in connection with, but not limited to, general tax services, excise tax and Passive Foreign Investment Company (PFIC) analysis.
| (d) | All Other Fees:The aggregate fees billed in each of the last two fiscal years for products and services provided by the principal accountant, other than the services reported in paragraphs (a) through (c) of this Item were: |
$0 for the fiscal year ended October 31, 2018; $0 for the fiscal year ended October 31, 2019.
| (e) | (1) ThePre-Approval Policies and Procedures (the “Policy”) adopted by the Audit Committee of the registrant (also, the “Fund”) sets forth the procedures pursuant to which services performed by the independent registered public accounting firm for the registrant may bepre-approved. The following are some main provisions from the Policy. |
| 1. | The Audit Committee mustpre-approve all audit services andnon-audit services that the independent registered public accounting firm provides to the Fund. |
| 2. | The Audit Committee mustpre-approve any engagement of the independent registered public accounting firm to providenon-audit services to any Service Affiliate (which is defined to include any entity controlling, controlled by, or under common control with the investment adviser that provides ongoing services to the Fund) during the period of the independent registered public accounting firm’s engagement to provide audit services to the Fund, if thenon-audit services to the Service Affiliate directly impact the Fund’s operations and financial reporting. |
| 3. | The Audit Committee shallpre-approve certainnon-audit services to the Fund and its Service Affiliates pursuant to procedures set forth in the Policy. |
| 4. | The Audit Committee, from time to time, may designate one or more of its members who are Independent Directors (each a “Designated Member”) to consider, on the Audit Committee’s behalf, anynon-audit services, whether to the Fund or to any Service Affiliate, that have not beenpre-approved by the Audit Committee. The Designated Member also shall review, on the Audit Committee’s behalf, any proposed material change in the nature or extent of anynon-audit services previously approved. In considering any requestednon-audit services or proposed material change in such services, the Designated Member shall not authorize services which would exceed $50,000 in fees for such services. |
| 5. | The independent registered public accounting firm may not provide specified prohibitednon-audit services set forth in the Policy to the Fund, the Fund’s investment adviser, the Service Affiliates or any other member of the investment company complex. |
| (e) | (2) One hundred percent of the services described in items 4(b) through 4(d) were approved in accordance with the Audit Committee’sPre-Approval Policy. As a result, none of such services was approved pursuant to paragraph (c) (7) (i) (c) of Rule2-01 of RegulationS-X. |
| (f) | Not applicable. |
| (g) | The aggregatenon-audit fees billed by the registrant’s accountant for services rendered to the registrant, and rendered to the registrant’s investment adviser (not including anysub-adviser whose role is primarily portfolio management and is subcontracted with or overseen by another investment adviser), and any entity controlling, controlled by, or under common control with the adviser that provides ongoing services to the registrant for each of the last two fiscal years of the registrant were: |
Non-Audit Fees: $236,921 for the fiscal year ended October 31, 2018; $98,573 for the fiscal year ended October 31, 2019.
| (h) | The registrant’s audit committee of the board of directors has considered whether the provision ofnon-audit services that were rendered to the registrant’s investment adviser (not including anysub-adviser whose role is primarily portfolio management and is subcontracted with or overseen by another investment adviser), and any entity controlling, controlled by, or under common control with the investment adviser that provides ongoing services to the registrant that were notpre-approved pursuant to paragraph (c)(7)(ii) of Rule2-01 of RegulationS-X is compatible with maintaining the principal accountant’s independence. |
Item 5. Audit Committee of Listed Registrants.
Not applicable.
Item 6. Investments.
| (a) | The Schedule of Investments in securities of unaffiliated issuers as of the close of the reporting period is included as part of the annual report filed under Item 1 of this form. |
| (b) | Not applicable. |
Item 7. Disclosure of Proxy Voting Policies and Procedures forClosed-End Management Investment Companies.
Not applicable.
Item 8. Portfolio Managers ofClosed-End Management Investment Companies.
Not applicable.
Item 9. Purchases of Equity Securities byClosed-End Management Investment Company and Affiliated Purchasers.
Not applicable.
Item 10. Submission of Matters to a Vote of Security Holders.
There have been no material changes to the procedures by which shareholders may recommend nominees to the registrant’s board of directors since the registrant last provided disclosure in response to this requirement.
Item 11. Controls and Procedures.
| (a) | The registrant’s principal executive and principal financial officers, or persons performing similar functions, have concluded that the registrant’s disclosure |
controls and procedures (as defined in Rule30a-3(c) under the Investment Company Act of 1940, as amended (the “1940 Act”) (17 CFR270.30a-3(c))) are generally effective to provide reasonable assurance, as of a date within 90 days of the filing date of the report that includes the disclosure required by this paragraph, based on their evaluation of these controls and procedures required by Rule30a-3(b) under the 1940 Act (17 CFR270.30a-3(b)) and Rules13a-15(b) or15d-15(b) under the Securities Exchange Act of 1934, as amended (17 CFR240.13a-15(b) or240.15d-15(b)). |
| (b) | There were no changes in the registrant’s internal control over financial reporting (as defined in Rule30a-3(d) under the 1940 Act (17 CFR270.30a-3(d)) that occurred during the period covered by this report that have materially affected, or is reasonably likely to materially affect, the registrant’s internal control over financial reporting. |
Item 12. Disclosure of Securities Lending Activities forClosed-End Management Investment Companies.
Not applicable.
Item 13. Exhibits.
(a)(1) | Code of Ethics is filed herewith. | |
(a)(2) | Separate certifications for each principal executive officer and principal financial officer of the registrant as required by Rule30a-2(a) under the 1940 Act (17 CFR270.30a-2(a)) and Section 302 of the Sarbanes-Oxley Act of 2002 are attached hereto. | |
(a)(3) | Not applicable. | |
(a)(4) | Response to Item 13(a)(4) is filed herewith. | |
(b) | Certifications pursuant to Rule30a-2(b) under the 1940 Act and Section 906 of the Sarbanes-Oxley Act of 2002 are attached hereto. |
SIGNATURES
Pursuant to the requirements of the Securities Exchange Act of 1934 and the Investment Company Act of 1940, the registrant has duly caused this report to be signed on its behalf by the undersigned, thereunto duly authorized.
| THE HARTFORD MUTUAL FUNDS II, INC. | ||||||
| Date: January 9, 2020 | By: | /s/ James E. Davey | ||||
| James E. Davey | ||||||
| President and Chief Executive Officer | ||||||
Pursuant to the requirements of the Securities Exchange Act of 1934 and the Investment Company Act of 1940, this report has been signed below by the following persons on behalf of the registrant and in the capacities and on the dates indicated.
| Date: January 9, 2020 | By: | /s/ James E. Davey | ||||
| James E. Davey | ||||||
| President and Chief Executive Officer | ||||||
| Date: January 9, 2020 | By: | /s/ Amy N. Furlong | ||||
| Amy N. Furlong | ||||||
| Treasurer | ||||||
| (Principal Financial Officer and Principal Accounting Officer) | ||||||